Planning, Programming and Production Control in Small and ...

COPEL
Companhia Paranaense de Energia - Copel
CNPJ/MF 76.483.817/0001-20
Inscrição Estadual 10146326-50
Companhia de Capital Aberto - CVM 1431-1
www.copel.com [email protected]
Rua Coronel Dulcídio, 800, Batel - Curitiba - PR
CEP 80420-170
Quarterly Financial Information
ITR
June / 2012
SUMMARY QUARTERLY FINANCIAL INFORMATION .................................................................................................................... 3
BALANCE SHEETS .............................................................................................................................................. 3 BALANCE SHEETS .............................................................................................................................................. 4 STATEMENTS OF INCOME ................................................................................................................................. 5 STATEMENTS OF INCOME – Turnover for the second quarter ............................................................................ 6 STATEMENTS OF COMPREHENSIVE INCOME.................................................................................................. 7 STATEMENTS OF CHANGES IN SHAREHOLDERS’ EQUITY ............................................................................. 8 STATEMENTS OF CASH FLOWS ........................................................................................................................ 9 STATEMENTS OF ADDED VALUE ..................................................................................................................... 11
NOTES TO THE QUARTELY FINANCIAL INFORMATION .......................................................................................... 13 1 General Information .............................................................................................................................. 13 2 Main Accounting Policies ...................................................................................................................... 13 3 Cash and Cash equivalents .................................................................................................................. 16 4 Bonds and Securities ............................................................................................................................ 16 5 Trade Accounts Receivable .................................................................................................................. 19 6 Recoverable Rate Deficit (CRC) Transferred to the Government of the State of Paraná ....................... 20 7 Accounts receivable related to the concession ...................................................................................... 22 8 Other Receivables ................................................................................................................................ 26 9 Inventories ............................................................................................................................................ 27 10 Income Tax, Social Contribution and Other Taxes ................................................................................ 27 11 Prepaid Expenses ................................................................................................................................. 34 12 Judicial Deposits ................................................................................................................................... 34 13 Receivable from related parties ............................................................................................................. 35 14 Investments .......................................................................................................................................... 36 15 Property, Plant and Equipment.............................................................................................................. 45 16 Intangible Assets ................................................................................................................................... 52 17 Payroll, Social Charges and Labor Accruals .......................................................................................... 56 18 Suppliers ............................................................................................................................................... 56 19 Loans and Financing ............................................................................................................................. 58 20 Post-Employment Benefits .................................................................................................................... 68 21 Regulatory Charges .............................................................................................................................. 70 22 Research and Development and Energy Efficiency ............................................................................... 70 23 Accounts Payable related to concession - Use of Public Property ......................................................... 71 24 Other Accounts Payable ....................................................................................................................... 73 25 Reserve for Contingencies .................................................................................................................... 73 26 Shareholders’ Equity ............................................................................................................................. 80 27 Operating Revenues ............................................................................................................................. 84 28 Operating Costs and Expenses ............................................................................................................. 85 29 Financial Income (Expenses) ................................................................................................................ 92 30 Operating Segments ............................................................................................................................. 93 31 Operating Lease Agreements ............................................................................................................... 96 32 Financial Instruments ............................................................................................................................ 97 33 Related Party Transactions ................................................................................................................. 110 34 Insurance ............................................................................................................................................ 113 35 Compensation Account for “Part A” ..................................................................................................... 113
COMMENTS ON PERFORMANCE FOR THE PERIOD .............................................................................................. 116 1 Distribution .......................................................................................................................................... 116 2 Energy Market .................................................................................................................................... 116 3 Administration ..................................................................................................................................... 119 4 Market relations .................................................................................................................................. 119 5 Tariffs.... .............................................................................................................................................. 120 6 Economic Financial Results ................................................................................................................ 122
OTHER INFORMATION THAT THE COMPANY UNDERSTANDS TO BE RELEVANT .............................................. 124 GROUPS IN CHARGE OF GOVERNANCE ................................................................................................................ 126 INDEPENDENT AUDITORS’ REVIEW REPORT ........................................................................................................ 127
3
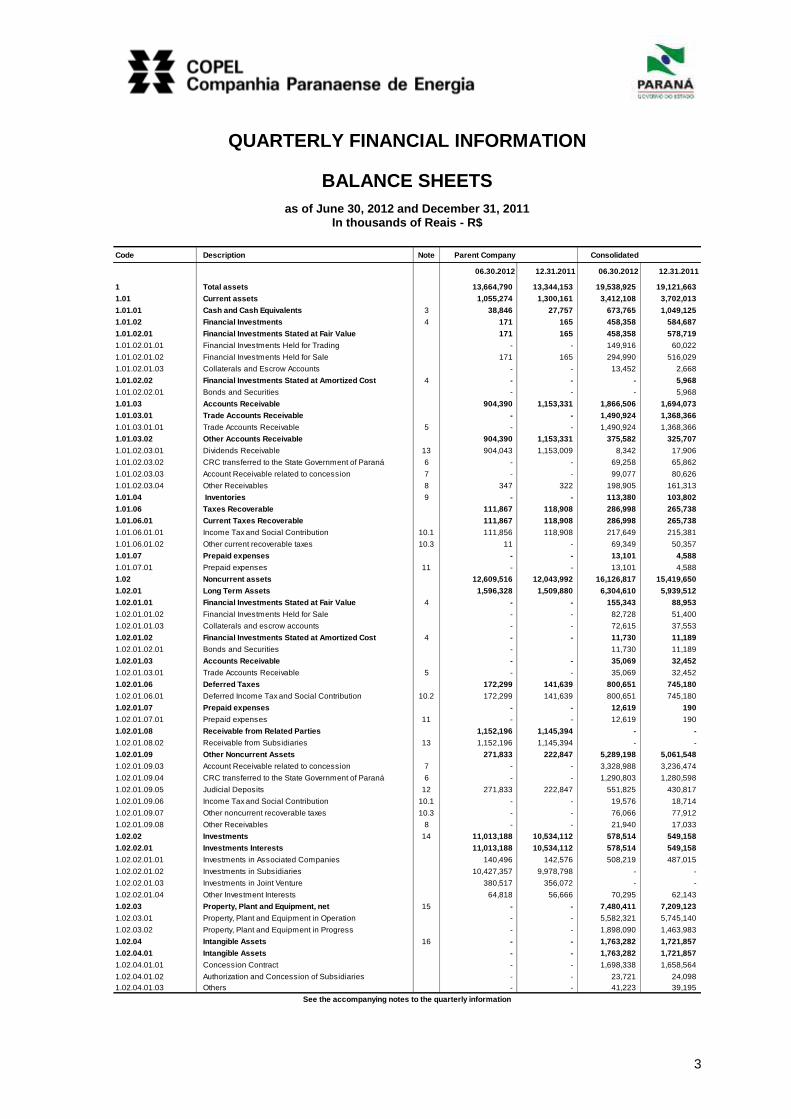
QUARTERLY FINANCIAL INFORMATION
BALANCE SHEETS
as of June 30, 2012 and December 31, 2011 In thousands of Reais - R$
Code Description Note Parent Company Consolidated
06.30.2012 12.31.2011 06.30.2012 12.31.2011
1 Total assets 13,664,790 13,344,153 19,538,925 19,121,663
1.01 Current assets 1,055,274 1,300,161 3,412,108 3,702,013
1.01.01 Cash and Cash Equivalents 3 38,846 27,757 673,765 1,049,125
1.01.02 Financial Investments 4 171 165 458,358 584,687
1.01.02.01 Financial Investments Stated at Fair Value 171 165 458,358 578,719
1.01.02.01.01 Financial Investments Held for Trading - - 149,916 60,022
1.01.02.01.02 Financial Investments Held for Sale 171 165 294,990 516,029
1.01.02.01.03 Collaterals and Escrow Accounts - - 13,452 2,668
1.01.02.02 Financial Investments Stated at Amortized Cost 4 - - - 5,968
1.01.02.02.01 Bonds and Securities - - - 5,968
1.01.03 Accounts Receivable 904,390 1,153,331 1,866,506 1,694,073
1.01.03.01 Trade Accounts Receivable - - 1,490,924 1,368,366
1.01.03.01.01 Trade Accounts Receivable 5 - - 1,490,924 1,368,366
1.01.03.02 Other Accounts Receivable 904,390 1,153,331 375,582 325,707
1.01.02.03.01 Dividends Receivable 13 904,043 1,153,009 8,342 17,906
1.01.02.03.02 CRC transferred to the State Government of Paraná 6 - - 69,258 65,862
1.01.02.03.03 Account Receivable related to concession 7 - - 99,077 80,626
1.01.02.03.04 Other Receivables 8 347 322 198,905 161,313
1.01.04 Inventories 9 - - 113,380 103,802
1.01.06 Taxes Recoverable 111,867 118,908 286,998 265,738
1.01.06.01 Current Taxes Recoverable 111,867 118,908 286,998 265,738
1.01.06.01.01 Income Tax and Social Contribution 10.1 111,856 118,908 217,649 215,381
1.01.06.01.02 Other current recoverable taxes 10.3 11 - 69,349 50,357
1.01.07 Prepaid expenses - - 13,101 4,588
1.01.07.01 Prepaid expenses 11 - - 13,101 4,588
1.02 Noncurrent assets 12,609,516 12,043,992 16,126,817 15,419,650
1.02.01 Long Term Assets 1,596,328 1,509,880 6,304,610 5,939,512
1.02.01.01 Financial Investments Stated at Fair Value 4 - - 155,343 88,953
1.02.01.01.02 Financial Investments Held for Sale - - 82,728 51,400
1.02.01.01.03 Collaterals and escrow accounts - - 72,615 37,553
1.02.01.02 Financial Investments Stated at Amortized Cost 4 - - 11,730 11,189
1.02.01.02.01 Bonds and Securities - 11,730 11,189
1.02.01.03 Accounts Receivable - - 35,069 32,452
1.02.01.03.01 Trade Accounts Receivable 5 - - 35,069 32,452
1.02.01.06 Deferred Taxes 172,299 141,639 800,651 745,180
1.02.01.06.01 Deferred Income Tax and Social Contribution 10.2 172,299 141,639 800,651 745,180
1.02.01.07 Prepaid expenses - - 12,619 190
1.02.01.07.01 Prepaid expenses 11 - - 12,619 190
1.02.01.08 Receivable from Related Parties 1,152,196 1,145,394 - -
1.02.01.08.02 Receivable from Subsidiaries 13 1,152,196 1,145,394 - -
1.02.01.09 Other Noncurrent Assets 271,833 222,847 5,289,198 5,061,548
1.02.01.09.03 Account Receivable related to concession 7 - - 3,328,988 3,236,474
1.02.01.09.04 CRC transferred to the State Government of Paraná 6 - - 1,290,803 1,280,598
1.02.01.09.05 Judicial Deposits 12 271,833 222,847 551,825 430,817
1.02.01.09.06 Income Tax and Social Contribution 10.1 - - 19,576 18,714
1.02.01.09.07 Other noncurrent recoverable taxes 10.3 - - 76,066 77,912
1.02.01.09.08 Other Receivables 8 - - 21,940 17,033
1.02.02 Investments 14 11,013,188 10,534,112 578,514 549,158
1.02.02.01 Investments Interests 11,013,188 10,534,112 578,514 549,158
1.02.02.01.01 Investments in Associated Companies 140,496 142,576 508,219 487,015
1.02.02.01.02 Investments in Subsidiaries 10,427,357 9,978,798 - -
1.02.02.01.03 Investments in Joint Venture 380,517 356,072 - -
1.02.02.01.04 Other Investment Interests 64,818 56,666 70,295 62,143
1.02.03 Property, Plant and Equipment, net 15 - - 7,480,411 7,209,123
1.02.03.01 Property, Plant and Equipment in Operation - - 5,582,321 5,745,140
1.02.03.02 Property, Plant and Equipment in Progress - - 1,898,090 1,463,983
1.02.04 Intangible Assets 16 - - 1,763,282 1,721,857
1.02.04.01 Intangible Assets - - 1,763,282 1,721,857
1.02.04.01.01 Concession Contract - - 1,698,338 1,658,564
1.02.04.01.02 Authorization and Concession of Subsidiaries - - 23,721 24,098
1.02.04.01.03 Others - - 41,223 39,195
See the accompanying notes to the quarterly information

4
BALANCE SHEETS
as of June 30, 2012 and December 31, 2011 (continued) In thousands of Reais - R$
Code Description Note
06.30.2012 12.31.2011 06.30.2011 12.31.2011
2 Total liabilities 13,664,790 13,344,153 19,538,925 19,121,663
2.01 Current liabilities 124,909 223,073 1,905,625 2,058,821
2.01.01 Payroll, social charges and accruals 17 252 153 212,636 224,095
2.01.01.01 Social charges and accruals 252 153 57,887 63,393
2.01.01.02 Payroll and accruals - - 154,749 160,702
2.01.02 Suppliers 1,327 2,065 769,417 747,453
2.01.02.01 Domestic Suppliers 18 1,327 2,065 769,417 747,453
2.01.03 Tax Liabilities 1,018 45,314 370,371 440,247
2.01.03.01 Federal Taxes 1,018 45,311 180,453 243,253
2.01.03.01.01 Income Tax and Social Contribution Payable 10.1 - 3,929 140,932 151,790
2.01.03.01.02 Other Federal Taxes 10.3 1,018 41,382 39,521 91,463
2.01.03.02 State Taxes 10.3 - - 188,732 193,808
2.01.03.03 Municipal Taxes 10.3 - 3 1,186 3,186
2.01.04 Loans and Financing 34,440 44,152 105,944 116,487
2.01.04.01 Loans and Financing 19 34,440 44,152 105,944 116,487
2.01.04.01.01 In Domestic Currency 31,152 39,668 102,650 111,997
2.01.04.01.02 In Foreign Currency 3,288 4,484 3,294 4,490
2.01.05 Other Liabilities 87,872 131,389 447,257 530,539
2.01.05.02 Others 87,872 131,389 447,257 530,539
2.01.05.02.02 Minimum Compulsary Dividend Payable 87,325 130,859 87,325 135,744
2.01.05.02.04 Post Employment Benefits 20 - - 22,180 36,037
2.01.05.02.05 Custumer charges due 21 - - 62,743 70,511
2.01.05.02.06 Research and Development and Energy Efficiency 22 - - 124,450 156,915
2.01.05.02.07 Payables related to Concession - Use of Public Property 23 - - 45,261 44,656
2.01.05.02.08 Other Accounts Payable 24 547 530 105,298 86,676
2.02 Noncurrent liabilities 1,312,173 1,294,386 5,149,732 4,993,314
2.02.01 Loans and Financing 970,521 965,772 2,127,413 2,057,985
2.02.01.01 Loans and Financing 19 970,521 965,772 2,127,413 2,057,985
2.02.01.01.01 In Domestic Currency 913,747 911,829 2,070,631 2,004,030
2.02.01.01.02 In Foreign Currency 56,774 53,943 56,782 53,955
2.02.02 Other Liabilities - - 1,053,278 1,006,596
2.02.02.02 Others - - 1,053,278 1,006,596
2.02.02.02.03 Suppliers 18 - - 84,839 108,462
2.02.02.02.04 Tax Liabilities 10.3 - - - 152
2.02.02.02.05 Post Employment Benefits 20 - - 457,444 432,838
2.02.02.02.06 Research and Development and Energy Efficiency 22 - - 124,746 94,649
2.02.02.02.07 Payables related to Concession - Use of Public Property 23 - - 386,032 370,442
2.02.02.02.08 Other Accounts Payable 24 - - 217 53
2.02.03 Deferred Taxes 33,091 33,259 875,794 927,910
2.02.01.06.02 Deferred Income Tax and Social Contribution 10.2 33,091 33,259 875,794 927,910
2.02.04 Provisions 25 308,561 295,355 1,093,247 1,000,823
2.02.04.01 Tax, Social Security, Labor and Civil Provisions 297,740 284,534 1,044,796 952,572
2.02.04.01.01 Provisions for Taxes 280,258 274,605 303,105 281,937
2.02.04.01.02 Labor and Social Security Provisions - - 129,563 128,505
2.02.04.01.03 Provisions for Employee Benefits - - 76,003 58,089
2.02.04.01.04 Civil Provisions 17,482 9,929 536,125 484,041
2.02.04.02 Other Provisions 10,821 10,821 48,451 48,251
2.02.04.02.01 Provisions for Environmental and Deactivation Liabilities - - 130 104
2.02.04.02.02 Provisions for Regulatory Liabilities 10,821 10,821 48,321 48,147
2.03 Consolidated shareholders' equity 26 12,227,708 11,826,694 12,483,568 12,069,528
2.03.01 Share capital 6,910,000 6,910,000 6,910,000 6,910,000
2.03.04 Profit Reserves 3,374,738 3,459,613 3,374,738 3,459,613
2.03.04.01 Legal Reserves 536,187 536,187 536,187 536,187
2.03.04.02 Retaindes earnings 2,838,551 2,838,551 2,838,551 2,838,551
2.03.04.08 Additional Dividend Proposed - 84,875 - 84,875
2.03.05 Accumulated Profit 544,692 - 544,692 -
2.03.06 Equity Evaluation Adjustments 1,398,278 1,457,081 1,398,278 1,457,081
2.03.06 Equity Evaluation Adjustments 26.2 - - 255,860 242,834
Parent Company Consolidated
See the accompanying notes to the quarterly information
5
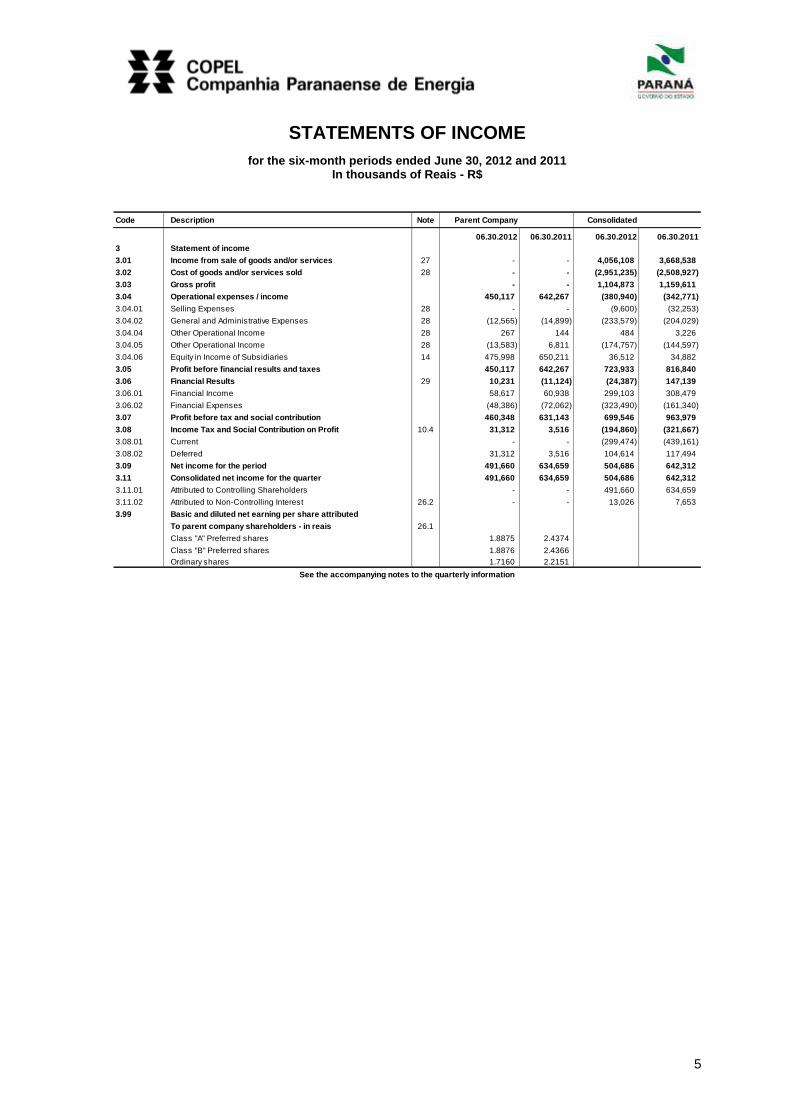
STATEMENTS OF INCOME
for the six-month periods ended June 30, 2012 and 2011 In thousands of Reais - R$
Code Description Note Parent Company Consolidated
06.30.2012 06.30.2011 06.30.2012 06.30.2011
3 Statement of income
3.01 Income from sale of goods and/or services 27 - - 4,056,108 3,668,538
3.02 Cost of goods and/or services sold 28 - - (2,951,235) (2,508,927)
3.03 Gross profit - - 1,104,873 1,159,611
3.04 Operational expenses / income 450,117 642,267 (380,940) (342,771)
3.04.01 Selling Expenses 28 - - (9,600) (32,253)
3.04.02 General and Administrative Expenses 28 (12,565) (14,899) (233,579) (204,029)
3.04.04 Other Operational Income 28 267 144 484 3,226
3.04.05 Other Operational Income 28 (13,583) 6,811 (174,757) (144,597)
3.04.06 Equity in Income of Subsidiaries 14 475,998 650,211 36,512 34,882
3.05 Profit before financial results and taxes 450,117 642,267 723,933 816,840
3.06 Financial Results 29 10,231 (11,124) (24,387) 147,139
3.06.01 Financial Income 58,617 60,938 299,103 308,479
3.06.02 Financial Expenses (48,386) (72,062) (323,490) (161,340)
3.07 Profit before tax and social contribution 460,348 631,143 699,546 963,979
3.08 Income Tax and Social Contribution on Profit 10.4 31,312 3,516 (194,860) (321,667)
3.08.01 Current - - (299,474) (439,161)
3.08.02 Deferred 31,312 3,516 104,614 117,494
3.09 Net income for the period 491,660 634,659 504,686 642,312
3.11 Consolidated net income for the quarter 491,660 634,659 504,686 642,312
3.11.01 Attributed to Controlling Shareholders - - 491,660 634,659
3.11.02 Attributed to Non-Controlling Interest 26.2 - - 13,026 7,653
3.99 Basic and diluted net earning per share attributed
To parent company shareholders - in reais 26.1
Class "A" Preferred shares 1.8875 2.4374
Class "B" Preferred shares 1.8876 2.4366
Ordinary shares 1.7160 2.2151
See the accompanying notes to the quarterly information

6
STATEMENTS OF INCOME – Turnover for the second quarter
for the three-month and six-month periods ended June 30, 2012 and 2011 In thousands of Reais - R$
Code Description
04.01.2012 01.01.2012 04.01.2011 01.01.2011
to 06.30.2012 to 06.30.2012 to 06.30.2011 to 06.30.2011
3 Statement of income
3.01 Income from sale of goods and/or services - - - -
3.02 Cost of goods and/or services sold - - - -
3.03 Gross profit - - - -
3.04 Operational expenses / income 142,612 450,117 264,618 642,267
3.04.01 Selling Expenses - - - -
3.04.02 General and Administrative Expenses (8,217) (12,565) (4,872) (14,899)
3.04.04 Other Operational Income 196 267 144 144
3.04.05 Other Operational Income (9,600) (13,583) (1,907) 6,811
3.04.06 Equity in Income of Subsidiaries 160,233 475,998 271,253 650,211
3.05 Profit before financial results and taxes 142,612 450,117 264,618 642,267
3.06 Financial Results 4,456 10,231 (13,225) (11,124)
3.06.01 Financial Income 28,380 58,617 30,837 60,938
3.06.02 Financial Expenses (23,924) (48,386) (44,062) (72,062)
3.07 Profit before tax and social contribution 147,068 460,348 251,393 631,143
3.08 Income Tax and Social Contribution on Profit 30,467 31,312 3,785 3,516
3.08.01 Current 680 - - -
3.08.02 Deferred 29,787 31,312 3,785 3,516
3.09 Net income for the period 177,535 491,660 255,178 634,659
3.11 Consolidated net income for the quarter 177,535 491,660 255,178 634,659
3.99 Basic and diluted net earning per share attributed
To parent company shareholders - in reais
Class "A" Preferred shares 0.6821 1.8875 0.9770 2.4374
Class "B" Preferred shares 0.6816 1.8876 0.9797 2.4366
Ordinary shares 0.6196 1.7160 0.8906 2.2151
Parent Company
See the accompanying notes to the quarterly information
Code Description
04.01.2012 01.01.2012 04.01.2011 01.01.2011
to 06.30.2012 to 06.30.2012 to 06.30.2011 to 06.30.2011
3 Statement of income
3.01 Income from sale of goods and/or services 2,031,470 4,056,108 1,842,308 3,668,538
3.02 Cost of goods and/or services sold (1,594,017) (2,951,235) (1,279,450) (2,508,927)
3.03 Gross profit 437,453 1,104,873 562,858 1,159,611
3.04 Operational expenses / income (174,448) (380,940) (213,795) (342,771)
3.04.01 Selling Expenses 15,294 (9,600) (18,966) (32,253)
3.04.02 General and Administrative Expenses (122,076) (233,579) (108,244) (204,029)
3.04.04 Other Operational Income 295 484 3,051 3,226
3.04.05 Other Operational Income (87,626) (174,757) (109,918) (144,597)
3.04.06 Equity in Income of Subsidiaries 19,665 36,512 20,282 34,882
3.05 Profit before financial results and taxes 263,005 723,933 349,063 816,840
3.06 Financial Results (39,673) (24,387) 36,779 147,139
3.06.01 Financial Income 170,797 299,103 124,450 308,479
3.06.02 Financial Expenses (210,470) (323,490) (87,671) (161,340)
3.07 Profit before tax and social contribution 223,332 699,546 385,842 963,979
3.08 Income Tax and Social Contribution on Profit (38,391) (194,860) (128,359) (321,667)
3.08.01 Current (106,144) (299,474) (164,195) (439,161)
3.08.02 Deferred 67,753 104,614 35,836 117,494
3.09 Net income for the period 184,941 504,686 257,483 642,312
3.11 Consolidated net income for the quarter 184,941 504,686 257,483 642,312
3.11.01 Attributed to Controlling Shareholders 177,535 491,660 255,178 634,659
3.11.02 Attributed to Non-Controlling Interest 7,406 13,026 2,305 7,653
Consolidated
See the accompanying notes to the quarterly information
7
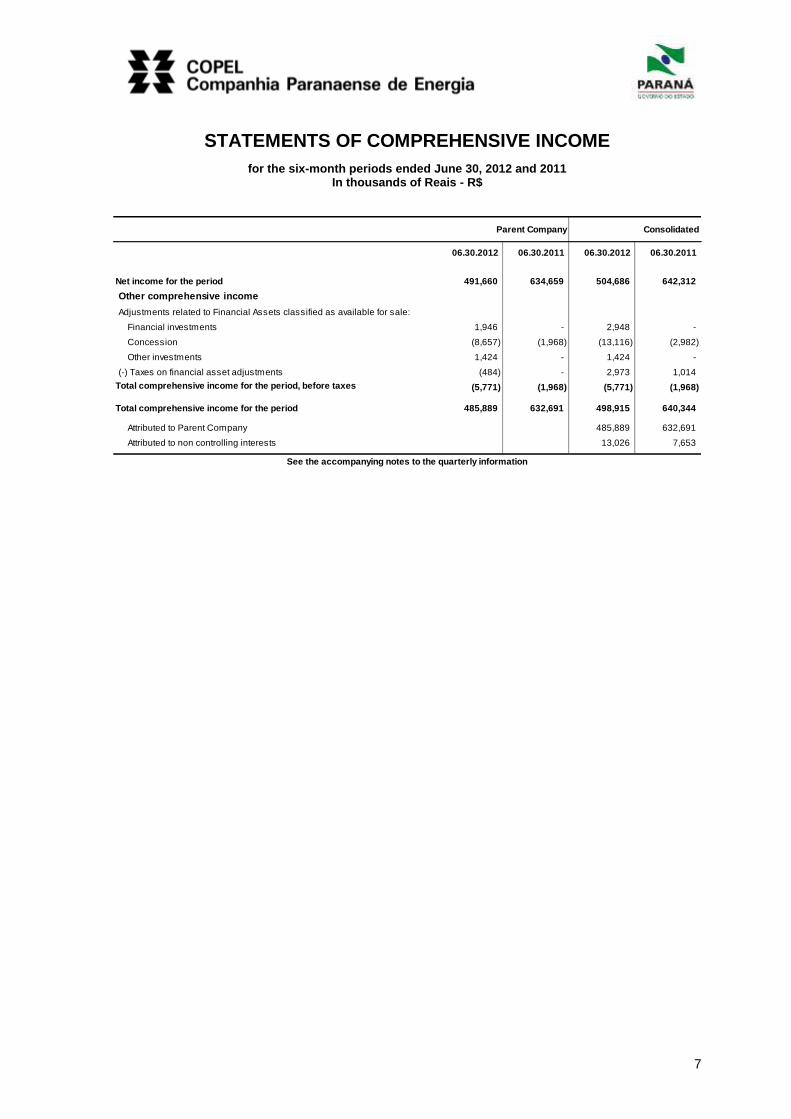
STATEMENTS OF COMPREHENSIVE INCOME
for the six-month periods ended June 30, 2012 and 2011 In thousands of Reais - R$
Parent Company Consolidated
06.30.2012 06.30.2011 06.30.2012 06.30.2011
Net income for the period 491,660 634,659 504,686 642,312
Other comprehensive income
Adjustments related to Financial Assets classified as available for sale:
Financial investments 1,946 - 2,948 -
Concession (8,657) (1,968) (13,116) (2,982)
Other investments 1,424 - 1,424 -
(-) Taxes on financial asset adjustments (484) - 2,973 1,014
Total comprehensive income for the period, before taxes (5,771) (1,968) (5,771) (1,968)
Total comprehensive income for the period 485,889 632,691 498,915 640,344
Attributed to Parent Company 485,889 632,691
Attributed to non controlling interests 13,026 7,653
See the accompanying notes to the quarterly information
8
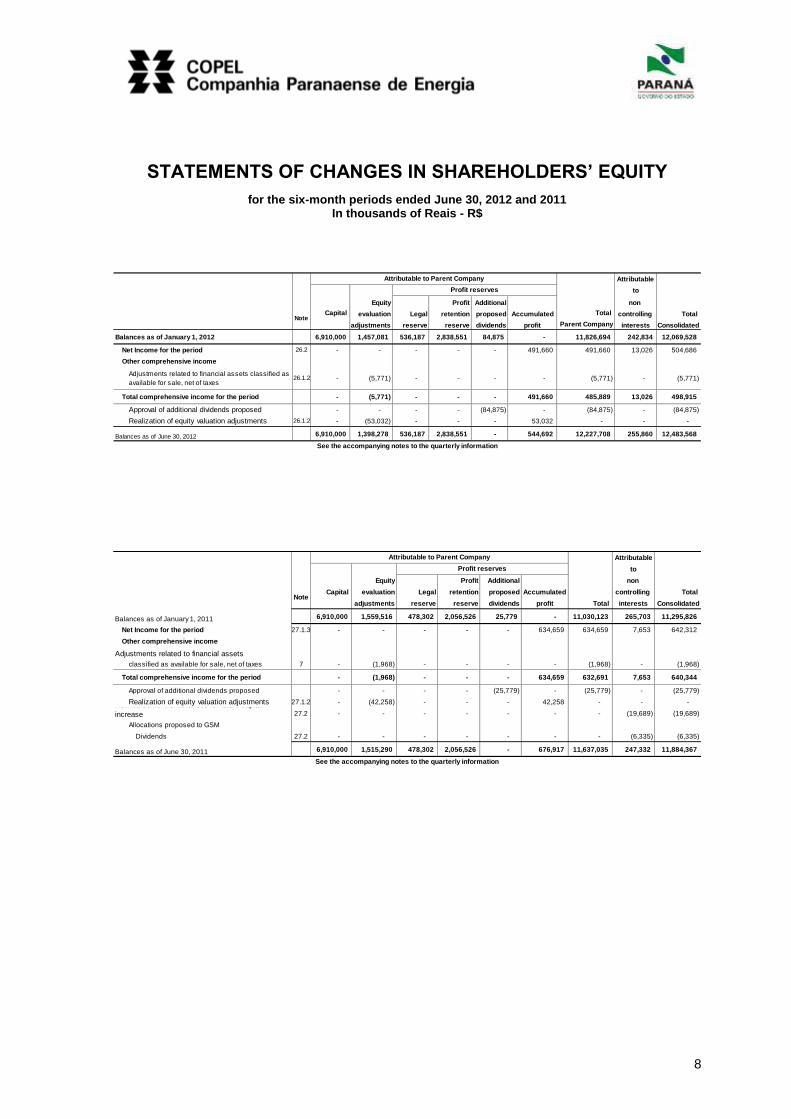
STATEMENTS OF CHANGES IN SHAREHOLDERS’ EQUITY
for the six-month periods ended June 30, 2012 and 2011 In thousands of Reais - R$
Attributable
to
Equity Profit Additional non
Capital evaluation Legal retention proposed Accumulated Total controlling Total
adjustments reserve reserve dividends profit Parent Company interests Consolidated
Balances as of January 1, 2012 6,910,000 1,457,081 536,187 2,838,551 84,875 - 11,826,694 242,834 12,069,528
Net Income for the period 26.2 - - - - - 491,660 491,660 13,026 504,686
Other comprehensive income
Adjustments related to financial assets classified as
available for sale, net of taxes26.1.2 - (5,771) - - - - (5,771) - (5,771)
Total comprehensive income for the period - (5,771) - - - 491,660 485,889 13,026 498,915
Approval of additional dividends proposed - - - - (84,875) - (84,875) - (84,875)
Realization of equity valuation adjustments 26.1.2 - (53,032) - - - 53,032 - - -
Balances as of June 30, 2012 6,910,000 1,398,278 536,187 2,838,551 - 544,692 12,227,708 255,860 12,483,568
Attributable to Parent Company
Profit reserves
Note
See the accompanying notes to the quarterly information
Attributable
to
Equity Profit Additional non
Capital evaluation Legal retention proposed Accumulated controlling Total
adjustments reserve reserve dividends profit Total interests Consolidated
Balances as of January 1, 2011 6,910,000 1,559,516 478,302 2,056,526 25,779 - 11,030,123 265,703 11,295,826
Net Income for the period 27.1.3 - - - - - 634,659 634,659 7,653 642,312
Other comprehensive income
Adjustments related to financial assets
classified as available for sale, net of taxes 7 - (1,968) - - - - (1,968) - (1,968)
Total comprehensive income for the period - (1,968) - - - 634,659 632,691 7,653 640,344
Approval of additional dividends proposed - - - - (25,779) - (25,779) - (25,779)
Realization of equity valuation adjustments 27.1.2 - (42,258) - - - 42,258 - - - Reimbursement of advances for future capital
increase 27.2 - - - - - - - (19,689) (19,689)
Allocations proposed to GSM
Dividends 27.2 - - - - - - - (6,335) (6,335)
Balances as of June 30, 2011 6,910,000 1,515,290 478,302 2,056,526 - 676,917 11,637,035 247,332 11,884,367
Attributable to Parent Company
Profit reserves
Note
See the accompanying notes to the quarterly information

9
STATEMENTS OF CASH FLOWS
for the six-month periods ended June 30, 2012 and 2011
In thousands of Reais - R$
Note Parent Company Consolidated
06.30.2012 06.30.2011 06.30.2012 06.30.2011
Cash flows from operational activities
Net income for the period 491,660 634,659 504,686 642,312
Adjustments to reconcile net income for the year with cash generated from
operating activities
Depreciation 15.3 - - 169,424 164,884
Amortization of intangible assets - concessions 16 - - 105,987 103,911
Amortization of intangible assets - others 16 - - 944 725
Amortization of investments - Concession rights 14.1 - - 364 364
Unrealized monetary and exchange variations - net (18,435) 8,593 (1,617) 23,707
Stated at fair value of accounts receivable related to concession 7.1 - - 194,985 -
Remuneration of accounts receivable related to concession 7.1 - - (173,311) (146,513)
Equity in earnings of subsidiaries 14.1 (475,998) (650,211) (36,512) (34,882)
Income tax and social contribution - - 299,474 439,161
Deferred income tax and social contribution (31,312) (3,516) (104,614) (117,494)
Provision for losses from Accounts Receivable 28.6 - - (12,284) 15,277
Provisions for losses on taxes recoverable 28.6 - - (3,729) 15,773
Provision (reversal) for legal claims 28.6 13,206 (7,188) 106,829 15,250
Provision for post employment benefits 20.3 267 323 85,694 67,347
Provision for research and development and energy efficiency 22.2 - - 36,696 33,079
Write off of accounts receivable related to concession 7.1 - - 3,807 12,569
Write off of property, plant and equipment 15.3 - - 3,018 17,293
Write off of intangible assets 16 - - 2,786 5,759
Decrease (increase) in assets
Trade accounts receivable - - 6,905 (172,033)
Dividends and interest on own capital received 247,591 114,604 24,673 14,357
CRC transferred to the Government of the State of Paraná 6.2 - - 75,432 71,842
Judicial deposits (48,986) 7,395 (121,008) 1,294
Other receivables (25) (5) (41,508) (24,942)
Inventories - - (9,578) (12,014)
Income tax and social contribution 7,052 21,046 (3,130) 27,004
Other current taxes recoverable (11) - (8,168) (977)
Receivable from related parties - - - 1,575
Prepaid expenses - - (20,942) (6,239)
Increase (decrease) in liabilities
Payroll, social charges and accruals 99 (103) (11,459) 21,050
Suppliers (738) 204 (34,048) (65,474)
Income tax and social contribution paid (3,929) (14,985) (310,332) (402,246)
Other taxes (40,367) (37,095) (59,170) (92,927)
Loans and financing - interest due and paid 19 (52,773) (18,352) (83,494) (55,269)
Debentures - interest due and paid - (32,524) - (32,524)
Post employment benefits 20.4 (267) (362) (74,945) (47,498)
Customer charges due - - (7,768) 24,369
Research and development and energy efficiency 22.2 - - (47,321) (23,323)
Payable related to the concession - use of public property - - (20,490) (20,492)
Other accounts payable 17 (4,192) 18,786 7,111
Provisions for legal claims 25 - - (17,362) (23,730)
Net cash generated from (used in) operating activities 87,051 18,291 437,700 447,436
(continued)
10
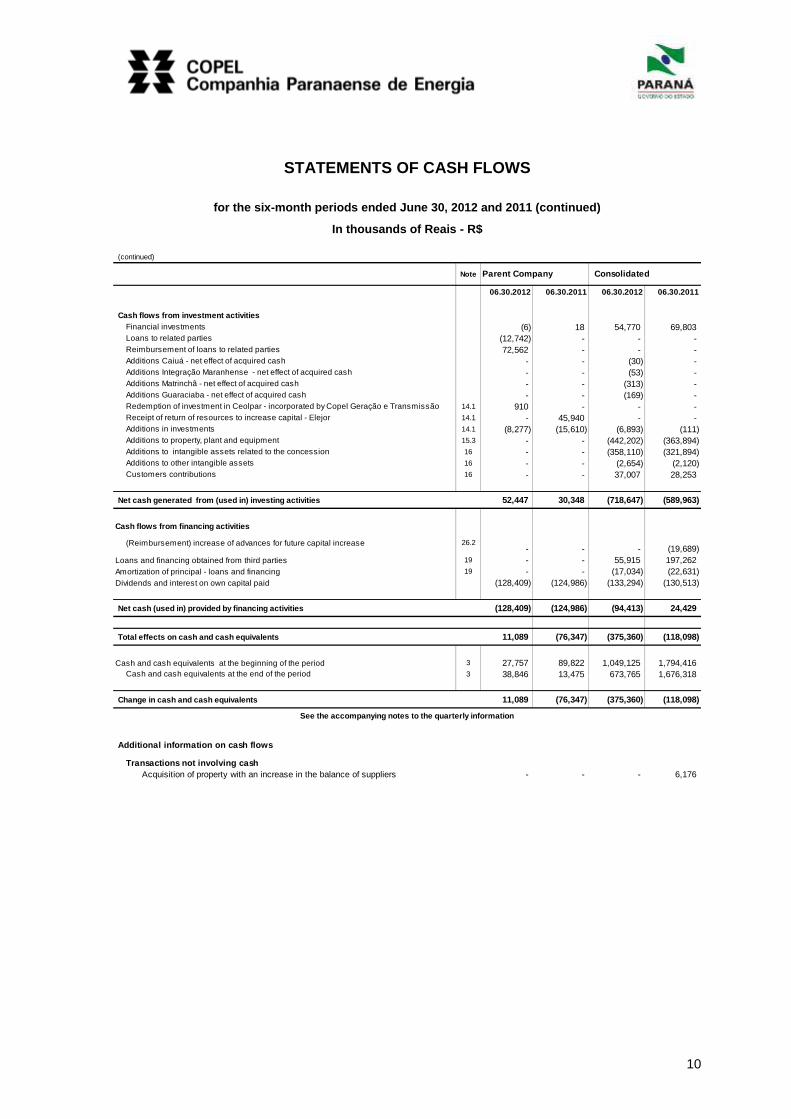
STATEMENTS OF CASH FLOWS
for the six-month periods ended June 30, 2012 and 2011 (continued)
In thousands of Reais - R$
(continued)
Note
06.30.2012 06.30.2011 06.30.2012 06.30.2011
Cash flows from investment activities
Financial investments (6) 18 54,770 69,803
Loans to related parties (12,742) - - -
Reimbursement of loans to related parties 72,562 - - -
Additions Caiuá - net effect of acquired cash - - (30) -
Additions Integração Maranhense - net effect of acquired cash - - (53) -
Additions Matrinchã - net effect of acquired cash - - (313) -
Additions Guaraciaba - net effect of acquired cash - - (169) -
Redemption of investment in Ceolpar - incorporated by Copel Geração e Transmissão 14.1 910 - - -
Receipt of return of resources to increase capital - Elejor 14.1 - 45,940 - -
Additions in investments 14.1 (8,277) (15,610) (6,893) (111)
Additions to property, plant and equipment 15.3 - - (442,202) (363,894)
Additions to intangible assets related to the concession 16 - - (358,110) (321,894)
Additions to other intangible assets 16 - - (2,654) (2,120)
Customers contributions 16 - - 37,007 28,253
Net cash generated from (used in) investing activities 52,447 30,348 (718,647) (589,963)
Cash flows from financing activities
(Reimbursement) increase of advances for future capital increase 26.2- - - (19,689)
Loans and financing obtained from third parties 19 - - 55,915 197,262
Amortization of principal - loans and financing 19 - - (17,034) (22,631)
Dividends and interest on own capital paid (128,409) (124,986) (133,294) (130,513)
Net cash (used in) provided by financing activities (128,409) (124,986) (94,413) 24,429
Total effects on cash and cash equivalents 11,089 (76,347) (375,360) (118,098)
Cash and cash equivalents at the beginning of the period 3 27,757 89,822 1,049,125 1,794,416
Cash and cash equivalents at the end of the period 3 38,846 13,475 673,765 1,676,318
Change in cash and cash equivalents 11,089 (76,347) (375,360) (118,098)
Additional information on cash flows
Transactions not involving cash
Acquisition of property with an increase in the balance of suppliers - - - 6,176
Parent Company Consolidated
See the accompanying notes to the quarterly information
11
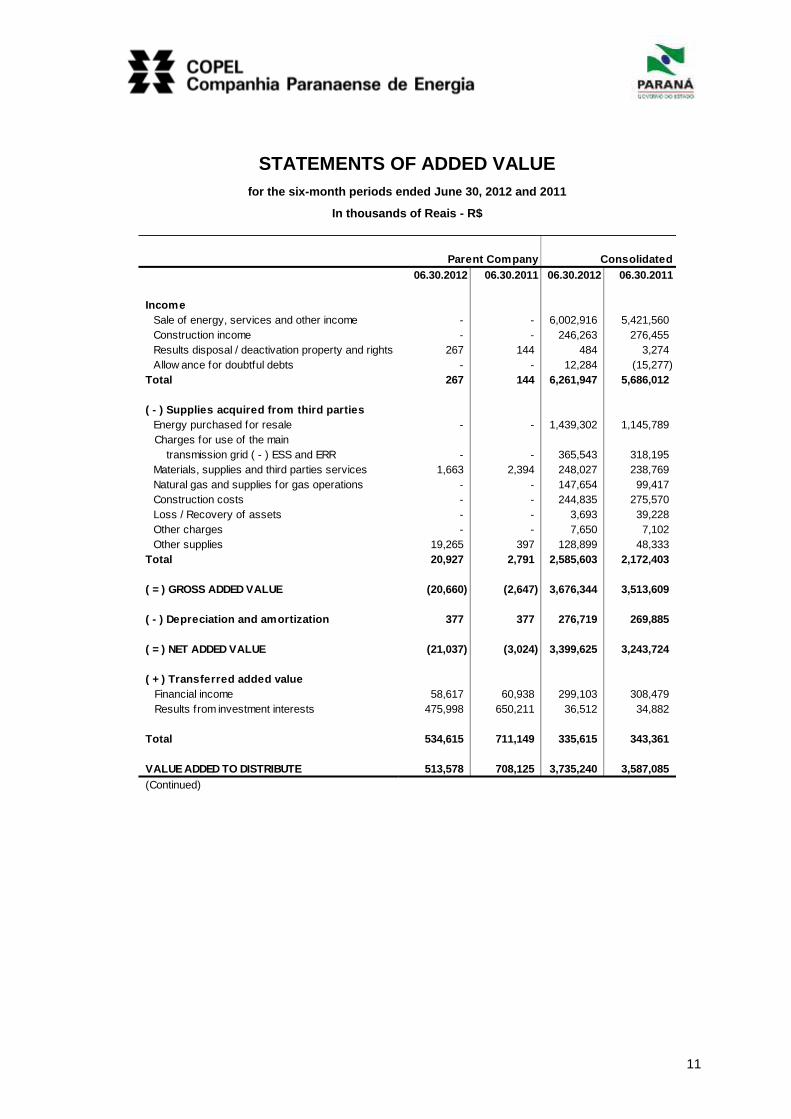
STATEMENTS OF ADDED VALUE
for the six-month periods ended June 30, 2012 and 2011
In thousands of Reais - R$
06.30.2012 06.30.2011 06.30.2012 06.30.2011
Income
Sale of energy, services and other income - - 6,002,916 5,421,560
Construction income - - 246,263 276,455
Results disposal / deactivation property and rights 267 144 484 3,274
Allow ance for doubtful debts - - 12,284 (15,277)
Total 267 144 6,261,947 5,686,012
( - ) Supplies acquired from third parties
Energy purchased for resale - - 1,439,302 1,145,789
Charges for use of the main
transmission grid ( - ) ESS and ERR - - 365,543 318,195
Materials, supplies and third parties services 1,663 2,394 248,027 238,769
Natural gas and supplies for gas operations - - 147,654 99,417
Construction costs - - 244,835 275,570
Loss / Recovery of assets - - 3,693 39,228
Other charges - - 7,650 7,102
Other supplies 19,265 397 128,899 48,333
Total 20,927 2,791 2,585,603 2,172,403
( = ) GROSS ADDED VALUE (20,660) (2,647) 3,676,344 3,513,609
( - ) Depreciation and amortization 377 377 276,719 269,885
( = ) NET ADDED VALUE (21,037) (3,024) 3,399,625 3,243,724
( + ) Transferred added value
Financial income 58,617 60,938 299,103 308,479
Results from investment interests 475,998 650,211 36,512 34,882
Total 534,615 711,149 335,615 343,361
VALUE ADDED TO DISTRIBUTE 513,578 708,125 3,735,240 3,587,085
(Continued)
Parent Company Consolidated
12
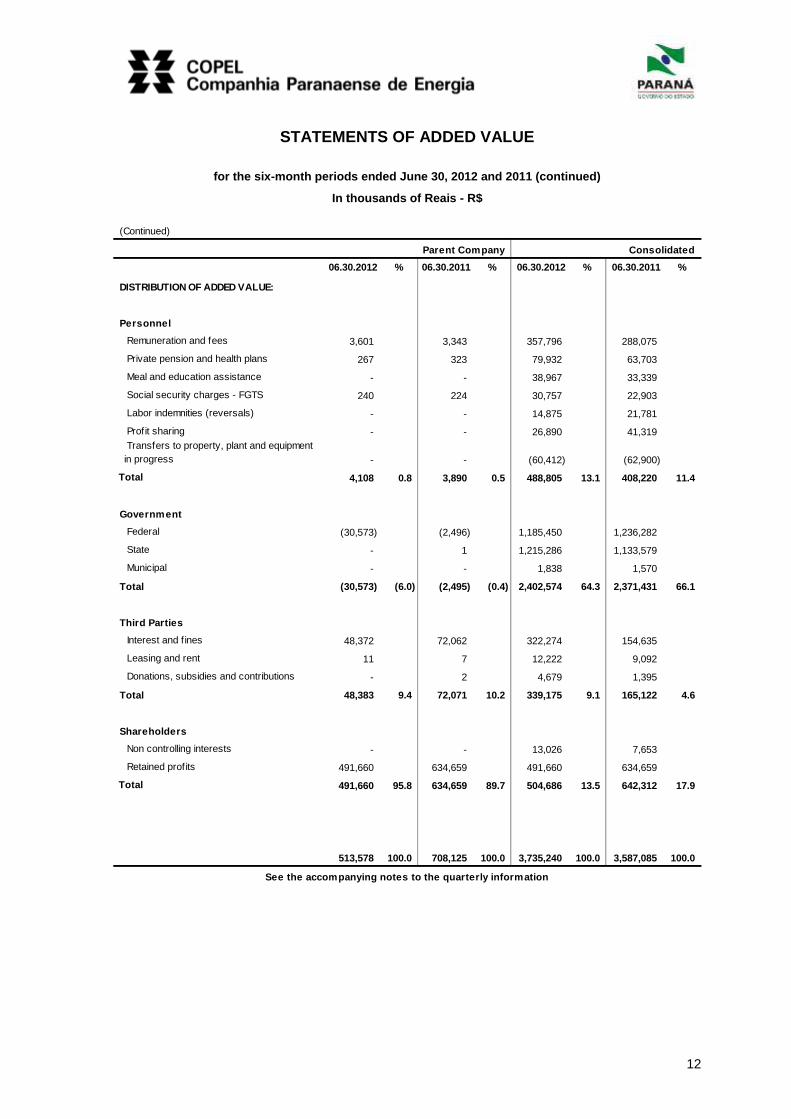
STATEMENTS OF ADDED VALUE
for the six-month periods ended June 30, 2012 and 2011 (continued)
In thousands of Reais - R$
(Continued)
06.30.2012 % 06.30.2011 % 06.30.2012 % 06.30.2011 %
DISTRIBUTION OF ADDED VALUE:
Personnel
Remuneration and fees 3,601 3,343 357,796 288,075
Private pension and health plans 267 323 79,932 63,703
Meal and education assistance - - 38,967 33,339
Social security charges - FGTS 240 224 30,757 22,903
Labor indemnities (reversals) - - 14,875 21,781
Profit sharing - - 26,890 41,319
Transfers to property, plant and equipment
in progress - - (60,412) (62,900)
Total 4,108 0.8 3,890 0.5 488,805 13.1 408,220 11.4
Government
Federal (30,573) (2,496) 1,185,450 1,236,282
State - 1 1,215,286 1,133,579
Municipal - - 1,838 1,570
Total (30,573) (6.0) (2,495) (0.4) 2,402,574 64.3 2,371,431 66.1
Third Parties
Interest and f ines 48,372 72,062 322,274 154,635
Leasing and rent 11 7 12,222 9,092
Donations, subsidies and contributions - 2 4,679 1,395
Total 48,383 9.4 72,071 10.2 339,175 9.1 165,122 4.6
Shareholders
Non controlling interests - - 13,026 7,653
Retained profits 491,660 634,659 491,660 634,659
Total 491,660 95.8 634,659 89.7 504,686 13.5 642,312 17.9
513,578 100.0 708,125 100.0 3,735,240 100.0 3,587,085 100.0
See the accompanying notes to the quarterly information
Parent Company Consolidated
13
NOTES TO THE QUARTELY FINANCIAL INFORMATION
for the six-month period ended June 30, 2012 In thousands of Reais - R$
1 General Information
Companhia Paranaense de Energia - Copel (Copel, the Company or the Parent Company), with
headquarters at Rua Coronel Dulcídio, 800, Batel, Curitiba, State of Paraná, is a public company
with shares traded on Corporate Governance Level 1 of BM&FBOVESPA’s Special Listings and on
stock exchanges in the United States of America and Spain. Copel is a mixed capital company,
controlled by the Government of the State of Paraná, engaged, through its subsidiaries, in
researching, studying, planning, building, and exploiting the production, transformation,
transportation, distribution, and sale of energy, in any form, but mainly electric energy. These
activities are regulated by the National Eletric Energy Agency (Agência Nacional de Energia Elétrica
or Aneel), which reports to the Ministry of Mines and Energy (Ministério de Minas e Energia or
MME). Additionally, Copel takes part in consortiums, private enterprises, or mixed capital
companies in order to operate mostly in the areas of energy, telecommunications, natural gas, and
water supply and sanitation.
The direct and indirect subsidiaries of the Company are described in note 14.
2 Main Accounting Policies
The significant accounting policies used for preparing this quarterly information are consistent with
those presented in Note 2 of the Annual Financial Statements at December 31, 2011, available in
the CVM and Copel’s web sites.
Authorization for the completion of these quarterly financial information was granted at the Meeting
of the Board of Officers held on August 13, 2012.
Statement of compliance
The Company’s quarterly financial information includes:
The consolidated quarterly financial information prepared in accordance with International
Financial Reporting Standards - IFRS issued by the International Accounting Standards
Board - IASB and also in accordance with accounting practices adopted in Brazil;
The individual quarterly financial information of the parent company prepared in accordance
with accounting practices adopted in Brazil.
Accounting practices adopted in Brazil include those in Brazilian Corporate Legislation and the
pronouncements, orientations and interpretations issued by the Accounting Pronouncements
14
Committee (Comitê de Pronunciamentos Contábeis or CPC) and approved by the Securities and
Exchange Comission – (Comissão de Valores Mobiliários or CVM).
The individual quarterly financial information present the values for investments in subsidiaries, joint
ventures and associated companies using the equity method, in accordance with Brazilian
legislation in force. Thus, these individual quarterly financial information are not in compliance with
the IFRSs, which require that these investments reported in the parent company’s individual
statements be stated at fair value or cost.
Given that there is no difference between the consolidated shareholders´ equity and the
consolidated profit attributed to the owners of the parent company, stated in the consolidated
quarterly financial information prepared in accordance with the IFRSs and the accounting practices
adopted in Brazil and the shareholders’ equity and net profit of the parent company, stated in the
individual quarterly financial information prepared in accordance with accounting practices adopted
in Brazil, the Company opted to present these individual and consolidated quarterly financial
information side by side, in one set of accounts.
This quarterly information is presented considering the rulings included in CPC 21 and IAS 34 -
Interim Information and the CVM SNC/SEP Official Circular 03/11.
Consequently, certain information disclosed in the notes to the financial statements for the year
ended December 31, 2011 which did not alter during the quarter has not been presented.
Therefore, this quarterly information should be read together with the financial statements at
December 31, 2011.
Basis of Presentation
The quarterly financial information were prepared based on historic cost, except for certain financial
instruments which were stated at fair values by their profit and losses, and financial assets held for
sale measured to their fair values.
Functional currency and presentation currency
The individual and consolidated financial statements are presented in Brazilian Reais, which is the
functional currency of the Company. All financial information present in Brazilian Reais were
rounded to the nearest thousand, except when otherwise indicated.
Use of estimates and judgment
According to IFRS and CPC rules, the preparation of individual and consolidated financial
statements requires that the company’s senior management make judgments, estimates and
assumptions which affect the application of accounting policies and assets, liabilities, income and
expenses reported values. The real results may divert from these estimates.
Estimates and assumptions are reviewed in a continuous way. Reviews of accounting estimates are
recognized in the year that those estimates are reviewed and in any future fiscal years affected.
Information about critical judgment related to accounting policies adopted that present an effect

15
over the values recognized in the consolidated and individual financial statements are included in
the following notes:
Note nº 7 – Accounts receivable related to concession;
Note nº 10.2 – Deferred income tax and social contribution;
Note nº 16.1 – Concession - Copel Distribuição; and
Note nº 31 – Operational lease agreements.
Information about uncertainty over assumptions and estimates that may present a significative risk
of resulting in material adjustments in the next fiscal year are included in the following notes:
Note nº 2.19.1 of the Financial Statements at December 31, 2011 - Unbilled revenues;
Note nº 2.29 of the Financial Statements at December 31, 2011 - Impairment value of assets;
Note nº 5 – Trade account receivable;
Note nº 15 – Property, plant and equipment;
Note nº 16 – Intangible assets;
Note nº 20 – Post-Employment benefits;
Note nº 25 – Tax, social security, labor and civil provisions; and
Note nº 32 – Financial Instruments.
Basis for consolidation
The consolidated quarterly financial information includes the quarterly financial information of the
Company, those of its subsidiaries and the exclusive investment funds.
Quarterly financial statements are included in the consolidated quarterly financial statements
starting in the date that the control or shared control started until the date that they cease to exist.
The asset, liability and statement of income accounts of controlled companies (note 14.2) are fully
consolidated line by line and the accounts of jointly-controlled entities are consolidated in proportion
to shareholding interest (note 14.3).
When necessary, the quarterly financial information of the subsidiaries are adjusted to adapt the
accounting policies established by the Group. All of the transactions, balances, income and
expenses between the Group companies are eliminated in the consolidated quarterly financial
information.
16
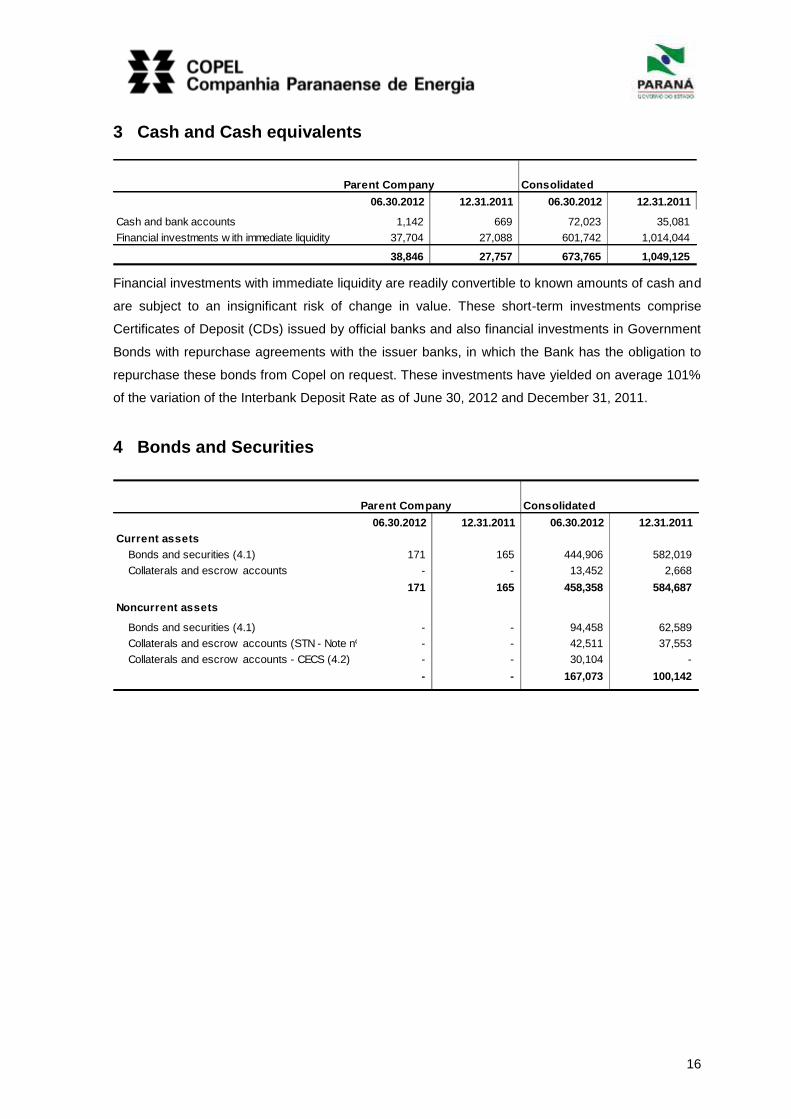
3 Cash and Cash equivalents
.
Parent Company Consolidated
06.30.2012 12.31.2011 06.30.2012 12.31.2011
Cash and bank accounts 1,142 669 72,023 35,081
Financial investments w ith immediate liquidity 37,704 27,088 601,742 1,014,044
38,846 27,757 673,765 1,049,125
Financial investments with immediate liquidity are readily convertible to known amounts of cash and
are subject to an insignificant risk of change in value. These short-term investments comprise
Certificates of Deposit (CDs) issued by official banks and also financial investments in Government
Bonds with repurchase agreements with the issuer banks, in which the Bank has the obligation to
repurchase these bonds from Copel on request. These investments have yielded on average 101%
of the variation of the Interbank Deposit Rate as of June 30, 2012 and December 31, 2011.
4 Bonds and Securities
06.30.2012 12.31.2011 06.30.2012 12.31.2011
Current assets
Bonds and securities (4.1) 171 165 444,906 582,019
Collaterals and escrow accounts - - 13,452 2,668
171 165 458,358 584,687
Noncurrent assets
Bonds and securities (4.1) - - 94,458 62,589
Collaterals and escrow accounts (STN - Note nº 19.1) - - 42,511 37,553
Collaterals and escrow accounts - CECS (4.2) - - 30,104 -
- - 167,073 100,142 .
Parent Company Consolidated
17
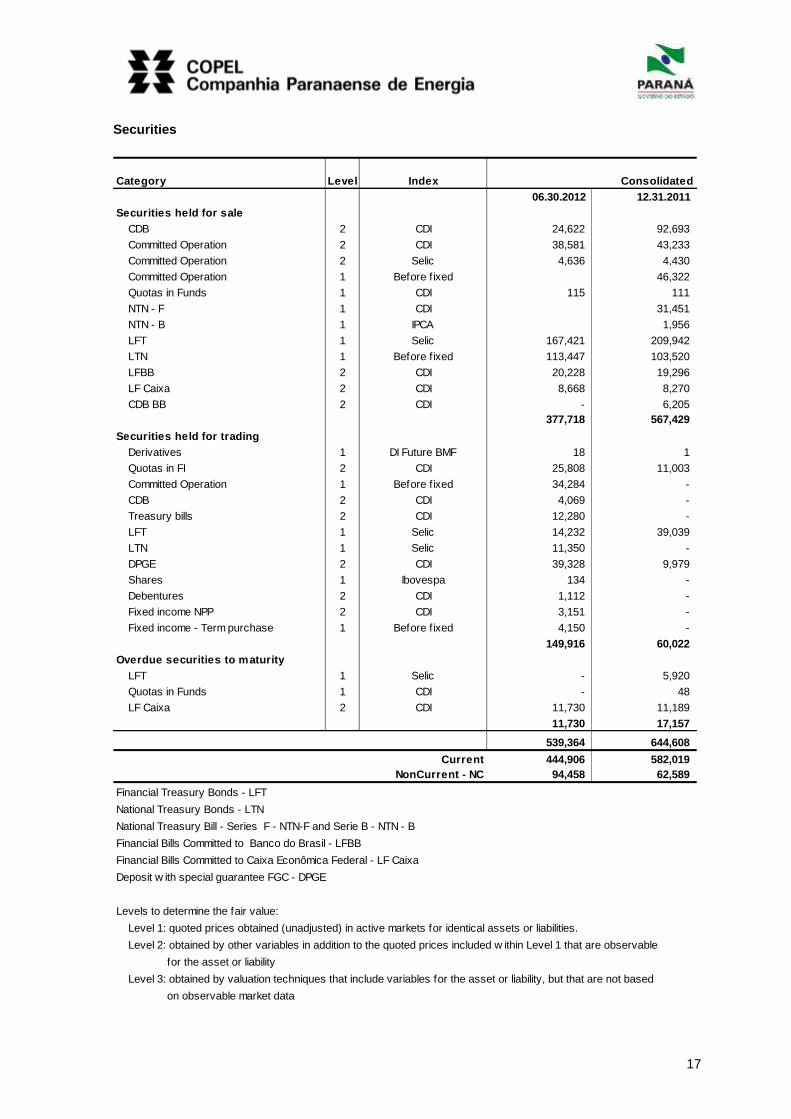
Securities
Category Level Index Consolidated
06.30.2012 12.31.2011
Securities held for sale
CDB 2 CDI 24,622 92,693
Committed Operation 2 CDI 38,581 43,233
Committed Operation 2 Selic 4,636 4,430
Committed Operation 1 Before f ixed 46,322
Quotas in Funds 1 CDI 115 111
NTN - F 1 CDI 31,451
NTN - B 1 IPCA 1,956
LFT 1 Selic 167,421 209,942
LTN 1 Before f ixed 113,447 103,520
LFBB 2 CDI 20,228 19,296
LF Caixa 2 CDI 8,668 8,270
CDB BB 2 CDI - 6,205
377,718 567,429
Securities held for trading
Derivatives 1 DI Future BMF 18 1
Quotas in FI 2 CDI 25,808 11,003
Committed Operation 1 Before f ixed 34,284 -
CDB 2 CDI 4,069 -
Treasury bills 2 CDI 12,280 -
LFT 1 Selic 14,232 39,039
LTN 1 Selic 11,350 -
DPGE 2 CDI 39,328 9,979
Shares 1 Ibovespa 134 -
Debentures 2 CDI 1,112 -
Fixed income NPP 2 CDI 3,151 -
Fixed income - Term purchase 1 Before f ixed 4,150 -
149,916 60,022
Overdue securities to maturity
LFT 1 Selic - 5,920
Quotas in Funds 1 CDI - 48
LF Caixa 2 CDI 11,730 11,189
11,730 17,157
539,364 644,608
Current 444,906 582,019
NonCurrent - NC 94,458 62,589
Financial Treasury Bonds - LFT
National Treasury Bonds - LTN
National Treasury Bill - Series F - NTN-F and Serie B - NTN - B
Financial Bills Committed to Banco do Brasil - LFBB
Financial Bills Committed to Caixa Econômica Federal - LF Caixa
Deposit w ith special guarantee FGC - DPGE
Levels to determine the fair value:
Level 1: quoted prices obtained (unadjusted) in active markets for identical assets or liabilities.
Level 2: obtained by other variables in addition to the quoted prices included w ithin Level 1 that are observable
for the asset or liability
Level 3: obtained by valuation techniques that include variables for the asset or liability, but that are not based
on observable market data
18
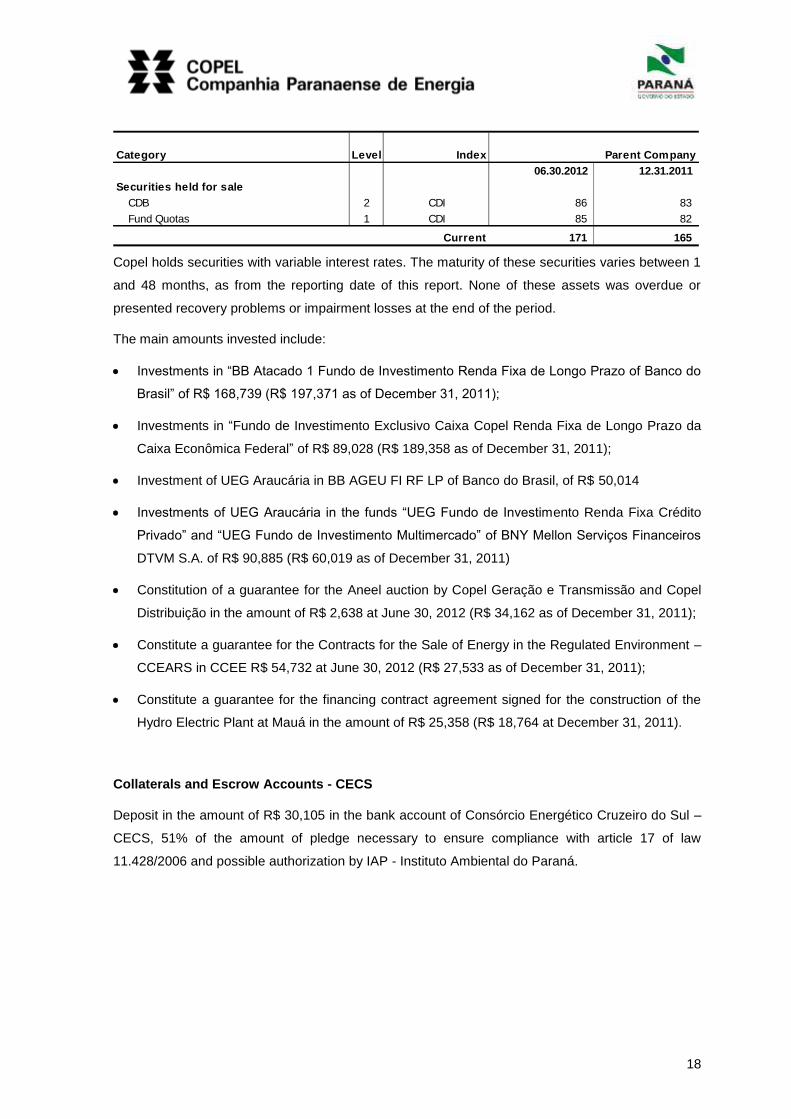
Category Level Index Parent Company
06.30.2012 12.31.2011
Securities held for sale
CDB 2 CDI 86 83
Fund Quotas 1 CDI 85 82
Current 171 165
Copel holds securities with variable interest rates. The maturity of these securities varies between 1
and 48 months, as from the reporting date of this report. None of these assets was overdue or
presented recovery problems or impairment losses at the end of the period.
The main amounts invested include:
Investments in “BB Atacado 1 Fundo de Investimento Renda Fixa de Longo Prazo of Banco do
Brasil” of R$ 168,739 (R$ 197,371 as of December 31, 2011);
Investments in “Fundo de Investimento Exclusivo Caixa Copel Renda Fixa de Longo Prazo da
Caixa Econômica Federal” of R$ 89,028 (R$ 189,358 as of December 31, 2011);
Investment of UEG Araucária in BB AGEU FI RF LP of Banco do Brasil, of R$ 50,014
Investments of UEG Araucária in the funds “UEG Fundo de Investimento Renda Fixa Crédito
Privado” and “UEG Fundo de Investimento Multimercado” of BNY Mellon Serviços Financeiros
DTVM S.A. of R$ 90,885 (R$ 60,019 as of December 31, 2011)
Constitution of a guarantee for the Aneel auction by Copel Geração e Transmissão and Copel
Distribuição in the amount of R$ 2,638 at June 30, 2012 (R$ 34,162 as of December 31, 2011);
Constitute a guarantee for the Contracts for the Sale of Energy in the Regulated Environment –
CCEARS in CCEE R$ 54,732 at June 30, 2012 (R$ 27,533 as of December 31, 2011);
Constitute a guarantee for the financing contract agreement signed for the construction of the
Hydro Electric Plant at Mauá in the amount of R$ 25,358 (R$ 18,764 at December 31, 2011).
Collaterals and Escrow Accounts - CECS
Deposit in the amount of R$ 30,105 in the bank account of Consórcio Energético Cruzeiro do Sul –
CECS, 51% of the amount of pledge necessary to ensure compliance with article 17 of law
11.428/2006 and possible authorization by IAP - Instituto Ambiental do Paraná.

19
5 Trade Accounts Receivable
Balances Overdue Overdue for Total
falling due up to 90 days more than 90 days
06.30.2012 12.31.2011
Customers
Residential 163,982 100,925 25,777 290,684 274,070
Industrial 102,602 40,336 13,591 156,529 142,118
Commercial 101,077 41,411 14,883 157,371 168,942
Rural 19,978 9,395 7,984 37,357 38,574
Public Entities 21,157 18,328 14,438 53,923 44,729
Public lighting 16,309 2,378 159 18,846 19,497
Public service 16,276 15,353 143 31,772 30,905
Unbilled 280,334 - - 280,334 288,095
Energy installments plan 41,742 6,532 21,784 70,058 59,557
Energy installments plan - Non Current 28,294 - - 28,294 25,737
Low income subsidy - Eletrobrás 5,255 - - 5,255 31,734
Fines and charges on energy bills 4,749 6,779 11,214 22,742 19,623
State Government "Luz Fraterna" program 24,161 11,036 15,759 50,956 38,763
Other receivables 1,127 1,518 6,429 9,074 14,470
Other receivables - non current 6,686 - - 6,686 6,626
833,729 253,991 132,161 1,219,881 1,203,440
Concessionaires and Permission holder
Energy supplies
CCEAR - auction 196,691 1,284 24,351 222,326 189,223
Bilateral contracts 22,535 - 119 22,654 21,540
CCEE 40,141 9,005 119 49,265 15,632
Reimbursement to generators - - 1,288 1,288 1,288
259,367 10,289 25,877 295,533 227,683
Charges from using transmission grid
Transmission grid 18,321 2,057 2,364 22,742 16,995
Basic netw ork and conection grid 27,700 405 2,147 30,252 25,833
46,021 2,462 4,511 52,994 42,828 .
Telecommunications
Telecommunication services 2,282 5,545 8,021 15,848 15,392
Telecommunication services - NC 89 - - 89 89
2,371 5,545 8,021 15,937 15,481 .
Gas distribution 31,015 683 1,134 32,832 27,305 .
Allowance for doubtful accounts (5.1) - - (91,184) (91,184) (115,919)
1,172,503 272,970 80,520 1,525,993 1,400,818
Current 1,137,434 272,970 80,520 1,490,924 1,368,366
Noncurrent - NC 35,069 - - 35,069 32,452
Consolidated
The average collection period for the electricity sold to customers is 12 days and 10 days for
concessionaries and other entities permitted to supply electricity.
Allowance for Doubtful Accounts
Copel’s senior management has considered the following amounts as sufficient to cover potential
losses on the realization of receivables:
20
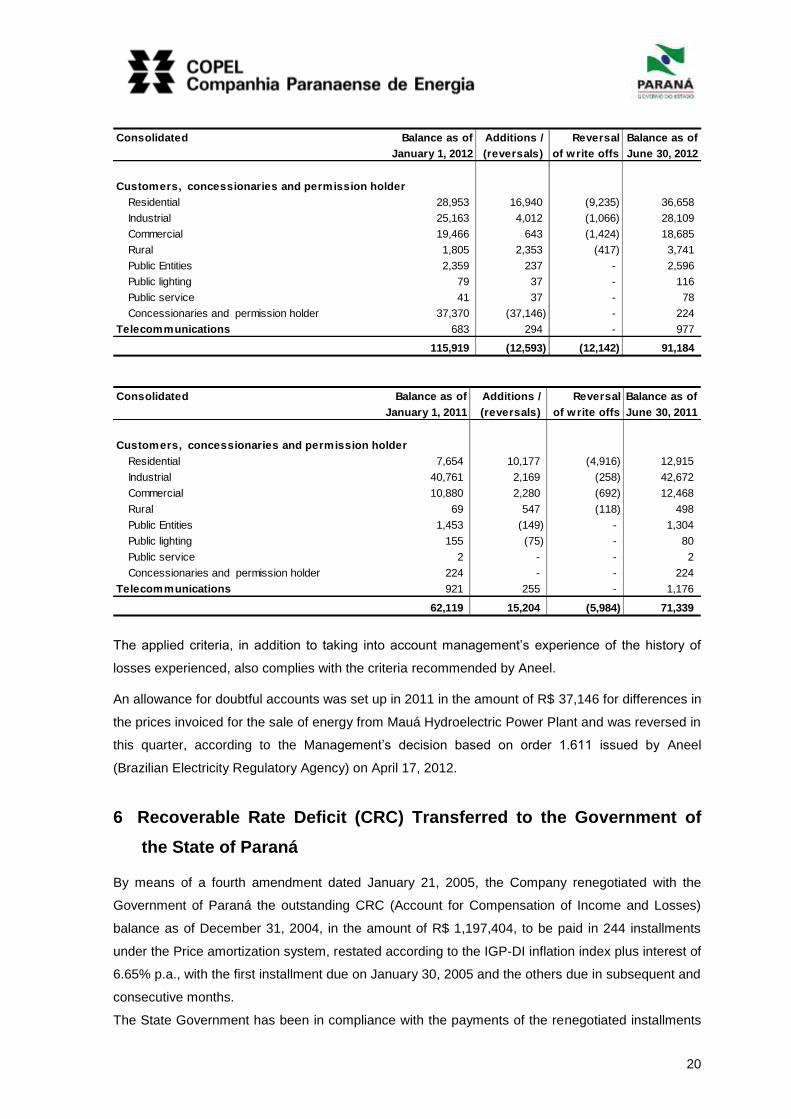
Consolidated Balance as of Additions / Reversal Balance as of
January 1, 2012 (reversals) of write offs June 30, 2012
Customers, concessionaries and permission holder
Residential 28,953 16,940 (9,235) 36,658
Industrial 25,163 4,012 (1,066) 28,109
Commercial 19,466 643 (1,424) 18,685
Rural 1,805 2,353 (417) 3,741
Public Entities 2,359 237 - 2,596
Public lighting 79 37 - 116
Public service 41 37 - 78
Concessionaries and permission holder 37,370 (37,146) - 224
Telecommunications 683 294 - 977
115,919 (12,593) (12,142) 91,184
Consolidated Balance as of Additions / Reversal Balance as of
January 1, 2011 (reversals) of write offs June 30, 2011
Customers, concessionaries and permission holder
Residential 7,654 10,177 (4,916) 12,915
Industrial 40,761 2,169 (258) 42,672
Commercial 10,880 2,280 (692) 12,468
Rural 69 547 (118) 498
Public Entities 1,453 (149) - 1,304
Public lighting 155 (75) - 80
Public service 2 - - 2
Concessionaries and permission holder 224 - - 224
Telecommunications 921 255 - 1,176
62,119 15,204 (5,984) 71,339
The applied criteria, in addition to taking into account management’s experience of the history of
losses experienced, also complies with the criteria recommended by Aneel.
An allowance for doubtful accounts was set up in 2011 in the amount of R$ 37,146 for differences in
the prices invoiced for the sale of energy from Mauá Hydroelectric Power Plant and was reversed in
this quarter, according to the Management’s decision based on order 1.611 issued by Aneel
(Brazilian Electricity Regulatory Agency) on April 17, 2012.
6 Recoverable Rate Deficit (CRC) Transferred to the Government of
the State of Paraná
By means of a fourth amendment dated January 21, 2005, the Company renegotiated with the
Government of Paraná the outstanding CRC (Account for Compensation of Income and Losses)
balance as of December 31, 2004, in the amount of R$ 1,197,404, to be paid in 244 installments
under the Price amortization system, restated according to the IGP-DI inflation index plus interest of
6.65% p.a., with the first installment due on January 30, 2005 and the others due in subsequent and
consecutive months.
The State Government has been in compliance with the payments of the renegotiated installments

21
according to the terms of the fourth amendment to the CRC agreement. Amortizations are secured
by resources from dividends.
Maturity of noncurrent installments:
.
06.30.2012 12.31.2011
2013 36,968 70,242
2014 77,605 74,914
2015 82,766 79,896
2016 88,270 85,209
2017 94,141 90,876
2018 100,402 96,920
2019 107,079 103,366
2020 114,200 110,240
2021 121,795 117,572
2022 129,895 125,391
2023 138,534 133,730
2024 147,747 142,624
After 2024 51,401 49,618
1,290,803 1,280,598
Consolidated
Changes in CRC
Current Noncurrent
Balances assets assets Consolidated
Balance as of January 1, 2012 65,862 1,280,598 1,346,460
Interest and fees 43,031 - 43,031
Monetary variations 660 45,342 46,002
Transfers 35,137 (35,137) -
Amortizations (75,432) - (75,432)
Balance as of June 30, 2012 69,258 1,290,803 1,360,061
Current Noncurrent
Balances assets assets Consolidated
Balance as of January 1, 2011 58,816 1,282,377 1,341,193
Interest and fees 42,907 - 42,907
Monetary variations 157 37,621 37,778
Transfers 31,611 (31,611) -
Amortizations (71,842) - (71,842)
Balance as of June 30, 2011 61,649 1,288,387 1,350,036
22
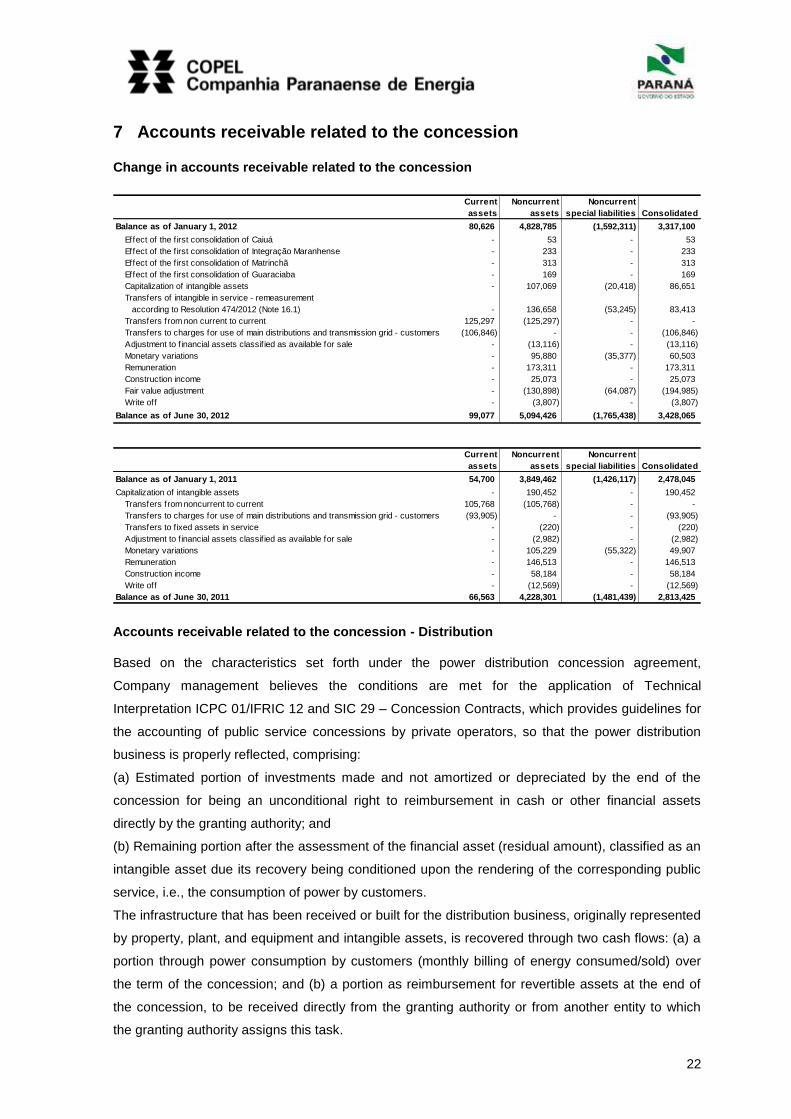
7 Accounts receivable related to the concession
Change in accounts receivable related to the concession
Current Noncurrent Noncurrent
assets assets special liabilities Consolidated
Balance as of January 1, 2012 80,626 4,828,785 (1,592,311) 3,317,100
Effect of the f irst consolidation of Caiuá - 53 - 53
Effect of the f irst consolidation of Integração Maranhense - 233 - 233
Effect of the f irst consolidation of Matrinchã - 313 - 313
Effect of the f irst consolidation of Guaraciaba - 169 - 169
Capitalization of intangible assets - 107,069 (20,418) 86,651
Transfers of intangible in service - remeasurement
according to Resolution 474/2012 (Note 16.1) - 136,658 (53,245) 83,413
Transfers from non current to current 125,297 (125,297) - -
Transfers to charges for use of main distributions and transmission grid - customers (106,846) - - (106,846)
Adjustment to f inancial assets classif ied as available for sale - (13,116) - (13,116)
Monetary variations - 95,880 (35,377) 60,503
Remuneration - 173,311 - 173,311
Construction income - 25,073 - 25,073
Fair value adjustment - (130,898) (64,087) (194,985)
Write off - (3,807) - (3,807)
Balance as of June 30, 2012 99,077 5,094,426 (1,765,438) 3,428,065
Current Noncurrent Noncurrent
assets assets special liabilities Consolidated
Balance as of January 1, 2011 54,700 3,849,462 (1,426,117) 2,478,045
Capitalization of intangible assets - 190,452 - 190,452
Transfers from noncurrent to current 105,768 (105,768) - -
Transfers to charges for use of main distributions and transmission grid - customers (93,905) - - (93,905)
Transfers to f ixed assets in service - (220) - (220)
Adjustment to f inancial assets classif ied as available for sale - (2,982) - (2,982)
Monetary variations - 105,229 (55,322) 49,907
Remuneration - 146,513 - 146,513
Construction income - 58,184 - 58,184
Write off - (12,569) - (12,569)
Balance as of June 30, 2011 66,563 4,228,301 (1,481,439) 2,813,425
Accounts receivable related to the concession - Distribution
Based on the characteristics set forth under the power distribution concession agreement,
Company management believes the conditions are met for the application of Technical
Interpretation ICPC 01/IFRIC 12 and SIC 29 – Concession Contracts, which provides guidelines for
the accounting of public service concessions by private operators, so that the power distribution
business is properly reflected, comprising:
(a) Estimated portion of investments made and not amortized or depreciated by the end of the
concession for being an unconditional right to reimbursement in cash or other financial assets
directly by the granting authority; and
(b) Remaining portion after the assessment of the financial asset (residual amount), classified as an
intangible asset due its recovery being conditioned upon the rendering of the corresponding public
service, i.e., the consumption of power by customers.
The infrastructure that has been received or built for the distribution business, originally represented
by property, plant, and equipment and intangible assets, is recovered through two cash flows: (a) a
portion through power consumption by customers (monthly billing of energy consumed/sold) over
the term of the concession; and (b) a portion as reimbursement for revertible assets at the end of
the concession, to be received directly from the granting authority or from another entity to which
the granting authority assigns this task.
23
This reimbursement is made based on the share of investments related to revertible assets which
has not been amortized or depreciated yet and which have been made with the purpose of ensuring
that the services rendered are continuous and up-to-date.
These financial assets, because they do not have determinable fixed cash flows, given that the
Company assumes that the indemnity will be based on the cost to replace concession assets and
because they don’t have the characteristics necessary to be classified into the other categories of
financial assets, are recognized as “available for sale”. Cash flows linked to these assets are
determined considering that the amount of the electricity rate called regulatory compensation basis
defined by the Concession Authority, whose methodology is the cost of replacing distribution
infrastructure goods linked to concession. This electricity rate basis (BRR) is adjusted every four
years considering various factors and has the purpose of reflecting the changes in prices of physical
assets, including write-offs, depreciation and additions to infrastructure goods (physical assets).
Compensation on this financial asset is based on the regulatory Weighted Average Cost of Capital
(WACC) approved by Aneel at the periodical electricity rate adjustment every four years and the
amount is included in the composition of the electricity rate revenue billed to consumers and
monthly received.
In the intervening periods between the date of the last and the next periodical electricity rate
adjustment, the balance of financial assets must be aligned with Management’s expectations about
the increase or decrease in its cash flows linked to the update and movement of infrastructure
goods (physical assets). The variations in cash flow estimates are directly recognized in the year’s
statement of income.
The portion of interest established at the beginning of the agreement, calculated by employing the
effective interest rate method, as well as any change in expected cash flows, are recorded in the
year’s statement of income.
The variation in fair value, arising from the difference between market interest rate and the effective
interest rate, is recorded directly in shareholders’ equity, net of taxes, as equity valuation
adjustment, without being recognized in the year’s statement of income. When a financial asset
classified as “available for sale” is settled gains or losses accumulated in shareholders’ equity are
recognized in the statement of income.
24
Electricity rate adjustment at Copel Distribuição
In November 2011 Aneel inspected the investments made by the concessionaire for the accrual
period from May 2008 to December 2011, therefore starting the electricity rate adjustment. After
analyzing the reports it received, Copel found various adjustments which it considered to be
necessary and took several actions at Aneel in an attempt to make the agency reconsider its initial
position by presenting the reasons for its constructive model and recognizing incurred costs. The
agency accepted some of these claims, which were reflected on the version approved by Aneel.
However, Copel is still arguing with Aneel at administrative proceedings about the effects of the
adjustment.
The Company understands that some procedures followed for the rate adjustment differ from the
methodology proposed by the Electricity Rate Regulation Procedures – Proret of the Electricity
Industry Accounting Manual – MCSE, and from the constructive model adopted by the
concessionaire.
Although Aneel has not announced its decision on the appeal filed by Copel about the
compensation basis amounts and other items, the new rate was approved at a public audience and
will be applied as from June 24, 2012.
According to Copel’s Management, although Aneel established a new regulatory compensation
basis, administrative proceedings which are being managed at the regulatory agency remain
undecided. This understanding is supported by the fact that we have not received the decision on
the appeal filed with the regulatory agency, which causes uncertainties about the final assessment
of the effects of this third cycle electricity rate adjustment.
Considering also that the regulatory compensation basis in the rate cycles is key to defining the new
electricity rate which will be charged by the Concessionaire and represents the best estimate of the
fair value of assets to be indemnified at the end of the concession, the Company will wait for Aneel
to make a decision for recognizing in full the effects of the electricity rate adjustment on its financial
statements.
Considering this scenario, the Company’s Management assessed all the effects arising from the
electricity rate adjustment and recorded in this quarter the write-off of R$ 152,416 for the estimated
and unrealized adjustments in this asset’s cash flows which, net of tax effects, total R$ 100,595.
This amount, together with the effects of the changes in prevailing depreciation rates as from
January 1, 2012 and recorded in the first quarter, in the amount of R$ 42,569 (R$ 28,095 net of
taxes), total a write-off of R$ 194,985 recognized in the six-month period’s statement of income (R$
128,690, net of taxes).
25
The effects of the decision approved by Aneel on June 19, 2012 through Resolution 1.296 on the
regulatory compensation basis still subject to administrative appeals filed before and after the
approval above will be revalued by the Company, which expects them to be reversed. Considering
this evaluation, the Company did not consider these amounts under discussion when reviewing the
expected cash flow of the indemnity’s financial assets, given that there is no objective evidence for
derecognizing these amounts from financial assets because the contractual rights to cash flows
have not expired, according to guideline issued by the Committee of Accounting Pronouncements
OCPC 03, item 13. If Aneel finally decides against the Company, these effects will be recognized in
the statement of income, totaling the estimated amount of R$ 155,111 and R$ 102,373 net of taxes.
The result of the electricity rate adjustment applied to Copel Distribuição is detailed in technical note
173/2012, available at Aneel’s site.
Commitments regarding transmission
7.1.1 TL 500 - kV Araraquara 2 - Taubaté
This transmission line was awarded to the Company at Aneel auction 001/10, on June 10, 2010
The total commitments assumed with suppliers of equipment and services related to TL 500 kV
Araraquara 2 Taubaté amounted to R$ 237,945 as of June 30, 2012.
7.1.2 Substation Cerquilho III 230 kV
This 230/138 kV (300 MVA) substation was awarded to the Company at Aneel auction 001/10 –
Aneel, on June 10, 2010.
The total commitments assumed with suppliers of equipment and services related to Substation
Cerquilho III, amounted to R$ 43,182 as of June 30, 2012.
26
8 Other Receivables
06.30.2012 12.31.2011
Current assets
Services in progress (8.1) 78,543 71,256
Advance payments to employees 33,244 11,588
Partnership in consortiums 29,988 29,483
Advance payments to suppliers 16,635 7,162
Advance payments for judicial deposits 9,092 3,514
Decommissioning in progress 6,545 9,359
Services provided to third parties 5,908 5,735
Disposal of property and rights 5,608 4,928
Installment plan for Onda Provedor de Serviços 4,348 4,348
Lease of the Araucária pow er plant 4,122 2,730
Purchase of fuel by CCC 3,402 6,875
Employee salary granted - recoverable 2,814 2,884
Allow ance for doubtful debts (8.2) (8,652) (8,351)
Other receivables 7,308 9,802
198,905 161,313
Noncurrent assets
Advance payments to suppliers 13,036 11,982
Services in progress (8.1) 5,461 -
Disposal of property and rights 2,007 2,007
Compulsory loans 1,318 3,044
Other receivables 118 -
21,940 17,033
Consolidated
Service in progress
This item refers to services currently in progress within the Company, most of which are related to
the Research and Development and Energy Efficiency programs, which upon conclusion are offset
against the respective liability recorded for this purpose, in compliance with the applicable
regulations.
Allowance for doubtful accounts
The allowance for doubtful accounts mainly refers to the balance of installments owed by Onda
Provedor de Serviços, whose realization is unlikely.
27
9 Inventories
Consolidated
Operation/Maintenance
06.30.2012 12.31.2011
Copel Geração e Transmissão 25,491 23,714
Copel Distribuição 77,554 69,579
Copel Telecomunicações 8,986 9,015
Compagas 1,345 1,491
UEG Araucária 4 3
113,380 103,802
10 Income Tax, Social Contribution and Other Taxes
Income tax (IR) and social contribution (CSLL)
.
06.30.2012 12.31.2011 06.30.2012 12.31.2011
Current assets
IR and CSLL paid in advance 111,856 131,567 373,458 678,745
IR and CSLL to be offset against liability - (1,025) (155,809) (451,730)
IRRF on JSCP to be offset against liability - (11,634) - (11,634)
111,856 118,908 217,649 215,381
Noncurrent assets
IR and CSLL paid in advance - - 19,576 18,714
- - 19,576 18,714
Current liabilities
IR and CSLL due - 4,954 296,741 603,520
IR and CSLL to be offset against asset - (1,025) (155,809) (451,730)
- 3,929 140,932 151,790
Parent Company Consolidated
Amounts recorded as corporate income tax (IRPJ) and social contribution (CSLL) paid in advance
refer to amounts paid in advance and corporate tax return (DIPJ) credits, which are offset against
the respective taxes payable by each company, pursuant to the Brazilian tax legislation.
Deferred income tax and social contribution
Company records deferred income tax, calculated at the rate of 15%, plus an additional rate of
10%, and deferred social contribution, at the rate of 9%.
28
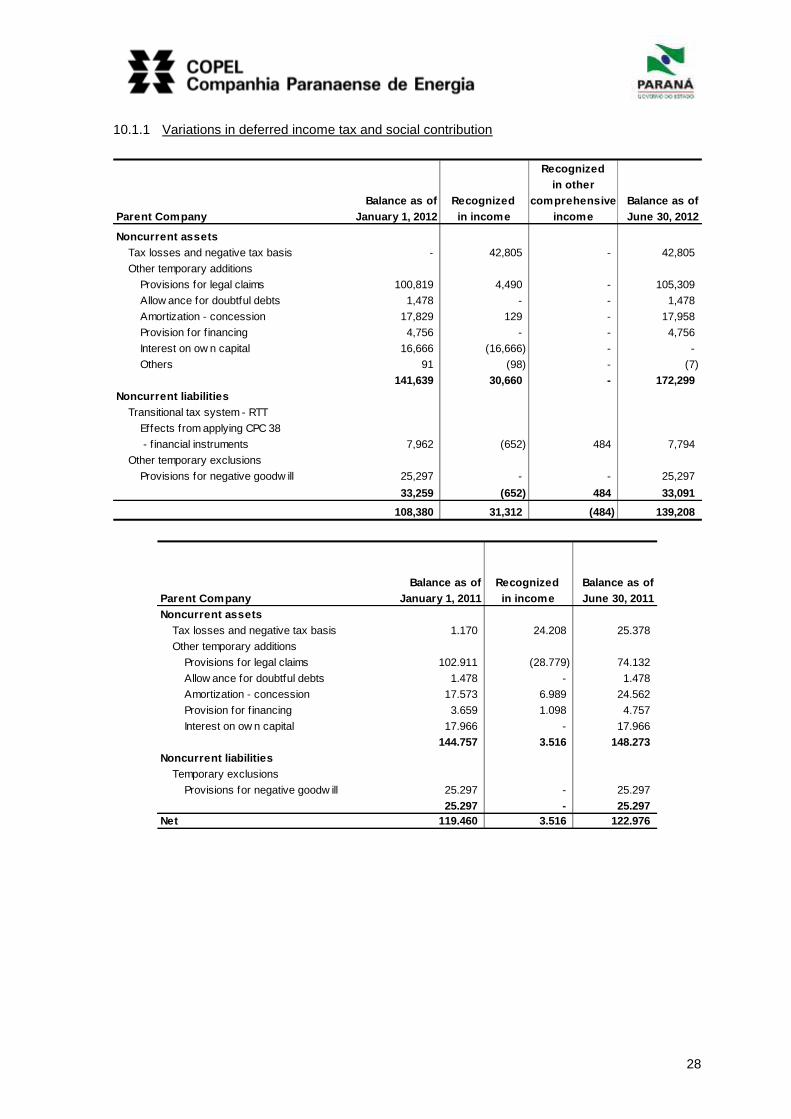
10.1.1 Variations in deferred income tax and social contribution
. Recognized
in other
Balance as of Recognized comprehensive Balance as of
Parent Company January 1, 2012 in income income June 30, 2012
Noncurrent assets
Tax losses and negative tax basis - 42,805 - 42,805
Other temporary additions - -
Provisions for legal claims 100,819 4,490 - 105,309
Allow ance for doubtful debts 1,478 - - 1,478
Amortization - concession 17,829 129 - 17,958
Provision for f inancing 4,756 - - 4,756
Interest on ow n capital 16,666 (16,666) - -
Others 91 (98) - (7)
141,639 30,660 - 172,299
Noncurrent liabilities
Transitional tax system - RTT -
Effects from applying CPC 38
- f inancial instruments 7,962 (652) 484 7,794
Other temporary exclusions - -
Provisions for negative goodw ill 25,297 - - 25,297
33,259 (652) 484 33,091
108,380 31,312 (484) 139,208
.
Balance as of Recognized Balance as of
Parent Company January 1, 2011 in income June 30, 2011
Noncurrent assets
Tax losses and negative tax basis 1.170 24.208 25.378
Other temporary additions -
Provisions for legal claims 102.911 (28.779) 74.132
Allow ance for doubtful debts 1.478 - 1.478
Amortization - concession 17.573 6.989 24.562
Provision for f inancing 3.659 1.098 4.757
Interest on ow n capital 17.966 - 17.966
144.757 3.516 148.273
Noncurrent liabilities
Temporary exclusions - -
Provisions for negative goodw ill 25.297 - 25.297
25.297 - 25.297
Net 119.460 3.516 122.976
29
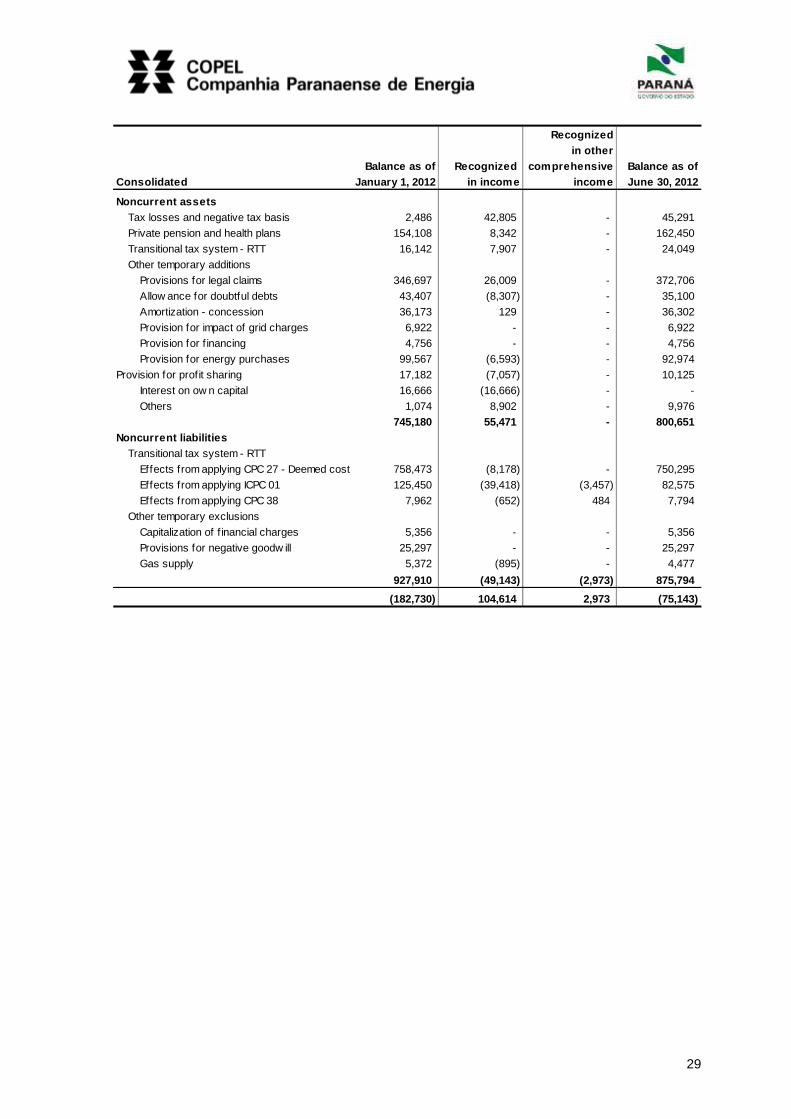
.
. Recognized
in other
Balance as of Recognized comprehensive Balance as of
Consolidated January 1, 2012 in income income June 30, 2012
Noncurrent assets
Tax losses and negative tax basis 2,486 42,805 - 45,291
Private pension and health plans 154,108 8,342 - 162,450
Transitional tax system - RTT 16,142 7,907 - 24,049
Other temporary additions
Provisions for legal claims 346,697 26,009 - 372,706
Allow ance for doubtful debts 43,407 (8,307) - 35,100
Amortization - concession 36,173 129 - 36,302
Provision for impact of grid charges 6,922 - - 6,922
Provision for f inancing 4,756 - - 4,756
Provision for energy purchases 99,567 (6,593) - 92,974
Provision for profit sharing 17,182 (7,057) - 10,125
Interest on ow n capital 16,666 (16,666) - -
Others 1,074 8,902 - 9,976
745,180 55,471 - 800,651
Noncurrent liabilities
Transitional tax system - RTT -
Effects from applying CPC 27 - Deemed cost 758,473 (8,178) - 750,295
Effects from applying ICPC 01 125,450 (39,418) (3,457) 82,575
Effects from applying CPC 38 7,962 (652) 484 7,794
Other temporary exclusions
Capitalization of f inancial charges 5,356 - - 5,356
Provisions for negative goodw ill 25,297 - - 25,297
Gas supply 5,372 (895) - 4,477
927,910 (49,143) (2,973) 875,794
(182,730) 104,614 2,973 (75,143)
30
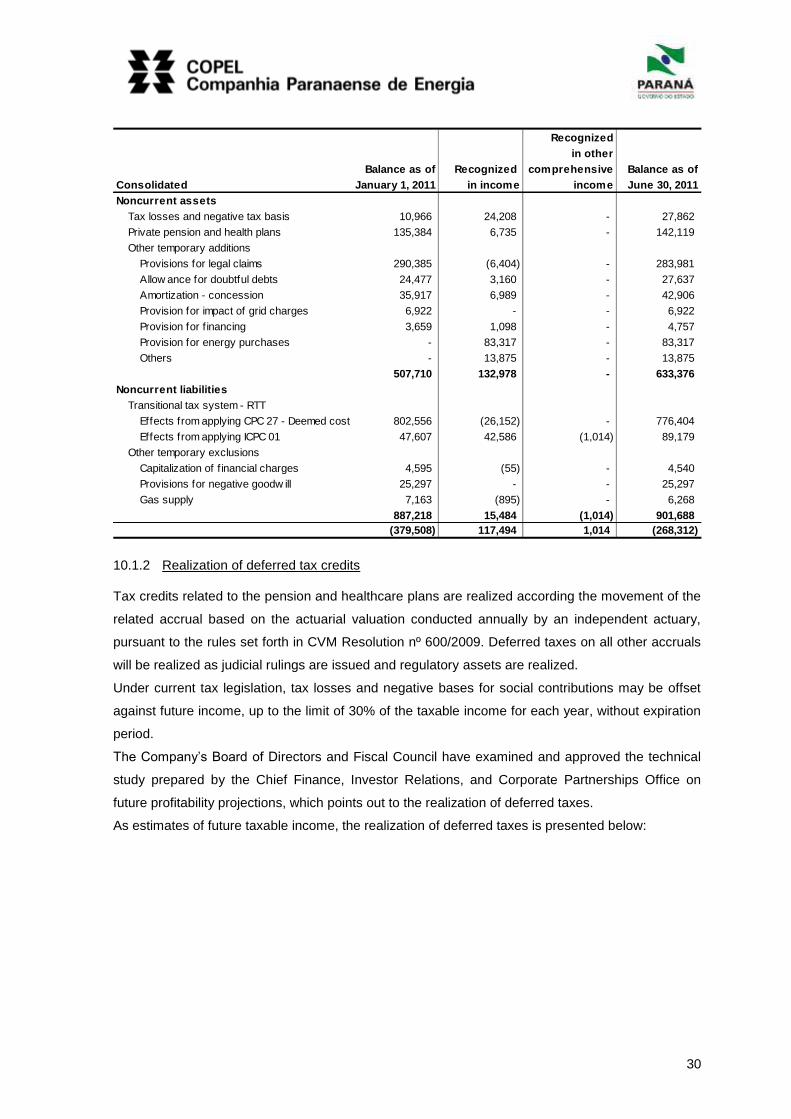
. Recognized
in other
Balance as of Recognized comprehensive Balance as of
Consolidated January 1, 2011 in income income June 30, 2011
Noncurrent assets
Tax losses and negative tax basis 10,966 24,208 - 27,862
Private pension and health plans 135,384 6,735 - 142,119
Other temporary additions
Provisions for legal claims 290,385 (6,404) - 283,981
Allow ance for doubtful debts 24,477 3,160 - 27,637
Amortization - concession 35,917 6,989 - 42,906
Provision for impact of grid charges 6,922 - - 6,922
Provision for f inancing 3,659 1,098 - 4,757
Provision for energy purchases - 83,317 - 83,317
Others - 13,875 - 13,875
507,710 132,978 - 633,376
Noncurrent liabilities
Transitional tax system - RTT -
Effects from applying CPC 27 - Deemed cost 802,556 (26,152) - 776,404
Effects from applying ICPC 01 47,607 42,586 (1,014) 89,179
Other temporary exclusions
Capitalization of f inancial charges 4,595 (55) - 4,540
Provisions for negative goodw ill 25,297 - - 25,297
Gas supply 7,163 (895) - 6,268
887,218 15,484 (1,014) 901,688
(379,508) 117,494 1,014 (268,312)
10.1.2 Realization of deferred tax credits
Tax credits related to the pension and healthcare plans are realized according the movement of the
related accrual based on the actuarial valuation conducted annually by an independent actuary,
pursuant to the rules set forth in CVM Resolution nº 600/2009. Deferred taxes on all other accruals
will be realized as judicial rulings are issued and regulatory assets are realized.
Under current tax legislation, tax losses and negative bases for social contributions may be offset
against future income, up to the limit of 30% of the taxable income for each year, without expiration
period.
The Company’s Board of Directors and Fiscal Council have examined and approved the technical
study prepared by the Chief Finance, Investor Relations, and Corporate Partnerships Office on
future profitability projections, which points out to the realization of deferred taxes.
As estimates of future taxable income, the realization of deferred taxes is presented below:
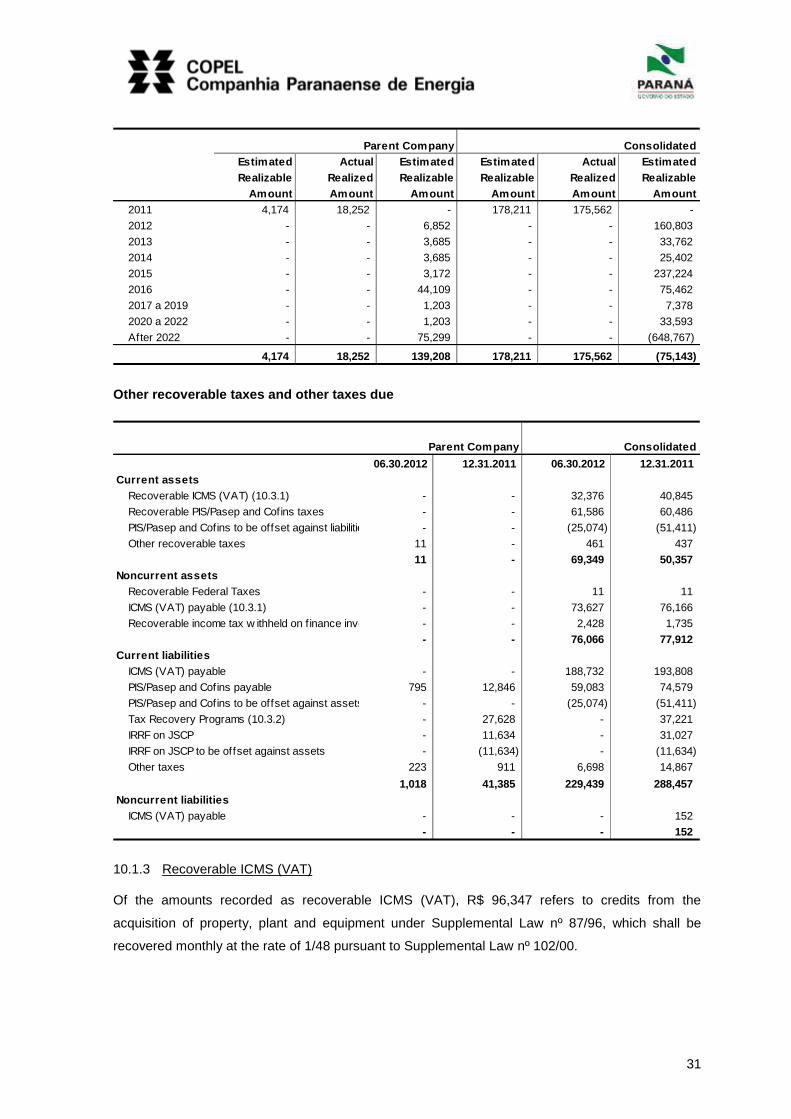
31
. Parent Company Consolidated
Estimated Actual Estimated Estimated Actual Estimated
Realizable Realized Realizable Realizable Realized Realizable
. Amount Amount Amount Amount Amount Amount
2011 4,174 18,252 - 178,211 175,562 -
2012 - - 6,852 - - 160,803
2013 - - 3,685 - - 33,762
2014 - - 3,685 - - 25,402
2015 - - 3,172 - - 237,224
2016 - - 44,109 - - 75,462
2017 a 2019 - - 1,203 - - 7,378
2020 a 2022 - - 1,203 - - 33,593
After 2022 - - 75,299 - - (648,767)
4,174 18,252 139,208 178,211 175,562 (75,143)
Other recoverable taxes and other taxes due
.
06.30.2012 12.31.2011 06.30.2012 12.31.2011
Current assets
Recoverable ICMS (VAT) (10.3.1) - - 32,376 40,845
Recoverable PIS/Pasep and Cofins taxes - - 61,586 60,486
PIS/Pasep and Cofins to be offset against liabilities - - (25,074) (51,411)
Other recoverable taxes 11 - 461 437
11 - 69,349 50,357
Noncurrent assets
Recoverable Federal Taxes - - 11 11
ICMS (VAT) payable (10.3.1) - - 73,627 76,166
Recoverable income tax w ithheld on f inance investments - - 2,428 1,735
- - 76,066 77,912
Current liabilities
ICMS (VAT) payable - - 188,732 193,808
PIS/Pasep and Cofins payable 795 12,846 59,083 74,579
PIS/Pasep and Cofins to be offset against assets - - (25,074) (51,411)
Tax Recovery Programs (10.3.2) - 27,628 - 37,221
IRRF on JSCP - 11,634 - 31,027
IRRF on JSCP to be offset against assets - (11,634) - (11,634)
Other taxes 223 911 6,698 14,867
1,018 41,385 229,439 288,457
Noncurrent liabilities
ICMS (VAT) payable - - - 152
- - - 152
Parent Company Consolidated
10.1.3 Recoverable ICMS (VAT)
Of the amounts recorded as recoverable ICMS (VAT), R$ 96,347 refers to credits from the
acquisition of property, plant and equipment under Supplemental Law nº 87/96, which shall be
recovered monthly at the rate of 1/48 pursuant to Supplemental Law nº 102/00.

32
10.1.4 Tax recovery programs
. Parent Company
Debt
amount
Benefits
Law 11,941
Tax loss
carryforward
Selic
interest
Corrected
debt valueAntecipation Balance of
corrected debt
Law 11,941/09
Cofins Rescission Claim 229,933 (80,927) - 18,754 167,760 (167,760) -
INSS 311 (93) - 44 262 (262) -
230,244 (81,020) - 18,798 168,022 (168,022) -
. Consolidated
Debt
amount
Benefits
Law 11,941
Tax loss
carryforward
Selic
interest
Corrected
debt valueAntecipation Balance of
corrected debt
Law 11,941/09
IRPJ 43,256 (8,898) (3,123) 3,356 34,591 (34,591) -
CSLL 5,925 (1,460) (428) 634 4,671 (4,671) -
Cofins 43,198 (9,633) (3,118) 3,550 33,997 (33,997) -
PIS/Pasep 8,893 (1,992) (642) 395 6,654 (6,654) -
Cofins Rescission Claim 229,933 (80,927) - 18,754 167,760 (167,760) -
INSS 311 (93) - 44 262 (262) -
331,516 (103,003) (7,311) 26,733 247,935 (247,935) -
The effect on profit or loss for the six-month period ended June 30, 2012, recorded as financial
expenses was R$ 492 on the Parent Company and R$ 662 on Consolidated (Note 29).
Installment Plan – Law nº 11,941/09
Pursuant to a ruling by the 4th District Federal Court, which became final on August 18, 1998, Copel
was granted immunity from the levy of COFINS tax on power sales. Even though this ruling was
final, the Federal Revenue Service (RFB) issued Copel two notices for failure to collect COFINS
tax: on February 19, 2002, notice nº 10980.000932/2002-90, for fiscal year 1997, and on August 22,
2003, notice nº 10980.007831/2003-21, for the first three quarters of 1998. Simultaneously, it filed a
lawsuit requesting the cancellation of the immunity ruling, which, after a long legal battle regarding
the lapse of RFB's right to dispute the ruling, has been submitted to 4th District Federal Court for
judgment on the merits. Copel has thus reclassified the corresponding risk of loss as probable,
since there’s consolidated legal precedent in favor of the federal government.
Due to the risk classification of this action as a probable loss, the Company had recorded a
provision in the amount of R$ 184,464, comprising R$ 61,872 in principal and R$ 122,592 in Selic
interest. Considering the level of risk of this action as probable, the Company chose to include it in
the scheme for payment in installments established by Law 11,941 of May 27, 2009, with payment
in 30 installments, considering the benefits of a reduction in the charges on arrears. Accordingly,
the total debt, with the increase of a fine on arrears in the amount of R$ 12,375, now becameR$
196,839.
33
On June 29, 2011, the Brazilian Federal Revenue Department consolidated the debt, in which the
difference of the ex-officio fine was included only in the notice of infraction related to 1998, and
additional interest in the amount of R$ 33,094. Accordingly, the total amount of the debt now
became R$ 229,933. After the consolidation of this debt, considering the benefits of a decrease in
charges on arrears of R$ 80,927, the debt related to the rescissory action now became R$ 149,006.
Debts of the National Institute of Social Security (INSS) referring to the Tax Notification of Issuing of
Debt nº 35.273.873-1 were also included in the consolidation in the amount of R$ 311, which when
the benefits of payment in installments were included, results in a debt of R$ 218.
Accordingly, the Company's total debt included in the payment in installments was R$ 149,224.
Considering the Selic interest on the payment in installments, as established in paragraph 3 of
article 3 of the abovementioned law until June 30, 2012 in the amount of R$ 18,798, and also
considering the monthly paid installments, the balance of the debt amounts to R$ 168,022. The
installment payment was settled since April 30, 2012.
With respect to Copel Distribuição, tax debts referring to income tax (IRPJ) and social contribution
on net income (CSLL) for February 2004 and to income tax for December 2007, March and April
2008, which total R$ 49,181, were included in the aforementioned payment in installments. These
taxes were settled in their respective accrual periods through Declarations of Offsetting (Dcomp),
which were not ratified by the Federal Revenue Department. Furthermore, in the same scheme for
payment in installments debts related to the review of the calculation basis for PIS/Pasep and
COFINS from 2005 to 2008, which after consolidation amounted to R$ 52,091, were included. The
benefits of the decrease in the charges on arrears granted by Law 11,941/09, in the scheme for
payment in 30 installments, amount to R$ 21,983. In the consolidation of the debt before the
Federal Revenue Department, tax loss carry forwards and the negative calculation base of CSLL
were used for settlement of part of the charges on arrears in the amount of R$ 7,311.
Accordingly, the Copel Distribuição's total debt included in the payment in installments was R$
71,978. Considering the Selic interest on the payment in installments, as established in paragraph 3
of article 3 of the abovementioned law until June 30, 2012 in the amount of R$ 7,937, and also
considering the monthly paid installments, the balance of the debt amounts to R$ 79,915. The
installment payment was settled since April 30, 2012.
Reconciliation of the provision for income tax and social contribution
The reconciliation of the provision for income tax (IRPJ) and social contribution (CSLL), calculated
at the applicable rates, with the amounts recorded in the statement of income is shown below:

34
Consolidated
06.30.2012 06.30.2011 06.30.2012 06.30.2011
Income before IRPJ and CSLL 460,348 631,143 699,546 963,979
IRPJ and CSLL (34%) (156,518) (214,589) (237,846) (327,753)
Tax effects on:
Dividends 54 6 54 6
Equity in income 158,923 218,338 12,414 11,854
Non deductible expenses (11) (7,057) (3,326) (9,974)
Tax benefits Law 11,941/09 7,087 7,087
Tax incentives - - 1,775 1,266
Interest on ow n capital 28,857 - 34,114 -
Others 7 (269) (2,045) (4,153)
Current IRPJ and CSLL - - (299,474) (439,161)
Deferred IRPJ and CSLL 31,312 3,516 104,614 117,494
Actual rate - % -6.8% -0.6% 27.9% 33.4%
Parent Company
11 Prepaid Expenses
06.30.2012 12.31.2011
Current assets
Program of incentive to alternative energy sources - Proinfa 11,779 36
Insurance premiums 1,310 4,527
Other 12 25
13,101 4,588
Noncurrent assets
Costs of f inancial transactions - mutual 12,427 -
Other 192 190
12,619 190
Consolidated
12 Judicial Deposits
.
Parent Company Consolidated
06.30.2012 12.31.2011 06.30.2012 12.31.2011
Taxes claims 271,833 222,847 334,924 226,566
Labor claims - - 82,998 72,873 .
Civil
Suppliers - - 95,562 92,853
Civil - - 24,640 24,706
Easements - - 6,854 6,823
Customers - - 2,363 2,289
- - 129,419 126,671 .
Others - - 4,484 4,707
271,833 222,847 551,825 430,817
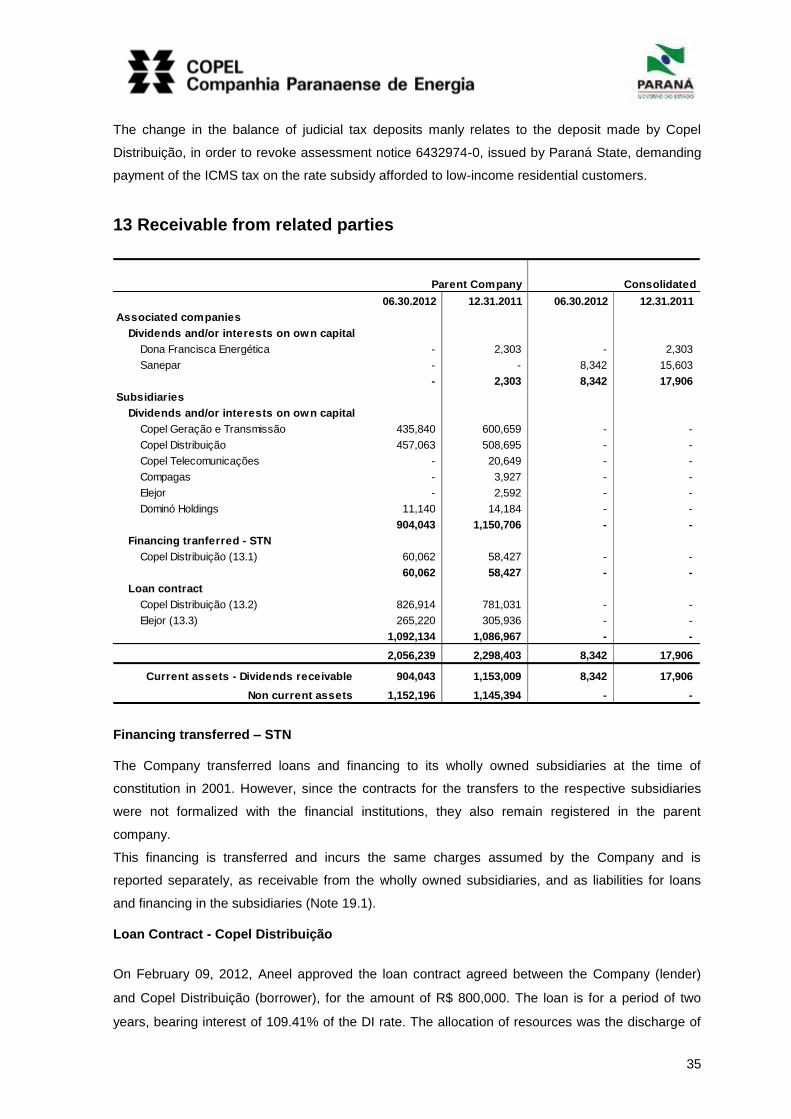
35
The change in the balance of judicial tax deposits manly relates to the deposit made by Copel
Distribuição, in order to revoke assessment notice 6432974-0, issued by Paraná State, demanding
payment of the ICMS tax on the rate subsidy afforded to low-income residential customers.
13 Receivable from related parties
Parent Company Consolidated
06.30.2012 12.31.2011 06.30.2012 12.31.2011
Associated companies
Dividends and/or interests on own capital
Dona Francisca Energética - 2,303 - 2,303
Sanepar - - 8,342 15,603
. - 2,303 8,342 17,906
Subsidiaries
Dividends and/or interests on own capital
Copel Geração e Transmissão 435,840 600,659 - -
Copel Distribuição 457,063 508,695 - -
Copel Telecomunicações - 20,649 - -
Compagas - 3,927 - -
Elejor - 2,592 - -
Dominó Holdings 11,140 14,184 - -
904,043 1,150,706 - -
Financing tranferred - STN
Copel Distribuição (13.1) 60,062 58,427 - -
60,062 58,427 - -
Loan contract
Copel Distribuição (13.2) 826,914 781,031 - -
Elejor (13.3) 265,220 305,936 - -
1,092,134 1,086,967 - -
2,056,239 2,298,403 8,342 17,906
Current assets - Dividends receivable 904,043 1,153,009 8,342 17,906
Non current assets 1,152,196 1,145,394 - -
Financing transferred – STN
The Company transferred loans and financing to its wholly owned subsidiaries at the time of
constitution in 2001. However, since the contracts for the transfers to the respective subsidiaries
were not formalized with the financial institutions, they also remain registered in the parent
company.
This financing is transferred and incurs the same charges assumed by the Company and is
reported separately, as receivable from the wholly owned subsidiaries, and as liabilities for loans
and financing in the subsidiaries (Note 19.1).
Loan Contract - Copel Distribuição
On February 09, 2012, Aneel approved the loan contract agreed between the Company (lender)
and Copel Distribuição (borrower), for the amount of R$ 800,000. The loan is for a period of two
years, bearing interest of 109.41% of the DI rate. The allocation of resources was the discharge of
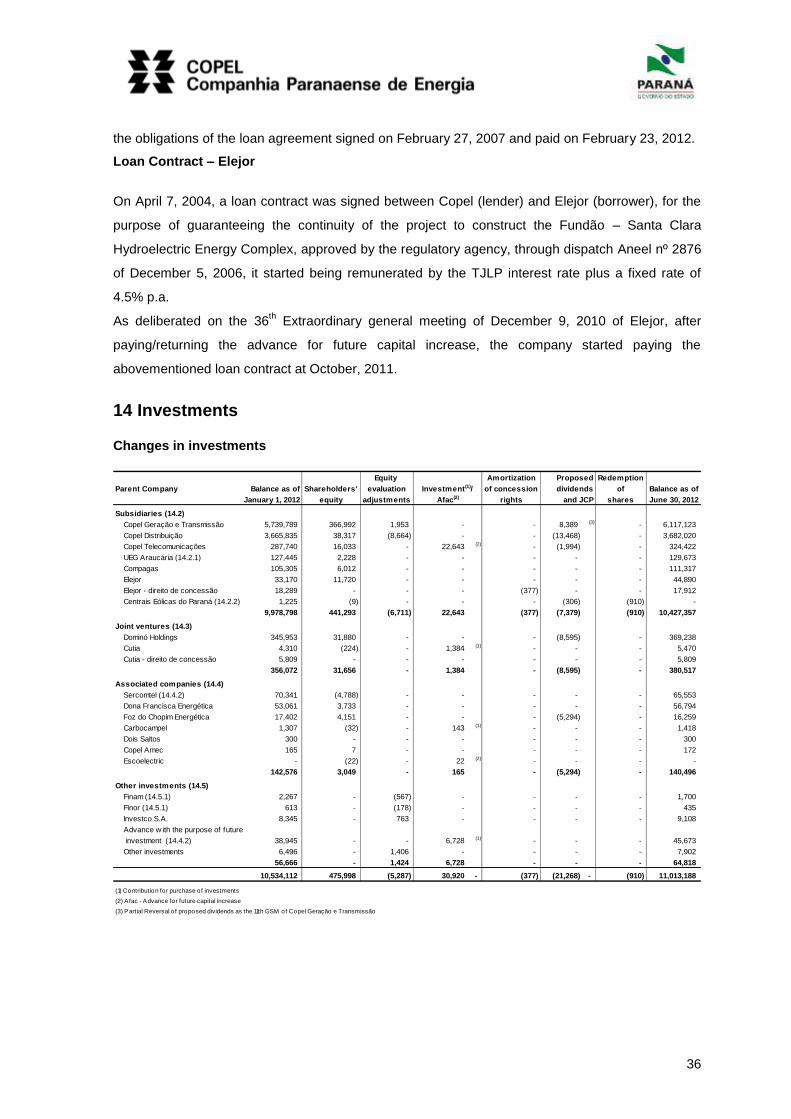
36
the obligations of the loan agreement signed on February 27, 2007 and paid on February 23, 2012.
Loan Contract – Elejor
On April 7, 2004, a loan contract was signed between Copel (lender) and Elejor (borrower), for the
purpose of guaranteeing the continuity of the project to construct the Fundão – Santa Clara
Hydroelectric Energy Complex, approved by the regulatory agency, through dispatch Aneel nº 2876
of December 5, 2006, it started being remunerated by the TJLP interest rate plus a fixed rate of
4.5% p.a.
As deliberated on the 36th Extraordinary general meeting of December 9, 2010 of Elejor, after
paying/returning the advance for future capital increase, the company started paying the
abovementioned loan contract at October, 2011.
14 Investments
Changes in investments
Equity Amortization Redemption
Parent Company Balance as of Shareholders' evaluation of concession of Balance as of
January 1, 2012 equity adjustments rights shares June 30, 2012
Subsidiaries (14.2)
Copel Geração e Transmissão 5,739,789 366,992 1,953 - - 8,389 (3) - 6,117,123
Copel Distribuição 3,665,835 38,317 (8,664) - - (13,468) - 3,682,020
Copel Telecomunicações 287,740 16,033 - 22,643 (2) - (1,994) - 324,422
UEG Araucária (14.2.1) 127,445 2,228 - - - - - 129,673
Compagas 105,305 6,012 - - - - - 111,317
Elejor 33,170 11,720 - - - - - 44,890
Elejor - direito de concessão 18,289 - - - (377) - - 17,912
Centrais Eólicas do Paraná (14.2.2) 1,225 (9) - - - (306) (910) -
9,978,798 441,293 (6,711) 22,643 (377) (7,379) (910) 10,427,357
Joint ventures (14.3)
Dominó Holdings 345,953 31,880 - - - (8,595) - 369,238
Cutia 4,310 (224) - 1,384 (1) - - - 5,470
Cutia - direito de concessão 5,809 - - - - - - 5,809
356,072 31,656 - 1,384 - (8,595) - 380,517
Associated companies (14.4)
Sercomtel (14.4.2) 70,341 (4,788) - - - - - 65,553
Dona Francisca Energética 53,061 3,733 - - - - - 56,794
Foz do Chopim Energética 17,402 4,151 - - - (5,294) - 16,259
Carbocampel 1,307 (32) - 143 (1) - - - 1,418
Dois Saltos 300 - - - - - - 300
Copel Amec 165 7 - - - - - 172
Escoelectric - (22) - 22 (2) - - - -
142,576 3,049 - 165 - (5,294) - 140,496
Other investments (14.5)
Finam (14.5.1) 2,267 - (567) - - - - 1,700
Finor (14.5.1) 613 - (178) - - - - 435
Investco S.A. 8,345 - 763 - - - - 9,108
Advance w ith the purpose of future
investment (14.4.2) 38,945 - - 6,728 (1) - - - 45,673
Other investments 6,496 - 1,406 - - - - 7,902
56,666 - 1,424 6,728 - - - 64,818
10,534,112 475,998 (5,287) 30,920 - (377) (21,268) - (910) 11,013,188
(1) Contribution for purchase of investments
(2) Afac - Advance for future capital increase
(3) Partial Reversal o f proposed dividends as the 11th GSM of Copel Geração e Transmissão
Proposed
dividends
and JCP
Investment(1)/
Afac(2)
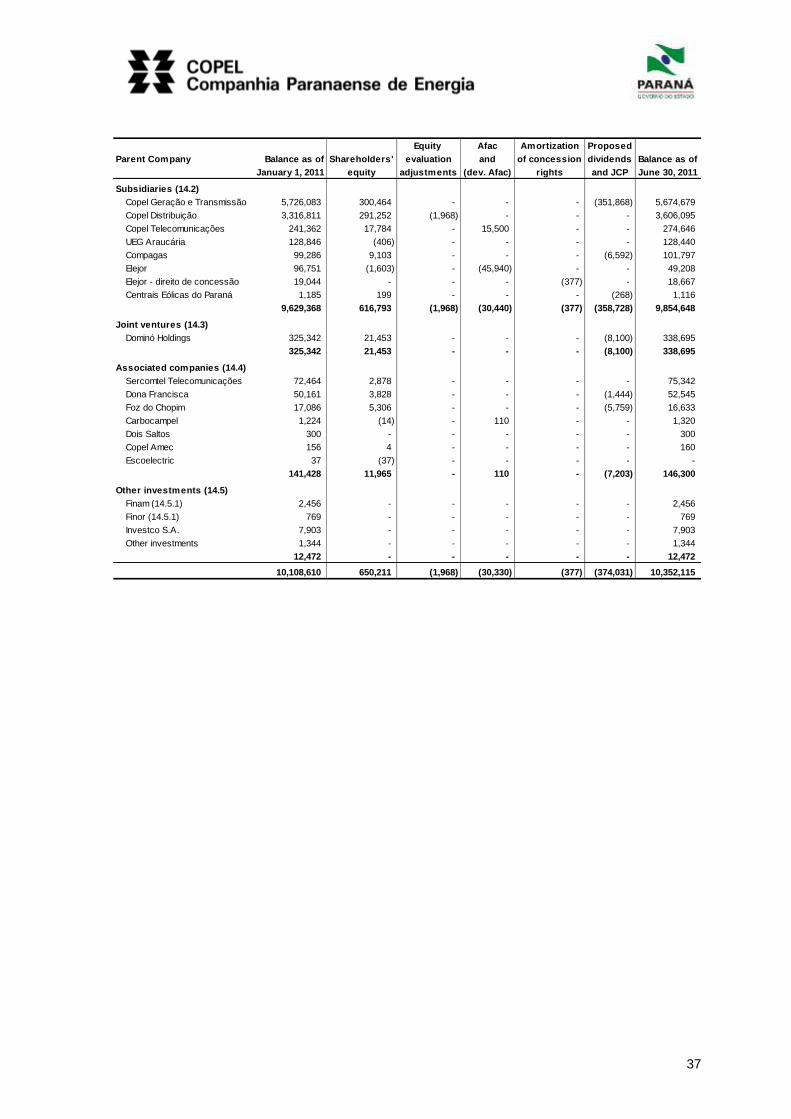
37
Equity Afac Amortization Proposed
Parent Company Balance as of Shareholders' evaluation and of concession dividends Balance as of
January 1, 2011 equity adjustments (dev. Afac) rights and JCP June 30, 2011
Subsidiaries (14.2)
Copel Geração e Transmissão 5,726,083 300,464 - - - (351,868) 5,674,679
Copel Distribuição 3,316,811 291,252 (1,968) - - - 3,606,095
Copel Telecomunicações 241,362 17,784 - 15,500 - - 274,646
UEG Araucária 128,846 (406) - - - - 128,440
Compagas 99,286 9,103 - - - (6,592) 101,797
Elejor 96,751 (1,603) - (45,940) - - 49,208
Elejor - direito de concessão 19,044 - - - (377) - 18,667
Centrais Eólicas do Paraná 1,185 199 - - - (268) 1,116
9,629,368 616,793 (1,968) (30,440) (377) (358,728) 9,854,648
Joint ventures (14.3)
Dominó Holdings 325,342 21,453 - - - (8,100) 338,695
325,342 21,453 - - - (8,100) 338,695
Associated companies (14.4)
Sercomtel Telecomunicações 72,464 2,878 - - - - 75,342
Dona Francisca 50,161 3,828 - - - (1,444) 52,545
Foz do Chopim 17,086 5,306 - - - (5,759) 16,633
Carbocampel 1,224 (14) - 110 - - 1,320
Dois Saltos 300 - - - - - 300
Copel Amec 156 4 - - - - 160
Escoelectric 37 (37) - - - - -
141,428 11,965 - 110 - (7,203) 146,300
Other investments (14.5)
Finam (14.5.1) 2,456 - - - - - 2,456
Finor (14.5.1) 769 - - - - - 769
Investco S.A. 7,903 - - - - - 7,903
Other investments 1,344 - - - - - 1,344
12,472 - - - - - 12,472
10,108,610 650,211 (1,968) (30,330) (377) (374,031) 10,352,115

38
Consolidated Equity Proposed Amortization
Balance as of Shareholders' evaluation Investment(1)/ dividends of concession Balance as of
January 1, 2012 equity adjustments Afac(2) and JCP rights June 30, 2012
Subsidiaries (14.4)
Sanepar 344.439 33.463 - - (9.815) (364) 367.723
Sercomtel Telecomunicações 70.341 (4.788) - - - - 65.553
Dona Francisca 53.061 3.733 - - - - 56.794
Foz do Chopim 17.402 4.151 - - (5.294) - 16.259
Carbocampel 1.307 (32) - 143 (1) - - 1.418
Dois Saltos 300 - - - - - 300
Copel Amec 165 7 - - - - 172
Escoelectric - (22) - 22 (2) - - -
487.015 36.512 - 165 (15.109) (364) 508.219
Other investments (14.5)
Finam (14.5.1) 2.267 - (567) - - - 1.700
Finor (14.5.1) 613 - (178) - - - 435
Investco S.A. 8.345 - 763 - - - 9.108
Assets for future use 4.290 - - - - - 4.290
Advance w ith the purpose of future
investment (14.4.2) 38.945 - - 6.728 (1) - - 45.673
Other investments 7.683 - 1.406 - - - 9.089
62.143 - 1.424 6.728 - - 70.295
549.158 36.512 1.424 6.893 (15.109) (364) 578.514
(1) Contribution for purchase of investments
(2) Afac - Advance for future capital increase
Consolidated Proposed Amortization
Balance as of Shareholders' dividends of concession Balance as of
January 1, 2011 equity and JCP rights June 30, 2011
Subsidiaries (14.4)
Sanepar 323,814 22,917 - (9,162) (364) 337,205
Sercomtel Telecomunicações 72,464 2,878 - - - 75,342
Dona Francisca 50,161 3,828 - (1,444) - 52,545
Foz do Chopim 17,086 5,306 - (5,759) - 16,633
Carbocampel 1,224 (14) 110 (2) - - 1,320
Dois Saltos 300 - - - - 300
Copel Amec 156 4 - - - 160
Escoelectric 37 (37) - - - -
465,242 34,882 110 (16,365) (364) 483,505
Other investments (14.5)
Finam (14.5.1) 2,456 - - - - 2,456
Finor (14.5.1) 769 - - - - 769
Investco S.A. 7,903 - - - - 7,903
Assets for future use 4,538 - - - - 4,538
Other investments 2,542 - 1 (1) - - 2,543
18,208 - 1 - - 18,209
483,450 34,882 111 (16,365) (364) 501,714
Investment(1)/
Afac(2)
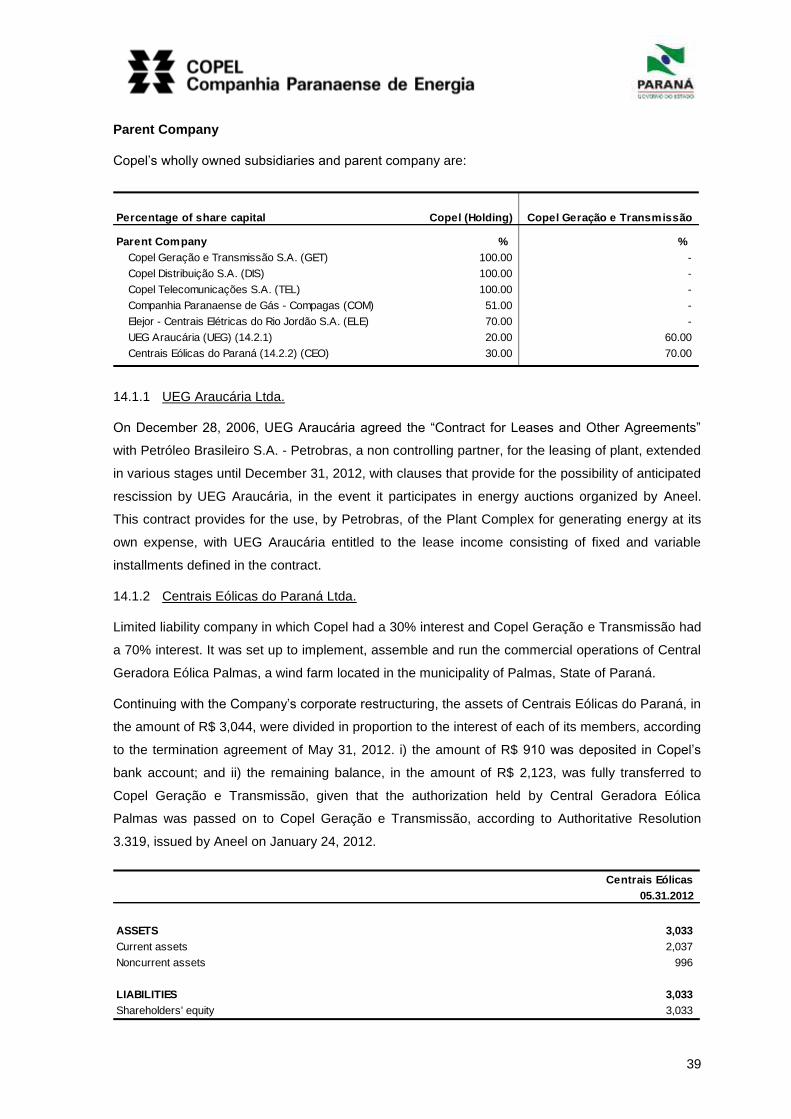
39
Parent Company
Copel’s wholly owned subsidiaries and parent company are:
Percentage of share capital Copel (Holding) Copel Geração e Transmissão
Parent Company % %
Copel Geração e Transmissão S.A. (GET) 100.00 -
Copel Distribuição S.A. (DIS) 100.00 -
Copel Telecomunicações S.A. (TEL) 100.00 -
Companhia Paranaense de Gás - Compagas (COM) 51.00 -
Elejor - Centrais Elétricas do Rio Jordão S.A. (ELE) 70.00 -
UEG Araucária (UEG) (14.2.1) 20.00 60.00
Centrais Eólicas do Paraná (14.2.2) (CEO) 30.00 70.00
14.1.1 UEG Araucária Ltda.
On December 28, 2006, UEG Araucária agreed the “Contract for Leases and Other Agreements”
with Petróleo Brasileiro S.A. - Petrobras, a non controlling partner, for the leasing of plant, extended
in various stages until December 31, 2012, with clauses that provide for the possibility of anticipated
rescission by UEG Araucária, in the event it participates in energy auctions organized by Aneel.
This contract provides for the use, by Petrobras, of the Plant Complex for generating energy at its
own expense, with UEG Araucária entitled to the lease income consisting of fixed and variable
installments defined in the contract.
14.1.2 Centrais Eólicas do Paraná Ltda.
Limited liability company in which Copel had a 30% interest and Copel Geração e Transmissão had
a 70% interest. It was set up to implement, assemble and run the commercial operations of Central
Geradora Eólica Palmas, a wind farm located in the municipality of Palmas, State of Paraná.
Continuing with the Company’s corporate restructuring, the assets of Centrais Eólicas do Paraná, in
the amount of R$ 3,044, were divided in proportion to the interest of each of its members, according
to the termination agreement of May 31, 2012. i) the amount of R$ 910 was deposited in Copel’s
bank account; and ii) the remaining balance, in the amount of R$ 2,123, was fully transferred to
Copel Geração e Transmissão, given that the authorization held by Central Geradora Eólica
Palmas was passed on to Copel Geração e Transmissão, according to Authoritative Resolution
3.319, issued by Aneel on January 24, 2012.
. Centrais Eólicas
05.31.2012
ASSETS 3,033
Current assets 2,037
Noncurrent assets 996
LIABILITIES 3,033
Shareholders' equity 3,033
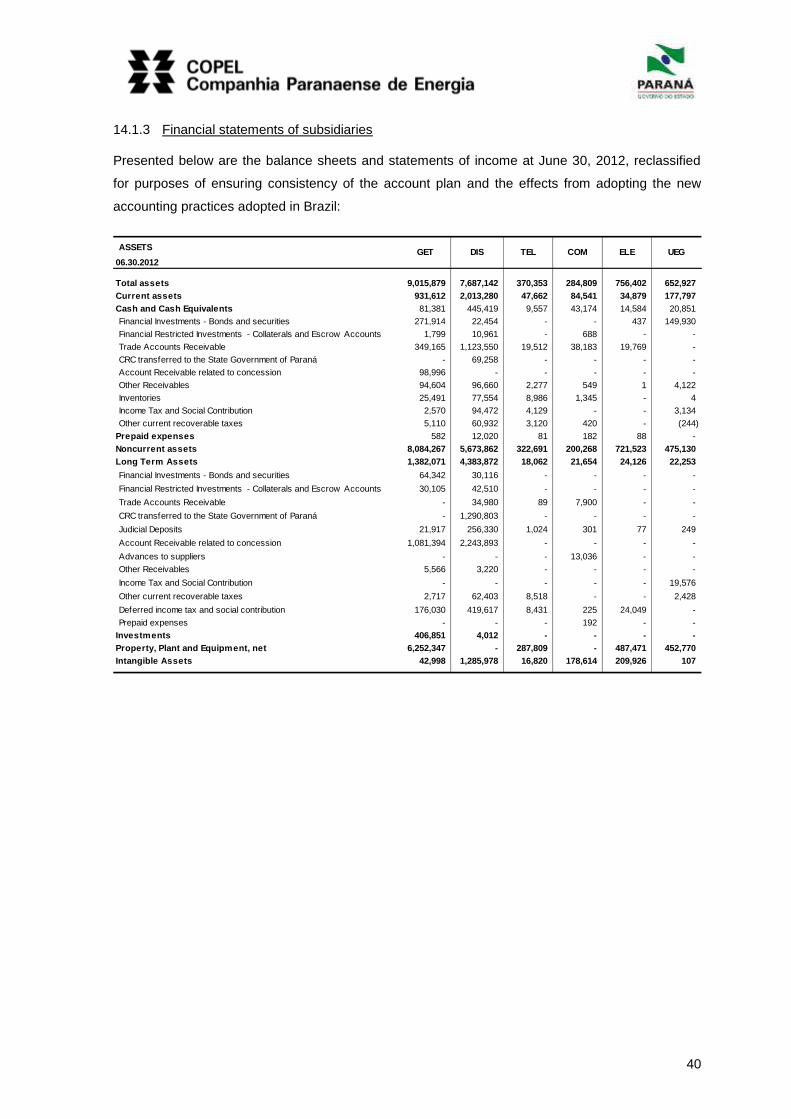
40
14.1.3 Financial statements of subsidiaries
Presented below are the balance sheets and statements of income at June 30, 2012, reclassified
for purposes of ensuring consistency of the account plan and the effects from adopting the new
accounting practices adopted in Brazil:
ASSETS
06.30.2012
Total assets 9,015,879 7,687,142 370,353 284,809 756,402 652,927
Current assets 931,612 2,013,280 47,662 84,541 34,879 177,797
Cash and Cash Equivalents 81,381 445,419 9,557 43,174 14,584 20,851
Financial Investments - Bonds and securities 271,914 22,454 - - 437 149,930
Financial Restricted Investments - Collaterals and Escrow Accounts 1,799 10,961 - 688 - -
Trade Accounts Receivable 349,165 1,123,550 19,512 38,183 19,769 -
CRC transferred to the State Government of Paraná - 69,258 - - - -
Account Receivable related to concession 98,996 - - - - -
Other Receivables 94,604 96,660 2,277 549 1 4,122
Inventories 25,491 77,554 8,986 1,345 - 4
Income Tax and Social Contribution 2,570 94,472 4,129 - - 3,134
Other current recoverable taxes 5,110 60,932 3,120 420 - (244)
Prepaid expenses 582 12,020 81 182 88 -
Noncurrent assets 8,084,267 5,673,862 322,691 200,268 721,523 475,130
Long Term Assets 1,382,071 4,383,872 18,062 21,654 24,126 22,253
Financial Investments - Bonds and securities 64,342 30,116 - - - -
Financial Restricted Investments - Collaterals and Escrow Accounts 30,105 42,510 - - - -
Trade Accounts Receivable - 34,980 89 7,900 - -
CRC transferred to the State Government of Paraná - 1,290,803 - - - -
Judicial Deposits 21,917 256,330 1,024 301 77 249
Account Receivable related to concession 1,081,394 2,243,893 - - - -
Advances to suppliers - - - 13,036 - -
Other Receivables 5,566 3,220 - - - -
Income Tax and Social Contribution - - - - - 19,576
Other current recoverable taxes 2,717 62,403 8,518 - - 2,428
Deferred income tax and social contribution 176,030 419,617 8,431 225 24,049 -
Prepaid expenses - - - 192 - -
Investments 406,851 4,012 - - - -
Property, Plant and Equipment, net 6,252,347 - 287,809 - 487,471 452,770
Intangible Assets 42,998 1,285,978 16,820 178,614 209,926 107
GET DIS TEL COM ELE UEG
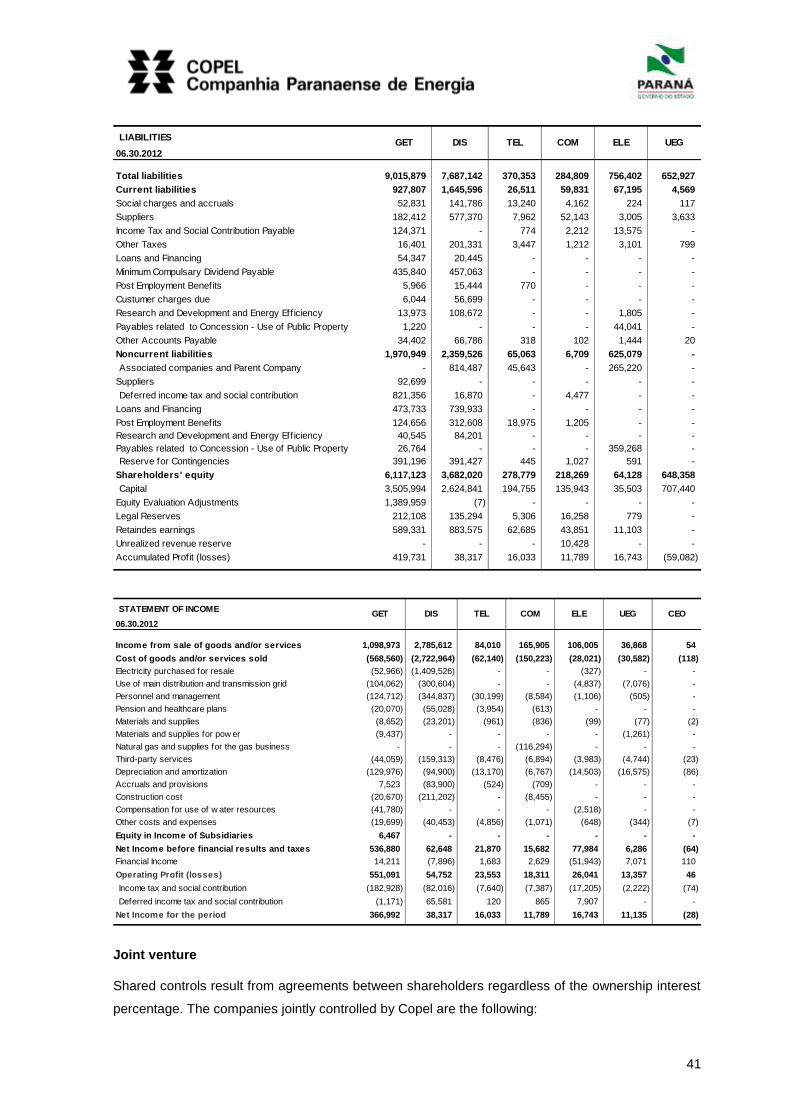
41
LIABILITIES
06.30.2012
Total liabilities 9,015,879 7,687,142 370,353 284,809 756,402 652,927
Current liabilities 927,807 1,645,596 26,511 59,831 67,195 4,569
Social charges and accruals 52,831 141,786 13,240 4,162 224 117
Suppliers 182,412 577,370 7,962 52,143 3,005 3,633
Income Tax and Social Contribution Payable 124,371 - 774 2,212 13,575 -
Other Taxes 16,401 201,331 3,447 1,212 3,101 799
Loans and Financing 54,347 20,445 - - - -
Minimum Compulsary Dividend Payable 435,840 457,063 - - - -
Post Employment Benefits 5,966 15,444 770 - - -
Custumer charges due 6,044 56,699 - - - -
Research and Development and Energy Efficiency 13,973 108,672 - - 1,805 -
Payables related to Concession - Use of Public Property 1,220 - - - 44,041 -
Other Accounts Payable 34,402 66,786 318 102 1,444 20
Noncurrent liabilities 1,970,949 2,359,526 65,063 6,709 625,079 -
Associated companies and Parent Company - 814,487 45,643 - 265,220 -
Suppliers 92,699 - - - - -
Deferred income tax and social contribution 821,356 16,870 - 4,477 - -
Loans and Financing 473,733 739,933 - - - -
Post Employment Benefits 124,656 312,608 18,975 1,205 - -
Research and Development and Energy Efficiency 40,545 84,201 - - - -
Payables related to Concession - Use of Public Property 26,764 - - - 359,268 -
Reserve for Contingencies 391,196 391,427 445 1,027 591 -
Shareholders' equity 6,117,123 3,682,020 278,779 218,269 64,128 648,358
Capital 3,505,994 2,624,841 194,755 135,943 35,503 707,440
Equity Evaluation Adjustments 1,389,959 (7) - - - -
Legal Reserves 212,108 135,294 5,306 16,258 779 -
Retaindes earnings 589,331 883,575 62,685 43,851 11,103 -
Unrealized revenue reserve - - - 10,428 - -
Accumulated Profit (losses) 419,731 38,317 16,033 11,789 16,743 (59,082)
GET DIS TEL COM ELE UEG
STATEMENT OF INCOME
06.30.2012
Income from sale of goods and/or services 1,098,973 2,785,612 84,010 165,905 106,005 36,868 54
Cost of goods and/or services sold (568,560) (2,722,964) (62,140) (150,223) (28,021) (30,582) (118)
Electricity purchased for resale (52,966) (1,409,526) - - (327) - -
Use of main distribution and transmission grid (104,062) (300,604) - - (4,837) (7,076) -
Personnel and management (124,712) (344,837) (30,199) (8,584) (1,106) (505) -
Pension and healthcare plans (20,070) (55,028) (3,954) (613) - - -
Materials and supplies (8,652) (23,201) (961) (836) (99) (77) (2)
Materials and supplies for pow er (9,437) - - - - (1,261) -
Natural gas and supplies for the gas business - - - (116,294) - - -
Third-party services (44,059) (159,313) (8,476) (6,894) (3,983) (4,744) (23)
Depreciation and amortization (129,976) (94,900) (13,170) (6,767) (14,503) (16,575) (86)
Accruals and provisions 7,523 (83,900) (524) (709) - - -
Construction cost (20,670) (211,202) - (8,455) - - -
Compensation for use of w ater resources (41,780) - - - (2,518) - -
Other costs and expenses (19,699) (40,453) (4,856) (1,071) (648) (344) (7)
Equity in Income of Subsidiaries 6,467 - - - - - -
Net Income before financial results and taxes 536,880 62,648 21,870 15,682 77,984 6,286 (64)
Financial Income 14,211 (7,896) 1,683 2,629 (51,943) 7,071 110
Operating Profit (losses) 551,091 54,752 23,553 18,311 26,041 13,357 46
Income tax and social contribution (182,928) (82,016) (7,640) (7,387) (17,205) (2,222) (74)
Deferred income tax and social contribution (1,171) 65,581 120 865 7,907 - -
Net Income for the period Lucro Líquido (Prejuízo) do Exercício366,992 38,317 16,033 11,789 16,743 11,135 (28)
GET DIS TEL COM ELE UEG CEO
Joint venture
Shared controls result from agreements between shareholders regardless of the ownership interest
percentage. The companies jointly controlled by Copel are the following:
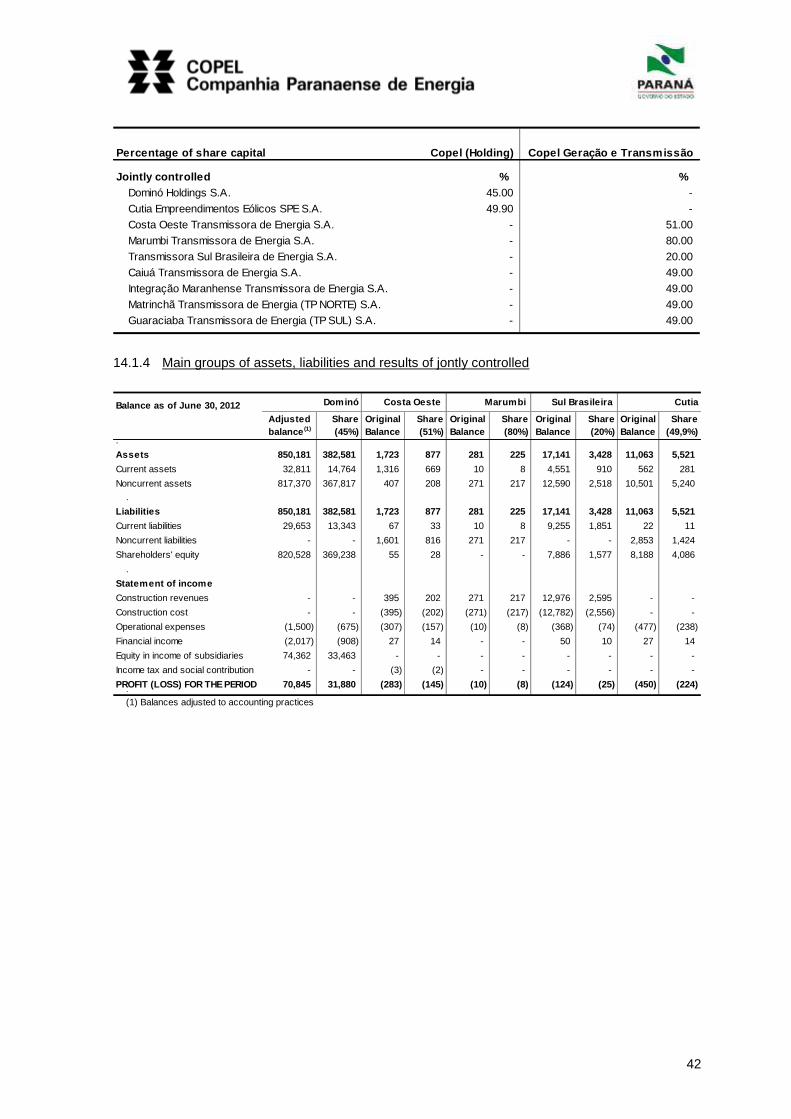
42
Percentage of share capital Copel (Holding) Copel Geração e Transmissão
Jointly controlled % %
Dominó Holdings S.A. 45.00 -
Cutia Empreendimentos Eólicos SPE S.A. 49.90 -
Costa Oeste Transmissora de Energia S.A. - 51.00
Marumbi Transmissora de Energia S.A. - 80.00
Transmissora Sul Brasileira de Energia S.A. - 20.00
Caiuá Transmissora de Energia S.A. - 49.00
Integração Maranhense Transmissora de Energia S.A. - 49.00
Matrinchã Transmissora de Energia (TP NORTE) S.A. - 49.00
Guaraciaba Transmissora de Energia (TP SUL) S.A. - 49.00
14.1.4 Main groups of assets, liabilities and results of jontly controlled
Balance as of June 30, 2012
Adjusted
balance (1)
Share
(45%)
Original
Balance
Share
(51%)
Original
Balance
Share
(80%)
Original
Balance
Share
(20%)
Original
Balance
Share
(49,9%) .
Assets 850,181 382,581 1,723 877 281 225 17,141 3,428 11,063 5,521
Current assets 32,811 14,764 1,316 669 10 8 4,551 910 562 281
Noncurrent assets 817,370 367,817 407 208 271 217 12,590 2,518 10,501 5,240
.
Liabilities 850,181 382,581 1,723 877 281 225 17,141 3,428 11,063 5,521
Current liabilities 29,653 13,343 67 33 10 8 9,255 1,851 22 11
Noncurrent liabilities - - 1,601 816 271 217 - - 2,853 1,424
Shareholders' equity 820,528 369,238 55 28 - - 7,886 1,577 8,188 4,086
.
Statement of income
Construction revenues - - 395 202 271 217 12,976 2,595 - -
Construction cost - - (395) (202) (271) (217) (12,782) (2,556) - -
Operational expenses (1,500) (675) (307) (157) (10) (8) (368) (74) (477) (238)
Financial income (2,017) (908) 27 14 - - 50 10 27 14
Equity in income of subsidiaries 74,362 33,463 - - - - - - - -
Income tax and social contribution - - (3) (2) - - - - - -
PROFIT (LOSS) FOR THE PERIOD 70,845 31,880 (283) (145) (10) (8) (124) (25) (450) (224) .
(1) Balances adjusted to accounting practices
Dominó Costa Oeste Marumbi Sul Brasileira Cutia

43
Balance as of June 30, 2012
Original
Balance
Share
(49%)
Original
Balance
Share
(49%)
Original
Balance
Share
(49%)
Original
Balance
Share
(49%) .
Assets 8,168 4,002 12,418 6,085 5,501 2,695 4,501 2,205
Current assets 8,059 3,949 11,943 5,852 4,862 2,382 4,157 2,036
Noncurrent assets 109 53 475 233 639 313 344 169
.
Liabilities 8,168 4,002 12,418 6,085 5,501 2,695 4,501 2,205
Current liabilities 656 321 1,427 699 - - - -
Noncurrent liabilities 7,538 3,694 11,001 5,390 - - - -
Shareholders' equity (26) (13) (10) (4) 5,501 2,695 4,501 2,205
.
Statement of income
Construction revenues 619 303 1,527 748 638 313 344 169
Construction cost (619) (303) (1,527) (748) (638) (313) (344) (169)
Operational expenses (26) (13) (9) (4) - - - -
Financial income - - - - - - - -
Equity in income of subsidiaries - - - - - - - -
Income tax and social contribution - - - - - - - -
PROFIT (LOSS) FOR THE PERIOD (26) (13) (9) (4) - - - - .
(1) Balances adjusted to accounting practices
I. Maranhense Matrinchã GuaraciabaCaiuá
Related Affiliates
Net Part.
Main Shareholders' income Group
06.30.2012 activity Assets (1) Liabilities (1) equity (1) Revenues (loss) (1) %
Cia. Saneamento do Paraná
- Sanepar (14.4.1) Basic sanitation 2,570,126 1,515,277 1,054,849 455,344 96,304 34.75
Sercomtel S.A. Telecomunicações Telecomunications 261,861 116,189 145,672 63,305 (8,294) 45.00
Foz do Chopim Energética Ltda. Energy 47,970 2,515 45,455 18,692 11,605 35.77
Dona Francisca Energética S.A. Energy 300,054 53,448 246,606 44,872 16,207 23.03
Dois Saltos Empreendimentos de
Geração de Energia Elétrica Ltda. Energy 1,352 352 1,000 - - 30.00
Copel Amec S/C Ltda. Serv. and consulting 362 3 359 - 16 48.00
Carbocampel S.A. Serv. and consulting 3,586 694 2,892 - (65) 49.00
Escoelectric Ltda. Serv. and consulting 2,740 5,132 (2,392) - (62) 40.00.
(1) Balances adjusted to accounting practices
14.1.5 Sanepar
In 1998, the acquisition of shares in Sanepar by Dominó Holdings S.A. generated the concession
right for the total amount of R$ 24,316, which at June 30, 2012 reported a balance of R$ 2,432.
Copel’s proportional investment (45%), in this balance corresponded to R$ 1,094 and is being
amortized over 15 years, as from 1999, at the rate of R$ 61 per month, and the amount registered
to profit/loss for the six-month period ending June 30, 2012 was R$ 364 (R$ 364 in 2011).
14.1.6 Sercomtel
The completion of work on the recovery tests of our assets, which occurred in 2011, adopting,
where applicable, the same assumptions mentioned in footnote Fixed Assets (Note 15.5) indicated
with an adequate level of security that assets linked to related Sercomtel S.A. Telecommunications
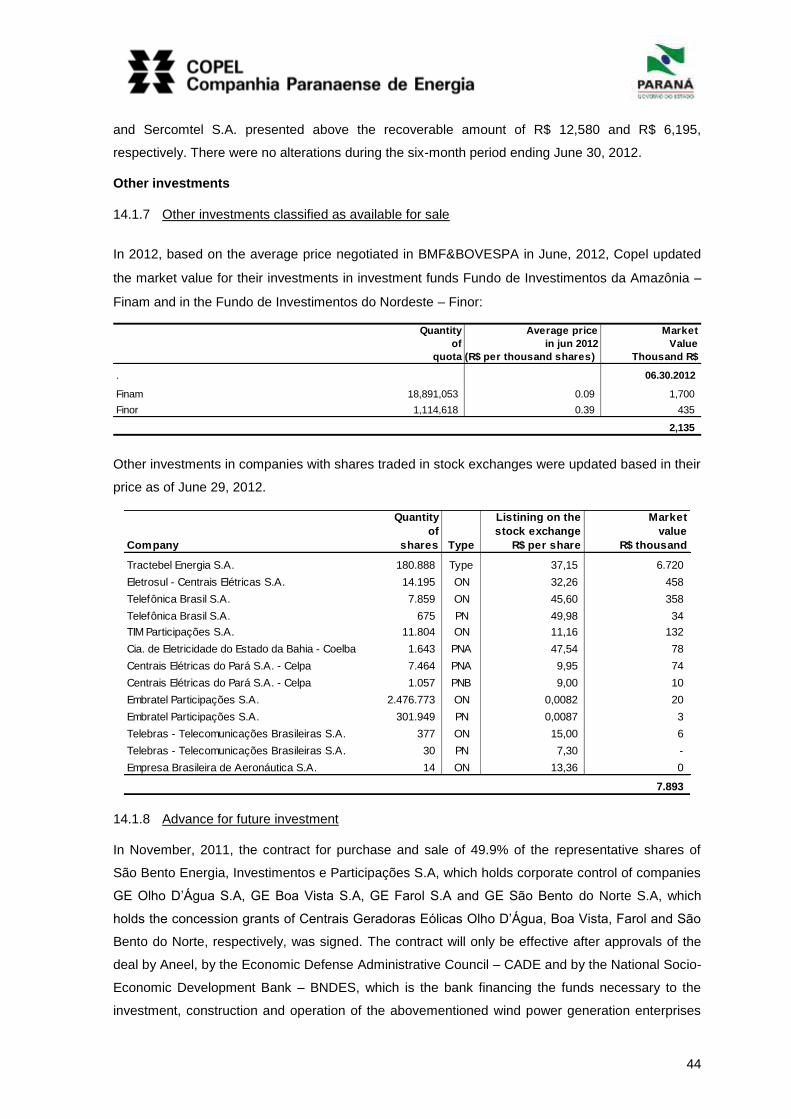
44
and Sercomtel S.A. presented above the recoverable amount of R$ 12,580 and R$ 6,195,
respectively. There were no alterations during the six-month period ending June 30, 2012.
Other investments
14.1.7 Other investments classified as available for sale
In 2012, based on the average price negotiated in BMF&BOVESPA in June, 2012, Copel updated
the market value for their investments in investment funds Fundo de Investimentos da Amazônia –
Finam and in the Fundo de Investimentos do Nordeste – Finor:
Quantity Average price Market
of in jun 2012 Value
quota (R$ per thousand shares) Thousand R$
. 06.30.2012
Finam 18,891,053 0.09 1,700
Finor 1,114,618 0.39 435
2,135
Other investments in companies with shares traded in stock exchanges were updated based in their
price as of June 29, 2012.
Quantity Listining on the Market
of stock exchange value
Company shares Type R$ per share R$ thousand
Tractebel Energia S.A. 180.888 Type 37,15 6.720
Eletrosul - Centrais Elétricas S.A. 14.195 ON 32,26 458
Telefônica Brasil S.A. 7.859 ON 45,60 358
Telefônica Brasil S.A. 675 PN 49,98 34
TIM Participações S.A. 11.804 ON 11,16 132
Cia. de Eletricidade do Estado da Bahia - Coelba 1.643 PNA 47,54 78
Centrais Elétricas do Pará S.A. - Celpa 7.464 PNA 9,95 74
Centrais Elétricas do Pará S.A. - Celpa 1.057 PNB 9,00 10
Embratel Participações S.A. 2.476.773 ON 0,0082 20
Embratel Participações S.A. 301.949 PN 0,0087 3
Telebras - Telecomunicações Brasileiras S.A. 377 ON 15,00 6
Telebras - Telecomunicações Brasileiras S.A. 30 PN 7,30 -
Empresa Brasileira de Aeronáutica S.A. 14 ON 13,36 0
7.893
14.1.8 Advance for future investment
In November, 2011, the contract for purchase and sale of 49.9% of the representative shares of
São Bento Energia, Investimentos e Participações S.A, which holds corporate control of companies
GE Olho D’Água S.A, GE Boa Vista S.A, GE Farol S.A and GE São Bento do Norte S.A, which
holds the concession grants of Centrais Geradoras Eólicas Olho D’Água, Boa Vista, Farol and São
Bento do Norte, respectively, was signed. The contract will only be effective after approvals of the
deal by Aneel, by the Economic Defense Administrative Council – CADE and by the National Socio-
Economic Development Bank – BNDES, which is the bank financing the funds necessary to the
investment, construction and operation of the abovementioned wind power generation enterprises

45
held by the controlled companies. The funds provided, which amount to R$ 45,673, were classified
as an advance for future investment. In case the approvals are not obtained, the seller is obliged to
repay the funds adjusted by the variation of the National Prices Index – IGPM.
Consolidated income statement segregated by company
Aiming to enable analysis of outcome by type of expenditure, costs and expenses are presented in
aggregate form. These statements represent the result of the activities of the six-month period
ending June 30, 2012, excluding revenue from the equity of subsidiaries.
STATEMENT OF INCOME
06.30.2012
NET OPERATING INCOME 1,098,973 2,785,612 84,010 165,905 106,005 36,868 3,068 - (225,866) 4,056,108
Electricity sales to f inal customers 60,962 1,158,533 - - - - - - (1,407) 1,218,088
Electricity sales to distributors 797,827 93,154 - - 105,870 - 54 - (147,497) 849,408
Charges for the use of the main transmission grid 199,137 1,288,057 - - - - - - (52,218) 1,434,976
Construction revenues 22,059 211,202 - 8,455 - - 3,014 - - 246,263
Revenues from telecommunications - - 81,374 - - - - - (19,986) 61,388
Distribution of piped gas - - - 153,161 - - - - - 153,161
Leases and rentals 638 33,310 2,573 - - 40,627 - - (2,641) 74,507
Other operating revenues 18,350 1,356 63 4,289 135 (3,759) - - (2,117) 18,317
OPERATING COSTS AND EXPENSES (568,560) (2,722,964) (62,140) (150,223) (28,021) (30,582) (4,245) (25,881) 225,479 (3,368,687)
Energy purchased for resale (52,966) (1,409,526) - - (327) - - - 147,397 (1,315,422)
Charges from use of grid system (104,062) (300,604) - - (4,837) (7,076) - - 51,079 (365,500)
Personnel and management (124,712) (344,837) (30,199) (8,584) (1,106) (505) (198) (4,515) - (514,656)
Private pension and health plans (20,070) (55,028) (3,954) (613) - - - (267) - (79,932)
Materials (8,652) (23,201) (961) (836) (99) (77) (3) (11) - (33,840)
Raw material and supplies - energy production (9,437) - - - - (1,261) - - - (10,698)
Natural gas and supplies - gas operations - - - (116,294) - - - - - (116,294)
Third parties services (44,059) (159,313) (8,476) (6,894) (3,983) (4,744) (344) (1,651) 26,383 (203,096)
Depreciation and amortization (129,976) (94,900) (13,170) (6,767) (14,503) (16,575) (451) (377) - (276,719)
Provisions and reversals 7,523 (83,900) (524) (709) - - - (13,206) - (90,816)
Construction cost (20,670) (211,202) - (8,455) - - (2,975) - - (244,835)
Compensation for use
of w ater resources (41,780) - - - (2,518) - - - - (44,298)
Other costs and operational expenses (19,699) (40,453) (4,856) (1,071) (648) (344) (274) (5,854) 620 (72,581)
EQUITY IN EARNINGS OF SUBSIDIARIES - - - - - - 33,463 3,049 - 36,512
PROFIT BEFORE FINANCIAL RESULTS AND TAXES 530,413 62,648 21,870 15,682 77,984 6,286 32,286 (22,832) (387) 723,933
Financial income (expense) 14,211 (7,896) 1,683 2,629 (51,943) 7,071 (760) 10,231 387 (24,387)
OPERATIONAL PROFIT 544,624 54,752 23,553 18,311 26,041 13,357 31,526 (12,601) - 699,546
Income tax and social contribution (182,928) (82,016) (7,640) (7,387) (17,205) (2,222) (76) - - (299,474)
Deferred income tax and social income (1,171) 65,581 120 865 7,907 - - 31,312 - 104,614
NET INCOME (LOSS) FOR THE YEAR 360,525 38,317 16,033 11,789 16,743 11,135 31,450 18,711 - 504,686
GET DIS TEL COM ELE UEG Eliminations ConsolidatedOther Holding
15 Property, Plant and Equipment
Asset in service by account nature
Consolidated Accumulated Net book
Cost depreciation Value
06.30.2012
Reservoirs, dams and aqueducts 7,108,618 (4,273,366) 2,835,252
Machinery and equipment 4,457,520 (2,334,471) 2,123,049
Buildings 1,376,671 (948,390) 428,281
Land 182,562 - 182,562
Vehicles 38,414 (28,114) 10,300
Furniture and tools 10,948 (8,071) 2,877
13,174,733 (7,592,412) 5,582,321
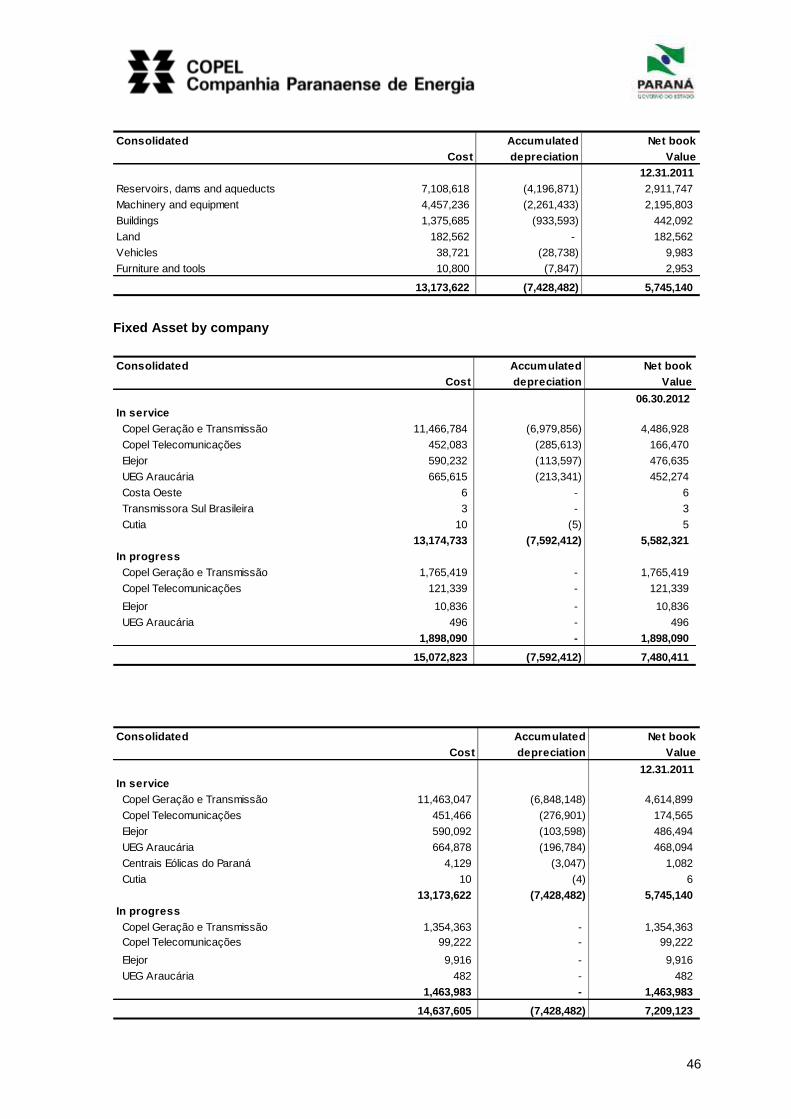
46
Consolidated Accumulated Net book
Cost depreciation Value
12.31.2011
Reservoirs, dams and aqueducts 7,108,618 (4,196,871) 2,911,747
Machinery and equipment 4,457,236 (2,261,433) 2,195,803
Buildings 1,375,685 (933,593) 442,092
Land 182,562 - 182,562
Vehicles 38,721 (28,738) 9,983
Furniture and tools 10,800 (7,847) 2,953
13,173,622 (7,428,482) 5,745,140
Fixed Asset by company
Consolidated Accumulated Net book
Cost depreciation Value
06.30.2012
In service
Copel Geração e Transmissão 11,466,784 (6,979,856) 4,486,928
Copel Telecomunicações 452,083 (285,613) 166,470
Elejor 590,232 (113,597) 476,635
UEG Araucária 665,615 (213,341) 452,274
Costa Oeste 6 - 6
Transmissora Sul Brasileira 3 - 3
Cutia 10 (5) 5
13,174,733 (7,592,412) 5,582,321
In progress
Copel Geração e Transmissão 1,765,419 - 1,765,419
Copel Telecomunicações 121,339 - 121,339
Elejor 10,836 - 10,836
UEG Araucária 496 - 496
1,898,090 - 1,898,090
15,072,823 (7,592,412) 7,480,411
Consolidated Accumulated Net book
Cost depreciation Value
12.31.2011
In service
Copel Geração e Transmissão 11,463,047 (6,848,148) 4,614,899
Copel Telecomunicações 451,466 (276,901) 174,565
Elejor 590,092 (103,598) 486,494
UEG Araucária 664,878 (196,784) 468,094
Centrais Eólicas do Paraná 4,129 (3,047) 1,082
Cutia 10 (4) 6
13,173,622 (7,428,482) 5,745,140
In progress
Copel Geração e Transmissão 1,354,363 - 1,354,363
Copel Telecomunicações 99,222 - 99,222
Elejor 9,916 - 9,916
UEG Araucária 482 - 482
1,463,983 - 1,463,983
14,637,605 (7,428,482) 7,209,123
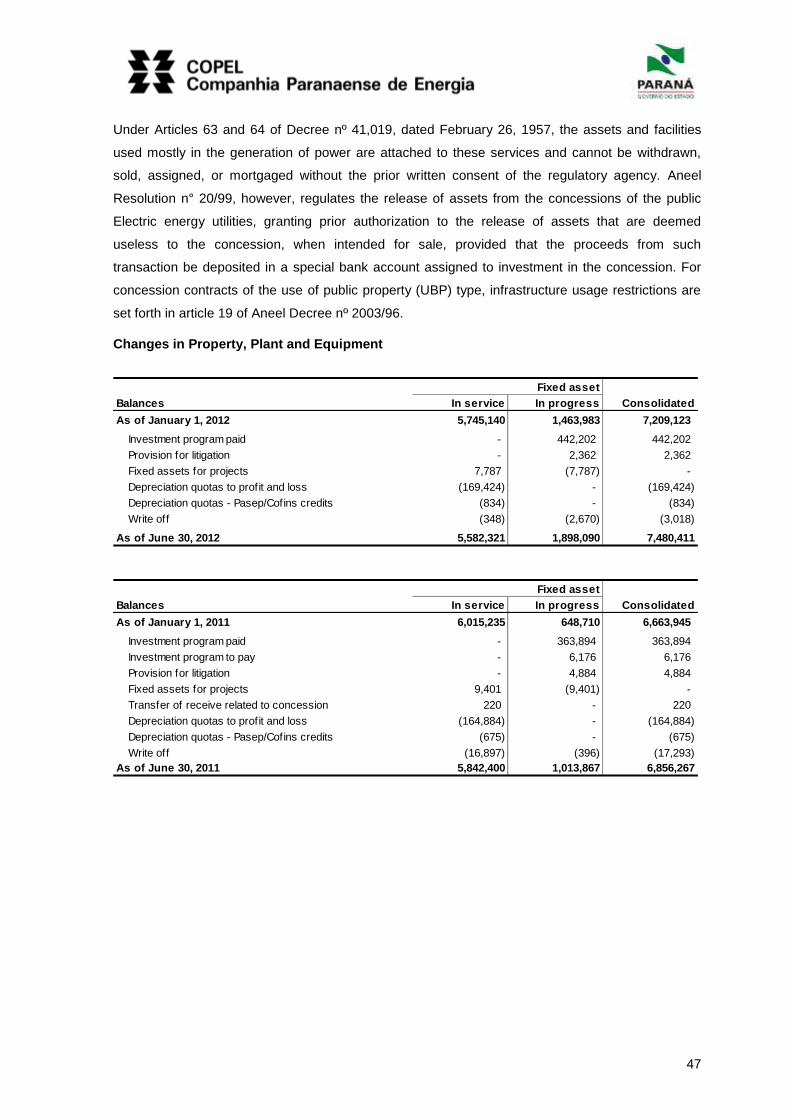
47
Under Articles 63 and 64 of Decree nº 41,019, dated February 26, 1957, the assets and facilities
used mostly in the generation of power are attached to these services and cannot be withdrawn,
sold, assigned, or mortgaged without the prior written consent of the regulatory agency. Aneel
Resolution n° 20/99, however, regulates the release of assets from the concessions of the public
Electric energy utilities, granting prior authorization to the release of assets that are deemed
useless to the concession, when intended for sale, provided that the proceeds from such
transaction be deposited in a special bank account assigned to investment in the concession. For
concession contracts of the use of public property (UBP) type, infrastructure usage restrictions are
set forth in article 19 of Aneel Decree nº 2003/96.
Changes in Property, Plant and Equipment
Balances In service In progress Consolidated
As of January 1, 2012 5,745,140 1,463,983 7,209,123
Investment program paid - 442,202 442,202
Provision for litigation - 2,362 2,362
Fixed assets for projects 7,787 (7,787) -
Depreciation quotas to profit and loss (169,424) - (169,424)
Depreciation quotas - Pasep/Cofins credits (834) - (834)
Write off (348) (2,670) (3,018)
As of June 30, 2012 5,582,321 1,898,090 7,480,411
Fixed asset
Balances In service In progress Consolidated
As of January 1, 2011 6,015,235 648,710 6,663,945
Investment program paid - 363,894 363,894
Investment program to pay - 6,176 6,176
Provision for litigation - 4,884 4,884
Fixed assets for projects 9,401 (9,401) -
Transfer of receive related to concession 220 - 220
Depreciation quotas to profit and loss (164,884) - (164,884)
Depreciation quotas - Pasep/Cofins credits (675) - (675)
Write off (16,897) (396) (17,293)
As of June 30, 2011 5,842,400 1,013,867 6,856,267
Fixed asset
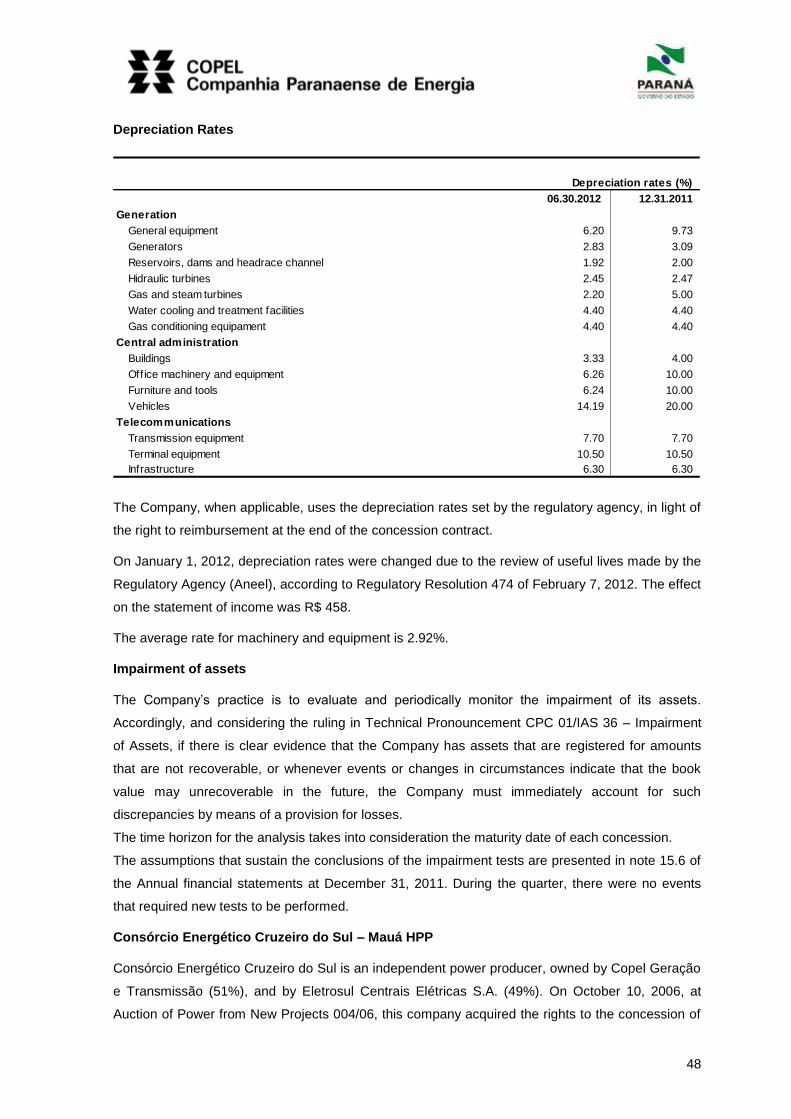
48
Depreciation Rates
Depreciation rates (%)
06.30.2012 12.31.2011
Generation
General equipment 6.20 9.73
Generators 2.83 3.09
Reservoirs, dams and headrace channel 1.92 2.00
Hidraulic turbines 2.45 2.47
Gas and steam turbines 2.20 5.00
Water cooling and treatment facilities 4.40 4.40
Gas conditioning equipament 4.40 4.40
Central administration
Buildings 3.33 4.00
Office machinery and equipment 6.26 10.00
Furniture and tools 6.24 10.00
Vehicles 14.19 20.00
Telecommunications
Transmission equipment 7.70 7.70
Terminal equipment 10.50 10.50
Infrastructure 6.30 6.30
The Company, when applicable, uses the depreciation rates set by the regulatory agency, in light of
the right to reimbursement at the end of the concession contract.
On January 1, 2012, depreciation rates were changed due to the review of useful lives made by the
Regulatory Agency (Aneel), according to Regulatory Resolution 474 of February 7, 2012. The effect
on the statement of income was R$ 458.
The average rate for machinery and equipment is 2.92%.
Impairment of assets
The Company’s practice is to evaluate and periodically monitor the impairment of its assets.
Accordingly, and considering the ruling in Technical Pronouncement CPC 01/IAS 36 – Impairment
of Assets, if there is clear evidence that the Company has assets that are registered for amounts
that are not recoverable, or whenever events or changes in circumstances indicate that the book
value may unrecoverable in the future, the Company must immediately account for such
discrepancies by means of a provision for losses.
The time horizon for the analysis takes into consideration the maturity date of each concession.
The assumptions that sustain the conclusions of the impairment tests are presented in note 15.6 of
the Annual financial statements at December 31, 2011. During the quarter, there were no events
that required new tests to be performed.
Consórcio Energético Cruzeiro do Sul – Mauá HPP
Consórcio Energético Cruzeiro do Sul is an independent power producer, owned by Copel Geração
e Transmissão (51%), and by Eletrosul Centrais Elétricas S.A. (49%). On October 10, 2006, at
Auction of Power from New Projects 004/06, this company acquired the rights to the concession of

49
the Mauá Hydroelectric Power Plant, which will feature 361 MW of installed capacity; the
concession is valid for 35 years from the date of signature, which took place on July 3, 2007.
This project is included in the Federal Government’s Growth Acceleration Program (PAC) and will
comprise a main powerhouse rated 350 MW and a secondary powerhouse rated 11 MW, for a total
of 361 MW of installed capacity, which is enough to supply approximately one million people. The
facility will take advantage of the hydroelectric potential discovered in the middle section of the
Tibagi River, between the towns of Telêmaco Borba and Ortigueira, in mideastern Paraná.
On November 17, 2008, the board of Banco Nacional de Desenvolvimento Econômico e Social –
BNDES approved the financing for the Mauá Hydroelectric Power Plant. The financed amount
corresponds to approximately 70% of Copel's total expenditures in connection with that facility.
The Mauá Hydroelectric Power Plant’s power output was sold at an Aneel auction at a price of R$
112.96/MWh, as of November 1, 2006, restated annually according to the variation of the IPCA
inflation index (R$ 151.16 /MWh as of June 30, 2012). A total of 192 average MW were sold, for
supply starting in January 2011 for 30 years. The assured power of the project, established in its
concession agreement, was 197.7 average MW, after full motorization.
The project has an Environmental Impact Study and an Environmental Impact Report, which have
been discussed at public hearings and meetings and approved by the licensing authority, resulting
in the issue of Installation License nº 6,496/08. The service order for the beginning of the
construction of the Mauá Hydroelectric Power Plant was signed on July 21, 2008.
Due to a preliminary injunction in Civil Action nº 1999.7001.007514-6, which has delayed the
beginning of construction work, thus delaying the beginning of commercial power generation by
each generating unit, Copel will guarantee the power purchase agreements with its own power
generation and with energy acquired through contracts in the Free Commercialization Environment
– ACL.
On June 28, 2012, the gates of the river’s deviation structures were closed and the reservoir started
to be filled. Operations will start in the second half of 2012.
Expenditures in this project have been recorded under property, plant, and equipment,
proportionally to the Company’s stake. As of June 30, 2012, Copel Geração e Transmissão’s
balance under property, plant and equipment related to this project was R$ 765,913.
Total expenses already owed to suppliers of equipment and services in connection with the Mauá
Power Plant amounted to R$ 35,602 as of June 30, 2012 (R$ 31,011 as of December 31, 2011).
50
HPP Colíder
On July 30, 2010, at Aneel Auction of Power from New Projects 003/10, Copel Geração e
Transmissão won the rights to the concession of the Colíder Hydroelectric Power Plant, which will
feature 300 MW of installed capacity; the concession is valid for 35 years from the date of signature
of Concession Contract nº 001/11-MME-HPP Colíder, which took place on January 17, 2011.
This project is included in the Federal Government’s Growth Acceleration Program (PAC) and will
comprise a main powerhouse rated 300 MW, which is enough to supply approximately one million
people. The facility will take advantage of the hydroelectric potential discovered on the Teles Pires
River, between the towns of Nova Canaã do Norte and Itaúba, in the northern region of the State of
Mato Grosso.
Copel has applied for financing from the National Economic and Social Development Bank (Banco
Nacional de Desenvolvimento Econômico e Social or BNDES) for the Colíder Hydroelectric Power
Plant.
The Colíder Hydroelectric Power Plant’s power output was sold at an Aneel auction at a final price
of R$ 103.40/MWh, as of July 1, 2010, restated according to the variation of the IPCA inflation index
(R$ 115.75/MWh as of June 30, 2012). A total of 125 average MW were sold, for supply starting in
January 2015 for 30 years. The assured power of the project, established in its concession
agreement, was 179.6 average MW, after full motorization.
The service order for the beginning of the construction of the Colíder Hydroelectric Power Plant was
signed on March 1, 2011.
The following activities are being carried out: Arenite quarry – the rock continues to be drilled for
concrete aggregates; right bank dam – waterproofing is being carried out and an injection curtain is
being built at the cutoff region and the nucleus is being backfilled. Backfilling is also being carried
out upstream and downstream. Horizontal and vertical filters are being built downstream together
with a drainage ditch. Excavations continue in the clay mine for waterproofing material to be used in
the dam; auxiliary cofferdams – backfilling continues at the upstream auxiliary cofferdam and
digging for the auxiliary downstream cofferdam also continues; and spillway – the injection curtain is
being built and primary holes are being consolidated upstream. The beam framework and
prestressing sheaths are being assembled.
The expenditures in this venture are recorded in fixed assets account group. On June 30, 2012, the
balance in fixed assets in progress on the project totaled R$ 796,844.
Total expenses already owed to suppliers of equipment and services in connection with the Colíder
Power Plant amounted to R$ 750,910 as of June 30, 2012.

51
Cavernoso II SHP
On August 26, 2010 at Aneel Auction nº 07/10, Copel Geração e Transmissão S.A. sold the power
output of the Cavernoso II SHP, a project with 19 MW of installed capacity located on the
Cavernoso River, between the towns of Virmond and Candói, in the State of Paraná. On account of
this sale, it obtained authorization to build and run the project for 35 years as of February 28, 2011,
the date of publication of Ordinance nº 133 of the Ministry of Mines and Energy.
This project is included in the Federal Government’s Growth Acceleration Program (PAC) and will
comprise a main power plant rated 19 MW, which is enough to supply 50 thousand people.
The Cavernoso II SHP’s power output was sold at a final price of R$ 146.99/MWh, as of August 1,
2010, restated according to the variation of the IPCA inflation index (R$ 164.48/MWh as of June 30,
2012). A total of 7.73 average MW were sold, for supply starting in November 2012 for 30 years.
The project’s assured power, set forth under Ordinance nº 133 of the Ministry of Mines and Energy,
dated February 25, 2011, is 10.56 average MW average.
The service order that authorizes the commencement of the mobilization and subsequent initiation
of the construction works was signed on April 18, 2011.
The following activities are being carried out: Left bank dam – the dam was raised to the height of
554.25 on the wall and to the height of 555.50 on the cutoff; water intake and intake channel – the
“dove chest” was treated with concrete. The treatment of the intake channel with shotcrete is in
progress; and control building and powerhouse – masonry work is being carried out on the control
building. The seal panel has just been set up at unit one, and the guides of the suction gate are
being assembled. Butterfly valves were placed at units one and two and the coil box at unit three.
Consoles were concreted to support the metal pillars above the height of 521.30 and stairs started
to be assembled.
The expenses incurred on this venture are recorded under property, plant and equipment. As of
June 30, 2012 the balance in property, plant and equipment in progress for the venture amounted to
R$ 87,197.
Total expenses already owed to suppliers of equipment and services in connection with the
Cavernoso SHP amounted to R$ 68,735 as of June 30, 2012.
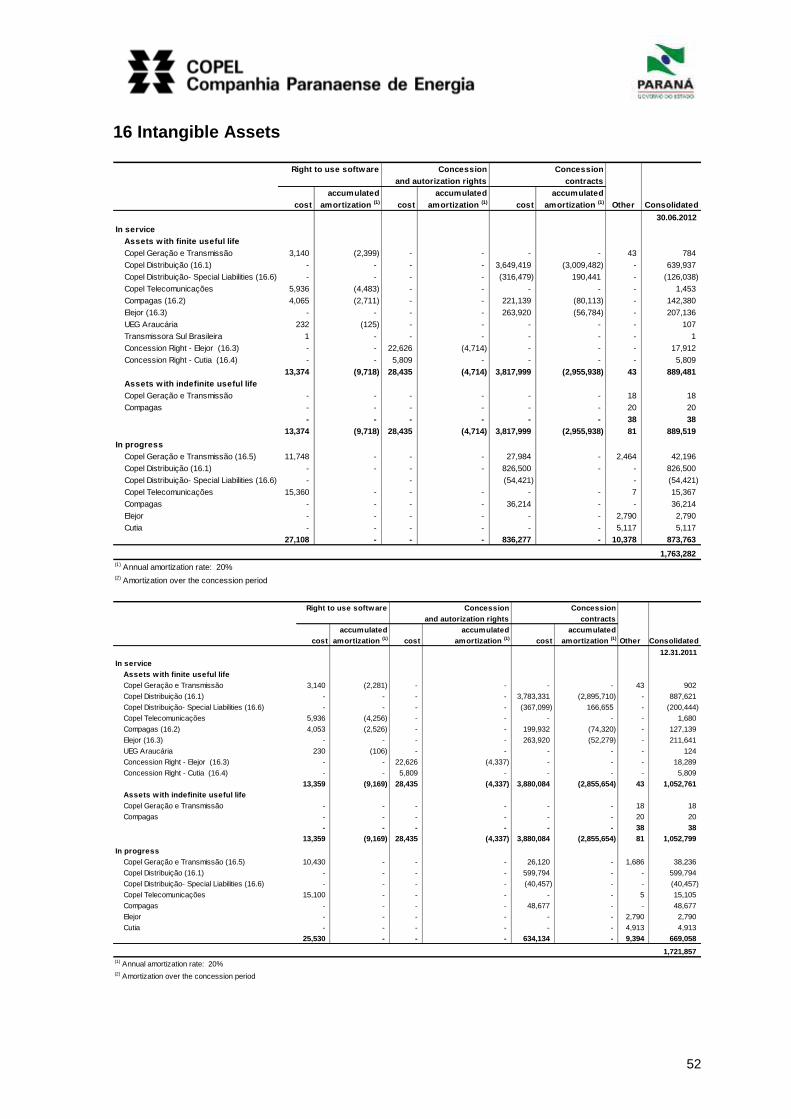
52
16 Intangible Assets
Right to use software Concession Concession
and autorization rights contracts
accumulated accumulated accumulated
cost amortization (1) cost amortization (1) cost amortization (1) Other Consolidated
30.06.2012
In service
Assets with finite useful life
Copel Geração e Transmissão 3,140 (2,399) - - - - 43 784
Copel Distribuição (16.1) - - - - 3,649,419 (3,009,482) - 639,937
Copel Distribuição- Special Liabilities (16.6) - - - - (316,479) 190,441 - (126,038)
Copel Telecomunicações 5,936 (4,483) - - - - - 1,453
Compagas (16.2) 4,065 (2,711) - - 221,139 (80,113) - 142,380
Elejor (16.3) - - - - 263,920 (56,784) - 207,136
UEG Araucária 232 (125) - - - - - 107
Transmissora Sul Brasileira 1 - - - - - - 1
Concession Right - Elejor (16.3) - - 22,626 (4,714) - - - 17,912
Concession Right - Cutia (16.4) - - 5,809 - - - - 5,809
13,374 (9,718) 28,435 (4,714) 3,817,999 (2,955,938) 43 889,481
Assets with indefinite useful life
Copel Geração e Transmissão - - - - - - 18 18
Compagas - - - - - - 20 20
- - - - - - 38 38
13,374 (9,718) 28,435 (4,714) 3,817,999 (2,955,938) 81 889,519
In progress
Copel Geração e Transmissão (16.5) 11,748 - - - 27,984 - 2,464 42,196
Copel Distribuição (16.1) - - - - 826,500 - - 826,500
Copel Distribuição- Special Liabilities (16.6) - - (54,421) - (54,421)
Copel Telecomunicações 15,360 - - - - - 7 15,367
Compagas - - - - 36,214 - - 36,214
Elejor - - - - - - 2,790 2,790
Cutia - - - - - - 5,117 5,117
27,108 - - - 836,277 - 10,378 873,763
1,763,282
(1) Annual amortization rate: 20%
(2) Amortization over the concession period
Right to use software Concession Concession
and autorization rights contracts
accumulated accumulated accumulated
cost amortization (1) cost amortization (1) cost amortization (1) Other Consolidated
12.31.2011
In service
Assets with finite useful life
Copel Geração e Transmissão 3,140 (2,281) - - - - 43 902
Copel Distribuição (16.1) - - - - 3,783,331 (2,895,710) - 887,621
Copel Distribuição- Special Liabilities (16.6) - - - - (367,099) 166,655 - (200,444)
Copel Telecomunicações 5,936 (4,256) - - - - - 1,680
Compagas (16.2) 4,053 (2,526) - - 199,932 (74,320) - 127,139
Elejor (16.3) - - - - 263,920 (52,279) - 211,641
UEG Araucária 230 (106) - - - - - 124
Concession Right - Elejor (16.3) - - 22,626 (4,337) - - - 18,289
Concession Right - Cutia (16.4) - - 5,809 - - - - 5,809
13,359 (9,169) 28,435 (4,337) 3,880,084 (2,855,654) 43 1,052,761
Assets with indefinite useful life
Copel Geração e Transmissão - - - - - - 18 18
Compagas - - - - - - 20 20
- - - - - - 38 38
13,359 (9,169) 28,435 (4,337) 3,880,084 (2,855,654) 81 1,052,799
In progress
Copel Geração e Transmissão (16.5) 10,430 - - - 26,120 - 1,686 38,236
Copel Distribuição (16.1) - - - - 599,794 - - 599,794
Copel Distribuição- Special Liabilities (16.6) - - - - (40,457) - - (40,457)
Copel Telecomunicações 15,100 - - - - - 5 15,105
Compagas - - - - 48,677 - - 48,677
Elejor - - - - - - 2,790 2,790
Cutia - - - - - - 4,913 4,913
25,530 - - - 634,134 - 9,394 669,058
1,721,857
(1) Annual amortization rate: 20%
(2) Amortization over the concession period
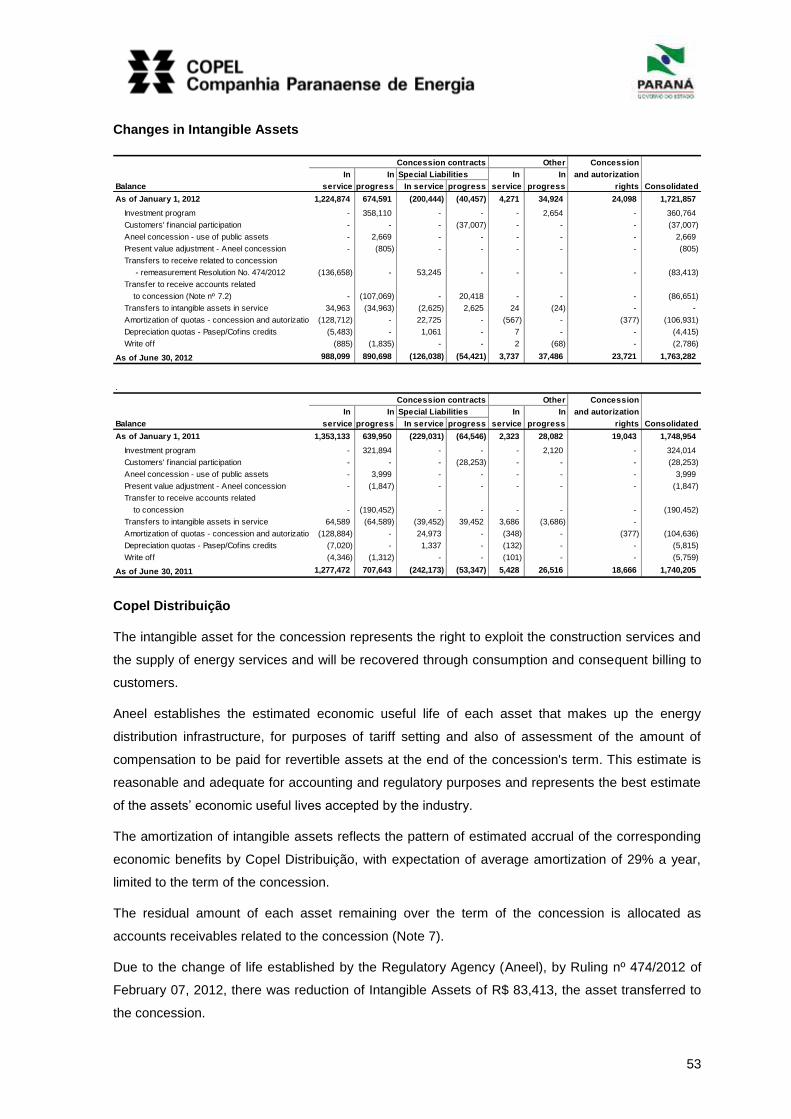
53
Changes in Intangible Assets
.
Concession contracts Other Concession
In In Special Liabilities In In and autorization
Balance service progress In serviceIn progress service progress rights Consolidated
As of January 1, 2012 1,224,874 674,591 (200,444) (40,457) 4,271 34,924 24,098 1,721,857
Investment program - 358,110 - - - 2,654 - 360,764
Customers' f inancial participation - - - (37,007) - - - (37,007)
Aneel concession - use of public assets - 2,669 - - - - - 2,669
Present value adjustment - Aneel concession - (805) - - - - - (805)
Transfers to receive related to concession
- remeasurement Resolution No. 474/2012 (136,658) - 53,245 - - - - (83,413)
Transfer to receive accounts related
to concession (Note nº 7.2) - (107,069) - 20,418 - - - (86,651)
Transfers to intangible assets in service 34,963 (34,963) (2,625) 2,625 24 (24) - -
Amortization of quotas - concession and autorization (128,712) - 22,725 - (567) - (377) (106,931)
Depreciation quotas - Pasep/Cofins credits (5,483) - 1,061 - 7 - - (4,415)
Write off (885) (1,835) - - 2 (68) - (2,786)
As of June 30, 2012 988,099 890,698 (126,038) (54,421) 3,737 37,486 23,721 1,763,282
.
Concession contracts Other Concession
In In Special Liabilities In In and autorization
Balance service progress In serviceIn progress service progress rights Consolidated
As of January 1, 2011 1,353,133 639,950 (229,031) (64,546) 2,323 28,082 19,043 1,748,954
Investment program - 321,894 - - - 2,120 - 324,014
Customers' f inancial participation - - - (28,253) - - - (28,253)
Aneel concession - use of public assets - 3,999 - - - - - 3,999
Present value adjustment - Aneel concession - (1,847) - - - - - (1,847)
Transfer to receive accounts related
to concession - (190,452) - - - - - (190,452)
Transfers to intangible assets in service 64,589 (64,589) (39,452) 39,452 3,686 (3,686) -
Amortization of quotas - concession and autorization (128,884) - 24,973 - (348) - (377) (104,636)
Depreciation quotas - Pasep/Cofins credits (7,020) - 1,337 - (132) - - (5,815)
Write off (4,346) (1,312) - - (101) - - (5,759)
As of June 30, 2011 1,277,472 707,643 (242,173) (53,347) 5,428 26,516 18,666 1,740,205
Copel Distribuição
The intangible asset for the concession represents the right to exploit the construction services and
the supply of energy services and will be recovered through consumption and consequent billing to
customers.
Aneel establishes the estimated economic useful life of each asset that makes up the energy
distribution infrastructure, for purposes of tariff setting and also of assessment of the amount of
compensation to be paid for revertible assets at the end of the concession's term. This estimate is
reasonable and adequate for accounting and regulatory purposes and represents the best estimate
of the assets’ economic useful lives accepted by the industry.
The amortization of intangible assets reflects the pattern of estimated accrual of the corresponding
economic benefits by Copel Distribuição, with expectation of average amortization of 29% a year,
limited to the term of the concession.
The residual amount of each asset remaining over the term of the concession is allocated as
accounts receivables related to the concession (Note 7).
Due to the change of life established by the Regulatory Agency (Aneel), by Ruling nº 474/2012 of
February 07, 2012, there was reduction of Intangible Assets of R$ 83,413, the asset transferred to
the concession.
54
Compagas
These intangible assets are related to the construction of infrastructure and the acquisition of the
necessary assets for the operation of gas distribution services and to the right to collect from
customers for gas supply. The construction of infrastructure and the acquisition of assets are
deemed service rendering by the granting authority.
Amortization of intangible assets reflects the standard expectation for the future economic benefits
of the asset to be consumed by Compagas, with expected average amortization of 7.1% p.a.,
limited to the concession period, for gas pipelines built until December 31, 2008 and 10% p.a. for
other assets.
At the end of the concession, the assets related to gas distribution service shall revert to the
granting authority, and Compagas shall be reimbursed for the investments made based on their
amortized replacement value, assessed through an independent auditing company, based on the
values to be determined then.
Elejor
Concession Contract
Intangible assets related to the use of public property (UBP) under an onerous concession. These
intangible assets have been amortized over the term of the concession contract, and the
corresponding liability has been amortized by payments. (Note 23).
Concession Rights
The acquisition of the shares held by Triunfo Participações S.A., on December 18, 2003, resulted in
total concession intangible asset of R$ 22,626, which presents balance of R$ 17,912 as of June 30,
2012, in the Parent Company. The straight line method of amortization of the concession intangible
asset was economically determined by the expected income from the commercial operation of the
concession, which expires in October 2036, and its effect on the statements of income as of June
30, 2012 was R$ 377 (R$ 377 in 2011).
Cutia
The acquisition resulted concession rights amounting to R$ 5,809, which will be amortized over the
concession period, from the start of commercial operation of the project, scheduled for January 01,
2015 for commitments resolutions by Aneel. The concession period of wind farms is 30 years from
the date of publication of resolutions autorizativas in the Official Gazette, which occurred on
January 05, 2012.
Copel Geração e Transmissão
Intangible assets related to the use of public property (UBP) under an onerous concession. These
intangible assets have been amortized over the term of the concession contract.
55
On June 30, 2012, the Group had R$ 13,819 (R$ 12,341 as of December 31, 2011) recorded in
connection with the Mauá Power Plant Concession Contract and R$ 14,165 (R$ 13,779 as of
December 31, 2011) recorded in connection with the Colíder Power Plant.
Special liabilities
Special liabilities comprise customers’ contributions, Federal Government budget grants, federal,
state, and municipal funds, and special credits assigned to the investments in facilities related to a
concession.
The scheduled date for settlement of these liabilities was the concession expiration date. Aneel, by
means of Regulatory Resolution nº 234/2006, dated October 31, 2006, as amended by Resolution
nº 338, dated November 25, 2008, established the guidelines, the applicable methodologies, and
the initial procedures for the conduction of the second cycle of the periodic tariff review involving the
Brazilian power distribution utilities, changing the characteristics of these liabilities. Both the
outstanding balance and new additions have been amortized as of July 1, 2008, pursuant to Aneel
Ruling nº 3,073/06 and Circular Letter nº 1,314/07. Amortization is calculated based on the same
average depreciation rate of the corresponding assets.
Recoverable value of intangible asset (finite useful life)
Although there is no indication of recovery loss, the Company has assessed the recoverable value
of its intangible assets based on the present value of the corresponding estimated future cash
flows.
The values assigned to the assumptions represent Company management’s evaluation of the
energy industry’s future trends and are based both on external sources of information and on
historical data.
Cash flows have been estimated based on the Company’s operating results and projections until
the end of the concession, under the following main assumptions:
Organic growth compatible with historical data and the Brazilian economy's growth prospects;
and
The average discount rate obtained through a methodology commonly employed on the market,
taking into account the weighted average cost of capital (WACC), as discussed in Note 15.5.
The recoverable value of these assets exceeds their book value, so there are no impairment losses
to record.
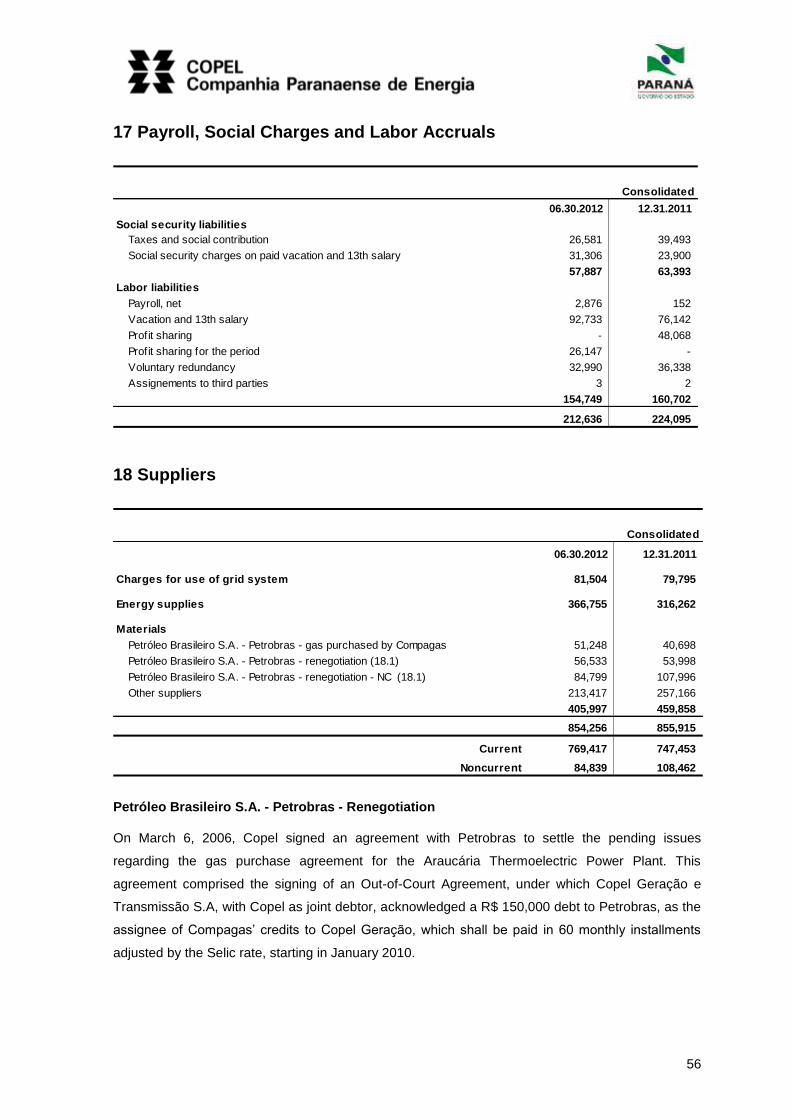
56
17 Payroll, Social Charges and Labor Accruals
06.30.2012 12.31.2011
Social security liabilities
Taxes and social contribution 26,581 39,493
Social security charges on paid vacation and 13th salary 31,306 23,900
57,887 63,393
Labor liabilities
Payroll, net 2,876 152
Vacation and 13th salary 92,733 76,142
Profit sharing - 48,068
Profit sharing for the period 26,147 -
Voluntary redundancy 32,990 36,338
Assignements to third parties 3 2
154,749 160,702
212,636 224,095
Consolidated
18 Suppliers
06.30.2012 12.31.2011
Charges for use of grid system 81,504 79,795
Energy supplies 366,755 316,262
Materials
Petróleo Brasileiro S.A. - Petrobras - gas purchased by Compagas 51,248 40,698
Petróleo Brasileiro S.A. - Petrobras - renegotiation (18.1) 56,533 53,998
Petróleo Brasileiro S.A. - Petrobras - renegotiation - NC (18.1) 84,799 107,996
Other suppliers 213,417 257,166
405,997 459,858
854,256 855,915
Current 769,417 747,453
Noncurrent 84,839 108,462
Consolidated
Petróleo Brasileiro S.A. - Petrobras - Renegotiation
On March 6, 2006, Copel signed an agreement with Petrobras to settle the pending issues
regarding the gas purchase agreement for the Araucária Thermoelectric Power Plant. This
agreement comprised the signing of an Out-of-Court Agreement, under which Copel Geração e
Transmissão S.A, with Copel as joint debtor, acknowledged a R$ 150,000 debt to Petrobras, as the
assignee of Compagas’ credits to Copel Geração, which shall be paid in 60 monthly installments
adjusted by the Selic rate, starting in January 2010.

57
On May 30, 2006, Copel Geração signed a Statement for the Ratification of mutual settlement with
Compagas under which both parties fully and irrevocably release each other from all obligations
and rights under the Natural Gas Purchase and Sale Agreement signed by them on May 30, 2000
and terminated on May 31, 2005, renouncing any claims against each other, on any grounds, as of
the date of the Out of Court Agreement and the acknowledgement of debt signed by them and by
Petrobras, with the participation of Copel. The acknowledgement of debt by Copel Geração
remains.
Main power purchase agreements
The table features the main power purchase agreements signed in the regulated power trading
environment. These contracts are shown at original value and restated annually according to the
IPCA inflation index.
Supply Energy purchased Auction Average purchase
period (anual average MW) date price (R$/MWh)
Auction of power from existing facilities
1st Auction - Product 2005 2005 to 2012 933.72 07.12.2004 57.51
1st Auction - Product 2006 2006 to 2013 452.34 07.12.2004 67.33
1st Auction - Product 2007 2007 to 2014 11.55 07.12.2004 75.46
2nd Auction - Product 2008 2008 to 2015 69.02 02.04.2005 83.13
4th Auction - Product 2009 2009 to 2016 44.13 11.10.2005 94.91
5th Auction - Product 2007 2007 to 2014 157.17 14.12.2006 104.74
11th Auction Adjust. P-12M Jan to Dec 2012 26.89 30.09.2011 73.63
1,694.82
Auction of power from new facilities
1st Auction - Product 2008 Hydro 2008 to 2037 3.61 16.12.2005 106.95
1st Auction - Product 2008 Therm 2008 to 2022 25.56 16.12.2005 132.26
1st Auction - Product 2009 Hydro 2009 to 2038 3.26 16.12.2005 114.28
1st Auction - Product 2009 Therm 2009 to 2023 41.59 16.12.2005 129.26
1st Auction - Product 2010 Hydro 2010 to 2039 66.31 16.12.2005 114.57
1st Auction - Product 2010 Therm 2010 to 2024 64.30 16.12.2005 121.81
3rd Auction - Product 2011 Hydro 2011 to 2040 57.66 10.10.2006 120.86
3rd Auction - Product 2011 Therm 2011 to 2025 54.22 10.10.2006 137.44
4th Auction - Product 2010 Therm 2010 to 2024 15.65 26.07.2007 134.64
5th Auction - Product 2012 Hydro 2012 to 2041 17.50 16.10.2007 129.14
5th Auction - Product 2012 Therm 2012 to 2026 117.27 16.10.2007 128.37
6th Auction - Product 2011 Therm 2011 to 2025 15.48 17.09.2008 128.42
7th Auction - Product 2013 Hydro 2013 to 2042 12.24 30.09.2008 98.98
7th Auction - Product 2013 Therm 2013 to 2027 303.99 30.09.2008 145.23
Santo Antonio 2012 to 2041 106.00 10.12.2007 78.87
Jirau 2013 to 2042 141.51 19.05.2008 71.37
1,046.15
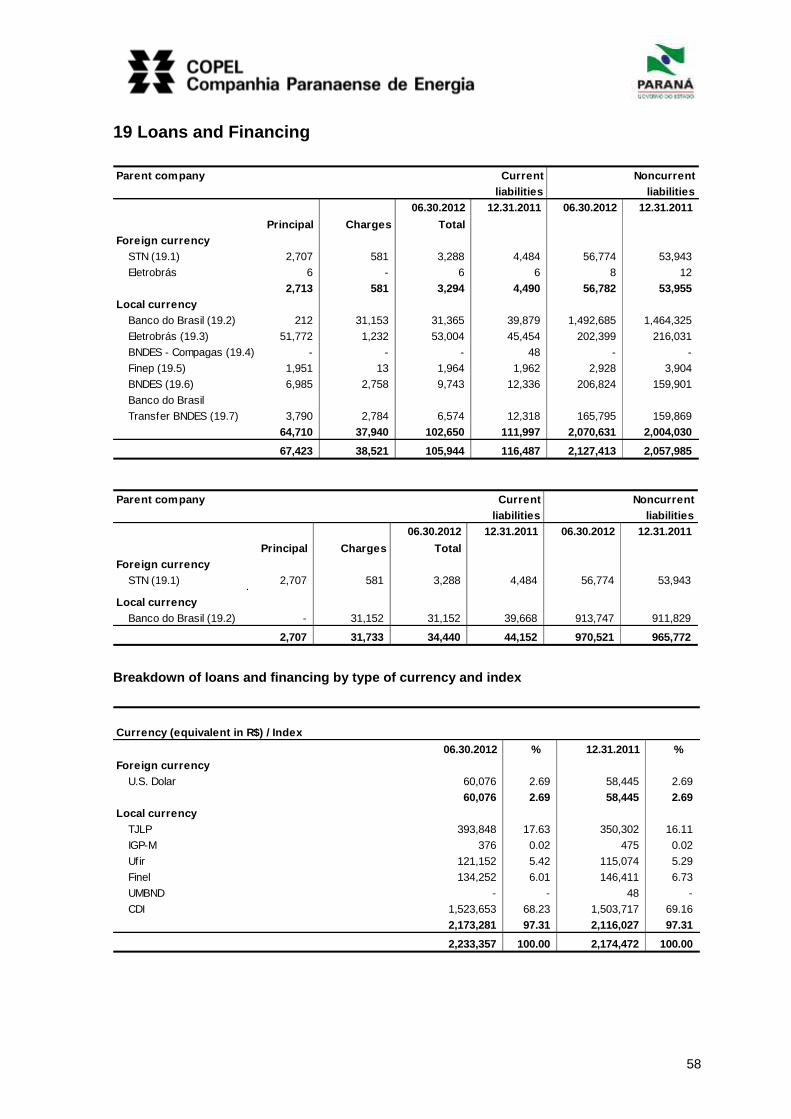
58
19 Loans and Financing
Parent company Current Noncurrent
liabilities liabilities
06.30.2012 12.31.2011 06.30.2012 12.31.2011
Principal Charges Total
Foreign currency
STN (19.1) 2,707 581 3,288 4,484 56,774 53,943
Eletrobrás 6 - 6 6 8 12
2,713 581 3,294 4,490 56,782 53,955
Local currency
Banco do Brasil (19.2) 212 31,153 31,365 39,879 1,492,685 1,464,325
Eletrobrás (19.3) 51,772 1,232 53,004 45,454 202,399 216,031
BNDES - Compagas (19.4) - - - 48 - -
Finep (19.5) 1,951 13 1,964 1,962 2,928 3,904
BNDES (19.6) 6,985 2,758 9,743 12,336 206,824 159,901
Banco do Brasil
Transfer BNDES (19.7) 3,790 2,784 6,574 12,318 165,795 159,869
64,710 37,940 102,650 111,997 2,070,631 2,004,030
67,423 38,521 105,944 116,487 2,127,413 2,057,985
Parent company Current Noncurrent
liabilities liabilities
06.30.2012 12.31.2011 06.30.2012 12.31.2011
Principal Charges Total
Foreign currency
STN (19.1) 2,707 581 3,288 4,484 56,774 53,943 .
Local currency
Banco do Brasil (19.2) - 31,152 31,152 39,668 913,747 911,829
2,707 31,733 34,440 44,152 970,521 965,772
Breakdown of loans and financing by type of currency and index
Currency (equivalent in R$) / Index
06.30.2012 % 12.31.2011 %
Foreign currency
U.S. Dolar 60,076 2.69 58,445 2.69
60,076 2.69 58,445 2.69
Local currency
TJLP 393,848 17.63 350,302 16.11
IGP-M 376 0.02 475 0.02
Ufir 121,152 5.42 115,074 5.29
Finel 134,252 6.01 146,411 6.73
UMBND - - 48 -
CDI 1,523,653 68.23 1,503,717 69.16
2,173,281 97.31 2,116,027 97.31
2,233,357 100.00 2,174,472 100.00
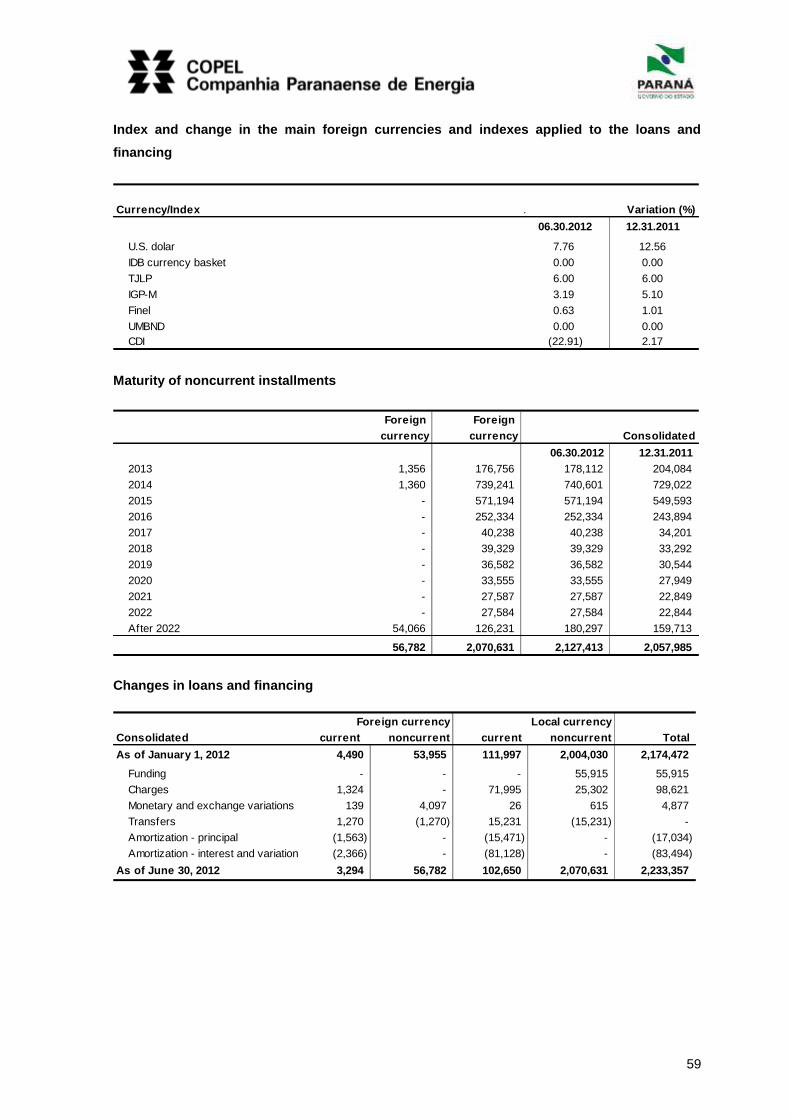
59
Index and change in the main foreign currencies and indexes applied to the loans and
financing
Currency/Index . Variation (%)
06.30.2012 12.31.2011
U.S. dolar 7.76 12.56
IDB currency basket 0.00 0.00
TJLP 6.00 6.00
IGP-M 3.19 5.10
Finel 0.63 1.01
UMBND 0.00 0.00
CDI (22.91) 2.17
Maturity of noncurrent installments
Foreign Foreign
currency currency Consolidated
06.30.2012 12.31.2011
2013 1,356 176,756 178,112 204,084
2014 1,360 739,241 740,601 729,022
2015 - 571,194 571,194 549,593
2016 - 252,334 252,334 243,894
2017 - 40,238 40,238 34,201
2018 - 39,329 39,329 33,292
2019 - 36,582 36,582 30,544
2020 - 33,555 33,555 27,949
2021 - 27,587 27,587 22,849
2022 - 27,584 27,584 22,844
After 2022 54,066 126,231 180,297 159,713
56,782 2,070,631 2,127,413 2,057,985
Changes in loans and financing
Foreign currency Local currency
Consolidated current noncurrent current noncurrent Total
As of January 1, 2012 4,490 53,955 111,997 2,004,030 2,174,472
Funding - - - 55,915 55,915
Charges 1,324 - 71,995 25,302 98,621
Monetary and exchange variations 139 4,097 26 615 4,877
Transfers 1,270 (1,270) 15,231 (15,231) -
Amortization - principal (1,563) - (15,471) - (17,034)
Amortization - interest and variation (2,366) - (81,128) - (83,494)
As of June 30, 2012 3,294 56,782 102,650 2,070,631 2,233,357
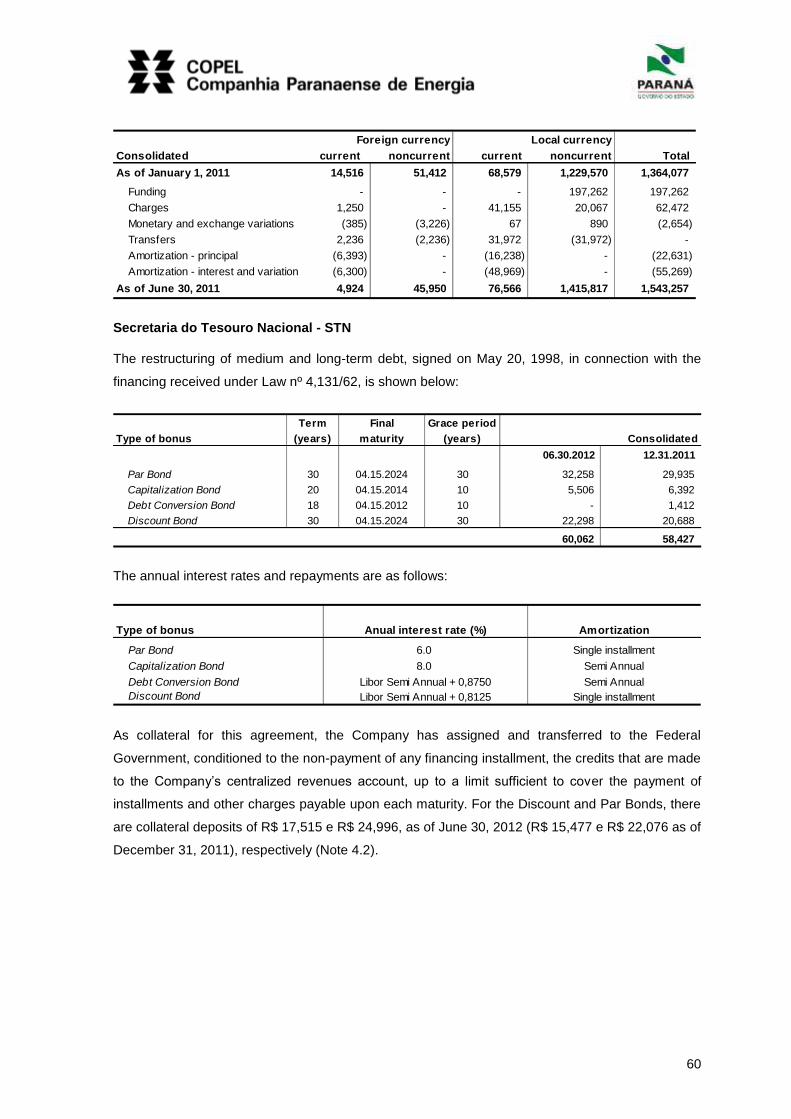
60
Foreign currency Local currency
Consolidated current noncurrent current noncurrent Total
As of January 1, 2011 14,516 51,412 68,579 1,229,570 1,364,077
Funding - - - 197,262 197,262
Charges 1,250 - 41,155 20,067 62,472
Monetary and exchange variations (385) (3,226) 67 890 (2,654)
Transfers 2,236 (2,236) 31,972 (31,972) -
Amortization - principal (6,393) - (16,238) - (22,631)
Amortization - interest and variation (6,300) - (48,969) - (55,269)
As of June 30, 2011 4,924 45,950 76,566 1,415,817 1,543,257
Secretaria do Tesouro Nacional - STN
The restructuring of medium and long-term debt, signed on May 20, 1998, in connection with the
financing received under Law nº 4,131/62, is shown below:
Term Final Grace period
Type of bonus (years) maturity (years)
06.30.2012 12.31.2011
Par Bond 30 04.15.2024 30 32,258 29,935
Capitalization Bond 20 04.15.2014 10 5,506 6,392
Debt Conversion Bond 18 04.15.2012 10 - 1,412
Discount Bond 30 04.15.2024 30 22,298 20,688
60,062 58,427
Consolidated
The annual interest rates and repayments are as follows:
Type of bonus Anual interest rate (%) Amortization
Par Bond 6.0 Single installment
Capitalization Bond 8.0 Semi Annual
Debt Conversion Bond Libor Semi Annual + 0,8750 Semi Annual
Discount Bond Libor Semi Annual + 0,8125 Single installment
As collateral for this agreement, the Company has assigned and transferred to the Federal
Government, conditioned to the non-payment of any financing installment, the credits that are made
to the Company’s centralized revenues account, up to a limit sufficient to cover the payment of
installments and other charges payable upon each maturity. For the Discount and Par Bonds, there
are collateral deposits of R$ 17,515 e R$ 24,996, as of June 30, 2012 (R$ 15,477 e R$ 22,076 as of
December 31, 2011), respectively (Note 4.2).
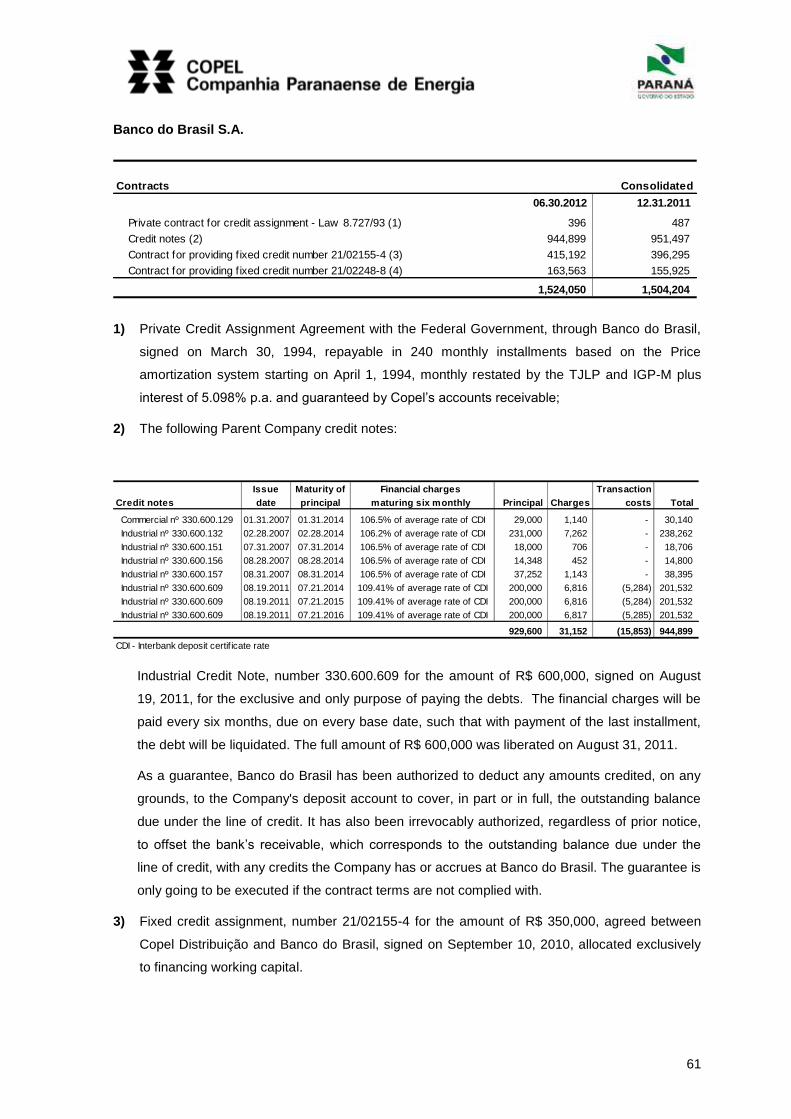
61
Banco do Brasil S.A.
Contracts
06.30.2012 12.31.2011
Private contract for credit assignment - Law 8.727/93 (1) 396 487
Credit notes (2) 944,899 951,497
Contract for providing fixed credit number 21/02155-4 (3) 415,192 396,295
Contract for providing fixed credit number 21/02248-8 (4) 163,563 155,925
1,524,050 1,504,204
Consolidated
1) Private Credit Assignment Agreement with the Federal Government, through Banco do Brasil,
signed on March 30, 1994, repayable in 240 monthly installments based on the Price
amortization system starting on April 1, 1994, monthly restated by the TJLP and IGP-M plus
interest of 5.098% p.a. and guaranteed by Copel’s accounts receivable;
2) The following Parent Company credit notes:
Issue Maturity of Financial charges Transaction
Credit notes date principal maturing six monthly Principal Charges costs Total
Commercial nº 330.600.129 01.31.2007 01.31.2014 106.5% of average rate of CDI 29,000 1,140 - 30,140
Industrial nº 330.600.132 02.28.2007 02.28.2014 106.2% of average rate of CDI 231,000 7,262 - 238,262
Industrial nº 330.600.151 07.31.2007 07.31.2014 106.5% of average rate of CDI 18,000 706 - 18,706
Industrial nº 330.600.156 08.28.2007 08.28.2014 106.5% of average rate of CDI 14,348 452 - 14,800
Industrial nº 330.600.157 08.31.2007 08.31.2014 106.5% of average rate of CDI 37,252 1,143 - 38,395
Industrial nº 330.600.609 08.19.2011 07.21.2014 109.41% of average rate of CDI 200,000 6,816 (5,284) 201,532
Industrial nº 330.600.609 08.19.2011 07.21.2015 109.41% of average rate of CDI 200,000 6,816 (5,284) 201,532
Industrial nº 330.600.609 08.19.2011 07.21.2016 109.41% of average rate of CDI 200,000 6,817 (5,285) 201,532
929,600 31,152 (15,853) 944,899
CDI - Interbank deposit certif icate rate
Industrial Credit Note, number 330.600.609 for the amount of R$ 600,000, signed on August
19, 2011, for the exclusive and only purpose of paying the debts. The financial charges will be
paid every six months, due on every base date, such that with payment of the last installment,
the debt will be liquidated. The full amount of R$ 600,000 was liberated on August 31, 2011.
As a guarantee, Banco do Brasil has been authorized to deduct any amounts credited, on any
grounds, to the Company's deposit account to cover, in part or in full, the outstanding balance
due under the line of credit. It has also been irrevocably authorized, regardless of prior notice,
to offset the bank’s receivable, which corresponds to the outstanding balance due under the
line of credit, with any credits the Company has or accrues at Banco do Brasil. The guarantee is
only going to be executed if the contract terms are not complied with.
3) Fixed credit assignment, number 21/02155-4 for the amount of R$ 350,000, agreed between
Copel Distribuição and Banco do Brasil, signed on September 10, 2010, allocated exclusively
to financing working capital.
62
The debt will be paid in three annual successive installments, the first falling due on August 25,
2013, for the amount of R$ 116,666, and the other for the amount of R$ 116,667, maturing on
July 11, 2014 and August 15, 2015, plus financial charges in proportion to the amount of the
principal sum amortized, such that, with the payment of the last installment the outstanding
balance will be zero.
Financial charges will be due on the debtor balance, calculated based on the basic
remuneration rate for savings accounts - IRP and additional charges based on the variable
interest rate, which will be calculated using the exponential method, based on the daily
equivalent rate – civil year (365 or 366 days). The effective rate resulting from adding the
variable interest rate and the IRP, will be equivalent, in each calculation period, to 98.5% of the
variation in the CDI for this same period. The charges will be debited and capitalized monthly to
the account tied to the contract, on each base date for the maturity and liquidation of the debt,
to be paid together with the principal payments.
To ensure payment of any liabilities under this agreement, Copel Distribuição agrees to assign,
bind and pledge as guarantee in favor of Banco do Brasil, trade bills receivable, endorsed and
accompanied by the corresponding signed authorization for withdrawal.
The contract includes clauses providing for anticipated maturity in certain conditions.
The amount of R$ 350,000 was liberated in full on September 9, 2010
4) Contract nº 21/02248-8 for opening a fixed loan facility in the amount of R$ 150,000, entered
into between Copel Distribuição and Banco do Brasil, signed on June 22, 2011, intended solely
and exclusively for financing working capital.
The debt will be paid in one lump sum with maturity on June 1, 2015.
Charges will be levied on the debit balance, calculated based on the index for basic
remuneration of passbook savings accounts (IRP) and additional charges based on the floating
interest rate that will be calculated by the exponential method, based on the daily equivalent
rate – civil year (365 or 366 days). The effective rate resulting from the unification of the floating
interest rate with the index for remuneration of savings accounts (IRP) will be equivalent in each
calculation period to 99.5% of the variation of the interbank deposit certificate (CDI) in the same
period. The charges will be debited and capitalized monthly in the account subject to the
contract each base date on the due date and on the settlement of the debt, for payment
together with the payment of the principal on June 1, 2015.
To assure payment of any obligations of the contract, Copel Distribuição is bound to yield, bond
and pledge as collateral to Banco do Brasil, trade bills duly endorsed and accompanied by
bordereaux.
The contract contains clauses establishing accelerated maturity in certain situations.
The amount of R$ 150,000 was received on June 22, 2011.
63
Eletrobras - Centrais Elétricas Brasileiras S.A.
Loans were originated from the Fund for Financing Eletrobras - Finel and Global Reversion Reserve
- RGR for expansion of the generation, transmission and distribution. The Repayments began in
September 1994 and the last payment is due in December, 2022. Interest of 5.0% to 8.0% p.a. and
principal are repaid monthly, adjusted by the index of Finel and Fiscal Reference Unit - Ufir.
Contract ECFS – 142/2006, was signed on May 11, 2006 by Copel Distribuição and Eletrobras, in
the amount of R$ 74,340, for use in the “Luz para Todos” rural electrification program. Out of the
total amount, R$ 42,480 came from RGR funds, and R$ 31,860 were economic subsidies from CDE
(Energy Development Account) funds. This loan has a grace period of 24 months and bears interest
of 5% p.a. plus a commission of 1% p.a. It is repayable in 120 equal monthly installments, with final
maturity on September 30, 2018.
The total amount disbursed was R$ 63,104, of which R$ 36,056 came from RGR funds and R$
27,048 from CDE funds. There will be no further disbursements under this agreement.
Contract ECFS - 206/07, signed on March 3, 2008 between Copel Distribuição and Eletrobras, for
the amount of R$ 126,430 to be invested in the “Luz para Todos” Rural Electricity Program. On
September 14, 2010 amendment ECFS-206-D / 2010 was signed, which altered the value of the
financing to R$ 109,642 being R$ 93,979 financed with funds from RGR and R$ 15,663 as an
economic subsidy. The contract has a grace period of 24 months, and interest of 5% p.a. and
commission of 1% p.a., and will be paid in 120 monthly, successive, equal installments, with the
final payment to be made on August 30, 2020. In August 2008, the amount of R$ 37,929 was
liberated, being R$ 32,511 in funds from RGR and R$ 5,418 in funds from CDE. In June 2009, R$
25,286 was liberated, being R$ 21,674 in funds from RGR and R$ 3,612 in funds from CDE. In
March 2010, R$ 25,286 was liberated, being R$ 21,674 in funds from RGR and R$ 3,612 in funds
from CDE. In May 2012, R$ 13.061 was liberated, being R$ 11,193 in funds from RGR and R$
1,868 in funds from CDE. The total amount disbursed was R$ 101,562, of which R$ 87,052 came
from RGR funds and R$ 14,510 from CDE funds. There will be no further disbursements under this
agreement.
Contract ECFS - 273/09, signed on February 18, 2010 between Copel Distribuição and Eletrobras,
for the amount of R$ 63,944 to be invested in the “Luz para Todos” Rural Electricity Program, being
R$ 54,809 financed with funds from RGR and R$ 9,134 with funds from CDE, as an economic
subsidy. The contract has a grace period of 24 months, and interest of 5% p.a. and commission of
1% p.a., and will be paid in 120 monthly, successive, equal installments, with the final payment to
be made on December 30, 2022. In December 2010, R$ 19,183 was liberated, being R$ 16,443 in
funds from RGR and R$ 2,740 in funds from CDE.
64
Contract ECF - 2540/06, signed on May 12, 2009 between Copel Distribuição and Eletrobras, for
the amount of R$ 2,844 to be invested in the National Program for Efficient Public Lighting - ReLuz,
with R$ 2,844 financed with funds from RGR allocated to cover 75% of the total cost of the Project
to Improve the Public Lighting System for the City of Ponta Grossa, in the State of Paraná. The
contract has a grace period of 9 months, and interest of 5% p.a. and commission of 1.5% p.a., and
will be paid in 60 successive, equal installments, with the final payment to be made on October 30,
2016. In January 2011, R$ 284 was liberated, and in August 2011, another R$ 1,935 was liberated,
with funds from RGR. Interest due each month during the grace period will be included in the debtor
balance.
The guarantee is represented by the income, supported by power of attorney granted by a public
instrument, and the issue of promissory notes equal to the number of installments falling due.
BNDES - Compagas
Financing obtained from BNDES to expand the gas distribution network. This financing agreement
is divided into sub credits, with one part corrected by the interest rate of 4% p.a. plus TJLP, and
another part by the variation in the BNDES Monetary Unit - UMBND. There are no restrictive
clauses in this contract, and the last installment falls due on January 15, 2012.
This guarantee financing by Compagas gas supply network, equivalent to the two financing
installments, shall be deposited to be exclusively kept and in checking account with Banco Itaú S.A.
Financiadora de Estudos e Projetos - Finep
Contracts Consolidated
06.30.2012 12.31.2011
Contract no. 02070791-00 (1) 2,869 3,440
Contract no. 02070790-00 (2) 2,023 2,426
4,892 5,866
1) Loan agreement nº 02070791-00, signed on November 28, 2007 to partially cover expenses
incurred in the preparation of the “Generation Research and Development Project for 2007”.
The total credit amounts of R$ 5,078, with the first installment, of R$ 1,464 liberated in April
2008, and the second one in the amount of R$ 2,321 in May 2009, the third installment for the
amount of R$ 866 in December 2010 and the remaining installments will be liberated
depending on financial and budget availability; 1% of the funds obtained are allocated to cover
inspection and supervision expenses. The principal amount of this debt will be subject to
interest of 6.37% p.a., resulting from the equalization factor, paid on the 15th of each month,
including during the grace period. The debtor balance will be paid to FINEP in 49 monthly
successive installments, with the first installment due on December 15, 2010 and the last one
on December 15, 2014.
65
In order to guarantee the contract, Copel Geração e Transmissão has authorized Banco do
Brasil to withhold the amounts due to FINEP from the bank account in which its monthly
revenues are deposited, in case of breach of contract.
2) Loan agreement nº 02070790-00, signed on November 28, 2007 to partially cover expenses
incurred in the preparation of the “Transmission Research and Development Project for 2007”.
The total credit amounts to R$ 3,535. The first installment, in the amount of R$ 844, was
released in October 2008, the second one, in the amount of R$ 2,451, was released in
December 2009, and the remaining ones will be deposited to the extent there is financial and
budget availability. A share of 1% of the funds will be allocated to cover inspection and
supervision expenses. The principal amount of this debt will be subject to equalized interest of
6.13 % p.a., due on the 15th day of each month, including the months of the grace period. The
outstanding balance will be paid to FINEP in 49 monthly and successive installments, the first
one due on December 15, 2010, and the last one on December 15, 2014.
To secure the contract, Copel Geração e Transmissão has authorized Banco do Brasil to
withhold the amounts due to FINEP from the checking account in which its monthly revenues
are deposited, in case of breach of contract.
3) Loan Agreement nº 02100567-00, signed on November 11, 2010, for the purpose of covering
part of the costs incurred in preparing the “BEL Project” by Copel Telecomunicações. On May
17, 2012 a termination agreement was signed for this financing and a new agreement number
02.12.0105-00 was signed on the same date, as described below.
4) Loan Agreement nº 021120105-00, signed on May 17, 2012, for the purpose of covering part of
the costs incurred in preparing the “BEL Project” by Copel Telecomunicações.
Credit of R$ 52,198 to be offered in six installments and divided into subcredit “A”” in the
amount of R$ 35,095 and subcredit “B” in the amount of R$ 17,103. The first installment of R$
13,997 was released on July 17, 2012 and the others will be released after the expenses
incurred with the first installment are evidenced, according to the financial and budgetary
resources available for Finep (Funds for Studies and Projects). The debt’s principal will bear
fixed interest rate of 4% annually and a managed prime rate of 3.5% annually for subcredit “A”
and subcredit “B”, respectively, resulting from the equalization factor, to be paid on the fifteenth
day of the month, including in the grace period. The debt balance will be paid to Finep in 81
monthly and successive installments. The first installment matures on February 15, 2014 and
the last one on October 15, 2020.

66
BNDES - Copel Geração e Transmissão
1) On March 17, 2009, Copel Geração e Transmissão signed with BNDES Loan Agreement nº
08.2.0989.1, with Copel as a intervening agent, to fund the construction of the Mauá
Hydroelectric Power Plant and its transmission system, in consortium with Eletrosul. The loan
amounts to R$ 169,500, which will be released in installments as funds are required and
pursuant to BNDES' financial scheduling.
This loan will be paid off in 179 monthly installments, starting on March 15, 2013 and ending on
January 15, 2028, bearing interest of 1.63% p.a. above the Long-Term Interest Rate (TJLP),
which will be paid quarterly during the grace period and monthly after the first payment of the
principal amount.
As a guarantee for the payment of all amounts due under this agreement, Copel Geração e
Transmissão has pledged in favor of BNDES a lien on all the revenues from the sale of energy
under Agreements for Energy Trade on the Regulated Power Market (“Contracts for the Sale of
Energy in the Regulated Environment ” or CCEARs) in connection with this project, which shall
be collected in a special main account for this purpose. The Company shall also set up two
"reserve accounts" to cover any shortfalls in the main account. This guarantee will be operated
under an Agreement on Revenue Transfer and Attachment, Account Management, and Other
Covenants signed by Copel Geração e Transmissão, BNDES, and Banco do Brasil.
The first installment was made available in July 2009, in the amount of R$ 55,748, the second
in February 2010 for the amount of R$ 29,193, the third in December 2010, for the amount of
R$ 52,555, the fourth in June 2011, for the amount of R$ 23,489, and the last in November
2011, for the amount of R$ 8,634.
An amendment was made to the agreement on 02.13.2012, changing the end of the grace
period for repayments from 02.15.2012 to 03.15.2013, with the other terms remaining
unchanged.
The contract contains provisions on accelerated maturity in certain conditions.
2) Contract nº 11.2.0952.1, signed between Copel Geração e Transmissão and BNDES, with
intervening Copel, signed on December 16, 2011, the amount of R $ 44,723 divided into two
subcredits: subcredit "A" in the amount of R $ 42,433 for the implementation of transmission
line between substations Foz do Iguaçu and Cascavel Oeste, with 115 km long, 525 kV single
circuit, and subcredit "B" in the amount of R $ 2,290 for the purchase of machinery and
equipment. The value of R $ 44,723 was released on March 20, 2012.
The debt will be repaid in 168 monthly and successive installments, with the first installment
due on May 15, 2012 and the last on April 15, 2026, with interest: subcredit "A" 1.82% p.a.
above TJLP, and subcredit "B" 1.42% p.a. paid quarterly in the period between January 15,
2012 and April 15, 2012, and monthly from the first principal repayment.

67
To guarantee the payment of contractual obligations, Copel Geração e Transmissão has
undertaken to assign to the BNDES the rights it holds under Concession Arrangement
027/2009-Aneel, and to submit as a guarantee to the BNDES the credit rights deriving from the
provision of energy transmission services stipulated in the Concession Arrangement
(Transmission Services Agreement 09/2010, entered into on 01.19.2009 by Copel Geração e
Transmissão and the National Electric System Operator (Operador Nacional do Sistema
Elétrico or ONS), the transmission concession operators and the users of the transmission
system, including the entire revenue deriving from the transmission services provided.
Copel Geração e Transmissão undertakes to receive this revenue in an escrow account until
the contract ends, and maintain a reserve account with funds ("minimum balance") equal to
(three) times the last payment due, including principal, interest and other contractual amounts.
The contract contains provisions on accelerated maturity in certain conditions.
Banco do Brasil - Distribution of Funds from BNDES
On April 16, 2009, Copel Geração e Transmissão signed with Banco do Brasil Loan Agreement nº
21/02000-0, with Copel as an intervening agent, to fund the construction of the Mauá Hydroelectric
Power Plant and its transmission system, in consortium with Eletrosul. The loan amounts to R$
169,500, which will be released in installments pursuant to the Uses and Sources Schedule
attached to the agreement.
This loan will be paid off in 179 monthly installments, starting on March 15, 2013 and ending on
January 15, 2028, bearing interest of 2.13% p.a. above the Long-Term Interest Rate (TJLP), which
will be paid quarterly during the grace period and monthly after the first payment of the principal
amount. As a guarantee for the payment of all amounts due under this agreement, Copel Geração e
Transmissão has pledged in favor of BNDES a lien on all the revenues from the sale of energy
under Agreements for Energy Trade on the Regulated Power Market (“Contracts for the Sale of
Energy in the Regulated Environment” or CCEARs) in connection with this project, which shall be
collected in a special main account for this purpose. The Company shall also set up two "reserve
accounts" to cover any shortfalls in the main account. This guarantee will be operated under an
Agreement on Revenue Transfer and Attachment, Account Management, and Other Covenants
signed by Copel Geração e Transmissão, BNDES and Banco do Brasil.
The first installment was made available in July 2009, in the amount of R$ 55,748, the second in
March 2010 for the amount of R$ 29,193, the third in December 2010, for the amount of R$ 52,555,
the fourth in June 2011, for the amount of R$ 23,489, and the last in November 2011, for the
amount of R$ 8,600.
An amendment was made to the agreement on 02.14.2012, changing the end of the grace period
for repayments from 02.15.2012 to 03.15.2013, with the other terms remaining unchanged.
The contract contains provisions on accelerated maturity in certain conditions.
68
Contracts with clauses for anticipated maturity
The Company and its subsidiaries have loan contracts which include clauses requiring that they
maintain certain economic-financial indices within previously established parameters, as well as
other conditions that have to be observed, such as: no alterations to the investment interest of the
Company in the capital that represents a change in control, without prior notice; specifically for
Copel Geração e Transmissão, no dividend distributions or payments for interest on own capital to
be made, for which the amount, individually or together, exceeds the minimum compulsory amount,
without prior and express authorization. Non compliance with these terms could result in the
anticipated maturity of the debts.
At June 30, 2012 all of the terms were analyzed, and it was identified that all of the parameters in
the contracts had been complied with.
20 Post-Employment Benefits
Benefit Pension Plan
The Company and its subsidiaries sponsor retirement and pension plans (Pension Plans I, II, and
III) and a medical and dental care plan (Healthcare Plan) to both current and retired employees and
their dependents.
The pension plans I and II are defined benefit plans for which the income is previously determined
based on the salary level of each individual and the Pension Plan III is a defined contribution plan.
(CD).
The costs assumed by the sponsors for these plans are registered according to the actuarial
evaluation prepared annually by independent actuaries in accordance with the rules established in
CVM Decision 600/09, which approved and made Technical Pronouncement CPC 33/IAS 19 and
IFRC 14, issued by the Accounting Pronouncements Committee – CPC compulsory for public stock
corporations, and refer to employee benefits, and correlated to IAS 19. The economic and financial
assumptions and for purposes of the actuarial evaluation are discussed with the independent
actuaries and approved by the sponsors’ management.
Healthcare Plan
The Company and its subsidiaries allocate resources for the coverage of health-care expenses
incurred by their employees and their dependents, within rules, limits, and conditions set in specific
regulations. Coverage includes periodic medical exams and is extended to all retirees and
pensioners for life.
Balance sheet and statement of income
Amounts recognized in the balance sheet, under Post-Employment Benefits, are summarized
below:

69
Consolidated
06.30.2012 12.31.2011
Pension plan (20.1) 416 14,410
Healthcare plan (20.2) 479,208 454,465
479,624 468,875
Current 22,180 36,037
Noncurrent 457,444 432,838
The amounts recognized in the statement of income are shown below:
Consolidated
06.30.2012 06.30.2011
Pension plan (CD) 27,351 23,021
Pension plan (CD) - management 259 305
Healthcare plan - post employment 35,476 27,536
Healthcare plan 22,581 16,467
Healthcare plan - management 27 18
85,694 67,347
(-) Transfers to contruction in progress (5,762) (3,644)
79,932 63,703
Changes in the Post-Employment Benefits balance
Current Noncurrent
Consolidated liabilities liabilities Total
As of January 1, 2012 36,037 432,838 468,875
Appropriation of actuarial calculation - 35,476 35,476
Pension and healthcare contributions 50,218 - 50,218
Transfers 10,870 (10,870) -
Amortizations (74,945) - (74,945)
As of June 30, 2012 22,180 457,444 479,624
Current Noncurrent
Consolidated liabilities liabilities Total
As of January 1, 2011 24,255 384,208 408,463
Appropriation of actuarial calculation - 27,536 27,536
Pension and healthcare contributions 39,811 - 39,811
Transfers 8,053 (8,053) -
Amortizations (47,498) - (47,498)
As of June 30, 2011 24,621 403,691 428,312
Actuarial valuation pursuant to CVM Ruling nº 600/2009
The Company, in compliance with CVM Decision 600/09, opted to prepare an annual actuarial
report.
The information, prepared in accordance with the Actuarial Evaluation Report of December 31,
2011, is presented in note 21 to the Annual Financial Statements at December 31, 2011.
70
21 Regulatory Charges
Consolidated
06.30.2012 12.31.2011
Fuel Consumption Account (CCC) 31,038 30,154
Energy Development Account (CDE) 23,512 20,718
Global Reversal Reserve (RGR) 8,193 19,639
62,743 70,511
22 Research and Development and Energy Efficiency
The concessionaries for public distribution, generation and transmission of electricity services are
required to allocate 1% of their annual net operational income to research and development in the
electrical sector and to energy efficiency programs, according to Law 9,991/00 and Aneel Normative
Resolutions 316/08 and 300/08.
Balances registered to invest in R&D (Research and Development) and PEE (Energy
efficiency program)
Applied and Balance Balance Balance as of Balance as of
unfinished to collect to apply 06.30.2012 12.31.2011
Research and Development - R&D
FNDCT - 3,189 - 3,189 3,018
MME - 1,596 - 1,596 1,510
R&D 18,165 - 115,545 133,710 120,936
18,165 4,785 115,545 138,495 125,464
Energy efficiency program - PEE 33,784 - 76,917 110,701 126,100
51,949 4,785 192,462 249,196 251,564
Current 124,450 156,915
Noncurrent 124,746 94,649
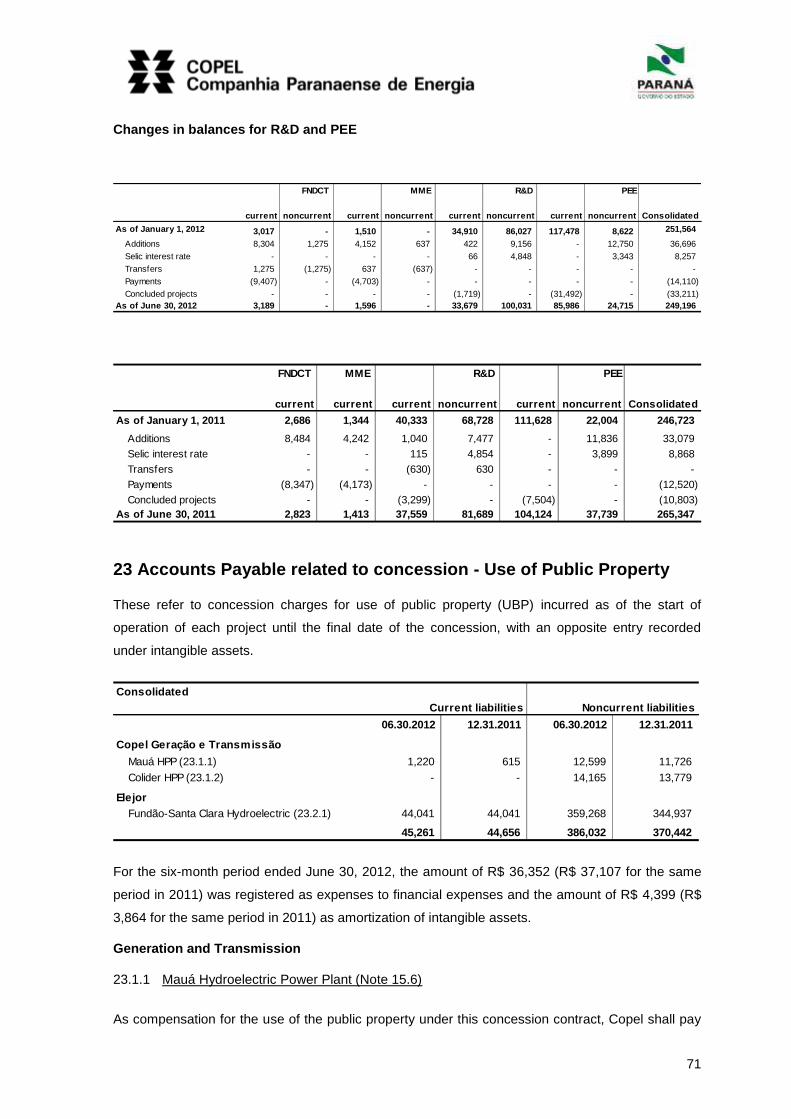
71
Changes in balances for R&D and PEE
FNDCT MME R&D PEE
current noncurrent current noncurrent current noncurrent current noncurrent Consolidated
As of January 1, 2012 3,017 - 1,510 - 34,910 86,027 117,478 8,622 251,564
Additions 8,304 1,275 4,152 637 422 9,156 - 12,750 36,696
Selic interest rate - - - - 66 4,848 - 3,343 8,257
Transfers 1,275 (1,275) 637 (637) - - - - -
Payments (9,407) - (4,703) - - - - - (14,110)
Concluded projects - - - - (1,719) - (31,492) - (33,211)
As of June 30, 2012 3,189 - 1,596 - 33,679 100,031 85,986 24,715 249,196
FNDCT MME R&D PEE
current current current noncurrent current noncurrent Consolidated
As of January 1, 2011 2,686 1,344 40,333 68,728 111,628 22,004 246,723
Additions 8,484 4,242 1,040 7,477 - 11,836 33,079
Selic interest rate - - 115 4,854 - 3,899 8,868
Transfers - - (630) 630 - - -
Payments (8,347) (4,173) - - - - (12,520)
Concluded projects - - (3,299) - (7,504) - (10,803)
As of June 30, 2011 2,823 1,413 37,559 81,689 104,124 37,739 265,347
23 Accounts Payable related to concession - Use of Public Property
These refer to concession charges for use of public property (UBP) incurred as of the start of
operation of each project until the final date of the concession, with an opposite entry recorded
under intangible assets.
Consolidated
Current liabilities Noncurrent liabilities
06.30.2012 12.31.2011 06.30.2012 12.31.2011
Copel Geração e Transmissão
Mauá HPP (23.1.1) 1,220 615 12,599 11,726
Colider HPP (23.1.2) - - 14,165 13,779
Elejor
Fundão-Santa Clara Hydroelectric (23.2.1) 44,041 44,041 359,268 344,937
45,261 44,656 386,032 370,442
For the six-month period ended June 30, 2012, the amount of R$ 36,352 (R$ 37,107 for the same
period in 2011) was registered as expenses to financial expenses and the amount of R$ 4,399 (R$
3,864 for the same period in 2011) as amortization of intangible assets.
Generation and Transmission
23.1.1 Mauá Hydroelectric Power Plant (Note 15.6)
As compensation for the use of the public property under this concession contract, Copel shall pay

72
to the Federal Government, from the facility’s start of commercial operation until the 35th year of the
concession, or as long as it runs the corresponding hydropower project, monthly installments
equivalent to 1/12 of the annual proposed payment of R$ 643 (51% of 1,262), pursuant to article 6
of Concession Contract nº 001/07 - MME – Mauá HPP.
These installments are restated annually or at the legally applicable intervals, according to the IPCA
inflation index.
The calculation of present value was made taking into account an actual net discount rate of around
5.65% p.a., compatible with the estimated noncurrent rate and not related to the expected rate of
return of the project.
The present value of the accounts payable related to concession - use of public property as of June
30, 2012, is R$ 13,820 (R$ 12,341, as of December 31, 2011).
23.1.2 Colíder Hydroelectric Power Plant (Note 15.7)
As compensation for the use of the public property under this concession contract, Copel shall pay
to the Federal Government, from the facility’s start of commercial operation until the 35th year of the
concession, or as long as it runs the corresponding hydropower project, monthly installments
equivalent to 1/12 of the annual proposed payment of R$ 1,256, pursuant to article 6 of Concession
Contract nº 001/11 - MME – HPP Colíder.
These installments are restated annually or at the legally applicable intervals, according to the IPCA
(Índice de Preços ao Consumidor Amplo or Wide Customer Price Index) inflation index.
The calculation of present value was made taking into account an actual net discount rate of around
7.74% p.a., compatible with the estimated noncurrent rate and not related to the expected rate of
return of the project.
The present value of the accounts payable related to concession - use of public property as of June
30, 2012 is R$ 14,165 (R$ 13,779, as of December 31, 2011).
Elejor
23.1.3 Fundão – Santa Clara Hydroelectric Energy Complex - HPPs Fundão and Santa Clara
As compensation for the use of the public property under this concession contract, Elejor shall pay
to the Federal Government, from the 6th until the 35
th year of the concession, or as long as it runs
the corresponding hydropower projects, monthly installments equivalent to 1/12 of the annual
proposed payment of R$ 19,000, pursuant to the Bidding Confirmation and to article 6 of
Concession Contract nº 125/01 – Aneel – Fundão – Santa Clara Hydroelectric Energy Complex -
HPPs Fundão and Santa Clara.
These installments are restated annually or at the legally applicable intervals, according to the IGP-
M inflation index, starting in May 2001.
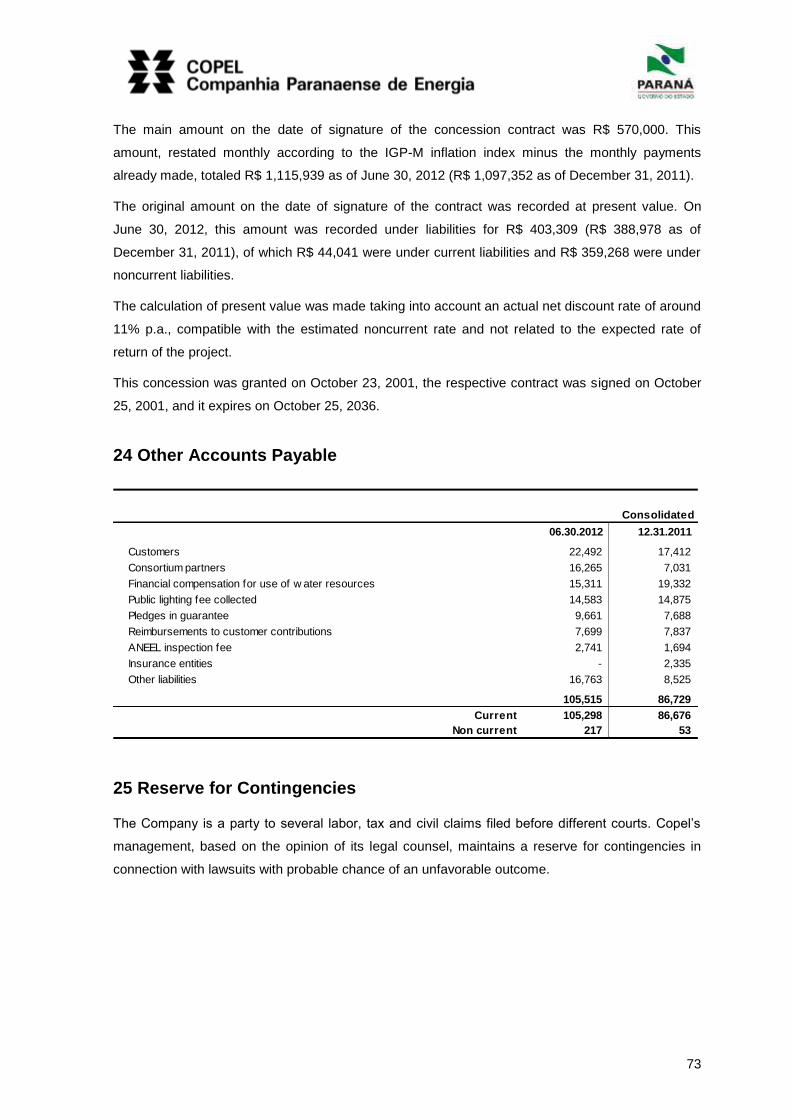
73
The main amount on the date of signature of the concession contract was R$ 570,000. This
amount, restated monthly according to the IGP-M inflation index minus the monthly payments
already made, totaled R$ 1,115,939 as of June 30, 2012 (R$ 1,097,352 as of December 31, 2011).
The original amount on the date of signature of the contract was recorded at present value. On
June 30, 2012, this amount was recorded under liabilities for R$ 403,309 (R$ 388,978 as of
December 31, 2011), of which R$ 44,041 were under current liabilities and R$ 359,268 were under
noncurrent liabilities.
The calculation of present value was made taking into account an actual net discount rate of around
11% p.a., compatible with the estimated noncurrent rate and not related to the expected rate of
return of the project.
This concession was granted on October 23, 2001, the respective contract was signed on October
25, 2001, and it expires on October 25, 2036.
24 Other Accounts Payable
Consolidated
06.30.2012 12.31.2011
Customers 22,492 17,412
Consortium partners 16,265 7,031
Financial compensation for use of w ater resources 15,311 19,332
Public lighting fee collected 14,583 14,875
Pledges in guarantee 9,661 7,688
Reimbursements to customer contributions 7,699 7,837
ANEEL inspection fee 2,741 1,694
Insurance entities - 2,335
Other liabilities 16,763 8,525
105,515 86,729
Current 105,298 86,676
Non current 217 53
25 Reserve for Contingencies
The Company is a party to several labor, tax and civil claims filed before different courts. Copel’s
management, based on the opinion of its legal counsel, maintains a reserve for contingencies in
connection with lawsuits with probable chance of an unfavorable outcome.
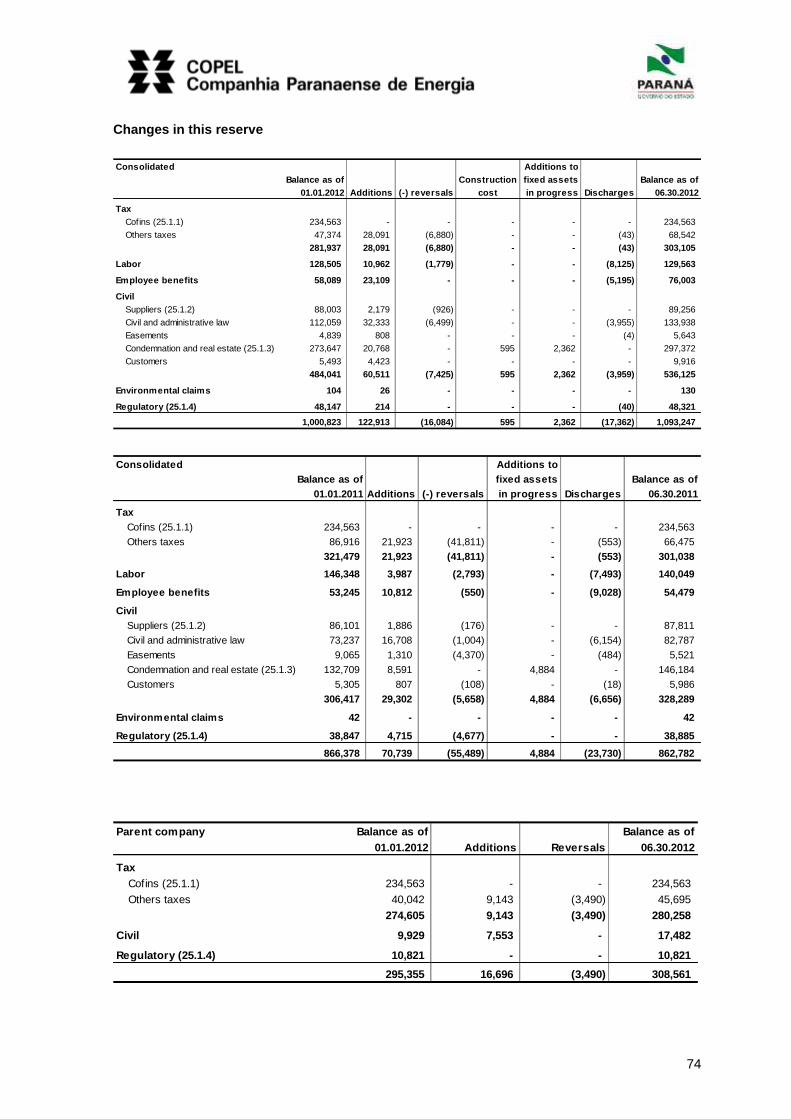
74
Changes in this reserve
Consolidated Additions to
Balance as of Construction fixed assets Balance as of
01.01.2012 Additions (-) reversals cost in progress Discharges 06.30.2012
Tax
Cofins (25.1.1) 234,563 - - - - - 234,563
Others taxes 47,374 28,091 (6,880) - - (43) 68,542
281,937 28,091 (6,880) - - (43) 303,105
Labor 128,505 10,962 (1,779) - - (8,125) 129,563
Employee benefits 58,089 23,109 - - - (5,195) 76,003
Civil
Suppliers (25.1.2) 88,003 2,179 (926) - - - 89,256
Civil and administrative law 112,059 32,333 (6,499) - - (3,955) 133,938
Easements 4,839 808 - - - (4) 5,643
Condemnation and real estate (25.1.3) 273,647 20,768 - 595 2,362 - 297,372
Customers 5,493 4,423 - - - - 9,916
484,041 60,511 (7,425) 595 2,362 (3,959) 536,125
Environmental claims 104 26 - - - - 130
Regulatory (25.1.4) 48,147 214 - - - (40) 48,321
1,000,823 122,913 (16,084) 595 2,362 (17,362) 1,093,247
Consolidated Additions to
Balance as of fixed assets Balance as of
01.01.2011 Additions (-) reversals in progress Discharges 06.30.2011
Tax
Cofins (25.1.1) 234,563 - - - - 234,563
Others taxes 86,916 21,923 (41,811) - (553) 66,475
321,479 21,923 (41,811) - (553) 301,038
Labor 146,348 3,987 (2,793) - (7,493) 140,049
Employee benefits 53,245 10,812 (550) - (9,028) 54,479
Civil
Suppliers (25.1.2) 86,101 1,886 (176) - - 87,811
Civil and administrative law 73,237 16,708 (1,004) - (6,154) 82,787
Easements 9,065 1,310 (4,370) - (484) 5,521
Condemnation and real estate (25.1.3) 132,709 8,591 - 4,884 - 146,184
Customers 5,305 807 (108) - (18) 5,986
306,417 29,302 (5,658) 4,884 (6,656) 328,289
Environmental claims 42 - - - - 42
Regulatory (25.1.4) 38,847 4,715 (4,677) - - 38,885
866,378 70,739 (55,489) 4,884 (23,730) 862,782
Parent company Balance as of Balance as of
01.01.2012 Additions Reversals 06.30.2012
Tax
Cofins (25.1.1) 234,563 - - 234,563
Others taxes 40,042 9,143 (3,490) 45,695
274,605 9,143 (3,490) 280,258
Civil 9,929 7,553 - 17,482
Regulatory (25.1.4) 10,821 - - 10,821
295,355 16,696 (3,490) 308,561
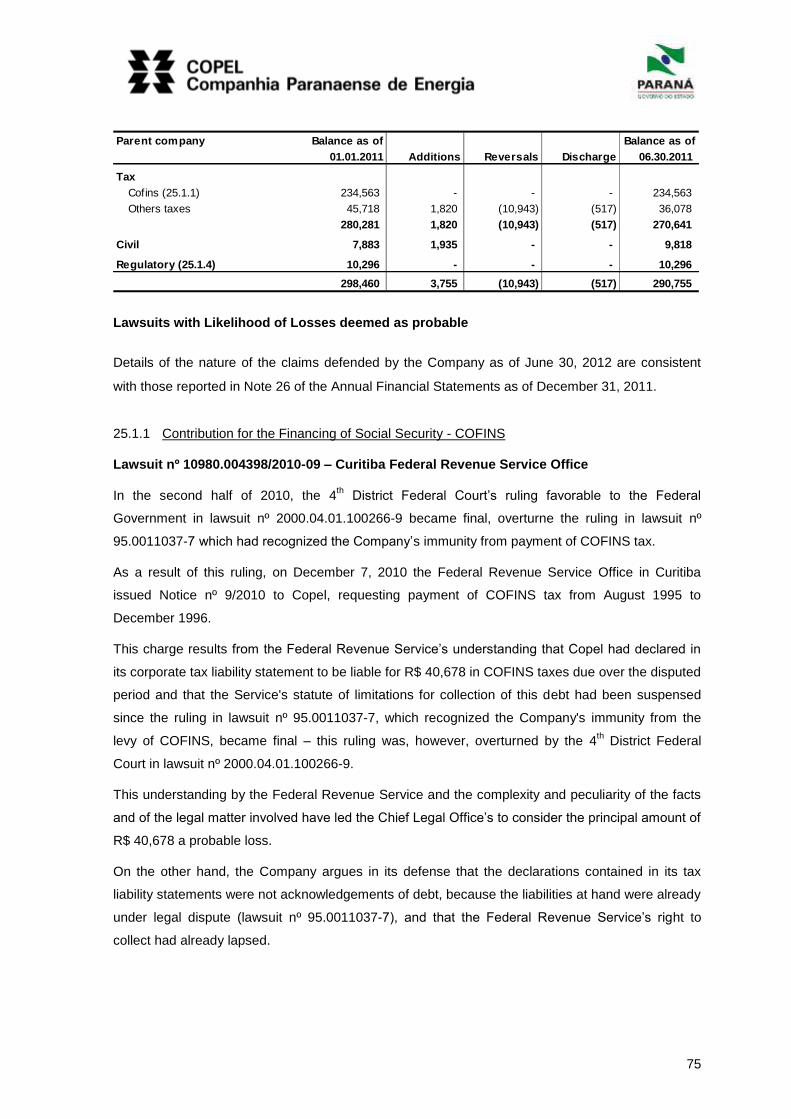
75
Parent company Balance as of Balance as of
01.01.2011 Additions Reversals Discharge 06.30.2011
Tax
Cofins (25.1.1) 234,563 - - - 234,563
Others taxes 45,718 1,820 (10,943) (517) 36,078
280,281 1,820 (10,943) (517) 270,641
Civil 7,883 1,935 - - 9,818
Regulatory (25.1.4) 10,296 - - - 10,296
298,460 3,755 (10,943) (517) 290,755
Lawsuits with Likelihood of Losses deemed as probable
Details of the nature of the claims defended by the Company as of June 30, 2012 are consistent
with those reported in Note 26 of the Annual Financial Statements as of December 31, 2011.
25.1.1 Contribution for the Financing of Social Security - COFINS
Lawsuit nº 10980.004398/2010-09 – Curitiba Federal Revenue Service Office
In the second half of 2010, the 4th District Federal Court’s ruling favorable to the Federal
Government in lawsuit nº 2000.04.01.100266-9 became final, overturne the ruling in lawsuit nº
95.0011037-7 which had recognized the Company’s immunity from payment of COFINS tax.
As a result of this ruling, on December 7, 2010 the Federal Revenue Service Office in Curitiba
issued Notice nº 9/2010 to Copel, requesting payment of COFINS tax from August 1995 to
December 1996.
This charge results from the Federal Revenue Service’s understanding that Copel had declared in
its corporate tax liability statement to be liable for R$ 40,678 in COFINS taxes due over the disputed
period and that the Service's statute of limitations for collection of this debt had been suspensed
since the ruling in lawsuit nº 95.0011037-7, which recognized the Company's immunity from the
levy of COFINS, became final – this ruling was, however, overturned by the 4th District Federal
Court in lawsuit nº 2000.04.01.100266-9.
This understanding by the Federal Revenue Service and the complexity and peculiarity of the facts
and of the legal matter involved have led the Chief Legal Office’s to consider the principal amount of
R$ 40,678 a probable loss.
On the other hand, the Company argues in its defense that the declarations contained in its tax
liability statements were not acknowledgements of debt, because the liabilities at hand were already
under legal dispute (lawsuit nº 95.0011037-7), and that the Federal Revenue Service’s right to
collect had already lapsed.
76
In order to suspend the liability for this tax credit an injunction was filed, number 5005264-
27.2011.404.7000, with the lower federal courts in Curitiba, for which a sentence was given against
Copel, and which recognized the right of the Superintendency of the Federal Revenue Services to
examine the rejection by the Company of Tax Summons number 09/2010, without the need to be
subject to the regular proceedings for the administrative rejections of the tax entries, which have a
suspension effect and which are governed by the Double degree of administrative jurisdiction.
The Company strategically opted not to appeal the decision so that it could file a motion to stay
execution at court, where the discovery phase is more detailed and all necessary types of evidence
can be produced.
Since Summons number 09/2010 was judged as valid by the Supreme Court, with respect to the
principal sum for the COFINS debt, of R$ 41,789, for the period August 1995 to December 1996.
The federal government brought tax collection proceedings for the debt included in notification
09/2010, case records number 5015930-53.2010.404.7000 at the second federal court, in the
amount of R$ 48,814. Copel then posted a judicial bond for the tax debt being collected and filed a
motion to stay execution (case records number 5022933-59.2012.404.7000), which caused
proceedings to be suspended until the motion is decided.
The interest and fines being charged on this tax debt are the object of administrative process
number 11453.720001/2011-23, which amounted to R$ 148,055 as of June 30, 2012. This amount
was classified by the company’s senior management as a loss deemed as possible, since there are
independent judicial defenses for the principal amount and for the charges amount, and that there
are strong arguments for the defense of the values related to interest and penalties.
Lawsuit nº 10980.720458/2011-15 – Curitiba Federal Revenue Service Office.
In the second half of 2010, the 4th District Federal Court’s ruling favorable to the Federal
Government in lawsuit nº 2000.04.01.100266-9 became final, overturning the ruling in lawsuit nº
95.0011037-7 which had recognized the Company’s immunity from payment of COFINS tax.
As a result of this sentence, the Federal Revenue Services filed the assessment, through which it
intends to demand payment of COFINS for the period from October 1998 to June 2001, as a result
of rescission claim 2000.04.01.100266-9 being accepted as legally valid.
The Federal Revenue Services understands that the sentence for the Rescission Claim had
suspended the liability period for constituting the aforementioned tax credit.
This understanding of the Federal Revenue Services, together with the complexity and peculiarity of
both the facts and the legal question involved in the process, explains the Legal Director’s decision
to consider the principal amount of R$ 194,317 as representing a probable loss.
Nevertheless, the Company has argued in its defense, that the Federal Government no longer has
the right to constitute this tax credit, given the lack of timely constitution of the tax credit, to prevent
the liability period from lapsing.
77
The interest and penalties related to the abovementioned tax debt amount to R$ 484.817 as of June
30, 2012, and it was classified as a loss deemed as possible by the company’s senior management,
and based on the opinion of their legal advisors, since there are independent defense lines for the
principal amount and for the charges amount, and that there are strong arguments for the defense
related to the values of interest and penalties.
25.1.2 Rio Pedrinho Energética S.A. and Consórcio Salto Natal Energética S.A.
The companies Rio Pedrinho Energética S.A. and Consórcio Salto Natal Energética S.A. required
the filing of the arbitration proceedings with the Chamber of Arbitrage of the Fundação Getúlio
Vargas, through which they plead the payment of the overdue installment values, as well as the
cancellation fines, related to the electric energy purchase and sale agreements signed with Copel
Distribuição. The arbitrage proceedings were judged to be valid and, consequently, Copel
Distribuição was sentenced to pay the claimed amounts plus the attorney’s fees. The Company has
filed for a court order at the Superior Court of Justice making the arbitration ruling void.
Given that both companies have identified the pledged amounts (R$ 35,913 on June 17, 2010, R$
22,823 on October 1, 2009 and R$ 11,833 on February 03, 2010), the legal directors have
continued to classify the action as representing a probable loss, highlighting that the same bank
bond letters were presented as guarantee for the amounts identified, and thus what remains,
besides the legal discussion in question, is the possibility of execution of any remaining balance that
may be determined as a result of the legal actions in question, which is the reason why
management decided to record a financial provision for the legal claims, for the original value of the
debts corrected to June 30, 2012, which amounts to R$ 107,640. Of this amount, R$ 18,383 has
been recorded to suppliers.
Copel does not accept there is an outstanding balance. However, the judge of the 3rd
Public
Finance Court ruled the amount of R$ 22,162 is outstanding, and released the amounts of R$
12,790 and R$ 9,371 to the enforcement creditors on 04.12.2012, via a bank guarantee. The matter
is still under consideration and has been subject to an appeal.
25.1.3 Ivaí Engenharia de Obras S.A.
In a lawsuit filed before the 1st Fiscal Court of Curitiba, Ivaí Engenharia de Obras S.A. won the right
to receive credits from Copel Geração e Transmissão in connection with the execution of contract
D-01, which comprised the Jordão River diversion works. These credits were compensation for a
supposed economic and financial imbalance in the contract. Based on this ruling, Ivaí filed a
separate collection lawsuit before the 4th Fiscal Court of Curitiba and obtained a ruling ordering
Copel to pay the amount of R$ 180,917, as of October 31, 2005, plus restatement by the average
between the INPC and IGP-DI inflation indicators, delinquent interest of 1% a month, and 3.2% as
legal fees. Copel is appealing this ruling.
Copel then obtained a preliminary injunction, issued by Minister Castro Meira of the Superior Court
of Justice (Tribunal Superior de Justiça or STJ) under nº 15,372-PR, suspending the collection suit
78
and the provisional enforcement requested by Ivaí.
The appeal claim, currently in progress in the Superior Court of Justice (Superior Tribunal de
Justiça or STJ), covers the absence of economic and financial imbalance in the contract, as well as
the nullity of the calculation performed by the judicial expert, who used wrong parameters to obtain
the value of condemnation, causing interest rates to be applied in duplicity (Selic rate + interest
rate). Although the Justice Court has dismissed the duplicity in the incidence of interest from the
elaboration of the expert report, it did not examine the appeal reasoning that showed that the
calculation contained within the expert report was wrong.
The company is currently waiting for the outcome of the Special Appeal it filed in the collection suit,
under nº 1,096,906, whose rapporteur is Minister Castro Meira, with the resume of voting by
Ministers Mauro Campbell Marques and Humberto Martins, after the unfavorable vote by the
Minister who is rapporteur of the Special Appeal, published in 2011 and which awaits return of the
claim to the Plenary after Minister Herman Benjamin requested to view the process.
In view of the unfavorable vote and of the analysis of previous decisions ruled by the other Ministers
that participated in the trial, the Company’s senior management, through a conservative approach,
proceeded to a detailed review of the process course over the last months and decided to
remeasure the value to be provisioned, from R$ 125,000, which represented the original value of
the debt in question, adjusted with legal interest and restated by inflation indexes allowed by the
Company, to R$ 261,044, once considered the form of adjustment of the debt, which is still under
discussion, only dismissing the incidence of interest in the expert’s calculation, and maintaining the
charge of Selic rate, and, from that point, restating the value to present day based on the
parameters fixed on the judgment by the Justice Court of the State of Paraná – TJPR (interest +
monetary restatement). Thus, the value provisioned reflects the expectation of the Company in the
event of an unfavorable closure to this claim.
The accumulation of interest, in this case, Selic interest rate plus interest on arrears, is a situation
rejected by the Judiciary Power, and it was already denied by the Supreme Justice Court (STJ) in
numerous precedents. For this reason, it is also a conservative approach to consider as a possible
risk the loss of the difference in the value deemed as probable and the eventual total value of the
condemnation, which is R$ 221,732, as of June 30, 2012.
On June 12, 2012 a decision unfavorable to Copel was rendered on appeal number 1.121.458 filed
by the Company against the judicial reexamination whose reporting judge was Justice Arnaldo
Esteves Lima. The aim of Copel is to terminate the payment obligation on the grounds that the
federal government does not have the right to claim the difference because an agreement has been
reached at the administrative level which has not yet been published.
25.1.4 Regulatory claims
The Company is disputing, both administratively and judicially, notifications issued by the regulatory
agency in connection with supposed regulatory violations, including the charge of R$ 35,535 in
79
lawsuits involving Companhia Estadual de Energia Elétrica - CEEE and Dona Francisca Energética
S.A., in which Aneel Ruling nº 288/2002 is being disputed. The probable success in these lawsuits
will result in changes in CCEE (Spot Market) accounting, which would require the recording of a
reserve for these amounts, since Copel would be required to pay off the amounts due.
Lawsuits with losses deemed as possible
Consolidated
06.30.2012 12.31.2011
Tax (25.2.1) 1,131,764 1,246,954
Civil (25.2.2) 752,064 542,386
Labor 226,144 176,448
Employee benefits 39,765 37,788
Regulatory 18,082 12,907
2,167,819 2,016,483
Breakdown of the main lawsuits with losses deemed as possible:
25.1.5 Tax claims
COFINS, Rescission Claim in the value of R$ 659,146. This value is related to interest and
penalties whose main debt is provisioned in the financial statements due to its classification as
a probable loss, however, in view of the strong arguments for the defense over the payment of
these charges, it is classified as possible. Additional information on this process is described on
item 25.1 in this same report.
Fiscal requirements according to Fiscal Notification of Debt Record – NFLD nº 35.273.870-7,
with approximate value of R$ 299,623, authored by the National Institute of Social Security –
INSS, against Copel, and related to the fiscal execution of social contribution.
Fiscal requirements according to NFLD nº 35.273.876-6, with approximate value of R$ 61,538
on June 30, 2012, authored by the INSS, agains Copel, and related to the fiscal execution of
social contribution levied upon labor transfer.
25.1.6 Civil claims
Civil claim related to the indemnification lawsuit nº 166-53.2011.8.16.0122, authored by
Mineradora Tibagiana Ltda, and whose defendant is the Consórcio Energético Cruzeiro do Sul
– CECS. Copel bears 51% of the total risk of the lawsuit, which equals to R$ 200,156, restated
as of June 30, 2012. The author claims being the owner of a mining decree issued by the
National Department of Mineral Production – DNPM, and defends that with the mining decree, it
is the legitimate holder of ownership and control of the area around Tibagi River. The
indemnification claimed refers to alleged losses in the company’s mining operations due to the
construction work of the Mauá Power Plant. The plaintiff’s attorney has been with the case
records since May 4, 2012 to challenge the appeal filed by Consórcio Energético Cruzeiro do
Sul – CECS.
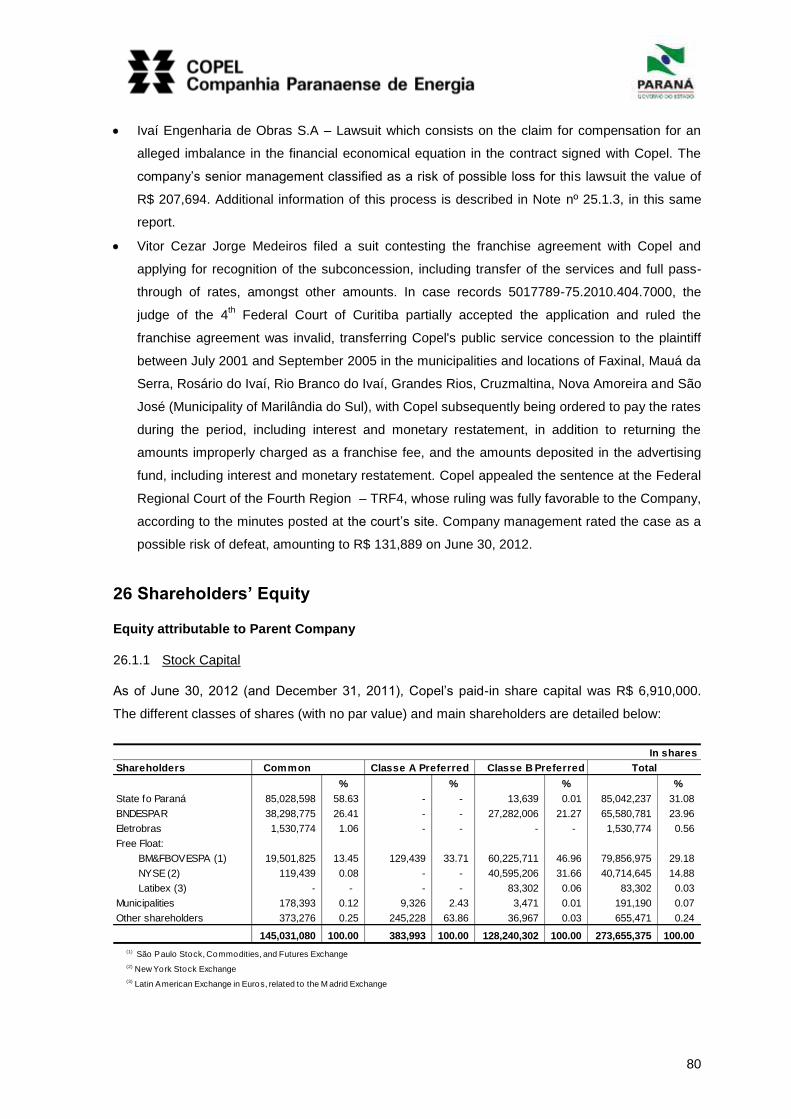
80
Ivaí Engenharia de Obras S.A – Lawsuit which consists on the claim for compensation for an
alleged imbalance in the financial economical equation in the contract signed with Copel. The
company’s senior management classified as a risk of possible loss for this lawsuit the value of
R$ 207,694. Additional information of this process is described in Note nº 25.1.3, in this same
report.
Vitor Cezar Jorge Medeiros filed a suit contesting the franchise agreement with Copel and
applying for recognition of the subconcession, including transfer of the services and full pass-
through of rates, amongst other amounts. In case records 5017789-75.2010.404.7000, the
judge of the 4th Federal Court of Curitiba partially accepted the application and ruled the
franchise agreement was invalid, transferring Copel's public service concession to the plaintiff
between July 2001 and September 2005 in the municipalities and locations of Faxinal, Mauá da
Serra, Rosário do Ivaí, Rio Branco do Ivaí, Grandes Rios, Cruzmaltina, Nova Amoreira and São
José (Municipality of Marilândia do Sul), with Copel subsequently being ordered to pay the rates
during the period, including interest and monetary restatement, in addition to returning the
amounts improperly charged as a franchise fee, and the amounts deposited in the advertising
fund, including interest and monetary restatement. Copel appealed the sentence at the Federal
Regional Court of the Fourth Region – TRF4, whose ruling was fully favorable to the Company,
according to the minutes posted at the court’s site. Company management rated the case as a
possible risk of defeat, amounting to R$ 131,889 on June 30, 2012.
26 Shareholders’ Equity
Equity attributable to Parent Company
26.1.1 Stock Capital
As of June 30, 2012 (and December 31, 2011), Copel’s paid-in share capital was R$ 6,910,000.
The different classes of shares (with no par value) and main shareholders are detailed below:
In shares
Shareholders Common Classe A Preferred Classe B Preferred Total
% % % %
State fo Paraná 85,028,598 58.63 - - 13,639 0.01 85,042,237 31.08
BNDESPAR 38,298,775 26.41 - - 27,282,006 21.27 65,580,781 23.96
Eletrobras 1,530,774 1.06 - - - - 1,530,774 0.56
Free Float:
BM&FBOVESPA (1) 19,501,825 13.45 129,439 33.71 60,225,711 46.96 79,856,975 29.18
NYSE (2) 119,439 0.08 - - 40,595,206 31.66 40,714,645 14.88
Latibex (3) - - - - 83,302 0.06 83,302 0.03
Municipalities 178,393 0.12 9,326 2.43 3,471 0.01 191,190 0.07
Other shareholders 373,276 0.25 245,228 63.86 36,967 0.03 655,471 0.24
145,031,080 100.00 383,993 100.00 128,240,302 100.00 273,655,375 100.00
(1) São Paulo Stock, Commodities, and Futures Exchange
(2) New York Stock Exchange
(3) Latin American Exchange in Euros, related to the M adrid Exchange
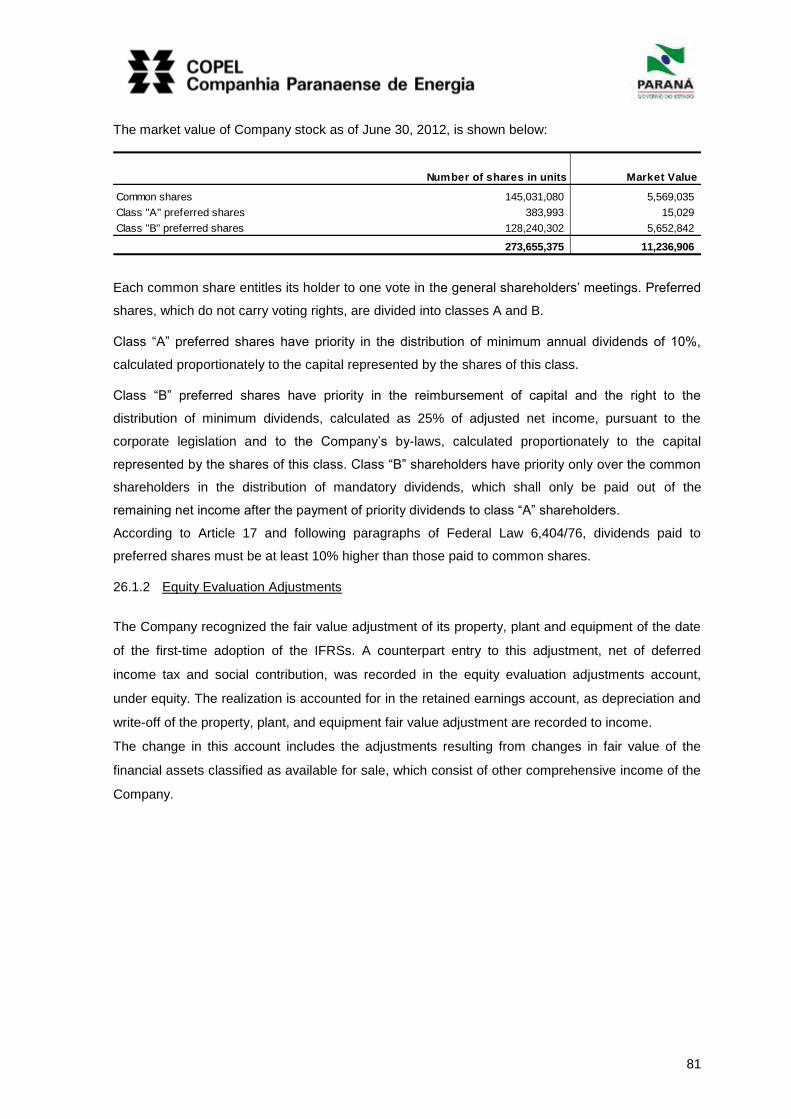
81
The market value of Company stock as of June 30, 2012, is shown below:
Number of shares in units Market Value
Common shares 145,031,080 5,569,035
Class "A" preferred shares 383,993 15,029
Class "B" preferred shares 128,240,302 5,652,842
273,655,375 11,236,906
Each common share entitles its holder to one vote in the general shareholders’ meetings. Preferred
shares, which do not carry voting rights, are divided into classes A and B.
Class “A” preferred shares have priority in the distribution of minimum annual dividends of 10%,
calculated proportionately to the capital represented by the shares of this class.
Class “B” preferred shares have priority in the reimbursement of capital and the right to the
distribution of minimum dividends, calculated as 25% of adjusted net income, pursuant to the
corporate legislation and to the Company’s by-laws, calculated proportionately to the capital
represented by the shares of this class. Class “B” shareholders have priority only over the common
shareholders in the distribution of mandatory dividends, which shall only be paid out of the
remaining net income after the payment of priority dividends to class “A” shareholders.
According to Article 17 and following paragraphs of Federal Law 6,404/76, dividends paid to
preferred shares must be at least 10% higher than those paid to common shares.
26.1.2 Equity Evaluation Adjustments
The Company recognized the fair value adjustment of its property, plant and equipment of the date
of the first-time adoption of the IFRSs. A counterpart entry to this adjustment, net of deferred
income tax and social contribution, was recorded in the equity evaluation adjustments account,
under equity. The realization is accounted for in the retained earnings account, as depreciation and
write-off of the property, plant, and equipment fair value adjustment are recorded to income.
The change in this account includes the adjustments resulting from changes in fair value of the
financial assets classified as available for sale, which consist of other comprehensive income of the
Company.
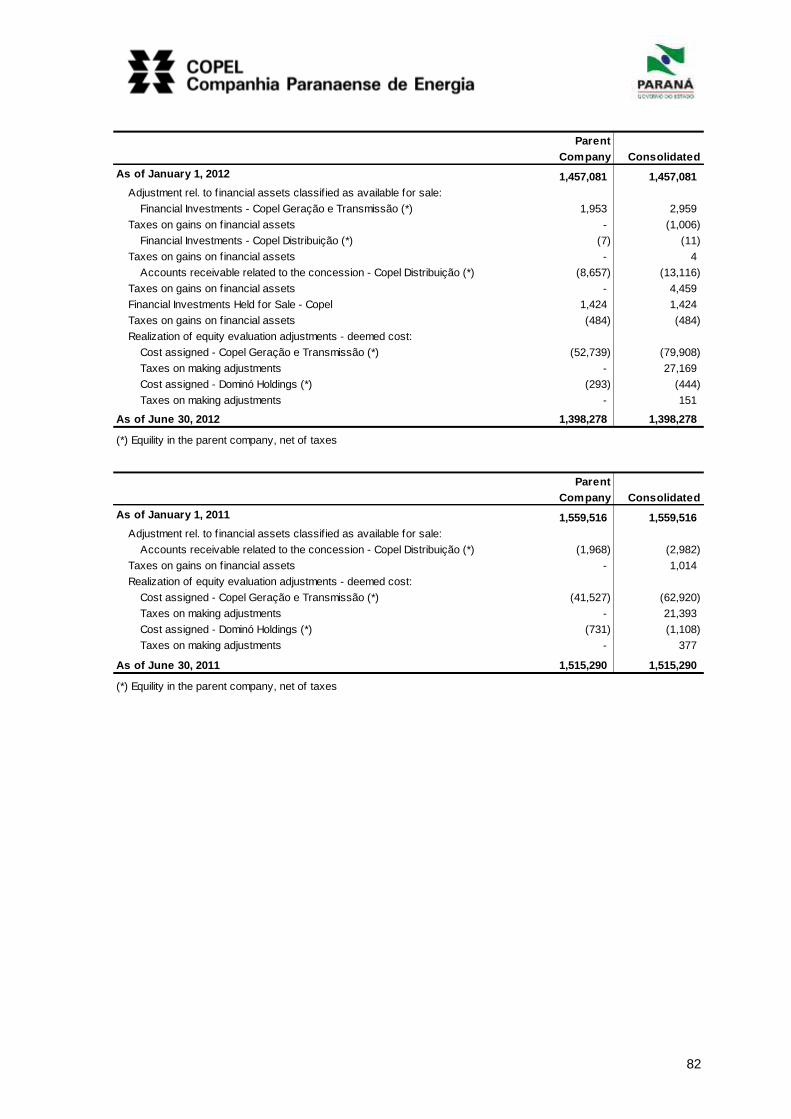
82
Parent
Company Consolidated
As of January 1, 2012 1,457,081 1,457,081
Adjustment rel. to f inancial assets classif ied as available for sale:
Financial Investments - Copel Geração e Transmissão (*) 1,953 2,959
Taxes on gains on f inancial assets - (1,006)
Financial Investments - Copel Distribuição (*) (7) (11)
Taxes on gains on f inancial assets - 4
Accounts receivable related to the concession - Copel Distribuição (*) (8,657) (13,116)
Taxes on gains on f inancial assets - 4,459
Financial Investments Held for Sale - Copel 1,424 1,424
Taxes on gains on f inancial assets (484) (484)
Realization of equity evaluation adjustments - deemed cost:
Cost assigned - Copel Geração e Transmissão (*) (52,739) (79,908)
Taxes on making adjustments - 27,169
Cost assigned - Dominó Holdings (*) (293) (444)
Taxes on making adjustments - 151
As of June 30, 2012 1,398,278 1,398,278
(*) Equility in the parent company, net of taxes
Parent
Company Consolidated
As of January 1, 2011 1,559,516 1,559,516
Adjustment rel. to f inancial assets classif ied as available for sale:
Accounts receivable related to the concession - Copel Distribuição (*) (1,968) (2,982)
Taxes on gains on f inancial assets - 1,014
Realization of equity evaluation adjustments - deemed cost:
Cost assigned - Copel Geração e Transmissão (*) (41,527) (62,920)
Taxes on making adjustments - 21,393
Cost assigned - Dominó Holdings (*) (731) (1,108)
Taxes on making adjustments - 377
As of June 30, 2011 1,515,290 1,515,290
(*) Equility in the parent company, net of taxes
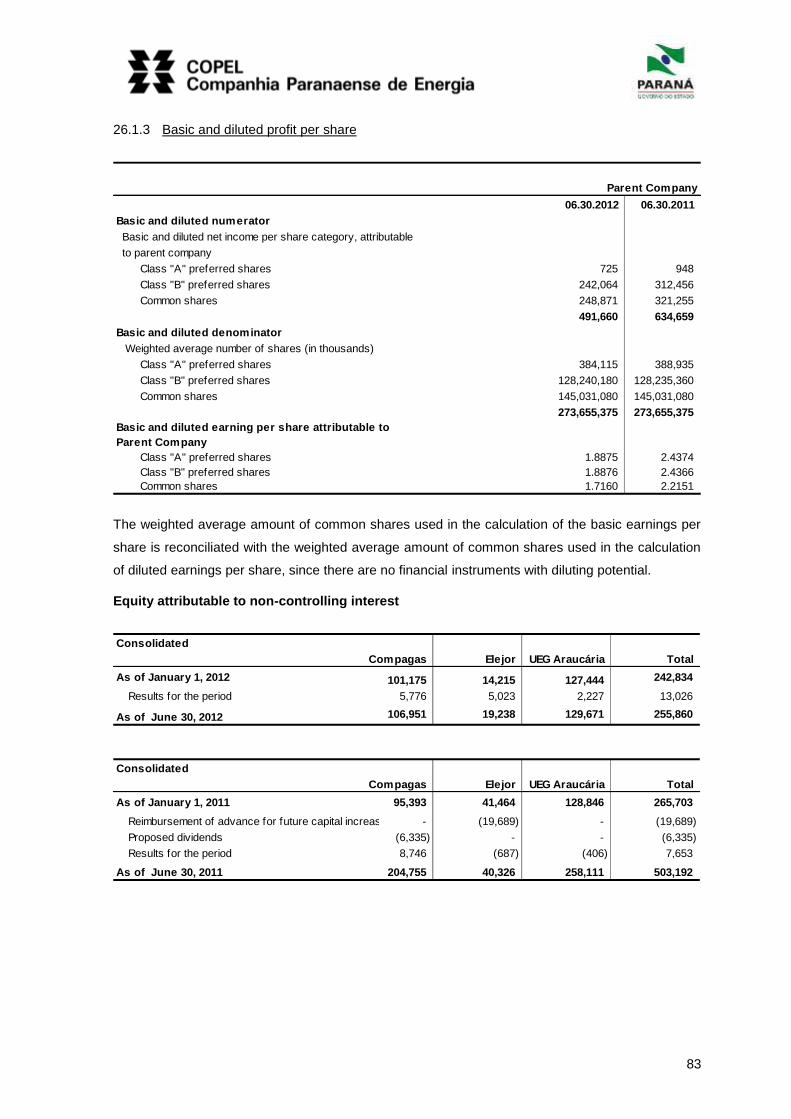
83
26.1.3 Basic and diluted profit per share
Parent Company
06.30.2012 06.30.2011
Basic and diluted numerator
Basic and diluted net income per share category, attributable
to parent company
Class "A" preferred shares 725 948
Class "B" preferred shares 242,064 312,456
Common shares 248,871 321,255
491,660 634,659
Basic and diluted denominator
Weighted average number of shares (in thousands)
Class "A" preferred shares 384,115 388,935
Class "B" preferred shares 128,240,180 128,235,360
Common shares 145,031,080 145,031,080
273,655,375 273,655,375
Basic and diluted earning per share attributable to
Parent Company
Class "A" preferred shares 1.8875 2.4374
Class "B" preferred shares 1.8876 2.4366
Common shares 1.7160 2.2151
The weighted average amount of common shares used in the calculation of the basic earnings per
share is reconciliated with the weighted average amount of common shares used in the calculation
of diluted earnings per share, since there are no financial instruments with diluting potential.
Equity attributable to non-controlling interest
Consolidated
Compagas Elejor UEG Araucária Total
As of January 1, 2012 101,175 14,215 127,444 242,834
Results for the period 5,776 5,023 2,227 13,026
As of June 30, 2012 106,951 19,238 129,671 255,860
Consolidated
Compagas Elejor UEG Araucária Total
As of January 1, 2011 95,393 41,464 128,846 265,703
Reimbursement of advance for future capital increase - AFAC- (19,689) - (19,689)
Proposed dividends (6,335) - - (6,335)
Results for the period 8,746 (687) (406) 7,653
As of June 30, 2011 204,755 40,326 258,111 503,192

84
27 Operating Revenues
Consolidated Gross PIS/Pasep Regulatory Service tax Net
revenues & Cofins taxes ICMS (VAT) charges (ISSQN ) revenues
06.30.2012
Electricity sales to f inal customers 1,955,668 (180,718) (517,622) (39,240) - 1,218,088
Electricity sales to distributors 970,828 (88,180) (196) (33,044) - 849,408
Charges for the use of the main transmission grid 2,697,933 (245,022) (669,632) (348,303) - 1,434,976
Construction revenues 246,263 - - - - 246,263
Revenues from telecommunications 79,281 (4,123) (13,613) - (157) 61,388
Distribution of piped gas 194,732 (17,904) (23,667) - - 153,161
Other operating revenues 104,474 (10,997) - - (653) 92,824
6,249,179 (546,944) (1,224,730) (420,587) (810) 4,056,108
Consolidated Gross PIS/Pasep Regulatory Service tax Net
revenues & Cofins taxes ICMS (VAT) charges (ISSQN ) revenues
06.30.2011
Electricity sales to f inal customers 1,823,819 (169,001) (485,209) (14,900) - 1,154,709
Electricity sales to distributors 785,054 (75,561) (157) (30,081) - 679,255
Charges for the use of the main transmission grid 2,514,491 (228,375) (621,017) (342,970) - 1,322,129
Construction revenues 276,455 - - - - 276,455
Revenues from telecommunications 73,541 (3,972) (12,189) - (365) 57,015
Distribution of piped gas 158,386 (14,334) (19,901) - (8) 124,143
Other operating revenues 66,269 (6,337) (1) (4,616) (483) 54,832
5,698,015 (497,580) (1,138,474) (392,567) (856) 3,668,538
Regulatory Charges
06.30.2012 06.30.2011
Fuel Consumptuon Account (CCC) 186,098 166,264
Energy Development Account (CDE) 140,980 124,679
Global Reversal Reserve (RGR) 49,163 61,445
Research and Development and Energy Efficiency Programs - R&D and EEP (22.2) 36,696 33,079
Other charges 7,650 7,100
420,587 392,567
Consolidated
Power sales to final customers by customer category
Electric power supply
Consolidated Gross income Net income
06.30.2012 06.30.2011 06.30.2012 06.30.2011
Residential 635,284 611,784 395,687 387,337
Industrial 653,604 598,801 407,097 379,117
Commercial, services and other activities 440,771 405,875 274,534 256,970
Rural 87,893 81,176 54,744 51,395
Public agencies 53,855 51,523 33,544 32,621
Public lighting 42,577 36,113 26,519 22,864
Public services 41,684 38,547 25,963 24,405
1,955,668 1,823,819 1,218,088 1,154,709
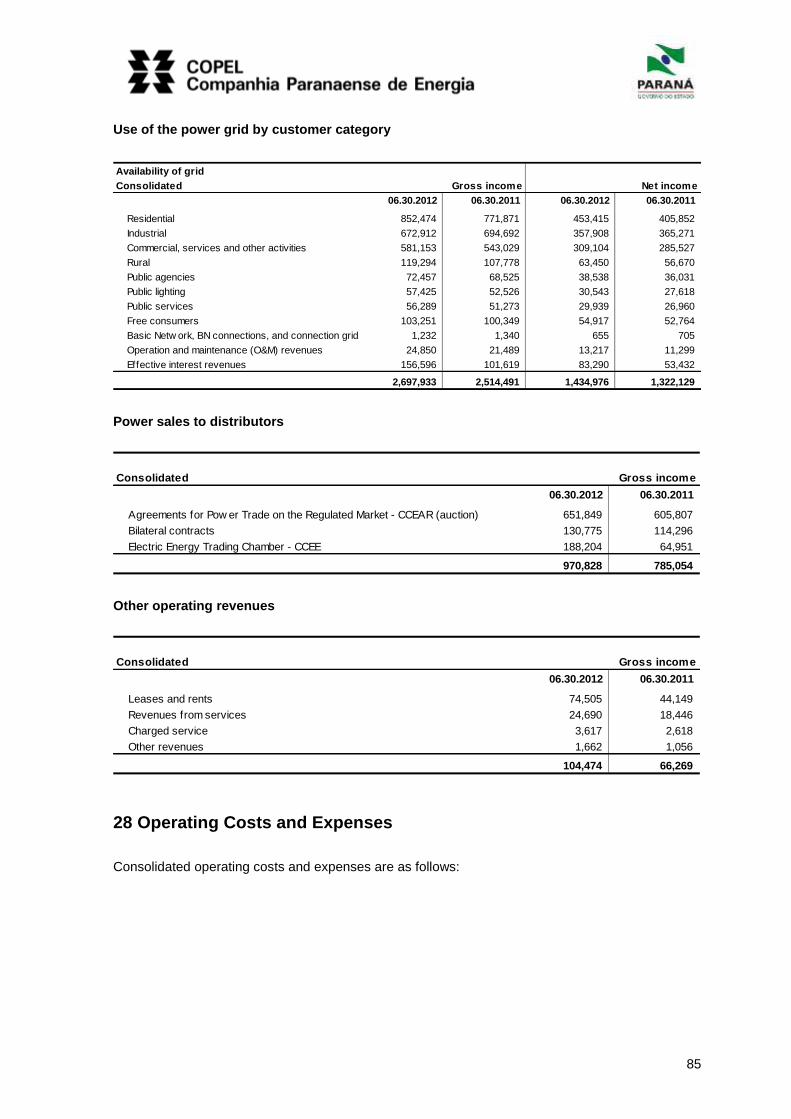
85
Use of the power grid by customer category
Availability of grid
Consolidated Gross income Net income
06.30.2012 06.30.2011 06.30.2012 06.30.2011
Residential 852,474 771,871 453,415 405,852
Industrial 672,912 694,692 357,908 365,271
Commercial, services and other activities 581,153 543,029 309,104 285,527
Rural 119,294 107,778 63,450 56,670
Public agencies 72,457 68,525 38,538 36,031
Public lighting 57,425 52,526 30,543 27,618
Public services 56,289 51,273 29,939 26,960
Free consumers 103,251 100,349 54,917 52,764
Basic Netw ork, BN connections, and connection grid 1,232 1,340 655 705
Operation and maintenance (O&M) revenues 24,850 21,489 13,217 11,299
Effective interest revenues 156,596 101,619 83,290 53,432
2,697,933 2,514,491 1,434,976 1,322,129
Power sales to distributors
Consolidated
06.30.2012 06.30.2011
Agreements for Pow er Trade on the Regulated Market - CCEAR (auction) 651,849 605,807
Bilateral contracts 130,775 114,296
Electric Energy Trading Chamber - CCEE 188,204 64,951
970,828 785,054
Gross income
Other operating revenues
Consolidated Gross income
06.30.2012 06.30.2011
Leases and rents 74,505 44,149
Revenues from services 24,690 18,446
Charged service 3,617 2,618
Other revenues 1,662 1,056
104,474 66,269
28 Operating Costs and Expenses
Consolidated operating costs and expenses are as follows:
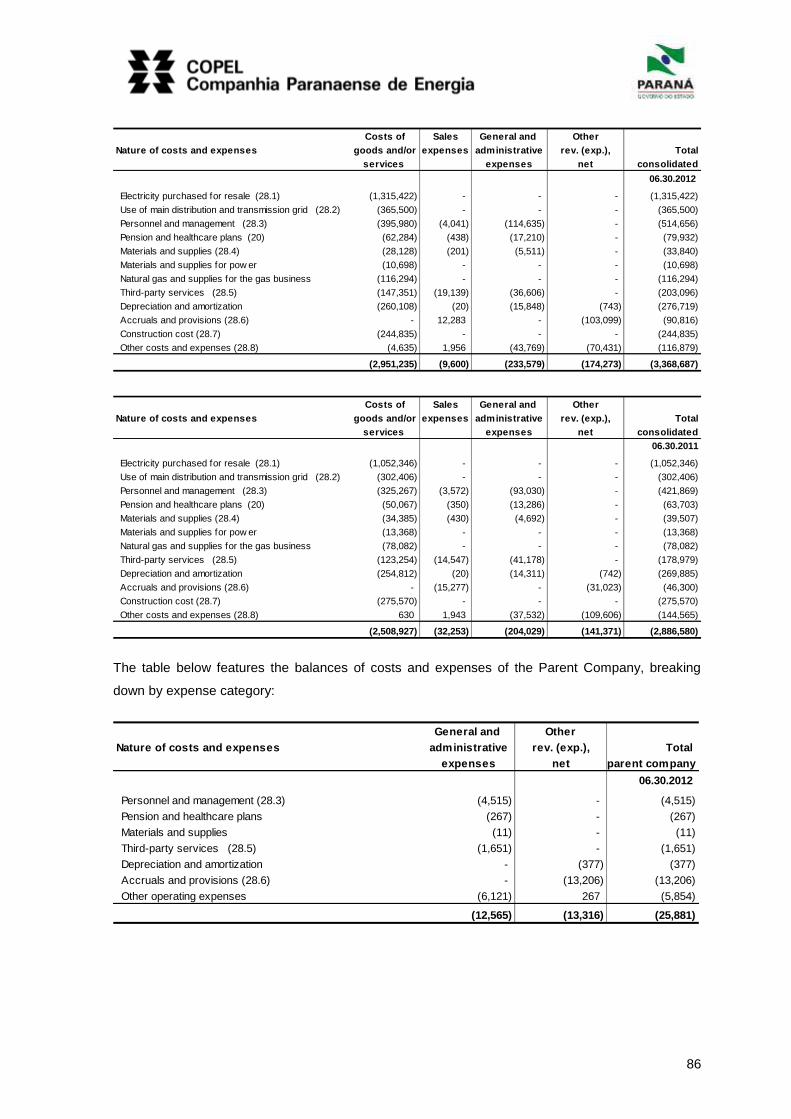
86
Costs of Sales General and Other
Nature of costs and expenses goods and/or expenses administrative rev. (exp.), Total
services expenses net consolidated
06.30.2012
Electricity purchased for resale (28.1) (1,315,422) - - - (1,315,422)
Use of main distribution and transmission grid (28.2) (365,500) - - - (365,500)
Personnel and management (28.3) (395,980) (4,041) (114,635) - (514,656)
Pension and healthcare plans (20) (62,284) (438) (17,210) - (79,932)
Materials and supplies (28.4) (28,128) (201) (5,511) - (33,840)
Materials and supplies for pow er (10,698) - - - (10,698)
Natural gas and supplies for the gas business (116,294) - - - (116,294)
Third-party services (28.5) (147,351) (19,139) (36,606) - (203,096)
Depreciation and amortization (260,108) (20) (15,848) (743) (276,719)
Accruals and provisions (28.6) - 12,283 - (103,099) (90,816)
Construction cost (28.7) (244,835) - - - (244,835)
Other costs and expenses (28.8) (4,635) 1,956 (43,769) (70,431) (116,879)
(2,951,235) (9,600) (233,579) (174,273) (3,368,687)
Costs of Sales General and Other
Nature of costs and expenses goods and/or expenses administrative rev. (exp.), Total
services expenses net consolidated
06.30.2011
Electricity purchased for resale (28.1) (1,052,346) - - - (1,052,346)
Use of main distribution and transmission grid (28.2) (302,406) - - - (302,406)
Personnel and management (28.3) (325,267) (3,572) (93,030) - (421,869)
Pension and healthcare plans (20) (50,067) (350) (13,286) - (63,703)
Materials and supplies (28.4) (34,385) (430) (4,692) - (39,507)
Materials and supplies for pow er (13,368) - - - (13,368)
Natural gas and supplies for the gas business (78,082) - - - (78,082)
Third-party services (28.5) (123,254) (14,547) (41,178) - (178,979)
Depreciation and amortization (254,812) (20) (14,311) (742) (269,885)
Accruals and provisions (28.6) - (15,277) - (31,023) (46,300)
Construction cost (28.7) (275,570) - - - (275,570)
Other costs and expenses (28.8) 630 1,943 (37,532) (109,606) (144,565)
(2,508,927) (32,253) (204,029) (141,371) (2,886,580)
The table below features the balances of costs and expenses of the Parent Company, breaking
down by expense category:
General and Other
Nature of costs and expenses administrative rev. (exp.), Total
expenses net parent company
06.30.2012
Personnel and management (28.3) (4,515) - (4,515)
Pension and healthcare plans (267) - (267)
Materials and supplies (11) - (11)
Third-party services (28.5) (1,651) - (1,651)
Depreciation and amortization - (377) (377)
Accruals and provisions (28.6) - (13,206) (13,206)
Other operating expenses (6,121) 267 (5,854)
(12,565) (13,316) (25,881)

87
General and Other
Nature of costs and expenses administrative rev. (exp.), Total
expenses net parent company
06.30.2011
Personnel and management (28.3) (4,236) - (4,236)
Pension and healthcare plans (323) - (323)
Materials and supplies (26) - (26)
Third-party services (28.5) (2,368) - (2,368)
Depreciation and amortization - (377) (377)
Accruals and provisions (28.6) - 7,188 7,188
Other operating expenses (7,946) 144 (7,802)
(14,899) 6,955 (7,944)
Electricity purchased for resale
06.30.2012 06.30.2011
Eletrobrás - Centrais Elétricas Brasileiras S.A. (Itaipu) 261,375 214,186
Furnas Centrais Elétricas S.A. - auction 192,115 183,113
Companhia Hidro Elétrica do São Francisco - Chesf - auction 184,349 170,519
Electric Energy Trading Chamber - CCEE 123,995 16,621
Companhia Energética de São Paulo - Cesp - auction 75,002 66,210
Itiquira Energética S.A. 66,806 62,758
Program for incentive to alternative energy sources - Proinfa 65,402 51,497
Centrais Elétricas do Norte do Brasil S. A. - Eletronorte - auction 60,667 56,473
Petróleo Brasileiro S.A. - Petrobras - leilão 44,327 49,812
Dona Francisca Energética S.A. 32,876 31,015
Companhia Energética de Minas Gerais - Cemig - auction 29,141 27,059
Cia. Estadual de Geração e Transmissão de Energia Elétrica S.A. - CEEE - auction 17,373 19,298
Light S.A. - auction 15,696 14,634
ThyssenKrupp CSA Companhia Siderúrgica - UTE Atlântico - auction 12,429 14,569
Tractbel Energia S.A. - auction 11,745 10,778
Duke Energy International, Geração Paranapanema S.A. - auction 10,792 9,986
Companhia de Geração Térmica de Energia Elétrica - Eletrobras CGTEE - auction 3,411 17,057
(-) PIS/Pasep/Cofins taxes on electricity purchased for resale (123,880) (93,443)
Others - auction 231,801 130,204
1,315,422 1,052,346
Consolidated
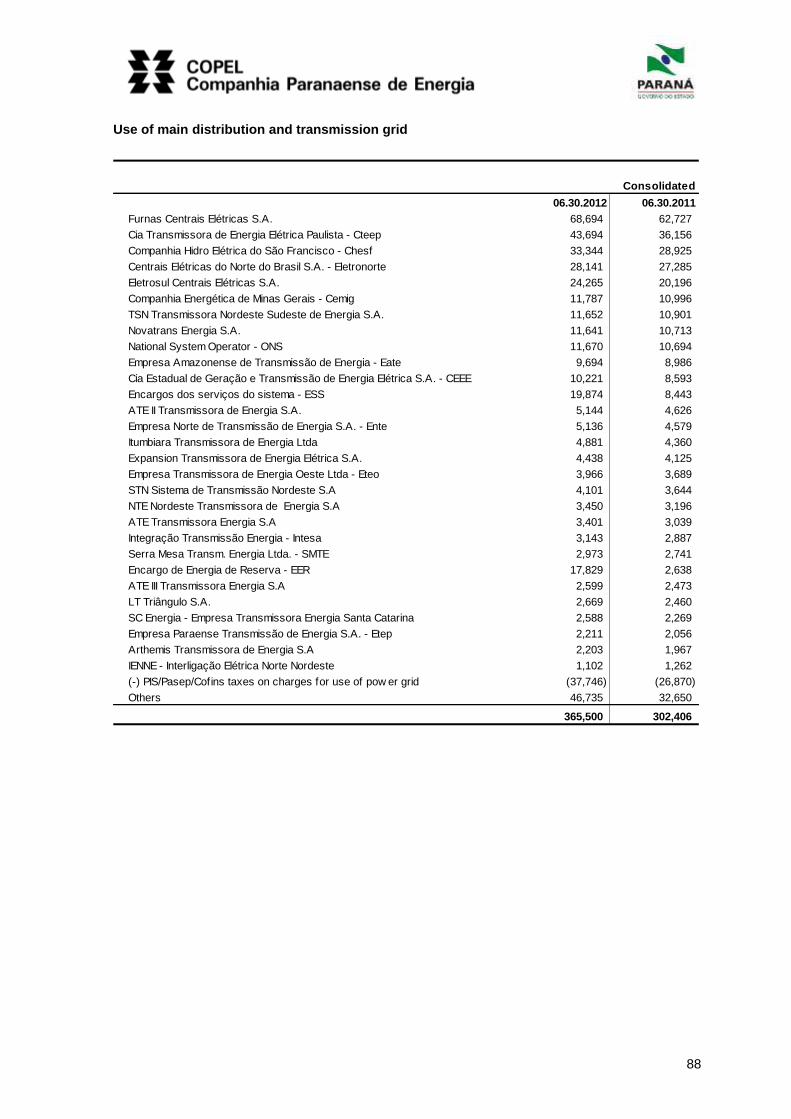
88
Use of main distribution and transmission grid
06.30.2012 06.30.2011
Furnas Centrais Elétricas S.A. 68,694 62,727
Cia Transmissora de Energia Elétrica Paulista - Cteep 43,694 36,156
Companhia Hidro Elétrica do São Francisco - Chesf 33,344 28,925
Centrais Elétricas do Norte do Brasil S.A. - Eletronorte 28,141 27,285
Eletrosul Centrais Elétricas S.A. 24,265 20,196
Companhia Energética de Minas Gerais - Cemig 11,787 10,996
TSN Transmissora Nordeste Sudeste de Energia S.A. 11,652 10,901
Novatrans Energia S.A. 11,641 10,713
National System Operator - ONS 11,670 10,694
Empresa Amazonense de Transmissão de Energia - Eate 9,694 8,986
Cia Estadual de Geração e Transmissão de Energia Elétrica S.A. - CEEE 10,221 8,593
Encargos dos serviços do sistema - ESS 19,874 8,443
ATE II Transmissora de Energia S.A. 5,144 4,626
Empresa Norte de Transmissão de Energia S.A. - Ente 5,136 4,579
Itumbiara Transmissora de Energia Ltda 4,881 4,360
Expansion Transmissora de Energia Elétrica S.A. 4,438 4,125
Empresa Transmissora de Energia Oeste Ltda - Eteo 3,966 3,689
STN Sistema de Transmissão Nordeste S.A 4,101 3,644
NTE Nordeste Transmissora de Energia S.A 3,450 3,196
ATE Transmissora Energia S.A 3,401 3,039
Integração Transmissão Energia - Intesa 3,143 2,887
Serra Mesa Transm. Energia Ltda. - SMTE 2,973 2,741
Encargo de Energia de Reserva - EER 17,829 2,638
ATE III Transmissora Energia S.A 2,599 2,473
LT Triângulo S.A. 2,669 2,460
SC Energia - Empresa Transmissora Energia Santa Catarina 2,588 2,269
Empresa Paraense Transmissão de Energia S.A. - Etep 2,211 2,056
Arthemis Transmissora de Energia S.A 2,203 1,967
IENNE - Interligação Elétrica Norte Nordeste 1,102 1,262
(-) PIS/Pasep/Cofins taxes on charges for use of pow er grid (37,746) (26,870)
Others 46,735 32,650
365,500 302,406
Consolidated
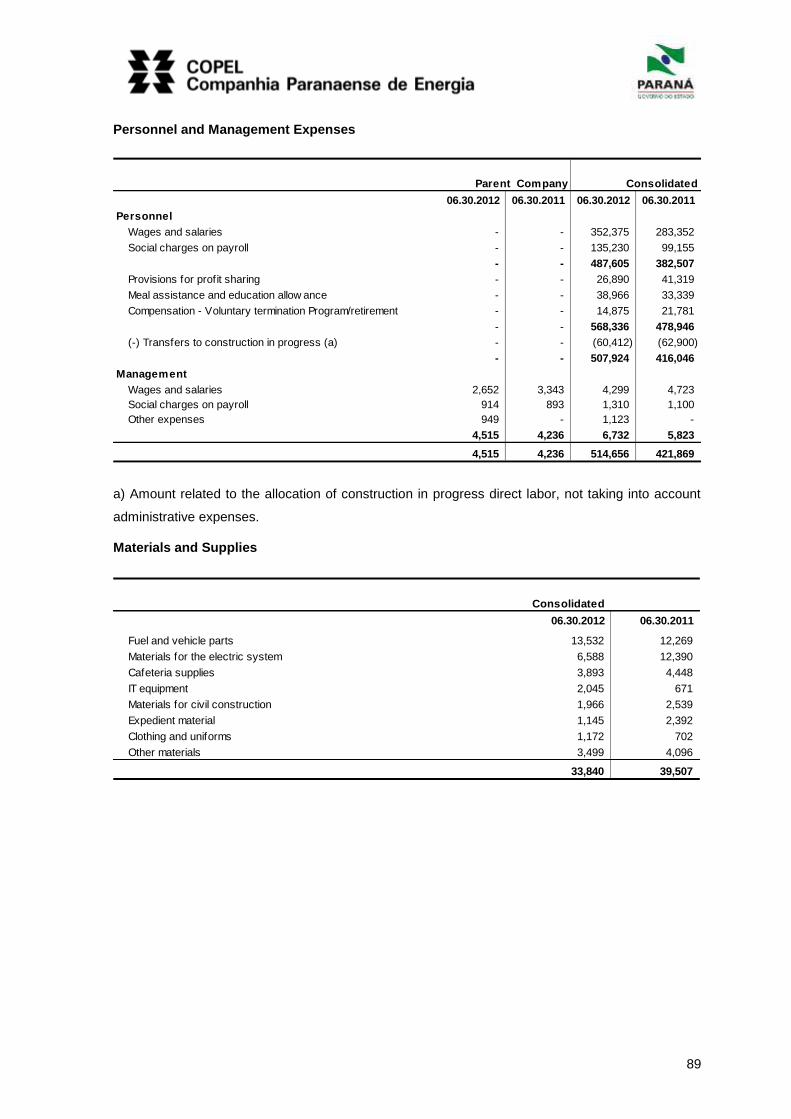
89
Personnel and Management Expenses
Parent Company Consolidated
06.30.2012 06.30.2011 06.30.2012 06.30.2011
Personnel
Wages and salaries - - 352,375 283,352
Social charges on payroll - - 135,230 99,155
- - 487,605 382,507
Provisions for profit sharing - - 26,890 41,319
Meal assistance and education allow ance - - 38,966 33,339
Compensation - Voluntary termination Program/retirement - - 14,875 21,781
- - 568,336 478,946
(-) Transfers to construction in progress (a) - - (60,412) (62,900)
- - 507,924 416,046
Management
Wages and salaries 2,652 3,343 4,299 4,723
Social charges on payroll 914 893 1,310 1,100
Other expenses 949 - 1,123 -
4,515 4,236 6,732 5,823
4,515 4,236 514,656 421,869
a) Amount related to the allocation of construction in progress direct labor, not taking into account
administrative expenses.
Materials and Supplies
Consolidated
06.30.2012 06.30.2011
Fuel and vehicle parts 13,532 12,269
Materials for the electric system 6,588 12,390
Cafeteria supplies 3,893 4,448
IT equipment 2,045 671
Materials for civil construction 1,966 2,539
Expedient material 1,145 2,392
Clothing and uniforms 1,172 702
Other materials 3,499 4,096
33,840 39,507
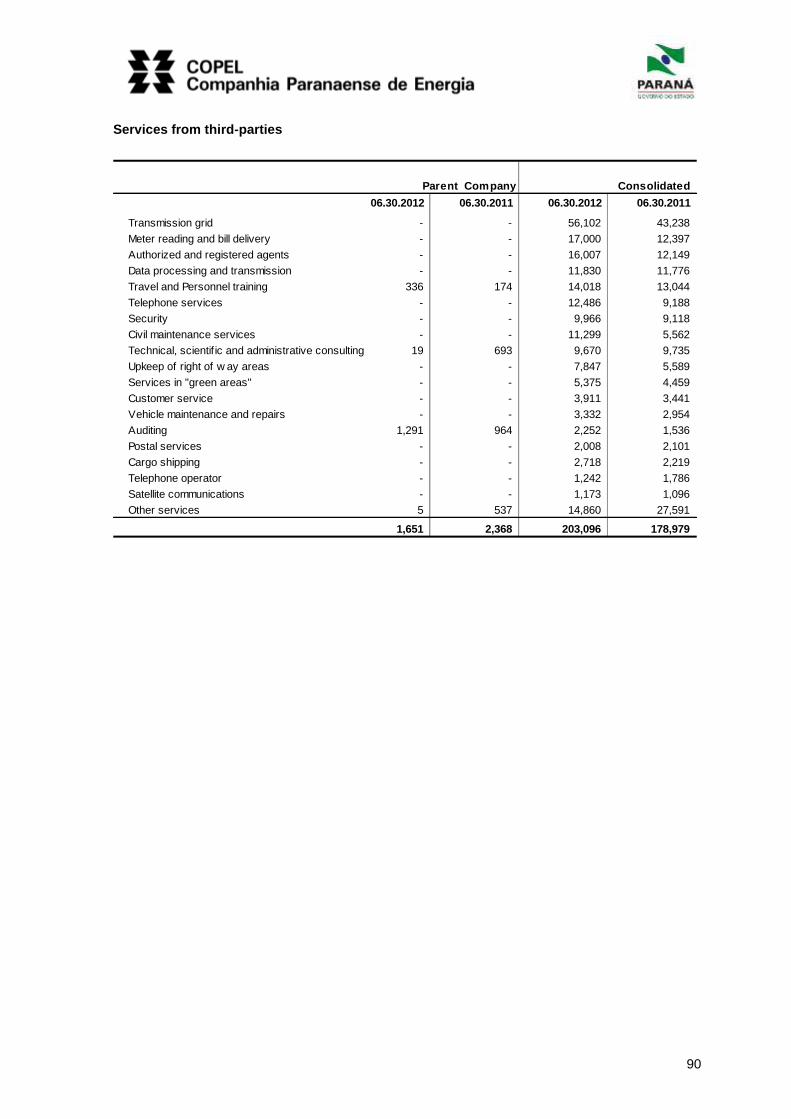
90
Services from third-parties
Parent Company Consolidated
06.30.2012 06.30.2011 06.30.2012 06.30.2011
Transmission grid - - 56,102 43,238
Meter reading and bill delivery - - 17,000 12,397
Authorized and registered agents - - 16,007 12,149
Data processing and transmission - - 11,830 11,776
Travel and Personnel training 336 174 14,018 13,044
Telephone services - - 12,486 9,188
Security - - 9,966 9,118
Civil maintenance services - - 11,299 5,562
Technical, scientif ic and administrative consulting 19 693 9,670 9,735
Upkeep of right of w ay areas - - 7,847 5,589
Services in "green areas" - - 5,375 4,459
Customer service - - 3,911 3,441
Vehicle maintenance and repairs - - 3,332 2,954
Auditing 1,291 964 2,252 1,536
Postal services - - 2,008 2,101
Cargo shipping - - 2,718 2,219
Telephone operator - - 1,242 1,786
Satellite communications - - 1,173 1,096
Other services 5 537 14,860 27,591
1,651 2,368 203,096 178,979
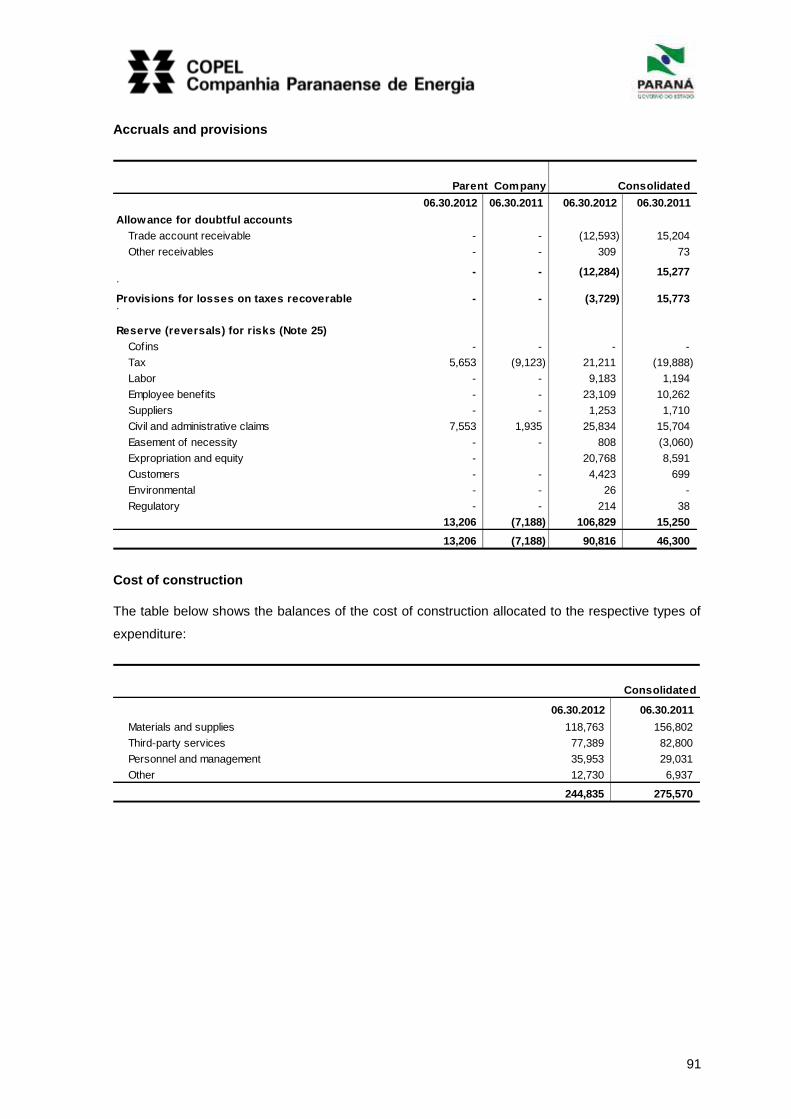
91
Accruals and provisions
Parent Company Consolidated
06.30.2012 06.30.2011 06.30.2012 06.30.2011
Allowance for doubtful accounts
Trade account receivable - - (12,593) 15,204
Other receivables - - 309 73
- - (12,284) 15,277 .
Provisions for losses on taxes recoverable - - (3,729) 15,773 .
Reserve (reversals) for risks (Note 25)
Cofins - - - -
Tax 5,653 (9,123) 21,211 (19,888)
Labor - - 9,183 1,194
Employee benefits - - 23,109 10,262
Suppliers - - 1,253 1,710
Civil and administrative claims 7,553 1,935 25,834 15,704
Easement of necessity - - 808 (3,060)
Expropriation and equity - 20,768 8,591
Customers - - 4,423 699
Environmental - - 26 -
Regulatory - - 214 38
13,206 (7,188) 106,829 15,250
13,206 (7,188) 90,816 46,300
Cost of construction
The table below shows the balances of the cost of construction allocated to the respective types of
expenditure:
06.30.2012 06.30.2011
Materials and supplies 118,763 156,802
Third-party services 77,389 82,800
Personnel and management 35,953 29,031
Other 12,730 6,937
244,835 275,570
Consolidated
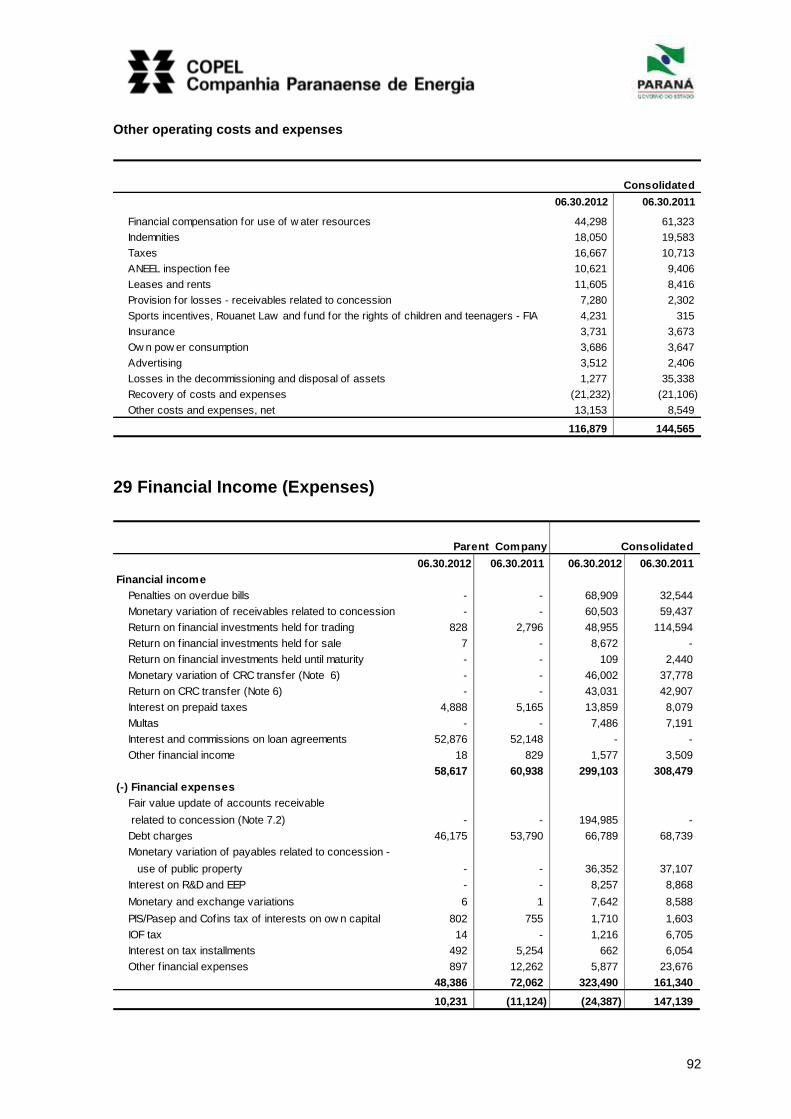
92
Other operating costs and expenses
Consolidated
06.30.2012 06.30.2011
Financial compensation for use of w ater resources 44,298 61,323
Indemnities 18,050 19,583
Taxes 16,667 10,713
ANEEL inspection fee 10,621 9,406
Leases and rents 11,605 8,416
Provision for losses - receivables related to concession 7,280 2,302
Sports incentives, Rouanet Law and fund for the rights of children and teenagers - FIA 4,231 315
Insurance 3,731 3,673
Ow n pow er consumption 3,686 3,647
Advertising 3,512 2,406
Losses in the decommissioning and disposal of assets 1,277 35,338
Recovery of costs and expenses (21,232) (21,106)
Other costs and expenses, net 13,153 8,549
116,879 144,565
29 Financial Income (Expenses)
Parent Company Consolidated
06.30.2012 06.30.2011 06.30.2012 06.30.2011
Financial income
Penalties on overdue bills - - 68,909 32,544
Monetary variation of receivables related to concession - - 60,503 59,437
Return on f inancial investments held for trading 828 2,796 48,955 114,594
Return on f inancial investments held for sale 7 - 8,672 -
Return on f inancial investments held until maturity - - 109 2,440
Monetary variation of CRC transfer (Note 6) - - 46,002 37,778
Return on CRC transfer (Note 6) - - 43,031 42,907
Interest on prepaid taxes 4,888 5,165 13,859 8,079
Multas - - 7,486 7,191
Interest and commissions on loan agreements 52,876 52,148 - -
Other f inancial income 18 829 1,577 3,509
58,617 60,938 299,103 308,479
(-) Financial expenses
Fair value update of accounts receivable
related to concession (Note 7.2) - - 194,985 -
Debt charges 46,175 53,790 66,789 68,739
Monetary variation of payables related to concession -
use of public property - - 36,352 37,107
Interest on R&D and EEP - - 8,257 8,868
Monetary and exchange variations 6 1 7,642 8,588
PIS/Pasep and Cofins tax of interests on ow n capital 802 755 1,710 1,603
IOF tax 14 - 1,216 6,705
Interest on tax installments 492 5,254 662 6,054
Other f inancial expenses 897 12,262 5,877 23,676
48,386 72,062 323,490 161,340
10,231 (11,124) (24,387) 147,139
93
The costs of loans and financing capitalized during the year of 2012 amounted to R$ 35,593, at an
average rate of 5.53% p.a.
30 Operating Segments
Products and services which generate revenues for the reportable segments
The Company operates in five reportable segments identified by management, through the Chief
Executive Office and the chief offices of each business area, taking into consideration the regulatory
environments, the strategic business units, and the different products and services. These
segments are managed separately, since each business and each company requires different
technologies and strategies.
In the quarter ended June 30, 2012 all sales were made within Brazilian territory.
We have not identified any customer who individually accounts for more than 10% of total net
revenues during the six-month period ended June 30, 2012.
The Group’s reporting segments are:
Power generation and transmission (GeT) - this segment comprises the generation of electric
energy from hydraulic, wind, and thermal projects, the transport and transformation of the power
generated by the Company, and the construction, operation, and maintenance of all power
transmission substations and lines. This segment operates through Copel Geração e Transmissão,
Elejor, UEG Araucária, Centrais Eólicas do Paraná, Costa Oeste, Marumbi, Sul Brasileira, Cutia,
Integração Maranhense, Matrinchã and Guaraciaba;
Power distribution and sales (DIS) - this segment comprises the distribution and sale of electric
energy, the operation and maintenance of the distribution infrastructure, and related services. It
operates through Copel Distribuição;
Telecommunications (TEL) - this segment comprises telecommunications and general
communications services. It operates through Copel Telecomunicações;
Gas - this segment comprises the public service of piped natural gas distribution. It operates
through Compagas; and
Holding Company (HOL) - this segment comprises participation in other companies. It operates
through Copel and Dominó Holdings.
The Company evaluates the performance of each segment based on information derived from
accounting records.
The accounting policies of the operational segments are the same as those described in Note 2 and
record transactions between segments as transactions with third-parties, i.e., at current market
prices.
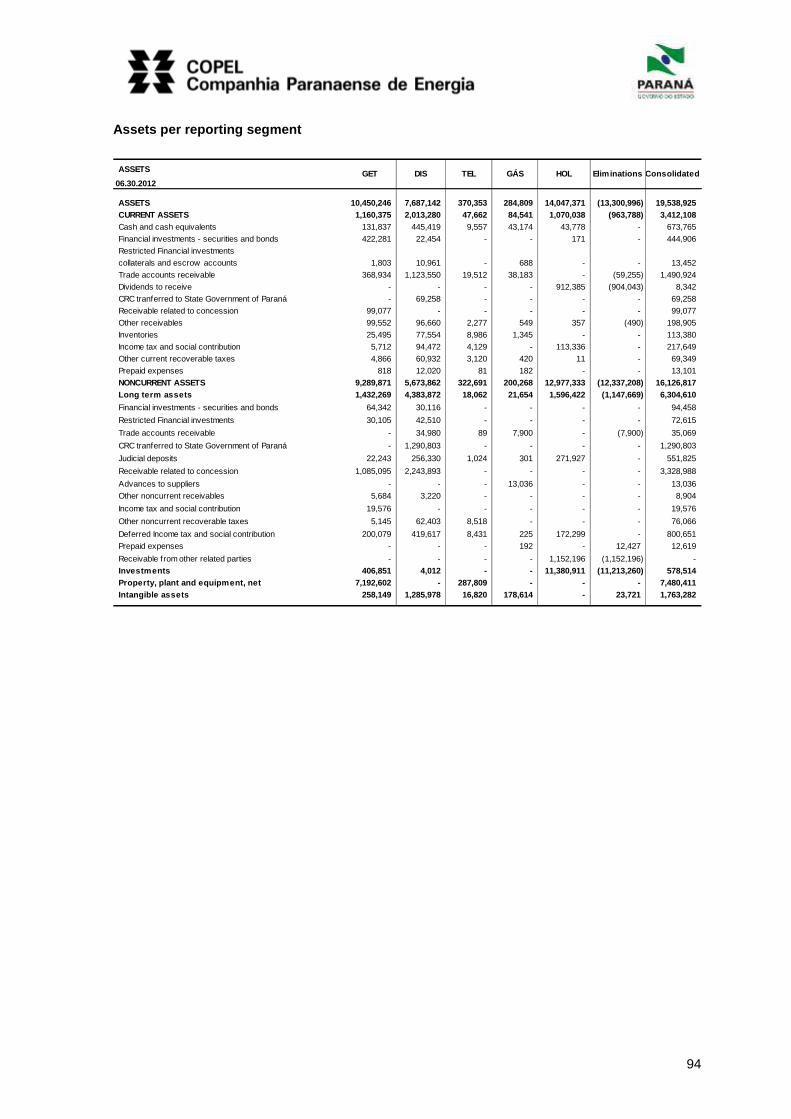
94
Assets per reporting segment
ASSETS
06.30.2012
ASSETS 10,450,246 7,687,142 370,353 284,809 14,047,371 (13,300,996) 19,538,925
CURRENT ASSETS 1,160,375 2,013,280 47,662 84,541 1,070,038 (963,788) 3,412,108
Cash and cash equivalents 131,837 445,419 9,557 43,174 43,778 - 673,765
Financial investments - securities and bonds 422,281 22,454 - - 171 - 444,906
Restricted Financial investments
collaterals and escrow accounts 1,803 10,961 - 688 - - 13,452
Trade accounts receivable 368,934 1,123,550 19,512 38,183 - (59,255) 1,490,924
Dividends to receive - - - - 912,385 (904,043) 8,342
CRC tranferred to State Government of Paraná - 69,258 - - - - 69,258
Receivable related to concession 99,077 - - - - - 99,077
Other receivables 99,552 96,660 2,277 549 357 (490) 198,905
Inventories 25,495 77,554 8,986 1,345 - - 113,380
Income tax and social contribution 5,712 94,472 4,129 - 113,336 - 217,649
Other current recoverable taxes 4,866 60,932 3,120 420 11 - 69,349
Prepaid expenses 818 12,020 81 182 - - 13,101
NONCURRENT ASSETS 9,289,871 5,673,862 322,691 200,268 12,977,333 (12,337,208) 16,126,817
Long term assets 1,432,269 4,383,872 18,062 21,654 1,596,422 (1,147,669) 6,304,610
Financial investments - securities and bonds 64,342 30,116 - - - - 94,458
Restricted Financial investments 30,105 42,510 - - - - 72,615
Trade accounts receivable - 34,980 89 7,900 - (7,900) 35,069
CRC tranferred to State Government of Paraná - 1,290,803 - - - - 1,290,803
Judicial deposits 22,243 256,330 1,024 301 271,927 - 551,825
Receivable related to concession 1,085,095 2,243,893 - - - - 3,328,988
Advances to suppliers - - - 13,036 - - 13,036
Other noncurrent receivables 5,684 3,220 - - - - 8,904
Income tax and social contribution 19,576 - - - - - 19,576
Other noncurrent recoverable taxes 5,145 62,403 8,518 - - - 76,066
Deferred Income tax and social contribution 200,079 419,617 8,431 225 172,299 - 800,651
Prepaid expenses - - - 192 - 12,427 12,619
Receivable from other related parties - - - - 1,152,196 (1,152,196) -
Investments 406,851 4,012 - - 11,380,911 (11,213,260) 578,514
Property, plant and equipment, net 7,192,602 - 287,809 - - - 7,480,411
Intangible assets 258,149 1,285,978 16,820 178,614 - 23,721 1,763,282
HOL Eliminations Consolidated GET DIS TEL GÁS

95
Liabilities per reporting segment
LIABILITIES
06.30.2012
TOTAL LIABILITIES 10,450,246 7,687,142 370,353 284,809 14,047,371 (13,300,996) 19,538,925
CURRENT LIABILITIES 1,002,494 1,645,596 26,511 59,831 138,252 (967,059) 1,905,625
Payroll and labor provisions 53,196 141,786 13,240 4,162 252 - 212,636
Suppliers 190,231 577,370 7,962 52,143 1,329 (59,618) 769,417
Income tax and social contribution 137,946 - 774 2,212 - - 140,932
Other taxes 20,340 201,331 3,447 1,212 3,219 (110) 229,439
Loans and financing 54,347 20,445 - - 34,440 (3,288) 105,944
Dividends payable 435,840 457,063 - - 98,465 (904,043) 87,325
Post employment benefits 5,966 15,444 770 - - - 22,180
Customer charges payable 6,044 56,699 - - - - 62,743
Research and development and energy eff iciency 15,778 108,672 - - - - 124,450
Payable related to concession - use of public property 45,261 - - - - - 45,261
Other accounts payable 37,545 66,786 318 102 547 - 105,298
NON CURRENT LIABILITIES 2,607,569 2,359,526 65,063 6,709 1,312,173 (1,201,308) 5,149,732
Associated and subsidiary companies 276,504 814,487 45,643 - - (1,136,634) -
Suppliers 92,739 - - - - (7,900) 84,839
Deferred Income tax and social contribution 821,356 16,870 - 4,477 33,091 - 875,794
Loans and financing 473,733 739,933 - - 970,521 (56,774) 2,127,413
Post employment benefits 124,656 312,608 18,975 1,205 - - 457,444
Research and development and energy eff iciency 40,545 84,201 - - - - 124,746
Payable related to concession - use of public property 386,032 - - - - - 386,032
Other accounts payable 217 - - - - - 217
Provisions for legal claims 391,787 391,427 445 1,027 308,561 - 1,093,247
EQUITY 6,840,183 3,682,020 278,779 218,269 12,596,946 (11,132,629) 12,483,568
Capital 4,260,278 2,624,841 194,755 135,943 7,023,368 (7,329,185) 6,910,000
Equity valuation adjustments 1,389,959 (7) - - 1,401,936 (1,393,610) 1,398,278
Legal reserve 212,887 135,294 5,306 16,258 552,734 (386,292) 536,187
Profit retention reserve 600,434 883,575 62,685 43,851 2,838,551 (1,813,060) 2,616,036
Unrealized income reserve - - - 10,428 212,087 - 222,515
Accumulated income (losses) 376,625 38,317 16,033 11,789 568,270 (466,342) 544,692
Attributable to non controlling interest 255,860 255,860
HOLGET DIS TEL GÁS Eliminations Consolidated
Statement of income per reporting segment
STATEMENT OF INCOME
06.30.2012
Gross profit 1,246,447 2,785,612 84,010 165,905 - (225,866) 4,056,108
Operational expenses (632,283) (2,722,964) (62,140) (150,223) (26,556) 225,479 (3,368,687)
Electricity purchased for resale (53,293) (1,409,526) - - - 147,397 (1,315,422)
Charges for the use of the pow ergrid (115,975) (300,604) - - - 51,079 (365,500)
Personnel and management (126,503) (344,837) (30,199) (8,584) (4,533) - (514,656)
Pension and healthcare plans (20,070) (55,028) (3,954) (613) (267) - (79,932)
Materials and supplies (8,831) (23,201) (961) (836) (11) - (33,840)
Raw materials and supplies for generation (10,698) - - - - - (10,698)
Natural gas and supplies for gas business - - - (116,294) - - (116,294)
Third party services (52,890) (159,313) (8,476) (6,894) (1,906) 26,383 (203,096)
Depreciation and amortization (161,141) (94,900) (13,170) (6,767) (741) - (276,719)
Provisions and reversals 7,523 (83,900) (524) (709) (13,206) - (90,816)
Construction cost (25,178) (211,202) - (8,455) - - (244,835)
Other operating costs and expenses (65,227) (40,453) (4,856) (1,071) (5,892) 620 (116,879)
EQUITY IN RESULTS SUBSIDIARIES 6,467 - - - 509,461 (479,416) 36,512
PROFIT BEFORE FINANCIAL RESULTS AND TAKES 620,631 62,648 21,870 15,682 482,905 (479,803) 723,933
Financial income (expenses) (30,513) (7,896) 1,683 2,629 9,323 387 (24,387)
OPERATING INCOME (LOSSES) 590,118 54,752 23,553 18,311 492,228 (479,416) 699,546
Income tax and social contribution (202,431) (82,016) (7,640) (7,387) - - (299,474)
Deferred income tax and social contribution 6,736 65,581 120 865 31,312 - 104,614
NET INCOME (LOSSES) FOR THE YEAR Lucro Líquido (Prejuízo) do Exercício394,423 38,317 16,033 11,789 523,540 (479,416) 504,686
GET DIS TEL GÁS HOL Eliminations Consolidated
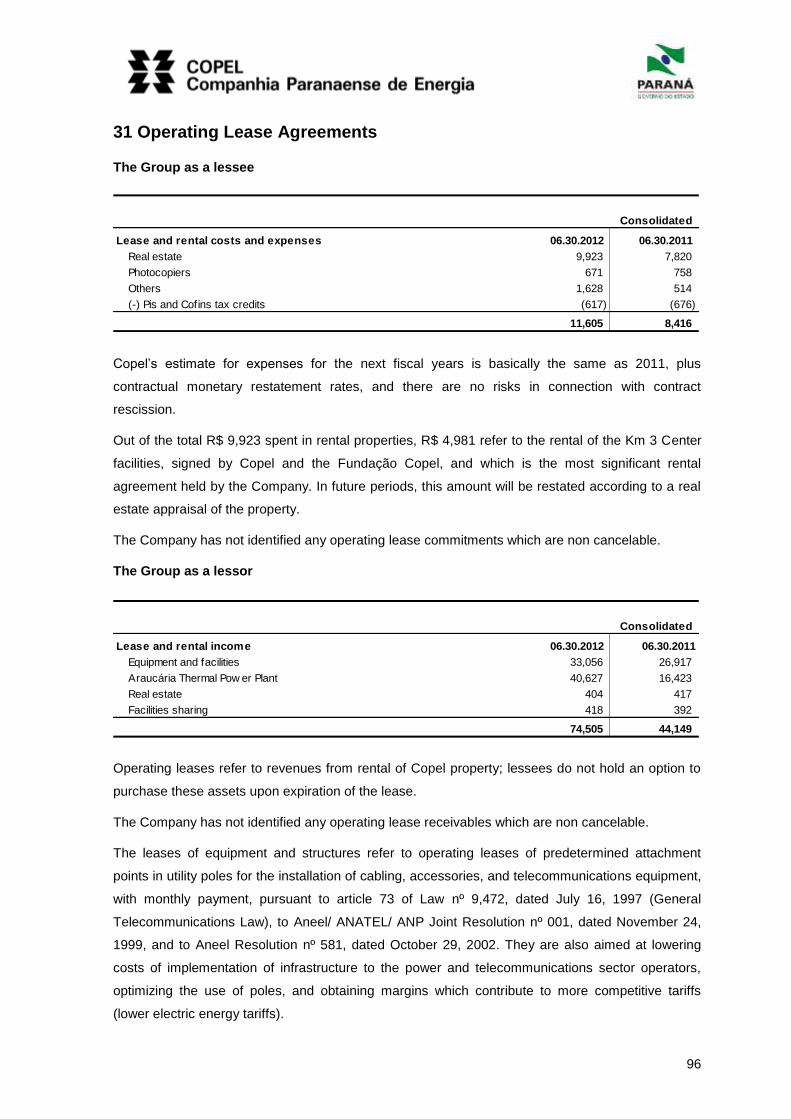
96
31 Operating Lease Agreements
The Group as a lessee
Consolidated
Lease and rental costs and expenses 06.30.2012 06.30.2011
Real estate 9,923 7,820
Photocopiers 671 758
Others 1,628 514
(-) Pis and Cofins tax credits (617) (676)
11,605 8,416
Copel’s estimate for expenses for the next fiscal years is basically the same as 2011, plus
contractual monetary restatement rates, and there are no risks in connection with contract
rescission.
Out of the total R$ 9,923 spent in rental properties, R$ 4,981 refer to the rental of the Km 3 Center
facilities, signed by Copel and the Fundação Copel, and which is the most significant rental
agreement held by the Company. In future periods, this amount will be restated according to a real
estate appraisal of the property.
The Company has not identified any operating lease commitments which are non cancelable.
The Group as a lessor
Consolidated
Lease and rental income 06.30.2012 06.30.2011
Equipment and facilities 33,056 26,917
Araucária Thermal Pow er Plant 40,627 16,423
Real estate 404 417
Facilities sharing 418 392
74,505 44,149
Operating leases refer to revenues from rental of Copel property; lessees do not hold an option to
purchase these assets upon expiration of the lease.
The Company has not identified any operating lease receivables which are non cancelable.
The leases of equipment and structures refer to operating leases of predetermined attachment
points in utility poles for the installation of cabling, accessories, and telecommunications equipment,
with monthly payment, pursuant to article 73 of Law nº 9,472, dated July 16, 1997 (General
Telecommunications Law), to Aneel/ ANATEL/ ANP Joint Resolution nº 001, dated November 24,
1999, and to Aneel Resolution nº 581, dated October 29, 2002. They are also aimed at lowering
costs of implementation of infrastructure to the power and telecommunications sector operators,
optimizing the use of poles, and obtaining margins which contribute to more competitive tariffs
(lower electric energy tariffs).
97
On December 28, 2006, UEG Araucária signed an agreement with Petróleo Brasileiro S.A. -
Petrobras, a minority shareholder, leasing the Araucária Thermal Power Plant for a period of one
year, ended on December 31, 2007 and extended a few times until December 31, 2012, subject to
early termination should UEG Araucária successfully participate at Aneel - sponsored power
auctions. The lease provides for the use of the Araucária Power Plant for power generation by
Petrobras, at its own expense; UEG Araucária is entitled to lease payments comprising a fixed and
a variable portion, pursuant to the lease agreement.
32 Financial Instruments
The use of financial instruments by the Company is restricted to Cash and Cash Equivalents,
Customers and Distributors, Accounts Receivable from Government Agencies, Recoverable Rate
Deficit (CRC) Transferred to the Government of the State of Paraná, Bonds and Securities,
Accounts Receivable Related to Concession, Accounts Payable Related to Concession, Loans and
Financing, Debentures, and Suppliers.
The Company holds mechanisms aiming to manage risk in the corporate areas and the company
subsidiaries. The risks are classified as critical, high, moderate, low or minimum according to their
final exposure, which considers the following impacts: financial, operational and image; and also the
frequency and occurrence of the risk.
Main risk factors inherent to the Company’s activites are identified and measured to their potential
negative impacts, in range of the strategic, process and projects goals.

98
Fair value and rating level for assessment of fair value of financial instruments
Consolidated
Level Accounting value
06.30.2012 12.31.2011
Financial assets
Cash and cash equivalent (Note 3) - 673,765 1,049,125
Trade accounts receivable (Note 5) - 1,403,936 1,275,282
Accounts receivable from government entities (Note 5) - 122,057 125,536
CRC transferred to state of Paraná (Note 6) - 1,360,061 1,346,460
Securities and bonds (NE nº 4.1) 1 362,612 438,310
Securities and bonds (NE nº 4.1) 2 176,752 206,298
Collaterals and escrow accounts (Note 4) - 86,067 40,221
Receivable related to concession (Note7) 3 3,428,065 3,317,100
Other investments (Note 14) 1 19,135 17,714
Financial liabilities
Loans and financing (Note 19) - 2,233,357 2,174,472
Derivatives 1 13 39
Payable related to concession - use of public property (Note 23) - 431,293 415,098
Eletrobras - Itaipu - 108,021 76,533
Petrobras - Compagas - 51,248 40,698
Other suppliers - 694,987 738,684
Level 1: obtained from prices quoted (not adjusted) on active markets for identical assets or liabilities
Level 2: obtained from other variables other than prices quoted included in level 1, w hich can be observed
for assets or liabilities
Level 3: obtained through evaluation techniques that include variables for the asset or liability, but are not
based on observable market data
Fair value are calculated considering the market value to all financial instruments with an active
market. For other instruments whose market values are not available, their fair values calculated
according to the present value of their future cash flows expected.
32.1.1 Non-derivative financial assets
Cash and cash equivalents, trade accounts receivable and receivables from government agencies
have fair values that are approximate to their book values, due to their nature and realization
schedules.
The CRC transferred to the State of Paraná has fair value of R$ 1,545,750 as of June 30, 2012.
Company based its calculation on the comparison with a noncurrent, variable interest rate National
Treasury bond (NTN-B), which yields approximately 4.3% p.a. plus the IPCA inflation index.
Bonds and Securities have fair values of R$ 539,365 as of June 30, 2012. The fair values have
been calculated according to information made available by the financial agents for each security
and to the market values of the bonds issued by the Brazilian government.
Collaterals and escrow accounts have fair values of R$ 70,159 as of June 30, 2012. The fair values
have been calculated based on the cost of the last issue by the Company, 109.41% of the CDI
variation.
Cash and cash equivalents, trade accounts receivable and receivables from government agencies
have fair values that are approximate to their book values, due to their nature and realization
schedules.
99
The CRC transferred to the State of Paraná has fair value of R$ 1,545,750 as of June 30, 2012.
Company based its calculation on the comparison with a noncurrent, variable interest rate National
Treasury bond (NTN-B), which yields approximately 4.3% p.a. plus the IPCA inflation index.
Bonds and Securities have fair values of R$ 539,365 as of June 30, 2012. The fair values have
been calculated according to information made available by the financial agents for each security
and to the market values of the bonds issued by the Brazilian government.
Collaterals and escrow accounts have fair values of R$ 70,159 as of June 30, 2012. The fair values
have been calculated based on the cost of the last issue by the Company, 109.41% of the CDI
variation.
32.1.2 Non-derivative financial liabilities
Liabilities to Eletrobras – Itaipu, Petrobras, and other suppliers have fair values that are
approximate to their book values, due to their nature and maturity.
The Company's loans and financing have fair value of R$ 2,067,400 as of June 30, 2012. The fair
value was calculated based on the cost of the last issue by the Company, 109.41% of the CDI
variation.
Accounts payable related to concession - use of public asset have fair value of R$ 537,748 as of
June 30, 2012, calculated based on the rate of return for the last project auctioned by Aneel and
won by the Company.
32.1.3 Derivative Financial Assets and Liabilities
The derivative financial asset - DI Adjustment Future - Asset comprises the account Securities and
has a fair value of R$ 16 as of June 30, 2012 (R$ 1 as of December 31, 2011), classified under
financial instruments held for trading.
The other obligations - DI Adjustment Future - Liability derivatives have a fair value of R$ 13 at June
30, 2012 (R$ 39 as of December 31, 2011) and are classified under financial instruments held for
trading.
The derivative financial asset - exclusive funds - Asset comprises the account Securities and has a
fair value of R$ 4,152 as of June 30, 2012, classified under financial instruments held for trading.
32.1.4 Rating level 3 for assessment of fair value
This rating level includes accounts receivable related to concession.
The detailed breakdown of receivables related to concession is featured in note 7, as detailed
below:
A table reconciling initial and final balances, with a separate breakdown of additions, disposals,
transfers, losses, monetary variation, and fair value adjustments;
Criteria for identification and measurement; and
Assumptions adopted by Company management to restate the recoverable amount.

100
Financial instruments by category
Consolidated
Book value
06.30.2012 12.31.2011
Financial assets
Held for trading
Cash equivalents - open market investments 601,742 1,014,044
Bonds and securities 149,916 60,022
Loans and receivables
Cash and cash equivalent 72,023 35,081
Customers, concessionaires and permission holder 1,403,936 1,275,282
Accounts receivable from government entities 122,057 125,536
CRC transferred to state of Paraná 1,360,061 1,346,460
Receivables related to concession 1,184,172 1,091,897
Collaterals and escrow accounts 86,067 40,221
Available for sale
Receivables related to concession 2,243,893 2,225,203
Securities 377,718 567,429
Other investments 19,135 17,714
Held to maturity
Securities 11,730 17,157
Financial liabilities
Fair value through profit or loss
Held for trading
Other liabilities - derivatives 13 39
Other financial liabilities
Loans and financing 2,233,357 2,174,472
Payable related to concession - use of public property 431,293 415,098
Eletrobras - Itaipu 108,021 76,533
Petrobras - Compagas 51,248 40,698
Other suppliers 694,987 738,684
Summary of bonds and securities held to maturity
Consolidated Net
Fair value book value
Description Rate p.y. Issue date Maturity Type 06.30.2012 12.31.2011 06.30.2012 12.31.2011
LFT SELIC 07.14.2009 03.07.2012 Amortized cost - 5,919 - 5,920
LF CAIXA 11.03.2011 11.07.2013 Amortized cost 5,335 5,089 5,335 5,089
LF CAIXA 11.07.2011 11.08.2013 Amortized cost 6,396 6,101 6,396 6,101
Risk Factors
32.1.5 Credit risk
Credit risk is defined as the possibility of the occurrence of losses related to non-compliance by a
client or counterpart to a financial instrument with their respective obligations under the terms
agreed on. Risk basically arises from trade accounts receivable and financial instruments as shown
below:
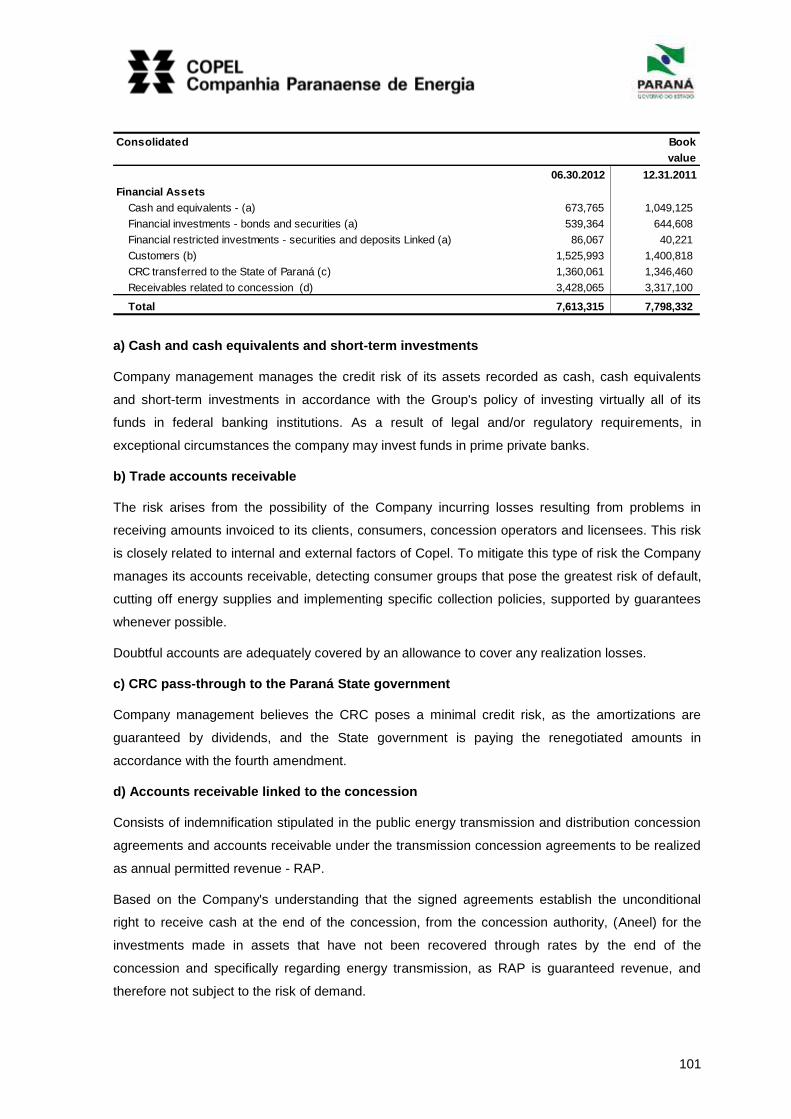
101
Consolidated Book
value
06.30.2012 12.31.2011
Financial Assets
Cash and equivalents - (a) 673,765 1,049,125
Financial investments - bonds and securities (a) 539,364 644,608
Financial restricted investments - securities and deposits Linked (a) 86,067 40,221
Customers (b) 1,525,993 1,400,818
CRC transferred to the State of Paraná (c) 1,360,061 1,346,460
Receivables related to concession (d) 3,428,065 3,317,100
Total 7,613,315 7,798,332
a) Cash and cash equivalents and short-term investments
Company management manages the credit risk of its assets recorded as cash, cash equivalents
and short-term investments in accordance with the Group's policy of investing virtually all of its
funds in federal banking institutions. As a result of legal and/or regulatory requirements, in
exceptional circumstances the company may invest funds in prime private banks.
b) Trade accounts receivable
The risk arises from the possibility of the Company incurring losses resulting from problems in
receiving amounts invoiced to its clients, consumers, concession operators and licensees. This risk
is closely related to internal and external factors of Copel. To mitigate this type of risk the Company
manages its accounts receivable, detecting consumer groups that pose the greatest risk of default,
cutting off energy supplies and implementing specific collection policies, supported by guarantees
whenever possible.
Doubtful accounts are adequately covered by an allowance to cover any realization losses.
c) CRC pass-through to the Paraná State government
Company management believes the CRC poses a minimal credit risk, as the amortizations are
guaranteed by dividends, and the State government is paying the renegotiated amounts in
accordance with the fourth amendment.
d) Accounts receivable linked to the concession
Consists of indemnification stipulated in the public energy transmission and distribution concession
agreements and accounts receivable under the transmission concession agreements to be realized
as annual permitted revenue - RAP.
Based on the Company's understanding that the signed agreements establish the unconditional
right to receive cash at the end of the concession, from the concession authority, (Aneel) for the
investments made in assets that have not been recovered through rates by the end of the
concession and specifically regarding energy transmission, as RAP is guaranteed revenue, and
therefore not subject to the risk of demand.
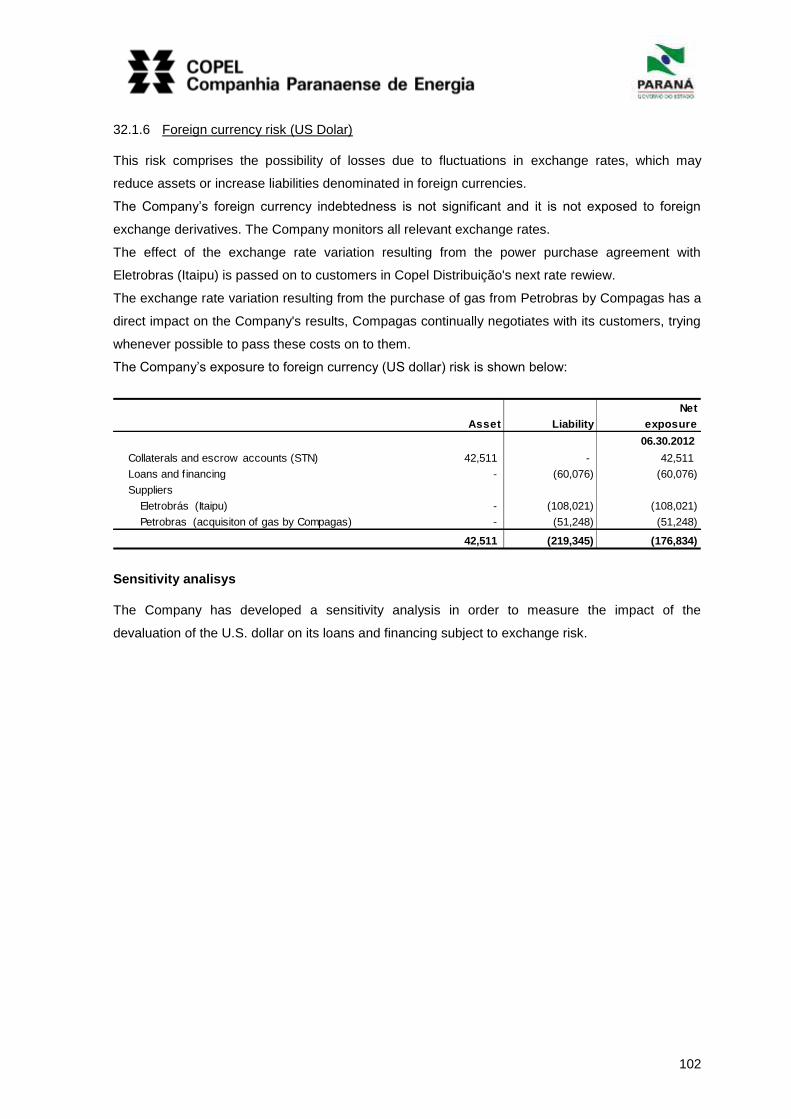
102
32.1.6 Foreign currency risk (US Dolar)
This risk comprises the possibility of losses due to fluctuations in exchange rates, which may
reduce assets or increase liabilities denominated in foreign currencies.
The Company’s foreign currency indebtedness is not significant and it is not exposed to foreign
exchange derivatives. The Company monitors all relevant exchange rates.
The effect of the exchange rate variation resulting from the power purchase agreement with
Eletrobras (Itaipu) is passed on to customers in Copel Distribuição's next rate rewiew.
The exchange rate variation resulting from the purchase of gas from Petrobras by Compagas has a
direct impact on the Company's results, Compagas continually negotiates with its customers, trying
whenever possible to pass these costs on to them.
The Company’s exposure to foreign currency (US dollar) risk is shown below:
Net
Asset Liability exposure
06.30.2012
Collaterals and escrow accounts (STN) 42,511 - 42,511
Loans and financing - (60,076) (60,076)
Suppliers
Eletrobrás (Itaipu) - (108,021) (108,021)
Petrobras (acquisiton of gas by Compagas) - (51,248) (51,248)
42,511 (219,345) (176,834)
Sensitivity analisys
The Company has developed a sensitivity analysis in order to measure the impact of the
devaluation of the U.S. dollar on its loans and financing subject to exchange risk.
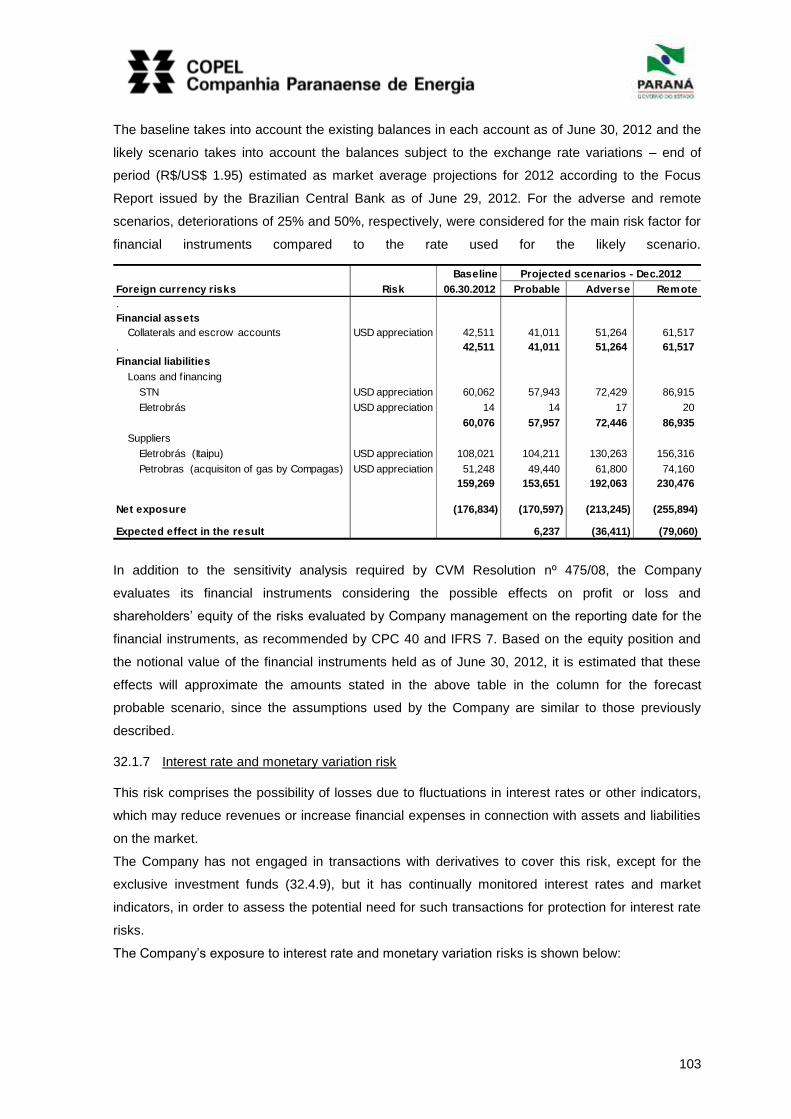
103
The baseline takes into account the existing balances in each account as of June 30, 2012 and the
likely scenario takes into account the balances subject to the exchange rate variations – end of
period (R$/US$ 1.95) estimated as market average projections for 2012 according to the Focus
Report issued by the Brazilian Central Bank as of June 29, 2012. For the adverse and remote
scenarios, deteriorations of 25% and 50%, respectively, were considered for the main risk factor for
financial instruments compared to the rate used for the likely scenario.
Baseline Projected scenarios - Dec.2012
Foreign currency risks Risk 06.30.2012 Probable Adverse Remote
.
Financial assets
Collaterals and escrow accounts USD appreciation 42,511 41,011 51,264 61,517
. 42,511 41,011 51,264 61,517
Financial liabilities
Loans and financing
STN USD appreciation 60,062 57,943 72,429 86,915
Eletrobrás USD appreciation 14 14 17 20
60,076 57,957 72,446 86,935
Suppliers
Eletrobrás (Itaipu) USD appreciation 108,021 104,211 130,263 156,316
Petrobras (acquisiton of gas by Compagas) USD appreciation 51,248 49,440 61,800 74,160
159,269 153,651 192,063 230,476
Net exposure (176,834) (170,597) (213,245) (255,894)
Expected effect in the result 6,237 (36,411) (79,060)
In addition to the sensitivity analysis required by CVM Resolution nº 475/08, the Company
evaluates its financial instruments considering the possible effects on profit or loss and
shareholders’ equity of the risks evaluated by Company management on the reporting date for the
financial instruments, as recommended by CPC 40 and IFRS 7. Based on the equity position and
the notional value of the financial instruments held as of June 30, 2012, it is estimated that these
effects will approximate the amounts stated in the above table in the column for the forecast
probable scenario, since the assumptions used by the Company are similar to those previously
described.
32.1.7 Interest rate and monetary variation risk
This risk comprises the possibility of losses due to fluctuations in interest rates or other indicators,
which may reduce revenues or increase financial expenses in connection with assets and liabilities
on the market.
The Company has not engaged in transactions with derivatives to cover this risk, except for the
exclusive investment funds (32.4.9), but it has continually monitored interest rates and market
indicators, in order to assess the potential need for such transactions for protection for interest rate
risks.
The Company’s exposure to interest rate and monetary variation risks is shown below:
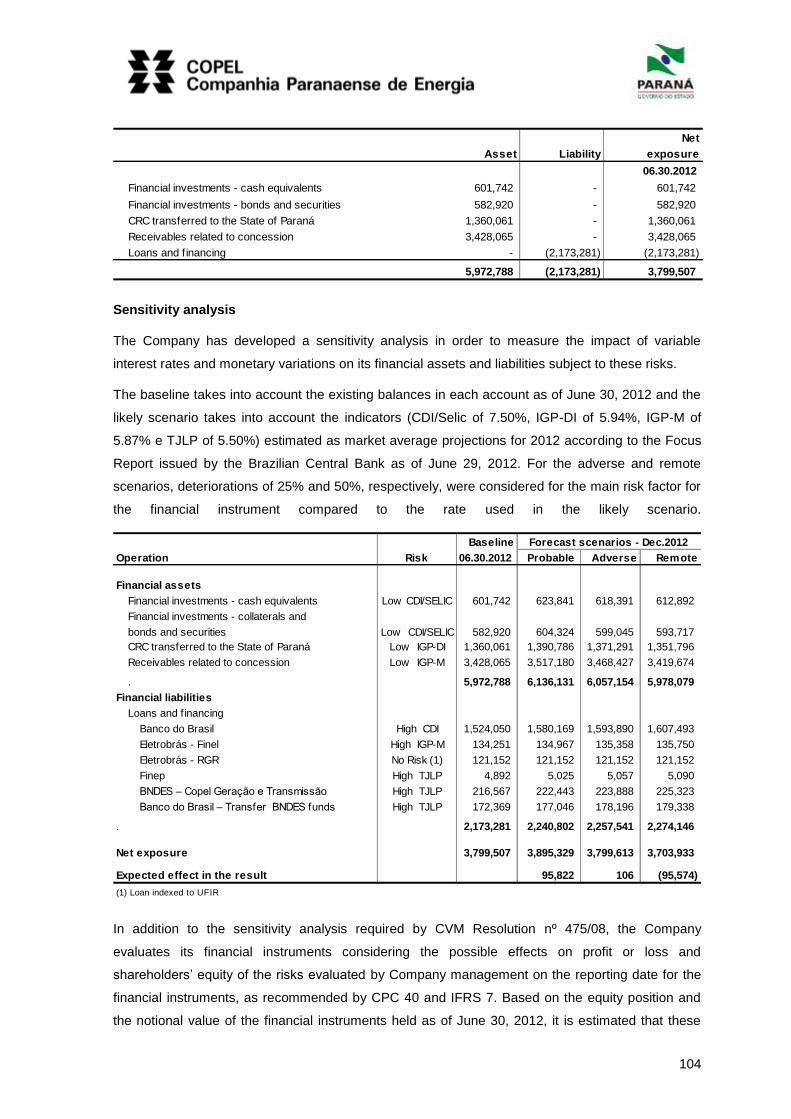
104
Net
Asset Liability exposure
06.30.2012
Financial investments - cash equivalents 601,742 - 601,742
Financial investments - bonds and securities 582,920 - 582,920
CRC transferred to the State of Paraná 1,360,061 - 1,360,061
Receivables related to concession 3,428,065 - 3,428,065
Loans and financing - (2,173,281) (2,173,281)
5,972,788 (2,173,281) 3,799,507
Sensitivity analysis
The Company has developed a sensitivity analysis in order to measure the impact of variable
interest rates and monetary variations on its financial assets and liabilities subject to these risks.
The baseline takes into account the existing balances in each account as of June 30, 2012 and the
likely scenario takes into account the indicators (CDI/Selic of 7.50%, IGP-DI of 5.94%, IGP-M of
5.87% e TJLP of 5.50%) estimated as market average projections for 2012 according to the Focus
Report issued by the Brazilian Central Bank as of June 29, 2012. For the adverse and remote
scenarios, deteriorations of 25% and 50%, respectively, were considered for the main risk factor for
the financial instrument compared to the rate used in the likely scenario.
Baseline Forecast scenarios - Dec.2012
Operation Risk 06.30.2012 Probable Adverse Remote
Financial assets
Financial investments - cash equivalents Low CDI/SELIC 601,742 623,841 618,391 612,892
Financial investments - collaterals and
bonds and securities Low CDI/SELIC 582,920 604,324 599,045 593,717
CRC transferred to the State of Paraná Low IGP-DI 1,360,061 1,390,786 1,371,291 1,351,796
Receivables related to concession Low IGP-M 3,428,065 3,517,180 3,468,427 3,419,674
. 5,972,788 6,136,131 6,057,154 5,978,079
Financial liabilities
Loans and financing
Banco do Brasil High CDI 1,524,050 1,580,169 1,593,890 1,607,493
Eletrobrás - Finel High IGP-M 134,251 134,967 135,358 135,750
Eletrobrás - RGR No Risk (1) 121,152 121,152 121,152 121,152
Finep High TJLP 4,892 5,025 5,057 5,090
BNDES – Copel Geração e Transmissão High TJLP 216,567 222,443 223,888 225,323
Banco do Brasil – Transfer BNDES funds High TJLP 172,369 177,046 178,196 179,338
. 2,173,281 2,240,802 2,257,541 2,274,146
Net exposure 3,799,507 3,895,329 3,799,613 3,703,933
Expected effect in the result 95,822 106 (95,574)
(1) Loan indexed to UFIR
In addition to the sensitivity analysis required by CVM Resolution nº 475/08, the Company
evaluates its financial instruments considering the possible effects on profit or loss and
shareholders’ equity of the risks evaluated by Company management on the reporting date for the
financial instruments, as recommended by CPC 40 and IFRS 7. Based on the equity position and
the notional value of the financial instruments held as of June 30, 2012, it is estimated that these
105
effects will approximate the amounts stated in the above table in the column for the forecast
probable scenario, since the assumptions used by the Company are similar to those previously
described.
32.1.8 Accelerated maturity risk
This risk results from the potential noncompliance with contract covenants, such as those contained
in the loan, financing, and debenture agreements of the Company, which usually require that certain
economic and financial indicators, which are calculated and analyzed periodically for compliance,
be kept at determined levels (financial covenants).
As of June 30, 2012 all of the conditions were analyzed and it was identified that all of the levels
provided in the contracts had been complied with.
32.1.9 Environmental Risks
The activities of the energy sector could have significant negative impacts and damage on the
environment. The applicable legislation imposes on those who directly or indirectly cause
environmental harm the duty to repair or compensate for the damages to the environment and to
affected third-parties, regardless of culpability (strict liability). The costs of environmental recovery
of compensation may force the Company to delay or redirect investments in other areas and may
have an adverse effect on the Company. The Company ensures the balance between
environmental conservation and the operation of its business by establishing guidelines and
practices to be observed in all operations, in order to reduce environmental impact, focusing on the
sustainable development of its business.
32.1.10 Power shortage risk
This risk results from the possibility of periods with low levels of rainfall, since Brazil relies heavily
on hydroelectric sources, which depend on the water levels in their reservoirs to operate.
A long period of drought may reduce the water levels in power plant reservoirs and result in losses
due to reduced revenues if a new rationing program is implemented.
According to the Annual Plan for Electricity Operation - PEN 2011, published annually on the
website: www.ons.org.br, the conditions for attending the electricity load are considered satisfactory
for the time horizon 2011/2015, and also considering that there is excess electricity guaranteed
with SIN during this period, the sensitivity analysis in relation to market growth, retaining the
timetables programmed in PEN 2011, average annual growth in the electricity load of up to 8 %
p.a., approximately 78 GWmed in 2015 can be tolerated, compared to the 5% p.a. from the
Reference Scenario, approximately 72 GWmed in the same year. This means that even with
anticipation of a little more than one year in the increase in the electricity load, as from 2013, it will
still be possible to maintain the conditions to attend the market within the guarantee criteria
postulated by CNPE (risk of deficit not higher than 5%).
32.1.11 Risk of non-renewal of concessions
Copel holds concessions for power generation, transmission, and distribution services, with the

106
expectation that they will be renewed by the Ministry of Mines and Energy (MME) with the support
of Aneel. If the extension of these concessions is not approved by the regulatory authority or even if
it occurs at additional costs to the Company ("onerous concession"), current profitability and activity
levels may be affected.
Maturty date
of concessions/authorizations
Concessions - Copel Geração e Transmissão
Hydroelectric Power Plants
Gov. Bento Munhoz da Rocha Netto (Foz do Areia) 05.23.2023
Gov. Ney Aminthas de Barros Braga (Segredo) 11.15.2029
Gov. José Richa (Caxias) 05.04.2030
Gov. Pedro Viriato Parigot de Souza 07.07.2015
Guaricana 08.16.2026
Chaminé 08.16.2026
Apucaraninha 12.10.2025
Mourão 07.07.2015
Derivação do Rio Jordão 15.11.2029
Marumbi - (a)
São Jorge 12.03.2024
Chopim I 07.07.2015
Rio dos Patos (b) 02.14.2014
Cavernoso 01.07.2031
Cavernoso II (under construction) 02.27.2046
Melissa - (c)
Salto do Vau - (c)
Pitangui - (c)
Mauá (51% of Copel) - under construction 07.02.2042
Colíder (under construction) 01.16.2046
Thermal Power Plant
Figueira 03.26.2019
Transmission concessions
Contract 060/01 - Transmission system 07.07.2015
Contract 075/01 - Transmission line - Bateias - Jaguariaíva 08.16.2031
Contract 006/08 - Transmission line Bateias - Pilarzinho 03.16.2038
Contract 027/09 - Transmission line Foz do Iguaçu - Cascavel Oeste 11.18.2039
Contract 010/10 - Transmission line Araraquara 2 - Taubaté 10.05.2040
Contract 015/10 - Sub-station Cerquilho III 10.05.2040
Concession - Copel Distribuição 07.07.2015
Concession - Compagas 07.06.2024
Concession - Elejor 10.24.2036
Authorization - UEG Araucária 12.22.2029
Authorization - Centrais Eólicas do Paraná 09.28.2029
(a) In progress for homologation from ANEEL
(b) Sent on January 27, 2011 requesting extension of concession (art.19 of law 9,074/95)
(c) at plants with capacity of less than 1 MW, only register with ANEEL
As far as potential reimbursements at the end of the concession, there is uncertainty regarding how
to measure the amounts to be paid for reversal of concession assets to the granting authority.
32.1.12 Gas shortage risk
This risk involves potential periods of shortage of natural gas supply to meet the Company’s gas
distribution and thermal generation business requirements.
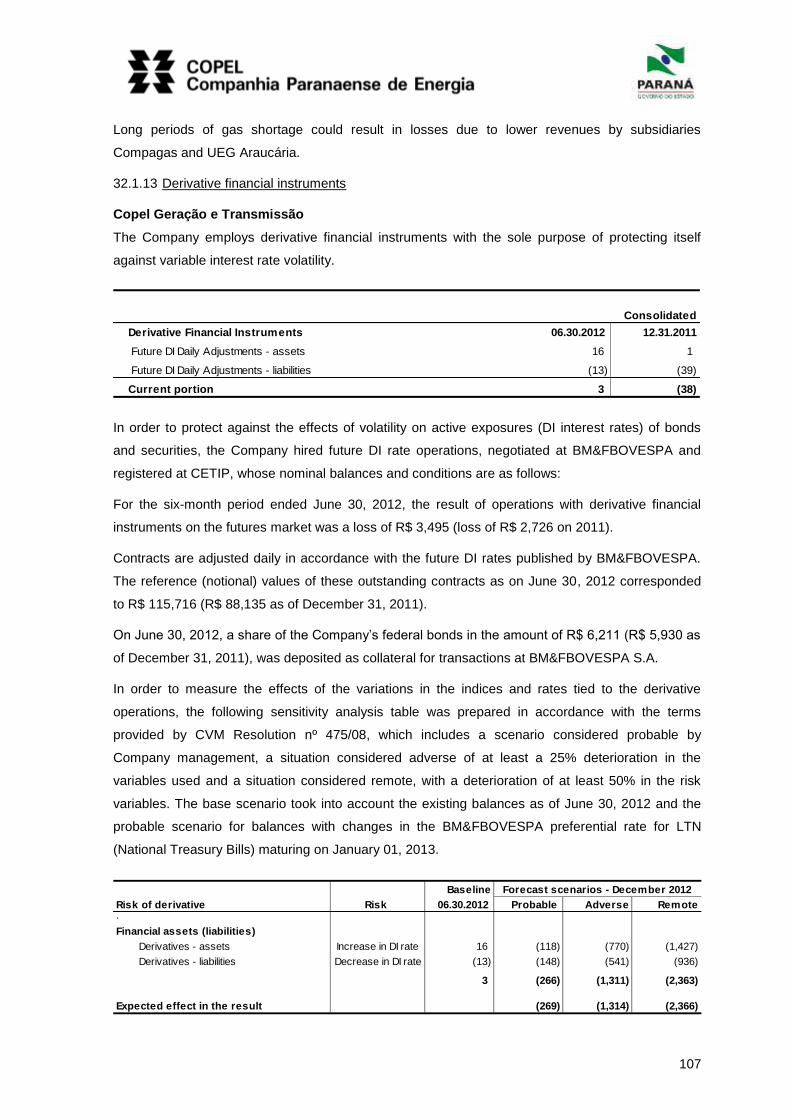
107
Long periods of gas shortage could result in losses due to lower revenues by subsidiaries
Compagas and UEG Araucária.
32.1.13 Derivative financial instruments
Copel Geração e Transmissão
The Company employs derivative financial instruments with the sole purpose of protecting itself
against variable interest rate volatility.
Consolidated
Derivative Financial Instruments 06.30.2012 12.31.2011
Future DI Daily Adjustments - assets 16 1
Future DI Daily Adjustments - liabilities (13) (39)
Current portion 3 (38)
In order to protect against the effects of volatility on active exposures (DI interest rates) of bonds
and securities, the Company hired future DI rate operations, negotiated at BM&FBOVESPA and
registered at CETIP, whose nominal balances and conditions are as follows:
For the six-month period ended June 30, 2012, the result of operations with derivative financial
instruments on the futures market was a loss of R$ 3,495 (loss of R$ 2,726 on 2011).
Contracts are adjusted daily in accordance with the future DI rates published by BM&FBOVESPA.
The reference (notional) values of these outstanding contracts as on June 30, 2012 corresponded
to R$ 115,716 (R$ 88,135 as of December 31, 2011).
On June 30, 2012, a share of the Company’s federal bonds in the amount of R$ 6,211 (R$ 5,930 as
of December 31, 2011), was deposited as collateral for transactions at BM&FBOVESPA S.A.
In order to measure the effects of the variations in the indices and rates tied to the derivative
operations, the following sensitivity analysis table was prepared in accordance with the terms
provided by CVM Resolution nº 475/08, which includes a scenario considered probable by
Company management, a situation considered adverse of at least a 25% deterioration in the
variables used and a situation considered remote, with a deterioration of at least 50% in the risk
variables. The base scenario took into account the existing balances as of June 30, 2012 and the
probable scenario for balances with changes in the BM&FBOVESPA preferential rate for LTN
(National Treasury Bills) maturing on January 01, 2013.
Baseline Forecast scenarios - December 2012
Risk of derivative Risk 06.30.2012 Probable Adverse Remote.
Financial assets (liabilities)
Derivatives - assets Increase in DI rate 16 (118) (770) (1,427)
Derivatives - liabilities Decrease in DI rate (13) (148) (541) (936)
3 (266) (1,311) (2,363)
Expected effect in the result (269) (1,314) (2,366)
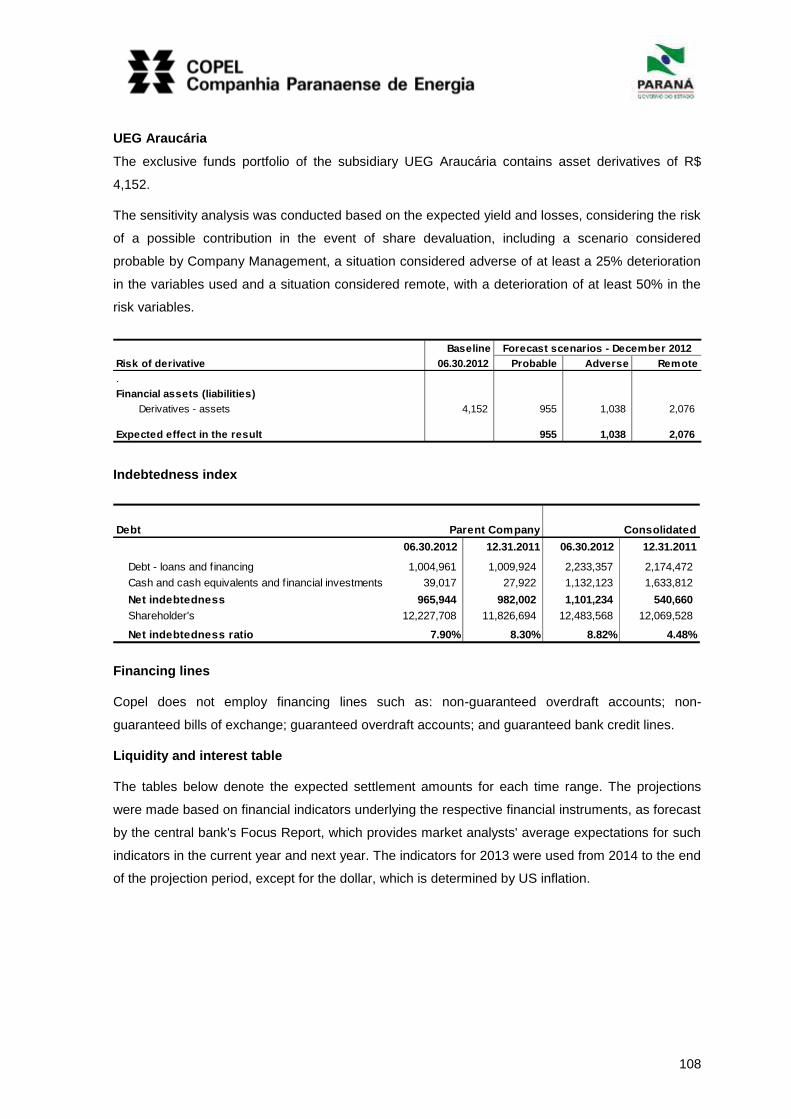
108
UEG Araucária
The exclusive funds portfolio of the subsidiary UEG Araucária contains asset derivatives of R$
4,152.
The sensitivity analysis was conducted based on the expected yield and losses, considering the risk
of a possible contribution in the event of share devaluation, including a scenario considered
probable by Company Management, a situation considered adverse of at least a 25% deterioration
in the variables used and a situation considered remote, with a deterioration of at least 50% in the
risk variables.
Baseline Forecast scenarios - December 2012
Risk of derivative 06.30.2012 Probable Adverse Remote
.
Financial assets (liabilities)
Derivatives - assets 4,152 955 1,038 2,076
Expected effect in the result 955 1,038 2,076
Indebtedness index
Debt Parent Company Consolidated
06.30.2012 12.31.2011 06.30.2012 12.31.2011
Debt - loans and financing 1,004,961 1,009,924 2,233,357 2,174,472
Cash and cash equivalents and financial investments 39,017 27,922 1,132,123 1,633,812
Net indebtedness 965,944 982,002 1,101,234 540,660
Shareholder's 12,227,708 11,826,694 12,483,568 12,069,528
Net indebtedness ratio 7.90% 8.30% 8.82% 4.48%
Financing lines
Copel does not employ financing lines such as: non-guaranteed overdraft accounts; non-
guaranteed bills of exchange; guaranteed overdraft accounts; and guaranteed bank credit lines.
Liquidity and interest table
The tables below denote the expected settlement amounts for each time range. The projections
were made based on financial indicators underlying the respective financial instruments, as forecast
by the central bank's Focus Report, which provides market analysts' average expectations for such
indicators in the current year and next year. The indicators for 2013 were used from 2014 to the end
of the projection period, except for the dollar, which is determined by US inflation.
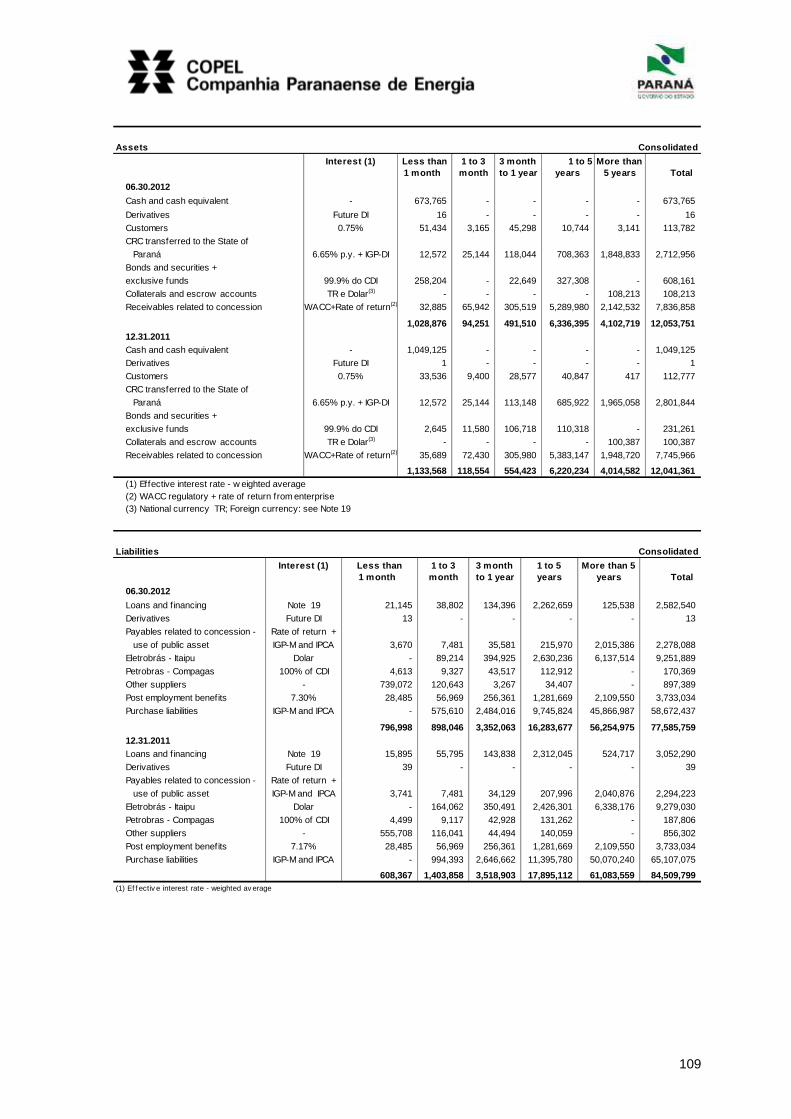
109
Assets Consolidated
Interest (1) Less than 1 to 3 3 month 1 to 5 More than
1 month month to 1 year years 5 years Total
06.30.2012
Cash and cash equivalent - 673,765 - - - - 673,765
Derivatives Future DI 16 - - - - 16
Customers 0.75% 51,434 3,165 45,298 10,744 3,141 113,782
CRC transferred to the State of
Paraná 6.65% p.y. + IGP-DI 12,572 25,144 118,044 708,363 1,848,833 2,712,956
Bonds and securities +
exclusive funds 99.9% do CDI 258,204 - 22,649 327,308 - 608,161
Collaterals and escrow accounts TR e Dolar(3) - - - - 108,213 108,213
Receivables related to concession WACC+Rate of return(2) 32,885 65,942 305,519 5,289,980 2,142,532 7,836,858
1,028,876 94,251 491,510 6,336,395 4,102,719 12,053,751
12.31.2011
Cash and cash equivalent - 1,049,125 - - - - 1,049,125
Derivatives Future DI 1 - - - - 1
Customers 0.75% 33,536 9,400 28,577 40,847 417 112,777
CRC transferred to the State of
Paraná 6.65% p.y. + IGP-DI 12,572 25,144 113,148 685,922 1,965,058 2,801,844
Bonds and securities +
exclusive funds 99.9% do CDI 2,645 11,580 106,718 110,318 - 231,261
Collaterals and escrow accounts TR e Dolar(3) - - - - 100,387 100,387
Receivables related to concession WACC+Rate of return(2) 35,689 72,430 305,980 5,383,147 1,948,720 7,745,966
1,133,568 118,554 554,423 6,220,234 4,014,582 12,041,361
(1) Effective interest rate - w eighted average
(2) WACC regulatory + rate of return from enterprise
(3) National currency TR; Foreign currency: see Note 19
Liabilities Consolidated
Interest (1) Less than 1 to 3 3 month 1 to 5 More than 5
1 month month to 1 year years years Total
06.30.2012
Loans and financing Note 19 21,145 38,802 134,396 2,262,659 125,538 2,582,540
Derivatives Future DI 13 - - - - 13
Payables related to concession - Rate of return +
use of public asset IGP-M and IPCA 3,670 7,481 35,581 215,970 2,015,386 2,278,088
Eletrobrás - Itaipu Dolar - 89,214 394,925 2,630,236 6,137,514 9,251,889
Petrobras - Compagas 100% of CDI 4,613 9,327 43,517 112,912 - 170,369
Other suppliers - 739,072 120,643 3,267 34,407 - 897,389
Post employment benefits 7.30% 28,485 56,969 256,361 1,281,669 2,109,550 3,733,034
Purchase liabilities IGP-M and IPCA - 575,610 2,484,016 9,745,824 45,866,987 58,672,437
796,998 898,046 3,352,063 16,283,677 56,254,975 77,585,759
12.31.2011
Loans and financing Note 19 15,895 55,795 143,838 2,312,045 524,717 3,052,290
Derivatives Future DI 39 - - - - 39
Payables related to concession - Rate of return +
use of public asset IGP-M and IPCA 3,741 7,481 34,129 207,996 2,040,876 2,294,223
Eletrobrás - Itaipu Dolar - 164,062 350,491 2,426,301 6,338,176 9,279,030
Petrobras - Compagas 100% of CDI 4,499 9,117 42,928 131,262 - 187,806
Other suppliers - 555,708 116,041 44,494 140,059 - 856,302
Post employment benefits 7.17% 28,485 56,969 256,361 1,281,669 2,109,550 3,733,034
Purchase liabilities IGP-M and IPCA - 994,393 2,646,662 11,395,780 50,070,240 65,107,075
608,367 1,403,858 3,518,903 17,895,112 61,083,559 84,509,799
(1) Ef f ectiv e interest rate - weighted av erage

110
33 Related Party Transactions
Parent Company
Parent company
Related parties / Nature of operation Assets Liabilities Results
06.30.2012 12.31.2011 06.30.2012 12.31.2011 06.30.2012 06.30.2011
Controlling shareholders
State of Paraná
Dividends payable (1) - - 54,855 57,855 - -
BNDESPAR (4)
Dividends payable (1) - - - 46,473 - -
Key management personnel
Fees and related charges (Note 28.3) - - - - (4,515) (4,236)
Pension plans and health care - - - - (267) (133)
The balances of transactions between the Company and its investees and subsidiaries are shown
in Note 13 and Note 14.
In 2002, the Company became guarantor of the loans signed by its investee Dona Francisca
Energética S.A. with the National Economic and Social Development Bank (BNDES) (joint debtor),
and with Bradesco (joint debtor). As of June 30, 2012, the outstanding debt was R$ 18,363 and R$
10,806, respectively.
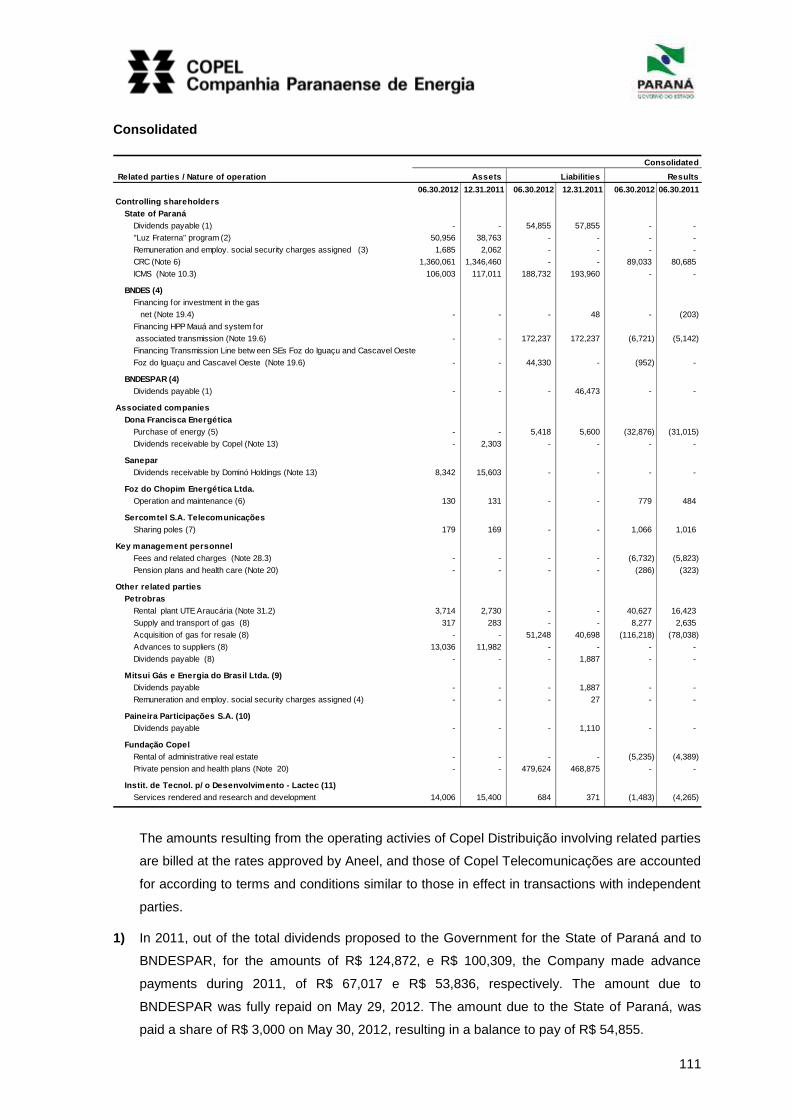
111
Consolidated
Consolidated
Related parties / Nature of operation Assets Liabilities Results
06.30.2012 12.31.2011 06.30.2012 12.31.2011 06.30.2012 06.30.2011
Controlling shareholders
State of Paraná
Dividends payable (1) - - 54,855 57,855 - -
"Luz Fraterna" program (2) 50,956 38,763 - - - -
Remuneration and employ. social security charges assigned (3) 1,685 2,062 - - - -
CRC (Note 6) 1,360,061 1,346,460 - - 89,033 80,685
ICMS (Note 10.3) 106,003 117,011 188,732 193,960 - -
BNDES (4)
Financing for investment in the gas
net (Note 19.4) - - - 48 - (203)
Financing HPP Mauá and system for
associated transmission (Note 19.6) - - 172,237 172,237 (6,721) (5,142)
Financing Transmission Line betw een SEs Foz do Iguaçu and Cascavel Oeste
Foz do Iguaçu and Cascavel Oeste (Note 19.6) - - 44,330 - (952) -
BNDESPAR (4)
Dividends payable (1) - - - 46,473 - -
Associated companies
Dona Francisca Energética
Purchase of energy (5) - - 5,418 5,600 (32,876) (31,015)
Dividends receivable by Copel (Note 13) - 2,303 - - - -
Sanepar
Dividends receivable by Dominó Holdings (Note 13) 8,342 15,603 - - - -
Foz do Chopim Energética Ltda.
Operation and maintenance (6) 130 131 - - 779 484
Sercomtel S.A. Telecomunicações
Sharing poles (7) 179 169 - - 1,066 1,016
Key management personnel
Fees and related charges (Note 28.3) - - - - (6,732) (5,823)
Pension plans and health care (Note 20) - - - - (286) (323)
Other related parties
Petrobras
Rental plant UTE Araucária (Note 31.2) 3,714 2,730 - - 40,627 16,423
Supply and transport of gas (8) 317 283 - - 8,277 2,635
Acquisition of gas for resale (8) - - 51,248 40,698 (116,218) (78,038)
Advances to suppliers (8) 13,036 11,982 - - - -
Dividends payable (8) - - - 1,887 - -
Mitsui Gás e Energia do Brasil Ltda. (9)
Dividends payable - - - 1,887 - -
Remuneration and employ. social security charges assigned (4) - - - 27 - -
Paineira Participações S.A. (10)
Dividends payable - - - 1,110 - -
Fundação Copel
Rental of administrative real estate - - - - (5,235) (4,389)
Private pension and health plans (Note 20) - - 479,624 468,875 - -
Instit. de Tecnol. p/ o Desenvolvimento - Lactec (11)
Services rendered and research and development 14,006 15,400 684 371 (1,483) (4,265)
The amounts resulting from the operating activies of Copel Distribuição involving related parties
are billed at the rates approved by Aneel, and those of Copel Telecomunicações are accounted
for according to terms and conditions similar to those in effect in transactions with independent
parties.
1) In 2011, out of the total dividends proposed to the Government for the State of Paraná and to
BNDESPAR, for the amounts of R$ 124,872, e R$ 100,309, the Company made advance
payments during 2011, of R$ 67,017 e R$ 53,836, respectively. The amount due to
BNDESPAR was fully repaid on May 29, 2012. The amount due to the State of Paraná, was
paid a share of R$ 3,000 on May 30, 2012, resulting in a balance to pay of R$ 54,855.

112
2) The Luz Fraterna Program, created under Law nº 491, dated September 11, 2003, allows the
State Government to pay for the electricity bills of low income families in Paraná – which have
duly applied for the program – provided their consumption does not exceed 100 kWh a month.
This benefit is available to residential customers with single phase connections, rural
customers with single phase connections or two phase connections with circuit breakers of up
to 50 ampères. Applicants must not have more than one electricity bill under their names and
must not have any pending debts to Copel.
3) Reimbursement of wages and social charges for employees transferred to the Paraná State
Government. The Company set aside a provision in the amount of R$ 1,190 in connection as of
June 30, 2012 and the amount of R$ 1,190 as of December 31, 2011.
4) BNDESPAR holds 23.96% of the share capital of the Company (26.41% of the common shares
and 21.27% of preferred shares) and the shareholders' agreement, has the right to appoint two
members of the Board of Directors. BNDESPAR is a wholly owned subsidiary of BNDES, with
which the Company has financing agreements described in Note 19.
5) Power purchase and sale agreement signed by Dona Francisca Energética and Copel Geração
e Transmissão, expiring on October 6, 2015.
6) Operation and maintenance services agreement, signed between Foz do Chopim Energética
Ltda. and Copel Geração e Transmissão, expiring on May 24, 2015.
7) Light Post sharing agreement, signed between Sercomtel S.A Telecomunicações and Copel
Distribuição, expiring on August 20, 2013.
8) Petrobras holds a 24.5% of the share capital of Compagas. Petrobras Distribuidora SA - BR
and Petrobras Gás S.A. - Gaspetro maintained relationships with Compagas.
The supply and transport of piped gas and the purchase of gas for resale are conducted at
market prices and conditions.
Advance payments to suppliers refer to the gas purchase contract covering guaranteed
volumes and transport capacity, higher than those actually consumed and used, which contains
a future compensation clause. Compagas has the right to receive unused gas in subsequent
months, and it may offset amounts under contract but not consumed over a period of up to 10
years. In light of the prospects of increased consumption by the market, Company management
believes it will consume the accumulated gas volumes as of June 30, 2012 in the next fiscal
years.
9) Mitsui Gás e Energia do Brasil Ltda. holds 24.5% of Compagas’share capital.
10) Paineira Participações S.A. holds 30% of Elejor share capital.
113
11) The Institute of Technology for Development (Lactec) was constituted on February 6, 1997 as a
not for profit organization whose goal is to promote economic, scientific, technological, and
social development and the sustainable conservation of the environment. In 2000, it was
qualified by the Ministry of Justice, based on Law nº 9,970, as a Public Interest Civil Society
Organization (OSCIP), which allows it, among other things, to enter partnerships with
government agencies with no need for competitive bidding. Its members are: Copel, the
Federal University of Paraná (UFPR), the Engineering Institute of Paraná (IEP), the Paraná
Federation of Industries (FIEP), and the Commercial Association of Paraná (ACP).
Lactec has service and R&D contracts with Copel Geração e Transmissão and Copel
Distribuição, which are subject to prior or later control and approval by Aneel.
The asset balances refer to Energy Efficiency and R&D programs, recorded under current
assets, in service in progress, until the respective projects are concluded, pursuant to Aneel.
34 Insurance
The specifications by type of risk and maturity dates for the Company’s main insurance is reported
in Note 35 of the Annual Financial Statements as of December 31, 2011.
35 Compensation Account for “Part A”
As a result of adopting international accounting Standards, the Company no longer registers
regulatory assets and liabilities, and reversed the existing balances.
These assets and liabilities continue to be registered in the regulatory records, introduced by Aneel
Normative Resolution 396.
The Compensation Account for Variations in Items from “Part A” - CVA accompanies the variations
reported between the amounts homologated for tariff adjustments, and the amounts actually
incurred during the tariff period, from the following cost components of “Part A”: Purchase of electric
power (Bilateral, Itaipu and Auctions), Energy Transportation Cost (Transport from Itaipu and the
Basic Grid) and Sector Charges (Fuel Consumption Account - CCC; Energy Development Account -
CDE; System Service Charges - ESS and Incentive Program for Alternative Energy Sources -
Proinfa).
Aneel authorized Copel Distribuição, through Homologatory Resolution 1,296, of June 19, 2012, to
adjust its supply tariffs as from June 24, 2012, by an average rate of -0.81%, with -0.11% that refers
to the tariff adjustment index and -0.70% for the pertinent financial components, of which, CVA,
represents a total of R$ (41,622), consisting of 2 parts : CVA being processed, for the tariff year
2011-2012, for the amount of R$ (42,525), and the balance to compensate for CVA from prior years
for the amount of R$ 903.
If the regulatory assets and liabilities had been registered, the Company would have reported the
following balances in its quarterly information:
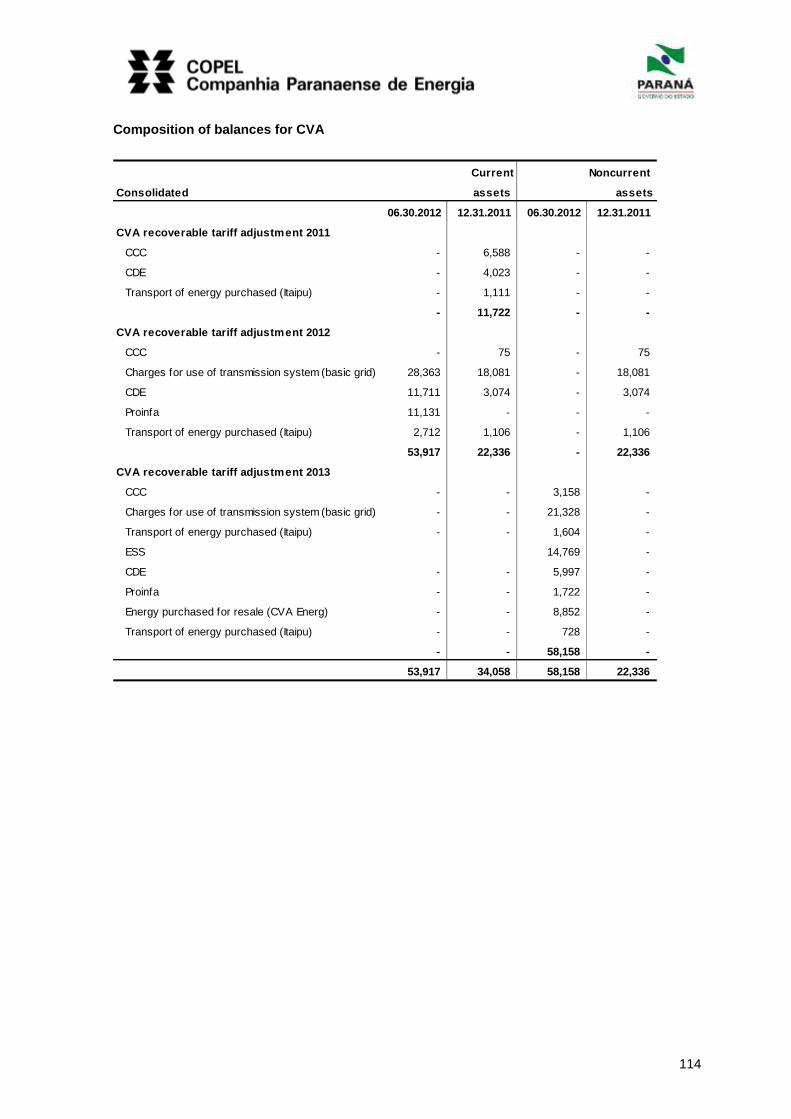
114
Composition of balances for CVA
Consolidated
06.30.2012 12.31.2011 06.30.2012 12.31.2011
CVA recoverable tariff adjustment 2011
CCC - 6,588 - -
CDE - 4,023 - -
Transport of energy purchased (Itaipu) - 1,111 - -
- 11,722 - -
CVA recoverable tariff adjustment 2012
CCC - 75 - 75
Charges for use of transmission system (basic grid) 28,363 18,081 - 18,081
CDE 11,711 3,074 - 3,074
Proinfa 11,131 - - -
Transport of energy purchased (Itaipu) 2,712 1,106 - 1,106
53,917 22,336 - 22,336
CVA recoverable tariff adjustment 2013
CCC - - 3,158 -
Charges for use of transmission system (basic grid) - - 21,328 -
Transport of energy purchased (Itaipu) - - 1,604 -
ESS 14,769 -
CDE - - 5,997 -
Proinfa - - 1,722 -
Energy purchased for resale (CVA Energ) - - 8,852 -
Transport of energy purchased (Itaipu) - - 728 -
- - 58,158 -
53,917 34,058 58,158 22,336
assets
Current
assets
Noncurrent
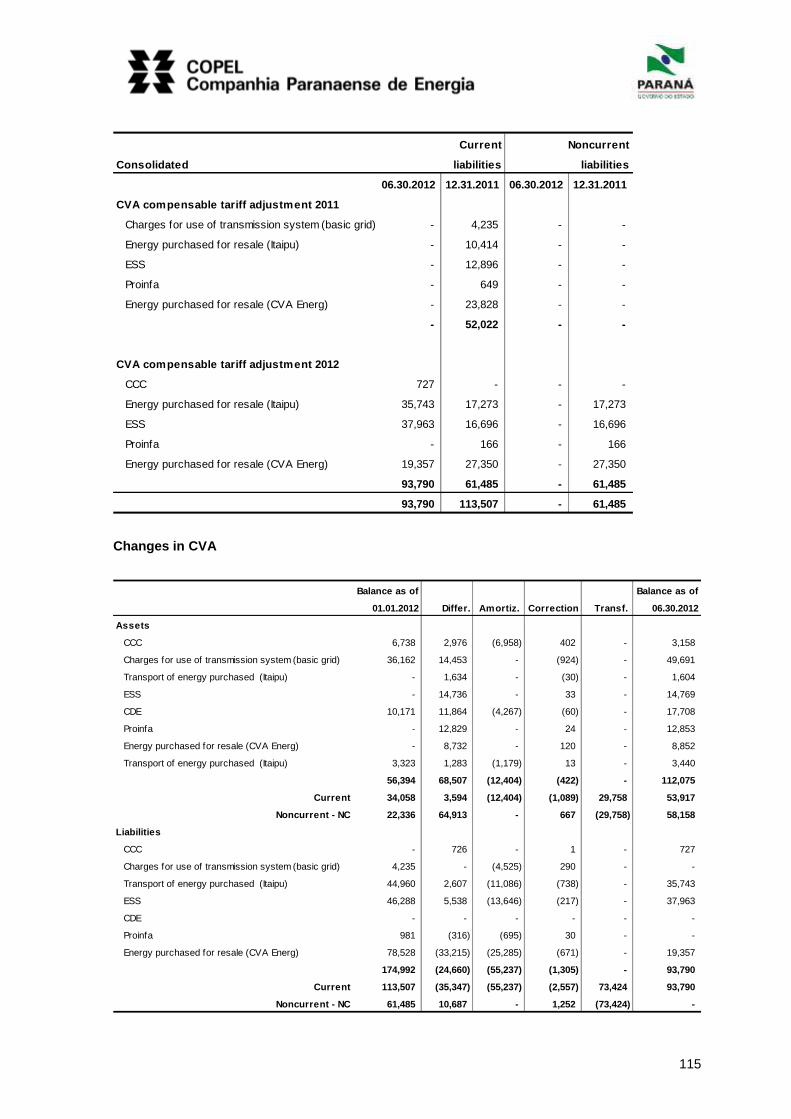
115
Consolidated
06.30.2012 12.31.2011 06.30.2012 12.31.2011
CVA compensable tariff adjustment 2011
Charges for use of transmission system (basic grid) - 4,235 - -
Energy purchased for resale (Itaipu) - 10,414 - -
ESS - 12,896 - -
Proinfa - 649 - -
Energy purchased for resale (CVA Energ) - 23,828 - -
- 52,022 - -
CVA compensable tariff adjustment 2012
CCC 727 - - -
Energy purchased for resale (Itaipu) 35,743 17,273 - 17,273
ESS 37,963 16,696 - 16,696
Proinfa - 166 - 166
Energy purchased for resale (CVA Energ) 19,357 27,350 - 27,350
93,790 61,485 - 61,485
93,790 113,507 - 61,485
liabilities
Current
liabilities
Noncurrent
Changes in CVA
. Balance as of Balance as of
01.01.2012 Differ. Amortiz. Correction Transf. 06.30.2012
Assets
CCC 6,738 2,976 (6,958) 402 - 3,158
Charges for use of transmission system (basic grid) 36,162 14,453 - (924) - 49,691
Transport of energy purchased (Itaipu) - 1,634 - (30) - 1,604
ESS - 14,736 - 33 - 14,769
CDE 10,171 11,864 (4,267) (60) - 17,708
Proinfa - 12,829 - 24 - 12,853
Energy purchased for resale (CVA Energ) - 8,732 - 120 - 8,852
Transport of energy purchased (Itaipu) 3,323 1,283 (1,179) 13 - 3,440
56,394 68,507 (12,404) (422) - 112,075
Current 34,058 3,594 (12,404) (1,089) 29,758 53,917
Noncurrent - NC 22,336 64,913 - 667 (29,758) 58,158
Liabilities
CCC - 726 - 1 - 727
Charges for use of transmission system (basic grid) 4,235 - (4,525) 290 - -
Transport of energy purchased (Itaipu) 44,960 2,607 (11,086) (738) - 35,743
ESS 46,288 5,538 (13,646) (217) - 37,963
CDE - - - - - -
Proinfa 981 (316) (695) 30 - -
Energy purchased for resale (CVA Energ) 78,528 (33,215) (25,285) (671) - 19,357
174,992 (24,660) (55,237) (1,305) - 93,790
Current 113,507 (35,347) (55,237) (2,557) 73,424 93,790
Noncurrent - NC 61,485 10,687 - 1,252 (73,424) -
116
COMMENTS ON PERFORMANCE FOR THE PERIOD
(Amounts expressed in thousands of reais, except when stated otherwise)
36 Distribution
Compact Grids - Copel has implemented compact networks in urban areas with significant urban
forestry close to the distribution grids. This technology avoids having to prune and cut trees and
improves the quality of the supply, since it reduces the number of disconnections. At the end of
June 2012, the extension of the compact grids installed was 3,542 km (2,366 km at June 2011), the
extension of the compact grids installed was 1,176 km in 12 months, a variation of 49.7%.
Isoleted Secondary Grid - Copel is also investing in secondary isolated grids for low voltage
(127/220 V), which provide significant advantages compared to the conventional aerial grid, such
as: improvement in the DEC and FEC indices, increased difficulty for electric energy stealing,
improvement in the environmental conditions and reduction to the pruned area, increased safety,
reduction to the drops in voltage throughout the network, and increased useful life of the
transformers from the decrease in the number of short circuits in the network, amongst others. By
the end of June 2012, the extent of the installed secondary isolated distribution grids was 8,240 km
(6,957 km in June de 2011), representing an increase of 1,283 km in the previous 12 months,
variation of 18.4%.
37 Energy Market
Market behavior - The energy generated by Copel during the first six months of 2012 was 8,326
GWh (12,693 GWh in the same period for 2011). The energy purchased from CCEAR (auctions)
was 9,462 GWh (9,132 GWh in the same period for 2011) and from Itaipu it was 2,609 GWh (2,615
GWh in the same period for 2011), as demonstrated in the following flow chart:
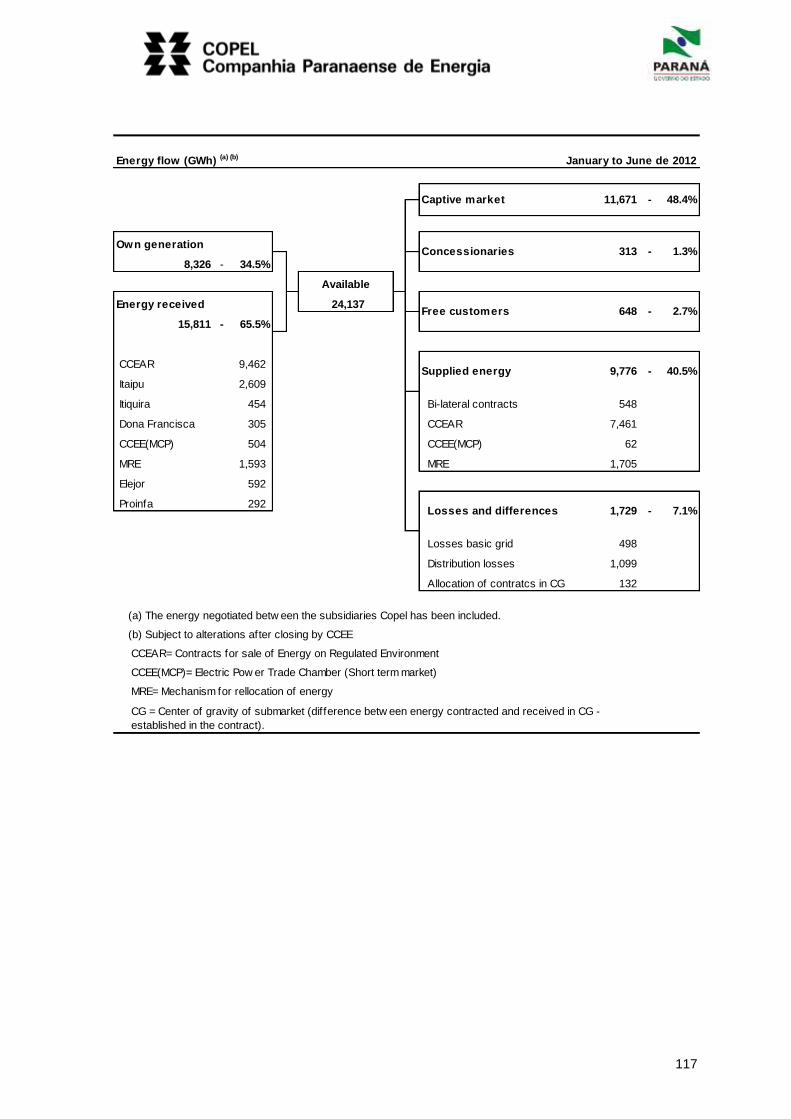
117
Energy flow (GWh) (a) (b) January to June de 2012
Own generation
8,326 - 34.5%
Available
Energy received 24,137
15,811 - 65.5%
CCEAR 9,462
Itaipu 2,609
Itiquira 454 Bi-lateral contracts 548
Dona Francisca 305 CCEAR 7,461
CCEE(MCP) 504 CCEE(MCP) 62
MRE 1,593 MRE 1,705
Elejor 592
Proinfa 292
Losses basic grid 498
Distribution losses 1,099
Allocation of contratcs in CG 132
(a) The energy negotiated betw een the subsidiaries Copel has been included.
(b) Subject to alterations after closing by CCEE
CCEAR= Contracts for sale of Energy on Regulated Environment
CCEE(MCP)= Electric Pow er Trade Chamber (Short term market)
MRE= Mechanism for rellocation of energy
CG = Center of gravity of submarket (difference betw een energy contracted and received in CG -
established in the contract).
Losses and differences 1,729 - 7.1%
Free customers 648 - 2.7%
Supplied energy 9,776 - 40.5%
Captive market 11,671 - 48.4%
Concessionaries 313 - 1.3%

118
Sale of energy (MWh) - The following table presents total energy sales by Copel between Copel
Distribuição and Copel Geração e Transmissão:
Class In MWh
January to January to Variation
June 2012 June 2011
Copel Distribuição
Captive market 11,671,271 11,222,911 4.0%
Industrial 3,750,040 3,673,765 2.1%
Residential 3,247,401 3,103,382 4.6%
Commercial 2,532,034 2,428,652 4.3%
Rural 1,049,178 964,801 8.7%
Others 1,092,618 1,052,311 3.8%
Concessionaries and permission holder 312,887 297,915 5.0%
CCEE (MCP) 17,099 168,954 -89.9%
Total Copel Distribuição 12,001,257 11,689,780 2.7%
Copel Geração e Transmissão
CCEAR (Copel Distribuição) 662,264 656,801 0.8%
CCEAR (other concessionaries) 6,799,062 6,972,444 -2.5%
Free customers 647,573 448,675 44.3%
Bi-lateral contracts 547,779 529,110 3.5%
CCEE(MCP) 44,520 25,324 75.8%
Sale MRE 1,705,290 4,234,605 -59.7%
Total Copel Geração e Transmissão 10,406,488 12,866,959 -19.1%
Total 22,407,745 24,556,739 -8.8%
P.S. Does not include energy available througt MRE (Mechanism for reallocation of energy)
CCEE(MCP): Electric Pow er Trade Chamber (Short term market)
CCEAR: Contracts for sale of Energy on Regulated Environment
Captive market of Copel Distribuição – The captive market increased 4.0% and was responsible for
the consumption of 11.671 GWh between January and June.
The Industrial class increased 2.1%, amounting to 3,750 GWh in the six months period ended June
30, 2012. This result was influenced by (i) the growth in industrial production in Paraná, particularly
the publishing and printing, petroleum refining and alcohol, wood and food, and (ii) by increasing
the number of consumers. At the end of June, this class represented 32.1% of Copel’s captive
market 83,186 customers attended.
Consumption by the residential class was of 3,247 GWh, registering growth of 4.6%, due to the
continued movement of credit expansion and income. By the end of June, 2012, this class
represented 27.8% of consumption of Copel’s captive market, with 3,135,696 residential
customers.
The commercial class consumed 2,532 GWh, representing an increase of 4.3%, influenced by the
growth of retail sales in the concession area. At the end of June, 2012, this class represented
21.7% of consumption of Copel’s captive market, with 323,493 customers attended.
The rural class consumed 1.049 GWh registering an increase of 8.7%, due mainly to the increase
in exports of agribusiness. At the end of June, 2012, this class represented 9.0% of consumption of
Copel’s captive market, with 376.473 customers attended.
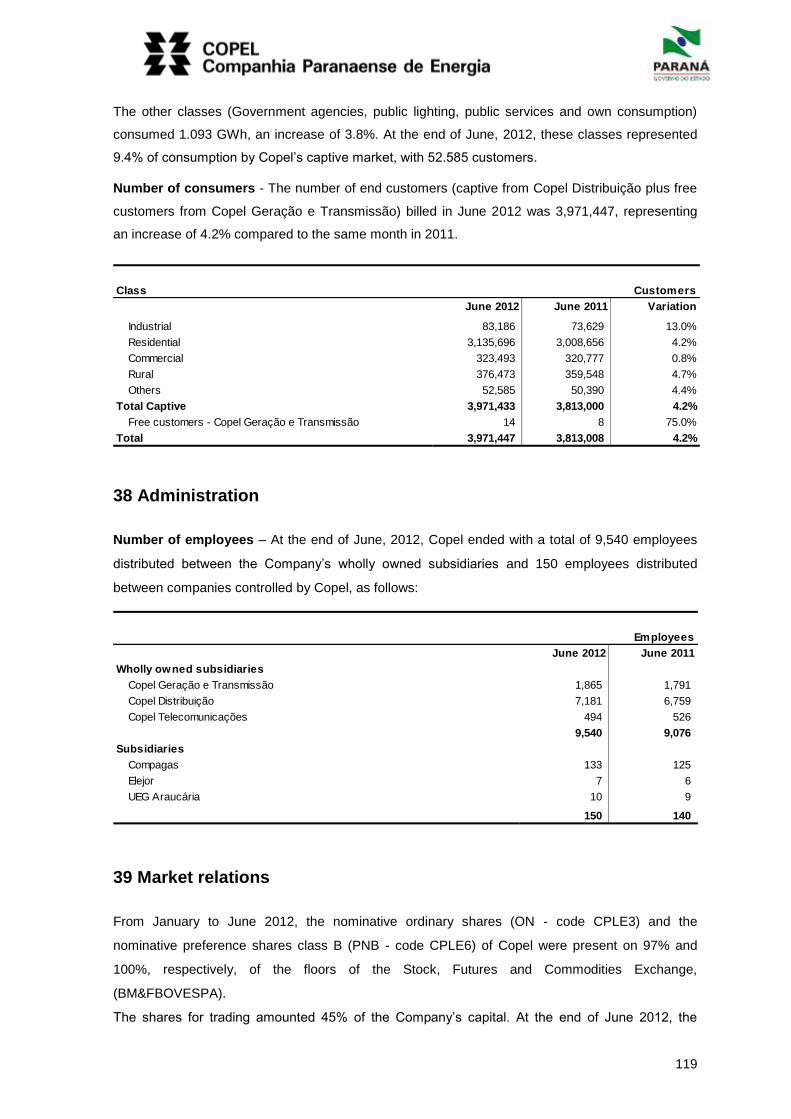
119
The other classes (Government agencies, public lighting, public services and own consumption)
consumed 1.093 GWh, an increase of 3.8%. At the end of June, 2012, these classes represented
9.4% of consumption by Copel’s captive market, with 52.585 customers.
Number of consumers - The number of end customers (captive from Copel Distribuição plus free
customers from Copel Geração e Transmissão) billed in June 2012 was 3,971,447, representing
an increase of 4.2% compared to the same month in 2011.
Class Customers
June 2012 June 2011 Variation
Industrial 83,186 73,629 13.0%
Residential 3,135,696 3,008,656 4.2%
Commercial 323,493 320,777 0.8%
Rural 376,473 359,548 4.7%
Others 52,585 50,390 4.4%
Total Captive 3,971,433 3,813,000 4.2%
Free customers - Copel Geração e Transmissão 14 8 75.0%
Total 3,971,447 3,813,008 4.2%
38 Administration
Number of employees – At the end of June, 2012, Copel ended with a total of 9,540 employees
distributed between the Company’s wholly owned subsidiaries and 150 employees distributed
between companies controlled by Copel, as follows:
Employees
June 2012 June 2011
Wholly owned subsidiaries
Copel Geração e Transmissão 1,865 1,791
Copel Distribuição 7,181 6,759
Copel Telecomunicações 494 526
9,540 9,076
Subsidiaries
Compagas 133 125
Elejor 7 6
UEG Araucária 10 9
150 140
39 Market relations
From January to June 2012, the nominative ordinary shares (ON - code CPLE3) and the
nominative preference shares class B (PNB - code CPLE6) of Copel were present on 97% and
100%, respectively, of the floors of the Stock, Futures and Commodities Exchange,
(BM&FBOVESPA).
The shares for trading amounted 45% of the Company’s capital. At the end of June 2012, the
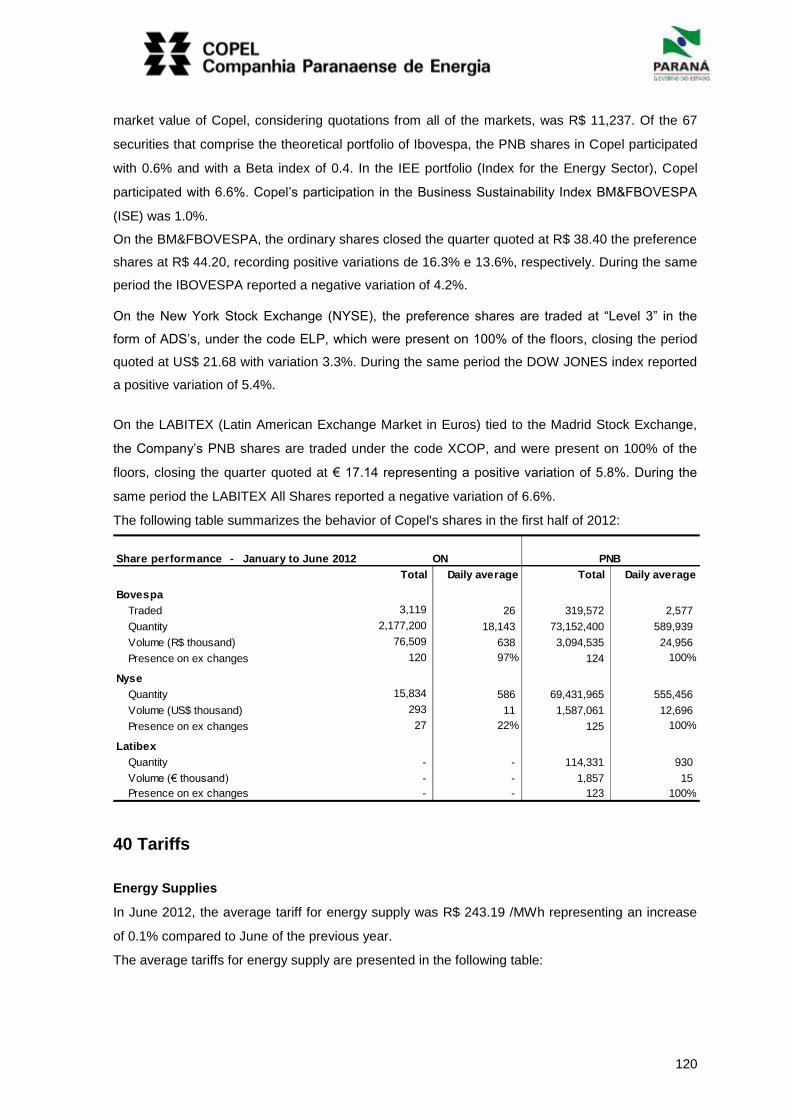
120
market value of Copel, considering quotations from all of the markets, was R$ 11,237. Of the 67
securities that comprise the theoretical portfolio of Ibovespa, the PNB shares in Copel participated
with 0.6% and with a Beta index of 0.4. In the IEE portfolio (Index for the Energy Sector), Copel
participated with 6.6%. Copel’s participation in the Business Sustainability Index BM&FBOVESPA
(ISE) was 1.0%.
On the BM&FBOVESPA, the ordinary shares closed the quarter quoted at R$ 38.40 the preference
shares at R$ 44.20, recording positive variations de 16.3% e 13.6%, respectively. During the same
period the IBOVESPA reported a negative variation of 4.2%.
On the New York Stock Exchange (NYSE), the preference shares are traded at “Level 3” in the
form of ADS’s, under the code ELP, which were present on 100% of the floors, closing the period
quoted at US$ 21.68 with variation 3.3%. During the same period the DOW JONES index reported
a positive variation of 5.4%.
On the LABITEX (Latin American Exchange Market in Euros) tied to the Madrid Stock Exchange,
the Company’s PNB shares are traded under the code XCOP, and were present on 100% of the
floors, closing the quarter quoted at € 17.14 representing a positive variation of 5.8%. During the
same period the LABITEX All Shares reported a negative variation of 6.6%.
The following table summarizes the behavior of Copel's shares in the first half of 2012:
Share performance - January to June 2012
Total Daily average Total Daily average
Bovespa
Traded 3,119 26 319,572 2,577
Quantity 2,177,200 18,143 73,152,400 589,939
Volume (R$ thousand) 76,509 638 3,094,535 24,956
Presence on ex changes 120 97% 124 100%
Nyse
Quantity 15,834 586 69,431,965 555,456
Volume (US$ thousand) 293 11 1,587,061 12,696
Presence on ex changes 27 22% 125 100%
Latibex
Quantity - - 114,331 930
Volume (€ thousand) - - 1,857 15
Presence on ex changes - - 123 100%
ON PNB
40 Tariffs
Energy Supplies
In June 2012, the average tariff for energy supply was R$ 243.19 /MWh representing an increase
of 0.1% compared to June of the previous year.
The average tariffs for energy supply are presented in the following table:

121
Average supply tariffs (a) R$/MWh
June 2012 June 2011 . Variation
Industrial (b) 207.23 219.64 -5.7%
Residential 299.82 290.58 3.2%
Commercial 269.56 264.06 2.1%
Rural 177.51 172.97 2.6%
Outhers 208.29 203.66 2.3%
243.19 242.99 0.1%
(a) Without ICM S
(b) Does not inclued free customers
Purchasing Energy
Copel’s main tariffs for purchasing energy are demonstrated in the following table:
Tariffs for purchase of energy R$/MWh
June 2012 June 2011 Variation
Itaipu 113.36 85.95 31.9%
Auction - CCEAR 2005-2012 80.51 75.84 6.2%
Auction - CCEAR 2006-2013 94.39 88.84 6.2%
Auction - CCEAR 2007-2014 107.53 101.62 5.8%
Auction - CCEAR 2007-2014 (A-1) 134.32 126.37 6.3%
Auction - CCEAR 2008-2015 113.55 106.94 6.2%
Auction - CCEAR 2008-H30 141.36 133.00 6.3%
Auction - CCEAR 2008-T15 (a) 174.92 164.75 6.2%
Auction - CCEAR 2009-2016 126.51 118.67 6.6%
Auction - CCEAR 2009-H30 151.14 142.19 6.3%
Auction - CCEAR 2009-T15 (a) 170.95 161.02 6.2%
Auction – CCEAR 2010 – H30 151.52 142.72 6.2%
Auction – CCEAR 2010 – T15 (a) 161.10 151.74 6.2%
Auction – CCEAR 2011 – H30 156.20 147.12 6.2%
Auction – CCEAR 2011 – T15 (3rd new pow er auction) 177.63 167.31 6.2%
Auction – CCEAR 2011 – T15 (6td new pow er auction) 150.48 141.74 6.2%
Auction – CCEAR 2012 – T15 (5td new pow er auction) 159.35 - -
Leilão – 11º de ajuste 73.63 - -
Itiquira 148.84 143.90 3.4%
Elejor 175.30 169.12 3.7%
(a) Average auction price fiixed by the IPCA. In practice the price is comprised of three components: a fixed portion, a
variable portion and expense in the CCEE. The costs of the last tw o itens depends on the order of plants as
programming of National System Operator - ONS
Supply of power
Copel’s main tariffs for the supply of energy are presented in the following table:
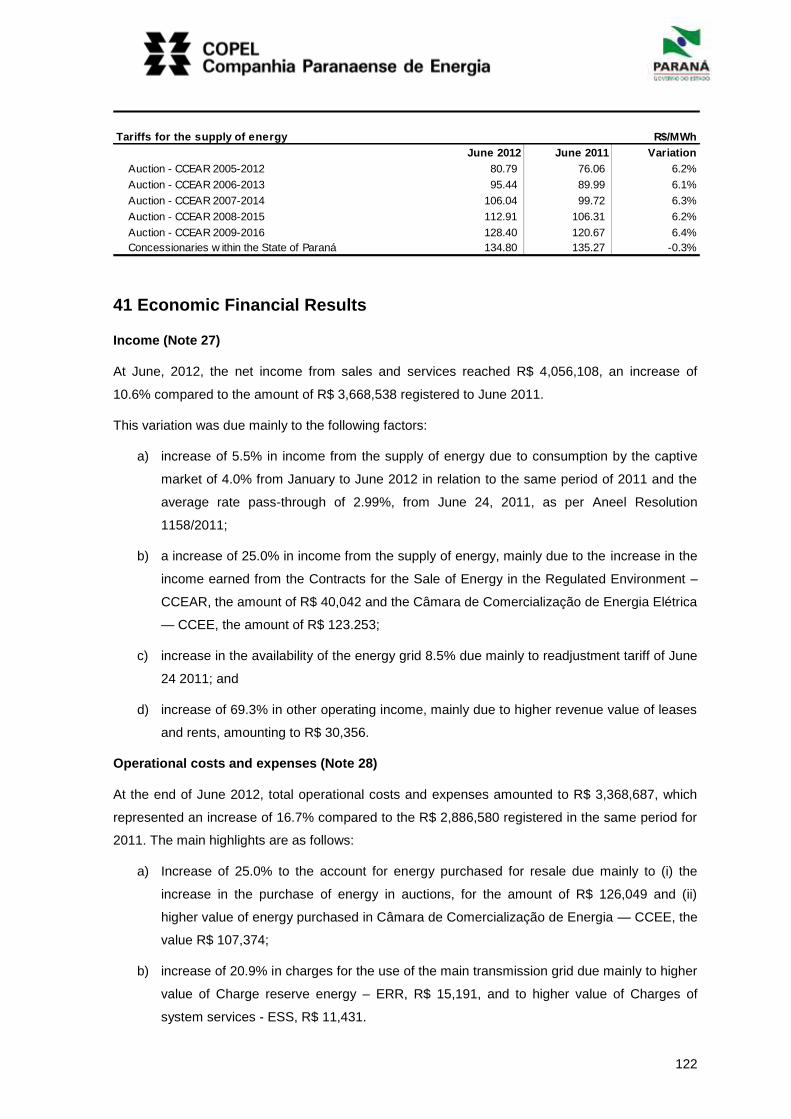
122
Tariffs for the supply of energy R$/MWh
June 2012 June 2011 Variation
Auction - CCEAR 2005-2012 80.79 76.06 6.2%
Auction - CCEAR 2006-2013 95.44 89.99 6.1%
Auction - CCEAR 2007-2014 106.04 99.72 6.3%
Auction - CCEAR 2008-2015 112.91 106.31 6.2%
Auction - CCEAR 2009-2016 128.40 120.67 6.4%
Concessionaries w ithin the State of Paraná 134.80 135.27 -0.3%
41 Economic Financial Results
Income (Note 27)
At June, 2012, the net income from sales and services reached R$ 4,056,108, an increase of
10.6% compared to the amount of R$ 3,668,538 registered to June 2011.
This variation was due mainly to the following factors:
a) increase of 5.5% in income from the supply of energy due to consumption by the captive
market of 4.0% from January to June 2012 in relation to the same period of 2011 and the
average rate pass-through of 2.99%, from June 24, 2011, as per Aneel Resolution
1158/2011;
b) a increase of 25.0% in income from the supply of energy, mainly due to the increase in the
income earned from the Contracts for the Sale of Energy in the Regulated Environment –
CCEAR, the amount of R$ 40,042 and the Câmara de Comercialização de Energia Elétrica
— CCEE, the amount of R$ 123.253;
c) increase in the availability of the energy grid 8.5% due mainly to readjustment tariff of June
24 2011; and
d) increase of 69.3% in other operating income, mainly due to higher revenue value of leases
and rents, amounting to R$ 30,356.
Operational costs and expenses (Note 28)
At the end of June 2012, total operational costs and expenses amounted to R$ 3,368,687, which
represented an increase of 16.7% compared to the R$ 2,886,580 registered in the same period for
2011. The main highlights are as follows:
a) Increase of 25.0% to the account for energy purchased for resale due mainly to (i) the
increase in the purchase of energy in auctions, for the amount of R$ 126,049 and (ii)
higher value of energy purchased in Câmara de Comercialização de Energia — CCEE, the
value R$ 107,374;
b) increase of 20.9% in charges for the use of the main transmission grid due mainly to higher
value of Charge reserve energy – ERR, R$ 15,191, and to higher value of Charges of
system services - ESS, R$ 11,431.
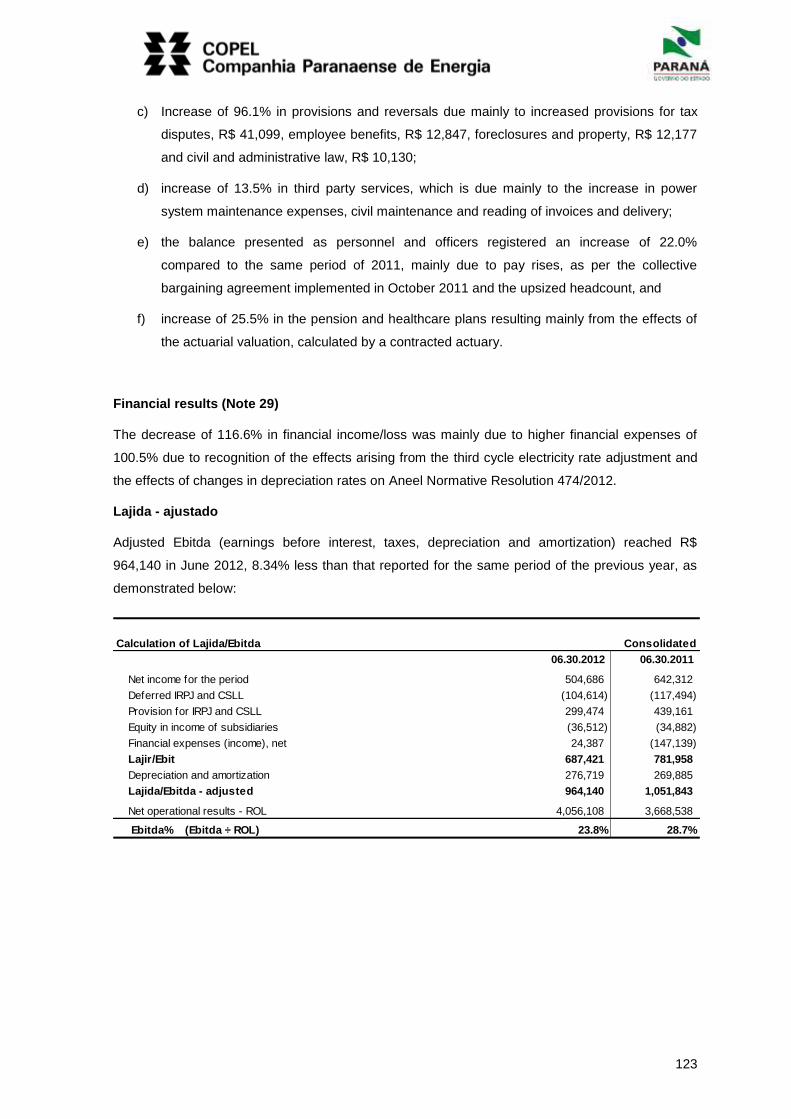
123
c) Increase of 96.1% in provisions and reversals due mainly to increased provisions for tax
disputes, R$ 41,099, employee benefits, R$ 12,847, foreclosures and property, R$ 12,177
and civil and administrative law, R$ 10,130;
d) increase of 13.5% in third party services, which is due mainly to the increase in power
system maintenance expenses, civil maintenance and reading of invoices and delivery;
e) the balance presented as personnel and officers registered an increase of 22.0%
compared to the same period of 2011, mainly due to pay rises, as per the collective
bargaining agreement implemented in October 2011 and the upsized headcount, and
f) increase of 25.5% in the pension and healthcare plans resulting mainly from the effects of
the actuarial valuation, calculated by a contracted actuary.
Financial results (Note 29)
The decrease of 116.6% in financial income/loss was mainly due to higher financial expenses of
100.5% due to recognition of the effects arising from the third cycle electricity rate adjustment and
the effects of changes in depreciation rates on Aneel Normative Resolution 474/2012.
Lajida - ajustado
Adjusted Ebitda (earnings before interest, taxes, depreciation and amortization) reached R$
964,140 in June 2012, 8.34% less than that reported for the same period of the previous year, as
demonstrated below:
Calculation of Lajida/Ebitda Consolidated
06.30.2012 06.30.2011
Net income for the period 504,686 642,312
Deferred IRPJ and CSLL (104,614) (117,494)
Provision for IRPJ and CSLL 299,474 439,161
Equity in income of subsidiaries (36,512) (34,882)
Financial expenses (income), net 24,387 (147,139)
Lajir/Ebit 687,421 781,958
Depreciation and amortization 276,719 269,885
Lajida/Ebitda - adjusted 964,140 1,051,843
Net operational results - ROL 4,056,108 3,668,538
Ebitda% (Ebitda ÷ ROL) 23.8% 28.7%
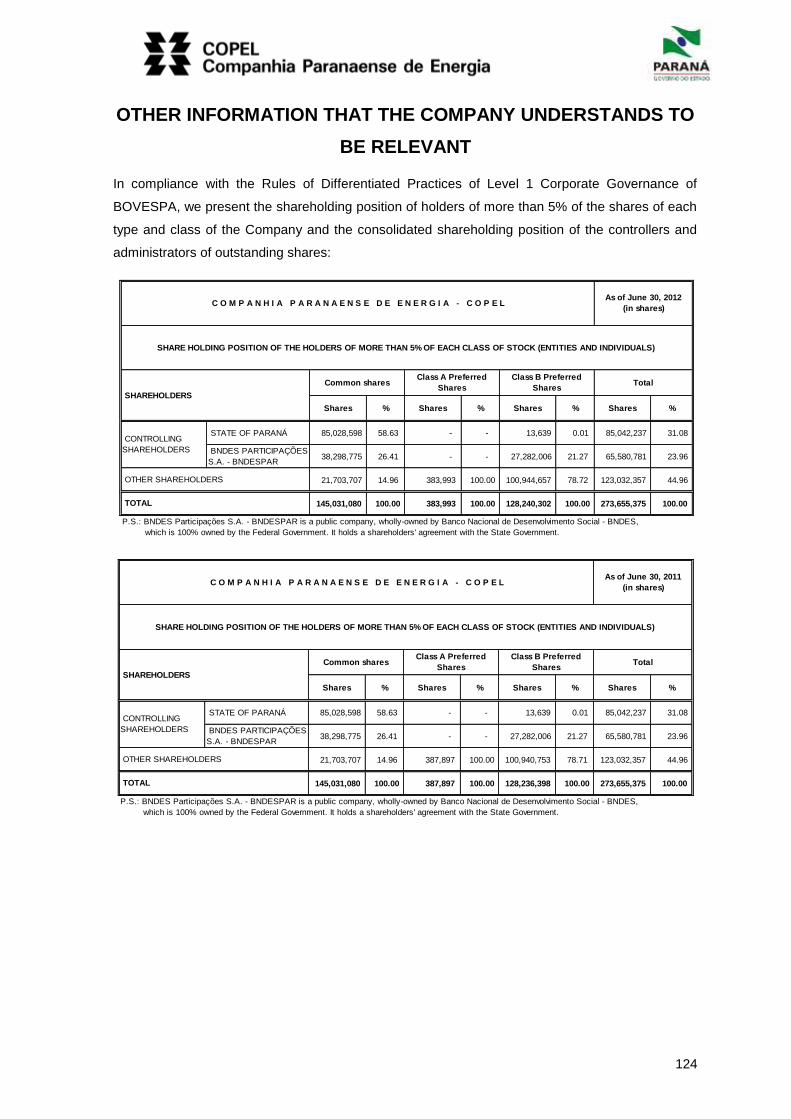
124
OTHER INFORMATION THAT THE COMPANY UNDERSTANDS TO
BE RELEVANT
In compliance with the Rules of Differentiated Practices of Level 1 Corporate Governance of
BOVESPA, we present the shareholding position of holders of more than 5% of the shares of each
type and class of the Company and the consolidated shareholding position of the controllers and
administrators of outstanding shares:
Shares % Shares % Shares % Shares %
STATE OF PARANÁ 85,028,598 58.63 - - 13,639 0.01 85,042,237 31.08
BNDES PARTICIPAÇÕES
S.A. - BNDESPAR 38,298,775 26.41 - - 27,282,006 21.27 65,580,781 23.96
21,703,707 14.96 383,993 100.00 100,944,657 78.72 123,032,357 44.96
145,031,080 100.00 383,993 100.00 128,240,302 100.00 273,655,375 100.00
P.S.: BNDES Participações S.A. - BNDESPAR is a public company, wholly-owned by Banco Nacional de Desenvolvimento Social - BNDES,
which is 100% owned by the Federal Government. It holds a shareholders' agreement with the State Government.
TOTAL
C O M P A N H I A P A R A N A E N S E D E E N E R G I A - C O P E L As of June 30, 2012
(in shares)
SHARE HOLDING POSITION OF THE HOLDERS OF MORE THAN 5% OF EACH CLASS OF STOCK (ENTITIES AND INDIVIDUALS)
SHAREHOLDERS
Common sharesClass A Preferred
Shares
Class B Preferred
SharesTotal
CONTROLLING
SHAREHOLDERS
OTHER SHAREHOLDERS
Shares % Shares % Shares % Shares %
STATE OF PARANÁ 85,028,598 58.63 - - 13,639 0.01 85,042,237 31.08
BNDES PARTICIPAÇÕES
S.A. - BNDESPAR 38,298,775 26.41 - - 27,282,006 21.27 65,580,781 23.96
21,703,707 14.96 387,897 100.00 100,940,753 78.71 123,032,357 44.96
145,031,080 100.00 387,897 100.00 128,236,398 100.00 273,655,375 100.00
P.S.: BNDES Participações S.A. - BNDESPAR is a public company, wholly-owned by Banco Nacional de Desenvolvimento Social - BNDES,
which is 100% owned by the Federal Government. It holds a shareholders' agreement with the State Government.
TOTAL
C O M P A N H I A P A R A N A E N S E D E E N E R G I A - C O P E L As of June 30, 2011
(in shares)
SHARE HOLDING POSITION OF THE HOLDERS OF MORE THAN 5% OF EACH CLASS OF STOCK (ENTITIES AND INDIVIDUALS)
SHAREHOLDERS
Common sharesClass A Preferred
Shares
Class B Preferred
SharesTotal
CONTROLLING
SHAREHOLDERS
OTHER SHAREHOLDERS
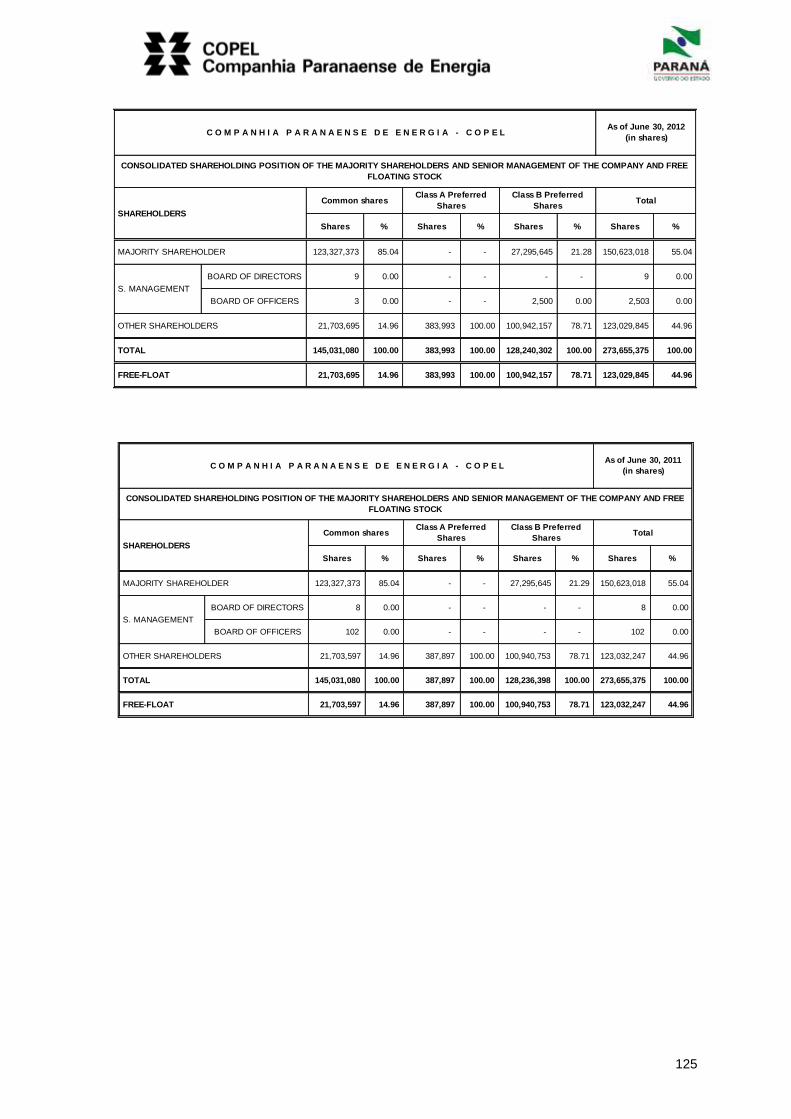
125
Shares % Shares % Shares % Shares %
123,327,373 85.04 - - 27,295,645 21.28 150,623,018 55.04
BOARD OF DIRECTORS 9 0.00 - - - - 9 0.00
BOARD OF OFFICERS 3 0.00 - - 2,500 0.00 2,503 0.00
21,703,695 14.96 383,993 100.00 100,942,157 78.71 123,029,845 44.96
145,031,080 100.00 383,993 100.00 128,240,302 100.00 273,655,375 100.00
21,703,695 14.96 383,993 100.00 100,942,157 78.71 123,029,845 44.96 FREE-FLOAT
MAJORITY SHAREHOLDER
S. MANAGEMENT
OTHER SHAREHOLDERS
TOTAL
C O M P A N H I A P A R A N A E N S E D E E N E R G I A - C O P E L As of June 30, 2012
(in shares)
CONSOLIDATED SHAREHOLDING POSITION OF THE MAJORITY SHAREHOLDERS AND SENIOR MANAGEMENT OF THE COMPANY AND FREE
FLOATING STOCK
SHAREHOLDERS
Common sharesClass A Preferred
Shares
Class B Preferred
SharesTotal
Shares % Shares % Shares % Shares %
123,327,373 85.04 - - 27,295,645 21.29 150,623,018 55.04
BOARD OF DIRECTORS 8 0.00 - - - - 8 0.00
BOARD OF OFFICERS 102 0.00 - - - - 102 0.00
OTHER SHAREHOLDERS 21,703,597 14.96 387,897 100.00 100,940,753 78.71 123,032,247 44.96
145,031,080 100.00 387,897 100.00 128,236,398 100.00 273,655,375 100.00
21,703,597 14.96 387,897 100.00 100,940,753 78.71 123,032,247 44.96
TOTAL
C O M P A N H I A P A R A N A E N S E D E E N E R G I A - C O P E L As of June 30, 2011
(in shares)
CONSOLIDATED SHAREHOLDING POSITION OF THE MAJORITY SHAREHOLDERS AND SENIOR MANAGEMENT OF THE COMPANY AND FREE
FLOATING STOCK
SHAREHOLDERS
Common sharesClass A Preferred
Shares
Class B Preferred
SharesTotal
MAJORITY SHAREHOLDER
S. MANAGEMENT
FREE-FLOAT

126
GROUPS IN CHARGE OF GOVERNANCE
BOARD OF DIRECTORS
Chairman: MAURICIO SCHULMAN
Executive Secretary: LINDOLFO ZIMMER
Members: CARLOS HOMERO GIACOMINI
FABIANO BRAGA CÔRTES
JOSE RICHA FILHO
PAULO PROCOPIAK DE AGUIAR
PEDRO LUIZ CERIZE
NILTON CAMARGO COSTA
NEY AMILTON CALDAS FERREIRA
AUDIT COMMITTEE
Chairman: CARLOS HOMERO GIACOMINI
Members: JOSE RICHA FILHO
FABIANO BRAGA CÔRTES
FISCAL COUNCIL Chairman: JOAQUIM ANTONIO GUIMARÃES DE
OLIVEIRA PORTES
Full Members: LUIZ EDUARDO DA VEIGA SEBASTIANI
JOSÉ TAVARES DA SILVA NETO
WANCLER FERREIRA DA SILVA
CARLOS EDUARDO PARENTE DE O. ALVES
Alternate Members: OSNI RISTOW
ROBERTO BRUNNER
VACANCY
JOSÉ LUIZ MONTANS ANACLETO JR.
CLÁUDIO JOSÉ CARVALHO DE ANDRADE
BOARD OF DIRECTORS
Chief Executive Officer LINDOLFO ZIMMER
Chief Corporate Management Officer YÁRA CHRISTINA EISENBACH
Chief Distribution Officer PEDRO AUGUSTO DO NASCIMENTO NETO
Chief Engineering Officer JORGE ANDRIGUETTO JUNIOR
Chief Financial and Investor Relations Officer RICARDO PORTUGAL ALVES
Chief Generation,Transmission and Telecommunications Officer
JAIME DE OLIVEIRA KUHN
Chief Environment and Corporate Citizenship Officer GILBERTO MENDES FERNANDES
Chief Legal Officer JULIO JACOB JUNIOR
Chief New Energy Officer HENRIQUE JOSÉ TERNES NETO
ACCOUNTANT
Accountant - CRC-PR-045809/0-2 ADRIANO FEDALTO
INFORMATION ON THIS REPORT [email protected]
Fone: +55 (41) 3331-4051
Information
s sobre Relações com Investidores: [email protected]
Fones: +55 (41) 3222-2027 / 3331-4359
Fax: +55 (41) 3331-2849
127
INDEPENDENT AUDITORS’ REVIEW REPORT
To the Shareholders and Management
Companhia Paranaense de Energia - Copel
Curitiba - PR
Introduction
We have revised the individual and consolidated interim financial statements of Companhia Paranaense de
Energia - Copel included in the Quarterly Information Forms, for the quarter ended June 30, 2012, which
include the balance sheet at June 30, 2012 and related statements of income and comprehensive income for
the three-month and six-month periods then ended, and the statements of changes in shareholders’ equity and
cash flows for the six-month period then ended, including a summary of the significant accounting practices
and other notes to the financial statements.
Management is responsible for preparing and presenting the individual and consolidated interim financial
statements in accordance with Technical Pronouncement CPC 21 (R1) – Interim Statements and consolidated
interim financial statements and with the international standard IAS 34 – Interim Financial Reporting, issued
by the International Accounting Standards Board – IASB, and for presenting this information in a manner
consistent with the norms issued by the Securities and Exchange Commission (CVM), applicable for
preparing Quarterly Information - ITR. Our responsibility is to express a conclusion on these interim
financial statements based on our review.
Extent of our review
We performed our review in accordance with Brazilian and international standards for reviewing interim
information (NBC TR 2410 – Review of Interim Information Performed by the Entity’s Auditors and ISRE
2410 - Review of Interim Financial Information Performed by the Independent Auditor of the Entity,
respectively). A review of interim information consists of making enquiries, mainly of persons responsible
for financial and accounting issues and applying analytical procedures and other review procedures. The
extent of our review is significantly less than that for an audit undertaken in accordance with auditing
standards and consequently, did not enable us to obtain assurance that we were informed of all of the
significant issues that could be identified during an audit. Therefore, we do not express an audit opinion.
Conclusion on the individual interim financial statements
Based on our review, we are not aware of any fact that leads us to understand that the aforementioned interim
individual financial statements included in the Quarterly Information referred to above were not prepared, in
all material respects, in accordance with CPC 21 (R1) applicable to the preparation of Quarterly Information
– ITR and presented in a manner consistent with the norms issued by the Securities and Exchange
Commission.
Conclusion on the consolidated interim financial statements
Based on our review, we are not aware of any fact that leads us to understand that the aforementioned interim
consolidated financial statements included in the Quarterly Information referred to above were not prepared,
in all material respects, in accordance with CPC 21(R1) and IAS 34 applicable to the preparation of Quarterly
Information – ITR and presented in a manner consistent with the norms issued by the Securities and
Exchange Commission.
128
Other issues
Interim statements of added value
We also reviewed the individual and consolidated interim statements of added value, for the six-month ended
June 30, 2012, which are management’s responsibility and presentation of which in the interim statements is
required according to the norms issued by the Securities and Exchange Commission, applicable for preparing
Quarterly Information - ITR and considered supplementary information by the IFRS, which do not require a
statement of added value to be reported. These statements were subject to the same review procedures
described previously, and based on our review, we are not aware of any fact that leads us to understand that
they were not prepared, in all material respects, in accordance with the interim individual and consolidated
statements taken as a whole.
Curitiba, August 14, 2012
KPMG Auditores Independentes
CRC 2SP014428/O-6-F-PR
A free translation of the original signed in Portuguese
José Luiz Ribeiro de Carvalho João Alberto Dias Panceri
Accountant - CRC 1SP141128/O-2-S-PR Accountant - CRC PR048555/O-2