A ESTRUTURA DA FLORESTA DE VÁRZEA DO BAIXO PURUS...
58
INSTITUTO NACIONAL DE PESQUISAS DA AMAZÔNIA PROGRAMA DE PÓS-GRADUAÇÃO EM ECOLOGIA A ESTRUTURA DA FLORESTA DE VÁRZEA DO BAIXO PURUS E SUA RELAÇÃO COM A DURAÇÃO DA INUNDAÇÃO BRUNO GARCIA LUIZE Manaus, Amazonas Novembro, 2010
Transcript of A ESTRUTURA DA FLORESTA DE VÁRZEA DO BAIXO PURUS...
INSTITUTO NACIONAL DE PESQUISAS DA AMAZÔNIA PROGRAMA DE PÓS-GRADUAÇÃO EM ECOLOGIA
A ESTRUTURA DA FLORESTA DE VÁRZEA DO BAIXO PURUS E SUA RELAÇÃO COM A DURAÇÃO DA INUNDAÇÃO
BRUNO GARCIA LUIZE
Manaus, Amazonas Novembro, 2010
i
BRUNO GARCIA LUIZE
A ESTRUTURA DA FLORESTA DE VÁRZEA DO BAIXO PURUS E SUA RELAÇÃO COM A DURAÇÃO DA INUNDAÇÃO
DR. EDUARDO MARTINS VENTICINQUE
Dissertação apresentada ao Instituto Nacional de Pesquisas da Amazônia como parte dos requisitos para obtenção do título de Mestre em Biologia (Ecologia).
Manaus, Amazonas Novembro, 2010
ii
Lista de Revisores e Banca Avaliadora Avaliação do projeto de mestrado Revisor Avaliação Data Dr. Bruce Walker Nelson INPA/CPEC Aprovado com
correções 27 outubro 2008
Dr. Leandro Ferreira MPEG Aprovado 03 novembro 2008
Dra. Maria Teresa Fernández Piedade INPA/CPBO
Aprovado com correções
30 outubro 2008
Avaliação do aula de qualificação Revisor Avaliação Data Dr. Bruce Walker Nelson INPA/CPEC Aprovado 26 janeiro 2009 Dr. Henrique Nascimento – INPA/CFT Aprovado 26 janeiro 2009 Dr. José Luis Campana Camargo – INPA/PDBFF
Aprovado 26 janeiro 2009
Avaliação da banca examinadora do trabalho escrito Revisor Avaliação Data Dra. Ana Luisa Kerty Mangabeira Albernaz MPEG
Aprovado 19 maio 2010
Dr. Ary Teixeira Oliveira Filho UFMG Aprovado com correções
22 maio 2010
Dra. Pia Parolin MaxPlank Aprovado 19 maio 2010
Avaliação da defesa oral pública Revisor Avaliação Data Dr. Alberto Vicentini INPA/CPBO Aprovado 29 junho 2010 Dr. Jochen Schongart INPA/MaxPlank Aprovado 29 junho 2010 Dra. Veridiana Vizoni Scudeller UFAM Aprovado 29 junho 2010
iii
Ficha Catalográfica
L953 Luize, Bruno Garcia A estrutura da floresta de várzea do baixo Purus e sua relação com a duração da inundação / Bruno Garcia Luize. -- Manaus : [s.n.], 2010. x, 56 f. : il.
Dissertação (mestrado em Biologia)--INPA, Manaus, 2010. Orientador: Dr. Eduardo Martins Venticinque Área de concentração: Ecologia
1.Ecologia florestal - Amazonas 2.Florestas de várzea 3.Influências florestais 4.Dinâmica florestal I.Título
CDD 19ª ed. 581.5
Sinopse: Estudei a diversidade da comunidade de árvores nas florestas inundáveis do baixo Purus, RDS Piagaçu Purus. Avaliei o gradiente de inundação e a distância como fatores influenciando na estruturação da comunidade. Palavras Chave: Gradiente ambiental complexo; Filtros ambientais; limitação a dispersão; Florestas aluviais; Várzea Amazonica.
iv
Dedicatória
A Mãe, Amar
Dedico à esta forte mulher que hoje é anjo ao meu lado
Tua energia e amor a mim são como Gaia a grande mãe da vida
À toda a família; este trabalho é para vocês: Denyze, Marcilio, Mariana e Ana Paula e
Emanuel
v
Agradecimentos
Ao Instituto Nacional de Pesquisas da Amazônia e a Coordenação de Pós Graduação
em Ecologia. Ao Conselho Nacional de Desenvolvimento Ciêntifico e Tecnológico -
CNPq pela bolsa de estudos concedida. Ao Instituto Max Planck pela ajuda no
financiamento do projeto. A Idea Wild pela doação de equipamentos para a realização
dos trabalhos no mato. Ao Centro de Unidades de Conservação- Ceuc da Secretaria
de Desenvolvimento Sustentável do Amazonas - SDS, pela licença concedida para
realizar as atividades na RDS-Piagaçú-Purus. Ao herbário INPA e a toda a sua equipe
é ótimo poder contar com a colaboração desta bonita coleção. Sem toda esta estrutura
seria muito dificil ter avançado em meus estudos.
Agradeço ao meu orientador, Dr. Eduardo Martins Venticinque, homem simples e
apaixonado por seu trabalho. Tua orientação e amizade me motivam e só fazem
aumentar a admiração que tenho por você. Desejo a você e a Marina muita felicidade
com esse meninão que chegou. Dadão, aprender a seu lado é uma oportunidade única,
é demais ser aluno deste grande professor.
Por falar em professores, sou um cara de sorte por poder estudar e aprender com os
meus professores de graduação em Rio Claro e agora com os professores da pós
graduação em Manaus. Foram anos intensos e de muitas descobertas e que me fazem
compreender pelo menos um tiquinho da grandeza desta Terra. Agradeço aos
revisores do projeto de mestrado e aos avaliadores de minha aula de qualificação os
doutores e doutoras: Maria Tereza F. Piedade; Bruce W. Nelson; Leandro Ferreira;
José Luis C. Camargo; Henrique Nascimento; Ana Luisa K. M. Albernaz; Ary
Teixeira de Oliveira Filho; Pia Parolin; Alberto Vicentini; Jochen Schongart;
Veridiana V. Scudeller. Vocês me trouxeram crescimento com críticas e sugestões de
extremo valor. Agradeço também aos grandes amigos que me ajudaram em discusões
vi
e nas revisões textuais e principalmente na minha maneira de olhar e apresentar os
conceitos e hipóteses. Em ecologia a interação impera.
À equipe do Instituto Piagaçu Purus (IPI) que acreditam no projeto maior que é a
RDS no grande coração do Purus. Agradeço toda a ajuda que tive de vocês e sei que
fizeram das tripas corações para me ajudar na realização do trabalho. Agradeço ao
Paulo, ao Renato e ao Zede pelos toques, a vida sempre ensina mais que os livros.
Agradeço imensamente aos moradores do beiradão do Purus, quem sabe um dia
consigam um apelido pra mim. Eu espero conseguir retribuir à altura a confiança que
vocês depositam no trabalho que está sendo feito. Agradeço especialmente ao Sr.
Isaac, Sr. Mário, Sr. Preto, Geovani, Zé Chico, Ezequias, Ducha, Sr. Lazaro; Sr.
Manuel; Sr. Dico sem o conhecimento de vocês não saberia por onde começar nessa
várzea imensa. Obrigado por abrirem as portas de suas casas e me ensinarem um
pouco da realidade que vocês experiênciam.
Agradeço toda a ajuda que tive na identificação botânica das plantas. Ao Sr. José
Ramos, Sr. José Lima o Sr. Sebastião Silvino (Sabá) e ao Sr. Issac, dia desses quero
conhecer metade do que conhecem das plantas da Amazônia. Agradeço também a
Ana Andrade e ao Eduardo Prata que diminuíram demais minhas aflições em uma
demonstração de amizade e paciência, sem contar o amor pela botânica. Aproveito
para agradecer ao PDBFF como um todo. A primeira vez agente nunca esquece.
Agradeço a dívida de uma vida que adquiri ao chegar em Manaus. Muito obrigado a
Mariana Mesquita Rabello e ao Marcelo Gordo por confiarem sua casa a mim. Desejo
muita harmonia em suas vidas e serei eternamente grato pela vida ter cruzado nosssos
caminhos. Por falar em amizade, tenho muitas pessoas que fazem parte de minha vida
e me ajudaram demais em todos os momentos sejam eles acadêmicos ou não. A Manô
ótima amiga pra trocar as pilhas e trazer ânimo. Ao André Antunes (Pardal) a Ana e
vii
ao João, linda a família que vocês formam. Ao Fábio Rohe, cara de coração grande e
que pode machucar muito as pessoas que lhe querem bem, mas sofre por saber que no
fundo não é assim. Aos amigos do laboratório, Brasa, Maíra, Rosinha, Gabriela e
Carine, trabalhar ao lado de vocês faz tudo ficar mais simples. Aos moradores do
Quilombo, minha primeira família ao sair de casa. Carlão e Carla, Jerônimo e Aninha,
Leonardo e Gabito, Mauricio, Tiago. Sempre lembrarei de um dos melhores períodos
de minha vida em que estive muito próximo de vocês. Muitos amigos ficarão de fora
deste agradecimento, saibam que gostaria de citar o nome de todos, mas estarão em
minhas orações ao anoitecer.
Agradeço a Manaus cidade de sentimentos intensos. Concordo que esta energia que
sentimos aqui seja proveniente das águas e da floresta que nos rodeia e é maravilhoso
poder fazer parte disso. Agradeço àquelas pessoas que a vida e a vinda a Manaus me
apresentou. Agradeço ao Amor e carinho que encontrei aqui. Tudo que passei nos
últimos dois anos de minha vida me fortalece e possibilita que eu seja uma pessoa
mais feliz. Espero logo estar comemorando mais uma vez com vocês.

viii
Resumo Nas planícies de inundação dos grandes rios da região Amazônica ocorrem florestas
aluviais, ricas em espécies de árvores tolerantes a períodos de alagamento de até oito
meses a cada ano. Utilizando dados de inventários botânicos com árvores ≥ 10 cm
DAP, em 16 parcelas de 0,315 ha, descrevemos o padrão de distribuição da
diversidade α de árvores em relação ao gradiente ambiental de profundidade de
inundação. Também avaliamos a influência do ambiente e do espaço geográfico na
variação da composição de espécies entre locais das florestas aluviais na paisagem de
várzea do baixo rio Purus, Amazonas. Amostramos 2 951 árvores de 304 espécies e
obtivemos como diversidade α de Fisher um valor de 85.05. A diversidade de árvores
é relacionada inversamente com o aumento da profundidade de inundação. A
dominância em cada parcela aumenta diretamente com a profundidade de inundação.
A dissimilaridade florística é alta e mais da metade da variação na composição
floristica é explicada pela variação na profundidade de inundação e na distância
geográfica entre os pares de parcelas. A maioria das espécies comuns não esteve
associada a um habitat espécifico na várzea. Ao longo do gradiente de profundidade
de inundação, além de ocorrer redução no número de espécies também ocorre a
substituição das espécies que participam da comunidade. O estudo do padrão de
distribuição da diversidade ao longo de gradientes de inundação é necessário para o
conhecimento da estruturação e para manutenção das espécies em florestas alagáveis
na Amazônia.
ix
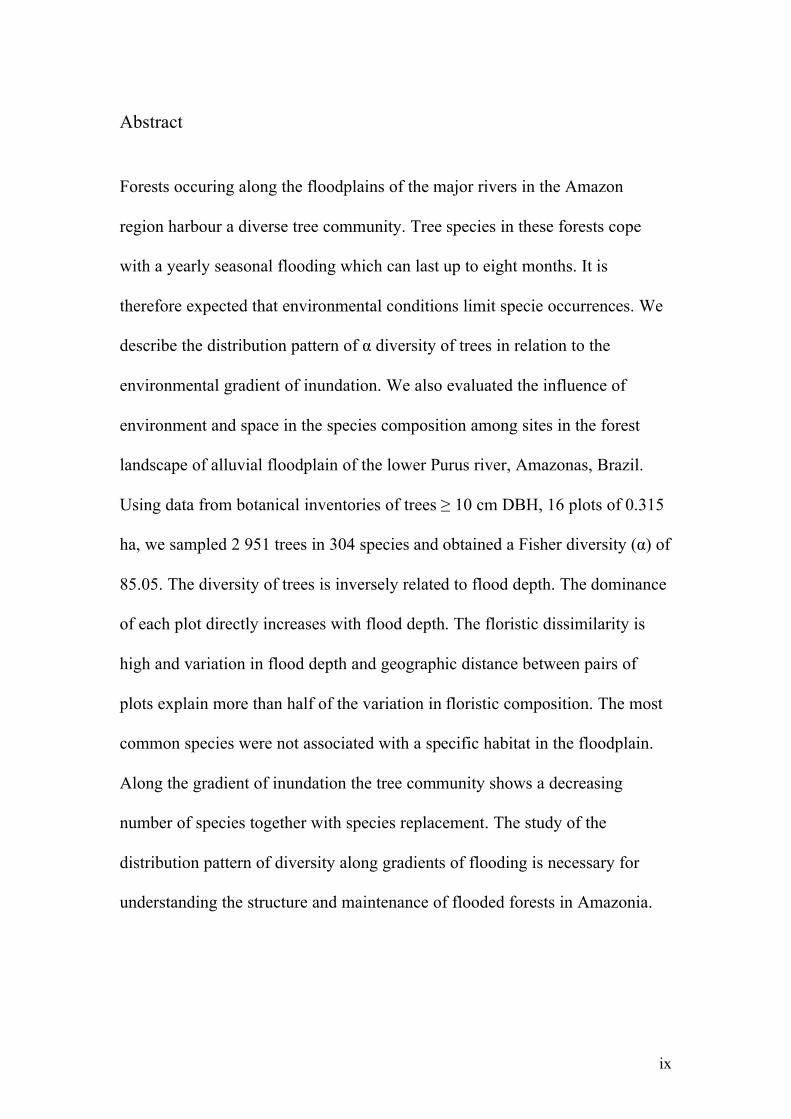
Abstract
Forests occuring along the floodplains of the major rivers in the Amazon
region harbour a diverse tree community. Tree species in these forests cope
with a yearly seasonal flooding which can last up to eight months. It is
therefore expected that environmental conditions limit specie occurrences. We
describe the distribution pattern of α diversity of trees in relation to the
environmental gradient of inundation. We also evaluated the influence of
environment and space in the species composition among sites in the forest
landscape of alluvial floodplain of the lower Purus river, Amazonas, Brazil.
Using data from botanical inventories of trees ≥ 10 cm DBH, 16 plots of 0.315
ha, we sampled 2 951 trees in 304 species and obtained a Fisher diversity (α) of
85.05. The diversity of trees is inversely related to flood depth. The dominance
of each plot directly increases with flood depth. The floristic dissimilarity is
high and variation in flood depth and geographic distance between pairs of
plots explain more than half of the variation in floristic composition. The most
common species were not associated with a specific habitat in the floodplain.
Along the gradient of inundation the tree community shows a decreasing
number of species together with species replacement. The study of the
distribution pattern of diversity along gradients of flooding is necessary for
understanding the structure and maintenance of flooded forests in Amazonia.
1
Sumário
Resumo ................................................................................................viii
Abstract .................................................................................................ix
Introdução Geral ...................................................................................2
Objetivo ..................................................................................................4
Manuscrito redigido segundo as normas da revista Ecography..........5
Methodology...........................................................................................9
Results ..................................................................................................14
Discussion .............................................................................................18
References ............................................................................................24
Figures e Tables ...................................................................................28
Conclusão Geral...................................................................................39
Referencias bibliográficas ...................................................................39
Apêndice ...............................................................................................41
Fichas de avaliação e parecer dos revisores do projeto de mestrado,
aula de qualificação, dissertação de mestrado e a ata da defesa
pública. .................................................................................................41
2
Introdução Geral
Florestas tropicais abrigam alta diversidade de espécies de árvores por unidade
de área. Nestas regiões, a diversidade de espécies varia, parcialmente, em função dos
limites de dispersão (Hubbel 2001), filtros ambientais (Ferrier et al. 2007; Tuomisto
and Roukolainen 2006) e filtros de interação (e.g., competição, predacão,
mutualismo) (Wright 2002) . De maneira simplificada, pode-se dizer que se as
espécies pudessem ocorrer em todos os locais, ou seja, se os limites de dispersão,
filtros ambientais e filtro de interação tivessem pouca influência na diversidade, então
diferentes locais exibiriam uma mesma composição. Estes locais teriam então o
mesmo peso na manutenção da biodiversidade (Legendre et al. 2005).
No entanto, as espécies de árvores das florestas tropicais não se distribuem de
maneira homogênea pela paisagem e a composição de espécies de cada comunidade é
afetada pela combinação de vários processos ecológicos (Duivenvoorden et al. 2002).
As florestas tropicais da Amazônia podem ser classificadas como florestas não
alagáveis (florestas de terra-firme), que ocorrem em terrenos relativamente mais
elevados e florestas alagáveis (florestas aluviais) que ocorrem nas planícies de
inundação às margens dos grandes rios (Pires and Prance 1985; Terborgh and
Andresen 1998). As florestas aluviais estão sujeitas a alagamentos sazonais
ocasionados por um pulso de inundação devido ao transbordamento marginal dos
grandes rios da Amazônia (Junk 1989). As árvores que ocupam estas florestas têm
adaptações fisiológicas, morfológicas e ecológicas para sobreviver às condições
ambientais variáveis destes ambientes (Parolin et al. 2004). Algumas espécies de
árvores suportam enchentes superiores a 9 m de profundidade e períodos de
submersão que chegam a oito meses por ano. Tais condições podem facilmente causar
o apodrecimento de raízes e a diminuição do crescimento das espécies lenhosas não
adaptadas (Ferreira et al. 2007). Porém, as limitações ambientais ocasionadas pelas
enchentes anuais não são as únicas limitações impostas às espécies árboreas nas
planícies aluviais. Nos terrenos sedimentares recém expostos para a colonização pelas
plantas, a alta incidência de radiação solar e a competição com gramíneas de rápido
crescimento são intensos (Wittmann and Junk 2003). Outra importante limitação
ambiental nas florestas aluviais é a ocorrência de períodos de estiagem coincidentes
3
com a fase que a floresta não está alagada e que pode causar estresse hídrico nas
plântulas e juvenis de espécies pouco adaptadas à falta de água (Parolin et al. 2010).
Estes fatores são determinantes no processo de regeneração dessas áreas.
As florestas aluviais que ocorrem nas margens dos grandes rios de águas
barrentas originados nos Andes são conhecidas como florestas de várzea (Prance
1979). As florestas de várzea estão nos terrenos mais recentes da bacia Amazônica e
os rios que passam por estas planícies carregam grande quantidade de sedimentos
provenientes do processo de erosão de seus leitos. O pulso de inundação anual, ao
qual as florestas de várzea estão sujeitas, confere a estas áreas uma alta fertilidade do
solo através da deposição dos sedimentos da erosão dos Andes que são carreados
pelos rios até as planícies aluviais.
As enchentes anuais e as mudanças do leito do rio ocasionam erosões nas
planícies de inundação e conferem caráter dinâmico às formações vegetais nas
várzeas (Salo et al. 1986; Kalliola et al. 1991). Assim, é possível encontrar manchas
de floresta de várzea em diferentes estádios sucessionais (Foster 1990; Worbes et al.
1992; Wittmann et al. 2004). Diferenças de sedimentação na planície de inundação
propiciam a formação de pequenas variações topográficas que, associadas à amplitude
do pulso de inundação, causam heterogeneidade ambiental (Albernaz et al. 2007).
A diversidade e a composição de espécies de árvores em um determinado
local da floresta aluvial é influenciada pelo pulso de inundação. Em geral, locais que
permanecem inundados por mais tempo e aqueles com maior profundidade de
inundação são os locais que uma menor quantidade de espécies consegue ocupar
(Ferreira 1997; Wittmann et al. 2002). A ocorrência de gradientes ambientais e sua
influência na diversidade de espécies é bastante estudada seja em escala local e de
paisagem (e.g. gradiente altitudinal), como em escala continental e global (e.g.
gradiente latitudinal) (ver Lomolino et al. 2006).
A descrição do padrão de variação da diversidade em comunidades ao longo
de gradientes levou a formulação de diferentes hipóteses a respeito dos processos que
explicam a variação na diversidade das espécies entre locais (eg. produtividade,
limitações ambientais, diferenciação de nicho) (ver Lomolino et al. 2004). O padrão
de distribuição da diversidade de árvores ao longo de gradientes ambientais,
ocasionado por variações na duração do período e na profundidade de inundação já
foi explorado nas florestas aluviais da Amazônia, tanto para as florestas de várzeas

4
(Ayres 1993; Wittmann et al. 2002) quanto para as florestas de igapó (Ferreira and
Strohlgren 1999; Ferreira 2000). No entanto, apenas o estudo de Wittmann e
colaboradores (2006) avaliou a influência dos limites de dispersão na estrutura das
comunidades de árvores nas florestas de várzea da Amazônia, indicando um efeito
espacial na escala da bacia amazônica.
Objetivo
Neste estudo analisamos o padrão de variação na diversidade local de árvores
ao longo do gradiente de inundação na paisagem de floresta de várzea do baixo rio
Purus. A similaridade florística foi relacionada com a diferença de profundidade de
inundação e com a distância geográfica entre localidades determinando a contribuição
relativa do gradiente ambiental (i.e., profundidade de inundação; duração do período
de inundação) e dos limites de dispersão (i.e., distância geográfica) na variação da
diversidade e da composição de espécies arbóreas. Descrevemos o padrão de
distribuição das espécies ao longo do gradiente de inundação e avaliamos a
possibilidade de espécies dominantes distribuindo-se por toda a paisagem
independentemente da condição ambiental. As as seguintes questões foram
abordadas: 1) Qual a relação entre o gradiente ambiental de profundidade da
inundação e a diversidade alfa de árvores?; 2) Qual o papel do espaço ambiental e do
espaço geográfico na estruturação da variação da diversidade alfa e da dissimilaridade
florística?; 3) Existe preferência das espécies comuns a determinadas posições ao
longo do gradiente ambiental de inundação?
5
Manuscrito redigido segundo as normas da revista Ecography 1
2
ENVINRONMENTAL AND SPATIAL FACTORS ON TREE SPECIES RICHNESS 3
AND COMMUNITY STRUCTURE OF FLOODED FORESTS IN PURUS RIVER, 4
CENTRAL AMAZON 5
Bruno Garcia Luize 6
Instituto Nacional de Pesquisas da Amazônia INPA 7
Address: Av. André Araújo, 2936, INPA-CPEC, Aleixo, CEP 69060-001, Manaus - AM 8
Eduardo Martins Venticinque 10
Universidade Federal do Amazonas UFAM 11
WCS Brasil - Wildlife Conservation Society 12
Address: Prédio do Projeto Sauim de Coleira – IB UFAM, CEP 69060-001, Manaus – AM 13

6
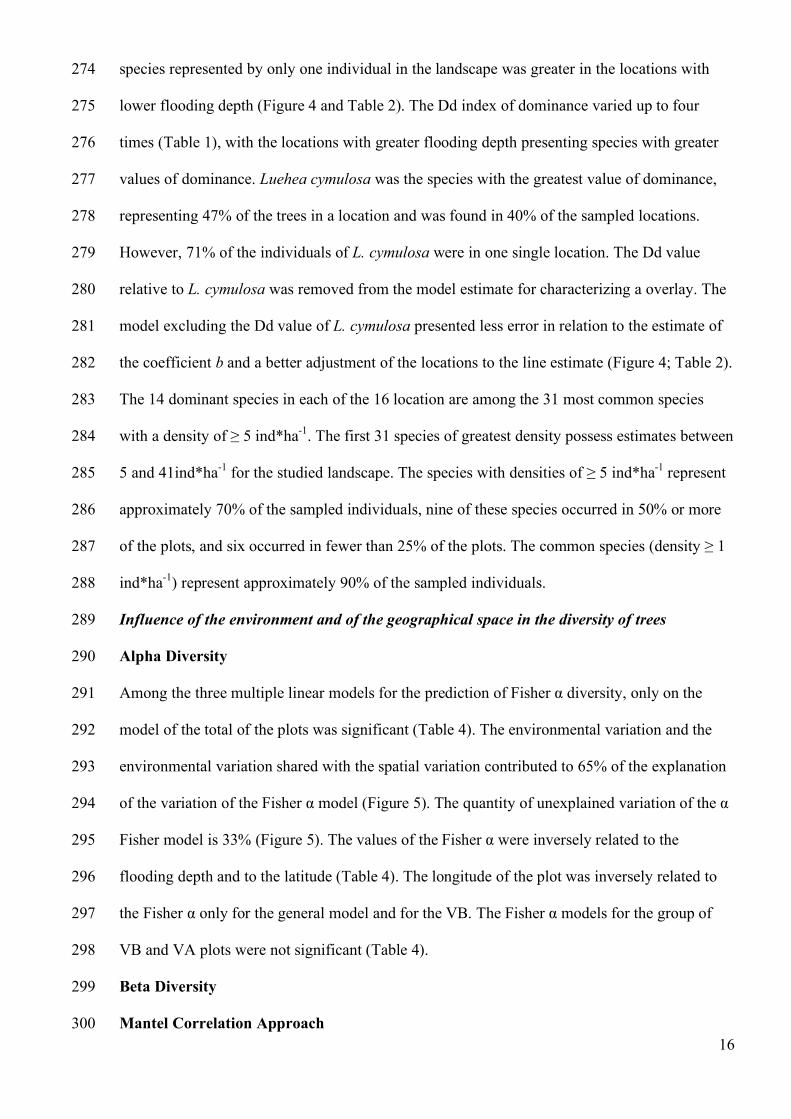
Abstract 15
In the floodplains of major rivers in the Amazon region occur alluvial forests rich in tree 16
species tolerant to flooding periods of up to eight months each year. Using data from 17
botanical inventories of trees ≥ 10 cm DBH, 16 plots of 0.315 ha, we describe the 18
distribution pattern of α diversity in relation to the environmental gradient of inundation. 19
We also evaluated the influence of environment and space in the species dissimilarity 20
composition among sites in the forest landscape of the alluvial floodplain of the lower 21
Purus river, Amazonas, Brazil. We sampled 2 951 trees in 304 species and obtained a 22
Fisher diversity (α) of 85.05. The diversity of trees is inversely related to increase in 23
flood depth. The dominance of each plot directly increases with flood depth. The 24
floristic dissimilarity is high and variation in flood depth and geographic distance 25
between pairs of plots explains more than half of the variation in composition 26
dissimilarity. 87% of the most common species was not associated with a specific 27
habitat in the floodplain. Along the gradient of inundation the tree community shows a 28
decreasing number of species together with species replacement. The study of the 29
distribution pattern of diversity along gradients of flooding and distance of localities is 30
necessary for understanding the structure and maintenance of the flooded forests in 31
Amazonia.32
7
The Amazon river basin occupies more than 6.8 million km2, draining the equivalent of 25% of 33
the surface area of South America (Goulding et al. 2003). The seasonality of the rain regimens 34
associated with the low declivities causes annually inundations that transform the land 35
environments on the edges of the larger Amazonian rivers into aquatic environments (Junk et al. 36
1989). Within these floodplains and terraces there occur alluvial tropical forests (known as 37
várzea and igapó, sensu Prance 1979). The plants that establish themselves in these 38
environments possess adaptations for aquatic-terrestrial life, in function of the regular and 39
predictable occurrence of the flood pulse (Junk 1989; Junk 1997; Parolin et al. 2004). The flood 40
pulse justifies the establishment of a complex environmental gradient (sensu Whittaker 1967) 41
represented by the duration and depth of the flooded area. This environmental gradient has 42
consequences in the structure of biological communities and is a determining factor in local 43
(Ayres 1993; Ferreira and Strohlgren 1999; Wittmann et al. 2002) or regional (Wittmann et al. 44
2006) diversity of trees. 45
Seasonal flooded forests cover approximately 144 000 km2 of the Central Amazon Region 46
(Hess et al. 2003). The geomorphological processes of erosion, sedimentation, and annual flood 47
pulse confer a dynamic character on the floodplains of the white-water rivers (várzea) 48
influencing the existence of plants communities in different successional states (Salo et al. 49
1986; Foster 1990; Worbes et al. 1992; Wittmann et al. 2004). The várzea landscapes are 50
formed by sediments rich in nutrients, eroded of the Andes and carried by the white-water rivers 51
to lowlands (Irion et al. 1997). The várzea forests of the Amazon contain the largest collection 52
of trees species that are flood-tolerant in the world floodplain forests (Wittmann et al. 2006), 53
hosting a great diversity of adaptations and arboreal species with the capacity to withstand 54
extreme flooding with more than eigth meters of depth and until six months of permanence 55
(Junk 1997). 56
The process through which the community structure is created and maintained and the manner 57
in which the species composition varies among the habitats is fundamental for understanding 58
the functioning of the ecosystems for the conservation of the biodiversity and for the efficient 59
8
allocation of economic resources in territorial management (Ferrier 2002; Legendre et al. 2005). 60
The environmental factors that influence the structure of the tree communities in the tropical 61
forests have been amply discussed in the literature and bear evidence to the complexities of 62
these communities. Many times not even the different combination of variables is capable of 63
explaining much with regards to the structure of the diversity in these communities (eg. 64
Duivenvoorden et al. 2002; Chave 2008). The difficulty in understanding the factors that 65
determine the structure of the arboreal community in the tropical forests is, in part, related to the 66
fact that the majority of tree species occur in low densities in an ecosystem with elevated 67
environmental heterogeneity (Pitman et al. 2001). 68
According to Tuomisto and Ruokolainen (2006), three ecological hypotheses with regards to 69
the structure of the communities have special relevance for forest communities. The first 70
implies that the species composition among localities float in a random fashion and is not 71
related to environmental factors, or rather, the same species present similar relative abundances 72
in geographically closer locations due to the limitation of species dispersal (Hubbell 2001). The 73
second, called the oligarchy hypothesis (Pitman et al. 2001), implies uniformity of forest 74
composition among localities and the dominance of oligarchic groups of species distribuited 75
regardless of environmental conditions and habitats patchs along the landscape (Pitman et al. 76
2001; tuomisto and Ruokolainen 2006). The third hypothesis considers that the distribution of 77
species is related to the environmental conditions, assuming that locations with similar 78
environmental conditions present greater floristic similarity than locations that differ in their 79
environmental conditions (Gentry 1988, Tuomisto et al. 1995). 80
These hypotheses, considered separately, seem to not explain the variation of the structure of 81
arboreal communities of várzea forests along the environmental and geographical gradients. For 82
these forests a high dominance of species is expected in comparison to the upland forests, given 83
that a lower number of species is adapted to the conditions of these environments (Pires and 84
Prance 1985). It is still expected that the variation of the diversity and the floristic composition 85
along the landscape be strongly related to the duration gradient and flooding depth throughout 86
9
the year (Ayres 1993; Ferreira and Stohlgren 1999; Witmann et al. 2002), selecting species 87
tolerant to consecutive flooding. On the other hand, comparisons indicate high local floristic 88
heterogeneity among patches of forest in the várzea (Terborgh and Andresen 1998), which 89
could mischaracterize the hypothesis of oligarchic species dominating extensive areas of forest. 90
The great majority of studies formalize predictions with respect to the diversity in relation to 91
environmental determinism (Ferreira and Stohlgren 1999; Wittmann et al. 2002), with only the 92
study by Wittmann and collaborators (2006) evaluating the effect of geographical distance in 93
the floristic composition of the várzea forest on a continental scale for the white-water rivers of 94
the Amazon Basin. 95
In this study, we analyzed on a local scale and on a landscape scale the structure of arboreal 96
communities of várzea forests in the region of the lower Purus River. We considered to this end 97
the three ecological hypotheses previously presented. Thus, we explored the following 98
questions: 1) What is the relationship between the environmental gradient of flooding depth and 99
the alpha diversity of trees; 2) What is the role of environmental distance and geographical 100
distance in the structure and in the variation of the alpha diversity and of the floristic 101
dissimilarity; 3) Does there exist preference for common species to determined positions along 102
the environmental gradient of flooding? 103
Methodology 104
Area of Study 105
The landscape we studied is located in the region of the lower Purus River, in the Central 106
Brazilian Amazon (Figure 1).The study was conducted in alluvial forests within the limits of the 107
Piagaçu-Purus Sustainable Development Reserve RDS-PP, a state conservation unit of the 108
sustainable use group (de Deus et al. 2003). The Purus River is a white-water river representing 109
5% (375 000km2) of the area of the Amazon Basin and possessing approximately 21 000km2 of 110
floodplains along its edges, constituting the largest area of floodplains among the tributaries of 111
the Amazon River (Goulding et al. 2003). The amplitude of the rainy period of the Purus River 112

10
varies annually at around 10 m in the city of Beruri, Amazonas, Brazil (HidroWeb 2010). The 113
rainy period occurs between December and February, with the peak of flooding from the 114
months of May to July. Once past the peak of the rainy season and flooding the water-levels of 115
the river begin receding, reaching their lowest levels in the months of October and November 116
(Haugaasen and Peres 2006). The total annual precipitation in the region of the lower Purus 117
River is around 2 000 mm and the average temperature is around 24 oC . Recent studies suggest 118
that the region of the lower Purus River (at approximately 62o, 63o long.) present a high 119
arboreal species richness, both for flooded forests and for upland forests (Albernaz et al. 2007; 120
Hopkins 2007). However, few projects have sampled the forests of this region (Haugassen and 121
Peres 2006; Albernaz et al. 2007). 122
Sampling of the vegetation 123
Between August and December of 2009 we inventoried the arboreal vegetation in 16 plots of 3 124
125 m2 (0.3125 ha), totaling an area of 5 ha. The plots had a rectangular format with dimensions 125
of 125x25m and were oriented in such a way that their main axis was contained in the lowest 126
variation of relief and guaranteed homogeneity of sample units. The location of the plots 127
followed two criteria: 1) spatial dispersion of the plots; 2) environmental gradient range. In 128
order to guarantee spatial dispersion we adopted a minimum distance of 1 km between plots. In 129
order to guarantee the range of the environmental gradient each plot was to present different 130
depths of flooding (1.6 to 9.1 m in 2009 flood season) until the entire environmental gradient 131
was contemplated. 132
All of the individual trees with DBH ≥ 10 cm (diameter at breast height at 1.30 m) were marked 133
and numbered with aluminum plates. Botanical samples from the trees in the plots were 134
collected and botanical determinations were done by comparison with the material from the 135
INPA (National Institute for Amazonian Research in Manaus, Brazil) herbarium and, when 136
determination was not possible, morphotyping of the materials was performed. For the 137
individuals that presented fertile structures, samples were collected with duplicates which were 138
later deposited in the INPA herbarium. Of the total of sampled individuals, 73% were identified 139

11
at the species level, 25% were morphotyped at the genus level, and just one percent was 140
morphotyped at the family level. 141
Environmental Data 142
Each vertex of the sub-plots was geo-referenced with the aid of the GPS Garmin® 60CSx 143
(Datum WGS 84; decimal degrees) instrument, forming a Geographical Information System 144
(GIS). The central point of each plot was utilized to calculate the linear geographical distance 145
between the plot pairings (Geographical Distance Matrix, GDM). In each sub-plot three 146
individuals were selected, whereby the height of the water mark left on the trunk during the 147
most recent flooding was measured (July-August 2009). The measurements of the water marks 148
were taken with the aid of a graduated tape measure with a minimum scale of 5 centimeters. 149
The flooding of 2009 was about 1.87±0.92 m above the average historical maximum level in 150
Beruri, Amazonas (HidroWeb 2010). We considered that the measurement of the water mark on 151
the tree trunk represents the maximum depth of the most recent flood season and assumed that 152
the greater the flooding depth, greater the period in which the várzea forest remains flooded. 153
We calculated the Euclidean distance in meters of depth among the inventoried plots 154
(Environmental Distance Matrix, EDM). We calculate all distance matrixes in R software (R -155
Development Core Team 2008). 156
Data analysis 157
The total number of species listed in each plot was used as the value of species richness 158
observed (Sobs). Possible differences in the values of species richness observed could be related 159
to the variation of the number of individuals sampled (Gotelli and Colwell 2001). Thus, we 160
calculated the numerical species richness (Srar) per individual added to the sample with the use 161
of rarefaction curves computed with the computer program EstimateS (Colwell 2006). We 162
utilized as a base of comparison Srar when the number of individuals reached 100 trees per plot. 163
The data from Srar are more appropriate for testing the ecological hypothesis relative to the 164
restriction of the number of species that occur in the most flooded parts of the várzea forest due 165
to the allusion made to the species abundance (Gotelli and Colwell 2001). We evaluated the 166
12
alpha diversity with the Fisher alpha coefficient (α Fisher) of each plot and of all the plots 167
together as a whole. The α Fisher is a parametric index of diversity that adjusts the distribution 168
of a logarithmic series, which relates the number of species found with a determined abundance 169
in the sample (Magurran 2004). Their values are relatively little impacted by the variation of the 170
sample size and are even robust when the empirical data do not conform to a logarithmic series 171
distribution (Magurran 2004). We calculated the number of unique species (singletons) for each 172
plot utilizing information from the species that occurred with just one individual in all the 16 173
plots sampled. We considered singletons as being species with low density of individuals per 174
hectare (< 0.2 ind*ha-1 in the landscape). We estimated the equitability in the sample through 175
the Berger-Parker Index (Dd), as it is a dominance index that is rather simple and intuitive. Its 176
value represents the most abundant species in each sample and is obtained through the 177
proportion in relation to the total abundance of that particular sample (Berger and Parker 1970; 178
Magurran 2004). We used models of simple linear regression with adjustment of minimum 179
squares to estimate the relation between the environmental gradient and the structural attributes 180
of the várzea forest (R Development Core Team 2008). 181
As a measure of variation in the composition of species between the plots we used the Bray-182
Curtis floristic similarity coefficient (CBC). The resulting dissimilarity matrix is quantitative and 183
considers the values of abundance of the species in the plot. The Bray-Curtis dissimilarity index 184
is the complement of CBC (1- CBC) and varies between zero and one, with zero indicating that all 185
the species are shared with similar relative abundances and one indicating that none of the 186
species are shared between location pairing. The Bray-Curtis similarity index is a quantitative 187
variation of the Sørensen similarity index (Magurran 2004). According to Tuomisto (2010), the 188
complement of the Sørensen index represents an exchange of species between locations 189
(Whittaker species turnover). Thus, we considered 1- CBC as being a measure of the magnitude 190
of exchange in the composition of species between locations. 191
In order to verify the relationship between the exchange of species (1- CBC) and the distance of 192
depth (EDM) or the geographical distance (GDM) between the plots, we calculated coefficients 193

13
of Pearson correlations using the Mantel procedure with 10 000 permutations (R Development 194
Core Team 2008). 195
We reduced to one the dimensions of the floristic dissimilarity matrix with the non-metric 196
multidimensional scaling technique (NMDS). We calculated the Euclidean distances between 197
the plots using the resulting axis values from the NMDS solution. Later, we correlated these 198
Euclidean distances with the original floristic dissimilarity matrix (1- CBC) in order to evaluate 199
the quantity of information from the exchange of species that is retained in the unidimensional 200
NMDS axis. High values of correlations indicate that the values summarized in the axis one 201
scores of the NMDS were maintained as faithfully as possible from the initial 1- CBC matrix. 202
We used multiple linear regressions to relate the values of the NMDS axis with the flooding 203
depth, latitude, and longitude. We partitioned the variation of the resulting model among the 204
explanatory variables and calculated the proportion of the explained variation: 1 – by the 205
environmental variation (flooding depth); 2 – by the variation in geographical space; 3 – by the 206
combination of environmental and spatial variation; and 4 –unexplained by the model. The 207
same procedure of partition of the variation was undertaken for a multiple linear model relating 208
the Fisher alpha diversity index of each location with the flooding depth, latitude, and 209
longitude. For these procedures we used the SAM software (Rangel-Filho et al. 2010). 210
We considered all of the species with a density of ≥ 1 ind * ha-1 in the sum of the plots as 211
common species in landscape scale (~900 Km2) (Pitmann et al. 2001). In order to test whether 212
the oligarchic species (Pitmann et al. 2001) are distributed along the entire landscape without 213
suffering effects of the environmental gradient of flooding, an analysis of indicator species was 214
applied (indicator value - IV) (Dufrene and Legendre 1997). We calculated the IV value for the 215
common species in the landscape with the use of the Pc-Ord program (Dufrene and Legendre 216
1997; McCune and Mefford 1999). We classified the sampled plots in two groups of habitats: 217
VA – high várzea (várzea alta), those plots with an maximum average historical flooding depth 218
of < 3.0 m (n = 7 locations) and VB – low várzea (várzea baixa), all the plots with an maximum 219
average historical level of flooding depth of ≥ 3.0 m (n = 9 locations) (Ayres 1993; Wittman et 220

14
al. 2002); in order to classify the plots we corrected the values of flooding depth measure in the 221
plots due to the flooding of 2009 having presented greater registered levels of flooding for the 222
Amazon Basin (HidroWeb 2010; 187±092 cm above the maximum average historical level in 223
Beruri). 224
Indicator species are defined as the most characteristic species of the given group (Dufrene and 225
Legendre 1997). Thus, the IV value combines the relative abundance with the relative 226
frequency of occurrence of the species in the samples of one of the two groups of locations 227
(Dufrene and Legendre 1997). The IV value was used to indicate whether there is preference 228
between the VA or VB habitats by the species, given a greater association with a determined 229
habitat with a greater IV value. On the other hand, low IV values indicate that the dominant 230
species in the landscape are distributed indifferently among the two habitats. The statistical 231
significance was evaluated by random procedure, where the 16 plots were permutated 10 000 232
times. The common species were directly ordered using the relative abundance value of the 233
species in the plot for the total of common species (> 1 ind*ha-1) and for the reduced total of 234
common species with a density of ≥ 5 ind * ha-1. We verified that the group of common species 235
with a ≥ 5 ind * ha-1 presents a proportion of indicated species similar to the proportion 236
presented by the group to the group of common species with a density of ≥ 1 ind*ha-1 (G=2.16; 237
p=0.14). We then presented the direct order only for the common species with a density of ≥ 5 238
ind * ha-1. 239
Results 240
General Pattern 241
2 951 individuals with DBH ≥10 cm were inventoried, in the five hectares of várzea forest in 242
the lower Purus River (Table 1). The sampled individuals belong to 304 species of trees. Our 243
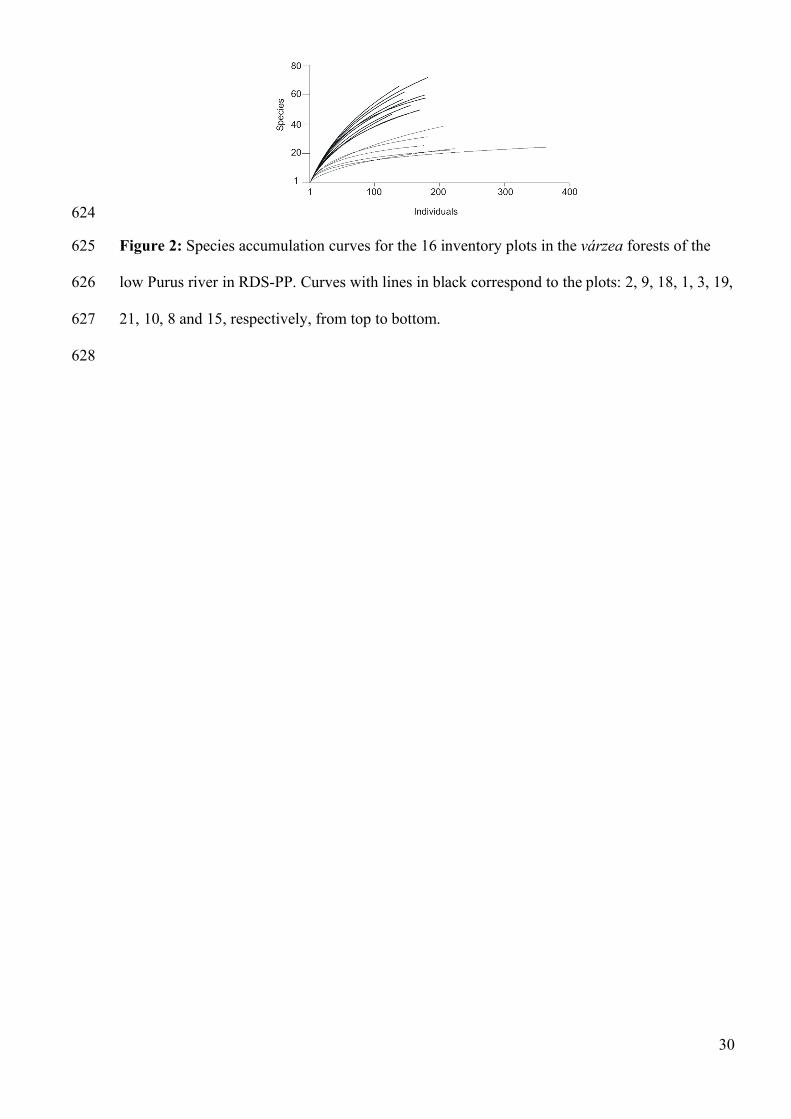
data show two distinct groups of curves of accumulation for the várzea forests (Figure 2). The 244
first group, in general, represents the communities sampled in the locations with lesser flooding 245
depth, whereas the second group represents the communities in locations with greater flooding 246

15
depth (Figure 2; Table 1). The density of trees varied between 406 and 1 171 individuals per 247
hectare and the total basal area varied between 26 and 48 m2 *ha-1. These two structural 248
attributes presented a light increase along the gradient of flooding depth (Table 1). However, 249
the adjustment of the linear models shows that the flooding depth was not related to the number 250
of individuals or with the basal area between each location (r2 = 0.17 e r2 = 0.03; p > 0.05, 251
respectively). 252
Considering the total number of species registered per plot, the percentage of species 253
represented by one individual varied between 30% and 50% of the species, with the greater 254
percentages being found in the plots that presented the greatest number of species. The species 255
richness in the várzea communities varied up to three times from one location to the another 256
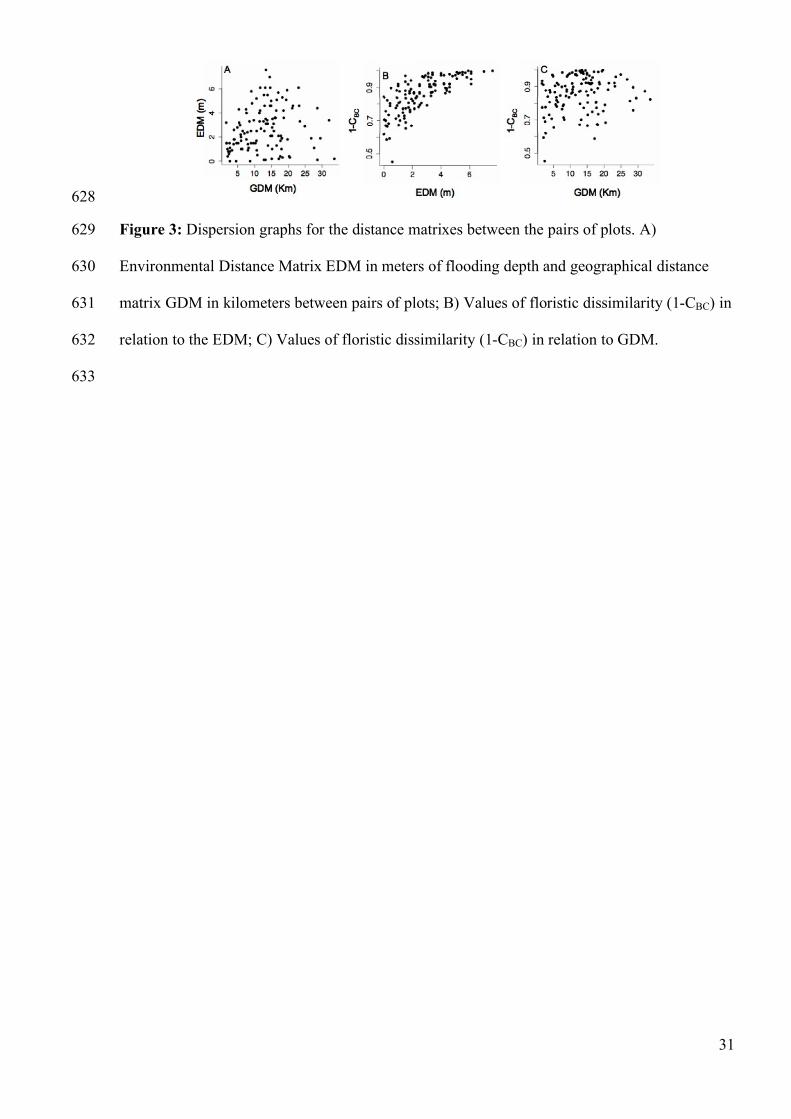
(Table 1). The exchange of species was high and only on pair of locations had a value of 1-CBC 257
< 0.5 (Figure 3). The two plots with the greatest value of similarity among them were in 258
locations whith greater flooding depth and lower species richness. Two pairs of locations shared 259
no species and presented 1- CBC equal to one. The exchange of species (1-CBC) for the total of 260
VB plots varied between 0.45 and 0.98, while for the total of VA plots varied between 0.58 and 261
0.82 (Figure 3). 262
Alpha diversity and Environmental gradient 263
We found an inverse relationship between the flooding depth and the quantity of species present 264
in the community (Figure 4). This relation is maintained as much in the observed values of the 265
species richness (Sobs) in each location as well as in the standardized richness values (Srar) 266
between the locations. The Fisher α diversity of trees in the várzea forest also decreased in 267
function of the increase in the flooding depth (Figure 4). Both the models of species richness 268
and the Fisher α diversity were inversely related to the flooding depth gradient and their 269
coefficients of determination were similar (Bstd ~ - 0.80; see Table 2). For the Fisher α diversity 270
the locations with greater flooding depth presented values between 6 and 26. In locations with 271
lower flooding depth, the Fisher α variation stood between 29 and 43. 272
We found 104 singletons (34 % of the species) in the 16 locations sampled. The quantity of 273
16
species represented by only one individual in the landscape was greater in the locations with 274
lower flooding depth (Figure 4 and Table 2). The Dd index of dominance varied up to four 275
times (Table 1), with the locations with greater flooding depth presenting species with greater 276
values of dominance. Luehea cymulosa was the species with the greatest value of dominance, 277
representing 47% of the trees in a location and was found in 40% of the sampled locations. 278
However, 71% of the individuals of L. cymulosa were in one single location. The Dd value 279
relative to L. cymulosa was removed from the model estimate for characterizing a overlay. The 280
model excluding the Dd value of L. cymulosa presented less error in relation to the estimate of 281
the coefficient b and a better adjustment of the locations to the line estimate (Figure 4; Table 2). 282
The 14 dominant species in each of the 16 location are among the 31 most common species 283
with a density of ≥ 5 ind*ha-1. The first 31 species of greatest density possess estimates between 284
5 and 41ind*ha-1 for the studied landscape. The species with densities of ≥ 5 ind*ha-1 represent 285
approximately 70% of the sampled individuals, nine of these species occurred in 50% or more 286
of the plots, and six occurred in fewer than 25% of the plots. The common species (density ≥ 1 287
ind*ha-1) represent approximately 90% of the sampled individuals. 288
Influence of the environment and of the geographical space in the diversity of trees 289
Alpha Diversity 290
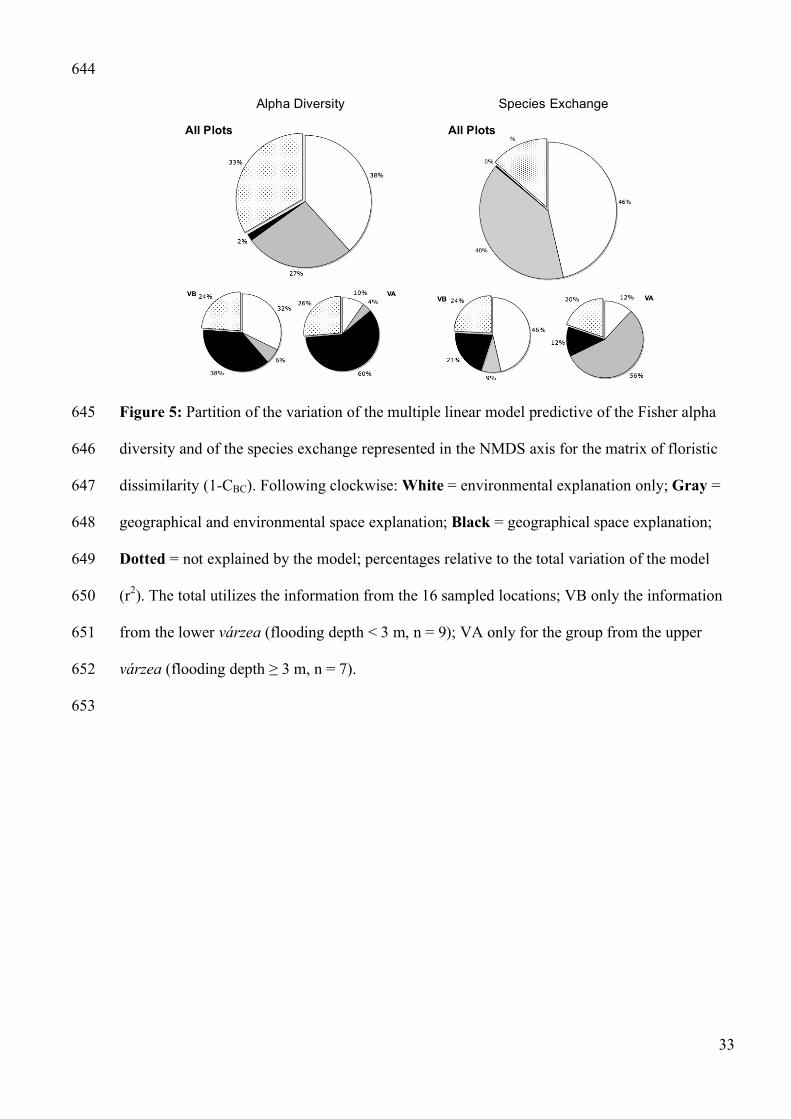
Among the three multiple linear models for the prediction of Fisher α diversity, only on the 291
model of the total of the plots was significant (Table 4). The environmental variation and the 292
environmental variation shared with the spatial variation contributed to 65% of the explanation 293
of the variation of the Fisher α model (Figure 5). The quantity of unexplained variation of the α 294
Fisher model is 33% (Figure 5). The values of the Fisher α were inversely related to the 295
flooding depth and to the latitude (Table 4). The longitude of the plot was inversely related to 296
the Fisher α only for the general model and for the VB. The Fisher α models for the group of 297
VB and VA plots were not significant (Table 4). 298
Beta Diversity 299
Mantel Correlation Approach 300
17
The floristic dissimilarity (1- CBC) was related to the EDM and was not related to the GDM 301
between the plots (Table 3, Figure 3). For the VA plots there was not any correlation of the 302
values of 1- CBC and the distance of flooding depth, and not at all with the geographical 303
distance. As for the group of VB plots, they presented a correlation between 1- CBC and the 304
distance of flooding depth (Table 3). However, the adjustment of the correlation diminishes in 305
relation to the correlation performed with the information from all the plots (Table 3, Figure 3). 306
The variation of floristic dissimilarity between the VB plots was not correlated to geographical 307
distance (Table 3). 308
NMDS Approach 309
The euclidian distance of the NMDS axis correlate 0.82 of the information from the original 1-310
CBC matrix that measures the exchange of species. Proximate values occurred between the 311
solutions of the NMDS axis for the VB (r = 0.72) and VA (r = 0.80). The partition of the 312
explanation of the multiple linear model, which estimates the values of the NMDS axis, shows 313
that 86% of the variation of the model is explained by environmental variation and by the 314
environmental variation shared with the variation in geographical space (Table 4, Figure 5). For 315
the group of VB plots, 68% of its variation is explained by the variation in the total of the 316
environmental and geographical space summed with the variation explained by the environment 317
only (Table 4, Figure 5). The group of VA plots did not have a significant multiple models as a 318
whole (Table 4). However, the b coefficient estimated for the predictive environmental variable 319
contributed to 12% of the explanation of the multiple models that estimates the exchange of 320
species for the VA plots (Table 4, Figure 5). 321
Indicator species 322
The 16 sampled locations on the lower Purus River included 124 common species with a 323
density of ≥ 1 ind* ha-1. These species represent approximately 90% of the individuals and 40% 324
of the samples species. The analysis of indicator species showed 29% of the common species in 325
the landscape having an IV value of ≥ 50. However, only 29 species had IV values that can be 326
differentiated from the expected chance value (IV p < 0.05). All of the 29 species considered 327

18
habitat indicators had an IV value of ≥ 55. More indicator species were found in the VA forests 328
than in the VB forests (VA: 24 species; VB: 5 species). The same proportion of indicator 329
species of VA and VB is maintained when we evaluate only the species with a density of ≥ 5 330
ind * ha-1 (G=0.193; P=0.686) (Figure 6). 331
The IV values, in general, were greater for the VA indicator species (57.1 ≥ IV ≤ 100), than 332
those found for the VB indicator species (55.6 ≥ IV ≤ 76.5) (Figure 6). Brosmium lactescens 333
and Tabernaemontana cymosa were the only species to reach the maximum IV value (Figure 334
6). These two species were frequent and abundant in the understore of várzeas forests of low-335
flooding depth (VA). Pseudobombax munguba and Hevea spruceana had the greatest IV values 336
in the group of plots that represent the forests that remained flooded for the longest periods of 337
time (VB) (Figure 6). These two species are components of the dossel and occur with frequency 338
in the VB forest and, in some cases, in the VA forests. 339
The low frequency of occurrence of the species with greater density helps to explain the local 340
pattern of high heterogeneity in the floristic composition. We observed that even the 341
communities with few rare species presented high floristic dissimilarity, as the dominant 342
species alternate locally. Of the 14 species with greater indexes of Dd dominance (4% of the 343
sampled species), two species were characteristic of VB (Hevea spruceana and Pseudobombax 344
munguba) and four species were characteristic of VA (Maquira coriacea; Hura crepitans; 345
Garcinia madruno and Virola surinamensis, see Figure 6). The other eight locally dominant 346
species did not present a distribution conditioned to a habitat and virtually could occur in all 347
várzea forest habitats. 348
Discussion 349
The diversity of trees in the landscape of the lower Purus River is shown to be relatively high in 350
relation to other inventories taken in várzea forests of the Amazon Region. Wittmann and 351
collaborators (2006) compiled 44 floristic inventories of arboreal species for the várzea forest 352
of the Amazon Region and listed the occurrence of 918 species. In this study we sampled an 353
19
area of five hectares and registered the occurrence of 304 species of trees, which could 354
represent up to 1/3 of the regional pool of species richness reported for the forest of the Amazon 355
várzea. The Fisher α diversity index for each of the sampling locations in this study varied 356
between 6 and 43. These values are comparable to the Fisher α diversity found by Wittman and 357
collaborators (2006) for the Amazon várzeas in general (α Fisher between 10 and 50). These 358
comparisons that consider the plots individually suggest that the diversity of trees of the lower 359
Purus River is relatively high on the local scale. Considering the diversity sampled by the total 360
of the plots presented by Wittman and collaborators (2006), our data show that the diversity of 361
the lower Purus River is high as well on the regional scale. The region of the lower Purus River 362
was recently evaluated as being a void of botanical collection in the Amazon (Hopkins 2007), 363
reiterating the need for botanical collections in this region with the aim of improving the 364
biogeographical characterizations of the Amazonian flora. 365
The structural attributes, tree density, and the total basal area of each sampling location did not 366
vary along the flooding gradient (see Table 1). This result is contrary to the one found in the 367
várzea forests of the lower Japurá River (Ayres 1993) and in the igapó forests of the Jaú River 368
(Ferreira and Stohlgren 1999), where an inverse relation between the structural attributes and 369
flooding depth was observed. The species richness observed in each sampling location varied 370
strongly along this gradient. The exchange of species was high, indicating heterogeneity in the 371
floristic composition between locations of várzea forests, as was also shown in Terborgh and 372
Andersen (1998). 373
The linear models we computed allow for the realization of robust estimates of the values of the 374
diversity attributes for the studied landscape. The richness of tree species, the Fisher α diversity, 375
the number of rare species and the relative abundance of the dominant species in the várzea 376
forest in the landscape of the lower Purus River can be predicted with reliability. With these 377
diversity attributes we can infer how many species will be in a given location and how these 378
species share their abundances in the community. The study of the pattern of variation of the 379
20
abundance curves of the species along the gradient makes possible the formulation of 380
hypotheses for the local structuration of the diversity in these communities (McGill et al. 2007). 381
As a pattern, we observed that the local diversity of arboreal species in the várzea is inversely 382
related to the flooding depth in the forest, results similar to those found in várzea forests (Ayres 383
1993; Wittmann et al. 2002) and igapó forests (Ferreira and Stohlgren 1999; Ferreira 1997) in 384
the Amazon. The number of unique species (singletons) in each location also decreases with the 385
increase in flooding. The community of trees sampled in the landscape of the lower Purus River 386
possesses close to 1/3 of the species with densities of ≤ 0.2 ind*ha-1. The dominant species had 387
higher relative abundances in the locations that remained flooded for longer periods of time. 388
Thus, we observed that the communities in the locations with greater flooding possess 389
distributions of abundance of species that resembles the geometric series model. As the flooding 390
depth decreases, the distribution of abundance of species resembles a logarithmic series. In the 391
communities of greater flooding the process of species filling (pre-emption model) during the 392
initial stages of succession is possibly the ecological process of greater influence in the local 393
richness of species (McGill et al. 2007; Wittmann et al. 2004). The number of species that will 394
occupy and participate in the community is somewhat reduced due to the limitations brought 395
about by environmental severity (eg. flooding, droughts, and extreme incidence of solar 396
radiation) and the greater competitive capacity of species tolerant to flooding and that are 397
capable of primarily colonizing the environment in early stages of succession. 398
We observed that few species (10%) represent the majority of the individuals (70%) sampled in 399
the landscape of the lower Purus River. The frequency of occurrence of the common species in 400
the locations was low (see Figure 5). Still, the inverse relation between the dominance and the 401
frequency of occurrence may be bringing about an increase in the exchange of species between 402
locations. In the Amazon scale, the floristic dissimilarity between regions of várzea forests may 403
be less due to the occurrence of some dominant species found habitually in the inventories 404
(Worbes et al. 1992; Ayres 1993; Nebel et al. 2001; Urrego et al. 1997; Santos and Jardim 405
2006). 406

21
The flooding depth was the factor most strongly related to the variation in the floristic 407
composition in the várzea forests. The neutral theory prediction (Hubbell 2001), which assumes 408
that there is no environmental effect in the variation of the species composition between 409
locations, is not supported by our data. The data also do not support the hypothesis of oligarchic 410
species (Pitman et al. 2001) due to the floristic heterogenety and a relation between the commun 411
species and the environmental variation. However, the prediction of oligarchic species 412
dominating extended areas of landscape must be evaluated with greater care because a great 413
number of species communs do not show an environmental preference. Our data do not reject 414
the hypothesis of species composition related to environmental conditions. We observed that 415
the two compartments of várzea forest that we evaluated (VB and VA) have influences both 416
from the environment and from the geographical space of their communities. However, the 417
roles of each of these variables have different weights along the environmental gradient. In 418
general, the environment had a preponderant role in the variation in species composition 419
between locations. In all our models the unexplained floristic composition variation was the 420
lesser in proportion. These results are different from those found in tropical upland forests (eg. 421
Duivenvoorden et al. 2002, Chave 2008). 422
In the várzea forests, the limitation to dispersion seems not to be a limiting ecological factor. 423
The reproductive behavior of many of the arboreal species that fruit during the high-water 424
season (Parolin et al. 2004; Haugaasen and Peres 2005), summed to the morphological 425
characteristics of the seeds are dispersed by fish or by fluctuation (Gottsberger 1978), can 426
guarantee the species greater capacity of dispersion throughout the várzea environment. On the 427
other hand, for the high várzea forests, the limitation of the species to environmental conditions 428
seems not to be as determinant in the distribution of the species throughout the landscape as for 429
the low várzea forests. We must remember that the two compartments of the community of 430
trees in the várzea forests we used here are somewhat arbitrary. The species with preferential 431
occurrence in one compartment can, occasionally, occur in the other, conferring a continuous 432
character on the community of trees in the várzea forests, in accordance with the Gleason 433
22
concept of open communities. 434
In the várzea forests the species are gradually substituted during the period of forest succession 435
and with the decrease of the influence of flooding (Worbes et al. 1992; Wittmann et al. 2004). 436
Due to the substitution of species in gradients, we found indicator species of specific 437
environmental conditions. On the other hand, the majorities of species (~77 % of the common 438
species) are capable of being distributed along the whole gradient, and are able to be 439
characterized as oligarchic species (sensu Pitman et al. 2001). Our data indicate that there exist 440
a number of species in the forest for which it is possible to realize prediction with respect to 441
their role in the structuring of communities. The predictions are possible, since some species are 442
common and occur indiscriminately characterizing a oligarghy species (Pitman et al. 2001), and 443
some are indicator species for specifics habitats. 444
Among the VA indicator species we found species that occur both in the flooded forests and the 445
upland forests (Wittmann et al. 2006). Among examples we can cite, Hura crepitans, Virola 446
surinamensis and Himatanthus sucuuba. H. crepitans have ample distributions that extend as 447
well to the dry tropical forests of Central America. V. surinamensis has a distribution in upland 448
forests in the Amazon, often associated with riparian habitats. H. sucuuba, despite occurring in 449
upland forests, is a species that presents physiological modifications, depending on the habitat 450
in which its population is found (Ferreira et al. 2007). Seeds and plants of H. sucuuba 451
originating in upland habitats do not possess the same “fitness” as when in flooded habitats 452
(Ferreira et al. 2007). Other VA indicator species possess distributions more associated with 453
seasonally flooded forests. Such is the case of Maquira coriacea, which can be found with 454
densities superior to 14 ind*ha-1 in the lesser flooded areas of the várzea forests of the Ucayali 455
River in Peru (Nebel et al. 2001b). 456
For VB, we found three indicator species for the group of species with a density of ≥ 5 ind*ha-1, 457
being that two are strongly associated with locations that have extreme flooding depths. 458
Pseudobombax munguba is a species known for colonizing the secondary stages of succession 459
in the VB forests of the Central Amazon (Worbes et al. 1992). This species possesses small 460
23
seeds that are dispersed by the wind and water during the rainy season (Parolin et al. 2004). 461
Another marked characteristic of this species is its capacity to store water in its trunk and lose 462
its leaves during the flooding, which makes possible a reduction in energetic metabolism 463
(Parolin et al. 2004). 464
The lower number of VB indicator species is expected to be related to the fact that these species 465
frequently occur as well in VA areas. This fact does not happen with the VA indicator species. 466
This observation suggests that the restrictions on the species along the flooding gradient are not 467
the same. In the locations of lesser flooding (VA), the effect of flooding on the reduction of the 468
capacity to colonize the environment is expected to be less restrictive towards the species. In the 469
locations of greater flooding (VB), the species are expected to suffer greater environmental 470
restriction and competition. In addition to more species being capable of colonizing the VA 471
areas, we also observed the presence of sub-forest species and emerging species among the 472
indicators of these environments. These species contributed considerably to the increase of the 473
diversity. 474
We observed that the várzea forests are rather heterogeneous in species composition and that 475
the complex environmental gradient occasioned by the flooding pulse is the factor that most 476
influences the distribution of diversity in these forests. The narrow relation between the 477
diversity and composition of trees and the environmental gradient of flooding depth needs to be 478
used for more precise comparisons between várzea forests from different locations, landscapes, 479
and regions. The description of this pattern can improve the understanding of the distribution of 480
diversity and of the species of trees in flooded tropical forests, contributing to the formulation 481
of conservation strategies of these forests. 482
Acknowledgements 483
The National Council for Scientific and Technological Development - CNPq for the scholarship 484
for the first author and for the financing of the project and the support by the project Universal 485
no. 479599/2008 4. To the Piaguçu Institutes– Ipi for the logistical and lodging support in the 486
RDS-PP. To the Conservation Unit Center– CEUC and the Secretary of Sustainable 487
24
Development - SDS for the license to perform research in the Conservation Unit. To Ideawild 488
for the donation of field research equipment that made possible the collection of data. I thank 489
Nelson, B. W.; Piedade, M. T. F.; Fereira, L. V.; Albernaz, A. L. K. M.; Andrade, A.; Oliveira 490
Filho, A. T.; Parolin, P.; Schongart, J.; Wittmann, F. K.; Stropp, J. C.; Scudeller, V. V.; and 491
Vicentini, A., who did the first revisions and suggestions in the preparation of this manuscript. 492
Special attention deserves to be extended to the residents of the lower Purus River region in the 493
communities of Cauá, Cuiuanã, and Itapurú who helped with the field activities. 494
References 495
Albernaz, A. L. K. M. et al. 2007 Contribuição ao conhecimento da distribuição de árvores. 496
- In: Albernaz, A. L. K. M. (ed.) Conservação da várzea: identificação e caracterização de 497
regiões biogeográficas. – Ibama/ProVárzea, pp. 77-93. 498
Ayres, J. M. 1993. As matas de várzea do Mamirauá. - Sociedade Civil Mamirauá, Estudos 499
de Mamirauá, vol. 1. 500
Berger, W. H., Parker, F. L. 1970. Diversity of planktonic Forminifera in deep-sea 501
sediments. - Science 168: 1345-1347. 502
Chave, J. 2008. Spatial variation in tree species composition across tropical forests: pattern 503
and process. – In: Schnitzer, S. and Carson, W. (eds), Tropical Forest Community Ecology. 504
Willey-Blackwell, pp. 11-30. 505
Colwell, R. K. 2006. EstimateS: Statistical estimation of species richness and shared species 506
from samples. Version 8. Persistent URL<purl.oclc.org/estimates> 507
de Deus, C. P et al. 2003. Piagaçu-Purus: Bases científicas para a criação de uma Reserva de 508
Desenvolvimento Sustentável. - Instituto de Desenvolvimento Sustentável Mamirauá. 509
Dufrêne, M. and Legendre, P. 1997. Species assemblages and indicator species: The need 510
for a flexible asymetrical approach. - Ecological monographs 67:345-366. 511
Duivenvoorden, J. F. et al. 2002. Beta Diversity in Tropical Forests. - Science 295:636-637. 512
Ferreira, L. V. 1997. Effects of flooding duration of species richness and floristic 513
25
composition in three hectares in the Jaú National Park in floodplain forests in Central 514
Amazonia. - Biodiversity Conservation 6:1353-1363. 515
Ferreira, L. V. and Strohlgren, T. J. 1999. Effects of river level fluctuation on plant species 516
richness, diversity, and distribution in a floodplain forest in central Amazonia. - Oecologia. 517
120: 582-587. 518
Ferreira, C. S. et al. 2007. Floodplain and upland populations of Amazonian Himatanthus 519
sucuuba: Effects of flooding on germination, seedling growth and mortality. - 520
Environmental and Experimental Botany 60: 477–483. 521
Ferrier, S. 2002. Mapping spatial pattern in biodiversity for regional conservation planning: 522
where to from here? - Syst. Biol. 51: 331-363. 523
Foster, R. B. 1990. Long-Term Change in the successional forest community of the Rio 524
Manu Floodplain. - In: Gentry, A.H. (Ed.) Four Neotropical Rainforests. Yale University 525
Press, pp 565-572. 526
Gentry, A. H. 1988. Changes in plant community diversity and floristic composition on 527
environmental and geographical gradients. - Annals of the Missouri Botanical Garden 75:1-528
34. 529
Gotelli, N. and Colwell, R. K. 2001. Quantifying biodiversity: procedures and pitfalls in the 530
measurement and comparison of species richness. - Ecology Letters 4: 379–391. 531
Gottsberger, G. 1978. Seed Dispersal by Fish in the Inundated Regions of Humaita, 532
Amazonia. – Biotropica 10(3): 170-183. 533
Goulding, M. et al. 2003. The Smithsonian atlas of the Amazon. - Smithsonian Books. 534
Haugaasen, T. and Peres, C. A. 2005. Tree Phenology in Adjacent Amazonian Flooded and 535
Unflooded Forests. - Biotropica 37(4): 620–630. 536
Haugaasen, T. and Peres, C. A. 2006. Floristic, edaphic and structural characteristics of 537
flooded and unflooded forests in the lower Rio Purus region of central Amazonia, Brazil. - 538
Acta Amazonica 36(1): 25-36. 539
Hess, L. L. et al. 2003. Dual-season mapping of wetland inundation and vegetation for the 540
26
central Amazon basin. - Remote Sensing of Environment 87:404-428. 541
HidroWeb 2010 – Sistema de informações hidrológicas. Agência Nacional das Águas ANA. 542
URL < http://hidroweb.ana.gov.br/> 543
Hopkins, M. J. G. 2007. Modelling the known and unknown plant biodiversity of the 544
Amazon Basin. - Journal of Biogeography 34:1400-1411 545
Hubbell, S. P. 2001. The Unified Neutral Theory of Biodiversity and Biogeography. - 546
Princeton University Press. 547
Irion, G. et al. 1997. The large central Amazonian river floodplains near Manaus: 548
geological, climatological, hydrological and geomorphological aspects. - In: Junk W.J. 549
(ed.), The Central Amazon Floddplain: Ecology of a Pulsing System. – Springer, pp. 67-96. 550
Junk, W. J. 1989. Flood tolerance and tree distribution in Central Amazonian floodplains. - 551
In Nielsen L. B. et al.(eds) Tropical forests: botanical dynamics, speciation and diversity. 552
Academic Press, pp. 47–64 553
Junk, W. J. et al. 1989. The flood pulse concept in river-floodplain systems. - In: Dodge, D. 554
P. (ed) Proc. Int. Large River Symp. Can. Spec. Publ. Fish. Aquat. Sci. (Vol.106), pp. 110-555
127. 556
Junk, W. J. 1997. Ed., The Central Amazon floodplain: Ecology of a pulsing system. - 557
Ecological Studies, vol. 126, Springer. 558
Junk, W. J., and Piedade, M. T. F. 1997. Plant life in the floodplain with special reference to 559
herbaceous plants. – In: Junk, W. J. (ed.), The Central Amazon floodplain: Ecology of a 560
pulsing system. - Ecological Studies, vol. 126, Springer, pp. 147– 185. 561
Junk, W. J. 2000. The central Amazon River floodplain: Concepts for the sustainable use of 562
its resources. - In Junk, W.J. et al. (eds.) The Central Amazon floodplain: Actual use and 563
options for sustainable management. Backhuys Publishers, pp. 75-94. 564
Legendre, P. et al. 2005. Analyzing beta diversity: partitioning the spatial variation of 565
community composition data. - Ecological Monographs 75:435–450. 566
Magurran, A. E. 2004. Measuring biological diversity. - Blackwell. 255p. 567
27
McCune, B. and Mefford, M. J. 1999. Multivariate Analysis of Ecological Data. Version 568
4.17, MjM Software, Gleneden Beach, Oregon, U.S.A. 569
McGill, B. J. et al. 2007. Species abundance distribuitions: moving beyond single prediction 570
theories to integration within an ecological framework. - Ecology Letters 10:995-1015. 571
Nebel, G. et al. 2001. Structure and floristic composition of flood plain forests in the 572
Peruvian Amazon I. Overstorey. - Forest Ecology and Management 150:27–57. 573
Nebel, G. et al. 2001b.The Amazon flood plain forest tree Maquira coriacea (Karsten) C.C. 574
Berg: aspects of ecology and management. – Forest Ecology and Management 150: 103-575
113. 576
Parolin, P. et al. 2004. Central Amazon floodplain forests: tree survival in a pulsing system. 577
- The Botanical Review 70(3): 357-380. 578
Pitman, N. C. A. et al. 2001. Dominance and distribution of tree species in upper 579
Amazonian terra firme forests. - Ecology 82:2101–2117. 580
Pires, J. M. and Prance, G. T. 1985. The vegetation types of the Brazilian Amazon. - In 581
Prance, G. T. and Lovejoy, T. E. (eds.) Key environments: Amazonia. Pergamon Press, pp. 582
109-145. 583
Prance, G. T. 1979. Notes on the vegetation of Amazonia III. The terminology of 584
Amazonian forest types subject to inundation. - Brittonia 31:26-38. 585
Rangel, T.F.L.V.B, et al. 2010. SAM: a comprehensive application for Spatial Analysis in 586
Macroecology. - Ecography 33:46-50. 587
R Development Core Team. 2008. R: A language and environment for statistical 588
computing. R Foundation for Statistical Computing, Vienna, Austria. Available in: www.R-589
project.org. 590
Salo, J. et al. 1986. River dynamics and the diversity of Amazon Lowland Forest. - Nature 591
322: 254-258. 592
Santos, G. C. and Jardim, M. A. G. 2006. Florística e estrutura do estrato arbóreo de uma 593
floresta de várzea no município de Santa Bárbara do Pará, Estado do Pará, Brasil. - Acta 594
28
Amazonica 36(4):437-446. 595
Tuomisto, H. et al. 1995. Dissecting Amazonian Biodiversity. – Science 269:63-66. 596
Tuomisto, H. and Ruokolainen, K. 2006. Analyzing or explaining beta diversity? 597
Understanding the targets of different analysis methods. – Ecology 87:2697–2708. 598
Tuomisto, H. 2010. A diversity of beta diversities: straightening up a concept gone awry. 599
Part 2. Quantifying beta diversity and related phenomena. – Ecography 33:23-45. 600
Terborgh, J. and Andresen, E. 1998. The composition of Amazonian forests: patterns at 601
local and regional scales. - Journal of Tropical Ecology 14:645-664. 602
Urrego, L. E. 1997. Floodable forests in the Middle Caquetá region: characterization and 603
succession. - Studies on the Colombian Amazonia, vol. 14. Tropenbos. 604
Wittmann, F. et al. 2002. Tree species distribution and community structure of central 605
Amazonian várzea forests by remote-sensing techniques. - Journal of Tropical Ecology 606
18:805–820. 607
Wittmann, F. et al. 2004. The várzea forests in Amazonia: flooding and the highly dynamic 608
geomorphology interact with natural forest succession. - Forest Ecology and Management, 609
196, 199–212. 610
Wittmann, F. et al. 2006. Tree species composition and diversity gradients in white-water 611
forests across the Amazon Basin. - Journal of Biogeography 33:1334-1347. 612
Worbes, M. 1997. The forest ecosystem of the floodplains. - In Junk, W. (ed) The central 613
Amazon floodplain: ecology of a pulsating system. Ecological Studies, vol. 126, Springer, 614
pp. 223-265. 615
Worbes, M. et al. 1992. On the dynamics, floristic subdivision and geographical distribution 616
of várzea forests in Central Amazonia. - Journal of Vegetation Science 3: 553-564. 617
Whittaker, R. H. 1967. Gradient analysis of vegetation. – Biol. Rev. 4: 207-264. 618
Figures e Tables 619

29
620
Figure 1: Flooding landscape of the lower Purus River, Central Amazon, Brazil. The dark 621
circles and numbers represent the locations of the sampled plots. The figure in the lower left 622
corner indicates the location of the studied landscape in relation to the Amazon Basin. 623
624
30
624
Figure 2: Species accumulation curves for the 16 inventory plots in the várzea forests of the 625
low Purus river in RDS-PP. Curves with lines in black correspond to the plots: 2, 9, 18, 1, 3, 19, 626
21, 10, 8 and 15, respectively, from top to bottom. 627
628
31
628
Figure 3: Dispersion graphs for the distance matrixes between the pairs of plots. A) 629
Environmental Distance Matrix EDM in meters of flooding depth and geographical distance 630
matrix GDM in kilometers between pairs of plots; B) Values of floristic dissimilarity (1-CBC) in 631
relation to the EDM; C) Values of floristic dissimilarity (1-CBC) in relation to GDM. 632
633

32
633
Figure 4: Graphs of the flooding depth gradient (m) in relation to A) Species richness 634
rarefacted in 100 individuals; B) α Fisher’s Alfa coeficient; C) Singletons – number of species 635
with one individual in the landscape (5ha); D) Dd – Berger-Parker Index, where: 1 - Maquira 636
coriacea; 2 - Hura crepitans; 3 - Pterocarpus amazonum; 4 - Mabea taquari; 5 - Garcinia 637
madruno; 6 - Triplaris surinamensis; 7 Luehea cymulosa; 8 - Guatteria cf. olivacea; 9 - 638
Tabebuia barbata; 10 - Pseudobombax munguba; 11 - Pouteria elegans; 12 - Virola 639
surinamensis; 13 - Leonia glycycarpa; 14 - Hevea spruceana; solid line: estimated straight line 640
without residual value (hollow point in the graph): dotted line: estimated straight line with 641
residual value. Corresponding values for the plots with 3 125 m2 allocated in the várzea forests 642
of the lower Purus River. 643
644
33
644
Alpha Diversity
Species Exchange
Figure 5: Partition of the variation of the multiple linear model predictive of the Fisher alpha 645
diversity and of the species exchange represented in the NMDS axis for the matrix of floristic 646
dissimilarity (1-CBC). Following clockwise: White = environmental explanation only; Gray = 647
geographical and environmental space explanation; Black = geographical space explanation; 648
Dotted = not explained by the model; percentages relative to the total variation of the model 649
(r2). The total utilizes the information from the 16 sampled locations; VB only the information 650
from the lower várzea (flooding depth < 3 m, n = 9); VA only for the group from the upper 651
várzea (flooding depth ≥ 3 m, n = 7). 652
653
All Plots All Plots
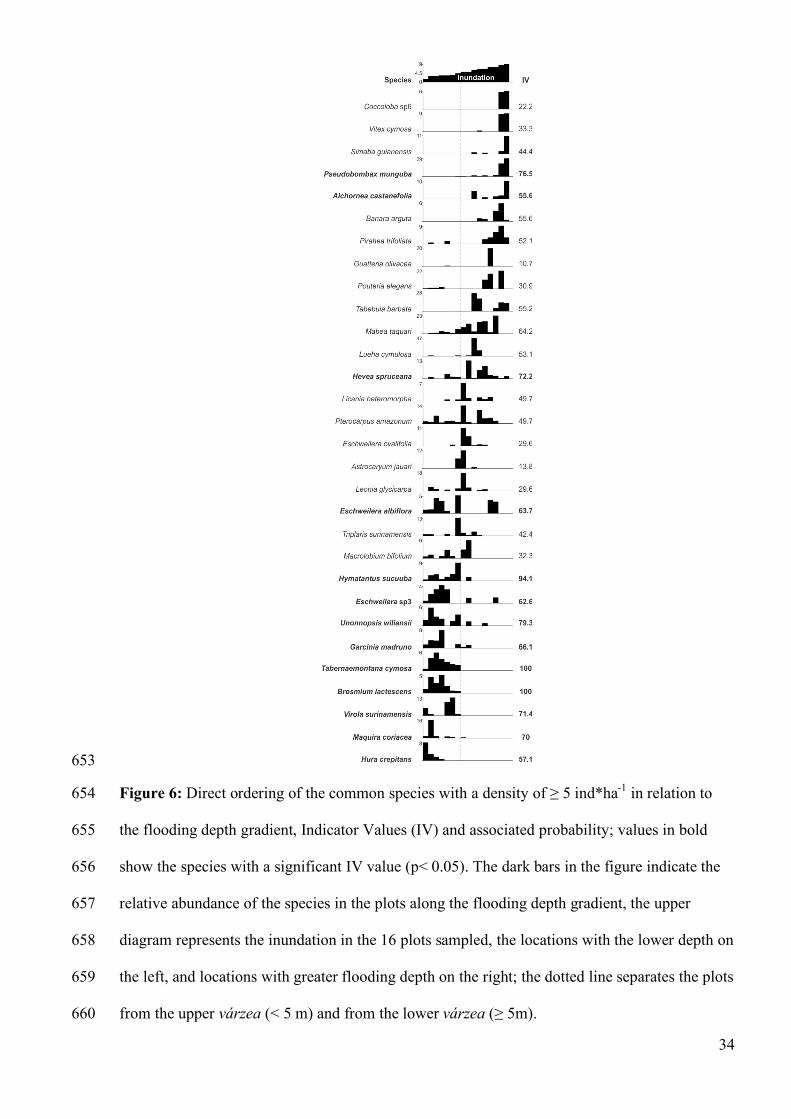
34
653
Figure 6: Direct ordering of the common species with a density of ≥ 5 ind*ha-1 in relation to 654
the flooding depth gradient, Indicator Values (IV) and associated probability; values in bold 655
show the species with a significant IV value (p< 0.05). The dark bars in the figure indicate the 656
relative abundance of the species in the plots along the flooding depth gradient, the upper 657
diagram represents the inundation in the 16 plots sampled, the locations with the lower depth on 658
the left, and locations with greater flooding depth on the right; the dotted line separates the plots 659
from the upper várzea (< 5 m) and from the lower várzea (≥ 5m).660

35
Table 1: Environmental and structural attributes of the plots (0.3125 ha) from the inventory in 661
the várzea forests of the RDS-PP. Depth (m) (min - max) - Average depth (m) and maximum 662
and minimum values (n=15) and *HD historical depth, which is corrected by -1.8 m the 663
maximum historical average level reach in the Purus river in 28 years; N - Abundance in 664
number of individuals; ABt - Total Basal Area (m2); Sobs - Observed species richness; Single – 665
Singletons, the number of species represented by one individual in the landscape; α Fisher (SD) 666
- Fisher’s Alpha coefficient (standard deviation); Dd - Index of Berger-Parker. Below are the 667
values for the sum of the plots. The values are for plots of 3 125 m2. 668
Plot Depth (m) (min - max); *HD (m) N ABt (m2) Sobs α Fisher (SD) Single Dd
1 3.1 (3.1 - 3.2);1.3* 178 15.2 60 31.8 (3.7) 5 0.16
2 1.6 (1.3 - 2.2);0.0* 183 10.0 73 43.5 (5.17) 14 0.08
3 3.1 (2.3 - 3.7);1.3* 180 9.8 58 29.6 (3.5) 9 0.06
8 6.6 (5.7 - 7.1);4.8* 127 8.8 47 26.9 (3.8) 9 0.16
9 3.3 (3.0 - 3.8);1.5* 139 8.4 66 49.1 (6.9) 14 0.08
10 4.4 (4.0 - 4.8); 2.6* 171 10.2 50 23.77 (2.8) 5 0.13
11 6.1 (5.7 - 6.9); 4.3* 225 11.4 24 6.8 (0.8) 2 0.47
12 7.7 (7.4 - 7.9); 5.9* 183 9.9 32 11.2 (1.3) 3 0.20
13 6.5 (6.2 - 7.0); 4.7* 207 12.3 39 14.2 (1.6) 4 0.19
14 9.1 (9.0 - 9.5); 7.3* 217 14.2 23 6.5 (0.8) 3 0.29
15 7.7 (7.1 - 8.1); 5.9* 148 8.9 47 23.76 (3.0) 10 0.23
17 8.6 (8.4 - 8.9); 6.8* 366 15.2 25 6.1 (0.6) 3 0.22
18 3.4 (2.9 - 3.7); 1.6* 150 10.3 62 40.4 (5.4) 9 0.10
19 3.5 (3.3 - 4.2); 1.7* 144 7.6 57 34.85 (4.6) 10 0.13
20 5.1 (4.9 - 5.8); 3.3* 177 14.9 26 8.4 (1.0) 0 0.22
21 5.1 (4.8 - 5.5); 3.3* 156 8.5 53 28.3 (3.6) 4 0.13
Total - 2951 175.78 304 85.02 (5.71) 104 -
669
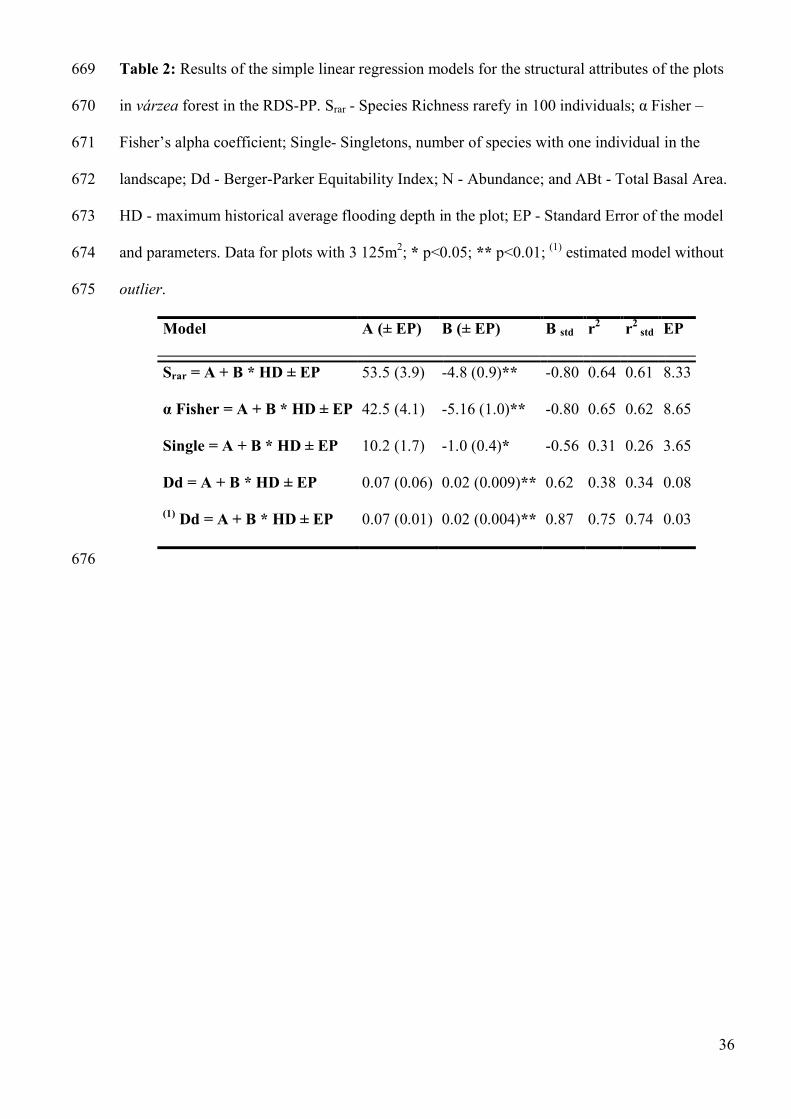
36
Table 2: Results of the simple linear regression models for the structural attributes of the plots 669
in várzea forest in the RDS-PP. Srar - Species Richness rarefy in 100 individuals; α Fisher – 670
Fisher’s alpha coefficient; Single- Singletons, number of species with one individual in the 671
landscape; Dd - Berger-Parker Equitability Index; N - Abundance; and ABt - Total Basal Area. 672
HD - maximum historical average flooding depth in the plot; EP - Standard Error of the model 673
and parameters. Data for plots with 3 125m2; * p<0.05; ** p<0.01; (1) estimated model without 674
outlier. 675
Model A (± EP) B (± EP) B std r2 r2 std EP
Srar = A + B * HD ± EP 53.5 (3.9) -4.8 (0.9)** -0.80 0.64 0.61 8.33
α Fisher = A + B * HD ± EP 42.5 (4.1) -5.16 (1.0)** -0.80 0.65 0.62 8.65
Single = A + B * HD ± EP 10.2 (1.7) -1.0 (0.4)* -0.56 0.31 0.26 3.65
Dd = A + B * HD ± EP 0.07 (0.06) 0.02 (0.009)** 0.62 0.38 0.34 0.08
(1) Dd = A + B * HD ± EP 0.07 (0.01) 0.02 (0.004)** 0.87 0.75 0.74 0.03
676
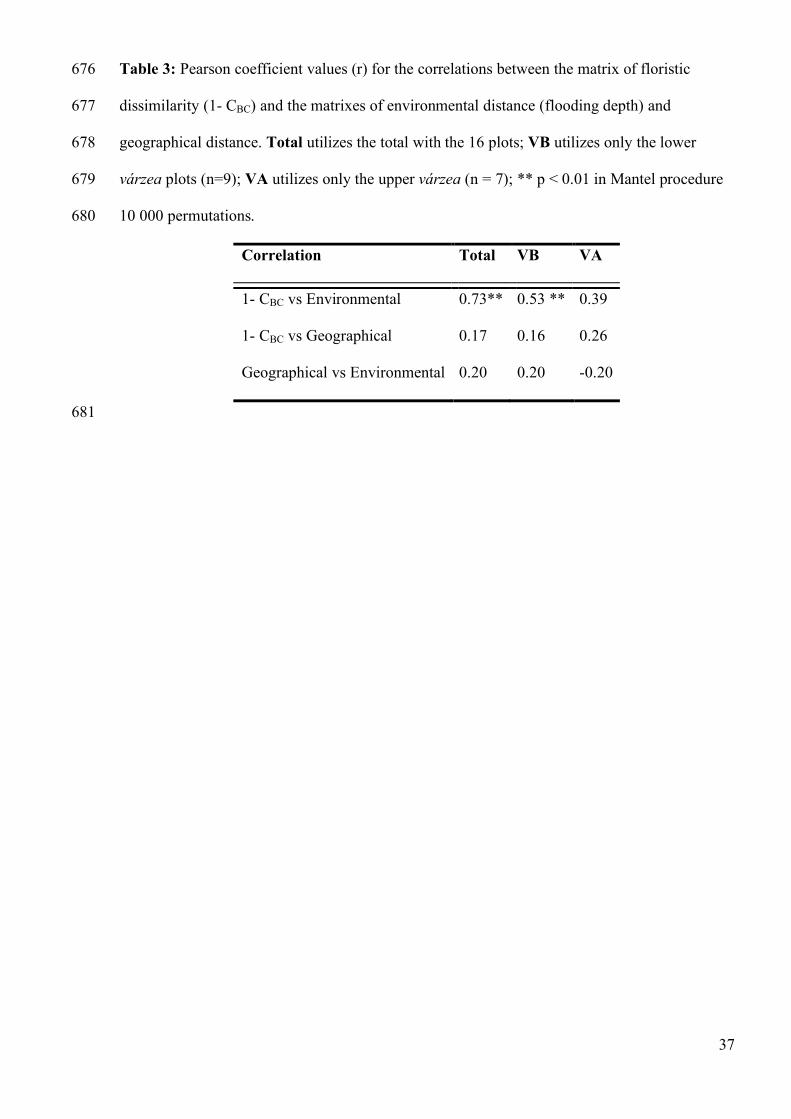
37
Table 3: Pearson coefficient values (r) for the correlations between the matrix of floristic 676
dissimilarity (1- CBC) and the matrixes of environmental distance (flooding depth) and 677
geographical distance. Total utilizes the total with the 16 plots; VB utilizes only the lower 678
várzea plots (n=9); VA utilizes only the upper várzea (n = 7); ** p < 0.01 in Mantel procedure 679
10 000 permutations. 680
Correlation Total VB VA
1- CBC vs Environmental 0.73** 0.53 ** 0.39
1- CBC vs Geographical 0.17 0.16 0.26
Geographical vs Environmental 0.20 0.20 -0.20
681
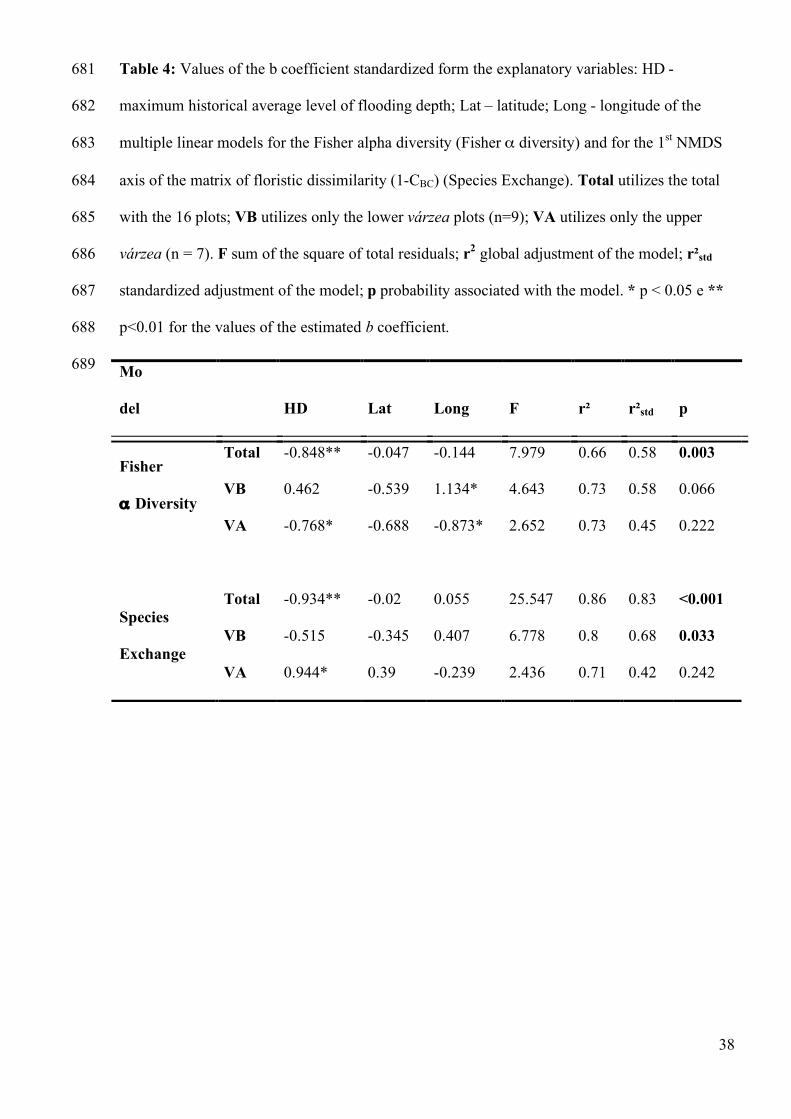
38
Table 4: Values of the b coefficient standardized form the explanatory variables: HD - 681
maximum historical average level of flooding depth; Lat – latitude; Long - longitude of the 682
multiple linear models for the Fisher alpha diversity (Fisher α diversity) and for the 1st NMDS 683
axis of the matrix of floristic dissimilarity (1-CBC) (Species Exchange). Total utilizes the total 684
with the 16 plots; VB utilizes only the lower várzea plots (n=9); VA utilizes only the upper 685
várzea (n = 7). F sum of the square of total residuals; r2 global adjustment of the model; r²std 686
standardized adjustment of the model; p probability associated with the model. * p < 0.05 e ** 687
p<0.01 for the values of the estimated b coefficient. 688
689 Mo
del HD Lat Long F r² r²std p
Total -0.848** -0.047 -0.144 7.979 0.66 0.58 0.003
VB 0.462 -0.539 1.134* 4.643 0.73 0.58 0.066 Fisher
α Diversity VA -0.768* -0.688 -0.873* 2.652 0.73 0.45 0.222
Total -0.934** -0.02 0.055 25.547 0.86 0.83 <0.001
VB -0.515 -0.345 0.407 6.778 0.8 0.68 0.033 Species
Exchange VA 0.944* 0.39 -0.239 2.436 0.71 0.42 0.242

39
Conclusão Geral
Observamos que as florestas de várzea são bastante heterogêneas em composição de espécies
e que o gradiente ambiental complexo ocasionado pelo pulso de inundação é o fator que mais
influencia na distribuição da diversidade dessas florestas. A estreita relação entre a
diversidade e composição de árvores e o gradiente ambiental de profundidade de inundação
necessita ser utilizada para comparações mais precisas entre florestas de várzea de diferentes
localidades, paisagens e regiões. A descrição deste padrão pode melhorar o entendimento da
distribuição da diversidade e das espécies de árvores nas florestas tropicais inundáveis,
contribuindo para formulações de estratégias de conservação dessas florestas.
Referencias bibliográficas
Albernaz, A. L. K. M. 2008. Conservação da várzea: identificação e caracterização de regiões biogeográficas. – Ibama/ProVárzea.
Ayres, J. M. 1993. As matas de várzea do Mamirauá. - Sociedade Civil Mamirauá, Estudos de Mamirauá, vol. 1.
Cavender-Bares, J. et al. 2009. The merging of community ecology and phylogenetic biology. - Ecology Letters 12: 693–715.
de Aguiar, M. A. M. et al. 2009. Global patterns of speciation and diversity. – Nature 460:384-387.
Duivenvoorden, J. F. et al. 2002. Beta Diversity in Tropical Forests. - Science 295:636-637. Ferreira, L. V. 1997. Effects of flooding duration of species richness and floristic
composition in three hectares in the Jaú National Park in floodplain forests in Central Amazonia. - Biodiversity Conservation 6:1353-1363.
Ferreira, L. V. and Strohlgren, T. J. 1999. Effects of river level fluctuation on plant species richness, diversity, and distribution in a floodplain forest in central Amazonia. - Oecologia. 120: 582-587.
Ferreira, L. V. 2000. Effects of flooding duration on species richness,floristic composition and forest structure in river margin habitat in Amazonian blackwater floodplain forests: implications for future design of protected areas. – Biodiversity and Conservation 9: 1–14.
Ferreira, C. S. et al. 2007. Floodplain and upland populations of Amazonian Himatanthus sucuuba: Effects of flooding on germination, seedling growth and mortality. - Environmental and Experimental Botany 60: 477–483.
40
Ferrier, S. et al. 2007. Using generalized dissimilarity modelling to analyse and predict patterns of beta diversity in regional biodiversity assessment. - Diversity and Distributions 13: 252–264.
Foster, R. B. 1990. Long-Term Change in the successional forest community of the Rio Manu Floodplain. - In: Gentry, A.H. (Ed.) Four Neotropical Rainforests. Yale University Press, pp 565-572.
Goulding, M. et al. 2003. The Smithsonian atlas of the Amazon. - Smithsonian Books. Hubbell, S. P. 2001. The Unified Neutral Theory of Biodiversity and Biogeography. -
Princeton University Press. Jabot, F. Et al. 2008. Reconciling neutral community models and environmental filtering:
theory and empirical test. - Oikos 117:1308-1320. Junk W. J. 1989. Flood tolerance and tree distribution in Central Amazonian floodplains. - In
Nielsen L. B. et al.(eds) Tropical forests: botanical dynamics, speciation and diversity. Academic Press, pp. 47–64
Kaliola, R. et al. 1991. New site formation and colonizing vegetation in primary sucession on the western Amazon floodplains. - Journal of Ecology 79:877-901.
Legendre, P. et al. 2005. Analyzing beta diversity: partitioning the spatial variation of community composition data. - Ecological Monographs 75:435–450.
Lomolino, M. V. et al. (eds) 2004. Foundations of biogeography:classic papers with commentaries. – The University of Chicago Press.
Lomolino, M. V. et al. 2006. Biogeography. – Sinauer Associates, Inc. Parolin, P. et al. 2004. Central Amazon floodplain forests: tree survival in a pulsing system. -
The Botanical Review 70(3): 357-380. Parolin, P. et al. 2010. Drought responses of flood-tolerant trees in Amazonian floodplains.
Annals of Botany 105(1):129-139. Pires, J. M. and Prance, G. T. 1985. The vegetation types of the Brazilian Amazon. - In
Prance, G. T. and Lovejoy, T. E. (eds.) Key environments: Amazonia. Pergamon Press, pp. 109-145.
Prance G. T. 1979. Notes on the vegetation of Amazonia III. The terminology of Amazonian forest types subject to inundation - Brittonia 31:26-38.
Salo, J, et al. 1986. River dynamics and the diversity of Amazon Lowland Forest. - Nature 322: 254-258.
Tuomisto, H. and Ruokolainen, K. 2006. Analyzing or explaining beta diversity? Understanding the targets of different analysis methods. – Ecology 87:2697–2708.
Tuomisto, H. Et al. 1995. Dissecting Amazonian Biodiversity. – Science 269:63-66. Terborgh, J. and Andresen, E. 1998. The composition of Amazonian forests: patterns at local
and regional scales. - Journal of Tropical Ecology. 14:645-664. Wittmann, F. et al. 2002. Tree species distribution and community structure of central
Amazonian várzea forests by remote-sensing techniques. - Journal of Tropical Ecology 18:805–820.
Wittmann, F. and Junk W. J.2003. Sapling communities in Amazonian white-water forests. - Journal of Biogeography 30:1533–1544.
Wittmann, F. et al. 2004. The várzea forests in Amazonia: flooding and the highly dynamic geomorphology interact with natural forest succession. - Forest Ecology and Management, 196, 199–212.
Worbes M. et al. 1992. On the dynamics, floristic subdivision and geographical distribution of várzea forests in Central Amazonia. - Journal of Vegetation Science 3: 553-564.
Wright, S. J. 2002. Plant diversity in tropical forests: a review of mechanisms of species coexistence. - Oecologia 130:1–14.
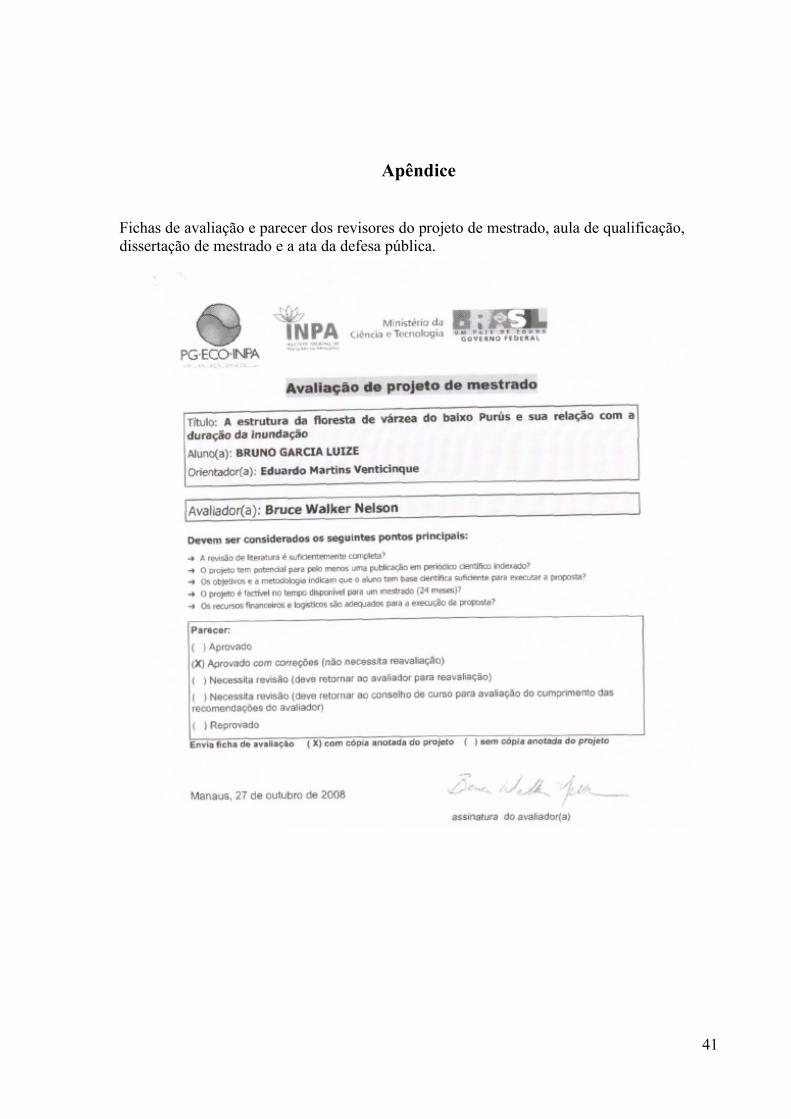
41
Apêndice
Fichas de avaliação e parecer dos revisores do projeto de mestrado, aula de qualificação, dissertação de mestrado e a ata da defesa pública.
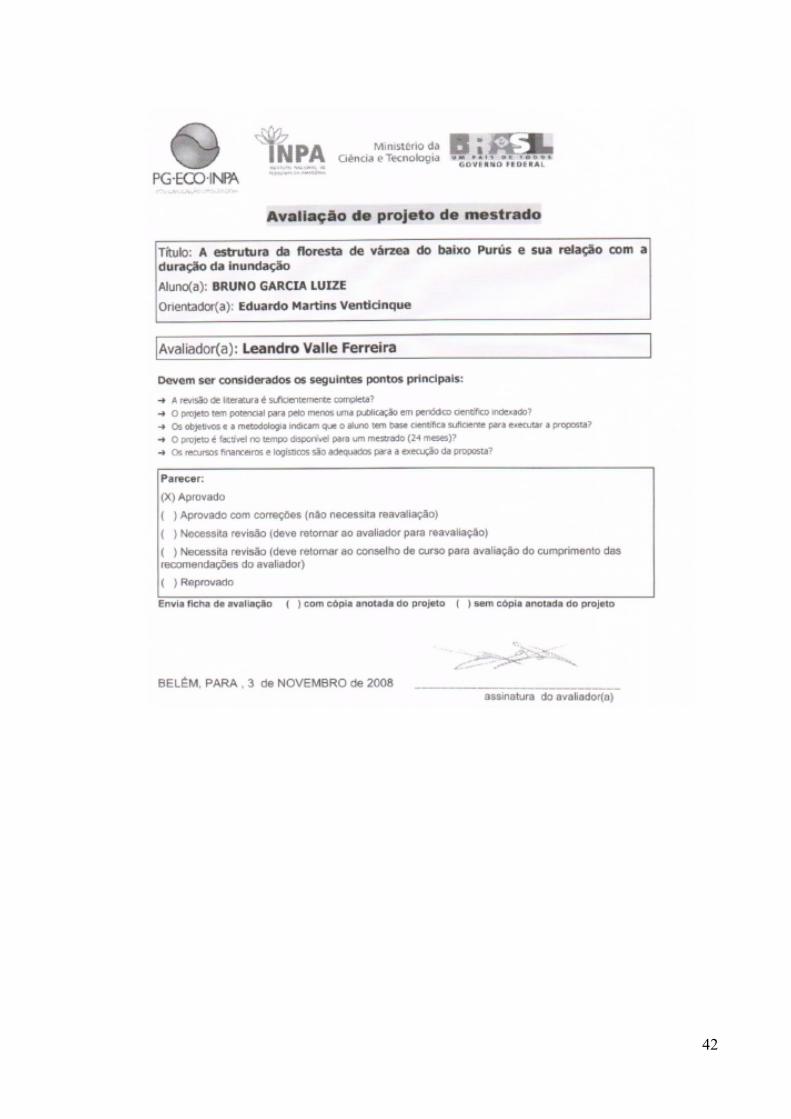
42
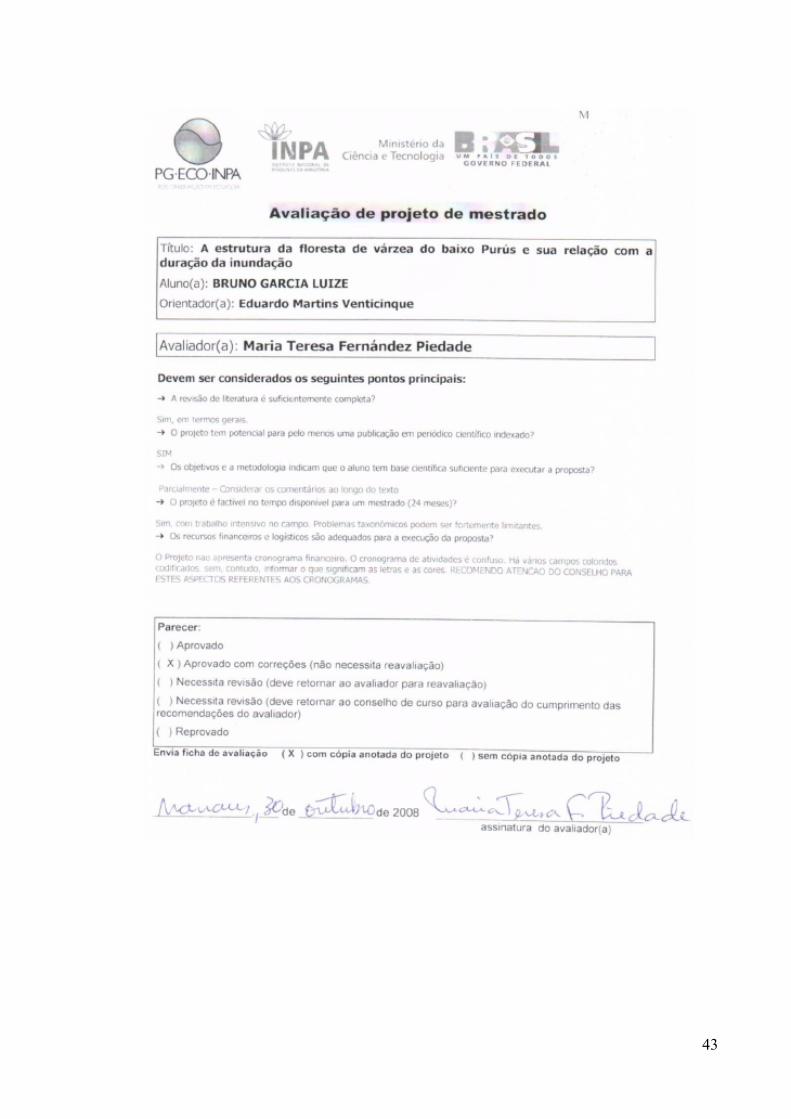
43

44
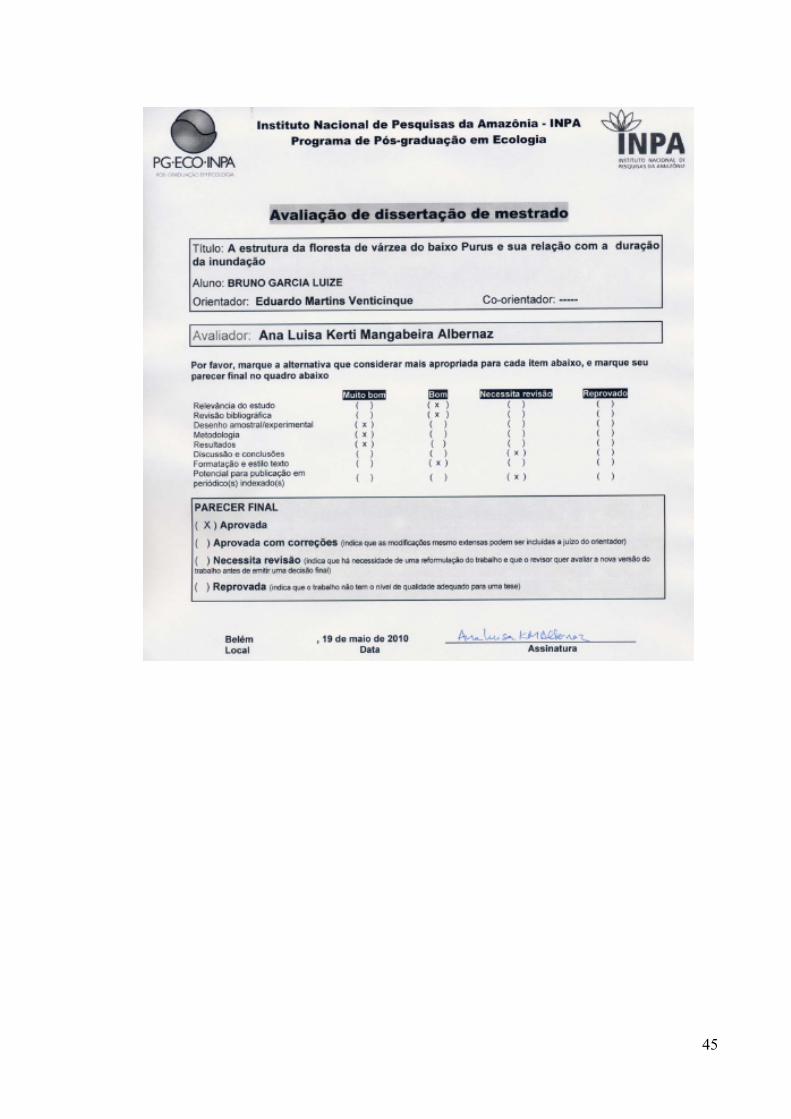
45
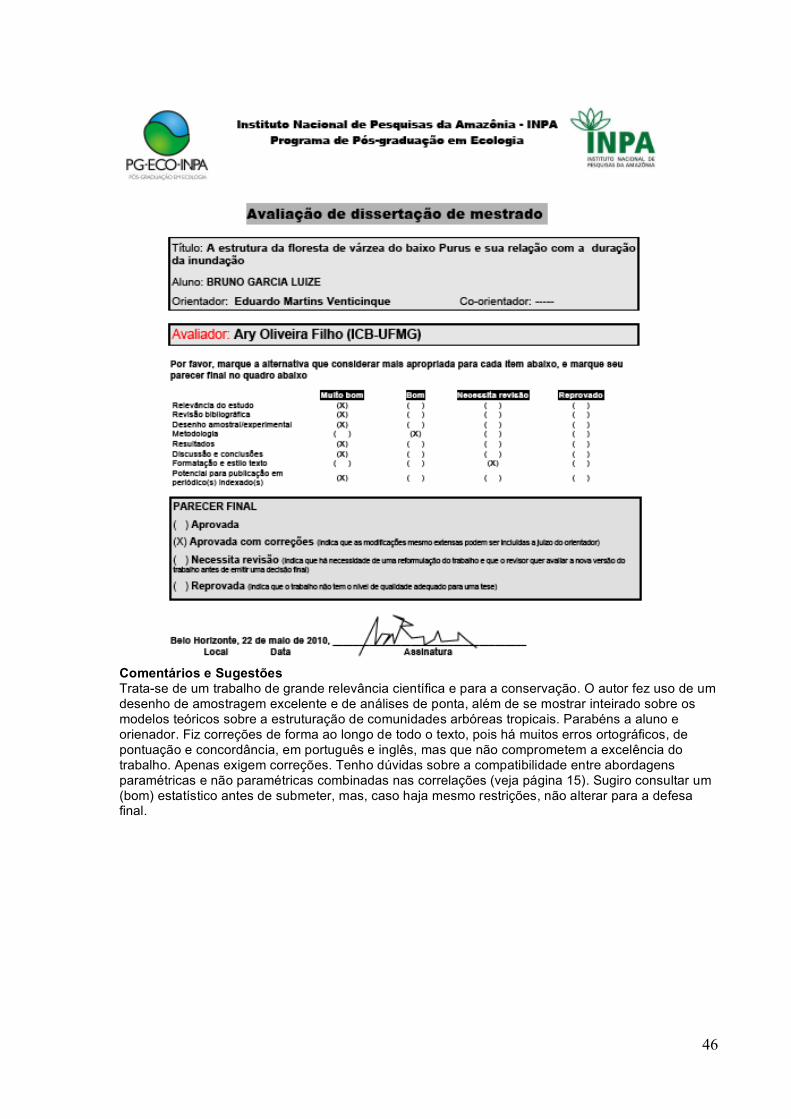
46
Comentários e Sugestões Trata-se de um trabalho de grande relevância científica e para a conservação. O autor fez uso de um desenho de amostragem excelente e de análises de ponta, além de se mostrar inteirado sobre os modelos teóricos sobre a estruturação de comunidades arbóreas tropicais. Parabéns a aluno e orienador. Fiz correções de forma ao longo de todo o texto, pois há muitos erros ortográficos, de pontuação e concordância, em português e inglês, mas que não comprometem a excelência do trabalho. Apenas exigem correções. Tenho dúvidas sobre a compatibilidade entre abordagens paramétricas e não paramétricas combinadas nas correlações (veja página 15). Sugiro consultar um (bom) estatístico antes de submeter, mas, caso haja mesmo restrições, não alterar para a defesa final.

47
Comentários e sugestões Acho que a tese é interessante, ela trata de um tema “up to date” com uma base de dados muito boa, está bem escrita e bem analisada. O contexto de discussao é bom. Acho que deveria juntar o aspecto de plantas generalistas vs. especialistas, sendo as generalistas distribuidas em amplos espaços. Cuidado com a ortografia: tem muitos erros no abstract ingles e na maneira de escrever os nomes de autores e os nomes botânicos latinos de plantas. Coloquei algumas correções no texto.
48