A INDÚSTRIA FARMACÊUTICA EM NÚMEROS - apifarma.pt em... · Associação Europeia da Indústria...
66
A INDÚSTRIA FARMACÊUTICA EM NÚMEROS THE PHARMACEUTICAL INDUSTRY IN FIGURES 2016
Transcript of A INDÚSTRIA FARMACÊUTICA EM NÚMEROS - apifarma.pt em... · Associação Europeia da Indústria...
A INDÚSTRIA FARMACÊUTICA EM NÚMEROS
THE PHARMACEUTICAL INDUSTRY IN FIGURES
20
16

IPRINCIPAIS INDICADORES ECONÓMICOS MAIN ECONOMIC INDICATORS
5
I.1Dados macroeconomicos em PortugalGeneral macroeconomic data in Portugal
6
I.2Dados macroeconomicos na EuropaGeneral macroeconomic data in Europe
9
IIPRINCIPAIS INDICADORES DEMOGRÁFICOS MAIN DEMOGRAPHIC INDICATORS
13
II.1População na EuropaEuropean population
14
II.2Estrutura da população e envelhecimento Structure and population aging
16
II.3Rácio total de dependência na UE Total dependency ratio EU
17
IIIPRINCIPAIS INDICADORES DE SAÚDE MAIN HEALTHCARE INDICATORS
19
III.1Despesa corrente em saúde - PortugalNational healthcare expenditure
20
III.2Serviços de Saúde - PortugalHealthcare Resources
22
III.3Actividade Assistencial Pública - PortugalCare Activity NHS
23
III.4Resultados em Saúde - PortugalHealth Results
24
III.5Principais causas de morte - PortugalMain death causes
25
III.6Esperança de vida na Europa Life expectancy in Europe
26
III.7Despesa corrente em saúde per capita, na Europa Current healthcare expenditure per capita, in Europe
27
III.8Despesa corrente em saúde em % PIB, na Europa Current healthcare expenditure as % of GDP, in Europe
28
III.9Despesa corrente em saúde por tipo de tratamento (%) Current healthcare expenditure by function of healthcare (%)
29
IVPRINCIPAIS INDICADORES DO SECTOR FARMACÊUTICOMAIN PHARMACEUTCAL SECTOR INDICATORS
30
IV.1Empresas farmacêuticas e armazenistas Pharmaceutical companies and wholesalers
31
IV.2Dívida hospitalar à indústria farmacêutica Hospital debts to the pharmaceutical industry
31
IV.3Mercado farmacêutico total na Europa Total pharmaceutical market in Europe
32
IV.4Emprego na indústria farmacêutica - Europa Employment in the pharmaceutical industry - Europe
33
ÍNDICE INDEX
1 de 65
IV.5Investimento em I&D - Europa R&D Investiment - Europe
34
VMERCADO FARMACÊUTICO PHARMACEUTICAL MARKET
35
V.1Produção Farmacêutica Pharmaceutical production
36
V.2Importação e exportação de matérias-primas e produtos farmacêuticosImports and exports of raw materials and pharmaceutical products
37
V.3Número total de medicamentos com AIM Number of Medicines with Marketing Authorization
38
V.4Número de medicamentos genéricos com AIM Number of generic medicines with Marketing Authorization
39
V.5Medicamentos Homeopáticos com registoHomeopathic Medicinal Products registered
39
V.6Mercado total em valor (PVP) Total market value (retail price)
40
V.7Mercado Ambulatório (PVP) Outpatient Market (retail price)
41
V.8Despesa per capita com medicamentos no ambulatório na UE Outpatient pharmaceutical expenses per capita in EU
45
VIMERCADO E ENCARGOS DO SNS NHS MARKET & EXPENDITURE
46
VI.1Encargos totais do SNS com medicamentos NHS expenditure with medicinal products
47
VI.2Mercado e encargos do SNS com medicamentos no ambulatórioOutpatient NHS market and expenditure with medicinal products
48
VI.3Evolução dos custos médios por receita e por embalagem, no SNS Evolution of average costs by prescription and package, in the NHS
49
VI.4Distribuição dos encargos do SNS por grupos farmacoterapêuticos Share of NHS expenditure by pharmacotherapeutic groups
50
VIIMERCADO DA AUTOMEDICAÇÃO SELF MEDICATION MARKET
51
VII.1Mercado da automedicação - MNSRM Non-prescription medicines market
52
VII.2Mercado da automedicação - Fora das FarmáciasNon-prescription medicines market in drugstores
53
VII.3Mercado da auto prescrição na Europa European Non-prescription medicines market
54
VIIIENSAIOS CLÍNICOS CLINICAL TRIALS
55
VIII.1Número de ensaios clínicos Number of clinical trials
56
VIII.2Número de ensaios clínicos por tipo de promotor Number of clinical trials by promoter
56
VIII.3Número de ensaios clínicos por área terapêuticaNumber of clinical trials by therapeutic area
57
2 de 65

VIII.4Tipo de medicamentos usados nos ensaios clinicosType of the drugs used in clinical trials
57
VIII.5Tipo de medicamentos usados nos ensaios clinicosType of the drugs used in clinical trials
57
VIII.6Número de ensaios clínicos em curso na UE - 2014Number of clinical trials ongoing in EU
58
IXMERCADO DOS DIV IVD MARKET
59
IX.1Evolução do mercado dos DIV em Portugal IVD market evolution in Portugal
60
IX.2Mercado de DIV em Portugal por categoria de produtosIVD market in Portugal by product category
60
IX.3Mercado dos DIV na Europa - 2014IVD market in Europe
61
XMERCADO DA SAÚDE ANIMAL ANIMAL HEALTH MARKET
62
X.1Evolução do mercado da saúde animal (incl. aditivos alimentares) Animal health market evolution (incl. food additives)
63
X.2Repartição do mercado da saúde animal por grupos terapêuticos Animal health market by therapeutic groups
63
X.3Repartição do mercado da saúde animal por espécies Animal health market by species
64
X.4Mercado da saúde animal na Europa Animal health market in Europe
64
3 de 65
ACSS Administração Central do Sistema de Saúde, IP
Central Administration of the Health System, IP
ADSE Assistência na Doença aos Serviços do Estado
Health Care Assistance of Public Employees
AESGP Associação Europeia para a Automedicação
Association of the European Self-Medication Industry
AIM / MA Autorização de Introdução no Mercado
Marketing Authorization
BdP Banco de Portugal
Portugal Bank
EFPIA Federação Europeia da Indústria Farmacêutica
European Federation of Pharmaceutical Industries Associations
EUROSTAT Órgão Central Estatístico da União Europeia
European Union Head Office of Statistics
IFAH Europe Federação Internacional de Saúde Animal da Europa
International Federation for Animal Health Europe
INE Instituto Nacional de Estatística
National Statistic Institute
INFARMED Autoridade Nacional do Medicamento e Produtos de Saúde, IP
National Authority of Medicines and Health Products, IP
IPC Índice de Preços no Consumidor
Consumer Prices Index
IVA / VAT Imposto sobre o Valor Acrescentado
Value Added Tax
MedTech Europe Associação Europeia da Indústria de Tecnologia Médica
European trade association representing the medical technology industries
MNSRM Medicamentos Não Sujeitos a Receita Médica
Non-Prescription Medicines
MSRM Medicamentos Sujeitos a Receita Médica
Prescription Medicines
OCDE / OECD Organização para a Cooperação e Desenvolvimento Económico
Organisation for Economic Co-operation and Development
PPC / PPP Paridade do Poder de Compra
Purchasing Power Parity
PIB / GDP Produto Interno Bruto
Gross Domestic Product
PVA / MSP Preço de Venda ao Armazenista
Ex-factory Price
PVP / RP Preço de Venda ao Público
Retail Price
SNS / NHS Serviço Nacional de Saúde
National Health Service
ABREVIATURAS ABBREVIATIONS
4 de 65

EDIÇÃO EDITION 2016
IPRINCIPAIS INDICADORES
ECONÓMICOS
MAIN ECONOMIC INDICATORS
5 de 65

População total Total population
População activaActive population
Taxa de Desemprego
Unemployment rate
2010 10.574 5.583 10,8%
2011 10.573 5.428 12,7%
2012 10.542 5.383 15,5%
2013 10.487 5.285 16,2%
2014 10.427 5.227 13,9%
2015 10.375 5.195 12,5%
2016 10.310 5.178 11,2%
Unidades: Milhares (média anual) / Units: Thousands (annual average)
Fonte: INE / Source: INE
Dados Populacionais e Taxa de DesempregoPopulation Data and Unemployment rate
Dados macroeconómicos em PortugalGeneral macroeconomic data in Portugal
I. PRINCIPAIS INDICADORES MACROECONÓMICOS
MAIN ECONOMIC INDICATORS
1.
10,8%
12,7%
15,5%16,2%
13,9%12,5%
11,2%
0,0%
2,0%
4,0%
6,0%
8,0%
10,0%
12,0%
14,0%
16,0%
18,0%
2010 2011 2012 2013 2014 2015 2016
Taxa de Desemprego (%)Unemployment rate
6 de 65
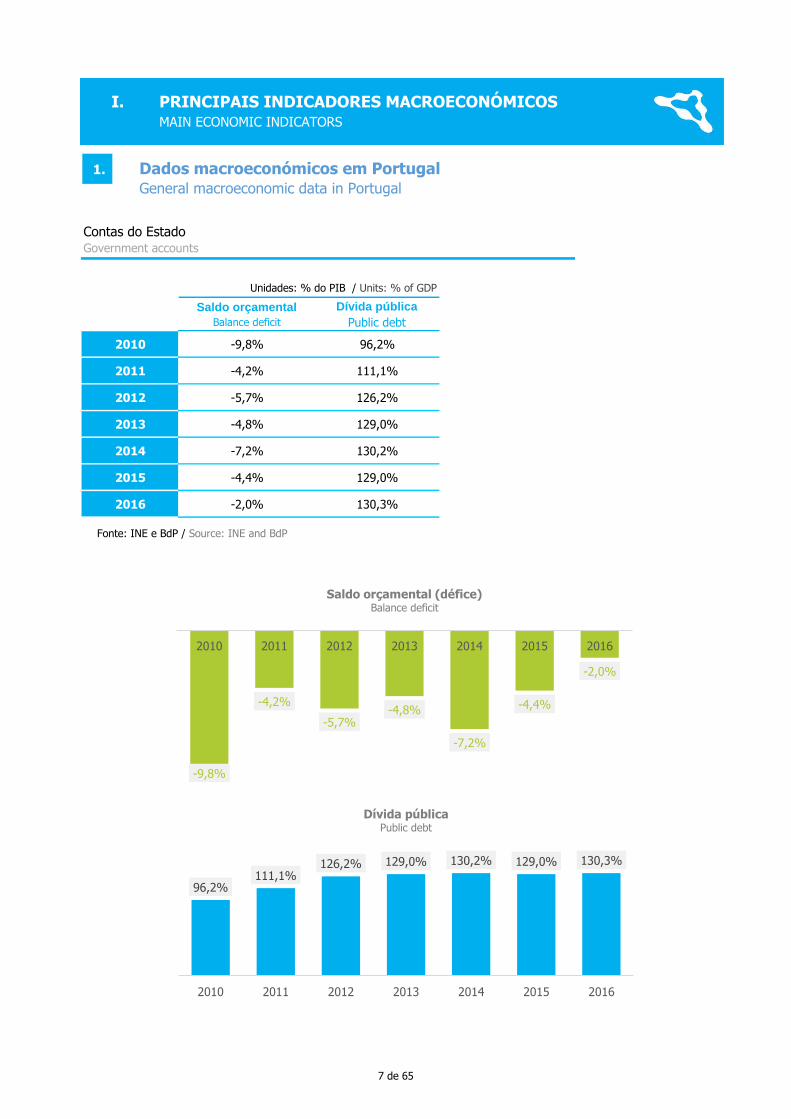
Unidades: % do PIB / Units: % of GDP
Saldo orçamental
Balance deficit
Dívida pública
Public debt
2010 -9,8% 96,2%
2011 -4,2% 111,1%
2012 -5,7% 126,2%
2013 -4,8% 129,0%
2014 -7,2% 130,2%
2015 -4,4% 129,0%
2016 -2,0% 130,3%
Dados macroeconómicos em PortugalGeneral macroeconomic data in Portugal
Contas do EstadoGovernment accounts
Fonte: INE e BdP / Source: INE and BdP
I. PRINCIPAIS INDICADORES MACROECONÓMICOS MAIN ECONOMIC INDICATORS
1.
-9,8%
-4,2%
-5,7%-4,8%
-7,2%
-4,4%
-2,0%
2010 2011 2012 2013 2014 2015 2016
Saldo orçamental (défice) Balance deficit
96,2%111,1%
126,2% 129,0% 130,2% 129,0% 130,3%
2010 2011 2012 2013 2014 2015 2016
Dívida pública Public debt
7 de 65

Per capita (euros)GDP per capita (euros)
PIB real - V.H. (%)Real GDP Growth rate
Taxa inflação (%)Inflation rate
Saldo Comercial
(%PIB) External balance (%GDP)
2010 17.018 1,9% 1,4% -7,1%
2011 16.686 -1,8% 3,7% -3,7%
2012 16.015 -4,0% 2,8% 0,1%
2013 16.282 -1,1% 0,3% 1,8%
2014 16.641 0,9% -0,2% 1,1%
2015 17.330 1,6% 0,5% 1,8%
2016 17.910 1,4% 0,6% 2,2%
Importações
Imports
- Tx. V.H.(%)
Exportações
Exports
- Tx. V.H.(%)
Taxa cambio euro-
dólarEuro-dollar rate
2010 12,9% 13,1% 1,326
2011 0,9% 12,4% 1,377
2012 -5,3% 5,1% 1,285
2013 1,9% 6,0% 1,328
2014 5,3% 3,1% 1,329
2015 3,6% 5,0% 1,110
2016 1,2% 2,3% 1,107
Dados macroeconómicos em PortugalGeneral macroeconomic data in Portugal
Dados EconómicosEconomic Data
Fonte: INE ( Base: 2011) e BdP / Source: INE and BdP
Fonte: INE / Source: INE
Importação e Exportação de bens e serviços - taxa de variação em valor; anual / Imports and Exports of goods and services - nominal change rate; annual
I. PRINCIPAIS INDICADORES MACROECONÓMICOS MAIN ECONOMIC INDICATORS
1.
1,9%
-1,8%
-4,0%
-1,1%
0,9%
1,6%1,4%
1,4%
3,7%
2,8%
0,3%
-0,2%
0,5%0,6%
2010 2011 2012 2013 2014 2015 2016
PIB real - V.H. (%)Real GDP Growth rate
Taxa inflação (%)Inflation rate
8 de 65

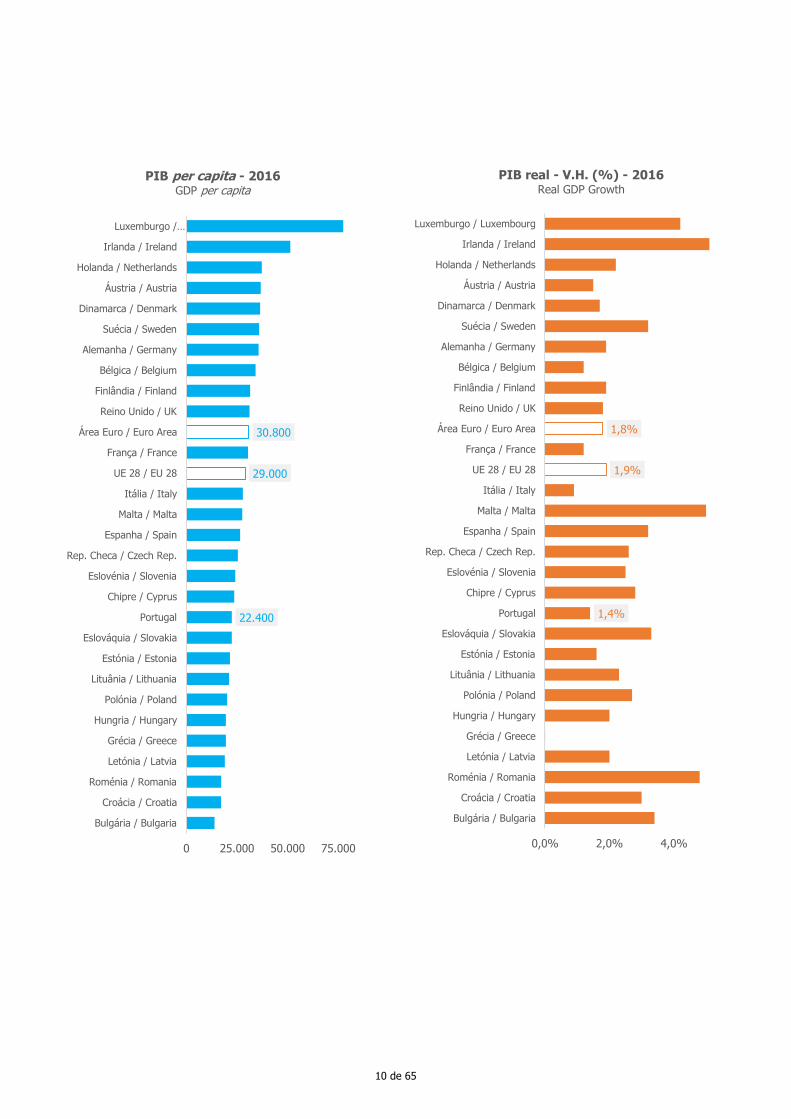
Unidade / Unit: euros PPS
Países
Countries
PIB real - V.H.
(%)Real GDP Growth rate
Per capita GDP per capita
Crescimento do PIB
per capita
GDP per capita growth
(%) - 2010-2016
Alemanha / Germany 1,9% 35.700 17,0%
Áustria / Austria 1,5% 36.700 14,7%
Bélgica / Belgium 1,2% 34.200 11,4%
Bulgária / Bulgaria 3,4% 13.900 21,9%
Chipre / Cyprus 2,8% 23.600 -7,1%
Croácia / Croatia 3,0% 17.100 13,2%
Dinamarca / Denmark 1,7% 36.400 10,6%
Eslováquia / Slovakia 3,3% 22.400 17,9%
Eslovénia / Slovenia 2,5% 24.100 13,7%
Espanha / Spain 3,2% 26.500 8,6%
Estónia / Estonia 1,6% 21.500 30,3%
Finlândia / Finland 1,9% 31.500 6,4%
França / France 1,2% 30.400 10,5%
Grécia / Greece 0,0% 19.500 -9,3%
Holanda / Netherlands 2,2% 37.200 9,1%
Hungria / Hungary 2,0% 19.500 18,9%
Irlanda / Ireland 5,1% 51.300 55,5%
Itália / Italy 0,9% 27.900 5,3%
Letónia / Latvia 2,0% 19.000 41,8%
Lituânia / Lithuania 2,3% 21.100 37,9%
Luxemburgo / Luxembourg 4,2% 77.400 18,3%
Malta / Malta 5,0% 27.600 29,6%
Polónia / Poland 2,7% 20.100 26,4%
Portugal 1,4% 22.400 7,2%
Reino Unido / UK 1,8% 31.200 14,3%
República Checa / Czech Rep. 2,6% 25.400 21,0%
Roménia / Romania 4,8% 17.200 31,3%
Suécia / Sweden 3,2% 35.900 12,9%
UE 28 / EU 28 1,9% 29.000 13,7%
Área Euro / Euro Area 1,8% 30.800 12,0%
Noruega / Norway 1,1% 43.300 -2,3%
Suiça / Switzerland 1,3% 46.200 14,6%
Islândia / Iceland 7,2% 37.400 27,6%
Dados macroeconómicos na EuropaGeneral macroeconomic data in Europe
Fonte / Source: EUROSTAT
Taxa de crescimento do PIB real e PIB per capitaReal GDP Growth and GDP per capita
2016
I. PRINCIPAIS INDICADORES ECONÓMICOS MAIN ECONOMIC INDICATORS
2.
9 de 65
1,4%
1,9%
1,8%
0,0% 2,0% 4,0%
Bulgária / Bulgaria
Croácia / Croatia
Roménia / Romania
Letónia / Latvia
Grécia / Greece
Hungria / Hungary
Polónia / Poland
Lituânia / Lithuania
Estónia / Estonia
Eslováquia / Slovakia
Portugal
Chipre / Cyprus
Eslovénia / Slovenia
Rep. Checa / Czech Rep.
Espanha / Spain
Malta / Malta
Itália / Italy
UE 28 / EU 28
França / France
Área Euro / Euro Area
Reino Unido / UK
Finlândia / Finland
Bélgica / Belgium
Alemanha / Germany
Suécia / Sweden
Dinamarca / Denmark
Áustria / Austria
Holanda / Netherlands
Irlanda / Ireland
Luxemburgo / Luxembourg
PIB real - V.H. (%) - 2016 Real GDP Growth
22.400
29.000
30.800
0 25.000 50.000 75.000
Bulgária / Bulgaria
Croácia / Croatia
Roménia / Romania
Letónia / Latvia
Grécia / Greece
Hungria / Hungary
Polónia / Poland
Lituânia / Lithuania
Estónia / Estonia
Eslováquia / Slovakia
Portugal
Chipre / Cyprus
Eslovénia / Slovenia
Rep. Checa / Czech Rep.
Espanha / Spain
Malta / Malta
Itália / Italy
UE 28 / EU 28
França / France
Área Euro / Euro Area
Reino Unido / UK
Finlândia / Finland
Bélgica / Belgium
Alemanha / Germany
Suécia / Sweden
Dinamarca / Denmark
Áustria / Austria
Holanda / Netherlands
Irlanda / Ireland
Luxemburgo /…
PIB per capita - 2016 GDP per capita
10 de 65
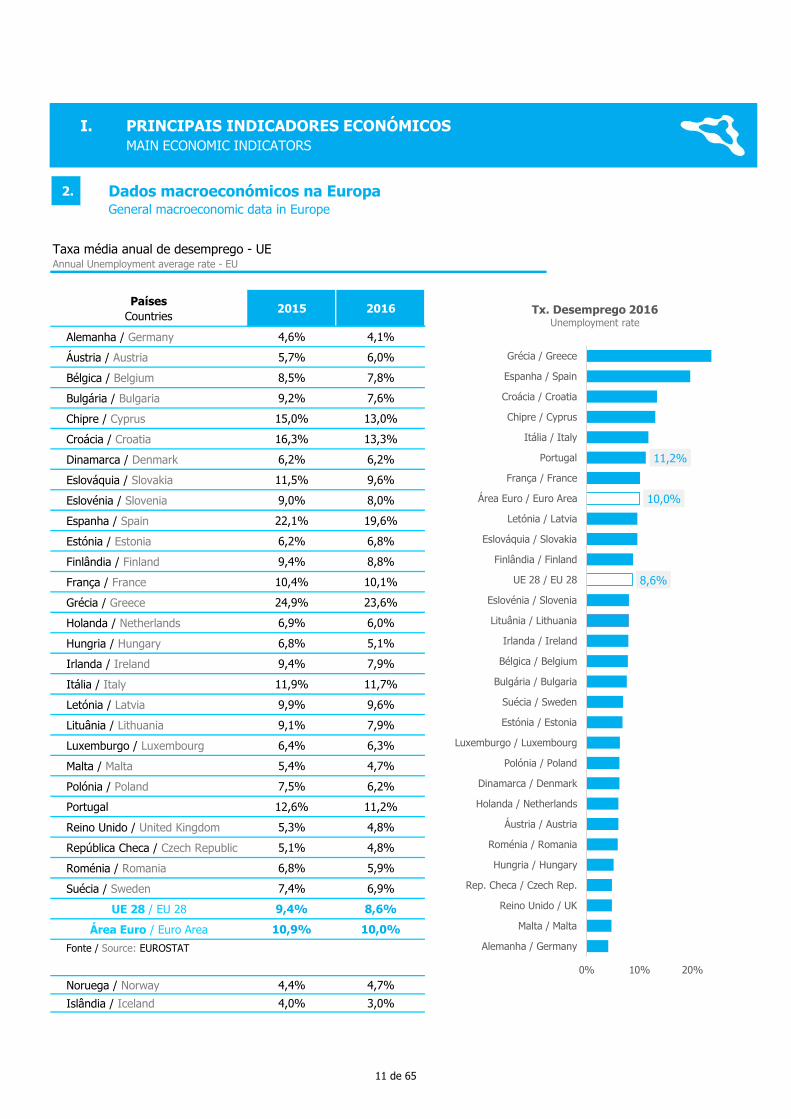
Países
Countries2015 2016
Crescimento / Growth 2010-2014 (%)
Alemanha / Germany 4,6% 4,1%
Áustria / Austria 5,7% 6,0%
Bélgica / Belgium 8,5% 7,8%
Bulgária / Bulgaria 9,2% 7,6%
Chipre / Cyprus 15,0% 13,0%
Croácia / Croatia 16,3% 13,3%
Dinamarca / Denmark 6,2% 6,2%
Eslováquia / Slovakia 11,5% 9,6%
Eslovénia / Slovenia 9,0% 8,0%
Espanha / Spain 22,1% 19,6%
Estónia / Estonia 6,2% 6,8%
Finlândia / Finland 9,4% 8,8%
França / France 10,4% 10,1%
Grécia / Greece 24,9% 23,6%
Holanda / Netherlands 6,9% 6,0%
Hungria / Hungary 6,8% 5,1%
Irlanda / Ireland 9,4% 7,9%
Itália / Italy 11,9% 11,7%
Letónia / Latvia 9,9% 9,6%
Lituânia / Lithuania 9,1% 7,9%
Luxemburgo / Luxembourg 6,4% 6,3%
Malta / Malta 5,4% 4,7%
Polónia / Poland 7,5% 6,2%
Portugal 12,6% 11,2%
Reino Unido / United Kingdom 5,3% 4,8%
República Checa / Czech Republic 5,1% 4,8%
Roménia / Romania 6,8% 5,9%
Suécia / Sweden 7,4% 6,9%
UE 28 / EU 28 9,4% 8,6%
Área Euro / Euro Area 10,9% 10,0%
Noruega / Norway 4,4% 4,7%
Islândia / Iceland 4,0% 3,0%
Dados macroeconómicos na EuropaGeneral macroeconomic data in Europe
Fonte / Source: EUROSTAT
Taxa média anual de desemprego - UEAnnual Unemployment average rate - EU
I. PRINCIPAIS INDICADORES ECONÓMICOS
MAIN ECONOMIC INDICATORS
2.
8,6%
10,0%
11,2%
0% 10% 20%
Alemanha / Germany
Malta / Malta
Reino Unido / UK
Rep. Checa / Czech Rep.
Hungria / Hungary
Roménia / Romania
Áustria / Austria
Holanda / Netherlands
Dinamarca / Denmark
Polónia / Poland
Luxemburgo / Luxembourg
Estónia / Estonia
Suécia / Sweden
Bulgária / Bulgaria
Bélgica / Belgium
Irlanda / Ireland
Lituânia / Lithuania
Eslovénia / Slovenia
UE 28 / EU 28
Finlândia / Finland
Eslováquia / Slovakia
Letónia / Latvia
Área Euro / Euro Area
França / France
Portugal
Itália / Italy
Chipre / Cyprus
Croácia / Croatia
Espanha / Spain
Grécia / Greece
Tx. Desemprego 2016Unemployment rate
11 de 65

Países Countries
2015 2016Crescimento / Growth 2010-2014 (%)
Alemanha / Germany 0,1% 0,4%
Áustria / Austria 0,8% 1,0%
Bélgica / Belgium 0,6% 1,8%
Bulgária / Bulgaria -1,1% -1,3%
Chipre / Cyprus -1,5% -1,2%
Croácia / Croatia -0,3% -0,6%
Dinamarca / Denmark 0,2% 0,0%
Eslováquia / Slovakia -0,3% -0,5%
Eslovénia / Slovenia -0,8% -0,2%
Espanha / Spain -0,6% -0,3%
Estónia / Estonia 0,1% 0,8%
Finlândia / Finland -0,2% 0,4%
França / France 0,1% 0,3%
Grécia / Greece -1,1% 0,0%
Holanda / Netherlands 0,2% 0,1%
Hungria / Hungary 0,1% 0,4%
Irlanda / Ireland 0,0% -0,2%
Itália / Italy 0,1% -0,1%
Letónia / Latvia 0,2% 0,1%
Lituânia / Lithuania -0,7% 0,7%
Luxemburgo / Luxembourg 0,1% 0,0%
Malta / Malta 1,2% 0,9%
Polónia / Poland -0,7% -0,2%
Portugal 0,5% 0,6%
Reino Unido / United Kingdom 0,0% 0,7%
República Checa / Czech Republic 0,3% 0,6%
Roménia / Romania -0,4% -1,1%
Suécia / Sweden 0,7% 1,1%
UE 28 / EU 28 0,0% 0,3%
Área Euro / Euro Area 0,0% 0,2%
Noruega / Norway 2,0% 3,9%
Suiça / Switzerland -0,8% -0,5%
Islândia / Iceland 0,3% 0,8%
Dados macroeconómicos na EuropaGeneral macroeconomic data in Europe
Fonte / Source: EUROSTAT
Taxa de inflação anual (%)Annual Inflation rate
I. PRINCIPAIS INDICADORES ECONÓMICOS
MAIN ECONOMIC INDICATORS
2.
0,6%
0,3%
0,2%
Bélgica / Belgium
Suécia / Sweden
Áustria / Austria
Malta / Malta
Estónia / Estonia
Lituânia / Lithuania
Reino Unido / UK
Portugal
Rep. Checa / Czech Rep.
Alemanha / Germany
Finlândia / Finland
Hungria / Hungary
França / France
UE 28 / EU 28
Área Euro / Euro Area
Holanda / Netherlands
Letónia / Latvia
Dinamarca / Denmark
Grécia / Greece
Luxemburgo / Luxembourg
Itália / Italy
Eslovénia / Slovenia
Irlanda / Ireland
Polónia / Poland
Espanha / Spain
Eslováquia / Slovakia
Croácia / Croatia
Roménia / Romania
Chipre / Cyprus
Bulgária / Bulgaria
Tx. Inflação- 2016Inflation Rate
12 de 65
EDIÇÃO EDITION 2016
IIPRINCIPAIS INDICADORES
DEMOGRÁFICOS
MAIN DEMOGRAPHIC INDICATORS
13 de 65

Unidade: Nº / Unit: Number
PaísesCountries
a 1 de Janeiro
at 1st January
% do total UE28
as % EU28
Alemanha / Germany 82.175.684 16,1% 0,5%
Áustria / Austria 8.690.076 1,7% 4,1%
Bélgica / Belgium 11.311.117 2,2% 4,3%
Bulgária / Bulgaria 7.153.784 1,4% -3,6%
Chipre / Cyprus 848.319 0,2% 3,6%
Croácia / Croatia 4.190.669 0,8% -2,6%
Dinamarca / Denmark 5.707.251 1,1% 3,1%
Eslováquia / Slovakia 5.426.252 1,1% 0,7%
Eslovénia / Slovenia 2.064.188 0,4% 0,8%
Espanha / Spain 46.440.099 9,1% -0,1%
Estónia / Estonia 1.315.944 0,3% -1,3%
Finlândia / Finland 5.487.308 1,1% 2,5%
França / France 66.759.950 13,1% 3,2%
Grécia / Greece 10.783.748 2,1% -3,0%
Holanda / Netherlands 16.979.120 3,3% 2,4%
Hungria / Hungary 9.830.485 1,9% -1,8%
Irlanda / Ireland 4.724.720 0,9% 3,9%
Itália / Italy 60.665.551 11,9% 2,5%
Letónia / Latvia 1.968.957 0,4% -7,1%
Lituânia / Lithuania 2.921.262 0,6% -7,0%
Luxemburgo / Luxembourg 576.249 0,1% 14,8%
Malta / Malta 434.403 0,1% 4,9%
Polónia / Poland 37.967.209 7,4% -0,1%
Portugal 10.341.330 2,0% -2,2%
Reino Unido / United Kingdom 65.382.556 12,8% 4,6%
República Checa / Czech Republic 10.553.843 2,1% 0,9%
Roménia / Romania 19.760.314 3,9% -2,6%
Suécia / Sweden 9.851.017 1,9% 5,5%
UE 28 / EU 28 510.278.701 100,0% 1,4%
Área Euro / Euro Area 339.881.573 66,6% 1,4%
Noruega / Norway 5.213.985 7,3%
Suiça / Switzerland 8.327.126 7,0%
Islândia / Iceland 332.529 4,7%
Fonte / Source: EUROSTAT
População na Europa European population
2016 Crescimento /
Growth (%) -
2010-2016
II. PRINCIPAIS INDICADORES DEMOGRÁFICOS MAIN DEMOGRAPHIC INDICATORS
1.
14 de 65

População Europeia 2016European Population
Crescimento da população (%): 2010-2016Population growth (%)
-2,2%
1,4%
-2,5% -2,0% -1,5% -1,0% -0,5% 0,0% 0,5% 1,0% 1,5% 2,0%
Portugal
UE 28 / EU 28
< 1,8 Milhões
Entre 1,8 e 4,8 Milhões
Entre 4,8 e 8,8 Milhões
Entre 8,8 e 19,6 Milhões
> 19,6 Milhões
15 de 65
Países Countries
Média de Idades
Median Age - 2016
Crescimento
Growth -
2010-2016
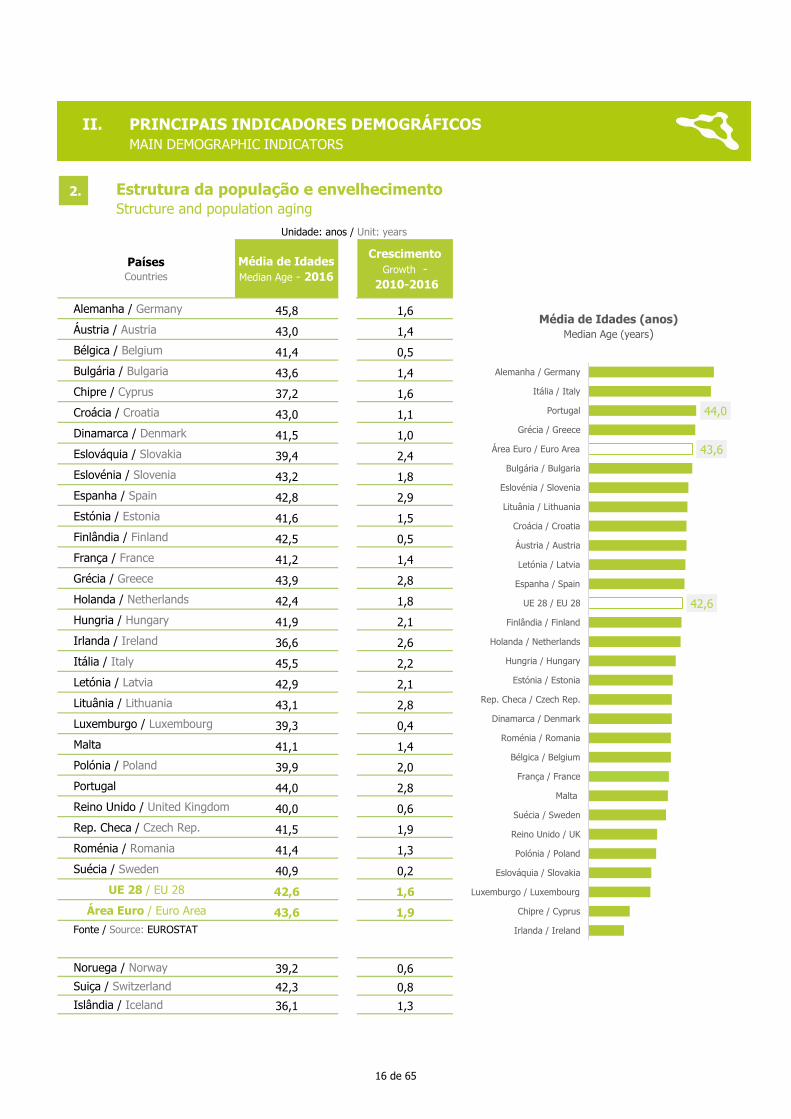
Alemanha / Germany 45,8 1,6
Áustria / Austria 43,0 1,4
Bélgica / Belgium 41,4 0,5
Bulgária / Bulgaria 43,6 1,4
Chipre / Cyprus 37,2 1,6
Croácia / Croatia 43,0 1,1
Dinamarca / Denmark 41,5 1,0
Eslováquia / Slovakia 39,4 2,4
Eslovénia / Slovenia 43,2 1,8
Espanha / Spain 42,8 2,9
Estónia / Estonia 41,6 1,5
Finlândia / Finland 42,5 0,5
França / France 41,2 1,4
Grécia / Greece 43,9 2,8
Holanda / Netherlands 42,4 1,8
Hungria / Hungary 41,9 2,1
Irlanda / Ireland 36,6 2,6
Itália / Italy 45,5 2,2
Letónia / Latvia 42,9 2,1
Lituânia / Lithuania 43,1 2,8
Luxemburgo / Luxembourg 39,3 0,4
Malta 41,1 1,4
Polónia / Poland 39,9 2,0
Portugal 44,0 2,8
Reino Unido / United Kingdom 40,0 0,6
Rep. Checa / Czech Rep. 41,5 1,9
Roménia / Romania 41,4 1,3
Suécia / Sweden 40,9 0,2
UE 28 / EU 28 42,6 1,6
Área Euro / Euro Area 43,6 1,9
Noruega / Norway 39,2 0,6
Suiça / Switzerland 42,3 0,8
Islândia / Iceland 36,1 1,3
Estrutura da população e envelhecimento Structure and population aging
Fonte / Source: EUROSTAT
Unidade: anos / Unit: years
II. PRINCIPAIS INDICADORES DEMOGRÁFICOS
MAIN DEMOGRAPHIC INDICATORS
2.
42,6
43,6
44,0
Irlanda / Ireland
Chipre / Cyprus
Luxemburgo / Luxembourg
Eslováquia / Slovakia
Polónia / Poland
Reino Unido / UK
Suécia / Sweden
Malta
França / France
Bélgica / Belgium
Roménia / Romania
Dinamarca / Denmark
Rep. Checa / Czech Rep.
Estónia / Estonia
Hungria / Hungary
Holanda / Netherlands
Finlândia / Finland
UE 28 / EU 28
Espanha / Spain
Letónia / Latvia
Áustria / Austria
Croácia / Croatia
Lituânia / Lithuania
Eslovénia / Slovenia
Bulgária / Bulgaria
Área Euro / Euro Area
Grécia / Greece
Portugal
Itália / Italy
Alemanha / Germany
Média de Idades (anos)
Median Age (years)
16 de 65

Unidades: % / Units: %
PaísesCountries
Rácio total de
Dependência /
Total dependency ratio
2016
Crescimento
(p.p)
Growth (p.p.) -
2010-2016
Alemanha / Germany 52,2% 0,4
Áustria / Austria 48,8% 0,5
Bélgica / Belgium 54,4% 2,7
Bulgária / Bulgaria 52,4% 6,8
Chipre / Cyprus 46,1% 3,8
Croácia / Croatia 51,1% 1,4
Dinamarca / Denmark 55,4% 3,0
Eslováquia / Slovakia 42,4% 3,6
Eslovénia / Slovenia 49,8% 5,8
Espanha / Spain 51,2% 4,8
Estónia / Estonia 54,1% 5,8
Finlândia / Finland 58,2% 7,6
França / France 59,4% 5,1
Grécia / Greece 55,5% 4,9
Holanda / Netherlands 53,0% 4,0
Hungria / Hungary 48,7% 3,0
Irlanda / Ireland 54,2% 6,8
Itália / Italy 55,5% 2,8
Letónia / Latvia 53,6% 5,9
Lituânia / Lithuania 50,7% 3,0
Luxemburgo / Luxembourg 44,3% -2,1
Malta / Malta 49,9% 6,6
Polónia / Poland 44,9% 4,3
Portugal 53,4% 2,9
Reino Unido / United Kingdom 55,4% 4,1
República Checa / Czech Rep. 50,8% 8,8
Roménia / Romania 49,0% 2,1
Suécia / Sweden 59,2% 6,1
UE 28 / EU 28 53,2% 3,6
Área Euro / Euro Area 54,1% 3,2
Noruega / Norway 52,3% 1,3
Suiça / Switzerland 48,8% 1,8
Islândia / Iceland 51,2% 2,1
Rácio total de dependência na UETotal dependency ratio EU
Fonte / Source: EUROSTAT
II. PRINCIPAIS INDICADORES DEMOGRÁFICOS
MAIN DEMOGRAPHIC INDICATORS
3.
53,2%
53,4%
54,1%
30,0% 40,0% 50,0% 60,0%
Eslováquia / Slovakia
Luxemburgo /…
Polónia / Poland
Chipre / Cyprus
Hungria / Hungary
Áustria / Austria
Roménia / Romania
Eslovénia / Slovenia
Malta / Malta
Lituânia / Lithuania
Rep. Checa / Czech Rep.
Croácia / Croatia
Espanha / Spain
Alemanha / Germany
Bulgária / Bulgaria
Holanda / Netherlands
UE 28 / EU 28
Portugal
Letónia / Latvia
Estónia / Estonia
Área Euro / Euro Area
Irlanda / Ireland
Bélgica / Belgium
Dinamarca / Denmark
Reino Unido / UK
Grécia / Greece
Itália / Italy
Finlândia / Finland
Suécia / Sweden
França / France
Rácio total de dependência 2016 Total dependency ratio
17 de 65
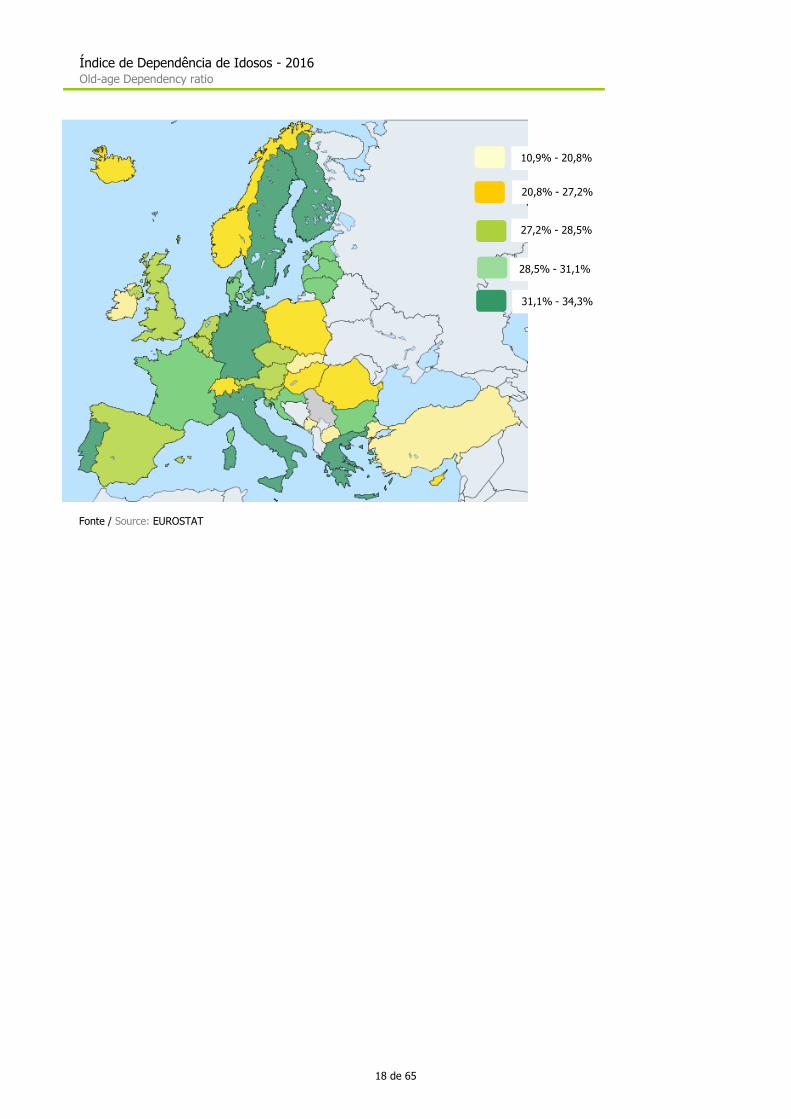
Índice de Dependência de Idosos - 2016Old-age Dependency ratio
Fonte / Source: EUROSTAT
10,9% - 20,8%
20,8% - 27,2%
27,2% - 28,5%
28,5% - 31,1%
31,1% - 34,3%
18 de 65
EDIÇÃO EDITION 2016
IIIPRINCIPAIS INDICADORES
DE SAÚDE
MAIN HEALTHCARE INDICATORS
19 de 65

Total (M€)V.H. (%)Growth rate
Per capita
(euros)
% PIB
GDP %
2010 17.668 1,9% 1.667 9,8%
2011 16.791 -5,0% 1.582 9,5%
2012 15.742 -6,2% 1.496 9,3%
2013 15.477 -1,7% 1.481 9,1%
2014 15.616 0,9% 1.501 9,0%
2015 16.106 3,1% 1.555 9,0%
2016 (P) 16.545 2,7% 1.602 8,9%
Fonte / Source: INE
Despesa corrente total em Saúde Total current Healthcare Expenditure
Despesa corrente em saúde - PortugalNational healthcare expenditure
Fonte / Source: INE, Base 2011; CSS
(P) - Previsão / Forecast
Distribuição da Despesa em Saúde por tipo de Prestador (%) - 2015
National healthcare expenditure by provider (%)
III. PRINCIPAIS INDICADORES DE SAÚDE
MAIN HEALTHCARE INDICATORS
1.
42%
27%
2%
5%
20%
2% 2%
Hospitais / Hospitals
Cuidados de Ambulatório / Ambulatory care
Cuidados continuados / Long-term care
Serviços auxiliares / ancillary services
Medicamentos e produtos médicos/ Pharmacies
Cuidados preventivos / Preventive Care
Outros
1.667
1.582
1.4961.481
1.501
1.555
1.602
1.350
1.400
1.450
1.500
1.550
1.600
1.650
1.700
2010 2011 2012 2013 2014 2015 2016 (P)
Despesa em Saúde per capita (euros)Health Expenditure per capita
1,9%
-5,0%
-6,2%
-1,7%
0,9%
3,1%2,7%
-8,0%
-6,0%
-4,0%
-2,0%
0,0%
2,0%
4,0%
2010 2011 2012 2013 2014 2015 2016(P)
V.H. da Despesa em Saúde (%)Health Expenditure annual growth rate
20 de 65
Total (M€)V.H. (%)Growth rate
% da Despesa Total do
Estado% Total Expenditure
% PIB
GDP %
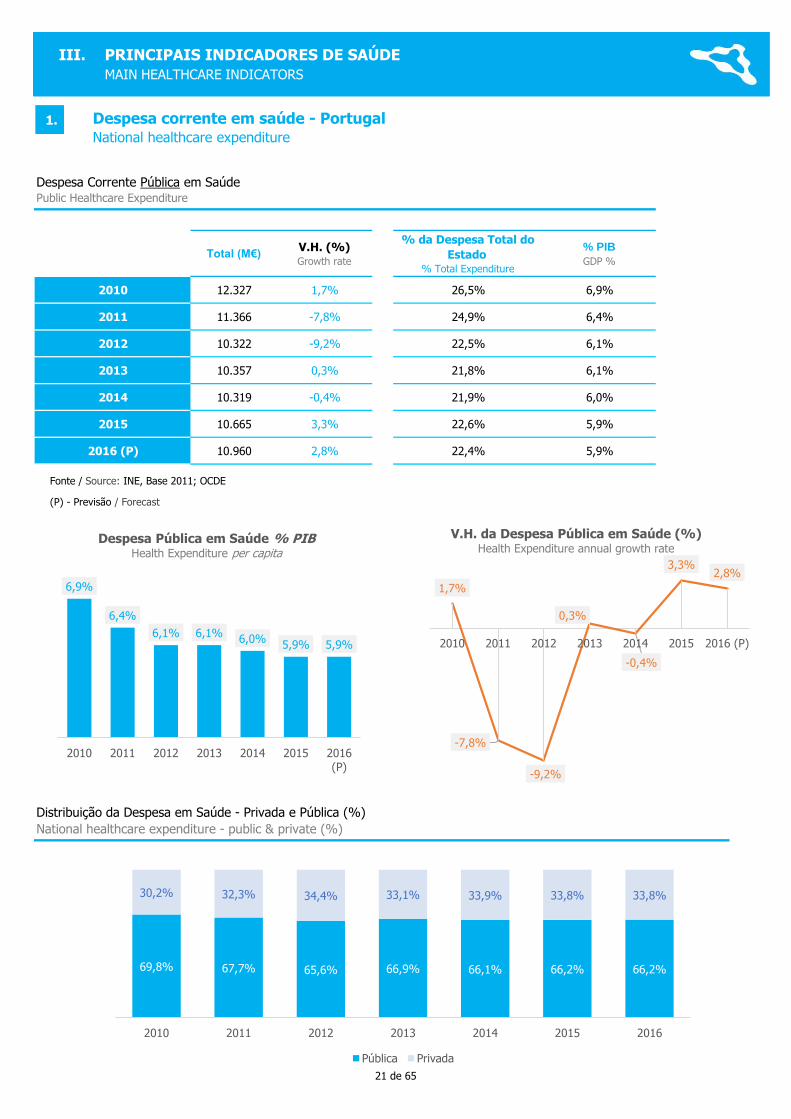
2010 12.327 1,7% 26,5% 6,9%
2011 11.366 -7,8% 24,9% 6,4%
2012 10.322 -9,2% 22,5% 6,1%
2013 10.357 0,3% 21,8% 6,1%
2014 10.319 -0,4% 21,9% 6,0%
2015 10.665 3,3% 22,6% 5,9%
2016 (P) 10.960 2,8% 22,4% 5,9%
Distribuição da Despesa em Saúde - Privada e Pública (%)
National healthcare expenditure - public & private (%)
Despesa corrente em saúde - PortugalNational healthcare expenditure
Despesa Corrente Pública em Saúde Public Healthcare Expenditure
Fonte / Source: INE, Base 2011; OCDE
(P) - Previsão / Forecast
III. PRINCIPAIS INDICADORES DE SAÚDE
MAIN HEALTHCARE INDICATORS
1.
69,8% 67,7% 65,6% 66,9% 66,1% 66,2% 66,2%
30,2% 32,3% 34,4% 33,1% 33,9% 33,8% 33,8%
2010 2011 2012 2013 2014 2015 2016
Pública Privada
6,9%
6,4%
6,1% 6,1%6,0%
5,9% 5,9%
4,5%
5,0%
5,5%
6,0%
6,5%
7,0%
7,5%
2010 2011 2012 2013 2014 2015 2016(P)
Despesa Pública em Saúde % PIBHealth Expenditure per capita
1,7%
-7,8%
-9,2%
0,3%
-0,4%
3,3%2,8%
-10,0%
-8,0%
-6,0%
-4,0%
-2,0%
0,0%
2,0%
4,0%
2010 2011 2012 2013 2014 2015 2016 (P)
V.H. da Despesa Pública em Saúde (%)Health Expenditure annual growth rate
21 de 65
Unidades / Units: Número / Number
2010 2011 2012 2013 2014 2015 2016
Crescimento
/ Growth (%)
2010-2016
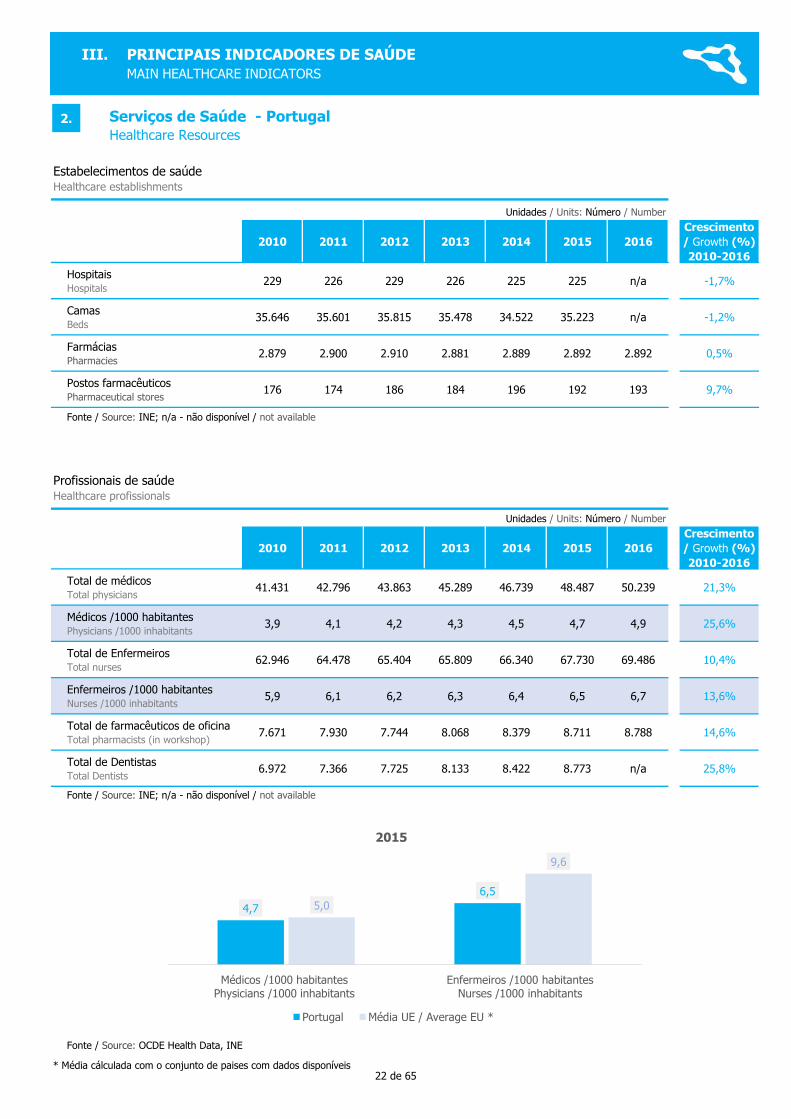
Hospitais Hospitals
229 226 229 226 225 225 n/a -1,7%
CamasBeds
35.646 35.601 35.815 35.478 34.522 35.223 n/a -1,2%
Farmácias Pharmacies
2.879 2.900 2.910 2.881 2.889 2.892 2.892 0,5%
Postos farmacêuticos Pharmaceutical stores
176 174 186 184 196 192 193 9,7%
Unidades / Units: Número / Number
2010 2011 2012 2013 2014 2015 2016
Crescimento
/ Growth (%)
2010-2016
Total de médicos Total physicians
41.431 42.796 43.863 45.289 46.739 48.487 50.239 21,3%
Médicos /1000 habitantes Physicians /1000 inhabitants
3,9 4,1 4,2 4,3 4,5 4,7 4,9 25,6%
Total de Enfermeiros Total nurses
62.946 64.478 65.404 65.809 66.340 67.730 69.486 10,4%
Enfermeiros /1000 habitantes Nurses /1000 inhabitants
5,9 6,1 6,2 6,3 6,4 6,5 6,7 13,6%
Total de farmacêuticos de oficinaTotal pharmacists (in workshop)
7.671 7.930 7.744 8.068 8.379 8.711 8.788 14,6%
Total de DentistasTotal Dentists
6.972 7.366 7.725 8.133 8.422 8.773 n/a 25,8%
* Média cálculada com o conjunto de paises com dados disponíveis
Fonte / Source: OCDE Health Data, INE
Serviços de Saúde - PortugalHealthcare Resources
Fonte / Source: INE; n/a - não disponível / not available
Fonte / Source: INE; n/a - não disponível / not available
Estabelecimentos de saúde Healthcare establishments
Profissionais de saúdeHealthcare profissionals
III. PRINCIPAIS INDICADORES DE SAÚDE
MAIN HEALTHCARE INDICATORS
2.
4,7
6,5
5,0
9,6
Médicos /1000 habitantesPhysicians /1000 inhabitants
Enfermeiros /1000 habitantesNurses /1000 inhabitants
2015
Portugal Média UE / Average EU *
22 de 65
Unidades / Units: Número / Number
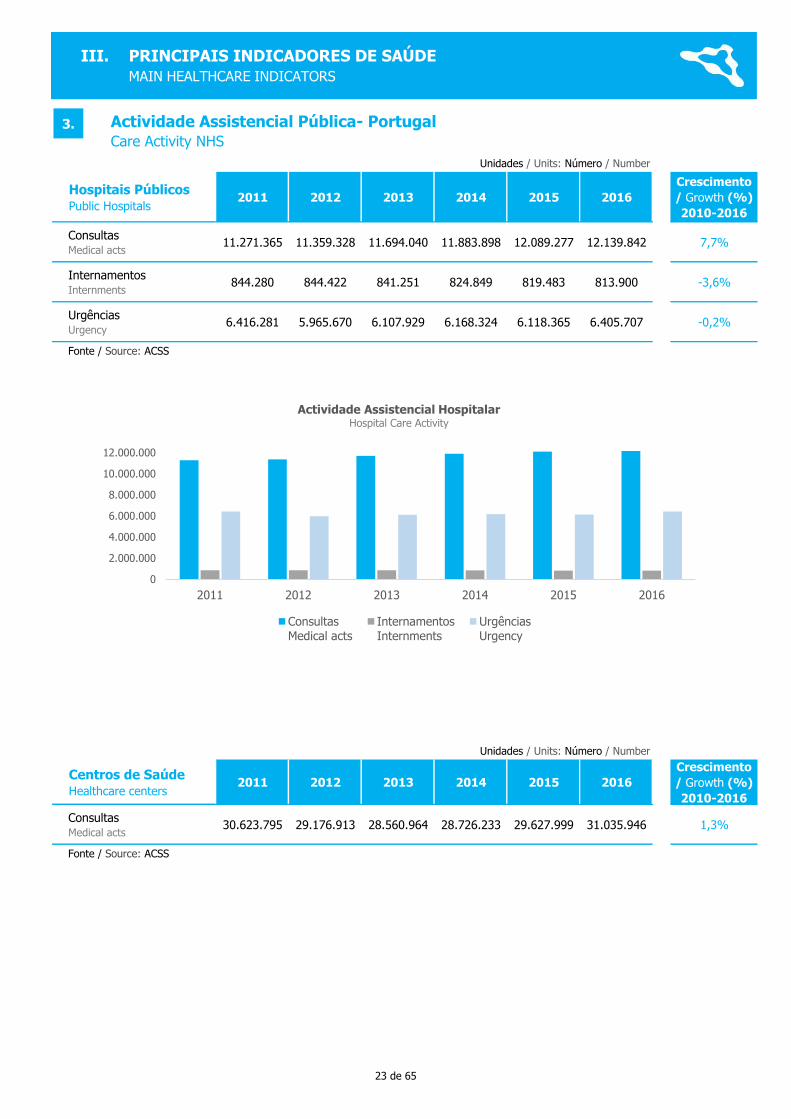
Hospitais PúblicosPublic Hospitals
2011 2012 2013 2014 2015 2016
Crescimento
/ Growth (%)
2010-2016
ConsultasMedical acts
11.271.365 11.359.328 11.694.040 11.883.898 12.089.277 12.139.842 7,7%
InternamentosInternments
844.280 844.422 841.251 824.849 819.483 813.900 -3,6%
Urgências Urgency
6.416.281 5.965.670 6.107.929 6.168.324 6.118.365 6.405.707 -0,2%
Unidades / Units: Número / Number
Centros de SaúdeHealthcare centers
2011 2012 2013 2014 2015 2016
Crescimento
/ Growth (%)
2010-2016
ConsultasMedical acts
30.623.795 29.176.913 28.560.964 28.726.233 29.627.999 31.035.946 1,3%
Actividade Assistencial Pública- PortugalCare Activity NHS
Fonte / Source: ACSS
Fonte / Source: ACSS
III. PRINCIPAIS INDICADORES DE SAÚDE
MAIN HEALTHCARE INDICATORS
3.
0
2.000.000
4.000.000
6.000.000
8.000.000
10.000.000
12.000.000
2011 2012 2013 2014 2015 2016
Actividade Assistencial HospitalarHospital Care Activity
ConsultasMedical acts
InternamentosInternments
UrgênciasUrgency
23 de 65
Unidade / Unit: %o
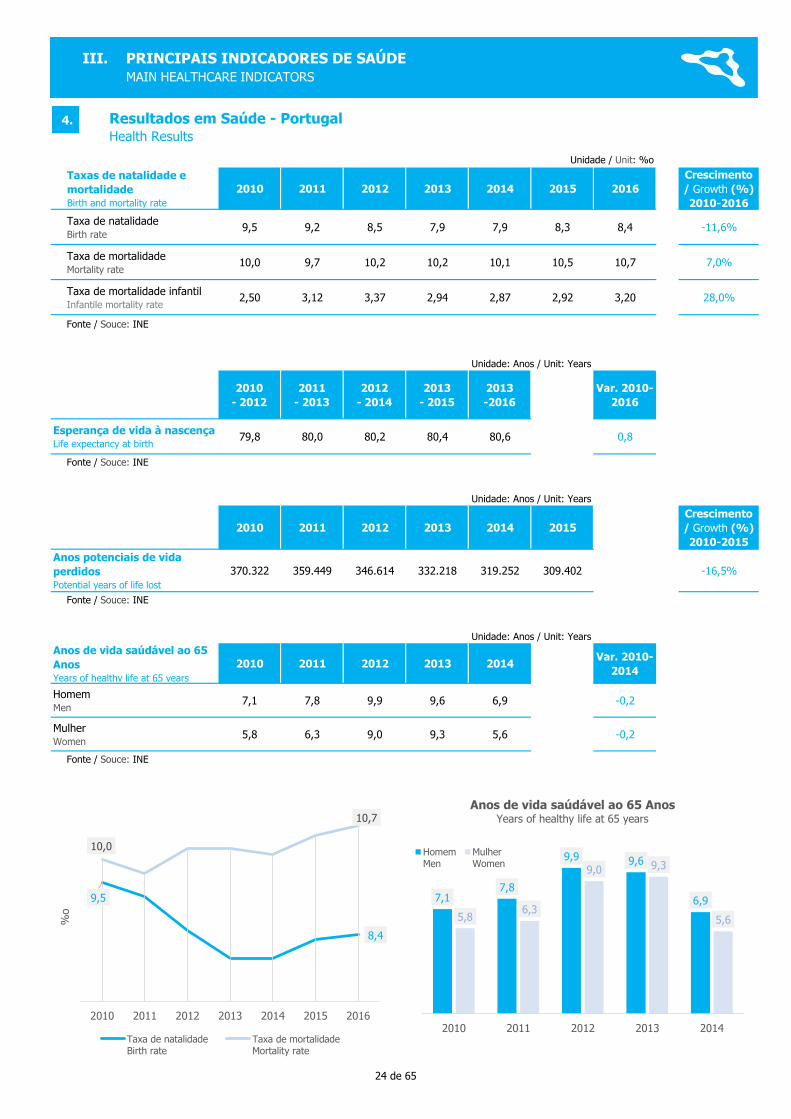
Taxas de natalidade e
mortalidade Birth and mortality rate
2010 2011 2012 2013 2014 2015 2016
Crescimento
/ Growth (%)
2010-2016
Taxa de natalidadeBirth rate
9,5 9,2 8,5 7,9 7,9 8,3 8,4 -11,6%
Taxa de mortalidade Mortality rate
10,0 9,7 10,2 10,2 10,1 10,5 10,7 7,0%
Taxa de mortalidade infantilInfantile mortality rate
2,50 3,12 3,37 2,94 2,87 2,92 3,20 28,0%
Unidade: Anos / Unit: Years
2010
- 2012
2011
- 2013
2012
- 2014
2013
- 2015
2013
-2016
Var. 2010-
2016
Esperança de vida à nascença Life expectancy at birth
79,8 80,0 80,2 80,4 80,6 0,8
Unidade: Anos / Unit: Years
2010 2011 2012 2013 2014 2015
Crescimento
/ Growth (%)
2010-2015
Anos potenciais de vida
perdidosPotential years of life lost
370.322 359.449 346.614 332.218 319.252 309.402 -16,5%
Unidade: Anos / Unit: Years
Anos de vida saúdável ao 65
AnosYears of healthy life at 65 years
2010 2011 2012 2013 2014Var. 2010-
2014
HomemMen
7,1 7,8 9,9 9,6 6,9 -0,2
MulherWomen
5,8 6,3 9,0 9,3 5,6 -0,2
Resultados em Saúde - PortugalHealth Results
Fonte / Souce: INE
Fonte / Souce: INE
Fonte / Souce: INE
Fonte / Souce: INE
III. PRINCIPAIS INDICADORES DE SAÚDE
MAIN HEALTHCARE INDICATORS
4.
9,5
8,4
10,0
10,7
7,0
7,5
8,0
8,5
9,0
9,5
10,0
10,5
11,0
2010 2011 2012 2013 2014 2015 2016
%o
Taxa de natalidadeBirth rate
Taxa de mortalidadeMortality rate
7,17,8
9,9 9,6
6,9
5,86,3
9,0 9,3
5,6
0,0
1,0
2,0
3,0
4,0
5,0
6,0
7,0
8,0
9,0
10,0
2010 2011 2012 2013 2014
Anos de vida saúdável ao 65 AnosYears of healthy life at 65 years
HomemMen
MulherWomen
24 de 65
Unidades / Units: Número / Number
2010 2011 2012 2013 2014 2015
Crescimento
/ Growth (%)
2010-2016
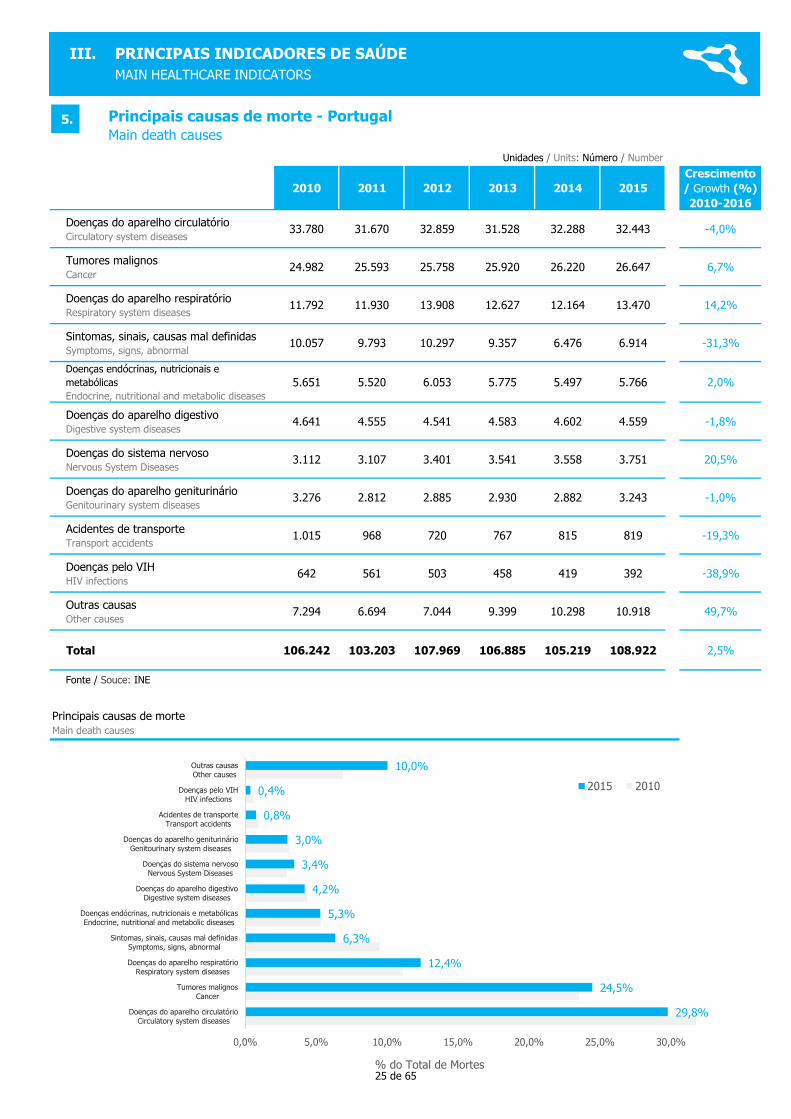
Doenças do aparelho circulatórioCirculatory system diseases
33.780 31.670 32.859 31.528 32.288 32.443 -4,0%
Tumores malignosCancer
24.982 25.593 25.758 25.920 26.220 26.647 6,7%
Doenças do aparelho respiratórioRespiratory system diseases
11.792 11.930 13.908 12.627 12.164 13.470 14,2%
Sintomas, sinais, causas mal definidasSymptoms, signs, abnormal
10.057 9.793 10.297 9.357 6.476 6.914 -31,3%
Doenças endócrinas, nutricionais e
metabólicas
Endocrine, nutritional and metabolic diseases
5.651 5.520 6.053 5.775 5.497 5.766 2,0%
Doenças do aparelho digestivo Digestive system diseases
4.641 4.555 4.541 4.583 4.602 4.559 -1,8%
Doenças do sistema nervoso Nervous System Diseases
3.112 3.107 3.401 3.541 3.558 3.751 20,5%
Doenças do aparelho geniturinárioGenitourinary system diseases
3.276 2.812 2.885 2.930 2.882 3.243 -1,0%
Acidentes de transporteTransport accidents
1.015 968 720 767 815 819 -19,3%
Doenças pelo VIHHIV infections
642 561 503 458 419 392 -38,9%
Outras causasOther causes
7.294 6.694 7.044 9.399 10.298 10.918 49,7%
Total 106.242 103.203 107.969 106.885 105.219 108.922 2,5%
Principais causas de morte - PortugalMain death causes
Fonte / Souce: INE
Principais causas de morte
Main death causes
III. PRINCIPAIS INDICADORES DE SAÚDE
MAIN HEALTHCARE INDICATORS
5.
29,8%
24,5%
12,4%
6,3%
5,3%
4,2%
3,4%
3,0%
0,8%
0,4%
10,0%
0,0% 5,0% 10,0% 15,0% 20,0% 25,0% 30,0%
Doenças do aparelho circulatórioCirculatory system diseases
Tumores malignosCancer
Doenças do aparelho respiratórioRespiratory system diseases
Sintomas, sinais, causas mal definidasSymptoms, signs, abnormal
Doenças endócrinas, nutricionais e metabólicasEndocrine, nutritional and metabolic diseases
Doenças do aparelho digestivoDigestive system diseases
Doenças do sistema nervosoNervous System Diseases
Doenças do aparelho geniturinárioGenitourinary system diseases
Acidentes de transporteTransport accidents
Doenças pelo VIHHIV infections
Outras causasOther causes
% do Total de Mortes
2015 2010
25 de 65
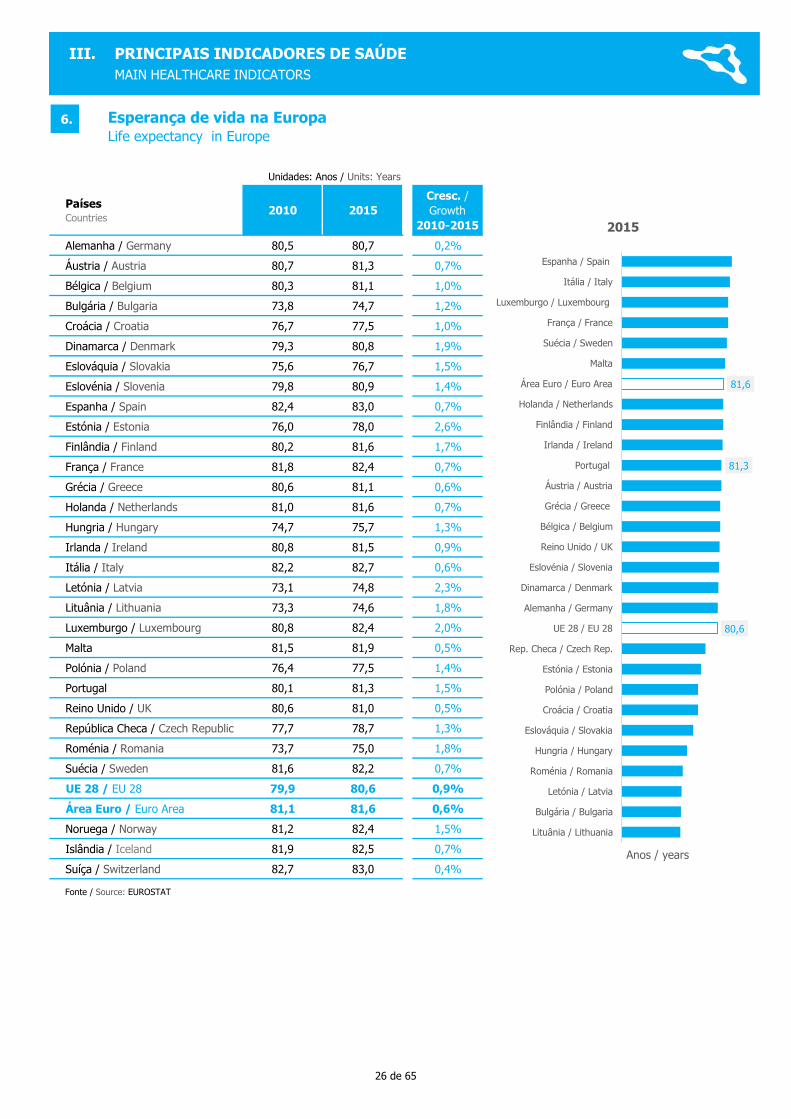
Unidades: Anos / Units: Years
Países Countries
2010 2015
Cresc. /
Growth
2010-2015
Alemanha / Germany 80,5 80,7 0,2%
Áustria / Austria 80,7 81,3 0,7%
Bélgica / Belgium 80,3 81,1 1,0%
Bulgária / Bulgaria 73,8 74,7 1,2%
Croácia / Croatia 76,7 77,5 1,0%
Dinamarca / Denmark 79,3 80,8 1,9%
Eslováquia / Slovakia 75,6 76,7 1,5%
Eslovénia / Slovenia 79,8 80,9 1,4%
Espanha / Spain 82,4 83,0 0,7%
Estónia / Estonia 76,0 78,0 2,6%
Finlândia / Finland 80,2 81,6 1,7%
França / France 81,8 82,4 0,7%
Grécia / Greece 80,6 81,1 0,6%
Holanda / Netherlands 81,0 81,6 0,7%
Hungria / Hungary 74,7 75,7 1,3%
Irlanda / Ireland 80,8 81,5 0,9%
Itália / Italy 82,2 82,7 0,6%
Letónia / Latvia 73,1 74,8 2,3%
Lituânia / Lithuania 73,3 74,6 1,8%
Luxemburgo / Luxembourg 80,8 82,4 2,0%
Malta 81,5 81,9 0,5%
Polónia / Poland 76,4 77,5 1,4%
Portugal 80,1 81,3 1,5%
Reino Unido / UK 80,6 81,0 0,5%
República Checa / Czech Republic 77,7 78,7 1,3%
Roménia / Romania 73,7 75,0 1,8%
Suécia / Sweden 81,6 82,2 0,7%
UE 28 / EU 28 79,9 80,6 0,9%
Área Euro / Euro Area 81,1 81,6 0,6%
Noruega / Norway 81,2 82,4 1,5%
Islândia / Iceland 81,9 82,5 0,7%
Suíça / Switzerland 82,7 83,0 0,4%
Fonte / Source: EUROSTAT
Esperança de vida na Europa Life expectancy in Europe
III. PRINCIPAIS INDICADORES DE SAÚDE
MAIN HEALTHCARE INDICATORS
6.
80,6
81,3
81,6
Lituânia / Lithuania
Bulgária / Bulgaria
Letónia / Latvia
Roménia / Romania
Hungria / Hungary
Eslováquia / Slovakia
Croácia / Croatia
Polónia / Poland
Estónia / Estonia
Rep. Checa / Czech Rep.
UE 28 / EU 28
Alemanha / Germany
Dinamarca / Denmark
Eslovénia / Slovenia
Reino Unido / UK
Bélgica / Belgium
Grécia / Greece
Áustria / Austria
Portugal
Irlanda / Ireland
Finlândia / Finland
Holanda / Netherlands
Área Euro / Euro Area
Malta
Suécia / Sweden
França / France
Luxemburgo / Luxembourg
Itália / Italy
Espanha / Spain
Anos / years
2015
26 de 65
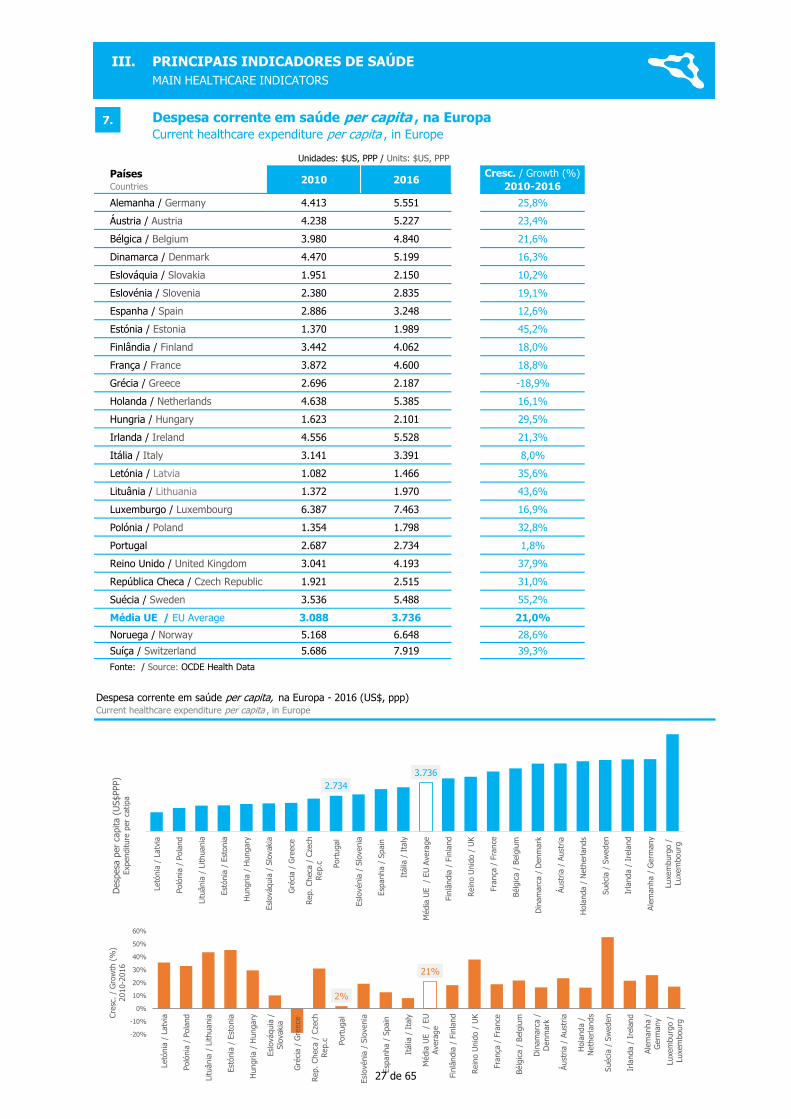
Unidades: $US, PPP / Units: $US, PPP
Países Countries
2010 2016Cresc. / Growth (%)
2010-2016
Alemanha / Germany 4.413 5.551 25,8%
Áustria / Austria 4.238 5.227 23,4%
Bélgica / Belgium 3.980 4.840 21,6%
Dinamarca / Denmark 4.470 5.199 16,3%
Eslováquia / Slovakia 1.951 2.150 10,2%
Eslovénia / Slovenia 2.380 2.835 19,1%
Espanha / Spain 2.886 3.248 12,6%
Estónia / Estonia 1.370 1.989 45,2%
Finlândia / Finland 3.442 4.062 18,0%
França / France 3.872 4.600 18,8%
Grécia / Greece 2.696 2.187 -18,9%
Holanda / Netherlands 4.638 5.385 16,1%
Hungria / Hungary 1.623 2.101 29,5%
Irlanda / Ireland 4.556 5.528 21,3%
Itália / Italy 3.141 3.391 8,0%
Letónia / Latvia 1.082 1.466 35,6%
Lituânia / Lithuania 1.372 1.970 43,6%
Luxemburgo / Luxembourg 6.387 7.463 16,9%
Polónia / Poland 1.354 1.798 32,8%
Portugal 2.687 2.734 1,8%
Reino Unido / United Kingdom 3.041 4.193 37,9%
República Checa / Czech Republic 1.921 2.515 31,0%
Suécia / Sweden 3.536 5.488 55,2%
Média UE / EU Average 3.088 3.736 21,0%
Noruega / Norway 5.168 6.648 28,6%
Suíça / Switzerland 5.686 7.919 39,3%
Fonte: / Source: OCDE Health Data
Despesa corrente em saúde per capita, na Europa - 2016 (US$, ppp)Current healthcare expenditure per capita , in Europe
Despesa corrente em saúde per capita , na Europa Current healthcare expenditure per capita , in Europe
2%
21%
-20%
-10%
0%
10%
20%
30%
40%
50%
60%
Letó
nia
/ L
atv
ia
Poló
nia
/ P
ola
nd
Lituânia
/ L
ithuania
Est
ónia
/ E
stonia
Hungria /
Hungary
Esl
ováquia
/
Slo
vakia
Gré
cia /
Gre
ece
Rep. Checa
/ C
zech
Rep.c Port
ugal
Esl
ovénia
/ S
lovenia
Esp
anha /
Spain
Itália
/ I
taly
Média
UE
/ EU
Avera
ge
Fin
lândia
/ F
inla
nd
Rein
o U
nid
o /
UK
Fra
nça
/ F
rance
Bélg
ica /
Belg
ium
Din
am
arc
a /
Denm
ark
Áust
ria /
Aust
ria
Hola
nda /
Neth
erlands
Suéci
a /
Sw
eden
Irla
nda /
Ire
land
Ale
manha /
Germ
any
Luxe
mburg
o /
Luxe
mbourg
Cre
sc. /
Gro
wth
(%
)
2010-2
016
III. PRINCIPAIS INDICADORES DE SAÚDE
MAIN HEALTHCARE INDICATORS
7.
2.734
3.736
0
1.000
2.000
3.000
4.000
5.000
6.000
7.000
8.000
Letó
nia
/ L
atv
ia
Poló
nia
/ P
ola
nd
Lituânia
/ L
ithuania
Est
ónia
/ E
stonia
Hungria /
Hungary
Esl
ováquia
/ S
lovakia
Gré
cia /
Gre
ece
Rep. Checa
/ C
zech
Rep.c Port
ugal
Esl
ovénia
/ S
lovenia
Esp
anha /
Spain
Itália
/ I
taly
Média
UE
/ EU
Avera
ge
Fin
lândia
/ F
inla
nd
Rein
o U
nid
o /
UK
Fra
nça
/ F
rance
Bélg
ica /
Belg
ium
Din
am
arc
a /
Denm
ark
Áust
ria /
Aust
ria
Hola
nda /
Neth
erlands
Suéci
a /
Sw
eden
Irla
nda /
Ire
land
Ale
manha /
Germ
any
Luxe
mburg
o /
Luxe
mbourg
Desp
esa
per
capita (
US$PPP)
Expenditure
per
catipa
27 de 65
Países Countries
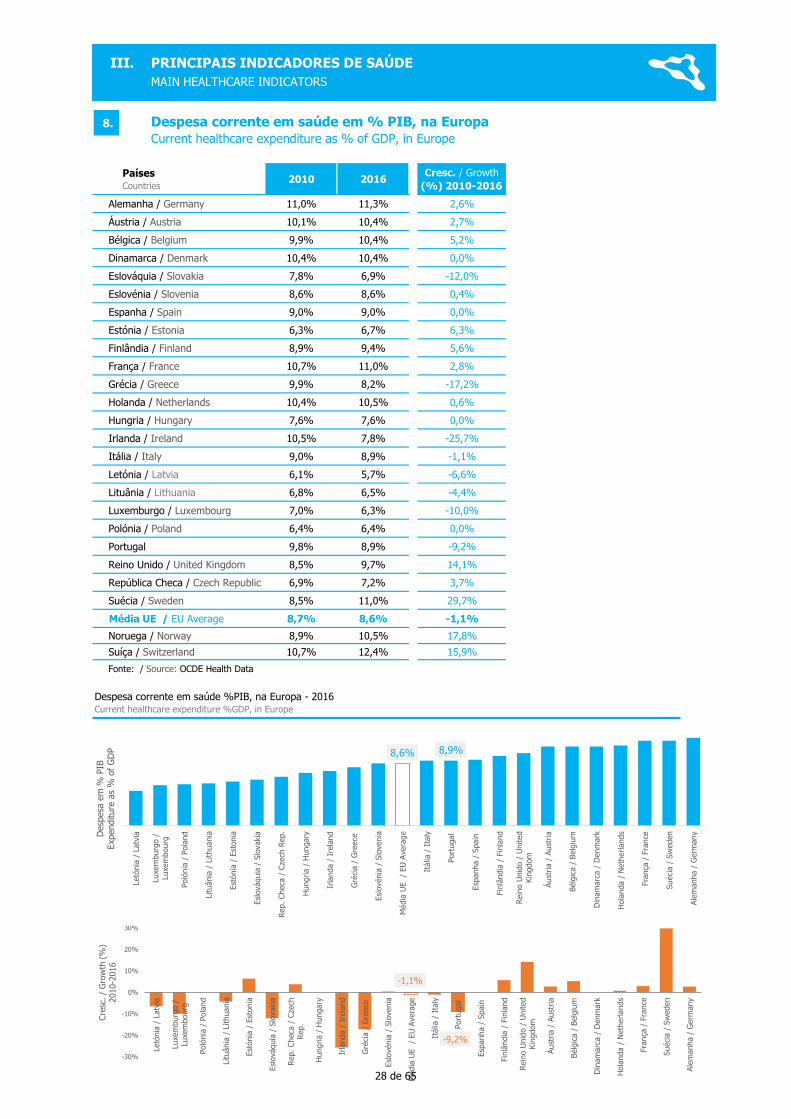
2010 2016Cresc. / Growth
(%) 2010-2016
Alemanha / Germany 11,0% 11,3% 2,6%
Áustria / Austria 10,1% 10,4% 2,7%
Bélgica / Belgium 9,9% 10,4% 5,2%
Dinamarca / Denmark 10,4% 10,4% 0,0%
Eslováquia / Slovakia 7,8% 6,9% -12,0%
Eslovénia / Slovenia 8,6% 8,6% 0,4%
Espanha / Spain 9,0% 9,0% 0,0%
Estónia / Estonia 6,3% 6,7% 6,3%
Finlândia / Finland 8,9% 9,4% 5,6%
França / France 10,7% 11,0% 2,8%
Grécia / Greece 9,9% 8,2% -17,2%
Holanda / Netherlands 10,4% 10,5% 0,6%
Hungria / Hungary 7,6% 7,6% 0,0%
Irlanda / Ireland 10,5% 7,8% -25,7%
Itália / Italy 9,0% 8,9% -1,1%
Letónia / Latvia 6,1% 5,7% -6,6%
Lituânia / Lithuania 6,8% 6,5% -4,4%
Luxemburgo / Luxembourg 7,0% 6,3% -10,0%
Polónia / Poland 6,4% 6,4% 0,0%
Portugal 9,8% 8,9% -9,2%
Reino Unido / United Kingdom 8,5% 9,7% 14,1%
República Checa / Czech Republic 6,9% 7,2% 3,7%
Suécia / Sweden 8,5% 11,0% 29,7%
Média UE / EU Average 8,7% 8,6% -1,1%
Noruega / Norway 8,9% 10,5% 17,8%
Suíça / Switzerland 10,7% 12,4% 15,9%
Fonte: / Source: OCDE Health Data
Despesa corrente em saúde em % PIB, na Europa Current healthcare expenditure as % of GDP, in Europe
Despesa corrente em saúde %PIB, na Europa - 2016Current healthcare expenditure %GDP, in Europe
-1,1%
-9,2%
-30%
-20%
-10%
0%
10%
20%
30%
40%
Letó
nia
/ L
atv
ia
Luxe
mburg
o /
Luxe
mbourg
Poló
nia
/ P
ola
nd
Lituânia
/ L
ithuania
Est
ónia
/ E
stonia
Esl
ováquia
/ S
lovakia
Rep. Checa
/ C
zech
Rep.
Hungria /
Hungary
Irla
nda /
Ire
land
Gré
cia /
Gre
ece
Esl
ovénia
/ S
lovenia
Média
UE
/ EU
Avera
ge
Itália
/ I
taly
Port
ugal
Esp
anha /
Spain
Fin
lândia
/ F
inla
nd
Rein
o U
nid
o /
United
Kin
gdom
Áust
ria /
Aust
ria
Bélg
ica /
Belg
ium
Din
am
arc
a /
Denm
ark
Hola
nda /
Neth
erlands
Fra
nça
/ F
rance
Suéci
a /
Sw
eden
Ale
manha /
Germ
any
Cre
sc. /
Gro
wth
(%
) 2010-2
016
III. PRINCIPAIS INDICADORES DE SAÚDE
MAIN HEALTHCARE INDICATORS
8.
8,6% 8,9%
Letó
nia
/ L
atv
ia
Luxe
mburg
o /
Luxe
mbourg
Poló
nia
/ P
ola
nd
Lituânia
/ L
ithuania
Est
ónia
/ E
stonia
Esl
ováquia
/ S
lovakia
Rep. Checa
/ C
zech
Rep.
Hungria /
Hungary
Irla
nda /
Ire
land
Gré
cia /
Gre
ece
Esl
ovénia
/ S
lovenia
Média
UE
/ EU
Avera
ge
Itália
/ I
taly
Port
ugal
Esp
anha /
Spain
Fin
lândia
/ F
inla
nd
Rein
o U
nid
o /
United
Kin
gdom
Áust
ria /
Aust
ria
Bélg
ica /
Belg
ium
Din
am
arc
a /
Denm
ark
Hola
nda /
Neth
erlands
Fra
nça
/ F
rance
Suéci
a /
Sw
eden
Ale
manha /
Germ
anyDesp
esa
em
% P
IBExpenditure
as
% o
f G
DP
28 de 65

Unidades / Units: %
Países
Countries
Com
internamento
/ In-patient
Ambulatório/
Outpatient
Serviços
auxiliares /
Ancillary services
Bens médicos
/ Medical goods
Prevenção
/Preventive
care
Administração
/Governance and
Administration
Outros
/others
Alemanha / Germany 27,4% 22,3% 4,9% 19,8% 3,0% 4,8% 17,8%
Áustria / Austria 33,3% 25,1% 3,0% 16,9% 2,2% 3,8% 15,7%
Bélgica / Belgium 28,6% 18,7% 5,0% 16,2% 1,7% 3,4% 26,4%
Dinamarca / Denmark 26,4% 29,5% 4,7% 10,2% 2,5% 2,4% 24,3%
Eslováquia / Slovakia 28,3% 22,4% 6,9% 35,3% 2,1% 3,2% 1,8%
Eslovénia / Slovenia 27,4% 27,8% 3,7% 22,4% 2,7% 3,5% 12,5%
Espanha / Spain (a) 23,7% 32,1% 5,0% 22,3% 2,0% 2,9% 12,0%
Estónia / Estonia 24,2% 30,5% 10,8% 20,9% 3,2% 1,9% 8,5%
Finlândia / Finland 23,8% 33,6% 3,3% 14,9% 4,0% 0,8% 19,6%
França / France 29,4% 18,7% 5,4% 20,1% 1,9% 6,0% 18,5%
Grécia / Greece 40,0% 21,3% 4,0% 28,3% 1,3% 2,6% 2,5%
Holanda / Netherlands 21,2% 25,3% 1,8% 12,7% 3,6% 3,9% 31,5%
Hungria / Hungary 26,8% 24,5% 5,2% 32,1% 2,6% 2,1% 6,7%
Irlanda / Ireland 24,2% 19,5% 2,9% 14,1% 2,7% 2,9% 33,7%
Itália / Italy 27,9% 27,7% 8,9% 20,7% 4,0% 1,9% 8,9%
Letónia / Latvia 20,8% 21,3% 11,9% 30,2% 2,0% 2,0% 11,8%
Lituânia / Lithuania 27,8% 22,3% 5,2% 30,1% 1,9% 2,0% 10,7%
Luxemburgo / Luxembourg (a) 25,3% 24,2% 5,9% 11,0% 2,4% 4,3% 26,9%
Polónia / Poland 24,0% 23,2% 4,7% 23,4% 2,7% 1,6% 20,4%
Portugal (a) 17,6% 39,3% 8,3% 19,6% 1,8% 1,9% 11,5%
Reino Unido / United Kingdom 23,7% 25,3% 1,8% 14,5% 5,2% 2,2% 27,3%
Rep. Checa / Czech Rep. 24,5% 27,5% 5,1% 20,0% 2,7% 2,6% 17,6%
Suécia / Sweden 20,6% 29,3% 3,7% 12,3% 3,1% 1,7% 29,3%
Média UE / EU Average 26,0% 25,7% 5,3% 20,3% 2,7% 2,8% 17,2%
Noruega / Norway 27,6% 20,9% 7,8% 10,9% 2,9% 0,6% 29,3%
Fonte / Source: OCDE Health Data
Nota: Saúde Pública= Prevenção + Financiamento da administração do sistema publico / Collective healthcare = Prevention + Governance and health system and financing
administration
Despesa corrente em saúde por tipo de tratamento (%) - 2015Current healthcare expenditure by function of healthcare (%)
III. PRINCIPAIS INDICADORES DE SAÚDE
MAIN HEALTHCARE INDICATORS
9.
0%
20%
40%
60%
80%
100%
Ale
manha /
Germ
any
Áust
ria /
Aust
ria
Bélg
ica /
Belg
ium
Din
am
arc
a /
Denm
ark
Esl
ováquia
/ S
lovakia
Esl
ovénia
/ S
lovenia
Esp
anha /
Spain
(a)
Est
ónia
/ E
stonia
Fin
lândia
/ F
inla
nd
Fra
nça
/ F
rance
Gré
cia /
Gre
ece
Hola
nda /
Neth
erlands
Hungria /
Hungary
Irla
nda /
Ire
land
Itália
/ I
taly
Letó
nia
/ L
atv
ia
Lituânia
/ L
ithuania
Luxem
burg
o /
Luxem
bourg
(a)
Poló
nia
/ P
ola
nd
Port
ugal (a
)
Rein
o U
nid
o /
United
Kin
gdom
Rep. Checa
/ C
zech
Rep.
Suéci
a /
Sw
eden
Média
UE /
EU
Avera
ge
Com internamento/ In-patient
Ambulatório/ Outpatient Serviços auxiliares / Ancillary services
Bens médicos / Medical goods Prevenção /Preventive care Administração /Governance and Administration
Outros /others
29 de 65

EDIÇÃO EDITION 2016
IVPRINCIPAIS INDICADORES
DO SECTOR FARMACÊUTICO
MAIN PHARMACEUTICAL SECTOR INDICATORS
30 de 65

Unidades / Units: Nº
2010 2011 2012 2013 2014 2015 2016
Empresas farmacêuticas
Pharmaceutical companies (1) 130 130 122 121 123 121 121
Armazéns de medicamentosWholesalers
402 406 409 409 443 n/d n/d
Fontes: Apifarma e Infarmed - Estatística do medicamento 2014 / Sources: Apifarma and Infarmed - Medicines Statistic 2014
(1) Empresas associadas da Apifarma, a 1 de Janeiro de cada ano / Affiliates of Apifarma, as of 1st January of each year
2010 2011 2012 2013 2014 2015 2016
Dívida a + de 90 dias (M€)Debt over 90 days (M€)
696 1.005 826 681 530 437 518
Dívida total (M€)Total debt (M€)
965 1.283 1.125 990 783 695 780
PMR (dias)
Average payment time (days)375 476 500 489 476 385 n/d
Fonte: Inquérito mensal da Apifarma / Source: Apifarma Survey
Dívidas dos hospitais à IF Hospital debts to industry
Dívida hospitalar à indústria farmacêutica Hospital debts to the pharmaceutical industry
Empresas farmacêuticas e armazenistas Pharmaceutical companies and wholesalers
IV. PRINCIPAIS INDICADORES DO SECTOR FARMACÊUTICO
MAIN PHARMACEUTCAL SECTOR INDICATORS
1.
2.
696
1.005826
681530
437 518
0
200
400
600
800
1.000
1.200
2010 2011 2012 2013 2014 2015 2016
Dívida a + de 90 dias (M€)Debt over 90 days (M€)
Dívida total (M€)Total debt (M€)
31 de 65
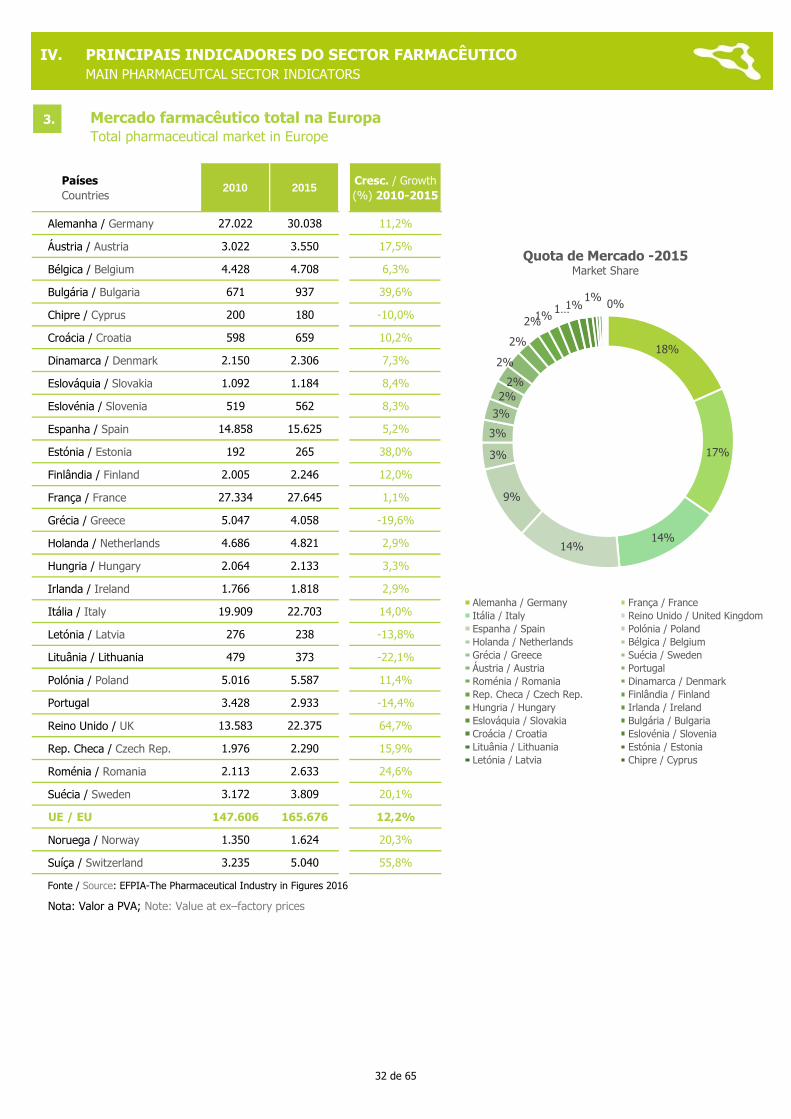
Países
Countries2010 2015
Cresc. / Growth
(%) 2010-2015
Alemanha / Germany 27.022 30.038 11,2%
Áustria / Austria 3.022 3.550 17,5%
Bélgica / Belgium 4.428 4.708 6,3%
Bulgária / Bulgaria 671 937 39,6%
Chipre / Cyprus 200 180 -10,0%
Croácia / Croatia 598 659 10,2%
Dinamarca / Denmark 2.150 2.306 7,3%
Eslováquia / Slovakia 1.092 1.184 8,4%
Eslovénia / Slovenia 519 562 8,3%
Espanha / Spain 14.858 15.625 5,2%
Estónia / Estonia 192 265 38,0%
Finlândia / Finland 2.005 2.246 12,0%
França / France 27.334 27.645 1,1%
Grécia / Greece 5.047 4.058 -19,6%
Holanda / Netherlands 4.686 4.821 2,9%
Hungria / Hungary 2.064 2.133 3,3%
Irlanda / Ireland 1.766 1.818 2,9%
Itália / Italy 19.909 22.703 14,0%
Letónia / Latvia 276 238 -13,8%
Lituânia / Lithuania 479 373 -22,1%
Polónia / Poland 5.016 5.587 11,4%
Portugal 3.428 2.933 -14,4%
Reino Unido / UK 13.583 22.375 64,7%
Rep. Checa / Czech Rep. 1.976 2.290 15,9%
Roménia / Romania 2.113 2.633 24,6%
Suécia / Sweden 3.172 3.809 20,1%
UE / EU 147.606 165.676 12,2%
Noruega / Norway 1.350 1.624 20,3%
Suíça / Switzerland 3.235 5.040 55,8%
Fonte / Source: EFPIA-The Pharmaceutical Industry in Figures 2016
Nota: Valor a PVA; Note: Value at ex–factory prices
Mercado farmacêutico total na Europa Total pharmaceutical market in Europe
IV. PRINCIPAIS INDICADORES DO SECTOR FARMACÊUTICO
MAIN PHARMACEUTCAL SECTOR INDICATORS
3.
18%
17%
14%14%
9%
3%
3%
3%
2%
2%
2%
2%
2%1%
1…1%
1% 0%
Quota de Mercado -2015Market Share
Alemanha / Germany França / France
Itália / Italy Reino Unido / United Kingdom
Espanha / Spain Polónia / Poland
Holanda / Netherlands Bélgica / Belgium
Grécia / Greece Suécia / Sweden
Áustria / Austria Portugal
Roménia / Romania Dinamarca / Denmark
Rep. Checa / Czech Rep. Finlândia / Finland
Hungria / Hungary Irlanda / Ireland
Eslováquia / Slovakia Bulgária / Bulgaria
Croácia / Croatia Eslovénia / Slovenia
Lituânia / Lithuania Estónia / Estonia
Letónia / Latvia Chipre / Cyprus
32 de 65
Países
Countries2010 2015
Cresc. / Growth
(%) 2010-2015
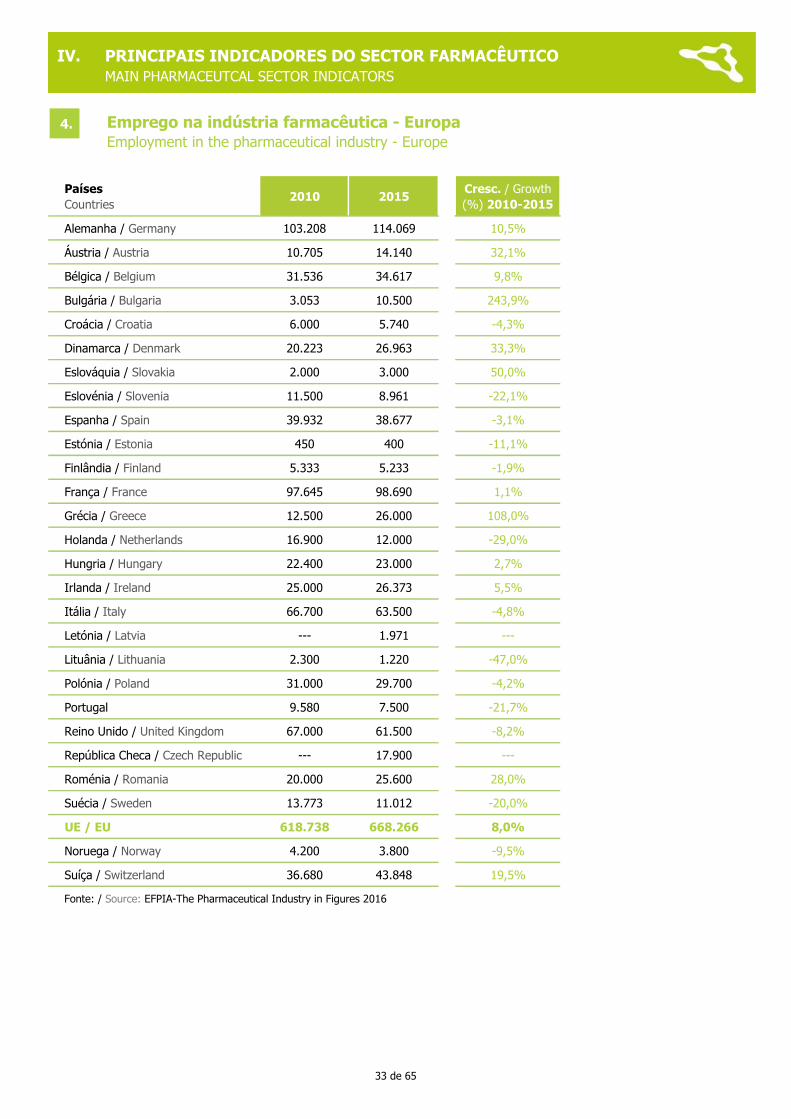
Alemanha / Germany 103.208 114.069 10,5%
Áustria / Austria 10.705 14.140 32,1%
Bélgica / Belgium 31.536 34.617 9,8%
Bulgária / Bulgaria 3.053 10.500 243,9%
Croácia / Croatia 6.000 5.740 -4,3%
Dinamarca / Denmark 20.223 26.963 33,3%
Eslováquia / Slovakia 2.000 3.000 50,0%
Eslovénia / Slovenia 11.500 8.961 -22,1%
Espanha / Spain 39.932 38.677 -3,1%
Estónia / Estonia 450 400 -11,1%
Finlândia / Finland 5.333 5.233 -1,9%
França / France 97.645 98.690 1,1%
Grécia / Greece 12.500 26.000 108,0%
Holanda / Netherlands 16.900 12.000 -29,0%
Hungria / Hungary 22.400 23.000 2,7%
Irlanda / Ireland 25.000 26.373 5,5%
Itália / Italy 66.700 63.500 -4,8%
Letónia / Latvia --- 1.971 ---
Lituânia / Lithuania 2.300 1.220 -47,0%
Polónia / Poland 31.000 29.700 -4,2%
Portugal 9.580 7.500 -21,7%
Reino Unido / United Kingdom 67.000 61.500 -8,2%
República Checa / Czech Republic --- 17.900 ---
Roménia / Romania 20.000 25.600 28,0%
Suécia / Sweden 13.773 11.012 -20,0%
UE / EU 618.738 668.266 8,0%
Noruega / Norway 4.200 3.800 -9,5%
Suíça / Switzerland 36.680 43.848 19,5%
Fonte: / Source: EFPIA-The Pharmaceutical Industry in Figures 2016
Emprego na indústria farmacêutica - Europa Employment in the pharmaceutical industry - Europe
IV. PRINCIPAIS INDICADORES DO SECTOR FARMACÊUTICO
MAIN PHARMACEUTCAL SECTOR INDICATORS
4.
33 de 65
Países
Countries2010 2015
Cresc. / Growth
(%) 2010-2015
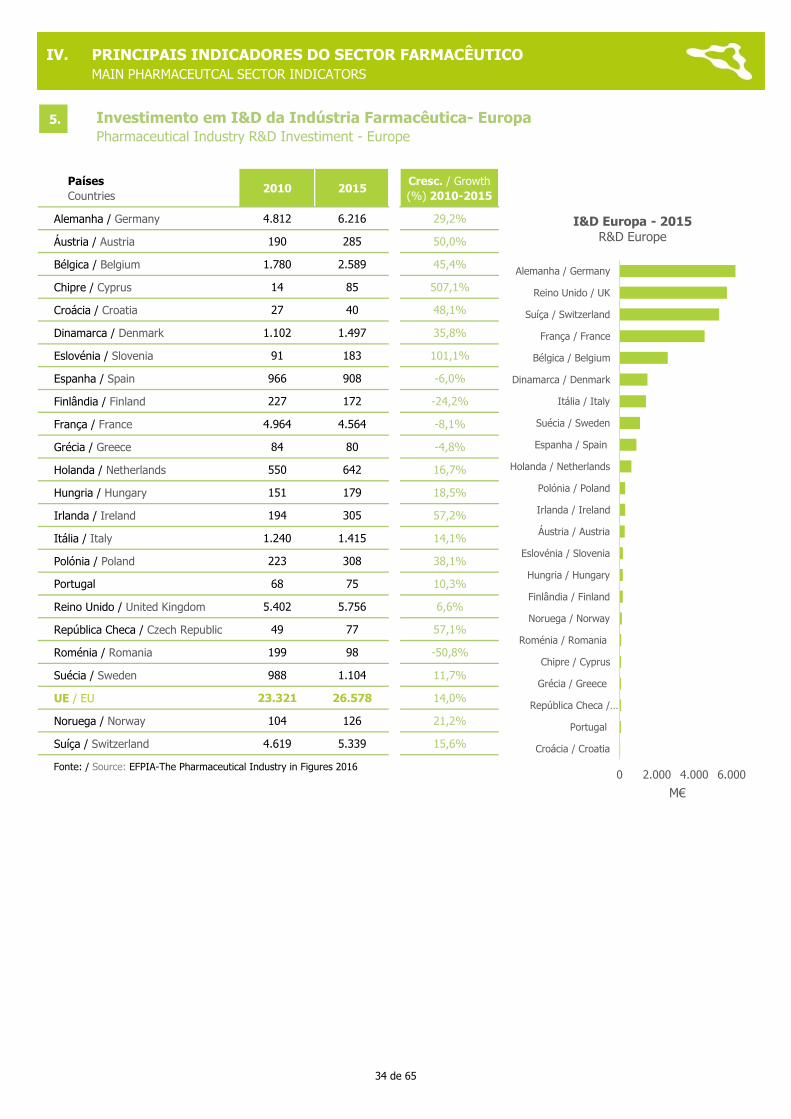
Alemanha / Germany 4.812 6.216 29,2%
Áustria / Austria 190 285 50,0%
Bélgica / Belgium 1.780 2.589 45,4%
Chipre / Cyprus 14 85 507,1%
Croácia / Croatia 27 40 48,1%
Dinamarca / Denmark 1.102 1.497 35,8%
Eslovénia / Slovenia 91 183 101,1%
Espanha / Spain 966 908 -6,0%
Finlândia / Finland 227 172 -24,2%
França / France 4.964 4.564 -8,1%
Grécia / Greece 84 80 -4,8%
Holanda / Netherlands 550 642 16,7%
Hungria / Hungary 151 179 18,5%
Irlanda / Ireland 194 305 57,2%
Itália / Italy 1.240 1.415 14,1%
Polónia / Poland 223 308 38,1%
Portugal 68 75 10,3%
Reino Unido / United Kingdom 5.402 5.756 6,6%
República Checa / Czech Republic 49 77 57,1%
Roménia / Romania 199 98 -50,8%
Suécia / Sweden 988 1.104 11,7%
UE / EU 23.321 26.578 14,0%
Noruega / Norway 104 126 21,2%
Suíça / Switzerland 4.619 5.339 15,6%
Fonte: / Source: EFPIA-The Pharmaceutical Industry in Figures 2016
Investimento em I&D da Indústria Farmacêutica- Europa Pharmaceutical Industry R&D Investiment - Europe
IV. PRINCIPAIS INDICADORES DO SECTOR FARMACÊUTICO
MAIN PHARMACEUTCAL SECTOR INDICATORS
5.
0 2.000 4.000 6.000
Croácia / Croatia
Portugal
República Checa /…
Grécia / Greece
Chipre / Cyprus
Roménia / Romania
Noruega / Norway
Finlândia / Finland
Hungria / Hungary
Eslovénia / Slovenia
Áustria / Austria
Irlanda / Ireland
Polónia / Poland
Holanda / Netherlands
Espanha / Spain
Suécia / Sweden
Itália / Italy
Dinamarca / Denmark
Bélgica / Belgium
França / France
Suíça / Switzerland
Reino Unido / UK
Alemanha / Germany
M€
I&D Europa - 2015
R&D Europe
34 de 65
EDIÇÃO EDITION 2016
VMERCADO FARMACÊUTICO
PHARMACEUTICAL MARKET
35 de 65

2010 2011 2012 2013 2014 2015 2016
Produção (M€)Production (M€)
1.679 1.533 1.387 1.434 1.486 1.516 1.707
V.H. (%)Growth rate (%)
-7,1% -8,7% -9,5% 3,4% 3,6% 2,0% 12,6%
Produção Farmacêutica Pharmaceutical production
Fonte: INE, INFARMED, Apifarma / Source: INE, INFARMED, Apifarma (1) Matérias-primas /Raw Materials: - 2936-2937-2938-2939-
2941 (2) Produtos farmacêuticos / Pharmaceutics Products: 3001-3002-3003-3004-3005-
3006
Evolução da Produção Farmacêutica em PortugalPharmaceutical production in Portugal
V. MERCADO FARMACÊUTICO
PHARMACEUTICAL MARKET
1.
1.679
1.533
1.387 1.434 1.486 1.516
1.707
2010 2011 2012 2013 2014 2015 2016
M€
-7,1%
-8,7% -9,5%
3,4% 3,6% 2,0%
12,6%
2010 2011 2012 2013 2014 2015 2016
V.H
.(%
)
36 de 65
Ano Importação (M€)
ImportV.H.(%)
Exportação (M€)
ExportV.H.(%)
Rácio Exp / Imp
(%)
Trade Balance
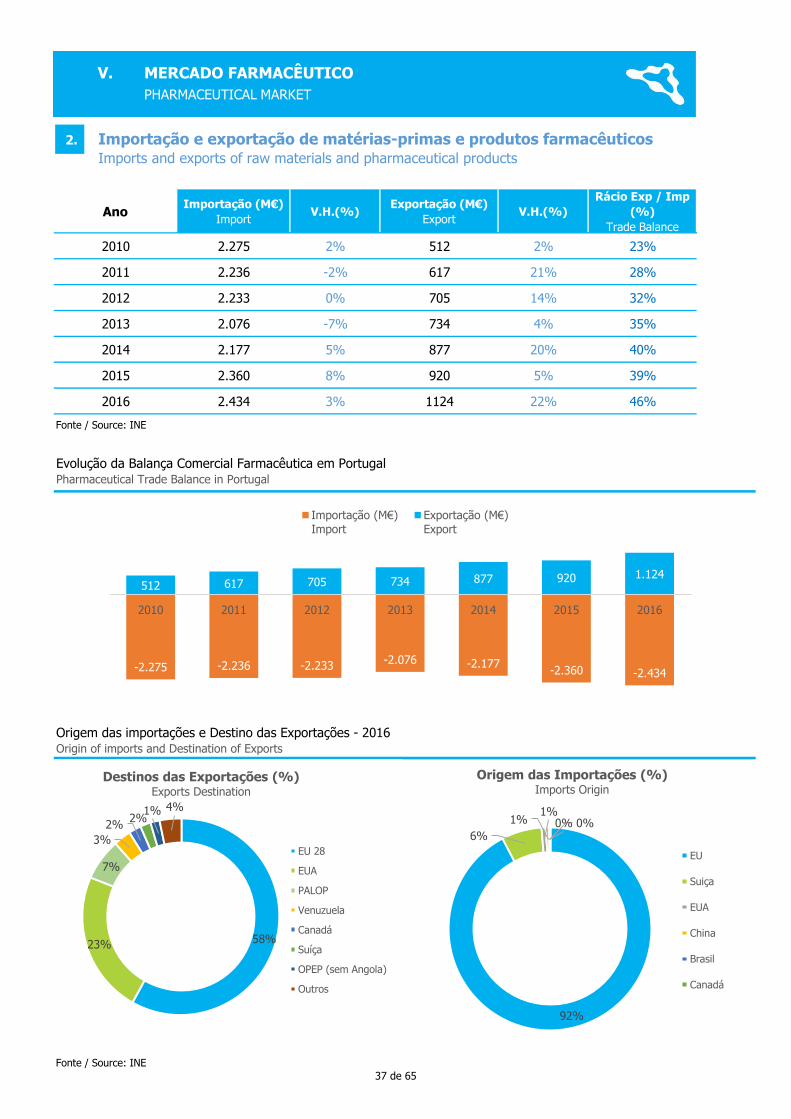
2010 2.275 2% 512 2% 23%
2011 2.236 -2% 617 21% 28%
2012 2.233 0% 705 14% 32%
2013 2.076 -7% 734 4% 35%
2014 2.177 5% 877 20% 40%
2015 2.360 8% 920 5% 39%
2016 2.434 3% 1124 22% 46%
Fonte / Source: INE
Evolução da Balança Comercial Farmacêutica em PortugalPharmaceutical Trade Balance in Portugal
Origem das importações e Destino das Exportações - 2016Origin of imports and Destination of Exports
Fonte / Source: INE
Importação e exportação de matérias-primas e produtos farmacêuticosImports and exports of raw materials and pharmaceutical products
V. MERCADO FARMACÊUTICO
PHARMACEUTICAL MARKET
2.
-2.275 -2.236 -2.233-2.076 -2.177
-2.360 -2.434
512 617 705 734 877 920 1.124
-2.500
-2.000
-1.500
-1.000
-500
0
500
1.000
1.500
2010 2011 2012 2013 2014 2015 2016
Importação (M€)Import
Exportação (M€)Export
58%23%
7%
3%
2%2%
1% 4%
Destinos das Exportações (%)Exports Destination
EU 28
EUA
PALOP
Venuzuela
Canadá
Suíça
OPEP (sem Angola)
Outros
92%
6%
1%1% 0% 0%
Origem das Importações (%)Imports Origin
EU
Suiça
EUA
China
Brasil
Canadá
37 de 65

Unidades: Número / Units: Number
2010 2011 2012 2013 2014Cresc. / Growth
2010-2014
Medicamentos Medical Drugs
14.817 15.859 16.253 16.484 16.428 10,9%
ApresentaçõesPresentations
53.777 57.733 58.781 58.957 57.742 7,4%
Caracterização dos medicamento quanto à classificação de Dispensa e Comparticipação - 2014Medicines characterization on Prescription classification and Reimbursement
Fonte: INFARMED - Estatística do Medicamento 2014 / Source: INFARMED - Medicines Statistic 2014
Fonte: INFARMED - Estatística do Medicamento 2014 / Source: INFARMED - Medicines Statistic 2014
Número total de medicamentos com AIM Number of Medicines with Marketing Authorization
V. MERCADO FARMACÊUTICO
PHARMACEUTICAL MARKET
3.
93%
7%
Classificação quanto à Dispensa
Precription classification
MSRMPrescription
MNSRMNon Prescription
39%
61%
Classificação quanto à Comparticipação
Reimbursement classification
ComparticipadosReimbursed
NãoComparticipadosNon reimbursed
14.817
15.85916.253 16.484 16.428
10.000
11.000
12.000
13.000
14.000
15.000
16.000
17.000
2010 2011 2012 2013 2014
N. de Medicamentos com AIMNumber of Medical Drugs with MA
38 de 65
Unidades: Número / Units: Number
2010 2011 2012 2013 2014Cresc. / Growth
2010-2014 (%)
Nº Medicamentos GenéricosNumber of generic drugs
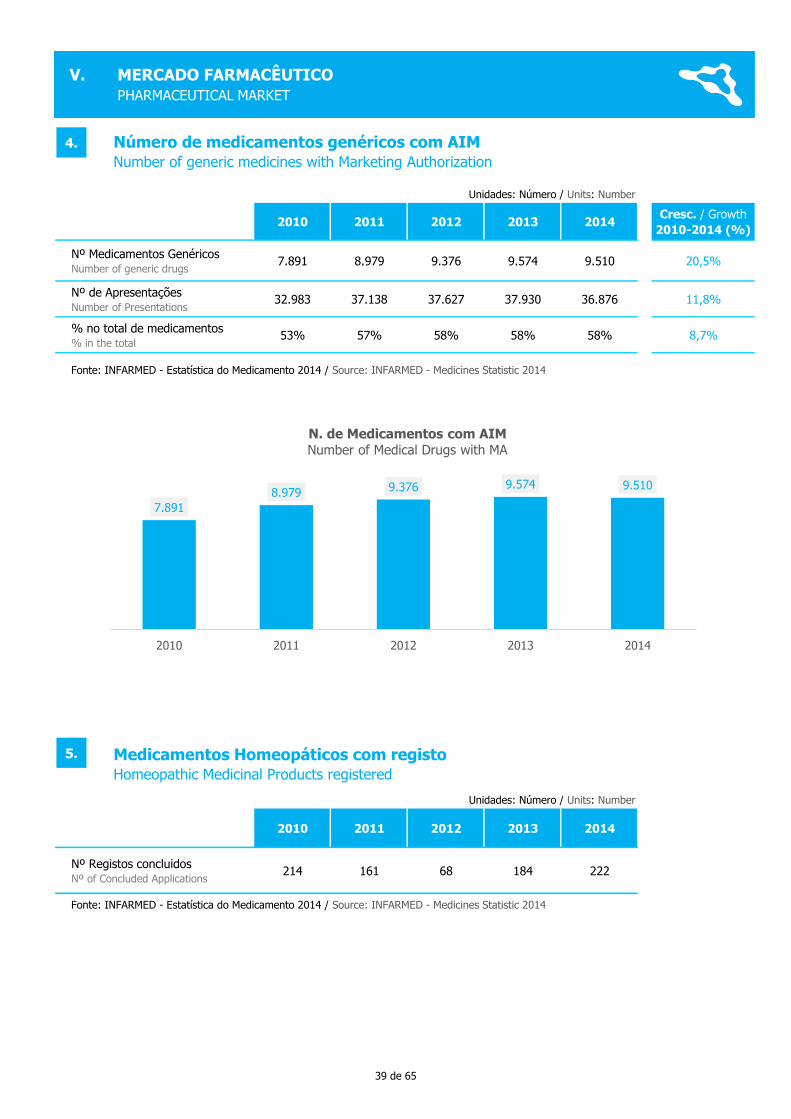
7.891 8.979 9.376 9.574 9.510 20,5%
Nº de ApresentaçõesNumber of Presentations
32.983 37.138 37.627 37.930 36.876 11,8%
% no total de medicamentos % in the total
53% 57% 58% 58% 58% 8,7%
Unidades: Número / Units: Number
2010 2011 2012 2013 2014
Nº Registos concluidosNº of Concluded Applications
214 161 68 184 222
Número de medicamentos genéricos com AIM Number of generic medicines with Marketing Authorization
Fonte: INFARMED - Estatística do Medicamento 2014 / Source: INFARMED - Medicines Statistic 2014
Medicamentos Homeopáticos com registoHomeopathic Medicinal Products registered
Fonte: INFARMED - Estatística do Medicamento 2014 / Source: INFARMED - Medicines Statistic 2014
V. MERCADO FARMACÊUTICO
PHARMACEUTICAL MARKET
4.
7.891
8.979 9.376 9.574 9.510
2010 2011 2012 2013 2014
N. de Medicamentos com AIM
Number of Medical Drugs with MA
5.
39 de 65
Unidades / Units: M€
2010 2011 2012 2013 2014 2015 2016
Cresc. /
Growth 2010-
2016 (%)
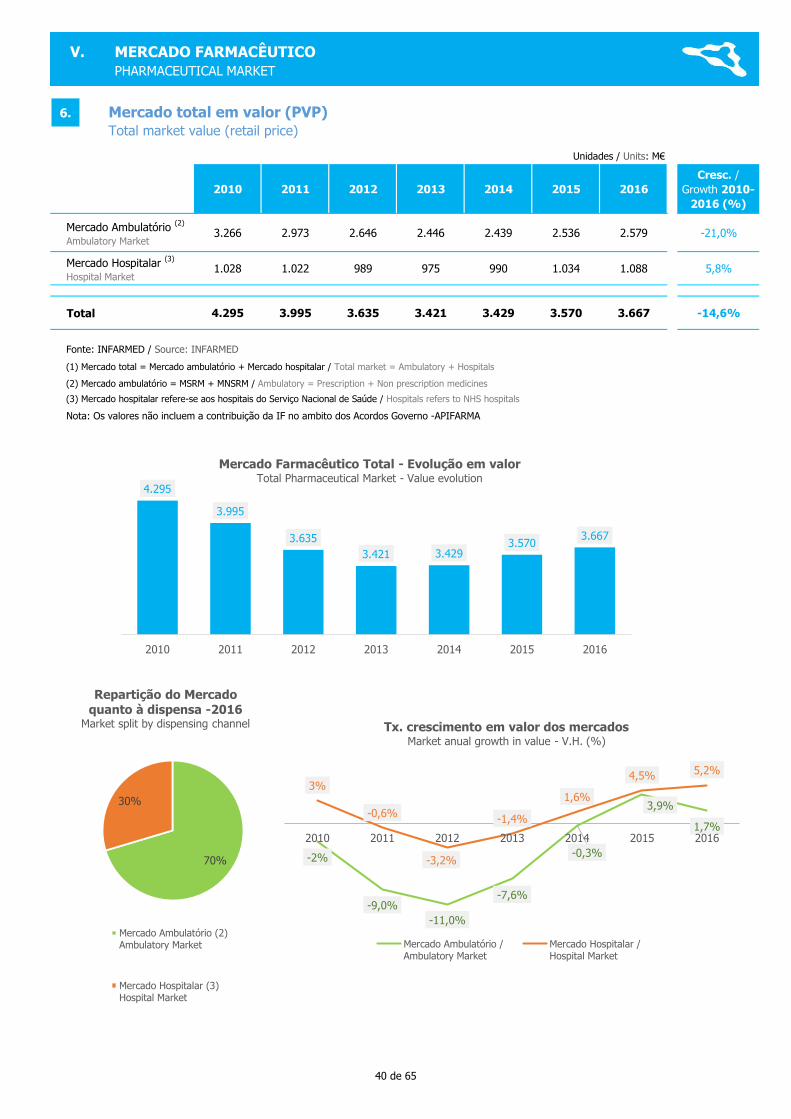
Mercado Ambulatório (2)
Ambulatory Market3.266 2.973 2.646 2.446 2.439 2.536 2.579 -21,0%
Mercado Hospitalar (3)
Hospital Market1.028 1.022 989 975 990 1.034 1.088 5,8%
Total 4.295 3.995 3.635 3.421 3.429 3.570 3.667 -14,6%
Nota: Os valores não incluem a contribuição da IF no ambito dos Acordos Governo -APIFARMA
(3) Mercado hospitalar refere-se aos hospitais do Serviço Nacional de Saúde / Hospitals refers to NHS hospitals
Mercado total em valor (PVP)
Total market value (retail price)
Fonte: INFARMED / Source: INFARMED
(1) Mercado total = Mercado ambulatório + Mercado hospitalar / Total market = Ambulatory + Hospitals
(2) Mercado ambulatório = MSRM + MNSRM / Ambulatory = Prescription + Non prescription medicines
V. MERCADO FARMACÊUTICO
PHARMACEUTICAL MARKET
6.
4.295
3.995
3.635
3.421 3.4293.570
3.667
2010 2011 2012 2013 2014 2015 2016
Mercado Farmacêutico Total - Evolução em valorTotal Pharmaceutical Market - Value evolution
70%
30%
Repartição do Mercado
quanto à dispensa -2016Market split by dispensing channel
Mercado Ambulatório (2)Ambulatory Market
Mercado Hospitalar (3)Hospital Market
-2%
-9,0%
-11,0%
-7,6%
-0,3%
3,9%
1,7%
3%
-0,6%
-3,2%
-1,4%
1,6%
4,5% 5,2%
-12%
-10%
-8%
-6%
-4%
-2%
0%
2%
4%
6%
8%
2010 2011 2012 2013 2014 2015 2016
Tx. crescimento em valor dos mercadosMarket anual growth in value - V.H. (%)
Mercado Ambulatório /Ambulatory Market
Mercado Hospitalar /Hospital Market
40 de 65
Unidades / Units: M€
Em valor
In value2010 2011 2012 2013 2014 2015 2016
Cresc.
/Growth (%)
2010-2016
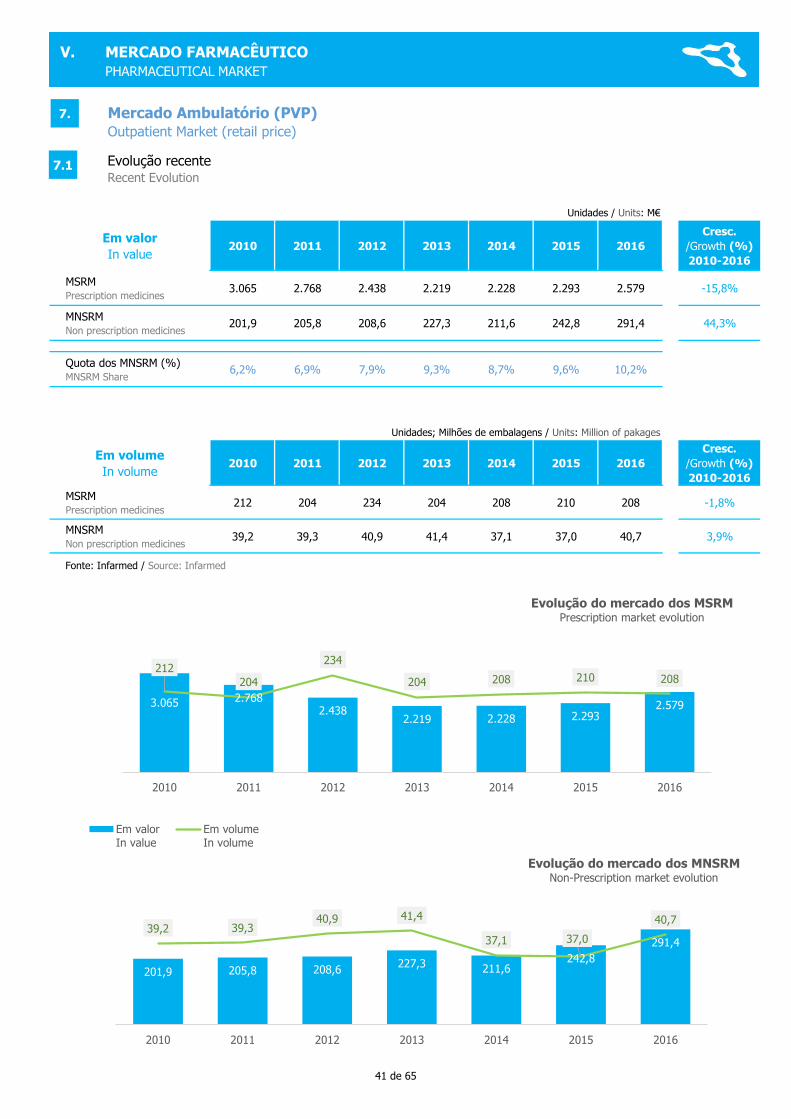
MSRMPrescription medicines
3.065 2.768 2.438 2.219 2.228 2.293 2.579 -15,8%
MNSRMNon prescription medicines
201,9 205,8 208,6 227,3 211,6 242,8 291,4 44,3%
Quota dos MNSRM (%)MNSRM Share
6,2% 6,9% 7,9% 9,3% 8,7% 9,6% 10,2%
Unidades; Milhões de embalagens / Units: Million of pakages
Em volume
In volume2010 2011 2012 2013 2014 2015 2016
Cresc.
/Growth (%)
2010-2016
MSRMPrescription medicines
212 204 234 204 208 210 208 -1,8%
MNSRMNon prescription medicines
39,2 39,3 40,9 41,4 37,1 37,0 40,7 3,9%
Mercado Ambulatório (PVP) Outpatient Market (retail price)
Fonte: Infarmed / Source: Infarmed
Evolução recente Recent Evolution
V. MERCADO FARMACÊUTICO
PHARMACEUTICAL MARKET
7.
3.065 2.7682.438
2.219 2.228 2.2932.579
212
204
234
204 208 210 208
100
120
140
160
180
200
220
240
260
500
1.000
1.500
2.000
2.500
3.000
3.500
2010 2011 2012 2013 2014 2015 2016
Evolução do mercado dos MSRM Prescription market evolution
Em valorIn value
Em volumeIn volume
201,9 205,8 208,6227,3 211,6
242,8
291,4
39,2 39,340,9 41,4
37,1 37,0
40,7
25,0
30,0
35,0
40,0
45,0
0,0
50,0
100,0
150,0
200,0
250,0
300,0
350,0
2010 2011 2012 2013 2014 2015 2016
Evolução do mercado dos MNSRM Non-Prescription market evolution
7.1
41 de 65
Grupos terapêuticos *
Therapeutic groups
Quota mercado (%)
(em valor, PVP)
Market share (in value)
V.H.Valor
/Growth in
Value (%)
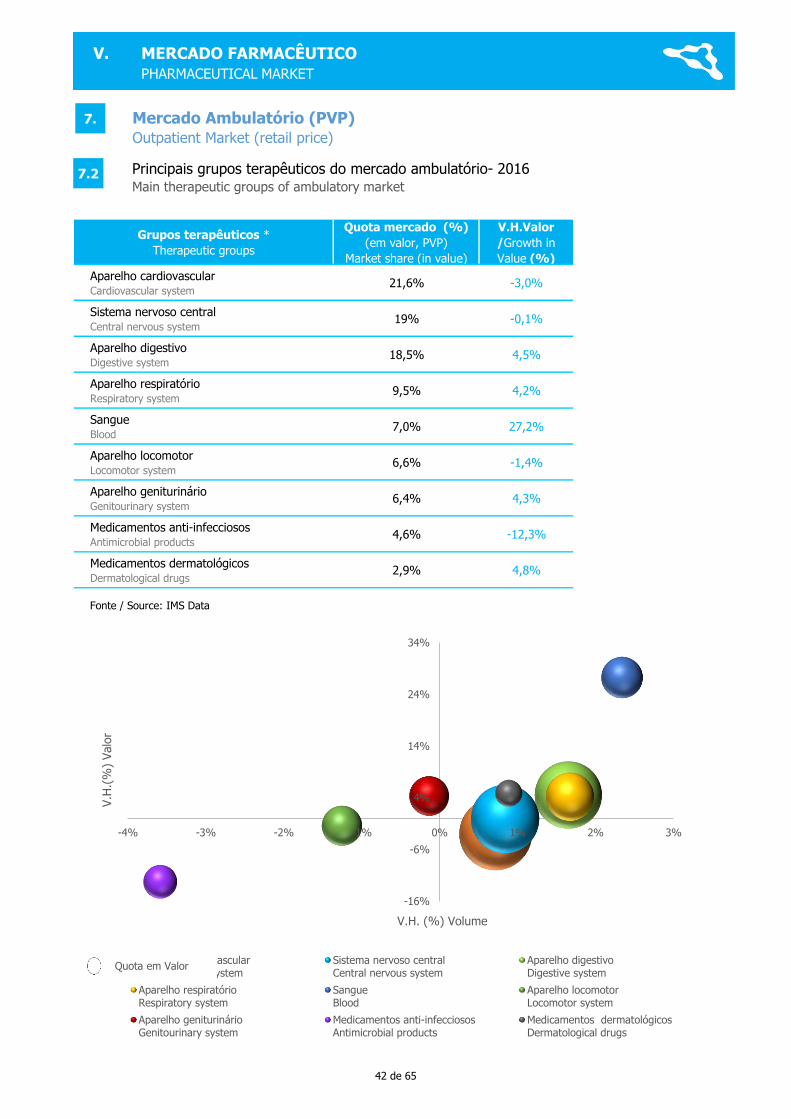
Aparelho cardiovascularCardiovascular system
21,6% -3,0%
Sistema nervoso centralCentral nervous system
19% -0,1%
Aparelho digestivoDigestive system
18,5% 4,5%
Aparelho respiratórioRespiratory system
9,5% 4,2%
SangueBlood
7,0% 27,2%
Aparelho locomotorLocomotor system
6,6% -1,4%
Aparelho geniturinárioGenitourinary system
6,4% 4,3%
Medicamentos anti-infecciososAntimicrobial products
4,6% -12,3%
Medicamentos dermatológicosDermatological drugs
2,9% 4,8%
Fonte / Source: IMS Data
Mercado Ambulatório (PVP) Outpatient Market (retail price)
Principais grupos terapêuticos do mercado ambulatório- 2016Main therapeutic groups of ambulatory market
V. MERCADO FARMACÊUTICO
PHARMACEUTICAL MARKET
7.
7.2
-16%
-6%
4%
14%
24%
34%
-4% -3% -2% -1% 0% 1% 2% 3%
V.H
.(%
) Valo
r
V.H. (%) Volume
Aparelho cardiovascularCardiovascular system
Sistema nervoso centralCentral nervous system
Aparelho digestivoDigestive system
Aparelho respiratórioRespiratory system
SangueBlood
Aparelho locomotorLocomotor system
Aparelho geniturinárioGenitourinary system
Medicamentos anti-infecciososAntimicrobial products
Medicamentos dermatológicosDermatological drugs
Quota em Valor
42 de 65
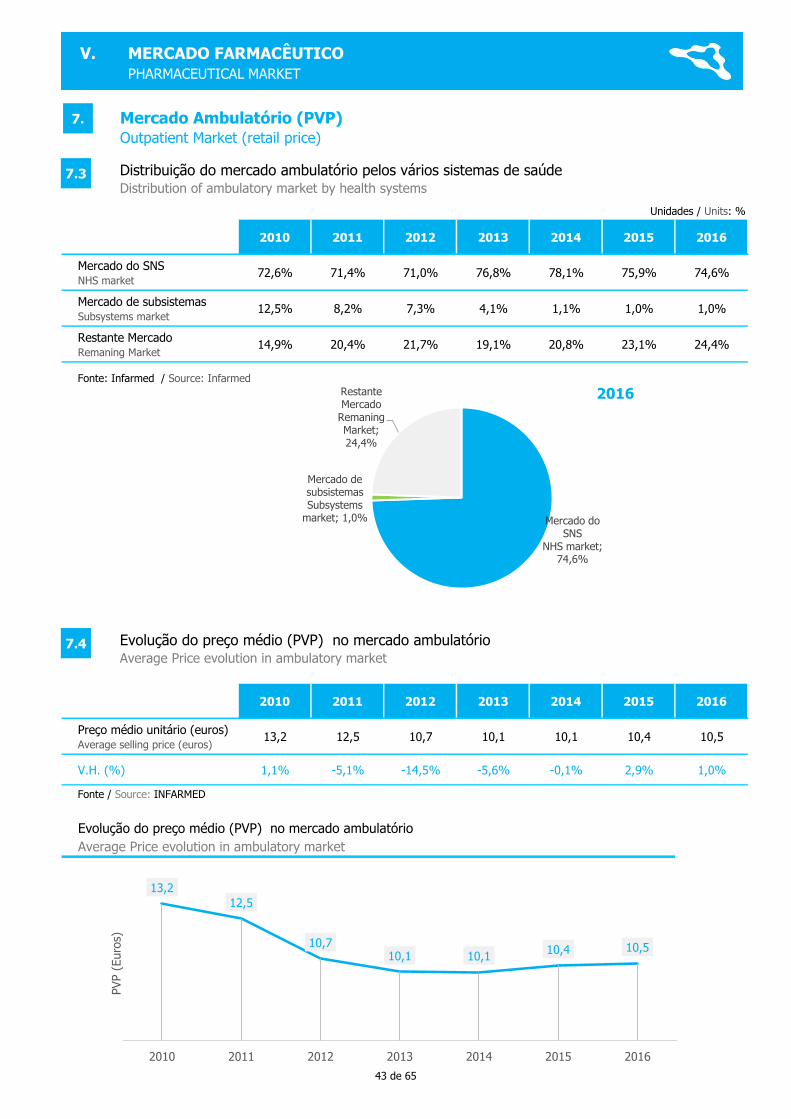
Unidades / Units: %
2010 2011 2012 2013 2014 2015 2016
Mercado do SNSNHS market
72,6% 71,4% 71,0% 76,8% 78,1% 75,9% 74,6%
Mercado de subsistemasSubsystems market
12,5% 8,2% 7,3% 4,1% 1,1% 1,0% 1,0%
Restante MercadoRemaning Market
14,9% 20,4% 21,7% 19,1% 20,8% 23,1% 24,4%
2010 2011 2012 2013 2014 2015 2016
Preço médio unitário (euros)Average selling price (euros)
13,2 12,5 10,7 10,1 10,1 10,4 10,5
V.H. (%) 1,1% -5,1% -14,5% -5,6% -0,1% 2,9% 1,0%
Evolução do preço médio (PVP) no mercado ambulatório
Evolução do preço médio (PVP) no mercado ambulatórioAverage Price evolution in ambulatory market
Fonte / Source: INFARMED
Average Price evolution in ambulatory market
Mercado Ambulatório (PVP) Outpatient Market (retail price)
Distribuição do mercado ambulatório pelos vários sistemas de saúde Distribution of ambulatory market by health systems
Fonte: Infarmed / Source: Infarmed
V. MERCADO FARMACÊUTICO
PHARMACEUTICAL MARKET
7.
7.3
Mercado do SNS
NHS market; 74,6%
Mercado de subsistemasSubsystems
market; 1,0%
Restante Mercado
Remaning Market; 24,4%
2016
7.4
13,2
12,5
10,710,1 10,1
10,4 10,5
2010 2011 2012 2013 2014 2015 2016
PVP (
Euro
s)
43 de 65
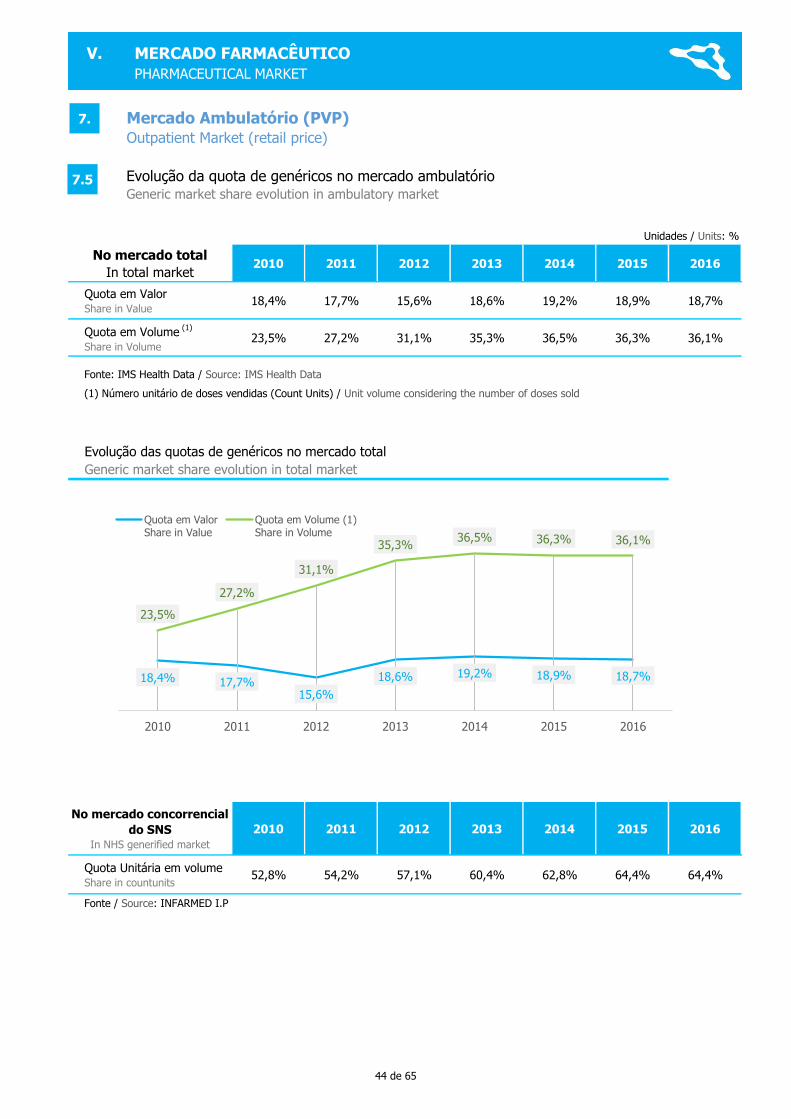
Unidades / Units: %
No mercado total
In total market2010 2011 2012 2013 2014 2015 2016
Quota em ValorShare in Value
18,4% 17,7% 15,6% 18,6% 19,2% 18,9% 18,7%
Quota em Volume (1)
Share in Volume23,5% 27,2% 31,1% 35,3% 36,5% 36,3% 36,1%
Evolução das quotas de genéricos no mercado total
No mercado concorrencial
do SNSIn NHS generified market
2010 2011 2012 2013 2014 2015 2016
Quota Unitária em volumeShare in countunits
52,8% 54,2% 57,1% 60,4% 62,8% 64,4% 64,4%
(1) Número unitário de doses vendidas (Count Units) / Unit volume considering the number of doses sold
Generic market share evolution in total market
Fonte / Source: INFARMED I.P
Mercado Ambulatório (PVP) Outpatient Market (retail price)
Evolução da quota de genéricos no mercado ambulatórioGeneric market share evolution in ambulatory market
Fonte: IMS Health Data / Source: IMS Health Data
V. MERCADO FARMACÊUTICO
PHARMACEUTICAL MARKET
7.
7.5
18,4% 17,7%15,6%
18,6% 19,2% 18,9% 18,7%
23,5%
27,2%
31,1%
35,3%36,5% 36,3% 36,1%
2010 2011 2012 2013 2014 2015 2016
Quota em ValorShare in Value
Quota em Volume (1)Share in Volume
44 de 65

Unidades / Units: US$, PPP
Paises Countries
2010 2015Crescimento / Growth 2010-2014 (%)
Variação / Change
2010-2015 (%)
Alemanha / Germany 661 766 16,0%
Áustria / Austria 524 633 20,7%
Bélgica / Belgium 624 679 8,8%
Dinamarca / Denmark 336 342 1,7%
Eslováquia / Slovakia 570 553 -2,9%
Eslovénia / Slovenia 472 501 6,1%
Espanha / Spain 525 572 9,0%
Estónia / Estonia 284 343 21,2%
Finlândia / Finland 465 501 7,7%
França / France 633 668 5,4%
Grécia / Greece 772 572 -25,9%
Holanda / Netherlands 457 417 -8,8%
Hungria / Hungary 540 559 3,5%
Irlanda / Ireland 675 684 1,4%
Itália / Italy 589 601 2,1%
Letónia / Latvia 279 384 37,6%
Lituânia / Lithuania 366 504 37,9%
Luxemburgo / Luxembourg 617 586 -5,0%
Polónia / Poland 329 357 8,4%
Portugal 518 413 -20,2%
Reino Unido / United Kingdom N/A 497 N/A
Rep. Checa / Czech Rep. 384 408 6,5%
Suécia / Sweden 471 519 10,1%
Média UE / EU Average 504 524 4,0%
Fonte / Source: OCDE Health data; n/a - não disponivel / not available
Despesa per capita com medicamentos no ambulatório na UE Outpatient pharmaceutical expenses per capita in EU
8.
V. MERCADO FARMACÊUTICO
PHARMACEUTICAL MARKET
413
524
0
100
200
300
400
500
600
700
800
Din
am
arc
a /
Denm
ark
Est
ónia
/ E
stonia
Poló
nia
/ P
ola
nd
Letó
nia
/ L
atv
ia
Rep. Checa
/ C
zech
…
Port
ugal
Hola
nda /
Neth
erlands
Rein
o U
nid
o /
UK
Esl
ovénia
/ S
lovenia
Fin
lândia
/ F
inla
nd
Lituânia
/ L
ithuania
Suéci
a /
Sw
eden
Média
UE /
EU
Avera
ge
Esl
ováquia
/ S
lovakia
Hungria /
Hungary
Gré
cia /
Gre
ece
Esp
anha /
Spain
Luxem
burg
o /
…
Itália
/ I
taly
Áust
ria /
Aust
ria
Fra
nça
/ F
rance
Bélg
ica /
Belg
ium
Irla
nda /
Ire
land
Ale
manha /
Germ
any
US$ P
PP
2015
45 de 65

EDIÇÃO EDITION 2016
VIMERCADO E ENCARGOS DO SNS
NHS MARKET & EXPENSES
46 de 65
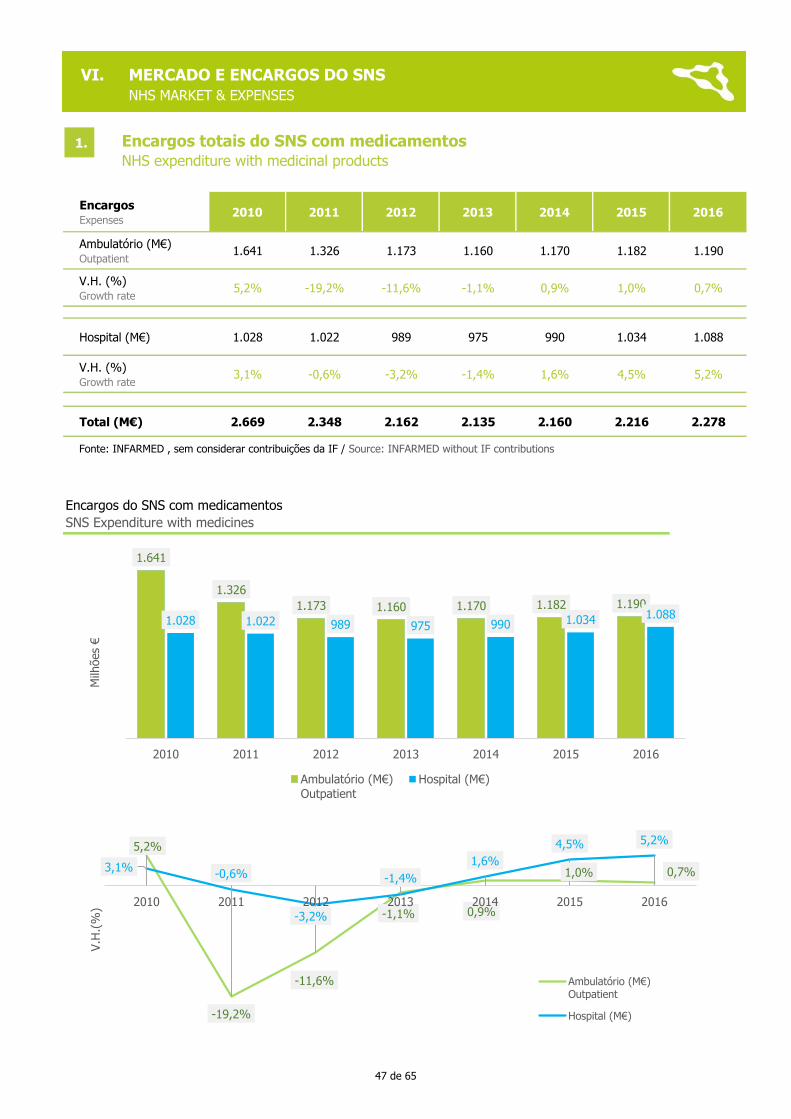
Encargos Expenses
2010 2011 2012 2013 2014 2015 2016
Ambulatório (M€)Outpatient
1.641 1.326 1.173 1.160 1.170 1.182 1.190
V.H. (%)Growth rate
5,2% -19,2% -11,6% -1,1% 0,9% 1,0% 0,7%
Hospital (M€) 1.028 1.022 989 975 990 1.034 1.088
V.H. (%)Growth rate
3,1% -0,6% -3,2% -1,4% 1,6% 4,5% 5,2%
Total (M€) 2.669 2.348 2.162 2.135 2.160 2.216 2.278
Fonte: INFARMED , sem considerar contribuições da IF / Source: INFARMED without IF contributions
Encargos do SNS com medicamentos
SNS Expenditure with medicines
Encargos totais do SNS com medicamentos NHS expenditure with medicinal products
VI. MERCADO E ENCARGOS DO SNS
NHS MARKET & EXPENSES
1.
1.641
1.326
1.173 1.160 1.170 1.182 1.190
1.028 1.022 989 975 990 1.034 1.088
0
200
400
600
800
1.000
1.200
1.400
1.600
1.800
2010 2011 2012 2013 2014 2015 2016
Milh
ões
€
Ambulatório (M€)Outpatient
Hospital (M€)
5,2%
-19,2%
-11,6%
-1,1% 0,9%
1,0% 0,7%3,1%-0,6%
-3,2%
-1,4%
1,6%
4,5% 5,2%
2010 2011 2012 2013 2014 2015 2016
V.H
.(%
)
Ambulatório (M€)Outpatient
Hospital (M€)
47 de 65

M. Ambulatório Outpatient Market
2010 2011 2012 2013 2014 2015 2016
Cresc. /
Growth (%)
2010-2016
Mercado (M€)Market
2.347 2.125 1.856 1.850 1.873 1.892 1.886 -19,6%
Encargos (M€)Expenditure
1.639 1.326 1.173 1.160 1.170 1.182 1.190 -27,4%
Tx. média de comparticipação
Average reimbursment rate69,9% 62,4% 63,2% 62,7% 62,5% 62,5% 63,1% -9,7%
Mercado e encargos do SNS com medicamentos no ambulatórioOutpatient NHS market and expenditure with medicinal products
Fonte / Source: INFARMED e CEFAR
Tx. média de comparticipação (%)Average reimbursment rate
VI. MERCADO E ENCARGOS DO SNS
NHS MARKET & EXPENSES
2.
69,9%
62,4%63,2% 62,7% 62,5% 62,5%
63,1%
55,0%
60,0%
65,0%
70,0%
75,0%
2010 2011 2012 2013 2014 2015 2016
48 de 65
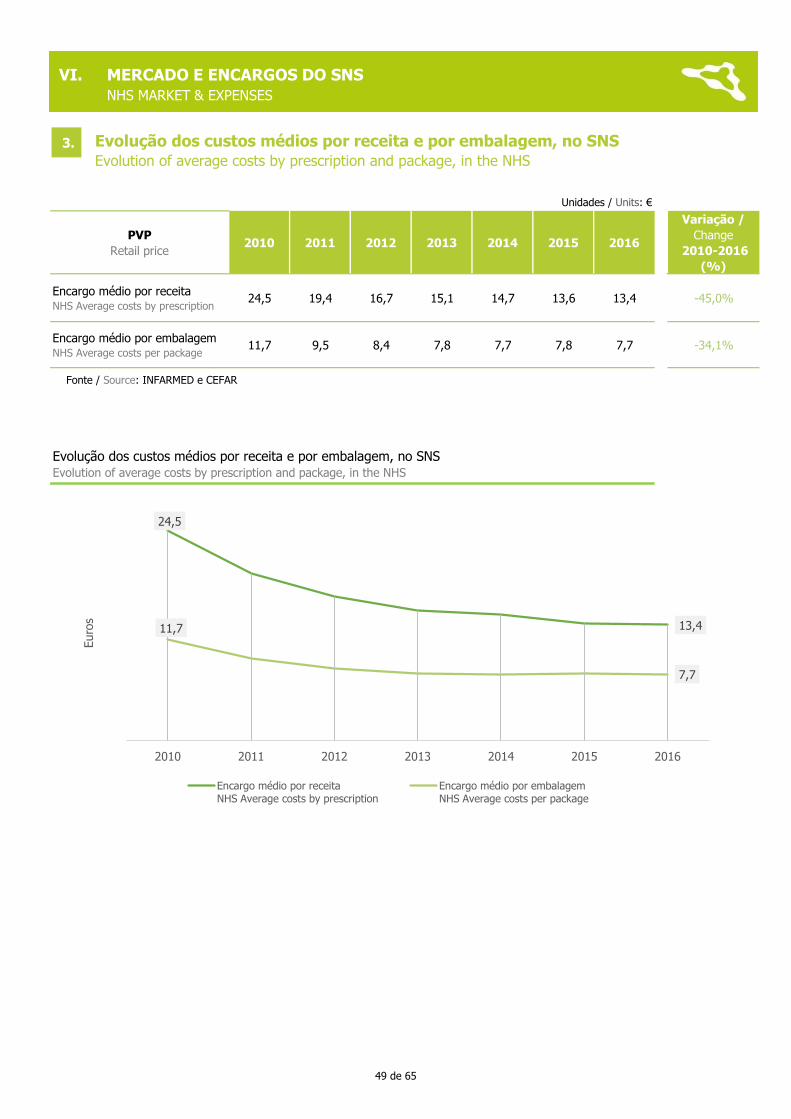
Unidades / Units: €
PVP
Retail price2010 2011 2012 2013 2014 2015 2016
Variação /
Change
2010-2016
(%)
Encargo médio por receita NHS Average costs by prescription
24,5 19,4 16,7 15,1 14,7 13,6 13,4 -45,0%
Encargo médio por embalagem NHS Average costs per package
11,7 9,5 8,4 7,8 7,7 7,8 7,7 -34,1%
Fonte / Source: INFARMED e CEFAR
Evolução dos custos médios por receita e por embalagem, no SNS Evolution of average costs by prescription and package, in the NHS
Evolução dos custos médios por receita e por embalagem, no SNS Evolution of average costs by prescription and package, in the NHS
VI. MERCADO E ENCARGOS DO SNS
NHS MARKET & EXPENSES
3.
24,5
13,411,7
7,7
0,0
5,0
10,0
15,0
20,0
25,0
2010 2011 2012 2013 2014 2015 2016
Euro
s
Encargo médio por receitaNHS Average costs by prescription
Encargo médio por embalagemNHS Average costs per package
49 de 65
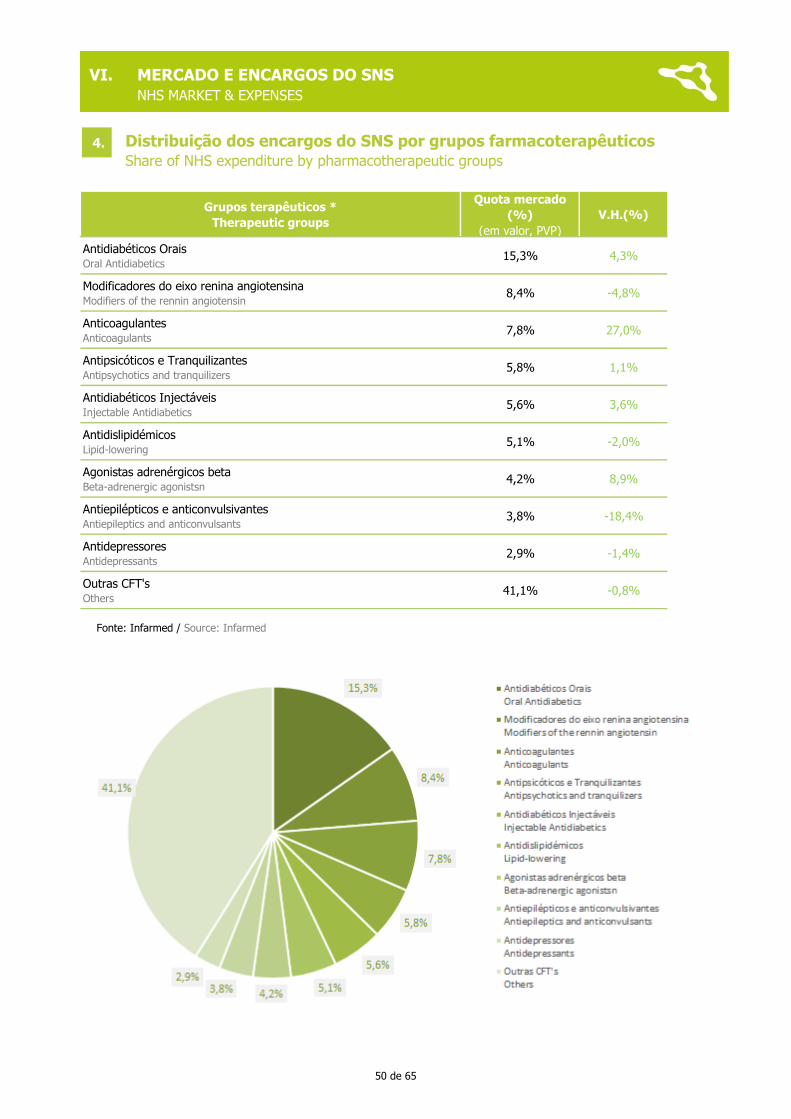
Grupos terapêuticos *
Therapeutic groups
Quota mercado
(%)
(em valor, PVP)
V.H.(%)
Antidiabéticos OraisOral Antidiabetics
15,3% 4,3%
Modificadores do eixo renina angiotensinaModifiers of the rennin angiotensin
8,4% -4,8%
AnticoagulantesAnticoagulants
7,8% 27,0%
Antipsicóticos e TranquilizantesAntipsychotics and tranquilizers
5,8% 1,1%
Antidiabéticos InjectáveisInjectable Antidiabetics
5,6% 3,6%
AntidislipidémicosLipid-lowering
5,1% -2,0%
Agonistas adrenérgicos betaBeta-adrenergic agonistsn
4,2% 8,9%
Antiepilépticos e anticonvulsivantesAntiepileptics and anticonvulsants
3,8% -18,4%
AntidepressoresAntidepressants
2,9% -1,4%
Outras CFT'sOthers
41,1% -0,8%
Distribuição dos encargos do SNS por grupos farmacoterapêuticos Share of NHS expenditure by pharmacotherapeutic groups
Fonte: Infarmed / Source: Infarmed
VI. MERCADO E ENCARGOS DO SNS
NHS MARKET & EXPENSES
4.
50 de 65

EDIÇÃO EDITION 2016
VIIMERCADO DA AUTOMEDICAÇÃO
SELF MEDICATION MARKET
51 de 65
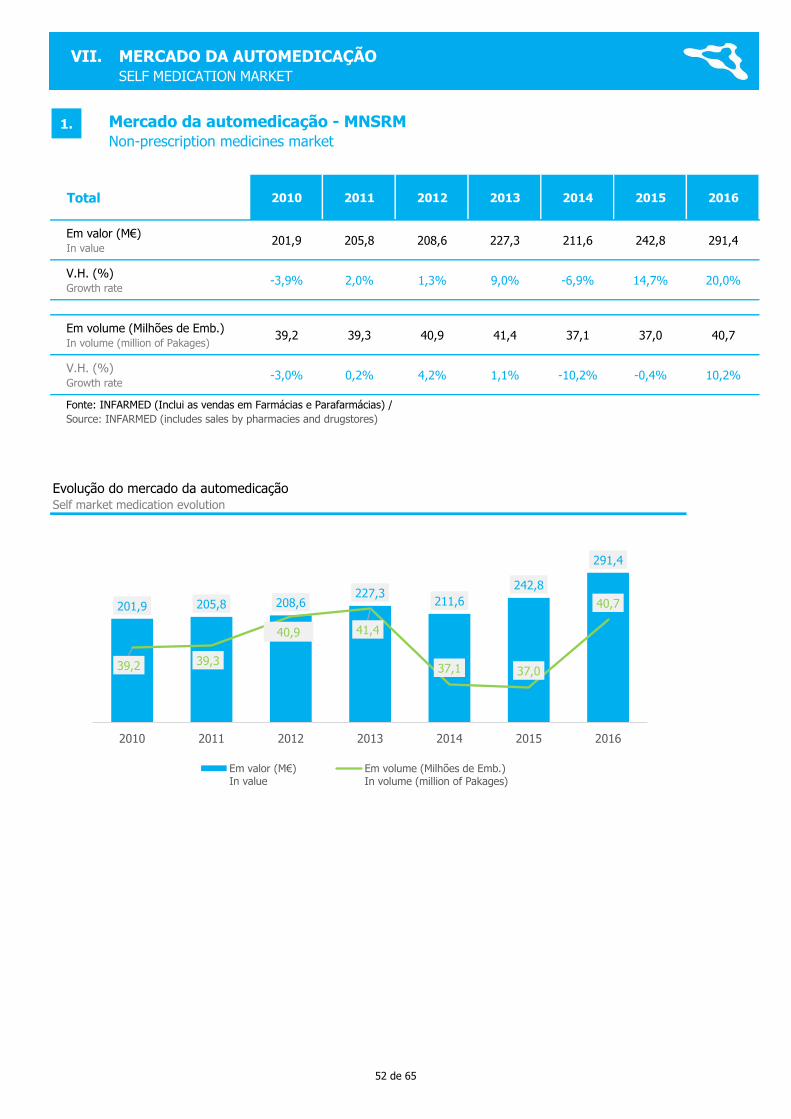
Total 2010 2011 2012 2013 2014 2015 2016
Em valor (M€)In value
201,9 205,8 208,6 227,3 211,6 242,8 291,4
V.H. (%)Growth rate
-3,9% 2,0% 1,3% 9,0% -6,9% 14,7% 20,0%
Em volume (Milhões de Emb.)In volume (million of Pakages)
39,2 39,3 40,9 41,4 37,1 37,0 40,7
V.H. (%)Growth rate
-3,0% 0,2% 4,2% 1,1% -10,2% -0,4% 10,2%
Mercado da automedicação - MNSRM Non-prescription medicines market
Fonte: INFARMED (Inclui as vendas em Farmácias e Parafarmácias) /
Source: INFARMED (includes sales by pharmacies and drugstores)
Evolução do mercado da automedicaçãoSelf market medication evolution
VII. MERCADO DA AUTOMEDICAÇÃOSELF MEDICATION MARKET
1.
201,9 205,8 208,6227,3
211,6
242,8
291,4
39,2 39,3
40,9 41,4
37,1 37,0
40,7
35,0
36,0
37,0
38,0
39,0
40,0
41,0
42,0
43,0
44,0
45,0
0,0
50,0
100,0
150,0
200,0
250,0
300,0
350,0
2010 2011 2012 2013 2014 2015 2016
Em valor (M€)In value
Em volume (Milhões de Emb.)In volume (million of Pakages)
52 de 65
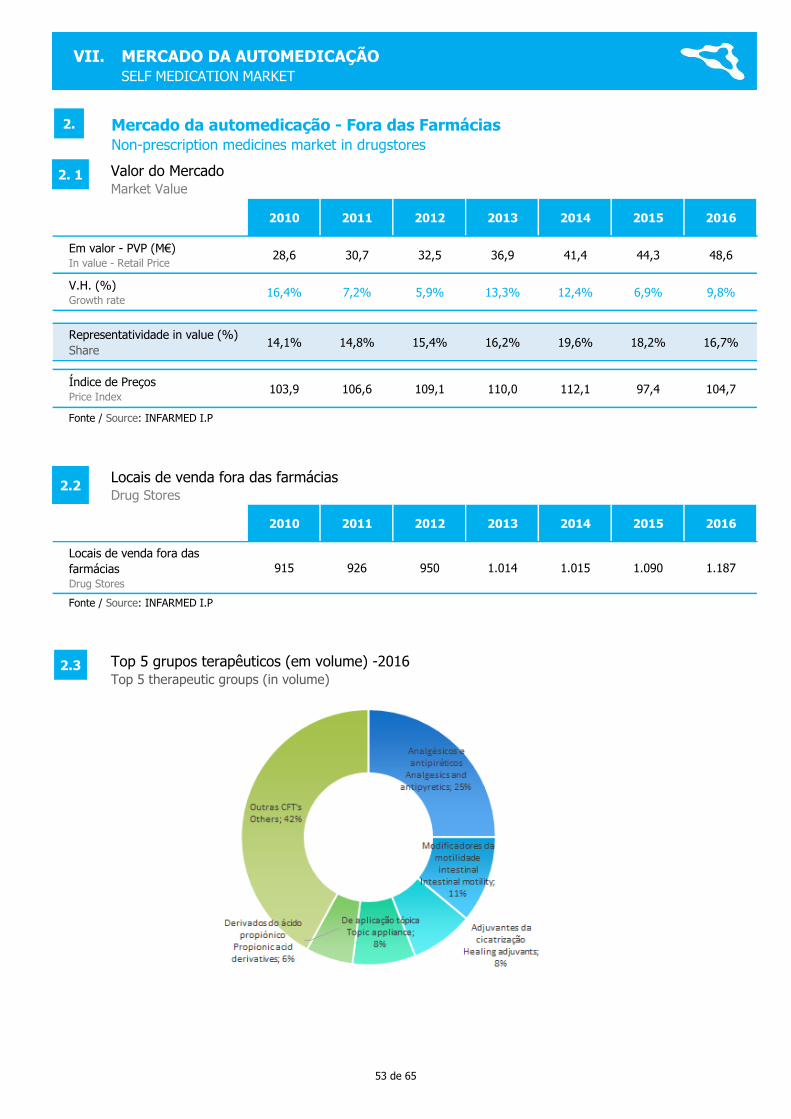
2010 2011 2012 2013 2014 2015 2016
Em valor - PVP (M€)In value - Retail Price
28,6 30,7 32,5 36,9 41,4 44,3 48,6
V.H. (%)Growth rate
16,4% 7,2% 5,9% 13,3% 12,4% 6,9% 9,8%
Representatividade in value (%)
Share14,1% 14,8% 15,4% 16,2% 19,6% 18,2% 16,7%
Índice de PreçosPrice Index
103,9 106,6 109,1 110,0 112,1 97,4 104,7
2010 2011 2012 2013 2014 2015 2016
Locais de venda fora das
farmáciasDrug Stores
915 926 950 1.014 1.015 1.090 1.187
Mercado da automedicação - Fora das FarmáciasNon-prescription medicines market in drugstores
Fonte / Source: INFARMED I.P
Fonte / Source: INFARMED I.P
Top 5 grupos terapêuticos (em volume) -2016Top 5 therapeutic groups (in volume)
Locais de venda fora das farmáciasDrug Stores
Valor do MercadoMarket Value
VII. MERCADO DA AUTOMEDICAÇÃOSELF MEDICATION MARKET
2.
2.3
2. 1
2.2
53 de 65

Unidades / Units: M€
Paises Countries
2016V.H. (%)
Growth
Alemanha / Germany 6.582,0 2,7%
Áustria / Austria 821,3 2,2%
Bélgica / Belgium 820,4 -0,5%
Bulgária / Bulgaria - 2015 389,0 9,0%
Dinamarca / Denmark 187,1 5,9%
Eslovénia / Slovenia 52,5 2,0%
Espanha / Spain 1.115,0 2,1%
Estónia / Estonia - 2015 48,9 7,3%
Finlândia / Finland 257,5 -2,0%
Grécia / Greece 161,0 0,0%
Holanda / Netherlands 789,0 5,9%
Hungria / Hungary - 2014 387,2 N/A
Itália / Italy 2.439,9 -1,9%
Letónia / Latvia - 2015 61,7 4,6%
Lituania / Lithuania 85,8 7,5%
Polónia / Poland 3.047,3 5,1%
Portugal 291,4 20,0%
Reino Unido / UK 2015 3.020,3 2,3%
Roménia / Romania 697,4 8,1%
Suécia / Sweden 718,0 1,2%
Suíça / Switzerland 708,2 -0,1%
Fonte: AESGP / Source: AESGP
Mercado da auto prescrição na Europa European Non-prescription medicines market
Mercado da auto prescrição na Europa European Non-prescription medicines market
VII. PRINCIPAIS INDICADORES DE SAÚDE
MAIN HEALTHCARE INDICATORS
3.
0
1.000
2.000
3.000
4.000
5.000
6.000
7.000
Ale
manha /
Germ
any
Poló
nia
/ P
ola
nd
Rein
o U
nid
o /
UK 2
015
Itália
/ I
taly
Esp
anha /
Spain
Áust
ria /
Aust
ria
Bélg
ica /
Belg
ium
Hola
nda /
Neth
erlands
Suéci
a /
Sw
eden
Suíç
a /
Sw
itze
rland
Rom
énia
/ R
om
ania
Bulg
ária /
Bulg
aria -
2015
Hungria /
Hungary
-2014 Port
ugal
Fin
lândia
/ F
inla
nd
Din
am
arc
a /
Denm
ark
Gré
cia /
Gre
ece
Lituania
/ L
ithuania
Letó
nia
/ L
atv
ia -
2015
Esl
ovénia
/ S
lovenia
Est
ónia
/ E
stonia
- 2
015
Milh
ões
€
54 de 65

EDIÇÃO EDITION 2016
VIIIENSAIOS CLÍNICOS
CLINICAL TRIALS
55 de 65
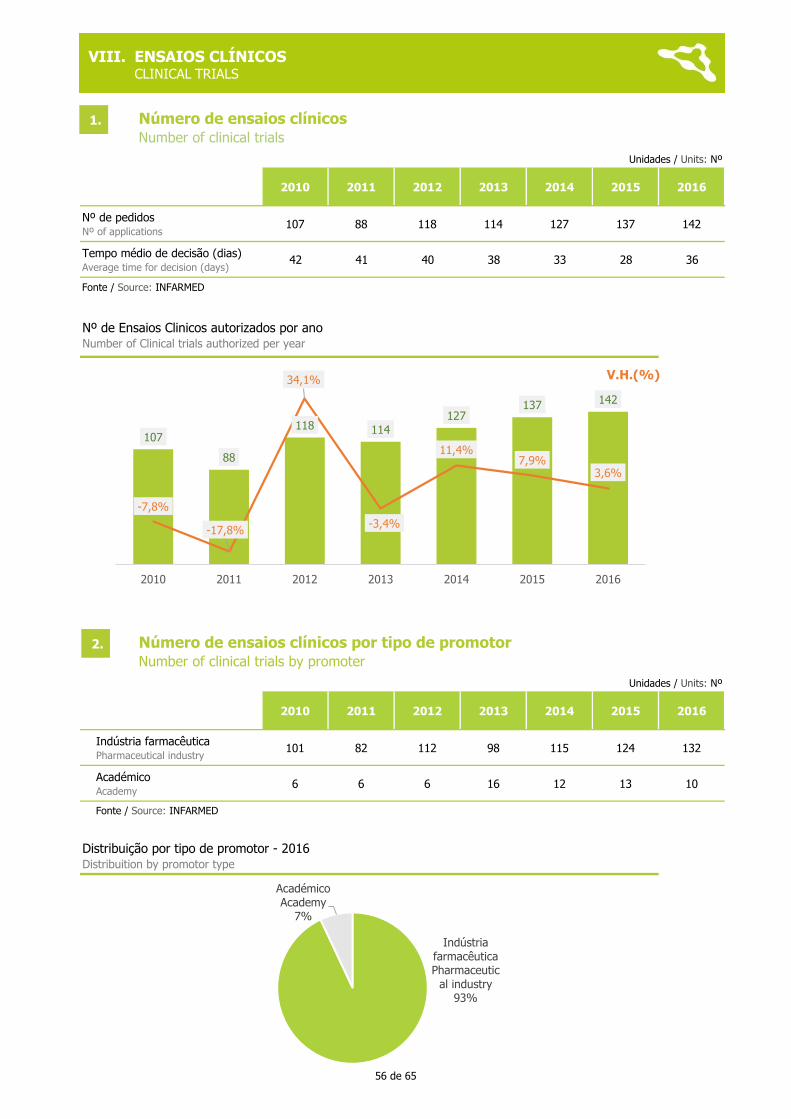
Unidades / Units: Nº
2010 2011 2012 2013 2014 2015 2016
Nº de pedidos Nº of applications
107 88 118 114 127 137 142
Tempo médio de decisão (dias)Average time for decision (days)
42 41 40 38 33 28 36
Fonte / Source: INFARMED
Unidades / Units: Nº
2010 2011 2012 2013 2014 2015 2016
Indústria farmacêuticaPharmaceutical industry
101 82 112 98 115 124 132
AcadémicoAcademy
6 6 6 16 12 13 10
Fonte / Source: INFARMED
Número de ensaios clínicos Number of clinical trials
Número de ensaios clínicos por tipo de promotor Number of clinical trials by promoter
Nº de Ensaios Clinicos autorizados por anoNumber of Clinical trials authorized per year
Distribuição por tipo de promotor - 2016Distribuition by promotor type
VIII. ENSAIOS CLÍNICOS CLINICAL TRIALS
2.
107
88
118 114127
137 142
-7,8%
-17,8%
34,1%
-3,4%
11,4%7,9%
3,6%
-22,0%
-12,0%
-2,0%
8,0%
18,0%
28,0%
0
20
40
60
80
100
120
140
160
2010 2011 2012 2013 2014 2015 2016
V.H.(%)
Indústria farmacêuticaPharmaceutic
al industry93%
AcadémicoAcademy
7%
1.
56 de 65

Unidades / Units: Nº
2016 V.H.(%)
Antineoplásicos e ImunomoduladoresOncology and Immunomodulators
58 -2%
Sistema Cardio-Vascular Cardiovascular
16 33%
Sistema Nervosos CentralCentral Nervous System
14 40%
Anti-InfecciososAnti-Infectives
13 -13%
Gastrointestinal e MetabolicoGastrointestinal and Metabolic
11 -35%
Sistema Musculo EsqueléticoSkeletal Muscle System
9 125%
Sangue e HematopoiéticosBlood and Hematopoietic
8 60%
Sistema RespiratórioRespiratory
6 20%
OutrosOthers
7 ---
Fonte / Source: INFARMED
Unidades / Units: Nº
2016 V.H.(%)
QuímicaChemistry
97 10%
Biológica / BiotecnológicaBiological / Biotechnology
37 -16%
Medicamento de Terapia AvançadaAdvanced therapies
5 ---
CombinadasCombined
3 -40%
Fonte / Source: INFARMED
Unidades / Units: Nº
2016 V.H.(%)
Fase IPhase I
26 73%
Fase IIPhase II
26 8%
Fase IIIPhase III
82 -9%
Fase IVPhase IV
8 0%
Fontes / Source: INFARMED
Número de ensaios clínicos por área terapêuticaNumber of clinical trials by therapeutic area
Tipo de medicamentos usados nos ensaios clinicosType of the drugs used in clinical trials
Tipo de medicamentos usados nos ensaios clinicosType of the drugs used in clinical trials
VIII. ENSAIOS CLÍNICOS
CLINICAL TRIALS
3.
4.
41%
11%
10%
9%
8%
6%
6%
4%
5%
Antineoplásicos e ImunomoduladoresOncology and Immunomodulators
Sistema Cardio-VascularCardiovascular
Sistema Nervosos CentralCentral Nervous System
Anti-InfecciososAnti-Infectives
Gastrointestinal e MetabolicoGastrointestinal and Metabolic
Sistema Musculo EsqueléticoSkeletal Muscle System
Sangue e HematopoiéticosBlood and Hematopoietic
Sistema RespiratórioRespiratory
OutrosOthers
Ensaios Clinicos por área terapêutica (%)Clinical trails by terapeutic area
5.
57 de 65
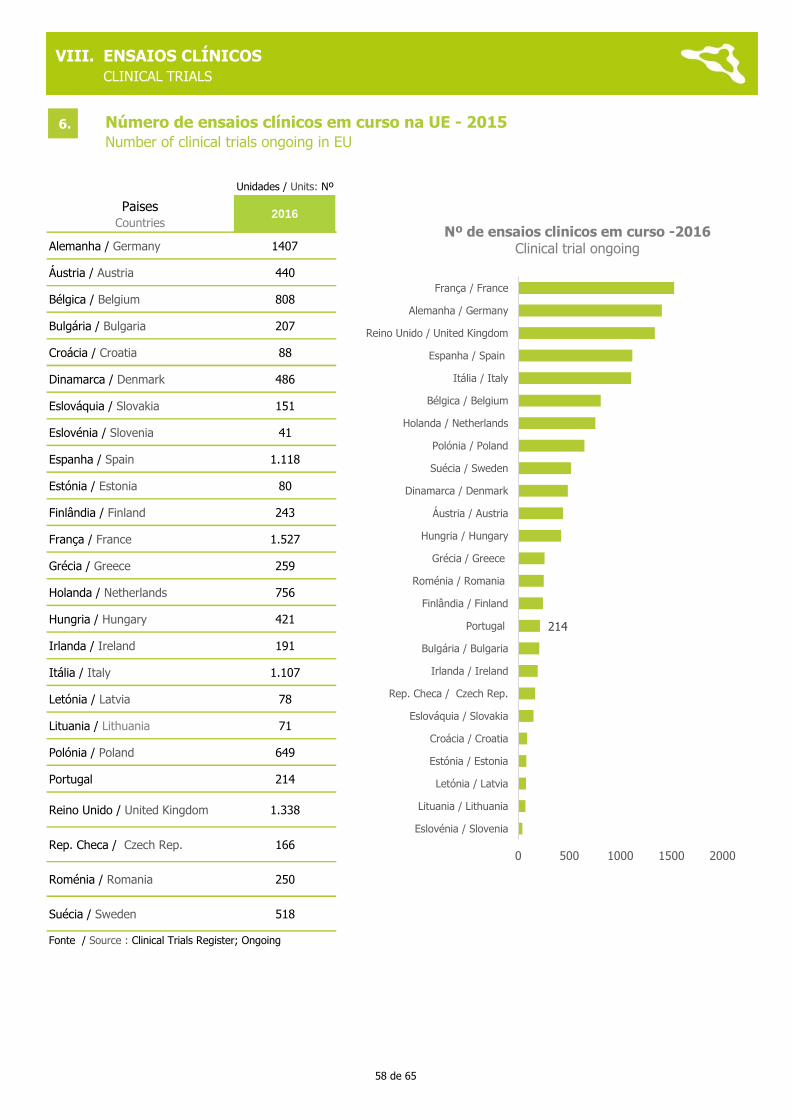
Unidades / Units: Nº
Paises Countries
2016
Alemanha / Germany 1407
Áustria / Austria 440
Bélgica / Belgium 808
Bulgária / Bulgaria 207
Croácia / Croatia 88
Dinamarca / Denmark 486
Eslováquia / Slovakia 151
Eslovénia / Slovenia 41
Espanha / Spain 1.118
Estónia / Estonia 80
Finlândia / Finland 243
França / France 1.527
Grécia / Greece 259
Holanda / Netherlands 756
Hungria / Hungary 421
Irlanda / Ireland 191
Itália / Italy 1.107
Letónia / Latvia 78
Lituania / Lithuania 71
Polónia / Poland 649
Portugal 214
Reino Unido / United Kingdom 1.338
Rep. Checa / Czech Rep. 166
Roménia / Romania 250
Suécia / Sweden 518
Número de ensaios clínicos em curso na UE - 2015Number of clinical trials ongoing in EU
Fonte / Source : Clinical Trials Register; Ongoing
VIII. ENSAIOS CLÍNICOS
CLINICAL TRIALS
6.
214
0 500 1000 1500 2000
Eslovénia / Slovenia
Lituania / Lithuania
Letónia / Latvia
Estónia / Estonia
Croácia / Croatia
Eslováquia / Slovakia
Rep. Checa / Czech Rep.
Irlanda / Ireland
Bulgária / Bulgaria
Portugal
Finlândia / Finland
Roménia / Romania
Grécia / Greece
Hungria / Hungary
Áustria / Austria
Dinamarca / Denmark
Suécia / Sweden
Polónia / Poland
Holanda / Netherlands
Bélgica / Belgium
Itália / Italy
Espanha / Spain
Reino Unido / United Kingdom
Alemanha / Germany
França / France
Nº de ensaios clinicos em curso -2016Clinical trial ongoing
58 de 65

EDIÇÃO EDITION 2016
IXMERCADO DOS DISPOSITIVOS MÉDICOS
PARA DIAGNÓSTICO IN VITRO
IN VITRO DIAGNOSTIC MEDICAL DEVICES MARKETPHARMACEUTICAL MARKET
59 de 65
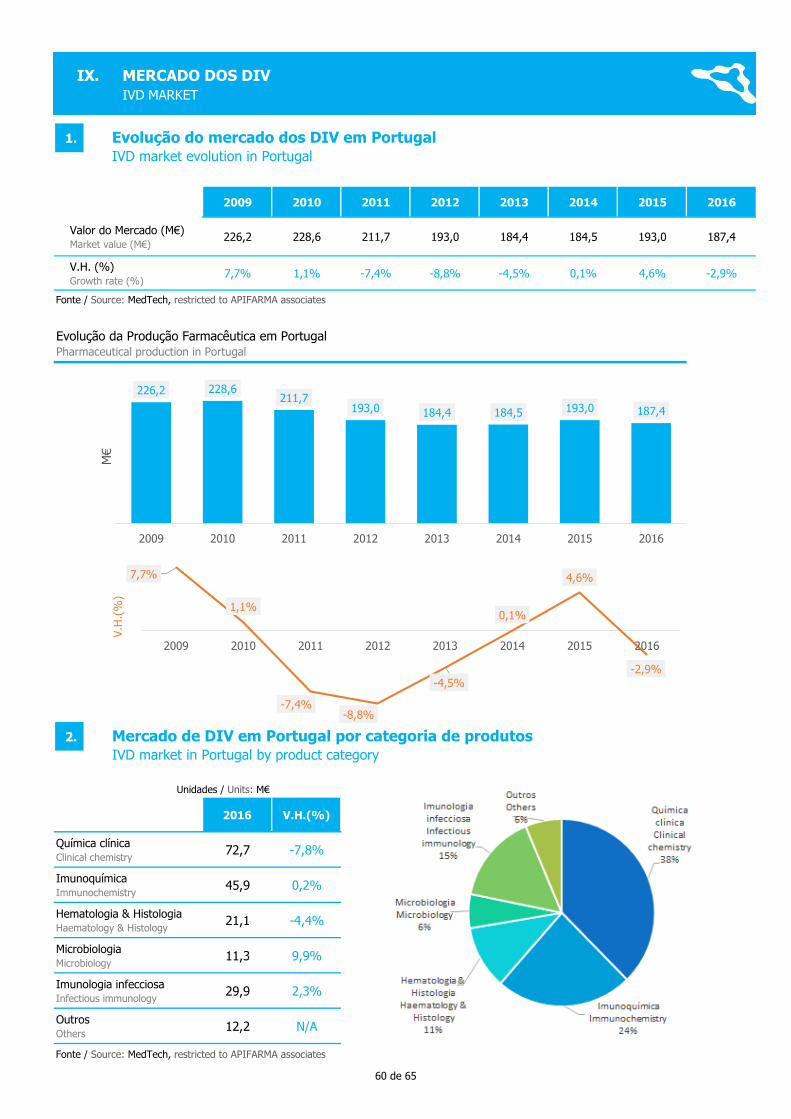
2009 2010 2011 2012 2013 2014 2015 2016
Valor do Mercado (M€)Market value (M€)
226,2 228,6 211,7 193,0 184,4 184,5 193,0 187,4
V.H. (%)Growth rate (%)
7,7% 1,1% -7,4% -8,8% -4,5% 0,1% 4,6% -2,9%
Unidades / Units: M€
2016 V.H.(%)
Química clínicaClinical chemistry
72,7 -7,8%
ImunoquímicaImmunochemistry
45,9 0,2%
Hematologia & HistologiaHaematology & Histology
21,1 -4,4%
MicrobiologiaMicrobiology
11,3 9,9%
Imunologia infecciosaInfectious immunology
29,9 2,3%
OutrosOthers
12,2 N/A
Fonte / Source: MedTech, restricted to APIFARMA associates
Evolução do mercado dos DIV em Portugal IVD market evolution in Portugal
Fonte / Source: MedTech, restricted to APIFARMA associates
Evolução da Produção Farmacêutica em PortugalPharmaceutical production in Portugal
Mercado de DIV em Portugal por categoria de produtosIVD market in Portugal by product category
7,7%
1,1%
-7,4%-8,8%
-4,5%
0,1%
4,6%
-2,9%
2009 2010 2011 2012 2013 2014 2015 2016
V.H
.(%
)
IX. MERCADO DOS DIV
IVD MARKET
1.
226,2 228,6211,7
193,0 184,4 184,5 193,0 187,4
2009 2010 2011 2012 2013 2014 2015 2016
M€
2.
60 de 65
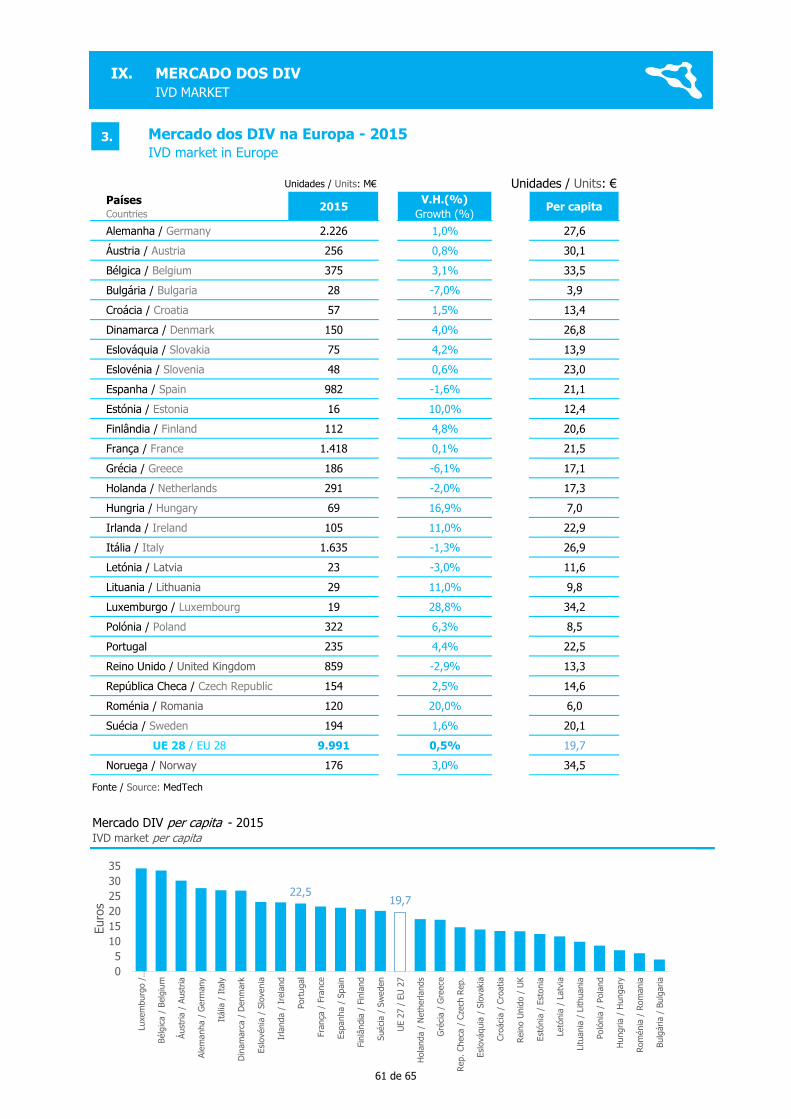
Unidades / Units: M€ Unidades / Units: €
Países Countries
2015V.H.(%)
Growth (%) Crescimento / Growth 2010-2014 (%) Per capita
Alemanha / Germany 2.226 1,0% 27,6
Áustria / Austria 256 0,8% 30,1
Bélgica / Belgium 375 3,1% 33,5
Bulgária / Bulgaria 28 -7,0% 3,9
Croácia / Croatia 57 1,5% 13,4
Dinamarca / Denmark 150 4,0% 26,8
Eslováquia / Slovakia 75 4,2% 13,9
Eslovénia / Slovenia 48 0,6% 23,0
Espanha / Spain 982 -1,6% 21,1
Estónia / Estonia 16 10,0% 12,4
Finlândia / Finland 112 4,8% 20,6
França / France 1.418 0,1% 21,5
Grécia / Greece 186 -6,1% 17,1
Holanda / Netherlands 291 -2,0% 17,3
Hungria / Hungary 69 16,9% 7,0
Irlanda / Ireland 105 11,0% 22,9
Itália / Italy 1.635 -1,3% 26,9
Letónia / Latvia 23 -3,0% 11,6
Lituania / Lithuania 29 11,0% 9,8
Luxemburgo / Luxembourg 19 28,8% 34,2
Polónia / Poland 322 6,3% 8,5
Portugal 235 4,4% 22,5
Reino Unido / United Kingdom 859 -2,9% 13,3
República Checa / Czech Republic 154 2,5% 14,6
Roménia / Romania 120 20,0% 6,0
Suécia / Sweden 194 1,6% 20,1
UE 28 / EU 28 9.991 0,5% 19,7
Noruega / Norway 176 3,0% 34,5
Mercado dos DIV na Europa - 2015
IVD market in Europe
Mercado DIV per capita - 2015IVD market per capita
Fonte / Source: MedTech
IX. MERCADO DOS DIV
IVD MARKET
3.
22,519,7
0
5
10
15
20
25
30
35
Luxe
mburg
o /
…
Bélg
ica /
Belg
ium
Áust
ria /
Aust
ria
Ale
manha /
Germ
any
Itália
/ I
taly
Din
am
arc
a /
Denm
ark
Esl
ovénia
/ S
lovenia
Irla
nda /
Ire
land
Port
ugal
Fra
nça
/ F
rance
Esp
anha /
Spain
Fin
lândia
/ F
inla
nd
Suéci
a /
Sw
eden
UE 2
7 /
EU
27
Hola
nda /
Neth
erlands
Gré
cia /
Gre
ece
Rep. Checa
/ C
zech
Rep.
Esl
ováquia
/ S
lovakia
Cro
áci
a /
Cro
atia
Rein
o U
nid
o /
UK
Est
ónia
/ E
stonia
Letó
nia
/ L
atv
ia
Lituania
/ L
ithuania
Poló
nia
/ P
ola
nd
Hungria /
Hungary
Rom
énia
/ R
om
ania
Bulg
ária /
Bulg
aria
Euro
s
61 de 65

EDIÇÃO EDITION 2016
XMERCADO DA SAÚDE ANIMAL
ANIMAL HEALTH MARKET
62 de 65
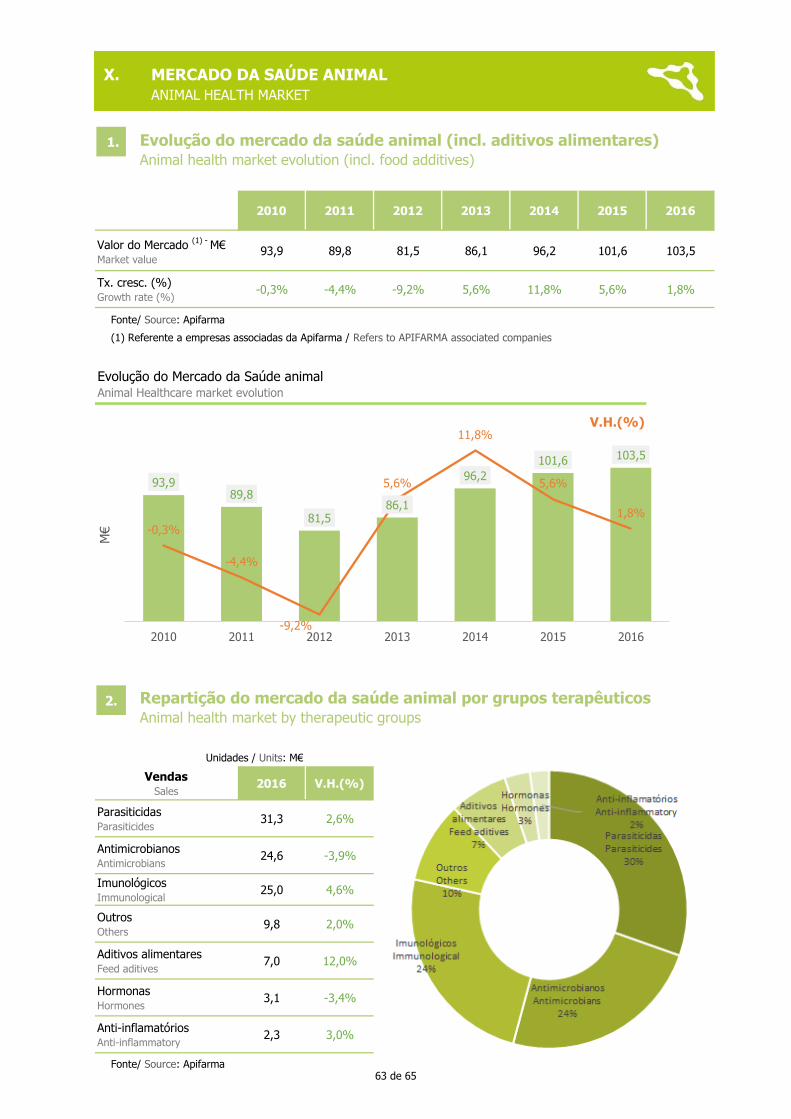
2010 2011 2012 2013 2014 2015 2016
Valor do Mercado (1) -
M€Market value
93,9 89,8 81,5 86,1 96,2 101,6 103,5
Tx. cresc. (%)Growth rate (%)
-0,3% -4,4% -9,2% 5,6% 11,8% 5,6% 1,8%
(1) Referente a empresas associadas da Apifarma / Refers to APIFARMA associated companies
Unidades / Units: M€
VendasSales
2016 V.H.(%)
ParasiticidasParasiticides
31,3 2,6%
AntimicrobianosAntimicrobians
24,6 -3,9%
ImunológicosImmunological
25,0 4,6%
OutrosOthers
9,8 2,0%
Aditivos alimentaresFeed aditives
7,0 12,0%
HormonasHormones
3,1 -3,4%
Anti-inflamatóriosAnti-inflammatory
2,3 3,0%
Fonte/ Source: Apifarma
Evolução do Mercado da Saúde animalAnimal Healthcare market evolution
Fonte/ Source: Apifarma
Evolução do mercado da saúde animal (incl. aditivos alimentares) Animal health market evolution (incl. food additives)
Repartição do mercado da saúde animal por grupos terapêuticos Animal health market by therapeutic groups
X. MERCADO DA SAÚDE ANIMAL
ANIMAL HEALTH MARKET
1.
93,989,8
81,586,1
96,2
101,6 103,5
-0,3%
-4,4%
-9,2%
5,6%
11,8%
5,6%
1,8%
-10,0%
-5,0%
0,0%
5,0%
10,0%
50,0
60,0
70,0
80,0
90,0
100,0
110,0
2010 2011 2012 2013 2014 2015 2016
M€
V.H.(%)
2.
63 de 65
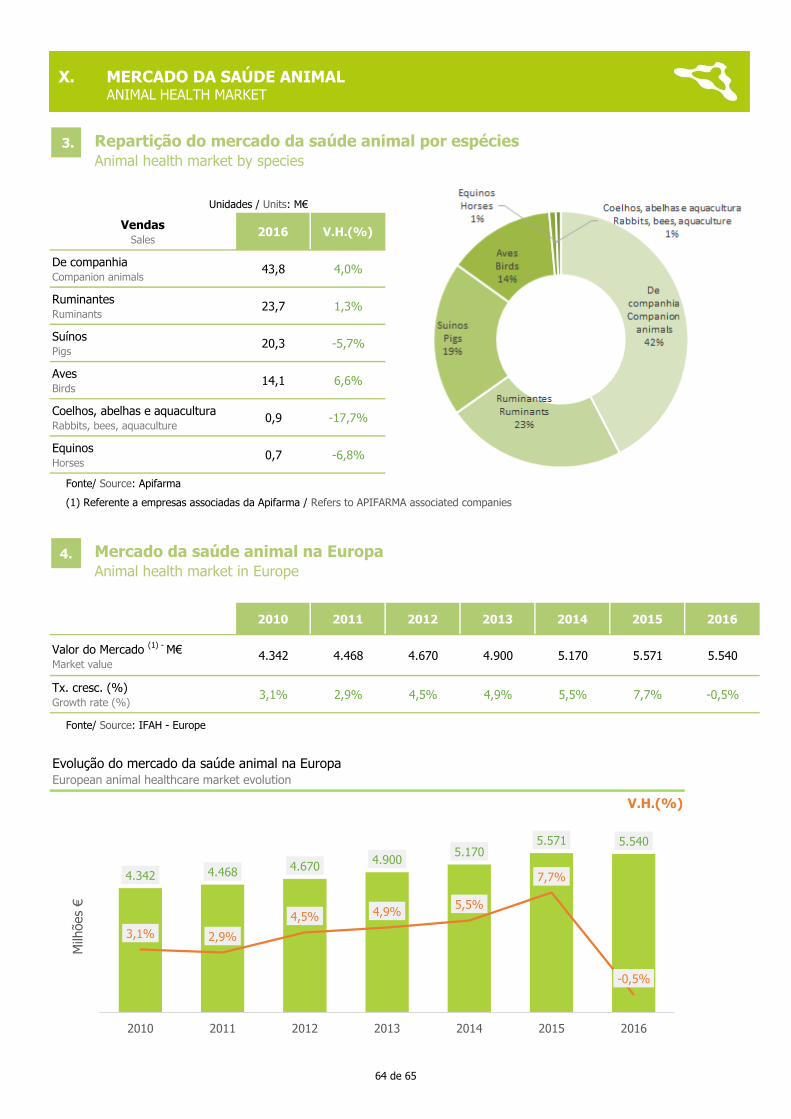
Unidades / Units: M€
VendasSales
2016 V.H.(%)
De companhiaCompanion animals
43,8 4,0%
RuminantesRuminants
23,7 1,3%
SuínosPigs
20,3 -5,7%
AvesBirds
14,1 6,6%
Coelhos, abelhas e aquaculturaRabbits, bees, aquaculture
0,9 -17,7%
EquinosHorses
0,7 -6,8%
(1) Referente a empresas associadas da Apifarma / Refers to APIFARMA associated companies
2010 2011 2012 2013 2014 2015 2016
Valor do Mercado (1) -
M€Market value
4.342 4.468 4.670 4.900 5.170 5.571 5.540
Tx. cresc. (%)Growth rate (%)
3,1% 2,9% 4,5% 4,9% 5,5% 7,7% -0,5%
Repartição do mercado da saúde animal por espécies Animal health market by species
Fonte/ Source: IFAH - Europe
Evolução do mercado da saúde animal na EuropaEuropean animal healthcare market evolution
Mercado da saúde animal na Europa Animal health market in Europe
Fonte/ Source: Apifarma
X. MERCADO DA SAÚDE ANIMAL ANIMAL HEALTH MARKET
3.
4.342 4.468 4.6704.900
5.1705.571 5.540
3,1% 2,9%
4,5% 4,9%5,5%
7,7%
-0,5%
-2,0%
0,0%
2,0%
4,0%
6,0%
8,0%
10,0%
12,0%
0
1.000
2.000
3.000
4.000
5.000
6.000
2010 2011 2012 2013 2014 2015 2016
Milh
ões
€
V.H.(%)
4.
64 de 65
Associação Portuguesada Indústria Farmacêutica
Av. Dom Vasco da Gama, nº 341400-128 Lisboa Portugal
T. 213 005 080F. 213 031 799
www.apifarma.pt


![Nº46 Setembro 2018 Boletim de Conjuntura - apifarma.pt · [ 2 / 5 ] Boletim de Conjuntura Nº46 Setembro 2018 Mercado de Genéricos e Mercado Generificado Em contraciclo, em Setembro,](https://static.fdocumentos.com/doc/165x107/5bead88409d3f2717a8b9b2c/no46-setembro-2018-boletim-de-conjuntura-2-5-boletim-de-conjuntura.jpg)