
A Sun glitter analysis of CBERS (WFI and CCD)...
7
A Sun glitter analysis of CBERS (WFI and CCD) and ASTER images of an oil seepage event at Campos Basin, Brazil João Antonio Lorenzzetti 1 Milton Kampel 1 Cristina Maria Bentz 2 1 Instituto Nacional de Pesquisas Espaciais - INPE Caixa Postal 515 - 12201-970 - São José dos Campos - SP, Brasil {loren, milton}@dsr.inpe.br 2 PETROBRAS/CENPES - Centro de Pesquisas Cidade Universitária, Q.7, Ilha do Fundão - 21949-900 - Rio de Janeiro - RJ, Brasil [email protected] Abstract. Visible images of CBERS-2 Wide Field of View Imager (WFI) and CCD cameras and ASTER VNIR sensors obtained during an oceanographic campaign of FITOSAT project in November 2004 show very clearly the presence of a relatively large oil seep event in the Campos Basin. The oil seep was observed in all these images in the Sun glitter region of the image. While the oil seep appears as a darker than background anomaly in the ASTER image, the reverse is observed in both, CCD and WFI images. In the paper we analyzed the imaging and illumination geometry for each sensor in conjunction with the probability density function of wave slopes given by Cox and Munk (1954). Assuming 15 o as the maximum inclination of reflecting facets and that the slope pdfs are different for oil free and oil contaminated areas we explain the different characteristics of the oil seep observed in the glitter areas of these images. Key words: Sun glitter, CBERS, ASTER, oil seepage, Campos Basin 1. Introduction FITOSAT project, a partnership of PETROBRAS, INPE and some Brazilian universities, had as a main goal the use of in situ and remote sensing technologies to monitor, describe and explain the environmental scenarios (natural or man made) occurring at the continental shelf and oceanic waters of the Campos Basin (RJ). One phase of the project consisted of an oceanographic campaign with the concomitant acquisition of a series of satellite images in the visible, thermal infrared and microwave regions of the electromagnetic spectrum. A few days before the beginning of the hydrographic campaign in November of 2004 a relatively large surface oil slick was reported in the area. A ROV sent to the bottom of the sea in the region of the slick (1200 m) documented that the surface film had its origin as an intense oil seep. Although no visible images could be acquired at the beginning of this event due to total cloud cover associated with the passage of a cold front, a Radarsat-1 SAR image obtained day 19 November, 2004 was important to map the feature (Figure 1, left panel). Quikscat wind data revealed that parts of dark features observed in that image were low wind regions. The circular pattern of the slick was induced by an oceanic eddy and the white alongated feature is the Brazil Current (BC). This interpretation was confirmed in the next days by Sea Surface Temperature maps. Two days later (Fig. 1 – right), the ENVISAT/ASAR image gave another view of the eddy revealing that the oil film had moved NW with the clockwise cyclonic circulation of the eddy. Eddy size estimated from these images is about 60 – 70 km. 6549
Transcript of A Sun glitter analysis of CBERS (WFI and CCD)...
A Sun glitter analysis of CBERS (WFI and CCD) and ASTER images of an oil seepage event at Campos Basin, Brazil
João Antonio Lorenzzetti 1
Milton Kampel 1 Cristina Maria Bentz 2
1 Instituto Nacional de Pesquisas Espaciais - INPE Caixa Postal 515 - 12201-970 - São José dos Campos - SP, Brasil
{loren, milton}@dsr.inpe.br
2 PETROBRAS/CENPES - Centro de Pesquisas Cidade Universitária, Q.7, Ilha do Fundão - 21949-900 - Rio de Janeiro - RJ, Brasil
Abstract. Visible images of CBERS-2 Wide Field of View Imager (WFI) and CCD cameras and ASTER VNIR sensors obtained during an oceanographic campaign of FITOSAT project in November 2004 show very clearly the presence of a relatively large oil seep event in the Campos Basin. The oil seep was observed in all these images in the Sun glitter region of the image. While the oil seep appears as a darker than background anomaly in the ASTER image, the reverse is observed in both, CCD and WFI images. In the paper we analyzed the imaging and illumination geometry for each sensor in conjunction with the probability density function of wave slopes given by Cox and Munk (1954). Assuming 15o as the maximum inclination of reflecting facets and that the slope pdfs are different for oil free and oil contaminated areas we explain the different characteristics of the oil seep observed in the glitter areas of these images. Key words: Sun glitter, CBERS, ASTER, oil seepage, Campos Basin
1. Introduction
FITOSAT project, a partnership of PETROBRAS, INPE and some Brazilian universities, had as a main goal the use of in situ and remote sensing technologies to monitor, describe and explain the environmental scenarios (natural or man made) occurring at the continental shelf and oceanic waters of the Campos Basin (RJ). One phase of the project consisted of an oceanographic campaign with the concomitant acquisition of a series of satellite images in the visible, thermal infrared and microwave regions of the electromagnetic spectrum.
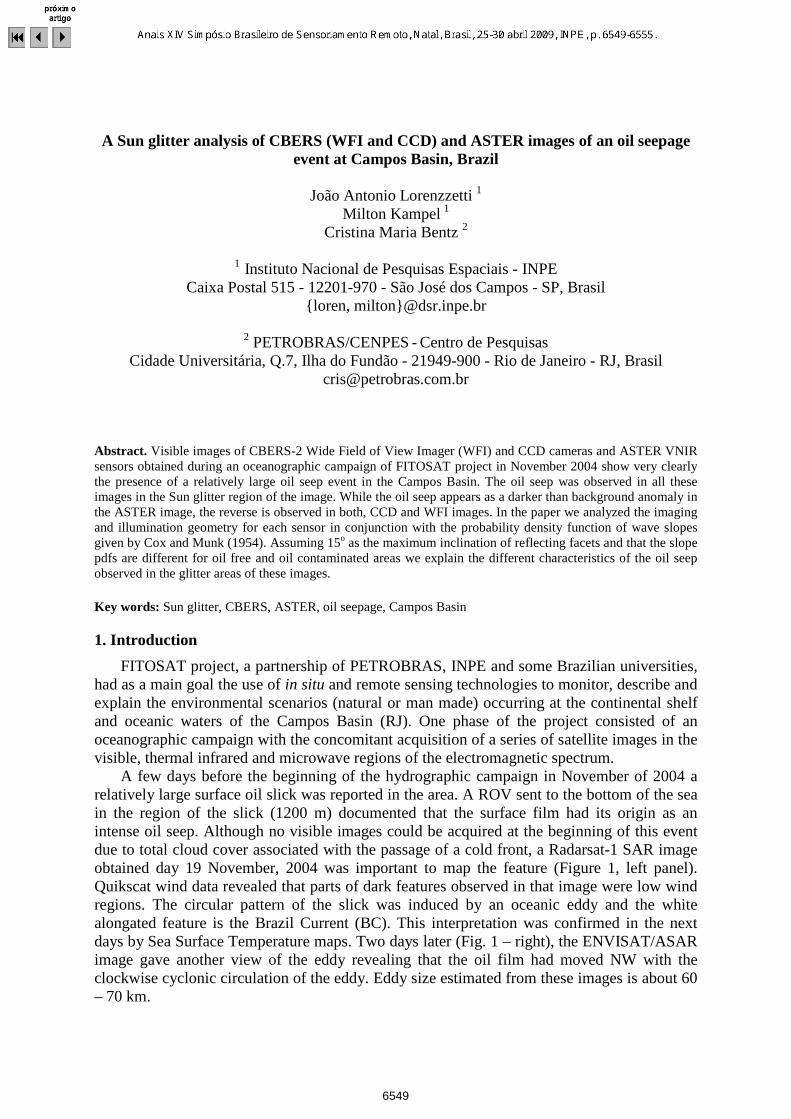
A few days before the beginning of the hydrographic campaign in November of 2004 a relatively large surface oil slick was reported in the area. A ROV sent to the bottom of the sea in the region of the slick (1200 m) documented that the surface film had its origin as an intense oil seep. Although no visible images could be acquired at the beginning of this event due to total cloud cover associated with the passage of a cold front, a Radarsat-1 SAR image obtained day 19 November, 2004 was important to map the feature (Figure 1, left panel). Quikscat wind data revealed that parts of dark features observed in that image were low wind regions. The circular pattern of the slick was induced by an oceanic eddy and the white alongated feature is the Brazil Current (BC). This interpretation was confirmed in the next days by Sea Surface Temperature maps. Two days later (Fig. 1 – right), the ENVISAT/ASAR image gave another view of the eddy revealing that the oil film had moved NW with the clockwise cyclonic circulation of the eddy. Eddy size estimated from these images is about 60 – 70 km.
6549
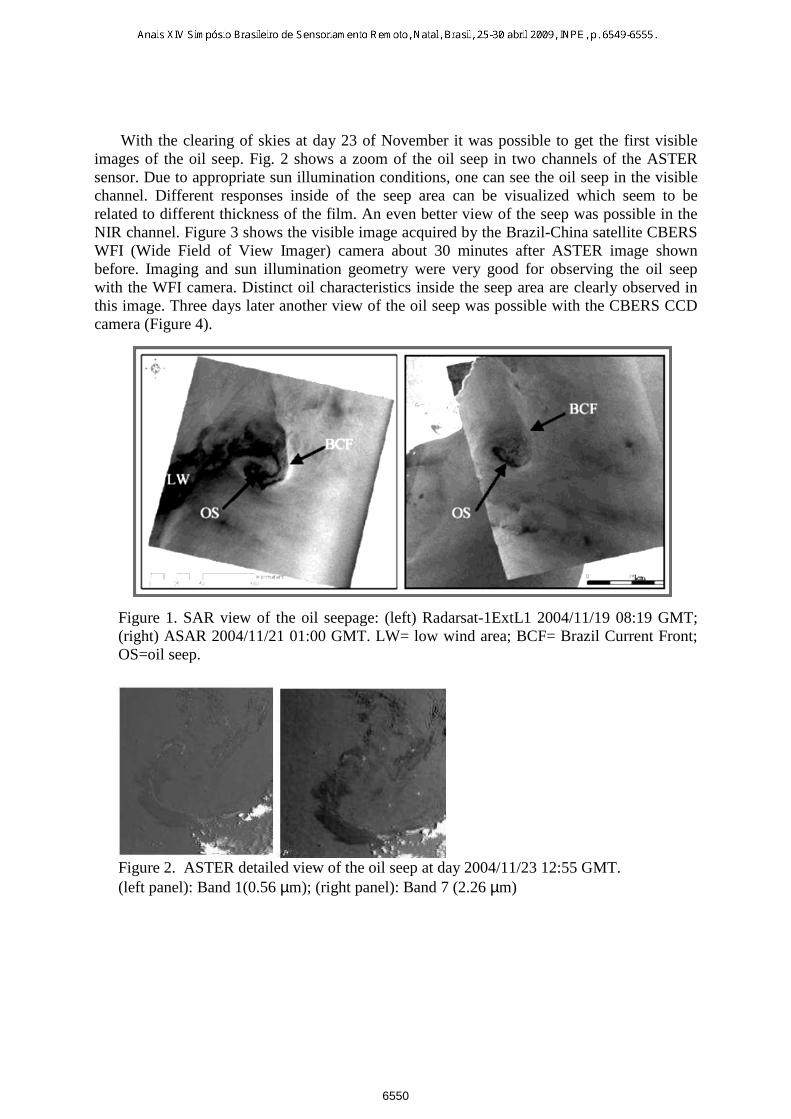
With the clearing of skies at day 23 of November it was possible to get the first visible images of the oil seep. Fig. 2 shows a zoom of the oil seep in two channels of the ASTER sensor. Due to appropriate sun illumination conditions, one can see the oil seep in the visible channel. Different responses inside of the seep area can be visualized which seem to be related to different thickness of the film. An even better view of the seep was possible in the NIR channel. Figure 3 shows the visible image acquired by the Brazil-China satellite CBERS WFI (Wide Field of View Imager) camera about 30 minutes after ASTER image shown before. Imaging and sun illumination geometry were very good for observing the oil seep with the WFI camera. Distinct oil characteristics inside the seep area are clearly observed in this image. Three days later another view of the oil seep was possible with the CBERS CCD camera (Figure 4).
Figure 1. SAR view of the oil seepage: (left) Radarsat-1ExtL1 2004/11/19 08:19 GMT; (right) ASAR 2004/11/21 01:00 GMT. LW= low wind area; BCF= Brazil Current Front; OS=oil seep.
Figure 2. ASTER detailed view of the oil seep at day 2004/11/23 12:55 GMT. (left panel): Band 1(0.56 µm); (right panel): Band 7 (2.26 µm)
6550
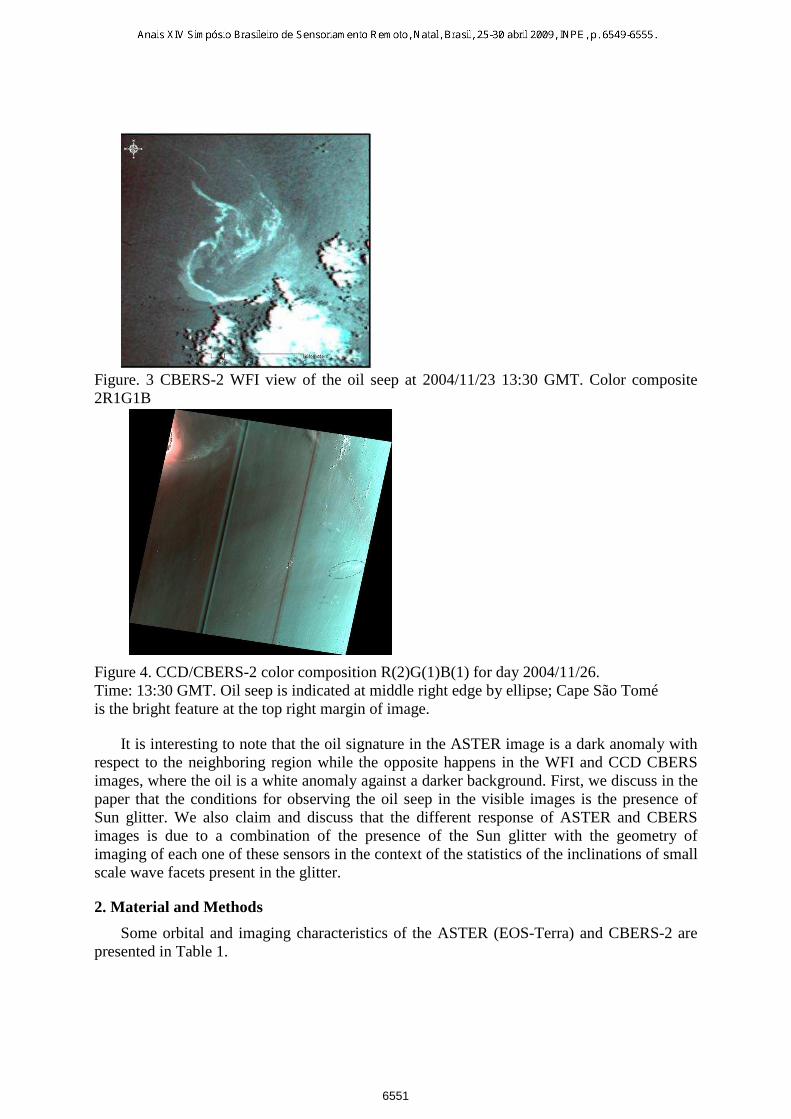
Figure. 3 CBERS-2 WFI view of the oil seep at 2004/11/23 13:30 GMT. Color composite 2R1G1B
Figure 4. CCD/CBERS-2 color composition R(2)G(1)B(1) for day 2004/11/26. Time: 13:30 GMT. Oil seep is indicated at middle right edge by ellipse; Cape São Tomé is the bright feature at the top right margin of image.
It is interesting to note that the oil signature in the ASTER image is a dark anomaly with respect to the neighboring region while the opposite happens in the WFI and CCD CBERS images, where the oil is a white anomaly against a darker background. First, we discuss in the paper that the conditions for observing the oil seep in the visible images is the presence of Sun glitter. We also claim and discuss that the different response of ASTER and CBERS images is due to a combination of the presence of the Sun glitter with the geometry of imaging of each one of these sensors in the context of the statistics of the inclinations of small scale wave facets present in the glitter.
2. Material and Methods
Some orbital and imaging characteristics of the ASTER (EOS-Terra) and CBERS-2 are presented in Table 1.
6551
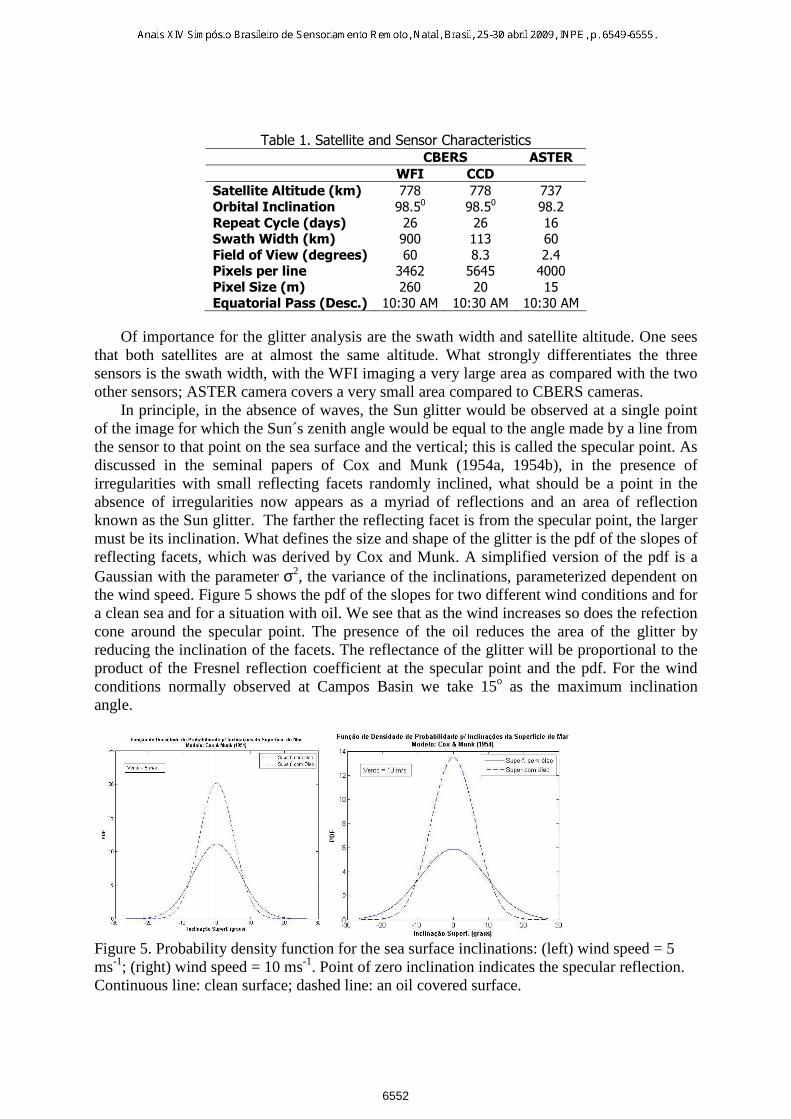
Table 1. Satellite and Sensor Characteristics
CBERS ASTER
WFI CCD
Satellite Altitude (km) 778 778 737
Orbital Inclination 98.50 98.5
0 98.2
Repeat Cycle (days) 26 26 16
Swath Width (km) 900 113 60
Field of View (degrees) 60 8.3 2.4
Pixels per line 3462 5645 4000
Pixel Size (m) 260 20 15
Equatorial Pass (Desc.) 10:30 AM 10:30 AM 10:30 AM
Of importance for the glitter analysis are the swath width and satellite altitude. One sees that both satellites are at almost the same altitude. What strongly differentiates the three sensors is the swath width, with the WFI imaging a very large area as compared with the two other sensors; ASTER camera covers a very small area compared to CBERS cameras.
In principle, in the absence of waves, the Sun glitter would be observed at a single point of the image for which the Sun´s zenith angle would be equal to the angle made by a line from the sensor to that point on the sea surface and the vertical; this is called the specular point. As discussed in the seminal papers of Cox and Munk (1954a, 1954b), in the presence of irregularities with small reflecting facets randomly inclined, what should be a point in the absence of irregularities now appears as a myriad of reflections and an area of reflection known as the Sun glitter. The farther the reflecting facet is from the specular point, the larger must be its inclination. What defines the size and shape of the glitter is the pdf of the slopes of reflecting facets, which was derived by Cox and Munk. A simplified version of the pdf is a Gaussian with the parameter σ2, the variance of the inclinations, parameterized dependent on the wind speed. Figure 5 shows the pdf of the slopes for two different wind conditions and for a clean sea and for a situation with oil. We see that as the wind increases so does the refection cone around the specular point. The presence of the oil reduces the area of the glitter by reducing the inclination of the facets. The reflectance of the glitter will be proportional to the product of the Fresnel reflection coefficient at the specular point and the pdf. For the wind conditions normally observed at Campos Basin we take 15o as the maximum inclination angle.
Figure 5. Probability density function for the sea surface inclinations: (left) wind speed = 5 ms-1; (right) wind speed = 10 ms-1. Point of zero inclination indicates the specular reflection. Continuous line: clean surface; dashed line: an oil covered surface.
6552
The region of the pdf curves from the central point (zero inclination) up to the point where both curves (with and without oil) join corresponds to an area of the glitter where the pixels affected by the oil appear brighter than the surrounding regions. For the areas where the pdf of clear water is greater than for oil covered areas the situation reverses and the oil areas will appear darker than the surroundings. This analysis is valid up to the point where the oil pixels are not too far from the specular point, with pdf values extremely low. In this case, the oil will be hardly visible in the image (Biegert e Berry, 1999). 3. Results and Discussion
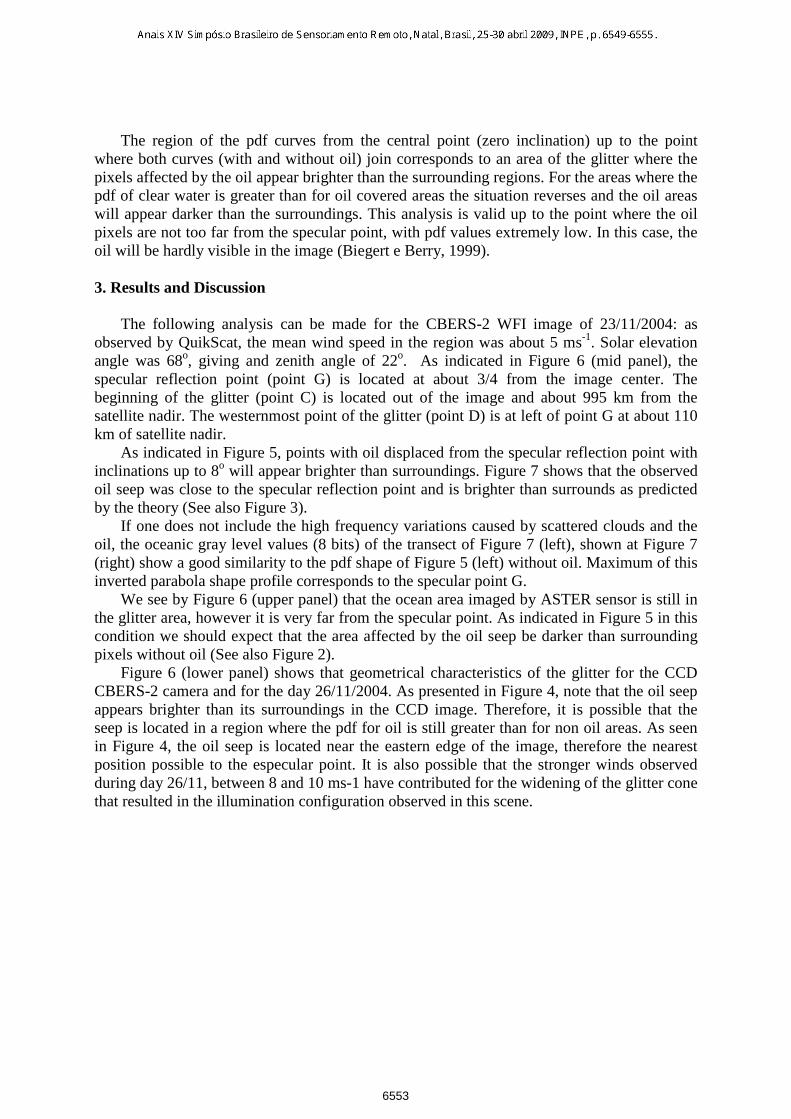
The following analysis can be made for the CBERS-2 WFI image of 23/11/2004: as observed by QuikScat, the mean wind speed in the region was about 5 ms-1. Solar elevation angle was 68o, giving and zenith angle of 22o. As indicated in Figure 6 (mid panel), the specular reflection point (point G) is located at about 3/4 from the image center. The beginning of the glitter (point C) is located out of the image and about 995 km from the satellite nadir. The westernmost point of the glitter (point D) is at left of point G at about 110 km of satellite nadir.
As indicated in Figure 5, points with oil displaced from the specular reflection point with inclinations up to 8o will appear brighter than surroundings. Figure 7 shows that the observed oil seep was close to the specular reflection point and is brighter than surrounds as predicted by the theory (See also Figure 3).
If one does not include the high frequency variations caused by scattered clouds and the oil, the oceanic gray level values (8 bits) of the transect of Figure 7 (left), shown at Figure 7 (right) show a good similarity to the pdf shape of Figure 5 (left) without oil. Maximum of this inverted parabola shape profile corresponds to the specular point G.
We see by Figure 6 (upper panel) that the ocean area imaged by ASTER sensor is still in the glitter area, however it is very far from the specular point. As indicated in Figure 5 in this condition we should expect that the area affected by the oil seep be darker than surrounding pixels without oil (See also Figure 2).
Figure 6 (lower panel) shows that geometrical characteristics of the glitter for the CCD CBERS-2 camera and for the day 26/11/2004. As presented in Figure 4, note that the oil seep appears brighter than its surroundings in the CCD image. Therefore, it is possible that the seep is located in a region where the pdf for oil is still greater than for non oil areas. As seen in Figure 4, the oil seep is located near the eastern edge of the image, therefore the nearest position possible to the especular point. It is also possible that the stronger winds observed during day 26/11, between 8 and 10 ms-1 have contributed for the widening of the glitter cone that resulted in the illumination configuration observed in this scene.
6553
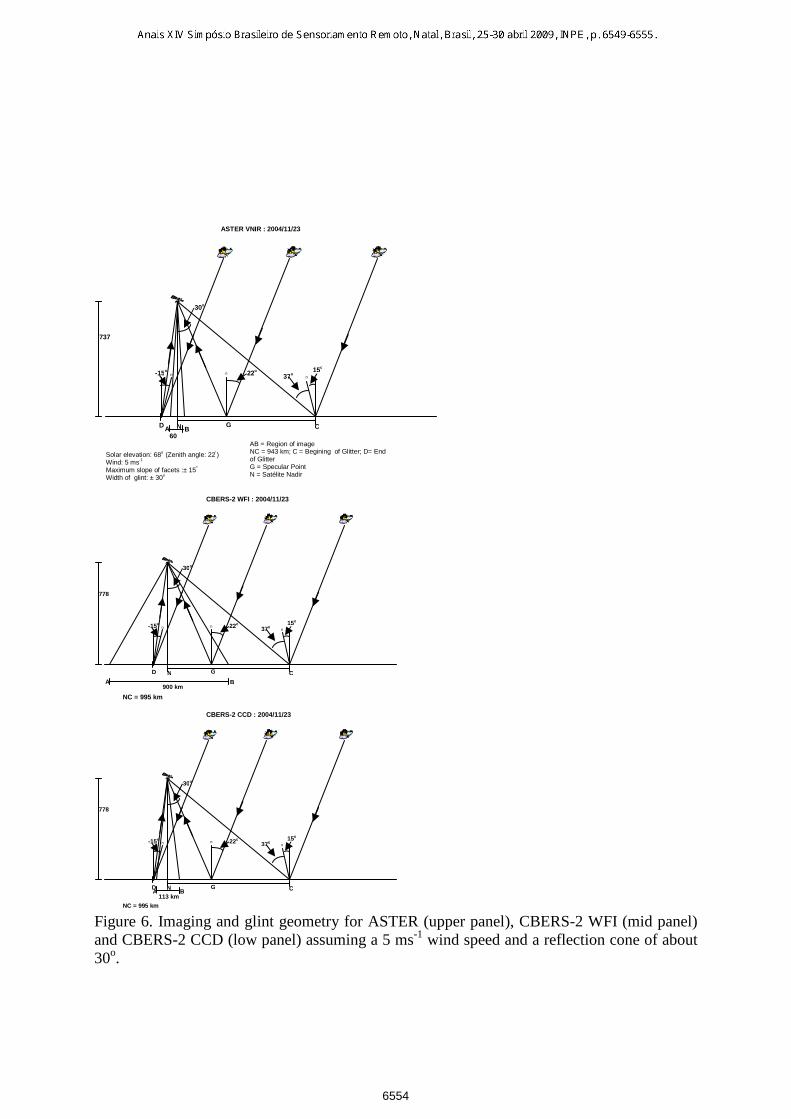
Figure 6. Imaging and glint geometry for ASTER (upper panel), CBERS-2 WFI (mid panel) and CBERS-2 CCD (low panel) assuming a 5 ms-1 wind speed and a reflection cone of about 30o.
30o
60
737
Solar elevation: 68o (Zenith angle: 22º) Wind: 5 ms-1 Maximum slope of facets :± 15º
Width of glint: ± 30o
n
G
22o n
15o 37o
N C
AB = Region of image NC = 943 km; C = Begining of Glitter; D= End of Glitter G = Specular Point N = Satélite Nadir
n -15o
D
ASTER VNIR : 2004/11/23
A B
30o
900 km
778
n
G
22o n
15o 37o
N C
NC = 995 km
n -15o
D
CBERS-2 WFI : 2004/11/23
A B
30o
113 km
778
n
G
22o n
15o 37o
N C
NC = 995 km
n -15o
D
CBERS-2 CCD : 2004/11/23
A B
6554
Figure 7. (Left) CBERS-2 WFI Band 1 image of 23/11/2004. Dark Arrow indicates position of the oil seep. Black line indicates position of image transect shown at right. (Right) Transect of digital numbers (8 bits) of WFI image. Black arrow indicates position in the image where ocean begins.
4. Conclusions
The analysis presented confirms that the use of the pdf of the slopes of reflecting ocean facets derived by Cox and Munk (1954) together with the information of imaging and solar illumination conditions can be used to explain the different patterns of brightness anomalies for the oil seep areas observed during the oceanographic FITOSAT campaign. A more detailed analysis which integrates quantitatively the reflectivity of the sea surface to the solar radiation to the statistical model of wave slope of Cox and Munk and an atmospheric correction procedure as presented by should be the final objective of a more precise study of the phenomenon observed in these images.
An ocean glitter model can also be very useful for evaluating the best and worst illumination conditions for observing oil seeps or oil spills in the glitter region of visible images. One must realize that the solar elevation angle can have an appreciable change during the course of the year depending on the latitude of the image and, therefore, the glitter pattern should change accordingly.
Agradecimentos
We would like to acknowledge the financial support o PETROBRÁS for the FITOSAT project.
References
Adamo, M.: De Carolis, G.; De Pasquale, V.; and Pasquariello, G. Combined use of SAR and Modis imagery to detect marine oil spills. In: Proc. Soc. Photo-Opt. Instr. Eng.(SPIE) Conference, v. 5980, 153-164, doi = 10.1117/12.627505, 2005. Biegert, E.K. and Berry, J.L. Mapping sea surface slicks from space. Backscatter Magazine, August, 1999. Cox, C. and Munk, W. Measurement of the roughness of the sea surface from photographs of the sun’s glitter, J. Opt. Soc. Am., 44, 838-850, 1954a. Cox, C. and Munk, W. Statistics of the sea surface derived from Sun glitter. J. Mar. Res., 13(2), 198-227, 1954b.
6555