Apresentação 4Q09 EN
33
0 2009 Earnings
-
Upload
generalshoppingriweb -
Category
Economy & Finance
-
view
97 -
download
0
Transcript of Apresentação 4Q09 EN

0
2009 Earnings

1
Disclaimer
This presentation contains statements that are forward-looking within the meaning of Section 27A of the Securities Act of 1933 and Section 21E of the Securities Exchange Act of 1934. Such forward-looking statements are only predictions and are not guarantees of future performance. Investors are cautioned that any such forward-looking statements are and will be, as the case may be, subject to many risks, uncertainties and factors relating to the operations and business environments of General Shopping and its subsidiaries that may cause the actual results of the companies to be materially different from any future results expressed or implied in such forward-looking statements.
This material is published solely for informational purposes and is not to be construed as a solicitation or an offer to buy or sell any securities or related financial instruments and should not be treated as giving investment advice. It is not targeted to the specific investment objectives, financial situation or particular needs of any recipient. No representation or warranty, either express or implied, is provided in relation to the accuracy, completeness or reliability of the information contained herein. This material should not be regarded by recipients as a substitute for the exercise of their own judgment.
Any opinions expressed in this material are expressed as of this date and subject to change without notice and General Shopping is not under the obligation to update or keep current the information contained herein. General Shopping and the respective affiliates, directors, partners and employees accept no liability whatsoever for any loss or damage of any kind arising out of the use of all or any part of this material. You should consult with your own legal, regulatory, tax, business, investment, financial and accounting advisers to the extent that you deem it necessary, and make your own investment, hedging and trading decision (including decisions regarding the suitability of this transaction) based upon your own judgment and advice from such advisers as you deem necessary and not upon any views expressed in this material.
2
Agenda
Sector Overview
Company Overview
Financial Performance
3Sector Overview
4
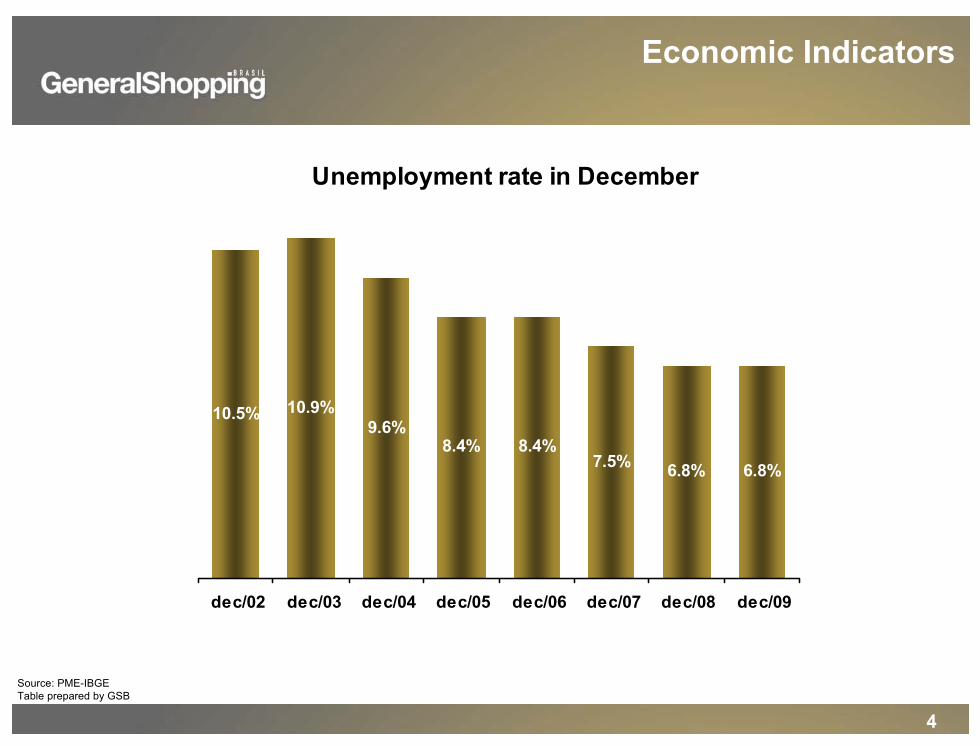
Economic Indicators
Unemployment rate in December
10.5% 10.9%9.6%
8.4% 8.4%7.5% 6.8% 6.8%
dec/02 dec/03 dec/04 dec/05 dec/06 dec/07 dec/08 dec/09
Source: PME-IBGETable prepared by GSB

5
Real income of the employed population (1)
29.729.027.2
22.1 22.8 24.4 25.9
2.2%
-6.6%
2.9%6.9% 6.5% 4.9%
6.7%
-10.0%
-8.0%
-6.0%
-4.0%
-2.0%
0.0%
2.0%
4.0%
6.0%
8.0%
10.0%
d ec/ 0 3 dec/ 0 4 dec/ 0 5 d ec/ 0 6 d ec/ 0 7 d ec/ 0 8 d ec/ 0 9
-30
-20
-10
0
10
20
30
Real income of the employed population - R$ billionSame year-ago growth
Economic Indicators
Source: PME-IBGE; Table prepared by GSB(1)Based on the employed population and average income of the employed population
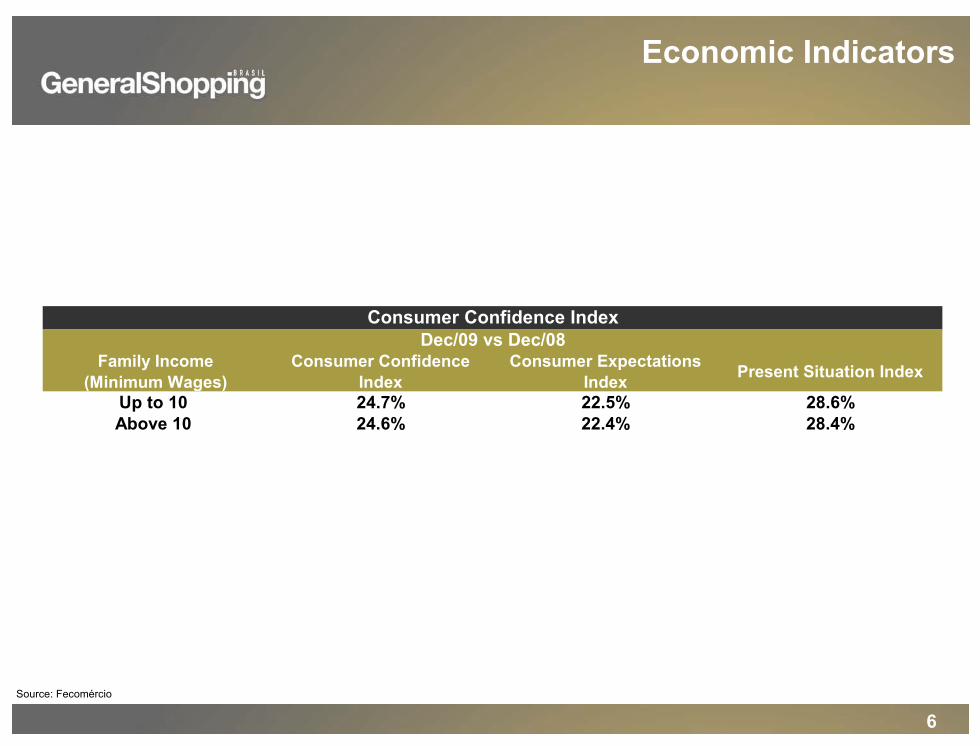
6Source: Fecomércio
Economic Indicators
Family Income (Minimum Wages)
Consumer Confidence Index
Consumer Expectations Index Present Situation Index
Up to 10 24.7% 22.5% 28.6%Above 10 24.6% 22.4% 28.4%
Consumer Confidence IndexDec/09 vs Dec/08

77(*) Excludes sales of gas and liquefied petroleum gas
11 8 8
637
81204
40
1.872
M exico Spain Brazil USA
GLA GLA / 1,000
Neighborhood Center
Community Center
Lifestyle Center
Thematic Center
Outlet Center
Power Center
Super Regional Center
Regional Center
18%
70%
Brazil USA
Retail Sales at Shopping Malls
Source: ABRASCE
(*)
Area and Area/Inhabitant by Country Types of Shopping Malls in USA
The Brazilian shopping center sector presents ample room for growth
Low Sector Penetration
8
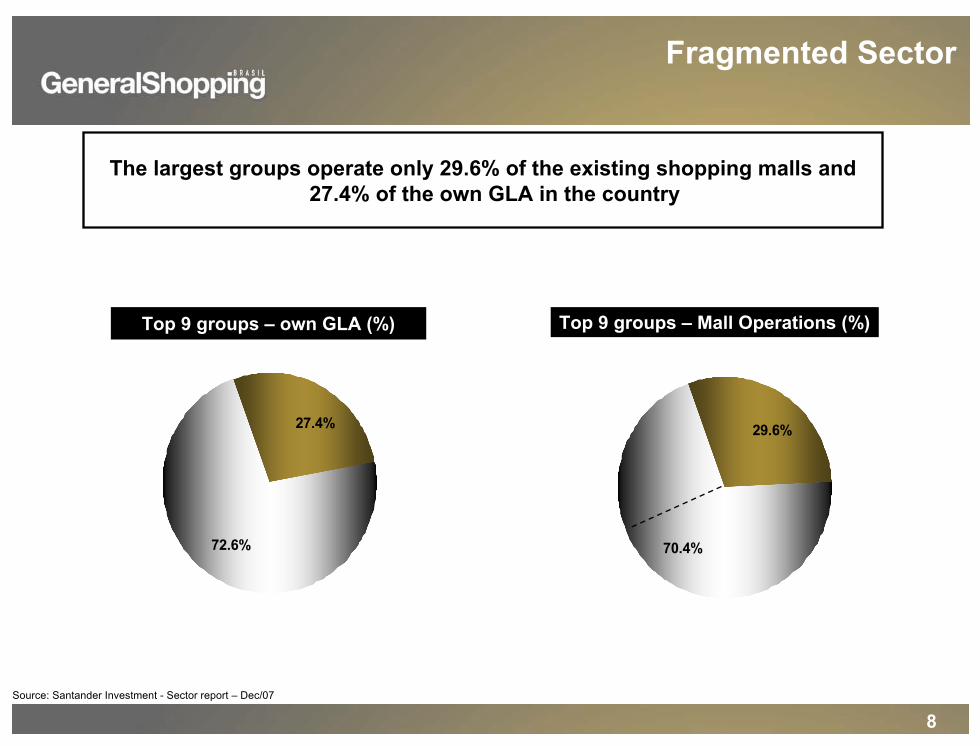
The largest groups operate only 29.6% of the existing shopping malls and 27.4% of the own GLA in the country
Source: Santander Investment - Sector report – Dec/07
Fragmented Sector
Top 9 groups – own GLA (%)
27.4%
72.6%
Top 9 groups – Mall Operations (%)
29.6%
70.4%

9Company Overview

10
Market-driven company with retail approachMarket-driven company with retail approach
B and C consumption classes as target marketB and C consumption classes as target market
Innovative complementary servicesInnovative complementary services
Majority ownership: 82.8% average interestMajority ownership: 82.8% average interest
Differentials

11
Own GLA(1)
35.3%
24.1%9.3%
31.3%
Concluded Greenfields
AcquisitionsExpansions
Greenfieldsunder Development
Consolidation
Shopping center acquisitions
GreenfieldsConcept and development of new shopping centers
Expansions
Interest stake increase in assetsGLA expansion of the original portfolioImplementation of mixed-use projects− Synergies + Profitability
Turnaround
Remodeling and retrofit of tenant mixInnovation in complementary services
(1) Considering current shopping centers, expansions and announced greenfields.
Diversified Growth Strategy

12
General Shopping Brasil
(1) Considering a call option to acquire an additional 20.0% stake
Poli Shopping 50.0% 4,527 2,264 52 15,400Internacional Shopping 100.0% 75,958 75,958 292 -Auto Shopping 100.0% 11,477 11,477 80 -Shopping Light 50.1% 14,140 7,092 134 -Santana Parque Shopping 50.0% 26,538 13,269 176 -Suzano Shopping 100.0% 19,583 19,583 174 -Cascavel JL Shopping 85.5% 8,877 7,590 80 2,953Top Center Shopping 100.0% 6,369 6,369 67 -Prudente Parque Shopping 100.0% 10,276 10,276 56 -Poli Shopping Osasco 100.0% 3,218 3,218 19 -Shopping do Vale 84.4% 16,487 13,913 94 -Shopping Unimart 100.0% 10,233 10,233 91 -Outlet Premium São Paulo(1) 30.0% 17,716 5,315 90 -
82.8% 225,399 186,557 1,405 18,353
Convention Center 100.0% 25,730 25,730Sulacap Project 90.0% 32,000 28,800Barueri Project 96.0% 25,000 24,000
94.9% 82,730 78,530
Shopping Center Interest Total GLA (m²)
Own GLA(m²)
Nº Stores
Own GLA Expansion (m2)
Greenfield Interest Total GLA (m²)
Own GLA(m²)

13
77,485
Growth : 322%
13,120
26,5388,877
6,36910,2763,218
16,48710,233
6,463
14,14011,477
Poli and Internacional
Shopping
Auto Shopping
Shopping Light
SuzanoShopping
Santana Parque
Shopping
Cascavel JL Shopping
PrudenteParque
Shopping
Top Center Shopping São Paulo
PoliShopping Osasco
Shopping do Vale
UnimartShopping
SuzanoShopping Expansion
InternacionalShopping Expansion
Outlet Premium São Paulo
Retrofit Top Center São
Paulo
BarueriProject
SulacapProject
PoliShoppingExpansion
Cascavel JL Shopping Expansion
Convention Center
17,716 203
25,000
32,00015,400 3,454
25,730 326,983
Portfolio
Total GLA Evolution (m2)
Greenfields
Acquisitions
Expansions
Oct06
Jul07
TOTAL GLA
3,000
Jul09
14
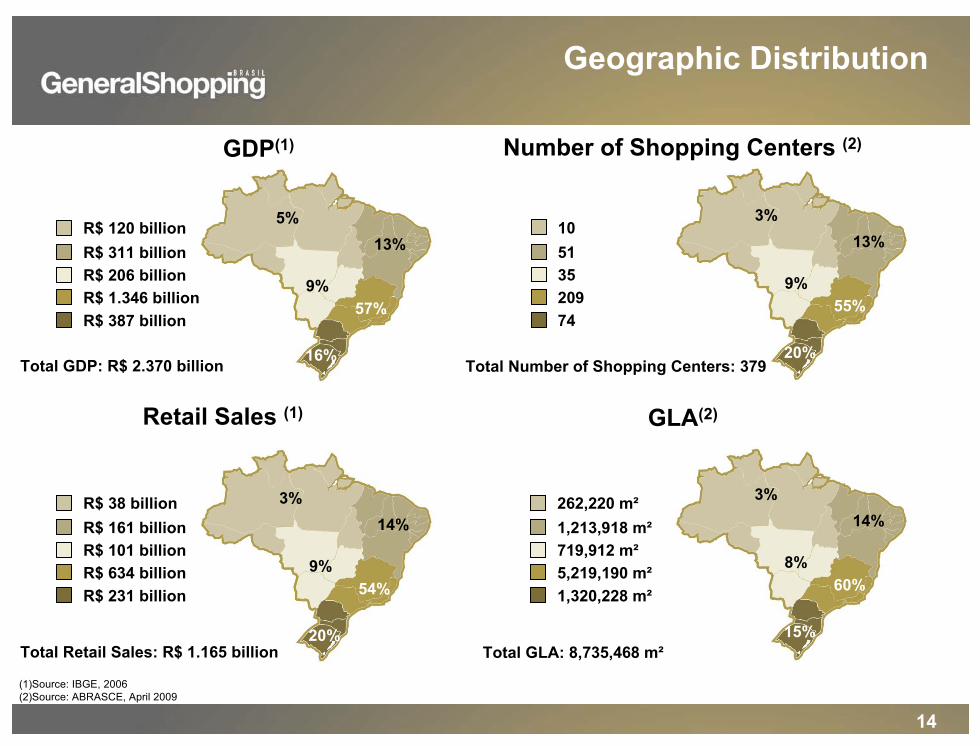
GDP(1) Number of Shopping Centers (2)
Retail Sales (1) GLA(2)
Geographic Distribution
(1)Source: IBGE, 2006(2)Source: ABRASCE, April 2009
R$ 38 billionR$ 161 billionR$ 101 billionR$ 634 billionR$ 231 billion
3%14%
9%54%
20%
3%14%
8%60%
15%
3%13%
9%55%
20%
5%13%
9%57%
16%
R$ 120 billionR$ 311 billionR$ 206 billionR$ 1.346 billionR$ 387 billion
Total GDP: R$ 2.370 billion
Total Retail Sales: R$ 1.165 billion
Total Number of Shopping Centers: 379
Total GLA: 8,735,468 m²
10513520974
262,220 m²1,213,918 m²719,912 m²5,219,190 m²1,320,228 m²

15
Dominant Player in São Paulo
Total GLA (m2)No. of storesVisitors/year (mm)
11,47780
NA
9
75,958292
23.5
1
Total GLA (m2)No. of storesVisitors/year (mm)
13
17,71690
NA
Total GLA (m2)No. of storesVisitors/year (mm)
14,140134
12.0
7
Total GLA (m2)No. of storesVisitors/year (mm)
19,5831749.0
6
Total GLA (m2)No. of storesVisitors/year (mm)
5
26,538176NA
Total GLA (m2)No. of storesVisitors/year (mm)
Total GLA (m2)No. of storesVisitors/year (mm)
15
25,000 NA NA
(1)
14
25,730NANA
Total GLA (m2)No. of storesVisitors/year (mm)
4
3,21819
1.5
Total GLA (m2)No. of storesVisitors/year (mm)
2
6,36967
4.0
Total GLA (m2)No. of storesVisitors/year (mm)
4,52752
6.0
3
Total GLA (m2)No. of storesVisitors/year (mm)
8
10,27656
4.0
Total GLA (m2)No. of storesVisitors/year (mm)
12
10,23391
6.48
Total GLA (m2)No. of storesVisitors/year (mm)
SP
São Paulo state30.9% of GDP32.6% of retail market
(1) Estimated
8
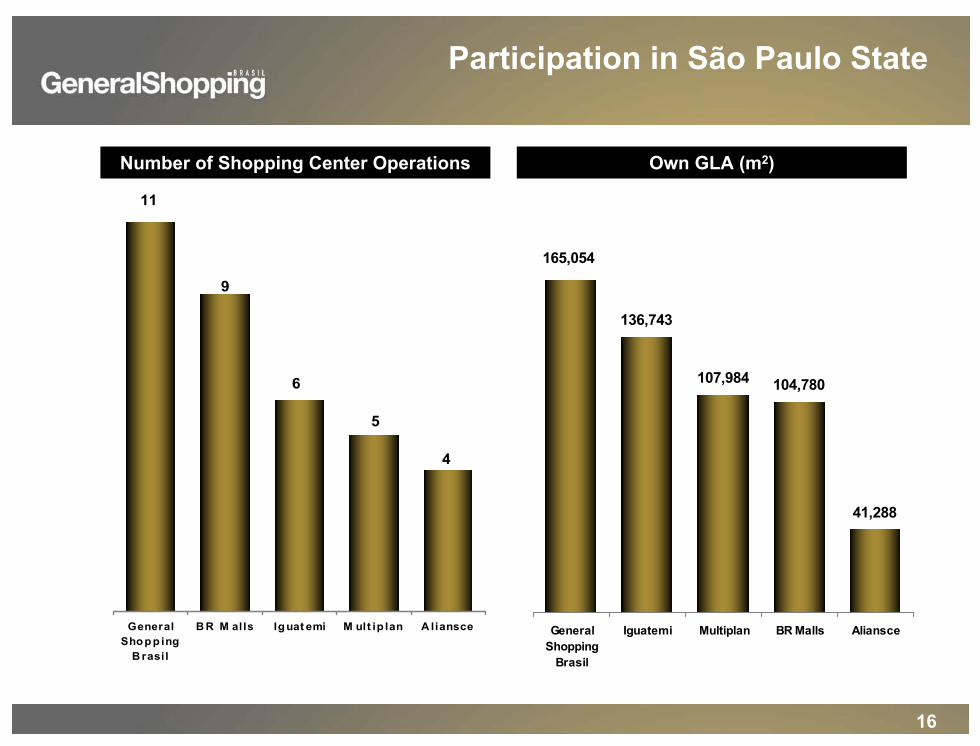
16
136,743
107,984 104,780
41,288
165,054
GeneralShopping
Brasil
Iguatemi Multiplan BR Malls Aliansce
9
11
6
5
4
GeneralShop p ing
B rasil
B R M alls Ig uat emi M ult ip lan A liansce
Number of Shopping Center Operations Own GLA (m2)
Participation in São Paulo State
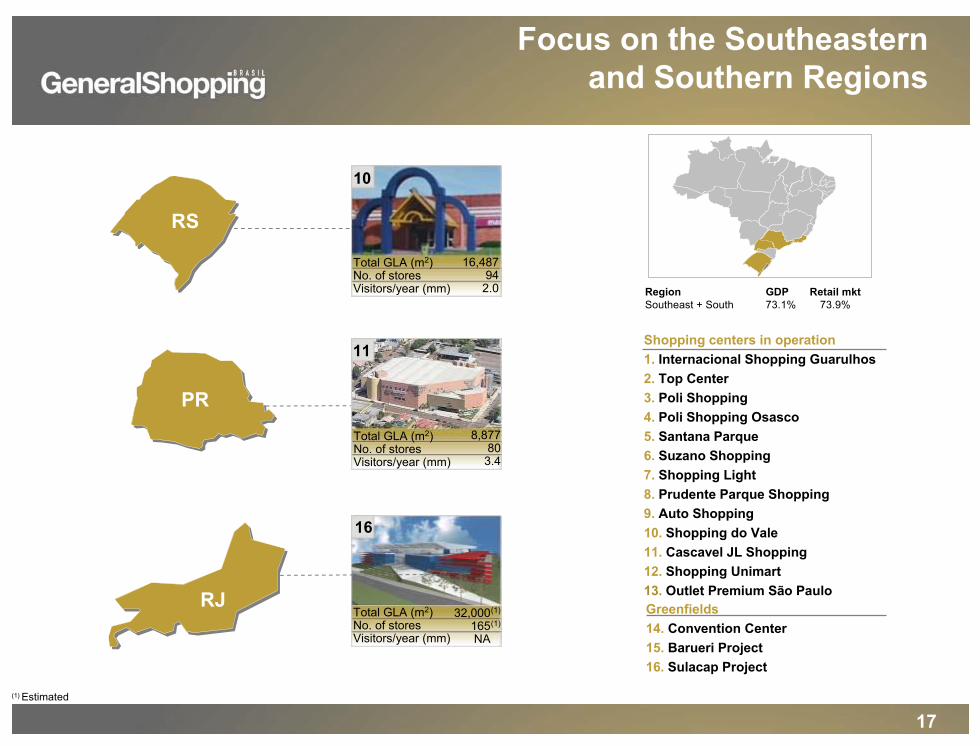
17
Focus on the Southeastern and Southern Regions
Shopping centers in operation1. Internacional Shopping Guarulhos2. Top Center3. Poli Shopping4. Poli Shopping Osasco5. Santana Parque6. Suzano Shopping7. Shopping Light8. Prudente Parque Shopping9. Auto Shopping10. Shopping do Vale11. Cascavel JL Shopping12. Shopping Unimart13. Outlet Premium São PauloGreenfields14. Convention Center15. Barueri Project16. Sulacap Project
16,48794
2.0
Total GLA (m2)No. of storesVisitors/year (mm)
10
11
8,87780
3.4
Total GLA (m2)No. of storesVisitors/year (mm)
32,000165NA
(1)
(1)
16
Total GLA (m2)No. of storesVisitors/year (mm)
RJ
RS
PR
RegionSoutheast + South
GDP Retail mkt73.1% 73.9%
(1) Estimated

18
Outlet Case
Outlet Project
Type: Greenfield
Stake: 30% (considering an additional call of 20% stake)
Influence area (inhabitants): super-regional
Occupancy Rate: 100.0%
Description: First outlet of the country. Entrance for main brands with outlet operations. Located on the
highway which connects São Paulo capital to the Campinas metropolitan region. Power center comprising
hotel and 2 theme parks.
Initiative: Sales channel for remainder merchandise with occupancy costs suitable to the off-price operation
Performance: Sales on average 150% above retailer’s basis scenario, in some cases up to 300%

19
Outlet - Greenfield
20
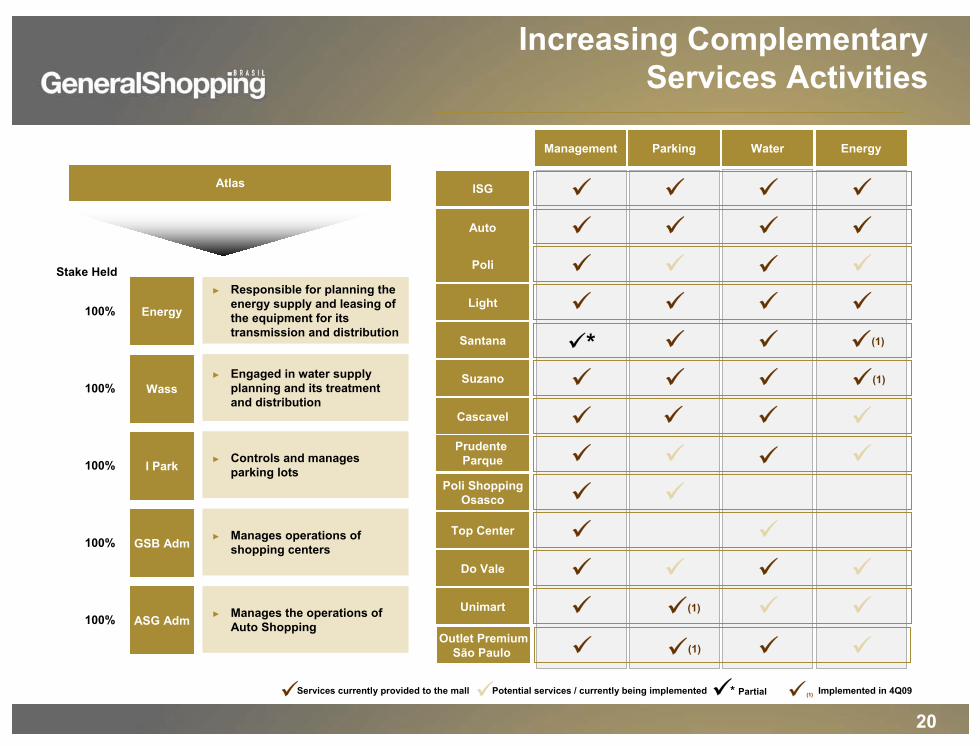
Services currently provided to the mall Potential services / currently being implemented
*
(1)
(1)
(1)
Atlas
Energy
Wass
I Park
GSB Adm
ASG Adm
Stake Held
100%
100%
100%
100%
100%
ISG
Auto
Poli
Light
Santana
Cascavel
PrudenteParque
Poli ShoppingOsasco
Top Center
Do Vale
Unimart
Suzano
Increasing Complementary Services Activities
Management Parking Water Energy
* Partial
► Responsible for planning the energy supply and leasing of the equipment for its transmission and distribution
► Engaged in water supply planning and its treatment and distribution
► Controls and manages parking lots
► Manages operations of shopping centers
► Manages the operations of Auto Shopping
Outlet Premium São Paulo (1)
(1) Implemented in 4Q09
21
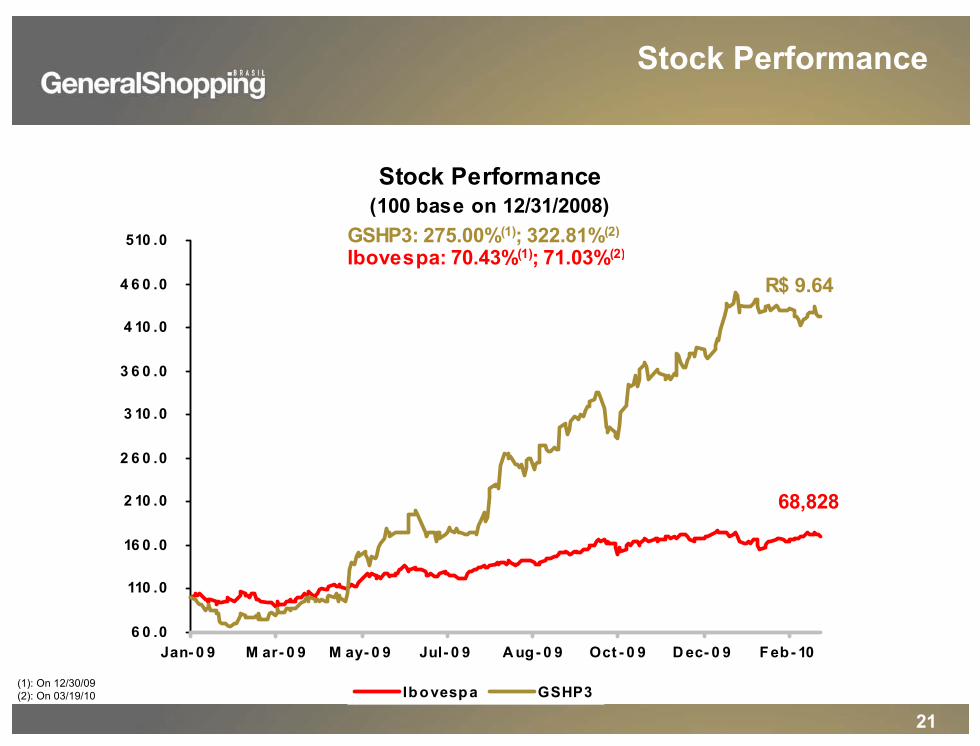
(1): On 12/30/09(2): On 03/19/10
Stock Performance(100 base on 12/31/2008)
6 0 .0
110 .0
16 0 .0
2 10 .0
2 6 0 .0
3 10 .0
3 6 0 .0
4 10 .0
4 6 0 .0
510 .0
Jan- 0 9 M ar- 0 9 M ay- 0 9 Jul- 0 9 A ug- 0 9 Oct - 0 9 D ec- 0 9 Feb- 10
Ibovespa GSHP3
R$ 9.64
68,828
GSHP3: 275.00%(1); 322.81%(2)
Ibovespa: 70.43%(1); 71.03%(2)
Stock Performance

22
40.59%
59.41%
Free float Controlling Stake
No. sharesControlling shareholder 29,990,000Free float 20,490,600Total 50,480,600
Market-making activities (through broker Ágora Senior) since October/07
Listed since July 2007
Shareholders

23Financial Performance

24
Total Gross Revenue (R$ million)
77.2 88.0
23.816.8
2008 2009Rent Services
+ 13.9%
+18.9%94.0
111.8
+ 42.0%
Gross Rent Revenue - 2009
8.5%
81.4%
4.5% 5.6%
Minimum Rent Percentage on SalesKey Money Advertising
Gross Services Revenue - 2009 5.9% 2.5%
17.5%
74.1%
Parking Energy Water Management
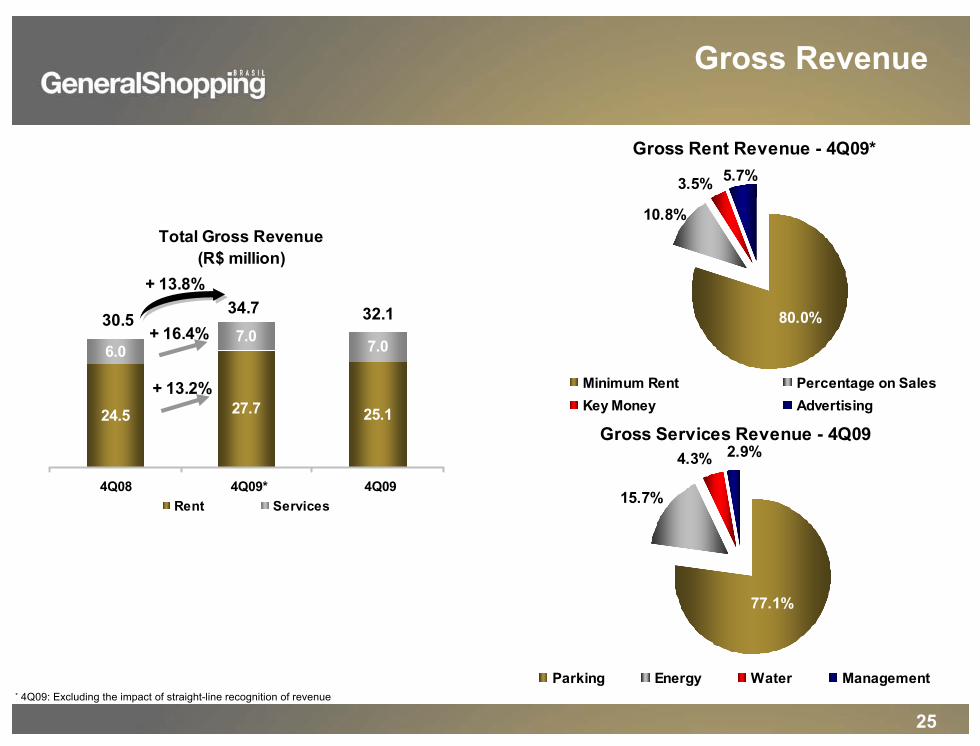
Gross Revenue
25
Gross Revenue
Gross Services Revenue - 4Q09
15.7%
4.3% 2.9%
77.1%
Parking Energy Water Management* 4Q09: Excluding the impact of straight-line recognition of revenue
Gross Rent Revenue - 4Q09*
10.8%
80.0%
3.5% 5.7%
Minimum Rent Percentage on SalesKey Money Advertising
Total Gross Revenue (R$ million)
24.5 27.7 25.1
7.0 7.06.0
4Q08 4Q09* 4Q09Rent Services
+ 13.2%
+ 13.8%
30.5 32.1+ 16.4%
34.7

26
Performance
Original Portfolio and Acquired Portfolio Evolution
(*) 4Q09: Excluding the impact of straight-line recognition of revenue; (**) Average in the period
4Q08 4Q09 4Q09 (*) 2008 2009 Chg.
GLA (m²)(**) 94,791 96,791 96,791 94,041 96,791 2.9%Rent (R$/m²) 153.47 142.86 159.98 499.68 539.13 7.9%Services (R$/m²) 45.39 44.25 44.25 137.56 159.06 15.6%Total (R$/m²) 198.85 187.11 204.23 637.25 698.18 9.6%
Acquired PorfolioGLA (m²)(**) 79,939 89,766 89,766 78,318 86,166 10.0%Rent (R$/m²) 124.00 125.13 135.86 385.83 415.27 7.6%Services (R$/m²) 21.95 30.81 30.81 49.35 98.18 98.9%Total (R$/m²) 145.95 155.94 166.67 435.18 513.45 18.0%
Total GSB GLA (m²)(**) 174,730 186,557 186,557 172,359 182,957 6.1%Rent (R$/m²) 139.99 134.33 148.37 447.95 480.79 7.3%Services (R$/m²) 34.66 37.78 37.78 97.48 130.39 33.8%Total (R$/m²) 174.65 172.11 186.16 545.43 611.18 12.1%
Original Portfolio
27
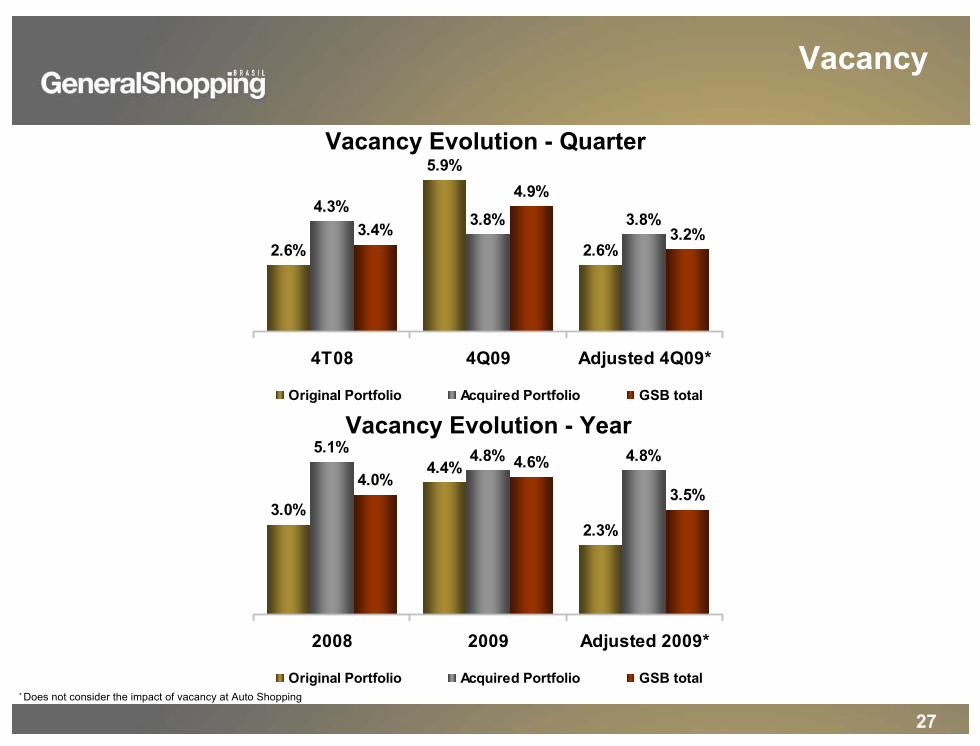
3.0%2.3%
5.1% 4.8% 4.8%4.0%
4.6%
3.5%4.4%
2008 2009 Adjusted 2009*
Original Portfolio Acquired Portfolio GSB total
2.6% 2.6%
4.3%3.8% 3.8%3.4%
4.9%
3.2%
5.9%
4T08 4Q09 Adjusted 4Q09*
Original Portfolio Acquired Portfolio GSB total
* Does not consider the impact of vacancy at Auto Shopping
Vacancy
Vacancy Evolution - Quarter
Vacancy Evolution - Year

28
Services Revenue
Services Revenues - 4Q09(R$ million)
4Q08 4.3 1.1 0.5 0.2
4Q09 5.4 1.1 0.3 0.2
Parking Energy Water Management
Services Revenues - 2009(R$ million)
2008 11.8 3.3 1.1 0.6
2009 17.7 4.1 1.4 0.6
Parking Energy Water Management

29
Consolidated NOI (R$ MM) and Margin Adjusted EBITDA (R$ MM) and Margin
Adjusted Net Income (R$ MM) Adjusted FFO (R$ MM)
Performance Indicators
73.3 82.9
82.4%84.3%
2008 2009
64.0
73.8
73.4%73.6%
2008 2009
25.8
-4.7
2008 2009
36.0
7.5
2008 2009
+ 13.1% + 15.5%

30
Performance Indicators
Consolidated NOI (R$ MM) and Margin Adjusted EBITDA (R$ MM) and Margin
Adjusted Net Income (R$ MM) Adjusted FFO (R$ MM)
24.6 27.825.2
87.7%86.2% 86.6%
4Q08 4Q09 4Q09*
21.4
25.4
22.8
74.9%78.2% 80.0%
4Q08 4Q09 4Q09*
10.2
3.5
7.6
4Q08 4Q09 4Q09*
6.3
13.410.8
4Q08 4Q09 4Q09** 4Q09: Excluding the impact of straight-line recognition of revenue
31
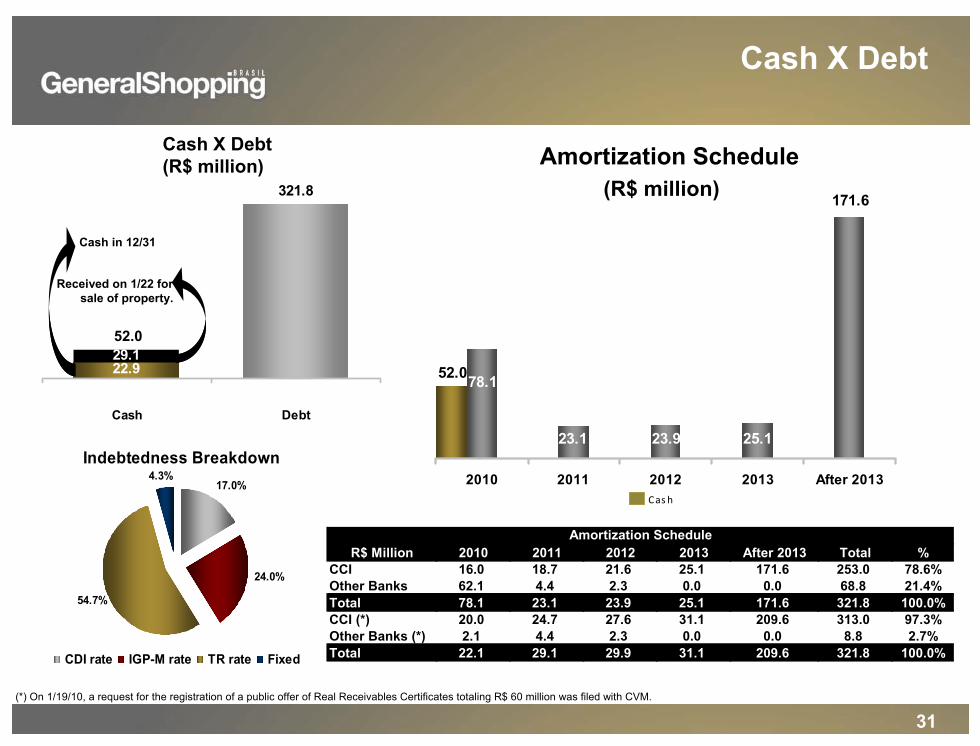
Indebtedness Breakdown17.0%
4.3%
54.7%
24.0%
CDI rate IGP-M rate TR rate Fixed
(*) On 1/19/10, a request for the registration of a public offer of Real Receivables Certificates totaling R$ 60 million was filed with CVM.
Amortization Schedule
Cash X Debt
321.8
29.122.9
Cash Debt
Cash X Debt(R$ million)
Cash in 12/31
Received on 1/22 for sale of property.
52.0
52.0
171.6
25.123.923.1
78.1
2010 2011 2012 2013 After 2013
(R$ million)
R$ Million 2010 2011 2012 2013 After 2013 Total %CCI 16.0 18.7 21.6 25.1 171.6 253.0 78.6%Other Banks 62.1 4.4 2.3 0.0 0.0 68.8 21.4%Total 78.1 23.1 23.9 25.1 171.6 321.8 100.0%CCI (*) 20.0 24.7 27.6 31.1 209.6 313.0 97.3%Other Banks (*) 2.1 4.4 2.3 0.0 0.0 8.8 2.7%Total 22.1 29.1 29.9 31.1 209.6 321.8 100.0%
Amortization Schedule
Cas h
32
GSB INVESTOR RELATIONS
Alessandro Poli VeroneziInvestor Relations Officer
Marcio SniokaInvestor Relations Manager
55 11 3159-5100
www.generalshopping.com.br
Contacts