ARLETE RITA PENITENTEalexandria.cpd.ufv.br:8000/teses/biologia celular e estrutural/2012... ·...
112
ARLETE RITA PENITENTE EFEITOS DA RESTRIÇÃO PROTÉICA EXPERIMENTAL SOBRE A MORFOLOGIA DO MIOCÁRDIO E AS PROPRIEDADES MECÂNICAS DOS MIÓCITOS CARDÍACOS ISOLADOS EM RATOS FISHER APÓS O DESMAME Tese apresentada à Universidade Federal de Viçosa, como parte das exigências do Programa de Pós-Graduação em Biologia Celular e Estrutural, para obtenção do título de Doctor Scientiae. VIÇOSA MINAS GERAIS – BRASIL 2012
Transcript of ARLETE RITA PENITENTEalexandria.cpd.ufv.br:8000/teses/biologia celular e estrutural/2012... ·...
ARLETE RITA PENITENTE
EFEITOS DA RESTRIÇÃO PROTÉICA EXPERIMENTAL SOBRE A
MORFOLOGIA DO MIOCÁRDIO E AS PROPRIEDADES MECÂNICAS DOS MIÓCITOS CARDÍACOS ISOLADOS EM RATOS FISHER APÓS O
DESMAME
Tese apresentada à Universidade Federal de Viçosa, como parte das exigências do Programa de Pós-Graduação em Biologia Celular e Estrutural, para obtenção do título de Doctor Scientiae.
VIÇOSA MINAS GERAIS – BRASIL
2012
Ficha catalográfica preparada pela Seção de Catalogação e Classificação da Biblioteca Central da UFV
T Penitente, Arlete Rita, 1973- P411e Efeitos da restrição protéica experimental sobre a 2012 morfologia do miocárdio e as propriedades mecânicas dos miócitos cardíacos isolados em ratos Fisher após o desmame / Arlete Rita Penitente. – Viçosa, MG, 2012. xiii, 78f. : il. (algumas col.) ; 29cm. Inclui anexos. Texto em português e inglês. Orientador: Clóvis Andrade Neves. Tese (doutorado) - Universidade Federal de Viçosa. Inclui bibliografia. 1. Coração. 2. Coração - Anatomia. 3. Morfologia. 4. Rato. 5. Miocárdio. 6. Fischer. I. Universidade Federal de Viçosa. II. Título. CDD 22. ed. 571.31
ii
“Só por fraqueza nos contentamos com o que os outros e nós mesmos deparamos nessa caça
ao saber; os mais aptos não se satisfazem e haverá sempre caminho a percorrer para quem
vier depois, e até para nós se agirmos de outro modo.”
(Montaigne, Ensaios III, XII)
iii
DEDICATÓRIADEDICATÓRIADEDICATÓRIADEDICATÓRIA
Ao meu Esposo Josias, Esposo Josias, Esposo Josias, Esposo Josias, pelo amor, dedicação, carinho e
apoio ao longo destes anos. Ao meu Pai DurvalPai DurvalPai DurvalPai Durval
(sempre presente), mesmo ausente. A minha Mãe MariaMãe MariaMãe MariaMãe Maria pelas orações.
Às Minhas Irmãs Minhas Irmãs Minhas Irmãs Minhas Irmãs pela amizade e apoio. Aos Meus SobrinhosMeus SobrinhosMeus SobrinhosMeus Sobrinhos, alegria da minha vida.
iv
AGRADECIMENTOSAGRADECIMENTOSAGRADECIMENTOSAGRADECIMENTOS A Deus pelo dom da vida e da saúde. Por me conduzir nos caminhos a seguir, sentindo sempre sua presença ao meu lado. Ao Meu Esposo Josias Barcelos Jr pelo amor, carinho e cumplicidade. Por estar ao meu lado e me fazer muito feliz! Meu refúgio mais seguro. Amo você! Ao meu falecido Pai Durval Penitente, pelo orgulho e brilho nos olhos a cada conquista. Exemplo de honestidade, dignidade e respeito que sempre tentei seguir. Obrigada por todas as palavras de incentivo das quais nunca esquecerei.
A minha Mãe Maria Cardoso Penitente, obrigada pelo amor, pela boa educação que me proporcionou e pelas orações que sempre me deram força para ir cada vez mais longe. As minhas Irmãs Arleide e Rogéria, pelo apoio familiar, incentivo e orações. Obrigada por cuidarem da nossa Mãe enquanto estou ausente! Aos meus cunhados Wilson e Zezinho pela torcida! Aos meus Sobrinhos Jéssica, Jeisy, Beatriz, Bárbara e Noberto por ser presença constante em todos os momentos da minha vida. A minha afilhada Jéssica Penitente Passamani, uma das alegrias da minha vida! Obrigada Arleide por me proporcionar este presente de Deus! A minha prima Ana Cristina pela confiança e amizade em todos os momentos! Ao meu primo Anderson, Tia Adélia e Tio Eliel pela força, apoio e orações! Ao meu Orientador Prof. Clóvis Andrade Neves, meus sinceros agradecimentos pelos valiosos ensinamentos, amizade sincera e incentivo. Obrigada por abrir as portas do Laboratório de Biologia Celular e Estrutural e me proporcionar à oportunidade de trilhar novos caminhos. Serei eternamente grata por tudo! Aos meus Co-Orientadores Prof. Antônio José Natali pelos ensinamentos, pela ótima estrutura do Laboratório de Educação Física que foram fundamentais para a realização deste e de outros trabalhos e Prof. Deoclécio Alves Chianca Jr., pelos ensinamentos, confiança e disposição em ajudar sempre. Á Amiga de toda vida: Amandinha por estar sempre presente!
v
As Amigas verdadeiras Fabiana e Lilian, por não medirem forças para me ajudar! Sou grata a Deus pela amizade! Ao Rômulo, obrigada pela companhia nessa caminhada. Obrigado pela amizade, convivência e ajuda valiosa nos experimentos. A Marcinha, Amiga e companheira de caminhada! Não tenho dúvida: Deus é mais!!! A Amiga Ângela pelo apoio e amizade. A Claudinha pela amizade sincera! Sentirei saudades! Ao Amigo Kenner pela amizade e importante apoio na realização desse trabalho! Ao Amigo Alex Bhering por muito nos auxiliar nos procedimentos e técnicas em histologia, pela paciência e disponibilidade em ajudar sem medir esforços. A Profa. Izabel R. S. C. Maldonado pela sabedoria, simplicidade e grandes ensinamentos! Aos professores do Programa de Pós-Graduação em Biologia Celular e Estrutural, em especial aos Profs Sérgio, Izabel, Mariana, Juliana e Adilson por todos os ensinamentos e incentivo. Ao Prof. André Talvani Pedrosa, pelo apoio, disposição sempre em ajudar e incentivo para continuar a caminhada. Aos Profs. Marcelo Eustáquio da Silva, Maria Lúcia Pedrosa (UFOP), Ita de Oliveira Silva e Izabel Regina S. C. Maldonado pela disposição em participar da Banca Examinadora e aos suplentes Sérgio da Matta, Maria C. G. Pelúzio e Mariana M. Neves pela disponibilidade. As Professoras Ita e Maria Tereza por todos os valiosos ensinamentos, incentivos e oportunidades! Ao Professor Vanderson Esperidião Antônio pelo exemplo de profissionalismo e competência! Aos Colegas do Laboratório de Biologia Celular e Estrutural (UFV), em especial Rômulo, Marli, Daiane, Lilian, Kenner, Alex, Claudinha com as quais sempre
vi
pude contar. Obrigada pela amizade. Daniel, Fernandinho, Jane, Vinícius, Sirlene, Madu, Rafael, Grazi, Tati, Silvinha, Edson, Dani, Maytê, Ana Paula, Michele, Kyvia pelos momentos de descontração e companheirismo. Ao Pessoal do Biotério de Experimentação Animal: Marcinha, Ângela, Prof. Guto, Judson, Bozzi, Fellipe, Bárbara, Juliana, Nathalia, Lucas, Miguel, Vitor, pelo apoio e pela disponibilidade em ajudar. Aos Amigos do Laboratório de Fisiologia Cardiovascular UFOP, do presente: Fernanda, Aline Arlindo, Luiz, Nathália, Aline Resende e Alessandra e de outras épocas: Fabiana, Vanessa, Joelma, Leonardo, Graça, Daniela, Eduardo, Antônio pela amizade, incentivo, apoio e companheirismo. A todos os professores do Programa de Pós-Graduação em Biologia Celular e estrutural, pela disposição em ajudar e por proporcionar um intercâmbio sadio entre os laboratórios da pós-graduação. À Profª. Sílvia Pompolo, por permitir a utilização de seu laboratório para aquisição das imagens utilizadas. Ao coordenador do Programa de Pós-graduação em Biologia Celular e Estrutural, professor José Eduardo Serrão pelo empenho em melhorar a qualidade do programa e também por sua infinita prestatividade. Ao Departamento de Biologia Geral, em especial a Beth, Diana e João Bosco por estarem sempre dispostas a ajudar em todos os momentos. Ao núcleo de Microscopia e Microanálise, em especial Carla, Patrícia e Gilmar e ao Laboratório de Anatomia Vegetal, pelo suporte. Aos técnicos: Maria Chaves dos Santos (Laboratório de Imunopatologia – UFOP) pelo auxílio na realização desse trabalho, Sr. Miltinho (Laboratório de Fisiologia Cardiovascular - UFOP) e Jair Pastor Mota (Laboratòrio de Nutrição Experimental da Escola de Nutrição), (UFOP) pelo cuidado com os animais, boa vontade e presteza. À Universidade Federal de Viçosa e ao Programa de Pós-Graduação em Biologia Celular e Estrutural pela valiosa oportunidade na realização do Doutorado e por todo aprendizado. À FAPEMIG com a concessão da bolsa de estudos, fundamental para a realização desse trabalho.
vii
ÍNDICE RESUMO.............................................................................................................ix
ABSTRACT........................................................................................................xi
1. INTRODUÇÃO GERAL............................................................................1
1.1. Desnutrição........................................................................................1
1.2. Alterações morfológicas do coração associadas à desnutrição-
protéica.....................................................................................................4
1.3. Alterações da homeostasia do Ca2+ no coração associadas à
desnutrição...............................................................................................6
2. OBJETIVOS............................................................................................11
3. REFERÊNCIAS BIBLIOGRÁFICAS.......................................................12
4. ARTIGOS................................................................................................16
4.1. Artigo 1: Protein restriction after weaning modifies the calcium
transient and induces single left ventricular cardiomyocytes contrac-
tile dysfunction in rats.............................................................................16
4.2. Artigo 2: Restrição protéica após desmame reduz a expressão
da SERCA2a e modifica a resposta contrátil de cardiomiócitos à
estimulação β-adrenérgica em ratos......................................................31
4.3. Artigo 3: Restrição proteica severa após o desmame induz o
remodelamento morfofuncional do ventrículo esquerdo em ratos
Fischer.....................................................................................................49
5. CONCLUSÕES........................................................................................74
6. ANEXO 1 – Artigos publicados com a participação da Autora No período do Doutorado ....................................................................75
6.1. Artigo 1: Novaes, Rd; PENITENTE, AR; Talvani, A; Natali, AJ;
Neves, CA; Maldonado, IRSC. (2012) Use of fluorescence in a modi-
fied dissector method to estimate the myocytes number in cardiac
tissue. Arquivos Brasileiros de Cardiologia. 62: 199-206........................75
viii
6.2. Artigo 2: Novaes, RD; PENITENTE, AR, Gonçalves, RV;
Talvani, A; Neves, CA; Maldonado, IRSC ; Natali, AJ. (2011) Effects of
Trypanosoma cruzi infection on myocardium morphology, single
cardiomyocyte contractile function and exercise tolerance in rats.
International Journal of Experimental Pathology. 92: 299-307................75
6.3. Artigo 3: Silva MF, Pelúzio MCG, Amorim PRS, Lavorato VN,
Santos NP, Bozi LMM, PENITENTE AR, Falkoski DL, Berfort FG,
Antônio José Natali. Treinamento em Natação Atenua a Disfunção
Contrátil de Cardiomiócitos de Ratos Diabéticos. Arquivos Brasileiros
de Cardiologia. 2011; 01: 2011-2016.....................................................75
ix
RESUMO PENITENTE, Arlete Rita, D.Sc., Universidade Federal de Viçosa, março de 2012. Efeitos da restrição protéica experimental sobre a morfologia do miocárdio e as propriedades mecânicas dos miócitos cardíacos isolados em ratos Fisher após o desmame. Orientador: Clóvis Andrade Neves. Coorientadores: Antônio José Natali e Deoclécio Alves Chianca Jr.
Alterações na nutrição em fases precoces da vida resultam no desenvolvimento
de adaptações que podem modificar permanentemente a estrutura de um
órgão ou tecido. Embora a função cardíaca esteja alterada em animais com
restrição protéica, ainda há informações limitadas sobre a mecânica, morfologia
e ultraestrutura dos cardiomiócitos, que levam à alteração da função cardíaca.
O presente estudo investigou a relação entre a restrição protéica severa pós-
desmame e as alterações morfológicas, moleculares e ultra-estruturais dos
cardiomiócitos ventriculares, além de suas propriedades mecânicas, dos sparks
de cálcio e da atuação do sistema β-adrenérgico, em ratos machos Fischer, a
partir do desmame. Os animais foram divididos aleatoriamente em grupo
controle (GC, n= 36) e grupo com restrição de proteínas (GRP, n= 36). Após o
desmame (28 dias após o nascimento), animais do GC e GRP receberam
dietas isocalóricas contendo 15% e 6% de proteína, respectivamente, por 35
dias. Em seguida, os animais foram pesados, sacrificados e tiveram os
corações removidos para a análise histológica, morfométrica, estereológica e
ultraestrutural; ou isolados por dispersão enzimática para análise das
propriedades mecânicas. Os resultados encontrados demonstraram que a
restrição protéica causou uma drástica redução no peso corporal, do coração e
do ventrículo esquerdo dos animais do GRP. Essas alterações foram
acompanhadas com uma diminuição no comprimento, largura e área dos
cardiomiócitos, além de um aumento da quantidade de colágeno no GRP em
relação ao GC de 38%. Porém em relação ao número de células o GRP
apresentou o mesmo número de células do GC. As análises ultra-estruturais
permitiram a observação de miofibrilas menos desenvolvidas, maior proporção
de mitocôndrias e retículo sarcoplasmático menos organizado no GRP.
Miócitos ventriculares do GRP também apresentaram alterações nas
x
propriedades contráteis, tanto em condições basais quanto após estimulação β-
adrenérgica. Além disso, o GRP apresentou menor expressão protéica de
SERCA2a e menor transiente de cálcio em relação ao GC, provocando
prejuízos na mecânica celular. De acordo com esses resultados, foi possível
concluir que a restrição protéica severa altera não apenas a morfologia do
coração, mas também aspectos bioquímicos e funcionais.
xi
ABSTRACT
PENITENTE, Arlete Rita, D.Sc., Federal Univesity of Viçosa, March, 2012. Effect of experimental protein restriction on the morphology of myocardial and the mechanical properties of cardiac myocytes isolated from Fisher rats after weaning. Adviser: Clóvis Andrade Neves. Co-advisers: Antônio José Natali and Deoclécio Alves Chianca Jr.
Nutrition deficits early in life result in adaptive changes which can permanently
modify the structure of an organ or tissue. Despite the fact that cardiac function
seem to be altered in rats fed low protein diet, available information about
mechanics, morphology and ultrastructure of cardiomyocytes in this model is
still limited. The present study investigated the relation between severe protein
restriction post weaning and morphological, molecular and ultrastructural
changes in ventricular cardiomyocytes in addition to the mechanics, intracellular
calcium sparks and β-adrenergic system action on these cells. Animals were
randomly divided in control (CG, n=36) and protein restriction (PRG, n=36)
groups. After weaning (28 days), the rats were fed either control (15% casein)
or low protein (6% casein) isocaloric diets for 35 days. Following this period,
rats were euthanized and hearts were removed for histological, morphometric,
estereological and ultrastructural analysis or processed in order to isolated
cardiomyocytes by enzymatic dispersion to perform mechanic test. Results
showed that protein restriction ended up in body weight, heart weight and left
ventricular reduction compared to same aged control rats. These changes were
accompanied by individual cardiomyocytes length, diameter and area reduction.
It was also noticed 38% increase in collagen deposition in the matrix of PRG
compared to CG rats. The number of cardiomyocytes was similar in both
groups. Ultrastructural analyses revealed less developed myofibrils and higher
proportion of less organized mitochondria and sarcoplasmic reticulum in the
cells of PRG. Myocytes of PRG also showed changes in the contractile
properties both in baseline and after β-adrenergic stimulation conditions. In
addition, cells from PRG exhibited lower expression of SERCA2a protein and
smaller calcium transient compared to CG which seems to impair the cell
mechanics. Based on these findings, we conclude that severe protein

xii
restriction after weaning may modify not only morphological but also
biochemical and functional aspects of the heart.
1
1. Introdução Geral
1.1. Desnutrição
A desnutrição, definida na literatura como uma deficiência de nutrientes
essenciais à sobrevivência e manutenção das funções vitais, pode estar
relacionada à ingestão inadequada de nutrientes (proteínas, carboidratos,
gorduras, sais minerais e vitaminas); conseqüência, geralmente, de uma dieta
restrita, determinando desequilíbrio entre a necessidade corpórea e a ingestão
de nutrientes (Sawaya et al, 2003). A desnutrição é considerada uma condição
patológica e ainda um sério problema de saúde pública, afetando um número
substancial de crianças, em diferentes partes do mundo, o que tem originado
expressivo número de estudos na tentativa de elucidar suas consequências no
adulto (WHO, 2010).
Dependendo do período de exposição e do grau de desnutrição, severas
conseqüências podem ocorrer durante o desenvolvimento do organismo e
também na vida adulta, predispondo ao desenvolvimento de doenças crônico-
degenerativas como hipertensão, diabetes e doenças cardíacas (Barker et al,
1993; Okoromah et al, 2011). Entretanto, a inter-relação entre os efeitos da
desnutrição sobre os diversos órgãos e sistemas, com destaque para o
coração, ainda não é totalmente esclarecida.
Todas as células do organismo, em maior ou menor intensidade, sofrem
alterações provocadas pela deficiência de qualquer um dos nutrientes
indispensáveis à sobrevivência. Assim, esta carência nutricional influencia no
grau de comprometimento e no funcionamento dos órgãos, decorrentes do
2
período de exposição do indivíduo, bem como a severidade desta restrição.
Com efeito, na vida fetal os órgãos passam por períodos críticos de
desenvolvimento que coincidem com períodos de rápida divisão celular. A
carência de nutrientes em períodos críticos de desenvolvimento, mesmo que
por pouco tempo, pode reduzir o número de células em alguns órgãos,
modificando seu metabolismo e / ou estrutura, afetando seu desenvolvimento e
função (Gluckman & Hanson, 2004; Lim et al, 2010). Portanto, devido à suas
diversas repercussões ao organismo e alta prevalência, a desnutrição é muito
estudada. Em humanos as avaliações epidemiológicas se sobrepõem e o uso
de modelos animais tem permitido cada vez mais esclarecimentos para que
este problema possa ser desvendado.
A desnutrição experimental pode ser induzida por alteração dos
componentes da dieta ou por redução da quantidade da mesma. Ela pode
ocorrer em várias fases do desenvolvimento e causar danos variáveis
dependendo da fase de desenvolvimento envolvida. A desnutrição intra-uterina,
por exemplo, induzida por alteração na dieta das fêmeas grávidas, envolve
fases de crescimento rápido e pode causar danos irreversíveis em vários
sistemas fetais, incluindo o cardiovascular (Barker et al.; 1993). Várias linhas
de pesquisa adotam a hipótese de que a desnutrição intra-uterina leva a uma
programação fetal, o que predispõe ao desenvolvimento de doenças crônico-
degenerativas. Hipertensão, doenças coronarianas, diabetes tipo II e doenças
renais são algumas das desordens relacionadas ao baixo peso ao nascer
(Barker e cols., 1993; Phillips e cols., 1994; Hoppe et al., 2007). Durante a
amamentação a desnutrição pode ser induzida restringindo a quantidade de
proteína dietética das fêmeas (Pedrosa & Moraes-Santos, 1987) ou
3
aumentando o tamanho da ninhada, provocando competição pelo leite materno
(Belmar, 1996). Outros protocolos induzem a desnutrição em animais
reduzindo em 50 % todos os componentes da dieta, ou seja, proteínas e
calorias (restrição alimentar de 50%) (Cicogna et al., 1999). O modelo de
desnutrição proposto neste trabalho foi baseado na redução do conteúdo
proteico da dieta oferecida ao grupo desnutrido de 15% para 6%, o que
representa uma redução de 68% da proteína dietética (caseína). Esta
metodologia assemelha-se aos métodos utilizados em outros trabalhos da
literatura (Agarwal e cols., 1981; Benabe e cols., 1998). O rato é o animal mais
utilizado nestes estudos por apresentar características como: fácil manuseio,
metabolismo acelerado e se adequar às diferentes metodologias de
desnutrição. Esta última característica possui relevância especial porque permite
investigações experimentais rápidas, principalmente de distúrbios promovidos
apenas tardiamente pela desnutrição no indivíduo adulto.
Ratos submetidos a diferentes níveis de desnutrição, inclusive proteica,
evidenciaram em seus órgãos, alterações anatômicas e histológicas,
compatíveis com a adaptação que o organismo promove para se ajustar às
condições nutricionais adversas (Benabe & Martinez-Maldonado, 1998;
Christian & Stewart, 2010). Nesse contexto, várias pesquisas apontam que a
desnutrição promove alterações de âmbito corpóreo geral, porém, o impacto da
mesma não se processa de igual maneira nos vários órgãos e tecidos do
organismo. Tal fato acontece devido a uma condição especial que assinala
certa seletividade (Freitas et al, 1994), privilegiando órgãos indispensáveis à
sobrevivência em relação a outros (Hanson et al., 2002; Gluckman & Hanson,
2004).
4
Outro fator a ser considerado são as grandes implicações econômicas e
sociais que advêm dos efeitos da desnutrição a médio e longo prazo,
principalmente porque as maiores taxas de desnutrição ocorrem em países em
desenvolvimento, que não podem financiar o tratamento de doenças crônico-
degenerativas. Nesse contexto, não há dúvidas da necessidade de estudos
relacionados às alterações fisiológicas que a desnutrição pode causar ao
organismo.
1.2. Alterações morfológicas do coração associadas à desnutrição
proteica
O adequado funcionamento do coração e, portanto, do sistema
cardiovascular depende diretamente da forma, da função do músculo e da
célula cardíaca. Assim, modificações na estrutura desse órgão podem acarretar
falhas, comprometendo outros sistemas e, dessa forma, o organismo
(Christian, 2010). O comprometimento muscular afetado pela desnutrição é
uma forma de adaptação à redução de nutrientes para suprir a célula, uma vez
que os tecidos musculares são fontes imediatas de aminoácidos. Ocorre
também enfraquecimento progressivo do miocárdio, diminuição da demanda
circulatória, conduzindo a uma situação de risco e sobrevida (Drott &
Lundholm, 1992; Gruber, 2012).
Evidências comprovam que restrição proteica materna pode levar à
redução no número de cardiomiócitos na prole, um importante fator de risco
para desordens cardiovasculares na vida adulta (Lim et al, 2010). Ratos cujas
mães foram submetidas à restrição proteica moderada (9% de caseína)
apresentaram diminuição no tamanho do coração, devido à redução do número
5
de cardiomiócitos (Corstius et al., 2005). Esses autores sugerem que tais
variações ocasionadas pela desnutrição, podem comprometer a função
cardíaca, levando a patologias cardiovasculares como hipertensão e
insuficiência cardíaca.
Alterações morfológicas e disfunção sistólica miocárdica foram
observadas em animais submetidos à restrição alimentar. Cicogna et al. (1999),
utilizando um modelo diferente de desnutrição, reduzindo todos os
componentes da dieta (restrição alimentar de 50%), e trabalhando com
preparações de músculo papilar isolado, observaram aumento de colágeno
intersticial no miocárdio cardíaco, acarretando danos ao sistema circulatório.
Cicogna (2000), trabalhando com este mesmo modelo experimental (restrição
alimentar de 50%), observou perda de peso corporal desproporcional, com
perda de peso maior no grupo experimental. Porém esse autor também
observou um aumento do peso relativo (relação peso ventrículo/peso corpo) do
ventrículo esquerdo nos animais do grupo experimental. Em outro estudo
realizado em ratos jovens desnutridos desde o nascimento (Fioretto et al,
2001), os autores perceberam perda de peso cardíaco, corpóreo e da massa
ventricular, indicando que o coração foi afetado pelos efeitos adversos da
desnutrição em relação ao peso e massa, verificando também que o ventrículo
esquerdo apresentou uma remodelação excêntrica, determinada pela
desproporcional redução da massa em relação ao volume. Outro autor
(Vandewoude, 2008), verificaram modificações no miocárdio em relação à
microvascularização e mecanismo de adaptação dos miócitos desnutridos.
Kothari (1992), estudando a massa e função ventricular esquerda de crianças
entre 1 e 5 anos de idade, saudáveis e desnutridas, verificou que a massa
6
ventricular esquerda foi menor nas crianças desnutridas do que nos controles,
porém, a relação massa ventricular esquerda / peso corpóreo mostrou-se
significativamente aumentada nas crianças desnutridas, sugerindo uma
relativa preservação cardíaca nesse grupo, em relação a diminuição do peso
corporal.
Em 2002, Cunha, analisando fragmentos do ventrículo esquerdo em
humanos adultos desnutridos e nutridos, verificou uma menor espessura dos
cardiomiócitos nos desnutridos, com hipotrofia miofibrilar, decorrente da
redução da síntese dos componentes das miofibrilas. Outros autores
observaram alterações focais em muitas fibras musculares, tais como a
desorganização e a perda das miofibrilas causando disfunção miocárdica
(Pinotti et al., 2010).
Dessa maneira, existe uma dependência direta entre as condições
morfofuncionais das células constituintes dos tecidos cardíacos, seu
desempenho e funcionamento normal. Nesse contexto, é de extrema
importância, a realização de pesquisa sobre parâmetros morfológicos e
funcionais do tecido e da célula cardíaca, podendo contribuir para a elucidação
do comportamento morfofuncional desse órgão, fundamental nas funções
vitais. Esses estudos seriam uma importante contribuição para a compreensão
dos efeitos deletérios causados pela restrição proteica no coração e seu
impacto sobre as doenças cardiovasculares.
1.3. Alterações da homeostasia do Ca2+ no coração associadas à
desnutrição
7
O íon cálcio (Ca2+) desempenha papel fundamental na regulação e
sinalização da função celular para a manutenção da homeostase. É
fundamental nos processos de secreção e liberação de neurotransmissores,
divisão celular, regulação dos processos de transcrição genética, proliferação
celular e apoptose (morte celular programada) (Berridge et al., 2000). No
miócito cardíaco, especialmente, o íon Ca2+ é fundamental desde a geração e
modulação da atividade elétrica do potencial de ação (PA), até a regulação e
controle do processo de contração (Bers, 2001; Bers, 2002). É evidente que um
dos principais mecanismos reguladores da contratilidade e relaxamento
cardíaco é o trânsito de cálcio (Ca2+) intracelular (Opie, 1998; Bers, 2001).
O processo de contração cardíaca inicia-se com a abertura dos canais
lentos de Ca2+ do sarcolema (canais do tipo L), com conseqüente entrada de
Ca2+ extracelular. Fabiato (1983) descreveu que a liberação de Ca2+ de retículo
sarcoplasmático (RS) é induzida pela ligação de Ca2+ aos canais de liberação
denominados receptores de rianodina (RyRs). É o aumento da concentração
de cálcio intracelular [Ca2+]i, no citosol (figura 1) que permite a ligação desse
íon à troponina C (TnC), possibilitando a interação actina-miosina. A
intensidade da contração depende da quantidade e da sensibilidade dos
miofilamentos ao Ca2+. Em condições fisiológicas, a ativação elétrica ou
excitação desencadeia a contração; e o aumento de [Ca2+]i é o fator que acopla
os dois fenômenos: excitação/contração. O conjunto desses processos é
denominado acoplamento excitação-contração. Quando a concentração
intracelular de Ca2+ começa a diminuir, principalmente pela recaptura de cálcio
pela da bomba de Ca2+ do RS (SERCA2a), inicia-se o relaxamento. A atividade
8
da SERCA2a é o processo mais importante na re-captação do Ca2+ nos
cardiomiócitos.
Outras proteínas, como o trocador Na+/ Ca2+ e a bomba de Ca2+ do
sarcolema, atuam como reguladores do fluxo de Ca2+ no miocárdio. Dessa
maneira, o ciclo do trânsito de Ca2+ intracelular é modulado pela atividade de
diferentes canais. Canais do tipo L, que regulam a contração e a atividade da
SERCA2a, regula também o relaxamento miocárdico (Opie, 1998; Bers, 2001;
2002) (figura 1).
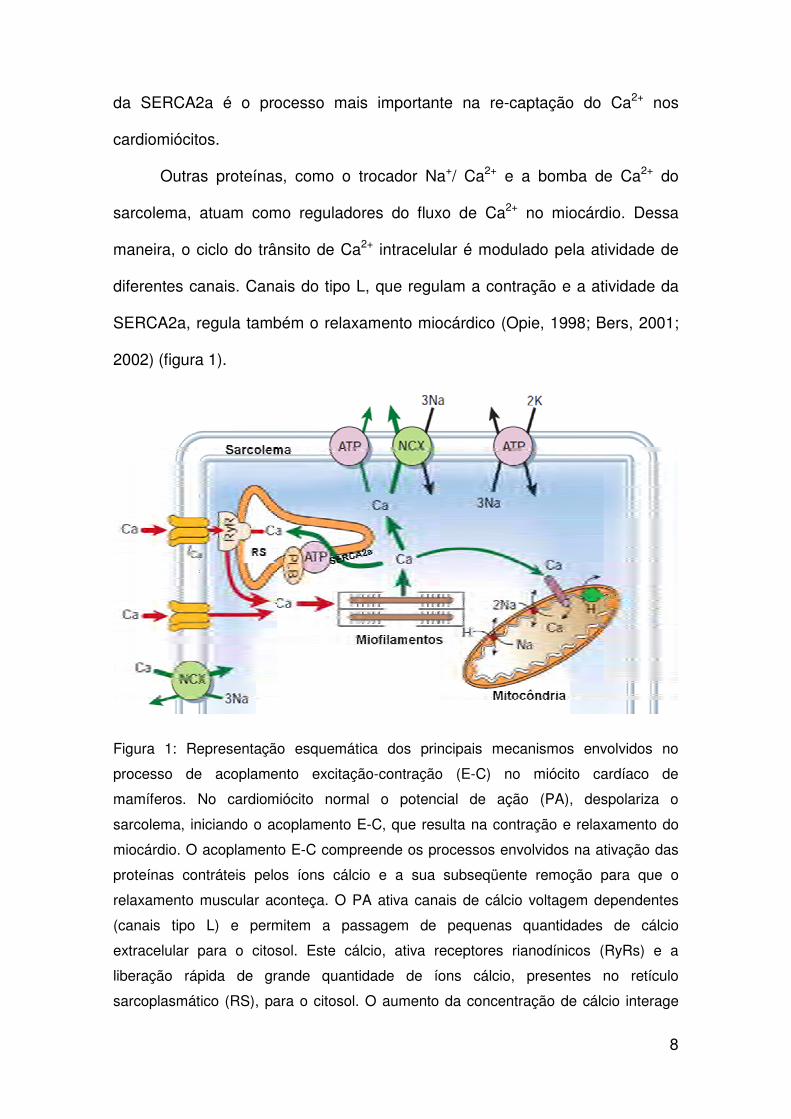
Figura 1: Representação esquemática dos principais mecanismos envolvidos no
processo de acoplamento excitação-contração (E-C) no miócito cardíaco de
mamíferos. No cardiomiócito normal o potencial de ação (PA), despolariza o
sarcolema, iniciando o acoplamento E-C, que resulta na contração e relaxamento do
miocárdio. O acoplamento E-C compreende os processos envolvidos na ativação das
proteínas contráteis pelos íons cálcio e a sua subseqüente remoção para que o
relaxamento muscular aconteça. O PA ativa canais de cálcio voltagem dependentes
(canais tipo L) e permitem a passagem de pequenas quantidades de cálcio
extracelular para o citosol. Este cálcio, ativa receptores rianodínicos (RyRs) e a
liberação rápida de grande quantidade de íons cálcio, presentes no retículo
sarcoplasmático (RS), para o citosol. O aumento da concentração de cálcio interage
9
com a troponina C, o que resulta no encurtamento do sarcômero, e conseqüente,
contração muscular. O relaxamento ocorre consecutivo à remoção do cálcio citosólico
através da atividade da bomba de cálcio pelo RS, SERCA2a, pela troca Na+/Ca2+ e
pela bomba de cálcio do sarcolema que retiram, respectivamente, 92%, 7% e 1% do
cálcio liberado durante a despolarização celular. RS – retículo sarcoplasmático; NCX -
mecanismo de troca sódio-cálcio; ATP - ATPase de Ca; ICa - corrente de Ca por meio
de canais tipo L; RyRs – receptores de rianodina; PLB – fosfolambam; ATP – trifosfato
de adenosina (modificado de Bers, 2002).
Em relação à estimulação beta-adrenérgica, suas principais
conseqüências em nível celular são o aumento da força de contração (efeito
inotrópico positivo) e o aumento da taxa de relaxamento (efeito lusitrópico
positivo). A via beta-adrenérgica compreende os processos envolvidos na
interação das catecolaminas com os receptores (β1 e β2 específicos)
presentes na membrana do cardiomiócito (sarcolema). Após a conversão do
estímulo extracelular (em resposta intracelular), ocorre uma cascata de
eventos, com alterações bioquímicas e moleculares para acontecer a contração
e relaxamento dos cardiomiócitos (Opie, 2001).
Este processo ocorre quando um agonista beta-adrenérgico (o
isoproterenol, por exemplo), interage com os receptores beta. Esta ligação
desencadeia alterações das proteínas G do sarcolema, levando à ativação da
adenil-ciclase e formação da adenosina 3'5' monofosfato (AMP-cíclico). O
aumento do AMPc ativa a proteinaquinase-A (PKA) do citosol da célula. A PKA
estimula o metabolismo dos cardiomiócitos e fosforila as proteínas dos canais
tipo L do sarcolema, permitindo uma maior entrada de Ca2+ para o citosol,
durante a despolarização celular. O aumento do influxo de cálcio induz ainda à
liberação de maior quantidade desse íon dos estoques do RS para o citosol,
resultando no aumento tanto da atividade ATPásica da miosina, quanto da
10
velocidade e força de contração (Opie et al., 1998; 2001). A proteína de
membrana do RS fosfolambam, inibe a atividade da SERCA2a, dificultando a
recaptação do cálcio para o RS. A ativação da PKA tem o papel de fosforilar a
proteína de membrana fosfolambam e inibir sua função. Como consequência,
ocorre aceleração da contração e do relaxamento miocárdico. Dessa maneira,
a estimulação da via beta-adrenérgica aumenta a força de contração e acelera
a contração e o relaxamento miocárdico (Strang et al., 1994). Alguns autores
relatam que a participação desses transportadores e receptores é dependente
da espécie (Bassani et al., 1994), da fase de desenvolvimento pré e pós-natal
(Bassani & Bassani, 2002) e pode estar alterada em certas condições
fisiopatológicas (Pogwizd et al., 1999). Na literatura, poucos estudos, até o
presente momento, avaliaram a relação entre função mecânica cardíaca,
morfologia celular, liberação espontânea de cálcio intracelular do RS e restrição
proteica após amamentação. Acredita-se que além das alterações morfológicas
do miocárdio evidenciadas pela desnutrição proteica também ocorrem
modificações nas propriedades mecânicas intrínsecas dos miócitos cardíacos,
podendo este ser um fator adicional na disfunção da mecânica do coração.
Além disso, ainda é pouco conhecido quais as propriedades mecânicas dos
cardiomiócitos são modificadas durante a restrição proteica que podem
interferir no funcionamento cardíaco. Elucidar esses mecanismos funcionais e
moleculares pode ajudar a compreender de forma mais ampla o impacto da
desnutrição sobre o músculo estriado cardíaco, além de definir o quanto as
alterações nesses componentes são capazes de contribuir para a disfunção
cardíaca.
11
2.0. Objetivo geral:
Investigar os efeitos da desnutrição proteica sobre os aspectos
morfofuncionais, propriedades mecânicas de miócitos ventriculares isolados e
perfil molecular das proteínas responsáveis pelo transiente de Ca2+ intracelular.
Objetivos Específicos:
• Investigar a influência da restrição proteica experimental sobre a
morfologia do miocárdio em ratos Fisher;
• Investigar a influência da restrição proteica experimental sobre as
propriedades mecânicas de cardiomiócitos isolados do ventrículo
esquerdo em ratos Ficher;
• Investigar influência da restrição proteica experimental sobre a
participação do cálcio e do sistema β-abrenérgico em cardiomiócitos
do ventrículo esquerdo em ratos Fisher.
• Investigar influência da restrição proteica experimental sobre o transiente
e sparks de cálcio em cardiomiócitos do ventrículo esquerdo em ratos
Fisher.
• Investigar a influência da restrição proteica experimental sobre o perfil
molecular das proteínas de membrana SERCA2a em cardiomiócitos
isolados do ventrículo esquerdo em ratos Fisher.
12
3.0. Referências Bibliográficas
Agarwal KN, Prasad C. & Taneja V. (1981) Protein deprivation and the brain:
effect on enzymes and free amino acids related to glutamate metabolism in
rats. Ann.Nutr.Metab 25: 228-233.
Barker DJ, Gluckman PD, Godfrey KM, Harding JE, Owens JA, Robinson JS.
(1993) Fetal nutrition and cardiovascular disease in adult life. Lancet 341: 938-
941.
Bassani RA, Bassani JWM, Bers DM. (1994) Relaxation in rabbit and rat
cardiac cells: species dependent differences in cellular mechanisms. J Physiol
476: 279-293.
Bassani RA, Bassani JWM. (2002) Contribution of Ca2+ transporters to
relaxation in intact ventricular myocytes from developing rats. American Journal
of Physiology 282: 2406-2413.
Belmar JCPHA & S-M.R. (1996) Malnutrition early in life impairs alpha-2
adrenoreceptor regulation of noradrenaline release in the rat cerebral cortex.
Nutrition Research 16, 1734-1740.
Benabe JE, Martinez-Maldonado M. (1998) The impact of malnutrition on
Kidney function. Miner Electrolyte Metab 24: 20-26.
Berridge MJ, Lipp P, Bootman MD. (2000) The versatility and universality of
calcium signalling. Nature Reviews 1: 11-21.
Bers DM. (2001) Excitation-Contraction Coupling and Cardiac Contractile
Force. The Netherlands: Kluwer Academic Publishers 32: 283-284.
Bers DM. (2002) Cardiac excitation-contraction coupling. Nature 415: 198-205.
13
Cicogna AC, Padovani CR, Georgette JC, Aragon FF, Okoshi MP. (1999)
Effects of Protein-Calorie Restriction on Mechanical Function of Hypertrophied
Cardiac Muscle. Arq. Bras. Cardiol. 72, 436-440.
Cicogna AC, Padovani CR, Okoshi K, Aragon FF, Okoshi MP. (2000)
Myocardial function during chronic food restriction in isolated hypertrophied
cardiac muscle. Am J M Sci 320: 244-248.
Cortius HB, Zimanye MA, Maka N, Herath T, Thomas W, Laarse AVD, Wreford
NG, Black J. (2005) Effect of intrauterine growth restriction on the number of
cardiomyocytes in the rat hearts Pediatric Research 57: 796-800.
Christian P. & Stewart CP. (2010) Maternal micronutrient deficiency, fetal
development and the risk of chronic disease. The Journal of Nutrition J Nutr
140: 437-445.
Cunha DF, Cunha SF, Reis MA, Teixeira VP. (2002) Heart weight and heart
weight / body weight coefficient in malnourished adults. Arquivos Brasileiros de
Cardiologia 78: 382-387.
Drott C, Lundholm K. (1992) Cardiac effects of caloric restriction-mechanisms
and potential hazards. Int J Obes Relat Meta Disord 16:481-486.
Fabiato A. (1983) Calcium-induced release of calcium from the cardiac
sarcoplasmic reticulum. The American Journal of Physiology 245: 1-14.
Fioretto JR, Querioz SS, Padovani CR, Matsubara LS, Okoshi K, Matsubara
BB. (2001) Ventricular remodeling and diastolic myocardial dysfunction in rats
submitted to protein-calorie malnutrition. Am J Physiol 282: 1327-1333.
Freitas RA, Souza LB, Pinto LP. (1994) Morphological and morphometric
analysis of the parotid glands of rats submitted to different levels of protein
deficiency. Rev Odontol Univ São Paulo 8: 43-49.
14
Gluckman PD, Hanson MA. (2004) The developmental origins of the metabolic
syndrome. Trends Endocrinol Metab 15:183-187.
Gruber C, Nink N, Nikam S, Magdowski G, Kripp G, Voswinckel R, Mühlfeld C.
(2012) Myocardial remodelling in left ventricular atrophy induced by caloric
restriction J Anat 220: 179–185.
Hanson M. (2002) Birth weight and the fetal origins of adult disease. Pediatr
Res 52: 473-484.
Hoppe CC, Evans RG, Bertram JF. & Moritz KM. (2007) Effects of dietary
protein restriction on nephron number in the rats. Am. J. Physiol. 292: 768-774.
Kothari SS, Patel TM, Shetalwad AN, Patel TK. (1992) Left ventricular mass
and function in children with severe protein energy malnutrition. Int J Cardiol
35: 19-25.
Lim K, Zimanyi MA. and Black MJ. (2010) Effect of maternal protein restriction
during pregnancy and lactation on the number of cardiomyocytes in the post
proliferative weanling rat heart. The Anatomical Record 293: 431-437.
Okoromah CAN, Ekure EN, Lesi FEA, Okunowo WO, Tijani BO, Okeiyi JC.
(2011) Prevalence, profile and predictors of malnutrition in children with
congenital heart defects: a case–control observational study. Arch Dis Child 96:
354-360.
Opie LH. (1998) Myocardial contraction and relaxation. In: Opie LH, ed. The
heart. Physiology, from cell to circulation. Philadelphia: Lippincott-Raven 14:
209-231
Opie LH. (2001) Normal and abnormal cardiac function: mechanism of cardiac
contraction and relaxation. In: Braunwald E, Zipes DP, Libby P. Heart disease:
a textbook of cardiovascular medicine. 6th ed. Philadelphia: Saunders;. 443-78.
15
Pedrosa MT.& Moraes-Santos T. (1987) Neuronal protein biosyntesis by
neonatally malnourished and nutritional recovered rats. Brazilian Journal of
Medical and Biological Research 20: 338-345.
Phillips DIW, Barker DJP, Hales CN, Hirst S. & Osmond C. (1994) Thinness at
Birth and Insulin-Resistance in Adult Life. Diabetologia 37: 150-154.
Pinotti MF, Leopoldo AS, Dal-Pai Silva M, Sugizaki MM, Nascimento AF, Lima-
Leopoldo AP, Aragon FF, Padovani CR, Cicogna AC. (2010) A comparative
study of myocardial function and morphology during fasting/refeeding and food
restriction in rats. Cardiovascular Pathology 19: 175-182.
Pogwizd SM, Qi M, Yuan W, Samarel AM, Bers DM. (1999) Upregulation of
Na+/Ca2+ exchanger expression and function in an arrhythmogenic rabbit model
of heart failure. Circulation Research 85: 1009-1019.
Sawaya AL, Martins P, Hoffman D, Roberts SB. (2003) The link between
childhood undernutrition and risk of chronic diseases in adulthood: A case study
of Brazil. Nutrition Reviews 61: 168-175.
Strang KT, Sweitzer NK, Greaser ML, Moss RL. (1994) Beta-adrenergic
receptor stimulation increases unloaded shortening velocity of skinned single
ventricular myocytes from rats. Circ Res 74: 542-549.
Vandewoude, MFJ. (2008) Morphometric changes in microvasculature in rat
myocardium during malnutrition. J Par Ent Nutrution 19: 376-380.
WHO - World Health Organization. Obesity (2010) Facts related to chronic
diseases.
Site: http://www.who.int/dietphysicalactivity/publications/facts/chronic/en
16
4.1. Paper 1 - Nutrition research submitted
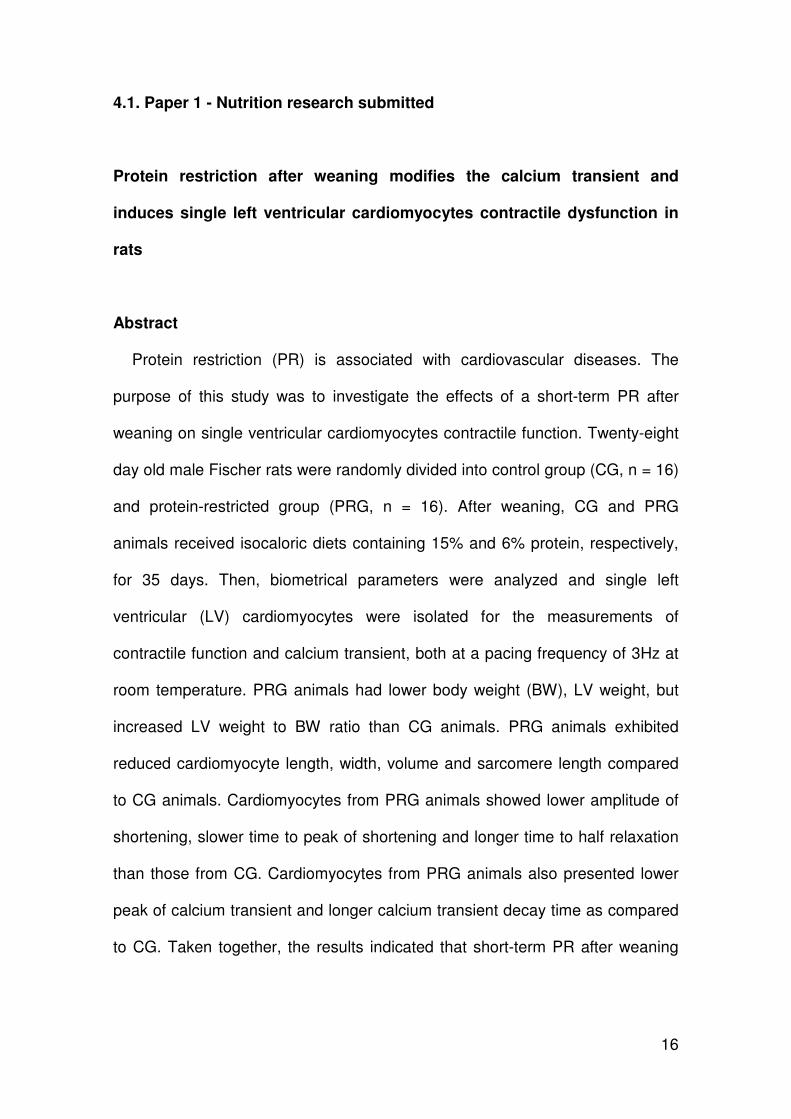
Protein restriction after weaning modifies the calcium transient and
induces single left ventricular cardiomyocytes contractile dysfunction in
rats
Abstract
Protein restriction (PR) is associated with cardiovascular diseases. The
purpose of this study was to investigate the effects of a short-term PR after
weaning on single ventricular cardiomyocytes contractile function. Twenty-eight
day old male Fischer rats were randomly divided into control group (CG, n = 16)
and protein-restricted group (PRG, n = 16). After weaning, CG and PRG
animals received isocaloric diets containing 15% and 6% protein, respectively,
for 35 days. Then, biometrical parameters were analyzed and single left
ventricular (LV) cardiomyocytes were isolated for the measurements of
contractile function and calcium transient, both at a pacing frequency of 3Hz at
room temperature. PRG animals had lower body weight (BW), LV weight, but
increased LV weight to BW ratio than CG animals. PRG animals exhibited
reduced cardiomyocyte length, width, volume and sarcomere length compared
to CG animals. Cardiomyocytes from PRG animals showed lower amplitude of
shortening, slower time to peak of shortening and longer time to half relaxation
than those from CG. Cardiomyocytes from PRG animals also presented lower
peak of calcium transient and longer calcium transient decay time as compared
to CG. Taken together, the results indicated that short-term PR after weaning

17
induces contractile dysfunctions in single LV cardiomyocytes of rats which is
probably associated with pathological changes in the cell calcium transient.
Keywords: Malnutrition, cardiomyocytes, cell contractility, calcium transient,
morphology.
18
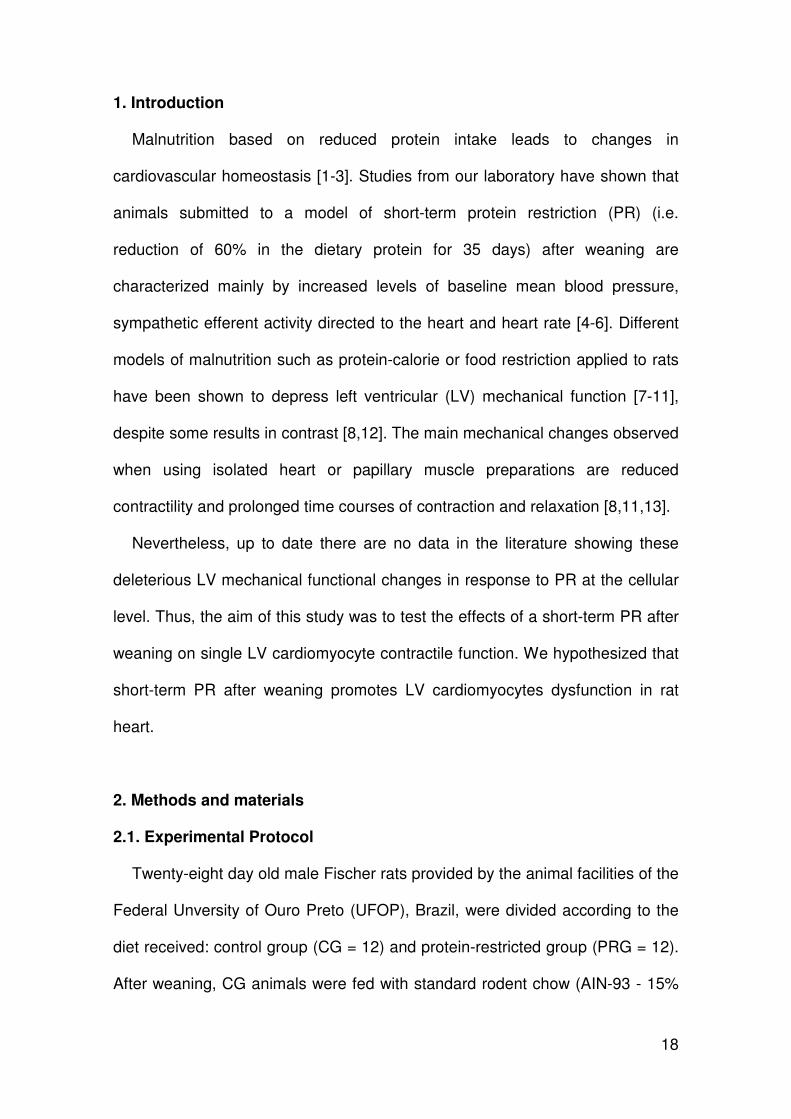
1. Introduction
Malnutrition based on reduced protein intake leads to changes in
cardiovascular homeostasis [1-3]. Studies from our laboratory have shown that
animals submitted to a model of short-term protein restriction (PR) (i.e.
reduction of 60% in the dietary protein for 35 days) after weaning are
characterized mainly by increased levels of baseline mean blood pressure,
sympathetic efferent activity directed to the heart and heart rate [4-6]. Different
models of malnutrition such as protein-calorie or food restriction applied to rats
have been shown to depress left ventricular (LV) mechanical function [7-11],
despite some results in contrast [8,12]. The main mechanical changes observed
when using isolated heart or papillary muscle preparations are reduced
contractility and prolonged time courses of contraction and relaxation [8,11,13].
Nevertheless, up to date there are no data in the literature showing these
deleterious LV mechanical functional changes in response to PR at the cellular
level. Thus, the aim of this study was to test the effects of a short-term PR after
weaning on single LV cardiomyocyte contractile function. We hypothesized that
short-term PR after weaning promotes LV cardiomyocytes dysfunction in rat
heart.
2. Methods and materials
2.1. Experimental Protocol
Twenty-eight day old male Fischer rats provided by the animal facilities of the
Federal Unversity of Ouro Preto (UFOP), Brazil, were divided according to the
diet received: control group (CG = 12) and protein-restricted group (PRG = 12).
After weaning, CG animals were fed with standard rodent chow (AIN-93 - 15%

19
protein) and the PRG animals received a diet containing 6% protein (casein) for
35 days [5]. The diets were isocaloric (422 kcal/100 g of diet) and the salts and
vitamins were at similar concentrations in both diets (Table 1). The animals
were maintained in a controlled temperature room (22ºC) with 12-hour light/dark
cycles and had water ad libitum. The experimental protocols were approved by
the institutional ethics committee (UFOP protocol 30/2009).
Table 1
Chemical composition of the diets (g/100g of chow)
CG PRG
Protein (casein) 15 6
Corn starch 68 77
Soybean oil 10 10
Salts mix 5 5
Vitamin mix 1 1
Fiber (cellulose) 1 1
Total caloric values 422 Kcal 422 Kcal
Control Group (CG) – Protein (Caseín) 15%;
Protein Restriction Group (PRG) - Protein (Caseín) 6%.
2.2. Biometric analysis
Thirty-five days after the protein restriction the animals from each group
were weighed and euthanized under anesthesia. The left ventricles were
dissected and weighed separately. The relative LV weight was calculated by
dividing the left ventricular weight (LVW) by body weight (BW) [5].
20
2.3. Cardiomyocytes isolation
After euthanasia, the heart was quickly removed and LV cardiomyocytes
were isolated as described by Novaes et al. [14]. Briefly, the heart was
cannulated through the aorta in a Langendorff system and perfused with
isolation solution (composition [mM]: 130 Na+, 5.4 K+, 1.4 Mg2+, 140 Cl-, 0.75
Ca2+, 5.0 Hepes, 10 glucose, 20 taurine and 10 creatine, pH= 7.3 at room
temperature). Then, the heart was perfused with calcium-free solution
containing 0.1 mM ethylene glycol-bis (beta-aminoethyl ether)-N, N, N', N'-
tetraacetic acid (EGTA) for 5 min. The heart was then perfused with a solution
containing 1.0 mg.ml-1 of type 2 collagenase (Worthington, USA) and 100.0 mM
CaCl2 for 25 min. The solutions were oxygenated (100% O2, White Martins, SP,
Brazil) and maintained at 35 ºC. After perfusion, the left ventricle was dissected
and placed in a glass recipient with an enzyme solution containing collagenase
(5.0 ml) and bovine serum albumin (10%). The recipient was shaken
moderately for 5 min at 37 °C, after which the solution was centrifuged. The
supernatant was removed and cardiomyocytes were resuspended in isolation
solution, stored in a refrigerator (5 °C) and used in a period up to 4 h after
isolation. Only calcium-tolerant, quiescent, rod-shaped cardiomyocytes showing
clear cross striations were studied.
2.4. Cell contractile function
Cardiomyocytes contractile function was measured using an edge motion
detection system (Ionoptix, Milton, MA, USA) mounted on an inverted
microscope (Nikon Eclipse TS100®, Tokyo, Japan), as previously described
[14]. Briefly, myocytes were placed in an experimental chamber with the base
21
glass and bathed in buffer with the following composition (in mM): 136.9 NaCl;
5.4 KCl; 0.37 NaH2PO4; 0.57 MgCl2, 5.0 Hepes; 5.6 glucose and 1.8 CaCl2
(pH= 7.4 at room temperature). Cardiomyocytes were field stimulated at a
frequency of 3.0 Hz (10 volts, 5 min duration) using a pair of steel electrodes
(Myopacer, Ionoptix, MA, USA). Cardiomyocytes were visualized on a personal
computer monitor with a NTSC camera (MyoCam, Ionoptix, MA, USA) attached
to the microscope using an image detection program (Ionwizard, Ionoptix, MA,
USA). This image was used to measure cell shortening (our index of
contractility) in response to electrical stimulation using a video motion edge
detector (IonWizard; IonOptix, MA, USA). All parameters were evaluated using
customized software developed in the MatLab® platform. Cell shortening from
stimulation (expressed as a percentage of resting cell length), time to peak of
shortening and time to half relaxation were measured and calculated as
previously described [14].
2.5. Cell dimensions
Cardiomyocytes were placed in an experimental chamber as mentioned
above and were visualized on a personal computer monitor with a NTSC
camera (Myocam, Ionoptix, MA, USA) attached to the microscope using an
image detection program (Ionwizard, Ionoptix, MA, USA). These resting cell
images were used to measure the cell length and width. The cell volume was
calculated using the formula: Volume (pL) = length (mm) x width (mm) x (7.59 x
10-3 pL/mm2) [15]. Using a Fast Fourier Transformation function of the same
system of image analysis the cardiomyocytes sarcomere length was also
measured.
22
2.6. Cell calcium transient
Cardiomyocytes were loaded with fluo-4 AM solution 10µmol/L (Molecular
Probes, Eugene, OR, USA) for 30 minutes at room temperature. Then,
cardiomyocytes were washed with a normal tyrode solution to remove excess
dye [16]. Next, cardiomyocytes were stimulated through a pair of platinum
electrodes with a voltage pulse of 0.2 ms, at 3 Hz [17]. The confocal scanning
system LSM 510® Meta (Zeiss, Jena, Germany) with an immersion objective
(x63) was used to obtain fluorescence images. Fluo-4 was excited at 488 nm
(argon laser) and emission intensity was measured at 510 nm. Images of
cardiomyocytes were scanned with a line of 512 pixels, randomly positioned
along a longitudinal axis of the cell, with caution to avoid passing by the
nucleus. The cells were scanned every 1.54 ms, and the sequences of scans
were transmitted in series to create two-dimensional images on the x-axis with a
temporal sequence. Digital images processing was performed using custom
routines written in IDL (Research Systems, Boulder, CO, USA). Ca2+ levels are
presented as ∆F/F0, where F0 is the minimum fluorescence intensity measured
between contractions at 3 Hz on the diastolic phase of the transient, and ∆F
equals (F-F0).
2.7. Statistics
Data are presented as mean and standard error of mean (mean ± SEM). The
normal distribution of data was verified by using the Kolmogorov-Smirnov test.
Biometric and cell contractile function data were compared using the unpaired
Student's t test. Morphometric data were compared using the Mann-Whitney
test. A value of p <0.05 was considered statistically significant.
23
3. Results
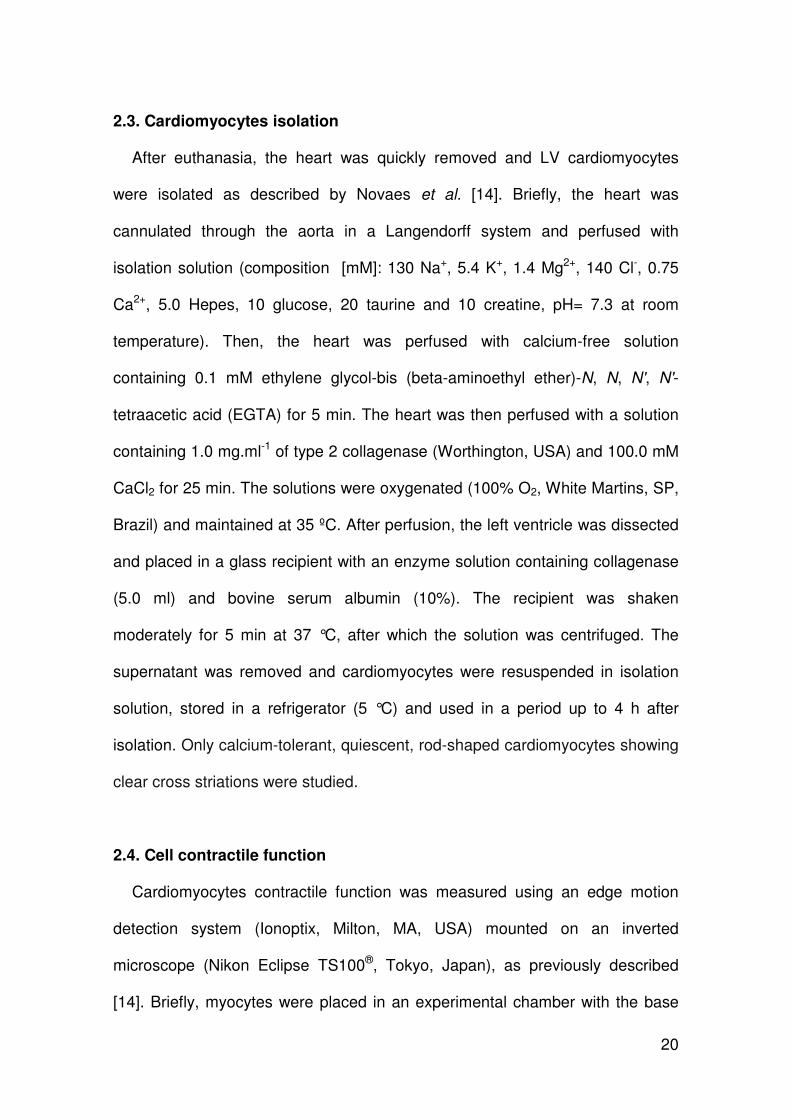
3.1. Biometric parameters
Protein restriction decreased body weight (BW), left ventricular weight (LVW)
and increased the LVW to BW ratio (Figure 1).
Figure 1. Biometric parameters. CG, control group. PRG, protein-restricted group. LV,
left ventricle. LV/BW, left ventricle weight to body weight ratio. Data are means ± SEM
of 12 animals in each group. *p <0.05.
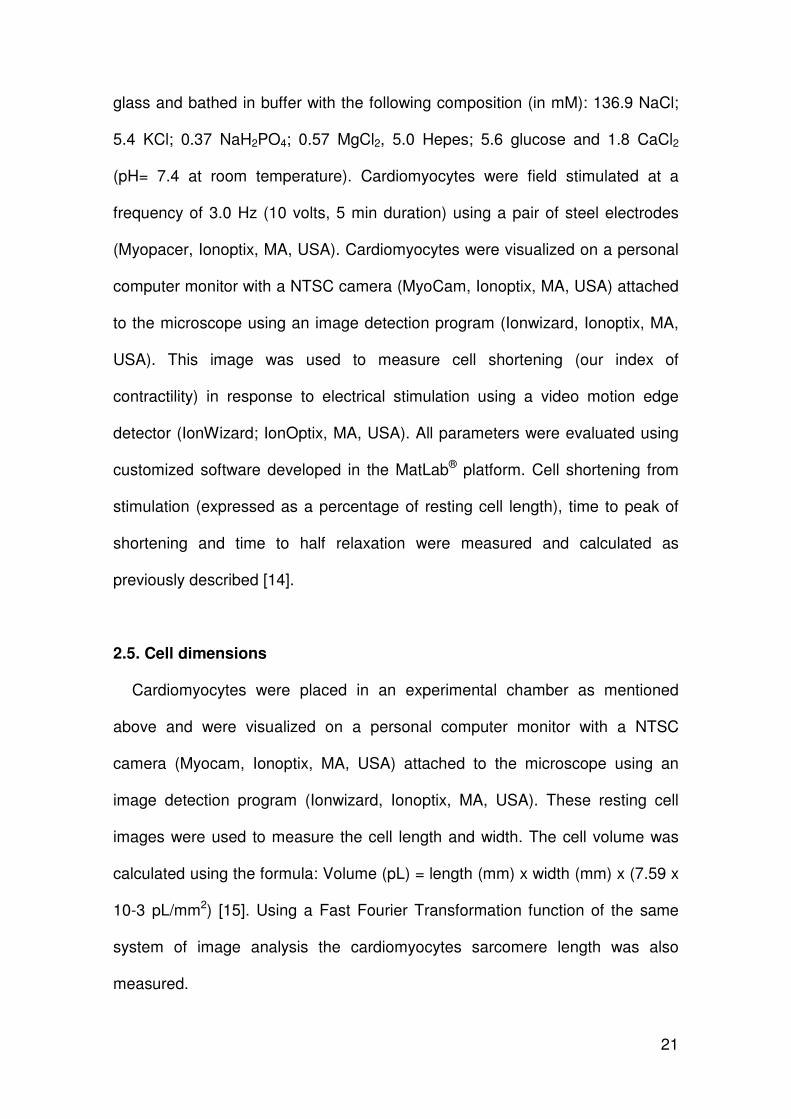
3.2. Cell dimensions and contractile function
The protein restriction reduced significantly all cell dimensions analyzed
(Table 2). There was significant reduction in shortening amplitude (Figure 2A),
prolongation of the time to peak of shortening (Figure 2B) and of the time to
half relaxation (Figure 2C) in LV myocytes from PRG animals compared to
those from CG.
24
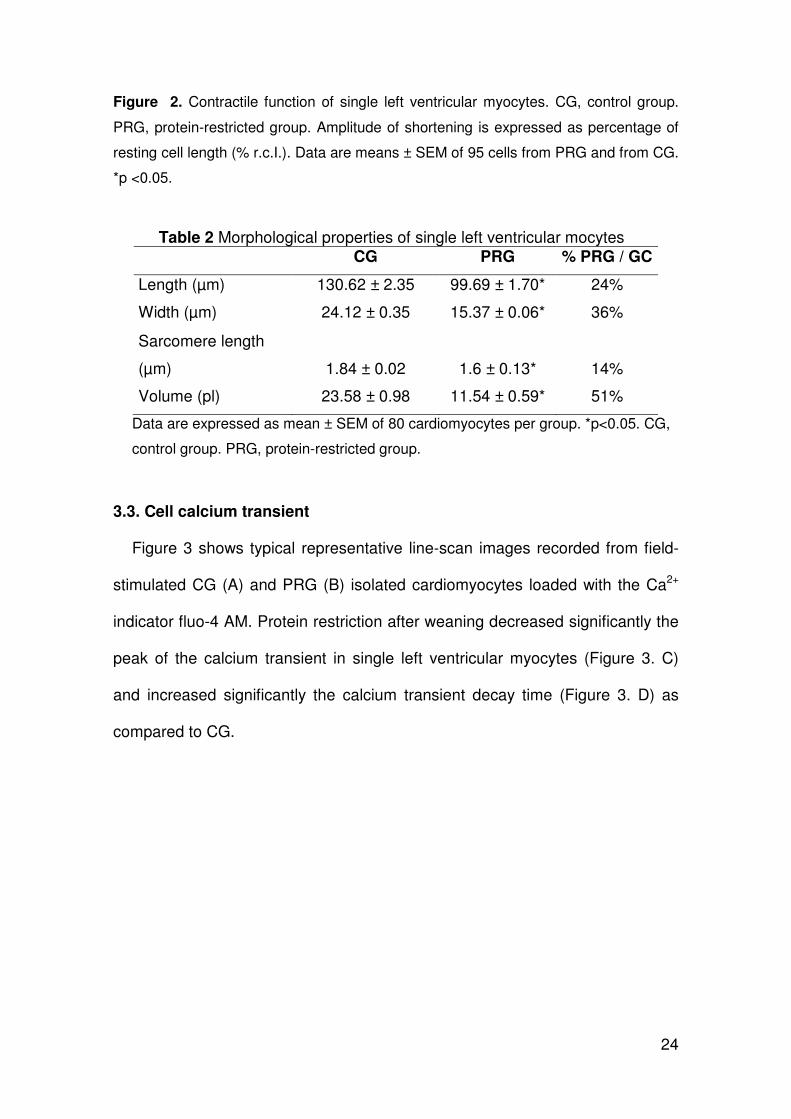
Figure 2. Contractile function of single left ventricular myocytes. CG, control group.
PRG, protein-restricted group. Amplitude of shortening is expressed as percentage of
resting cell length (% r.c.I.). Data are means ± SEM of 95 cells from PRG and from CG.
*p <0.05.
Table 2 Morphological properties of single left ventricular mocytes
CG PRG % PRG / GC
Length (µm) 130.62 ± 2.35 99.69 ± 1.70* 24%
Width (µm) 24.12 ± 0.35 15.37 ± 0.06* 36%
Sarcomere length
(µm) 1.84 ± 0.02 1.6 ± 0.13* 14%
Volume (pl) 23.58 ± 0.98 11.54 ± 0.59* 51%
Data are expressed as mean ± SEM of 80 cardiomyocytes per group. *p<0.05. CG,
control group. PRG, protein-restricted group.
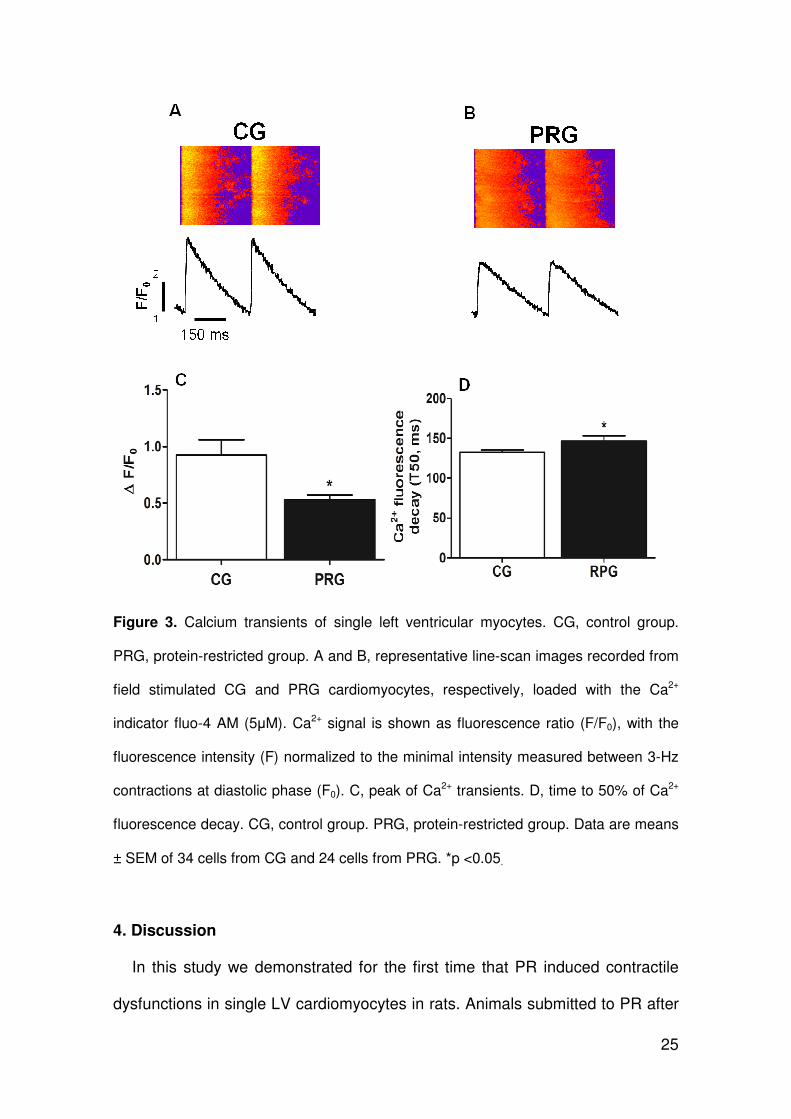
3.3. Cell calcium transient
Figure 3 shows typical representative line-scan images recorded from field-
stimulated CG (A) and PRG (B) isolated cardiomyocytes loaded with the Ca2+
indicator fluo-4 AM. Protein restriction after weaning decreased significantly the
peak of the calcium transient in single left ventricular myocytes (Figure 3. C)
and increased significantly the calcium transient decay time (Figure 3. D) as
compared to CG.
25
Figure 3. Calcium transients of single left ventricular myocytes. CG, control group.
PRG, protein-restricted group. A and B, representative line-scan images recorded from
field stimulated CG and PRG cardiomyocytes, respectively, loaded with the Ca2+
indicator fluo-4 AM (5µM). Ca2+ signal is shown as fluorescence ratio (F/F0), with the
fluorescence intensity (F) normalized to the minimal intensity measured between 3-Hz
contractions at diastolic phase (F0). C, peak of Ca2+ transients. D, time to 50% of Ca2+
fluorescence decay. CG, control group. PRG, protein-restricted group. Data are means
± SEM of 34 cells from CG and 24 cells from PRG. *p <0.05.
4. Discussion
In this study we demonstrated for the first time that PR induced contractile
dysfunctions in single LV cardiomyocytes in rats. Animals submitted to PR after
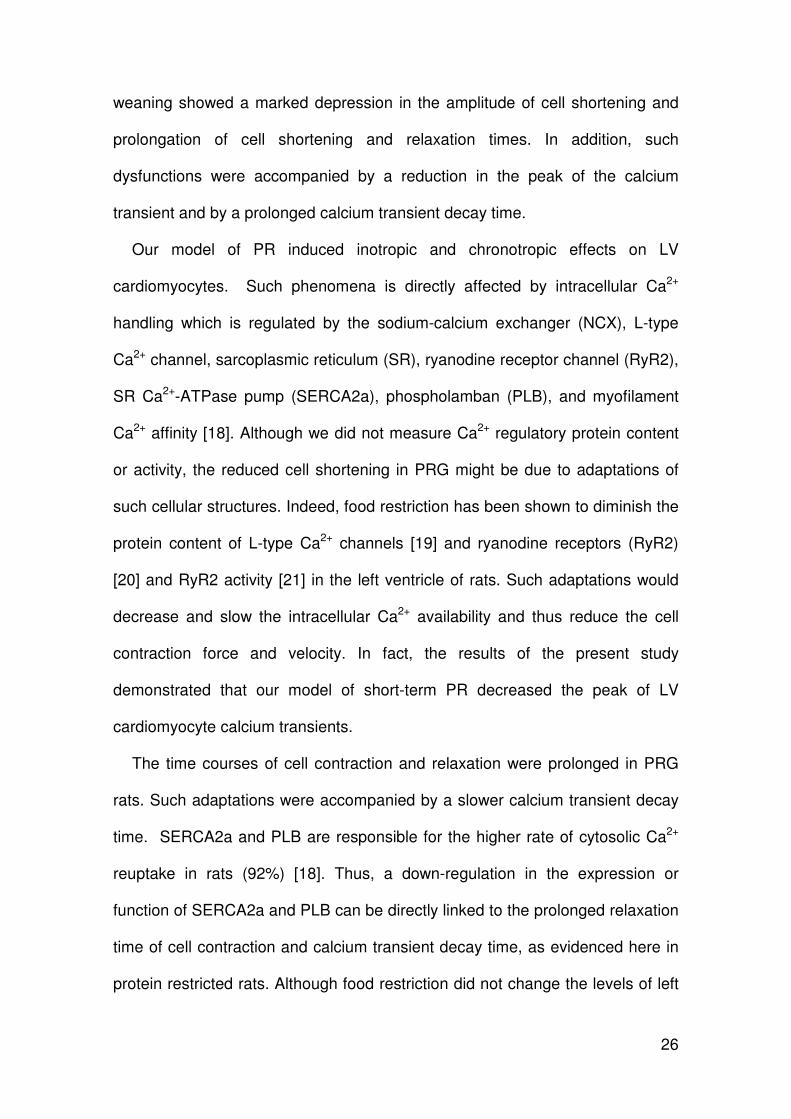
26
weaning showed a marked depression in the amplitude of cell shortening and
prolongation of cell shortening and relaxation times. In addition, such
dysfunctions were accompanied by a reduction in the peak of the calcium
transient and by a prolonged calcium transient decay time.
Our model of PR induced inotropic and chronotropic effects on LV
cardiomyocytes. Such phenomena is directly affected by intracellular Ca2+
handling which is regulated by the sodium-calcium exchanger (NCX), L-type
Ca2+ channel, sarcoplasmic reticulum (SR), ryanodine receptor channel (RyR2),
SR Ca2+-ATPase pump (SERCA2a), phospholamban (PLB), and myofilament
Ca2+ affinity [18]. Although we did not measure Ca2+ regulatory protein content
or activity, the reduced cell shortening in PRG might be due to adaptations of
such cellular structures. Indeed, food restriction has been shown to diminish the
protein content of L-type Ca2+ channels [19] and ryanodine receptors (RyR2)
[20] and RyR2 activity [21] in the left ventricle of rats. Such adaptations would
decrease and slow the intracellular Ca2+ availability and thus reduce the cell
contraction force and velocity. In fact, the results of the present study
demonstrated that our model of short-term PR decreased the peak of LV
cardiomyocyte calcium transients.
The time courses of cell contraction and relaxation were prolonged in PRG
rats. Such adaptations were accompanied by a slower calcium transient decay
time. SERCA2a and PLB are responsible for the higher rate of cytosolic Ca2+
reuptake in rats (92%) [18]. Thus, a down-regulation in the expression or
function of SERCA2a and PLB can be directly linked to the prolonged relaxation
time of cell contraction and calcium transient decay time, as evidenced here in
protein restricted rats. Although food restriction did not change the levels of left
27
ventricle SERCA2a and PLB mRNAs in rats [20], it decreased the SR Ca2+
uptake activity in the rat myocardium [22]. In addition, there are evidences that
food restriction reduces the rate of dissociation of Ca2+ from troponin-C [21-23].
The prolonged cell shortening time courses observed in response to PR may
also be due to the changes in the myosin isozyme distribution. In rats, V1
isomyosin shows high ATPase and contractile activity compared with V3
isomyosin [24]. There are evidences that short-term food restriction induces a
shift in the myosin isozyme distribution toward the slow V3 isoform [7,25].
In the present study short-term PR reduced the animal BW and LVW, but the
LVW to BW ratio increased. These results have been shown previously in this
model [4-6] and food restricted rats [8,10,11,20]. At the cellular level, PR
reduced the LV myocyte length, width, volume and sarcomere length. These
changes reflect the reduced LVW in PRG rats and confirm the remodeling
process that occurs in the myocardium in response to PR.
Altogether our data on cellular mechanical dysfunctions in response to PR
are consistent with those observed in whole heart and in multicellular
preparations which shows reduced contractility and prolonged time courses of
contraction and relaxation in undernourished rats. In summary, short-term PR
after weaning induces contractile dysfunctions in single LV cardiomyocytes of
rats which is probably associated with pathological changes in the cell calcium
transient.
Acknowledgements
Research supported by FAPEMIG. Ms. A.R. Penitente was a recipient of a
PhD scholarship from FAPEMIG. A.J. Natali is a CNPq fellow.
28
References
[1] Langley-Evans SC, Phillips GJ, Benediktsson R, Gardner DS, Edwards CR,
Jackson AA, Seckl JR. Protein intake in pregnancy, placental glucocorticoid
metabolism and the programming of hypertension in the rat. Placenta 1996;
17:169-172.
[2] Barker DJP, Clark PM. Fetal undernutrition and disease in later. Life J
Reprod Fertil 1997;2:105-112.
[3] Plagemann A, Harder T, Rake A, Melchior K, Rohde W, Dorner G.
Hypothalamic nuclei are malformed in weanling offspring of low protein
malnourished rat dams. J Nutr 2000;130:2582-2589.
[4] Oliveira EL, Cardoso LM, Pedrosa ML, Silva ME, Dan NJ, Colombari E,
Moraes MF, Chianca DAJr. Alow protein diet causes na increase in the
basal levels and variability of mean arterial pressure and heart rate in Fisher
rats. Nutr Neurosci 2004;7:201-205.
[5] Penitente AR, Fernandes LG, Cardoso LM, Silva ME, Pedrosa ML, Silva
AL, Haibara AS, Moraes MFD, Chianca DAJr. Malnutrition enhances
cardiovascular responses to chemoreflex activation in awake rats. Life Sci
2007;81:609-614.
[6] Martins CDD, Chianca DAJr, Fernandes LG. Cardiac autonomic
balance in rats submitted to protein restriction after weaning. Clin Exp
Pharm Physiol 2011;38:89-93.
[7] Haddad F, Bodel PW, McCue SA, Herrick PE, Baldwin KM. Food restriction-
induced transformations in cardiac functional and biochemical properties in
rats. J Appl Physiol 1993;74:606-612.
[8] Cicogna AC, Padovani CR, Okoshi K, Matsubara LS, Aragon FF, Okoshi
MP. The influence of temporal food restriction on the performance of
isolated cardiac muscle. Nutr Res 2001;21:639-648.
29
[9] Okoshi K, Matsubara LS, Okoshi MP, Cicogna AC, Fioretto JR, Padovani
CR. Food restriction-induced myocardial dysfunction demonstrated by the
combination of in vivo and in vitro studies. Nutr Res 2002;22:1353-1364.
[10] Gut AL, Okoshi MP, Padovani CR, Aragon FF, Cicogna AC. Myocardial
dysfunction induced by food restriction is related to calcium cycling and
beta-adrenergic system changes. Nutr Res 2003;23:911-919.
[11] Pinotti MF, Leopoldo AS, Dal-Pai Silva M, Sugizaki MM, Nascimento AF,
Lima-Leopoldo AP, Aragon FF, Padovani CR, Cicogna AC. A comparative
study of myocardial function and morphology during fasting/refeeding and
food restriction in rats. Cardiovasc Pathol 2010;19:175-182.
[12] Nutter DO, Murray TG, Heymsfield SB, Fuller EO. The effect of chronic
protein-calorie undernutrition in the rat on myocardial function and cardiac
function. Circ Res 1979;45:144-152.
[13] Cicogna AC, Padovani CR, Okoshi K, Aragon FF, Okoshi MP. Myocardial
function during chronic food restriction in isolated hypertrophied cardiac
muscle. Am J M Sci 2000;320:244-248.
[14] Novaes R.D., Penitente A.R., Gonçalves R.V., Talvani A., Neves C.A.,
Maldonado I.R.S.C. & Natali A.J. Effects of Trypanosoma cruzi infection on
myocardium morphology, single cardiomyocyte contractile function and
exercise tolerance in rats. Int J Exp Pathol 2011;92:299-307.
[15] Satoh H, Delbridge LM, Blatter LA, Bers DM. Surface: volume relationship
in cardiac myocytes studied with confocal microscopy and membrane
capacitance measurements: species-dependence and developmental
effects. Biophys J 1996;32:1494-1504.
[16] Lauton-Santos S, Guatimosim S, Castro CH, Oliveira FA, Almeida AP,
Dias-Peixoto MF, Gomes MA, Pessoa P, Pesquero JL, Pesquero JB, Bader
30
M, Cruz JS. Kinin B1 receptor participates in the control of cardiac function
in mice. Life Sci 2007;81:814-822.
[17] Guatimosim S, Sobie EA, dos Santos CJ, Martin LA, Lederer WJ.
Molecular identification of a TTX-sensitive Ca2+ current. Am J. Physiol-Cell.
2001;280:1327-1339.
[18] Bers DM. Cardiac excitation-contraction coupling. Nature 2002;415:198-
205.
[19] De Tomasi LC, Bruno A, Sugizaki MM. Food restriction promotes
downregulation of myocardial L-type Ca2+ channels. Can J Pharm Sci
2009;87:426-431.
[20] Vizotto VA, Sugizaki MM, Lima AP. Down-regulation of the cardiac
sarcoplasmic reticulum ryanodine channel in severely food restricted rats.
Braz J Med Biol Res 2007;40:27-31.
[21] O'Brien PJ, Shen H, Bissonette D, Jeejeebhoy KN. Effects of hypocaloric
feeding and refeeding on myocardial Ca and ATP cycling in the rat. Mol Cell
Biochem 1995;142:151-161.
[22] Rupp H, Maisch B, Brilla CG. Schedule-induced psychological stress and
molecular structures of cardiomyocytes. Am J Physiol 1997;272:776-782.
[23] Klebanov S, Herlihy JT. Effect of life-long food restriction on cardiac myosin
composition. J Geront 1997;52:184-189.
[24] Pope B, Hoh JF, Weeds A. The ATPase activities of rat cardiac myosin
isoenzymes. FEBS Lett 1980;118:205-208.
[25] Morris GS, Surdyka DG, Haddad F. Apparent influence of metabolism on
cardiac isomyosin profile of food restricted rats. Am J Physiol
1990;258:346-351.
31
4.2. Paper 2
Severe protein restriction after weaning reduces the expression of
SERCA2a and modifies the basal and β-adrenergic contractility in murine
ventricular cardiomyocytes
Abstract
It has been reported that protein restriction (PR) is able to impair cardiac
structure and function. However, the mechanisms responsible for the cardiac
dysfunction in PR remain poorly understood. The aim of this study was to
evaluate the effects of severe protein restriction after weaning on the
expression of SERCA2a and basal and β-adrenergic contractility in murine
ventricular cardiomyocytes. After breastfeeding (28 days) male Fisher rats were
randomly divided into two groups: a control group (CG, n = 20) and protein-
restricted group (PRG, n = 20). The animals in the PRG and CG received
isocaloric diets for 35 days containing 15% and 6% protein, respectively. The
animals were then weighed, before being euthanised so that the hearts could
be removed for analysis. The myocytes of the left ventricle (LV) were
processed for the analysis of contractility, Ca2+ sparks and the expression of the
membrane protein SERCA2a. The animals of the PRG showed a significant
reduction in body, heart and left ventricle masses. Cardiomyocytes from the
PRG presented with reduced amplitudes of shortening and a maximum velocity
of contraction and relaxation at a baseline, as well as after β-
adrenergic stimulation compared to the CG. Lower levels of SERCA2a
32
expression and a higher frequency and lower amplitude of Ca2+ sparks during
cell diastole were observed in the cardiomyocytes from PRG. Severe protein
restriction after weaning induces morphological and functional changes to the
heart and ventricular cardiomyocytes. The pathological changes of
cardiomyocyte mechanics suggest the potential involvement of the β-adrenergic
system, which is possibly associated with changes in SERCA2a expression and
disturbances in Ca2+ intracellular kinetics.
Keywords: isolated cardiac myocytes, left ventricle, cardiac dysfunction,
calcium sparks, β-adrenergic system.
33
1. Introduction
There is evidence that malnutrition in early life stages is associated with
cardiac dysfunction (De Tomazi et al., 2009). Despite the extensive literature on
the impact of malnutrition on the digestive, endocrine, and musculoskeletal
systems (Okoromah et al., 2011; Gruber et al, 2012), little is known about the
effects of severe protein restriction (PR) on the function of the cardiovascular
system (Penitente et al., 2007; Martins et al., 2011). Even more scarce is
information regarding the cardiac molecular and cellular adaptations that are
induced by protein restriction, which can potentially modify the contractile
performance of cardiomyocytes and the whole heart (Cicogna, 2001).
Previous studies indicated that a 50% food restriction is able to induce
cardiac dysfunction that manifests as pathological changes in cardiac
contraction and relaxation, which are associated with a decreased sensitivity to
calcium (Sugizaki et al., 2009; Gut et al., 2003). However, it was not possible to
determine how much each of the individual diet components contributed to or
was a determinant of cardiac dysfunction. Moreover, the mechanical behaviour
of isolated cardiomyocytes under conditions of protein restriction remained an
issue that is still not well resolved. To the best of our knowledge, up to the
present date no studies have investigated the basic characteristics of cell
contractility, autonomic sensitivity, intracellular calcium kinetics and the
expression of calcium regulatory proteins in cardiomyocytes in response to
severe protein restriction.
Considering that the understanding of the influence of malnutrition on
heart dysfunction is essential for the design of rational intervention strategies,
34
the present study was designed to investigate the Ca2+ sparks, the expression
of SERCA2a and the involvement of the β-adrenergic system in cardiomyocyte
mechanical dysfunction induced by severe protein restriction after weaning in
rats.
2. Material and Methods
2.1. Animals
Twenty-eight day old male Fischer rats provided by the animal facilities of
the Federal Unversity of Ouro Preto (UFOP), Brazil, were divided according to
the diet received: control group (CG, n = 20) and protein-restricted group (PRG,
n = 20). After weaning, CG animals were fed with standard rodent chow (AIN-93
- 15% protein) and the PRG animals received a diet containing 6% protein
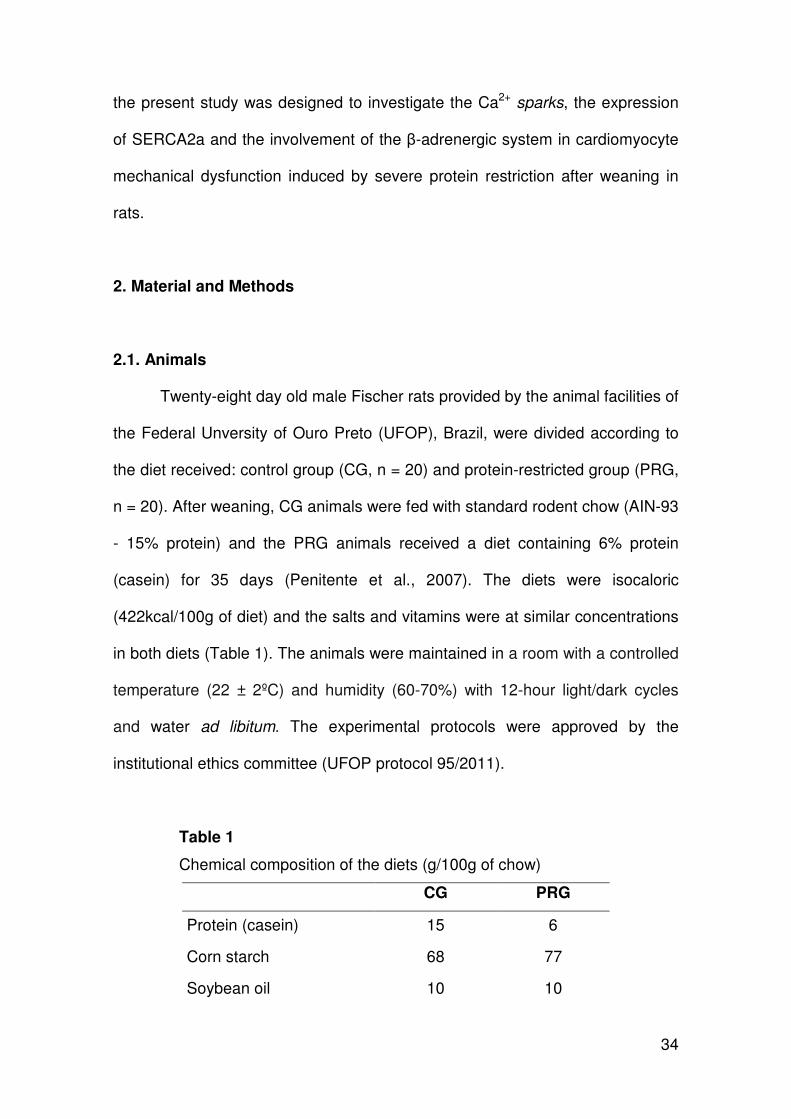
(casein) for 35 days (Penitente et al., 2007). The diets were isocaloric
(422kcal/100g of diet) and the salts and vitamins were at similar concentrations
in both diets (Table 1). The animals were maintained in a room with a controlled
temperature (22 ± 2ºC) and humidity (60-70%) with 12-hour light/dark cycles
and water ad libitum. The experimental protocols were approved by the
institutional ethics committee (UFOP protocol 95/2011).
Table 1
Chemical composition of the diets (g/100g of chow)
CG PRG
Protein (casein) 15 6
Corn starch 68 77
Soybean oil 10 10
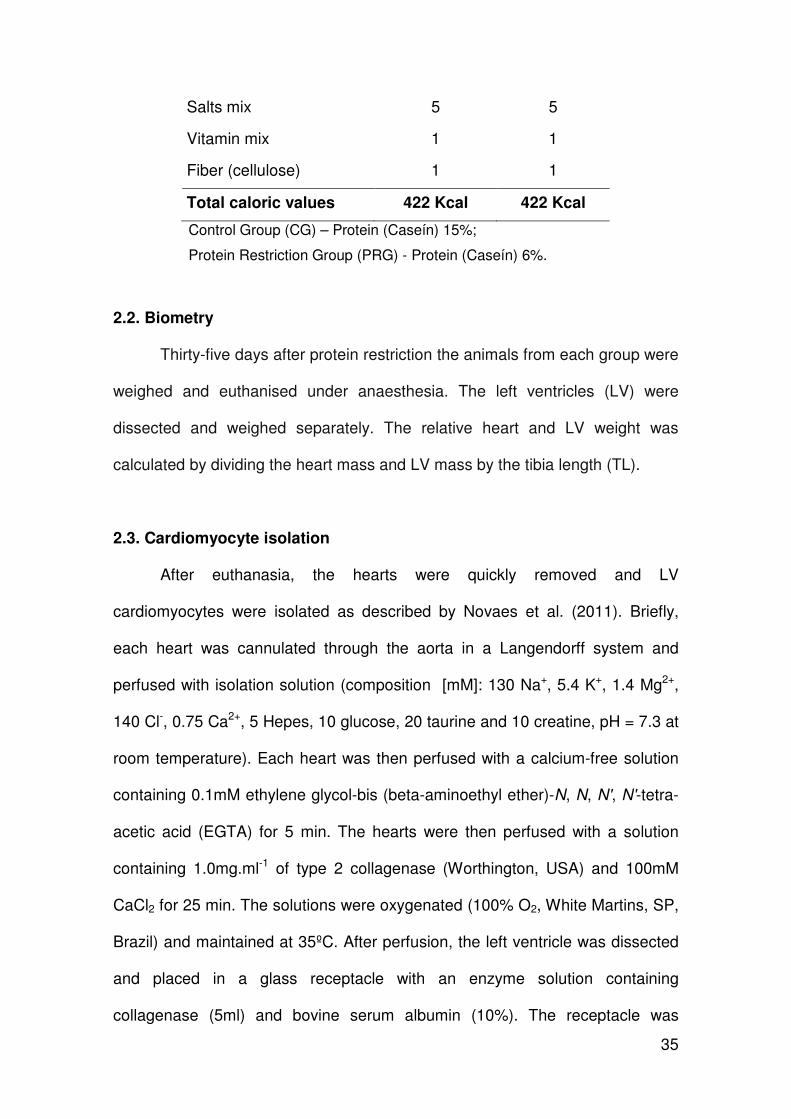
35
Salts mix 5 5
Vitamin mix 1 1
Fiber (cellulose) 1 1
Total caloric values 422 Kcal 422 Kcal
Control Group (CG) – Protein (Caseín) 15%;
Protein Restriction Group (PRG) - Protein (Caseín) 6%.
2.2. Biometry
Thirty-five days after protein restriction the animals from each group were
weighed and euthanised under anaesthesia. The left ventricles (LV) were
dissected and weighed separately. The relative heart and LV weight was
calculated by dividing the heart mass and LV mass by the tibia length (TL).
2.3. Cardiomyocyte isolation
After euthanasia, the hearts were quickly removed and LV
cardiomyocytes were isolated as described by Novaes et al. (2011). Briefly,
each heart was cannulated through the aorta in a Langendorff system and
perfused with isolation solution (composition [mM]: 130 Na+, 5.4 K+, 1.4 Mg2+,
140 Cl-, 0.75 Ca2+, 5 Hepes, 10 glucose, 20 taurine and 10 creatine, pH = 7.3 at
room temperature). Each heart was then perfused with a calcium-free solution
containing 0.1mM ethylene glycol-bis (beta-aminoethyl ether)-N, N, N', N'-tetra-
acetic acid (EGTA) for 5 min. The hearts were then perfused with a solution
containing 1.0mg.ml-1 of type 2 collagenase (Worthington, USA) and 100mM
CaCl2 for 25 min. The solutions were oxygenated (100% O2, White Martins, SP,
Brazil) and maintained at 35ºC. After perfusion, the left ventricle was dissected
and placed in a glass receptacle with an enzyme solution containing
collagenase (5ml) and bovine serum albumin (10%). The receptacle was
36
shaken moderately for 5 min at 37°C, after which the solution was centrifuged.
The supernatant was removed and the cardiomyocytes were resuspended in an
isolation solution, stored in a refrigerator (5°C) and used up to 4h after isolation.
Only calcium-tolerant, quiescent, rod-shaped cardiomyocytes showing clear
cross striations were studied.
2.4. Contractile analysis
Cardiomyocyte contractile function was measured using an edge motion
detection system (Ionoptix, Milton, MA, USA) mounted on an inverted
microscope (Nikon Eclipse TS100®, Tokyo, Japan), as previously described
[Novaes et al., 2011]. Briefly, myocytes were placed in an experimental
chamber with the base glass and bathed in buffer with the following composition
(in mM): 136.9 NaCl; 5.4 KCl; 0.37 NaH2PO4; 0.57 MgCl2; 5 Hepes; 5.6
glucose; and 1.8 CaCl2 (pH = 7.4 at room temperature). Cardiomyocytes were
field stimulated at a frequency of 3Hz (10 volts, 5 min duration) using a pair of
steel electrodes (Myopacer, Ionoptix, MA, USA). Cardiomyocytes were
visualised on a personal computer monitor with an NTSC camera (MyoCam,
Ionoptix, MA, USA) attached to the microscope using an image detection
program (Ionwizard, Ionoptix, MA, USA). This image was used to measure cell
shortening (our index of contractility) in response to electrical stimulation using
a video motion edge detector (IonWizard; IonOptix, MA, USA). All parameters
were evaluated using customised software developed using the MatLab®
platform. Cell shortening from stimulation time (expressed as a percentage of
resting cell length) to the peak of shortening and time to half relaxation were
measured and calculated as previously described.
37
2.5. β-adrenergic stimulation
The contractile response of cardiomyocytes to β-adrenergic stimulation
was assessed using the non-selective agonist isoproterenol (ISO, 1, 2 and
3mM) at a stimulation rate of 1Hz. After recording the baseline cell shortening,
ISO was infused in the experimental chamber through an automatic pipette. The
cells were electrically stimulated after 5 min of infusion when cell shortening
was recorded (Novaes et al. 2011). This procedure was repeated for each ISO
concentration in different myocytes.
2.6. Ca2+ sparks analysis
Cardiomyocytes were incubated with the fluorescent probe fluo-
4:00 (10µmol/L, Molecular Probes, Eugene, OR, USA) at room temperature for
20 minutes. The cells were washed with Tyrode's solution to remove the excess
probe (Lauton-Santos et al., 2007). Ca2+ sparks were analysed using a confocal
microscope (LSM 510 Meta Zeiss, Jena, Germany) with a 63x oil immersion
objective lens and an argon laser at 488nm. The cell images were digitised at
512 pixels and the axis of the cell scan was positioned lengthwise, being careful
not to intercept regions of nuclei. Cardiomyocytes were scanned at 1.54ms and
the sequence of scans was obtained in a series to create two-dimensional
images. Digital image processing was performed using custom routines written
in IDL (Research Systems, Boulder, CO, USA). The Ca2+ sparks amplitudes are
represented as ∆F/F0, where ∆F is the variation in fluorescence intensity
compared to the minimal fluorescence (F0) measured at each Ca2+ sparks.
2.7. SERCA2a analysis
38
After isolation, cardiomyocytes were homogenised in lysis buffer (100mM
NaCl, 50mM Tris-base, 5mM EDTA-2Na, 50mM Na4P2O7.10H2O, 1mM MgCl2,
1% Nonidet P40, 0.3% Triton x-100, and 0.5% sodium deoxycholate; pH = 8),
containing protease inhibitors (200mM PMSF, 15.7mg/mL benzamidine, and
10µM pepstatin) and phosphatase inhibitors (20mM NaF, and 1mM Na3VO4)
and then centrifuged at 8000g (4ºC).
Total proteins were quantified using the Bradford method (Bradford, 1976).
30mg of protein was diluted in buffer (5X-2M Tris, pH = 6.8; 20% Glycerol, 30%
SDS, 25% mercaptoethanol, 0.1% Bromophenol Blue) for separation by SDS-
PAGE using a standard molecular weight (BIO-RAD). After separation in the
gel, proteins were transferred to a PVDF membrane (Millipore, Billerica, MA,
USA) with a pore size of 0.45µm. The quality of the transfer was monitored by
staining the membrane with solution of Ponceau (0.2%). The membranes were
washed with TBS-Tween (0.05% Tween) and placed in blocking solution for 1
hour. They were then incubated at 4°C with primary specific antibodies: anti-
glyceraldehyde 3-phosphate dehydrogenase (GAPDH) [1:6000], (Santa Cruz
Biotechnology, Santa Cruz, CA, USA), anti-SERCA2a [1:1000], washed with
TBS containing 0.2% Tween20 (TBST) for 5 minutes (three times) and then
incubated for 2 hours with secondary antibody conjugated to peroxidase (HRP)
(1:5000, anti-goat IgG-HRP and anti-rabbit IgG-HRP (Sigma, St. Louis, MO,
USA). The protein bands were detected by a chemiluminescence reaction (kit
ECL plus, Amersham Biosciences Limited, Little Chalfont, Buckinghamshire,
England, UK). The intensity of bands was evaluated by densitometric analysis
using the ImageQuant™ software (Amersham Biosciences Limited). Protein
levels were normalised by the GAPDH expression level.
39
2.8. Statistical analysis
Data are expressed as mean and the standard error of the mean (mean
± SEM). The normal distribution of data was verified using the Kolmogorov-
Smirnov test. Biometric and cell contractile function data were compared using
the Student's t test. A p value <0.05 was considered statistically significant.
3.0. Results
3.1. Biometry
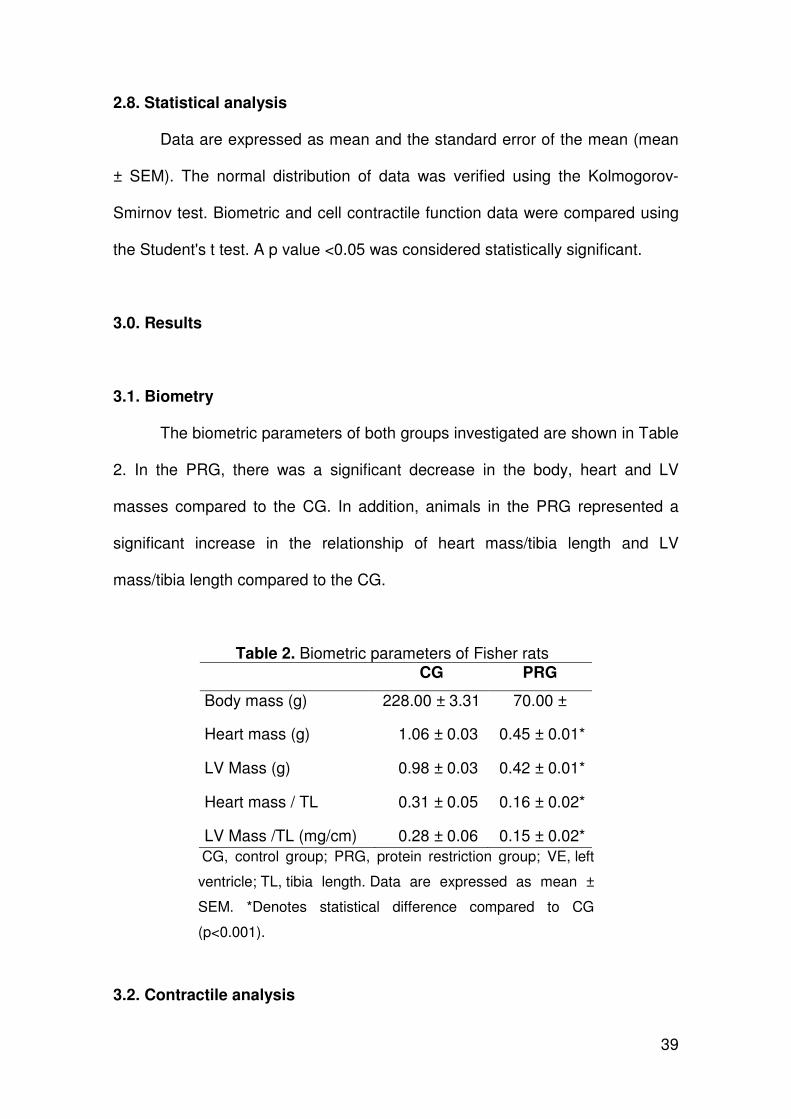
The biometric parameters of both groups investigated are shown in Table
2. In the PRG, there was a significant decrease in the body, heart and LV
masses compared to the CG. In addition, animals in the PRG represented a
significant increase in the relationship of heart mass/tibia length and LV
mass/tibia length compared to the CG.
Table 2. Biometric parameters of Fisher rats
CG PRG
Body mass (g) 228.00 ± 3.31 70.00 ±
Heart mass (g) 1.06 ± 0.03 0.45 ± 0.01*
LV Mass (g) 0.98 ± 0.03 0.42 ± 0.01*
Heart mass / TL 0.31 ± 0.05 0.16 ± 0.02*
LV Mass /TL (mg/cm) 0.28 ± 0.06 0.15 ± 0.02*
CG, control group; PRG, protein restriction group; VE, left
ventricle; TL, tibia length. Data are expressed as mean ±
SEM. *Denotes statistical difference compared to CG
(p<0.001).
3.2. Contractile analysis
40
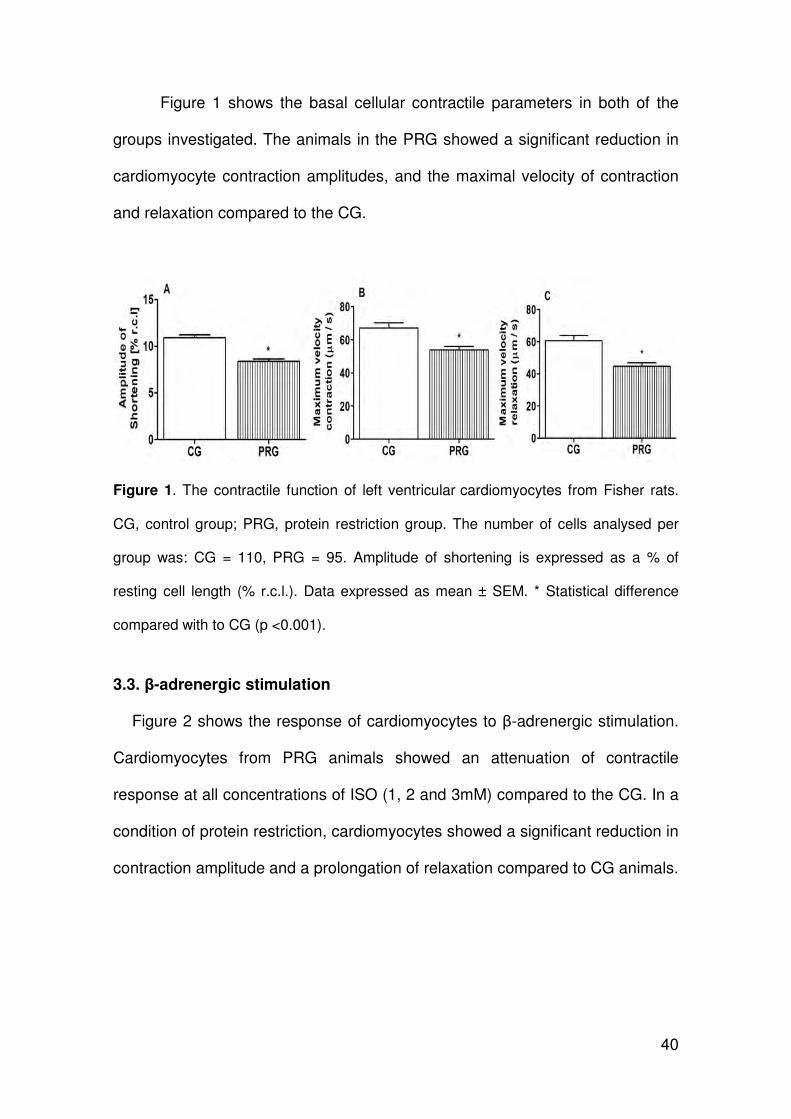
Figure 1 shows the basal cellular contractile parameters in both of the
groups investigated. The animals in the PRG showed a significant reduction in
cardiomyocyte contraction amplitudes, and the maximal velocity of contraction
and relaxation compared to the CG.
Figure 1. The contractile function of left ventricular cardiomyocytes from Fisher rats.
CG, control group; PRG, protein restriction group. The number of cells analysed per
group was: CG = 110, PRG = 95. Amplitude of shortening is expressed as a % of
resting cell length (% r.c.l.). Data expressed as mean ± SEM. * Statistical difference
compared with to CG (p <0.001).
3.3. β-adrenergic stimulation
Figure 2 shows the response of cardiomyocytes to β-adrenergic stimulation.
Cardiomyocytes from PRG animals showed an attenuation of contractile
response at all concentrations of ISO (1, 2 and 3mM) compared to the CG. In a
condition of protein restriction, cardiomyocytes showed a significant reduction in
contraction amplitude and a prolongation of relaxation compared to CG animals.
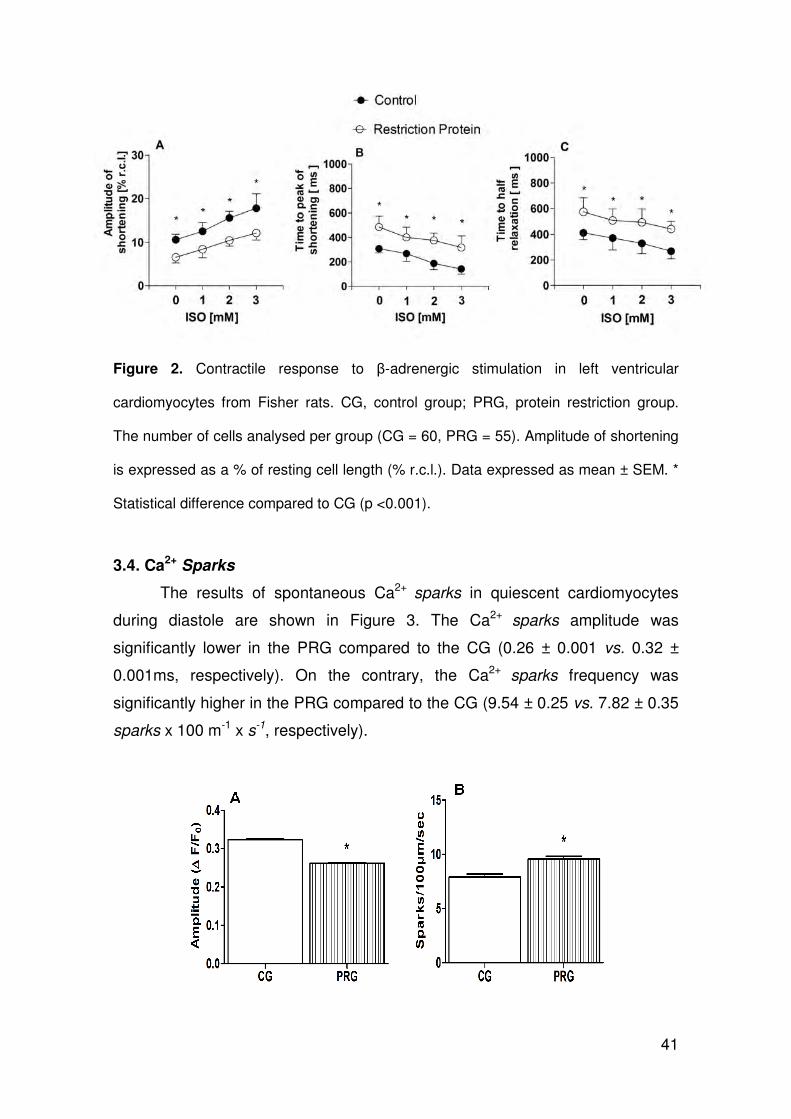
41
Figure 2. Contractile response to β-adrenergic stimulation in left ventricular
cardiomyocytes from Fisher rats. CG, control group; PRG, protein restriction group.
The number of cells analysed per group (CG = 60, PRG = 55). Amplitude of shortening
is expressed as a % of resting cell length (% r.c.l.). Data expressed as mean ± SEM. *
Statistical difference compared to CG (p <0.001).
3.4. Ca2+ Sparks
The results of spontaneous Ca2+ sparks in quiescent cardiomyocytes
during diastole are shown in Figure 3. The Ca2+ sparks amplitude was
significantly lower in the PRG compared to the CG (0.26 ± 0.001 vs. 0.32 ±
0.001ms, respectively). On the contrary, the Ca2+ sparks frequency was
significantly higher in the PRG compared to the CG (9.54 ± 0.25 vs. 7.82 ± 0.35
sparks x 100 m-1 x s-1, respectively).
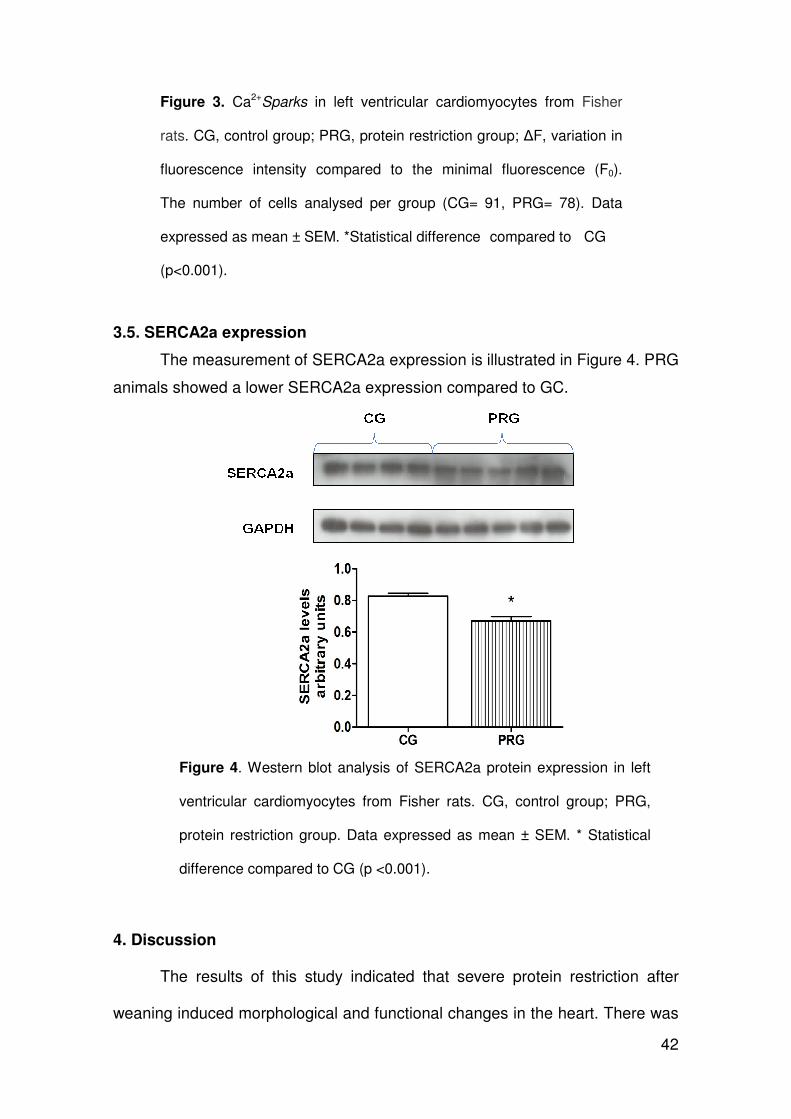
42
Figure 3. Ca2+Sparks in left ventricular cardiomyocytes from Fisher
rats. CG, control group; PRG, protein restriction group; ∆F, variation in
fluorescence intensity compared to the minimal fluorescence (F0).
The number of cells analysed per group (CG= 91, PRG= 78). Data
expressed as mean ± SEM. *Statistical difference compared to CG
(p<0.001).
3.5. SERCA2a expression
The measurement of SERCA2a expression is illustrated in Figure 4. PRG
animals showed a lower SERCA2a expression compared to GC.
Figure 4. Western blot analysis of SERCA2a protein expression in left
ventricular cardiomyocytes from Fisher rats. CG, control group; PRG,
protein restriction group. Data expressed as mean ± SEM. * Statistical
difference compared to CG (p <0.001).
4. Discussion
The results of this study indicated that severe protein restriction after
weaning induced morphological and functional changes in the heart. There was
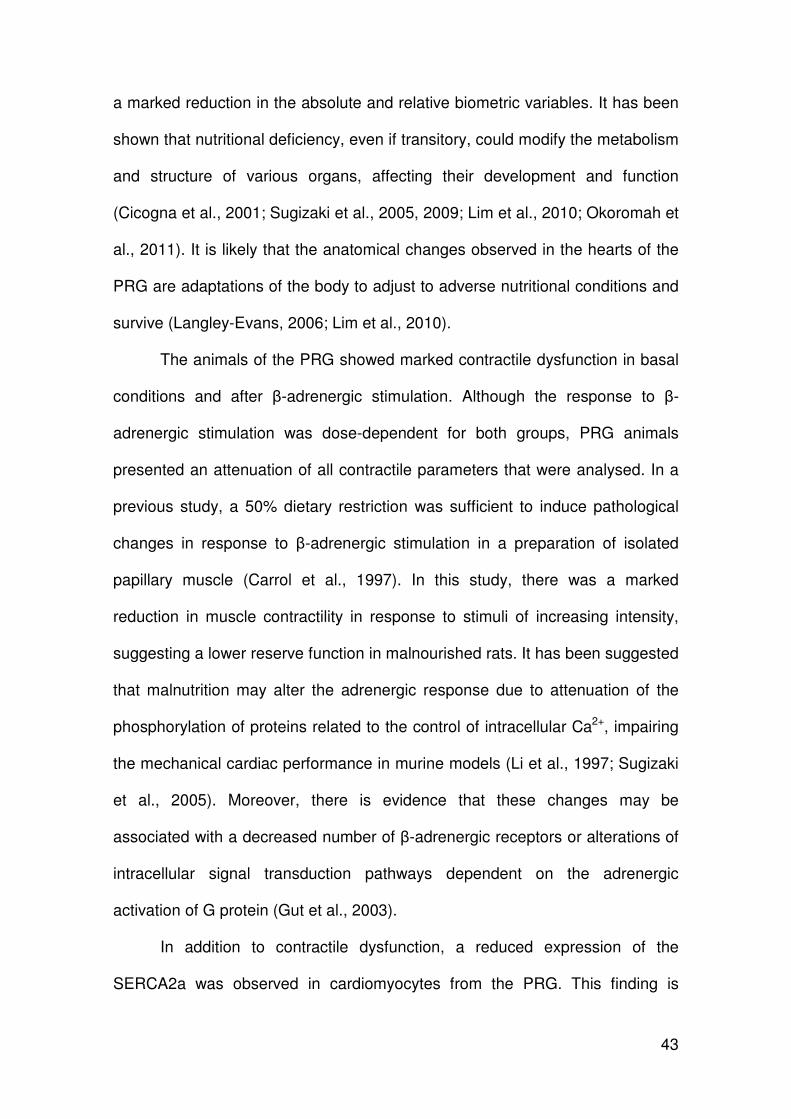
43
a marked reduction in the absolute and relative biometric variables. It has been
shown that nutritional deficiency, even if transitory, could modify the metabolism
and structure of various organs, affecting their development and function
(Cicogna et al., 2001; Sugizaki et al., 2005, 2009; Lim et al., 2010; Okoromah et
al., 2011). It is likely that the anatomical changes observed in the hearts of the
PRG are adaptations of the body to adjust to adverse nutritional conditions and
survive (Langley-Evans, 2006; Lim et al., 2010).
The animals of the PRG showed marked contractile dysfunction in basal
conditions and after β-adrenergic stimulation. Although the response to β-
adrenergic stimulation was dose-dependent for both groups, PRG animals
presented an attenuation of all contractile parameters that were analysed. In a
previous study, a 50% dietary restriction was sufficient to induce pathological
changes in response to β-adrenergic stimulation in a preparation of isolated
papillary muscle (Carrol et al., 1997). In this study, there was a marked
reduction in muscle contractility in response to stimuli of increasing intensity,
suggesting a lower reserve function in malnourished rats. It has been suggested
that malnutrition may alter the adrenergic response due to attenuation of the
phosphorylation of proteins related to the control of intracellular Ca2+, impairing
the mechanical cardiac performance in murine models (Li et al., 1997; Sugizaki
et al., 2005). Moreover, there is evidence that these changes may be
associated with a decreased number of β-adrenergic receptors or alterations of
intracellular signal transduction pathways dependent on the adrenergic
activation of G protein (Gut et al., 2003).
In addition to contractile dysfunction, a reduced expression of the
SERCA2a was observed in cardiomyocytes from the PRG. This finding is
44
consistent with the potential inhibition of calcium uptake by the sarcoplasmic
reticulum during relaxation of cardiomyocytes. The principal component
associated with the [Ca2+]i transient control is the Ca2+ ATP-dependent
transporter of the sarcoplasmic reticulum (SERCA2a). This transporter is
responsible for the higher rate of re-uptake of cytosolic Ca2+ (90%) (Bers et al.,
2001) and its expression, structure and/or function are often impaired in heart
diseases with different aetiologies, such as diabetes mellitus, hypertension, and
autoimmune cardiopathies (Bers et al., 2003; Novaes et al., 2011). Pathological
changes of SERCA2a resulted in a lower re-uptake of cytosolic Ca2+ into the
sarcoplasmic reticulum, and an increased cytosolic Ca2+ concentration,
impairing cell relaxation (Bers et al., 2003; Leopoldo et al., 2011). Thus, it is not
unrealistic to assume that the lower activity of SERCA2a induced by protein
restriction applied in the experimental model investigated may be related to
attenuation of cardiomyocyte relaxation. This explains, in part, the prolongation
of relaxation time observed in the PRG ccardiomyocytes, which is possibly
related to the elevation of cytosolic Ca2+ that is dependent on the lower
reuptake of the cytosolic Ca2+ to the sarcoplasmic reticulum by SERCA2a.
The frequency and amplitude of basal spontaneous pulses of Ca2+ from
the sarcoplasmic reticulum (Ca2+ sparks) are important indicators of the
functional state of the ryanodine channels (RyR2) (Bers et al., 2001). A smaller
amplitude and higher frequency of Ca2+ sparks was evidenced in the PRG
compared to the CG. These results indicate that protein restriction after
weaning can modify the function of RyR2. Other researchers, working with
different animal models of cardiac dysfunction, also found similar results to
those found in this study (Bers et al., 2003; Vizotto et al., 2007).
45
The abnormal activity of RyR2 has been shown in different types of
heart disease (George, 2008). A common feature in most models of
experimental heart failure is the decline of the Ca2+ content of the sarcoplasmic
reticulum. This change can be caused by changes in the function of SERCA2a,
the Na+/Ca2+ transporter of the sarcolemma (NCX) and RyR2 (George, 2008).
However, detailed analysis of these molecular transporters requires additional
studies to define its role in cardiac dysfunction in conditions of protein
restriction. Bers et al. (1998) observed that the spontaneous release of Ca2+
from the sarcoplasmic reticulum depends mainly on the concentration of
cytosolic Ca2+ and Ca2+-loading of the sarcoplasmic reticulum. Thus, the
reduction of Ca2+ mobilisation can act as a trigger point of spontaneous activity,
conducing to increase the spontaneous release of Ca2+ during diastole.
Furthermore, increased Ca2+ sparks observed in cases of cardiac dysfunction
have been related to a change of the control exercised by the protein
FKBP12.6 on Ca2+ channel release from the sarcoplasmic reticulum (Marks,
2001, Marks et al. 2002). Although the role of FKBP12.6 in the stabilisation of
the Ca2+ channel from the sarcoplasmic reticulum was recognised, little is
known about the role of this regulatory protein in the pathogenesis of heart
failure (Marx et al., 2000), which indicates the need for further investigations.
The results indicated that severe protein restriction after weaning is able
to induce morphological and functional changes in the heart and ventricular
cardiomyocytes. The pathological changes of cardiomyocyte mechanics
suggest a potential involvement of the β-adrenergic pathway that participates in
the modulation of cellular contractility, which is possibly associated with
changes in SERCA2a expression and disturbances in the Ca2+ intracellular
46
kinetics. Although these findings suggest new aspects of the pathophysiology of
heart disease associated with malnutrition, the involvement of Ca2+ transport
proteins and the activation of signalling pathways that regulate the Ca2+
intracellular kinetics under conditions of protein restriction remains poorly
understood and requires further study.
5. Acknowledgements
We thank the Center for Microscopy and Microanalysis of the Federal
University of Viçosa and also FAPEMIG for financial support..
6. References
Bers DM, Li L, Satoh H, Mccall E. (1998) Factors that control sarcoplasmic
reticulum release in intact ventricular myocytes. Ann NY Acad Sci 853: 157-177.
Bers DM. (2001) Excitation-contraction coupling and cardiac contractile force.
The Netherlands: Kluwer Academic Publishers 32: 283-284.
Bers DM, Eisner DA, Valdivia HH. (2003) Sarcoplasmic reticulum Ca2+ and
heart failure roles of diastolic leak and Ca2+ transport. Circul Res 93: 487-490.
Bradford, M.M. (1976) Rapid and sensitive method for the quantitation of
microgram quantities of protein utilizing the principle of protein-dye binding.
Anal Biochem 72: 248-254.
Cicogna AC, Padovani CR, Okoshi K, Matsubara LS, Aragon FF, Okoshi MP.
(2001) The influence of temporal food restriction on the performance of isolated
cardiac muscle. Nut Res 21: 639–648.
George CH. (2008) Sarcoplasmic reticulum Ca2+ leak in heart failure: mere
observation or functional relevance? Cardiovasc Res 77: 302-314.
47
Gruber C, Nink N, Nikam S, Magdowski G, Kripp G, Voswinckel R, Mühlfeld C.
(2012) Myocardial remodelling in left ventricular atrophy induced by caloric
restriction. J Anat 220: 179–185.
Gut AL, Okoshi MP, Padovani CR, Aragon FF, Cicogna AC. (2003) Myocardial
dysfunction induced by food restriction is related to calcium cycling and beta-
adrenergic system changes. Nutr Res 23: 911-919.
Langley-Evans SC. (2006) Developmental programming of health and disease.
Proc Nutr Soc 65: 97-105.
Leopoldo AS, Lima-Leopoldo AP, Sugizaki MM, Nascimento AF, Campos DHS,
Luvizotto RAM, Castardeli E, Alves CAB, Brum PC, Cicogna AC. (2011)
Involvement of l-type calcium channel and SERCA2a in myocardial dysfunction
induced by obesity. Journal of Cellular Physiology 22: 1-29.
Lim K, Zimanyi MA, Black MJ. (2010) Effect of maternal protein restriction
during pregnancy and lactation on the number of cardiomyocytes in the post
proliferative weanling rat heart. Anatomical Record 293: 431-437.
Li P, Hofmann PA, LI B, Malhotra A, Cheng W, Sonnenblick EH, Meggs LG,
Anversa P. (1997) Myocardial infarction alters myofilament calcium sensitivity
and mechanical behavior of myocytes. Am J Physiol 272: 360-70.
Marks AR. (2001) Ryanodine receptors/calcium release channels in heart
failure and sudden cardiac death. J Mol Cell Cardiol 33: 615-624.
Marks AR, Priori S, Memmi M, Kontula K, Laitinen PJ. (2002a) Involvement of
the cardiac ryanodine receptor/calcium release channel in catecholaminergic
polymorphic ventricular tachycardia J Cell Physiol 190: 1-6.
Martins CDD, Chianca DAJr, Fernandes LG. (2011) Cardiac autonomic balance
in rats submitted to protein restriction after weaning. Clin Exp Pharm Physiol 38:
89-93.
48
Marx SO, Reiken S, Hisamatsu Y, Jayaraman T, Burkhoff D, Rosemblit N,
Marks AR. (2000) PKA Phosphorylation dissociates FKBP12.6 from the calcium
release channel (ryanodine receptor): defective regulation in failing hearts. Cell
101: 365-376.
Novaes RD, Penitente AR, Gonçalves RV, Talvani A, Neves CA, Maldonado
IRSC, Natali AJ. (2011) Effects of Trypanosoma cruzi infection on myocardium
morphology, single cardiomyocyte contractile function and exercise tolerance in
rats. Int J Exp Pathol 92: 299-307.
Okoromah CAN, Ekure EN, Lesi FEA, Okunowo WO, Tijani BO, Okeiyi JC.
(2011) Prevalence, profile and predictors of malnutrition in children with
congenital heart defects: a case–control observational study. Arch Dis Child 96:
354-360.
Penitente AR, Fernandes LG, Cardoso LM, Silva ME, Pedrosa ML, Silva AL,
Haibara AS, Moraes MFD, Chianca DA Jr. (2007) Malnutrition enhances
cardiovascular responses to chemoreflex activation in awake rats. Life Sciences
81: 609-614.
Sugizaki MM, Carvalho RF, Aragon FF, Padovani CR, Okoshi K, Okoshi MP.
(2005) Myocardial dysfunction induced by food restriction is related to
morphological damage in normotensive middle-aged rats. J Biomed Sci 12:
641-649.
Sugizaki MM, Leopoldo AS, Okoshi MP, Bruno A, Conde SJ, Lima-Leopoldo
AP. (2009) Severe food restriction induces myocardial dysfunction related to
SERCA2 activity. Can J Physiol Pharmacol 87: 666-673.
Vizotto VA, Carvalho RF, Sugizaki MM, Lima AP, Aragon FF, Padovani CR,
Castro AVB, Pai-Silva MDal, Nogueira CR, Cicogna AC. (2007) Down-
regulation of the cardiac sarcoplasmic reticulum ryanodine channel in severely
food-restricted rats. Braz J Med Biol Res 40: 27-31.
49
4.3. Paper 3
Protein malnutrition after weaning induces left ventricular
morphofunctional remodeling in Fischer rat
Abstract
We investigated the relationship between a low protein diet,
morphological, ultrastructural and functional myocardial changes in male
Fischer rats, after breastfeeding. The animals were divided into control group
(CG) and protein-restricted group (PRG). After weaning, animals were weighed
PRG and CG and were isocaloric diets containing 15% and 6% protein,
respectively, for 35 days. Then the animals were weighed and sacrificed. The
hearts were removed and processed for histological, morphometric,
stereological and ultrastructural. Cardiomyocytes eight animals from each group
were processed for analysis of mechanical properties. The results
demonstrated that the restriction protein (PR) caused a reduction in body
weight, heart and left ventricular PRG. These changes were accompanied by
decreases in length, width and area of cardiomyocytes, in addition to
the increased amount of interstitial collagen in PRG. The ultrastructural
analysis allowed to observe less-developed myofibrils and an apparent increase
in the proportion of mitochondria. In addition, ventricular myocytes PRG also
showed changes in contractile responses: increasing the amplitude
of contraction, decreasing the time of cardiac contraction and relaxation in
the heart of high concentrations of extracellular calcium [Ca2+]e = 1.8mM to
50
[Ca2+]e = 5.0 mM. According to these results, we concluded that protein
deficiency affects myocardial performance, and this damage could be attributed
to the contractile the contractile, change in morphology and ultrastructure of
cardiomyocytes.
Keywords: Ultrastructure, morphology, cardiac dysfunction, cardiomyopathy.
51
1. introduction
Several studies have associated protein restriction (PR) with an
increased incidence of cardiovascular disease (Barker et al., 1989, Lim et al.,
2010). Previous studies indicated that intrauterine malnutrition causes a
pathological reorganization of the histoarchitecture in vital organs such as
lungs, kidneys and heart; aspect directly associated to the permanent reduction
of the functional units of these organs (Corstius et al, 2005; Lipsett et al., 2006,
Zimanyi et al., 2006, Gruber et al., 2012).
It has been systematically shown that mechanical and hemodynamics
dysfunctions observed in cardiac diseases with different etiologies are directly
associated with pathological changes in cell structure and function (Leopold et
al, 2011). Currently, little is known about the influence of protein restriction (PR)
on the cardiac remodeling in the cellular and subcellular level (ultrastructural)
(Zucoloto & Rossi, 1982; Pinotti et al., 2010). However, there are strong
indications that the pathogenesis of cardiovascular disorders such as poor
control of heart rate and blood pressure (Penitent et al., 2007, Martins et al.,
2011) and the reduction of the cardiac contraction strength, recognized present
in RP, presents a metabolic and cellular basis (Christian & Stewart, 2010; Lima-
Leopoldo et al., 2011).
Admittedly, the cardiac development represented by cellular hyperplasia is
maintained during the first 2 weeks in the postnatal period in rats (Li et al.,
1996). After this period, the cardiomyocytes are no longer proliferate and only
the growth becomes viable (Li et al., 1996). It was previously demonstrated that
the PR is capable of reducing the number of heart cells only during the cell
52
hyperplasia (Corstius et al., 2005). However, there is limited information about
the potential for malnutrition impairs the cardiac myocytes development after
cessation of cell proliferation phase.
Thus, the objective of this study was to investigate the influence of severe
protein restriction after weaning on the morphology and ultrastructure of the left
ventricle, and the contractile function of isolated cardiac myocytes from Fisher
rats.
2. Material and methods
2.1. Animals
Twenty-eight day old male Fischer rats provided by the animal facilities of
the Federal Unversity of Ouro Preto (UFOP), Brazil, were divided according to
the diet received: control group (CG, n = 16) and protein-restricted group (PRG,
n = 16). After weaning, CG animals were fed with standard rodent chow (AIN-93
- 15% protein) and the PRG animals received a diet containing 6% protein
(casein) for 35 days (Penitente et al., 2007). The diets were isocaloric (422
kcal/100 g of diet) and the salts and vitamins were at similar concentrations in
both diets (Table 1). The animals were maintained in a controlled temperature
room (22 ± 2 ºC) and humidity (60-70%) with 12-hour light/dark cycles and had
water ad libitum. The experimental protocols were approved by the Ethics
Committee of the Federal University of Viçosa (UFV protocol 95/2011).
Table 1. Chemical composition of the diets (g/100g of chow)
Nutrients CG PRG
53
Protein (casein) 15 6
Corn starch 68 77
Soybean oil 10 10
Salts mix 5 5
Vitamin mix 1 1
Fiber (cellulose) 1 1
Total caloric values 422 Kcal 422 Kcal
GC, control group; GRP, protein restriction group.
2.2. Biometric and morphometric analysis
After the experimental protocol, eight animals from each group were
weighed and sacrificed. The hearts were removed and weighed. The left
ventricles (LV) were dissected, weighed separately and the volume was
determined by the method of Scherle (Scherle, 1970). The LV were placed in
histological fixative for 48 h (10% formaldehyde in 0.1 M phosphate buffer, pH
7.2). The ventricles were dehydrated in ethanol, clarified in xylene and
embedded in paraffin. The blocks were cut into 4 µm thick sections, stained with
hematoxylin and eosin (H&E), Masson's trichrome, Sirius red (Sirius Red F3B,
Mobay Chemical Co., New Jersey, USA) and mounted on slides. The
histological sections stained with H&E were visualized and images captured
using a light microscope (Olympus BX-60, Tokyo, Japan) connected to a digital
camera (Olympus Q-Color-3, Tokyo, Japan). Through digital images were
calculated the length and width of cardiomyocytes in 150 fields for each group.
Were investigated fifty cells per animal with a 40x objective lens.
The histological sections stained with Sirius Red were observed under
polarized light (Axioscópio, Zeiss, Tokyo, Japan) and used to determine the
proportion of collagen present in the extracellular matrix. For this analysis was
54
used the software Image-Pro Plus 4.5 (Media Cybernetcs, Silver Spring, MD,
USA) based on the properties of birefringence of the collagen fibrils under
polarized light. Ten fields were investigated by histological animal with 20x
objective lens.
2.3. Stereological analysis
Fragments of the LV were obtained by the orientador method to define
isotropic and uniform random sections (IUR) required for stereological analysis
(Novaes et al., 2012). The stereological analysis was performed on sections
stained with Masson’s trichrome (figure 1). Were investigated 10 microscopic
fields per animal obtained randomly with a 40x objective lens (Olympus BX-60,
Tokyo, Japan). The volume of cardiomyocytes (V [imc], mm3) and blood vessels
(V [vessels], mm3), total length of cardiomyocytes (L [imc], km) and blood
vessels (L [vessels], km) in the LV were estimated according to the
methodology described by Brüel et al. (2005).
The number of cardiomyocytes (IMC) in a three-dimensional space was
estimated using the physical disector method (Novaes et al., 2012). The
disector consists of two parallel planes delimited by a test area (AT = 2670 µm2)
and separated by a known distance (h = 3 µm). The numerical density of
cardiomyocytes (Nv [imc] imc / mm3) was determined from 10 disector pairs for
each animal, defined as Nv [imc] = Q-[imc] / h × AT, where Q-[imc] represents
the number of cardiomyocyte nuclei counted in the test area on the disector
reference plane (look up'' plan'') (Novaes et al., 2012). The total number of
cardiomyocytes in the LV was estimated as the product Nv [imc] / LV volume.
According to the protocol described by Eisele et al., (2008) the tissue retraction
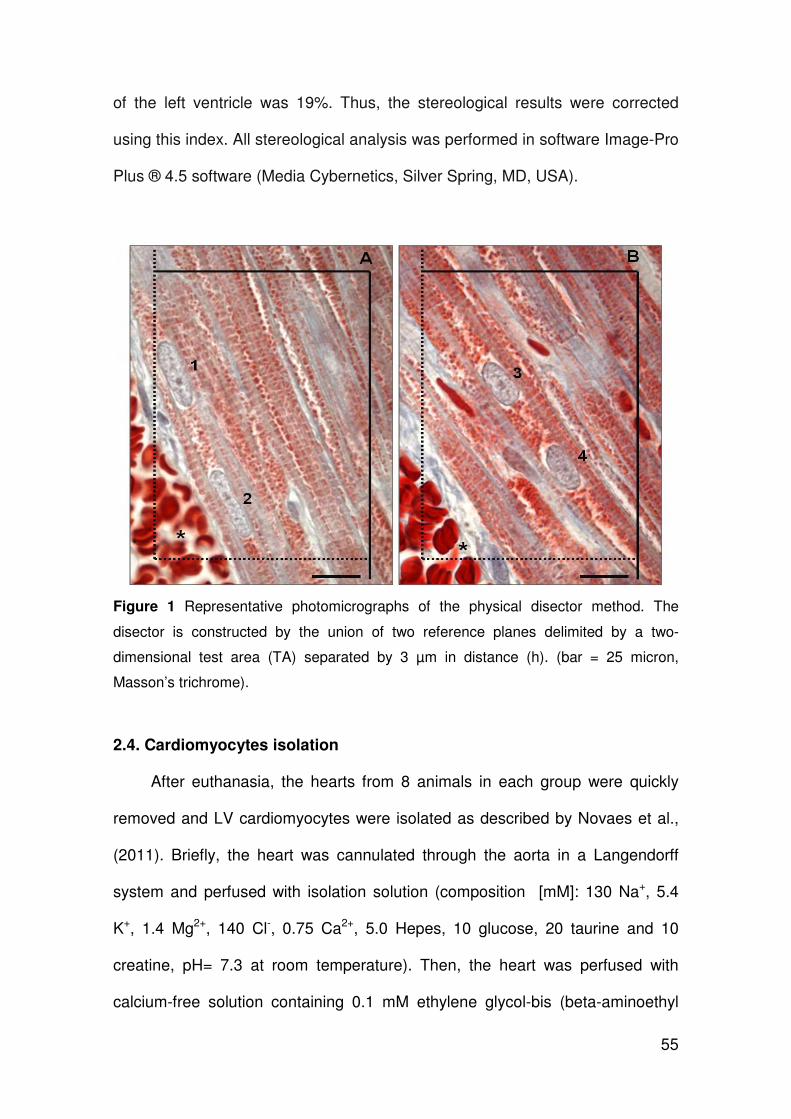
55
of the left ventricle was 19%. Thus, the stereological results were corrected
using this index. All stereological analysis was performed in software Image-Pro
Plus ® 4.5 software (Media Cybernetics, Silver Spring, MD, USA).
Figure 1 Representative photomicrographs of the physical disector method. The
disector is constructed by the union of two reference planes delimited by a two-
dimensional test area (TA) separated by 3 µm in distance (h). (bar = 25 micron,
Masson’s trichrome).
2.4. Cardiomyocytes isolation
After euthanasia, the hearts from 8 animals in each group were quickly
removed and LV cardiomyocytes were isolated as described by Novaes et al.,
(2011). Briefly, the heart was cannulated through the aorta in a Langendorff
system and perfused with isolation solution (composition [mM]: 130 Na+, 5.4
K+, 1.4 Mg2+, 140 Cl-, 0.75 Ca2+, 5.0 Hepes, 10 glucose, 20 taurine and 10
creatine, pH= 7.3 at room temperature). Then, the heart was perfused with
calcium-free solution containing 0.1 mM ethylene glycol-bis (beta-aminoethyl
56
ether)-N, N, N', N'-tetraacetic acid (EGTA) for 5 min. The heart was then
perfused with a solution containing 1.0 mg.ml-1 of type 2 collagenase
(Worthington, USA) and 100.0 mM CaCl2 for 25 min. The solutions were
oxygenated (100% O2, White Martins, SP, Brazil) and maintained at 35 ºC. After
perfusion, the left ventricle was dissected and placed in a glass recipient with an
enzyme solution containing collagenase (5.0 ml) and bovine serum albumin
(10%). The recipient was shaken moderately for 5 min at 37 °C, after which the
solution was centrifuged. The supernatant was removed and cardiomyocytes
were resuspended in isolation solution, stored in a refrigerator (5 °C) and used
in a period up to 4h after isolation. Only calcium-tolerant, quiescent, rod-shaped
cardiomyocytes showing clear cross striations were studied.
2.5. Cell contractility
Cardiomyocytes contractile function was measured using an edge motion
detection system (Ionoptix, Milton, MA, USA) mounted on an inverted
microscope (Nikon Eclipse TS100®, Tokyo, Japan), as previously described
[Novaes et al., 2011]. Briefly, myocytes were placed in an experimental
chamber with the base glass and bathed in buffer with the following composition
(in mM): 136.9 NaCl; 5.4 KCl; 0.37 NaH2PO4; 0.57 MgCl2, 5.0 Hepes; 5.6
glucose and 1.8 CaCl2 (pH= 7.4 at room temperature). Cardiomyocytes were
field stimulated at a frequency of 3.0 Hz (10 volts, 5 min duration) using a pair of
steel electrodes (Myopacer, Ionoptix, MA, USA). Cardiomyocytes were
visualized on a personal computer monitor with a NTSC camera (MyoCam,
Ionoptix, MA, USA) attached to the microscope using an image detection
program (Ionwizard, Ionoptix, MA, USA). This image was used to measure cell
57
shortening (our index of contractility) in response to electrical stimulation using
a video motion edge detector (IonWizard; IonOptix, MA, USA). All parameters
were evaluated using customized software developed in the MatLab® platform.
Cell shortening from stimulation (expressed as a percentage of resting cell
length), time to peak of shortening and time to half relaxation were measured
and calculated as previously described (Novaes et al., 2011).
2.6. Transmission electron microscopy
Fragments of the left ventricle (1 mm2) were transferred to fixative solution
(2.5% glutaraldehyde in sodium cacodylate buffer 0.1 M [pH 7.2]). After washing
with buffer, the samples were post-fixed with 1% osmium tetroxide, in the same
buffer for 2 h. Dehydration was performed in a graded series of ethanol,
followed by incorporation in LR-White resin (London Resin Company Ltd,
England). After inclusion, ultrathin sections were obtained and stained with
uranyl acetate 2% lead citrate and 0.2% in 1M sodium hydroxide and observed
in transmission electron microscope Zeiss EM 109 (Jena, Germany) in the
Nucleus Microscopy and Microanalysis of the Federal University of Viçosa.
2.7. Statistical analysis
Data are expressed as mean and standard error of mean (mean ± SEM).
The normal distribution of data was verified by using the Kolmogorov-Smirnov
test. Biometric and cell contractile function data were compared using the
Student's t test. Morphometric data were compared using the Mann-Whitney U
test. A p value <0.05 was considered statistically significant.
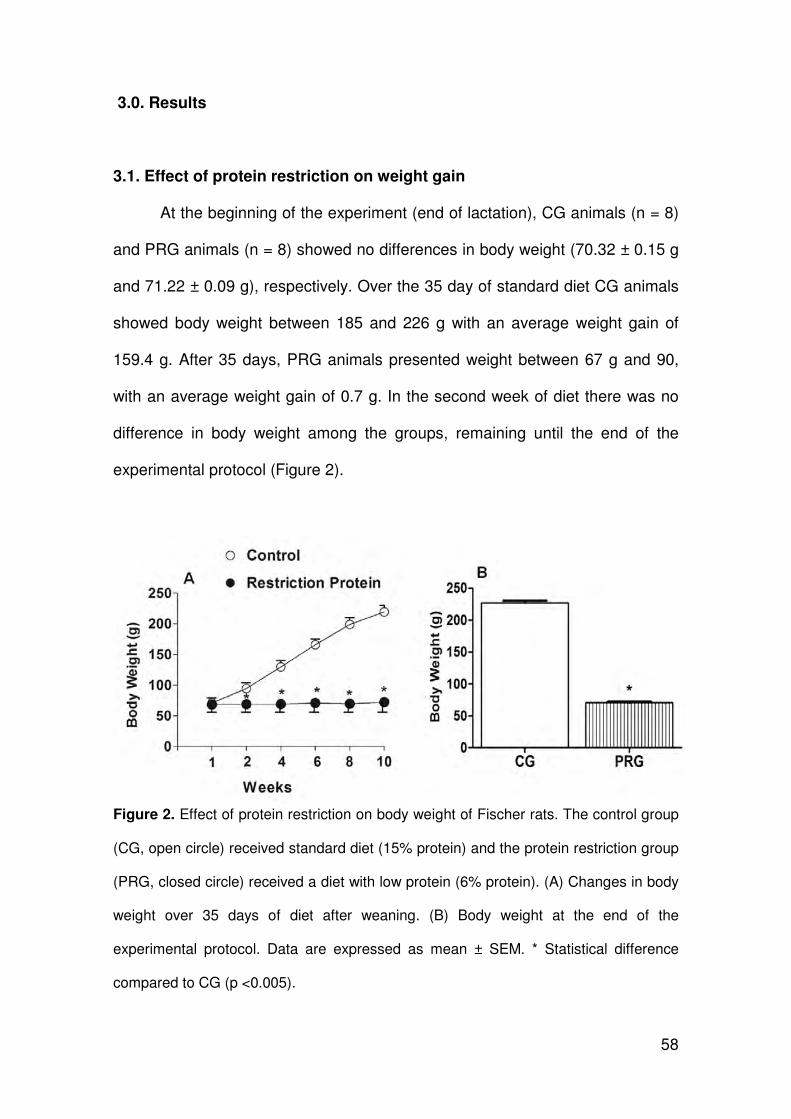
58
3.0. Results
3.1. Effect of protein restriction on weight gain
At the beginning of the experiment (end of lactation), CG animals (n = 8)
and PRG animals (n = 8) showed no differences in body weight (70.32 ± 0.15 g
and 71.22 ± 0.09 g), respectively. Over the 35 day of standard diet CG animals
showed body weight between 185 and 226 g with an average weight gain of
159.4 g. After 35 days, PRG animals presented weight between 67 g and 90,
with an average weight gain of 0.7 g. In the second week of diet there was no
difference in body weight among the groups, remaining until the end of the
experimental protocol (Figure 2).
Figure 2. Effect of protein restriction on body weight of Fischer rats. The control group
(CG, open circle) received standard diet (15% protein) and the protein restriction group
(PRG, closed circle) received a diet with low protein (6% protein). (A) Changes in body
weight over 35 days of diet after weaning. (B) Body weight at the end of the
experimental protocol. Data are expressed as mean ± SEM. * Statistical difference
compared to CG (p <0.005).
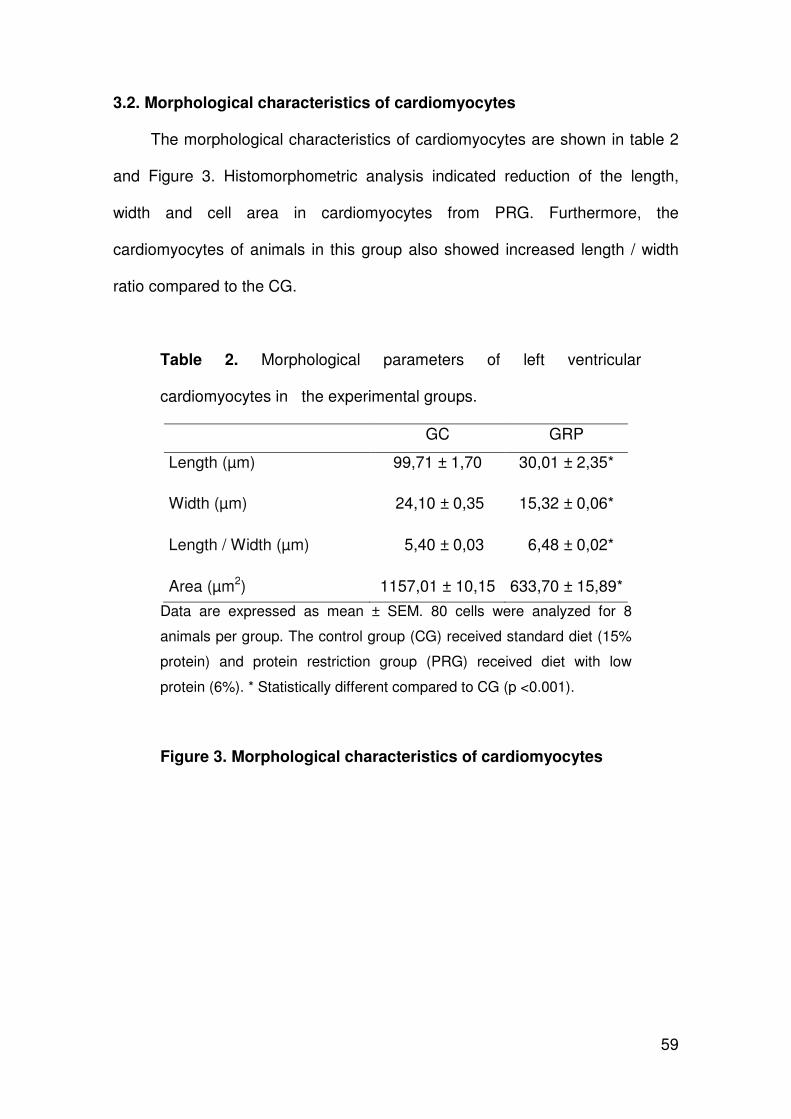
59
3.2. Morphological characteristics of cardiomyocytes
The morphological characteristics of cardiomyocytes are shown in table 2
and Figure 3. Histomorphometric analysis indicated reduction of the length,
width and cell area in cardiomyocytes from PRG. Furthermore, the
cardiomyocytes of animals in this group also showed increased length / width
ratio compared to the CG.
Table 2. Morphological parameters of left ventricular
cardiomyocytes in the experimental groups.
GC GRP
Length (µm) 99,71 ± 1,70 30,01 ± 2,35*
Width (µm) 24,10 ± 0,35 15,32 ± 0,06*
Length / Width (µm) 5,40 ± 0,03 6,48 ± 0,02*
Area (µm2) 1157,01 ± 10,15 633,70 ± 15,89*
Data are expressed as mean ± SEM. 80 cells were analyzed for 8
animals per group. The control group (CG) received standard diet (15%
protein) and protein restriction group (PRG) received diet with low
protein (6%). * Statistically different compared to CG (p <0.001).
Figure 3. Morphological characteristics of cardiomyocytes
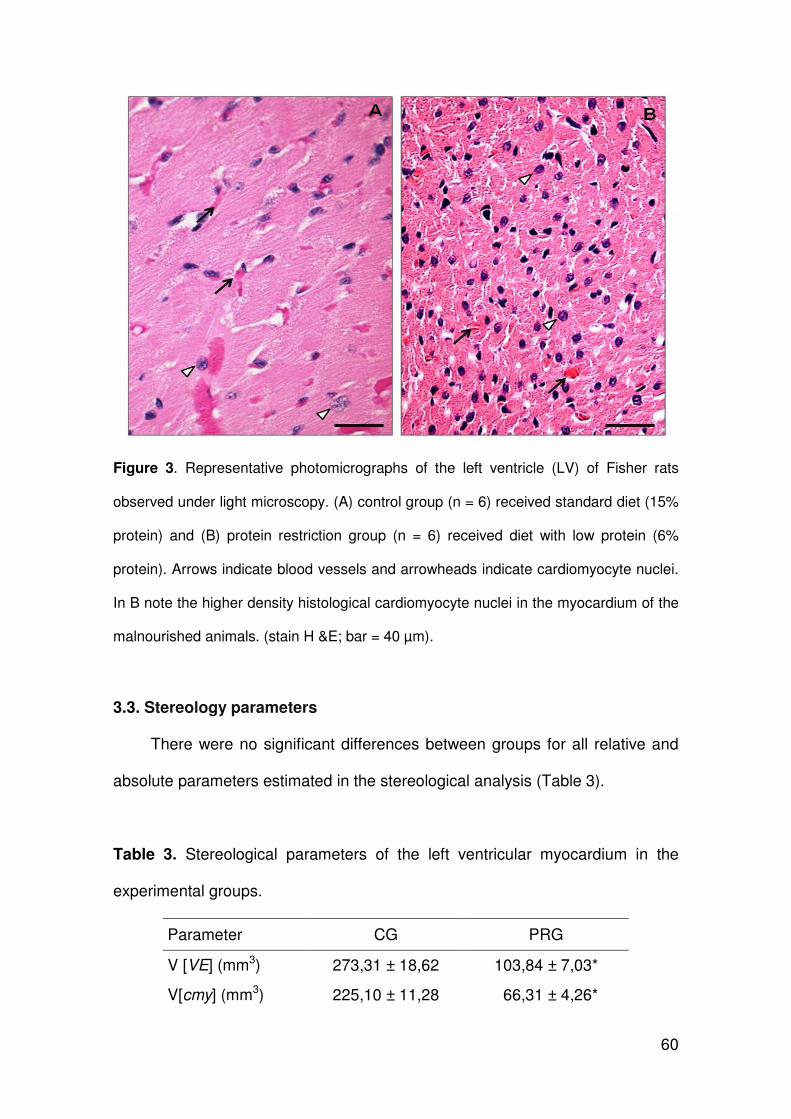
60
Figure 3. Representative photomicrographs of the left ventricle (LV) of Fisher rats
observed under light microscopy. (A) control group (n = 6) received standard diet (15%
protein) and (B) protein restriction group (n = 6) received diet with low protein (6%
protein). Arrows indicate blood vessels and arrowheads indicate cardiomyocyte nuclei.
In B note the higher density histological cardiomyocyte nuclei in the myocardium of the
malnourished animals. (stain H &E; bar = 40 µm).
3.3. Stereology parameters
There were no significant differences between groups for all relative and
absolute parameters estimated in the stereological analysis (Table 3).
Table 3. Stereological parameters of the left ventricular myocardium in the
experimental groups.
Parameter CG PRG
V [VE] (mm3) 273,31 ± 18,62 103,84 ± 7,03*
V[cmy] (mm3) 225,10 ± 11,28 66,31 ± 4,26*
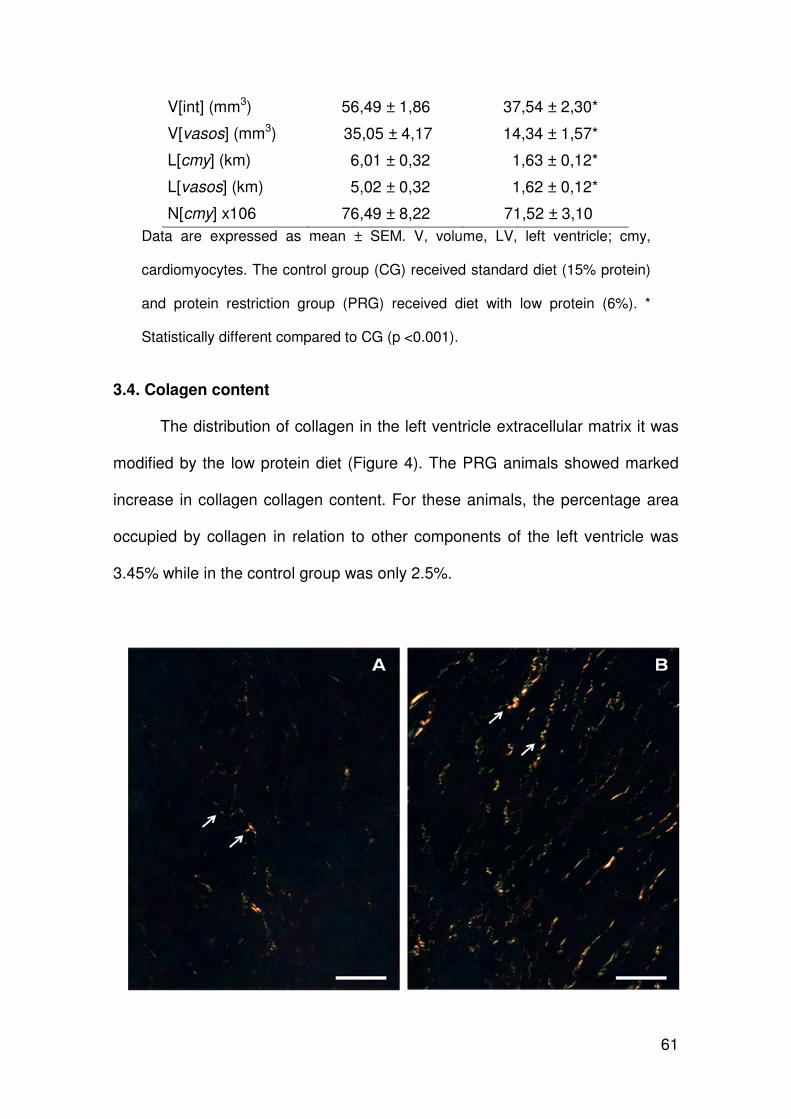
61
V[int] (mm3) 56,49 ± 1,86 37,54 ± 2,30*
V[vasos] (mm3) 35,05 ± 4,17 14,34 ± 1,57*
L[cmy] (km) 6,01 ± 0,32 1,63 ± 0,12*
L[vasos] (km) 5,02 ± 0,32 1,62 ± 0,12*
N[cmy] x106 76,49 ± 8,22 71,52 ± 3,10
Data are expressed as mean ± SEM. V, volume, LV, left ventricle; cmy,
cardiomyocytes. The control group (CG) received standard diet (15% protein)
and protein restriction group (PRG) received diet with low protein (6%). *
Statistically different compared to CG (p <0.001).
3.4. Colagen content
The distribution of collagen in the left ventricle extracellular matrix it was
modified by the low protein diet (Figure 4). The PRG animals showed marked
increase in collagen collagen content. For these animals, the percentage area
occupied by collagen in relation to other components of the left ventricle was
3.45% while in the control group was only 2.5%.
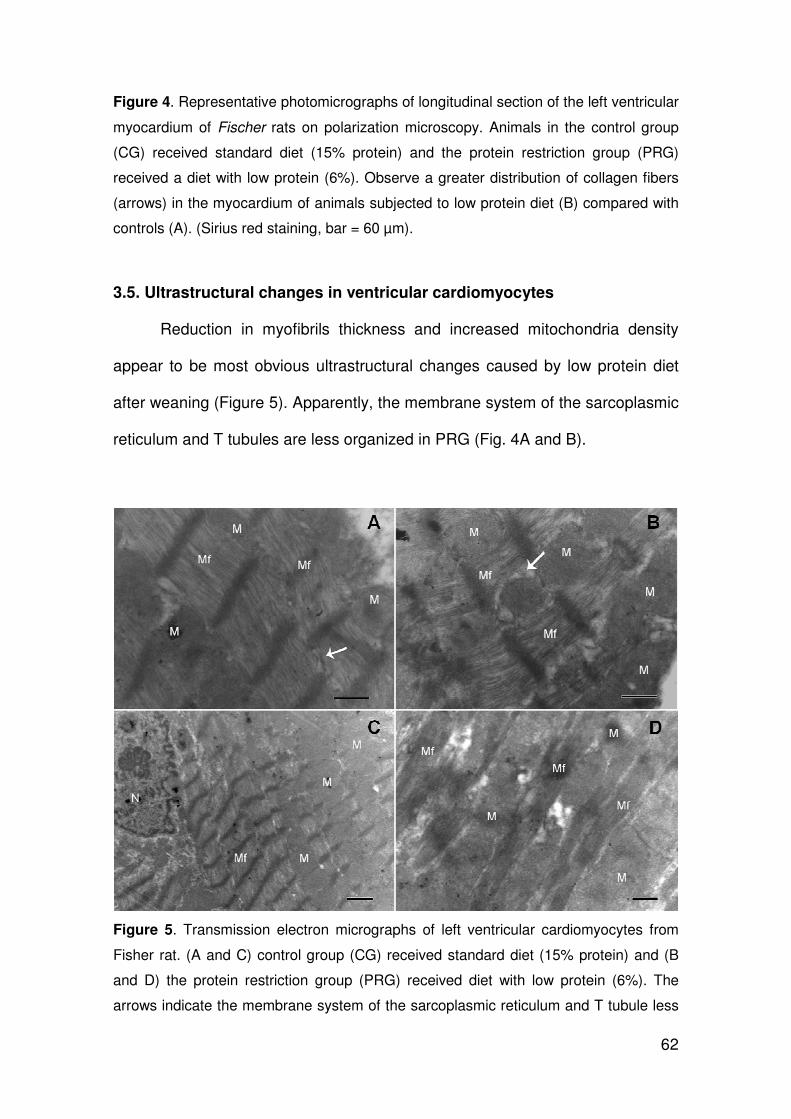
62
Figure 4. Representative photomicrographs of longitudinal section of the left ventricular
myocardium of Fischer rats on polarization microscopy. Animals in the control group
(CG) received standard diet (15% protein) and the protein restriction group (PRG)
received a diet with low protein (6%). Observe a greater distribution of collagen fibers
(arrows) in the myocardium of animals subjected to low protein diet (B) compared with
controls (A). (Sirius red staining, bar = 60 µm).
3.5. Ultrastructural changes in ventricular cardiomyocytes
Reduction in myofibrils thickness and increased mitochondria density
appear to be most obvious ultrastructural changes caused by low protein diet
after weaning (Figure 5). Apparently, the membrane system of the sarcoplasmic
reticulum and T tubules are less organized in PRG (Fig. 4A and B).
Figure 5. Transmission electron micrographs of left ventricular cardiomyocytes from
Fisher rat. (A and C) control group (CG) received standard diet (15% protein) and (B
and D) the protein restriction group (PRG) received diet with low protein (6%). The
arrows indicate the membrane system of the sarcoplasmic reticulum and T tubule less
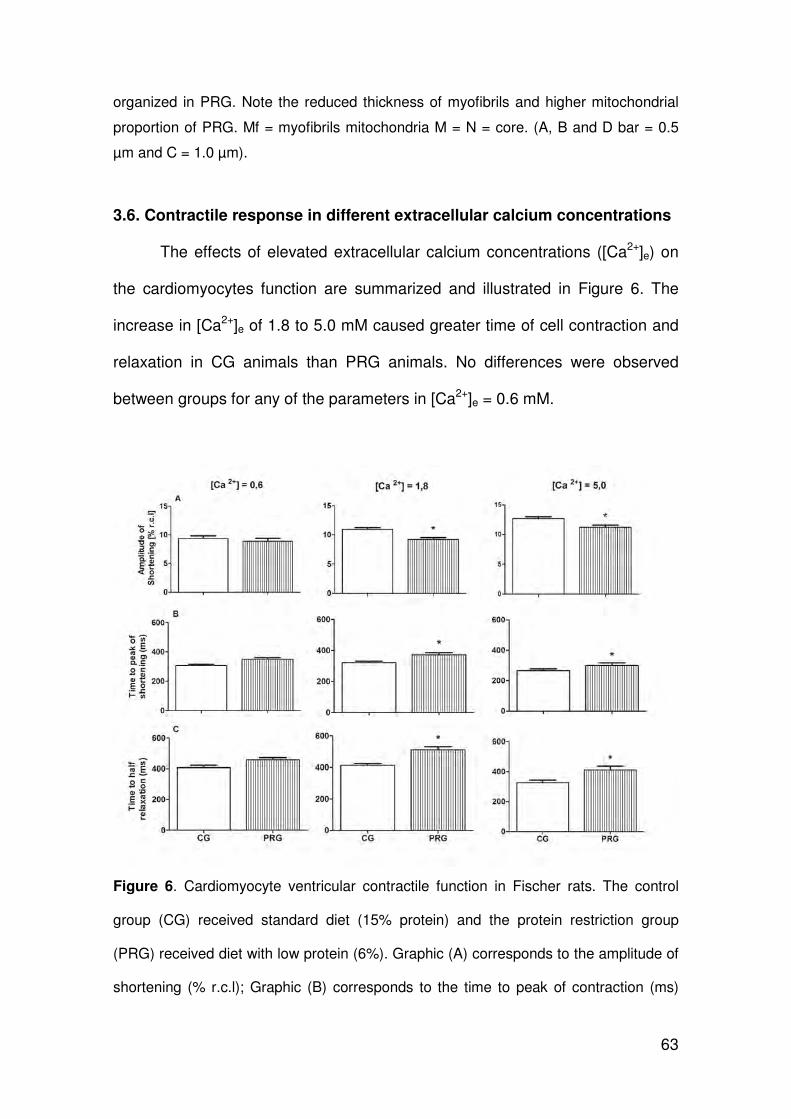
63
organized in PRG. Note the reduced thickness of myofibrils and higher mitochondrial
proportion of PRG. Mf = myofibrils mitochondria M = N = core. (A, B and D bar = 0.5
µm and C = 1.0 µm).
3.6. Contractile response in different extracellular calcium concentrations
The effects of elevated extracellular calcium concentrations ([Ca2+]e) on
the cardiomyocytes function are summarized and illustrated in Figure 6. The
increase in [Ca2+]e of 1.8 to 5.0 mM caused greater time of cell contraction and
relaxation in CG animals than PRG animals. No differences were observed
between groups for any of the parameters in [Ca2+]e = 0.6 mM.
Figure 6. Cardiomyocyte ventricular contractile function in Fischer rats. The control
group (CG) received standard diet (15% protein) and the protein restriction group
(PRG) received diet with low protein (6%). Graphic (A) corresponds to the amplitude of
shortening (% r.c.l); Graphic (B) corresponds to the time to peak of contraction (ms)
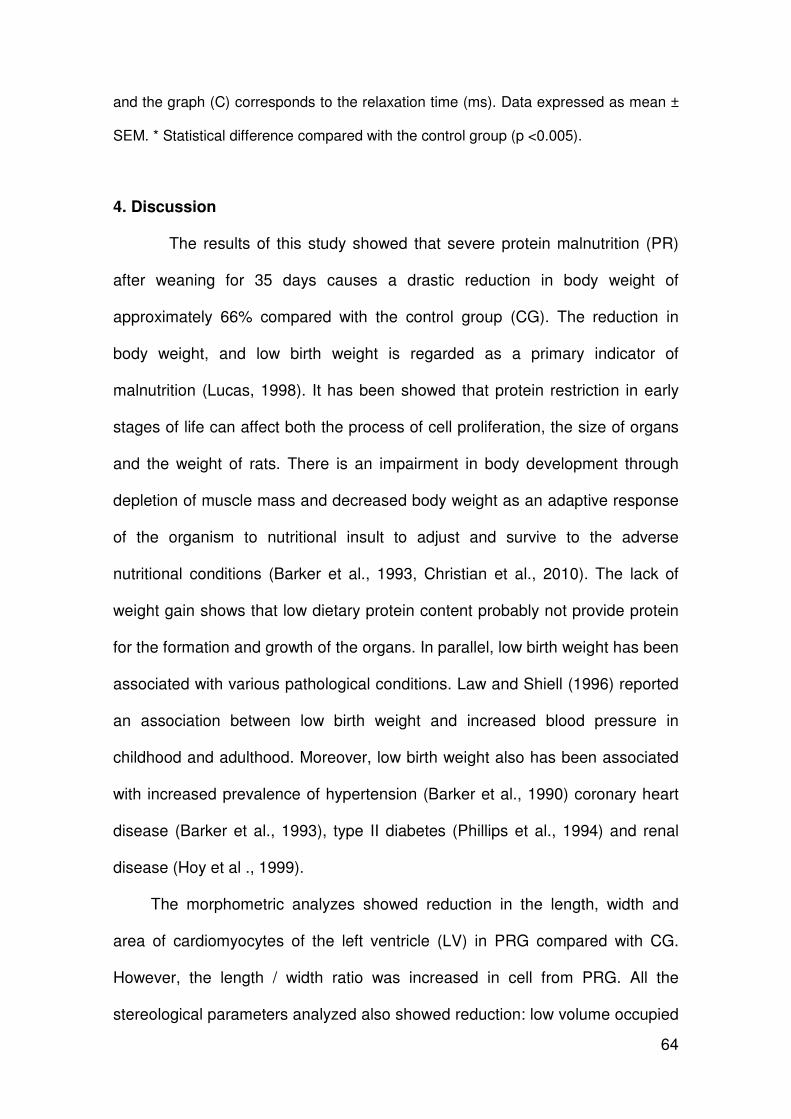
64
and the graph (C) corresponds to the relaxation time (ms). Data expressed as mean ±
SEM. * Statistical difference compared with the control group (p <0.005).
4. Discussion
The results of this study showed that severe protein malnutrition (PR)
after weaning for 35 days causes a drastic reduction in body weight of
approximately 66% compared with the control group (CG). The reduction in
body weight, and low birth weight is regarded as a primary indicator of
malnutrition (Lucas, 1998). It has been showed that protein restriction in early
stages of life can affect both the process of cell proliferation, the size of organs
and the weight of rats. There is an impairment in body development through
depletion of muscle mass and decreased body weight as an adaptive response
of the organism to nutritional insult to adjust and survive to the adverse
nutritional conditions (Barker et al., 1993, Christian et al., 2010). The lack of
weight gain shows that low dietary protein content probably not provide protein
for the formation and growth of the organs. In parallel, low birth weight has been
associated with various pathological conditions. Law and Shiell (1996) reported
an association between low birth weight and increased blood pressure in
childhood and adulthood. Moreover, low birth weight also has been associated
with increased prevalence of hypertension (Barker et al., 1990) coronary heart
disease (Barker et al., 1993), type II diabetes (Phillips et al., 1994) and renal
disease (Hoy et al ., 1999).
The morphometric analyzes showed reduction in the length, width and
area of cardiomyocytes of the left ventricle (LV) in PRG compared with CG.
However, the length / width ratio was increased in cell from PRG. All the
stereological parameters analyzed also showed reduction: low volume occupied
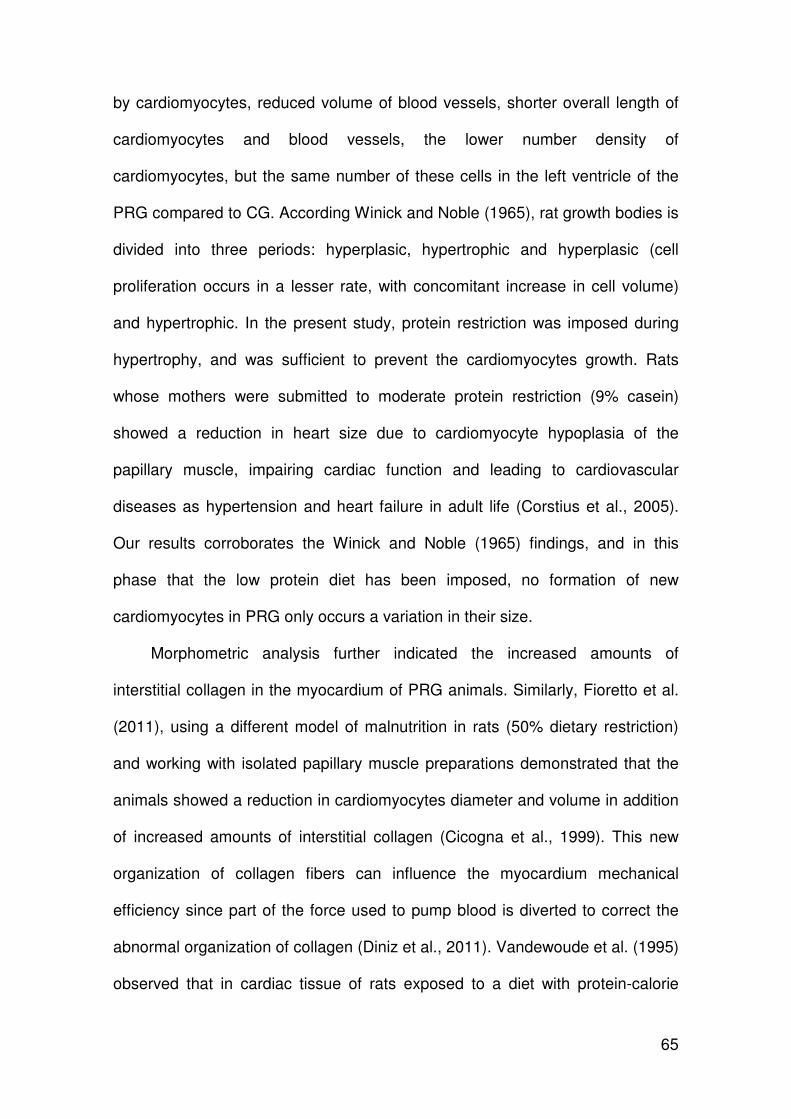
65
by cardiomyocytes, reduced volume of blood vessels, shorter overall length of
cardiomyocytes and blood vessels, the lower number density of
cardiomyocytes, but the same number of these cells in the left ventricle of the
PRG compared to CG. According Winick and Noble (1965), rat growth bodies is
divided into three periods: hyperplasic, hypertrophic and hyperplasic (cell
proliferation occurs in a lesser rate, with concomitant increase in cell volume)
and hypertrophic. In the present study, protein restriction was imposed during
hypertrophy, and was sufficient to prevent the cardiomyocytes growth. Rats
whose mothers were submitted to moderate protein restriction (9% casein)
showed a reduction in heart size due to cardiomyocyte hypoplasia of the
papillary muscle, impairing cardiac function and leading to cardiovascular
diseases as hypertension and heart failure in adult life (Corstius et al., 2005).
Our results corroborates the Winick and Noble (1965) findings, and in this
phase that the low protein diet has been imposed, no formation of new
cardiomyocytes in PRG only occurs a variation in their size.
Morphometric analysis further indicated the increased amounts of
interstitial collagen in the myocardium of PRG animals. Similarly, Fioretto et al.
(2011), using a different model of malnutrition in rats (50% dietary restriction)
and working with isolated papillary muscle preparations demonstrated that the
animals showed a reduction in cardiomyocytes diameter and volume in addition
of increased amounts of interstitial collagen (Cicogna et al., 1999). This new
organization of collagen fibers can influence the myocardium mechanical
efficiency since part of the force used to pump blood is diverted to correct the
abnormal organization of collagen (Diniz et al., 2011). Vandewoude et al. (1995)
observed that in cardiac tissue of rats exposed to a diet with protein-calorie
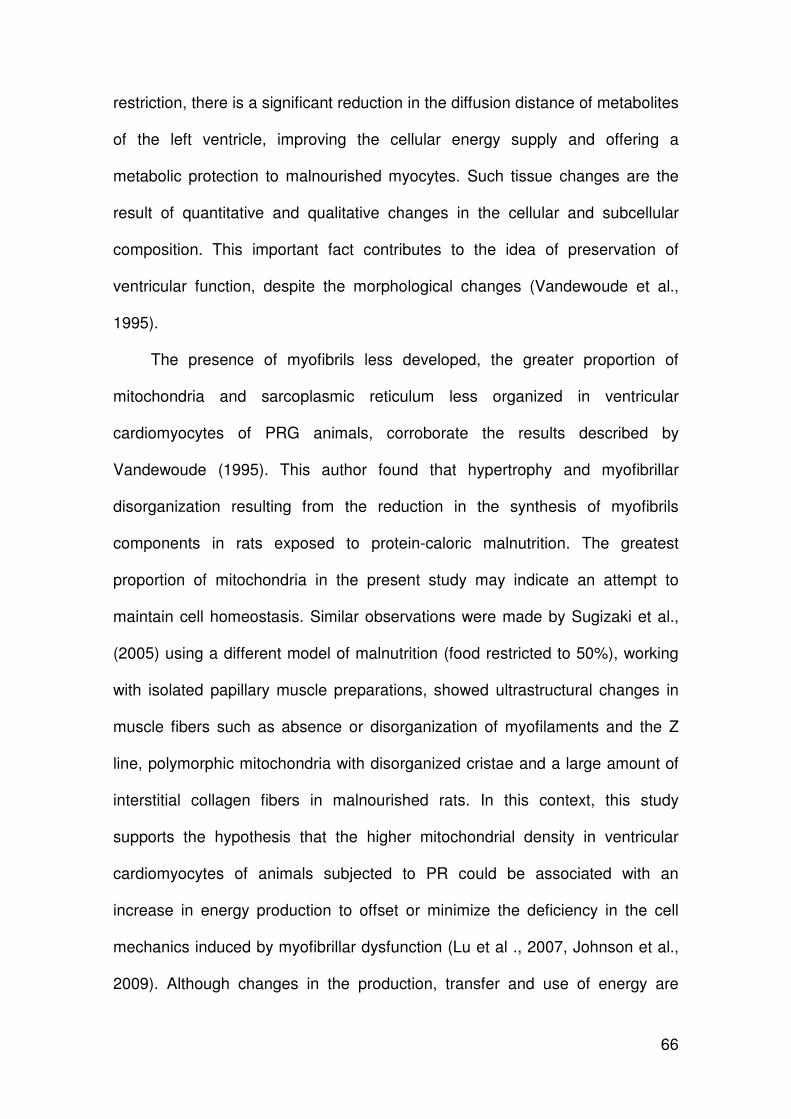
66
restriction, there is a significant reduction in the diffusion distance of metabolites
of the left ventricle, improving the cellular energy supply and offering a
metabolic protection to malnourished myocytes. Such tissue changes are the
result of quantitative and qualitative changes in the cellular and subcellular
composition. This important fact contributes to the idea of preservation of
ventricular function, despite the morphological changes (Vandewoude et al.,
1995).
The presence of myofibrils less developed, the greater proportion of
mitochondria and sarcoplasmic reticulum less organized in ventricular
cardiomyocytes of PRG animals, corroborate the results described by
Vandewoude (1995). This author found that hypertrophy and myofibrillar
disorganization resulting from the reduction in the synthesis of myofibrils
components in rats exposed to protein-caloric malnutrition. The greatest
proportion of mitochondria in the present study may indicate an attempt to
maintain cell homeostasis. Similar observations were made by Sugizaki et al.,
(2005) using a different model of malnutrition (food restricted to 50%), working
with isolated papillary muscle preparations, showed ultrastructural changes in
muscle fibers such as absence or disorganization of myofilaments and the Z
line, polymorphic mitochondria with disorganized cristae and a large amount of
interstitial collagen fibers in malnourished rats. In this context, this study
supports the hypothesis that the higher mitochondrial density in ventricular
cardiomyocytes of animals subjected to PR could be associated with an
increase in energy production to offset or minimize the deficiency in the cell
mechanics induced by myofibrillar dysfunction (Lu et al ., 2007, Johnson et al.,
2009). Although changes in the production, transfer and use of energy are
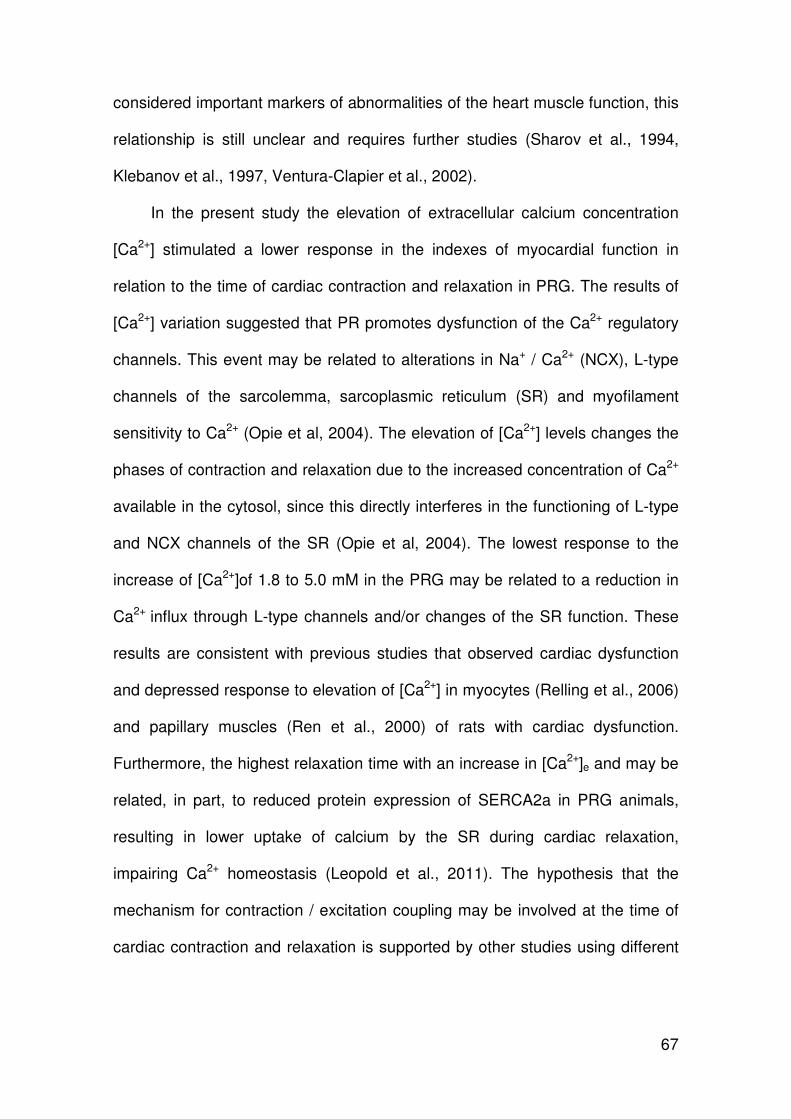
67
considered important markers of abnormalities of the heart muscle function, this
relationship is still unclear and requires further studies (Sharov et al., 1994,
Klebanov et al., 1997, Ventura-Clapier et al., 2002).
In the present study the elevation of extracellular calcium concentration
[Ca2+] stimulated a lower response in the indexes of myocardial function in
relation to the time of cardiac contraction and relaxation in PRG. The results of
[Ca2+] variation suggested that PR promotes dysfunction of the Ca2+ regulatory
channels. This event may be related to alterations in Na+ / Ca2+ (NCX), L-type
channels of the sarcolemma, sarcoplasmic reticulum (SR) and myofilament
sensitivity to Ca2+ (Opie et al, 2004). The elevation of [Ca2+] levels changes the
phases of contraction and relaxation due to the increased concentration of Ca2+
available in the cytosol, since this directly interferes in the functioning of L-type
and NCX channels of the SR (Opie et al, 2004). The lowest response to the
increase of [Ca2+]of 1.8 to 5.0 mM in the PRG may be related to a reduction in
Ca2+ influx through L-type channels and/or changes of the SR function. These
results are consistent with previous studies that observed cardiac dysfunction
and depressed response to elevation of [Ca2+] in myocytes (Relling et al., 2006)
and papillary muscles (Ren et al., 2000) of rats with cardiac dysfunction.
Furthermore, the highest relaxation time with an increase in [Ca2+]e and may be
related, in part, to reduced protein expression of SERCA2a in PRG animals,
resulting in lower uptake of calcium by the SR during cardiac relaxation,
impairing Ca2+ homeostasis (Leopold et al., 2011). The hypothesis that the
mechanism for contraction / excitation coupling may be involved at the time of
cardiac contraction and relaxation is supported by other studies using different
68
model of malnutrition in rats (50% reduction in feed) in a preparation of isolated
papillary muscle (Kaye et al., 2008; Leopold et al., 2011).
In this study it was observed that the PR conduces to a
morphofunctional rearrangement of the left ventricle. Although this presents a
reorganization characteristic predominantly pathological, it is considered that
part of the changes found represents an adaptive mechanism in the quest for
survival under conditions of severe protein restriction (Okoshi et al., 2011).
Considering the PR as a risk factor related to the pathogenesis of
cardiomyopathies, additional studies are needed to identify what biochemical
and molecular mechanisms affected by RP can lead to cardiac remodeling.
5. Acknowledgments
We thank the Center for Microscopy and Microanalysis of the Federal
University of Viçosa and also FAPEMIG for financial support.
6. References
Bancroft, J.D., Gamble, M. (2008) Theory and Pratices of Histological
Techniques. 6ª ed. Elsevier.725.
Barker D.J., Osmond C., Golding J., Kuh D., Wadsworth M.E. (1989) Growth in
utero, blood pressure in childhood and adult life, and mortality from
cardiovascular disease. B. M. J. 298, 564-567.
Barker D.J., Bull A.R., Osmond C., Simmonds S.J. (1990) Fetal and placental
size and risk of hypertension in adult life. BMJ 301, 259-262.
69
Barker D.J., Gluckman P.D., Godfrey K.M., Harding J.E., Owens J.A.,
Ronbinson J.S. (1993) Fetal nutrition and cardiovascular disease in adult life.
Lancet 341, 938-941.
Brüel A., Oxlund H., Nyengaard J.R. (2005) The total length of myocytes and
capillaries, and total number of myocyte nuclei in the rat heart are time
dependently increased by growth hormone. Growth Horm. IGF Res. 15, 256-
264.
Corstius H.B., Zimanyi M.A., Maka N., Herath T., Thomas W., Van der Laarse
A., Wreford N.G., Black M.J. (2005) Effect of intrauterine growth restriction on
the number of cardiomyocytes in rat hearts. Pediatr Res 57: 796-800.
Christian P. & Stewart C.P. (2010) Maternal Micronutrient Deficiency, Fetal
Development, and the Risk of Chronic Disease. J. Nutr. 140, 437-445.
Cicogna A.C., Padovani C.R., Georgette J.C., Aragon F.F., Okoshi M.P. (1999)
Effects of Protein-Calorie Restriction on Mechanical Function of Hypertrophied
Cardiac Muscle. Arq. Bras. Cardiol. 72, 436-440.
De Tomasi L.C., Bruno A., Sugizaki M.M. (2009) Food restriction promotes
downregulation of myocardial L-type Ca2+ channels. Canad. J. Physiol. Pharm.
87: 426-431.
Diniz T.G., Benedicto H.G., Agreste F.R., Clebis N. K., Hernandez-Blazquez
F.J., Bombonato P.P. (2011) Morphometry of the collagen fibers in healthy and
diabetic rats treated with vitamin C. Pesq. Vet. Bras. 31, 1-6.
Eisele J.C., Schaefer I-M., Nyengaard J.R., Post H., Liebetanz D., Brüel A.,
Mühlfeld C. (2008) Effect of voluntary exercise on number and volume of
cardiomyocytes and their mitochondria in the mouse left ventricle. Basic. Res.
Cardiol. 103,12-21.
70
Fioretto J.R. (2011) Ventricular remodeling and diastolic myocardial dysfunction
in rats submitted to protein-calorie malnutrition. Am. J. Physiol. 282, 1327-1333.
Haddad F., Bodell P.W., McCue S.A., Herrick R.E., Baldwin K.M. (1993) Food
restriction-induced transformations in cardiac functional and biochemical
properties in rats. J. Appl. Physiol. 74, 606–612.
Hoy W.E., Rees M., Kile E., Mathews J.D., Wang Z. (1999) A new dimension to
the Barker hypothesis: low birthweight and susceptibility to renal disease.
Kidney Int. 56, 1072-1077.
Gruber C., Nink N., Nikam S., Magdowski G., Kripp G., Voswinckel R., Mühlfeld
C. (2012) Myocardial remodelling in left ventricular atrophy induced by caloric
restriction. J. Anat. 220, 179-185.
Johnson W.T. & Johnson L.K. (2009) Copper deficiency inhibits Ca2+-induced
swelling in rat cardiac mitochondria. J. Nutrit. Bioch. 20, 248-253.
Kaye D., Hoshijima M., Chien K.R. (2008) Reversing advanced heart failure by
targeting Ca2+ cycling. Ann. Rev. Med. 59, 13-28.
Klebanov S., Herlihy J.T., (1997) Efect of life-long food restriction on cardiac
myosin composition. J. Gerontol. 52: 184-189.
Law C.M. & Shiell A.W. (1996) Is blood pressure inversely related to birth
weight? The strength of evidence from a systematic review of the literature. J.
Hypert. 14, 935-941.
Leopoldo A.S., Lima-Leopoldo A.P., Sugizaki M.M., Nascimento A.F., Campos
D.H.S., Luvizotto R.A.M., Castardeli E., Alves C.A.B., Brum P.C., Cicogna A.C.
(2011) Involvement of l-type calcium channel and SERCA2a in myocardial
dysfunction induced by obesity. J. Cel. Physiol. 22, 1-29.
71
Li F., Wang X., Capasso J.M., Gerdes A.M. (1996) Rapid transition of cardiac
myocytes from hyperplasia to hypertrophy during postnatal development. J.
Mol. Cell. Cardiol. 28:1737–1746.
Lim K., Zimanyi M.A., Black M.J. (2010) Effect of maternal protein restriction
during pregnancy and lactation on the number of cardiomyocytes in the post
proliferative weanling rat heart. The Anat. 293, 431-437.
Lima-Leopoldo A.P., Leopoldo A.S., Sugizaki M.M., Bruno A., Nascimento A.F.,
Luvizotto R.A.M. (2011) Myocardial dysfunction and abnormalities in
intracellular calcium handling in obese rats. Arq. Bras. Cardiol. 13, 1-9.
Lipsett J., Tamblyn M., Madigan K., Roberts P., Cool J.C., Runciman S.I.,
McMillen I.C., Robinson J., Owens J.A. (2006) Restricted fetal growth and lung
development: a morphometric analysis of pulmonary structure. Pediatr.
Pulmonol. 41, 1138-1145.
Lu MC, Tzang BS, Kuo WW, Wu FL, Chen YS, Tsai CH. (2007) More activated
cardiac mitochondrial-dependent apoptotic pathway in obese Zucker rats.
Obesit. 15: 2634-2642.
Lucas A., Baker B.A., Desai M., Hales C.N. (1998) Nutrition in pregnant or
lactating rats programs lipid metabolism in the offspring. Br. J. Nutr. 76, 605-
612.
Martins C.D.D., Chianca D.A.Jr., Fernandes L.G. (2011) Cardiac autonomic
balance in rats submitted to protein restriction after weaning. Clin Exp Pharm
Physiol 38, 89-93.
Novaes R.D., Penitente A.R., Gonçalves R.V., Talvani A, Neves C.A.,
Maldonado I.R.S.C., Natali A.J. (2011) Effects of Trypanosoma cruzi infection
on myocardium morphology, single cardiomyocyte contractile function and
exercise tolerance in rats. Int. J. Exp. Pathol. 92, 299-307.
72
Novaes R.D., Penitente A.R., Talvani A., Natali AJ., Neves CA., Maldonado I.R.
S.C. (2012) Use of fluorescence in a modified disector method to estimate the
myocytes number in cardiac tissue. Arq. Bras. Cardiol. 98, 252-258
Okoshi M.P., Okoshi K., Dal-Pai V., Dal-Pai M., Matsubara L.S., Cicogna A.C.
(2011) Mechanical, biochemical, and morphological changes in the heart from
chronic food-restricted rats. Can. J. Physiol. Pharm. 79, 1-7.
Opie L.H., Bers DM. (2004) Heart physiology: from cell to circulation. In: Opie
LH, ditor. Excitation-contraction coupling and calcium. Philadelphia: Lippincott
Williams & Wilkins 56, 159-185.
Olfert E.D., Cross B.M., M. A.A. (1993) Canadian Council on Animal Care.
Guide to the Care and Use o Experimental Animals. In Ed Bradda Printing
Services. Ottawa, Ontario.
Penitente A.R., Fernandes L.G., Cardoso L.M., Silva M.E., Pedrosa M.L., Silva
A.L., Haibara A.S., Moraes M.F.D., Chianca D.A.Jr. (2007) Malnutrition
enhances cardiovascular responses to chemoreflex activation in awake rats. Lif.
Scienc. 81, 609-614.
Phillips D.I.W., Barker D.J.P., Hales C.N., Hirst S., Osmond C. (1994) Thinness
at Birth and Insulin-Resistance in Adult Life. Diabet. 37, 150-154.
Pinotti M.F., Leopoldo A.S., Dal-Pai S.M., Sugizaki M.M., Nascimento A.F.,
Lima-Leopoldo A.P., Aragon F.F., Padovani C.R., Cicogna A.C. (2010) A
comparative study of myocardial function and morphology during
fasting/refeeding and food restriction in rats. Card. Pathol. 19, 175-182.
Relling D.P., Esberg L.B., Fang C.X., Johnson W.T., Murphy E.J., Carlson E.C.
(2006) High-fat-diet-induced juvenile obesity leads to cardiomyocyte dysfunction
and upregulation of Foxo3a transcription factor independent of lipotoxicity and
apoptosis. J Hypert. 24, 549-561.
73
Ren J., Walsh M.F., Jefferson L., Natavio M., Lig K.J., Sowers J.R. (2000) Basal
and ethanol-induced cardiac contractile response in lean and obese Zucker rat
hearts. J Biomed Sci. 7, 390-400.
Rossi M.A. & zucoloto S. 1982) Ultrastructural changes in nutritional
cardiomyopathy of protein-calorie malnourished rats. J. exp. Path. 63, 242-254.
Sharov V.G., Sabbah H.N., Shimoyama H., Ali A.S., Levine T.B., Lesch M.,
Goldstein S. (1994) Abnormalities of contractile structures in viable myocytes of
the failing heart. Int. J. Cardiol. 43: 287-297.
Scherle W. (1970) A simple method for volumetry of organs in quantitative
stereology. Mikroskopie 26, 57-63.
Sugizaki M.M., Carvalho R.F., Aragon F.F. (2005) Myocardial dysfunction
induced by food restriction is related to morphological damage in normotensive
middle-aged rats. J. Biomed. Sci. 12,641–649.
Vandewoude, M.F.J. (1995) Morphometric changes in microvasculature in rat
myocardium during malnutrition. J. Par. Ent. Nutrution. 19, 376-380.
Ventura-Clapier R., De Sousa E., Veksler V. (2002) Metabolic Myopathy in
Heart Failure. Physiol. Sci. 17: 191-196.
Winick M & Noble A. (1966) This week's citation classic cellular response in rats
during malnutrition at various ages. J. Nutrit. 89:300-6.
Zimanyi M.A., Denton K.M., Forbes J.M., Thallas-Bonke V., Thomas M.C., Poon
F., Black M.J. (2006) A developmental nephron deficit in rats is associated with
increased susceptibility to a secondary renal injury due to advanced glycation
end-products. Diabetol. 49, 801-810.
74
5. Conclusões
Os animais submetidos à dieta hipoproteica (GRP) apresentaram
diminuição do peso corporal, peso do coração e do ventrículo esquerdo em
relação ao grupo controle, demonstrando que a dieta composta por 6% de
proteína, foi eficiente para promover a desnutrição no modelo experimental.
Em nível celular, o GRP apresentou diminuição de todos os parâmetros
celulares: morfológicos, estereológicos e alterações na ultra-estrutura do
cardiomiócito.
Os resultados confirmam a hipótese de que dieta hipoproteica é capaz
de afetar a histoarquitetura dos cardiomiócitos ventriculares, contribuindo para
alteração da função contrátil e influenciando de forma negativa na mecânica do
miocárdio.
A redução na contratilidade e maior tempo para contração e
relaxamento dos cardiomiócitos isolados, tanto em condições basais, quanto
após estimulação β-adrenérgica são as principais disfunções mecânicas
provocadas pela restrição protéica severa.
As disfunções mecânicas supracitadas estão associadas às alterações
no trânsito de cálcio intracelular e menor expressão da SERCA2a.
75
6. Anexo 1
Artigos publicados com a participação da Autora no período de
Doutorado
6.1. Artigo 1: Novaes, Rd; PENITENTE, AR; Talvani, A; Natali, AJ; Neves, CA;
Maldonado, IRSC. (2012) Use of fluorescence in a modified dissector method
to estimate the myocytes number in cardiac tissue. Arquivos Brasileiros de
Cardiologia. 62: 199-315
6.2. Artigo 2: Novaes, RD; PENITENTE, AR, Gonçalves, RV; Talvani, A; Neves,
CA; Maldonado, IRSC; Natali, AJ. (2011) Effects of Trypanosoma cruzi infection
on myocardium morphology, single cardiomyocyte contractile function and
exercise tolerance in rats. International Journal of Experimental Pathology.
6.3. Artigo 3: Silva MF, Pelúzio MCG, Amorim PRS, Lavorato VN, Santos NP,
Bozi LMM, PENITENTE AR, Falkoski DL, Berfort FG, Antônio José Natali.
Treinamento em Natação Atenua a Disfunção Contrátil de Cardiomiócitos de
Ratos Diabéticos. Arquivos Brasileiros de Cardiologia.
Use of Fluorescence in a Modified Disector Method to Estimate the Number of Myocytes in Cardiac Tissue
Rômulo Dias Novaes1, Arlete Rita Penitente1, André Talvani2, Antônio José Natali1, Clóvis Andrade Neves1, Izabel Regina Santos Costa Maldonado1 Universidade Federal de Viçosa, Viçosa1; Universidade Federal de Ouro Perto, Ouro Preto2, MG, Brazil
AbstractBackground: Conventional disector methods currently require considerable financial, technical and operational costs to estimate the number of cells, including cardyomyocytes, in a 3D area.
Objective: To use fluorescence microscopy in a modified disector method to determine the number of myocytes in cardiac tissue in normal and pathological conditions.
Methods: The study employed four-month-old male Wistar rats with weight of 366.25 ± 88.21g randomized in control (CG, n=8) and infected (IG, n=8) groups. IG animals were inoculated with T. cruzi Y strain (300,000 trypomastigotes/50g wt). After eight weeks, the animals were weighted and euthanized. The left ventricles (LV) were removed for stereological analysis of numerical density of cardiomyocytes (Nv[c]) and total number of these cells in the LV (N[c]). These parameters were estimated using a fluorescent disector (FD) and compared with the conventional optical (OD) and physical (PD) disector methods.
Results: In both disector methods, IG animals presented significant decrease of Nv[c] and N[c] compared to CG animals (P< 0.05). There was no significant difference in these variables despite the disector method applied in CG and IG animals (P> 0.05). A strong correlation, equal or above 96%, was obtained between FD, OD and PD.
Conclusion: The FD method seems to be equally reliable to determine Nv[c] and N[c] in normal and pathological conditions and presents some advantages compared to conventional disector methods: reduction of histological slices and images in the stereological analysis, reduction of time to analyze the images, construction of FD in simple microscopes using the epifluorescence mode, distinction of disector planes in lower magnifications. (Arq Bras Cardiol. 2011; [online].ahead print, PP.0-0)
Keywords: Cell separation; flow cytometry; myocytes, cardiac.
���������� ������������ ������ ���� Av. PH Rolfs, S/N - Campus Universitário - Centro - 36570-000 – Viçosa, MG, Brasil E-mail: [email protected] Manuscript received July 08, 2011, revised manuscript received August 18, 2011; accept August 26, 2011.
both methods have reduced the bias of particle quantity estimation, they still required the acquisition of a large number of histological images and a great deal of time to perform the counts. Particularly, the optical disector also requires a light microscope of high cost adapted with axis-Z mobile stage11. Moreover, the physical disector is extremely laborious because it requires serial histological sections and images with a perfect alignment in the different parallel sections3,10.
Considering that the aim of the sampling design for stereology is to obtain the maximal amount of quantitative structural information at a given total cost, time or effort, the purpose of this study was to use fluorescence microscopy in a modified disector method to determine the number of myocytes in cardiac tissue in normal and pathological conditions. Thus, a murine model of T. cruzi infection that recognizably conduces to disruption of cardiac myocytes and modifies the number of these cells in the myocardium was used.12 We hypothesized that the proposed method would reduce the operational cost observed in conventional methods, while maintaining the accuracy of cell quantity measurements.
IntroductionOver the past years a great effort was made to develop a
reliable and reproducible method to estimate the number of particles in organs and tissues, but until 1984, all these methods had intrinsic biases1-3. In 1984, Sterio described several modifications in the approaches used to estimate the quantity of objects in three-dimensional space and introduced the disector method4. Most authors currently consider the disector method unbiased and the well-established theoretical background makes the method largely acceptable5-7.
The disector may be obtained through two different methods based on the same theoretical principles and basic requirements to estimate the number of particles. These methods are the optical and physical disector4,8-10. Although
������������� ����������� �����������������������
Novaes et alFluorescence to estimate number of cardiomyocytes
Methods
Animals and experimental groups
Four-month-old male Wistar rats with initial weight of 366.25 ± 88.21 g were provided with rodent chow and water ad libitum and maintained in animal facilities in a controlled environment (temperature at 22 ± 3 ºC, humidity at 60 - 70 % and 12 hour light/dark inverted cycles). Sample sizes were determined considering the probability p = 1/2 to occur increase or decrease of the variables of interest. Thus, considering the significance level � = 0.05, the minimal significant number of animals used in the statistical analysis was: p = (1/2)events; therefore, if n = 5, p = (1/2)5 or p = 0.03; then, p < 0.05.10 Due to the intrinsic variability of the parasitism in target organs and the mortality associated with T. cruzi infection, a correction factor of 50% was incorporated into the initial calculation, determining samples of 8 animals, randomly allocated into control (CG, n = 8) and infected (IG, n = 8) groups.
Infection
IG animals were inoculated intraperitoneally with T. cruzi Y strain (300,000 trypomastigotes/50g body weight in 1 mL of infected mice blood13. Infection was confirmed four days post-inoculation by the presence of trypomastigotes in peripheral blood collected from the rat’s tail as described by Brener14. All experimental procedures were conducted in accordance with the Brazilian College of Animal Experimentation and approved by the Animal Research Ethics Commission of the Veterinary Department of the Universidade Federal de Viçosa, Brazil (protocol number 30/2009).
Biometrical analysis
Eight weeks after inoculation, the animals were euthanized under anesthesia and the hearts were removed. The left ventricles (LV) were dissected and weighed separately. LV volume was obtained by the submersion method, where the liquid displacement from the organ volume is weighed. As the specific gravity (�) of isotonic saline is 1.0048, the volume is obtained by: volume= weight/�, or simply volume (103 mm3������������15. LV weight and volume was determined including the interventricular septum.
Tissue processing and determination of histological areas
The atria and ventricles were put into histological fixative for 48 hours (freshly prepared 10% w/v formaldehyde in 0.1 M phosphate buffer pH 7.2)16,17. LV fragments were obtained through the orientator method to define isotropic and uniform random sections (IUR) required in the stereological study3. These fragments were dehydrated in ethanol, cleared in xylol and waxed. Blocks were cut into 3 μm sections and stained by hematoxylin-eosin (H&E) or 4’,6-diamidino-2-phenylindole at 0.2% (DAPI)18.
The representative number of disectors used in the stereological analysis for each animal was determined considering the stabilization of the coefficient of variation (CV) of number of myocytes nuclei in ascending random samples
of disectors (5, 10, 15, 20 and 25). Then, the arithmetical mean and the respective CV for each sample size were calculated. When the increase of disector numbers resulted in no significant difference of CV between 3 consecutive samples, the smallest sample size was considered as the minimal representative size19. Using this method, the variation of number of myocytes nuclei was stabilized from the sample of 10 disectors.
Optical and physical disector methods
Sections stained with H&E were mounted on histology slides using Entelan® mounting medium (Merk, Darmstadt, Germany) and the images were captured using a light microscope (Olympus BX-60®, Tokyo, Japan) connected to a digital camera (Olympus QColor-3®, Tokyo, Japan). Observation was made with a 100× planachromatic oil immersion objective (NA= 1.25) to clearly identify cardiomyocyte (cmy) nuclei boundaries16,17.
The number of cardiomyocyte nuclei (cmyn) in a 3-dimensional probe was estimated using the optical (OD) and physical (PD) disector methods3. The disector consists of 2 parallel planes aimed at sampling ‘‘top points’’ of particles in between. Sampling volume was created with 2 parallel sections separated by 3 μm (h) and 2 reference planes both containing a test frame (AT). In both disector methods, a pair of photomicrographs separated by h distance is used to form the two reference planes. In the OD, the parallel photomicrographs are obtained in the same histological area adjusting the focal plane (h = 3 μm) using the micrometrical screw. In the PD, two serial sections are obtained in the microtome (h = 3 μm) and the same histological area is photographed in both sections, supplying two photomicrographs physically separated.
Fluorescent disector method
In the fluorescent disector method (FD), sections stained with DAPI were mounted on histology slides using 50% sucrose solution in distillated water (w/v). Images were captured in an epifluorescence mode of the same microscope using a HBO 100 mercury lamp and a filter for dye excitation at 365 nm and a light emission at 460 nm. Observation was made with the same 100× planachromatic lens previously described. In this method, using the 3 μm (h) sections, the two reference planes required to delimitate the disector are obtained in a unique image and pairs of photomicrographs are not required as in the conventional methods. Furthermore, the cmyn present over the thickness of the section may be observed inside or outside the focal plane. To avoid repeat cells count, sections were obtained in semi-series, using 1 in every 20 sections. The FD was additionally obtained with a 40× objective lens only to demonstrate the possibility of applying the method using smaller magnifications.
Estimation of numerical density and total number of cardiomyocytes
The numerical density of cmyn (Nv[c], cmyn per mm3) was determined from 10 random disector pairs for each animal, defined as Nv[c]= Q-[cmyn] / h×AT ; where Q- represents the number of profiles of cmyn counted in the test area on the
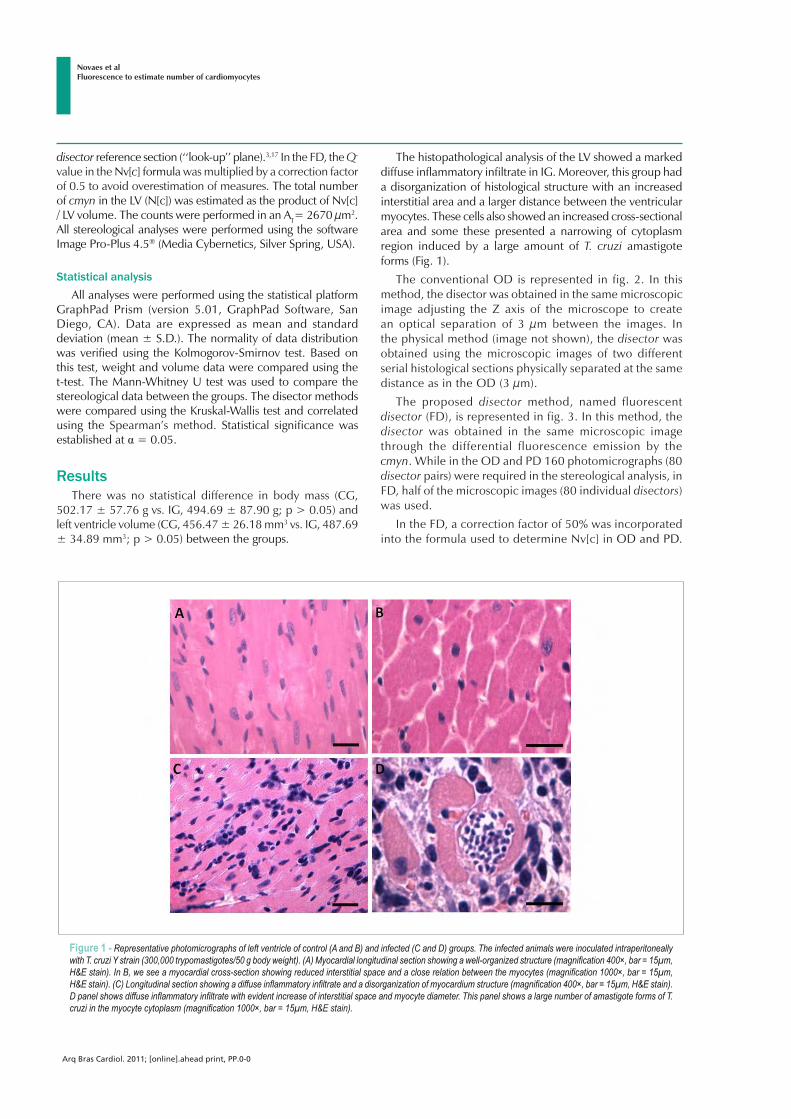
������������� ����������� �����������������������
Novaes et alFluorescence to estimate number of cardiomyocytes
disector reference section (‘‘look-up’’ plane).3,17 In the FD, the Q- value in the Nv[c] formula was multiplied by a correction factor of 0.5 to avoid overestimation of measures. The total number of cmyn in the LV (N[c]) was estimated as the product of Nv[c] / LV volume. The counts were performed in an AT= 2670 μm2. All stereological analyses were performed using the software Image Pro-Plus 4.5® (Media Cybernetics, Silver Spring, USA).
Statistical analysis
All analyses were performed using the statistical platform GraphPad Prism (version 5.01, GraphPad Software, San Diego, CA). Data are expressed as mean and standard deviation (mean ± S.D.). The normality of data distribution was verified using the Kolmogorov-Smirnov test. Based on this test, weight and volume data were compared using the t-test. The Mann-Whitney U test was used to compare the stereological data between the groups. The disector methods were compared using the Kruskal-Wallis test and correlated using the Spearman’s method. Statistical significance was established at � = 0.05.
ResultsThere was no statistical difference in body mass (CG,
502.17 ± 57.76 g vs. IG, 494.69 ± 87.90 g; p > 0.05) and left ventricle volume (CG, 456.47 ± 26.18 mm3 vs. IG, 487.69 ± 34.89 mm3; p > 0.05) between the groups.
The histopathological analysis of the LV showed a marked diffuse inflammatory infiltrate in IG. Moreover, this group had a disorganization of histological structure with an increased interstitial area and a larger distance between the ventricular myocytes. These cells also showed an increased cross-sectional area and some these presented a narrowing of cytoplasm region induced by a large amount of T. cruzi amastigote forms (Fig. 1).
The conventional OD is represented in fig. 2. In this method, the disector was obtained in the same microscopic image adjusting the Z axis of the microscope to create an optical separation of 3 μm between the images. In the physical method (image not shown), the disector was obtained using the microscopic images of two different serial histological sections physically separated at the same distance as in the OD (3 μm).
The proposed disector method, named fluorescent disector (FD), is represented in fig. 3. In this method, the disector was obtained in the same microscopic image through the differential fluorescence emission by the cmyn. While in the OD and PD 160 photomicrographs (80 disector pairs) were required in the stereological analysis, in FD, half of the microscopic images (80 individual disectors) was used.
In the FD, a correction factor of 50% was incorporated into the formula used to determine Nv[c] in OD and PD.
Figure 1 - Representative photomicrographs of left ventricle of control (A and B) and infected (C and D) groups. The infected animals were inoculated intraperitoneally ������������ ���������������������������������������������������!��"������#�#����������#��������������������##$����������������������%������&��'�����*�+�,���-/0���������1��2������������������#����$�������������������������������#������������#�����#��������������������������������%������+���'�����*�+�,���-/0����������3��4����������#��������������������55������6����������%#���������������������������5�����������������������%������&��'�����*�+�,���-/0���������7�����#���������55������6����������%#�����������8��������������5�����������#�����������������������������������#���������#�����������5������������5�����5��������������������������#����������%������+���'�����*�+�,���H&E stain).
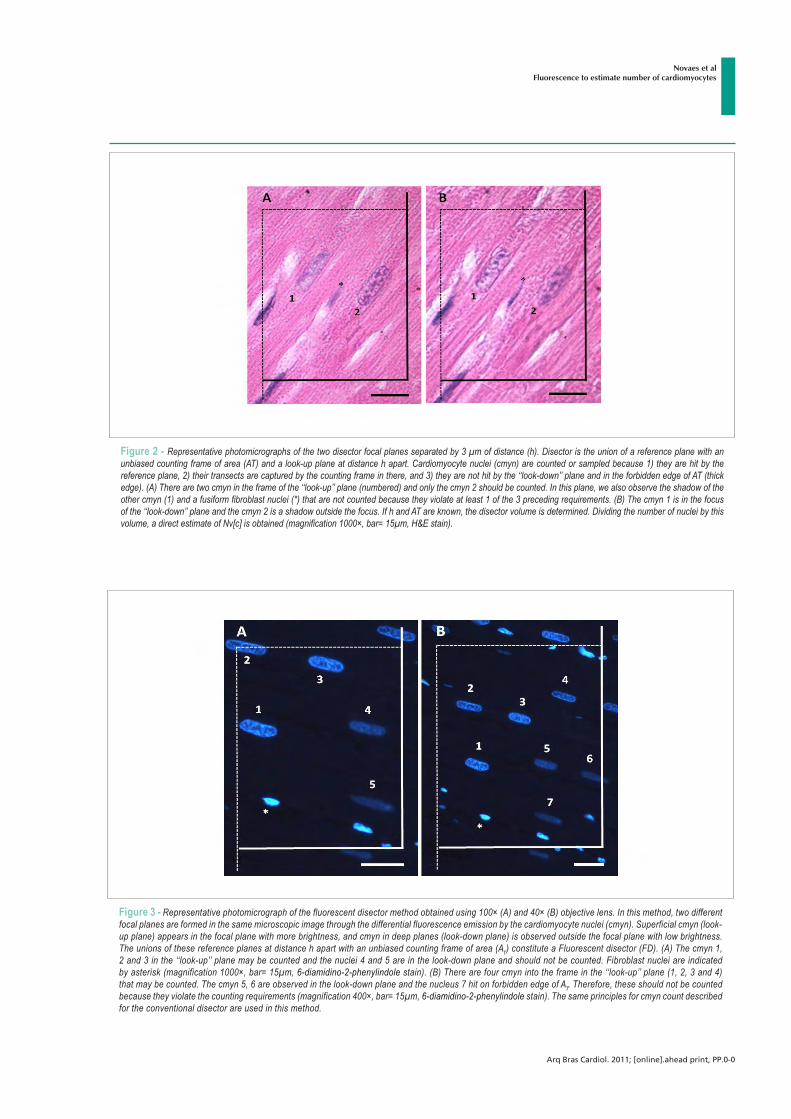
������������� ����������� �����������������������
Novaes et alFluorescence to estimate number of cardiomyocytes
Figure 2 - :����������8�����������������5����������������5��#��#�������������������,���5��������������7��������������������5����5������#�����������������������������5�����5������!���������#��;$����#�����������������������3�������������#�������������������������#����������+���������������������reference plane, 2) their transects are captured by the counting frame in there, and 3) they are not hit by the ‘‘look-down’’ plane and in the forbidden edge of AT (thick edge). (A) There are two cmyn in the frame of the ‘‘look-up’’ plane (numbered) and only the cmyn 2 should be counted. In this plane, we also observe the shadow of the ����������+��������5���5���%���#������#����@���������������������������������8��#�������#�����+��5����������������F�����������2����������+�����������5����of the ‘‘look-down’’ plane and the cmyn 2 is a shadow outside the focus. If h and AT are known, the disector volume is determined. Dividing the number of nuclei by this 8�#����������������������5�G8JK�������������������%������+���'����*�+�,���-/0��������
Figure 3 -�:����������8����������������5�����5#�������������������������������������+��'��!������&�'��2����L���8��#�����1���������������������55�����focal planes are formed in the same microscopic image through the differential fluorescence emission by the cardiomyocyte nuclei (cmyn). Superficial cmyn (look-up plane) appears in the focal plane with more brightness, and cmyn in deep planes (look-down plane) is observed outside the focal plane with low brightness. The unions of these reference planes at distance h apart with an unbiased counting frame of area (AT��������������M#����������������M7����!����������+��N��������������OO#��;$��PP��#����������������������������#���&�����������������#��;$������#������������#�����������������M����#������#������������������������;�������5�������+���'����*�+�,���6-diamidino-2-phenylindole����������2����������5����������������5�����������OO#��;$��PP��#�����+��N��������&��that may be counted. The cmyn 5, 6 are observed in the look-down plane and the nucleus 7 hit on forbidden edge of AT. Therefore, these should not be counted ������������8��#�����������������F���������������5�������&��'����*�+�,���6-diamidino-2-phenylindole stain). The same principles for cmyn count described for the conventional disector are used in this method.
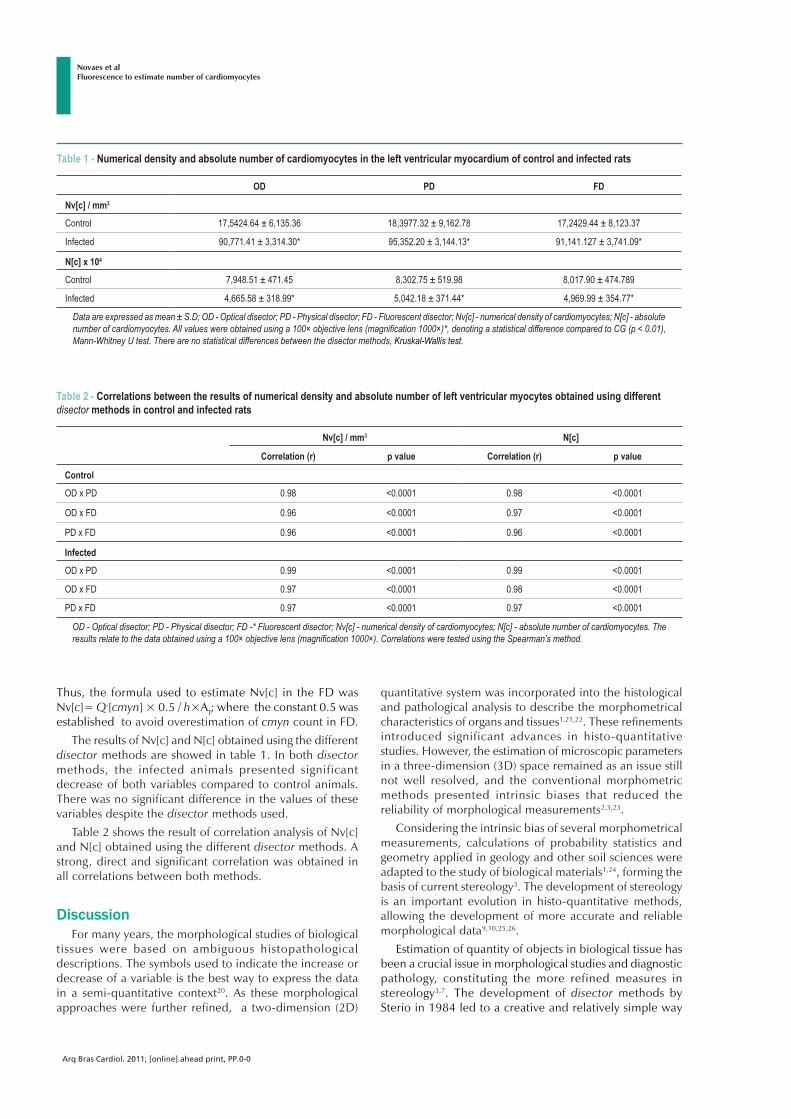
������������� ����������� �����������������������
Novaes et alFluorescence to estimate number of cardiomyocytes
Table 1 - Numerical density and absolute number of cardiomyocytes in the left ventricular myocardium of control and infected rats
OD PD FD
Nv[c] / mm3
Control 17,5424.64 ± 6,135.36 18,3977.32 ± 9,162.78 17,2429.44 ± 8,123.37
Infected 90,771.41 ± 3,314.30* 95,352.20 ± 3,144.13* 91,141.127 ± 3,741.09*
N[c] x 104
Control 7,948.51 ± 471.45 8,302.75 ± 519.98 8,017.90 ± 474.789
Infected 4,665.58 ± 318.99* 5,042.18 ± 371.44* 4,969.99 ± 354.77*
Data are expressed as mean ± S.D; OD - Optical disector; PD - Physical disector; FD - Fluorescent disector; Nv[c] - numerical density of cardiomyocytes; N[c] - absolute �������5��������������!##�8�#�������������������������+��'���L���8��#����������%������+���'�@����������������������#���55���������������3^����_����+���Mann-Whitney U test. There are no statistical differences between the disector methods, Kruskal-Wallis test.
Table 2 - Correlations between the results of numerical density and absolute number of left ventricular myocytes obtained using different disector methods in control and infected rats
Nv[c] / mm3 N[c]
Correlation (r) p value Correlation (r) p value
Control
OD x PD 0.98 <0.0001 0.98 <0.0001
OD x FD 0.96 <0.0001 0.97 <0.0001
PD x FD 0.96 <0.0001 0.96 <0.0001
Infected
OD x PD 0.99 <0.0001 0.99 <0.0001
OD x FD 0.97 <0.0001 0.98 <0.0001
PD x FD 0.97 <0.0001 0.97 <0.0001
{7�$�{����#�������|�}7�$�}�����#�������|�M7�$@�M#��������������|�G8JK�$�������#����������5������������|�GJK�$�����#�����������5���������������������#����#���������������������������������+��'���L���8��#����������%������+���'���3��#����������������������������~������P����������
Thus, the formula used to estimate Nv[c] in the FD was Nv[c]= Q-[cmyn] × 0.5 / h×AT; where the constant 0.5 was established to avoid overestimation of cmyn count in FD.
The results of Nv[c] and N[c] obtained using the different disector methods are showed in table 1. In both disector methods, the infected animals presented significant decrease of both variables compared to control animals. There was no significant difference in the values of these variables despite the disector methods used.
Table 2 shows the result of correlation analysis of Nv[c] and N[c] obtained using the different disector methods. A strong, direct and significant correlation was obtained in all correlations between both methods.
DiscussionFor many years, the morphological studies of biological
tissues were based on ambiguous histopathological descriptions. The symbols used to indicate the increase or decrease of a variable is the best way to express the data in a semi-quantitative context20. As these morphological approaches were further refined, a two-dimension (2D)
quantitative system was incorporated into the histological and pathological analysis to describe the morphometrical characteristics of organs and tissues1,21,22. These refinements introduced significant advances in histo-quantitative studies. However, the estimation of microscopic parameters in a three-dimension (3D) space remained as an issue still not well resolved, and the conventional morphometric methods presented intrinsic biases that reduced the reliability of morphological measurements2,3,23.
Considering the intrinsic bias of several morphometrical measurements, calculations of probability statistics and geometry applied in geology and other soil sciences were adapted to the study of biological materials1,24, forming the basis of current stereology3. The development of stereology is an important evolution in histo-quantitative methods, allowing the development of more accurate and reliable morphological data9,10,25,26.
Estimation of quantity of objects in biological tissue has been a crucial issue in morphological studies and diagnostic pathology, constituting the more refined measures in stereology3,7. The development of disector methods by Sterio in 1984 led to a creative and relatively simple way
������������� ����������� �����������������������
Novaes et alFluorescence to estimate number of cardiomyocytes
to estimate the number of particles in an organ or tissue4. However, the disector method still requires a series of technical requirements that increase the time and cost of data acquisition5,8,10. The need to obtain and analyze a large number of microscopic images is a common limitation of both OD and PD methods, especially when several groups and tissue samples are studied at once. Moreover, the costs for acquiring or adapting a microscope with controlled Z axis contribute to limit the application of OD11. On other hand, obtaining a PD is extremely laborious because it involves the quality of the microtomy, appropriate processing of serial sections and technical ability to determine a perfect alignment of these sections4. Furthermore, minimal alignment error can lead to a bias in the cell count characterized by an overestimation or underestimation of stereological outcomes. Thus, these conventional disector methods still require considerable financial, technical and operational costs to estimate the quantity of particles in a 3D area11.
This study proposes an alternative method to estimate the quantity of myocytes in the cardiac tissue using fluorescence microscopy in a modified disector method. The construction of a FD was based on similar requirements as used for particle counts described in the conventional disector methods. However, an adaptation of the formula to determine N[c] was required in FD. The introduction of a correction factor was necessary to reduce overestimation of measurements. In conventional methods, particle count results exclude those which hit the forbidden plane (generally look-down plane), contributing to reduce the measurement bias27,28. As in the FD, the presence or absence of the same particle cannot be observed in both disector planes, as it occurs in OD and PD. The calculation of probability determines a 0.5 correction factor to the N[c] formula, considering 50% of chances of a particle be observed or not in both planes.
The application of the FD using the proposed method provided similar results of Nv[c] and N[c] compared to the other disector methods, without any significant differences between the methods. Both methods presented sufficient
sensibility to determine the reduction of left ventricle myocyte number in the murine model of T. cruzi-induced cardiac infection. This model was selected for this study due to the well-established tropism to cardiac tissue presented by this parasite and its ability to reduce the number of myocytes due to parasite replication, differentiation and cell evasion, which propagates in an ongoing destructive process12,13. In addition, the correlations between the FD with conventional methods were strong, indicating that the FD method may be equally reliable to estimate the number of myocytes in the cardiac tissue. The reliability of these measures seems to be maintained in both health and pathological conditions.
Although the FD is also an optical method, this study demonstrated that the FD may also be obtained using objective lens with lower magnifications (40×) compared with conventional lens (100×) required in OD. In OD, lower magnifications are not often used because they determine a large depth-of-field, which hinders the acquisition of different disector focal planes (look-up and look-down) because it maintains all section structures inside the focus, in despite of the Z axis adjustment3.
Conclusion The FD described in this study offered an alternative
method to estimate the number of myocytes in the cardiac tissue. This method seems to be equally reliable in normal and pathological conditions to determine the same parameters of Nv[c] and N[c] obtained using conventional disector methods. Although the results has been similar between the three methods, the FD showed some advantages compared to OD and PD such as: 1) reduction (by half) of the number of histological slices and images required in the stereological analysis, 2) reduction of time to analyze the required images, 3) construction of FD in simple microscopes using the epifluorescence mode, 4) distinction of disector look-up and look-down planes using lower magnifications, 5) reliability of stereological results demanding reduced technical and operational cost compared to the OD and PD methods.
References
1. Weibel ER, Kistler GS, Scherle WF. Practical stereological methods for morphometric cytology. J Cell Biol. 1966;30(1):23-38.
2. Aherne WA. Methods of counting discrete tissue components in microscopical sections. J R Micr Soc. 1967;87(3):493-508.
3. Mandarim-de-Lacerda CA. Stereological tools in biomedical research. An Acad Bras Cienc. 2003;75(4):469-86.
4. Sterio DC. The unbiased estimation of number and sizes of arbitrary particles using the disector. J Microsc. 1984;134(Pt2):127-36.
5. Dorph-Petersen KA, Nyengaard JR, Gundersen HJ. Tissue shrinkage and unbiased stereological estimation of particle number and size. J Microsc. 2001;204(Pt3):232-46.
6. Charleston LB, Thyer AC, Klein NA, Soules MR, Charleston JS. An improved method for the production of slides from oversized samples of glycol methacrylate-embedded tissues: Application for optical disector based stereology. J Histotechnol. 2003;26(1):49-52.
7. Eisele JC, Schaefer I-M, Nyengaard JR, Post H, Liebetanz D, Brüel A, et al. Effect of voluntary exercise on number and volume of cardiomyocytes and their mitochondria in the mouse left ventricle. Basic Res Cardiol. 2008;103(1):12-21.
8. Gundersen HJ, Bagger P, Bendtsen TF, Evans SM, Korbo L, Marcussen N, et al. The new stereological tools: disector, fractionator, nucleator and point sampled intercepts and their use in pathological research and diagnosis. APMIS. 1988;96(10):857-81.
������������� ����������� �����������������������
Novaes et alFluorescence to estimate number of cardiomyocytes
9. Weibel ER. Measuring through the microscope: development and evolution of stereological methods. J Microsc. 1989;155(Pt3):393-403.
10. Cruz-Orive LM, Weibel ER. Recent stereological methods for cell biology: a brief survey. Am J Physiol. 1990;258(4 Pt1):148-56.
11. Xavier-Vidal R. Disector Z-axis mechanical method for stereology. An Acad Bras Cienc. 2010;82(2):539-44.
12. Marin-Neto JA, Cunha-Neto E, Maciel BC, Simões MV. Pathogenesis of chronic Chagas’ heart disease. Circulation. 2007;115(9):1109-23.
13. Martinelli PM, Camargos ER, Azevedo AA, Chiari E, Morel G, Machado CRS. Cardiac NGF and GDNF expression during Trypanosoma cruzi infection in rats. Auton Neurosci. 2006;130(1-2):32-40.
14. Brener Z. Therapeutic activity and criterion of cure on mice experimentally infected with Trypanosoma cruzi. Rev Inst Med Trop São Paulo. 1962;4:389-96.
15. Scherle W. A simple method for volumetry of organs in quantitative stereology. Mikroskopie. 1970;26(1):57-60.
16. Xavier-Vidal R, Neves MC, Villar VC, Viana WN, Mandarim-de-Lacerda CA. Estereologia do miocárdio em fetos humanos: estudo quantitativo das modificações estruturais nos dois últimos trimestres de gestação. Arq Bras Cardiol. 1993;60(4):221-4.
17. Xavier-Vidal R, Madi K. Comparação entre os miocárdios ventriculares direito e esquerdo durante período fetal humano: uma avaliação estereológica. Arq Bras Cardiol. 1999;72(5):581-6.
18. Masotti L, Cavatorta P, Avitabile M, Barcellona ML, von Berger J, Ragusa N. Characterization of 4’-6 diamidino-2 phenylindole (DAPI) as a fluorescent probe of DNA structure. Ital J Biochem. 1982;31(2):90-9.
19. Moro L, Vasconcelos AC, Santos FGA, Alves CM, Nunes JES, Sampaio IBM. Determination of the minimal representative number of microscopical fields to quantify apoptosis in canine lymph nodes. Arq Bras Med Vet Zootec. 2004;56(3):408-10.
20. Bucher O. [Contribution on the method of morphometry]. Anat Anz. 1967;120(1):39-40.
21. Rohr H. Principles, possibilities of use and limits of morphometry. Acta Histochem Suppl. 1976;16:83-9.
22. Rohr H, Oberholzer M, Barstsch G, Keller M. Morphometry in experimental pathology: methods, baseline data and applications. Int Rev Exp Pathol. 1976;15:233-325.
23. Elias H, Hyde DM. A guide to practical stereology. NewYork: Karger; 1983.
24. Chalkley HW. Methods for quantitative morphological analysis of tissues. J Natl Cancer Inst. 1943;4:47-53.
25. Co l l an Y. S te reo logy in d iagnos t i c pa tho logy. Pa tho log ica . 1997;89(4):462-6.
26. von Bartheld C. Counting particles in tissue sections: choices of methods and importance of calibrationto minimize biases. Histol Histopathol. 2002;17(2):639-48.
27. Weibel ER. Stereological methods: practical methods for biological morphometry. London: Academic Press; 1979.
28. Mouton PR. Principles and practices of unbiased stereology: an introduction for bioscientist. Baltimore: John Hopkins University Press; 2002.
ORIG INAL ART ICLE
Effects of Trypanosoma cruzi infection on myocardialmorphology, single cardiomyocyte contractile function andexercise tolerance in ratsRomulo D. Novaes*, Arlete R. Penitente*, Reggiani V. Goncalves*, Andre Talvani�, Clovis A. Neves*,Izabel R. S. C. Maldonado* and Antonio J. Natali�*Department of General Biology, Federal University of Vicosa, Vicosa, Minas Gerais, Brazil,
�Department of Biological Sciences and
NUPEB, Federal University of Ouro Preto, Ouro Preto, Minas Gerais, Brazil and�Department of Physical Education, Federal
University of Vicosa, Vicosa, Minas Gerais, Brazil
Chagas’ disease is an underappreciated illness caused by
the intracellular protozoan parasite Trypanosoma cruzi
(T. cruzi) that is an important health problem in 18 develop-
ing countries in South and Central America (Biolo et al.
2010; Rassi et al. 2010). Its main clinical manifestations are
cardiac and ⁄ or digestive disturbances, with a prevalence of
about 12–14 million cases worldwide, and it has been
considered a major cause of cardiac infectious disease in
endemic countries (WHO 2005). Chronic Chagasic cardio-
myopathy is the main cause of death and occurs in approxi-
mately 30% of infected subjects (Marin-Neto et al. 2007;
Rassi et al. 2010). The clinical course of Chagas’ disease
shows great variability, and the mechanisms responsible for
the development of this potentially lethal cardiomyopathy
are not understood (Biolo et al. 2010; Rassi et al. 2010).
Cardiac denervation, interstitial mononuclear infiltrate,
myocyte and vascular degenerative changes, fibrosis and
hypertrophy characterize the main pathologic features of
chronic Chagasic cardiomyopathy (Marin-Neto et al. 2007;
Biolo et al. 2010; Rassi et al. 2010). These morphological
changes coexist and are associated with abnormalities of the
electrical and contractile cardiac activities characterized
mainly by conduction defects, frequent and complex ventric-
ular arrhythmias and systolic ventricular dysfunction
(Marin-Neto et al. 2007; Biolo et al. 2010). In addition, the
chronotropic incompetence caused by changes in the sympa-
INTERNATIONAL
JOURNAL OF
EXPERIMENTAL
PATHOLOGY
doi: 10.1111/j.1365-2613.2011.00781.x
Received for publication: 21 February2011Accepted for publication: 27 May2011
Correspondence:Antonio Jose NataliDepartment of Physical EducationFederal University of VicosaAv. Peter Henry Rolfs, s ⁄ nºZip code: 35.570-000Vicosa-MGBrazilTel.: +55 (031) 3899 4390Fax: +55 31 3899 2249E-mail: [email protected]
Summary
The aim of this study was to investigate the effects of Trypanosoma cruzi (T. cruzi)
infection on myocardial morphology, single cardiomyocyte contractile function and
exercise tolerance in rats. Adult Wistar rats were randomized into control (n = 14)
and infected (n = 14) groups. Infected animals were inoculated with T. cruzi Y strain
(300,000 trypomastigotes ⁄ 50 g body weight). After 9 weeks, the animals were sub-
jected to a treadmill running protocol. Then, the right atrium (RA) and left ventricle
(LV) were removed for morphological and cell contractile evaluation. The infected
animals exhibited a significant reduction in distance travelled, total time to fatigue
and workload. In addition, these animals had hypertrophy, increased myocardial cel-
lularity, and an increase in the proportion of collagen and blood vessels. RA and LV
myocytes from infected animals showed marked contractile dysfunction under basal
conditions and a reduced contractile response to b-adrenergic stimulation. The work-
load of infected animals was correlated closely with the amplitude of cell shortening
of RA and LV myocytes. T. cruzi infection influenced the myocardial morphology
and the mechanical properties of RA and LV single myocytes negatively and reduced
exercise tolerance. Single cardiomyocyte contractile dysfunction could constitute an
additional mechanism of cardiac impairment and reduced exercise tolerance in this
infection.
Keywords
cellular contractility, Chagas’ cardiomyopathy, myocytes, physical capacity
Int. J. Exp. Path. (2011), 92, 299–307
� 2011 The Authors. International Journal of Experimental Pathology � 2011 International Journal of Experimental Pathology 299
thetic and parasympathetic tonus induced by an immune-
mediated process has been recognized as one of the mecha-
nisms capable of interfering with the capacity of the heart to
increase heart rate in response to different stimuli, including
physical exercise (Colucci et al. 1989; Talvani et al. 2006;
Sousa et al. 2009).
Few studies have evaluated exercise performance and the
factors affecting functional capacity and exercise tolerance in
patients with Chagas’ disease. Moreover, it is not known
whether T. cruzi infection can also lead to changes in exercise
tolerance in experimental animal models. The reduction of
exercise tolerance in individuals with Chagas’ disease is mul-
tifactorial and is involved with pathological changes in sev-
eral organs and tissues, such as peripheral nervous system,
skeletal and cardiac muscles (Meiler et al. 1987; Montes de
Oca et al. 2004). Moreover, previous studies indicated that
atrial and ventricular mechanical and electrical abnormalities
may have an important role in exercise intolerance in Cha-
gas’ disease (Gallo et al. 1975; Mady et al. 2000; Lima et al.
2010). However, several aspects of the cellular and molecular
basis of these changes remain to be clarified.
Recently, our group showed for the first time changes in
the cellular mechanics of cardiac myocytes isolated from the
atrium and ventricle of C57BL ⁄ 6 mice infected with T. cruzi
(Roman-Campos et al. 2009). We observed decreased myo-
cyte contraction amplitude and a prolonged contraction and
relaxation time course in the very beginning of the parasit-
ism that remained until the chronic phase of the disease.
Data from our laboratory also showed that in normal rats,
exercise performance is significantly influenced by the elec-
tromechanical characteristics of cardiomyocytes (Prımola-
Gomes et al. 2009). In this study, cardiomyocytes isolated
from rats with high running capacity had greater calcium
(Ca2+) transients, amplitude of cell contraction, maximum
velocity of contraction and relaxation compared with rats of
the same progeny with standard running capacity.
The aim of this study was to investigate the effects of
T. cruzi infection on myocardial morphology, single cardio-
myocyte contractile function and exercise tolerance in rats.
We hypothesized that T. cruzi infection can lead to changes
in cardiac morphology, and to single cardiomyocyte contrac-
tile dysfunction and can also influence exercise tolerance in
rats.
Materials and methods
Animals and infection
Four-month-old male Wistar rats with an initial weight of
366.25 ± 31.17 g were given rodent chow and water ad libi-
tum and maintained in animal facilities with a controlled
temperature of 22 �C and 12-h light ⁄ dark inverted cycles.
Animals were randomly divided into control (CG = 14) and
infected (IG = 14) groups. Animals from the IG were inocu-
lated intraperitoneally with T. cruzi Y strain (300,000
trypomastigotes ⁄ 50 g body weight, about 21,00000 trypo-
mastigotes) (Martinelli et al. 2006) contained in 700 ll of
infected blood from mouse diluted in saline solution 0.9%
(Brener 1962). Infection was confirmed 4 days postinocula-
tion by the presence of trypomastigotes in peripheral blood
collected from the rat’s tail, and the level of parasitaemia
was recorded daily after inoculation as described by Brener
(1962). Mortality was investigated during the experiment.
All experimental procedures were conducted in accordance
with the Brazilian College of Animal Experimentation and
approved by the Animal Research Ethics Commission of the
Veterinary Department at the Federal University of Vicosa,
Brazil (protocol 30 ⁄ 2009).
Measurement of exercise tolerance
Nine weeks after inoculation, all animals were evaluated for
exercise tolerance using a treadmill incremental running pro-
tocol adapted from Koch and Britton (2001). Briefly, the rats
were familiarized with the motor-driven treadmill (Insight
Instruments�, Ribeirao Preto, Brazil) by running at a speed
of 10 m ⁄ min at 5% inclination for 5 min ⁄ day for seven con-
secutive days. Two days after familiarization, the exercise
trial was performed on three consecutive days at a constant
slope of 5% with the starting speed at 10 m ⁄ min. Treadmill
velocity was increased by 1 m ⁄ min every 2 min, and each rat
ran until fatigue. Fatigue was defined as the point at which
the animals were no longer able to keep pace with the tread-
mill. Travelled distance (m), time until fatigue and workload
were used as indexes of exercise tolerance (Lacerda et al.
2006). Workload (W; kg) was calculated using the equation
W = body mass (kg) · TTF (total time to fatigue)
(min) · treadmill speed (m ⁄ min) · sine h (treadmill inclina-
tion), where TTF is time until fatigue (Brooks et al. 1984).
Because of variability in the performance data, the mean of
the indices of running performance was calculated for the
three trials for each rat and analysed.
Heart biometry and myocardial stereology
Forty-eight hours after the exercise test, five animals from
each group were sacrificed, and the hearts were removed
and weighed. The atria and ventricles were dissected,
weighed separately and the right atrium (RA) and left ventri-
cle (LV) isolated. Hypertrophy was determined by measuring
RA and LV volume using the submersion method described
by Scherle (1970).
The atria and ventricles were fixed for 48 h (in freshly pre-
pared 10% w ⁄ v formaldehyde in 0.1 M phosphate buffer,
pH 7.2). The fragments of the RA and LV were obtained
through the Orthrip method for stereological study (Manda-
rim-de-Lacerda 2003). These fragments were dehydrated in
ethanol, cleared in xylol and embedded in paraffin. Blocks
were cut into 4-lm sections and stained by Masson’s trichro-
me or haematoxylin–eosin (H&E) and mounted on histology
slides. The slides were visualized and the images captured
using a light microscope (Olympus BX-60�; Olympus,
Toquio, Japan) connected to a digital camera (Olympus
QColor-3�; Olympus, Toquio, Japan). Sixty fields from each
300 R. D. Novaes et al.
� 2011 The Authors. International Journal of Experimental Pathology � 2011 International Journal of Experimental Pathology, 92, 299–307
Masson’s trichromic (objective ·20) and H&E (objective
·40) stain were randomly chosen, and a total of
4.37 · 106 lm2 and 1.41 · 106 lm2 of myocardium area,
respectively, were analysed. Sections stained with Masson’s
trichromic were used for myocardial stereological analysis.
For this analysis, a test system of 72 points was used in a
standard test area of 73 · 103 lm2 (Mandarim-de-Lacerda
2003). All the stereological analyses were performed accord-
ing to Bezerra et al. (2008).
The stereological parameter of volume density (Vv) was
estimated by point counting for cardiomyocytes [cmy], colla-
gen [col] and intramyocardial blood vessels [ibvs] according
to the formula Vv [structure] = PP [structure] ⁄ PT, where PP
is the number of points that hit the structure and PT is the
total number of test points. The amount of intramyocardial
vascularization was defined as the ratio of Vv [ibvs] ⁄ Vv
[cmy]. The mean cross-sectional area of cardiomyocytes was
estimated according to the following relationship: A [cmy] =
Vv [cmy] ⁄ 2.QA [cmyn]; QA [cmyn] = N [cmy] ⁄ AT, where
QA [cmyn] is the number of cardiomyocyte nuclei profiles in
the analysed area (AT). Overestimation of the measurements
was avoided by the exclusion of nuclei profiles incident on
two edges of the AT.
Myocardial histopathology
For each group, 25 sections of 8 lm thickness stained with
Sirius red and Fast green were used to quantify collagen and
total protein in cardiac tissue using a spectrophotometric
method previously described (Lopez-De Leon & Rojkind
1985).
The inflammatory process was evaluated by the correla-
tion index between the number of cells observed in the myo-
cardium from CG and IG animals (Caldas et al. 2008). All
morphological analyses were performed using the software
image pro-plus 4.5� (Media Cybernetics, Silver Spring,
MD, USA).
Cardiomyocytes isolation
Nine animals from each group were used in this set of experi-
ments. At the time of sacrifice, the heart was removed rapidly
and extraneous tissue dissected away. The heart was flushed
immediately with modified HEPES (4-2-hydroxyethyl-1-
piperazineethanesulfonic acid)-Tyrode’s solution of the fol-
lowing composition (mM): 130 NaCl, 5.4 KCl, 1.4 MgCl2,
0.4 NaH2PO4, 0.75 CaCl2, 5 HEPES, 10 glucose, 20 taurine
and 10 creatine (pH 7.4) and then blotted and weighed
before being mounted onto a Langendorff perfusion appara-
tus for the isolation of myocytes using a collagenase–protease
dispersion technique as described previously (Natali et al.
2002). Briefly, the heart was perfused for 10–15 min with a
solution containing 1 mg ⁄ ml collagenase type II (Worthing-
ton Biochemical Co.; Worthington, OH, USA). The digested
heart was removed from the cannula, and the RA and LV
were separated and cut into small pieces. Ventricular and
atrial cardiomyocyte cells were isolated mechanically (5 min
at 37 �C), and single cells were separated from the non-dis-
persed tissue by filtration. The resulting cell suspension was
centrifuged at 30 g for 45 s, resuspended in HEPES-Tyrode’s
and stored at 4 �C until analysis. Only calcium-tolerant, qui-
escent, rod-shaped cardiomyocytes showing clear cross-stria-
tions were studied. The isolated cardiac myocytes were used
within 4 h after isolation.
Measurements of cell contractility
Cellular contractile function was evaluated as described by
Natali et al. (2002). Isolated cells were placed in a chamber
with a glass coverslip base mounted on the stage of an
inverted phase-contrast video microscope (Eclipse-TS100�;
Nikon, Toquio, Japan). The chamber was perfused with Ty-
rode’s solution (in mM): 140 NaCl, 5.4 KCl, 1 MgCl2, 1.8
CaCl2, 10 HEPES and 10 glucose (pH 7.4) at room temper-
ature (approximately 28 �C). Myocytes were stimulated via
platinum bath electrodes with voltage pulses of a duration
of 5 ms and an intensity of 20 V at the stimulation fre-
quency of 3 Hz. Cells were visualized on a PC monitor with
a NTSC camera (Myo-Cam CCD100V�; Ionoptix, Milton,
MA, USA) in partial scanning mode. This image was used to
measure cell shortening (index of contractile function) in
response to electrical stimulation using a video motion edge
detection system (Ionoptix). The cell image was sampled at
240 Hz, and cell shortening was calculated from the output
of the edge detector using an IonWizard A ⁄ D converter (Ion-
optix). Eight to 16 consecutive contractions were averaged,
and cell shortening (expressed as a percentage of resting cell
length), time to peak shortening and time to half relaxation
were calculated (Roman-Campos et al. 2009).
b-Adrenergic stimulation
The contractile response of isolated cardiomyocytes to b-
adrenergic stimulation was assessed using the non-selective
agonist isoproterenol (ISO, 1, 2 and 3 mM) at a stimulation
rate of 1 Hz. After recording the baseline cell shortening,
ISO was infused in the experimental chamber through an
automatic pipette. The cells were electrically stimulated after
5 min of infusion when cell shortening was recorded (Pra-
hash et al. 2000). This procedure was repeated for each ISO
concentration in different myocytes. Cell contractile function
was analysed, and the variation (D) from the baseline to the
larger stimulus (ISO, 3 mM) was used as an index of
b-adrenergic sensitivity.
Statistics
Data are presented as mean and standard error of the mean
(mean ± SEM). The normal distribution of the data was ver-
ified using the Kolmogorov–Smirnov test. Parameters of
exercise tolerance, biometric and cell contractile function
data were compared using the Student’s t-test. Stereological
data and karyometric parameters were compared using the
Mann–Whitney U test. The relationship between cell con-
Exercise tolerance in Chagas’ disease 301
� 2011 The Authors. International Journal of Experimental Pathology � 2011 International Journal of Experimental Pathology, 92, 299–307
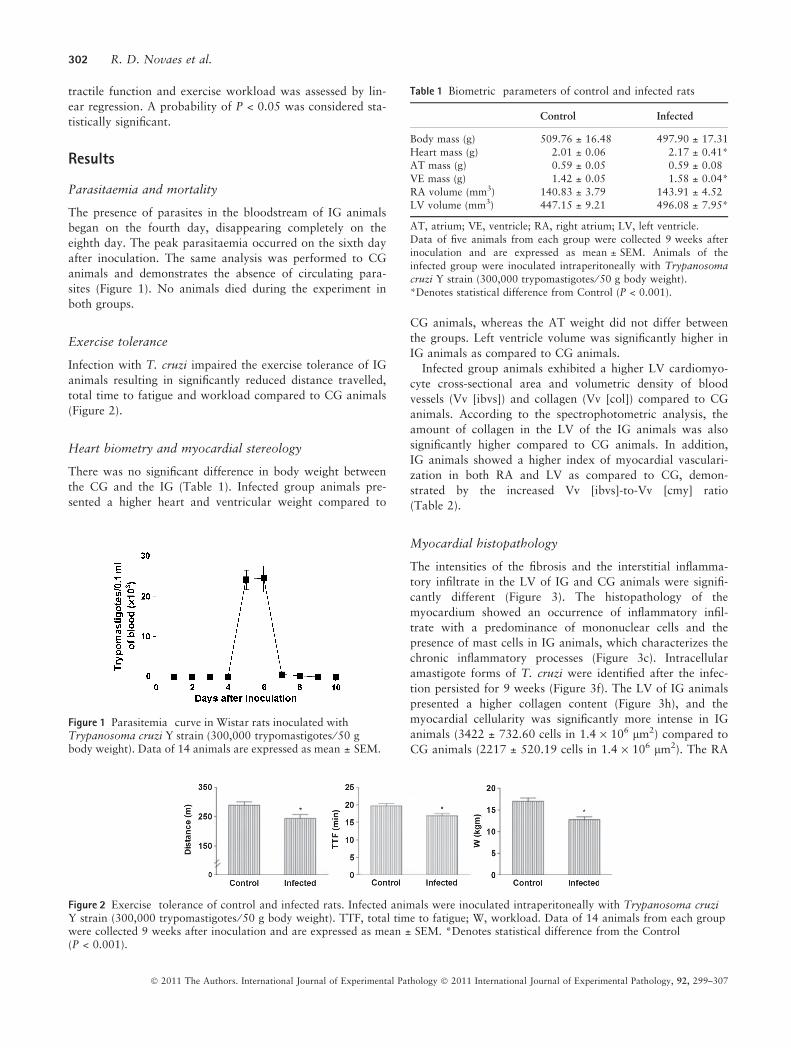
tractile function and exercise workload was assessed by lin-
ear regression. A probability of P < 0.05 was considered sta-
tistically significant.
Results
Parasitaemia and mortality
The presence of parasites in the bloodstream of IG animals
began on the fourth day, disappearing completely on the
eighth day. The peak parasitaemia occurred on the sixth day
after inoculation. The same analysis was performed to CG
animals and demonstrates the absence of circulating para-
sites (Figure 1). No animals died during the experiment in
both groups.
Exercise tolerance
Infection with T. cruzi impaired the exercise tolerance of IG
animals resulting in significantly reduced distance travelled,
total time to fatigue and workload compared to CG animals
(Figure 2).
Heart biometry and myocardial stereology
There was no significant difference in body weight between
the CG and the IG (Table 1). Infected group animals pre-
sented a higher heart and ventricular weight compared to
CG animals, whereas the AT weight did not differ between
the groups. Left ventricle volume was significantly higher in
IG animals as compared to CG animals.
Infected group animals exhibited a higher LV cardiomyo-
cyte cross-sectional area and volumetric density of blood
vessels (Vv [ibvs]) and collagen (Vv [col]) compared to CG
animals. According to the spectrophotometric analysis, the
amount of collagen in the LV of the IG animals was also
significantly higher compared to CG animals. In addition,
IG animals showed a higher index of myocardial vasculari-
zation in both RA and LV as compared to CG, demon-
strated by the increased Vv [ibvs]-to-Vv [cmy] ratio
(Table 2).
Myocardial histopathology
The intensities of the fibrosis and the interstitial inflamma-
tory infiltrate in the LV of IG and CG animals were signifi-
cantly different (Figure 3). The histopathology of the
myocardium showed an occurrence of inflammatory infil-
trate with a predominance of mononuclear cells and the
presence of mast cells in IG animals, which characterizes the
chronic inflammatory processes (Figure 3c). Intracellular
amastigote forms of T. cruzi were identified after the infec-
tion persisted for 9 weeks (Figure 3f). The LV of IG animals
presented a higher collagen content (Figure 3h), and the
myocardial cellularity was significantly more intense in IG
animals (3422 ± 732.60 cells in 1.4 · 106 lm2) compared to
CG animals (2217 ± 520.19 cells in 1.4 · 106 lm2). The RA
Figure 1 Parasitemia curve in Wistar rats inoculated withTrypanosoma cruzi Y strain (300,000 trypomastigotes ⁄ 50 gbody weight). Data of 14 animals are expressed as mean ± SEM.
Figure 2 Exercise tolerance of control and infected rats. Infected animals were inoculated intraperitoneally with Trypanosoma cruziY strain (300,000 trypomastigotes ⁄ 50 g body weight). TTF, total time to fatigue; W, workload. Data of 14 animals from each groupwere collected 9 weeks after inoculation and are expressed as mean ± SEM. *Denotes statistical difference from the Control(P < 0.001).
Table 1 Biometric parameters of control and infected rats
Control Infected
Body mass (g) 509.76 ± 16.48 497.90 ± 17.31
Heart mass (g) 2.01 ± 0.06 2.17 ± 0.41*AT mass (g) 0.59 ± 0.05 0.59 ± 0.08
VE mass (g) 1.42 ± 0.05 1.58 ± 0.04*
RA volume (mm3) 140.83 ± 3.79 143.91 ± 4.52LV volume (mm3) 447.15 ± 9.21 496.08 ± 7.95*
AT, atrium; VE, ventricle; RA, right atrium; LV, left ventricle.
Data of five animals from each group were collected 9 weeks afterinoculation and are expressed as mean ± SEM. Animals of the
infected group were inoculated intraperitoneally with Trypanosomacruzi Y strain (300,000 trypomastigotes ⁄ 50 g body weight).
*Denotes statistical difference from Control (P < 0.001).
302 R. D. Novaes et al.
� 2011 The Authors. International Journal of Experimental Pathology � 2011 International Journal of Experimental Pathology, 92, 299–307
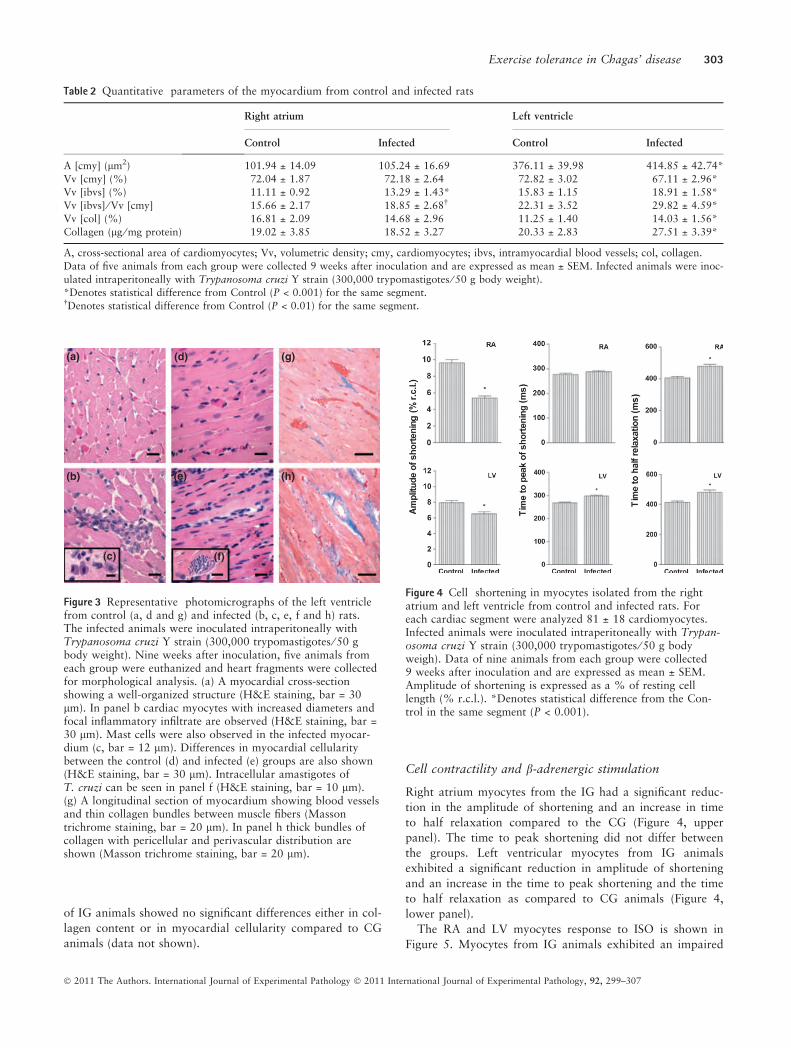
of IG animals showed no significant differences either in col-
lagen content or in myocardial cellularity compared to CG
animals (data not shown).
Cell contractility and b-adrenergic stimulation
Right atrium myocytes from the IG had a significant reduc-
tion in the amplitude of shortening and an increase in time
to half relaxation compared to the CG (Figure 4, upper
panel). The time to peak shortening did not differ between
the groups. Left ventricular myocytes from IG animals
exhibited a significant reduction in amplitude of shortening
and an increase in the time to peak shortening and the time
to half relaxation as compared to CG animals (Figure 4,
lower panel).
The RA and LV myocytes response to ISO is shown in
Figure 5. Myocytes from IG animals exhibited an impaired
Table 2 Quantitative parameters of the myocardium from control and infected rats
Right atrium Left ventricle
Control Infected Control Infected
A [cmy] (lm2) 101.94 ± 14.09 105.24 ± 16.69 376.11 ± 39.98 414.85 ± 42.74*
Vv [cmy] (%) 72.04 ± 1.87 72.18 ± 2.64 72.82 ± 3.02 67.11 ± 2.96*Vv [ibvs] (%) 11.11 ± 0.92 13.29 ± 1.43* 15.83 ± 1.15 18.91 ± 1.58*
Vv [ibvs] ⁄ Vv [cmy] 15.66 ± 2.17 18.85 ± 2.68� 22.31 ± 3.52 29.82 ± 4.59*
Vv [col] (%) 16.81 ± 2.09 14.68 ± 2.96 11.25 ± 1.40 14.03 ± 1.56*
Collagen (lg ⁄ mg protein) 19.02 ± 3.85 18.52 ± 3.27 20.33 ± 2.83 27.51 ± 3.39*
A, cross-sectional area of cardiomyocytes; Vv, volumetric density; cmy, cardiomyocytes; ibvs, intramyocardial blood vessels; col, collagen.
Data of five animals from each group were collected 9 weeks after inoculation and are expressed as mean ± SEM. Infected animals were inoc-
ulated intraperitoneally with Trypanosoma cruzi Y strain (300,000 trypomastigotes ⁄ 50 g body weight).*Denotes statistical difference from Control (P < 0.001) for the same segment.�Denotes statistical difference from Control (P < 0.01) for the same segment.
(a)
(b)
(d)
(e)
(g)
(h)
(c) (f)
Figure 3 Representative photomicrographs of the left ventriclefrom control (a, d and g) and infected (b, c, e, f and h) rats.The infected animals were inoculated intraperitoneally withTrypanosoma cruzi Y strain (300,000 trypomastigotes ⁄ 50 gbody weight). Nine weeks after inoculation, five animals fromeach group were euthanized and heart fragments were collectedfor morphological analysis. (a) A myocardial cross-sectionshowing a well-organized structure (H&E staining, bar = 30lm). In panel b cardiac myocytes with increased diameters andfocal inflammatory infiltrate are observed (H&E staining, bar =30 lm). Mast cells were also observed in the infected myocar-dium (c, bar = 12 lm). Differences in myocardial cellularitybetween the control (d) and infected (e) groups are also shown(H&E staining, bar = 30 lm). Intracellular amastigotes ofT. cruzi can be seen in panel f (H&E staining, bar = 10 lm).(g) A longitudinal section of myocardium showing blood vesselsand thin collagen bundles between muscle fibers (Massontrichrome staining, bar = 20 lm). In panel h thick bundles ofcollagen with pericellular and perivascular distribution areshown (Masson trichrome staining, bar = 20 lm).
Figure 4 Cell shortening in myocytes isolated from the rightatrium and left ventricle from control and infected rats. Foreach cardiac segment were analyzed 81 ± 18 cardiomyocytes.Infected animals were inoculated intraperitoneally with Trypan-osoma cruzi Y strain (300,000 trypomastigotes ⁄ 50 g bodyweigh). Data of nine animals from each group were collected9 weeks after inoculation and are expressed as mean ± SEM.Amplitude of shortening is expressed as a % of resting celllength (% r.c.l.). *Denotes statistical difference from the Con-trol in the same segment (P < 0.001).
Exercise tolerance in Chagas’ disease 303
� 2011 The Authors. International Journal of Experimental Pathology � 2011 International Journal of Experimental Pathology, 92, 299–307
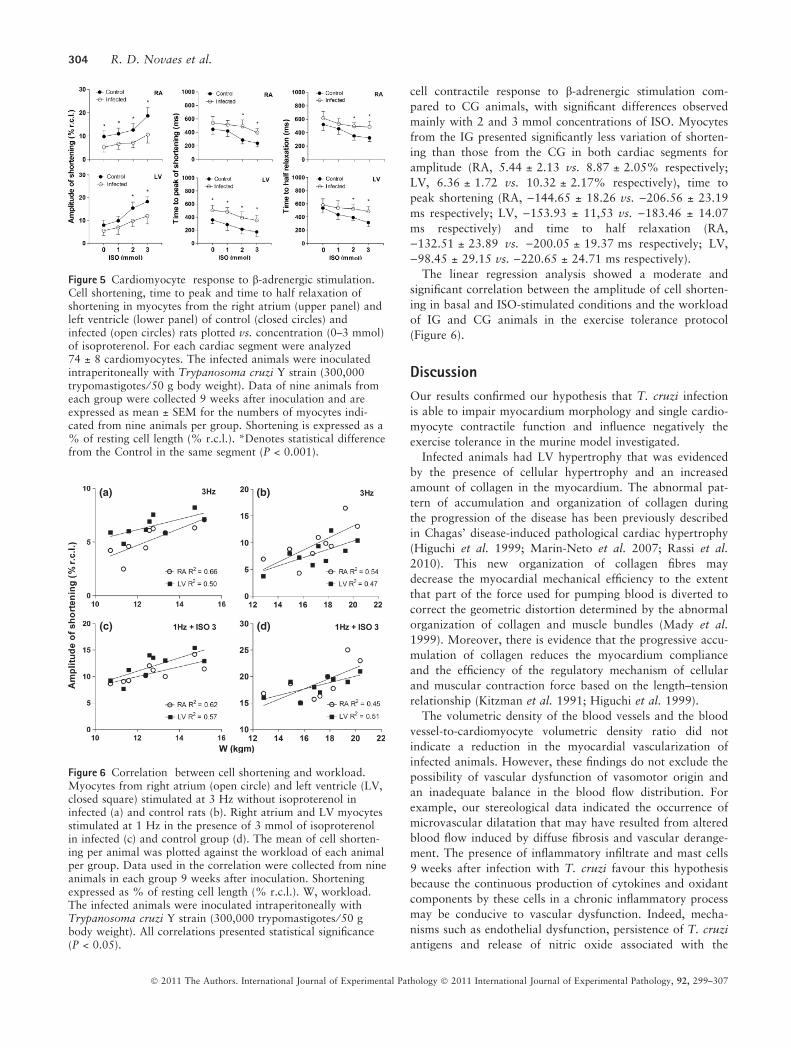
cell contractile response to b-adrenergic stimulation com-
pared to CG animals, with significant differences observed
mainly with 2 and 3 mmol concentrations of ISO. Myocytes
from the IG presented significantly less variation of shorten-
ing than those from the CG in both cardiac segments for
amplitude (RA, 5.44 ± 2.13 vs. 8.87 ± 2.05% respectively;
LV, 6.36 ± 1.72 vs. 10.32 ± 2.17% respectively), time to
peak shortening (RA, )144.65 ± 18.26 vs. )206.56 ± 23.19
ms respectively; LV, )153.93 ± 11,53 vs. )183.46 ± 14.07
ms respectively) and time to half relaxation (RA,
)132.51 ± 23.89 vs. )200.05 ± 19.37 ms respectively; LV,
)98.45 ± 29.15 vs. )220.65 ± 24.71 ms respectively).
The linear regression analysis showed a moderate and
significant correlation between the amplitude of cell shorten-
ing in basal and ISO-stimulated conditions and the workload
of IG and CG animals in the exercise tolerance protocol
(Figure 6).
Discussion
Our results confirmed our hypothesis that T. cruzi infection
is able to impair myocardium morphology and single cardio-
myocyte contractile function and influence negatively the
exercise tolerance in the murine model investigated.
Infected animals had LV hypertrophy that was evidenced
by the presence of cellular hypertrophy and an increased
amount of collagen in the myocardium. The abnormal pat-
tern of accumulation and organization of collagen during
the progression of the disease has been previously described
in Chagas’ disease-induced pathological cardiac hypertrophy
(Higuchi et al. 1999; Marin-Neto et al. 2007; Rassi et al.
2010). This new organization of collagen fibres may
decrease the myocardial mechanical efficiency to the extent
that part of the force used for pumping blood is diverted to
correct the geometric distortion determined by the abnormal
organization of collagen and muscle bundles (Mady et al.
1999). Moreover, there is evidence that the progressive accu-
mulation of collagen reduces the myocardium compliance
and the efficiency of the regulatory mechanism of cellular
and muscular contraction force based on the length–tension
relationship (Kitzman et al. 1991; Higuchi et al. 1999).
The volumetric density of the blood vessels and the blood
vessel-to-cardiomyocyte volumetric density ratio did not
indicate a reduction in the myocardial vascularization of
infected animals. However, these findings do not exclude the
possibility of vascular dysfunction of vasomotor origin and
an inadequate balance in the blood flow distribution. For
example, our stereological data indicated the occurrence of
microvascular dilatation that may have resulted from altered
blood flow induced by diffuse fibrosis and vascular derange-
ment. The presence of inflammatory infiltrate and mast cells
9 weeks after infection with T. cruzi favour this hypothesis
because the continuous production of cytokines and oxidant
components by these cells in a chronic inflammatory process
may be conducive to vascular dysfunction. Indeed, mecha-
nisms such as endothelial dysfunction, persistence of T. cruzi
antigens and release of nitric oxide associated with the
Figure 5 Cardiomyocyte response to b-adrenergic stimulation.Cell shortening, time to peak and time to half relaxation ofshortening in myocytes from the right atrium (upper panel) andleft ventricle (lower panel) of control (closed circles) andinfected (open circles) rats plotted vs. concentration (0–3 mmol)of isoproterenol. For each cardiac segment were analyzed74 ± 8 cardiomyocytes. The infected animals were inoculatedintraperitoneally with Trypanosoma cruzi Y strain (300,000trypomastigotes ⁄ 50 g body weight). Data of nine animals fromeach group were collected 9 weeks after inoculation and areexpressed as mean ± SEM for the numbers of myocytes indi-cated from nine animals per group. Shortening is expressed as a% of resting cell length (% r.c.l.). *Denotes statistical differencefrom the Control in the same segment (P < 0.001).
(a) (b)
(c) (d)
Figure 6 Correlation between cell shortening and workload.Myocytes from right atrium (open circle) and left ventricle (LV,closed square) stimulated at 3 Hz without isoproterenol ininfected (a) and control rats (b). Right atrium and LV myocytesstimulated at 1 Hz in the presence of 3 mmol of isoproterenolin infected (c) and control group (d). The mean of cell shorten-ing per animal was plotted against the workload of each animalper group. Data used in the correlation were collected from nineanimals in each group 9 weeks after inoculation. Shorteningexpressed as % of resting cell length (% r.c.l.). W, workload.The infected animals were inoculated intraperitoneally withTrypanosoma cruzi Y strain (300,000 trypomastigotes ⁄ 50 gbody weight). All correlations presented statistical significance(P < 0.05).
304 R. D. Novaes et al.
� 2011 The Authors. International Journal of Experimental Pathology � 2011 International Journal of Experimental Pathology, 92, 299–307
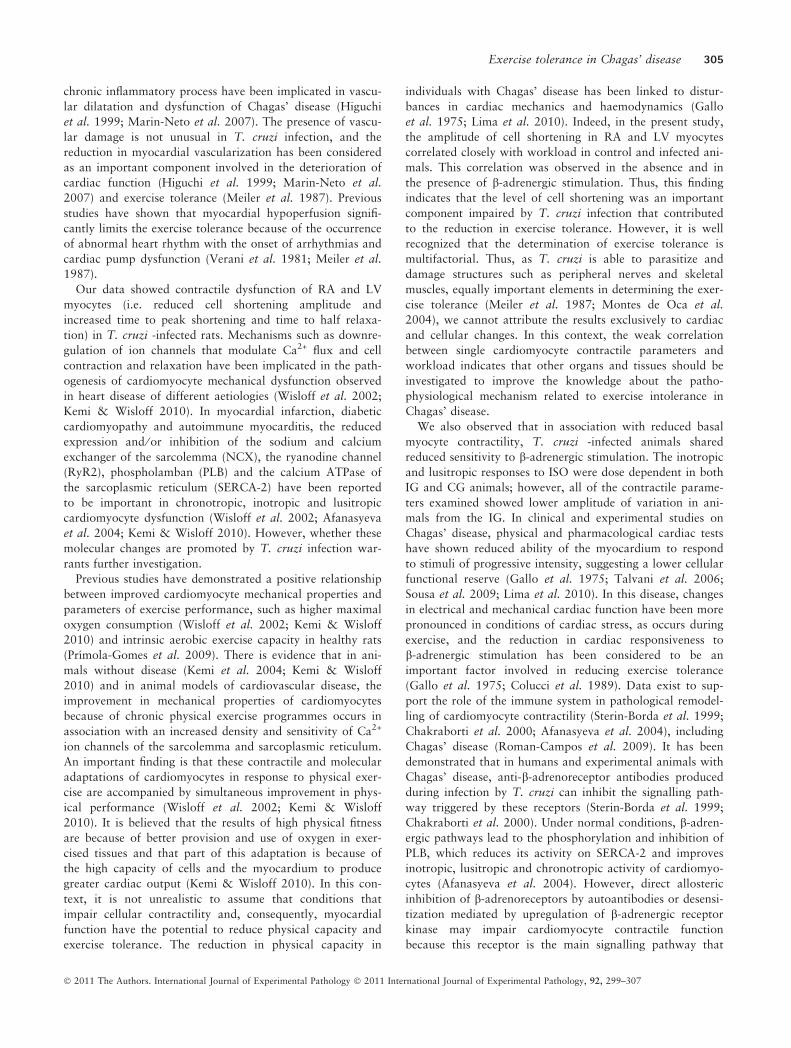
chronic inflammatory process have been implicated in vascu-
lar dilatation and dysfunction of Chagas’ disease (Higuchi
et al. 1999; Marin-Neto et al. 2007). The presence of vascu-
lar damage is not unusual in T. cruzi infection, and the
reduction in myocardial vascularization has been considered
as an important component involved in the deterioration of
cardiac function (Higuchi et al. 1999; Marin-Neto et al.
2007) and exercise tolerance (Meiler et al. 1987). Previous
studies have shown that myocardial hypoperfusion signifi-
cantly limits the exercise tolerance because of the occurrence
of abnormal heart rhythm with the onset of arrhythmias and
cardiac pump dysfunction (Verani et al. 1981; Meiler et al.
1987).
Our data showed contractile dysfunction of RA and LV
myocytes (i.e. reduced cell shortening amplitude and
increased time to peak shortening and time to half relaxa-
tion) in T. cruzi -infected rats. Mechanisms such as downre-
gulation of ion channels that modulate Ca2+ flux and cell
contraction and relaxation have been implicated in the path-
ogenesis of cardiomyocyte mechanical dysfunction observed
in heart disease of different aetiologies (Wisloff et al. 2002;
Kemi & Wisloff 2010). In myocardial infarction, diabetic
cardiomyopathy and autoimmune myocarditis, the reduced
expression and ⁄ or inhibition of the sodium and calcium
exchanger of the sarcolemma (NCX), the ryanodine channel
(RyR2), phospholamban (PLB) and the calcium ATPase of
the sarcoplasmic reticulum (SERCA-2) have been reported
to be important in chronotropic, inotropic and lusitropic
cardiomyocyte dysfunction (Wisloff et al. 2002; Afanasyeva
et al. 2004; Kemi & Wisloff 2010). However, whether these
molecular changes are promoted by T. cruzi infection war-
rants further investigation.
Previous studies have demonstrated a positive relationship
between improved cardiomyocyte mechanical properties and
parameters of exercise performance, such as higher maximal
oxygen consumption (Wisloff et al. 2002; Kemi & Wisloff
2010) and intrinsic aerobic exercise capacity in healthy rats
(Prımola-Gomes et al. 2009). There is evidence that in ani-
mals without disease (Kemi et al. 2004; Kemi & Wisloff
2010) and in animal models of cardiovascular disease, the
improvement in mechanical properties of cardiomyocytes
because of chronic physical exercise programmes occurs in
association with an increased density and sensitivity of Ca2+
ion channels of the sarcolemma and sarcoplasmic reticulum.
An important finding is that these contractile and molecular
adaptations of cardiomyocytes in response to physical exer-
cise are accompanied by simultaneous improvement in phys-
ical performance (Wisloff et al. 2002; Kemi & Wisloff
2010). It is believed that the results of high physical fitness
are because of better provision and use of oxygen in exer-
cised tissues and that part of this adaptation is because of
the high capacity of cells and the myocardium to produce
greater cardiac output (Kemi & Wisloff 2010). In this con-
text, it is not unrealistic to assume that conditions that
impair cellular contractility and, consequently, myocardial
function have the potential to reduce physical capacity and
exercise tolerance. The reduction in physical capacity in
individuals with Chagas’ disease has been linked to distur-
bances in cardiac mechanics and haemodynamics (Gallo
et al. 1975; Lima et al. 2010). Indeed, in the present study,
the amplitude of cell shortening in RA and LV myocytes
correlated closely with workload in control and infected ani-
mals. This correlation was observed in the absence and in
the presence of b-adrenergic stimulation. Thus, this finding
indicates that the level of cell shortening was an important
component impaired by T. cruzi infection that contributed
to the reduction in exercise tolerance. However, it is well
recognized that the determination of exercise tolerance is
multifactorial. Thus, as T. cruzi is able to parasitize and
damage structures such as peripheral nerves and skeletal
muscles, equally important elements in determining the exer-
cise tolerance (Meiler et al. 1987; Montes de Oca et al.
2004), we cannot attribute the results exclusively to cardiac
and cellular changes. In this context, the weak correlation
between single cardiomyocyte contractile parameters and
workload indicates that other organs and tissues should be
investigated to improve the knowledge about the patho-
physiological mechanism related to exercise intolerance in
Chagas’ disease.
We also observed that in association with reduced basal
myocyte contractility, T. cruzi -infected animals shared
reduced sensitivity to b-adrenergic stimulation. The inotropic
and lusitropic responses to ISO were dose dependent in both
IG and CG animals; however, all of the contractile parame-
ters examined showed lower amplitude of variation in ani-
mals from the IG. In clinical and experimental studies on
Chagas’ disease, physical and pharmacological cardiac tests
have shown reduced ability of the myocardium to respond
to stimuli of progressive intensity, suggesting a lower cellular
functional reserve (Gallo et al. 1975; Talvani et al. 2006;
Sousa et al. 2009; Lima et al. 2010). In this disease, changes
in electrical and mechanical cardiac function have been more
pronounced in conditions of cardiac stress, as occurs during
exercise, and the reduction in cardiac responsiveness to
b-adrenergic stimulation has been considered to be an
important factor involved in reducing exercise tolerance
(Gallo et al. 1975; Colucci et al. 1989). Data exist to sup-
port the role of the immune system in pathological remodel-
ling of cardiomyocyte contractility (Sterin-Borda et al. 1999;
Chakraborti et al. 2000; Afanasyeva et al. 2004), including
Chagas’ disease (Roman-Campos et al. 2009). It has been
demonstrated that in humans and experimental animals with
Chagas’ disease, anti-b-adrenoreceptor antibodies produced
during infection by T. cruzi can inhibit the signalling path-
way triggered by these receptors (Sterin-Borda et al. 1999;
Chakraborti et al. 2000). Under normal conditions, b-adren-
ergic pathways lead to the phosphorylation and inhibition of
PLB, which reduces its activity on SERCA-2 and improves
inotropic, lusitropic and chronotropic activity of cardiomyo-
cytes (Afanasyeva et al. 2004). However, direct allosteric
inhibition of b-adrenoreceptors by autoantibodies or desensi-
tization mediated by upregulation of b-adrenergic receptor
kinase may impair cardiomyocyte contractile function
because this receptor is the main signalling pathway that
Exercise tolerance in Chagas’ disease 305
� 2011 The Authors. International Journal of Experimental Pathology � 2011 International Journal of Experimental Pathology, 92, 299–307
regulates cellular mechanics through adjustments in Ca2+
kinetics. Furthermore, inhibition of b signalling reduces the
phosphorylation and activation of RyR2 and Ca2+ entry into
the cell via the L-type current mediated by the Ca2+-induced
Ca2+-release mechanism (Afanasyeva et al. 2004).
In summary, we showed that experimental T. cruzi infec-
tion negatively influenced myocardial morphology, the
mechanical properties of single RA and LV myocytes and
exercise tolerance in rats. The results of the cell mechanics
associated with b-adrenergic stimulation support the hypoth-
esis that single cardiomyocyte contractile dysfunction could
constitute an additional mechanism of cardiac impairment
and reduced exercise tolerance in animals infected with
T. cruzi. The experimental model presented here can be use-
ful for future studies investigating, in addition to the cardiac
muscle, the participation of other tissues in exercise intoler-
ance. However, little is known about the influence of the
parasite in the signalling pathways through which it acts to
modulate the single cardiomyocyte mechanics: thus, further
studies are needed in this area.
Acknowledgements
Research supported by FAPEMIG (PRONEX). Romulo D.
Novaes was a recipient of the MS scholarship from FAP-
EMIG. Antonio J. Natali is a CNPq fellow.
Contributions
All listed authors meet ICMJE authorship criteria and
nobody who qualifies for authorship has been excluded.
Authors contributed to research design, acquisition, analy-
sis and interpretation of data; drafting the paper or revis-
ing it critically; and approval of the submitted and final
versions.
References
Afanasyeva M., Georgakopoulos D., Rose N.R. (2004) Autoimmune
myocarditis: cellular mediators of cardiac dysfunction. Autoim-
mun. Rev. 3, 476–486.
Bezerra D.G.A., Andrade L.M.L., Cruz F.O.P., Mandarim-de-lacer-
da C.A. (2008) Atorvastatin attenuates cardiomyocyte loss in
adult rats from protein-restricted dams. J. Card. Fail. 14, 151–
160.
Biolo A., Ribeiro A.L., Clausell N. (2010) Chagas cardiomyopathy-
where do we stand after a hundred years? Prog. Cardiovasc. Dis.
52, 300–316.
Brener Z. (1962) Therapeutic activity and criterion of cure on mice
experimentally infected with Trypanosoma cruzi. Rev. Inst. Med.
Trop. Sao Paulo 4, 389–396.
Brooks G.A., Donovan C.M., White T.P. (1984) Estimation of
anaerobic energy production and efficiency in rats during exercise.
J. Appl. Physiol. 56, 520–525.
Caldas I.S., Talvani A., Caldas S. et al. (2008) Benznidazole therapy
during acute phase of Chagas disease reduces parasite load but
does not prevent chronic cardiac lesions. Parasitol. Res. 103,
413–421.
Chakraborti S., Chakraborti T., Shaw G. (2000) Beta-adrenergic
mechanisms in cardiac diseases: a perspective. Cell. Signal. 12,
499–513.
Colucci W.S., Ribeiro J.P., Rocco M.B. et al. (1989) Impaired chro-
notropic response to exercise in patients with congestive heart
failure: role of postsynaptic beta-adrenergic desensitization. Circu-
lation 80, 314–323.
Gallo L. Jr, Neto J.A., Manco J.C., Rassi A., Amorim D.S. (1975)
Abnormal heart rate responses during exercise in patients with
Chagas’ disease. Cardiology 60, 147–162.
Higuchi M.L., Fukasawa S., Brito T., Parzianello L.C., Bellotti G.,
Ramires J.A.F. (1999) Different microcirculatory and interstitial
matrix patterns in idiopathic dilated cardiomyopathy and Chagas’
disease: a three dimensional confocal microscopy study. Heart 82,
279–285.
Kemi O.J. & Wisloff U. (2010) Mechanisms of exercise-induced
improvements in the contractile apparatus of the mammalian
myocardium. Acta Physiol. 199, 425–439.
Kemi O.J., Haram P.M., Wisloff U., Ellingsen O. (2004) Aerobic fit-
ness is associated with cardiomyocyte contractile capacity and
endothelial function in exercise training and detraining. Circula-
tion 109, 2897–2904.
Kitzman D.W., Higginbotham M.B., Cobb F.R., Sheikh K.H., Sul-
livan M.J. (1991) Exercise intolerance in patients with heart
failure and preserved left ventricular systolic function: failure of
the Frank-Starling mechanism. J. Am. Coll. Cardiol. 17, 1065–
1072.
Koch L.G. & Britton S.L. (2001) Artificial selection for intrinsic aer-
obic endurance running capacity in rats. Physiol. Genomics 5,
45–52.
Lacerda A.R., Marubayashi U., Balthazar C.H., Coimbra C.C.
(2006) Evidence that brain nitric oxide inhibition increases meta-
bolic cost of exercise, reducing running performance in rats. Neu-
rosci. Lett. 393, 260–263.
Lima M.M.O., Pereira M.C., Rocha M.O.C., Beloti F.R., Alencar
M.C.N., Ribeiro A.L.P. (2010) Left ventricular diastolic function
and exercise capacity in patients with Chagas cardiomyopathy.
Echocardiography 27, 519–524.
Lopez-De Leon A., Rojkind M. (1985) A simple micromethod
for collagen and total protein determination in formalin-fixed
paraffin-embedded sections. Histochem. Cytochem. 33, 737–
743.
Mady C., Ianni B.M., Arteaga E. et al. (1999) Relation between
interstitial myocardial collagen and the degree of clinical impair-
ment in Chagas’ disease. Am. J. Cardiol. 84, 354–356.
Mady C., Ianni B.M., Arteaga E., Salemi V.M.C., Frimm C.C.
(2000) Maximal functional capacity in patients with chagas’ car-
diomyopathy without congestive heart failure. J. Card. Fail. 3,
220–224.
Mandarim-de-Lacerda C.A. (2003) Stereological tools in biomedical
research. An. Acad. Bras. Cienc. 75, 469–486.
Marin-Neto J.A., Cunha-Neto E., Maciel B.C., Simoes M.V. (2007)
Pathogenesis of chronic Chagas’ heart disease. Circulation 115,
1109–1123.
Martinelli P.M., Camargos E.R.S., Azevedo A.A., Chiari E., Morel
G., Machado C.R.S. (2006) Cardiac NGF and GDNF expression
during Trypanosoma cruzi infection in rats. Auton. Neurosci.
130, 32–40.
Meiler S.E.L., Ashton J.J., Moeschberger M.L., Unverferth D.V.,
Leier C.V. (1987) An analysis of the determinants of exercise
performance in congestive heart failure. Am. Heart J. 113, 1207–
1217.
306 R. D. Novaes et al.
� 2011 The Authors. International Journal of Experimental Pathology � 2011 International Journal of Experimental Pathology, 92, 299–307
Montes de Oca M., Torres S.H., Loyo J.G. et al. (2004) Exercise
performance and skeletal muscles in patients with advanced Cha-
gas disease. Chest 125, 1306–1314.
Natali A.J., Wilson L.A., Peckham M., Turner D.L., Harrison S.M.,
White E. (2002) Different regional effects of voluntary exercise
on the mechanical and electrical properties of rat ventricular myo-
cytes. J. Physiol. 541, 863–875.
Prahash A.J.C., Gupta S., Anand I.S. (2000) Myocyte response to b-
adrenergic stimulation is preserved in the noninfarcted myocar-
dium of globally dysfunctional rat hearts after myocardial infarc-
tion. Circulation 102, 1840–1846.
Prımola-Gomes T.N., Campos L.A., Lauton-Santos S. et al. (2009)
Exercise capacity is related to calcium transients in ventricular
cardiomyocytes. J. Appl. Physiol. 107, 593–598.
Rassi A. Jr, Rassi A., Marin-Neto J.A. (2010) Chagas disease. Lan-
cet 375, 1388–1402.
Roman-Campos D., Duarte H.L.L., Sales P.A. Jr et al. (2009)
Changes in cellular contractility and cytokines profile during Try-
panosoma cruzi infection in mice. Basic Res. Cardiol. 104, 238–
246.
Scherle W. (1970) A simple method for volumetry of organs in
quantitative stereology. Mikroskopie 26, 57–63.
Sousa L.A.P., Rocha M.O.C., Britto R.R., Lombardi F., Ribeiro
A.L. (2009) Chagas disease alters the relationship between heart
rate variability and daily physical activity. Int. J. Cardiol. 135,
257–259.
Sterin-Borda L., Gorelik G., Postan M., Gonzalez Cappa S.,
Borda E. (1999) Alterations in cardiac beta-adrenergic recep-
tors in chagasic mice and their association circulating beta-
adrenoceptor-related autoantibodies. Cardiovasc. Res. 41, 116–
125.
Talvani A., Rocha M.O.C., Ribeiro A.L., Borda E., Sterin-Borda L.,
Teixeira M.M. (2006) Levels of anti-M2 and anti-b1 autoantibod-
ies do not correlate with the degree of heart dysfunction in Cha-
gas’ heart disease. Microbes Infect. 8, 2459–2464.
Verani M.S., Hartung G.H., Hoepfel-Harris J., Welton D.E., Pratt
C.M., Miller R.R. (1981) Effects of exercise training on left ven-
tricular performance and myocardial perfusion in patients with
coronary artery disease. Am. J. Cardiol. 47, 797–803.
WHO, World Health Organization (2005) Tropical Disease
Research: Progress 2003–2004 seventeenth programme report of
the UNICEF ⁄ UNDP ⁄ World Bank ⁄ WHO. Special Programme for
Research & Training in Tropical Diseases (TRD). Programme
report, n. 17. Geneva pp. 31–33.
Wisloff U., Loennechen J.P., Currie S., Smith G.L., Ellingsen O.
(2002) Aerobic exercise reduces cardiomyocyte hypertrophy and
increases contractility, Ca2+ sensitivity and SERCA-2 in rat after
myocardial infarction. Cardiovasc. Res. 54, 162–174.
Exercise tolerance in Chagas’ disease 307
� 2011 The Authors. International Journal of Experimental Pathology � 2011 International Journal of Experimental Pathology, 92, 299–307
Treinamento em Natação Atenua a Disfunção Contrátil de Cardiomiócitos de Ratos DiabéticosSwimming Training Attenuates Contractile Dysfunction in Diabetic Rat Cardiomyocytes
Márcia Ferreira da Silva, Maria do Carmo Gouveia Pelúzio, Paulo Roberto dos Santos Amorim, Vitor Neiva Lavorato, Natália Pereira do Santos, Luiz Henrique Marchesi Bozi, Arlete Rita Penitente, Daniel Luciano Falkoski, Felipe Gomes Berfort, Antonio Jose NataliUniversidade Federal de Viçosa, Viçosa, MG - Brasil
ResumoFundamento: O diabete experimental promove disfunção contrátil em cardiomiócitos, mas os efeitos do treinamento em natação nesta disfunção não são conhecidos.
Objetivo: Testar os efeitos de um programa de treino em natação (PTN) sobre a disfunção contrátil de cardiomiócitos de ratos com diabete experimental.
Métodos: Ratos Wistar (idade: 30 dias; peso corporal médio: 84,19 g) com diabete induzida por estreptozotocina (60 mg/kg de peso corporal; glicemia > 300 mg/dl) foram alocados em diabéticos sedentários (DS, n = 10) e diabéticos exercitados (DE, n = 13). Animais da mesma idade e peso serviram de controles sedentários (CS, n = 10) e controles exercitados (CE, n = 06). Os animais DE e CE foram submetidos a um PTN (05 dias/semana, 90 min/dia), por 08 semanas. Os miócitos do ventrículo esquerdo (VE) foram isolados e estimulados eletricamente a 3,0 Hz em temperatura ambiente (~ 25o C).
Resultados: O diabete reduziu a função contrátil nos cardiomiócitos dos animais em relação aos controles (i.e., menor amplitude de contração, maior tempo de contração e relaxamento). O PTN atenuou a redução na amplitude de contração (CS, 11 ± 0,2% vs DE, 11,6 ± 0,2%), o tempo para o pico de contração (CS, 319 ± 5,8 ms vs DE, 333 ± 4,8 ms) e o tempo para 50% de relaxamento (CS, 619 ± 22,2 ms vs DE, 698 ± 18,6 ms) dos cardiomiócitos dos animais diabéticos. O diabete reduziu as dimensões dos cardiomiócitos, porém, o PTN minimizou a redução da largura e volume celular, sem alterar o comprimento.
Conclusão: O programa de treino em natação atenuou a disfunção contrátil dos miócitos do VE de ratos com diabete experimental. (Arq Bras Cardiol. 2011; [online].ahead print, PP.0-0)
Palavras-chave: Natação, esforço físico, miócitos cardíacos, ratos, diabete melito.
AbstractBackground: Experimental diabetes promotes contractile dysfunction in cardiomyocytes, but the effects of swimming in this disorder are not known.
Objective: To test the effects of a swimming training program (STP) on cardiomyocyte contractile dysfunction in rats with experimental diabetes.
Methods: Wistar rats (age: 30 days; mean body weight: 84.19 g) with diabetes induced by streptozotocin (60 mg/kg body weight; glucose > 300 mg/dl) were divided into sedentary diabetic rats (SD, n = 10) and exercised diabetic rats (ED, n = 13). Animals of same age and weight served as sedentary controls (SC, n = 10) and exercised controls (EC, n = 06). Animals and ED and EC underwent a STP (05 days/week, 90 min/day) for 08 weeks. Left ventricular (LV) myocytes were isolated and electrically stimulated at 3.0 Hz at room temperature (~ 25° C).
Results: Diabetes reduced contractile function in cardiomyocytes of animals compared to controls (i.e., lower amplitude of contraction, longer duration of contraction and relaxation). The STP attenuated the reduced amplitude of contraction (SC, 11 ± 0.2% vs ED, 11.6 ± 0.2%), time to peak contraction (SC, 319 ± 5.8 ms vs ED, 333 ± 4.8 ms) and time to 50.0% of relaxation (SC, 619 ± 22.2 ms vs ED 698 ± 18.6 ms) of cardiomyocytes of diabetic rats. Diabetes reduced the size of cardiomyocytes, however, the STP minimized the reduction of cell volume and width, without changing length.
Conclusion: The swimming training program attenuated the contractile dysfunction of the LV myocytes of rats with experimental diabetes. (Arq Bras Cardiol. 2011; [online].ahead print, PP.0-0)
Keywords: Swimming; physical exertion; myocytes, cardiac; rats; diabetes mellitus.
Full texts in English - http://www.arquivosonline.com.br
Correspondência: Antonio Jose Natali • Av. PH Rolfs, s/n - Departamento de Educação Física - Campus Universitário da Universidade Federal de Viçosa - 36570-000 - Viçosa, MG - Brasil E-mail: [email protected] Artigo recebido em 06/08/10; revisado recebido em 29/10/10; aceito em 21/12/10.
Silva e cols.Exercício e disfunção contrátil em coração diabético
IntroduçãoO diabete melito do tipo 1 é um fator de risco para
eventos cardiovasculares, incluindo o desenvolvimento da cardiomiopatia diabética. A incapacidade em manter a homeostase da glicose no miocárdio compromete a estrutura e a função cardíaca em humanos e em animais com diabete experimental1-4. Em nível celular, foi demonstrado que o diabete prejudica a função contrátil dos cardiomiócitos, principalmente por provocar alterações estruturais e funcionais na regulação do cálcio (Ca2+) intracelular5-7.
O exercício físico regular tem sido usado como um agente efetivo de proteção cardíaca para diabéticos, uma vez que as anormalidades estruturais e funcionais do coração diabético respondem favoravelmente ao exercício8-10. Por exemplo, em animais diabéticos, o exercício crônico atenuou alterações na função ventricular esquerda, tais como redução nos volumes sistólico, diastólico final e de ejeção, no débito cardíaco e na fração de encurtamento7,11,12.
Em nível celular, entretanto, poucos estudos sobre os efeitos do exercício crônico na função contrátil de cardiomiócitos de animais diabéticos foram realizados e, além de usarem exclusivamente a corrida em esteira, apresentaram resultados controversos. Por exemplo, programas de corrida contínua em esteira com intensidade leve (09 m/min, 0% de inclinação, 30 min/dia) ou moderada (18 m/min, 0% de inclinação) não afetaram a contração dos cardiomiócitos de ratos13. Outro programa de corrida contínua com intensidade alta (18 m/min, 5% de inclinação, 60 min/dia) provocou adaptações negativas, pois prolongou o tempo de contração celular e não alterou a amplitude de contração dos cardiomiócitos de ratos14. Entretanto, programas de corrida em esteira com intensidade mais alta (20-25 m/min, 5% de inclinação, 60 min/dia) foram capazes de restaurar a função contrátil dos cardiomiócitos de ratos e camundongos7,15. Portanto, até o momento, os efeitos do exercício contínuo com duração superior a 60 minutos diários, especificamente a natação, sobre a função contrátil de cardiomiócitos de ratos diabéticos não são conhecidos.
Assim, este estudo tem como objetivo testar se um programa de natação, com duração diária de 90 minutos, altera a função contrátil de cardiomiócitos isolados do ventrículo esquerdo de ratos com diabete experimental.
Métodos
Animais de experimentação e tratamentosRatos Wistar (idade 30 dias; peso corporal médio de 84,19
g) foram divididos em 04 grupos: Controle sedentário (CS, n = 10); Controle exercitado (CE, n = 10); Diabético sedentário (DS, n = 20); e Diabético exercitado (DE, n = 20) e foram mantidos em ambiente com temperatura média de 22° C e regime de luminosidade invertido de 12/12 horas claro/escuro com água e ração comercial ad libitum.
Foram seguidas as normas estabelecidas no Guide for the Care and Use of Laboratory Animals (Institute of Laboratory Animal Resources, National Academy of Sciences, Washington, D.C., 1996) e respeitados os Princípios Éticos na Experimentação Animal do Colégio Brasileiro de
Experimentação Animal (COBEA). O estudo foi aprovado pela Comissão de Ética da Universidade Federal de Viçosa (processo nº 03/2009).
Indução do diabeteApós jejum de 12 horas, os animais dos grupos DE e DS
receberam uma injeção intraperitoneal (60 mg/kg de peso corporal) de estreptozotocina (STZ, Sigma, St. Louis, EUA), diluída em 1,0 ml de tampão citrato de sódio (0,1 M, pH 4,5). Os animais dos grupos CS e CE receberam a mesma dose de tampão citrato de sódio (0,1 M, pH 4,5) sem STZ. Sete dias após a aplicação de STZ e jejum de 12 horas, a glicose sanguínea de repouso foi aferida (One touch ultra - Johnson & Johnson, México). Animais com níveis de glicose sanguínea de jejum superior a 300 mg/dl foram considerados diabéticos (DS, n = 10; DE, n = 13). A glicose sanguínea de jejum e o peso corporal foram monitorados semanalmente durante o período experimental.
Programa de treino em nataçãoApós 45 dias de hiperglicemia, os animais do grupo DE
e CE foram submetidos a um programa de treinamento em natação (adaptado de Medeiros e cols.16), por 8 semanas. Na primeira semana, os animais exercitaram-se na água, sem sobrecarga, durante 10-50 min, sendo a duração aumentada em 10 min/dia. Na segunda semana, os animais exercitaram com uma carga de 1% de seu peso corporal e a duração do exercício foi aumentada em 10 min/dia até atingir 90 min de natação ininterruptos. A partir da terceira semana, a carga foi aumentada semanalmente (0,5% do peso corporal) até atingir 4% do peso corporal na 8ª semana. Durante as sessões de natação, os animais dos grupos DS e CN eram colocados em uma caixa de polipropileno com água aquecida (28-30° C) e profundidade de 10 cm.
Quatro animais do grupo CE morreram por afogamento.
Isolamento dos cardiomiócitosApós eutanásia, o coração foi removido e os miócitos do
ventrículo esquerdo foram isolados conforme descrito por Natali e cols.17. Resumidamente, o coração foi canulado via artéria aorta em um sistema Langendorff e perfundido com solução de isolamento [composição (mM): 130 Na+; 5,4 K+; 1,4 Mg+; 140 Cl-; 0,75 Ca2+; 5,0 Hepes; 10 glicose; 20 taurina; e 10 creatina; pH = 7,3 em temperatura ambiente]. Em seguida, o coração foi perfundido com solução livre de cálcio contendo 0,1 mM de ethylene glycol-bis (ß-aminoethyl ether)-N, N, N’, N’-tetraacetic acid (EGTA), por um período de 4-6 min. Na sequência, o coração foi perfundido com solução contendo 1,0 mg.ml-1 de colagenase tipo 2 (Worthington, EUA) e 100,0 mM de CaCl2 por 20 a 25 min. As soluções utilizadas foram oxigenadas (O2 100% - White Martins, Brasil) e mantidas em temperatura de 35o C. Após perfusões, os ventrículos foram separados dos átrios e pesados. Em seguida, o ventrículo esquerdo foi colocado em frasco contendo 5,0 ml da solução enzimática (colagenase) e albumina sérica bovina (10%). O frasco foi agitado moderadamente durante 05 min, em banho-maria a 37o C, após o qual o tecido foi retirado do frasco e o restante foi centrifugado (3.000 rpm)
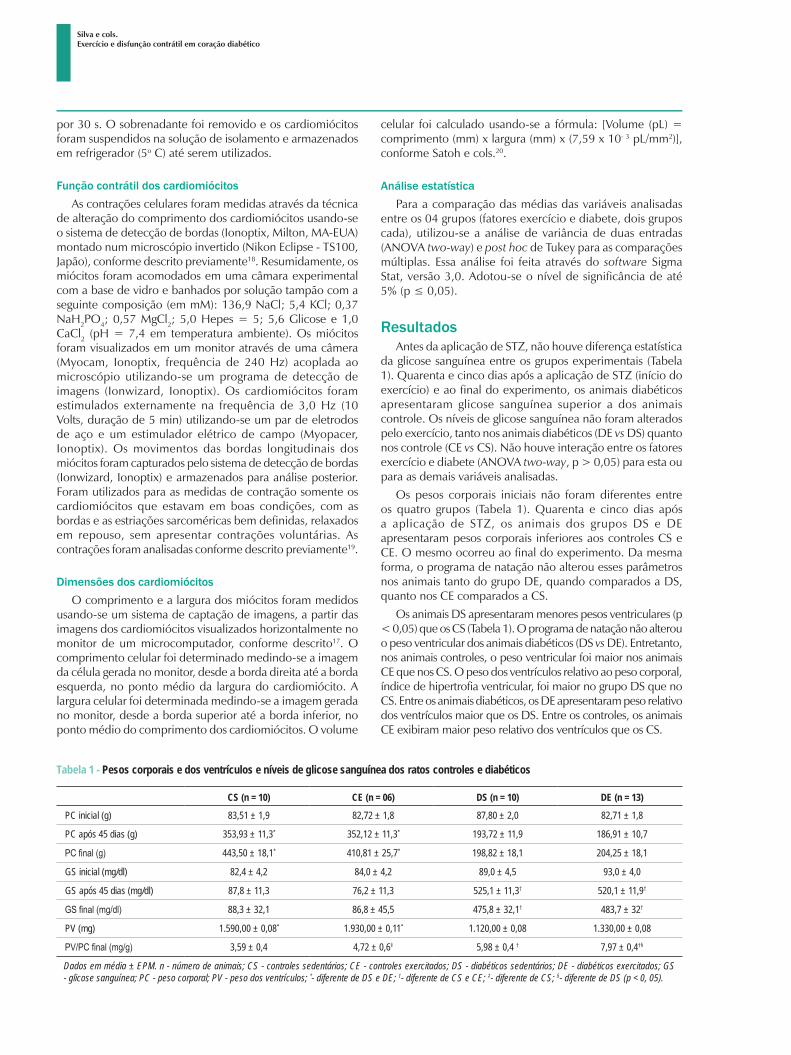
Silva e cols.Exercício e disfunção contrátil em coração diabético
por 30 s. O sobrenadante foi removido e os cardiomiócitos foram suspendidos na solução de isolamento e armazenados em refrigerador (5o C) até serem utilizados.
Função contrátil dos cardiomiócitosAs contrações celulares foram medidas através da técnica
de alteração do comprimento dos cardiomiócitos usando-se o sistema de detecção de bordas (Ionoptix, Milton, MA-EUA) montado num microscópio invertido (Nikon Eclipse - TS100, Japão), conforme descrito previamente18. Resumidamente, os miócitos foram acomodados em uma câmara experimental com a base de vidro e banhados por solução tampão com a seguinte composição (em mM): 136,9 NaCl; 5,4 KCl; 0,37 NaH2PO4; 0,57 MgCl2; 5,0 Hepes = 5; 5,6 Glicose e 1,0 CaCl2 (pH = 7,4 em temperatura ambiente). Os miócitos foram visualizados em um monitor através de uma câmera (Myocam, Ionoptix, frequência de 240 Hz) acoplada ao microscópio utilizando-se um programa de detecção de imagens (Ionwizard, Ionoptix). Os cardiomiócitos foram estimulados externamente na frequência de 3,0 Hz (10 Volts, duração de 5 min) utilizando-se um par de eletrodos de aço e um estimulador elétrico de campo (Myopacer, Ionoptix). Os movimentos das bordas longitudinais dos miócitos foram capturados pelo sistema de detecção de bordas (Ionwizard, Ionoptix) e armazenados para análise posterior. Foram utilizados para as medidas de contração somente os cardiomiócitos que estavam em boas condições, com as bordas e as estriações sarcoméricas bem definidas, relaxados em repouso, sem apresentar contrações voluntárias. As contrações foram analisadas conforme descrito previamente19.
Dimensões dos cardiomiócitosO comprimento e a largura dos miócitos foram medidos
usando-se um sistema de captação de imagens, a partir das imagens dos cardiomiócitos visualizados horizontalmente no monitor de um microcomputador, conforme descrito17. O comprimento celular foi determinado medindo-se a imagem da célula gerada no monitor, desde a borda direita até a borda esquerda, no ponto médio da largura do cardiomiócito. A largura celular foi determinada medindo-se a imagem gerada no monitor, desde a borda superior até a borda inferior, no ponto médio do comprimento dos cardiomiócitos. O volume
celular foi calculado usando-se a fórmula: [Volume (pL) = comprimento (mm) x largura (mm) x (7,59 x 10- 3 pL/mm2)], conforme Satoh e cols.20.
Análise estatísticaPara a comparação das médias das variáveis analisadas
entre os 04 grupos (fatores exercício e diabete, dois grupos cada), utilizou-se a análise de variância de duas entradas (ANOVA two-way) e post hoc de Tukey para as comparações múltiplas. Essa análise foi feita através do software Sigma Stat, versão 3,0. Adotou-se o nível de significância de até 5% (p ≤ 0,05).
ResultadosAntes da aplicação de STZ, não houve diferença estatística
da glicose sanguínea entre os grupos experimentais (Tabela 1). Quarenta e cinco dias após a aplicação de STZ (início do exercício) e ao final do experimento, os animais diabéticos apresentaram glicose sanguínea superior a dos animais controle. Os níveis de glicose sanguínea não foram alterados pelo exercício, tanto nos animais diabéticos (DE vs DS) quanto nos controle (CE vs CS). Não houve interação entre os fatores exercício e diabete (ANOVA two-way, p > 0,05) para esta ou para as demais variáveis analisadas.
Os pesos corporais iniciais não foram diferentes entre os quatro grupos (Tabela 1). Quarenta e cinco dias após a aplicação de STZ, os animais dos grupos DS e DE apresentaram pesos corporais inferiores aos controles CS e CE. O mesmo ocorreu ao final do experimento. Da mesma forma, o programa de natação não alterou esses parâmetros nos animais tanto do grupo DE, quando comparados a DS, quanto nos CE comparados a CS.
Os animais DS apresentaram menores pesos ventriculares (p < 0,05) que os CS (Tabela 1). O programa de natação não alterou o peso ventricular dos animais diabéticos (DS vs DE). Entretanto, nos animais controles, o peso ventricular foi maior nos animais CE que nos CS. O peso dos ventrículos relativo ao peso corporal, índice de hipertrofia ventricular, foi maior no grupo DS que no CS. Entre os animais diabéticos, os DE apresentaram peso relativo dos ventrículos maior que os DS. Entre os controles, os animais CE exibiram maior peso relativo dos ventrículos que os CS.
Tabela 1 - Pesos corporais e dos ventrículos e níveis de glicose sanguínea dos ratos controles e diabéticos
CS (n = 10) CE (n = 06) DS (n = 10) DE (n = 13)
PC inicial (g) 83,51 ± 1,9 82,72 ± 1,8 87,80 ± 2,0 82,71 ± 1,8
PC após 45 dias (g) 353,93 ± 11,3* 352,12 ± 11,3* 193,72 ± 11,9 186,91 ± 10,7
PC final (g) 443,50 ± 18,1* 410,81 ± 25,7* 198,82 ± 18,1 204,25 ± 18,1
GS inicial (mg/dl) 82,4 ± 4,2 84,0 ± 4,2 89,0 ± 4,5 93,0 ± 4,0
GS após 45 dias (mg/dl) 87,8 ± 11,3 76,2 ± 11,3 525,1 ± 11,3† 520,1 ± 11,9†
GS final (mg/dl) 88,3 ± 32,1 86,8 ± 45,5 475,8 ± 32,1† 483,7 ± 32†
PV (mg) 1.590,00 ± 0,08* 1.930,00 ± 0,11* 1.120,00 ± 0,08 1.330,00 ± 0,08
PV/PC final (mg/g) 3,59 ± 0,4 4,72 ± 0,6‡ 5,98 ± 0,4 † 7,97 ± 0,4†§
Dados em média ± EPM. n - número de animais; CS - controles sedentários; CE - controles exercitados; DS - diabéticos sedentários; DE - diabéticos exercitados; GS - glicose sanguínea; PC - peso corporal; PV - peso dos ventrículos; *- diferente de DS e DE; †- diferente de CS e CE; ‡- diferente de CS; §- diferente de DS (p < 0, 05).
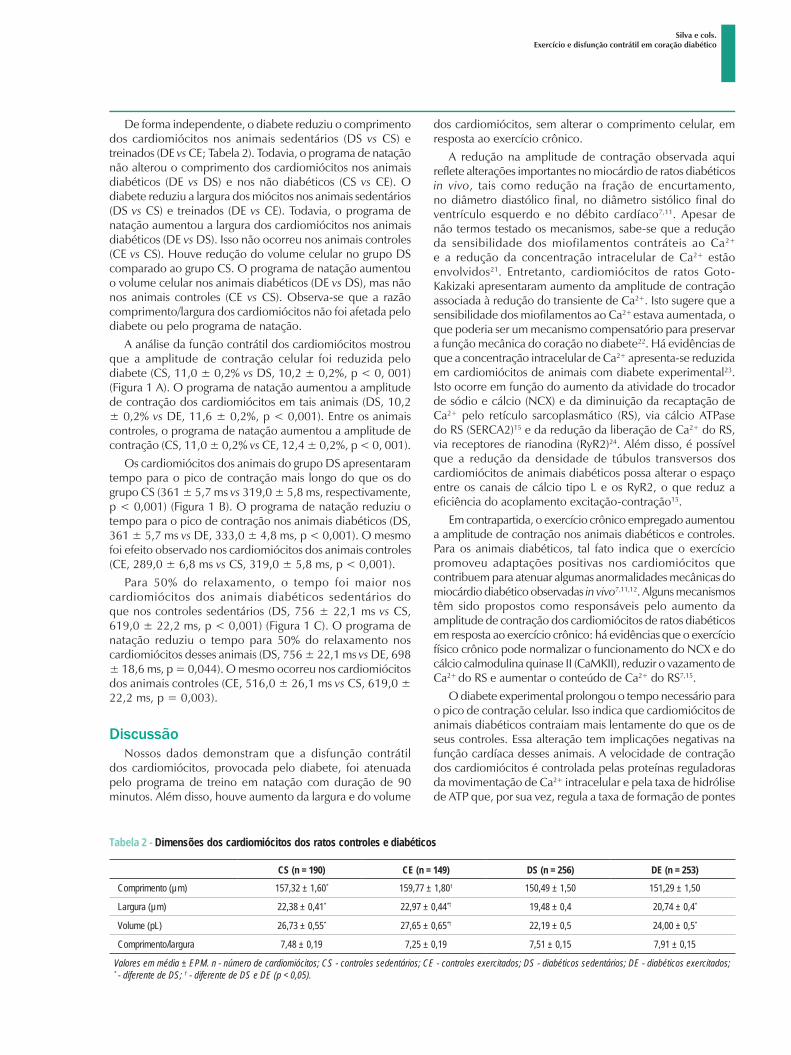
Silva e cols.Exercício e disfunção contrátil em coração diabético
De forma independente, o diabete reduziu o comprimento dos cardiomiócitos nos animais sedentários (DS vs CS) e treinados (DE vs CE; Tabela 2). Todavia, o programa de natação não alterou o comprimento dos cardiomiócitos nos animais diabéticos (DE vs DS) e nos não diabéticos (CS vs CE). O diabete reduziu a largura dos miócitos nos animais sedentários (DS vs CS) e treinados (DE vs CE). Todavia, o programa de natação aumentou a largura dos cardiomiócitos nos animais diabéticos (DE vs DS). Isso não ocorreu nos animais controles (CE vs CS). Houve redução do volume celular no grupo DS comparado ao grupo CS. O programa de natação aumentou o volume celular nos animais diabéticos (DE vs DS), mas não nos animais controles (CE vs CS). Observa-se que a razão comprimento/largura dos cardiomiócitos não foi afetada pelo diabete ou pelo programa de natação.
A análise da função contrátil dos cardiomiócitos mostrou que a amplitude de contração celular foi reduzida pelo diabete (CS, 11,0 ± 0,2% vs DS, 10,2 ± 0,2%, p < 0, 001) (Figura 1 A). O programa de natação aumentou a amplitude de contração dos cardiomiócitos em tais animais (DS, 10,2 ± 0,2% vs DE, 11,6 ± 0,2%, p < 0,001). Entre os animais controles, o programa de natação aumentou a amplitude de contração (CS, 11,0 ± 0,2% vs CE, 12,4 ± 0,2%, p < 0, 001).
Os cardiomiócitos dos animais do grupo DS apresentaram tempo para o pico de contração mais longo do que os do grupo CS (361 ± 5,7 ms vs 319,0 ± 5,8 ms, respectivamente, p < 0,001) (Figura 1 B). O programa de natação reduziu o tempo para o pico de contração nos animais diabéticos (DS, 361 ± 5,7 ms vs DE, 333,0 ± 4,8 ms, p < 0,001). O mesmo foi efeito observado nos cardiomiócitos dos animais controles (CE, 289,0 ± 6,8 ms vs CS, 319,0 ± 5,8 ms, p < 0,001).
Para 50% do relaxamento, o tempo foi maior nos cardiomiócitos dos animais diabéticos sedentários do que nos controles sedentários (DS, 756 ± 22,1 ms vs CS, 619,0 ± 22,2 ms, p < 0,001) (Figura 1 C). O programa de natação reduziu o tempo para 50% do relaxamento nos cardiomiócitos desses animais (DS, 756 ± 22,1 ms vs DE, 698 ± 18,6 ms, p = 0,044). O mesmo ocorreu nos cardiomiócitos dos animais controles (CE, 516,0 ± 26,1 ms vs CS, 619,0 ± 22,2 ms, p = 0,003).
DiscussãoNossos dados demonstram que a disfunção contrátil
dos cardiomiócitos, provocada pelo diabete, foi atenuada pelo programa de treino em natação com duração de 90 minutos. Além disso, houve aumento da largura e do volume
dos cardiomiócitos, sem alterar o comprimento celular, em resposta ao exercício crônico.
A redução na amplitude de contração observada aqui reflete alterações importantes no miocárdio de ratos diabéticos in vivo, tais como redução na fração de encurtamento, no diâmetro diastólico final, no diâmetro sistólico final do ventrículo esquerdo e no débito cardíaco7,11. Apesar de não termos testado os mecanismos, sabe-se que a redução da sensibilidade dos miofilamentos contráteis ao Ca2+ e a redução da concentração intracelular de Ca2+ estão envolvidos21. Entretanto, cardiomiócitos de ratos Goto-Kakizaki apresentaram aumento da amplitude de contração associada à redução do transiente de Ca2+. Isto sugere que a sensibilidade dos miofilamentos ao Ca2+ estava aumentada, o que poderia ser um mecanismo compensatório para preservar a função mecânica do coração no diabete22. Há evidências de que a concentração intracelular de Ca2+ apresenta-se reduzida em cardiomiócitos de animais com diabete experimental23. Isto ocorre em função do aumento da atividade do trocador de sódio e cálcio (NCX) e da diminuição da recaptação de Ca2+ pelo retículo sarcoplasmático (RS), via cálcio ATPase do RS (SERCA2)15 e da redução da liberação de Ca2+ do RS, via receptores de rianodina (RyR2)24. Além disso, é possível que a redução da densidade de túbulos transversos dos cardiomiócitos de animais diabéticos possa alterar o espaço entre os canais de cálcio tipo L e os RyR2, o que reduz a eficiência do acoplamento excitação-contração15.
Em contrapartida, o exercício crônico empregado aumentou a amplitude de contração nos animais diabéticos e controles. Para os animais diabéticos, tal fato indica que o exercício promoveu adaptações positivas nos cardiomiócitos que contribuem para atenuar algumas anormalidades mecânicas do miocárdio diabético observadas in vivo7,11,12. Alguns mecanismos têm sido propostos como responsáveis pelo aumento da amplitude de contração dos cardiomiócitos de ratos diabéticos em resposta ao exercício crônico: há evidências que o exercício físico crônico pode normalizar o funcionamento do NCX e do cálcio calmodulina quinase II (CaMKII), reduzir o vazamento de Ca2+ do RS e aumentar o conteúdo de Ca2+ do RS7,15.
O diabete experimental prolongou o tempo necessário para o pico de contração celular. Isso indica que cardiomiócitos de animais diabéticos contraiam mais lentamente do que os de seus controles. Essa alteração tem implicações negativas na função cardíaca desses animais. A velocidade de contração dos cardiomiócitos é controlada pelas proteínas reguladoras da movimentação de Ca2+ intracelular e pela taxa de hidrólise de ATP que, por sua vez, regula a taxa de formação de pontes
Tabela 2 - Dimensões dos cardiomiócitos dos ratos controles e diabéticos
CS (n = 190) CE (n = 149) DS (n = 256) DE (n = 253)
Comprimento (µm) 157,32 ± 1,60* 159,77 ± 1,80† 150,49 ± 1,50 151,29 ± 1,50
Largura (µm) 22,38 ± 0,41* 22,97 ± 0,44*† 19,48 ± 0,4 20,74 ± 0,4*
Volume (pL) 26,73 ± 0,55* 27,65 ± 0,65*† 22,19 ± 0,5 24,00 ± 0,5*
Comprimento/largura 7,48 ± 0,19 7,25 ± 0,19 7,51 ± 0,15 7,91 ± 0,15
Valores em média ± EPM. n - número de cardiomiócitos; CS - controles sedentários; CE - controles exercitados; DS - diabéticos sedentários; DE - diabéticos exercitados; * - diferente de DS; † - diferente de DS e DE (p < 0,05).
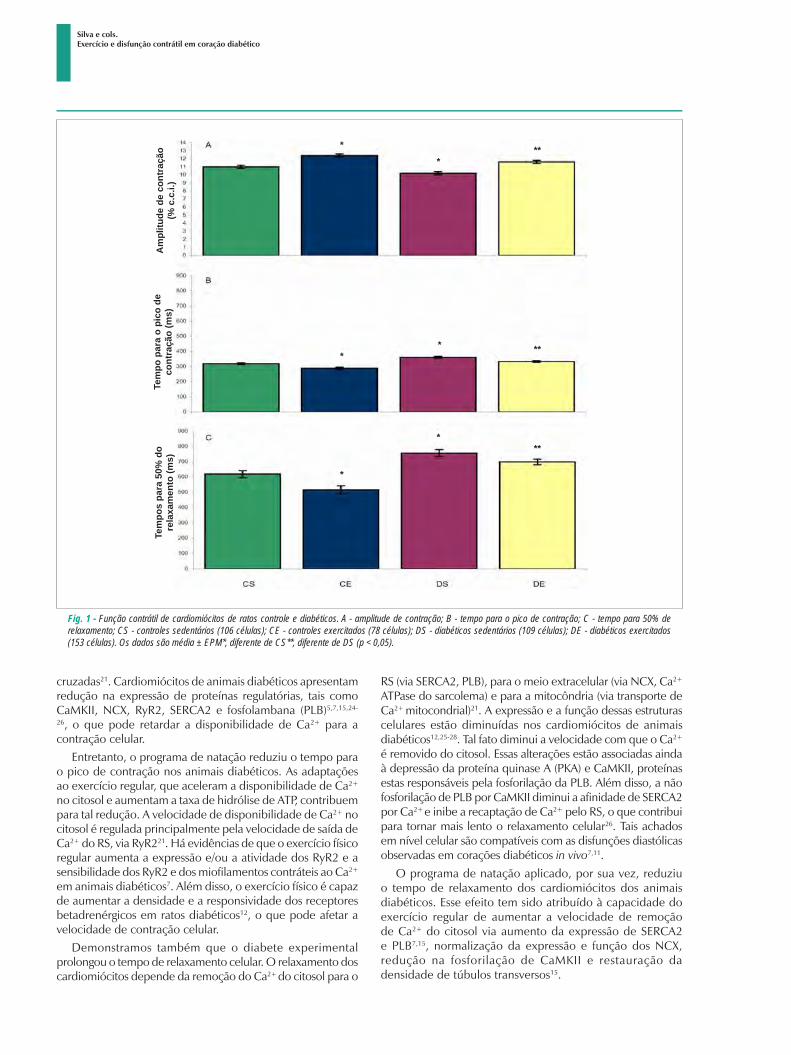
Silva e cols.Exercício e disfunção contrátil em coração diabético
cruzadas21. Cardiomiócitos de animais diabéticos apresentam redução na expressão de proteínas regulatórias, tais como CaMKII, NCX, RyR2, SERCA2 e fosfolambana (PLB)5,7,15,24-
26, o que pode retardar a disponibilidade de Ca2+ para a contração celular.
Entretanto, o programa de natação reduziu o tempo para o pico de contração nos animais diabéticos. As adaptações ao exercício regular, que aceleram a disponibilidade de Ca2+ no citosol e aumentam a taxa de hidrólise de ATP, contribuem para tal redução. A velocidade de disponibilidade de Ca2+ no citosol é regulada principalmente pela velocidade de saída de Ca2+ do RS, via RyR221. Há evidências de que o exercício físico regular aumenta a expressão e/ou a atividade dos RyR2 e a sensibilidade dos RyR2 e dos miofilamentos contráteis ao Ca2+
em animais diabéticos7. Além disso, o exercício físico é capaz de aumentar a densidade e a responsividade dos receptores betadrenérgicos em ratos diabéticos12, o que pode afetar a velocidade de contração celular.
Demonstramos também que o diabete experimental prolongou o tempo de relaxamento celular. O relaxamento dos cardiomiócitos depende da remoção do Ca2+ do citosol para o
RS (via SERCA2, PLB), para o meio extracelular (via NCX, Ca2+ ATPase do sarcolema) e para a mitocôndria (via transporte de Ca2+ mitocondrial)21. A expressão e a função dessas estruturas celulares estão diminuídas nos cardiomiócitos de animais diabéticos12,25-28. Tal fato diminui a velocidade com que o Ca2+ é removido do citosol. Essas alterações estão associadas ainda à depressão da proteína quinase A (PKA) e CaMKII, proteínas estas responsáveis pela fosforilação da PLB. Além disso, a não fosforilação de PLB por CaMKII diminui a afinidade de SERCA2 por Ca2+ e inibe a recaptação de Ca2+ pelo RS, o que contribui para tornar mais lento o relaxamento celular26. Tais achados em nível celular são compatíveis com as disfunções diastólicas observadas em corações diabéticos in vivo7,11.
O programa de natação aplicado, por sua vez, reduziu o tempo de relaxamento dos cardiomiócitos dos animais diabéticos. Esse efeito tem sido atribuído à capacidade do exercício regular de aumentar a velocidade de remoção de Ca2+ do citosol via aumento da expressão de SERCA2 e PLB7,15, normalização da expressão e função dos NCX, redução na fosforilação de CaMKII e restauração da densidade de túbulos transversos15.
Fig. 1 - Função contrátil de cardiomiócitos de ratos controle e diabéticos. A - amplitude de contração; B - tempo para o pico de contração; C - tempo para 50% de relaxamento; CS - controles sedentários (106 células); CE - controles exercitados (78 células); DS - diabéticos sedentários (109 células); DE - diabéticos exercitados (153 células). Os dados são média ± EPM*, diferente de CS**, diferente de DS (p < 0,05).
Tem
pos
para
50%
do
rela
xam
ento
(ms)
Am
plitu
de d
e co
ntra
ção
(% c
.c.i.
)Te
mpo
par
a o
pico
de
cont
raçã
o (m
s)
**
**
**
*
*
**
*
*
Silva e cols.Exercício e disfunção contrátil em coração diabético
O programa de natação aplicado não alterou a glicemia de jejum dos animais controles e diabéticos em repouso. Nos animais diabéticos, a STZ induz a apoptose das células β-pancreáticas29, o que inibe a secreção de insulina. É possível também que tenha havido um aumento na secreção de glucagon em tais animais30 e sua ação contrarregulatória tenha auxiliado na manutenção da hiperglicemia. Nossos resultados são coerentes com os de outros estudos7,11-14,31, apesar destes terem utilizado protocolos de exercício diferentes (i.e., esteira rolante). Por outro lado, alguns estudos demonstraram que o exercício foi capaz de melhorar o metabolismo de glicose em ratos diabéticos32,33. Provavelmente, a falta de consenso entre os resultados desses estudos é devida ao uso de diferentes procedimentos metodológicos.
Os animais diabéticos apresentaram poliúria e polidipsia características do diabete, mas, apesar de alimentarem-se normalmente, sem restrição alimentar [ex., consumo semanal de ração (diabéticos: 199,47 ± 3,55 g vs controles: 194,36 ± 4,4 g)], movimentarem-se livremente dentro da caixa de alojamento (grupo DS) e exercitarem-se (grupo DE), não ganharam tanto peso quanto os controles não diabéticos. Os menores pesos corporais e ventriculares dos animais diabéticos indicam que eles tiveram o crescimento prejudicado. Em ratos com diabete induzida por STZ, além da secreção de insulina, a secreção de hormônios, tais como o hormônio de crescimento, o glucagon, o polipeptídeo pancreático e, por consequência, o fator de crescimento similar à insulina, são alteradas e afetam o crescimento34-36. Sabe-se também que o diabete induz o aumento da utilização de ácidos graxos e acelera o catabolismo proteico37.
Ainda assim, o programa de natação aplicado não foi capaz de alterar significativamente o peso corporal dos animais diabéticos ou não diabéticos, mas aumentou o peso absoluto dos ventrículos nos animais não diabéticos. Entretanto, mais importante, tanto o diabete quanto o programa de natação aumentaram o peso relativo dos ventrículos nos animais diabéticos e o programa de natação aumentou este parâmetro
nos animais controles não diabéticos, o que denota hipertrofia ventricular. Hipertrofia cardíaca induzida por diabete experimental (patológica) e por exercício crônico (fisiológica) já foram documentadas em estudos prévios7,14,17,31.
A redução nas dimensões dos cardiomiócitos nos animais diabéticos em relação aos controles, observada no presente estudo, é coerente com o menor peso ventricular apresentado pelos animais diabéticos. Todavia, o programa de natação utilizado aumentou o volume dos cardiomiócitos dos ratos diabéticos. Tal fato sugere que a inibição do crescimento celular provocada pelo diabete foi afetada pelo exercício físico aplicado e denota hipertrofia celular. De fato, o aumento do peso relativo do ventrículo nos animais do grupo DE foi mais pronunciado que nos animais CE (33,3% vs 31,5%, respectivamente).
Conclusão Concluímos que o programa de treinamento em natação
aplicado atenuou a disfunção contrátil dos cardiomiócitos do VE de ratos com diabete experimental. Esses achados são relevantes para o conhecimento, em nível celular, dos benefícios do exercício físico na função contrátil do músculo cardíaco de indivíduos com diabete tipo I.
Potencial Conflito de Interesses
Declaro não haver conflito de interesses pertinentes.
Fontes de Financiamento
O presente estudo foi financiado pela FAPEMIG.
Vinculação Acadêmica
Este artigo é parte de dissertação de Mestrado de Márcia Ferreira da Silva pela Universidade Federal de Viçosa.
Referências1. Fang ZY, Prins JB, Marwick TH. Diabetic cardiomyopathy: evidence,
mechanisms, and therapeutic implications. Endocr Rev. 2004;25(4):543-67.
2. Jweied EE, McKinney RD, Walker LA, Brodsky I, Geha AS, Massad MG, et al. Depressed cardiac myofilament function in human diabetes mellitus. Am J Physiol Heart Circ Physiol. 2005;289(6):H2478-83.
3. Lacombe VA, Viatchenko-Karpinski S, Terentyev D, Sridhar A, Emani S, Bonagura JD, et al. Mechanisms of impaired calcium handling underlying subclinical diastolic dysfunction in diabetes. Am J Physiol Regul Integr Comp Physiol. 2007;293(5):R1787-97.
4. Reuter H, Gronke S, Adam C, Ribati M, Brabender J, Zobel C, et al. Sarcoplasmic Ca2+ release is prolonged in nonfailing myocardium of diabetic patients. Mol Cell Biochem. 2008;308(1-2):141-9.
5. Kim HW, Ch YS, Lee HR, Park SY, Kim YH. Diabetic alterations in cardiac sarcoplasmic reticulum Ca2+-ATPase and phospholamban protein expression. Life Sci. 2001;70(4):367-79.
6. Bracken N, Howarth FC, Singh J. Effects of streptozotocin-induced diabetes on contraction and calcium transport in rat ventricular cardiomyocytes. Ann N Y Acad Sci. 2006;1084:208-22.
7. Shao CH, Wehrens XH, Wyatt TA, Parbhu S, Rozanski GJ, Patel KP, et al. Exercise training during diabetes attenuates cardiac ryanodine receptor dysregulation. J Appl Physiol. 2009;106(4):1280-92.
8. Lehmann R, Kaplan V, Bingisser R, Bloch KE, Spinas GA. Impact of physical activity on cardiovascular risk factors in IDDM. Diabetes Care. 1997;20(10):1603-11.
9. Searls YM, Smirnova IV, Fegley BR, Stehno-Bittel L. Exercise attenuates diabetes-induced ultrastructural changes in rat cardiac tissue. Med Sci Sports Exerc. 2004;36(11):1863-70.
10. Monteiro P, Gonçalves L, Providencia LA. Diabetes and cardiovascular disease: the road to cardioprotection. Heart. 2005;91(12):1621-5.
11. Loganathan R, Bilgen M, Al-Hafez B, Zhero SV, Alenezy MD, Smirnova IV. Exercise training improves cardiac performance in diabetes: in vivo demonstration with quantitative cine-MRI analyses. J Appl Physiol. 2007;102(2):665-72.
12. Bidasee KR, Zheng H, Shao CH, Parbhu SK, Rozanski GJ, Patel KP. Exercise training initiated after the onset of diabetes preserves myocardial function: effects on expression of beta-adrenoceptors. J Appl Physiol. 2008;105(3):907-14.
Silva e cols.Exercício e disfunção contrátil em coração diabético
13. Howarth FC, Almugaddum FA, Qureshi MA, Ljubisavijevic M. Effects of varying intensity exercise on shortening and intracellular calcium in ventricular myocytes from streptozotocin (STZ)-induced diabetic rats. Mol Cell Biochem. 2008;317(1-2):161-7.
14. Howarth FC, Almugaddum FA, Qureshi MA, Ljubisavijevic M. The effects of heavy long-term exercise on ventricular myocyte shortening and intracellular Ca2+ in streptozotocin-induced diabetic rat. J Diabetes Complications. 2009;24(4):278-85.
15. Stolen TO, Hoydal MA, Kemi OJ, Catalucci D, Ceci M, Aasum E, et al. Interval training normalizes cardiomyocyte function, diastolic Ca2+ control, and SR Ca2+ release synchronicity in a mouse model of diabetic cardiomyopathy. Circ Res. 2009;105(6):527-36.
16. Medeiros A, Gianolla RM, Kalil LMP, Bacurau RFP, Rosa LFBC, Negrão CE, et al. Efeito do treinamento físico com natação sobre o sistema cardiovascular de ratos normotensos. Rev paul Educ Fís. 2000;14(1):7-15.
17. Natali AJ, Wilson LA, Peckham M, Turner DL, Harrison SM, White E. Different regional effects of voluntary exercise on the mechanical and electrical properties of rat ventricular myocytes. J Physiol. 2002;541(Pt 3):863-75.
18. Prímola-Gomes TN, Campos LA, Lauton-Santos S, Balthazar CH, Guatimosim S, Capettini LS, et al. Exercise capacity is related to calcium transients in ventricular cardiomyocytes. J Appl Physiol. 2009;107(2):593-8.
19. Roman-Campos D, Duarte HL, Sales PA, Natali AJ, Ropert C, Gazzinelli RT, et al. Changes in cellular contractility and cytokines profile during Trypanosoma cruzi infection in mice. Basic Res Cardiol. 2009;104(3):238-46.
20. Satoh H, Delbridge LM, Blatter LA, Bers DM. Surface:volume relationship in cardiac myocytes studied with confocal microscopy and membrane capacitance measurements: species-dependence and developmental effects. Biophys J. 1996;70(3):1494-504.
21. Bers DM. Calcium cycling and signaling in cardiac myocytes. Annu Rev Physiol. 2008;70:23-49.
22. Howarth FC, Qureshi MA. Myofilament sensitivity to Ca2+ in ventricular myocytes from the Goto-Kakizaki diabetic rat. Mol Cell Biochem. 2008;315(1-2):69-74.
23. Ren J, Bode AM. Altered cardiac excitation-contraction coupling in ventricular myocytes from spontaneously diabetic BB rats. Am J Physiol Heart Circ Physiol. 2000;279(1):H238-44.
24. Bidasee KR, Nallani K, Yu Y, Cocklin RR, Zhang Y, Wang M, et al. Chronic diabetes increases advanced glycation end products on cardiac ryanodine receptors/calcium-release channels. Diabetes. 2003;52(7):1825-36.
25. Bidasee KR, Zhang Y, Shao CH, Wang M, Patel KP, Dincer UD, et al. Diabetes increases formation of advanced glycation end products on Sarco(endo)plasmic reticulum Ca2+-ATPase. Diabetes. 2004;53(2):463-73.
26. Choi KM, Zhong Y, Hoit BD, Grupp IL, Hahn H, Dilly KW, et al. Defective intracellular Ca2+ signaling contributes to cardiomyopathy in Type 1 diabetic rats. Am J Physiol Heart Circ Physiol. 2002;283(4):H1398-408.
27. Hattori Y, Matsuda N, Kimura J, Ishitani T, Tamada A, Gando S, et al. Diminished function and expression of the cardiac Na+-Ca2+ exchanger in diabetic rats: implication in Ca2+ overload. J Physiol. 2000;527(Pt 1):85-94.
28. Vasanji Z, Cantor EJ, Juric D, Moyen M, Netticadan T. Alterations in cardiac contractile performance and sarcoplasmic reticulum function in sucrose-fed rats is associated with insulin resistance. Am J Physiol Cell Physiol. 2008;291(4):C772-80.
29. Konrad RJ, Mikolaenko I, Tolar JF, Liu K, Kudlow JE. The potential mechanism of the diabetogenic action of streptozotocin: inhibition of pancreatic beta-cell O-GlcNAc-selective N-acetyl-beta-D-glucosaminidase. Biochem J. 2001;356(1):31-41.
30. Ponery AS, Adeghate E. Distribution of NPY and SP and their effects on glucagon secretion from the in vitro normal and diabetic pancreatic tissues. Peptides. 2000;21(10):1503-9.
31. Howarth FC, Marzouqi FM, Al Saeedi AM, Hameed RS, Adeghate E. The effect of a heavy exercise program on the distribution of pancreatic hormones in the streptozotocin-induced diabetic rat. JOP. 2009;10(5):485-91.
32. Broderick TL, Poirier P, Gillis M. Exercise training restores abnormal myocardial glucose utilization and cardiac function in diabetes. Diabetes Metab Res Rev. 2005;21(1):44-50.
33. Hall JL, Sexton WL, Stanley WC. Exercise training attenuates the reduction in myocardial GLUT-4 in diabetic rats. J Appl Physiol. 1995;78(1):76-81.
34. Gomes RJ, Leme JA, de Moura LP, de Araújo MB, Rogatto GP, de Moura RF, et al. Growth factors and glucose homeostasis in diabetic rats: effects of exercise training. Cell Biochem Funct. 2009;27(4):199-204.
35. de Almeida Leme JA, de Araújo MB, de Moura LP, Gomes, RJ, de Moura RF, Rogatto GP, et al. Effects of physical training on serum and pituitary growth hormone contents in diabetic rats. Pituitary. 2009;12(4):304-8.
36. Menon RK, Stephan DA, Rao RH, Shen-Orr Z, Downs LS, Roberts CT, et al. Tissue-specific regulation of the growth hormone receptor gene in streptozocin-induced diabetes in the rat. J Endocrinol. 1994;142(3):453-62.
37. Howarth FC, Chandler NJ, Kharche S, Tellez JO, Greener ID, Yamanushi TT, et al. Effects of streptozotocin-induced diabetes on connexin43 mRNA and protein expression in ventricular muscle. Mol Cell Biochem. 2008;319(1-2):105-14.