ASSOCIAÇÃO ENTRE OS POLIMORFISMOS NOS GENES … · mudanças de peso corporal e consumo alimentar...
182
Universidade Federal do Rio de Janeiro Centro de Ciências da Saúde Instituto de Nutrição Josué de Castro Programa de Pós-Graduação em Nutrição ASSOCIAÇÃO ENTRE OS POLIMORFISMOS NOS GENES RELACIONADOS À OBESIDADE E ÀS MUDANÇAS DE PESO CORPORAL E CONSUMO ALIMENTAR DE GESTANTES MAISA CRUZ MARTINS RIO DE JANEIRO 2017
Transcript of ASSOCIAÇÃO ENTRE OS POLIMORFISMOS NOS GENES … · mudanças de peso corporal e consumo alimentar...
Universidade Federal do Rio de Janeiro
Centro de Ciências da Saúde
Instituto de Nutrição Josué de Castro
Programa de Pós-Graduação em Nutrição
ASSOCIAÇÃO ENTRE OS POLIMORFISMOS NOS GENES
RELACIONADOS À OBESIDADE E ÀS MUDANÇAS DE PESO CORPORAL
E CONSUMO ALIMENTAR DE GESTANTES
MAISA CRUZ MARTINS
RIO DE JANEIRO
2017

Associação entre os polimorfismos nos genes relacionados à obesidade e às
mudanças de peso corporal e consumo alimentar de gestantes
MAISA CRUZ MARTINS
Tese apresentada ao Programa de Pós-Graduação em
Nutrição (PPGN), do Instituto de Nutrição Josué de Castro da
Universidade Federal do Rio de Janeiro, como parte dos
requisitos necessários à obtenção do título de Doutor em
Ciências Nutricionais.
Orientador: Prof. Dr. Gilberto Kac
RIO DE JANEIRO
Julho/2017

ASSOCIAÇÃO ENTRE OS POLIMORFISMOS NOS GENES RELACIONADOS À
OBESIDADE E ÀS MUDANÇAS DE PESO CORPORAL E CONSUMO
ALIMENTAR DE GESTANTES
Maisa Cruz Martins
Tese submetida à banca examinadora e ao Programa de Pós-Graduação em Nutrição do
Instituto de Nutrição Josué de Castro da Universidade Federal do Rio de Janeiro, como parte
dos requisitos necessários para a obtenção do grau de Doutor em Ciências Nutricionais.
Examinada por:
____________________________________ Prof. Dra. Elisa Maria de Aquino Lacerda
Universidade Federal do Rio de Janeiro
Instituto de Nutrição Josué de Castro
Revisora
____________________________________
Prof. Dra. Gloria Valéria da Veiga
Universidade Federal do Rio de Janeiro
Instituto de Nutrição Josué de Castro
____________________________________
Prof. Dra. Denise Pires de Carvalho
Universidade Federal do Rio de Janeiro
Instituto de Biofísica Carlos Chagas Filho
____________________________________
Prof. Dr. Claudio José Struchiner
Fundação Oswaldo Cruz
Escola Nacional de Saúde Pública
____________________________________
Prof. Dra. Vivian Wahrlich
Universidade Federal Fluminense
Faculdade de Nutrição Emília de Jesus Ferreiro
____________________________________
Prof. Dr. Gilberto Kac
Universidade Federal do Rio de Janeiro
Instituto de Nutrição Josué de Castro
Orientador
RIO DE JANEIRO, RJ - BRASIL
Julho de 2017

iv
Martins, Maisa Cruz
Associação entre os polimorfismos nos genes
relacionados à obesidade e às mudanças de peso corporal e
consumo alimentar de gestantes/Maisa Cruz Martins – Rio de
Janeiro: UFRJ/INJC, 2017.
XXVI, 156 p.: il.; 29,7 cm.
Orientador: Gilberto Kac
Tese – UFRJ/INJC/Programa de Pós-graduação em
Nutrição, 2017.
Referências Bibliográficas: p. 140-152.
1. Gestantes. 2. Polimorfismos de nucleotídeo único. 3.
Peso pré-gestacional. 4. Ganho de peso gestacional. 5.
Retenção de peso pós-parto. 6. Consumo alimentar. 7. Estudo
de coorte. I. Martins, Maisa Cruz. II. Universidade Federal
do Rio de Janeiro, INJC, Programa de Pós-graduação em
Nutrição. III. Título.

v
Dedicatória
A todos que, mesmo sem saber a importância dos gestos e palavras, contribuíram para a conclusão deste trabalho e
da realização deste sonho.

vi
Agradecimentos
Primeiramente gostaria de agradecer a Deus por ter me permitido evoluir
constantemente. Sou grata por Sua constante presença em minha vida, que me alenta e
sustenta nos momentos alegres e difíceis, auxiliando para que me transforme em alguém
melhor.
Apesar do processo solitário a que qualquer investigador está destinado ao escrever
uma tese, este trabalho é o resultado de significativas contribuições que recolhi durante
minha trajetória profissional em diversas instituições, convivendo com pessoas dedicadas
ao ensino e a aprendizagem. Assim, agradeço especialmente às professoras Leonor Maria
Pacheco Santos e Ana Marlúcia Oliveira Assis, que incentivaram e contribuíram para
minha formação profissional. A caminhada para chegar até este momento foi repleta de
desafios e conquistas.
Agradeço ao meu orientador, Gilberto Kac, a disponibilidade manifestada para
orientar este trabalho e a confiança no meu potencial, impondo desafios com determinação.
Obrigada pelos ensinamentos, pela dedicação e por tornar o tempo de trabalho uma ótima
convivência.
À Janet Trujillo, agradeço a iniciação no campo da genética e as valiosas
contribuições durante a elaboração dos artigos que fazem parte deste trabalho.
Ao meu pai João, ‘in memoriam’, agradeço os ensinamentos e o incentivo aos
estudos. À minha mãe Damiana, por sua simplicidade e por entender minha busca pelo
crescimento pessoal e profissional. Aos meus irmãos Rosa, Beto e Sérgio e sobrinhos,
agradeço o orgulho e carinho que sentem de mim, mesmo a distância.
Agradeço à minha grande amiga e família de coração, Janaina Castrioto, o
permanente estímulo que, por vezes, se tornou decisivo em determinados momentos da
elaboração desta tese.
Sou grata às minhas amigas e colegas de trabalho Vanessa Chaia e Marcelly Lopes
pela compreensão e apoio nos momentos em que precisei me afastar das atividades do
LANUTRI para concluir esta tese.
Agradeço aos amigos que acompanharam minha trajetória, tanto de perto quanto de
longe, entendendo muitas vezes a minha ausência. Um agradecimento especial às minhas

vii
amigas nutricionistas Heloisa Gomes, Simone Pinho, Sônia Borba, Audrey Cintra, Thaís
Ferreira e Isabela da Matta, pela nossa amizade e convívio saudável.
Aos membros da equipe do Observatório de Epidemiologia Nutricional, que sempre
estiveram disponíveis para auxiliar nos momentos que precisei, especialmente às minhas
colegas de doutorado Dayana Farias e Jaqueline Lepsch. Muito obrigada a todos!
Sou grata à professora Elisa Maria de Aquino Lacerda pela disponibilidade e
atenção para revisar esse documento, as quais foram importantes para o aprimoramento
deste trabalho.
Agradeço aos membros da banca, por terem aceitado o convite e pelo tempo
dedicado na leitura crítica do presente trabalho.
Aos professores e funcionários do Programa de Pós-graduação em Nutrição do
Instituto de Nutrição Josué de Castro, sou grata pela atenção e dedicação em nos atender.
Às gestantes que participaram do estudo, sem as quais não seria possível realizar
esse trabalho.
Enfim, o meu profundo e sentido agradecimento a todas as pessoas que contribuíram
para a concretização desta tese, estimulando-me intelectual e emocionalmente.
Rio de Janeiro, julho de 2017.
Maisa Cruz Martins

viii
RESUMO
Introdução: Acompanhando o cenário da epidemia global da obesidade, grande parcela das
mulheres está iniciando a gestação com peso acima do recomendado, ganhando peso
excessivamente ao longo da gestação e retendo percentual elevado do peso acumulado nesse
período. Entre os diversos fatores que contribuem para o excesso de massa corporal, as
diferenças genéticas desempenham importante papel no processo de expressividade do
fenótipo da obesidade, provavelmente por meio de mecanismos de controle da
saciedade/apetite e preferências alimentares. Objetivo: Estudar a associação entre os
polimorfismos de nucleotídeo único (SNPs) nos genes relacionados à obesidade (FTO - massa
de gordura e obesidade associadas, rs9939609; MC4R - melanocortina-4 receptor,
rs17782313; LEP – leptina, rs7799039 e LEPR - receptor da leptina, rs1137101) e mudanças
de peso corporal e consumo alimentar de gestantes. Método: Coorte prospectiva de gestantes
acompanhadas em um Centro Municipal de Saúde, localizado no bairro da Tijuca no
município do Rio de Janeiro, nos seguintes períodos: 5-13, 20-26 e 30-36 semanas
gestacionais e 30-45 dias pós-parto. Foram realizadas medidas antropométricas (massa
corporal e estatura) e dosagens das concentrações plasmáticas de leptina. Foram obtidos
dados de consumo alimentar por meio de um questionário de frequência alimentar (QFA),
referentes aos períodos pré-gestacional e gestacional. Os SNPs foram analisados por reação
em cadeia da polimerase em tempo real (PCR). As associações entre os polimorfismos dos
genes e as variáveis dependentes (peso pré-gestacional, ganho de peso gestacional, retenção
de peso pós-parto, concentração plasmática de leptina e consumo alimentar) foram
investigadas por meio de modelos regressão longitudinal linear de efeitos mistos, regressão
linear múltipla e modelos de regressão de Poisson, ajustados por fatores obstétricos,
socioeconômicos, demográfico e ingestão energética total. Resultados: O SNP do gene do
FTO-rs9939609 (alelo-A) foi significativamente associado ao excesso de peso pré-
gestacional e à percentagem mais elevada de energia derivada dos carboidratos no período
pré-gestacional. Este SNP também foi associado à percentagem mais elevada de energia total
e à percentagem mais elevada de energia dos alimentos ultraprocessados durante a gestação.
O SNP do gene MC4R-rs17782313 (alelo-C) foi positivamente associado à percentagem mais
elevada de energia derivada de alimentos ultraprocessados ao longo da gestação. Os SNPs nos
genes LEP-rs7799039 e LEPR-rs1137101 não foram estatisticamente associados às

ix
concentrações plasmáticas de leptina ao longo da gestação e aos componentes do consumo
alimentar, contudo, o gene LEP-rs7799039 foi significativamente associado ao maior risco de
ganho de peso gestacional excessivo. Conclusão: Os SNPs em genes relacionados à
obesidade estão associados as mudanças do peso corporal e do consumo alimentar de
gestantes.
Palavras-chave: Gestantes; Polimorfismos de nucleotídeo único; Peso pré-gestacional;
Ganho de peso gestacional; Retenção de peso pós-parto; Consumo alimentar; Estudo de
coorte.

x
ABSTRACT
Introduction: A large proportion of women are initiating gestation above the recommended
weight, gaining excessive weight during pregnancy and retaining a high percentage of the
gestational weight gain as a result of the global epidemic of obesity. Among the many factors
contributing to overweight, genetic differences play an important role in the process of
expressiveness of the obesity phenotype, probably through control mechanisms of
satiety/appetite and food preferences. Objective: To study the association between single
nucleotide polymorphisms (SNPs) in obesity-related genes (FTO - fat mass and obesity,
rs9939609; MC4R - melanocortin 4 receptor, rs17782313; LEP – leptin, rs7799039 e LEPR -
leptin receptor, rs1137101) and changes in body weight and dietary intake during gestation.
Method: Prospective cohort of pregnant women attending a Municipal Health Center, located
in the district of Tijuca in the city of Rio de Janeiro, in the following periods: 5-13, 20-26 and
30-36 gestational weeks and 30-45 days postpartum. Anthropometric measurements (weight
and height) and plasma concentration of leptin were performed. Food intake data were
obtained through a food frequency questionnaire (FFQ), referring to the pre-gestational and
gestational periods. SNPs were analyzed by real-time polymerase chain reaction (PCR). The
associations between the gene polymorphisms and the dependent variables (pre-gestational
weight, gestational weight gain, postpartum weight retention, plasma leptin concentration and
dietary intake) were investigated by longitudinal mixed effects regression models, multiple
linear regression and Poisson regression models, adjusted for obstetric, socioeconomic,
demographic factors and energy intake. Results: The FTO-rs9939609 (A-allele) gene SNP
was significantly associated with pre-pregnancy overweight and with the highest percentage
of energy from carbohydrates in pre-pregnancy. This SNP was also associated with the
highest percentage of total energy and with the highest percentage of energy from
ultraprocessed foods during pregnancy. The SNP of the MC4R-rs17782313 gene (C-allele)
was positively associated with the highest percentage of energy derived from ultraprocessed
foods throughout pregnancy. SNPs in the genes LEP-rs7799039 and LEPR-rs1137101 were
not statistically associated with plasma concentrations of leptin throughout pregnancy and
with food consumption components, however, the LEP-rs7799039 gene was significantly
associated with the increased risk of excessive gestational weight gain. Conclusion: SNPs in

xi
genes related to obesity are associated with changes in body weight and dietary intake of
pregnant women.
Keywords: Pregnant women; Single nucleotide polymorphisms; Pre-gestational weight;
Gestational weight gain; Postpartum weight retention; Food consumption; Cohort study.

xii
SUMÁRIO
APRESENTAÇÃO.................................................................................................... 27
1 INTRODUÇÃO...................................................................................................... 29
2 REFERENCIAL TEÓRICO................................................................................. 31
2.1 Epidemiologia do excesso de peso...................................................................... 31
2.2 Avaliação da composição corporal...................................................................... 33
2.2.1 Avaliação da composição corporal na população geral................................ 33
2.2.2 Avaliação da composição corporal em gestantes......................................... 35
2.3 Principais fatores condicionantes da obesidade.................................................. 36
2.4 Informações básicas sobre genética humana....................................................... 37
2.4.1 Estrutura do material genético humano........................................................ 37
2.4.2 Variação genética......................................................................................... 38
2.4.3 Polimorfismos de nucleotídeo único (SNPs)................................................ 39
2.5 SNPs em genes candidatos à obesidade.............................................................. 40
2.5.1 FTO (gene de massa de gordura e obesidade associadas)............................. 42
2.5.2 MC4R (gene receptor da melanocortina-4)................................................... 43
2.5.3 LEP e LEPR (genes da leptina e do seu receptor)........................................ 43
2.6 Determinantes do ganho de peso materno........................................................... 44
2.6.1 IMC pré-gestacional..................................................................................... 44
2.6.2 Ganho de peso gestacional............................................................................ 45
2.6.3 Retenção de peso pós-parto.......................................................................... 47
2.6.4 Leptina.......................................................................................................... 48
2.6.5 Consumo alimentar....................................................................................... 50
3 JUSTIFICATIVA................................................................................................... 53
4 HIPÓTESES............................................................................................................ 54

xiii
5 OBJETIVOS........................................................................................................... 55
5.1 Objetivo geral...................................................................................................... 55
5.2 Objetivos específicos........................................................................................... 55
6 MÉTODOS.............................................................................................................. 56
6.1 Delineamento do estudo...................................................................................... 56
6.2 Aspectos éticos.................................................................................................... 56
6.3 Critérios de elegibilidade..................................................................................... 56
6.4 Critérios de exclusão........................................................................................... 58
6.5 Captação das participantes do estudo.................................................................. 58
6.6 Capacitação da equipe e controle de qualidade dos dados................................. 58
6.7 Procedimentos para coleta dos dados.................................................................. 59
6.8 Logística da coleta de dados................................................................................ 59
6.9 Variáveis do estudo............................................................................................. 60
6.9.1 Informações demográficas, socioeconômicas obstétricas e de estilo de
vida........................................................................................................................ 61
6.9.2 Medidas antropométricas.............................................................................. 61
6.9.3 Consumo alimentar....................................................................................... 62
6.9.4 Dados bioquímicos e genéticos..................................................................... 64
6.9.4.1 Concentração plasmática de leptina....................................................... 64
6.9.4.2 Polimorfismos genéticos (FTO, MC4R, LEP e LEPR)......................... 64
6.10 Análises estatísticas........................................................................................... 65
6.10.1 Análise descritiva........................................................................................ 67
6.10.2 Análise gráfica............................................................................................ 67
6.10.3 Análise de regressão linear múltipla........................................................... 67
6.10.4 Análise de regressão de Poisson................................................................. 67
6.10.5 Análise de regressão longitudinal de efeitos mistos................................... 68

xiv
7 RESULTADOS....................................................................................................... 72
7.1 Artigo 1. Association of the FTO (rs9939609) and MC4R (rs17782313) gene
polymorphisms with maternal body weight during pregnancy
Associação dos polimorfismos dos genes FTO (rs9939609) e MC4R
(rs17782313) com o peso corporal materno durante a gestação................................ 73
7.2 Artigo 2. Leptin (rs7799039) and leptin receptor (rs1137101) gene
polymorphisms and body weight changes and leptin concentrations throughout
pregnancy
Polimorfismos nos genes da leptina (rs7799039) e do receptor da leptina
(rs1137101) e mudanças do peso corporal e das concentrações de leptina ao longo
da gestação................................................................................................................. 94
7.3 Artigo 3. Associations between obesity candidate gene polymorphisms (FTO,
MC4R, LEP and LEPR) and dietary intake in pregnant women
Associações entre polimorfismos nos genes candidatos à obesidade (FTO, MC4R,
LEP e LEPR) e ingestão dietética em mulheres gestantes......................................... 115
8 CONCLUSÕES....................................................................................................... 136
9 CONSIDERAÇÕES FINAIS................................................................................. 138
10 REFERÊNCIAS DA TESE DE DOUTORADO................................................ 140
11 APÊNDICES......................................................................................................... 153
12 ANEXOS............................................................................................................... 174
xv
LISTA DE QUADROS
Quadro 1. Panorama dos estudos populacionais brasileiros sobre prevalências do
excesso de peso e obesidade em indivíduos adultos....................................................... 31
Quadro 2. Panorama dos estudos populacionais brasileiros sobre prevalências do
excesso de peso e obesidade em indivíduos adultos, de acordo com o sexo................... 32
Quadro 3. Recomendações e classificação do ganho de peso gestacional, de acordo
com IMC materno pré-gestacional.................................................................................. 46
Quadro 4. Classificação das variáveis do estudo, de acordo com os artigos da tese...... 60
Quadro 5. Produtos alimentares que representaram o grupo de alimentos
ultraprocessados............................................................................................................... 63
Quadro 6A. Quadro demonstrativo das técnicas de análise estatística do artigo 1........ 69
Quadro 6B. Quadro demonstrativo das técnicas de análise estatística do artigo 2........ 70
Quadro 6C. Quadro demonstrativo das técnicas de análise estatística do artigo 3........ 71

xvi
LISTA DE TABELAS
ARTIGO 1
Table 1. Maternal characteristics according to the FTO (rs9939609) and the MC4R
(rs17782313) gene polymorphisms
Tabela 1. Características maternas de acordo com o polimorfismo nos genes FTO
(rs9939609) e MC4R (rs17782313)............................................................................... 88
Table 2. Associations of adiposity risk alleles (FTO and MC4R) with body weight
changes before, during pregnancy and early postpartum
Tabela 2. Associações dos alelos de risco de adiposidade (FTO e MC4R) com as
mudanças de peso corporal antes e durante a gestação e no pós-parto......................... 89
Table 3. Longitudinal analysis between FTO (rs9939609), MC4R (rs17782313) and
trajectory of body weight during pregnancy
Tabela 3. Análise longitudinal entre FTO (rs9939609), MC4R (rs17782313) e a
trajetória do peso corporal durante a gestação............................................................... 90
Supplementary Table 1. Descriptive characteristics of the study population, by
participation or non-participation in the genetic study
Tabela suplementar 1. Características descritivas da população estudada, por
participação ou não participação no estudo genético..................................................... 91
Supplementary Table 2. Associations of combined effect of FTO (rs9939609) and
MC4R (rs17782313) with body weight changes before, during pregnancy and
immediate postpartum
Tabela suplementar 2. Associações de efeito combinado do FTO (rs9939609) e
MC4R (rs17782313) com mudanças de peso corporal antes e durante a gestação e no
pós-parto......................................................................................................................... 92
xvii
ARTIGO 2
Table 1. Maternal characteristic of the study population stratifying for pre-
pregnancy BMI categories
Tabela 1. Características maternas da população estudada estratificando por
categorias de IMC pré-gestacional................................................................................ 109
Table 2. Genotype and allele frequencies of the LEP-rs7799039 and of the LEPR-
rs1137101 polymorphisms of the study population stratifying for pre-pregnancy BMI
categories
Tabela 2. Frequências dos genótipo e dos alelos dos polimorfismos LEP-rs7799039
e LEPR-rs1137101 da população estudada estratificando por categorias de IMC pré-
gestacional...................................................................................................................... 110
Table 3. Distribution of the pre-pregnancy body weight and BMI, total GWG and
plasma leptin concentrations according to genotypes of the LEP-rs7799039 and of
the LEPR-rs1137101 genes
Tabela 3. Distribuição do peso corporal e do IMC pré-gestacional, GPG total e
concentrações plasmáticas de leptina de acordo com os genótipos dos genes LEP-
rs7799039 e LEPR-rs1137101....................................................................................... 111
Table 4. Associations of the LEP-rs7799039 and LEPR-rs1137101 polymorphisms
with pre-pregnancy BMI, GWG and leptin concentrations
Tabela 4. Associações dos polimorfismos LEP-rs7799039 e LEPR-rs1137101 com
IMC pré-gestacional, GPG e concentrações de leptina.................................................. 112
Table 5. Longitudinal analysis between LEP-rs7799039 and LEPR-rs1137101 gene
polymorphisms and maternal body weight and leptin concentration throughout
pregnancy
Tabela 5. Análise longitudinal entre os polimorfismos dos genes LEP-rs7799039 e
LEPR-rs1137101 e o peso corporal materno e a concentração de leptina ao longo da
gestação.......................................................................................................................... 113

xviii
ARTIGO 3
Table 1. Maternal descriptive characteristics and dietary intake of the study sample
Tabela 1. Características descritivas maternas e a ingestão dietética da amostra do
estudo............................................................................................................................. 130
Table 2. Distribution of daily dietary intake before and during pregnancy and
variation according to genotypes of the FTO-rs9939609, MC4R-rs17782313, LEP-
rs7799039 and LEPR-rs1137101 genes polymorphisms, considering the dominant
genetic model for all genes
Tabela 2. Distribuição da ingestão dietética diária antes e durante a gestação e a
variação de acordo com os genótipos dos genes FTO-rs9939609, MC4R-rs17782313,
LEP-rs7799039 e LEPR-rs1137101, considerando o modelo genético dominante
para todos os genes......................................................................................................... 131
Table 3. Linear regression models between FTO-rs9939609, MC4R-rs17782313,
LEP-rs7799039 and LEPR-rs1137101 gene polymorphisms and daily dietary intake
before and during pregnancy, considering the dominant genetic model for all genes
Tabela 3. Modelos de regressão linear entre os polimorfismos dos genes LEP-
rs9939609, MC4R-rs17782313, LEP-rs7799039 e LEPR-rs1137101 e a ingestão
dietética diária durante os períodos pré-gestacional e gestacional, considerando o
modelo genético dominante para todos os genes........................................................... 133
Table 4. Longitudinal analysis between FTO, MC4R, LEP and LEPR gene
polymorphisms and daily dietary intake, according to genotypes
Tabela 4. Análise longitudinal entre os polimorfismos dos genes FTO, MC4R, LEP
e LEPR e o consumo dietético diário, de acordo com os genótipos.............................. 134
Supplementary Table 1. Genotype distribution and allele frequencies of the FTO-
rs9939609, MC4R-rs17782313, LEP-rs7799039 and LEPR-rs1137101 gene
polymorphisms
Tabela suplementar 1. Distribuição dos genótipos e da frequência alélica dos
polimorfismos dos genes FTO-rs9939609, MC4R-rs17782313, LEP-rs7799039 e
LEPR-rs1137101............................................................................................................ 135

xix
LISTA DE FIGURAS
Figura 1. Estrutura simplificada dos elementos do material genético humano............. 38
Figura 2. Polimorfismo de um único nucleotídeo (SNP).............................................. 39
Figura 3. Localização cromossômica do gene FTO...................................................... 42
Figura 4. Localização cromossômica do gene MC4R................................................... 43
Figura 5. Localização cromossômica do gene LEP....................................................... 43
Figura 6. Localização cromossômica do gene LEPR.................................................... 44
Figura 7. Coleta de dados em cada ponto de acompanhamento do estudo.................... 57
Figura 8. Fluxograma do tamanho amostral dos artigos apresentados na tese.............. 66
ARTIGO 1
Figure 1. Flowchart illustrating the recruitment and selection of the study
population
Figura 1. Fluxograma do recrutamento e da seleção da população estudada................ 87
Supplementary Figure 1. Trajectory of body weight during pregnancy by FTO
(rs9939609) polymorphism
Figura suplementar 1. Trajetória do peso corporal durante a gestação de acordo
com o polimorfismo FTO (rs9939609)........................................................................... 93
ARTIGO 2
Figure 1. Flowchart illustrating the recruitment and selection of the study
population
Figura 1. Fluxograma do recrutamento e da seleção da amostra estudada.................... 108
ARTIGO 3
Figure 1. Flowchart illustrating the recruitment and selection of the study sample
Figura 1. Fluxograma do recrutamento e da seleção da amostra do estudo.................. 129

xx
LISTA DE APÊNDICES
Apêndice A. Do-files das análises estatísticas do artigo 1....................................... 154
Apêndice B. Do-files das análises estatísticas do artigo 2........................................ 159
Apêndice C. Do-files das análises estatísticas do artigo 3........................................ 166

xxi
LISTA DE ANEXOS
Anexo 1. Aprovação do Comitê de Ética....................................................................... 175
Anexo 2. Termo de Consentimento Livre e Esclarecido................................................ 176
Anexo 3. Protocolo de extração do DNA....................................................................... 178
Anexo 4. Publicação do Artigo 1 no periódico Nutrition............................................... 179

xxii
LISTA DE ANEXOS ONLINE
Anexo online 1. Questionário de Frequência Alimentar (QFA) do primeiro trimestre
gestacional...................................................................................................................... 182
Anexo online 2. Questionário Geral-1do primeiro trimestre gestacional...................... 182
Anexo online 3. Questionário Geral-2 do segundo trimestre gestacional...................... 182
Anexo online 4. Questionário Geral-3 do terceiro trimestre gestacional....................... 182
Anexo online 5. Questionário de Frequência Alimentar (QFA) do terceiro trimestre
gestacional...................................................................................................................... 182
Anexo online 6. Questionário Geral-4 do pós-parto...................................................... 182

xxiii
LISTA DE ABREVIATURAS
ABNT Associação Brasileira de Normas Técnicas
ADP/BodPod Pletismografia por deslocamento do ar
AIC Akaike Information Criterion
ANOVA Análise de variância
BIA Bioimpedância elétrica
BIC Bayesian Information Criterion
BMI Body Mass Index
CEP Comitê de Ética em Pesquisa
CFM Conselho Federal de Medicina
CHO Carboidratos
CI Confidence Intervals
CMS Centro Municipal de Saúde
CNPq Conselho Nacional de Desenvolvimento Científico e Tecnológico
CNS Conselho Nacional de Saúde
CONEP Comissão Nacional de Ética em Pesquisa
DAFEE Laboratório de Desenvolvimento de Alimentos para Fins Especiais e
Educacionais
DC Dobras Cutâneas
DCNT Doenças Crônicas não Transmissíveis
DEXA Densitometria com emissão de raio X de dupla energia
DUM Data da Última Menstruação
ELISA Enzyme-linked Immunosorbent Assay
FAPERJ Fundação de Amparo à Pesquisa do Estado do Rio de Janeiro
FAO Organização para a Alimentação e Agricultura das Nações Unidas
FFQ Food Frequency Questionnaire
FTO Massa de gordura e obesidade associadas - Fat mass and obesity associated
GHO Global Health Observatory
GPG Ganho de Peso Gestacional
GW Gestational Weeks
GWG Gestational Weight Gain
HB Heitor Beltrão
IBGE Instituto Brasileiro de Geografia e Estatística

xxiv
IC 95% Intervalo de Confiança de 95%
IMC Índice de Massa Corporal
INJC Instituto de Nutrição Josué de Castro
IOM Institute of Medicine
IPUB Instituto de Psiquiatria da Universidade Federal do Rio de Janeiro
IQR Inter Quartile Range
LEP Leptina
LEPR Receptor da Leptina
LIP Lipídeos
LME Longitudinal Mixed Effects
LTPA Leisure-Time Physical Activity
MC4R Receptor da Melanocortina-4 - Melanocortin-4 receptor
NCBI National Center for Biotechnology
NCDs Non-Communicable Chronic Diseases
OMS Organização Mundial da Saúde
PAFL Prática de Atividade Física de Lazer
PC Perímetro da Cintura
PET Tomografia por Emissão de Pósitrons
POF Pesquisa de Orçamentos Familiares
PRT Proteínas
QFA Questionário de Frequência Alimentar
RM Ressonância Magnética
RR Relative Risks
SD Standard Deviations
SG Semanas de Gestação
SMS Secretaria Municipal de Saúde
STATA Stata Data Analysis and Statistical Software
TACO Tabela Brasileira de Composição de Alimentos
TC Tomografia Computadorizada
TCLE Termo de Consentimento Livre e Esclarecido
UERJ Universidade do Estado do Rio de Janeiro
UFRJ Universidade Federal do Rio de Janeiro
USDA United States Department of Agriculture

xxv
DENOMINAÇÕES E CONCEITOS BÁSICOS DE GENÉTICA
Alelo Qualquer uma das formas alternativas de um gene especifico que esta
localizado no mesmo locus em um cromossomo homólogo, sendo
responsáveis por variações em uma característica geneticamente
hereditária.
Cromossomo Estrutura constituída por DNA. É a forma de armazenamento do DNA.
DNA Corresponde ao material hereditário (ácido desoxirribonucleico) que
contém dentro de sua estrutura a informação genética necessária para
especificar todos os aspectos da embriogênese, desenvolvimento,
crescimento, metabolismo e reprodução.
Expressividade Corresponde ao grau em que um genótipo particular é expresso no
fenótipo.
Fenótipo São as características observáveis de um indivíduo, por exemplo cor
dos olhos ou presença de uma doença particular.
Gene Corresponde a uma região de DNA cromossômico ou unidade de
informação genética que contém instruções específicas para a síntese
de proteínas.
Gene dominante São genes que se manifestam tanto em homozigose, quanto em
heterozigose.
Gene recessivo São genes que só se manifestam quando estão em homozigose.
Genoma Conjunto completo do DNA de um organismo, incluindo todos os seus
genes.
GWAS Estudos de associação ampla do genoma nos quais SNPs são testados
em amostras individuais de DNA para observar suas associações com
doenças.
Genotipagem Processo de determinação do genótipo ou conteúdo genômico
utilizando o DNA, mediante procedimento de laboratório.

xxvi
Genótipo Constituição genética do indivíduo.
Herança simples ou
mendeliana
Corresponde à passagem de genes de uma geração para outra.
Herança
monogênica
Refere-se ao tipo de herança em que uma característica é determinada
pela expressão de um único gene ou alelo, não por vários genes como
na herança poligênica.
Hereditariedade Transmissão de características dos pais para seus filhos por meio do
material genético
Heterozigoto Significa que os alelos presentes em um lócus genético são diferentes.
Exemplo: Aa.
Homozigoto Significa que os alelos presentes em um lócus genético são idênticos.
Exemplo: AA ou aa.
Lócus Posição (local) ocupado pelo gene no cromossomo. “Loci” é o plural
de lócus.
Penetrância A proporção de indivíduos com um genótipo específico que manifesta
esse genótipo ao nível do fenótipo.
Seleção natural Resultado das interações entre variações genéticas em uma população
e o ambiente.
SNP Corresponde alteração de uma única base na sequência do DNA
(Polimorfismo de nucleotídeo único).
Variação genética Alteração genética dentro de uma população.
APRESENTAÇÃO
27
APRESENTAÇÃO
Esta tese de doutorado apresenta resultados de um estudo realizado com mulheres
gestantes provenientes do projeto intitulado ‘Saúde mental e estado nutricional na gestação e
no pós-parto: estudo prospectivo com ensaio clínico randomizado aninhado’. Este projeto foi
desenvolvido no Centro Municipal de Saúde Heitor Beltrão (CMS HB), da Secretaria
Municipal de Saúde (SMS) do Rio de Janeiro. O recrutamento das mulheres ocorreu durante o
período de novembro de 2009 a outubro de 2011, sendo a coleta de dados finalizada em junho
de 2012. O estudo foi realizado por pesquisadores do Observatório de Epidemiologia
Nutricional do Instituto de Nutrição Josué de Castro (INJC) e contou com a parceria do
Instituto de Psiquiatria da Universidade Federal do Rio de Janeiro (IPUB - UFRJ). A pesquisa
foi financiada pela Fundação de Amparo à Pesquisa do Estado do Rio de Janeiro (FAPERJ) e
pelo Conselho Nacional de Desenvolvimento Científico e Tecnológico (CNPq).
A presente tese intitulada ‘Associação entre os polimorfismos nos genes relacionados
à obesidade e às mudanças de peso corporal e consumo alimentar de gestantes’ foi
desenvolvida com a finalidade de investigar se os polimorfismos de genes relacionados à
obesidade estão associados com mudanças no peso corporal e no consumo alimentar de
gestantes. Este documento está estruturado nas seguintes seções: introdução, na qual é
realizada abordagem geral sobre a temática que envolve esta tese; referencial teórico, no qual
é traçada uma estruturação conceitual sobre os principais pilares da tese para o entendimento
do estudo; justificativa; hipóteses; objetivos; métodos; resultados; conclusões, considerações
finais; referências bibliográficas, apêndices e anexos.
A seção de resultados/discussão é composta por três manuscritos científicos. O
primeiro artigo foi publicado na revista Nutrition e intitulado ‘Association of the FTO
(rs9939609) and MC4R (rs17782313) gene polymorphisms with maternal body weight during
pregnancy’. O segundo artigo foi aceito para publicação na revista Nutrition Research e
intitula-se ‘Leptin (rs7799039) and leptin receptor (rs1137101) gene polymorphisms and
body weight changes and leptin concentrations throughout pregnancy’. O terceiro manuscrito
foi submetido à British Journal of Nutrition para publicação e intitula-se ‘Associations
between obesity candidate gene polymorphisms (FTO, MC4R, LEP and LEPR) and dietary
intake in pregnant women’.
A seção considerações finais é fundamentada nos principais resultados dos três
manuscritos realizados. As referências da tese obedecem a norma NB-66 da Associação

APRESENTAÇÃO
28
Brasileira de Normas Técnicas (ABNT), enquanto as referências dos artigos atendem aos
requisitos técnicos das revistas.
INTRODUÇÃO
29
1 INTRODUÇÃO
A prevalência do excesso de peso tem aumentado nas últimas décadas de forma
constante em todos os grupos etários e sociais, configurando-se na atualidade como um dos
problemas prioritários de saúde pública (WHO, 2014). Consequentemente, a proporção de
mulheres com excesso de peso em idade reprodutiva tem aumentado em diversas partes do
mundo (Ng et al., 2014; Gilmore, Klempel-Donchenko e Redman, 2015), inclusive no Brasil
(IBGE, 2010, 2015; Brasil, 2017). A obesidade está associada ao risco concomitante ou
aumentado de quase todas as doenças crônicas não transmissíveis (DCNT), incluindo diabetes
tipo 2, alguns tipos de câncer, dislipidemia, doenças cardiovasculares e osteoartrite (Hruby e
Hu, 2015). A obesidade também desempenha papel significativo nos transtornos reprodutivos
em mulheres como distúrbios menstruais, infertilidade, dificuldades na reprodução assistida e
aborto espontâneo (Dağ e Dilbaz, 2015)
O período gestacional é caracterizado por adaptações fisiológicas para suprir as
demandas da gestação e da lactação, e o estado nutricional pré-gestacional materno constitui
um dos principais determinantes para o ganho de peso durante este período (Institute of
Medicine, 2009). O ganho de peso gestacional (GPG) excessivo está associado a mudanças de
peso no pós-parto, ou seja, quanto maior o ganho de peso neste período, maior será a retenção
de peso no pós-parto (Siega-Riz et al., 2009). A compreensão dessas associações é complexa,
pois o excesso de peso adquirido em uma gestação pode ter um efeito cumulativo em longo
prazo sobre o ganho de peso em gestações subsequentes (Gilmore, Klempel-Donchenko e
Redman, 2015), ampliando a trajetória de ganho de peso e contribuindo para o
desenvolvimento ou agravamento da epidemia da obesidade em mulheres (Nehring et al.,
2011; Mannan, Doi e Mamun, 2013; Rong et al., 2015).
A obesidade materna é um fator de risco bem estabelecido para resultados obstétricos
e neonatais adversos, incluindo aumento do risco de diabetes gestacional, parto por cesariana,
pré-eclâmpsia, complicações no nascimento e macrossomia (Ovesen, Rasmussen e Kesmodel,
2011; Shin e Song, 2015; Marchi et al., 2015). Além disso, evidências sugerem que a
obesidade materna e o GPG excessivo também possuem influência adversa em longo prazo
sobre a saúde do filho, por meio do processo de programação metabólica (Cnattingius et al.,
2012; Gomes et al., 2015; Lawrence et al., 2014). Tais constatações traduzem-se em alerta
crescente de impacto social e econômico para o sistema de saúde pública (Morgan et al.,
INTRODUÇÃO
30
2014), o que salienta a relevância de maiores investigações sobre as possíveis causas do
excesso de peso materno.
A teoria convencional sustenta que a obesidade é o resultado de um desequilíbrio de
longo prazo entre a ingestão e o gasto energético, que favorece o balanço energético positivo
(Agurs-Collins e Bouchard, 2008). Tradicionalmente, esse desequilíbrio ocorre devido à
ingestão de alimentos e bebidas de alta densidade energética, geralmente de baixo custo,
combinado com estilo de vida sedentário (Hill, Wyatt e Peters, 2012; Hall et al., 2012). No
entanto, a fisiopatologia da obesidade é complexa e as causas do balanço de energia positivo
envolvem uma interação complexa entre fatores ambientais, socioeconômicos e genéticos,
tornando a gestão e a prevenção da obesidade desafiadoras (Choquet e Meyre, 2011b; Hurt et
al., 2011; Hruby e Hu, 2015).
Os estudos genéticos têm contribuído significativamente para a compreensão da
fisiologia da regulação da massa corporal, por meio de modelos animais e da investigação dos
fatores genéticos relacionados às formas raras e comuns de obesidade humana. Desde o
mapeamento do genoma humano (1990 – 2003), vários polimorfismos de nucleotídeo único
(SNPs) de genes com potencial de associação com o excesso de peso têm sido identificados, a
exemplo do FTO (massa de gordura e obesidade associadas), MC4R (receptor da
melanocortina-4), LEP (leptina) e LEPR (receptor da leptina). Estes genes têm sido
frequentemente estudados em decorrência de estarem envolvidos em vias centrais ou
periféricas de controle da ingestão e gasto energético (Sonestedt et al., 2009; Stutzmann et al.,
2009; Boumaiza et al., 2012). Nesse sentido, é concebível que estas variantes genéticas
também possam estar associadas ao peso pré-gestacional e as mudanças de peso corporal
materno durante a gestação e no pós-parto, bem como aos componentes da ingestão alimentar.
Contudo, ainda são escassos os estudos que abordam os efeitos da genética sobre esses
desfechos.
REFERENCIAL TEÓRICO
31
2 REFERENCIAL TEÓRICO
2.1 EPIDEMIOLOGIA DO EXCESSO DE PESO
A natureza global da epidemia de obesidade foi formalmente reconhecida pela
Organização Mundial de Saúde (OMS) em 1997 (WHO, 2000) e, desde então, sua prevalência
ascendente vem sendo observada em todo mundo (Ng et al., 2014). Um dos aspectos mais
preocupantes da epidemia de obesidade é que a prevalência também tem aumentado
rapidamente entre crianças e adolescentes (WHO, 2014; Lobstein et al., 2015). Em 2014, a
OMS estimou que mais de 1,9 bilhões de pessoas com idade ≥ 18 anos apresentavam índice
de massa corporal [IMC = peso (kg)/estatura (m2)] ≥ 25,0 kg/m2 (excesso de peso),
correspondendo a 39% da população adulta no mundo, destes 13% apresentavam IMC ≥ 30,0
kg/m2 (obesidade) (WHO, 2016). A região das Américas foi a que apresentou a maior
prevalência de excesso de peso (61%, destes 27% de obesidade) e a região sudeste da Ásia a
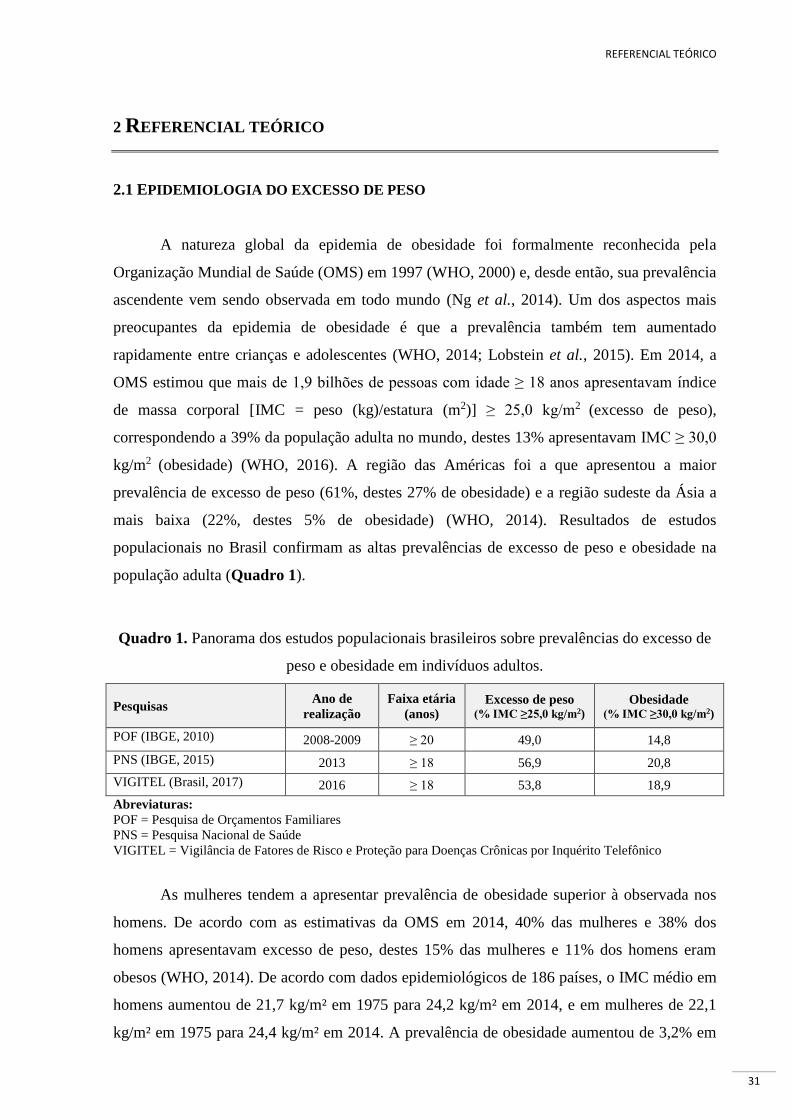
mais baixa (22%, destes 5% de obesidade) (WHO, 2014). Resultados de estudos
populacionais no Brasil confirmam as altas prevalências de excesso de peso e obesidade na
população adulta (Quadro 1).
Quadro 1. Panorama dos estudos populacionais brasileiros sobre prevalências do excesso de
peso e obesidade em indivíduos adultos.
Pesquisas Ano de
realização
Faixa etária
(anos) Excesso de peso
(% IMC ≥25,0 kg/m2)
Obesidade (% IMC ≥30,0 kg/m2)
POF (IBGE, 2010) 2008-2009 ≥ 20 49,0 14,8
PNS (IBGE, 2015) 2013 ≥ 18 56,9 20,8
VIGITEL (Brasil, 2017) 2016 ≥ 18 53,8 18,9
Abreviaturas:
POF = Pesquisa de Orçamentos Familiares
PNS = Pesquisa Nacional de Saúde
VIGITEL = Vigilância de Fatores de Risco e Proteção para Doenças Crônicas por Inquérito Telefônico
As mulheres tendem a apresentar prevalência de obesidade superior à observada nos
homens. De acordo com as estimativas da OMS em 2014, 40% das mulheres e 38% dos
homens apresentavam excesso de peso, destes 15% das mulheres e 11% dos homens eram
obesos (WHO, 2014). De acordo com dados epidemiológicos de 186 países, o IMC médio em
homens aumentou de 21,7 kg/m² em 1975 para 24,2 kg/m² em 2014, e em mulheres de 22,1
kg/m² em 1975 para 24,4 kg/m² em 2014. A prevalência de obesidade aumentou de 3,2% em

REFERENCIAL TEÓRICO
32
1975 para 10,8% em 2014 nos homens e de 6,4% a 14,9% em mulheres (NCD Risk Factor
Collaboration, 2016).
Dados de 2014 do Global Health Observatory (GHO) para o Brasil sugerem que as
prevalências de excesso de peso e obesidade para homens e mulheres (≥ 18 anos) eram de
55,2% e 53,0%; 17,1% e 24,0%, respectivamente (GHO-WHO, 2014). Dados de pesquisas
populacionais realizadas no Brasil também demonstram esta tendência (Quadro 2). Dados do
Instituto Brasileiro de Geografia e Estatística (IBGE) indicam que nos 34 anos decorridos de
1974-1975 a 2008-2009, a prevalência de excesso de peso em adultos aumenta em quase três
vezes no sexo masculino (de 18,5% para 50,1%) e em quase duas vezes no sexo feminino (de
28,7% para 48,0%). No mesmo período, a prevalência de obesidade aumenta em mais de
quatro vezes para homens (de 2,8% para 12,5%) e em mais de duas vezes para mulheres (de
8,0% para 16,9%) (IBGE, 2010).
Quadro 2. Panorama dos estudos populacionais brasileiros sobre prevalências do excesso de
peso e obesidade em indivíduos adultos, de acordo com o sexo.
Pesquisas Ano de
realização
Faixa etária
(anos)
Excesso de peso (% IMC ≥25,0 kg/m2)
Obesidade (% IMC ≥30,0 kg/m2)
Homens Mulheres Homens Mulheres
PNDS (Brasil, 2009) 2006 15-49 - 43,1 - 16,1
POF (IBGE, 2010) 2008-2009 ≥ 20 50,1 48,0 12,5 16,9
PNS (IBGE, 2015) 2013 ≥ 18 55,6 58,2 16,8 24,4
VIGITEL (Brasil, 2017) 2016 ≥ 18 57,7 50,5 18,1 19,6
Abreviaturas:
PNDS = Pesquisa Nacional de Demografia e Saúde da Criança e da Mulher
POF = Pesquisa de Orçamentos Familiares
PNS = Pesquisa Nacional de Saúde
VIGITEL = Vigilância de Fatores de Risco e Proteção para Doenças Crônicas por Inquérito Telefônico
Foi observado na maioria dos países desenvolvidos que a taxa de aumento do IMC
desde 2000 foi mais lenta do que nas décadas anteriores (Ng et al., 2014). No entanto, como a
taxa de aumento do IMC foi acelerada em países não desenvolvidos, o aumento global do
IMC não diminuiu (NCD Risk Factor Collaboration, 2016). Por outro lado, Hurt et al. (2011)
consideram que a população atingiu um ponto de saturação e que a parcela ainda não afetada
pode ser considerada como não suscetível à obesidade, dando falsa impressão da estabilidade
da prevalência de obesidade na população.
Em decorrência da relevância econômica e dos problemas de saúde pública derivados
do aumento do IMC na população, em 2013, a OMS incluiu a temática adiposidade entre os

REFERENCIAL TEÓRICO
33
objetivos do Plano Global de enfrentamento das DCNT até o ano de 2025. A meta em relação
à obesidade é conter o aumento da prevalência para corresponder às taxas de 2010 (WHO,
2014). Contudo, esta meta não será alcançada caso as tendências de aumento da prevalência
do excesso de peso observadas pós-2000 sejam mantidas (NCD Risk Factor Collaboration,
2016).
2.2 AVALIAÇÃO DA COMPOSIÇÃO CORPORAL
2.2.1 Avaliação da composição corporal na população geral
A obesidade pode ser definida de uma maneira simplificada como o acúmulo
excessivo de gordura corporal, sob a forma de tecido adiposo, sendo conseqüência de balanço
energético positivo, capaz de acarretar prejuízos à saúde dos indivíduos (WHO, 2000). A
obesidade possui etiologia complexa e multifatorial, envolvendo a interação de fatores sociais,
comportamentais, culturais, fisiológicos, metabólicos e genéticos (Agurs-Collins e Bouchard,
2008; Hurt et al., 2011; Bray et al., 2016). Mais recentemente, a alteração induzida por
epigenética na expressão genética emergiu como uma forma alternativa na qual os
componentes ambientais podem influenciar o fenótipo da obesidade (Fleisch, Wright e
Baccarelli, 2012).
Do ponto de vista da composição corporal, a obesidade é caracterizada pela elevada
quantidade de massa gorda (Caballero, 2007; Flegal et al., 2009; WHO, 2014). Por
conseguinte, medições acuradas da adiposidade são importantes para permitir diagnóstico e
tratamento apropriados da obesidade (Madden e Smith, 2014).
As técnicas in vivo não medem a composição corporal diretamente, apenas predizem
medidas das propriedades do corpo (Wells e Fewtrell, 2006). Os métodos indiretos são
baseados em suposições quanto à densidade de tecidos corporais, concentrações de água e
eletrólitos e/ou inter-relações biológicas entre os componentes do corpo e os tecidos corporais
(Wells e Fewtrell, 2006; Duren et al., 2008), não existindo um método universalmente
recomendado para a avaliação da composição corporal. Estes métodos variam de acordo com
suas bases físicas, custo, acurácia e praticidade, e apresentam vantagens e desvantagens
(Duren et al., 2008).
Os métodos indiretos baseados em imagem, particularmente tomografia
computadorizada (TC), ressonância magnética (RM) e densitometria com emissão de raio X
de dupla energia (DEXA), são considerados tecnologias de referência padrão-ouro para a

REFERENCIAL TEÓRICO
34
análise da composição corporal (Prado e Heymsfield, 2014). Porém, constituem tecnologias
de alto custo e exigem pessoal qualificado para sua utilização, inviabilizando uso em estudos
populacionais e ou em atendimentos coletivos em redes de saúde pública (Cornier et al.,
2011; Seabolt, Welch e Silver, 2015).
O método duplamente indireto da bioimpedância elétrica (BIA) é considerado
acessível financeiramente, comparado aos métodos de imagem (Kyle et al., 2004a; Hurst et
al., 2015). Contudo, a utilização deste método pode resultar em estimativas imprecisas nas
situações em que o balanço hidroeletrolítico está alterado e em mulheres obesas (Bosaeus et
al., 2014).
O método antropométrico, que também corresponde a um método duplamente indireto
de avaliação da composição corporal, tem sido o mais utilizado para fins epidemiológicos e
prática clínica por ser considerado mais prático e menos oneroso (Lee et al., 2014; Bray et al.,
2016). Entre as diversas técnicas antropométricas para estimar a gordura corporal, destacam-
se as medidas de espessura de dobras cutâneas (DC), perímetro da cintura (PC) e medidas de
dimensão corporal, como peso e estatura para o cálculo do IMC.
O IMC é o parâmetro mais utilizado para estimar a composição corporal por ser
considerado não invasivo, relativamente simples e de baixo custo (Romero-Corral et al.,
2008; Okorodudu et al., 2010; Gómez-Ambrosi et al., 2012; Arroyo-Johnson e Mincey,
2016). Este índice é classificado pela OMS em seis categorias para indivíduos adultos, com
base nas tendências gerais da relação entre o IMC e DCNT ou taxas de mortalidade (WHO,
2000): <18,5 kg/m2 = baixo peso; 18,5 – 24,9 kg/m2 = peso normal; 25,0 – 29,9 kg/m2 =
sobrepeso; 30,0 – 34,9 kg/m2 = obesidade grau I; 35,0 – 39,9 kg/m2 = obesidade grau II e ≥ 40
kg/m2 = obesidade grau III.
Geralmente as pessoas com pesos corporais elevados apresentam maiores quantidades
de gordura corporal (Duren et al., 2008). Contudo, o IMC não é capaz de atender aos fatores
de variação na composição corporal (idade, sexo e etnia) (Hunma et al., 2016; Hung et al.,
2017) e de fornecer informações sobre quantidade e distribuição da gordura corporal
(Romero-Corral et al., 2008; Flegal et al., 2009; Okorodudu et al., 2010; Lee et al., 2014;
Ablove et al., 2015). Neste sentido, a inclusão de outras medidas antropométricas tais como o
PC e o espessamento de DC, em conjunto com o IMC, seria desejável e adequado para
identificar os indivíduos com risco aumentado de desenvolver obesidade e doenças associadas
(Bhurosy e Jeewon, 2013; Lee et al., 2014).

REFERENCIAL TEÓRICO
35
As consequências para a saúde associadas à obesidade dependem não só da quantidade
de gordura em excesso, mas também da sua distribuição corporal que pode variar
consideravelmente, inclusive entre indivíduos obesos (Klein et al., 2007). A adiposidade
visceral (intra-abdominal) é considerada a medida mais crítica para a avaliação do risco à
saúde, independente da gordura corporal total (Caballero, 2007; Lee et al., 2014).
2.2.2 Avaliação da composição corporal em gestantes
A massa corporal na maioria dos indivíduos é mantido relativamente estável por
interações complexas entre os reguladores de curto e longo prazo do balanço energético,
mesmo considerando as flutuações diárias na ingestão e no gasto de energia (Augustine,
Ladyman e Grattan, 2008). Em contrapartida, a gestação é caracterizada por um período
heterogêneo no ciclo de vida das mulheres, na qual adaptações fisiológicas, metabólicas e
nutricionais são fundamentais para a saúde materna, o desenvolvimento fetal, o parto e a
lactação (Augustine, Ladyman e Grattan, 2008; Yogev e Catalano, 2009), resultando em
mudanças na composição corporal materna (Catalano e deMouzon, 2015). Além disso, o
aumento no tecido adiposo materno é também uma importante resposta adaptativa à gestação
(Straughen, Trudeau e Misra, 2013).
A utilização de métodos baseados em imagens é limitada em gestantes em decorrência
da exposição a radiações ionizantes (TC e DEXA) ou dispendiosos para serem aplicados em
estudos populacionais (Straughen, Trudeau e Misra, 2013; Van der Wijden et al., 2013;
Marshall et al., 2016). O método da pletismografia por deslocamento do ar (ADP/BodPod),
fundamentado na densidade corporal para calcular a proporção da gordura corporal, tem sido
limitado devido à incapacidade de avaliar a densidade corporal das gestantes independentes
do feto e dos tecidos de suporte, além de sofrer influência da densidade e da composição do
tecido livre de gordura ao longo da gestação (Widen e Gallagher, 2014). A inviabilidade de
separação dos tecidos materno/fetal e a hidratação do tecido livre de gordura também
interferem na validade e na interpretação dos resultados da composição corporal obtidos pelo
método da BIA (Kyle et al., 2004b; Straughen, Trudeau e Misra, 2013; Widen e Gallagher,
2014).
O método antropométrico é o mais utilizado para estimar a composição corporal
materna durante a gestação. Medidas de DC e do perímetro do braço têm sido utilizadas para
esta finalidade (Van der Wijden et al., 2013; Dodd et al., 2015). Contudo, estimativas de
alterações na gordura corporal durante a gestação derivadas de DC são propensas a erro de

REFERENCIAL TEÓRICO
36
medição, especialmente devido à dificuldade de obter medidas válidas e confiáveis em
decorrência da presença de edemas e da variabilidade do grau de hidratação (Widen e
Gallagher, 2014). O IMC se correlaciona significativamente com o percentual de gordura
corporal no início da gestação, porém, esta correlação se enfraquece no final da gestação em
consequência da contribuição do teor de água corporal total no GPG (Sewell et al., 2007).
Portanto, o IMC pode ser considerado um indicador limitado da variação de tecido adiposo
materno ao longo da gestação (Dodd et al., 2015; Marshall et al., 2016).
O GPG excessivo tem sido associado ao maior acúmulo de tecido adiposo materno
(Berggren et al., 2016). Contudo, o GPG é uma medida complexa, que reflete a combinação
de acúmulo de gordura materna, a expansão do volume plasmático relacionado à gestação, o
edema periférico, a massa placentária, a massa fetal e o volume de líquido amniótico (Institute
of Medicine, 2009; Widen e Gallagher, 2014). Pode, portanto, também não ser considerado o
melhor indicador que reflete o diagnóstico da adiposidade materna (Van der Wijden et al.,
2013).
De forma geral, a obtenção de estimativas da composição corporal materna durante a
gestação ainda são propensas a erros (Widen e Gallagher, 2014). Atualmente, o Ministério
da Saúde Brasileiro adota recomendações de ganho total de peso, segundo estado nutricional
inicial da gestante (Institute of Medicine, 2009), e classifica o estado nutricional de acordo
com categorias de IMC por semana gestacional (Atalah Samur et al., 1997).
2.3 PRINCIPAIS FATORES CONDICIONANTES DA OBESIDADE
A obesidade é uma das DCNT mais relevantes na saúde pública devido a sua
associação com doenças cardiovasculares (Bastien et al., 2014), diabetes (Abdullah et al.,
2010) e câncer (Renehan et al., 2008), bem como pela sua associação com altas taxas de
mortalidade por todas as causas (Flegal et al., 2013).
Além de promover os agravos à saúde, a obesidade também impacta em
consequências econômicas relativas ao custo financeiro destinado aos cuidados com a saúde
(consultas, internações, medicamentos, etc.) e a perda de produtividade (Finkelstein et al.,
2010; Malik, Willett e Hu, 2013). Somam-se, ainda, prejuízos psicossociais relacionados à
questão da discriminação a indivíduos sob essa condição patológica (Preiss, Brennan e
Clarke, 2013).

REFERENCIAL TEÓRICO
37
O fenômeno da globalização tem contribuído sobremaneira para as modificações no
estilo de vida da população, com impacto sobre a incidência da obesidade e de suas
comorbidades associadas em vários países (Caballero, 2007; Malik, Willett e Hu, 2013). A
prevalência da obesidade nos países em desenvolvimento estava associada inicialmente ao
maior status socioeconômico, porém, com a acessibilidade aos alimentos densos em energia,
esta epidemia se espalhou para os grupos socioeconômicos menos privilegiados (Canoy e
Buchan, 2007). O consumo frequente de alimentos e bebidas com grande densidade
energética - frequentemente servidos em grandes porções - e o estilo de vida sedentário
favorecem o balanço energético positivo, contribuindo para o acúmulo de tecido corporal
gorduroso (Malik, Willett e Hu, 2013; Popkin e Hawkes, 2016). Todavia, observa-se grande
variabilidade na suscetibilidade ao desenvolvimento da obesidade, detectada entre os
indivíduos expostos aos mesmos fatores de risco ambiental, o que sugere que as diferenças
genéticas também atuam neste processo de expressividade do fenótipo da obesidade
(Bouchard, 2007; Herrera, Keildson e Lindgren, 2011; Hurt et al., 2011).
A multicausalidade da obesidade implica que nenhum dos fatores isolados podem,
decisivamente, explicar o aumento da incidência de obesidade (Hurt et al., 2011). Porém,
levando em consideração que o aumento da prevalência da obesidade ocorreu em um curto
período de tempo, os fatores ambientais e comportamentais do estilo de vida provavelmente
contribuem significativamente para a epidemia global desta doença (Agurs-Collins e
Bouchard, 2008).
As intervenções para o tratamento da obesidade variam de modificações no estilo de
vida, que envolvem a educação alimentar e o aumento do gasto energético por meio da prática
de atividade física, a opções de farmacoterapia e intervenções cirúrgicas (Wyatt, 2013).
Provavelmente, o conhecimento das bases genéticas em conjunto com as influências
ambientais que levam à obesidade poderá permitir identificar populações vulneráveis e
intervir de modo a controlar esta epidemia em gerações futuras.
2.4 INFORMAÇÕES BÁSICAS SOBRE GENÉTICA HUMANA
2.4.1 Estrutura do material genético humano
O material genético em humanos está presente em cada célula do corpo, na sua
maioria no núcleo de células, sendo constituído por 46 cromossomos dispostos em 23 pares.
Desses 23 pares, 22 são iguais nos homens e mulheres e são chamados autossômicos,
REFERENCIAL TEÓRICO
38
numerados do maior ao menor. O par remanescente compreende os cromossomos sexuais:
dois cromossomos X em mulheres e um cromossomo X e outro Y em homens (Nussbaum,
McInnes e Willard, 2015).
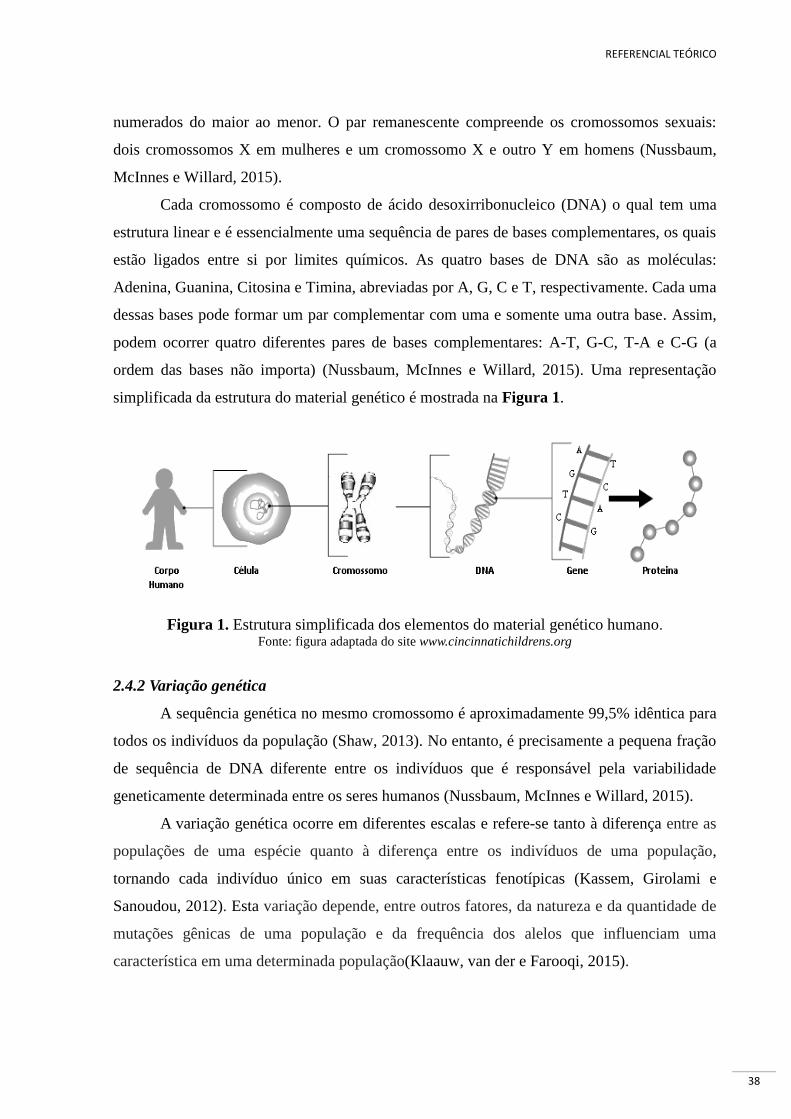
Cada cromossomo é composto de ácido desoxirribonucleico (DNA) o qual tem uma
estrutura linear e é essencialmente uma sequência de pares de bases complementares, os quais
estão ligados entre si por limites químicos. As quatro bases de DNA são as moléculas:
Adenina, Guanina, Citosina e Timina, abreviadas por A, G, C e T, respectivamente. Cada uma
dessas bases pode formar um par complementar com uma e somente uma outra base. Assim,
podem ocorrer quatro diferentes pares de bases complementares: A-T, G-C, T-A e C-G (a
ordem das bases não importa) (Nussbaum, McInnes e Willard, 2015). Uma representação
simplificada da estrutura do material genético é mostrada na Figura 1.
Figura 1. Estrutura simplificada dos elementos do material genético humano. Fonte: figura adaptada do site www.cincinnatichildrens.org
2.4.2 Variação genética
A sequência genética no mesmo cromossomo é aproximadamente 99,5% idêntica para
todos os indivíduos da população (Shaw, 2013). No entanto, é precisamente a pequena fração
de sequência de DNA diferente entre os indivíduos que é responsável pela variabilidade
geneticamente determinada entre os seres humanos (Nussbaum, McInnes e Willard, 2015).
A variação genética ocorre em diferentes escalas e refere-se tanto à diferença entre as
populações de uma espécie quanto à diferença entre os indivíduos de uma população,
tornando cada indivíduo único em suas características fenotípicas (Kassem, Girolami e
Sanoudou, 2012). Esta variação depende, entre outros fatores, da natureza e da quantidade de
mutações gênicas de uma população e da frequência dos alelos que influenciam uma
característica em uma determinada população(Klaauw, van der e Farooqi, 2015).
REFERENCIAL TEÓRICO
39
2.4.3 Polimorfismos de nucleotídeo único (SNPs)
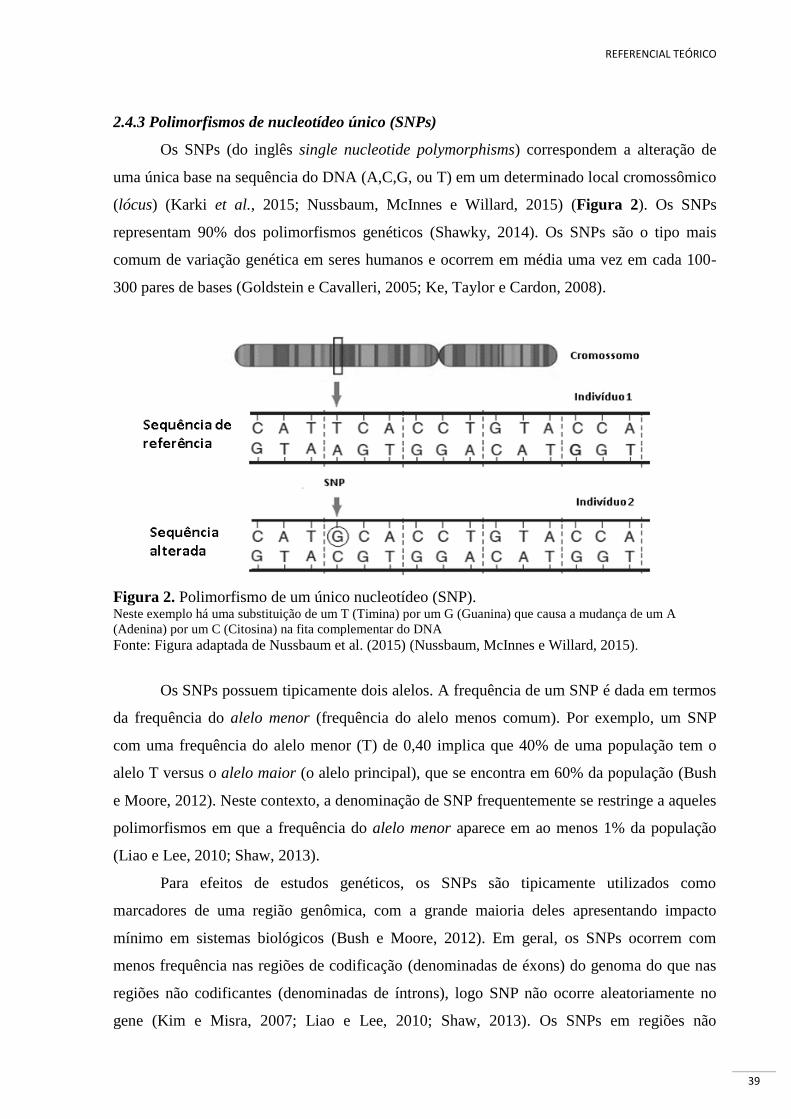
Os SNPs (do inglês single nucleotide polymorphisms) correspondem a alteração de
uma única base na sequência do DNA (A,C,G, ou T) em um determinado local cromossômico
(lócus) (Karki et al., 2015; Nussbaum, McInnes e Willard, 2015) (Figura 2). Os SNPs
representam 90% dos polimorfismos genéticos (Shawky, 2014). Os SNPs são o tipo mais
comum de variação genética em seres humanos e ocorrem em média uma vez em cada 100-
300 pares de bases (Goldstein e Cavalleri, 2005; Ke, Taylor e Cardon, 2008).
Figura 2. Polimorfismo de um único nucleotídeo (SNP). Neste exemplo há uma substituição de um T (Timina) por um G (Guanina) que causa a mudança de um A
(Adenina) por um C (Citosina) na fita complementar do DNA
Fonte: Figura adaptada de Nussbaum et al. (2015) (Nussbaum, McInnes e Willard, 2015).
Os SNPs possuem tipicamente dois alelos. A frequência de um SNP é dada em termos
da frequência do alelo menor (frequência do alelo menos comum). Por exemplo, um SNP
com uma frequência do alelo menor (T) de 0,40 implica que 40% de uma população tem o
alelo T versus o alelo maior (o alelo principal), que se encontra em 60% da população (Bush
e Moore, 2012). Neste contexto, a denominação de SNP frequentemente se restringe a aqueles
polimorfismos em que a frequência do alelo menor aparece em ao menos 1% da população
(Liao e Lee, 2010; Shaw, 2013).
Para efeitos de estudos genéticos, os SNPs são tipicamente utilizados como
marcadores de uma região genômica, com a grande maioria deles apresentando impacto
mínimo em sistemas biológicos (Bush e Moore, 2012). Em geral, os SNPs ocorrem com
menos frequência nas regiões de codificação (denominadas de éxons) do genoma do que nas
regiões não codificantes (denominadas de íntrons), logo SNP não ocorre aleatoriamente no
gene (Kim e Misra, 2007; Liao e Lee, 2010; Shaw, 2013). Os SNPs em regiões não

REFERENCIAL TEÓRICO
40
codificantes, embora não alterem proteínas codificadas, servem como importantes marcadores
genéticos ou físicos para estudos de genômica comparativa ou evolutiva, pois afetam a
expressão de genes que podem causar doenças (Shawky, 2014). Os SNPs, quando presentes
nas regiões de codificação, podem causar alterações na estrutura das proteínas e, portanto,
promover o desenvolvimento de doença (Kim e Misra, 2007).
Ao longo dos últimos anos, milhões de polimorfismos em genes humanos foram
validados no SNP database (dbSNP – banco de dados incorporado ao National Center for
Biotechnology - NCBI). Atualmente, o banco conta com 325.658.303 SNPs descritos para o
Homo sapiens, sendo 135.967.291 validados (dbSNP build 150 – fevereiro/2017). Cada SNP
depositado no dbSNP tem um registro particular indicado como #rs (refSNP) seguido de um
número definido pela ordem de depósito no banco. Estes avanços na descoberta de um
número expressivo de SNPs contribuíram para considerável aumento do número de
publicações científicas, na tentativa de associar estes polimorfismos a doenças ou à
suscetibilidade a estas (Ke, Taylor e Cardon, 2008; Albuquerque, Manco e Nóbrega, 2016).
Se um SNP aumenta a suscetibilidade a uma doença específica de interesse, devemos
notar que sua presença é mais comum entre os indivíduos afetados por esta condição do que
entre os indivíduos não afetados. Assim, por meio da genotipagem de grande número de
indivíduos, as ferramentas de genética populacional são capazes de destacar a base genética
de doenças poligênicas como a obesidade comum (Kim e Misra, 2007; Albuquerque, Manco e
Nóbrega, 2016). Porém, as bases genéticas das doenças geralmente são complexas pela
interação entre vários genes e o ambiente.
2.5 SNPs EM GENES CANDIDATOS À OBESIDADE
Os genes com função biológica conhecida que regulam direta ou indiretamente os
processos de desenvolvimento das características investigadas são conhecidos como genes
candidatos (Farooqi e O’Rahilly, 2007; Zhu e Zhao, 2007).
O objetivo central da genética humana é identificar fatores de risco genéticos para
doenças comuns e complexas. Existem diversas tecnologias, diferentes desenhos de estudos e
ferramentas analíticas para identificar fatores de risco genéticos. Estudos de análise de ligação
(Genome-Wide Linkage Studies – GWLS) e, mais recentemente, estudos de associação ampla
do genoma (Genome Wide Association Studies - GWAS) têm sido as principais ferramentas

REFERENCIAL TEÓRICO
41
para identificar variantes para doenças mendelianas e complexas, respectivamente (Londin et
al., 2013).
Os GWLS avaliam marcadores amplamente espaçados em todo o genoma para
determinar se eles são herdados juntamente com a doença em famílias com numerosos
indivíduos afetados (Ott, Wang e Leal, 2015). Este tipo de análise é utilizada na identificação
de mutações causadoras de doença monogênica (mendeliana) para estudar a transmissão de
um segmento cromossômico de uma geração para a outra em uma genealogia (Londin et al.,
2013).
A abordagem GWAS tem conduzido, desde 2005, à descoberta e avanço nos insights
sobre os determinantes genéticos da obesidade comum (Singh, Kumar e Mahalingam, 2017).
Os GWAS medem e analisam variações de sequência de DNA de todo o genoma humano
para identificar fatores de risco genéticos para doenças que são comuns na população (Bush e
Moore, 2012). O objetivo final do GWAS é identificar associação entre uma variável genética
e uma condição especificada, bem como identificar os fundamentos biológicos da
susceptibilidade à doença para desenvolver novas estratégias de prevenção e tratamento. A
variação genética mais comumente estudada é o SNP (Ott, Wang e Leal, 2015).
A obesidade tem uma expressão fenotípica heterogênea e os mecanismos moleculares
envolvidos na sua origem parecem ser muitos e diversos. A obesidade monogênica não
sindrômica refere-se a um único transtorno genético que leva a uma forma altamente
penetrante da doença (Bell, Walley e Froguel, 2005; Choquet e Meyre, 2011a; Waalen, 2014),
promovendo acúmulo excessivo de gordura corporal independentemente de interações com
outros genes ou fatores ambientais (González Jiménez et al., 2012). Este tipo de obesidade é
raro, afetando aproximadamente 5% da população, grave e geralmente de início precoce
(Farooqi e O’Rahilly, 2005).
Ao contrário da obesidade monogênica, a obesidade poligênica é causada por
alterações de múltiplos genes que interagem com os fatores ambientais e conferem diferentes
graus de suscetibilidade à obesidade (Albuquerque et al., 2015). O estudo da obesidade
poligênica é mais complexo do que a obesidade monogênica e configura-se como a hipótese
mais aceita para as formas comuns de obesidade (Singh, Kumar e Mahalingam, 2017).
Entre os vários genes estudados em associação com a obesidade, destacam-se os genes
FTO (massa de gordura e obesidade associadas; rs9939609), MC4R (melanocortina-4
receptor; rs17782313), LEP (leptina; rs7799039) e LEPR (receptor da leptina; rs1137101),

REFERENCIAL TEÓRICO
42
conhecidos por codificar proteínas envolvidas na regulação do balanço energético. É
concebível que essas variantes genéticas envolvidas na susceptibilidade da obesidade possam
desempenhar papel importante na regulação do peso e do consumo alimentar durante a
gestação. Contudo, são escassos ou inexistentes os estudos que abordam os efeitos da genética
sobre os desfechos gestacionais, principalmente sobre as mudanças relacionadas ao peso
(peso pré-gestacional, GPG e retenção de peso) e ao consumo alimentar materno.
2.5.1 FTO (fat mass and obesity associated gene de - massa de gordura e obesidade associadas)
Entre vários genes estudados para obesidade, destaca-se o FTO, que é um gene
relacionado à massa gorda e ao aumento do IMC. O FTO foi o primeiro gene de
suscetibilidade à obesidade identificado em 2007 por meio de GWAS (Frayling et al., 2007) e
tem sido constantemente associado a desfechos relacionados à obesidade poligênica em várias
populações (Dina et al., 2007; Scuteri et al., 2007; Rodríguez-López et al., 2010; Herrera,
Keildson e Lindgren, 2011; Vasan et al., 2012; Singh, Kumar e Mahalingam, 2017).
O gene FTO está localizado na região cromossômica 16q12.2, e seu tamanho é de
1.334 pares de bases (Figura 3). Entre os diversos polimorfismos deste gene, a variante
rs9939609, localizada no intron, tem sido amplamente investigada e corresponde a
substituição da base Timina por Adenina (TA). O alelo-A desta variante está diretamente
relacionado a um maior acúmulo de gordura corporal, de modo que os adultos homozigotos
para o alelo de risco (AA) têm peso 2-3 kg maior e chance 1,67 vez maior de desenvolver
obesidade, em comparação com indivíduos sem o alelo de risco (Frayling et al., 2007).
Figura 3. Localização cromossômica do gene FTO Fonte: http://www.genecards.org/cgi-bin/carddisp.pl?gene=FTO
Supõe-se que, devido a sua alta expressão no hipotálamo, região que está diretamente
ligada ao controle do apetite e ao metabolismo energético, sua ação ocorre pela estimulação
dessa região cerebral para poupar os estoques de gordura corporal (Dina et al., 2007). Este
efeito pode ocorrer a partir da diminuição da saciedade e/ou do aumento da capacidade de
captação de gordura pelos adipócitos (Frayling et al., 2007). Entretanto, seu mecanismo de
ação ainda não foi esclarecido (Waalen, 2014).

REFERENCIAL TEÓRICO
43
2.5.2 MC4R (melanocortina-4 receptor - receptor da melanocortina-4)
As mutações MC4R representam a forma mais comum de obesidade monogênica
humana, afetando 0,2-5,8% dos indivíduos com obesidade grave precoce (Farooqi et al.,
2003; Hinney et al., 2006). Além disso, o GWAS forneceu evidências convincentes de que
também a variação comum no MC4R contribui para a susceptibilidade da obesidade na
população, e ele foi o segundo gene identificado de susceptibilidade à obesidade poligênica
(Loos et al., 2008). Este gene está localizado no cromossomo 18q21.32 e seu tamanho
corresponde a 1.666 pares de bases (Figura 4).
Figura 4. Localização cromossômica do gene MC4R Fonte: http://www.genecards.org/cgi-bin/carddisp.pl?gene=MC4r
A variante rs17782313 do gene MC4R corresponde a substituição da Timina por
Citosina (TC). Esta variante apresenta papel importante no controle do apetite e na
homeostase energética e, consequentemente, é de grande relevância para o fenótipo de
excesso de peso corporal (Farooqi et al., 2003; Obregón et al., 2016). Neste sentido, o
polimorfismo rs17782313 (MC4R) tem sido fortemente associado com a obesidade e o maior
IMC em adultos e crianças (Loos et al., 2008; Beckers et al., 2011).
2.5.3 LEP e LEPR (leptin and leptin receptor - leptina e seu receptor)
Os polimorfismos dos genes da leptina (LEP) e do seu receptor (LEPR) estão
relacionados à via biológica para a regulação da ingestão alimentar e do gasto energético, com
provável associação com a obesidade e suas complicações (Guizar-Mendoza et al., 2005;
Khosropour, Shojaee e Lotfi, 2016).
O polimorfismo no gene da LEP codifica a proteína leptina, que é um dos importantes
sinais periféricos na regulação do peso corporal. Este gene está localizado no cromossomo
7q32.1 e seu tamanho corresponde a 16.428 pares de bases (Figura 5).
Figura 5. Localização cromossômica do gene LEP Fonte: http://www.genecards.org/cgi-bin/carddisp.pl?gene=lep
REFERENCIAL TEÓRICO
44
A variante LEP-rs7799039 corresponde à transição Guanina para Adenina (GA) na
região promotora do gene (Boumaiza et al., 2012), sendo o alelo-A associado com o aumento
da produção e secreção de leptina (Constantin et al., 2010; Sahin et al., 2013) e com o IMC
(Hinuy et al., 2008; Dasgupta et al., 2015).
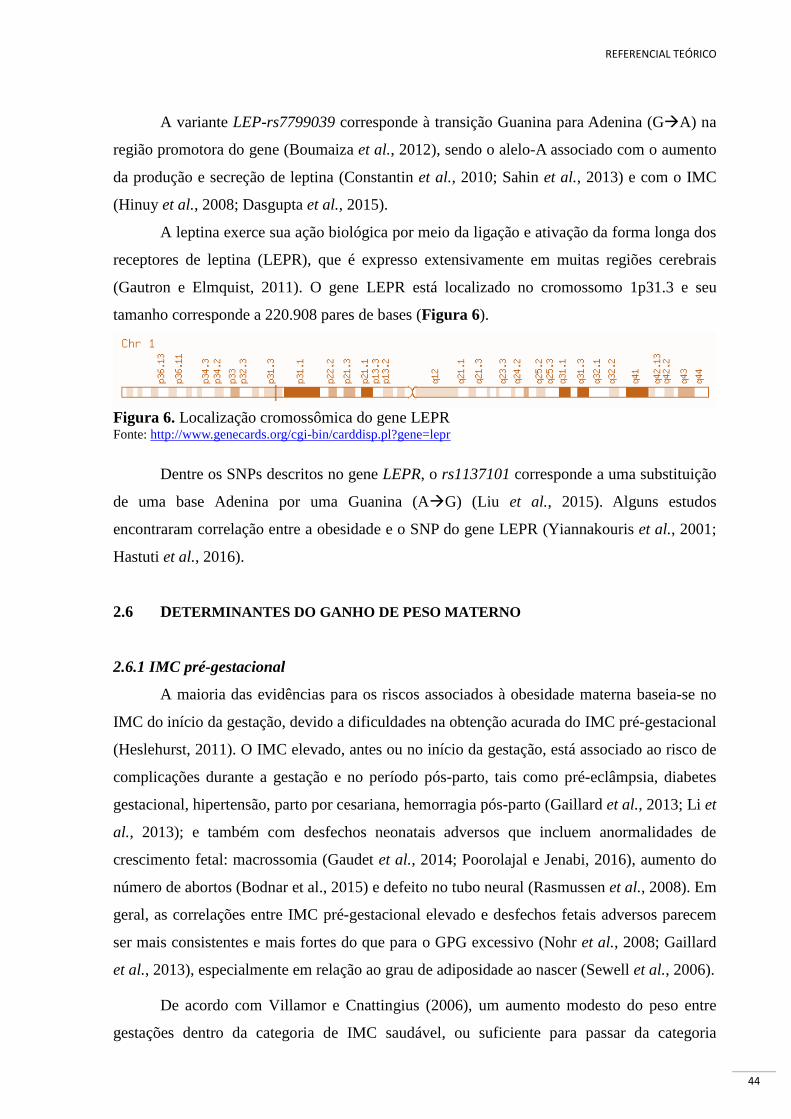
A leptina exerce sua ação biológica por meio da ligação e ativação da forma longa dos
receptores de leptina (LEPR), que é expresso extensivamente em muitas regiões cerebrais
(Gautron e Elmquist, 2011). O gene LEPR está localizado no cromossomo 1p31.3 e seu
tamanho corresponde a 220.908 pares de bases (Figura 6).
Figura 6. Localização cromossômica do gene LEPR Fonte: http://www.genecards.org/cgi-bin/carddisp.pl?gene=lepr
Dentre os SNPs descritos no gene LEPR, o rs1137101 corresponde a uma substituição
de uma base Adenina por uma Guanina (AG) (Liu et al., 2015). Alguns estudos
encontraram correlação entre a obesidade e o SNP do gene LEPR (Yiannakouris et al., 2001;
Hastuti et al., 2016).
2.6 DETERMINANTES DO GANHO DE PESO MATERNO
2.6.1 IMC pré-gestacional
A maioria das evidências para os riscos associados à obesidade materna baseia-se no
IMC do início da gestação, devido a dificuldades na obtenção acurada do IMC pré-gestacional
(Heslehurst, 2011). O IMC elevado, antes ou no início da gestação, está associado ao risco de
complicações durante a gestação e no período pós-parto, tais como pré-eclâmpsia, diabetes
gestacional, hipertensão, parto por cesariana, hemorragia pós-parto (Gaillard et al., 2013; Li et
al., 2013); e também com desfechos neonatais adversos que incluem anormalidades de
crescimento fetal: macrossomia (Gaudet et al., 2014; Poorolajal e Jenabi, 2016), aumento do
número de abortos (Bodnar et al., 2015) e defeito no tubo neural (Rasmussen et al., 2008). Em
geral, as correlações entre IMC pré-gestacional elevado e desfechos fetais adversos parecem
ser mais consistentes e mais fortes do que para o GPG excessivo (Nohr et al., 2008; Gaillard
et al., 2013), especialmente em relação ao grau de adiposidade ao nascer (Sewell et al., 2006).
De acordo com Villamor e Cnattingius (2006), um aumento modesto do peso entre
gestações dentro da categoria de IMC saudável, ou suficiente para passar da categoria

REFERENCIAL TEÓRICO
45
saudável para excesso de peso, seria suficiente para aumentar o risco médio de resultados
adversos graves em gestação subsequente (Villamor e Cnattingius, 2006). Estudo
retrospectivo de coorte envolvendo 121.049 mulheres no Missouri, Estados Unidos,
demonstrou que mulheres que iniciaram a primeira gestação com excesso de peso
aumentaram as probabilidades de apresentar recém-nascido grande para idade gestacional,
pré-eclâmpsia, parto por cesariana e óbitos neonatais em uma segunda gestação em 54%,
156%, 85% e 37%, respectivamente (Tabet et al., 2015).
O IMC pré-gestacional também se caracteriza por ser um dos principais determinantes
para o GPG. As recomendações das agências reguladoras, como o Institute of Medicine (IOM)
dos Estados Unidos, são de que as mulheres com sobrepeso e obesidade ganhem menos peso
durante a gestação do que aquelas com peso normal ou baixo peso (Institute of Medicine,
2009). Assim, é imprescindível avaliar o estado nutricional no início da gestação para
determinar a recomendação adequada de ganho de peso e realizar orientação nutricional
apropriada para cada caso.
2.6.2 Ganho de peso gestacional
O GPG adequado é necessário para um resultado favorável da gestação. Entretanto, os
componentes específicos do ganho de peso possuem estimativas imprecisas e variáveis entre
as mulheres (Poston, Harthoorn e Van Der Beek, 2011; Gilmore, Klempel-Donchenko e
Redman, 2015). Os componentes maternos contribuem com aproximadamente 65% e os
produtos de concepção contribuem com os 35% restantes (Institute of Medicine, 2009). O
GPG total é composto pela água corporal, proteína (massa livre de gordura) e gordura (massa
gorda) do feto, bem como pela placenta, útero, líquido amniótico, expansão do volume de
sangue materno, glândulas mamárias e tecido adiposo materno (Gilmore, Klempel-
Donchenko e Redman, 2015). O padrão de GPG é relativamente pequeno no 1º trimestre,
havendo um ganho mais acentuado no 2º trimestre em relação ao 3º trimestre (Institute of
Medicine, 2009).
Em resposta à crescente evidência que o GPG excessivo e a retenção de peso no pós-
parto predispõem tanto as mães quanto seus filhos a DCNT, o IOM revisou suas
recomendações de 1990 e lançou novas recomendações do ganho de peso em 2009 (Institute
of Medicine, 2009). Contudo, não existe consenso quanto ao que constitui o GPG ideal
(Ohadike et al., 2016). Atualmente, as recomendações estabelecidas pelo IOM são as mais
aceitas e têm sido utilizadas como referência em muitos estudos. De acordo com esta
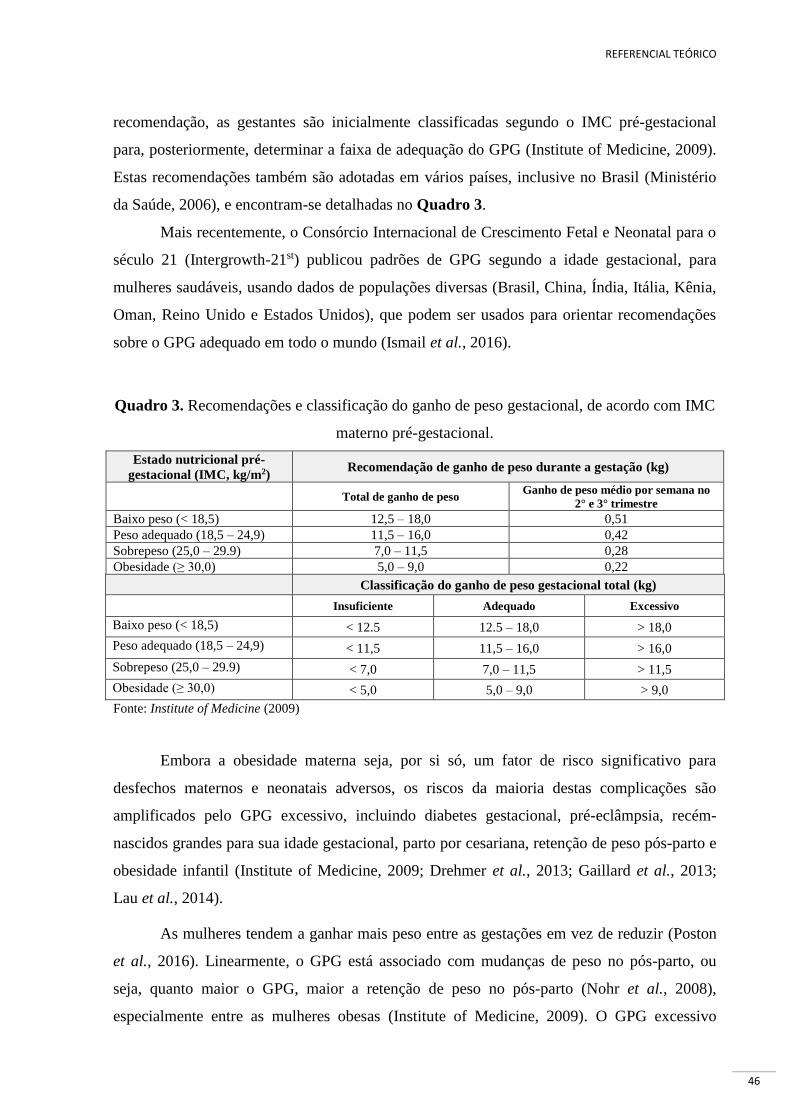
REFERENCIAL TEÓRICO
46
recomendação, as gestantes são inicialmente classificadas segundo o IMC pré-gestacional
para, posteriormente, determinar a faixa de adequação do GPG (Institute of Medicine, 2009).
Estas recomendações também são adotadas em vários países, inclusive no Brasil (Ministério
da Saúde, 2006), e encontram-se detalhadas no Quadro 3.
Mais recentemente, o Consórcio Internacional de Crescimento Fetal e Neonatal para o
século 21 (Intergrowth-21st) publicou padrões de GPG segundo a idade gestacional, para
mulheres saudáveis, usando dados de populações diversas (Brasil, China, Índia, Itália, Kênia,
Oman, Reino Unido e Estados Unidos), que podem ser usados para orientar recomendações
sobre o GPG adequado em todo o mundo (Ismail et al., 2016).
Quadro 3. Recomendações e classificação do ganho de peso gestacional, de acordo com IMC
materno pré-gestacional.
Estado nutricional pré-
gestacional (IMC, kg/m2) Recomendação de ganho de peso durante a gestação (kg)
Total de ganho de peso Ganho de peso médio por semana no
2° e 3° trimestre
Baixo peso (< 18,5) 12,5 – 18,0 0,51
Peso adequado (18,5 – 24,9) 11,5 – 16,0 0,42
Sobrepeso (25,0 – 29.9) 7,0 – 11,5 0,28
Obesidade (≥ 30,0) 5,0 – 9,0 0,22
Classificação do ganho de peso gestacional total (kg)
Insuficiente Adequado Excessivo
Baixo peso (< 18,5) < 12.5 12.5 – 18,0 > 18,0
Peso adequado (18,5 – 24,9) < 11,5 11,5 – 16,0 > 16,0
Sobrepeso (25,0 – 29.9) < 7,0 7,0 – 11,5 > 11,5
Obesidade (≥ 30,0) < 5,0 5,0 – 9,0 > 9,0 Fonte: Institute of Medicine (2009)
Embora a obesidade materna seja, por si só, um fator de risco significativo para
desfechos maternos e neonatais adversos, os riscos da maioria destas complicações são
amplificados pelo GPG excessivo, incluindo diabetes gestacional, pré-eclâmpsia, recém-
nascidos grandes para sua idade gestacional, parto por cesariana, retenção de peso pós-parto e
obesidade infantil (Institute of Medicine, 2009; Drehmer et al., 2013; Gaillard et al., 2013;
Lau et al., 2014).
As mulheres tendem a ganhar mais peso entre as gestações em vez de reduzir (Poston
et al., 2016). Linearmente, o GPG está associado com mudanças de peso no pós-parto, ou
seja, quanto maior o GPG, maior a retenção de peso no pós-parto (Nohr et al., 2008),
especialmente entre as mulheres obesas (Institute of Medicine, 2009). O GPG excessivo

REFERENCIAL TEÓRICO
47
nestas mulheres está associado principalmente com excesso de tecido adiposo e não ao tecido
magro (Berggren et al., 2016). O excesso de peso pré-gestacional e o GPG excessivo pode ter
efeito cumulativo em longo prazo sobre o ganho de peso em gestações subsequentes (Yogev e
Catalano, 2009; Siega-Riz et al., 2009), ampliando a trajetória de ganho de peso e
contribuindo para o desenvolvimento ou agravamento da epidemia da obesidade em mulheres.
Evidências sugerem que a obesidade materna e o GPG excessivo não estão associados
apenas a resultados adversos da gestação, mas também têm influência transgeracional sobre
os resultados de saúde relacionados à obesidade infantil e adulta (Rooney, Mathiason e
Schauberger, 2011; Cnattingius et al., 2012; Lawrence et al., 2014).
A obesidade pré-gestacional materna e o GPG excessivo são fatores de risco
modificáveis comuns e importantes para os desfechos materno e fetais. As mulheres também
estão ficando grávidas em uma idade mais avançada e com um número crescente de
condições médicas crônicas, como hipertensão e diabetes (Catalano e deMouzon, 2015).
Logo, estratégias preventivas centradas na melhoria da saúde materna no período pré-
gestacional e gestacional podem melhorar os resultados de saúde em curto e longo prazos
(Gaillard et al., 2016). De acordo com o IOM, as mulheres identificadas com excesso de peso
devem ser consideradas gestantes de risco e devem receber atenção diferenciada, ou seja, uma
avaliação clínica e laboratorial específica, assim como serem referenciadas para avaliação
especializada por um nutricionista (Institute of Medicine, 2009).
2.6.3 Retenção de peso pós-parto
A retenção do peso ganho durante a gestação é altamente variável, podendo
representar fator determinante da obesidade em mulheres, e está associada a uma complexa
rede de inter-relações incluindo o GPG excessivo, o estado nutricional pré-gestacional, a
amamentação, a raça, a idade, a paridade, o estado civil, a prática de atividade física e o
consumo alimentar (Lacerda e Leal, 2004; Endres et al., 2015).
As recomendações atuais orientam que as mulheres iniciem a gestação com o peso
adequado e sigam as recomendações do IOM para o GPG. No entanto, muitas mulheres
acumulam excesso de peso adquirido durante a gestação, aumentado o risco para o sobrepeso
e a obesidade nas gestações posteriores e ao longo da vida. É possível que essas mulheres
tenham mudanças sutis nos mecanismos reguladores do apetite, diferenças na resistência à
insulina ou diferenças na taxa metabólica basal que as tornem suscetíveis ao GPG excessivo, e

REFERENCIAL TEÓRICO
48
essas alterações persistem ao longo do tempo promovendo maior adiposidade materna
(McClure et al., 2013; Endres et al., 2015).
Os dados de estudos epidemiológicos sugerem que o mecanismo que liga o GPG
excessivo à adiposidade a curto, médio e a longo prazos está associado à retenção de peso no
pós-parto. Em estudo realizado nos Estado Unidos, aproximadamente 75% das mulheres eram
mais pesadas em relação ao seu peso pré-gestacional (47,4% das mulheres apresentaram mais
que 4,5 kg e 24,2% mais que 9 kg) um ano após o parto (Endres et al., 2015). Outro estudo
realizado no mesmo país mostrou que o GPG excessivo não estava associado
significativamente apenas ao peso materno aos 8 anos pós-parto, mas especificamente com à
gordura abdominal (McClure et al., 2013).
Em um estudo brasileiro, mulheres com GPG excessivo retiveram significativamente
mais peso aos 9 meses pós-parto, comparadas com aquelas com GPG adequado ou
insuficiente (Kac et al., 2004). Em um estudo realizado na capital da Suécia observou-se que
a retenção de peso um ano pós-parto foi um importante determinante do sobrepeso 15 anos
depois (Linné et al., 2004). Em um estudo realizado na Austrália, demonstrou-se que as
mulheres que ganharam peso gestacional acima das recomendações do IOM tiveram um risco
aumentado duas vezes de sobrepeso e quase 5 vezes de obesidade 21 anos após a gestação,
comparando com as mulheres com ganho de peso adequado (Mamun et al., 2010).
De acordo com os estudos apresentados, o GPG pode ser considerado o preditor mais
importante para a retenção de peso pós-parto. A estratégia de monitoramento do ganho de
peso ao longo da gestação é essencial para reduzir o risco de obesidade materna e prevenir
desfechos obstétricos adversos.
2.6.4 Leptina
Ambientes obesogênicos e o comportamento humano têm potencial para contribuir
para o aumento agudo na prevalência de sobrepeso e obesidade na população. No entanto, não
se deve omitir a biologia desta discussão. Vários outros fatores biológicos correlatos comuns
do ganho de peso ou da obesidade incluem os mecanismos de ação da leptina e outros
hormônios, e a regulação do apetite e saciedade (Agurs-Collins e Bouchard, 2008).
A leptina é um hormônio que desempenha papel importante em vários processos
fisiológicos, incluindo a regulação da função endócrina, função imunológica, inflamação,
reprodução e angiogênese (Miehle, Stepan e Fasshauer, 2012). Este hormônio se destaca pela

REFERENCIAL TEÓRICO
49
atividade de regulação da ingestão alimentar e o controle do gasto energético por meio da
ação de receptores da leptina localizados no hipotálamo, que detecta e integra esses sinais
promovendo a manutenção da homeostase energética e do peso corporal (Gautron e Elmquist,
2011) (Zhou e Rui, 2013).
Esta adipocina é produzida e secretada predominantemente por adipócitos no tecido
adiposo branco (Castellano Filho et al., 2013), mas também pode ser sintetizada pela placenta
durante a gestação (Maymó et al., 2011). A leptina tem como particularidade ser secretada de
forma pulsátil, exibindo um ritmo circadiano com os níveis mais baixos no meio da tarde e os
níveis mais altos à meia-noite (Park e Ahima, 2015).
Os indivíduos obesos geralmente exibem altos níveis de expressão de leptina no tecido
adiposo e apresentam níveis elevados de leptina circulante, e estes níveis elevados não
conseguem reduzir o excesso de adiposidade, indicando resistência à leptina (Minocci et al.,
2000; Zhou e Rui, 2013; Park e Ahima, 2015; Khosropour, Shojaee e Lotfi, 2016). A gordura
subcutânea produz mais leptina do que a gordura visceral, o que pode, em parte, contribuir
para níveis mais elevados de leptina nas mulheres em comparação com os homens (Minocci
et al., 2000).
Durante a gestação as concentrações plasmáticas de leptina materna estão
significativamente mais elevadas, em comparação a mulheres não gestantes, e não é
acompanhado pelo efeito central clássico na regulação da ingestão alimentar. Uma possível
função do aumento dos níveis de leptina materna é intensificar a mobilização das reservas de
gordura materna para incrementar a disponibilidade e apoiar a transferência transplacentária
de nutrientes (Hauguel-de Mouzon, Lepercq e Catalano, 2006). Porém, o exato papel da
hiperleptinemia temporária durante a gestação ainda não está completamente esclarecido
(Augustine, Ladyman e Grattan, 2008).
O aumento da concentração de leptina materna precede o aumento fisiológico do IMC
materno e declina rapidamente após o parto, sugerindo que a placenta contribui
substancialmente para elevar a concentração da leptina materna, e não apenas o tecido
adiposo materno (Hauguel-de Mouzon, Lepercq e Catalano, 2006).
As concentrações elevadas de leptina materna têm sido associadas ao IMC materno e
tendem a aumentar progressivamente ao longo da gestação (Misra e Trudeau, 2011;
Castellano Filho et al., 2013; Franco-Sena et al., 2015). Embora as mulheres obesas
apresentem maiores concentrações de leptina no início da gestação, elas apresentam menor

REFERENCIAL TEÓRICO
50
taxa de aumento de leptina ao longo da gestação em comparação com as mulheres sem
excesso de peso, provavelmente devido ao seu menor GPG (Misra e Trudeau, 2011;
Castellano Filho et al., 2013).
2.6.5 Consumo alimentar
A alimentação desempenha papel primordial durante todo o ciclo de vida dos
indivíduos, uma vez que nutrientes e energia são essenciais para a manutenção do organismo.
O estado nutricional materno adequado antes e durante a gestação é importante para o
crescimento e desenvolvimento do feto (Thompson et al., 2010). Idealmente, as mulheres em
idade fértil deveriam consumir uma variedade de alimentos saudáveis para manter uma
nutrição adequada e continuar com estes hábitos durante a gestação (Kaiser e Allen, 2008;
Ramakrishnan et al., 2012; Nnam, 2015).
Resultados adequados da gestação dependem da ingestão de nutrientes suficientes para
atender aos requisitos maternos e fetais. As necessidades nutricionais maternas de energia e
proteína encontram-se aumentadas durante a gestação para garantir o crescimento e o
desenvolvimento fetal adequados; o desenvolvimento da placenta e dos tecidos maternos; o
suprimento das maiores demandas metabólicas e a manutenção do peso materno e da prática
de atividade física (Nnam, 2015). As recomendações alimentares e nutricionais variam de
acordo com as diferenças individuais relacionadas ao estado nutricional materno, à faixa
etária e ao estado de saúde da mulher (Kaiser e Allen, 2008).
A energia é o principal determinante no ganho de peso gestacional. Evidência
disponível sugere que a eficiência do metabolismo energético pode aumentar durante a
gestação, mas os mecanismos envolvidos não são bem compreendidos (Abu-Saad e Fraser,
2010). A recomendação adicional de energia estabelecida em 1989 pelo Food and Nutrition
Board/National Research Council (FNB/NRC), para as mulheres que iniciam a gestação com
um peso saudável, corresponde a 300 kcal/dia a partir do 2º trimestre de gestação (National
Research Council, 1989). Em 2004, o custo energético total da gestação de mulheres
saudáveis indicado por especialistas da Food and Agriculture Organization of the United
Nations (FAO) e da OMS (FAO/WHO/UNU) foi de aproximadamente 77.000 kcal, associado
a estimativa de ganho de peso gestacional total entre 10 a 14 kg com média de 12 kg e recém-
nascidos 3,3 kg e menores índices de complicações materno-fetais. A recomendação deste
grupo corresponde a um adicional de 85 kcal no primeiro trimestre, 285 kcal no segundo
trimestre e 475 kcal no terceiro trimestre (FAO/WHO, 2004). O IOM recomenda um

REFERENCIAL TEÓRICO
51
adicional 340 kcal no segundo trimestre e 452 kcal no terceiro trimestre (Institute of
Medicine, 2009).
De acordo com a American Dietetic Association, a maioria das mulheres gestantes
precisa de 2.200 a 2.900 kcal/dia (Kaiser e Allen, 2008). As recomendações nutricionais na
obesidade gestacional não são totalmente claras. A ingestão excessiva de energia durante a
gestação pode ser tão prejudicial quanto a sua deficiência, especialmente em mulheres com
sobrepeso e as obesas (Marangoni et al., 2016). De acordo com o IOM dos Estados Unidos, a
distribuição do aporte de energia dos macronutrientes na dieta pode variar entre 10-35% de
proteína, 20-35% de lipídios e 46-65% de carboidratos (Institute of Medicine, 2009).
Entre os macronutrientes, geralmente a recomendação de ingestão de proteína requer
mais atenção durante a gestação. A demanda proteica aumenta progressivamente para
sustentar a síntese proteica, a fim de fornecer suporte nutricional para deposição e
manutenção dos tecidos maternos e o crescimento fetal, especialmente durante o terceiro
trimestre (Abu-Saad e Fraser, 2010). Estas adaptações são complexas e mudam gradualmente
ao longo da gestação. O National Research Council (1989) recomenda um adicional de 10
g/dia de proteína ao longo da gestação. Em 2007, o comitê FAO/WHO/UNU revisou a
recomendação de 1985 e estimou as necessidades proteicas adicionais de 1g, 9g e 31g/dia no
1º, 2º, 3º trimestres, respectivamente (WHO, 2007).
A qualidade das gorduras na alimentação das gestantes é mais importante do que a sua
quantidade total. Alguns ácidos graxos poli-insaturados (ácidos graxos ômega-6 e omega-3)
são essenciais para o desenvolvimento humano e a saúde, mas não podem ser sintetizados
pelo corpo humano, por isso devem ser obtidos por meio da alimentação. Durante a gestação,
a alimentação e as reservas corporais de ácidos graxos poliinsaturados essenciais são
fundamentais para atender às necessidades materna e fetal (Abu-Saad e Fraser, 2010;
Marangoni et al., 2016).
O consumo de um quantitativo maior de alimentos para satisfazer as necessidades
energéticas, aliado ao aumento da absorção e eficiência da utilização de nutrientes que
normalmente ocorre na gestação, geralmente são suficientes para satisfazer as necessidades da
maioria dos nutrientes específicos. No entanto, a ingestão inadequada de micronutrientes é
prejudicial durante as fases de desenvolvimento e crescimento do feto. Neste sentido, a
suplementação de vitaminas e minerais pode ser apropriada em algumas situações, até mesmo
antes da concepção (Kaiser e Allen, 2008; Nnam, 2015).

REFERENCIAL TEÓRICO
52
A ingestão alimentar habitual materna é um dos determinantes do ganho de peso na
gestação, e está associado direta ou indiretamente ao desenvolvimento de complicações
durante a gestação. Estudos associam o maior consumo de alimentos não saudáveis no
período gestacional, como alimentos processados e ultraprocessados, com o aumento do
ganho de peso gestacional (Uusitalo et al., 2009) e a elevação da retenção de peso pós-parto
(Martins e Benicio, 2011).
A identificação de padrões alimentares tornou-se recentemente uma ferramenta útil em
estudos epidemiológicos que procuram explorar a relação entre exposições dietéticas e
desfechos relacionados ao estado de saúde (Thompson et al., 2010; Grieger, Grzeskowiak e
Clifton, 2014). Neste contexto, os estudos sugerem que os padrões alimentares caracterizados
por alta concentração de alimentos ricos em gorduras saturadas, açúcar refinado ou sódio
estão associados aos desfechos adversos da gestação, quando comparados aos padrões
alimentares caracterizados por uma variedade de frutas, vegetais e grãos integrais (Zhang et
al., 2006; Brantsæter et al., 2009; Stuebe, Oken e Gillman, 2009; Ramakrishnan et al., 2012;
Grieger, Grzeskowiak e Clifton, 2014; Englund-Ögge et al., 2014).
Considerando que a gestação é um período em que as mulheres são mais propensas a
mudar seu padrão de ingestão de alimentos devido à preocupação com a saúde da criança, a
identificação e a compreensão dos fatores alimentares, juntamente com outros fatores que
influenciam o ganho de peso gestacional, pode contribuir para formulação de estratégias de
promoção de hábitos alimentares saudáveis antes e durante a gestação com o objetivo de
reduzir o risco de resultados adversos da gestação (Grieger, Grzeskowiak e Clifton, 2014).

JUSTIFICATIVA
53
3 JUSTIFICATIVA
A crescente prevalência da obesidade é bastante preocupante, pois está relacionada ao
aumento do risco de doenças crônicas, como doenças cardíacas, hipertensão arterial,
dislipidemias, diabetes, entre outras. A complexidade clínico-epidemiológica que envolve a
temática da obesidade está fortemente associada aos fatores ambientais, especialmente aos
hábitos alimentares e ao estilo de vida sedentário, aliados a fatores genéticos. A variação
interindividual da obesidade e fenótipos relacionados têm origem em múltiplos determinantes
genéticos, desta forma, a ciência tem avançado na identificação de genes específicos que
possam estar associados à obesidade. Contudo, estudos de associação entre os polimorfismos
nos genes relacionados à obesidade e às mudanças de peso corporal e consumo alimentar de
gestantes ainda são escassos ou inexistentes.
A interação entre genes e ambiente é importante no desenvolvimento da obesidade e
pode apresentar importantes implicações em nível de saúde pública. A expectativa dos
estudos genéticos é que os genes envolvidos na regulação da adiposidade corporal possam
potencialmente responder a intervenções ambientais, alterando sua expressão. Assim,
marcadores genéticos poderão auxiliar na identificação de indivíduos com maior chance de se
beneficiar de intervenções sobre seu estilo de vida (hábitos dietéticos e prática de atividade
física), direcionando a abordagem terapêutica para indivíduos de risco e minimizando os
impactos negativos à saúde.
Considerando o aumento progressivo da prevalência do sobrepeso e da obesidade em
mulheres em idade fértil e a relevância epidemiológica das consequências da obesidade
materna e do GPG excessivo, bem como o ciclo transgeracional de obesidade, investigações
de fatores genéticos associados aos fenótipos da obesidade materna contribuem com avanços
em direção a uma compreensão mais abrangente sobre a temática, podendo direcionar novas
estratégias de prevenção da obesidade materna. Dessa forma, os resultados obtidos nesta tese
de doutorado poderão contribuir para o direcionamento de novas evidências científicas que
subsidiem políticas públicas de controle e prevenção dos desfechos relacionados ao excesso
de peso materno.
HIPÓTESES
54
4 HIPÓTESES
As hipóteses relacionadas aos estudos desta tese de doutorado são:
Hipótese 1
Mulheres que apresentam algum dos polimorfismos nos genes estudados (FTO-rs9939609;
MC4R-rs17782313; LEP-rs7799039 e LEPR-rs1137101) são mais suscetíveis ao excesso de
peso pré-gestacional e ao ganho de peso gestacional excessivo.
Hipótese 2
Mulheres portadoras dos polimorfismos nos genes LEP-rs7799039 e LEPR-rs1137101
apresentam maiores concentrações plasmáticas de leptina ao longo da gestação.
Hipótese 3
Mulheres que apresentam algum dos polimorfismos nos genes isolados estudados (FTO-
rs9939609; MC4R-rs17782313; LEP-rs7799039 e LEPR-rs1137101) apresentam maior
ingestão energética total, bem como maiores percentuais de energia derivados dos lipídios,
carboidratos e de alimentos ultraprocessados.

OBJETIVOS
55
5 OBJETIVOS
5.1 OBJETIVO GERAL
Estudar a associação entre os polimorfismos em genes relacionados à obesidade (FTO-
rs9939609, MC4R-rs17782313, LEP-rs7799039 e LEPR-rs1137101) e as mudanças de peso
corporal e consumo alimentar em gestantes.
5.2 OBJETIVOS ESPECÍFICOS
5.2.1 Artigo 1
(i) Avaliar a associação entre os SNPs dos genes FTO e MC4R e o peso pré-gestacional e as
mudanças do peso corporal materno durante a gestação e no pós-parto.
5.2.2 Artigo 2
(ii) Investigar se os SNPs dos genes da LEP e LEPR influenciam no peso pré-gestacional, no
ganho de peso gestacional e nas concentrações plasmáticas de lep tina ao longo da
gestação.
5.2.3 Artigo 3
(iii) Investigar a associação dos SNPs dos genes do FTO, MC4R, LEP e LEPR com a ingestão
energética total e o percentual de energia derivados de macronutrientes e alimentos
ultraprocessados durante os períodos pré-gestacional e gestacional.

MÉTODOS
56
6 MÉTODOS
6.1 DELINEAMENTO DO ESTUDO
O conjunto de dados utilizados nesta tese advém de um estudo de coorte prospectiva
(projeto matriz) realizado no CMS HB, localizado no bairro da Tijuca no município do Rio de
Janeiro, durante o período de novembro de 2009 a outubro de 2011. A execução do projeto
correspondeu a coleta de dados em quatro períodos do seguimento: ≤ 13 semanas de gestação
(SG) = 10 trimestre, 20 - 26 SG = 20 trimestre e 30 - 36 SG = 30 trimestre, e no pós-parto
imediato (30 a 45 dias), conforme detalhamento na Figura 7.
6.2 ASPECTOS ÉTICOS
O projeto de pesquisa que deu origem ao estudo da presente tese foi aprovado pelo
Comitê de Ética em Pesquisa (CEP) da Secretaria Municipal de Saúde e Defesa Civil do
município do Rio de Janeiro (Anexo 1) e pelo CEP do Hospital Maternidade Escola da UFRJ
(Processo n° 0023.0.361.000-08). A participação das mulheres na pesquisa esteve
condicionada à assinatura de duas vias do Termo de Consentimento Livre e Esclarecido
(TCLE) (Anexo 2), que foi obtida de forma livre e espontânea, após terem sido feitos todos os
esclarecimentos pertinentes ao estudo. A constituição do biorrepositório foi devidamente
aprovada (registro número 16647) pela Comissão Nacional de Ética em Pesquisa (CONEP).
6.3 CRITÉRIOS DE ELEGIBILIDADE
Os critérios de elegibilidade foram estabelecidos atendendo as exigências do projeto
matriz. Deste modo, foram recrutadas mulheres que atenderam aos seguintes critérios de
elegibilidade: (i) ter no máximo 13 SG; (ii) estar entre 20 e 40 anos de idade; (iii) estar livre
de doenças infecto-parasitárias e DCNT, exceto obesidade; (iv) realizar o acompanhamento
pré-natal no local de estudo.
Do total das 299 mulheres que inicialmente aceitaram participar do estudo, 40 não
atenderam aos seguintes critérios de elegibilidade: 12 mulheres confirmaram diagnóstico de
doenças infecto-parasitárias; 2 mulheres confirmaram diagnóstico de DCNT; 16 mulheres
estavam com mais de 13 SG no baseline; 10 mulheres abandonaram o acompanhamento do
pré-natal na unidade de saúde. Desta forma, 259 mulheres atenderam aos requisitos de
elegibilidade do estudo.

MÉTODOS
57
Figura 7. Coleta de dados em cada ponto de acompanhamento do estudo Abreviaturas: QFA = Questionário de frequência alimentar; SNPs = Polimorfismos de nucleotídeo único
20 Trimestre
(20 - 26 semanas)
PERÍODO GESTACIONAL
10 Trimestre
(5 -13 semanas)
30 Trimestre
(30 - 36 semanas)
PRIMEIRA ENTREVISTA
- Coleta de sangue
(SNPs e Leptina)
- Antropometria
(Estatura e Massa corporal)
- QFA
(Consumo alimentar pré-
gestacional)
SEGUNDA ENTREVISTA
- Questionário Geral-1
(Dados demográficos,
socioeconômicos,
obstétricos e de estilo de
vida)
- Coleta de sangue
(Leptina)
- Antropometria
(Massa corporal)
- Questionário Geral-2
(Dados demográficos,
socioeconômicos,
obstétricos e de estilo de
vida)
PRIMEIRA ENTREVISTA
- Coleta de sangue
(Leptina)
- Antropometria
(Massa corporal)
- Questionário Geral-3
(Dados demográficos,
socioeconômicos,
obstétricos e de estilo de
vida)
SEGUNDA ENTREVISTA
- QFA
(Consumo alimentar
gestacional)
PÓS-PARTO
30 - 45 dias
- Questionário Geral-4
(Dados demográficos,
socioeconômicos,
obstétricos e de estilo de
vida)
- Antropometria
(Massa corporal)
CA
PTA
ÇÃ
O D
AS
GES
TAN
TES

MÉTODOS
58
6.4 CRITÉRIOS DE EXCLUSÃO
Os critérios gerais de exclusão do presente estudo corresponderam a: (i) mulheres que
abortaram durante o acompanhamento do estudo (n = 25); (ii) mulheres que apresentaram
gestação gemelar (n = 4); (iii) mulheres que tiveram bebês natimortos (n = 5). Assim, a
amostra inicial do estudo resultou em 225 mulheres.
6.5 CAPTAÇÃO DAS PARTICIPANTES DO ESTUDO
A captação das mulheres para o estudo aconteceu durante o período de novembro de
2009 a outubro de 2011. A captação/recrutamento das mulheres na unidade de estudo ocorreu
mediante abordagem às gestantes que compareceram pela primeira vez à consulta de pré-natal
e às mulheres que obtiveram resultado positivo no teste imunológico de gravidez realizado na
unidade. Visando subsidiar análises sobre potenciais vieses de seleção, as mulheres elegíveis
inicialmente responderam a um questionário contendo as seguintes questões: data da última
menstruação, idade, escolaridade, peso pré-gestacional, número de filhos prévios,
informações sobre DCNT, doenças infecciosas, local da residência e local no qual seria
realizado o pré-natal. Aquelas que se enquadravam nos critérios de elegibilidade, previamente
estabelecidos na linha de base do estudo foram convidadas a participar do projeto. Do total de
322 mulheres convidadas a participar do estudo, 299 (92,7%) concordaram e tiveram a
primeira entrevista agendada, após assinatura do TCLE.
6.6 CAPACITAÇÃO DA EQUIPE E CONTROLE DE QUALIDADE DOS DADOS
A coleta de dados foi realizada por equipe composta por alunos de graduação e pós-
graduação do Observatório de Epidemiologia Nutricional do INJC-UFRJ. A equipe foi
devidamente capacitada, mediante treinamento prático na unidade do estudo durante o
período de agosto a outubro de 2009. A entrada de novos entrevistadores na equipe foi
condicionada a realização de novos treinamentos. Estratégias de controle da qualidade e
consistência das informações foram adotadas mediante a elaboração de manuais e protocolos
para a coleta dos dados.
Foi realizado um estudo piloto no CMS HB, no período de setembro a outubro de
2009, com o objetivo de testar os instrumentos elaborados para a coleta de dados, propor e
executar modificações nos questionários e aperfeiçoar as técnicas de aferição e logística.

MÉTODOS
59
Após a realização das entrevistas para a coleta de dados, os questionários eram
imediatamente revisados pelos entrevistadores e posteriormente por um revisor, visando
minimizar erros de preenchimento.
6.7 PROCEDIMENTOS PARA COLETA DE DADOS
A coleta de dados de campo ocorreu entre novembro de 2009 e junho de 2012. Os
dados foram coletados mediante agendamentos prévios com a gestante. Para minimizar as
perdas de seguimento, as participantes foram contatadas por telefone no dia anterior às
entrevistas para confirmação do agendamento e para lembrá-las, quando necessário, das
recomendações de jejum de 12 horas, em caso de coleta de sangue. A remarcação da
entrevista também foi realizada por telefone para as gestantes que não puderam comparecer
no dia em que estavam agendadas. Na impossibilidade do contato telefônico, cartas foram
enviadas com a mesma finalidade.
Em casos nos quais a gestante não compareceu a consulta do pré-natal próxima à data
provável do parto, foram realizados contatos telefônicos para saber se o parto já havia
ocorrido e, em caso positivo, para agendar a entrevista do pós-parto.
6.8 LOGÍSTICA DA COLETA DE DADOS
No primeiro trimestre gestacional foram realizadas duas entrevistas. Na primeira
entrevista foi aplicado um questionário semiquantitativo de frequência alimentar (QFA) para
coletar informações sobre consumo alimentar referente ao período pré-gestacional (Anexo
online 1). Também foram realizadas as medidas de massa corporal e de estatura e coleta de
amostras de sangue. Na segunda entrevista foi aplicado o Questionário Geral-1 (Anexo online
2) para obtenção dos dados demográficos, socioeconômicos, obstétricos e de estilo de vida.
No segundo trimestre gestacional foi aplicado o Questionário Geral-2 (Anexo online
3) e realizadas a aferição da massa corporal e nova coleta de amostra de sangue.
No último trimestre da gestação foram realizadas duas entrevistas. Na primeira foi
aplicado o Questionário Geral-3 (Anexo online 4), novamente aferida a massa corporal das
gestantes e realizada nova coleta de amostra de sangue. Na segunda entrevista foi aplicado o
QFA para obter dados de consumo alimentar referente ao período gestacional (Anexo online
5).

MÉTODOS
60
A última coleta de dados ocorreu aproximadamente de quatro a seis semanas após o
parto. Neste momento foi aplicado o Questionário Geral-4 do pós-parto (Anexo online 6) e
realizada aferição da massa corporal das mulheres.
6.9 VARIÁVEIS DO ESTUDO
A seleção das variáveis para compor os modelos finais das regressões pontuais e
longitudinais se deu com base na plausibilidade biológica da associação e nos valores de p
≤0,20 na análise bivariada para cada uma das variáveis, conforme detalhado em cada artigo.
No Quadro 4 são apresentadas as variáveis dependentes e independentes, de acordo
com as análises das associações dos polimorfismos com os desfechos dos Artigos (A1, A2 e
A3). A descrição das variáveis encontra-se a seguir.
Quadro 4. Classificação das variáveis do estudo, de acordo com os artigos da tese.
Variáveis do estudo Tipo da variável
Covariáveis Dependente Independente
Idade materna A1 – A2 – A3
Escolaridade materna A1 – A2
Cor da pele referida pela mulher A1 – A2 – A3
PAFL A1 – A2
Sexo da criança A1
Paridade A1 – A2 – A3
Idade gestacional A1 – A2 – A3
Hábito de fumar A1 – A2
Renda familiar per capita A3
Ingestão energética no 10 trimestre A2
IMC pré-gestacional A1 – A2 A1 – A3
GPG no 10, 20 e 30 trimestres (g/SG) A1
GPG total (kg) A1 A1
GPG insuficiente A1 – A2
GPG excessivo A1 – A2
Retenção de peso pós-parto (g/SG) A1
IMC pós-parto (kg/m2) A1
Peso materno (kg) A1 – A2 A2
Leptina plasmática no 10, 20 e 30 trimestres (ng/dL) A2 A2
Leptina plasmática ao longo da gestação A2
Ingestão energética total (kcal/dia) A3
% de energia dos CHO A3
% de energia das PTN A3
% de energia dos LIP A3
% de energia dos alimentos ultraprocessados A3
SNP no gene FTO A1 – A3
SNP no gene MC4R A1 – A3
SNP no gene LEP A2 – A3
SNP no gene LEPR A2 – A3 Abreviaturas: A1 = Artigo 1; A2 = Artigo 2; A3 = Artigo 3; PAFL = prática de atividade física de lazer antes da gestação;
IMC = índice de massa corporal; GPG = ganho de peso gestacional; SG = semana gestacional; CHO = carboidratos; PTN =
proteínas; LIP = lipídios; SNP = polimorfismo de único nucleotídeo; FTO = massa de gordura e obesidade associadas; MC4R
= melanocortina-4 receptor; LEP = leptina; LEPR = receptor da leptina.
MÉTODOS
61
6.9.1 Informações demográficas, socioeconômicas, obstétricas e de estilo de vida
As informações demográficas, socioeconômicas, obstétricas e de estilo de vida foram
coletadas por meio de questionário geral estruturado respondido pelas participantes a cada
trimestre da gestação e no pós-parto (Anexos online 2-4 e 6). As entrevistas foram realizadas
presencialmente em local reservado (sala) na unidade de estudo.
As variáveis relacionadas a este tópico e avaliadas no presente estudo foram: idade
(anos), escolaridade (anos), paridade (número de filhos), idade gestacional (em semanas) sexo
da criança, tabagismo durante a gestação (nunca fumou, fumante atual ou ex-fumante), prática
de atividade física de lazer antes da gestação (sim ou não), cor da pele referida pelas mulheres
(branca, parda/mulata/morena/cabocla) e renda per capita familiar.
A idade gestacional foi avaliada em semanas e calculada a partir dos dados obtidos na
primeira ultrassonografia (USG) realizada antes de 24 SG (Butt et al., 2014). Na ausência de
informação sobre a semana gestacional pela USG, foi utilizada a data da última menstruação
(DUM) para estimar a SG (n = 2).
6.9.2 Medidas antropométricas
A avaliação antropométrica foi realizada pela obtenção das medidas de massa corporal
e estatura materna, de acordo com as técnicas de Lohman et al. (1988). A estatura foi medida
apenas na primeira entrevista (≤ 13 SG), enquanto a massa corporal foi aferida nos três
trimestres da gestação e no pós-parto.
A aferição da massa corporal foi realizada em balança plataforma eletrônica com
display digital (Filizola, São Paulo, Brasil), com precisão de 100 g e capacidade máxima de
150 kg. Devido à precisão da balança digital, a medição foi realizada apenas uma única vez
em cada procedimento. Posteriormente, foi obtido a última medida de massa corporal materna
registrada em prontuário médico durante a última consulta ao pré-natal. Também foi
registrado a informação do peso pré-gestacional relatado pela gestante na primeira entrevista
(baseline), quando era do seu conhecimento.
A estatura foi medida em duplicata utilizando estadiômetro portátil (Seca, Hamburgo,
Alemanha), com escala de medição de 0,5 cm. No caso de a diferença entre as medidas ser
maior que 0,5 cm, uma terceira medida foi aferida e a média das duas medidas mais próximas
foi utilizada nas análises.

MÉTODOS
62
O IMC pré-gestacional foi obtido pela razão do peso pré-gestacional informado pela
gestante na primeira entrevista e o quadrado da estatura aferida no baseline [peso (kg)/estatura
(m2)]. O IMC pós-parto também foi calculado, considerando a massa corporal aferida neste
período. A classificação do estado nutricional das mulheres obedeceu ao recomendado pela
OMS (WHO, 2000): <18,5 kg/m2 = baixo peso; 18,5 – 24,9 kg/m2 = peso normal; 25,0 – 29,9
kg/m2 = sobrepeso; ≥30,0 kg/m2 = obesidade.
O GPG total foi obtido pela diferença entre o último peso registrado em prontuário
durante a última consulta ao pré-natal e o peso pré-gestacional informado pela gestante. As
mulheres foram classificadas de acordo com as categorias de GPG (insuficiente, adequado e
excessivo) com base nas recomendações do IOM descritas no Quadro 3. O GPG por
trimestre da gestação também foi calculado e dividido pela SG correspondente.
A retenção de peso pós-parto foi calculada pela diferença entre o peso aferido no pós-
parto e o peso pré-gestacional informado pela gestante no baseline.
6.9.3 Consumo alimentar
As informações referentes ao consumo alimentar foram coletadas no baseline e no
terceiro trimestre (30 – 36 SG). A primeira avaliação referiu-se ao consumo alimentar da
mulher nos seis meses anteriores à concepção e a segunda correspondeu aos últimos seis
meses anteriores à última entrevista.
Para obtenção dos dados de consumo alimentar foi utilizado um QFA desenvolvido
para a população adulta do Rio de Janeiro e validado utilizando o recordatório de 24 horas. Os
coeficientes de correlação na validação para energia, carboidrato, proteína e gordura foram
0,44, 0,34, 0,44, e 0,41 respectivamente (Sichieri e Everhart, 1998).
Este instrumento foi utilizado para o presente estudo (Anexos online 1 e 5). O QFA
foi composto por 82 itens alimentares, incluindo bebidas não alcoólicas e alcoólicas, e 8
opções de respostas de frequência de consumo. As respostas de frequências de consumo
apresentadas pelo instrumento foram posteriormente convertidas em frequências diárias de
consumo da seguinte forma: >3 vezes/dia=4; 2 a 3 vezes/dia=2,5; 1 vez/dia=1; 5 a 6
vezes/semana=0,79; 2 a 4 vezes/semana=0,43; 1 vez/semana=0,14; 1 a 3 vezes/mês=0,07 e
nunca ou quase nunca=0. As porções em medidas caseiras dos alimentos referidos no QFA
foram quantificadas em gramas (g) e/ou mililitros (mL), mediante a utilização de tabela para
avaliação de consumo alimentar em medidas caseiras (Pinheiro et al., 2004).
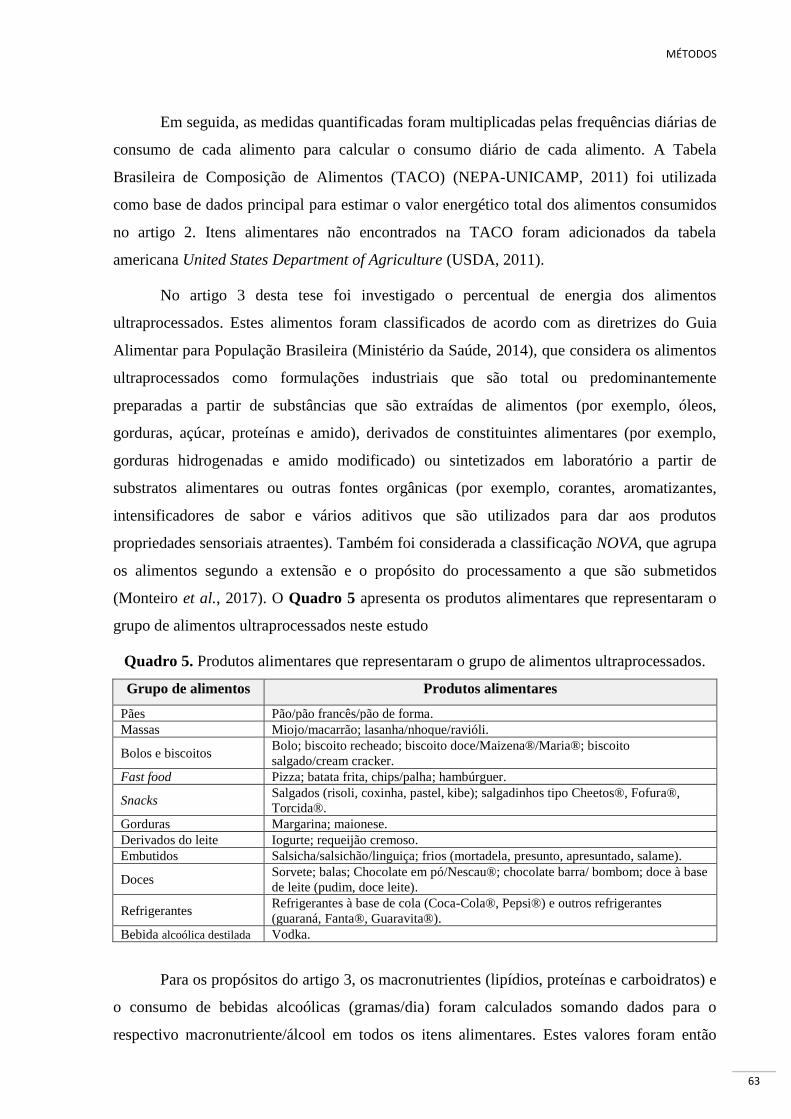
MÉTODOS
63
Em seguida, as medidas quantificadas foram multiplicadas pelas frequências diárias de
consumo de cada alimento para calcular o consumo diário de cada alimento. A Tabela
Brasileira de Composição de Alimentos (TACO) (NEPA-UNICAMP, 2011) foi utilizada
como base de dados principal para estimar o valor energético total dos alimentos consumidos
no artigo 2. Itens alimentares não encontrados na TACO foram adicionados da tabela
americana United States Department of Agriculture (USDA, 2011).
No artigo 3 desta tese foi investigado o percentual de energia dos alimentos
ultraprocessados. Estes alimentos foram classificados de acordo com as diretrizes do Guia
Alimentar para População Brasileira (Ministério da Saúde, 2014), que considera os alimentos
ultraprocessados como formulações industriais que são total ou predominantemente
preparadas a partir de substâncias que são extraídas de alimentos (por exemplo, óleos,
gorduras, açúcar, proteínas e amido), derivados de constituintes alimentares (por exemplo,
gorduras hidrogenadas e amido modificado) ou sintetizados em laboratório a partir de
substratos alimentares ou outras fontes orgânicas (por exemplo, corantes, aromatizantes,
intensificadores de sabor e vários aditivos que são utilizados para dar aos produtos
propriedades sensoriais atraentes). Também foi considerada a classificação NOVA, que agrupa
os alimentos segundo a extensão e o propósito do processamento a que são submetidos
(Monteiro et al., 2017). O Quadro 5 apresenta os produtos alimentares que representaram o
grupo de alimentos ultraprocessados neste estudo
Quadro 5. Produtos alimentares que representaram o grupo de alimentos ultraprocessados.
Grupo de alimentos Produtos alimentares
Pães Pão/pão francês/pão de forma.
Massas Miojo/macarrão; lasanha/nhoque/ravióli.
Bolos e biscoitos Bolo; biscoito recheado; biscoito doce/Maizena®/Maria®; biscoito
salgado/cream cracker.
Fast food Pizza; batata frita, chips/palha; hambúrguer.
Snacks Salgados (risoli, coxinha, pastel, kibe); salgadinhos tipo Cheetos®, Fofura®,
Torcida®.
Gorduras Margarina; maionese.
Derivados do leite Iogurte; requeijão cremoso.
Embutidos Salsicha/salsichão/linguiça; frios (mortadela, presunto, apresuntado, salame).
Doces Sorvete; balas; Chocolate em pó/Nescau®; chocolate barra/ bombom; doce à base
de leite (pudim, doce leite).
Refrigerantes Refrigerantes à base de cola (Coca-Cola®, Pepsi®) e outros refrigerantes
(guaraná, Fanta®, Guaravita®).
Bebida alcoólica destilada Vodka.
Para os propósitos do artigo 3, os macronutrientes (lipídios, proteínas e carboidratos) e
o consumo de bebidas alcoólicas (gramas/dia) foram calculados somando dados para o
respectivo macronutriente/álcool em todos os itens alimentares. Estes valores foram então

MÉTODOS
64
convertidos em energia multiplicando a quantidade total (g) de macronutrientes/álcool pelo
número de kcalorias por grama (1 g de lipídio = 9 kcalorias, 1 g de proteína ou carboidrato =
4 kcalorias e 1 g de etanol = 7 kcalorias). As percentagens de energia derivadas das ingestões
de lipídeos, carboidratos e proteínas foram calculadas dividindo o valor energético do
macronutriente especifico pela soma de energia de todos os componentes (isto é, carboidratos,
proteínas, gorduras e álcool) e depois multiplicando por 100. A percentagem diária de energia
de alimentos ultraprocessados foi calculada dividindo a energia diária desses alimentos pela
energia total consumida (kcal) e depois multiplicando por 100.
6.9.4 Dados bioquímicos e genéticos
A coleta de amostra de sangue foi realizada por punção venosa periférica, utilizando
materiais descartáveis. A coleta foi realizada por profissional da área de enfermagem no
laboratório do CMS HB (local do estudo). Após a coleta, as amostras de sangue foram
manipuladas e acondicionadas de acordo com os protocolos de realizações dos exames
laboratoriais.
6.9.4.1 Concentração plasmática de leptina
Foram realizadas coletas de sangue venoso periférico nas participantes do estudo nos
três trimestres de acompanhamento, após jejum de 12 horas. O sangue coletado foi
imediatamente centrifugado e as alíquotas de soro armazenadas a -80oC em frasco para
criogenia contendo gás nitrogênio, até serem transportadas para o Laboratório de
Desenvolvimento de Alimentos para Fins Especiais e Educacionais (DAFEE) do INJC da
UFRJ, no qual as amostras foram armazenadas e analisadas posteriormente. A concentração
plasmática da leptina foi realizada pelo método Enzyme-linked Immunosorbent Assay
(ELISA), utilizando-se kits comerciais (Millipore, St. Charles, USA) com sensibilidade de 0,5
ng/mL.
6.9.4.2 Polimorfismos genéticos (FTO, MC4R, LEP e LEPR)
Foi realizada uma coleta de sangue no primeiro trimestre da gestação de
aproximadamente 5 mL, para determinação dos polimorfismos genéticos. O sangue foi
coletado em tubos estéreis e armazenado em ultra freezer (-80ºC) para posterior análise. A
primeira etapa da análise foi realizada no Laboratório de Metabolismo Macromolecular
Firmino Torres de Castro, do Instituto de Biofísica Carlos Chagas Filho da UFRJ, e consistiu
MÉTODOS
65
na extração total do DNA genômico a partir de leucócitos provenientes de sangue periférico
venoso pelo método do fenol clorofórmio, de acordo com protocolo em anexo (Anexo 3).
A segunda etapa foi realizada no Laboratório de Bioquímica Nutricional do INJC da
UFRJ e consistiu na amplificação do fragmento de DNA extraído para avaliação dos
polimorfismos estudados por discriminação alélica (TaqMan® Genotyping Master Mix assay,
Life Technologies – detalhe do produto no link abaixo), adotando-se a técnica da reação em
cadeia do DNA polimerase (PCR) em tempo real (StepOnePlus, Life Technologies, Guilford,
CT, USA). A acurácia dos dados obtidos foi avaliada pela análise em duplicata de 10% da
amostra, com obtenção de 99% de concordância.
Link do produto: https://tools.thermofisher.com/content/sfs/manuals/TaqMan_SNP_Genotyping_Assays_man.pdf
6.10 ANÁLISES ESTATÍSTICAS
Foi construído banco de dados no software Stata Data Analysis and Statistical
Software (STATA), versão 12.0. Os dados foram digitados em duplicata e analisados quanto à
consistência, antes de proceder à etapa de análise. Os do-files detalhados sobre as análises
estatísticas dos dados apresentados nas tabelas principais dos artigos apresentados encontram-
se nos Apêndices A-C. Foram considerados estatisticamente significativos valores de p <
0,05.
Na Figura 8 encontra-se o detalhamento do tamanho da amostra analisado, de acordo
com os artigos apresentados nesta tese.
Abaixo serão descritas as análises estatísticas realizadas neste estudo e, em seguida,
serão apresentados nos Quadros 6A-C as análises estatísticas específicas dos Artigos desta
tese.

MÉTODOS
66
Figura 8. Fluxograma do tamanho amostral dos artigos apresentados na tese. Abreviaturas: DCNT = Doenças crônicas não transmissíveis.
Gestantes convidadas a participar do estudo: N=322
Gestantes que concordaram participar do estudo: N = 299 (92.7%)
Mulheres elegíveis a participarem do estudo: N = 269
Amostra inicial do estudo após os critérios de elegibilidade e exclusão: N = 235
N = 211 Gestantes
Artigo 1: N = 136Não soube informar peso pré-gestacional (n=8); Não genotipagem (n=67)
Artigo 2: N = 147Glicose plasmática ≥ 126 mg/dL (n=2);Não genotipagem (n=62)
Artigo 3: N = 149Não genotipagem (n=62
sem dados do baseline (n=5)
perdas de seguimento (n=9)
abandonaram o pré-natal na unidade de estudo (n=10)
34 gestantes excluídas: Aborto (n=25); Gestação gemelar (n=4); Natimortos (n=5).
30 gestantes não atenderam aos critérios de eligibilidade:
Confirmação do diagnóstico de doenças infecciosas (n=10) e parasitárias (n=2); DCNT (n=2); >13 semanas gestacional no baseline (n=16).
MÉTODOS
67
6.10.1 Análise descritiva
Foram realizadas análises descritivas com o objetivo de verificar as características da
amostra do estudo. Procedimentos clássicos como cálculo de médias e intervalos de confiança
de 95% (IC 95%) ou desvio padrão (DP); medianas e intervalo interquartil (IQR) foram
realizados para as variáveis contínuas simétricas e assimétricas, respectivamente. Para as
variáveis categóricas foram apresentadas as medidas de frequência e proporção. Para testar
diferenças entre estratos foram utilizados os testes t de Student ou análise de variância
(ANOVA) para as variáveis simétricas e Mann–Whitney U test ou Kruskal-Wallis para as
variáveis assimétricas. Testes do chi-quadrado ou teste exato de Fisher foram utilizados para
as variáveis categóricas. A normalidade foi testada por meio da construção de histogramas e,
adicionalmente, pelo teste de Shapiro-Wilk.
6.10.2 Análise gráfica
Gráficos foram construídos a partir de análises de regressão longitudinal de efeitos
mistos com o objetivo de representar visualmente a evolução do peso materno ao longo da
gestação, de acordo com os genótipos do gene FTO-rs9939609.
6.10.3 Analise de regressão linear múltipla:
Modelos ajustados de regressão linear múltipla foram utilizados com o objetivo de
verificar a existência de associação entre as variáveis dependentes do artigo 1 (GPG e
retenção de peso pós-parto), artigo 2 (concentração plasmática de leptina por trimestre
gestacional) e artigo 3 (ingestão energética diária, percentual de energia dos macronutrientes e
dos alimentos ultraprocessados) e os polimorfismos estudados.
6.10.4 Análise de regressão de Poisson
Foi utilizada a regressão de Poisson com variância robusta para estimar os riscos
relativos (RR) e IC 95%. Esta regressão foi utilizada para estimar a associação entre os
polimorfismos estudados e as categorias de IMC pré-gestacional (< 25 e ≥ 25 kg/m2) (Artigos
1 e 2) e IMC pós-parto (< 25 e ≥ 25 kg/m2) (Artigo 1). Foi considerado o IMC ≥ 25,0 kg/m2
como categoria de excesso de peso.
Esta análise também foi utilizada para avaliar as associações entre os polimorfismos e
as categorias de GPG (insuficiente e excessivo) (Artigos 1 e 2).

MÉTODOS
68
6.10.5 Análise de regressão longitudinal de efeitos mistos
Modelos de regressão longitudinal de efeitos mistos (LME – longitudinal mixed
effects) foram empregados para avaliar se houve alteração significativa nos desfechos ao
longo da gestação, comparando entre os genótipos dos polimorfismos. As variáveis de
desfechos utilizadas nesta análise foram o peso materno (Artigos 1 e 2), concentrações de
leptina plasmática (Artigo 2), ingestão de energia total e percentual de energia dos
macronutrientes e do grupo de alimentos ultraprocessados (Artigo 3). Esses modelos de
regressão consideram a dependência entre as observações de um mesmo indivíduo e a semana
gestacional exata da análise, não agrupando as mulheres apenas por trimestre gestacional. O
modelo LME acomoda covariáveis tempo-dependentes e tempo-independentes e possibilita
analisar dados com medidas repetidas não equidistantes.
Nos modelos de regressão de LME dos Artigos 1 e 2 foi utilizada a idade gestacional
linear e quadrática (variáveis referentes ao tempo), pois as mudanças longitudinais de peso
corporal e concentração plasmática da leptina ao longo da gestação se assemelham a uma
parábola. Para o Artigo 3 foi considerada apenas a idade gestacional linear. A idade
gestacional foi analisada como variável de efeito aleatório no modelo para permitir variações
individuais no peso, nas concentrações de leptina e na ingestão de energia ao longo do tempo,
enquanto os polimorfismos e as demais variáveis foram analisados como efeitos fixos,
permitindo assim verificar o efeito da variação comum entre as mulheres.
As análises de regressão de LME do Artigo 3 foram realizadas com dados de consumo
alimentar nos dois períodos de acompanhamento (pré-gestacional e gestacional).

MÉTODOS
69
Quadro 6A. Quadro demonstrativo das técnicas de análise estatística do Artigo 1
OBJETIVO ANÁLISE ESTATÍSTICA VARIÁVEIS DEPENDENTES VARIÁVEIS DE CONTROLE
Avaliar a associação entre SNPs (FTO e
MC4R) e GPG.
Regressão linear múltipla GPG por trimestre de gestação
GPG total
Modelo 1 = sexo da criança, PAFL, idade materna,
cor da pele, paridade e idade gestacional.
Modelo 2 = Modelo 1 + IMC pré-gestacional.
Avaliar a associação entre SNPs (FTO e
MC4R) e retenção de peso pós-parto.
Regressão linear múltipla Retenção de peso pós-parto por
semana pós-parto
Modelo 1 = sexo da criança, PAFL, idade materna,
cor da pele e paridade.
Modelo 2 = Modelo 1 + GPG total.
Avaliar o risco relativo de excesso de peso pré-
gestacional (IMC ≥ 25,0 kg/m2), de acordo com
SNPs dos genes FTO e MC4R.
Regressão de Poisson Excesso de peso pré-gestacional Modelo 1 = PAFL, idade materna, cor da pele,
escolaridade materna, paridade e hábito de fumar.
Modelo 2 = Modelo 1 + estatura materna.
Avaliar o risco relativo de GPG insuficiente e
GPG em excesso, de acordo com SNPs dos
genes FTO e MC4R.
Regressão de Poisson GPG insuficiente
GPG em excesso
Modelo 1 = sexo da criança, PAFL, idade materna,
cor da pele, paridade.
Modelo 2 = Modelo 1 + IMC pré-gestacional.
Avaliar o risco relativo de excesso de peso pós-
parto (IMC ≥ 25,0 kg/m2), de acordo com SNPs
dos genes FTO e MC4R.
Regressão de Poisson Excesso de peso pós-parto Modelo 1 = PAFL, idade materna, cor da pele,
escolaridade materna, paridade e hábito de fumar.
Modelo 2 = Modelo 1 + IMC pré-gestacional.
Avaliar a trajetória do peso materno ao longo
do período da gestação, de acordo com SNPs
dos genes FTO e MC4R.
Regressão longitudinal de efeitos
mistos (LME)
Peso materno ao longodo período
da gestação
Obs.: Idade gestacional foi utilizada como variável
de efeito aleatório em todos os modelos.
Variáveis fixas:
Modelo 1 = SG e SG2.
Modelo 2 = Modelo 1 + sexo da criança,
escolaridade materna, PAFL, idade materna, cor da
pele, paridade, hábito de fumar e estatura materna.
Modelo 3 = Modelo 2 - estatura materna + IMC
pré-gestacional. Abreviaturas: SG = semana gestacional; SNP = polimorfismo de único nucleotídeo; FTO = massa de gordura e obesidade associadas; MC4R = melanocortina-4 receptor; PAFL = prática de
atividade física de lazer antes da gestação; GPG = ganho de peso gestacional; IMC = índice de massa corporal.
Notas:
Variáveis categóricas: sexo da criança; PAFL (sim ou não); cor da pele (branca e não branca); hábito de fumar (nunca fumou e fumante + ex-fumante); paridade (0, 1 e ≥ 2).

MÉTODOS
70
Quadro 6B. Quadro demonstrativo das técnicas de análise estatística do Artigo 2
OBJETIVO ANÁLISE ESTATÍSTICA VARIÁVEIS DEPENDENTES VARIÁVEIS DE CONTROLE
Avaliar a associação entre SNPs (LEP e LEPR)
e concentrações plasmáticas de leptina.
Rregressão linear múltipla Leptina no 10 trimestre
Leptina no 20 trimestre
Leptina no 30 trimestre
PAFL, SG, idade materna, cor da pele, hábito de
fumar e peso corporal materno no trimestre.
Avaliar o risco relativo de excesso de peso pré-
gestacional (IMC ≥ 25,0 kg/m2), de acordo com
SNPs dos genes LEP e LEPR.
Regressão de Poisson Excesso de peso pré-gestacional PAFL, idade materna, cor da pele, paridade, hábito
de fumar, ingestão energética pré-gestacional e
escolaridade materna.
Avaliar o risco relativo de GPG insuficiente e
GPG em excesso, de acordo com SNPs dos
genes LEP e LEPR.
Regressão de Poisson GPG insuficiente
GPG em excesso
PAFL, SG do parto, idade materna, cor da pele,
paridade, hábito de fumar, leptina do primeiro
trimestre e IMC pré-gestacional.
Avaliar a trajetória do peso materno ao longo
do período da gestação, de acordo com SNPs
dos genes LEP e LEPR.
Regressão longitudinal de efeitos
mistos (LME)
Peso materno ao longo do
período da gestação
Obs.: idade gestacional foi utilizada como variável
de efeito aleatório no modelo.
Variáveis fixas:
SG, SG2, PAFL, idade materna, cor da pele, hábito
de fumar, paridade, escolaridade materna e estatura
materna.
Avaliar a trajetória da concentração plasmática
de leptina ao longo do período da gestação, de
acordo com SNPs dos genes LEP e LEPR.
Regressão longitudinal de efeitos
mistos (LME)
Concentração plasmática de
leptina ao longo do período da
gestação
Obs.: idade gestacional foi utilizada como variável
de efeito aleatório no modelo.
Variáveis fixas:
SG, SG2, PAFL, idade materna, cor da pele, hábito
de fumar e peso materno ao longo da gestação.
Abreviaturas: SG = semana gestacional; SNP = polimorfismo de único nucleotídeo; LEP = leptina; LEPR = receptor da leptina; PAFL = prática de atividade física de lazer;
GPG = ganho de peso gestacional; IMC = índice de massa corporal.
Notas:
Variáveis categóricas: PAFL (sim ou não); cor da pele (branca e não branca); hábito de fumar (nunca fumou e fumante + ex-fumante); paridade (0 e ≥ 1).
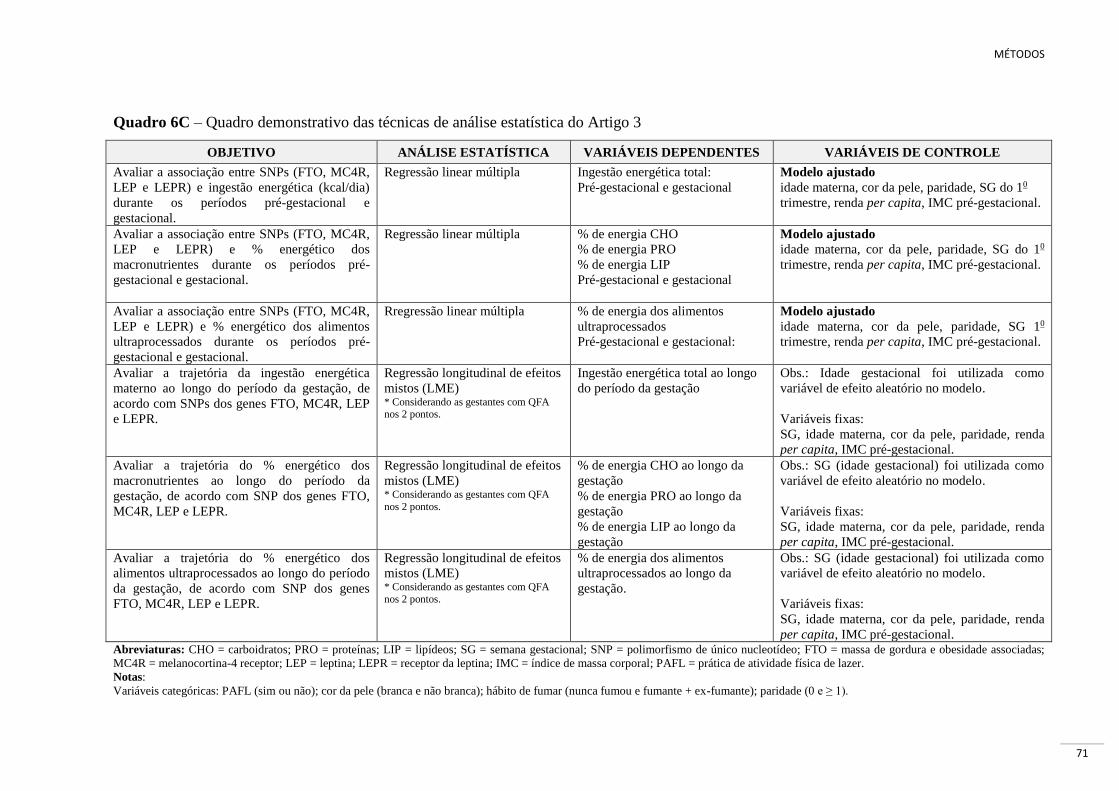
MÉTODOS
71
Quadro 6C – Quadro demonstrativo das técnicas de análise estatística do Artigo 3
OBJETIVO ANÁLISE ESTATÍSTICA VARIÁVEIS DEPENDENTES VARIÁVEIS DE CONTROLE
Avaliar a associação entre SNPs (FTO, MC4R,
LEP e LEPR) e ingestão energética (kcal/dia)
durante os períodos pré-gestacional e
gestacional.
Regressão linear múltipla Ingestão energética total:
Pré-gestacional e gestacional
Modelo ajustado
idade materna, cor da pele, paridade, SG do 10
trimestre, renda per capita, IMC pré-gestacional.
Avaliar a associação entre SNPs (FTO, MC4R,
LEP e LEPR) e % energético dos
macronutrientes durante os períodos pré-
gestacional e gestacional.
Regressão linear múltipla % de energia CHO
% de energia PRO
% de energia LIP
Pré-gestacional e gestacional
Modelo ajustado
idade materna, cor da pele, paridade, SG do 10
trimestre, renda per capita, IMC pré-gestacional.
Avaliar a associação entre SNPs (FTO, MC4R,
LEP e LEPR) e % energético dos alimentos
ultraprocessados durante os períodos pré-
gestacional e gestacional.
Rregressão linear múltipla % de energia dos alimentos
ultraprocessados
Pré-gestacional e gestacional:
Modelo ajustado
idade materna, cor da pele, paridade, SG 10
trimestre, renda per capita, IMC pré-gestacional.
Avaliar a trajetória da ingestão energética
materno ao longo do período da gestação, de
acordo com SNPs dos genes FTO, MC4R, LEP
e LEPR.
Regressão longitudinal de efeitos
mistos (LME) * Considerando as gestantes com QFA nos 2 pontos.
Ingestão energética total ao longo
do período da gestação
Obs.: Idade gestacional foi utilizada como
variável de efeito aleatório no modelo.
Variáveis fixas:
SG, idade materna, cor da pele, paridade, renda
per capita, IMC pré-gestacional.
Avaliar a trajetória do % energético dos
macronutrientes ao longo do período da
gestação, de acordo com SNP dos genes FTO,
MC4R, LEP e LEPR.
Regressão longitudinal de efeitos
mistos (LME) * Considerando as gestantes com QFA
nos 2 pontos.
% de energia CHO ao longo da
gestação
% de energia PRO ao longo da
gestação
% de energia LIP ao longo da
gestação
Obs.: SG (idade gestacional) foi utilizada como
variável de efeito aleatório no modelo.
Variáveis fixas:
SG, idade materna, cor da pele, paridade, renda
per capita, IMC pré-gestacional.
Avaliar a trajetória do % energético dos
alimentos ultraprocessados ao longo do período
da gestação, de acordo com SNP dos genes
FTO, MC4R, LEP e LEPR.
Regressão longitudinal de efeitos
mistos (LME) * Considerando as gestantes com QFA
nos 2 pontos.
% de energia dos alimentos
ultraprocessados ao longo da
gestação.
Obs.: SG (idade gestacional) foi utilizada como
variável de efeito aleatório no modelo.
Variáveis fixas:
SG, idade materna, cor da pele, paridade, renda
per capita, IMC pré-gestacional. Abreviaturas: CHO = carboidratos; PRO = proteínas; LIP = lipídeos; SG = semana gestacional; SNP = polimorfismo de único nucleotídeo; FTO = massa de gordura e obesidade associadas;
MC4R = melanocortina-4 receptor; LEP = leptina; LEPR = receptor da leptina; IMC = índice de massa corporal; PAFL = prática de atividade física de lazer.
Notas:
Variáveis categóricas: PAFL (sim ou não); cor da pele (branca e não branca); hábito de fumar (nunca fumou e fumante + ex-fumante); paridade (0 e ≥ 1).

RESULTADOS
72
7. RESULTADOS
A seção de resultados foi dividida em três artigos elaborados para a tese de doutorado,
sendo o primeiro publicado, o segundo aceito para publicação e o terceiro submetido para
publicação.
7.1 Artigo 1
Association of the FTO (rs9939609) and MC4R (rs17782313) gene polymorphisms with
maternal body weight during pregnancy.
Associação dos polimorfismos dos genes FTO (rs9939609) e MC4R (rs17782313) com o
peso corporal materno durante a gestação.
7.2 Artigo 2
Leptin (rs7799039) and leptin receptor (rs1137101) gene polymorphisms and body weight
changes and leptin concentrations throughout pregnancy.
Polimorfismos nos genes da leptina (rs7799039) e do receptor da leptina (rs1137101) e
mudanças do peso corporal e das concentrações de leptina ao longo da gestação.
7.3 Artigo 3
Associations between obesity candidate gene polymorphisms (FTO, MC4R, LEP and LEPR)
and dietary intake in pregnancy women.
Associações entre polimorfismos nos genes candidatos à obesidade (FTO, MC4R, LEP e
LEPR) e ingestão dietética em mulheres gestantes.

RESULTADOS (Artigo 1)
73
7.1 ARTIGO 1.
ASSOCIATION OF THE FTO (RS9939609) AND MC4R (RS17782313) GENE
POLYMORPHISMS WITH MATERNAL BODY WEIGHT DURING PREGNANCY (Anexo 4)
Publicado no periódico Nutrition em 2016 (v. 32, n. 11, p. 1223-1230, 2016)
Abstract
Objective: Fat mass and obesity (FTO) and melanocortin 4 receptor (MC4R) genes have been
consistently associated with the risk of obesity, but few studies have examined the association
of the obesity-risk alleles with gestational outcomes. Our aim was to evaluate the association
between single-nucleotide polymorphisms (SNPs) of the FTO (rs9939609) and MC4R
(rs17782313) genes with changes in maternal body weight during pregnancy.
Methods: A sample of 136 pregnant women were followed in a prospective cohort at 5-13,
20-26 and 30-36 gestational weeks and 30-45 days postpartum. SNPs were analyzed by real-
time PCR. Associations between polymorphisms and the outcomes were investigated through
longitudinal linear mixed-effects models, multiple linear regression models and Poisson
regression models.
Results: A SNP in the FTO (rs9939609) gene but not in the MC4R (rs17782313) gene was
significantly associated with pre-pregnancy BMI ≥ 25 kg/m2 (RRFTO=2.1; 95%CI 1.4 to 3.1).
Neither SNP was statistically associated with excessive gestational weight gain (GWG) and
postpartum weight retention (PPWR). For FTO (rs9939609) gene, women with the AA
genotype were heavier in the body weight trajectory of pregnancy, but not when their weight
had been adjusted for pre-pregnancy BMI (βFTO=0.5 kg; 95%CI -1.9 to 3.0). These women
started pregnancy heavier but gained less weight (FTO*gestational age=-0.1; 95%CI: -0.2 to
0.03) when compared to those with at least one T allele.
Conclusions: The FTO (rs9939609) AA genotype is positively associated with pre-pregnancy
excessive weight. We found no evidence of a significant effect of the MC4R (rs17782313) or
the FTO (rs9939609) gene polymorphisms on the GWG and PPWR.
Keywords: pregnancy, weight gain, weight retention, polymorphism, cohort study.

RESULTADOS (Artigo 1)
74
Introduction
Pregnancy is a complex process in women lifecycle, in which several metabolic
adaptations happen to support fetal development, delivery and lactation. Excessive gestational
weight gain (GWG) is associated with increased risks of pregnancy-induced hypertension,
caesarean delivery and a large-for-gestational age infant [1, 2]. It is also the primary factor
contributing to increased postpartum weight retention [3, 4] and may contribute to the
epidemic of obesity among women of childbearing age [5, 6].
An individual’s susceptibility to obesity is thought to result from a combination of
their genetics, behavior and environment [7, 8]. Genetic factors play an important role in the
development of obesity. Up to date, several single nucleotide polymorphisms (SNPs) of
obesogenic genes associated with the increased risk of overweight or obesity and with
behavioral risk factors have been published [8, 9]. In particular, the variant rs9939609 T/A of
the fat mass and obesity-associated protein (FTO) gene, located in the intron 1 on
chromosome 16q12.2 [10], and the variant rs17782313 T/C of the melanocortin-4 receptor
(MC4R) gene, mapped 188 kb downstream of the gene and encoded by a single exon gene on
chromosome 18q22 [11], have been well documented as major contributors to obesity
populations [10, 12-15].
Given the relevance of maternal and fetal fat to overall GWG, it is conceivable that
genetic variants that are known to be associated with adiposity might be associated with
GWG [16]. To the best of our knowledge, few studies were able to investigate the
longitudinal association between polymorphism (FTO and MC4R) and the body weight
throughout pregnancy. The results are still inconclusive [16-18], requiring more research for
elucidating the role of these genetic markers on pregnancy body weight change. Thus, the aim
of the present study was to examine the association of the FTO (rs9939609) and MC4R
(rs17782313) gene polymorphisms with changes in maternal body weight during pregnancy.
Methods
Study design
We analyzed data of a prospective cohort of pregnant women who received prenatal
care at public health center in the city of Rio de Janeiro, Brazil, from November 2009 to
October 2011. Data were collected at three time points during the pregnancy: 5th to 13th (first
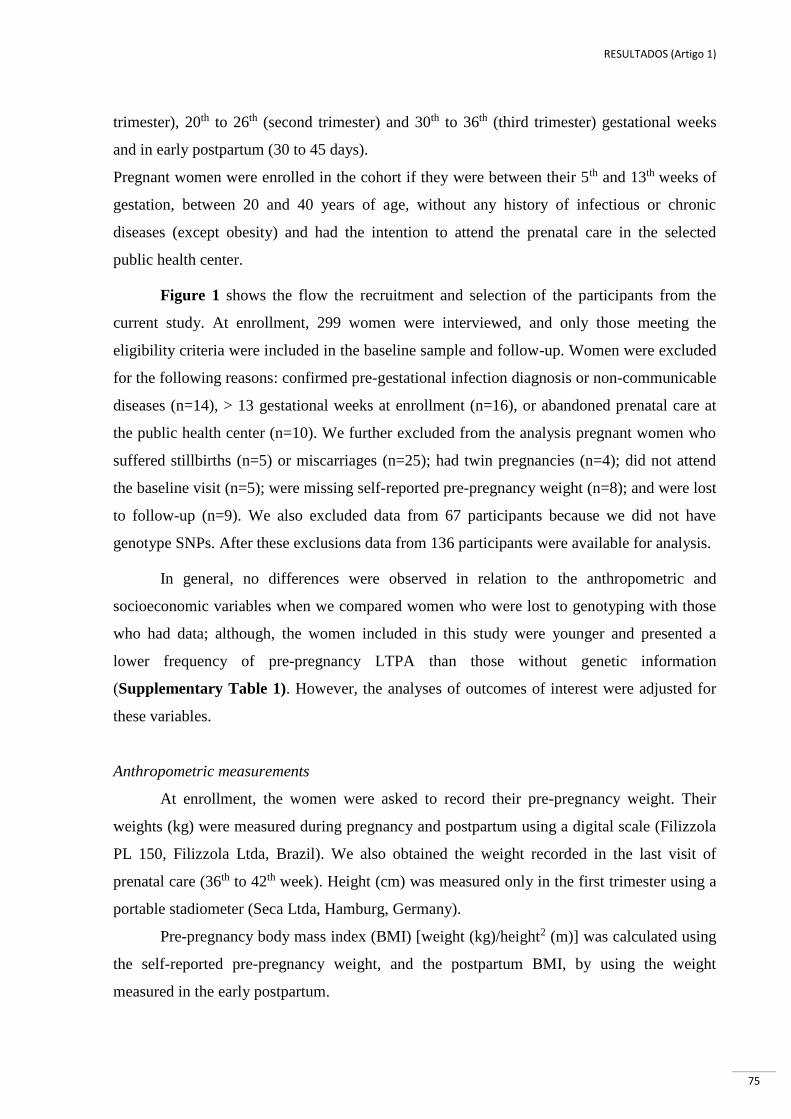
RESULTADOS (Artigo 1)
75
trimester), 20th to 26th (second trimester) and 30th to 36th (third trimester) gestational weeks
and in early postpartum (30 to 45 days).
Pregnant women were enrolled in the cohort if they were between their 5th and 13th weeks of
gestation, between 20 and 40 years of age, without any history of infectious or chronic
diseases (except obesity) and had the intention to attend the prenatal care in the selected
public health center.
Figure 1 shows the flow the recruitment and selection of the participants from the
current study. At enrollment, 299 women were interviewed, and only those meeting the
eligibility criteria were included in the baseline sample and follow-up. Women were excluded
for the following reasons: confirmed pre-gestational infection diagnosis or non-communicable
diseases (n=14), > 13 gestational weeks at enrollment (n=16), or abandoned prenatal care at
the public health center (n=10). We further excluded from the analysis pregnant women who
suffered stillbirths (n=5) or miscarriages (n=25); had twin pregnancies (n=4); did not attend
the baseline visit (n=5); were missing self-reported pre-pregnancy weight (n=8); and were lost
to follow-up (n=9). We also excluded data from 67 participants because we did not have
genotype SNPs. After these exclusions data from 136 participants were available for analysis.
In general, no differences were observed in relation to the anthropometric and
socioeconomic variables when we compared women who were lost to genotyping with those
who had data; although, the women included in this study were younger and presented a
lower frequency of pre-pregnancy LTPA than those without genetic information
(Supplementary Table 1). However, the analyses of outcomes of interest were adjusted for
these variables.
Anthropometric measurements
At enrollment, the women were asked to record their pre-pregnancy weight. Their
weights (kg) were measured during pregnancy and postpartum using a digital scale (Filizzola
PL 150, Filizzola Ltda, Brazil). We also obtained the weight recorded in the last visit of
prenatal care (36th to 42th week). Height (cm) was measured only in the first trimester using a
portable stadiometer (Seca Ltda, Hamburg, Germany).
Pre-pregnancy body mass index (BMI) [weight (kg)/height2 (m)] was calculated using
the self-reported pre-pregnancy weight, and the postpartum BMI, by using the weight
measured in the early postpartum.

RESULTADOS (Artigo 1)
76
Total GWG (kg) was estimated using the difference between the last weight measured
prior to delivery and the self-reported pre-pregnancy weight. Maternal weight gains up to the
first, second and third trimesters were calculated and divided by the weeks of gestation. In
addition, women were classified according to categories of GWG (insufficient, normal and
excessive) based on the Institute of Medicine (IOM) recommendations [19].
Postpartum weight retention (PPWR) was calculated by the difference between the
early postpartum weight and the self-reported pre-pregnancy weight.
The gestational age (weeks) was estimated based on the first ultrasound performed
prior to the 24th week of gestation. For those without an ultrasound or when the first
ultrasound was performed after the 24th week of gestation, the gestational age was calculated
based on the reported date of the last menstrual period (n=2).
Covariates
Structured interviews were conducted to obtain the following maternal data: maternal
age at baseline (years), self-reported skin color (white/black or mixed), living with partner
(yes/no), education (years of schooling), self-reported pre-pregnancy leisure-time physical
activity (LTPA) (no/yes), smoking habit (non-smoking, former smoker and current smokes),
parity (number of deliveries) and the sex of the child. The total energy intake (kcal/d) was
assessed with a validated food frequency questionnaire (FFQ) [20], which was administered
in the first and third trimesters of the pregnancy.
Genotyping
At baseline visit, blood samples (5 ml) were collected, processed and stored at -80º C
until polymorphisms analysis. DNA was extracted by phenol-chloroform method. SNP
rs17782313 and rs9939609 of the MC4R and FTO genes, respectively, were analyzed by Real
Time PCR amplification (StepOnePlus™, Life Technologies) using an allelic discrimination
assay (TaqMan® Genotyping Master Mix assay, Life Technologies). Duplicates were
performed in 10% of sample with ≥ 99% agreement rates.
Statistical analyses
The continuous variables in asymmetric distributions were expressed as the medians
and interquartile range (IQR), whereas the measurement data in symmetric distributions were

RESULTADOS (Artigo 1)
77
presented as the means and standard deviations (SD) and absolute and relative frequencies to
describe categorical ones.
We employed additive and recessive models for the FTO (rs9939609) gene because
previous studies had demonstrated that one risk allele has little or no effect and two are
required to cross the threshold [10] [12]. We employed only the dominant model for the
MC4R (rs17782313) gene because the number of minor allele homozygotes was small in our
sample (n=4). The participants were further classified into two groups to investigate the
combined effect of MC4R (rs17782313) and FTO (rs9939609): (1) those with at least one risk
allele of each polymorphism or (2) those carrying only one risk allele from one of the
polymorphisms or none of the risk alleles.
Multiple linear regression models were performed to examine the associations
between the changes in maternal body weight, assessed as GWG and PPWR and the maternal
genotypes. In addition, Poisson’s regression with robust variance was used to address the
association between genotypes and GWG categories according to IOM [19] and also with pre-
pregnancy BMI classified into two categories (<25 or ≥25 kg/m²), allowing an estimation of
the relative risks (RR) and it’s 95% confidence interval (95% CI).
Longitudinal linear mixed-effects (LME) models were performed to test the
association between the polymorphisms and weight trajectories during pregnancy. These
models do not assume linear weight gain over the period of gestation but allow for the
gradient of weight across pregnancy. LME models account for random variation among
individuals and between individuals [21], which allows for the estimation of subject-specific
means. These models also account for unbalanced data due to measurements at irregular time
points of observation. Gestational age (weeks) was included in all models both as random and
fixed effects to adjust for variations in weight over time. The FTO/MC4R polymorphisms and
all other covariates were analyzed as fixed-effects. The quadratic gestational age term was
included in all models to adjust for the longitudinal changes in weight during pregnancy that
resemble a parabola. We also tested the interaction term between genotypes and gestational
age to evaluate whether the association between weight and genotypes differed between the
gestational weeks. The dependencies in the data were handled with an unstructured
covariance matrix.
The multivariable analyses were adjusted for potential confounders. Covariates were
chosen as potential confounding factors based on the biological plausibility of the association
and their p-values in the bivariate analysis with each of the outcome variables. All covariates

RESULTADOS (Artigo 1)
78
that presented a p-value ≤0.20 in the bivariate analysis were selected to compose the final
model of each outcome variable in the regression analyses. Because the association between
pre-pregnancy BMI and gestational weight gain is nonlinear, both linear and quadratic terms
were included in the models.
Different models were constructed for each outcome and we used the restricted log-
likelihood and Akaike’s information criterion as global fit criteria to select the best model. A
significance level at 5% was considered in all the analysis. Statistical analyses were
performed using STATA software (version 12.0, College Station, Texas, USA).
Ethical procedures
The study protocol was approved by the Ethics Committee of the Municipality
Secretary of Health of Rio de Janeiro City (Protocol number: 0139.0.314.000-09). All
subjects enrolled in this study gave written informed consent for their participation after an
explanation of the study.
Results
The median age of participants was 27 (IQR: 22 to 31) years old, and 73.5% women
reported as having black or mixed skin color (Table 1).
The genotype frequencies were TT=33.8%, AT=49.3% and AA=16.9% for the FTO
(rs9939609) and TT=64.0%, CT=33.1% and CC=2.9% for the MC4R (rs17782313). These
frequencies were in Hardy–Weinberg equilibrium for both SNPs.
The AA genotype of the FTO (rs9939609) gene, for the additive and recessive models,
was significantly associated with higher pre-pregnancy mean weights (p=0.01; p<0.01,
respectively) and BMI (p<0.01) and with higher gestational body weight at the first (p=0.02;
p=0.01, respectively) and the second (p=0.05; p=0.02, respectively) trimesters in comparison
to the other genotypes, but not with maternal height. Women having the polymorphic MC4R
(rs17782313) genotype did not show any statistically significant difference for pre-pregnancy
weight, BMI or maternal height (Table 1).
Women with the AA genotype of the FTO (rs9939609) gene presented a higher risk of
pre-pregnancy excessive weight compared to those with AT/TT genotypes (RR=2.1; 95%CI
1.4 to 3.1), even after adjustment for maternal pre-pregnancy LTPA, age, skin color,
education, parity, smoking and height (Table 2).
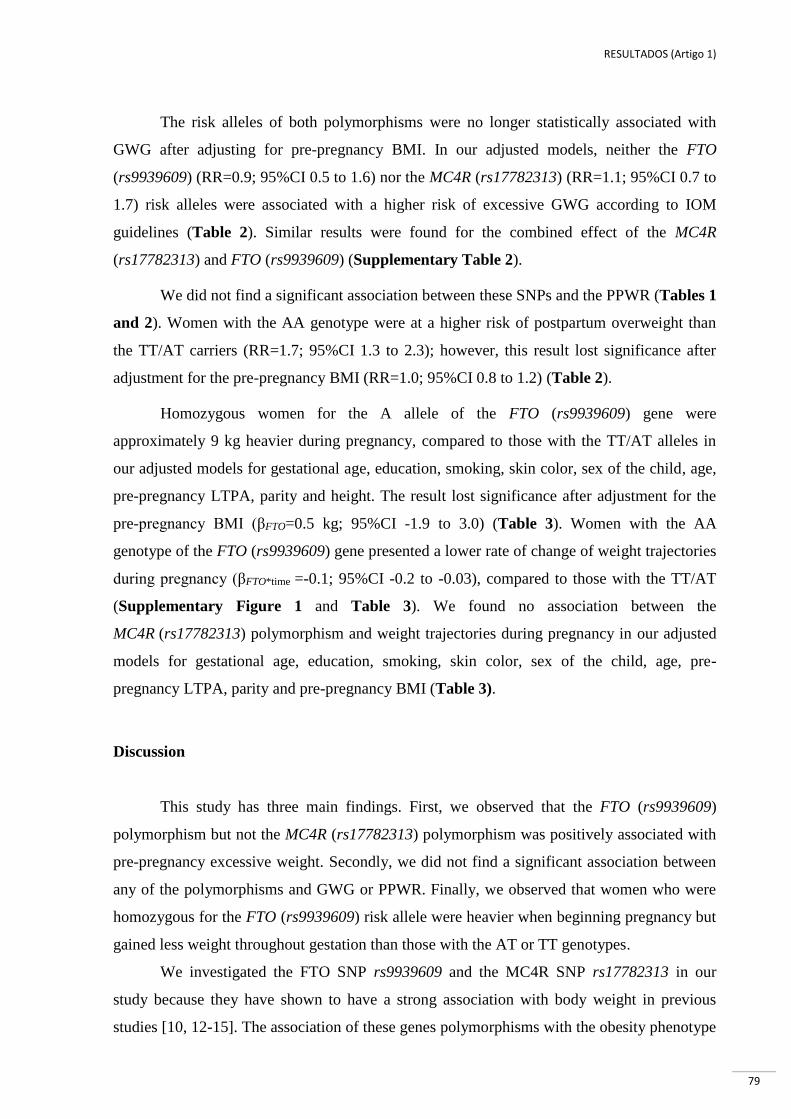
RESULTADOS (Artigo 1)
79
The risk alleles of both polymorphisms were no longer statistically associated with
GWG after adjusting for pre-pregnancy BMI. In our adjusted models, neither the FTO
(rs9939609) (RR=0.9; 95%CI 0.5 to 1.6) nor the MC4R (rs17782313) (RR=1.1; 95%CI 0.7 to
1.7) risk alleles were associated with a higher risk of excessive GWG according to IOM
guidelines (Table 2). Similar results were found for the combined effect of the MC4R
(rs17782313) and FTO (rs9939609) (Supplementary Table 2).
We did not find a significant association between these SNPs and the PPWR (Tables 1
and 2). Women with the AA genotype were at a higher risk of postpartum overweight than
the TT/AT carriers (RR=1.7; 95%CI 1.3 to 2.3); however, this result lost significance after
adjustment for the pre-pregnancy BMI (RR=1.0; 95%CI 0.8 to 1.2) (Table 2).
Homozygous women for the A allele of the FTO (rs9939609) gene were
approximately 9 kg heavier during pregnancy, compared to those with the TT/AT alleles in
our adjusted models for gestational age, education, smoking, skin color, sex of the child, age,
pre-pregnancy LTPA, parity and height. The result lost significance after adjustment for the
pre-pregnancy BMI (βFTO=0.5 kg; 95%CI -1.9 to 3.0) (Table 3). Women with the AA
genotype of the FTO (rs9939609) gene presented a lower rate of change of weight trajectories
during pregnancy (βFTO*time =-0.1; 95%CI -0.2 to -0.03), compared to those with the TT/AT
(Supplementary Figure 1 and Table 3). We found no association between the
MC4R (rs17782313) polymorphism and weight trajectories during pregnancy in our adjusted
models for gestational age, education, smoking, skin color, sex of the child, age, pre-
pregnancy LTPA, parity and pre-pregnancy BMI (Table 3).
Discussion
This study has three main findings. First, we observed that the FTO (rs9939609)
polymorphism but not the MC4R (rs17782313) polymorphism was positively associated with
pre-pregnancy excessive weight. Secondly, we did not find a significant association between
any of the polymorphisms and GWG or PPWR. Finally, we observed that women who were
homozygous for the FTO (rs9939609) risk allele were heavier when beginning pregnancy but
gained less weight throughout gestation than those with the AT or TT genotypes.
We investigated the FTO SNP rs9939609 and the MC4R SNP rs17782313 in our
study because they have shown to have a strong association with body weight in previous
studies [10, 12-15]. The association of these genes polymorphisms with the obesity phenotype

RESULTADOS (Artigo 1)
80
in a multiethnic group such as the Brazilian population has not been previously reported. The
minor allele frequency observed in this study (0.42 and 0.20 for rs9939609 A-allele and
rs17782313 C-allele, respectively) were quite similar to those in the international HapMap
project CEU data (0.45 and 0.26, respectively) and within the range of reported values
in other studies (0.44 and 0.24, respectively) [10, 14].
The mechanisms underlying the physiological relationship between FTO (rs9939609)
and MC4R (rs17782313) and alterations of body weight are yet to be elucidated. It is known
that FTO and MC4R are highly expressed in the hypothalamic region [22, 23], an area that is
known to be involved in the regulation of appetite. Habitual diet is one of the many
environmental factors that potentially contribute to inter-individual differences in body fat
mass. In this study, we did not find significant association between FTO SNP rs9939609 and
MC4R SNP rs17782313 with energy intake, which is in line with the findings of Hasselbalch
et al. [24], but inconsistent with the findings of other studies [25, 26]. The dietary information
collected on our study is based on an extensive self-reported FFQ and several components of
dietary intake were studied.
We identified that pregnant women with the risk alleles (AA) of FTO (rs9939609) had
a higher risk to have pre-pregnancy overweight BMI (RR=2.1 (95%CI 1.4-3.1, p<0.01),
which is consistent with the findings of Lawlor et al. [16] study, where FTO (rs9939609) was
associated with pre-pregnancy BMI. These British pregnant women presented mean
difference per risk allele of 0.40 kg/m2 (95%CI 0.25-0.54). In contrast, Groth et al. [18]
reported that the FTO (rs9939609) risk alleles were not associated with pre-pregnancy BMI in
a study of low-income black pregnant women. Our sample is composed of low-income
women, but the degree of miscegenation in Brazil is very high and the racial/ethnic
composition of this study was based only in self-reported skin color (73.5% black or mixed).
Different populations are exposed to the different environmental and genetic influences that
may interact with genetic variants. On the other hand, our results are consistent with
investigations that have indicated that FTO plays a key role in changes in adiposity-related
phenotypes in populations around the world [12, 13, 27].
In our study, carriers of two copies of the risk allele of FTO (rs9939609) had
significantly higher body weight than the homozygous subjects showing the major allele,
which is in agreement with the results of previous studies [10, 28].
Common variants near MC4R have been reproducibly associated with the fat
mass, weight and risk of obesity [9, 14, 29]. Lawler et al. [16] found no association between
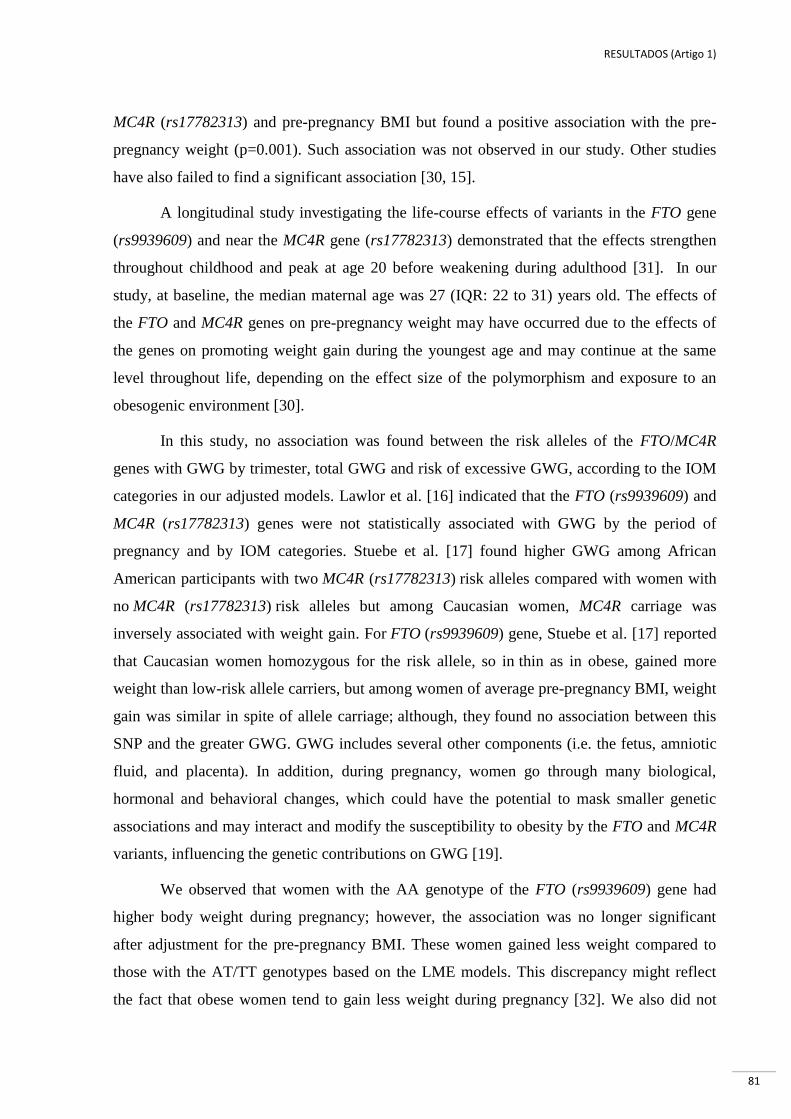
RESULTADOS (Artigo 1)
81
MC4R (rs17782313) and pre-pregnancy BMI but found a positive association with the pre-
pregnancy weight (p=0.001). Such association was not observed in our study. Other studies
have also failed to find a significant association [30, 15].
A longitudinal study investigating the life-course effects of variants in the FTO gene
(rs9939609) and near the MC4R gene (rs17782313) demonstrated that the effects strengthen
throughout childhood and peak at age 20 before weakening during adulthood [31]. In our
study, at baseline, the median maternal age was 27 (IQR: 22 to 31) years old. The effects of
the FTO and MC4R genes on pre-pregnancy weight may have occurred due to the effects of
the genes on promoting weight gain during the youngest age and may continue at the same
level throughout life, depending on the effect size of the polymorphism and exposure to an
obesogenic environment [30].
In this study, no association was found between the risk alleles of the FTO/MC4R
genes with GWG by trimester, total GWG and risk of excessive GWG, according to the IOM
categories in our adjusted models. Lawlor et al. [16] indicated that the FTO (rs9939609) and
MC4R (rs17782313) genes were not statistically associated with GWG by the period of
pregnancy and by IOM categories. Stuebe et al. [17] found higher GWG among African
American participants with two MC4R (rs17782313) risk alleles compared with women with
no MC4R (rs17782313) risk alleles but among Caucasian women, MC4R carriage was
inversely associated with weight gain. For FTO (rs9939609) gene, Stuebe et al. [17] reported
that Caucasian women homozygous for the risk allele, so in thin as in obese, gained more
weight than low-risk allele carriers, but among women of average pre-pregnancy BMI, weight
gain was similar in spite of allele carriage; although, they found no association between this
SNP and the greater GWG. GWG includes several other components (i.e. the fetus, amniotic
fluid, and placenta). In addition, during pregnancy, women go through many biological,
hormonal and behavioral changes, which could have the potential to mask smaller genetic
associations and may interact and modify the susceptibility to obesity by the FTO and MC4R
variants, influencing the genetic contributions on GWG [19].
We observed that women with the AA genotype of the FTO (rs9939609) gene had
higher body weight during pregnancy; however, the association was no longer significant
after adjustment for the pre-pregnancy BMI. These women gained less weight compared to
those with the AT/TT genotypes based on the LME models. This discrepancy might reflect
the fact that obese women tend to gain less weight during pregnancy [32]. We also did not

RESULTADOS (Artigo 1)
82
find an association between the MC4R (rs17782313) polymorphism and weight trajectories
during pregnancy.
We did not observe an association between the FTO (rs9939609) and MC4R
(rs17782313) polymorphisms on the PPWR at <45 days after adjustment for the pre-
pregnancy BMI, which is in agreement with the study by Lawlor et al. [16], where the PPWR
was calculated at approximately 8 weeks after delivery. The PPWR is presumably due to a
combination of several factors, such as dietary intake, lack of physical activity, lactation,
smoking status, pre-pregnancy BMI, GWG and parity [33] and also genetics [4].
Our study has strengths and limitations. The main strength is the availability of
standardized longitudinal weight measurements across pregnancy, which allowed analysis of
the genetic associations with the changes of body weight over time. In addition, we controlled
our results for important confounding variables, such as gestational age, education, smoking,
skin color, pre-pregnancy LTPA, age and parity. On the other hand, some limitations from our
study must be highlighted. We relied on self-reported pre-pregnancy weight as is the case in
most studies of GWG, and misclassification of GWG may not be ruled out as for women who
inaccurately reported their pre-pregnancy weights. However, previous studies have shown
that self-reported pre-pregnancy weight is a good approximation of the true weight [34, 35].
Another limitation of our study is the small sample size, which resulted in a lower power for
detecting a statistically significant effect of the polymorphism in the weight changes during
pregnancy. Besides that, we were able to find that FTO (rs9939609) polymorphism showed
some association with pre-pregnancy BMI, but not with MC4R (rs17782313) polymorphism.
This could be due to the lower power of the study, or indeed, to a real small effect size in this
relationship. Our results agreed in the direction and significance of the association when
compared to the other two studies on the same topic (Lawlor and Stuebe), that definitely
presented a bigger sample size to detect an effect size for the studied polymorphisms [16, 17].
In conclusion, our study found that the SNP in the FTO gene (rs9939609) but not in
the MC4R gene (rs17782313) was significantly associated with pre-pregnancy excessive
weight. However, these women gained less weight throughout gestation than women with the
AT and TT genotypes, and neither of the polymorphisms were statistically associated with
excessive GWG and PPWR. The characterization of effects of the genetic factor implicated in
weight gain during pregnancy and postpartum may potentially guide targeted intervention for
preventing obesity and the avoidance of adverse pregnancy complications. However, further
replications of association studies with different ethnicities and larger cohorts or cohort

RESULTADOS (Artigo 1)
83
consortiums and a sampling strategy that collects additional time points throughout the
pregnancy are necessary to improve our understanding of the specific roles of FTO and MC4R
in gestational weight.

RESULTADOS (Artigo 1)
84
References
[1] Li N, Liu E, Guo J, Pan L, Li B, Wang P, et al. Maternal prepregnancy body mass
index and gestational weight gain on pregnancy outcomes. PloS One 2013;8:e82310.
doi:10.1371/journal.pone.0082310.
[2] Gaillard R, Durmuş B, Hofman A, Mackenbach JP, Steegers EA, Jaddoe VW. Risk
factors and outcomes of maternal obesity and excessive weight gain during pregnancy.
Obesity 2013;21:1046–55.
[3] Mannan M, Doi SA, Mamun AA. Association between weight gain during pregnancy
and postpartum weight retention and obesity: a bias-adjusted meta-analysis. Nutr Rev
2013;71:343–52.
[4] Rong K, Yu K, Han X, Szeto IM, Qin X, Wang J, et al. Pre-pregnancy BMI,
gestational weight gain and postpartum weight retention: a meta-analysis of observational
studies. Public Health Nutr 2015;18:2172–82.
[5] Ng M, Fleming T, Robinson M, Thomson B, Graetz N, Margono C, et al. Global,
regional, and national prevalence of overweight and obesity in children and adults during
1980–2013: a systematic analysis for the Global Burden of Disease Study 2013. The Lancet
2014;384:766–81.
[6] Raatikainen K, Heiskanen N, Heinonen S. Transition from Overweight to Obesity
Worsens Pregnancy Outcome in a BMI-dependent Manner. Obesity 2006;14:165–71.
[7] Warrington NM, Wu YY, Pennell CE, Marsh JA, Beilin LJ, Palmer LJ, et al.
Modelling BMI trajectories in children for genetic association studies. PloS One
2013;8:e53897.
[8] Albuquerque D, Stice E, Rodríguez-López R, Manco L, Nóbrega C. Current review of
genetics of human obesity: from molecular mechanisms to an evolutionary perspective. Mol
Genet Genomics 2015:1–31.
[9] Speliotes EK, Willer CJ, Berndt SI, Monda KL, Thorleifsson G, Jackson AU, et al.
Association analyses of 249,796 individuals reveal 18 new loci associated with body mass
index. Nat Genet 2010;42:937–48.
[10] Frayling TM, Timpson NJ, Weedon MN, Zeggini E, Freathy RM, Lindgren CM, et al.
A common variant in the FTO gene is associated with body mass index and predisposes to
childhood and adult obesity. Science 2007;316:889–94.
[11] Farooqi IS, Keogh JM, Yeo GSH, Lank EJ, Cheetham T, O’Rahilly S. Clinical
spectrum of obesity and mutations in the melanocortin 4 receptor gene. N Engl J Med
2003;348:1085–95. doi:10.1056/NEJMoa022050.
[12] Dina C, Meyre D, Gallina S, Durand E, Körner A, Jacobson P, et al. Variation in FTO
contributes to childhood obesity and severe adult obesity. Nat Genet 2007;39:724–6.

RESULTADOS (Artigo 1)
85
[13] Loos RJ, Yeo GS. The bigger picture of FTO [mdash] the first GWAS-identified
obesity gene. Nat Rev Endocrinol 2014;10:51–61.
[14] Loos RJ, Lindgren CM, Li S, Wheeler E, Zhao JH, Prokopenko I, et al. Common
variants near MC4R are associated with fat mass, weight and risk of obesity. Nat Genet
2008;40:768–75.
[15] Liu G, Zhu H, Dong Y, Podolsky RH, Treiber FA, Snieder H. Influence of common
variants in FTO and near INSIG2 and MC4R on growth curves for adiposity in African– and
European–American youth. Eur J Epidemiol 2011;26:463–73. doi:10.1007/s10654-011-9583-
4.
[16] Lawlor DA, Fraser A, Macdonald-Wallis C, Nelson SM, Palmer TM, Smith GD, et al.
Maternal and offspring adiposity-related genetic variants and gestational weight gain. Am J
Clin Nutr 2011;94:149–55.
[17] Stuebe AM, Lyon H, Herring AH, Ghosh J, Wise A, North KE, et al. Obesity and
diabetes genetic variants associated with gestational weight gain. Am J Obstet Gynecol
2010;203:283.e1–283.e17.
[18] Groth SW, Morrison-Beedy D. GNB3 and FTO Polymorphisms and Pregnancy
Weight Gain in Black Women. Biol Res Nurs 2015;17:405–12.
doi:10.1177/1099800414561118.
[19] Institute of Medicine (US) and National Research Council (US) Committee to
Reexamine IOM Pregnancy Weight Guidelines. Weight Gain During Pregnancy:
Reexamining the Guidelines. Washington (DC): National Academies Press (US); 2009.
[20] Sichieri R, Everhart JE. Validity of a Brazilian food frequency questionnaire against
dietary recalls and estimated energy intake. Nutr Res 1998;18:1649–59.
[21] Verbeke G, Molenberghs G. Linear mixed models for longitudinal data. Springer
Science & Business Media; 2009.
[22] Gerken T, Girard CA, Tung Y-CL, Webby CJ, Saudek V, Hewitson KS, et al. The
Obesity-Associated FTO Gene Encodes a 2-Oxoglutarate-Dependent Nucleic Acid
Demethylase. Science 2007;318:1469–72. doi:10.1126/science.1151710.
[23] Tao Y-X. The melanocortin-4 receptor: physiology, pharmacology, and
pathophysiology. Endocr Rev 2010;31:506–43. doi:10.1210/er.2009-0037.
[24] Hasselbalch AL, Angquist L, Christiansen L, Heitmann BL, Kyvik KO, Sørensen TIA.
A variant in the fat mass and obesity-associated gene (FTO) and variants near the
melanocortin-4 receptor gene (MC4R) do not influence dietary intake. J Nutr 2010;140:831–
4. doi:10.3945/jn.109.114439.
[25] Speakman JR, Rance KA, Johnstone AM. Polymorphisms of the FTO Gene Are
Associated With Variation in Energy Intake, but not Energy Expenditure. Obesity
2008;16:1961–5. doi:10.1038/oby.2008.318.

RESULTADOS (Artigo 1)
86
[26] Qi L, Kraft P, Hunter DJ, Hu FB. The common obesity variant near MC4R gene is
associated with higher intakes of total energy and dietary fat, weight change and diabetes risk
in women. Hum Mol Genet 2008;17:3502–8. doi:10.1093/hmg/ddn242.
[27] Hallman DM, Friedel VC, Eissa MA, Boerwinkle E, Huber JC, Harrist RB, et al. The
association of variants in the FTO gene with longitudinal body mass index profiles in non-
Hispanic white children and adolescents. Int J Obes 2012;36:61–8.
[28] Sentinelli F, Incani M, Coccia F, Capoccia D, Cambuli VM, Romeo S, et al.
Association of FTO Polymorphisms with Early Age of Obesity in Obese Italian Subjects. J
Diabetes Res 2012;2012:e872176. doi:10.1155/2012/872176.
[29] Willer CJ, Speliotes EK, Loos RJ, Li S, Lindgren CM, Heid IM, et al. Six new loci
associated with body mass index highlight a neuronal influence on body weight regulation.
Nat Genet 2009;41:25–34.
[30] Vasan SK, Fall T, Neville MJ, Antonisamy B, Fall CH, Geethanjali FS, et al.
Associations of Variants in FTO and Near MC4R With Obesity Traits in South Asian Indians.
Obesity 2012;20:2268–77. doi:10.1038/oby.2012.64.
[31] Hardy R, Wills AK, Wong A, Elks CE, Wareham NJ, Loos RJ, et al. Life course
variations in the associations between FTO and MC4R gene variants and body size. Hum Mol
Genet 2010;19:545–52.
[32] Chu SY, Callaghan WM, Bish CL, D’Angelo D. Gestational weight gain by body
mass index among US women delivering live births, 2004-2005: fueling future obesity. Am J
Obstet Gynecol 2009;200:271.e1–217.e7.
[33] Gunderson EP, Abrams B. Epidemiology of Gestational Weight Changes After
Pregnancy. Epidemiol Rev 2000;22:261–74.
[34] Park S, Sappenfield WM, Bish C, Bensyl DM, Goodman D, Menges J. Reliability and
validity of birth certificate prepregnancy weight and height among women enrolled in
prenatal WIC program: Florida, 2005. Matern Child Health J 2011;15:851–9.
[35] Shin D, Chung H, Weatherspoon L, Song WO. Validity of prepregnancy weight status
estimated from self-reported height and weight. Matern Child Health J 2014;18:1667–74.

RESULTADOS (Artigo 1)
87
Figure 1 - Flowchart illustrating the recruitment and selection of the study population
Pregnant women at enrollment: 299
Folow-up: 259 participants
225 participants
203 participants of the current study
Final sample136 participants included in study with FTO and MC4R data
64 did not have blood samples forgenotyping and 03 had onlygenotiping for one of thepolymorphisms.
Miscarriage [n=25]
Stillbirth [n=05]
Losses to follow-up: only information at baseline [n=09].
Twin pregnancies [n=4]
40 did not meet eligibility criteria: confirmed pre-gestationalinfection diagnosis or noncommunicable diseases [n=14], >13gestational weeks at enrollment [n=16] or abandoned prenatal careat the public health center [n=10].
13 Missing data: did not attendbaseline visit [05], missing self-reported pre-pregnancy weight[n=08].

RESULTADOS (Artigo 1)
88
Table 1 - Maternal characteristics according to the FTO (rs9939609) and the MC4R (rs17782313) gene polymorphisms
Characteristic N
Total
FTO (rs9939609)
MC4R (rs17782313)
Recessive model Additive model Dominant model
TT/AT AA p-value TT AT AA p TT CT/CC p-value
Descriptive
Maternal age1, years 136
27 (22 to 31) 27 (23 to 31) 24 (22 to 32) 0.36 27 (23 to 31) 27 (22 to 31) 24 (22 to 32) 0.60 27 (22 to 32) 27 (22 to 31) 0.90
Self-reported skin color2 136
Black or mixed 100 (73.5) 85 (75.2) 15 (65.2) 0.32 32 (69.6) 53 (79.1) 15 (65.2) 0.32 651(70.1) 39 (79.6) 0.23
Education1, years 136 9 (6 to 11) 9 (6 to 11) 9 (7 to 11) 0.96 8.5 (5 to 11) 10 (7 to 11) 9 (7 to 11) 0.12 10 (6 to 11) 9 (6 to 11) 0.73
Living with partner2 136
Yes 111 (81.6) 93 (82.3) 18 (78.3) 0.77 41 (89.1) 52 (77.6) 18 (78.3) 0.26 71 (81.6) 40 (81.6) 0.99
Smoking habit at baseline2 136
Non-smoking 97 (71.3) 80 (70.8) 17 (73.9) 0.76 31 (67.4) 49 (73.1) 17 (73.9) 0.77 61 (70.1) 36 (73.5) 0.68
Pre-pregnancy LTPA2 134
No 108 (80.6) 88 (79.3) 20 (87.0) 0.56 36 (80.0) 52 (78.8) 20 (87.0) 0.69 67 (78.8) 41 (83.7) 0.49
Parity2 136
0 55 (40.4) 45 (39.8) 10 (43.5)
0.38
16 (34.8) 29 (43.3) 10 (43.5)
0.59
39 (44.8) 16 (32.6)
0.18 1 45 (33.1) 40 (35.4) 5 (21.7) 17 (37.0) 23 (34.3) 5 (21.7) 24 (27.6) 21 (42.9)
≥2 36 (26.5) 28 (24.8) 8 (34.8) 13 (28.2) 15 (22.4) 8 (34.8) 24 (27.6) 12 (24.5)
Sex of the child2 134
Male 64 (47.8) 54 (48.2) 10 (45.5) 0.81 18 (40.0) 36 (53.7) 10 (45.4) 0.35 48 (55.8) 16 (33.3) 0.01
Calorie intake1, kcal/d 133 2279.7
(1895.1 to
2641.7)
2251.6 (1905.7 to
2610.7)
2567.5 (1648.5 to
2995.7)
0.51 2397.2
(1897.2 to
2713.8)
2199.1 (1963.8 to
2590.7)
2567.5 (1648.5 to
2995.7)
0.70 2361.8
(1883.1 to
2713.8)
2186.4 (1907.6 to
2609.3)
0.68
Self-reported pre-pregnancy weight3, kg 136 62.7 + 12.9 61.2 + 12.3 70.1 + 13.4 <0.01 61.8 + 11.4 60.7 + 13.0 70.1 + 13.4 0.01 61.5 + 13.0 64.7 + 12.6 0.16
Maternal height3, cm 136 159.5 + 6.5 159.4 + 6.4 160.1 + 6.8 0.62 159.9 + 6.2 159.1 + 6.6 160.1 + 6.8 0.72 158.9 + 5.8 160.7 + 7.5 0.12
Pre-pregnancy BMI3, kg/m2 136 24.6 + 4.5 24.0 + 4.2 27.4 + 5.3 <0.01 24.1 + 4.1b 23.9 + 4.3b 27.4 + 5.3a <0.01 24.3 + 4.9 25.0 + 3.9 0.43
Pregnancy weight in 1st trimester3, kg 136 63.8 + 12.5 62.5 + 12.1 70.2 + 12.8 0.01 62.7 + 11.4b 62.4 + 12.7b 70.2 + 12.8a 0.02 62.8 + 12.5 65.7 + 12.4 0.19
Pregnancy weight in 2nd trimester3, kg 128 68.6 + 12.2 67.4 + 12.0 74.1 + 12.0 0.02 68.4 + 11.6 66.7 + 12.4 74.1 + 12.0 0.05 67.4 + 11.9 70.7 + 12.7 0.14
Pregnancy weight in 3rd trimester 3, kg 135 75.3 + 12.5 74.4 + 12.6 79.7 + 11.0 0.06 75.0 + 11.6 73.9 + 13.3 79.7 + 11.1 0.16 74.4 + 11.9 76.8 + 13.5 0.30
Postpartum weight retention3, kg 122 3.9 + 5.4 4.2 + 5.2 2.4 + 6.3 0.18 3.8 + 5.1 4.4 + 5.4 2.4 + 6.3 0.36 4.3 + 5.4 3.2 + 5.5 0.26
Abbreviations: FTO - fat mass and obesity-associated gene; MC4R - melanocortin-4 receptor gene; LTPA - leisure time physical activity; BMI - body mass index.
Data are presented as: 1median (IQR), p-value refers to Mann-Whitney U test or Kruskal-Wallis; 2absolute frequency (%), p-value refers to Pearson χ2 tests or Fisher's exact test; 3mean + SD, p-value refers to Student's t test or analysis of variance (ANOVA). Different letters in the same row indicate significant differences (Tukey's test p < 0.05).

RESULTADOS (Artigo 1)
89
Table 2 - Associations of adiposity risk alleles (FTO and MC4R) with body weight changes before, during pregnancy and early postpartum
FTO recessive model (rs9939609) risk alleles (AA) MC4R dominant model (rs17782313) risk alleles (CT/CC)
Characteristics Crude Adjusted Crude Adjusted
Model 1 Model 2 Model 1 Model 2
β (95% CI) β (95% CI) β (95% CI) β (95% CI) β (95% CI) β (95% CI)
GWG in 1st trimester1, g/wk -163.4 (-345.5 to 18.7) -168.5 (-358.0 to 21.0) -74.4 (-265.6 to 116.8) 10.5 (-131.2 to 152.2) 43.9 (-105.7 to 193.5) 93.7 (-52.3 to 239.6)
GWG in 2nd trimester1, g/wk -94.8 (-196.1 to 6.5) -100.1 (-205.4 to 5.2) -56.8 (-162.1 to 48.5) -2.4 (-82.9 to 78.0) 33.2 (-50.9 to 117.3) 40.2 (-41.4 to 121.7)
GWG in 3rd trimester1, g/wk -85.0 (-184.5 to 14.5) -77.6 (-178.5 to 23.4) -90.9 (-196.3 to 14.6) 25.6 (-53.8 to 104.9) 36.9 (-43.4 to 117.1) 26.0 (-56.2 to 108.2)
Total GWG1, kg -3.6 (-6.2 to -1.1)* -3.4 (-6.1 to -0.7)* -1.9 (-4.5 to 0.7) -0.8 (-2.8 to 1.3) -0.1 (-2.2 to 2.1) 0.3 (-1.7 to 2.4)
PPWR2†, g/wk -505.9 (-1064.4 to 52.6) -474.2 (-1057.5 to 109.0) 131.2 (-166.6 to 428.9) -265.8 (-690.4 to 158.8) -170.4 (-611.0 to 270.2) -80.0 (-298.9 to 138.9)
RR pre-pregnancy BMI3 ‡
overweight (BMI ≥25 kg/m2) 2.2 (1.4 to 3.2)** 2.1 (1.4 to 3.1)** 2.1 (1.4 to 3.1)** 1.0 (0.6 to 1.6) 1.1 (0.7 to 1.7) 1.1 (0.7 to 1.7)
RR total GWG by IOM category4 ‡
insufficienta 0.8 (0.5 to 1.5) 0.8 (0.5 to 1.4) 0.8 (0.4 to 1.5) 0.9 (0.6 to 1.3) 0.9 (0.5 to 1.5) 0.9 (0.5 to 1.4)
excessiveb 1.0 (0.5 to 1.7) 1.0 (0.6 to 1.7) 0.9 (0.5 to 1.6) 1.0 (0.7 to 1.5) 1.1 (0.7 to 1.7) 1.1 (0.7 to 1.7)
RR postpartum BMI5 ‡
overweight (BMI ≥25 kg/m2) 1.7 (1.3 to 2.2)** 1.7 (1.3 to 2.3)** 1.0 (0.8 to 1.2) 1.1 (0.8 to 1.5) 1.2 (0.8 to 1.6) 0.9 (0.7 to 1.2)
Abbreviations: FTO - fat mass and obesity-associated gene; MC4R - melanocortin-4 receptor; GWG - gestational weight gain; CI - confidence interval; RR - relative risk; PPWR - postpartum
weight retention. *p<0.05; **p<0.01 † Calculated as the difference between post- and pre-pregnancy weights and adjusted for weeks since birth. ‡ Note that estimates in this row is relative risk (RR); Wald tests were used to derive the p values. 1Model 1 was adjusted for sex of the child, pre-pregnancy LTPA, maternal age, skin color self-reported, parity and gestational age; Model 2= Model 1 plus pre-pregnancy BMI (linear and
quadratic terms). 2Model 1 was adjusted for sex of the child, pre-pregnancy LTPA, maternal age, skin color self-reported and parity; Model 2= Model 1 plus total weight gain. 3Model 1 was adjusted for pre-pregnancy LTPA, maternal age, skin color self-reported, years of education, parity and smoking maternal status; Model 2= Model 1 plus maternal height. 4Model 1 was adjusted for sex of the child, pre-pregnancy LTPA, maternal age, skin color self-reported and parity; Model 2= Model 1 plus pre-pregnancy BMI (linear and quadratic terms). 5Model 1 was adjusted for pre-pregnancy LTPA, maternal age, skin color self-reported, years of education, parity and smoking maternal status; Model 2= Model 1 plus pre-pregnancy BMI
(linear and quadratic terms). aPre-pregnancy BMI: 18.5-24.9 kg/m2 (GWG <11.5 kg); 25.0-29.9 kg/m2 (GWG <7.0 kg); ≥ 30.0 kg/m2 (GWG <5.0 kg). bPre-pregnancy BMI: 18.5-24.9 kg/m2 (GWG >16.0 kg); 25.0-29.9 kg/m2 (GWG >11.5 kg); ≥ 30.0 kg/m2 (GWG >9.0 kg).
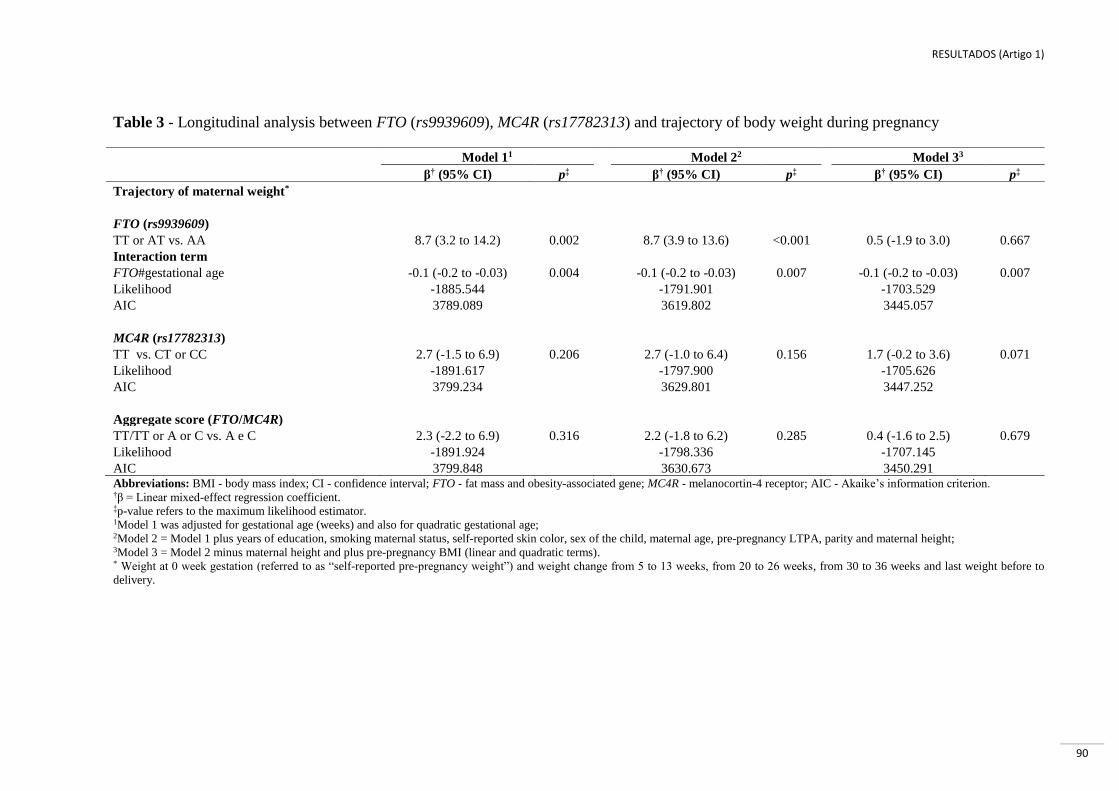
RESULTADOS (Artigo 1)
90
Table 3 - Longitudinal analysis between FTO (rs9939609), MC4R (rs17782313) and trajectory of body weight during pregnancy
Model 11 Model 22 Model 33
β† (95% CI) p‡ β† (95% CI) p‡ β† (95% CI) p‡
Trajectory of maternal weight*
FTO (rs9939609)
TT or AT vs. AA 8.7 (3.2 to 14.2) 0.002 8.7 (3.9 to 13.6) <0.001 0.5 (-1.9 to 3.0) 0.667
Interaction term
FTO#gestational age -0.1 (-0.2 to -0.03) 0.004 -0.1 (-0.2 to -0.03) 0.007 -0.1 (-0.2 to -0.03) 0.007
Likelihood -1885.544 -1791.901 -1703.529
AIC 3789.089 3619.802 3445.057
MC4R (rs17782313)
TT vs. CT or CC 2.7 (-1.5 to 6.9) 0.206 2.7 (-1.0 to 6.4) 0.156 1.7 (-0.2 to 3.6) 0.071
Likelihood -1891.617 -1797.900 -1705.626
AIC 3799.234 3629.801 3447.252
Aggregate score (FTO/MC4R)
TT/TT or A or C vs. A e C 2.3 (-2.2 to 6.9) 0.316 2.2 (-1.8 to 6.2) 0.285 0.4 (-1.6 to 2.5) 0.679
Likelihood -1891.924 -1798.336 -1707.145
AIC 3799.848 3630.673 3450.291 Abbreviations: BMI - body mass index; CI - confidence interval; FTO - fat mass and obesity-associated gene; MC4R - melanocortin-4 receptor; AIC - Akaike’s information criterion. †β = Linear mixed-effect regression coefficient. ‡p-value refers to the maximum likelihood estimator. 1Model 1 was adjusted for gestational age (weeks) and also for quadratic gestational age; 2Model 2 = Model 1 plus years of education, smoking maternal status, self-reported skin color, sex of the child, maternal age, pre-pregnancy LTPA, parity and maternal height; 3Model 3 = Model 2 minus maternal height and plus pre-pregnancy BMI (linear and quadratic terms). * Weight at 0 week gestation (referred to as “self-reported pre-pregnancy weight”) and weight change from 5 to 13 weeks, from 20 to 26 weeks, from 30 to 36 weeks and last weight before to
delivery.
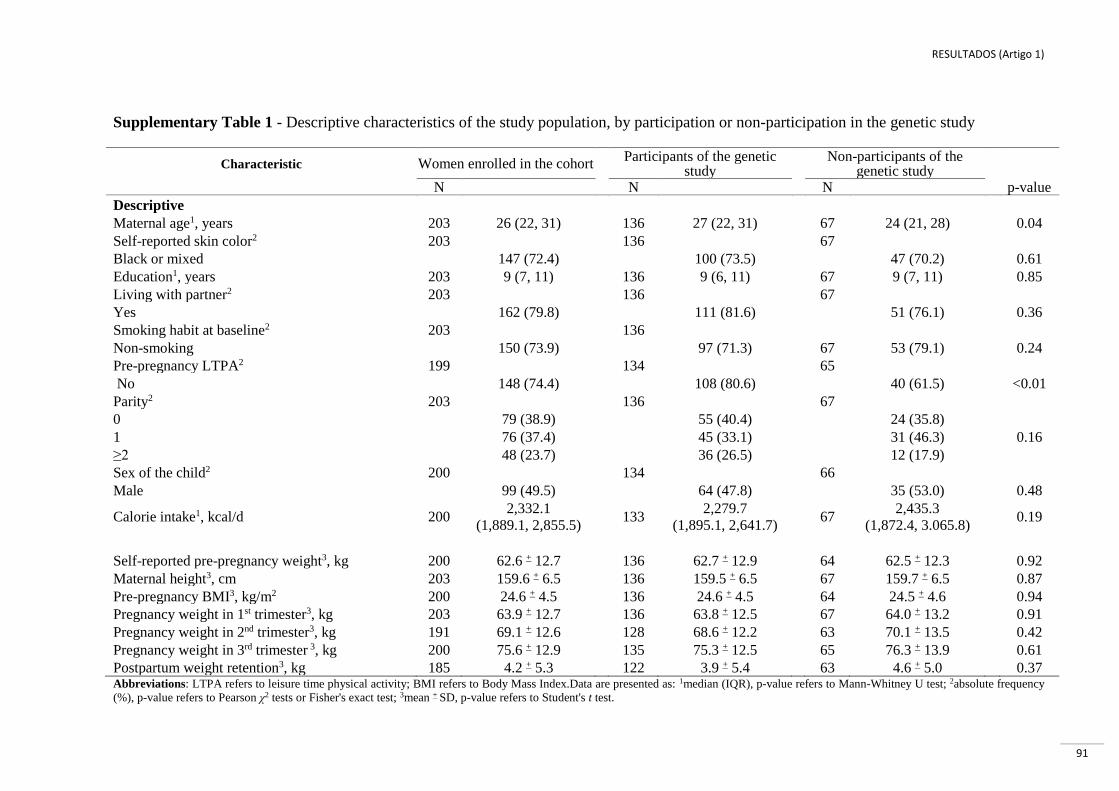
RESULTADOS (Artigo 1)
91
Supplementary Table 1 - Descriptive characteristics of the study population, by participation or non-participation in the genetic study
Characteristic Women enrolled in the cohort Participants of the genetic
study
Non-participants of the genetic study
N N N p-value
Descriptive
Maternal age1, years 203 26 (22, 31) 136 27 (22, 31) 67 24 (21, 28) 0.04
Self-reported skin color2 203 136 67
Black or mixed 147 (72.4)
100 (73.5) 47 (70.2) 0.61
Education1, years 203 9 (7, 11) 136 9 (6, 11) 67 9 (7, 11) 0.85
Living with partner2 203 136 67
Yes 162 (79.8)
111 (81.6) 51 (76.1) 0.36
Smoking habit at baseline2 203 136
Non-smoking 150 (73.9)
97 (71.3) 67 53 (79.1) 0.24
Pre-pregnancy LTPA2 199 134 65
No 148 (74.4) 108 (80.6) 40 (61.5) <0.01
Parity2 203 136 67
0 79 (38.9) 55 (40.4) 24 (35.8)
1 76 (37.4) 45 (33.1) 31 (46.3) 0.16
≥2 48 (23.7) 36 (26.5) 12 (17.9)
Sex of the child2 200 134 66
Male 99 (49.5) 64 (47.8) 35 (53.0) 0.48
Calorie intake1, kcal/d 200 2,332.1
(1,889.1, 2,855.5) 133
2,279.7
(1,895.1, 2,641.7) 67
2,435.3
(1,872.4, 3.065.8) 0.19
Self-reported pre-pregnancy weight3, kg 200 62.6 + 12.7 136 62.7 + 12.9 64 62.5 + 12.3 0.92
Maternal height3, cm 203 159.6 + 6.5 136 159.5 + 6.5 67 159.7 + 6.5 0.87
Pre-pregnancy BMI3, kg/m2 200 24.6 + 4.5 136 24.6 + 4.5 64 24.5 + 4.6 0.94
Pregnancy weight in 1st trimester3, kg 203 63.9 + 12.7 136 63.8 + 12.5 67 64.0 + 13.2 0.91
Pregnancy weight in 2nd trimester3, kg 191 69.1 + 12.6 128 68.6 + 12.2 63 70.1 + 13.5 0.42
Pregnancy weight in 3rd trimester 3, kg 200 75.6 + 12.9 135 75.3 + 12.5 65 76.3 + 13.9 0.61
Postpartum weight retention3, kg 185 4.2 + 5.3 122 3.9 + 5.4 63 4.6 + 5.0 0.37 Abbreviations: LTPA refers to leisure time physical activity; BMI refers to Body Mass Index.Data are presented as: 1median (IQR), p-value refers to Mann-Whitney U test; 2absolute frequency
(%), p-value refers to Pearson χ2 tests or Fisher's exact test; 3mean + SD, p-value refers to Student's t test.
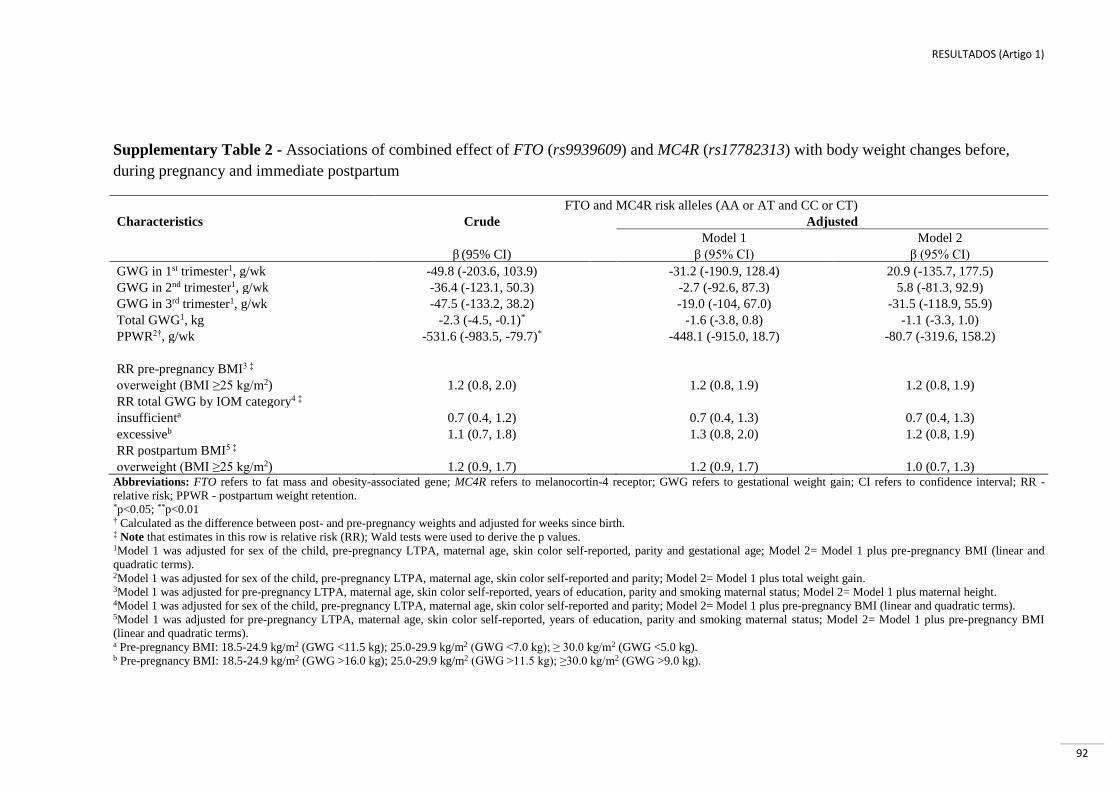
RESULTADOS (Artigo 1)
92
Supplementary Table 2 - Associations of combined effect of FTO (rs9939609) and MC4R (rs17782313) with body weight changes before,
during pregnancy and immediate postpartum
FTO and MC4R risk alleles (AA or AT and CC or CT)
Characteristics Crude Adjusted
Model 1 Model 2
β (95% CI) β (95% CI) β (95% CI)
GWG in 1st trimester1, g/wk -49.8 (-203.6, 103.9) -31.2 (-190.9, 128.4) 20.9 (-135.7, 177.5)
GWG in 2nd trimester1, g/wk -36.4 (-123.1, 50.3) -2.7 (-92.6, 87.3) 5.8 (-81.3, 92.9)
GWG in 3rd trimester1, g/wk -47.5 (-133.2, 38.2) -19.0 (-104, 67.0) -31.5 (-118.9, 55.9)
Total GWG1, kg -2.3 (-4.5, -0.1)* -1.6 (-3.8, 0.8) -1.1 (-3.3, 1.0)
PPWR2†, g/wk -531.6 (-983.5, -79.7)* -448.1 (-915.0, 18.7) -80.7 (-319.6, 158.2)
RR pre-pregnancy BMI3 ‡
overweight (BMI ≥25 kg/m2) 1.2 (0.8, 2.0) 1.2 (0.8, 1.9) 1.2 (0.8, 1.9)
RR total GWG by IOM category4 ‡
insufficienta 0.7 (0.4, 1.2) 0.7 (0.4, 1.3) 0.7 (0.4, 1.3)
excessiveb 1.1 (0.7, 1.8) 1.3 (0.8, 2.0) 1.2 (0.8, 1.9)
RR postpartum BMI5 ‡
overweight (BMI ≥25 kg/m2) 1.2 (0.9, 1.7) 1.2 (0.9, 1.7) 1.0 (0.7, 1.3) Abbreviations: FTO refers to fat mass and obesity-associated gene; MC4R refers to melanocortin-4 receptor; GWG refers to gestational weight gain; CI refers to confidence interval; RR -
relative risk; PPWR - postpartum weight retention. *p<0.05; **p<0.01 † Calculated as the difference between post- and pre-pregnancy weights and adjusted for weeks since birth. ‡ Note that estimates in this row is relative risk (RR); Wald tests were used to derive the p values. 1Model 1 was adjusted for sex of the child, pre-pregnancy LTPA, maternal age, skin color self-reported, parity and gestational age; Model 2= Model 1 plus pre-pregnancy BMI (linear and
quadratic terms). 2Model 1 was adjusted for sex of the child, pre-pregnancy LTPA, maternal age, skin color self-reported and parity; Model 2= Model 1 plus total weight gain. 3Model 1 was adjusted for pre-pregnancy LTPA, maternal age, skin color self-reported, years of education, parity and smoking maternal status; Model 2= Model 1 plus maternal height. 4Model 1 was adjusted for sex of the child, pre-pregnancy LTPA, maternal age, skin color self-reported and parity; Model 2= Model 1 plus pre-pregnancy BMI (linear and quadratic terms). 5Model 1 was adjusted for pre-pregnancy LTPA, maternal age, skin color self-reported, years of education, parity and smoking maternal status; Model 2= Model 1 plus pre-pregnancy BMI
(linear and quadratic terms). a Pre-pregnancy BMI: 18.5-24.9 kg/m2 (GWG <11.5 kg); 25.0-29.9 kg/m2 (GWG <7.0 kg); ≥ 30.0 kg/m2 (GWG <5.0 kg). b Pre-pregnancy BMI: 18.5-24.9 kg/m2 (GWG >16.0 kg); 25.0-29.9 kg/m2 (GWG >11.5 kg); ≥30.0 kg/m2 (GWG >9.0 kg).

RESULTADOS (Artigo 1)
93
Supplementary Figure 1 - Trajectory of body weight during pregnancy by FTO (rs9939609)
polymorphism
Note: β (95% CI): -0.1 (-0.2 to -0.03); p=0.007
a) TT or AT genotypes (n=113) and AA genotype (n=23).
b) Fitted values were predicted using a linear mixed-effect (LME) regression model adjusted for
gestational age (linear and quadratic terms), years of education, smoking maternal status, self-reported
skin color, sex of the child, maternal age, self-reported pre-pregnancy leisure-time physical activity,
parity and pre-pregnancy BMI (linear and quadratic terms).
c) Weight at 0 week gestation (referred to as “self-reported pre-pregnancy weight”) and weight change
from 5 to 13 weeks, from 20 to 26 weeks, from 30 to 36 weeks and last weight before to delivery.

RESULTADOS (Artigo 2)
94
7.2 ARTIGO 2.
LEPTIN (RS7799039) AND LEPTIN RECEPTOR (RS1137101) GENE POLYMORPHISMS
AND BODY WEIGHT CHANGES AND LEPTIN CONCENTRATIONS THROUGHOUT
PREGNANCY
Aceito para publicação no periódico Nutrition Research em 2017
ABSTRACT
Leptin gene (LEP) and leptin receptor gene (LEPR) polymorphisms have been associated
with body weight and leptin concentration. We hypothesized that LEP-rs7799039 and LEPR-
rs1137101 genes are related to risk of pre-pregnancy overweight/obesity (BMI ≥ 25 kg/m2),
as well as excessive gestational weight gain (GWG) and high concentrations of leptin
throughout pregnancy. We investigated a prospective cohort of 147 Brazilian pregnant
women that was followed through 5-13, 20-26 and 30-36 gestational weeks. Genetic variants
of the LEP and LEPR were analyzed by real-time PCR and leptin by enzyme linked
immunosorbent assay. Maternal body weight and plasma leptin concentrations were measured
throughout pregnancy. Statistical analyses included multiple linear regression, linear mixed-
effects and Poisson regression models. Genotype AA carriers for the LEP-rs7799039 gene
kept lower body weight throughout pregnancy compared to those with GG or GA+GG
carriers ([βAAvsGG= -7.91 kg; 95% CI, -14.21 to -1.61, p=0.01]; [βAAvsGA+GG= -7.66 kg;
95%CI, -14.07 to -1.25, p=0.02]). The A-allele was significantly associated with an increased
risk for excessive GWG ([RRLEP-GAvsGG, 2.16; 95% CI, 1.23 – 3.80]; [RRLEP-AAvsGG,
2.37; 95% CI, 1.04 – 5.39]). Neither LEP-rs7799039 nor LEPR-rs1137101 polymorphisms
were significantly associated with pre-pregnancy overweight/obesity risk and leptin
concentrations throughout pregnancy. In conclusion, our results indicate that women carriers
of AA genotype for LEP-rs7799039 displayed lower body weight throughout pregnancy
compared to those that were GG or GA+GG carriers. LEP-rs7799039 was significantly
associated with an increased risk for excessive GWG, but the results do not support
significant associations of the LEP-rs7799039 and LEPR-rs1137101 with pre-pregnancy
overweight/obesity risk and leptin concentrations throughout pregnancy.
Keywords: Polymorphisms, leptin, pregnancy, body weight gain, cohort study

RESULTADOS (Artigo 2)
95
1. INTRODUCTION
Obesity is currently considered to be one of the major public health problems
worldwide. Consequently, the number of overweight women is increasing and has already
reached 40% of the overall female population, while 15% were classified as obese in 2014
[1]. Inevitably, the number of women entering pregnancy with obesity is also rising. Higher
maternal body weight before pregnancy and excessive gestational weight gain (GWG) results
in a significant increase in pregnancy adverse outcomes, including preeclampsia, gestational
diabetes mellitus, cesarean delivery, postpartum complications [2] and a greater risk of
maternal mortality [3].
With the rise of obesity prevalence, molecular epidemiology studies have evaluated
the association of different genetic polymorphisms in genes such as FTO, MC4R, PPARG,
ADBR2, INSIG2, with the risk of obesity [4,5]. Several single nucleotide polymorphisms
(SNPs) of adipokine genes, such as leptin (LEP) and leptin receptor (LEPR), are studied
because they interact at the central level, particularly in the hypothalamus. The LEP-
rs7799039 SNP is a G to A transition at nucleotide position -2548 upstream of the ATG start
site in the LEP gene 5′ promoter region [6] and the A-allele has been associated with
increased leptin production and secretion from adipocytes as compared with the G allele [7].
The LEPR-rs1137101 SNP is an A to G transition in codon 223 (CAG to CGG) at position
668 in exon 6, and causes a non-conservative change (glutamine to arginine) [8] and
potentially a disruption in the leptin-signaling pathway, contributing to the impact on body
weight [9].
Leptin has important effects in controlling body weight, metabolism [10] and
reproductive functions [11]. Therefore, it could be anticipated that genetic variations in the
leptin gene can modulate its circulating levels and may affect various pathophysiological
states, one of which is obesity [12]. It is secreted predominantly by adipocytes in white
adipose tissue [13], but during pregnancy leptin is also synthesized by the placenta [14] and
its levels are much higher during pregnancy than that of non-pregnant women [15]. In
pregnant women, studies have demonstrated an association between serum leptin
concentrations and pre-pregnancy body mass index (BMI) [16], and GWG [13], indicating
that mechanisms mediating leptin/leptin receptor synthesis may be sensitive to the fluctuation
of maternal weight as the pregnancy progresses.
Although some studies have demonstrated significant associations between SNPs of
LEP and LEPR genes and body weight [6,17] and leptin concentrations [12,18] in the adult
RESULTADOS (Artigo 2)
96
population, little is known about associations of these polymorphisms with pre-pregnancy
weight, GWG and plasma repeated measure leptin concentrations throughout pregnancy. The
hypothesis of the present study is that the SNPs in the LEP-rs7799039 and LEPR-rs1137101
genes are related to the risk of pre-pregnancy overweight/obesity, as well as excessive GWG
and high concentrations of leptin throughout pregnancy. Therefore, the aims of this study
were to (1) assess whether LEP-rs7799039 and LEPR-rs1137101 SNPs can influence the pre-
pregnancy body weight and GWG, and further (2) verify whether these SNPs can influence
the leptin concentrations throughout pregnancy in a prospective cohort of Brazilian pregnant
women.
2. METHODS AND MATERIALS
2.1. Research design
We analyzed data from a prospective cohort of pregnant women who received prenatal
care at a public health center in the city of Rio de Janeiro from November 2009 to October
2011. Data were collected over three visits during pregnancy: 5 to 13 (baseline), 20 to 26 and
30 to 36 gestational weeks (GW).
2.2. Subjects
A total of 299 pregnant women were enrolled in the study if they were between 5 and
13 GW, between 20 and 40 years of age, devoid of any history of infectious or non-
communicable chronic diseases (NCDs) (except obesity), and had the intention to attend the
prenatal care in the selected public health center. Following the baseline clinical evaluation,
women were excluded for several reasons. Thus, the baseline sample consisted of 147
pregnant women (143 participants with LEP and LEPR SNPs, two with only LEP and two
with only LEPR SNPs). A subsample of pregnant women participated in a clinical trial nested
within the main cohort with omega-3 supplementation (fish oil) after the second trimester
(n=36). Therefore, we excluded from the analysis the plasma leptin concentration data from
these women in the third trimester. We also excluded these women from the longitudinal and
GWG analysis (Figure 1).

RESULTADOS (Artigo 2)
97
The ethics committee of the Municipality Secretary of Health of Rio de Janeiro City
(Protocol number: 0139.0.314.000-09, 13 August 2009) approved the study. Written informed
consent was obtained from the study participants. All ethical procedures of this study
involving human beings followed the Brazilian Resolution 196/96.
2.3. Anthropometric measurements
At enrollment, women self-reported their pre-pregnancy body weight. Maternal body
weight (kg) was measured during pregnancy using a digital scale (Filizzola PL 150, Filizzola
Ltda, Brazil). We also obtained the weight recorded on the medical record at the last visit of
the prenatal care (between 36 to 42 GW). Height (cm) was measured at the baseline visits
using a portable stadiometer (Seca Ltda, Hamburg, Germany) in duplicates according to
standardized procedures [19], and the means of these measures was used. Pre-pregnancy BMI
was calculated using self-reported pre-pregnancy weight (kg) divided by the square of height
(in meters), and classified into two categories: underweight or normal weight (BMI < 25
kg/m2) and overweight/obese (BMI ≥ 25 kg/m2).
GWG (kg) was estimated by using the difference between the weight recorded on the
medical record at the last visit of the prenatal care and the self-reported pre-pregnancy weight.
GWG was classified as insufficient, adequate or excessive according to the Institute of
Medicine of the United States of America (IOM) [3].
2.4. Laboratory assays
At the baseline visit, venous blood samples (5 mL) were collected, processed, and
stored at -800C until polymorphisms analysis were performed. DNA was extracted from
whole blood samples by a proteinase K and phenol-chloroform method. SNPs rs7799039 of
the LEP gene and rs1137101 of the LEPR genes were determined by real-time polymerase
chain reaction amplification method (StepOnePlus, Life Technologies, Guilford, CT, USA)
using an allelic discrimination assays (TaqMan® Genotyping Master Mix assay, Life
Technologies). The accuracy of genotyping was evaluated by performing duplicate analysis of
10% of sample with ≥99% agreement rates.
Maternal venous blood samples (5 ml) were collected in EDTA tubes after a 12-hour
fasting period for all follow-ups. The blood samples were centrifuged (5,000 rpm for 5 min),

RESULTADOS (Artigo 2)
98
and the plasma was separated and stored at −800C until analysis. Plasma leptin (ng/dL) levels
were determined by enzyme linked immunosorbent assay (ELISA) using commercial kits
(Millipore, St. Charles, Missouri, USA) with sensitivities of 0.5 ng/dL.
2.5. Covariates
Structured interviews were conducted to obtain the following maternal data: age at
baseline (years), self-reported skin color (white/black or brown), education (years of
schooling), self-reported pre-pregnancy leisure-time physical activity (LTPA) (no/yes),
smoking habit at baseline (nonsmoking, former smoker and current smoker), calorie intake
(kcal/d) and parity (number of deliveries). The total calorie intake (kcal/d) was assessed with
a validated food frequency questionnaire (FFQ) [20], which was administered in the first
trimester of the pregnancy. The gestational age (week) was estimated based on the first
ultrasound performed prior to 24 weeks of gestation, however the reported date of the last
menstrual period was used if the ultrasound was not available (n=2).
2.6. Statistical analysis
Data are reported as means and standard deviation (SD), as medians and interquartile
ranges (IQRs) or as counts and percentages. Due to the positive skew observed in the
distribution of the leptin concentrations, the data was log transformed before statistical
analysis and subsequently back-transformed for easy interpretation of the results as geometric
means and 95% confidence interval (95% CI).
Data were analyzed using STATA statistics software (version 12.0, College Station,
TX, USA) and a significance level at 5% was assumed in all the analysis. Comparisons
between SNPs and maternal characteristics were assessed by Student’s t test or analysis of
variance, Mann–Whitney U test or Kruskal-Wallis and chi-square test or Exact Fisher test,
according to the distribution of the variables. The potential associations between
polymorphisms and plasma leptin concentrations were evaluated using multiple linear
regression analysis adjusted by covariates. Poisson’s regression with robust variance was used
to address the association between genotypes and pre-pregnancy BMI categories (< 25 and ≥
25 kg/m2) and also with GWG categories according to the IOM [3] adjusted by covariates,
allowing an estimation of the relative risks (RR) and 95% CI.

RESULTADOS (Artigo 2)
99
Longitudinal linear mixed-effects (LME) models were performed to test the
association between the SNPs and the changes of plasma leptin concentrations and body
weight throughout pregnancy. LME regression coefficients account for the dependency
between observations of the same individual and for the exact gestational age of date
collection, not grouping women by gestational trimesters. Gestational age was included in all
models as both random and fixed effects to adjust for the overall and the individual variations
in leptin concentrations and body weight over time. The LEP/LEPR polymorphisms and all
other covariates were analyzed as fixed-effects only. The quadratic gestational age term was
included in all models to adjust for the longitudinal changes in plasma leptin concentrations
and body weight that resemble a parabola. The dependencies in the data were handled with an
unstructured covariance matrix.
The variables included in the adjusted models were chosen based on the biological
plausibility of the associations with both polymorphisms and outcomes. The pre-pregnancy
BMI models were adjusted for self-reported pre-pregnancy LTPA, maternal age, self-reported
skin color, parity, maternal smoking status, calorie intake in the first trimester and years of
education. The models having GWG as the outcome were adjusted for self-reported pre-
pregnancy LTPA, gestational age at delivery, maternal age, self-reported skin color, parity,
maternal smoking status, first trimester log leptin, and pre-pregnancy BMI. The models
having plasma leptin concentrations as the outcome were adjusted for self-reported pre-
pregnancy LTPA, gestational age, maternal age, self-reported skin color, maternal smoking
status and maternal body weight throughout pregnancy.
3. RESULTS
3.1. Maternal characteristic
The sample consisted of pregnant women with the following medians (IQR): age of 27
years (22-31 years), 9 years of education (7-11 years), 74.8% of women self-reported as
having black or brown (mixed race) skin color and 72.8% reported being nonsmokers at
baseline. There were 34.7% of pregnant women with pre-pregnancy BMI ≥ 25 kg/m2 (21.8%
were overweight [n=32] and 12.9% with obesity [n=19]), and 65.3% with pre-pregnancy BMI
< 25 kg/m2 (3.4% were underweight [n=5] and 61.9% with normal weight [n=91]) (data not
shown). Women who were overweight/obese prior to pregnancy gained less weight than

RESULTADOS (Artigo 2)
100
underweight or normal weight women during pregnancy (10.9 ± 7.0 vs. 13.2 ± 5.0; p=0.02)
and were more likely to have gained excessive GWG (p<0.01) when compared to
underweight or normal weight women. We found an increase in the geometric means of leptin
concentration from the first to the second trimester followed by a slight decline in the third
trimester ([15.5; 95% CI = 13.8 – 17.3] [27.4; 95% CI = 24.6 – 30.5] [24.2; 95% CI = 21.4 –
27.4], respectively). Overweight/obese women had higher leptin concentrations in all
gestation trimesters (p<0.01) when compared to underweight or normal weight women (Table
1).
3.2. Genotypes frequencies
The minor allele frequencies for LEP-rs7799039 and for LEPR-rs1137101 genes were
31.4% and 50.3%, respectively. The genotype distributions were in Hardy-Weinberg
equilibrium. We found no significant differences between the distribution of genotypes and
pre-pregnancy BMI categories (< 25 vs. ≥ 25 kg/m2) (Table 2).
3.3. Associations of the LEP and LEPR SNPs with pre-pregnancy body weight and
GWG
Homozygous subjects for the A-allele of the LEP-rs7799039 tended to have lower pre-
pregnancy body weight (AA=59.1 kg, GG=63.7 kg, GA=62.1 kg) when compared with
carriers of the G-allele (GG or GA), although differences were not statistically significant
(p=0.44) (Table 3).
Women who carried the A-allele of the LEP-rs7799039 were at a higher risk for
excessive GWG than the GG carriers ([RRLEP-GAvsGG, 2.16; 95% CI, 1.23 – 3.80];
[RRLEP-AAvsGG, 2.37; 95% CI, 1.04 – 5.39]) according to the adjusted Poisson’s
regression models (Table 4).
Genotype AA carriers for rs7799039 SNP began pregnancy with lower body weight
compared to those GG or GA+GG carriers, and this pattern was maintained throughout
pregnancy ([βAAvsGG = -7.91 kg; 95% CI, -14.21 to -1.61; p=0.01] [βAAvsGA+GG = -7.66
kg; 95%CI, -14.07 to -1.25; p=0.02]) after adjustment for the confounders (Table 5).
RESULTADOS (Artigo 2)
101
3.4. Associations of the LEP and LEPR polymorphisms with plasma leptin
concentrations
We did not find significant differences between geometric means of the leptin
concentrations according to the genotypes groups of the LEP-rs7799039 and LEPR-
rs1137101 genes (Table 3). These SNPs were not associated with log-transformed leptin
concentrations throughout pregnancy trimesters in any of the different genetic models tested
(co-dominant, recessive and dominant) (Table 4), or with changes in leptin concentrations
during pregnancy (Table 5).
4. DISCUSSION
In this study, women carriers of the AA genotype for LEP-rs7799039 presented with
lower body weight throughout pregnancy compared to those that were GG or GA+GG
carriers; however, the A-allele was significantly associated with a higher risk for excessive
GWG. We reported a lack of association between the LEP-rs7799039 and LEPR-rs1137101
SNPs with pre-pregnancy overweight/obesity risk and leptin concentrations throughout
pregnancy.
To our knowledge, this is the first study examining the association between LEP-
rs7799039 and LEPR-rs1137101 polymorphisms and GWG and leptin concentration
throughout pregnancy, proving it difficult to compare our data.
Increased maternal body weight before pregnancy and excessive GWG may also be a
primary contributor to the future development of obesity in women [21]. Considering the pre-
pregnancy body weight and BMI, our results are in line with studies that indicate that the SNP
rs7799039 may not be considered a relevant obesity marker for Spanish [22], Romanian [23],
and Malaysian populations [24], but differs from other studies that found an association with
obesity [6,12,17]. Alternatively, we found a significant association for GA or AA genotypes
with a higher risk for excessive GWG when compared to the GG genotype. The associations
of LEP-rs7799039 SNP with obesity in Brazilian subjects have been contentious. Hinuy et al.
reported that women carrying the GG genotype had four times the higher risk of obesity when
compared to the A-allele carriers [25]. However, Duarte et al. [26] in a multiethnic group and
Oliveira et al. [27] in a group of European-Caucasian ethnicity reported a lack of association
between the LEP polymorphism and obesity. The frequency of the LEP-rs7799039 A-allele
RESULTADOS (Artigo 2)
102
(0.31) observed in our study was similar to the range of those found in additional studies in
Brazilian population [25–27].
According to four systematic reviews, LEPR-rs1137101 did not show an overall
statistically significant association to obesity-related outcomes (waist circumference or BMI)
in the general population [28–31]. In Brazilian subjects, the LEPR-rs1137101 was associated
with an increased risk for obesity (OR= 2.14; 95%CI: 1.01 to 4.52) in European descent [27]
and nonsmokers Caucasian population [32], and in a multiethnic sample (OR= 1.79; 95%CI:
1.11 to 2.90) [26]. It is worth nothing that these results were performed in both men and
women, and the mean age was higher than in our study with pregnant women. The G allele
frequency of 0.50 for rs1137101 in this study was very similar to 0.45, the overall rate (varied
from 0.32 - 0.58) observed in different Caucasian populations [30]. However, this is a
difference from the study in multiethnic subjects in the same city of our study (varied from
0.39–0.43) [26]. It is important to point out that the racial/ethnic evaluation of this study was
based on a self-reported measure. Independently of how skin color was assessed, the
distribution of frequency of minor alleles was similar between black/brown and white women
(A-allele LEP=0.30 and 0.35; G-allele LEPR=0.51 and 0.49, respectively).
We reported that overweight/obese women had higher leptin concentrations in all
gestation trimesters. In humans, levels of circulating leptin are directly proportional to BMI
and the percentage of body fat [33] and, in general, women show higher leptin concentrations
compared to men [34]. In individuals with normal body weight, leptin acts in the
hypothalamus to decrease appetite and increase energy expenditure, but obese individuals
present high circulating leptin levels, which may reflect either leptin tolerance or leptin
resistance [35].
Our results revealed no significant associations between the LEP-rs7799039 and
LEPR-rs1137101 polymorphisms and leptin concentrations throughout pregnancy. However,
we cannot determine the proportion of placental leptin. There is strong evidence that suggests
that the placenta, rather than the maternal adipose tissue, makes a substantial contribution to
the rise in maternal leptin plasma concentrations [14]. According to placental perfusion
studies, 98.4% of placental leptin is released into the maternal circulation [36]. Placenta and
white adipose tissue express the same gene, except for the presence of a specific upstream
placental enhancer, which suggests that leptin expression is regulated in a tissue-specific
manner [37].

RESULTADOS (Artigo 2)
103
The potential effect of the LEP-rs7799039 and LEPR-rs1137101 SNP on leptin
expression in adults is controversial. The AA genotype of the LEP-rs7799039 was associated
with increased leptin concentration in obese individuals from a South Indian population when
compared to the wild-type GG genotype [12]. In Brazilian women, the G allele contributed to
increased leptin concentration [25]. However, in a study conducted by Oliveira et al. [27] with
both Brazilian men and women, the rs7799039 SNP was not associated with leptin
concentration, a result similar with the ones observed on the present investigation. The LEPR-
rs1137101 G-allele was associated with leptinemia in Brazil [27], whereas it reported a non-
significant trend toward a higher serum leptin concentration to this allele in Romanian
subjects [23].
It is possible that the discrepant results of the associations between these
polymorphisms, body weight and leptin concentration may be due to a cumulative effect
combining several different factors, which together may have affected the outcomes. These
include a wide difference in the obesogenic environments from where the subjects are
recruited for the study, ethnic diversity, subject’s characteristics, selected set of confounders
and interaction amongst genes.
The main strengths are the availability of standardized longitudinal weight and plasma
leptin concentration measurements in the first, second and third pregnancy trimester, which
allowed analysis of the genetic associations with the changes of body weight and leptin
concentrations over time. In addition, we investigated two polymorphisms in the same group
of subjects and adjusted our results for important confounders. However, our study has some
limitations such as the sample size of our cohort, which may not be sufficient to detect weak
effects of gene variants and diminished the statistical power for some outcomes of the study.
An additional limitation is that we relied on self-reported pre-pregnancy weight, and
misclassification of GWG and pre-pregnancy BMI may not be ruled out for women who
inaccurately reported their pre-pregnancy weights. However, this is the case in most studies of
GWG.
Pregnancy is a complex process during which several metabolic and body adaptations
are required to support the adequate growth and development of the fetus, delivery, lactation
and the requirements to maintain the health of the mother, and these patterns of alterations are
a result of a variety of interactions amongst genes and environmental factors. The hypothesis
of the present study is that the polymorphisms in the LEP-rs7799039 and LEPR-rs1137101
genes are related to pre-pregnancy overweight/obesity risk, as well as excessive GWG and

RESULTADOS (Artigo 2)
104
high concentrations of leptin throughout pregnancy. Our results indicate that the LEP-
rs7799039 was significantly associated with a higher risk for excessive GWG, but the results
do not support significant associations of the LEP-rs7799039 and LEPR-rs1137101 with pre-
pregnancy overweight/obesity risk and leptin concentrations throughout pregnancy. We solely
confirm the hypothesis that LEP-rs7799039 is associated with GWG. It is recommended to
further evaluate these results in a larger cohort and in other ethnic populations to demonstrate
the validity of our findings.
Acknowledgements
We would like to acknowledge Professor Rosane Silva for her technical support in the
genotyping analysis and allowing us to conduct DNA extraction in the Laboratory of
Macromolecular Metabolism Firmino Torres de Castro, Biophysics Institute, Rio de Janeiro
Federal University (UFRJ). We also thank Professor Maria das Graças Tavares do Carmo for
allowing us to work at the Laboratory of Nutritional Biochemistry of the Nutrition Institute,
UFRJ.
This study was supported by the National Council for Scientific and Technological
Development (CNPq) and the Carlos Chagas Filho Foundation for Research Support of Rio
de Janeiro State (FAPERJ). The funders had no role in the design, analysis, or writing of this
article and the authors declare that they do not have any conflict of interest.

RESULTADOS (Artigo 2)
105
REFERENCES
[1] WHO. Global status report on noncommunicable diseases 2014. Switzerland: World
Health Organization; 2014.
[2] Gaillard R, Durmuş B, Hofman A, Mackenbach JP, Steegers EAP, Jaddoe VWV. Risk
factors and outcomes of maternal obesity and excessive weight gain during pregnancy. Obes
Silver Spring Md 2013;21:1046–55. doi:10.1002/oby.20088.
[3] Institute of Medicine and National Research Council, editor. Weight gain during
pregnancy: reexamining the guidelines. Washington, DC: The National Academies Press;
2009.
[4] Herrera BM, Lindgren CM. The Genetics of Obesity. Curr Diab Rep 2010;10:498–
505. doi:10.1007/s11892-010-0153-z.
[5] Albuquerque D, Stice E, Rodríguez-López R, Manco L, Nóbrega C. Current review of
genetics of human obesity: from molecular mechanisms to an evolutionary perspective. Mol
Genet Genomics 2015;290:1191–221. doi:10.1007/s00438-015-1015-9.
[6] Boumaiza I, Omezzine A, Rejeb J, Rebhi L, Ouedrani A, Ben Rejeb N, et al.
Relationship between leptin G2548A and leptin receptor Q223R gene polymorphisms and
obesity and metabolic syndrome risk in Tunisian volunteers. Genet Test Mol Biomark
2012;16:726–33. doi:10.1089/gtmb.2011.0324.
[7] Hoffstedt J, Eriksson P, Mottagui-Tabar S, Arner P. A polymorphism in the leptin
promoter region (-2548 G/A) influences gene expression and adipose tissue secretion of
leptin. Horm Metab Res 2002;34:355–9. doi:10.1055/s-2002-33466.
[8] Liu Y, Chen S-Q, Jing Z-H, Hou X, Chen Y, Song X-J, et al. Association of LEPR
Gln223Arg polymorphism with T2DM: A meta-analysis. Diabetes Res Clin Pract
2015;109:e21-6. doi:10.1016/j.diabres.2015.05.042.
[9] Yiannakouris N, Yannakoulia M, Melistas L, Chan JL, Klimis-Zacas D, Mantzoros
CS. The Q223R polymorphism of the leptin receptor gene is significantly associated with
obesity and predicts a small percentage of body weight and body composition variability. J
Clin Endocrinol Metab 2001;86:4434–9. doi:10.1210/jcem.86.9.7842.
[10] Morris DL, Rui L. Recent advances in understanding leptin signaling and leptin
resistance. Am J Physiol Endocrinol Metab 2009;297:E1247-59.
doi:10.1152/ajpendo.00274.2009.
[11] Cervero A, Domínguez F, Horcajadas JA, Quiñonero A, Pellicer A, Simón C. The role
of the leptin in reproduction. Curr Opin Obstet Gynecol 2006;18:297–303.
doi:10.1097/01.gco.0000193004.35287.89.
[12] Dasgupta S, Salman M, Siddalingaiah LB, Lakshmi GL, Xaviour D, Sreenath J.
Genetic variants in leptin: Determinants of obesity and leptin levels in South Indian
population. Adipocyte 2015;4:135–40. doi:10.4161/21623945.2014.975538.
[13] Castellano Filho DS, do Amaral Correa JO, Dos Santos Ramos P, de Oliveira
Montessi M, Aarestrup BJV, Aarestrup FM. Body weight gain and serum leptin levels of non-

RESULTADOS (Artigo 2)
106
overweight and overweight/obese pregnant women. Med Sci Monit Int Med J Exp Clin Res
2013;19:1043–9. doi:10.12659/MSM.884027.
[14] Hauguel-de Mouzon S, Lepercq J, Catalano P. The known and unknown of leptin in
pregnancy. Am J Obstet Gynecol 2006;194:1537–45. doi:10.1016/j.ajog.2005.06.064.
[15] Henson MC, Castracane VD. Leptin in pregnancy. Biol Reprod 2000;63:1219–28.
[16] Misra VK, Trudeau S. The influence of overweight and obesity on longitudinal trends
in maternal serum leptin levels during pregnancy. Obes Silver Spring Md 2011;19:416–21.
doi:10.1038/oby.2010.172.
[17] Sahin DS, Tumer C, Demir C, Celik MM, Celik M, Ucar E, et al. Association with
leptin gene C.-2548 G>A polymorphism, serum leptin levels, and body mass index in Turkish
obese patients. Cell Biochem Biophys 2013;65:243–7. doi:10.1007/s12013-012-9427-1.
[18] Ben Ali S, Kallel A, Ftouhi B, Sediri Y, Feki M, Slimane H, et al. Association of G-
2548A LEP polymorphism with plasma leptin levels in Tunisian obese patients. Clin
Biochem 2009;42:584–8. doi:10.1016/j.clinbiochem.2008.11.001.
[19] Lohman T, Roche A, Martorell R. Antropometric Standardization Reference Manual.
vol. 4. 3rd ed. 1988.
[20] Sichieri R, Everhart JE. Validity of a Brazilian food frequency questionnaire against
dietary recalls and estimated energy intake. Nutr Res 1998;18:1649–59.
[21] Rooney BL, Schauberger CW, Mathiason MA. Impact of perinatal weight change on
long-term obesity and obesity-related illnesses. Obstet Gynecol 2005;106:1349–56.
doi:10.1097/01.AOG.0000185480.09068.4a.
[22] Portolés O, Sorlí JV, Francés F, Coltell O, González JI, Sáiz C, et al. Effect of genetic
variation in the leptin gene promoter and the leptin receptor gene on obesity risk in a
population-based case-control study in Spain. Eur J Epidemiol 2006;21:605–12.
doi:10.1007/s10654-006-9045-6.
[23] Constantin A, Costache G, Sima AV, Glavce CS, Vladica M, Popov DL. Leptin G-
2548A and leptin receptor Q223R gene polymorphisms are not associated with obesity in
Romanian subjects. Biochem Biophys Res Commun 2010;391:282–6.
doi:10.1016/j.bbrc.2009.11.050.
[24] Fan S-H, Say Y-H. Leptin and leptin receptor gene polymorphisms and their
association with plasma leptin levels and obesity in a multi-ethnic Malaysian suburban
population. J Physiol Anthropol 2014;33:15. doi:10.1186/1880-6805-33-15.
[25] Hinuy HM, Hirata MH, Forti N, Diament J, Sampaio MF, Armaganijan D, et al.
Leptin G-2548A promoter polymorphism is associated with increased plasma leptin and BMI
in Brazilian women. Arq Bras Endocrinol Metabol 2008;52:611–6.
[26] Duarte S, Francischetti E, Genelhu V, Cabello P, Pimentel M. LEPR p. Q223R, beta3-
AR p. W64R and LEP c.-2548G> A gene variants in obese Brazilian subjects. Genet Mol Res
GMR 2006;6:1035–43.

RESULTADOS (Artigo 2)
107
[27] Oliveira R de, Cerda A, Genvigir FDV, Sampaio MF, Armaganijan D, Bernik MMS,
et al. Leptin receptor gene polymorphisms are associated with adiposity and metabolic
alterations in Brazilian individuals. Arq Bras Endocrinol Amp Metabol 2013;57:677–84.
doi:10.1590/S0004-27302013000900002.
[28] Heo M, Leibel RL, Boyer BB, Chung WK, Koulu M, Karvonen MK, et al. Pooling
analysis of genetic data: the association of leptin receptor (LEPR) polymorphisms with
variables related to human adiposity. Genetics 2001;159:1163–78.
[29] Heo M, Leibel RL, Fontaine KR, Boyer BB, Chung WK, Koulu M, et al. A meta-
analytic investigation of linkage and association of common leptin receptor (LEPR)
polymorphisms with body mass index and waist circumference. Int J Obes Relat Metab
Disord 2002;26:640–6. doi:10.1038/sj.ijo.0801990.
[30] Paracchini V, Pedotti P, Taioli E. Genetics of leptin and obesity: a HuGE review. Am
J Epidemiol 2005;162:101–14. doi:10.1093/aje/kwi174.
[31] Yu Z, Han S, Cao X, Zhu C, Wang X, Guo X. Genetic polymorphisms in adipokine
genes and the risk of obesity: a systematic review and meta-analysis. Obes Silver Spring Md
2012;20:396–406. doi:10.1038/oby.2011.148.
[32] Mattevi VS, Zembrzuski VM, Hutz MH. Association analysis of genes involved in the
leptin-signaling pathway with obesity in Brazil. Int J Obes Relat Metab Disord
2002;26:1179–85.
[33] Minocci A, Savia G, Lucantoni R, Berselli ME, Tagliaferri M, Calò G, et al. Leptin
plasma concentrations are dependent on body fat distribution in obese patients. Int J Obes
Relat Metab Disord 2000;24:1139–44.
[34] Hellström L, Wahrenberg H, Hruska K, Reynisdottir S, Arner P. Mechanisms behind
gender differences in circulating leptin levels. J Intern Med 2000;247:457–62.
[35] Jung CH, Kim M-S. Molecular mechanisms of central leptin resistance in obesity.
Arch Pharm Res 2013;36:201–7. doi:10.1007/s12272-013-0020-y.
[36] Linnemann K, Malek A, Sager R, Blum WF, Schneider H, Fusch C. Leptin Production
and Release in the Dually in Vitro Perfused Human Placenta 1. J Clin Endocrinol Metab
2000;85:4298–301.
[37] Bi S, Gavrilova O, Gong D-W, Mason MM, Reitman M. Identification of a placental
enhancer for the human leptin gene. J Biol Chem 1997;272:30583–8.

RESULTADOS (Artigo 2)
108
Figure 1 - Flowchart illustrating the recruitment and selection of the study population Note:
NCDs = non-communicable chronic diseases; LEP = leptin; LEPR = leptin receptor; SNP = single nucleotide
polymorphism
Pregnant women at enrollment: N = 299
Folow-up: N = 259 participants
N = 223 participants
Present study: N = 209
10 and 20 trimesters = 147 women
30 trimester = 111 women
Final sample: N = 147- 143 participants with LEP and LEPR SNPs- 02 participants with only LEP SNP- 02 participants with only LEPR SNP
Women participated in a clinical trial [n=36]
62 did not have blood samplesfor genotyping
Miscarriage [n=25]
Fasting plasma glucose ≥126 mg/dL [n=2]
Stillbirth [n=5]
Losses to follow-up: only information at baseline [n=9]
Twin pregnancies [n=4]
40 did not meet eligibility criteria: confirmedpre-gestational infection diagnosis or NCDs[n=14], >13 gestational weeks at enrollment[n=16] or abandoned prenatal care at the publichealth center [n=10]
Missing data: did not attendbaseline visit [n=5]

RESULTADOS (Artigo 2)
109
Table 1. Maternal characteristic of the study population stratifying for pre-pregnancy BMI categories.
Variables Study population
Underweight or normal
weight
(BMI < 25 kg/m2)
Overweight/obese
(BMI ≥ 25kg/m2)
N n n p-value
Maternal age (y) 147 27 (22 - 31) 96 26.5 (21 – 31) 51 27 (24 – 34) 0.101
Self-reported skin color, n (%) 147 96 51
Black or brown (mixed race) 110 (74.8) 74 (77.1) 36 (70.6) 0.392
Education (y) 147 9 (7 – 11) 96 10 (7 – 11) 51 9 (6 – 11) 0.931
Smoking habit at baseline, n (%) 147 96 51
Nonsmoking 107 (72.8) 75 (78.1) 32 (62.8) 0.052
Calorie intake (kcal/d) at first trimester 146 2,299 (1,895– 2,802) 95 2,207 (1,895 – 2,641) 51 2,436 (1,883 – 2,975) 0.281
Pre-pregnancy LTPA, n (%) 146 96 50
No 119 (81.5) 77 (80.2) 42 (84.0) 0.582
Parity, n (%) 147 96 51
0 57 (38.8) 39 (40.6) 18 (35.3) 0.532
≥1 90 (61.2) 57 (59.4) 33 (64.7)
Self-reported pre-pregnancy weight (kg) 147 62.5 ± 13.1 96 55.4 ± 6.2 51 75.9 ± 11.9 <0.013
Total gestational weight gain (kg) 110 12.5 ± 5.9 72 13.2 ± 5.0 38 10.9 ± 7.0 0.053
Adequacy of gestational weight gaina, n (%) 110 72 38
Insufficient 38 (34.5) 29 (40.3) 9 (23.7)
Normal 38 (34.6) 28 (38.9) 10 (26.3) <0.012
Excessive 34 (30.9) 15 (20.8) 19 (50.0)
Leptinb (ng/dL)
First trimester 146 15.5 (13.8 – 17.3) 95 11.9 (10.5 – 13.5) 51 25.1 (21.8 – 28.9) <0.013
Second trimester 141 27.4 (24.6 – 30.5) 91 23.7 (20.7 – 27.2) 50 35.7 (30.5 – 41.8) <0.013
Third trimester 105 24.2 (21.4 – 27.4) 70 20.8 (17.9 – 24.1) 35 32.9 (26.8 – 40.4) <0.013
Abbreviations: LTPA = leisure-time physical activity; BMI = body mass index.
Data are presented as medians (IQRs) or means ± SD (continuous variables) and percentages (categorical variables). p-value refers to 1Mann-Whitney U test; 2Pearson χ2 tests and 3Student's t. aAccording to the Institute of Medicine of the United States of America (IOM - 2009). bLog transformed values were used, but estimates provided in the table were back-transformed and data are presented as geometric means (95% confidence interval).

RESULTADOS (Artigo 2)
110
Table 2. Genotype and allele frequencies of the LEP-rs7799039 and of the LEPR-rs1137101
polymorphisms of the study population stratifying for pre-pregnancy BMI categories.
Gene/Genotypes/Allele Study population
Underweight or normal
weight (BMI < 25 kg/m2)
Overweight/obese
(BMI ≥ 25 kg/m2)
N (%) n (%) n (%) p-
value
LEP-rs7799039
GG 69 (47.6) 42 (44.7) 27 (52.9) 0.171
GA 61 (42.1) 39 (42.5) 22 (43.1)
AA 15 (10.3) 13 (13.8) 2 (3.9)
G-allele 199 (68.6) 123 (65.4) 76 (74.5)
A-allele 91 (31.4) 65 (34.6) 26 (25.5) 0.112
p-value (HW) 0.78 0.42 0.33
LEPR-rs1137101
AA 38 (26.2) 26 (27.7) 12 (23.5) 0.762
AG 68 (46.9) 42 (44.7) 26 (51.0)
GG 39 (26.9) 26 (27.6) 13 (25.5)
A-allele 144 (49.7) 94 (50.0.) 50 (49.0)
G-allele 146 (50.3) 94 (50.0) 52 (51.0) 0.872
p-value (HW) 0.46 0.30 0.89 Abbreviations: LEP = leptin; LEPR = leptin receptor; SNPs = single nucleotide polymorphisms; BMI = body mass index;
HW = Hardy–Weinberg equilibrium.
p-value (HW) refers to Pearson χ2 tests.
Comparison between underweight or normal weight and overweight/obese subjects, p-value refers to 1Fisher's exact test or 2Pearson χ2 tests.

RESULTADOS (Artigo 2)
111
Table 3. Distribution of the pre-pregnancy body weight and BMI, total GWG and plasma leptin concentrations according to genotypes of the
LEP-rs7799039 and of the LEPR-rs1137101 genes.
Gene/Genotypes Pre-pregnancy body
weight (kg)
Pre-pregnancy BMI
(kg/m2)
Total GWG (kg)
Leptina (ng/dL) by trimester
First Second Third
n Means ± SD n Means ± SD n Means ± SD n Means (95% CI) n Means (95% CI) n Means (95% CI)
LEP-rs7799039
GG 69 63.7 ± 12.5 69 24.6 ± 4.6 53 12.8 ± 5.5 68 15.2 (13.0 - 17.7) 67 28.5 (24.6 – 33.0) 49 24.7 (20.8 – 29.4)
GA 61 62.1 ± 13.4 61 24.8 ± 4.9 42 11.7 ± 6.5 61 16.2 (13.4 - 19.6) 59 25.6 (21.2 – 30.9) 42 23.1 (18.6 – 28.7)
AA 15 59.1 ± 14.6 15 22.9 ± 4.4 13 13.2 ± 5.8 15 13.8 (10.1 - 18.8) 13 28.8 (21.4 – 38.6) 12 23.7 (17.1 – 32.4)
p-value* (GG vs GA vs AA) 0.44 0.38 0.59 0.67 0.63 0.88
p-value (GA vs GG) 0.48 0.86 0.38 0.58 0.37 0.62
p-value (AA vs GG) 0.21 0.19 0.81 0.59 0.96 0.81
p-value (AA vs GA+GG) 0.28 0.17 0.62 0.49 0.76 0.95
p-value (GA+AA vs GG) 0.31 0.78 0.29 0.76 0.44 0.62
LEPR-rs1137101
AA 38 63.2 ± 13.8 38 24.5 ± 4.9 33 12.1 ± 6.5 38 16.1 (12.6 – 20.6) 37 27.8 (22.5 – 34.3) 32 23.5 (18.2 – 30.2)
AG 68 61.8 ± 11.2 68 24.6 ± 4.3 46 13.2 ± 5.0 67 15.5 (13.4 – 18.00) 65 28.9 (24.8 – 33.6) 45 23.6 (19.9 – 28.0)
GG 39 63.9 ± 15.3 39 24.8 ± 5.1 29 11.7 ± 6.6 39 15.5 (12.3 – 19.6) 37 25.1 (19.6 – 32.1) 26 27.2 (20.4 – 36.3)
p-value (AA vs AG vs GG) 0.72 0.96 0.54 0.96 0.58 0.62
p-value (AG vs AA) 0.59 0.93 0.43 0.77 0.76 0.97
p-value (GG vs AA) 0.82 0.81 0.79 0.82 0.53 0.43
p-value (GG vs AG+AA) 0.52 0.80 0.41 0.91 0.32 0.33
p-value (AG+GG vs AA) 0.82 0.86 0.71 0.76 0.93 0.67
Abbreviations: LEP = leptin; LEPR = leptin receptor; BMI = body mass index; GWG = gestational weight gain.
Comparison of the groups was performed using analysis of variance or Student's test. aLog transformed values were used for testing differences, but estimates provided in the table were back-transformed and data are presented as geometric means (95% confidence interval).

RESULTADOS (Artigo 2)
112
Table 4. Associations of the LEP-rs7799039 and LEPR-rs1137101 polymorphisms with pre-pregnancy BMI, GWG and leptin concentrations.
Pre-pregnancy BMIa
(kg/m2) Total GWG by IOM categoryb (log) Leptin by trimesterc
Overweight/obese ( ≥25 ) Insufficient1 Excessive1 First Second Third
RR (95% CI) RR (95% CI) RR (95% CI) β(95% CI) β(95% CI) β(95% CI)
LEP-rs7799039
Co-dominant
(GA vs GG) 1.00 (0.64 – 1.56) 0.56 (0.30 – 1.05) 2.16 (1.23 – 3.80)** 0.046 (-0.029 to 0.122) -0.024 (-0.115 to 0.066) -0.014 (-0.116 to 0.088)
(AA vs GG) 0.36 (0.10 – 1.31) 0.58 (0.22 – 1.53) 2.37 (1.04 – 5.39)* 0.020 (-0.104 to 0.144) 0.066 (-0.086 to 0.217) 0.054 (-0.105 to 0.214)
Recessive
(AA vs GA+GG) 0.37 (0.11 – 1.29) 0.77 (0.30 – 1.96) 1.60 (0.72 – 3.54) 0.005 (-0.113 to 0.123) 0.094 (-0.050 to 0.238) 0.080 (-0.065 to 0.224)
Dominant
(GA+AA vs GG) 0.89 (0.57 – 1.38) 0.59 (0.34 – 1.02) 2.18 (1.27 - 3.71)** 0.041 (-0.031 to 0.114) -0.008 (-0.093 to 0.078) 0.004 (-0.091 to 0.099)
LEPR-rs1137101
Co-dominant
(AG vs AA) 1.28 (0.74 – 2.23) 1.32 (0.80 – 2.18) 1.41 (0.65 – 3.05) -0.001 (-0.083 to 0.081) 0.025 (-0.077 to 0.127) -0.022 (-0.133 to 0.090)
(GG vs AA) 1.15 (0.62 – 2.13) 0.48 (0.18 – 1.24) 1.88 (0.87 – 4.08) -0.030 (-0.136 to 0.076) -0.054 (-0.173 to 0.066) 0.007 (-0.147 to 0.132)
Recessive
(GG vs AG+AA) 0.94 (0.56 – 1.57) 0.41 (0.17 – 1.01) 1.51 (0.94 – 2.41) -0.029 (-0.112 to 0.053) -0.074 (-0.171 to 0.023) 0.018 (-0.094 to 0.131)
Dominant
(AG+GG vs AA) 1.21 (0.72 – 2.01) 0.97 (0.58 – 1.61) 1.63 (0.78 – 3.42) -0.012 (-0.094 to 0.069) 0.001 (-0.096 to 0.097) -0.009 (-0.155 to 0.097) Abbreviations: LEP = leptin; LEPR = leptin receptor; BMI = body mass index; GWG = gestational weight gain; LTPA = leisure-time physical activity; IOM = Institute of Medicine of the United States of America. Estimates in column RR=relative risk, Wald tests were used to derive the p-values. *p-value < 0.05; **p-value < 0.01. aModel adjusted for pre-pregnancy LTPA, maternal age, self-reported skin color, parity, maternal smoking status, calorie intake at first trimester and years of education. bModel adjusted for pre-pregnancy LTPA, gestational age at delivery, maternal age, self-reported skin color, parity, maternal smoking status, log leptin first trimester and pre-pregnancy BMI. cModel adjusted for pre-pregnancy LTPA, gestational age, maternal age, self-reported skin color, maternal smoking status and maternal body weight (kg) by trimester. 1According to the Institute of Medicine of the United States of America (IOM – 2009).
Total number of observations LEP-rs7799039: [Pre-pregnancy BMI (GA vs GG, n=124; AA vs GG, n=78; recessive and dominant, n=138)]; [Total GWG by IOM category (GA vs GG, n=62; AA vs GG, n=45;
recessive and dominant, n=70)]; [(log) Leptin by trimester: First (GA vs GG, n=128; AA vs GG, n=82; recessive and dominant, n=143); Second (GA vs GG, n=122; AA vs GG, n=76; recessive and dominant, n=135);
Third (GA vs GG, n=84; AA vs GG, n=57; recessive and dominant, n=96)]. Total number of observations LEPR-rs1137101: [Pre-pregnancy BMI (AG vs AA, n=103; GG vs AA, n=73; recessive and dominant, n=139)]; Total GWG by IOM category (AG vs AA, n=53; GG vs AA, n=42;
recessive and dominant, n=70)]; [(log) Leptin by trimester: First (AG vs AA, n=105; GG vs AA, n=76; recessive and dominant, n=143); Second (AG vs AA, n=99; GG vs AA, n=72; recessive and dominant, n=135);
Third (AG vs AA, n=72; GG vs AA, n=55; recessive and dominant, n=97)].

RESULTADOS (Artigo 2)
113
Table 5. Longitudinal analysis between LEP-rs7799039 and LEPR-rs1137101 gene polymorphisms and maternal body weight and leptin
concentration throughout pregnancy.
Maternal weight (kg)a,1 (log) Leptinb
β (95% CI) p-value* β(95% CI) p-value
LEP-rs7799039
Co-dominant
(GA vs. GG) 2.20 (-2.52 to 6.93) 0.36 0.008 (-0.062 to 0.077) 0.83
(AA vs. GG) -7.91 (-14.21 to -1.61) 0.01 0.016 (-0.095 to 0.128) 0.77
Recessive
(AA vs. GA+GG) -7.66 (-14.07 to -1.25) 0.02 0.026 (-0.081 to 0.133) 0.64
Dominant
(GA+AA vs. GG) -0.16 (-4.51 to 4.19) 0.94 0.011 (-0.055 to 0.077) 0.74
LEPR-rs1137101
Co-dominant
(AG vs. AA) 2.50 (-2.31 to 7.31) 0.31 0.013 (-0.061 to 0.087) 0.73
(GG vs. AA) 1.53 (-4.21 to 7.27) 0.61 -0.024 (-0.117 to 0.068) 0.61
Recessive
(GG vs. AG+AA) -0.64 (-5.40 to 4.11) 0.79 -0.034 (-0.109 to 0.041) 0.38
Dominant
(AG+GG vs. AA) 1.85 (-2.60 to 6.31) 0.42 0.001 (-0.074 to 0.075) 0.99 Abbreviations: LEP = leptin; LEPR = leptin receptor; LTPA = leisure-time physical activity. aModel adjusted for gestational age (wk) and quadratic gestational age, pre-pregnancy LTPA, maternal age, self-reported skin color, maternal smoking status, parity, years of education and
maternal height. bModel adjusted for gestational age (wk) and quadratic gestational age, pre-pregnancy LTPA, maternal age, self-reported skin color, maternal smoking status and maternal weight throughout
pregnancy (kg). 1Weight at 0 wk gestation (referred to as self-reported pre-pregnancy weight) and weight change from 5 to 13 wk, from 20 to 26 wk, from 30 to 36 wk, and last weight before to delivery.
β= Linear mixed-effect regression coefficient; p-value refers to the maximum likelihood estimator.
Observations LEP-rs7799039:
Maternal weight [GA vs GG: total number of observations (data) = 456; total number of groups (women = 95), and mean of 4.8 observations per group]; [AA vs GG: total number of
observations (data) = 315; total number of groups (women = 66), and mean of 4.8 observations per group]; [Recessive and Dominant: total number of observations (data) = 519; total number of
groups (women = 108), and mean of 4.8 observations per group].
(log) Leptin [AG vs AA: total number of observations (data) = 334; total number of groups (women = 129), and mean of 2.6 observations per group]; [AA vs GG: total number of observations
(data) = 215; total number of groups (women = 83), and mean of 2.6 observations per group]; [Recessive and Dominant: total number of observations (data) = 374; total number of groups
(women = 144), and mean of 2.6 observations per group].
Continued on next page…

RESULTADOS (Artigo 2)
114
Table 2 (Continued)
Observations LEPR-rs1137101:
Maternal weight [GA vs GG: total number of observations (data) = 383; total number of groups (women = 80), and mean of 4.8 observations per group]; [GG vs AA: total number of
observations (data) = 297; total number of groups (women = 61), and mean of 4.9 observations per group]; [Recessive and Dominant: total number of observations (data) = 520; total number of
groups (women = 108), and mean of 4.8 observations per group].
(log) Leptin [GA vs GG: total number of observations (data) = 276; total number of groups (women = 106), and mean of 2.6 observations per group]; [GG vs AA: total number of observations
(data) = 203; total number of groups (women = 76), and mean of 2.7 observations per group]; [Recessive and Dominant: total number of observations (data) = 375; total number of groups
(women = 144), and mean of 2.6 observations per group].
The group refers to the number of women with at least one data point in time and observations refers to the total number of data points in time for all women.

RESULTADOS (Artigo 3)
115
7.3 ARTIGO 3.
ASSOCIATIONS BETWEEN OBESITY CANDIDATE GENE POLYMORPHISMS (FTO,
MC4R, LEP AND LEPR) AND DIETARY INTAKE IN PREGNANT WOMEN
Submetido ao periódico British Journal of Nutrition em 2017
ABSTRACT
The purpose of this study was to investigate the associations between the obesity candidate
genes (FTO, MC4R, LEP and LEPR) with a focus on the daily total energy intake and
percentage of energy from macronutrients and ultra-processed foods before and during
pregnancy. A sample of 149 pregnant women was followed in a prospective cohort at a Public
Health Center in Rio de Janeiro, Brazil. A food frequency questionnaire was administered at
5-13 weeks of gestation (to assess pre-pregnancy dietary intake) and weeks 30-36 (to assess
dietary intake during pregnancy). Genotyping was performed using real-time polymerase
chain reaction. The means and variations of energy intake and percentage of energy from
macronutrients and ultra-processed foods, according to the genotypes were compared using
ANOVA or Student’s t test. Associations between polymorphisms and the outcomes were
investigated through multiple linear regression and longitudinal linear mixed-effects models.
A-allele of the FTO-rs9939609 was positively associated with the percentage of energy from
carbohydrates (β=2.7; 95% CI 0.5, 4.8; p=0.016) in pre-pregnancy, and with total energy
intake (β=0.054; 95% CI 0.003, 0.106; p=0.039) and mean percentage of energy from ultra-
processed foods (β=6.3; 95% CI 1.4, 11.1; p=0.012) during pregnancy, compared with the TT
genotype. C-allele of the MC4R-rs17782313 was associated with higher percentage of energy
from ultra-processed foods throughout pregnancy, compared with the TT genotype (β=4.2;
95% CI 0.4, 8.0; p=0.030). These findings suggest significant associations between FTO-
rs9939609 and MC4R-rs17782313 genes and the components of dietary intake in pregnant
women.
Keywords: Dietary intake, Pregnant women, Polymorphisms.
RESULTADOS (Artigo 3)
116
Introduction
Dietary intake is an important human behavior that is intimately related to health(1).
The availability of low-cost high energy-dense foods, along with decreased physical activity,
are often considered to be the biggest contributors to the rising prevalence of obesity and diet-
related non-communicable diseases (NCDs)(2,3). Maternal obesity is becoming more
prevalent(4) and women are more likely to retain gestational weight with each successive
pregnancy contributing to the development or aggravation of the obesity epidemic(5). Maternal
obesity and excessive gestational weight gain (GWG) are major risk factors for gestational
diabetes, preeclampsia and fetal adiposity(6,7). Consequently, obesity in pregnancy is placing a
considerable burden on healthcare services and resources(8).
Although environmental factors contribute to an important role in the development of
obesity, genetic factors also have a substantial contribution on its etiology(9). Studies of
candidate genes for obesity-susceptibility have allowed the identification of important genes
and single nucleotide polymorphisms (SNPs) involved in the mechanisms of dietary
consumption, such as energy intake, food preferences, and satiety responsiveness(1,10,11). The
rs9939609 SNP of the fat mass and obesity-associated (FTO) gene, along with the rs7799039
SNP of the leptin (LEP) gene and the rs1137101 SNP of the leptin receptor (LEPR) gene has
been associated with high total energy intake(12,13). Further, the rs17782313 SNP of the
melanocortin-4 receptor (MC4R) gene has been associated with food intake and eating
behavior patterns(14,15).
Nutritional demands increase during pregnancy due to the metabolic and physiological
changes(16). Given the potential importance of weight management interventions in
pregnancy, and due to the profound effect that diet can have on weight gain and regulation,
the purpose of this study was to investigate the associations between obesity predisposing
gene SNPs (FTO-rs9939609; MC4R-rs17782313; LEP-rs7799039 and LEPR-rs1137101) and
daily total energy intake, percentage of energy from macronutrients and ultra-processed foods
(i.e., energy-dense foods). We hypothesized that FTO, MC4R, LEP and LEPR gene SNPs
may be related with an increased total energy intake, as well as increased energy from
carbohydrate, fat and ultra-processed foods before and during pregnancy.

RESULTADOS (Artigo 3)
117
Methods
Study design and subjects
This study comprised a prospective cohort of pregnant women attending a prenatal
care service offered by a public health center in Rio de Janeiro, Brazil. The enrollment of
women occurred from November 2009 to October 2011, and the follow-up lasted until July
2012.
A total of 322 pregnant women were invited and 299 (92.7%) agreed to participate in
the study. Elegibility criterias were: until 13 weeks of gestation, 20-40 years of age, had no
history of infectious or NCDs (except obesity), and intended to attend prenatal care in the
selected health center. The follow up times occurred at between 5-13 (baseline), 20-26 and
30-36 gestational weeks (GW).
Following recruitment, 79 women were excluded. After exclusions, the baseline total
sample comprised 220 pregnant women. From the baseline to the third-time visit (30-36 GW),
9 follow-up losses occurred. Furthermore, we excluded women who did not have blood
samples for genotyping (n=62). The final sample of the present study was composed of 149
women with genotyping (FTO, n=146; MC4R, n=145; LEP, n=147 and LEPR, n=147)
(Figure 1).
The Rio de Janeiro Municipal Health Secretary Research Ethics Committee approved
the study procedures (reference number: 0139.0.314.000–09). All participants signed a term
of consent freely and spontaneously, detailing all procedures to be carried out, according to
the Brazilian Resolution 466/2012.
Dietary intake assessments
The dietary intake was evaluated utilizing a semi-quantitative food frequency
questionnaire (FFQ), based on a version originally developed and validated for the adult
population of Rio de Janeiro(17). Dietary intake data was collected at two time intervals: a) 5-
13 GW (covering 6 months prior to the first interview, herein called the pre-pregnancy); b) at
30-36 GW (covering the last 6 months prior to the last interview, herein called during
pregnancy). The FFQ was composed of 82 food items with eight frequency options that were

RESULTADOS (Artigo 3)
118
transformed into daily frequency, as follows: >3 times/day=4, 2–3 times/day=2.5, 1
time/day=1, 5–6 times/week=0.79, 2–4 times/week=0.43, 1 time/week=0.14, 1–3
times/month=0.07, and never or hardly ever=0. Portion sizes were converted into grams or
milliliters, based on the Brazilian household measures table(18). The daily nutrient amount for
a given food was calculated by multiplying the usual portion size per daily frequency and its
nutrient content, based on data from the Brazilian Table of Food Composition(19) and added
food items from the United States Department of Agriculture National Nutrient Database for
Standard(20).
Macronutrients and alcohol consumptions (grams/day) were calculated by summing
the data for the respective macronutrient/alcohol across food and drinks, respectively. These
values were then converted into energy by multiplying the total grams of the
macronutrient/alcohol by the number of calories per gram.
Ultra-processed foods were classified in accordance with the official Brazilian national
food and nutrition guideline(21) and with the new food classification system, which considers
the extent and the purpose of industrial food processing (22). Ultra-processed foods were
represented in this study by the following food products: sweet or savoury packaged snacks,
French fries, ice-cream, chocolate, candies (confectionery), mass-produced packaged breads
and buns; margarines, mayonnaise, cookies (biscuits), cakes, yoghurts, pre-prepared pies and
pasta and pizza dishes; sausages, burgers, hot dogs, and other reconstituted meat products;
noodles, fried or baked salted pastries, soft drinks and alcoholic beverage (vodka).
DNA isolation and SNP genotyping
Venous blood samples (5 mL) were collected at baseline, processed and stored at -
800C until polymorphism analyses. DNA was isolated from whole blood samples by the
proteinase K and phenol-chloroform technique. Genotyping was performed by real-time
polymerase chain reaction amplification method (StepOnePlus, Life Technologies, Guilford,
CT, USA) using an allelic discrimination assays (TaqMan® Genotyping Master Mix assay,
Life Technologies). The accuracy of genotyping was evaluated by performing a duplicate
analysis of 10% of the sample with ≥ 99% agreement rates.

RESULTADOS (Artigo 3)
119
Covariates assessment
A standardized questionnaire was administered at baseline (5-13 GW) to obtain the
following maternal variables: age (years), education (years of schooling), per capita family
income (Real-R$), leisure time physical activity (LTPA) practice before pregnancy (yes/no),
smoking habits (nonsmoking, former smoker and current smoker), alcohol consumption
(no/yes), parity (number of deliveries), and self-reported skin color (white/black/mixed).
Pre-pregnancy body mass index (BMI) was calculated using the self-reported pre-
pregnancy weight at baseline and height measured with a portable stadiometer (Seca, Ltd,
Hamburg, Germany) until 13 weeks of gestation according to standardized procedures(23).
The gestational age was estimated based on the first ultrasound performed prior to 24
weeks of gestation(24), however the reported date of the last menstrual period was used if the
ultrasound data was not available (n=2).
Statistical analyses
The maternal characteristics were described as a number with frequency (%) or
medians with interquartile range (IQR= 25th-75th percentiles) and mean with 95% confidence
interval (CI). Data that were not normally distributed (energy intake and percentage of energy
from protein) were logarithmic-transformed (log10) prior to data analysis and subsequently
back-transformed using the inverse of the natural logarithm function. Comparisons between
genotypes and outcomes were performed using a Student’s t test and analysis of variance
(ANOVA).
The variation (∆) in the total energy intake and the percentage of energy of each
macronutrient, along with ultra-processed foods, between before and during pregnancy by
genotypes was calculated (Delta= variable value during pregnancy - variable value in pre-
pregnancy).
We did not employ a recessive genetic model for analyses because the number of
minor allele homozygotes for all SNPs was small in our sample.
Crude and adjusted linear regression models were performed to assess cross‐sectional
associations between genotype at a candidate SNP and the outcomes. The variables included
in the adjusted models were selected according to the biological plausibility of the association

RESULTADOS (Artigo 3)
120
with total energy intake. The following variables attended this condition and were included in
the adjusted models: maternal age, self-reported skin color, parity, gestational age, per capita
income and pre-pregnancy BMI.
We further employed linear mixed-effect (LME) regression models to investigate the
longitudinal associations between polymorphisms and alterations in total energy intake and
the percentage of energy from macronutrients and ultra-processed foods from pre-pregnancy
to pregnancy. The models were adjusted for maternal age, self-reported skin color, parity,
gestational age, per capita income and pre-pregnancy BMI. LME models account for random
variation of intra-individuals and between individuals. Gestational age (in weeks) represents
the time variable in all models and was considered a fixed and random effect. The gene
polymorphisms, and all other covariates, were analyzed as fixed-effect variables.
Dependencies in the data were handled with an unstructured covariance matrix.
Statistical analyses were conducted using STATA (version 12.0, College Station, TX,
USA) software and a significance level at 5% was assumed in all the analysis.
Results
Characteristics of the study sample
The 149 women comprised a median (IQR) age of 27 (22–31) years and 9.0 (7-11)
years of education. There were 34.9% of women with a pre-pregnancy BMI ≥ 25 kg/m2. The
difference of geometric mean of the total energy intake between before and during pregnancy
was not statistically significant (Table 1).
Genotype frequencies
The minor allele frequencies of the FTO-rs9939609, MC4R-rs17782313, LEP-
rs7799039 and LEPR-rs1137101 were 42.0% (A-allele), 19.0% (C-allele), 31.0% (A-allele)
and 50.0% (G-allele), respectively, and the genotype distributions were in accordance with
Hardy-Weinberg equilibrium (p>0.05) (online Supplementary Table S1).

RESULTADOS (Artigo 3)
121
Daily total energy intake
Considering women with FFQ data before and during pregnancy, carriers of the A-
allele of FTO presented an increased total energy intake geometric mean during pregnancy
(TT vs. AT+AA = [2091; 95% CI 1904, 2297]; [2353; 95% CI 2202, 2513]; p=0.041,
respectively), and positive variation from pre-pregnancy to pregnancy (TT vs. AT+AA = [-
259.8; 95% CI -494.9, -24.7]; [112.6; 95% CI -68.2, 293.6]; p=0.015, respectively) (Table 2).
During pregnancy, the multivariate linear regression model was statistically significant
following adjustment for the potential confounders (β=0.054; 95% CI 0.003, 0.106; p=0.039)
(Table 3).
Percentage of energy from carbohydrates
The percentage of energy from carbohydrates was higher in A-allele carriers of FTO-
rs9939609 before pregnancy (TT vs. AT+AA = [54.6; 95% CI 52.7, 56.4]; [57.0; 95% CI
55.8, 58.2]; p=0.020, respectively) (Table 2), even after adjustment for confounders (β=2.7;
95% CI 0.5, 4.8; p=0.016) (Table 3).
Percentage of energy from protein
Women who carried A-allele of the LEP-rs7799039 tended to present a higher
percentage of energy from (log) protein (GG vs. GA+AA = [15.4; 95% CI 14.6, 16.2]; [16.6;
95% CI 15.8, 17.4]; p=0.036, respectively) during pregnancy, and presented a positive
variation (GG vs. GA+AA = [-0.5; 95% CI -1.4, 0.4]; [0.8; 95% CI -0.0, 1.6]; p=0.031,
respectively) from pre-pregnancy to pregnancy (Table 2), but lost significance in dominant
genetic model after adjustment for confounders (Table 3).
The A-allele of the FTO-rs9939609 gene was negatively, and significantly, associated
with the percentage of energy from (log) protein before (β = -0.038; 95% CI -0.066, -0.009;
p=0.009) and during pregnancy (β = -0.041; 95% CI -0.074, -0.009; p=0.012) when compared
to the TT carriers in the adjusted model (Table 3), and maintained this pattern throughout
pregnancy (β = -0.026; 95% CI -0.050, -0.002; p=0.037) (Table 4).

RESULTADOS (Artigo 3)
122
Percentage of energy from fat
The percentage of energy from fat was reduced from pre-pregnancy to pregnancy.
However, carriers of the A-allele of FTO-rs9939609 tended to reduce less these values (TT
vs. AT+AA = [-3.0; 95% CI -5.0, -0.9]; [-0.7; 95% CI -1.8, 0.3]; p=0.031, respectively)
(Table 2).
Percentage of energy from ultra-processed foods
Women who carried A-allele of the FTO-rs9939609 gene tended to present a higher
percentage of energy from ultra-processed foods (TT vs. AT+AA = [40.6; 95% CI 36.9,
44.3]; [45.6; 95% CI 47.7, 48.5]; p=0.041, respectively) during pregnancy (Table 2), even
after adjustment for confounders (β = 6.3; 95% CI 1.4, 11.1; p=0.012) (Table 3). The
percentage of energy from ultra-processed foods was reduced from pre-pregnancy to
pregnancy. However, carriers of the A-allele of FTO-rs9939609 tended to reduce less these
values (TT vs. AT+AA = [-6.4; 95% CI -10.2, -2.6]; [-1.1; 95% CI -3.9, 1.7]; p=0.026,
respectively) (Table 2).
We found in the adjusted linear mixed-effect models that women carrying the C-allele
of the MC4R-rs17782313 began pregnancy with higher percentage of energy from ultra-
processed foods compared with the TT genotype, and the level remained higher throughout
pregnancy (β=4.2; 95% CI 0.4, 8.0; p=0.030) (Table 4).
Discussion
This study has several main findings. The A-allele of the FTO-rs9939609 was
positively associated with the percentage of energy from carbohydrates before pregnancy, and
was positively associated with total energy intake and with percentage of energy from ultra-
processed foods during pregnancy. Additionally, the FTO risk allele was negatively
associated with the percentage of energy from protein before and during pregnancy and
throughout pregnancy. The C-allele of the MC4R-rs17782313 presented higher percentage of
energy from ultra-processed foods throughout pregnancy.
The minor allele frequency observed in this study for FTO-rs9939609 A-allele (0.42)
and MC4R-rs17782313 C-allele (0.19) were quite similar to the range of reported values in
RESULTADOS (Artigo 3)
123
other published studies with Brazilian women (0.40/0.45 for FTO-rs9939609 and 0.23/0.15
for MC4R-rs17782313 C allele)(25).
Many of the genetic variants associated with weight increases are highly expressed in
the hypothalamus, a crucial neural center for energy balance and regulation of food intake(26).
Research involving humans have suggested that the risk allele of FTO-rs9939609 gene may
influence food consumption parameters including total energy intake(27,28), food
preferences(29,27) and appetite regulation(10,30), suggesting that diet may mediate the effect of
the FTO on obesity. However, these associations have not been replicated in other
studies(31,32). We observed that this variant was negatively associated with the percentage of
energy from protein before and during pregnancy. Protein is considered the most satiating
macronutrient(33) thus, it is plausible that the A-allele of the FTO was related to modifications
on food cravings and appetite with increased energy intake from ultra-processed foods.
A study showed that subjects homozygous for FTO-rs9939609 appears to determine
neural responses to circulating concentrations of the hunger hormone ghrelin(34), which may
lead to increased energy intake in those carrying the risk allele. The role of FTO in the
pathogenesis of obesity has additionally been demonstrated in a rodent model, which
indicated that increased expression of FTO leads to increased fat mass and obesity via
hyperphagia(35).
MC4R gene is the most common cause of severe early monogenic obesity(36) and an
important contributor to polygenic obesity in humans(15), however, their expression is
variable, their penetrance incomplete, and both expression and penetrance are age
dependent(37). In addition, the incomplete penetrance and the variable expression of MC4R
mutations suggest an important environmental influence.
The rs17782313 C-allele has been associated with high snack consumption(14) and
with high intakes of total energy and dietary fat in women of European ancestry(38). We
observed that MC4R-rs17782313 genotypes were not associated with daily energy intake and
percentage of energy from macronutrients. This is consistent with the results of a published
study in European adults(32). However, we found that the intake of energy from ultra-
processed foods was significantly increased in subjects with MC4R minor alleles throughout
pregnancy. MC4R-rs17782313 C allele displayed a positive association with ramen and
processed foods including canned tuna, fish cake, ham and cheese when compared to the
rs17782313 T-allele in a study with Korean middle-aged adults(39).

RESULTADOS (Artigo 3)
124
The phenotypic features of MC4R deficiency include hyperphagia(15,36) through the
leptin-melanocortin signaling system(40), and the severity of hyperphagia may decline with
age and was greater in homozygous compared to heterozygous cases(36,37). In our study, the
majority of the pregnant women were heterozygous with only four homozygous subjects with
the minor allele.
There are limited studies evaluating the association of LEP-rs7799039 and its receptor
(lEPR-rs1137101) with food intake in the adult population. Research conducted in Brazil on
children (4 years of age) found that G-allele carriers of the LEPR-rs1137101, but not LEP-
rs7799039, had a higher total energy intake(41). In Tunisian adults, subjects with the AA
genotype for LEP-rs7799039 and GG genotype for LEPR-rs1137101 genes had a
significantly higher daily energy intake(13). We did not find an association between these
SNPs and total energy intake.
There is evidence to conclude that obesity candidate gene SNPs may be associated
with dietary intake parameters, and their identification may contribute to prevent future health
problems. However, phenotype intensity is potentially modulated by environmental and
individual characteristics(15), and the genetic contribution to population phenotypic
differentiation is driven by differences in causal allele frequencies, effect sizes, and genetic
architecture(42).
Our study did have limitations and strengths that need to be highlighted. One of the
limitations is the moderate sample size, which resulted in a lower power for detecting a
statistically significant effect of the polymorphisms on the dietary intake parameters. An
additional limitation is that some of the associations may have been attenuated by an
imprecision of dietary intake measurements. The predominant strength refers to the use of a
validated FFQ and trained interviewers to administer the FFQ who followed standardized
procedures. Further, the longitudinal design that allowed analysis of the genetic associations
with phenotypes over time was an additional strength. Moreover, we controlled our results for
important confounders, such as maternal age, self-reported skin color, parity, gestational age,
per capita income and pre-pregnancy BMI.
In conclusion, the A-allele carriers of the FTO-rs9939609 had a higher percentage of
energy from carbohydrates before pregnancy, and had a higher total energy intake and
percentage of energy from ultra-processed foods during pregnancy. The FTO risk allele also
was negatively associated with the percentage of energy from protein before and during
pregnancy and throughout pregnancy, compared with those with the TT-genotype. The C-

RESULTADOS (Artigo 3)
125
allele carriers of the MC4R-rs17782313 presented a higher percentage of energy from ultra-
processed foods throughout pregnancy, compared with those with TT-genotype. Future
studies using high-quality dietary data are required to consolidate whether obesity-susceptible
genes are associated with dietary intake to prevent obesity in genetically predisposed
individuals.
Acknowledgments
We would like to acknowledge Professor Rosane Silva for her technical support in the
genotyping analysis and allowing us to conduct DNA extraction in the Laboratory of
Macromolecular Metabolism Firmino Torres de Castro, Biophysics Institute, Rio de Janeiro
Federal University (UFRJ). We also thank Professor Maria das Graças Tavares do Carmo for
allowing us to work at the Laboratory of Nutritional Biochemistry of the Nutrition Institute,
UFRJ.
Financial Support
This study was supported by the Carlos Chagas Filho Research Foundation from the State of
Rio de Janeiro (FAPERJ) (grant numbers E-26/111.400/2010, E-26/110.681/2012; E-
26/112.181/2012; E-26/111.698/2013). The funders had no role in the design, analysis, or
writing of this article and the authors declare that they do not have any conflict of interest.
Conflict of interest
The authors declare no conflict of interest.
Authorship
The authors’ contributions are as follows: M. C. M. performed statistical analysis, participated
in the interpretation of results and writing of the manuscript. J. T., A. A. F. V, D. R. F and E.
L. R. contributed to the discussion and data interpretation. G. K. participated in the designing
the work and reviewed the manuscript.
Supplementary material accompanies this paper.
RESULTADOS (Artigo 3)
126
REFERENCES
1. Tanaka T (2014) Genetics of energy and macronutrient intake in humans. Curr. Nutr.
Rep. 3, 170–177.
2. Malik VS, Willett WC & Hu FB (2013) Global obesity: trends, risk factors and policy
implications. Nat. Rev. Endocrinol. 9, 13–27.
3. Ng M, Fleming T, Robinson M, et al. (2014) Global, regional, and national prevalence
of overweight and obesity in children and adults during 1980–2013: a systematic
analysis for the Global Burden of Disease Study 2013. The Lancet 384, 766–781.
4. Valsamakis G, Kyriazi EL, Mouslech Z, et al. (2015) Effect of maternal obesity on
pregnancy outcomes and long-term metabolic consequences. Horm. Athens 14, 345–357.
5. Yogev Y & Catalano PM (2009) Pregnancy and obesity. Obstet. Gynecol. Clin. North
Am. 36, 285–300.
6. Ovesen P, Rasmussen S & Kesmodel U (2011) Effect of prepregnancy maternal
overweight and obesity on pregnancy outcome. Obstet. Gynecol. 118, 305–312.
7. Marchi J, Berg M, Dencker A, et al. (2015) Risks associated with obesity in pregnancy,
for the mother and baby: a systematic review of reviews. Obes. Rev. 16, 621–638.
8. Morgan KL, Rahman MA, Macey S, et al. (2014) Obesity in pregnancy: a retrospective
prevalence-based study on health service utilisation and costs on the NHS. BMJ Open 4,
e003983.
9. Herrera BM & Lindgren CM (2010) The genetics of obesity. Curr. Diab. Rep. 10, 498–
505.
10. Dougkas A, Yaqoob P, Givens DI, et al. (2013) The impact of obesity-related SNP on
appetite and energy intake. Br. J. Nutr. 110, 1151–1156.
11. Mariman EC, Bouwman FG, Aller EE, et al. (2015) Extreme obesity is associated with
variation in genes related to the circadian rhythm of food intake and hypothalamic
signaling. Physiol. Genomics 47, 225–231.
12. Sonestedt E, Roos C, Gullberg B, et al. (2009) Fat and carbohydrate intake modify the
association between genetic variation in the FTO genotype and obesity. Am. J. Clin.
Nutr. 90, 1418–1425.
13. Boumaiza I, Omezzine A, Rejeb J, et al. (2012) Relationship between leptin G2548A
and leptin receptor Q223R gene polymorphisms and obesity and metabolic syndrome
risk in Tunisian volunteers. Genet. Test. Mol. Biomark. 16, 726–733.
14. Stutzmann F, Cauchi S, Durand E, et al. (2009) Common genetic variation near MC4R
is associated with eating behaviour patterns in European populations. Int. J. Obes. 33,
373–378.
RESULTADOS (Artigo 3)
127
15. Cecil J, Dalton M, Finlayson G, et al. (2012) Obesity and eating behaviour in children
and adolescents: contribution of common gene polymorphisms. Int. Rev. Psychiatry 24,
200–210.
16. Plećaš D, Plešinac S & Kontić-Vučinić O (2014) Nutrition in pregnancy: Basic
principles and recommendations. Srp. Arh. Celok. Lek. 142, 125–130.
17. Sichieri R & Everhart JE (1998) Validity of a Brazilian food frequency questionnaire
against dietary recalls and estimated energy intake. Nutr. Res. 18, 1649–1659.
18. Pinheiro ABV, Lacerda EM de A, Benzecry EH, et al. (2004) Tabela para avaliação de
consumo alimentar em medidas caseiras. 5th ed. São Paulo: Atheneu.
19. NEPA-UNICAMP (2011) Tabela Brasileira de Composição de Alimentos (TACO). 4th
ed. Campinas-SP: NEPA/UNICAMP.
20. USDA (2011) National Nutrient Database for Standard Reference, Release 24.
http://www.ars.usda.gov/ba/bhnrc/ndl (accessed March 2017).
21. Ministry of Health of Brazil (2015) Dietary Guidelines for the Brazilian Population. 2nd
ed. Brasilia, DF, Brazil: Ministry of Health of Brazil.
22. Monteiro CA, Cannon G, Levy R, et al. (2016) NOVA. The star shines bright. [Food
classification. Public health]. World Nutr. 7, 28–38.
23. Lohman TG, Roche AF & Martorell R (1988) Anthropometric standardization reference
manual. Champaign, IL: Human Kinetics Books.
24. Butt K, Lim K, Bly S, et al. (2014) Determination of gestational age by ultrasound. J.
Obstet. Gynaecol. Can. 36, 171–181.
25. Da Cunha PA, de Carlos Back LK, Sereia AFR, et al. (2013) Interaction between
obesity-related genes, FTO and MC4R, associated to an increase of breast cancer risk.
Mol. Biol. Rep. 40, 6657–6664.
26. Hofker M & Wijmenga C (2009) A supersized list of obesity genes. Nat. Genet. 41,
139–140.
27. Cecil JE, Tavendale R, Watt P, et al. (2008) An obesity-associated FTO gene variant and
increased energy intake in children. N. Engl. J. Med. 359, 2558–2566.
28. Qi Q, Downer MK, Kilpeläinen TO, et al. (2015) Dietary intake, FTO genetic variants
and adiposity: a combined analysis of over 16,000 children and adolescents. Diabetes
64, 2467–2476.
29. Brunkwall L, Ericson U, Hellstrand S, et al. (2013) Genetic variation in the fat mass and
obesity-associated gene (FTO) in association with food preferences in healthy adults.
Food Nutr. Res. 57, 20028.
30. den Hoed M, Westerterp-Plantenga MS, Bouwman FG, et al. (2009) Postprandial
responses in hunger and satiety are associated with the rs9939609 single nucleotide
polymorphism in FTO. Am. J. Clin. Nutr. 90, 1426–1432.
RESULTADOS (Artigo 3)
128
31. Liu G, Zhu H, Lagou V, et al. (2010) FTO variant rs9939609 is associated with body
mass index and waist circumference, but not with energy intake or physical activity in
European-and African-American youth. BMC Med. Genet. 11, 57.
32. Hasselbalch AL, Ängquist L, Christiansen L, et al. (2010) A variant in the fat mass and
obesity-associated gene (FTO) and variants near the melanocortin-4 receptor gene
(MC4R) do not influence dietary intake. J. Nutr. 140, 831–834.
33. Morell P & Fiszman S (2017) Revisiting the role of protein-induced satiation and satiety.
Food Hydrocoll. 68, 199–210.
34. Karra E, O’Daly OG, Choudhury AI, et al. (2013) A link between FTO, ghrelin, and
impaired brain food-cue responsivity. J. Clin. Invest. 123, 3539–3551.
35. Church C, Moir L, McMurray F, et al. (2010) Overexpression of Fto leads to increased
food intake and results in obesity. Nat. Genet. 42, 1086–1092.
36. Farooqi IS, Keogh JM, Yeo GS, et al. (2003) Clinical spectrum of obesity and mutations
in the melanocortin 4 receptor gene. N. Engl. J. Med. 348, 1085–1095.
37. Stutzmann F, Tan K, Vatin V, et al. (2008) Prevalence of melanocortin-4 receptor
deficiency in Europeans and their age-dependent penetrance in multigenerational
pedigrees. Diabetes 57, 2511–2518.
38. Qi L, Kraft P, Hunter DJ, et al. (2008) The common obesity variant near MC4R gene is
associated with higher intakes of total energy and dietary fat, weight change and diabetes
risk in women. Hum. Mol. Genet. 17, 3502–3508.
39. Park S, Daily JW, Zhang X, et al. (2016) Interactions with the MC4R rs17782313
variant, mental stress and energy intake and the risk of obesity in genome epidemiology
study. Nutr. Metab. 13, 38.
40. Girardet C & Butler AA (2014) Neural melanocortin receptors in obesity and related
metabolic disorders. Biochim. Biophys. Acta 1842, 482–494.
41. Zandoná MR, Rodrigues RO, Albiero G, et al. (2013) Polymorphisms in LEPR, PPARG
and APM1 genes: associations with energy intake and metabolic traits in young children.
Arq. Bras. Endocrinol. Metabol. 57, 603–611.
42. Brown BC, Ye CJ, Price AL, et al. (2016) Transethnic genetic-correlation estimates
from summary statistics. Am. J. Hum. Genet. 99, 76–88.

RESULTADOS (Artigo 3)
129
Figure 1 – Flowchart illustrating the recruitment and selection of the study sample
Abbreviations: NCDs = non-communicable chronic diseases; FTO = fat mass and obesity-associated gene;
MC4R = melanocortin-4 receptor gene; LEP = leptin; LEPR = leptin receptor; SNPs = single nucleotide
polymorphisms.
Pregnant women invited to participate in the study: N=322
Pregnant women who agreed to participate: N = 299 (92.7%)
Folow-up: N = 220 pregnant women
N = 211 pregnant women
N = 149 participants eligible for the final analysis
LEPR polymorphism (n=147)
Dietary data duringpre-pregnancy
(n=145)
Dietary data duringpregnancy (n=139)
LEP polymorphism (n=147)
Dietary data duringpre-pregnancy
(n=145)
Dietary data duringpregnancy (n=139)
MC4R polymosphism
(n=145)
Dietary data duringpre-pregnancy
(n=143)
Dietary data duringpregnancy (n=138)
FTO polymorphism (n=146)
Dietary data during pre-pregnancy
(n=144)
Dietary data during pregnancy (n=139)
141 women had all the SNPs1 woman had only FTO, MC4R and LEPR SNPs2 women had only FTO, MC4R and LEP SNPs2 women had only FTO, LEP and LEPR SNPs1 woman had only MC4R, LEP and LEPR SNPs1 woman had only LEP and LEPR SNPs1 woman had only LEPR SNP
62 did not have bloodsamples for genotyping
9 Losses to follow-up: 9 only information at baseline
79 Excluded:40 did not meet eligibility criteria [confirmedinfectious (n=10) and parasitic (n=2) diseases orNCDs (n=2), >13 gestational weeks at enrollment(n=16) or abandoned prenatal care at the publichealth center (n=10)]; 4 twin pregnancies; 25miscarriage; 5 stillbirth; 5 missing the baseline data

RESULTADOS (Artigo 3)
130
Table 1. Maternal descriptive characteristics and dietary intake of the study sample
Maternal characteristics Value study sample
Sociodemographic and lifestyle (n=149) Median (IQR) n (%)
Age (y) 27 (22 – 31)
Education (y) 9 (7 – 11)
Per-capita family income (R$)a 475.0 (315.0 – 667.0)
Parity (number of parturitions)
0 57 (38.3)
≥1 92 (61.7)
Early pregnancy alcohol consumption
No 121 (81.2)
Yes 28 (18.8)
Early pregnancy smoking habit
Nonsmoking 108 (72.5)
Former smoker 31 (20.8)
Current smoker 10 (6.7)
LTPA before pregnancya
No 119 (81.0)
Yes 28 (19.0)
Self-reported skin color
White 39 (26.2)
Black 35 (23.5)
Brown (mixed race) 75 (50.3)
Pre-pregnancy BMI (kg/m²) status
Underweight (<18.5) 5 (3.4)
Normal weight (18.5 - 24.9) 92 (61.7)
Overweight (25.0 - 29.9) 33 (22.2)
Obesity (≥ 30.0) 19 (12.7)
Daily dietary intake pre-pregnancy (n=147)b mean (95% CI)
Total energy (kcal/day) 2394 (2263, 2524)
% of energy from
Carbohydrates 56.2 (55.2, 57.2)
Protein 16.1 (15.6, 16.6)
Fat 26.7 (25.9, 27.5)
Ultra-processed foods 47.4 (45.4, 49.5)
Daily dietary intake during pregnancy (n=141)c mean (95% CI)
Total energy (kcal/day) 2401 (2275, 2526)
% of energy from
Carbohydrates 58.3 (57.4, 59.2)
Protein 16.4 (15.8, 17.0)
Fat 25.2 (24.4, 25.9)
Ultra-processed foods 44.2 (41.9, 46.4) Abbreviations: R$ = real; LTPA = leisure-time physical activity; BMI = body mass index; IQR = interquartile range; CI =
confidence interval.
Notes: aVariables with missing information: three missing values for per-capita family income and two missing values for leisure
time physical activity. bDifference of the total sample size: one missing for food frequency questionnaire and one exclusion because implausible
total energy intake (>6000 kcal/day). cDifference of the total sample size: seven missing for food frequency questionnaire and one exclusion because implausible
total energy intake (>6000 kcal/day).

RESULTADOS (Artigo 3)
131
Table 2. Distribution of daily dietary intake before and during pregnancy and variation according to genotypes of the FTO-rs9939609, MC4R-
rs17782313, LEP-rs7799039 and LEPR-rs1137101 gene polymorphisms, considering the dominant genetic model for all genes
Gene Genotypes Pre-pregnancy Pregnancy Delta (∆)†
Mean (95% CI)
p-
value*
Mean (95% CI)
p-
value*
Mean (95% CI)
p-
value*
Total energy (kcal/day)a
FTO TT (n=47) 2311 (2088, 2557) 0.627 2091 (1904, 2297) 0.041 -259.8 (-494.9, -24.7) 0.015
AT+AA (n=90) 2246 (2103, 2399) 2353 (2202, 2513) 112.6 (-68.2, 293.6)
MC4R TT (n=89) 2307 (2158, 2467) 0.593 2342 (2185, 2511) 0.072 39.8 (-146.6, 226.3) 0.193
CT+CC (n=47) 2236 (2028, 2465) 2113 (1943, 2297) -160.1 (-385.8, 65.5)
LEP GG (n=63) 2284 (2101, 2483) 0.897 2384 (2209, 2574) 0.098 75.0 (-164.3, 314.3) 0.281
GA+AA (n=74) 2268 (2106, 2442) 2176 (2014, 2351) -84.8 (-265.0, 95.5)
LEPR AA (n=35) 2214 (1992, 2460) 0.530 2347 (2124, 2593) 0.427 123.5 (-148.5, 395.4) 0.235
AG+GG (n=102) 2303 (2160, 2457) 2232 (2091, 2382) -74.8 (-245.1, 95.5)
% of energy from Carbohydrates
FTO TT (n=47) 54.6 (52.7, 56.4) 0.020 58.3 (56.7, 59.9) 0.970 3.8 (1.4, 6.1) 0.056
AT+AA (n=90) 57.0 (55.8, 58.2) 58.2 (57.2, 59.4) 1.2 (-0.2, 2.7)
MC4R TT (n=89) 56.6 (55.3, 57.9) 0.315 58.2 (57.0, 57.2) 0.509 1.6 (0.0, 3.1) 0.213
CT+CC (n=47) 55.6 (53.9, 57.2) 58.8 (57.2, 60.4) 3.2 (1.1, 5.3)
LEP GG (n=63) 55.6 (54.0, 57.0) 0.302 58.9 (57.7, 60.1) 0.231 3.3 (1.5, 5.2) 0.080
GA+AA (n=74) 56.6 (55.3, 58.0) 57.8 (56.4, 59.2) 1.2 (-0.5, 2.8)
LEPR AA (n=35) 56.8 (54.8, 58.9) 0.497 57.4 (55.6, 59.2) 0.240 0.6 (-2.0, 3.1) 0.157
AG+GG (n=102) 56.1 (55.2, 57.2) 58.6 (57.6, 59.7) 2.6 (1.2, 4.0)
% of energy from Proteina
FTO TT (n=47) 16.5 (15.7, 17.4) 0.225 16.6 (15.7, 17.7) 0.170 0.4 (-0.6, 1.3) 0.704
AT+AA (n=90) 15.8 (15.2, 16.5) 15.8 (15.2, 16.5) 0.1 (-0.7, 0.9)
MC4R TT (n=89) 16.1 (15.6, 16.8) 0.684 16.4 (15.7, 17.1) 0.160 0.4 (-0.4, 1.2) 0.347
CT+CC (n=47) 15.9 (15.0, 16.9) 15.5 (14.6, 16.5) -0.2 (-1.2, 0.8)
LEP GG (n=63) 16.0 (15.2, 16.8) 0.864 15.4 (14.6, 16.2) 0.036 -0.5 (-1.4, 0.4) 0.031
GA+AA (n=74) 16.1 (15.5, 16.7) 16.6 (15.8, 17.4) 0.8 (-0.0, 1.6)
LEPR AA (n=35) 15.6 (14.7, 16.5) 0.280 16.3 (15.1, 17.6) 0.678 1.0 (-0.4, 2.3) 0.158
AG+GG (n=102) 16.2 (15.6, 16.8) 16.0 (15.4, 16.7) -0.0 (-0.7, 0.7)
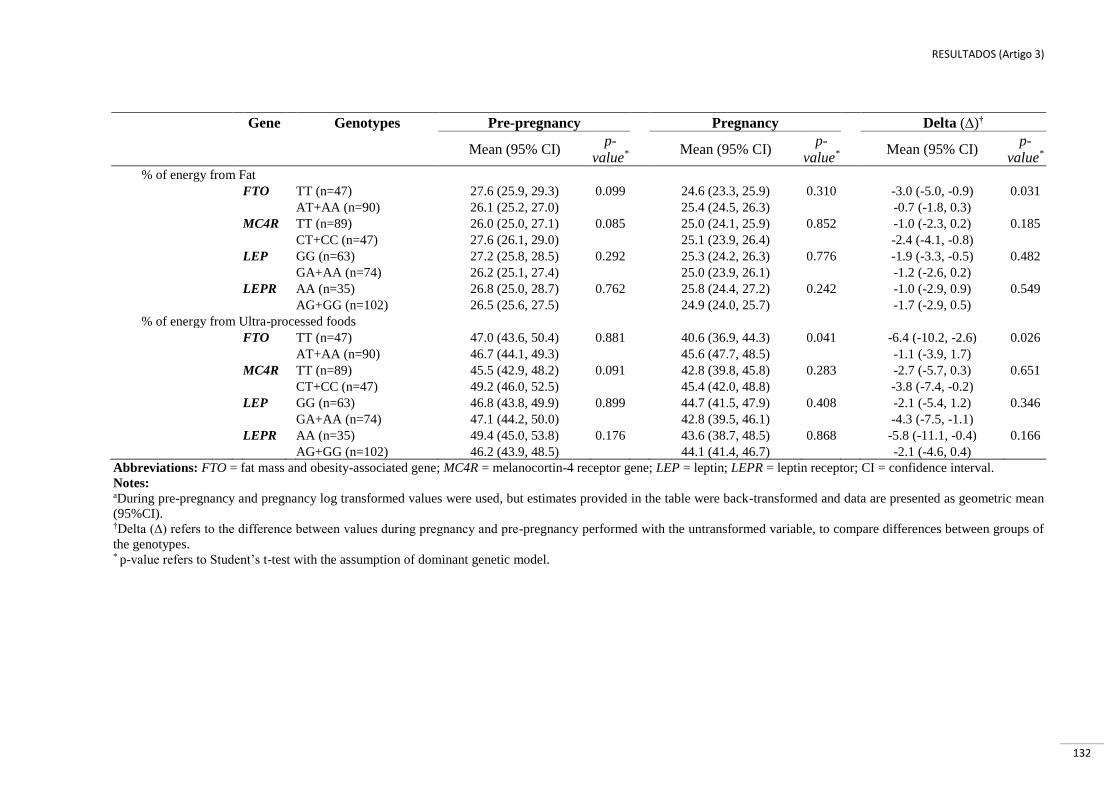
RESULTADOS (Artigo 3)
132
Gene Genotypes Pre-pregnancy Pregnancy Delta (∆)†
Mean (95% CI)
p-
value*
Mean (95% CI)
p-
value*
Mean (95% CI)
p-
value*
% of energy from Fat
FTO TT (n=47) 27.6 (25.9, 29.3) 0.099 24.6 (23.3, 25.9) 0.310 -3.0 (-5.0, -0.9) 0.031
AT+AA (n=90) 26.1 (25.2, 27.0) 25.4 (24.5, 26.3) -0.7 (-1.8, 0.3)
MC4R TT (n=89) 26.0 (25.0, 27.1) 0.085 25.0 (24.1, 25.9) 0.852 -1.0 (-2.3, 0.2) 0.185
CT+CC (n=47) 27.6 (26.1, 29.0) 25.1 (23.9, 26.4) -2.4 (-4.1, -0.8)
LEP GG (n=63) 27.2 (25.8, 28.5) 0.292 25.3 (24.2, 26.3) 0.776 -1.9 (-3.3, -0.5) 0.482
GA+AA (n=74) 26.2 (25.1, 27.4) 25.0 (23.9, 26.1) -1.2 (-2.6, 0.2)
LEPR AA (n=35) 26.8 (25.0, 28.7) 0.762 25.8 (24.4, 27.2) 0.242 -1.0 (-2.9, 0.9) 0.549
AG+GG (n=102) 26.5 (25.6, 27.5) 24.9 (24.0, 25.7) -1.7 (-2.9, 0.5)
% of energy from Ultra-processed foods
FTO TT (n=47) 47.0 (43.6, 50.4) 0.881 40.6 (36.9, 44.3) 0.041 -6.4 (-10.2, -2.6) 0.026
AT+AA (n=90) 46.7 (44.1, 49.3) 45.6 (47.7, 48.5) -1.1 (-3.9, 1.7)
MC4R TT (n=89) 45.5 (42.9, 48.2) 0.091 42.8 (39.8, 45.8) 0.283 -2.7 (-5.7, 0.3) 0.651
CT+CC (n=47) 49.2 (46.0, 52.5) 45.4 (42.0, 48.8) -3.8 (-7.4, -0.2)
LEP GG (n=63) 46.8 (43.8, 49.9) 0.899 44.7 (41.5, 47.9) 0.408 -2.1 (-5.4, 1.2) 0.346
GA+AA (n=74) 47.1 (44.2, 50.0) 42.8 (39.5, 46.1) -4.3 (-7.5, -1.1)
LEPR AA (n=35) 49.4 (45.0, 53.8) 0.176 43.6 (38.7, 48.5) 0.868 -5.8 (-11.1, -0.4) 0.166
AG+GG (n=102) 46.2 (43.9, 48.5) 44.1 (41.4, 46.7) -2.1 (-4.6, 0.4)
Abbreviations: FTO = fat mass and obesity-associated gene; MC4R = melanocortin-4 receptor gene; LEP = leptin; LEPR = leptin receptor; CI = confidence interval.
Notes: aDuring pre-pregnancy and pregnancy log transformed values were used, but estimates provided in the table were back-transformed and data are presented as geometric mean
(95%CI). †Delta (∆) refers to the difference between values during pregnancy and pre-pregnancy performed with the untransformed variable, to compare differences between groups of
the genotypes. * p-value refers to Student’s t-test with the assumption of dominant genetic model.

RESULTADOS (Artigo 3)
133
Table 3. Linear regression models between FTO-rs9939609, MC4R-rs17782313, LEP-rs7799039 and LEPR-rs1137101 gene polymorphisms and daily
dietary intake before and during pregnancy, considering the dominant* genetic model for all genes
Outcomes Gene Pre-pregnancy Pregnancy
Crude Adjusted† Crude Adjusted†
β (95% CI) p-
value
β (95% CI) p-
value
β (95% CI)
p-
value
β (95% CI) p-
value
(log)Total energya
(kcal/day)
FTO -0.014 (-0.065, 0.037) 0.598 0.020 (-0.031, 0.071) 0.441 0.055 (0.006, 0.105) 0.028 0.054 (0.003, 0.106) 0.039
MC4R -0.015 (-0.065, 0.034) 0.544 -0.025 (-0.074, 0.024) 0.311 0.046 (-0.088, 0.011) 0.124 -0.040 (-0.091, 0.010) 0.115
LEP 0.002 (-0.046, 0.050) 0.939 0.018 (-0.029, 0.065) 0.447 -0.036 (-0.084, 0.011) 0.131 -0.032 (-0.081, 0.017) 0.202
LEPR -0.004 (-0.057, 0.050) 0.896 -0.009 (-0.060, 0.042) 0.728 -0.018 (-0.072, 0.037) 0.525 -0.021 (-0.078, 0.035) 0.452
% of energy from
Carbohydrates FTO 2.5 (0.4, 4.5) 0.018 2.7 (0.5, 4.8) 0.016 0.1 (-1.8, 1.9) 0.963 0.2 (-1.8, 2.2) 0.830
MC4R -0.4 (-2.5, 1.7) 0.703 -0.25 (-2.4, 1.9) 0.822 0.7 (-1.2, 2.6) 0.451 0.8 (-1.1, 2.8) 0.402
LEP 1.0 (-0.9, 3.0) 0.295 1.19 (-0.9, 3.2) 0.255 -1.1 (-2.9, 0.8) 0.253 -0.6 (-2.5, 1.3) 0.525
LEPR -0.5 (-2.7, 1.7) 0.643 -0.48 (-2.7, 1.8) 0.668 1.3 (-0.8, 3.3) 0.214 1.5 (-0.6, 3.6) 0.169
(log) Proteina FTO -0.019 (-0.047, 0.008) 1.167 -0.038 (-0.066, -0.009) 0.009 -0.024 (-0.057, 0.008) 0.139 -0.041 (-0.074, -0.009) 0.012
MC4R -0.010 (-0.37, 0.018) 0.494 -0.010 (-0.038, 0.018) 0.492 -0.026 (-0.058, 0.006) 0.111 -0.029 (-0.061, 0.003) 0.079
LEP 0.005 (-0.021, 0.032) 0.689 -0.003 (-0.030, 0.024) 0.812 0.030 (-0.001, 0.061) 0.053 0.023 (-0.008, 0.053) 0.146
LEPR 0.022 (-0.006, 0.052) 0.126 0.022 (-0.006, 0.051) 0.125 0.009 (-0.045, 0.026) 0.613 -0.015 (-0.050, 0.020) 0.408
Fat FTO -1.4 (-3.2, 0.3) 0.101 -0.9 (-2.7, 1.0) 0.356 0.8 (-0.7, 2.3) 0.315 1.2 (-0.3, 2.8) 0.122
MC4R 1.2 (-0.5, 2.9) 0.176 0.9 (-0.9, 2.7) 0.331 0.2 (-1.4, 1.7) 0.839 0.1 (-1.4, 1.7) 0.863
LEP -0.9 (-2.6, 0.7) 0.268 -0.7 (-2.4, 1.1) 0.456 -0.2 (-1.7, 1.3) 0.792 -0.4 (-1.9, 1.2) 0.628
LEPR -0.7 (-2.5, 1.2) 0.475 -0.5 (-2.4, 1.3) 0.568 -1.0 (-2.6, 0.7) 0.237 -1.0 (-2.6, 0.8) 0.269
Ultra-processed
foods
FTO -0.8 (-4.3, 4.1) 0.969 2.0 (-2.3, 6.3) 0.366 5.3 (0.5, 10.1) 0.031 6.3 (1.4, 11.1) 0.012
MC4R 3.5 (-0.6, 7.6) 0.098 3.8 (-0.4, 8.0) 0.078 3.0 (-1.8, 7.8) 0.208 3.8 (-0.9, 8.6) 0.114
LEP -0.5 (-4.6, 3.6) 0.823 1.1 (-3.0, 5.3) 0.585 -1.6 (-6.2, 3.0) 0.486 -1.5 (-6.1, 3.1) 0.514
LEPR -4.2 (-8.6, 0.3) 0.065 -3.7 (-8.0, 0.6) 0.095 0.7 (-4.6, 6.0) 0.787 0.7 (-4.6, 6.0) 0.791 Abbreviations: FTO = fat mass and obesity-associated gene; MC4R = melanocortin-4 receptor gene; LEP = leptin; LEPR = leptin receptor; β = linear regression coefficient; CI = confidence
interval.
Notes:
aLog transformed values were used. *Dominant genetic model (FTO = TT vs. AT + AA; MC4R = TT vs. CT + CC; LEP = GG vs. GA + AA; LEPR = AA vs. AG + GG). †Models were adjusted for maternal age, self-reported skin color, parity, gestational age, per capita income and pre-pregnancy body mass index.

RESULTADOS (Artigo 3)
134
Table 4. Longitudinal analysis between FTO-rs9939609, MC4R-rs17782313, LEP-rs7799039 and LEPR-rs1137101 gene polymorphisms and
daily dietary intake, according to genotypes.
SNPs/
Genotypes
(log) Total energy
(kcal)a, †
% of energy from†
Carbohydrates (log) Proteina Fat Ultra-processed foods
β‡ (95% CI) p-
value
β‡ (95% CI)
p-
value
β‡ (95% CI)
p-
value
β‡ (95% CI)
p-
value
β‡ (95% CI)
p-
value
FTO-rs9939609
AT vs. TT 0.024
(-0.018, 0.065) 0.260
1.4
(-0.2, 2.9) 0.083
-0.022
(-0.048, 0.003) 0.090
-0.2
(-1.5, 1.2) 0.789
2.1
(-1.9, 6.1) 0.311
AT+AA vs. TT 0.031
(-0.008, 0.070) 0.121
1.2
(-0.3, 2.7) 0.112
-0.026
(-0.050, -0.002) 0.037
0.1
(-1.2, 1.3) 0.957
2.6
(-1.2, 6.4) 0.186
MC4R-rs17782313
CT vs. TT -0.032
(-0.073, 0.009) 0.122
-0.1
(-1.6, 1.5) 0.946
-0.013
(-0.038, 0.013) 0.326
0.6
(-0.7, 1.9) 0.348
4.4
(0.5, 8.3) 0.026
CT+CC vs. TT -0.033
(-0.073, 0.006) 0.101
0.1
(-1.5, 1.6) 0.927
-0.017
(-0.042, 0.008) 0.183
0.7
(-0.6, 2.0) 0.300
4.2
(0.4, 8.0) 0.030
LEP-rs7799039
GA vs. GG -0.011
(-0.051, 0.029) 0.581
0.5
(-1.0, 2.0) 0.518
0.008
(-0.017, 0.033) 0.523
-1.0
(-2.4, 0.3) 0.143
-1.7
(-5.5, 2.1) 0.377
GA+AA vs. GG -0.014
(-0.052, 0.024) 0.462
0.1
(-1.4, 1.5) 0.960
0.013
(-0.011, 0.036) 0.287
0.6
(-1.9, 0.7) 0.365
-0.3
(-4.0, 3.3) 0.856
LEPR-rs1137101
AG vs. AA -0.004
(-0.050, 0.042) 0.871
0.8
(-0.9, 2.5) 0.359
0.009
(-0.020, 0.037) 0.554
-1.0
(-2.5, 0.4) 0.167
-2.4
(-6.8, 1.9) 0.280
AG+GG vs. AA -0.006
(-0.048, 0.037) 0.797
0.5
(-1.2, 2.1) 0.582
0.009
(-0.018, 0.036) 0.513
-0.8
(-2.1, 0.6) 0.272
-1.9
(-5.9, 2.2) 0.364
Abbreviations: SNPs = single nucleotide polymorphisms; FTO = fat mass and obesity-associated gene; MC4R = melanocortin-4 receptor gene; LEP = leptin; LEPR = leptin
receptor; CI =confidence interval.
Notes: aLog transformed values were used. †Models were adjusted for gestational age (wk), maternal age, self-reported skin color, parity, per capita income and pre-pregnancy body mass index. ‡β= Linear mixed-effect regression coefficient; p-value refers to the maximum likelihood estimator.

RESULTADOS (Artigo 3)
135
Supplementary Table 1. Genotype distribution and allele frequencies of the FTO-rs9939609,
MC4R-rs17782313, LEP-rs7799039 and LEPR-rs1137101 gene polymorphisms
SNPs Study sample
n (%) p-value (HW)†
FTO-rs9939609 (n=146)
TT 47 (32.2) 0.518
AT 75 (51.4)
AA 24 (16.4)
T-allele 169 (58.0)
A-allele 123 (42.0)
MC4R-rs17782313 (n=145)
TT 94 (64.8) 0.511
CT 47 (32.4)
CC 4 (2.8)
T-allele 235 (81.0)
C-allele 55 (19.0)
LEP-rs7799039 (n=147)
GG 70 (47.6) 0.816
GA 62 (42.2)
AA 15 (10.2)
G-allele 202 (69.0)
A-allele 92 (31.0)
LEPR-rs1137101 (n=147)
AA 39 (26.5) 0.364
AG 68 (46.3)
GG 40 (27.2)
A-allele 146 (50.0)
G-allele 148 (50.0) Abbreviations: SNPs = single nucleotide polymorphisms; FTO = fat mass and obesity-associated gene; MC4R =
melanocortin-4 receptor gene; LEP = leptin; LEPR = leptin receptor; HW = Hardy–Weinberg equilibrium.
Note: †Hardy–Weinberg equilibrium test, p-value refers to Pearson χ2 tests.
(FTO = TT, Wild type; AT, heterozygote; and AA, homozygote for risk allele); (MC4R = TT, Wild type; CT,
heterozygote; and CC, homozygote for risk allele); (LEP = GG, Wild type; GA, heterozygote; and AA,
homozygote for risk allele); (LEPR = AA, Wild type; AG, heterozygote; and GG, homozygote for risk allele).

CONCLUSÕES
136
8. CONCLUSÕES
A presente tese apresentou três artigos científicos como principais produtos. As
principais conclusões foram:
Gene FTO (rs9939609)
O SNP do gene do FTO-rs9939609 foi significativamente associado ao o excesso de
peso pré-gestacional; no entanto, mulheres portadoras do genótipo AA ganharam menos peso
ao longo da gestação quando comparadas a mulheres com os genótipos AT e TT. No presente
estudo não foram encontradas associações deste polimorfismo com o GPG e a retenção de
peso pós-parto. Contudo, foram encontradas associações significativas com a percentagem
mais elevada de energia derivada dos carboidratos no período pré-gestacional, e também a
percentagem mais elevada de energia total e a percentagem de energia derivada de alimentos
ultraprocessados durante a gestação. Adicionalmente, este polimorfismo foi associado
negativamente ao percentual de energia proveniente das proteínas nos períodos pré-
gestacional e gestacional.
Gene MC4R (rs17782313)
O polimorfismo no gene MC4R-rs17782313 (alelo C) não foi associado ao excesso de
peso pré-gestacional, o GPG e a retenção de peso pós-parto. Porém, foi associado à
percentagem mais elevada de energia derivada de alimentos ultraprocessados ao longo do
período gestacional, em comparação com aquelas portadoras do genótipo TT.
Gene LEP (rs7799039)
Este polimorfismo não foi associado estatisticamente ao risco de excesso de peso pré-
gestacional, concentração plasmática de leptina durante a gestação ou com os parâmetros de
consumo alimentar nos períodos pré-gestacional e gestacional. As mulheres portadoras de
genótipo AA do gene LEP-rs7799039 apresentaram menor peso corporal ao longo da
gestação em comparação com as portadoras dos genótipos GG ou GA+GG; mas o alelo A
mostrou-se significativamente associado ao maior risco de GPG excessivo.

CONCLUSÕES
137
LEPR (rs1137101)
Não foi encontrada nenhuma associação estatisticamente significante deste
polimorfismo ao peso pré-gestacional excessivo, GPG excessivo, concentração plasmática de
leptina ao longo da gestação e parâmetros de consumo alimentar antes e durante a gestação.

CONSIDERAÇÕES FINAIS
138
9. CONSIDERAÇÕES FINAIS
À medida que a prevalência de obesidade continua a aumentar em todo o mundo,
cresce a necessidade de maior compreensão dos mecanismos desta doença para que se possa
promover a sua prevenção, minimizar os impactos à saúde e reduzir a carga econômica. Com
este propósito, pesquisadores estão investigando maneiras pelas quais a genética pode estar
causando impacto nesta epidemia. Alguns avanços foram alcançados, porém ainda existem
lacunas e muitos estudos ainda precisam ser realizados na busca por evidências mais
consistentes. A genética vinculada ao processo gestacional é uma área de relevância a ser
explorada, pois a obesidade materna está relacionada a vários mecanismos de risco de
complicações gestacional para a mãe e o feto. Apesar desta importancia, ainda é escasso ou
inexistente o conhecimento sobre como os genes contribuem para as mudanças de peso ao
longo da gestação.
A presente tese apresentou resultados sobre as associações dos SNPs dos genes
relacionados à obesidade com as mudanças de peso corporal e consumo alimentar em
mulheres gestantes. Os genes FTO-rs9939609, MC4R-rs17782313 e LEPR-rs1137101 são
altamente expressos no cérebro, particularmente no hipotalamo, enfatizando sua importância
nos mecanismos relacionados ao sistema nervoso central para o controle da obesidade. É
reconhecido que o apetite e o comportamento alimentar sofrem influência genética e há
indícios de que o componente genético atue sobre o gasto energético, notadamente sobre a
taxa metabólica basal. Contudo, diversos são os desafios da via biológica da obesidade
comum e muitos questionamentos ainda precisam ser mais bem explorados.
Os fatores relacionados aos padrões alimentares e à prática de atividade física são
considerados fatores ambientais de risco da obesidade. A saúde materna e o consumo
alimentar, antes e durante o período gestacional, são importantes fatores para o
desenvolvimento adequado da gestação. Entre os genes estudados, o FTO-rs9939609 e o
MC4R-rs17782313 foram associados aos parâmetros de consumo alimentar, além de o gene
FTO-rs9939609 também ter sido associado ao excesso do peso pré-gestacional. O gene LEP-
rs7799039 foi associado ao risco de GPG excessivo. Assim, os resultados deste estudo
agregam novos conhecimentos à literatura científica e podem contribuir para o
direcionamento de novas pesquisas sobre evidências genéticas e desfechos gestacionais.
Com o avanço no conhecimento do genoma humano e o desenvolvimento de
tecnologias abrangentes, provavelmente será possível abordar simultaneamente as

CONSIDERAÇÕES FINAIS
139
características genéticas e ambientais e contribuir para o desenvolvimento de medidas que
objetivem a redução da prevalência da obesidade e suas comorbidades. Nesta perspectiva, são
necessários novos estudos longitudinais para avaliar as associações entre os polimorfismos
genéticos e parâmetros relacionados ao peso e ao consumo alimentar antes, durante e após a
gestação.
Os resultados da presente tese são inovadores, pois avaliam a influência genética sobre
as mudanças do peso corporal e do consumo alimentar na gestação com técnicas estatísticas
longitudinais ajustadas para o efeito de outras potenciais variáveis confundidoras. A
compreensão e a interligação dos fatores que exercem influência na gestação e nos seus
desfechos adversos são de suma importância para propor mudanças nos hábitos modificáveis
e estabelecer medidas de prevenção do excesso de peso na gestação.

REFERÊNCIAS DA TESE
140
10. REFERÊNCIAS
ABDULLAH, A. et al. The magnitude of association between overweight and obesity and the
risk of diabetes: a meta-analysis of prospective cohort studies. Diabetes research and
clinical practice, v. 89, n. 3, p. 309–319, 2010.
ABLOVE, T. et al. Body mass index continues to accurately predict percent body fat as
women age despite changes in muscle mass and height. Menopause, v. 22, n. 7, p. 727–730,
2015.
ABU-SAAD, K.; FRASER, D. Maternal nutrition and birth outcomes. Epidemiologic
reviews, v. 32, n. 1, p. 5–25, 2010.
AGURS-COLLINS, T.; BOUCHARD, C. Gene‐Nutrition and Gene‐Physical Activity
Interactions in the Etiology of Obesity. Obesity, v. 16, n. S3, 2008.
ALBUQUERQUE, D. et al. Current review of genetics of human obesity: from molecular
mechanisms to an evolutionary perspective. Molecular Genetics and Genomics, v. 290, n. 4,
p. 1191–221, 2015.
ALBUQUERQUE, D.; MANCO, L.; NÓBREGA, C. Genetics of Human Obesity. In:
AHMAD, S. I.; IMAM, S. K. (Eds.). Obesity: A Practical Guide. Cham: Springer
International Publishing, 2016. p. 87–106.
ARROYO-JOHNSON, C.; MINCEY, K. D. Obesity Epidemiology Worldwide.
Gastroenterology Clinics of North America, v. 45, n. 4, p. 571–579, 2016.
ATALAH SAMUR, E. et al. Propuesta de un nuevo estándar de evaluación nutricional en
embarazadas. Rev. Med. Chile, v. 125, n. 12, p. 1429–36, 1997.
AUGUSTINE, R. A.; LADYMAN, S. R.; GRATTAN, D. R. From feeding one to feeding
many: hormone-induced changes in bodyweight homeostasis during pregnancy. The Journal
of Physiology, v. 586, n. 2, p. 387–397, 15 jan. 2008.
BASTIEN, M. et al. Overview of epidemiology and contribution of obesity to cardiovascular
disease. Progress in cardiovascular diseases, v. 56, n. 4, p. 369–381, 2014.
BECKERS, S. et al. Association study of MC4R with complex obesity and replication of the
rs17782313 association signal. Molecular genetics and metabolism, v. 103, n. 1, p. 71–75,
2011.
BELL, C. G.; WALLEY, A. J.; FROGUEL, P. The genetics of human obesity. Nature
Reviews Genetics, v. 6, n. 3, p. 221–234, 2005.
BERGGREN, E. K. et al. Maternal fat, but not lean, mass is increased among
overweight/obese women with excess gestational weight gain. American journal of
obstetrics and gynecology, v. 214, n. 6, p. 745-e1, 2016.
BHUROSY, T.; JEEWON, R. Pitfalls of using body mass index (BMI) in assessment of
obesity risk. Current Research in Nutrition and Food Science, v. 1, n. 1, p. 71, 2013.

REFERÊNCIAS DA TESE
141
BODNAR, L. M. et al. Maternal prepregnancy obesity and cause-specific stillbirth. The
American journal of clinical nutrition, v. 102, n. 4, p. 858–864, 2015.
BOSAEUS, M. et al. Accuracy of quantitative magnetic resonance and eight-electrode
bioelectrical impedance analysis in normal weight and obese women. Clinical Nutrition, v.
33, n. 3, p. 471–477, 2014.
BOUCHARD, C. The biological predisposition to obesity: beyond the thrifty genotype
scenario. International journal of obesity, v. 31, n. 9, p. 1337, 2007.
BOUMAIZA, I. et al. Relationship between leptin G2548A and leptin receptor Q223R gene
polymorphisms and obesity and metabolic syndrome risk in Tunisian volunteers. Genetic
Testing and Molecular Biomarkers, v. 16, n. 7, p. 726–733, jul. 2012.
BRANTSÆTER, A. L. et al. A dietary pattern characterized by high intake of vegetables,
fruits, and vegetable oils is associated with reduced risk of preeclampsia in nulliparous
pregnant Norwegian women. The Journal of nutrition, v. 139, n. 6, p. 1162–1168, 2009.
BRASIL. Pesquisa Nacional de Demografia e Saúde da Criança e da Mulher-PNDS
2006: dimensões do processo reprodutivo e da saúde da criança. Brasilia: Ministerio da
Saúde, 2009.
___. Vigitel Brasil 2016: Vigilância de Fatores de Risco e Proteção para Doenças
Crônicas por Inquérito Telefônico,. 1. ed. Brasilia: Ministério da Saúde, 2017.
BRAY, G. A. et al. Management of obesity. The Lancet, v. 387, n. 10031, p. 1947–1956,
2016.
BUSH, W. S.; MOORE, J. H. Genome-wide association studies. PLoS Comput Biol, v. 8, n.
12, p. e1002822, 2012.
BUTT, K. et al. Determination of gestational age by ultrasound. Journal of Obstetrics and
Gynaecology Canada, v. 36, n. 2, p. 171–181, 2014.
CABALLERO, B. The global epidemic of obesity: an overview. Epidemiologic reviews, v.
29, n. 1, p. 1–5, 2007.
CANOY, D.; BUCHAN, I. Challenges in obesity epidemiology. Obesity reviews, v. 8, n. s1,
p. 1–11, 2007.
CASTELLANO FILHO, D. S. et al. Body weight gain and serum leptin levels of non-
overweight and overweight/obese pregnant women. Medical Science Monitor:
International Medical Journal of Experimental and Clinical Research, v. 19, p. 1043–
1049, 22 nov. 2013.
CATALANO, P.; DEMOUZON, S. Maternal obesity and metabolic risk to the offspring: why
lifestyle interventions may have not achieved the desired outcomes. International journal of
obesity, v. 39, n. 4, p. 642–649, abr. 2015.
CHOQUET, H.; MEYRE, D. Molecular basis of obesity: current status and future prospects.
Current genomics, v. 12, n. 3, p. 154–168, 2011a.

REFERÊNCIAS DA TESE
142
___. Genetics of Obesity: What have we Learned? Current Genomics, v. 12, n. 3, p. 169,
maio 2011b.
CNATTINGIUS, S. et al. High birth weight and obesity—a vicious circle across generations.
International journal of obesity, v. 36, n. 10, p. 1320–1324, 2012.
CONSTANTIN, A. et al. Leptin G-2548A and leptin receptor Q223R gene polymorphisms
are not associated with obesity in Romanian subjects. Biochemical and Biophysical
Research Communications, v. 391, n. 1, p. 282–286, 1 jan. 2010.
CORNIER, M.-A. et al. Assessing adiposity. Circulation, v. 124, n. 18, p. 1996–2019, 2011.
DAĞ, Z. Ö.; DILBAZ, B. Impact of obesity on infertility in women. Journal of the Turkish
German Gynecological Association, v. 16, n. 2, p. 111, 2015.
DASGUPTA, S. et al. Genetic variants in leptin: Determinants of obesity and leptin levels in
South Indian population. Adipocyte, v. 4, n. 2, p. 135–140, jun. 2015.
DINA, C. et al. Variation in FTO contributes to childhood obesity and severe adult obesity.
Nature genetics, v. 39, n. 6, p. 724–726, 2007.
DODD, J. M. et al. Effects of an antenatal dietary intervention on maternal anthropometric
measures in pregnant women with obesity. Obesity, v. 23, n. 8, p. 1555–1562, 2015.
DREHMER, M. et al. Association of second and third trimester weight gain in pregnancy
with maternal and fetal outcomes. PloS one, v. 8, n. 1, p. e54704, 2013.
DUREN, D. L. et al. Body Composition Methods: Comparisons and Interpretation. Journal
of diabetes science and technology (Online), v. 2, n. 6, p. 1139–1146, nov. 2008.
ENDRES, L. K. et al. Postpartum Weight Retention Risk Factors and Relationship to Obesity
at One Year. Obstetrics and gynecology, v. 125, n. 1, p. 144, 2015.
ENGLUND-ÖGGE, L. et al. Maternal dietary patterns and preterm delivery: results from
large prospective cohort study. Bmj, v. 348, p. g1446, 2014.
FAO/WHO. Human energy requirements: Report of a Joint FAO/WHO/UNU Expert
Consultation. Food and nutrition technical report series. Rome: [s.n.].
FAROOQI, I. S. et al. Clinical spectrum of obesity and mutations in the melanocortin 4
receptor gene. The New England Journal of Medicine, v. 348, n. 12, p. 1085–1095, 20 mar.
2003.
FAROOQI, I. S.; O’RAHILLY, S. Monogenic obesity in humans. Annu. Rev. Med., v. 56, p.
443–458, 2005.
FAROOQI, I. S.; O’RAHILLY, S. Genetic factors in human obesity. Obesity Reviews, v. 8,
n. s1, p. 37–40, 2007.
FINKELSTEIN, E. A. et al. The costs of obesity in the workplace. Journal of Occupational
and Environmental Medicine, v. 52, n. 10, p. 971–976, out. 2010.
REFERÊNCIAS DA TESE
143
FLEGAL, K. M. et al. Comparisons of percentage body fat, body mass index, waist
circumference, and waist-stature ratio in adults. The American Journal of Clinical
Nutrition, v. 89, n. 2, p. 500–508, fev. 2009.
FLEGAL, K. M. et al. Association of all-cause mortality with overweight and obesity using
standard body mass index categories: a systematic review and meta-analysis. Jama, v. 309, n.
1, p. 71–82, 2013.
FLEISCH, A. F.; WRIGHT, R. O.; BACCARELLI, A. A. Environmental epigenetics: a role
in endocrine disease? Journal of molecular endocrinology, v. 49, n. 2, p. R61–R67, 2012.
FRANCO-SENA, A. B. et al. Factors associated with prospective leptin concentrations
throughout pregnancy in pregestational normal weight, overweight and obese women.
Clinical endocrinology, v. 82, n. 1, p. 127–135, 2015.
FRAYLING, T. M. et al. A common variant in the FTO gene is associated with body mass
index and predisposes to childhood and adult obesity. Science, v. 316, n. 5826, p. 889–894,
2007.
GAILLARD, R. et al. Risk factors and outcomes of maternal obesity and excessive weight
gain during pregnancy. Obesity, v. 21, n. 5, p. 1046–1055, 2013.
___. Childhood health consequences of maternal obesity during pregnancy: a narrative
review. Annals of Nutrition and Metabolism, v. 69, n. 3–4, p. 171–180, 2016.
GAUDET, L. et al. Maternal obesity and occurrence of fetal macrosomia: a systematic review
and meta-analysis. BioMed research international, v. 2014, 2014.
GAUTRON, L.; ELMQUIST, J. K. Sixteen years and counting: an update on leptin in energy
balance. The Journal of Clinical Investigation, v. 121, n. 6, p. 2087–2093, 1 jun. 2011.
GHO-WHO. Global Health Observatory. Overweight and obesity. Disponível em:
<http://www.who.int/gho/ncd/risk_factors/overweight/en/>. Acesso em: 1 jun. 2017.
GILMORE, L. A.; KLEMPEL-DONCHENKO, M.; REDMAN, L. M. Pregnancy as a
window to future health: excessive gestational weight gain and obesity. In: SEMINARS
IN PERINATOLOGY. Elsevier, 2015
GOLDSTEIN, D. B.; CAVALLERI, G. L. Genomics: understanding human diversity.
Nature, v. 437, n. 7063, p. 1241–1242, 2005.
GOMES, F. M. DA S. et al. The intergenerational effects on birth weight and its relations to
maternal conditions, Sao Paulo, Brazil. BioMed research international, v. 2015, 2015.
GÓMEZ-AMBROSI, J. et al. Body mass index classification misses subjects with increased
cardiometabolic risk factors related to elevated adiposity. International journal of obesity,
v. 36, n. 2, p. 286–294, 2012.
GONZÁLEZ JIMÉNEZ, E. et al. Obesidad monogénica humana: papel del sistema leptina-
melanocortina en la regulación de la ingesta de alimentos y el peso corporal en humanos.
Anales del Sistema Sanitario de Navarra, v. 35, p. 285–293, 2012.
REFERÊNCIAS DA TESE
144
GRIEGER, J. A.; GRZESKOWIAK, L. E.; CLIFTON, V. L. Preconception dietary patterns in
human pregnancies are associated with preterm delivery. The Journal of nutrition, v. 144, n.
7, p. 1075–1080, 2014.
GUIZAR-MENDOZA, J. M. et al. Association analysis of the Gln223Arg polymorphism in
the human leptin receptor gene, and traits related to obesity in Mexican adolescents. J Hum
Hypertens, v. 19, n. 5, p. 341–346, 20 jan. 2005.
HALL, K. D. et al. Energy balance and its components: implications for body weight
regulation. The American journal of clinical nutrition, v. 95, n. 4, p. 989–994, 2012.
HASTUTI, P. et al. Polymorphism in leptin receptor gene was associated with obesity in
Yogyakarta, Indonesia. Egyptian Journal of Medical Human Genetics, v. 17, n. 3, p. 271–
276, 2016.
HAUGUEL-DE MOUZON, S.; LEPERCQ, J.; CATALANO, P. The known and unknown of
leptin in pregnancy. American Journal of Obstetrics and Gynecology, v. 194, n. 6, p.
1537–1545, jun. 2006.
HERRERA, B. M.; KEILDSON, S.; LINDGREN, C. M. Genetics and epigenetics of obesity.
Maturitas, v. 69, n. 1, p. 41–49, 2011.
HESLEHURST, N. Identifying “at risk”women and the impact of maternal obesity on
National Health Service maternity services. Proceedings of the Nutrition Society, v. 70, n.
04, p. 439–449, 2011.
HILL, J. O.; WYATT, H. R.; PETERS, J. C. Energy balance and obesity. Circulation, v. 126,
n. 1, p. 126–132, 2012.
HINNEY, A. et al. Prevalence, spectrum, and functional characterization of melanocortin-4
receptor gene mutations in a representative population-based sample and obese adults from
Germany. The Journal of Clinical Endocrinology & Metabolism, v. 91, n. 5, p. 1761–
1769, 2006.
HINUY, H. M. et al. Leptin G-2548A promoter polymorphism is associated with increased
plasma leptin and BMI in Brazilian women. Arq Bras Endocrinol Metabol, v. 52, n. 4, p.
611–616, 06PY - 2008 2008.
HRUBY, A.; HU, F. B. The Epidemiology of Obesity: A Big Picture. PharmacoEconomics,
v. 33, n. 7, p. 673, jul. 2015.
HUNG, S.-P. et al. Combine body mass index and body fat percentage measures to improve
the accuracy of obesity screening in young adults. Obesity research & clinical practice, v.
11, n. 1, p. 11–18, 2017.
HUNMA, S. et al. Body composition-derived BMI cut-offs for overweight and obesity in
Indians and Creoles of Mauritius: comparison with Caucasians. International Journal of
Obesity, v. 40, n. 12, p. 1906–1914, 2016.
HURST, P. R. et al. Validity and reliability of bioelectrical impedance analysis to estimate
body fat percentage against air displacement plethysmography and dual‐energy X‐ray
absorptiometry. Nutrition & Dietetics, 2015.

REFERÊNCIAS DA TESE
145
HURT, R. T. et al. Obesity epidemic: overview, pathophysiology, and the intensive care unit
conundrum. Journal of Parenteral and Enteral Nutrition, v. 35, n. 5_suppl, p. 4S–13S,
2011.
IBGE. Pesquisa de Orçamentos Familiares 2008-2009: antropometria e estado
nutricional de crianças, adolescentes e adultos no Brasil. Rio de Janeiro: IBGE, 2010.
___. Pesquisa Nacional de Saúde : 2013 : ciclos de vida : Brasil e grandes regiões. Rio de
Janeiro: IBGE, 2015.
INSTITUTE OF MEDICINE (ED.). Weight gain during pregnancy: reexamining the
guidelines. Washington, DC: The National Academies Press, 2009.
ISMAIL, L. C. et al. Gestational weight gain standards based on women enrolled in the Fetal
Growth Longitudinal Study of the INTERGROWTH-21st Project: a prospective longitudinal
cohort study. bmj, v. 352, p. i555, 2016.
KAC, G. et al. Gestational weight gain and prepregnancy weight influence postpartum weight
retention in a cohort of Brazilian women. The Journal of nutrition, v. 134, n. 3, p. 661–666,
2004.
KAISER, L.; ALLEN, L. Position of the American Dietetic Association: Nutrition and
lifestyle for a healthy pregnancy outcome. Journal Of The American Dietetic Association,
v. 108, p. 553–561, 2008.
KARKI, R. et al. Defining “mutation” and “polymorphism” in the era of personal genomics.
BMC Medical Genomics, v. 8, 2015.
KASSEM, H. S.; GIROLAMI, F.; SANOUDOU, D. Molecular genetics made simple. Global
Cardiology Science and Practice, v. 2012, n. 1, p. 6, 2012.
KE, X.; TAYLOR, M. S.; CARDON, L. R. Singleton SNPs in the human genome and
implications for genome-wide association studies. European Journal of Human Genetics,
v. 16, n. 4, p. 506–515, 2008.
KHOSROPOUR, S.; SHOJAEE, M.; LOTFI, P. Obesity, Leptin and Leptin Receptors. Gene
Cell Tissue, v. 3, n. 4, p. e39980, 2016.
KIM, S.; MISRA, A. SNP genotyping: technologies and biomedical applications. Annu. Rev.
Biomed. Eng., v. 9, p. 289–320, 2007.
KLAAUW, A. A. VAN DER; FAROOQI, I. S. The hunger genes: pathways to obesity. Cell,
v. 161, n. 1, p. 119–132, 2015.
KLEIN, S. et al. Waist circumference and cardiometabolic risk: a consensus statement from
shaping America’s health: Association for Weight Management and Obesity Prevention;
NAASO, the Obesity Society; the American Society for Nutrition; and the American Diabetes
Association. Obesity, v. 15, n. 5, p. 1061–1067, 2007.
KYLE, U. G. et al. Bioelectrical impedance analysis—part I: review of principles and
methods. Clinical nutrition, v. 23, n. 5, p. 1226–1243, 2004a.
REFERÊNCIAS DA TESE
146
___. Bioelectrical impedance analysis—part II: utilization in clinical practice. Clinical
nutrition, v. 23, n. 6, p. 1430–1453, 2004b.
LACERDA, E. M. DE A.; LEAL, M. DO C. Risk factors associated with postpartum weight
gain and retention: a systematic review. Revista Brasileira de Epidemiologia, v. 7, n. 2, p.
187–200, 2004.
LAU, E. Y. et al. Maternal weight gain in pregnancy and risk of obesity among offspring: a
systematic review. Journal of obesity, v. 2014, 2014.
LAWRENCE, G. M. et al. Associations of Maternal Pre-pregnancy Body Mass Index and
Gestational Weight Gain with Offspring Longitudinal Change in BMI. Obesity (Silver
Spring, Md.), v. 22, n. 4, p. 1165, abr. 2014.
LEE, J. J. et al. Predictive equations for central obesity via anthropometrics, stereovision
imaging and MRI in adults. Obesity, v. 22, n. 3, p. 852–862, 2014.
LI, N. et al. Maternal prepregnancy body mass index and gestational weight gain on
pregnancy outcomes. PLoS ONE, v. 8, n. 12, 2013.
LIAO, P.-Y.; LEE, K. H. From SNPs to functional polymorphism: The insight into
biotechnology applications. Biochemical Engineering Journal, v. 49, n. 2, p. 149–158,
2010.
LINNÉ, Y. et al. Long‐term weight development in women: A 15‐year follow‐up of the
effects of pregnancy. Obesity, v. 12, n. 7, p. 1166–1178, 2004.
LIU, Y. et al. Association of LEPR Gln223Arg polymorphism with T2DM: A meta-analysis.
Diabetes Research and Clinical Practice, v. 109, n. 3, p. e21-26, set. 2015.
LOBSTEIN, T. et al. Child and adolescent obesity: part of a bigger picture. The Lancet, v.
385, n. 9986, p. 2510–2520, 2015.
LOHMAN, T.; ROCHE, A.; MARTORELL, R. Antropometric Standardization Reference
Manual. 3. ed. [s.l: s.n.]. v. 4
LONDIN, E. et al. Use of linkage analysis, genome-wide association studies, and next-
generation sequencing in the identification of disease-causing mutations.
Pharmacogenomics: Methods and Protocols, p. 127–146, 2013.
LOOS, R. J. et al. Common variants near MC4R are associated with fat mass, weight and risk
of obesity. Nature genetics, v. 40, n. 6, p. 768–775, 2008.
MADDEN, A.; SMITH, S. Body composition and morphological assessment of nutritional
status in adults: a review of anthropometric variables. Journal of Human Nutrition and
Dietetics, 2014.
MALIK, V. S.; WILLETT, W. C.; HU, F. B. Global obesity: trends, risk factors and policy
implications. Nature Reviews. Endocrinology, v. 9, n. 1, p. 13–27, jan. 2013.

REFERÊNCIAS DA TESE
147
MAMUN, A. A. et al. Associations of excess weight gain during pregnancy with long-term
maternal overweight and obesity: evidence from 21 y postpartum follow-up. The American
journal of clinical nutrition, v. 91, n. 5, p. 1336–1341, 2010.
MANNAN, M.; DOI, S. A.; MAMUN, A. A. Association between weight gain during
pregnancy and postpartum weight retention and obesity: a bias-adjusted meta-analysis.
Nutrition reviews, v. 71, n. 6, p. 343–352, 2013.
MARANGONI, F. et al. Maternal Diet and Nutrient Requirements in Pregnancy and
Breastfeeding. An Italian Consensus Document. Nutrients, v. 8, n. 10, p. 629, 2016.
MARCHI, J. et al. Risks associated with obesity in pregnancy, for the mother and baby: a
systematic review of reviews. Obesity Reviews, v. 16, n. 8, p. 621–638, 2015.
MARSHALL, N. E. et al. Comparison of multiple methods to measure maternal fat mass in
late gestation. The American journal of clinical nutrition, v. 103, n. 4, p. 1055–1063, 2016.
MARTINS, A. P. B.; BENICIO, M. H. D. Influência do consumo alimentar na gestação sobre
a retenção de peso pós-parto. Revista de saúde pública, v. 45, n. 5, p. 870–877, 2011.
MAYMÓ, J. L. et al. Review: Leptin gene expression in the placenta – Regulation of a key
hormone in trophoblast proliferation and survival. Placenta, v. 32, p. S146–S153, 1 mar.
2011.
MCCLURE, C. K. et al. Associations between gestational weight gain and BMI, abdominal
adiposity, and traditional measures of cardiometabolic risk in mothers 8 y postpartum. The
American journal of clinical nutrition, v. 98, n. 5, p. 1218–1225, 2013.
MIEHLE, K.; STEPAN, H.; FASSHAUER, M. Leptin, adiponectin and other adipokines in
gestational diabetes mellitus and pre‐eclampsia. Clinical endocrinology, v. 76, n. 1, p. 2–11,
2012.
MINISTÉRIO DA SAÚDE. Pré-natal e puerpério: atenção qualificada e humanizada-
manual técnico. 3. ed. [s.l.] Ministério da Saúde, 2006.
___. Guia alimentar para a população brasileira. Brasilia, DF, Brazil: Ministerio da Saúde,
2014.
MINOCCI, A. et al. Leptin plasma concentrations are dependent on body fat distribution in
obese patients. International journal of obesity, v. 24, n. 9, p. 1139, 2000.
MISRA, V. K.; TRUDEAU, S. The influence of overweight and obesity on longitudinal
trends in maternal serum leptin levels during pregnancy. Obesity (Silver Spring, Md.), v. 19,
n. 2, p. 416–421, fev. 2011.
MONTEIRO, C. A. et al. The UN Decade of Nutrition, the NOVA food classification and the
trouble with ultra-processing. Public Health Nutrition, p. 1–13, 2017.
MORGAN, K. L. et al. Obesity in pregnancy: a retrospective prevalence-based study on
health service utilisation and costs on the NHS. BMJ open, v. 4, n. 2, p. e003983, 2014.

REFERÊNCIAS DA TESE
148
NATIONAL RESEARCH COUNCIL. Recommended Dietary Allowances: 10th Edition.
Washington, DC: The National Academies Press, 1989.
NCD RISK FACTOR COLLABORATION. Trends in adult body-mass index in 200
countries from 1975 to 2014: a pooled analysis of 1698 population-based measurement
studies with 19· 2 million participants. The Lancet, v. 387, n. 10026, p. 1377–1396, 2016.
NEHRING, I. et al. Gestational weight gain and long-term postpartum weight retention: a
meta-analysis. The American journal of clinical nutrition, v. 94, n. 5, p. 1225–1231, 2011.
NEPA-UNICAMP. Tabela Brasileira de Composição de Alimentos (TACO). 4. ed.
Campinas-SP: NEPA/UNICAMP, 2011.
NG, M. et al. Global, regional, and national prevalence of overweight and obesity in children
and adults during 1980–2013: a systematic analysis for the Global Burden of Disease Study
2013. The Lancet, v. 384, n. 9945, p. 766–781, 2014.
NNAM, N. Improving maternal nutrition for better pregnancy outcomes. Proceedings of the
Nutrition Society, v. 74, n. 04, p. 454–459, 2015.
NOHR, E. A. et al. Combined associations of prepregnancy body mass index and gestational
weight gain with the outcome of pregnancy. The American Journal of Clinical Nutrition, v.
87, n. 6, p. 1750–1759, 2008.
NUSSBAUM, R. L.; MCINNES, R. R.; WILLARD, H. F. Thompson & Thompson genetics
in medicine. [s.l.] Elsevier Health Sciences, 2015.
OBREGÓN, A. et al. Association of the melanocortin 4 receptor gene rs17782313
polymorphism with rewarding value of food and eating behavior in Chilean children. Journal
of Physiology and Biochemistry, p. 1–7, 2016.
OHADIKE, C. O. et al. Systematic review of the methodological quality of studies aimed at
creating gestational weight gain charts. Advances in Nutrition: An International Review
Journal, v. 7, n. 2, p. 313–322, 2016.
OKORODUDU, D. et al. Diagnostic performance of body mass index to identify obesity as
defined by body adiposity: a systematic review and meta-analysis. International journal of
obesity, v. 34, n. 5, p. 791–799, 2010.
OTT, J.; WANG, J.; LEAL, S. M. Genetic linkage analysis in the age of whole-genome
sequencing. Nature Reviews Genetics, v. 16, n. 5, p. 275–284, 2015.
OVESEN, P.; RASMUSSEN, S.; KESMODEL, U. Effect of prepregnancy maternal
overweight and obesity on pregnancy outcome. Obstetrics & Gynecology, v. 118, n. 2, Part
1, p. 305–312, 2011.
PARK, H.-K.; AHIMA, R. S. Physiology of leptin: energy homeostasis, neuroendocrine
function and metabolism. Metabolism: clinical and experimental, v. 64, n. 1, p. 24–34, jan.
2015.
PINHEIRO, A. B. V. et al. Tabela para avaliação de consumo alimentar em medidas
caseiras. 5. ed. São Paulo: Atheneu, 2004.

REFERÊNCIAS DA TESE
149
POOROLAJAL, J.; JENABI, E. The association between body mass index and preeclampsia:
a meta-analysis. The Journal of Maternal-Fetal & Neonatal Medicine, v. 29, n. 22, p.
3670–3676, 2016.
POPKIN, B. M.; HAWKES, C. The sweetening of the global diet, particularly beverages:
patterns, trends and policy responses for diabetes prevention. The lancet. Diabetes &
endocrinology, v. 4, n. 2, p. 174–186, fev. 2016.
POSTON, L. et al. Preconceptional and maternal obesity: epidemiology and health
consequences. The Lancet Diabetes & Endocrinology, v. 4, n. 12, p. 1025–1036, 2016.
POSTON, L.; HARTHOORN, L. F.; VAN DER BEEK, E. M. Obesity in pregnancy:
implications for the mother and lifelong health of the child. A consensus statement. Pediatric
research, v. 69, n. 2, p. 175–180, 2011.
PRADO, C. M.; HEYMSFIELD, S. B. Lean tissue imaging a new era for nutritional
assessment and intervention. Journal of Parenteral and Enteral Nutrition, v. 38, n. 8, p.
940–953, 2014.
PREISS, K.; BRENNAN, L.; CLARKE, D. A systematic review of variables associated with
the relationship between obesity and depression. Obesity Reviews, v. 14, n. 11, p. 906–918, 1
nov. 2013.
RAMAKRISHNAN, U. et al. Effect of women’s nutrition before and during early pregnancy
on maternal and infant outcomes: a systematic review. Paediatric and perinatal
epidemiology, v. 26, n. s1, p. 285–301, 2012.
RASMUSSEN, S. A. et al. Maternal obesity and risk of neural tube defects: a metaanalysis.
American journal of obstetrics and gynecology, v. 198, n. 6, p. 611–619, 2008.
RENEHAN, A. G. et al. Body-mass index and incidence of cancer: a systematic review and
meta-analysis of prospective observational studies. The Lancet, v. 371, n. 9612, p. 569–578,
2008.
RODRÍGUEZ-LÓPEZ, R. et al. Association of FTO gene polymorphisms and morbid obesity
in the population of Extremadura (Spain). Endocrinología y nutrición: órgano de la
Sociedad Española de Endocrinología y Nutrición, v. 57, n. 5, p. 203–209, 2010.
ROMERO-CORRAL, A. et al. Accuracy of body mass index in diagnosing obesity in the
adult general population. International journal of obesity, v. 32, n. 6, p. 959–966, 2008.
RONG, K. et al. Pre-pregnancy BMI, gestational weight gain and postpartum weight
retention: a meta-analysis of observational studies. Public health nutrition, v. 18, n. 12, p.
2172–2182, 2015.
ROONEY, B. L.; MATHIASON, M. A.; SCHAUBERGER, C. W. Predictors of obesity in
childhood, adolescence, and adulthood in a birth cohort. Maternal and child health journal,
v. 15, n. 8, p. 1166–1175, 2011.
SAHIN, D. S. et al. Association with leptin gene c.-2548 g>a polymorphism, serum leptin
levels, and body mass index in Turkish obese patients. Cell Biochemistry and Biophysics, v.
65, n. 2, p. 243–247, 2013.

REFERÊNCIAS DA TESE
150
SCUTERI, A. et al. Genome-Wide Association Scan Shows Genetic Variants in the FTO
Gene Are Associated with Obesity-Related Traits. PLoS Genetics, v. 3, n. 7, p. e115, jul.
2007.
SEABOLT, L. A.; WELCH, E. B.; SILVER, H. J. Imaging methods for analyzing body
composition in human obesity and cardiometabolic disease. Annals of the New York
Academy of Sciences, v. 1353, n. 1, p. 41–59, 2015.
SEWELL, M. F. et al. Increased neonatal fat mass, not lean body mass, is associated with
maternal obesity. American journal of obstetrics and gynecology, v. 195, n. 4, p. 1100–
1103, 2006.
___. Body mass index: a true indicator of body fat in obese gravidas. The Journal of
reproductive medicine, v. 52, n. 10, p. 907–911, 2007.
SHAW, G. Polymorphism and single nucleotide polymorphisms (SNPs). BJU international,
v. 112, n. 5, p. 664–665, 2013.
SHAWKY, R. M. Reduced penetrance in human inherited disease. Egyptian Journal of
Medical Human Genetics, v. 15, n. 2, p. 103–111, 2014.
SHIN, D.; SONG, W. O. Prepregnancy body mass index is an independent risk factor for
gestational hypertension, gestational diabetes, preterm labor, and small-and large-for-
gestational-age infants. The Journal of Maternal-Fetal & Neonatal Medicine, v. 28, n. 14,
p. 1679–1686, 2015.
SICHIERI, R.; EVERHART, J. E. Validity of a Brazilian food frequency questionnaire
against dietary recalls and estimated energy intake. Nutrition Research, v. 18, n. 10, p.
1649–59, 1998.
SIEGA-RIZ, A. M. et al. A systematic review of outcomes of maternal weight gain according
to the Institute of Medicine recommendations: birthweight, fetal growth, and postpartum
weight retention. American journal of obstetrics and gynecology, v. 201, n. 4, p. 339-e1,
2009.
SINGH, R. K.; KUMAR, P.; MAHALINGAM, K. Molecular genetics of human obesity: A
comprehensive review. Comptes rendus biologies, v. 340, n. 2, p. 87–108, 2017.
SONESTEDT, E. et al. Fat and carbohydrate intake modify the association between genetic
variation in the FTO genotype and obesity. The American journal of clinical nutrition, v.
90, n. 5, p. 1418–1425, 2009.
STRAUGHEN, J.; TRUDEAU, S.; MISRA, V. Changes in adipose tissue distribution during
pregnancy in overweight and obese compared with normal weight women. Nutrition &
diabetes, v. 3, n. 8, p. e84, 2013.
STUEBE, A. M.; OKEN, E.; GILLMAN, M. W. Associations of diet and physical activity
during pregnancy with risk for excessive gestational weight gain. American journal of
obstetrics and gynecology, v. 201, n. 1, p. 58-e1, 2009.

REFERÊNCIAS DA TESE
151
STUTZMANN, F. et al. Common genetic variation near MC4R is associated with eating
behaviour patterns in European populations. International journal of obesity, v. 33, n. 3, p.
373–378, 2009.
TABET, M. et al. Prepregnancy body mass index in a first uncomplicated pregnancy and
outcomes of a second pregnancy. American journal of obstetrics and gynecology, v. 213, n.
4, p. 548-e1, 2015.
THOMPSON, J. M. et al. Maternal dietary patterns in pregnancy and the association with
small-for-gestational-age infants. British journal of nutrition, v. 103, n. 11, p. 1665–1673,
2010.
USDA. National Nutrient Database for Standard Reference, Release 24. Disponível em:
<http://www.ars.usda.gov/ba/bhnrc/ndl>. Acesso em: 12 mar. 2017.
UUSITALO, U. et al. Unhealthy dietary patterns are associated with weight gain during
pregnancy among Finnish women. Public health nutrition, v. 12, n. 12, p. 2392–2399, 2009.
VAN DER WIJDEN, C. et al. The concurrent validity between leptin, BMI and skin folds
during pregnancy and the year after. Nutrition & diabetes, v. 3, n. 9, p. e86, 2013.
VASAN, S. K. et al. Associations of variants in FTO and near MC4R with obesity traits in
South Asian Indians. Obesity, v. 20, n. 11, p. 2268–2277, 2012.
VILLAMOR, E.; CNATTINGIUS, S. Interpregnancy weight change and risk of adverse
pregnancy outcomes: a population-based study. The Lancet, v. 368, n. 9542, p. 1164–1170,
2006.
WAALEN, J. The genetics of human obesity. Translational Research, v. 164, n. 4, p. 293–
301, 2014.
WELLS, J.; FEWTRELL, M. Measuring body composition. Archives of disease in
childhood, v. 91, n. 7, p. 612–617, 2006.
WHO. Obesity: preventing and managing the global epidemic. [s.l.] World Health
Organization, 2000.
___. Protein and amino acid requirements in human nutrition: report of a joint
FAO/WHO/UNU expert consultation. In: Protein and amino acid requirements in human
nutrition: report of a joint FAO/WHO/UNU expert consultation. [s.l: s.n.]. .
___. Global status report on noncommunicable diseases 2014. Switzerland: World Health
Organization, 2014.
___. Obesity and overweight. Fact sheet N 311. Updated June 2016. World Health
Organization: Gineve, Switzerland, 2016.
WIDEN, E.; GALLAGHER, D. Body composition changes in pregnancy: measurement,
predictors and outcomes. European journal of clinical nutrition, v. 68, n. 6, p. 643–652,
2014.

REFERÊNCIAS DA TESE
152
WYATT, H. R. Update on treatment strategies for obesity. The Journal of Clinical
Endocrinology & Metabolism, v. 98, n. 4, p. 1299–1306, 2013.
YIANNAKOURIS, N. et al. The Q223R polymorphism of the leptin receptor gene is
significantly associated with obesity and predicts a small percentage of body weight and body
composition variability. The Journal of Clinical Endocrinology and Metabolism, v. 86, n.
9, p. 4434–4439, set. 2001.
YOGEV, Y.; CATALANO, P. M. Pregnancy and obesity. Obstetrics and gynecology clinics
of North America, v. 36, n. 2, p. 285–300, 2009.
ZHANG, C. et al. A prospective study of dietary patterns, meat intake and the risk of
gestational diabetes mellitus. Diabetologia, v. 49, n. 11, p. 2604–2613, 2006.
ZHOU, Y.; RUI, L. Leptin signaling and leptin resistance. Frontiers of medicine, v. 7, n. 2,
p. 207–222, jun. 2013.
ZHU, M.; ZHAO, S. Candidate gene identification approach: progress and challenges. Int J
Biol Sci, v. 3, n. 7, p. 420–427, 2007.

APÊNDICES
153
11. APÊNDICES
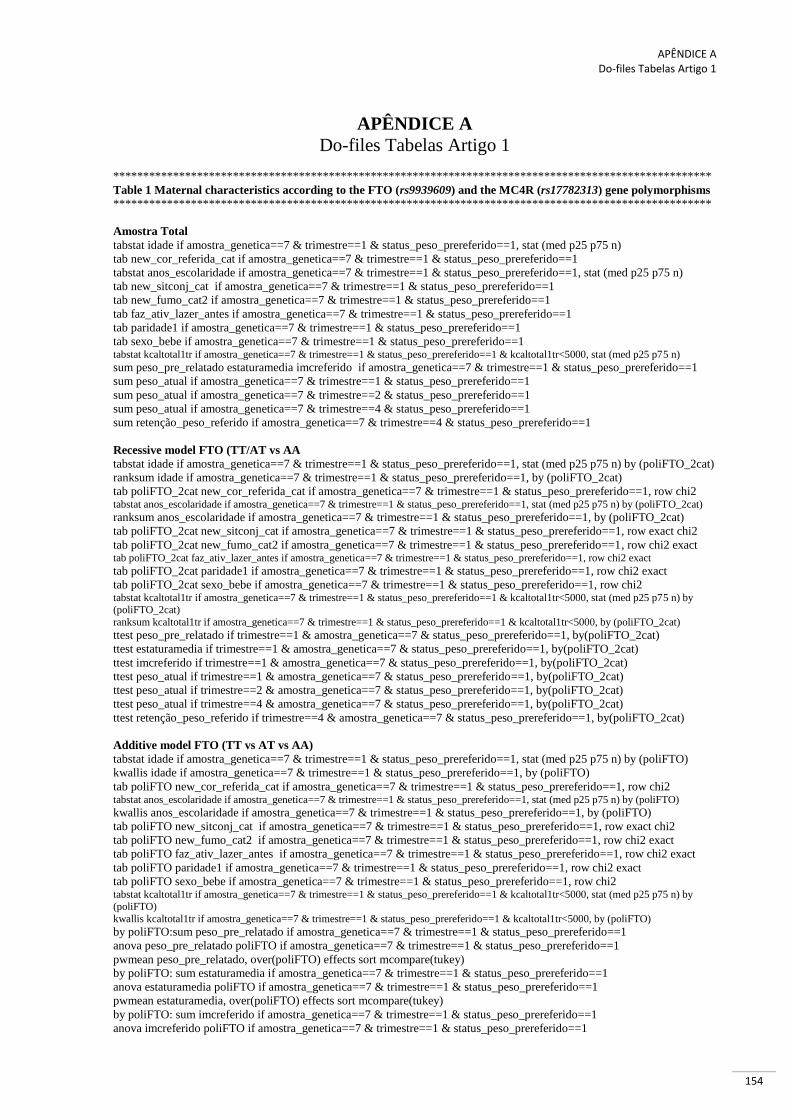
APÊNDICE A Do-files Tabelas Artigo 1
154
APÊNDICE A
Do-files Tabelas Artigo 1
****************************************************************************************************
Table 1 Maternal characteristics according to the FTO (rs9939609) and the MC4R (rs17782313) gene polymorphisms
****************************************************************************************************
Amostra Total
tabstat idade if amostra_genetica==7 & trimestre==1 & status_peso_prereferido==1, stat (med p25 p75 n)
tab new_cor_referida_cat if amostra_genetica==7 & trimestre==1 & status_peso_prereferido==1
tabstat anos_escolaridade if amostra_genetica==7 & trimestre==1 & status_peso_prereferido==1, stat (med p25 p75 n)
tab new_sitconj_cat if amostra_genetica==7 & trimestre==1 & status_peso_prereferido==1
tab new_fumo_cat2 if amostra_genetica==7 & trimestre==1 & status_peso_prereferido==1
tab faz_ativ_lazer_antes if amostra_genetica==7 & trimestre==1 & status_peso_prereferido==1
tab paridade1 if amostra_genetica==7 & trimestre==1 & status_peso_prereferido==1
tab sexo_bebe if amostra_genetica==7 & trimestre==1 & status_peso_prereferido==1 tabstat kcaltotal1tr if amostra_genetica==7 & trimestre==1 & status_peso_prereferido==1 & kcaltotal1tr<5000, stat (med p25 p75 n)
sum peso_pre_relatado estaturamedia imcreferido if amostra_genetica==7 & trimestre==1 & status_peso_prereferido==1
sum peso_atual if amostra_genetica==7 & trimestre==1 & status_peso_prereferido==1
sum peso_atual if amostra_genetica==7 & trimestre==2 & status_peso_prereferido==1
sum peso_atual if amostra_genetica==7 & trimestre==4 & status_peso_prereferido==1
sum retenção_peso_referido if amostra_genetica==7 & trimestre==4 & status_peso_prereferido==1
Recessive model FTO (TT/AT vs AA
tabstat idade if amostra_genetica==7 & trimestre==1 & status_peso_prereferido==1, stat (med p25 p75 n) by (poliFTO_2cat)
ranksum idade if amostra_genetica==7 & trimestre==1 & status_peso_prereferido==1, by (poliFTO_2cat)
tab poliFTO_2cat new_cor_referida_cat if amostra_genetica==7 & trimestre==1 & status_peso_prereferido==1, row chi2 tabstat anos_escolaridade if amostra_genetica==7 & trimestre==1 & status_peso_prereferido==1, stat (med p25 p75 n) by (poliFTO_2cat)
ranksum anos_escolaridade if amostra_genetica==7 & trimestre==1 & status_peso_prereferido==1, by (poliFTO_2cat)
tab poliFTO_2cat new_sitconj_cat if amostra_genetica==7 & trimestre==1 & status_peso_prereferido==1, row exact chi2
tab poliFTO_2cat new_fumo_cat2 if amostra_genetica==7 & trimestre==1 & status_peso_prereferido==1, row chi2 exact tab poliFTO_2cat faz_ativ_lazer_antes if amostra_genetica==7 & trimestre==1 & status_peso_prereferido==1, row chi2 exact
tab poliFTO_2cat paridade1 if amostra_genetica==7 & trimestre==1 & status_peso_prereferido==1, row chi2 exact
tab poliFTO_2cat sexo_bebe if amostra_genetica==7 & trimestre==1 & status_peso_prereferido==1, row chi2 tabstat kcaltotal1tr if amostra_genetica==7 & trimestre==1 & status_peso_prereferido==1 & kcaltotal1tr<5000, stat (med p25 p75 n) by (poliFTO_2cat)
ranksum kcaltotal1tr if amostra_genetica==7 & trimestre==1 & status_peso_prereferido==1 & kcaltotal1tr<5000, by (poliFTO_2cat)
ttest peso_pre_relatado if trimestre==1 & amostra_genetica==7 & status_peso_prereferido==1, by(poliFTO_2cat)
ttest estaturamedia if trimestre==1 & amostra_genetica==7 & status_peso_prereferido==1, by(poliFTO_2cat)
ttest imcreferido if trimestre==1 & amostra_genetica==7 & status_peso_prereferido==1, by(poliFTO_2cat)
ttest peso_atual if trimestre==1 & amostra_genetica==7 & status_peso_prereferido==1, by(poliFTO_2cat)
ttest peso_atual if trimestre==2 & amostra_genetica==7 & status_peso_prereferido==1, by(poliFTO_2cat)
ttest peso_atual if trimestre==4 & amostra_genetica==7 & status_peso_prereferido==1, by(poliFTO_2cat)
ttest retenção_peso_referido if trimestre==4 & amostra_genetica==7 & status_peso_prereferido==1, by(poliFTO_2cat)
Additive model FTO (TT vs AT vs AA)
tabstat idade if amostra_genetica==7 & trimestre==1 & status_peso_prereferido==1, stat (med p25 p75 n) by (poliFTO)
kwallis idade if amostra_genetica==7 & trimestre==1 & status_peso_prereferido==1, by (poliFTO)
tab poliFTO new_cor_referida_cat if amostra_genetica==7 & trimestre==1 & status_peso_prereferido==1, row chi2 tabstat anos_escolaridade if amostra_genetica==7 & trimestre==1 & status_peso_prereferido==1, stat (med p25 p75 n) by (poliFTO)
kwallis anos_escolaridade if amostra_genetica==7 & trimestre==1 & status_peso_prereferido==1, by (poliFTO)
tab poliFTO new_sitconj_cat if amostra_genetica==7 & trimestre==1 & status_peso_prereferido==1, row exact chi2
tab poliFTO new_fumo_cat2 if amostra_genetica==7 & trimestre==1 & status_peso_prereferido==1, row chi2 exact
tab poliFTO faz_ativ_lazer_antes if amostra_genetica==7 & trimestre==1 & status_peso_prereferido==1, row chi2 exact
tab poliFTO paridade1 if amostra_genetica==7 & trimestre==1 & status_peso_prereferido==1, row chi2 exact
tab poliFTO sexo_bebe if amostra_genetica==7 & trimestre==1 & status_peso_prereferido==1, row chi2 tabstat kcaltotal1tr if amostra_genetica==7 & trimestre==1 & status_peso_prereferido==1 & kcaltotal1tr<5000, stat (med p25 p75 n) by (poliFTO)
kwallis kcaltotal1tr if amostra_genetica==7 & trimestre==1 & status_peso_prereferido==1 & kcaltotal1tr<5000, by (poliFTO)
by poliFTO:sum peso_pre_relatado if amostra_genetica==7 & trimestre==1 & status_peso_prereferido==1
anova peso_pre_relatado poliFTO if amostra_genetica==7 & trimestre==1 & status_peso_prereferido==1
pwmean peso_pre_relatado, over(poliFTO) effects sort mcompare(tukey)
by poliFTO: sum estaturamedia if amostra_genetica==7 & trimestre==1 & status_peso_prereferido==1
anova estaturamedia poliFTO if amostra_genetica==7 & trimestre==1 & status_peso_prereferido==1
pwmean estaturamedia, over(poliFTO) effects sort mcompare(tukey)
by poliFTO: sum imcreferido if amostra_genetica==7 & trimestre==1 & status_peso_prereferido==1
anova imcreferido poliFTO if amostra_genetica==7 & trimestre==1 & status_peso_prereferido==1

APÊNDICE A Do-files Tabelas Artigo 1
155
pwmean imcreferido, over(poliFTO) effects sort mcompare(tukey)
by poliFTO: sum peso_atual if amostra_genetica==7 & trimestre==1 & status_peso_prereferido==1
anova peso_atual poliFTO if amostra_genetica==7 & trimestre==1 & status_peso_prereferido==1
pwmean peso_atual, over(poliFTO) effects sort mcompare(tukey)
by poliFTO: sum peso_atual if amostra_genetica==7 & trimestre==2 & status_peso_prereferido==1
anova peso_atual poliFTO if amostra_genetica==7 & trimestre==2 & status_peso_prereferido==1
pwmean peso_atual, over(poliFTO) effects sort mcompare(tukey)
by poliFTO: sum peso_atual if amostra_genetica==7 & trimestre==4 & status_peso_prereferido==1
anova peso_atual poliFTO if amostra_genetica==7 & trimestre==4 & status_peso_prereferido==1
pwmean peso_atual, over(poliFTO) effects sort mcompare(tukey)
by poliFTO: sum retenção_peso_referido if amostra_genetica==7 & trimestre==4 & status_peso_prereferido==1
anova retenção_peso_referido poliFTO if amostra_genetica==7 & trimestre==4 & status_peso_prereferido==1
pwmean retenção_peso_referido, over(poliFTO) effects sort mcompare(tukey)
Dominant model MC4R (TT vs CT/CC)
tabstat idade if amostra_genetica==7 & trimestre==1 & status_peso_prereferido==1, stat (med p25 p75 n) by (poliMC4R2)
ranksum idade if amostra_genetica==7 & trimestre==1 & status_peso_prereferido==1, by (poliMC4R2)
tab poliMC4R2 new_cor_referida_cat if amostra_genetica==7 & trimestre==1 & status_peso_prereferido==1, row chi2 tabstat anos_escolaridade if amostra_genetica==7 & trimestre==1 & status_peso_prereferido==1, stat (med p25 p75 n) by (poliMC4R2)
ranksum anos_escolaridade if amostra_genetica==7 & trimestre==1 & status_peso_prereferido==1, by (poliMC4R2)
tab poliMC4R2 new_sitconj_cat if amostra_genetica==7 & trimestre==1 & status_peso_prereferido==1, row exact chi2
tab poliMC4R2 new_fumo_cat2 if amostra_genetica==7 & trimestre==1 & status_peso_prereferido==1, row chi2 exact
tab poliMC4R2 faz_ativ_lazer_antes if amostra_genetica==7 & trimestre==1 & status_peso_prereferido==1, row chi2 exact
tab poliMC4R2 paridade1 if amostra_genetica==7 & trimestre==1 & status_peso_prereferido==1, row chi2 exact
tab poliMC4R2 sexo_bebe if amostra_genetica==7 & trimestre==1 & status_peso_prereferido==1, row chi2 tabstat kcaltotal1tr if amostra_genetica==7 & trimestre==1 & status_peso_prereferido==1 & kcaltotal1tr<5000, stat (med p25 p75 n) by
(poliMC4R2) ranksum kcaltotal1tr if amostra_genetica==7 & trimestre==1 & status_peso_prereferido==1 & kcaltotal1tr<5000, by (poliMC4R2)
ttest peso_pre_relatado if trimestre==1 & amostra_genetica==7 & status_peso_prereferido==1, by(poliMC4R2)
ttest estaturamedia if trimestre==1 & amostra_genetica==7 & status_peso_prereferido==1, by(poliMC4R2)
ttest imcreferido if trimestre==1 & amostra_genetica==7 & status_peso_prereferido==1, by(poliMC4R2)
ttest peso_atual if trimestre==1 & amostra_genetica==7 & status_peso_prereferido==1, by(poliMC4R2)
ttest peso_atual if trimestre==2 & amostra_genetica==7 & status_peso_prereferido==1, by(poliMC4R2)
ttest peso_atual if trimestre==4 & amostra_genetica==7 & status_peso_prereferido==1, by(poliMC4R2)
ttest retenção_peso_referido if trimestre==4 & amostra_genetica==7 & status_peso_prereferido==1, by(poliMC4R2)
****************************************************************************************************
Table 2 Associations of adiposity risk alleles (FTO and MC4R) with body weight changes before, during pregnancy
and early postpartum
****************************************************************************************************
*******************************************regressão linear múltipla**************************************
FTO - GWG in 1st trimester (g/wk) regress gan_peso_sem_1per i.poliFTO_2cat if amostra_genetica==7 & seguimento==1 & status_peso_prereferido==1
regress gan_peso_sem_1per i.poliFTO_2cat i.sexo_bebe i.faz_ativ_lazer_antes idade i.new_cor_referida_cat sg1seg i.paridade1 if amostra_genetica==7 & seguimento==1 & status_peso_prereferido==1
regress gan_peso_sem_1per i.poliFTO_2cat i.sexo_bebe i.faz_ativ_lazer_antes idade i.new_cor_referida_cat sg1seg i.paridade1 imcreferido
imcreferido2 if amostra_genetica==7 & seguimento==1 & status_peso_prereferido==1
FTO - GWG in 2nd trimester (g/wk) regress gan_peso_sem_2per i.poliFTO_2cat if amostra_genetica==7 & seguimento==1 & status_peso_prereferido==1 regress gan_peso_sem_2per i.poliFTO_2cat i.sexo_bebe i.faz_ativ_lazer_antes idade i.new_cor_referida_cat i.paridade1 sg2seg if
amostra_genetica==7 & seguimento==1 & status_peso_prereferido==1
regress gan_peso_sem_2per i.poliFTO_2cat i.sexo_bebe i.faz_ativ_lazer_antes idade i.new_cor_referida_cat i.paridade1 sg2seg imcreferido imcreferido2 if amostra_genetica==7 & seguimento==1 & status_peso_prereferido==1
FTO - GWG in 3rd trimester (g/wk) regress gan_peso_sem_3per i.poliFTO_2cat if amostra_genetica==7 & seguimento==1 & status_peso_prereferido==1
regress gan_peso_sem_3per i.poliFTO_2cat i.sexo_bebe i.faz_ativ_lazer_antes idade i.new_cor_referida_cat i.paridade1 sg3seg if amostra_genetica==7 & seguimento==1 & status_peso_prereferido==1
regress gan_peso_sem_3per i.poliFTO_2cat i.sexo_bebe i.faz_ativ_lazer_antes idade i.new_cor_referida_cat i.paridade1 sg3seg imcreferido
imcreferido2 if amostra_genetica==7 & seguimento==1 & status_peso_prereferido==1
FTO - Total GWG, (kg) regress ganhopesogest_ref i.poliFTO_2cat if amostra_genetica==7 & seguimento==1 & status_peso_prereferido==1 regress ganhopesogest_ref i.poliFTO_2cat i.sexo_bebe i.faz_ativ_lazer_antes idade i.new_cor_referida_cat sg4seg i.paridade1 if
amostra_genetica==7 & seguimento==1 & status_peso_prereferido==1

APÊNDICE A Do-files Tabelas Artigo 1
156
regress ganhopesogest_ref i.poliFTO_2cat i.sexo_bebe i.faz_ativ_lazer_antes idade i.new_cor_referida_cat sg4seg i.paridade1 imcreferido
imcreferido2 if amostra_genetica==7 & seguimento==1 & status_peso_prereferido==1
FTO - PPWR, (g/wk) regress retenção_peso_referido_corr i.poliFTO_2cat if amostra_genetica==7 & seguimento==1 & status_peso_prereferido==1
regress retenção_peso_referido_corr i.poliFTO_2cat i.sexo_bebe i.faz_ativ_lazer_antes idade i.paridade1 i.new_cor_referida_cat if
amostra_genetica==7 & seguimento==1 & status_peso_prereferido==1 regress retenção_peso_referido_corr i.poliFTO_2cat i.sexo_bebe i.faz_ativ_lazer_antes idade i.paridade1 i.new_cor_referida_cat
ganhopesogest_ref if amostra_genetica==7 & seguimento==1 & status_peso_prereferido==1
MC4R2 - GWG in 1st trimester (g/wk) regress gan_peso_sem_1per i.poliMC4R2 if amostra_genetica==7 & seguimento==1 & status_peso_prereferido==1
regress gan_peso_sem_1per i.poliMC4R2 i.sexo_bebe i.faz_ativ_lazer_antes idade i.new_cor_referida_cat sg1seg i.paridade1 if
amostra_genetica==7 & seguimento==1 & status_peso_prereferido==1 regress gan_peso_sem_1per i.poliMC4R2 i.sexo_bebe i.faz_ativ_lazer_antes idade i.new_cor_referida_cat sg1seg i.paridade1 imcreferido
imcreferido2 if amostra_genetica==7 & seguimento==1 & status_peso_prereferido==1
MC4R2 - GWG in 2nd trimester (g/wk) regress gan_peso_sem_2per i.poliMC4R2 if amostra_genetica==7 & seguimento==1 & status_peso_prereferido==1
regress gan_peso_sem_2per i.poliMC4R2 i.sexo_bebe i.faz_ativ_lazer_antes idade i.new_cor_referida_cat i.paridade1 sg2seg if
amostra_genetica==7 & seguimento==1 & status_peso_prereferido==1 regress gan_peso_sem_2per i.poliMC4R2 i.sexo_bebe i.faz_ativ_lazer_antes idade i.new_cor_referida_cat i.paridade1 sg2seg imcreferido
imcreferido2 if amostra_genetica==7 & seguimento==1 & status_peso_prereferido==1
MC4R2 - GWG in 3rd trimester (g/wk) regress gan_peso_sem_3per i.poliMC4R2 if amostra_genetica==7 & seguimento==1 & status_peso_prereferido==1
regress gan_peso_sem_3per i.poliMC4R2 i.sexo_bebe i.faz_ativ_lazer_antes idade i.new_cor_referida_cat i.paridade1 sg3seg if
amostra_genetica==7 & seguimento==1 & status_peso_prereferido==1 regress gan_peso_sem_3per i.poliMC4R2 i.sexo_bebe i.faz_ativ_lazer_antes idade i.new_cor_referida_cat i.paridade1 sg3seg imcreferido
imcreferido2 if amostra_genetica==7 & seguimento==1 & status_peso_prereferido==1
MC4R2 - Total GWG, (kg) regress ganhopesogest_ref i.poliMC4R2 if amostra_genetica==7 & seguimento==1 & status_peso_prereferido==1
regress ganhopesogest_ref i.poliMC4R2 i.sexo_bebe i.faz_ativ_lazer_antes idade i.new_cor_referida_cat sg4seg i.paridade1 if
amostra_genetica==7 & seguimento==1 & status_peso_prereferido==1 regress ganhopesogest_ref i.poliMC4R2 i.sexo_bebe i.faz_ativ_lazer_antes idade i.new_cor_referida_cat sg4seg i.paridade1 imcreferido
imcreferido2 if amostra_genetica==7 & seguimento==1 & status_peso_prereferido==1
MC4R - PPWR, (g/wk) regress retenção_peso_referido_corr i.poliMC4R2 if amostra_genetica==7 & seguimento==1 & status_peso_prereferido==1
regress retenção_peso_referido_corr i.poliMC4R2 i.sexo_bebe i.faz_ativ_lazer_antes idade i.paridade1 i.new_cor_referida_cat if amostra_genetica==7 & seguimento==1 & status_peso_prereferido==1
regress retenção_peso_referido_corr i.poliMC4R2 i.sexo_bebe i.faz_ativ_lazer_antes idade i.paridade1 i.new_cor_referida_cat
ganhopesogest_ref if amostra_genetica==7 & seguimento==1 & status_peso_prereferido==1
**********************************************regressão de Poisson**************************************
FTO - RR pre-pregnancy BMI - overweight (BMI >=25 kg/m2 poisson catimcrefer_new0 i.poliFTO_2cat if amostra_genetica==7 & seguimento==1 & status_peso_prereferido==1, irr vce(robust)
poisson catimcrefer_new0 i.poliFTO_2cat i.new_fumo_cat2 i.new_cor_referida_cat idade anos_escolaridade i.faz_ativ_lazer_antes
i.paridade1 if amostra_genetica==7 & seguimento==1 & status_peso_prereferido==1, irr vce(robust) poisson catimcrefer_new0 i.poliFTO_2cat i.new_fumo_cat2 i.new_cor_referida_cat idade anos_escolaridade i.faz_ativ_lazer_antes
i.paridade1 estaturamedia if amostra_genetica==7 & seguimento==1 & status_peso_prereferido==1, irr vce(robust)
FTO - RR total GWG by IOM category - insufficiente poisson cat_gan_peso_ref_iom2 i.poliFTO_2cat if amostra_genetica==7 & seguimento==1 & status_peso_prereferido==1, irr vce(robust)
poisson cat_gan_peso_ref_iom2 i.poliFTO_2cat i.sexo_bebe i.faz_ativ_lazer_antes idade i.new_cor_referida_cat i.paridade1 if
amostra_genetica==7 & seguimento==1 & status_peso_prereferido==1, irr vce(robust) poisson cat_gan_peso_ref_iom2 i.poliFTO_2cat i.sexo_bebe i.faz_ativ_lazer_antes idade i.new_cor_referida_cat i.paridade1 imcreferido
imcreferido2 if amostra_genetica==7 & seguimento==1 & status_peso_prereferido==1, irr vce(robust)
FTO - RR total GWG by IOM category - excessive poisson cat_gan_peso_ref_iom1 i.poliMC4R2 if amostra_genetica==7 & seguimento==1 & status_peso_prereferido==1, irr vce(robust) poisson cat_gan_peso_ref_iom1 i.poliMC4R2 i.sexo_bebe i.faz_ativ_lazer_antes idade i.new_cor_referida_cat i.paridade1 if
amostra_genetica==7 & seguimento==1 & status_peso_prereferido==1, irr vce(robust)
poisson cat_gan_peso_ref_iom1 i.poliMC4R2 i.sexo_bebe i.faz_ativ_lazer_antes idade i.new_cor_referida_cat i.paridade1 imcreferido imcreferido2 if amostra_genetica==7 & seguimento==1 & status_peso_prereferido==1, irr vce(robust)
FTO - RR postpartum BMI overweight (BMI >=25 kg/m2) poisson new_imc_catposparto0 i.poliFTO_2cat if amostra_genetica==7 & seguimento==1 & status_peso_prereferido==1, irr vce(robust)
poisson new_imc_catposparto0 i.poliFTO_2cat i.new_fumo_cat2 i.new_cor_referida_cat idade anos_escolaridade i.faz_ativ_lazer_antes
i.paridade1 if amostra_genetica==7 & seguimento==1 & status_peso_prereferido==1, irr vce(robust)

APÊNDICE A Do-files Tabelas Artigo 1
157
poisson new_imc_catposparto0 i.poliFTO_2cat i.new_fumo_cat2 i.new_cor_referida_cat idade anos_escolaridade i.faz_ativ_lazer_antes
i.paridade1 imcreferido imcreferido2 if amostra_genetica==7 & seguimento==1 & status_peso_prereferido==1, irr vce(robust)
MC4R - RR pre-pregnancy BMI - overweight (BMI >=25 kg/m2) poisson catimcrefer_new0 i.poliMC4R2 if amostra_genetica==7 & seguimento==1 & status_peso_prereferido==1, irr vce(robust)
poisson catimcrefer_new0 i.poliMC4R2 i.new_fumo_cat2 i.new_cor_referida_cat idade anos_escolaridade i.faz_ativ_lazer_antes i.paridade1
if amostra_genetica==7 & seguimento==1 & status_peso_prereferido==1, irr vce(robust) poisson catimcrefer_new0 i.poliMC4R2 i.new_fumo_cat2 i.new_cor_referida_cat idade anos_escolaridade i.faz_ativ_lazer_antes i.paridade1
estaturamedia if amostra_genetica==7 & seguimento==1 & status_peso_prereferido==1, irr vce(robust)
MC4R - RR total GWG by IOM category - insufficiente poisson cat_gan_peso_ref_iom2 i.poliMC4R2 if amostra_genetica==7 & seguimento==1 & status_peso_prereferido==1, irr vce(robust)
poisson cat_gan_peso_ref_iom2 i.poliMC4R2 i.sexo_bebe i.faz_ativ_lazer_antes idade i.new_cor_referida_cat i.paridade1 if
amostra_genetica==7 & seguimento==1 & status_peso_prereferido==1, irr vce(robust) poisson cat_gan_peso_ref_iom2 i.poliMC4R2 i.sexo_bebe i.faz_ativ_lazer_antes idade i.new_cor_referida_cat i.paridade1 imcreferido
imcreferido2 if amostra_genetica==7 & seguimento==1 & status_peso_prereferido==1, irr vce(robust)
MC4R - RR total GWG by IOM category - excessive poisson cat_gan_peso_ref_iom1 i.poliMC4R2 if amostra_genetica==7 & seguimento==1 & status_peso_prereferido==1, irr vce(robust)
poisson cat_gan_peso_ref_iom1 i.poliMC4R2 i.sexo_bebe i.faz_ativ_lazer_antes idade i.new_cor_referida_cat i.paridade1 if
amostra_genetica==7 & seguimento==1 & status_peso_prereferido==1, irr vce(robust) poisson cat_gan_peso_ref_iom1 i.poliMC4R2 i.sexo_bebe i.faz_ativ_lazer_antes idade i.new_cor_referida_cat i.paridade1 imcreferido
imcreferido2 if amostra_genetica==7 & seguimento==1 & status_peso_prereferido==1, irr vce(robust)
MC4R - RR postpartum BMI overweight (BMI >=25 kg/m2) poisson new_imc_catposparto0 i.poliMC4R2 if amostra_genetica==7 & seguimento==1 & status_peso_prereferido==1, irr vce(robust)
poisson new_imc_catposparto0 i.poliMC4R2 i.new_fumo_cat2 i.new_cor_referida_cat idade anos_escolaridade i.faz_ativ_lazer_antes
i.paridade1 if amostra_genetica==7 & seguimento==1 & status_peso_prereferido==1, irr vce(robust) poisson new_imc_catposparto0 i.poliMC4R2 i.new_fumo_cat2 i.new_cor_referida_cat idade anos_escolaridade i.faz_ativ_lazer_antes
i.paridade1 imcreferido imcreferido2 if amostra_genetica==7 & seguimento==1 & status_peso_prereferido==1, irr vce(robust)
****************************************************************************************************
**Table 3 - Longitudinal analysis between FTO (rs9939609), MC4R (rs17782313) and trajectory of body weight
during pregnancy
****************************************************************************************************
FTO - Trajectory of maternal weight (TT or AT vs. AA) xi: xtmixed peso_atual i.poliFTO_2cat sg_padrao sg_padrao2 if amostra_genetica==7 & seguimento~=5 & status_peso_prereferido==1, || id:
sg_padrao, covariance(uns) variance
xi: xtmixed peso_atual i.poliFTO_2cat sg_padrao anos_escolaridade i.new_fumo_cat2 i.new_cor_referida_cat i.sexo_bebe idade i.faz_ativ_lazer_antes estaturamedia i.paridade1 sg_padrao2 if amostra_genetica==7 & seguimento~=5 & status_peso_prereferido==1,|| id:
sg_padrao, covariance(uns) variance
xi: xtmixed peso_atual i.poliFTO_2cat sg_padrao anos_escolaridade i.new_fumo_cat2 i.new_cor_referida_cat i.sexo_bebe idade i.faz_ativ_lazer_antes i.paridade1 imcreferido imcreferido2 sg_padrao2 if amostra_genetica==7 & seguimento~=5 &
status_peso_prereferido==1,|| id: sg_padrao, covariance(uns) variance
FTO - Trajectory of maternal weight (FTO#gestational age) xi: xtmixed peso_atual poliFTO_2cat##c.sg_padrao sg_padrao2 if amostra_genetica==7 & seguimento~=5 & status_peso_prereferido==1, || id: sg_padrao, covariance(uns) variance
xi: xtmixed peso_atual poliFTO_2cat##c.sg_padrao anos_escolaridade i.new_fumo_cat2 i.new_cor_referida_cat i.sexo_bebe idade
i.faz_ativ_lazer_antes estaturamedia i.paridade1 sg_padrao2 if amostra_genetica==7 & seguimento~=5 & status_peso_prereferido==1,|| id:
sg_padrao, covariance(uns) variance
xi: xtmixed peso_atual poliFTO_2cat##c.sg_padrao anos_escolaridade i.new_fumo_cat2 i.new_cor_referida_cat i.sexo_bebe idade
i.faz_ativ_lazer_antes i.paridade1 imcreferido imcreferido2 sg_padrao2 if amostra_genetica==7 & seguimento~=5 & status_peso_prereferido==1,|| id: sg_padrao, covariance(uns) variance
MC4R - Trajectory of maternal weight (TT vs. CT or CC) xi: xtmixed peso_atual i.poliMC4R2 sg_padrao sg_padrao2 if amostra_genetica==7 & seguimento~=5 & status_peso_prereferido==1, || id:
sg_padrao, covariance(uns) variance
xi: xtmixed peso_atual i.poliMC4R2 sg_padrao anos_escolaridade i.new_fumo_cat2 i.new_cor_referida_cat i.sexo_bebe idade i.faz_ativ_lazer_antes estaturamedia i.paridade1 sg_padrao2 if amostra_genetica==7 & seguimento~=5 & status_peso_prereferido==1,|| id:
sg_padrao, covariance(uns) variance
xi: xtmixed peso_atual i.poliMC4R2 sg_padrao anos_escolaridade i.new_fumo_cat2 i.new_cor_referida_cat i.sexo_bebe idade i.faz_ativ_lazer_antes i.paridade1 imcreferido imcreferido2 sg_padrao2 if amostra_genetica==7 & seguimento~=5 &
status_peso_prereferido==1,|| id: sg_padrao, covariance(uns) variance
Aggregate score (FTO/MC4R)0=(TT/TT) or (AAorAT/TT or CCorCT/TT) 1=(AAorAT/CCorCT) xi: xtmixed peso_atual i.fto2mc4r2mod_news_R sg_padrao sg_padrao2 if amostra_genetica==7 & seguimento~=5 &
status_peso_prereferido==1, || id: sg_padrao, covariance(uns) variance

APÊNDICE A Do-files Tabelas Artigo 1
158
xi: xtmixed peso_atual i.fto2mc4r2mod_news_R sg_padrao anos_escolaridade i.new_fumo_cat2 i.new_cor_referida_cat i.sexo_bebe idade
i.faz_ativ_lazer_antes i.paridade1 estaturamedia sg_padrao2 if amostra_genetica==7 & seguimento~=5 & status_peso_prereferido==1,|| id:
sg_padrao, covariance(uns) variance xi: xtmixed peso_atual i.fto2mc4r2mod_news_R sg_padrao anos_escolaridade i.new_fumo_cat2 i.new_cor_referida_cat i.sexo_bebe idade
i.faz_ativ_lazer_antes i.paridade1 imcreferido imcreferido2 sg_padrao2 if amostra_genetica==7 & seguimento~=5 &
status_peso_prereferido==1,|| id: sg_padrao, covariance(uns) variance
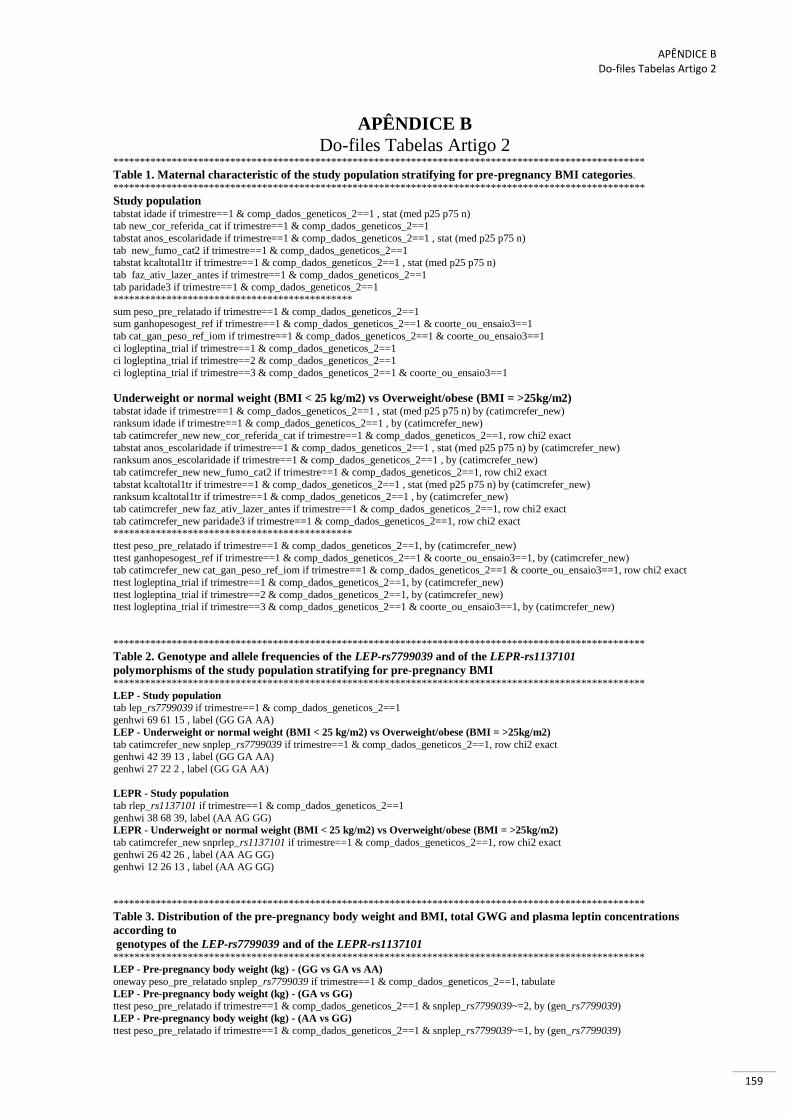
APÊNDICE B Do-files Tabelas Artigo 2
159
APÊNDICE B
Do-files Tabelas Artigo 2 ****************************************************************************************************
Table 1. Maternal characteristic of the study population stratifying for pre-pregnancy BMI categories.
****************************************************************************************************
Study population tabstat idade if trimestre==1 & comp_dados_geneticos_2==1 , stat (med p25 p75 n) tab new_cor_referida_cat if trimestre==1 & comp_dados_geneticos_2==1
tabstat anos_escolaridade if trimestre==1 & comp_dados_geneticos_2==1 , stat (med p25 p75 n)
tab new_fumo_cat2 if trimestre==1 & comp_dados_geneticos_2==1 tabstat kcaltotal1tr if trimestre==1 & comp_dados_geneticos_2==1 , stat (med p25 p75 n)
tab faz_ativ_lazer_antes if trimestre==1 & comp_dados_geneticos_2==1 tab paridade3 if trimestre==1 & comp_dados_geneticos_2==1
*********************************************
sum peso_pre_relatado if trimestre==1 & comp_dados_geneticos_2==1 sum ganhopesogest_ref if trimestre==1 & comp_dados_geneticos_2==1 & coorte_ou_ensaio3==1
tab cat_gan_peso_ref_iom if trimestre==1 & comp_dados_geneticos_2==1 & coorte_ou_ensaio3==1
ci logleptina_trial if trimestre==1 & comp_dados_geneticos_2==1 ci logleptina_trial if trimestre==2 & comp_dados_geneticos_2==1
ci logleptina_trial if trimestre==3 & comp_dados_geneticos_2==1 & coorte_ou_ensaio3==1
Underweight or normal weight (BMI < 25 kg/m2) vs Overweight/obese (BMI = >25kg/m2) tabstat idade if trimestre==1 & comp_dados_geneticos_2==1 , stat (med p25 p75 n) by (catimcrefer_new) ranksum idade if trimestre==1 & comp_dados_geneticos_2==1 , by (catimcrefer_new)
tab catimcrefer_new new_cor_referida_cat if trimestre==1 & comp_dados_geneticos_2==1, row chi2 exact
tabstat anos_escolaridade if trimestre==1 & comp_dados_geneticos_2==1 , stat (med p25 p75 n) by (catimcrefer_new) ranksum anos_escolaridade if trimestre==1 & comp_dados_geneticos_2==1 , by (catimcrefer_new)
tab catimcrefer_new new_fumo_cat2 if trimestre==1 & comp_dados_geneticos_2==1, row chi2 exact
tabstat kcaltotal1tr if trimestre==1 & comp_dados_geneticos_2==1 , stat (med p25 p75 n) by (catimcrefer_new) ranksum kcaltotal1tr if trimestre==1 & comp_dados_geneticos_2==1 , by (catimcrefer_new)
tab catimcrefer_new faz_ativ_lazer_antes if trimestre==1 & comp_dados_geneticos_2==1, row chi2 exact
tab catimcrefer_new paridade3 if trimestre==1 & comp_dados_geneticos_2==1, row chi2 exact *********************************************
ttest peso_pre_relatado if trimestre==1 & comp_dados_geneticos_2==1, by (catimcrefer_new)
ttest ganhopesogest_ref if trimestre==1 & comp_dados_geneticos_2==1 & coorte_ou_ensaio3==1, by (catimcrefer_new)
tab catimcrefer_new cat_gan_peso_ref_iom if trimestre==1 & comp_dados_geneticos_2==1 & coorte_ou_ensaio3==1, row chi2 exact
ttest logleptina_trial if trimestre==1 & comp_dados_geneticos_2==1, by (catimcrefer_new)
ttest logleptina_trial if trimestre==2 & comp_dados_geneticos_2==1, by (catimcrefer_new) ttest logleptina_trial if trimestre==3 & comp_dados_geneticos_2==1 & coorte_ou_ensaio3==1, by (catimcrefer_new)
****************************************************************************************************
Table 2. Genotype and allele frequencies of the LEP-rs7799039 and of the LEPR-rs1137101
polymorphisms of the study population stratifying for pre-pregnancy BMI ****************************************************************************************************
LEP - Study population
tab lep_rs7799039 if trimestre==1 & comp_dados_geneticos_2==1 genhwi 69 61 15 , label (GG GA AA)
LEP - Underweight or normal weight (BMI < 25 kg/m2) vs Overweight/obese (BMI = >25kg/m2)
tab catimcrefer_new snplep_rs7799039 if trimestre==1 & comp_dados_geneticos_2==1, row chi2 exact genhwi 42 39 13 , label (GG GA AA)
genhwi 27 22 2 , label (GG GA AA)
LEPR - Study population
tab rlep_rs1137101 if trimestre==1 & comp_dados_geneticos_2==1
genhwi 38 68 39, label (AA AG GG) LEPR - Underweight or normal weight (BMI < 25 kg/m2) vs Overweight/obese (BMI = >25kg/m2)
tab catimcrefer_new snprlep_rs1137101 if trimestre==1 & comp_dados_geneticos_2==1, row chi2 exact
genhwi 26 42 26 , label (AA AG GG) genhwi 12 26 13 , label (AA AG GG)
****************************************************************************************************
Table 3. Distribution of the pre-pregnancy body weight and BMI, total GWG and plasma leptin concentrations
according to
genotypes of the LEP-rs7799039 and of the LEPR-rs1137101
**************************************************************************************************** LEP - Pre-pregnancy body weight (kg) - (GG vs GA vs AA)
oneway peso_pre_relatado snplep_rs7799039 if trimestre==1 & comp_dados_geneticos_2==1, tabulate
LEP - Pre-pregnancy body weight (kg) - (GA vs GG)
ttest peso_pre_relatado if trimestre==1 & comp_dados_geneticos_2==1 & snplep_rs7799039~=2, by (gen_rs7799039)
LEP - Pre-pregnancy body weight (kg) - (AA vs GG)
ttest peso_pre_relatado if trimestre==1 & comp_dados_geneticos_2==1 & snplep_rs7799039~=1, by (gen_rs7799039)

APÊNDICE B Do-files Tabelas Artigo 2
160
LEP - Pre-pregnancy body weight (kg) - (AA vs GA+GG)
ttest peso_pre_relatado if trimestre==1 & comp_dados_geneticos_2==1, by (re_gen_rs7799039)
LEP - Pre-pregnancy body weight (kg) - (GA+AA vs GG)
ttest peso_pre_relatado if trimestre==1 & comp_dados_geneticos_2==1, by (gen_rs7799039)
*********************************************
LEP - Pre-pregnancy BMI (kg/m2) - (GG vs GA vs AA)
oneway imcreferido snplep_rs7799039 if trimestre==1 & comp_dados_geneticos_2==1, tabulate
LEP - Pre-pregnancy BMI (kg/m2) - (GA vs GG)
ttest imcreferido if trimestre==1 & comp_dados_geneticos_2==1 & snplep_rs7799039~=2, by (gen_rs7799039) LEP - Pre-pregnancy BMI (kg/m2) - (AA vs GG)
ttest imcreferido if trimestre==1 & comp_dados_geneticos_2==1 & snplep_rs7799039~=1, by (gen_rs7799039)
LEP - Pre-pregnancy BMI (kg/m2) - (AA vs GA+GG)
ttest imcreferido if trimestre==1 & comp_dados_geneticos_2==1, by (re_gen_rs7799039)
LEP - Pre-pregnancy BMI (kg/m2) - (GA+AA vs GG)
ttest imcreferido if trimestre==1 & comp_dados_geneticos_2==1, by (gen_rs7799039) *********************************************
LEP - Total GWG (kg) - (GG vs GA vs AA)
oneway ganhopesogest_ref snplep_rs7799039 if trimestre==1 & comp_dados_geneticos_2==1, tabulate
LEP - Total GWG (kg) - (GA vs GG)
ttest ganhopesogest_ref if trimestre==1 & comp_dados_geneticos_2==1 & snplep_rs7799039~=2, by (gen_rs7799039)
LEP - Total GWG (kg) - (AA vs GG)
ttest ganhopesogest_ref if trimestre==1 & comp_dados_geneticos_2==1 & snplep_rs7799039~=1, by (gen_rs7799039)
LEP - Total GWG (kg) - (AA vs GA+GG)
ttest ganhopesogest_ref if trimestre==1 & comp_dados_geneticos_2==1, by (re_gen_rs7799039) LEP - Total GWG (kg) - (GA+AA vs GG)
ttest ganhopesogest_ref if trimestre==1 & comp_dados_geneticos_2==1, by (gen_rs7799039)
********************************************* LEP - Leptina (ng/dL) First trimester - (GG vs GA vs AA)
oneway logleptina_trial snplep_rs7799039 if trimestre==1 & comp_dados_geneticos_2==1, tabulate
LEP - Leptina (ng/dL) First trimester - (GA vs GG)
ttest logleptina_trial if trimestre==1 & comp_dados_geneticos_2==1 & snplep_rs7799039~=2, by (gen_rs7799039)
LEP - Leptina (ng/dL) First trimester - (AA vs GG)
ttest logleptina_trial if trimestre==1 & comp_dados_geneticos_2==1 & snplep_rs7799039~=1, by (gen_rs7799039) LEP - Leptina (ng/dL) First trimester - (AA vs GA+GG)
ttest logleptina_trial if trimestre==1 & comp_dados_geneticos_2==1, by (re_gen_rs7799039)
LEP - Leptina (ng/dL) First trimester) - (GA+AA vs GG)
ttest logleptina_trial if trimestre==1 & comp_dados_geneticos_2==1, by (gen_rs7799039)
********************************************* LEP - Leptina (ng/dL) Second trimester - (GG vs GA vs AA)
oneway logleptina_trial snplep_rs7799039 if trimestre==2 & comp_dados_geneticos_2==1, tabulate
LEP - Leptina (ng/dL) Second trimester - (GA vs GG)
ttest logleptina_trial if trimestre==2 & comp_dados_geneticos_2==1 & snplep_rs7799039~=2, by (gen_rs7799039)
LEP - Leptina (ng/dL) Second trimester - (AA vs GG)
ttest logleptina_trial if trimestre==2 & comp_dados_geneticos_2==1 & snplep_rs7799039~=1, by (gen_rs7799039) LEP - Leptina (ng/dL) Second trimester - (AA vs GA+GG)
ttest logleptina_trial if trimestre==2 & comp_dados_geneticos_2==1, by (re_gen_rs7799039)
LEP - Leptina (ng/dL) Second trimester) - (GA+AA vs GG)
ttest logleptina_trial if trimestre==2 & comp_dados_geneticos_2==1, by (gen_rs7799039)
*********************************************
LEP - Leptina (ng/dL) Third trimester - (GG vs GA vs AA)
oneway logleptina_trial snplep_rs7799039 if trimestre==3 & comp_dados_geneticos_2==1 & coorte_ou_ensaio3==1, tabulate
LEP - Leptina (ng/dL) Third trimester - (GA vs GG)
ttest logleptina_trial if trimestre==3 & comp_dados_geneticos_2==1 & snplep_rs7799039~=2 & coorte_ou_ensaio3==1, by (gen_rs7799039)
LEP - Leptina (ng/dL) Third trimester - (AA vs GG)
ttest logleptina_trial if trimestre==3 & comp_dados_geneticos_2==1 & snplep_rs7799039~=1 & coorte_ou_ensaio3==1, by (gen_rs7799039)
LEP - Leptina (ng/dL) Third trimester - (AA vs GA+GG)
ttest logleptina_trial if trimestre==3 & comp_dados_geneticos_2==1 & coorte_ou_ensaio3==1, by (re_gen_rs7799039) LEP - Leptina (ng/dL) Third trimester) - (GA+AA vs GG)
ttest logleptina_trial if trimestre==3 & comp_dados_geneticos_2==1 & coorte_ou_ensaio3==1, by (gen_rs7799039)
********************************************* *********************************************
LEPR - Pre-pregnancy body weight (kg) - (AA vs AG vs GG)
oneway peso_pre_relatado snprlep_rs1137101 if trimestre==1 & comp_dados_geneticos_2==1, tabulate LEPR - Pre-pregnancy body weight (kg) - (AG vs AA)
ttest peso_pre_relatado if trimestre==1 & comp_dados_geneticos_2==1 & snprlep_rs1137101~=2, by (gen_rs1137101)
LEPR - Pre-pregnancy body weight (kg) - (GG vs AA)
ttest peso_pre_relatado if trimestre==1 & comp_dados_geneticos_2==1 & snprlep_rs1137101~=1, by (gen_rs1137101)
LEPR - Pre-pregnancy body weight (kg) - (GG vs AG+AA)
ttest peso_pre_relatado if trimestre==1 & comp_dados_geneticos_2==1, by (re_gen_rs1137101) LEPR - Pre-pregnancy body weight (kg) - (AG+GG vs AA)
ttest peso_pre_relatado if trimestre==1 & comp_dados_geneticos_2==1, by (gen_rs1137101)
*********************************************
LEPR - Pre-pregnancy BMI (kg/m2) - (AA vs AG vs GG)
oneway imcreferido snprlep_rs1137101 if trimestre==1 & comp_dados_geneticos_2==1, tabulate

APÊNDICE B Do-files Tabelas Artigo 2
161
LEPR - Pre-pregnancy BMI (kg/m2) - (AG vs AA)
ttest imcreferido if trimestre==1 & comp_dados_geneticos_2==1 & snprlep_rs1137101~=2, by (gen_rs1137101)
LEPR - Pre-pregnancy BMI (kg/m2) - (GG vs AA)
ttest imcreferido if trimestre==1 & comp_dados_geneticos_2==1 & snprlep_rs1137101~=1, by (gen_rs1137101)
LEPR - Pre-pregnancy BMI (kg/m2) - (GG vs AG+AA)
ttest imcreferido if trimestre==1 & comp_dados_geneticos_2==1, by (re_gen_rs1137101) LEPR - Pre-pregnancy BMI (kg/m2) - (AG+GG vs AA)
ttest imcreferido if trimestre==1 & comp_dados_geneticos_2==1, by (gen_rs1137101)
********************************************* LEPR - Total GWG (kg) - (AA vs AG vs GG)
oneway ganhopesogest_ref snprlep_rs1137101 if trimestre==1 & comp_dados_geneticos_2==1, tabulate
LEPR - Total GWG (kg) - (AG vs AA)
ttest ganhopesogest_ref if trimestre==1 & comp_dados_geneticos_2==1 & snprlep_rs1137101~=2, by (gen_rs1137101)
LEPR - Total GWG (kg) - (GG vs AA)
ttest ganhopesogest_ref if trimestre==1 & comp_dados_geneticos_2==1 & snprlep_rs1137101~=1, by (gen_rs1137101) LEPR - Total GWG (kg) - (GG vs AG+AA)
ttest ganhopesogest_ref if trimestre==1 & comp_dados_geneticos_2==1, by (re_gen_rs1137101)
LEPR - Total GWG (kg) - (AG+GG vs AA)
ttest ganhopesogest_ref if trimestre==1 & comp_dados_geneticos_2==1, by (gen_rs1137101)
*********************************************
LEPR - Leptina (ng/dL) First trimester - (AA vs AG vs GG)
oneway logleptina_trial snprlep_rs1137101 if trimestre==1 & comp_dados_geneticos_2==1, tabulate
LEPR - Leptina (ng/dL) First trimester - (AG vs AA)
ttest logleptina_trial if trimestre==1 & comp_dados_geneticos_2==1 & snprlep_rs1137101~=2, by (gen_rs1137101) LEPR - Leptina (ng/dL) First trimester - (GG vs AA)
ttest logleptina_trial if trimestre==1 & comp_dados_geneticos_2==1 & snprlep_rs1137101~=1, by (gen_rs1137101)
LEPR - Leptina (ng/dL) First trimester - (GG vs AG+AA)
ttest logleptina_trial if trimestre==1 & comp_dados_geneticos_2==1, by (re_gen_rs1137101)
LEPR - Leptina (ng/dL) First trimester) - (AG+GG vs AA)
ttest logleptina_trial if trimestre==1 & comp_dados_geneticos_2==1, by (gen_rs1137101) *********************************************
LEPR - Leptina (ng/dL) Second trimester - (AA vs AG vs GG)
oneway logleptina_trial snprlep_rs1137101 if trimestre==2 & comp_dados_geneticos_2==1, tabulate LEPR - Leptina (ng/dL) Second trimester - (AG vs AA)
ttest logleptina_trial if trimestre==2 & comp_dados_geneticos_2==1 & snprlep_rs1137101~=2, by (gen_rs1137101)
LEPR - Leptina (ng/dL) Second trimester - (GG vs AA)
ttest logleptina_trial if trimestre==2 & comp_dados_geneticos_2==1 & snprlep_rs1137101~=1, by (gen_rs1137101)
LEPR - Leptina (ng/dL) Second trimester - (GG vs AG+AA)
ttest logleptina_trial if trimestre==2 & comp_dados_geneticos_2==1, by (re_gen_rs1137101)
LEPR - Leptina (ng/dL) Second trimester) - (AG+GG vs AA)
ttest logleptina_trial if trimestre==2 & comp_dados_geneticos_2==1, by (gen_rs1137101) *********************************************
LEPR - Leptina (ng/dL) Third trimester - (AA vs AG vs GG)
oneway logleptina_trial snprlep_rs1137101 if trimestre==3 & comp_dados_geneticos_2==1 & coorte_ou_ensaio3==1, tabulate LEPR - Leptina (ng/dL) Third trimester - (AG vs AA)
ttest logleptina_trial if trimestre==3 & comp_dados_geneticos_2==1 & snprlep_rs1137101~=2 & coorte_ou_ensaio3==1, by
(gen_rs1137101) LEPR - Leptina (ng/dL) Third trimester - (GG vs AA)
ttest logleptina_trial if trimestre==3 & comp_dados_geneticos_2==1 & snprlep_rs1137101~=1 & coorte_ou_ensaio3==1, by
(gen_rs1137101) LEPR - Leptina (ng/dL) Third trimester - (GG vs AG+AA)
ttest logleptina_trial if trimestre==3 & comp_dados_geneticos_2==1 & coorte_ou_ensaio3==1, by (re_gen_rs1137101)
LEPR - Leptina (ng/dL) Third trimester) - (AG+GG vs AA)
ttest logleptina_trial if trimestre==3 & comp_dados_geneticos_2==1 & coorte_ou_ensaio3==1, by (gen_rs1137101)
****************************************************************************************************
Table 4. Associations of the LEP-rs7799039 and LEPR-rs1137101 polymorphisms with pre-pregnancy BMI,
GWG and leptin concentrations. **************************************************************************************************** LEP-rs7799039(GA vs GG)- Pre-pregnancy BMI (kg/m2)- Overweight/obese (>=25)- RR (95% CI)
poisson catimcrefer_new0 i.snplep_rs7799039 i.faz_ativ_lazer_antes idade i.new_cor_referida_cat i.paridade3 i.new_fumo_cat2
anos_escolaridade kcaltotal1tr /// if trimestre==1 & comp_dados_geneticos_2==1 & snplep_rs7799039~=2, irr vce(robust)
LEP-rs7799039(AA vs GG)-Pre-pregnancy BMI (kg/m2)- Overweight/obese (>=25)- RR (95% CI)
poisson catimcrefer_new0 i.snplep_rs7799039 i.faz_ativ_lazer_antes idade i.new_cor_referida_cat i.paridade3 i.new_fumo_cat2
anos_escolaridade kcaltotal1tr ///
if trimestre==1 & comp_dados_geneticos_2==1 & snplep_rs7799039~=1, irr vce(robust) LEP-rs7799039(AA vs GA+GG)-Pre-pregnancy BMI (kg/m2)- Overweight/obese (>=25)- RR (95% CI)
poisson catimcrefer_new0 i.re_gen_rs7799039 i.faz_ativ_lazer_antes idade i.new_cor_referida_cat i.paridade3 i.new_fumo_cat2
anos_escolaridade kcaltotal1tr /// if trimestre==1 & comp_dados_geneticos_2==1, irr vce(robust)
LEP-rs7799039(GA+AA vs GG)-Pre-pregnancy BMI (kg/m2)- Overweight/obese (>=25)- RR (95% CI)
poisson catimcrefer_new0 i.gen_rs7799039 i.faz_ativ_lazer_antes idade i.new_cor_referida_cat i.paridade3 i.new_fumo_cat2 anos_escolaridade kcaltotal1tr ///

APÊNDICE B Do-files Tabelas Artigo 2
162
if trimestre==1 & comp_dados_geneticos_2==1, irr vce(robust)
**********************
LEP-rs7799039(GA vs GG)-Total GWG by IOM category - Insufficient - RR (95% CI)
poisson cat_gan_peso_ref_iom2 i.snplep_rs7799039 i.faz_ativ_lazer_antes idade i.new_cor_referida_cat i.paridade3 i.new_fumo_cat2
logleptina_trial imcreferido sg4seg ///
if trimestre==1 & comp_dados_geneticos_2==1 & coorte_ou_ensaio3==1 & snplep_rs7799039~=2, irr vce(robust) LEP-rs7799039(AA vs GG)-Total GWG by IOM category - Insufficient - RR (95% CI)
poisson cat_gan_peso_ref_iom2 i.snplep_rs7799039 i.faz_ativ_lazer_antes idade i.new_cor_referida_cat i.paridade3 i.new_fumo_cat2
logleptina_trial imcreferido sg4seg /// if trimestre==1 & comp_dados_geneticos_2==1 & coorte_ou_ensaio3==1 & snplep_rs7799039~=1, irr vce(robust)
LEP-rs7799039(AA vs GA+GG)-Total GWG by IOM category - Insufficient - RR (95% CI
poisson cat_gan_peso_ref_iom2 i.re_gen_rs7799039 i.faz_ativ_lazer_antes idade i.new_cor_referida_cat i.paridade3 i.new_fumo_cat2 logleptina_trial imcreferido sg4seg ///
if trimestre==1 & comp_dados_geneticos_2==1 & coorte_ou_ensaio3==1, irr vce(robust)
LEP-rs7799039(GA+AA vs GG)-Total GWG by IOM category - Insufficient - RR (95% CI
poisson cat_gan_peso_ref_iom2 i.gen_rs7799039 i.faz_ativ_lazer_antes idade i.new_cor_referida_cat i.paridade3 i.new_fumo_cat2
logleptina_trial imcreferido sg4seg ///
logleptina_trial if trimestre==1 & comp_dados_geneticos_2==1 & coorte_ou_ensaio3==1, irr vce(robust)
**********************
LEP-rs7799039(GA vs GG)-Total GWG by IOM category - Excessive - RR (95% CI)
poisson cat_gan_peso_ref_iom1 i.snplep_rs7799039 i.faz_ativ_lazer_antes idade i.new_cor_referida_cat i.paridade3 i.new_fumo_cat2 logleptina_trial imcreferido sg4seg ///
if trimestre==1 & comp_dados_geneticos_2==1 & coorte_ou_ensaio3==1 & snplep_rs7799039~=2, irr vce(robust)
LEP-rs7799039(AA vs GG)-Total GWG by IOM category - Excessive - RR (95% CI)
poisson cat_gan_peso_ref_iom1 i.snplep_rs7799039 i.faz_ativ_lazer_antes idade i.new_cor_referida_cat i.paridade3 i.new_fumo_cat2
logleptina_trial imcreferido sg4seg ///
if trimestre==1 & comp_dados_geneticos_2==1 & coorte_ou_ensaio3==1 & snplep_rs7799039~=1, irr vce(robust) LEP-rs7799039(AA vs GA+GG)-Total GWG by IOM category - Excessive - RR (95% CI
poisson cat_gan_peso_ref_iom1 i.re_gen_rs7799039 i.faz_ativ_lazer_antes idade i.new_cor_referida_cat i.paridade3 i.new_fumo_cat2
logleptina_trial imcreferido sg4seg /// if trimestre==1 & comp_dados_geneticos_2==1 & coorte_ou_ensaio3==1, irr vce(robust)
LEP-rs7799039(GA+AA vs GG)-Total GWG by IOM category - Excessive - RR (95% CI
poisson cat_gan_peso_ref_iom1 i.gen_rs7799039 i.faz_ativ_lazer_antes idade i.new_cor_referida_cat i.paridade3 i.new_fumo_cat2 logleptina_trial imcreferido sg4seg ///
if trimestre==1 & comp_dados_geneticos_2==1 & coorte_ou_ensaio3==1, irr vce(robust)
********************** LEP-rs7799039(GA vs GG)-(log) Leptin by First trimester
regress logleptina_trial i.snplep_rs7799039 sg_padrao idade i.faz_ativ_lazer_antes i.new_cor_referida_cat i.new_fumo_cat2 peso_atual if trimestre==1 & snplep_rs7799039~=2 & comp_dados_geneticos_2==1
LEP-rs7799039(AA vs GG)-(log) Leptin by First trimester
regress logleptina_trial i.snplep_rs7799039 sg_padrao idade i.faz_ativ_lazer_antes i.new_cor_referida_cat i.new_fumo_cat2 peso_atual if trimestre==1 & snplep_rs7799039~=1 & comp_dados_geneticos_2==1
LEP-rs7799039(AA vs GA+GG)-(log) Leptin by First trimester
regress logleptina_trial i.re_gen_rs7799039 sg_padrao idade i.faz_ativ_lazer_antes i.new_cor_referida_cat i.new_fumo_cat2 peso_atual if trimestre==1 & comp_dados_geneticos_2==1
LEP-rs7799039(GA+AA vs GG)-(log) Leptin by First trimester
regress logleptina_trial i.gen_rs7799039 sg_padrao idade i.faz_ativ_lazer_antes i.new_cor_referida_cat i.new_fumo_cat2 peso_atual if trimestre==1 & comp_dados_geneticos_2==1
**********************
LEP-rs7799039(GA vs GG)-(log) Leptin by Second trimester
regress logleptina_trial i.snplep_rs7799039 sg_padrao idade i.faz_ativ_lazer_antes i.new_cor_referida_cat i.new_fumo_cat2 peso_atual if
trimestre==2 & snplep_rs7799039~=2 & comp_dados_geneticos_2==1
LEP-rs7799039(AA vs GG)-(log) Leptin by Second trimester
regress logleptina_trial i.snplep_rs7799039 sg_padrao idade i.faz_ativ_lazer_antes i.new_cor_referida_cat i.new_fumo_cat2 peso_atual if
trimestre==2 & snplep_rs7799039~=1 & comp_dados_geneticos_2==1
LEP-rs7799039(AA vs GA+GG)-(log) Leptin by Second trimester
regress logleptina_trial i.re_gen_rs7799039 sg_padrao idade i.faz_ativ_lazer_antes i.new_cor_referida_cat i.new_fumo_cat2 peso_atual if
trimestre==2 & comp_dados_geneticos_2==1
LEP-rs7799039(GA+AA vs GG)-(log) Leptin by Second trimester
regress logleptina_trial i.gen_rs7799039 sg_padrao idade i.faz_ativ_lazer_antes i.new_cor_referida_cat i.new_fumo_cat2 peso_atual if
trimestre==2 & comp_dados_geneticos_2==1
********************** LEP-rs7799039(GA vs GG)-(log) Leptin by Third trimester
regress logleptina_trial i.snplep_rs7799039 sg_padrao idade i.faz_ativ_lazer_antes i.new_cor_referida_cat i.new_fumo_cat2 peso_atual if
trimestre==3 & snplep_rs7799039~=2 & comp_dados_geneticos_2==1 LEP-rs7799039(AA vs GG)-(log) Leptin by Third trimester
regress logleptina_trial i.snplep_rs7799039 sg_padrao idade i.faz_ativ_lazer_antes i.new_cor_referida_cat i.new_fumo_cat2 peso_atual if
trimestre==3 & snplep_rs7799039~=1 & comp_dados_geneticos_2==1 LEP-rs7799039(AA vs GA+GG)-(log) Leptin by Third trimester
regress logleptina_trial i.re_gen_rs7799039 sg_padrao idade i.faz_ativ_lazer_antes i.new_cor_referida_cat i.new_fumo_cat2 peso_atual if
trimestre==3 & comp_dados_geneticos_2==1 LEP-rs7799039(GA+AA vs GG)-(log) Leptin by Third trimester
regress logleptina_trial i.gen_rs7799039 sg_padrao idade i.faz_ativ_lazer_antes i.new_cor_referida_cat i.new_fumo_cat2 peso_atual if
trimestre==3 & comp_dados_geneticos_2==1
**********************
**********************

APÊNDICE B Do-files Tabelas Artigo 2
163
LEPR-rs1137101(AG vs AA)- Pre-pregnancy BMI (kg/m2)- Overweight/obese (>=25)- RR (95% CI)
poisson catimcrefer_new0 i.snprlep_rs1137101 i.faz_ativ_lazer_antes idade i.new_cor_referida_cat i.paridade3 i.new_fumo_cat2
anos_escolaridade kcaltotal1tr if trimestre==1 & comp_dados_geneticos_2==1 & snprlep_rs1137101~=2, irr vce(robust) LEPR-rs1137101(GG vs AA)-Pre-pregnancy BMI (kg/m2)- Overweight/obese (>=25)- RR (95% CI)
poisson catimcrefer_new0 i.snprlep_rs1137101 i.faz_ativ_lazer_antes idade i.new_cor_referida_cat i.paridade3 i.new_fumo_cat2
anos_escolaridade kcaltotal1tr if trimestre==1 & comp_dados_geneticos_2==1 & snprlep_rs1137101~=1, irr vce(robust) LEPR-rs1137101(GG vs AG+AA)-Pre-pregnancy BMI (kg/m2)- Overweight/obese (>=25)- RR (95% CI)
poisson catimcrefer_new0 i.re_gen_rs1137101 i.faz_ativ_lazer_antes idade i.new_cor_referida_cat i.paridade3 i.new_fumo_cat2
anos_escolaridade kcaltotal1tr if trimestre==1 & comp_dados_geneticos_2==1, irr vce(robust) LEPR-rs1137101(AG+GG vs AA)-Pre-pregnancy BMI (kg/m2)- Overweight/obese (>=25)- RR (95% CI)
poisson catimcrefer_new0 i.gen_rs1137101 i.faz_ativ_lazer_antes idade i.new_cor_referida_cat i.paridade3 i.new_fumo_cat2
anos_escolaridade kcaltotal1tr if trimestre==1 & comp_dados_geneticos_2==1, irr vce(robust) **********************
LEPR-rs1137101(AG vs AA)-Total GWG by IOM category - Insufficient - RR (95% CI)
poisson cat_gan_peso_ref_iom2 i.snprlep_rs1137101 i.faz_ativ_lazer_antes idade i.new_cor_referida_cat i.paridade3 i.new_fumo_cat2 logleptina_trial imcreferido sg4seg if trimestre==1 & comp_dados_geneticos_2==1 & coorte_ou_ensaio3==1 & snprlep_rs1137101~=2, irr
vce(robust)
LEPR-rs1137101(GG vs AA)-Total GWG by IOM category - Insufficient - RR (95% CI)
poisson cat_gan_peso_ref_iom2 i.snprlep_rs1137101 i.faz_ativ_lazer_antes idade i.new_cor_referida_cat i.paridade3 i.new_fumo_cat2
logleptina_trial imcreferido sg4seg if trimestre==1 & comp_dados_geneticos_2==1 & coorte_ou_ensaio3==1 & snprlep_rs1137101~=1, irr
vce(robust) LEPR-rs1137101(GG vs AG+AA)-Total GWG by IOM category - Insufficient - RR (95% CI)
poisson cat_gan_peso_ref_iom2 i.re_gen_rs1137101 i.faz_ativ_lazer_antes idade i.new_cor_referida_cat i.paridade3 i.new_fumo_cat2
logleptina_trial imcreferido sg4seg if trimestre==1 & comp_dados_geneticos_2==1 & coorte_ou_ensaio3==1, irr vce(robust) LEPR-rs1137101(AG+GG vs AA)-Total GWG by IOM category - Insufficient - RR (95% CI)
poisson cat_gan_peso_ref_iom2 i.gen_rs1137101 i.faz_ativ_lazer_antes idade i.new_cor_referida_cat i.paridade3 i.new_fumo_cat2
logleptina_trial imcreferido sg4seg if trimestre==1 & comp_dados_geneticos_2==1 & coorte_ou_ensaio3==1, irr vce(robust) **********************
LEPR-rs1137101(AG vs AA)-Total GWG by IOM category - Excessive - RR (95% CI)
poisson cat_gan_peso_ref_iom1 i.snprlep_rs1137101 i.faz_ativ_lazer_antes idade i.new_cor_referida_cat i.paridade3 i.new_fumo_cat2 logleptina_trial imcreferido sg4seg if trimestre==1 & comp_dados_geneticos_2==1 & coorte_ou_ensaio3==1 & snprlep_rs1137101~=2, irr
vce(robust)
LEPR-rs1137101(GG vs AA)-Total GWG by IOM category - Excessive - RR (95% CI)
poisson cat_gan_peso_ref_iom1 i.snprlep_rs1137101 i.faz_ativ_lazer_antes idade i.new_cor_referida_cat i.paridade3 i.new_fumo_cat2
logleptina_trial imcreferido sg4seg if trimestre==1 & comp_dados_geneticos_2==1 & coorte_ou_ensaio3==1 & snprlep_rs1137101~=1, irr
vce(robust) LEPR-rs1137101(GG vs AG+AA)-Total GWG by IOM category - Excessive - RR (95% CI)
poisson cat_gan_peso_ref_iom1 i.re_gen_rs1137101 i.faz_ativ_lazer_antes idade i.new_cor_referida_cat i.paridade3 i.new_fumo_cat2 logleptina_trial imcreferido sg4seg if trimestre==1 & comp_dados_geneticos_2==1 & coorte_ou_ensaio3==1, irr vce(robust)
LEPR-rs1137101(AG+GG vs AA)-Total GWG by IOM category - Excessive - RR (95% CI)
poisson cat_gan_peso_ref_iom1 i.gen_rs1137101 i.faz_ativ_lazer_antes idade i.new_cor_referida_cat i.paridade3 i.new_fumo_cat2 logleptina_trial imcreferido sg4seg if trimestre==1 & comp_dados_geneticos_2==1 & coorte_ou_ensaio3==1, irr vce(robust)
**********************
LEPR-rs1137101(AG vs AA)-(log) Leptin by First trimester
regress logleptina_trial i.snprlep_rs1137101 sg_padrao idade i.faz_ativ_lazer_antes i.new_cor_referida_cat i.new_fumo_cat2 peso_atual if
trimestre==1 & snprlep_rs1137101~=2 & comp_dados_geneticos_2==1
LEPR-rs1137101(GG vs AA)-(log) Leptin by First trimester
regress logleptina_trial i.snprlep_rs1137101 sg_padrao idade i.faz_ativ_lazer_antes i.new_cor_referida_cat i.new_fumo_cat2 peso_atual if
trimestre==1 & snprlep_rs1137101~=1 & comp_dados_geneticos_2==1
LEPR-rs1137101(GG vs AG+AA)-(log) Leptin by First trimester
regress logleptina_trial i.re_gen_rs1137101 sg_padrao idade i.faz_ativ_lazer_antes i.new_cor_referida_cat i.new_fumo_cat2 peso_atual if
trimestre==1 & comp_dados_geneticos_2==1
LEPR-rs1137101(AG+GG vs AA)-(log) Leptin by First trimester
regress logleptina_trial i.gen_rs1137101 sg_padrao idade i.faz_ativ_lazer_antes i.new_cor_referida_cat i.new_fumo_cat2 peso_atual if
trimestre==1 & comp_dados_geneticos_2==1
********************** LEPR-rs1137101(AG vs AA)-(log) Leptin by Second trimester
regress logleptina_trial i.snprlep_rs1137101 sg_padrao idade i.faz_ativ_lazer_antes i.new_cor_referida_cat i.new_fumo_cat2 peso_atual if
trimestre==2 & snprlep_rs1137101~=2 & comp_dados_geneticos_2==1 LEPR-rs1137101(GG vs AA)-(log) Leptin by Second trimester
regress logleptina_trial i.snprlep_rs1137101 sg_padrao idade i.faz_ativ_lazer_antes i.new_cor_referida_cat i.new_fumo_cat2 peso_atual if
trimestre==2 & snprlep_rs1137101~=1 & comp_dados_geneticos_2==1 LEPR-rs1137101(GG vs AG+AA)-(log) Leptin by Second trimester
regress logleptina_trial i.re_gen_rs1137101 sg_padrao idade i.faz_ativ_lazer_antes i.new_cor_referida_cat i.new_fumo_cat2 peso_atual if
trimestre==2 & comp_dados_geneticos_2==1 LEPR-rs1137101(AG+GG vs AA)-(log) Leptin by Second trimester
regress logleptina_trial i.gen_rs1137101 sg_padrao idade i.faz_ativ_lazer_antes i.new_cor_referida_cat i.new_fumo_cat2 peso_atual if
trimestre==2 & comp_dados_geneticos_2==1 **********************
LEPR-rs1137101(AG vs AA)-(log) Leptin by Third trimester
regress logleptina_trial i.snprlep_rs1137101 sg_padrao idade i.faz_ativ_lazer_antes i.new_cor_referida_cat i.new_fumo_cat2 peso_atual if trimestre==3 & snprlep_rs1137101~=2 & comp_dados_geneticos_2==1
LEPR-rs1137101(GG vs AA)-(log) Leptin by Third trimester
regress logleptina_trial i.snprlep_rs1137101 sg_padrao idade i.faz_ativ_lazer_antes i.new_cor_referida_cat i.new_fumo_cat2 peso_atual if
trimestre==3 & snprlep_rs1137101~=1 & comp_dados_geneticos_2==1
LEPR-rs1137101(GG vs AG+AA)-(log) Leptin by Third trimester

APÊNDICE B Do-files Tabelas Artigo 2
164
regress logleptina_trial i.re_gen_rs1137101 sg_padrao idade i.faz_ativ_lazer_antes i.new_cor_referida_cat i.new_fumo_cat2 peso_atual if
trimestre==3 & comp_dados_geneticos_2==1
LEPR-rs1137101(AG+GG vs AA)-(log) Leptin by Third trimester
regress logleptina_trial i.gen_rs1137101 sg_padrao idade i.faz_ativ_lazer_antes i.new_cor_referida_cat i.new_fumo_cat2 peso_atual if
trimestre==3 & comp_dados_geneticos_2==1
****************************************************************************************************
Table 5. Longitudinal analysis between LEP-rs7799039 and LEPR-rs1137101 gene polymorphisms and maternal
body weight and leptin concentration throughout pregnancy **************************************************************************************************** LEP-rs7799039 - (log) Leptin ß(95% CI)
Co-dominant-(GA vs. GG) xi: xtmixed logleptina_trial i.snplep_rs7799039 sg_padrao sg_padrao2 idade i.faz_ativ_lazer_antes i.new_cor_referida_cat i.new_fumo_cat2
peso_atual if trimestre>=1 & trimestre<=3 & snplep_rs7799039~=2 & comp_dados_geneticos_2==1 || id: sg_padrao, covariance(uns)
variance Co-dominant-(AA vs. GG)
xi: xtmixed logleptina_trial i.snplep_rs7799039 sg_padrao sg_padrao2 idade i.faz_ativ_lazer_antes i.new_cor_referida_cat i.new_fumo_cat2
peso_atualif trimestre>=1 & trimestre<=3 & snplep_rs7799039~=1 & comp_dados_geneticos_2==1 || id: sg_padrao, covariance(uns)
variance
Recessive-(AA vs. GA+GG)
xi: xtmixed logleptina_trial i.re_gen_rs7799039 sg_padrao sg_padrao2 idade i.faz_ativ_lazer_antes i.new_cor_referida_cat i.new_fumo_cat2 peso_atual if trimestre>=1 & trimestre<=3 & comp_dados_geneticos_2==1 || id: sg_padrao, covariance(uns) variance
Dominant-(GA+AA vs. GG)
********************** LEP-rs7799039 - Maternal weight (kg)ß (95% CI)
Co-dominant-(GA vs. GG)
xi: xtmixed peso_atual i.snplep_rs7799039 sg_padrao sg_padrao2 idade i.faz_ativ_lazer_antes i.new_cor_referida_cat i.new_fumo_cat2 i.paridade3 anos_escolaridade estaturamedia if trimestre<=4 & comp_dados_geneticos_2==1 & snplep_rs7799039~=2 &
coorte_ou_ensaio3==1|| id: sg_padrao, covariance(uns) variance
Co-dominant-(AA vs. GG) xi: xtmixed peso_atual i.snplep_rs7799039 sg_padrao sg_padrao2 idade i.faz_ativ_lazer_antes i.new_cor_referida_cat i.new_fumo_cat2
i.paridade3 anos_escolaridade estaturamedia if trimestre<=4 & comp_dados_geneticos_2==1 & snplep_rs7799039~=1 &
coorte_ou_ensaio3==1|| id: sg_padrao, covariance(uns) variance Recessive-(AA vs. GA+GG)
xi: xtmixed peso_atual i.re_gen_rs7799039 sg_padrao sg_padrao2 idade i.faz_ativ_lazer_antes i.new_cor_referida_cat i.new_fumo_cat2
i.paridade3 anos_escolaridade estaturamedia if trimestre<=4 & comp_dados_geneticos_2==1 & coorte_ou_ensaio3==1|| id: sg_padrao,
covariance(uns) variance
Dominant-(GA+AA vs. GG)
xi: xtmixed peso_atual i.gen_rs7799039 sg_padrao sg_padrao2 idade i.faz_ativ_lazer_antes i.new_cor_referida_cat i.new_fumo_cat2 i.paridade3 anos_escolaridade estaturamedia if trimestre<=4 & comp_dados_geneticos_2==1 & coorte_ou_ensaio3==1|| id: sg_padrao,
covariance(uns) variance
********************** **********************
LEPR-rs1137101 - (log) Leptin ß(95% CI)
Co-dominant-(AG vs. AA) xi: xtmixed logleptina_trial i.snprlep_rs1137101 sg_padrao sg_padrao2 idade i.faz_ativ_lazer_antes i.new_cor_referida_cat
i.new_fumo_cat2 peso_atual if trimestre>=1 & trimestre<=3 & snprlep_rs1137101~=2 & comp_dados_geneticos_2==1 || id: sg_padrao,
covariance(uns) variance Co-dominant-(GG vs. AA)
xi: xtmixed logleptina_trial i.snprlep_rs1137101 sg_padrao sg_padrao2 idade i.faz_ativ_lazer_antes i.new_cor_referida_cat
i.new_fumo_cat2 peso_atual if trimestre>=1 & trimestre<=3 & snprlep_rs1137101~=1 & comp_dados_geneticos_2==1 || id: sg_padrao, covariance(uns) variance
Recessive-(GG vs. AG+AA)
xi: xtmixed logleptina_trial i.re_gen_rs1137101 sg_padrao sg_padrao2 idade i.faz_ativ_lazer_antes i.new_cor_referida_cat i.new_fumo_cat2 peso_atual if trimestre>=1 & trimestre<=3 & comp_dados_geneticos_2==1 || id: sg_padrao, covariance(uns) variance
Dominant-(AG+GG vs. AA)
xi: xtmixed logleptina_trial i.gen_rs1137101 sg_padrao sg_padrao2 idade i.faz_ativ_lazer_antes i.new_cor_referida_cat i.new_fumo_cat2 peso_atual if trimestre>=1 & trimestre<=3 & comp_dados_geneticos_2==1 || id: sg_padrao, covariance(uns) variance
**********************
LEPR-rs1137101 - Maternal weight (kg)ß (95% CI)
Co-dominant-(AG vs. AA)
xi: xtmixed peso_atual i.snprlep_rs1137101 sg_padrao sg_padrao2 idade i.faz_ativ_lazer_antes i.new_cor_referida_cat i.new_fumo_cat2
i.paridade3 anos_escolaridade estaturamedia if trimestre<=4 & comp_dados_geneticos_2==1 & snprlep_rs1137101~=2 & coorte_ou_ensaio3==1|| id: sg_padrao, covariance(uns) variance
Co-dominant-(GG vs. AA) xi: xtmixed peso_atual i.snprlep_rs1137101 sg_padrao sg_padrao2 idade i.faz_ativ_lazer_antes i.new_cor_referida_cat i.new_fumo_cat2
i.paridade3 anos_escolaridade estaturamedia if trimestre<=4 & comp_dados_geneticos_2==1 & snprlep_rs1137101~=1 &
coorte_ou_ensaio3==1|| id: sg_padrao, covariance(uns) variance Recessive-(GG vs. AG+AA)
xi: xtmixed peso_atual i.re_gen_rs1137101 sg_padrao sg_padrao2 idade i.faz_ativ_lazer_antes i.new_cor_referida_cat i.new_fumo_cat2
i.paridade3 anos_escolaridade estaturamedia if trimestre<=4 & comp_dados_geneticos_2==1 & coorte_ou_ensaio3==1|| id: sg_padrao, covariance(uns) variance
Dominant-(AG+GG vs. AA)

APÊNDICE B Do-files Tabelas Artigo 2
165
xi: xtmixed peso_atual i.gen_rs1137101 sg_padrao sg_padrao2 idade i.faz_ativ_lazer_antes i.new_cor_referida_cat i.new_fumo_cat2
i.paridade3 anos_escolaridade estaturamedia if trimestre<=4 & comp_dados_geneticos_2==1 & coorte_ou_ensaio3==1|| id: sg_padrao,
covariance(uns) variance

APÊNDICE C Do-files Tabelas Artigo 3
166
APÊNDICE C
Do-files Tabelas Artigo 3
****************************************************************************************************
Table 1 – Maternal descriptive characteristics and dietary intake of the study sample
****************************************************************************************************
Sociodemographic and lifestyle
tabstat idade if trimestre==1 & artigo_3==1 , stat (med p25 p75 n)
tabstat anos_escolaridade if trimestre==1 & artigo_3==1 , stat (med p25 p75 n)
tabstat renda_percapta if trimestre==1 & artigo_3==1 , stat (med p25 p75 n)
tab paridade3 if trimestre==1 & artigo_3==1
tab consome_alcool if trimestre==1 & artigo_3==1
tab new_fumo_cat1 if trimestre==1 & artigo_3==1
tab faz_ativ_lazer_antes if trimestre==1 & artigo_3==1
tab new_cor_referida_cat_3 if trimestre==1 & artigo_3==1
tab catimcrefer if trimestre==1 & artigo_3==1
Daily dietary intake during pre-pregnancy
ci logkcaltotalnutr if trimestre==1 & amostra_genetica_3==3
ci perkcalcarbtotal if trimestre==1 & amostra_genetica_3==3
ci logperkcalprottotal if trimestre==1 & amostra_genetica_3==3
ci perkcalliptotal if trimestre==1 & amostra_genetica_3==3
ci perprocessadkcalnutrt if trimestre==1 & amostra_genetica_3==3
Daily dietary intake during pregnancy
ci logkcaltotalnutr if trimestre==3 & amostra_genetica_3==3
ci perkcalcarbtotal if trimestre==3 & amostra_genetica_3==3
ci logperkcalprottotal if trimestre==3 & amostra_genetica_3==3
ci perkcalliptotal if trimestre==3 & amostra_genetica_3==3
ci perprocessadkcalnutrt if trimestre==3 & amostra_genetica_3==3
****************************************************************************************************
Table 2 - Distribution of daily dietary intake during pre-pregnancy and pregnancy and variation
according to genotypes of the FTO (rs9939609), MC4R (rs17782313), LEP (rs7799039) and LEPR (rs1137101)
genes polymorphisms, considering the dominant genetic model for all genes
****************************************************************************************************
During Pre-pregnancy
**********
FTO ttest logkcaltotalnutr if trimestre==1 & regdiet1_3tri==1 & artigo_3==1 & amostra_genetica_3==3, by(poliFTOdom)
ttest perkcalcarbtotal_1TR if trimestre==1 & regdiet1_3tri==1 & artigo_3==1 & amostra_genetica_3==3, by(poliFTOdom)
ttest logperkcalprottotal if trimestre==1 & regdiet1_3tri==1 & artigo_3==1 & amostra_genetica_3==3, by(poliFTOdom) ttest perkcalliptotal_1TR if trimestre==1 & regdiet1_3tri==1 & artigo_3==1 & amostra_genetica_3==3, by(poliFTOdom)
ttest perprocessadkcalnutrt_1TR if trimestre==1 & regdiet1_3tri==1 & artigo_3==1 & amostra_genetica_3==3, by(poliFTOdom)
**********
MC4R2 ttest logkcaltotalnutr if trimestre==1 & regdiet1_3tri==1 & artigo_3==1 & amostra_genetica_3==3, by(poliMC4R2)
ttest perkcalcarbtotal_1TR if trimestre==1 & regdiet1_3tri==1 & artigo_3==1 & amostra_genetica_3==3, by(poliMC4R2)
ttest logperkcalprottotal if trimestre==1 & regdiet1_3tri==1 & artigo_3==1 & amostra_genetica_3==3, by(poliMC4R2) ttest perkcalliptotal_1TR if trimestre==1 & regdiet1_3tri==1 & artigo_3==1 & amostra_genetica_3==3, by(poliMC4R2)
ttest perprocessadkcalnutrt_1TR if trimestre==1 & regdiet1_3tri==1 & artigo_3==1 & amostra_genetica_3==3, by(poliMC4R2)
**********
LEP ttest logkcaltotalnutr if trimestre==1 & regdiet1_3tri==1 & artigo_3==1 & amostra_genetica_3==3, by(gen_rs7799039)
ttest perkcalcarbtotal_1TR if trimestre==1 & regdiet1_3tri==1 & artigo_3==1 & amostra_genetica_3==3, by(gen_rs7799039) ttest logperkcalprottotal if trimestre==1 & regdiet1_3tri==1 & artigo_3==1 & amostra_genetica_3==3, by(gen_rs7799039)
ttest perkcalliptotal_1TR if trimestre==1 & regdiet1_3tri==1 & artigo_3==1 & amostra_genetica_3==3, by(gen_rs7799039)
ttest perprocessadkcalnutrt_1TR if trimestre==1 & regdiet1_3tri==1 & artigo_3==1 & amostra_genetica_3==3, by(gen_rs7799039)
**********
LEPR ttest logkcaltotalnutr if trimestre==1 & regdiet1_3tri==1 & artigo_3==1 & amostra_genetica_3==3, by(gen_rs1137101) ttest perkcalcarbtotal_1TR if trimestre==1 & regdiet1_3tri==1 & artigo_3==1 & amostra_genetica_3==3, by(gen_rs1137101)
ttest logperkcalprottotal if trimestre==1 & regdiet1_3tri==1 & artigo_3==1 & amostra_genetica_3==3, by(gen_rs1137101)
ttest perkcalliptotal_1TR if trimestre==1 & regdiet1_3tri==1 & artigo_3==1 & amostra_genetica_3==3, by(gen_rs1137101) ttest perprocessadkcalnutrt_1TR if trimestre==1 & regdiet1_3tri==1 & artigo_3==1 & amostra_genetica_3==3, by(gen_rs1137101)
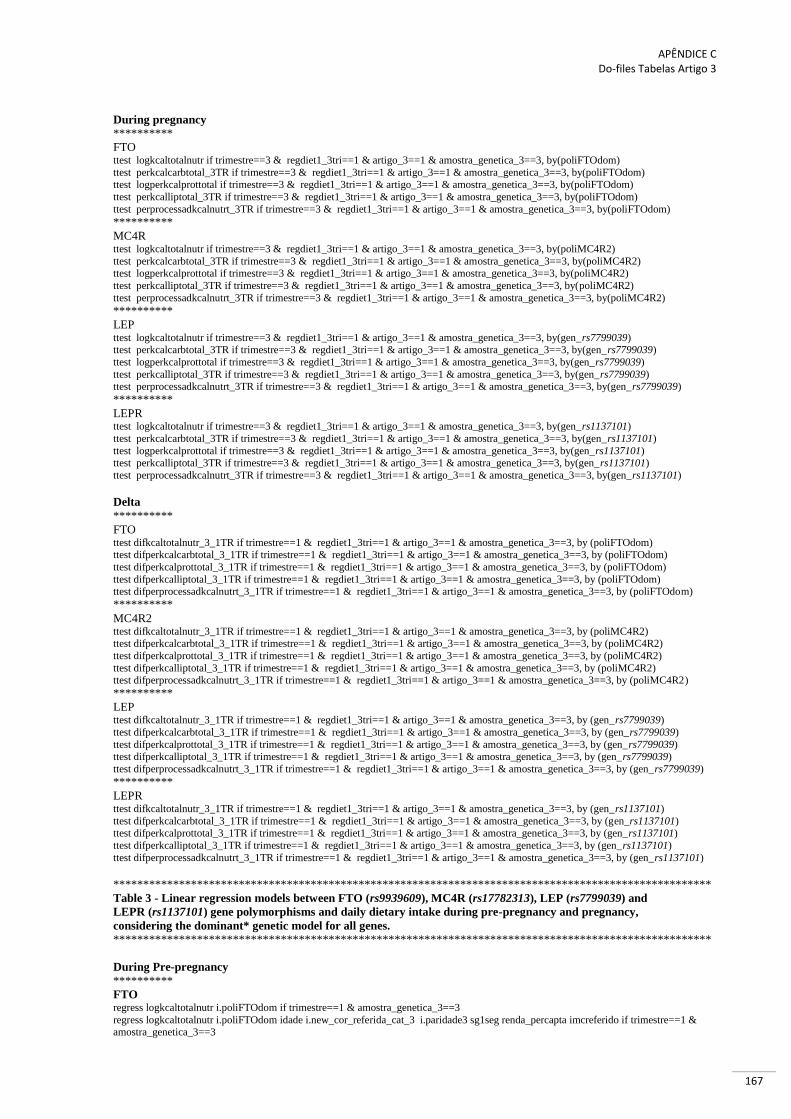
APÊNDICE C Do-files Tabelas Artigo 3
167
During pregnancy
**********
FTO ttest logkcaltotalnutr if trimestre==3 & regdiet1_3tri==1 & artigo_3==1 & amostra_genetica_3==3, by(poliFTOdom)
ttest perkcalcarbtotal_3TR if trimestre==3 & regdiet1_3tri==1 & artigo_3==1 & amostra_genetica_3==3, by(poliFTOdom) ttest logperkcalprottotal if trimestre==3 & regdiet1_3tri==1 & artigo_3==1 & amostra_genetica_3==3, by(poliFTOdom)
ttest perkcalliptotal_3TR if trimestre==3 & regdiet1_3tri==1 & artigo_3==1 & amostra_genetica_3==3, by(poliFTOdom)
ttest perprocessadkcalnutrt_3TR if trimestre==3 & regdiet1_3tri==1 & artigo_3==1 & amostra_genetica_3==3, by(poliFTOdom)
**********
MC4R ttest logkcaltotalnutr if trimestre==3 & regdiet1_3tri==1 & artigo_3==1 & amostra_genetica_3==3, by(poliMC4R2)
ttest perkcalcarbtotal_3TR if trimestre==3 & regdiet1_3tri==1 & artigo_3==1 & amostra_genetica_3==3, by(poliMC4R2) ttest logperkcalprottotal if trimestre==3 & regdiet1_3tri==1 & artigo_3==1 & amostra_genetica_3==3, by(poliMC4R2)
ttest perkcalliptotal_3TR if trimestre==3 & regdiet1_3tri==1 & artigo_3==1 & amostra_genetica_3==3, by(poliMC4R2)
ttest perprocessadkcalnutrt_3TR if trimestre==3 & regdiet1_3tri==1 & artigo_3==1 & amostra_genetica_3==3, by(poliMC4R2)
**********
LEP ttest logkcaltotalnutr if trimestre==3 & regdiet1_3tri==1 & artigo_3==1 & amostra_genetica_3==3, by(gen_rs7799039) ttest perkcalcarbtotal_3TR if trimestre==3 & regdiet1_3tri==1 & artigo_3==1 & amostra_genetica_3==3, by(gen_rs7799039)
ttest logperkcalprottotal if trimestre==3 & regdiet1_3tri==1 & artigo_3==1 & amostra_genetica_3==3, by(gen_rs7799039)
ttest perkcalliptotal_3TR if trimestre==3 & regdiet1_3tri==1 & artigo_3==1 & amostra_genetica_3==3, by(gen_rs7799039) ttest perprocessadkcalnutrt_3TR if trimestre==3 & regdiet1_3tri==1 & artigo_3==1 & amostra_genetica_3==3, by(gen_rs7799039)
**********
LEPR ttest logkcaltotalnutr if trimestre==3 & regdiet1_3tri==1 & artigo_3==1 & amostra_genetica_3==3, by(gen_rs1137101)
ttest perkcalcarbtotal_3TR if trimestre==3 & regdiet1_3tri==1 & artigo_3==1 & amostra_genetica_3==3, by(gen_rs1137101)
ttest logperkcalprottotal if trimestre==3 & regdiet1_3tri==1 & artigo_3==1 & amostra_genetica_3==3, by(gen_rs1137101) ttest perkcalliptotal_3TR if trimestre==3 & regdiet1_3tri==1 & artigo_3==1 & amostra_genetica_3==3, by(gen_rs1137101)
ttest perprocessadkcalnutrt_3TR if trimestre==3 & regdiet1_3tri==1 & artigo_3==1 & amostra_genetica_3==3, by(gen_rs1137101)
Delta
**********
FTO ttest difkcaltotalnutr_3_1TR if trimestre==1 & regdiet1_3tri==1 & artigo_3==1 & amostra_genetica_3==3, by (poliFTOdom) ttest difperkcalcarbtotal_3_1TR if trimestre==1 & regdiet1_3tri==1 & artigo_3==1 & amostra_genetica_3==3, by (poliFTOdom)
ttest difperkcalprottotal_3_1TR if trimestre==1 & regdiet1_3tri==1 & artigo_3==1 & amostra_genetica_3==3, by (poliFTOdom)
ttest difperkcalliptotal_3_1TR if trimestre==1 & regdiet1_3tri==1 & artigo_3==1 & amostra_genetica_3==3, by (poliFTOdom) ttest difperprocessadkcalnutrt_3_1TR if trimestre==1 & regdiet1_3tri==1 & artigo_3==1 & amostra_genetica_3==3, by (poliFTOdom)
**********
MC4R2 ttest difkcaltotalnutr_3_1TR if trimestre==1 & regdiet1_3tri==1 & artigo_3==1 & amostra_genetica_3==3, by (poliMC4R2) ttest difperkcalcarbtotal_3_1TR if trimestre==1 & regdiet1_3tri==1 & artigo_3==1 & amostra_genetica_3==3, by (poliMC4R2)
ttest difperkcalprottotal_3_1TR if trimestre==1 & regdiet1_3tri==1 & artigo_3==1 & amostra_genetica_3==3, by (poliMC4R2)
ttest difperkcalliptotal_3_1TR if trimestre==1 & regdiet1_3tri==1 & artigo_3==1 & amostra_genetica_3==3, by (poliMC4R2) ttest difperprocessadkcalnutrt_3_1TR if trimestre==1 & regdiet1_3tri==1 & artigo_3==1 & amostra_genetica_3==3, by (poliMC4R2)
**********
LEP ttest difkcaltotalnutr_3_1TR if trimestre==1 & regdiet1_3tri==1 & artigo_3==1 & amostra_genetica_3==3, by (gen_rs7799039)
ttest difperkcalcarbtotal_3_1TR if trimestre==1 & regdiet1_3tri==1 & artigo_3==1 & amostra_genetica_3==3, by (gen_rs7799039)
ttest difperkcalprottotal_3_1TR if trimestre==1 & regdiet1_3tri==1 & artigo_3==1 & amostra_genetica_3==3, by (gen_rs7799039) ttest difperkcalliptotal_3_1TR if trimestre==1 & regdiet1_3tri==1 & artigo_3==1 & amostra_genetica_3==3, by (gen_rs7799039)
ttest difperprocessadkcalnutrt_3_1TR if trimestre==1 & regdiet1_3tri==1 & artigo_3==1 & amostra_genetica_3==3, by (gen_rs7799039)
**********
LEPR ttest difkcaltotalnutr_3_1TR if trimestre==1 & regdiet1_3tri==1 & artigo_3==1 & amostra_genetica_3==3, by (gen_rs1137101)
ttest difperkcalcarbtotal_3_1TR if trimestre==1 & regdiet1_3tri==1 & artigo_3==1 & amostra_genetica_3==3, by (gen_rs1137101) ttest difperkcalprottotal_3_1TR if trimestre==1 & regdiet1_3tri==1 & artigo_3==1 & amostra_genetica_3==3, by (gen_rs1137101)
ttest difperkcalliptotal_3_1TR if trimestre==1 & regdiet1_3tri==1 & artigo_3==1 & amostra_genetica_3==3, by (gen_rs1137101)
ttest difperprocessadkcalnutrt_3_1TR if trimestre==1 & regdiet1_3tri==1 & artigo_3==1 & amostra_genetica_3==3, by (gen_rs1137101)
****************************************************************************************************
Table 3 - Linear regression models between FTO (rs9939609), MC4R (rs17782313), LEP (rs7799039) and
LEPR (rs1137101) gene polymorphisms and daily dietary intake during pre-pregnancy and pregnancy,
considering the dominant* genetic model for all genes.
****************************************************************************************************
During Pre-pregnancy
**********
FTO regress logkcaltotalnutr i.poliFTOdom if trimestre==1 & amostra_genetica_3==3
regress logkcaltotalnutr i.poliFTOdom idade i.new_cor_referida_cat_3 i.paridade3 sg1seg renda_percapta imcreferido if trimestre==1 & amostra_genetica_3==3
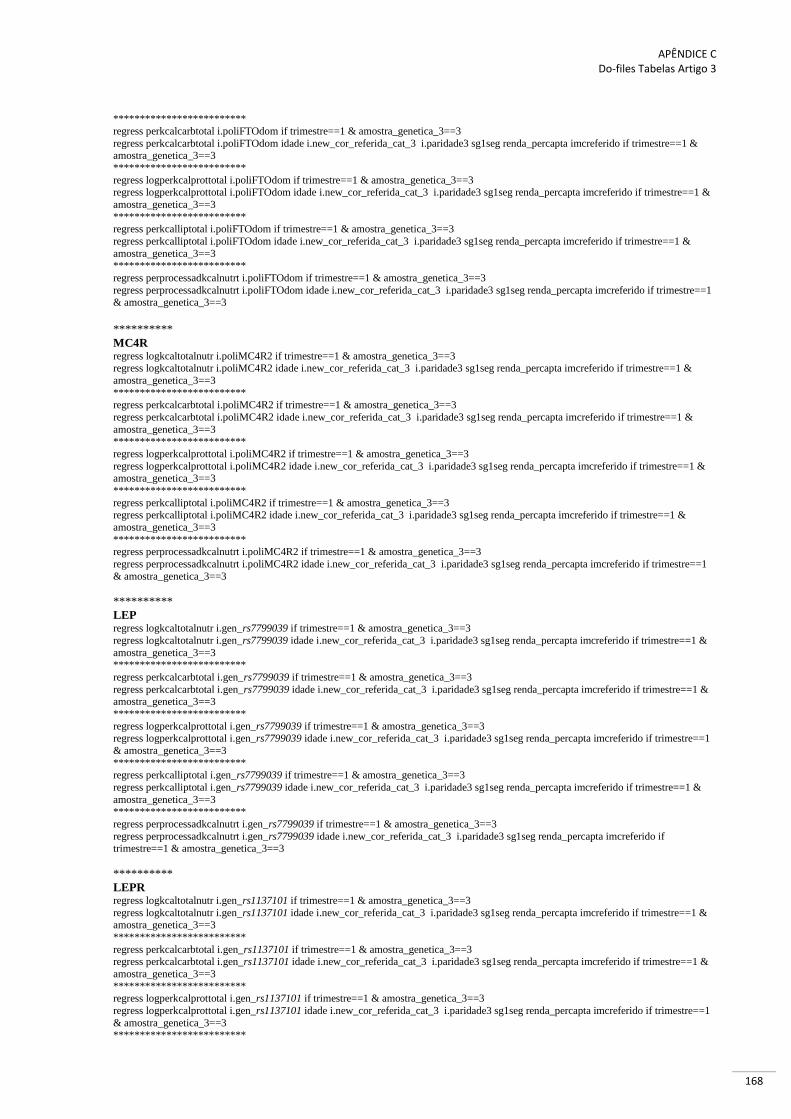
APÊNDICE C Do-files Tabelas Artigo 3
168
*************************
regress perkcalcarbtotal i.poliFTOdom if trimestre==1 & amostra_genetica_3==3
regress perkcalcarbtotal i.poliFTOdom idade i.new_cor_referida_cat_3 i.paridade3 sg1seg renda_percapta imcreferido if trimestre==1 & amostra_genetica_3==3
*************************
regress logperkcalprottotal i.poliFTOdom if trimestre==1 & amostra_genetica_3==3 regress logperkcalprottotal i.poliFTOdom idade i.new_cor_referida_cat_3 i.paridade3 sg1seg renda_percapta imcreferido if trimestre==1 &
amostra_genetica_3==3
************************* regress perkcalliptotal i.poliFTOdom if trimestre==1 & amostra_genetica_3==3
regress perkcalliptotal i.poliFTOdom idade i.new_cor_referida_cat_3 i.paridade3 sg1seg renda_percapta imcreferido if trimestre==1 &
amostra_genetica_3==3 *************************
regress perprocessadkcalnutrt i.poliFTOdom if trimestre==1 & amostra_genetica_3==3
regress perprocessadkcalnutrt i.poliFTOdom idade i.new_cor_referida_cat_3 i.paridade3 sg1seg renda_percapta imcreferido if trimestre==1 & amostra_genetica_3==3
**********
MC4R regress logkcaltotalnutr i.poliMC4R2 if trimestre==1 & amostra_genetica_3==3 regress logkcaltotalnutr i.poliMC4R2 idade i.new_cor_referida_cat_3 i.paridade3 sg1seg renda_percapta imcreferido if trimestre==1 &
amostra_genetica_3==3
************************* regress perkcalcarbtotal i.poliMC4R2 if trimestre==1 & amostra_genetica_3==3
regress perkcalcarbtotal i.poliMC4R2 idade i.new_cor_referida_cat_3 i.paridade3 sg1seg renda_percapta imcreferido if trimestre==1 &
amostra_genetica_3==3 *************************
regress logperkcalprottotal i.poliMC4R2 if trimestre==1 & amostra_genetica_3==3
regress logperkcalprottotal i.poliMC4R2 idade i.new_cor_referida_cat_3 i.paridade3 sg1seg renda_percapta imcreferido if trimestre==1 & amostra_genetica_3==3
*************************
regress perkcalliptotal i.poliMC4R2 if trimestre==1 & amostra_genetica_3==3 regress perkcalliptotal i.poliMC4R2 idade i.new_cor_referida_cat_3 i.paridade3 sg1seg renda_percapta imcreferido if trimestre==1 &
amostra_genetica_3==3
************************* regress perprocessadkcalnutrt i.poliMC4R2 if trimestre==1 & amostra_genetica_3==3
regress perprocessadkcalnutrt i.poliMC4R2 idade i.new_cor_referida_cat_3 i.paridade3 sg1seg renda_percapta imcreferido if trimestre==1
& amostra_genetica_3==3
**********
LEP regress logkcaltotalnutr i.gen_rs7799039 if trimestre==1 & amostra_genetica_3==3
regress logkcaltotalnutr i.gen_rs7799039 idade i.new_cor_referida_cat_3 i.paridade3 sg1seg renda_percapta imcreferido if trimestre==1 &
amostra_genetica_3==3 *************************
regress perkcalcarbtotal i.gen_rs7799039 if trimestre==1 & amostra_genetica_3==3
regress perkcalcarbtotal i.gen_rs7799039 idade i.new_cor_referida_cat_3 i.paridade3 sg1seg renda_percapta imcreferido if trimestre==1 & amostra_genetica_3==3
*************************
regress logperkcalprottotal i.gen_rs7799039 if trimestre==1 & amostra_genetica_3==3 regress logperkcalprottotal i.gen_rs7799039 idade i.new_cor_referida_cat_3 i.paridade3 sg1seg renda_percapta imcreferido if trimestre==1
& amostra_genetica_3==3
************************* regress perkcalliptotal i.gen_rs7799039 if trimestre==1 & amostra_genetica_3==3
regress perkcalliptotal i.gen_rs7799039 idade i.new_cor_referida_cat_3 i.paridade3 sg1seg renda_percapta imcreferido if trimestre==1 &
amostra_genetica_3==3 *************************
regress perprocessadkcalnutrt i.gen_rs7799039 if trimestre==1 & amostra_genetica_3==3
regress perprocessadkcalnutrt i.gen_rs7799039 idade i.new_cor_referida_cat_3 i.paridade3 sg1seg renda_percapta imcreferido if trimestre==1 & amostra_genetica_3==3
**********
LEPR regress logkcaltotalnutr i.gen_rs1137101 if trimestre==1 & amostra_genetica_3==3
regress logkcaltotalnutr i.gen_rs1137101 idade i.new_cor_referida_cat_3 i.paridade3 sg1seg renda_percapta imcreferido if trimestre==1 & amostra_genetica_3==3
*************************
regress perkcalcarbtotal i.gen_rs1137101 if trimestre==1 & amostra_genetica_3==3 regress perkcalcarbtotal i.gen_rs1137101 idade i.new_cor_referida_cat_3 i.paridade3 sg1seg renda_percapta imcreferido if trimestre==1 &
amostra_genetica_3==3
************************* regress logperkcalprottotal i.gen_rs1137101 if trimestre==1 & amostra_genetica_3==3
regress logperkcalprottotal i.gen_rs1137101 idade i.new_cor_referida_cat_3 i.paridade3 sg1seg renda_percapta imcreferido if trimestre==1
& amostra_genetica_3==3 *************************

APÊNDICE C Do-files Tabelas Artigo 3
169
regress perkcalliptotal i.gen_rs1137101 if trimestre==1 & amostra_genetica_3==3
regress perkcalliptotal i.gen_rs1137101 idade i.new_cor_referida_cat_3 i.paridade3 sg1seg renda_percapta imcreferido if trimestre==1 &
amostra_genetica_3==3 *************************
regress perprocessadkcalnutrt i.gen_rs1137101 if trimestre==1 & amostra_genetica_3==3
regress perprocessadkcalnutrt i.gen_rs1137101 idade i.new_cor_referida_cat_3 i.paridade3 sg1seg renda_percapta imcreferido if trimestre==1 & amostra_genetica_3==3
During Pre-pregnancy
**********
FTO regress logkcaltotalnutr i.poliFTOdom if trimestre==3 & amostra_genetica_3==3
regress logkcaltotalnutr i.poliFTOdom idade i.new_cor_referida_cat_3 i.paridade3 sg1seg renda_percapta imcreferido if trimestre==3 & amostra_genetica_3==3
*************************
regress perkcalcarbtotal i.poliFTOdom if trimestre==3 & amostra_genetica_3==3 regress perkcalcarbtotal i.poliFTOdom idade i.new_cor_referida_cat_3 i.paridade3 sg1seg renda_percapta imcreferido if trimestre==3 &
amostra_genetica_3==3
************************* regress logperkcalprottotal i.poliFTOdom if trimestre==3 & amostra_genetica_3==3
regress logperkcalprottotal i.poliFTOdom idade i.new_cor_referida_cat_3 i.paridade3 sg1seg renda_percapta imcreferido if trimestre==3 &
amostra_genetica_3==3 *************************
regress perkcalliptotal i.poliFTOdom if trimestre==3 & amostra_genetica_3==3
regress perkcalliptotal i.poliFTOdom idade i.new_cor_referida_cat_3 i.paridade3 sg1seg renda_percapta imcreferido if trimestre==3 & amostra_genetica_3==3
*************************
regress perprocessadkcalnutrt i.poliFTOdom if trimestre==3 & amostra_genetica_3==3 regress perprocessadkcalnutrt i.poliFTOdom idade i.new_cor_referida_cat_3 i.paridade3 sg1seg renda_percapta imcreferido if trimestre==3
& amostra_genetica_3==3
**********
MC4R regress logkcaltotalnutr i.poliMC4R2 if trimestre==3 & amostra_genetica_3==3
regress logkcaltotalnutr i.poliMC4R2 idade i.new_cor_referida_cat_3 i.paridade3 sg1seg renda_percapta imcreferido if trimestre==3 &
amostra_genetica_3==3
*************************
regress perkcalcarbtotal i.poliMC4R2 if trimestre==3 & amostra_genetica_3==3
regress perkcalcarbtotal i.poliMC4R2 idade i.new_cor_referida_cat_3 i.paridade3 sg1seg renda_percapta imcreferido if trimestre==3 & amostra_genetica_3==3
*************************
regress logperkcalprottotal i.poliMC4R2 if trimestre==3 & amostra_genetica_3==3 regress logperkcalprottotal i.poliMC4R2 idade i.new_cor_referida_cat_3 i.paridade3 sg1seg renda_percapta imcreferido if trimestre==3 &
amostra_genetica_3==3
************************* regress perkcalliptotal i.poliMC4R2 if trimestre==3 & amostra_genetica_3==3
regress perkcalliptotal i.poliMC4R2 idade i.new_cor_referida_cat_3 i.paridade3 sg1seg renda_percapta imcreferido if trimestre==3 &
amostra_genetica_3==3 *************************
regress perprocessadkcalnutrt i.poliMC4R2 if trimestre==3 & amostra_genetica_3==3 regress perprocessadkcalnutrt i.poliMC4R2 idade i.new_cor_referida_cat_3 i.paridade3 sg1seg renda_percapta imcreferido if trimestre==3
& amostra_genetica_3==3
**********
LEP regress logkcaltotalnutr i.gen_rs7799039 if trimestre==3 & amostra_genetica_3==3 regress logkcaltotalnutr i.gen_rs7799039 idade i.new_cor_referida_cat_3 i.paridade3 sg1seg renda_percapta imcreferido if trimestre==3 &
amostra_genetica_3==3
************************* regress perkcalcarbtotal i.gen_rs7799039 if trimestre==3 & amostra_genetica_3==3
regress perkcalcarbtotal i.gen_rs7799039 idade i.new_cor_referida_cat_3 i.paridade3 sg1seg renda_percapta imcreferido if trimestre==3 &
amostra_genetica_3==3 *************************
regress logperkcalprottotal i.gen_rs7799039 if trimestre==3 & amostra_genetica_3==3 regress logperkcalprottotal i.gen_rs7799039 idade i.new_cor_referida_cat_3 i.paridade3 sg1seg renda_percapta imcreferido if trimestre==3
& amostra_genetica_3==3
************************* regress perkcalliptotal i.gen_rs7799039 if trimestre==3 & amostra_genetica_3==3
regress perkcalliptotal i.gen_rs7799039 idade i.new_cor_referida_cat_3 i.paridade3 sg1seg renda_percapta imcreferido if trimestre==3 &
amostra_genetica_3==3 *************************
regress perprocessadkcalnutrt i.gen_rs7799039 if trimestre==3 & amostra_genetica_3==3
regress perprocessadkcalnutrt i.gen_rs7799039 idade i.new_cor_referida_cat_3 i.paridade3 sg1seg renda_percapta imcreferido if trimestre==3 & amostra_genetica_3==3
APÊNDICE C Do-files Tabelas Artigo 3
170
**********
LEPR regress logkcaltotalnutr i.gen_rs1137101 if trimestre==3 & amostra_genetica_3==3
regress logkcaltotalnutr i.gen_rs1137101 idade i.new_cor_referida_cat_3 i.paridade3 sg1seg renda_percapta imcreferido if trimestre==3 & amostra_genetica_3==3
*************************
regress perkcalcarbtotal i.gen_rs1137101 if trimestre==3 & amostra_genetica_3==3 regress perkcalcarbtotal i.gen_rs1137101 idade i.new_cor_referida_cat_3 i.paridade3 sg1seg renda_percapta imcreferido if trimestre==3 &
amostra_genetica_3==3
************************* regress logperkcalprottotal i.gen_rs1137101 if trimestre==3 & amostra_genetica_3==3
regress logperkcalprottotal i.gen_rs1137101 idade i.new_cor_referida_cat_3 i.paridade3 sg1seg renda_percapta imcreferido if trimestre==3
& amostra_genetica_3==3 *************************
regress perkcalliptotal i.gen_rs1137101 if trimestre==3 & amostra_genetica_3==3
regress perkcalliptotal i.gen_rs1137101 idade i.new_cor_referida_cat_3 i.paridade3 sg1seg renda_percapta imcreferido if trimestre==3 & amostra_genetica_3==3
*************************
regress perprocessadkcalnutrt i.gen_rs1137101 if trimestre==3 & amostra_genetica_3==3 regress perprocessadkcalnutrt i.gen_rs1137101 idade i.new_cor_referida_cat_3 i.paridade3 sg1seg renda_percapta imcreferido if
trimestre==3 & amostra_genetica_3==3
****************************************************************************************************
Table 4 - Longitudinal analysis between FTO, MC4R, LEP and LEPR gene polymorphisms and daily dietary
intake, according to genotypes.
****************************************************************************************************
FTO
**********************************************
AT vs. TT
********************************************** xi: xtmixed logkcaltotalnutr i.poliFTO sg_padrao if amostra_genetica_3==3 & regdiet1_3tri==1 & artigo_3==1 || id: sg_padrao,
covariance(uns) variance
xi: xtmixed logkcaltotalnutr i.poliFTO sg_padrao idade i.new_cor_referida_cat i.paridade3 renda_percapta imcreferido /// if amostra_genetica_3==3 & regdiet1_3tri==1 & artigo_3==1 || id: sg_padrao, covariance(uns) variance
**********************************************
xi: xtmixed perkcalcarbtotal i.poliFTO sg_padrao if amostra_genetica_3==3 & regdiet1_3tri==1 & artigo_3==1 || id: sg_padrao, covariance(uns) variance
xi: xtmixed perkcalcarbtotal i.poliFTO sg_padrao idade i.new_cor_referida_cat i.paridade3 renda_percapta imcreferido ///
if amostra_genetica_3==3 & regdiet1_3tri==1 & artigo_3==1 || id: sg_padrao, covariance(uns) variance **********************************************
xi: xtmixed logperkcalprottotal i.poliFTO sg_padrao if amostra_genetica_3==3 & regdiet1_3tri==1 & artigo_3==1 || id: sg_padrao,
covariance(uns) variance xi: xtmixed logperkcalprottotal i.poliFTO sg_padrao idade i.new_cor_referida_cat i.paridade3 renda_percapta imcreferido ///
if amostra_genetica_3==3 & regdiet1_3tri==1 & artigo_3==1 || id: sg_padrao, covariance(uns) variance
********************************************** xi: xtmixed perkcalliptotal i.poliFTO sg_padrao if amostra_genetica_3==3 & regdiet1_3tri==1 & artigo_3==1 || id: sg_padrao,
covariance(uns) variance
xi: xtmixed perkcalliptotal i.poliFTO sg_padrao idade i.new_cor_referida_cat i.paridade3 renda_percapta imcreferido /// if amostra_genetica_3==3 & regdiet1_3tri==1 & artigo_3==1 || id: sg_padrao, covariance(uns) variance
**********************************************
xi: xtmixed perprocessadkcalnutrt i.poliFTO sg_padrao if amostra_genetica_3==3 & regdiet1_3tri==1 & artigo_3==1 || id: sg_padrao, covariance(uns) variance
xi: xtmixed perprocessadkcalnutrt i.poliFTO sg_padrao idade i.new_cor_referida_cat i.paridade3 renda_percapta imcreferido ///
if amostra_genetica_3==3 & regdiet1_3tri==1 & artigo_3==1 || id: sg_padrao, covariance(uns) variance
**********************************************
AT+AA vs. TT
********************************************** xi: xtmixed logkcaltotalnutr i.poliFTOdom sg_padrao if amostra_genetica_3==3 & regdiet1_3tri==1 & artigo_3==1 || id: sg_padrao,
covariance(uns) variance xi: xtmixed logkcaltotalnutr i.poliFTOdom sg_padrao idade i.new_cor_referida_cat i.paridade3 renda_percapta imcreferido ///
if amostra_genetica_3==3 & regdiet1_3tri==1 & artigo_3==1 || id: sg_padrao, covariance(uns) variance
********************************************** xi: xtmixed perkcalcarbtotal i.poliFTOdom sg_padrao if amostra_genetica_3==3 & regdiet1_3tri==1 & artigo_3==1 || id: sg_padrao,
covariance(uns) variance
xi: xtmixed perkcalcarbtotal i.poliFTOdom sg_padrao idade i.new_cor_referida_cat i.paridade3 renda_percapta imcreferido /// if amostra_genetica_3==3 & regdiet1_3tri==1 & artigo_3==1 || id: sg_padrao, covariance(uns) variance
**********************************************
xi: xtmixed logperkcalprottotal i.poliFTOdom sg_padrao if amostra_genetica_3==3 & regdiet1_3tri==1 & artigo_3==1 || id: sg_padrao,
covariance(uns) variance
xi: xtmixed logperkcalprottotal i.poliFTOdom sg_padrao idade i.new_cor_referida_cat i.paridade3 renda_percapta imcreferido ///

APÊNDICE C Do-files Tabelas Artigo 3
171
if amostra_genetica_3==3 & regdiet1_3tri==1 & artigo_3==1 || id: sg_padrao, covariance(uns) variance
**********************************************
xi: xtmixed perkcalliptotal i.poliFTOdom sg_padrao if amostra_genetica_3==3 & regdiet1_3tri==1 & artigo_3==1 || id: sg_padrao, covariance(uns) variance
xi: xtmixed perkcalliptotal i.poliFTOdom sg_padrao idade i.new_cor_referida_cat i.paridade3 renda_percapta imcreferido ///
if amostra_genetica_3==3 & regdiet1_3tri==1 & artigo_3==1 || id: sg_padrao, covariance(uns) variance **********************************************
xi: xtmixed perprocessadkcalnutrt i.poliFTOdom sg_padrao if amostra_genetica_3==3 & regdiet1_3tri==1 & artigo_3==1 || id: sg_padrao,
covariance(uns) variance xi: xtmixed perprocessadkcalnutrt i.poliFTOdom sg_padrao idade i.new_cor_referida_cat i.paridade3 renda_percapta imcreferido ///
if amostra_genetica_3==3 & regdiet1_3tri==1 & artigo_3==1 || id: sg_padrao, covariance(uns) variance
MC4R **********************************************
CT vs. TT **********************************************
xi: xtmixed logkcaltotalnutr i.poliMC4R sg_padrao if amostra_genetica_3==3 & regdiet1_3tri==1 & artigo_3==1 || id: sg_padrao,
covariance(uns) variance
xi: xtmixed logkcaltotalnutr i.poliMC4R sg_padrao idade i.new_cor_referida_cat i.paridade3 renda_percapta imcreferido ///
if amostra_genetica_3==3 & regdiet1_3tri==1 & artigo_3==1 || id: sg_padrao, covariance(uns) variance
********************************************** xi: xtmixed perkcalcarbtotal i.poliMC4R sg_padrao if amostra_genetica_3==3 & regdiet1_3tri==1 & artigo_3==1 || id: sg_padrao,
covariance(uns) variance
xi: xtmixed perkcalcarbtotal i.poliMC4R sg_padrao idade i.new_cor_referida_cat i.paridade3 renda_percapta /// if amostra_genetica_3==3 & regdiet1_3tri==1 & artigo_3==1 || id: sg_padrao, covariance(uns) variance
**********************************************
xi: xtmixed logperkcalprottotal i.poliMC4R sg_padrao if amostra_genetica_3==3 & regdiet1_3tri==1 & artigo_3==1 || id: sg_padrao, covariance(uns) variance
xi: xtmixed logperkcalprottotal i.poliMC4R sg_padrao idade i.new_cor_referida_cat i.paridade3 renda_percapta imcreferido ///
if amostra_genetica_3==3 & regdiet1_3tri==1 & artigo_3==1 || id: sg_padrao, covariance(uns) variance **********************************************
xi: xtmixed perkcalliptotal i.poliMC4R sg_padrao if amostra_genetica_3==3 & regdiet1_3tri==1 & artigo_3==1 || id: sg_padrao,
covariance(uns) variance xi: xtmixed perkcalliptotal i.poliMC4R sg_padrao idade i.new_cor_referida_cat i.paridade3 renda_percapta imcreferido ///
if amostra_genetica_3==3 & regdiet1_3tri==1 & artigo_3==1 || id: sg_padrao, covariance(uns) variance
**********************************************
xi: xtmixed perprocessadkcalnutrt i.poliMC4R sg_padrao if amostra_genetica_3==3 & regdiet1_3tri==1 & artigo_3==1 || id: sg_padrao,
covariance(uns) variance
xi: xtmixed perprocessadkcalnutrt i.poliMC4R sg_padrao idade i.new_cor_referida_cat i.paridade3 renda_percapta imcreferido /// if amostra_genetica_3==3 & regdiet1_3tri==1 & artigo_3==1 || id: sg_padrao, covariance(uns) variance
**********************************************
CT+CC vs. TT **********************************************
xi: xtmixed logkcaltotalnutr i.poliMC4R2 sg_padrao if amostra_genetica_3==3 & regdiet1_3tri==1 & artigo_3==1 || id: sg_padrao,
covariance(uns) variance xi: xtmixed logkcaltotalnutr i.poliMC4R2 sg_padrao idade i.new_cor_referida_cat i.paridade3 renda_percapta imcreferido ///
if amostra_genetica_3==3 & regdiet1_3tri==1 & artigo_3==1 || id: sg_padrao, covariance(uns) variance
********************************************** xi: xtmixed perkcalcarbtotal i.poliMC4R2 sg_padrao if amostra_genetica_3==3 & regdiet1_3tri==1 & artigo_3==1 || id: sg_padrao,
covariance(uns) variance
xi: xtmixed perkcalcarbtotal i.poliMC4R2 sg_padrao idade i.new_cor_referida_cat i.paridade3 renda_percapta imcreferido /// if amostra_genetica_3==3 & regdiet1_3tri==1 & artigo_3==1 || id: sg_padrao, covariance(uns) variance
**********************************************
xi: xtmixed logperkcalprottotal i.poliMC4R2 sg_padrao if amostra_genetica_3==3 & regdiet1_3tri==1 & artigo_3==1 || id: sg_padrao, covariance(uns) variance
xi: xtmixed logperkcalprottotal i.poliMC4R2 sg_padrao idade i.new_cor_referida_cat i.paridade3 renda_percapta imcreferido ///
if amostra_genetica_3==3 & regdiet1_3tri==1 & artigo_3==1 || id: sg_padrao, covariance(uns) variance **********************************************
xi: xtmixed perkcalliptotal i.poliMC4R2 sg_padrao if amostra_genetica_3==3 & regdiet1_3tri==1 & artigo_3==1 || id: sg_padrao,
covariance(uns) variance xi: xtmixed perkcalliptotal i.poliMC4R2 sg_padrao idade i.new_cor_referida_cat i.paridade3 renda_percapta imcreferido ///
if amostra_genetica_3==3 & regdiet1_3tri==1 & artigo_3==1 || id: sg_padrao, covariance(uns) variance
********************************************** xi: xtmixed perprocessadkcalnutrt i.poliMC4R2 sg_padrao if amostra_genetica_3==3 & regdiet1_3tri==1 & artigo_3==1 || id: sg_padrao,
covariance(uns) variance xi: xtmixed perprocessadkcalnutrt i.poliMC4R2 sg_padrao idade i.new_cor_referida_cat i.paridade3 renda_percapta imcreferido ///
if amostra_genetica_3==3 & regdiet1_3tri==1 & artigo_3==1 || id: sg_padrao, covariance(uns) variance
LEP **********************************************
GA vs. GG
********************************************** xi: xtmixed logkcaltotalnutr i.snplep_rs7799039 sg_padrao if amostra_genetica_3==3 & regdiet1_3tri==1 & artigo_3==1 || id: sg_padrao,
covariance(uns) variance
xi: xtmixed logkcaltotalnutr i.snplep_rs7799039 sg_padrao idade i.new_cor_referida_cat i.paridade3 renda_percapta imcreferido ///

APÊNDICE C Do-files Tabelas Artigo 3
172
if amostra_genetica_3==3 & regdiet1_3tri==1 & artigo_3==1 || id: sg_padrao, covariance(uns) variance
**********************************************
xi: xtmixed perkcalcarbtotal i.snplep_rs7799039 sg_padrao if amostra_genetica_3==3 & regdiet1_3tri==1 & artigo_3==1 || id: sg_padrao, covariance(uns) variance
xi: xtmixed perkcalcarbtotal i.snplep_rs7799039 sg_padrao idade i.new_cor_referida_cat i.paridade3 renda_percapta ///
if amostra_genetica_3==3 & regdiet1_3tri==1 & artigo_3==1 || id: sg_padrao, covariance(uns) variance **********************************************
xi: xtmixed logperkcalprottotal i.snplep_rs7799039 sg_padrao if amostra_genetica_3==3 & regdiet1_3tri==1 & artigo_3==1 || id: sg_padrao,
covariance(uns) variance xi: xtmixed logperkcalprottotal i.snplep_rs7799039 sg_padrao idade i.new_cor_referida_cat i.paridade3 renda_percapta imcreferido ///
if amostra_genetica_3==3 & regdiet1_3tri==1 & artigo_3==1 || id: sg_padrao, covariance(uns) variance
********************************************** xi: xtmixed perkcalliptotal i.snplep_rs7799039 sg_padrao if amostra_genetica_3==3 & regdiet1_3tri==1 & artigo_3==1 || id: sg_padrao,
covariance(uns) variance
xi: xtmixed perkcalliptotal i.snplep_rs7799039 sg_padrao idade i.new_cor_referida_cat i.paridade3 renda_percapta imcreferido /// if amostra_genetica_3==3 & regdiet1_3tri==1 & artigo_3==1 || id: sg_padrao, covariance(uns) variance
**********************************************
xi: xtmixed perprocessadkcalnutrt i.snplep_rs7799039 sg_padrao if amostra_genetica_3==3 & regdiet1_3tri==1 & artigo_3==1 || id:
sg_padrao, covariance(uns) variance
xi: xtmixed perprocessadkcalnutrt i.snplep_rs7799039 sg_padrao idade i.new_cor_referida_cat i.paridade3 renda_percapta imcreferido ///
if amostra_genetica_3==3 & regdiet1_3tri==1 & artigo_3==1 || id: sg_padrao, covariance(uns) variance ********************************************
GA+AA vs. GG
******************************************** xi: xtmixed logkcaltotalnutr i.gen_rs7799039 sg_padrao if amostra_genetica_3==3 & regdiet1_3tri==1 & artigo_3==1 || id: sg_padrao,
covariance(uns) variance
xi: xtmixed logkcaltotalnutr i.gen_rs7799039 sg_padrao idade i.new_cor_referida_cat i.paridade3 renda_percapta imcreferido /// if amostra_genetica_3==3 & regdiet1_3tri==1 & artigo_3==1 || id: sg_padrao, covariance(uns) variance
**********************************************
xi: xtmixed perkcalcarbtotal i.gen_rs7799039 sg_padrao if amostra_genetica_3==3 & regdiet1_3tri==1 & artigo_3==1 || id: sg_padrao, covariance(uns) variance
xi: xtmixed perkcalcarbtotal i.gen_rs7799039 sg_padrao idade i.new_cor_referida_cat i.paridade3 renda_percapta imcreferido ///
if amostra_genetica_3==3 & regdiet1_3tri==1 & artigo_3==1 || id: sg_padrao, covariance(uns) variance **********************************************
xi: xtmixed logperkcalprottotal i.gen_rs7799039 sg_padrao if amostra_genetica_3==3 & regdiet1_3tri==1 & artigo_3==1 || id: sg_padrao,
covariance(uns) variance xi: xtmixed logperkcalprottotal i.gen_rs7799039 sg_padrao idade i.new_cor_referida_cat i.paridade3 renda_percapta imcreferido ///
if amostra_genetica_3==3 & regdiet1_3tri==1 & artigo_3==1 || id: sg_padrao, covariance(uns) variance **********************************************
xi: xtmixed perkcalliptotal i.gen_rs7799039 sg_padrao if amostra_genetica_3==3 & regdiet1_3tri==1 & artigo_3==1 || id: sg_padrao,
covariance(uns) variance xi: xtmixed perkcalliptotal i.gen_rs7799039 sg_padrao idade i.new_cor_referida_cat i.paridade3 renda_percapta imcreferido ///
if amostra_genetica_3==3 & regdiet1_3tri==1 & artigo_3==1 || id: sg_padrao, covariance(uns) variance
********************************************** xi: xtmixed perprocessadkcalnutrt i.gen_rs7799039 sg_padrao if amostra_genetica_3==3 & regdiet1_3tri==1 & artigo_3==1 || id: sg_padrao,
covariance(uns) variance
xi: xtmixed perprocessadkcalnutrt i.gen_rs7799039 sg_padrao idade i.new_cor_referida_cat i.paridade3 renda_percapta imcreferido /// if amostra_genetica_3==3 & regdiet1_3tri==1 & artigo_3==1 || id: sg_padrao, covariance(uns) variance
LEPR **********************************************
AG vs. AA **********************************************
xi: xtmixed logkcaltotalnutr i.snprlep_rs1137101 sg_padrao if amostra_genetica_3==3 & regdiet1_3tri==1 & artigo_3==1 || id: sg_padrao,
covariance(uns) variance
xi: xtmixed logkcaltotalnutr i.snprlep_rs1137101 sg_padrao idade i.new_cor_referida_cat i.paridade3 renda_percapta imcreferido ///
if amostra_genetica_3==3 & regdiet1_3tri==1 & artigo_3==1 || id: sg_padrao, covariance(uns) variance
********************************************** xi: xtmixed perkcalcarbtotal i.snprlep_rs1137101 sg_padrao if amostra_genetica_3==3 & regdiet1_3tri==1 & artigo_3==1 || id: sg_padrao,
covariance(uns) variance
xi: xtmixed perkcalcarbtotal i.snprlep_rs1137101 sg_padrao idade i.new_cor_referida_cat i.paridade3 renda_percapta imcreferido /// if amostra_genetica_3==3 & regdiet1_3tri==1 & artigo_3==1 || id: sg_padrao, covariance(uns) variance
**********************************************
xi: xtmixed logperkcalprottotal i.snprlep_rs1137101 sg_padrao if amostra_genetica_3==3 & regdiet1_3tri==1 & artigo_3==1 || id: sg_padrao, covariance(uns) variance
xi: xtmixed logperkcalprottotal i.snprlep_rs1137101 sg_padrao idade i.new_cor_referida_cat i.paridade3 renda_percapta imcreferido ///
if amostra_genetica_3==3 & regdiet1_3tri==1 & artigo_3==1 || id: sg_padrao, covariance(uns) variance **********************************************
xi: xtmixed perkcalliptotal i.snprlep_rs1137101 sg_padrao if amostra_genetica_3==3 & regdiet1_3tri==1 & artigo_3==1 || id: sg_padrao,
covariance(uns) variance xi: xtmixed perkcalliptotal i.snprlep_rs1137101 sg_padrao idade i.new_cor_referida_cat i.paridade3 renda_percapta imcreferido ///
if amostra_genetica_3==3 & regdiet1_3tri==1 & artigo_3==1 || id: sg_padrao, covariance(uns) variance
**********************************************
xi: xtmixed perprocessadkcalnutrt i.snprlep_rs1137101 sg_padrao if amostra_genetica_3==3 & regdiet1_3tri==1 & artigo_3==1 || id:
sg_padrao, covariance(uns) variance
APÊNDICE C Do-files Tabelas Artigo 3
173
xi: xtmixed perprocessadkcalnutrt i.snprlep_rs1137101 sg_padrao idade i.new_cor_referida_cat i.paridade3 renda_percapta imcreferido ///
if amostra_genetica_3==3 & regdiet1_3tri==1 & artigo_3==1 || id: sg_padrao, covariance(uns) variance
********************************************** AG+GG vs. AA
**********************************************
xi: xtmixed logkcaltotalnutr i.gen_rs1137101 sg_padrao if amostra_genetica_3==3 & regdiet1_3tri==1 & artigo_3==1 || id: sg_padrao, covariance(uns) variance
xi: xtmixed logkcaltotalnutr i.gen_rs1137101 sg_padrao idade i.new_cor_referida_cat i.paridade3 renda_percapta imcreferido ///
if amostra_genetica_3==3 & regdiet1_3tri==1 & artigo_3==1 || id: sg_padrao, covariance(uns) variance **********************************************
xi: xtmixed perkcalcarbtotal i.gen_rs1137101 sg_padrao if amostra_genetica_3==3 & regdiet1_3tri==1 & artigo_3==1 || id: sg_padrao,
covariance(uns) variance xi: xtmixed perkcalcarbtotal i.gen_rs1137101 sg_padrao idade i.new_cor_referida_cat i.paridade3 renda_percapta imcreferido ///
if amostra_genetica_3==3 & regdiet1_3tri==1 & artigo_3==1 || id: sg_padrao, covariance(uns) variance
********************************************** xi: xtmixed logperkcalprottotal i.gen_rs1137101 sg_padrao if amostra_genetica_3==3 & regdiet1_3tri==1 & artigo_3==1 || id: sg_padrao,
covariance(uns) variance
xi: xtmixed logperkcalprottotal i.gen_rs1137101 sg_padrao idade i.new_cor_referida_cat i.paridade3 renda_percapta imcreferido ///
if amostra_genetica_3==3 & regdiet1_3tri==1 & artigo_3==1 || id: sg_padrao, covariance(uns) variance
**********************************************
xi: xtmixed perkcalliptotal i.gen_rs1137101 sg_padrao if amostra_genetica_3==3 & regdiet1_3tri==1 & artigo_3==1 || id: sg_padrao, covariance(uns) variance
xi: xtmixed perkcalliptotal i.gen_rs1137101 sg_padrao idade i.new_cor_referida_cat i.paridade3 renda_percapta imcreferido ///
if amostra_genetica_3==3 & regdiet1_3tri==1 & artigo_3==1 || id: sg_padrao, covariance(uns) variance **********************************************
xi: xtmixed perprocessadkcalnutrt i.gen_rs1137101 sg_padrao if amostra_genetica_3==3 & regdiet1_3tri==1 & artigo_3==1 || id: sg_padrao,
covariance(uns) variance xi: xtmixed perprocessadkcalnutrt i.gen_rs1137101 sg_padrao idade i.new_cor_referida_cat i.paridade3 renda_percapta imcreferido ///
if amostra_genetica_3==3 & regdiet1_3tri==1 & artigo_3==1 || id: sg_padrao, covariance(uns) variance

ANEXOS
174
12. ANEXOS

ANEXO 1 Aprovação do Comitê de Ética
175

ANEXO 2 TCLE
176
TERMO DE CONSENTIMENTO LIVRE E ESCLARECIDO PARA PARTICIPAR DA PESQUISA
“Estado nutricional e saúde mental na gestação e no pós-parto: Estudo prospectivo com ensaio clínico randomizado”
Você está sendo convidada a fazer parte de uma pesquisa que tem por objetivo entender melhor a
relação entre a alimentação e a ocorrência de problemas como a ansiedade e o estresse durante a gestação e após o parto. Neste estudo, também avaliaremos se o ômega-3 (um composto natural presente em vários alimentos, como peixes e alguns vegetais) protege as gestantes de tais problemas.
Você não é obrigada a participar e, mesmo aceitando fazer parte do estudo, poderá desistir e retirar o seu consentimento a qualquer momento. Sua recusa em participar do estudo não trará nenhum prejuízo em sua relação com o pesquisador, com o seu médico ou com a maternidade; ou seja, você poderá seguir normalmente com o seu atendimento nesta unidade de saúde. Como irei participar?
Você fará uma avaliação completa e detalhada sobre sua saúde. No total, você terá 4 consultas com nossa equipe: 4 durante o pré-natal (com até 13 semanas, na 24ª e 34ª semanas) e uma de 30 a 45 dias após o nascimento de seu filho. Todas estas consultas serão preferencialmente marcadas em dias em que você já tenha que vir ao hospital. O tempo aproximado destas consultas é de 30-45 minutos.
Durante as consultas, você irá responder a perguntas e preencher questionários para obtermos informações como: sua identificação (endereço e telefone), dados demográficos (nome, estado civil, idade), situação social e econômica, história obstétrica, uso de álcool, fumo e outras drogas, violência familiar, estresse e ansiedade, atividade física e como você se alimenta. Em todas as 4 consultas iremos também avaliar seu peso e altura e coletar amostras de sangue para avaliarmos o açúcar, gorduras, colesterol e níveis de hormônios.
Além disso, em cada consulta, deixaremos com você dois aparelhos por um período de 24 horas (1 dia): um chamado de “frequencímetro polar” que mede a freqüência cardíaca (batimentos do coração) e o outro “pedômetro” que conta o número de passos que você dará durante este dia. No dia seguinte, um pesquisador do projeto irá até a sua casa recolher esses equipamentos, não sendo necessário, portanto, que você retorne ao hospital apenas para devolvê-los.
A partir da 18ª semana de gestação, um grupo de mulheres que estiverem participando do estudo serão convidadas a integrar uma parte diferente do estudo e serão orientadas a fazer uso de um suplemento na forma de cápsulas, contendo ômega-3. Se você fizer parte deste grupo, você deverá fazer uso de 5-6 cápsulas por dia junto das refeições (almoço), todos os dias até 30 dias após o parto. Você não precisará comprar ou pagar por este suplemento, ou seja, você vai recebê-lo de graça.
É importante você saber que esta suplementação é composta unicamente de óleo de peixes marinhos, porém sem qualquer sabor ou cheiro característico de peixe. Além do óleo, o outro ingrediente presente é uma pequena quantidade de vitamina E. O uso desta suplementação durante a gestação não traz nenhum risco ou efeito colateral para a sua saúde e a do bebê. No entanto, já foram relatados a ocorrência passageira de diarréia, regurgitação e refluxo. Consumir o óleo na forma de cápsula torna apenas mais prático.

ANEXO 2 TCLE
177
Todas as informações que você fornecer serão mantidas em segredo e utilizadas apenas para a pesquisa. Nenhuma outra pessoa ou profissional terá acesso a suas informações, somente os pesquisadores que trabalham para esta pesquisa. Quando divulgarmos os resultados deste trabalho, seu nome em momento algum irá aparecer, bem como qualquer outra informação fornecida, ou resultado de exame de sangue. Portanto, não há riscos em participar desta pesquisa, apenas a necessidade de coletar sangue e o tempo que você irá gastar com as avaliações durante as consultas. Por ocasião da coleta de sangue, você poderá observar a formação pequeno hematoma na região do braço onde ocorreu a picada da agulha. Sempre usaremos materiais descartáveis. Quais as vantagens?
Ao participar deste estudo, você terá a oportunidade de realizar uma avaliação mais completa e detalhada da sua saúde. O acompanhamento de seus hábitos durante a gestação, como o seu ganho de peso e sua alimentação, são medidas importantes para garantir a saúde do seu bebê ao nascer. Este acompanhamento também é importante para que você tenha uma vida mais saudável, prevenindo problemas futuros como a obesidade, ansiedade e depressão. Você terá acesso a todos os seus resultados se assim desejar.
Este termo de consentimento é um documento importante e você irá receber uma cópia na qual consta o telefone e o endereço do pesquisador principal, podendo tirar suas dúvidas sobre o projeto e sua participação, agora ou a qualquer momento. Meu consentimento:
Minha participação é de livre e espontânea vontade, ou seja, não fui pressionada por ninguém para participar desta pesquisa. Tenho liberdade para continuar ou recusar, em qualquer momento, a participar da pesquisa. O meu atendimento e de meu (minha) filho(a), nesta unidade não será, em momento algum, afetado pela minha recusa. Desta forma, concordo em participar deste estudo estando totalmente esclarecida dos objetivos, riscos e benefícios desta pesquisa, uma vez que tive em mãos este documento e a oportunidade de lê-lo antes de assinar. ________________________________ data Nome e assinatura do pesquisador ________________________________ Telefones: ___________________________ Nome do sujeito da pesquisa _______________________________ data Assinatura do sujeito da pesquisa Contato do coordenador da pesquisa: Professor Dr. Gilberto Kac
Universidade Federal do Rio de Janeiro - UFRJ Telefones: 25626595 / 93152301 E-mail: [email protected]
Juliana dos Santos Vaz Nutricionista, doutoranda UFRJ Telefones: 74221922 E-mail: [email protected]
Secretaria Municipal de Saúde e Defesa Civil / Comitê de Ética em Pesquisa Rua Afonso Cavalcanti, 455 Bloco 1 - Sala 715 Email: [email protected]

ANEXO 3 Protocolo de extração do DNA
178
PROTOCOLO EXTRAÇÃO DE DNA COM FENOL-CLOROFÓRMIO
1. Descongelar o sangue a temperatura ambiente.
2. Homogeneizar suavemente.
LISE DE MEMBRANAS CELULAR E NUCLEAR (SDS =solubiliza as membranas
e proteinase K =degrada proteínas)
3. Transferir 2 ml do sangue para um tubo Falcon 15 ml e adicionar igual volume de tampão
K 2X (para ficar com uma concentração final de 1X).
4. Adicionar 100 µl de proteinase K (20 mg/dl) e homogeneizar suavemente.
5. Incubar a 37° C overnight.
6. Observar a aparência do tubo (fácil movimento do conteúdo do tubo).
EXTRAÇÃO DE PROTEÍNAS E OUTROS (fenol = atrai os fragmentos de
proteínas e lipídios).
7. Adicionar 4 ml de fenol-clorofórmio e agitar suavemente por 1 min.
8. Centrifugar a 3.200 rpm por 20 min na centrifuga clínica.
Separação de fases superior (aquosa) e inferior (fenol).
9. Retirar a fase aquosa para outro tubo falcon 15 ml. Passar para o ítem 13.
Se não aparecer uma fase aquosa, transferir todo o volume (8 ml) para um tubo falcon 50
ml e adicionar igual volume (8 ml) de tampão K. Homogeneizar suavemente, transferir
para tubo corex e centrifugar novamente à 10.000 rpm por 5 min.
10. Transferir a fase aquosa para um tubo falcon 50 ml.
11. Adicionar ao tubo corex, 4 ml de tampão K, homogeneizar suavemente e centrifugar a
10.000 rpm por 5 min, para lavar a interface.
12. Retirar novamente a fase aquosa e juntar à outra fase aquosa retirada (volume total ± 20
ml).
13. Colocar igual volume de clorofórmio e agitar suavemente.
14. Centrifugar a 3.200 rpm por 5 min na centrifuga clínica.
15. Retirar a fase aquosa para outro tubo corex (falcon 50 ml (± 10 ml)).
PRECIPITAÇÃO DO DNA
16. Adicionar 200 ul NaCl 4 M para uma concentração final de 0,2 M e homogeneizar
suavemente.

ANEXO 3 Protocolo de extração do DNA
179
17. Adicionar 2 volumes de etanol absoluto e homogeneizar suavemente. Verificar a presença
de fibras (se presente seguir para item 20. Caso não verifique fibra, continuar com itens 18
e 19).
18. Colocar a -20° C por 1 hora, no mínimo.
19. Centrifugar em tubos corex a 10.000 rpm por 15 mim e a 4° C (marcar a posição dos
tubos na centrifuga, para posterior visualização do pellet). Verificar se o sobrenadante
ficou com uma coloração escura e se o pellet está claro.
LAVAGEM DO DNA
20. Desprezar o sobrenadante. Lavar o pellet com etanol 70% e desprezar o sobrenadante,
secar o pellet por inversão em papel toalha e colocar a 55° C por 10 min. O pellet deve
estar aderido à parede do tubo, mas bem espalhado e não concentrado num ponto.
RESSUSPENSÃO DO DNA
21. Ressuspender no máximo com 500 µl de TE-4 do seguinte modo: adicionar 100 µl de TE-
4 em cada tubo corex, lavando bem a parede onde estiver espalhado o pellet. Transferir as
soluções para um tubo 1,5 ml, mas não descartar os tubos corex. Adicionar 100 µl a um
tubo corex e repetir o procedimento anterior, lavando a parede. Transferir o volume para o
outro tubo corex e repetir o procedimento de lavagem. Retirar o volume do lavado e
transferir para o tubo de 1,5 ml, perfazendo o volume total de 500 µl.
22. Ler a DO (após pellet/fibra estar totalmente dissolvido) para quantificar o DNA.
23. Guardar a -20° C.

ANEXO 4 Artigo 1 publicado na Periódico Nutrition
180

ANEXOS ONLINE
181
ANEXOS ONLINE DA TESE

ANEXOS ONLINE
182
Anexo online 1. Questionário de Frequência Alimentar (QFA) do primeiro trimestre
gestacional:
https://drive.google.com/file/d/0ByVGJIL4qFLfWHhSRlRiWUkxdVE/view?usp=sharing
Anexo online 2. Questionário Geral-1do primeiro trimestre gestacional:
https://drive.google.com/file/d/0ByVGJIL4qFLfV2o1QndyTUFFMjA/view?usp=sharing
Anexo online 3. Questionário Geral-2 do segundo trimestre gestacional
https://drive.google.com/file/d/0ByVGJIL4qFLfNTdsYVlEbHREVW8/view?usp=sharing
Anexo online 4. Questionário Geral-3 do terceiro trimestre gestacional
https://drive.google.com/file/d/0ByVGJIL4qFLfcGl4QjNHb20xMUU/view?usp=sharing
Anexo online 5. Questionário de Frequência Alimentar (QFA) do terceiro trimestre
gestacional
https://drive.google.com/file/d/0ByVGJIL4qFLfemlwWHo1OXlSU3M/view?usp=sharing
Anexo online 6. Questionário Geral-4 do pós-parto
https://drive.google.com/file/d/0ByVGJIL4qFLfbGhwSGVfazN6MXc/view?usp=sharing