Avaliação da estimativa da taxa de filtração glomerular...
131
Avaliação da estimativa da taxa de filtração glomerular com cistatina C em pacientes pediátricos LUCIANO DA SILVA SELISTRE Porto Alegre 2012
Transcript of Avaliação da estimativa da taxa de filtração glomerular...
Avaliação da estimativa da taxa de filtração
glomerular com cistatina C em pacientes
pediátricos
LUCIANO DA SILVA SELISTRE
Porto Alegre 2012
PONTIFÍCIA UNIVERSIDADE CATÓLICA DO RIO GRANDE DO SUL FACULDADE DE MEDICINA
PÓS-GRADUAÇÃO EM CLÍNICA MÉDICA
Avaliação da estimativa da taxa de filtração
glomerular com cistatina C em pacientes pediátricos
LUCIANO DA SILVA SELISTRE
ORIENTADORES: Professor Doutor David Saitovitch
Professor Doutor Ivan Carlos Ferreira Antonello
COORIENTADORES: Professor Doutora Laurence Dubourg
Professor Doutor Pierre Joseph Cochat
Tese de Doutorado apresentada como re-
quisito para obtenção do título de Doutor em
Medicina. Área de concentração: Nefrologia.
Porto Alegre 2012

Dados Internacionais de Catalogação na Publicação (CIP)
Bibliotecária Responsável
Ficha catalográfica elaborada pela bibliotecária: Isabel Merlo Crespo CRB 10/1201
S465a Selistre, Luciano da Silva
Avaliação da estimativa da taxa de filtração glomerular com cistatina C em pacientes pediátricos / Luciano da Silva Selistre. Porto Alegre: PUCRS, 2012.
131 f.: il. Inclui 4 artigos publicados e 1 capítulo de livro.
Orientadores: Prof. Dr. David Saitovitch e Prof. Dr. Ivan Carlos Ferreira Antonello. Coorientadores: Profa. Dra. Laurence Dubourg e Prof. Dr. Pierre Joseph Cochat.
Tese (Doutorado) – Pontifícia Universidade Católica do Rio
Grande do Sul. Faculdade de Medicina. Pós-Graduação em Clínica Médica. Área de Concentração: Nefrologia.
1. CISTATINAS. 2. TAXA DE FILTRAÇÃO GLOMERULAR. 3. INULINA. 4. PEDIATRIA. 5. NEFROLOGIA. 6. ESTUDO TRANSVERSAL. I. Saitovitch, David. II. Antonello, Ivan Carlos Ferreira. II. Título.
CDD 616.61
CDU 616.61-073(043.2)
NLM WJ 342
FOLHA DE APROVAÇÃO
LUCIANO DA SILVA SELISTRE
Avaliação da estimativa da taxa de filtração glomerular com cistatina C em pacientes pediátricos
Tese apresentada como requisito para a obtenção do grau de Doutor em Clínica Médica, pelo programa de Pós-Graduação da Faculdade de Medicina da Pontifícia Universidade Católica do Rio Grande do Sul.
Orientador: DAVID SAITOVITCH
Aprovada em 18 de dezembro de 2012.
BANCA EXAMINADORA
______________________________________ CARLOS E POLI DE FIGUEIREDO – PUCRS
________________________________________ MÁRIO BERNARDES WAGNER – UFRGS/PUCRS
______________________________________ CLOTILDE DUCK GARCIA – UFSCMPA
________________________________________ PAULO CESAR KOCH NOGUEIRA – UNIFESP

Dedico esta tese
Aos meus pais,
Fábio de Souza Selistre e Ligia Maria da Silva Selistre, perenes orientadores na
formação da minha inquietação na aquisição de novos conhecimentos e critérios éticos;
Minha esposa,
Vandréa Carla de Souza, por sua paciência e seu amor que norteiam as minhas
decisões.
AGRADECIMENTOS
Ao meu orientador
Prof. Dr. David Saitovitch, pelo incentivo e orientação na concepção deste
estudo.
Aos meus coorientadores:
Prof. Dr. Ivan Carlos Ferreira Antonello, pelo espírito crítico e paternal durante
a construção dessa tese.
Ao Prof. Dr. Pierre Joseph Cochat pelo estágio no serviço de Nefrologia
Pediátrica em Lyon e dedicação e carinho com os brasileiros.
Ao Serviço de Éxploration Fonctionelle Rénale de Lyon, representadas pelos Prof.
Dra. Laurence Dubourg e Prof. Dr. Aoumour Hadja-Aissa pela doação e orientação
para a pesquisa.
Ao Serviço de Epidemiologia e Bioestatística de Lyon através dos Prof. Dra. Muriel
Rabbilloud e Prof. Dr. René Ecochard pelo acolhimento e correção da metodologia
estatística do trabalho.
Ao Serviço de Nefrologia da PUCRS que sedimentou o ímpeto para desbravar novos
caminhos na ciência.
À Associação Brasileira de Transplantes de Órgãos e Société Francophone de
Transplantation, nas pessoas do Prof. Dr. Pierre Cochat, Prof. Dr. Valter Duro
Garcia e da Prof. Dra. Clotilde Duck Garcia pelo incentivo à pesquisa e à
permutação entre França e Brasil na área de transplante renal pediátrico.
À Prof. Ms Demirse Marilva Ruffato pela revisão gramatical da língua portuguesa.

“Todo efeito tem uma causa. Todo efeito inteligente tem uma causa inteligente. O poder
da causa inteligente está na razão da grandeza do efeito.”
Hippolyte Leon Denizard Rivail (1804, Lyon – 1869, Paris).
LISTA DE ABREVIATURAS
IMC Índice de Massa Corporal
SC Área Superfície Corporal
BUN Blood Urea Nitrogen
CrP Creatinina Plasmática
Cys C Cistatina C Sérica
mGFR Taxa de Filtração Glomerular medida
eGFR Taxa de Filtração Glomerular estimada
eGFRCys Equações para eGFR baseada em Cys C
eGFRPCr Equações para eGFR baseada em PCr
eGFRCom Equações para eGFR baseada em PCr e Cys C
CKD Chronic Kidney Disease
CKiD Cohort Study of Kidney Disease in Children equation
IQR Amplitude Interquartil
DP Desvio Padrão
K/DOQI Kidney Disease Outcomes Quality Initiative
IDMS Isotope Dilution Mass Spectrometry
Lista de publicações
Artigo 1 GFR estimation in adolescents and Young adults?----------------------------------39
Artigo 2 Comparison of Cystatin C and Creatinine-based glomerular filtration rate
formulas with inuline clearance in pediatric renal transplantation-----------------------------48
Artigo 3 Early Renal Abnormalities in Children with Postnatal Diagnosed Autosomal
Dominant Polycystic Kidney Disease----------------------------------------------------------------52
Artigo 4 Which GFR estimating equations can be reliably used in children with
standardized Creatinine and Cystatine C measurements? ------------------------------------58
Capítulo de livro Interprétation d’une Clairance ou comment estimer la fonction rénale
en 2011?-----------------------------------------------------------------------------------------------------92
Resumos de Congressos
How to estimate the Glomerular Filtration rate in Adolescents and Young Adults--------97
Estimating glomerular filtration rate in Children and Young Adults---------------------------99
Early Renal Abnormalities in Children with Autossomal Dominant Polycystic Kidney
Disease-----------------------------------------------------------------------------------------------------103
Can we accurately use to "new" Schwartz-formula to estimate glomerular filtration rate
in pediatric renal transplant recipients--------------------------------------------------------------103
Which equation to estimate Glomerular Filtration Rate in renal hyperfiltrating children?---
----------------------------------------------------------------------------------------------------------------104
Schwartz formula: is one K coefficient enough for all children? -----------------------------105

SUMÁRIO
CONSIDERAÇÕES SOBRE A TESE
RESUMO
ABSTRACT
1.0 INTRODUÇÃO ......................................................................................................... 17
1.1 Aspectos Gerais ................................................................................................ 17
1.2 Inulina – Taxa de Filtração Glomerular ........................................................... 18
1.3 Creatinina Plasmática ..................................................................................... 18
1.3.1 Dosagem Laboratorial Creatinina ................................................................... 18
1.3.2 Creatinina na Pediatria ................................................................................... 19
1.4 Cistatina C ..................................................................................................... 20
1.4.1 Dosagem de Cistatina C ................................................................................ 21
1.4.2 Cistatina C na Pediatria .................................................................................. 22
2.0 OBJETIVOS ........................................................................................................... 24
3 .0 PACIENTES E MÉTODOS ........................................................................................ 26
3.1 Definições de Termos ..................................................................................... 26
3.2 Delineamento do Estudo ................................................................................. 27
3.3 Amostra ........................................................................................................... 27
3.4 Período de Realização do Estudo ................................................................... 27
3.5 Critérios de Inclusão ....................................................................................... 28
3.6 Critérios de Exclusão ...................................................................................... 28
3.7 Desfechos de Interesse .................................................................................. 28
3. 8 Variáveis Analisadas ........................................................................................ 29
3. 8.1 Determinação da Depuração Renal de Inulina ............................................... 30
3. 8.2 Dosagem de Inulina no Plasma ...................................................................... 30
3. 8.3 Dosagem de Inulina na Urina ......................................................................... 31
3. 8.4 Dosagem de Creatinina no plasma ................................................................ 31
3. 8.5 Dosagem de Cistatina C no plasma ............................................................... 32
3. 8.6 Dosagem de Ureia em Amostra de Soro ........................................................ 32
3.9 Análise Estatística ............................................................................................. 33
3.9.1 Bland-Altman para Medidas Repetidas em Modelo Misto .............................. 33
3.9.2 Coeficiente de Correlação de Concordância (CCC) ....................................... 35

3.9.3 Acurácia ......................................................................................................... 35
3.9.4 Curvas de Características de Operação do Receptor (Curvas ROC) ............. 36
3.10 Aspectos Éticos .............................................................................................. 37
4.0 RESULTADOS –PUBLICAÇÕES ................................................................................. 38
4.1 Artigo 1 ............................................................................................................. 39
4.2 Artigo 2 ............................................................................................................. 48
4.3 Artigo 3 ............................................................................................................. 52
4.4 Artigo 4 ............................................................................................................. 58
4.5 Capítulo de Livro .............................................................................................. 92
4.6 Resumos de Congressos ................................................................................. 96
5.0 PONDERAÇÕES FINAIS............................................................................................107
4.0 CONCLUSÕES.........................................................................................................111
4.0 REFERÊNCIAS BIBLIOGRÁFICAS – PROJETO .............................................................113
4.0 ANEXOS..................................................................................................................118
CONSIDERAÇÕES SOBRE A TESE

O Programa de Pós-Graduação em Medicina e Ciências da Saúde –
FAMED/PUCRS não exige um formato específico para apresentação da tese de
doutorado. Assim, o formato segue a preferência do autor, sendo a mesma escrita
conforme as recomendações de Spector (Spector, N. Manual para Redação de Teses,
Dissertações e Projetos de Pesquisa. Rio de Janeiro: Guanabara Koogan; 1997. 117
p.). As referências bibliográficas na introdução seguem as normas de Vancouver e as
citações indicadas no texto seguiram o sistema de citações em sequência.
A avaliação da Taxa de Filtração Glomerular (TFG) é considerada o melhor índice
para avaliar a função renal. Sua estimativa acurada é necessária para detectar,
classificar e acompanhar o estágio da doença renal. Há escassos trabalhos brasileiros
na literatura, que avaliem esse parâmetro em crianças. Objetivando à solução desse
fato, realizamos pesquisa em França com a produção de um banco de dados a partir
da coorte de Lyon do serviço de nefrologia pediátrica.
Incluímos nessa tese, como introdução, o projeto basilar que nos levou a realizar a
pesquisa. Após, descrevemos as produções científicas. O autor participou da revisão
da literatura, do desenvolvimento da ideia, da preparação do projeto, da seleção dos
pacientes, da coleta de dados, da análise e interpretação dos dados e da redação da
tese e do artigo. No Laboratório de Fisiologia Renal do Hospital Edouard Herriot de
Lyon, a técnica e procedimentos para avaliação das substâncias estudadas foi instruída
pela professora Laurence Dubourg.
O primeiro manuscrito foi o artigo original, que deu o escopo para o tema, publicado
na revista internacional Journal of the American Society of Nephrology (fator de impacto
9,66) sobre avaliação de equações em adolescentes e adultos jovens. Outros dois
artigos basearam-se na doença renal policística autossômica dominante e

transplantados renais pediátricos, tendo sido publicados nas revistas Pediatric
Nephrology (fator de impacto 2,52) e Transplantation Proceedings (fator de impacto
1,05).
No momento, estamos com um quarto artigo em vias de encaminhamento para
publicação para Clinical Journal of the American Society of Nephrology (fator de
impacto 5,22). Concomitantemente, participamos da elaboração de capítulo de livro,
em francês, e de 5 temas livres apresentados em congressos internacionais, versando
sobre o mesmo assunto.

RESUMO

RESUMO
Introdução: As recomendações internacionais e nacionais recomendam a aferição da
taxa de filtração glomerular como preditor de doença renal na população geral, com
uso de creatinina plasmática. Entretanto, na pediatria existe uma alta prevalência de
fatores que interferem na creatinina plasmática, dentre os quais a taxa de crescimento.
As equações mais empregadas são derivadas da fórmula de Schwartz abreviada
(bedside). A cistatina C sérica, uma proteína não glicosilada de baixo peso molecular
que é produzida por todas as células nucleadas, tem sido apontada como um marcador
de filtração glomerular. Nesse contexto, há dúvidas em relação à cistatina C na
pediatria, devido à escassez de estudos com delineamento adequado no Brasil.
Objetivo: Avaliar transversalmente a acurácia diagnóstica da cistatina C, creatinina
plasmática, ou ambas em estimar mudanças na TFG comparados à inulina numa
coorte prospectiva de crianças com doença renal.
Pacientes e Métodos: Em uma fase inicial, adquirimos a estratégia metodológica para
a realização da TFG por depuração plasmática de inulina, em pediatria e na população
de adultos jovens, com respectiva publicação. Após, utilizou-se de medidas
simultâneas e repetidas de depuração renal de inulina em pacientes pediátricos. A
análise foi realizada por modelo linear misto, devido ao número repetido de medidas no
mesmo paciente. Para avaliar a concordância entre os métodos foram utilizados
gráficos de Bland Altman e teste de correlação de concordância. Em uma segunda
fase, foram realizadas medidas de cistatina C e de creatinina plasmática em pacientes
renais pediátricos, inclusive transplantados, com subsequente publicação de um artigo
e submissão de outro para análise.
Resultados: Essa tese gerou 4 apresentações em congressos científicos
internacionais, 4 artigos e 1 capítulo de livro em francês (em anexo).
Conclusões: A aferição adequada da TFG é de fundamental importância na prática
clínica em todas as fases da vida do indivíduo. A TFG declina progressivamente, com o
tempo, na maioria das enfermidades renais, o que resulta em complicações como
hipertensão arterial, anemia, desnutrição, enfermidade óssea, neuropatias.
Descritores: Cistatinas. Taxa de Filtração Glomerular. Inulina. Pediatria.

ABSTRACT

1 Introdução 15
ABSTRACT
Introduction: There have been national and international recommendations to
estimate glomerular filtration rate as a predictor of kidney disease, in the general
population, measuring plasma creatinine concentration. In pediatrics, however, there
is a high incidence of factors that affect plasma creatinine concentration, such as
growth rate and the equations most commonly used to estimate GFR are derivative
from Bedside Schwartz formula. The serum cystatin C, an unglycosylated protein of
low molecular weight, produced by all nucleated cells, has been proposed as a
marker of glomerular filtration. In this context in Brazil, there have been doubts
among professionals about using cystatin C in pediatrics, due to the lack of
appropriate studies about it. Objective: We sought to investigate the transversal
diagnostic accuracy, either related to cystatin C or plasma creatinine or both in
comparison with inulin, for estimating changes in GFR in a prospective cohort of
children with kidney disease. Patients and Methods: Firstly, we have chosen as
methodological strategy for the estimation of GFR the measurement by inulin
clearance, in pediatrics and in a young adult population, followed by a respective
publication. Secondly, we have used repeated and simultaneous measurements of
renal clearance by inulin in pediatric patients. The analysis has been performed by
linear mixed model due to the number of repeated measurements from the same
patient. In order to assess the equivalence between methods, we applied Bland &
Altman graphics, as well as concordance correlation tests. In a second phase, we
had cystatin C and serum creatinine measured in pediatric renal patients, including
those patients who had undergone a transplant. Consequently, an article was
submitted to publication and another one was submitted to analysis. Results: This
thesis has generated four presentations at international scientific congresses, 4
articles and 1 book chapter in French (attached). Conclusions: The adequate
measurement of GFR is of fundamental importance in clinical practice in all phases of
one's life. The GFR progressively declines with time, in most renal diseases, which
results in complications such as hypertension, anemia, malnutrition, bone disease,
neuropathies.
Keywords: Glomerular Filtration Rate. Inulin. Pediatrics. Cystatins.

1 Introdução 16
INTRODUÇÃO – PROJETO INICIAL

1 Introdução 17
1 INTRODUÇÃO
1.1 ASPECTOS GERAIS
A Taxa de Filtração Glomerular (TFG) é considerada o melhor índice de
função renal, e a técnica mais utilizada para a sua avaliação é a medida da
depuração plasmática de certos compostos endógenos ou exógenos pelos rins1-38. A
taxa de depuração (clearance) é definida como a quantidade de plasma que é
eliminada de uma substância na unidade de tempo. A determinação estrita da TFG
requer a medida da depuração de um marcador que não seja reabsorvido e nem
secretado pelo túbulo, sendo excretado na urina apenas por filtração glomerular1-38.
A TFG poder ser aferida pelo método de infusão endovenosa contínua de
substâncias exógenas (exemplo: inulina), com coletas de urina e sangue a intervalos
regulares, sendo esta a técnica padrão de depuração renal1-8.
A TFG pode ser medida por meio da determinação da concentração
plasmática de proteínas endógenas, como ureia, creatinina e cistatina C.
A dosagem plasmática de ureia foi introduzida como índice de função renal,
em 1903, por Strauss. A ureia conserva-se como um teste de baixa precisão por ter
poucos caracteres de um marcador ideal, visto que não tem uma produção
constante, variando na ingestão e no catabolismo proteico e apresentando uma
grande reabsorção tubular1, 2.
A avaliação precisa da TFG é uma importante chave para a identificação e
tratamento da doença renal crônica (DRC), cujas primeiras etapas são silenciosas e
não são detectadas com exames de rotina. A função renal declina progressivamente
com o tempo, na maioria das enfermidades renais, o que resulta em complicações
como hipertensão arterial, anemia, desnutrição, enfermidade óssea, neuropatia e
baixa qualidade de vida2.
1 Introdução 18
1.2 INULINA
Em 1935, Shannon e Smith propuseram como substância ideal para a medida
da taxa de filtração glomerular, a inulina3, 22. A depuração renal da inulina é o padrão
ouro de medida da TFG, tanto para animais como para o homem; e, desde que foi
descrito em 1951, poucas mudanças foram feitas na técnica original1-2,22-23. A inulina
é um polímero de frutose com peso molecular de aproximadamente 5.200 daltons,
sendo encontrada na natureza em poucas espécies de plantas, como a alcachofra
de Jerusalém, a dália e a chicória. Possui todos os atributos de um marcador ideal
de extracelular, é livremente filtrada pelos glomérulos, não sofre reabsorção nem
secreção pela célula tubular renal22-23.
A técnica de injeção única de inulina é outra forma de se medir a TFG,
através do cálculo da dose injetada dividida pela área sob a curva de decaimento
plasmático27,38. Para calcular a área sob a curva de maneira acurada, são
necessárias várias amostras da concentração ou da atividade do marcador no
plasma. A estimativa dessa área fundamenta-se na estimativa da inclinação na
curva, denominado como método da inclinação-intercepto.
Na prática clínica, a TFG é estimada, preferencialmente, pela creatinina
plasmática (CrP)4. A cistatina C (Cys C) tornou-se mais frequente como novo
marcador da TGF, visto que a CrP possui variação importante na sua medida em
pacientes com doença renal1,2,4-38.
1.3 CREATININA PLASMÁTICA
As determinações da CrP e da sua depuração em urina de 24 horas são os
procedimentos mais utilizados para a avaliação da função de filtração glomerular na
rotina laboratorial1,2,23,38. A CrP é formada a partir da hidrólise não-enzimática da
creatina e da fosfocreatina musculares, com um peso molecular de 113 daltons e
sem ligação a proteínas plasmáticas. Noventa e oito por cento da creatina é
estocada no músculo após ter sido sintetizada no fígado a partir dos aminoácidos
glicina e arginina. A outra fonte de creatina é a ingestão de proteína animal5,23.
Um percentual próximo a 2% da creatina muscular é convertido em creatinina
a cada dia. Entretanto, apresentam alguns inconvenientes. Variáveis pré-analíticas,
como a perda de urina durante a coleta e a hidratação do paciente, –– bem como a

1 Introdução 19
interferência analítica o método de Jaffé dependente decorrente da presença de
bilirrubina, glicose, ascorbato e hemólise, ou substâncias exógenas como as
ciclosporinas e cefalosporinas e outros medicamentos e seus metabólitos –– podem
prejudicar o uso da CrP1,4-38. A desproteinização de amostras e o uso de métodos
enzimáticos, a creatinina iminoidrolase ou amidoidrolase, foram implantados na
prática laboratorial para extrair esses interferentes6,22-23.
Nas situações em que a função renal está discretamente alterada, a
correlação entre a CrP e a filtração glomerular é menor, levando a uma estimativa
imprecisa da filtração glomerular, devido à alta variabilidade interindividual e a
secreção tubular da mesma5,23.
Nos consensos, recomenda-se a aplicação de fórmulas para avaliar a TFG
em vez da depuração da CrP. Essas equações propõem-se a minimizar os fatores
que interferem na CrP, tais como peso, altura, idade, sexo, raça, dieta e o método
analítico laboratorial1,2.
1.4.1 CREATININA PLASMÁTICA NA PEDIATRIA
Notoriamente, a CrP é a substância mais utilizada para aferição da TFG, seja
por fórmulas ou por coleta de 24 horas. Entretanto, como descrito anteriormente
possui as mesmas dificuldades, seja na aferição laboratorial, seja na variabilidade
interindividual que varia com o crescimento da criança22-23,33.
A depuração de creatinina também traz limitações pela necessidade de
armazenar urina por um período de 24 horas, pois fica sujeita a erros de coleta e ao
esvaziamento incompleto da bexiga, além do efeito de secreção tubular da
creatinina.
Assim, a estimativa do clearance de creatinina pode ser realizada, com
confiabilidade razoável, por fórmulas que relacionam a estatura, ou altura em
centímetros, com o valor da CrP em mmol/litro. A equação mais difundida na
pediatria é a de Schwartz simplificada2,11,19-20,23. Essa fórmula foi proposta pela
primeira vez, em 1976, por Schwartz2, tendo sido revisada em 2009. A equação
derivou-se da relação, por regressão linear, entre a CrP e altura de 349 crianças
portadoras de doença renal crônica, com idade mediana de 10,8 anos e com retardo
de crescimento20,23,33. Após análise por regressão multivariada, demonstrou-se que a
razão entre a CrP e estatura possui a melhor correlação com TFG (R2=0.65),

1 Introdução 20
indicando essa associação (altura e CrP) como essencial para avaliar a filtração
glomerular em população pediátrica2,20.
1.4 CISTATINA C
A cistatina C (Cys C) é uma proteína não glicosilada, de baixo peso molecular
de 13,35 daltons, constituída por uma cadeia polipeptídica de 120 aminoácidos, com
uma ponte de enxofre entre os resíduos 73 e 83 e uma entre os resíduos 97 e 11714.
O ponto isoelétrico é de 9,3 e ela tem carga positiva, inibidora da proteinase da
cistina, que é produzida pela maioria das células nucleadas, e está presente em
todos os líquidos biológicos em concentrações fisiologicamente relevantes6-7.
A Cyst C é produzida em taxa uniforme pelas células nucleadas, sendo um
inibidor das proteinases cisteínicas. O seu gene é localizado no cromossoma 20. A
Cyst C faz parte de uma superfamília com 12 membros, subdividida em: Família 1,
ou estefinas, na qual estão incluídas as cistatinas A e B; Família 2, ou cistatinas, que
compreende as cistatinas C, D, E, F, G, S, AS e SN; e a Família 3, formada por duas
glicoproteínas nomeadas kininogênios6-7.
A determinação plasmática da Cys C possui alta sensibilidade na avaliação
do índice de filtração glomerular8-14,16-37. A concentração média normal dessa
proteína é de 0,7 mg/dL e aumenta proporcionalmente com a diminuição da taxa de
filtração glomerular (TFG). Esta alta sensibilidade deve-se ao fato de a Cys C ser
produzida de forma constante, de sua produção não ser influenciada por processos
inflamatórios, dieta ou massa muscular e de não ocorrerem variações no sexo do
paciente8,7-14,25.
Estudos mostram que os níveis séricos de Cys C começam a aumentar
quando a TFG está em torno de 88 ml/min, enquanto a concentração sérica de
creatinina somente aumenta quando a TFG está abaixo de 75 ml/min9-10,22.
Os principais atributos da Cys C, como marcador de função renal, são o peso
molecular baixo e a característica isoelétrica, os quais permitem que essa proteína
seja facilmente filtrada através da membrana glomerular, sendo reabsorvida no
túbulo proximal em uma proporção significativa e, então, catabolizada de forma
quase total neste sítio9. Não estão descritas rotas extrarrenais de eliminação da Cys
C, e fatores como processos inflamatórios e infecciosos não alteram os níveis dessa
proteína, que são essencialmente dependentes da filtração glomerular. Portanto, os

1 Introdução 21
níveis séricos de Cyst C não seriam afetados pela massa muscular nem pela idade,
nítidas vantagens sobre a CrP9, 11-13.
1.4.1 CISTATINA C - dosagem laboratorial.
Ensaios automatizados baseados em nefelometria e turbidimetria possibilitaram a
ampliação do uso da Cyst C na rotina. O primeiro ensaio laboratorial por
turbidimetria (PETIA – Particle-enhanced immunoturbidimetry assay) para a
dosagem de Cyst C em amostras de soro e plasma foi comercializado em 1994. Em
1997, se propôs o primeiro ensaio laboratorial baseado na técnica de
nefelometria9,14,36.
A nefelometria é uma técnica para medir as concentrações de
imunoglobulinas e outras proteínas plasmáticas de uma amostra. É utilizado, para
isso, um aparelho específico que mede a turbidez e mede a difração (desvio) da luz
ao passar por uma solução contendo complexos imunológicos34.
Já a imunoturbidimetria mede a diminuição da luz ao passar por um complexo
antígeno-anticorpo. Em outras palavras, a turbidimetria mede o quanto a solução
antígeno-anticorpo absorve da luz e o quanto ela deixa passar. Essa técnica, assim
como a nefelometria, é usada para medir a concentração plasmática de diversas
proteínas34.
A principal diferença entre nefelometria e a turbidimetria é que na nefelometria
a luz é difundida, ou seja, atravessa a solução, enquanto que na turbidimetria a luz
não difundida (a absorvida) é medida.
Em princípio, a dosagem sérica de Cyst C não apresenta interferências
laboratoriais com bilirrubinas, paraproteínas, hemoglobina, triglicérides, processos
inflamatórios, proteinúria, massa muscular, sexo, etnia ou superfície
corpórea7,9,12,14,32.
O uso de doses elevadas de corticoides tem sido associado ao aumento da
produção de Cyst C e à elevação dos seus níveis séricos15,22,36. A terapia com
corticoides resulta em subestimativa do TFG dose-dependente, devido à elevação
da cistatina C. A disfunção da tireoide, mesmo sendo leve, altera os seus níveis36. A
Cyst C possui valores influenciados pela ação dos hormônios na sua produção
celular, sendo eles inferiores no hipotireoidismo e elevados no hipertireoidismo9,36.

1 Introdução 22
1.4.2 CISTATINA C EM PEDIATRIA
A determinação de Cys C apresentaria vantagens em relação à CrP em
populações pediátricas7,13,17-19,21-22. Por estar relacionada com a massa muscular, a
CrP poderia não detectar alterações na TFG em crianças menores de 4 anos.16-17
Por outro lado, a Cys C seria constante em crianças a partir do primeiro ano de vida
até a fase adulta18. Bokenkamp e colaboradores descreveram uma acurácia melhor
para Cys C em relação à CrP para aferição da TFG em crianças, quando comparado
à inulina6.
Filler e colaboradores definiram os intervalos adequados para Cys C em
crianças, sendo eles mais elevados em neonatologia, com redução gradativa no
decorrer do primeiro ano de vida, e permanecendo constantes entre o primeiro ano
de vida até os 17 anos19.
Finney H et al.5 definiram, pela primeira vez, os intervalos de referência para
a concentração sérica de Cyst C na população pediátrica, notando que a sua
concentração não se alterava por influência de variantes antropométricas, como
peso e massa muscular, no desenvolvimento das crianças. A Cyst C é mais elevada
em prematuros (0,43 à 2,77 mg/dL), neonatos (0,81 à 2,32 mg/dL) e gradativamente
cai no primeiro ano de vida. Em crianças com idade entre 1 e 17 anos, a Cyst C foi
constante entre 0,50 a 1,27 mg/dL. Já a CrP tem comportamento semelhante nos
primeiros meses de vida, porém os níveis séricos crescem gradualmente na infância
e na adolescência, independente da filtração glomerular.
Como não há trabalhos no Sul do Brasil que avaliem a Cys C como marcador
de TFG em pacientes pediátricos, decidiu-se avaliar este marcador, utilizando-o
como componente em fórmulas para medida de TFG. Para isso, seria de
fundamental importância a utilização de inulina, que é o padrão ouro para avaliação
de TFG, como controle das medidas que incluíssem Cys C, técnica não disponível
para uso rotineiro no Rio Grande do Sul. Assim, a possibilidade de concretizar este
estudo com um número suficiente de indivíduos seria conduzindo a pesquisa em um
Centro que realizasse rotineiramente a avaliação da TFG através da inulina em
pacientes pediátricos.

2 OBJETIVOS

2 Objetivos 24
2 OBJETIVOS
GERAL
Comparar o desempenho preditivo de fórmulas para estimativa de TFG
utilizando Cys C, com equações que utilizam CrP, em pacientes pediátricos, tendo
como padrão ouro a medida da TFG com a inulina.
ESPECÍFICOS
1. Colacionar quatro fórmulas para medida da TFG utilizando Cys C isoladamente
(Filler19 e Bricon12) ou associada à CrP (CKID20 e Zappitelli21) com duas
equações (Schwartz bedside20 e Schwartz Lyon22) que utilizam
exclusivamente CrP, em pacientes pediátricos;
2. Confrontar o desempenho preditivo de quatro fórmulas para medida da TFG
utilizando Cys C, isoladamente (Filler e Bricon) ou associada à CrP (CKiD e
Zappitelli), com duas equações (Schwartz bedside e Schwartz Lyon) que
utilizam exclusivamente CrP, utilizando-se como padrão ouro de controle a
TFG estimada com inulina como marcador, em pacientes pediátricos.

3 PACIENTES E MÉTODOS

3 Pacientes e Métodos 26
3 PACIENTES E MÉTODOS
3.1 Definição de Termos
Variáveis de confusão: aquelas cujas modificações durante o período do
estudo poderiam interferir na taxa de filtração glomerular. As variáveis de confusão
cujas modificações poderiam interferir nos valores de inulina, creatinina e cistatina C
são: índice de massa corporal (IMC), dose diária de prednisona, inulina, bexiga
neurogênica, uso de diuréticos.
Insuficiência Renal Crônica: consiste em lesão renal e perda
progressiva e irreversível da função dos rins (glomerular, tubular e endócrina).
Estadiamento da Insuficiência Renal Crônica: definido pela taxa de
filtração glomerular pela inulina em grupo 1 (>90 ml/min /1,73m2), grupo 2 (60-89),
grupo 3 (30-59), grupo 4 (15-29) e grupo 5 (<15).
Síndrome nefrótica: presença de proteinúria 3,5 g/1,73m² em 24 h ou
50 mg/ Kg de peso, acompanhada de hipoalbuminemia, dislipidemia e edema.
Índice de massa corporal: IMC (kg/m²) = Peso/Altura².
Percentil altura e peso: Os resultados dos percentis de crescimento são
comparados com as medidas normais ou padrão para meninos ou meninas da
mesma idade e sexo. Os resultados foram interpretados como médias de percentis.
Classificação do estado nutricional, como se segue:
Acima do percentil 97: classificar como sobrepeso;

3 Pacientes e Métodos 27
Entre os percentis 97 e 10: faixa de normalidade nutricional;
Entre os percentis 10 e 3: classificar como risco nutricional;
Entre os percentis 3 e 0,1: classificar como peso baixo;
Abaixo do percentil 0,1: classificar como peso muito baixo.
3.2 Delineamento do Estudo
Estudo transversal com medidas repetidas da coorte da população pediátrica
do Serviço de Nefrologia Pediátrica da região Rhône-Alpes, França.
Fase 1
Lyon – França
Aquisição da metodologia da aferição da TFG através da inulina.
Comparar a TFG através da inulina e a TFG estimada por Cyst C e CrP.
Estágio no serviço de bioestatística do Hôpital Edouard Herriot.
Fase 2
Brasil
Análise de dados, redação da tese, confecção e submissão do artigo a uma
revista de impacto internacional e defesa pública do doutorado.
3.3 Amostra
A amostra é composta de 259 crianças com 695 medidas, média de 3
medidas, por indivíduo, de clearance de inulina da coorte do Serviço de Nefrologia
do Hôpital Mére et Enfants e Hôpital Edouard Herriot.
3.4 Período de Realização do Estudo
1. Contato e aceite do serviço de Lyon para estágio prático-teórico (anexo1)

3 Pacientes e Métodos 28
2. Estágio prático-teórico no serviço de transplantes renais e laboratório de
fisiologia renal do Hôpital Femme Mère et Enfants (Lyon-França) com
submissão dos dados em artigos científicos: julho/2010 a dezembro/2011
(anexo 2).
3. Execução do projeto no Brasil com coleta de cistatina C em pacientes
pediátricos: foi abortado por falta de recursos financeiros e técnicos no país.
4. Aprovação no teste de qualificação em abril de 2012.
5. Análise dos dados coletados na França: maio/2011 a junho/2012.
6. Confecção da tese de doutorado e artigo para publicação: julho/2012 a
outubro/2012.
7. Apresentação da tese: 18 de dezembro de 2012.
3.5 Critérios de Inclusão
1. Idade inferior a 18 anos.
2. Ambos os sexos.
3. Função renal medida pela inulina.
4. Consentimento informado assinado pelo responsável (em anexo).
3.6 Critérios de Exclusão
Pacientes portadores de hipotireoidismo.
Alta doses de corticoterapia, acima de 0,5 mg/kg de peso
3.7 Desfechos de Interesse
Taxa de filtração glomerular.

3 Pacientes e Métodos 29
3.8 Variáveis Analisadas
Foram avaliados os seguintes parâmetros: idade, índice de massa
corporal, doença básica, faixa etária, TFG por inulina e estimadas pelas fórmulas.
Fórmulas utilizadas para estimar a taxa de filtração glomerular.
Formula (mL/min per 1,73 m²)
Creatinina plasmática
Schwartz Lyon
2009 Schwartz bedside
eGFR = k × altura (cm)/CrP
k*= 35,5 meninos >13 anos
k*= 32,5 todas as outras crianças
k**= 0,401 meninos >13 anos
k**= 0,368 todas as outras crianças
eGFR* = 36,5 × altura (cm)/CrP
eGFR** = 0,413 × altura (cm)/CrP
Cistatina C
Bricon
Filler
eGFR** = (78/Cys C**) + 4
log(eGFR)**= 1,962 + [1,123 × log (1/Cys C**)
Combinadas
CKID
Zappitelli
eGFR** = 39,1 × [altura (m)/(CrP**)]0,516 × [1,8/Cys
C] 0,294 × [30/BUN (mg/dl)]0,169 × [1,099]masculino ×
[altura(m)/1,4] 0,188
eGFR* = [507,76 × e0,003×altura (m)]/[Cys C**0,635] ×
[CrP*0,547]
Se transplante renal, × 1,165
Se espinha bífida, × [CrP*0,547])/40,45
µmol/L*, mg/dL**
CrP(µmol/L) = CrP (mg/dL) ×88,4

3 Pacientes e Métodos 30
3.8.1 Determinação da Depuração Renal de Inulina
As medidas de depuração foram feitas no laboratório da Unidade de
Éxploration Functionelle Rénale de Lyon - França. Os pacientes foram mantidos em
repouso absoluto no leito, em decúbito dorsal, após período de jejum de 12 horas e
dieta pobre em proteínas nas 18 horas que antecederam ao exame.
A apresentação farmacêutica da inulina utilizada foi o polyfructosan, uma
forma sintética de inulina (sinistrin, INUTEST 25%, Fresenius Kabi Austria GmbH,
Linz, Austria). Esse polímero de frutose tem elevada solubilidade e conveniência
para administração endovenosa, com equivalente permeabilidade na membrana
basal glomerular. A inulina foi administrada com técnica de infusão contínua, em veia
periférica e com Bomba de Infusão após dose em bolus de 30 mg/kg de peso diluída
em 100ml de SF 0,9%. O tempo de infusão foi de 05h30min, dando início às
07h30min e término às 13h. Os pacientes receberam aporte hídrico de 5 ml/kg
antes da infusão do bolus, seguidos por 3 ml/kg de água a cada 30 minutos e
solução de cloreto de sódio à 0,9%, até o final do exame. Após 90 minutos de
infusão, tempo necessário para a estabilização da inulina no sangue, foi feita coleta
de sangue e solicitado ao paciente esvaziamento espontâneo da bexiga, dando
início ao 1º período de depuração. Para cada paciente foram feitos 04 períodos de
clearance, e o resultado final dado como a média dos 04 períodos.
O esvaziamento vesical se deu de modo espontâneo. A decisão por não
cateterização foi baseada em estudos já publicados de validação de métodos de
depuração que utilizaram a depuração renal de inulina como método padrão-ouro e
com esvaziamento espontâneo da bexiga.
O método empregado foi espectrofotometria, utilizando o reagente de antrona
117.
3.8.2 Dosagem de Inulina no plasma
Os plasmas foram desproteinizados por meio da diluição 1:11 do plasma (50
μl) em ácido perclórico a 5% (500 μl) e centrifugação de 06 min; em tubo de ensaio,
aos 250 μl do sobrenadante se adicionava 3,0ml do reagente de antrona. Para o
tubo branco, adicionava-se 3,0ml de reagente de antrona a 250 μl de ácido
perclórico a 5%.

3 Pacientes e Métodos 31
Os tubos foram agitados antes e depois da adição do reagente de antrona e
colocados em banho-maria por 10 minutos. Após esse período cronometrado, os
tubos foram resfriados em água corrente; a leitura da amostra foi feita por
espectrofotometria em 620nm e a concentração plasmática dada pela equação:
Concentração plasmática de inulina (mg/dL)= (Absorbância da amostra x Fc x11)/5.
3.8.3 Dosagem de Inulina na urina
Em tubo de ensaio, 100 μl da amostra de urina diluída foi adicionada a 150μl
de ácido perclórico a 5%, seguido por 03ml do reagente de antrona. Os tubos foram
agitados antes e após a adição do reagente de antrona. Para o tubo branco (blank),
100 μl de água destilada era adicionada a 150 μl de ácido perclórico a 5%, seguido
por 03ml do reagente de antrona.
O tubo foi agitado antes e após a adição do reagente de antrona. Os tubos de
ensaio (amostras e blank) foram colocados em banho-maria a 52ºC por 10 minutos,
depois resfriados em água corrente; por fim, foi feita a leitura da absorbância em
espectrofotômetro a 620nm.
A concentração em mg/dL foi calculada pela fórmula baixo: Concentração
Urinária de inulina (mg/dL)= (Absorbância x Fc x 11 x 3)/2.
3.8.4 Dosagem de Creatinina Plasmática
A medida da CrP foi determinada pelo método colorimétrico de Jaffé
modificado. O método tem como princípio a reação, em solução alcalina, da
creatinina com o ácido pícrico, formando um complexo amarelo avermelhado. A
leitura espectrofotométrica foi medida em comprimento de onda de 512 nm; a
intensidade da cor é diretamente proporcional à CS de creatinina.
Os insumos empregados foram produzidos pela empresa Roche da França.
A sensibilidade e a linearidade para o ensaio de creatinina sérica são,
respectivamente, 0,2 e 25 mg/dL. O coeficiente de variação intraensaio foi de 0,7% e
o interensaio é de 4% em concentrações mais baixas de CrP (45-50 μmol/l) e 1,5%
na mais alta concentração (580 μmol/l), respectivamente. Os valores de referência
foram estabelecidos para homens em 62-106 μmol/l e, para mulheres, em 44-80
μmol/l. Os resultados foram estandardizados por regressão linear, ajustadas pela

3 Pacientes e Métodos 32
espectrometria cromatográfica de massa (LCMS). LCMS foi calibrada por três
laboratórios europeus e 2 americanos, com as concentrações variando entre 66,5 e
404 μmol/l. Os parâmetros da regressão linear eram adquiridas de 54 amostras com
creatinina sérica variando de 41 a 220 μmol/l. 94,2% das amostras do nosso grupo
estavam dentro desse nível. A calibração respeitava a seguinte equação: creatinina
sérica estandardizada= 0,9395* (Jaffé compensada creatinina sérica em µmol/l) +
4.6964. Intercept (4.6964; 95% IC [-2.4619 to 11.8656]) e slope (0.9395; 95% CI
[0.8719 to 1.0072]), não sendo significativamente diferente de zero e 1,
respectivamente. O coeficiente de correlação foi de 0,97.
3.8.5 Dosagem de Cistatina C Plasmática
A medida da CS de cistatina C foi realizada em amostras de soro por técnica
de Nefelometria. As amostras foram dosadas em nefelômetro BN II Dade Behring
(Sistema BN), empregando-se insumos da mesma procedência do equipamento (kit
N Latex Cystatin C)22.
O método de imunonefelometria utiliza partículas de poliestireno carregadas
com anticorpo de coelho específico contra a cistatina C humana, que, na presença
de amostras de soro contendo cistatina C, sofrem aglutinação, gerando
luminescência. A intensidade de luz dispersa no equipamento depende da
concentração da proteína cistatina C na amostra; a concentração analítica da
amostra pode ser determinada por comparação com diluições de um padrão de
concentração conhecida. Para o ensaio laboratorial, todos os passos foram
executados automaticamente pelo aparelho (Sistema BN), que inclui um software.
As amostras de soro foram diluídas a 1:100 com diluente N; esse reagente N
é composto por uma suspensão de partículas de poliestireno carregadas com
aproximadamente 0,03g/L de anticorpo de coelho anticistatina C humana.
O controle de qualidade é dado pelos controles do material do calibrador, cuja
fonte é um purificado de cistatina C humana (control cystatin c). A curva de
calibração fornece intervalos de medidas de 0,23-7,25mg/dL. A variação intraensaio
é de 2,3 a 4,1%; a variação interensaio de 2,6 a 3,3%; o valor de referência é de
0,50 a 0,96 mg/dL.
3.8.6 Dosagem de Uréia Plasmática

3 Pacientes e Métodos 33
A ureia foi dosada em amostra de soro pelo método cinético, que utiliza o
sistema enzimático urease/glutamato desidrogenase (GLDH).
A ureia contida na amostra é hidrolisada em amônia e CO2 na presença da
enzima urease. A amônia formada reage com alfacetoglutarato e NADH
(dinucleotide adenina de nicotinamide), na presença de GLDH, gerando NAD, L-
glutamato e água. A diminuição na absorbância devido ao consumo de NADH é
medida cineticamente.
Nós convertemos o resultado de ureia em mmol/L para o resultado de BUN em
mg/dL, dividindo-a por 0,357.
3.9 Análise Estatística
A análise estatística foi executada com o Software livre R versão 13.0. Os
dados foram previamente avaliados quanto à sua distribuição, tendo sido aplicado o
teste de normalidade de Kolmogorov-Smirnov. O teste Mann-Whitney foi utilizado
para comparação entre medidas, quando apropriado.
As medidas de depuração foram normatizadas para 1,73m² de superfície
corpórea. Para cálculos da superfície corporal foi utilizada a equação de DuBois: SC
(m²)= (0,007184)*(Altura 0,725)*(Peso0,425), com peso em kg e altura em cm.
3.9.1 Bland-Altman para medidas repetidas com modelo misto
O desempenho de seis fórmulas foi comparado com o clearance de inulina.
Para análise dos dados, foram utilizadas a razão média entre a TFG estimada e a
TFG real com representação gráfica de Bland-Altman23,40.
A análise estatística de Bland-Altman foi utilizada para avaliar o grau de
concordância entre a depuração de inulina e as fórmulas de estimação. A razão
média das diferenças representa uma estimativa de erro ou bias, uma diferença
sistemática entre os métodos de depuração da inulina e das fórmulas; o desvio
padrão dessas razões mede as flutuações ao redor da média. Noventa e nove por
cento dessas diferenças estarão entre dois limites definidos como limites de

3 Pacientes e Métodos 34
concordância: o limite inferior, dado pela média das diferenças subtraída de 1.96xdp;
e o limite superior, dado pela média das diferenças somado a 1.96xdp. Para medir o
grau de concordância, foram considerados o erro (bias) e os limites de concordância.
A TFG estimada (TFGe) e a TFG medida (TFGm) foram comparadas entre e intra
indivíduos.
A terminologia de medidas repetidas é usada para nomear medidas dispostas
na mesma variável ou na mesma unidade experimental, em mais de uma ocasião.Os
modelos mistos proporcionam a modelagem intraindivíduo, muitas vezes em dados
agrupados. As observações no mesmo indivíduo não podem ser consideradas não
correlacionadas e os modelos mistos constituem uma ferramenta conveniente para
adequar essa análise intraindivíduo. Diversos planejamentos com medidas repetidas
são corriqueiros, sejam longitudinais, transversais e Split plot (parcelas
subdivididas). Nós optamos pelo tipo transversal, já que a análise longitudinal não foi
possível, pela pouca variância durante o tempo.
As medidas repetidas foram mensuradas através de agrupamentos de
pacientes e ajustadas por modelo linear de efeito misto41. Foram estimados os
limites de 95% de intervalo de confiança para razão das médias associando a
variância entre e intrassujeito24. Foi utilizado o seguinte modelo:
Onde: log.difference = log (valor de TFGe) – log (valor de TFGm). Como o resultado
em diferenças de Logaritmo Taxa não é fácil de interpretar, foi utilizada a operação
inversa (anti-log = log (TFGe) / log (TFGm)). Desta forma, para tornar a
apresentação de dados mais clara, os mesmos são apresentados diretamente em
razão TFGe / TFGm. A razão para cada par de medidas (j) no indivíduo (i) foi
modelada como segue:
Sendo Rij a razão entre a fórmula e a inulina, β a razão média entre essas medidas,
I a interação entre indivíduos e Eij os efeitos randômicos intraindivíduo para cada
razão entre a fórmula e a inulina. Foram estimados os limites de concordância,
somando as variâncias intra e interindivíduos, e calculando o desvio padrão da razão
média, como o modelo:
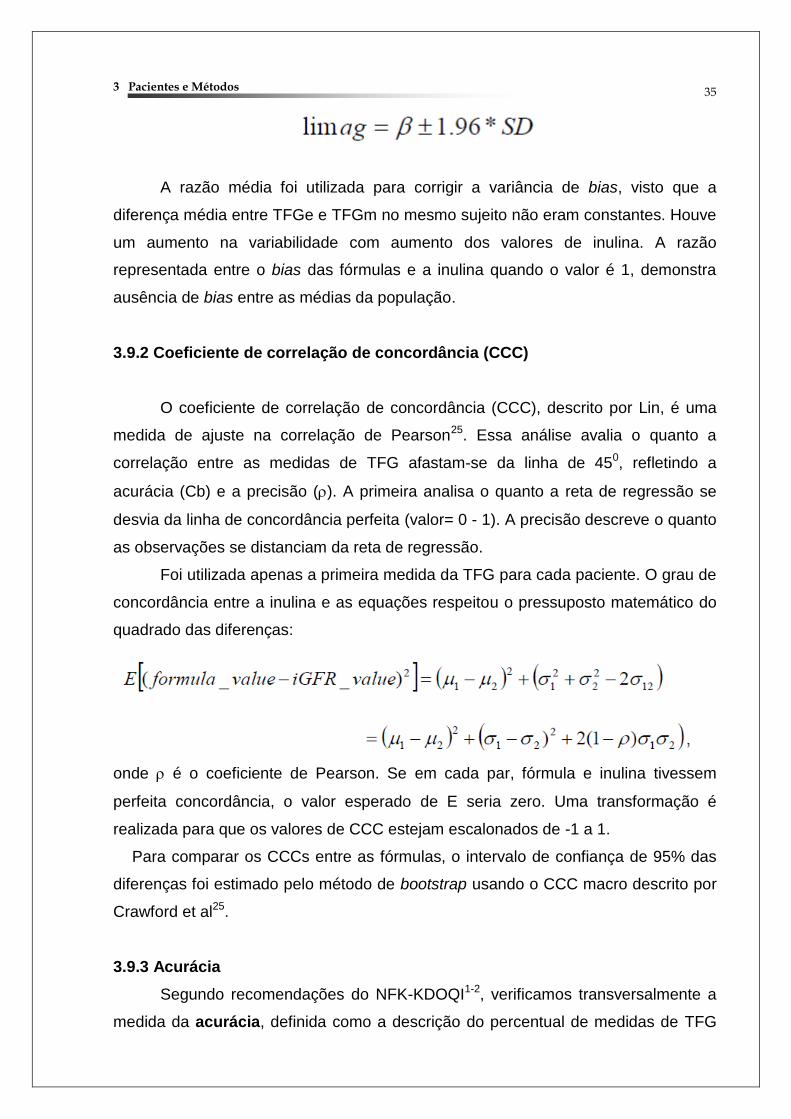
3 Pacientes e Métodos 35
A razão média foi utilizada para corrigir a variância de bias, visto que a
diferença média entre TFGe e TFGm no mesmo sujeito não eram constantes. Houve
um aumento na variabilidade com aumento dos valores de inulina. A razão
representada entre o bias das fórmulas e a inulina quando o valor é 1, demonstra
ausência de bias entre as médias da população.
3.9.2 Coeficiente de correlação de concordância (CCC)
O coeficiente de correlação de concordância (CCC), descrito por Lin, é uma
medida de ajuste na correlação de Pearson25. Essa análise avalia o quanto a
correlação entre as medidas de TFG afastam-se da linha de 450, refletindo a
acurácia (Cb) e a precisão (). A primeira analisa o quanto a reta de regressão se
desvia da linha de concordância perfeita (valor= 0 - 1). A precisão descreve o quanto
as observações se distanciam da reta de regressão.
Foi utilizada apenas a primeira medida da TFG para cada paciente. O grau de
concordância entre a inulina e as equações respeitou o pressuposto matemático do
quadrado das diferenças:
onde é o coeficiente de Pearson. Se em cada par, fórmula e inulina tivessem
perfeita concordância, o valor esperado de E seria zero. Uma transformação é
realizada para que os valores de CCC estejam escalonados de -1 a 1.
Para comparar os CCCs entre as fórmulas, o intervalo de confiança de 95% das
diferenças foi estimado pelo método de bootstrap usando o CCC macro descrito por
Crawford et al25.
3.9.3 Acurácia
Segundo recomendações do NFK-KDOQI1-2, verificamos transversalmente a
medida da acurácia, definida como a descrição do percentual de medidas de TFG

3 Pacientes e Métodos 36
estimado que estivessem dentro de 10 e 30% das medidas de TFG por Inulina (valor
verdadeiro).
3.10.4 Curvas de Características de Operação do Receptor (Curvas ROC-
Receiver Operating Characteristic).
Utilizamos a área sobre a curva ROC (AUC) para determinar a habilidade da
TFGe em discriminar pacientes com ou sem insuficiência renal crônica (definida por
TFGm < 60 ml/min/ per 1.73 m2).
Para calcular o AUC é necessário calcular a o diagnóstico de IRC estimado
pelo padrão ouro que é a inulina. O AUC sobre os pontos de grade é calculado de
acordo com:
Na equação acima, Pc representa o valor médio da variável no ponto m
obtido pelo modelo e Oc o valor médio observado (inulina) da variável no ponto m.
Caso as anomalias simuladas e observadas sejam ambas positivas ou negativas, o
numerador na equação acima será positivo. Já quando as anomalias são opostas
em sinal, o numerador contribuirá negativamente. Dessa forma, quanto mais positivo
(negativo) for o valor de AUC, maior será a semelhança entre as anomalias
simuladas e observadas. O valor de AUC sempre estará entre –1 e 1.
O método de Delong Clarke-Pearson comparou AUCs43. O valor de p<0.05 foi
considerado como estatisticamente significativo. Para análise foi utilizado programa
R para Windows versão 2.13.
3 Pacientes e Métodos 37
3.10 Aspectos Éticos
O estudo encontra-se dentro das normas e diretrizes regulamentadoras de
pesquisas envolvendo seres humanos, conforme a Resolução no 196/96, do Conse-
lho Nacional de Saúde.
Considera-se que toda pesquisa com seres humanos envolve risco, podendo
causar dano eventual imediato ou tardio, comprometendo o indivíduo ou a coletivi-
dade. Não obstante, os riscos potenciais do presente estudo são admissíveis, pois o es-
tudo oferece elevada possibilidade de gerar conhecimento para entender, prevenir ou
aliviar um problema que afeta o bem-estar dos sujeitos da pesquisa e de outros
indivíduos.
O projeto foi aprovado pelos Comitês de Ética das instituições participantes
do estudo (anexos).

4 RESULTADOS - PUBLICAÇÕES

4 Resultados 39
4.1 PRIMEIRO ARTIGO. Publicado em junho de 2012 no Journal of the
American Society of Nephrology Jun;23(6):989-96.

4 Resultados 40
4 Resultados 41
4 Resultados 42

4 Resultados 43

4 Resultados 44
4 Resultados 45

4 Resultados 46

4 Resultados 47
4 Resultados 48
4.2 SEGUNDO ARTIGO. Publicado em outubro de 2012 na Transplantation-
Proceedings Oct;44(8):2357-9.

4 Resultados 49
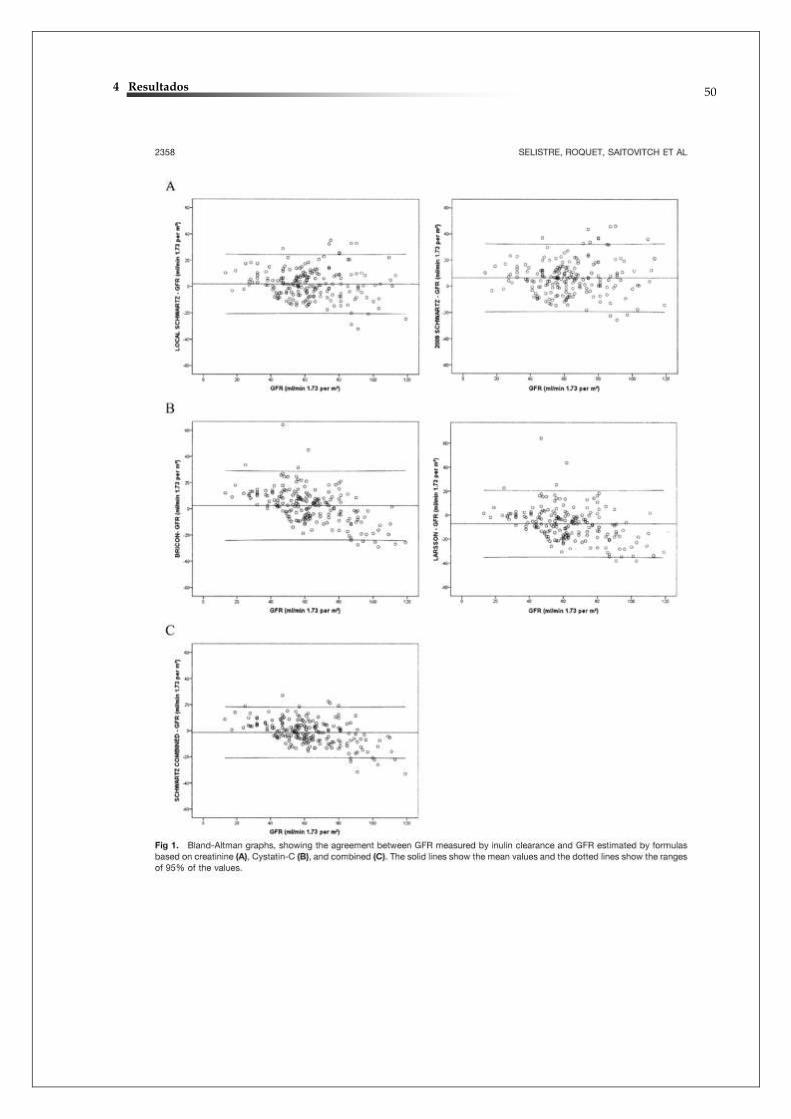
4 Resultados 50
4 Resultados 51

4 Resultados 52
4.3 TERCEIRO ARTIGO. Publicado em junho de 2012 na Pediatric Nephrology
2012 Sep;27(9):1589-93.

4 Resultados 53

4 Resultados 54

4 Resultados 55
4 Resultados 56

4 Resultados 57

4 Resultados 58
4.5 QUARTO ARTIGO. - SERÁ ENCAMINHADO PARA CLINICAL JOURNAL OF SOCIETY OF NEPHROLOGY.

4 Resultados 59
Which GFR estimating equations can be reliably used in children with standardized
creatinine and cystatine C measurements?
AUTHORS
Luciano Selistre1-2-8, Vandréa De Souza1, Pierre Cochat 1-3-4-5, Olga Dolomanova1,
David Saitovitch2, Ivan Carlos Ferreira Antonello2, Aoumeur Hadj-Aissa1,4, Bruno
Ranchin3, Justine Bacchetta1-3-4, Muriel Rabilloud4-7 , Laurence Dubourg 1-3-4-5
1. Exploration Fonctionnelle Rénale et Métabolique, Groupement Hospitalier
Edouard-Herriot, Hospices Civils de Lyon
2. Pontificia Universidade Católica do Rio Grande do Sul, Brazil
3. Centre de Référence des Maladies Rénales Rares, Service de Néphrologie et
Rhumatologie Pédiatriques, Hospices Civils de Lyon, Lyon, France
4. Université Claude-Bernard Lyon 1, Lyon, France
5. FRE 3310, CNRS, Université Claude-Bernard Lyon 1, Lyon, France
6. Laboratoire de Biochimie et Biologie Moléculaire, Groupement Hospitalier
Edouard-Herriot, Lyon, France
7. Hospices Civils de Lyon, Service de Biostatistique, CNRS, UMR5558, Laboratoire
de Biométrie et Biologie Evolutive, Equipe Biostatistique-Santé, Villeurbanne, France
8. Universidade de Caxias do Sul, Brazil.
CORRESPONDING AUTHOR:
Luciano Selistre
Exploration Fonctionnelle Rénale et Métabolique - Pavillon P
Hôpital Edouard Herriot, 5 Place d’Arsonval,
F-69437 Lyon cedex 03
Tel: 33 4 72 11 02 44
Fax: +33 4 27 85 67 68

4 Resultados 60
Summary
The limitations of estimates of glomerular filtration rate (GFR) based only on plasma
creatinine measurements have spurred an interest in more sensitive markers of GFR.
Cystatin C, a low-molecular-weight glycoprotein freely filtered through the glomerular
basement membrane and with minimal non-renal elimination, may be such a marker.
The diagnostic accuracy of cystatin C estimated GFR (eGFR) by various cystatin C.
equations have varied in different studies. We hypothesized that the age range and
GFR of enrolled patients affects the diagnostic accuracy of a cystatin C and
creatinine equations. We analyzed 259 consecutively enrolled children and
adolescents at a single French center in a prospective and cross-sectional study.
Cystatin C was analyzed with nephelometry and IDMS-traceable plasma creatinine to
eGFR was estimated by the equations validated in children. GFR was measured by
inulin. GFR was estimated using the plasma creatinine–based the 2009 Schwartz
bedside and a Schwartz Lyon equations, and 4 cystatin C-derived equations (2
simples cystatin, Filler and Bricon, and 2 combined with creatinine, CKiD and
Zappitelli). In children, Schwartz Lyon had low median ratio bias and high accuracy
such that 93% of estimates were within 30% of measured GFR. In adolescents, the
median mean ratio bias of 2 equations, Schwartz Lyon and CKiD, was low and
accuracy was high such that 90–93%. In the GFR categories <60 and <90 ml/min per
1.73 m2, the Receiver-operating characteristics (ROC) to children and adolescents
wasn't between haven’t significantly different between CKiD, Filler, 2009 Schwartz
bedside and Schwartz Lyon. These results were an improvement compared to the
other equation based cystatin C and 2009 Schwartz bedside, both of which had high
median bias and reduced accuracy. The diagnostic accuracy of various equations
varies with GFR and range age. In addition, we found no evidence that serum
cystatin C–based estimates of renal function are superior to serum creatinine-based
estimates.
INTRODUCTION
Assessment of glomerular filtration rate (GFR) is an important tool for
monitoring renal function. GFR has to be determined by measuring the clearance of
an exogenous marker totally and exclusively eliminated by glomerular filtration, such

4 Resultados 61
as inulin4, 26-27. However, in clinical practice, determination of the GFR by inulin is
quite cumbersome27-29.
Therefore, plasma creatinine (PCr) and creatinine clearance are widely used
as non-invasive methods for the assessment of GFR, although several drawbacks
have been identified1, 4, 27, 29. The monitoring of GFR based on equations of creatinine
may have a bias compared with the current gold standard4. PCr production is
proportional to muscle mass and varies considerably intra- and inter-individually1, 26.
PCr is freely filtered by the glomerulus, not reabsorbed by the proximal tubules and is
secreted in small amounts. PCr is also not sensitive for detecting small decreases in
GFR because of the non-linear relationship between its plasma concentration and
GFR. PCr values have to be adjusted for body height and body composition to reflect
renal function in paediatric patients accurately1, 4, 20, 26-29.
Unlike PCr, cystatin C (Cys-C) is produced at a constant rate by all nucleated
body cells. Cys-C is a non-glycosylated basic protein (13.36 kDa) and can be found
in a variety of biologic fluids6. Cys-C serum concentration is not influenced by gender,
inflammation, or lean tissue mass and is regarded to be mainly determined by GFR.
Cys-C has been described as meeting many of the characteristics of an ideal GFR
marker (e.g., endogenously produced at a constant rate, freely filtered in the
glomerulus, neither reabsorbed nor secreted in the renal tubule, not extrarenally
eliminated) and has been reported to be at least as accurate as the commonly used
serum creatinine to detect impaired renal function in various patient groups, including
renal transplant patients and children1, 6-9, 11-13, 16, 18-19, 28, 30-32.
Several prediction equations have been derived from both paediatric and adult
patients to estimate GFR from the serum Cys-C concentration8, 12-13, 20-21. Until
recently, however, studies that have evaluated Cys-C have used the serum
concentration rather than an estimate of GFR based on the measured
concentration20, 22, 33-40.
Accordingly, the objective of this study was to compare GFR level with
equations that include Cys-C, PCr, or both levels adjusted for staging of chronic
kidney disease (CKD) at in a cohort of children and adolescents.The equations were
compared with inulin GFR reference measurement.

4 Resultados 62
MATERIAL AND METHODS
Study Population
Children cohort of 259 French children who were followed at the Hopital Mére-
enfants at Lyon, aged 1 to 18 years, who underwent renal functional assessments
between October 2003 and July 2011 (695 GFR measurements in all with an
average of 2 measurements per patient). The baseline population was divided into
two age groups: 165 children (<13 years, 318 measurements) and 194 adolescents
(13-18 years, 341 measurements). The age limits for adolescents was chosen to
allow comparisons with the original Schwartz cohort.
The study was approved by the Research Ethics Board.
Laboratory Assessment
Measure of glomerular filtration rate (mGFR) was measured by the plasma
clearance of radiolabel by the clearance of inulin (polyfructosan infusion, Inutest®;
Fresenius Kagi, Graz, Austria). A standard technique was used by a trained staff with
a continuous infusion after a priming dose of polyfructosan (30 mg/kg). Water
diuresis was induced by oral administration of 5 ml/kg of water followed by 3 ml/kg
every 30 minutes combined with an intravenous infusion of 0.9% sodium chloride.
This enabled the patients to spontaneously empty their bladder every 30 minutes.
Three to four urine samples were collected, and a blood sample was drawn mid-way
through each collection period.22
The clearance values were obtained from the mean values of the three to four
30-minute clearance periods. Patients needing intermittent urethral catheterization
were excluded from this study. To obtain valid results in patients with mild urologic
abnormalities, polyfructosan was diluted in mannitol 10%, and water diuresis was
induced before the arrival of the patients; thus, the increase of urine volume and the
secondary decrease of urinary concentration of inulin allows minimization of the
errors caused by mild urological problems, by allowing a diminution of sample
variability and a facilitation of vesical voiding. In addition, whatever the pathology of
the patient, a maximum scatter of 20% between the three or four clearance periods

4 Resultados 63
was accepted to assess the validity of mGFR measurement in each period.
Measurements of plasma and urine polyfructosan were performed using an
enzymatic method. The results were expressed to 1.73 m2, according to the Dubois
formula of body surface.
Plasma creatinine (PCr) was obtained from a kinetic colorimetric compensated
Jaffe technique (Roche Modular, Meylan, France; compensation according to
manufacturer’s recommendations) for which the imprecision of the assay method was
checked (intra-assay coefficient was 0.7%; inter-assay coefficients were 4.0% at low
concentration PCr (45 – 60 µmol/L) and 1.5 % at High concentration PCr (580
µmol/L), respectively. All measurements of PCr were performed with the same
method all over the study period. The results for PCr were standardized by linear
regression adjustment of the concentrations obtained by the compensated Jaffé
assay and the concentrations obtained by liquid chromatography-mass spectrometry
(LCMS). Briefly, the LCMS apparatus was calibrated with three European standards
(BCR; Bureau community Reference 573, 574 and 575) and two American standards
(SRM; Standard Reference Material) which PCr concentrations range from 66.5 to
404 µmol/l. The parameters for the linear regression line were obtained for 54
patients with serum creatinine values ranging from 41 to 220 µmol/L. 94.2% (993) of
our plasma creatinine values were within this range. Calibration equation was as
follows: standardized serum creatinine = 0.9395 * (Jaffé compensated serum
creatinine in µmol/l) + 4.6964. Intercept (4.6964; 95% CI [-2.4619 to 11.8656]) and
slope (0.9395; 95% CI [0.8719 to 1.0072]) were not significantly different from zero
and 1 respectively. The coefficient of correlation r was 0.97. Mean difference
between LCMS and compensated Jaffé was 1.24 ±10.05 µmol/l. Stability of the PCr
assays was assessed during the study. Blinded ProBioQal controls were tested every
5 weeks and a nationwide-blinded control was tested each year37.
Blood Urea Nitrogen (BUN) were analyzed centrally at the CKiD’s laboratory at
the Hopital Edouard Herriot Lyon on an Advia 2400 (Siemens Diagnostics,
Tarrytown, NY). BUN [mmol/L]= 2x urea [mmol/L].
eGFR was estimated with equations that used plasma PCr (Schwartz 2009
(bedside)20 and the Schwartz Lyon22), equations that used Cys-C (Filler and Bricon)8,
12 and combined PCr and Cys-C (CKiD and Zappitelli)20-21, 29 (Tables 1). All the
eGFRs were normalized by body surface area and expressed in mL/min per 1.73 m2.
4 Resultados 64
Plasma cystatin C (Cys-C) from a nephelemetric technique (BN2; Behring, Paris,
France). We had previously checked that the Roche compensated method closely
agreed with an enzymatic Roche method.
Statistical analysis
The eGFR and the mGFR were compared for individual patients using the
following measures:
1) Mean ratio= Mean eGFR / mGFR, to asses bias.
2) Concordance correlation of eGFR with mGFR, to asses agreement
The mean ratio was used in order to correct the variance of bias (mean difference
between eGFR and mGRF in the same subject), that was not constant. There was an
increase in variability when the magnitude of the Inulin measurement increased. The
ratio represents the bias between formula and Inulin clearance; that means, no bias if
the mean ratio is equal to 123.
The concordance correlation coefficient (CCC) is a measure of agreement that
adjusts the Pearson correlation downward if there is a systematic bias between the
measures being compared25.
We performed comparisons in the overall data set and in age subgroups. Also,
we used accuracy 10 and 30% according K/DOQI guidelines. Accuracy 10% and
30% are defined as a proportion of mGFR that were within 10 and 30% of the
mGFR27.
Comparing performance of creatinine-based and cystatin C equations
We compared performance of the 5 based formulas with mGFR in our overall
data set and in age subgroups. For data analysis, we used mean ratio, CCC, and
Bland Altman graph.
In order to compare the CCCs between all formulas, the 95% confidence intervals
of the differences were estimated by a bootstrap method using the CCC macro
described by Crawford et al.25

4 Resultados 65
The repeated measurements were grouped by patient and adjusted by a linear
mixed effects model. We estimated the 95% limits of agreement of mean ratio by
adding the within-patient and between-patient variances.
We used area under the ROC curves (AUC) to determine the ability of the eGFR
to discriminate between patients with and without CKD (defined by an mGFR < 60
ml/min/ per 1.73 m)41. The Delong Clarke-Pearson method is used to compare
AUCs. A value of p<0.05 was considered to indicate statistical significance. These
calculations were performed using R for windows version 2.13.
4 Resultados 66
RESULTS
Baseline characteristics of the study population are presented in Table 2. 695
measurements of mGFR and eGFR were available in 259 patients. The median [IQR]
age was 11.4 yrs [7.9-13.9], and 61% were male. Most subjects (77%) had mGFR
superior 60 ml/min/ per 1.73 m2. Forty-two percent had tubulointersticial disease.
Table 2 shows the median IQR [IQR] derived from the five GFR estimating equations
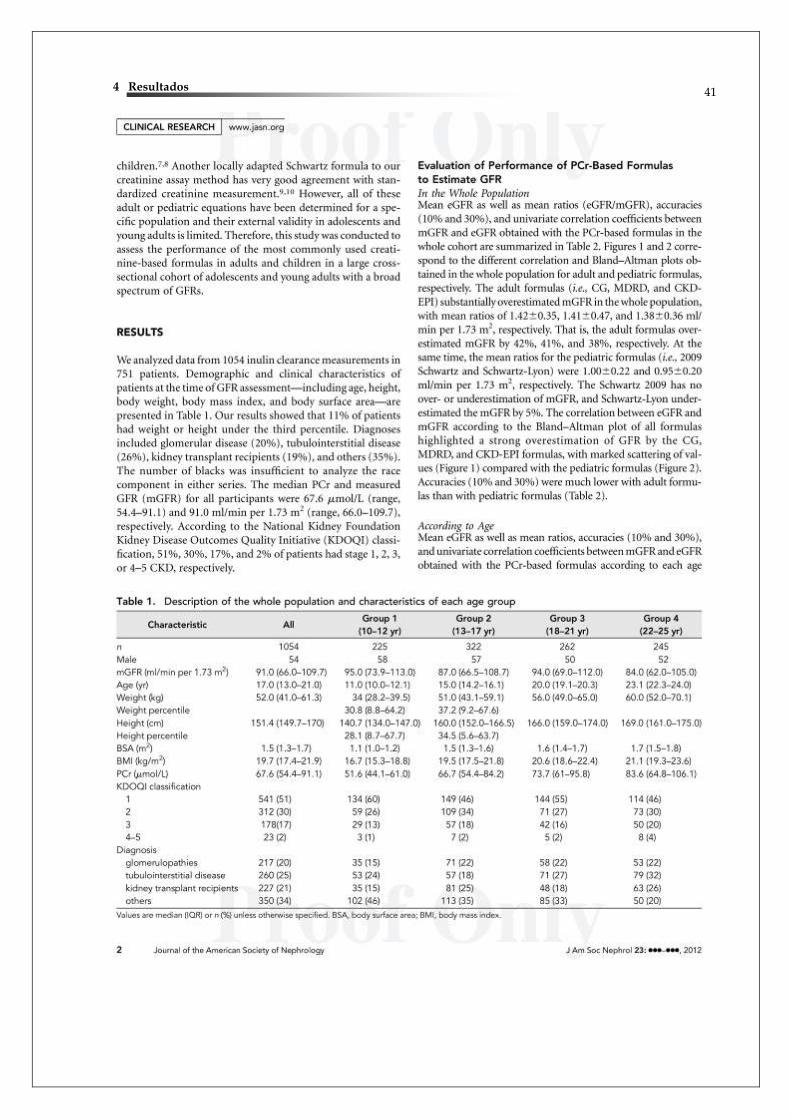
with measured GFR at different time points in the study cohort.
The percentage error of the eGFR by all of the equations with respect to the
mGFR is shown in table 3.
Bias, Precision, and Accuracy of Estimated GFR
In the whole population
The performance of the various estimates of GFR is shown in Table 2 and
(Figure 1). The mean ratio differences between equations and inulin are statistically
significantly different of zero (p< 0.001). We then compared the diagnostic
performance of the combined based prediction (eGFRCom) equations with that of the
simplified PCr prediction (eGFRCr) and Cyst-C-based GFR-estimating equations
(eGFRCys). The Schwartz Lyon (Intercept, 1.05; 95% CI, 0.701.40), 2009 Schwartz
bedside (Intercept, 1.10; 95% CI, 0.701.50), Filler (Intercept, 1.13; 95% CI,
0.691.60) and Bricon (Intercept, 1.05; 95% CI, 0.571.52) equations produced a
statistically significant overestimation of GFR.
The Zappitelli (Intercept, 1.01; 95% CI, 0.621.40) and CKiD equations
(Intercept, 0.99; 95% CI, 0.641.35) had bias ratio near zero without significantly
difference between GFR by inulin. However the percentage of values that fell within
10 and 30 accuracy of the true GFR wasn't different of Schwartz Lyon (table 1).
According to age
4 Resultados 67
Children
When the same evaluations were performed in the subgroup of age Group 1
(Table 2, children<13 yrs, G1) with the true GFR, the Filler, 2009 Schwartz bedside
and Bricon overestimated GFR at 15% (Intercept, 1.15; 95% CI, 0.751.55), 12%
(Intercept, 1.12; 95% CI, 0.721.52) and 4% (Intercept, 1.04; 95% CI, 0.511.39),
respectively. In contrast to CKID (Intercept, 0.99; 95% CI, 0.621.35) and Zappitelli
(Intercept, 0.98; 95% CI, 0.621.34) had prediction at underestimated at 1% and 2%
equation for G1 without significantly difference by mGFR. Moreover, eGFR/GFR
obtained by the Schwartz Lyon (Intercept, 1.00; 95% CI, 0.511.39) did not differ
significantly from those between GFR values predicted by either the CKiD or
Zappitelli.
Schwartz Lyon had accuracy superior to eGFRCys and 2009 Schwartz bedside,
the proportions of patients with GFR estimates within accuracy 10 and 30 of
measured GFR (Table 2) an weren't significantly higher for eGFRCom.
Adolescents
At adolescents group (Table 2, children≥13 yrs, G2), mean ratio eGFR/GFR to
CKID and Schwartz Lyon underestimated the mGFR at 1% (Intercept, 0.99; 95% CI,
0.541.35) and 3% (Intercept, 0.97; 95% CI, 0.541.40) respectively, being
statistically difference (p<0.05) between both. The Zappitelli, Filler, 2009 Schwartz
bedside and Bricon were significantly different by CKiD and Schwartz Lyon (p<0.01)
and overestimated the mGFR by 5% (Intercept, 1.05; 95% CI, 0.641.45), 6%
(Intercept, 1.06; 95% CI, 0.591.60), 9% (Intercept, 1.09; 95% CI, 0.611.58) and
11% (Intercept, 1.11; 95% CI, 0.631.57) respectively.
CKiD have 54% of eGFR values were within the 10% cut-off of mGFR, and 93% of
the eGFR values were within the 30% cut-off of mGFR, with differ significantly from
all other equation (p<0.05).
According to K/DOQI classification subgroups

4 Resultados 68
To stage of CKD I (mGFR ≥ 90ml/min per 1.73 m²), the results for mean
eGFR, mean ratio and accuracies 10 and 30% are presented in Table 4 with
respective standard deviations. CKiD formulas and 2009 Schwartz bedside had a
better and significantly performance than other formulas in the whole normal GFR
population with a mean eGFR/mGFR ratio of underestimated of 3% (Intercept, 0.97;
95% CI, 0.551.38, p<0.001) and overestimated of 3% (Intercept, 1.03; 95% CI,
0.601.48, p<0.001), respectively. However, there wasn't any difference to
accuracies 10 and 30 between all equations.
At stage II (60 ≤mGFR > 90ml/min per 1.73 m²), the bias of Schwartz Lyon
(Intercept, 1.00; 95% CI, 0.64–1.35) was similar with CKID (Intercept, 0.99; 95% CI,
0.62–1.35) and near zero. Both equations had accuracies 30 similar and statistically
superior to other equations (p<0.05), except Zappitelli. To accuracies 10, CKiD was
the value better than other formulas.
Schwartz Lyon and Zappitelli were superior and significantly all the other
equations with overestimated of 11% (Intercept, 1.11; 95% CI, 0.641.58, 95% CI,
0.661.56, p<0.001) to stage III of CKD (30 ≤GFR >60 ml/min per 1.73 m²). The
accuracies 10 and 30 weren't superior to CKiD when mGFR were inferior to 30
ml/min per 1.73 m²:
Agreement and Reproducibility between GFR measurement methods
All the population, the concordance correlation coefficients between the
measured GFR and the estimation equation GFR are shown in Table 3. Agreement
higher methods were for CKID (CCC of 0.89, 95% CI 0.86, 0.91), Schwartz Lyon
(CCC of 0.88, 95% CI 0.86, 0.90) and Zappitelli (CCC of 0.87, 95% CI 0.84, 0.89)
without statistically difference between those equation. The 2009 Schwartz bedside
(CCC of 0.85, 95% CI 0.81, 0.89), Filler (CCC of 0.80, 95% CI 0.76, 0.84) and Bricon
(CCC of 0.81, 95% CI 0.76, 0.84) formulas were lower and significantly inferior than
CKiD, Zappitelli and Schwartz Lyon.
Children

4 Resultados 69
The performance analysis was repeated after subdividing patients by age
range. In children, concordance was strongest to the equation Schwartz Lyon (CCC
of 0.88, 95% CI 0.84, 0.90), but without difference to CKiD (CCC of 0.89, 95% CI
0.86, 0.91) The formulas based strictly on Cys-C (CCC of 0.84, 95% CI 0.80, 0.88,
CCC of 0.76, 95% CI 0.70, 0.81) or Zappitelli (CCC of 0.84, 95% CI 0.79, 0.88) and
2009 Schwartz bedside (CCC of 0.84, 95% CI 0.81, 0.89) were statistically lower
(p<0.05).
Adolescents
In adolescent populations, equation performance varies considerably,
particularly between the combined and other equations, with significantly better
concordance to CKiD (CCC of 0.92, 95% CI 0.89, 0.95) and Zapittelli (CCC of 0.90,
95% CI 0.85, 0.93) formula than to other formulas.
Moreover, the equations based at PCr, 2009 Schwartz bedside (CCC of 0.86, 95%
CI 0.84, 0.91) and Schwartz Lyon (CCC of 0.88, 95% CI 0.83, 0.92), were superior
only with Bricon (CCC of 0.85, 95% CI 0.87, 0.90). Filler (CCC of 0.87, 95% CI 0.81,
0.88) had similar concordance with PCr equations that group.
Association between eGFR measurement and CKD classification
ROC curves for the eGFR measurements and CKD classification are shown in
Figure 4 and their respective AUC values are provided in Table 3. eGFR values were
related to 2 range of mGFR (>60 and >90 ml/min per 1.73 m²).
In the whole population
The AUC was significantly higher with eGFR measurement based at 2009
Schwartz bedside, Schwartz Lyon and Filler (AUC 0.949; CI 0.925, 0.973, p<0.01)
than Zappitelli (AUC 0.920; CI 0.888, 0.951, p=0.03) and Bricon (AUC 0.902; CI
0.867, 0.937, p=0.02) for diagnosis of mild CKD (mGFR <90 ml/min per 1.73 m²).
Almost, CKiD had AUC lower, isn't significant (AUC 0.943; CI 0.917, 0.970, p=0.4)

4 Resultados 70
By contrast, only Bricon (0.902; 95% CI 0.867–0.937, p<0.01) was lower than the
AUC for others eGFR at moderate CKD (mGFR <60 ml ml/min per 1.73 m²) with all
other equations (Table 4, Fig.4).
According to age
To evaluate the diagnostic validity by age range, the ROC analysis was
performed. Within G1 (<13 yrs) or G2 (≥13 yrs) haven’t significantly different between
CKiD, Filler, 2009 Schwartz bedside and Schwartz Lyon (P=0.3) to mild and
moderate CKD (table 4). However, the AUC for Bricon was significantly smaller than
those (P<0.05) at both range age and level of CKD. Also, Zappitelli had AUC
statistically inferior to G1 with moderate CKD.
4 Resultados 71
DISCUSSION
This is the first study to examine the consistency of performance of eGFR with
repeated measures Cyst-C and PCr compared with inulin in a cohort comprising a
pediatric population. We found no substantial evidence that equations based on
Cyst-C alone or in combination with PCr provide better GFR estimates than the PCr
equations, notably Schwartz Lyon with mild and moderate chronic kidney disease in
population with age inferior 13 yrs, or with normal renal function.
For the measurement of GFR, the inulin continuous perfusion method is
considered to be the gold standard, because inulin meets the ideal requirements for
a glomerular tracer, except for a minor extra-renal clearance. In our study suggest
that performance to eGFRCom, eGFRPCr and eGFRCys, changed with level CKD
and age range to population pediatric27-29, 42.
We analyzed the diagnostic accuracy of various equations by three methods: first,
by the ability of the equations to classify the measured mGFR appropriately, as
tested by the AUC, sensitivity, and specificity; by the accuracy of the equations in
predicting the measured GFR, as tested by the ratio bias, ratio SD of bias, and eGFR
values within 10% and 30% of the respective inulin and by the concordance
correlation coefficients between the mGFR and the eGFR.
We compared the diagnostic performance of these prediction equations for the
subgroup to age under of 13 yrs with data for all 341 measurements. The equation of
CKiD20, Zappitelli21 and Schwartz Lyon22 estimated GFR near the real valor to that
group, no difference between them (p=0.08). In contrast to the eGFRCys and 2009
Schwartz bedside5 that overestimated and were different to anterior (p<0.01). Thus,
the results obtained in this study confirmed the Study CKiD formula in a general
pediatric cohort, where Schwartz et al described an overestimated less than 15% to
Schwartz 2009 compared with iohexol-based GFR20, 29. Unlike the Schwartz 2009,
Schwartz Lyon used 2 coefficients for age and gender which would explain this
difference between biases. Filler and Lepage suggested that, like the Schwartz
original and 2009 bedside prediction equation overestimates GFR and that eGFRCys
might be more suitable for children. Although, Sharma et al.38 report that the
reciprocal of had a significantly higher concordance with eGFRCys and mGFR, there
wasn't clear the superiority evident with eGFRCys or eGFRCom to agreement with
inulin in our population under 13 yrs.
4 Resultados 72
To allow for appropriate clinical and research application, we aimed to examine
the distribution of GFRs obtained from eGFR estimating equations in a sample of
adolescents from our population. Among adolescents, the CKiD obtained estimated
GFR near true GFR by inulin and statistically better than all other equations.
Exception Schwartz Lyon, the other formulas overestimated, in our study, of 5% to
11%, being inferior Schwartz Lyon equation (p<0.05). The concordance correlation
coefficient with measured GFR was higher in the group of adolescents for all
assessments, both eGFRCom. The reason for this is not completely clear, but
formulas for eGFRCom also perform better like stipulated Fadrowski et al43, the
pediatric GFR estimating equations systematically underestimate GFR because they
were derived in children with CKD. It underestimated to adolescents is associated
account for the relationship between creatinine production and muscle mass by
growth and GFR29, 44. Our work is unique that studies the different formulas to
estimate renal function in adolescents with the reference method to GFR. Alike the
CKiD study failed to demonstrate a difference to adolescents, our findings
demonstrated benefits to eGFR with equation CKiD that group. This formula yielded
87.7% of estimated GFR within 30% of the iohexol-based GFR (CKiD), and 45.6%
within 10% to general population.29
The concordance correlation coefficient with measured GFR was higher in the
group of adolescents for all assessments, both eGFRCom. The reason for this is not
completely clear, but formulas for eGFRCom also perform better. It is well known that
eGFR calculated by the modification of diet in renal disease formula underestimates
GFR in the normal range by up to 30% but only by 6% in patients with CKD.11, 27-28
With lower estimated GFR (eGFR), we looked for evidence of morbidities that are
commonly associated with decreased GFR to support a potential diagnosis of CKD1,
4, 27-28. Unlike the findings in previous studies, we found that the ROC plot area of PCr
equation wasn't worse than that of only Cyst-C or combined PCr to all population.
Indeed, the areas for the equations were not significantly different among equations,
exception to Bricon. These data confronted to the promising results reported in other
recent pediatric studies37-38. There wasn't an apparent variance in the diagnostic
accuracy of eGFR equations in GFR or age categorization and GFR prediction.
Andersen et al45 published a review about the Cyst-C and area under the ROC curve.
They described in five studies of the remaining, Cyst-C had a significantly higher area
under the curve (AUC) than did PCr, in four studies there was no significant
4 Resultados 73
difference. However, no study found creatinine to be significantly better than Cyst-C.
According the authors, to make a reliable assessment of a method’s ability to
discriminate between normal and moderately decreased GFR the ROC analysis
should only include data from patients with GFR values no less than 50%. Otherwise,
the diagnostic value of the method will be overestimated. Unfortunately, this was not
the case in any of the papers aforementioned.
Furthermore, the diagnostic accuracy of the equations estimated by eGFR values
within 10% and 30% of the respective inulin varied more expressively in the GFR
ranges ≤30 and <60 ml/min per 1.73 m2. The CKiD equations had a higher accuracy
in the all GFR ranger. However, was significantly only to GFR ranges ≤60 and <90
ml/min per 1.73 m2 to the Schwartz Lyon and Zappitelli. No equations had greater
accuracy in the GFR categories ≥ 90 ml/min per 1.73 m2. There was an apparent
discrepancy in the diagnostic accuracy of eGFR equations in GFR categorization and
GFR prediction. For example, the Bouvet equation had an excellent AUC and
correlation coefficient overall; however, it had a relatively large relative bias and lower
predictive accuracy in the low GFR range. It is important to consider that the AUC
and sensitivity of an equation depends on the cutoff points selected for GFR
categorization and the equation’s tendency to underestimate or overestimate the
GFR38, 41, 45.
On the other hand, the accuracy of an equation for GFR prediction varies by
the closeness of an eGFR to the measured GFR, regardless of the equation’s
tendency to underestimate or overestimate the measured GFR38, 44. This point was
further evident from a higher percentage error of the eGFRCys and 2009 Schwartz
bedside equation at the low GFR. While Bachetta et al22 concluded that the
eGFRCys can be used reliably in a general pediatric population, without significant
differences between inulin clearance, we found difference important favoring
Schwartz Lyon and CKiD.
Variation in creatinine assays is a great concern, adding systematic errors to
eGFR. IDMS is considered the gold standard for establishing true creatinine
concentration5, 20, 29, 39. Thus, creatinine values must be traceable to an IDMS
reference value for creatinine measurements to be comparable regardless of method
or laboratory used. Concerning the PCr equations, the CKiD, 2009 Schwartz bedside,
Schwartz Lyon were developed for use only with standardized creatinine values and
while the Zappitelli equation has not. Therefore, the eGFR using the Zappitelli
4 Resultados 74
equation with standardized serum creatinine is generally higher and less accurate
than with non-standardized creatinine29. Following the latest recommendations,
serum creatinine was measured by an IDMS traceable Jaffé method in our study.
In addition, the method of Cyst-C measurement in our study, using Siemens Dade-
Behring determination, may differ from the Dako kit, which has been reported as
perhaps the less precise measurement of Cyst-C available20, 29, 39, 44. Almost, the
Cyst-C based estimate formula from original CKiD studies used the Dako kit as well;
this formula did perform well with our population. Zappitelli, Filler and Bricon were
built using the Siemens Dade-Behring that not explains the inferior performance with
CKiD. Several factors may contribute to the insufficient performance of most of the
equations based Cyst-C in our study group cannot be applied our population. It has
been demonstrated that cystatin C is affected by factors other than GFR29. Thus, in
patients with chronic kidney disease, cystatin C was 4.3% lower for every 20 years of
age and 9.2% lower in women33. In addition, diabetes was associated with 8.5%
higher levels of cystatin C. Higher BMI, C-reactive protein and leucocytes count, and
lower serum albumin were also associated with higher levels of cystatin C46-47.
However, were not found in our population. Unlike our laboratory, there is no
standardization between assays and laboratories for Cyst-C47. According to recent
studies, a downward shift in calibration for the Siemens Cyst-C method occurred
between 2006 and 201048. Therefore, eGFRcys that were derived from results
obtained from older lots of reagent and calibrator cannot be used with the current
Siemens method. These observations emphasize the need for an international
cystatin C reference value and may partly explain the results of our study. For the
time being, the lack of standardization is a serious obstacle for routine use of
eGFRcys38-39, 43, 47-48. If this obstacle could be overcome, eGFR levels based solely
on cystatin C (without the need for correction for age, sex or ethnicity) could provide
a more accurate way of estimating GFR than creatinine-based formulae, which
require information on patient age, sex and ethnicity48.
Researchers have developed Cyst-C-based GFR-estimating equations, and have
compared their performance with original Schwartz equation. Blufpand et al.36
demonstrated that Cyst-C-based equations are more accurate in GFR prediction in
oncology paediatric, than PCr equations. Filler et al.9, 19 found that Cyst-C-based
equations might diagnostic accuracy of various Cyst-C-based or associated PCr
equations varies with mGFR at children.

4 Resultados 75
Examination of the estimating formulas a follow-up period, longitudinal direct
measurement of GFR to show substantial differences from the rest of the population
(data not shown). Abraham et al49 showed that during a 1-year follow-up period,
longitudinal direct measurement of GFR can be complemented with consistent
estimates of GFR using transition models and biomarker data. The marriage of direct
and estimated GFR provides a continuity of GFR data that befits the longitudinal
study platform. Additional follow-up time and the availability GFR data hold the
promise for realizing the full potential of longitudinal estimating equations.
CONCLUSION
We have demonstrated that the cystatin C-derived formulas for estimating
GFR seem less accurate in non selected pediatric patients. The diagnostic accuracy
of eGFRCys does not appear to be superior to that of either creatinine
measurements in the pediatric population investigated, notably to age inferior 13 yrs.
This study, together with the higher costs and larger assay time of Cyst-C compared
PCr, lead us to suggest that use of Cyst-C as marker of the GFR is of no advantage
in large pediatrics populations. In assessing the utility of a screening test, cost is a
significant factor, as well as its diagnostic sensitivity. It has been reported that the
cost of the cystatin C assay is 13-fold greater than the assay for serum creatinine
(10). Costing was similar in our laboratory.
The international standardization of creatinine assays with the IDMS method will
probably improve the accuracy of “universal” creatinine-based formulas20, 27, 29, but to
date, these cystatin C-derived formulas can be used reliably when reference methods
for measuring the true GFR are not available or when the local adaptation of
Schwartz formula has not been performed
Further studies on larger populations are required to validate this report and to
evaluate the potential utility of eGFRCr, notably Schwartz Lyon equations, in the
progression and monitoring of CKD in children and adolescents.

4 Resultados 76
Table 1. Formulas used for the estimation of glomerular filtration rate
Formula (ml/min per 1.73 m²)
With plasma creatinine Schwartz Lyon 2009 Schwartz bedside
eGFR = k × height (cm)//PCr k= 35.5 in boys >13 years of age k= 32.5 in other children eGFR = 36.5 × height (cm)/PCr
With serum cystatin C Bricon Filler
eGFR = (78/Cys) + 4 log(eGFR)= 1.962 + [1.123 × log (1/Cys)
Combined formula CKID Zappitelli
eGFR = 39.1 × [height (m)/(PCr/88.4)]
0.516 × [1.8/Cys]
0.294
× [30/BUN (mg/dl)]0.169
× [1.099]male
× [height (m)/1.4] 0.188
eGFR = [507.76 × e
0.003×height (m)]/[Cys
0.635] × [PCr
0.547]
If renal transplant, × 1.165 If spina bifida, × [PCr
0.547])/40.45

4 Resultados 77
Table 2 – Baseline of the whole population and each age group characteristics.
All
Group 1
(1-12 years)
Group 2
(13-18 years)
*Patients 259 165 94
Males (%) 51.5 54.5 46
*mGFR(N) 695 341 354
*mGFR
(ml/min/1.73 m²; median [IQR])
85.0
[64.0-109.0]
87.0
[66.0-112.0]
80.5
[57.8-105.5]
*Age (yr; median [IQR]) 11.4 [7.9-13.9] 9.3 [7.0-10.9] 14.9 [13.8-15.0]
*Follow-up (months; median [IQR]) 29 [16-43] 25 [14-37] 32 [19-47]
*Weight (kg; median [IQR]) 34.6 [24.1-47.3] 27 [21.2-33.5] 48.8 [42.3-58.5]
*Weight percentile (median [IQR]) 30 [9.7-57.1] 34.5 [12.3-60.3] 24.5 [7.5-56.2]
*Height (cm, median [IQR]) 141.7
[122.0-154.0]
140.7
[134.0-147.0]
157.7
[150.5-163.8]
*Height percentile (median [IQR]) 32 [5.5-54.5] 32.6 [7.5-57.7] 17.4 [3.6-49.8]
*BSA (m², median [IQR]) 1.18 [0.9-1.42] 0.99 [0.84-1.18] 1.47 [1.33-1.59]
*BMI (kg/m²; median [IQR]) 17.1 [16.2-20.1] 16.1 [15.1-18.4] 19.5 [18.1-22.0]
*BMI percentile (median [IQR]) 43.0 [16.2-72.6] 44.6 [23.0-76.4] 39.4 [12.5-69.1]
*PCr (µmol/l ; median [IQR]) 54.5 [42.3-70.5] 48.8 [38.5-63.5] 65.3 [52.4-95.6]
*Cyst C(mg/dl; median [IQR]) 1.02 [0.84-1.26] 1.00 [0.83-1.15] 1.07 [0.84-1.45]
BUN (mg/dl; median [IQR]) 16.2 [11.8-23.2] 16.3 [11.5-22.1] 16.4 [12.4-24.8]
K/DOQI classification n (%)
*I 102 (39) 81 (49) 34 (36)
II 97 (38) 60 (37) 36 (38)
*III 60 (23) 24 (14) 24 (26)
Diagnosis n (%)
Glomerulopathies 53 (21) 31 (19) 22 (23)
Tubulointersticial disease 110 (42) 69 (42) 41 (44)
Kidney transplant recipients 60 (23) 38 (23) 22 (23)
*others 36 (14) 27 (16) 9 (10)
IQR= interquartile range, mGFR= measured glomerular filtration rate by inulin clearance, BSA= body surface area,
BMI= body mass index, PCr= plasma creatinine, BUN= blood urea nitrogen) *p < 0.05

4 Resultados 78
Table 3 – Bias, SD of bias, Lins’concordance and 30% accuracy of the four estimating GFR
formulas (compared with measured GFR) for the total population and each subgroups
Schwartz
2009
Schwartz
Lyon
Filler Bricon CKID Zappitelli
A. All measurements (N=695) mGFR= 84 ±32.7 (ml/min per 1.73m²)
eGFR (ml/min/1.73m²) 91.0 ±34.2 83 ±30.7 93 ±30.7 85 ±24.2 86 ±25.5 84 ±31.3
Lin's concordance
correlation coefficient,
ρc (95% CI)
0.86b
(0.83 - 0.89)
0.88
(0.85 - 0.90)
0.86b
(0.82 - 0.89)
0.76a,b
(0.71 - 0.80)
0.88
(0.86 - 0.90)
0.90
(0.89 - 0.91)
Mean ratio
(eGFR / mGFR)
1.10 ±0.23 0.99±0.16 1.13 ±0.22 1.06 ±0.14 1.05 ±0.20 1.01±0.20
95% limits of
agreement
0.87, 1.34 0.82, 1.15 0.91, 1.35 0.82, 1.30 0.86, 1.25 0.81;1.21
Accuracy 10% 40a,b
84a,b
48
92
39a,b
87a,b
36a,b
86a,b
40
93
47
(%) 30% 90
B. Group 1 (<13 years, N=341) mGFR= 89.4 ±31.9 (ml/min per 1.73m²)
eGFR (ml/min/1.73m²) 96.5 ±30.1 86.0 ±26.4 86.7 ± 28.5 80.1 ±22.3 78.0 ±23.2 89.5 ±28.2
Lin's concordance
correlation coefficient,
ρc (95% CI)
0.85a,b
(0.81 - 0.89)
0.87
(0.84 - 0.90)
0.79a,b
(0.73 - 0.84)
0.71a,b
(0.64 - 0.77)
0.81a,b
(0.76 - 0.85)
0.87b
(0.83 - 0.90)
Mean ratio
(eGFR / mGFR)
1.12 ±0.26 1.04 ±0.18 1.13 ±0.20 1.00 ±0.25 1.02 ±0.19 0.94 ±0.19
95% limits of
agreement
0.86 , 1.38 0.86, 1.23 0.94, 1.33 0.75, 1.25 0.83, 1.21 0.76, 1.11
Accuracy 10% 43a,b
84a,b
48
93
42a,b
88a,b
37a,b
86a,b
40a
93
51
(%) 30% 92
C. Group 2 (≥13 years, N=354) mGFR= 80.8 ±32.5 (ml/min per 1.73m²)
eGFR( ml/min/1.73m²) 85.7 ±37.0 76.3 ±32.9 79.3 ±32.3 74.1 ±25.5 73.1 ±27.4 78.5 ±33.2
Lin's concordance
correlation coefficient,
ρc (95% CI)
0.86a
(0.80 - 0.91)
0.88a
(0.83 - 0.92)
0.86a
(0.82- 0.89)
0.81a;b
(0.74 - 0.87)
0.89
(0.85 - 0.93)
0.90
(0.87 - 0.93)
Mean ratio
(eGFR / mGFR)
1.12 ±0.26 1.06 ±0.25 1.14 ±0.24 1.02 ±0.23 1.05 ±0.16 1.01±0.19
95% limits of
agreement
0.86, 1.38 0.81, 1.31 0.90, 1.38 0.80, 1.23 0.89, 1.25 0.83, 1.21
Accuracy 10% 36a
84a
38
90
37
86a
35a
86a
40
92
43
(%) 30% 89
a p < 0.05 for difference between Zappitelli formula and other equations;
b p < 0.05 for difference between creatinine and
cystatin equations, favoring Schwartz Lyon; All results are expressed in mean ± standard deviation mGFR= Measured
glomerular filtration rate by Inulin clearance, eGFR= estimated glomerular filtration rate.

4 Resultados 79
Table 7 – Means ratio bias and accuracies according to K/DOQI classification and equations
Schwartz
2009
Schwartz
Lyon
Filler Bricon CKID Zappitelli
I. GFR ≥ 90ml/min/1.73 m² (N=283) mGFR= 116.1 ±22.4 ml/min per 1.73m²
eGFR (ml/min/1.73m²) 119.1 ± 29.6 112.6 ± 26.7 107.4 ±24.3 96.3 ± 18.5 97.3 ± 19.6 110.3 ±24.4
Mean ratio
(eGFR / mGFR)
1.03 ± 0.23 0.98 ± 0.21 1.06 ±0.16 0.93 ± 0.15 0.96 ± 0.15 0.95±0.18
95% limits of agreement 0.81, 1.25 0.76, 1.19 0.86, 1.26 0.78, 1.08 0.81, 1.11 0.77;1.13
Accuracy 10 % 44 b,c
91c
46c
93
41b,c
90b,c
27 b,c
87 b,c
27 b,c
90 b,c
50
(%) 30% 95
II. 60 ≤GFR >90ml/min per 1.73 m² (N=251) mGFR= 75.2 ±8.4 ml/min per 1.73m²
eGFR (ml/min/1.73m²) 83.5 ± 15.8 79.0 ± 15.0 77.2 ± 18.5 72.7 ± 14.7 70.0 ± 12.7 77.2 ±15.5
Mean ratio
(eGFR / mGFR)
1.12 ±0.18 1.00 ±0.19 1.14 ±0.21 1.07 ±0.19 1.06 ±0.15 1.03 ±0.18
95% limits of agreement 0.94 , 1.29 0.89, 1.22 0.95, 1.33 0.89, 1.26 0.91, 1.21 0.85, 1.21
Accuracy 10 % 43a,b,c
86 a,b,c
49
93a
43a
89b,c
48
93a
46 b,c
98
50
(%) 30% 92a
III. 30 ≤GFR >60 ml/min per 1.73 m² (N=161) mGFR= 44.5 ±10.8 ml/min per 1.73m²
eGFR( ml/min/1.73m²) 53.3 ± 14.8 50.3 ± 13.7 53.3 ±15.2 54.8 ± 14.1 49.5 ± 12.8 48.5 ± 14.1
Mean ratio
(eGFR / mGFR)
1.25 ± 0.27 1.18 ± 0.18 1.25 ±0.25 1.27 ± 0.27 1.21 ± 0.21 1.11 ± 0.23
95% limits of agreement 0.98, 1.52 0.93, 1.44 0.99, 1.50 0.98,1.56 0.97,1.46 0.89,1.34
Accuracy 10 % 25a,b,c
68a,b,c
33 a
80 a
31 a,b,c
80c
34b,c
76a,b,c
52
90
36a
(%) 30% 80 a
a p < 0.05 for difference between CKID formula and other equations, favoring CKiD;
b p < 0.05 for difference between
creatinine and cystatin equations, favoring Schwartz Lyon, c p < 0.05 for difference between Zappitelli formula and other
equations, favoring Zappitelli; All results are expressed in mean ± standard deviation mGFR= Measured glomerular filtration
rate by Inulin clearance, eGFR= estimated glomerular filtration rate.

4 Resultados 80
Table8. Area under the ROC curves to detect GFR < 90 and 60 ml/min per1.73m²
Schwartz
2009
Schwartz
Lyon
Filler Bricon CKID Zappitelli
GFR < 90 ml/min per 1.73 m²
All measurements
AUC 0.879 0.871 0.792 0.744 0.780 0.849
95% CI 0.834, 0.924 0.823, 0.818 0.732, 0.851 0.608, 0.808 0.726, 0.847 0.798, 0.901
Std Error 0.023 0.024 0.030 0.033 0.031 0.026
Group 1 (<13 yrs)
AUC 0.853 0.855 0.775 0.727 0.777 0.853
95% CI 0.791, 0.915 0.793, 0.918 0.700, 0.849 0.647, 0.807 0.702, 0.852 0.791, 0.916
Std Error 0.032 0.032 0.038 0.041 0.038 0.032
Group 2 (≥13 yrs)
AUC 0.925 0.898 0.832 0.784 0.813 0.839
95% CI 0.869, 0.981 0.825, 0.970 0.737, 0.928 0.676, 0.892 0.711, 0.915 0.746, 0.931
Std Error 0.028 0.037 0.049 0.055 0.052 0.047
GFR < 75 ml/min per 1.73 m²
All measurements
AUC 0.856 0.862 0.840 0.808 0.862 0.869
95% CI 0.791, 0.904 0.809, 0.915 0.768, 0.894 0.753, 0.864 0.815, 0.908 0.818, 0.919
Std Error 0.029 0.027 0.028 0.028 0.024 0.026
Group 1 (<13 yrs)
AUC 0.814 0.845 0.805 0.795 0.850 0.859
95% CI 0.732, 0.895 0.772, 0.919 0.727, 0.882 0.722, 0.869 0.790, 0.910 0.789, 0.929
Std Error 0.042 0.037 0.039 0.038 0.030 0.036
Group 2 (≥13 yrs)
AUC 0.887 0.879 0.885 0.818 0.889 0.865
95% CI 0.811, 0.964 0.802, 0.957 0.810, 0.960 0.802, 0.907 0.816, 0.961 0.786, 0.945
Std Error 0.039 0.040 0.038 0.049 0.037 0.041
GFR < 60 ml/min per 1.73 m²
All measurements
AUC 0.813 0.853 0.877 0.879 0.905 0,889
95% CI 0.729, 0.896 0.777, 0.929 0.811, 0.942 0.816, 0.942 0.851, 0.958 0.827, 0.951
Std Error 0.043 0.039 0.033 0.032 0.027 0.032
Group 1 (<13 yrs)
AUC 0.746 0.785 0.859 0.856 0.884 0.855
95% CI 0.620, 0.873 0.664, 0.906 0.761, 0.958 0.757, 0.954 0.799, 0.968 0.751, 0.959
Std Error 0.065 0.062 0.050 0.050 0.043 0.053
Group 2 (≥13 yrs)
AUC 0.882 0.923 0.888 0.894 0.922 0.908
95% CI 0.782, 0.981 0.837, 1.000 0.800, 0.975 0.815, 0.973 0.858, 0.986 0.840, 0.977
Std Error 0.051 0.041 0.044 0.040 0.033 0.035
AUC= area under ROC curves, 95% CI= 95% Confidence Interval

4 Resultados 81
0.0 0.2 0.4 0.6 0.8 1.0
0.0
0.2
0.4
0.6
0.8
1.0
1-Specificity
Se
nsitiv
ity
0.0 0.2 0.4 0.6 0.8 1.0
0.0
0.2
0.4
0.6
0.8
1.0
1-Specificity
Se
nsitiv
ity
0.0 0.2 0.4 0.6 0.8 1.0
0.0
0.2
0.4
0.6
0.8
1.0
1-Specificity
Se
nsitiv
ity
0.0 0.2 0.4 0.6 0.8 1.0
0.0
0.2
0.4
0.6
0.8
1.0
1-Specificity
Se
nsitiv
ity
0.0 0.2 0.4 0.6 0.8 1.0
0.0
0.2
0.4
0.6
0.8
1.0
1-Specificity
Se
nsitiv
ity
0.0 0.2 0.4 0.6 0.8 1.0
0.0
0.2
0.4
0.6
0.8
1.0
1-Specificity
Se
nsitiv
ity
BriconFiller
Schwartz.2009Schwartz.Lyon
CKiDZappitelli
0.0 0.2 0.4 0.6 0.8 1.0
0.0
0.2
0.4
0.6
0.8
1.0
1-SpecificityS
en
sitiv
ity
0.0 0.2 0.4 0.6 0.8 1.0
0.0
0.2
0.4
0.6
0.8
1.0
1-SpecificityS
en
sitiv
ity
0.0 0.2 0.4 0.6 0.8 1.0
0.0
0.2
0.4
0.6
0.8
1.0
1-SpecificityS
en
sitiv
ity
0.0 0.2 0.4 0.6 0.8 1.0
0.0
0.2
0.4
0.6
0.8
1.0
1-SpecificityS
en
sitiv
ity
0.0 0.2 0.4 0.6 0.8 1.0
0.0
0.2
0.4
0.6
0.8
1.0
1-SpecificityS
en
sitiv
ity
0.0 0.2 0.4 0.6 0.8 1.0
0.0
0.2
0.4
0.6
0.8
1.0
1-SpecificityS
en
sitiv
ity
BriconFiller
Schwartz.2009Schwartz.Lyon
CKiDZappitelli
FIG 4 A. AUC of equations for the diagnosis of moderate chronic kidney disease (GFR <90 ml/min per 1.73m²). B AUC of equations for the diagnosis of mild chronic kidney disease (GFR <60 ml/min per 1.73m²)
B A

4 Resultados 82
0 50 100 150 200
-10
12
3 Schwartz 2009
Inulin clearance ml/min/1.73m²
Sch
wa
rtz 2
00
9 in
ulin
e r
atio
0 50 100 150 200
-10
12
3
Schwartz Lyon
Inulin clearance ml/min/1.73/m²
Sch
wa
rtz L
yo
n in
ulin
e r
atio
0 50 100 150 200
-10
12
3
Bricon
Inulin clearance ml/min/1.73m²
Bri
co
n in
ulin
e r
atio
0 50 100 150 200
-10
12
3Filler
Inulin clearance ml/min/1.73m²
Fille
r in
ulin
e r
atio
0 50 100 150 200
-10
12
3
CKiD
Inulin clearance ml/min/1.73m²
CK
iD in
ulin
e r
atio
0 50 100 150 200
-10
12
3
Zappitelli
Inulin clearance ml/min/1.73m²
Za
pp
ite
lli in
ulin
e r
atio
FIG 2 Estimation equation bias according to level of estimated GFR in ml per min per 1.73m². Bias was calculated by ratio the measured GFR from the estimated GFR and is expressed in ml per min per 1.73m². The mean bias is represented by the solid line and the limits of concordance 95% by the dashed lines.

4 Resultados 83
2 3 4 5 6 7
23
45
67
Log Schwartz 2009 ml/min/1.73m²
Lo
g In
ulin
e m
l/m
in/1
.73
m
Line of perfect concordance
Reduced major axis
CCC: 0.86 (95% CI 0.83 - 0.89)
2 3 4 5 6 7
23
45
67
Log Schwartz Lyon ml/min/1.73m
Lo
g In
ulin
e m
l/m
in/1
.73
m
Line of perfect concordance
Reduced major axis
CCC: 0.88 (95% CI 0.85 - 0.9)
2 3 4 5 6 7
23
45
6
Log Bricon ml/min/1.73m
Lo
g In
ulin
e m
l/m
in/1
.73
m
Line of perfect concordance
Reduced major axis
CCC: 0.81 (95% CI 0.76 - 0.84)
2 3 4 5 6 7
23
45
67
Log Filler ml/min/1.73m
Lo
g In
ulin
e m
l/m
in/1
.73
m
Line of perfect concordance
Reduced major axis
CCC: 0.86 (95% CI 0.82 - 0.89)
2 3 4 5 6 7
23
45
67
Log CKiD ml/min/1.73m
Lo
g In
ulin
e m
l/m
in/1
.73
m
Line of perfect concordance
Reduced major axis
CCC: 0.91 (95% CI 0.89 - 0.92)
2 3 4 5 6 7
23
45
67
Log Zappitelli ml/min/1.73m
Lo
g In
ulin
e m
l/m
in/1
.73
m
Line of perfect concordance
Reduced major axis
CCC: 0.9 (95% CI 0.88 - 0.91)
FIG 3 Concordance Correlation Coefficient (CCC) graphs using logarithmic transformation of mGFR and eGFR. Performance of five formulas in comparison mGFR. From left to right, and from top to bottom: Schwartz 2009, Schwartz Lyon, Bricon, Filler, CKiD and Zappitelli. Line of perfect concordance: (---), Regression line:
()

4 Resultados 84
Abbreviations
BMI Body mass index
BSA Body surface area
PCr Plasma creatinine
Cys-C Plasma cystatin C
BUN Blood Urea Nitrogen
mGFR Measure glomerular filtration rate
eGFR Estimated glomerular filtration rate
eGFRCys Cys-C based eGFR equations
eGFRPCr PCr based eGFR equations
eGFRCom Combined PCr and Cys-C based eGFR equations
CKD Chronic kidney disease
CKiD A Prospective Cohort Study of Kidney Disease in Children equation
IQR interquartile range
SD Standard deviation
K/DOQI Kidney Disease Outcomes Quality Initiative
ACKNOWLEDGMENTS
The authors thank the staff and the patients who participated in the study.
DISCLOSURES
None

4 Resultados 85
References
1. Steinberg EP, Eknoyan G, Levin NW, et al. Methods used to evaluate the quality of evidence underlying the National Kidney Foundation-Dialysis Outcomes Quality Initiative Clinical Practice Guidelines: description, findings, and implications. Am J Kidney Dis 2000;36:1-11.
2. K/DOQI clinical practice guidelines for chronic kidney disease: evaluation, classification, and stratification. Am J Kidney Dis 2002;39:S1-266.
3. Shannon JA, Smith HW. The Excretion of Inulin, Xylose and Urea by Normal and Phlorizinized Man. J Clin Invest 1935;14:393-401.
4. Levin N, Eknoyan G, Pipp M, Steinberg E. National Kidney Foundation: Dialysis Outcome Quality Initiative--development of methodology for clinical practice guidelines. Nephrol Dial Transplant 1997;12:2060-3.
5. Filler G, Priem F, Vollmer I, Gellermann J, Jung K. Diagnostic sensitivity of serum cystatin for impaired glomerular filtration rate. Pediatr Nephrol 1999;13:501-5.
6. Myers GL, Miller WG, Coresh J, et al. Recommendations for improving serum creatinine measurement: a report from the Laboratory Working Group of the National Kidney Disease Education Program. Clin Chem 2006;52:5-18.
7. Bokenkamp A, Domanetzki M, Zinck R, Schumann G, Byrd D, Brodehl J. Cystatin C--a new marker of glomerular filtration rate in children independent of age and height. Pediatrics 1998;101:875-81.
8. Stickle D, Cole B, Hock K, Hruska KA, Scott MG. Correlation of plasma concentrations of cystatin C and creatinine to inulin clearance in a pediatric population. Clin Chem 1998;44:1334-8.
9. Filler G, Bokenkamp A, Hofmann W, Le Bricon T, Martinez-Bru C, Grubb A. Cystatin C as a marker of GFR--history, indications, and future research. Clin Biochem 2005;38:1-8.
10. Larsson A, Malm J, Grubb A, Hansson LO. Calculation of glomerular filtration rate expressed in mL/min from plasma cystatin C values in mg/dL. Scand J Clin Lab Invest 2004;64:25-30.
11. Grubb A, Nyman U, Bjork J, et al. Simple cystatin C-based prediction equations for glomerular filtration rate compared with the modification of diet in renal disease prediction equation for adults and the Schwartz and the Counahan-Barratt prediction equations for children. Clin Chem 2005;51:1420-31.
12. Le Bricon T, Leblanc I, Benlakehal M, Gay-Bellile C, Erlich D, Boudaoud S. Evaluation of renal function in intensive care: plasma cystatin C vs. creatinine and derived glomerular filtration rate estimates. Clin Chem Lab Med 2005;43:953-7.
13. Bouvet Y, Bouissou F, Coulais Y, et al. GFR is better estimated by considering both serum cystatin C and creatinine levels. Pediatr Nephrol 2006;21:1299-306.

4 Resultados 86
14. Ylinen EA, Ala-Houhala M, Harmoinen AP, Knip M. Cystatin C as a marker for glomerular filtration rate in pediatric patients. Pediatr Nephrol 1999;13:506-9.
15. Krieser D, Rosenberg AR, Kainer G, Naidoo D. The relationship between serum creatinine, serum cystatin C and glomerular filtration rate in pediatric renal transplant recipients: a pilot study. Pediatr Transplant 2002;6:392-5.
16. Willems HL, Hilbrands LB, van de Calseyde JF, Monnens LA, Swinkels DW. Is serum cystatin C the marker of choice to predict glomerular filtration rate in paediatric patients? Ann Clin Biochem 2003;40:60-4.
17. Filler G, Lepage N. Should the Schwartz formula for estimation of GFR be replaced by cystatin C formula? Pediatr Nephrol 2003;18:981-5.
18. Schwartz GJ, Munoz A, Schneider MF, et al. New equations to estimate GFR in children with CKD. J Am Soc Nephrol 2009;20:629-37.
19. Zappitelli M, Parvex P, Joseph L, et al. Derivation and validation of cystatin C-based prediction equations for GFR in children. Am J Kidney Dis 2006;48:221-30.
20. Bacchetta J, Cochat P, Rognant N, Ranchin B, Hadj-Aissa A, Dubourg L. Which creatinine and cystatin C equations can be reliably used in children? Clin J Am Soc Nephrol 2011;6:552-60.
21. Crawford SB, Kosinski AS, Lin HM, Williamson JM, Barnhart HX. Computer programs for the concordance correlation coefficient. Comput Methods Programs Biomed 2007;88:62-74.
22. Bland JM, Altman DG. Measuring agreement in method comparison studies. Stat Methods Med Res 1999;8:135-60.
23. King TS, Chinchilli VM, Carrasco JL. A repeated measures concordance correlation coefficient. Stat Med 2007;26:3095-113.
24. Schoonjans F, Depuydt C, Comhaire F. Presentation of receiver-operating characteristics (ROC) plots. Clin Chem 1996;42:986-7.
25. Levey AS. Measurement of renal function in chronic renal disease. Kidney Int 1990;38:167-84.
26. Cirillo M, Anastasio P, De Santo NG. Relationship of gender, age, and body mass index to errors in predicted kidney function. Nephrol Dial Transplant 2005;20:1791-8.
27. Cockcroft DW, Gault MH. Prediction of creatinine clearance from serum creatinine. Nephron 1976;16:31-41.
28. Levey AS, Coresh J, Greene T, et al. Expressing the Modification of Diet in Renal Disease Study equation for estimating glomerular filtration rate with standardized serum creatinine values. Clin Chem 2007;53:766-72.

4 Resultados 87
29. Levey AS, Stevens LA, Schmid CH, et al. A new equation to estimate glomerular filtration rate. Ann Intern Med 2009;150:604-12.
30. Hogg RJ, Furth S, Lemley KV, et al. National Kidney Foundation's Kidney Disease Outcomes Quality Initiative clinical practice guidelines for chronic kidney disease in children and adolescents: evaluation, classification, and stratification. Pediatrics 2003;111:1416-21.
31. Dubourg L, Cochat P, Baverel G, Hadj-Aïssa A. Schwartz formula has to be adapted to the method of creatinine determination. In: 40th annual meeting - european society for paediatric nephrology. Palermo, Italy: Pediatr Nephrol 2006:1526.
32. Bacchetta J, Cochat P, Rognant N, Ranchin B, Hadj-Aissa A, Dubourg L. Which Creatinine and Cystatin C Equations Can Be Reliably Used in Children? Clin J Am Soc Nephrol 2010.
33. Pierrat A, Gravier E, Saunders C, et al. Predicting GFR in children and adults: a comparison of the Cockcroft-Gault, Schwartz, and modification of diet in renal disease formulas. Kidney Int 2003;64:1425-36.
34. Fadrowski JJ, Neu AM, Schwartz GJ, Furth SL. Pediatric GFR estimating equations applied to adolescents in the general population. Clin J Am Soc Nephrol 2011;6:1427-35.
35. Chavers BM, Rheault MN, Foley RN. Kidney function reference values in US adolescents: National Health And Nutrition Examination Survey 1999-2008. Clin J Am Soc Nephrol 2011;6:1956-62.
36. Filler G, Foster J, Acker A, Lepage N, Akbari A, Ehrich JH. The Cockcroft-Gault formula should not be used in children. Kidney Int 2005;67:2321-4.
37. Levey AS, Bosch JP, Lewis JB, Greene T, Rogers N, Roth D. A more accurate method to estimate glomerular filtration rate from serum creatinine: a new prediction equation. Modification of Diet in Renal Disease Study Group. Ann Intern Med 1999;130:461-70.
38. Schwartz GJ, Work DF. Measurement and estimation of GFR in children and adolescents. Clin J Am Soc Nephrol 2009;4:1832-43.
39. Stevens LA, Coresh J, Greene T, Levey AS. Assessing kidney function--measured and estimated glomerular filtration rate. N Engl J Med 2006;354:2473-83.
40. Centers for Disease Control and Prevention: CDC Growth Charts. 2011. (Accessed september 2011, at http://www.cdc.gov/growthcharts/computer_programs.htm.)
41. Buron F, Hadj-Aissa A, Dubourg L, et al. Estimating Glomerular Filtration Rate in Kidney Transplant Recipients: Performance Over Time of Four Creatinine-Based Formulas. Transplantation 2011.

4 Resultados 88
42. Dubourg L, Hadj-Aissa A, Ferrier B. Adaptation of an enzymatic polyfructosan assay to clinical practice. Anal Biochem 2010;405:266-8.
43. Dubois D, Dubois EF. A formula to estimate the approximate surface area if height and weight be known. Arch Intern Med 1916;17:863-71.
44. White CA, Akbari A, Doucette S, et al. Effect of clinical variables and immunosuppression on serum cystatin C and beta-trace protein in kidney transplant recipients. Am J Kidney Dis 2009;54:922-30.
45. White CA, Akbari A, Doucette S, Fergusson D, Knoll GA. Estimating glomerular filtration rate in kidney transplantation: is the new chronic kidney disease epidemiology collaboration equation any better? Clin Chem 2010;56:474-7.
46. Maillard N, Mariat C, Bonneau C, et al. Cystatin C-based equations in renal transplantation: moving toward a better glomerular filtration rate prediction? Transplantation 2008;85:1855-8.
47. Zahran A, Qureshi M, Shoker A. Comparison between creatinine and cystatin C-based GFR equations in renal transplantation. Nephrol Dial Transplant 2007;22:2659-68.
48. Xu H, Lu Y, Teng D, Wang J, Wang L, Li Y. Assessment of glomerular filtration rate in renal transplant patients using serum cystatin C. Transplant Proc 2006;38:2006-8.
49. Zahran A, El-Husseini A, Shoker A. Can cystatin C replace creatinine to estimate glomerular filtration rate? A literature review. Am J Nephrol 2007;27:197-205.
50. Filler G, Sharma AP. How to monitor renal function in pediatric solid organ transplant recipients. Pediatr Transplant 2008;12:393-401.
51. Poge U, Gerhardt TM, Stoffel-Wagner B, Woitas RP. Need of standardization for creatinine and cystatin C-based GFR equations in renal transplantation. Nephrol Dial Transplant 2008;23:1763; author reply -4.
52. Poge U, Gerhardt T, Stoffel-Wagner B, et al. Cystatin C-based calculation of glomerular filtration rate in kidney transplant recipients. Kidney Int 2006;70:204-10.
53. Sweeney WE, Jr., Avner ED. Diagnosis and management of childhood polycystic kidney disease. Pediatr Nephrol 2011;26:675-92.
54. Fick GM, Duley IT, Johnson AM, Strain JD, Manco-Johnson ML, Gabow PA. The spectrum of autosomal dominant polycystic kidney disease in children. J Am Soc Nephrol 1994;4:1654-60.
55. Sharp C, Johnson A, Gabow P. Factors relating to urinary protein excretion in children with autosomal dominant polycystic kidney disease. J Am Soc Nephrol 1998;9:1908-14.

4 Resultados 89
56. Fick-Brosnahan GM, Tran ZV, Johnson AM, Strain JD, Gabow PA. Progression of autosomal-dominant polycystic kidney disease in children. Kidney Int 2001;59:1654-62.
57. Tee JB, Acott PD, McLellan DH, Crocker JF. Phenotypic heterogeneity in pediatric autosomal dominant polycystic kidney disease at first presentation: a single-center, 20-year review. Am J Kidney Dis 2004;43:296-303.
58. Wong H, Vivian L, Weiler G, Filler G. Patients with autosomal dominant polycystic kidney disease hyperfiltrate early in their disease. Am J Kidney Dis 2004;43:624-8.
59. Shamshirsaz AA, Reza Bekheirnia M, Kamgar M, et al. Autosomal-dominant polycystic kidney disease in infancy and childhood: progression and outcome. Kidney Int 2005;68:2218-24.
60. Boyer O, Gagnadoux MF, Guest G, et al. Prognosis of autosomal dominant polycystic kidney disease diagnosed in utero or at birth. Pediatr Nephrol 2007;22:380-8.
61. Fencl F, Janda J, Blahova K, et al. Genotype-phenotype correlation in children with autosomal dominant polycystic kidney disease. Pediatr Nephrol 2009;24:983-9.
62. Mekahli D, Woolf AS, Bockenhauer D. Similar renal outcomes in children with ADPKD diagnosed by screening or presenting with symptoms. Pediatr Nephrol 2010;25:2275-82.
63. Lurbe E, Cifkova R, Cruickshank JK, et al. Management of high blood pressure in children and adolescents: recommendations of the European Society of Hypertension. J Hypertens 2009;27:1719-42.
64. Gibb DM, Shah V, Preece M, Barratt TM. Variability of urine albumin excretion in normal and diabetic children. Pediatr Nephrol 1989;3:414-9.
65. Cadnapaphornchai MA, McFann K, Strain JD, Masoumi A, Schrier RW. Prospective change in renal volume and function in children with ADPKD. Clin J Am Soc Nephrol 2009;4:820-9.
66. Diamond LH, Daly DC. Forum of the End-Stage Renal Disease Networks' role in implementing the National Kidney Foundation-Dialysis Outcomes Quality Initiative Clinical Practice Guidelines. Adv Ren Replace Ther 1999;6:28-35.
67. Goolsby MJ. National Kidney Foundation Guidelines for chronic kidney disease: evaluation, classification, and stratification. J Am Acad Nurse Pract 2002;14:238-42.
68. Kilpatrick ES, Keevil BG, Addison GM. Does adjustment of GFR to extracellular fluid volume improve the clinical utility of cystatin C? Arch Dis Child 2000;82:499-502.
69. Patel SS, Kimmel PL, Singh A. New clinical practice guidelines for chronic kidney disease: a framework for K/DOQI. Semin Nephrol 2002;22:449-58.

4 Resultados 90
70. Hellerstein S, Berenbom M, Erwin P, Wilson N, DiMaggio S. The ratio of urinary cystatin C to urinary creatinine for detecting decreased GFR. Pediatr Nephrol 2004;19:521-5.
71. Vupputuri S, Fox CS, Coresh J, Woodward M, Muntner P. Differential estimation of CKD using creatinine- versus cystatin C-based estimating equations by category of body mass index. Am J Kidney Dis 2009;53:993-1001.
72. Andersen TB, Erlandsen EJ, Frokiaer J, Eskild-Jensen A, Brochner-Mortensen J. Comparison of within- and between-subject variation of serum cystatin C and serum creatinine in children aged 2-13 years. Scand J Clin Lab Invest 2010;70:54-9.
73. Aydin F, Tezcan G, Gungor O, et al. Can serum cystatin C reflect the glomerular filtration rate accurately in pediatric patients under chemotherapeutic treatment? A comparative study with Tc-99m DTPA two-plasma sample method. Nucl Med Commun 2010;31:301-6.
74. Blufpand HN, Tromp J, Abbink FC, et al. Cystatin C more accurately detects mildly impaired renal function than creatinine in children receiving treatment for malignancy. Pediatr Blood Cancer 2011;57:262-7.
75. Buron F, Hadj-Aissa A, Dubourg L, et al. Estimating glomerular filtration rate in kidney transplant recipients: performance over time of four creatinine-based formulas. Transplantation 2011;92:1005-11.
76. Sharma AP, Yasin A, Garg AX, Filler G. Diagnostic Accuracy of Cystatin C-Based eGFR Equations at Different GFR Levels in Children. Clin J Am Soc Nephrol 2011;6:1599-608.
77. Weinert LS, Camargo EG, Soares AA, Silveiro SP. Glomerular filtration rate estimation: performance of serum cystatin C-based prediction equations. Clinical Chemistry and Laboratory Medicine 2011;49:1761-71.
78. Xirouchakis E, Marelli L, Cholongitas E, et al. Comparison of cystatin C and creatinine-based glomerular filtration rate formulas with 51Cr-EDTA clearance in patients with cirrhosis. Clin J Am Soc Nephrol 2011;6:84-92.
79. Mitka M. Guidelines offer "roadmap" for chronic kidney disease. JAMA 2002;287:973.
80. Andersen TB, Eskild-Jensen A, Frokiaer J, Brochner-Mortensen J. Measuring glomerular filtration rate in children; can cystatin C replace established methods? A review. Pediatr Nephrol 2009;24:929-41.
81. Stevens LA, Schmid CH, Greene T, et al. Factors other than glomerular filtration rate affect serum cystatin C levels. Kidney Int 2009;75:652-60.
82. White CA, Rule AD, Collier CP, et al. The impact of interlaboratory differences in cystatin C assay measurement on glomerular filtration rate estimation. Clin J Am Soc Nephrol 2011;6:2150-6.
4 Resultados 91
83. Maahs DM, Jalal D, McFann K, Rewers M, Snell-Bergeon JK. Systematic shifts in cystatin C between 2006 and 2010. Clin J Am Soc Nephrol 2011;6:1952-5.
84. Abraham AG, Schwartz GJ, Furth S, Warady BA, Munoz A. Longitudinal formulas to estimate GFR in children with CKD. Clin J Am Soc Nephrol 2009;4:1724-30.

4 Resultados 92
4.6 CAPÍTULO DE LIVRO ENTRETIENS DE BICHAT 2011 – Revisão
sistemática da técnica de aferição de TFG
4 Resultados 93
4 Resultados 94

4 Resultados 95

4 Resultados 96
4.7 TEMAS LIVRES DE CONGRESSOS

4 Resultados 97
NDT Plus (2011) 4 (suppl 2):doi: 10.1093/ndtplus/4.s2.30This article appears
in: Abstracts from the 48th ERA-EDTA Congress, June 23-26 2011, Prague,
Czech Republic
HOW TO ESTIMATE THE GLOMERULAR FILTRATION RATE IN ADOLESCENTS
AND YOUNG ADULTS?
Luciano Selistre1, Vandrea Souza1, Olga Domanova1, Pierre Cochat2, Bruno
Ranchin2, Annie Varennes3, Laurence Dubourg1 andAoumeur Hadj-Aissa1
1. 1Exploration Fonctionnelle Renale Hospices Civils de Lyon et
Universite Lyon 1 Lyon France, Metropolitan
2. 2Nephrologie Pediatrique Hospices Civils de Lyon et Universite Lyon 1
Lyon France, Metropolitan
3. 3Laboratoire de Biochimie Hospices Civils de Lyon Lyon France,
Metropolitan
Abstract
INTRODUCTION AND AIMS: The measure of glomerular filtration rate (GFR) is
challenging in adolescents and young adults. The reference methods are difficult to
use in daily practice and the estimated GFR by formulas incorporating plasma
creatinine (Pcr) are still commonly used. These estimators are widely studied either
in children or in adults but rarely in adolescents. We therefore evaluated the
performance of six formulas for estimating GFR (GFRe): Cockcroft-Gault (CG),
MDRD simplified, CKDEPI, Schwartz 2009, Léger, and locally adapted Schwartz
(Local Schwartz, k=33 or 37) in adolescent patients and young adults compared with
a reference method: inulin clearance (GFRin).
METHODS: 1,277 measurements of GFRin were performed in 927 patients (54%
males) aged between 10 and 25 years (mean±SD: 16.8+4.5 yrs - median 16 yrs. The
BMI was of 19.4+4 kg/m2. We studied four groups: 1 (10-13 yrs, n=348, 57% M,
GFRin=92+31 ml/min per 1.73 m2, 2 (14-16 yrs, n=288, 51.5% M, GFRin =93+31
ml/min per 1.73 m2, 3 (17-20 yrs, n=334, 54% M, GFRin =94+30 ml/min per 1.73
m2), 4 (21-25 yrs, n=307, 53% M, GFRin=85+30 ml/min per 1.73 m2. Pcr was
measured by a colorimetric method (Roche compensated). We checked the
correlation with the Roche enzymatic technique (n = 199, y = 1.0 x + 1.6, r2 = 0.997).

4 Resultados 98
RESULTS: The mean (ml/min/1.73m2) estimated GFR by CG, MDRD, CKDEPI,
Schwartz 2009, Léger and Local Schwartz were 83+47, 177+92, 124+37, 92+32,
94+32 and 86+29, respectively. The bias for CG, MDRD, CKDEPI, Schwartz 2009,
Leger, Local Schwartz were 39±31, 64±67, 34±25, 0,7±19, 3+22 and -5±18,
respectively. The precisions 10%, 30% and 50% were 25.5%, 46%, and 23% for CG;
7%, 16%, 19% for MDRD; 14%, 31%, 28% for CKDEPI; 38%, 49%, 12% for
Schwartz 2009; 36%, 53%, 11% for Local Schwartz and 34%, 52%, 14% for Léger.
The correlation of Spearman was 0.44 for CG, 0.68 for MDRD, 0.68 for CKDEPI,
0.80 for Schwartz 2009, 0.81 for Local Schwartz and 0.76 for Léger.
CONCLUSIONS: The three most conventional formulas widely used in adults (CG,
MDRD, CKDEPI) overestimate the GFR in adolescents and young adults. The use of
the modified Schwartz formula (2009 or Local) is an accurate and simple estimation
of GFR in clinical practice in this population of patients.

4 Resultados 99
Special Issue: Abstracts of the 15th Annual Meeting of the French Society of
Pharmacology and Therapeutics, the 78th Annual Meeting of the Society of
Physiology, the 32nd Pharmacovigilance Meeting, the 12th APNET Seminar and
the 9th CHU CIC Meeting, 22-24 March 2011, Grenoble, France
4 Resultados 100

4 Resultados 101
4 Resultados 102

4 Resultados 103

4 Resultados 104
The 45th Annual Meeting on September 6th–8th 2012,Krakow, Poland
Pediatr Nephrol (2012) 27:1605–1829 DOI 10.1007/s00467-012-2232-
7

4 Resultados 105

5 PONDERAÇÕES FINAIS

5 Discussão 107
5 PONDERAÇÕES FINAIS
A pesquisa científica pode ser caracterizada como atividade intelectual intencional
que visa responder às necessidades humanas, percebidas no indivíduo como
sensação permanente de insatisfação. Pesquisar é o exercício intencional da pura
atividade intelectual, visando melhorar as condições práticas de existência. Para que
a pesquisa científica aconteça, é necessário estar imbuído do espírito científico.
Dessa forma, presumimos na hipótese de que a CrP não seja adequada para
medir TFG na pediatria. Para essa proposição, optamos em utilizar inulina como
padrão para aferição da TFG.
Devido à inexistência de inulina para investigação no Brasil em crianças,
referenciamos a amostra ao serviço de nefrologia pediátrica de Lyon (França) que
rotineiramente utiliza inulina em avaliação de crianças portadoras de doenças renais.
No projeto, estudamos o uso de inulina na aferição da TFG na faixa etária
entre 10 e 25 anos. Concomitantemente, comparamos o comportamento das
fórmulas pediátricas baseadas na CrP para estimação da TFG. Concluímos que
essas equações possuem uma melhor relação com o padrão-ouro (inulina) do que
as aplicadas de uso rotineiro no adulto (CKD-EPI, MDRD e Crockfot-Gault).
Verificamos que essas fórmulas de adultos, quando aplicadas em crianças e
adolescentes, superestimam muito a TFG, enquanto as pediátricas, mesmo se
aplicadas numa população de jovens adultos (18 a 25 anos), subestimam a TFG em
10%. Em função destes achados e da simplicidade da fórmula de Schwartz 2009
simplificada, recomendamos seu uso na estimação da TFG de crianças,
adolescentes e adultos jovens. São circunstâncias consideradas inéditas na
literatura até a publicação da nossa pesquisa no JASN.
Concomitantemente a essa publicação, organizamos um artigo de revisão da
aferição da TFG para a Revista da Sociedade Médica Francesa, com a orientação
da professora Laurence Dubourg. Também foi apresentada, em conclave nacional, a
experiência do grupo de Lyon na investigação da função renal em vários aspectos.

5 Discussão 108
Então, confinamos o pressuposto que a Cyst C poderia substituir a CrP na
estimativa da TFG na população pediátrica. Para tanto, averiguamos o estudo
transversal da coorte de Lyon. Idealizamos o estudo com modelagem estatística
utilizando o programa R. Para tanto, foi realizado estágio de 4 meses no serviço de
bioestatística e epidemiologia de Lyon.
Nesse trabalho, propomos uma nova maneira na busca pela eficiente análise da
reprodutibilidade. Grande parte dos estudos práticos nos diversos campos da ciência
envolve o uso de algum tipo de modelo de regressão, com o objetivo de descrever
comportamentos, identificar fatores que afetam e/ou explicam certos fenômenos,
entre outros objetivos relacionados.
Os resultados aqui obtidos sugeriram uma nova maneira de verificação da
reprodutibilidade, não baseada exclusivamente em médias, mas na correspondência
entre as medidas obtidas nos dois momentos distintos e na distribuição dos valores
para a diferença entre as medidas em tempos diferentes.
O coeficiente de correlação de Pearson mede a correlação entre as duas séries
de medidas, mas não o quanto as medidas desviam da reta a 45º, portanto, era
impossível detectar a acurácia entre as duas séries de medidas feitas. Como
complemento ao teste de Pearson, realizamos o coeficiente de correlação de
concordância proposto por Lin que possibilitou, pela primeira vez em estudos de
TFG, identificar a acurácia em medidas repetidas.
Outro fato original da nossa pesquisa, foi a aplicação da inulina como padrão-
ouro para TFG, a Cyst C e CrP IDMS como modelo de referência laboratorial.
Podemos criticar algumas deficiências, como a ausência de marcador de puberdade
e o delineamento da coorte que não foi estruturada prospectivamente para o tipo de
análise realizada.
O nosso estudo é o primeiro a examinar a consistência no desempenho na
eGFR com Cyst C associada ou não à CrP usando o clearance de inulina como
padrão ouro na pediatria. Não encontramos nenhuma evidência substancial de que a
Cyst C isolada ou em combinação com CrP forneceestimativa superior do que o uso
isolado da CrP, em pacientes com função renal normal ou com perda moderada na
TFG.
Outrossim, quando investigamos os indivíduos transplantados renais,
encontramos uma associação estreita entre o padrão-ouro e as fórmulas conjugadas
de CrP com Cys C para a TFG. Possivelmente, essa associação poderia ser uma
5 Discussão 109
compensação balanceada entre a baixa produção de CrP pela massa muscular e o
uso de corticoides que elevariam os níveis de Cys C nos transplantados.
Em outro momento, no subgrupo das crianças portadoras de doença renal
policística autossômica dominante, corroborando várias publicações anteriores, nós
demonstramos alteração na função renal, seja associada à microalbuminúria seja à
redução da TFG, em fases precoces do diagnóstico. Salientamos, nessa publicação,
que somente a aferição de CrP como índice de estimação da TFG acarretaria uma
diferença em até 12%, quando comparada ao uso de inulina. Concluímos que
haveria necessidade de acompanhamento precoce desses pacientes e, se possível,
que se fizesse o uso de algum método de referência para aferir a TFG.
Não podemos nos delegar de comentar sobre os benefícios e importância da
internacionalização. O programa internacional trouxe-nos o aprimoramento nas
habilidades cognitivas, no pensamento crítico, na busca de informação, na resolução
de problemas, na tomada de decisão e na capacidade de lidar com mudanças.
Vimos que o estabelecimento de parcerias estratégicas para ampliação do
horizonte acadêmico e fortalecimento e promoção da imagem institucional são
essenciais para melhora da qualidade da produção do conhecimento acadêmico.
Infelizmente, num primeiro momento, ficamos constrangidos por notar que nosso
estado não era conhecido fora do eixo Rio-São Paulo. Mas, paulatinamente,
começamos a mostrar nossa região, com inserções culturais e científicas.
Dessa forma, ficou evidenciada a importância estratégica da internacionalização
para a comunidade acadêmica, condição básica para o êxito das nossas iniciativas.
O processo de internacionalização exige o comprometimento da alta administração,
professores, funcionários e estudantes, atuando como força integradora e com
resultados imediatos sobre as atividades de ensino, pesquisa e extensão.
6 CONCLUSÕES

6 Conclusões 111
6 CONCLUSÕES
Os resultados da presente tese permitem que se estabeleçam as seguintes
proposições:
1. Verificamos a aplicabilidade das fórmulas pediátricas para a população adulta
jovem até os 25 anos;
2. Demonstramos que o uso de um padrão de referência para TFG é
fundamental para detectar alterações em pacientes pediátricos portadores de
Doença Renal Policística Autossômica Dominante;
3. Estatisticamente, na população de transplantados renais, a associação da
cistatina C isolada não aparenta superioridade com a creatinina plasmática;
4. A cistatina C isolada em crianças menores de 13 anos não se demonstrou
superior à creatinina plasmática para estimar a TFG;
5. Em pacientes com estágio I de doença renal crônica, a cistatina C associada
à creatinina plasmática demonstrou grau de superioridade para estimação da
TFG.
6. Apesar do surgimento de novos índices, verificamos que a creatinina
plasmática permanece como um marcador de eleição para a função renal.
Entretanto, salienta-se que adequação na técnica laboratorial e
estandardização internacional (IDMS) na medida da creatinina são
fundamentais para a decisão clínica.

7 REFERÊNCIAS BIBLIOGRÁFICAS – PROJETO

113
7 REFERÊNCIAS BIBLIOGRÁFICAS
1. Steinberg EP, Eknoyan G, Levin NW, et al. Methods used to evaluate the quality
of evidence underlying the National Kidney Foundation-Dialysis Outcomes Quality
Initiative Clinical Practice Guidelines: description, findings, and implications. Am J
Kidney Dis 2000;36:1-11.
2. Schwartz GJ, Haycock GB, Edelmann CM, Jr., Spitzer A. A simple estimate of
glomerular filtration rate in children derived from body length and plasma creatinine.
Pediatrics 1976;58:259-63.
3. Shannon JA, Smith HW. The Excretion of Inulin, Xylose and Urea by Normal and
Phlorizinized Man. J Clin Invest 1935;14:393-401.
4. Levin N, Eknoyan G, Pipp M, Steinberg E. National Kidney Foundation: Dialysis
Outcome Quality Initiative--development of methodology for clinical practice
guidelines. Nephrol Dial Transplant 1997;12:2060-3.
5. Myers GL, Miller WG, Coresh J, et al. Recommendations for improving serum
creatinine measurement: a report from the Laboratory Working Group of the National
Kidney Disease Education Program. Clin Chem 2006;52:5-18.
6. Bokenkamp A, Domanetzki M, Zinck R, Schumann G, Byrd D, Brodehl J. Cystatin
C--a new marker of glomerular filtration rate in children independent of age and
height. Pediatrics 1998;101:875-81.
7. Stickle D, Cole B, Hock K, Hruska KA, Scott MG. Correlation of plasma
concentrations of cystatin C and creatinine to inulin clearance in a pediatric
population. Clin Chem 1998;44:1334-8.
8. Filler G, Priem F, Vollmer I, Gellermann J, Jung K. Diagnostic sensitivity of serum
cystatin for impaired glomerular filtration rate. Pediatr Nephrol 1999;13:501-5.

114
9. Filler G, Bokenkamp A, Hofmann W, Le Bricon T, Martinez-Bru C, Grubb A.
Cystatin C as a marker of GFR--history, indications, and future research. Clin
Biochem 2005;38:1-8.
10. Larsson A, Malm J, Grubb A, Hansson LO. Calculation of glomerular filtration
rate expressed in mL/min from plasma cystatin C values in mg/dL. Scand J Clin Lab
Invest 2004;64:25-30.
11. Grubb A, Nyman U, Bjork J, et al. Simple cystatin C-based prediction equations
for glomerular filtration rate compared with the modification of diet in renal disease
prediction equation for adults and the Schwartz and the Counahan-Barratt prediction
equations for children. Clin Chem 2005;51:1420-31.
12. Le Bricon T, Leblanc I, Benlakehal M, Gay-Bellile C, Erlich D, Boudaoud S.
Evaluation of renal function in intensive care: plasma cystatin C vs. creatinine and
derived glomerular filtration rate estimates. Clin Chem Lab Med 2005;43:953-7.
13. Bouvet Y, Bouissou F, Coulais Y, et al. GFR is better estimated by considering
both serum cystatin C and creatinine levels. Pediatr Nephrol 2006;21:1299-306.
14. Grubb A, Simonsen O, Sturfelt G, Truedsson L, Thysell H. Serum concentration
of cystatin C, factor D and beta 2-microglobulin as a measure of glomerular filtration
rate. Acta Med Scand 1985;218:499-503.
15. Risch L, Huber AR. Glucocorticoids and increased serum cystatin C
concentrations. Clin Chim Acta 2002;320:133-4.
16. Ylinen EA, Ala-Houhala M, Harmoinen AP, Knip M. Cystatin C as a marker for
glomerular filtration rate in pediatric patients. Pediatr Nephrol 1999;13:506-9.
17. Krieser D, Rosenberg AR, Kainer G, Naidoo D. The relationship between serum
creatinine, serum cystatin C and glomerular filtration rate in pediatric renal transplant
recipients: a pilot study. Pediatr Transplant 2002;6:392-5.
18. Willems HL, Hilbrands LB, van de Calseyde JF, Monnens LA, Swinkels DW. Is
serum cystatin C the marker of choice to predict glomerular filtration rate in paediatric
patients? Ann Clin Biochem 2003;40:60-4.

115
19. Filler G, Lepage N. Should the Schwartz formula for estimation of GFR be
replaced by cystatin C formula? Pediatr Nephrol 2003;18:981-5.
20. Schwartz GJ, Munoz A, Schneider MF, et al. New equations to estimate GFR in
children with CKD. J Am Soc Nephrol 2009;20:629-37.
21. Zappitelli M, Parvex P, Joseph L, et al. Derivation and validation of cystatin C-
based prediction equations for GFR in children. Am J Kidney Dis 2006;48:221-30.
22. Bacchetta J, Cochat P, Rognant N, Ranchin B, Hadj-Aissa A, Dubourg L. Which
creatinine and cystatin C equations can be reliably used in children? Clin J Am Soc
Nephrol 2011;6:552-60.
23. Bland JM, Altman DG. Measuring agreement in method comparison studies.
Stat Methods Med Res 1999;8:135-60.
24. King TS, Chinchilli VM, Carrasco JL. A repeated measures concordance
correlation coefficient. Stat Med 2007;26:3095-113.
25. Crawford SB, Kosinski AS, Lin HM, Williamson JM, Barnhart HX. Computer
programs for the concordance correlation coefficient. Comput Methods Programs
Biomed 2007;88:62-74.
26. Diamond LH, Daly DC. Forum of the End-Stage Renal Disease Networks' role
in implementing the National Kidney Foundation-Dialysis Outcomes Quality Initiative
Clinical Practice Guidelines. Adv Ren Replace Ther 1999;6:28-35.
27. K/DOQI clinical practice guidelines for chronic kidney disease: evaluation,
classification, and stratification. Am J Kidney Dis 2002;39:S1-266.
28. Goolsby MJ. National Kidney Foundation Guidelines for chronic kidney disease:
evaluation, classification, and stratification. J Am Acad Nurse Pract 2002;14:238-42.
29. Schwartz GJ, Work DF. Measurement and estimation of GFR in children and
adolescents. Clin J Am Soc Nephrol 2009;4:1832-43.
30. Kilpatrick ES, Keevil BG, Addison GM. Does adjustment of GFR to extracellular
fluid volume improve the clinical utility of cystatin C? Arch Dis Child 2000;82:499-502.

116
31. Patel SS, Kimmel PL, Singh A. New clinical practice guidelines for chronic
kidney disease: a framework for K/DOQI. Semin Nephrol 2002;22:449-58.
32. Hellerstein S, Berenbom M, Erwin P, Wilson N, DiMaggio S. The ratio of urinary
cystatin C to urinary creatinine for detecting decreased GFR. Pediatr Nephrol
2004;19:521-5.
33. Vupputuri S, Fox CS, Coresh J, Woodward M, Muntner P. Differential
estimation of CKD using creatinine- versus cystatin C-based estimating equations by
category of body mass index. Am J Kidney Dis 2009;53:993-1001.
34. Andersen TB, Erlandsen EJ, Frokiaer J, Eskild-Jensen A, Brochner-Mortensen
J. Comparison of within- and between-subject variation of serum cystatin C and
serum creatinine in children aged 2-13 years. Scand J Clin Lab Invest 2010;70:54-9.
35. Aydin F, Tezcan G, Gungor O, et al. Can serum cystatin C reflect the
glomerular filtration rate accurately in pediatric patients under chemotherapeutic
treatment? A comparative study with Tc-99m DTPA two-plasma sample method.
Nucl Med Commun 2010;31:301-6.
36. Blufpand HN, Tromp J, Abbink FC, et al. Cystatin C more accurately detects
mildly impaired renal function than creatinine in children receiving treatment for
malignancy. Pediatr Blood Cancer 2011;57:262-7.
37. Buron F, Hadj-Aissa A, Dubourg L, et al. Estimating glomerular filtration rate in
kidney transplant recipients: performance over time of four creatinine-based
formulas. Transplantation 2011;92:1005-11.
38. Sharma AP, Yasin A, Garg AX, Filler G. Diagnostic Accuracy of Cystatin C-
Based eGFR Equations at Different GFR Levels in Children. Clin J Am Soc Nephrol
2011;6:1599-608.
39. Weinert LS, Camargo EG, Soares AA, Silveiro SP. Glomerular filtration rate
estimation: performance of serum cystatin C-based prediction equations. Clinical
Chemistry and Laboratory Medicine 2011;49:1761-71.

117
40. Xirouchakis E, Marelli L, Cholongitas E, et al. Comparison of cystatin C and
creatinine-based glomerular filtration rate formulas with 51Cr-EDTA clearance in
patients with cirrhosis. Clin J Am Soc Nephrol 2011;6:84-92.
41. Schoonjans F, Depuydt C, Comhaire F. Presentation of receiver-operating
characteristics (ROC) plots. Clin Chem 1996;42:986-7.
42. Mitka M. Guidelines offer "roadmap" for chronic kidney disease. JAMA
2002;287:973.
43. Fadrowski JJ, Neu AM, Schwartz GJ, Furth SL. Pediatric GFR estimating
equations applied to adolescents in the general population. Clin J Am Soc Nephrol
2011;6:1427-35.
44. Chavers BM, Rheault MN, Foley RN. Kidney function reference values in US
adolescents: National Health And Nutrition Examination Survey 1999-2008. Clin J
Am Soc Nephrol 2011;6:1956-62.
45. Andersen TB, Eskild-Jensen A, Frokiaer J, Brochner-Mortensen J. Measuring
glomerular filtration rate in children; can cystatin C replace established methods? A
review. Pediatr Nephrol 2009;24:929-41.
46. Stevens LA, Schmid CH, Greene T, et al. Factors other than glomerular filtration
rate affect serum cystatin C levels. Kidney Int 2009;75:652-60.
47. White CA, Rule AD, Collier CP, et al. The impact of interlaboratory differences
in cystatin C assay measurement on glomerular filtration rate estimation. Clin J Am
Soc Nephrol 2011;6:2150-6.
48. Maahs DM, Jalal D, McFann K, Rewers M, Snell-Bergeon JK. Systematic shifts
in cystatin C between 2006 and 2010. Clin J Am Soc Nephrol 2011;6:1952-5.
49. Abraham AG, Schwartz GJ, Furth S, Warady BA, Munoz A. Longitudinal
formulas to estimate GFR in children with CKD. Clin J Am Soc Nephrol 2009;4:1724-
30.

118
ANEXOS

119
ANEXO 1
APROVAÇÃO DO COMISSÃO CIENTÍFICA E PARECER DO COMITÊ DE ÉTICA

120

121

122

123
ANEXO 2
APROVAÇÕES DO SERVIÇO FRANCÊS

124

125

126

127
ANEXO 3
ATA DE DEFESA DE TESE

128