Bombeamento biótico da umidade atmosférica do ciclo hidrológico terrestre
27
Hydrol. Earth Syst. Sci. Discuss., 3, 2621–2673, 2006 www. hydrol-earth-syst -sci-discus s.net/3/2621/2006/ © Author(s) 2 006. This work is licensed under a Creative Commons License. Hydrology and Earth System Sciences Discussions Papers published in Hydrology and Earth System Sciences Discussions are under open-access review for the journal Hydrology and Earth System Sciences Biotic pump of atmospheric moisture as driver of the hydrological cycle on land A. M. Makarieva and V. G. Gorshkov Petersburg Nuclear Physics Institute, Gatchina, St. Petersburg, Russia Received: 31 March 2006 – Accepted: 8 May 2006 – Published: 30 August 2006 Correspondence to: A. M. Makarieva ([email protected]) 2621 Abstract In this paper the basic geoph ysi cal and ecolo gical princip les are joint ly analyzed that allow the landmasses of Earth to remain moistened sufficiently for terrestrial life to be poss ible. 1. Under grav ity , land inev itab ly loses wate r to the ocean. T o keep land moistened, the gravitational water runoff must be continuously compensated by the 5 atmospheric ocean-to-land moisture transport. Using data for five terrestrial transects of the International Geosphere Biosphere Program we show that the mean distance to which the passive geophysical air fluxes can transport moisture over non-forested areas, does not exceed several hundred kilometers; precipitation decreases exponen- tially with distance from the ocean. 2. In contrast, precipitation over e xtensive natural 10 for ests does not depend on the distance from the ocean along sever al thous and kilo- meters, as illustrated for the Amazon and Yenisey river basins and Equatorial Africa. This points to the existence of an active biotic pump transporting atmospheric moisture inlan d from the ocean. 3. Physic al principle s of the bioti c moisture pump are inv esti- gated based on the previously unstudied properties of atmospheric water vapor, which 15 can be either in or out of hydrostatic equilibrium depending on the lapse rate of air temperature. A novel physical principle is formulated according to which the low-lev el air moves from areas with weak evaporation to areas with more intensive evaporation. Due to the high leaf area index, natural forests maintain high transpiration fluxes, which support the ascending air motion over the forest and “suck in” moist air from the ocean, 20 whic h is the essenc e of the biotic pump of atmosph eric moist ure. In the result, the gravitational runoff water losses from the optimally moistened forest soil can be fully compensated by the biotically enhanced precipitation at any distance from the ocean. 4. It is discussed how a continent-scale biotic water pump mechanism could be pro- duced by natural selec tion acting on individua l trees. 5. Replacement of the natural 25 forest cover by a low leaf index vegetation leads to an up to tenfold reduction in mean continental precipitation and runoff, in contrast to the previously available estimates made without accounting for the biotic moisture pump. The analyzed body of evidence 2622
-
Upload
zuleika-soave-guarany -
Category
Documents
-
view
220 -
download
0
Transcript of Bombeamento biótico da umidade atmosférica do ciclo hidrológico terrestre
7/30/2019 Bombeamento biótico da umidade atmosférica do ciclo hidrológico terrestre
http://slidepdf.com/reader/full/bombeamento-biotico-da-umidade-atmosferica-do-ciclo-hidrologico-terrestre 1/27
Hydrol. Earth Syst. Sci. Discuss., 3, 2621–2673, 2006
www.hydrol-earth-syst-sci-discuss.net/3/2621/2006/
© Author(s) 2006. This work is licensed
under a Creative Commons License.
Hydrology andEarth System
SciencesDiscussions
Papers published in Hydrology and Earth System Sciences Discussions are under
open-access review for the journal Hydrology and Earth System Sciences
Biotic pump of atmospheric moisture as
driver of the hydrological cycle on land
A. M. Makarieva and V. G. Gorshkov
Petersburg Nuclear Physics Institute, Gatchina, St. Petersburg, Russia
Received: 31 March 2006 – Accepted: 8 May 2006 – Published: 30 August 2006
Correspondence to: A. M. Makarieva ([email protected])
2621
Abstract
In this paper the basic geophysical and ecological principles are jointly analyzed that
allow the landmasses of Earth to remain moistened sufficiently for terrestrial life to be
possible. 1. Under gravity, land inevitably loses water to the ocean. To keep land
moistened, the gravitational water runoff must be continuously compensated by the5
atmospheric ocean-to-land moisture transport. Using data for five terrestrial transects
of the International Geosphere Biosphere Program we show that the mean distance
to which the passive geophysical air fluxes can transport moisture over non-forested
areas, does not exceed several hundred kilometers; precipitation decreases exponen-
tially with distance from the ocean. 2. In contrast, precipitation over extensive natural10
forests does not depend on the distance from the ocean along several thousand kilo-
meters, as illustrated for the Amazon and Yenisey river basins and Equatorial Africa.This points to the existence of an active biotic pump transporting atmospheric moisture
inland from the ocean. 3. Physical principles of the biotic moisture pump are investi-
gated based on the previously unstudied properties of atmospheric water vapor, which15
can be either in or out of hydrostatic equilibrium depending on the lapse rate of air
temperature. A novel physical principle is formulated according to which the low-level
air moves from areas with weak evaporation to areas with more intensive evaporation.
Due to the high leaf area index, natural forests maintain high transpiration fluxes, which
support the ascending air motion over the forest and “suck in” moist air from the ocean,20
which is the essence of the biotic pump of atmospheric moisture. In the result, the
gravitational runoff water losses from the optimally moistened forest soil can be fully
compensated by the biotically enhanced precipitation at any distance from the ocean.
4. It is discussed how a continent-scale biotic water pump mechanism could be pro-
duced by natural selection acting on individual trees. 5. Replacement of the natural25
forest cover by a low leaf index vegetation leads to an up to tenfold reduction in mean
continental precipitation and runoff, in contrast to the previously available estimates
made without accounting for the biotic moisture pump. The analyzed body of evidence
2622
7/30/2019 Bombeamento biótico da umidade atmosférica do ciclo hidrológico terrestre
http://slidepdf.com/reader/full/bombeamento-biotico-da-umidade-atmosferica-do-ciclo-hidrologico-terrestre 2/27
testifies that the long-term stability of an intense terrestrial water cycle is unachievable
without the recovery of natural, self-sustaining forests on continent-wide areas.
1 Is it a trivial problem, to keep land moistened?
Liquid water is an indispensable prerequisite for all life on Earth. While in the ocean
the problem of water supply to living organisms is solved, the landmasses are elevated5
above the sea level. Under gravity, all liquid water accumulated in soil and underground
reservoirs inevitably flows down to the ocean in the direction of the maximum slope of
continental surfaces. Water accumulated in lakes, bogs and mountain glaciers feeding
rivers also leaves to the ocean. So, to accumulate and maintain optimal moisture stores
on land, it is necessary to compensate the gravitational runo ff of water from land to the10
ocean by a reverse, ocean-to-land, moisture flow.
When soil is sufficiently wet, productivity of plants and ecological community as a
whole is maximized. With natural selection coming into play, higher productivity is as-
sociated with higher competitive capacity. Thus, evolution of terrestrial life forms should
culminate in a state when all land is occupied by ecological communities functioning at15
a maximum possible power limited only by the incoming solar radiation. In such a state
local stores of soil and underground moisture, ensuring maximum productivity of terres-
trial ecological communities, should be equally large everywhere on land irrespective of
the local distance to the ocean. Being determined by the local moisture store, local loss
of water to river runoff per unit ground surface area should be distance-independent as20
well. It follows that in the stationary state the amount of locally precipitating moisture,
which is brought from the ocean to compensate local losses to runoff, should be evenly
distributed over the land surface.
In the meantime, passive geophysical air fluxes transporting ocean-evaporated mois-
ture to the continents weaken exponentially as they propagate inland. The empirically25
established characteristic scale length on which such fluxes are damped out is of the
order of several hundred kilometers, i.e. much less than the linear dimensions of the
2623
continents. Geophysical atmospheric ocean-to-land moisture fluxes cannot therefore
compensate local losses of moisture to river runoff that, on forested territories, are
equally high far from the ocean as well as close to it. This means that no purely geo-
physical explanation can be given to the observed existence of highly productive forest
ecosystems on continent-scale areas of the order of tens of millions square kilometers,5
like those of the Amazonia, Equatorial Africa or Siberia.
To ensure functioning of such ecosystems, an active mechanism (pump) is neces-
sary to transport moisture inland from the ocean at a rate dictated by the needs of
ecological community. Such a mechanism originated on land in the course of biologi-
cal evolution and took the form of forest – a contiguous surface cover consisting of tall10
plants (trees) closely interacting with all other organisms of the ecological community.
Forests are responsible both for the initial accumulation of water on continents in the
geological past and for the stable maintenance of the accumulated water stores in thesubsequent periods of life existence on land. In this paper we analyze the geophysical
and ecological principles of the biotic water pump transporting moisture to the conti-15
nents from the ocean. It is shown that only intact contiguous cover of natural forests
having extensive borders with large water bodies (sea, ocean) is able to keep land
moistened up to an optimal for life level everywhere on land, no matter how far from
the ocean.
The paper is structured as follows. In Sect. 2 the exponential weakening of precip-20
itation with distance from the ocean is demonstrated for non-forested territories using
the data for five terrestrial transects of the International Geosphere Biosphere Program
(Sect. 2.1); it is shown that no such weakening occurs in natural forests, which points
to the existence of the biotic pump of atmospheric moisture (Sect. 2.2); how the water
cycle on land is impaired when this pump is broken due to deforestation is estimated in25
Sect. 2.3. In Sect. 3 the physical principles of the biotic pump functioning are investi-gated. The non-equilibrium vertical distribution of atmospheric water vapor associated
with the observed vertical lapse rate of air temperature (Sect. 3.1) produces an up-
ward directed force, termed evaporative force, which causes the ascending motion of
2624
7/30/2019 Bombeamento biótico da umidade atmosférica do ciclo hidrológico terrestre
http://slidepdf.com/reader/full/bombeamento-biotico-da-umidade-atmosferica-do-ciclo-hidrologico-terrestre 3/27
air masses (Sect. 3.2), as well as the horizontal air motions from areas with low evap-
oration to areas with high evaporation. This physical principle explains the existence
of deserts, monsoons and trade winds; it also underlies functioning of the biotic mois-
ture pump in natural forests. Due to the high leaf area index, natural forests maintain
powerful transpiration exceeding evaporation from the oceanic surface. The transpira-5
tion flux supports ascending fluxes of air and “sucks in” moist air from the ocean. In
the result, forest precipitation increases up to a level when the runo ff losses from opti-
mally moistened soil are fully compensated at any distance from the ocean (Sect. 3.3).
Mechanisms of efficient retention of soil moisture in natural forests are considered in
Sect. 3.4. In Sect. 4 it is discussed how the continent-scale biotic pump of atmospheric10
moisture could be produced by natural selection acting on individual trees. In Sect. 5,
based on the obtained results, it is concluded that the long-term stability of a terres-
trial water cycle compatible with human existence is unachievable without recovery of
natural, self-sustaining forests on continent-wide areas.
2 Passive physical and active biotic mechanisms of ocean-to-land moisture15
transport
2.1 Physical moisture fluxes in the absence of biotic control
Let F be the horizontal moisture flux equal to the amount of atmospheric moisture
passing inland across a unit horizontal length perpendicular to the stream line per unit
time, dimension kg H2O m−1 s−1. With air masses propagating inland to a distance x 20
from the ocean (x is measured along the stream line), their moisture content decreases
at the expense of the precipitated water locally lost to runo ff. Thus, change of F per unit
covered distance is equal to local runoff. Due to the homogeneity of the atmosphere,
the probability that water vapor molecules join the runoff, does not depend on the
distance traveled by these molecules in the atmosphere. It follows that the change d F 25
2625
of the flux of atmospheric moisture over distance dx is proportional to the flux itself:
R (x ) ≡d F (x )
dx = −
1
l F (x ) or F (x ) = F (0) exp{−
x
l }, (1)
where R (x ) is the local loss of water to runoff per unit surface area, kg H2O m−2
s−1
, l is the mean distance traveled by an H2O molecule from a given site to the site where
it went to runoff, F (0) is the value of flux F in the initial point x =0. Parameter l reflects5
the intensity of precipitation formation processes (moisture upwelling, condensation
and precipitation) (Savenije, 1995); the more rapid they are, the shorter the distance l .As far as a certain amount, E , of the precipitated water evaporates from the surface
and returns to the atmosphere, precipitation P is always higher than runoff R :
P =
E +
R ≡ k R , k ≥ 1. (2)10
For example, global runoff constitutes 35% of terrestrial precipitation (Dai and Tren-
berth, 2002), which gives a global mean k ≈3. Eq. (1) can then be re-written as
P (x ) = P (0)exp{−x
l } or lnP (x ) = lnP (0)−
x
l , (3)
where P (0)=kR (0) is precipitation in the initial point x =0.
Linear scale l can be determined from the observed decline of precipitation P with15
distance x on those territories where the biotic control of water cycle is weak or absent
altogether. Such areas are represented by deserts, i.e. territories completely deprived
of vegetation cover, as well as by low-productive ecosystems with low leaf area in-
dex, open canopies and/or short vegetation cover (semideserts, steppes, savannas,
grasslands). We collected data on five extensive terrestrial regions satisfying this crite-20
rion, i.e. not covered by natural close-canopy forests, Fig. 1. These regions representthe non-forested parts of five terrestrial transects proposed by the International Geo-
sphere Biosphere Program (IGBP) for studying the effects of precipitation gradients
under global change (Canadell et al., 2002), Table 1. Within each region distance x
2626
7/30/2019 Bombeamento biótico da umidade atmosférica do ciclo hidrológico terrestre
http://slidepdf.com/reader/full/bombeamento-biotico-da-umidade-atmosferica-do-ciclo-hidrologico-terrestre 4/27
was counted in the inland direction approximately perpendicular to the regional iso-
hyets (Savenije, 1995), Fig. 1.
Based on the available meteorological data, the dependence of precipitation P on
distance x was investigated in each region, Fig. 2a. In all regions this dependence
accurately conforms to the exponential law Eq. (3), which is manifested in the high5
values of the squared correlation coefficients (0.90–0.99), Table 1. This indicates that
the possible dependence on x of coefficient k , Eq. (2), which we do not analyze, is
weak compared to the main exponential dependence of precipitation P on distance,
which is taken into account in Eq. (3). Estimated from parameter b of the linear re-
gression ln P =a+bx as l =-1/b, see Eq. (3), scale length l takes the values of several10
hundred kilometers, from 220 km in Argentina at 31◦
S to 870 km in the North America,
except for region 4a in Argentina at 45◦
S, where l =93 km, Table 1. Such a rapid de-
crease of precipitation has to do with the influence of the high Andean mountain range
impeding the movement of westerly air masses coming to the region from the Pacific
Ocean (Austin and Sala, 2002). On the island of Hawaii, high (>4 km a.s.l.) mountains15
also create a large gradient of precipitation which can change more than tenfold over
100 km (Austin and Vitousek, 2000). In West Africa, the value of l =400 km obtained for
the areas with P ≤1200 mm year−1
, Table 1, compares well with the results of Savenije
(1995), who found l ≈970 km for areas with P ≥800 mmyear−1
and l ∼300 km for the
more arid zones of this region.20
Total amount of precipitation Π (kg H2O year−1
) over the entire path Ll traveled by
air masses to the inner parts of the continent, 0≤x ≤L, in an area of width D (for river
basins D can be approximated by the smoothed length of the coastal line) is, due toEq. (3), equal to
Π = D
L0
P (x )dx ≈ P (0)l D. (4)25
As is clear from Eq. (4), l represents a characteristic linear scale equal to the width
of the band of land adjacent the coast which would be moistened by the incoming
oceanic air masses if the precipitated moisture were uniformly distributed over x with
2627
a density P (0). For land areas with ordinary orography (regions 1–3, 4b, 5) the mean
value of l is about 600 km, Table 1, i.e. it is significantly smaller than the characteristic
horizontal dimensions of the continents. Thus, the passive geophysical transport of
moisture to land would only be able to ensure normal life functioning in a narrow band
near the ocean of a width not exceeding several hundred kilometers; the much more5
extensive inner parts of the continents would have invariably remained arid. Already at
this stage of our consideration we come to the conclusion that in order to explain the
observed existence of the extensive well-moistened continental areas several thousand
kilometers in length (the Amazon river basin, Equatorial Africa, Siberia), where natural
forests are still functioning (Bryant et al., 1997), it is necessary to involve a different,10
active mechanism of ocean-to-land moisture transport.
2.2 Biotic pump of atmospheric moisture
Let us now consider the spatial distribution of precipitation on extensive territories cov-
ered by natural forests. As far as soil moisture content ultimately dictates life condi-
tions for all species in the ecological community, functioning of the community should15
be aimed at keeping soil moisture at a stationary level optimal for life. Maintenance
of high soil moisture content W (units kg H2O m−2
=mm H2O) enables the ecological
community to achieve high power of functioning even when the precipitation regime
is fluctuating. For example, transpiration of natural forests in the Amazon river basin,
where soil moisture content is high throughout the year (Hodnett et al., 1996), is lim-20
ited by the incoming solar energy only. It increases during the dry season when the
clear sky conditions predominate (da Rocha et al., 2004; Werth and Avissar, 2004).
Dry periods during the vegetative season in natural forests of higher latitudes neither
bring about a decrease of transpiration (Goulden et al., 1997; Tchebakova et al., 2002).In contrast, transpiration of open ecosystems like savannas, grasslands or shrublands25
incapable of maintaining high soil moisture content year round, drops radically during
the dry season (Hutley et al., 2001; Kurc and Small, 2004).
Change of soil moisture content with time, dW/dt, is linked to precipitation P , evap-
2628
7/30/2019 Bombeamento biótico da umidade atmosférica do ciclo hidrológico terrestre
http://slidepdf.com/reader/full/bombeamento-biotico-da-umidade-atmosferica-do-ciclo-hidrologico-terrestre 5/27
oration E and runoff R via the law of matter conservation, dW/dt=P −E −R . High
stationary (dW/dt=0) soil moisture content is inseparably associated with a significant
runoff, i.e. loss of water by the ecosystem. In areas where neither the surface slope,
nor soil moisture content depend on distance x from the ocean, W (x )=W (0), loss of
ecosystem water to runoff is spatially uniform as well, R (x )=R (0). It follows that in the5
stationary case precipitation P , which maintains stationary soil moisture content and
compensates the runoff, cannot decrease with distance from the ocean either. The
conditions W (x )=W (0) and R (x )=R (0) are incompatible with an exponential decline of
P (x ), Eq. (3).
When the soil moisture content is sufficiently high, transpiration, which makes up a10
major part of total evaporation from the surface, E , is dictated by solar energy. There-
fore, when x is counted along the parallel, on well-moistened continental areas we
have E (x )=E (0), i.e. evaporation does not depend on the distance from the ocean.
Coupled with constant runoff, R (x )=R (0), this means that precipitation P is similarly
independent of the distance from the ocean, P (x )=E (0)+R (0)=P (0). When the con-15
sidered area is oriented, and x counted, along the meridian, transpiration increases
towards the equator following the increasing flux of solar energy. In such areas, at con-
stant soil moisture content and runoff, precipitation must also grow towards the equator
irrespective of the distance from the ocean.
We collected precipitation data for three extensive terrestrial regions spreading along20
2.5 thousand kilometers in length each and representing the largest remnants of
Earth’s natural forest cover (Bryant et al., 1997). These are the Amazon basin, the
Congo basin (its equatorial part) and the Yenisey basin, regions 6, 7 and 8 in Fig. 1.As can be seen from Fig. 2b, precipitation in the Amazon and Congo basins is inde-
pendent of the distance from the coast at around 2000 mm year−1
. In the Yenisey river25
basin, which has a meridional orientation, Fig. 1, precipitation increases with distance
from the ocean from about 400 mm year−1
at the mouth to about 800mm year−1
on the
upper reaches of the river, Fig. 2b.
Similar precipitation, P (0)=790 mm year−1
, is registered at 125◦
E in that part of the
2629
North East China Continental Transect (NECT) (region 2), which is closest to the Pa-
cific Ocean, 400 km from the coast. In the meantime, the upper reaches of Yenisey
river are about four thousand kilometers away from the Pacific Ocean, and about six
thousand kilometers away from the Atlantic Ocean; in fact, it is one of the innermost
continental areas on the planet, Fig. 1. Due to the low oceanic temperature in the5
region of their formation, Arctic air masses that dominate the Yenisey basin ( Shver,
1976) are characterized by low moisture content (less than 8 mm of precipitable water
in the atmospheric column compared to 16 mm in the Pacific Ocean at NECT (Randel
et al., 1996). According to Eq. (1), this moisture content should decrease even further
as these air masses move inland to the south.10
In other words, if the modern territory of the forest-covered Yenisey basin were, in-
stead, a desert with precipitation of the order of 100 mm year−1
, this would not be
surprising from the geophysical point of view (indeed, one is not surprised at the factthat the innermost part of NECT and other non-forested regions, Fig. 2a, are extremely
arid). This could easily be explained by the character of atmospheric circulation and15
large distance from any of the oceans. In contrast, the existence of a luxurious water
cycle (Yenisey is the seventh most powerful river in the world) as well as the southward
increase of precipitation in this area is quite remarkable, geophysically unexpected
and can only be explained by functioning of an active biotic mechanism pumping atmo-
spheric moisture from ocean to land. Similar biotic pumps should ensure high precipi-20
tation rates throughout the natural forests of the Amazon basin and Equatorial Africa.
It can be concluded, therefore, that all the largest and most powerful river basins
must have formed as an outcome of the existence of forest pumps of atmospheric
moisture. Forest moisture pump ensures an ocean-to-land flux of moisture, which
compensates for the runoff of water from the optimally moistened forest soil. This25
makes it possible for forests to develop the maximally possible transpiration fluxes thatare limited by solar radiation only. Thus, precipitation over forests increases up to the
maximum value possible at a given constant runoff (i.e., coefficient k in Eq. (2), the
precipitation/runoff ratio, is maximized for a given R .) Forest moisture pump deter-
2630
7/30/2019 Bombeamento biótico da umidade atmosférica do ciclo hidrológico terrestre
http://slidepdf.com/reader/full/bombeamento-biotico-da-umidade-atmosferica-do-ciclo-hidrologico-terrestre 6/27
mines both the ultimate distance to which the atmospheric moisture penetrates on the
continent from the ocean, as well as the magnitude of the incoming moisture flux per
unit length of the coastal line. Dictated by the biota, both parameters are practically
independent of the geophysical fluctuations of atmospheric moisture circulation. The
biotic pumps of atmospheric moisture enhance precipitation on land at the expense of5
decreasing precipitation over the ocean. This should lead to appearance of extensive
oceanic “deserts” – large areas with low precipitation (see, e.g., Fig. 1 of Adler et al.,
2001).
2.3 Deforestation consequences for the water cycle on land
Let us denote as P f(x )=P f(0) the spatially uniform distribution of precipitation over a10
river basin covered by natural forest (low index f stands for forest), which spreads over
distance L inland and over distance D along the oceanic coast. Total precipitation Πf
on this territory is equal to Πf=P f(0)LD, where the product LD=S estimates the area
occupied by the river basin. According to Eq. (4) and the results of Sect. 2.1, total
precipitation Πd on a territory deprived of the natural forest cover (low index d stands15
for deforestation, desertification) is equal to Πd=P d(0)l dD, where l d∼600km. One thus
obtains
P fP d
=Πf
Πd
=P f(0)L
P d(0)l d. (5)
Equation (5) shows that mean precipitation P ≡Π/S in a deforested river basin oflinear size L will decrease inversely proportionally to L. For example, for the Amazon20
river basin L≈3×10³
km, which means that Amazonian deforestation would have led to
at least a L/l d≈ 5-fold decrease of mean precipitation in the region. This effect, i.e. a
80% reduction in precipitation, is several times larger than the available estimates that
are based on global circulation models not accounting for the proposed biotic moisture
pump. According to such model estimates, deforestation of the Amazon river basin25
would have led to (Πf−Πd)/S =270±60 mm year−1
(±1 s.e., n=22 models) (McGuffie
2631
and Henderson-Sellers, 2001), i.e. only 13% of the modern basin mean precipitation
of 2100 mm year−1
(Marengo, 2004).
Reduction of the characteristic distance of the inland propagation of atmospheric
moisture from L to l dL is not the single consequence of deforestation. Impairment of
the biotic moisture pump in the course of deforestation causes the ocean-to-land flux of5
atmospheric moisture via the coastal zone to diminish. In the result, the amount of pre-
cipitation P (0) in the coastal zone decrease from the initial high biotic value P (0)=P f(0)
down to P (0)=P d(0)<P f(0). As will be shown in Sect. 3.3, in the case of complete
elimination of the vegetation cover, precipitation in the coastal zone can be reduced
practically to zero, P d(0)=0, see Fig. 4a. In the case when the natural forest is re-10
placed by an open-canopy, low leaf area index ecosystem, cf. Fig. 4b, c in Sect. 3.3,
the characteristic magnitude of reduction in P (0) can be estimated comparing the ob-
served values of precipitation P (0) in the coastal zones of forested versus non-forestedterritories under similar geophysical conditions of atmospheric circulation. A good ex-
ample is the comparison of the arid ecosystem in the northeast Brazil, the so-called15
caatinga, which receives about P d(0)=800 mm year−1
precipitation (Oyama and Nobre,
2004), with the forested coast of the Amazon river basin, where P f(0)>2000 mm year−1
(Marengo, 2004), which gives P f(0)/P d(0)>2.5. According to Eq. (5), the cumulative
effect of deforestation can amount to more than a tenfold reduction of the mean basin
precipitation. The innermost continental areas will be most affected. For example, at20
x =1200 km (in the Amazon river basin this approximately corresponds to the city of
Manaus, Brazil) local precipitation will decrease by
P f(x )
P d(x )=
P f(0)
P d(0)
1
exp(−x/l )=
2.5
exp(−1200/600)= 18.5 (6)
times, while in Rio Branco, Brazil (x ≈+2500 km) precipitation will decrease by 160
times, i.e. the internal part of the continent will turn to a desert. Total river runoff from25
the basin to the ocean, which is equal toL
0R (x )dx =Π/k , see Eq. (2), will undergo the
same or even more drastic changes as the total precipitation, Eq. ( 5), due to decrease
2632
7/30/2019 Bombeamento biótico da umidade atmosférica do ciclo hidrológico terrestre
http://slidepdf.com/reader/full/bombeamento-biotico-da-umidade-atmosferica-do-ciclo-hidrologico-terrestre 7/27
of coefficient k , Eq. (2).
Ratio Πf/Πd>10, Eq. (5), characterizes the power of the biotic pump of atmospheric
moisture: the biotically induced ocean-to-land moisture flux does not decrease expo-
nentially with distance from the ocean and it is more than an order of magnitude larger
than in the biotically non-controlled, purely geophysical state. At any distance from the5
ocean and under any fluctuations of external geophysical conditions this moisture flux
prevents forest soil from drying. As follows from the above ratio, geophysical fluctua-
tions of the precipitation regime can be no more than 10% as powerful as the biotic
pump. Relative fluctuations of river runoff are dictated by fluctuations in the work of
the biotic pump, i.e. they do not exceed 10% of its power either. This prevents floods10
in the forested river basin. Summing up, the undisturbed natural forests create an
autonomous cycle of water on land, which is decoupled from whatever abiotic environ-
mental fluctuations. We will now consider the physical and biological principles along
which this unique biotic mechanism functions.
3 Physical foundations of the biotic pump of atmospheric moisture15
3.1 Non-equilibrium vertical distribution of atmospheric water vapor
In this section we describe a physical effect, which, as we show, plays an important role
in the meteorological processes on Earth, but so far remains practically undiscussed
in the meteorological literature.
Atmospheric air is in hydrostatic equilibrium (everywhere in Sect. 3 under air we un-20
derstand dry air). Hydrostatic equilibrium means that air pressure p at a given height zin the atmosphere is balanced by the weight of atmospheric column above z. Change
d p of air pressure over vertical distance dz is equal to the weight of air in the atmo-
spheric column of thickness dz (Landau and Lifschitz, 1987):
−d p
dz= MNg. (7)
25
2633
Here N (mol m−3
) is molar air density at height z, M =29gmol−1
is air molar mass,
which is practically independent of z, g=9.8 m s−2
is the acceleration of gravity. Atmo-
spheric air is close to ideal gas and conforms to the equation of state, p=NR T , where
T is absolute air temperature at height z, R =8.3 J K−1
mol−1
is the universal gas con-
stant. Therefore, Eq. (7) and its solution can be written in the following well-known form5
(Landau and Lifschitz, 1987):
d p
dz= −
p
h, p(z) = ps exp{−
z0
d z
h}, h ≡
RT
Mg, (8)
where ps is air pressure at the Earth’s surface. In the good approximation of
z-independent air molar mass M and temperature T taken to be equal to the
mean global surface temperature, T =T s=288 K (15◦C), we have h=hs=8.4km and10
p(z)=ps exp(−z/hs).Hydrostatic equilibrium of atmospheric water vapor with molar mass M w =18 g mol
−1
is described by Eq. (8) with h replaced by hw ≡RT/M w g, hws ≡ RT s/M w g=13.5km.
Immediately above the wet soil or open water surface, water vapor is in the state of
saturation. The dependence of partial pressure pH2O of saturated water vapor on air15
temperature T is governed by the well-known Clapeyron-Clausius law (Landau et al.,
1965; Raval and Ramanathan, 1989):
pH2O = pH2Os exp{T H2O
T s−
T H2O
T }, T H2O ≡
QH2O
R ≈ 5300K, (9)
where low index s refers to corresponding values at the Earth’s surface,
QH2O≈44kJmol−1
is the molar latent heat of evaporization. Taking the derivative of20
the partial pressure of saturated water vapor pH2O(z) over height z we obtain from
Eq. (9):d pH2O
d z= −
pH2O
hH2O
, pH2O = pH2Os exp{−
z0
dz
hH2O
}, hH2O ≡T 2
{−d T
dz}T H2O
. (10)
2634
7/30/2019 Bombeamento biótico da umidade atmosférica do ciclo hidrológico terrestre
http://slidepdf.com/reader/full/bombeamento-biotico-da-umidade-atmosferica-do-ciclo-hidrologico-terrestre 8/27
Equations (10) have the same form as the hydrostatic equilibrium Eqs. (8) for at-
mospheric air, but with a different height parameter hH2O, which, in the case of water
vapor, depends on the atmospheric lapse rate Γ of air temperature, Γ≡−dT/dz. The
second equation in Eqs. (10) is another mathematical form of the Clapeyron-Clausius
law, Eq. (9).5
Written for water vapor with hw instead of h, Eq. (8) formally coincides with Eq. (10)
if the equality hH2O=hw is fulfilled. This equality can be solved for the atmospheric
temperature lapse rate Γ. The obtained solution Γ=ΓH2O corresponds to the case
when water vapor is saturated in the entire atmospheric column being at the same
time in hydrostatic equilibrium, when at any height z its partial pressure is equal to the10
weight of water vapor in the atmospheric column above z. Equating the scale heights
hw ≡RT/M w g, Eq. (8) and hH2O, Eq. (10), we arrive at the following value of ΓH2O:
−d T
dz= ΓH2O =
T sH
= 1.2Kk m−1, H ≡RT H2O
M w g= 250km. (11)
Note that due to the large value of H hw , hw /H ≈0.051, one can put exp(−z/H ) ≈ 1
for any z≤hw , which we did when obtaining Eq. (11). In Eq. (11) ΓH2O=1.2 K km−1
15
is calculated for the mean global surface temperature T s=288 K. Differences in the
absolute surface temperatures of equatorial and polar regions change this value by no
more than 10%.
The obtained value of ΓH2O=1.2 K km−1
, Eq. (11), is a fundamental parameter dic-
tating the character of atmospheric processes.20
When Γ<ΓH2O, water vapor in the entire atmosphere is in hydrostatic equilibrium, but
it is saturated at the surface only, i.e. pw (z)<pH2O(T (z)) for z>0 and pw (z)=pH2O(T s) for
z=0, where pw is partial pressure of water vapor at height z (and pH2O, as before, is the
saturated pressure of water vapor at T (z)). Relative humidity pw /pH2O decreases with
height. As far as in the state of hydrostatic equilibrium air pressure p and water vapor25
pressure pw at a given height z are compensated by the weight of air and water vapor in
the atmospheric column above z, in this state macroscopic fluxes of air and water vapor
2635
in the atmosphere are absent. Solar radiation absorbed by the Earth’s surface makes
water evaporate from the oceanic and soil surface, but the evaporated water undergoes
condensation immediately at a microscopic distance above the surface, which is of the
order of one free path length of water vapor molecules. Energy used for evaporation is
ultimately released in the form of thermal radiation of the Earth’s surface, with no input5
of latent heat into the atmosphere.
At Γ>ΓH2O the situation is quite different. In this case water vapor is saturated at all
heights, pw (z)=pH2O(T (z)), but it is out of hydrostatic equilibrium. Due to the steep de-
cline of air temperature with height, the atmospheric column above any height z cannot
bear a sufficient amount of water for its weight to compensate water vapor partial pres-10
sure at height z. The excessive moisture condenses and precipitates. Partial pressure
of the saturated water vapor near the surface exceeds the weight of water vapor in the
entire atmospheric column. The lapse rate of water vapor partial pressure, −d pw /dz ,becomes larger than the weight of a unit volume of water vapor, cf. Eq. (7). There
appears an uncompensated force acting on atmospheric air and water vapor. Under15
this force, upward fluxes of air and water vapor originate that are accompanied by the
vertical transport of latent heat. With water vapor continuously leaving the surface layer
for the upper atmosphere, saturation of water vapor near the surface is maintained by
continuous evaporation. Notably, if evaporation discontinues, atmospheric water va-
por ultimately comes to the state of hydrostatic equilibrium with relative humidity at the20
surface much less than unity.
Violation of hydrostatic equilibrium is manifested as a strong compression of the
vertical distribution of water vapor as compared to the distribution of atmospheric air,
Eq. (8). At the observed mean atmospheric value of Γ=Γob=6.5K km−1
, see Ap-
pendix A, we obtain from Eqs. (8), (10) and (11):25
hhH2O
=Γob
ΓH2O
M w
M T sT ≡ β ≡ βs
T sT
, βs = 3.5. (12)
The compression coefficient β grows weakly with z due to the z-dependent drop
of temperature T corresponding to Γob=6.5K km−1
. At z=hH2O, which defines the
2636
7/30/2019 Bombeamento biótico da umidade atmosférica do ciclo hidrológico terrestre
http://slidepdf.com/reader/full/bombeamento-biotico-da-umidade-atmosferica-do-ciclo-hidrologico-terrestre 9/27
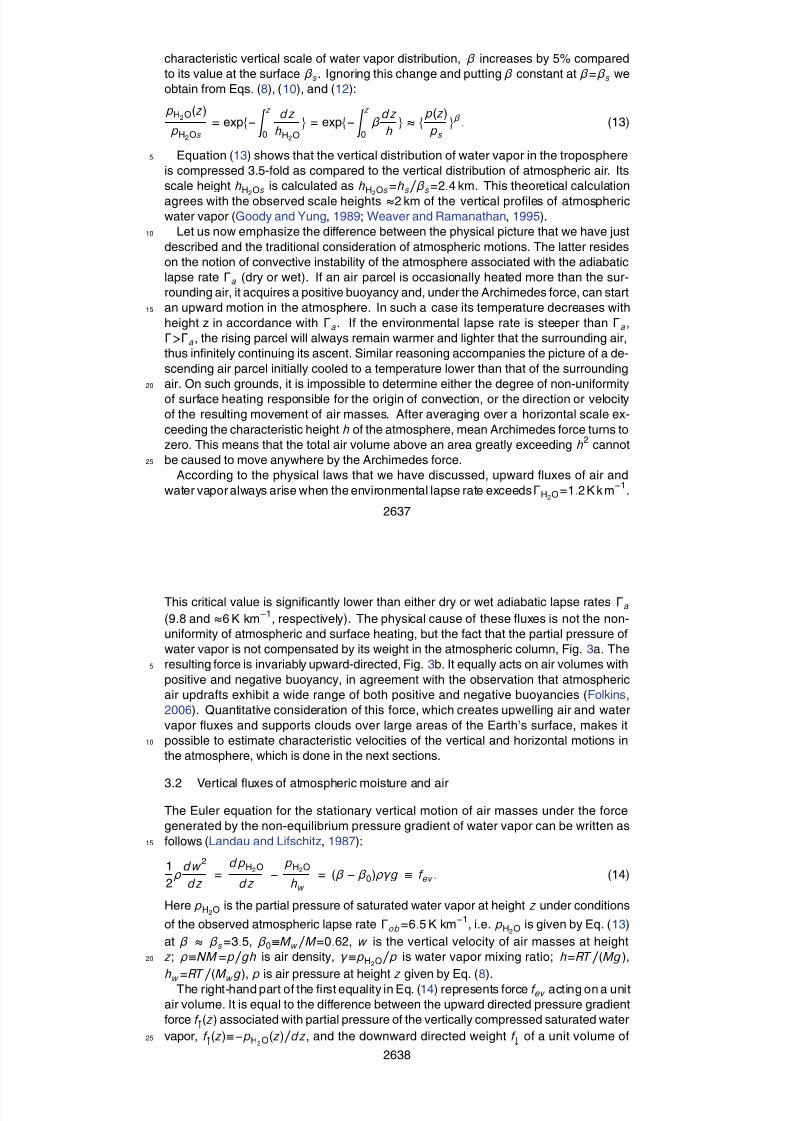
characteristic vertical scale of water vapor distribution, β increases by 5% compared
to its value at the surface βs. Ignoring this change and putting β constant at β=βs we
obtain from Eqs. (8), (10), and (12):
pH2O(z)
pH2Os
= exp{−
z0
d z
hH2O
} = exp{−
z0
βd z
h} ≈ {
p(z)
ps
}β. (13)
Equation (13) shows that the vertical distribution of water vapor in the troposphere5
is compressed 3.5-fold as compared to the vertical distribution of atmospheric air. Its
scale height hH2
Os is calculated as hH2
Os=hs/βs=2.4 km. This theoretical calculation
agrees with the observed scale heights ≈2 km of the vertical profiles of atmospheric
water vapor (Goody and Yung, 1989; Weaver and Ramanathan, 1995).
Let us now emphasize the difference between the physical picture that we have just10
described and the traditional consideration of atmospheric motions. The latter resides
on the notion of convective instability of the atmosphere associated with the adiabatic
lapse rate Γa (dry or wet). If an air parcel is occasionally heated more than the sur-
rounding air, it acquires a positive buoyancy and, under the Archimedes force, can start
an upward motion in the atmosphere. In such a case its temperature decreases with15
height z in accordance with Γa. If the environmental lapse rate is steeper than Γa,
Γ>Γa, the rising parcel will always remain warmer and lighter that the surrounding air,
thus infinitely continuing its ascent. Similar reasoning accompanies the picture of a de-
scending air parcel initially cooled to a temperature lower than that of the surrounding
air. On such grounds, it is impossible to determine either the degree of non-uniformity20
of surface heating responsible for the origin of convection, or the direction or velocity
of the resulting movement of air masses. After averaging over a horizontal scale ex-
ceeding the characteristic height h of the atmosphere, mean Archimedes force turns to
zero. This means that the total air volume above an area greatly exceeding h2cannot
be caused to move anywhere by the Archimedes force.25
According to the physical laws that we have discussed, upward fluxes of air and
water vapor always arise when the environmental lapse rate exceeds ΓH2O=1.2 K k m−1
.
2637
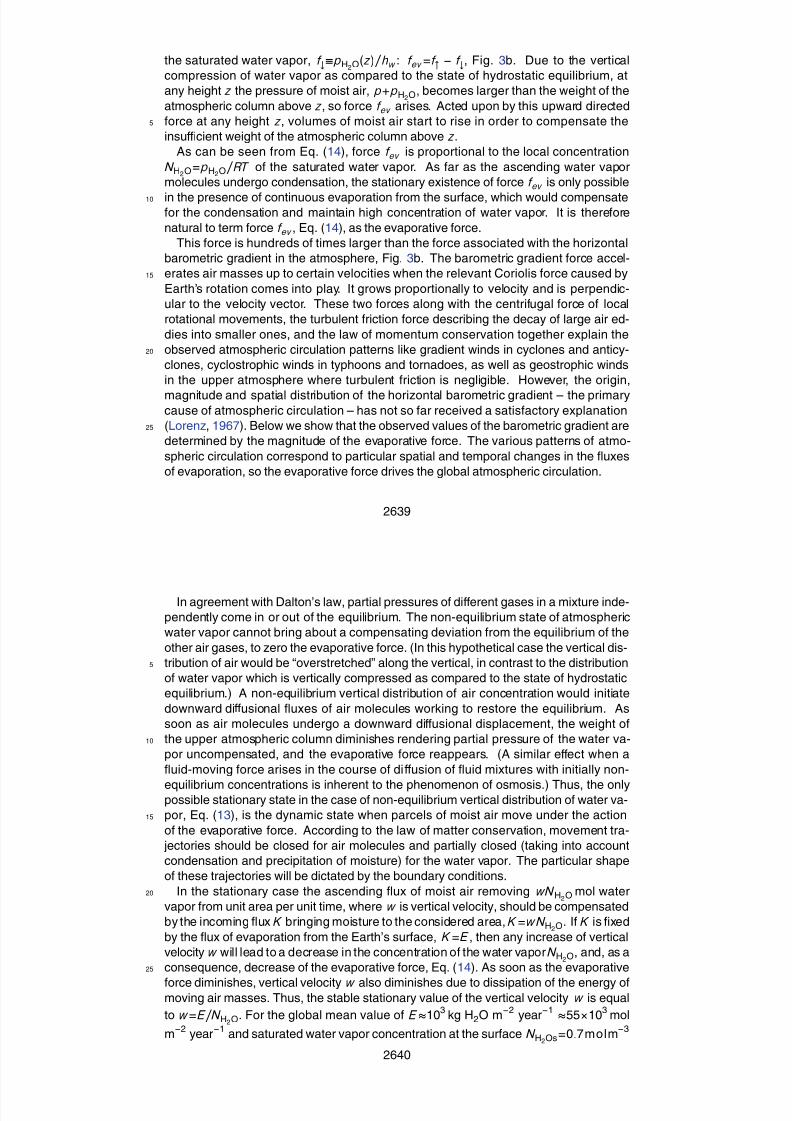
This critical value is significantly lower than either dry or wet adiabatic lapse rates Γa
(9.8 and ≈6 K km−1
, respectively). The physical cause of these fluxes is not the non-
uniformity of atmospheric and surface heating, but the fact that the partial pressure of
water vapor is not compensated by its weight in the atmospheric column, Fig. 3a. The
resulting force is invariably upward-directed, Fig. 3b. It equally acts on air volumes with5
positive and negative buoyancy, in agreement with the observation that atmospheric
air updrafts exhibit a wide range of both positive and negative buoyancies (Folkins,
2006). Quantitative consideration of this force, which creates upwelling air and water
vapor fluxes and supports clouds over large areas of the Earth’s surface, makes it
possible to estimate characteristic velocities of the vertical and horizontal motions in10
the atmosphere, which is done in the next sections.
3.2 Vertical fluxes of atmospheric moisture and air
The Euler equation for the stationary vertical motion of air masses under the force
generated by the non-equilibrium pressure gradient of water vapor can be written as
follows (Landau and Lifschitz, 1987):15
1
2ρ
d w 2
dz=
d pH2O
d z−
pH2O
hw
= (β − β0)ργg ≡ f ev . (14)
Here pH2O is the partial pressure of saturated water vapor at height z under conditions
of the observed atmospheric lapse rate Γob=6.5 K km−1
, i.e. pH2O is given by Eq. (13)
at β ≈ βs=3.5, β0≡M w /M =0.62, w is the vertical velocity of air masses at height
z; ρ≡NM =p/gh is air density, γ ≡pH2O/p is water vapor mixing ratio; h=RT /(Mg),20
hw
=RT /(M w
g), p is air pressure at height z given by Eq. (8).
The right-hand part of the first equality in Eq. (14) represents force f ev acting on a unit
air volume. It is equal to the difference between the upward directed pressure gradient
force f ↑(z) associated with partial pressure of the vertically compressed saturated water
vapor, f ↑(z)≡−pH2O(z)/dz, and the downward directed weight f ↓ of a unit volume of25
2638
7/30/2019 Bombeamento biótico da umidade atmosférica do ciclo hidrológico terrestre
http://slidepdf.com/reader/full/bombeamento-biotico-da-umidade-atmosferica-do-ciclo-hidrologico-terrestre 10/27
the saturated water vapor, f ↓≡pH2O(z)/hw : f ev =f ↑ − f ↓, Fig. 3b. Due to the vertical
compression of water vapor as compared to the state of hydrostatic equilibrium, at
any height z the pressure of moist air, p+pH2O, becomes larger than the weight of the
atmospheric column above z, so force f ev arises. Acted upon by this upward directed
force at any height z, volumes of moist air start to rise in order to compensate the5
insufficient weight of the atmospheric column above z.
As can be seen from Eq. (14), force f ev is proportional to the local concentration
N H2O=pH2O/RT of the saturated water vapor. As far as the ascending water vapor
molecules undergo condensation, the stationary existence of force f ev is only possible
in the presence of continuous evaporation from the surface, which would compensate10
for the condensation and maintain high concentration of water vapor. It is therefore
natural to term force f ev , Eq. (14), as the evaporative force.
This force is hundreds of times larger than the force associated with the horizontal
barometric gradient in the atmosphere, Fig. 3b. The barometric gradient force accel-
erates air masses up to certain velocities when the relevant Coriolis force caused by15
Earth’s rotation comes into play. It grows proportionally to velocity and is perpendic-
ular to the velocity vector. These two forces along with the centrifugal force of local
rotational movements, the turbulent friction force describing the decay of large air ed-
dies into smaller ones, and the law of momentum conservation together explain the
observed atmospheric circulation patterns like gradient winds in cyclones and anticy-20
clones, cyclostrophic winds in typhoons and tornadoes, as well as geostrophic winds
in the upper atmosphere where turbulent friction is negligible. However, the origin,
magnitude and spatial distribution of the horizontal barometric gradient – the primarycause of atmospheric circulation – has not so far received a satisfactory explanation
(Lorenz, 1967). Below we show that the observed values of the barometric gradient are25
determined by the magnitude of the evaporative force. The various patterns of atmo-
spheric circulation correspond to particular spatial and temporal changes in the fluxes
of evaporation, so the evaporative force drives the global atmospheric circulation.
2639
In agreement with Dalton’s law, partial pressures of different gases in a mixture inde-
pendently come in or out of the equilibrium. The non-equilibrium state of atmospheric
water vapor cannot bring about a compensating deviation from the equilibrium of the
other air gases, to zero the evaporative force. (In this hypothetical case the vertical dis-
tribution of air would be “overstretched” along the vertical, in contrast to the distribution5
of water vapor which is vertically compressed as compared to the state of hydrostatic
equilibrium.) A non-equilibrium vertical distribution of air concentration would initiate
downward diffusional fluxes of air molecules working to restore the equilibrium. As
soon as air molecules undergo a downward diffusional displacement, the weight of
the upper atmospheric column diminishes rendering partial pressure of the water va-10
por uncompensated, and the evaporative force reappears. (A similar effect when a
fluid-moving force arises in the course of diffusion of fluid mixtures with initially non-
equilibrium concentrations is inherent to the phenomenon of osmosis.) Thus, the onlypossible stationary state in the case of non-equilibrium vertical distribution of water va-
por, Eq. (13), is the dynamic state when parcels of moist air move under the action15
of the evaporative force. According to the law of matter conservation, movement tra-
jectories should be closed for air molecules and partially closed (taking into account
condensation and precipitation of moisture) for the water vapor. The particular shape
of these trajectories will be dictated by the boundary conditions.
In the stationary case the ascending flux of moist air removing wN H2O mol water20
vapor from unit area per unit time, where w is vertical velocity, should be compensated
by the incoming flux K bringing moisture to the considered area, K =wN H2O. If K is fixed
by the flux of evaporation from the Earth’s surface, K =E , then any increase of vertical
velocity w will lead to a decrease in the concentration of the water vapor N H2O, and, as a
consequence, decrease of the evaporative force, Eq. (14). As soon as the evaporative25
force diminishes, vertical velocity w also diminishes due to dissipation of the energy ofmoving air masses. Thus, the stable stationary value of the vertical velocity w is equal
to w =E/N H2O. For the global mean value of E ≈103
kg H2O m−2
year−1 ≈55×10
3mol
m−2
year−1
and saturated water vapor concentration at the surface N H2Os=0.7molm−3
2640
7/30/2019 Bombeamento biótico da umidade atmosférica do ciclo hidrológico terrestre
http://slidepdf.com/reader/full/bombeamento-biotico-da-umidade-atmosferica-do-ciclo-hidrologico-terrestre 11/27
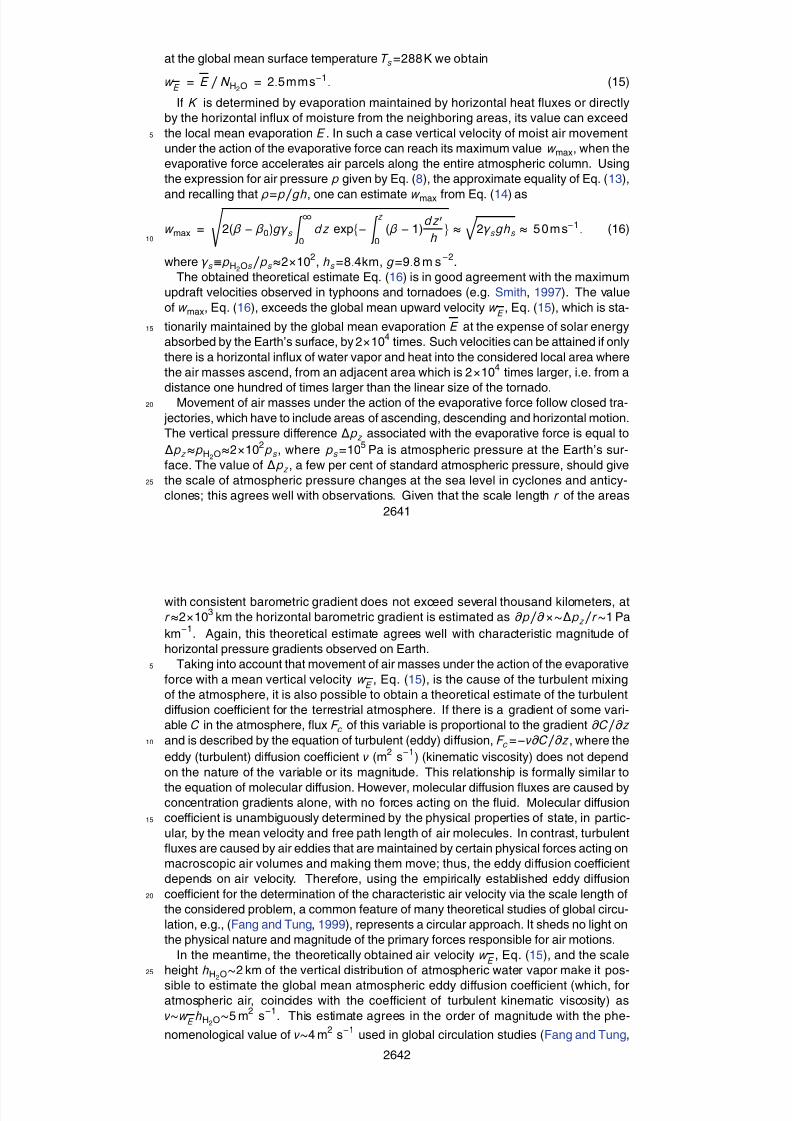
at the global mean surface temperature T s=288 K we obtain
w E
= E / N H2O = 2.5m m s−1. (15)
If K is determined by evaporation maintained by horizontal heat fluxes or directly
by the horizontal influx of moisture from the neighboring areas, its value can exceed
the local mean evaporation E . In such a case vertical velocity of moist air movement5
under the action of the evaporative force can reach its maximum value w max, when the
evaporative force accelerates air parcels along the entire atmospheric column. Using
the expression for air pressure p given by Eq. (8), the approximate equality of Eq. (13),
and recalling that ρ=p/gh, one can estimate w max from Eq. (14) as
w max =
2(β − β0)gγ s
∞0
d z exp{−
z0
(β − 1)d z
h} ≈
2γ sghs ≈ 5 0 m s−1. (16)
10
where γ s≡pH2Os/ps≈2×102
, hs=8.4km, g=9.8 m s−2
.
The obtained theoretical estimate Eq. (16) is in good agreement with the maximum
updraft velocities observed in typhoons and tornadoes (e.g. Smith, 1997). The value
of w max, Eq. (16), exceeds the global mean upward velocity w E
, Eq. (15), which is sta-
tionarily maintained by the global mean evaporation E at the expense of solar energy15
absorbed by the Earth’s surface, by 2×10⁴
times. Such velocities can be attained if only
there is a horizontal influx of water vapor and heat into the considered local area where
the air masses ascend, from an adjacent area which is 2×10⁴
times larger, i.e. from a
distance one hundred of times larger than the linear size of the tornado.Movement of air masses under the action of the evaporative force follow closed tra-20
jectories, which have to include areas of ascending, descending and horizontal motion.
The vertical pressure difference ∆pz associated with the evaporative force is equal to
∆pz≈pH2O≈2×10²ps, where ps=10
5Pa is atmospheric pressure at the Earth’s sur-
face. The value of ∆pz, a few per cent of standard atmospheric pressure, should give
the scale of atmospheric pressure changes at the sea level in cyclones and anticy-25
clones; this agrees well with observations. Given that the scale length r of the areas
2641
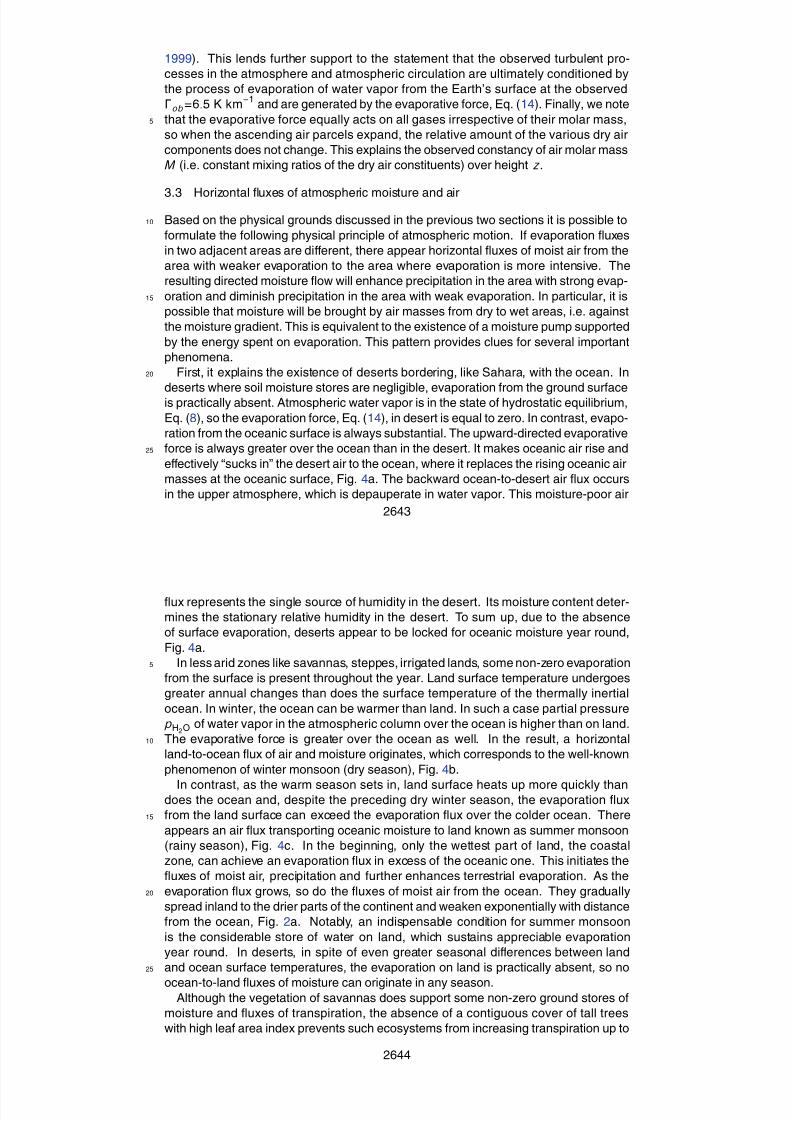
with consistent barometric gradient does not exceed several thousand kilometers, at
r ≈2×10³
km the horizontal barometric gradient is estimated as ∂p/∂×∼∆pz/r ∼1 Pa
km−1
. Again, this theoretical estimate agrees well with characteristic magnitude of
horizontal pressure gradients observed on Earth.
Taking into account that movement of air masses under the action of the evaporative5
force with a mean vertical velocity w E
, Eq. (15), is the cause of the turbulent mixing
of the atmosphere, it is also possible to obtain a theoretical estimate of the turbulent
diffusion coefficient for the terrestrial atmosphere. If there is a gradient of some vari-
able C in the atmosphere, flux F c of this variable is proportional to the gradient ∂C/∂zand is described by the equation of turbulent (eddy) diffusion, F c=−ν∂C/∂z, where the10
eddy (turbulent) diffusion coefficient ν (m2
s−1
) (kinematic viscosity) does not depend
on the nature of the variable or its magnitude. This relationship is formally similar to
the equation of molecular diffusion. However, molecular diffusion fluxes are caused byconcentration gradients alone, with no forces acting on the fluid. Molecular diffusion
coefficient is unambiguously determined by the physical properties of state, in partic-15
ular, by the mean velocity and free path length of air molecules. In contrast, turbulent
fluxes are caused by air eddies that are maintained by certain physical forces acting on
macroscopic air volumes and making them move; thus, the eddy diffusion coefficient
depends on air velocity. Therefore, using the empirically established eddy diffusion
coefficient for the determination of the characteristic air velocity via the scale length of20
the considered problem, a common feature of many theoretical studies of global circu-
lation, e.g., (Fang and Tung, 1999), represents a circular approach. It sheds no light on
the physical nature and magnitude of the primary forces responsible for air motions.
In the meantime, the theoretically obtained air velocity w E
, Eq. (15), and the scale
height hH2O∼2 km of the vertical distribution of atmospheric water vapor make it pos-25
sible to estimate the global mean atmospheric eddy diffusion coefficient (which, foratmospheric air, coincides with the coefficient of turbulent kinematic viscosity) as
ν∼w E
hH2O∼5 m2
s−1
. This estimate agrees in the order of magnitude with the phe-
nomenological value of ν∼4 m2
s−1
used in global circulation studies (Fang and Tung,
2642
7/30/2019 Bombeamento biótico da umidade atmosférica do ciclo hidrológico terrestre
http://slidepdf.com/reader/full/bombeamento-biotico-da-umidade-atmosferica-do-ciclo-hidrologico-terrestre 12/27
1999). This lends further support to the statement that the observed turbulent pro-
cesses in the atmosphere and atmospheric circulation are ultimately conditioned by
the process of evaporation of water vapor from the Earth’s surface at the observed
Γob=6.5 K km−1
and are generated by the evaporative force, Eq. (14). Finally, we note
that the evaporative force equally acts on all gases irrespective of their molar mass,5
so when the ascending air parcels expand, the relative amount of the various dry air
components does not change. This explains the observed constancy of air molar mass
M (i.e. constant mixing ratios of the dry air constituents) over height z.
3.3 Horizontal fluxes of atmospheric moisture and air
Based on the physical grounds discussed in the previous two sections it is possible to10
formulate the following physical principle of atmospheric motion. If evaporation fluxes
in two adjacent areas are different, there appear horizontal fluxes of moist air from the
area with weaker evaporation to the area where evaporation is more intensive. The
resulting directed moisture flow will enhance precipitation in the area with strong evap-
oration and diminish precipitation in the area with weak evaporation. In particular, it is15
possible that moisture will be brought by air masses from dry to wet areas, i.e. against
the moisture gradient. This is equivalent to the existence of a moisture pump supported
by the energy spent on evaporation. This pattern provides clues for several important
phenomena.
First, it explains the existence of deserts bordering, like Sahara, with the ocean. In20
deserts where soil moisture stores are negligible, evaporation from the ground surfaceis practically absent. Atmospheric water vapor is in the state of hydrostatic equilibrium,
Eq. (8), so the evaporation force, Eq. (14), in desert is equal to zero. In contrast, evapo-
ration from the oceanic surface is always substantial. The upward-directed evaporative
force is always greater over the ocean than in the desert. It makes oceanic air rise and25
effectively “sucks in” the desert air to the ocean, where it replaces the rising oceanic air
masses at the oceanic surface, Fig. 4a. The backward ocean-to-desert air flux occurs
in the upper atmosphere, which is depauperate in water vapor. This moisture-poor air
2643
flux represents the single source of humidity in the desert. Its moisture content deter-
mines the stationary relative humidity in the desert. To sum up, due to the absence
of surface evaporation, deserts appear to be locked for oceanic moisture year round,
Fig. 4a.
In less arid zones like savannas, steppes, irrigated lands, some non-zero evaporation5
from the surface is present throughout the year. Land surface temperature undergoes
greater annual changes than does the surface temperature of the thermally inertial
ocean. In winter, the ocean can be warmer than land. In such a case partial pressure
pH2O of water vapor in the atmospheric column over the ocean is higher than on land.
The evaporative force is greater over the ocean as well. In the result, a horizontal10
land-to-ocean flux of air and moisture originates, which corresponds to the well-known
phenomenon of winter monsoon (dry season), Fig. 4b.
In contrast, as the warm season sets in, land surface heats up more quickly thandoes the ocean and, despite the preceding dry winter season, the evaporation flux
from the land surface can exceed the evaporation flux over the colder ocean. There15
appears an air flux transporting oceanic moisture to land known as summer monsoon
(rainy season), Fig. 4c. In the beginning, only the wettest part of land, the coastal
zone, can achieve an evaporation flux in excess of the oceanic one. This initiates the
fluxes of moist air, precipitation and further enhances terrestrial evaporation. As the
evaporation flux grows, so do the fluxes of moist air from the ocean. They gradually20
spread inland to the drier parts of the continent and weaken exponentially with distance
from the ocean, Fig. 2a. Notably, an indispensable condition for summer monsoon
is the considerable store of water on land, which sustains appreciable evaporation
year round. In deserts, in spite of even greater seasonal differences between land
and ocean surface temperatures, the evaporation on land is practically absent, so no25
ocean-to-land fluxes of moisture can originate in any season.Although the vegetation of savannas does support some non-zero ground stores of
moisture and fluxes of transpiration, the absence of a contiguous cover of tall trees
with high leaf area index prevents such ecosystems from increasing transpiration up to
2644
7/30/2019 Bombeamento biótico da umidade atmosférica do ciclo hidrológico terrestre
http://slidepdf.com/reader/full/bombeamento-biotico-da-umidade-atmosferica-do-ciclo-hidrologico-terrestre 13/27
a level when the appearing flux of atmospheric moisture from the ocean would com-
pensate runoff from the optimally moistened soil. The biotic pump of atmospheric
moisture does not work in such scarcely vegetated ecosystems; precipitation weakens
exponentially with distance from the ocean, Fig. 2a.
The phenomenon of trade winds (Hadley circulation) can also be explained on these5
grounds. As far as in the stationary case solar radiation is the source of energy for
evaporation, the increase of the solar flux towards the equator should be accompanied
by a corresponding increase of evaporation flux E , evaporative force f ev , Eq. (14), and
vertical velocity w , Eq. (15). The intensive ascent of moist air on the equator has
to be compensated by horizontal air fluxes originating at higher latitudes and moving10
towards the equator, where they ascend and travel back in the upper atmosphere,
Fig. 4d. Subsidence of dry air masses at the non-equatorial border of Hadley cells
leads diminishes water vapor concentration in these areas, producing an additional,
unrelated to the geography of solar radiation, decrease of the evaporative force. This
creates favorable conditions for Ferrel circulation, i.e. movement of air masses from15
subtropics to higher latitudes.
Finally, natural forest ecosystems can ensure the necessary ocean-to-land flux of at-
mospheric moisture in any direction. Due to the high leaf area index, which is equal to
the total area of all leaves of the plant divided by the plant projection area on the ground
surface, the cumulative evaporating surface of the forest can be much higher than the20
open water surface of the same area. Forest transpiration can be several times higher
than the evaporation flux in the ocean, approaching the maximum possible value lim-
ited by solar radiation. Maximum evaporation, corresponding to the global mean solarflux absorbed by the Earth’s surface I =150Wm
−2, is about I/(ρH2OsQ)≈2 myear
−1,
where ρH2Os=10−2
kg m−3
is the water vapor density at the surface at T s=288 K. In the25
meantime, global evaporation from the oceanic surface is substantially lower, about
1.2m year−1
(L’vovitch, 1979). Intensive ascending fluxes of moist air generated by for-
est transpiration induce the compensating low-level horizontal influx of moisture-laden
air from the ocean. When the incoming air fluxes ascend, the oceanic moisture con-
2645
denses and precipitates over the forest. Unburdened of moisture, dry air returns to the
ocean from land in the upper atmosphere.
As far as in the natural forest with high leaf area index transpiration, limited by solar
radiation only, can exceed evaporation from the ocean all year round, the correspond-
ing horizontal influx of oceanic moisture into the forest can persist throughout the year5
as well, Fig. 4e. Here lies the difference between the undisturbed natural forest and
open ecosystems with low leaf area index. In the latter ecosystems the ocean-to-land
flux can only originate when the land surface temperature is much higher than the
oceanic surface temperature, Fig. 4b, c.
Total force causing air above the natural forest canopy to ascend is equal to the sum10
of local evaporative forces generated by the transpiration of individual trees. On the
other hand, this cumulative force acts to pump the atmospheric moisture inland from
the ocean via the coastline. Therefore, the total flux F (0) of moisture from the oceanto the river basin, which compensates the total runoff, is proportional to the number
of trees in the forest and, consequently, to the area of the forest-covered river basin.15
According to the law of matter conservation (continuity equation), the horizontal flux of
moisture via the vertical cross-section of the atmospheric column along the coastline,
F (0)=W auDh, where D is the coastline length (basin width), h is the height of the
atmospheric column, u is horizontal air velocity and W a (kg H2O m−2
) is the moisture
content in the atmospheric column, should be equal to the ascending flux of moisture20
across the horizontal cross-section of the atmospheric column above the entire river
basin of area DL, which is equal to W aw fDL, where w f is the vertical velocity of air
motion. From this we obtain w f=uh/L.
The magnitudes of the velocities w f and u are determined by the condition that the
power developed by the evaporative force in the atmospheric column above the forest25
canopy is equal to the power of dissipation of the horizontal air fluxes near the Earth’ssurface. The power Aev of the evaporative force f ev over the forest canopy is equal to
Aev = f ev w fhH2ODL∼ρ(β−β0)γ sgw fhH2ODL, see Eq. (14). The power of dissipation Af r
associated with the friction force f f r is equal to Af r =f f r uzsDL. Friction force is equal
2646
7/30/2019 Bombeamento biótico da umidade atmosférica do ciclo hidrológico terrestre
http://slidepdf.com/reader/full/bombeamento-biotico-da-umidade-atmosferica-do-ciclo-hidrologico-terrestre 14/27
to f f r =ρν∂2
u/∂z2
=ρνu/z2s (Lorenz, 1967), where zs is the height of the surface layer
where velocity u changes rapidly with height due to substantial friction. Taking into
account that ν∼w fhH2O, we have f f r =ρw fhH2Ou/z2s . Equating powers Aev andAf r we
obtain (β−β0)γ sg∼u2/zs. Taking zs∼ 25m and γ s∼2×10⁻²
, we obtain an estimate of
the horizontal velocity u ∼ 4 m s−1
, which coincides in its order of magnitude with the5
observed global mean wind speed (Gustavson, 1979).
Horizontal velocity u sufficient for the compensation of the river runoff R from the
optimally moistened soil in the river basin of area DL covered by natural forest is cal-
culated from the relationship RDL=W a
uD. For example, for the tropical Amazon we
have R ∼103
kg H2O m−2
year−1
(Marengo, 2004), W a∼50kg H2O m−2
(Randel et al.,10
1996) and L∼3000 km, Fig. 2b, so u=RL/W a∼1.6 m s−1
and w f=Rh/W a ∼ 5.6 m m s−1
at h=8.4km, see Eq. (8). It follows from the relationship w f>w E ≈2.5 m m s
−1, where
w E
, Eq. (15), corresponds to the global mean evaporation from the Earth’s surface,
that only undisturbed natural forests with closed canopies and high leaf area index can
maintain optimal soil moisture content at any distance from the ocean at the expense15
of pumping atmospheric moisture from the ocean. This is because only such ecosys-
tems are able to ensure transpiration fluxes exceeding the fluxes of evaporation from
the open water surface of the ocean.
The outlined principles of horizontal air motions, Fig. 4a–e, allow one to make several
generalizations. First, if the coastal zone of width l ∼600 km is deforested, the flow of20
oceanic moisture to the inner part of the continent is switched o ff, thus dooming the
inner continental forest to perish. On the other hand, a narrow band of forest alongthe coast cannot develop a power high enough for pumping atmospheric moisture from
the ocean in amounts sufficient for keeping the entire continent moistened and for
supporting powerful river systems. Moreover, if the inner part of the continent is turned25
to an extensive desert with negligible evaporation, the originating horizontal land-to-
ocean air fluxes, cf. Fig. 4a, may become more powerful than the small ocean-to-land
air fluxes maintained by the narrow forest band near the coast. In such a case the
2647
forest will aridify and die out despite its immediate closeness to the open water surface
of the ocean or inner sea. Third, as far as the direction and velocity of horizontal
air motions is dictated by the difference in evaporative forces between the considered
areas, it should apparently be easier for the biota to pump atmospheric moisture from
a cold ocean with low evaporation, i.e. from an ocean situated in higher latitudes than5
the forested river basin itself. This explains the stable existence of the forested basins
of the Great Siberian Rivers.
In the meantime, pumping of atmospheric moisture to land from a warm ocean,
which is realized in the tropical river basins, is a more complex problem. If the flux
of evaporation from the warm oceanic surface exceeds the transpiration flux from the10
forest canopy, there appears a land-to-ocean flux of atmospheric moisture, which, to-
gether with the river runoff, will act to deplete forest moisture stores. To avoid this, it is
necessary for the forest to maintain high transpiration at all times. Even if during themost unfavorable season of the warmest oceanic temperatures this flux will neverthe-
less prevent the moisture of the atmospheric column above the forest from being blown15
away to the ocean. Thus, we come to a non-trivial conclusion that the more moisture is
evaporated from the land surface, the less moisture is lost by land. High transpiration
rates observed in the Amazon forests during the dry season (da Rocha et al., 2004)
can well serve this goal.
In the next section we consider the physical principles of efficient moisture retention20
under the closed canopy, which prevent uncontrollable losses of atmospheric mois-
ture and allow the trees to maintain high transpiration power independent of rainfall
fluctuations.
3.4 Water preservation by closed canopies
In natural forest ecosystems with well-developed closed canopies the daytime air tem-25
perature increases in the upward direction, i.e. it is higher in the canopy than at the
ground surface (Shuttleworth, 1989; Kruijt et al., 2000; Szarzynski and Anhuf, 2001),
because the incoming solar radiation is predominantly absorbed in the canopy. When
2648
7/30/2019 Bombeamento biótico da umidade atmosférica do ciclo hidrológico terrestre
http://slidepdf.com/reader/full/bombeamento-biotico-da-umidade-atmosferica-do-ciclo-hidrologico-terrestre 15/27
canopy temperature T c exceeds ground temperature T g, the under-canopy lapse rate
becomes negative, Γ=−dT/dz ≈ (T c−T g)/zc<0, where zc is the canopy height reach-
ing several tens of meters in natural forests. As far as Γ<0<ΓH2O=1.2 K km−1
, in this
case, according to the results of the previous sections, water vapor under the canopy
remains in hydrostatic equilibrium. Evaporation from soil and the upward fluxes of5
water vapor from beneath the canopy are absent. Water vapor partial pressure pw
conforms to Eq. (8) (with p and h changed for pw and hw , respectively) and remains
practically constant under the canopy with zchw , pw (z)≈pw (0)≡pws . Relative humid-
ity RH (z), which is equal to 100% immediately above the wet soil surface, decreases
with height as RH (z)=1/ exp{[T w /T s]−[T w /T (z)]}, cf. Eqs. (8) and (9) (Szarzynski and10
Anhuf, 2001).
The daytime hydrostatic equilibrium of the saturated water vapor above the ground
surface under the closed canopy prevents biotically uncontrolled losses of soil water
to the upper atmosphere. This mechanism explains why the ground surface of undis-
turbed closed-canopy forests always remains wet, which is manifested as low fire sus-15
ceptibility of undisturbed natural forests with closed canopies (Cochrane et al., 1999;
Nepstad et al., 2004). In higher latitudes, where the solar angle is lower than in the
tropics and solar beams at midday are slanting rather than perpendicular to the sur-
face, the daytime temperature inversion within the canopy can arise at a lesser degree
of canopy closure than in the tropics, as far as the lower solar angle diminishes the20
difference in the solar radiation obtained by canopy and inter-canopy patches, e.g.,
(Breshears et al., 1998).
At nighttime the soil surface under the closed canopy is warmer than the canopy due
to the rapid radiative cooling of the latter (Shuttleworth et al., 1985; Szarzynski and
Anhuf, 2001). The observed temperature lapse rate Γob is positive and can exceed25
the mean global value of 6.5 K km−1
by dozens of times (Szarzynski and Anhuf, 2001).
This leads to a very high value of the compression coe fficient β, Eq. (12), for water
vapor. Water vapor is saturated in the entire atmospheric column under the canopy. For
example, in the tropical forests of Venezuela the nighttime lapse rate under the canopy
2649
is about Γob=70K km−1ΓH2O (Szarzynski and Anhuf, 2001), which corresponds to
β=36, see Eq. (12). Relative humidity under the canopy is then equal to 100% at all
heights. In spite of the huge evaporative force, Eq. (14) that arises at large values of
β, the ascending fluxes of air under the closed canopy of natural forests remain small
due to the high aerodynamic resistance of the trees.5
Above the closed canopy, as well as on open areas like pastures and within open
canopies, e.g., (Mahrt et al., 2000), nighttime temperature inversions are common,
caused by the rapid radiative cooling of the ground surface or canopy. Air temperature
increases with height up to several hundred meters ( Karlsson, 2000; Acevedo et al.,
2004). Temperature inversions result in the condensation of water vapor in the lower10
cooler layer near the surface (or canopy) often accompanied by formation of fog. As
far as at Γ<0<ΓH2O there are no ascending fluxes of water vapor, fog moisture remains
near the ground surface z=0. However, with increasing solar heating during the day-time and Γ growing up to Γ>ΓH2O, there appear upward water vapor fluxes. On open
areas and areas covered by low vegetation, fog moisture is then taken away from the15
ground layer to the upper atmospheric layers and ultimately leaves the ecosystem. By
contrast, fog formed at night above the closed canopy at z=zc gravitates to the ground
layer z=0 under the canopy, where during the daytime the moisture is prevented from
leaking to the upper atmosphere by the daytime temperature inversion.
This analysis illustrates that both large canopy height and high degree of canopy20
closure inherent to undisturbed natural forests are important for efficient soil water
retention.
During the day air temperature above the forest canopy rapidly decreases with
height, ΓΓH2O (Szarzynski and Anhuf, 2001). Transpiration of water vapor from the
leaf stomata lead to formation of an ascending flux of water vapor and air, which sup-25
ports clouds. When stomata are closed and transpiration ceases, the ascent of airmasses discontinues as well. The evaporative force f ev , Eq. (14), vanishes; liquid at-
mospheric water, no longer supported, precipitates under gravity. Precipitation fluxes
can be additionally regulated by the biota via directed change of various biogenic con-
2650
7/30/2019 Bombeamento biótico da umidade atmosférica do ciclo hidrológico terrestre
http://slidepdf.com/reader/full/bombeamento-biotico-da-umidade-atmosferica-do-ciclo-hidrologico-terrestre 16/27
densation nuclei. Observations indicate that stomata of most plants close during the
midday (Bond and Kavanagh, 1999; Goulden et al., 2004). This allows one to expect
that precipitation on land should predominantly occur in the second part of the day. In
the ocean, where there is no diurnal biological cycle of water vapor ascent, the diurnal
cycle of precipitation is not expected to be pronounced either. These predictions are in5
agreement with the available data on the diurnal cycle of rainfall in the tropics ( Nesbitt
et al., 2003).
4 Biological principles of the biotic pump of atmospheric moisture
Based on the analysis of the spatial distribution of precipitation over forested and non-
forested areas, in Sect. 2 we demonstrated that the biotic pump of atmospheric mois-10
ture must exist, as follows from the law of matter conservation and the small length
l ∼600 km of the physical dampening of precipitation fluxes on land. In Sect. 3 the
physical principles of the biotic pump were described. Regarding the ecological and
biological grounds of its functioning, the inherently complex applications of the laws of
physics by natural forest ecosystems have been refined and polished during the hun-15
dred million years of evolution, so it will hardly be ever possible to study them in detail.
However, it is worthy to check that the existence of the biotic moisture pump does not
contradict the known biological principles of life organization.
Moisture enters a forest-covered river basin via the linear coastline, while it is spent
on the two-dimensional area of the basin. Area-specific loss of water to runo ff is inde-20
pendent of distance x from the ocean, R (x )=R (0), due to the constant moisture content
W (x )=W (0) of the uniformly moistened forest soil, Sect. 2. Thus, the atmospheric flux
of moisture via the coastline (dimension kg H2O m−1
s−1
), which compensates river
runoff in a river basin of length L (L is counted inland from the coast), F (0)=L
0R (x )dx ,
should grow linearly with basin length L, F (0)=R (0)L. The biotic moisture pump works25
to ensure this effect. Without biotic pump the value of F (0) would be independent of L,
cf. Eq. (1), R (x ) would exponentially decrease with growing distance x from the ocean,
2651
while the mean basin runoff would decrease inversely proportionally to L, Sect. 2.
The problem of meeting the demand of matter or energy of an n-dimensional area
(n=2 for the river basin) by a flux of matter or energy via an (n−1)-dimensional area
(one-dimensional coastline of the river basin) is a fundamental biological problem re-
peatedly faced by life in the course of evolution. Living organisms consume energy via5
the two-dimensional body surface and spend it within the three-dimensional body vol-
ume. In very much the same manner as local runoff and precipitation in natural forests
are maintained independent of the distance from the ocean, living cells are supplied by
an energy flux that is on average independent of the size of the organism.
Analysis of the metabolic power of living organisms from bacteria to the largest mam-10
mals revealed that, independent of organismal body size, mean energy consumption
of living tissues constitutes 1–10 W kg−1
(Makarieva et al., 2005a,b,c). The smallest
organisms like unicells can satisfy their energetic needs at the expense of passive dif-fusion fluxes of matter, if their linear body size L is much less than the scale length
l of exponential weakening of the diffusion matter fluxes. For example, bacteria have15
to transport the food obtained via cell surface over less than one micron (bacterial cell
length), while the distance between elephant’s trunk (the food-gathering organ) and its
brain or heart is about ten million times longer. Passive diffusion fluxes cannot meet the
energetic demands of large organisms with Ll . Thus, large organisms had to invent
active pumps (e.g., lungs, heart), which pump matter and energy into the organism and20
distribute them within it. Similarly, passive geophysical fluxes of moisture can ensure
sufficient soil moistening at small distances Ll from the ocean, while to keep large
territories with Ll biologically productive, the biotic pump of atmospheric moisture is
necessary.
Biological pumps like lungs or heart, which supply living cells of large organisms25
with energy and matter, are complex mechanisms. They have evolved in the courseof natural selection of individual organisms possessing most efficient pumps in the
population. The biotic pump of atmospheric moisture, grounded in plant physiology
and including sensing of the environmental parameters and reaction to their change
2652
7/30/2019 Bombeamento biótico da umidade atmosférica do ciclo hidrológico terrestre
http://slidepdf.com/reader/full/bombeamento-biotico-da-umidade-atmosferica-do-ciclo-hidrologico-terrestre 17/27
by a corresponding change in the physiological state of the plant (e.g., stomata open-
ing/closure), is also a complex, highly-ordered biotic mechanism. However, in contrast
to an individual organism of a given body size, natural forest ecosystem of linear size Lis not an object of natural selection, as it consists of a large number of competing indi-
viduals like, e.g., trees. A fundamental theoretical question is therefore how the biotic5
pump of atmospheric moisture or any other biotic mechanisms regulating regional or
global environmental parameters could have been produced by natural selection which
acts on individual organisms.
The discussion around this question has already a several decades’ history in the
biological literature, e.g., (Doolittle, 1981; Baerlocher, 1990), and is largely organized10
along two opposing lines of reasoning. The first attitude (shared, among others, by
many supporters of the Gaia hypothesis) is that the state when ecosystem as a whole
regulates regional or global environment for its benefit appears is the most probable
macroscopic physical property of the ecosystem, like Maxwell’s or Boltzmann’s dis-
tributions characterizing gas as a whole rather than particular molecules. No natural15
selection is needed for such a state to become established.
The opponents of this attitude implicitly recognize that the biotic control of any envi-
ronmental conditions is a very complex process having nothing to do with the physical
processes of thermodynamics (either linear, or non-linear). As such, it could have only
evolved as the product of natural selection, like any other complex function of living or-20
ganisms. However, continue the opponents, one individual performing some job on en-
vironmental regulation makes the regional environment slightly better for all individuals,
including those who do nothing. Hence, individuals capable of environmental control donot have a selective advantage over their conspecifics. Moreover, doing something for
the global environment, the regulators spend their metabolic energy and can therefore25
lose to the non-regulators who spend all their energy on competitive interaction. Thus,
since natural selection cannot favor regulatory capabilities on the individual level, the
biotic control of regional or global environment could not have appeared in the course
of biological evolution and, hence, it does not exist.
2653
Most recently, this logical opposition could be followed in the discussion of A. Kleidon
(first attitude) and V. Arora (second attitude) (Kleidon, 2004, 2005; Arora, 2005). The
contradiction between the observational evidence lending support to the existence of
biotic mechanisms of environmental control, including the biotic pump of atmospheric
moisture, and the apparent impossibility of finding a logically coherent physical and5
biological explanation of this evidence, prevents the wide scientific recognition of the
decisive role the natural ecosystems play in maintaining the environment in a state
suitable for life, including the biotic control of water cycle on land.
This contradiction is solved in the biotic regulation concept (Gorshkov, 1995; Gor-
shkov et al., 2000). First, it was shown that the degree of orderliness of ecological10
and biological systems is about twenty orders of magnitude higher than the degree of
orderliness of any of the so-called physically self-organized open non-linear systems
(Gorshkov and Makarieva, 2001). Natural selection of competing biological objects (in-dividuals) is the only way by which the biological information accumulates in the course
of evolution. Therefore, any highly organized life property, including the biotic pump of15
atmospheric moisture, can only originate as a product of natural selection.
Second, a fundamental parameter of the biotic sensitivity εb was introduced (Gor-
shkov, 1984, 1995; Gorshkov et al., 2000, 2004), which, if finite, makes it possible for
various biotic mechanisms of global environmental control (including the biotic pump of
atmospheric moisture) to originate in the course of natural selection acting on individual20
organisms (trees). Under tree below we shall understand an individual tree together
with all the other organisms of the ecological community that are rigidly correlated with
this tree (e.g., soil bacteria and fungi). Each tree works to maintain optimal soil mois-
ture conditions on the area it occupies. If the occasional relative change of soil moisture
content under the tree is less than ε, the tree does not react to it. According to our esti-25
mates (Gorshkov et al., 2000, 2004), biotic sensitivity with respect to changes of majorenvironmental parameters is of the order of ε∼10
−2−10−3
. Trees’ ability to remain
highly sensitive to environmental conditions is genetically programmed via individual
selection of trees with ε<10−2
. Those individuals who have lost this ability and have
2654
7/30/2019 Bombeamento biótico da umidade atmosférica do ciclo hidrológico terrestre
http://slidepdf.com/reader/full/bombeamento-biotico-da-umidade-atmosferica-do-ciclo-hidrologico-terrestre 18/27
a poor sensitivity ε>10−2
, suffer from large fluctuations of local soil moisture content,
which adversely affect their biological performance. Such trees lose competitiveness
and are forced out from the population by normal trees with ε<10−2
.
If the local soil moisture content occasionally deviates from its optimum value by a
relative amount exceeding biotic sensitivity ε, the tree does notice this change and5
initiates compensating environmental processes in order to increase or decrease the
local moisture content restoring the optimal conditions. Environmental impact of the
tree can take a variety of forms, including change of transpiration fluxes via stomata
opening/closure, regulation of the vertical temperature gradient below the canopy, fa-
cilitation of precipitation by biogenic aerosols, and other unknown processes, of which10
some are possibly unknowable due to the high complexity of the object under study.
On average, functioning of the tree results in pumping moisture out of the atmosphere
and increase of the local precipitation, which compensates for the local losses of soil
water to runoff. If the environmental changes performed by the tree lead to optimization
of the local soil moisture content to the accuracy of the biotic sensitivity ε, the tree and15
its associated biota acquire competitive advantage over neighboring trees incapable
of performing the needed environmental changes. These deficient neighbors lose in
competition with, and are replaced by, normal trees capable of environmental control.
In the result, all trees remaining in the forest are genetically programmed to act in one
and the same direction, thus forming a regional biotic pump of atmospheric moisture,20
which compensates for the river runoff. At the same time, individual trees continue
to compete with each other, and forest as a whole does not have a “physiology” of a
superorganism.
5 Conclusions
In this paper we introduced and described the biotic pump of atmospheric moisture. It25
makes use of the fundamental physical principle that horizontal fluxes of air and water
vapor are directed from areas with weaker evaporation to areas with stronger evapo-
2655
ration. Natural forest ecosystems, with their high leaf area index and high transpiration
exceeding evaporation from open water surface, are capable of pumping atmospheric
moisture from the ocean in amounts sufficient for the maintenance of optimal soil mois-
ture stores, compensating the river runoff and ensuring maximum ecosystem produc-
tivity.5
The biotic moisture pump, as well as the mechanisms of efficient soil moisture
preservation described in Sect. 3.4, work in undisturbed natural forests only. Natural
forest represents a contiguous cover of tall trees that are rigidly associated with other
biological species of the ecological community and genetically programmed to function
in the particular geographic region. The vegetation cover of grasslands, shrublands, sa-10
vannas, steppes, prairies, artificially thinned exploited forests, plantations, pastures or
arable lands is unable to switch on the biotic moisture pump and maintain soil moisture
content in a state optimal for life. Water cycle on such territories is critically dependenton the distance from the ocean; it is determined by random fluctuations and seasonal
changes of rainfall brought from the ocean. Such territories are prone to droughts,15
floods and fires. We emphasize that the contemporary wide spread of scarcely veg-
etated ecosystems, in particular, African savannas, is rigidly correlated with anthro-
pogenic activities during the last several thousand years (see, e.g., Tutin et al., 1997).
Savannas represent a succesional state of the ecosystem returning to its undisturbed
forest state; this transition spontaneously occurs as soon as the artificial disturbances20
like fire and overgrazing are stopped (van de Koppel and Prins, 1988). Since savannas
and other open ecosystems suffer from rapid soil erosion (Lal, 1990), their prolonged
existence is only possible due to continuous cycling with the forest state, when the
mineral and organic content of soil is restored. Therefore, the growing anthropogenic
pressure on savannas, which prevents their periodic transitions to forests, gradually25
turns savannas to deserts. The same is true for steppes and prairies of the temperatezone.
Only primary aboriginal forests are able to ensure the long-term stability of the biotic
moisture pump functioning, as far as the genetic properties of aboriginal forests are
2656
7/30/2019 Bombeamento biótico da umidade atmosférica do ciclo hidrológico terrestre
http://slidepdf.com/reader/full/bombeamento-biotico-da-umidade-atmosferica-do-ciclo-hidrologico-terrestre 19/27
correlated with the geophysical properties of the region they occupy. Artificially planted
exotic vegetation with geographically irrelevant genetic programs cannot persist on an
alien territory for a long time; their temporal prosperity is followed by environmental
degradation and ecological collapse. On the other hand, secondary aboriginal forests
that are in the process of self-recovery from anthropogenic or natural disturbances like5
fires, cutting or windfall, are not capable of efficiently running the biotic pump either. In
such forests all mechanisms of environmental regulation, including the biotic moisture
pump, are under repair and cannot yet function efficiently.
For the biotic moisture pump to work properly, it is also important that the natural
forest cover have an immediate border with the ocean or, at least, the distance to the10
ocean be much less than the scale length l , Eq. (1), of the exponential weakening of
the geophysical ocean-to-land moisture fluxes. The two largest tropical river basins
of Amazon and Congo are covered by rainforests spreading inland from the oceanic
coastline. Northern river basins of Russia, Canada and Alaska are covered by natural
taiga forests, which, at the northernmost forest line, border with tundra wetlands linking15
them to the oceanic coast. If the natural forest cover is eliminated along the oceanic
coastline on a band l ∼600 km wide, the biotic moisture pump stalls. The remaining
inland forests are no longer able to pump atmospheric moisture from the ocean. There
is no longer surplus to runoff to rivers or to recharge groundwater. Soil water either
leaves to the ocean as runoff or is blown away via the atmosphere after being transpired20
by the forests. The river basin ceases to exist, the forests die back after the soil dries
up. The total store of fresh water on land including the water of soil, bogs, mountain
glaciers and lakes, can be estimated by the lake store alone and constitutes around1.5×10
14m
3(L’vovitch, 1979), while the global river runoff is of the order of 0.37×10
14
m3
yr−1
(Dai and Trenberth, 2002). This means that all liquid moisture accumulated on25
land runs to the ocean in about four years. Total destruction of the biotic moisture pump
due to deforestation (i.e., complete elimination of the contiguous forest cover bordering
with the ocean) will in several years turn any river basin to desert.
In Australia, the continent-scale forested river basins ceased to exist about 50–100
2657
thousand years ago, a time period approximately coinciding with the arrival of first hu-
mans. There is a host of indirect evidence suggesting that humans are responsible
for the ancient deforestation of the Australian continent (see discussion in Bowman,
2002). It is clear how this could have happened. To deforest the continent, it was
enough to destroy forests on a narrow band of width l along the continent’s perimeter.5
This could be easily done by the first human settlements in the course of their house-
hold activities or due to the human-induced fires. This done, the biotic water pump
of the inner undisturbed forested part of the continent was cut o ff from the ocean and
stalled. Rapid runoff and evaporation eliminated the stores of soil moisture and the
inland forests perished by themselves even in the absence of intense anthropogenic10
activities or fires in the inner parts of the continent. As estimated above, this forest-to
desert transition should have been instantaneous on the geological time scale, so it
is not surprising that practically no paleodata were left to tell more details about thisecological catastrophe. Notably, most deserts of the world border with the ocean or
inner seas. As far as the coastal zone is the preferred area for human settlements, the15
modern extensive deserts of Earth should all be of anthropogenic origin.
Modern practice of forest cutting and exploitation, which is responsible for the un-
precedented high rate of deforestation world over (Bryant et al., 1997), was born in
Western Europe. Remarkably, in this part of land there are no areas separated from
the ocean or inner seacoast by more than l ∼600 km, the scale length of exponen-20
tial weakening of the geophysical ocean-to-land moisture fluxes, Sect. 2.1. Therefore,
elimination of natural European forests, which today is being finalized in Scandinavia,
has not led to complete desertification of Europe. This worked to support the illusion
that the forest cutting tradition can be safely imported to the other parts of the planet,
despite the accumulating evidence about the disastrous consequences of such prac-25
tices when applied to vast continental areas. Even in Western Europe one has beenrecently witnessing an increase in catastrophic droughts, fires and floods, likely facili-
tated by the on-going elimination of the remaining natural forests in the mountains. The
decline of Alpine forests, which, via the biotic moisture pump, used to enhance precip-
2658
7/30/2019 Bombeamento biótico da umidade atmosférica do ciclo hidrológico terrestre
http://slidepdf.com/reader/full/bombeamento-biotico-da-umidade-atmosferica-do-ciclo-hidrologico-terrestre 20/27
itation in the mountains, should have led to the decline of mountain glaciers, although
the latter phenomenon is almost exclusively considered in the framework of global
warming and atmospheric CO2 build-up, while the biotic pump effects are ignored.
We also note that when the forest cover is (partially) replaced by an artificial water
body, like the water storage reservoirs of hydropower plants, the controlling function5
of forest transpiration and the biotic pump weaken causing reduction of runoff and
precipitation in the corresponding river basin.
The results obtained form the basis of a possible strategy to restore human-friendly
water conditions on most part of the Earth’s landmasses, including modern deserts and
other arid zones. As we have shown, elimination of the forest cover in world’s largest10
river basins would have the following consequences: at least one order of magnitude’s
decline of the river runoff, appearance of droughts, floods and fires, partial desertifica-
tion of the coastal zone and complete desertification of the inner parts of the continents,
see Eqs. (5) and (6), associated economic losses would by far exceed the economic
benefits of forest cutting, let alone such a scenario would make life of millions of peo-15
ple impossible. Therefore, it is worthy to urgently reconsider the modern forest policy
everywhere in the world. First of all, it is necessary to immediately stop any attempts
of destroying the extant natural forest remnants and, in particular, those bordering with
the ocean or inner seas. Further on, it is necessary to initiate a world-wide company
on facilitating natural gradual recovery of aboriginal forest ecosystems on territories20
adjacent to the remaining natural forests. Only extensive contiguous natural forests will
be able to run a stable water cycle and subsequently intensify it, gradually extending
the river basin at the expense of newly recovering territories.In intact primary forests the relative area of natural disturbances like tree gaps does
not exceed 10% (Coley and Barone, 1996; Szarzynski and Anhuf, 2001). Approx-25
imately the same share of land surface is currently exploited by man as arable land,
pastures and industrial forest plantations. Therefore, if natural forests are restored over
most parts of currently unused arid territories, such a state will be as stable as are the
natural forests that have persisted through millions of years. The recovered luxurious
2659
water resources on land will be at full disposal of the ecologically literate humanity of
the future.
Appendix A
Physical basis of the tropospheric lapse rate of air temperature5
The decrease of air temperature with height observed in the troposphere is conditioned
by the presence of atmospheric greenhouse substances; however, it is not related to
the magnitude of the planetary greenhouse effect.
Greenhouse substances perform resonance absorption of thermal radiation emitted
by the Earth’s surface and re-emit it isotropically in all directions. Half of the absorbed10
thermal radiation is re-directed back to the surface. This random walk of thermal pho-
tons in the atmosphere results in an increase of the density of radiation energy near
the surface and its drop with atmospheric height.
The resulting negative vertical gradient of radiative energy density can be related to
the lapse rate of the so-called brightness temperature. It is defined as the tempera-15
ture of a blackbody, which emits a radiation flux equal to the upward flux of thermal
radiation observed at height z in the atmosphere. In the course of inelastic collisional
interaction with molecules of the greenhouse substances, air molecules lose their ki-
netic energy (this energy is imparted to the molecules of the greenhouse substances
and ultimately lost into space in the form of thermal radiation). In the result, air temper-20
ature approaches brightness temperature of thermal radiation; there appears a nega-
tive vertical gradient (lapse rate) of air temperature close to the lapse rate of radiative
brightness temperature. It is due to these physical processes that the environmental
temperature lapse rate arises.
Thermal radiation spectrum of the Earth’s surface is close to the blackbody spectrum25
at Earth’s surface temperature. If the greenhouse substances of the terrestrial atmo-
sphere had but one or a few absorption lines (narrow bands) with respect to thermal
2660
7/30/2019 Bombeamento biótico da umidade atmosférica do ciclo hidrológico terrestre
http://slidepdf.com/reader/full/bombeamento-biotico-da-umidade-atmosferica-do-ciclo-hidrologico-terrestre 21/27
radiation, then all the radiation emitted from the Earth’s surface, except for those lines,
would leave into space unimpeded, without interacting with the atmosphere. Bright-
ness temperature of the entire spectrum, except for those lines, would not change with
height. In such a case the surface temperature would coincide with the brightness tem-
perature of thermal radiation emitted into space, i.e. the planetary greenhouse effect5
would be close to zero.
However, if the amount of greenhouse substances with those narrow absorption
bands is large and the absorption lines have large absorption cross-sections, bright-
ness temperature of thermal radiation in the corresponding spectral interval can rapidly
drop with height, theoretically down to absolute zero. Collisional excitation of these ab-10
sorption lines by air molecules would deplete the kinetic energy of the latter, resulting
in a decrease of air temperature with height. Thus, there appears a large negative ver-
tical gradient of air temperature, which, as described in Sect. 3, causes the observed
upward fluxes of latent heat and evaporation. Condensation of the ascending water
vapor with release of latent heat increases air temperature, enhances the collisional15
excitation of the greenhouse substances and diminishes the lapse rates of both bright-
ness and air temperatures. In the result, the magnitude of the air temperature lapse
rates is fixed at the observed value of Γob=6.5 K km−1
.
Therefore, the observed value of Γob=6.5K km−1
can be a product of one narrow
absorption line with large absorption cross-section present in the atmosphere. The20
greenhouse substance with that narrow efficient line absorbs all the released latent
heat and thermal energy of the dissipating processes of atmospheric circulation, turns
this energy into thermal radiation and partially re-directs to the surface. At the surfacethe radiative energy corresponding to the narrow absorption line is distributed over the
entire thermal spectrum and leaves into space.25
On the other hand, if the absorption lines of the greenhouse substances covered
the whole thermal spectrum of the surface, but they exclusively interacted with thermal
photons under conditions of the so-called radiative equilibrium, when the collisional
excitation of these lines is negligible, in such a case the planetary greenhouse effect
2661
could reach large values (i.e. the planetary surface would be much warmer than in the
absence of greenhouse substances), while the lapse rate of air temperature remained
close to zero.
Therefore, the magnitudes of the planetary greenhouse effect and air temperature
lapse rate Γ are not unambiguously related to each other. However, in the absence of5
all greenhouse substances in the atmosphere, both air temperature lapse rate, evapo-
rative force (Sect. 3.3) and greenhouse effect are all equal to zero.
Acknowledgements. This research uses data provided by the Community Climate SystemModel project supported by the Directorate for Geosciences of the National Science Foundationand the Office of Biological and Environmental Research of the U.S. Department of Energy.10
References
Acevedo, O. C., Moraes, O. L. L., da Silva, R., Fitzjarrald ,D. R., Sakai, R. K., Staebler, R. M.,and Czikowsky, M. J.: Inferring nocturnal surface fluxes from vertical profiles of scalars in anAmazon pasture, Global Change Biology, 10, 886–894, 2004. 2650
Adler, R. F., Huffman, G. J., Bolvin, D. T., Curtis, S., and Nelkin, E. J.: Tropical rainfall dis-15
tributions determined using TRMM combined with other satellite and rain gauge, J. Appl.Meteorol., 39, 2007–2023, 2001. 2631
Arora, V.: Comment on “Optimized stomatal conductance of vegetated land surfaces and itseffects on simulated productivity and climate” edited by: Kleidon, A., Geophys. Res. Lett.,32, L08708, doi:10.1029/2004GL022110, 2005. 265420
Austin, A. T. and Sala, O. E.: Carbon and nitrogen dynamics across a natural precipitationgradient in Patagonia, Argentina, J. Vegetation Sci., 13, 351–360, 2002. 2627, 2669
Austin, A. T. and Vitousek, P. M.: Precipitation, decomposition and litter decomposability ofMetrosideros polymorpha in native forests on Hawaii, J. Ecology, 88, 129–138, 2000. 2627
Baerlocher, F.: The Gaia hypothesis: A fruitful fallacy? Experientia, 46, 232–238, 1990. 265325
Barrett, J. E., McCulley, R. L., Lane, D. R., Burke, I. C., and Lauenroth, W. K.: Influenceof climate variability on plant production and N-mineralization in Central US grasslands, J.Vegetation Sci., 13, 383–394, 2002. 2669
2662
7/30/2019 Bombeamento biótico da umidade atmosférica do ciclo hidrológico terrestre
http://slidepdf.com/reader/full/bombeamento-biotico-da-umidade-atmosferica-do-ciclo-hidrologico-terrestre 22/27
Bond, B. J. and Kavanagh, K. L.: Stomatal behavior of four woody species in relation to leaf-specific hydraulic conductance and threshold water potential, Tree Physiology, 19, 503–510,1999. 2651
Bowman, D. M. J. S.: The Australian summer monsoon: a biogeographic perspective, Aus-tralian Geographic Studies, 40, 261–277, 2002. 26585
Breshears, D. D., Nyhan, J. W., Heil, C. E., and Wilcox, B. P.: Effects of woody plants on micro-climate in a semiarid woodland: soil temperature and evaporation in canopy and intercanopypatches, Int. J. Plant Sci., 159, 1010–1017, 1998. 2649
Bryant, D., Nielsen, D., and Tangley, L.: The last frontier forests: ecosystems and economieson the edge, World Resources Institute, Washington, 1997. 2628, 2629, 2658, 266910
Cabido, M., Gonzalez, C., Acosta, A., and Diaz, S.: Vegetation changes along a precipitationgradient in central Argentina, Vegetatio, 109, 5–14, 1993. 2669Canadell, J. G., Steffen, W. L., and White, P. S.: IGBP/GCTE terrestrial transects: Dynamics
of terrestrial ecosystems under environmental change – Introduction, J. Vegetation Sci., 13,297–300, 2002. 2626, 266915
Cochrane, M. A., Alencar, A., Schulze, M. D., Souza, C. M., Nepstad, D. C., Lefebvre, P., andDavidson, E. A.: Positive feedbacks in the fire dynamic of closed canopy tropical forests,Sci., 284, 1832–1835. 2649
Coley, P. D. and Barone, J. A.: Herbivory and plant defenses in tropical forests, Annual Reviewof Ecology and Systematics, 27, 305–335, 1996. 265920
Cook, G. D. and Heerdegen, R. G.: Spatial variation in the duration of the rainy season inmonsoonal Australia, Int. J. Climatology, 21, 1723–1732, 2001. 2669
da Rocha, H. R., Goulden, M. L., Miller, S. D., Menton, M. C., Pinto, L. D. V. O., de Freitas, H.C., and Silva Figueira, A. M. E.: Seasonality of water and heat fluxes over a tropical forest ineastern Amazonia, Ecological Appl., 14(Suppl), S22–S32, 2004. 2628, 264825
Dai, A. and Trenberth, K. E.: Estimates of freshwater discharge from continents: latitudinal andseasonal variations, J. Hydrometeorol., 3, 660–687, 2002. 2626, 2657
Doolittle, W. F.: Is nature really Motherly?, CoEvolution Quaterly, 29, 58–63, 1981. 2653Fang, M. and Tung, K. K.: Time-dependent nonlinear Hadley circulation, J. Atmos. Sci., 56,
1797–1807, 1999. 264230
Folkins, I.: Convective damping of buoyancy anomalies and its effect on lapse rates in thetropical lower troposphere. Atmos. Chem. Phys., 6, 1–12, 2006. 2638
Goody, R. M. and Yung, Y. L.: Atmospheric radiation, theoretical basis, 2nd edn, Oxford Univ.
2663
Press, New York, 1989. 2637Gorshkov, V. G.: Ecology of man, Leningrad Polytechnical Institute, Leningrad, 1984. 2654Gorshkov, V. G.: Physical and biological bases of life stability, Springer, Berlin, 1995. 2654Gorshkov, V. G., Gorshkov, V. V., and Makarieva, A. M.: Biotic regulation of the environment:
Key issue of global change, Springer, London, 2000. 26545
Gorshkov, V. G. and Makarieva, A. M.: On the possibility of physical self-organization of biolog-ical and ecological systems, Doklady Biological Sci., 378, 258–261, 2001. 2654
Gorshkov, V. G., Makarieva, A. M., and Gorshkov, V. V.: Revising the fundamentals of ecologicalknowledge: The biota-environment interaction, Ecol. Complexity, 1, 17–36, 2004. 2654
Goulden, M. L., Daube, B. C., Fan, S.-M., Sutton, D. J., Bazzaz, A., Munger, J. W., and Wofsy,10
S. C.: Physiological response of a black spruce forest to weather, J. Geophys. Res., 102D,28 987–28 996, 1997. 2628
Goulden, M. L., Miller, S. D., da Rocha, H. R., Menton, M. C., de Freitas, H. C., Silva Figueira,A. M. E., and de Sousa, C. A. D.: Diel and seasonal patterns of tropical forest CO2 exchange,
Ecol. Appl., 14(Suppl), S42–S54, 2004. 265115
Gustavson, M. R.: Limits to the wind power utilization, Sci., 204, 13–17, 1979. 2647Hodnett, M. G., Oyama, M. D., Tomasella, J., and Marques Filho, A. de O.: Comparisons of
long-term soil water storage behaviour under pasture and forest in three areas of Amazonia,in: Amazonian deforestation and climate, edited by: Gash, J. H. C., Nobre, C. A., Roberts, J.M., and Victoria, R. L., 57–77, John Wiley & Sons, Chichester, 1996. 262820
Hutley, L. B., O’Grady, A. P., and Eamus, D.: Monsoonal influences on evapotranspiration ofsavanna vegetation of northern Australia, Oecologia, 126, 434–443, 2001. 2628
Karlsson, I. M.: Nocturnal air temperature variations between forest and open areas, J. Appl.Meteorol., 39, 851–862, 2000. 2650
Kleidon, A.: Optimized stomatal conductance of vegetated land surfaces and its ef-25
fects on simulated productivity and climate, Geophys. Res. Lett., 31, L21203,doi:10.1029/2004GL020769, 2004. 2654
Kleidon, A.: Reply to comment by V. Arora on “Optimized stomatal conductance of vegetated
land surfaces and its eff
ects on simulated productivity and climate”, Geophys. Res. Lett., 32,L08709, doi:10.1029/2005GL022355, 2005. 265430
Kruijt, B., Malhi, Y., Lloyd, J., Nobre, A. D., Miranda, A. C., Pereira, M. G. P., Culf, A., and Grace,J.: Turbulence statistics above and within two Amazon rain forest canopies, Boundary-LayerMeteorol., 94, 297–331, 2000. 2648
2664
7/30/2019 Bombeamento biótico da umidade atmosférica do ciclo hidrológico terrestre
http://slidepdf.com/reader/full/bombeamento-biotico-da-umidade-atmosferica-do-ciclo-hidrologico-terrestre 23/27
Kurc, S. A. and Small, E.E.: Dynamics of evapotranspiration in semiarid grassland and shrub-land ecosystems during the summer monsoon season, central New Mexico, Water Resour.Res., 40, W09305, doi:10.1029/2004WR003068, 2004. 2628
Lal, R.: Soil erosion and land degradation: the global risks, in: Advances in soil science, 11,Soil degradation, edited by: Lal, R. and Stewart, B. A., 129–172, Springer, New York, 1990.5
2656Landau, L. D., Akhiezer, A. I., and Lifshitz, E. M.: General Physics., Mechanics and Molecular
Physics, Nauka, Moscow, 1965. 2634Landau, L. D. and Lifshitz, E. M.: Course of Theoretical Physics, 6, Fluid Mechanics, 2nd ed.,
Butterworth-Heinemann, Oxford, 1987. 2633, 2634, 263810
Lorenz, E. N.: The nature and theory of the general circulation of the atmosphere, WorldMeteorological Organization, Geneva, 1967. 2639, 2647L’vovitch, M. I.: World water resources and their future, American Geological Union, Washing-
ton, 1979. 2645, 2657Mahrt, L., Lee, X., Black, A., Neumann, H., and Staebler, R. M.: Nocturnal mixing in a forest15
subcanopy, Agric. Forest Meteorol., 101, 67–78, 2000. 2650Makarieva, A. M., Gorshkov, V. G., and Li, B.-L.: Biochemical universality of living matter and
its metabolic implications, Functional Ecol., 19, 547–557, 2005a. 2652Makarieva, A. M., Gorshkov, V. G., and Li, B.-L.: Revising the distributive networks models
of West, Brown and Enquist (1997) and Banavar, Maritan and Rinaldo (1999): Metabolic20
inequity of living tissues provides clues for the observed allometric scaling rules, J. Theor.Biol., 237, 291–301, 2005b. 2652
Makarieva, A. M., Gorshkov, V. G., and Li, B.-L.: Energetics of the smallest: Do bacteria breatheat the same rate as whales?, Proceedings of the Royal Society of London B, 272, 2219–2224, 2005c. 265225
Marengo, J. A.: Interdecadal variability and trends of rainfall across the Amazon basin, Theor.Appl. Climatology, 78, 79–96, 2004. 2632, 2647
McGuffie, K. and Henderson-Sellers, A.: Forty years of numerical climate modelling, Int. J.Climatology, 21, 1067–1109, 2001. 2631
McGuire, A. D., Prentice, I. C., Ramankutty, N., Reichenau, T., Schloss, A., Tian, H., Williams,30
L. J., and Wittenberg, U.: Carbon balance of the terrestrial biosphere in the twentieth century:Analyses of CO2, climate and land-use effects with four process-based ecosystem models,Global Biogeochem. Cycles, 15, 183–206, 2001. 2669
2665
Miller, J. M., Williams, R. J., and Farquhar, G. D.: Carbon isotope discrimination by a sequenceof Eucalyptus species along a subcontinental rainfall gradient in Australia, Funct. Ecol., 15,222–232, 2001. 2669
Nepstad, D., Lefebvre, P., da Silva, U. L., Tomasella, J., Schlesinger, P., Solorzano, L., Ray, P.M. D., and Benito, J. G.: Amazon drought and its implications for forest flammability and tree5
growth: a basin-wide analysis, Global Change Biol., 10, 704–717, 2004. 2649Nesbitt, S. W. and Zipser, E. J.: The diurnal cycle of rainfall and convective intensity according
to three years of TRMM measurements, J. Climate, 16, 1456–1475, 2003. 2651Ni, J. and Zhang, X. S.: Climate variability, ecological gradient and the Northeast China Tran-
sect (NECT), J. Arid Environments, 46, 313–325, 2000. 266910
Nicholson, S. E.: The nature of rainfall variability over Africa on time scales of decades tomillenia, Global and Planetary Change, 26, 137–158, 2000. 2669
Oyama, M. D. and Nobre, C. A.: Climatic consequences of a large-scale desertification inNortheast Brazil: A GCM simulation study, J. Climate, 17, 3203–3213, 2004. 2632
Randel, D. L., Haar, T. H. V., Ringerud, M. A., Stephens, G. L., Greenwald, T. J., and Comb, C.15
L.: New global water vapor dataset, Bulletin of the American Meteorol. Society, 77, 1233–1254, 1996. 2630, 2647
Raval, A. and Ramanathan, V.: Observational determination of the greenhouse e ffect, Nature,342, 758–761, 1989. 2634
Savenije, H. H. G.: New definitions for moisture recycling and the relationship with land-use20
change in the Sahel, J. Hydrology, 167, 57–78, 1995. 2626, 2627Shver, C. A.: Atmospheric precipitation on the territory of the USSR, Meteoizdat, Leningrad,
1976. 2630Shuttleworth, W. J.: Micrometeorology of temperate and tropical forest, Philosophical Transac-
tions of the Royal Society of London B, 324, 207–228, 1989. 264825
Shuttleworth, W. J., Gash, J. H. C., Lloyd, C. R., Moore, C. J., Roberts, J., Marques-Filho, A.O., Fisch, G., Filho, V. P. S., Ribeiro, M. N. G., Molion, L. C. B., Sa, L. D. A., Nobre, J. C.A., Cabral, O. M. R., Patel, S. R., and Carvalho, J. M.: Daily variations of temperature and
humidity within and above Amazonian forest, Weather, 40, 102–108, 1985. 2649Smith, S. B.: Comments on “An interesting mesoscale storm-environment interaction observed30
just prior to changes in severe storm behavior”, Weather and Forecasting, 12, 368–372,1997. 2641
Szarzynski, J. and Anhuf, D.: Micrometeorological conditions and canopy energy exchanges of
2666
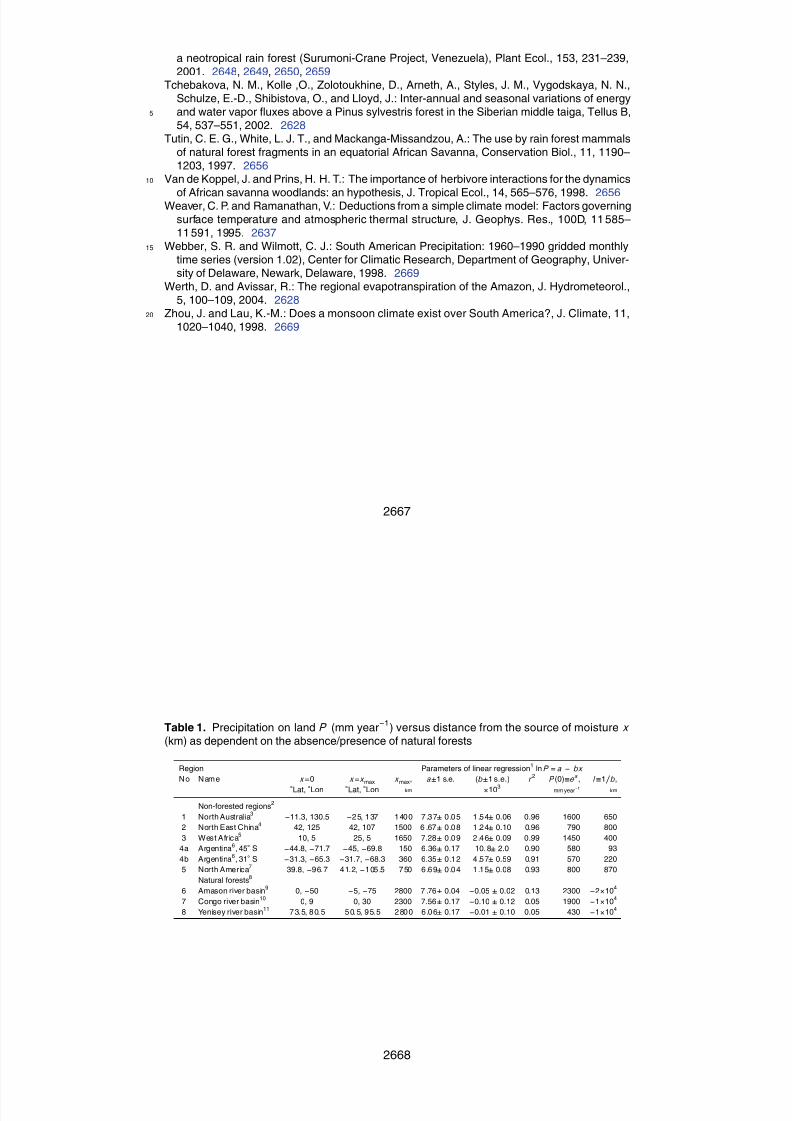
7/30/2019 Bombeamento biótico da umidade atmosférica do ciclo hidrológico terrestre
http://slidepdf.com/reader/full/bombeamento-biotico-da-umidade-atmosferica-do-ciclo-hidrologico-terrestre 24/27
a neotropical rain forest (Surumoni-Crane Project, Venezuela), Plant Ecol., 153, 231–239,2001. 2648, 2649, 2650, 2659
Tchebakova, N. M., Kolle ,O., Zolotoukhine, D., Arneth, A., Styles, J. M., Vygodskaya, N. N.,Schulze, E.-D., Shibistova, O., and Lloyd, J.: Inter-annual and seasonal variations of energyand water vapor fluxes above a Pinus sylvestris forest in the Siberian middle taiga, Tellus B,5
54, 537–551, 2002. 2628Tutin, C. E. G., White, L. J. T., and Mackanga-Missandzou, A.: The use by rain forest mammals
of natural forest fragments in an equatorial African Savanna, Conservation Biol., 11, 1190–1203, 1997. 2656
Van de Koppel, J. and Prins, H. H. T.: The importance of herbivore interactions for the dynamics10
of African savanna woodlands: an hypothesis, J. Tropical Ecol., 14, 565–576, 1998. 2656Weaver, C. P. and Ramanathan, V.: Deductions from a simple climate model: Factors governingsurface temperature and atmospheric thermal structure, J. Geophys. Res., 100D, 11 585–11 591, 1995. 2637
Webber, S. R. and Wilmott, C. J.: South American Precipitation: 1960–1990 gridded monthly15
time series (version 1.02), Center for Climatic Research, Department of Geography, Univer-sity of Delaware, Newark, Delaware, 1998. 2669
Werth, D. and Avissar, R.: The regional evapotranspiration of the Amazon, J. Hydrometeorol.,5, 100–109, 2004. 2628
Zhou, J. and Lau, K.-M.: Does a monsoon climate exist over South America?, J. Climate, 11,20
1020–1040, 1998. 2669
2667
Table 1. Precipitation on land P (mm year−1
) versus distance from the source of moisture x (km) as dependent on the absence/presence of natural forests
Region Parameters of linear regression1
ln P = a − bx
N o N am e x =0 x =x max x max, a±1 s.e. (b±1 s.e.) r 2 P (0)≡ea, l ≡1/b,◦Lat, ◦Lon ◦Lat, ◦Lon km ×103 mm year
−1km
Non-forested regions2
1 North Australia3 −11.3, 130.5 −2 5, 1 37 1 40 0 7 .3 7± 0 .0 5 1 .5 4± 0.06 0.96 1600 650
2 North East China4 42, 125 42, 107 1500 6 .67± 0 .0 8 1 .2 4± 0.10 0.96 790 800
3 West Afr ica5
10, 5 25, 5 1650 7.28± 0 .0 9 2 .4 6± 0.09 0.99 1450 400
4a Argentina6, 45◦
S −44.8, −71.7 −45, −69.8 150 6.36± 0.17 10. 8± 2.0 0.90 580 93
4b Argentina6, 31◦
S −31.3, −65.3 −31.7, −68.3 360 6.35± 0 .1 2 4 .5 7± 0.59 0.91 570 220
5 North America7 39.8, −96.7 41.2, −1 05 .5 7 50 6 .6 9± 0 .0 4 1 .1 5± 0.08 0.93 800 870
Natural forests8
6 Amason river basin9
0, −50 −5, −75 2800 7 .76± 0.04 −0.05 ± 0.02 0.13 2300 −2×10⁴
7 Congo river basin10
0, 9 0, 30 2300 7.56± 0.17 −0.10 ± 0.12 0.05 1900 −1×10⁴
8 Yenisey river basin11 7 3. 5, 8 0. 5 5 0. 5, 9 5. 5 2 80 0 6 .0 6± 0.17 −0.01 ± 0.10 0.05 430 −1×10⁴
2668
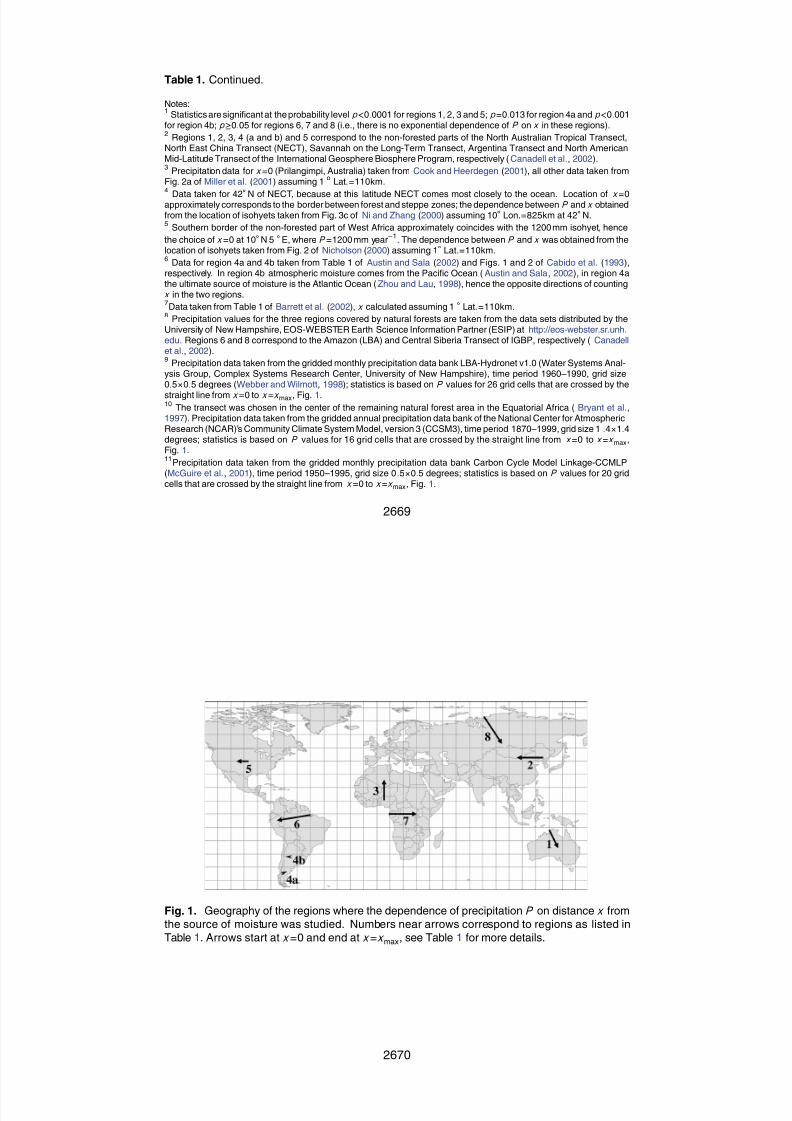
7/30/2019 Bombeamento biótico da umidade atmosférica do ciclo hidrológico terrestre
http://slidepdf.com/reader/full/bombeamento-biotico-da-umidade-atmosferica-do-ciclo-hidrologico-terrestre 25/27
Table 1. Continued.
Notes:1
Statistics are significant at the probability level p<0.0001 for regions 1, 2, 3 and 5; p=0.013 for region 4a and p<0.001for region 4b; p≥0.05 for regions 6, 7 and 8 (i.e., there is no exponential dependence of P on x in these regions).2
Regions 1, 2, 3, 4 (a and b) and 5 correspond to the non-forested parts of the North Australian Tropical Transect,North East China Transect (NECT), Savannah on the Long-Term Transect, Argentina Transect and North AmericanMid-Latitude Transect of the International Geosphere Biosphere Program, respectively (Canadell et al., 2002).3
Precipitation data for x =0 (Prilangimpi, Australia) taken from Cook and Heerdegen (2001), all other data taken fromFig. 2a of Miller et al. (2001) assuming 1
oLat.=110km.
4
Data taken for 42◦
N of NECT, because at this latitude NECT comes most closely to the ocean. Location of x =0approximately corresponds to the border between forest and steppe zones; the dependence between P and x obtainedfrom the location of isohyets taken from Fig. 3c of Ni and Zhang (2000) assuming 10
◦Lon.=825km at 42
◦N.
5Southern border of the non-forested part of West Africa approximately coincides with the 1200 mm isohyet, hence
the choice of x =0 at 10◦
N 5◦
E, where P =1200 mm year−1
. The dependence between P and x was obtained from thelocation of isohyets taken from Fig. 2 of Nicholson (2000) assuming 1
◦Lat.=110km.
6Data for region 4a and 4b taken from Table 1 of Austin and Sala (2002) and Figs. 1 and 2 of Cabido et al. (1993),
respectively. In region 4b atmospheric moisture comes from the Pacific Ocean (Austin and Sala, 2002), in region 4athe ultimate source of moisture is the Atlantic Ocean (Zhou and Lau, 1998), hence the opposite directions of countingx in the two regions.7
Data taken from Table 1 of Barrett et al. (2002), x calculated assuming 1◦
Lat.=110km.8
Precipitation values for the three regions covered by natural forests are taken from the data sets distributed by theUniversity of New Hampshire, EOS-WEBSTER Earth Science Information Partner (ESIP) at http://eos-webster.sr.unh.edu. Regions 6 and 8 correspond to the Amazon (LBA) and Central Siberia Transect of IGBP, respectively ( Canadellet al., 2002).9
Precipitation data taken from the gridded monthly precipitation data bank LBA-Hydronet v1.0 (Water Systems Anal-ysis Group, Complex Systems Research Center, University of New Hampshire), time period 1960–1990, grid size0.5×0.5 degrees (Webber and Wilmott, 1998); statistics is based on P values for 26 grid cells that are crossed by the
straight line from x =0 to x =x max, Fig. 1.10
The transect was chosen in the center of the remaining natural forest area in the Equatorial Africa ( Bryant et al.,1997). Precipitation data taken from the gridded annual precipitation data bank of the National Center for AtmosphericResearch (NCAR)’s Community Climate System Model, version 3 (CCSM3), time period 1870–1999, grid size 1.4×1.4degrees; statistics is based on P values for 16 grid cells that are crossed by the straight line from x =0 to x =x max,Fig. 1.11
Precipitation data taken from the gridded monthly precipitation data bank Carbon Cycle Model Linkage-CCMLP(McGuire et al., 2001), time period 1950–1995, grid size 0.5×0.5 degrees; statistics is based on P values for 20 gridcells that are crossed by the straight line from x =0 to x =x max, Fig. 1.
2669
Fig. 1. Geography of the regions where the dependence of precipitation P on distance x fromthe source of moisture was studied. Numbers near arrows correspond to regions as listed inTable 1. Arrows start at x =0 and end at x =x max, see Table 1 for more details.
2670
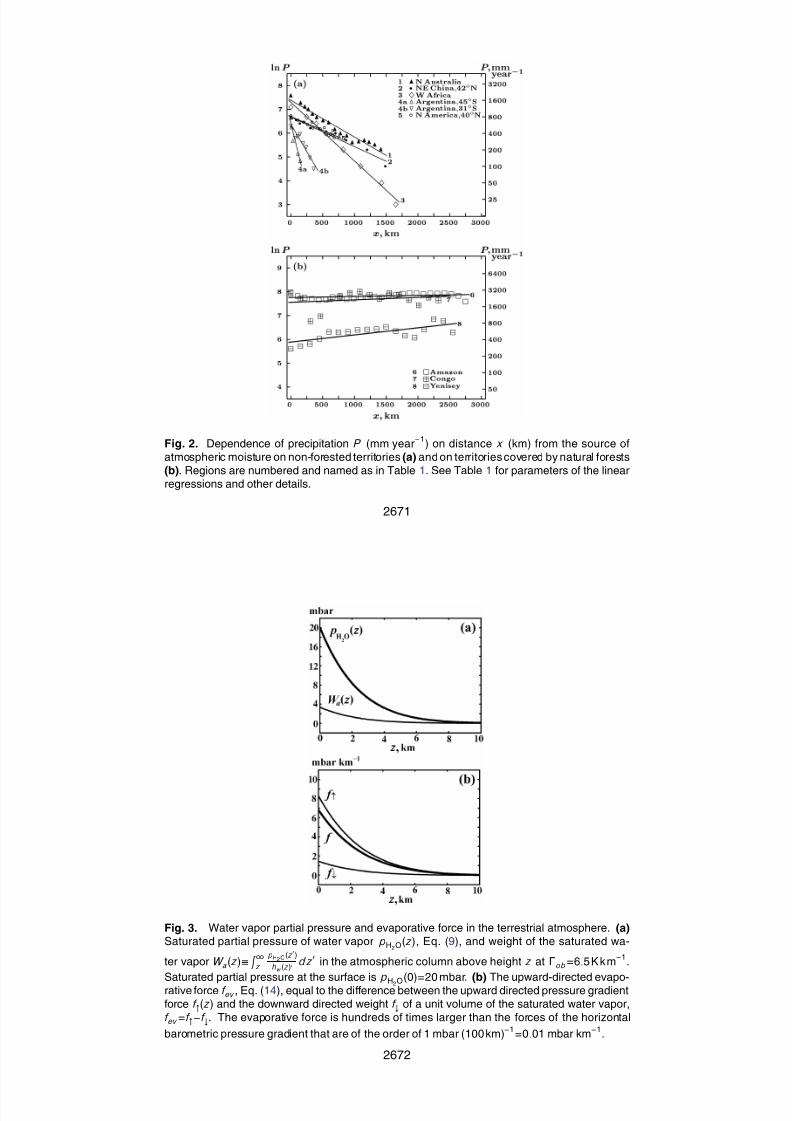
7/30/2019 Bombeamento biótico da umidade atmosférica do ciclo hidrológico terrestre
http://slidepdf.com/reader/full/bombeamento-biotico-da-umidade-atmosferica-do-ciclo-hidrologico-terrestre 26/27
Fig. 2. Dependence of precipitation P (mm year−1
) on distance x (km) from the source ofatmospheric moisture on non-forested territories (a) and on territories covered by natural forests(b). Regions are numbered and named as in Table 1. See Table 1 for parameters of the linearregressions and other details.
2671
Fig. 3. Water vapor partial pressure and evaporative force in the terrestrial atmosphere. (a)Saturated partial pressure of water vapor pH2O(z), Eq. (9), and weight of the saturated wa-
ter vapor W a(z)≡
∞
z
pH2O(z)
hw (z)dz in the atmospheric column above height z at Γob=6.5 K k m
−1.
Saturated partial pressure at the surface is pH2O(0)=
20 mbar. (b) The upward-directed evapo-rative force f ev , Eq. (14), equal to the difference between the upward directed pressure gradientforce f ↑(z) and the downward directed weight f ↓ of a unit volume of the saturated water vapor,f ev =f ↑−f ↓. The evaporative force is hundreds of times larger than the forces of the horizontal
barometric pressure gradient that are of the order of 1 mbar (100 km)−1
=0.01 mbar km−1
.
2672
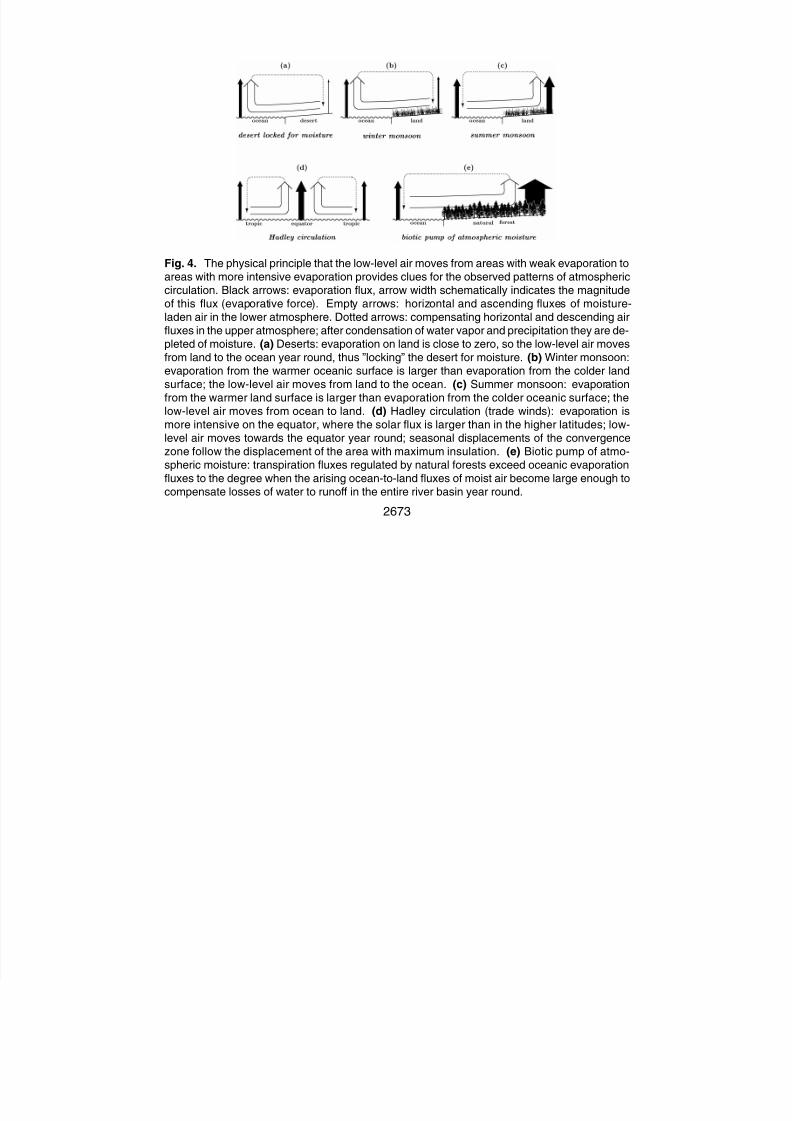
7/30/2019 Bombeamento biótico da umidade atmosférica do ciclo hidrológico terrestre
http://slidepdf.com/reader/full/bombeamento-biotico-da-umidade-atmosferica-do-ciclo-hidrologico-terrestre 27/27
Fig. 4. The physical principle that the low-level air moves from areas with weak evaporation toareas with more intensive evaporation provides clues for the observed patterns of atmosphericcirculation. Black arrows: evaporation flux, arrow width schematically indicates the magnitudeof this flux (evaporative force). Empty arrows: horizontal and ascending fluxes of moisture-laden air in the lower atmosphere. Dotted arrows: compensating horizontal and descending airfluxes in the upper atmosphere; after condensation of water vapor and precipitation they are de-pleted of moisture. (a) Deserts: evaporation on land is close to zero, so the low-level air movesfrom land to the ocean year round, thus ”locking” the desert for moisture. (b) Winter monsoon:evaporation from the warmer oceanic surface is larger than evaporation from the colder landsurface; the low-level air moves from land to the ocean. (c) Summer monsoon: evaporationfrom the warmer land surface is larger than evaporation from the colder oceanic surface; thelow-level air moves from ocean to land. (d) Hadley circulation (trade winds): evaporation ismore intensive on the equator, where the solar flux is larger than in the higher latitudes; low-level air moves towards the equator year round; seasonal displacements of the convergencezone follow the displacement of the area with maximum insulation. (e) Biotic pump of atmo-spheric moisture: transpiration fluxes regulated by natural forests exceed oceanic evaporationfluxes to the degree when the arising ocean-to-land fluxes of moist air become large enough tocompensate losses of water to runoff in the entire river basin year round.
2673