Broker de Informação Dinâmica e Estruturada para ... · Broker de Informação Dinâmica e...
112
Broker de Informação Dinâmica e Estruturada para Dispositivos Móveis Pedro Miguel Pereira Lopes Dissertação para obtenção do Grau de Mestre em Engenharia Informática e de Computadores Júri Presidente: Prof. Joaquim Armando Pires Jorge Orientador: Prof. Mário Rui Gomes Vogais: Prof. Helena Isabel de Jesus Galhardas Setembro de 2008
-
Upload
truongdieu -
Category
Documents
-
view
220 -
download
0
Transcript of Broker de Informação Dinâmica e Estruturada para ... · Broker de Informação Dinâmica e...
Broker de Informação Dinâmica e Estruturada para Dispositivos
Móveis
Pedro Miguel Pereira Lopes
Dissertação para obtenção do Grau de Mestre em
Engenharia Informática e de Computadores
Júri
Presidente: Prof. Joaquim Armando Pires Jorge
Orientador: Prof. Mário Rui Gomes
Vogais: Prof. Helena Isabel de Jesus Galhardas
Setembro de 2008


AbstractWhy did we create countries to join a immense group of people? Why did the mobile phone, PDA, laptop and
smart-phone concepts got merged? Why is there a need to unify? The simple answer would be: minimize the
clutter, maximize the efficiency, and focus on the substance of the problem. Data however, is a paradigmatic
subject which will be studied in depth throughout this work: when unified and transformed into information,
the once siloed and of little interest data, reveals it’s real value when combined with other pieces of data.
Various methods, concepts and examples were analyzed, in order to develop a structure where various
sets of data could be efficiently acquired and unified into pieces of relevant and useful information.
A great part of this work was developed at the M-Insight1 company, and applied in it’s main product.
1M-Insight Technologies is an technology based company, dedicated to multimedia content’s edition and distribution, of high graphic
value, in mobile devices.
i

ResumoPorque grandes grupos de pessoas se juntaram e formar países? Porque razão se juntaram os conceitos
de mobile phone, PDA, laptop e smart-phone num só? Porque existe a necessidade de unificar? A resposta
simples seria: minimizar a desorganização, aumentar a eficiência e focar a substância do problema. A fusão
de dados é no entanto um assunto paradigmático, que irá merecer um foco especial neste trabalho: quando
unificados e transformados em informação, os anteriores dados isolados e desinteressantes, revelam em si
um valor imenso valor quando combinados com outros dados.
Vários métodos, conceitos e exemplos foram abalizados, de modo a construir uma estrutura onde vários
conjuntos de dados pudessem ser adquiridos e unificados, transformado-os em pedaços de informação
relevantes e úteis.
Grande parte deste trabalho foi desenvolvido na M-Insight2, e posteriormente aplicado no seu produto
principal.
2M-Insight Technologies é uma empresa de base tecnológica, dedicada à edição e distribuição de conteúdos multimédia, de elevado
valor gráfico, em dispositivos móveis.
iii

AgradecimentosQuero agradecer a toda a empresa M-Insight Technologies pelo ambiente e apoio fornecido. Em especial:
• Ao Eng. João Pereira e Eng. Manuel Sobral por serem os responsáveis na criação deste projecto
aliciante, sem eles não seria possível a realização deste trabalho.
• Ao Eng. Jorge Teixeira e ao Eng. José Leite pelo apoio e orientação dados ao longo do desenvolvi-
mento deste projecto, assim como as suas sugestões para a redacção da tese.
• A todos os meus colegas de trabalho que sempre proporcionaram um bom ambiente dentro da em-
presa.
Quero agradecer ao Prof. Mário Rui Gomes, por ter facultado excelentes condições para o desenvolvi-
mento deste trabalho de engenharia, assim como pelos seus conselhos ao longo da investigação, e ao Prof.
Bruno Martins pela ajuda prestada na compreensão de sistemas de integração de dados.
Quero também agradecer à minha família e amigos por todo o apoio e paciência.
v

Table of Contents
Abstract i
Resumo iii
Acknowledgements v
List of Figures xii
List of Tables xiii
List of Acronyms xv
I Delineating the Path to Follow
1 Introduction 3
1.1 Context . . . . . . . . . . . . . . . . . . . . . . . . . . . . . . . . . . . . . . . . . . . . . . . . 4
1.2 Objectives . . . . . . . . . . . . . . . . . . . . . . . . . . . . . . . . . . . . . . . . . . . . . . 5
1.3 Thesis Statement . . . . . . . . . . . . . . . . . . . . . . . . . . . . . . . . . . . . . . . . . . 6
1.4 Thesis Structure . . . . . . . . . . . . . . . . . . . . . . . . . . . . . . . . . . . . . . . . . . . 6
II Gathering and Unifying Data
2 Data Unification Problematic 11
2.1 A paradigmatic example: Google Earth and Google Maps . . . . . . . . . . . . . . . . . . . . 11
2.2 How to Unify Data . . . . . . . . . . . . . . . . . . . . . . . . . . . . . . . . . . . . . . . . . . 14
2.2.1 Data Integration . . . . . . . . . . . . . . . . . . . . . . . . . . . . . . . . . . . . . . . 15
2.2.2 Mashup . . . . . . . . . . . . . . . . . . . . . . . . . . . . . . . . . . . . . . . . . . . 17
2.3 Conclusions . . . . . . . . . . . . . . . . . . . . . . . . . . . . . . . . . . . . . . . . . . . . . 17
3 Data Gathering Methods 19
3.1 Feeds . . . . . . . . . . . . . . . . . . . . . . . . . . . . . . . . . . . . . . . . . . . . . . . . 19
3.1.1 RSS . . . . . . . . . . . . . . . . . . . . . . . . . . . . . . . . . . . . . . . . . . . . . 19
3.1.2 Atom . . . . . . . . . . . . . . . . . . . . . . . . . . . . . . . . . . . . . . . . . . . . . 21
3.2 Web Services . . . . . . . . . . . . . . . . . . . . . . . . . . . . . . . . . . . . . . . . . . . . 21
3.2.1 Remote procedure calls . . . . . . . . . . . . . . . . . . . . . . . . . . . . . . . . . . . 21
3.2.2 Service-oriented architecture . . . . . . . . . . . . . . . . . . . . . . . . . . . . . . . . 22
3.2.3 Representational state transfer . . . . . . . . . . . . . . . . . . . . . . . . . . . . . . . 23
3.3 Web Scrapping . . . . . . . . . . . . . . . . . . . . . . . . . . . . . . . . . . . . . . . . . . . 24
3.4 Technologies Comparison . . . . . . . . . . . . . . . . . . . . . . . . . . . . . . . . . . . . . 25
3.5 Conclusions . . . . . . . . . . . . . . . . . . . . . . . . . . . . . . . . . . . . . . . . . . . . . 26
vii

III Content Edition and Management
4 Content Edition and Management: Basic Concepts 29
4.1 Workflow . . . . . . . . . . . . . . . . . . . . . . . . . . . . . . . . . . . . . . . . . . . . . . . 29
4.1.1 Newspaper analogy . . . . . . . . . . . . . . . . . . . . . . . . . . . . . . . . . . . . . 29
4.1.2 Content Production Workflow . . . . . . . . . . . . . . . . . . . . . . . . . . . . . . . . 29
4.2 Global Arquitecture . . . . . . . . . . . . . . . . . . . . . . . . . . . . . . . . . . . . . . . . . 32
4.3 The Content . . . . . . . . . . . . . . . . . . . . . . . . . . . . . . . . . . . . . . . . . . . . . 33
4.4 The Screen . . . . . . . . . . . . . . . . . . . . . . . . . . . . . . . . . . . . . . . . . . . . . 34
4.5 Fast Screen Creation/Edition . . . . . . . . . . . . . . . . . . . . . . . . . . . . . . . . . . . . 37
4.6 Conclusions . . . . . . . . . . . . . . . . . . . . . . . . . . . . . . . . . . . . . . . . . . . . . 40
5 MI-Edition Module 41
5.1 Architecture . . . . . . . . . . . . . . . . . . . . . . . . . . . . . . . . . . . . . . . . . . . . . 41
5.2 MI-Editor . . . . . . . . . . . . . . . . . . . . . . . . . . . . . . . . . . . . . . . . . . . . . . . 41
5.2.1 Features . . . . . . . . . . . . . . . . . . . . . . . . . . . . . . . . . . . . . . . . . . . 42
5.2.2 GUI Details . . . . . . . . . . . . . . . . . . . . . . . . . . . . . . . . . . . . . . . . . 42
5.3 MI-Manager . . . . . . . . . . . . . . . . . . . . . . . . . . . . . . . . . . . . . . . . . . . . . 46
5.4 Content Management Libraries . . . . . . . . . . . . . . . . . . . . . . . . . . . . . . . . . . . 46
5.5 Conclusions . . . . . . . . . . . . . . . . . . . . . . . . . . . . . . . . . . . . . . . . . . . . . 46
6 MI-Information Broker 49
6.1 Architecture . . . . . . . . . . . . . . . . . . . . . . . . . . . . . . . . . . . . . . . . . . . . . 49
6.2 Broker Engine . . . . . . . . . . . . . . . . . . . . . . . . . . . . . . . . . . . . . . . . . . . . 51
6.3 Broker Service Interface . . . . . . . . . . . . . . . . . . . . . . . . . . . . . . . . . . . . . . 53
6.4 Information Flow . . . . . . . . . . . . . . . . . . . . . . . . . . . . . . . . . . . . . . . . . . . 53
6.5 Implementations . . . . . . . . . . . . . . . . . . . . . . . . . . . . . . . . . . . . . . . . . . . 56
6.5.1 Broker Service Weather Implementation . . . . . . . . . . . . . . . . . . . . . . . . . . 56
6.5.2 Broker Service Events Implementation . . . . . . . . . . . . . . . . . . . . . . . . . . . 56
6.6 Conclusions . . . . . . . . . . . . . . . . . . . . . . . . . . . . . . . . . . . . . . . . . . . . . 56
IV Results
7 Evaluation 61
7.1 Complete Edition Process Demonstrations . . . . . . . . . . . . . . . . . . . . . . . . . . . . 61
7.1.1 Demo 1: Creating an editor . . . . . . . . . . . . . . . . . . . . . . . . . . . . . . . . . 61
7.1.2 Demo 2: Screen creation, edition and approval . . . . . . . . . . . . . . . . . . . . . . 63
7.1.3 Demo 3: Updating a screen with weather information . . . . . . . . . . . . . . . . . . . 68
7.2 Measurements . . . . . . . . . . . . . . . . . . . . . . . . . . . . . . . . . . . . . . . . . . . . 70
7.2.1 Screen Production . . . . . . . . . . . . . . . . . . . . . . . . . . . . . . . . . . . . . . 70
7.2.2 MI-Information Broker . . . . . . . . . . . . . . . . . . . . . . . . . . . . . . . . . . . . 73
viii

7.3 Conclusions . . . . . . . . . . . . . . . . . . . . . . . . . . . . . . . . . . . . . . . . . . . . . 74
8 Conclusions 75
8.1 Main Contributions . . . . . . . . . . . . . . . . . . . . . . . . . . . . . . . . . . . . . . . . . 76
8.2 Future Work . . . . . . . . . . . . . . . . . . . . . . . . . . . . . . . . . . . . . . . . . . . . . 76
Bibliography 77
V Appendix
A Appendix A: Work Planning 83
B Appendix B: Edition Process 87
B.1 Edition Process Workflow . . . . . . . . . . . . . . . . . . . . . . . . . . . . . . . . . . . . . . 87
C Appendix C: Broker Technologies 89
C.1 The Broker Service Interface . . . . . . . . . . . . . . . . . . . . . . . . . . . . . . . . . . . . 89
C.2 Broker Implementation Output . . . . . . . . . . . . . . . . . . . . . . . . . . . . . . . . . . . 91
C.3 Supporting Data Base Objects . . . . . . . . . . . . . . . . . . . . . . . . . . . . . . . . . . . 92
ix


List of Figures
1.1 Example of the client’s received information . . . . . . . . . . . . . . . . . . . . . . . . . . . . 4
1.2 General Model . . . . . . . . . . . . . . . . . . . . . . . . . . . . . . . . . . . . . . . . . . . . 5
2.1 Google Earth’s tremendous amount of available information in London,UK . . . . . . . . . . . 12
2.2 Google Earth’s weather report on the southern UK . . . . . . . . . . . . . . . . . . . . . . . . 13
2.3 Simple schematic for a Data Warehouse . . . . . . . . . . . . . . . . . . . . . . . . . . . . . . 16
2.4 Simple schematic for a Wrapper Mediator . . . . . . . . . . . . . . . . . . . . . . . . . . . . . 16
3.1 Remote Procedure Calling Mechanism . . . . . . . . . . . . . . . . . . . . . . . . . . . . . . 22
4.1 Main Actors of the Edition Process . . . . . . . . . . . . . . . . . . . . . . . . . . . . . . . . . 31
4.2 Global Architecture Overview . . . . . . . . . . . . . . . . . . . . . . . . . . . . . . . . . . . . 32
4.3 The content scheme . . . . . . . . . . . . . . . . . . . . . . . . . . . . . . . . . . . . . . . . . 34
4.4 An example of a content instantiation: two content instances . . . . . . . . . . . . . . . . . . . 35
4.5 An example of a screen instantiation: the "Weather Lisbon" screen . . . . . . . . . . . . . . . 36
4.6 Screen Terminology . . . . . . . . . . . . . . . . . . . . . . . . . . . . . . . . . . . . . . . . . 37
4.7 Usage of a macro template to create/edit a screen . . . . . . . . . . . . . . . . . . . . . . . . 39
5.1 MI-Edition Module Architecture . . . . . . . . . . . . . . . . . . . . . . . . . . . . . . . . . . . 41
5.2 MI-Editor screen edition in the "Personalized" mode . . . . . . . . . . . . . . . . . . . . . . . 43
5.3 MI-Editor screen edition in the "Fast" mode . . . . . . . . . . . . . . . . . . . . . . . . . . . . 44
5.4 Using MI-Editor to edit the Weather Lisbon screen and it’s Macro Template . . . . . . . . . . . 45
5.5 Using MI-Manager to modify an editor’s values . . . . . . . . . . . . . . . . . . . . . . . . . . 46
6.1 MI-Information Broker’s GUI . . . . . . . . . . . . . . . . . . . . . . . . . . . . . . . . . . . . 49
6.2 MI-Information Broker Architecture . . . . . . . . . . . . . . . . . . . . . . . . . . . . . . . . . 50
6.3 MI-Information Broker Supporting Classes . . . . . . . . . . . . . . . . . . . . . . . . . . . . . 51
6.4 MI-Information Broker Engine State Machine . . . . . . . . . . . . . . . . . . . . . . . . . . . 52
6.5 Information flow example: transforming the weather underground RSS feed into content data . 54
6.6 Interpreting multiple rows on a data table and it’s propagation to linked screens . . . . . . . . . 55
6.7 Data Set/Output Screen relation of the Broker Service Weather Implementation . . . . . . . . 57
6.8 Data Set/Output Screen relation of the Broker Service Events Implementation . . . . . . . . . 58
7.1 Creating an editor through the MI-Manager application . . . . . . . . . . . . . . . . . . . . . . 62
7.2 Screen creation, edition and approval - Steps 1.x . . . . . . . . . . . . . . . . . . . . . . . . . 65
7.3 Screen creation, edition and approval - Steps 1.x (continuation) . . . . . . . . . . . . . . . . . 66
7.4 Screen creation, edition and approval - Steps 2.x . . . . . . . . . . . . . . . . . . . . . . . . . 67
7.5 Demo 3: Updating a screen with weather information . . . . . . . . . . . . . . . . . . . . . . . 69
7.6 Lx1 Screen Production Time Graph . . . . . . . . . . . . . . . . . . . . . . . . . . . . . . . . 71
7.7 Lx2 Screen Production Time Graph . . . . . . . . . . . . . . . . . . . . . . . . . . . . . . . . 72
xi

A.1 Thesis Work Planning done at 8/Jan/2008 . . . . . . . . . . . . . . . . . . . . . . . . . . . . . 84
A.2 Thesis Work analysis at 28/Aug/2008 . . . . . . . . . . . . . . . . . . . . . . . . . . . . . . . 85
B.1 Edition Process Workflow Diagram . . . . . . . . . . . . . . . . . . . . . . . . . . . . . . . . . 87
B.2 Use Cases Diagram on the Edition Process . . . . . . . . . . . . . . . . . . . . . . . . . . . . 88
C.1 The DataSet object model . . . . . . . . . . . . . . . . . . . . . . . . . . . . . . . . . . . . . 91
C.2 Data Base Objects for the Weather Underground Object . . . . . . . . . . . . . . . . . . . . . 92
C.3 Data Base Objects for the Weather Bug Object . . . . . . . . . . . . . . . . . . . . . . . . . . 93
C.4 Data Base Objects for the Eventful Object . . . . . . . . . . . . . . . . . . . . . . . . . . . . . 94
xii

List of Tables
3.1 RSS Versions and Recommendations [1] . . . . . . . . . . . . . . . . . . . . . . . . . . . . . 20
3.2 Information gathering technologies comparison . . . . . . . . . . . . . . . . . . . . . . . . . . 25
7.1 Lx1 Screen Production Time . . . . . . . . . . . . . . . . . . . . . . . . . . . . . . . . . . . . 71
7.2 Lx2 Screen Production Time . . . . . . . . . . . . . . . . . . . . . . . . . . . . . . . . . . . . 72
7.3 Time consumed when using the developed broker implementations . . . . . . . . . . . . . . . 74
xiii

List of AcronymsAPI Application Programming Interface
APP Atom Publishing Protocol
CEO Chief Executive Officer
CORBA Common Object Request Broker Architecture
CPU Central Processing Unit
DCOM Distributed Component Object Model
ETL Extract, Transform, Load
GAV Global As View
GIS Geographic Information System
GUI Graphical User Interface
HTTP Hypertext Transfer Protocol
LAV Local As View
MDI Multiple Document Interface
NAS Network Attached Storage
OS Operating System
PDA Personal Digital Assistant
REST Representational State Transfer
RMI Remote Method Invocation
RPC Remote procedure call
RSS Really Simple Syndication
SAN Storage Area Network
SOA Service Oriented Architecture
SOAP Simple Object Access Protocol
SVG Scalable Vector Graphics
UDDI Universal Description, Discovery, and Integration
URI Uniform Resource Identifier
W3C World Wide Web Consortium
WSDL Web Services Description Language
WS-I Web Services Interoperability
XML eXtensible Markup Language
xv

Part I
Delineating the Path to Follow


1 Introduction"Everything should be as simple as it is,
but not simpler."
Albert Einstein
Taking a broader look at our world today, we can clearly envision a major trend: everything and everyone
are moving towards a global union. The globalization of markets, cultures, technologies and information.
Nowadays, more than ever, unity is strength.
In contemporary days however, unifying information has been a major problematic, because of the expo-
nential information growth in our world. In 2006, 161 exabytes of digital information were created and copied,
continuing an unprecedented period of information growth. This digital universe equals approximately three
million times the information in all the books ever written - or the equivalent of 12 stacks of books, each ex-
tending more than 93 million miles from the earth to the sun. According to IDC [2], the amount of data created
and copied in 2010 will surge more than six fold to 988 exabytes, a compound annual growth rate of 57%.
Having such a large amount of in data available, there is an opportunity to gather it and unify it, so that
a greater value can be extrapolated from these data. Mashups [3] are a good example of this growing trend:
executive editor David Berlind says mashups are the fastest growing ecosystem on the Web and that by
2007, there will be 10 new mashups per day[4]. The focus of this work however, is another form of data
gathering and unifying, which is the information broker. An information broker functions just like mashups, the
difference being that the first is majorally applied outside the web sites context, and the second is connoted
as an information merging mechanism for web sites.
The reason why the information broker was chosen as a major focus for this work, was due to a challenge
proposed by the M-Insight Technologies company: this being to build a system where various contents could
be inserted automatically on a structured database (latterly to be used on various applications and mobile
devices). This challenge led to others, since there was a need to support this automatic system with a
comprehensive edition process, where contents could be inserted manually (this is, by specialized personnel),
supporting the automatic content retrieval and insertion on to the structured contents data base.
This engineering work will present the problematic of data unification and transformation to information,
and a data unification and treatment solution will be made to unravel a specific problem of an business
enterprise product.
3

1.1 Context
This work is inserted in M-Insight’s main product project. The project consists on the gathering, distribution
and presentation of touristic information for mobile devices.
Consider this example: a tourist arrives to Lisbon and wishes to know more about this city. He uses the
product stated above on his mobile device and acquires information of:
• What places to visit
• Guided tours
• Lodging
• Restaurants
• Other touristic information
An example of such information is presented in Figure 1.1.
Figure 1.1: Example of the client’s received information
To sustain the above product’s concept, the supporting system should allow a user to be able, through
technology and applications, to obtain personalized information from the heterogeneity of inputs and through
its contextualization. That is, regardless of the device and consequently the technology, the client has to
see what information (searched according to the client’s user profile, its target device and location) was
transmitted.
This type of system is based on a client/server model, where the client is a mobile device and the server
is responsible to provide personalized contents and operations support. This model is divided into two pro-
cesses: the registration process and the procedure for the content’s request, as shown in Figure 1.2[5].
Having a structure where the client device can interact with the server and obtain personalized contents,
4
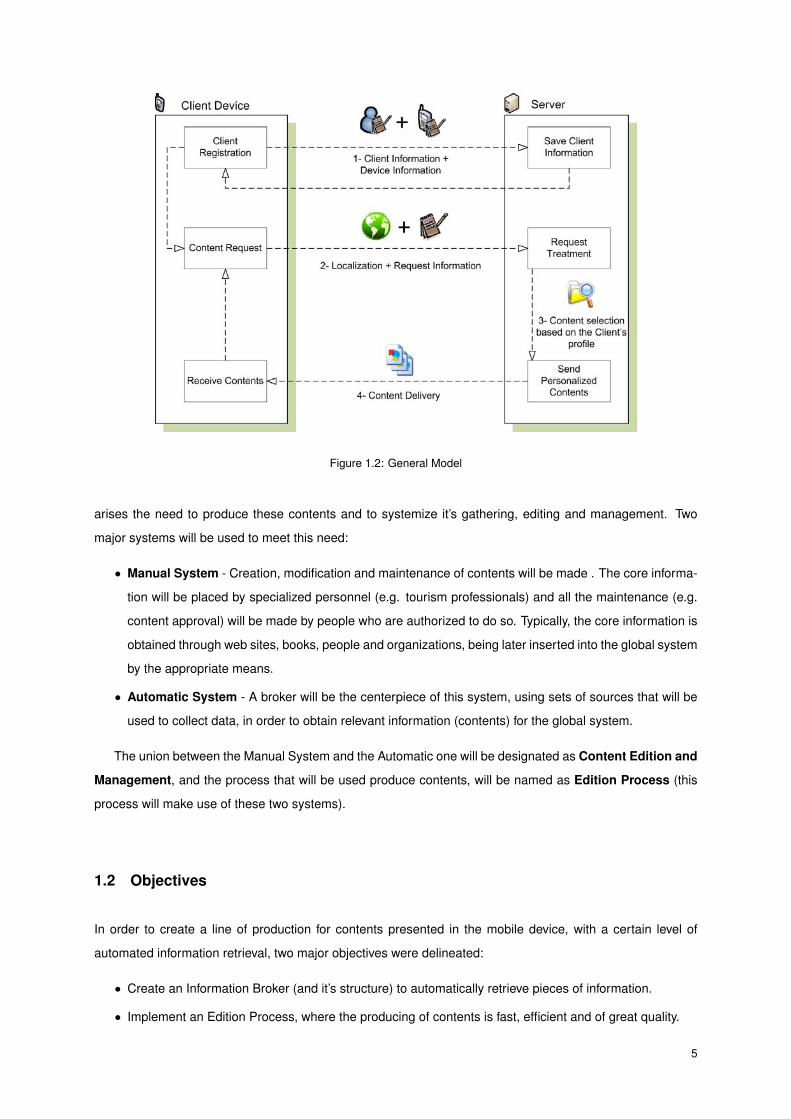
Figure 1.2: General Model
arises the need to produce these contents and to systemize it’s gathering, editing and management. Two
major systems will be used to meet this need:
• Manual System - Creation, modification and maintenance of contents will be made . The core informa-
tion will be placed by specialized personnel (e.g. tourism professionals) and all the maintenance (e.g.
content approval) will be made by people who are authorized to do so. Typically, the core information is
obtained through web sites, books, people and organizations, being later inserted into the global system
by the appropriate means.
• Automatic System - A broker will be the centerpiece of this system, using sets of sources that will be
used to collect data, in order to obtain relevant information (contents) for the global system.
The union between the Manual System and the Automatic one will be designated as Content Edition and
Management, and the process that will be used produce contents, will be named as Edition Process (this
process will make use of these two systems).
1.2 Objectives
In order to create a line of production for contents presented in the mobile device, with a certain level of
automated information retrieval, two major objectives were delineated:
• Create an Information Broker (and it’s structure) to automatically retrieve pieces of information.
• Implement an Edition Process, where the producing of contents is fast, efficient and of great quality.
5

1.3 Thesis Statement
It is possible to guarantee the effectiveness and efficiency of a content production process for mobile devices,
using a broker and a set of supporting applications.
1.4 Thesis Structure
The author chose to organize this work in four parts, in order to group the various chapters that share the
same the same global theme. Each part is totaly based it’s previous parts.
Part I - Delineating the Path to Follow
The objectives of this work are portrayed in this section, where a general context of this thesis is given.
This part will only contain one chapter, which will give a global overview of this work, and will mark a set of
objectives which will later be addressed in this work.
Part II - Gathering and Unifying Data
With a known path to follow, this part uncovers the concepts necessary to reach this objective. The theory
behind the later to be developed information broker is specified here, as well for the methods used for the
information gathering that will be used by this broker.
This part’s first chapter will address the Data Unification Problematic, offering a small study on how the
Google Earth and Google Maps are used to create more value when integrated with other information, and a
study of different data unification methods is made.
The following chapter, named Data Gathering Methods, tackles different methods on how to obtain infor-
mation from different data sources, comparing them and reviewing them.
Part III - Content Edition and Management
The theory of the above part be instantiated in here, offering a more practical (and technical) approach, where
the edition process and broker implementation will be explained. Three chapters will be encapsulated in this
part, each one tackling a different objective.
The first chapter (Content Edition and Management: Basic Concepts) will introduce all the basic con-
cepts necessary to understand the following ones, thus making this chapter of essential reading, if one wishes
to understand the following chapters.
The following chapters (MI-Edition Module and MI-Information Broker) will offer an in-depth explanation
of the implementation work made by the author. The MI-Edition Module will serve as a basis for the content
edition process and the MI-Information Broker explains the implementation work of the information broker.
Part IV - Results
All the previous work will be merged in this part. Firstly, the Evaluation chapter will present some important
measurements and results that derived of all the work made above. The Conclusions chapter will offer a
6

brief summary of all the work made by the author and it’s main contributions and perspectives of future work.
Appendix A: Work Planning
The planning of the work will be presented this appendix.
Appendix B: Edition Process
Extra information about the edition process workflow is given this appendix, providing complementary infor-
mation about the edition process workflow and the different roles involved in this process..
Appendix C: Broker Technologies
Various technologies used by the information broker and it’s implementations will be presented in this ap-
pendix.
7


Part II
Gathering and Unifying Data


2 Data Unification Problematic
"The real act of discovery consists not in
finding new lands, but in seeing with new
eyes."
Marcel Proust
A single, siloed piece of data may have a strong value. Crossing this data with another piece of relevant
data will certainly increase its overall value. An illustrative example is one’s personal data: one’s name,
address and phone number provide little information about an individual. Though when this data is crossed
with online payments, transactions and miscellaneous information associated with this subject, the value of
the first data grows to astonishing proportions.
2.1 A paradigmatic example: Google Earth and Google Maps
Google Earth and Google Maps are two technologies powered by the Mountain View company which provide
almost the same features but in different ways. While Google Maps is available through the window of your
browser, Google Earth is a downloadable application which can be installed on your computer in order to view
the satellite imagery straight from one’s desktop [6].
Google Earth is a powerful geographic information system (GIS)1 [7] and is a proprietary virtual globe
program that was originally called Earth Viewer, and was created by Keyhole, Inc, a company acquired by
Google in 2004. It is available under three different licenses: Google Earth, a free version with limited func-
tionality; Google Earth Plus ($20 per year), which includes additional features; and Google Earth Pro ($400
per year), which is intended for commercial use[8]. The target of this study will be the free version of this
application.
Google Maps is a Google service offering powerful, user-friendly mapping technology and local business
information - including business locations, contact information, and driving directions. A list of this service’s
main features are[9]:
• Integrated business search results - finding business locations and contact information all in one
location, integrated on the map.
• Satellite imagery - viewing of a satellite image (or a satellite image with superimposed map data).
• Terrain maps - viewing of physical features, such as mountains and vegetation, with elevation shading.
• Detailed directions - customizable trip planning.
The Offered Information by Google Maps tends to be a great a target for mashups, because it offers
some basic geographic information for the user, e.g. street names, traffic conditions.
On the other hand, Google Earth features many layers (Figure 2.1) as a source for information on busi-
nesses and points of interest, as well as showcasing the contents of many communities, such as Wikipedia,
Panoramio and YouTube. Most of these layers are updated frequently, making this an interesting means to
1A geographic information system (GIS) integrates hardware, software, and data for capturing, managing, analyzing, and displaying
all forms of geographically referenced information.
11
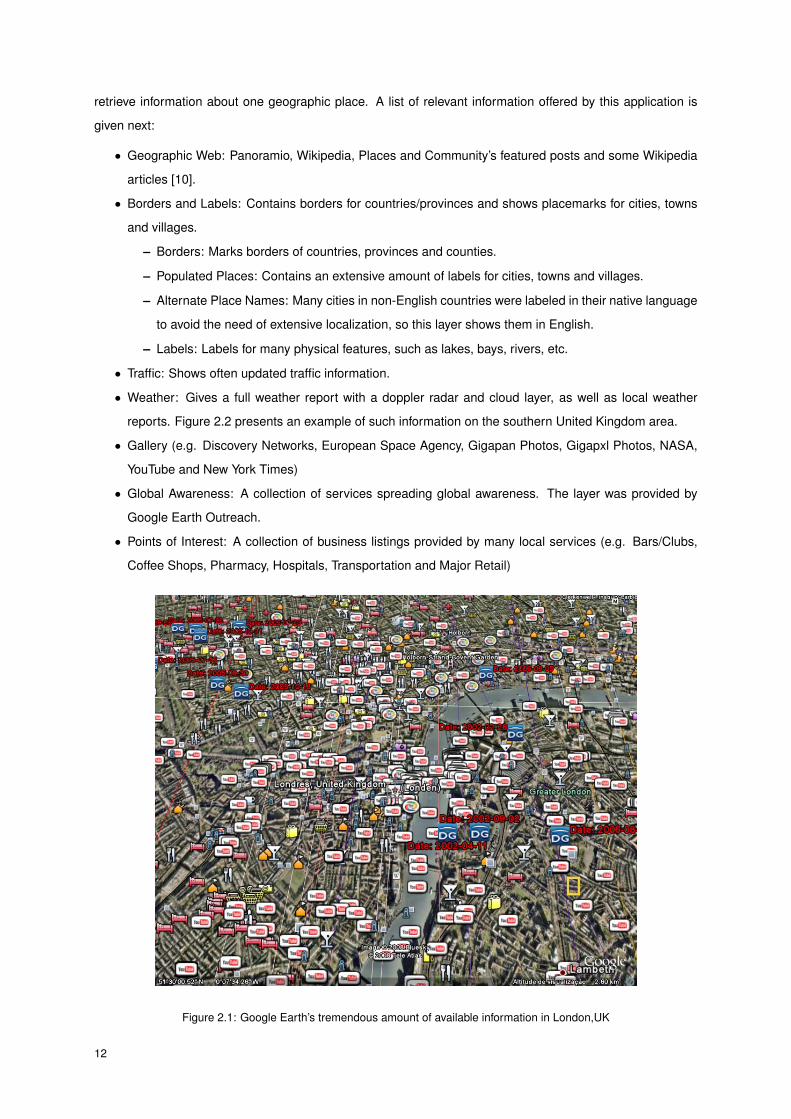
retrieve information about one geographic place. A list of relevant information offered by this application is
given next:
• Geographic Web: Panoramio, Wikipedia, Places and Community’s featured posts and some Wikipedia
articles [10].
• Borders and Labels: Contains borders for countries/provinces and shows placemarks for cities, towns
and villages.
– Borders: Marks borders of countries, provinces and counties.
– Populated Places: Contains an extensive amount of labels for cities, towns and villages.
– Alternate Place Names: Many cities in non-English countries were labeled in their native language
to avoid the need of extensive localization, so this layer shows them in English.
– Labels: Labels for many physical features, such as lakes, bays, rivers, etc.
• Traffic: Shows often updated traffic information.
• Weather: Gives a full weather report with a doppler radar and cloud layer, as well as local weather
reports. Figure 2.2 presents an example of such information on the southern United Kingdom area.
• Gallery (e.g. Discovery Networks, European Space Agency, Gigapan Photos, Gigapxl Photos, NASA,
YouTube and New York Times)
• Global Awareness: A collection of services spreading global awareness. The layer was provided by
Google Earth Outreach.
• Points of Interest: A collection of business listings provided by many local services (e.g. Bars/Clubs,
Coffee Shops, Pharmacy, Hospitals, Transportation and Major Retail)
Figure 2.1: Google Earth’s tremendous amount of available information in London,UK
12
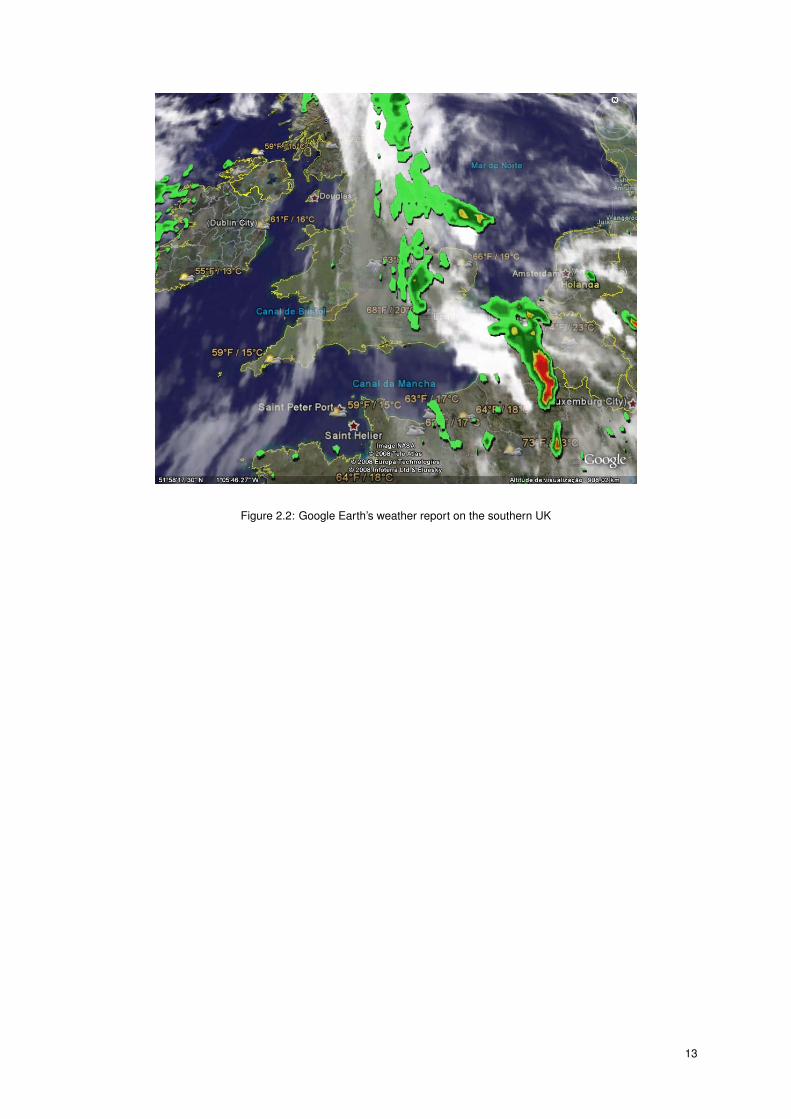
Figure 2.2: Google Earth’s weather report on the southern UK
13

The Business Value of the integration of web services with GIS has recently attracted much attention.
Free web mapping services providers such as Google Maps and Microsoft Virtual Earth have become very
popular. They use large distributed systems for information sharing on the Internet based on geospatial
location. Also they provide their web APIs for professional developers.
Many organizations have recently realized georeferenciated information can give them an edge, making
the geographic information systems a palatable resource. Google Maps is being used by some companies
as a means to map their information on the globe and improve their overall value:
NYTimes.com, which started in 1996 as the online version of The New York Times, today is the largest
newspaper site in the US.
At the beginning of 2006, The Times decided it needed to create a first rate presence for its online travel
section. Using the Google Maps API, The Times mashed up news and information for all its travel destinations
on an intuitive mapping interface and overlaid hotels, restaurants and other points of interests that readers
could browse through. Nowadays, over 50% of the pages in the travel section uses Google Maps.
The Times also uses the Maps API in other sections such as real estate, in election news, and to help
readers visualize locally relevant information like the occurrences of crane incidents and homicides in New
York City [11].
Tripadvisor.com, the world’s largest online travel community, relies on its six million members to share
real advice about the best places to go and stay when traveling.
To expand into social networks, Tripadvisor uses the Google Maps API to create interactive applications
for new users. The Cities I’ve visited application allows users to pin on a map places they’ve been or want to
go and to share their personalized maps with friends and family. Five months after launch, the application had
over five million downloads. For CEO Steve Kaufer, this success was achieved in large part due to Google
Maps’s intuitive user interface and its portability to other social networks.
By switching from the original list-view of restaurants to a map-centric view, Tripadvisor received 1.5MM
reviews of restaurants in four months, which was four times as many as it had received in seven years [12].
Final Thoughts
A promising future for these platforms is undeniable. Google Earth and Google Maps are two good and
pragmatic example of what can achieved by taking bits and pieces of scattered data and mix them all in one
structured place. The information value of this mixture is very high and is a good illustration of this thesis
statement.
2.2 How to Unify Data
The following sub-sections take different two names but serve the same purpose: data unification. Whilst
data integration is a broad area that implies all methods of data unification, the mashups are connoted as a
means to unify data for the web.
14

2.2.1 Data Integration
Data integration is the process of combining data residing at different sources and providing the user with a
unified view of these data [13]. It has been the focus of extensive theoretical work and numerous open prob-
lems remain to be solved. In management practice, data integration is frequently called Enterprise Information
Integration.
he problem of combining heterogeneous data sources under a single query interface is not a new one. The
rapid adoption of databases after the 1960s naturally led to the need to share or merge existing repositories.
This merging can be done at several levels in the database architecture[14]. There are two major approaches
to tackle this problem:
• Data Warehouse - deferred style of integrating data. All the data is collected into a single data base,
which is then used for all the queries for information.
• Wrapper Mediator Method - immediate style of integrating data. The information queries are done
through a mediator that is linked with various wrappers. There is no need for a data base that unifies all
the data, because all the data is gathered from the wrappers (which obey to a mediated schema).
A data warehouse is a repository of an organization’s electronically stored data designed to facilitate
reporting and analysis. An efficient data warehouse is able to retrieve and analyze data, to extract, transform
and load data, and to manage dictionary data – so that it can be used for business intelligence [15].
This classic definition of the data warehouse focuses on data storage. However, the means to retrieve
and analyze data, to extract, transform and load data, and to manage the data dictionary are also considered
essential components of a data warehousing system. Many references to data warehousing use this broader
context. Thus, an expanded definition for data warehousing includes business intelligence tools, tools to
extract, transform, and load data into the repository, and tools to manage and retrieve metadata.
Here data from several sources are extracted, transformed, and loaded (ETL) into source and can be
queried with a single schema. This can be perceived architecturally as a tightly coupled approach because
the data reside together in a single repository at query time. Problems with tight coupling can arise with the
"freshness" of data, for example when an original data source is updated, but the warehouse still contains the
older data and the ETL process needs to be executed again. It is also difficult to construct data warehouses
when you only have a query interface to the data sources and no access to the full data. This problem
frequently arises when integrating several commercial query services like travel or classified advertisement
web applications.
Figure 2.3 presents a simple schematic for a data warehouse, where the data from the source databases
is extracted, transformed then loaded into the data warehouse.
Using the Wrapper Mediator method, the external resources are considered as materialized views over a
virtual mediated schema[16], resulting in "virtual data integration". This virtual schema is called the mediated
schema. For each data source (such as the crime database and weather website) a wrapper (or adapter)
is made tailored. These wrappers simply transform the local query results (those returned by the respective
websites or databases) into an easily processed form for the data integration solution (Figure 2.4). When a
query is made to the mediated schema, the data integration solution transforms this query into appropriate
15

Figure 2.3: Simple schematic for a Data Warehouse
queries over the respective data sources. Finally, the results of these queries are combined into the answer
to the first query.
This method can also be called as view based query answering because we can consider each of the data
sources to be a view over the (nonexistent) mediated schema [17]. Formally such an approach is called Local
As View (LAV), where Local refers to the local sources/databases. An alternate model of integration is one
where the mediated schema is designed to be a view over the sources. This approach called Global As View
(GAV) - where Global refers to the global (mediated) schema - is often used due to the simplicity involved in
answering queries issued over the mediated schema. However, the obvious drawback is the need to rewrite
the view for mediated schema whenever a new source is to be integrated and/or an existing source changes
its schema.
Figure 2.4: Simple schematic for a Wrapper Mediator
16

2.2.2 Mashup
A good insight as to what makes a mashup [3] is to look at the etymology of the term: it was borrowed from
the pop music scene, where a mashup is a new song that is mixed from the vocal and instrumental tracks
from two different source songs (usually belonging to different genres). Like these "bastard pop" songs, a
mashup is an unusual or innovative composition of content (often from unrelated data sources), made for
human (rather than computerized) consumption.
A mashup is a web application that combines data from more than one source into a single integrated
tool; an example is the use of cartographic data from Google Maps to add location information to real-estate
data, thereby creating a new and distinct web service that was not originally provided by either source.
Many people are experimenting with mashups using Amazon, eBay, Flickr, Google, Microsoft, Yahoo and
YouTube APIs, which has led to the creation of various mashup editors like Yahoo Pipes, Google Mashup
Editor, Microsoft Popfly, JackBe’s Prest, IBM Sharable Code, Serena Software and Kapow Robosuite.
Executive editor David Berlind [4] says mashups are the fastest growing ecosystem on the Web and that
by 2007, there will be 10 new mashups per day.
Mashup Examples
• Frozenbear.com merges Google maps and Singles to let you know where the single people are in your
neighborhood.
• Parkingcarma.com helps you track down parking spaces in the Bay Area.
• Wikicrimes.org merges Google maps and local crimes information to track down the most dangerous
areas.
• Maps.webfoot.com combines U.S. Census Bureau information with Google Maps, this page offers a
fantastic view on some major US statistics
• Wii.findnearby.net combines Goggle maps, Amazon and Ebay informations to help Nintendo Wii own-
ers to find parts for their gaming machine and find other Nintendo fans.
2.3 Conclusions
This chapter presented the relevance of data unification and proved it’s value using the Google Earth and
Google Maps examples, which are two important cases of how heterogenic data can be merged to create
additional value and additional relevant information.
Two data integration methods were studied: the Data Warehouse and Wrapper Mediator Method, each
one serving the same purpose (data integration), but differing on how this integration is made.
Mashups were addressed as well, due to their growing popularity and massification. This method of data
unification is being used largely in various web sites and it is believed to be a growing trend.
17

3 Data Gathering MethodsThis chapter describes the three major information retrieval methods over the Internet.
3.1 Feeds
A web feed (or news feed) is a data format used for providing users with frequently updated content. Content
distributors syndicate a web feed, thereby allowing users to subscribe to it. Making a collection of web feeds
accessible in one spot is known as aggregation, which is performed by an Internet aggregator. A web feed is
also sometimes referred to as a syndicated feed [1].
RSS/Atom/XML are technologies, but syndication is a process. RSS and Atom are two most popular types
of feeds, be they news articles, weblog posts, a series of photographs, and more. XML is the base technology
both are built on [18].
The kinds of content delivered by a web feed are typically HTML (webpage content) or links to webpages
and other kinds of digital media. Often when websites provide web feeds to notify users of content updates,
they only include summaries in the web feed rather than the full content itself.
3.1.1 RSS
RSS was first invented by Netscape. They wanted to use an XML format to distribute news, stories and
information. Netscape refined the version of RSS and then dropped it. Userland Software to control of the
specficiation and continued to develop it, releasing a newer version. A non-commercial group picked up RSS
at the same time and based on their interpretation of the Netscape’s original concept of RSS they too released
a new version. UserLand was not happy with the non-commercial version and continued development of their
own version of RSS (Really Simple Syndication), eventually UserLand released RSS 2.0 [19].
Because there are different versions of RSS, the term RSS is most frequently used as a name to mean
the syndication of Web content, rather than as an acronym for its founding technology. When using the name
RSS the speaker may be referring to any of the following versions of Web content syndication:
• RDF Site Summary (RSS 0.9, RSS 1.0)
• Rich Site Summary (RSS 0.91, RSS 1.0)
• Really Simple Syndication (RSS 2.0)
RSS 2.0 is the most used version of this format, due to its extensibility, stability and usage for general
purpose, metadata-rich syndication, although there are multiple incompatible and widely adopted versions of
RSS [20]. Table 3.1 represents RSS versions and recommendations.
19

Table 3.1: RSS Versions and Recommendations [1]
Version Owner Pros Status Recommendation
0.90 Netscape - Obsoleted by 1.0 Not recommended
0.91 UserLand Simple Officially obsoleted
by 2.0, but still quite
popular
Use for basic syn-
dication. Easy mi-
gration path to 2.0 if
you need more flex-
ibility
0.92, 0.93, 0.94 UserLand Allows richer meta-
data than 0.91
Obsoleted by 2.0 Use 2.0 instead
1.0 RSS-DEV Working
Group
RDF-based, exten-
sibility via modules,
not controlled by a
single vendor
Stable core, active
module develop-
ment
Use for RDF-based
applications or if
you need advanced
RDF-specific mod-
ules
2.0 UserLand Extensibility via
modules, easy
migration path from
0.9x branch
Stable core, active
module develop-
ment
Use for general-
purpose,
metadata-rich
syndication
20

3.1.2 Atom
The name Atom applies to a pair of related standards. The Atom Syndication Format is an XML-based
Web content and metadata syndication format used for web feeds, while the Atom Publishing Protocol (short
AtomPub or APP) is a simple application-level protocol publishing and editing Web Resources using HTTP
and XML [21]. The format is aimed to be [22]:
• 100% vendor neutral;
• implemented by everybody;
• freely extensible by anybody;
• cleanly and thoroughly specified.
The Atom format was developed as an alternative to RSS. Ben Trott was one of the advocates of the new
format that became Atom. He believed that RSS had problems that ought to be fixed. Since RSS was frozen,
and in any case had to remain backward compatible, there could be advantages in doing a fresh design [23].
The RSS 2.0 specification is copyrighted by Harvard University and is frozen. No significant changes can
be made (although the specification is under a Creative Commons licence) and it is intended that future work
be done under a different name; Atom is one example of such work [24].
3.2 Web Services
A Web service is a software system designed to support interoperable machine-to-machine interaction over
a network [25]. It has an interface described in a machine-processable format (specifically WSDL). Other
systems interact with the Web service in a manner prescribed by its description using SOAP-messages,
typically conveyed using HTTP with an XML serialization in conjunction with other Web-related standards.
The W3C Web service definition encompasses many different systems, but in common usage the term
refers to clients and servers that communicate using XML messages that follow the SOAP standard. In such
systems, there is often machine-readable description of the operations offered by the service written in the
Web Services Description Language (WSDL). The latter is not a requirement of a SOAP endpoint, but it is a
prerequisite for automated client-side code generation in many Java and .NET SOAP frameworks (frameworks
such as Spring, Apache Axis2 and Apache CXF being notable exceptions). Some industry organizations, such
as the WS-I, mandate both SOAP and WSDL in their definition of a Web service.
More recently, RESTful Web services have been regaining popularity. These also meet the W3C definition,
and are often better integrated with HTTP than SOAP-based services. They do not require XML messages
or WSDL service-API definitions.
3.2.1 Remote procedure calls
RPC is a powerful technique for constructing distributed, client-server based applications. It is based on
extending the notion of conventional, or local procedure calling, so that the called procedure doesn’t need to
exist in the same address space as the calling procedure. The two processes may be on the same system, or
they may be on different systems with a network connecting them. By using RPC, programmers of distributed
21
applications avoid the details of the interface with the network. The transport independence of RPC isolates
the application from the physical and logical elements of the data communications mechanism and allows the
application to use a variety of transports.
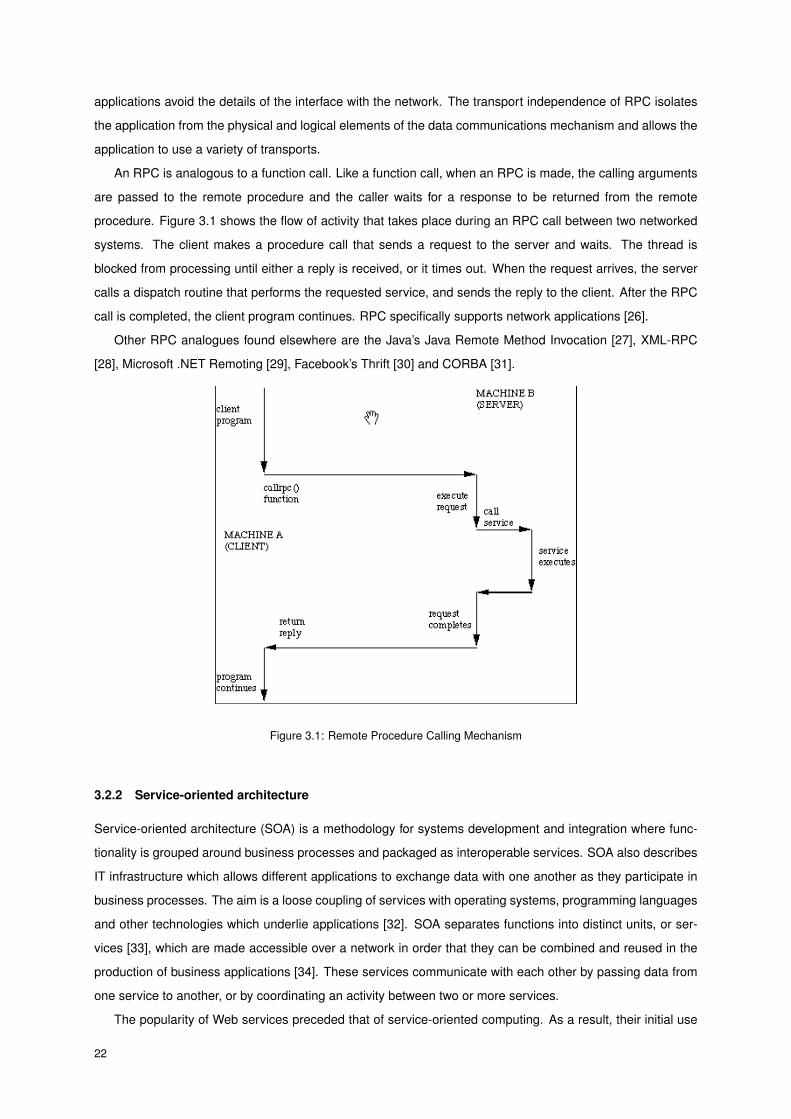
An RPC is analogous to a function call. Like a function call, when an RPC is made, the calling arguments
are passed to the remote procedure and the caller waits for a response to be returned from the remote
procedure. Figure 3.1 shows the flow of activity that takes place during an RPC call between two networked
systems. The client makes a procedure call that sends a request to the server and waits. The thread is
blocked from processing until either a reply is received, or it times out. When the request arrives, the server
calls a dispatch routine that performs the requested service, and sends the reply to the client. After the RPC
call is completed, the client program continues. RPC specifically supports network applications [26].
Other RPC analogues found elsewhere are the Java’s Java Remote Method Invocation [27], XML-RPC
[28], Microsoft .NET Remoting [29], Facebook’s Thrift [30] and CORBA [31].
Figure 3.1: Remote Procedure Calling Mechanism
3.2.2 Service-oriented architecture
Service-oriented architecture (SOA) is a methodology for systems development and integration where func-
tionality is grouped around business processes and packaged as interoperable services. SOA also describes
IT infrastructure which allows different applications to exchange data with one another as they participate in
business processes. The aim is a loose coupling of services with operating systems, programming languages
and other technologies which underlie applications [32]. SOA separates functions into distinct units, or ser-
vices [33], which are made accessible over a network in order that they can be combined and reused in the
production of business applications [34]. These services communicate with each other by passing data from
one service to another, or by coordinating an activity between two or more services.
The popularity of Web services preceded that of service-oriented computing. As a result, their initial use
22
was primarily within traditional distributed solutions wherein they were most commonly used to facilitate point-
to-point integration channels. As the maturity and adoption of Web services standards increased, so did the
scope of their utilization [35].
First-Generation Web Services Platform
The original Web services technology platform is comprised of the following core open technologies and
specifications:
• Web Services Description Language (WSDL)
• XML Schema Definition Language (XSD)
• SOAP (formerly the Simple Object Access Protocol)
• UDDI (Universal Description, Discovery, and Integration)
• WS-I Basic Profile
Second-Generation Web Services Platform (WS-* extensions)
Some of the greatest quality of service-related gaps in the first-generation platform lie in the areas of message-
level security, cross-service transactions, and reliable messaging. These, along with many other extensions,
are being provided by the second-generation Web services platform.
Consisting of numerous specifications that build upon the fundamental first-generation messaging frame-
work, this set of Web services technologies (generally labeled as "WS-* extensions") provides a rich feature-
set far more complex both in technology and in design.
Some of the notable WS-* specifications include:
• WS-Security (and WS-SX)
• WS-Coordination, WS-AtomicTransaction, WS-BusinessActivity (and WS-TX)
• WS-ReliableMessaging (and WS-RX)
• WS-Policy
• WS-Addressing
3.2.3 Representational state transfer
The terms "representational state transfer" and "REST" were introduced in 2000 in the doctoral dissertation
of Roy Fielding,[36] one of the principal authors of the Hypertext Transfer Protocol (HTTP) specification
REST relies on a single application protocol (HTTP), universal resource indicators (URI) and standard-
ized data formats, through XML. It employs established HTTP methods such as GET and POST to direct
applications. So instead of creating a standard, machine-readable way for applications to discover and use
application components on remote systems - the way SOAP is being used for Web services - REST devel-
opers use URIs to create a common ground so applications can use HTTP and XML to share data. REST
developers use XML documents rather than application-method calls to tell distributed programs how to use
each other’s data [37].
23

An important concept in REST is the existence of resources (sources of specific information), each of
which is referenced with a global identifier (e.g., a URI in HTTP). In order to manipulate these resources,
components of the network (clients and servers) communicate via a standardized interface (e.g., HTTP) and
exchange representations of these resources (the actual documents conveying the information). For example,
a resource which is a circle may accept and return a representation which specifies a center point and radius,
formatted in SVG, but may also accept and return a representation which specifies any three distinct points
along the curve as a comma-separated list.
Systems which follow Fielding’s REST principles are often referred to as "RESTful".
3.3 Web Scrapping
Web scraping (sometimes called harvesting) generically describes any of various means to extract content
from a website over HTTP for the purpose of transforming that content into another format suitable for use in
another context.
Screen scraping is often considered an inelegant solution, and for good reasons. It has two primary
inherent drawbacks. The first being that, unlike APIs with interfaces, scraping has no specific programmatic
contract between content-provider and content-consumer. Scrapers must design their tools around a model
of the source content and hope that the provider consistently adheres to this model of presentation. Web sites
have a tendency to overhaul their look-and-feel periodically to remain fresh and stylish, which imparts severe
maintenance headaches on behalf of the scrapers because their tools are likely to fail [3].
The second issue is the lack of sophisticated, re-usable screen-scraping toolkit software, colloquially
known as scrAPIs. The dearth of such APIs and toolkits is largely due to the extremely application-specific
needs of each individual scraping tool. This leads to large development overheads as designers are forced to
reverse-engineer content, develop data models, parse, and aggregate raw data from the provider’s site [3].
Legal issues arise on the usage of this method. Although scraping is against the terms of use of some
websites, the enforceability of these terms is unclear [38]. The extraction of an open contents site, may violate
copyright laws. For example, the GNU Free Documentation Licence (GFDL) and Creative Commons Share
Alike (CC-BY-SA) require the republisher to inform its readers of the licence conditions, and to give the proper
credits to the original author [39][40].
With these means, virtually any information can be extracted from published web sites. However, the
structure may vary over time, obliging the change of reading methods of the scrapper, rising its maintenance
costs.
24
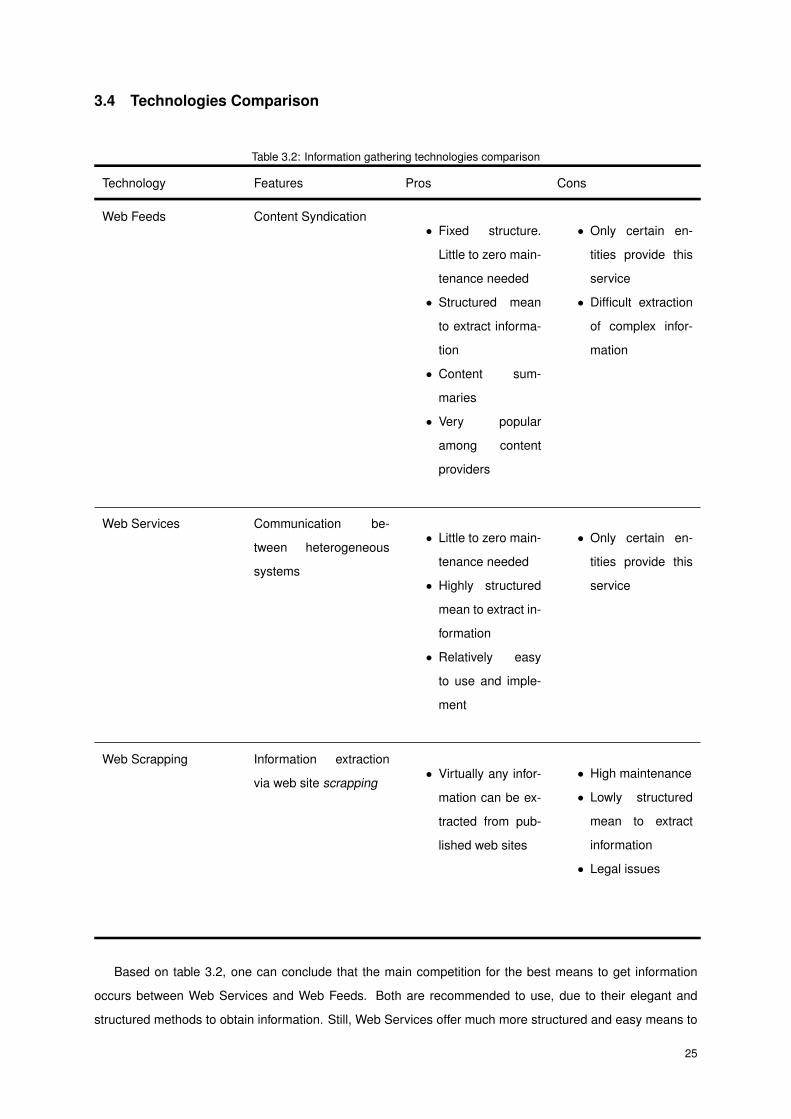
3.4 Technologies Comparison
Table 3.2: Information gathering technologies comparison
Technology Features Pros Cons
Web Feeds Content Syndication• Fixed structure.
Little to zero main-
tenance needed
• Structured mean
to extract informa-
tion
• Content sum-
maries
• Very popular
among content
providers
• Only certain en-
tities provide this
service
• Difficult extraction
of complex infor-
mation
Web Services Communication be-
tween heterogeneous
systems
• Little to zero main-
tenance needed
• Highly structured
mean to extract in-
formation
• Relatively easy
to use and imple-
ment
• Only certain en-
tities provide this
service
Web Scrapping Information extraction
via web site scrapping• Virtually any infor-
mation can be ex-
tracted from pub-
lished web sites
• High maintenance
• Lowly structured
mean to extract
information
• Legal issues
Based on table 3.2, one can conclude that the main competition for the best means to get information
occurs between Web Services and Web Feeds. Both are recommended to use, due to their elegant and
structured methods to obtain information. Still, Web Services offer much more structured and easy means to
25

obtain simple and complex information. Web Feeds, on the other hand, are much more popular.
Web Scrapping is the black sheep among these technologies, due to it’s volatility. Web sites constantly
change over time, and the results through this method can reveal rather unpredictable.
3.5 Conclusions
Three major gathering methods were studied in this chapter: Web Feeds, Web Services and Web Scrapping.
Web Services and Web Feeds. Both are recommended to use, due to their elegant and structured methods
to obtain information. Still, Web Services offer much more structured and easy means to obtain simple and
complex information. Web Feeds, on the other hand, are much more popular. On the other hand, Web
Scrapping, is a dodgy method to use, due to to it’s volatility. Web sites constantly change over time, and the
results through this method can reveal rather unpredictable.
26
Part III
Content Edition and Management

4 Content Edition and Management: Basic Concepts
The theory behind an information broker was addressed in the previous part, but one must first understand the
structure in which the broker will be based upon. Since this work will be implemented in a corporate context,
in which the global vision was already defined, one must first study what is the globally defined structure and
where does this work will be placed.
The structure that will support the broker, the production process and basilar concepts on which the
following chapters will be supported on, will be described in this chapter.
4.1 Workflow
4.1.1 Newspaper analogy
First and foremost, a workflow must be idealized, in order build a coherent and effective production process.
The analogy used to build this workflow is the publication of a newspaper. The production line of a newspaper,
as it’s core, boils down to this: a journalist gathers information of a given subject over multiple sources and
processes all that information into the form of an article. This article is then submitted to an editor, who will
decide if the article is suitable for publication or if it must be reviewed again by the journalist. If the article is
approved, it will be made available newspaper and will be styled according to a template which is maintained
by a designer.
Other aspect of a newspaper are it’s typical last pages, which provide various information about weather,
horoscope and other third party information. The newspaper only gathers these information from the sources
and places it on it’s page layout.
Finally, a director will manage this process.
4.1.2 Content Production Workflow
The desired workflow for the content production for mobile devices is very similar to the example given above
of the newspaper production process. In this case, The news article will be a screen, and the newspaper
layout will be named as screen template; the journalist will be a content editor, the newspaper editor will
be named as a reviewer, the director will be a named as a manager and the newspaper designer will be
a specialized technician (which will be responsible for the screen template’s maintenance). As for the last
pages of the newspaper, which are treated automatically, the information broker be it’s equivalent in this
process.
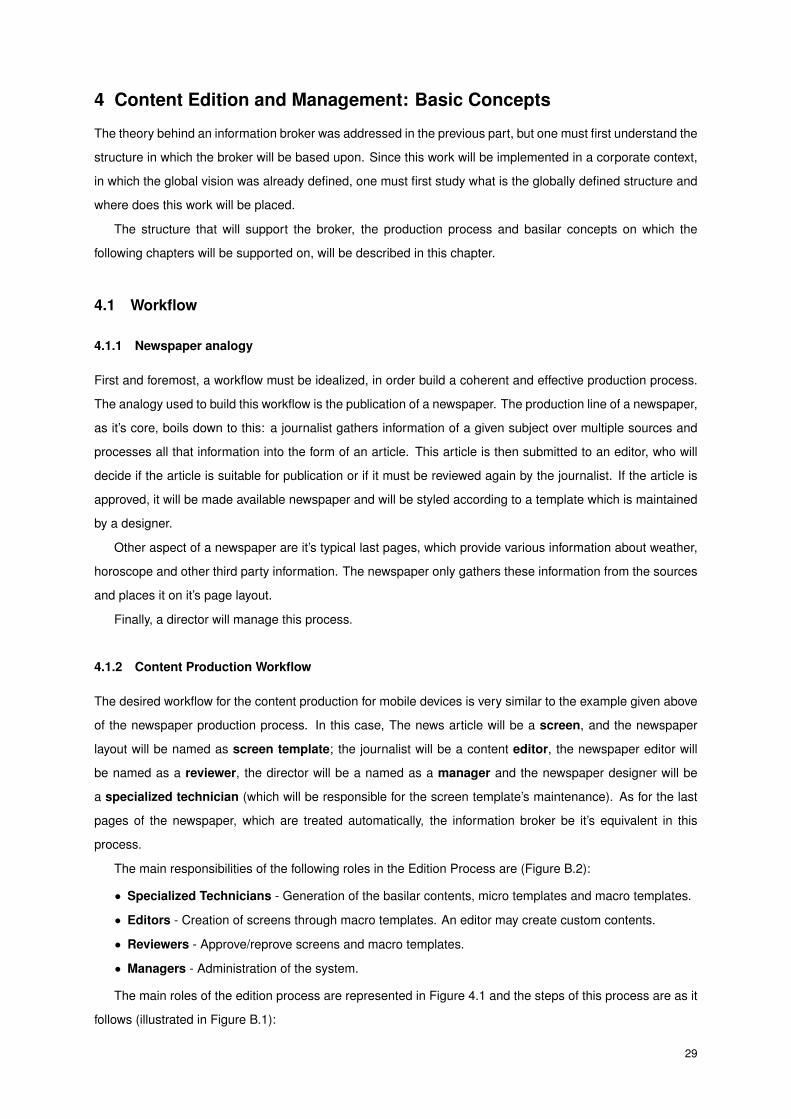
The main responsibilities of the following roles in the Edition Process are (Figure B.2):
• Specialized Technicians - Generation of the basilar contents, micro templates and macro templates.
• Editors - Creation of screens through macro templates. An editor may create custom contents.
• Reviewers - Approve/reprove screens and macro templates.
• Managers - Administration of the system.
The main roles of the edition process are represented in Figure 4.1 and the steps of this process are as it
follows (illustrated in Figure B.1):
29

Step (1). A specialized technician creates screen templates.
Step (2). A specialized technician (typically, the one that created the templates) edits and submits the templates
for approval.
Step (3). A reviwer analyses the submitted templates. If the template is approved, continue to the next step. If
the the template is reproved, return to Step (2)
Step (4). An editor creates a new screen based on the above template, using the information provided by the
information sources.
Step (5). An editor(typically, the one that created the screen) edits the screen and submits it for approval.
Step (6). A reviwer analyses the submitted screen. If the screen is approved, continue to the next step. If the the
screen is reproved, return to Step (5)
Step (7). The screen is made available for selected end users
Step (8). Repeat Step (4)
After a screen is created and approved, the information broker can update it with relevant informa-
tion, using the appropriate data sources. For example, after the Weather Lisbon4.5 screen is created, the
information broker can updated it daily with the current weather conditions.
During the whole process, a manager can administrate various points of the process (e.g. content prop-
erties, approvals).
30
Figure 4.1: Main Actors of the Edition Process
31

4.2 Global Arquitecture
Now that a workflow is designed, a modularized architecture must be made, in order to build a system where
the workflow can be implemented. The global architecture overview in which all the work will be developed is
presented in Figure 4.2, whose players are:
Figure 4.2: Global Architecture Overview
• Client Device
– Resources - Used by the content interpreter and obtained through the server.
∗ XML - Typically, these files will hold the screen’s structure and properties.
∗ Multimedia Files - Images, videos and sounds referenced by the XML; therefore used on the
screen’s presentation.
32

∗ Other - For example, configuration files used by the content interpreter.
– Content Interpreter - Interprets and processes the resources and uses the presentation module
to expose this information to the user.
– Presentation Module - Presents screens and other information to the user and manages user
interaction.
• Mobile Services Provider - TMN, Vodafone or Optimus are examples of such. This will will be the
bridge between the server and the client’s mobile device.
• Server
– Requests Manager - Receives and processes the client’s requests and sends the proper re-
sources back to the client. The translation from the structured contents in the data base to XML is
done here.
– Content Management
∗ Edition Module - The creation, maintenance and management of structured contents will be
made in this module. It will serve as a bridge that links the information broker with the data
base as well.
∗ Information Broker - Does automatic information retrieval of information using various sources
and forwards this structured information to the data base (through the edition module).
• Data Base - Contains structured content information, multimedia files and other types of information.
• Information Sources - These sources can be the ones used directly by the information broker (e.g.
Web Services and Web Feeds) or other kind of sources (e.g. information obtained on-site, books,
tourism agencies) which are used by the content editors.
The Information Broker and Edition Module (which is closely related with the first) will be the main focus
of this work.
4.3 The Content
A workflow and a arquitecture are designed. Now, the building blocks of this system must be designed. The
basilar block of the whole structure will be called a content. A content is an abstract concept that strives to
represent a piece of information on a structerd way. Figure 4.3 represents the content’s main structure. It’s
main actors are:
• Content - the basilar element in which all of the remaining structure will be built upon. The are many
types of contents available, however they are not of interest to this study.
• Content Data Properties - these properties can be thought as the content’s attributes. These are
defined by the content’s micro template.
• Micro Template - because there are many similar contents in the production process, the micro tem-
plate concept was created. As the name states, the micro template sets the content’s basilar structure,
facilitating the content’s creation and maintenance. The data properties that a content should have are
defined in it’s micro template.
33
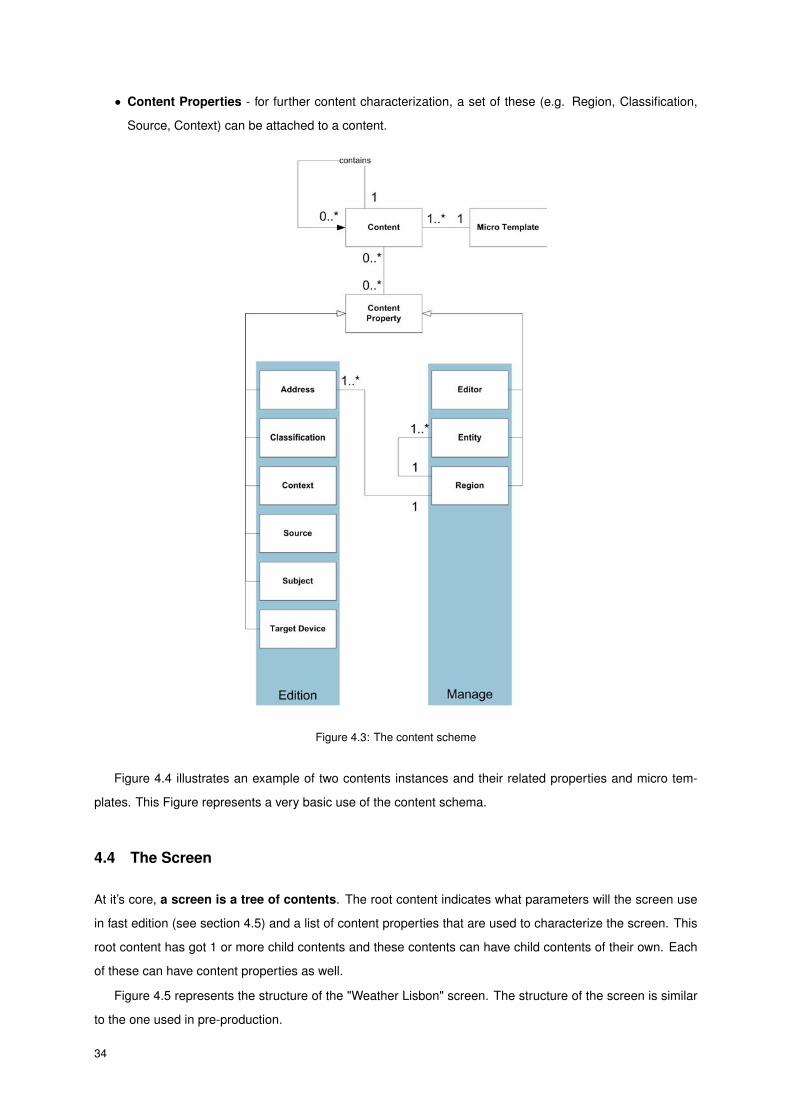
• Content Properties - for further content characterization, a set of these (e.g. Region, Classification,
Source, Context) can be attached to a content.
Figure 4.3: The content scheme
Figure 4.4 illustrates an example of two contents instances and their related properties and micro tem-
plates. This Figure represents a very basic use of the content schema.
4.4 The Screen
At it’s core, a screen is a tree of contents. The root content indicates what parameters will the screen use
in fast edition (see section 4.5) and a list of content properties that are used to characterize the screen. This
root content has got 1 or more child contents and these contents can have child contents of their own. Each
of these can have content properties as well.
Figure 4.5 represents the structure of the "Weather Lisbon" screen. The structure of the screen is similar
to the one used in pre-production.
34
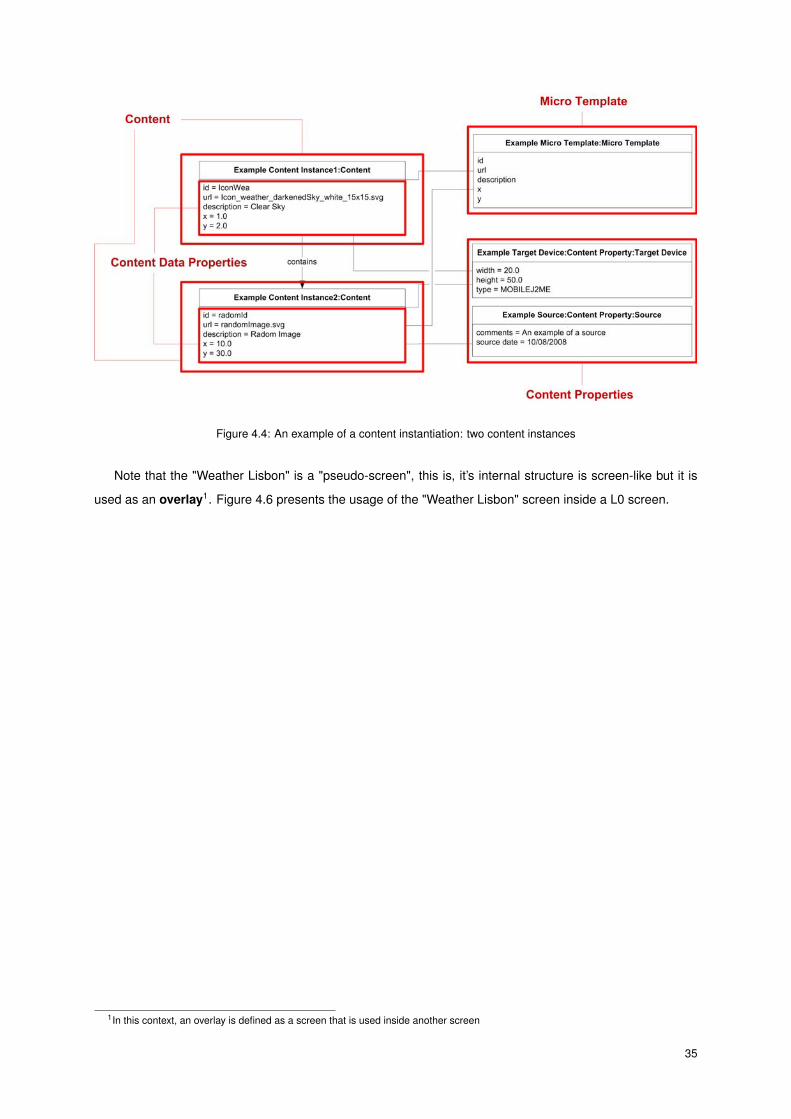
Figure 4.4: An example of a content instantiation: two content instances
Note that the "Weather Lisbon" is a "pseudo-screen", this is, it’s internal structure is screen-like but it is
used as an overlay1. Figure 4.6 presents the usage of the "Weather Lisbon" screen inside a L0 screen.
1In this context, an overlay is defined as a screen that is used inside another screen
35
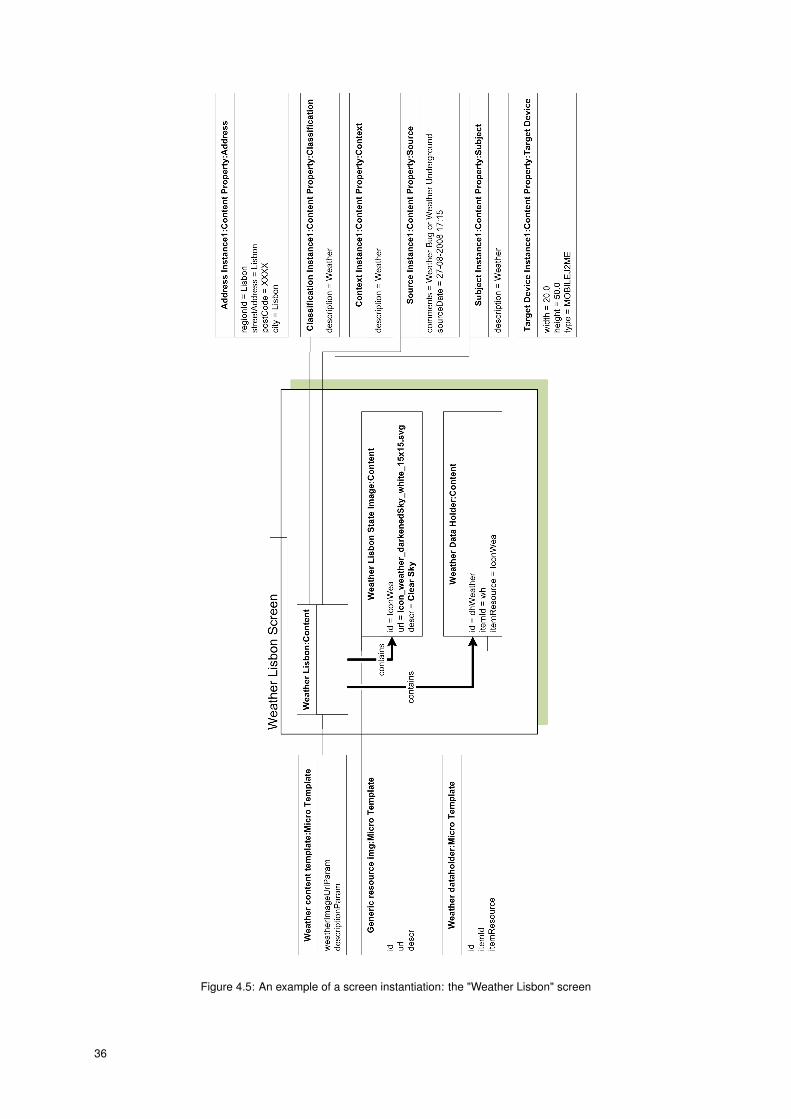
Figure 4.5: An example of a screen instantiation: the "Weather Lisbon" screen
36
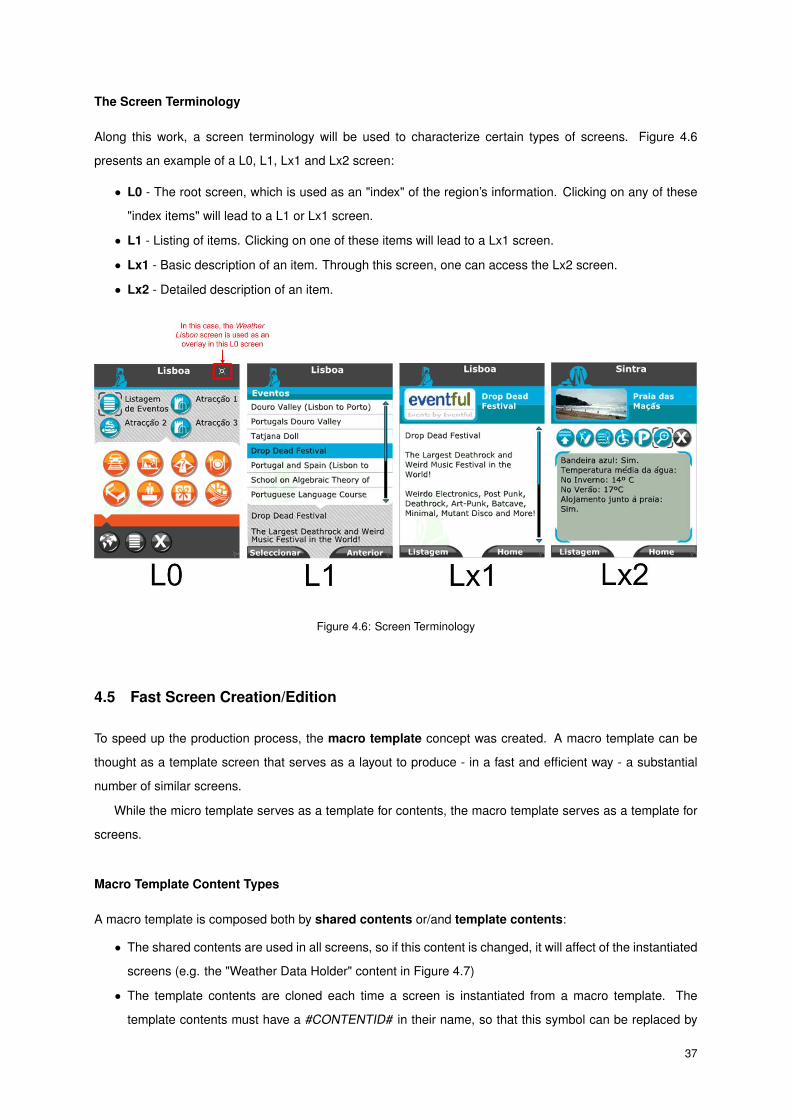
The Screen Terminology
Along this work, a screen terminology will be used to characterize certain types of screens. Figure 4.6
presents an example of a L0, L1, Lx1 and Lx2 screen:
• L0 - The root screen, which is used as an "index" of the region’s information. Clicking on any of these
"index items" will lead to a L1 or Lx1 screen.
• L1 - Listing of items. Clicking on one of these items will lead to a Lx1 screen.
• Lx1 - Basic description of an item. Through this screen, one can access the Lx2 screen.
• Lx2 - Detailed description of an item.
Figure 4.6: Screen Terminology
4.5 Fast Screen Creation/Edition
To speed up the production process, the macro template concept was created. A macro template can be
thought as a template screen that serves as a layout to produce - in a fast and efficient way - a substantial
number of similar screens.
While the micro template serves as a template for contents, the macro template serves as a template for
screens.
Macro Template Content Types
A macro template is composed both by shared contents or/and template contents:
• The shared contents are used in all screens, so if this content is changed, it will affect of the instantiated
screens (e.g. the "Weather Data Holder" content in Figure 4.7)
• The template contents are cloned each time a screen is instantiated from a macro template. The
template contents must have a #CONTENTID# in their name, so that this symbol can be replaced by
37
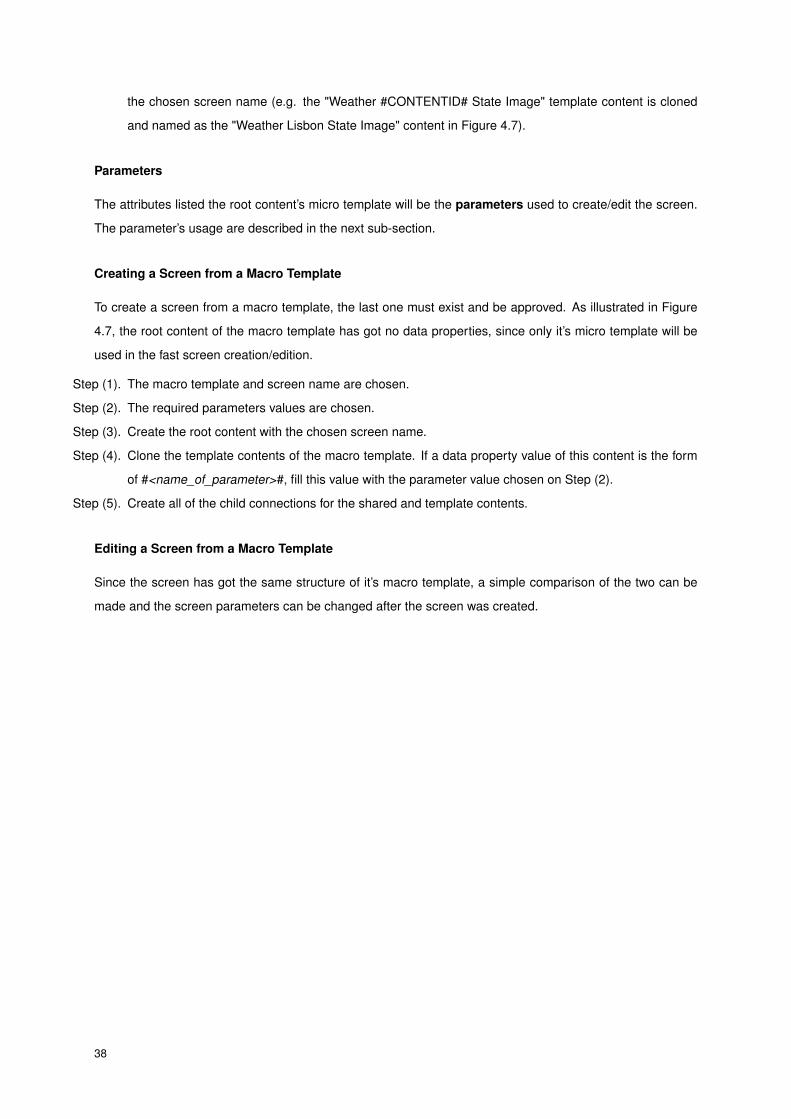
the chosen screen name (e.g. the "Weather #CONTENTID# State Image" template content is cloned
and named as the "Weather Lisbon State Image" content in Figure 4.7).
Parameters
The attributes listed the root content’s micro template will be the parameters used to create/edit the screen.
The parameter’s usage are described in the next sub-section.
Creating a Screen from a Macro Template
To create a screen from a macro template, the last one must exist and be approved. As illustrated in Figure
4.7, the root content of the macro template has got no data properties, since only it’s micro template will be
used in the fast screen creation/edition.
Step (1). The macro template and screen name are chosen.
Step (2). The required parameters values are chosen.
Step (3). Create the root content with the chosen screen name.
Step (4). Clone the template contents of the macro template. If a data property value of this content is the form
of #<name_of_parameter>#, fill this value with the parameter value chosen on Step (2).
Step (5). Create all of the child connections for the shared and template contents.
Editing a Screen from a Macro Template
Since the screen has got the same structure of it’s macro template, a simple comparison of the two can be
made and the screen parameters can be changed after the screen was created.
38
Figure 4.7: Usage of a macro template to create/edit a screen
39

4.6 Conclusions
This chapter covered the basic concepts needed for one to understand the following chapters. Starting on the
design of a workflow, where a content can be produced in a coherent and effective way, a set of roles and a
solid architecture was build to support this design.
After the major idea was created, there was a need have building blocks that could hold this structure,
thus the content concept was created. Then, the screen concept was created (which is nothing more than
a collection of structured contents) and finally, the screen template concept was created to speed up the
production process.
40

5 MI-Edition Module
5.1 Architecture
In the last chapter, a modularized global architecture (Figure 4.2) was built. In this current chapter (and the
next one) will address specific modules of this architecture. Firstly, the MI-Edition module will be tackled, and
it is composed by (Figure 5.1):
• MI-Editor - edition of micro templates, macro templates, screens, content’s characteristics and approval
management.
• MI-Manager - management of editors, entities and regions.
• Content Management Libraries - set of libraries that manage content’s data and their persistence in
the data base.
Figure 5.1: MI-Edition Module Architecture
The MI-Editor/MI-Manager is an important separation of concepts: while MI-Editor serves the edition
part of the whole production process, this is, screen edition and maintenance, the MI-Manager manages
properties that are used in various parts of the production line (website, screens and payments). Therefore,
this dissociation increases the simplification, concept and security of the two applications.
5.2 MI-Editor
MI-Editor is an C#.NET developed Windows application. It’s main purpose is to aid the screen/macro tem-
plate/micro template development and deployment and all editors, reviwers, managers and specialized tech-
nicians can access this application (although there are certain restrictions for each role). This application will
mainly communicate with a data base.
The GUI development of this application was largely facilitated due to the usage of the Infragistics Ne-
tAdvantage libraries for .NET [41]. These libraries are a comprehensive suite of ASP.NET and Windows
41
Forms controls, components, and tools for the .NET platform. Thanks to these libraries, a great amount of
development time was cut.
5.2.1 Features
• Content edition
• Screen/macro template) edition and approval
• Micro Template edition
• Fast screen edition
• Fast screen preview - using a phone emulator (Sun Java (TM) Wireless Toolkit 2.5.2 for CLDC)
• Resources synchronization - copies the screen’s resources from a source folder to the emulador’s
folder and/or the server’s folder.
• Import/export of screens/macro templates/micro templates - persistence of data into a .DAT file
• Privileges of editors according to their role - The roles assigned to a certain editor will define the
content privileges they will gain when working with the MI-Editor application.
5.2.2 GUI Details
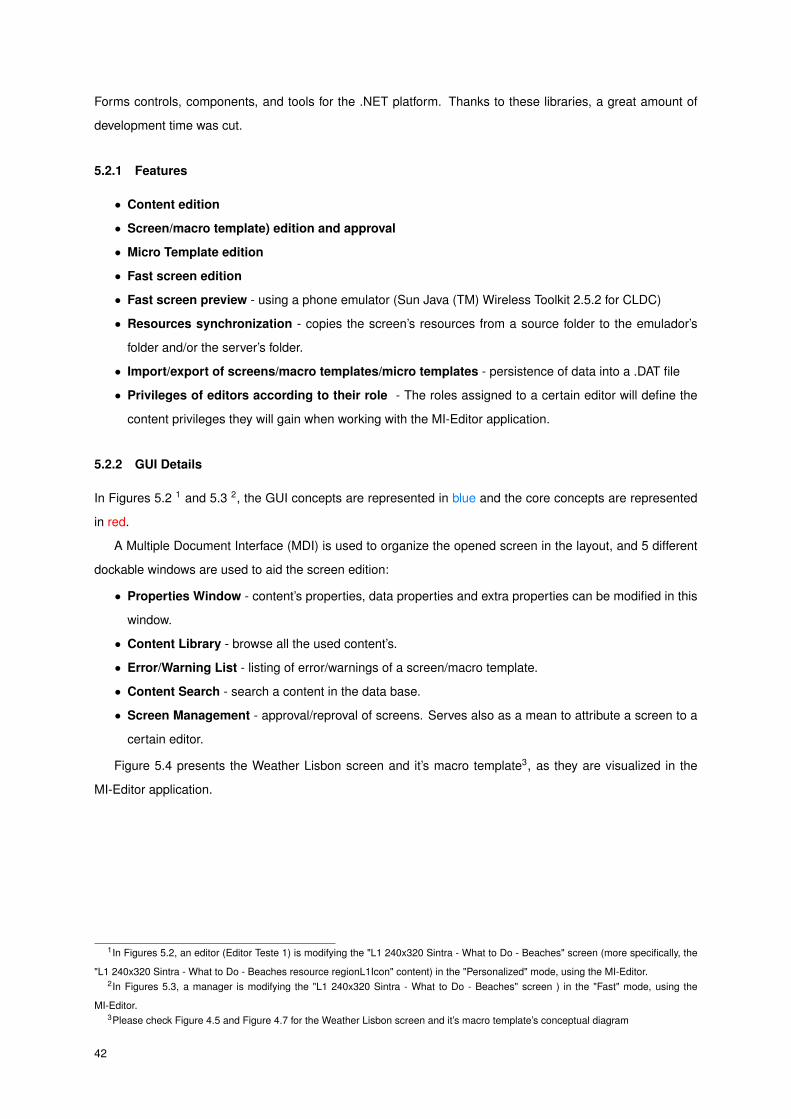
In Figures 5.2 1 and 5.3 2, the GUI concepts are represented in blue and the core concepts are represented
in red.
A Multiple Document Interface (MDI) is used to organize the opened screen in the layout, and 5 different
dockable windows are used to aid the screen edition:
• Properties Window - content’s properties, data properties and extra properties can be modified in this
window.
• Content Library - browse all the used content’s.
• Error/Warning List - listing of error/warnings of a screen/macro template.
• Content Search - search a content in the data base.
• Screen Management - approval/reproval of screens. Serves also as a mean to attribute a screen to a
certain editor.
Figure 5.4 presents the Weather Lisbon screen and it’s macro template3, as they are visualized in the
MI-Editor application.
1In Figures 5.2, an editor (Editor Teste 1) is modifying the "L1 240x320 Sintra - What to Do - Beaches" screen (more specifically, the
"L1 240x320 Sintra - What to Do - Beaches resource regionL1Icon" content) in the "Personalized" mode, using the MI-Editor.2In Figures 5.3, a manager is modifying the "L1 240x320 Sintra - What to Do - Beaches" screen ) in the "Fast" mode, using the
MI-Editor.3Please check Figure 4.5 and Figure 4.7 for the Weather Lisbon screen and it’s macro template’s conceptual diagram
42
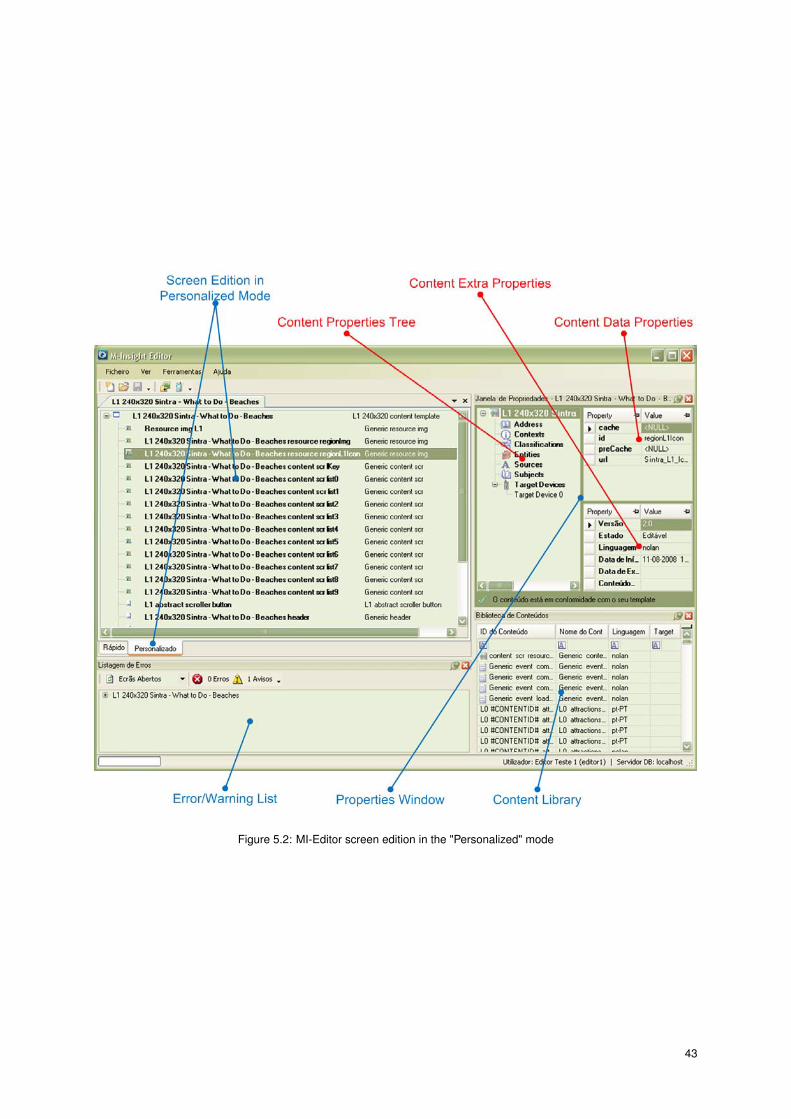
Figure 5.2: MI-Editor screen edition in the "Personalized" mode
43
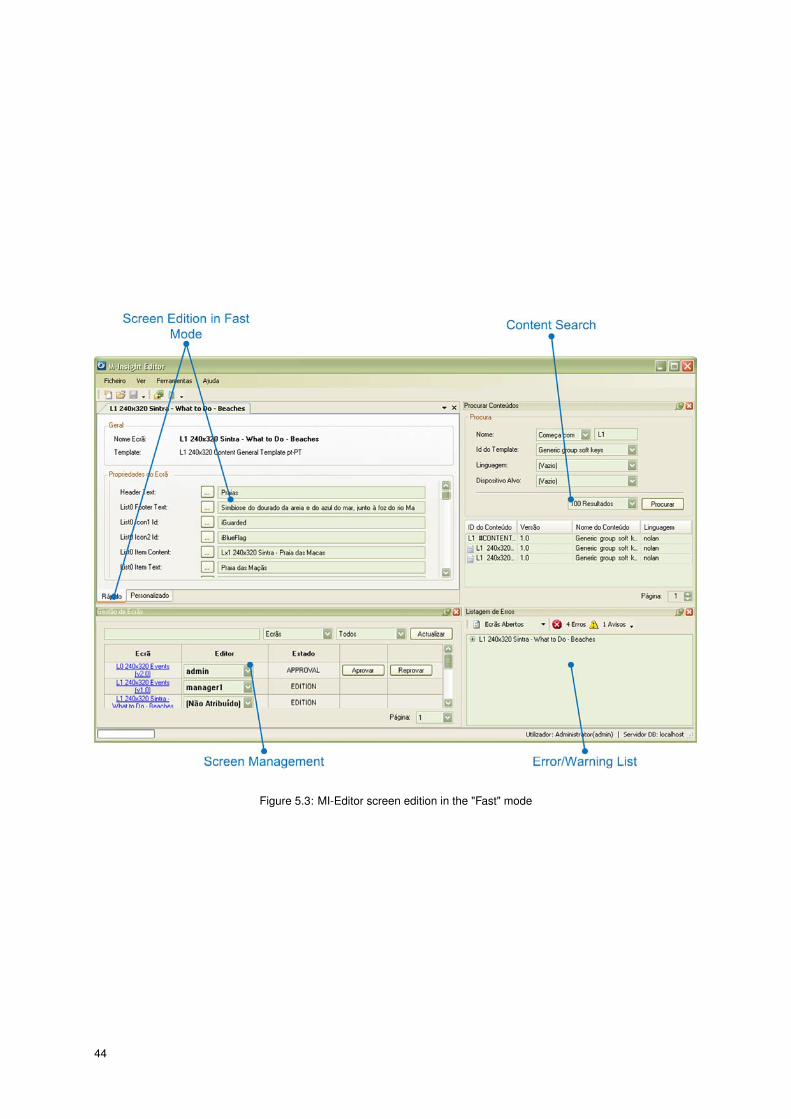
Figure 5.3: MI-Editor screen edition in the "Fast" mode
44
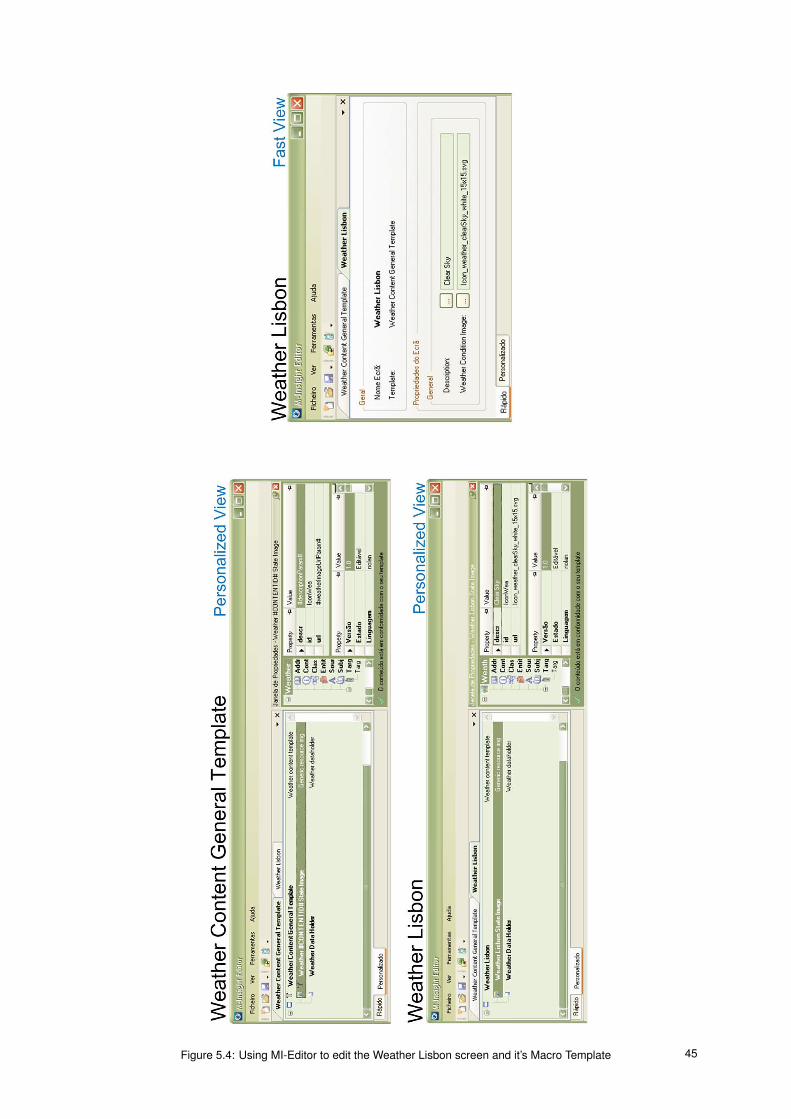
Figure 5.4: Using MI-Editor to edit the Weather Lisbon screen and it’s Macro Template 45
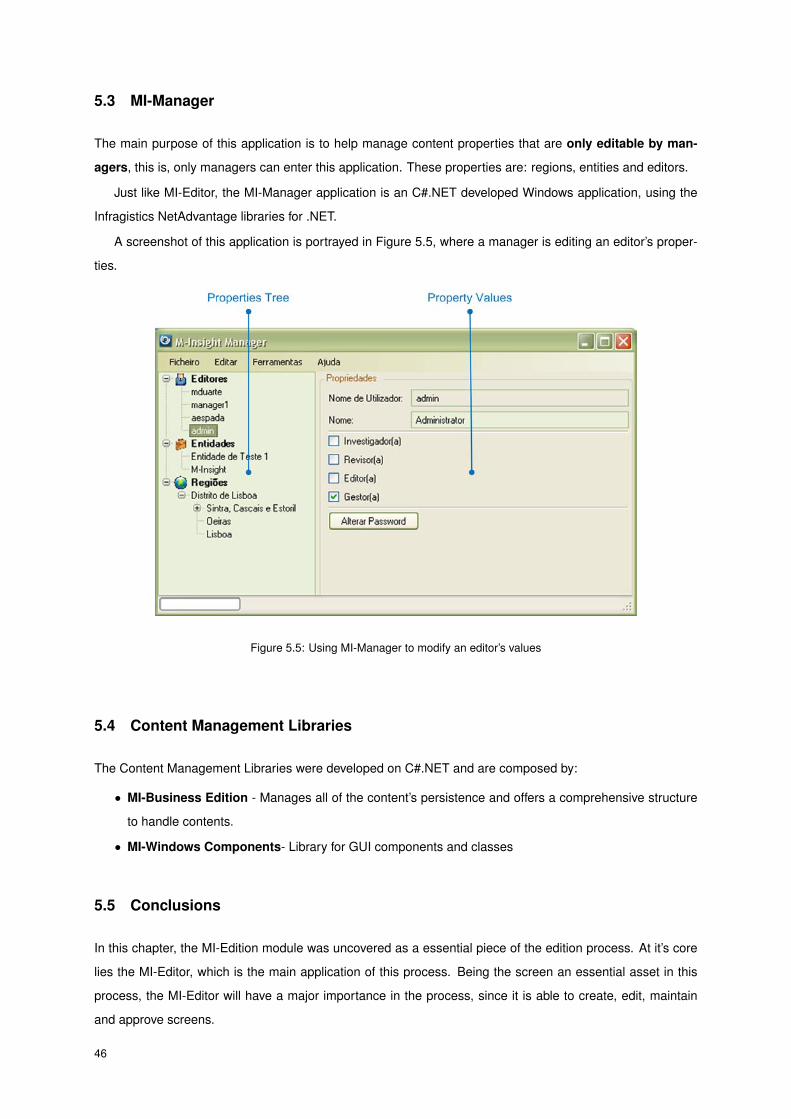
5.3 MI-Manager
The main purpose of this application is to help manage content properties that are only editable by man-
agers, this is, only managers can enter this application. These properties are: regions, entities and editors.
Just like MI-Editor, the MI-Manager application is an C#.NET developed Windows application, using the
Infragistics NetAdvantage libraries for .NET.
A screenshot of this application is portrayed in Figure 5.5, where a manager is editing an editor’s proper-
ties.
Figure 5.5: Using MI-Manager to modify an editor’s values
5.4 Content Management Libraries
The Content Management Libraries were developed on C#.NET and are composed by:
• MI-Business Edition - Manages all of the content’s persistence and offers a comprehensive structure
to handle contents.
• MI-Windows Components- Library for GUI components and classes
5.5 Conclusions
In this chapter, the MI-Edition module was uncovered as a essential piece of the edition process. At it’s core
lies the MI-Editor, which is the main application of this process. Being the screen an essential asset in this
process, the MI-Editor will have a major importance in the process, since it is able to create, edit, maintain
and approve screens.
46

The MI-Manager application was developed to help manage the whole process. Also, the Content Man-
agement Libraries were developed to serve as a bridge between different modules and the structured contents
data base.
47

6 MI-Information Broker
"Simplicity means the achievement of
maximum effect with minimum means."
Dr. Koichi Kawana, Architect
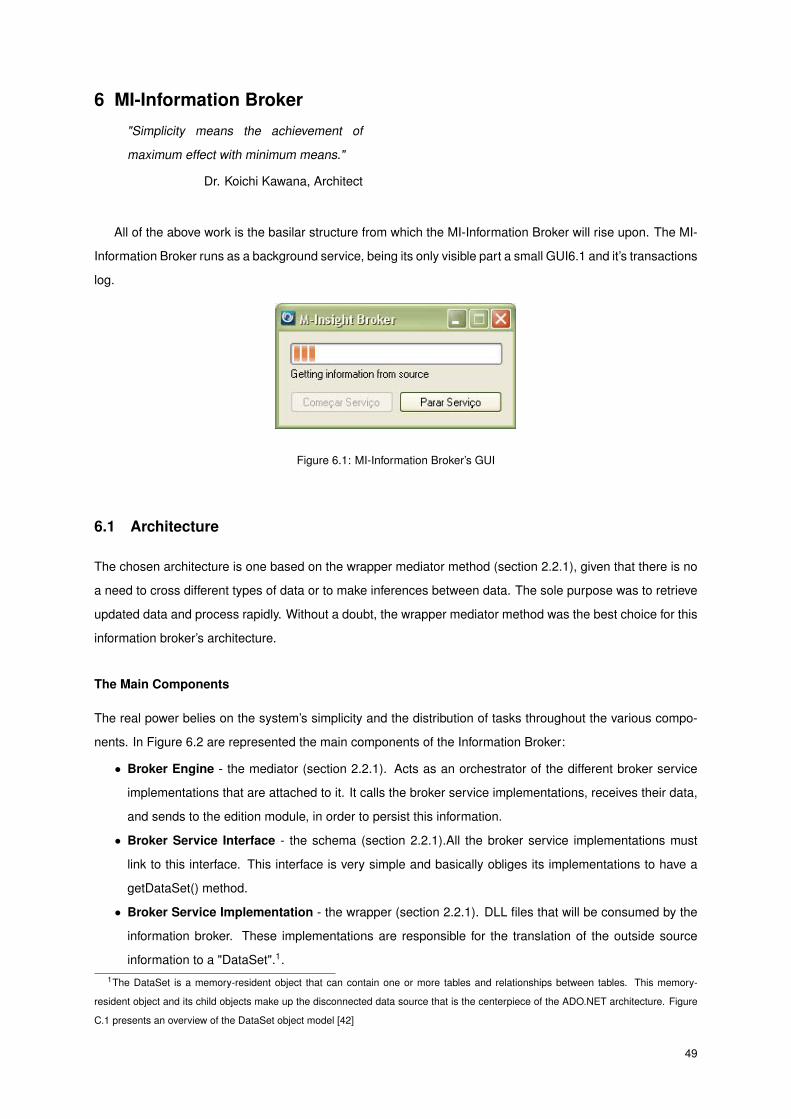
All of the above work is the basilar structure from which the MI-Information Broker will rise upon. The MI-
Information Broker runs as a background service, being its only visible part a small GUI6.1 and it’s transactions
log.
Figure 6.1: MI-Information Broker’s GUI
6.1 Architecture
The chosen architecture is one based on the wrapper mediator method (section 2.2.1), given that there is no
a need to cross different types of data or to make inferences between data. The sole purpose was to retrieve
updated data and process rapidly. Without a doubt, the wrapper mediator method was the best choice for this
information broker’s architecture.
The Main Components
The real power belies on the system’s simplicity and the distribution of tasks throughout the various compo-
nents. In Figure 6.2 are represented the main components of the Information Broker:
• Broker Engine - the mediator (section 2.2.1). Acts as an orchestrator of the different broker service
implementations that are attached to it. It calls the broker service implementations, receives their data,
and sends to the edition module, in order to persist this information.
• Broker Service Interface - the schema (section 2.2.1).All the broker service implementations must
link to this interface. This interface is very simple and basically obliges its implementations to have a
getDataSet() method.
• Broker Service Implementation - the wrapper (section 2.2.1). DLL files that will be consumed by the
information broker. These implementations are responsible for the translation of the outside source
information to a "DataSet".1.1The DataSet is a memory-resident object that can contain one or more tables and relationships between tables. This memory-
resident object and its child objects make up the disconnected data source that is the centerpiece of the ADO.NET architecture. Figure
C.1 presents an overview of the DataSet object model [42]
49
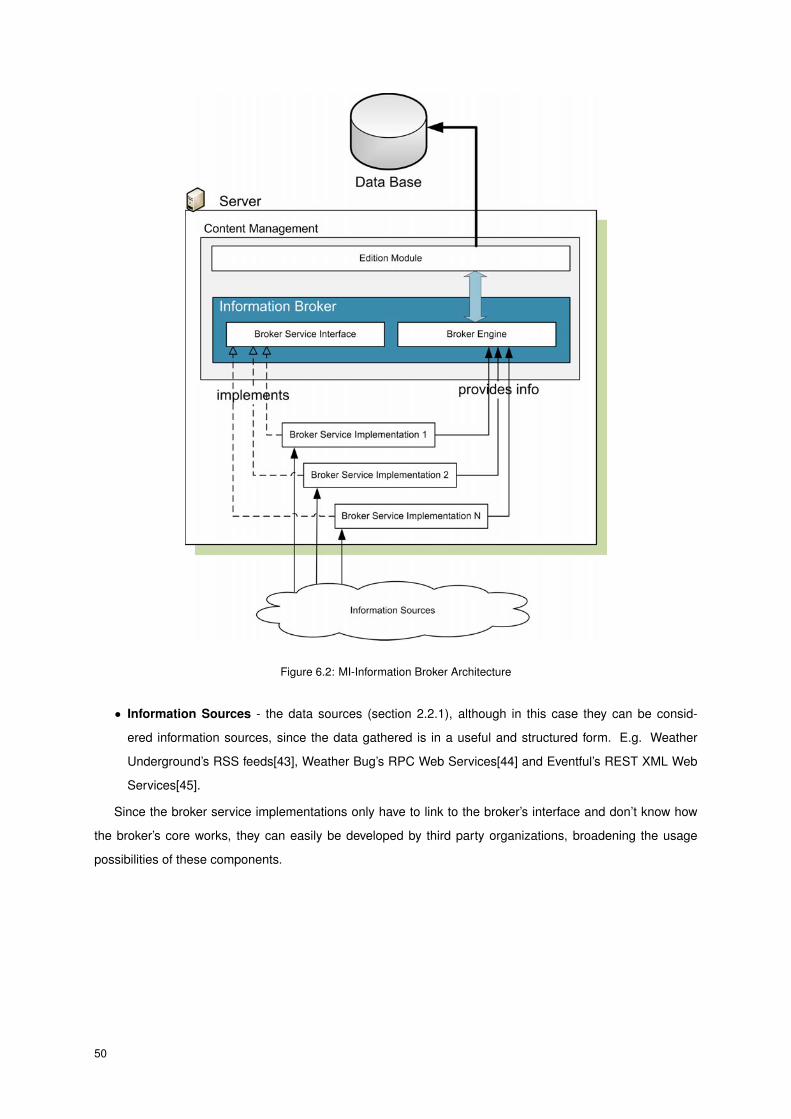
Figure 6.2: MI-Information Broker Architecture
• Information Sources - the data sources (section 2.2.1), although in this case they can be consid-
ered information sources, since the data gathered is in a useful and structured form. E.g. Weather
Underground’s RSS feeds[43], Weather Bug’s RPC Web Services[44] and Eventful’s REST XML Web
Services[45].
Since the broker service implementations only have to link to the broker’s interface and don’t know how
the broker’s core works, they can easily be developed by third party organizations, broadening the usage
possibilities of these components.
50
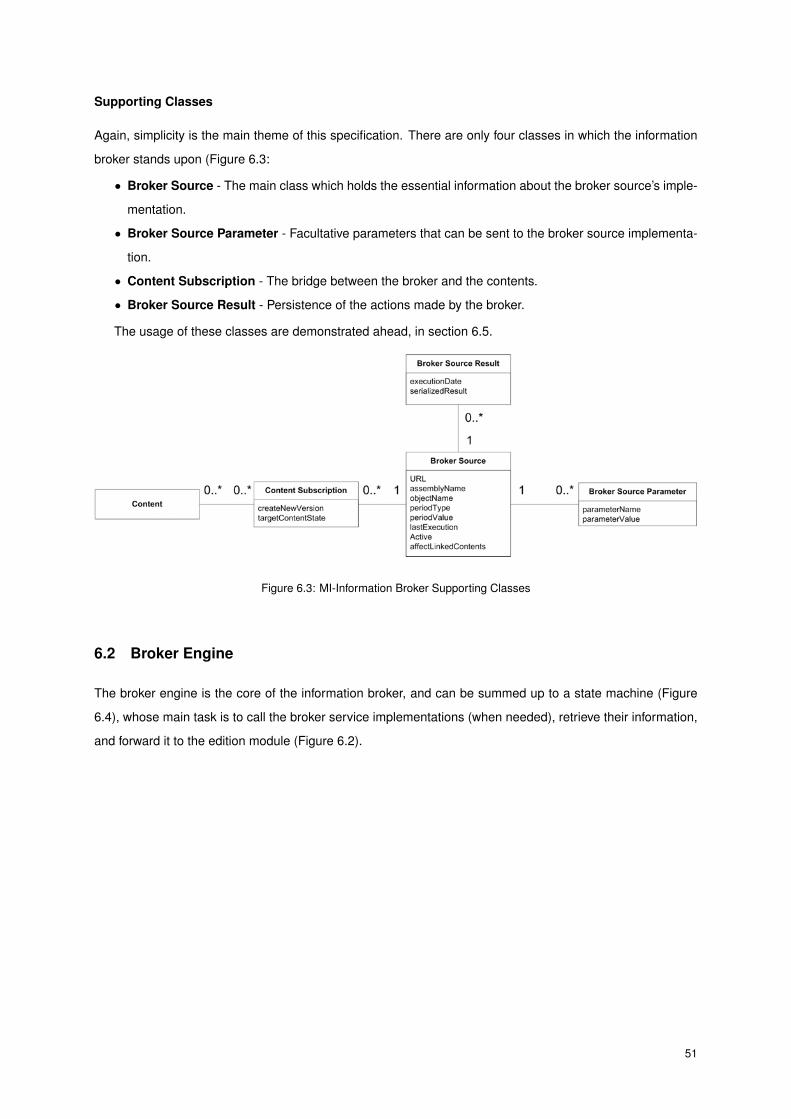
Supporting Classes
Again, simplicity is the main theme of this specification. There are only four classes in which the information
broker stands upon (Figure 6.3:
• Broker Source - The main class which holds the essential information about the broker source’s imple-
mentation.
• Broker Source Parameter - Facultative parameters that can be sent to the broker source implementa-
tion.
• Content Subscription - The bridge between the broker and the contents.
• Broker Source Result - Persistence of the actions made by the broker.
The usage of these classes are demonstrated ahead, in section 6.5.
Figure 6.3: MI-Information Broker Supporting Classes
6.2 Broker Engine
The broker engine is the core of the information broker, and can be summed up to a state machine (Figure
6.4), whose main task is to call the broker service implementations (when needed), retrieve their information,
and forward it to the edition module (Figure 6.2).
51
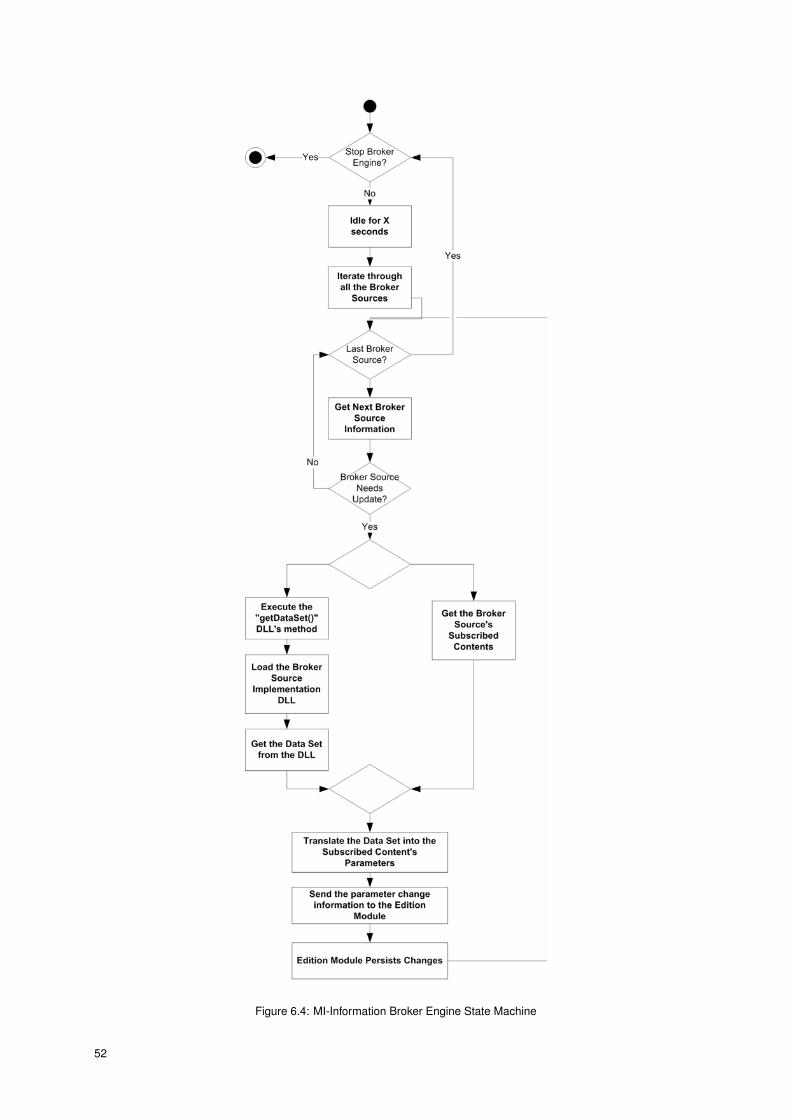
Figure 6.4: MI-Information Broker Engine State Machine
52
6.3 Broker Service Interface
In order to communicate with the information broker, the broker service implementations must implement the
broker service interface. As stated in the Program 1 C# code of the broker service interface, the implemen-
tation must have a method named getDataSet(), which returns a data set and receives an URL and a list of
facultative parameters. The broker source parameter code is presented in Program 2 (appendix C).
Program 1 The Broker Service Interface code in C#.NET.namespace MInsight.BrokerServiceInterface
{
public interface IBrokerService
{
DataSet getDataSet(string url, SortedList<string, BrokerSourceParameter> parameters);
}
}
6.4 Information Flow
Interpreting the Broker Service Implementations Data
The information broker receives data from the broker service implementations through data sets. Each one
can contain multiple data tables, though there is one restriction: the table whose name is RESERVED_PROPERTIES
will be interpreted as a special data table.
The normal data tables will be interpreted as such:
• Each column name represents a parameter name of the screen.
• Each cell represents a parameter value.
• For single lined tables, the cell’s column name will be used to map the target parameter (Figure 6.5).
• For multiple lined tables, the concatenation of the cell’s column name with the cell’s index will be used
to map the target parameter (Figure 6.6).
The RESERVED_PROPERTIES data table is a facultative one in the data set, and can only have one
column named "linkParameterName" with one row. A unique cell will exist in this data table, indicating which
parameter in the screen maps the linked screens.
When a linked screen is computed, the initial data set will be filtered when processing this linked screen.
For example, in Figure 6.6, when the Lx1 240x320 Events1 screen is processed, the Events data table will be
filtered, this is, only the Index = 1 row will be used.
53
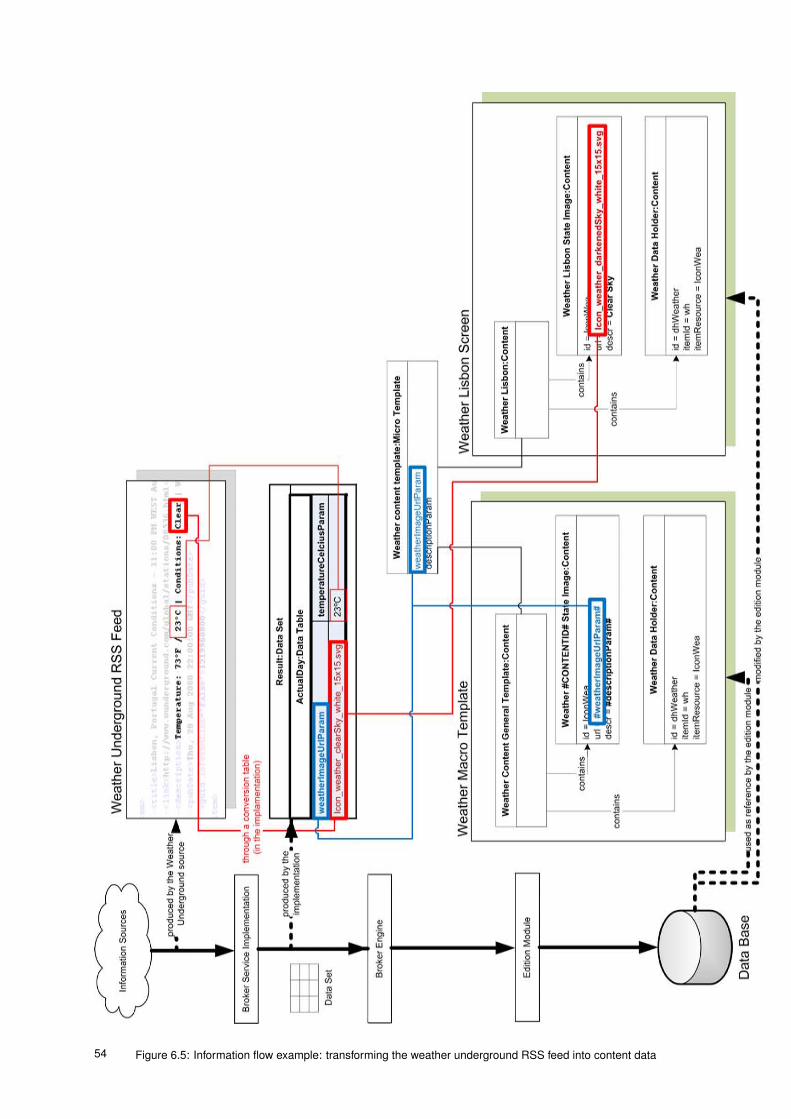
Figure 6.5: Information flow example: transforming the weather underground RSS feed into content data54
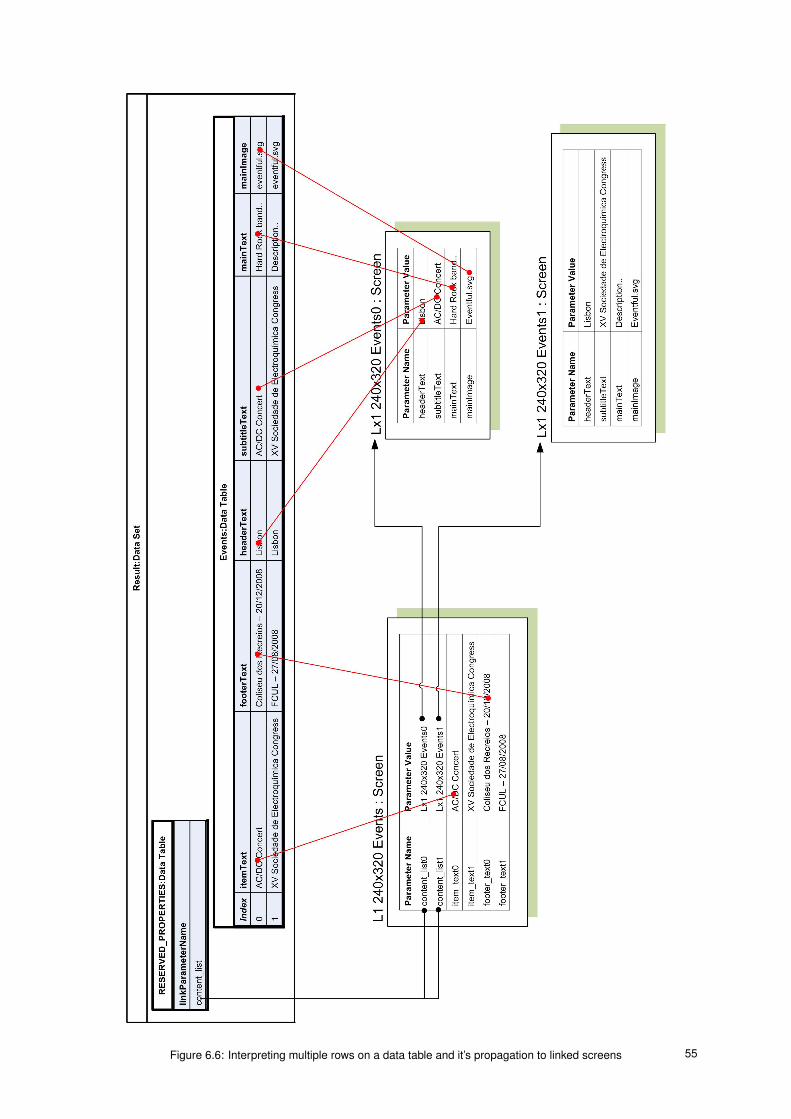
Figure 6.6: Interpreting multiple rows on a data table and it’s propagation to linked screens 55

6.5 Implementations
As stated above, the broker service implementation is relatively general component that can easily be devel-
oped by third parties. For the time being, the existing implementations were developed in-house.
Two implementations were developed to demonstrate the concept:
• Broker Service Weather Implementation - Retrieves information both from Weather Underground and
Weather Bug and will be used in production.
• Broker Service Weather Bug - Retrieves information from Eventful.
Further detail of the data base objects configuration used by the information broker to access each one of
these implementations can be seen in appendix C.3.
A detailed study of these implementations is portrayed on the next sub-sections.
6.5.1 Broker Service Weather Implementation
The broker service weather implementation is composed by two objects:
• Weather Underground Object - acquires information from the Weather Underground’s RSS feeds[43].
• Weather Bug Object - acquires information from the Weather Bug’s RPC web services[44]
Figure 6.7 presents the data set/output screen relation when the two objects are executed. Note that
both the implementations were run at the same time, offering the exact same results, even though they are
provided by different sources.
6.5.2 Broker Service Events Implementation
The broker service events implementation is composed by the Eventful Object. This object acquires infor-
mation from the Eventful’s REST XML web services[45].
Figure 6.8 presents the data set/output screen relation when the Eventful Object is executed. More details
on this process are available in sub-section 6.4
6.6 Conclusions
In this chapter, a global architecture of the information broker was built, based on a wrapper mediator ar-
chitecture. Three major parts of this system are the broker engine, broker implementations and the broker
interface. Combining these different parts, the MI-Information Broker is formed. This broker will operate as
a part of a content production line, automatically populating multiple screens with information captured on
outside sources. Two implementations were tailored by the author to demonstrate the concept: the Events
implementation (gets various information about events in a given region) and the Weather implementation
(gets weather information for a given region). The latest is currently being used in production.
56
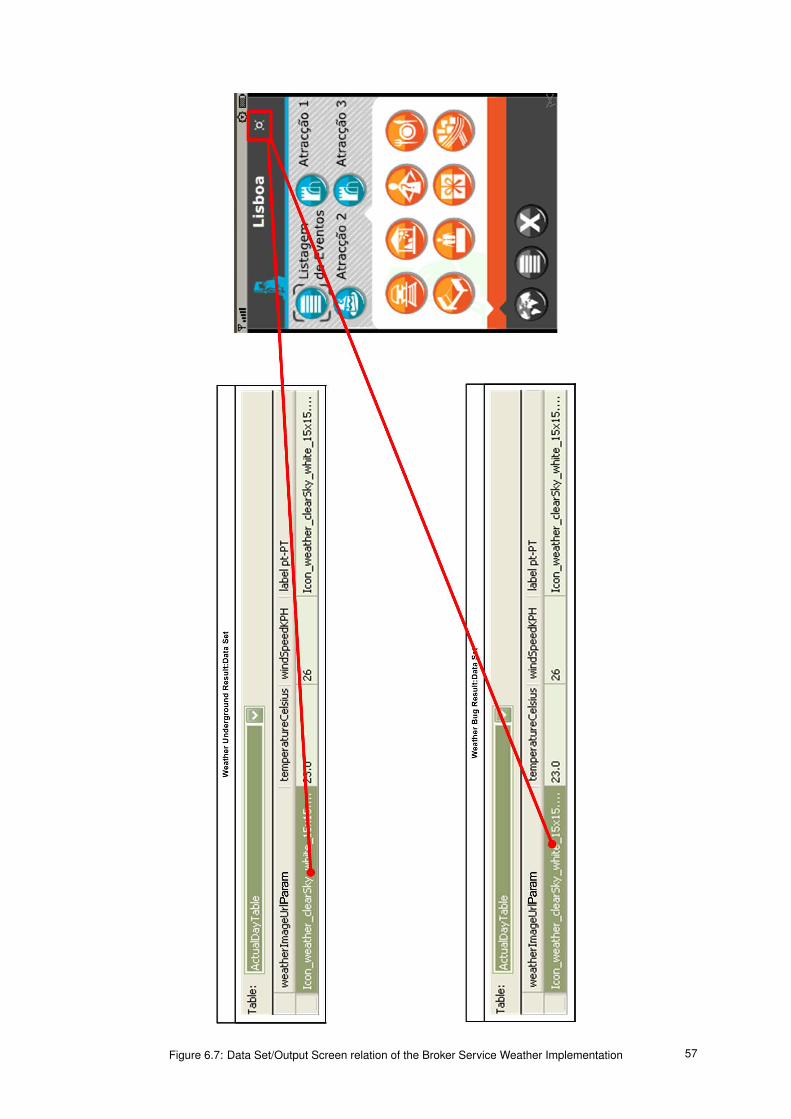
Figure 6.7: Data Set/Output Screen relation of the Broker Service Weather Implementation 57

Figure 6.8: Data Set/Output Screen relation of the Broker Service Events Implementation
58

Part IV
Results

7 EvaluationAll of the above chapters merge here. Results and measures derived from the work made above are listed in
this chapter.
7.1 Complete Edition Process Demonstrations
The following three demonstrations have a relevant ordering. With the knowledge acquired in demonstration
1, one can understand demonstration 2. The same happens with demonstration 3, that relies on the concepts
of the previous demonstrations.
The three demonstrations are:
• Demo 1: Creating an editor - An editor is created (using the MI-Manager). This editor will be used on
the next demonstration.
• Demo 2: Screen creation, edition and approval - Having the editors and managing properties set,
one can create a screen and approve it (using the MI-Editor). This demonstration presents the core
procedures of the edition process.
• Demo 3: Updating a screen with weather information - Now that all the managing properties and
screens are taken cared of, one has got the knowledge to create a screen that is updated with the
MI-Information Broker’s provided information.
7.1.1 Demo 1: Creating an editor
Prerequisites
There is a default editor in the database, which is the admin editor. This editor has got managing privileges
and will be used to access the MI-Manager application in this demonstration.
Demo Details
Step (1). Manager login - Login as admin, the default manager.
Step (2). Browsing through the different properties - After logging in, one can browse through the existing
properties, change or delete them, or create new ones.
Step (3). Add a new editor - To create a new editor, one must right click the root editor’s node, and click the
"Add" menu item.
Step (4). Setting up the editor - A new editor is created, with the editor1 username, a password, and alias name
of Editor1.
Step (5). Changing the editor’s roles - After the editor is created, one can modify it’s roles. In this case, editor1
will have the role of EDITOR.
61

Figure 7.1: Creating an editor through the MI-Manager application
62
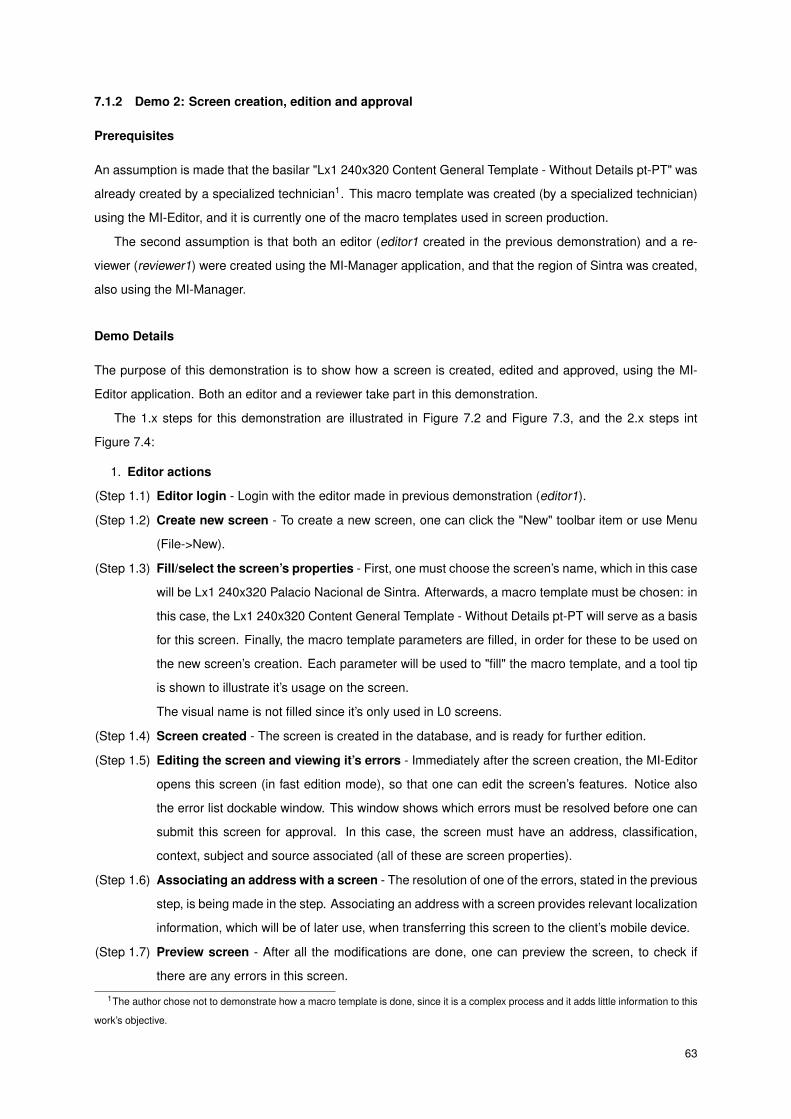
7.1.2 Demo 2: Screen creation, edition and approval
Prerequisites
An assumption is made that the basilar "Lx1 240x320 Content General Template - Without Details pt-PT" was
already created by a specialized technician1. This macro template was created (by a specialized technician)
using the MI-Editor, and it is currently one of the macro templates used in screen production.
The second assumption is that both an editor (editor1 created in the previous demonstration) and a re-
viewer (reviewer1) were created using the MI-Manager application, and that the region of Sintra was created,
also using the MI-Manager.
Demo Details
The purpose of this demonstration is to show how a screen is created, edited and approved, using the MI-
Editor application. Both an editor and a reviewer take part in this demonstration.
The 1.x steps for this demonstration are illustrated in Figure 7.2 and Figure 7.3, and the 2.x steps int
Figure 7.4:
1. Editor actions
(Step 1.1) Editor login - Login with the editor made in previous demonstration (editor1).
(Step 1.2) Create new screen - To create a new screen, one can click the "New" toolbar item or use Menu
(File->New).
(Step 1.3) Fill/select the screen’s properties - First, one must choose the screen’s name, which in this case
will be Lx1 240x320 Palacio Nacional de Sintra. Afterwards, a macro template must be chosen: in
this case, the Lx1 240x320 Content General Template - Without Details pt-PT will serve as a basis
for this screen. Finally, the macro template parameters are filled, in order for these to be used on
the new screen’s creation. Each parameter will be used to "fill" the macro template, and a tool tip
is shown to illustrate it’s usage on the screen.
The visual name is not filled since it’s only used in L0 screens.
(Step 1.4) Screen created - The screen is created in the database, and is ready for further edition.
(Step 1.5) Editing the screen and viewing it’s errors - Immediately after the screen creation, the MI-Editor
opens this screen (in fast edition mode), so that one can edit the screen’s features. Notice also
the error list dockable window. This window shows which errors must be resolved before one can
submit this screen for approval. In this case, the screen must have an address, classification,
context, subject and source associated (all of these are screen properties).
(Step 1.6) Associating an address with a screen - The resolution of one of the errors, stated in the previous
step, is being made in the step. Associating an address with a screen provides relevant localization
information, which will be of later use, when transferring this screen to the client’s mobile device.
(Step 1.7) Preview screen - After all the modifications are done, one can preview the screen, to check if
there are any errors in this screen.
1The author chose not to demonstrate how a macro template is done, since it is a complex process and it adds little information to this
work’s objective.
63

(Step 1.8) Configuration of the preview - Since a screen can have many languages and can be used in
multiples device types, these properties must be chosen before the screen preview. When the
client mobile device requests a screen, these options are automatically chosen.
(Step 1.9) Preview: launch phone emulator - Screen preview on a mobile device emulator, which is the
Sun’s Java (TM) Wireless Toolkit 2.5.2 for CLDC.
(Step 1.10) Submit the screen for approval - Now that the screen is ready, it is sent for approval.
(Step 1.11) Screen submitted for approval - The screen was sent for approval. A reviewer will check this
screen and will decide if this screen is fit for the final client. If the screen reproved, the editor
(editor1) must review this screen again, and submit it for approval again.
2. Reviewer actions
(Step 2.1) Reviewer login - Login with reviewer1.
(Step 2.2) Open the screen management dock window - To check which are the pending screens that
need approval, the reviewer opens the screen management dock window.
(Step 2.3) Screen management - In this case, the filter was set to find the screens that need approval. In
this window, the reviewer can approve, reprove and open the screen (clicking the screen’s name).
Just like the editor, the reviewer can preview the screen, but cannot modify it.
(Step 2.4) Screen expiration date - The reviewer chose to approve this screen. An expiration date is asked
for this screen because the mobile device can constantly ping the server if there are new updates
to the screen. Having an expiration date, the mobile device will only request the screen again
when the expiration date is passed.
(Step 2.5) Screen is approved and available for mobile devices - The screen is approved and is available
for the mobile devices that are allowed to download this screen.
64
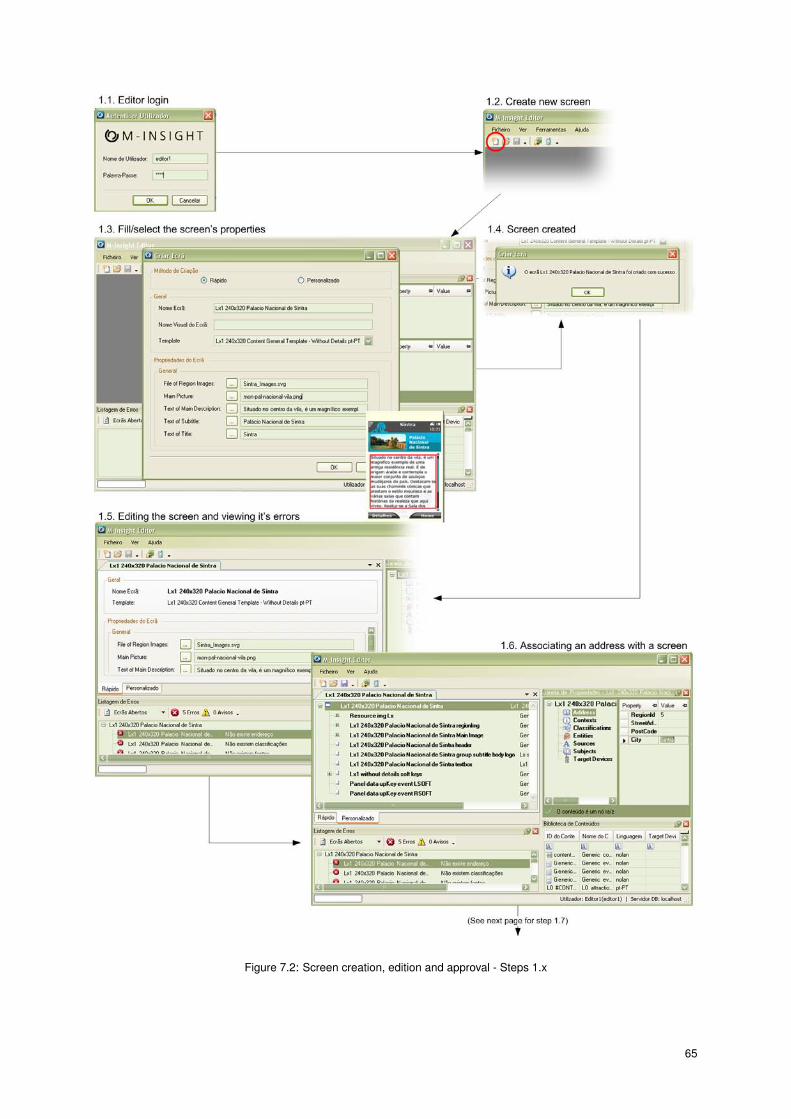
Figure 7.2: Screen creation, edition and approval - Steps 1.x
65
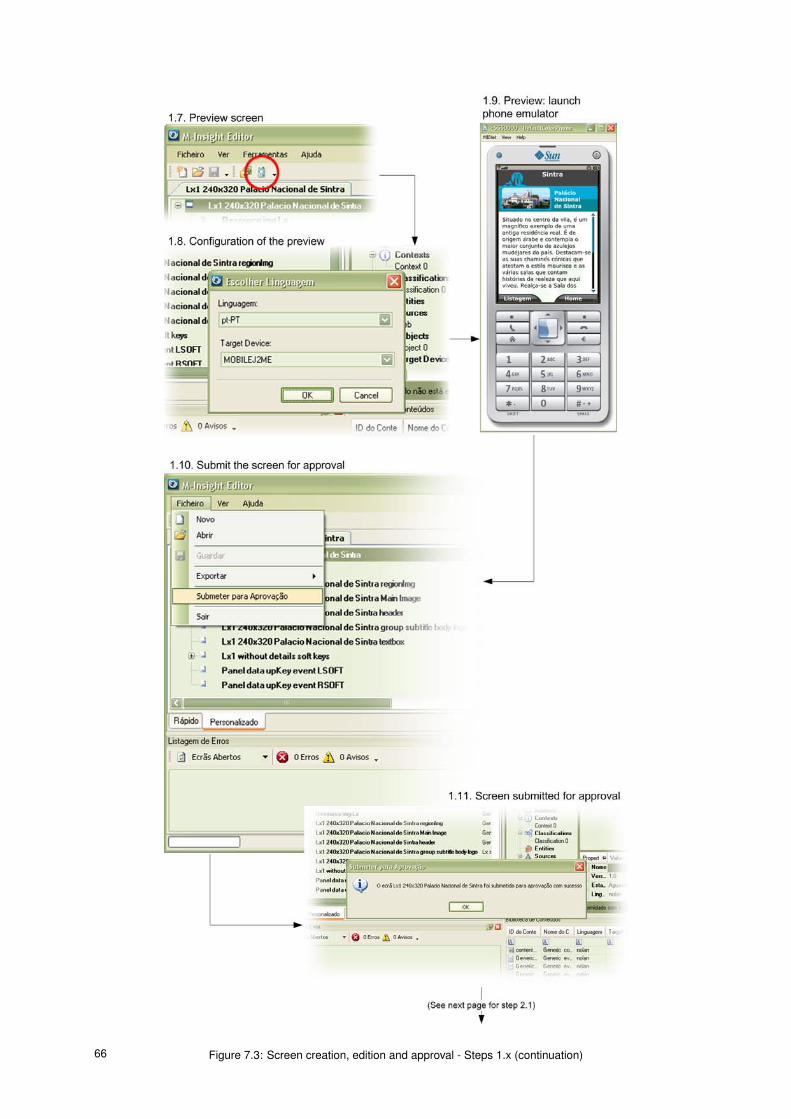
Figure 7.3: Screen creation, edition and approval - Steps 1.x (continuation)66
Figure 7.4: Screen creation, edition and approval - Steps 2.x 67

7.1.3 Demo 3: Updating a screen with weather information
Figure 7.5 presents a very simplified demonstration on how to create a L0 Screen (L0 Lisbon) with an overlay
of the Lisbon’s current weather conditions. The two major pieces of developed work (the MI-Editor and MI-
Information Broker) are featured in this illustration, where their most significant functionalities are portrayed
(macro template/screen edition by the MI-Editor and content update by the MI-Information Broker).
A detailed explanation of the edition process is given in part III.
68

Figure 7.5: Demo 3: Updating a screen with weather information 69
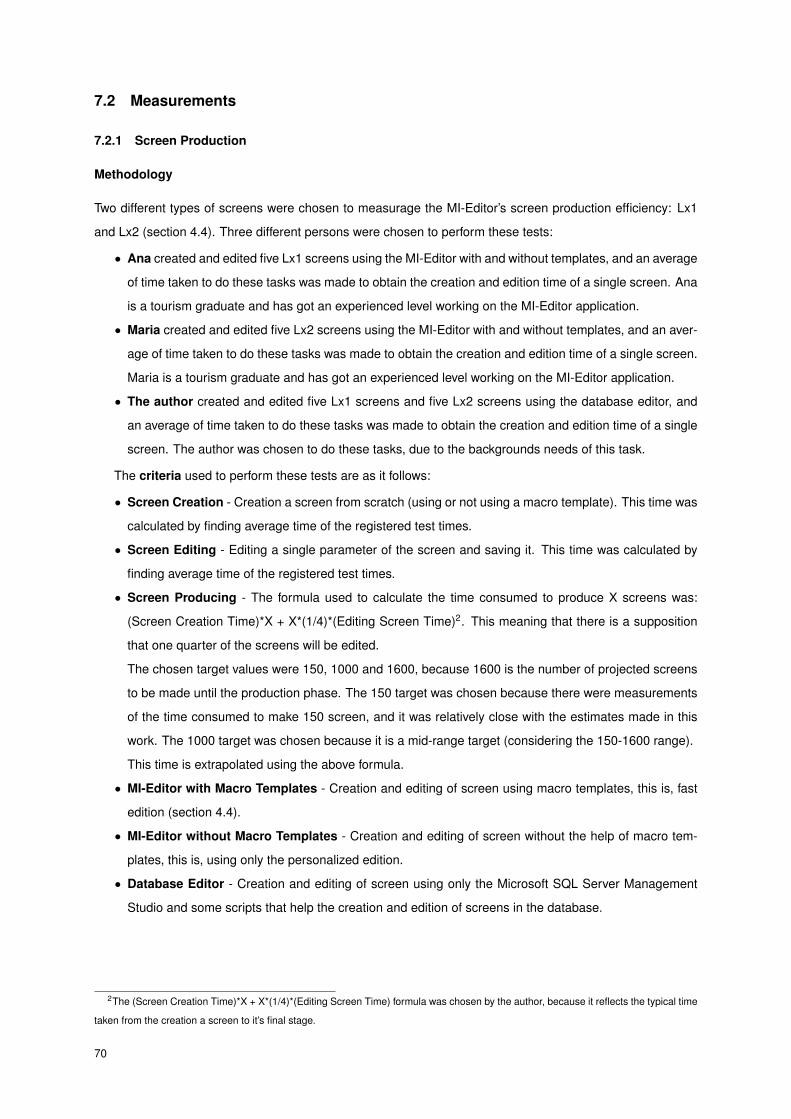
7.2 Measurements
7.2.1 Screen Production
Methodology
Two different types of screens were chosen to measurage the MI-Editor’s screen production efficiency: Lx1
and Lx2 (section 4.4). Three different persons were chosen to perform these tests:
• Ana created and edited five Lx1 screens using the MI-Editor with and without templates, and an average
of time taken to do these tasks was made to obtain the creation and edition time of a single screen. Ana
is a tourism graduate and has got an experienced level working on the MI-Editor application.
• Maria created and edited five Lx2 screens using the MI-Editor with and without templates, and an aver-
age of time taken to do these tasks was made to obtain the creation and edition time of a single screen.
Maria is a tourism graduate and has got an experienced level working on the MI-Editor application.
• The author created and edited five Lx1 screens and five Lx2 screens using the database editor, and
an average of time taken to do these tasks was made to obtain the creation and edition time of a single
screen. The author was chosen to do these tasks, due to the backgrounds needs of this task.
The criteria used to perform these tests are as it follows:
• Screen Creation - Creation a screen from scratch (using or not using a macro template). This time was
calculated by finding average time of the registered test times.
• Screen Editing - Editing a single parameter of the screen and saving it. This time was calculated by
finding average time of the registered test times.
• Screen Producing - The formula used to calculate the time consumed to produce X screens was:
(Screen Creation Time)*X + X*(1/4)*(Editing Screen Time)2. This meaning that there is a supposition
that one quarter of the screens will be edited.
The chosen target values were 150, 1000 and 1600, because 1600 is the number of projected screens
to be made until the production phase. The 150 target was chosen because there were measurements
of the time consumed to make 150 screen, and it was relatively close with the estimates made in this
work. The 1000 target was chosen because it is a mid-range target (considering the 150-1600 range).
This time is extrapolated using the above formula.
• MI-Editor with Macro Templates - Creation and editing of screen using macro templates, this is, fast
edition (section 4.4).
• MI-Editor without Macro Templates - Creation and editing of screen without the help of macro tem-
plates, this is, using only the personalized edition.
• Database Editor - Creation and editing of screen using only the Microsoft SQL Server Management
Studio and some scripts that help the creation and edition of screens in the database.
2The (Screen Creation Time)*X + X*(1/4)*(Editing Screen Time) formula was chosen by the author, because it reflects the typical time
taken from the creation a screen to it’s final stage.
70
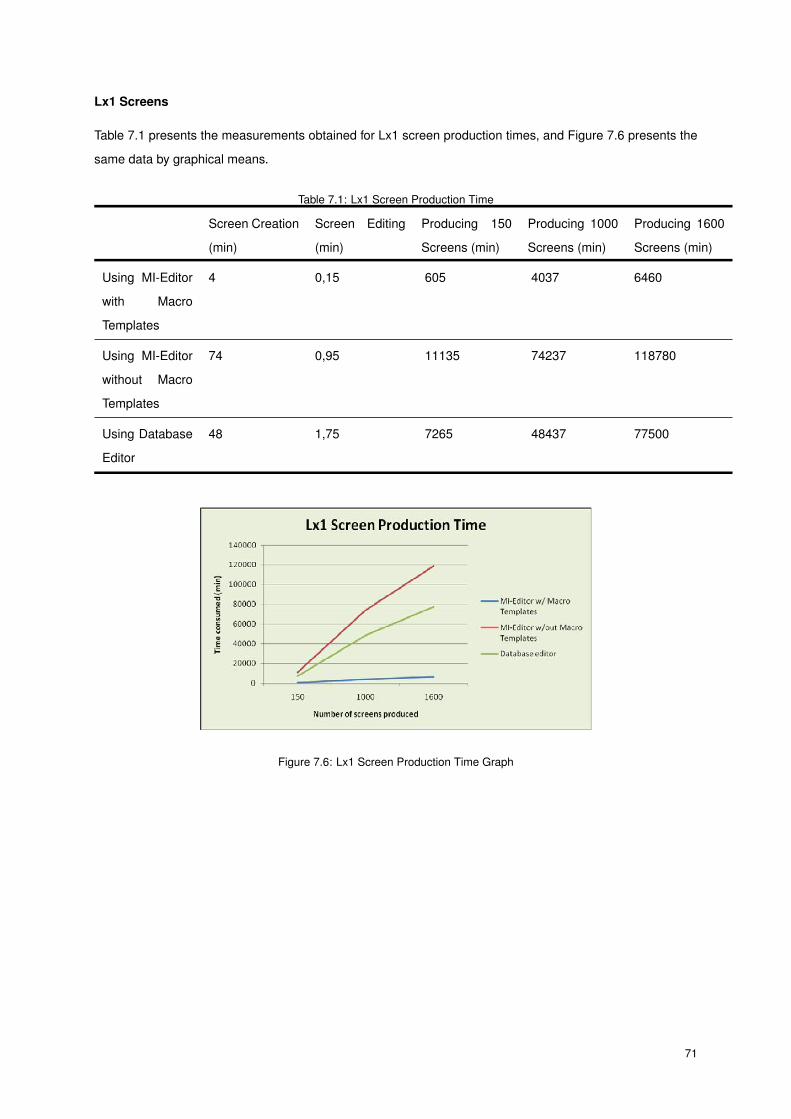
Lx1 Screens
Table 7.1 presents the measurements obtained for Lx1 screen production times, and Figure 7.6 presents the
same data by graphical means.
Table 7.1: Lx1 Screen Production Time
Screen Creation
(min)
Screen Editing
(min)
Producing 150
Screens (min)
Producing 1000
Screens (min)
Producing 1600
Screens (min)
Using MI-Editor
with Macro
Templates
4 0,15 605 4037 6460
Using MI-Editor
without Macro
Templates
74 0,95 11135 74237 118780
Using Database
Editor
48 1,75 7265 48437 77500
Figure 7.6: Lx1 Screen Production Time Graph
71
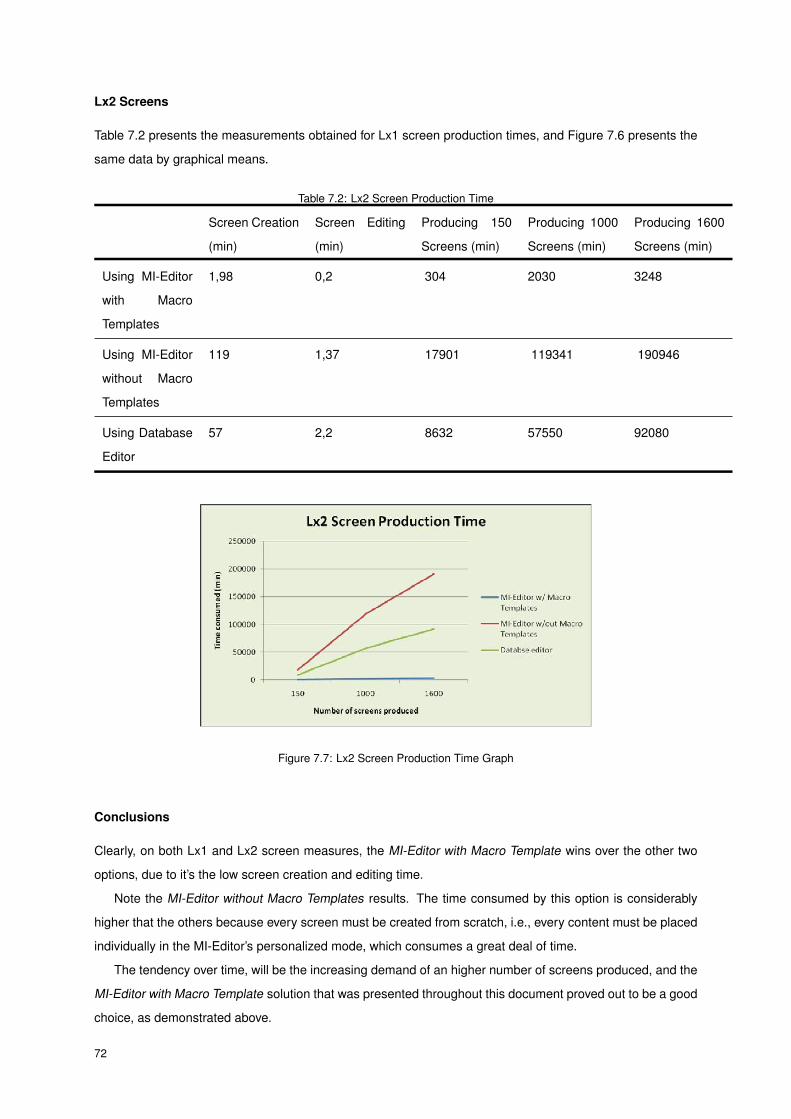
Lx2 Screens
Table 7.2 presents the measurements obtained for Lx1 screen production times, and Figure 7.6 presents the
same data by graphical means.
Table 7.2: Lx2 Screen Production Time
Screen Creation
(min)
Screen Editing
(min)
Producing 150
Screens (min)
Producing 1000
Screens (min)
Producing 1600
Screens (min)
Using MI-Editor
with Macro
Templates
1,98 0,2 304 2030 3248
Using MI-Editor
without Macro
Templates
119 1,37 17901 119341 190946
Using Database
Editor
57 2,2 8632 57550 92080
Figure 7.7: Lx2 Screen Production Time Graph
Conclusions
Clearly, on both Lx1 and Lx2 screen measures, the MI-Editor with Macro Template wins over the other two
options, due to it’s the low screen creation and editing time.
Note the MI-Editor without Macro Templates results. The time consumed by this option is considerably
higher that the others because every screen must be created from scratch, i.e., every content must be placed
individually in the MI-Editor’s personalized mode, which consumes a great deal of time.
The tendency over time, will be the increasing demand of an higher number of screens produced, and the
MI-Editor with Macro Template solution that was presented throughout this document proved out to be a good
choice, as demonstrated above.
72
7.2.2 MI-Information Broker
The purpose of these measurements is to get some information about the time taken by a given implementa-
tion to retrieves data and to measure the efficiency of the Broker Engine.
Methodology
3 rounds of tests were performed and the presented measures in Table 7.3 are the resulting average of these
3 rounds. The database used was located locally in the tests machine.
To measure each parameter, time markers were inserted in the code, in order to have a very accurate time
measure.
Technical specifications of the tests machine:
• CPU - Intel Core 2 Duo Processor T7300 - 2.03Ghz, 800Mhz FSB, 4Mb L2 Cache
• OS - Microsoft Windows XP Profissional SP3
• Chipset - Mobile Intel 965PM Express
• Memory - 2048MB DDR2 (2x1024Mb, 667MHz Dual Channel Support)
• Graphics Card - NVIDIA GeForce 8400M G 128Mb VRAM
Different time makers were placed on the source code to measure the time taken in beetween the different
checkpoints. The checkpoints used to perform these tests are as it follows:
Checkpoint (1). Time consumed to acquire data from a source (e.g. measure of time between a request of data to the
Eventful service and it’s response and data transfer).
Checkpoint (2). Translation of the received information from the source (e.g. Eventful service) and it’s transformation to
a data set.
Checkpoint (3). Time consumed for the Broker engine to process the received data (data set) from the implementation.
Checkpoint (4). Time consumed to persist the received information from the implementation to the structured contents
data base.
73

Test Results
Table 7.3 presents the results of the measurements made to the Information Broker.
Table 7.3: Time consumed when using the developed broker implementations
Consumed Time (seconds)
Weather Under-
ground Object
Weather Bug Ob-
ject
Eventful Object
ImplementationsOutside Source
Data Acquirement30,563 1,766 2.094
Processing4 0,016 0,016 0,015
EngineProcessing1 0,234 0,218 0,453
Data Persistence2 0,016 0,032 0,063
Total Consumed Time (seconds) 0,829 2,032 2,625
Conclusions
Interpreting the data presented in Table 7.3, one can conclude that the major bottleneck comes from the data
sources, although the Weather Underground feeds are extremely fast (when compared with the other two).
Considering that the Information Broker will not have a considerable load, since the obtaining of data is
made sparsely over time (e.g. hourly), one can consider the total consumed times very satisfying.
7.3 Conclusions
This chapter presented the results of all the work developed previously in this document. Measuring the
efficiency of the MI-Editor and MI-Information Broker - which are two major pieces in the content production
process - and observing the (desired) results provided by this work in a entreprise context, one can conclude
that the thesis statement is proved, validating this document’s work. All of the described work in this document
is currently being used in a real enterprise production process, and is reflecting the measurements made by
the author.
74
8 Conclusions
Even though the title of this thesis is focused on an information broker, the truth is that the broker is the tip
of an iceberg: to reach a point where the broker could be implemented, a whole basis had to be laid and
developed upon (edition process, MI-Editor, MI-Manager, general concepts), so there could be a basis where
the broker could work on. The information broker became a key piece of the whole edition process (which
was developed in this work also) and increased the value of the information that a client could receive on his
mobile device.
This thesis firstly presented the relevance of data unification, and proved it’s value using the Google Earth
and Google Maps examples, which are two important cases of how heterogenic data can be merged to create
additional value and additional relevant information.
Two data integration methods were studied: the Data Warehouse and Wrapper Mediator Method, each
one serving the same purpose (data integration), but differing on how this integration is made. Mashups were
addressed as well, due to their growing popularity and massification. This method of data unification is being
used largely in various web sites and it is believed to be a growing trend.
Three major gathering methods were studied: Web Feeds, Web Services and Web Scrapping. Web
Services and Web Feeds. Both are recommended to use, due to their elegant and structured methods to
obtain information. Still, Web Services offer much more structured and easy means to obtain simple and
complex information. Web Feeds, on the other hand, are much more popular. On the other hand, Web
Scrapping, is a dodgy method to use, due to to it’s volatility. Web sites constantly change over time, and the
results through this method can reveal rather unpredictable.
Afterwards, a workflow was designed to produce contents in a coherent and effective way, and a set of
roles and a solid architecture was build to support this design. There was a need to have building blocks that
could hold this structure, thus the content concept was created. Then, the screen concept was created (which
is nothing more than a collection of structured contents) and finally, the screen template concept was created
to speed up the production process.
The MI-Edition module was uncovered as a essential piece of the edition process. At it’s core lies the
MI-Editor, which is the main application of this process. Being the screen an essential asset in this process,
the MI-Editor will have a major importance in the process, since it is able to create, edit, maintain and approve
screens.
The MI-Manager application was developed to help manage the whole process. Also, the Content Man-
agement Libraries were developed to serve as a bridge between different modules and the structured contents
data base.
A global architecture of the information broker was built, based on a wrapper mediator architecture. Three
major parts of this system are the broker engine, broker implementations and the broker interface. Combining
these different parts, the MI-Information Broker is formed. This broker will operate as a part of a content
production line, automatically populating multiple screens with information captured on outside sources. Two
implementations were tailored by the author to demonstrate the concept: the Events implementation (gets
various information about events in a given region) and the Weather implementation (gets weather information
for a given region). The latest is currently being used in production.
75

Measuring the efficiency of the MI-Editor and MI-Information Broker - which are two major pieces in the
content production process - and observing the (desired) results provided by this work in a entreprise context,
one can conclude that the thesis statement is proved, validating this document’s work. All of the described
work in this document is currently being used in a real enterprise production process, and is reflecting the
measurements made by the author.
8.1 Main Contributions
Based on a proved concept (the wrapper mediator method), the MI-Information Broker was developed based
on a well known basilar structure and implemented to solve a specific problem on a (pragmatic) enterprise
context.
The work developed on MI-Editor, MI-Manager, MI-Information Broker and general edition process con-
cepts are currently being used as part of a whole production process on a company, and are center pieces of
the content production system. By the time of this work’s publication, the MI-Editor was used by two tourism
professionals to create, edit and approve 300+ screens. Also the MI-Manager is being used to manage parts
of the edition process, and the MI-Information Broker is up and running, delivering updated weather informa-
tion to some screens.
8.2 Future Work
For the time being, the current solution solves the enunciated problems in the beginning of this document.
Eventually the organization where this solution implemented will grow, and new features will be added to the
Information Broker:
• Deferred mode - broker usage in deferred mode, as an addiction to the immediate mode. This way,
the information can be treated and new and more interesting information can be gathered using data
warehousing and data mining.
• Web crawling and improved gathering intelligence - to complement the currently available informa-
tion obtained by the deferred mode (stated above), web crawling and other types of gathering methods
will be used to collect useful information and process it to obtain other kinds of valuable information.
• Deeper connection between the information broker and the MI-Editor - right now, the connection
between the information broker and MI-Editor is fairly weak. In the future, the MI-Editor will have some
features that will permit the MI-Editor to retrieve directly informations from the information broker.
76

Bibliography[1] M. Pilgrim, “What is rss.” Website XML.com, 2002. http://www.xml.com/pub/a/2002/12/18/
dive-into-xml.html.
[2] Business.Maktoob.com, “Idc study forecasts 988 billion gb of digital info to be created in 2010.” Website,
2007. http://business.maktoob.com/NewsDetails-20070218033953-IDC_study_forecasts_
988_billion_GB_of_digital_info_to_be_created_in_2010.htm.
[3] D. Merrill, “Mashups: The new breed of web app.” Website, 2006. http://www.ibm.com/
developerworks/xml/library/x-mashups.html.
[4] D. Berlind, “At the whiteboard: What is a mashup?.” Website ZDNet, 2008. http://news.zdnet.com/
2422-13569_22-152729.html.
[5] J. Jesus, “Sistemas de supervisão baseados em dispositivos móveis,” Master’s thesis, Instituto Superior
Técnico, Lisbon PT, 2007.
[6] B. Popa, “Google earth vs. google maps.” Website, 2007. http://news.softpedia.com/news/
Google-Earth-vs-Google-Maps-65440.shtml.
[7] GIS.com, “What is gis?.” Website. http://www.gis.com/whatisgis/index.html.
[8] google.com, “Google earth product comparison.” Website. http://earth.google.com/product_
comparison.html.
[9] google.com, “What is google maps?.” Website, 2008. http://maps.google.com/support/bin/
answer.py?hl=en&answer=7060.
[10] F. Taylor, “Google earth blog: August geographic web layer update.” Website. http://www.gearthblog.
com/blog/archives/2008/08/august_geographic_web_layer_update.html.
[11] google.com, “Google maps case study: New york times.” Website, 2008. http://maps.google.com/
help/maps/casestudies/nytimes.html.
[12] google.com, “Google maps case study: Tripadvisor.” Website, 2008. http://maps.google.com/help/
maps/casestudies/tripadvisor.html.
[13] M. Lenzerini, “Wdata integration: A theoretical perspective.” Centro Universitario Residen-
ziale di Bertinoro - Website, 2002. http://www.centrocongressibertinoro.it/file/doc/
DataIntegration-surveyPods2002.pdf.
[14] P. Ziegler and K. R. Dittrich, “Three decades of data integration - all problems solved?.” Depart-
ment of Informatics, University of Zurich, 2004. http://www.ifi.uzh.ch/~pziegler/papers/
ZieglerWCC2004.pdf.
[15] C. Preimesberger, “Teradata’s new dw appliance begets wrath from netezza.” EWeek Blogs,
2008. http://blogs.eweek.com/storage_station/content/teradatas_new_dw_appliance_
begets_wrath_from_netezza.html.
77

[16] Z. H. Hongzhi Wang, Jianzhong Li, “An effective wrapper architecture to heterogeneous data source,” 17
th International Conference on Advanced Information Networking and Applications (AINA’03), 2003.
[17] L. Xu. and D. W. Embley, “Combining the best of global-as-view and local-as-view for data integration,”
Department of Computer Science Brigham Young University Provo, Utah 84602, U.S.A.
[18] D. Shea, “What is rss/xml/atom/syndication?.” Website mezzoblue, 2002. http://www.mezzoblue.com/
archives/2004/05/19/what_is_rssx/.
[19] R. Specifications, “History of rss.” Website, 2004. http://www.rss-specifications.com/
history-rss.htm.
[20] A. Alliance, “The myth of rss compatibility.” Website, 2004. http://diveintomark.org/archives/
2004/02/04/incompatible-rss.
[21] A. Alliance, “Atom publishing protocol - introduction.” Website, 2007. http://www.atomenabled.org/
developers/protocol/.
[22] A. Wiki, “Atom road map.” Website, 2005. http://www.intertwingly.net/wiki/pie/RoadMap.
[23] B. Trott, “Why we need echo.” Website, 2003. http://www.sixapart.com/blog/2003/06/why_we_
need_ech.html.
[24] A. Wiki, “Rss 2.0 and atom 1.0 compared.” Website, 2005. http://www.intertwingly.net/wiki/
pie/Rss20AndAtom10Compared.
[25] W3C, “Web services glossary.” Website, 2004. http://www.w3.org/TR/ws-gloss/.
[26] D. Marshall, “Remote procedure calls (rpc).” Website, 1999. http://www.cs.cf.ac.uk/Dave/C/
node33.html.
[27] I. J. Taylor and A. Harrison, From P2p to Web Services and Grids: Peers in a Client/Server World.
Springer, 2004.
[28] U. Software, “Xml-rpc specification.” Website, 2003. http://www.xmlrpc.com/spec.
[29] P. Obermeyer and J. Hawkins, “Microsoft .net remoting: A technical overview.” Website, 2001. http:
//msdn.microsoft.com/en-us/library/ms973857.aspx.
[30] F. D. Wiki, “Main page - facebook developers wiki.” Website. http://wiki.developers.facebook.
com/index.php/Main_Page.
[31] O. M. Group, “Corba component model, v4.0.” Website, 2008. http://www.omg.org/technology/
documents/formal/components.htm.
[32] G. Newcomer, Eric; Lomow, Understanding SOA with Web Services. Addison-Wesley Professional,
2004.
[33] M. Bell, Service-Oriented Modeling (SOA): Service Analysis, Design, and Architecture. Wiley, 2008.
78
[34] T. Erl, Service-Oriented Architecture (SOA): Concepts, Technology, and Design. Prentice Hall PTR,
2005.
[35] T. Erl, “Service-oriented computing in the real world.” Website, 2007. http://www.whatissoa.com/
p24.asp.
[36] R. Fielding, Architectural Styles and the Design of Network-based Software Architectures. PhD the-
sis, UNIVERSITY OF CALIFORNIA, IRVINE US, 2000. http://www.ics.uci.edu/~fielding/pubs/
dissertation/rest_arch_style.htm.
[37] R. McMillan, “A restful approach to web services.” Website, 2003. http://www.networkworld.com/
ee/2003/eerest.html.
[38] E. F. Foundation, “Frequently asked questions (and answers) about linking.” Website. http://www.
chillingeffects.org/linking/faq.cgi#QID596.
[39] GNU, “Gnu free documentation license.” Website, 2008. http://www.gnu.org/copyleft/fdl.html.
[40] C. Commons, “Creative commons attribution-share alike 2.5 generic.” Website. http://
creativecommons.org/licenses/by-sa/2.5/.
[41] Infragistics, “Infragistics netadvantage for .net.” Website. http://www.infragistics.com/dotnet/
netadvantagenewfeatures.aspx#Overview.
[42] R. Dobson, “Programming microsoft sql server 2000 with microsoft visual basic .net.” Website. http:
//www.microsoft.com/mspress/books/sampchap/5792a.aspx.
[43] WunderWiki, “Wunderwiki faq - rss.” Website. http://wiki.wunderground.com/index.php/FAQ_-_
RSS.
[44] WeatherBug, “Weatherbug api.” Website. http://apireg.weatherbug.com/terms.aspx.
[45] Eventful, “Eventful - api and services.” Website. http://api.eventful.com/.
[46] C. C. Gamito, “E3dm - aplicação de entretenimento em 3d para dispositivo móvel de Última geração,”
Master’s thesis, Instituto Superior Técnico, Lisbon PT, 2004.
[47] J. Lu, “What is an information broker?.” Website, 2000. http://www.cs.toronto.edu/km/xib/
document/broker_tutorial/definition.html.
[48] J. Lu, “Towards extensible information brokers based on xml,” CAiSE*00, 12th Conference on Advanced
Information Systems Engineering, Stockholm. http://www.cs.toronto.edu/~jglu/pub/caiseLNCS.
pdf.
[49] T. Primrose and E. Adler, “America online and time warner will merge to create world’s first internet-age
media and communications company.” TimerWarner.com - Website, 2000. http://www.timewarner.
com/corp/newsroom/pr/0,20812,667602,00.html.
79


Part V
Appendix


A Appendix A: Work PlanningAll of the proposed objectives at 8/Jan/2008 (Figure A.1) were accomplished before the stipulated dead
line(Figure A.2). The development of the Edition Module took more time than expected, but on the hand,
the development of the Information Broker revealed to be much less time consuming than expected.
The hourly workload on Figure A.1 and Figure A.2 corresponds to 4 hours per day.
83

Figure A.1: Thesis Work Planning done at 8/Jan/2008
84

Figure A.2: Thesis Work analysis at 28/Aug/2008
85

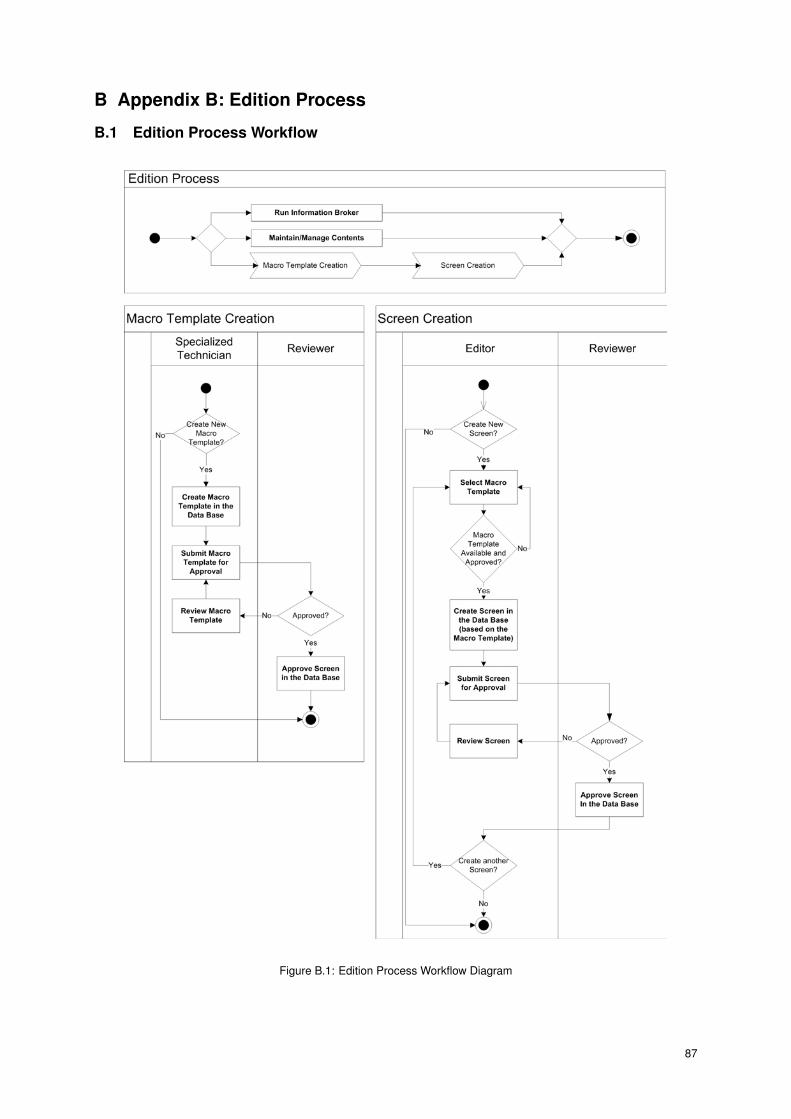
B Appendix B: Edition Process
B.1 Edition Process Workflow
Figure B.1: Edition Process Workflow Diagram
87

The main responsibilities of the following roles in the Edition Process are (Figure B.2):
• Specialized Technicians - Generation of the basilar contents, micro templates and macro templates.
• Editors - Creation of screens through macro templates. An editor may create custom contents.
• Reviewers - Approve/reprove screens and macro templates.
• Managers - Administration of the system.
Figure B.2: Use Cases Diagram on the Edition Process
88

C Appendix C: Broker Technologies
C.1 The Broker Service Interface
To communicate with the Broker Engine, a Broker Implementation must implement the Broker Service Inter-
face (described in Program 2).
89
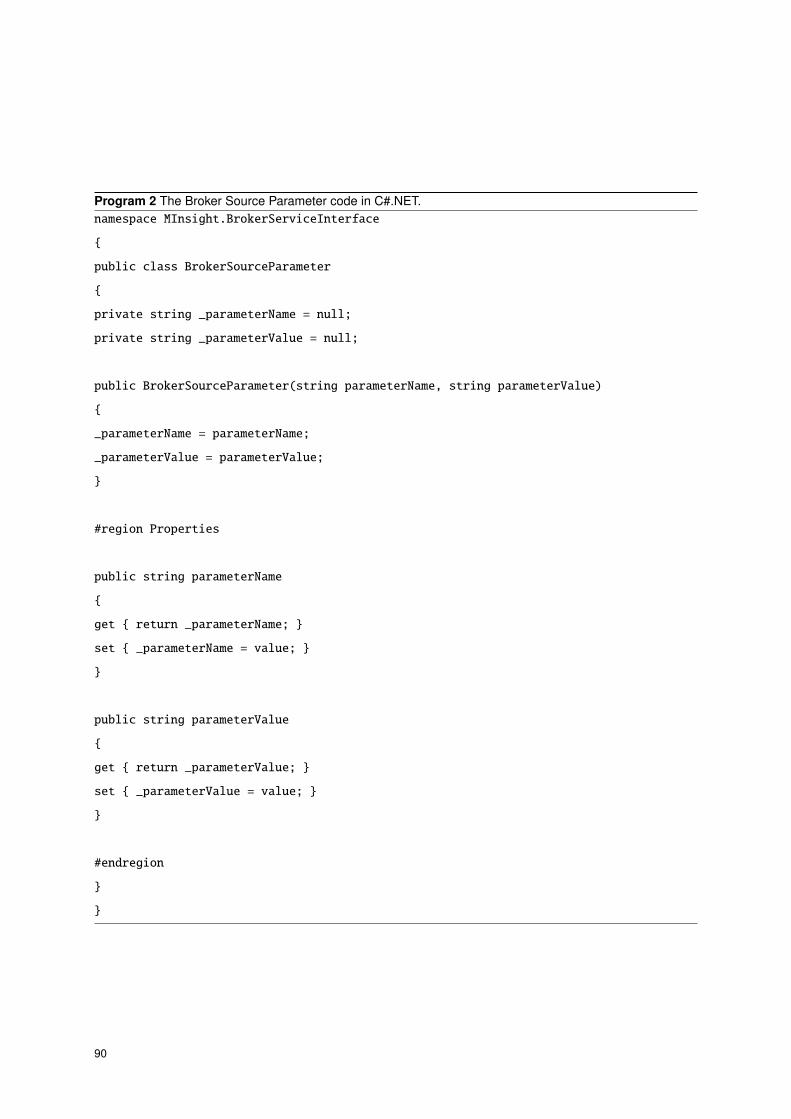
Program 2 The Broker Source Parameter code in C#.NET.namespace MInsight.BrokerServiceInterface
{
public class BrokerSourceParameter
{
private string _parameterName = null;
private string _parameterValue = null;
public BrokerSourceParameter(string parameterName, string parameterValue)
{
_parameterName = parameterName;
_parameterValue = parameterValue;
}
#region Properties
public string parameterName
{
get { return _parameterName; }
set { _parameterName = value; }
}
public string parameterValue
{
get { return _parameterValue; }
set { _parameterValue = value; }
}
#endregion
}
}
90
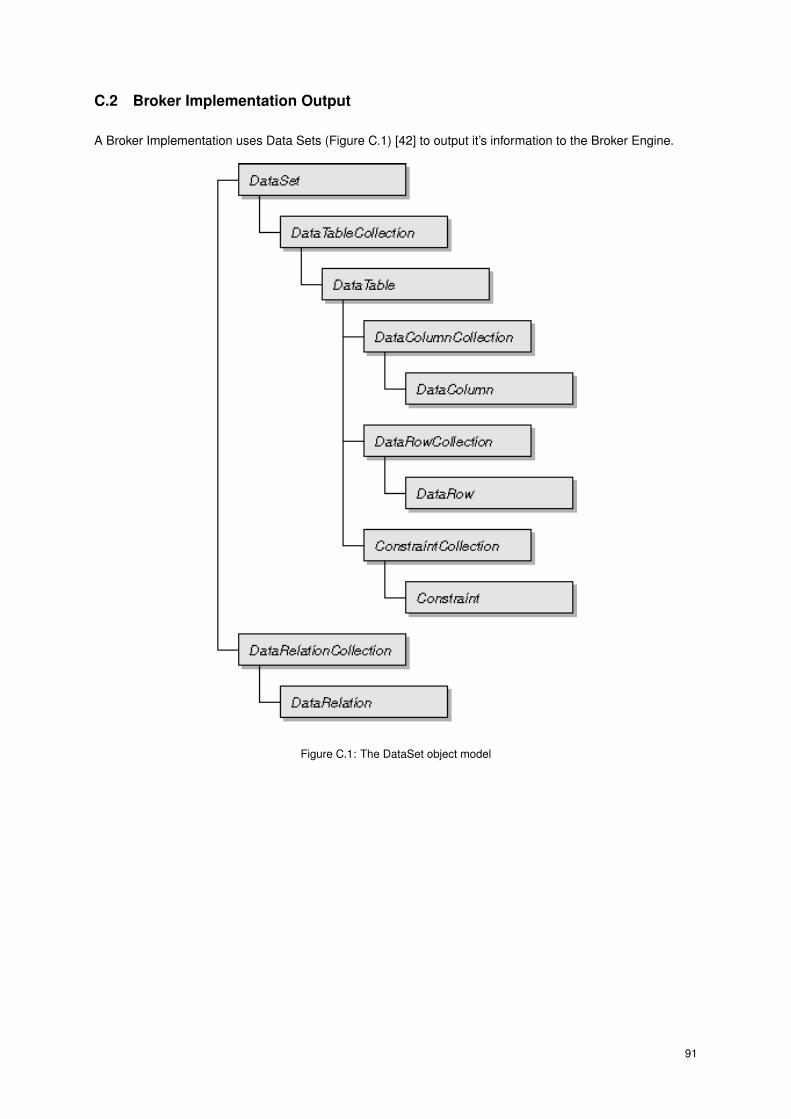
C.2 Broker Implementation Output
A Broker Implementation uses Data Sets (Figure C.1) [42] to output it’s information to the Broker Engine.
Figure C.1: The DataSet object model
91

C.3 Supporting Data Base Objects
In order for the information broker to know how to relate the implementation’s data with the screens, a set of
data base objects are used to access the information of each one of the implementation’s objects:
• Figure C.2 presents the data base objects of the Weather Underground Object.
• Figure C.3 presents the data base objects of the Weather Bug Object.
• Figure C.4 presents the data base objects of the Eventful Object.
Note that all of these supporting data base objects are orientated to retrieve data from a specific region,
which, in this case, is the city of Lisbon.
Figure C.2: Data Base Objects for the Weather Underground Object
92
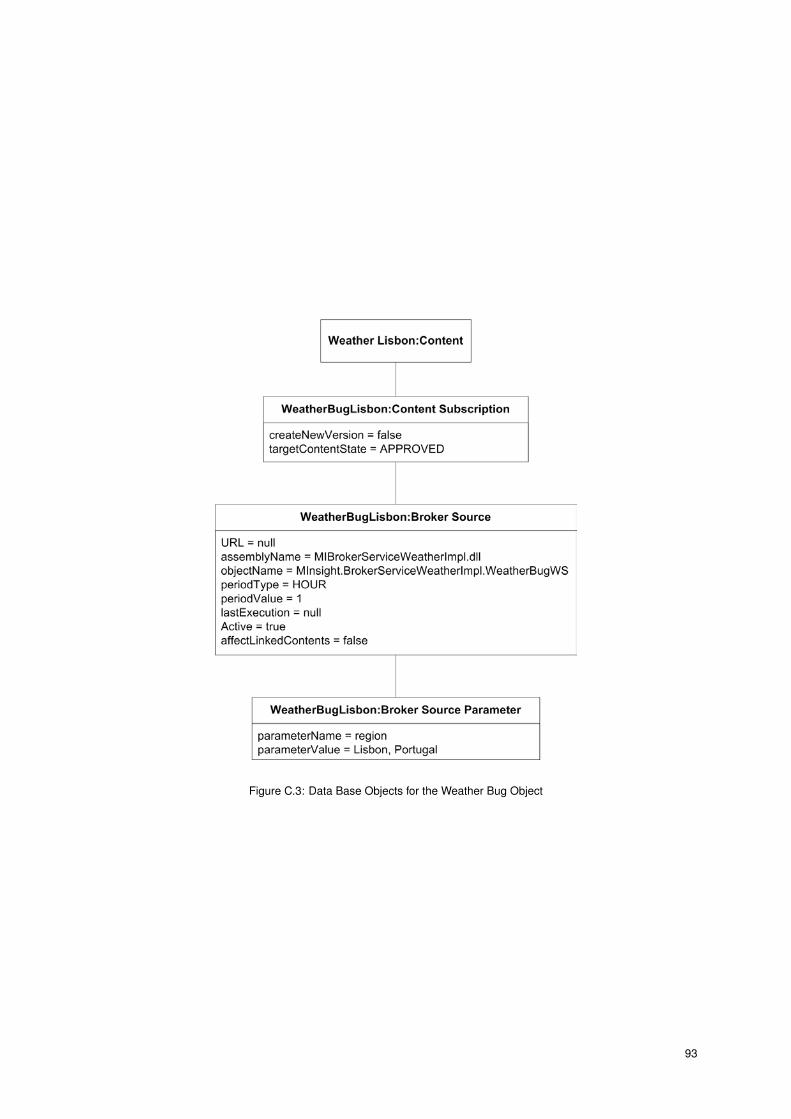
Figure C.3: Data Base Objects for the Weather Bug Object
93

Figure C.4: Data Base Objects for the Eventful Object
94