Caracterização e estudos das propriedades no … Aos amigos queridos Geison, Rafael, Luisa,...
231
i UNIVERSIDADE FEDERAL DE SANTA CATARINA CENTRO DE CIÊNCIAS DA SAÚDE PROGRAMA DE PÓS-GRADUAÇÃO EM FARMÁCIA Caracterização e estudos das propriedades no estado sólido do cloridrato de venlafaxina Larissa Sakis Bernardi Florianópolis 2013
-
Upload
vuongkhuong -
Category
Documents
-
view
217 -
download
0
Transcript of Caracterização e estudos das propriedades no … Aos amigos queridos Geison, Rafael, Luisa,...

i
UNIVERSIDADE FEDERAL DE SANTA CATARINA
CENTRO DE CIÊNCIAS DA SAÚDE
PROGRAMA DE PÓS-GRADUAÇÃO EM FARMÁCIA
Caracterização e estudos das propriedades no estado sólido
do cloridrato de venlafaxina
Larissa Sakis Bernardi
Florianópolis
2013

ii

iii
Caracterização e estudos das propriedades no estado sólido
do cloridrato de venlafaxina
por
Larissa Sakis Bernardi
Tese submetida ao Programa de Pós-Graduação em Farmácia da Universidade Federal de Santa Catarina como requisito parcial à
obtenção do Grau de Doutor em Farmácia.
Orientador: Profa. Dra. Simone Gonçalves Cardoso
Florianópolis
2013

iv

v
Dedico este trabalho à minha família: pai, mãe,
Paulo, Gui, Diógenes, Miriam, Andrei e Sofia, pelo amor e apoio constante, que sempre estiveram presentes em todos
os momentos de minha vida.

vi

vii
“Há um tempo em que é preciso abandonar as roupas usadas, que já tem a forma do nosso corpo e esquecer os nossos caminhos, que nos levam sempre
aos mesmos lugares. É o tempo da travessia, e, se não ousarmos fazê-la, teremos ficado para sempre à
margem de nós mesmos.”
Fernando Pessoa

viii

ix
AGRADECIMENTOS Agradeço à Deus pelos dons, saúde, inteligência, oportunidades e força por mais uma grande conquista. À querida Profa Dra Simone Gonçalves Cardoso, que eu prefiro simplesmente chamar de Si, pela oportunidade, orientação, compreensão, dedicação, apoio e amizade. Muito Obrigada pela contribuição na minha formação profissional e pessoal, tenho certeza de outra pessoa não faria tudo o que você fez por mim! Ao meu amado Paulo, que sempre acreditou mais em mim do que eu mesma, que sempre me impulsionou e me ajudou muito para que este sonho fosse realizado. Te amo muito!!! Aos meus pais, Aldair e Osmar; meus irmãos, Diógenes e Guilena; meus cunhados, Miriam e Andrei e à minha pequena sobrinha Sofia, pelo amor, carinho, incentivo, confiança e apoio dedicado à minha formação. Mesmo longe eu sabia que poderia contar com vocês sempre. Amo muito!!! Ao Prof. Dr. Ruggero Bettini, da Università degli Studi di Parma, Itália, por abrir as portas de seu laboratório para mim, e pelos inúmeros ensinamentos. Com certeza aprendi muito com ele. À Profa Dra Silvia Lucia Cuffini, por estar sempre pronta a ajudar e não me deixar desanimar, muito obrigada pelas ideias “salvadoras de projetos”, co-orientação e apoio durante a realização desta tese. Ao Prof. Dr. Carlos Eduardo Maduro de Campos, pelos inúmeros experimentos realizados, tempo empregado e explicações dadas. Ao Prof. Dr. Fábio Furlan Ferreira, pela grande ajuda nas análises de DRX e pela disponibilização do equipamento. Aos Professores Marcos Antônio Segatto Silva, Eloir Paulo Schenkel, Elenara Lemos Senna, Flávio Reginatto e Hellen Stulzer Koerich, pela amizade e ensinamentos.

x
Aos amigos queridos Geison, Rafael, Luisa, Fábio, Nana, Bruno e Suelen, pelo convívio, alegrias e churrascadas divertidíssimas. Aos amigos e colegas de laboratório Ana, Cassi, Gis, Andréa G., Gabi, Silvinha, Monika, Manu, Amarílis, Cinira, Andrea K., Camila, Vivi, Paola, Aline, Juli, Taís, Mari, Carlos, Carol, Cacá e Thiaguinho, pelo convívio, amizade, companheirismo, desabafos, colaboração e apoio durante estes anos. Às funcionárias Solange e Claudinha, pela atenção dispensada. Ao Programa de Pós-Graduação em Farmácia e à Universidade Federal de Santa Catarina, por possibilitarem a realização deste trabalho. À FAPESC e CNPq, pelo apoio financeiro com o fornecimento das bolsas de Doutorado, Mestrado e Doutorado sanduíche. A todos que, mesmo não citados, participaram e colaboraram para a realização desse sonho.

xi
RESUMO O cloridrato de venlafaxina (VEN) é um inibidor da recaptação da serotonina e norepinefrina eficaz no tratamento da doença da depressão e distúrbios de ansiedade generalizada. Este trabalho contemplou a caracterização do cloridrato de venlafaxina; o desenvolvimento e a validação de método por cromatografia líquida de alta eficiência (CLAE) para quantificação do fármaco em cápsulas de liberação prolongada, bem como o estudo das diferentes formas cristalinas do cloridrato de venlafaxina, a avaliação da presença dos diferentes polimorfos em matérias-primas e o desenvolvimento e validação de um método de quantificação das Formas polimórficas 1 e 2 do fármaco por difração de raios-X, empregando o método de Rietveld. O método por CLAE em fase reversa foi desenvolvido e validado para determinação de teor e ensaios de dissolução. O método mostrou-se linear (r> 0,99), exato (98,8 - 101,2%) e preciso (DPR< 0,9%). O fármaco foi caracterizado através de diferentes técnicas analíticas, como: termogravimetria (TG), calorimetria exploratória diferencial (DSC), infravermelho (IV), microscopia eletrônica de varredura (MEV) e difração de raios-X em pó (DRXP), demonstrando as propriedades físico-químicas do fármaco. Além disso, foram realizados estudos de compatibilidade entre o fármaco e alguns excipientes utilizados no desenvolvimento das formas farmacêuticas sólidas disponíveis comercialmente, como talco, estearato de magnésio, celulose microcristalina, amido glicolato de sódio, amido e lactose monoidratada. Nenhuma evidência de interação no estado sólido ou incompatibilidade foram observadas por DSC e DRIFT. Quatro matérias-primas de diferentes fornecedores foram caracterizadas utilizando as técnicas analíticas anteriormente citadas, e verificou-se que duas correspondiam à Forma polimórfica 1, enquanto as outras duas eram misturas das Forma 1 e 2 do fármaco. Realizou-se, também, a caracterização das Formas polimórficas 1 e 2, que foram obtidas a partir de diferentes métodos de cristalização, e uma nova forma polimórfica, Forma 3, obtida a partir da recristalização da fusão da Forma 2, foi isolada, caracterizada e demonstrou ser diferente daquelas depositadas no Cambridge Crystallographic Database. A caracterização dos três polimorfos foi realizada por DRXP, DRIFT, DSC, MEV, Espectroscopia Raman, microscopia de fase quente, temperatura variável de difração de raios-X de pó e medições de solubilidade. A avaliação termodinâmica entre as Formas polimórficas 1 e 3 foi

xii
realizada, encontrando-se uma relação monotrópica entre as duas, sendo a Forma 3 a forma polimórfica mais estável. Um método de quantificação de fases polimórficas para as Formas 1 e 2 do cloridrato de venlafaxina por DRX, empregando o refinamento de Rietveld, foi desenvolvido e validado. O método foi validado de acordo com os guias do ICH e FDA, sendo considerado linear na faixa de 4,86 - 97,06% (p/p Forma 2/Forma 1), preciso e exato, com limites de detecção de 1,16% e quantificação de 3,50%. Palavras-chave: Cloridrato de venlafaxina; Validação; Dissolução; Caracterização no estado sólido; Polimorfismo; Relação termodinâmica; método de Rietveld, Análise quantitativa de fase.

xiii
ABSTRACT Venlafaxine hydrochloride (VEN) is a potent serotonin and norepinephrine reuptake inhibitor effective in treatment of the depression disease and generalized anxiety disorder. The present work included the characterization of venlafaxine hydrochloride, development and validation of a method to quantify the drug in extended-release capsules by high performance liquid chromatography (HPLC), as well as the study of different crystalline forms of venlafaxine hydrochloride, evaluation of the presence of different polymorphs in raw materials and development and validation of a quantification method for polymorphic Forms 1 and 2 by X-ray diffraction using the Rietveld refinement. The HPLC method was developed, validated and successfully applied in dissolution tests. The method was linear (r> 0.99), accurate (98.8 to 101.2%) and precise (RSD< 0.9%). The drug was characterized by various analytical techniques, such as thermogravimetry (TG), differential scanning calorimetry (DSC), infrared (IR), scanning electron microscopy (SEM), and X-ray powder diffraction (XRPD), demonstrating the physicochemical properties of the drug. In addition, compatibility studies were performed between the drug and some excipients like talc, magnesium stearate, microcrystalline cellulose, sodium starch glycolate, starch and lactose monohydrate. No evidence of interaction or incompatibility in the solid state was observed by DSC and DRIFT. Four raw materials from different suppliers were characterized using the analytical techniques mentioned above, and it was found that two raw materials corresponded to VEN Form 1, while the other two were mixtures of Forms 1 and 2. Also, the characterization of the polymorphic Forms 1 and 2, which were obtained from differents crystallization methods, was carried out. A new polymorphic form, Form 3, obtained from the “melted” of Form 2 was isolated, characterized and showed to be different from those deposited at the Cambridge Crystallographic Database. The characterization of the three polymorphs was performed by DRXP, DRIFT, DSC, SEM, Raman spectroscopy, hot stage microscopy, variable temperature X-ray powder diffraction measurements, and solubility. VEN polymorphic thermodynamic relationship was performed and a monotropic relationship between Forms 1 and 3 was found, and the Form 3 demonstrates to be the most stable polymorphic form. A method for polymorphic phases quantification of the Form 1 and 2 by XRPD using Rietveld refinement was developed and then validated according to ICH

xiv
and FDA guidelines. It was considered linear in the range from 4.86 to 97.06% (w/w Form 2/Form 1), precise and accurate, with detection of limits of 1.16% and quantitation of 3.50%. Keywords: Venlafaxine hydrochloride; Validation; Dissolution; Solid-state characterization; Polymorphism; Thermodynamic relationship; Rietveld method; Quantitative phase analysis.

xv
LISTA DE FIGURAS
Capítulo 1
Figura 1. Estrutura do cloridrato de venlafaxina............................. 7
Figura 2. Sete sistemas cristalinos fundamentais dos sólidos.......... 18
Figura 3. Diagrama de energia em função da temperatura de um sistema de dois polimorfos: A) Relação enantiotrópica e; B) Relação monotrópica. Onde HI e HII = a entalpia; GI e GII = a energia livre de Gibbs; mpI e mpII = o ponto de fusão das Formas I e II, respectivamente e; Tt I/II é a temperatura de transição...........
21
Figura 4. A) Curva de solubilidade (mg mL-1) em função da temperatura de dois polimorfos obtidos no intervalo de temperatura entre 25-100 °C; B) Gráfico de Van't Hoff do polimorfo 1 (quadrados) e de polimorfo 2 (círculos).......................
23
Figura 5. Refinamento de Rietveld para um pico de difração. Observado (círculos), Calculado (linha) e diferença (linha inferior).......................................................................................
31
Figura 6. Refinamento de Rietveld para matéria-prima do cloridrato de venlafaxina. Observado (círculos), Calculado (linha) e diferença (linha inferior)…………………………………………
32
Capítulo 3
Figure 1. HPLC chromatograms of venlafaxine hydrochloride (A) extended release capsules (40 µg/mL). (B) After oxidative condition. (C) After acidic condition. (D) After photolytic condition. (E) After basic condition ………………………………
55
Figure 2. Release behavior of venlafaxine in different conditions.. 60
Figure 3. Release of venlafaxine in different media using 75 rpm rotation speed and apparatus (II) paddle .………..………………..
62
Capítulo 4
Figure 1. Chemical Structure of Venlafaxine hydrochloride .…… 74

xvi
Figure 2. DSC and TG/DTG curves of pure Venlafaxine hydrochloride obtained in nitrogen atmosphere (50 mL min-1) and heating rate of 10 °C min-1 ………………………………..............
77
Figure 3. X-Ray Powder Diffraction of Venlafaxine hydrochloride…………………………………………………….
78
Figure 4. SEM Photomicrograph of Venlafaxine hydrochloride: A) 5000x magnification; B) 20000x magnification ……………...
78
Figure 5. DSC curves of Venlafaxine hydrochloride (VEN) and excipients obtained in dynamic nitrogen atmosphere (50 mL min-1 and heating rate of 10 °C min-1 ………………………………........
80
Figure 6. DRIFT spectra of physical mixtures Venlafaxine hydrochloride and excipients……….……………………………
81
Figure 7. SEM Photomicrograph of A) Microcrystalline cellulose (100x), B) VEN:Microcrystalline cellulose (100x), C) Magnesium stearate (1.000x), D) VEN:Magneium stearate (1.000x), E) Starch (500x), and F) VEN:Starch (500x) ………………………………..
82
Capítulo 5
Figure 1. Chemical structure of Venlafaxine Hydrochloride……... 93
Figure 2. XRPD patterns A) Form 1 experimental and calculated (WOBMUV); B) Form 2 experimental and calculated (WOBMUV01) …………………..………………………………..
98
Figure 3. SEM Photomicrographs of the two polymorphic forms of VEN. (A) Blocks (Form 1); (B) Needles (Form 2) at 200X magnification ……....………………...............................................
99
Figure 4. A) DRIFT spectra: VEN Forms 1 and 2; B) Raman spectra: VEN Forms 1 and 2 .…...………………………...............
100
Figure 5. DSC curves of VEN: A) Form 1 (dashed lines) and Form 2 (solid lines); and B) VEN1-VEN4 obtained with heating rate of 2 °C min-1 ……….………………………………………...
102
Figure 6. ssNMR spectra of VEN Forms 1 and 2 …………...….... 103
Figure 7. SEM Photomicrographs of 1 - VEN1; 2 - VEN2; 3 -

xvii
VEN3; 4 - VEN4; at 2,000X magnification. ................................... 105
Figure 8. XRPD patterns of VEN polymorphs: raw material (VEN1-VEN4) …………………………………………………..
106
Figure 9. Experimental (noisy lines) and calculated (thick black lines) XRPD patterns: A) VEN3 and B) VEN4 samples. Gray lines represent the difference between experimental and calculated patterns…..……………………………………………..
107
Capítulo 6
Figure 1 Chemical structure of venlafaxine hydrochloride………. 119
Figure 2 - Optical microscopy of the two forms of VEN. (A) Form 1 (blocks); (B) Form 2 (needles); (C) Form 3 (slides).Original magnification 20X ………………………………
121
Figure 3 - XRPD patterns of VEN polymorphs: Form 1 and Form 2 …………………………………………………………………...
122
Figure 4 – DSC curve of polymorphic Forms 1 of VEN under nitrogen atmosphere (100 mL min-1) heating at: A) 2 °C min-1; B) 5 °C min-1; C) 10 °C min-1 …………………………………….
124
Figure 5 – DSC curve of polymorphic Forms 2 of VEN under nitrogen atmosphere (100 mL min-1) heating at: A) 2 °C min-1; B) 5 °C min-1; C) 10 °C min-1 ……..……………………………..
124
Figure 6 – Hot Stage Microscopy of Polymorphic forms of VEN: A) Form 2 and B) Form 1 …..……………………………………..
126
Figure 7 – VTPXRD of the polymorphic forms of VEN: A) Form 2; B) Form 1…………… ………………………………………...
127
Figure 8 – A) Solubility data of Form 1 (triangle symbol) and Form 2 (square symbol) of VEN; B) Van’t Hoff solubility plots of Form1 (triangle symbol) and Form 2 (square symbol) of VEN in Triacetin…………………………………………………………....
129
Figure 9 – Rietveld Refinement of Form 2 ……………...……….. 130
Figure 10 - DSC curve of the VEN new polymorphic form heated at 5 °C min-1 under nitrogen atmosphere (100 mL min-1)…………
131
Figure 11. XRPD patterns of VEN: A) Form 6 calculated

xviii
(WOBMUV02), and B) Form 3………….……………………….. 132
Figure 12. A) Solubility data of Form 1 (triangle symbol) and Form 3 (square symbol) of VEN; B) Van’t Hoff solubility plots of Form1 (triangle symbol) and Form 3 (square symbol) of VEN in Triacetin……………………………………………………………
133
Capítulo 7
Figure 1. Rietveld refinement for Form 2 of VEN……………… 151
Figure 2. Calibration correlation for Venlafaxine Hydrochloride… 151
Figure 3. Linearity using the height of the peak 12.74° to calculate de LOD and LOQ …………………………………………………
153

xix
LISTA DE FLUXOGRAMAS Capítulo 2
Fluxograma 1. Desenvolvimento e Validação de Metodologia Analítica...........................................................................................
37
Fluxograma 2. Avaliação do perfil de dissolução e cinética de liberação do cloridrato de venlafaxina em cápsulas de liberação prolongada........................................................................................
38
Fluxograma 3. Caracterização do cloridrato de venlafaxina e estudos de compatibilidade fármaco:excipiente..............................
39
Fluxograma 4. Estudos do estado sólido de diferentes matérias-primas do cloridrato de venlafaxina.................................................
40
Fluxograma 5. Estudo das relações termodinâmicas dos polimorfos do cloridrato de venlafaxina..........................................
41
Fluxograma 6. Desenvolvimento e validação de um método de quantificação por DRX empregando o refinamento de Rietveld.....
42

xx
LISTA DE TABELAS
Capítulo 1
Tabela 1. Técnicas de cristalização, particularidades e influências na forma e tamanho do cristal......................................................
19
Tabela 2. Dados Cristalinos para os dois polimorfos relatados no Cambridge DataBase do cloridrato de venlafaxina ........................
26
Capítulo 3
Tabela 1. Inter-day and between-analysts precision data of the method ..........................................................................................
56
Tabela 2. Accuracy data of the method ......................................... 57
Tabela 3. Chromatographic conditions and range investigated during robustness testing ……………………………………….....
58
Tabela 4. Determination of venlafaxine hydrochloride in pharmaceutical dosage forms ……………………….…………….
59
Tabela 5. Dissolution efficiency values obtained from dissolution tests assessed with different dissolution methods…………………
61
Tabela 6. Results of fitting to different kinetic release equations ... 63
Tabela 7. Kinetic constants calculated from first order kinetic release: (k1), (t1/2), (Q6) and (Q12) …………………………………
63
Capítulo 5
Table 1. DSC data for Venlafaxine Hydrochloride raw materials (VEN1 - VEN4) obtained at heating rates of 10 ºC min-1 and 2 °C min-1………………………………………………………………
101
Table 2. 13C ssNMR chemical shifts for Venlafaxine Hydrochloride Form 1 and Form 2.…………………………….
104

xxi
Capítulo 6
Table 1 – Solubility determination of VEN Form1 and Form 2 in Triacetin ………………………………………………………...
128
Capítulo 7
Tabela 1. Crystal data for two polymorphs of VEN …………… 144
Tabela 2. Repeatability and Inter-day precision data of the method 152
Tabela 3. Accuracy data of the method…………………………… 153

xxii
LISTA DE ABREVIATURAS, SIGLAS E SÍMBOLOS ANOVA Análise de Variância ANVISA Agência Nacional de Vigilância Sanitária CCDAE Cromatografia em Camada Delgada de Alta Eficiência CCD Cambridge Crystallographic Database CLAE Cromatografia líquida de Alta Eficiência CLUE Cromatografia líquida de Ultra Eficiência DPR Desvio Padrão Relativo DRX Difração de raios-X DRXM Difração de Raio X de Monocristal DRXP Difração de Raio X de Pó DSC Calorimetria Exploratória Dferencial HSM Microscopia em Fase Quente ICH International Conference on Harmonization IV Infravermelho LOD Limite de Detecção LOQ Limite de Quantificação MEV Microscopia Eletrônica de Varredura RMN Ressonância Magnética Nuclear rpm Rotações Por Minuto HPLC High-Performance Liquid Chromatography ssRMN Ressonância Magnética Nuclear no estado sólido SEM Scanning Electronic Microscopy TG Termogravimetria UV Ultravioleta mg Miligrama mL Mililitro USP Farmacopeia Americana UR Umidade Relativa VEN Venlafaxine Hydrochloride XRPD X-Ray Powder Diffraction

xxiii
SUMÁRIO Lista de figuras............................................................................... xv
Lista de Fluxogramas.................................................................... xix
Lista de tabelas............................................................................... xx
Lista de abreviaturas, siglas e símbolos.................................... xxii
Introdução...................................................................................... 1
Objetivos
Objetivo geral.................................................................................. 3
Objetivos específicos...................................................................... 3
Capítulo 1
Revisão bibliográfica..................................................................... 5
1. Cloridrato de Venlafaxina ....................................................... 7
2. Metodologias Analíticas: Desenvolvimento e Validação de Métodos de Quantificação e Estudos de Dissolução...............
9
2.1. Estudos de Dissolução..................................................... 11
2.2. Método para a Quantificação do Cloridrato de Venlafaxina.....................................................................................
12
3. Caracterização e Estudos de Compatibilidade..................... 13
3.1. Caracterização de Fármacos no Estado Sólido............. 13
3.2. Estudos de Compatibilidade Fármaco:Excipiente...... 16
4. Polimorfismo................................................................................ 17
4.1. Técnicas Analíticas Empregadas na Identificação e Caracterização dos polimorfos.........................................................
24
4.2. Polimorfismo do Cloridrato de Venlafaxina....................... 25
5. Quantificação de Formas Polimorficas........................................ 28

xxiv
Capítulo 2
Metodologia................................................................................... 35
Capítulo 3
Desenvolvimento e validação de metodologia analítica ....... 43
Introdução ....................................................................................... 45
Publicação científica: Development and validation of a stability-indicating LC method for the determination of Venlafaxine in extended release capsules and dissolution kinetic studies …..
47
Capítulo 4
Caracterização térmica e estudos de compatibilidade fármaco/excipiente .......................................................................
69
Introdução ...................................................................................... 71
Publicação científica: Characterization of Venlafaxine Hydrochloride and Compatibility Studies with pharmaceutical Excipients ………………………….............................................
73
Capítulo 5
Estudos do estado sólido de diferentes matérias-primas do cloridrato de venlafaxina ..............................................................
87
Introdução ....................................................................................... 89
Publicação científica: Solid-state evaluation and polymorphic quantification using Rietveld Method in venlafaxine hydrochloride raw materials ………………………....……….
91
Capítulo 6
Estudo das relações termodinâmicas dos polimorfos do cloridrato de venlafaxina ..……………...................……………………...
113
Introdução ....................................................................................... 115

xxv
Publicação científica: Thermodynamic Relationship Study of the Venlafaxine Hydrochloride Polymorphs………..………………....
117
Capítulo 7
Quantificação polimórfica por DRX empregando o método de Rietveld ............................………………………………………
139
Introdução ....................................................................................... 141
Publicação científica: Development and validation of a method for Venlafaxine Hydrochloride polymorphic forms quantification using Rietveld refinement …….………………………….........
143
Discussão geral............................................................................... 159
Conclusões...................................................................................... 177
Referências..................................................................................... 181

xxvi

1
INTRODUÇÃO
No intuito de garantir um medicamento seguro e eficaz as agências regulamentadoras vêm estabelecendo diversas exigências para garantir a confiabilidade e a qualidade dos produtos farmacêuticos, incluindo a caracterização completa dos fármacos, os estudos de compatibilidade, o desenvolvimento e validação de metodologias analíticas, os estudos de polimorfismo dos fármacos, entre outros (BYRN et al., 1995; BRITTAIN, 1999; BERNSTEIN, 2002; GANDHI et al., 2002; SHABIR, 2003; BRASIL, 2003b; ICH, 2005; STÖCKL, 2009; CHIENG; RADES; AALTONEN, 2011).
O conhecimento das características dos diferentes polimorfos de insumos farmacêuticos ativos, particularmente aqueles que possuem múltiplas formas polimórficas, está entre os processos mais críticos e menos compreendidos da manufatura de medicamentos. Estudos envolvendo sólidos cristalinos desempenham importantes papéis na indústria farmacêutica e vem recebendo atenção de entidades regulamentadoras como a ANVISA (Agência Nacional de Vigilância Sanitária) e o FDA (Food and Drug Administration), influenciando diversas áreas da pesquisa acadêmica (BRITTAIN, 1999; VIPPAGUNTA; BRITTAIN; GRANT, 2001; BRASIL, 2003b; FDA, 2007; ICH, 2005). A presença de diferentes polimorfos para o mesmo fármaco pode levar a alterações no processo de absorção e, consequentemente, de biodisponibilidade (SIVALAKSHMIDEVI et al., 2002; DEIJ et al., 2008;). Desta forma, conhecer, caracterizar e determinar a pureza polimórfica dos ingredientes ativos se torna de grande relevância (STEPHENSON; FORBES; REUTZEL-EDENS, 2001; RAW et al., 2004; FDA, 2007; NEMET; SAJÓ; DEMETER, 2010).
O cloridrato de venlafaxina é um potente antidepressivo inibidor ativo de aminas no neurônio pré-sináptico que, além de inibir a recaptação da serotonina, age sobre a noradrenalina e a dopamina; mostra rápido início de ação e alta eficiência, sendo um dos principais fármacos de escolha para o tratamento de depressão e transtorno obsessivo compulsivo (HARVEY et al., 2000; GUTIERREZ et al., 2003). Este fármaco foi escolhido como objeto de estudo porque pode sofrer modificações no seu estado cristalino durante o processo de síntese, formando polimorfos. Seis diferentes polimorfos do cloridrato de venlafaxina foram descritos, entretanto, muitos dados disponíveis na literatura estão em desacordo, fazendo do polimorfismo um tema

2
promissor para os estudos. Além disto, monografias farmacopéicas para todas as formas farmacêuticas disponíveis contendo o fármaco eram inexistentes no início do desenvolvimento deste trabalho.
Considerando o exposto, este trabalho contemplou a caracterização do cloridrato de venlafaxina; o desenvolvimento e validação de método por cromatografia líquida de alta eficiência (CLAE) para quantificação do fármaco em cápsulas de liberação prolongada, bem como o estudo das diferentes formas cristalinas do cloridrato de venlafaxina, avaliação da presença dos diferentes polimorfos em matérias-primas e o desenvolvimento e validação de um método de quantificação das formas polimórficas 1 e 2 do fármaco por difração de raios-X empregando o método de Rietveld.
Esta tese está apresentada na forma de capítulos, organizados da seguinte forma: Capítulo 1 - Revisão Bibliográfica; Capítulo 2 – Metodologia; Capítulo 3 - Artigo científico (1) intitulado: Development and validation of a stability-indicating LC method for the determination of Venlafaxine in extended release capsules and dissolution kinetic studies; Capítulo 4 - Artigo científico (2) intitulado: Characterization of Venlafaxine Hydrochloride and Compatibility Studies with pharmaceutical Excipients; Capítulo 5 - Artigo científico (3) intitulado: Solid-state evaluation and polymorphic quantification using Rietveld Method in venlafaxine hydrochloride raw materials; Capítulo 6 - Artigo científico (4) intitulado: Thermodynamic Relationship Study of the Venlafaxine Hydrochloride Polymorphs e; Capítulo 7 - Artigo científico (5) intitulado: Development and validation of a method for Venlafaxine Hydrochloride polymorphic forms quantification using Rietveld refinement. No final apresenta-se uma discussão geral em função de todos os resultados obtidos.

3
OBJETIVOS Objetivo geral
Realizar a caracterização físico-química, desenvolver e validar
métodos de quantificação e realizar estudos no estado sólido do cloridrato de venlafaxina. Objetivo específicos � Desenvolver e validar método indicativo de estabilidade por
cromatografia líquida de alta eficiência (CLAE) para determinação quantitativa do fármaco em cápsulas de liberação prolongada;
� Desenvolver método de dissolução para cápsulas de liberação prolongada do cloridrato de venlafaxina e estudar a cinética de dissolução do fármaco;
� Caracterizar o fármaco no estado sólido através de análises espectroscópicas, térmica, difração de raios X e microscopia eletrônica de varredura;
� Avaliar a compatibilidade entre o fármaco e diversos excipientes farmacêuticos;
� Realizar recristalizações do fármaco e caracterizar os cristais obtidos;
� Avaliar a presença de diferentes polimorfos do cloridrato de venlafaxina em matérias-primas de diferentes fornecedores;
� Avaliar a relação termodinâmica das Formas polimórficas 1, 2 e 3 do fármaco;
� Caracterizar a Forma polimórfica 3 obtida; � Desenvolver e validar método de quantificação das Formas
polimórficas 1 e 2 do cloridrato de venlafaxina por difração de raios-X empregando o método de Rietveld.

4

5
CAPÍTULO 1 – Revisão bibliográfica

6

7
1. CLORIDRATO DE VENLAFAXINA
O cloridrato de venlafaxina (Figura 1) é um derivado sintético
bicíclico fenetilamínico, descrito quimicamente como cloridrato de (R/S)-1-[(2-dimetilamino)-1-(4-metoxifenil)etil] cicloexanol. Possui a seguinte fórmula empírica: C17H27NO2•HCl e peso molecular de 313,87 daltons. É um sólido cristalino branco, apresentado como mistura racêmica, com solubilidade de 500 mg/mL em água, 250 mg/ml em dimetilsulfóxido e livremente solúvel em álcoois; e possui coeficiente de partição octanol:água de 0,43 (MOFFAT; OSSELTON; WIDDOP, 2004; BRITISH PHARMACOPOEIA, 2011).
Figura 1: Estrutura do cloridrato de venlafaxina
O cloridrato de venlafaxina é um antidepressivo ativo inibidor
da recaptação de aminas no neurônio pré-sináptico. Seu mecanismo de ação está diretamente associado à potencialização da atividade neurotransmissora no sistema nervoso central. Mostra rápido início de ação, alta eficiência e possui estrutura química totalmente diferente dos antidepressivos tricíclicos clássicos, tetracíclicos e outros agentes conhecidos (ANDREWS; NINAN; NEMEROFF, 1996; MONTGOMERY, 1999; HARVEY; RUDOLPH; PRESKORN, 2000; OLVER; BURROWS; NORMAN, 2001; STAHL; ENTSUAH; RUDOLPH, 2002; GUTIERREZ; STIMMEL; AISO, 2003; AMSTERDAM et al., 2009; NAKAJIMA et al., 2010).
Seu sucesso como fármaco antidepressivo é associado ao seu duplo mecanismo de ação dose dependente na inibição da recaptação de dois importantes transmissores no sistema nervoso central: a serotonina e a noradrenalina. Em doses baixas o cloridrato de venlafaxina tem uma ação mais potente na inibição da recaptação de serotonina, enquanto que

8
em doses mais elevadas a potencialização se dá sobre a noradrenalina, além de uma fraca inibição na recaptação da dopamina. Este comportamento é explicado pela afinidade trinta vezes superior do cloridrato de venlafaxina pelo transportador de serotonina do que pelo da noradrenalina (ANDREWS, NINAN; NEMEROFF, 1996; HARVEY; RUDOLPH; PRESKORN, 2000; OLVER; BURROWS; NORMAN, 2001; TRAN et al., 2003; GUTIERREZ; STIMMEL; AISO, 2003; HAKAN et al., 2008).
Igualmente aos antidepressivos pertencentes a sua classe, o cloridrato de venlafaxina não exerce ação sobre os receptores muscarínicos, histaminérgicos ou alfa-adrenérgicos e, por esta razão não produz efeitos significativos no nível autônomo, anticolinérgico, hipnossedativo ou cardiovascular, o que se traduz em um baixo potencial de produção de efeito colateral e na probabilidade de causar sedação e aumento de peso como ocorre com os antidepressivos tricíclicos clássicos (RUDOLPH; DERIVAN, 1996; AUGUSTIN; COLD; JANN, 1997; TROY et al., 1997a; TROY et al., 1997b; TRAN et al., 2003, SOUZA FILHO et al., 2010).
O perfil terapêutico do cloridrato de venlafaxina sugere sua utilização no tratamento das desordens de depressão severa maior, depressão atípica, depressão remissiva e resistente a outro tratamento. O seu papel como fármaco de escolha nestes casos é demonstrado em numerosos estudos de meta análises (STAHL; ENTSUAH; RUDOLPH, 2002; GUTIERREZ; STIMMEL; AISO, 2003; PERAHIA et al., 2008; SCHMITT, et al., 2009; SILVA; HANWELLA, 2012). É também demonstrada a sua eficácia no tratamento das desordens de transtorno de ansiedade generalizada (BANDELOW et al., 2002; SRAMEK; ZAROTSKY; CUTLER, 2002; GORMAN, 2003; GUTIERREZ; STIMMEL; AISO, 2003; BHOGAL; BALDWIN, 2007), bem como, no transtorno obsessivo compulsivo (TOC) (BANDELOW et al., 2002; DENYS et al., 2006; TORRESAN et al., 2008).
Após administração oral, o cloridrato de venlafaxina é rápido e extensivamente absorvido no trato gastro intestinal (92%) nas doses habituais (25-100 mg/dia) e seu tempo de meia vida é de aproximadamente 5 horas. O fármaco sofre biotransformação hepática pela isoforma [CYP]2D6 do citocromo P450, com a formação do principal metabólito ativo O-desmetilvenlafaxina, caracterizado por um tempo de meia vida de 11 horas (STAHL et al., 2005). Entretanto, devido ao extenso metabolismo de primeira passagem, somente 12,6% é disponível no sistema circulatório. A excreção renal é a principal via de

9
eliminação. Estima-se que aproximadamente 87% da dose administrada por via oral seja excretada na urina nas primeiras 48 horas, e desta, 5% correspondem ao fármaco não metabolizado, 26% ao metabólito ativo e 27% a outros metabólitos inativos (HOWELL et al.,1993; TROY et al., 1997a; TROY et al., 1997b; STAHL et al., 2005; AMSTERDAM et al., 2009).
Comercialmente, o cloridrato de venlafaxina é encontrado na forma de comprimidos e cápsulas de liberação imediata e comprimidos e cápsulas de liberação prolongada. Inicialmente, a terapia era realizada somente com comprimidos de liberação imediata, constituída de duas a três administrações diárias para manter uma adequada concentração plasmática do fármaco e garantir os efeitos farmacológicos (TROY et al., 1997a). Subsequentemente, foi desenvolvida uma formulação de liberação prolongada, permitindo assim, uma única administração diária. Nessa formulação o fármaco é encapsulado em microesferas e a liberação é controlada por difusão, fornecendo uma duração prolongada da absorção do fármaco e, dessa forma, mantendo os níveis séricos. As vantagens potenciais dessa formulação refletem sobre uma maior adesão e tolerabilidade do paciente, mantendo ou melhorando a eficácia terapêutica (CUNNINGHAM, 1997; STAHL et al., 2005; WRIGHT et al., 2009; SOUZA FILHO et al., 2010). 2. METODOLOGIAS ANALÍTICAS: DESENVOLVIMENTO E VALIDAÇÃO DE MÉTODOS DE QUANTIFICAÇÃO E ESTUDOS DE DISSOLUÇÃO
A qualidade e a segurança de um fármaco são geralmente asseguradas monitorando e controlando seu teor, suas impurezas e seus produtos de degradação com o emprego de técnicas analíticas adequadas (AHUJA, 1998; GOROG, 2000; RAO; NAGARAJU, 2003; SHABIR, 2003; ICH, 2005; BRETNALL; CLARKE, 2011). Para isso, é necessário garantir que os métodos utilizados gerem resultados confiáveis e reprodutíveis, visto que estes resultados poderão ser utilizados para aprovação e posterior liberação dos medicamentos para o mercado (SHABIR, 2003; BRETNALL; CLARKE, 2011).
A cromatografia líquida de alta eficiência (CLAE) é amplamente empregada para a determinação quantitativa de fármacos

10
em matérias-primas e formas farmacêuticas, na determinação de impurezas e produtos de degradação, em estudos de dissolução e estabilidade, além de ser utilizada nas análises em matrizes biológicas (CARDOSO; SCHAPOVAL, 1999; OLIVEIRA et al., 2007; ELSHANAWANE; MOSTAFA; ELGAWISH, 2008; MADHAVI et al., 2008; OLIVEIRA et al., 2010a; KUMINEK et al., 2011). É uma técnica bastante conhecida e dominada, possuindo características de resolução, precisão e exatidão significativas (ICH, 1996; ICH, 1999; SHABIR, 2003; RAO & NAGARAJU, 2003; ICH, 2005; USP 34, 2011).
Inicialmente, para fármacos que não possuem monografias em farmacopeias, é necessário que um método analítico quantitativo por CLAE seja desenvolvido levando em consideração as características do fármaco. Dessa forma, etapas como escolha da melhor condição analítica com avaliações de: composição da fase móvel, coluna cromatográfica, comprimento de onda ultravioleta de absorção máxima do fármaco deverão ser avaliados. Posteriormente, para garantir que o método analítico atenda às exigências de suas aplicações deve-se realizar o processo conhecido como validação (ICH, 1996; ICH, 1999; ICH, 2005; ALSANTE et al., 2007; HILLS et al., 2008; REIFSNYDER; McKNIGHT; KELLEY, 2011; ROZET et al., 2011).
Conforme a Resolução 899 da ANVISA, o ICH (2005) e a Farmacopeia Americana (2011), os estudos de validação devem avaliar parâmetros como precisão, exatidão, linearidade, intervalo, sensibilidade, especificidade, robustez e limites de quantificação e detecção, os quais devem ser adequados ao tipo de aplicação pretendida (BRASIL, 2003b; ICH, 2005; USP 34, 2011; REIFSNYDER; McKNIGHT; KELLEY, 2011). Entretanto, quanto à definição e execução dos parâmetros analíticos de validação as agências regulamentadoras acima citadas reconhecem que não há necessidade avaliar todos os parâmetros (ICH, 2005; USP 34, 2011; REIFSNYDER; McKNIGHT; KELLEY, 2011). Sendo assim, fica sob a responsabilidade do analista definir quais os parâmetros que serão conferidos, visto que o tipo de método e o seu propósito é que irão determinar o desenvolvimento do processo (SWARTZ et al., 1998; ERMER, 2001; HILLS et al., 2008; ROZET et al., 2011).
Além disso, de acordo com as Boas Práticas de Fabricação, todos os medicamentos devem ser testados com um método analítico indicativo de estabilidade que forneça evidências sobre como a qualidade de uma substância ou medicamento varia com o tempo sob a influência de diferentes fatores ambientais, tais como: temperatura,

11
umidade e luz, permitindo assim, recomendações de condições de armazenamento, períodos de retestes e prazos de validade (BAKSHI; SINGH, 2002; BRASIL, 2003b; ICH, 2005; ALSANTE et al., 2007; RAO; RADHAKRISHNANAND, 2008; MADHAVI et al., 2008; ELSHANAWANE; MOSTAFA; ELGAWISH, 2008; HILLS et al., 2008; REIFSNYDER; McKNIGHT; KELLEY, 2011).
Estudos de degradação estresse do fármaco, incluindo hidrólise, oxidação, fotólise e estresse térmico, devem ser realizados durante a validação para garantir que o método permita quantificar, com precisão, os ingredientes ativos sem interferência de produtos de degradação, impurezas do processo, excipientes, ou outras impurezas potenciais (BRASIL, 2003b; ICH, 2006; RAO; RADHAKRISHNANAND, 2008; MADHAVI et al., 2008; HILLS et al., 2008; REIFSNYDER; McKNIGHT; KELLEY, 2011, ROZET et al., 2011).
2.1. ESTUDOS DE DISSOLUÇÃO Os estudos de dissolução in vitro constituem-se em um dos
instrumentos essenciais para avaliação das propriedades biofarmacêuticas das formas farmacêuticas sólidas de uso oral, fornecendo informações úteis tanto para a pesquisa e desenvolvimento, como para a produção e controle de qualidade (JORGENSEN; BHAGWAT, 1998; MANADAS et al., 2002; AZARMI; ROAC; LOBENBERG, 2007; ROSSI et al., 2011).
A dissolução é definida como o processo pelo qual um fármaco é liberado de sua forma farmacêutica, tornando-se disponível para ser absorvido pelo organismo (CHOWDARY; RAJYALAKSHMI, 1987; MARCOLONGO, 2003, SIEWERT et al., 2003; ROSSI et al., 2011). Para se ter conhecimento de como está acontecendo o processo de dissolução realiza-se a avaliação do perfil de dissolução. Neste procedimento determina-se a quantidade de fármaco que se dissolve em intervalos de tempos diferentes. O perfil de dissolução fornece, deste modo, informações sobre a velocidade de dissolução, a quantidade máxima dissolvida e, ainda, em que ponto mudanças significativas de dissolução podem estar ocorrendo (FERRAZ; CONSIGLIERI; STORPIRTIS, 1998; FORTUNATO, 2005; COLLIER et al., 2011; KUMINEK et al., 2012). Métodos cromatográficos têm sido amplamente utilizados como ferramentas para a quantificação dos fármacos em testes de dissolução, pois são suficientemente sensíveis para determinar com exatidão e precisão a quantidade de substância ativa na amostra, além de demonstrarem rapidez no tempo de análise,

12
versatilidade e facilidade de automação (BREIER et al., 2005; MENEGOLA; STEPPE; SCHAPOVAL, 2007; ROSSI et al., 2011; COLLIER et al., 2011; KUMINEK et al., 2012).
2.2. MÉTODOS PARA A QUANTIFICAÇÃO DO
CLORIDRATO DE VENLAFAXINA Na literatura científica foram encontrados métodos para a
determinação do cloridrato de venlafaxina e seus metabólitos em fluidos biológicos. A maioria destes trabalhos utiliza a CLAE com detecção na região do ultravioleta (MATOGA et al., 2001), detecção fluorimétrica (LUAN VU et al., 1997) ou acoplada à espectrometria de massas, após extração em fase sólida (JUAN; ZHILING; HUANDE, 2005; BHATT et al., 2005) ou extração líquido-líquido (WEN et al., 2007a).
Asafu-Adjaye e colaboradores (2007) demonstraram a estabilidade gástrica e intestinal in vitro do cloridrato de venlafaxina, através de metodologia por CLAE utilizando detecção no UV, coluna C18, com fase móvel constituída de acetonitrila e tampão fosfato de potássio pH 6,5 (30:70, v/v) (ASAFU-ADJAYE et al., 2007). Makhija e Vavia (2002) desenvolveram método indicativo de estabilidade do fármaco para quantificação do cloridrato de venlafaxina em formulações farmacêuticas por CLAE com detecção no UV utilizando coluna C8 e fase móvel composta por acetonitrila e fosfato de sódio pH 6,8 (75:25, v/v) (MAKHIJA; VAVIA, 2002). Rao e Raju (2006) utilizaram CLAE com detector DAD para avaliação de venlafaxina em presença de impurezas de síntese e produtos de degradação (RAO; RAJU, 2006). Para determinação de cloridrato de venlafaxina em suas formas farmacêuticas encontra-se apenas um método por voltametria, descrito por LIMA e colaboradores (LIMA et al., 1999).
Outras técnicas cromatográficas têm sido propostas para análise do cloridrato de venlafaxina em matéria-prima e formulações. Shirvi e colaboradores (2010) e Ramesh e colaboradores (2011) desenvolveram e validaram métodos de quantificação do cloridrato de venlafaxina por cromatografia em camada delgada de alta eficiência (CCDAE), com vantagens de diminuir a quantidade de solventes empregados e quantificar concentrações menores de fármaco quando comparados à CLAE (SHIRVI et al., 2010; RAMESH et al., 2011). Enquanto Chhalotiya; Patel e Bhatt (2011) desenvolveram e validaram um método de quantificação do cloridrato de venlafaxina em comprimidos por cromatografia líquida de ultra eficiência (CLUE) com menor tempo de

13
retenção para o fármaco, diminuindo assim, o tempo de análise (CHHALOTIYA; PATEL; BHATT, 2011).
Em levantamento recente realizado na literatura foi encontrada monografia para cápsulas de liberação modificada na Farmacopeia Americana (USP 35, 2012) utilizando uma coluna C18 e como fase móvel acetonitrila, trietilamina, água (250:4:750 v:v:v, respectivamente) ajustado em pH 3.5 com ácido fosfórico.
Entretanto, nenhum método indicativo de estabilidade, que contemplasse todas as condições de estabilidade preconizadas pelos compêndios oficiais, para quantificação do cloridrato de venlafaxina em cápsulas e que também pudesse ser empregado em estudos de dissolução do fármaco para liberação prolongada foram relatados. 3. CARACTERIZAÇÃO E ESTUDOS DE COMPATIBILIDADE 3.1. CARACTERIZAÇÃO DE FÁRMACOS NO ESTADO SÓLIDO
O estado sólido é caracterizado por possuir uma estrutura tridimensional definida, com volume definido. Os sólidos podem ser distinguidos em cristais e amorfos, dependendo se possuem ou não uma estrutura regular no arranjo das partículas que os compõem (BRITTAIN, 1995; BYRN; PFEIFFER; STOWELL, 1999; VIPPAGUNTA; BRITTAIN; GRANT, 2001; STORPIRTIS et al., 2009). Nos sólidos amorfos, as moléculas estão dispostas mais ou menos ao acaso, enquanto que nos sólidos cristalinos, além da ordem posicional, a estrutura é determinada pela orientação das unidades constituintes, umas relativamente às outras. Como consequência, o cristal tem uma estrutura caracterizada por uma repetição regular dos componentes, apresentando propriedades de sistemas homogêneos, simétricos e anisotrópicos (BYRN; PFEIFFER; STOWELL, 1999; VIPPAGUNTA; BRITTAIN; GRANT, 2001; GYRON; MUTZ; GARNIER, 2004; STORPIRTIS et al., 2009).
As diferenças do estado sólido podem afetar as propriedades químicas e físicas, como: densidades e fluxo dos pós, características coesivas, compressibilidade, uniformidade de distribuição de doses, reologia, estabilidade, perfil de dissolução, biodisponibilidade entre outras (BYRN; PFEIFFER; STOWELL, 1999; VIPPAGUNTA;

14
BRITTAIN; GRANT, 2001; GYRON; MUTZ; GARNIER, 2004). Não é incomum observar mudanças de estado sólido devido às condições extremas utilizadas em operações de manufatura, tais como estresse mecânico e térmico ou exposição a solventes. Como resultado, o desempenho do fármaco pode ser significativamente alterado ou não satisfazer as especificações de qualidade. As variações nas propriedades físico-químicas do fármaco podem também ter impacto nas propriedades terapêuticas, de fabricação e comercial (BYRN et al., 1995; TOMSSETTI et al., 2005; PALACIO et al., 2007; CHIENG; RADES; AALTONEN, 2011).
A caracterização de propriedades do estado sólido de um fármaco utilizando técnicas analíticas apropriadas é, desta forma, um pré-requisito essencial para o desenvolvimento de formas farmacêuticas sólidas (BYRN et al., 1995; GANDHI et al., 2002; CHIENG; RADES; AALTONEN, 2011).
Nesse sentido, agências regulamentadoras, como FDA e ANVISA (Agência Nacional de Vigilância Sanitária), têm estabelecido requisitos regulamentares específicos para avaliar as características no estado sólido dos fármacos (BRASIL, 2003b; CHAWLA; BANSAL, 2004).
Diferentes técnicas analíticas têm sido empregadas a fim de obter uma caracterização completa dos fármacos no estado sólido (BRITTAIN et al., 1991; BRITTAIN, 1995; RAW; YU, 2004; CHAWLA; BANSAL, 2004; CHIENG; RADES; AALTONEN, 2011), e incluem: Difração de Raios-X, Análise Térmica, Técnicas espectroscópicas e microscópicas.
A Difração de raios-X (DRX) é baseada na lei de Bragg, em que o padrão de difração apresenta uma série de reflexões, as quais são identificadas no difratograma pelo ângulo (2θ) ou pela distância interplanar (d) contra a sua intensidade. Este padrão está relacionado com a composição química e com o ordenamento cristalino das moléculas no cristal (BRITTAN, 1995; JENKINS; SNYDER, 1996; BRITTAIN, 1999; PHADNIS; CAVATUR; SURYANARAYANAN, 1997; CUFFINI et al., 2007; SYKULA-ZAJA et al., 2011).
Os padrões de difração de raios-X de pó e/ou monocristal de uma substância permitem identificá-la, bem como fornecem informações sobre sua estrutura espacial, grau de cristalinidade e polimorfismo (STEPHENSON; FORBES; REUTZEL-EDENS, 2001; NEWMAN; BYRN, 2003; RODRÍGUEZ-SPONG et al., 2004; SHAH; KAKUMANU; BANSAL, 2006; AALTONEN, 2009).

15
Através da difração de raios-X de monocristal (DRXM), uma amostra cristalina de onde se retira um monocristal é utilizada para que parâmetros que permitam determinar a estrutura cristalina sejam avaliados. Já na difração de raios-X de pó (DRXP) uma pequena quantidade de fármaco é suficiente para que a análise seja realizada, além de estar ao alcance da rotina industrial (BRITTAIN, 1999; CUFFINI et al., 2007; SYKULA-ZAJA et al., 2011).
A análise térmica inclui técnicas como a calorimetria exploratória diferencial (DSC) e a termogravimetria (TG), onde as propriedades físicas de uma substância e/ou os seus produtos de reação são medidos em função de um programa de temperatura controlada e são amplamente utilizadas na rotina farmacêutica (GIRON, 1998; GIRON, 2002; TOMASSETTI et al., 2005; LÓPEZ et al., 2008; OLIVEIRA et al., 2010b; CHIENG; RADES; AALTONEN, 2011)
Existem diferentes possíveis aplicações da análise térmica na indústria farmacêutica como, por exemplo: na caracterização de ingredientes ativos e inativos, em análise de rotina do controle de qualidade e estudo de estabilidade (GIRON, 2002; GOMBAS et al., 2002; TOMASSETTI et al., 2005; OLIVEIRA et al., 2010b; CHIENG; RADES; AALTONEN, 2011). Através do DSC e TG é possível inferir sobre as características térmicas da amostra, assim como sobre a estabilidade, a faixa de fusão e pureza pela respectiva entalpia de fusão. Parâmetros cinéticos (energia de ativação, o fator de frequência e da ordem de reação) também podem ser medidos de acordo com o progresso de reações (CIDES et al., 2006; TITA et al., 2008; LÓPEZ et al., 2008; FELIX et al., 2009).
Técnicas espectroscópicas como a espectroscopia de infravermelho (IV), Raman e ressonância magnética nuclear (RMN), têm sido utilizadas para identificar substâncias. As técnicas espectroscópicas vibracionais (IV e Raman) conseguem identificar o composto através das bandas de vibrações moleculares características de grupamentos químicos (ELIZAROVA; SHTYLEVA; PLETENEVA, 2008; CHIENG; RADES; AALTONEN, 2011). Já a RMN permite determinar o aspecto estrutural dos compostos (BUGAY, 2001; OFFERDAHL, 2004; BERENDT et al., 2006).
Microscopias óptica (com e sem luz polarizada) e eletrônica de varredura (MEV) são utilizadas para determinação de tamanho e morfologia das partículas. O estudo dos materiais sólidos é possível porque um feixe de luz pode ser transmitido ou refletido quando ele é

16
incidido sobre uma amostra (RASENACK; MULLER, 2002; PRICE; YOUNG, 2004).
3.2. ESTUDOS DE COMPATIBILIDADE
FÁRMACO:EXCIPIENTE Uma formulação bem sucedida, estável e eficaz, depende
também da seleção cuidadosa dos excipientes (GOMBAS et al., 2002; MEDEIROS et al., 2007; SANTOS et al., 2008; OLIVEIRA et al., 2009). Os excipientes são muitas vezes considerados inertes, podem apresentar incompatibilidades e/ou interações sólido-sólido com o fármaco. O uso inadequado de excipientes farmacêuticos nas formas farmacêuticas sólidas orais podem causar graves implicações biofarmacêuticas como modificação do mecanismo de liberação e características de absorção do fármaco (MERCURI et al., 2001; MURA, GRATTERI; FAUCCI, 2002; TOMASSETTI et al., 2005; KOVALESKI et al., 2007; AHUJA, 2007).
A avaliação da compatibilidade do fármaco com excipiente é necessária a fim de selecionar os excipientes adequados, com o intuito de prevenir incompatibilidades ou para conhecer alguma interação física e/ou química entre os componentes, o que poderia resultar na perda da estabilidade do fármaco com consequentes alterações na biodisponibilidade (MERCURI et al., 2001; VERMA e GARG, 2005; TOMASSETTI et al., 2005; OLIVEIRA et al., 2009; OLIVEIRA et al., 2010b).
Os estudos de compatibilidade são normalmente realizados utilizando misturas físicas do fármaco com diferentes excipientes, que possivelmente farão parte da formulação na proporção de 1:1 (massa/massa), no intuito de maximizar a probabilidade de observar alguma interação, as quais são avaliadas através de técnicas como de DSC, TG, DRX, IV, MEV (MURA; GRATTERI; FAUCCI, 2002; VERMA; GARG, 2004; TOMASSETTI et al., 2005; CIDES et al., 2006; TITA et al., 2008; OLIVEIRA et al., 2009; OLIVEIRA et al., 2010b; CHIENG; RADES; AALTONEN, 2011).
Utilizando a análise térmica, DSC e TG, é possível, através de observações referentes ao aparecimento, mudança ou desaparecimento de eventos endotérmicos ou exotérmicos característicos em misturas binárias homogêneas fármaco:excipiente (1:1, m/m) sugerir a interação entre os compostos e uma possível incompatibilidade, sendo uma importante ferramenta para o estudo de pré-formulação de

17
medicamentos. No entanto, a interpretação dos dados térmicos nem sempre é fácil. Deve-se enfatizar que as interações observadas a temperaturas elevadas podem não ser relevante em condições ambientais (BUCKTON; RUSSEL; BEEZER, 1991; GIRON, 2002; LIZARRAGA; ZABALETA; PALOP, 2007; TITA et al., 2008).
O aparecimento de novas bandas de absorção, o alargamento ou alterações na intensidade nas bandas de IV é a principal característica para evidenciar interações entre o fármaco e excipiente (STEPHENSON; FORBES; REUTZEL-EDENS, 2001; ZIMMERMANN; BARANOVIC, 2011). Métodos de avaliação microscópica como o MEV possibilitam a avaliação da homogeneidade das amostras e determinação do tamanho e forma das partículas. 4. POLIMORFISMO EM FÁRMACOS
Polimorfismo pode ser definido como a possibilidade de uma substância existir em duas ou mais formas cristalinas, com diferentes arranjos e conformações de moléculas no estado sólido. Os polimorfos apresentam retículos cristalinos diferentes e, consequentemente, sua energia pode ser suficientemente diferente para influenciar sua estabilidade ou propriedades biológicas (BRITTAIN, 1999; BERNSTEIN, 2002; ATTWOOD, 2003; FLORENCE; GIRON; MUTZ; GARNIER, 2004; GAVEZZOTTI, 2007; BOND, 2009; SYKULA-ZAJA et al., 2011).
Polimorfos são relativamente comuns em sólidos farmacêuticos, uma vez que muitos fármacos podem cristalizar em diferentes formas cristalinas. Assim, o controle da forma do cristal é muito importante durante os vários estágios de desenvolvimento dos novos fármacos, pois como resultado do polimorfismo eles podem exibir propriedades físico-químicas diferentes, como: densidade, ponto de fusão, solubilidade, estabilidade, velocidade de dissolução, as quais podem afetar sua biodisponibilidade, efetividade terapêutica (BRITTAIN, 1999; GRANT, 1999; BERNSTEIN, 2002; GIRON, 2003; RAW et al., 2004; BYRN et al., 2005; ROY; NANGIA, 2005; GAVEZZOTTI, 2007; PUROHIT; VENUGOPALAN, 2009; BOND, 2009).
Os sólidos cristalinos são formados pela repetição periódica e ordenada dos seus átomos ou moléculas nas três dimensões de uma

18
unidade estrutural tridimensional, chamada de cela cristalina, e suas propriedades físico-químicas dependem dos arranjos dos átomos (BYRN; PFEIFFER; STOWELL, 1999; MULLIN, 2000; MORISSETTE et al., 2004; GAVEZZOTTI, 2007; STORPIRTIS et al., 2009). No estado sólido as moléculas podem existir em um dos sete arranjos cristalinos fundamentais, os quais estão definidos pela relação entre as dimensões individuais de a, b, c e entre os ângulos individuais α, β, γ da cela unitária: triclínico, monoclínico, ortorrômbico, romboédrico, tetragonal, hexagonal ou cúbico (Figura 2) (VLACK, 1970; CULLITY, 1978; BRITTAIN, 1999).
Figura 2 – Sete sistemas cristalinos fundamentais dos sólidos
(Adaptado de FLORENCE; ATTWOOD, 2011).
Um sólido, tendo a mesma estrutura interna, pode ter diferentes morfologias que definem o hábito cristalino. O aspecto diferente macroscópico do hábito cristalino (em forma de agulha, túbulos, placas, etc), bem como o arranjo cristalino, é determinado pelas condições diferentes de crescimento do cristal, que são afetadas pelo solvente utilizado na cristalização, pela temperatura, pressão, concentração, presença de impurezas, taxa de agitação e de arrefecimento (MULLIN, 2000).
A cristalização desempenha um papel crítico no controle da forma cristalina e na distribuição de tamanho. A fase cristalina é criada como consequência de processos de agregação molecular em solução que levam à formação de núcleos, a fim de permitir o desenvolvimento de cristais macroscópicos durante a fase de crescimento. Os fatores que

19
afetam os mecanismos através dos quais os cristais são formados são: solubilidade, modificações do solvente de cristalização, sobressaturação, difusividade, temperatura, a reatividade de superfícies para a nucleação e fatores externos, como ultrassom (VIPPAGUNTA; BRITTAIN; GRANT, 2001; NOWEEA et al., 2007).
Evaporação de solvente, resfriamento lento, difusão de solventes, sublimação, são alguns exemplos das muitas técnicas que têm sido empregadas para a realização da cristalização de fármacos no sentido de controlar o crescimento do cristal, determinar a estrutura cristalina e ainda encontrar novos polimorfos (Tabela 1) (VIPPAGUNTA; BRITTAIN; GRANT, 2001; CUNHA, 2008).
Tabela 1 – Técnicas de cristalização, particularidades e fatores que
influenciam a forma e o tamanho do cristal.
Técnicas de Cristalização Particularidades
Fatores que influenciam a forma e o tamanho do
cristal
Evaporação de Solvente
Uma solução próxima à saturação é preparada com diferentes solventes
voláteis e as soluções são deixadas para evaporar
Volatilidade do solvente Concentração inicial Taxa de evaporação Temperatura Pressão Umidade relativa ambiente
Resfriamento Lento
Utilizado para compostos menos solúveis em que o ponto de ebulição do solvente está no intervalo 30 - 90 °C. Prepara-se
uma solução saturada em que o solvente é aquecido até próximo ao ponto de
ebulição.
Solvente Perfil de Resfriamento Concentração Mistura
Difusão de Solventes
Aplicados para amostras sensíveis ao ar. Usam-se dois solventes de densidade diferentes. Os cristais se formam na
interface dos solventes que se difundem lentamente.
Solventes Grau de difusão
Difusão de Vapor
Uma solução preparada em um tubo de ensaio pequeno é colocada em um tubo maior, contendo um segundo solvente menos eficiente e este tubo é selado. O
método funciona melhor se a solução de solvente é menos volátil e, assim, há
predominantemente a difusão do segundo solvente para dentro da solução de
amostra.
Solvente Temperatura Concentração
Sublimação a Vácuo
Uma quantidade pequena de amostra é selada sob vácuo em um tubo submetido a
gradiente de temperatura em diferentes maneiras. Técnica ideal para compostos
muitos sensíveis ao ar.
Gradiente de Temperatura Pressão Tipo de Superfície

20
O fato de cada polimorfo ter uma estrutura cristalina própria e distinta dos outros, faz com que cada um tenha uma energia potencial diferente e, consequentemente, uma estabilidade relativa diferente. Dependendo da energia, os polimorfos podem sofrer alterações e se transformar em outro polimorfo, fazendo com que um metaestável (com uma energia maior) se transforme em outro mais estável (com energia menor). Essa transição sólido-sólido pode ser estudada e explicada através da relação termodinâmica dos mesmos (BRITTAIN, 1999; KAWAKAMI, 2007; HERMAN et al., 2011; KHAMAR et al., 2012).
Entender as diferenças dos polimorfos e suas estabilidades relativas é, portanto, essencial na seleção de uma forma polimórfica especial com características desejáveis para a manipulação de produtos farmacêuticos, bem como na definição da condição de armazenamento mais apropriada para o medicamento (GIRON; MUTZ; GARNIER, 2004; ROY et al., 2007; KAWAKAMI, 2007; HERMAN et al., 2011; KHAMAR et al., 2012).
A estabilidade relativa de dois polimorfos pode ser descrita embasando-se em duas classes de relações que interligam os dois polimorfos: relação enantiotrópica e monotrópica (Figura 3). Dois polimorfos ditos enantiotrópicos são capazes de se interconverterem em uma dada temperatura através de uma transição de fase sólido-sólido, enquanto que na relação monotrópica essa interconversão polimórfica não é possível antes da temperatura de fusão (THRELFALL, 1995; BRITTAIN, 1999; VIPPAGUNTA; BRITTAIN; GRANT, 1999; BERNSTEIN, 2002; BARBAS; PROHENS; PUIGJANER, 2007; KAWAKAMI, 2007; CHIENG; RADES; AALTONEN, 2011, HERMAN et al., 2011; KHAMAR et al., 2012).

21
Figura 3 – Diagrama de energia em função da temperatura de um
sistema de dois polimorfos: A) Relação enantiotrópica e; B) Relação monotrópica. Onde HI e HII = a entalpia; GI e GII = a energia livre de Gibbs; mpI e mpII = o ponto de fusão das Formas I e II, respectivamente e; Tt I/II é a temperatura de transição (Adaptado de BRITTAIN, 1999).
Para polimorfos enantiotrópicos a temperatura de transição é de grande importância, uma vez que define a temperatura na qual a relação da estabilidade entre as duas formas polimórficas torna-se invertida e, dessa forma, problemas polimórficos em formulação e armazenamento podem ser evitados (GRANT et al., 1984; THRELFALL, 1995; BRITTAIN, 1999; KAWAKAMI, 2007; PRANZO et al., 2010; HERMAN et al., 2011; KHAMAR et al., 2012). Para determinar experimentalmente ou estimar a temperatura de transição, vários métodos encontram-se disponíveis. O método mais comumente utilizado é o gráfico de Van't Hoff, o qual é possível ser desenhado a partir de medidas de solubilidades em diferentes temperaturas para cada um dos polimorfos (BRITTAIN, 1999, PRANZO et al., 2010).

22
A solubilidade de uma substância é definida como a quantidade máxima de soluto que pode dissolver-se em certa quantidade de solvente em uma determinada temperatura, e é altamente dependente da temperatura. A medida de solubilidade em função da temperatura é comumente usada para a caracterização de fármacos (BRITTAIN, 1999; ATTWOOD; FLORENCE, 2003). Para que um sólido se solubilize as forças de atração entre as moléculas de soluto e as do solvente devem ultrapassar as forças de atração que ligam o sólido. Em outras palavras, para que o processo ocorra espontaneamente, a energia livre de solvatação emitida deve superar a soma da energia livre do retículo sólido mais a energia livre de formação de cavidades no solvente. O equilíbrio das forças atrativas e repulsivas determina a solubilidade de equilíbrio do sólido em questão (BRITTAIN, 1999; ATTWOOD; FLORENCE, 2003; NICOLI et al., 2008; PRANZO et al., 2010).
A curva de solubilidade dos cristais em função da temperatura, no caso de uma mistura ideal soluto-solvente, assumindo que a entalpia de fusão do sólido puro seja independente da temperatura, é determinada pela equação de Van't Hoff e uma relação linear pode ser dada pelo gráfico de Van't Hoff (GRANT et al., 1984; BRITTAIN, 1999; ATTWOOD; FLORENCE, 2003; NICOLI et al., 2008; PRANZO et al., 2010). No gráfico de Van’t Hoff (Figura 4) o valor de solubilidade logarítmica de cada forma polimórfica em diferentes temperaturas é traçado contra o recíproco da temperatura absoluta. A temperatura de transição é a temperatura na qual as duas formas têm a mesma solubilidade (GRANT et al., 1984; KAWAKAMI, 2007; ROY et al., 2007; PRANZO et al., 2010).

23
Figura 4 – A) Curva de solubilidade (mg mL-1) em função da
temperatura de dois polimorfos obtidos no intervalo de temperatura entre 25-100 °C; B) Gráfico de Van't Hoff do polimorfo 1 (quadrados) e de polimorfo 2 (círculos) (PRANZO et al., 2010).
A estabilidade relativa de várias formas polimórficas e da
possibilidade de interconversão entre elas pode ter graves consequências no prazo de validade do produto e manutenção das propriedades desejadas (KAWAKAMI, 2007; PRANZO et al., 2010; HERMAN et al., 2011; KHAMAR et al., 2012).
Diante do potencial do polimorfismo em afetar significativamente as propriedades físicas de um composto, agências regulamentadoras, como ANVISA e FDA, passaram a exigir, para aprovação de um novo medicamento, a aplicação de procedimentos analíticos adequados para detectar o tipo de cristal que está sendo utilizado nos produtos farmacêuticos (BYRN et al., 1995; VIPPAGUNTA; BRITTAIN; GRANT, 2001; GIRON, 2003; RAW et al., 2004; CHIENG; RADES; AALTONEN, 2011). O monitoramento

24
permite verificar se as diferenças entre os polimorfos podem alterar e modificar a biodisponibilidade do fármaco e, portanto, modificar a equivalência terapêutica ou outras propriedades que induzem a alterações na dose ou formulação. Assim, é importante caracterizar o estado sólido das substâncias da melhor forma possível. Isto implica na utilização de uma série de técnicas de forma adequada e integrada (VIPPAGUNTA; BRITTAIN; GRANT, 2001; GIRON, 2003; CHIENG; RADES; AALTONEN, 2011).
4.1. TÉCNICAS ANALÍTICAS EMPREGADAS NA
IDENTIFICAÇÃO E CARACTERIZAÇÃO DOS POLIMORFOS Técnicas para determinação da estrutura cristalina –
Através de difração de raios-X (DRX) de monocristal e de pó, com fontes convencionais ou radiação síncrotron (BRITTAN, 1995; JENKINS; SNYDER, 1996; PHADNIS; CAVATUR; SURYANARAYANAN, 1997; CUFFINI et al., 2007; SYKULA-ZAJA et al., 2011). A difração de raios X em pó é a técnica "padrão" para diferenciar polimorfos. Cada forma de cristal produz um padrão de difração, que pode ser usado como uma impressão digital para aquela forma e, portanto, importante para a diferenciação dos polimorfos durante o descobrimento de um novo fármaco, desenvolvimento da formulação, e na produção do medicamento (BYRN; PFEIFFER; STOWELL, 1999, VIPPAGUNTA; BRITTAIN; GRANT, 2001; CUFFINI et al., 2007; SYKULA-ZAJA et al., 2011). Além disso, a técnica de DRX tem sido empregada para a quantificação de formas polimórfica em misturas, utilizando programas de refinamento de estruturas como TOPAS, GSAS que utilizam o método de Rietveld (TIWARI; CHAWLA; BANSAL, 2007; ANTONIO et al., 2011).
Técnicas termoanalíticas – As mais utilizadas no estudo de polimorfismo são a calorimetria exploratória diferencial (DSC) e a termogravimetria (TG), através das quais é possível inferir sobre as características térmicas da amostra (GIRON, 1995; GIRON, 2002; GOMBAS et al., 2002; ROY et al., 2005; ROY et al., 2007; OLIVEIRA et al., 2010b).
Técnicas espectroscópicas – Espectroscopia de infravermelho (IV), Raman e ressonância magnética nuclear do estado sólido (ssRMN). Elas são utilizadas para identificar uma substância através das bandas de vibração molecular características de grupamentos químicos , e determinar o aspecto estrutural dos compostos (BUGAY, 2001;

25
TISHMACK; BUGAY; BYRN, 2003; FINI et al., 2008; ZIMMERMANN; BARANOVIC, 2011).
Técnicas para caracterização morfológica – Microscopias óptica (com e sem luz polarizada) e eletrônica de varredura (MEV). Ferramentas importantes para a caracterização dos polimorfos no âmbito de verificar o hábito cristalino e tamanho da partícula (GOODHEW; HUMPHREYS; BEANLAND, 2000; PRICE; YOUNG, 2004).
Técnicas para avaliação de desempenho – Dissolução intrínseca. A dissolução intrínseca é uma técnica que tem sido muito empregada nos estudos de caracterização de fármacos sólidos. Ela é definida como a velocidade de dissolução da substância pura em forma de pastilhas, em que a área superficial é constante (YU et al., 2004). Permite avaliar a velocidade de transferência de massa por área de superfície dissolvente (mg cm-2 min-1), e mede as propriedades intrínsecas do fármaco em função do meio de dissolução (AULTON, 2005). Para um mesmo fármaco com formas cristalinas diferentes, a velocidade de dissolução intrínseca em condições sink é proporcional à sua solubilidade (BYRN et al., 1999, TSINMAN et al., 2009; USP 34, 2011).
4.2. POLIMORFISMO DO CLORIDRATO DE
VENLAFAXINA Existem relatos que o cloridrato de venlafaxina pode sofrer
modificações no seu estado cristalino durante o processo de síntese, formando polimorfos com hábitos cristalinos diferentes. Desde 2000, através de técnicas de recristalizações, polimorfos do cloridrato de venlafaxina com diferentes morfologias foram descobertos e relatados (VEJA; FERNANDÉZ; ECHEVERRÍA, 2000; SIVALAKSHMIDEVI et al., 2002; RAO et al., 2002; ROY et al., 2005; ROY et al., 2007).
Dois monocristais do cloridrato de venlafaxina foram obtidos e tiveram suas estruturas elucidadas e depositadas no “Cambridge Crystallographic Database” (CCD) (Tabela 2): Forma 1: WOBMUV. CCDC 150349 e Forma 2: WOBMUV01. CCDC 198947 (VEJA; FERNANDÉZ; ECHEVERRÍA, 2000; SIVALAKSHMIDEVI et al., 2002).
Em 2000, Vega, Fernandez e Echeverría, através de recristalização por evaporação lenta a partir de uma solução em água, chegaram a um monocristal do cloridrato de venlafaxina na forma de blocos/placas. Este polimorfo foi chamado de Forma 1, a estrutura do

26
cristal foi elucidada e relatada como: estrutura ortorrômbica com grupo espacial Pca21.
Já em 2002, Sivalakshmidevi e colaboradores encontraram uma nova forma polimórfica com grupo espacial monoclínico P21/n, chamado de Forma 2. Os cristais foram obtidos a partir da evaporação de uma solução de cloridrato de venlafaxina em uma mistura de metanol e acetato de etila (1:8) (SIVALAKSHMIDEVI et al., 2002). Tabela 2 – Dados Cristalinos para os dois polimorfos relatados no Cambridge DataBase do cloridrato de venlafaxina.

27
Desde então, diferentes estudos contemplando o polimorfismo do cloridrato de venlafaxina têm sido realizados com o intuito de obter novos polimorfos e compreender o comportamento termoanalítico do fármaco.
Rao e colaboradores (2002) realizaram a caracterização da Forma 1 e da Forma 2 através da análise térmica, definindo a Forma 2 como a forma mais estável. A análise por DSC, levou à identificação da Forma 1 com ponto de fusão de 211 °C (Tonset em 208 °C) e da Forma 2 com fusão em 221 °C (Tonset em 216 °C). A mistura das duas formas apresentou dois eventos de fusão: o primeiro em 211 °C correspondente à de fusão da Forma 1, e o segundo em 219 °C, fusão da Forma 2.
Roy e colaboradores (2005) identificaram 5 formas polimórficas do cloridrato de venlafaxina obtidas por recristalizações da matéria-prima. Estes formas polimórficas foram caracterizadas por calorimetria diferencial exploratória (DSC), análise termogravimétrica (TG) e difratometria de raios-X em pó. Os pesquisadores classificaram as formas de acordo com o seu ponto de fusão. Em particular, eles identificaram a Forma 1 (ponto de fusão na faixa de 210 - 212 °C), Forma 2 (ponto de fusão em 208 - 210 °C); Forma 3, obtida a partir da fusão da Forma 1, com ponto de fusão em 202 - 204 °C, Forma 4 (uma forma hidratada), que funde em 219 - 220 °C e a Forma 5 obtido pela sublimação completa de Forma 2 fundindo em 216 – 218 °C. Através dos estudos os autores definiram a Forma 2 como a forma mais estável, uma vez que ela possui uma entropia de distribuição do grupo hidrofóbico mais compacto e mais elevado calculado a partir do espectro de Infravermelho. O mesmo grupo de pesquisa (Roy et al., 2007) isolou uma sexta forma estável (Forma 6) obtido por transição sólido-sólido das Formas 1 e 2 na temperatura de 180 - 190 °C. Nesta faixa de temperatura foi observada uma conversão completa dos cristais semelhantes a agulhas (a 25 °C) em cristais na forma de placas Eles concluíram que a Forma 6 mostrou ser o polimorfo termodinamicamente mais estável entre todas as formas isoladas e que possui uma relação enantiotrópica com as Formas 1 e 2.
Como descrito acima, ainda existem controvérsias no que diz respeito aos estudos do polimorfismo do cloridrato de venlafaxina, sendo assim, um estudo mais aprofundado do fármaco é justificado, de modo a elucidar e avaliar o comportamento dos polimorfos.

28
5. QUANTIFICAÇÃO DE FORMAS POLIMÓRFICAS
Sabendo-se que diferentes formas cristalinas podem conduzir a
diferenças significativas nas propriedades físicas e químicas dos fármacos, como: ponto de fusão, densidade, dureza, solubilidade, estabilidade, entre outras, que podem acarretar em uma taxa de dissolução distinta, comprometendo a biodisponibilidade dos fármacos (GRANT, 1999; HALEBLIAN; MCCROME, 1969), um Guia do ICH foi disponibilizado oferecendo orientação sobre quando e como as formas polimórficas devem ser monitoradas e controladas (ICH, 1999).
Tradicionalmente, a forma mais estável é favorecida em relação as outras formas no emprego em formulações medicamentosas, devido à sua menor tendência para as transformações em fase sólida. Portanto, é importante identificar a forma estável no estágio inicial de desenvolvimento de fármacos para evitar recuos posteriores (MILLER, et al., 2005; GU; YOUNG; GRANT, 2001; AALTONEN et al., 2009). No entanto, as formas metaestáveis são, por vezes, escolhidas deliberadamente, geralmente quando possuem uma melhor solubilidade e biodisponibilidade (SINGHAL; CURATOLO, 2004; ALLTONEN et al., 2009). Além disso, a forma polimórfica metaestável pode ser inadvertidamente gerada devido ao estresse produzido por tratamento térmico, mecânico e à umidade durante o processamento ou armazenamento do medicamento. Contaminação por essas misturas polimórficas pode influenciar negativamente tanto a estabilidade quanto o desempenho do produto final (ZANG et al., 2004; TIWARI; CHAWLA; BANSAL, 2007; AALTONEN et al., 2009). Assim, um acompanhamento adequado no estado sólido das formas polimórficas, tanto qualitativa quanto quantitativa, é fundamental para garantir produtos de alta qualidade (BUCKTON, 1999; VIPPAGUNTA; BRITTAIN; GRANT, 2001; GIRON; MUTZ; GARNIER, 2004; RAW et al., 2004).
Dessa forma, tornou-se imprescindível desenvolver métodos de quantificação precisos e exatos para tais impurezas físicas de baixo nível contemplado a separação de fase cristalina em produtos farmacêuticos (VIPPAGUNTA; BRITTAIN; GRANT, 2001; TIWARI; CHAWLA; BANSAL, 2007; ANTONIO et al., 2011). A análise quantitativa do estado sólido na indústria farmacêutica está em constante

29
desenvolvimento (STEPHENSON; FORBES; REUTZEL-EDENS, 2001). Há uma demanda crescente para garantir a qualidade e justificar a pureza polimórfica dos ingredientes ativos (RAW et al., 2004; FDA, 2007; NEMET; SAJÓ; DEMETER, 2010).
De acordo com os regulamentos do FDA o método de análise quantitativo para avaliar a proporção das formas polimórficas presentes em um dado fármaco deve ser validado através da avaliação de parâmetros como: linearidade, limites de detecção e quantificação, precisão, exatidão (FDA, 2007, ICH, 2005). Um dos principais desafios analíticos é o desenvolvimento de métodos de análise precisos, com limites de quantificação e de detecção baixos o suficiente para identificar e quantificar um polimorfo único em uma mistura de polimorfos. Por esta razão, métodos mais sensíveis estão sendo desenvolvidos (VIPPAGUNTA; BRITTAIN; GRANT, 2001; STEPHENSON; FORBES; REUTZEL-EDENS, 2001; TIWARI; CHAWLA; BANSAL, 2007; NEMET; SAJÓ; DEMETER, 2010; ANTONIO et al., 2011).
Multiplicidade de técnicas analíticas, tais como infravermelho (IR), Raman, espectroscopia de RMN no estado sólido (ssRMN), métodos térmicos (DSC e TG), e difração de raios-X de pó (DRXP), têm sido relatados no emprego da determinação do teor polimórfico em misturas ou de conteúdo amorfo em materiais cristalinos, para níveis tão baixos quanto 1% (AGATONOVIC-KUSTRIN et al., 1999; TIWARI; CHAWLA; BANSAL, 2007; NEMET; SAJÓ; DEMETER, 2010; ANTONIO et al., 2011). No entanto, algumas vantagens, como a unicidade do padrão de raios-X dos compostos, de natureza não destrutiva, simplicidade e medição à temperatura ambiente, fazem da difração de raios X de pó (DRXP) a técnica preferida e amplamente utilizada para a quantificação de misturas polimórficas (BARTOLOMEI; RAMUSINO; GHETI, 1997; VIPPAGUNTA; BRITTAIN; GRANT, 2001; TIWARI; CHAWLA; BANSAL, 2007; NEMET; SAJÓ; DEMETER, 2010; ANTONIO et al., 2011).
O difratograma de raios-X de cada forma cristalina de um dado composto é único. Se houver uma mistura de sólidos cristalinos, cada um destes componentes terá um padrão diferente, independentemente do outro componente de uma mistura, tornando possível a análise independente (BARTOLOMEI; RAMUSINO; GHETI, 1997; AGATONOVIC-KUSTRIN et al., 1999; ANTONIO et al., 2011).
Um dos fatores críticos para o desenvolvimento de método para avaliar as formas polimórficas é a geração da curva de calibração

30
autêntica e validada, a qual reproduz o material real que vai ser ensaiado no futuro (HILL; HOWARD, 1987; AGATONOVIC-KUSTRIN et al., 1999; TIWARI; CHAWLA; BANSAL, 2007).
A análise quantitativa dos polimorfos na mistura em pó, por DRXP, normalmente requeria que pelo menos um pico de alta intensidade para cada forma polimórfica fosse disponível para as medições de intensidade. Um gráfico da relação da intensidade de pico em função da proporção em peso dos componentes deveria resultar numa linha reta, o que necessitava de uma medição precisa da intensidade, altura e área dos picos de difração, fortemente influenciados pelos parâmetros do aparelho, da amostra, e a preparação das amostras (SURANARAYANAN, 1990; AGATONOVIC-KUSTRIN et al., 1999; VIPPAGUNTA; BRITTAIN; GRANT, 2001). Vários parâmetros de exemplo de preparação, como o tipo de suporte de amostras, a rotação da amostra, o tamanho das partículas, a embalagem do pó, e efeitos de orientação preferencial, têm demonstrado serem críticos nas análises quantitativas convencionais (HURST; SCHROEDER; STYRON, 1997; TIWARI; CHAWLA; BANSAL, 2007).
O método de Rietveld, que consiste no refinamento de parâmetros de um modelo estrutural, para fornecer um cálculo do padrão de difração de raios-X de pó semelhante ao observado, tem sido amplamente utilizado no refinamento da estrutura, quantificação de fases cristalinas ou amorfas, e outras aplicações (Figura 5) (TIWARI; CHAWLA; BANSAL, 2007; NEMET; SAJÓ; DEMETER, 2010; ANTONIO et al., 2011).

31
Figura 5 - Refinamento de Rietveld para um pico de difração. Observado (círculos), Calculado (linha) e Diferença (linha inferior). (McCUSKER et al., 1999).
Embora a técnica de Rietveld tenha sido inicialmente
desenvolvida para o refinamento da estrutura de cristal, revelou-se muito eficaz também em análise quantitativa de fase, pois o fator de escala Rietveld de uma fase refere-se a sua quantidade relativa em uma mistura multifásica. A melhoria do desempenho do método, em comparação com os métodos convencionais de pico individuais, deriva do fato de que o padrão de difração como um todo contribui para a análise, assim, o impacto da sobreposição de pico da amostra e efeitos relacionados (como orientação preferencial) é minimizado. Usando constantes físicas a partir de dados da estrutura dos cristais para o cálculo de intensidades reflexão eliminam-se os erros associados com as medidas de intensidade, procedimentos de calibração e preparo de amostras. A descrição detalhada dos métodos quantitativos Rietveld e de orientação prática para a sua utilização é, de um modo geral, encontrada na literatura (RIETVELD, 1969; YOUNG, 1993; McCUSKER et al., 1999; IYENGAR; PHADINS; SURYANARAYANAN, 2001; YAMAMURA; TAKAHIRA; MOMOSE, 2007; MADSEN; SCARLETT, 2008).
A quantificação pelo método de Rietveld tem como característica fundamental o ajuste de um difratograma a um padrão difratométrico conhecido, normalmente indexados em bancos de dados como o “Cambridge Crystallographic Database”, permitindo, assim, extrair informações da estrutura cristalina e informações analíticas dos materiais (RIETVELD, 1969; HILL; HOWARD, 1987; HILL, 1991; MADSEN; SCARLETT, 2008).
O modelo estrutural adaptado por Rietveld inclui vários tipos de parâmetros, entre os quais: parâmetros da estrutura cristalina, parâmetros do perfil das reflexões, parâmetros globais, parâmetros da intensidade, que permitem calcular, através de um algoritmo, um padrão difratométrico adequado à fase que se pretende estudar, o qual é comparado com o difratograma observado (Figura 6) (YOUNG, 1993). A diferença entre ambos é então minimizada fazendo variar os parâmetros no modelo estabelecido, utilizando um processo de minimização baseado no princípio dos mínimos quadrados. Desta forma, o método de Rietveld é um método iterativo e envolve uma série de parâmetros que são refinados a cada ciclo de iteração, até que se

32
atinja o máximo possível de convergência a partir do ajuste do padrão difratométrico de uma amostra experimental simples ou com várias fases (HILL; HOWARD, 1987; YOUNG, 1993; ALBINATI; WILLIS, 2006).
Figura 6 - Refinamento de Rietveld para matéria-prima do
cloridrato de venlafaxina. Observado (círculos), Calculado (linha) e diferença (linha inferior).
Há diversos programas computacionais comerciais para o refinamento pelo método de Rietveld, entre eles o FullProf (RODRIGUEZ-CARVAJAL, 1993), GSAS (LARSON; DREELE, 1994; TOBY, 2001), TOPAS (NGUYEN; TRAN; KOTOCOVA, 2002). A escolha do programa depende de diversos fatores, como o custo/benefício, o tipo de material que se quer analisar, a qualidade da interface com o usuário.
Neste trabalho, foi utilizado o programa computacional TOPAS, o qual se tornou o padrão em indústrias para a análise quantitativa de fases polimórficas, por conseguir determinar estruturas muito grandes e desordenadas (NGUYEN; TRAN; KOTOCOVA, 2002).

33

35

36
CAPÍTULO 2 –Metodologia

37
METODOLOGIA Para facilitar a visualização das diferentes etapas de execução do trabalho, a metodologia está apresentada na forma de fluxogramas, que se encontram apresentados na sequência. Fluxograma 1: Desenvolvimento e Validação de Metodologia Analítica

38
Fluxograma 2: Avaliação do perfil de dissolução e cinética de liberação do cloridrato de venlafaxina em cápsulas de liberação prolongada

39
Fluxograma 3: Caracterização do cloridrato de venlafaxina e estudos de compatibilidade fármaco:excipiente

40
Fluxograma 4: Estudos do estado sólido de diferentes matérias-primas do cloridrato de venlafaxina

41
Fluxograma 5: Estudo das relações termodinâmicas dos polimorfos do cloridrato de venlafaxina

42
Fluxograma 6: Desenvolvimento e validação de um método de quantificação por DRX empregando o refinamento de Rietveld.

43

44
CAPÍTULO 3 – Desenvolvimento e validação de metodologia analítica.
Journal of Chromatographic Science, v. 47, p. 770 – 776, 2009.

45
INTRODUÇÃO

46
A análise de fármacos é necessária nas diversas fases do desenvolvimento farmacêutico, como nos estudos de formulação e controle de qualidade da forma farmacêutica. Dessa forma, os métodos utilizados nestas etapas devem ser adequados ao fim proposto. Para assegurar a confiabilidade dos resultados e a credibilidade nos procedimentos aplicados no controle de qualidade de medicamentos, o desenvolvimento e a validação de metodologia analítica são essenciais (SHABIR, 2003; BRASIL, 2003; ICH, 2005; HILLS et al., 2008).
O cloridrato de venlafaxina encontra-se disponível comercialmente em diferentes formas farmacêuticas, entretanto, a forma de cápsulas de liberação prolongada é a preferida, por ser de uma única administração diária. No entanto, como previamente destacado, embora se encontre na literatura métodos de quantificação para o cloridrato de venlafaxina, nenhum método indicativo de estabilidade para quantificação do fármaco em cápsulas de liberação prolongada, e que também pudesse ser empregado em estudos de dissolução do fármaco nesta formulação, foi relatado, havendo assim, a necessidade de desenvolver e validar métodos para identificação, quantificação e avaliação da dissolução do fármaco.
O presente capítulo tem como objetivo demonstrar os resultados do desenvolvimento e validação de método analítico para quantificação de cloridrato de venlafaxina, bem como a aplicação do método para a avaliação de ensaios de perfil de dissolução em cápsulas de liberação prolongada.

47
Development and validation of a stability-indicating LC method for the determination of Venlafaxine in extended release capsules and
dissolution kinetic studies

48
Abstract A stability indicating reversed-phase high-performance liquid chromatography (HPLC) method is developed and validated for the determination of venlafaxine hydrochloride in extended release capsules containing spherical beads and for dissolution studies. The method is carried out on a Luna C18 column (250 x 4.6 mm), maintained at 35 ºC. The mobile phase is composed of ammonium acetate buffer 32 mM, adjusted to pH 6.8 with phosphoric acid:acetonitrile:methanol (62:30:8, v/v/v) run at a flow rate of 1.0 mL/min, and detection at 226 nm. Validation parameters such as the specificity, linearity, precision, accuracy, and robustness are evaluated, giving results within the acceptable range. In order to evaluate the best dissolution condition, the dissolution profiles are performed under different conditions, such as media (HCl, water, phosphate buffer), apparatus (I and II) and rotation speed (50, 75 and 100 rpm). The kinetics release mechanism is evaluated by fitting different models, such as the zero order rate, first order and Higuchi. Moreover, the proposed method is successfully applied for the assay of venlafaxine in extended release capsules. Keywords: Venlafaxine hydrochloride, liquid chromatography, method validation, dissolution Introduction
Venlafaxine hydrochloride (VEN) is a phenethylamine bicyclic derivative, chemically known as 1-[2-(dimethylamino)-1-(4-methoxy-phenyl)ethyl]cyclohexanol hydrochloride. It is a novel, non-tricyclic

49
antidepressant, and the mechanism of action in humans is believed to be associated with potential of neurotransmitter activity in the central nervous system. Preclinical studies have shown that VEN is a potent inhibitor of neuronal serotonin and norepinephrine reuptake and a weak inhibitor of dopamine reuptake (1–3).
VEN extended-release capsules, which contains spherical beads, are formulated for once-a-day oral administration. In this formulation, drug release is controlled by diffusion through the coating membrane on the beads and is not pH-dependent (4). Spherical beads are good-quality particulate solid dosage forms due to their technological characteristics, which include high flowability and large surface area (5). Beads are frequently used in controlled release systems because they offer flexibility for further modifications, such as coating. Moreover, they are freely dispersed in the gastrointestinal tract with low risk of side effects and dose dumping, and consequently, low inter- and intra-patient variability (6,7).
A stability-indicating method is defined as an analytical method that accurately quantitates the active ingredients without interference from degradation products, process impurities, excipients, or other potential impurities. These interfering compounds can be originated from various sources of the synthetic route and from the process employed in the manufacturing of pharmaceutical dosage forms. The presence of degradants and impurities in pharmaceutical formulations can result in changes in their chemical, pharmacological, and toxicological properties, which affect their efficacy and safety. Therefore, the adoption of stability-indicating methods is always required to control the quality of pharmaceuticals during and after their production (8–10).
The majority of VEN analytical methods documented in the scientific literature, such as capillary electrophoresis (11,12), high-performance liquid chromatography (HPLC) (13), and liquid chromatography tandem mass spectrometry (14–16), are bioanalytical in nature and utilized for VEN drug monitoring, metabolism, and pharmacokinetics studies. For determining VEN in bulk material and pharmaceutical formulations, two stability-indicating methods using HPLC have been described (17,18). Additionally, the in vitro determination of gastric and intestinal stability of VEN was studied (19). However, a validated method for the quantitation of VEN in extended-release capsules containing spherical beads has not been described.

50
The in vitro dissolution studies are relevant to the prediction of in vivo performance of the products as an attempt to identify potential problems of drug release and absorption. This is to ensure the physiological availability of the drug. Dissolution studies are a very important tool for quality control of finished products to assess batch-to-batch consistency of drug release from solid dosage forms (20–23). Studies on the bioavailability of drugs from a given dosage form revealed that, in many cases, several dosage forms with the same content of the active compound did not give the same therapeutic effect (24).
Currently, there is no published method validated for the dissolution profile studies and for the quantitative analysis of VEN extended-release capsules. As the liquid chromatography with UV detection has been used for quality control of most of pharmaceuticals, this study aims at developing and validating a sensitive stability-indicating HPLC method to be applied to the analysis of VEN in extended-release pharmaceutical products and dissolution profiles studies. Experimental Chemical and reagents
VEN was purchased from DEG (lot: VH06/0106/07, São Paulo, Brazil). A total of six batches of capsules containing 150 mg and 75 mg of VEN extended-release pellets (reference product Effexor XR® and two generic formulations from distinct laboratories) were obtained from commercial sources within their shelf life period. HPLC-grade acetonitrile and methanol were obtained from Tedia (Fairfield, OH). All chemicals used were pharmaceutical- or special analytical-grade. During all the analyses, ultrapure water obtained using a Milli-Q Gradient System (Millipore, Bedford, MA). Apparatus and chromatographic conditions
The HPLC analysis was performed on a Shimadzu LC-10A system (Shimadzu, Kyoto, Japan) equipped with a LC-10AD pump, DGU-14A degasser, SPD-10AV variable-wavelength detector (set at 226 nm), SPD-M10AVP photodiode array (PDA) detector, and a SCL-10Avp system controller unit. The experiments were carried out on a reversed-phase Phenomenex (Torrance, CA), Luna C18 column (250

51
mm ↔ 4.6 mm i.d., 5 µm). A security guard holder (4.0 mm↔3.0 mm i.d.) has been employed to protect the analytical column. The LC system was operated isocratically, maintaining the column at 35ºC using a mobile phase of ammonium– acetate buffer 32 mM, adjusted to pH 6.8 with phosphoric acid–acetonitrile–methanol (62:30:8, v/v/v). It was filtered through a 0.45-µm membrane filter and run at a flow rate of 1.0 mL/min. The injection volume was 20 µL for both standards and samples. Data acquisition was performed using CLASS-VP software to measure the detected peak areas. The dissolution test was performed using rotating basket and paddle apparatus in a Vankel 7000 dissolution tester (VanKel Technology Group, Cary, NC), in accordance with the United States Pharmacopoeia, USP 32 (22). Procedure Preparation of Reference Solutions
The stock solutions of VEN were prepared by weighing out 10 mg of the solution, transferring them to individual 10-mL volumetric flasks, and diluting to volume with water–methanol (50:50 v/v) to obtain a concentration of 1mg/mL. The stock solutions were stored at 4–8ºC and protected from light. Working standard solutions were prepared daily by diluting the stock solutions to an appropriate concentration with the mobile phase.
Preparation of Sample Solutions
To prepare the sample stock solution, the pellets from the capsules containing 150 and 75mg of VEN were accurately weighed and crushed to a fine powder. An appropriate amount was transferred into a 50-mL volumetric flask, diluted to volume with water–methanol (50:50 v/v), and sonicated for 30min, obtaining a final concentration of 1 mg/mL of the active pharmaceutical ingredient. This solution was stored at 4–8ºC and protected from light. Working sample solutions were prepared daily by diluting the stock solution to an appropriate concentration with the mobile phase. Method validation
The method was validated in samples of pharmaceutical formulations with the label claim of 150 mg of VEN by the determination of the following parameters: specificity, linearity, range,

52
precision, accuracy, limit of detection (LOD), limit of quantitation (LOQ), and robustness, following the International Conference on Harmonization (ICH) guidelines (25). Specificity
The specificity of the method was determined by subjecting a sample solution (1 mg/mL) to accelerated degradation by acidic, basic, oxidative, and photolytic conditions to evaluate the interference in the quantitation of VEN. After the procedures, the samples were diluted in mobile phase to a final concentration of 40 µg/mL. A sample solution in 5 M hydrochloric acid, refluxed at 70 ºC for 5 h, was used for the acidic hydrolysis. For the basic hydrolysis evaluation, a sample solution in 5 M sodium hydroxide was refluxed at 100 ºC for 7 h. The oxidative degradation was induced by storing the sample solutions in 30% hydrogen peroxide, at ambient temperature for 6 h, and protected from light. Photodegradation was induced by exposing the sample to 200 Wh/m2 near UV light for 15 days. Then, the specificity of the method was established by determining the peak purity of VEN in degradated samples using a PDA detector. Linearity and range
Linearity was determined by constructing three calibration curves. For the construction of each calibration curve, appropriate amounts of the stock solution were diluted with mobile phase, yielding concentrations of 10, 20, 30, 40, 50, 60, and 70 µg/mL. Before injection of the solutions, the column was equilibrated for at least 20 min with mobile phase flowing through the system. Three replicate 20 µL injections of standard solution were made to verify the repeatability of the detector response at each concentration. The peak areas of the chromatograms were plotted against the concentrations of VEN to obtain the respective calibration curves. The seven concentrations of the standard solutions were subjected to regression analysis by the least squares method to calculate the calibration equation and correlation coefficient (r). Linearity was expressed as correlation coefficient; the value must be > 0.99.
Precision
The precision of the method was determined by repeatability and intermediate precision studies. Repeatability was examined by six evaluations of the same concentration sample of VEN, on the same day

53
and under the same experimental conditions. The intermediate precision of the method was assessed by performing the analysis on three different days (inter-days) and also by other analysts performing the analysis in the same laboratory (between-analysts). Precision was expressed as relative standard deviation (RSD); the results must be lower than 5%. Accuracy
The accuracy was evaluated by the recovery of known amounts of the reference substance added to a sample solution (containing 20 µg/mL of VEN and excipients) to obtain solutions with final concentrations of 32, 40, and 48 µg/mL, equivalent to 80, 100, and 120 % of the nominal analytical values, respectively. The accuracy was calculated as the percentage of the drug recovered from the formulation matrix. Limits of quantitation (LOQ) and detection (LOD)
The LOQ was taken as the lowest concentration of analyte in a sample that could be determined with acceptable precision and accuracy. The LOD was taken as the lowest absolute concentration of analyte in a sample that could be detected but not necessarily quantified. The LOD and LOQ were calculated from the slope and the standard deviation (SD) of the intercept of the mean of three calibration graphs, which were determined by a linear regression model as defined by the ICH (25). The values were also evaluated in an experimental assay. Robustness
The robustness of an analytical method is a measure of its capacity to remain unaffected by small but deliberate variations in method parameters, and provides an indication of its reliability during normal usage (25). According to this definition, two approaches are possible to evaluate robustness: either a one-variable- at-a-time (OVAT) procedure or an experimental design procedure. The OVAT procedure varies the levels of one factor while keeping the other factors at nominal levels. The experimental design is an experimental set-up that allows simultaneously studying a number of factors in a low number of experiments. In robustness testing, usually two-level screening designs, such as factorial, fractional factorial or Plackett-Burman designs are applied (26–28). The robustness of the proposed method was determined by analyzing the same samples under a variety of conditions of the method parameters, such as: flow rate, column temperature,

54
changing the mobile phase composition, and pH. The factorial 24 was applied to evaluate the relationships between one or more measured responses. System suitability
To ensure the validity of the analytical procedure, a system suitability test was carried out. Data from six injections of 20 µL of the working standard solution containing 40 µg/mL were used for evaluating the system suitability parameters, such as asymmetry, theoretical plates, retention time, and peak area. Method Application Analysis of Pharmaceutical Extended Release Capsules
For the quantitation of VEN in the dosage forms, 20 capsules of each pharmaceutical sample containing 150 and 75 mg of VEN extended-release beads were separated, accurately weighed, and crushed to a fine powder. An appropriate amount of each sample was transferred into a 100 mL volumetric flask, diluted to volume with water–methanol (50:50 v/v), and sonicated for 30 min, obtaining final concentrations of 1 mg/mL (stock solutions). For the analysis, the stock solutions were diluted daily to appropriate concentrations with mobile phase. An aliquot of 20 µL was injected for the analysis, and the amount of each drug per capsules was calculated against the respective reference standard. In vitro dissolution studies
The in vitro dissolution studies of VEN capsules containing extended-release beads were performed using 900 mL of the medium and evaluated using the following parameters: dissolution rates, dissolution media, and apparatus. The dissolution media tested were ultrapure water (50, 75, and 100 rpm), HCl 0.1 M (75 rpm), and phosphate buffer pH 6.8 (75 rpm). The media were degassed by heating followed by vacuum filtration. Apparatus I (basket) and apparatus II (paddle) with sinkers (to maintain the capsule in the vessel bottom) were used. The temperature of the cell was maintained at 37 ± 0.5 ºC by using a thermostatic bath. At each sample time interval, an exact volume (10 mL) of the sample was withdrawn from flask, filtered, and immediately replaced with an identical volume of fresh medium to maintain the

55
dissolution sink condition. At predetermined time intervals (1, 2, 3, 4, 5, 6, 7, 8, 9, 10, 11, 12, and 24 h), the concentration of VEN in the dissolution medium was determined by the proposed HPLC method. The cumulative percentage of drug release was plotted against time in order to obtain the release profile and to calculate the in vitro dissolution data (n = 6). The dissolution profiles of VEN extended release beads were evaluated using the concept of dissolution efficiency (DE). The DE was proposed by Khan in 1975 (29) and is calculated from area under curve (AUC). The calculations were performed for each individual vessel of the dissolution profiles. The resulting DE values were submitted to statistical analysis using one-way analysis variance (ANOVA) in order to detect the existence of significant differences between the respective profiles. Tukey-Kramer HSD (Honestly Significant Difference) test was used for evaluation of quantitative effects of the differences using 5 % significance level.
The release kinetics of VEN was assessed by first order, zero order, and Higuchi equations (30, 31). The mathematical evaluation was performed considering the points up to 12 h of drug release because those precede the beginning of the profile plateau. Results and discussion
A reversed-phase HPLC method was proposed as a suitable
method for determining VEN in drug dissolution studies and pharmaceutical dosage form. To obtain the best chromatographic conditions, the wavelength for detection, the column, and the mobile phase composition were adequately selected. The use of ammonium acetate 32 Mm (pH 6.8) in combination with acetonitrile and methanol (62:30:8 v/v/v) at 35 ºC resulted in a better peak symmetry (1.3) and in a relatively short retention time (6.8 min), which allowed a rapid determination of the drug. This is important for routine analysis. The optimized conditions of the method were validated and a typical chromatogram is shown in Figure 1A.
The specificity of the analytical method for VEN is indicated in Figure 1, where the acidic condition generated one additional peak. Under basic, oxidative, and photolytic conditions, there was neither change in the area nor additional peak detected. In a previously published paper, Makhija and Vavia (17) obtained similar results under acid, basic, and oxidative conditions using different chromatographic

56
conditions. However, the photo-stability of the drug was not evaluated by these authors. According to them, the acid-degraded product would result by the o-demethylation of the 4-methoxy group attached to the phenyl ring. The studies with the PDA detector has shown that the VEN peak was free from any coeluting peak with values of peak purity index > 0.9999, thus demonstrating that the proposed method is specific.
Figure 1. HPLC chromatograms of venlafaxine hydrochloride (A) extended release capsules (40 µg/mL). (B) After oxidative condition. (C) After acidic condition. (D) After photolytic condition. (E) After basic condition.
The calibration curves constructed for VEN were found to be linear in the 10–70 µg/mL range. The values of the correlation coefficients and calibration equations calculated were: r = 0.9999, y = 44450.4 ± 120.1x + 2826.6 ± 3515.8; where x is concentration and y is

57
the peak absolute area. This r-value indicated the linearity of the calibration curves for the method. Furthermore, ANOVA demonstrated significant linear regression and non-significant linearity deviation (P < 0.01).
The precision evaluated as the repeatability of the method was studied by calculating the RSD for six determinations of VEN in a 40 µg/mL solution performed on the same day and under the same experimental conditions. The RSD value obtained was 0.2 %.
The intermediate precision was assessed by analyzing one sample of the pharmaceutical formulation on three different days (inter-days); the RSD value obtained was 0.9 %. Between analysts precision was determined by calculating the RSD for the analysis of one samples of the pharmaceutical formulation by three analysts; the value was found to be 0.5 % (Table 1). Table 1 - Inter-day and between-analysts precision data of the method
The accuracy was assessed from three replicate determinations
of three different added standard solutions containing 12, 20, and 28 µg/mL of VEN. The absolute means obtained were 98.8, 100.6, and 101.2 % with a mean value of 100.2 % and RSD of 1.2 % (Table 2). These results show that the method was accurate within the desired range.

58
Table 2 - Accuracy data of the method.
For calculating the LOD and LOQ, the calibration equation for VEN was generated by using the mean values of the three independent calibration graphs. The mean of the slope and the SD of the intercept of the independent curves were 444450.4 and 3515.8, respectively. The values calculated for the LOD and LOQ were 0.24 and 0.80 µg/mL, respectively. These values were also confirmed experimentally.
For robustness testing, the ½ fractionated factorial 24 design was applied because it considers possible combinations between the factors at low (-) and high (+) levels with a low number of experiments. The experimental ranges of the selected variables evaluated are given in Table 3, and the results demonstrated that the method was robust. Moreover, the analysis of variance ANOVA was performed, and the model terms (variables) were not significant (P < 0.05). The stability of the analytical solution was also analyzed, and it was found to be stable up to 72 h (100.2 %, assay). Table 3 - Chromatographic conditions and range investigated during robustness testing.

59
The system suitability test was also performed to evaluate the resolution and reproducibility of the system for the analysis to be performed using six replicate injections of a standard solution containing 40 µg/mL of VEN. The RSD values calculated for peak area and retention time were 0.2 and 0.5 %, respectively. The mean asymmetry and theoretical plates ± RSD were 1.3 ± 0.8 % and 9814 ± 0.6 %, respectively. The results showed that the parameters are within the suitable range.
The LC method validated in this paper was applied for the determination of VEN in extended release capsules without prior separation of the excipients of the formulation. The results are shown in Table 4. Table 4 - Determination of venlafaxine hydrochloride in pharmaceutical dosage forms.

60
In vitro dissolution studies is considered a fundamental requirement in the pharmaceutical industry in order to ensure the quality of solid pharmaceutical forms, guarantee the quality from lot to lot, orientate the development of new formulations, and secure the uniformity quality and performance of the drug even after modifications (23,32).
The proposed HPLC method was successfully applied for determining VEN in dissolution studies. The selection of medium composition testing was related to physiological conditions. The media used were 0.1 M hydrochloric acid (pH 1.2), water (pH 5.0), and phosphate buffer (pH 6.8). Several types of dissolution apparatus are described in USP 32 (22). Apparatus 1 and 2 are the most widely used for oral solid dosage forms. The basket (apparatus 1) is routinely used for capsules at dissolution rates of 75 and 100 rpm, whereas the paddle (apparatus 2) is mainly used for tablets at 50 and 75 rpm (21). In case of extended-release dosage forms, Jorgensen and Bhagwat suggested to use both of these apparatuses with water as the dissolution medium (33).
In order to investigate the release behavior of VEN, different conditions were tested, and the obtained profiles are presented in Figure 2.

61
Figure 2 - Release behavior of venlafaxine in different conditions.
Evaluating the dissolved percentage curves versus time, it can be observed that VEN presented quite a difference in the dissolution profiles. The results clearly indicate that in hydrochloric acid medium the drug content release was lower than in water and the buffer medium. The significant index of drug dissolution performance was verified using the concept of DE. The calculated DE are shown in Table 5. The values were submitted to statistical analysis using ANOVA to detect the existence of significant differences. The ANOVA showed that all DE

62
values were significantly different (Fcalculated = 82.22 > Fcritic= 2.84; p < 0.05). Table 5 - Dissolution efficiency values obtained from dissolution tests assessed with different dissolution methods.
However, it did not indicate which differences should be considered. In order to verify the significance of the differences, a pair wise comparison by Tukey-Kramer test using 5% significance level was performed. The results showed that the DE obtained in water-75 rpm-basket, water-75 rpm-paddle; water- 100 rpm-paddle, and buffer pH 6.8-75 rpm-paddle do not have a significant difference (p < 0.05). The same was observed for water-50 rpm-paddle and HCl-75 rpm-paddle (p < 0.05). On the other hand, the most difference was observed in water-100 rpm-basket; the results showed significant difference (p > 0.05).
Through the DE values, the best conditions to evaluate the mechanism of release were determined. In Figure 3, the superposition of the VEN drug release in different medium using 75 rpm dissolution rate and apparatus paddle is demonstrated.

63
Figure 3 - Release of venlafaxine in different media using 75 rpm rotation speed and apparatus (II) paddle.
The kinetics release mechanism of VEN extended-release beads was evaluated by fitting different models, such as the zero order rate equation (Qt = Q0 – K0t) which describes the systems where the release rate is independent of the concentration of the dissolved species. The first-order equation (ln Qt = ln Q0 – k1t ), describes the release from systems where dissolution rate is dependent on the concentration of the dissolving species. The Higuchi square root equation (Qt = KHt1/2) describes the release from systems where the solid drug is dispersed in an insoluble matrix and the rate of drug release is related to the rate of drug diffusion. The mathematical evaluation was performed considering the points up to 12 h of drug release because those precede the beginning of the profile plateau.
The results of kinetics fitting are demonstrated in Table 6. It is evident that a linear relationship model, which best characterized these release profiles (r-value) is an apparent first order process. In this way, the first order kinetic release indicates that the amount of drug released is dependent on the matrix drug load (extended release forms). In the pharmaceutical dosage forms following this dissolution profile, such as those containing water-soluble drugs in spherical beads, the release of the drug is proportional to the amount of drug remaining in its interior in

64
such a way that the amount of drug released by unit of time diminishes (30). Table 6 - Results of fitting to different kinetic release equations.
The K1 (kinetic constants), t50% (first-order constant) of VEN
dissolved at 6 h (Q6) and 12 h (Q12) were calculated and are demonstrated in Table 7. Table 7 - Kinetic constants calculated from first order kinetic release: (k1), (t1/2), (Q6) and (Q12)
According to the results, it is evident that the dissolution profile of VEN in acid medium exhibited lower dissolution constant rates than buffer and water medium. Using the HPLC developed method, the in vitro dissolution studies were successful performed. Conclusion
The results of the validation studies show that the LC method is specific and accurate, and possesses significant linearity and precision characteristics without any interference from the excipients. The

65
proposed method was successfully applied for the quantitation of VEN in extended-release pharmaceutical dosage forms and for dissolution kinetic studies. The new method contributes to improve quality control, ensuring the therapeutic efficacy of this medicine. Acknowledgments
The authors wish to thank CNPQ (Conselho Nacional de Desenvolvimento Científico e Tecnológico) for the support.

66
References 1. M. Rudorfer and W. Potter. Antidepressants: a comparative review of the clinical pharmacology and therapeutic use of the "newer" versus the "older" drugs. Drugs. 37: 713–738 (1989). 2. J.M. Andrews, P.T. Ninan and C.B. Nemeroff. Venlafaxine: a novel antidepressant that has a dual mechanism of action. Depression. 4: 48–56 (1996). 3. M.A. Gutierrez, G.L. Stimmel and J.Y. Aiso. Venlafaxine: A 2003 Update. Clin. Ther. 25: 2138– 2154 (2003). 4. Effexor XR® (venlafaxine hydrochloride) extended release capsules. (2008) Available at: http://www.wyeth.com/content/showlabeling.asp?id=100. 5. N.R. Trivedi, M.G. Rajan, J.R. Johnson and A.J. Shukla. Pharmaceutical Approaches to preparing pelletized dosage forms using the extrusion-spheronization process. Crit. Rev. Ther Drug. 24: 1-40 (2007). 6. I. Ghebre-Sellanie. Multiparticulate oral drug delivery. Marcel Dekker Inc. New York. 1994. 7. M-S. Kim, J-S. Kim, Y-H. You, H. J. Park, S. Lee, J-S. Park, J-S. Woo and S-J Hwang. Development and optimization of a novel oral controlled delivery system for tamsulosin hydrochloride using response surface methodology. Int. J. Pharm. 341: 97-104 (2007). 8. K.M. Alsante, A. Ando, R. Brown, J. Ensing, T.D. Hatajik, W. Kong and Y. Tsuda. The role of degradant profiling in active pharmaceutical ingredients and drug products. Adv. Drug Deliver. Rev. 59: 29-37 (2007). 9. M. Bakshi and S. Singh. Development of validated stability-indicating assay methods – critical review. J. Pharm Biomed. Anal. 28: 1011-1040 (2002).

67
10. R.N. Rao and V. Nagaraju. An overview of the recent trends in development of HPLC methods for determination of impurities in drugs. J. Pharm Biomed. Anal. 33: 335-377 (2003). 11. S. Rudaz, C. Stella, A.E. Balant-Gorgia, S. Fanali and J.L. Veuthey. Simultaneous stereoselective analysis of venlafaxine and O-desmethylvenlafaxine enantiomers in clinical samples by capillary electrophoresis using charged cyclodextrins. J. Pharm. Biomed. Anal. 23: 107–115 (2000). 12. S. Rudaz, J.L. Veuthey, C. Desiderio and S. Fanali. Enantioseparation of Venlafaxine and O-Desmethylvenlafaxine by Capillary Electrophoresis with Mixed Cyclodextrins. Chromatographia. 50: 369–372 (1999). 13. R.L. Vu, D. Helmeste, L. Albers and C. Reist. Rapid determination of venlafaxine and O-desmethylvenlafaxine in human plasma by high-performance liquid chromatography with fluorimetric detection. J. Chromatogr. B. 703: 195–201 (1997). 14. J. Bhatt, A. Jangid, G. Venkatesh, G. Subbaiah, S. Singh. Liquid chromatography–tandem mass spectrometry (LC–MS–MS) method for simultaneous determination of venlafaxine and its active metabolite O-desmethylvenlafaxine in human plasma J. Chromatogr. B. 829: 75–81 (2005). 15. W. Liu, H. Cai and H. Li. High performance liquid chromatography-electrospray ionization mass spectrometry (HPLC-MS/ESI) method for simultaneous determination of venlafaxine and its three metabolites in human plasma. J. Chromatogr. B. 850: 405–411 (2007). 16. W. Liu, H. Cai and F. Wang. Simultaneous stereoselective analysis of venlafaxine and O-desmethylvenlafaxine enantiomers in human plasma by HPLC-ESI/MS using a vancomycin chiral column. J. Chromatogr. B. 850: 183–189 (2007). 17. S.N. Makhija and P.R. Vavia. Stability indicating LC method for the estimation of venlafaxine in pharmaceutical formulations. J. Pharm. Biomed. Anal. 28: 1055–1059 (2002).

68
18. R.N. Rao and A.N. Raju. Simultaneous separation and determination of process-related substances and degradation products of venlafaxine by reversed-phase HPLC. J. Sep. Sci. 29: 2733-2744 (2006). 19. E.B. Asafu-Adjaye, P.J. Faustino, M.A. Tawakkul, L.W. Anderson, L.X. Yu, W. Know, D.A. Volpe. Validation and application of a stability-indicating HPLC method for the in vitro determination of gastric and intestinal stability of venlafaxine. J. Pharm. Biomed. Anal. 43: 1854–1859 (2007). 20. S. Furlanetto, F. Maestrelli, S. Orlandini, S. Pinzauti and P. Mura. Optimization of dissolution test precision for a Ketoprofen oral extend-release product. J. Pharm. Biomed. Anal. 32: 159–162 (2003). 21. FDA 1997, Center for drug evaluation and research, Guidance for Industry: Dissolution testing of immediate release solid oral dosage forms, August 1997. 22. United States Pharmacopeia (USP 32), United Pharmacopeial Convention Inc., Rockville, USA, 2008. 23. S. Azarmi, W. Roa and R. Löbenberg. Current perspectives in dissolution testing of conventional and novel dosage forms. Int. J. Pharm. 328: 12-21 (2007). 24. U.V. Banakar. Pharmaceutical dissolution testing. 1st ed, Marcel Dekker Inc., New York, 1992. 25. International Conference on Harmonisation (ICH), Harmonised tripartite guideline: validation of analytical procedures: text and methodology Q2 (R1) (2005). 26. B. Dejaegher and Y.V. Heyden. Ruggedness and robustness testing. J. Chrom. A. 1158: 138-157 (2007). 27. Y.V. Heyden, A. Nijhuis, J. Smeyers-Verbeke, B.G.M. Vandeginste and D.L. Massart. Guidance for robustness/ruggedness test in method validation. J. Pharm. Biomed. Anal. 24: 723-753 (2001).

69
28. R. Ragonese, M. Mulholland and J. Kalman. Full and fractionated experimental designs for robustness testing in the high-performance liquid chromatographic analysis of codeine phosphate, pseudoephedrine hydrochloride and chlorpheniramine maleate in a pharmaceutical preparation. J. Chromatogr. A. 870: 45-51 (2000). 29. K.A. Khan and C.T. Rhodes. Concept of dissolution efficiency. J. Pharm. Pharmacol. London. 27: 48-49 (1975). 30. P. Costa and J.M.S. Lobo. Modeling and comparison of dissolution profiles. Eur. J. Pharm. Sci. 13: 123–133 (2001). 31. R. Manadas, M.E. Pina and F. Veiga. A dissolução in vitro na previsão da absorção oral de fármacos em formas farmacêuticas de liberação modificada. Braz. J. Pharm. Sci. 38: 375-399 (2002). 32. J.B. Dressman, G.L. Amidon, C. Reppas and V.P. Shah. Dissolution testing as a prognostic tool for oral drug absorption: immediate release dosage forms. Pharm. Res. 15: 11-22 (1998). 33. E.D. Jorgensen and D. Bhagwat. Development of dissolution tests for oral extended-release products. Pharm. Sci. Technol. Today. 1: 128-135 (1998).

70
CAPÍTULO 4 - Caracterização e estudos de compatibilidade fármaco/excipiente.
Journal of Thermal Analysis and Calorimetry, v. 97, p. 729 - 733, 2009.

71

72
INTRODUÇÃO
A caracterização de propriedades no estado sólido usando técnicas analíticas apropriadas é um pré-requisito no desenvolvimento de medicamentos, para assegurar a eficácia, a segurança e a qualidade do produto final, pois diferenças nas propriedades físico-químicas podem alterar a biodisponibilidade e, consequentemente, a terapêutica (GIRON, 2002; AALTONEN et al., 2009). Além disso, estudos de compatibilidade fármaco:excipiente durante estudos de pré-formulação são importantes processos para selecionar os excipientes adequados, com o intuito de prevenir incompatibilidades ou para conhecer alguma interação física e/ou química entre os componentes (TOMASSETTI et al., 2005; KOVALESKI et al., 2007).
Diferentes técnicas analíticas têm sido empregadas a fim de se obter uma caracterização completa dos fármacos no estado sólido (BRITTAIN et al., 1991; CHIENG; RADES; AALTONEN, 2011), e incluem: Difração de Raios-X, Análise Térmica, Técnicas espectroscópicas e microscópicas.
Uma ampla busca na literatura revelou que, até o momento não foi relatado nenhum estudo de caracterização no estado sólido do cloridrato de venlafaxina, que permita conhecer as características desejadas do fármaco para o desenvolvimento de formulações.
Neste capítulo são apresentados os resultados da caracterização do cloridrato de venlafaxina por DSC, TG, SEM, XRPD e IV. Também são descritos os estudos de compatibilidade entre o fármaco e alguns excipientes utilizados no desenvolvimento das formas farmacêuticas sólidas disponíveis comercialmente: talco, estearato de magnésio, celulose microcristalina, amido glicolato de sódio, amido e lactose monoidratada.

73

74
Characterization of Venlafaxine Hydrochloride and Compatibility Studies with pharmaceutical Excipients
Abstract The thermal analytical study of venlafaxine hydrochloride, a third generation antidepressant, was investigated using thermogravimetry (TG) and differential scanning calorimetry (DSC). The DSC curves have shown a sharp endothermic event at 211 °C and TG demonstrated a single stage of mass loss between 254 and 283 °C. Solid-state characterization was carried out by DRIFT, SEM and XRPD demonstrating the drug physicochemical properties including cristallinity. Drug-excipient compatibility studies investigated by DSC have shown a possible physical interaction of the drug with magnesium stearate, microcrystalline cellulose and starch. Nevertheless, these results were not confirmed by DRIFT and SEM analyses. Keywords: Venlafaxine Hydrochloride, Solid-State characterization, Compatibility studies.

75
Introduction
Venlafaxine hydrochloride (VEN), (1-[2-(dimethylamino)-1-(4- methoxyphenyl) ethyl]cyclohexanol) (Figure 1), a third generation antidepressant, inhibits the reuptake of serotonin, norepinephrine and to a lesser extent dopamine [1, 2]. VEN has been shown to be effective for treatment of major depression in a broad range of patients [3, 4].
Figure 1 – Chemical Structure of Venlafaxine hydrochloride.
Thermal analyses are routine methods for analysis of drugs and
substances of pharmaceutical interest [5, 6]. These methods include differential scanning calorimetry (DSC) and thermogravimetry (TG), in which physical properties of a substance and/or its reaction products are measured as function of a controlled temperature program [5-7].
Studying the drug-excipient compatibility during the formulation of products is an important process to know any physical and chemical interaction between the compounds [8]. Thermal techniques have been increasingly used for evaluating possible incompatibility quickly through comparison of thermal curves of pure substances with curve obtained from a 1:1 mixture [9].
The characterization of solid-state properties at an early stage by using appropriate analytical methodologies is an essential pre-requisite in the development of solid dosage forms both from scientific and regulatory points of view [10]. Variations in physicochemical properties of the pharmaceutical active ingredient may have an impact on the therapeutic, manufacturing, commercial, and legal levels [11]. In this work, the VEN characterization and compatibility studies have been investigated by using a variety of techniques including thermal analysis (TG/DTG and DSC), Diffuse Reflectance Infrared Fourier Transform

76
Spectroscopy (DRIFT), Scanning Electron Microscopy (SEM), and X–Ray Powder Diffraction (XRPD). Experimental Materials
Venlafaxine hydrochloride bulk material was obtained from DEG (lot: VH06/0106/07). The tested pharmaceutical excipients in the compatibility studies were: starch (snow flake® 3400), sodium starch glycolate; microcrystalline cellulose (Microcel® 200); magnesium stearate; lactose monohydrate, and talc.
Preparation of physical mixtures
The interaction study was performed by using a physical mixture of VEN and excipients of equal weights (1:1 mass/mass). The physical mixtures were prepared through simple mixing, kept into an amber glass vials, and submitted to the analysis. Methods Differencial Scanning Calorimetry (DSC)
The DSC curves were obtained using a Shimadzu DSC-60 cell under dynamic nitrogen atmosphere with the flow rate of 50 mL min-1. Approximately 2 mg of samples were weighted out and placed in a sealed aluminum pan. The analysis was carried out from 30 °C to 400 °C at a heating rate of 10 °C min-1. Thermogravimetric analysis (TG)
The TG/DTG measurements were performed in the thermobalance TGA-50 (Shimadzu), under dynamic nitrogen atmosphere with flow rate of 50 mL min-1. Approximately 6 mg of the samples were placed in platinum crucibles and heated from 30 °C to 600 °C at a heating rate of 10 °C min-1. X – Ray Powder Diffraction (XRPD)
The powder diffraction pattern of VEN was obtained in the Siemens diffractometer D5000 model, with a Cukα 40 kw tube and

77
current of 40 mA, in the range of 3 – 65 (2θ) with a pass time of 1 second. Diffuse Reflectance Infrared Fourier Transform Spectroscopy (DRIFT)
The DRIFT spectra were measured in the Shimadzu spectrophotometer (Prestige), with a scan range of 400 - 4000 cm-1 with an average of over 32 scans at a spectral resolution of 4 cm-1 in KBr. A background spectrum was obtained for each experimental condition. Scanning Electron Microscopy (SEM)
The photomicrographs were taken with a Phillips scanning electron microscope, model XL30. The sample was placed on metal stubs by using double-sided adhesive tape, vacuum-coated with gold (350 Å) in a Polaron E 5000 sputter coating unit and directly analyzed by SEM (5000 x and 20000 x). Results and discussion Characterization of Venlafaxine hydrochloride
The TG/DTG and DSC curves obtained for VEN are shown in Figure 2. The DSC curve has shown a sharp endothermic event (Tpeak = 211 °C; Tonset = 209 °C; ∆Hfusion = -96.75 J g-1), corresponding to the melting point followed by decomposition. The TG/DTG curve has shown a single stage of mass loss between 254 – 283 °C (∆m = 98.5 %; DTGpeak = 274.30 °C). The DSC data combined with TG allow evidencing a thermal stability up to 200 °C.

78
Figure 2 - DSC and TG/DTG curves of pure Venlafaxine
hydrochloride obtained in nitrogen atmosphere (50 mL min-1) and heating rate of 10 °C min-1.
The DRIFT spectrum of VEN has shown a characteristic stronger band of the O–H at 3200–3420 cm-1, stretching vibrations of C=C at 1513 cm-1, followed by C–O–CH3 stretching at 1243 cm-1 and the resonance band at 1179 cm-1 for N–C.
X-ray powder diffraction has been used for qualitative and quantitative identification of crystallinity [12, 13]. The XRPD patterns of VEN (Figure 3) revealed several diffraction peaks which indicate its crystalline character. The relative crystallinity (Xc
rel) of VEN was calculated based on the Ruland method, in which the area of the crystalline diffraction relative to the total area of the diffractogram is taken as a measure of crystallinity [14]. The Xc
rel index calculated for VEN was 60.01 %.

79
Figure 3 – X-Ray Powder Diffraction of Venlafaxine hydrochloride.
The SEM photomicrographs taken at magnification 5.000x and 20.000x are given in Figure 4. It was observed that VEN is characterized by regular shaped crystals.
Figure 4 – SEM Photomicrograph of Venlafaxine hydrochloride:
A) 5000x magnification; B) 20000x magnification. Compatibility study with excipients
In fact, DSC has been proposed to be a rapid method for evaluating physicochemical interactions between components of the formulation through the comparison of thermal curves of pure substances with the curve obtained from a 1:1 physical mixture and therefore select adequate excipients with suitable compatibility [8 - 10].

80
The thermal profiles of the mixtures venlafaxine/talc, venlafaxine/sodium glycolate starch, and venlafaxine/monohydrate lactose (Figure 5) can be considered as a superposition of the curves of VEN and excipients, demonstrating the absence of interaction.
The DSC curve of venlafaxine/talc has shown the characteristic endothermic event of VEN melting point at 211 ºC and successive endothermic and exothermic events from 240 ºC, which can be related to chemical and/or physical reactions in the thermal degradation of the mixture. In venlafaxine/sodium glycolate starch mixture a small endothermic event was observed in the range of 164 - 187 ºC, followed by melting of VEN at 219 ºC. The DSC curve of venlafaxine/monohydrate lactose has shown an endothermic event at 146 ºC, corresponding to dehydration of lactose bound water; an exothermic event in the range of 157 - 170 °C due to the lactose crystalline transition [15, 16]; and an endothermic event at 217 ºC corresponding to the simultaneous melting of lactose and VEN, followed by exothermic degradation events.
Differences were observed in the DSC curves of venlafaxine/microcrystalline cellulose, venlafaxine/magnesium stearate, and venlafaxine/starch mixtures (Figure 5), in which the melting point of the drug shifted to a higher temperature of Tpeak = 241 °C, 252 °C and 226 °C, respectively. These results indicated the occurrence of a strong interaction in the solid state with temperature, but not necessarily corresponding to incompatibility.
The results of venlafaxine/microcrystalline cellulose have shown one endothermic event at 195 ºC, which can be attributed to the rupture of the cellulose glycosidic bonds, and the melting of VEN at 241 ºC. DSC curve of venlafaxine/magnesium stearate has shown three endothermic events. The first in the range of 100 - 122 ºC corresponding to the dehydration process of magnesium stearate; the second at 186 ºC, which might be due to palmitate impurity or salts of other fatty acids [17, 18]; and the third event at 252 ºC corresponding to the melting point of VEN. DSC curve of venlafaxine/starch has shown an endothermic event in the range of 167 – 191 °C that could be related to a delayed polymer dehydration [19] or melting point of the starch snow flakes® 3400. The endothermic event of VEN melting was shifted to 226 ºC, confirming the interaction between the two compounds. One possible reason can be a Maillard reaction between the hydroxyl groups of starch and the amine group of VEN [20].

81
Figure 5 – DSC curves of Venlafaxine hydrochloride (VEN) and
excipients obtained in dynamic nitrogen atmosphere (50 mL min-1) and heating rate of 10 °C min-1.
DRIFT has been applied as a supplementary technique to investigate drug-excipient interaction and to confirm the results obtained from the thermal analysis. It is the most suitable technique of the non-destructive spectroscopic methods and has become an attractive method in the analysis of pharmaceutical solids, since the materials are not subject to thermal or mechanical energy during sample preparation, therefore preventing solid-state transformations [12]. The appearance of new absorption band(s), broadening of band(s) and alteration in intensity is the main characteristics to evidence interactions between drug and excipients.
The spectra of the drug and all excipients used in this study were obtained for pure compounds as well for binary mixtures (1:1 mass/mass) in order to identify a possible chemical interaction between them (Figure 6). The DRIFT spectra did not show evidence on chemical interaction in the solid state. Moreover, the spectra of binaries mixtures can be considered as the superposition of the individual ones without absence, shift or broadening in the vibration bands of VEN. It demonstrated the absence of chemical interactions between VEN and microcrystalline cellulose, magnesium stearate and starch, suggesting

82
that the modification showed by DSC curves can be related to a possible physical interaction.
Figure 6 – DRIFT spectra of physical mixtures Venlafaxine hydrochloride and excipients.
The photomicrographs obtained by SEM (Fig. 7) did not evidence any interaction between VEN and the excipients, providing visual support for the DRIFT results. The SEM images have shown that both VEN and excipients particles maintained their morphology and the drug crystals appeared dispersed on the surface of excipients particles.

83
Figure 7 – SEM Photomicrograph of A) Microcrystalline cellulose (100x), B) VEN:Microcrystalline cellulose (100x), C) Magnesium stearate (1.000x), D) VEN:Magneium stearate (1.000x), E) Starch (500x), and F) VEN:Starch (500x). Conclusion
The thermal analysis provided information about the thermal stability and decomposition of pure VEN and the binary mixtures which can be used in the quality control. The characterization was obtained by DRIFT, SEM, and XRPD, which, in turn, demonstrated VEN physicochemical properties including the crystallinity. In the compatibility studies, the modifications found in the DSC curves suggested a possible physical interaction of VEN with magnesium stearate, starch and microcrystalline cellulose. Additional DRIFT and

84
SEM analyses were carried out and no evidence of solid-state interaction or incompatibility was observed. Acknowledgments
The authors wish to thank CNPq and CAPES for the support.

85
References [1] Andrews JM, Ninan PT, Nemeroff CB. Venlafaxine: a novel antidepressant that has a dual mechanism of action. Depression 1996;4:48-56. [2] Olver JS, Burrows GD, Norman TR. Third-generation antidepressants: do they offer advantages over the SSRIs?. CNS Drugs 2001;15:941-54. [3] Lecrubier Y, Bourin M, Moon CAL, Schifano F, Blanchard C, Danjou P, Hackett D. Efficacy of venlafaxine in depressive illness in general practice. Acta Psychiatr Scand 1997;95:485-93. [4] Gutierrez MA, Stimmel GL, Aiso JY. Venlafaxine: a 2003 update. Clin Ther 2003;25:2138-54. [5] Giron D. Contribution of thermal methods and related techniques to the rational development of pharmaceuticals - Part 1. Pharm Sci Technol Today 1998;1:191-9. [6] Giron D. Applications of thermal analysis and coupled techniques in pharmaceutical industry. J Therm Anal Cal 2002;68:335-57. [7] Ozawa T. Thermal analysis - review and prospect. Thermochim Acta 2000;355:35-42. [8] Verma RK, Garg S. Compatibility studies between isosorbide mononitrate and selected excipients used in the development of extended release formulations. J Pharm Biomed Anal 2004;35:449-58. [9] Araújo AAS, Cides LCS, Storpirtis S, Matos JR, Bruns RE. Effects of experimental conditions on the estimation of kinetic parameters of the thermal decomposition of AZT using factorial design. J Therm Anal Cal 2005;79:697-701. [10] Gandhi R, Pillai O, Thilagavathi R, Gopalakrishnan B, Kaul CL, Panchagnula R. Characterization of azithromycin hydrates. Eur J Pharm Sci 2002;16:175-84.

86
[11] Tomassetti M, Catalani A, Rossi V, Vecchio S. Thermal analysis study of the interactions between acetaminophen and excipients in solid dosage forms and in some binary mixtures. J Pharm Biomed Anal 2005;37:949-55. [12] Stephenson GA, Forbes RA, Reutzel-Edens SM. Characterization of the solid state: quantitative issues. Adv Drug Deliv Rev 2001;48:67-90. [13] Phadnis NV, Cavatur RK, Suryanarayanan R. Identification of drugs in pharmaceutical dosage forms by X-ray powder diffractometry. J Pharm Biomed Anal 1997;15:929-43. [14] Ruland W. X-ray determination of crystallinity and diffuse disorder scattering. Acta Crystallogr 1961;14:1180-5. [15] Cides LCS, Araújo AAS, Santos-Filho M, Matos JR. Thermal behaviour, compatibility study and decomposition kinetics of glimepiride under isothermal and non-isothermal conditions. J Therm Anal Cal 2006;84:441-5. [16] Araújo AAS, Storpirtis S, Mercuri LP, Carvalho FMS, Santos-Filho M, Matos JR. Thermal analysis of the antiretroviral zidovudine (AZT) and evaluation of the compatibility with excipients used in solid dosage forms. Int J Pharm 2003;260:303-14. [17] Sharpe SA, Celik M, Newman AW, Brittain HG. Physical characterization of the polymorphic variations of magnesium stearate and magnesium palmitate hydrate species. Struct Chem 1997;8:73-84. [18] Marini A, Berbenni V, Moioli S, Bruni G, Cofrancesco P, Margheritis C, Villa M. Drug-excipient compatibility studies by physico-chemical techniques. The case of indomethacin. J Therm Anal Cal. 2003;73:529-45. [19] Mura P, Faucci MT, Manderioli A, Bramanti G, Ceccarelli L. Compatibility study between ibuproxam and pharmaceutical excipients using differential scanning calorimetry, hot-stage microscopy and scanning electron microscopy. J Pharm Biomed Anal 1998;18:151-63.

87
[20] Santos AFO, Basílio Jr ID, Souza FS, Medeiros AFD, Pinto MF, Santana DP, Macedo RO. Application of thermal analysis of binary mixtures with metformin. J Therm Anal Cal 2008;93:361-4.

88
CAPÍTULO 5 – Estudos no estado sólido de diferentes matérias-primas do cloridrato de venlafaxina.
Solid-state evaluation and polymorphic quantification using Rietveld Method in venlafaxine hydrochloride raw materials

89

90
INTRODUÇÃO
O estudo, o isolamento e a caracterização polimórfica assumiram considerável interesse, tanto científico em pesquisas acadêmicas quanto econômico, pelas indústrias farmacêuticas (GIRON, 2001; GIRON, 2002; BARBAS, 2007). Como cada polimorfo pode apresentar diferentes características in vivo, é desejável que somente um polimorfo seja utilizado na formulação farmacêutica. O conhecimento dos polimorfos e suas características físicas e físico-químicas são, portanto, indispensáveis para o desenvolvimento de fármacos que são administrados em formas farmacêuticas sólidas (YORK, 1983; BERNSTEIN, 2002; BOND, 2009).
Ao caracterizar e avaliar quatro distintas matérias-primas, obtidas de diferentes farmácias de manipulação, observou-se que as mesmas apresentaram algumas diferenças físico-químicas, principalmente em relação ao seu perfil térmico, ponto de fusão e padrão de difração de raios-X. Houve, assim, a necessidade de estudos mais detalhados sobre as possíveis causas das diferenças, destacando a presença de diferentes polimorfos. Duas formas polimórficas foram obtidas por recristalização, caracterizadas e utilizadas para fazer a comparação e a identificação polimórfica entre as matérias-primas.
Neste capítulo são apresentados os resultados da caracterização de duas formas polimórficas puras do cloridrato de venlafaxina, obtidas por recristalização, utilizando técnicas de DRX, DSC, SEM, IV, RS, RMN e ssRMN; a identificação polimórfica em quatro diferentes matérias-primas disponíveis comercialmente, bem como a quantificação da relação polimórfica nas matérias-primas que apresentaram mistura, utilizando o método de Rietveld.

91

92
Solid-state evaluation and polymorphic quantification using Rietveld Method in venlafaxine hydrochloride raw materials Abstract Venlafaxine Hydrochloride (VEN) is an antidepressant drug widely used for treatment of depression disease. The purpose of this study was the preparation and solid state characterization of the pure polymorphs (Form 1 and Form 2) and the polymorphic identification and quantification in four commercially available VEN raw materials. These two polymorphic forms were obtained from different crystallization methods and characterized by X-ray Powder Diffraction (XRPD), Diffuse Reflectance Infrared Fourier Transform (DRIFT), Raman Spectroscopy (RS), liquid and solid state Nuclear Magnetic Resonance (NMR and ssNMR) spectroscopies, Differential Scanning Calorimetry (DSC), and Scanning Electronic Microscopy (SEM) techniques. The main differences were observed by DSC and XRPD and, XRPD was chosen as the standard technique for the identification and quantification studies in combination with the Rietveld Method in the commercial raw materials (VEN1 to VEN4) from different manufacturers. Through the analyses, it was possible to conclude that VEN1 and VEN2 were only composed of Form 1, while VEN3 and VEN4 were a mixture of Forms 1 and 2. Additionally, the Rietveld refinement was successfully applied to quantify the polymorphic ratio presented in VEN3 and VEN4. Keywords Venlafaxine hydrochloride, polymorphism, X-ray powder diffraction, Rietveld Method.

93
1. Introduction
Since pharmaceutical solids can exist in different crystalline structures, the polymorphism becomes a major concern for the pharmaceutical industry in the development of a new drug and during stability of the drugs, once that different structures may have different properties that could influence the performance of the drug product (1, 2, 3).
Polymorphism is defined as the ability of a substance to exist as two or more crystalline forms. The polymorphs differ in internal solid-state structure, in the arrangement and/or conformation of the molecules in the crystalline lattice and have significant commercial and industrial implications in various fields (2).
The different polymorphs can show distinct physical properties, such as melting point, solubility, dissolution rate and stability (physical and chemical), which may affect their pharmaceutical processing, therapeutic efficacy, bioavailability, performance, and quality. These concerns have led to increased regulatory requirements by the Food and Drug Administration (FDA) in order to avoid problems related with polymorphism (3, 4, 5).
Understanding the differences in the physical properties of the polymorphs and their relative stabilities are therefore essential for the pharmaceutical manufacturers in the selection of a special form that has the desirable characteristics for administration of the medicines (6, 7).
Venlafaxine hydrochloride (VEN), Figure 1, chemically known as ±1-[2-(dimethylamino)-1-(4-methoxyphenyl)-ethyl] cyclohexanol hydrochloride, is an antidepressive drug that acts by simultaneously blocking the re-uptake of neuronal norepinephrine and serotonin (8, 9, 10). VEN is a widely prescribed antidepressant drug with sales of US $3.7 billion per annum (11, 12).

94
Figure 1 - Chemical structure of venlafaxine hydrochloride
The recrystallization of VEN can yield crystals with two
different morphologies, viz. blocks (Form 1) and needles (Form 2). Crystal structure of Form 1 has been reported in the orthorhombic space group Pca21 by Vega et al. (2000) (13). Form 2 of VEN was found in the monoclinic space group P21/n by Sivalakshmidevi et al. (2002) (14). Although the polymorphs do not show significant differences in vivo, Saikat Roy et al. have reported that the Form 2 is preferred in the formulation because it has a larger particle size with better filtration and drying characteristics. However, the Form 2 is under patent and some countries disallowed the use of this patented form in pharmaceutical formulation (7, 15, 16).
To ensure the ideal polymorphic form for the development of new formulations and in order to assure the reproducible and reliable quality control of the final products, the raw material needs to be previously well characterized (5, 17). Different strategies for a systematic study of polymorphism can be applied and usually involve a combination of different techniques (18).
X-ray powder diffraction (XRPD) is one of the most used techniques for studying polymorphs. It is the “standard” technique to differentiate polymorphs, each crystal form produces a diffraction pattern that can be used as a fingerprint for that form and thus employed to screen polymorphs during drug discovery, formulation development, and manufacturing (19). Differential scanning calorimetry (DSC), Raman spectroscopy (RS), diffuse reflectance infrared Fourier transform spectroscopy (DRIFT), solid state Nuclear Magnetic Ressonace (ssNMR), and Scanning Electronic Microscopy (SEM) are, among other techniques, also applied in the characterization of polymorphs (19, 20, 21, 22).

95
The aim of this study was the preparation and solid state characterization of the pure VEN polymorphs (Form 1 and Form 2) through different techniques: XRPD, DRIFT, RS, ssNMR, DSC and, SEM. Additionally, the evaluation of VEN raw materials purchased from diverse suppliers was carried out employing XRPD followed by the Rietveld refinement method in order to identify the presence and the amount of each polymorphic form. 2. Materials and methods 2.1 Materials Venlafaxine hydrochloride (CAS 99300-78-4) raw materials were obtained from different suppliers and were identified as VEN1–VEN4. All chemicals used were of pharmaceutical analytical grade. 2.1.1. Preparation of polymorphs
To obtain the monoclinic form (Form 2), approximately 50 mg of VEN1 was dissolved in 4 mL of methanol:ethyl acetate (1:8, v:v) and the solution was submitted to low temperature (3-8 °C) until VEN crystallization was complete (14). To get the orthorhombic form (Form 1), an amount corresponding to about 50 mg of VEN was dissolved in 2 mL of dichloromethane and allowed to slow evaporation under ambient conditions during 5 weeks until the total of the solvent has evaporated. The pure phases 1 and 2 were confirmed by comparing its XRPD patterns with those calculated from refs 13 and 14. 2.2 Methods 2.2.1. Scanning electron microscopy (SEM)
The morphology of VEN Form 1, Form 2 and the four raw materials were observed by a scanning electron microscope (Phillips XL30). Samples were mounted on metal stubs by using double-side adhesive tape, vacuum-coated with gold (350 Å) in a Polaron E 5000 sputter coating unit and directly analyzed by SEM (2,000 X).

96
2.2.2. Assay of VEN raw material by HPLC
Assay of VEN raw materials was determined by a stability indicating HPLC method previously validated (23). The purity was determined by comparison between standard and sample solutions. 2.2.3. Powder X-ray diffractometry (PXRD)
The diffraction patterns of VEN were obtained in a Stoe STADI-P powder diffractometer using Cu kα1 radiation selected by a Ge (1 1 1) curved monochromator, tube voltage of 40 kV and current of 40 mA, and the signals were detected by a multistrip silicon detector Mythen 1K. The samples were loaded in 0.7-mm borosilicate glass capillaries that were held spinning during data collection in the range 5° – 50° (2θ) with step sizes of 0.015° and 60 s of integration time at each 1.05°. 2.2.4. Polymorphic Quantification Methodology - Rietveld Refinements
The polymorphic quantification of the raw materials VEN3 and VEN4 was carried out by means of the Rietveld method using the software program Topas Academic v.4.1 (24) and the published structural data (13, 14) for venlafaxine hydrochloride. The background was fitted using a 12-term Chebyschev polynomial. The peak asymmetry was fitted by the simple axial divergence model of Cheary and Coelho (25, 26). The peak profiles were modeled by the Double-Voigt approach with anisotropic peak profiles adjusted using a 4-term preferred orientation spherical harmonics of the crystals. Both the peak asymmetry as well as peak profiles were kept fixed during the refinement of VEN samples. The values were obtained from the refinement of a Si (SRM-640c) standard reference material distributed by NIST (National Institute of Standards and Technology, USA). Only the terms describing the preferred orientation of the crystallites were then refined. An analytical correction was applied in order to reduce aberrations affecting data collected with 1D position sensitive detectors in Debye-Scherrer capillary geometry (27). 2.2.5. Differential scanning calorimetry (DSC)

97
DSC curves were recorded using a Shimadzu DSC-60 cell under dynamic atmosphere with a 50 mL min-1 nitrogen flow rate. Approximately 2 mg of each sample of VEN powder were weighted out and placed in a sealed aluminum pan; an empty aluminum pan was used as reference. Heating rate of 2 ºC min-1 was employed over the temperature range of 30 – 250 ºC. 2.2.6. Diffuse reflectance infrared Fourier transform spectroscopy (DRIFT) The DRIFT spectra were acquired on a Shimadzu spectrophotometer (Prestige) in the range of 400 – 4000 cm-1 (average of over 32 scans) at a spectral resolution of 4 cm-1 in KBr. A background spectrum was obtained for each experimental condition 2.2.7. Raman spectroscopy (RS)
Raman spectra were collected in backscattering geometry using an Agiltron PeakSeeker 785 PRO Raman system (Woburn, MA, USA) with a diode laser of 785 nm and 300 mW at the source. The collected Raman radiation was dispersed with a grating and focused on a Peltier-cooled charge-coupled device CCD detector obtaining a spectral resolution of 6 cm-1. The laser was focused on the sample by 20x objective lens of a microscope. All spectra were recorded in the spectral window of 200 – 2000 cm-1 with the same acquisition time (15 seconds). The powders were analyzed in glass blades at room temperature. 2.2.8. Solid-state 13C nuclear magnetic resonance (ssNMR)
High resolution 13C solid state spectra for both Form 1 and Form 2 were recorded using the ramp CP/MAS sequence with proton decoupling during acquisition. The solid state NMR experiments were performed at room temperature in a Bruker Avance II spectrometer operating at 300.13 MHz for protons and equipped with a 4 mm MAS probe. The operating frequency for carbons was 75.46 MHz. Adamantane was used as an external reference for the 13C spectra and to set the Harmann-Hahn matching condition in the cross polarization experiments. Spinning rate was 10 kHz. The number of transients was 512 and 1024 for Form 1 and Form 2 respectively, in order to obtain an adequate signal to noise ratio. The recycling time was 10 s for Form 1

98
and 6 s for Form 2, the contact time during CP was 3 ms and the acquisition time was 41 ms for the two samples. SPINAL 64 sequence was used for decoupling during acquisition with a proton field H1H satisfying ω1H/2π = γH ω1H/2π = 78.2 kHz. Quaternary carbon spectra were recorded for the two samples. These spectra were acquired with the non-quaternary suppression (NQS) sequence, where the 1H and 13C radio-frequency (rf) fields are removed during 40 µs after CP and before the acquisition. This delay allows the carbon magnetization to decay because of the 1H-13C dipolar coupling, resulting in spectra where CH and CH2 are substantially removed. This experiment allows us, then, to identify quaternary carbon signals and methyl groups. 3. Results and discussion
3.1 Solid state characterization of Venlafaxine Hydrochloride Form 1 and Form 2
In order to obtain the pure form of each different crystalline
form of VEN, recrystallization experiments were carried out. The pure Forms 1 and 2 were confirmed by comparing their X-ray powder diffraction (XRPD) patterns with the powder patterns calculated from crystal structures that were deposited in the Cambridge Structural Database (CSD) (Figure 2) (28, 29).

99
Figure 2 - XRPD patterns A) Form 1 experimental and
calculated (WOBMUV); B) Form 2 experimental and calculated (WOBMUV01).
The assay of the polymorphic forms and commercial samples of
VEN were determined to be more than 99.8%, when evaluated by stability indicating HPLC method (23).
During crystallization process of a substance, external factors can produce the formation of a special crystalline habit. The crystal morphology plays an important role in pharmaceutical processing and developing of solid dosage forms. Differences in crystal habit may strongly influence the particle orientation; modify flowability, packing, compaction, compressibility and, dissolution characteristics (30, 31).
The SEM (Fig. 3) showed two different morphologies in agreement with blocks (Form 1) and needles (Form 2) reported in the literature.

100
Figure 3 - SEM Photomicrographs of the two polymorphic
forms of VEN. (A) Blocks (Form 1); (B) Needles (Form 2) at 200X magnification.
The fundamental frequency positions in the DRIFT spectra
(Fig. 4A) of both polymorphic forms showed the characteristics vibration of VEN, a broad peak related vibrations O–H at 3450–3200 cm-1, stretching vibrations of C=C at 1513 cm-1, followed by C–O–CH3 stretching at 1246 cm-1 and the resonance band at 1183 cm-1 for N–C vibrations (32).
The DRIFT spectra of VEN Form 1 and 2 did not revealed significant differences that can be used to distinguish the two forms. The main difference was observed only in the large broad peak related vibrations O–H of Form 2.
The Raman spectra of the pure Forms 1 and 2 in the range of 200-2000 cm-1 are presented in Figure 4B. There are basically the same features in the spectra of Form 1 and Form 2, but Form 1 presented slightly sharper peaks with different relative intensities between 800 and 880 cm-1 and a higher baseline. The baseline increase is attributed to fluorescence effects from undefined source, since no degradation was observed; maybe it can be related with some photo-induced phenomena. The relative intensities between 800 and 880 cm-1 and some peaks at 1470, 1300, 1250, 980 cm-1 may be used as a probe to distinguish between Forms 1 and 2.

101
Figure 4 - A) DRIFT spectra: VEN Forms 1 and 2; B) Raman spectra: VEN Forms 1 and 2.
The DSC curves of Forms 1 and 2 of VEN obtained at 2 °C
min-1 are shown in figure 5A and table 1. The DSC curve of Form 1 revealed a single sharp endothermic even at 208.34 °C (Tonset = 207.77 ºC; ∆Hfusion = -106.14 J g-1), corresponding to the VEN melting point. The DSC curve of Form 2 showed an unique endothermic event at 214.09 °C (Tonset = 213.61 ºC; ∆Hfusion = -131.52 J g-1) also corresponding to the melting point.
The characterization of VEN polymorphs using DSC was already described in the literature. However, in the papers and patents related, some DSC curves and melting points of Forms 1 and 2 are not consistent (7, 13, 14, 16).
Roy et al., 2005, described that the DSC curves for the both Forms showed two endothermic events. The DSC curve of Form 1 exhibited a major endotherm at 210 - 211 °C and a minor peak at 214 - 215 °C, and the DSC curve for Form 2 displayed endotherms in the

102
same range of temperature of Form 1 (208 - 209, 215 - 216 °C) but with the size of peaks reversed (7, 16). Thus, our results are in disagreement with the authors. In order to confirm the identity and purity of our polymorphs, the Rietveld method was applied and revealed that the re-crystalized Forms 1 and 2 were 100% pure forms.
Table 1 - DSC data for Venlafaxine Hydrochloride raw
materials (VEN1 - VEN4) obtained at heating rates of 10 ºC min-1 and 2 °C min-1.
2 °C min-1
Sample Tonset (°C) Tpeak (°C) ∆H (Jg-1)
Form 1 207.76 208.34 -106.14
Form 2 213.61 214.09 -131.52
VEN1 208.60 209.40 -78.57
VEN2 208.70 209.00 -169.85
VEN3 207.15 208.60 -110.97
210.60 211.37 -3.24
VEN4 206.90 207.95 -119.8
211.26 211.96 -33.88

103
Figure 5 - DSC curves of VEN: A) Form 1 (dashed lines) and
Form 2 (solid lines); and B) VEN1-VEN4 obtained with heating rate of 2 °C min-1.
The two polymorphs of VEN were also studied by ssNMR. The
13C NMR spectra for VEN Forms 1 and 2 are shown in Figure 6. The assignments for the 13C spectra (see carbon numbering in Fig. 1) were done taking into account the quaternary carbon spectra and by comparing with the solution 13C spectra and simulations resulting from commercial software. The 13C ssNMR chemical shifts for both Form 1 and Form 2 are displayed in Table 2 together with the solution NMR 13C chemical shifts. The two solid forms can be clearly distinguished from their high resolution 13C ssNMR spectra. Both Form 1 and Form 2 13C spectra showed distinct resonances for each carbon in the molecule. The two polymorphs have a single molecule in the asymmetric unit. Despite their distinct 13C spectra, the chemical shifts differences between them indicate that the molecular conformation on both polymorphs is very similar or that crystal packing effects have equally large effects, compensating for conformational differences, on the chemical shifts. These facts are in agreement with X-Ray reports (13, 14), providing an assurance of their physical purity.

104
Figure 6 - ssNMR spectra of VEN Forms 1 and 2.

105
Table 2 - 13C ssNMR chemical shifts for Venlafaxine Hydrochloride Form 1 and Form 2.
Chemical shift (ppm)
Carbon ssNMR NMR (CDCl3)
Form 1 Form 2
1 135.3 134.3 130.0
2, 6 131.4 133.3 130.7 133.8 130.0
3, 5 118.4 109.4 116.1 108.8 113.8
4 158.4 158.6 158.6
7 52.0 51.7 52.2
8 74.6 74.7 73.4
9, 13 37.8 38.6 36.3 38.4 31.1 36.4
10, 12 22.0 24.3 22.1 22.8 21.0
11 26.6 26.2 25.1
14 60.0 60.0 59.8
15, 16 42.1 43.9 43.0 44.0 42.4 44.8
17 56.3 55.4 55.0
Polymorphic Forms 1 and 2 were readily distinguishable from
their XRPD patterns (Fig. 2). XRPD patterns of Form 1 exhibited two characteristic peaks with significant intensity diffraction at 10.30º and 20.30º (2θ), in addition peaks at 15.10º, 18.30º and, 22.75º (2θ) are present only in Form 1. The Form 2 pattern showed three Bragg peaks at 2θ: 8.40º, 12.78º and 16.41º that are not present in Form 1. These angles were used for the polymorphic characterization of the commercial samples.

106
3.2 Solid state characterization of Venlafaxine hydrochloride commercial raw materials
The SEM images of VEN raw materials (Fig. 7) confirmed the
differences in the crystalline habit, morphology and size particles of Forms 1 and 2. The VEN2, VEN3 and VEN4 samples showed mixtures of rods and irregulars plates particles (with particle size and frequency of aggregates differing in the samples). The VEN1 showed the smaller rod-like particles.
Figure 7 - SEM Photomicrographs of 1 - VEN1; 2 - VEN2; 3 -
VEN3; 4 - VEN4; at 2,000X magnification. The DRIFT and Raman spectra of VEN1 – VEN4 showed the
same characteristics vibration of the Form 1 and Form 2. No significance differences were observed that could distinguish the pure phases or a mixture of polymorphs of VEN in the raw materials.
The DSC curves of VEN1 - VEN4 were obtained at 2 °C min-1 and the results can be observed in figure 5B and table 1. Comparing the DSC curves of polymorphic forms, we could relate the VEN1 and VEN2 to the Form 1, due to the unique single sharp event at 209.1 °C

107
while the VEN3 and VEN4 showed to be a mixture of the two polymorphic forms once that two endothermic events can be visualized.
The XRPD patterns of VEN raw materials (Fig. 8) confirmed that VEN1 and VEN2 were composed just by Form 1, whereas VEN3 and VEN4 were a mixture of the two polymorphs. It is worth highlighting that, although our experiments were performed using borosilicate glass capillaries, we observed the slight influence of preferred orientation effects. The XRPD technique is a quick tool capable to confirm the presence/absence of the polymorphic forms in the samples, proving that the XRPD must be included in the routine laboratorial methods.
Figure 8 - XRPD patterns of VEN polymorphs: raw material
(VEN1-VEN4). 3.3 Polymorphic quantification using Rietveld Method and
XRD. The Rietveld method, originally developed for the refinement of
crystal structures, proved to be very efficient in quantitative phase analysis, as the Rietveld scale factor of a phase relates to its relative amount in a multiphase mixture. The method has been successfully applied for quantitative applications of pharmaceutical solids in the last years (33, 34, 35). Previous studies demonstrated that parameters like type of sample holder, sample spinning, particle size, powder packing, and preferred orientation effects, have been critical to acquire XRPD

108
patterns sufficiently good to be used in the Rietveld analyses (33, 35, 36).
Initially our experiments were performed in a zero background holder, showing strong preferential orientation effects. Therefore, the phase quantification procedure was performed using XRPD patterns collected in 0.7-mm borosilicate glass capillaries in order to minimize the preferred orientation effect. The Rietveld refinements fitting for samples VEN3 and VEN4 are shown in Fig. 9. The results presented 17.5% of Form 1 and 82.5% of Form 2 (± 0.3) in VEN3, while VEN4 contains 57.5% of Form 1 and 42.5% of Form 2 (± 0.8). The goodness of fit indicator and R-factors (37) for both VEN3 and VEN4 samples are, respectively: VEN3 – χ2 = 1.83, Rwp = 0.0600, Rp = 0.0422, RBragg_Form_1 = 0.0198, RBragg_Form_2 = 0.0237; VEN4 – χ2 = 1.76, Rwp = 0.0542, Rp = 0.0408, RBragg_Form_1 = 0.0191, RBragg_Form_2 = 0.0178.
Figure 9 - Experimental (noisy lines) and calculated (thick
black lines) XRPD patterns: A) VEN3 and B) VEN4 samples. Gray

109
lines represent the difference between experimental and calculated patterns.
4. Conclusion
The two pure polymorphs of VEN (Form 1: orthorhombic and
Form 2: monoclinic) were obtained from VEN1 through recrystallization solvent methods. The pure polymorphs and the raw materials (VEN1 to VEN4) were characterized using structural, thermal and spectroscopic techniques. DSC and XRPD analyses showed that VEN1 and VEN2 raw materials were pure Form 1, while VEN3 and VEN4 presented a mixture of the two forms. The Rietveld refinement procedure using XRPD data collected using capillary showed that VEN3 has smaller content of Form 1 and VEN4 has higher content of Form 1. The XRPD technique is a powerful tool capable to confirm the presence/absence of the polymorphic forms in the samples and even quantify them, demonstrating that it must be included in the routine laboratorial methods. Finally, this study showed the diversity in the solid state properties of VEN available in the market, providing information about the solid state characterization of the samples in order to improve the quality control and the reproducibility of the formulations.
Acknowledgements The authors wish to thank FAPESC, CAPES, FAPESP (proc.
nr. 2008/1537-3) and CNPq (proc. nr. 309811/2009-0) for the support. The X-Ray Diffraction Laboratory (LDRX), Central Electron Microscopy Laboratory (LCME) at UFSC, and X-Ray Diffraction Laboratory at UFABC, ssRMN analyses was performed in Facultad de Matemática, Astronomía y Física – Universidad Nacional de Córdoba, Argentina.

110
References 1. H. Brittain, Polymorphism in Pharmaceutical Solids, Marcel Dekker, New York EUA, 1999. 2. J. Bernstein, Polymorphism in Molecular Crystals. Clarendon, Oxford, 2002. 3. A.S. Raw, M.S. Faurness, D.S. Gill, R.C. Adams, F.O. Holcombe, L.X. Yu, Regulatory considerations of pharmaceutical solid polymorphism in abbreviated new drug applications (ANDAs), Adv. Drug Deliv. Rev. 56 (2004) 397 – 414. 4. D. Giron, Characterization of salts of drug substances, J. Therm. Anal. Calorim. 73 (2003) 441 – 457. 5. S. Byrn, R. Pfeiffer, M. Ganey, C. Hoiberg, G. Poochikian, Pharmaceutical solids: A strategic approach to regulatory considerations, Pharm. Res. 12 (1995) 945 – 954. 6. D. Giron, M. Mutz, S. Garnier, Solid-state of pharmaceutical compounds: Impact of the ICH Q6 guideline on industrial development, J. Therm. Anal. Calorim. 77 (2004) 709 – 747. 7. S. Roy, P.M. Bhatt, A. Nangia, G.J. Kruger, Stable Polymorph of Venlafaxine Hydrochloride by Solid-to-Solid Phase Transition at High Temperature, Cryst. Growth Des. 7 (2007) 476 – 480. 8. J.M. Andrews, P.T. Ninan, C.B. Nemeroff, Venlafaxine: a novel antidepressant that has a dual mechanism of action, Depression 4 (1996) 48 – 56. 9. J.S. Olver, G.D. Burrows, T.R. Norman, Third-generation antidepressants: do they offer advantages over the SSRIs? CNS Drugs 15 (2001) 941 – 54. 10. Y. Lecrubier, M. Bourin, C.A.L. Moon, F. Schifano, C. Blanchard, P. Danjou, D. Hackett, Efficacy of venlafaxine in depressive illness in general practice, Acta Psychiatr. Scand. 95 (1997) 485 – 93.

111
11. THE ECONOMIST. Prescription for change: a survey of pharmaceuticals, June 18th, 2005. 12. Effexor XR® (venlafaxine hydrochloride) extended release capsules. (2008) Available at: http://www.wyeth.com/content/showlabeling.asp?id=100. 13. D. Vega, D. Fernandez, G. Echeverria, 1-[2-(1-Hydroxycyclohexyl)-2-(4- methoxyphenyl)ethyl]dimethyl- ammonium chloride (venlafaxine hydrochloride), Acta Crystallogr. 56 (2000) 1009 – 1010. 14. A. Sivalakshmidevi, K. Vyas, S. Mahender Rao, G. Om Reddy, A monoclinic polymorph of venlafaxine hydrochloride, Acta Crystallogr. 58 (2002) 1072 – 1074. 15. Downloaded from the PriorArt Database. http://www.priorartdatabase. com/IPCOM/000029066. 16. S. Roy, S. Aitipamula, A. Nangia. Thermochemical Analysis of Venlafaxine Hydrochloride Polymorphs 1-5. Cryst. Growth Des. 5 (2005) 2268 – 2276. 17. ICH harmonized guideline. 1999. Q6A Specifications: Test procedures and acceptance criteria for new drug substances and new drug products: Chemical substances. 18. A.M. Tudor, C.D. Melia, J.S. Binns, P.J. Hendra, S. Church, M.C. Davies, The application of Fourier-transform Raman spectroscopy to the analysis of pharmaceuticals and biomaterials, J. Pharm. Biomed. Anal. 8 (1990) 717 – 720. 19. S.R. Byrn, R.R. Pfeiffer, J.G. Stowell, Solid-State Chemistry of Drugs, Second edition, West Lafayette, Indiana EUA, 1999. 20. M. Sheikhzadeh, S. Rohani, A. Jutan, T. Manifar, K. Murthy, S. Horne, Solid-State Characterization of Buspirone Hydrochloride Polymorphs, Pharm. Res. 23 (2006) 1043 – 1050.

112
21. M.A. Palacio, S. Cuffini, R. Badini, A. Karlsson, S.M. Palacios, Solid-state characterization of two polymorphic forms of R-albuterol sulfate, J. Pharm. Biomed. Anal. 43 (2007) 1531 – 1534. 22. J.P. Carini, C. Pavei, A.P.C. Silva, G. Machado, A.S. Mexias, V.P. Pereira, S.L. Filho, P. Mayorga, Solid state evaluation of some thalidomide raw materials, Int. J. Pharm. 372 (2009) 17 – 23. 23. L.S. Bernardi, P.R. Oliveira, F.S. Murakami, S.H.M. Borgmann, M.Z. Arend, S.G. Cardoso, Development and Validation of a Stability-Indicating LC Method for the Determination of Venlafaxine in Extended-Release Capsules and Dissolution Kinetic Studies, J. Chromatogr. Sci. 47 (2009) 770 – 776. 24. A.A. Coelho. Topas Academic. 4.1, Coelho Software, Brisbane, Australia, 2007. 25. R.W. Cheary, A.A. Coelho. Fundamental parameters approach to X-ray line-profile fitting. J Appl Crystallogr. 25(1992) 109–121. 26. R.W. Cheary, A.A. Coelho. Axial divergence in a conventional X-ray powder diffractometer. I. Theoretical foundations. J Appl Crystallogr 31(1998) 851–861. 27. F. Gozzo, A. Cervellino, M. Leoni, P. Scardi, A. Bergamaschi, B. Schmitt, Z. Kristallogr. 225 (2010) 616–624. 28. D. Vega, D. Fernandez, G. Echeverria. WOBMUV. CCDC 150349. 2000. 29. A. Sivalakshmidevi, K. Vyas, S.M. Rao, G.O. Reddy. WOBMUV01. CCDC 198947. 2002. 30. A.K. Tiwary, Modification of crystal habit and its role in dosage form performance, Drug Dev. Ind. Pharm. 27 (2001) 699–709. 31. G. Chawla, P. Gupta, R. Thilagavathi, A.K. Chakraborti, A.K. Bansal, Characterization of solid-state forms of celecoxib, Eur. J. Pharm. Sci. 20 (2003) 305–317.

113
32. L.S. Bernardi, P.R. Oliveira, F.S. Murakami, M.A.S. Silva, S.H.M. Borgmann, S.G. Cardoso. Characterization of venlafaxine hydrochloride and compatibility studies with pharmaceutical excipients. J. Therm. Anal. Calorim. 97 (2009) 729 – 733. 33. S.G. Antonio, F.R. Benini, F.F. Ferreira, P.C.P. Rosa, C.O. Paiva-Santos, Quantitative Phase Analyses Through The Rietveld Method with X-Ray Powder Diffraction Data of Heat-Treated Carbamazepine Form III, J. Pharm. Sci. 7 (2011) 2658 – 2664. 34. S.S. Iyengar, N.V. Phadnis, R. Suryanarayanan, Quantitative analysis of complex pharmaceutical mixtures by the Rietveld method, Powder Diffr. 16 (2001) 20–24. 35. Z. Németa, I. Sajó, Á. Demeter, Rietveld refinement in the routine quantitative analysis of famotidine polymorphs, J. Pharm. Biomed. Anal. 51 (2010) 572–576. 36. M. Tiwari, G. Chawla, A. K. Bansal, Quantification of olanzapine polymorphs using powder X-ray diffraction technique, J. Pharm. Biomed. Anal. 43 (2007) 865–872. 37. B.H. Toby. R factors in Rietveld analysis: How good is good enough? Powder Diffraction 21(2006) 67-70.

114
CAPÍTULO 6 – Estudo das relações termodinâmicas dos polimorfos do cloridrato de venlafaxina
Thermodynamic Relationship Study of the Venlafaxine Hydrochloride Polymorphs

115

116
INTRODUÇÃO
Como visto no capítulo anterior, o cloridrato de venlafaxina pode ser recristalizado em diferentes formas polimórficas. Além disto, observou-se que as matérias-primas apresentaram mistura de polimorfos. Entretanto, o comportamento e algumas características em termos de energia e estabilidade destas formas polimórficas ainda são confusos e faltam estudos que as esclareçam. Dessa forma, estudo envolvendo a relação termodinâmica entre os polimorfos encontrados tornou-se necessário.
Conhecer a relação termodinâmica dos polimorfos, ou seja, determinar se eles são enantiotrópicos ou monotrópicos, é importante para selecionar uma forma polimórfica para o desenvolvimento farmacotécnico; evitar que o polimorfo utilizado na formulação se transforme em outro durante o tempo de armazenamento; e definir a condição de armazenamento mais apropriada para o medicamento, onde o polimorfo selecionado seja estável e mantenha as características desejáveis para promover o efeito farmacológico (GIRON, MUTZ & GARNIER, 2004; ROY et al., 2007; KAWAKAMI, 2007; HERMAN et al., 2011; KHAMAR et al., 2012).
O presente capítulo tem como objetivo a avaliação da relação termodinâmica das formas polimórficas 1, 2 e 3 do cloridrato de venlafaxina utilizando DSC em diferentes taxas de aquecimento, microscopia de fase quente, determinação da solubilidade com a construção do Gráfico de Van’t Hoff e Difração de Raios-X de pó com programa de aquecimento.

117

118
Thermodynamic Relationship Study of the Venlafaxine Hydrochloride Polymorphs
Abstract Three polymorphs of venlafaxine hydrochloride (VEN) were evaluated regarding to their thermal profile and thermodynamic relationship in an attempt to elucidate the relevant literature of VEN. Different techniques such as differential scanning calorimetry (DSC), hot stage microscopy (HSM), variable temperature X-ray powder diffraction (VTXRPD) and, solubility measurements were employed for this purpose. The DSC results showed that the Form 1 presented only one endothermic event at 212.8 ºC while the Form 2 showed two endothermic events at 210.7ºC and 221.1ºC, separated by an exothermic event. By HSM it was possible to visualize that a new re-crystallized form arose from the VEN Form 2 melted. From the solubility studies and the Rietveld method it was possible to identify the presence of the an amount of Form 1 in the Form 2 (about 3%) that could be responsible for the first endothermic event visualized in the DSC curve of the Form 2. Additionally, the new form obtained by melting the Form 2, identified as Form 3, was isolated and characterized. XRPD analysis confirmed that this new form was not related to any deposited in the Cambridge Crystallographic Database. Moreover, a monotropic thermodynamic relationship between Form 1 and Form 3 could be established, and the Form 3 was considered the more stable polymorphic form of VEN. Keywords: Venlafaxine Hydrochloride, Polymorphism, Solubility determination, Thermodynamic relationship

119
1. Introduction Many drugs may appear in more than one crystalline structure
i.e. in different polymorphs due to different arrangement of molecules in the lattice (packing polymorphism) or because of different conformation of the molecules in the lattice (conformational polymorphism) (1-4).
As a result of polymorphism, the molecules can exhibit different physical properties that may affect their bioavailability, performance, stability, quality and eventually therapeutic efficacy (1, 2, 4, 5). The awareness of the consequences that different polymorphs can carry in pharmaceutical formulations has led to an increased regulatory interest in studies of crystalline solids (2, 4, 5).
Understanding the thermodynamic relationships between the different polymorphs play important roles to comprehend the solid-state properties and behavior of drug substances to avoid that phase transformations in the pharmaceutical formulation could significantly alter and/or hamper to meet the quality specifications (1, 2, 6, 7).
Venlafaxine hydrochloride (VEN) (Figure 1), a potent serotonin and norepinephrine reuptake inhibitor effective in the treatment of depression disease and generalized anxiety disorder (8, 9, 10) can be considered a “highly polymorphic” drug (11), as it exhibits at least three polymorphs (12-14). Roy et al (12), in an attempt to clarify the state of the art relevant to VEN polymorphism, classified the polymorphs of VEN according to their main melting endotherms in differential scanning calorimetry, DSC. Thus, five polymorphs were reported: Form 1 (210-212 °C), Form 2 (208-210 °C), Form 3 (202-204 °C, phase from melting), Form 4 (219-220 °C, hydrate/alcohol solvate) and Form 5 (216-218 °C, phase from sublimation). However, far from being clarified the polymorphism of VEN is still an issue to be addressed as the data available in the literature (including patents) are largely in disagreement. In particular, the DSC curves and melting points of Forms 1 and 2 are not consistent, and the thermodynamic relationship between the various forms is still an open question (12, 13, 14).

120
Figure 1 Chemical structure of venlafaxine hydrochloride
This study aimed at contributing to the clarification of the VEN polymorphism by coupling thermal analysis (differential scanning calorimetry, hot stage microscopy and variable temperature powder X ray diffraction) with solubility measurements. 2. Materials and Methods 2.1. Preparation of polymorphs
To obtain the orthorhombic form (Form 1), an amount corresponding to about 50 mg of VEN (lot: VH07/0006/23, DEG, São Paulo, Brazil) was dissolved in 2 mL of dichloromethane and allowed to slow evaporation under ambient conditions during 5 weeks until the solvent had completely evaporated. To get the monoclinic form (Form 2), approximately 50 mg of VEN was dissolved in 4 mL of methanol:ethyl acetate (1:8) and the solution was submitted to low temperature (3-8 °C) until VEN crystallization was complete (15).
In order to obtain the Form 3, an amount corresponding to about 150 mg of Form 2 was weighted and placed in a little column containing glass balls. Nitrogen was purged through the column for 1 h and then it was put in an oven at 209 °C for 2 h. 2.2. Optical Microscopy and Hot Stage Microscopy (HSM)

121
Crystal morphologies of VEN Forms 1, 2 and 3 were observed with an Optiphot2-Pol microscope (Nikon, Tokyo, Japan) fitted with a Nikon Coolpix 4500 camera (original magnification 20X).
Hot stage microscopy analyses were carried out using the same microscope equipped with a HSF 91 plate (Linkam Scientific Instrument, U.K.). Hot stage observations were carried out from 25 to 220 °C under a flux of dry Nitrogen (10 mL min-1). 2.3. Differential Scanning Calorimetry (DSC)
Differential scanning calorimetry analysis were performed on a Mettler DSC 821e (Mettler Toledo, Columbus, OH) driven by STARe software (METTLER Toledo). Approximately 5 mg of each sample of VEN were weighted and placed in a sealed and pierced Aluminum pan. Heating rates of 2 ºC min-1, 5 ºC min-1 and, 10 ºC min-1were employed over the temperature range of 25 – 250 ºC under dynamic Nitrogen atmosphere with the flow rate of 100 mL min-1. The DSC cell was previously calibrated with Indium (mp 156.6 ºC; ∆Hfus= 28.54 J g-1). 2.4. X-Ray Diffraction Studies
X-rays patterns on powder were obtained in a PanAlytical XPert PRO Multi-Purpose Diffractometer with a Cu kα radiation, tube voltage 45 kV and current of 40 mA, in the range of 5 – 40° (2θ) with a 0.016° step size and 20 s step time. The Variable Temperature X-ray Powder Diffraction (VTXRPD) was performed on the VEN crystals of polymorphic Forms 1 and 2. An amount of the each polymorphic form was loaded into the HTK16 heating sample holder and subjected to VTXRPD analysis at 10 °C intervals from 25 °C to 200 °C. 2.5 X-Ray Diffraction Studies for Rietveld Refinements - Polymorphic Quantification
The diffraction pattern of Form 2 to Rietveld method was obtained in a Stoe STADI-P powder diffractometer using Cu kα1 radiation selected by a Ge (1 1 1) curved monochromator, tube voltage of 40 kV and current of 40 mA, and the signals were detected by a multistrip silicon detector Mythen 1K. The sample were loaded in 0.7-mm or borosilicate glass capillaries that were held spinning during data collection in the range 5° – 50° (2θ) with step sizes of 0.015° and 60 s of

122
integration time at each 1.05°. Polymorphic quantification was carried out by means of the Rietveld method using the software program Topas Academic v.4. (16) and the published structural data (17, 18) for venlafaxine hydrochloride. The background was fitted using a 12-term Chebyschev polynomial. Peak asymmetry was fitted by the simple axial divergence model of Cheary and Coelho (19, 20). The peak profiles were modeled by the Double-Voigt approach with anisotropic peak profiles adjusted using a 4-term preferred orientation spherical harmonics of the crystals. An analytical correction was applied in order to reduce aberrations affecting data collected with 1D position sensitive detectors in Debye-Scherrer capillary geometry. 2.6. Solubility Determination
Equilibrium solubility determination was performed in the 40 – 100 °C interval. An excess of VEN Form 1, Form 2 or Form 3 (10 mg) was suspended in 1 mL of Triacetin (Merck, Germany) in EppendorfTM vials and stirred with vortex three times within 1 h. Thereafter, the suspensions were allowed to settle for 48 hours, then they were filtered (0.45 µm), diluted and analyzed by HPLC to determine the VEN concentration (21). Each measurement was performed in triplicate. 3. Results and Discussion
To obtain the polymorphic Forms 1 and 2 of VEN, different crystallization methods were employed. The morphological features of the polymorphic forms were visually examined using optical microscopy. The Form 1 exhibited blocks crystal habit while, the Form 2 aroused as fine needles (Figure 2).
Figure 2 - Optical microscopy of the two forms of VEN. (A)
Form 1 (blocks); (B) Form 2 (needles); (C) Form 3 (slides). Original magnification 20X.

123
In order to confirm the identification of the polymorphic forms of
VEN, the XRPD patterns of Form 1 and 2 were compared with the patterns deposited in the Cambridge Crystallographic Database (17, 18).
The observed differences in the XRPD patterns (Figure 3) between the two forms were found mainly in low angle (the differences are in positions and relative intensities). Form 1 showed characteristic peaks at 15.10º, 18.30º, 22.75º (2θ) corresponding only to this form while the pattern of Form 2 presented peaks at 8.40º, 12.78º, 16.41º, 19.05º, and 21.28º (2θ) that were not present in Form 1. The diffraction pattern of Form 2 was perfectly superimposed to that obtained from the commercial product used for VEN re-crystallization (data not shown).
Figure 3 - XRPD patterns of VEN polymorphs: Form 1 and Form 2 The DSC traces of Form 1 and 2 were obtained at different
heating rates, in order to study the behavior of VEN according to the temperature. The DSC curve of Form 1 heated at 5 °C min-1 showed a single sharp endothermic event at 212.8 °C (Tonset= 210.7 °C, ∆Hfus= -121.5 J g-1) (Figure 4B). When the Form 1 was recorded at scan rates of 2 and 10 °C min-1, very similar DSC were obtained as in all cases a single endothermic event, interpreted as the melting of Form 1, was

124
recorded. In these curves, the melting of Form 1 can be observed at 211.3 °C (Tonset= 210.4 °C, ∆Hfus= -121.8 J g-1), 212.5 °C (Tonset= 211.3 °C, ∆Hfus= -130.2 J g-1) at 2 and 10 °C min-1 respectively (Figure 4). Thus, Form 1 consistently gave rise to a single endotherm with small difference between the recorded melting points that were largely within the experimental error of the method (standard error on the onset temperature = 0.4 °C).
On the contrary, the DSC curve of Form 2 heated at 5 °C min-1 showed two endothermic events separated by an exothermic event. The first and minor event at 210.7 °C (Tonset= 208.7 °C) and the exothermic event followed by the major endothermic event at 221.1 °C (Tonset= 220.6 °C). The relevant ∆H of fusion or re-crystallization could not be calculated due to the overlapping of the events (Figure 5B).
Some differences could be observed in the DSC curves of Form 2 when the heating rate was changed for 2 and 10 °C min-1. At 2 °C min-1, the first endothermic and the exothermic event were barely visible, and the second endothermic event was bigger and sharp at 220.6 °C (Tonset= 219.9 °C, ∆Hfus= -100.4 J g-1). When the DSC curve was recorded at 10 °C min-1, the curve showed the two endothermic events separated by the exothermic event. Similarly from the curves obtained at 5 ° C min-1, in this curve the first endothermic event (212.55 °C, Tonset = 209.4 °C) and the exothermic event were minors and the second endothermic event (220.58 °C, Tonset= 219.33 °C) was the bigger (figure 5C). The ∆H values were not possible to be calculated due to overlapping of the events.
These results are not in agreement with Roy et al., (12), where the DSC curves for both forms showed two endothermic events. The DSC curve of Form 1 exhibited a major endotherm at 210 - 211 °C and a minor peak at 214 - 215 °C, and the DSC curve for Form 2 showed endotherms in the same temperature range of Form 1 (208 - 209, 215 - 216 °C) but with the peaks size reversed (12).

125
Figure 4 – DSC curve of polymorphic Forms 1 of VEN under
nitrogen atmosphere (100 mL min-1) heating at: A) 2 °C min-1; B) 5 °C min-1; C) 10 °C min-1.
Figure 5 – DSC curve of polymorphic Forms 2 of VEN under nitrogen atmosphere (100 mL min-1) heating at: A) 2 °C min-1; B) 5 °C min-1; C) 10 °C min-1.

126
Observing the DSC results, it was evident that for Form 1 the endothermic event (at 212.8 °C) was the melting point, however for Form 2 the melting point was not clear. The difficulty to determine the melting point of Form 2 was because the first endothermic event occurred at about the same temperature of Form 1. This result raised some possibilities: 1) There was an amount of Form 1 in the Form 2 sample that was not detectable by XRPD; 2) There is an enantiotropic relationship between the polymorphic forms and, 3) The melting point of the two forms was almost the same; but it rarely happens (according to our knowledge in polymorphism of pharmaceuticals).
In order to understand the DSC results, the HSM was performed for the Forms 1 and 2 (figure 6). By means of HSM it was possible to visualize for Form 2 a transition of the crystals starting approximately at 170 °C, with the needles growing and becoming a plate like form. There was a melting point at 210 °C with the simultaneous recrystallization of VEN from the “melted” forming big needles crystals that melted again at 220 °C.
The Form 1 was also analyzed by HSM and the results showed that at 170 °C the plate morphology of the Form 1 began to grow and at approximately 200 °C all the crystals were bigger. The melting point was at 211 °C, being in agreement with the DSC curve.

127
Figure 6 – Hot Stage Microscopy of Polymorphic forms of VEN:
A) Form 2 and B) Form 1. Original magnification 20X. The VTXRPD was performed in order to verify a possible solid-
solid phase transition with the temperature. According to the VTXRPD of Forms 1 and 2 (figure 7), there were no phase transitions at 170 °C, showing that those modifications observed by HMS could be related to morphological changes and not to crystalline transitions. It was in agreement with the DSC results, which did not demonstrated thermal events at this temperature. Differently, Roy et al., 2007, observed that the Form 6 of VEN was obtained at about 170 °C from a solid-solid transition from both Forms 1 and 2 (12).

128
Figure 7 – VTPXRD of the polymorphic forms of VEN: A) Form
2; B) Form 1.

129
Additionally, the solubility determination of the Forms 1 and 2 of VEN was carried out to complement the results obtained by DSC. This method has been widely used to assess the thermodynamic stability of related polymorphs. For a pair of polymorphs, at a given temperature and at any solvent, the thermodynamically stable phase presents a lower solubility (1, 19). This way, it was possible to determine the temperature range of the thermodynamic stability of VEN Forms 1 and 2 by measuring the equilibrium solubility of these polymorphs. The relationship was estimated by evaluating the VEN solubility in Triacetin at different temperatures in the 40 –100 °C interval. This solvent was selected because it was able to discriminate the solubility data of the polymorphic forms of VEN.
The values obtained (table 1 and fig. 8A) demonstrated that the Form 2 was lightly more soluble than Form 1. However the difference was small and not statistically significant (ANOVA, p > 0.05).
Table 1 – Solubility determination of VEN Form1 and Form 2 in Triacetin.
Solubility (µg/ml)
Temperature (°C) Form 1 Form 2
40 381.32 (0.22) 385.32 (1.30)
60 453.26 (1.41) 476.01 (1.27)
80 498.83 (0.81) 516.50 (0.78)
100 575.76 (1.46) 606.60 (1.08)
Standard deviation in parenthesis (n = 3).

130
Figure 8 – A) Solubility data of Form 1 (triangle symbol) and Form 2 (square symbol) of VEN; B) Van’t Hoff solubility plots of Form1 (triangle symbol) and Form 2 (square symbol) of VEN in Triacetin.
From the solubility data, the Van’t Hoff plot for the two polymorphic Forms of VEN was constructed (fig. 8B). By equating the linearity equations it was possible to find the intersection point and to determine the temperature at which the two curves cross. The temperature was found to be 14.64 ° C. This could be the transition temperature from Form 2 to Form 1 and, therefore, the two polymorphic forms would show an enantiotropic relationship. However, problems such as slow equilibrium resulting from a low rate of dissolution, the influence of impurities, and the apparent heterogeneity in the energy

131
content of the crystalline solid can lead to large discrepancies in the reported values (1).
Furthermore, analyzing these results, we can propose that there is an amount of Form 1 in the Form 2 sample and the transformation of the Form 2 to Form 1 is mediate by dissolution, in this case the solubility data observed is the solubility of the Form 1 and the thermodynamic relationship cannot be performed. Considering this, DSC analysis was carried out on the solid phases recovered at the end of the equilibrium solubility experiments. The Form 2 recovered after equilibrium at 25 °C showed a single sharp and clean melting point at 210 °C, demonstrating that the Form 2 was transformed in Form 1. DSC curve of Form 1 recovered after equilibrium solubility experiments at 80 °C demonstrated the melting point at 211 °C. These results allow us to propose that Form 1 is thermodynamically stable at least up to that temperature.
Thus, the Rietveld method was applied in order to certify and quantify the polymorphic Form 2 (fig. 9). The quantification results confirmed that there were approximately 3% contamination of Form 1 in the Form 2, which could explain the DSC curve of the Form 2 with two fusion events, the first event in the same temperature of the melting point of Form 1, and the solubility data equivalent to the Form 1. However, further studies involving the Form 2 must be performed in order to obtain it as pure crystal and achieve a true DSC curve.
Figure 9 – Rietveld Refinement of Form 2 Moreover, considering the results of the Form 2 in the DSC
curves, HSM, VTXRPD, the endothermic event at about 220 °C may be attributed to the melting of a polymorphic form non-isolable by

132
crystallization, obtained from the “melted” of the Form 2. In order to identify this new polymorphic form, the Form 2 was thermally treated and then characterized. The DSC curve of the new form (fig. 10) heated at 5 °C min-1 showed an unique sharp endothermic event at 220.7 °C (Tonset= 219.38 °C, ∆Hfus= -113.34 J g-1).
Figure 10 – DSC curve of the VEN new polymorphic form heated at 5 °C min-1 under nitrogen atmosphere (100 mL min-1).
Through of the OM of the Form 3 (fig. 2C) it was possible to observed crystals like slides. The XRPD pattern of the new form was compared with the patterns deposited in the Cambridge Crystallographic Database (fig. 11) (18, 19, 20). The XRPD of the new form showed numerous distinctive peaks indicating its high crystallinity. Additionally, in low angle, the overlap with the Form 6, found by Roy at al., 2007 (20), can be observed. But not a complete superimposed.
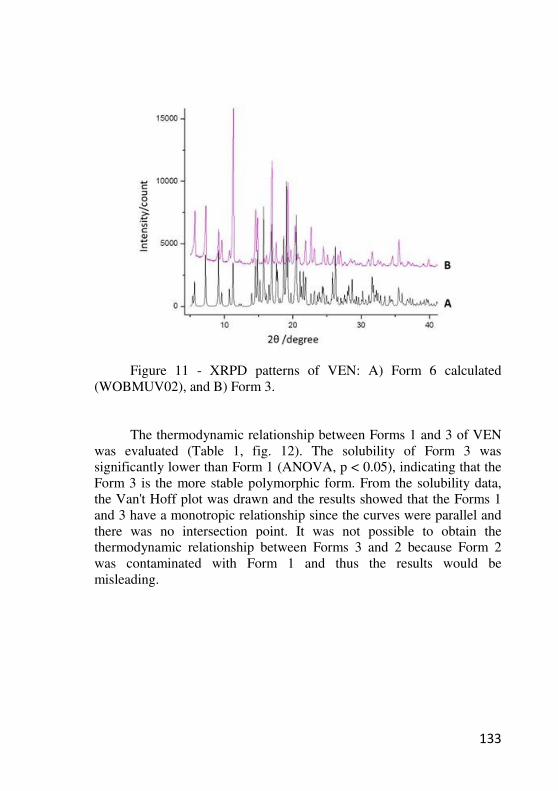
133
Figure 11 - XRPD patterns of VEN: A) Form 6 calculated
(WOBMUV02), and B) Form 3. The thermodynamic relationship between Forms 1 and 3 of VEN
was evaluated (Table 1, fig. 12). The solubility of Form 3 was significantly lower than Form 1 (ANOVA, p < 0.05), indicating that the Form 3 is the more stable polymorphic form. From the solubility data, the Van't Hoff plot was drawn and the results showed that the Forms 1 and 3 have a monotropic relationship since the curves were parallel and there was no intersection point. It was not possible to obtain the thermodynamic relationship between Forms 3 and 2 because Form 2 was contaminated with Form 1 and thus the results would be misleading.

134
Figure 12 – A) Solubility data of Form 1 (triangle symbol) and Form 3 (square symbol) of VEN; B) Van’t Hoff solubility plots of Form1 (triangle symbol) and Form 3 (square symbol) of VEN in Triacetin. 4. Conclusions
The thermodynamic relationship of venlafaxine hydrochloride polymorphic Forms 1, 2 and 3 was evaluated. Although the solubility study indicated an enantiotropic relationship, analyzing the results of the solubility and the DSC curves, it was proposed that there was an amount of Form 1 in the Form 2. It was confirmed when the Rietveld method for quantification was applied, disabling evaluation of the thermodynamic relationship between them. Furthermore a new polymorphic form was obtained from the “melted” of Form 2, named as Form 3. The Form 3 was characterized and solubility studies were carried out in order to evaluate the thermodynamic relationship between this Form and Form 1.

135
The results demonstrated a monotropic relationship and Form 3 was considered the more stable polymorphic form of VEN.
Acknowledgements
The authors wish to thank CNPq for the support, Prof. Dr. Ruggero Bettini for availability and valuable comments.

136
References 1. H.G. Brittain. Polymorphism in Pharmaceutical Solids, (2 ed.) Marcel Dekker, New York, 1999. 2. J. Bernstein. Polymorphism of pharmaceuticals. In: Polymorphism in molecular crystal. Oxford Science Publications, Oxford, 240 – 256, 2002. 3. D. Giron, M. Mutz, S. Garnier. Solid-state of pharmaceutical compounds. Journal of Thermal Analysis and Calorimetry, v.77, p. 709–747, 2004. 4. R. Barbas, R. Prohens and C. Puigjaner. A new polymorph of norfloxacin - Complete characterization and relative stability of its trimorphic system. Journal of Thermal Analysis and Calorimetry, v. 89, p. 687 – 692, 2007. 5. R. Purohit and P. Venugopalan. Polymorphism: An Overview. Resonance, p. 882 – 893, 2009. 6. S.R. Vippagunta, H.G. Brittain, D.J.W. Grant. Crystalline solids. Advanced Drug Delivery Reviews, v. 48, p. 3 – 26, 2001. 7. N. Chieng, T. Rades, J. Aaltonen. An overview of recent studies on the analysis of pharmaceutical polymorphs. Journal of Pharmaceutical and Biomedical Analysis, v. 55, p. 618–644, 2011. 8. M.A. Gutierrez, G.L. Stimmel, J.Y. Aiso. Venlafaxine: A 2003 Update. Clinical Therapeutics v. 25, p. 2138 – 2154, 2003. 9. G. Parker, K. Roy, K. Wilhelm, P. Mitchell. Assessing the comparative effectiveness of antidepressant therapies: A prospective clinical practice study. Journal of Clinical Psychiatry, v. 62, p. 117 - 125, 2001. 10. C.W. Wright, M.S. Aikman, E. Werts, J. Seabolt, J.M. . Haeusler. Bioequivalence of Single and Multiple Doses of Venlafaxine Extended-Release Tablets and Capsules in the Fasted and Fed States: Four Open-

137
Label, Randomized Crossover Trials in Healthy Volunteers. Clinical Therapeutics. vol. 31, p. 2722 - 2734 , 2009. 11. S.L. Morissette, O. Almarsson, M.L. Peterson, J.F. Remenar, M.J. Read, A.V. Lemmo, S. Ellis, M.J. Cima, C.R. Gardner. High-throughput crystallization: polymorphs, salts, co-crystals and solvates of pharmaceutical solids. Advanced Drug Delivery Reviews, v. 56, p. 275 - 300, 2004. 12. S. Roy, S. Aitipamula, A. Nangia. Thermochemical Analysis of Venlafaxine Hydrochloride Polymorphs 1-5. Crystal Growth & Design, v. 5, p. 2268 - 2276, 2005. 13. S. Roy, P.M. Bhatt, A. Nangia, G.J. Kruger. Stable Polymorph of Venlafaxine Hydrochloride by Solid-to-Solid Phase Transition at High Temperature. Crystal Growth & Design, v. 7, p. 476 – 480, 2007. 14. Patents of Venlafaxine Hydrochloride: (a) American Home Products, U.S. Patent 4,535,186, 1985. (b) Dr. Reddy’s Research Foundation, WO 02/46140 A1, 2002. (c) Teva Pharmaceuticals, U.S. Patent 2002/0183553, 2002. (d) Egis Gyo´gyszergya´ rrt, WO 03/042161 A1, 2003. (e) Ciba Specialty Chemicals, U.S. 2003/0105359 A1, 2003. (f) Teva Pharmaceuticals, WO 03/048082 A2, 2003. (g) Wyeth, U.S. 2003/0109585 A1, 2003. (h) Wyeth, U.S. 2003/ 0114536 A1, 2003. (i) Cadila Healthcare, WO 03/050074 A1, 2003. 15. A. Sivalakshmidevi, K. Vyas, S. M. Rao, G. O. Reddy. A monoclinic polymorph of venlafaxine hydrochloride. Acta Crystallographica Section E, v. 58, p. 1072 – 1074, 2002. 16. A.A. Coelho. Topas academic. 4.1 Brisbane, Australia: Coelho Software, Topas Academic, 2007. 17. D. Vega, D. Fernandez, G. Echeverria. WOBMUV. CCDC 150349. 2000. 18. A. Sivalakshmidevi, K. Vyas, S.M. Rao, G.O. Reddy. WOBMUV01. CCDC 198947. 2002.

138
19. R.W.Cheary, A.A. Coelho. Axial divergence in a conventional X-ray powder diffractometer. I. Theoretical foundations. Journal of Applied Crystallography, v. 31, p. 851 – 861, 1998. 20. R.W. Cheary, A.A. Coelho. Axial divergence in a conventional X-ray powder diffractometer. II. Realization and evaluation in a fundamental-parameter profile fitting procedure. Journal of Applied Crystallography, v. 31, p. 862 – 868, 1998. 21. L.S. Bernardi, P.R. Oliveira, F.S. Murakami, S.H.M. Borgmann, M.Z. Arend, S.G. Cardoso. Development and Validation of a Stability-Indicating LC Method for the Determination of Venlafaxine in Extended-Release Capsules and Dissolution Kinetic Studies. Journal of Chromatographic Science, v. 47, p. 770 – 776, 2009. 19. Carstensen, J.T. Advanced Pharmaceutical Solids. Drugs and Pharmaceutical Science, v.110, p.121-124, 2001. 20. S. Roy, P.M. Bhatt, A. Nangia, G.J. Kruger. WOBMUV02. CCDC 642747, 2007.

139

140
CAPÍTULO 7 – Quantificação polimórfica por DRX empregando o método de Rietveld
Development and validation of a method for Venlafaxine Hydrochloride polymorphic forms quantification using Rietveld refinement

141

142
INTRODUÇÃO
Sabendo-se dos problemas que diferentes propriedades físico-químicas provenientes de diferentes polimorfos podem acarretar em uma formulação farmacêutica, um acompanhamento adequado no estado sólido das formas polimórficas, tanto qualitativo quanto quantitativo, é fundamental para garantir produtos de alta qualidade (BUCKTON, 1999; VIPPAGUNTA; BRITTAIN; GRANT, 2001; GIRON; MUTZ; GARNIER, 2004; RAW et al., 2004). De acordo com os regulamentos do FDA e ICH, o método de análise quantitativo para a proporção das formas polimórficas deve ser validado e, além de avaliar parâmetros como linearidade, precisão e exatidão os métodos precisam demonstrar ter um baixo limite de detecção e quantificação. (FDA, 2007, ICH, 2005).
Conforme demonstrado no capítulo 5, a quantificação das formas polimórficas do cloridrato de venlafaxina em matérias-primas formadas por misturas polimórficas, através dos padrões de DRX utilizando o refinamento de Rietveld, é possível. Entretanto, para que os resultados encontrados sejam confiáveis e reprodutíveis, e para que este procedimento seja adequado para a aplicação pretendida, uma validação do método, seguindo os parâmetros do ICH e FDA, deve ser realizada, ou seja, deve ser demonstrado que o método é linear, preciso, exato e que tenha baixos limites de detecção e quantificação.
Ressalta-se que nenhum estudo de validação utilizando o método de Rietveld foi encontrado na literatura, representando uma inovação para as pesquisas na linha de polimorfismo. Estes estudos poderão ser úteis na avaliação de outros fármacos cuja mistura polimórfica ou o uso de um polimorfo diferente acarretaria em problemas de biodisponibilidade.
O presente capítulo apresenta o desenvolvimento de um método de quantificação de fases polimórficas do cloridrato de venlafaxina por DRX empregando o refinamento de Rietveld, além da validação do método com a avaliação de parâmetros como linearidade, limites de detecção e quantificação, precisão e exatidão segundo as recomendações do ICH (2005).

143

144
Development and validation of a method for Venlafaxine Hydrochloride polymorphic forms quantification using Rietveld
refinement
Abstract An accurate, precise and reliable X-ray powder diffraction (XRPD) method using Rietveld refinement was developed and validated for the quantitative determination of Venlafaxine hydrochloride (VEN) polymorphic forms in their binary mixtures. To minimize the preferred orientation effect, considered to be the major source of error in XRPD, the samples were minced and filled in 0.7 mm borosilicate glass capillaries. Validation parameters such as linearity, precision, accuracy were evaluated, giving results within the acceptable range. The Rietveld refinement assay displayed a LOD of 1.16% (w/w) and LOQ of 3.50% (w/w). Validation results showed excellent correlation between actual and predicted concentrations with r = 0.999. The study showed the application of the Rietveld refinement to assure more reliable quantitative results in quantification of polymorphic phases.
Keywords: Venlafaxine Hydrochloride; Rietveld method; X-ray powder diffractometry; Quantitative phase analysis; Polymorphism.

145
1. Introduction Venlafaxine hydrochloride (VEN) is a potent serotonin and
norepinephrine reuptake inhibitor effective in treatment of the depression disease and generalized anxiety disorder (1, 2, 3). VEN is commercially available in two polymorphic forms: Form 1 reported in the orthorhombic space group Pca21, Form 2 found in the monoclinic space group P21/n (4,5) (table 1) and in a mixture of the two polymorphs. Although these polymorphic forms did not show significant differences in vivo, it is very important to have a validated methodology to quantify the polymorphic forms in a mixture once that the Form 2 is preferred to use in pharmaceuticals formulations due the larger particle size with better filtration and drying characteristics (6). Table 1 - Crystal data for two polymorphs of VEN

146
Different crystalline forms can carry significant differences in
their physical properties, such as density, hardness, tabletability, melting point, enthalpy of fusion, solubility, stability, and other thermodynamic and kinetic properties that can result in a different dissolution rate and consequently in a different bioavailability (7, 8, 9). Therefore, proper monitoring of solid-state forms, both qualitative and quantitative, is crucial in order to ensure high-quality products (9, 10).
The importance of the drug polymorphic phase quantification in the pharmaceutical industry is constantly growing (11). There is an ever-increasing demand for the quality assurance to justify the polymorphic purity of active ingredients (12, 13, 14).
According to FDA regulations, a method for quantitative analysis of the ratio of polymorphic forms must be validated (9, 13). Additionally, the International Conference on Harmonization (ICH) provides guidance on when and how polymorphic forms should be monitored and controlled. The ICH also presents guidelines with the recommended parameters that need to be evaluated in order to validate a quantification method, such as linearity, accuracy, precision, limit of detection, and limit of quantitation (9, 13, 15, 16).
X-ray powder diffraction (XRPD) is a powerful technique for characterizing pharmaceutical solids and offers a unique advantage of determining the percentages of polymorphs in the quantitative analysis of mixtures (9, 16, 17, 18).
One of the main analytical challenges is the development of analytical methods with a lower limit of detection for identifying and quantifying a single polymorph in a mixture of polymorphs. For this reason more and more sensitive methods are being developed (9, 11, 14, 18).
Initially developed for the refinement of the crystal structure, the Rietveld technique proved to be very efficient and sensitive also in quantitative phase analysis, as the Rietveld scale factor of a phase relates to its relative amount in a multiphase mixture.
In the Rietveld method, the whole diffraction pattern contributes to the analysis, thus the impact of peak overlap and sample related effects (as preferred orientation) are minimized. Using physical constants from crystal structure data for calculating reflection intensities eliminates the errors associated with intensity measurements and calibration procedure (19-23).

147
In this work, a Rietveld method to obtain quantitative phase of the two polymorphs of venlafaxine hydrochloride by conventional X-ray powder diffraction data was developed and validated according ICH and FDA guidelines, which can be employed in the routine phase analysis of VEN mixtures. 2. Materials and methods 2.1 Materials
Venlafaxine hydrochloride (CAS 99300-78-4) raw material was purchased from DEG (lot: VH06/0106/07, São Paulo, Brazil). All chemicals used were of pharmaceutical analytical grade. 2.1.1. Preparation of polymorphs
To obtain the monoclinic form (Form 2), approximately 50 mg of VEN was dissolved in 4 mL of methanol:ethyl acetate (1:8, v:v) and the solution was submitted to low temperature (3-8 °C) until VEN crystallization was complete (5). To get the orthorhombic form (Form 1), an amount corresponding to about 50 mg of VEN was dissolved in 2 mL of dichloromethane and allowed to slow evaporation under ambient conditions during 5 weeks until the solvent has completely evaporated. The purity of phases 1 and 2 was confirmed by comparing the XRPD patterns with those calculated from refs 4 and 5. 2.2 Methods 2.2.1. Scanning electron microscopy (SEM)
The morphology of VEN Form 1 and Form 2 was observed by a scanning electron microscope (Phillips XL30). Samples were mounted on metal stubs by using double-side adhesive tape, vacuum-coated with gold (350 Å) in a Polaron E 5000 sputter coating unit and directly analyzed by SEM (2,000 X).

148
2.2.2. Powder X-ray diffractometry
The diffraction patterns of VEN were obtained in a Stoe STADI-P powder diffractometer using Cu kα1 radiation selected by a Ge (1 1 1) curved monochromator, tube voltage of 40 kV and current of 40 mA, and the signals were detected by a multistrip silicon detector Mythen 1K. Samples were loaded in 0.7-mm borosilicate glass capillaries that were held spinning during data collection in the range 5° – 50° (2θ) with step sizes of 0.015° and 60 s of integration time at each 1.05°. 2.2.3. Polymorphic Quantification Methodology - Rietveld Refinements
The validation of quantification method was carried out by means of the Rietveld method using the software program Topas Academic v.4.1 (24) and the published structural data (4, 5) for venlafaxine hydrochloride. The background was fitted using a 12-term Chebyschev polynomial. The peak asymmetry was fitted by the simple axial divergence model of Cheary and Coelho (25, 26). The peak profiles were modeled by the Double-Voigt approach with anisotropic peak profiles adjusted using a 4-term preferred orientation spherical harmonics of the crystals. Both the peak asymmetry as well as peak profiles were kept fixed during the refinement of VEN samples. The values were obtained from the refinement of a Si (SRM-640c) standard reference material distributed by NIST (National Institute of Standards and Technology, USA). Only the terms describing the preferred orientation of the crystallites were then refined. An analytical correction was applied in order to reduce aberrations affecting data collected with 1D position sensitive detectors in Debye-Scherrer capillary geometry (27). 2.2.4. Effect of preferred orientation
To avoid the preferential orientation effects, the Forms 1 and 2 of VEN were minced, passed through sieves and positioned on 0.7-mm borosilicate glass capillaries.

149
2.2.3. Validation Parameters
The analytical method was validated for quantification of VEN Form 1 and 2 by the determination of the parameters: linearity, accuracy, precision and limits of detection (LOD) and quantitation (LOQ) following the ICH guidelines (16): Linearity: The linearity was carried out with a mixture of VEN Form 1 and 2 in various ratios (4.86, 24.27, 48.53, 72.80, and 97.06%, w/w, Form 2/Form 1) in a controlled environment (20 ± 2 °C; 50 ±5% RH). Samples were made in triplicate and accurately weighed 20 mg powder mixtures were loaded on 0.7-mm borosilicate glass capillaries. A graph was plotted between observed percentages vs. theoretical percentage of Form 2 in Form 1 in order to obtain a correlation. Accuracy: The accuracy was evaluated by the recovery of known amounts of VEN Form 2 at three different concentrations (24.27, 48.53, and 72.80% (w/w)), in triplicate. Precision: The precision of the method was determined by repeatability and intermediate precision studies examining three different concentration samples: 24.27, 48.53, and 72.80% (w/w) of Form 2 of VEN. Repeatability was obtained by six evaluations on the same day and under the same experimental conditions. The intermediate precision of the method was assessed by performing the analysis on two different days (inter-days). Precision was expressed as relative standard deviation (RSD). LOD and LOQ: A calibration curve using the height of the 12.74° peak was plotted versus the percentages of Form 2 in the Form 1 (% w/w). The LOD and LOQ were determined by using the calibration equation and the equations (1) and (2), respectively. (1) LOD = 3.3 σ/S (2) LOQ = 10 σ/S
Where, σ is the standard deviation of the response and S is the slope of calibration curve.

150
3. Results and discussion 3.1. Qualitative solid state characterization
Initially, in order to quantify the polymorphic phases of VEN in a mixture of polymorphs, the two polymorphic forms of VEN were obtained by recrystallization methods. Both forms showed different morphology when observed under the microscope, Form 1 is found like blocks (orthorhombic, Pca21) and Form 2 as needles (monoclinic, P21/n) (4, 5).
The Forms 1 and 2 were confirmed by matching their X-ray powder diffraction (XRPD) patterns with the powder patterns calculated from crystal structures that were deposited on Cambridge Structural Database (CSD) (4, 5). 3.2. Optimization of sample preparation and instrument parameters
The main concern in the development of the method was how to obtain good data collection by X-ray diffraction to allow to the application of the Rietveld refinement. So, parameters like preferential orientation and intensity of the peaks must be optimized.
Crystallographic orientation of particles can affect intensity up to 100%, and the consequence is more pronounced for acicular and irregular shaped crystals (28). Knowing that the Form 2 can recrystallize as a needles and this morphology has a big problem related to preferred orientation, different ways of sample preparation were tested in the data collection of the XRPD patterns.
First, polymorphic forms were only minced and placed in a sample holder, zero background. In order to fix the sample on the support, a small quantity of oil was used; however influences of the oil could be seen in the diffraction patterns and a strong preferential orientation.
Polymorphic forms then were minced and filled in a quartz capillary. The problem of preferential orientation slightly decreased, but not to a satisfactory level. Moreover, the use of the quartz showed an amorphous alo in the diffraction patterns.

151
Particle size plays a major role in preferred orientation (29) and the use of smaller particles has been reported to aid in minimizing preferred orientation of the particles (30).
Next step was to chop the samples and pass through sieves with pores of different sizes: 200, 130, 50 µm. After this procedure, the samples were placed on zero background holder and the data collected. It was verified that this concern in preparing the sample was not sufficient to minimize the effects of preferred orientation. When the particles that passed through the large sieve were evaluated, it was found that their size did not change. With the lower particle size sample, an electrostatic charge was created, difficulting the XRPD analyze. The mesh with intermediate pores was chosen because it showed the best diffraction pattern.
After sieving with the 130 µm mesh, the samples were filled in 0.7 mm borosilicate glass capillaries, which afforded well defined peaks, with great intensity and no preferred orientation. Several instrumental parameters that critically affect the diffraction peaks have been reported. Among these parameters, scan rate and chopper increment have a direct impact on the counting statistics (31).
The instrument parameters have been optimized in the polymorphic mixture (1%, w/w) and finally these optimized parameters have been used in the quantification of Form 2 in the mixture. The best condition was found with step sizes of 0.015° and 60 s of integration time at each 1.05°. 3.3. Validation of the analytical method To accomplish the quantification of polymorphic phases, the Rietveld refinement was done using TOPAS academic v.4.1 (24), Several diffraction X-ray patterns were obtained. First, refinements were done on the diffraction patterns of each VEN pure polymorph to determine its profile and instrumental parameters.

152
Figure 1 – Rietveld refinement for Form 2 of VEN.
The validation of the method was performed following the ICH guidelines (16).
Correlation of the predicted versus actual concentration of Form 2 into the Form1 (% w/w) was determined by constructing the three standard curves each one with five calibration points in the range of 4.86- 97.06% (Figure 2). The method developed was found to be linear and the correlation was excellent with r = 0.999, the slope was nearly equal to unity, and the intercept was practically zero.
Figure 2 – Calibration correlation for Venlafaxine Hydrochloride.

153
The precision evaluated as the repeatability of the method was
studied by calculating the RSD for three different concentration samples: 24.27, 48.53 and 72.80% (w/w) of Form 2 of VEN performed on the same day and under the same experimental conditions. The RSD values obtained were 3.82, 5.43, and 3.86%, respectively. The intermediate precision was assessed by also analyzing three different concentration samples: 24.27, 48.53, and 72.80% (w/w) of Form 2 of VEN on two different days (inter-days); the RSD values obtained were 1.33, 0.07, and 0.69%, respectively (Table 2).
Table 2 – Repeatability and Inter-day precision data of the method.
The accuracy was assessed from the recovery of known amounts of VEN Form 2 by independently examining three different concentrations (24.27, 48.53 and 72.80% (w/w)) in triplicate. The absolute means obtained were 25.06, 49.33, and 72.90% corresponding to the recovery of 103.25, 101.66, and 100.14%, respectively, with a mean value of 101.68% and RSD of 1.55% (Table 3). These results showed that the method was accurate within the desired range.

154
Table 3 – Accuracy data of the method.
In order to obtain the LOD and LOQ, a new linearity using the height of the peak at 12.74° versus the concentration of the Form 2 in the range of 4.86, 24.27, 48.53, 72.80, 97.06% (w/w Form 2/Form 1) was performed (Figure 3).
For calculating the LOD and LOQ, the equations (1) and (2) and the calibration equation were used. The mean of the slope and the SD of the intercept of the independent curves were 148.66 and 52.09, respectively. The values calculated for the LOD and LOQ were 1.16 and 3.50% (w/w, Form 2/Form 1), respectively.
Figure 3 – Linearity using the height of the peak 12.74° to calculate de LOD and LOQ.

155
4. Conclusion A quantitative XRPD method using Rietveld refinement was developed for the determination of venlafaxine hydrochloride polymorphic forms. In order to minimize the errors associated with quantification and to obtain an accurate method, the sample preparation and instrument parameters were previously optimized. Particle size and sample holder were found to significantly affect the preferred orientation, best results were obtained when the Forms 1 and 2 were sieved with intermediary mesh and filled in the 0.7 mm borosilicate glass capillary. The results of the validation studies showed that the method was specific and accurate, linear in the range of 4.86–97.06% (w/w) with LOD as low as 1.16% and LOQ of 3.50%. Through this method it would be possible to quantify the polymorphic mixture of VEN in bulk drug samples. Aknowledgements The authors wish to thank FAPESC, CAPES, and CNPq for the support. The X-Ray Diffraction Laboratory (LDRX), Central Electron Microscopy Laboratory (LCME) at UFSC, and X-Ray Diffraction Laboratory at UFABC.

156
References 1. J.S. Olver, G.D. Burrows, T.R. Norman. Third-generation antidepressants: do they offer advantages over the SSRIs? CNS Drugs 15 (2001) 941 – 954. 2. M.A Gutierrez , G.L Stimmel, J.Y. Aiso. Venlafaxine: A 2003 Update. Clin. Ther. 25 (2003) 2138 - 2154. 3. J.D. Amsterdam, C.H. Wang, M. Shwarz, J. Shults. Venlafaxine versus lithium monotherapy of rapid and non-rapid cycling patients with bipolar II major depressive episode: A randomized, parallel group, open-label trial. J. Affect. Disord. 112 (2009) 219 - 230. 4. D. Vega, D. Fernandéz, G. Echeverría. 1-[2-(1- ydroxycyclohexyl)-2-(4- methoxyphenyl)ethyl]dimethyl- ammonium chloride (venlafaxine hydrochloride). Acta Crystallogr. 56 (2000) 1009 – 1010. 5. A. Sivalakshmidevi, K. Vyas, S.M. Rao, G.O. Reddy. A monoclinic polymorph of venlafaxine hydrochloride. Acta Crystallogr. 58 (2002) 1072 - 1074. 6. S. Roy, P.M. Bhatt, A. Nangia, G.J. Kruger, Stable Polymorph of Venlafaxine Hydrochloride by Solid-to-Solid Phase Transition at High Temperature, Cryst. Growth Des. 7 (2007) 476 – 480. 7. D.J.W. Grant, Theory and origin of polymorphism, in: H.G. Brittain (Ed.), Polymorphism in Pharmaceutical Solids, Vol. 95, Marcel Dekker, New York, 1999, pp. 1–33. 8. J.K. Haleblian, W.C. McCrone, Pharmaceutical applications of polymorphism, J. Pharm. Sci. 58 (1969) 911–929. 9. S.R. Vippagunta, H.G. Brittain, D.J.W. Grant. Crystalline solids, Adv. Drug Deliv. Rev. 48 (2001) 3 – 26. 10. G.D.P. Buckton, Assessment of disorder in crystalline powders – a review of analytical techniques and their application, Int. J. Pharm. 179 (1999) 141–158.

157
11. G.A. Stephenson, R.A. Forbes, S.-M. Reutzel-Edens, Characterization of the solid state: quantitative issues, Adv. Drug Deliv. Rev. 48 (2001) 67–90. 12. A.S. Raw, M.S. Furness, D.S. Gill, R.C. Adams, F.O. Holcombe Jr., L.X. Yu, Regulatory considerations of pharmaceutical solid polymorphism in Abbreviated New Drug Applications (ANDAs), Adv. Drug Deliv. Rev. 56 (2004) 397–414. 13. FOOD and DRUG ADMINISTRATION, Center for Drug Evaluation and Research, Guidance for Industry, ANDAs: Pharmaceutical Solid Polymorphism: Chemistry, Manufacturing, and Controls Information, 2007, http://www.fda.gov/cder/guidance/index.htm. 14. Z. Német, I. Sajó, Á. Demeter, Rietveld refinement in the routine quantitative analysis of famotidine polymorphs, J. Pharm. Biomed. Anal. 51 (2010) 572–576. 15. ICH - International Conference on Harmonization - Harmonized Tripartite Guideline, Specification: Test procedures and acceptance criteria for new drug substances and new drug products: Chemical substances, 1999. 16. ICH – International Conference on Harmonization - Technical Requirements for Registration of Pharmaceuticals for Human Use: Guideline on Validation of Analytical Procedure Q2 (R1): Text and Methodology, 2005. 17. M. Bartolomei, M.C. Ramusino, P. Gheti. Solid-state investigation of fluocinolone acetonide. J. Pharm. Biomed. Analysis 15 (1997) 1813–1821. 18. M. Tiwari, G. Chawla, A.K. Bansal. Quantification of olanzapine polymorphs using powder X-ray diffraction technique. J. Pharm. Biomed. Analysis 43 (2007) 865 – 872. 19. H.M. Rietveld. A profile refinement method for nuclear and magnetic structures. J Appl. Crystallogr. 2 (1969) 65 – 71.

158
20. I.C. Madsen, N.V.Y. Scarlett, Quantitative phase analysis, in: R.E. Dinnebier, S.J.L. Billinge (Eds.), Powder Diffraction: Theory and Practice, RCS Publishing, Cambridge, 2008, pp. 298–331. 21. L.B. McCusker, R.B. Von Dreele, D.E. Cox, D. Louer, P. Scardi, Rietveld refinement guidelines, J. Appl. Crystallogr. 32 (1999) 36–50. 22. S.S. Iyengar, N.V. Phadnis, R. Suryanarayanan, Quantitative analysis of complex pharmaceutical mixtures by the Rietveld method. Powder Diffr. 16 (2001) 20–24. 23. Young RA. 1993. (Reprinted 1996). The Rietveld method. 2nd ed. New York: Oxford University Press. 24. A.A. Coelho. Topas Academic. 4.1, Coelho Software, Brisbane, Australia, 2007. 25. R.W. Cheary, A.A. Coelho. Fundamental parameters approach to X-ray line-profile fitting. J Appl Crystallogr. 25(1992) 109–121. 26. R.W. Cheary, A.A. Coelho. Axial divergence in a conventional X-ray powder diffractometer. I. Theoretical foundations. J Appl Crystallogr 31(1998) 851–861. 27. F. Gozzo, A. Cervellino, M. Leoni, P. Scardi, A. Bergamaschi, B. Schmitt, Z. Kristallogr. 225 (2010) 616–624. 28. S.N.C. Roberts, A.C. Williams, I.M. Grimsey, S.W. Booth, J. Pharm. Biomed. Anal. 28 (2002) 1149–1159. 29. R. Suryanarayanan, C.S. Herman. Quantitative analysis of the active ingredient in a multi-component tablet formulation by powder X-ray diffractometry. Int. J. Pharm. 77 (1991) 287–295. 30. R. Suryanarayanan. Determination of the Relative Amounts of Anhydrous Carbamazepine (C15H12N2O) and Carbamazepine Dihydrate (C15H12N2O • 2H2O) in a Mixture by Powder X-ray Diffractometry. Pharm. Res. 6 (1989) 1017–1023.

159
31. V.J. Hurst, P.A. Schroeder, R.W. Styron. Accurate quantification of quartz and other phases by powder X-ray diffractometry. Anal. Chim. Acta 337 (1997) 233–252.

160
DISCUSSÃO GERAL

161

162
O cloridrato de venlafaxina é um potente antidepressivo, cujo mecanismo de ação se dá sob a inibição da recaptação da serotonina, da noradrenalina e, em menor escala, da dopamina (OLVER, BURROWS & NORMAN, 2001; GUTIERREZ, STIMMEL & AISO, 2003). Embora na literatura seja possível encontrar estudos sobre o fármaco, alguns temas relevantes para avaliar e demonstrar a qualidade dos produtos disponíveis comercialmente, ainda são incompletos. Dessa forma, buscando uma avaliação das formulações encontradas comercialmente frente à qualidade dos produtos, desenvolveu-se e validou-se procedimento para a determinação do cloridrato de venlafaxina em cápsulas de liberação modificada que foi aplicado, também, na avaliação de perfil de dissolução, como demonstrado no capítulo 3.
Inicialmente diferentes condições cromatográficas foram testadas a fim de selecionar um método confiável e reprodutível. O comprimento de onda selecionado foi aquele que permitiu uma maior absorção no espectro de varredura por UV. Diferentes colunas cromatográficas de fase reversa foram testadas, bem como fases móveis contendo diferentes proporções de solventes, tampões, molaridades e pHs de tampões. Melhores resultados foram obtidos utilizando uma coluna Luna C18 (150 X 4,6 mm) mantida a 35 ºC, detecção no UV a 226 nm, fase móvel composta por tampão acetato de amônio 32 mM (pH 6,8 ajustada com ácido fosfórico), acetonitrila e metanol nas proporções 62:30:8 (v/v/v), com fluxo de 1,0 mL/min.
Essa condição cromatográfica permitiu que a análise fosse realizada em 8 minutos, uma vez que o tempo de retenção do fármaco foi de 6,8 minutos, demonstrando ser um método rápido e que pode ser empregado em indústrias farmacêuticas como método de rotina.
Os parâmetros de validação analisados para o método desenvolvido foram: especificidade, linearidade, precisão, exatidão, robustez e limites de detecção e quantificação, avaliados de acordo com os critérios descritos em guias de validação do ICH (2005), USP 34 (2011) e ANVISA (BRASIL, 2003b).
A avaliação da especificidade foi determinada através de estudos de degradação acelerada nas condições de estresse ácido, básico, oxidação e fotólise do fármaco. O tempo de análise foi aumentado para 20 minutos para que, caso houvesse a formação de algum produto de degradação mais apolar que o fármaco e tivesse um tempo de retenção maior, este pudesse ser verificado. Foi possível observar a formação de um produto de degradação na condição de estresse ácido, pela

163
diminuição do pico do cloridrato de venlafaxina e pelo aparecimento de um novo pico, o qual se encontrou resolvido em relação ao fármaco e com um tempo de retenção maior que o fármaco, demonstrando que o método pode ser usado como indicativo da estabilidade, com especificidade e seletividade.
Makhija e Vavia (2002), em estudos semelhantes, obtiveram e identificaram um produto de degradação ácido, o qual seria resultado da O-desmetilação do grupo 4-metoxi ligado ao anel fenil, e, portanto, o metabólito ativo do fármaco. Entretanto, de acordo com o sistema cromatográfico desenvolvido e os resultados encontrados verificou-se que o produto de degradação formado no presente estudo teria uma polaridade menor que o fármaco, dessa forma, ainda não identificado. Ressalta-se que o estudo de especificidade realizado no método desenvolvido foi importante para complementar o estudo de Makhija e Vavia, uma vez que os autores não avaliaram a estabilidade do fármaco frente à luz, um importante parâmetro para prever o uso de revestimentos, bem como a melhor forma de armazenamento da formulação.
Além dos estudos de estresse em diferentes condições para a verificação da estabilidade do fármaco frente a condições extremas, um estudo para verificar a estabilidade do fármaco na solução de injeção foi realizado. Para tanto, uma solução contendo o fármaco em metanol e água nas proporções de 50:50 (v:v) foi deixada em temperatura ambiente e analisada após 72 horas, esse tempo foi escolhido por ser o tempo necessário para realizar toda a validação do método, os resultados de teor encontrados para o fármaco foi de 100,2 % comprovando que o fármaco é estável na solução de armazenamento.
O método apresentou-se linear na faixa de 10-70 µg/mL (r = 0,999). Os dados obtidos para a repetibilidade (DPR ≤ 0,2%), precisão intermediária (avaliada pela precisão inter-dias: DPR ≤ 0,9 e inter-analistas: DPR ≤ 0,5%) e exatidão (100,20% ± 1,2%) estão dentro dos valores preconizados. A avaliação da robustez, através da superfície de resposta, demonstrou que mudanças pequenas e deliberadas em diversos fatores não influenciaram significativamente os resultados. Desta forma, demonstrou-se que o método proposto cumpre os requisitos preconizados pela literatura, sendo considerado preciso, exato e robusto, e pode ser aplicado com êxito tanto para a quantificação do cloridrato de venlafaxina em cápsulas de liberação modificada, bem como para avaliar a quantidade de fármaco dissolvida em função do tempo em estudos de dissolução.

164
Os estudos de dissolução inicialmente foram realizados em meio água (pH 5,0), com equipamento 1 (cesta) em 75 e 100 rpm, conforme preconizado pela USP (USP 34, 2011), e com o equipamento 2 (pás) em três rotações diferentes (50, 75 e 100 rpm), com o intuito de escolher o aparato e a rotação que melhor avaliasse o perfil de dissolução do fármaco. A partir dos resultados obtidos verificou-se que usando pás, com o auxílio de “sinkers” para manter as cápsulas no fundo das cubas, em 75 rpm, obteve-se o melhor perfil para avaliar o mecanismo de liberação do cloridrato de venlafaxina a partir de formulações de liberação prolongada. Após, foram realizados estudos em dois outros meios, ácido clorídrico 0,1 M (pH 1,2) e tampão fosfato (pH 6,8) objetivando avaliar o comportamento do fármaco em diferentes pHs. Para a avaliação da dissolução do fármaco foram utilizadas 6 cápsulas de Effexor XR® 150 mg para cada um dos meios.
Além disso, nenhum método de dissolução para o cloridrato de venlafaxina encontrava-se descrito na literatura ou em monografias farmacopéicas no momento da execução dos experimentos. Dessa forma, estudos incluindo mais de um meio de dissolução foram necessários a fim de comprovar que o sistema de dissolução escolhido na realização dos estudos era realmente eficaz na distinção das concentrações obtidas nos diferentes pontos de coleta.
Através de avaliações do coeficiente de correlação, diferentes modelos cinéticos, como Zero Ordem, Primeira Ordem, e Higuchi foram aplicados para conhecer o mecanismo de liberação do fármaco (COSTA & LOBO, 2001; MANADAS, PINA & VEIGA, 2002). O modelo que melhor descreveu a liberação do fármaco foi o de primeira ordem, onde a velocidade de dissolução é dependente da concentração das espécies dissolvidas. Depois de determinado o modelo cinético de liberação do fármaco, parâmetros como: K1 (constante cinética), t50% (constante de primeira ordem), quantidade de cloridrato de venlafaxina dissolvido em 6 h (Q6) e 12 h (Q12) foram calculados para conhecer como e a que velocidade o fármaco é liberado para ser absorvido pelo organismo.
Através dos parâmetros calculados verificou-se que o fármaco nos meios água e tampão fosfato de potássio pH 6,8 não apresentaram diferenças significativas, se pode inferir que qualquer um dos meios pode ser utilizados nos estudos de dissolução, entretanto, pela facilidade de obtenção e menor tempo dispendido na preparação do meio sugere-se que o meio água seja o melhor meio de dissolução para avaliar a dissolução de cápsulas de liberação modificada do cloridrato de venlafaxina. Em levantamento recente realizado na literatura foi

165
encontrada monografia para cápsulas de liberação modificada na Farmacopéia Americana (USP 35, 2012) onde o meio de dissolução indicado é água, mesmo meio encontrado ser o melhor nos nossos estudos.
Posteriormente foi realizada a caracterização do cloridrato de venlafaxina, bem como os estudos de compatibilidade fármaco:excipiente. Os resultados são apresentados no capítulo 4. Destaca-se que nenhum outro artigo relacionado a este tema foi encontrado na literatura. Entretanto, conhecer as características do fármaco é essencial para o desenvolvimento de uma formulação bem sucedida (STEPHENSON et al., 2001; VIPPAGUNTA, BRITTAIN & GRANT, 2001; CHIENG, RADES & AALTONEN, 2011).
O perfil da curva DSC do cloridrato de venlafaxina se apresentou com um único evento endotérmico em 211 °C relacionado ao evento de fusão do fármaco. Além disso, a partir de 250 °C, pode se observar certa instabilidade térmica na curva DSC podendo corresponder à sua degradação, a qual é confirmada pela análise TG, onde se verifica um evento de perda de massa significativa (∆m = 98 %) na região de 254 °C – 283 °C. Com essa avaliação pode-se inferir que o fármaco é estável termicamente até aproximadamente 200 °C.
As demais técnicas utilizadas na caracterização permitiram a identificação de grupamentos químicos presentes na estrutura do fármaco, através de Infravermelho (IV); a visualização do formato dos cristais, bem como a homogeneidade da amostra pela Microscopia Eletrônica de Varredura (MEV) e a verificação da característica cristalina demonstrada pelos vários picos de difração pela Difração de Raios X (DRX).
Para os estudos de compatibilidade, misturas físicas, na proporção de 1:1 (massa/massa) fármaco:excipiente foram preparadas misturando os compostos com agitação por 1 minuto em vórtex, mantidas em “vials” de vidro âmbar, e foram analisadas por DSC, DRIFT e MEV.
Dentre os vários excipientes existentes que podem ser empregados na formulação de um medicamento, escolheram-se, para realizar os estudos de compatibilidade, aqueles utilizados na formulação comercial do cloridrato de venlafaxina e disponíveis no laboratório.
Os estudos foram realizados utilizando como principal ferramenta a análise térmica (DSC), por ser um método rápido e eficaz para avaliar possíveis interações ou incompatibilidades através da comparação das curvas DSC dos compostos separados e em mistura

166
(TOMASSETTI et al., 2005; SANTOS et al., 2008; OLIVEIRA et al., 2010). DRIFT e MEV foram utilizadas como técnicas complementares e/ou confirmatórias.
Na análise térmica o parâmetro avaliado foi o evento endotérmico do fármaco na curva DSC. Mudanças no ponto de fusão de aproximadamente mais de 10 °C foram considerados como possíveis interações. O perfil das curvas DSC das misturas de cloridrato de venlafaxina/talco, cloridrato de venlafaxina/amido glicolato de sódio, cloridrato de venlafaxina/lactose não apresentaram mudanças, sendo consideradas como sobreposição das curvas do fármaco e dos excipientes indicando, assim, que não há interação entre eles. Entretanto, as misturas de cloridrato de venlafaxina/celulose microcristalina, cloridrato de venlafaxina/estearato de magnésio, cloridrato de venlafaxina/amido, apresentaram um deslocamento significativo no ponto de fusão do fármaco. Dessa forma, para comprovar se houve uma incompatibilidade entre o fármaco e os excipientes, outras técnicas de avaliação foram realizadas.
O MEV foi empregado como uma metodologia complementar, e através das micrografias pode-se observar o tamanho, a forma cristalina e a maneira com que o fármaco e excipientes estão agrupados.
IV foi realizado como metodologia confirmatória, uma vez que alterações nos espectros poderia ser resultado da interação química dos compostos resultando em um produto diferente dos originais. Para as análises de IV misturas de 3% (m/m) dos excipientes, fármaco e, misturas 1:1 (fármaco:excipiente) com brometo de potássio foram realizadas. Essa proporção foi obedecida para evitar que, alterações nos espectros de DRIFT relacionadas à concentração dos alvos de estudos fossem equivocadamente confundidas com uma incompatibilidade química dos compostos. Os resultados indicaram a presença de todas as bandas das misturas como sendo uma superposição dos compostos individuais, classificando as alterações observadas nas curvas DSC como uma possível interação física e não uma incompatibilidade química.
A análise térmica é uma técnica muito utilizada para avaliar preliminarmente compatibilidades em misturas binárias fármaco:excipiente, e forneceu informações importantes sobre o comportamento térmico e decomposição do cloridrato de venlafaxina. Adicionalmente, através de IV e MEV pode-se concluir que nenhuma evidência de interação química ou incompatibilidade foi observada.

167
Outra etapa do trabalho constituiu em avaliar a presença de polimorfos em matérias-primas disponíveis comercialmente e utilizadas em farmácias de manipulação. Quatro diferentes matérias-primas foram adquiridas e caracterizadas através de CLAE, DSC, IV, MEV e DRX, no intuito de identificar o fármaco, conhecer suas características físico-químicas, fazer uma comparação entre as diferentes matérias-primas e, dessa forma, garantir a qualidade das mesmas.
Diferenças nas características físico-químicas, principalmente nas curvas DSC e nos padrões de difração das amostras foram observadas, surgindo assim, a necessidade de estudos mais detalhados sobre as possíveis causas das diferenças, destacando a presença de diferentes polimorfos nas matérias-primas. No capítulo 5, encontram-se os resultados da caracterização das matérias-primas, a obtenção de dois diferentes polimorfos do fármaco já descritos na literatura, bem como a comparação das matérias-primas com os polimorfos do cloridrato de venlafaxina.
Já é sabido que o cloridrato de venlafaxina pode se cristalizar em diferentes formas polimórficas, contudo, algumas divergências foram encontradas nos relatos de polimorfismo do fármaco. Com o objetivo de caracterizar e comparar as matérias-primas adquiridas com as mesmas técnicas e sob as mesmas condições, a obtenção de dois polimorfos, Forma 1 e Forma 2, se fez necessária. Para tanto, diferentes formas de cristalização, utilizando diferentes solventes foram avaliadas, inclusive aquelas já relatadas na literatura (VEGA, FERNANDÉZ & ECHEVERRÍA, 2000; SIVALAKSHMIDEVI et al., 2002).
A forma polimórfica 2 do fármaco foi obtida através da técnica detalhada por Sivalakshmidevi e colaboradores (2002), onde certa quantidade de fármaco é dissolvida em uma mistura dos solventes metanol e acetato de etila, na proporção de 1:8 (v/v). Uma solução saturada com o fármaco nesses solventes foi obtida quando se utilizou 50 mg de fármaco em 4 mL de solvente. De acordo com os autores a cristalização se dava pela evaporação do solvente em condição ambiente. Porém, nessa condição não se conseguiu obter os cristais da Forma 2. Outras condições foram testadas, e a melhor condição foi obtida quando a solução saturada do fármaco foi mantida em baixa temperatura (3-8 °C).
Para a obtenção da Forma 1 do cloridrato de venlafaxina, como o método de cristalização proposto por Vega e colaboradores (2000) não foi reprodutível, diferentes solventes e formas de cristalização foram testados. Obteve-se monocristais da Forma 1 quando uma solução

168
saturada com 50 mg do fármaco em 2 mL de diclorometano foi submetida à evaporação lenta do solvente. A velocidade de evaporação foi controlada fechando os frascos contendo as soluções com tampa, e colocando uma agulha de seringa, sendo que o tamanho do orifício da agulha controlou a evaporação.
Após a obtenção dos dois polimorfos, realizou-se a caracterização de ambos. Inicialmente, a diferenciação dos dois polimorfos se deu pela aparência dos cristais obtidos. A Forma 1 apresentou-se como placas, enquanto que a forma 2 como agulhas bem finas. Posteriormente, análises de DRX de pó foram realizadas, e os padrões de difrações obtidos foram comparados com aqueles depositados no Cambridge Crystallographic DataBase: Forma 1: WOBMUV. CCDC 150349 e Forma 2: WOBMUV01. CCDC 198947 (VEGA, FERNANDÉZ & ECHEVERRÍA, 2000; SIVALAKSHMIDEVI et al., 2002).
Com as fases puras identificadas, as demais técnicas foram realizadas. Através de IV e Raman pode-se identificar, para ambas as formas polimórficas, a presença de todas as bandas de absorção dos grupamentos químicos. Entretanto, nos resultados da espectroscopia Raman observou-se que a Forma 1 apresentou bandas mais nítidas e com intensidades maiores na região entre 800 e 880 cm-1 além de um aumento na linha de base, o que pode ser explicado pelo efeito de fluorescência desse polimorfo. Também foi possível verificar diferenças em algumas bandas: 1470, 1300, 1250, 980 cm-1 no Raman que podem ser utilizados para distinguir as duas formas polimórficas.
Fazendo uma comparação entre os espectros de IV da Forma 1 e Forma 2, nenhuma diferença de deslocamento de bandas foi verificada, é possível somente observar um alargamento na banda relacionada à OH da Forma 2.
Através do DSC foi possível verificar as diferenças nos eventos térmicos. Em uma taxa de aquecimento de 2 °C/min, a curva de DSC da Forma 1 apresentou um único evento endotérmico relacionado ao ponto de fusão, em 208,34 °C. Já a curva de DSC da Forma 2 mostrou um evento endotérmico em 214,09 °C, também relacionado ao ponto de fusão desta forma.
Grandes divergências na literatura envolvendo a caracterização das duas formas polimórficas são observadas no ponto de fusão das mesmas. A Forma 1 apresenta um ou dois eventos endotérmicos, enquanto que alguns autores trazem a Forma 2 com dois eventos endotérmicos, separados por um evento exotérmico ou somente um

169
evento endotérmico ou, ainda, com dois eventos endotérmicos. Comparando os relatos encontrados na literatura, observa-se que diferenças de equipamento e fluxo de nitrogênio resultam em curvas com aspecto diferenciado (RAO et al., 2002; ROY et al., 2005), o que pode comprometer a conclusão dos resultados. Além disso, uma “impureza” proveniente de pequena quantidade de uma forma polimórfica na outra pode provocar uma conclusão errônea em relação ao perfil térmico dos polimorfos.
O monocristal da Forma 1, obtido a partir da técnica de recristalização, foi analisado por DRX de monocristal e os resultados indicaram que se tratava da Forma 1 pura. Para conhecer a forma polimórfica 2 obtida, o método de Rietveld foi aplicado, fazendo uma comparação do padrão de difração da Forma 2 com os padrões de difração das formas polimórficas 1 e 2 depositados no Cambridge Crystallographic DataBase (CCD). Os resultados indicaram que a Forma 2 é completamente pura, ou seja, 100 % da Forma 2.
Fazendo uma correlação entre o IV e DSC das Formas polimórficas 1 e 2, pode-se inferir que os resultados estão de acordo uma vez que a Forma 2 por possuir um alargamento da banda relacionada ao grupamento químico OH, relacionado à formação de pontes de hidrogênio conferindo uma maior estabilidade na estrutura da Forma 2, possui o ponto de fusão em uma temperatura mais elevada.
As quatro matérias-primas adquiridas foram nomeadas como: VEN1, VEN2, VEN3 e VEN4, e foram avaliadas por DSC em 2 °C/min. As curvas DSC das matérias-primas 3 e 4 apresentaram diferenças no perfil térmico, demonstrando dois eventos endotérmicos. Pode-se inferir, assim, a presença da Forma 2 nas matérias-primas VEN3 e VEN4 e concluir que as duas matérias-primas podem ser misturas polimórficas.
A comparação pelos padrões de difração é uma ferramenta padrão para a identificação e detecção de formas polimórficas diferentes nas matérias-primas, uma vez que eles são impressões digitais de cada polimorfo. A comparação entre os ângulos difratados serve como parâmetro para diferenciação. Observou-se diferenças nos padrões de difrações das Formas polimórfica 1 e 2, principalmente em baixo ângulo.
O padrão de difração da Forma 1 apresentou-se resolvido, com dois picos característicos de difração, em 10,30º e 20,30º (2θ), além dos picos em 15,10º, 18,31º e, 22,75º (2θ), relacionados apenas à Forma 1. O padrão de difração da Forma 2 demonstrou picos correspondentes

170
apenas a esta forma, em 8,40º, 12,78º, 16,41º, 19,05º e, 21,28º (2θ). Encontradas as principais diferenças nos padrões de difração entre as duas formas, estas podem ser utilizadas para a caracterização e a correta identificação das formas polimórficas das matérias-primas.
Através dos padrões de difração das matérias-primas e das avaliações por DSC foi possível afirmar que as matérias-primas VEN1 e VEN2 são a Forma polimórfica 1 pura, enquanto que as matérias-primas VEN3 e VEN4 são misturas das duas formas.
O método de Rietveld, em combinação com DRX, é amplamente utilizado na quantificação de mistura de diferentes fases cristalinas. A partir dos resultados de DRX foi possível fazer a quantificação das fases polimórficas, sendo que a VEN3 apresentou 17.5% de Forma 1 e 82.5% de Forma 2 (± 0.3), enquanto que a VEN4 é formada por 57.5% de Forma 1 e 42.5% de Forma 2 (± 0.8).
Avaliando os resultados de variação de entalpia das curvas DSC para VEN3 e VEN4 esperava-se que a VEN4, que apresenta uma variação de entalpia maior que a VEN3 no segundo evento de fusão relacionado à fusão da Forma 2, fosse composta por uma quantidade maior de Forma 2 o que foi provado não ser verdadeiro quando a quantificação de fases pelo método de Rietveld foi realizada. Isso evidencia que o comportamento das Formas polimórficas 1 e 2 do cloridrato de venlafaxina quando em mistura frente ao aquecimento ainda não está completamente explicado e dessa forma, demonstrando que o DRX é a técnica mais indicada para avaliar o polimorfismo do fármaco.
No capítulo 6 encontram-se os resultados do trabalho iniciado na Università degli Studi di Parma, Itália, realizados sob a orientação do professor Dr. Ruggero Bettini. Durante a execução do projeto sanduíche encontraram-se dificuldades em avaliar os resultados que estavam sendo obtidos na cristalização do cloridrato de venlafaxina por fluído supercrítico. Dessa forma, decidiu-se investigar as Formas polimórficas 1 e 2 em relação às propriedades que ainda não estão bem definidas na literatura e a relação termodinâmica entre eles.
No decorrer do capítulo nota-se que os resultados das curvas DSC das formas polimórficas 1 e 2 do fármaco apresentam algumas diferenças no seu perfil quando comparados às curvas realizadas aqui no Brasil, o que pode ser explicado pelo fato das análises serem realizadas em equipamentos diferentes e condições de análises diferentes como: o fluxo de nitrogênio e o cadinho aberto, porém não comprometendo a conclusão final do trabalho.

171
Inicialmente foram realizadas análises em DSC com taxas de aquecimento diferenciadas: 2, 5 e 10 °C/min, no intuito de verificar a existência de uma relação entre os eventos observados nas curvas DSC dos polimorfos com as taxas de aquecimento. Observa-se que a Forma 1 apresenta um único evento endotérmico nas três taxas de aquecimento, em aproximadamente 211 °C, relacionada à sua fusão. O perfil das curvas DSC da Forma 2 apresentam-se, no entanto, diferenciados conforme a taxa de aquecimento é alterada. Nas taxas de aquecimento de 5 e 10 °C/min evidenciam-se dois eventos endotérmicos e um evento exotérmico, o qual se torna mais pronunciado quando analisado em 10 °C/min. Quando foi utilizada uma taxa de aquecimento baixa, de 2 °C/min, o primeiro evento endotérmico foi pouco visível.
Como o primeiro evento endotérmico da Forma 2 coincide com o ponto de fusão da Forma 1, algumas hipóteses foram levantadas a fim de elucidar e entender o comportamento térmico da Forma 2: 1) Há uma pequena contaminação de Forma 1 na amostra de Forma 2, que não é visível por Difração de Raios-X; 2) Há uma relação enantiotrópica entre as formas polimórficas 1 e 2, onde uma delas se transforma em outra através de uma transição sólido-sólido e; 3) O ponto de fusão das duas formas é praticamente o mesmo, o que dificilmente acontece no âmbito de polimorfismo.
A fim de compreender os resultados de DSC, a Microscopia em fase quente (HSM) foi realizada. Para as Formas 1 e 2 observou-se uma mudança no hábito cristalino dos cristais que se transformam em placas em aproximadamente 170 °C, a qual pode estar correlacionada à mudança de hábito, pois na difração de raios-X de pó com aquecimento nenhuma mudança da estrutura cristalina foi verificada nas temperaturas analisadas. Esses resultados estão de acordo com as curvas DSC, as quais não demonstraram eventos nesta temperatura. Diferentemente de Roy e colaboradores, 2007, que afirmam que a Forma 6, chamada por eles, foi obtida a partir de uma transição sólido-sólido de ambas as Formas 1 e 2 em aproximadamente 170 ° C (ROY et al., 2007).
Após a mudança de hábito cristalino, a Forma 1 funde em 211 °C, confirmando o observado na curva DSC. Já a Forma 2 evidencia uma fusão em, aproximadamente, 211 °C e, concomitantemente, acontece uma recristalização de um novo polimorfo com cristais na forma de agulhas alongadas seguida da fusão dessa nova forma polimórfica em 220 °C.

172
Complementarmente foi realizado o ensaio de solubilidade, onde as solubilidades das duas formas polimórficas foram avaliadas em diferentes temperaturas utilizando como solvente a Triacetina, único solvente encontrado capaz de permitir a diferenciação das solubilidades dos dois polimorfos. Os resultados encontrados demonstraram que a Forma 2 foi ligeiramente mais solúvel do que a Forma 1. No entanto, a diferença foi muito pequena e não significativa (ANOVA, p > 0,05).
Através dos valores obtidos na solubilidade foi possível traçar um gráfico de Van’t Hoff (GRANT et al., 1984; KAWAKAMI, 2007; ROY et al., 2007; PRANZO et al., 2010), muito usado para avaliar a relação termodinâmica entre polimorfos. Para polimorfos chamados enantiotrópicos, aqueles em que o polimorfo menos estável se interconverte no polimorfo mais estável, igualando as equações das retas dos dois polimorfos é possível obter o ponto de encontro entre as duas retas, significando o ponto de transição de uma forma para outra. No caso deste estudo foi encontrado um valor de 14,64 °C, o que significaria que as Forma 1 e 2 do cloridrato de venlafaxina possuem uma relação enantiotrópica entre eles.
No entanto, analisando os resultados obtidos até o momento, pode-se propor que existe uma contaminação da Forma 1 na Forma 2, onde a transformação da Forma 2 em Forma 1 é mediante dissolução. Neste caso, os dados de solubilidade observados seriam da Forma 1 e, portanto, a relação termodinâmica não poderia ser avaliada. A comprovação se dá nas curvas DSC efetuadas com o sólido recuperado após os estudos de solubilidade. A Forma 2 recuperada após o equilíbrio a 25 °C apresentou um ponto de fusão único em 210 °C, enquanto que a Forma 1 recuperada depois do equilíbrio à 80 °C demonstrou o ponto de fusão em 211 °C. Estes resultados permitem também propor que a Forma 1 é termodinamicamente estável, pelo menos, até a temperatura analisada.
Adicionalmente, a quantificação empregando o método de Rietveld foi avaliada para a Forma 2. Os resultados evidenciaram a presença de aproximadamente 3 % de Forma 1 na Forma 2, o que poderia explicar a curva DSC da Forma 2, com dois eventos de fusão, sendo o primeiro evento na mesma temperatura do ponto de fusão da Forma 1 e os dados de solubilidade que são equivalente à Forma 1.
Além disso, considerando os resultados encontrados para a Forma 2 na curva DSC, HSM, o evento endotérmico em aproximadamente 220 °C pode ser atribuído à fusão de uma forma polimórfica não-isolável por cristalização, obtida a partir da fusão da

173
Forma 2. Provavelmente a forma polimórfica 3 é dependente da taxa de aquecimento, o que pode ser observado pelas curvas DSC, além de não ser obtida a partir de métodos de cristalização com solventes. Quando a taxa de aquecimento foi de 2 °C/min a recristalização ocorreu lentamente, o que prejudicou a visualização da fusão da Forma 2, sendo apenas observada a fusão da Forma 3.
A Forma 3 foi obtida através do tratamento térmico da Forma 2, colocando-a em uma coluna cromatográfica repleta de esferas de vidro com nitrogênio, para garantir uma atmosfera inerte, e mantida por 2 horas em uma estufa a 209 °C. Através da microscopia óptica foi possível visualizar que a Forma 3 é composta por cristais na forma de lâminas. Na curva DSC observou-se um ponto de fusão em 220 °C. Por DRX foi possível verificar a característica cristalina através dos diferentes picos de difrações. Em baixo ângulo foi possível observar alguma sobreposição dos picos de DRX da Forma 3 com a Forma 6, obtida por Roy e colaboradores (2007), porém não houve uma sobreposição de todo padrão de difração, demonstrando que uma nova forma polimórfica com padrões de difração não depositados no Cambridge Crystallographic DataBase foi encontrada.
A relação termodinâmica da Forma 3 com a Forma 1 foi avaliada através dos estudo de solubilidade e da plotagem do gráfico de Van’t Hoff. Os resultados demonstraram que a Forma 3 apresentou uma solubilidade menor, sendo a forma termodinamicamente mais estável e que apresentou uma relação monotrópica com a Forma 1, uma vez que as curvas foram paralelas e não houve nenhum ponto de intersecção.
Como visto no capítulo 5, foi possível quantificar as matérias-primas formadas por misturas polimórficas empregando o método de Rietveld, entretanto, para que os resultados encontrados sejam confiáveis e reprodutíveis e que este procedimento seja adequado para a aplicação pretendida, uma validação do método deve ser realizada, avaliando os parâmetros descritos nos compêndios oficiais. Assim, o desenvolvimento e a validação do método de quantificação por DRX utilizando o refinamento de Rietveld estão descritos no capítulo 7.
Primeiramente, foi realizada uma análise qualitativa das duas formas polimórficas obtidas por métodos de cristalizações descritos anteriormente, no intuito de confirmar as formas polimórficas para serem empregadas na validação. Foram verificadas as melhores condições de preparação da amostra e condições de coleta de dados do equipamento e, por fim, a validação foi conduzida.

174
Sabendo-se que a quantificação de fases pelo refinamento de Rietveld leva em consideração todo o padrão de difração de Raios-X e tem como característica fundamental o ajuste do difratograma analisado a um padrão de difração conhecido, normalmente indexados em bancos de dados como o “Cambridge Crystallographic Database”, uma grande preocupação na coleta de dados é que os padrões de difração analisados e conhecidos sejam muito semelhantes entre si. Desta forma, alguns cuidados na preparação da amostra (para minimizar orientação preferencial) e nos parâmetros de coleta do equipamento devem ser avaliados criteriosamente no desenvolvimento do método.
Um dos maiores problemas que influenciam nos padrões de difração é a orientação preferencial das amostras. Dependendo do hábito cristalino a partícula tem uma preferência a se acomodar por uma posição no porta-amostra, o que pode, inclusive, mascarar ou fazer desaparecer um pico completamente. Sabendo-se que formas aciculares e formas de agulhas tem muita orientação preferencial, e considerando que a Forma 2 do cloridrato de venlafaxina recristaliza-se na forma de agulhas, trabalhou-se inicialmente com o modo de preparação da amostra para minimizar esta orientação preferencial.
Em um primeiro momento as formas polimórficas foram apenas picadas e colocadas no suporte “zero background”. Devido às rotações do equipamento foi necessário fixar as amostras nos porta-amostras e, para este fim, utilizou-se uma pequena quantidade de graxa. Porém, verificou-se que houve influência da graxa nos padrões de difração (mostrando halos amorfos) e uma forte orientação preferencial.
As formas polimórficas picadas foram colocadas em um capilar de quartzo para tentar minimizar a orientação preferencial, uma vez que durante a coleta de dados do capilar é necessário fazê-lo rotar para coletar dados de todos os pontos do capilar. Entretanto, problema da orientação preferencial foi apenas ligeiramente reduzido.
O passo seguinte foi picar as formas polimórficas e passar por malhas com poros de tamanhos diferentes: 200, 130, 50 µm. Após este procedimento, as amostras foram colocadas no suporte “zero background” e os dados coletados. Verificou-se que este cuidado na preparação da amostra não foi suficiente para minimizar os efeitos de orientação preferencial. Houve somente uma redução quando se utilizou a malha intermediária. Além disso, os padrões de difração dos cristais passados por peneira com tamanho de poro grande e os cristais sem este tratamento não demonstraram diferenças. Os cristais passados pela

175
peneira de tamanho pequeno foram de difícil manuseio, uma vez que cargas eletrostáticas foram criadas.
Finalmente, optou-se por passar os cristais na malha de tamanho intermediário, acondicionando os mesmos em capilares de borossilicato com 0,7 milímetros de diâmetro, o que originou picos bem definidos, com grande intensidade e quase nenhuma orientação preferencial. Definida a condição de preparação da amostra, os parâmetros do instrumento foram otimizados com uma mistura polimórfica de 1% de Forma 2 na Forma 1 (p/p), encontrando-se como melhor condição 0,015° de step e 60 s de tempo a cada 1,05°. Otimizadas as condições de preparo de amostra e parâmetros do equipamento, a validação do método foi conduzida avaliando-se os parâmetros descritos nos guias do ICH e FDA: linearidade, precisão, exatidão, limites de detecção e quantificação. Verificou-se que capacidade do capilar foi de 20 mg de amostra, e escolheu-se a faixa de análise de 5-100% (p/p) de Forma 2 na Forma 1. Cálculos para conhecer a quantidade a ser pesada de cada uma das formas foram realizados. Ao realizar o refinamento de Rietveld verificou-se que a Forma 2 utilizada estava “contaminada” com praticamente 3% de Forma 1, então, na avaliação da validação do método essa quantidade foi descontada resultando em uma nova faixa de análise 4,86 – 97,06%.
A fim de verificar uma correlação entre a concentração nominal em cada capilar e a concentração encontrada após análise, uma curva de linearidade foi construída. Para tanto, misturas físicas de Forma 2 e Forma 1 foram realizadas nas proporções de 4,86, 24,27, 48,53, 72,8, e 97,06%, (p/p Forma 2/Forma 1) em ambiente controlado (20 ± 2 °C, 50 ± 5% UR). As amostras foram feitas em triplicata. O método descrito foi encontrado ser linear na faixa avaliada, com excelente correlação (r = 0,999), e o intercepto foi praticamente zero.
A exatidão foi avaliada através da recuperação de quantidades conhecidas de Forma 2 de VEN examinadas independentemente em triplicata, em três concentrações diferentes: 24,27, 48,53, e 72,80% (w/w). Os resultados de concentração obtidos foram de 25,06, 49,33, e 72,90%, correspondendo à recuperação de 103,30, 101,66, e 100,14%, respectivamente, demonstrando que o método foi exato.
A precisão do método foi determinada por estudos de repetibilidade e precisão intermediária examinando três amostras de concentração diferentes: 24,27, 48,53 e 72,80% (p/p Forma 2/Forma 1de VEN). A repetibilidade foi obtida através de seis avaliações no mesmo

176
dia e sob as mesmas condições experimentais de cada uma das concentrações. Os valores de DPR obtidos foram 3,82, 5,43, e 3,86%, respectivamente. A precisão intermediária do método foi avaliada pela realização da análise em dois dias diferentes (inter-dias) em triplicata. A precisão foi expressa em DPR (%) e os resultados encontrados foram de 1,33, 0,07 e, 0,69%, respectivamente.
Para obter os limites de detecção (LOD) e quantificação (LOQ), houve a necessidade de construir uma nova curva de calibração utilizando o resultado da altura de um pico escolhido, uma vez que a linearidade construída inicialmente verificava somente uma correlação entre os dados nominais e os resultados obtidos. Assim, um novo gráfico da altura do pico em 12,74° em função das percentagens de Forma 2 na Forma 1 (% w/w) na mesma faixa de 4,86 – 97,06% foi construída. Os LOD e LOQ foram determinados utilizando a equação da curva de calibração e as equações descritas no ICH. O método avaliado mostrou ser bem sensível, apresentando valores de LOD e LOQ de 1,16 e 3,50% (p/p Forma 2/Forma 1), respectivamente. Concluiu-se que o método de Rietveld permitiu quantificar, com precisão e exatidão, polimorfos do cloridrato de venlafaxina em mistura.

177

178
CONCLUSÕES

179

180
� Método de quantificação por cromatografia líquida em fase reversa, indicativo de estabilidade, foi desenvolvido e validado para análise de teor e estudos de dissolução do cloridrato de venlafaxina em cápsulas de liberação prolongada, mostrando ser específico, exato e preciso.
� O perfil de dissolução do fármaco indicou que a dissolução do cloridrato de venlafaxina em cápsulas de liberação prolongada segue cinética de primeira ordem;
� Matéria-prima do cloridrato de venlafaxina foi caracterizada através de DSC, TG, DRX, DRIFT e MEV e os resultados obtidos podem ser utilizados como parâmetros de controle de qualidade para futuros estudos;
� Estudos de pré-formulação foram realizados e não se observou incompatibilidade entre o fármaco e os excipientes avaliados;
� As Formas polimórfica 1 e 2 do cloridrato de venlafaxina foram obtidas pelo método de cristalização por evaporação;
� Quatro matérias-primas de diferentes fornecedores foram caracterizadas utilizando diferentes técnicas analíticas, indicando que as matérias-primas 1 e 2 correspondem à Forma polimórfica 1, enquanto que as matérias-primas 3 e 4 são misturas das Forma 1 e 2 do cloridrato de venlafaxina;
� Pelo método de refinamento de Rietveld encontrou-se que a matéria-prima 3 é formada por 17,5% de Forma 1 e 82,5% de Forma 2 (± 0.3), enquanto a matéria-prima 4 é composta por 57,5% de Forma 1 e 42,5% de Forma 2 (± 0.8);
� Não foi possível avaliar a relação termodinâmica entre as formas polimórficas 1 e 2 do cloridrato de venlafaxina, pois se encontrou uma contaminação da Forma 1 na Forma 2, impossibilitando os estudos;

181
� Uma nova forma polimórfica, Forma 3, obtida a partir da recristalização da fusão da forma 2, foi isolada, caracterizada e demonstrou ser diferente daquelas depositadas no Cambridge Crystallographic Database;
� A avaliação termodinâmica entre as Formas polimórficas 1 e 3 foi realizada, encontrando-se uma relação monotrópica entre as duas, sendo a Forma 3 a forma polimórfica mais estável.
� Um método de quantificação de fases polimórficas para as Formas 1 e 2 do cloridrato de venlafaxina por DRX empregando o refinamento de Rietveld, foi desenvolvido e validado.
� O método foi validado de acordo com os guias do ICH e FDA, sendo considerado linear na faixa de 4,86 - 97,06% (p/p Forma 2/Forma 1), preciso e exato, com limites de detecção de 1,16% e quantificação de 3,50%.

182
REFERÊNCIAS

183

184
AALTONEN, J.; ALLESO, M.; MIRZA, S.; KORADIA, V.; GORDON, K.C.; RANTANEN, J. Solid form screening – A review. European Journal of Pharmaceutics and Biopharmaceutics, v. 71, p. 23-37, 2009. AGATONOVIC-KUSTRIN, S.A.; WU, V.; RADES, T.; SAVILLE, D.; TUCKER, I.G. Powder diffractometric assay of two polymorphic forms of ranitidine hydrochloride. International Journal of Pharmaceutics, v. 184, p. 104–114, 1999. AHUJA, S. Assuring quality of drugs by monitoring impurities. Advanced Drug Delivery Reviews, v. 59, p. 3–11, 2007. AHUJA, S. Impurities Evaluation of Pharmaceuticals, Marcel Dekker, New York, 1998. ALBINATI, A.; WILLIS, B. T. M. The Rietveld method. International Tables for Crystallography, v. C, p. 710-712, 2006. ALSANTE, K.M.; ANDO, A.; BROWN, R.; ENSING, J.; HATAJIK, T.D.; KONG, W.; TSUDA, Y. The role of degradant profiling in active pharmaceutical ingredients and drug products. Advanced Drug Delivery Reviews, v. 59, p. 29–37, 2007 AMSTERDAM, J. D.; WANG, C.H.; SHWARZ, M.; SHULTS, J. Venlafaxine versus lithium monotherapy of rapid and non-rapid cycling patients with bipolar II major depressive episode: A randomized, parallel group, open-label trial. Journal of Affective Disorders, v. 112, p. 219-230, 2009. ANDREWS, J.M.; NINAN, P.T.; NEMEROFF, C.B. Venlafaxine: a novel antidepressant that has a dual mechanism of action. Depression, v. 4, p. 48 – 56, 1996. ANTONIO, S. G.; BENINI, F. R.; FERREIRA, F. F.; ROSA, P. C. P.; PAIVA-SANTOS, C. O. Quantitative Phase Analyses Through The Rietveld Method with X-Ray Powder Diffraction Data of Heat-Treated Carbamazepine Form III. Journal of Pharmaceutical Sciences, v. 100, p. 2658-1664, 2011.

185
ASAFU-ADJAYE, E.B.; FAUSTINO, P..; TAWAKKUL, M.A.; ANDERSON, L.W.; YU, L.X.; KWON, H.; VOLPE, D.A. Validation and application of a stability-indicating HPLC method for the in vitro determination of gastric and intestinal stability of venlafaxina. Journal of Pharmaceutical and Biomedical Analysis, v. 43-5, p. 1854-1859, 2007.
ATTWOOD, D; FLORENCE, A.T. Princípios físico-químicos em Farmácia. 3 ed, Universidade de São Paulo, São Paulo, 2003. 690 p. AUGUSTIN B.G.; COLD J.A.; JANN M.W. Venlafaxine and nefazodone, two pharmacologically distinct antidepressants. Pharmacotherapy, v. 17, p. 511-530, 1997. AULTON, M.E. Delineamento de Formas Farmacêuticas. 2 ed. Artmed, Porto Alegre, 2005. 677 p. AZARMI, S.; ROAC, W.; LOBENBERG, R. Current perspectives in dissolution testing of conventional and novel dosage forms. International Journal of Pharmaceutics, v. 328, p. 12–21, 2007. BAKSHI, M.; SINGH, S. Development of validated stability indicating assay methods – critical review. Journal of Pharmaceutical and Biomedical Analysis, v. 28, p. 1011–1040, 2002. BANDELOW, B.; ZOHAR, J.; HOLLANDER, E.; KASPER, S.; MOLLER, H.J. World Federation of Societies of Biological Psychiatry (WFSBP) guidelines for the pharmacological treatment of anxiety, obsessive compulsive and posttraumatic stress disorders. World Journal of Biological Psychiatry, v. 3, p. 171-199, 2002. BARBAS, R.; PROHENS, R.; PUIGJANER, C. A new polymorph of Norfloxacin - Complete characterization and relative stability of its trimorphic system. Journal of Thermal Analysis and Calorimetry, v. 89, p. 687–692, 2007. BARTOLOMEI, M.; RAMUSINO, M.C.; GHETI, P. Solid-state investigation of fluocinolone acetonide. Journal of Pharmaceutical and Biomedical Analysis, v. 15, p. 1813–1821, 1997.

186
BERENDT, R.T.; SPERGER, D.M.; MUNSON, E.J.; ISBESTER, P.K. Solid-state NMR spectroscopy in pharmaceutical research and analysis. Trends in Analytical Chemistry, v. 25, p. 977–984, 2006. BERNSTEIN, J. Polymorphism in Molecular Crystals. Clarendon press, Oxford, EUA, 2002. 410 p. BHATT, J.; JANGID, A.; VENKATESH, G.; SUBBAIAH, G.; SINGH, S. Liquid chromatography–tandem mass spectrometry (LC–MS–MS) method for simultaneous determination of venlafaxine and its active metabolite O-desmethyl venlafaxine in human plasma. Journal of Chromatography B, v. 829, p. 75-81, 2005. BHOGAL, K.S.; BALDWIN, D.S. Pharmacological treatment of social phobia. Psychiatry, v. 6, p. 217 - 223, 2007. BOND, A.D. Polymorphism in molecular crystals. Current Opinion in Solid State and Materials Science, v.13, p. 91–97, 2009. BRASIL. Agência Nacional de Vigilância Sanitária - ANVISA. RDC 136, de 29 de maio de 2003. Dispõe sobre o registro de medicamento novo. Diário Oficial da União, Brasília, 02 jun. 2003a. BRASIL. Agência Nacional de Vigilância Sanitária - ANVISA. RE 899, de 29 de maio de 2003. Guia para a validação de métodos analíticos e bioanalíticos. Diário Oficial da União, Brasília, 02 jun. 2003b. BREIER, A.R.; PAIM, C.S.; STEPPE, M.; SCHAPOVAL, E.E.S. Development and Validation of Dissolution Tests for Fexofenadine Hydrochloride Capsules and Coated Tablets. Journal of Pharmaceutical Science, v. 8, p. 289-298, 2005. BRETNALL, A.E.; CLARKE, G.S. Validation of Analytical Test Methods. Separation Science and Technology, v. 10, p. 429–457, 2011. BRITISH PHARMACOPOEIA. Her Majesty’s Stationary Office, London, 2011.

187
BRITTAIN, H.G. Physical Characterization of Pharmaceutical Solids, Marcel Dekker, Inc., New York, 1995. 424 p. BRITTAIN, H.G. Polymorphism in Pharmaceutical Solids, 2 ed, Marcel Dekker, New York, 1999. 448 p. BRITTAIN, H.G.; BOGDANOWICH, S.J.; BUGAY, D.E., DEVICENTIS, J.; LEWEN, G.; NEWMAN, A.W. Physical characterization of pharmaceutical solids, Pharmaceutical Research, v. 8, p. 963–973, 1991. BUCKTON, G.; RUSSEL, S.J.; BEEZER, A.E. Pharmaceutical calorimetry: a selective review. Thermochimica Acta, v. 193, p. 195-214, 1991. BUCKTON, G.D.P. Assessment of disorder in crystalline powders – a review of analytical techniques and their application. International Journal of Pharmaceutics, v. 179, p. 141–158, 1999. BUGAY D.E. Characterization of the solid-state: spectroscopic techniques. Advanced Drug Delivery Review, v. 48, p. 43-65, 2001. BYRN, S.; PFEIFFER, R.; GANEY, M.; HOIBERG, C.; POOCHIKIAN, G. Pharmaceuticals solids, a strategic approach to regulatory considerations. Pharmaceutical Research, v. 12, p. 945–954, 1995. BYRN, S.R.; PFEIFFER, R.R.; STOWELL, J.G. Solid-State Chemistry of Drugs, 2 ed., West Lafayette, Indiana, 1999. 576 p. CARDOSO, S.G.; SCHAPOVAL, E.E.S. High-performance liquid chromatographic assay of terbinafine hydrochloride in tablets and creams. Journal of Pharmaceutical and Biomedical Analysis, v. 19, p. 809–812, 1999. CHAWLA G.; BANSAL A.K. Challenges in Polymorphism of Pharmaceuticals, CRIPS, v. 5, p. 12-15, 2004. CHHALOTIYA, U.K.; PATEL, H.B.; BHATT, K.K. Development and validation of an ultra performance liquid chromatography method for

188
venlafaxine hydrochloride in bulk and capsule dosage form. Indian Journal of Pharmaceutical Sciences, v. 72, p. 814-818, 2010. CHIENG, N.; RADES, T. AALTONEN, J. An overview of recent studies on the analysis of pharmaceutical polymorphs. Journal of Pharmaceutical and Biomedical Analysis, v. 55, p. 618–644, 2011. CHOWDARY, K. P. R.; RAJYALAKSHMI, Y. Dissolution rate in modern pharmacy. East Pharmaceutical, v. 30, p. 51-54, 1987. CIDES, L.C.S.; ARAÚJO, A.A.S.; SANTOS-FILHO, M.; MATOS, J.R. Thermal behaviour, compatibility study and decomposition kinetics of glimepiride under isothermal and non-isothermal conditions. Journal of Thermal Analysis and Calorimetry, v. 84, p. 441–445, 2006. COLLIER, J.W.; SHAH, R.B.; BRYANT, A.R.; HABIB, M.J.; KHAN, M.A.; FAUSTINO, P.J. Development and application of a validated HPLC method for the analysis of dissolution samples of levothyroxine sodium drug products. Journal of Pharmaceutical and Biomedical Analysis, v. 54, p. 433–438, 2011. COSTA, P.; LOBO, J.M.S. Modeling and comparison of dissolution profiles. European Journal of Pharmaceutical Sciences, v. 13, p. 123–133, 2001. CUFFINI, S.L.; ELLENA, J.F.; MASCARENHAS Y.P.; AYALA, A.P.; SIELSER, H.W.; MENDES FILHO, J.; MONTI, G.A.; AIASSA, V.; SPERANDEO, N.R. Physicochemical characterization of deflazacort: Thermal analysis, crystallographic and spectroscopic study. Steroids, v. 72, p. 261–269, 2007. CULLITY, B.D. Elements of x-ray diffraction, 2nd. Ed. New York: Addison-Wesley Publishing; 1978. 514 p. CUNHA, S. Método simples de formação de monocristal de substância orgânica para estudo para estudo estrutural por difração de raios X. Química Nova, v. 31, p. 906-909, 2008.

189
CUNNINGHAM L.A. Once-Daily Venlafaxine Extended Release (XR) and Venlafaxine Immediate Release (IR) in Outpatients with Major Depression. Annals of Clinical Psychiatry, v. 9, p. 157-164, 1997. DENYS, D.; FLUITMAN, S.; KAVELAARS, A.; HEIJNEN, C., WESTENBERG, H.G.M. Effects of paroxetine and venlafaxine on immune parameters in patients with obsessive compulsive disorder. Psychoneuroendocrinology, v. 31, p. 355–360, 2006. ELIZAROVA, T.; SHTYLEVA, S.; PLETENEVA, T. Using near-infrared spectrophotometry for the identification of pharmaceuticals and drugs. Pharmaceutical Chemistry Journal, v. 42, p. 432–434, 2008. ELSHANAWANE, A.A.; MOSTAFA, S.M.; ELGAWISH, M.S. Application of a Validated, Stability- Indicating LC Method to Stress Degradation Studies of Ramipril and Moexipril.HCl. Chromatographia, v. 67, p. 567–573, 2008. ERMER, J. Validation in Pharmaceutical Analysis. Part I: An Integrated approach. Journal of Pharmaceutical and Biomedical Analysis, v. 24, p. 755-767, 2001. FELIX, F.S.; CIDES, L.C.S.; ANGNES, L.; MATOS, J.R. Thermal behavior study and decomposition kinetics of salbutamol under isothermal and non-isothermal conditions. Journal of Thermal Analysis and Calorimetry, v. 95, p. 877–880, 2009. FERRAZ, H. G., CONSIGLIERI, V. O., STORPIRTIS, S. Avaliação da cinética de dissolução de ampicilina em comprimidos comercializados no Brasil. Revista Farmácia e Bioquímica, v. 34 n. 2, p. 93-99, 1998. FINI, A.; OSPITALI, F.; ZOPPETTI, G.; PUPPINI, N. ATR/Raman and Fractal Characterization of HPBCD/Progesterone Complex Solid Particles. Pharmaceutical Research, v. 25, No. 9, p. 2030-2040, 2008. FOOD and DRUG ADMINISTRATION, Center for Drug Evaluation and Research, Guidance for Industry, ANDAs: Pharmaceutical Solid Polymorphism: Chemistry, Manufacturing, and Controls Information, 2007, http://www.fda.gov/cder/guidance/index.htm.

190
FORTUNATO, D. Dissolution Method Development for Immediate Release Solid Oral Dosage Forms. Dissolution Technologies, v. 12, p. 12-14, 2005. GANDHI, R.; PILLAI, O.; THILAGAVATHI, R.; GOPALAKRISHNAN, B.; KAUL, C.L.; PANCHAGNULA, R. Characterization of azithromycin hydrates. European Journal of Pharmaceutical Sciences, v.16, p. 175–84, 2002. GAVEZZOTTI, A. A Solid-State Chemist’s View of the Crystal Polymorphism of Organic Compounds. Journal of Pharmaceutical Sciences, v. 96, p. 2232-2241, 2007. GIRON, D. Applications of thermal analysis and coupled techniques in pharmaceutical industry. Journal of Thermal Analysis and Calorimetry, v. 68, p. 335-357, 2002. GIRON, D. Contribution of thermal methods and related techniques to the rational development of pharmaceuticals — Part 1. Pharmaceutical Science & Technology Today, v. 1, p. 191–199, 1998. GIRON, D. Thermal Analysis and Calorimetric Methods in the Characterization of Polymorphs and Solvates, Thermochimica Acta, v. 248, p. 1-59, 1995. GIRON, D.; MUTZ, M.; GARNIER, S. Solid-state of pharmaceutical compounds. Journal of Thermal Analysis and Calorimetry, v. 77, p. 709–747, 2004. GIRON, G. Characterization of salts of drug substances. Journal of Thermal Analysis and Calorimetry, v. 73, p. 441 – 457, 2003. GOMBAS, A.; SZABO-REVESZ, P.; KATA, M.; REGDON, G.; EROS, I. Quantitative determination of crystallinity of a-lactose monohydrate by DSC. Journal of Thermal Analysis and Calorimetry, v. 68, p. 503–510, 2002. GOODHEW P.J.; HUMPHREYS J.; BEANLAND R. Electron Microscopy and Analysis, 3rd Edition, Taylor and Francis, London, 2000. 251 p.

191
GORMAN, J.M. Treating generalized anxiety disorder. Journal of Clinical Psychiatry, v.64, p. 24-29, 2003. GOROG, S. Identification and Determination of Impurities in Drugs, 1 ed. Elsevier Sciences, Amsterdam, 2000. 748 p. GRANT D.J.W. Theory and origin of polymorphism. In: Brittain HG, editor. Polymorphism in pharmaceutical solids. New York: Marcel Dekker, 1999. 654 p. GRANT, D.J.W.; MEHDIZADEH, M.; CHOW, A.H.L.; FAIRBROTHER, J.E. Non-linear Van’t Hoff solubility-temperature plots and their pharmaceutical interpretation. International Journal of Pharmaceutical, v. 18, p. 25–38, 1984. GU, C.-H.; YOUNG, V.; GRANT, D.W.J. Polymorph screening: influence of solvents on the rate of solvent-mediated polymorphic transformation. Journal of Pharmaceutical Sciences, v. 90, p. 1878–1890, 2001. GUTIERREZ, M.A.; STIMMEL, G.L.; AISO, J.Y. Venlafaxine: A 2003 Update. Clinical Therapeutics, v. 25, p. 2138-2154, 2003. HAKAN, K.; TEVFIK, A.; GOKHAN, G.; MURAT, Y.; GOKHAN, K.U.; MER, C.; TURGAY, C.; TAYFUN, I.U. Stimulus properties of venlafaxine in a conditioned taste aversion procedure. European Journal of Pharmacology, v. 596, p. 102–106, 2008. HARVEY, A.T.; RUDOLPH, R.L.; PRESKORN, S.H. Evidence of the Dual Mechanism Action of Venlafaxine. Archives of General Psychiatry, v. 57, p. 503–509, 2000. HERMAN, C.; LEYSSENS, T.; VERMYLEN, V.; HALLION, V.; HAUT, B. Towards an accurate and precise determination of the solid–solid transition temperature of enantiotropic systems. Journal of Chemical Thermodynamics, v. 43, p. 677–682, 2011.

192
HILL, R.J. Expanded use of the Rietveld method in studies of phase abundance in multiphase mixtures. Powder Diffraction, v. 6, p. 74-77, 1991. HILL, R.J.; HOWARD, C.J. J. Quantitative phase analysis from neutron powder diffraction data using the Rietveld method. Applied Crystallography, v. 20, p. 467–474, 1987. HILLS, R.G.; PILCH, M.; DOWDING, K.J.; RED-HORSE, J.; PAEZ, T.L.; BABUSKA, I.; TEMPONE, R. Validation Challenge Workshop. Computer Methods in Applied Mechanics and Engineering, v. 197, p. 2375–2380, 2008. HOWELL, S.R.; HUSBANDS, G.E.M.; SCATINA, J.A.; SISENWINE, S.F. Metabolic disposition of 14C-venlafaxine in mouse, rat, dog, rhesus monkey and man. Xenobiotica, v. 23, p. 349-359, 1993. HURST, V.J.; SCHROEDER, P.A.; STYRON, R.W. Accurate quantification of quartz and other phases by powder x-ray diffractometry. Analytica Chimica Acta, v. 337, p. 233–252, 1997. ICH - International Conference on Harmonisation of technical requirements for registration of pharmaceuticals for human use: Guideline on validation of analytical procedure: Text and Methodology, 1996. ICH - International Conference on Harmonisation of technical requirements for registration of pharmaceuticals for human use: Guideline on specifications: test procedures and acceptance criteria for biotechnological/biological products, 1999. ICH - International Conference on Harmonisation of technical requirements for registration of pharmaceuticals for human use: Guideline on impurities in new drug substances, 2006. ICH – International Conference on Harmonisation of technical requirements for registration of pharmaceuticals for human use: Guideline on Validation of Analytical Procedure Q2 (R1): Text and Methodology, 2005.

193
IYENGAR, S.S.; PHADINS, N.V.; SURYANARAYANAN, R. Quantitative analysis of complex pharmaceutical mixtures by the Rietveld method, Powder Diffraction, v. 16, p. 20–24, 2001. JENKINS, R.; SNYDER, R.L. Introduction to X-Ray Powder Diffractometry, Wiley-Interscience, New York, 1996. 432 p. JORGENSEN, E.D.; BHAGWAT, D. Development of dissolution tests for oral extended-release products. Pharmaceutical Science & Technology Today, v. 1, p. 128-135, 1998. JUAN, H.; ZHILING, Z.; HUANDE, L. Simultaneous determination of fluoxetine, citalopram, paroxetine, venlafaxine in plasma by high performance liquid chromatography–electrospray ionization mass spectrometry (HPLC–MS/ESI). Journal of Chromatography B, v. 820-1, p. 33-39, 2005. KAWAKAMI, K. Reversibility of Enantiotropically Related Polymorphic Transformations from a Practical Viewpoint: Thermal Analysis of Kinetically Reversible/Irreversible Polymorphic Transformations. Journal of Pharmaceutical Sciences, v. 96, p. 982-989, 2007. KHAMAR, D.; BRADSHAW, I.J.; HUTCHEON, G.A.; SETON, L. Solid State Transformations Mediated by a Kinetically Stable Form. Crystal Growth Design, v. 12, p. 109–118, 2012. KOVALESKI, J.; KRAUT, B.; MATTIUZ, A.; GIANGIULIO, M.; BROBST, G.; CAGNO, W.; KULKARNI, P.; RAUCH, T. Impurities in generic pharmaceutical development. Advanced Drug Delivery Reviews, v. 59, p. 56–63, 2007. KUMINEK, G.; STULZER, H.K.; TAGLIARI, M.; OLIVEIRA, P.R.; BERNARDI, L.S.; RAUBER, G.; CARDOSO, S. G. Liquid chromatographic method for the simultaneous determination of buclizine, tryptophan, pyridoxine, and cyanocobalamin in tablets and oral suspension. Journal of AOAC international, v. 94, p. 1785-1790, 2011.

194
KUMINEK, G.; STULZER, H.K.; TAGLIARI, M.P.; OLIVEIRA, P.R.; BERNARDI, L.S.; RAUBER, G.; CARDOSO, S.G. Development and validation of a stability-indicating HPLC method for the determination of buclizine hydrochloride in tablets and oral suspension and its application to dissolution studies. Química Nova, v. 35, p. 207-212, 2012. LARSON, A.C.; DREELE, R.B.V. GSAS – General Structure Analysis System. Los Alamos, USA: Los Alamos National Laboratory, 1994. LIMA, J.L.F.C.; LOO, D.V.; DELERUE-MATOS, C.; SILVA, A.S.R. Electrochemical behaviour of Venlafaxine and its determination in pharmaceutical products using square wave voltammetry. Il Farmaco, v. 54, p. 145-148, 1999. LIZARRAGA, E.; ZABALETA,C.; PALOP, J.A. Thermal stability and decomposition of pharmaceutical compounds. Journal of Thermal Analysis and Calorimetry, v. 89, p. 783-792, 2007. LÓPEZ, F.A.; MERC, A.L.R.; ALGUACIL, F.J.; LÓPEZ-DELGADO, A. L. A kinetic study on the thermal behavior of chitosan. Journal of Thermal Analysis and Calorimetry, v. 91, p. 633–639, 2008. LUAN VU, R.; HELMESTE, D.; ALBERS, L.; REIST, C. Rapid determination of venlafaxine and O-desmethylvenlafaxine in human plasma by high-performance liquid chromatography with fluorimetric detection. Journal of Chromatography B, v. 703, p. 195-201, 1997. MADHAVI, A.; REDDY, G.S.; SURYANARAYANA, M.V.; NAIDU, A. Development of a New Analytical Method for Determination of Related Components in Nateglinide. Chromatographia, v. 67, p. 639–645, 2008. MADSEN, I.C.; SCARLETT, N.V.Y. Quantitative phase analysis, in: R.E. Dinnebier, S.J.L. Billinge (Eds.), Powder Diffraction: Theory and Practice, RCS Publishing, Cambridge, 2008. MAKHIJA, S.N.; VAVIA, P.R. Stability indicating LC method for the estimation of venlafaxine in pharmaceutical formulations. Journal of Pharmaceutical and Biomedical Analysis, v. 28, p. 1055-1059, 2002.

195
MANADAS, R.; PINA, M. E.; VEIGA, F. A. Dissolução in vitro na previsão da absorção oral de fármacos em formas farmacêuticas de liberação modificada. Revista Brasileira de Ciências Farmacêuticas, v. 38, p. 375-399, 2002. MARCOLONGO, R. Dissolução de medicamentos: fundamentos, aplicações, aspectos regulatórios e perspectivas na área farmacêutica. 2003. 117f. Dissertação (Metrado em Fármacos e Medicamentos) – Universidade de São Paulo, São Paulo, 2003. MATOGA, M.; PEHOURCQ, F.; TITIER, K.; DUMORA, F.; JARRY, C. Rapid high-performance liquid chromatographic measurement of venlafaxine and O-desmethylvenlafaxine in human plasma: Application to management of acute intoxications. Journal of Chromatography B, v. 760, p. 213-218, 2001. McCUSKER, L.B.; VON DREELE, R.B.; COX, D.E.; LOUER, D.; SCARDI, P. Rietveld refinement guidelines, Journal of Applied Crystallography, v. 32, p. 36–50, 1999. MEDEIROS, A.C.D.; CORREIA, L.P.; SIMÕES, M.O.S.; MACEDO, R.O. Technological quality determination of pharmaceutical disintegrant by DSC cooling and DSC photovisual. Journal of Thermal Analysis and Calorimetry, v. 88, p. 311–315, 2007. MENEGOLA, J.; STEPPE, M.; SCHAPOVAL, E.E.S. Dissolution test for citalopram in tablets and comparison of in vitro dissolution profiles. European Journal of Pharmaceutics and Biopharmaceutics, v. 67, p. 524–530, 2007. MERCURI, L.P.; MATOS, J.R.; PINHO, J.J.R.G.; STORPIRTIS, S. Aplicação de Métodos Termoanalíticos em Estudos de Pré-Formulação de Comprimidos de Cloridrato de Metformina — Parte II. Revista Portuguesa de Farmácia, v. 1, p. 33–41, 2001. MILLER, J.M.; COLLMAN, B.M.; GREENE, L.R.; GRANT, D.J.W.; BLACKBURN, A.C. Identifying the stable polymorph early in the drug discovery-development process. Pharmaceutical Development and Technology, v. 10, p. 291–297, 2005.

196
MOFFAT, A.C.; OSSELTON, M.D.; WIDDOP, B. - CLARKE’S - Analysis of Drug and Poisons, Pharmaceutical Press: London. Electronic version, 2004. MONTGOMERY, S. A. Rapid Onset Action of Venlafexine. International Clinical Pshychopharmacology, v. 14, p. 21–27, 1999. MORISSETTE, S.L.; ALMARSSON, O.; PETERSON, M.L.; REMENAR, J.F.; READ, M.J.; LEMMO, A.V.; ELLISA, S.; CIMA, M.J.; GARDNER, C.R. High-throughput crystallization: polymorphs, salts, co-crystals and solvates of pharmaceutical solids. Advanced Drug Delivery Reviews, v. 56, p. 275– 300, 2004. MULLIN, J.W. Crystallization, 4 Ed. Butterworth-Heinemann, Oxford, EUA, 2000. 610 p. MURA, P.; GRATTERI, P.; FAUCCI, M.T. Compatibility studies of multicomponent tablet formulations. DSC and experimental mixture design. Journal of Thermal Analysis and Calorimetry, v. 68, p. 541–551, 2002. NAKAJIMA, S.; SUZUKI, T.; WATANABE, K.; KASHIMA, H.; UCHIDA H. Accelerating response to antidepressant treatment in depression: A review and clinical suggestions. Progress in Neuro-Psychopharmacology & Biological Psychiatry, v. 34, p. 259–264, 2010. NEMET, Z.; SAJÓ, I.; DEMETER, Á. Rietveld refinement in the routine quantitative analysis of famotidine polymorphs. Journal of Pharmaceutical and Biomedical Analysis, v. 51, p. 572–576, 2010. NEWMAN, A.W.; BYRN, S.R. Solid-state analysis of the active pharmaceutical ingredient in drug products. Drug Discovery Today, v. 8, p. 898-905, 2003. NGUYEN, G.T.; TRAN, V.D.; KOTOCOVA, M. TOPAS - Parallel Programming Environment for Distributed Computing. International Conference on Computational Science, v.2329, p. 890−899, 2002.

197
NICOLI, S.; BILZI, S.; SANTI, P.; CAIRA, M.R.; LI, J.; BETTINI, R., Ethyl-paraben and nicotinamide mixtures: apparent solubility, thermal behaviour and X ray structures of the 1:1 co-crystal. Journal of Pharmaceutical Science, v. 97, p. 4830-4839, 2008. NOWEEA, S.M.; ABBAS, A.; ROMAGNOLI, J.A. Optimization in seeded cooling crystallization: A parameter estimation and dynamic optimization study. Chemical Engineering and Processing, v. 46, p. 1096–1106, 2007. OFFERDAHL, T.J. Solid-state NMR spectroscopy for pharmaceutical analysis. Pharmaceutical Technology, v. 28, p. 54-68, 2004. OLIVEIRA, P.R.; BARTH, T.; TODESCHINI, V.; DALMORA, S.L. Simultaneous Liquid Chromatographic Determination of Ezetimibe and Simvastatin in Pharmaceutical Products. Journal of AOAC International, v. 90, p. 1566-1572, 2007. OLIVEIRA, P.R.; BERNARDI, L.S.; MURAKAMI, F.S.; MENDES, C.; SILVA, M.A.S. Thermal characterization and compatibility studies of norfloxacin for development of extended release tablets. Journal of Thermal Analysis and Calorimetry, v. 97, p. 741-745, 2009. OLIVEIRA, P.R.; BERNARDI, L.S.; MENDES, C.; SANGOI, M.S.; SILVA, M.A.S. Liquid chromatographic determination of lumiracoxib in pharmaceutical formulations. Journal of Pharmaceutical and Biomedical Analysis, v. 51, p. 728–732, 2010a. OLIVEIRA, P.R.; STULZER, H.K.; BERNARDI. L.S.; BORGMANN, S.H.M.; CARDOSO, S.G.; SILVA, M.A.S. Sibutramine hydrochloride monohydrate Thermal behavior, decomposition kinetics and compatibility studies. Journal of Thermal Analysis and Calorimetry, v. 100, p. 277–282, 2010b. OLVER, J.S.; BURROWS, G.D.; NORMAN, T.R. Third-generation antidepressants: do they offer advantages over the SSRIs? CNS Drugs, v. 15, p. 941 – 54, 2001. OZAWA, T. Thermal analysis—review and prospect. Thermochimica Acta, v. 355, p. 35–42, 2000.
198
PALACIO, M.A.; CUFFINI, S.; BADINI, R.; KARLSSON. A.; PALACIOS, S.M. Solid-state characterization of two polymorphic forms of R-albuterol sulfate. Journal of Pharmaceutical and Biomedical Analysis, v. 43, p. 1531–1534, 2007. PERAHIA, D.G.S.; PRITCHETT, Y.L.; KAJDASZ, D.K.; BAUER, M.; JAIN, R.; RUSSEL, J.M.; WALKER, D.J.; SPENCER, K.A.; FROUD, D.M.; RASKIN, J.; THASE, M.E. A randomized, double-blind comparison of duloxetine and venlafaxine in the treatment of patients with major depressive disorder. Journal of Psychiatric Research, v. 42, p. 22–34, 2008. PHADNIS, N.; CAVATUR, R.K.; SURYANARAYANAN, R. Identification of drugs in pharmaceutical dosage forms by X-ray powder diffractometry. Journal of Pharmaceutical and Biomedical Analysis, v. 15, p. 929-943, 1997. PRANZO, M. B.; CRUICKSHANK, D.; CORUZZI, M.; CAIRA, M. R.; BETTINI, R. Enantiotropically Related Albendazole Polymorphs. Journal of Pharmaceutical Sciences, v. 99, p. 3731–3742, 2010. PRICE, R.; YOUNG, P.M. Visualization of the crystallization of lactose from the amorphous state. Journal of Pharmaceutical Sciences, v. 93, p. 155–164, 2004. PUROHIT, R.; VENUGOPALAN, P. Polymorphism: An Overview. Resonance, p. 882 – 893, 2009. RAMESH, B.; NARAYANA, P.S.; REDDY, A.S.; DEVI, P.S. Stability-indicating HPTLC method for analysis of venlafaxine hydrochloride, and use of the method to study degradation kinetics. Journal of Planar Chromatography, v. 24, p. 160-165, 2011. RAO R.N.; RAJU A.N. Simultaneous separation and determination of process-related substances and degradation products of venlafaxine by reversed-phase HPLC. Journal Separation Science, v. 29, p. 2733 – 2744, 2006.

199
RAO, D.V.S.; RADHAKRISHNANAND, P. Stress Degradation Studies on Dutasteride and Development of a Stability-Indicating HPLC Assay Method for Bulk Drug and Pharmaceutical Dosage Form. Chromatographia, v. 67, p. 841–845, 2008. RAO, R.N.; NAGARAJU, V. An overview of the recent trends in development of HPLC methods for determination of impurities in drugs. Journal of Pharmaceutical and Biomedical Analysis, v. 33, p. 335 – 377, 2003. RAO, S.M.; VYAS, K.; SIVALAKSHMIDEVI, A.; OM REDDY, G. Novel crystalline polymorphic forms of venlafaxine hydrochloride and a process for their preparation. WIPO Patent Application WO/2002/046140 A1, 2002. RASENACK, N.; MULLER, B.W. Crystal habit and tableting behavior. International Journal of Pharmaceutics, v. 244, p. 45–57, 2002. RAW A.S., YU L.X., Pharmaceutical solid polymorphism in drug development and regulation, Advanced Drug Delivery Reviews, v. 56 (3), p. 235-236, 2004. RAW, A.S.; FAURNESS, M.S.; GILL, D.S.; ADAMS, R.C.; HOLCOMBE, F.O.; YU, L.X. Regulatory considerations of pharmaceutical solid polymorphism in abbreviated new drug applications (ANDAs). Advanced Drug Delivery Reviews, v. 56, p. 397 – 414, 2004. REIFSNYDER, D.H.; McKNIGHT, N.L.; KELLEY, B. Process Validation. Comprehensive Biotechnology, v. 3, p. 511–519, 2011. RIETVELD H.M. A profile refinement method for nuclear and magnetic structures. Journal of Applied Crystallography, v. 2, p. 65–71, 1969. RODRIGUEZ-CARVAJAL, J. Recent advances in magnetic structure determination by neutron powder diffraction. Physica B: Condensed Matter, v. 192, p. 55-69, 1993.

200
RODRÍGUEZ-SPONG, B.; PRICE, C.P.; JAYASANKAR, A.; MATZGER, A.J.; RODRÍGUEZ-HORNEDO, N. General principles of pharmaceutical solid polymorphism: a supramolecular perspective. Advanced drug delivery reviews, v. 56, p. 241-274, 2004. ROSSI, R.C.; DIAS, C.L.; BAJERSKI, L.; BERGOLD, A.M.; FROEHLICH P.E. Development and validation of discriminating method of dissolution for fosamprenavir tablets based on in vivo data. Journal of Pharmaceutical and Biomedical Analysis, v. 54, p. 439–444, 2011. ROY, S.; AITIPAMULA, S.; NANGIA, A. Thermochemical Analysis of Venlafaxine Hydrochloride Polymorphs 1-5. Crystal Growth & Design, v. 5, no 6, p. 2268-2276, 2005. ROY, S.; BHATT, P.. M.; NANGIA, A.; KRUGER, G.J. Stable Polymorph of Venlafaxine Hydrochloride by Solid-to-Solid Phase Transition at High Temperature. Crystal Growth & Design, v. 7, n. 3, p. 476-480, 2007. ROZET, E.; MARINI, R.D.; ZIEMONS, E.; BOULANGER, B.; HUBERT, P.H. Advances in validation, risk and uncertainty assessment of bioanalytical methods. Journal of Pharmaceutical and Biomedical Analysis, v. 55, p. 848–858, 2011. RUDOLPH R.L.; DERIVAN A.T. The safety and tolerability of venlafaxine hydrochloride: Analysis of the clinical trials database. Journal of Clinical Psychopharmacology, v. 16, p. 54-61, 1996. SANTOS, A.F.O.; BASÍLIO, I.D.J; SOUZA, F.S.; MEDEIROS, A.F.D.; PINTO, M.F.; SANTANA, D.P.; MACEDO, R.O. Application of thermal analysis of binary mixtures with metformin. Journal of Thermal Analysis and Calorimetry, v. 93 (2), p. 361–364, 2008. SCHMITT, A.B.; BAUER, M.; VOLZ, H.P.; MOELLER, H.J.; JIANG, Q.; NINAN, P.T.; LOESCHMANN, P.A.. Differential effects of venlafaxine in the treatment of major depressive disorder according to baseline severity. European Archives of Psychiatry and Clinical Neuroscience, v. 259, p. 329–339, 2009.

201
SHABIR, G.A. Validation of high-performance liquid chromatography methods for pharmaceutical analysis, understanding the differences and similarities between validation requirements of the US Food and Drug Administration, the US Pharmacopeia and the International Conference on Harmonization. Journal of Chromatography A, v. 987, p. 57-66, 2003. SHAH, B.; KAKUMANU, V.K.; BANSAL, A.K. Analytical techniques for quantification of amorphous/crystalline phases in pharmaceutical solids. Journal of Pharmaceutical Sciences, v. 95, p. 1641-1665, 2006. SHIRVI, V.D.; CHANNABASAVARAJ, K.P.; KUMAR, G.V.; MANI, T.T. HPTLC analysis of venlafaxine hydrochloride in the bulk drug and tablets. Journal of Planar Chromatography, v. 23, p. 369-372, 2010. SIEWERT, M.; DRESSMAN, J.; BROWN, C.K.; SHAH, V.P. FIP/AAPS Guidelines to Dissolution/in Vitro Release Testing of Novel/Special Dosage Forms. AAPS PharmSciTech, v. 4, p. 1-10, 2003. SINGHAL, D.; CURATOLO, W. Drug polymorphism and dosage form design: a practical perspective. Advanced Drug Delivery Reviews, v. 56, p. 335–347, 2004. SILVA, V.A.; HANWELLA, R. Efficacy and tolerability of venlafaxine versus specific serotonin reuptake inhibitors in treatment of major depressive disorder: a meta-analysis of published studies. International Clinical Psychopharmacology, v. 27, p. 8–16, 2012. SIVALAKSHMIDEVI, A.; VYAS, K,; RAO S.M.; REDDY G.O. A monoclinic polymorph of venlafaxine hydrochloride. Acta Crystallographica, v. 58, p. 1072-1074, 2002. SIVALAKSHMIDEVI, A.; VYAS, K,; RAO S.M.; REDDY G.O. WOBMUV01. CCDC 198947. 2002. SOUZA FILHO, J.H.; BONIFÁCIO, F.N.; BEDOR, D.C.G.; RAMOS, V.L.; SOUSA, C.E.M.; SARDÓN, L.L.F.; GONÇALVES, T.M.; MOREIRA, R.C.D.; LEAL, L.B.; SANTANA, D.P. Relative Bioavailability of Two Formulations of Venlafaxine Extended-Release

202
75-mg Capsules in Healthy Brazilian Male Volunteers: A Single-Dose, Randomized- Sequence, Open-Label, Two-Period Crossover Study in the Fasting and Fed States. Clinical Therapeutics, v. 32, p. 2088-2096, 2010. SRAMEK, J.J.; ZAROTSKY, V.; CUTLER, N.R. Generalised anxiety disorder: Treatment options Drugs, v. 62, p.1635-1648, 2002. STAHL, S.M.; ENTSUAH, A.R.; RUDOLPH, R.L. Comparative efficacy between venlafaxine and SSRIs: a pooled analysis of patients with depression. Biological Psychiatry, v. 52, p. 1166–1174, 2002. STAHL, S.M.; GRADY, M.M.; MORET, C.; BRILEY, M. SNRIs: Their Pharmacology, Clinical Efficacy, and Tolerability in Comparison with Other Classes of Antidepressants. CNS Spectrums, v.10, p. 732-747, 2005. STEPHENSON, G.A.; FORBES, R.A.; REUTZEL-EDENS, S.M. Characterization of the solid state: quantitative issues. Advanced Drug Delivery Reviews, v. 48, p. 67–90, 2001. STORPIRTIS, S.; GONÇALVES, J.E.; CHIANN, C.; GAI, M.N. Biofarmacotécnica, Guanabara Koogan, Rio de Janeiro, Brasil, 2009. 321 p. SURANARAYANAN, R. Determination of the relative amounts of a-carbamazepine and b-carbamazepine in a mixture by powder X-ray diffractometry. Powder Diffraction, v. 6, p. 155–159, 1990. SWARTZ, M.E.; KRULL, I.S. Validação de Métodos Cromatográficos. Pharmaceutical Technology, v. 2, (3), p. 12 – 20, 1998. SYKULA-ZAJA, A.; LODUGA-CHRUSCINSKA, E.; PALECZ, B.; DINNEBIIER, R. E.; GRIESSER, U. J.; NIEDERWANGER, V. Thermal and X-ray analysis of racemic bupivacaine hydrochloride. Journal of Thermal Analysis and Calorimetry, 105, p. 1031–1036, 2011. THRELFALL, T.L. Analysis of Organic Polymorphs: A Review. Analyst, v.120, p. 2435 – 2460, 1995.

203
TISHMACK P.A.; BUGAY D.E.; BYRN S.R. Solid-state nuclear magnetic resonance spectroscopy. Journal of Pharmaceutical Science, v. 92, p. 441-474, 2003. TITA, B.; MARIAN, E.; TITA, D.; VLASE, G.; DOCA, N.; VLASE, T. Comparative kinetic study of decomposition of some diazepine derivatives under isothermal and non-isothermal conditions. Journal of Thermal Analysis and Calorimetry, v. 94, p. 447–452, 2008. TITA, B.; FULIAS, A.; BANDUR, G.; MARIAN, E.; TITA, D. Compatibility study between ketoprofen and pharmaceutical excipients used in solid dosage forms. Journal of Pharmaceutical and Biomedical Analysis, v. 56, p. 221– 227, 2011. TIWARI, M.; CHAWLA, G.; BANSAL, A.K. Quantification of olanzapine polymorphs using powder X-ray diffraction technique. Journal of Pharmaceutical and Biomedical Analysis, v. 43, p. 865–872, 2007. TOBY, B.H. EXPEGUI, A graphical user interface for GSAS. Journal of Applied Crystallography, v. 34, p. 210-213, 2001. TOMASSETTI, M.; CATALANI, A.; ROSSI, V.; VECCHIO, S. Thermal analysis study of the interactions between acetaminophen and excipients in solid dosage forms and in some binary mixtures. Journal of Pharmaceutical and Biomedical Analysis, v. 37, p. 949–955, 2005. TORRESAN, R.C.; SMAIRA, S.I.; RAMOS-CERQUEIRA, A.T.A.; TORRES, A.R. Qualidade de vida no transtorno obsessivo-compulsivo: uma revisão. Revista de Psiquiatria Clínica, v. 35, p. 13-19, 2008. TRAN P.V.; BYMASTER F.P.; McNAMARA R.K.; POTTER W.Z. Dual monoamine modulation for improved treatment of major depressive disorder. Journal of Clinical Psychopharmacology, v. 23, p. 78-86, 2003. TROY, S.M.; DILEA, C.; MARTIN, P.T.; LEISTER, C.A.; FRUNCILLO, R.J.; CHIANG, S.T. Pharmacokinetics of once-daily venlafaxine extended release (ER) in healthy volunteers. Current

204
therapeutic research, clinical and experimental, v. 58, p.504– 514, 1997a. TROY, S.M.; PARKER, V.P.; HICKS, D.R.; POLLACK, G.M.; CHIANG, S. T. Pharmacokinetics and effect of food on the bioavailability of orally administered venlafaxine. Journal of Clinical Pharmacology, v. 37, p. 954-961,1997b. TSINMAN, K.; AVDEEF, A.; TSINMAN, O., VOLOBOY, D. Powder Dissolution Method for Estimating Rotating Disk Intrinsic Dissolution Rates of Low Solubility Drugs. Pharmaceutical Research, v. 26, p. 2093-2100, 2009. UNITED STATES PHARMACOPEIA The (USP) 34 ed. Rokville, United States Convention, 2011. UNITED STATES PHARMACOPEIA The (USP) 35 ed. Rokville, United States Convention, 2013. VEGA, D.; FERNANDÉZ, D.; ECHEVERRÍA, G. 1-[2-(1- ydroxycyclohexyl)-2-(4- methoxyphenyl)ethyl]dimethyl- ammonium chloride (venlafaxine hydrochloride). Acta Crystallographica, v. 56, p. 1009-1010, 2000. VEGA, D.; FERNANDÉZ, D.; ECHEVERRÍA, G. WOBMUV. CCDC 150349. 2000 VERMA R.K.; GARG, S. Compatibility studies between isosorbide mononitrate and selected excipients used in the development of extended release formulations. Journal of Pharmaceutical and Biomedical Analysis, v. 35, p. 449–458, 2004. VIEGAS, T.X.; CURATELLA, R.U.; VANWINKLE, L.L.; BRINKER, G. Intrinsic drug dissolution testing using the stationary disk system. Dissolution Technologies, v. 8, p. 11-15, 2001. VIPPAGUNTA, S.R.; BRITTAIN, H.G.; GRANT, D.J.W. Crystalline solids. Advanced Drug Delivery Reviews, v. 48, p. 23–26, 2001.

205
VLACK , V.H.L. Arranjos Atômicos. In:Princípios de Ciência dos Materiais. São Paulo, Ed. Edgard Blucher Ltda, Cap.3, p.45-75, 1970. WEN, L.; CAI, H.; LI, H. High performance liquid chromatography-electrospray ionization mass spectrometry (HPLC-MS/ESI) method for simultaneous determination of venlafaxine and its three metabolites in human plasma. Journal of Chromatography B, v. 850, p 405-411, 2007. WRIGHT, C.W.; AIKMAN, M.S.; WERTS, E.; SEABOLT, J.; HAEUSLER, J.M.C. Bioequivalence of Single and Multiple Doses of Venlafaxine Extended-Release Tablets and Capsules in the Fasted and Fed States: Four Open-Label, Randomized Crossover Trials in Healthy Volunteers. Clinical Therapeutics, v. 31, p. 2722-2734, 2009. YAMAMURA, S.; TAKAHIRA, R.; MOMOSE, Y. Crystallization kinetics of amorphous griseofulvin by pattern fitting procedure using X-ray diffraction data. Pharmaceutical Research, v. 24, p. 880–887, 2007. YOUNG RA. The Rietveld method. 2nd ed. Oxford University Press, New York, 1993 (Reprinted 1996). 298 p. YU, L.X.; CARLIN, A.S.; AMIDON, G.L.; HUSSAIN, A.S. Feasibility studies of utilizing disk intrinsic dissolution rate to classify drugs. International Journal of Pharmaceutics, v. 270, p. 221-7, 2004. ZAKERI-MILANI, P.; BARZEGAR-JALALI, M.; AZIMI, M.; VALIZADEH, H. Biopharmaceutical classification of drugs using intrinsic dissolution rate (IDR) and rat intestinal permeability. European Journal of Pharmaceutics and Biopharmaceutics, v. 73, p. 102–106, 2009. ZANG, G.G.Z.; LAW, D.; SCHMITT, E.A.; QIU, Y. Phase transformation considerations during process development and manufacture of solid oral dosage forms. Advanced Drug Delivery Reviews, v. 56 p. 371–390, 2004.

206
ZIMMERMANN, B.; BARANOVIC, G. Thermal analysis of paracetamol polymorphs by FT-IR spectroscopies. Journal of Pharmaceutical and Biomedical Analysis, v. 54, p. 295–302, 2011.