
Comparative analysis of the use of space in 7-a-side and 8 ... · competições de jovens nos jogos...
12
Motricidade © Edições Desafio Singular 2015, vol. 11, n. 4, pp. 92-103 http://dx.doi.org/10.6063/motricidade.4138 Comparative analysis of the use of space in 7-a-side and 8-a-side soccer: how to determine minimum sample size in observational methodology Análise comparativa da utilização do espaço de jogo em Futebol-7 e Futebol-8: aplicação da Metodologia Observacional para a determinação do tamanho mínimo da amostra Daniel Lapresa 1* , Ildefonso Álvarez 2 , M. Teresa Anguera 3 , Javier Arana 4 , Belén Garzón 1 ORIGINAL ARTICLE | ARTIGO ORIGINAL ABSTRACT In 2011-2012, the Spanish Soccer Federation changed the format of junior championship matches played between regional-level teams in Spain from a 7-a-side to an 8-a-side format. Soon afterwards, the regional federations followed in their footsteps by adapting their competition formats accordingly. Taking the use of space as a functional indicator of the quality of play in U-10 soccer, the present study examines the relative suitability of the 7-a-side and 8-a-side formats for developing the skills of young players. Of 9 hypothesis contrasts relating to the zone in which a move initiated in the attacking team’s goal area ended, only one was significant (p < .05) in the standard analysis, even though the contingency tables suggested there were genuine differences between the two formats studied. Consequently, the statistical software program GPower was used to determine the minimum sample size necessary to detect significant differences for four levels of statistical power: 95%, 90%, 85%, and 80%. Given the difficulty of organizing a new round of data collection, we simulated an increase in sample size while maintaining the characteristics of the original data (frequencies, variability, and distribution). The results obtained through the original sampling were then compared with those from the simulation. Keywords: observational methodology, sample size, statistical power, soccer. RESUMO No decorrer da época desportiva 2011-2012, a Federação Espanhola de Futebol alterou o formato das competições de jovens nos jogos realizados entre as equipas representativas das diferentes regiões autónomas de Espanha. No sentido de respeitar as normas instituídas, as federações regionais adaptaram as respetivas competições. Considerando-se a utilização do espaço como um indicador funcional da qualidade de jogo neste nível, o presente estudo examina a adequação dos dois formatos: Futebol-7 e Futebol-8. De entre as nove hipóteses encontradas acerca da relação entre a zona em que a situação de jogo se iniciava e que, posteriormente, terminava, apenas uma hipótese se mostrou significativa (p < .05). Não obstante, as tabelas de contingência evidenciaram diferenças significativas entre a situação de jogo reduzido de 7x7 e 8x8. Utilizou-se o software estatístico G-Power para determinar o tamanho mínimo da amostra que, provavelmente, permitiria encontrar diferenças significativas nos diferentes níveis de potência do teste: 95%, 90%, 85%, e 80%. Dadas as dificuldades em organizar uma nova recolha de dados, simulou-se o aumento do tamanho da amostra respeitando-se as características dos dados originais, nomeadamente os valores encontrados, a variabilidade e a distribuição. Os resultados obtidos através da amostra original foram, posteriormente, comparados com os resultados da simulação. Palavras-chave: metodologia observacional, tamanho da amostra, potência do teste, futebol. Manuscript received July 10 th , 2014; Accepted March 27 th , 2015 1 University of La Rioja, Spain 2 Isabel I University, Spain 3 University of Barcelona, Spain 4 International University of La Rioja (UNIR), Spain * Corresponding author: Edificio Vives. C/ Luis de Ulloa s/n. 26007. Logroño (La Rioja). E-mail: [email protected]
Transcript of Comparative analysis of the use of space in 7-a-side and 8 ... · competições de jovens nos jogos...

Motricidade © Edições Desafio Singular
2015, vol. 11, n. 4, pp. 92-103 http://dx.doi.org/10.6063/motricidade.4138
Comparative analysis of the use of space in 7-a-side and 8-a-side soccer: how to determine minimum sample size in observational methodology
Análise comparativa da utilização do espaço de jogo em Futebol-7 e Futebol-8: aplicação da Metodologia Observacional para a determinação do tamanho mínimo da amostra
Daniel Lapresa1*, Ildefonso Álvarez2, M. Teresa Anguera3, Javier Arana4, Belén Garzón1 ORIGINAL ARTICLE | ARTIGO ORIGINAL
ABSTRACT In 2011-2012, the Spanish Soccer Federation changed the format of junior championship matches played
between regional-level teams in Spain from a 7-a-side to an 8-a-side format. Soon afterwards, the regional
federations followed in their footsteps by adapting their competition formats accordingly. Taking the use
of space as a functional indicator of the quality of play in U-10 soccer, the present study examines the
relative suitability of the 7-a-side and 8-a-side formats for developing the skills of young players. Of 9
hypothesis contrasts relating to the zone in which a move initiated in the attacking team’s goal area ended,
only one was significant (p < .05) in the standard analysis, even though the contingency tables suggested
there were genuine differences between the two formats studied. Consequently, the statistical software
program GPower was used to determine the minimum sample size necessary to detect significant
differences for four levels of statistical power: 95%, 90%, 85%, and 80%. Given the difficulty of organizing
a new round of data collection, we simulated an increase in sample size while maintaining the
characteristics of the original data (frequencies, variability, and distribution). The results obtained through
the original sampling were then compared with those from the simulation.
Keywords: observational methodology, sample size, statistical power, soccer.
RESUMO No decorrer da época desportiva 2011-2012, a Federação Espanhola de Futebol alterou o formato das
competições de jovens nos jogos realizados entre as equipas representativas das diferentes regiões
autónomas de Espanha. No sentido de respeitar as normas instituídas, as federações regionais adaptaram
as respetivas competições. Considerando-se a utilização do espaço como um indicador funcional da
qualidade de jogo neste nível, o presente estudo examina a adequação dos dois formatos: Futebol-7 e
Futebol-8. De entre as nove hipóteses encontradas acerca da relação entre a zona em que a situação de jogo
se iniciava e que, posteriormente, terminava, apenas uma hipótese se mostrou significativa (p < .05). Não
obstante, as tabelas de contingência evidenciaram diferenças significativas entre a situação de jogo reduzido
de 7x7 e 8x8. Utilizou-se o software estatístico G-Power para determinar o tamanho mínimo da amostra
que, provavelmente, permitiria encontrar diferenças significativas nos diferentes níveis de potência do teste:
95%, 90%, 85%, e 80%. Dadas as dificuldades em organizar uma nova recolha de dados, simulou-se o
aumento do tamanho da amostra respeitando-se as características dos dados originais, nomeadamente os
valores encontrados, a variabilidade e a distribuição. Os resultados obtidos através da amostra original
foram, posteriormente, comparados com os resultados da simulação.
Palavras-chave: metodologia observacional, tamanho da amostra, potência do teste, futebol.
Manuscript received July 10th
, 2014; Accepted March 27th
, 2015
1 University of La Rioja, Spain
2 Isabel I University, Spain
3 University of Barcelona, Spain
4 International University of La Rioja (UNIR), Spain
* Corresponding author: Edificio Vives. C/ Luis de Ulloa s/n. 26007. Logroño (La Rioja). E-mail:

Determination of minimum sample size in observational methodology | 93
INTRODUCTION
Competition formats in grassroots soccer
influence not only the educational opportunities
associated with the practice of sport, but also the
preparation of future soccer players in terms of
physical and psychological development and
acquisition of skills and tactical knowledge
(Lapresa, 2009). Modifications to standard game
formats through variations in player numbers
and pitch size influence children’s ability to
perform technical-tactical tasks both efficiently
and effectively (Vegas, 2006; Lapresa, Arana,
Garzón, Egüen, & Amatria, 2008; Castelo, 2009).
Scientific studies justifying the competition
formats designed by sports institutions are
therefore necessary (Ardá, 1998; Ardá &
Anguera, 2000; Arana, 2011; Arana, Lapresa,
Anguera, & Garzón, 2012; Lapresa, Arana,
Anguera, & Garzón, 2013; Exteazarra, 2014).
The Spanish Soccer Federation (RFEF) is
made up of 19 regional federations, responsible
for organizing competitions within each of
Spain’s regions, or autonomous communities.
The RFEF also organizes junior championship
matches between these regions. In 2011-2012,
the RFEF changed the game format in the U-12
age group (ages 10-12) from 7-a-side to 8-a-side.
The regional federations followed suit, believing
that by adopting the format used at the national
level, their teams would be better equipped to
compete against other regional sides in the short-
to-medium term.
Supporters of the 8-a-side game format, such
as Meléndez (2001, 2010) and Wein (1995),
argue that this format produces a more balanced
distribution of players on the pitch (Figure 1),
although it is also possible that this more
balanced model could make it more difficult for
U-12 players to build successful attacks. It has
been argued that the greater imbalance created
by the 7-a-side format and the consequent ease
of opening up spaces on the pitch could be more
conducive to the development of technical skills
in young players (Wein, 2006; Federazione
Italiana Giuoco Calcio, 2008). Furthermore, as
noted by Ardá (1998) and Lapresa (2009), the 7-
a-side format offers, from both a technical and
tactical perspective, a potentially greater range of
playing positions and consequently more
opportunities for fostering the development of
players at this level.
Figure 1. Most common tactical formations used in
the 7-a-side format (1-2-3-1) and 8-a-side format (1-3-
3-1). The shaded areas on the 7-a-side pitch indicate
zones that are most likely to be affected by its less
balanced formation. Adapted from Meléndez (2010).
This study had two distinct yet related aims.
The first was to, using observational
methodology, examine differences in the use of
pitch space by attacking teams in 7-a-side and 8-
a-side soccer by considering the start and end
spatial locations of the offensive sequence of play
along with the ball path. The analysis focused on
moves that begin in the goal area of the team
being observed, as these provide a good measure
of a team’s ability to move the ball up the pitch.
Castellano (2000) and Perea (2008) describe the
difficulties of reaching the rival goal area when a
move begins deep in one’s own defense, and
using sequential analyses, Castellano (2000)
illustrated that as play moves closer to the
opponent’s goal, the space behind becomes less
defined, while that ahead becomes increasingly
delimited.
The second aim of our study was to calculate
the minimum sample size required to detect
statistical differences in the use of pitch space
between the 7-a-side and 8-a-side formats.
Increasing sample size (without altering
significance level or effect size) increases the
chances of detecting significant differences
between study groups. In other words, it
increases the statistical power of the study. As
stated by Dupont and Plummer (1990) and

94 | D Lapresa, I Álvarez, MT Anguera, J Arana, B Garzón
Ninín, Villalón, Terrasa, and Rubinstein (2007)
it helps to think of sample size as a lens through
which differences can be examined. While a
small sample can reduce the chances of detecting
true differences, an overly large simple size can
uncover insignificant details. Minimum sample
size calculation is an inherent part of many
studies and requires a methodologically sound
analysis, particularly in observational
methodology studies such as the present one,
where it is not uncommon to suspect that the
sample size was not large enough to detect
significant differences. While large-scale
observational sampling may be desirable, it can
require an excessive use of valuable resources
(Kerlinger & Lee, 2001).
METHOD
For the purpose of the present observational
study, we organized two triangular tournaments
(7-a-side and 8-a-side) between three soccer
teams about to move up from the U-10 age group
to the U-12 age group. Each team played two
matches (A vs B, B vs C, and A vs C) in each of
the tournaments. The study design was point (no
within- or between-session follow-up),
nomothetic (observation of three teams), and
unidimensional (focus on the use of space)
(Anguera, Blanco-Villaseñor, & Losada, 2001;
Anguera, Blanco-Villaseñor, Hernández-Mendo,
& Losada, 2011). It was also non-participatory
(no interaction between observers and
observees) and active, as it sought to fulfill the
criterion of scientific rigor and relied fully on the
observer’s perception (direct observation). The
study was approved by a scientific committee at
the University of La Rioja and conducted in
accordance with the Ethical Principles of
Psychologists and Code of Conduct of the
American Psychological Association and the
guidelines of the Ethics Committee of the
Spanish Association of Psychologists.
Participants
The participants were members of the three
top-ranking soccer teams that took part in the U-
10 5-a-side league organized by the regional
soccer federation in La Rioja, Spain. 5-a-side
soccer in this age group is played using the same
pitch and ball as that used in adult futsal. The
children had never played an official 7-a-side
game, and had no experience of 8-a-side soccer,
as this format had not yet been introduced in the
region at the time of the tournament.
Observation instrument
Table 1 shows the observation instrument
created for the study. The instrument was
designed to analyze the movement of a ball up a
soccer pitch (Santos, et al., 2009; Sarmento,
Leitão, Anguera, & Campaniço, 2009) and
combined a field format system, used to analyze
the movement of the ball through the different
zones of the pitch (criterion 5), and a category
system consisting of five exhaustive and
mutually exclusive categories (criteria 1,2,3,4,6).
Table 1.
Structure of the observation instrument.
No. Criterion Type of
criterion
Category
System
Field
format
Brief description: codes
1 Game format Fixed X 7-a-side; 8-a-side
2 Ball possession Fixed X Observed team; Rival team; Not
observable
3 Zone in which move starts Variable X ZS10, ZS20, ZS30, ZS40, ZS50, ZS60,
ZS70, ZS80, ZS90
4 Zone in which move ends Variable X ZE10, ZE20, ZE30, ZE40, ZE50,
ZE60, ZE70, ZE80, ZE90
5 Zone(s) through which the move
develops Variable X
The path followed by the ball through
the different zones of the pitch (ZD)
from the start to the end of the move
6 Zone in which there is a single contact
between the ball and a rival player Variable X
ZIR10, ZIR20, ZIR30, ZIR40, ZIR50,
ZIR60, ZIR70, ZIR80, ZIR90
Figures 2-6 show the nine zones into which
the pitch was divided. Each zone had the same
dimensions: 13.33 × 21 m. In match analysis
studies, it is standard practice to divide the pitch

Determination of minimum sample size in observational methodology | 95
into corridors and sectors using imaginary lines
(Vales, 1998; Ardá & Anguera, 2000; Perea,
2008; Costa, Garganta, Greco, & Mesquita,
2009). In addition to the nine zones, the pitch
was divided into three transverse sectors (safety,
creation, and definition) to analyze depth of play
and three longitudinal strips (left, central, and
right) to analyze breadth, or width, of play.
Procedure
The two tournaments were held at the end of
the season, when the children were about to
move from the 5-a-side U-10 format to the U-12
format. The 8-a-side tournament was played one
week after the 7-a-side tournament. All the
matches lasted 25 minutes, and as the first aim
of the study was to analyze how game format (7-
a-side vs 8-a-side) influences the use of space in
offensive play, the following parameters were
kept constant across all matches: pitch size (63 x
40 m), ball size (no. 4), use of a referee, match
rules, players, use of a coach, and tactical
formation (1-2-3-1 for 7-a-side games and 1-3-3-
1 for 8-a-side games).
The digital recordings of the matches were
viewed using Windows Media Player. The
datasets for all matches were generated using
SDIS coding syntax in SDIS-GSEQ version 5.1, as
described by Bakeman and Quera (1992, 1996,
2001, 2011). The data were sequential, event-
based (type I) data (Bakeman, 1978).
The initial observational sample consisted of
340 moves for the 7-a-side matches and 349 for
the 8-a-side matches. The final number of moves
included in the data analysis (all those that
started in zone 20–the zone containing the
attacking team’s goal) was 67 for the 7-a-side
format and 77 for the 8-a-side format.
The data were coded from the observation
instrument by two observers. The first coded the
entire observational sample, while the second
coded just one match for each game format. The
observers received prior training in the use of the
observation instrument, whose simple design
does not require familiarity with soccer or soccer
terminology (see Anguera, 2003).
The reliability of the data generated was
assessed by Cohen’s kappa (Cohen, 1960), which
is a measure of agreement between nominal
classifications with distinct categories. The kappa
statistic quantifies interobserver agreement after
correcting for the level of agreement that would
be expected by chance (Von Eye & Von Eye,
2005). It was computed using SDIS-GSEQ 5.1.
The fact that a similar number of moves was
recorded in both the datasets used for this
analysis (49 for the 7-a-side match and 51 for the
8-a-side match) ensured alignment and greatly
facilitated calculations (Bakeman, McArthur, &
Quera, 1996; Quera, Bakeman, & Gnisci, 2007).
The level of interobserver agreement was 93% for
the 7-a-side match (kappa = .92) and 94%
(kappa = .94) for the 8-a-side match, which
based on the criteria proposed by Landis and
Koch (1977, p. 165) can be considered “almost
perfect”.
Data analysis
Categorical variables were analyzed using
Pearson’s 2 test of independence and Cramer’s
V. The variables analyzed were the forward-most
zones, sectors (safety, creation, and definition)
and strips (left, central, and right) in which
offensive moves initiated in zone 20 (attacking
team’s goal area) ended.
Discrepancies between expected and observed
frequencies can be quantified by the 2 statistic.
The Pearson 2 test is used when data are ordered
according to a single classification criterion
(Kerlinger & Lee, 2001). The test indicates the
two-tailed significance of the data, in other
words, the probability of obtaining these data in
the event that the null hypothesis is true. When
p < .05 the null hypothesis is rejected. It can then
be concluded that: a) the variables tested are not
independent of each other; b) the variables tested
are significantly related to each other; or c) the
observed or empirical frequencies (fo) are
significantly different from the expected
frequencies (fe), i.e., there are significant
differences between the data for the groups
compared.
Cramer’s V is an extension of the phi
correlation coefficient, although in this case, and
in contrast to the coefficient of contingency, it is
normalized (Martín, Cabero, & de Paz, 2007).
Cramer’s V ranges between 0 and 1, with values

96 | D Lapresa, I Álvarez, MT Anguera, J Arana, B Garzón
close to 0 indicating no association, and those
close to 1 indicating strong association.
Statistical analysis with a minimum sample size
When a statistical hypothesis test yields a
non-significant result, it is advisable to test the
statistical power of each comparison by
calculating the sample size that would be
required to detect significant differences between
groups. If the estimated sample is not excessively
large, then revision of the empirical study should
be considered. If, on the other hand, it is
unreasonably large, it can be concluded that the
study was conducted correctly and that the
results are not statistically significant.
In the present study, the software program
GPower 3.1.2 was used to estimate minimum
sample size following the procedures described
by Faul, Erdfelder, Lang, and Buchner (2007) and
Faul, Erdfelder, Buchner, and Lang (2009).
GPower enables users to specify certain values a
priori and then computes the sample size
required to achieve these. In this study the
parameters specified were:
a) The probability of making a type I or
α error, which indicates the maximum error we
are prepared to accept when rejecting the null
hypothesis of data equivalence. The general
consensus in the scientific community is that this
should be set at 5% (p < .05).
b) The power or sensitivity of the test to
detect significant results. This is defined by the
probability 1 – β, where β is the probability of
wrongly not rejecting the alternative hypothesis.
The value of 1 – β depends on the type of study
being conducted, but the most widely used
values range between 0.80 and 0.95, which
correspond to a probability of between 80% and
95% of detecting significant differences.
c) Effect size, in other words, the
standardized distance between the mean results
obtained for two groups being compared. Its
value depends on the data from the original
sample.
d) Degrees of freedom of the test, which
indicate the number of possibilities that the
differences between the groups may be
significant.
In order to calculate the minimum sample size
for the present study the above parameters were
specified as follows:
a) α (probability of type I error): p < .05.
b) Probability of not committing a type II
error, or 1 – β = 0.95.
c) Effect size: calculated a priori by GPower
using the observed frequencies in the
original sample.
d) Degrees of freedom: 8 (we distinguished
between nine groups, corresponding to
each of the nine pitch zone, so 9 - 1 = 8).
Once the values for the input parameters
(above) and the output parameters (values or
frequencies from original analysis plus variability
and distribution) are entered, the software
computes the necessary sample size for the
powers specified.
RESULTS
Differences in the use of pitch space in the 7-a-
side and 8-a-side game formats
The first step involved a general analysis of
the zones in which moves initiated in zone 20
ended. The hypothesis test applied to the
contingency table zone * format (figure 2)
revealed no significant differences between the 7-
a-side and 8-a-side format (Pearson’s 2 =
10.227; p < .249; d.f. = 8; Cramer’s v = .249).
In the general analysis by sector, the
hypothesis test applied to the contingency table
Sector * Format (Figure 3) once again revealed
no significant differences (Pearson’s 2 = 1.650;
p < .438; d.f. = 2; Cramer’s V = 0.107).
The next step involved applying a more
specific hypothesis test (by zone) to each of the
three sectors (safety, creation, and definition).
Figure 4 shows the combined results from the
corresponding contingency tables. No significant
differences were found between the two formats
for any of the sectors: safety (Pearson’s 2 =
2.302; p < .316; d.f. = 2; Cramer’s V = .392),
creation (Pearson’s 2 = 4.232; p < .121; d.f. =
2; Cramer’s V = .224), or definition (Pearson’s
2 = 2.181; p < .336; d.f. = 2; Cramer’s V =
.220).

Determination of minimum sample size in observational methodology | 97
Figure 2. Results for the contingency table Zone *
Format.
Figure 3. Results for the contingency table Sector
* Format.
In the general analysis by longitudinal strip,
the hypothesis test applied to the contingency
table Strip * Format (Figure 5) revealed
significant differences between the formats
(Pearson’s 2 = 6.677; p < .035; d.f. = 2;
Cramer’s V = .215).
We then applied a more specific hypothesis
test (by zone) to each of the three strips (left,
central, and right). Figure 6 shows the combined
results from the corresponding contingency
tables, with no significant differences observed
between the two formats for any of the strips
analyzed: left (Pearson’s 2 = 2.733; p < .255; d.f.
= 2; Cramer’s V = .279), central (Pearson’s 2 =
.334; p < .846; d.f. = 2; Cramer’s V = .075), or
right (Pearson’s 2 = .543; p < .762; d.f. = 2;
Cramer’s V = .104).
Figure 4. Combined results from the contingency
tables for Format * Sector (by zone) in which moves
ended (i.e., safety, creation, and definition)
Figure 5. Results from the contingency table Strip
* Format

98 | D Lapresa, I Álvarez, MT Anguera, J Arana, B Garzón
Figure 6. Combined results from the contingency
tables for Format * Strip (by zone) in which moves
ended (i.e., left, central, and right)
Determination of minimum sample size for
detecting significant differences
In our analysis of the original data, significant
differences between the 7-a-side and 8-a-side
formats were found only in the longitudinal strip
analysis. Were we to apply the conventional
criterion (p < .05, as in the approach taken by
Neyman & Pearson, 1933), the analysis would
end here (Balluerka, Gómez, & Hidalgo, 2005).
However, a glance at the data in the contingency
table in Figure 2 clearly suggests that the groups
are not as similar as the null hypothesis
significance test would appear to indicate. In the
7-a-side format, the percentage of moves ending
in the lateral strips was evenly distributed
between the right- and left-hand strips
(essentially in the safety and creation zones),
while in the 8-a-side format, a majority of moves
ended in the right-hand strip. In other words, the
use of pitch space does not appear to be the same
in the two game formats.
Larger samples increase the likelihood of
detecting significant differences between groups,
i.e., they increase the power of the statistical test
(Sun, Pan, & Wang, 2011). Table 2 shows the
results for the minimum sample size calculated
by GPower.
The analysis shows that for the different levels
of statistical power analyzed, the number of
moves required to yield potentially significant
results would be 569 (for a power of 95%), 478
(for 90%), 420 (for 85%), and 376 (for 80%).
Given the difficulty of organizing a new round
of data collection, we proceeded to simulate an
increase in sample size, while conserving the
characteristics of the original data. Specifically,
we tripled and quadrupled the number of original
observations, thereby avoiding any modification
of the initial groups. This gave a new number of
moves as follows: 144 x 3 = 432 ≈ 478 (90%)
and 420 (85%); 144 x 4 = 576 ≈ 569 (95%).
Table 2.
Determination of sample size with a power of 95%, 90%, 85%, and 80%. 95% 90% 85% 80%
Input: Effect size w .2 .2 .2 .2
α err prob .05 .05 .05 .05
Power (1-β err prob) .95 .90 .85 .80
Df 8 8 8 8
Output Noncentrality parameter λ 22.760 19.120 16.800 15.040
Critical χ² 15.507 15.507 15.507 15.507
Total sample size 569 478 420 376
Actual power .950 .900 .850 .800
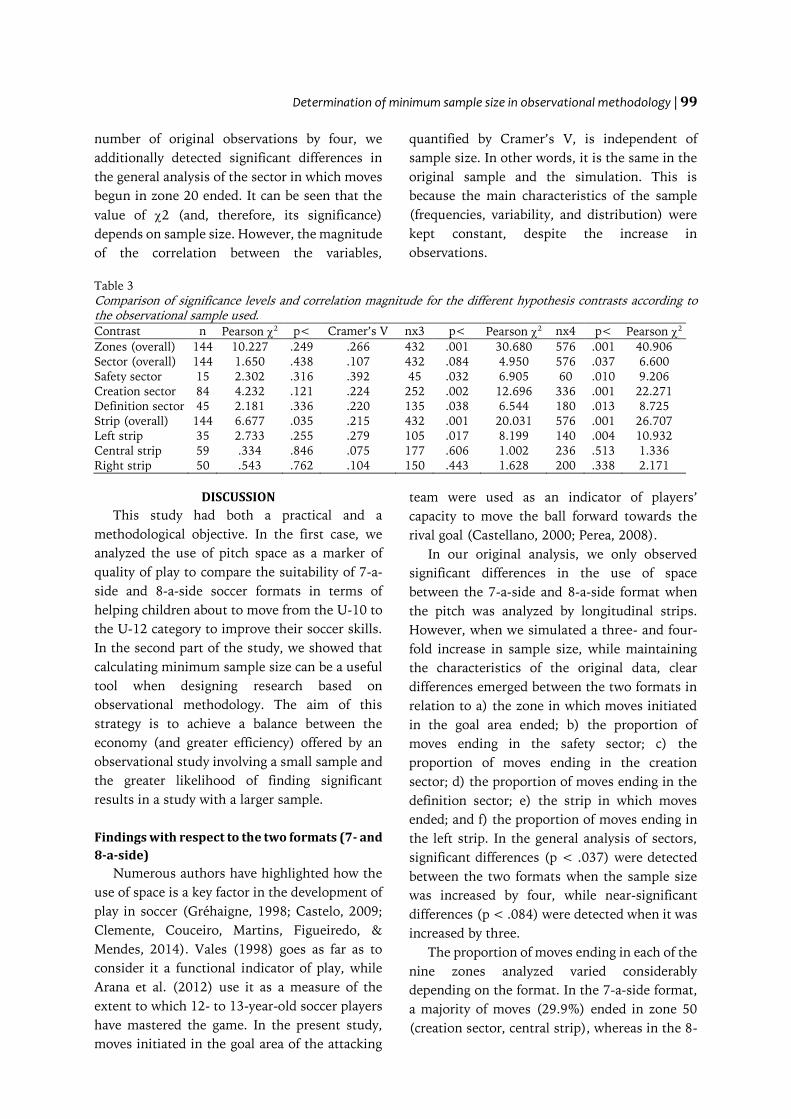
Table 3 compares the results from the original
sample with those from the simulation. In the
nine comparisons conducted, game format was
only significantly associated with the strip in
which the offensive moves ended (p < .05).
However, when we multiplied the number of
observations in the original data sets by three,
significant associations were detected between
game format and numerous variables, namely,
the zone in which moves ended; the proportion
of moves ending in the safety, creation, and
definition sectors; the strip (general analysis) in
which moves ended; and the proportion of moves
ending in the left-hand strip. On multiplying the
Determination of minimum sample size in observational methodology | 99
number of original observations by four, we
additionally detected significant differences in
the general analysis of the sector in which moves
begun in zone 20 ended. It can be seen that the
value of 2 (and, therefore, its significance)
depends on sample size. However, the magnitude
of the correlation between the variables,
quantified by Cramer’s V, is independent of
sample size. In other words, it is the same in the
original sample and the simulation. This is
because the main characteristics of the sample
(frequencies, variability, and distribution) were
kept constant, despite the increase in
observations.
Table 3
Comparison of significance levels and correlation magnitude for the different hypothesis contrasts according to
the observational sample used.
Contrast n Pearson 2 p< Cramer’s V nx3 p< Pearson 2
nx4 p< Pearson 2
Zones (overall) 144 10.227 .249 .266 432 .001 30.680 576 .001 40.906
Sector (overall) 144 1.650 .438 .107 432 .084 4.950 576 .037 6.600
Safety sector 15 2.302 .316 .392 45 .032 6.905 60 .010 9.206
Creation sector 84 4.232 .121 .224 252 .002 12.696 336 .001 22.271
Definition sector 45 2.181 .336 .220 135 .038 6.544 180 .013 8.725
Strip (overall) 144 6.677 .035 .215 432 .001 20.031 576 .001 26.707
Left strip 35 2.733 .255 .279 105 .017 8.199 140 .004 10.932
Central strip 59 .334 .846 .075 177 .606 1.002 236 .513 1.336
Right strip 50 .543 .762 .104 150 .443 1.628 200 .338 2.171
DISCUSSION
This study had both a practical and a
methodological objective. In the first case, we
analyzed the use of pitch space as a marker of
quality of play to compare the suitability of 7-a-
side and 8-a-side soccer formats in terms of
helping children about to move from the U-10 to
the U-12 category to improve their soccer skills.
In the second part of the study, we showed that
calculating minimum sample size can be a useful
tool when designing research based on
observational methodology. The aim of this
strategy is to achieve a balance between the
economy (and greater efficiency) offered by an
observational study involving a small sample and
the greater likelihood of finding significant
results in a study with a larger sample.
Findings with respect to the two formats (7- and
8-a-side)
Numerous authors have highlighted how the
use of space is a key factor in the development of
play in soccer (Gréhaigne, 1998; Castelo, 2009;
Clemente, Couceiro, Martins, Figueiredo, &
Mendes, 2014). Vales (1998) goes as far as to
consider it a functional indicator of play, while
Arana et al. (2012) use it as a measure of the
extent to which 12- to 13-year-old soccer players
have mastered the game. In the present study,
moves initiated in the goal area of the attacking
team were used as an indicator of players’
capacity to move the ball forward towards the
rival goal (Castellano, 2000; Perea, 2008).
In our original analysis, we only observed
significant differences in the use of space
between the 7-a-side and 8-a-side format when
the pitch was analyzed by longitudinal strips.
However, when we simulated a three- and four-
fold increase in sample size, while maintaining
the characteristics of the original data, clear
differences emerged between the two formats in
relation to a) the zone in which moves initiated
in the goal area ended; b) the proportion of
moves ending in the safety sector; c) the
proportion of moves ending in the creation
sector; d) the proportion of moves ending in the
definition sector; e) the strip in which moves
ended; and f) the proportion of moves ending in
the left strip. In the general analysis of sectors,
significant differences (p < .037) were detected
between the two formats when the sample size
was increased by four, while near-significant
differences (p < .084) were detected when it was
increased by three.
The proportion of moves ending in each of the
nine zones analyzed varied considerably
depending on the format. In the 7-a-side format,
a majority of moves (29.9%) ended in zone 50
(creation sector, central strip), whereas in the 8-

100 | D Lapresa, I Álvarez, MT Anguera, J Arana, B Garzón
a-side format, a majority of moves (26%) ended
in zone 60 (creation sector, right strip).
In the sector analysis, most 7-a-side moves
ended in the safety sector, whereas most 8-a-side
moves ended in the creation sector. Although
this would appear to suggest a greater depth of
play in the 8-a-side format, it would be
interesting to apply sequential analysis
(Bakeman, 1978) to explore whether the more
frequent loss of possession seen in the safety
sector in 7-a-side games is due to a higher
frequency of short actions in this format, in
which the less balanced 1-2-3-1 formation makes
it easier to find open spaces and create play
(Etxeazarra, 2014). In the 7-a-side format, most
moves ended in the central strip, regardless of
sector. In addition, there was a clear balance
between the number of moves that ended in each
of the zones in the two lateral strips. This
balance, combined with the higher percentage of
moves ending in the central strip, is an argument
in favor of the 7-a-side format. The results
obtained in both formats are in line with those
reported in relation to depth of play in both adult
soccer (Mombaerts, 1991; Perea, 2008; Castelo,
2009) and 7-a-side soccer (Ardá, 1998; Ardá &
Anguera, 2000).
In contrast to the above, the more balanced
tactical formation characteristic of 8-a-side
soccer appears to lead to a higher percentage of
moves ending in the right-hand strip, to a lack of
balance in terms of the zones in which moves end
when considered by strip, and to a
disproportionally high presence of zones 50 and
80, corresponding to the central strip. In this
regard, Ardá (1998), in a study of 7-a-side soccer,
and Arana (2011), in a study of 7-, 9-, and 11-a-
side soccer also found that a higher proportion of
moves ended in the strip in which they had
begun.
Findings with respect to the determination of
minimum sample size
Several factors contribute to the level of
significance achieved by statistical tests, one of
the most important being sample size (Sedlmeier
& Gigerenzer, 1989). The value of the 2 statistic,
for instance, depends on the number of data
points used in its calculation: the greater the
number of empirical observations (fo), the
greater the difference that will be obtained in the
numerator [(fo – fe)2] and the higher the value of
2 will be, regardless of the number of expected
observations (fe). In other words, the value of the
contrast statistic is not independent of sample
size. Since a higher 2 value corresponds to a
lower significance value, large samples tend to
yield more significant differences. By increasing
sample size, we reduce standard error and
increase statistical power (Sun et al., 2011).
The present study provides a good illustration
of the above. Of the nine original comparisons,
only one—that of the relationship between game
format and strip in which moves ended—proved
to be significant at the conventional level of p <
.05. However, direct observation of the
percentages for each pitch zone suggested that
there were genuine differences between the two
formats studied. Hence, we sought to calculate
the minimum sample size required to detect
significant differences. As the study and data
collection had already been completed, this
analysis was based on a simulation in which we
examined the effect of a three- and four-fold
increase in sample size, while maintaining the
characteristics of the original data. The result was
that the number of significant differences rose
from 1 to 6 in the case of the three-fold increase
and 7 in the case of the four-fold increase (see
Table 3). The only differences that continued to
be non-significant were those that also appeared
to be similar at first glance.
It should be highlighted that significant
differences are not always found when sample
size is increased (De la Fuente, Cañadas,
Guardia, & Lozano, 2009), as there simply might
not be a relationship between variables.
Likewise, the relationship might be so weak that
an impossibly large sample size would be needed
to detect any significant differences. In sum, the
procedure is only appropriate when, as in the
present study, there is good reason to suspect
that the groups being compared are indeed
different but that the differences are masked
because the study is underpowered (Cohen,
1988, 1990).

Determination of minimum sample size in observational methodology | 101
CONCLUSIONS
The present study had two objectives. The
first, of a more practical nature, was to analyze
the use of space as a functional indicator of player
skills with the broader aim of comparing the
suitability of 7-a-side and 8-a-side soccer for
developing these skills in children about to move
up to the U-12 category. The results obtained in
relation to both the depth and width of play
support the theoretical assumption that the
distribution of players on the pitch is more
balanced in the 8-a-side format, making it more
difficult for players to find open spaces and create
play than in the 7-a-side format. This is an
important consideration, as players in the age
group studied have limited ball skills.
With reference to depth of play, the analysis
of the combined results shows that the greatest
differences between the two formats occurred in
the safety sector (more moves ended here in the
7-a-side format) and in the creation sector (more
moves ended here in the 8-a-side format). These
differences could be related to the fact that the
use of the 1-2-3-1 formation in 7-a-side soccer
facilitates the creation of open spaces and
movement of the ball upfield. However, this
theory needs to be studied in greater detail in
future studies.
With respect to width of play, the analysis by
longitudinal strip shows that play was practically
symmetrical in each of the three sectors (safety,
creation, and definition) in the 7-a-side format.
This format was associated with better-quality
play, since more moves ended in the central strip
and the numbers of moves ending in the two
lateral strips were similar. In the 8-a-side format,
by contrast, there was a clear tendency for moves
to end in the right-hand strip. This is probably
due to the greater difficulty that players of this
age have finding space in which to build an attack
due to the 1-3-3-1 formation.
The second objective of this study, which had
a methodological root, was to illustrate how
determination of minimum sample size can be
used to analyze the power of an observational
methodology study to detect significant
differences between comparison groups. Based
on a statistical significance level of p < .05, our
original analysis revealed largely insignificant
differences between the use of space in 7-a-side
and 8-a-side games, but the percentages in the
contingency tables clearly suggested that there
were genuine differences between the formats.
Given that the power of statistical tests can be
increased by increasing the number of
observations, we calculated the minimum sample
size necessary to detect significant differences. By
simulating an increase in sample size without
changing the parameters that characterized the
original sample, we aimed to strike a balance, or
rather compromise, between a small, yet
efficient, sample and a large sample that, while
offering a greater chance of detecting significant
differences, would be unfeasible.
Acknowledgments:
We gratefully acknowledge the support of the Spanish
Government within the project La actividad física y el
deporte como potenciadores del estilo de vida
saludable. Evaluación del comportamiento deportivo
desde metodologías no intrusivas (Secretaría de
Estado de Investigación, Desarrollo e Innovación del
Ministerio de Economia y Competitividad).
Conflicts of Interest:
Nothing to declare.
Funding:
Spanish Government [DEP2015-66069-P].
REFERENCES
Anguera, M.T. (2003). La observación. In C. Moreno
Rosset (Ed.), Evaluación psicológica. Concepto,
proceso y aplicación en las áreas del desarrollo y
de la inteligencia (pp. 271-308). Madrid: Sanz y
Torres.
Anguera, M.T., Blanco-Villaseñor, A., & Losada, J. L.
(2001). Diseños observacionales, cuestión clave
en el proceso de la metodología observacional.
Metodología de las Ciencias del
Comportamiento, 3, 135-161.
Anguera, M.T., Blanco-Villaseñor, A., Hernández-
Mendo, A., & Losada, J.L. (2011). Diseños
observacionales: ajuste y aplicación en psicología
del deporte. Cuadernos de Psicología del
Deporte, 11 (2), 63-76.
Arana, J. (2011). Adaptando el fútbol al niño de 12-13
años: análisis observacional de la utilización del
espacio en las modalidades de fútbol 7, fútbol 9 y
fútbol 11. Doctoral thesis. Logroño: Universidad
de La Rioja.
102 | D Lapresa, I Álvarez, MT Anguera, J Arana, B Garzón
Arana, J., Lapresa, D., Anguera, M.T., & Garzón, B.
(2012). Adapting football to the child: an
application of the logistic regression model in
observational methodology. Quality & Quantity,
47 (6), 3473-3480. doi: 10.1007/s11135-012-
9734-z
Ardá, A. (1998). Análisis de patrones en fútbol a 7.
Doctoral thesis. La Coruña: Universidad de La
Coruña.
Ardá, T., & Anguera, M.T. (2000). Evaluación
prospectiva en programas de entrenamiento de
fútbol a 7 mediante indicadores de éxito en
diseños diacrónicos intensivos retrospectivos.
Psicothema, 12 (2), 52-55.
Bakeman, R. (1978). Untangling streams of behavior:
Sequential analysis of observation data. In G.P.
Sackett (Ed.), Observing Behavior, Vol. 2: Data
collection and analysis methods (pp. 63-78).
Baltimore: University of Park Press.
Bakeman, R., & Quera, V. (1996). Análisis de la
interacción. Análisis secuencial con SDIS y GSEQ.
Madrid: Ra-Ma.
Bakeman, R., McArthur, D., & Quera, V. (1996).
Detecting group differences in sequential
association using sampled permutations: Log
odds, kappa, and phi compared. Behavior
Research Methods, Instruments, and Computers,
28 (3), 446-457.
Balluerka, N., Gómez, J., & Hidalgo, M.D. (2005). The
controversy over null hypothesis significance
testing revisited. Methodology: European Journal
of Research Methods for the Behavioral and
Social Sciences, 1 (2), 55-70. doi: 10.1027/1614-
1881.1.2.55
Castelo, J. (2009). Futebol. Organizaçao dinámica do
jogo. Lisboa: Centro de Estudos de Futebol da
Universidades Lusófona de Humanidades e
Tecnologías.
Castellano, J. (2000). Observación y análisis de la
acción de juego en el fútbol. Doctoral thesis.
Vitoria: Universidad del País Vasco.
Clemente, F.M., Couceiro, M.S., Martins, F.M.,
Figueiredo, A.J., & Mendes, R.S. (2014). Análise
de jogo no Futebol: Métricas de avaliação do
comportamento coletivo. Motricidade, 10 (1),
14-26. doi: 10.6063/motricidade.10(1).1517
Cohen, J. (1988). Statistical power analysis for the
behavioral sciences (2nd ed.). Hillsdale, NJ:
Erlbaum.
Cohen, J. (1990). Things I have learned (so far).
American Psychologist, 45, 1304-1312.
Costa, I., Garganta, J., Greco, P. y Mesquita, I. (2009).
Avaliação do desempenho tático no futebol:
Concepção e desenvolvimento da grelha de
observação do teste “GR3-3GR”. Revista Mineira
de Educação Física, 17 (2), 36-64.
De la Fuente, E.I., Cañadas, G.R., Guardia, J., &
Lozano, L.M. (2009). Hypothesis probability or
statistical significance? Methodology: European
Journal of Research Methods for the Behavioral
and Social Sciences, 5 (1), 35-39. doi:
10.1027/1614-2241.5.1.35
Dupont, W.D., & Plummer W.D. (1990) Power and
sample size calculations. A review and computer
program. Controlled Clinical Trials, 11, 116-128.
Etxeazarra, I. (2014). Análisis de la respuesta física y
del comportamiento motor en competición de
futbolistas de categoría alevín, infantil y cadete.
Doctoral thesis. Vitoria: Universidad del País
Vasco.
Faul, F., Erdfelder, E., Buchner, A., & Lang, A.G.
(2009). Statistical power analyses using G*Power
3.1: Tests for correlation and regression analyses.
Behavior Research Methods, 41, 1149-1160. doi:
10.3758/BRM.41.4.1149
Faul, F., Erdfelder, E., Lang, A.G., & Buchner, A.
(2007). G*Power 3: A flexible statistical power
analysis program for the social, behavioral, and
biomedical sciences. Behavior Research Methods,
39, 175-191.
Federazione Italiana Giuoco Calcio (2008). Guida
tecnica per le scuole di Calcio. Roma: Settore
Giovanile e Scolastico.
Gréhaigne, J. F. (1998). Game systems in soccer from
the point of view of coverage of space. In T. Reilly
(Ed.). Science and soccer (316-321). London: E.
and F.N. Spon.
Hoaglin, D., Mosteller, F., & Tukey, J.W. (1983).
Understanding Robust and Exploratory Bata
Analysis. New York: John Wiley & Sons.
Kerlinger, F.N., & Lee, H.B. (2001). Investigación del
Comportamiento. Métodos de Investigación en
Ciencias Sociales. Mexico: McGraw-Hill.
Landis, J.R., & Koch, G.G. (1977). The measurement
of observer agreement for categorical data.
Biometrics, 33 (1), 159-174.
Lapresa, D. (2009). Hacia una optimización del
modelo de competiciones en fútbol. in II
Congreso Internacional de Deportes de Equipo.
[Electronic version]. Universidad de La Coruña:
Editorial y Centro de Formación Alto
Rendimiento.
Lapresa, D., Arana, J., Anguera, M.T., & Garzón, B.
(2013). Comparative analysis of the sequentiality
using SDIS-GSEQ and THEME: a concrete
example in soccer. Journal of Sport Sciences, 31
(15), 1687-1695. doi:
10.1080/02640414.2013.796061
Lapresa, D., Arana, J., Garzón, B., Egüen, R., &
Amatria, M. (2008). Enseñando a jugar “el
fútbol”. Hacia una iniciación coherente. Logroño:
Universidad de La Rioja y Real Federación
Española de Fútbol.
Martín, Q., Cabero, M.T., & de Paz, Y. (2007).
Tratamiento estadístico de datos con SPSS.
Prácticas resueltas y comentadas. Madrid:
Thomson Editores Spain, Paraninfo, S.A.
Meléndez, G. (2001). Pautas para la organización de
una escuela de fútbol base. In I Jornadas
Universidad de La Rioja – Federación Riojana de
Fútbol. Universidad de La Rioja: Logroño, 24-25
May.

Determination of minimum sample size in observational methodology | 103
Meléndez, G. (2010). ¿Fútbol 8? ¿Por qué? (Inf. Téc.).
Real Federación Española de Fútbol: Escuela
Nacional de Entrenadores.
Mombaerts, E. (1991). Football, de l'analyse du jeu à
la formation du Joueur. Joinville-le-Pont: Ed.
Actio.
Neyman, J., & Pearson, E. S. (1933). On the problem
of the most efficient tests of statistical
hypotheses. Transactions of the Royal Society of
London Series A, 231, 289-337.
Ninín, L., Villalón, G., Terrasa, S., & Rubinstein, F.
(2007). Tamaño muestral y poder estadístico:
¿Para que sirven? Evidencia, 10 (5), 148-150.
Perea, A.E. (2008). Análisis de las acciones colectivas
en el fútbol de rendimiento. Doctoral thesis.
Vitoria: Universidad del País Vasco.
Quera, V., Bakeman, R., & Gnisci, A. (2007). Observer
agreement for event sequences: Methods and
software for sequence alignment and reliability
estimates. Behavior Research Methods, 39 (1),
39-49.
Santos, F.M., Fernández, J., Oliveira, M.C., Leitão, C.,
Anguera, M.T., & Campaniço, J. (2009). The
pivot player in handball and patterns detection –
Instrument. Motricidade, 5 (3), 29-36. doi:
10.6063/motricidade.5(3).193
Sarmento, H., Leitão, C., Anguera, M.T., &
Campaniço, J. (2009). Observational
methodology in football: Development of an
instrument to study the offensive game in
football. Motricidade, 5 (3), 19-24. doi:
10.6063/motricidade.5(3).191
Sedlmeier, P., & Gigerenzer, G. (1989). Do studies of
statistical power have an effect on the power of
studies? Psychological Bulletin, 105, 309-316.
Sun, S., Pan, W., & Wang, L.L. (2011). Rethinking
Observed Power. Methodology: European
Journal of Research Methods for the Behavioral
and Social Sciences, 7 (3), 81-87.
Vales, A. (1998). Una propuesta de indicadores
tácticos para la optimización de los sistemas de
juego en fútbol. Doctoral thesis. La Coruña:
Universidad de La Coruña.
Vegas, G. (2006). Metodología de enseñanza basada en
la implicación cognitiva del jugador de fútbol
base. Doctoral thesis. Granada: Universidad de
Granada.
Von Eye, A., & Von Eye, M. (2005). Can one use
Cohen´s Kappa to examine disagreement?
Methodology: European Journal of Research
Methods for the Behavioral and Social Sciences, 5
(1), 35-39.
Wein, H. (2006). Developing Youth Football Players.
Illinois: Human Kinetics.
Todo o conteúdo da revista Motricidade está licenciado sob a Creative Commons, exceto
quando especificado em contrário e nos conteúdos retirados de outras fontes bibliográficas.


![Estudo comparativo entre as osteossínteses de tornozelo ... · Gaiarsa GP. Comparative study of osteosynthesis of ankle with conventional and bioabsorbable implants [dissertation].](https://static.fdocumentos.com/doc/165x107/5c4a0a4093f3c34c5507c459/estudo-comparativo-entre-as-osteossinteses-de-tornozelo-gaiarsa-gp-comparative.jpg)