
CONFIGURAÇÃO DE PRODUTOS EM LINHAS DE PRODUTO DE …
90
CONFIGURAÇÃO DE PRODUTOS EM LINHAS DE PRODUTO DE SOFTWARE USANDO TÉCNICAS DE BUSCA
Transcript of CONFIGURAÇÃO DE PRODUTOS EM LINHAS DE PRODUTO DE …
CONFIGURAÇÃO DE PRODUTOS EM LINHAS
DE PRODUTO DE SOFTWARE USANDO
TÉCNICAS DE BUSCA

JULIANA ALVES PEREIRA
CONFIGURAÇÃO DE PRODUTOS EM LINHAS
DE PRODUTO DE SOFTWARE USANDO
TÉCNICAS DE BUSCA
Dissertação apresentada ao Programa dePós-Graduação em Ciência da Computaçãodo Instituto de Ciências Exatas da Univer-sidade Federal de Minas Gerais como re-quisito parcial para a obtenção do grau deMestre em Ciência da Computação.
Orientador: Eduardo Magno Lages FigueiredoCoorientador: Thiago Ferreira de Noronha
Belo Horizonte
Abril de 2014

JULIANA ALVES PEREIRA
SEARCH-BASED PRODUCT CONFIGURATION
IN SOFTWARE PRODUCT LINES
Dissertation presented to the GraduateProgram in Computer Science of the Fed-eral University of Minas Gerais in partialfulfillment of the requirements for the de-gree of Master in Computer Science.
Advisor: Eduardo Magno Lages FigueiredoCo-Advisor: Thiago Ferreira de Noronha
Belo Horizonte
April 2014
c© 2014, Juliana Alves Pereira.Todos os direitos reservados.
Pereira, Juliana Alves
P436s Search-Based Product Configuration in SoftwareProduct Lines / Juliana Alves Pereira. — BeloHorizonte, 2014
xxiv, 66 f. : il. ; 29cm
Dissertação (mestrado) — Universidade Federal deMinas Gerais. Departamento de Ciência daComputação.
Orientador: Eduardo Magno LagesFigueiredo Coorientador: Thiago Ferreira de Noronha
1. Computação - Teses. 2. Engenharia de software -Teses. 3. Otimização - Teses. I. Orientador.II. Coorientador. III. Título.
CDU 519.6*32 (043)


I dedicate this achievement to God who always stood beside me.
ix


Acknowledgments
This work is the result of the effort and learning provided to me and coming of severalpeople who directly and indirectly contributed to this achievement.
First of all I am thankful to God for life. My family for their support andattention. To my parents, Ana Maria and Denisio, by love and dedication that taughtme the values of life and provided me with an education that was the basis of mypersonal and professional formation. To my brothers, Fernando and Jaqueline, for thewords of encouragement and the constant presence in my life. To my husband Johnythank you for your patience, the love, affection, and for all unconditional support atall times. To my brother in law Kaique, my mother in-law Mires and my father in-lawSebastiao by the precious moments of sharing, prayers and positive thinking.
I am lucky to have the opportunity for collaboration with two brilliant researcherswho contributed a lot to this dissertation. First, I would like to specially thank myadvisor Dr. Eduardo Figueiredo for the availability, collaboration, knowledge transmit-ted and ability to stimulate along this master dissertation. I am very grateful for thequality supervision I received, for your friendship, for moments of reflection and discus-sion that contributed to the enrichment of my learning during this work. I extend mygratitude to my co-advisor, Dr. Thiago Noronha, who has always actively participatedin my work, discussions and meetings, always with great ideas and suggestions thatcontributed to the enrichment and results achieved in this research.
I am thankful to my friends, especially to lab friends LabSoft, by time dividedtogether. To teachers of the Master in Computer Science at UFMG, thank you forthe teachings and quality training I received in the course subjects. The secretariat ofthe DCC for all the support, attention and friendship. And, the Fapemig for financialsupport necessary to carry on this work.
To all those who collaborated directly or indirectly in this work my infinite grat-itude for having believed in my abilities and especially by the support I received toachieve this dream.
Thank you!
xi


“Victory is always possible for the person who refuses to stop fighting.”(Hill, Napoleon)
xiii

Resumo
Linha de produtos de software (LPS) é um conjunto de sistemas de software que com-partilham um conjunto comum de características que satisfaçam as necessidades es-pecíficas de um determinado segmento de mercado. Uma característica representa umincremento na funcionalidade relevante para alguns stakeholders. LPSs geralmenteusam um modelo de características para capturar e documentar as características co-muns e variáveis. O principal desafio de usar modelos de características é derivar umaconfiguração de produto que satisfaça os requisitos do negócio e do cliente. Embora osuporte automatizado para a configuração do produto já foi investigado na literatura,os requisitos do cliente são geralmente negligenciados. Esta dissertação apresenta umaabordagem de engenharia de software baseada em busca para resolver o problema deencontrar a configuração de produto ótima que maximiza a satisfação do cliente. Apósmodelar a configuração do produto em LPS como um problema de otimização, estadissertação propõe um algoritmo exato e uma heurística para resolver o problema deconfiguração do produto. Experimentos computacionais mostraram que o algoritmoexato pode encontrar a configuração do produto ótima para instâncias reais da liter-atura e que a diferença relativa entre o resultado heurístico e a solução ótima é de nomáximo 3%.
Palavras-chave : Linhas de Produto de Software, Configuração do Produto, Otimiza-ção Combinatória, Engenharia de Software Baseada em Busca.
xv

Abstract
Software product line (SPL) is a set of software systems that share a common set of fea-tures satisfying the specific needs of a particular market segment. A feature representsan increment in functionality relevant to some stakeholders. SPLs commonly use a fea-ture model to capture and document common and varying features. The key challengeof using feature models is to derive a product configuration that satisfies business andcustomer requirements. Although automated support for product configuration has al-ready been investigated in the literature, customer requirements are usually neglected.This dissertation presents a search-based software engineering approach to tackle theproblem of finding the optimal product configuration that maximizes the customer sat-isfaction. After modeling SPL product configuration as an optimization problem, thisdissertation proposes an exact algorithm and a heuristic to solve the product configu-ration problem. Computational experiments showed that the exact algorithm can findthe optimal product configuration for real-life SPL instances found in the literatureand that the relative optimality gap of the heuristic is at most 3%.
Keywords: Software Product Lines, Product Configuration, Combinatorial Optimiza-tion, Search-Based Software Engineering.
xvii

List of Figures
1.1 Overview of the Method to Automatic Product Configuration . . . . . . . 3
2.1 Example of a Feature Model for a Mobile Phone Product Line . . . . . . . 62.2 Example of a Sample Product Configuration . . . . . . . . . . . . . . . . . 82.3 Example of a Decorate Feature Model with Non-Functional Features . . . 9
3.1 Overview Research Process . . . . . . . . . . . . . . . . . . . . . . . . . . 153.2 Feature Model Editor SPLOT and FeatureIDE . . . . . . . . . . . . . . . . 263.3 Product Configuration SPLOT and FeatureIDE . . . . . . . . . . . . . . . 273.4 SPLConfig’s Architecture . . . . . . . . . . . . . . . . . . . . . . . . . . . 293.5 SPLConfig View in the Eclipse IDE . . . . . . . . . . . . . . . . . . . . . . 313.6 SPLConfig Main View . . . . . . . . . . . . . . . . . . . . . . . . . . . . . 313.7 SPLConfig Preference Page . . . . . . . . . . . . . . . . . . . . . . . . . . 32
xix

List of Tables
3.1 Number Searched for Years 2000-2013 . . . . . . . . . . . . . . . . . . . . 193.2 Characteristics each Tool Supports . . . . . . . . . . . . . . . . . . . . . . 213.3 Main Functionalities SPLOT and FeatureIDE . . . . . . . . . . . . . . . . 233.4 Background of Participants . . . . . . . . . . . . . . . . . . . . . . . . . . 24
5.1 Characteristics of the Original Feature Model Instances . . . . . . . . . . . 445.2 Characteristics of the Preprocessed Feature Model Instances . . . . . . . . 455.3 Average Time to Obtain the Optimal Solution . . . . . . . . . . . . . . . . 465.4 Results for the Greedy Algorithm . . . . . . . . . . . . . . . . . . . . . . . 47
xxi

Contents
Acknowledgments xi
Resumo xv
Abstract xvii
List of Figures xix
List of Tables xxi
1 Introduction 11.1 Problem Description and Motivation . . . . . . . . . . . . . . . . . . . 21.2 Goal and Contributions . . . . . . . . . . . . . . . . . . . . . . . . . . . 31.3 Dissertation Outline . . . . . . . . . . . . . . . . . . . . . . . . . . . . 4
2 Background 52.1 Domain Engineering . . . . . . . . . . . . . . . . . . . . . . . . . . . . 52.2 Application Engineering . . . . . . . . . . . . . . . . . . . . . . . . . . 72.3 Search-Based Software Engineering . . . . . . . . . . . . . . . . . . . . 92.4 Concluding Remarks . . . . . . . . . . . . . . . . . . . . . . . . . . . . 11
3 SPL Management Tools 133.1 Literature Review . . . . . . . . . . . . . . . . . . . . . . . . . . . . . . 13
3.1.1 Study Settings . . . . . . . . . . . . . . . . . . . . . . . . . . . 143.1.2 Results and Analysis . . . . . . . . . . . . . . . . . . . . . . . . 183.1.3 Threats to Validity . . . . . . . . . . . . . . . . . . . . . . . . . 20
3.2 Comparative Study . . . . . . . . . . . . . . . . . . . . . . . . . . . . . 223.2.1 Study Settings . . . . . . . . . . . . . . . . . . . . . . . . . . . 223.2.2 Results and Analysis . . . . . . . . . . . . . . . . . . . . . . . . 253.2.3 Threats to Validity . . . . . . . . . . . . . . . . . . . . . . . . . 27
xxiii
3.3 Tool Support . . . . . . . . . . . . . . . . . . . . . . . . . . . . . . . . 283.3.1 SPLConfig Architecture . . . . . . . . . . . . . . . . . . . . . . 283.3.2 Design and Implementation Decisions . . . . . . . . . . . . . . . 30
3.4 Concluding Remarks . . . . . . . . . . . . . . . . . . . . . . . . . . . . 31
4 Search-Based Algorithms for Product Configuration 334.1 Problem Definition . . . . . . . . . . . . . . . . . . . . . . . . . . . . . 334.2 Preprocessing Algorithm . . . . . . . . . . . . . . . . . . . . . . . . . . 354.3 Backtracking Algorithm . . . . . . . . . . . . . . . . . . . . . . . . . . 384.4 Greedy Heuristic Algorithm . . . . . . . . . . . . . . . . . . . . . . . . 39
5 Computational Results 435.1 Benchmark Instances . . . . . . . . . . . . . . . . . . . . . . . . . . . . 435.2 Preprocessing Algorithm . . . . . . . . . . . . . . . . . . . . . . . . . . 455.3 Backtracking Algorithm . . . . . . . . . . . . . . . . . . . . . . . . . . 465.4 Greedy Heuristic Algorithm . . . . . . . . . . . . . . . . . . . . . . . . 475.5 Threats to Validity . . . . . . . . . . . . . . . . . . . . . . . . . . . . . 485.6 Concluding Remarks . . . . . . . . . . . . . . . . . . . . . . . . . . . . 49
6 Conclusion 516.1 Related Work . . . . . . . . . . . . . . . . . . . . . . . . . . . . . . . . 526.2 Future Work . . . . . . . . . . . . . . . . . . . . . . . . . . . . . . . . . 55
Bibliography 57
xxiv
Chapter 1
Introduction
The growing need for developing larger and more complex software systems demandsbetter support for reusable software artifacts [Pohl et al., 2005]. In order to addressthese demands, software product line (SPL) has been increasingly adopted in softwareindustry [Clements and Northrop, 2001; Deelstra et al., 2004; van der Linden et al.,2007; Apel et al., 2013]. SPL is a set of software systems that share a common andvariable set of features satisfying the specific needs of a particular market segment [Pohlet al., 2005]. It is built around a set of common software components with points ofvariability that allow product configuration [Clements and Northrop, 2001; van derLinden et al., 2007]. Large companies, such as Hewlett-Packard, Nokia, Motorola, andDell have adopted SPL practices [Apel et al., 2013].
An important concept of an SPL is the feature model. Feature models are used torepresent the common and variable features in SPL [Czarnecki and Eisenecker, 2000;Kang et al., 1990]. A feature represents an increment in functionality or a systemproperty relevant to some stakeholders [Batory, 2005; Kang et al., 1990]. It may refer tofunctional requirements [Jarzabek et al., 2003], architecture decisions [Bernardo et al.,2002] or design patterns [Prehofer, 2001]. The potential benefits of SPLs are achievedthrough a software architecture designed to increase reuse of features in several SPLproducts. In practice, developing an SPL involves modeling of features representingdifferent viewpoints, sub-systems, or concerns of the software system [Batory, 2005;Beuche et al., 2004]. There are common features found on all products of the productline (known as mandatory features) and variable features that allow distinguishingbetween products in a product line (generally represented by optional or alternativefeatures). Variable features define points of variation and their role is to permit theinstantiation of different products by enabling or disabling specific SPL functionality.
1
2 Chapter 1. Introduction
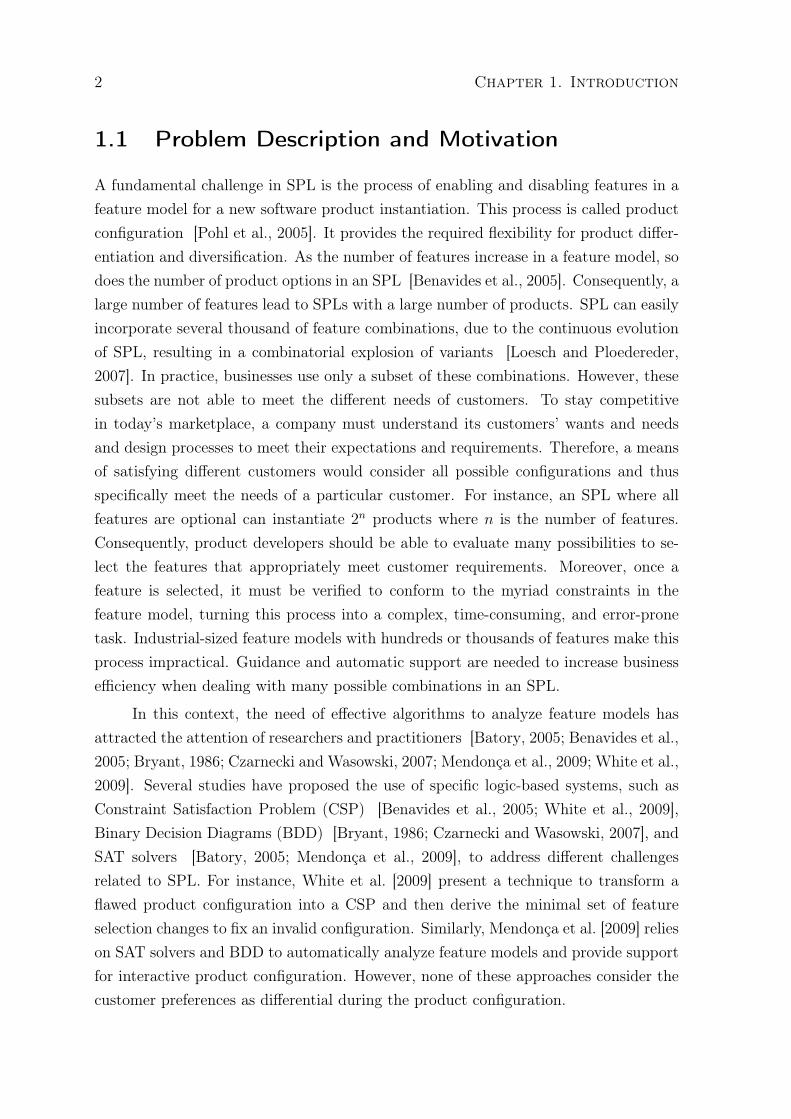
1.1 Problem Description and Motivation
A fundamental challenge in SPL is the process of enabling and disabling features in afeature model for a new software product instantiation. This process is called productconfiguration [Pohl et al., 2005]. It provides the required flexibility for product differ-entiation and diversification. As the number of features increase in a feature model, sodoes the number of product options in an SPL [Benavides et al., 2005]. Consequently, alarge number of features lead to SPLs with a large number of products. SPL can easilyincorporate several thousand of feature combinations, due to the continuous evolutionof SPL, resulting in a combinatorial explosion of variants [Loesch and Ploedereder,2007]. In practice, businesses use only a subset of these combinations. However, thesesubsets are not able to meet the different needs of customers. To stay competitivein today’s marketplace, a company must understand its customers’ wants and needsand design processes to meet their expectations and requirements. Therefore, a meansof satisfying different customers would consider all possible configurations and thusspecifically meet the needs of a particular customer. For instance, an SPL where allfeatures are optional can instantiate 2n products where n is the number of features.Consequently, product developers should be able to evaluate many possibilities to se-lect the features that appropriately meet customer requirements. Moreover, once afeature is selected, it must be verified to conform to the myriad constraints in thefeature model, turning this process into a complex, time-consuming, and error-pronetask. Industrial-sized feature models with hundreds or thousands of features make thisprocess impractical. Guidance and automatic support are needed to increase businessefficiency when dealing with many possible combinations in an SPL.
In this context, the need of effective algorithms to analyze feature models hasattracted the attention of researchers and practitioners [Batory, 2005; Benavides et al.,2005; Bryant, 1986; Czarnecki and Wasowski, 2007; Mendonça et al., 2009; White et al.,2009]. Several studies have proposed the use of specific logic-based systems, such asConstraint Satisfaction Problem (CSP) [Benavides et al., 2005; White et al., 2009],Binary Decision Diagrams (BDD) [Bryant, 1986; Czarnecki and Wasowski, 2007], andSAT solvers [Batory, 2005; Mendonça et al., 2009], to address different challengesrelated to SPL. For instance, White et al. [2009] present a technique to transform aflawed product configuration into a CSP and then derive the minimal set of featureselection changes to fix an invalid configuration. Similarly, Mendonça et al. [2009] relieson SAT solvers and BDD to automatically analyze feature models and provide supportfor interactive product configuration. However, none of these approaches consider thecustomer preferences as differential during the product configuration.
1.2. Goal and Contributions 3
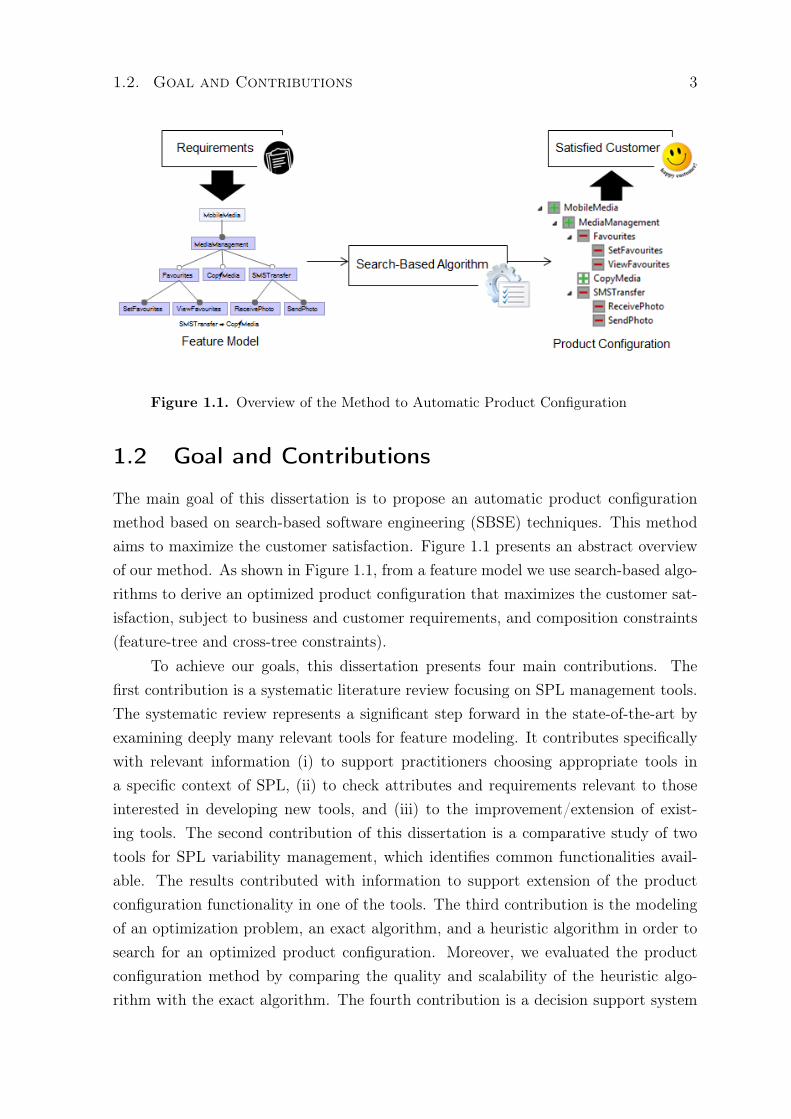
Figure 1.1. Overview of the Method to Automatic Product Configuration
1.2 Goal and Contributions
The main goal of this dissertation is to propose an automatic product configurationmethod based on search-based software engineering (SBSE) techniques. This methodaims to maximize the customer satisfaction. Figure 1.1 presents an abstract overviewof our method. As shown in Figure 1.1, from a feature model we use search-based algo-rithms to derive an optimized product configuration that maximizes the customer sat-isfaction, subject to business and customer requirements, and composition constraints(feature-tree and cross-tree constraints).
To achieve our goals, this dissertation presents four main contributions. Thefirst contribution is a systematic literature review focusing on SPL management tools.The systematic review represents a significant step forward in the state-of-the-art byexamining deeply many relevant tools for feature modeling. It contributes specificallywith relevant information (i) to support practitioners choosing appropriate tools ina specific context of SPL, (ii) to check attributes and requirements relevant to thoseinterested in developing new tools, and (iii) to the improvement/extension of exist-ing tools. The second contribution of this dissertation is a comparative study of twotools for SPL variability management, which identifies common functionalities avail-able. The results contributed with information to support extension of the productconfiguration functionality in one of the tools. The third contribution is the modelingof an optimization problem, an exact algorithm, and a heuristic algorithm in order tosearch for an optimized product configuration. Moreover, we evaluated the productconfiguration method by comparing the quality and scalability of the heuristic algo-rithm with the exact algorithm. The fourth contribution is a decision support system
4 Chapter 1. Introduction
for businesses. This system enables to reduce the effort required in task execution forproduct configuration. Ultimately, we expect the ideas discussed in this dissertationto raise awareness in our research field of the importance of the product configurationfor supporting business models.
Parts of the results presented in this dissertation were published in the papers:
• Pereira, J., Figueiredo, E., and Noronha, T. F. (2013). Modelo Computacionalpara Apoiar a Configuração de Produtos em Linha de Produtos de Software. In:Workshop de Engenharia de Software Baseada em Busca (WESB), co-located atCBSoft.
• Pereira, J., Souza, C. G., Figueiredo, E., Abilio, R., Vale, G., and Costa, H.(2013). Software Variability Management: An Exploratory Study with Two Fea-ture Modeling Tools. In: Simpósio Brasileiro de Componentes, Arquiteturas eReutilização de Software (SBCARS), co-located at CBSoft.
• Pereira, J. and Figueiredo, E. (2013). Configuração de Produtos em Linha deProdutos de Software. In: Workshop de Teses e Dissertações do CBSoft (WTD-Soft), co-located at CBSoft.
• Pereira, J.; Figueiredo, E., and Costa, H. (2012). Linha de Produtos de Soft-ware: Conceitos e Ferramentas. In: VII Escola Regional de Informática de MinasGerais (ERI-MG), co-located at SMC.
1.3 Dissertation Outline
This dissertation is organized as follows. Chapter 2 introduces background conceptsabout software product line (SPL) and search-based software engineering (SBSE).Chapter 3 first presents a systematic literature review focusing in SPL managementtools, where it is possible to see which functionalities have been emphasized in pastresearch and thus to identify gaps and opportunities for future research. Moreover, itpresents a comparative study detailed with two SPL management tools. Finally, thischapter presents SPLConfig, a decision support system to automatic product configu-ration. Chapter 4 models the problem of SPL product configuration as an optimizationproblem and proposes two search-based algorithms to solve this problem. Chapter 5presents and discusses the results of the computational experiments to evaluate theperformance of the proposed algorithms in Chapter 4. Finally, Chapter 6 concludesthis dissertation, discusses the limitations of related work, and proposes future researchdirections.
Chapter 2
Background
Software product line (SPL) is a set of software systems that share a common and vari-able set of features satisfying the specific needs of a particular market segment [Pohlet al., 2005]. It consists of two development processes, namely: domain engineering andapplication engineering [Apel et al., 2013]. In this chapter, we provide the backgroundinformation necessary for reading this dissertation including domain engineering, appli-cation engineering, and search-based software engineering (SBSE). Section 2.1 definesdomain engineering and shows how it can be represented. Section 2.2 defines applica-tion engineering and shows how it can be used for the construction of a unique andvalid product configuration in SPLs. Section 2.3 describes SBSE and its importancein the process of application engineering. Finally, concluding remarks are discussed inSection 2.4.
2.1 Domain Engineering
Domain engineering is responsible for defining the commonality and variability of theSPL [Czarnecki et al., 2006; Pohl et al., 2005]. Commonality and variability are keyconcepts in SPL which are represented by feature models [Kang et al., 2002]. In afeature model, common features to the domain composes the core and others featurescomposes the variation points [Pohl et al., 2005]. Over the past years, several featuresmodeling techniques have been developed in order to document and manage variability[Chen and Babar, 2011; Sinnema and Deelstra, 2007]. The first feature model wasproposed as part of the feature-oriented domain analysis (FODA) method [Kang et al.,1990]. It has been applied in a number of domains including mobile phones [Figueiredoet al., 2008], telecom systems [Griss et al., 1998], network protocols [Barbeau andBordeleau, 2002], Linux kernel [Lotufo et al., 2010], among others.
5
6 Chapter 2. Background
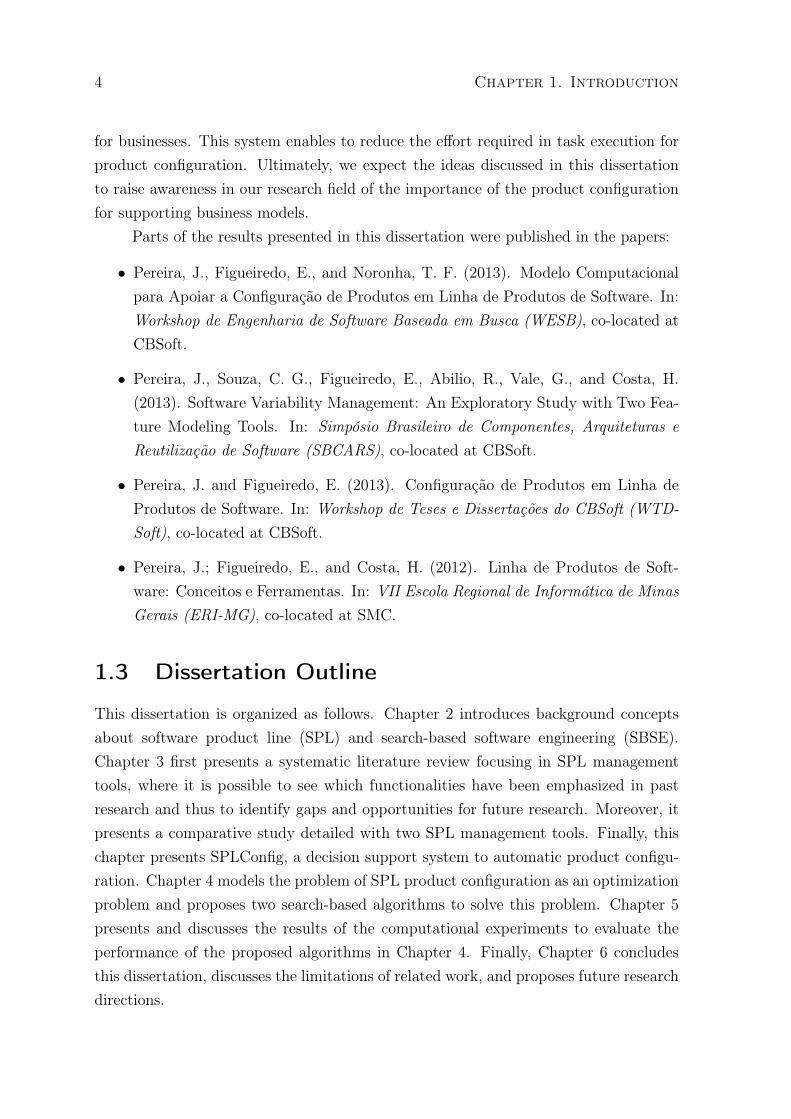
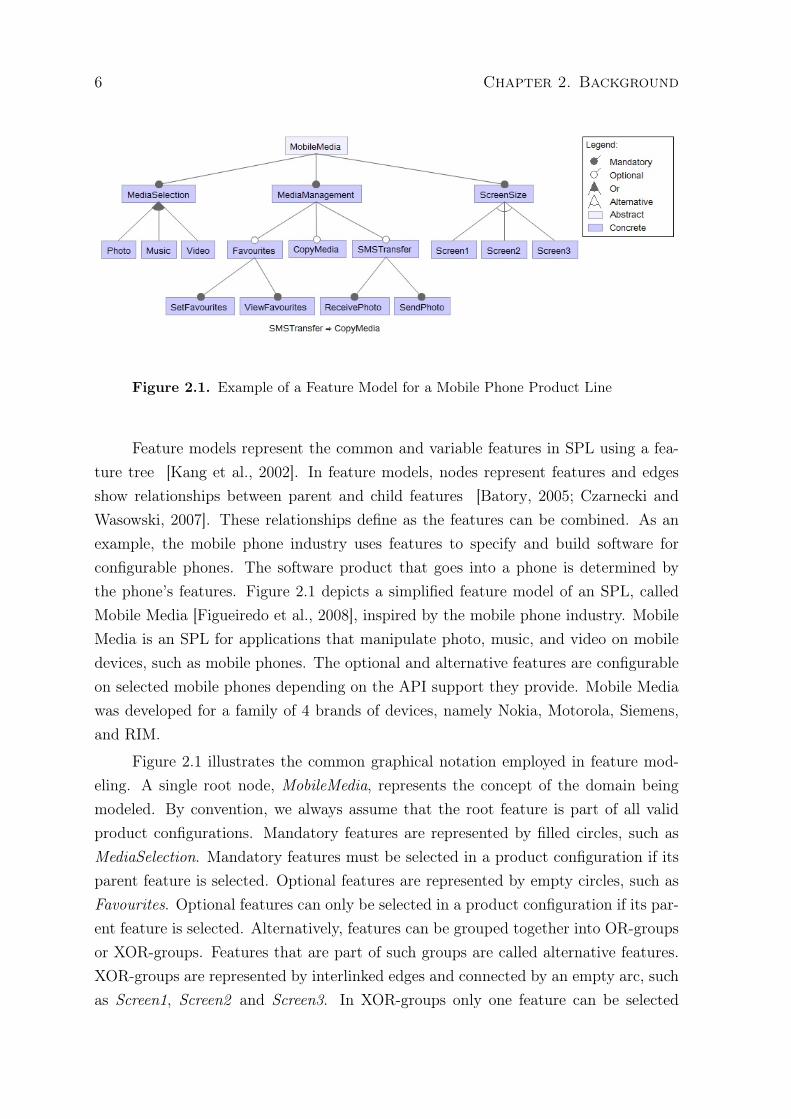
Figure 2.1. Example of a Feature Model for a Mobile Phone Product Line
Feature models represent the common and variable features in SPL using a fea-ture tree [Kang et al., 2002]. In feature models, nodes represent features and edgesshow relationships between parent and child features [Batory, 2005; Czarnecki andWasowski, 2007]. These relationships define as the features can be combined. As anexample, the mobile phone industry uses features to specify and build software forconfigurable phones. The software product that goes into a phone is determined bythe phone’s features. Figure 2.1 depicts a simplified feature model of an SPL, calledMobile Media [Figueiredo et al., 2008], inspired by the mobile phone industry. MobileMedia is an SPL for applications that manipulate photo, music, and video on mobiledevices, such as mobile phones. The optional and alternative features are configurableon selected mobile phones depending on the API support they provide. Mobile Mediawas developed for a family of 4 brands of devices, namely Nokia, Motorola, Siemens,and RIM.
Figure 2.1 illustrates the common graphical notation employed in feature mod-eling. A single root node, MobileMedia, represents the concept of the domain beingmodeled. By convention, we always assume that the root feature is part of all validproduct configurations. Mandatory features are represented by filled circles, such asMediaSelection. Mandatory features must be selected in a product configuration if itsparent feature is selected. Optional features are represented by empty circles, such asFavourites. Optional features can only be selected in a product configuration if its par-ent feature is selected. Alternatively, features can be grouped together into OR-groupsor XOR-groups. Features that are part of such groups are called alternative features.XOR-groups are represented by interlinked edges and connected by an empty arc, suchas Screen1, Screen2 and Screen3. In XOR-groups only one feature can be selected
2.2. Application Engineering 7
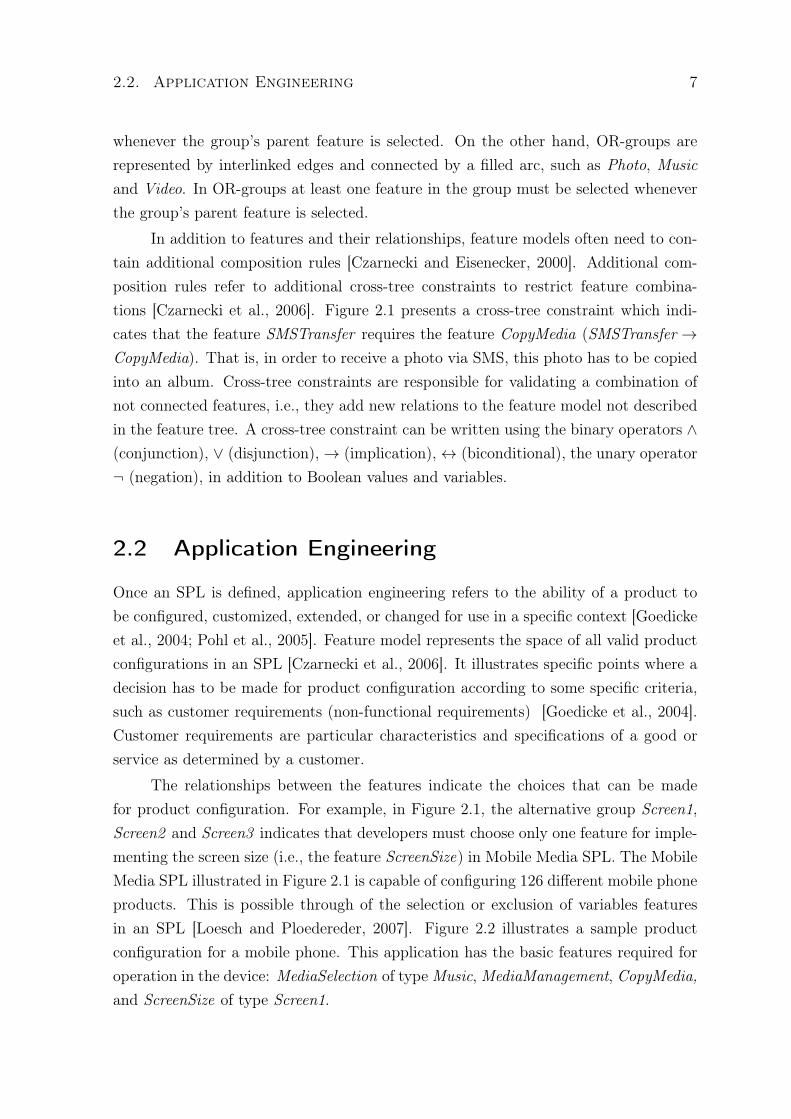
whenever the group’s parent feature is selected. On the other hand, OR-groups arerepresented by interlinked edges and connected by a filled arc, such as Photo, Musicand Video. In OR-groups at least one feature in the group must be selected wheneverthe group’s parent feature is selected.
In addition to features and their relationships, feature models often need to con-tain additional composition rules [Czarnecki and Eisenecker, 2000]. Additional com-position rules refer to additional cross-tree constraints to restrict feature combina-tions [Czarnecki et al., 2006]. Figure 2.1 presents a cross-tree constraint which indi-cates that the feature SMSTransfer requires the feature CopyMedia (SMSTransfer →CopyMedia). That is, in order to receive a photo via SMS, this photo has to be copiedinto an album. Cross-tree constraints are responsible for validating a combination ofnot connected features, i.e., they add new relations to the feature model not describedin the feature tree. A cross-tree constraint can be written using the binary operators ∧(conjunction), ∨ (disjunction),→ (implication),↔ (biconditional), the unary operator¬ (negation), in addition to Boolean values and variables.
2.2 Application Engineering
Once an SPL is defined, application engineering refers to the ability of a product tobe configured, customized, extended, or changed for use in a specific context [Goedickeet al., 2004; Pohl et al., 2005]. Feature model represents the space of all valid productconfigurations in an SPL [Czarnecki et al., 2006]. It illustrates specific points where adecision has to be made for product configuration according to some specific criteria,such as customer requirements (non-functional requirements) [Goedicke et al., 2004].Customer requirements are particular characteristics and specifications of a good orservice as determined by a customer.
The relationships between the features indicate the choices that can be madefor product configuration. For example, in Figure 2.1, the alternative group Screen1,Screen2 and Screen3 indicates that developers must choose only one feature for imple-menting the screen size (i.e., the feature ScreenSize) in Mobile Media SPL. The MobileMedia SPL illustrated in Figure 2.1 is capable of configuring 126 different mobile phoneproducts. This is possible through of the selection or exclusion of variables featuresin an SPL [Loesch and Ploedereder, 2007]. Figure 2.2 illustrates a sample productconfiguration for a mobile phone. This application has the basic features required foroperation in the device: MediaSelection of typeMusic, MediaManagement, CopyMedia,and ScreenSize of type Screen1.

8 Chapter 2. Background
Figure 2.2. Example of a Sample Product Configuration
Some researchers have developed visualization techniques to assist developersin decision making during the product configuration process [Botterweck et al., 2007;Mendonça et al., 2009; Thüm et al., 2014]. However, industrial case studies have shownthat product configuration is still a time-consuming and expensive activity [Deelstraet al., 2004]. For instance, during product configuration a feature model is configuredmanually through successive steps, by one or more developers, until a final productis obtained and provided to the customer. The manual processes commonly used toproduct configuration scale poorly for NP-hard problems. Moreover, these approachesfocus more on functional requirements of a product and their dependencies and less onnon-functional requirements.
Generally, companies sell small subsets of configurations. However, in practicethese subsets are not able to meet the different need of customers. For example, in mostcases customers pay for functionality that will never be used. Therefore, a key needwith SPL is determining how to configure a set of features for a customer requirementset. In Figure 2.1, every feature refers to functional features of the Mobile MediaSPL. However, every feature may have associated non-functional features [Kang et al.,1990]. For instance, considering the Mobile Media SPL, it is possible to identify non-functional features related to each feature, such as cost and level of importance (benefit)of each feature for the customer. It means that every product not only differs becauseof its functional features, but because of its non-functional features too. Therefore,we propose to extend feature models with non-functional features and we adapted inFigure 2.3 the proposed notation in Benavides et al. [2005] to our problem.
2.3. Search-Based Software Engineering 9
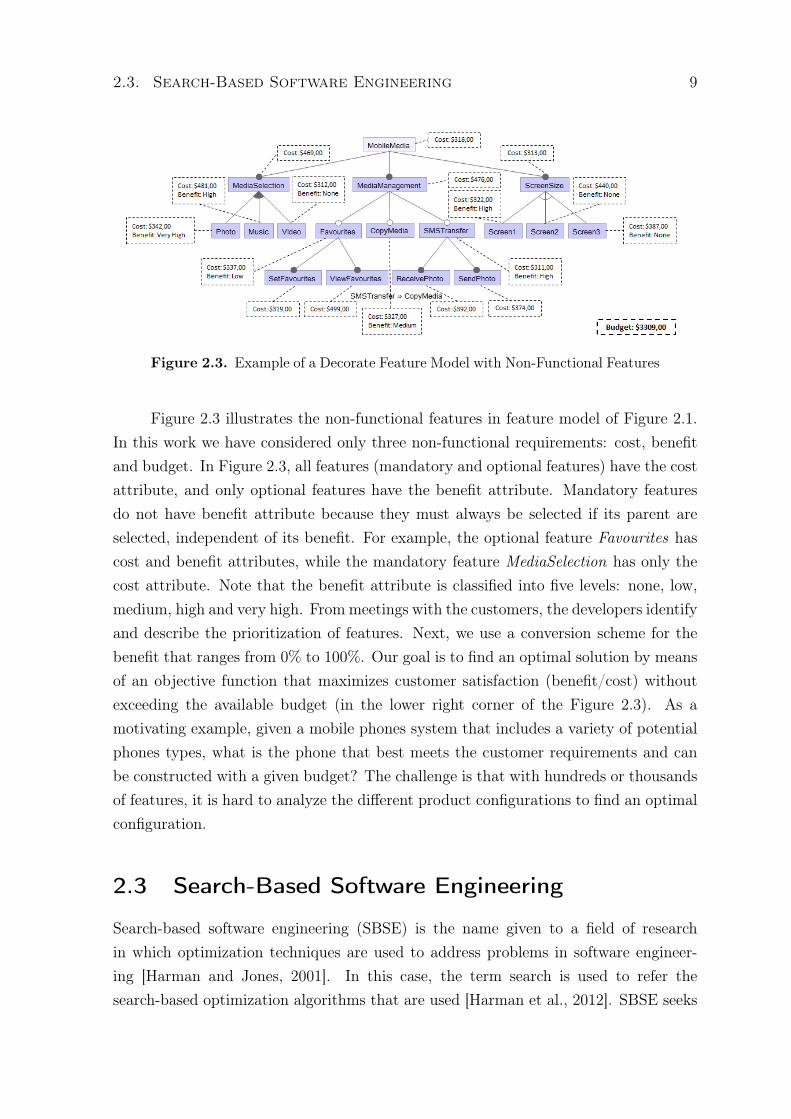
Figure 2.3. Example of a Decorate Feature Model with Non-Functional Features
Figure 2.3 illustrates the non-functional features in feature model of Figure 2.1.In this work we have considered only three non-functional requirements: cost, benefitand budget. In Figure 2.3, all features (mandatory and optional features) have the costattribute, and only optional features have the benefit attribute. Mandatory featuresdo not have benefit attribute because they must always be selected if its parent areselected, independent of its benefit. For example, the optional feature Favourites hascost and benefit attributes, while the mandatory feature MediaSelection has only thecost attribute. Note that the benefit attribute is classified into five levels: none, low,medium, high and very high. From meetings with the customers, the developers identifyand describe the prioritization of features. Next, we use a conversion scheme for thebenefit that ranges from 0% to 100%. Our goal is to find an optimal solution by meansof an objective function that maximizes customer satisfaction (benefit/cost) withoutexceeding the available budget (in the lower right corner of the Figure 2.3). As amotivating example, given a mobile phones system that includes a variety of potentialphones types, what is the phone that best meets the customer requirements and canbe constructed with a given budget? The challenge is that with hundreds or thousandsof features, it is hard to analyze the different product configurations to find an optimalconfiguration.
2.3 Search-Based Software Engineering
Search-based software engineering (SBSE) is the name given to a field of researchin which optimization techniques are used to address problems in software engineer-ing [Harman and Jones, 2001]. In this case, the term search is used to refer thesearch-based optimization algorithms that are used [Harman et al., 2012]. SBSE seeks
10 Chapter 2. Background
to reformulate software engineering problems as search-based optimization problems.Therefore, a search problem is one in which optimal or near-optimal solutions are soughtin a search space of candidate solutions, guided by a fitness function that distinguishesbetween better and worse solutions [Harman et al., 2012].
SBSE has proved to be an applicable and successful field, with many studiesacross the software engineering life cycle, from requirements and project planning tomaintenance and reengineering [Harman et al., 2012]. There is a repository of publi-cations on SBSE available on the Web.1 This repository includes over one thousandrelevant publications from 1976 to 2014, where a wide variety of different optimizationand search techniques have been used. For example, Local Search, Simulated Annealing(SA), and Genetic Algorithms (GAs). There is also increasing evidence of industrial in-terest in SBSE by many software-centric organizations including IBM [Yoo et al., 2011],Microsoft [Lakhotia et al., 2010], Motorola [Baker et al., 2006], and Nokia [Del Rosso,2006].
A general trend towards SPL has taken to an increase for using of SBSE tech-niques. SBSE is relevant for SPLs because SBSE offers a suite of adaptive, automatedand semiautomatic solutions in situations typified by large complex problem spaceswith multiple competing and conflicting objectives. Basically, it has been used wherethere is a large set of choices and finding good solutions can be hard. An extensivenumber of SBSE studies for solving problems in SPL have been documented in theliterature, such as the applicability of SBSE for automatic analysis of feature mod-els. These studies use Constraint Satisfaction Problem (CSP) [Benavides et al., 2005;White et al., 2009], Binary Decision Diagrams (BDD) [Bryant, 1986; Czarnecki andWasowski, 2007; Mendonça et al., 2009], SAT solvers [Batory, 2005; Mendonça et al.,2009], Alloy [Gheyi et al., 2006], Prolog [Beuche et al., 2004]. They work with im-portant metrics associated with feature models that can be used to measure differentaspects of the corresponding SPL. For example, the number of product configurationscan be computed by counting the number of valid configurations in the feature model.Despite the relative success of methods that make use of search-based algorithms toaddress SPL-specific problems, there are still open issues related to optimization of theproduct configuration. Developers face a number of challenges when attempting to de-rive an optimized product configuration that satisfies a set of requirements. Therefore,this dissertation relies on SBSE techniques for automatic product configuration in SPL.Our study complements and extends manual techniques of product configuration.
1http://crestweb.cs.ucl.ac.uk/resources/sbse_repository/
2.4. Concluding Remarks 11
2.4 Concluding Remarks
In this chapter, we introduced domain engineering and application engineering in SPLs.We showed how feature models can be used to build valid product configuration inSPL. In addition, we show that to quickly derive a product configuration that meetsthe customer requirements, developers need algorithmic techniques to automaticallygenerate a feature selection that optimizes desired product properties. Finally, wediscussed the use of search-based software engineering (SBSE) for solving problems inSPL, and argued that these techniques can be applied effectively in the applicationengineering during product configuration. The next chapter contributes specificallywith a systematic literature review and a comparative study of tools that support SPLvariability management. Our goal in the next chapter is identify a tool to add thefunctionality of automatic product configuration using SBSE techniques.

Chapter 3
SPL Management Tools
Since feature models are undergoing a rapid process of maturation, feature modelingtools are constantly being developed in practice. Despite the excellent SPL manage-ment tools, there remains, to date, no comprehensive survey of the whole field of tools.It is therefore timely to review the SPL tool literature, the relationships between theapplications to which it has been applied, the techniques used, trends, and open prob-lems. Section 3.1 extends the discussion on SPL by examining and classifying severaltools to support SPL variability management discussed in the literature. It presentsa survey of the state-of-the-art that identifies which functionalities have been empha-sized in past research and thus to identify gaps and possibilities for future research.Section 3.2 describes a comparative study with two SPL variability management tools.Section 3.3 presents SPLConfig a tool to support SPL product configuration usingsearch-based software engineering (SBSE) techniques. Finally, concluding remarks arediscussed in Section 3.4.
3.1 Literature Review
Variability management tools are necessary to support the organizations in the SPLmanagement. They provides the companies a guide for the development of SPLs, aswell as a complete environment of development and maintenance of the SPL. However,the choose of one tool that best meets the companies SPL development goals is farfrom trivial. This is a critical activity, due to a sharp increase in the number ofSPL management tools made available. Furthermore, tool support should assist thecomplete process, and not just some functionality, because it would lead to the need touse several tools and information traceability among them. In this context, this studycontributes with a systematic literature review of tools to support SPL variability
13
14 Chapter 3. SPL Management Tools
management. The systematic review was conducted in order to identify, gather andclassify tools in the literature that support the SPL management, including stages fromconception until products derivation and SPL evolution.
Systematic review is one study method that has obtained much attention latelyin software engineering [Kitchenham et al., 2009]. Our systematic review representsa significant step forward in the state-of-the-art by examining deeply many relevanttools for feature modeling. General propose of this study is to give a visual summary,by categorizing of existing tools to provide a search in journals and conference pro-ceedings since 2000. Therefore, we have used a systematic and rigorous method toaccomplish an extension study, identifying and selecting the reviewed primary studies.The next sections are organized as follows. Section 3.1.1 presents the steps carried bythe systematic review. Section 3.1.2 reports and analyzes the results of this system-atic review, and contributes specifically with relevant information to the extension ofexisting tools. Finally, Section 3.1.3 presents the threats to validity related for this sys-tematic literature review and how they were addressed prior of the study to minimizetheir impact.
3.1.1 Study Settings
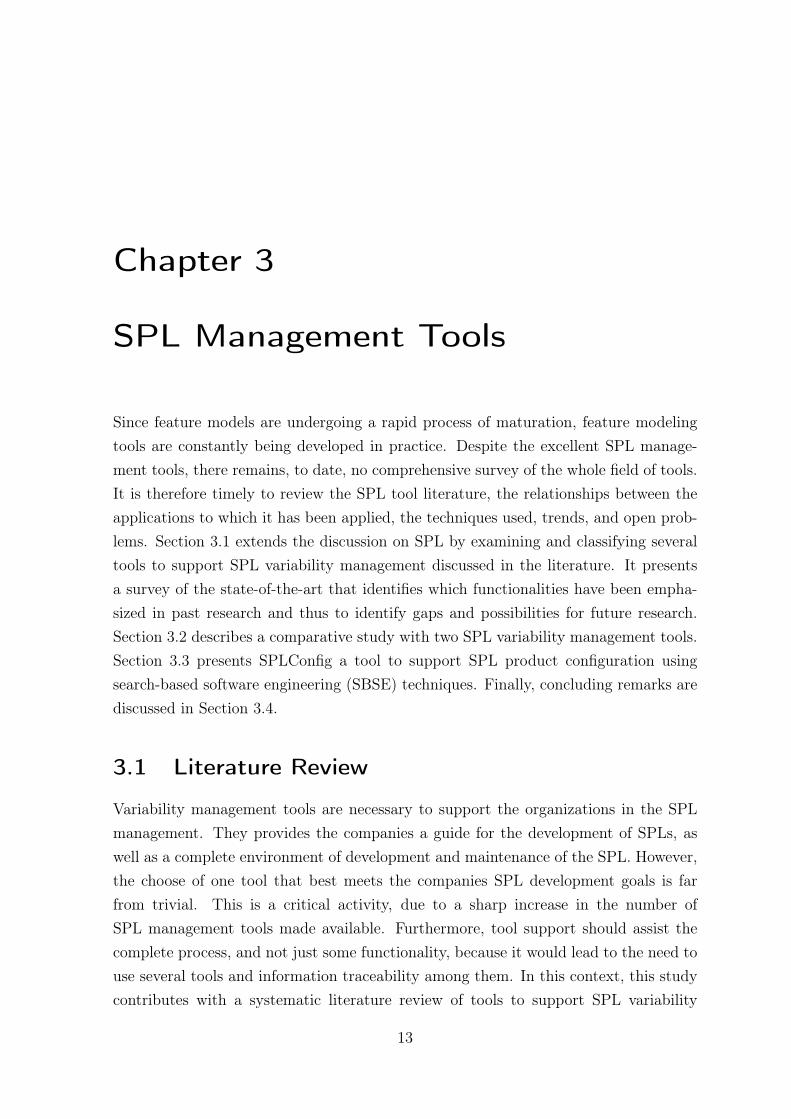
This study has been carried out according to the guideline for systematic literaturereview described in Kitchenham et al. [2009]. The guideline is structured accordingthree-step process for Planning, Conducting and Reporting the review. Figure 3.1depicts an overview of our research process comprising each step and its stagessequence. The execution of the overall process involves iteration, feedback, andrefinement of the defined process [Kitchenham et al., 2009]. The systematic reviewsteps, together with the protocol are detailed as follows.
Step 1. Has the goal of developing a protocol that specifies the plan that thesystematic review will follow to identify, assess, and collate evidence [Kitchenhamet al., 2009]. The Planning step includes several actions:
Identification of the need for a review. The need for a systematic revieworiginates from increase in the number of SPL management tools made available.In this context, the choice of one tool that best fits practitioners needs in a specificcontext of SPL is far from trivial. Therefore, a systematic review aims to give acomplete, comprehensive and valid picture of the tools available in the literature, inorder to find out how the available tools are providing support to the process.
3.1. Literature Review 15
Figure 3.1. Overview Research Process
Specifying the research questions. The focuses of the research questions are iden-tify SPL management tools, focusing since the SPL conception, to its development,maintenance and evolution. More specifically, we investigate three research questions(RQs) in this paper:
• RQ1. How many SPL management tools have been cited in the literature since2000?
• RQ2. What are the main characteristics of the tools?
• RQ3. What are the main functionalities of the tools?
To address RQ1, we identified the tools that are being cited in the literaturesince 2000. With respect to RQ2, we identify the types of tools that are beendevelopments and where the tools were developed. Through these descriptions, it ispossible to map the current adoption of the tools. Finally, with respect to RQ3, weconcerned with how the tool supports each stage of the development process, namely:domain engineering and application engineering. In particular, what SPL topics,contributions and novelty they constitute. Thus, it is possible to map how tools aresupporting an SPL management process and if the process is not fully supported,i.e. there are many gaps in the existing tools, or if there is a necessity of developingfunctionalities that are not addressed by the tools. The analysis did not focus onthe strengths or on the weaknesses of the tools, because the goal was to identifywhat the tools do and compare them. Therefore, the systematic review is conductedto identify, to analyze and interpret all available evidence related the research questions.
16 Chapter 3. SPL Management Tools
Developing a review protocol. We conducted a systematic literature review injournals and conferences proceedings published from January 1st 2000 to December31th 2013, by the fact that visibility provided by SPL in recent years has produceda higher concentration of research [Lisboa et al., 2010]. Three researchers wereinvolved in this process and all of them continuously discussed and refined the researchquestions, search strings, inclusion and exclusion criteria.
Step 2. Conducting the review means executing the protocol planned in the previousphase. To conduct a systematic literature review includes several actions:
Identification of research. Based on the research questions, some keywords wereextracted and used to search the primary study sources. The search string used wasconstructed using the strategy by [Chen and Babar, 2011]. Following this strategy,search string addressed by this study is:
• (“management tool”) AND (“feature modeling” OR “product configuration” OR“variability management”) AND (“product line” OR “product family” OR “systemfamily”).
The primary studies were identified by using a search string on three scientificdatabases: ACM Digital Library1, IEEE Xplore2 and ScienceDirect3. These librarieswere chosen because they are some of the most relevant sources in software engineering[Travassos and Biolchini, 2007]. The search was performed using the specific syntaxof each database and considering only the title, keywords and abstract. In addtion tothe search in digital libraries, the references of the primary studies were also read inorder to identify others primary studies relevant (technique called “snowballing”).
Selection of primary studies. The basis for the selection of primary studies is theinclusion and exclusion criteria [Kitchenham et al., 2009]. We defined two inclusioncriteria (IC):
• IC1. The publications should be "journal" or "conference" and only works writ-ten in English were considered.
• IC2. We included only primary studies that present tools to manage one ormore phases of the development cycle and maintenance of SPLs. Therefore, the
1http://dl.acm.org/2http://ieeexplore.ieee.org/3http://www.sciencedirect.com/
3.1. Literature Review 17
abstract should explicitly mentions that the focus of the paper contributes withtools to support SPL variability management.
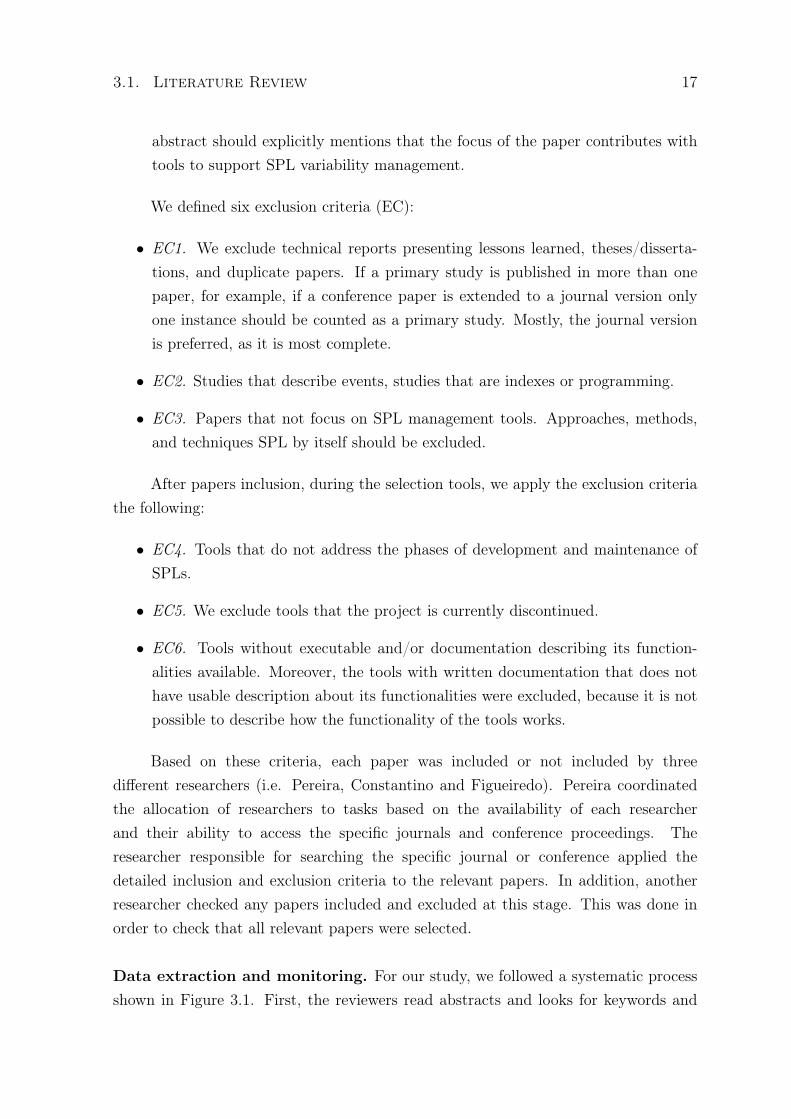
We defined six exclusion criteria (EC):
• EC1. We exclude technical reports presenting lessons learned, theses/disserta-tions, and duplicate papers. If a primary study is published in more than onepaper, for example, if a conference paper is extended to a journal version onlyone instance should be counted as a primary study. Mostly, the journal versionis preferred, as it is most complete.
• EC2. Studies that describe events, studies that are indexes or programming.
• EC3. Papers that not focus on SPL management tools. Approaches, methods,and techniques SPL by itself should be excluded.
After papers inclusion, during the selection tools, we apply the exclusion criteriathe following:
• EC4. Tools that do not address the phases of development and maintenance ofSPLs.
• EC5. We exclude tools that the project is currently discontinued.
• EC6. Tools without executable and/or documentation describing its function-alities available. Moreover, the tools with written documentation that does nothave usable description about its functionalities were excluded, because it is notpossible to describe how the functionality of the tools works.
Based on these criteria, each paper was included or not included by threedifferent researchers (i.e. Pereira, Constantino and Figueiredo). Pereira coordinatedthe allocation of researchers to tasks based on the availability of each researcherand their ability to access the specific journals and conference proceedings. Theresearcher responsible for searching the specific journal or conference applied thedetailed inclusion and exclusion criteria to the relevant papers. In addition, anotherresearcher checked any papers included and excluded at this stage. This was done inorder to check that all relevant papers were selected.
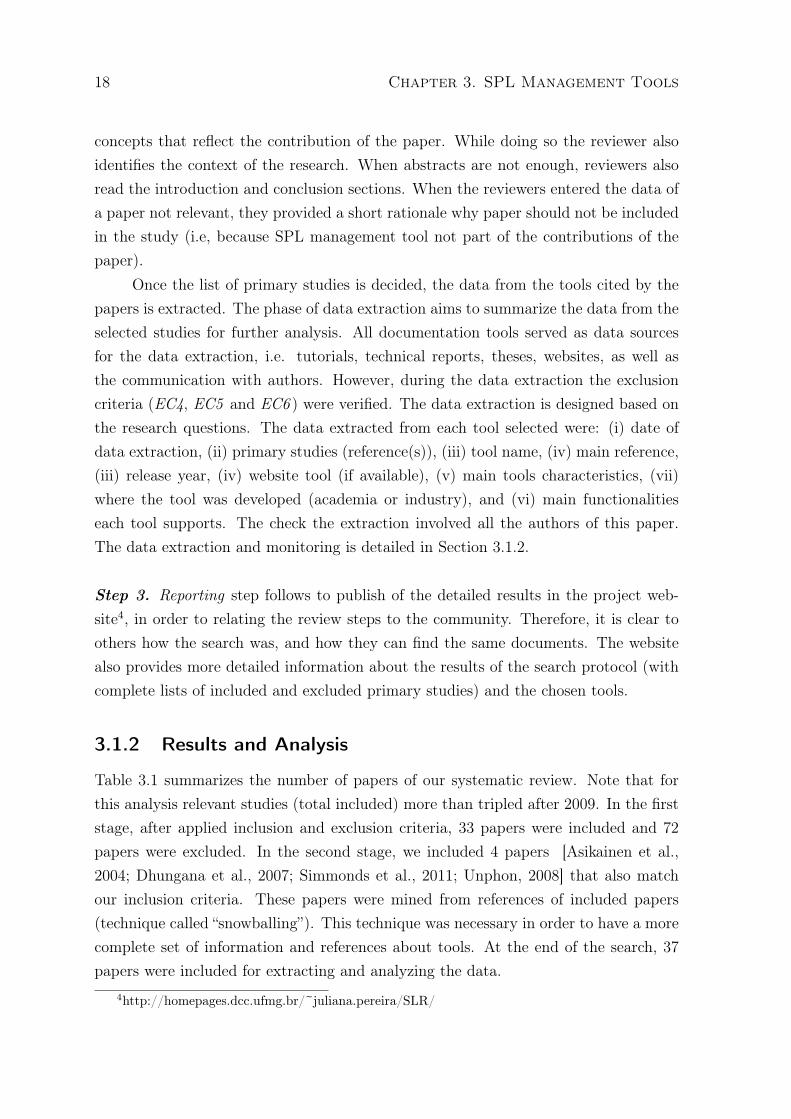
Data extraction and monitoring. For our study, we followed a systematic processshown in Figure 3.1. First, the reviewers read abstracts and looks for keywords and
18 Chapter 3. SPL Management Tools
concepts that reflect the contribution of the paper. While doing so the reviewer alsoidentifies the context of the research. When abstracts are not enough, reviewers alsoread the introduction and conclusion sections. When the reviewers entered the data ofa paper not relevant, they provided a short rationale why paper should not be includedin the study (i.e, because SPL management tool not part of the contributions of thepaper).
Once the list of primary studies is decided, the data from the tools cited by thepapers is extracted. The phase of data extraction aims to summarize the data from theselected studies for further analysis. All documentation tools served as data sourcesfor the data extraction, i.e. tutorials, technical reports, theses, websites, as well asthe communication with authors. However, during the data extraction the exclusioncriteria (EC4, EC5 and EC6 ) were verified. The data extraction is designed based onthe research questions. The data extracted from each tool selected were: (i) date ofdata extraction, (ii) primary studies (reference(s)), (iii) tool name, (iv) main reference,(iii) release year, (iv) website tool (if available), (v) main tools characteristics, (vii)where the tool was developed (academia or industry), and (vi) main functionalitieseach tool supports. The check the extraction involved all the authors of this paper.The data extraction and monitoring is detailed in Section 3.1.2.
Step 3. Reporting step follows to publish of the detailed results in the project web-site4, in order to relating the review steps to the community. Therefore, it is clear toothers how the search was, and how they can find the same documents. The websitealso provides more detailed information about the results of the search protocol (withcomplete lists of included and excluded primary studies) and the chosen tools.
3.1.2 Results and Analysis
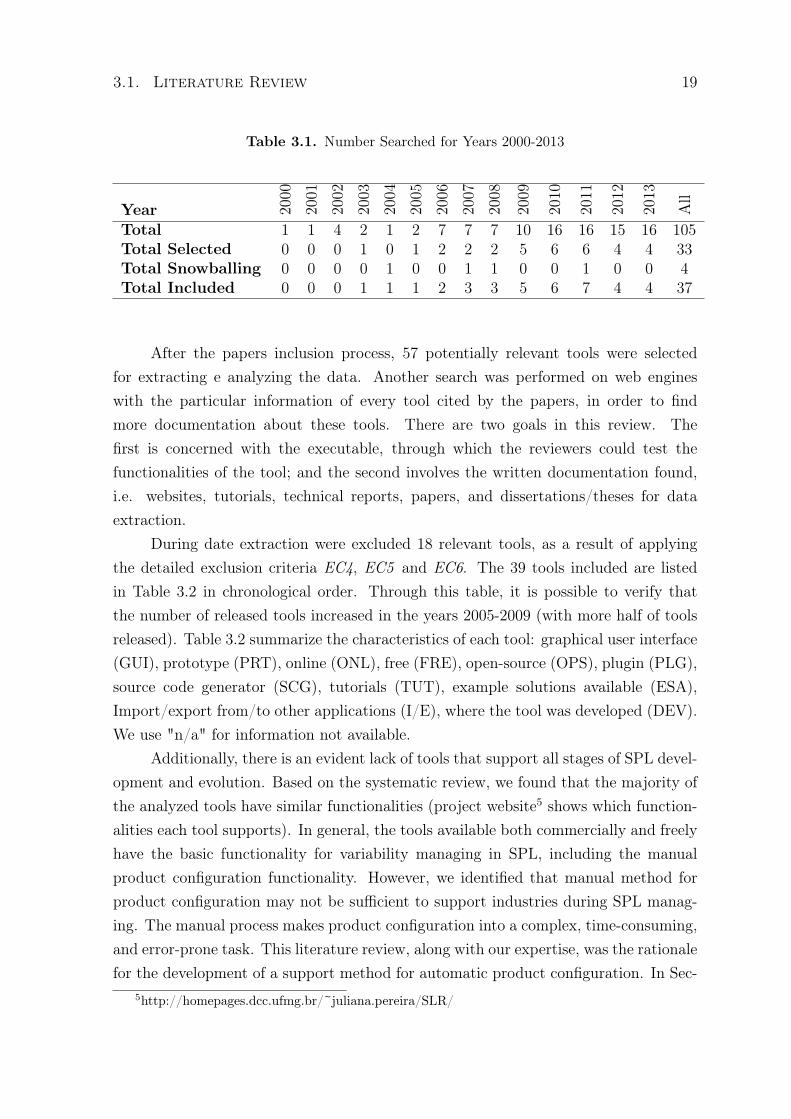
Table 3.1 summarizes the number of papers of our systematic review. Note that forthis analysis relevant studies (total included) more than tripled after 2009. In the firststage, after applied inclusion and exclusion criteria, 33 papers were included and 72papers were excluded. In the second stage, we included 4 papers [Asikainen et al.,2004; Dhungana et al., 2007; Simmonds et al., 2011; Unphon, 2008] that also matchour inclusion criteria. These papers were mined from references of included papers(technique called “snowballing”). This technique was necessary in order to have a morecomplete set of information and references about tools. At the end of the search, 37papers were included for extracting and analyzing the data.
4http://homepages.dcc.ufmg.br/~juliana.pereira/SLR/
3.1. Literature Review 19
Table 3.1. Number Searched for Years 2000-2013
Year 2000
2001
2002
2003
2004
2005
2006
2007
2008
2009
2010
2011
2012
2013
All
Total 1 1 4 2 1 2 7 7 7 10 16 16 15 16 105Total Selected 0 0 0 1 0 1 2 2 2 5 6 6 4 4 33Total Snowballing 0 0 0 0 1 0 0 1 1 0 0 1 0 0 4Total Included 0 0 0 1 1 1 2 3 3 5 6 7 4 4 37
After the papers inclusion process, 57 potentially relevant tools were selectedfor extracting e analyzing the data. Another search was performed on web engineswith the particular information of every tool cited by the papers, in order to findmore documentation about these tools. There are two goals in this review. Thefirst is concerned with the executable, through which the reviewers could test thefunctionalities of the tool; and the second involves the written documentation found,i.e. websites, tutorials, technical reports, papers, and dissertations/theses for dataextraction.
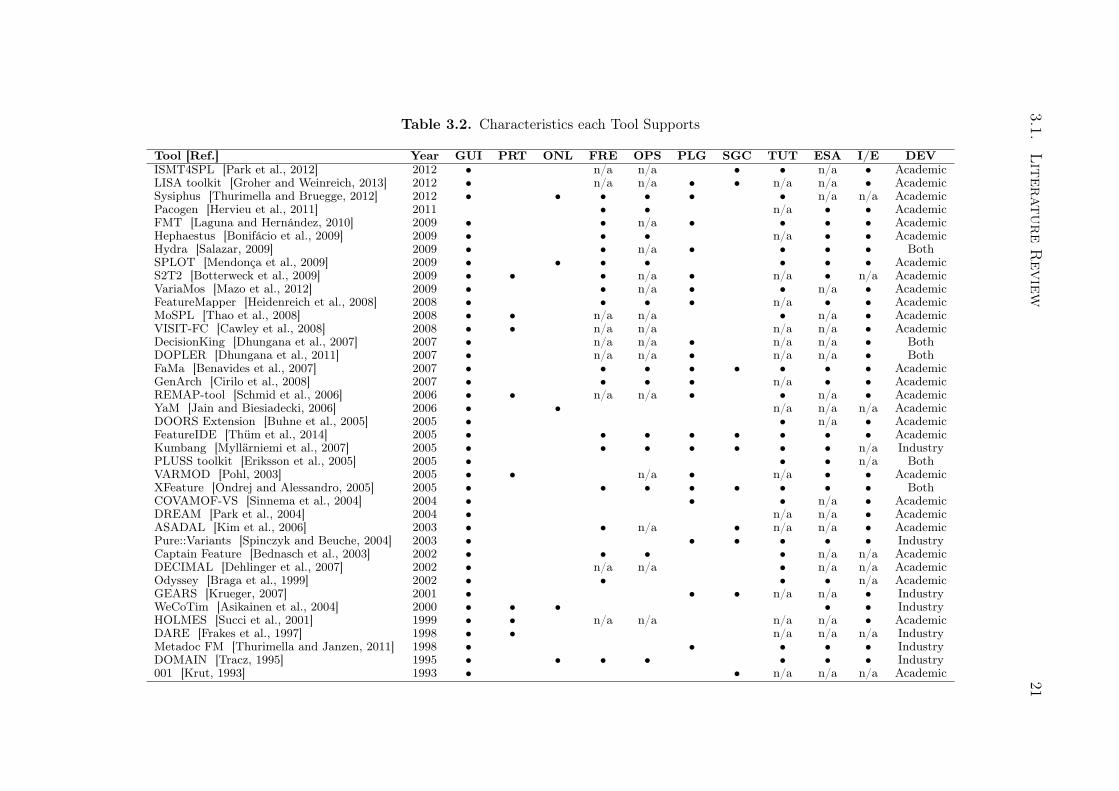
During date extraction were excluded 18 relevant tools, as a result of applyingthe detailed exclusion criteria EC4, EC5 and EC6. The 39 tools included are listedin Table 3.2 in chronological order. Through this table, it is possible to verify thatthe number of released tools increased in the years 2005-2009 (with more half of toolsreleased). Table 3.2 summarize the characteristics of each tool: graphical user interface(GUI), prototype (PRT), online (ONL), free (FRE), open-source (OPS), plugin (PLG),source code generator (SCG), tutorials (TUT), example solutions available (ESA),Import/export from/to other applications (I/E), where the tool was developed (DEV).We use "n/a" for information not available.
Additionally, there is an evident lack of tools that support all stages of SPL devel-opment and evolution. Based on the systematic review, we found that the majority ofthe analyzed tools have similar functionalities (project website5 shows which function-alities each tool supports). In general, the tools available both commercially and freelyhave the basic functionality for variability managing in SPL, including the manualproduct configuration functionality. However, we identified that manual method forproduct configuration may not be sufficient to support industries during SPL manag-ing. The manual process makes product configuration into a complex, time-consuming,and error-prone task. This literature review, along with our expertise, was the rationalefor the development of a support method for automatic product configuration. In Sec-
5http://homepages.dcc.ufmg.br/~juliana.pereira/SLR/
20 Chapter 3. SPL Management Tools
tion 3.2, we conduct a comparative study between two variability management tools,in order to support extension of the automatic product configuration functionality inone of the tools.
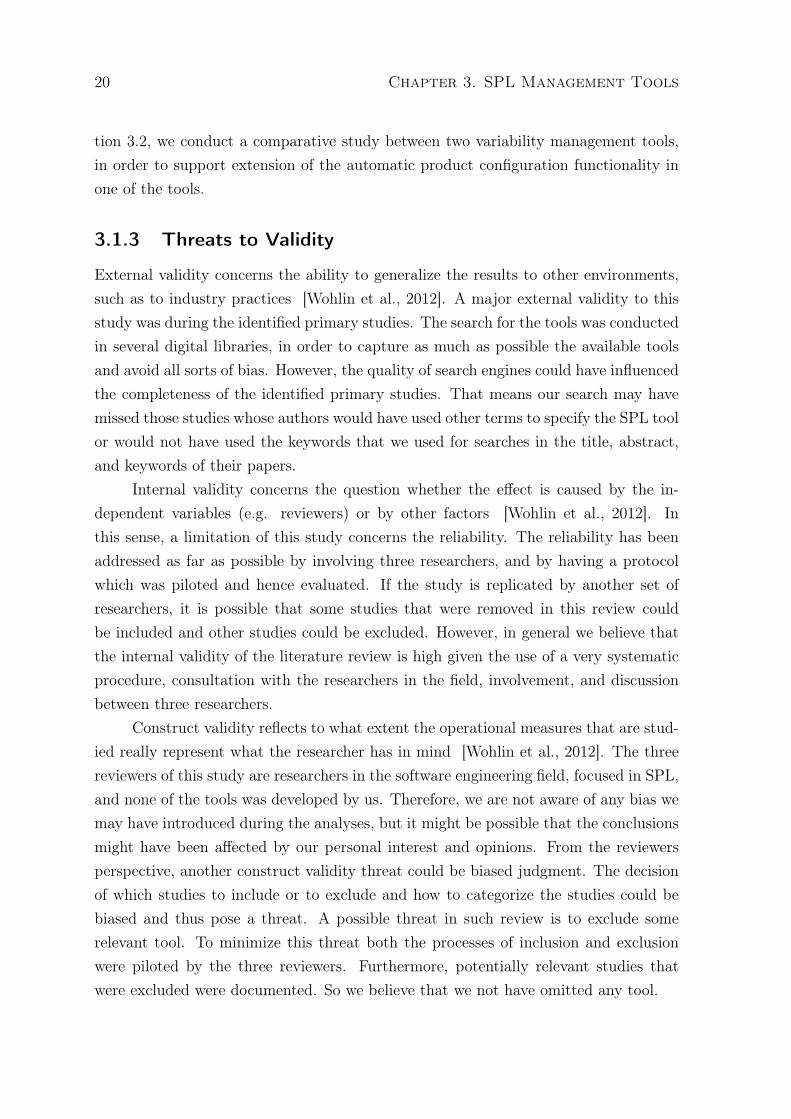
3.1.3 Threats to Validity
External validity concerns the ability to generalize the results to other environments,such as to industry practices [Wohlin et al., 2012]. A major external validity to thisstudy was during the identified primary studies. The search for the tools was conductedin several digital libraries, in order to capture as much as possible the available toolsand avoid all sorts of bias. However, the quality of search engines could have influencedthe completeness of the identified primary studies. That means our search may havemissed those studies whose authors would have used other terms to specify the SPL toolor would not have used the keywords that we used for searches in the title, abstract,and keywords of their papers.
Internal validity concerns the question whether the effect is caused by the in-dependent variables (e.g. reviewers) or by other factors [Wohlin et al., 2012]. Inthis sense, a limitation of this study concerns the reliability. The reliability has beenaddressed as far as possible by involving three researchers, and by having a protocolwhich was piloted and hence evaluated. If the study is replicated by another set ofresearchers, it is possible that some studies that were removed in this review couldbe included and other studies could be excluded. However, in general we believe thatthe internal validity of the literature review is high given the use of a very systematicprocedure, consultation with the researchers in the field, involvement, and discussionbetween three researchers.
Construct validity reflects to what extent the operational measures that are stud-ied really represent what the researcher has in mind [Wohlin et al., 2012]. The threereviewers of this study are researchers in the software engineering field, focused in SPL,and none of the tools was developed by us. Therefore, we are not aware of any bias wemay have introduced during the analyses, but it might be possible that the conclusionsmight have been affected by our personal interest and opinions. From the reviewersperspective, another construct validity threat could be biased judgment. The decisionof which studies to include or to exclude and how to categorize the studies could bebiased and thus pose a threat. A possible threat in such review is to exclude somerelevant tool. To minimize this threat both the processes of inclusion and exclusionwere piloted by the three reviewers. Furthermore, potentially relevant studies thatwere excluded were documented. So we believe that we not have omitted any tool.
3.1.Lit
erat
ure
Rev
iew21
Table 3.2. Characteristics each Tool Supports
Tool [Ref.] Year GUI PRT ONL FRE OPS PLG SGC TUT ESA I/E DEVISMT4SPL [Park et al., 2012] 2012 • n/a n/a • • n/a • AcademicLISA toolkit [Groher and Weinreich, 2013] 2012 • n/a n/a • • n/a n/a • AcademicSysiphus [Thurimella and Bruegge, 2012] 2012 • • • • • • n/a n/a AcademicPacogen [Hervieu et al., 2011] 2011 • • n/a • • AcademicFMT [Laguna and Hernández, 2010] 2009 • • n/a • • • • AcademicHephaestus [Bonifácio et al., 2009] 2009 • • • n/a • • AcademicHydra [Salazar, 2009] 2009 • • n/a • • • • BothSPLOT [Mendonça et al., 2009] 2009 • • • • • • • AcademicS2T2 [Botterweck et al., 2009] 2009 • • • n/a • n/a • n/a AcademicVariaMos [Mazo et al., 2012] 2009 • • n/a • • n/a • AcademicFeatureMapper [Heidenreich et al., 2008] 2008 • • • • n/a • • AcademicMoSPL [Thao et al., 2008] 2008 • • n/a n/a • n/a • AcademicVISIT-FC [Cawley et al., 2008] 2008 • • n/a n/a n/a n/a • AcademicDecisionKing [Dhungana et al., 2007] 2007 • n/a n/a • n/a n/a • BothDOPLER [Dhungana et al., 2011] 2007 • n/a n/a • n/a n/a • BothFaMa [Benavides et al., 2007] 2007 • • • • • • • • AcademicGenArch [Cirilo et al., 2008] 2007 • • • • n/a • • AcademicREMAP-tool [Schmid et al., 2006] 2006 • • n/a n/a • • n/a • AcademicYaM [Jain and Biesiadecki, 2006] 2006 • • n/a n/a n/a AcademicDOORS Extension [Buhne et al., 2005] 2005 • • n/a • AcademicFeatureIDE [Thüm et al., 2014] 2005 • • • • • • • • AcademicKumbang [Myllärniemi et al., 2007] 2005 • • • • • • • n/a IndustryPLUSS toolkit [Eriksson et al., 2005] 2005 • • • n/a BothVARMOD [Pohl, 2003] 2005 • • n/a • n/a • • AcademicXFeature [Ondrej and Alessandro, 2005] 2005 • • • • • • • • BothCOVAMOF-VS [Sinnema et al., 2004] 2004 • • • n/a • AcademicDREAM [Park et al., 2004] 2004 • n/a n/a • AcademicASADAL [Kim et al., 2006] 2003 • • n/a • n/a n/a • AcademicPure::Variants [Spinczyk and Beuche, 2004] 2003 • • • • • • IndustryCaptain Feature [Bednasch et al., 2003] 2002 • • • • n/a n/a AcademicDECIMAL [Dehlinger et al., 2007] 2002 • n/a n/a • n/a n/a AcademicOdyssey [Braga et al., 1999] 2002 • • • • n/a AcademicGEARS [Krueger, 2007] 2001 • • • n/a n/a • IndustryWeCoTim [Asikainen et al., 2004] 2000 • • • • • IndustryHOLMES [Succi et al., 2001] 1999 • • n/a n/a n/a n/a • AcademicDARE [Frakes et al., 1997] 1998 • • n/a n/a n/a IndustryMetadoc FM [Thurimella and Janzen, 2011] 1998 • • • • • IndustryDOMAIN [Tracz, 1995] 1995 • • • • • • • Industry001 [Krut, 1993] 1993 • • n/a n/a n/a Academic
22 Chapter 3. SPL Management Tools
Conclusion validity concerns the relation between the treatments and the outcomeof the review [Wohlin et al., 2012]. From the reviewers perspective, a potential threatto conclusion validity is the reliability of the data extraction categories from the tools,since not all the information was obvious to answer the research question and somedata had to be interpreted. Therefore, in order to ensure the validity, multiple sourcesof data were analyzed, i.e. papers, prototypes, technical reports, manuals, and toolsexecution. Furthermore, in the event of a disagreement between the two primaryreviewers, the third reviewer acted as an arbitrator to ensure agreement was reached.
3.2 Comparative Study
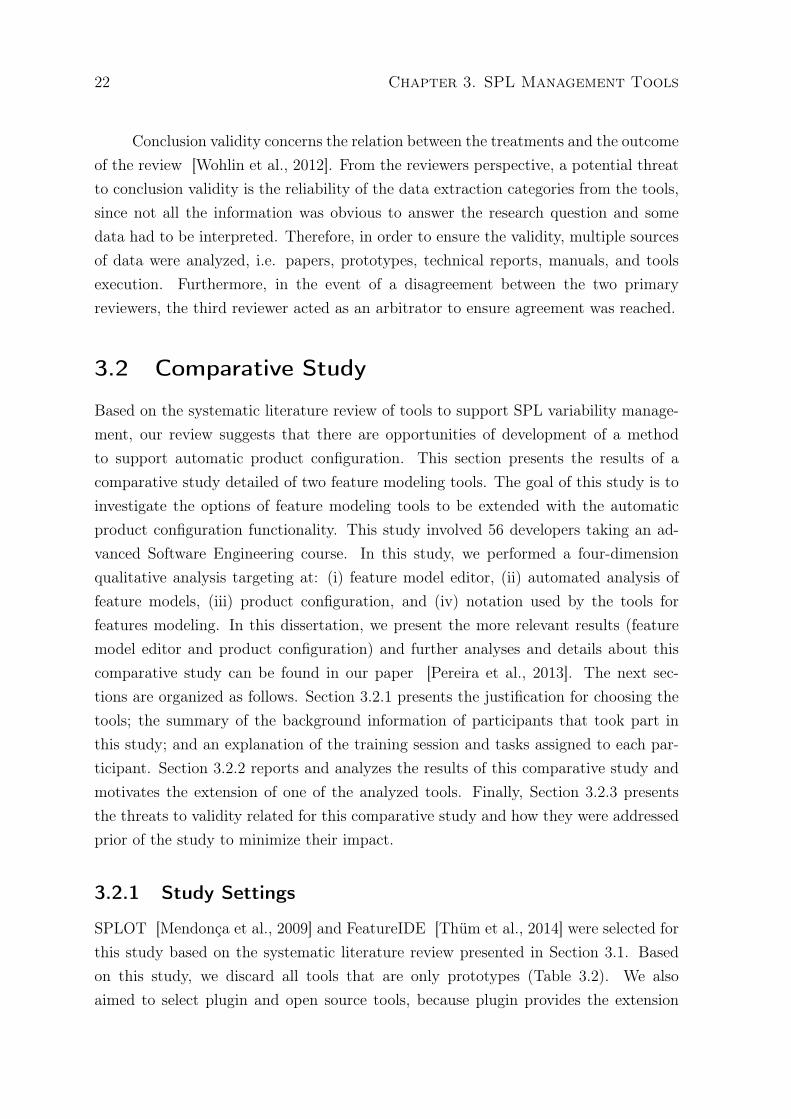
Based on the systematic literature review of tools to support SPL variability manage-ment, our review suggests that there are opportunities of development of a methodto support automatic product configuration. This section presents the results of acomparative study detailed of two feature modeling tools. The goal of this study is toinvestigate the options of feature modeling tools to be extended with the automaticproduct configuration functionality. This study involved 56 developers taking an ad-vanced Software Engineering course. In this study, we performed a four-dimensionqualitative analysis targeting at: (i) feature model editor, (ii) automated analysis offeature models, (iii) product configuration, and (iv) notation used by the tools forfeatures modeling. In this dissertation, we present the more relevant results (featuremodel editor and product configuration) and further analyses and details about thiscomparative study can be found in our paper [Pereira et al., 2013]. The next sec-tions are organized as follows. Section 3.2.1 presents the justification for choosing thetools; the summary of the background information of participants that took part inthis study; and an explanation of the training session and tasks assigned to each par-ticipant. Section 3.2.2 reports and analyzes the results of this comparative study andmotivates the extension of one of the analyzed tools. Finally, Section 3.2.3 presentsthe threats to validity related for this comparative study and how they were addressedprior of the study to minimize their impact.
3.2.1 Study Settings
SPLOT [Mendonça et al., 2009] and FeatureIDE [Thüm et al., 2014] were selected forthis study based on the systematic literature review presented in Section 3.1. Basedon this study, we discard all tools that are only prototypes (Table 3.2). We alsoaimed to select plugin and open source tools, because plugin provides the extension

3.2. Comparative Study 23
of tools already established and known, and open source tools allow its extension.On the other hand, proprietary tools could hinder some sorts of analyses, well as itsextension. For instance, we do not have access to all the functionalities of the tool.In a second analysis, we also include only tools with tutorials and example solutionsavailable, because the tutorial and example solutions are important for users that donot have previous training before the tool usage. Moreover, we include tools withfunctionality import/export from/to other applications. This characteristic concernsthe interoperability between other applications, allowing users to migration and the useof additional functionality not provided by the tool. After applying these filters, fourtools were selected (SPLOT, FaMa, FeatureIDE, and XFeature). Finally, we verifythe key functionalities provided by typical feature modeling tools, such as to createand edit a feature model (domain representation, variability, mandatory features, andcomposition rule), automatically analyze the feature model (reports and consistencycheck), and product configuration (manual product configuration). After this filter, weselected three tools (SPLOT, FaMa, FeatureIDE). Next, we decide to select FeatureIDEand SPLOT, because they are mature tools that we have experienced and that we havecontact with the developers of these tools. Table 3.3 summarizes the main functionalityof both SPLOT and FeatureIDE tools.
Table 3.3. Main Functionalities SPLOT and FeatureIDE
Functionality SPLOT FeatureIDEFeature model editor X XAutomated feature model analysis X XManual product configuration X XTutorials and example solutions X XAvailable online XIntegration with code XFeature model notation tree tree and diagram
SPLOT [Mendonça et al., 2009] is a Web-based, free and open source project.At the tool website , we can find a repository of more than 400 feature models createdby tool users over four years. Additionally, it also provides a standalone tool versionthat can be installed in a private machine. On the other hand, FeatureIDE [Thümet al., 2014] is a standalone project implemented as an Eclipse plugin. FeatureIDE isintegrated with several programming and composition languages with a focus on de-velopment for reuse. It was developed to support both aspect-oriented [Kiczales et al.,2001] and feature oriented programming [Batory, 2005]. While FeatureIDE widely
24 Chapter 3. SPL Management Tools
covers the SPL development process, SPLOT does not provide means for generationor integration of code.
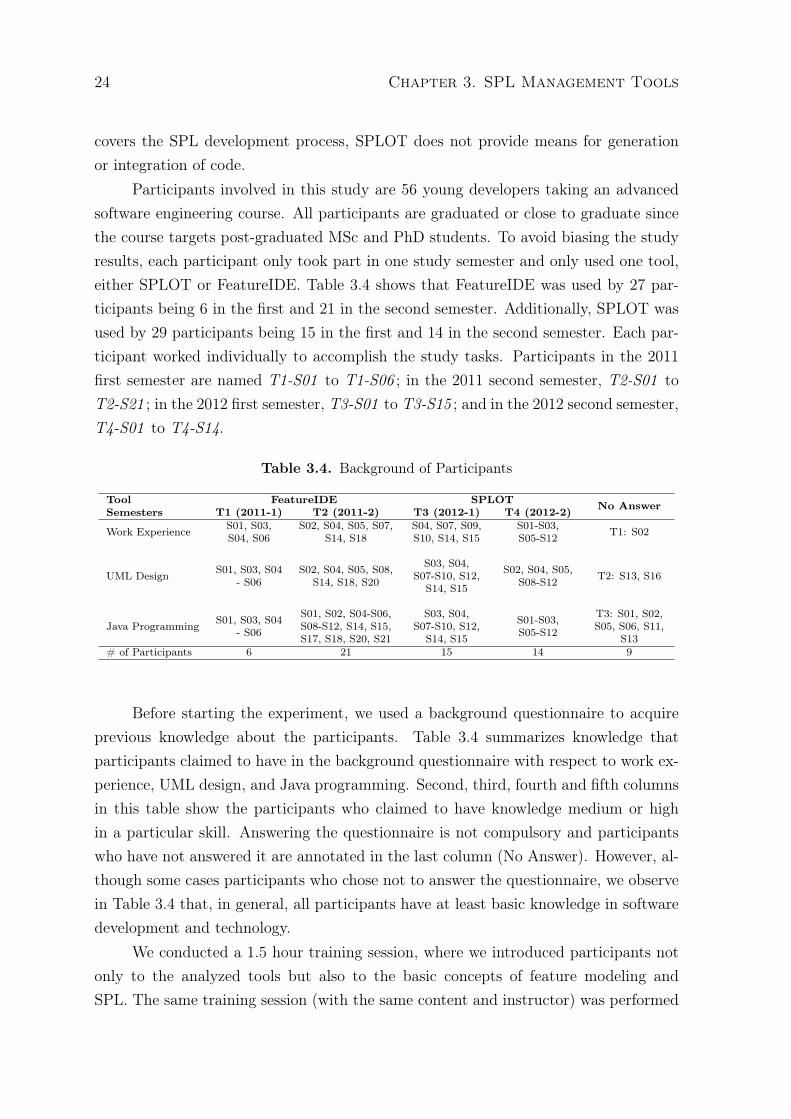
Participants involved in this study are 56 young developers taking an advancedsoftware engineering course. All participants are graduated or close to graduate sincethe course targets post-graduated MSc and PhD students. To avoid biasing the studyresults, each participant only took part in one study semester and only used one tool,either SPLOT or FeatureIDE. Table 3.4 shows that FeatureIDE was used by 27 par-ticipants being 6 in the first and 21 in the second semester. Additionally, SPLOT wasused by 29 participants being 15 in the first and 14 in the second semester. Each par-ticipant worked individually to accomplish the study tasks. Participants in the 2011first semester are named T1-S01 to T1-S06 ; in the 2011 second semester, T2-S01 toT2-S21 ; in the 2012 first semester, T3-S01 to T3-S15 ; and in the 2012 second semester,T4-S01 to T4-S14.
Table 3.4. Background of Participants
Tool FeatureIDE SPLOT No AnswerSemesters T1 (2011-1) T2 (2011-2) T3 (2012-1) T4 (2012-2)
Work Experience S01, S03,S04, S06
S02, S04, S05, S07,S14, S18
S04, S07, S09,S10, S14, S15
S01-S03,S05-S12 T1: S02
UML Design S01, S03, S04- S06
S02, S04, S05, S08,S14, S18, S20
S03, S04,S07-S10, S12,
S14, S15
S02, S04, S05,S08-S12 T2: S13, S16
Java Programming S01, S03, S04- S06
S01, S02, S04-S06,S08-S12, S14, S15,S17, S18, S20, S21
S03, S04,S07-S10, S12,
S14, S15
S01-S03,S05-S12
T3: S01, S02,S05, S06, S11,
S13# of Participants 6 21 15 14 9
Before starting the experiment, we used a background questionnaire to acquireprevious knowledge about the participants. Table 3.4 summarizes knowledge thatparticipants claimed to have in the background questionnaire with respect to work ex-perience, UML design, and Java programming. Second, third, fourth and fifth columnsin this table show the participants who claimed to have knowledge medium or highin a particular skill. Answering the questionnaire is not compulsory and participantswho have not answered it are annotated in the last column (No Answer). However, al-though some cases participants who chose not to answer the questionnaire, we observein Table 3.4 that, in general, all participants have at least basic knowledge in softwaredevelopment and technology.
We conducted a 1.5 hour training session, where we introduced participants notonly to the analyzed tools but also to the basic concepts of feature modeling andSPL. The same training session (with the same content and instructor) was performed
3.2. Comparative Study 25
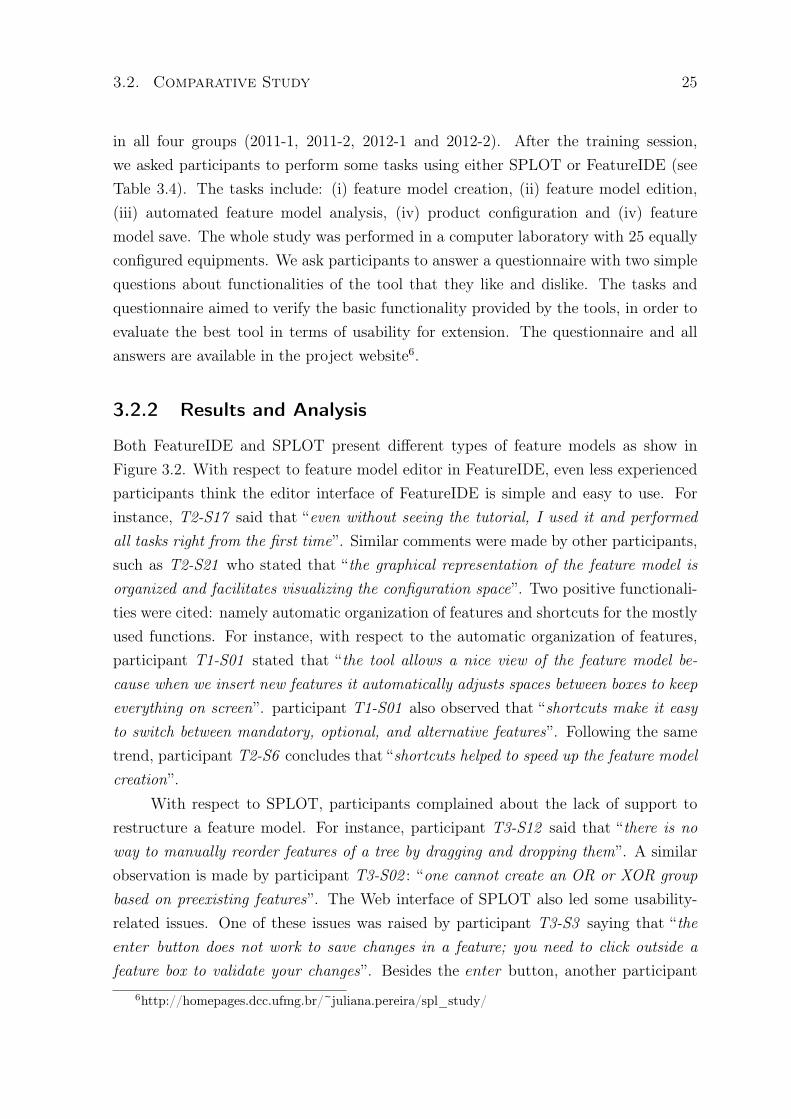
in all four groups (2011-1, 2011-2, 2012-1 and 2012-2). After the training session,we asked participants to perform some tasks using either SPLOT or FeatureIDE (seeTable 3.4). The tasks include: (i) feature model creation, (ii) feature model edition,(iii) automated feature model analysis, (iv) product configuration and (iv) featuremodel save. The whole study was performed in a computer laboratory with 25 equallyconfigured equipments. We ask participants to answer a questionnaire with two simplequestions about functionalities of the tool that they like and dislike. The tasks andquestionnaire aimed to verify the basic functionality provided by the tools, in order toevaluate the best tool in terms of usability for extension. The questionnaire and allanswers are available in the project website6.
3.2.2 Results and Analysis
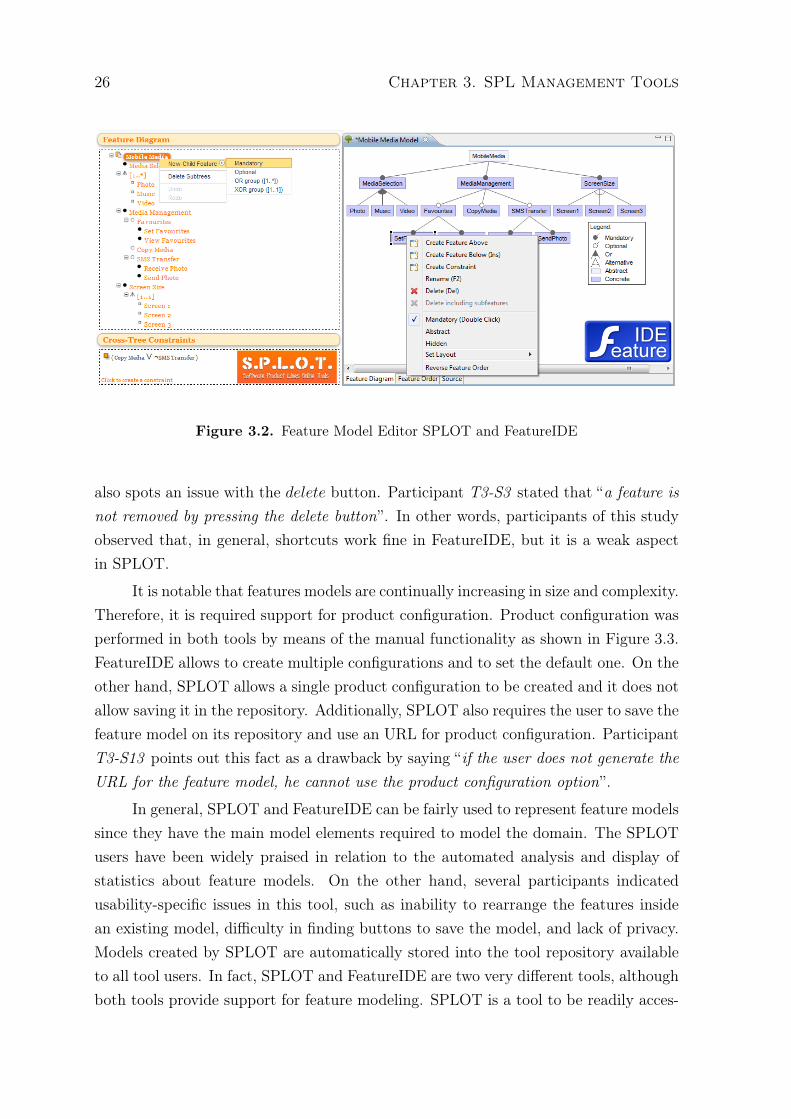
Both FeatureIDE and SPLOT present different types of feature models as show inFigure 3.2. With respect to feature model editor in FeatureIDE, even less experiencedparticipants think the editor interface of FeatureIDE is simple and easy to use. Forinstance, T2-S17 said that “even without seeing the tutorial, I used it and performedall tasks right from the first time”. Similar comments were made by other participants,such as T2-S21 who stated that “the graphical representation of the feature model isorganized and facilitates visualizing the configuration space”. Two positive functionali-ties were cited: namely automatic organization of features and shortcuts for the mostlyused functions. For instance, with respect to the automatic organization of features,participant T1-S01 stated that “the tool allows a nice view of the feature model be-cause when we insert new features it automatically adjusts spaces between boxes to keepeverything on screen”. participant T1-S01 also observed that “shortcuts make it easyto switch between mandatory, optional, and alternative features”. Following the sametrend, participant T2-S6 concludes that “shortcuts helped to speed up the feature modelcreation”.
With respect to SPLOT, participants complained about the lack of support torestructure a feature model. For instance, participant T3-S12 said that “there is noway to manually reorder features of a tree by dragging and dropping them”. A similarobservation is made by participant T3-S02 : “one cannot create an OR or XOR groupbased on preexisting features”. The Web interface of SPLOT also led some usability-related issues. One of these issues was raised by participant T3-S3 saying that “theenter button does not work to save changes in a feature; you need to click outside afeature box to validate your changes”. Besides the enter button, another participant
6http://homepages.dcc.ufmg.br/~juliana.pereira/spl_study/
26 Chapter 3. SPL Management Tools
Figure 3.2. Feature Model Editor SPLOT and FeatureIDE
also spots an issue with the delete button. Participant T3-S3 stated that “a feature isnot removed by pressing the delete button”. In other words, participants of this studyobserved that, in general, shortcuts work fine in FeatureIDE, but it is a weak aspectin SPLOT.
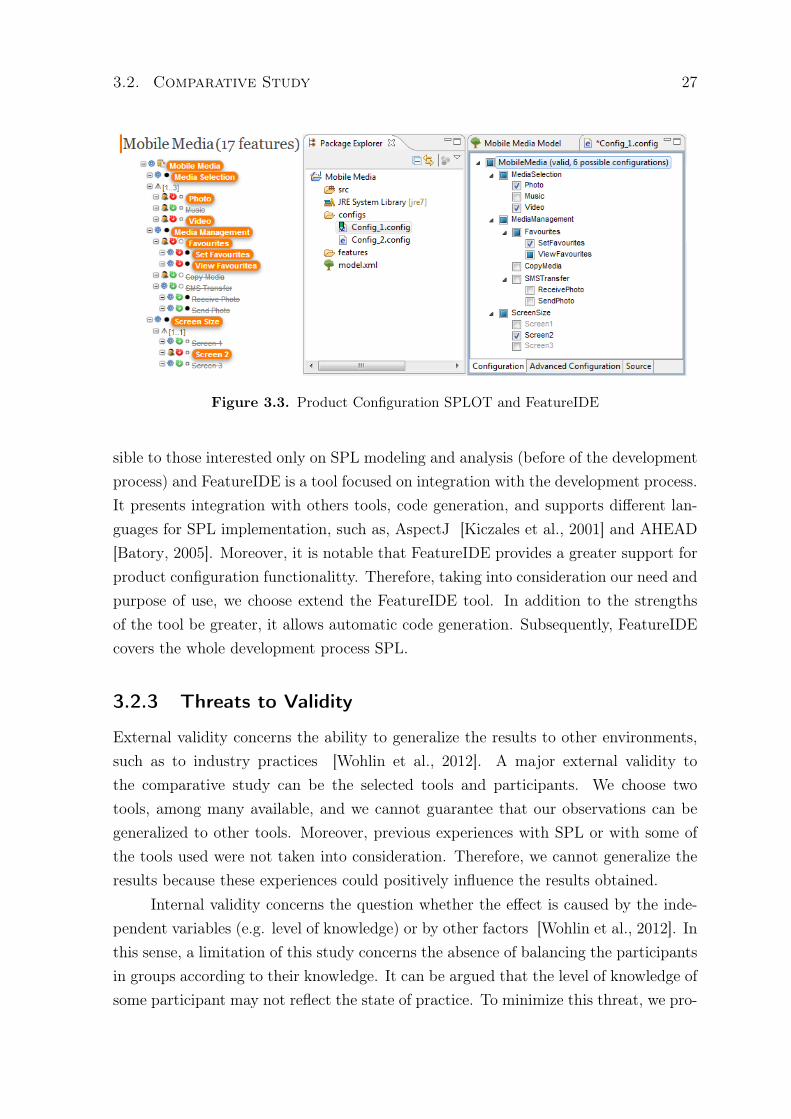
It is notable that features models are continually increasing in size and complexity.Therefore, it is required support for product configuration. Product configuration wasperformed in both tools by means of the manual functionality as shown in Figure 3.3.FeatureIDE allows to create multiple configurations and to set the default one. On theother hand, SPLOT allows a single product configuration to be created and it does notallow saving it in the repository. Additionally, SPLOT also requires the user to save thefeature model on its repository and use an URL for product configuration. ParticipantT3-S13 points out this fact as a drawback by saying “if the user does not generate theURL for the feature model, he cannot use the product configuration option”.
In general, SPLOT and FeatureIDE can be fairly used to represent feature modelssince they have the main model elements required to model the domain. The SPLOTusers have been widely praised in relation to the automated analysis and display ofstatistics about feature models. On the other hand, several participants indicatedusability-specific issues in this tool, such as inability to rearrange the features insidean existing model, difficulty in finding buttons to save the model, and lack of privacy.Models created by SPLOT are automatically stored into the tool repository availableto all tool users. In fact, SPLOT and FeatureIDE are two very different tools, althoughboth tools provide support for feature modeling. SPLOT is a tool to be readily acces-
3.2. Comparative Study 27
Figure 3.3. Product Configuration SPLOT and FeatureIDE
sible to those interested only on SPL modeling and analysis (before of the developmentprocess) and FeatureIDE is a tool focused on integration with the development process.It presents integration with others tools, code generation, and supports different lan-guages for SPL implementation, such as, AspectJ [Kiczales et al., 2001] and AHEAD[Batory, 2005]. Moreover, it is notable that FeatureIDE provides a greater support forproduct configuration functionalitty. Therefore, taking into consideration our need andpurpose of use, we choose extend the FeatureIDE tool. In addition to the strengthsof the tool be greater, it allows automatic code generation. Subsequently, FeatureIDEcovers the whole development process SPL.
3.2.3 Threats to Validity
External validity concerns the ability to generalize the results to other environments,such as to industry practices [Wohlin et al., 2012]. A major external validity tothe comparative study can be the selected tools and participants. We choose twotools, among many available, and we cannot guarantee that our observations can begeneralized to other tools. Moreover, previous experiences with SPL or with some ofthe tools used were not taken into consideration. Therefore, we cannot generalize theresults because these experiences could positively influence the results obtained.
Internal validity concerns the question whether the effect is caused by the inde-pendent variables (e.g. level of knowledge) or by other factors [Wohlin et al., 2012]. Inthis sense, a limitation of this study concerns the absence of balancing the participantsin groups according to their knowledge. It can be argued that the level of knowledge ofsome participant may not reflect the state of practice. To minimize this threat, we pro-
28 Chapter 3. SPL Management Tools
vide 1.5 hour training session to introduce participants to the basic required knowledgeand a questionnaire for helping the better characterize the sample as a whole. Addi-tionally, 1.5 hour training session may not have been enough for subjects that beginwithout much knowledge and being exposed for the first time to these tools. However,Basili et al. [1999] and Kitchenham et al. [2002] argue that even less experienced par-ticipants can help researchers to obtain preliminary, but still important evidence thatshould be further investigated in later controlled experiments.
The construct and conclusion threats may have occurred in the formulation of thequestionnaire or during the interpretation of the results by the researchers since ourstudy is mainly qualitative. Due to this qualitative nature, data are not suitable forquantitative analysis and statistical tests. As far as we are concerned, this is the firstexperiment conducted to analyze and compare these tools. To minimize this threat,we cross-discuss all the experimental procedures. Basili et al. [1999] and Kitchenhamet al. [2002] argue that qualitative studies play an important role in experimentationin software engineering.
3.3 Tool Support
Based on the results of our experiments, we decided to implement a tool, calledSPLConfig, to support automatic product configuration. The main goal of the SPLCon-fig tool is to derive an optimized feature selection that satisfies an arbitrary set ofrequirements. The primary contribution of this tool is to assist industries during prod-uct configuration, answering the following question: What is the set of features thatbalances cost and customer satisfaction, based on available budget? By resolving thisproblem, industries can more effectively achieve greater customer satisfaction. Sec-tion 3.3.1 presents the SPLConfig architecture and Section 3.3.2 discusses its designand implementation.
3.3.1 SPLConfig Architecture
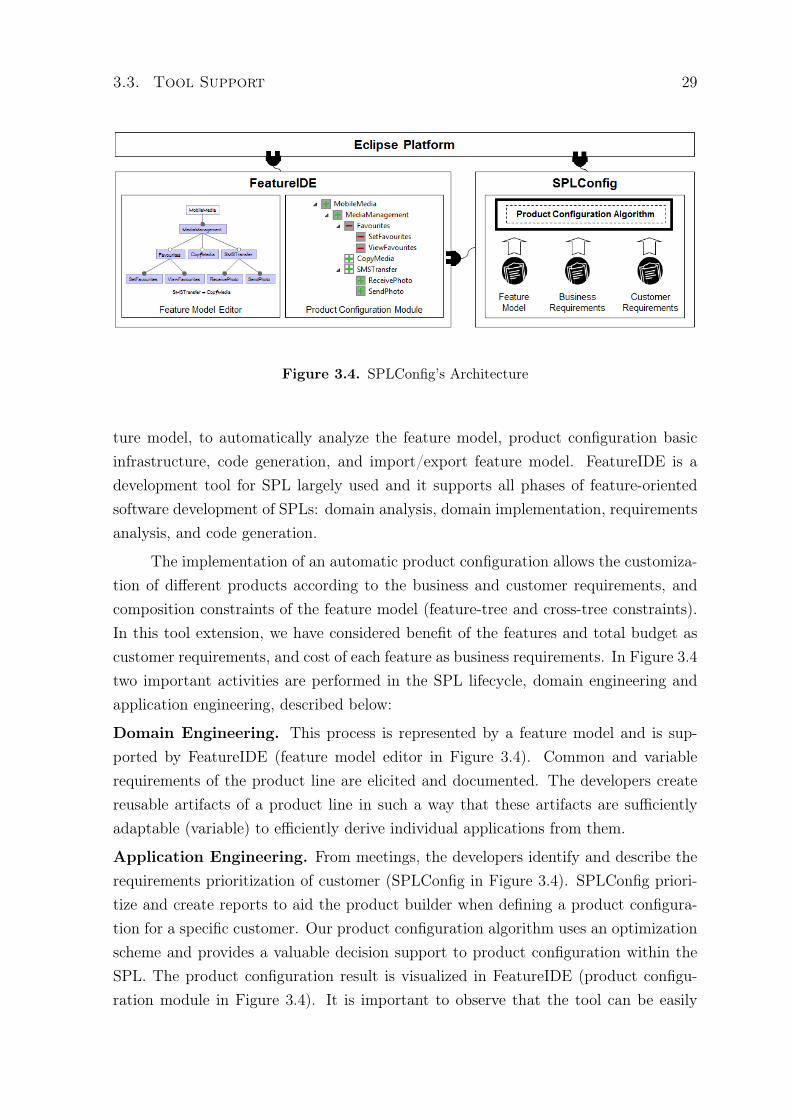
SPLConfig is an Eclipse plugin implemented in Java. It requires one additional plugin,named FeatureIDE, in order to support product configuration. Figure 3.4 presentsthe architecture of SPLConfig and its relationships with FeatureIDE and Eclipse plat-form. The decision of extending FeatureIDE is particularly attractive for two reasons.First, FeatureIDE is open source, extensible, modular, and easy to understand its code.Second, our motivation in extending FeatureIDE occurred because we could reuse thekey functionality of typical feature modeling tools, such as to create and edit a fea-
3.3. Tool Support 29
Figure 3.4. SPLConfig’s Architecture
ture model, to automatically analyze the feature model, product configuration basicinfrastructure, code generation, and import/export feature model. FeatureIDE is adevelopment tool for SPL largely used and it supports all phases of feature-orientedsoftware development of SPLs: domain analysis, domain implementation, requirementsanalysis, and code generation.
The implementation of an automatic product configuration allows the customiza-tion of different products according to the business and customer requirements, andcomposition constraints of the feature model (feature-tree and cross-tree constraints).In this tool extension, we have considered benefit of the features and total budget ascustomer requirements, and cost of each feature as business requirements. In Figure 3.4two important activities are performed in the SPL lifecycle, domain engineering andapplication engineering, described below:
Domain Engineering. This process is represented by a feature model and is sup-ported by FeatureIDE (feature model editor in Figure 3.4). Common and variablerequirements of the product line are elicited and documented. The developers createreusable artifacts of a product line in such a way that these artifacts are sufficientlyadaptable (variable) to efficiently derive individual applications from them.
Application Engineering. From meetings, the developers identify and describe therequirements prioritization of customer (SPLConfig in Figure 3.4). SPLConfig priori-tize and create reports to aid the product builder when defining a product configura-tion for a specific customer. Our product configuration algorithm uses an optimizationscheme and provides a valuable decision support to product configuration within theSPL. The product configuration result is visualized in FeatureIDE (product configu-ration module in Figure 3.4). It is important to observe that the tool can be easily
30 Chapter 3. SPL Management Tools
extended - by means of new algorithms - to support additional non-functional features.Chapter 4 presents algorithms implemented to optimization of the product configura-tion.
As show in Figure 3.4 an early stage, feature modeling enables SPL scoping, i.e.,deciding which features should be supported by an SPL and which should not. Thisresult is a feature model represented in FeatureIDE. In a second stage, during the prod-uct configuration, it is necessary to choose the features that appropriately fulfill thebusiness and customer requirements. The variables features are defined as the set offeatures that can implement the customer requirement. This stage allows a single prod-uct configuration to be created through search-based algorithms in SPLConfig. Thisproduct configuration is presented by FeatureIDE in the product configuration module.In a third stage, SPLConfig allows manual configuration of features if necessary. In afourth stage, it also allows compiling and building the product.
3.3.2 Design and Implementation Decisions
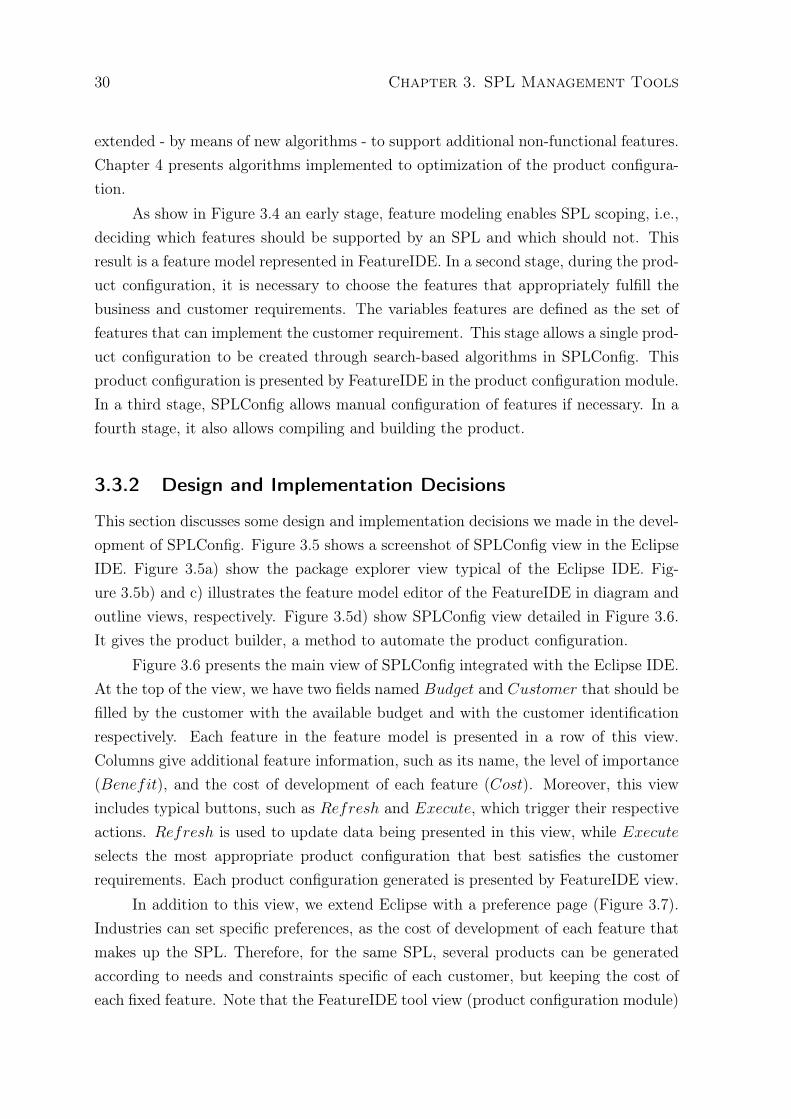
This section discusses some design and implementation decisions we made in the devel-opment of SPLConfig. Figure 3.5 shows a screenshot of SPLConfig view in the EclipseIDE. Figure 3.5a) show the package explorer view typical of the Eclipse IDE. Fig-ure 3.5b) and c) illustrates the feature model editor of the FeatureIDE in diagram andoutline views, respectively. Figure 3.5d) show SPLConfig view detailed in Figure 3.6.It gives the product builder, a method to automate the product configuration.
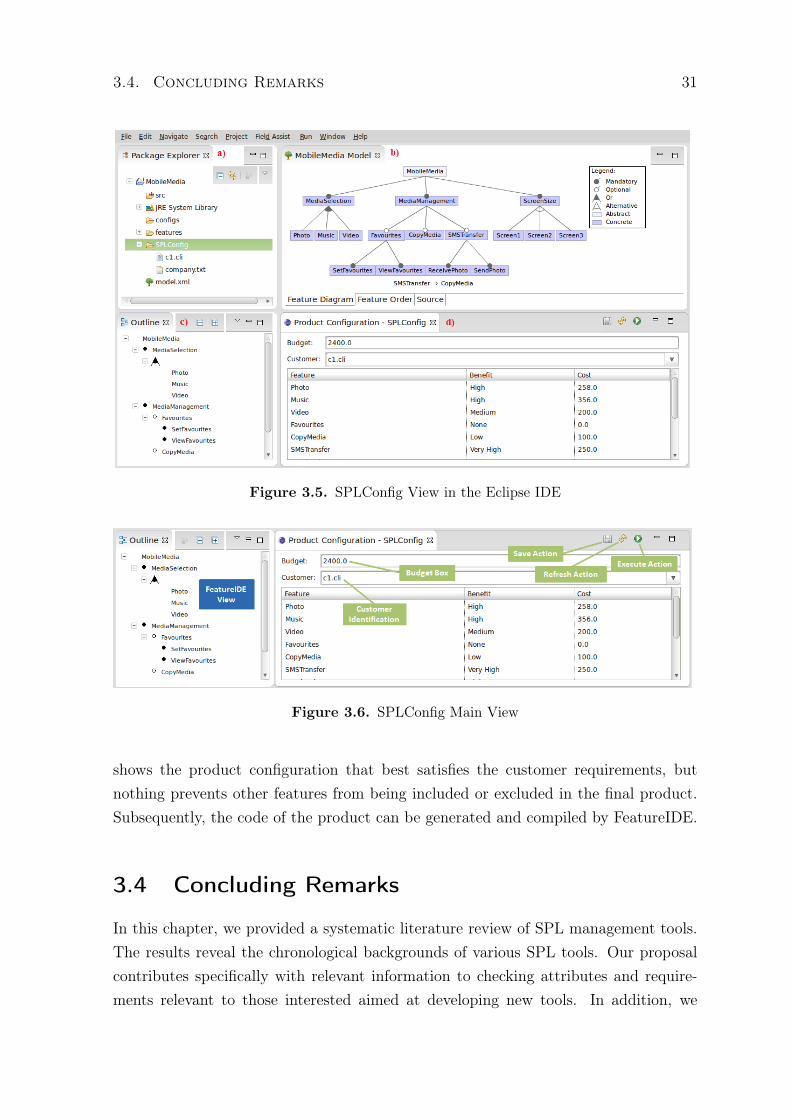
Figure 3.6 presents the main view of SPLConfig integrated with the Eclipse IDE.At the top of the view, we have two fields named Budget and Customer that should befilled by the customer with the available budget and with the customer identificationrespectively. Each feature in the feature model is presented in a row of this view.Columns give additional feature information, such as its name, the level of importance(Benefit), and the cost of development of each feature (Cost). Moreover, this viewincludes typical buttons, such as Refresh and Execute, which trigger their respectiveactions. Refresh is used to update data being presented in this view, while Executeselects the most appropriate product configuration that best satisfies the customerrequirements. Each product configuration generated is presented by FeatureIDE view.
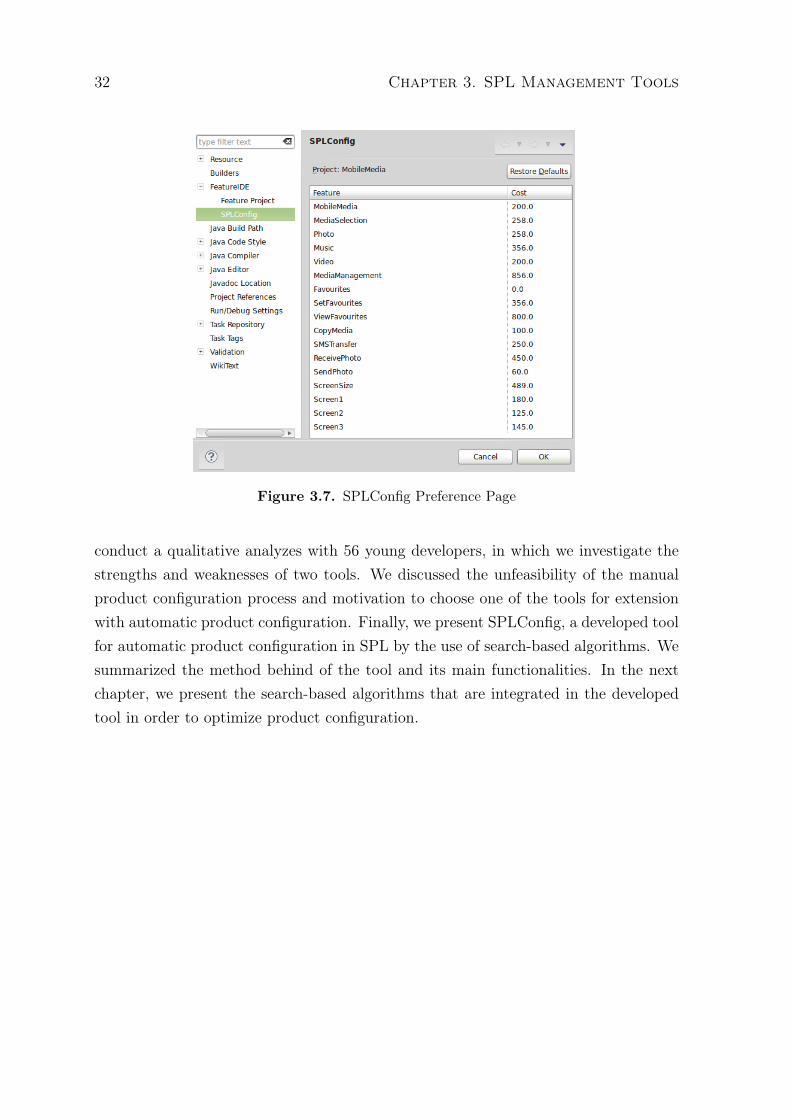
In addition to this view, we extend Eclipse with a preference page (Figure 3.7).Industries can set specific preferences, as the cost of development of each feature thatmakes up the SPL. Therefore, for the same SPL, several products can be generatedaccording to needs and constraints specific of each customer, but keeping the cost ofeach fixed feature. Note that the FeatureIDE tool view (product configuration module)
3.4. Concluding Remarks 31
Figure 3.5. SPLConfig View in the Eclipse IDE
Figure 3.6. SPLConfig Main View
shows the product configuration that best satisfies the customer requirements, butnothing prevents other features from being included or excluded in the final product.Subsequently, the code of the product can be generated and compiled by FeatureIDE.
3.4 Concluding Remarks
In this chapter, we provided a systematic literature review of SPL management tools.The results reveal the chronological backgrounds of various SPL tools. Our proposalcontributes specifically with relevant information to checking attributes and require-ments relevant to those interested aimed at developing new tools. In addition, we
32 Chapter 3. SPL Management Tools
Figure 3.7. SPLConfig Preference Page
conduct a qualitative analyzes with 56 young developers, in which we investigate thestrengths and weaknesses of two tools. We discussed the unfeasibility of the manualproduct configuration process and motivation to choose one of the tools for extensionwith automatic product configuration. Finally, we present SPLConfig, a developed toolfor automatic product configuration in SPL by the use of search-based algorithms. Wesummarized the method behind of the tool and its main functionalities. In the nextchapter, we present the search-based algorithms that are integrated in the developedtool in order to optimize product configuration.

Chapter 4
Search-Based Algorithms forProduct Configuration
This chapter presents search-based algorithms for optimizing product configuration inSPLs. In Section 4.1, SPL product configuration is modeled as an optimization prob-lem. This problem aims at maximizing the customer satisfaction, subject to businessand customer requirements. It is NP-hard as it contains a SAT [Cormen et al., 2009] aswell as a Knapsack [Gallo and Simeone, 1989] sub-problem, both well-known NP-hardproblems. A preprocessing algorithm to reduce the size of the feature model is proposedin Section 4.2. Then, an exact backtracking algorithm is proposed in Section 4.3. Asthe worst case complexity of the latter grows exponentially with the number of features,a greedy heuristic algorithm is proposed in Section 4.4.
4.1 Problem Definition
SPL systems need to generate and evaluate different product configurations that satisfya set of business and customer requirements, in order to assist the user to find theproduct configuration that best attends their needs to. Explicitly generate all validproduct configurations and evaluate all of them may be impractical as the number ofconfigurations grows exponentially with the number of features. The problem of SPLproduct configuration (SPL-PC) proposed here is described as follows. The decision ifa feature is selected or not is modeled by variable xi ∈ {0, 1} such that
xi =
{1 if feature i is selected0 otherwise
33

34 Chapter 4. Search-Based Algorithms for Product Configuration
The constants defined by the model are the following:
• T = (V,A) is a rooted tree where V is a set of nodes, which represent features,and A is a set of arcs such that (i, j) ∈ A denotes that j can only be selected if iis also selected. T is referred as the feature tree and j is said a sub-feature of i.
• M ⊆ V is the set of mandatory features, such that the root node r ∈M .
• O ⊂ V is the set of optional features, such that O ∪M = V and O ∩M = ∅.
• XORi ⊂ 2V is the set of all exclusive alternatives rooted in i ∈ V , such that ifQ ∈ XORi then (i, s) ∈ A, for all s ∈ Q. Moreover, if R ∈ (XORi or ORi) thens /∈ R. XORi = ∅ if there is no exclusive alternative rooted on i.
• ORi ⊂ 2V is the set of all non-exclusive alternatives rooted in i ∈ V , such thatif Q ∈ ORi then (i, s) ∈ A, for all s ∈ Q. Moreover, if R ∈ (XORi or ORi) thens /∈ R. ORi = ∅ if there is no non-exclusive alternative rooted on i.
• ci ∈ R is the cost of the feature i ∈ V .
• D ∈ R is the available customer budget.
• bi ∈ N is the level of importance of the feature i ∈ V , with bi = 0 for all i ∈ M ,and bj ≤ bi, for all (i, j) ∈ A.
• E = (E1(x), E2(x), ...) is the set of cross-tree constraints, where Ej(x) is a logi-cal expression over the variables x. It admits conjunction (∧), disjunction (∨),negation (¬), implication (→), and biconditional (↔) operations. For example,E1(x) = (x1 ∧ x2) ∨ x3 → x4 implies that if Feature 1 and Feature 2 are si-multaneously selected or if Feature 3 is selected, them Feature 4 must also beselect.
Given the variables and constants described above, SPL-PC is defined as follows:
Maximize
F (x) =∑i∈V
bixi (1)
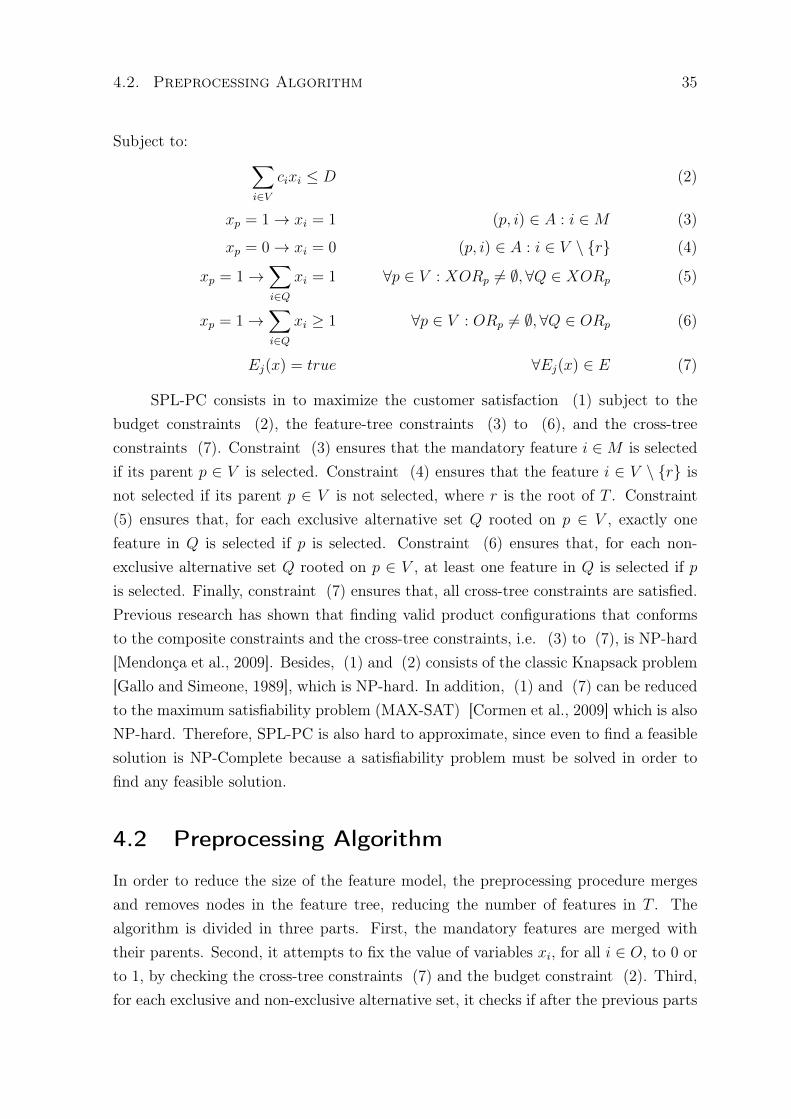
4.2. Preprocessing Algorithm 35
Subject to: ∑i∈V
cixi ≤ D (2)
xp = 1→ xi = 1 (p, i) ∈ A : i ∈M (3)
xp = 0→ xi = 0 (p, i) ∈ A : i ∈ V \ {r} (4)
xp = 1→∑i∈Q
xi = 1 ∀p ∈ V : XORp 6= ∅,∀Q ∈ XORp (5)
xp = 1→∑i∈Q
xi ≥ 1 ∀p ∈ V : ORp 6= ∅,∀Q ∈ ORp (6)
Ej(x) = true ∀Ej(x) ∈ E (7)
SPL-PC consists in to maximize the customer satisfaction (1) subject to thebudget constraints (2), the feature-tree constraints (3) to (6), and the cross-treeconstraints (7). Constraint (3) ensures that the mandatory feature i ∈M is selectedif its parent p ∈ V is selected. Constraint (4) ensures that the feature i ∈ V \ {r} isnot selected if its parent p ∈ V is not selected, where r is the root of T . Constraint(5) ensures that, for each exclusive alternative set Q rooted on p ∈ V , exactly onefeature in Q is selected if p is selected. Constraint (6) ensures that, for each non-exclusive alternative set Q rooted on p ∈ V , at least one feature in Q is selected if pis selected. Finally, constraint (7) ensures that, all cross-tree constraints are satisfied.Previous research has shown that finding valid product configurations that conformsto the composite constraints and the cross-tree constraints, i.e. (3) to (7), is NP-hard[Mendonça et al., 2009]. Besides, (1) and (2) consists of the classic Knapsack problem[Gallo and Simeone, 1989], which is NP-hard. In addition, (1) and (7) can be reducedto the maximum satisfiability problem (MAX-SAT) [Cormen et al., 2009] which is alsoNP-hard. Therefore, SPL-PC is also hard to approximate, since even to find a feasiblesolution is NP-Complete because a satisfiability problem must be solved in order tofind any feasible solution.
4.2 Preprocessing Algorithm
In order to reduce the size of the feature model, the preprocessing procedure mergesand removes nodes in the feature tree, reducing the number of features in T . Thealgorithm is divided in three parts. First, the mandatory features are merged withtheir parents. Second, it attempts to fix the value of variables xi, for all i ∈ O, to 0 orto 1, by checking the cross-tree constraints (7) and the budget constraint (2). Third,for each exclusive and non-exclusive alternative set, it checks if after the previous parts
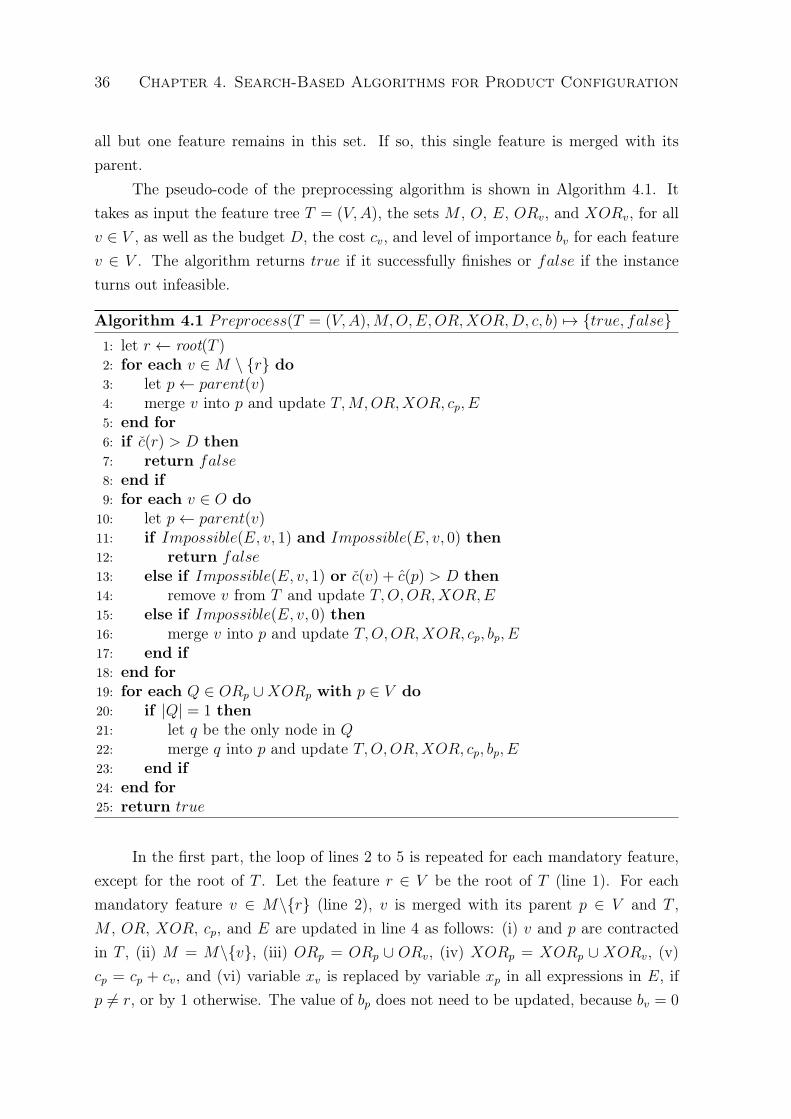
36 Chapter 4. Search-Based Algorithms for Product Configuration
all but one feature remains in this set. If so, this single feature is merged with itsparent.
The pseudo-code of the preprocessing algorithm is shown in Algorithm 4.1. Ittakes as input the feature tree T = (V,A), the sets M , O, E, ORv, and XORv, for allv ∈ V , as well as the budget D, the cost cv, and level of importance bv for each featurev ∈ V . The algorithm returns true if it successfully finishes or false if the instanceturns out infeasible.
Algorithm 4.1 Preprocess(T = (V,A),M,O,E,OR,XOR,D, c, b) 7→ {true, false}1: let r ← root(T )2: for each v ∈M \ {r} do3: let p← parent(v)4: merge v into p and update T,M,OR,XOR, cp, E5: end for6: if c(r) > D then7: return false8: end if9: for each v ∈ O do
10: let p← parent(v)11: if Impossible(E, v, 1) and Impossible(E, v, 0) then12: return false13: else if Impossible(E, v, 1) or c(v) + c(p) > D then14: remove v from T and update T,O,OR,XOR,E15: else if Impossible(E, v, 0) then16: merge v into p and update T,O,OR,XOR, cp, bp, E17: end if18: end for19: for each Q ∈ ORp ∪XORp with p ∈ V do20: if |Q| = 1 then21: let q be the only node in Q22: merge q into p and update T,O,OR,XOR, cp, bp, E23: end if24: end for25: return true
In the first part, the loop of lines 2 to 5 is repeated for each mandatory feature,except for the root of T . Let the feature r ∈ V be the root of T (line 1). For eachmandatory feature v ∈ M\{r} (line 2), v is merged with its parent p ∈ V and T ,M , OR, XOR, cp, and E are updated in line 4 as follows: (i) v and p are contractedin T , (ii) M = M\{v}, (iii) ORp = ORp ∪ ORv, (iv) XORp = XORp ∪ XORv, (v)cp = cp + cv, and (vi) variable xv is replaced by variable xp in all expressions in E, ifp 6= r, or by 1 otherwise. The value of bp does not need to be updated, because bv = 0
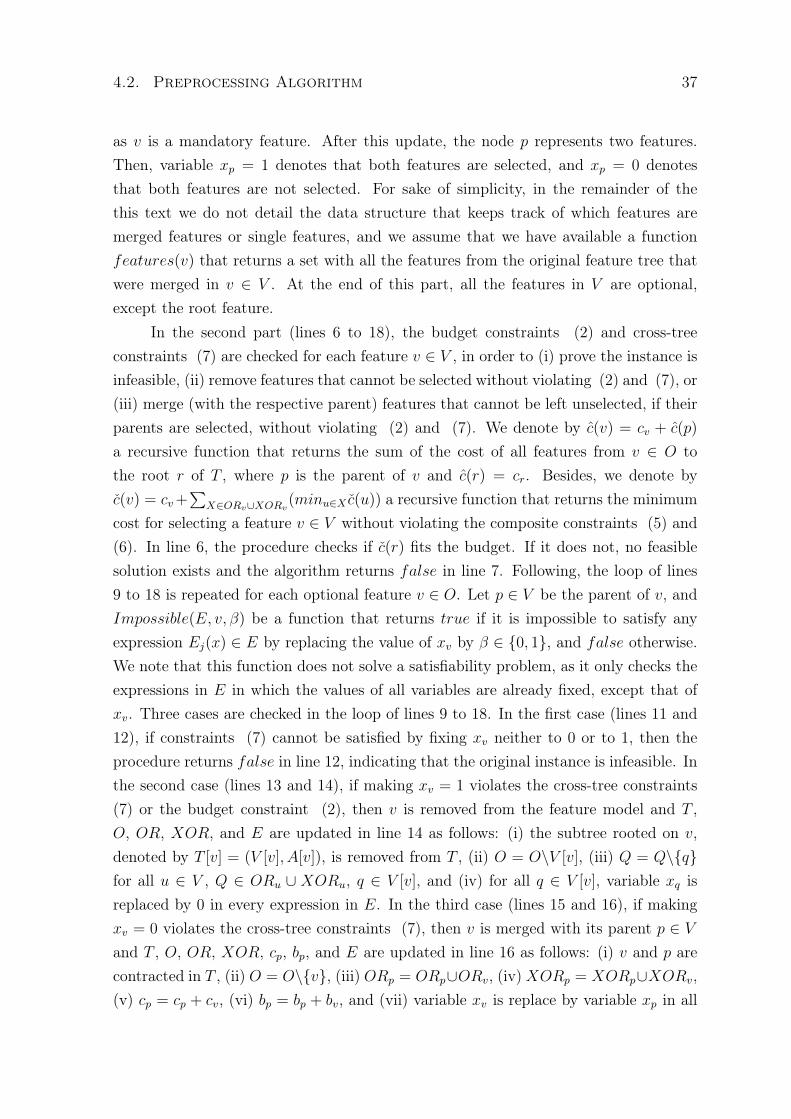
4.2. Preprocessing Algorithm 37
as v is a mandatory feature. After this update, the node p represents two features.Then, variable xp = 1 denotes that both features are selected, and xp = 0 denotesthat both features are not selected. For sake of simplicity, in the remainder of thethis text we do not detail the data structure that keeps track of which features aremerged features or single features, and we assume that we have available a functionfeatures(v) that returns a set with all the features from the original feature tree thatwere merged in v ∈ V . At the end of this part, all the features in V are optional,except the root feature.
In the second part (lines 6 to 18), the budget constraints (2) and cross-treeconstraints (7) are checked for each feature v ∈ V , in order to (i) prove the instance isinfeasible, (ii) remove features that cannot be selected without violating (2) and (7), or(iii) merge (with the respective parent) features that cannot be left unselected, if theirparents are selected, without violating (2) and (7). We denote by c(v) = cv + c(p)
a recursive function that returns the sum of the cost of all features from v ∈ O tothe root r of T , where p is the parent of v and c(r) = cr. Besides, we denote byc(v) = cv+
∑X∈ORv∪XORv
(minu∈X c(u)) a recursive function that returns the minimumcost for selecting a feature v ∈ V without violating the composite constraints (5) and(6). In line 6, the procedure checks if c(r) fits the budget. If it does not, no feasiblesolution exists and the algorithm returns false in line 7. Following, the loop of lines9 to 18 is repeated for each optional feature v ∈ O. Let p ∈ V be the parent of v, andImpossible(E, v, β) be a function that returns true if it is impossible to satisfy anyexpression Ej(x) ∈ E by replacing the value of xv by β ∈ {0, 1}, and false otherwise.We note that this function does not solve a satisfiability problem, as it only checks theexpressions in E in which the values of all variables are already fixed, except that ofxv. Three cases are checked in the loop of lines 9 to 18. In the first case (lines 11 and12), if constraints (7) cannot be satisfied by fixing xv neither to 0 or to 1, then theprocedure returns false in line 12, indicating that the original instance is infeasible. Inthe second case (lines 13 and 14), if making xv = 1 violates the cross-tree constraints(7) or the budget constraint (2), then v is removed from the feature model and T ,O, OR, XOR, and E are updated in line 14 as follows: (i) the subtree rooted on v,denoted by T [v] = (V [v], A[v]), is removed from T , (ii) O = O\V [v], (iii) Q = Q\{q}for all u ∈ V , Q ∈ ORu ∪ XORu, q ∈ V [v], and (iv) for all q ∈ V [v], variable xq isreplaced by 0 in every expression in E. In the third case (lines 15 and 16), if makingxv = 0 violates the cross-tree constraints (7), then v is merged with its parent p ∈ Vand T , O, OR, XOR, cp, bp, and E are updated in line 16 as follows: (i) v and p arecontracted in T , (ii) O = O\{v}, (iii) ORp = ORp∪ORv, (iv)XORp = XORp∪XORv,(v) cp = cp + cv, (vi) bp = bp + bv, and (vii) variable xv is replace by variable xp in all
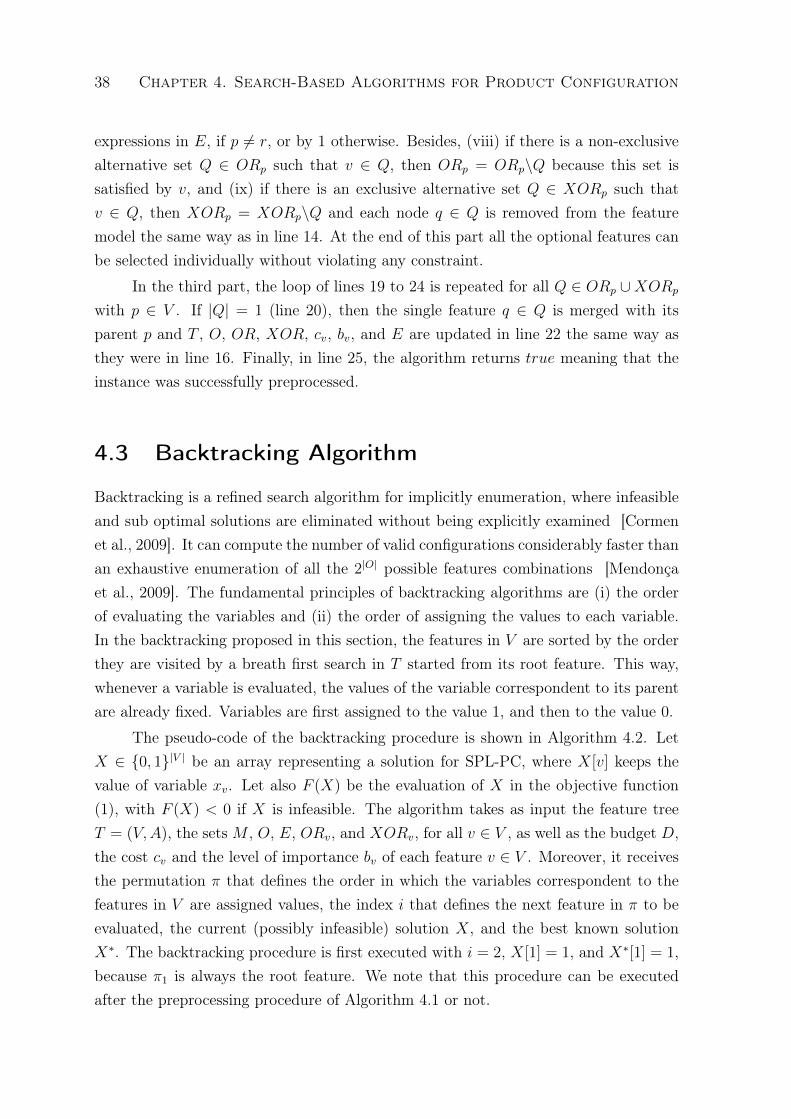
38 Chapter 4. Search-Based Algorithms for Product Configuration
expressions in E, if p 6= r, or by 1 otherwise. Besides, (viii) if there is a non-exclusivealternative set Q ∈ ORp such that v ∈ Q, then ORp = ORp\Q because this set issatisfied by v, and (ix) if there is an exclusive alternative set Q ∈ XORp such thatv ∈ Q, then XORp = XORp\Q and each node q ∈ Q is removed from the featuremodel the same way as in line 14. At the end of this part all the optional features canbe selected individually without violating any constraint.
In the third part, the loop of lines 19 to 24 is repeated for all Q ∈ ORp ∪XORp
with p ∈ V . If |Q| = 1 (line 20), then the single feature q ∈ Q is merged with itsparent p and T , O, OR, XOR, cv, bv, and E are updated in line 22 the same way asthey were in line 16. Finally, in line 25, the algorithm returns true meaning that theinstance was successfully preprocessed.
4.3 Backtracking Algorithm
Backtracking is a refined search algorithm for implicitly enumeration, where infeasibleand sub optimal solutions are eliminated without being explicitly examined [Cormenet al., 2009]. It can compute the number of valid configurations considerably faster thanan exhaustive enumeration of all the 2|O| possible features combinations [Mendonçaet al., 2009]. The fundamental principles of backtracking algorithms are (i) the orderof evaluating the variables and (ii) the order of assigning the values to each variable.In the backtracking proposed in this section, the features in V are sorted by the orderthey are visited by a breath first search in T started from its root feature. This way,whenever a variable is evaluated, the values of the variable correspondent to its parentare already fixed. Variables are first assigned to the value 1, and then to the value 0.
The pseudo-code of the backtracking procedure is shown in Algorithm 4.2. LetX ∈ {0, 1}|V | be an array representing a solution for SPL-PC, where X[v] keeps thevalue of variable xv. Let also F (X) be the evaluation of X in the objective function(1), with F (X) < 0 if X is infeasible. The algorithm takes as input the feature treeT = (V,A), the setsM , O, E, ORv, and XORv, for all v ∈ V , as well as the budget D,the cost cv and the level of importance bv of each feature v ∈ V . Moreover, it receivesthe permutation π that defines the order in which the variables correspondent to thefeatures in V are assigned values, the index i that defines the next feature in π to beevaluated, the current (possibly infeasible) solution X, and the best known solutionX∗. The backtracking procedure is first executed with i = 2, X[1] = 1, and X∗[1] = 1,because π1 is always the root feature. We note that this procedure can be executedafter the preprocessing procedure of Algorithm 4.1 or not.
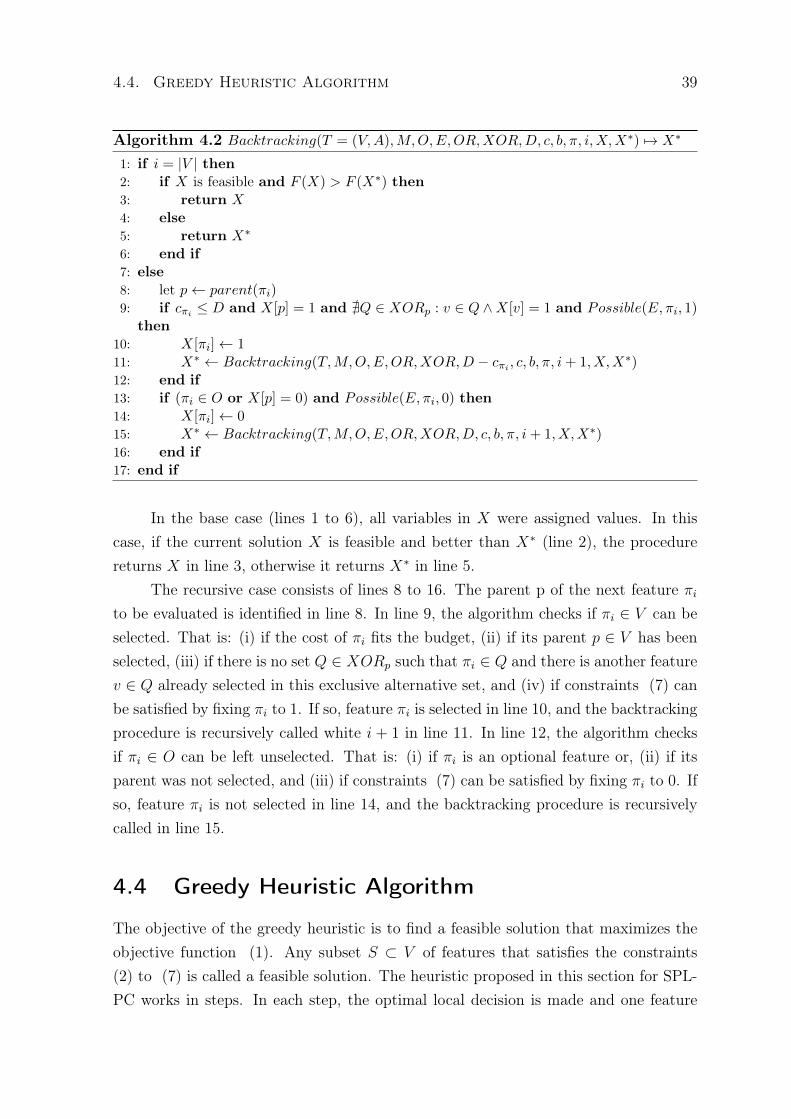
4.4. Greedy Heuristic Algorithm 39
Algorithm 4.2 Backtracking(T = (V,A),M,O,E,OR,XOR,D, c, b, π, i,X,X∗) 7→ X∗
1: if i = |V | then2: if X is feasible and F (X) > F (X∗) then3: return X4: else5: return X∗
6: end if7: else8: let p← parent(πi)9: if cπi ≤ D and X[p] = 1 and @Q ∈ XORp : v ∈ Q ∧X[v] = 1 and Possible(E, πi, 1)
then10: X[πi]← 111: X∗ ← Backtracking(T,M,O,E,OR,XOR,D − cπi , c, b, π, i+ 1, X,X∗)12: end if13: if (πi ∈ O or X[p] = 0) and Possible(E, πi, 0) then14: X[πi]← 015: X∗ ← Backtracking(T,M,O,E,OR,XOR,D, c, b, π, i+ 1, X,X∗)16: end if17: end if
In the base case (lines 1 to 6), all variables in X were assigned values. In thiscase, if the current solution X is feasible and better than X∗ (line 2), the procedurereturns X in line 3, otherwise it returns X∗ in line 5.
The recursive case consists of lines 8 to 16. The parent p of the next feature πito be evaluated is identified in line 8. In line 9, the algorithm checks if πi ∈ V can beselected. That is: (i) if the cost of πi fits the budget, (ii) if its parent p ∈ V has beenselected, (iii) if there is no set Q ∈ XORp such that πi ∈ Q and there is another featurev ∈ Q already selected in this exclusive alternative set, and (iv) if constraints (7) canbe satisfied by fixing πi to 1. If so, feature πi is selected in line 10, and the backtrackingprocedure is recursively called white i + 1 in line 11. In line 12, the algorithm checksif πi ∈ O can be left unselected. That is: (i) if πi is an optional feature or, (ii) if itsparent was not selected, and (iii) if constraints (7) can be satisfied by fixing πi to 0. Ifso, feature πi is not selected in line 14, and the backtracking procedure is recursivelycalled in line 15.
4.4 Greedy Heuristic Algorithm
The objective of the greedy heuristic is to find a feasible solution that maximizes theobjective function (1). Any subset S ⊂ V of features that satisfies the constraints(2) to (7) is called a feasible solution. The heuristic proposed in this section for SPL-PC works in steps. In each step, the optimal local decision is made and one feature
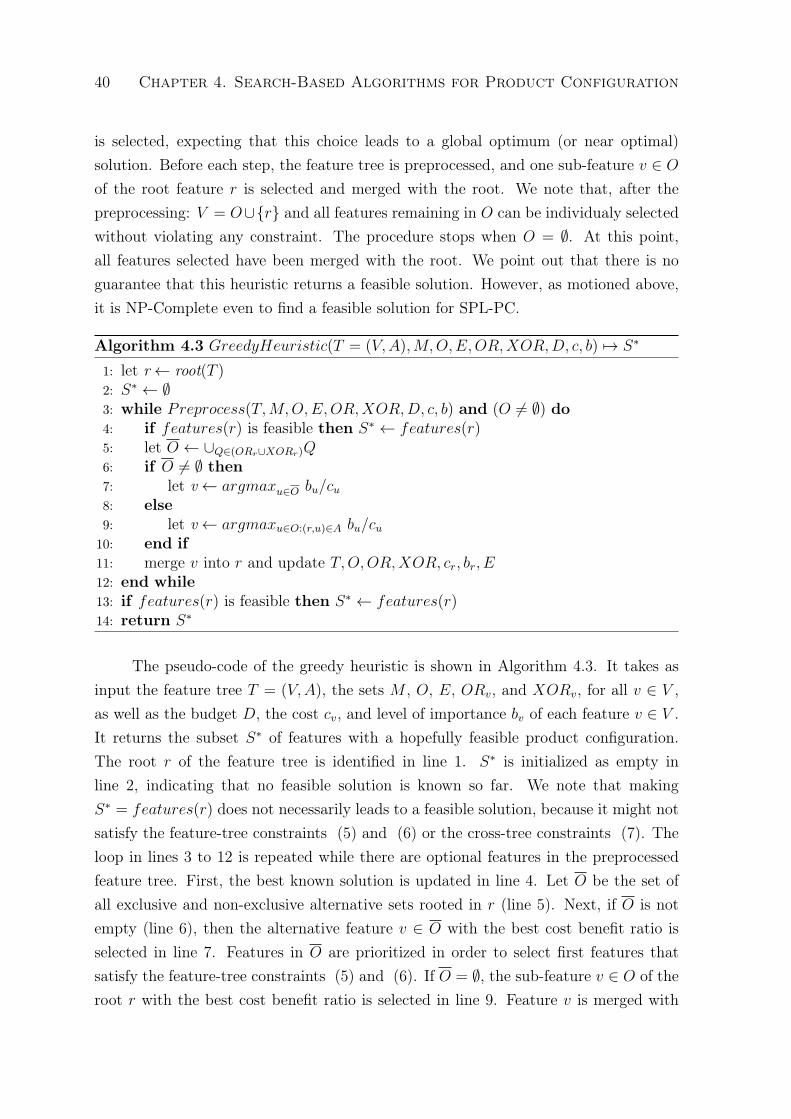
40 Chapter 4. Search-Based Algorithms for Product Configuration
is selected, expecting that this choice leads to a global optimum (or near optimal)solution. Before each step, the feature tree is preprocessed, and one sub-feature v ∈ Oof the root feature r is selected and merged with the root. We note that, after thepreprocessing: V = O∪{r} and all features remaining in O can be individualy selectedwithout violating any constraint. The procedure stops when O = ∅. At this point,all features selected have been merged with the root. We point out that there is noguarantee that this heuristic returns a feasible solution. However, as motioned above,it is NP-Complete even to find a feasible solution for SPL-PC.
Algorithm 4.3 GreedyHeuristic(T = (V,A),M,O,E,OR,XOR,D, c, b) 7→ S∗
1: let r← root(T )2: S∗ ← ∅3: while Preprocess(T,M,O,E,OR,XOR,D, c, b) and (O 6= ∅) do4: if features(r) is feasible then S∗ ← features(r)5: let O ← ∪Q∈(ORr∪XORr)Q6: if O 6= ∅ then7: let v← argmaxu∈O bu/cu8: else9: let v← argmaxu∈O:(r,u)∈A bu/cu
10: end if11: merge v into r and update T,O,OR,XOR, cr, br, E12: end while13: if features(r) is feasible then S∗ ← features(r)14: return S∗
The pseudo-code of the greedy heuristic is shown in Algorithm 4.3. It takes asinput the feature tree T = (V,A), the sets M , O, E, ORv, and XORv, for all v ∈ V ,as well as the budget D, the cost cv, and level of importance bv of each feature v ∈ V .It returns the subset S∗ of features with a hopefully feasible product configuration.The root r of the feature tree is identified in line 1. S∗ is initialized as empty inline 2, indicating that no feasible solution is known so far. We note that makingS∗ = features(r) does not necessarily leads to a feasible solution, because it might notsatisfy the feature-tree constraints (5) and (6) or the cross-tree constraints (7). Theloop in lines 3 to 12 is repeated while there are optional features in the preprocessedfeature tree. First, the best known solution is updated in line 4. Let O be the set ofall exclusive and non-exclusive alternative sets rooted in r (line 5). Next, if O is notempty (line 6), then the alternative feature v ∈ O with the best cost benefit ratio isselected in line 7. Features in O are prioritized in order to select first features thatsatisfy the feature-tree constraints (5) and (6). If O = ∅, the sub-feature v ∈ O of theroot r with the best cost benefit ratio is selected in line 9. Feature v is merged with

4.4. Greedy Heuristic Algorithm 41
the root in order to guarantee it is selected, and T , O, OR, XOR, cr, br and E areupdated in line 11, the same way as they were in line 16 of Algorithm 4.1. Finally, thebest known solution is updated in line 13 and returned it in line 14.

Chapter 5
Computational Results
This chapter reports the results of empirical studies carried out to evaluate the algo-rithms proposed in Chapter 4. The experiments were conducted on an Intel Core 2Duo E7500 machine running with a dual-core 2.93 GHz processor and 3 GB of RAMmemory and 3MB of cache. Moreover, the algorithms were implemented in Java andcompiled with gnu gcc, version 4.4.3. Section 5.1 provides details of the benchmarkinstances used in the study. Section 5.2 evaluates how much the preprocessing algo-rithm reduce the size of the feature models. Section 5.3 analyzes the time spent by thebacktracking algorithm to find the optimal solution with and without the preprocess-ing algorithm. Section 5.4 measures the performance of the greedy heuristic, regardingexecution time and solution quality. Section 5.5 discussed the threat to validity of theobtained results. Finally, concluding remarks are discussed in Section 5.6.
5.1 Benchmark Instances
We reviewed a large number of research works in the field of SPL and selected aset of ten feature models that were used as benchmark instances. The search wasconducted in order to select literature instances of different sizes with and withoutcross-tree constraints. Table 5.1 shows the feature models sorted by their number offeatures. Each row depicts a feature model. The first column identifies the featuremodel (FM). The second column describes the feature model name and provides areference to the work where the model was introduced (Feature Model [Ref.]). The thirdand fourth columns describe the number of features (|V |) and cross-tree constraints(|E|) for each model, respectively. The fifth and sixth columns show the numberof mandatory (|M |) and optional (|O|) features, respectively. Note that half of thefeature models have cross-tree constraints. The seventh and eighth columns show the
43
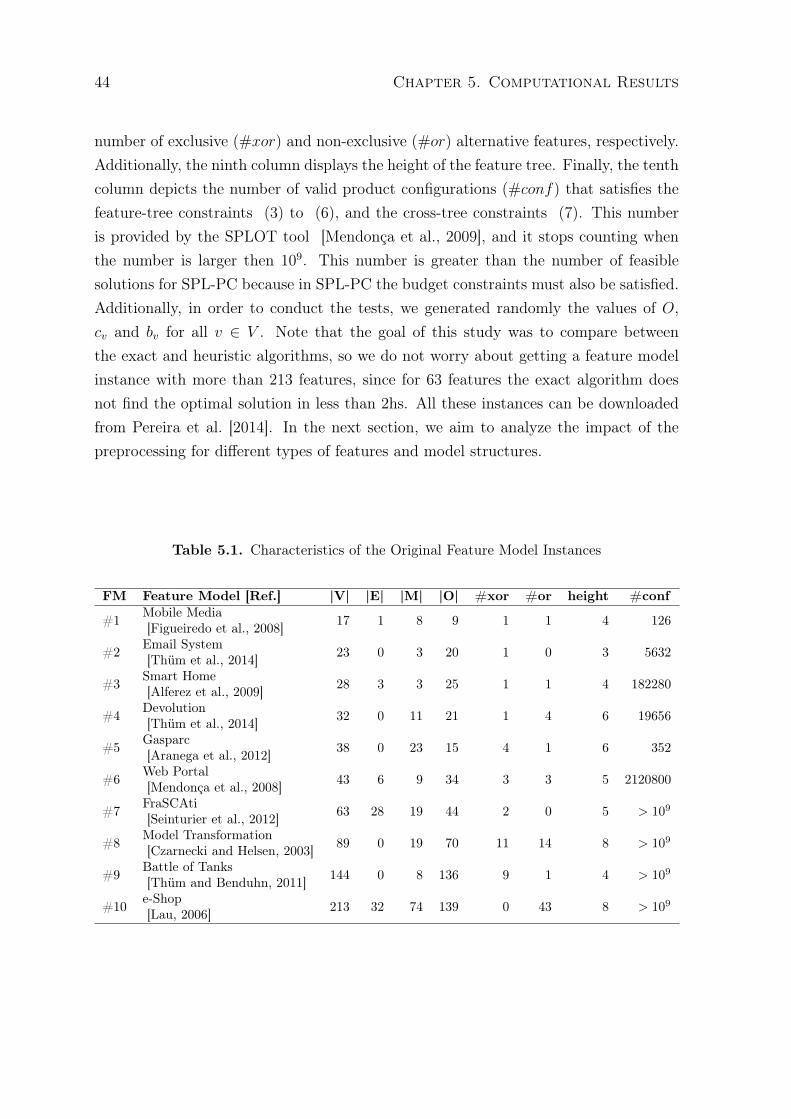
44 Chapter 5. Computational Results
number of exclusive (#xor) and non-exclusive (#or) alternative features, respectively.Additionally, the ninth column displays the height of the feature tree. Finally, the tenthcolumn depicts the number of valid product configurations (#conf) that satisfies thefeature-tree constraints (3) to (6), and the cross-tree constraints (7). This numberis provided by the SPLOT tool [Mendonça et al., 2009], and it stops counting whenthe number is larger then 109. This number is greater than the number of feasiblesolutions for SPL-PC because in SPL-PC the budget constraints must also be satisfied.Additionally, in order to conduct the tests, we generated randomly the values of O,cv and bv for all v ∈ V . Note that the goal of this study was to compare betweenthe exact and heuristic algorithms, so we do not worry about getting a feature modelinstance with more than 213 features, since for 63 features the exact algorithm doesnot find the optimal solution in less than 2hs. All these instances can be downloadedfrom Pereira et al. [2014]. In the next section, we aim to analyze the impact of thepreprocessing for different types of features and model structures.
Table 5.1. Characteristics of the Original Feature Model Instances
FM Feature Model [Ref.] |V| |E| |M| |O| #xor #or height #conf
#1 Mobile Media[Figueiredo et al., 2008] 17 1 8 9 1 1 4 126
#2 Email System[Thüm et al., 2014] 23 0 3 20 1 0 3 5632
#3 Smart Home[Alferez et al., 2009] 28 3 3 25 1 1 4 182280
#4 Devolution[Thüm et al., 2014] 32 0 11 21 1 4 6 19656
#5 Gasparc[Aranega et al., 2012] 38 0 23 15 4 1 6 352
#6 Web Portal[Mendonça et al., 2008] 43 6 9 34 3 3 5 2120800
#7 FraSCAti[Seinturier et al., 2012] 63 28 19 44 2 0 5 > 109
#8 Model Transformation[Czarnecki and Helsen, 2003] 89 0 19 70 11 14 8 > 109
#9 Battle of Tanks[Thüm and Benduhn, 2011] 144 0 8 136 9 1 4 > 109
#10 e-Shop[Lau, 2006] 213 32 74 139 0 43 8 > 109
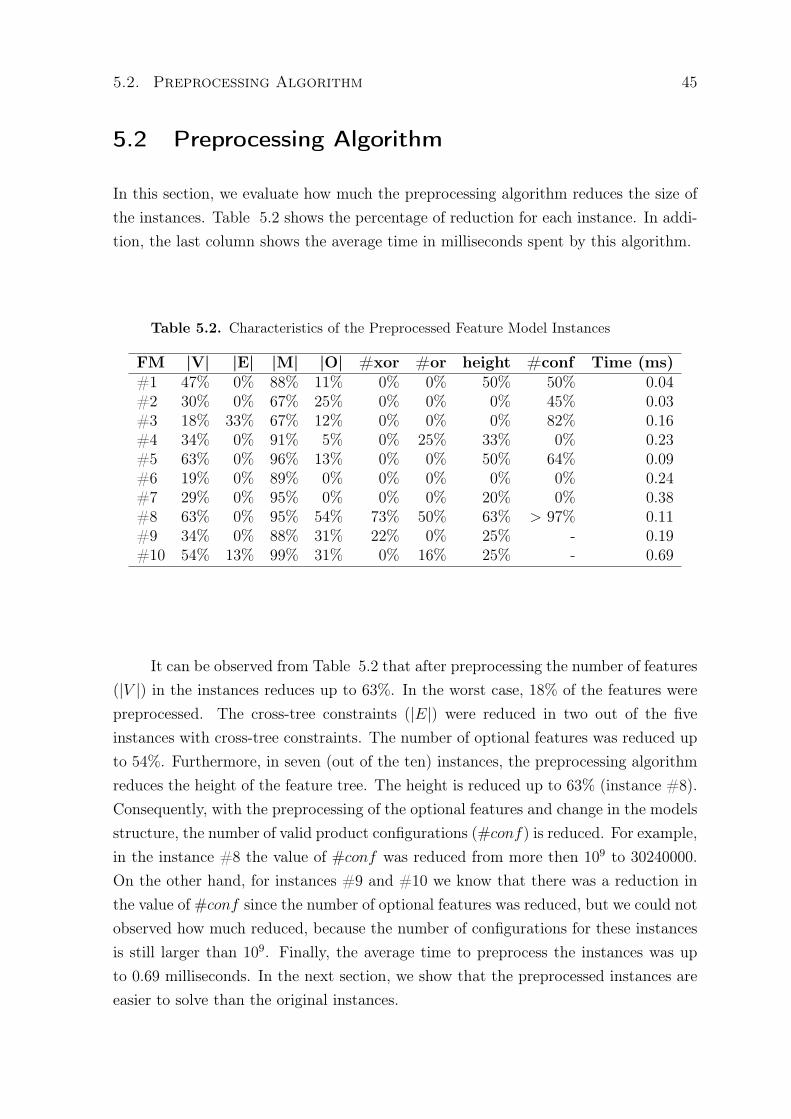
5.2. Preprocessing Algorithm 45
5.2 Preprocessing Algorithm
In this section, we evaluate how much the preprocessing algorithm reduces the size ofthe instances. Table 5.2 shows the percentage of reduction for each instance. In addi-tion, the last column shows the average time in milliseconds spent by this algorithm.
Table 5.2. Characteristics of the Preprocessed Feature Model Instances
FM |V| |E| |M| |O| #xor #or height #conf Time (ms)#1 47% 0% 88% 11% 0% 0% 50% 50% 0.04#2 30% 0% 67% 25% 0% 0% 0% 45% 0.03#3 18% 33% 67% 12% 0% 0% 0% 82% 0.16#4 34% 0% 91% 5% 0% 25% 33% 0% 0.23#5 63% 0% 96% 13% 0% 0% 50% 64% 0.09#6 19% 0% 89% 0% 0% 0% 0% 0% 0.24#7 29% 0% 95% 0% 0% 0% 20% 0% 0.38#8 63% 0% 95% 54% 73% 50% 63% > 97% 0.11#9 34% 0% 88% 31% 22% 0% 25% - 0.19#10 54% 13% 99% 31% 0% 16% 25% - 0.69
It can be observed from Table 5.2 that after preprocessing the number of features(|V |) in the instances reduces up to 63%. In the worst case, 18% of the features werepreprocessed. The cross-tree constraints (|E|) were reduced in two out of the fiveinstances with cross-tree constraints. The number of optional features was reduced upto 54%. Furthermore, in seven (out of the ten) instances, the preprocessing algorithmreduces the height of the feature tree. The height is reduced up to 63% (instance #8).Consequently, with the preprocessing of the optional features and change in the modelsstructure, the number of valid product configurations (#conf) is reduced. For example,in the instance #8 the value of #conf was reduced from more then 109 to 30240000.On the other hand, for instances #9 and #10 we know that there was a reduction inthe value of #conf since the number of optional features was reduced, but we could notobserved how much reduced, because the number of configurations for these instancesis still larger than 109. Finally, the average time to preprocess the instances was upto 0.69 milliseconds. In the next section, we show that the preprocessed instances areeasier to solve than the original instances.
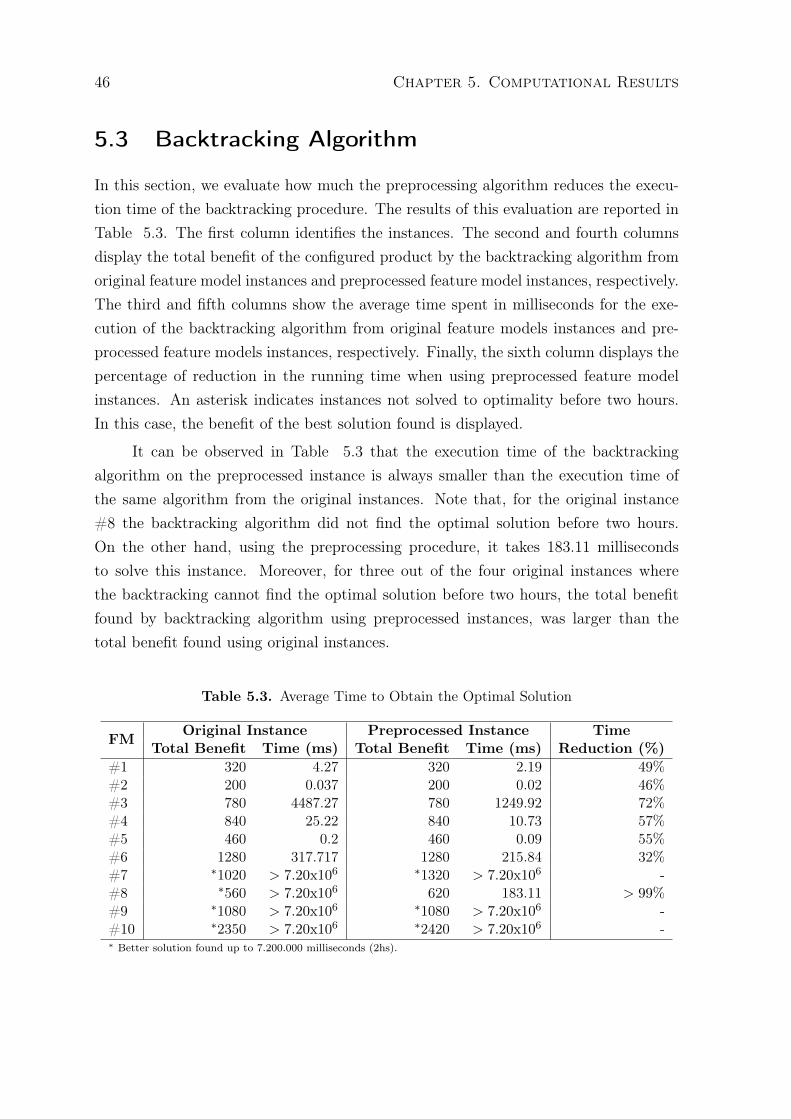
46 Chapter 5. Computational Results
5.3 Backtracking Algorithm
In this section, we evaluate how much the preprocessing algorithm reduces the execu-tion time of the backtracking procedure. The results of this evaluation are reported inTable 5.3. The first column identifies the instances. The second and fourth columnsdisplay the total benefit of the configured product by the backtracking algorithm fromoriginal feature model instances and preprocessed feature model instances, respectively.The third and fifth columns show the average time spent in milliseconds for the exe-cution of the backtracking algorithm from original feature models instances and pre-processed feature models instances, respectively. Finally, the sixth column displays thepercentage of reduction in the running time when using preprocessed feature modelinstances. An asterisk indicates instances not solved to optimality before two hours.In this case, the benefit of the best solution found is displayed.
It can be observed in Table 5.3 that the execution time of the backtrackingalgorithm on the preprocessed instance is always smaller than the execution time ofthe same algorithm from the original instances. Note that, for the original instance#8 the backtracking algorithm did not find the optimal solution before two hours.On the other hand, using the preprocessing procedure, it takes 183.11 millisecondsto solve this instance. Moreover, for three out of the four original instances wherethe backtracking cannot find the optimal solution before two hours, the total benefitfound by backtracking algorithm using preprocessed instances, was larger than thetotal benefit found using original instances.
Table 5.3. Average Time to Obtain the Optimal Solution
FM Original Instance Preprocessed Instance TimeTotal Benefit Time (ms) Total Benefit Time (ms) Reduction (%)
#1 320 4.27 320 2.19 49%#2 200 0.037 200 0.02 46%#3 780 4487.27 780 1249.92 72%#4 840 25.22 840 10.73 57%#5 460 0.2 460 0.09 55%#6 1280 317.717 1280 215.84 32%#7 ∗1020 > 7.20x106 ∗1320 > 7.20x10⁶ -#8 ∗560 > 7.20x10⁶ 620 183.11 > 99%#9 ∗1080 > 7.20x106 ∗1080 > 7.20x10⁶ -#10 ∗2350 > 7.20x106 ∗2420 > 7.20x10⁶ -∗ Better solution found up to 7.200.000 milliseconds (2hs).
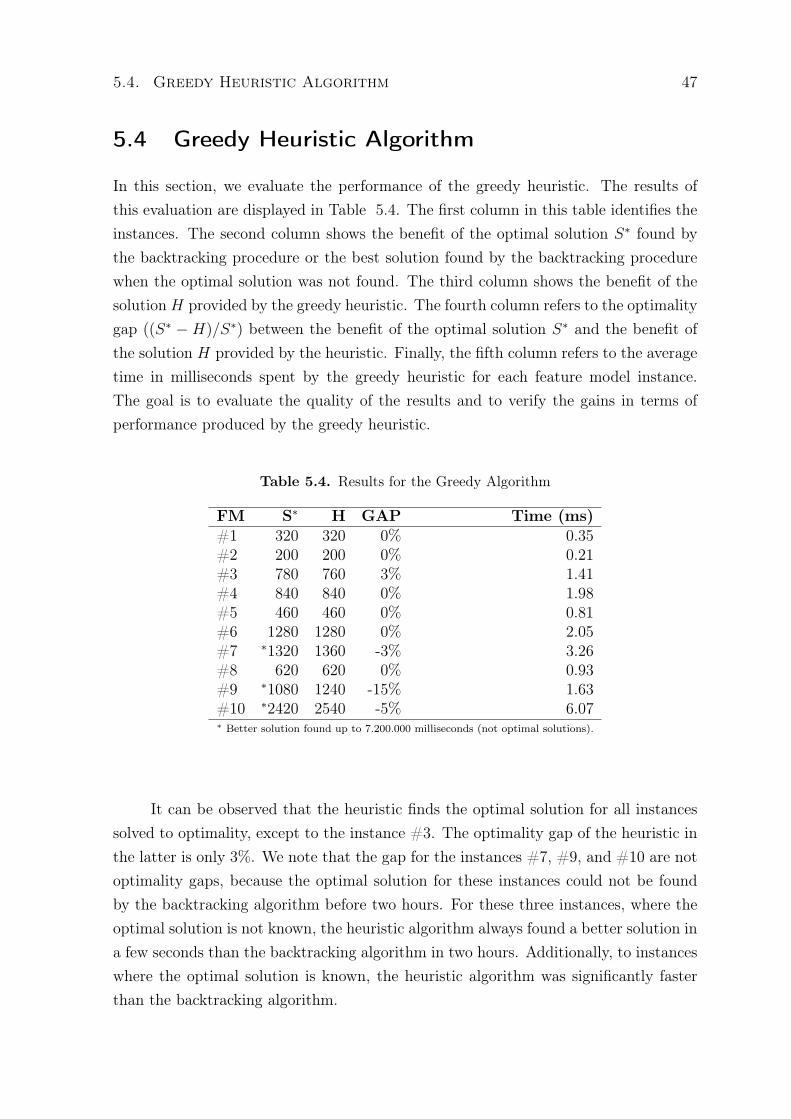
5.4. Greedy Heuristic Algorithm 47
5.4 Greedy Heuristic Algorithm
In this section, we evaluate the performance of the greedy heuristic. The results ofthis evaluation are displayed in Table 5.4. The first column in this table identifies theinstances. The second column shows the benefit of the optimal solution S∗ found bythe backtracking procedure or the best solution found by the backtracking procedurewhen the optimal solution was not found. The third column shows the benefit of thesolutionH provided by the greedy heuristic. The fourth column refers to the optimalitygap ((S∗ − H)/S∗) between the benefit of the optimal solution S∗ and the benefit ofthe solution H provided by the heuristic. Finally, the fifth column refers to the averagetime in milliseconds spent by the greedy heuristic for each feature model instance.The goal is to evaluate the quality of the results and to verify the gains in terms ofperformance produced by the greedy heuristic.
Table 5.4. Results for the Greedy Algorithm
FM S∗ H GAP Time (ms)#1 320 320 0% 0.35#2 200 200 0% 0.21#3 780 760 3% 1.41#4 840 840 0% 1.98#5 460 460 0% 0.81#6 1280 1280 0% 2.05#7 ∗1320 1360 -3% 3.26#8 620 620 0% 0.93#9 ∗1080 1240 -15% 1.63#10 ∗2420 2540 -5% 6.07∗ Better solution found up to 7.200.000 milliseconds (not optimal solutions).
It can be observed that the heuristic finds the optimal solution for all instancessolved to optimality, except to the instance #3. The optimality gap of the heuristic inthe latter is only 3%. We note that the gap for the instances #7, #9, and #10 are notoptimality gaps, because the optimal solution for these instances could not be foundby the backtracking algorithm before two hours. For these three instances, where theoptimal solution is not known, the heuristic algorithm always found a better solution ina few seconds than the backtracking algorithm in two hours. Additionally, to instanceswhere the optimal solution is known, the heuristic algorithm was significantly fasterthan the backtracking algorithm.
48 Chapter 5. Computational Results
5.5 Threats to Validity
A key issue when performing these experiments is the validity of the results. Questionswe need to answer include: was the study designed and performed in a sound andcontrolled manner? to which domain can the results generalize? This section presentsthe different validity threats related to computational results. We presented how thethreats were addressed prior to the experiment to minimize the likelihood of theirrealization and impact. We discussed the experiment validity with respect to the fourgroups of common threats to validity: internal validity, external validity, constructvalidity, and conclusion validity [Wohlin et al., 2012].
External validity concerns the ability to generalize the results to other environ-ments, such as to industry practices [Wohlin et al., 2012]. To minimize threats toexternal validity, we use feature models acquired from existing publications in SPLcommunity. During the selection of the feature models, we use sufficient size and vari-ety to ensure significance. Moreover, to simulate practical situation as far as possible,we randomly generate the constants: D, cv and bv, for all v ∈ V . However, we cannotclaim that the generated values can be held true in practice. Moreover, the number ofbenchmark instances used can be considered threat to external validity. However, weconsider that our experiments rely on SPLs in important contexts that represent smalland medium SPLs.
Threats to internal validity are influences that have not been considered andit can affect the execution time of all exact and heuristic solutions [Wohlin et al.,2012]. In this sense, a limitation of this study concerns the choice of the machine, thelanguage, or the compiler. In addition, the quality of the coding. However, to avoidthese effects, we describe the resources used during the computational experiments indetails. We reported the average time (in milliseconds) of the execution of each instance1000 times, in order to avoid as much interference as possible. Moreover, to eliminatemachine dependencies, all tests were performed on the same machine and the samecompiler. Every effort has been made to minimize the influence of the environment:platform, coding, compiling, paging, caching, etc.
The decision of which feature models choose to include in the studies can bea threat to construct validity (feature models with structure widely used in practiceshould be considered). To minimize this threat, we chose feature models with differentstructure and feature types. Furthermore, we documented the characteristics of thefeature models used.
Conclusion validity concerns the relation between the treatments and the outcomeof the experiment [Wohlin et al., 2012]. A potential conclusion validity threat is if the
5.6. Concluding Remarks 49
benchmark instances are sufficient to the computational evaluation, since we cannotsay that these instances are always used in practice. Therefore, in order to ensure thevalidity, we have opted to analyze only feature models from real-life SPL documentedin literature.
5.6 Concluding Remarks
This chapter showed computational results deriving optimized product configurationsin feature models from literature SPLs. The performance was measured using tenfeature model instances, sampled from several domains. The results showed that thebacktracking algorithm take significantly advantage from the preprocessing procedure.The backtracking algorithm on preprocessed instances was always faster than the samealgorithm on the original instances. While the backtracking algorithm to original in-stances found the optimal solution to six out of the ten instances studied in the litera-ture, the backtracking algorithm on preprocessed instances found the optimal solutionto seven out of ten instances tested. However, since finding an optimal solution isNP-hard, our results argued the necessity of using a heuristic algorithm for solving theproblem. The heuristic algorithm proposed in Chapter 4 found the optimal solutionfor all instances where the optimum is known, except the instance #3 (Smart Home),where the optimality gap was 3%. Moreover, it found a better solution than the back-tracking algorithm for three instances where the backtracking did not find an optimalsolution in two hours of execution. In the next chapter, we conclude this dissertation,discuss the limitations of related work, and propose future research directions.

Chapter 6
Conclusion
After decades of research in Software Product Line (SPL), a vast number of automatedtools for creating and editing feature models have been proposed in the literature (Sec-tion 3.1). However, there is still little support for automated product configuration. Astudy of the tools has shown that product configuration is made manually through suc-cessive steps, by one or more developers, until a final product that matches customerrequirements is obtained. Therefore, customer requirements are usually neglected, al-though product configuration has already been investigated in the literature. Guidanceand automated support are needed to increase business efficiency when dealing withmany possible combinations in an SPL.
This dissertation presented a search-based software engineering (SBSE) approachto tackle the problem of finding the optimal product configuration that satisfies businessand costumer requirements. First, a systematic literature review of SPL managementtools highlighted that there is a need for automatic product configuration. Next, weconducted a comparative study to choose one of the existing tools to be extended withthe needed feature. Based on the results of this study, we extended the FeatureIDEtool with a decision support system for business that reduces the effort required forproduct configuration. Next, we modeled the problem of finding the optimal productconfiguration that maximizes the customer satisfaction as an optimization problem.Three algorithms were proposed: a preprocessing algorithm, backtracking procedureand a greedy heuristic. The preprocessing algorithm follows preprocessing the fea-ture model, and it is used with backtracking procedure and a greedy heuristic. Thebacktracking and greedy heuristic algorithms are exact and approximation algorithmthat can be used to solve the problem. Although the backtracking algorithm has ex-ponential complexity, the greedy heuristic algorithm has polynomial complexity withGAP optimality. Our computational results focus over a dataset of ten SPL instances
51
52 Chapter 6. Conclusion
documented in literature that explore several characteristics of feature models. Thebacktracking algorithm on preprocessed instances was always faster than the samealgorithm on the original instances. Moreover, we empirically verified with our exper-iments that the optimality GAP of the heuristic is at most 3%. The heuristic wasimplemented as part of our decision support system and allows new algorithms to beeasily incorporated as further characteristics of feature models are examined. Next,the Section 6.1 summarizes the related works and Section 6.2 points out directions forfuture work.
6.1 Related Work
This section compares related work to our systematic literature review and compar-ative study of SPL management tools. It also investigated the state-of-the-art aboutthe use of search-based techniques to address SPL product configuration problems.
SPL Management Tools. Analysis of existing SPL management tools has beenperformed in previous studies, such as the detailed below. The purpose of these studiesof a general way is to facilitate tools selection in the context of SPL. However, oursystematic review differs from others studies because it includes a large number oftools, characteristics, and functionalities not addressed by previous studies. Moreover,we complement our systematic review with a comparative study detailed between twotools. Our comparative study involved 56 developers taking an advanced SE course.We do not known of any study that perform a comparative analysis of tools throughof concrete experimental data.
Beuche et al. [2004] focus on the problems of requirements management for SPL.The result is a comprehensive analysis of four requirements management tools (BorlandCaliberRM, Telelogic DOORS, QA Systems IRqA, and RequiLine of RWTH Achen) inthe context of SPL based on practical experiences. This paper is intended to direct theattention of both researchers and tool developers to the current problem of inadequaterequirements management tools for SPL. Despite our systematic review investigatewhat are the tools that support requirements management, we do not analyze how thisfunctionality is covered by the tools.
Unphon [2008] compare ten variability modeling and configuration tools(AHEAD, FAMA, Feature Modeling Plug-in, Gears, Kumbang Tools, MetaEdit+,Product Modeler, pure::variants, RequiLine and XFeature). This work categorizesits comparisons into general information (creator, first public release date/year, latest
6.1. Related Work 53
stable version, cost, and software license), technical infrastructure (application type,implementation language, and supported language), operating systems support (Win-dows, Mac OS X, Linux, and Unix), rendering of modeling (GUI tree, table, box&arrow,and textual language), format of input/output models support (database, HTML, XM-L/XMI, CSV, user-define, and grammar), modeling and configuration functionalities(model verification, product family verification, product derivation wizard, and instal-lation wizard), and development functionalities (IDE support, source code generator,link to artefact at requirement level, and link to artifact at design/implementationlevel). Our systematic literature review complements this study with the assessmentof new tools, and different characteristics and functionalities.
Capilla et al. [2007] and Lisboa et al. [2010] aims at finding out how the availabletools offer support to the domain engineering process. They defined the current limits oftool support for the processes and they highlighted the need of these tools to incorporateadditional functionalities. Capilla et al. [2007] analyze the current state of practice offive SPL management tools, and Lisboa et al. [2010] present an systematic literaturereview of nineteen SPL management tools. They involved the identification of externalcharacteristics about the tools and of the functionalities they support. On the otherhand, our systematic literature review includes not only domain engineering processanalysis, but also analysis for the whole domain engineering and application engineeringprocesses. In addition, our study complements these studies with the assessment ofnew tools and additional characteristics.
The study in Djebbi et al. [2007] was undertaken in collaboration with a groupof industries to evaluate three SPL management tools (XFeature, Pure::Variant, andRequiLine). The purpose of the study was two fold: (i) to understand the salientcharacteristics of SPL management tools, and (ii) to evaluate the ability of existingtools to satisfy the expectations of industries. On the other hand, our comparativestudy was conducted with two other tools (SPLOT and FeatureIDE).
Another study related to ours was conducted by Simmonds et al. [2011]. Thisstudy investigates the appropriateness of different approaches to support variabilitymanagement. Moreover, it summarizes the usability of eight tools (Clafer, EPFComposer, FaMa-OVM, fmp, Hydra, SPLOT, and VEdit) that support variabilitymanagement. However, these tools are evaluated by the authors of the paper, whileour comparative study is based on concrete experimental data.
SPL Product Configuration. Automated reasoning is an ever challenging field inSPL engineering [Wesowski, 2004]. Botterweck et al. [2007], Mendonça et al. [2009],and Thüm et al. [2014] have proposed visualization techniques for representing staged
54 Chapter 6. Conclusion
feature configuration in SPLs. However, industrial-sized feature models with hundredsor thousands of features make a manual feature selection process hard. Moreover, theseapproaches focus more on functional features of a product and their dependencies andless on non-functional features. Although it is accepted that in an SPL it is necessaryto deal with non-functional features [Kang et al., 1990, 1998], there is no consensusabout how to deal with them.
Van Deursen and Klint [2002]; Mannion [2002] investigate automatic analysisof feature models. Van Deursen and Klint [2002] explore automated manipulationof feature descriptions providing algebra to operate on the feature models. Mannion[2002] uses first-order logic for product line reasoning. However this work only providesa model based on propositional logic using AND, OR and XOR logical operators tomodel SPLs. Both attempts have at least two limitations: (i) they only considerfunctional features and (ii) they basically aim to answer the single question of howmany products a model has.
Benavides et al. [2005] investigated the product configuration problem and appliedConstraint Satisfaction Problems (CSPs) to support feature selection. However, theyconsidered that non-functional features only apply to leaf features. In addition, theirexperiments were conducted in only four SPLs. As a result, the experimentation hasshown the exponential behavior of the solution space when the number of featuresincreases. Their implementation has good performance for feature models with upto 25 features. On the other hand, our study (i) considered that the non-functionalfeatures are attributes of all features in the feature model; (ii) we have measured thesolving time for ten literature SPLs; (iii) our exact algorithm has a good performanceup to 43 features (when we use our exact algorithm on preprocessed instances it wasable to solve 89 features); (iv) we implemented a heuristic to solve the problem; and(v) our solutions proposed considered cross-tree constraints.
Karatas et al. [2010] used extended feature models to represent non-functionalfeatures and introduced a mapping from extended feature models to constraint logicprogramming over finite domains. Their technique works well for small-scale prob-lems, while for large-scale problems, their technique is too computationally demand-ing. In contrast, our heuristic algorithm has polynomial complexity that can handlenon-functional features and thus can solve the SPL product configuration optimizationeven on large-scale problems.
Exact techniques show exponential time complexity and do not scale to largeindustrial feature models with hundreds or thousands of features. However, to the bestof our knowledge, there is only one work [White et al., 2009] providing a polynomialcomplexity algorithm for the optimization product configuration in SPL that adheres
6.2. Future Work 55
to a set of non-functional features. They proposed the Filtered Cartesian Flattening(FCF) technique. However, their approach still requires significant computing time forlarge-scale problems. Moreover, this work does not involve feature models instanceswith cross-tree constraints, their approach only considered attributes in leaf features,and the feature models instances are generated randomly.
Although automated support for product configuration has already been exten-sively investigated in the literature, customer preferences are usually neglected. Wehave known of only one study [Bagheri et al., 2010] that represent and consider thecustomer requirements as main during the product configuration process. Bagheriet al. [2010] present a semi-automated approach to feature model configuration basedon a fuzzy propositional language. It uses a variant of propositional logic along withfuzzy logic to represent feature models and their quality attributes, in order to captureboth hard and soft constraints of the customers. Our work also considers the customerrequirements. However, while this work considers hard and soft constraints of the cus-tomer, our work considers the level of importance (none, low, medium, high, very high)of each feature for the customers. Moreover, our study differs from others by providinga decision support system for business.
6.2 Future Work
As future work, we recommend the extension of our exact and heuristic algorithms toinclude other non-functional features [Kang et al., 1998]. For example, we encourageresearchers to extend these algorithms to consider the difficulties of developing andmaintaining of the product for the industries, in order to minimize the developmenteffort integrating features to compose a product. Moreover, to simulate practical situ-ation as far as possible, further work should address case studies in industry, in orderto ensure that realistic instances of requirements are being generated, through directcontact with the business and customers. Ultimately, our goal was to inspire otherresearchers to examine further properties in SPL that can lead to the developmentof new algorithms and eventually to integrate these algorithms with the algorithmsintroduced in this dissertation.

Bibliography
Alferez, M., Santos, J., Moreira, A.and Garcia, A., Kulesza, U., Araujo, J., and Amaral,V. (2009). Multi-view composition language for software product line requirements.In 2nd International Conference on Software Language Engineering (SLE), pages136–154.
Apel, S., Batory, D., Kästner, C., and Saake, G. (2013). Feature-Oriented SoftwareProduct Lines: Concepts and Implementation. Springer-Verlag.
Aranega, V., Etien, A., and Mosser, S. (2012). Using feature model to build modeltransformation chains. In 15th international conference on Model Driven EngineeringLanguages and Systems (MODELS), pages 562–578.
Asikainen, T., Männistö, T., and Soininen, T. (2004). Using a configurator for mod-elling and configuring software product lines based on feature models. In Workshopon Software Variability Management for Product Derivation, Software Product LineConference (SPLC), pages 24–35.
Bagheri, E., Di Noia, T., Ragone, A., and Gasevic, D. (2010). Configuring softwareproduct line feature models based on stakeholders’ soft and hard requirements. In14th International Software Product Line Conference (SPLC), pages 16–31.
Baker, P., Harman, M., Steinhofel, K., and Skaliotis, A. (2006). Search based ap-proaches to component selection and prioritization for the next release problem. In22nd International Conference on Software Maintenance (ICSM), pages 176–185.
Barbeau, M. and Bordeleau, F. (2002). A protocol stack development tool using gener-ative programming. Generative Programming and Component Engineering (GPCE),2487(0):93–109.
Basili, V., Shull, F., and Lanubile, F. (1999). Building knowledge through families ofexperiments. IEEE Transactions on Software Engineering, 25(4):456–473.
57
58 Bibliography
Batory, D. S. (2005). Feature models, grammars and propositional formulas. In 9thInternational Software Product Lines Conference (SPLC), pages 7–20.
Bednasch, T., Endler, C., and Lang, M. (2003). Captain feature tool. Tool available onSourceForge at: https://sourceforge.net/projects/captainfeature/ [Online;01-April-2013].
Benavides, D., Martin-Arroyo, P. T., and Cortes, A. R. (2005). Automated reasoningon feature models. In 17th Conference on Advanced Information Systems Engineering(CAiSE), pages 491–503.
Benavides, D., Segura, S., Trinidad, P., and Ruiz-cortés, A. (2007). Fama: Toolinga framework for the automated analysis of feature models. In 1th InternationalWorkshop on Variability Modelling of Software Intensive Systems (VAMOS), pages129–134.
Bernardo, M., Ciancarini, P., and Donatiello, L. (2002). Architecting families of soft-ware systems with process algebras. ACM Transactions on Software Engineeringand Methodology, 11(4):386–426.
Beuche, D., Papajewski, H., and Schröder-Preikschat, W. (2004). Variability manage-ment with feature models. Journal Science of Computer Programming, 53(3):333–352.
Bonifácio, R., Teixeira, L., and Borba, P. (2009). Hephaestus: A tool for managingspl variabilities. In Brazilian Symposium on Components, Architectures and ReuseSoftware (SBCARS), pages 26–34.
Botterweck, G., Janota, M., and Schneeweiss, D. (2009). A design of a configurablefeature model configurator. In 3th International Workshop on Variability Modellingof Software Intensive Systems (VaMoS), pages 165–168.
Botterweck, G., Nestor, D., Preubner, A., Cawley, C., and Thiel, S. (2007). Towardssupporting feature configuration by interactive visualization. In 1st InternationalWorkshop on visualization in Software Product Line Engineering (ViSPLE), pages125–131.
Braga, R., Werner, C., and Mattoso, M. (1999). Odyssey: A reuse environment basedon domain models. In IEEE Symposium on Application-Specific Systems and Soft-ware Engineering and Technology (ASSET), pages 50–57.
Bibliography 59
Bryant, R. (1986). Graph-based algorithms for boolean function manipulation. IEEETransactions on Computers, 35(8):677–691.
Buhne, S., Lauenroth, K., and Pohl, K. (2005). Modelling requirements variabilityacross product lines. In 13th IEEE International Conference on Requirements Engi-neering, pages 41–50.
Capilla, R., Sánchez, A., and Dueñas, J. (2007). An analysis of variability modeling andmanagement tools for product line development. In Software and Service VariabilityManagement Workshop - Concepts, Models, and Tools, pages 32–47.
Cawley, C., Nestor, D., Preussner, A., Botterweck, G., and Thiel, S. (2008). Inter-active visualisation to support product configuration in software product lines. In2th International Workshop on Variability Modeling of Software-Intensive Systems(VaMoS), pages 7–16.
Chen, L. and Babar, M. A. (2011). A systematic review of evaluation of variabilitymanagement approaches in software product lines. Journal Information and SoftwareTechnology, 53(4):344–362.
Cirilo, E., Kulesza, U., and Lucena, C. J. P. (2008). A product derivation tool based onmodel-driven techniques and annotations. Journal of Universal Computer Science,14(8):1344–1367.
Clements, P. and Northrop, L. (2001). Software product lines: Practices and patterns.Addison-Wesley.
Cormen, T., Leiserson, C. E., Rivest, R. L., and Stein, C. (2009). Introduction toalgorithms. Mit Press.
Czarnecki, K. and Eisenecker, U. W. (2000). Generative programming: Methods, tools,and applications. Addison-Wesley.
Czarnecki, K. and Helsen, S. (2003). Classification of model transformation approaches.Available at: http://www.ptidej.net/course/ift6251/fall05/presentations/
050914/Czarnecki_Helsen.pdf/.
Czarnecki, K., Kim, C. H. P., and Kalleberg, K. T. (2006). Feature models are views onontologies. In 10th International Software Product Lines Conference (SPLC), pages41–51.
60 Bibliography
Czarnecki, K. and Wasowski, A. (2007). Feature diagrams and logics: There andback again. In 11th International Software Product Lines Conference (SPLC), pages23–34.
Deelstra, S., Sinnema, M., and Bosch, J. (2004). Experiences in software product fam-ilies: Problems and issues during product derivation. In 3th International SoftwareProduct Line Conference (SPLC), pages 165–182.
Dehlinger, J., Humphrey, M., Suvorov, L., Padmanabhan, P., and Lutz, R. (2007). Dec-imal and plfaultcat: From product-line requirements to product-line member soft-ware fault trees. In 29th International Conference on Software Engineering (ICSE),pages 49–50.
Del Rosso, C. (2006). Reducing internal fragmentation in segregated free lists usinggenetic algorithms. In International Workshop on Interdisciplinary Software Engi-neering Research (WISER), pages 57–60.
Dhungana, D., Grünbacher, P., and Rabiser, R. (2007). Decisionking: A flexible andextensible tool for integrated variability modeling. In 1st International Workshop onVariability Modelling of Software-intensive Systems, pages 119–128.
Dhungana, D., Grünbacher, P., and Rabiser, R. (2011). The dopler meta-tool fordecision-oriented variability modeling: A multiple case study. Journal AutomatedSoftware Engineering, 18(1):77–114.
Djebbi, O., Salinesi, C., and Fanmuy, G. (2007). Industry survey of product lines man-agement tools: Requirements, qualities and open issues. In 15th IEEE InternationalRequirements Engineering Conference (IREC), pages 301–306.
Eriksson, M., Morast, H., Börstler, J., and Borg, K. (2005). The pluss toolkit: Extend-ing telelogic doors and ibm-rational rose to support product line use case modeling.In 20th International Conference on Automated Software Engineering (ASE), pages300–304.
Figueiredo, E., Cacho, N., Sant’Anna, C., Monteiro, M., Kulesza, U., Garcia, A.,Soares, S., Ferrari, F., Khan, S., Filho, F. C., and Dantas, F. (2008). Evolvingsoftware product lines with aspects: An empirical study. In 30th InternationalConference on Software Engineering (ICSE), pages 261–270.
Frakes, W. B., Prieto-Diaz, R., and Fox, C. (1997). Dare-cots: A domain analysissupport tool. In 17th International Conference of the Chilean Computer ScienceSociety, pages 73–77.
Bibliography 61
Gallo, G. and Simeone, B. (1989). On the supermodular knapsack problem. JournalMathematical Programming, 45(1):295–309.
Gheyi, R., Massoni, T., and Borba, P. (2006). A theory for feature models in alloy. In1th Alloy Workshop, pages 71–80.
Goedicke, M., Köllmann, C., and Zdun, U. (2004). Designing runtime variation pointsin product line architectures: Three cases. Journal Science of Computer Program-ming, 53(3):353–380.
Griss, M. L., Favaro, J., and d’Alessandro, M. (1998). Integrating feature modelingwith the rseb. In 5th International Conference on Software Reuse (ICSR), pages76–85.
Groher, I. and Weinreich, R. (2013). Supporting variability management in architecturedesign and implementation. In 46th Hawaii International Conference on SystemSciences (HICSS), pages 4995–5004.
Harman, M. and Jones, B. F. (2001). Search based software engineering. JournalInformation and Software Technology, 43(0):833–839.
Harman, M., Mansouri, S. A., and Zhang, Y. (2012). Search-based software engineering:Trends, techniques and applications. Journal ACM Computing Surveys (CSUR),45(1):1–61.
Heidenreich, F., Kopcsek, J., and Wende, C. (2008). Featuremapper: Mapping featuresto models. In 30th International Conference on Software Engineering (ICSE), pages943–944.
Hervieu, A., Baudry, B., and Gotlieb, A. (2011). Pacogen: Automatic generation ofpairwise test configurations from feature models. In 22nd International Symposiumon Software Reliability Engineering (ISSRE), pages 120–129.
Jain, A. and Biesiadecki, J. (2006). Yam: A framework for rapid software develop-ment. In Second IEEE International Conference on Space Mission Challenges forInformation Technology (SMC-IT), pages 182–194.
Jarzabek, S., Ong, W. C., and Zhang, H. (2003). Handling variant requirements indomain modeling. Journal of Systems and Software, 68(3):171–182.
Kang, K., Cohen, S., Hess, J., Novak, W., and Peterson, S. (1990). Feature-orienteddomain analysis (foda) feasibility study. Available at: http://www.sei.cmu.edu/
reports/90tr021.pdf/.
62 Bibliography
Kang, K., Kim, S., Lee, J., Kim, K., Shin, E., and Huh, M. (1998). Form: A feature-oriented reuse method with domain-specific reference architectures. Annals of Soft-ware Engineering, 5(1):143–168.
Kang, K. C., Lee, J., and Donohoe, P. (2002). Feature-oriented product line engineer-ing. IEEE Software, 19(4):58–65.
Karatas, A., Oguztüzün, H., and Dogru, A. (2010). Mapping extended feature modelsto constraint logic programming over finite domains. In 14th International SoftwareProduct Line Conference (SPLC), pages 286–299.
Kiczales, G., Hilsdale, E., Hugunin, J., Kersten, M., Palm, J., and Griswold, W. G.(2001). An overview of aspectj. In European Conference on Object-Oriented Pro-gramming (ECOOP), pages 327–354.
Kim, K., Kim, H., Ahn, M., Seo, M., Chang, Y., and Kang, K. C. (2006). Asadal: Atool system for co-development of software and test environment based on productline engineering. In 28th international conference on Software engineering (ICSE),pages 783–786.
Kitchenham, B., Brereton, O. P., Budgen, D., Turner, M., Bailey, J., and Linkman, S.(2009). Systematic literature reviews in software engineering: A systematic literaturereview. Journal Information and Software Technology, 51(1):7–15.
Kitchenham, B., Pfleeger, S., Pickard, L., Jones, P., Hoaglin, D., El Emam, K., andRosenberg, J. (2002). Preliminary guidelines for empirical research in software engi-neering. IEEE Transactions on Software Engineering, 28(8):721–734.
Krueger, C. (2007). Biglever software gears and the 3-tiered spl methodology. In 22thConference on Object-Oriented Programming Systems, Languages, and Applications(OOPSLA), pages 844–845.
Krut, J. R. W. (1993). Integrating 001 tool support in the feature-oriented domainanalysis methodology. technical report, software engineering institute (sei). Pa-per available at: http://repository.cmu.edu/cgi/viewcontent.cgi?article=
1166&context=sei. [Online; 03-June-2013].
Laguna, M. and Hernández, C. (2010). A software product line approach for e-commerce systems. In 7th International Conference on e-Business Engineering(ICEBE), pages 230–235.
Bibliography 63
Lakhotia, K., Tillmann, N., Harman, M., and De Halleux, J. (2010). Flopsy: Search-based floating point constraint solving for symbolic execution. In 22nd InternationalConference on Testing Software and Systems (ICTSS), pages 142–157.
Lau, S. Q. (2006). Domain analysis of e-commerce systems using feature-based modeltemplates. PhD thesis, Master’s thesis, Dept. Electrical and Computer Engineering,University of Waterloo, Canada. Available at: http://http://gsd.uwaterloo.ca/node/98.
Lisboa, L. B., Garcia, V. C.and Lucrà c©dio, D., Almeida, E. S., Meira, S. R. L., andFortes, R. P. M. (2010). A systematic review of domain analysis tools. JournalInformation and Software Technology, 52(1):1–13.
Loesch, F. and Ploedereder, E. (2007). Optimization of variability in software productlines. In 11th International Software Product Line Conference (SPLC), pages 151–162.
Lotufo, R., She, S., Berger, T., Czarnecki, K., and Wasowski, A. (2010). Evolutionof the linux kernel variability model. In 14th International Software Product LineConference (SPLC), pages 136–150.
Mannion, M. (2002). Using first-order logic for product line model validation. In SecondSoftware Product Line Conference (SPLC), pages 176–187.
Mazo, R., Salinesi, C., and Diaz, D. (2012). Variamos: A tool for product line drivensystems engineering with a constraint based approach. In 24th International Con-ference on Advanced Information Systems Engineering (CAiSE), pages 1–8.
Mendonça, M., Bartolomei, T., and Donald, C. (2008). Decision-making coordinationin collaborative product configuration. In 23rd Annual ACM Symposium on AppliedComputing (SAC), pages 108–113.
Mendonça, M., Branco, M., and Cowan, D. (2009). S.p.l.o.t.: Software product linesonline tools. In 24th Conference on Object-Oriented Programming Systems, Lan-guages, and Applications (OOPSLA), pages 761–762.
Myllärniemi, V., Raatikainen, M., and Männistö, T. (2007). T.: Kumbang tools. In11th Software Product Line Conference (SPLC), pages 135–136.
Ondrej, R. and Alessandro, P. (2005). Xfeature modeling tool. Available at: http:
//www.pnp-software.com/XFeature/. Automatic Control Laboratory, ETH Zürich[Online; accessed 01-April-2013].
64 Bibliography
Park, J., Moon, M., and Yeom, K. (2004). Dream: Domain requirement asset man-ager in product lines. In International Symposium on Future Software Technology(ISFST).
Park, K., Ryu, D., and Baik, J. (2012). An integrated software management tool foradopting software product lines. In 11th International Conference on Computer andInformation Science (ICIS), pages 553–558.
Pereira, J., Maciel, L., Noronha, T., and Figueiredo, E. (2014). Instances: Search-basedproduct configuration in software product lines. Available at: http://homepages.
dcc.ufmg.br/~juliana.pereira/spl_study. [Online; accessed 04-January-2014].
Pereira, J., Souza, C. G., Figueiredo, E., Abilio, R., Vale, G., and Costa, H. (2013).Software variability management: An exploratory study with two feature modelingtools. In Brazilian Symposium on Components, Architectures and Reuse Software(SBCARS), pages 20–29.
Pohl, K. (2003). Varmod-prime tool environment. Available at: http:
//www.sse.uni-due.de/en/component/content/article/87-forschung/
abgeschlossene-projekte/148-varmod-prime-tool-environment. [Online;accessed 01-April-2013].
Pohl, K., Böckle, G., and Van der Linden, F. J. (2005). Software product line engi-neering: Foundations, principles and techniques. Springer-Verlag.
Prehofer, C. (2001). Feature-oriented programming: A new way of object composition.Concurrency and Computation: Practice and Experience, 13(6):465–501.
Salazar, J. R. (2009). Herramienta para el modelado y configuración de modelos decaracterísticas. PhD thesis, MsC Thesis, Dpto. Lenguajes y Ciencias de la Com-putación, Universidad de Málaga. Available at: http://caosd.lcc.uma.es/spl/
hydra/documents/PFC_JRSalazar.pdf [Online; accessed 03-January-2014].
Schmid, K., Krennrich, K., and Eisenbarth, M. (2006). Requirements management forproduct lines: Extending professional tools. In 10th International Software ProductLine Conference (SPLC), pages 113–122.
Seinturier, L., Merle, P., Rouvoy, R., Romero, D.and Schiavoni, V., and Stefani, J.(2012). A component-based middleware platform for reconfigurable service-orientedarchitectures. Software Practice and Experience, 42(5):559–583.
Bibliography 65
Simmonds, J., Bastarrica, M., Silvestre, L., and Quispe, A. (2011). Analyzing method-ologies and tools for specifying variability in software processes. computer sci-ence department, universidad de chile, santiago, chile. Paper available at: http:
//www.dcc.uchile.cl/TR/2011/TR_DCC-20111104-012.pdf. [Online; 03-January-2014].
Sinnema, M. and Deelstra, S. (2007). Classifying variability modeling techniques.Journal Information and Software Technology, 49(7):717–739.
Sinnema, M., Deelstra, S., Nijhuis, J., and Bosch, J. (2004). Covamof: A frameworkfor modeling variability in software product families. In 3th International SoftwareProduct Line Conference (SPLC), pages 197–213.
Spinczyk, O. and Beuche, D. (2004). Modeling and building software product lineswith eclipse. In 19th conference on Object-oriented programming systems, languages,and applications (OOPSLA), pages 18–19.
Succi, G., Yip, J., and Pedrycz, W. (2001). Holmes: an intelligent system to supportsoftware product line development. In 23rd International Conference on SoftwareEngineering (ICSE), pages 829–830.
Thao, C., Munson, E. V., and Nguyen, T. N. (2008). Software configuration man-agement for product derivation in software product families. In 15th InternationalConference and Workshop on the Engineering of Computer Based Systems (ECBS),pages 265–274.
Thüm, T. and Benduhn, F. (2011). Spl2go: An online repository for open-source soft-ware product lines. Available at: http://spl2go.cs.ovgu.de/projects. [Online;accessed 10-December-2013].
Thüm, T., Kästner, C., Benduhn, F., Meinicke, J., Saake, G., and Leich, T. (2014). Fea-tureide: An extensible framework for feature-oriented software development. JournalScience of Computer Programming, 79(0):70–85.
Thurimella, A. K. and Bruegge, B. (2012). Issue-based variability management in-formation and software technology. Journal Information and Software Technology,54(9):933–950.
Thurimella, A. K. and Janzen, D. (2011). Metadoc feature modeler: A plug-in for ibmrational doors. In 15th International Software Product Line Conference (SPLC),pages 313–322.
66 Bibliography
Tracz, W. (1995). A dssa domain analysis tool. ACM SIGSOFT Software Engineering,20(3):49–62.
Travassos, G. and Biolchini, J. (2007). Systematic review applied to software engineer-ing. In Brazilian Symposium on Software Engineering (SBES), pages 1–436.
Unphon, H. (2008). A comparison of variability modeling and configuration tools forproduct line architecture. Paper available at: http://www.itu.dk/people/unphon/technical_notes/CVC_v2008-06-30.pdf. [Online; accessed 15-January-2013].
van der Linden, F., Schmid, K., and Rommes, E. (2007). Software product lines inaction: The best industrial practice in product line engineering. Springer-Verlag.
Van Deursen, A. and Klint, P. (2002). Domain-specific language design requires featuredescriptions. Journal of Computing and Information Technology, 10(1):1–17.
Wesowski, A. (2004). Automatic generation of program families by model restrictions.In Third Software Product Line Conference (SPLC), pages 73–89.
White, J., Dougherty, B., and Schmidt, D. (2009). Selecting highly optimal architec-tural feature sets with filtered cartesian flattening. Journal of Systems and Software,89(8):1268–1284.
Wohlin, C., Runeson, P., Höst, M., Ohlsson, M. C., Regnell, B., and Wesslén, A.(2012). Experimentation in Software Engineering: An Introduction. Kluwer Aca-demic Publishers.
Yoo, S., Harman, M., and Ur, S. (2011). Highly scalable multi-objective test suiteminimization using graphics card. In 3th international conference on Search basedsoftware engineering (SSBSE), pages 219–236.