cosa.pdf
17
Elderly people’s perspectives on quality of life KATARINA WILHELMSON*, CHRISTINA ANDERSSON*, MARGDA WAERN# and PETER ALLEBECK* ABSTRACT Quality of life has become increasingly important as an outcome in medical research. The influence of health status is often emphasised, but other dimensions are important. In order to improve quality of life, there is a need to know what people themselves consider important to their perception of quality of life. The aim of this study was to investigate what older people consider to be important for their quality of life, and to explore the impact of gender, education and health status on individual perceptions. The study was of 141 randomly selected people aged from 67 to 99 years that formed a control sample for a study of suicide among older people. They were interviewed in person about their health, socio- demographic background and, using an open-ended question, what they con- si de red to cons tit ute qual ity of li fe . Thei r ans we rs we re grouped into ei ght categories, with social relations being the most frequent response, followed by health, activities, functional ability, wellbeing, personal beliefs and attitudes, their own home and personal finances. In addition, they were asked to choose from a ‘show card’ three items that they regarded as important to quality of life. Functional ability was the most frequently selected domain, followed by physical health, social relations and being able to continue to live in one’s present home. Our conclusion is that social relations, functional ability and activities influence the quality of life of elderly people as much as health status. KEY WORDS – qual it y of li fe , ag ed 80 pl us, healt h status, soci o-econo mi c factors. Introduction Qual it y of li fe has become increasi ngly import ant as an outcome in medical research and there is a vast literature on the topic. A Medline search with quality of life as the MeSH Major Topic for publications duri ng Janua ry 1990 to May 2004 yielde d over 15,000 hits. Many qualit y of life instruments have been developed during recent decades (Anderson * Depar tmen t of Social Medi cine, Go ¨ teborg University, Sweden. # Ins ti tute of Cl inic al Ne uros ci ence, Sa hl gr enska Universi ty Hospit al , Go ¨ teborg University, Sweden. Ageing & Society 25, 2005, 585–600. f 2005 Cambridge University Press 585 doi:10.1017/ S01446 86X050 03454 Printe d in the Uni ted Kingdo m
-
Upload
francisco-rojas -
Category
Documents
-
view
215 -
download
0
Transcript of cosa.pdf

8/11/2019 cosa.pdf
http://slidepdf.com/reader/full/cosapdf 1/17
Elderly people’s perspectives on quality of life
KATARINA WILHELMSON*, CHRISTINA ANDERSSON*,MARGDA WAERN# and PETER ALLEBECK*
ABSTRACT
Quality of life has become increasingly important as an outcome in medicalresearch. The influence of health status is often emphasised, but other dimensionsare important. In order to improve quality of life, there is a need to know what
people themselves consider important to their perception of quality of life. Theaim of this study was to investigate what older people consider to be important fortheir quality of life, and to explore the impact of gender, education and healthstatus on individual perceptions. The study was of 141 randomly selected peopleaged from 67 to 99 years that formed a control sample for a study of suicideamong older people. They were interviewed in person about their health, socio-demographic background and, using an open-ended question, what they con-sidered to constitute quality of life. Their answers were grouped into eightcategories, with social relations being the most frequent response, followed byhealth, activities, functional ability, wellbeing, personal beliefs and attitudes, their
own home and personal finances. In addition, they were asked to choose froma ‘show card’ three items that they regarded as important to quality of life.Functional ability was the most frequently selected domain, followed by physicalhealth, social relations and being able to continue to live in one’s present home.Our conclusion is that social relations, functional ability and activities influencethe quality of life of elderly people as much as health status.
KEY WORDS – quality of life, aged 80 plus, health status, socio-economicfactors.
Introduction
Quality of life has become increasingly important as an outcome inmedical research and there is a vast literature on the topic. A Medline search with quality of life as the MeSH Major Topic for publicationsduring January 1990 to May 2004 yielded over 15,000 hits. Many quality
of life instruments have been developed during recent decades (Anderson
* Department of Social Medicine Goteborg University Sweden
Ageing & Society 25, 2005, 585–600. f 2005 Cambridge University Press 585doi:10.1017/S0144686X05003454 Printed in the United Kingdom
8/11/2019 cosa.pdf
http://slidepdf.com/reader/full/cosapdf 2/17
et al . 1996; Wood-Dauphinee 1999). The impact of health status on thequality of life is often emphasised; indeed, many quality of life instrumentsmeasure general health status rather than quality of life (Faden and
German 1994; Leplege and Hunt 1997; Carr and Higginson 2001). Someuse the term health-related quality of life (Faden and German 1994;Leplege and Hunt 1997) to emphasise that they measure the quality of life as influenced by health status, but the two terms are sometimesconfounded (Gill and Feinstein 1994; Albert 1998). There are manydimensions of quality of life besides health status; many quality of lifeinstruments include different dimensions or domains such as physicalfunctioning, emotional functioning, cognitive functioning, social function-ing, life satisfaction, health perceptions, economic status, recreation, sexual
functioning and energy and vitality (Arnold 1991).The influence of health status on the quality of life is not easily under-
stood. Functional status and symptoms may well have an impact on qualityof life, but they are not synonymous with quality of life (Hunt 1997). Assumptions about the overall quality of life of individual patientsshould not be based on measures of their health status alone (Covinskyet al . 1999). As Albrecht and Devlieger (1999) pointed out, many peoplerate their quality of life as ‘good’ or ‘very good’ despite poor healthstatus – the ‘disability paradox’. Quality of life is a dynamic construct(Allison, Locker and Feine 1997). It varies among individuals and also forone person at different stages in life and by health status and experience(Carr, Gibson and Robinson 2001). Psychological phenomena such asadaptation, coping, expectancy, optimism, self-control and self-conceptmodify the individual’s conception of quality of life (Allison, Locker andFeine 1997).
Quality of life measurements have been criticised on the grounds thatthere is no clear definition of what quality of life is and how it is operation-
alised (Hunt 1997). Gill and Feinstein (1994) found that only 11 of 75 articlesthat measured quality of life actually defined the concept. They concludedthat quality of life can only suitably be measured by determining theopinions of patients and by supplementing (or replacing) the instrumentsdeveloped by ‘experts’. If social and health services are to assist peopleimprove their quality of life, they need to know what aspects of their livespeople themselves consider to be important, but few studies have askedindividuals to define what these are (Carr and Higginson 2001). Bowling (1995) asked a random sample of 2,000 British adults about the most
important things in their lives. They most frequently mentioned relation-ships with family or relatives, followed by their own health. Similar results
586 Katarina Wilhelmson et al.

8/11/2019 cosa.pdf
http://slidepdf.com/reader/full/cosapdf 3/17
similarly valued components of a good quality of life. A Swedish studyasked 87 healthy elderly people about what quality of life meant to them,and found an emphasis on health and independence, contentment and a
peaceful life, and personal integrity in terms of moral and caring attitudes(Nilsson et al . 1996).Quality of life among older people has also been studied in projects
funded by the UK Economic and Social Research Council (ESRC)Growing Older Programme (Walker 2004). In one of these, Gabriel andBowling (2004) found the main quality of life themes to be social relation-ships, home and neighbourhood, social capital, psychological wellbeing and outlooks, activities and hobbies, health and functional ability, andsocial roles and activities. In another study, Wiggins et al . (2004) found
the quality of life in early old age to be influenced by social support andparticipation, the quality and quantity of social contact, feelings of trustand reciprocity about local neighbourhood, health and security. Despitethese studies, information on what older people consider constitutes agood quality of life remains scarce. The aim of this study was to investigatewhat elderly people consider to be important for their quality of life, and toexplore the impact of gender, education and health status on individuals’perception of quality of life.
Study population and methods
The study population was Scandinavian-born men and women aged 65or more years who lived in the City of Goteborg and an extensive ruralarea in the west of Sweden in 1997. The elderly (65+ years) population of the study area was 210,703. The subjects were a control sample in a studyof suicide among older people, and were randomly chosen from the roster
of the regional tax authorities, living in the same area and with the samesex and birth year ( +/x 2 years) as the study cases in the suicide study(Rubenowitz et al . 2001): 240 people were invited and 153 participated(response rate 64 per cent). The reasons for non-participation includedpoor health (13), social reasons (8) and lack of interest (60). This studyincluded those who were interviewed in person (face-to-face or by tele-phone) and answered the questions on quality of life. Thus, we excludedten proxy interviews (due to dementia) and two interviews lacking responses to the quality of life questions. A total of 141 people (79 men,
62 women) participated in this study, of whom six were interviewed bytelephone (by their choice). Socio-demographic background data for the
Elderly people’s perspectives on quality of life 587

8/11/2019 cosa.pdf
http://slidepdf.com/reader/full/cosapdf 4/17
The median age was 76 years for both men (range 67–98 years) andwomen (range 67–99 years).
The interviews were carried out using a semi-structured questionnaireduring March 1998 to September 1999. The subjects were sent a letter
with information about the study and later telephoned. The interviewswere undertaken by a geriatrician (KW), a psychiatric occupationaltherapist (CA), and a psychiatric nurse, all being experienced interviewers.Most took place in the participants’ homes, although a few chose theinterviewer’s office. The questionnaire covered the informant’s socio-demographic characteristics and what they considered to be their qualityof life and health status. There was an open-ended question, ‘What isquality of life for you?’ Then, they were asked to choose three statementsfrom a show card about things that might influence the quality of life.1
They were not asked to place them in rank order. Among the respondents, 138 people (77 men and 61 women) answered
T A B L E 1. Characteristics of the participants
Attribute Men Women
Age groups (years)65–69 7 470–74 27 1475–79 15 2180–84 8 1185–89 14 990–94 4 295+ 4 1
Marital statusNever married 8 2Married/cohabitating 50 21Divorced 3 3
Widow/widower 18 36Educational level
Elementary only 38 30 Above elementary 41 32
Social class1
I 22 11II 25 21III 32 30
Total (sample sizes) 79 62
Notes : 1. According to the Swedish Socio-economic Classification. Social class I (SEI >47) are professionals
and other higher non-manual employees, or self-employed; social class II (SEI 33–47) are lower tointermediate non-manual employees; and social class III (SEI 11–22) are manual workers ( Swedish Socio-economic Classification 1995. Statistics Sweden, Stockholm.).
588 Katarina Wilhelmson et al.
8/11/2019 cosa.pdf
http://slidepdf.com/reader/full/cosapdf 5/17
fragmented into statements in different categories, but each responsecould only contribute once to a category. The categorisation was re-evaluated until the various categories accorded with the original statements
and all the statements were categorised.Turning to the responses to the show card list, 139 people (77 men and62 women) gave three answers, but two men (aged 84 and 90 years) didnot choose any item from the show card (one said that all were equallyimportant). The single items were grouped into domains after all theinterviews were complete, and it was found that the domains includeddifferent numbers of items (Tables 3–4). If a participant selected more thanone item from the same domain, the answer was included only once.
We used the Cumulative Illness Rating Scale for Geriatrics (CIRS-G) (Miller
et al . 1992) to assess ‘illness burden’. This rating scale is a modificationof the Cumulative Illness Rating Scale that indicates the common healthproblems of older people (Linn, Linn and Gurel 1968). The revised scaleprovides ratings of disability in 13 somatic organ systems plus psychiatricdisorders. The scores range from ‘0’ (no problems) to ‘4’ (severe illness/severe impairment in function).2 Severe illness was defined as a rating above ‘2’ in any category.
Statistical analyses
Since men were over-represented, the results were calculated for men andwomen separately. Statistical tests of the differences between subgroups yielded no more significant results than mere chance.
Results
The informants descriptions of quality of life
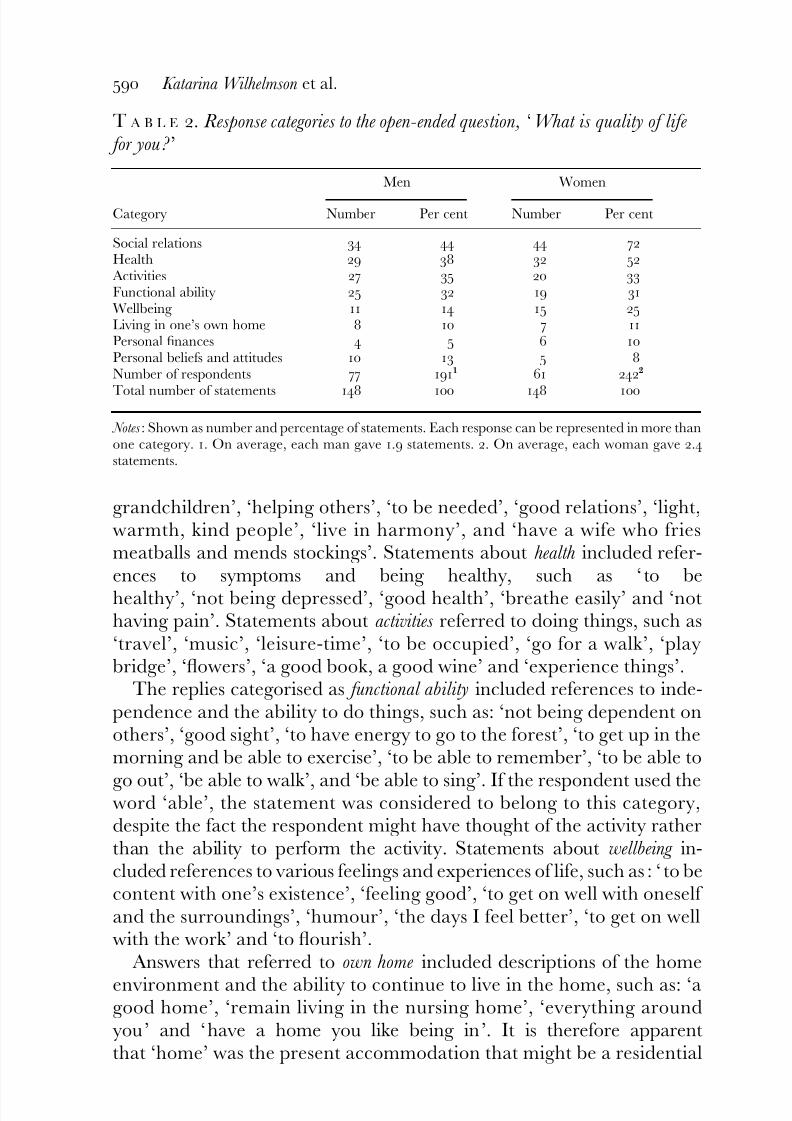
Analysis of the open-ended question ‘ What is the quality of life for you’resulted in eight categories (Table 2). The most frequently mentioneddomain was social relationships , followed by health , activities and functional ability. This rank order was similar for men and women, although theordering differed by gender for the less frequently mentioned domainsown home, finances and personal beliefs and attitudes . The frequencies of the mostcommon answers did however differ greatly between men and women,partly because on average women gave 27 per cent more answers thanmen. Social relations were cited by 72 per cent of women but only 44 per
cent of men, and health by 52 per cent of women and 38 per cent of men.The references to social relations included answers that directly described
Elderly people’s perspectives on quality of life 589
8/11/2019 cosa.pdf
http://slidepdf.com/reader/full/cosapdf 6/17
grandchildren’, ‘helping others’, ‘to be needed’, ‘good relations’, ‘light,warmth, kind people’, ‘live in harmony’, and ‘have a wife who friesmeatballs and mends stockings’. Statements about health included refer-ences to symptoms and being healthy, such as ‘ to behealthy’, ‘not being depressed’, ‘good health’, ‘breathe easily’ and ‘nothaving pain’. Statements about activities referred to doing things, such as‘travel’, ‘music’, ‘leisure-time’, ‘to be occupied’, ‘go for a walk’, ‘playbridge’, ‘flowers’, ‘a good book, a good wine’ and ‘experience things’.
The replies categorised as functional ability included references to inde-pendence and the ability to do things, such as: ‘not being dependent onothers’, ‘good sight’, ‘to have energy to go to the forest’, ‘to get up in themorning and be able to exercise’, ‘to be able to remember’, ‘to be able to
go out’, ‘be able to walk’, and ‘be able to sing’. If the respondent used theword ‘able’, the statement was considered to belong to this category,despite the fact the respondent might have thought of the activity ratherthan the ability to perform the activity. Statements about wellbeing in-cluded references to various feelings and experiences of life, such as : ‘ to becontent with one’s existence’, ‘feeling good’, ‘to get on well with oneself and the surroundings’, ‘humour’, ‘the days I feel better’, ‘to get on wellwith the work’ and ‘to flourish’.
Answers that referred to own home included descriptions of the home
environment and the ability to continue to live in the home, such as: ‘agood home’, ‘remain living in the nursing home’, ‘everything around
T A B L E 2. Response categories to the open-ended question, ‘What is quality of life for you ? ’
Category
Men Women
Number Per cent Number Per cent
Social relations 34 44 44 72Health 29 38 32 52 Activities 27 35 20 33Functional ability 25 32 19 31Wellbeing 11 14 15 25Living in one’s own home 8 10 7 11Personal finances 4 5 6 10Personal beliefs and attitudes 10 13 5 8Number of respondents 77 1911 61 2422
Total number of statements 148 100 148 100
Notes : Shown as number and percentage of statements. Each response can be represented in more thanone category. 1. On average, each man gave 1.9 statements. 2. On average, each woman gave 2.4statements.
590 Katarina Wilhelmson et al.
8/11/2019 cosa.pdf
http://slidepdf.com/reader/full/cosapdf 7/17
institution. The finances domain included statements regarding economicindependence and not worrying about one’s personal finances. Statementsabout personal beliefs and attitudes included references to religion and atti-
tudes about ways of living, such as: ‘eating the right sort of food so youfeel well’, ‘not denying yourself’ and ‘contact with church’.
Show card domains and items
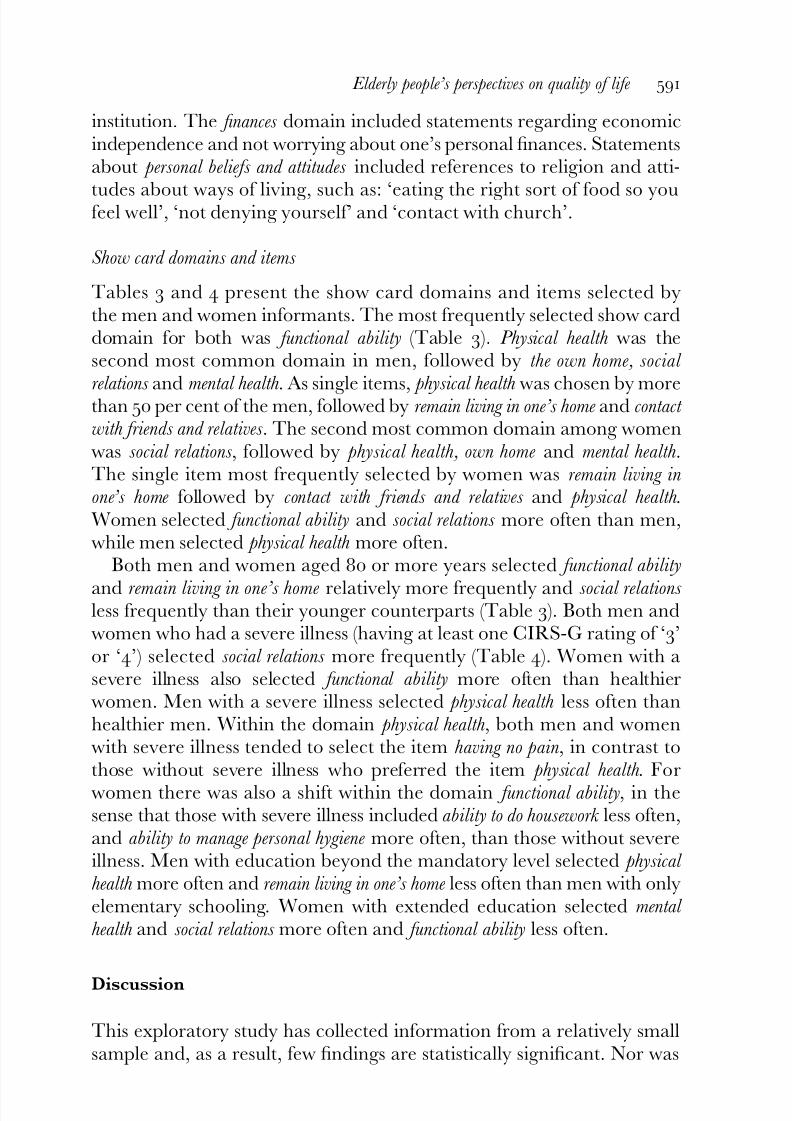
Tables 3 and 4 present the show card domains and items selected bythe men and women informants. The most frequently selected show carddomain for both was functional ability (Table 3). Physical health was thesecond most common domain in men, followed by the own home, social
relations and mental health . As single items, physical health was chosen by morethan 50 per cent of the men, followed by remain living in one’s home and contact with friends and relatives . The second most common domain among womenwas social relations , followed by physical health, own home and mental health .The single item most frequently selected by women was remain living inone’s home followed by contact with friends and relatives and physical health .Women selected functional ability and social relations more often than men,while men selected physical health more often.
Both men and women aged 80 or more years selected functional ability
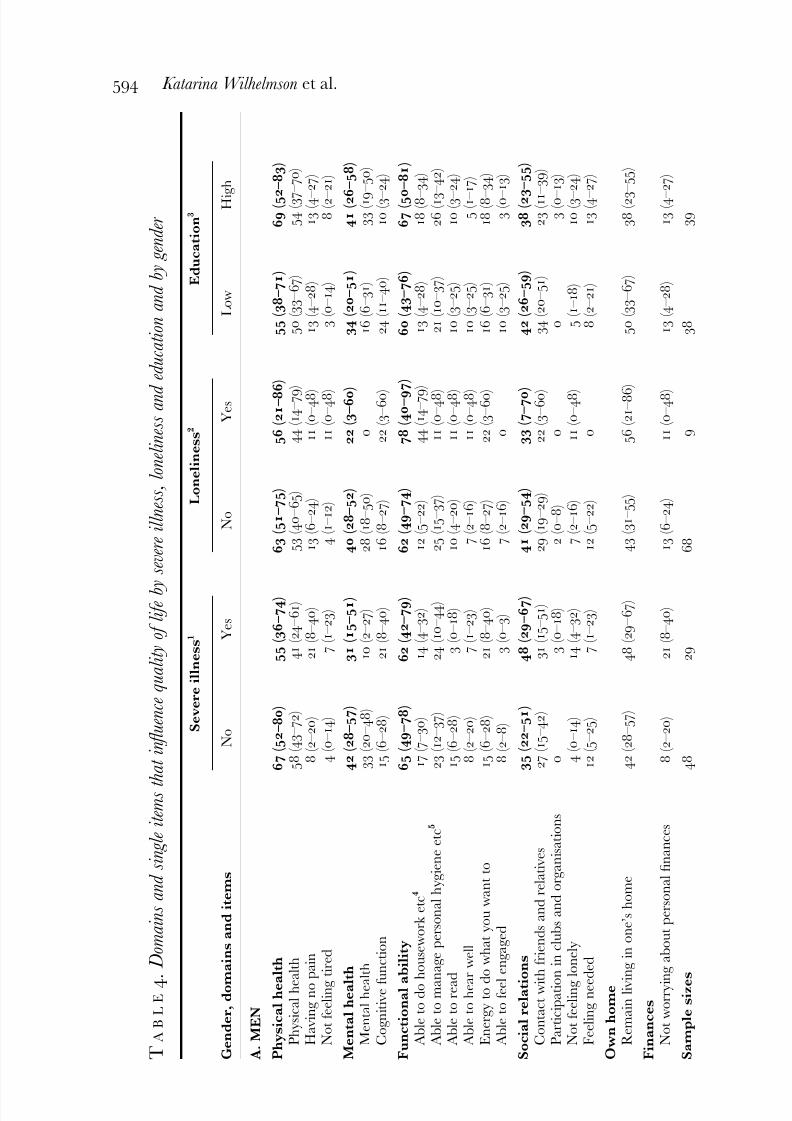
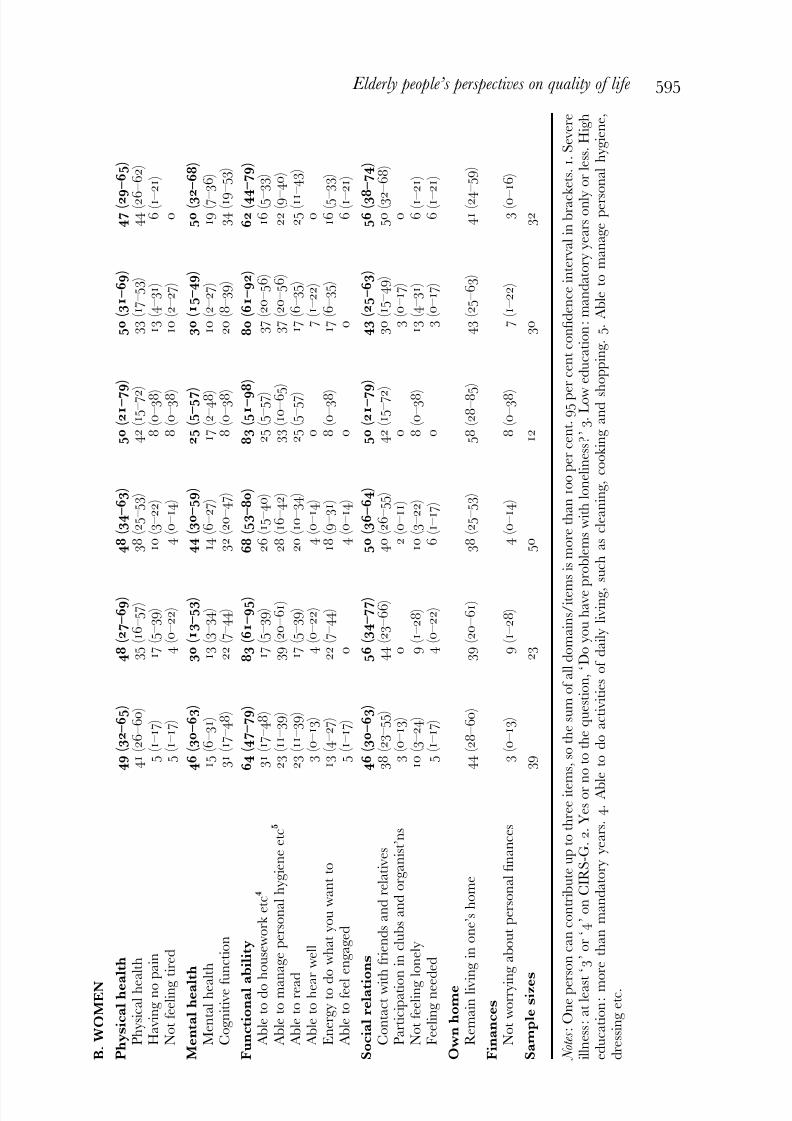
and remain living in one’s home relatively more frequently and social relations less frequently than their younger counterparts (Table 3). Both men andwomen who had a severe illness (having at least one CIRS-G rating of ‘3’or ‘4’) selected social relations more frequently (Table 4). Women with asevere illness also selected functional ability more often than healthierwomen. Men with a severe illness selected physical health less often thanhealthier men. Within the domain physical health , both men and womenwith severe illness tended to select the item having no pain, in contrast tothose without severe illness who preferred the item physical health . For
women there was also a shift within the domain functional ability, in thesense that those with severe illness included ability to do housework less often,and ability to manage personal hygiene more often, than those without severeillness. Men with education beyond the mandatory level selected physical health more often and remain living in one’s home less often than men with onlyelementary schooling. Women with extended education selected mental health and social relations more often and functional ability less often.
Discussion
Elderly people’s perspectives on quality of life 591

8/11/2019 cosa.pdf
http://slidepdf.com/reader/full/cosapdf 8/17
L E 3 .
T h e d o m a i n s a n d s i n g l e i t e m
s i d e n t i fi e d a s i n fl u e n c i n g q u a l i t y o f l i f e b y g e n d e r a n d a g e g r o u p
i n a n d
i t e m s
M e n
A g e g r o u p ( y e a r s )
W o m e n
A g e g r o u p ( y e a r s )
L e s s t h a n 8 0
8 0 o r m o r e
A l l
L e s s t h a
n 8 0
8 0 o r m o r e
A
l l
c a l h e a
l t h
6 5 ( 5 0 – 7 8 )
5 7 ( 3 7 – 7 6 )
6 2 ( 5 1 – 7 3 )
4 9 ( 3 2 –
6 5 )
4 8 ( 2 7 – 6 9 )
4 8 ( 3
5 – 6 1 )
i c a l h e a l t h
5 3 ( 3 8 – 6 7 )
5 0 ( 3 1 – 6 9 )
5 2 ( 4 0 – 6 3 )
4 4 ( 2 8 –
6 0 )
3 0 ( 1 3 – 5 3 )
3 9 ( 2
7 – 5 2 )
i n g n o p a i n
1 8 ( 9 – 3 2 )
4 ( 0 – 1 8 )
1 3 ( 6 – 2 3 )
5 ( 1 – 1 7 )
1 7 ( 5 – 3 9 )
1 0 ( 4
– 2 0 )
f e e l i n g
t i r e d
6 ( 1 – 1 7 )
4 ( 0 – 1 8 )
5 ( 1 – 1 3 )
3 ( 0 – 1
3 )
9 ( 1 – 2 8 )
5 ( 1 – 1 3 )
a l h e a l t h
3 3 ( 2 0 – 4 7 )
4 6 ( 2 8 – 6 6 )
3 8 ( 2 7 – 4 9 )
4 9 ( 3 2 –
6 5 )
2 6 ( 1 0 – 4 8 )
4 0 ( 2
8 – 5 4 )
n t a l h e a
l t h
2 4 ( 1 3 – 3 9 )
2 5 ( 1 1 – 4 5 )
2 5 ( 1 6 – 3 6 )
2 0 ( 9 – 3
6 )
4 ( 0 – 2 2 )
1 4 ( 7
– 2 6 )
n i t i v e f u n c t i o n
1 4 ( 6 – 2 7 )
2 1 ( 8 – 4 1 )
1 7 ( 9 – 2 7 )
3 1 ( 1 7 – 4 8 )
2 2 ( 7 – 4 4 )
2 7 ( 1 7 – 4 0 )
i o n a l a
b i l i t y
5 9 ( 4 4 – 7 3 )
7 1 ( 5 1 – 8 7 )
6 4 ( 5 2 – 7 4 )
6 2 ( 4 4 –
7 7 )
8 7 ( 6 6 – 9 7 )
7 1 ( 5
8 – 8 2 )
t o d o
h o u s e w o r k e t c 1
1 6 ( 7 – 3 0 )
1 4 ( 4 – 3 3 )
1 6 ( 8 – 2 6 )
2 8 ( 1 5 – 4 5 )
2 2 ( 7 – 4 4 )
2 6 ( 1 6 – 3 8 )
t o m a n a g e p e r s o n a l h y g i e n e e t c 2
2 6 ( 1 5 – 4 1 )
1 8 ( 6 – 3 7 )
2 3 ( 1 4 – 3 4 )
2 6 ( 1 3 – 4 2 )
3 5 ( 1 6 – 5 7 )
2 9 ( 1 8 – 4 2 )
t o r e a d
1 0 ( 3 – 2 2 )
1 1 ( 2 – 2 8 )
1 0 ( 5 – 1 9 )
1 8 ( 7 – 3 4 )
2 6 ( 1 0 – 4 8 )
2 1 ( 1 2 – 3 3 )
t o h e a
r w e l l
6 ( 1 – 1 7 )
1 1 ( 2 – 2 8 )
8 ( 3 – 1 6 )
3 ( 0 – 1
3 )
4 ( 0 – 2 2 )
3 ( 0
– 1 1 )
r g y t o d
o w h a t y o u w a n t t o
1 2 ( 5 – 2 5 )
2 5 ( 1 1 – 4 5 )
1 7 ( 9 – 2 7 )
1 3 ( 4 – 2
7 )
2 2 ( 7 – 4 4 )
1 6 ( 8
– 2 8 )
t o f e e l e n g a g e d
2 ( 0 – 1 1 )
1 4 ( 4 – 3 3 )
6 ( 2 – 1 4 )
3 ( 0 – 1
3 )
4 ( 0 – 2 2 )
3 ( 0
– 1 1 )
r e l a t i o n s
4 3 ( 2 9 – 5 8 )
3 6 ( 1 9 – 5 6 )
4 0 ( 2 9 – 5 2 )
5 4 ( 3 7 –
7 0 )
4 4 ( 2 3 – 6 6 )
5 0 ( 3
7 – 6 3 )
t a c t w i t h f r i e n d s a n d r e l a t i v e s
2 9 ( 1 7 – 4 3 )
2 9 ( 1 3 – 4 9 )
2 9 ( 1 9 – 4 0 )
4 6 ( 3 0 –
6 3 )
3 0 ( 1 3 – 5 3 )
4 0 ( 2
8 – 5 4 )
i c i p a t i o
n i n c l u b s a n d o r g a n i s a t i o n s
2 ( 0 – 1 1 )
0
1 ( 0 – 7 )
3 ( 0 – 1
3 )
0
2 ( 0
– 9 )
f e e l i n g
l o n e l y
1 2 ( 5 – 1 2 )
0
8 ( 3 – 1 6 )
8 ( 2 – 2
1 )
1 3 ( 3 – 3 4 )
1 0 ( 4
– 2 0 )
i n g n e e
d e d
1 0 ( 3 – 2 2 )
1 1 ( 2 – 2 8 )
1 0 ( 5 – 1 9 )
8 ( 2 – 2
1 )
0
5 ( 1 – 1 3 )
h o m e
m a i n l i v i n g i n o n e ’ s h o m e
4 1 ( 2 7 – 5 6 )
5 0 ( 3 1 – 6 9 )
4 4 ( 3 3 – 5 6 )
3 6 ( 2 1 – 5 3 )
5 2 ( 3 1 – 7 3 )
4 2 ( 3
0 – 5 5 )
m y
w o r r y i n g a b o u t p e r s o n a l fi n a n c e s
1 4 ( 6 – 2 7 )
1 1 ( 2 – 2 8 )
1 3 ( 6 – 2 3 )
8 ( 2 – 2
1 )
0
5 ( 1 – 1 3 )
l e s i z e s
4 9
2 8
7 7
3 9
2 3
6 2
T h e fi g u
r e s a r e t h e p e r c e n t a g e s t h a t s e l e c t e d t h e d o m a i n s a n d i t e m s f r o m t h e
s h o w c a r d . E a c h i n f o r m a n t c o u l d
c o n t r i b u t e u p t o t h r e e i t e m s , t h e r e f o r e t h e s u m s
o m a i n s / i t e m s a r e m o r e t h a n 1 0 0 p e r c e n t . 9 5 % c o n fi d e n c e i n t e r v a l s i n b r a c k e t s . 1 . A b l e t o d o a c t i v i t i e s o f d a i l y l i v i n g , s u c h a s c l e a n i n g , c o o k i n g a n d s h o p p i n g .
t o m a n a g e p e r s o n a l h y g i e n e , d r e s s i n g e t c
.
592 Katarina Wilhelmson et al.

8/11/2019 cosa.pdf
http://slidepdf.com/reader/full/cosapdf 9/17
the sample totally representative of the older population, since men wereover-represented. The separate results for the male and female sub-samples may be taken as representative of elderly men and elderly women.
When comparing studies of quality of life from different countries, onemust be aware that linguistic as well as cultural – including ethnic, politicaland civic – differences might be influential (Bajekal et al . 2004; Warneset al . 1999). The Swedish word for quality of life, livskvalitet , has the samemeaning and nuances as the English term. Nonetheless, differentlanguages make it difficult to compare our findings with studies done inother countries, especially when the respondents had to choose from theshow card. Cultural differences might have especially influenced theanswers to the open-ended question.
Although the conclusions must be cautiously drawn, several findingsare striking and in accordance with previous studies. In answer to ourquestion on what they themselves considered to constitute quality of life,all but a few had no difficulty understanding the term ‘quality of life’.Even though many authors have emphasised that quality of life is indi- vidual and is best evaluated by the individual (Gill and Feinstein 1994 ;O’Boyle 1997), there have been few similar, systematic and comparablestudies (Bowling 1995; Farquhar 1995; Nilsson et al . 1996; Gabriel andBowling 2004).
Both an open-ended question and the selection of items from a showcard were used. There were some discrepancies in the responses to thetwo approaches. Showing a list clearly prompts the participant to chooseitems from that list (Bowling 1995). Social relations dominated the answersto the open question, while functional ability was the domain most frequentlychosen from the show card. Remain living in one’s home was frequently chosenfrom the show card, but seldom mentioned in the responses to the open-ended question. Activities were not included on the show card, but were
commonly mentioned among the responses to the open question. Theimportance of activities and functional abilities was in accordance withthe representation of good health in old age as including the ability to‘go and do’ meaningful activity (Bryant, Corbett and Kutner 2001), andwith the main quality of life themes in the study by Gabriel and Bowling (2004). The order of the items on a show card might also influence theanswers, including the frequency of references to different domains. Thefact that there were more references to functional ability than any otherdomain on the show card may be a reason for the high number of
responses that referred to this domain. The use of pre-coded responsesmight also influence the answers. These methodological influences must
Elderly people’s perspectives on quality of life 593
8/11/2019 cosa.pdf
http://slidepdf.com/reader/full/cosapdf 10/17
L E 4 .
D o m a i n s a n d s i n g l e i t e m s t h
a t i n fl u e n c e q u a l i t y o f l i f e b y
s e v e r e i l l n e s s , l o n e l i n e s s a n d
e d u c a t i o n a n d b y g e n d e r
e r , d o m
a i n s a n d i t e m s
S e v e r e i l l n e s s 1
L o n e l i n e s s 2
E d u c a t i o n 3
N o
Y e s
N o
Y e s
L o w
H i g h
E N c
a l h e a
l t h
6 7 ( 5 2 – 8 0 )
5 5 ( 3 6 – 7 4 )
6 3 ( 5 1 – 7 5 )
5 6 ( 2 1 – 8 6 )
5 5 ( 3 8 – 7 1 )
6 9 ( 5 2
– 8 3 )
i c a l h e a l t h
5 8 ( 4 3 – 7 2 )
4 1 ( 2 4 – 6 1 )
5 3 ( 4 0 – 6 5 )
4 4 ( 1 4 – 7 9
)
5 0 ( 3 3 – 6 7 )
5 4 ( 3 7
– 7 0 )
i n g n o p a i n
8 ( 2 – 2 0 )
2 1 ( 8 – 4 0 )
1 3 ( 6 – 2 4 )
1 1 ( 0 – 4 8 )
1 3 ( 4 – 2 8 )
1 3 ( 4 –
2 7 )
f e e l i n g
t i r e d
4 ( 0 – 1 4 )
7 ( 1 – 2 3 )
4 ( 1 – 1 2 )
1 1 ( 0 – 4 8 )
3 ( 0 – 1 4 )
8 ( 2 –
2 1 )
a l h e a l t h
4 2 ( 2 8 – 5 7 )
3 1 ( 1 5 – 5 1 )
4 0 ( 2 8 – 5 2 )
2 2 ( 3 – 6 0 )
3 4 ( 2 0 – 5 1 )
4 1 ( 2 6
– 5 8 )
n t a l h e a
l t h
3 3 ( 2 0 – 4 8 )
1 0 ( 2 – 2 7 )
2 8 ( 1 8 – 5 0 )
0
1 6 ( 6 – 3 1 )
3 3 ( 1 9
– 5 0 )
n i t i v e f u n c t i o n
1 5 ( 6 – 2 8 )
2 1 ( 8 – 4 0 )
1 6 ( 8 – 2 7 )
2 2 ( 3 – 6 0 )
2 4 ( 1 1 – 4 0 )
1 0 ( 3 –
2 4 )
i o n a l a
b i l i t y
6 5 ( 4 9 – 7 8 )
6 2 ( 4 2 – 7 9 )
6 2 ( 4 9 – 7 4 )
7 8 ( 4 0 – 9 7 )
6 0 ( 4 3 – 7 6 )
6 7 ( 5 0
– 8 1 )
t o d o h o u s e w o r k e t c 4
1 7 ( 7 – 3 0 )
1 4 ( 4 – 3 2 )
1 2 ( 5 – 2 2 )
4 4 ( 1 4 – 7 9
)
1 3 ( 4 – 2 8 )
1 8 ( 8 –
3 4 )
t o m a n a g e p e r s o n a l h y g i e n e e t c 5
2 3 ( 1 2 – 3 7 )
2 4 ( 1 0 – 4 4 )
2 5 ( 1 5 – 3 7 )
1 1 ( 0 – 4 8 )
2 1 ( 1 0 – 3 7 )
2 6 ( 1 3
– 4 2 )
t o r e a d
1 5 ( 6 – 2 8 )
3 ( 0 – 1 8 )
1 0 ( 4 – 2 0 )
1 1 ( 0 – 4 8 )
1 0 ( 3 – 2 5 )
1 0 ( 3 –
2 4 )
t o h e a
r w e l l
8 ( 2 – 2 0 )
7 ( 1 – 2 3 )
7 ( 2 – 1 6 )
1 1 ( 0 – 4 8 )
1 0 ( 3 – 2 5 )
5 ( 1 –
1 7 )
r g y t o d
o w h a t y o u w a n t t o
1 5 ( 6 – 2 8 )
2 1 ( 8 – 4 0 )
1 6 ( 8 – 2 7 )
2 2 ( 3 – 6 0 )
1 6 ( 6 – 3 1 )
1 8 ( 8 –
3 4 )
t o f e e l e n g a g e d
8 ( 2 – 8 )
3 ( 0 – 3 )
7 ( 2 – 1 6 )
0
1 0 ( 3 – 2 5 )
3 ( 0 –
1 3 )
r e l a t i o n s
3 5 ( 2 2 – 5 1 )
4 8 ( 2 9 – 6 7 )
4 1 ( 2 9 – 5 4 )
3 3 ( 7 – 7 0 )
4 2 ( 2 6 – 5 9 )
3 8 ( 2 3
– 5 5 )
t a c t w i t h f r i e n d s a n d r e l a t i v e s
2 7 ( 1 5 – 4 2 )
3 1 ( 1 5 – 5 1 )
2 9 ( 1 9 – 2 9 )
2 2 ( 3 – 6 0 )
3 4 ( 2 0 – 5 1 )
2 3 ( 1 1 – 3 9 )
i c i p a t i o
n i n c l u b s a n d o r g a n i s a t i o n s
0
3 ( 0 – 1 8 )
2 ( 0 – 8 )
0
0
3 ( 0 –
1 3 )
f e e l i n g
l o n e l y
4 ( 0 – 1 4 )
1 4 ( 4 – 3 2 )
7 ( 2 – 1 6 )
1 1 ( 0 – 4 8 )
5 ( 1 – 1 8 )
1 0 ( 3 –
2 4 )
i n g n e e
d e d
1 2 ( 5 – 2 5 )
7 ( 1 – 2 3 )
1 2 ( 5 – 2 2 )
0
8 ( 2 – 2 1 )
1 3 ( 4 –
2 7 )
h o m e
m a i n l i v i n g i n o n e ’ s h o m e
4 2 ( 2 8 – 5 7 )
4 8 ( 2 9 – 6 7 )
4 3 ( 3 1 – 5 5 )
5 6 ( 2 1 – 8 6
)
5 0 ( 3 3 – 6 7 )
3 8 ( 2 3
– 5 5 )
c e s
w o r r y i n g a b o u t p e r s o n a l fi n a n c e s
8 ( 2 – 2 0 )
2 1 ( 8 – 4 0 )
1 3 ( 6 – 2 4 )
1 1 ( 0 – 4 8 )
1 3 ( 4 – 2 8 )
1 3 ( 4 –
2 7 )
l e s i z e s
4 8
2 9
6 8
9
3 8
3 9
594 Katarina Wilhelmson et al.
8/11/2019 cosa.pdf
http://slidepdf.com/reader/full/cosapdf 11/17
O M E N
c a l h e a
l t h
4 9 ( 3 2 – 6 5 )
4 8 ( 2 7 – 6 9 )
4 8 ( 3 4 – 6 3 )
5 0 ( 2 1 – 7 9 )
5 0 ( 3 1 – 6 9 )
4 7 ( 2 9
– 6 5 )
i c a l h e a l t h
4 1 ( 2 6 – 6 0 )
3 5 ( 1 6 – 5 7 )
3 8 ( 2 5 – 5 3 )
4 2 ( 1 5 – 7 2 )
3 3 ( 1 7 – 5 3 )
4 4 ( 2 6
– 6 2 )
i n g n o p a i n
5 ( 1 – 1 7 )
1 7 ( 5 – 3 9 )
1 0 ( 3 – 2 2 )
8 ( 0 – 3 8 )
1 3 ( 4 – 3 1 )
6 ( 1 –
2 1 )
f e e l i n g
t i r e d
5 ( 1 – 1 7 )
4 ( 0 – 2 2 )
4 ( 0 – 1 4 )
8 ( 0 – 3 8 )
1 0 ( 2 – 2 7 )
0
a l h e a l t h
4 6 ( 3 0 – 6 3 )
3 0 ( 1 3 – 5 3 )
4 4 ( 3 0 – 5 9 )
2 5 ( 5 – 5 7 )
3 0 ( 1 5 – 4 9 )
5 0 ( 3 2
– 6 8 )
n t a l h e a
l t h
1 5 ( 6 – 3 1 )
1 3 ( 3 – 3 4 )
1 4 ( 6 – 2 7 )
1 7 ( 2 – 4 8 )
1 0 ( 2 – 2 7 )
1 9 ( 7 –
3 6 )
n i t i v e f u n c t i o n
3 1 ( 1 7 – 4 8 )
2 2 ( 7 – 4 4 )
3 2 ( 2 0 – 4 7 )
8 ( 0 – 3 8 )
2 0 ( 8 – 3 9 )
3 4 ( 1 9
– 5 3 )
i o n a l a
b i l i t y
6 4 ( 4 7 – 7 9 )
8 3 ( 6 1 – 9 5 )
6 8 ( 5 3 – 8 0 )
8 3 ( 5 1 – 9 8 )
8 0 ( 6 1 – 9 2 )
6 2 ( 4 4
– 7 9 )
t o d o h o u s e w o r k e t c 4
3 1 ( 1 7 – 4 8 )
1 7 ( 5 – 3 9 )
2 6 ( 1 5 – 4 0 )
2 5 ( 5 – 5 7 )
3 7 ( 2 0 – 5 6 )
1 6 ( 5 –
3 3 )
t o m a n a g e p e r s o n a l h y g i e n e e t c 5
2 3 ( 1 1 – 3 9 )
3 9 ( 2 0 – 6 1 )
2 8 ( 1 6 – 4 2 )
3 3 ( 1 0 – 6 5
)
3 7 ( 2 0 – 5 6 )
2 2 ( 9 –
4 0 )
t o r e a d
2 3 ( 1 1 – 3 9 )
1 7 ( 5 – 3 9 )
2 0 ( 1 0 – 3 4 )
2 5 ( 5 – 5 7 )
1 7 ( 6 – 3 5 )
2 5 ( 1 1 – 4 3 )
t o h e a
r w e l l
3 ( 0 – 1 3 )
4 ( 0 – 2 2 )
4 ( 0 – 1 4 )
0
7 ( 1 – 2 2 )
0
r g y t o d
o w h a t y o u w a n t t o
1 3 ( 4 – 2 7 )
2 2 ( 7 – 4 4 )
1 8 ( 9 – 3 1 )
8 ( 0 – 3 8 )
1 7 ( 6 – 3 5 )
1 6 ( 5 –
3 3 )
t o f e e l e n g a g e d
5 ( 1 – 1 7 )
0
4 ( 0 – 1 4 )
0
0
6 ( 1 –
2 1 )
r e l a t i o n s
4 6 ( 3 0 – 6 3 )
5 6 ( 3 4 – 7 7 )
5 0 ( 3 6 – 6 4 )
5 0 ( 2 1 – 7 9 )
4 3 ( 2 5 – 6 3 )
5 6 ( 3 8
– 7 4 )
t a c t w i t h f r i e n d s a n d r e l a t i v e s
3 8 ( 2 3 – 5 5 )
4 4 ( 2 3 – 6 6 )
4 0 ( 2 6 – 5 5 )
4 2 ( 1 5 – 7 2 )
3 0 ( 1 5 – 4 9 )
5 0 ( 3 2
– 6 8 )
i c i p a t i o
n i n c l u b s a n d o r g a n i s t ’ n s
3 ( 0 – 1 3 )
0
2 ( 0 – 1 1 )
0
3 ( 0 – 1 7 )
0
f e e l i n g
l o n e l y
1 0 ( 3 – 2 4 )
9 ( 1 – 2 8 )
1 0 ( 3 – 2 2 )
8 ( 0 – 3 8 )
1 3 ( 4 – 3 1 )
6 ( 1 –
2 1 )
i n g n e e
d e d
5 ( 1 – 1 7 )
4 ( 0 – 2 2 )
6 ( 1 – 1 7 )
0
3 ( 0 – 1 7 )
6 ( 1 –
2 1 )
h o m e
m a i n l i v i n g i n o n e ’ s h o m e
4 4 ( 2 8 – 6 0 )
3 9 ( 2 0 – 6 1 )
3 8 ( 2 5 – 5 3 )
5 8 ( 2 8 – 8 5
)
4 3 ( 2 5 – 6 3 )
4 1 ( 2 4
– 5 9 )
c e s
w o r r y i n g a b o u t p e r s o n a l fi n a n c e s
3 ( 0 – 1 3 )
9 ( 1 – 2 8 )
4 ( 0 – 1 4 )
8 ( 0 – 3 8 )
7 ( 1 – 2 2 )
3 ( 0 –
1 6 )
l e s i z e s
3 9
2 3
5 0
1 2
3 0
3 2
O n e p e r s o n c a n c o n t r i b u t e u p t o t h r e e i t e m s , s o t h e s u m o f a l l d o m a i n s / i t e m
s i s m o r e t h a n 1 0 0 p e r c e n t . 9 5 p e r c e n t c o n fi d e n c e i n t e r v a l i n b r a c k e t s . 1 . S e v e r e
a t l e a s t ‘ 3 ’ o r ‘ 4 ’ o n C I R S - G . 2 . Y e s o r n o t o t h e q u e s t i o n , ‘ D o y o u h a v e p r o b l e m s w i t h l o n e l i n e s s ? ’ 3 . L o w
e d u c a t i o n : m a n d a t o r y y e a r s o n l y
o r l e s s . H i g h
i o n : m o r e t h a n m a n d a t o r y y e a r s . 4 . A b
l e t o d o a c t i v i t i e s o f d a i l y l i v i n g ,
s u c h a s c l e a n i n g , c o o k i n g a n d s h o p p i n g . 5 . A b l e t o m a n a g e p e r s o n a l h y g i e n e ,
g e t c .
Elderly people’s perspectives on quality of life 595
8/11/2019 cosa.pdf
http://slidepdf.com/reader/full/cosapdf 12/17
Neither the open-ended question nor the show card generated health as the most frequently mentioned category or domain, and social re-lations, activities and functional ability were valued as equally important.
This was true for men and for women, accorded with Bowling’s (1995),Farquhar’s (1995), Gabriel and Bowling’s (2004) and Wiggins et al .’s(2004) results, and emphasises the important role of non-health dimen-sions in quality of life. In Bowling’s study, more than 50 per cent of therespondents mentioned finances, standard of living, or housing. Gabrieland Bowling (2004) and Wiggins et al . (2004) also found that the home,neighbourhood and finances were important aspects of quality of life.These findings contrast with those of Nilsson et al . (1996) and our own,that own home, finances and not worrying about finances were among the least
commonly cited domains and items. On the other hand, when selecting from the show card list, the ability to remain living in one’s home was highly valued. Given the wording ‘ to be able to remain living in your home’,the responses might have been grouped within the functional abilitydomain.
Wellbeing and personal beliefs and attitudes , while not mentioned as fre-quently as social relations, health, activities and functional ability, were alsoimportant aspects of quality of life, as acknowledged in earlier studies.Bowling (1995) included items on religion and spiritual life, and The World Health Organisation Quality of Life Assessment Group (WHOQOL 1998) has thedomain ‘ spirituality/religion/personal beliefs ’. Psychological wellbeing has been recognised as important in many studies ( e.g . Costantini et al .2000; Gabriel and Bowling 2004).
There were few statistically significant differences between the sub-groups (results not shown), indeed no more than could be expected bymere chance, which partly reflects the small sample sizes, but nonethelessthere were interesting findings. The fact that women included functional
ability and social relations more frequently than men can be seen as partof women’s greater responsibility for the household and social networks.This finding is congruent with that of Bowling (1995), that women valuedsocial relations more than men. Growing old increases the risk of func-tional impairment and thereby increases the risk of having to move to anursing home. This might explain why men and women aged 80 or more years valued functional ability and remain living in one’s home more than the younger respondents. These results are similar to those of Farquhar (1995),who asked elderly people what would improve their quality of life. Those
aged 85 or more years answered to be more mobile/able more than twice asoften as those aged 65–85 years. People with severe illness chose the item
596 Katarina Wilhelmson et al.

8/11/2019 cosa.pdf
http://slidepdf.com/reader/full/cosapdf 13/17
illness, with a focus on the symptoms. There was a shift from able to dohousework to able to manage personal hygiene for women with severe illness,which also can be seen as an adaptation in persons who require help with
the housework. As Allison, Locker and Feine (1997) pointed out, quality of life isdynamic and modified by psychological phenomena such as adaptationand coping. ‘ Response shift ’, which involves changing internal standards, values and the conceptualisation of quality of life, can be an importantmediator of this adaptation process (Sprangers and Schwartz 1999). Oneway of enhancing quality of life for those with chronic illness is by helping them adjust their expectations and adapt to their changed clinical status(Carr, Gibson and Robinson 2001). Albrecth and Devlieger (1999) stated
that quality of life is dependent upon the individual finding a balanceamong body, mind and spirit, and on the ability to establish and main-tain a harmonious set of relationships given the person’s social contextand external environment. Those with severe illness also selected social relations more frequently than their healthier counterparts. That socialrelations are highly valued by people with severe disease such as cancerhas previously been shown ( e.g . Costantini et al . 2000). Gabriel andBowling (2004) pointed out that there is a dynamic interplay betweenpeople and the surrounding social structures of a changing society. Facili-tating social relations and activities, and enhancing functional ability,might improve the quality of life of elderly people as much as medicaltreatment.
Conclusion
Quality of life is a dynamic concept, and its interpretation is influenced by
many individual factors such as age and illness. Determining the factorsthat influence quality of life among older people needs to draw on theperspectives of the individuals involved. To summarise the findings of thisexploratory study, it has been shown that there were clear differences inwhat was perceived to be important to quality of life among differentsubgroups. Those aged 80 or more years particularly valued functionalability, and those with severe illness placed a relatively high valuation onsocial relations. Further research is needed to confirm these differences.The essential point is that other dimensions besides health status are
important to the quality of life of elderly people. Our conclusion is thatsocial relations, functional ability and activities may influence the quality
Elderly people’s perspectives on quality of life 597
8/11/2019 cosa.pdf
http://slidepdf.com/reader/full/cosapdf 14/17
Acknowledgements
The study was supported by grants from the Swedish Council for Social Research and The Vardal Foundation. The authors are grateful to Eva Johansson for carrying
out interviews, to Marina Johansson and Valter Sundh for technical support, andto all the subjects who kindly participated in the study.
N O T E S
1 The list on the show card was prepared by one of the authors (KW), who has several years’ experience in geriatrics and research interviewing. The list included sev-eral items that are often used in quality of life instruments (Arnold 1991; Carr andHigginson 2001), which were adapted, drawing on our clinical geriatric experience.
The items covered (in this order): physical health; mental health; cognitive function;having no pain; to be able to do activities of daily living, such as cleaning, shopping,cooking; to be able to manage personal hygiene, dressing etc.; to have contact withfriends and relatives; to be able to read; to be able to hear well; participation inclubs and organisations; not feeling lonely; not feeling tired; energy to do what you want to ; to be able to feel engaged ; to feel needed ; to be able to remainliving in your home; not to worry about personal finances; and other things. Thelist was read out loud (several times if needed) for the six people interviewed bytelephone.
2 A rating of ‘0 ’ indicates no problem; of ‘1 ’ indicates current mild problem orpast significant problem; of ‘2’ moderate disability or morbidity, or requires ‘first
line’ therapy; of ‘3’ severe/constant significant disability, or ‘uncontrollable’ chronicproblems; and of ‘4’ extremely severe problems, or immediate treatment required,or end-stage organ failure, or severe impairment in function.
References
Albert, S. M. 1998. Defining and measuring quality of life in medicine. Journal of the American Medical Association, 279, 429, discussion 31.
Albrecht, G. L. and Devlieger, P. J. 1999. The disability paradox : high quality of life
against all odds. Social Science and Medicine , 48, 977–88. Allison, P. J., Locker, D. and Feine, J. S. 1997. Quality of life : a dynamic construct. Social
Science and Medicine , 45, 221–30. Anderson, R. T., Aaronson, N. K., Bullinger, M. and McBee, W. L. 1996. A review of
the progress towards developing health-related quality-of-life instruments for inter-national clinical studies and outcomes research. Pharmacoeconomics , 10, 336–55.
Arnold, S. B. 1991. Measurement of quality of life in the frail elderly. In Birren, J. E.,Lubben, J. E., Cichowlas Rowe, J. and Deutchman, D. E. (eds), The Concept and
Measurement of Quality of Life in the Frail Elderly. Academic, San Diego, California, 50–73.Bajekal, M., Blane, D., Grewal, I., Karlsen, S. and Nazroo, J. 2004. Ethnic differences
in influences on quality of life at older ages: a quantitative analysis. Ageing & Society, 24, 5,709–28.
Bowling, A. 1995. What things are important in people’s lives? A survey of the public’s
598 Katarina Wilhelmson et al.

8/11/2019 cosa.pdf
http://slidepdf.com/reader/full/cosapdf 15/17
Bryant, L. L., Corbett, K. K. and Kutner, J. S. 2001. In their own words : a modelof healthy aging. Social Science and Medicine , 53, 927–41.
Carr, A. J., Gibson, B. and Robinson, P. G. 2001. Measuring quality of life: isquality of life determined by expectations or experience? British Medical Journal , 322,
1240–3.Carr, A. J. and Higginson, I. J. 2001. Are quality of life measures patient-centred ?
British Medical Journal , 322, 1357–60.Costantini, M., Mencaglia, E., Giulio, P. D., Cortesi, E., Roila, F., Ballatori, E.,
Tamburini, M., Casali, P., Licitra, L., Candis, D. D., Massidda, B., Luzzani, M.,Campora, E., Placido, S. D., Palmeri, S., Angela, P. M., Baracco, G., Gareri, R.,Martignetti, A., Ragosa, S., Zoda, L., Ionta, M. T., Bulletti, S. and Pastore, L. 2000.Cancer patients as ‘experts’ in defining quality of life domains: a multicentre survey bythe Italian Group for the Evaluation of Outcomes in Oncology (IGEO). Quality of Life Research , 9, 151–9.
Covinsky, K. E., Wu, A. W., Landefeld, C. S., Connors, A. F. Jr, Phillips, R. S., Tsevat, J.,
Dawson, N. V., Lynn, J. and Fortinsky, R. H. 1999. Health status versus quality of life in older patients: does the distinction matter? American Journal of Medicine , 106,435–40.
Faden, R. and German, P. S. 1994. Quality of life: considerations in geriatrics. Clinical Geriatric Medicine , 10, 541–51.
Farquhar, M. 1995. Elderly people’s definitions of quality of life. Social Science and Medicine ,41, 1439–46.
Gabriel, Z. and Bowling, A. 2004. Quality of life from the perspectives of older people. Ageing & Society, 24, 5, 675–91.
Gill, T. M. and Feinstein, A. R. 1994. A critical appraisal of the quality of quality-of-lifemeasurements. Journal of the American Medical Association, 272, 619–26.
Hunt, S. M. 1997. The problem of quality of life. Quality of Life Research , 6, 205–12.Leplege, A. and Hunt, S. 1997. The problem of quality of life in medicine. Journal of the
American Medical Association, 278, 47–50.Linn, B. S., Linn, M. W. and Gurel, L. 1968. Cumulative illness rating scale. Journal of
the Amercian Geriatrics Society, 16, 622–6.Miller, M. D., Paradis, C. F., Houck, P. R., Mazumdar, S., Stack, J. A., Rifai, A. H.,
Mulsant, B. and Reynolds, C. F. 3rd 1992. Rating chronic medical illness burden ingeropsychiatric practice and research: application of the Cumulative Illness Rating Scale. Psychiatry Research , 41, 3, 237–48.
Nilsson, M., Ekman, S. L., Ericsson, K. and Winblad, B. 1996. Some characteristics of the quality of life in old age illustrated by means of Allardt’s concept. Scandinavian
Journal of Caring Sciences , 10, 116–21.O’Boyle, C. A. 1997. Measuring the quality of later life. Philosophical Transactions of the
Royal Society of London: B Biological Sciences , 352, 1363, 1871–9.Rubenowitz, E., Waern, M., Wilhelmson, K. and Allebeck, P. 2001. Life events and
psychosocial factors in elderly suicides: a case-control study. Psychological Medicine , 31,1193–202.
Sprangers, M. A. and Schwartz, C. E. 1999. Integrating response shift into health-related quality of life research: a theoretical model. Social Science and Medicine , 48,1507–15.
Walker, A. 2004. The ESRC Growing Older research programme, 1999–2004. Ageing &
Society, 24, 5, 657–74.Warnes, A. M., King, R., Williams, A. M. and Patterson, G. 1999. The well-being of Britishexpatriate retirees in southern Europe. Ageing & Society, 19, 717–40.
Elderly people’s perspectives on quality of life 599
8/11/2019 cosa.pdf
http://slidepdf.com/reader/full/cosapdf 16/17
Wood-Dauphinee, S. 1999. Assessing quality of life in clinical research: from where havewe come and where are we going? Journal of Clinical Epidemiology, 52, 355–63.
World Health Organization Quality of Life Assessment (WHOQOL) 1998. WHOQOL:development and general psychometric properties. Social Science and Medicine , 46,
1569–850.
Accepted 19 November 2004 Address for correspondence : Katarina Wilhelmson, University of Goteborg, Department of SocialMedicine, Box 453, S-405 30 Goteborg, Sweden.
E-mail: [email protected]
600 Katarina Wilhelmson et al.
8/11/2019 cosa.pdf
http://slidepdf.com/reader/full/cosapdf 17/17
Reproducedwithpermissionof thecopyrightowner. Further reproductionprohibitedwithoutpermission.