DEPARTAMENTO DE CIÊNCIAS DA VIDA - CORE obrigada maior que tudo à minha luz, à minha flor, à...
74
DEPARTAMENTO DE CIÊNCIAS DA VIDA FACULDADE DE CIÊNCIAS E TECNOLOGIA UNIVERSIDADE DE COIMBRA Evolution of haploid chromosome numbers in the sunflower family. Are genomic duplications associated to ancient climate changes? Lucie Mota 2014 Dissertação apresentada à Universidade de Coimbra para cumprimento dos requisitos necessários à obtenção do grau de Mestre em Ecologia – Especialização em Investigação em Ecologia, realizada sob a orientação científica do Professor Doutor João Carlos Mano Castro Loureiro e do Doutor Rubén Torices Blanco (Universidade de Coimbra).
Transcript of DEPARTAMENTO DE CIÊNCIAS DA VIDA - CORE obrigada maior que tudo à minha luz, à minha flor, à...
DEPARTAMENTO DE CIÊNCIAS DA VIDA
FACULDADE DE CIÊNCIAS E TECNOLOGIA UNIVERSIDADE DE COIMBRA
Evolution of haploid chromosome numbers in the sunflower family. Are genomic duplications associated to ancient climate changes?
Lucie Mota
2014
Dissertação apresentada à Universidade de Coimbra para cumprimento dos requisitos necessários à obtenção do grau de Mestre em Ecologia – Especialização em Investigação em Ecologia, realizada sob a orientação científica do Professor Doutor João Carlos Mano Castro Loureiro e do Doutor Rubén Torices Blanco (Universidade de Coimbra).

�
Agradecimentos
Por tudo: por me teres transmitido o gosto por todas as formas pelas quais a vida se expressa, em cada
momento, em cada olhar, em cada sensação. Nunca será suficiente o meu agradecimento pelo teu apoio
inesgotável, pela tua ajuda constante, pela tua admiração e pelo orgulho que sempre senti. Merci Papa! Merci
Maman! Por sempre acreditares em mim, por te “aborreceres” com a minha falta de confiança, por me
apoiares e ajudares sempre com uma força enorme! Obrigada por tudo! Foi sempre tudo graças a vocês! São
a minha fonte de força e persistência!
Obrigada aos meus amigos orientadores por terem sempre desejado e aceite a minha sinceridade em todas as
etapas e tarefas. Sabem o quanto é importante para mim poder sê-lo. Um grande obrigada do fundo do coração
por terem sempre acreditado em mim, desde o “famoso” passeio pedestre. Obrigada Narcissus scaberulus por
teres sido o motivo do nosso encontro. Obrigada pela amizade, por todo o apoio e compreensão, e pela
paciência! Obrigada por todos os conhecimentos e experiência partilhados tão generosamente e
genuinamente. Obrigada João (“nós podemos guiar-te, mas o caminho é teu”)! Obrigada Sílvia! Obrigada
Rubén! “The force will be with you!” Penso nisso frequentemente. Obrigada pela sabedoria que sempre
soubeste tão bem transmitir-me, uma pequena parte de toda a que possuis, pela força e ânimo que sempre senti
da tua parte, e principalmente, pela amizade! Acho que nunca ouvi tantas vezes a expressão “somos malucos!”
como durante estes 2 anos!
Um obrigada à Lucía pelo carinho, humor e sorrisos constantes. Admiro o teu perfeccionismo. Obrigada
Mariana, por todas as conversas que partilhámos. Sei que posso ir ter contigo quando me “desoriento”,
porque és sempre tão sensata e paciente. Muito obrigada Daniela, pela cumplicidade, pela amizade, pelo
companheirismo, pelas gargalhadas. És uma pequenina grande! Obrigada Gabriela: relembro muitas vezes
os teus conselhos! Obrigada pelo ânimo, pela confiança, pelo optimismo e pela amizade! Mesmo longe, estás
sempre aqui!
Obrigada ao Dani, ao Bruno, ao Rubén H., à Vicky, à Ana A., à Ana M., à Andreia e à Joana (a ti, também
pela conversa no corredor sobre o “tal” passeio que mudou tudo) pela amizade, força e apoio. À Liliana, ao
Filipe e ao João A. por terem tido sempre paciência para aturar as minhas brincadeiras (conseguimos
“sobreviver” ao ambiente de uma sala em que estiveram 4 teses em construção, e inteirinhos!) E agora: o
prometido passeio a Viseu, n’é Filipe?
Obrigada a todos os elementos do Centro de Ecologia Funcional com quem tenho contactado ao longo destes
4 anos, pela constante simpatia e por fazerem do Centro um local de trabalho acolhedor. Por me terem feito e
fazerem gostar das plantas. Espero gostar cada vez mais.

Um obrigada maior que tudo à minha luz, à minha flor, à minha princesa, ao meu pinguim. És a minha força,
és a minha coragem, és a minha inspiração, és o meu orgulho. Adoro-te tanto e infinitamente! (sei que daqui
a uns anos – poucos, que já és tão crescida – vais achar isto muito lamechas! Se não achas já!)
Obrigada a ti, pela força, pelo optimismo constante e (quase) contagiante, por acreditares que existe sempre
uma solução e, principalmente, por me “puxares” quando me perco no meio dos sonhos e da ilusão…Obrigada
por apoiares, mesmo quando não entendes muito bem este mundo de “malucos”! (E venham mais 10!!!)
O último obrigada é ao meu irmão, o meu “gémeo”, o meu ídolo, o meu guerreiro. Sempre a apoiar-me!
Sempre a apoiar-te! (Poucas palavras, mas claras e concisas, que não tens tempo a perder! Ah ah ah!)
Dedico esta tese a todos vós, e também a ti, mamie. Saudades, muitas.


“Era preciso agradecer às flores
Terem guardado em si,
Límpida e pura,
Aquela promessa antiga
Duma manhã futura.”
Sophia de Mello Breyner Andresen
“En croyant à des fleurs, souvent on les fait naître.”
Edmond Rostan

Table of Contents
Abstract ........................................................................................................................... 1
Resumo ............................................................................................................................ 3
1. Introduction ............................................................................................................. 5
2. Materials and Methods ......................................................................................... 11
Chromosome numbers collection ............................................................................... 13
Phylogenetic hypotheses ............................................................................................. 14
Evolutionary models of haploid chromosome number change................................... 14
Ancestral chromosome number of Asteraceae ........................................................... 16
Polyploidization events and climate changes ............................................................. 16
3. Results .................................................................................................................... 19
Models of chromosome evolution in Asteraceae ........................................................ 21
The ancestral haploid chromosome number in Asteraceae ........................................ 21
The expected number of changes along each branch.................................................. 33
Polyploidization events and climate changes ............................................................. 33
4. Discussion ............................................................................................................... 35
Models of chromosome evolution in Asteraceae ........................................................ 37
Ancestral chromosome numbers ................................................................................. 38
Polyploidy and climate changes ................................................................................. 38
5. References .............................................................................................................. 43
6. Appendix I .............................................................................................................. 55

1
Abstract
The remarkable diversity of land plants is associated with immense genetic variation
manifested also by a wide range of chromosome numbers. Changes of chromosome
number during evolution of angiosperms are likely to have played a role in speciation,
being their study of utmost importance, especially at the present time when a probabilistic
model is available to study chromosome evolution within a phylogenetic framework. In
the present study likelihood models of chromosome number evolution were fitted to the
largest family of flowering plants, the Asteraceae family. Specifically, two phylogenetic
supertrees of this family were used to reconstruct the ancestral chromosome number and
infer genomic events, as whole genome duplications and dysploidies. In addition, we
tested if genomic duplications were linked with periods of ancient climate changes. The
results of this Thesis evidenced that n = 9 was the most probable ancestral chromosome
number of the family, irrespectively of the supertrees used. Also, our models supported
that genomic duplications, as well as, descending dysploidy, were common genomic
events in the evolution of Asteraceae. The increase in the number of chromosomes
through polyploidy events was related with a high frequency of chromosome losses which
was the most frequent event in the chromosome number evolution. The exploratory
approach applied in this Thesis provided a first insight about the linkage that may exist
between genome doubling processes and periods of climate changes. More than a half of
the branches with polyploidization events coincided with these stressful periods. Further
phylogenetic studies and genetic investigations focused in obtaining more complete
phylogenetic trees will help to more accurately date the time of occurrence of these
ancient genomic duplication, and therefore will allow a better assessment of the causal
link between climate changes and the success of polyploid lineages.
Key words: Asteraceae, chromosome number evolution, climate changes, polyploidy,
probabilistic models.

3
Resumo
A extraordinária diversidade das plantas terrestres está associada a uma imensa variação
genética manifestada também por uma grande variedade de números cromossomáticos.
As alterações no número cromossomático que ocorreram durante a evolução das
angiospérmicas tiveram provavelmente um papel fundamental no processo de especiação,
sendo o seu estudo de uma elevada importância, especialmente agora que existem
métodos probabilísticos que possibilitam o estudo da evolução cromossomática num
contexto filogenético. Na presente Tese, estes modelos foram aplicados à maior família
de plantas com flor, a família das Asteraceae. Especificamente, foram usadas duas super-
árvores filogenéticas desta família de modo a reconstruir o número cromossomático
ancestral e inferir o número de eventos genómicos como duplicações e disploidias.
Adicionalmente, testou-se a ligação entre duplicações genómicas e períodos ancestrais de
alterações climáticas. Os resultados desta Tese evidenciaram que n = 9 foi o número
cromossomático ancestral mais provável para a família, independentemente da super-
árvore utilizada. Foi igualmente notório que as duplicações genómicas e as disploidias
descendentes foram eventos genómicos comuns durante a evolução da família
Asteraceae. O aumento no número de cromossomas causado pelos eventos de duplicação
está relacionado com a elevada frequência de redução no número de cromossomas, a qual
constitui o tipo de evento mais comum durante a evolução do número de cromossomas.
Também, a abordagem aplicada nesta Tese fornece uma primeira visão sobre a ligação
que pode existir entre processos de duplicação genómica e períodos de alterações
climáticas. Mais de metade dos ramos com eventos de poliploidização coincide com esses
períodos de stress. Estudos filogenéticos e investigações genéticas futuras que permitam
obter árvores filogenéticas mais completas ajudarão a datar com mais precisão o momento
em que estas duplicações genómicas ocorreram, e consequentemente permitirão uma
melhor avaliação da ligação causal entre as alterações climáticas e o sucesso de linhagens
poliplóides.
Palavras-chave: alterações climáticas, Asteraceae, evolução do número cromossomático,
modelos probabilísticos, poliploidia.

5
1. Introduction

Introduction
7
The remarkable diversity of land plants is associated with immense genetic variation
manifested also by a wide range of genome sizes and chromosome numbers (Lysák &
Schubert, 2013). Whereas genome size of land plants varies more than 2,300-fold, from
64 Mbp (Genlisea aurea, Greilhuber et al., 2006) to approximately 150,000 Mbp (Paris
japonica; Pellicer et al., 2010), chromosome numbers vary from n = 2 in six angiosperm
species (Vanzela et al., 1996; Cremonini, 2005) to n > 320 in Sedum suaveolens (Uhl,
1978). This large variation of chromosome numbers found in angiosperms is driven by
two main mechanisms operating in opposite directions: increases through polyploidy
(whole genome duplications, WGD) and decreases (or increases) through structural
chromosomal rearrangements (dysploidy). Indeed, polyploidy seems to be one of the
main mechanisms responsible for the evolutionary success of many species, mainly those
unable to disperse naturally or through human-mediated translocation to climatically
suitable habitats (Hegarty & Hiscock, 2008). For example, the recurrent occurrence of
polyploids in different habitats from that of their diploid progenitors constitutes a proof
of the ability of polyploids to colonize new environmental niches (Hegarty & Hiscock,
2008). Still, the evolutionary success of polyploids have been a controversial and a much
debated topic, with some authors considering that polyploidy is most often an
evolutionary dead-end (Mayrose et al., 2011), while others defend its fundamental role
on the evolution of flowering plants (Hegarty & Hiscock, 2008; Lim et al., 2008; Soltis
& Soltis, 2000; Soltis et al., 2014). Despite of this, several studies have suggested that
47% to 100% of flowering plants can be traced to a polyploid event at some point within
its diversification or had a polyploid ancestry (Van de Peer et al., 2009; Wood et al., 2009;
Fawcett & Van de Peer, 2010; Vanneste et al., 2014;). Therefore, changes of chromosome
number during evolution of angiosperms are likely to have played a role in speciation,
being their study of utmost importance, especially at the present time when a specific
probabilistic model is available to study chromosome evolution within a phylogenetic
framework (Mayrose et al., 2010).
The recurrent observations of a high frequency of polyploids in harsh and unstable
environments (Fawcett & Van de Peer, 2010), such as high altitudes and latitudes (e.g.,
artic areas; Brochmann et al., 2004) has been stated to suggest that the success of some
ancient WGD might be linked with periods of climatic change. During a climate change,
the increase of empty niches due to the extinction of many species that were not able to
deal with the environmental changes might bring an opportunity to recently formed
Introduction
8
polyploids to persist at the first critical stages (Van de Peer et al., 2009). Indeed, several
studies based on more or less complex study-systems have shown the highest ability of
the polyploids to cope with specific periods of climate change (Comes & Kadereit, 1998;
Antonelli et al., 2010; Couvreur et al., 2010; Fawcett & Van de Peer, 2010; Vanneste et
al., 2014).
The study of ancient WGDs represents a challenge. Until now, the available studies
employed threshold techniques to infer the occurrence and the location of polyploidy
events (e.g. Stebbins, 1938); still these studies suffered from a large degree of
extrapolation, and did not take into account the phylogenetic relationships and the
possible occurrence of aneuploidy or dysploidy during evolution (Glick & Mayrose,
2014). In addition, as the knowledge about the evolutionary changes in chromosome
numbers is incomplete, in angiosperms the base number (‘x’) has been commonly used
(Cusimano et al., 2012). However, a misunderstanding between the definition of base
number and other concepts such as the monoploid chromosome number (i.e, the number
of apparently originally unique chromosomes in a haploid set) has often been observed
(Langlet, 1927 cited in Cusimano et al., 2012; Roy & Manton, 1964; reviewed in Glick
& Mayrose, 2014). To clarify the nomenclature, it has been proposed that the base number
should be estimated inferring the haploid ancestral chromosome number of the most
recent common ancestor (MRCA) of the group examined (Cusimano et al., 2012; Glick
& Mayrose, 2014). With that purpose a new mathematical model has been recently
developed to fit the evolution of chromosome numbers in a given lineage working under
a robust probabilistic inference framework (Mayrose et al., 2010). Both dysploidies and
polyploidies are considered on this method, allowing to test the importance of these
genomic processes along the evolution. Hence, this model represents a great opportunity
to explore the occurrence of ancient WGD and its evolutionary implications (Glick &
Mayrose, 2014). In the present study we fit these likelihood models of chromosome
number evolution to the largest family of flowering plants, the sunflower family.
The sunflower family (Asteraceae) comprises the largest number of described species of
any plant family, 24,000-30,000 species distributed in 1,600-1,700 genera (Funk et al.,
2009). Its members occur on all continents except Antarctica, existing in a great range of
habitats and presenting many different habits (Funk et al., 2005). Considering the
incredibly large number of species and its comparatively young age (Barreda et al., 2012),
it is not surprising that this family possesses one of the highest rates of diversification
Introduction
9
among all flowering plants, being also indicative of the ecological success and
evolutionary ability of its members (Funk et al., 2009).
So far, a very large range of chromosome numbers has been described in Asteraceae: n =
2 to n = ca. 216 chromosomes, being n = 9 the most frequent number reported in this
family (Semple & Watanabe, 2009). Many authors suggested x = 9 as the base number of
this family (Stebbins 1950; Solbrig 1977; Cronquist, 1981, Bremer, 1994 cited in Semple
& Watanabe 2009; Santosh & Raghbir 2013), but x = 8 has also been reported (Vallès et
al., 2005). Furthermore, several paleoploidization events have been suggested along the
evolution of this family. Barker et al. (2008) examined gene duplication and retention in
Asteraceae and found that at least three ancient WGD have occurred in this family. Thus,
ancient polyploidization may be, in part, responsible for the evolutionary success of the
family (Funk et al., 2009). However, to date, the evolution of chromosome numbers has
not been studied under a probabilistic phylogenetic method that could provide robust
estimations of ancient WGD in this successful lineage.
Thus, the general aim of this work was to explore the evolution of haploid chromosome
numbers along the history of the Asteraceae. In particular, the ancestral chromosome
number of this family, as well as the ancestral chromosome numbers of its main lineages
were inferred using two different phylogenetic hypotheses. Furthermore, events of
chromosomal changes, as duplications and dysploidies that occurred along the evolution
were estimated and located in a phylogenetic tree. Finally, it was assessed if WGD were
linked with periods of ancient climate change, mainly those that occurred during the
Cenozoic Era, the age of origin of the sunflower family.

11
2. Materials and Methods

Materials and Methods
13
Chromosome numbers collection
The number of chromosomes of genera and species of Asteraceae and of the outgroup
family’s Calyceraceae and Goodeniaceae were collected from the website: Index to
Chromosome numbers in Asteraceae (http://www.lib.kobe-
u.ac.jp/infolib/meta_pub/G0000003asteraceae_e). To start, we searched the taxa
included in the supertrees published by Funk et al. (2005; 2009; 403 and 757,
respectively) including the outgroup families. Both supertrees represent mainly
phylogenetic relationships between genera, however, some problematic species were also
considered. These supertrees cover approximately 24% (with 2005 supertree) and 46%
(with 2009 supertree) of the ca. 1650 genera of the Asteraceae family. Still, as there was
no chromosome number information for 91 and 198 taxa of the 2005 and 2009 supertrees,
respectively, the final total coverage of chromosome number data was of 77.4% (2005)
and 73.8% (2009) of the taxa included in the supertrees.
Chromosome numbers were coded using the following approach: first, all reported
chromosome numbers of each genus were searched, regardless of their frequency in
different species, but excluding B chromosomes data, odd numbers, and situations when
chromosome counts were given as intervals of numbers. Then, the available chromosome
information of the diploid level was converted into haploid chromosome numbers,
keeping the same frequency. After this conversion, 125 monomorphic (40.06%) and 187
polymorphic genera (59.94%) were obtained for the 2005 data, and 293 monomorphic
(52.42%) and 266 polymorphic (47.58%) genera for the 2009 data. The evolution of
haploid chromosome numbers was then analysed considering both data sets: with
(hereafter polymorphic data) or without chromosome number polymorphism (hereafter
single data). In the single data, only one chromosome number was selected from the
polymorphic dataset. For that, the following criteria were used: the most frequent
chromosome number, and, when more than one chromosome number had the same
frequency, the lowest chromosome number. This second criterion was used because the
lowest haploid chromosome numbers are typically assumed to represent the
nonpolyploidized state, i.e., the base chromosome number (Mayrose et al., 2010).
Materials and Methods
14
Phylogenetic hypotheses
As revealed above, two different phylogenetic hypotheses for the Asteraceae family were
used: Funk et al. (2005) and (2009). For the 2005 supertree, the branch length
modifications of Torices (2010) were used. By other way, for the 2009 supertree, time-
calibrated branch lengths were estimated using the BLADJ function of Phylocom v.4.0.1b
software (Webb et al., 2008). Basically, this software enables to fix the root node at a
specified age and fixes the other nodes for which age estimates are already available. The
remainder branch lengths can then be assessed by placing the nodes between dated nodes,
or between dated nodes and terminals. Finally, BLADJ presents a new phylogeny with
adjusted branch lengths.
The 2009 supertree was first translated into a Newick tree file format. Then, nodes with
known age were fixed based on bibliographic review of information on clade age
estimates. These age estimates were mainly selected based on molecular dating in which
fossil calibration had been previously used, although other dating methods were also
considered (e.g., geological dating; Table S1 in Appendix I). As clade ages estimates are
usually given as time intervals, and as BLADJ function only accepts one age for each
node, the mean value of the minimum and the maximum time estimates was calculated
and used as calibration age (Table S1 in Appendix I). In some cases, the age clade data
was not consistent among sources; in these situations, the most reliable age estimation
(i.e., the most consistent with the other estimations) was selected.
Evolutionary models of haploid chromosome number change
For both trees, the evolution of haploid chromosome numbers of Asteraceae was inferred
using chromEvol software v.2.0 (Glick & Mayrose, 2014), through both the maximum
likelihood (ML) and the Bayesian phylogenetic inference (Bayes) methods. This software
is based on a probabilistic model of chromosome number evolution that assumes that
changes in chromosome number over time result from a combination of polyploidy
(demi-duplication and duplication events) and dysploidy (ascending or descending, by
chromosome fission or fusion events, respectively) along branches of a phylogeny
(Mayrose et al., 2010). By comparing the fit of the different models to biological data, it
is possible to test the probability of those events and therefore to understand the pathways
Materials and Methods
15
by which chromosome numbers evolve (Mayrose et al., 2010) and to estimate the
ancestral chromosome numbers at internal nodes of the tree (Glick & Mayrose, 2014).
This software offers the possibility to test 10 models based on different combinations of
nine parameters: chromosome loss rate (δ), which considers that the number of
chromosomes might decrease by one, with rate δ; chromosome gain rate (λ) that assumes
that the number of chromosomes might increase by one, with rate λ; chromosome
duplication rate (ρ) that considers that the number of chromosomes might double, with
rate ρ; chromosome demi-duplication rate (μ), which assumes the union of reduced and
unreduced gametes leading to, for example, triplication events, with rate μ; linear
chromosome loss rate (δ1), that considers that the chromosome loss rate depends on the
current number of chromosomes; linear chromosome gain rate (λ1), that considers that the
chromosome gain rate depends on the current number of chromosomes; base
chromosome number (β) which is the monoploid chromosome number; base chromosome
number rate (ν) and base chromosome number optimized by the program. We did not
allow chromEvol optimizing base number as the software’s authors suggest for complex
data sets (Glick & Mayrose, 2014). Then, for those models including a base chromosome
number rate, we fixed the hypothetical base number of Asteraceae at 9, according to the
previous known data about the Asteraceae’s base number (Stebbins 1950; Solbrig 1977;
Cronquist, 1981, Bremer, 1994 cited in Semple & Watanabe 2009; Santosh & Raghbir
2013). Four of the models have only constant rates (Mc1, Mc2, Mc3, Mc0), whereas the
other four include two linear rate parameters (Ml1, Ml2, Ml3, Ml0; Table S2 in Appendix
I). Both model sets have a null model (Mc0 and Ml0) that assumes no polyploidization
events. Finally, two Mb models (Mb1 and Mb2) consider that the evolution of
chromosome number can be influenced by the base number and by the base number rate
(Table S2 in Appendix I). The M1 models (Mc1 and Ml1) assume that the number of
chromosomes might increase (by chromosome gain) or decrease (by chromosome loss)
by one or might double (polyploidization), having, therefore, three parameters:
chromosome gain, chromosome loss and polyploidization rates (Table S2 in Appendix I).
The M2 models (Mc2 and Ml2) consider that the rate of demi-polyploidization (or demi-
duplication) is equal to that of polyploidization, including the possibility of chromosome
gains and losses (three parameters). In M3 models (Mc3 and Ml3), the demi-
polyploidization is treated as an additional free parameter, considering that the rate of
demi-polyploidization is different than that of polyploidization (four parameters: gain
chromosome, loss chromosome, demi-polyploidization and polyploidization rates). The
Materials and Methods
16
Mb1 considers four parameters: constant chromosome gain rate, constant chromosome
loss rate, base chromosome number rate and base chromosome number. The Mb2 adds
the chromosome duplication rate, thus considering five parameters in its analysis.
Two approaches were used to estimate the model parameters of chromosome evolution
in Asteraceae and thus disentangle which genetic events might have occurred during the
evolution of this family. First, all models were fitted and compared using the Akaike
Information Criteria (AIC) value (Burnham and Anderson, 2004 cited in Bolker, 2007).
The model with lowest AIC value was considered the best model. Second, model
averaged parameters were estimated by weighting each rate parameter by the AIC weights
of each model (Bolker, 2007); then each parameter’s value was compared to those
obtained with the best model. All models were fitted twice considering single and
polymorphic data. The minimum chromosome number was set to 2, and the maximum
number was set to 5-fold higher than the empirical data. The branch lengths were scaled
by 0.01 to get parameters values below the bounds established for the algorithms included
in chromEvol software. To compute the expected number of changes along each branch,
as well as, the ancestral haploid chromosome numbers at nodes, the best-fit model for
both supertrees and for both datasets (single and polymorphic data) was rerun computing
20,000 simulations.
Ancestral chromosome number of Asteraceae
Considering the results of the previous section: 2, 8, 9 or 10 were tested as likely ancestor
haploid numbers of Asteraceae, using polymorphic data. These haploid numbers were
inferred with the highest PP at the root of the Asteraceae (see results). For that, the best
models were rerun with each one of them, either 8, 9 or 10 being fixed at the node of the
most recent ancestor of Asteraceae. The obtained AIC values were compared with those
obtained previously without fixing the ancestral value.
Polyploidization events and climate changes
To evaluate if polyploidization events (WGD) occurred preferentially associated with
ancient climate changes, genomic duplications and demi-duplications that occurred along
Materials and Methods
17
the evolution of Asteraceae family were mapped. By this way it was possible to calculate
the proportion of polyploidization events occurring near ancient climate change events.
According to Zachos et al. (2001), four main periods of climate changes occurred during
the evolution of the Asteraceae family: between Mid-Paleocene and Early Eocene (59-52
My), between Early-middle-Miocene and Early-Oligocene (49-32 My), between Late-
middle-Miocene (17-15 My) and between Late-Miocene and Early-Pliocene (6-3.2 My).
The genomic duplications and demi-duplications events inferred in the best-fitted models
(see above) were mapped on both phylogenetic trees. The probability of each genomic
event type was mapped according with these probabilities groups: ≥ 0.5, ≥ 0.8 and ≥ 0.95.
As ChromEvol only enables to identify those branches in which a polyploidization event
occurred with a probability higher than 0.5, but not the exact period time along the branch,
it was impossible to determine exactly when this events occurred within each branch.
Thus, polyploidization events were simply depicted in the middle of their respective
branches. Afterwards, it was evaluated if those branches in which a polyploidization event
had been reconstructed, also presented at least one climate change event along the whole
branch evolution. Thereby, the percentage of branches associated with polyploidization
events in each period of climate change was estimated.


19
3. Results

Results
21
Models of chromosome evolution in Asteraceae
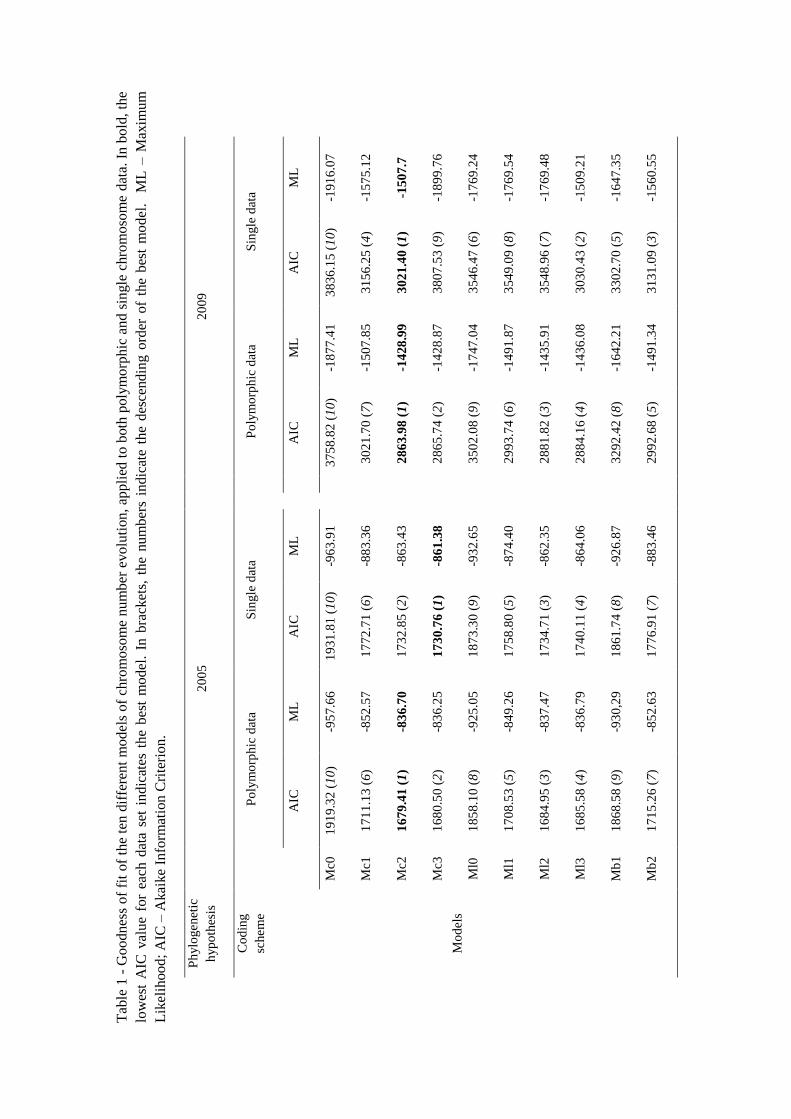
Regardless of the phylogenetic hypothesis and the coding scheme used, the best models
were always Mc2 or Mc3 (Table 1). Both models consider the same three parameters on
their analysis, i.e., chromosome gain rate, chromosome loss rate and chromosome
duplication rate, with the difference that the Mc2 model considers that duplication and
demi-duplication rates are equal, whereas Mc3 model assumes that the demi-duplication
rate is an additional free parameter. This result supports that genomic duplications,
together with dysploidies, were very important events in the evolution of Asteraceae. In
addition, the Mc0 model, that considers no polyploidization events on the evolution of
haploid chromosome number, was the model with the worst score in any of the four set
of analyses (Table 1).
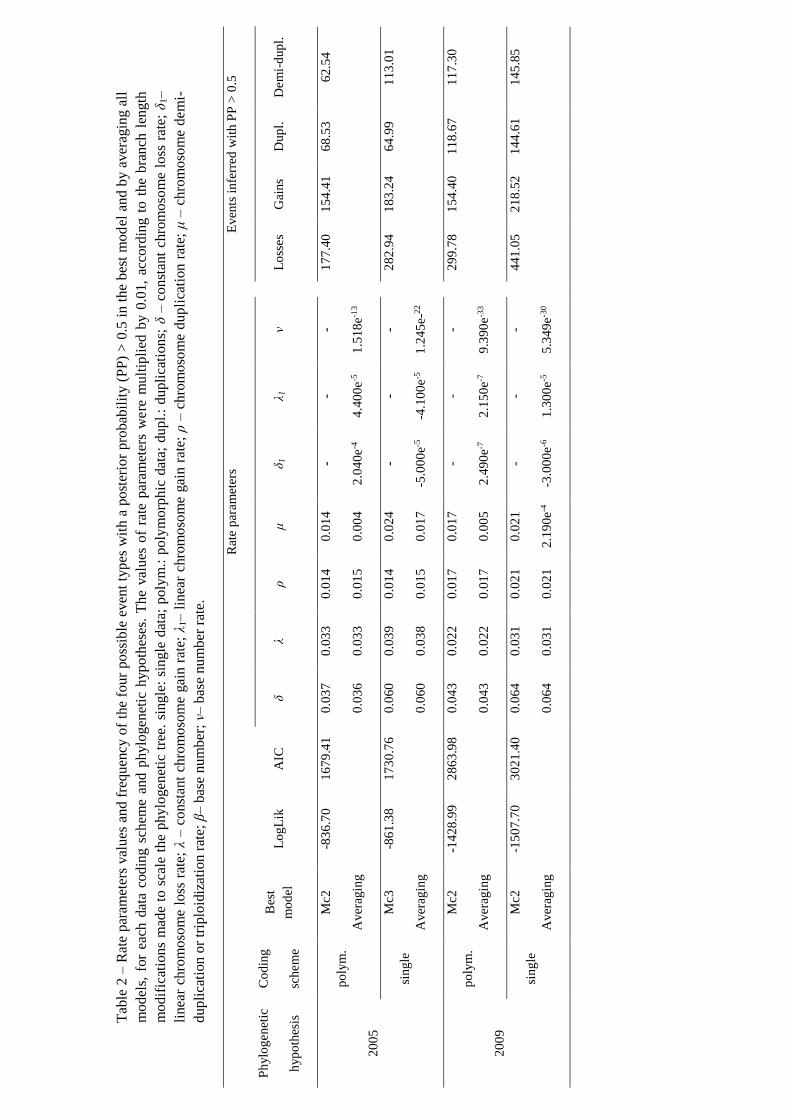
The comparison of the rate parameter values obtained by the best model and by the
averaging model revealed that the rates of chromosome loss, gain and duplication were
equal or very near (Δ = 0.01), in both approaches, irrespective of the phylogenetic
hypotheses and coding scheme (Table 2). However, for the demi-duplications the rate
was lower for the averaging models than for the respective best model (Table 2). Also, in
the averaged models, the linear rate parameters (i.e., linear chromosome loss and linear
chromosome gain rates) and the base chromosome number rate had very low values
(Table 2).
The ancestral haploid chromosome number in Asteraceae
The two methods used in the ancestral chromosome number analyses provided very
different results. The ML method always inferred n = 2 as the most likelihood ancestral
for Asteraceae, whereas that Bayesian analysis led to n = 8, 9 or 10 depending on the
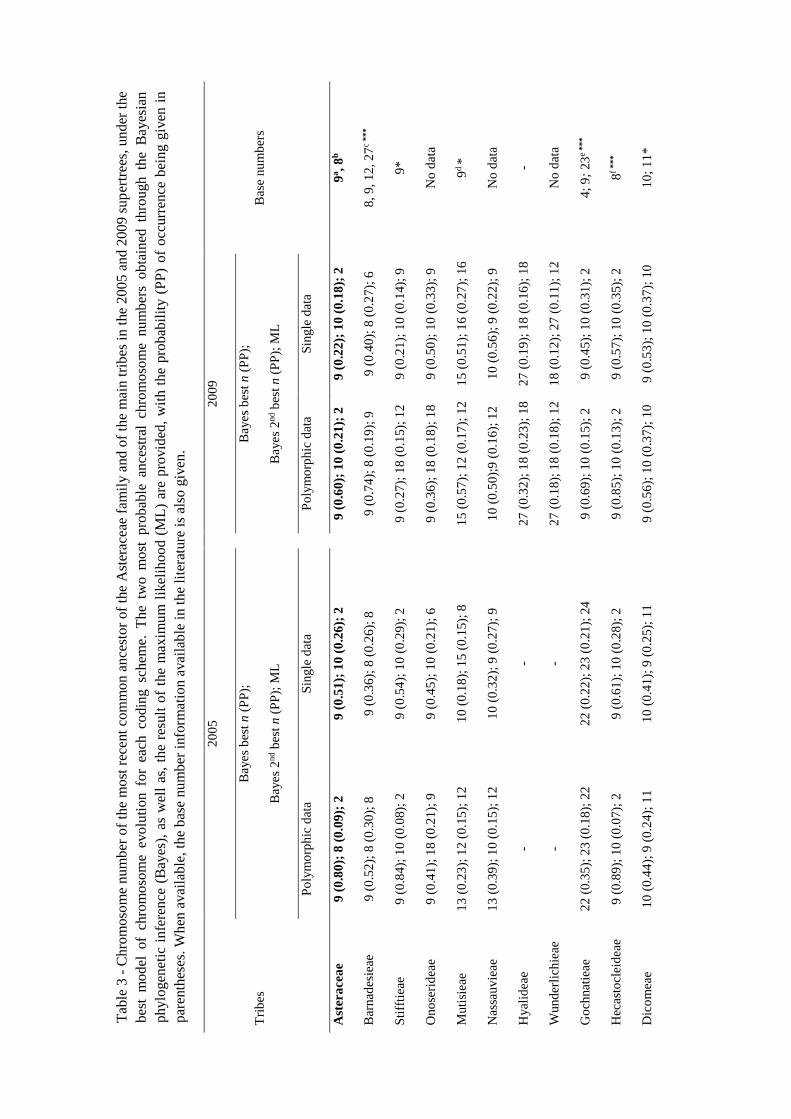
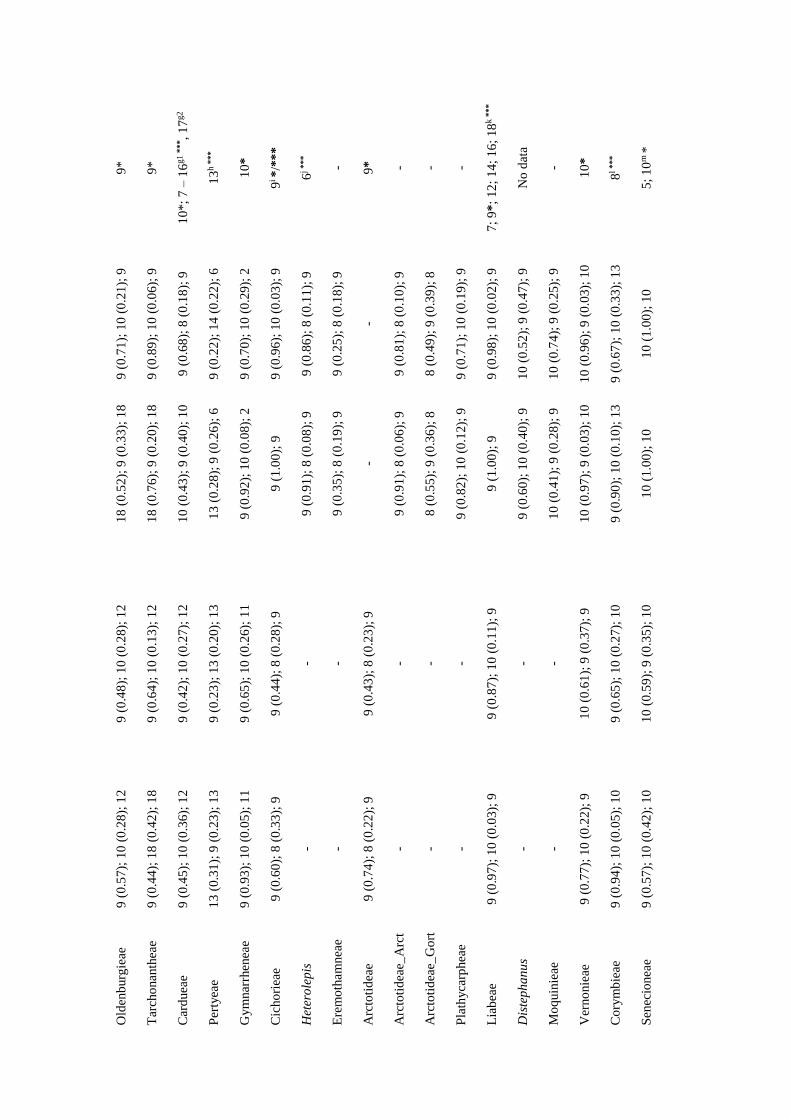
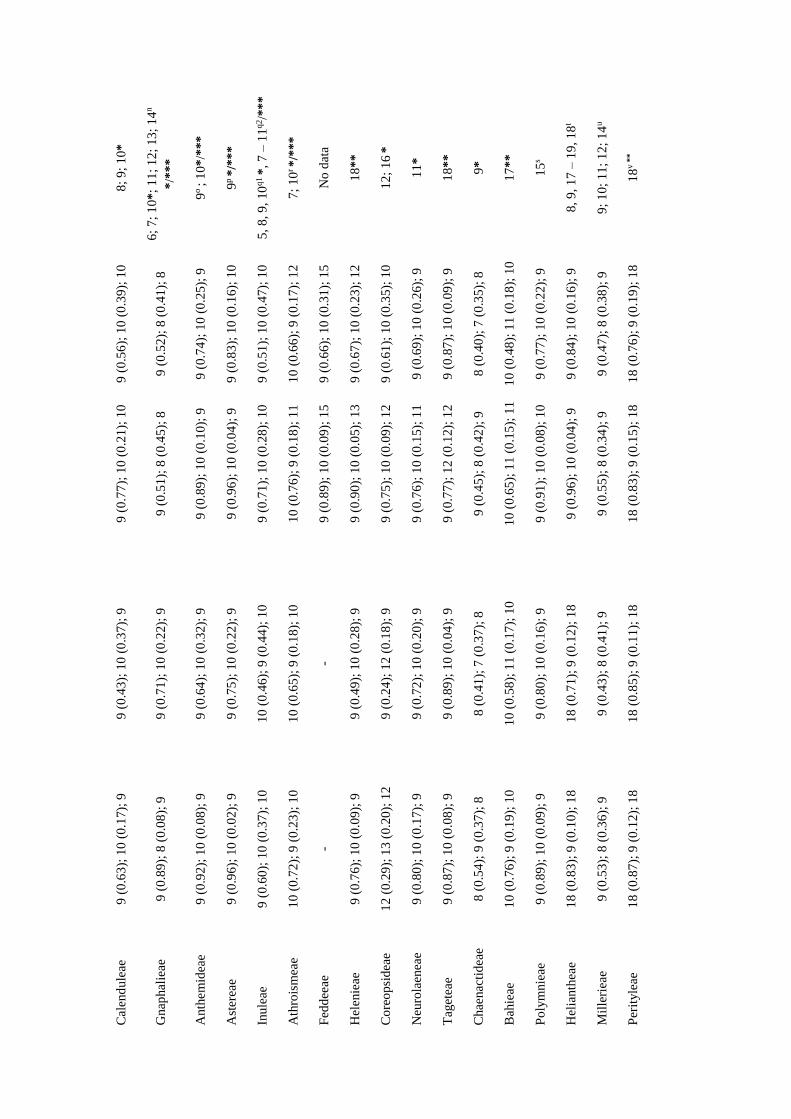
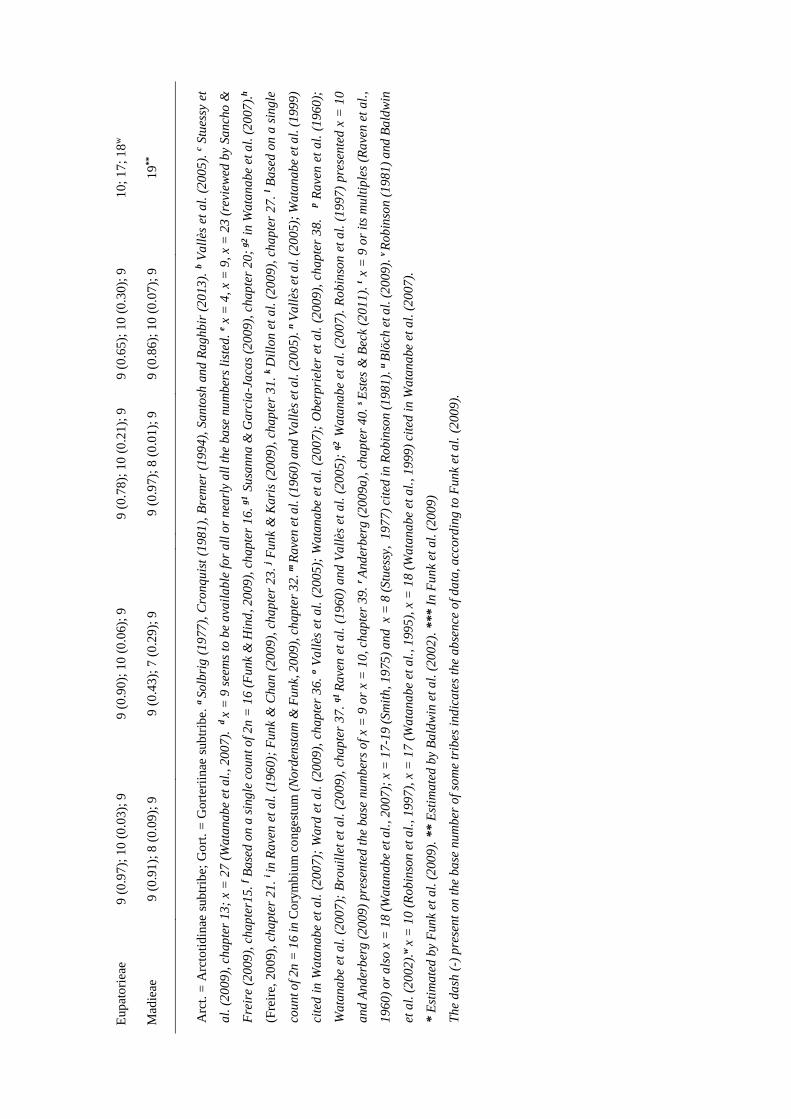
coding scheme and the phylogenetic tree (Table 3). Nevertheless, n = 9 was always the
ancestral chromosome number with the highest posterior probability (PP), while n = 8
and n = 10 were the second best haploid ancestral chromosome numbers inferred by the
Bayesian analyses (Table 3). Fixing the most recent ancestor of Asteraceae family with
each one of these haploid numbers (n = 2, 8, 9 or 10) resulted in n = 9 as the best ancestral
number, with the lowest AIC value, for both phylogenetic hypotheses (Table 4).
Results
22
However, in 2009 supertree, the n = 10 model had an AIC value very similar to that
obtained using n = 9 (∆ AIC = 1.38).
For most of the main lineages, the estimated ancestral haploid number was mainly n = 9
and n = 10, with some exceptions, which ranged from n = 12 to n = 22 (Table 3). Also,
in most of cases, the Bayesian inference and the ML method reconstructed the same
ancestral number (Table 3).
Tab
le 1
- G
ood
nes
s o
f fi
t of
the
ten
dif
fere
nt
model
s of
chro
moso
me
num
ber
evolu
tion,
appli
ed t
o b
oth
poly
mo
rph
ic a
nd
sin
gle
chro
mo
som
e d
ata.
In
bo
ld,
the
low
est
AIC
val
ue
for
each
dat
a se
t in
dic
ates
the
bes
t m
odel
. In
bra
cket
s, t
he
num
ber
s in
dic
ate
the
des
cend
ing o
rder
of
the
bes
t m
od
el.
ML
– M
axim
um
Lik
elih
ood;
AIC
– A
kai
ke
Info
rmat
ion
Cri
teri
on.
Ph
ylo
genet
ic
hyp
oth
esis
20
05
20
09
Co
din
g
schem
e
P
oly
mo
rph
ic d
ata
Sin
gle
dat
a
Po
lym
orp
hic
dat
a
Sin
gle
dat
a
Mo
del
s
A
IC
ML
A
IC
ML
A
IC
ML
A
IC
ML
Mc0
1
91
9.3
2 (
10
) -9
57
.66
19
31
.81
(1
0)
-96
3.9
1
37
58
.82
(1
0)
-18
77
.41
3
83
6.1
5 (
10
) -1
91
6.0
7
Mc1
1
71
1.1
3 (
6)
-85
2.5
7
17
72
.71
(6
) -8
83
.36
30
21
.70
(7
) -1
50
7.8
5
31
56
.25
(4
) -1
57
5.1
2
Mc2
1
67
9.4
1 (
1)
-83
6.7
0
17
32
.85
(2
) -8
63
.43
28
63
.98
(1
) -1
428
.99
30
21
.40
(1
) -1
507
.7
Mc3
1
68
0.5
0 (
2)
-83
6.2
5
17
30
.76
(1
) -8
61
.38
28
65
.74
(2
) -1
42
8.8
7
38
07
.53
(9
) -1
89
9.7
6
Ml0
1
85
8.1
0 (
8)
-92
5.0
5
18
73
.30
(9
) -9
32
.65
35
02
.08
(9
) -1
74
7.0
4
35
46
.47
(6
) -1
76
9.2
4
Ml1
1
70
8.5
3 (
5)
-84
9.2
6
17
58
.80
(5
) -8
74
.40
29
93
.74
(6
) -1
49
1.8
7
35
49
.09
(8
) -1
76
9.5
4
Ml2
1
68
4.9
5 (
3)
-83
7.4
7
17
34
.71
(3
) -8
62
.35
28
81
.82
(3
) -1
43
5.9
1
35
48
.96
(7
) -1
76
9.4
8
Ml3
1
68
5.5
8 (
4)
-83
6.7
9
17
40
.11
(4
) -8
64
.06
28
84
.16
(4
) -1
43
6.0
8
30
30
.43
(2
) -1
50
9.2
1
Mb
1
18
68
.58
(9
) -9
30
,29
18
61
.74
(8
) -9
26
.87
32
92
.42
(8
) -1
64
2.2
1
33
02
.70
(5
) -1
64
7.3
5
Mb
2
17
15
.26
(7
) -8
52
.63
17
76
.91
(7
) -8
83
.46
29
92
.68
(5
) -1
49
1.3
4
31
31
.09
(3
) -1
56
0.5
5

Tab
le 2
– R
ate
par
amet
ers
val
ues
an
d f
req
uen
cy o
f th
e fo
ur
poss
ible
even
t ty
pes
wit
h a
post
erio
r pro
bab
ilit
y (
PP
) >
0.5
in
th
e b
est
mo
del
an
d b
y a
ver
agin
g a
ll
model
s, f
or
each
dat
a co
din
g s
chem
e an
d p
hylo
gen
etic
hypoth
eses
. T
he
val
ues
of
rate
par
amet
ers
were
mu
ltip
lied
by 0
.01,
acco
rdin
g t
o t
he
bra
nch
len
gth
modif
icat
ions
mad
e to
sca
le t
he
ph
ylo
gen
etic
tre
e. s
ingle
: si
ngle
dat
a; p
oly
m.:
poly
morp
hic
dat
a; d
up
l.:
du
pli
cati
on
s; δ
– c
on
stan
t ch
rom
oso
me
loss
rat
e; δ
1–
linea
r ch
rom
oso
me
loss
rat
e; λ
– c
on
stan
t ch
rom
oso
me
gai
n r
ate;
λ1–
lin
ear
chro
moso
me
gai
n r
ate;
ρ –
ch
rom
oso
me
du
pli
cati
on
rat
e; μ
– c
hro
mo
som
e d
em
i-
dupli
cati
on o
r tr
iplo
idiz
atio
n r
ate;
β–
bas
e num
ber
; ν–
bas
e num
ber
rat
e.
R
ate
par
am
eter
s
Even
ts i
nfe
rred
wit
h P
P >
0.5
Ph
ylo
genet
ic
hyp
oth
esis
Co
din
g
schem
e
Bes
t
mo
del
L
og
Lik
A
IC
δ
λ ρ
μ
δ1
λ 1
ν
Lo
sses
Gai
ns
Dup
l.
Dem
i-d
up
l.
20
05
po
lym
.
Mc2
-8
36
.70
16
79
.41
0
.03
7
0.0
33
0.0
14
0.0
14
- -
-
17
7.4
0
15
4.4
1
68
.53
62
.54
Aver
agin
g
0.0
36
0.0
33
0.0
15
0.0
04
2.0
40
e-4
4.4
00
e-5
1.5
18
e-13
sin
gle
Mc3
-8
61
.38
17
30
.76
0
.06
0
0.0
39
0.0
14
0.0
24
- -
-
28
2.9
4
18
3.2
4
64
.99
11
3.0
1
Aver
agin
g
0.0
60
0.0
38
0.0
15
0.0
17
-5.0
00
e-5
-4.1
00
e-5
1.2
45
e-22
20
09
po
lym
.
Mc2
-1
428
.99
28
63
.98
0
.04
3
0.0
22
0.0
17
0.0
17
- -
-
29
9.7
8
15
4.4
0
11
8.6
7
11
7.3
0
Aver
agin
g
0.0
43
0.0
22
0.0
17
0.0
05
2.4
90
e-7
2.1
50
e-7
9.3
90
e-33
sin
gle
Mc2
-1
50
7.7
0
30
21
.40
0
.06
4
0.0
31
0.0
21
0.0
21
- -
-
44
1.0
5
21
8.5
2
14
4.6
1
14
5.8
5
Aver
agin
g
0.0
64
0.0
31
0.0
21
2.1
90
e-4
-3.0
00
e-6
1.3
00
e-5
5.3
49
e-30

Tab
le 3
- C
hro
mo
som
e n
um
ber
of
the
mo
st r
ecen
t co
mm
on a
nce
stor
of
the
Ast
erac
eae
fam
ily a
nd o
f th
e m
ain
tri
bes
in
the
20
05
an
d 2
00
9 s
up
ertr
ees,
un
der
the
bes
t m
odel
of
chro
mo
som
e ev
olu
tio
n f
or
each
codin
g sc
hem
e. T
he
two m
ost
pro
bab
le a
nce
stra
l ch
rom
oso
me
nu
mb
ers
ob
tain
ed t
hro
ugh
th
e B
ayes
ian
phylo
gen
etic
in
fere
nce
(B
ayes
), a
s w
ell
as,
the
resu
lt o
f th
e m
axim
um
lik
elih
ood (
ML
) ar
e pro
vid
ed,
wit
h t
he
pro
bab
ilit
y (
PP
) o
f o
ccurr
ence
bei
ng g
iven
in
par
enth
eses
. W
hen
avai
lable
, th
e b
ase
nu
mber
info
rmat
ion a
vai
lable
in t
he
lite
ratu
re i
s al
so g
iven
.
2
00
5
2
00
9
Bas
e nu
mb
ers
Tri
bes
Bay
es
bes
t n
(P
P);
Bay
es
2nd b
est
n (
PP
); M
L
Bay
es
bes
t n
(P
P);
Bay
es
2nd b
est
n (
PP
); M
L
P
oly
mo
rph
ic d
ata
Sin
gle
dat
a
P
oly
mo
rph
ic d
ata
Sin
gle
dat
a
Ast
era
cea
e
9 (
0.8
0);
8 (
0.0
9);
2
9 (
0.5
1);
10
(0
.26
); 2
9 (
0.6
0);
10
(0
.21
); 2
9
(0
.22
); 1
0 (
0.1
8);
2
9a,
8b
Bar
nad
esie
ae
9 (
0.5
2);
8 (
0.3
0);
8
9 (
0.3
6);
8 (
0.2
6);
8
9
(0
.74
); 8
(0
.19
); 9
9
(0
.40
); 8
(0
.27
); 6
8
, 9
, 1
2, 2
7c
***
Sti
ffti
eae
9 (
0.8
4);
10
(0
.08);
2
9 (
0.5
4);
10
(0
.29);
2
9
(0
.27
); 1
8 (
0.1
5);
12
9
(0
.21
); 1
0 (
0.1
4);
9
9*
Ono
seri
dea
e 9
(0
.41
); 1
8 (
0.2
1);
9
9 (
0.4
5);
10
(0
.21);
6
9
(0
.36
); 1
8 (
0.1
8);
18
9
(0
.50
); 1
0 (
0.3
3);
9
No
dat
a
Muti
siea
e
13
(0.2
3);
12
(0
.15
); 1
2
10
(0.1
8);
15
(0
.15
); 8
15
(0.5
7);
12
(0
.17
); 1
2
15
(0.5
1);
16
(0
.27
); 1
6
9d
*
Nas
sauv
ieae
1
3 (
0.3
9);
10
(0
.15
); 1
2
10
(0.3
2);
9 (
0.2
7);
9
1
0 (
0.5
0);
9 (
0.1
6);
12
1
0 (
0.5
6);
9 (
0.2
2);
9
No
dat
a
Hyal
idea
e
- -
2
7 (
0.3
2);
18
(0
.23
); 1
8
27
(0.1
9);
18
(0
.16
); 1
8
-
Wund
erli
chie
ae
- -
2
7 (
0.1
8);
18
(0
.18
); 1
2
18
(0.1
2);
27
(0
.11
); 1
2
No
dat
a
Go
chnat
ieae
2
2 (
0.3
5);
23
(0
.18
); 2
2
22
(0.2
2);
23
(0
.21
); 2
4
9
(0
.69
); 1
0 (
0.1
5);
2
9 (
0.4
5);
10
(0
.31);
2
4;
9;
23
e ***
Hec
asto
clei
dea
e 9
(0
.89
); 1
0 (
0.0
7);
2
9 (
0.6
1);
10
(0
.28);
2
9
(0
.85
); 1
0 (
0.1
3);
2
9 (
0.5
7);
10
(0
.35);
2
8f
***
Dic
om
eae
10
(0.4
4);
9 (
0.2
4);
11
1
0 (
0.4
1);
9 (
0.2
5);
11
9 (
0.5
6);
10
(0
.37);
10
9
(0
.53
); 1
0 (
0.3
7);
10
1
0;
11
*
Old
enb
urg
ieae
9
(0
.57
); 1
0 (
0.2
8);
12
9
(0
.48
); 1
0 (
0.2
8);
12
18
(0.5
2);
9 (
0.3
3);
18
9
(0
.71
); 1
0 (
0.2
1);
9
9*
Tar
cho
nan
thea
e
9 (
0.4
4);
18
(0
.42);
18
9
(0
.64
); 1
0 (
0.1
3);
12
18
(0.7
6);
9 (
0.2
0);
18
9
(0
.89
); 1
0 (
0.0
6);
9
9*
Car
duea
e
9 (
0.4
5);
10
(0
.36);
12
9
(0
.42
); 1
0 (
0.2
7);
12
1
0 (
0.4
3);
9 (
0.4
0);
10
9
(0
.68
); 8
(0
.18
); 9
1
0*;
7 –
16
g1 *
**,
17
g2
Per
tyea
e
13
(0.3
1);
9 (
0.2
3);
13
9
(0
.23
); 1
3 (
0.2
0);
13
13
(0.2
8);
9 (
0.2
6);
6
9 (
0.2
2);
14
(0
.22);
6
13
h *
**
Gym
nar
rhen
eae
9 (
0.9
3);
10
(0
.05);
11
9
(0
.65
); 1
0 (
0.2
6);
11
9
(0
.92
); 1
0 (
0.0
8);
2
9 (
0.7
0);
10
(0
.29);
2
10
*
Cic
ho
riea
e
9 (
0.6
0);
8 (
0.3
3);
9
9 (
0.4
4);
8 (
0.2
8);
9
9
(1
.00
); 9
9
(0
.96
); 1
0 (
0.0
3);
9
9i *
/**
*
Het
ero
lep
is
- -
9
(0
.91
); 8
(0
.08
); 9
9
(0
.86
); 8
(0
.11
); 9
6
j ***
Ere
mo
tham
nea
e
- -
9
(0
.35
); 8
(0
.19
); 9
9
(0
.25
); 8
(0
.18
); 9
-
Arc
toti
dea
e
9 (
0.7
4);
8 (
0.2
2);
9
9 (
0.4
3);
8 (
0.2
3);
9
-
- 9
*
Arc
toti
dea
e_A
rct
- -
9
(0
.91
); 8
(0
.06
); 9
9
(0
.81
); 8
(0
.10
); 9
-
Arc
toti
dea
e_G
ort
-
-
8 (
0.5
5);
9 (
0.3
6);
8
8 (
0.4
9);
9 (
0.3
9);
8
-
Pla
thyca
rphea
e
- -
9
(0
.82
); 1
0 (
0.1
2);
9
9 (
0.7
1);
10
(0
.19);
9
-
Lia
bea
e
9 (
0.9
7);
10
(0
.03);
9
9 (
0.8
7);
10
(0
.11);
9
9
(1
.00
); 9
9
(0
.98
); 1
0 (
0.0
2);
9
7;
9*
; 12
; 1
4;
16
; 18
k *
**
Dis
tep
ha
nu
s -
-
9 (
0.6
0);
10
(0
.40);
9
10
(0.5
2);
9 (
0.4
7);
9
No
dat
a
Mo
quin
ieae
-
-
10
(0.4
1);
9 (
0.2
8);
9
10
(0.7
4);
9 (
0.2
5);
9
-
Ver
no
nie
ae
9 (
0.7
7);
10
(0
.22);
9
10
(0.6
1);
9 (
0.3
7);
9
1
0 (
0.9
7);
9 (
0.0
3);
10
1
0 (
0.9
6);
9 (
0.0
3);
10
1
0*
Co
rym
bie
ae
9 (
0.9
4);
10
(0
.05);
10
9
(0
.65
); 1
0 (
0.2
7);
10
9 (
0.9
0);
10
(0
.10);
13
9
(0
.67
); 1
0 (
0.3
3);
13
8
l ***
Sen
ecio
nea
e
9 (
0.5
7);
10
(0
.42);
10
1
0 (
0.5
9);
9 (
0.3
5);
10
10
(1.0
0);
10
1
0 (
1.0
0);
10
5
; 1
0m
*
Cal
end
ule
ae
9 (
0.6
3);
10
(0
.17);
9
9 (
0.4
3);
10
(0
.37);
9
9
(0
.77
); 1
0 (
0.2
1);
10
9
(0
.56
); 1
0 (
0.3
9);
10
8
; 9
; 1
0*
Gnap
hal
ieae
9
(0
.89
); 8
(0
.08
); 9
9
(0
.71
); 1
0 (
0.2
2);
9
9
(0
.51
); 8
(0
.45
); 8
9
(0
.52
); 8
(0
.41
); 8
6
; 7
; 1
0*
; 1
1;
12
; 13
; 1
4n
*/*
**
Anth
em
idea
e 9
(0
.92
); 1
0 (
0.0
8);
9
9 (
0.6
4);
10
(0
.32);
9
9
(0
.89
); 1
0 (
0.1
0);
9
9 (
0.7
4);
10
(0
.25);
9
9o ;
10*
/***
Ast
erea
e 9
(0
.96
); 1
0 (
0.0
2);
9
9 (
0.7
5);
10
(0
.22);
9
9
(0
.96
); 1
0 (
0.0
4);
9
9 (
0.8
3);
10
(0
.16);
10
9
p *
/**
*
Inule
ae
9 (
0.6
0);
10
(0
.37);
10
1
0 (
0.4
6);
9 (
0.4
4);
10
9 (
0.7
1);
10
(0
.28);
10
9
(0
.51
); 1
0 (
0.4
7);
10
5
, 8
, 9
, 10
q1 *
, 7
– 1
1q2/*
**
Ath
rois
mea
e
10
(0.7
2);
9 (
0.2
3);
10
1
0 (
0.6
5);
9 (
0.1
8);
10
10
(0.7
6);
9 (
0.1
8);
11
1
0 (
0.6
6);
9 (
0.1
7);
12
7
; 1
0r *
/***
Fed
dee
ae
- -
9
(0
.89
); 1
0 (
0.0
9);
15
9
(0
.66
); 1
0 (
0.3
1);
15
N
o d
ata
Hel
enie
ae
9 (
0.7
6);
10
(0
.09);
9
9 (
0.4
9);
10
(0
.28);
9
9
(0
.90
); 1
0 (
0.0
5);
13
9 (
0.6
7);
10
(0
.23);
12
1
8*
*
Co
reo
psi
dea
e 1
2 (
0.2
9);
13
(0
.20
); 1
2
9 (
0.2
4);
12
(0
.18);
9
9
(0
.75
); 1
0 (
0.0
9);
12
9
(0
.61
); 1
0 (
0.3
5);
10
1
2;
16
*
Neu
rola
enea
e
9 (
0.8
0);
10
(0
.17);
9
9 (
0.7
2);
10
(0
.20);
9
9
(0
.76
); 1
0 (
0.1
5);
11
9
(0
.69
); 1
0 (
0.2
6);
9
11
*
Tag
etea
e 9
(0
.87
); 1
0 (
0.0
8);
9
9 (
0.8
9);
10
(0
.04);
9
9
(0
.77
); 1
2 (
0.1
2);
12
9
(0
.87
); 1
0 (
0.0
9);
9
18
**
Chae
nac
tid
eae
8 (
0.5
4);
9 (
0.3
7);
8
8 (
0.4
1);
7 (
0.3
7);
8
9
(0
.45
); 8
(0
.42
); 9
8
(0
.40
); 7
(0
.35
); 8
9
*
Bah
ieae
1
0 (
0.7
6);
9 (
0.1
9);
10
10
(0.5
8);
11
(0
.17
); 1
0
1
0 (
0.6
5);
11
(0
.15
); 1
1
10
(0.4
8);
11
(0
.18
); 1
0
17
**
Po
lym
nie
ae
9 (
0.8
9);
10
(0
.09);
9
9 (
0.8
0);
10
(0
.16);
9
9
(0
.91
); 1
0 (
0.0
8);
10
9
(0
.77
); 1
0 (
0.2
2);
9
15
s
Hel
ianth
eae
18
(0.8
3);
9 (
0.1
0);
18
1
8 (
0.7
1);
9 (
0.1
2);
18
9
(0
.96
); 1
0 (
0.0
4);
9
9 (
0.8
4);
10
(0
.16);
9
8,
9, 1
7 –
19
, 1
8t
Mil
leri
eae
9 (
0.5
3);
8 (
0.3
6);
9
9 (
0.4
3);
8 (
0.4
1);
9
9
(0
.55
); 8
(0
.34
); 9
9
(0
.47
); 8
(0
.38
); 9
9
; 1
0;
11
; 1
2;
14
u
Per
ityle
ae
18
(0.8
7);
9 (
0.1
2);
18
1
8 (
0.8
5);
9 (
0.1
1);
18
18
(0.8
3);
9 (
0.1
5);
18
1
8 (
0.7
6);
9 (
0.1
9);
18
1
8v *
*
Eup
ato
riea
e
9 (
0.9
7);
10
(0
.03);
9
9 (
0.9
0);
10
(0
.06);
9
9
(0
.78
); 1
0 (
0.2
1);
9
9 (
0.6
5);
10
(0
.30);
9
10
; 1
7;
18
w
Mad
ieae
9
(0
.91
); 8
(0
.09
); 9
9
(0
.43
); 7
(0
.29
); 9
9 (
0.9
7);
8 (
0.0
1);
9
9 (
0.8
6);
10
(0
.07);
9
19
**
Arc
t. =
Arc
toti
din
ae s
ub
trib
e; G
ort
. =
Gort
erii
nae
sub
trib
e. a
So
lbri
g (
19
77
), C
ron
qu
ist
(19
81
), B
rem
er (
19
94
), S
an
tosh
an
d R
ag
hb
ir (
20
13
). b
Va
llès
et
al.
(2
00
5).
c S
tues
sy e
t
al.
(2
00
9),
ch
ap
ter
13
; x
= 2
7 (
Wa
tan
ab
e et
al.
, 20
07
).
d x
= 9
see
ms
to b
e a
vail
ab
le f
or
all
or
nea
rly
all
th
e b
ase
nu
mb
ers
list
ed.
e x
= 4
, x
= 9
, x
= 2
3 (
revi
ew
ed b
y S
an
cho
&
Fre
ire
(20
09
), c
ha
pte
r15.
f B
ase
d o
n a
sin
gle
co
un
t o
f 2
n =
16
(F
un
k &
Hin
d,
20
09
), c
ha
pte
r 1
6.
g1
Su
san
na &
Ga
rcia
-Ja
cas
(20
09
), c
hap
ter
20
; g2 i
n W
ata
na
be
et a
l. (
20
07
).h
(Fre
ire,
20
09),
ch
ap
ter
21
. i in
Ra
ven
et
al.
(1
96
0);
Fu
nk
& C
ha
n (
20
09
), c
ha
pte
r 2
3.
j Fu
nk
& K
ari
s (2
00
9),
ch
ap
ter
31
. k
Dil
lon
et
al.
(2
00
9),
ch
ap
ter
27
. l B
ase
d o
n a
sin
gle
cou
nt o
f 2n
= 1
6 in
Co
rym
biu
m c
ongest
um
(N
ord
enst
am
& F
un
k, 2
009
), c
hap
ter
32
. m
Rave
n e
t a
l. (
19
60
) an
d V
all
ès e
t a
l. (
20
05
). n
Va
llès
et
al.
(2
00
5);
Wa
tan
ab
e et
al.
(1
99
9)
cite
d i
n W
ata
na
be
et a
l. (
20
07
); W
ard
et
al.
(2
00
9),
ch
ap
ter
36
. o V
all
ès e
t a
l. (
20
05
); W
ata
na
be
et a
l. (
20
07
); O
ber
pri
eler
et
al.
(2
00
9),
ch
ap
ter
38
.
p R
ave
n e
t a
l. (
19
60
);
Wa
tan
ab
e et
al.
(2
00
7);
Bro
uil
let
et a
l. (
20
09
), c
ha
pte
r 3
7.
q1 R
ave
n e
t a
l. (
19
60
) a
nd
Va
llès
et
al.
(2
00
5);
q2
W
ata
na
be
et a
l. (
20
07
). R
ob
inso
n e
t a
l. (
19
97
) p
rese
nte
d x
= 1
0
an
d A
nd
erb
erg
(2
009
) p
rese
nte
d t
he
ba
se n
um
ber
s o
f x
= 9
or
x =
10
, ch
ap
ter
39
. r A
nd
erb
erg
(2
00
9a
), c
ha
pte
r 4
0.
s E
stes
& B
eck
(20
11
). t
x =
9 o
r it
s m
ult
iple
s (R
ave
n e
t a
l.,
19
60
) o
r a
lso
x =
18
(W
ata
na
be
et a
l., 20
07
); x
= 1
7-1
9 (
Sm
ith
, 1
975
) a
nd
x
= 8
(S
tues
sy, 1
97
7)
cite
d i
n R
ob
inso
n (
19
81
). u
Blö
ch e
t a
l. (
20
09
). v
Ro
bin
son
(1
98
1)
and
Ba
ldw
in
et a
l. (
20
02
).w
x =
10
(R
ob
inso
n e
t a
l., 1
997
), x
= 1
7 (
Wa
tan
ab
e et
al.
, 1
99
5),
x =
18
(W
ata
na
be
et a
l., 1
999
) ci
ted
in
Wa
tan
abe
et a
l. (
20
07
).
* E
stim
ate
d b
y F
un
k et
al.
(2
00
9).
**
Est
ima
ted
by
Ba
ldw
in e
t a
l. (
20
02
). *
**
In F
un
k et
al.
(2
00
9)
Th
e d
ash
(-)
pre
sen
t o
n t
he
base
nu
mb
er o
f so
me
trib
es i
nd
ica
tes
the
ab
sen
ce o
f d
ata
, a
ccord
ing
to
Fun
k et
al.
(2
00
9).
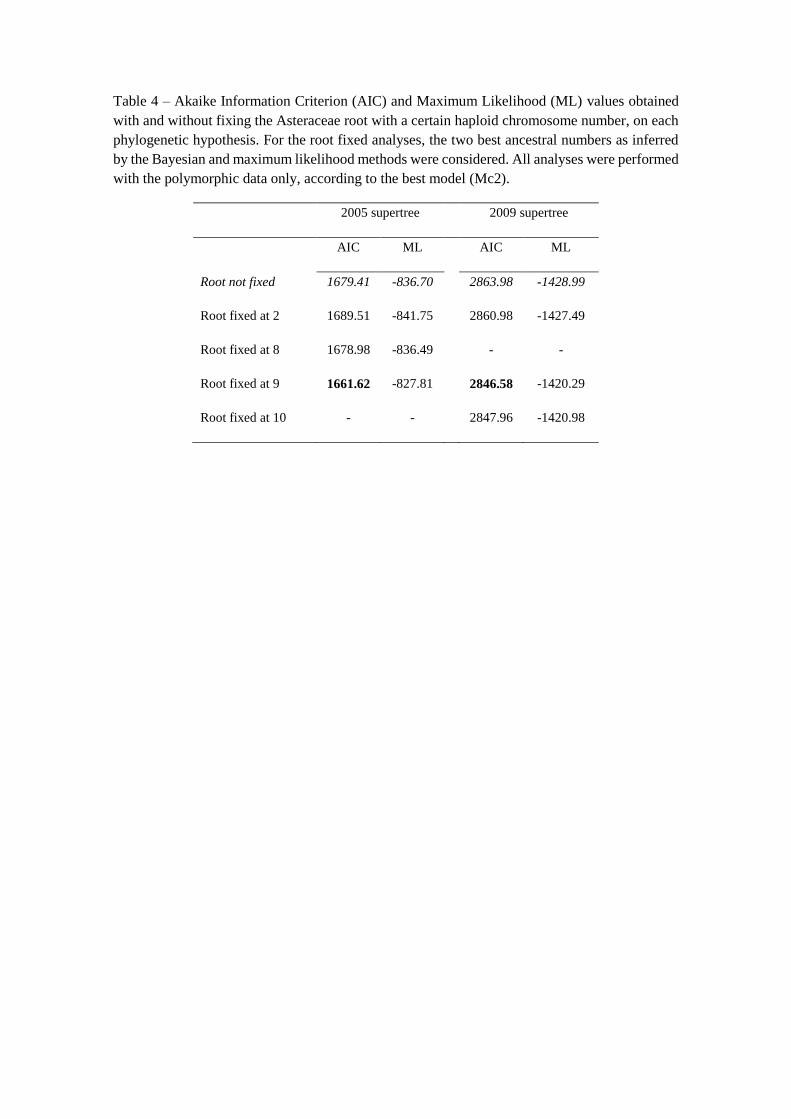
Table 4 – Akaike Information Criterion (AIC) and Maximum Likelihood (ML) values obtained
with and without fixing the Asteraceae root with a certain haploid chromosome number, on each
phylogenetic hypothesis. For the root fixed analyses, the two best ancestral numbers as inferred
by the Bayesian and maximum likelihood methods were considered. All analyses were performed
with the polymorphic data only, according to the best model (Mc2).
2005 supertree 2009 supertree
AIC ML AIC ML
Root not fixed 1679.41 -836.70 2863.98 -1428.99
Root fixed at 2 1689.51 -841.75 2860.98 -1427.49
Root fixed at 8 1678.98 -836.49 - -
Root fixed at 9 1661.62 -827.81 2846.58 -1420.29
Root fixed at 10 - - 2847.96 -1420.98

33
The expected number of changes along each branch
Regardless of the phylogenetic hypothesis and the coding scheme, the most common
inferred events with a PP > 0.5 were the chromosome losses (Table 2). The number of
events of chromosome number change were, in general, higher for the single data than
for the polymorphic data, irrespective of the type of event (Table 2). Only the number of
duplications events in 2005 supertree were higher for the polymorphic data than for the
single data (Table 2).
The number of chromosome duplications was higher than the number of chromosome
demi-duplications for polymorphic data, whereas the opposite was observed for the single
data, irrespective the phylogenetic hypothesis (Table 2). Nevertheless the differences
between the number of duplications and demi-duplications were very low with the
exception of the best model for single data in 2005 supertree (Table 2).
Polyploidization events and climate changes
Many branches in which a polyploidization event was inferred coincided with ancient
climate change periods (Figure 1). The polyploidization events were associated more
frequently to the most recent period of climate change, namely the Late-Miocene and
Early-Pliocene (6.0 - 3.2 Mya). This association was weaker in older climate change
events (Figure 1).
In detail, during the period of Mid-Paleocene and Early Eocene, there were no branches
with polyploidization events (Figures 1A and 1B). During the Early-middle-Miocene and
the Early-Oligocene, the number of branches with polyploidization events was very low,
with duplications (2.74%) coinciding with climate change events in a lower proportion
than demi-duplications (4.11%) for the 2005 supertree (Figure 1A), whereas the opposite
was observed in the 2009 supertree (Figure 1B). In Late-middle-Miocene, an increase in
polyploidization events was observed (from 4.11% to 24.66% - 2005 supertree; from
1.48% to 14.07% - 2009 supertree), with the number of branches with duplications events
being higher than the number of branches with demi-duplications. The same trend was
observed for the period of Late-Miocene and Early-Pliocene but with a higher number of
polyploidization events (63.01% and 58.52% of total polyploidization events in the 2005
and 2009 supertrees, respectively), in both phylogenetic hypotheses.
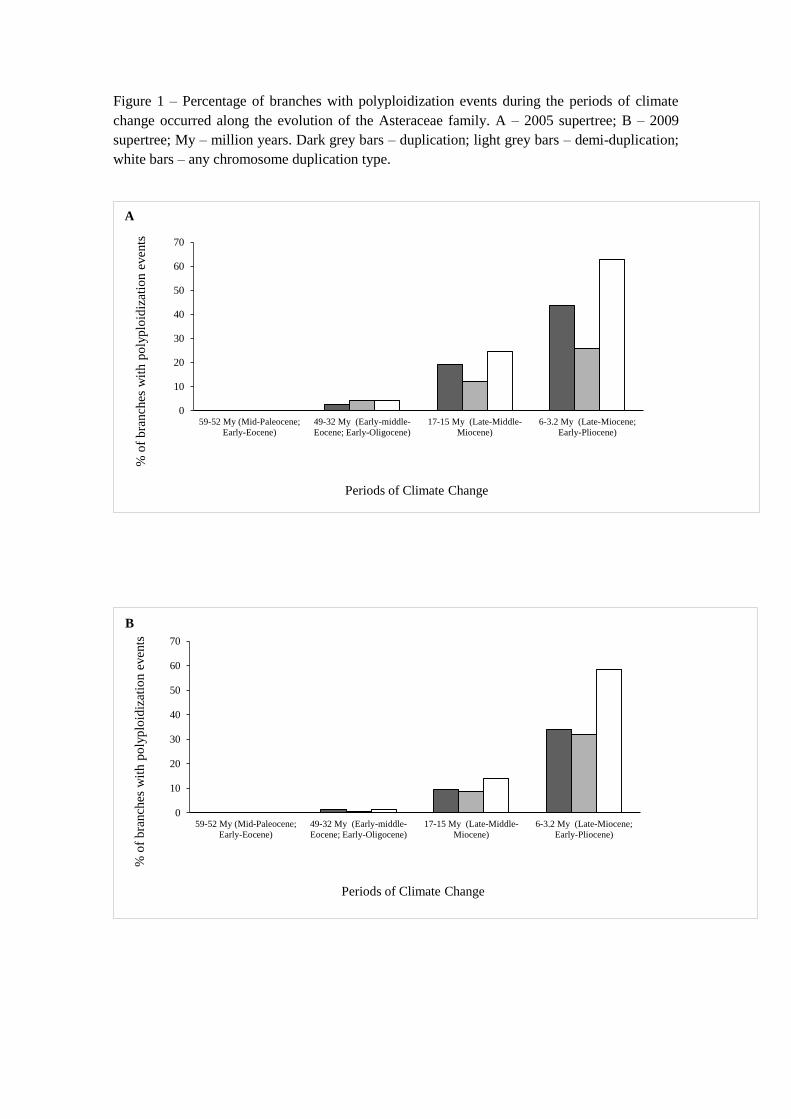
Figure 1 – Percentage of branches with polyploidization events during the periods of climate
change occurred along the evolution of the Asteraceae family. A – 2005 supertree; B – 2009
supertree; My – million years. Dark grey bars – duplication; light grey bars – demi-duplication;
white bars – any chromosome duplication type.
0
10
20
30
40
50
60
70
59-52 My (Mid-Paleocene;
Early-Eocene)
49-32 My (Early-middle-
Eocene; Early-Oligocene)
17-15 My (Late-Middle-
Miocene)
6-3.2 My (Late-Miocene;
Early-Pliocene)
% o
f b
ranch
es w
ith p
oly
plo
idiz
atio
n e
ven
ts
Periods of Climate Change
A
0
10
20
30
40
50
60
70
59-52 My (Mid-Paleocene;
Early-Eocene)
49-32 My (Early-middle-
Eocene; Early-Oligocene)
17-15 My (Late-Middle-
Miocene)
6-3.2 My (Late-Miocene;
Early-Pliocene)
% o
f b
ranch
es w
ith p
oly
plo
idiz
atio
n e
ven
ts
Periods of Climate Change
B

35
4. Discussion

Discussion
37
Models of chromosome evolution in Asteraceae
The analysis of the chromosome number evolution in Asteraceae revealed that the haploid
chromosome number shifted frequently along the evolution of the Asteraceae family. The
best evolutionary models obtained (Mc2 and Mc3 models) showed that dysploidy and
polyploidy were very important events, being frequently associated (Table 1). More
exactly, the descending dysploidies through chromosome fusion were the most common
genetic mechanism along the evolution of this family (Table 2). These results are similar
to those obtained for the Araceae (Cusimano et al., 2012), Melanthiaceae (Pellicer et al.,
2014), and Colchicaceae (Chacón et al., 2014) families. In addition, previous studies in
specific tribes of the Asteraceae family using other approaches have also shown that
dysploidies (more precisely, descending dysploidy) and genome duplications were two
frequent and important processes of chromosomal number change (Ito et al., 2000;
Anderberg, 2009b; Funk & Chan, 2009; Semple & Watanabe, 2009; Susanna & Garcia-
Jacas, 2009; Ward et al., 2009); whereas in other tribes, polyploidy seems to have played
the most important role (Robinson, 1981; Vallès et al., 2005; Baldwin, 2009; Kilian et al.,
2009; Oberprieler et al., 2009; Sancho & Freire, 2009; Stuessy et al., 2009). A recent
study exploring karyotypic changes in fifteen clades of angiosperms also highlighted the
co-occurrence of dysploidy and polyploidy (Escudero et al., 2014). Thus, our results and
previous studies emphasize the importance of these phenomena and their association in
the evolution of chromosome number of flowering plants, and of Asteraceae in particular.
The differences observed in the number of events that occurred along the branches,
between coding schemes and phylogenetic hypotheses, may be explained by the
complexity and diversity of the Asteraceae family. This family comprises a vast number
of species, and phylogenetic uncertainties still exist for some tribes, as the Heliantheae,
Senecioneae and Mutisieae tribes. Furthermore, for several genus and species no
chromosomal data was available (Semple & Watanabe, 2009). These sampling
difficulties suggest both the need for more phylogenetic studies to solve the uncertain
position of some tribes, as well as further cytological investigations. Finally, the inclusion
of polymorphic data seemed to provide more reliable inferences than that chromosome
number reduction, and thus, future studies are encouraged to follow the same approach
and consider chromosome number polymorphisms.
Discussion
38
Ancestral chromosome numbers
Our models of chromosome number evolution allowed to infer for first time the ancestral
haploid numbers for the sunflower family using a statistical approach (for further and
more precise information of all the ancestral numbers inferred, see Figure S1 in Appendix
1). Overall, our results agreed with previous hypotheses of ancestral chromosome
numbers for the family and for many of its tribes (Table 3), with n = 9 (under Bayesian
inference) being the most probable ancestral chromosome number of the Asteraceae
family (Solbrig, 1977; Cronquist, 1981, Bremer, 1994 cited in Semple & Watanabe, 2009;
Santosh & Raghbir, 2013). Unexpectedly, the ancestral number for Asteraceae obtained
under ML was n = 2, a very low and unreliable number (Table 3). Considering that other
ancestral ML estimations across the tree were very consistent with the Bayesian approach,
it is difficult to envisage the causes for this large disagreement in the root of the family.
Still, several disagreements were observed between the ancestral inferences of this study
and those of previous works for ancestral and base chromosome number estimations (e.g.,
Anthemideae, Mutisieae, Hecastocleideae, and Corymbieae; Table 2). Two main factors
might have contributed for the observed disagreement between previous estimations: 1)
the use of different approaches, mainly basic chromosome numbers instead of the haploid
chromosome number; and 2) incomplete taxon sampling. First, previous estimations have
been frequently based in algebraic inferences or, considered solely the lowest available
haploid count as the ancestral condition instead of using specific models of chromosome
evolution (Powell et al. (1974) cited in Funk & Hind (2009); Weitz (1989) cited in
Nordenstam & Funk (2009). Second, in spite our analysis makes use of the largest
phylogenetic trees of the family, they still represent an incomplete data set. Future studies
with more complete phylogenetic trees will allow to get even better inferences of ancestral
states and to solve if the disagreements that may be related with the lack of complete
sampling.
Polyploidy and climate changes
The present study revealed that it is very likely that several WGD occurred in the
evolution of different lineages of Asteraceae. For instance, a WGD event with a high
probability (≥ 0.8) was observed near the base of the Heliantheae alliance (for further and
more precise information of all the duplication and demi-duplication events inferred, see
Discussion
39
Figure S2 in Appendix 1). This result seems to be in accordance with previous evidences
from genomic and cytological analyses that also revealed independent genome
duplications near the base of this lineage (Baldwin et al., 2002; Barker et al., 2008). The
origin of the Heliantheae might have occurred during the Late-Middle Miocene (Figure
S2). Although our analyses agree with the results of Barker et al. (2008) in this particular
case, the two other suggested paleopolyploidization events inferred by their genome
analyses, i.e., 1) a paleopolyploidization placed near the origin of the family just prior to
the rapid radiation of its tribes; and 2) an independent genome duplication near the base
of the tribe Mutisieae, were not confirmed by our study. This disagreement may be related
with the different approaches followed. While Barker et al. (2008) performed a
comparative study of thousands of expressed sequence tag (ESTs) from 18 Asteraceae
species and two outgroups (Solanum lycopersicon and Arabidopsis thaliana), our study
focuses on inferring the evolution of chromosome numbers using data from more than
500 genera. Therefore, the lack of congruence might be produced mainly because of the
very low sampling effort in Barker et al. (2008), which might have led to an incorrect
localization of the WGD events that were found. Indeed, considering the outgroups used
in Barker et al. (2008), the WGD attributed to the origin of Asteraceae might have
occurred before the origin of this family. In addition, these authors suggest that there was
another WGD at the base of the tribe Mutisieae. However, only one species of this tribe,
Gerbera hybrida, was included in that study. In our study, no WGD was discovered at
the origin of the Mutisieae, but rather within the tribe in the origin of the genus Gerbera
(Figure S1).
Ancient polyploidization events may be harder to detect than recent ones, because of the
genomic changes and restructuring that follows polyploidization events. The majority of
the WGD reconstructed were observed mainly towards the tips of the tree (Figure S2).
The same pattern was observed in the Araceae (Cusimano et al., 2012) and Melanthiaceae
(Pellicer et al., 2014) families. Further studies combining haploid chromosome number
evolution and genome wide analyses will help to assess the reliability of these results.
The lack of accuracy to find the exact place of WGD events makes it difficult to assess
whether ancient climate changes could trigger the success of old WGD in the evolution
of plant lineages. Dynesius and Jansson (2000) suggested that species formed by abrupt
mechanisms such as polyploidy may be present on higher proportions in harsh and
Discussion
40
unstable environments, as are the periods of climatic change (Fawcett & Van de Peer,
2010). Our exploratory approach provided a first insight in this issue. More than a half of
the branches with polyploidization events underwent periods of climate change,
suggesting that WGD may be linked with stress conditions. No WGD was found during
the first period of climate changes that was considered, mainly because the origin of
Asteraceae was estimated on 50 million years (Funk et al., 2005), much later than the
mentioned period. Most of the WGDs were related with the most recent period of climate
change, namely the period between the Late Miocene and the Early Pliocene (Figure 1).
This period of time was marked by cooling conditions and a subtle warming trend, which
may explain its instability (Zachos et al., 2001). The high occurrence of polyploids (in
particular, of recently evolved polyploids) at present time in arctic areas is a well-known
example of polyploid distribution in harsh areas of the Earth (Brochmann et al., 2004).
Van de Peer et al. (2009) argued that most of the ancient WGD that survived - and
according to these authors, a few - did so because they occurred at specific times, e.g.
during major ecological upheavals and periods of extinction, when the competition with
diploids was reduced and when new ecological niches became available. In stable
ecosystems, the competition may be much higher than in severely perturbed environments
( Van de Peer et al., 2009; Fawcett & Van de Peer, 2010). The same authors defended
that the availability of ecological niches could be the single most important determinant
for the survival and long-term evolutionary success of a newly arisen polyploid. To fully
assess the potential effect of ancient climate changes on the evolutionary success of
polyploids future studies should focus in exploring in detail the WGD found in these
analyses, in particular to get more accurate estimations of their age, and therefore be able
to more systematically assess the validity of the correlations that were found.
The evolutionary significance of polyploidy has long been a controversial subject. The
results obtained by Mayrose et al. (2011) suggested that the newly formed polyploid
lineages generally fail to persist, indicating that polyploidy is most often an evolutionary
dead-end; however, the authors considered that the expanded genomic potential of those
polyploids that do persist drives longer-term evolutionary success. On the other hand,
Soltis & Soltis (2000) defended that the pattern of divergent speciation at the polyploid
level contradicts the view of polyploids as evolutionary dead-ends, and even considered
that polyploidy has a major role on the evolution and speciation, because genomic studies
indicate numerous ancient WGD events across the angiosperms, being its genomes
Discussion
41
fundamentally polyploids (Soltis et al., 2014). This Thesis revealed that the evolution of
the Asteraceae family was marked by a considerable number of polyploidy events, with
some tribes being of polyploid origin (e.g., all the tribes included on the Heliantheae
alliance have a tetraploid ancestor). Furthermore, our analyses provided the first
macroevolutionary observation of a possible link between climate changes events and the
probability of genome duplications. Still, further studies are needed to fully understand
this relation, as well as, the importance of that these genomic mechanisms have along the
evolution of the Asteraceae family.

43
5. References

References
45
Anderberg, A. A. (2009a). Athroismeae. In V. A. Funk, A. Susanna, T. F. Stuessy, & R.
J. Bayer (Eds.), Systematics, Evolution, and Biogeography of Compositae (pp. 681–
688). Vienna, Austria: International Association for Plant Taxonomy.
Anderberg, A. A. (2009b). Inuleae. In V. A. Funk, A. Susanna, T. F. Stuessy, & R. J.
Bayer (Eds.), Systematics, Evolution, and Biogeography of Compositae (pp. 667–
680). Vienna, Austria: International Association for Plant Taxonomy.
Antonelli, A., Verola, C. F., Parisod, C., & Gustafsson, A. L. S. (2010). Climate cooling
promoted the expansion and radiation of a threatened group of South American
orchids (Epidendroideae: Laeliinae). Biological Journal of the Linnean Society, 100,
597–607.
Baldwin, B. G. (2009). Heliantheae alliance. In V. A. Funk, A. Susanna, T. F. Stuessy, &
R. J. Bayer (Eds.), Systematics, Evolution, and Biogeography of Compositae (pp.
689–711). Vienna, Austria: International Association for Plant Taxonomy.
Baldwin, B. G., & Sanderson, M. J. (1998). Age and rate of diversification of the
Hawaiian silversword alliance (Compositae). Proceedings of the National Academy
of Sciences of the United States of America, 95, 9402–9406.
Baldwin, B. G., Wessa, B. L., & Panero, J. L. (2002). Nuclear rDNA evidence for major
lineages of Helenioid Heliantheae (Compositae). Systematic Botany, 27(1), 161–
198.
Barker, M. S., Kane, N. C., Matvienko, M., Kozik, A., Michelmore, R. W., Knapp, S. J.,
& Rieseberg, L. H. (2008). Multiple paleopolyploidizations during the evolution of
the Compositae reveal parallel patterns of duplicate gene retention after millions of
years. Molecular Biology and Evolution, 25(11), 2445–2455.
Barreda, V. D., Palazzesi, L., Katinas, L., Crisci, J. V, Tellería, M. C., Bremer, K.,
Passala, M. G., Bechis, F., Corsolini, R. (2012). An extinct Eocene taxon of the daisy
family (Asteraceae): evolutionary, ecological and biogeographical implications.
Annals of Botany, 109(1), 127–134.
References
46
Barres, L., Sanmartín, I., Anderson, C. L., Susanna, A., Buerki, S., Galbany-Casals, M.,
& Vilatersana, R. (2013). Reconstructing the evolution and biogeographic history of
tribe Cardueae (Compositae). American Journal of Botany, 100(5), 867–882.
Beaulieu, J. M., Tank, D. C., & Donoghue, M. J. (2013). A Southern Hemisphere origin
for campanulid angiosperms, with traces of the break-up of Gondwana. BMC
Evolutionary Biology, 13(1).
Bell, C. D., Soltis, D. E., & Soltis, P. S. (2010). The age and diversification of the
angiosperms re-revisited. American Journal of Botany, 97(8), 1296–1303.
Bergh, N. G., & Linder, H. P. (2009). Cape diversification and repeated out-of-southern-
Africa dispersal in paper daisies (Asteraceae-Gnaphalieae). Molecular
Phylogenetics and Evolution, 51(1), 5–18.
Blackmore, S., Van Campo, E., & Crane, P. R. (1986). Lophate Compositae pollen from
the Miocene and Pliocene of the Mediterranean region. Pollen et Spores, 28, 391-
402.
Blöch, C., Weiss-Schneeweiss, H., Schneeweiss, G. M., Barfuss, M. H. J., Rebernig, C.
a, Villaseñor, J. L., & Stuessy, T. F. (2009). Molecular phylogenetic analyses of
nuclear and plastid DNA sequences support dysploid and polyploid chromosome
number changes and reticulate evolution in the diversification of Melampodium
(Millerieae, Asteraceae). Molecular Phylogenetics and Evolution, 53(1), 220–233.
Bolker, B. (2007). Ecological Methods and Data in R. Princeton, Oxford: Princeton
University Press.
Brochmann, C., Brysting, A. K., Alsos, I. G., Borgen, L., Grundt, H. H., Scheen, A. C.,
& Elven, R. (2004). Biological relevance of polyploidy: ecology to genomics.
Polyploidy in arctic plants. Biological Journal of the Linnean Society, 82, 521–536.
Brouillet, L., Lowrey, T. K., Urbatsch, L., Karaman-Castro, V., Sancho, G., Wagstaff, S.,
& Semple, J. C. (2009). Astereae. In V. A. Funk, A. Susanna, T. F. Stuessy, & R. J.
Bayer (Eds.), Systematics, Evolution, and Biogeography of Compositae (pp. 589–
629). Vienna, Austria: International Association for Plant Taxonomy.
References
47
Chacón, J., Cusimano, N., & Renner, S. S. (2014). The evolution of Colchicaceae, with a
focus on chromosome numbers. Systematic Botany, 39(2), 415–427.
Comes, H. P., & Kadereit, J. W. (1998). The effect of Quaternary climatic changes on
plant distribution and evolution. Trends in Plant Science, 3(11), 432–438.
Couvreur, T. L. P., Franzke, A., Al-Shehbaz, I. A., Bakker, F. T., Koch, M. A., &
Mummenhoff, K. (2010). Molecular phylogenetics, temporal diversification, and
principles of evolution in the mustard family (Brassicaceae). Molecular Biology and
Evolution, 27(1), 55–71.
Cremonini, R. (2005). Low chromosome number angiosperms. Caryologia: International
Journal of Cytology, Cytosystematics and Cytogenetics, 58(4), 403–409.
Cusimano, N., Sousa, A., & Renner, S. S. (2012). Maximum likelihood inference implies
a high, not a low, ancestral haploid chromosome number in Araceae, with a critique
of the bias introduced by “x”. Annals of Botany, 109(4), 681–692.
DeVore, M. L., & Stuessy, T. F. (1995). The place and time of origin of the Asteraceae,
with additional comments on the Calyceraceae and Goodeniaceae. In D. J. N., Hind,
C. Jeffrey & G. V. Pope (Eds.), Advances in Compositae Systematics (pp. 23-40).
Kew: Royal Botanical Gardens.
Dillon, M. O., Funk, V. A., Robinson, H., & Chan, R. (2009). Liabeae. In V. A. Funk, A.
Susanna, T. F. Stuessy, & R. J. Bayer (Eds.), Systematics, Evolution, and
Biogeography of Compositae (pp. 417–437). Vienna, Austria: International
Association for Plant Taxonomy.
Escudero, M., Martín-Bravo, S., Mayrose, I., Fernández-Mazuecos, M., Fiz-Palacios, O.,
Hipp, A. L., Pimentel, M., Jiménez-Mejías, P., Valcárcel, V., Vargas, P., & Luceño,
M. (2014). Karyotypic changes through dysploidy persist longer over evolutionary
time than polyploid changes. PloS One, 9(1).
Estes, D., & Beck, J. (2011). A new species of Polymnia (Asteraceae: Tribe Polymnieae)
from Tennessee. Systematic Botany, 36(2), 481–486.
References
48
Fawcett, J. A., & Van de Peer, Y. (2010). Angiosperm polyploids and their road to
evolutionary success. Trends in Evolutionary Biology, 2(1).
Francisco-Ortega, J., Crawford, D. J., Santos-Guerra, A., & Sa-Fontinha, S. (1995).
Genetic divergence among mediterranean and macaronesian genera of the subtribe
Chrysantheminae (Asteraceae). American Journal of Botany, 82(10), 1321–1328.
Francisco-Ortega, J., Santos-Guerra, A., Hines, A., & Jansen, R. K. (1997). Molecular
evidence for a Mediterranean origin of the Macaronesian endemic genus
Argyranthemum (Asteraceae), 84(11), 1595–1613.
Freire, S. E. (2009). Pertyeae (Pertyoideae). In V. A. Funk, A. Susanna, T. F. Stuessy, &
R. J. Bayer (Eds.), Systematics, Evolution, and Biogeography of Compositae (pp.
315–326). Vienna, Austria: International Association for Plant Taxonomy.
Funk, V. A., Bayer, R. J., Keeley, S., Chan, R., Watson, L., Gemeinholzer, B., Schilling,
E., Panero, J. L., Baldwin, B. G., Garcia-Jacas, N., Susanna, A., & Jansen, R. K.
(2005). Everywhere but Antarctica : using a supertree to understand the diversity and
distribution of the Compositae. Biologiske Skrifter, 55, 343–374.
Funk, V. A., & Chan, R. (2009). Introduction to Cichorioideae. In V. A. Funk, A.
Susanna, T. F. Stuessy, & R. J. Bayer (Eds.), Systematics, Evolution, and
Biogeography of Compositae (pp. 336–342). Vienna, Austria: International
Association for Plant Taxonomy.
Funk, V. A., & Hind, D. J. N. (2009). Hecastocleideae (Hecastocleidoideae). In V. A.
Funk, A. Susanna, T. F. Stuessy, & R. J. Bayer (Eds.), Systematics, Evolution, and
Biogeography of Compositae (pp. 261–265). Vienna, Austria: International
Association for Plant Taxonomy.
Funk, V. A., & Karis, P. O. (2009). Heterolepis: an unplaced genus. In V. A. Funk, A.
Susanna, T. F. Stuessy, & R. J. Bayer (Eds.), Systematics, Evolution, and
Biogeography of Compositae (pp. 484–486). Vienna, Austria: International
Association for Plant Taxonomy.
References
49
Funk, V. A., Susanna, A., Stuessy, T. F., & Bayer, R. J. (Eds.). (2009). Systematics,
Evolution, and Biogeography of Compositae. Vienna, Austria: International
Association for Plant Taxonomy.
Glick, L., & Mayrose, I. (2014). ChromEvol: assessing the pattern of chromosome
number evolution and the inference of polyploidy along a phylogeny. Molecular
Biology and Evolution, 31(7), 1914–22.
Graham, A. (1994). A contribution to the geologic history of the Compositae. In D. J. N.
Hind & H. J. Beentje (Eds.), Compositae: Proceedings of the International
Compositae Conference (pp. 123–140). Kew: Royal Botanical Gardens.
Greilhuber, J., Borsch, T., Müller, K., Worberg, A., Porembski, S., & Barthlott, W.
(2006). Smallest angiosperm genomes found in Lentibulariaceae, with
chromosomes of bacterial size. Plant Biology, 8(6), 770–777.
Hegarty, M. J., & Hiscock, S. J. (2008). Genomic clues to the evolutionary success of
polyploid plants. Current Biology, 18(10), 435–444.
Hershkovitz, M. A., Arroyo, M. T. K., Bell, C., & Hinojosa, L. F. (2006). Phylogeny of
Chaetanthera (Asteraceae: Mutisieae) reveals both ancient and recent origins of the
high elevation lineages. Molecular Phylogenetics and Evolution, 41(3), 594–605.
Ito, M., Yahara, T., King, R. M., Watanabe, K., Oshita, S., Yokoyama, J., & Crawford,
D. J. (2000). Molecular phylogeny of Eupatorieae (Asteraceae) estimated from
cpDNA RFLP and its implication for the polyploid origin hypothesis of the tribe.
Journal of Plant Research, 113, 91–96.
Katinas, L., Crisci, J. V, Tellería, M. C., Barreda, V., & Palazzesi, L. (2007). Early history
of Asteraceae in Patagonia : evidence from fossil pollen grains. New Zealand
Journal of Botany, 45, 605–610.
Kilian, N., Gemeinholzer, B., & Lack, H. W. (2009). Cichorieae. In V. A. Funk, A.
Susanna, T. F. Stuessy, & R. J. Bayer (Eds.), Systematics, Evolution, and
Biogeography of Compositae (pp. 343–383). Vienna, Austria: International
Association for Plant Taxonomy.
References
50
Kim, K.-J., Choi, K.-S., & Jansen, R. K. (2005). Two chloroplast DNA inversions
originated simultaneously during the early evolution of the sunflower family
(Asteraceae). Molecular Biology and Evolution, 22(9), 1783–1792.
Kimball, R. T., Crawford, D. J., & Smith, E. B. (2003). Evolutionary processes in the
genus Coreocarpus: insights from molecular phylogenetics. Evolution, 57(1), 52–
61.
Lim, K. Y., Soltis, D. E., Soltis, P. S., Tate, J., Matyasek, R., Srubarova, H., Kovarik, A.,
Pires, J. C., Xiong, Z., & Leitch, A. R. (2008). Rapid chromosome evolution in
recently formed polyploids in Tragopogon (Asteraceae). PloS One, 3(10).
Lysák, M. A., & Schubert, I. (2013). Mechanisms of Chromosome Rearrangements. In J.
Greilhuber, J. Dolezel, & J. F. Wendel (Eds.), Plant Genome Diversity: Physical
Structure, Behaviour and Evolution of Plant Genomes. Vol. 2 (pp. 137–147). Wien:
Springer-Verlag.
Mayrose, I., Barker, M. S., & Otto, S. P. (2010). Probabilistic models of chromosome
number evolution and the inference of polyploidy. Systematic Biology, 59(2), 132–
144.
Mayrose, I., Zhan, S. H., Rothfels, C. J., Magnuson-Ford, K., Barker, M. S., Rieseberg,
L. H., & Otto, S. P. (2011). Recently formed polyploid plants diversify at lower
rates. Science, 333.
Nordenstam, B., & Funk, V. A. (2009). Corymbieae. In V. A. Funk, A. Susanna, T. F.
Stuessy, & R. J. Bayer (Eds.), Systematics, Evolution, and Biogeography of
Compositae (pp. 487–491). Vienna, Austria: International Association for Plant
Taxonomy.
Oberprieler, C. (2005). Temporal and spatial diversification of Circum-Mediterranean
Compositae-Anthemideae. Taxon, 54(4), 951–966.
Oberprieler, C., Himmelreich, S., Källersjö, M., Vallès, J., Watson, L. E., & Vogt, R.
(2009). Anthemideae. In V. A. Funk, A. Susanna, T. F. Stuessy, & R. J. Bayer (Eds.),
References
51
Systematics, Evolution, and Biogeography of Compositae (pp. 630–666). Vienna,
Austria: International Association for Plant Taxonomy.
Palazzesi, L., Barreda, V., Tellería, M. C. (2009). Fossil pollen grains of Asteraceae from
the Miocene of Patagonia. Review of Palaeobotany and Palynology, 155, 83-88.
Pellicer, J., Fay, M. F., & Leitch, I. J. (2010). The largest eukaryotic genome of them all ?
Botanical Journal of Linnean Society, 164, 10–15.
Pellicer, J., Kelly, L. J., Leitch, I. J., Zomlefer, W. B., & Fay, M. F. (2014). A universe
of dwarfs and giants: genome size and chromosome evolution in the monocot family
Melanthiaceae. The New Phytologist, 201(4), 1484–1497.
Pelser, P. B., & Watson, L. E. (2009). Introduction to Asteroideae. In V. A. Funk, A.
Susanna, T. F. Stuessy, & R. J. Bayer (Eds.), Systematics, Evolution, and
Biogeography of Compositae (pp. 495–502). Vienna, Austria: International
Association for Plant Taxonomy.
Raven, P. H., Solbrig, O. T., Kyhos, D. W., & Snow, R. (1960). Chromosome numbers
in Compositae. I. Astereae. American Journal of Botany, 47, 124–132.
Robinson, H. (1981). A revision of the tribal and subtribal limits of the Heliantheae
(Asteraceae). Smithsonian Contributions to Botany, 1–102.
Robinson, H., Carr, G. D., King, R. M., & Powell, A. M. (1997). Chromosome numbers
in Compositae, XVII: Senecioneae III. Annals of the Missouri Botanical Garden,
84, 893–906.
Roy, S. K., & Manton, I. (1964). A new base number in the genus Lygodium. New
Phytologist, 64(2), 286–292.
Sancho, G., & Freire, S. E. (2009). Gochnatieae (Gochnatioideae) and Hyalideae
(Wunderlichioideae p.p.). In V. A. Funk, A. Susanna, T. F. Stuessy, & R. J. Bayer
(Eds.), Systematics, Evolution, and Biogeography of Compositae (pp. 249–260).
Vienna, Austria: International Association for Plant Taxonomy.
References
52
Santosh, B., & Raghbir, C. G. (2013). Male meiosis and chromosome number in
Asteraceae family from district kangra of H.P. (Western Himalayas). International
Journal of Botany and Research, 3(1), 43–58.
Semple, J. C., & Watanabe, K. (2009). A review of chromosome numbers in Asteraceae
with hypotheses on chromosomal base number evolution. In V. A. Funk, A. Susanna,
T. F. Stuessy, & R. J. Bayer (Eds.), Systematics, Evolution, and Biogeography of
Compositae. Vienna, Austria: International Association for Plant Taxonomy.
Solbrig, O. T. (1977). Chromosomal cytology and evolution in the family Compositae. In
V. H. Heywood, J. B. Harborne, & B. L. Turner (Eds.), The biology and chemistry
of the Compositae (pp. 269–281). London, New York, San Francisco: Academic
Press.
Soltis, D. E., Visger, C. J., & Soltis, P. S. (2014). The polyploidy revolution then...and
now: Stebbins revisited. American Journal of Botany, 101(7), 1057–1078.
Soltis, P. S., & Soltis, D. E. (2000). The role of genetic and genomic attributes in the
success of polyploids. Proceedings of the National Academy of Sciences of the
United States of America, 97(13), 7051–7057.
Stebbins, G. L. J. (1938). Cytological characteristics associated with the different growth
habits in the dicotyledons. American Journal of Botany, 25, 189–198.
Stebbins, G. L. J. (1950). Variation and evolution in plants. Columbia University Press.
New York.
Stuessy, T. F., Urtubey, E., & Gruenstaeudl, M. (2009). Barnadesieae (Barnadesioideae).
In V. A. Funk, A. Susanna, T. F. Stuessy, & R. J. Bayer (Eds.), Systematics,
Evolution, and Biogeography of Compositae (pp. 215–228). Vienna, Austria:
International Association for Plant Taxonomy.
Susanna, A., & Garcia-Jacas, N. (2009). Cardueae (Carduoideae). In V. A. Funk, A.
Susanna, T. F. Stuessy, & R. J. Bayer (Eds.), Systematics, Evolution, and
Biogeography of Compositae (pp. 293–313). Vienna, Austria: International
Association for Plant Taxonomy.
References
53
Swenson, U., Nylinder, S., & Wagstaff, S. J. (2012). Are Asteraceae 1.5 billion years old?
A reply to heads. Systematic Biology, 61(3), 522–532.
Torices, R. (2010). Adding time-calibrated branch lengths to the Asteraceae supertree.
Journal of Systematics and Evolution, 48(4), 271–278.
Tremetsberger, K., Gemeinholzer, B., Zetzsche, H., Blackmore, S., Kilian, N., &
Talavera, S. (2012). Divergence time estimation in Cichorieae (Asteraceae) using a
fossil-calibrated relaxed molecular clock. Organisms Diversity & Evolution, 13(1),
1–13.
Tremetsberger, K., Stuessy, T. F., Kadlec, G., Urtubey, E., Baeza, C. M., Beck, S. G.,
Valdebenito, H. A., Ruas, C. F., & Matzenbacher, N. I. (2006). AFLP Phylogeny of
South American species of Hypochaeris (Asteraceae, Lactuceae). Systematic
Botany, 31(3), 610–626.
Uhl, C. (1978). Chromosomes of Mexican Sedum II. Section Pachysedum. Rhodora, 80,
491–512.
Vallès, J., Garnatje, T., Garcia, S., Sanz, M., & Korobkov, A. A. (2005). Chromosome
numbers in the tribes Anthemideae and Inuleae (Asteraceae). Botanical Journal of
the Linnean Society, 148, 77–85.
Van de Peer, Y., Maere, S., & Meyer, A. (2009). The evolutionary significance of ancient
genome duplications. Nature Reviews. Genetics, 10(10), 725–732.
Vanneste, K., Maere, S., Van de Peer, Y. (2014). Tangled up in two : a burst of genome
duplications at the end of the Cretaceous and the consequences for plant evolution.
Philosophical Transactions of the Royal Society.Biological Sciences, 369.
Vanzela, A., Guerra, M., & Luceño, M. (1996). Rhynchospora tenuis Link (Cyperaceae):
a species with the lowest number of holocentric chromosomes (n = 2). Cytobios, 88,
219–228.
Wagstaff, S. J., Breitwieser, I., & Swenson, U. (2006). Origin and relationships of the
austral genus Abrotanella (Asteraceae) inferred from DNA sequences. Taxon, 55(1),
95–106.
References
54
Ward, J., Bayer, R. J., Breitwieser, I., Smissen, R., Galbany-Casals, M., & Unwin, M.
(2009). Gnaphalieae. In V. A. Funk, A. Susanna, T. F. Stuessy, & R. J. Bayer (Eds.),
Systematics, Evolution, and Biogeography of Compositae (pp. 539–588). Vienna,
Austria: International Association for Plant Taxonomy.
Watanabe, K., Yahara, T., Hashimoto, G., Nagatani, Y., Soejima, A., Kawahara, T., &
Nakazawa, M. (2007). Chromosome numbers and karyotypes in Asteraceae.
BioOne, Annals of the Missouri Botanical Garden, 94(3), 643–654.
Webb, C. O., Ackerly, D. D., & Kembel, S. W. (2008). Phylocom: software for the
analysis of phylogenetic community structure and trait evolution. Bioinformatics,
Phylogenetics, 24(18), 2098–2100.
Wikström, N., Savolainen, V., & Chase, M. W. (2001). Evolution of the angiosperms:
calibrating the family tree. Proceedings of the Royal Society, Biological Sciences,
268, 2211–2220.
Wood, T. E., Takebayashi, N., Barker, M. S., Mayrose, I., Greenspoon, P. B., &
Rieseberg, L. H. (2009). The frequency of polyploid speciation in vascular plants.
Proceedings of the National Academy of Sciences of the United States of America,
106(33), 13875–13879.
Zachos, J., Pagani, M., Sloan, L., Thomas, E., & Billups, K. (2001). Trends, rhythms, and
aberrations in global climate 65 Ma to present. Science, 292, 686–693.
Zhang, J.-W., Nie, Z.-L., Wen, J., & Sun, H. (2011). Molecular phylogeny and
biogeography of three closely related genera, Soroseris, Stebbinsia, and
Syncalathium (Asteraceae, Cichorieae), endemic to the Tibetan Plateau, SW China.
Taxon, 60( 1), 15–26.

55
6. Appendix I

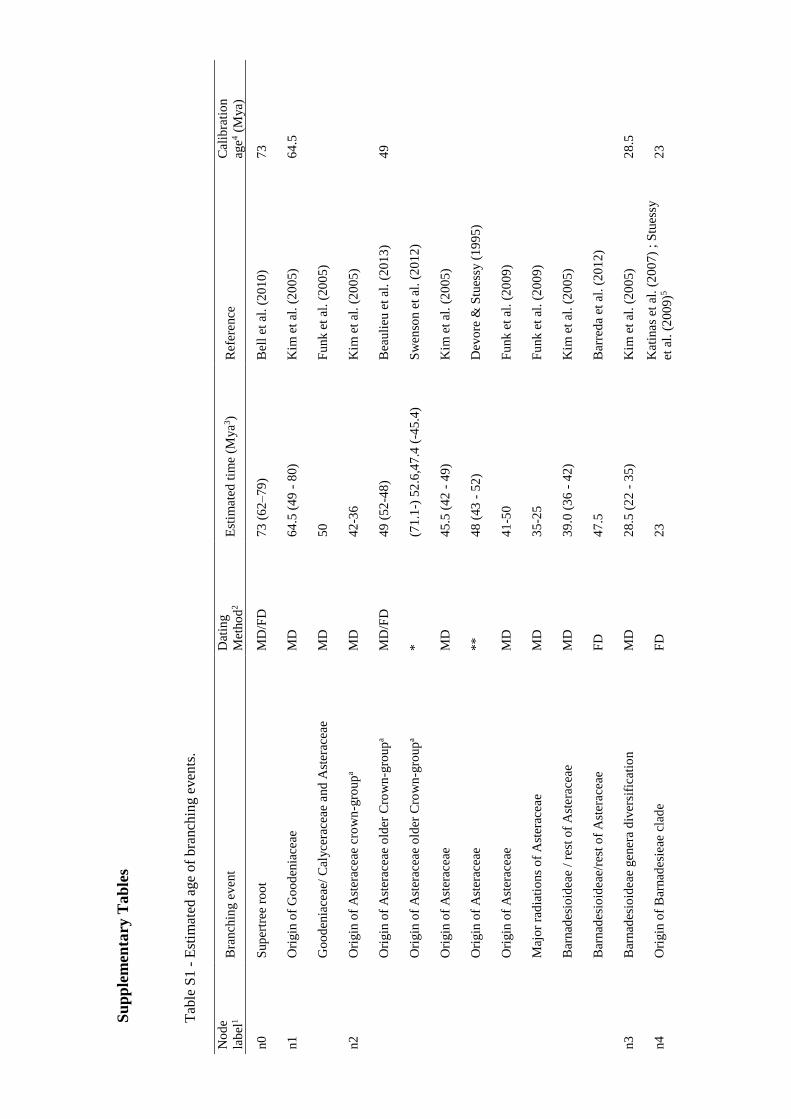
Su
pp
lem
enta
ry T
ab
les
Tab
le S
1 -
Est
imat
ed a
ge
of
bra
nch
ing e
ven
ts.
No
de
lab
el1
Bra
nch
ing e
ven
t D
atin
g
Met
ho
d2
Est
imate
d t
ime
(Mya
3)
Ref
erence
C
alib
rati
on
age4
(M
ya)
n0
S
up
ertr
ee r
oo
t M
D/F
D
73
(62
–79
) B
ell
et a
l. (
201
0)
73
n1
O
rigin
of
Go
od
enia
ceae
M
D
64
.5 (
49
- 8
0)
Kim
et
al.
(20
05
) 6
4.5
G
oo
den
iace
ae/
Cal
yce
race
ae a
nd
Ast
erac
eae
MD
5
0
Fu
nk e
t al
. (2
00
5)
n2
O
rigin
of
Ast
erac
eae
cro
wn
-gro
up
a M
D
42
-36
Kim
et
al.
(20
05
)
O
rigin
of
Ast
erac
eae
old
er C
row
n-g
roup
a
MD
/FD
4
9 (
52
-48
) B
eauli
eu e
t al
. (2
01
3)
49
O
rigin
of
Ast
erac
eae
old
er C
row
n-g
roup
a
*
(71
.1-)
52
.6,4
7.4
(-4
5.4
) S
wen
son e
t al
. (2
01
2)
O
rigin
of
Ast
erac
eae
MD
4
5.5
(4
2 -
49)
Kim
et
al.
(20
05
)
O
rigin
of
Ast
erac
eae
**
4
8 (
43
- 5
2)
Dev
ore
& S
tues
sy (
19
95
)
O
rigin
of
Ast
erac
eae
MD
4
1-5
0
Fu
nk e
t al
. (2
00
9)
M
ajo
r ra
dia
tio
ns
of
Ast
erac
eae
MD
3
5-2
5
Fu
nk e
t al
. (2
00
9)
B
arnad
esio
idea
e /
rest
of
Ast
era
ceae
M
D
39
.0 (
36
- 4
2)
Kim
et
al.
(20
05
)
B
arnad
esio
idea
e/re
st o
f A
ster
ace
ae
FD
4
7.5
B
arre
da
et a
l. (
20
12
)
n3
B
arnad
esio
idea
e gen
era
div
ersi
fica
tio
n
MD
2
8.5
(2
2 -
35)
Kim
et
al.
(20
05
) 2
8.5
n4
O
rigin
of
Bar
nad
esie
ae c
lad
e
FD
2
3
Kat
inas
et a
l. (
20
07)
; S
tues
sy
et a
l. (
20
09
)5
23
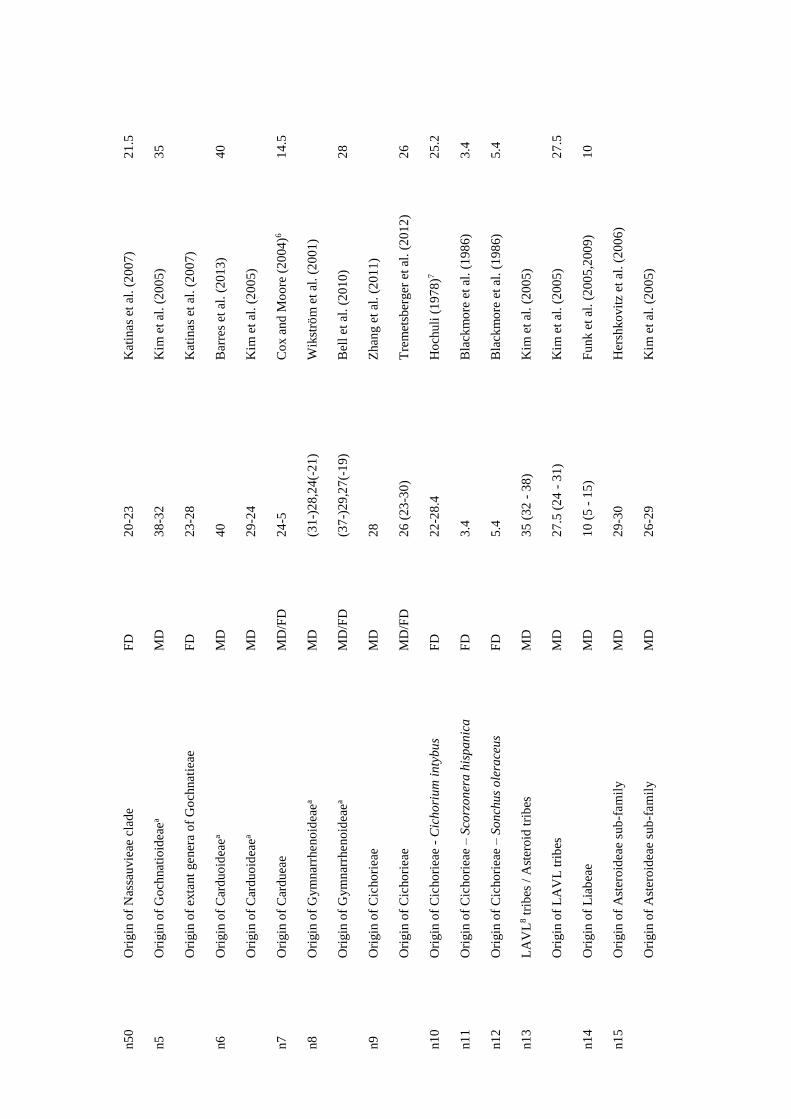
n5
0
Ori
gin
of
Nas
sau
vie
ae c
lad
e
FD
2
0-2
3
Kat
inas
et a
l. (
20
07)
21
.5
n5
O
rigin
of
Go
chnat
ioid
eae
a
MD
3
8-3
2
Kim
et
al.
(20
05
) 3
5
O
rigin
of
exta
nt
gen
era
of
Go
chnat
ieae
F
D
23
-28
Kat
inas
et a
l. (
20
07)
n6
O
rigin
of
Car
duo
idea
ea
MD
4
0
Bar
res
et a
l. (
20
13)
40
O
rigin
of
Car
duo
idea
ea
MD
2
9-2
4
Kim
et
al.
(20
05
)
n7
O
rigin
of
Car
duea
e
MD
/FD
2
4-5
C
ox a
nd
Mo
ore
(2
004
)6
14
.5
n8
O
rigin
of
Gym
nar
rheno
idea
ea
MD
(3
1-)
28
,24
(-2
1)
Wik
strö
m e
t al
. (2
00
1)
O
rigin
of
Gym
nar
rheno
idea
ea
MD
/FD
(3
7-)
29
,27
(-1
9)
Bel
l et
al.
(2
01
0)
28
n9
O
rigin
of
Cic
ho
riea
e
MD
2
8
Zhan
g e
t al
. (2
01
1)
O
rigin
of
Cic
ho
riea
e
MD
/FD
2
6 (
23
-30
) T
rem
etsb
erger
et
al.
(20
12
) 2
6
n1
0
Ori
gin
of
Cic
ho
riea
e -
Cic
ho
riu
m i
nty
bu
s F
D
22
-28
.4
Ho
chuli
(1
97
8)7
2
5.2
n1
1
Ori
gin
of
Cic
ho
riea
e –
Sco
rzo
ner
a h
isp
an
ica
F
D
3.4
B
lack
mo
re e
t al
. (1
98
6)
3.4
n1
2
Ori
gin
of
Cic
ho
riea
e –
So
nch
us
ole
race
us
FD
5
.4
Bla
ckm
ore
et
al.
(19
86)
5.4
n1
3
LA
VL
8 t
rib
es /
Ast
ero
id t
rib
es
MD
3
5 (
32
- 3
8)
Kim
et
al.
(20
05
)
O
rigin
of
LA
VL
tri
bes
M
D
27
.5 (
24
- 3
1)
Kim
et
al.
(20
05
) 2
7.5
n1
4
Ori
gin
of
Lia
bea
e M
D
10
(5 -
15
) F
unk e
t al
. (2
00
5,2
00
9)
10
n1
5
Ori
gin
of
Ast
ero
idea
e su
b-f
am
ily
MD
2
9-3
0
Her
shko
vit
z et
al.
(2
00
6)
O
rigin
of
Ast
ero
idea
e su
b-f
am
ily
MD
2
6-2
9
Kim
et
al.
(20
05
)
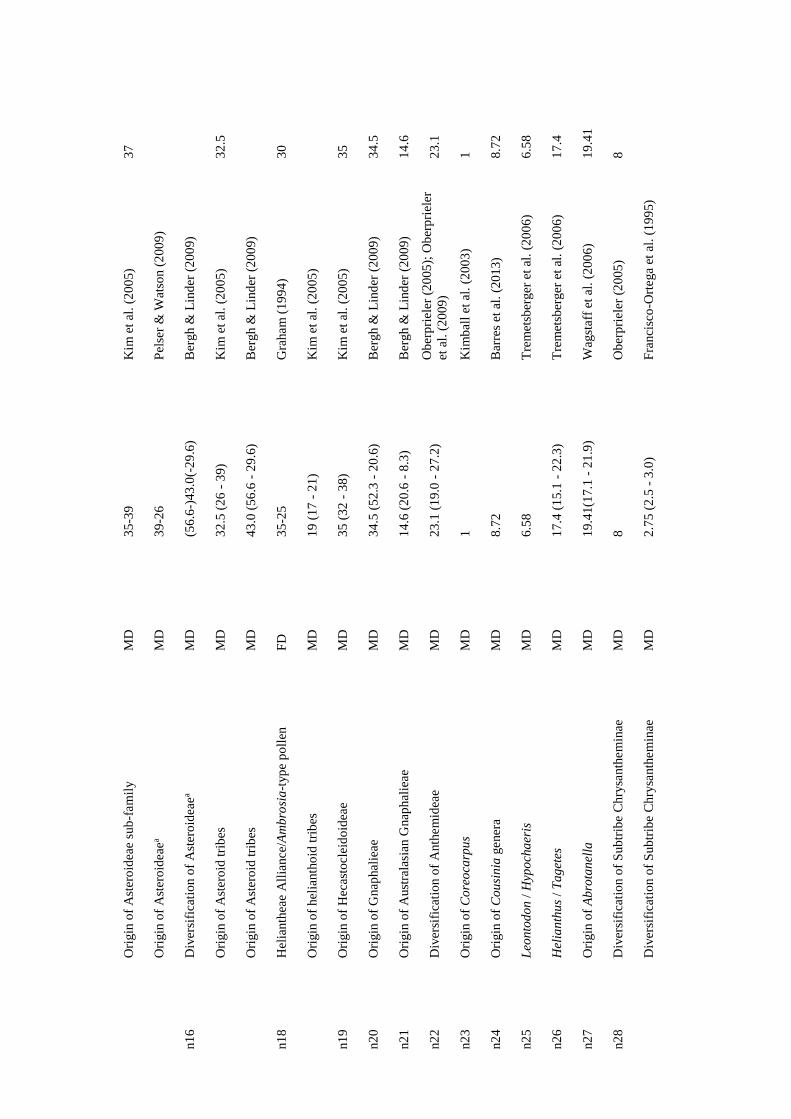
O
rigin
of
Ast
ero
idea
e su
b-f
am
ily
MD
3
5-3
9
Kim
et
al.
(20
05
) 3
7
O
rigin
of
Ast
ero
idea
ea
MD
3
9-2
6
Pel
ser
& W
atso
n (
20
09
)
n1
6
Div
ersi
fica
tio
n o
f A
ster
oid
eae
a M
D
(56
.6-)
43
.0(-
29
.6)
Ber
gh &
Lin
der
(2
00
9)
O
rigin
of
Ast
ero
id t
rib
es
MD
3
2.5
(2
6 -
39)
Kim
et
al.
(20
05
) 3
2.5
O
rigin
of
Ast
ero
id t
rib
es
MD
4
3.0
(5
6.6
- 2
9.6
) B
ergh &
Lin
der
(2
00
9)
n1
8
Hel
ianth
eae
All
iance
/Am
bro
sia
-typ
e p
oll
en
FD
3
5-2
5
Gra
ham
(1
99
4)
30
O
rigin
of
hel
ianth
oid
tri
bes
M
D
19
(17
- 2
1)
Kim
et
al.
(20
05
)
n1
9
Ori
gin
of
Hec
asto
clei
do
idea
e
MD
3
5 (
32
- 3
8)
Kim
et
al.
(20
05
) 3
5
n2
0
Ori
gin
of
Gnap
hal
ieae
M
D
34
.5 (
52
.3 -
20
.6)
Ber
gh &
Lin
der
(2
00
9)
34
.5
n2
1
Ori
gin
of
Aust
rala
sian
Gnap
hal
ieae
M
D
14
.6 (
20
.6 -
8.3
) B
ergh &
Lin
der
(2
00
9)
14
.6
n2
2
Div
ersi
fica
tio
n o
f A
nth
em
idea
e
MD
2
3.1
(1
9.0
- 2
7.2
) O
ber
pri
eler
(2
005
); O
ber
pri
eler
et a
l. (
20
09
) 2
3.1
n2
3
Ori
gin
of
Co
reo
carp
us
MD
1
K
imb
all
et a
l. (
20
03
) 1
n2
4
Ori
gin
of
Co
usi
nia
gener
a
MD
8
.72
Bar
res
et a
l. (
20
13)
8.7
2
n2
5
Leo
nto
do
n /
Hyp
och
aer
is
MD
6
.58
Tre
met
sber
ger
et
al.
(20
06
) 6
.58
n2
6
Hel
ian
thu
s /
Ta
get
es
MD
1
7.4
(1
5.1
- 2
2.3
) T
rem
etsb
erger
et
al.
(20
06
) 1
7.4
n2
7
Ori
gin
of
Ab
rota
nel
la
MD
1
9.4
1(1
7.1
- 2
1.9
) W
agst
aff
et
al.
(20
06
) 1
9.4
1
n2
8
Div
ersi
fica
tio
n o
f S
ub
trib
e C
hry
santh
em
inae
M
D
8
Ob
erp
riel
er (
20
05
) 8
D
iver
sifi
cati
on o
f S
ub
trib
e C
hry
santh
em
inae
M
D
2.7
5 (
2.5
- 3
.0)
Fra
nci
sco
-Ort
ega
et a
l. (
19
95)
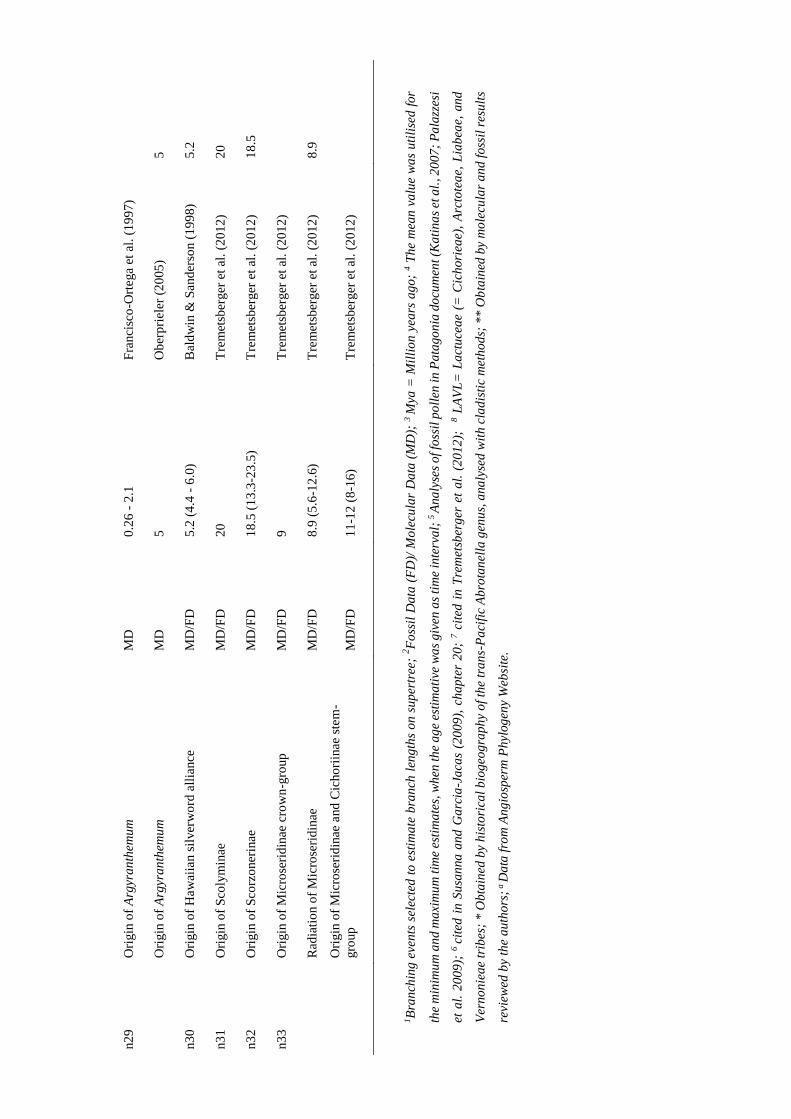
n2
9
Ori
gin
of
Arg
yra
nth
emu
m
MD
0
.26
- 2
.1
Fra
nci
sco
-Ort
ega
et a
l. (
19
97)
O
rigin
of
Arg
yra
nth
emu
m
MD
5
O
ber
pri
eler
(2
005
) 5
n3
0
Ori
gin
of
Haw
aiia
n s
ilver
wo
rd a
llia
nce
M
D/F
D
5.2
(4
.4 -
6.0
) B
ald
win
& S
and
erso
n (
19
98
) 5
.2
n3
1
Ori
gin
of
Sco
lym
inae
M
D/F
D
20
Tre
met
sber
ger
et
al.
(20
12
) 2
0
n3
2
Ori
gin
of
Sco
rzo
ner
inae
M
D/F
D
18
.5 (
13
.3-2
3.5
) T
rem
etsb
erger
et
al.
(20
12
) 1
8.5
n3
3
Ori
gin
of
Mic
rose
rid
inae
cro
wn
-gro
up
M
D/F
D
9
Tre
met
sber
ger
et
al.
(20
12
)
R
adia
tio
n o
f M
icro
seri
din
ae
MD
/FD
8
.9 (
5.6
-12
.6)
Tre
met
sber
ger
et
al.
(20
12
) 8
.9
Ori
gin
of
Mic
rose
rid
inae
and
Cic
ho
riin
ae s
tem
-
gro
up
MD
/FD
1
1-1
2 (
8-1
6)
Tre
met
sber
ger
et
al.
(20
12
)
1B
ran
chin
g e
ven
ts s
elec
ted
to
est
ima
te b
ran
ch l
eng
ths
on s
up
ertr
ee;
2F
oss
il D
ata
(F
D)/
Mo
lecu
lar
Da
ta (
MD
); 3
Mya
= M
illi
on
yea
rs a
go;
4 T
he
mea
n v
alu
e w
as
uti
lise
d f
or
the
min
imu
m a
nd
ma
xim
um
tim
e es
tim
ate
s, w
hen
th
e a
ge
esti
ma
tive
wa
s g
iven
as
tim
e in
terv
al;
5 A
na
lyse
s o
f fo
ssil
po
llen
in
Pa
tago
nia
do
cum
ent (K
ati
na
s et
al.
, 2
007
; P
ala
zzes
i
et a
l. 2
00
9);
6 c
ited
in
Su
san
na
an
d G
arc
ia-J
aca
s (2
00
9),
ch
ap
ter
20
; 7 c
ited
in
Tre
met
sber
ger
et
al.
(2
01
2);
8 L
AV
L=
La
ctu
cea
e (=
Cic
ho
riea
e),
Arc
tote
ae,
Lia
bea
e, a
nd
Ver
no
nie
ae
trib
es;
* O
bta
ined
by
his
tori
cal
bio
geo
gra
ph
y o
f th
e tr
an
s-P
aci
fic
Ab
rota
nel
la g
enu
s, a
na
lyse
d w
ith
cla
dis
tic
met
ho
ds;
**
Ob
tain
ed b
y m
ole
cula
r a
nd
fo
ssil
res
ult
s
revi
ewed
by
the
au
tho
rs; a
Da
ta f
rom
An
gio
sper
m P
hyl
og
eny
Web
site
.
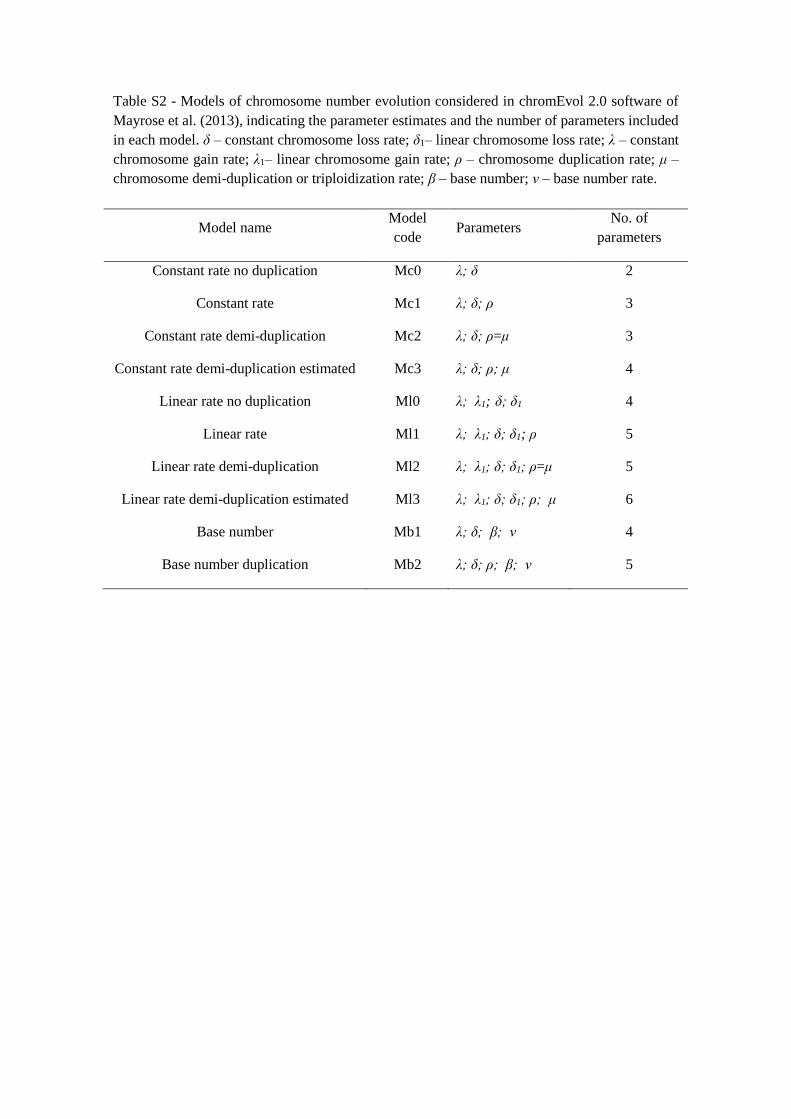
Table S2 - Models of chromosome number evolution considered in chromEvol 2.0 software of
Mayrose et al. (2013), indicating the parameter estimates and the number of parameters included
in each model. δ – constant chromosome loss rate; δ1– linear chromosome loss rate; λ – constant
chromosome gain rate; λ1– linear chromosome gain rate; ρ – chromosome duplication rate; μ –
chromosome demi-duplication or triploidization rate; β – base number; ν – base number rate.
Model name Model
code Parameters
No. of
parameters
Constant rate no duplication Mc0 λ; δ 2
Constant rate Mc1 λ; δ; ρ 3
Constant rate demi-duplication Mc2 λ; δ; ρ=μ 3
Constant rate demi-duplication estimated Mc3 λ; δ; ρ; μ 4
Linear rate no duplication Ml0 λ; λ1; δ; δ1 4
Linear rate Ml1 λ; λ1; δ; δ1; ρ 5
Linear rate demi-duplication Ml2 λ; λ1; δ; δ1; ρ=μ 5
Linear rate demi-duplication estimated Ml3 λ; λ1; δ; δ1; ρ; μ 6
Base number Mb1 λ; δ; β; ν 4
Base number duplication Mb2 λ; δ; ρ; β; ν 5

63
Supplementary Figures
Figure S1. Chromosome number evolution in the 2005 supertree using the polymorphic
data set, according to the Mc2 model. Pie charts at nodes represent the probabilities of
the inferred chromosome number(s); numbers inside charts show the chromosome
number with the highest probability. Numbers at the tips are the most common haploid
chromosome number for each taxa. The colour coding of chromosome numbers is
explained in the inset.
Given the very large size of this tree, this figure is available in electronic format at this
site: http://cfe.uc.pt/files/figs1.pdf
Figure S2. Duplication and demi-duplication events inferred and mapped in the 2005
supertree. The periods of climate changes occurred during the evolution of the Asteraceae
family are represented. The colours symbolize the temperatures that characterized each
period of climate changes: red – warm temperatures; blue – cold temperatures; purple –
oscillations between warm and cold temperatures. The star symbol symbolizes whole
genomic duplication events and the circle symbolizes demi-duplication events. The
colour coding of the duplications and demi-duplications is explained in the inset.
Given the very large size of this tree, this figure is available in electronic format at this
site: http://cfe.uc.pt/files/figs2.pdf