Lista de Postos Shell - Promoção Shell V-Power & Fox - Rock in Rio ...

Mechanical Engineering Research; Vol. 2, No. 2; 2012 ISSN 1927-0607 E-ISSN 1927-0615
Published by Canadian Center of Science and Education
31
Design of Perforated Shell Dryings Drums
Heikki Martikka1 & Erkki Taitokari2 1 Himtech Oy, Engineering, Ollintie 4, Joutseno, Finland 2 Oy Scan Fibre Ltd, Liisakatu 26, FIN-55100 Imatra, Finland
Correspondence: Heikki Martikka, Himtech Oy, Engineering, Ollintie 4, Joutseno FIN-54100, Finland. Tel: 358-408-393-167. E-mail: [email protected]
Received: May 22, 2012 Accepted: June 2, 2012 Online Published: August 8, 2012
doi:10.5539/mer.v2n2p31 URL: http://dx.doi.org/10.5539/mer.v2n2p31
This research is financed by Himtech Oy
Abstract
In this study the results of optimum design of perforated cylindrical shell dryings drums are considered. These drums are used for pressurised drying of wet mass. They are important also in filter technology in macro, micro and nanoscales. The goal is formulated as maximisation of customer satisfaction on the most important decision variables. These are the fatigue endurance measured by crack propagation life, rate of water removal from mass through holes, risk of crack initiation and total cost. For perforated cylinders and plates basic engineering models are developed to get loads on the drum and to get equivalent material models to be used cost effectively in FEM. The validity of the surrogate models is tested using detailed FEM models. The results give a reasonable trade-off between many contradictory requirements. One optimal geometry is obtained and the softer steel is preferable due to better fatigue endurance and lower costs. Different surrogate models apply for static and dynamic loading.
Keywords: perforated cylinders, equivalent models, optimal fuzzy design, drum drying
1. Introduction
The use of multi-holed or perforated plates and shells is important in process industry and in heat exchangers, drying drums and energy production. Perforated shells are important in the processing industry when wet masses need to be dried in a continuous process. The material to be dried may be wood chips or pulp mass, biomass, fabric, inorganic granular materials. Various wetness removal methods include gravity, centrifugal forces, mechanical pressure, vibration, under pressure, hot air flows. Water removal by mechanical pressure can be more cost effective than by evaporation. The shells are subjected to large static and dynamic and contact loads. Their manufacturing is costly and produces inevitably some initial cracks at welds and at hole edges.
The goal has been set to design large scale structures using equivalent material models which give accurate enough stress strain results in static and dynamic loading. The equivalent elastic constant can be chosen to give the same strain as the original solid material under the same load. This concept is used by (Slot & O‘Donnell, 1971). Jhung and Jo (2006) have derived equivalent elastic modules and Poisson’s ratio for use in FEM modal analysis of perforated circular plates. They determined the natural frequency in air and from it the Poisson’s ratio. Now static analysis is used to get the equivalent elastic modulus, wall thickness and from these the actual ligament maximum stress. The results found by (Slot et al., 1971) and (Jhung & Jo, 2006) are reliable within their ranges of validity. The theory discussed by (Gibson & Ashby, 1997) can be used to derive equivalent material properties for cellular structures. The perforated materials are a mixture of metal and holes and thus they are a member of a broad class of composites. Now the plate is an orthotropic material.
For steels the fatigue endurance is important and the models of (Gurney, 1978) are useful to evaluate differences in fatigue life between steels of different strengths. Analytical models for plates are discussed by (Szilard, 1975) and (Ventsel & Krauthammer, 2001). Now a case study of a drying rotating drum is considered. Wet mass is fed inside and compressed between inner drum and the perforated shell. Water flows out through the holes and the dried mass is conveyed out. The goal is to obtain optimal dryness with satisfactory fatigue life. The optimum design method used by as (Martikka & Pöllänen, 2009) and (Pöllänen & Martikka, 2010) is applied. It is based on the results of (Diaz, 1988). The concept and surrogate models accuracy are checked using FEM.

www.ccsenet.org/mer Mechanical Engineering Research Vol. 2, No. 2; 2012
32
2. Basics of a Drying Drum Case Study
2.1 Geometry of the Case Study Drum
Basic geometry and loads are shown in Figure 1.
a) b)
F1
r’
R
N
N F3 water
out
wet mass in
dried mass out
F2
1=67
2 3=110
=37.5
=5
2=+=42.5
average pressure
N = 270-
Deformation under pressure before rollers
lr=.04
ltot=0.75
1s=.035
hr=.21 h=.03
ls=.15
D=2R=1.67
droll=.68
p
l=0.32
Figure 1. Basic model: a) Geometry and loads; b) Side view. Average pressure p=1.7MPa
Dimensions, stress and force loads are shown in Figure 2.
a) b) c)
lig,max =2 .7 = Ktnlig,nom
= 1.132.4
lig,nom=2.4
P=0.12
r=0.035 k=0.05 r
N
F2 = F2e2
F1e2
N
e2 F1
F3
Initial cracks
Figure 2. Perforated shell structure: a) Dimensions. b) Fracture locations. c) Free body model for the drum shell
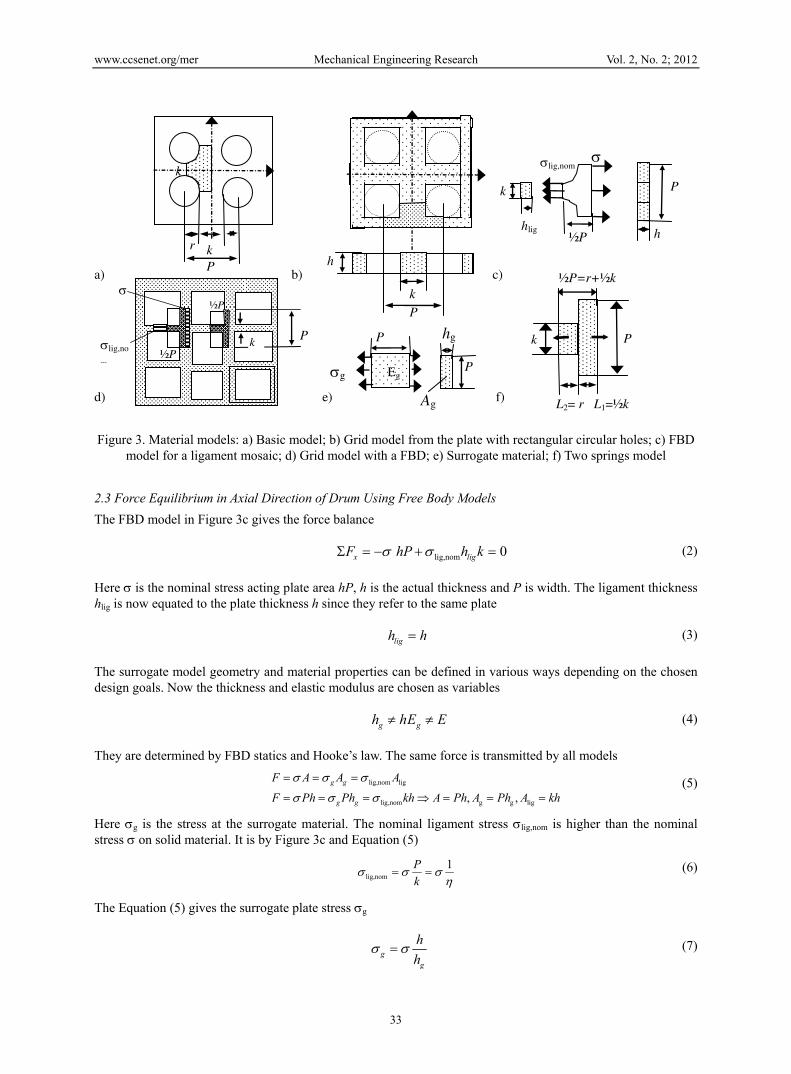
2.2 Simple Stress-strain Models for Perforated Plates
Simple models can be derived using basic mechanics. A plate with regularly spaced circular perforation can be approximated by a grid type model, Figure 3. The ligament efficiency is defined as
2 12 1 2 1 1
k r r PP r k
P P k k
(1)
www.ccsenet.org/mer Mechanical Engineering Research Vol. 2, No. 2; 2012
33
a) b) c) d) e) f)
P
L2= r L1=½k
P k
½P=r+½k
hg P
g Eg P
Ag
lig,nom
k P
½P h hlig r
P k
k
P k
h
k lig,no
m
½P
½P
Figure 3. Material models: a) Basic model; b) Grid model from the plate with rectangular circular holes; c) FBD model for a ligament mosaic; d) Grid model with a FBD; e) Surrogate material; f) Two springs model
2.3 Force Equilibrium in Axial Direction of Drum Using Free Body Models
The FBD model in Figure 3c gives the force balance
lig,nom 0x ligF hP h k (2)
Here is the nominal stress acting plate area hP, h is the actual thickness and P is width. The ligament thickness hlig is now equated to the plate thickness h since they refer to the same plate
ligh h (3)
The surrogate model geometry and material properties can be defined in various ways depending on the chosen design goals. Now the thickness and elastic modulus are chosen as variables
g gh hE E (4)
They are determined by FBD statics and Hooke’s law. The same force is transmitted by all models
lig,nom lig
lig,nom g g lig, ,
g g
g g
F A A A
F Ph Ph kh A Ph A Ph A kh
(5)
Here g is the stress at the surrogate material. The nominal ligament stress lig,nom is higher than the nominal stress on solid material. It is by Figure 3c and Equation (5)
lig,nom
1P
k
(6)
The Equation (5) gives the surrogate plate stress g
gg
h
h (7)

www.ccsenet.org/mer Mechanical Engineering Research Vol. 2, No. 2; 2012
34
Using Hooke’s law one obtains one Equation with three unknowns defining the fictive surrogate material and plate thickness. Two more Equations are needed.
g g gE h E h (8)
The strain is one important variable. One convenient and feasible choice to define the surrogate material g is to require that it gives the same strain as the original solid material
g (9)
Using this in Equation (9) one obtains an equation for two unknowns.
g gEh E h (10)
The surrogate elastic modulus Eg of the perforated shell can be obtained by using a model for two rod springs in series as in Figure 3f
1 21 21
1 2 1 22
1 2 1
12 1 2 2
1 1 1, ,
1 12 1 1
g
EA EAEPh EPkk k
k k k L k L r
k L A r Ph r P P P
k L A k Pk k k k k
(11)
From this the surrogate spring constant is obtained and from it the surrogate elastic modulus
1g g g 1 g1 2
111 1 2 1 2
2
gg 2
1 1,
1
1
gg
E A E A LEA Pk
kL L L L L kk
EE E E
E
(12)
Now the definition of ligament efficiency is used to relate the thickness and elastic modulus ratios
g g gg
1, ,gEh
h h E Eh E
(13)
This can be used in the FEM models of the perforated cylinder shell. From Equation (6) and Equation (13) the nominal ligament stress lig,nom can be obtained using the surrogate stress concept
lig,nom 2
1 1 1 1g g
(14)
The maximum ligament stress lig,max is now obtained from the surrogate stress
lig,max t lig,nom t 2
1gK K
(15)
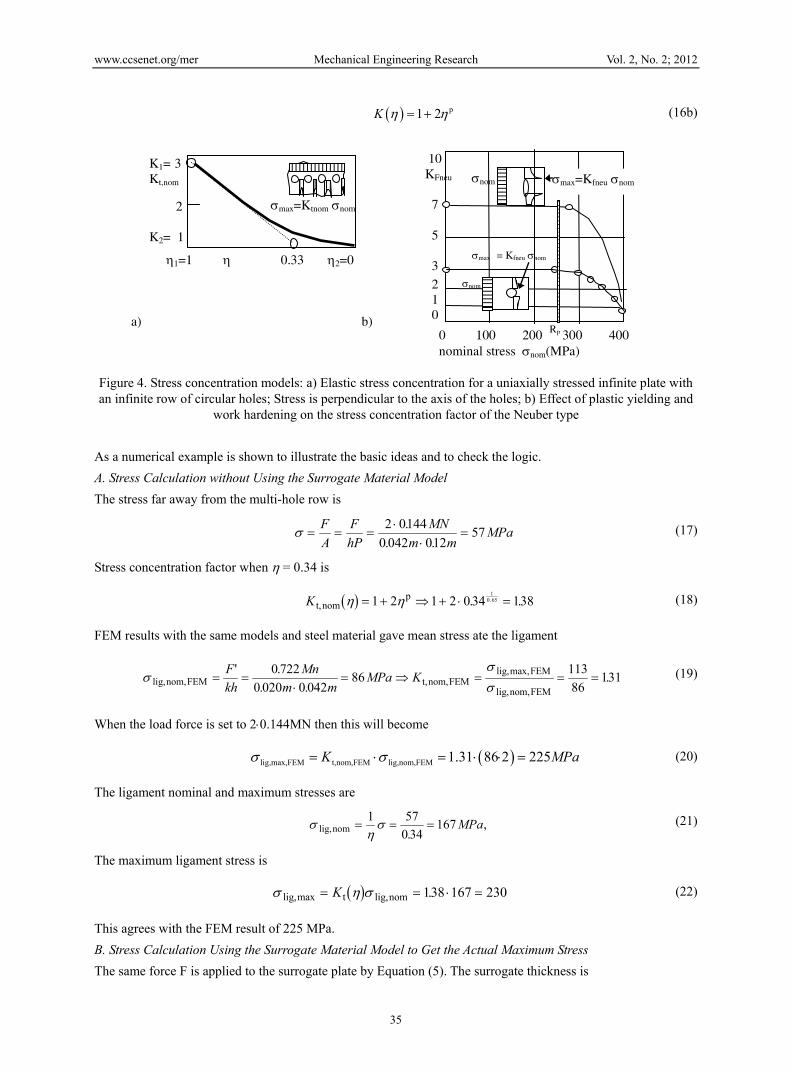
Here Kt() is the stress concentration factor depending to the ligament efficiency. A reasonable model for it may be obtained by data fitting to Peterson’s model for a row of circular holes under tension as by (Pilkey & Pilkey, 2008). In Figure 4a the model is shown. The Neuber stress concentration is shown in Figure 4b. It is based on models by (Martikka and Pöllänen, 2010). The steel has yield stress Rp =250 and UTS Rm=360 MPa. Plastic yielding decreases the stress concentration factor to close to unity.
pt,nom 2 1 2 1 1 2 2
1 11 1 2 1 0.65
, 3, 1, 1, 0
3 13 1
1 0.35p
K K K K K K K
Kp K K p p
(16a)
Thus the simple model is obtained
www.ccsenet.org/mer Mechanical Engineering Research Vol. 2, No. 2; 2012
35
p1 2K (16b)
a) b)
K1= 3 Kt,nom 2 K2= 1
1=1 0.33 2=0
max=Ktnom nom
10 KFneu 7 5
3
2 1 0
0 100 200 300 400 nominal stress nom(MPa)
nom
nom
max = Kfneu nom
max=Kfneu nom
Rp
Figure 4. Stress concentration models: a) Elastic stress concentration for a uniaxially stressed infinite plate with an infinite row of circular holes; Stress is perpendicular to the axis of the holes; b) Effect of plastic yielding and
work hardening on the stress concentration factor of the Neuber type
As a numerical example is shown to illustrate the basic ideas and to check the logic.
A. Stress Calculation without Using the Surrogate Material Model
The stress far away from the multi-hole row is
F
A
F
hP
MN
m mMPa
2 0144
0 042 01257
.
. . (17)
Stress concentration factor when = 0.34 is
K t,nomp 1 2 1 2 0 34 138
10 65. .. (18)
FEM results with the same models and steel material gave mean stress ate the ligament
lig,nom,FEM t,nom,FEM
lig,max,FEM
lig,nom,FEM
F
kh
Mn
m mMPa K
' .
. ..
0 722
0 020 0 04286
113
86131 (19)
When the load force is set to 20.144MN then this will become
lig,max,FEM t,nom,FEM lig,nom,FEM 1.31 86 2 225K MPa (20)
The ligament nominal and maximum stresses are
lig,nom
1 57
0 34167
.,MPa (21)
The maximum ligament stress is
lig,max t lig,nom K 138 167 230. (22)
This agrees with the FEM result of 225 MPa.
B. Stress Calculation Using the Surrogate Material Model to Get the Actual Maximum Stress
The same force F is applied to the surrogate plate by Equation (5). The surrogate thickness is

www.ccsenet.org/mer Mechanical Engineering Research Vol. 2, No. 2; 2012
36
hh m
mg
0 042
0 340123
.
.. ( 23)
The surrogate material stress is
gg g g g
F
A
F
h P
MN
m m
hF
h Ph
h
hMPa
2 0144
0123 0120 34 57 19 4
.
. .. . (24)
The ligament maximum stress is given by Equation (14)
lig gK.max ..
. t1
1381
034194 231
2 2 (25)
This demonstration shows that actual stress can be obtained from the surrogate stress
2.4 Load Force and Torque Analysis Using Statics
Torque equilibrium around the axis of the drum in Figure 1a
T rF R N r F R N1 10 (26)
Here the friction force depends on the coefficient of friction between non-metal wet mass and metal. Generally is between 0.3...0.35. Now a realistic value is about = 0.32. Using this normal force can be calculated as
F MN r R1 03 106 0835 . , . , . (27)
NrF
R
MNMN
1
1
106 0 3
0 32 0 83512
. .
. .. (28)
The angles between forces are shown in Figure 1
1 2 3 N37.5, 5, 67, 37.5 5 42.5, 110, 270 (29)
The friction coefficient and the compressive resultant normal force are
0.32, 1.2 ,N MN (30)
Force balance can be written as
F F N N F F 1 2 3 0 (31)
In component form
F N N F FN
N
N
N1
1
1
1212
22
23
3
30
cos
sin
cos
sin
cos
sin
cos
sin
cos
sin
(32)
Substitution of known data gives two equations with two unknowns. They can be solved from
N N
N N
2 3 N
cos cos 90cos 670.3 1.2 0.317 1.2
sin sin 90sin 67
cos 42.5 cos1100 , 270 270 37.5
sin 42.5 sin110
MN MN MN
F F
(33)
The external reaction forces due to supporting cylinders are
F MN F2 30 964 0 . , (34)
2.5 Local Bending Model of a Tube with Mid Stiffener
Local bending line moment at the shell due to the stiffeners is
22
22
1 1, 0.32,
252502 1 2
r
plm p pl l
lh
A
(35)

www.ccsenet.org/mer Mechanical Engineering Research Vol. 2, No. 2; 2012
37
Where
1
2 4
12 2
3 18 , 0.3, 0.042 , 0.735m h m R m
R h
(36)
2.6 Plate Model with Even Pressure Model
A plate model with stiff supports can be applied to the locally pressured area.
a) b)
a
b m
l x
M(x)
b=a
a=l h
R
Figure 5. Surrogate models: a) Cylinder with a plate model; b) Plate and beam model
According to (Szilard, 1975) the line bending moment of a plate with stiff supports at all ends is
2 2 214 200.0513 , 0.32 , / 1
Mm c pa pl pl l b a
b (37)
2.7 Simple Beam and Plate Models for Maximum Bending Moment
Bending moment approximations are
ms
pl pl
1 1
8
1
12
1
20
1
252 2.. .. ... (38)
Where the model parameter s depends on the chosen approximation model
s
s
s
s t
8
12
20
25
,
,
,
,
beam, free fixed.supports
beam, fixed fixed support
plate, b / a 1, fixed fixed
ube.with.stiffener. ring.and.internal.pressure
(39)
The nominal bending stress depends on the moment
b M
W
mb
bh
m
hs
pl
hb16
2 16
2
2
16
2
1
(40)
2.8 Global Dending of a Cylinder
The dominant bending forces can be obtained by projecting all forces to F2 direction
e e e e e2 1 1 2 2 0 F N N FN N (41)
In matrix form one obtains
cos
sin
cos
sin
cos
sin
cos
sin
cos
sin
2
21
1
1
1212
22
20
F N N FN
N
N
N
(42)
The result is

www.ccsenet.org/mer Mechanical Engineering Research Vol. 2, No. 2; 2012
38
e e e e e e2 1 1 2 2 2 0 F N N FN N (43)
The force F2 acting at the roller 2 is
F F N NN N2 2 1 1 2 212
cos cos cos (44)
Bending moment M (Nm) at mid point and bending stress are
2bend,M 2
,2 4
F l M MM
W R h
(45)
2.9 Bending Stress to Local Pressure Bulging on the Shell
The nominal local bending stress at the ligaments is higher due to ligament efficiency factor 2
bend,pbend,p lig,nom,p21
6
,pl
s h
(46)
The maximal stress is higher at hole edges due to stress concentration factor Kt,nom.
max,p t,nom lig,nom,p K (47)
3. Total Stress
The total maximum stress due to inner pressure (p) and bending moment (M) constraints is
max,p t,nom bend,p max,M t,nom bend,M
1 1,K K
(48)
Total maximum stress is sum of pressure and moment caused stresses
max max, max, p M (49)
Constructional method of increasing the fatigue life can be derived from the stress equation. The cracks start at the holes edges situated at the maximum moment. The bending moment by the beam model can be used to find safe enough locations of the holes, Figure 4c.
M x Q xM l
M lXx
l 1
234 0 9
0 5 0 5.
. .M (50)
Thus the optimal location for the fist row of holes is at 90% of the length l since there the maximum stress has decreased sufficiently from the extreme position at x = l. When the moment is halved the stresses also are halved and fatigue life is increased by 8 fold.
max max.0 9l l X M (51)
4. Design Variables and Goal
The design goals can advantageously expressed using fuzzy logic. One may proceed in the followings stages.
4.1 Technical and Economic Design Variables
Geometrical design variables are thickness and ligament geometry. Material variables are material classes and their properties. Functional variables are safety factors.

www.ccsenet.org/mer Mechanical Engineering Research Vol. 2, No. 2; 2012
39
Table 1. Geometrical design variables options. Principle of modelling of the general satisfaction functions. Its position and skewness can be varied
index
ligament efficiency lig(ilig)=
drum wall thickness h(ih) (m)
1 2 3 4 5 6 7 8
0.34 0.35 0.36 0.37 0.38 0.40 0.42 -
0.030 0.032 0.034 0.036 0.038 0.040 0.041 0.042
a b c d
e
xk x2
1
0 z1 z2 1
P1 s1
P2
P3
P4
P5
s2
s3
s4
s5
Small s1 values are desired
Indifference to s2 values Medium s3 values are desired Narrow range of s4 is desired Large s5 values are desired
Table 2. Material variables. The Paris law C and m parameters are calculated with Gurney’s (1978) model
Stress ratio Rs = min/ min = 0, Kth (Nmm3/2)
OX steel im = 1 St52 steel im=2
Yield strength (Pa)
unit cost (eur/kg)
density (kg/m3)
ecological value
corrosion resistance
Elastic modules
Threshold intensity
critical crack
initial crack size
Paris C parameter
Paris m exponent
Re(1) = 1E+09
Cm(1) = 20
rho(1) = 8000
eco(1) = .1
corres(1) = .8
E(1) = 2.1eE+11
Kth(1) = 275
a0kr(1) = 1/127
a0(1) = .1 ' mm
C(1) = 4.64E-12
m(1) = 2.52
Re(2) = 3.4E+08
Cm(2) = 5
rho(2) = 8000
eco(2) = .7
corres(2) = .15
E(2) = 2.1E+11
Kth(2) = 190-144 Rs
a0kr(2) = 1/14.6
a0(2) = .1, mm
C(2) = 1.67E-14
m(2) = 3.36
4.2 Fuzzy Goal Formulation Using Decision Variables
Any vague goal of a concept can be defined easily as maximisation of total customer satisfaction on it (A. Diaz, 1988).The total event is decision variable s and intersection of other decision variables sk
s s s s s s s 1 2 3 4 5 6 (52)
The design goal is maximisation of the total satisfaction of the customer on the product
P s P s P s P s P s Q P 1 2 ..... , maxn (53)
Now all goals and constraints are formulated consistently by one flexible fuzzy function. This is illustrated in Table 1.
5. Decision Variables
5.1 Fatigue Life
This may defined as fatigue life N in cycles of operations in years. The fatigue life of a perforated plate depends on the third power of the ligament efficiency. The equation suggests =1 as optimal.
3opt3
max
max, 1C
N k
(54)
When the structure contains initial flaws then the fatigue life is about the same as time spent in crack growth

www.ccsenet.org/mer Mechanical Engineering Research Vol. 2, No. 2; 2012
40
since initiation time is not needed. According to (Gurney, 1978) the Paris-Erdogan law is applicable,
2
m Icf max min
e
1, ,
KdaC K K Y a a
dN R
(55)
Where
a is crack length, in mm units
K is stress intensity factor range,
is stress, (MPa)
Y is factor due to geometry close to crack. Now Y = 1.2, at the edge of the holes Y = Ktn
af is the final crack length, mm
Re is yield strength and KIc is fracture toughness.
a0 is initial crack size. It depends on steel strength. For steels with Rm >700, a0 =0.015, mm and with Rm < 700, a0 = 0.05mm. Now a0 is estimated conservatively as 0.1mm.
The factor C is estimated according to (Gurney, 1978). In this model the exponent m depends on the yield strength approximately as
m R CA
BC C C
600
0 264e m corrPa
.' ' (56)
Here the parameters are A = 131.510-6, B = 895.4 at the stress ratio, Rs = min/max = 0, Ccorr is corrosion enhancement factor. Some rough estimates are: Ccorr =1 with no corrosion and Ccorr = 10 with wet corrosion.
Ccorr increases when the surface moisture is increased from dry to 80%.
At very low K values Ccorr is 20 and at high K values it is about 3.
The fatigue life in number of cycles from initial to final crack length is
1 12 2
1m 61 11
0 f2
1 1 1,
101m m
NN s
a aC m Y
(57)
High value if s1 is desirable
1 1min 1 1max 1 2, 0 8, : , 2,0.1s N s s s bias p p (58)
5.2 Wetness Removal Rate
The wetness removal outflow rate Q (m3/s) depends on pressure difference and ligament efficiency
4
4 42 2out out2 2
1 , 1Q Q d
k kP kP w wA P P
(59)
Here using models by (Dimarogonas & al, 1992) (p 83) for piston damper
kp
ht C p p MPa
128
996 0 802 10 0 8 10 30 0 173 3, . . , , . (60)
Large value of wet removal rate is desired
4
2 out
2min 2 2max 1 2
1 ,
0 1, : , 0.2,0.2
s w
s s s bias p p
(61)
5.3 Crack Initiation Risk
Crack propagation rate may be expressed as
da
dNC
K
E
n
I (62)

www.ccsenet.org/mer Mechanical Engineering Research Vol. 2, No. 2; 2012
41
If the ratio in the exponent is small then the crack growth is slow
K a EN
mmmm
245 10
12 (63)
According to the statistical work hardening the accumulation of internal defects is small if
23
Re
2
a0kr 20kr e 03
1, , 0.1
C E ima im R im a mm
(64)
The crack initiation risk may be defined as
s
a im
a ima im mm
kr3
0
00 01 , . (65)
Small value of s3 is desirable although high values may be inevitable
3min 3 3max 1 20.1 20, : , 0.1,3s s s bias p p (66)
5.4 Cost of Material and Manufacturing
This may defined as total cost of material including manufacturing
4 4 min 4 4 max 1 2, , : , 0.1,3s K s s s K Cost bias p p (67)
Cost is defined as material cost, unit cost time the mass
K cm c hPr
P
r
P
22
12 2
1, (68)
Or
K c hP c hP K 2 2 21 1 2 2max (69)
6. Optimisation Results
Fatigue life may be increased by closing the nearest row of holes close to the mid parts since the bending moment at 0.9 l hole ligament will decrease to half and the fatigue life increase by 8 fold using the beam model.
Table 3. Results of optimisation. The holes start at distance x=0.9l from the maximal moment. Here im = 1 denotes the high strength steel and im =2 denotes the medium strength steel
property Ox im=1 Fe52 im=2
PG, Total satisfaction 4.710-6 667210-6
lig = , ligament efficiency 0.34 0.34
h (m) wall thickness 0.042 0.042
s1/Ps1,fatigue life/satisfaction 1.05/0.025 2.8/0.18
s2/Ps2,wetness removal rate/satisfaction 0.19/0.05 0.19/0.05
s3/Ps3,crack initiation risk/satisfaction 12.7/0.074 1.46/0.96
s4/Ps4, cost/satisfaction 6.810-5/0.05 1.710-5/0.74

www.ccsenet.org/mer Mechanical Engineering Research Vol. 2, No. 2; 2012
42
One may note the following. Total satisfaction on the drum with low strength steel was higher than with the drum with high strength steel. The satisfaction on water removal rate does not depend on the steel strength but only on the geometry. The difference in satisfaction is that the high strength steel has a low fatigue life and higher crack initiation risk and higher material cost than the low strength steel,
7. FEM Results
In FEM modelling (IDEAS) perforated surrogate model used. Wall thickness is the same h = 0.42 and = 0.34 and loads are the same as previously.
7.1 Elastic Modulus and Thickness of Perforated Material
Elastic modulus and density are needed in dynamical modelling. In static calculations the material properties are not needed only loads and geometry. Same total strain and thickness are assumed
k
P
kk r P k0 34
0120 0408 012 0 04 0 041
212
..
. , . . . (70)
Thus surrogate elastic modulus as function of ligament strength is estimated as
E E E MP MPag
1
0 34 200000 2 68000 12
. , (71)
The surrogate thickness is as function of ligament strength is
h hg 1 1
0 340 042 01235
.. . (72)
7.2 Poisson’s Ratio Estimations
When perforations are large the material approaches a grid or even a planar cellar orthotropic structure. In normal load direction loading it behaves as steel but in transverse directions as a cellular solid plate loaded at in-plane loading. Thus the reciprocity relationship may now be applied using the model by (Gibson & Ashby, 1997)
x x gg
zz
E
E
68000
2000003 01. . (73)
7.3 FEM Analysis of the Drum
FEM results are shown in Figure 6. For steel models with optimal dimensions the FEM stress concentration factor was 1.31 and the analytical rough model gave 1.38.
lig,max,FEM t,nom,FEM lig,nom,FEM K MPa131 86 2 225. (74)
The surrogate material was orthotropic. In the normal to surface z direction it was like steel. But in transverse x and y direction a honeycomb likes structure.
E MPa G MPa
E MPa G MPa
E MPa G MPa
1
2
3
68000 3091 01
68000 3091 01
200000 76923 0 3
12 12
23 23
13 13
, , .
, , .
, , .
(75)
The surrogate material stress by analytical model is
gg g g g
F
A
F
h P
MN
m m
hF
h Ph
h
hMPa
2 0144
0123 0120 34 57 19 4
.
. .. .
The FEM stress was calculated as principal stress.
g,FEM 1951. MPa
The results of the surrogate model are reasonably close to the accurate FEM result.

www.ccsenet.org/mer Mechanical Engineering Research Vol. 2, No. 2; 2012
43
a) b)
c) d) e)
F
r = 0.04m
a = 0.06m b =0.06m
h =0.042m
Figure 6. FEM results: a) Actual steel model for getting the stress concentration factor; The mean tensile stress at the ligament is 86 MPa and the maximum stress is 113MPa at hole edge. Thus the nominal stress concentration factor is 1.31. The analytical estimate was 1.38; b) strains in tensile direction, max 0.0182 mm; c) The surrogate
model showing boundary conditions and load of even load force distribution; Dimension in load direction is 0.06m, in transverse to load direction 0.06m and height is 0.1235 m; d) Maximum principal stress is 19.51MPa;
e) Translation in the tensile direction (x) is 0.0172 mm
FEM model of the drum and picture of a typical drying drum machine are shown in Figure 7.
Figure 7. a) FEM model of the drum; b) Picture of a typical drying drum machine
8. Conclusions
www.ccsenet.org/mer Mechanical Engineering Research Vol. 2, No. 2; 2012
44
In design tasks there appear cases when the structure is macrogeometrically complex and large and the material microgeometry is also complex, like perforated shells. FEM is an efficient tool to solve such tasks. But a large amount of elements is needed and calculation times become too long with many degrees of freedom. One solution to speed up calculations is to use super elements. Another way to use FEM effectively is to use simplified homogeneous surrogate materials which are geometrically simple and give satisfactorily accurate results after a moderate simple post-processing.
One advantage of these physical simple models is that they can be used both in FEM analysis and also in concept innovation in analytical optimisation work. Another advantage is that the models are useful in concept optimisation and the stresses at critical locations are accurate enough. One disadvantage is that additional post-processing models have to be used to get strains and stresses. The other disadvantage is that the range of satisfactory accuracy needs to be considered. The future goal is to apply these methods to design of similar equipment.
References
Diaz, A. (1988). Goal aggregation in design optimization. Engineering Optimization, 13, 257-273. http://dx.doi.org/10.1080/03052158808940958
Dimarogonas, A. D., & Haddad, S. (1992). Vibration for Engineers. Prentice Hall.
Gibson, L. M., & Ashby, M. F. (1997). Cellular solids. Cambridge University Press.
Gurney, T. R. (1978). An analysis of some crack propagation data for steel subjected to pulsating tension loading. The Welding Institute, 59/1978/E. IDEAS FEM program.
Jo Jhung, Myung, & Jo, Jong Chull. (2006). Equivalent material properties of perforated plate with triangular or square penetration pattern for dynamic analysis. Nuclear Engineering and Technology, 38(7), 689-696.
Martikka, H. I., & Pöllänen, I. (2009). Multi-objective optimisation by technical laws and heuristics. Memetic computing. http://dx.doi.org/10.1007/s12293-009-0007-x
Pilkey, W. D., & Pilkey, D. F. (2008). Peterson’s Stress Concentration Factors (3rd ed.).
Pöllänen, I., & Martikka, H. (2010). Fatigue endurance dimensioning by strain life method with a novel notch coefficient. Machine Design, 2010, 43-48.
Slot, T., & O’Donnell, W. J. (1971). Effective Elastic Constants for thick Perforated Plates with Triangular and Square Penetration Patterns. Journal of Engineering for Industry, 93(4), 935-942. http://dx.doi.org/10.1115/1.3428087
Szilard, R. (1975). Theory and Analysis of Plates. USA: Prentice-Hall.
Ventsel, E., & Krauthammer, T. (2001). Thin Plates and shells. New York, NY: Marcel Dekker. http://dx.doi.org/10.1201/9780203908723