Diploma 2010 - REROdoc.rero.ch/record/22531/files/Sautaux_6318785_TD.pdf · FTV Année académique...
56
Wien, 29.11.2010 D D e e g g r r e e e e C C o o u u r r s s e e L L i i f f e e T T e e c c h h n n o o l l o o g g i i e e s s Option Biotechnology D D i i p p l l o o m m a a 2 2 0 0 1 1 0 0 C C h h r r i i s s t t e e l l S S a a u u t t a a u u x x Q Q u u a a n n t t i i f f i i c c a a t t i i o o n n o o f f b b i i o o h h y y d d r r o o g g e e n n p p r r o o d d u u c c t t i i o o n n o o n n d d e e f f i i n n e e d d m m e e d d i i a a Professors K URT E YER | S ERGIO S CHMID Experts: C HRISTOPH H ERWIG | S IMON R ITTMANN Domain Engineering Sciences Rte du Rawyl 47 CH-1950 Sion 2 Phone +41 27 606 85 11 Fax +41 27 606 85 75 [email protected] www.hevs.ch
Transcript of Diploma 2010 - REROdoc.rero.ch/record/22531/files/Sautaux_6318785_TD.pdf · FTV Année académique...

Wien, 29.11.2010
DDeeggrreeee CCoouurrssee LLiiffee TTeecchhnnoollooggiieess OOppttiioonn BBiiootteecchhnnoollooggyy
DDiipplloommaa 22001100
CChhrriisstteell SSaauuttaauuxx
QQuuaannttiiffiiccaattiioonn ooff bbiioohhyyddrrooggeenn pprroodduuccttiioonn oonn ddeeffiinneedd mmeeddiiaa
Professors KURT EYER | SE RGIO SCHMID
Experts: CHRISTOP H HERW IG | S IMON R ITTMANN
Domain Engineering Sciences Rte du Rawyl 47 CH-1950 Sion 2 Phone +41 27 606 85 11 Fax +41 27 606 85 75 [email protected] www.hevs.ch

II
ABSTRACT III
ACKNOWLEDGMENTS V
L’ÎLE MYSTERIEUSE VI
TABLE OF ABBREVIATIONS VII

III
Object ives
Objectives of this bachelor’s Thesis was the quantification of biohydrogen production using Enterobacter aerogenes DSM 30053 with a defined medium.
Methods | Experiences | Results
In this bachelor’s thesis, hydrogen production performance of facultative anaerobe Enterobacter aerogenes has been investigated with a defined medium. A repeted batch system was set-up for dark fermentative biohydrogen production and different concentrations of glucose, and xylose were tested for the production of biohydrogen. A continuous system for dark fermentative biohydrogen production was set-up, and production of biohydrogen was investigated among different pH and dilution rates. It was shown that hydrogen may effectively be produced by E. aerogenes DSM 30053 by using defined medium. The substrate of 20 g/l glucose, in batch and with a pH of 6.8 resulted in the highest yield of hydrogen (0.17 mol/C-mol). The maximum hydrogen productivity reaches 19.45 mmol/l/h with a continuous culture with glucose 20 g/l and pH 6.8. Results show a tendency to have less CO2 and more H2 production with an increasing pH, between pH 6.4 and 6.8, and a tendency to have a higher specific H2 production with a higher dilution rate.
Quantification of biohydrogen production on defined media Sautaux Christel
HES-SO Valais Route du Rawyl 47 1950 Sion
Phone 027 606 85 11 Website www.hevs.ch
Bachelor’s Thesis | 2 0 1 0 |
Degree course Life Technologies
Field of application Major
Supervising professor Sergio Schmid Kurt Eyer
Christoph Herwig

IV
FSI
FTV
Année académique / Studienjahr 2009/2010
No TD / Nr. DA bt/2010/61
Mandant / Auftraggeber HES—SO Vala is Industr ie Etabl issement par tenai re
Technische Universität Wien
Etudiant / Student Christel Sautaux
Lieu d’exécution / Ausführungsort
HES—SO Vala is
Industr ie
Etabl issement par tenai re
Professeurs / Dozenten Kurt Eyer | Sergio Schmid
Expert / Experte (données complètes) Dr. Christoph Herwig Technische Universität Wien Karlsplatz 13 |1040 Wien Travail confidentiel / vertrauliche Arbeit
oui / ja 1 non / nein
Titre / Titel Process development for enhanced fermentative biohy drogen production
Goals:
1) Find optimised process conditions for the production of biohydrogen using different substrates. 2) Establish a batch system for biohydrogen production 3) Set up a repeated batch biohydrogen production system
The process for biohydrogen production has to be established. This comprises a high sophisticated bioreactor environment with multiple measurements and controls. On-line and off-line data will be used to quantify the biological reaction. Data exploitation will comprise the calculation of rates and yields in which the biohydrogen productivity will be evaluated. The growth conditions for the microbes will be facultative and strict anaerobic.
The fermentations will be done with: — Two different anaerobic fermentative biohydrogen producing strains (Enterobacter aerogenes, Clostridium
uliginosum)
— Different substrates (pentoses, hexoses)
— Different bioreactor setup by using batch cultures and repeated batch cultures
Activities and Expected Results:
For efficient biohydrogen production, following factors will be studied for each strain and substrate:
— Influence of: oxidation-reduction potential (ORP), pH, N2-sparging, agitation, temperature, initial substrate concentration
— Production of metabolic end products (i.e. acetate, formate);
— Product yield and evolution rate H2/sugar [g/g], HER [mol H2/g CDW/h].
1 Par sa signature, l’étudiant s’engage à respecter strictement le caractère confidentiel du travail de diplôme qui lui est confié
et des informations mises à sa disposition; il s’engage également à appliquer formellement la directive y relative. Durch seine Unterschrift verpflichtet sich der Student, die Richtlinie einzuhalten sowie die Vertraulichkeit der Diplomarbeit
und der dafür zur Verfügung gestellten Informationen zu wahren.

V
ACKNOWLEDGEMENTS
I would like to thank my supervisor Professor Dr. Christoph Herwig that gave me
the opportunity to join his group in Vienna. His enthusiasm is communicative and
the word “team” has a real meaning with him.
I thank my mentor, Simon Rittmann. He had a lot of patience with me and he
helped me a lot in the lab and in writing this bachelor thesis.
I would like to thank also my workmates Patrick Wechselberger, Oliver Spadiut,
Christian Dietzsch, Andreas Posch, Arne Seifert, Mohammed Jazini, Joseph
Schulze, Patrick Sagmeister, Silvia Gluderer, Birgitt Wittholm and a special thank
for Katharina Denk: without her, it would not have been the same!
I also thank my professors in Sion, Sergio Schmid and Kurt Eyer that gave me the
opportunity to come in Vienna and helped me to prepare my work.
Last but not least, I thank my family, and especially my mother, Claudine, for her
support during my whole life. She is always present for me. MERCI!
VI
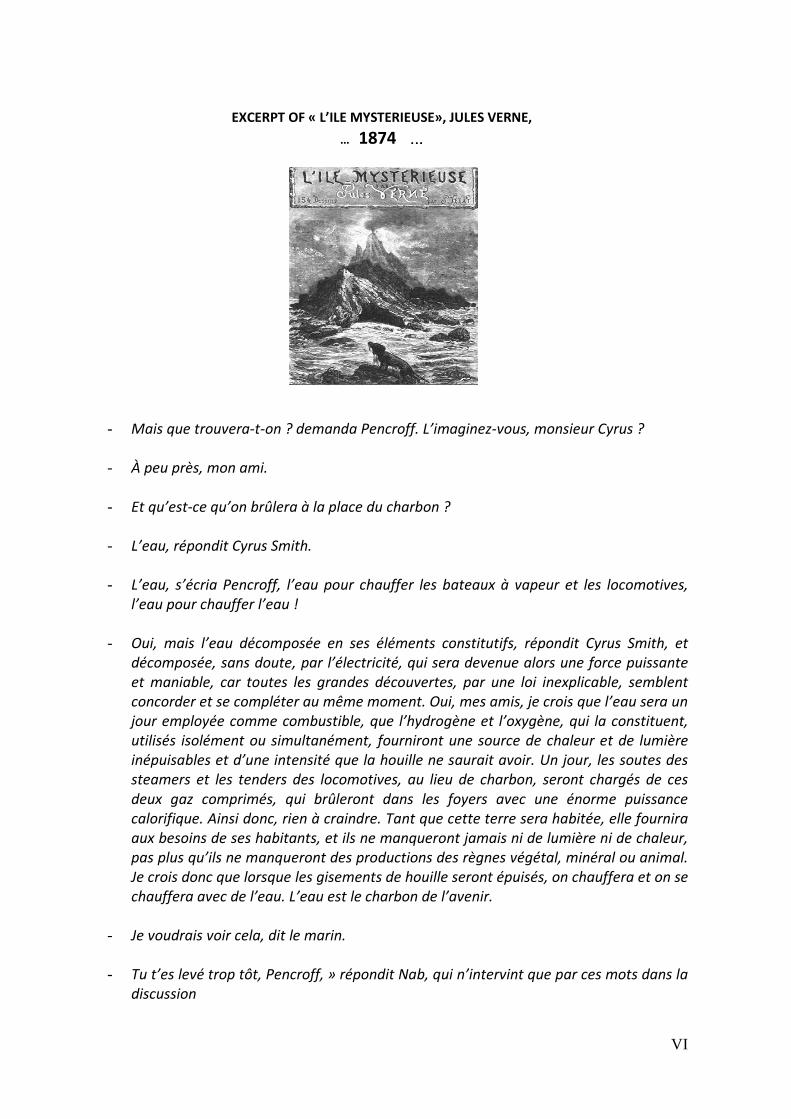
EXCERPT OF « L’ILE MYSTERIEUSE», JULES VERNE,
… 1874 …………
- Mais que trouvera-t-on ? demanda Pencroff. L’imaginez-vous, monsieur Cyrus ?
- À peu près, mon ami.
- Et qu’est-ce qu’on brûlera à la place du charbon ?
- L’eau, répondit Cyrus Smith.
- L’eau, s’écria Pencroff, l’eau pour chauffer les bateaux à vapeur et les locomotives, l’eau pour chauffer l’eau !
- Oui, mais l’eau décomposée en ses éléments constitutifs, répondit Cyrus Smith, et
décomposée, sans doute, par l’électricité, qui sera devenue alors une force puissante et maniable, car toutes les grandes découvertes, par une loi inexplicable, semblent concorder et se compléter au même moment. Oui, mes amis, je crois que l’eau sera un jour employée comme combustible, que l’hydrogène et l’oxygène, qui la constituent, utilisés isolément ou simultanément, fourniront une source de chaleur et de lumière inépuisables et d’une intensité que la houille ne saurait avoir. Un jour, les soutes des steamers et les tenders des locomotives, au lieu de charbon, seront chargés de ces deux gaz comprimés, qui brûleront dans les foyers avec une énorme puissance calorifique. Ainsi donc, rien à craindre. Tant que cette terre sera habitée, elle fournira aux besoins de ses habitants, et ils ne manqueront jamais ni de lumière ni de chaleur, pas plus qu’ils ne manqueront des productions des règnes végétal, minéral ou animal. Je crois donc que lorsque les gisements de houille seront épuisés, on chauffera et on se chauffera avec de l’eau. L’eau est le charbon de l’avenir.
- Je voudrais voir cela, dit le marin.
- Tu t’es levé trop tôt, Pencroff, » répondit Nab, qui n’intervint que par ces mots dans la discussion

VII
TABLE OF ABBREVIATIONS
Biohydrogen biological hydrogen
C carbon -
CDW cell dry weight -
CER carbon dioxide evolution rate C-mmol/l/h
CO2 carbon dioxide -
Cubian CuBiAn XC analyzer -
DSM Deutsche Sammlung von Microorganismus
E.aerogenes Enterobacter aerogenes
glu glucose
h hours -
H2 hydrogen -
HER hydrogen evolution rate mmol/l/h
HPLC High pressure liquid chromatography -
M Molarity Mol/L
min. minutes -
MM Molecular mass g/mol
N2 nitrogen -
NaOH Sodium hydroxide -
OD600 Optical density at 600 nm -
PIMS Process Information Management System -
rI Volumetric rate of component I mmol/l/h
rpm Revolution per minute rpm
T Temperature ºC
t Time h
VR Volume of the bioreactor L
vvm Volume air per volume media per minute L/L/min
X Biomass concentration g/L
X0 Incoming biomass concentration g/L
YX/S biomass Yield C-mol/C-
mol
µ Specific growth rate 1/h

QQuuaannttiiffiiccaattiioonn ooff bbiioohhyyddrrooggeenn pprroodduuccttiioonn oonn ddeeffiinneedd mmeeddiiaa
1
SUMMARY
1. Introduction ........................................................................................................................ 4
1.1 The emergence of the idea of a Hydrogen Economy .................................................. 4
1.2 Biohydrogen production .............................................................................................. 6
1.2.1 Biophotolysis of water.......................................................................................... 6
1.2.2 Photofermentation ............................................................................................... 7
1.2.3 Bioelectrohydrogenesis ........................................................................................ 8
1.2.4 Hybrid system using photosynthetic and fermentative bacteria ........................ 8
2. Theoritical part ................................................................................................................... 9
2.1 Dark fermentation ....................................................................................................... 9
2.1.1 Advantages and limitations of hydrogen production by dark fermentation ....... 9
2.1.2 Fermentative biohydrogen production pathways ............................................. 11
2.2 Choice of a micro-organism for biohydrogen production ......................................... 13
3. Objectives ......................................................................................................................... 14
4. Material and Methods ...................................................................................................... 15
4.1 Microorganism and culture condition ....................................................................... 15
4.1.1 Microorganism : ................................................................................................. 15
4.1.2 Preculture preparation: ...................................................................................... 15
4.1.3 Cultivation conditions for fermentation using 1L Applikon bioreactor : ........... 15
4.1.4 Medium Preparation .......................................................................................... 16
4.1.5 Microbiological quality assurance: ..................................................................... 17

QQuuaannttiiffiiccaattiioonn ooff bbiioohhyyddrrooggeenn pprroodduuccttiioonn oonn ddeeffiinneedd mmeeddiiaa
2
4.2 Experimental procedure ............................................................................................ 17
4.2.1 The bioreactor .................................................................................................... 17
4.2.2 Bioreactor Set-up ............................................................................................... 18
4.3 Analytical Methods .................................................................................................... 19
4.3.1 Determination of biomass concentration .......................................................... 19
4.3.2 Determination of the optical density (OD)......................................................... 19
4.3.3 Gas Analyzer ....................................................................................................... 19
4.3.4 Quantification of substrates and metabolites ................................................... 20
4.4 Data Exploitation ....................................................................................................... 21
4.4.1 Batch culture fermentation ................................................................................ 21
4.4.2 Continuous fermentations ................................................................................. 23
5. Results .............................................................................................................................. 24
5.1 Suitability of the defined medium to produce hydrogen with Enterobacter
aerogenes DSM 30053 ......................................................................................................... 24
5.2 Hydrogen production BY Enterobacter aerogenes DSM 30053 in Batch Mode: ..... 26
5.2.1 Effect of initial glucose concentration: .............................................................. 26
5.2.2 Comparison yields and physiological response of E. aerogenes DSM 30053
towards an initial glucose concentration and initial xylose concentration ..................... 33
5.3 Hydrogen production in continuous culture ............................................................. 36
5.3.1 Effect of pH ......................................................................................................... 36
5.3.2 Effect of dilution rate ......................................................................................... 38
6. Discussion ......................................................................................................................... 40
6.1 Suitability of the defined medium to produce hydrogen with E aerogenes DSM
30053... ................................................................................................................................. 40

QQuuaannttiiffiiccaattiioonn ooff bbiioohhyyddrrooggeenn pprroodduuccttiioonn oonn ddeeffiinneedd mmeeddiiaa
3
6.2 Hydrogen production BY Enterobacter aerogenes DSM 30053 in Batch Mode: ...... 40
6.2.1 Effect of initial glucose concentration: .............................................................. 40
6.2.2 Comparison yields and physiological response of Enterobacter aerogenes DSM
30053 towards an initial glucose concentration (10 g/l,) and initial xylose concentration
(10 g/l)… ........................................................................................................................... 42
6.3 Hydrogen production in continuous culture ............................................................. 43
7. Conclusion and perspectives ............................................................................................ 44
8. Bibliography ...................................................................................................................... 45
9. Appendix ........................................................................................................................... 48
9.1 Stock solution ............................................................................................................ 48

QQuuaannttiiffiiccaattiioonn ooff bbiioohhyyddrrooggeenn pprroodduuccttiioonn oonn ddeeffiinneedd mmeeddiiaa
4
1. INTRODUCTION
1.1 THE EMERGENCE OF THE IDEA OF A HYDROGEN ECONOMY
Energy is vital to global prosperity, yet dependence on fossil fuels as our primary energy
source contributes to global climate change, environmental degradation, and health
problems. More than 80% of energy consumed today is derived from burning fossil fuels
[Bockris, 2002]., Since the mid-19th
century, mankind has slowly been shifting utilization of
primary energy sources from one form of energy to another: from solids to liquids to gases
as demonstrated in the left part of the Figure 1 [Dunn, 2002].
Figure 1: Global energy systems transition, 1850-2150 [Hefner, 2000]
The move from solid to liquid to gas fuels involves another sort of transition: the less visible
process of “decarbonization”. From wood to coal to oil to natural gas, the ratio of hydrogen
(H) to carbon (C) in the molecule of each successive source has increased. Roughly speaking,
the ratio is between 1 to 3 and 1 to 10 for wood; 1 to 2 for coal; 2 to 1 for oil; and 4 to 1 for
natural gas. Between 1860 and 1990, the H-C ratio rose six-fold. The trend toward
‘decarbonization’ is at the heart of understanding the evolution of the energy system
[Winter, 2000].

QQuuaannttiiffiiccaattiioonn ooff bbiioohhyyddrrooggeenn pprroodduuccttiioonn oonn ddeeffiinneedd mmeeddiiaa
5
Some scientists predict a new economy based on hydrogen, which might fundamentally
change the global market, economy and society, as coal did in the 19th
century and
petroleum in the 20th
century [Rocha, 2001]. Hydrogen is not a primary energy source, but,
as shown in figure 2, hydrogen has been suggested as the energy carrier of the future,
serving as a medium through which primary energy sources (such as wind or solar energy)
can be stored, transmitted and utilized to fulfill our energy needs [Das, 2001].
Figure 2: A hydrogen energy system: Hydrogen as energy carrier. This figure shows the current industrial
production of hydrogen, which does not involve biohydrogen from dark fermentation processes. [Jensen,
2000]
Hydrogen is regarded as a clean, non-polluting fuel, because its product of combustion is
H2O, and moreover, hydrogen is harmless to mammals and the environment. This colorless,
odorless and tasteless element has the highest gravimetric energy density of any known fuel
and may be used in internal combustion engines or to produce electricity through fuel cells
[Rittmann, 2008]. Hydrogen is everywhere, but it is hard to find on earth as a separate
element. Instead, it is primarily found in combination with oxygen in water, in combination
with carbon in a range of hydrocarbons, and in combination with carbon in plants, animals,
and other forms of life [HTAP, 1998]. Hydrogen may be produced by a number of different
processes, including electrolysis of water, thermo catalytic reformation of hydrogen-rich
organic compounds, and biological processes. Currently, hydrogen is produced, almost

QQuuaannttiiffiiccaattiioonn ooff bbiioohhyyddrrooggeenn pprroodduuccttiioonn oonn ddeeffiinneedd mmeeddiiaa
6
exclusively, by electrolysis of water or by steam reformation of methane. Biological
production of hydrogen (biohydrogen), using (micro) organisms, is an exciting new area of
technology development that offers the potential production of usable hydrogen from a
variety of renewable resources [Levin, 2003; Rittmann, 2008]. Biohydrogen is already a part
of the biocarburants as describes by the European Directive 2003/30/EC of the 8th
of May
2003 that should promote the use of biofuels or renewable fuels for transport.
1.2 BIOHYDROGEN PRODUCTION
There are several biological hydrogen production processes that can be classified as follows:
• Biophotolysis of water (direct or indirect)
• Photofermentation
• Bioelectrohydrogenesis
• Fermentative hydrogen production (this is the process used in the present work and
this point will be discussed with more attention in chapter 2)
1.2.1 Biophotolysis of water
A production of hydrogen by direct biophotolysis is a biological process that uses solar
energy, as well as the photosynthetic system of algae or cyanobacteria to convert water in
chemical energy [Suzuki, 1982]. The principal advantage of direct photolysis is the
production of hydrogen only with water and solar energy, as follows:
2H2O + light energy ���� 2H2 + O2 Eq. 1
The principal disadvantages of this process are the requirement for a high intensity of light,
which is very expensive in a technologic point of view, and the oxygen sensitivity of the
several enzymes participating in photo biohydrogen production [Nath, 2004].

QQuuaannttiiffiiccaattiioonn ooff bbiioohhyyddrrooggeenn pprroodduuccttiioonn oonn ddeeffiinneedd mmeeddiiaa
7
In indirect biophotolysis, problems of the oxygen sensitivity in the hydrogen evolving
process are potentially circumvented by separating temporally and/or spatially oxygen
evolution and hydrogen evolution [Hallenbeck, 2002]. In this process, CO2 is continually fixed
and relaxed, and used for the transport of electrons between the reaction that produce O2
(scission of water), and the reactions that are O2-sensitive (with hydrogenase).
In indirect biophotolysis, H2 is produced as follows [Das, 2008]:
12H2O + 6CO2 + light energy ���� C6H12O6 + 6O2 Eq. 2
C6H12O6 + 12H2O + light energy ���� 12H2 + 6CO2 Eq. 3
Cyanobacteria are essentially used for that type of biophotolysis.
1.2.2 Photofermentation
Purple non-sulfur bacteria evolve molecular hydrogen catalyzed by the enzyme nitrogenase
under nitrogen-deficient conditions using light energy and reduced compounds (organic
acids) as follows [Levin, 2004]:
C6H12O6 + 12 H2O + light energy ���� 12 H2 + 6 CO2 Eq. 4
The major benefits of photofermentation are given below [Das, 2001]:
• A large energy spectrum can be used by these bacteria
• A lot of different organic wastes can be used as substrate. This could be use in
association with wastewater treatment.
• High theoretical conversion yield
• This process takes place under anaerobic conditions and can be combined with a
dark fermentation that gives acetic acid as final product
The major problem with this approach is the scale-up. It is necessary to expose the microbes
to a very big surface to obtain a sufficient solar energy. In addition, the solar energy
conversion efficiency is very low.

QQuuaannttiiffiiccaattiioonn ooff bbiioohhyyddrrooggeenn pprroodduuccttiioonn oonn ddeeffiinneedd mmeeddiiaa
8
1.2.3 Bioelectrohydrogenesis
Bioelectrohydrogenesis uses microorganisms that are electrochemically active for hydrogen
production. In the presence of a moderate voltage, organic compounds are used as energy
and carbon source and hydrogen is evolved as a by-product. These reactions take place
inside an electrochemical cell through coupled anode/cathode reactions. The density of the
current on the surface of the electrodes is low and low volumetric production of hydrogen is
obtained. Actually, this volumetric production is lower than the production obtained in dark-
and/or photofermentations [Hallenbeck, 2009].
1.2.4 Hybrid system using photosynthetic and fermentative bacteria
Hybrid systems consist of non-photosynthetic and photosynthetic bacteria and can enhance
the hydrogen yield. A variety of carbohydrates may be degraded by bacteria that produce
hydrogen using dark fermentation. Other resulting products from dark fermentation could
be sources for photosynthetic bacteria to produce hydrogen, as shown in Figure 3.
Figure 3: Hybrid system using photosynthetic and fermentative bacteria. [Tao, 2007]
The concomitant production of hydrogen from different substrates by dark and photo
fermentation, not only reduces the light energy demand of photosynthetic bacteria, but also
increases overall hydrogen production yield [Das, 2001; Mogidell, 2007].

QQuuaannttiiffiiccaattiioonn ooff bbiioohhyyddrrooggeenn pprroodduuccttiioonn oonn ddeeffiinneedd mmeeddiiaa
9
2. THEORITICAL PART
2.1 DARK FERMENTATION
Dark fermentative biohydrogen production is ubiquitously occurring in several microbial
species. This phenomenon occurs under anaerobic condition (for detailed information on
microbes capable of dark fermentative biohydrogen production, please refer to the relevant
literature [Rittmann, 2008; Nath 2004]). When bacteria grow on organic substrates
(heterotrophic growth), these substrates are degraded by oxidation to provide building
blocks and energy for growth and metabolism. This oxidation generates electrons which
need to be disposed off to maintain electrical neutrality. In anaerobic environments,
hydrogen acts as electron acceptor [Nath, 2004]. The evolution rate of hydrogen is higher
from fermentative processes, than using other applications (for example biophotolysis or
photofermentation), but, in comparison, the hydrogen yield (mol H2/mol substrate) is lower
[Nandi, 2001].
2.1.1 Advantages and limitations of hydrogen production by dark fermentation
Biohydrogen production by dark fermentation offers several advantages in comparison to
other processes:
• H2 can be produced all day long without the requirement of a light source
• It is an anaerobic process; there is no O2 limitation problem
• Some fermentatively growing bacteria comprise a very high hydrogen evolution rate.
For instance Ito et al., 2005, obtained a volumetric H2 production of 80 mmol H2/l.h
by using an Enterobacter sp. [Ito, 2004]
• A variety of carbon sources (biomass, pure substance, various wastes) may be used
as substrates for biohydrogen production (please refer to figure 4) [Das, 2004; Das,
2001]

QQuuaannttiiffiiccaattiioonn ooff bbiioohhyyddrrooggeenn pprroodduuccttiioonn oonn ddeeffiinneedd mmeeddiiaa
10
Figure 4: Schematic process of biohydrogen production via dark fermentation.
Pure substrates used for biohydrogen production are for example: glucose, xylose, cellulose,
sucrose or maltose. Following wastewaters were, for example, investigated for feasibility of
biohydrogen production: sugary wastewater, bean curd manufacturing waste or rice bran
[Hallenbeck, 2002]. Moreover, metabolites produced by dark fermentation, for example,
acetate, lactate, glutamate, may for instance be used in a second stage, by
photofermentative microbes, also leading to an enhanced overall H2 evolution [Madigan,
2001; Modigell, 2007].
The major limitations in the process using dark fermentation are the following [Nath, 2004]:
� Low achievable yields of H2, in comparison to hydrogen produced by electrolysis
� If H2 yields increase, H2 fermentation becomes thermodynamically unfavourable,
because end-product inhibition occurs [Hallenbeck, 2002]
� Product gas mixture contains CO2 which has to be separated
Various approaches exist to overcome these limitations, for example:
� Metabolic shift of biochemical pathways to arrest the formation of alcohol and acids
[Mahyudin, 1997; Kumar, 2001]
� Maintaining low partial pressure of H2 and CO2 to keep biohydrogen fermentation
thermodynamically favourable, e.g. by inert gas sparging [Nath, 2004].

QQuuaannttiiffiiccaattiioonn ooff bbiioohhyyddrrooggeenn pprroodduuccttiioonn oonn ddeeffiinneedd mmeeddiiaa
11
2.1.2 Fermentative biohydrogen production pathways
As shown in Figure 5, there are three representative pathways for the production of
biohydrogen by fermentative bacteria [Tanisho, 1997]
Figure 5: Representative pathways of fermentative hydrogen evolution.
The main pathway of glycolysis, that converts glucose into pyruvate, can be expressed as
follows:
C6H12O6 + 2NAD+ ���� 2CH3COCOOH + 2NADH + 2H
+ Eq. 5
NADH pathway:
The evolution of hydrogen through NADH pathway is driven by the necessity for reoxidizing
the residual NADH of metabolic reactions as follows:
NADH + H+ ���� NAD
+ + H2 Eq. 6
Formate
H2
Glucose
Pyruvate
Acetyl-CoA
Products
H2
NADH
Fd
H2

QQuuaannttiiffiiccaattiioonn ooff bbiioohhyyddrrooggeenn pprroodduuccttiioonn oonn ddeeffiinneedd mmeeddiiaa
12
Pyruvate pathway:
The pathway of pyruvate decomposition through acetyl-CoA produces formate as follows, by
using the enzyme PFL (pyruvate/formate lyase):
CH3COCOOH + HCoA ���� CH3CO CoA + HCOOH Eq. 7
In the next step, hydrogen is obtained by decomposition of formate (HCOOH) as follows:
HCOOH ���� H2 + CO2 Eq. 8
Under most conditions during “enteric-type” (performed by species belonging to the order
Enterobacteriales) fermentations, the degradation of formate is incomplete, because
formate is only broken down to H2 and CO2 under acetic conditions and when intracellular
formate concentrations are high.
The acetyl CoA gives rise to metabolites, such as acetate and ethanol, which is then
excreted:
CH3 CO CoA + H2O ���� CH3 COOH + H CoA Eq. 9
CH3 CO CoA + 2NADH + 2H+ ���� CH3CH2OH + H CoA + 2NAD
+ Eq. 10
The oxidation of acetyl-CoA, as described in the equation 6, results in the reduction of
ferredoxine (Fd). The reduced form of Fd(red) is oxidized by hydrogenase that regenerates
Fd(ox) and transmittes electrons for the reduction of H2. The complete reaction can be
written as follows [Nath, 2004]:
Pyruvate + CoA + 2Fd(ox) → Acetyl-CoA + 2Fd(red) + CO2 Eq. 11
2H+ + Fd(red) → H2 + Fd(ox) Eq. 12
If CO2 is available, pyruvate can lead to the production of formate and succinate as follows:
CH3COCOOH + CO2 + NADH + H+ ���� 2HCOOH + H2O + NAD
+ Eq. 13
CH3COCOOH + CO2 + 2NADH + 2H+ ���� 2CH3COOH + H2O + 2NAD
+ Eq. 14
QQuuaannttiiffiiccaattiioonn ooff bbiioohhyyddrrooggeenn pprroodduuccttiioonn oonn ddeeffiinneedd mmeeddiiaa
13
From the above equations, it is understood that the production of succinate and formate
should be decreased by some means to obtain high yield of hydrogen. Thus, if CO2 is
removed compulsorily form the culture liquid, the production of formate and succinate may
be reduced. This will result in an increased hydrogen production, due to more availability of
NADH [Das, 2001; Tanisho 1997].
The maximum stoichiometric hydrogen yield from the “enteric-type” fermentation might be
2 mole H2 per mole of glucose, but in practice only half of the theoretical amount is
observed [Hallenbeck, 2005]. Several reasons can explain this lower amount of H2, for
example the degradation of glucose that may involve different pathways without producing
hydrogen, the partial consumption of glucose for construction of cellular biomass or the
intracellular consumption of hydrogen for the synthesis of other metabolites [Woodward,
2000; Rittmann, 2008].
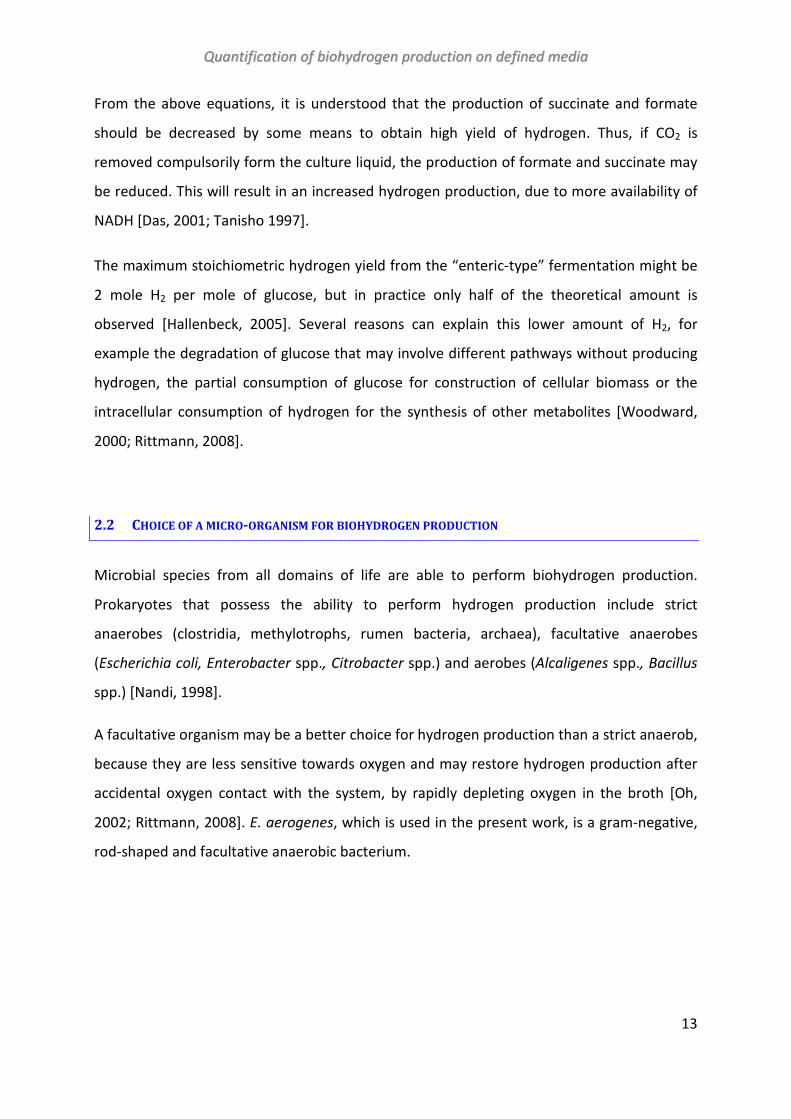
2.2 CHOICE OF A MICRO-ORGANISM FOR BIOHYDROGEN PRODUCTION
Microbial species from all domains of life are able to perform biohydrogen production.
Prokaryotes that possess the ability to perform hydrogen production include strict
anaerobes (clostridia, methylotrophs, rumen bacteria, archaea), facultative anaerobes
(Escherichia coli, Enterobacter spp., Citrobacter spp.) and aerobes (Alcaligenes spp., Bacillus
spp.) [Nandi, 1998].
A facultative organism may be a better choice for hydrogen production than a strict anaerob,
because they are less sensitive towards oxygen and may restore hydrogen production after
accidental oxygen contact with the system, by rapidly depleting oxygen in the broth [Oh,
2002; Rittmann, 2008]. E. aerogenes, which is used in the present work, is a gram-negative,
rod-shaped and facultative anaerobic bacterium.

QQuuaannttiiffiiccaattiioonn ooff bbiioohhyyddrrooggeenn pprroodduuccttiioonn oonn ddeeffiinneedd mmeeddiiaa
14
3. OBJECTIVES
The objectives of this work were the following:
Establishment of a batch system for dark fermentative biohydrogen production
Set up a repeated batch system for dark fermentative biohydrogen production
Set up a continuous system for dark fermentative biohydrogen production
Quantification of biohydrogen production using Enterobacter aerogenes DSM 30053
with a defined medium
Comparison of product yields, rates and specific growth rates between using defined
medium and complex medium, whereas results from dark fermentations using
complex medium are obtained from literature
Comparison of yields, rates and specific growth rates between:
o different initial concentrations of glucose
o glucose and xylose
o different pH
The process for biohydrogen production had to be established. This comprised a
sophisticated bioreactor environment with online, in-line and offline measurements and
controls. Online and offline data were used to quantify the biological reactions. Data
exploitation comprised the calculation of rates and yields for describing biohydrogen
productivity.

QQuuaannttiiffiiccaattiioonn ooff bbiioohhyyddrrooggeenn pprroodduuccttiioonn oonn ddeeffiinneedd mmeeddiiaa
15
4. MATERIAL AND METHODS
4.1 MICROORGANISM AND CULTURE CONDITION
4.1.1 Microorganism :
The facultative-anaerobic bacterial strain Enterobacter aerogenes DSM 30053 was used in
the present work for all cultivations. Cryocultures were stored at -80°C in 2 ml cryo vials
(VWR, Bohemia, NY, USA) in a final concentration of glycerol of 12,5% (v/v).
4.1.2 Preculture preparation:
For preculture preparation, a cryovial of Enterobacter aerogenes DSM 30053 was removed
from -80°C and 10µl of bacterial suspension were transferred to an Erlenmeyer-flask
containing medium by using an inoculation loop, which was extensively decontaminated by
flaming using a Bunsen burner. The procedure was performed twice in a laminar flow
chamber (Hermasafe, Thermo, Germany). Moreover, a negative control was also established
by applying the same procedure as mentioned above, but without using suspension for
inoculation. Afterwards all Erlenmeyer-flasks were incubated at 30°C on a rotary shaker with
170 rpm (Multitron, Infors, Switzerland) for 12 hours.
4.1.3 Cultivation conditions for fermentation using 1L Applikon bioreactor :
The cultivation conditions were as follows:
- Temperature: 30 °C
- N2 flow: 0,1 l/min
- Agitator speed: Lag phase: 400 rpm
Exponential phase: 800 rpm

QQuuaannttiiffiiccaattiioonn ooff bbiioohhyyddrrooggeenn pprroodduuccttiioonn oonn ddeeffiinneedd mmeeddiiaa
16
4.1.4 Medium Preparation
The composition of the medium is given in Table 1. Medium was prepared according to
Delisa et al., 1999 with minor modifications. (Addition of PPG against foam, changes of
hydratations of some products because of availability in the lab) For preparation of 1L of
medium, a stock solution of MgSO4 (62 g L-1
) and trace elements (0,25 g CoCl2 ∙6H2O L-1
; 1.5
g MnCl2∙4H2O L-1
; 0.12 g CuCL2 ∙2H2O L-1
; 0,3 g H3BO3 L-1
; 0,25 g Na2MoO4 ∙2H2O L-1
; 1,3 g
Zn(CH3COO)2 2H2O L-1
; 10 g FeIII
citrate L-1
) were mixed in 100 ml of distilled water and
sterilized for 20 min at 121°C.
KH2PO4 (13,3 g/l), (NH4)2HPO4 (4 g/l), PPG (100 μl) and citric acid (1,7 g/l) were mixed in 770
ml of distilled water and sterilized in the bioreactor for 20 min at 121°C. Stock solutions of
glucose (400 g/l), xylose (200 g/l) and EDTA (0.84 g/l) were sterilized separately. Thiamine
(0.45 g/l) was sterilized by filtration, by using 0.2 µm sterile filters (ReZist, Whatman, Dassel,
Germany). The pH of 6.8 was adjusted by using 2 M (80g/l) NaOH solution, which was
autoclaved before application.
Table 1: Medium composition
Component Batch Medium (per L)
Glucose/Xylose 5 - 40 g
KH2PO4 13.3 g
(NH4)2HPO4 4.0 g
MgSO4 ∙H2O 0.6 g
Citric acid 1.7 g
EDTA 8.4 mg
CoCl2 ∙6H2O 2.5 mg
MnCl2∙4H2O 15.0 mg
CuCL2 ∙2H2O 1.2 mg
H3BO3 3.0 mg
Na2MoO4 ∙2H2O 2.5 mg
Zn(CH3COO)2 ∙ 2H2O 13.0 mg
FeIII
citrate 100.0 mg
Thiamine ∙ HCl 4.5 mg
PPG 100 μl

QQuuaannttiiffiiccaattiioonn ooff bbiioohhyyddrrooggeenn pprroodduuccttiioonn oonn ddeeffiinneedd mmeeddiiaa
17
4.1.5 Microbiological quality assurance:
For investigation of culture pureness, strain Enterobacter aerogenes DSM 30053 was
routinely streaked out on two agar plates prepared as indicated in appendix by using an
thoroughly flamed inoculation loop, and withdrawal of approximately 10 µl of culture from
each the Erlenmeyer flask. Incubation of cultures was performed in an incubation chamber
(HT Infors AG, Bottmingen, Switzerland) over night. Afterwards single colonies were
individually picked, streaked out on an object carrier with cover slip and investigated by
using an inverse microscope (IX2-SLP, Olympus, Japan) with a total magnification of 1000.
Moreover, fermentation culture was also investigated by using this procedure. Colony shape
and coloring was not taken into account for colony pureness.
4.2 EXPERIMENTAL PROCEDURE
4.2.1 The bioreactor
A 1 L bioreactor (Applikon, The Netherlands), was used for all the fermentations. As shown
in Figure 6, the reactor is equipped with an internal stirrer, a sparger for air/nitrogen and
several ports, which could be used for sampling, feeding, or for base supply. The remaining
ports were closed by applying a septum in order to be able to inoculate, and for injection of
additional solutions, when required.
Figure 6: Bioreactor used for the fermentations: 1. Septum; 2. Base
income; 3. pH probe; 4. Motor; 5. Syringe for injection; 6. Condenser; 7.
Output for probes; 8. Air/nitrogen inlet; 9. Water outlet for the double
vessel.

QQuuaannttiiffiiccaattiioonn ooff bbiioohhyyddrrooggeenn pprroodduuccttiioonn oonn ddeeffiinneedd mmeeddiiaa
18
4.2.2 Bioreactor Set-up
First, the bioreactor was cleaned, and equipped with all probes, septa and tubes needed for
fermentation. In order to keep the sterility inside the bioreactor, a 0,45 μl sterile filter was
used on all ingas tubes. This kind of sterile filter was also used on the outgas tube, to assure
that no bacteria were able to contaminate the environment. For autoclavation, every tube
was closed by a horse clamp.
The bioreactor-condenser was connected to an off-gas outlet tube leading to an empty
pressure-resistant bottle (Schott, Mainz, Germany) (used as before passing to the O2/CO2 gas
analyzer system (DasGip, Bluesens, Germany) and the H2 gas analyzer system (Bluesens,
Germany). Before autoclavation, the pH probe was calibrated applying a two point
calibration using calibration buffers of pH 7 and pH 4 (Hamilton Duracel Buffer, Bonaduz,
Switzerland). The redox probe was calibrated also using a two point calibration, with redox
calibration buffer of 220 mV and 180 mV (Mettler Toledo, Greifensee, Switzerland).
Finally, some elements of the medium, as explained in part 1.1.3, were transferred and
autoclaved with the bioreactor for 20 minutes at 121°C. The autoclave used was an
industrial autoclave (Zirbus, Germany).
After autoclaving and cooling of the bioreactor, the entire system was connected to the
required analysis and detection devices. Parameters were adjusted to cultivation conditions.
The pH of the cultures was controlled by the automatic addition of NaOH (1M – 3M). The
amount of NaOH solution added was determined gravimetrically by placing the NaOH
containing pressure-resistant bottle on a balance (Sartorius, Germany).
The technical N2 (Messer, Austria) inlet flow was maintained constant at 0.1 l/min by using a
mass flow controller (4800-Series, Brooks Instruments, Hatfield, USA)

QQuuaannttiiffiiccaattiioonn ooff bbiioohhyyddrrooggeenn pprroodduuccttiioonn oonn ddeeffiinneedd mmeeddiiaa
19
4.3 ANALYTICAL METHODS
4.3.1 Determination of biomass concentration
During all experiments, samples were taken in regular intervals, and biomass quantification
was carried out in four individual tubes in parallel. To determine cell dry weights (CDW), 10
ml of culture medium was added to pre-weighted glass tubes, centrifuged (4000 rpm at 4°C
for 20 min, centrifuge Sigma 3K30, rotor 11156). 2 ml of supernatant were removed carefully
by aspiration and transferred to 2 ml of Eppendorf-tubes and concomitantly frozen at -20°C.
Biomass pellets were resuspended in 5 ml of 4°C water using a Vortex (Genie2, VWR,
Bohemia, NY, USA) for resuspension of cells. Biomass containing tubes were centrifuged at
4000 rpm for 10 minutes and the supernatant was discarded. The cell pellet washing
procedure was performed twice. Following the second washing procedure the biomass
containing glass tubes were transferred to a drying oven and stored inside for 72 hours on
105°C. Before being weighted on an analytical balance, dried biomass containing tubes were
kept in a desiccator in order to prevent rehydration [SOP001, BioVT, TUWien].
4.3.2 Determination of the optical density (OD)
The optical density (OD) of each sample was measured at λ 600 nm in a spectrophotometer (HITACHI
U-1100, Japan). Distilled water was used as a reference. When necessary, the samples were diluted
with distilled water in order to measure within the linear range (ranging from OD(600nm] 0.2 to 0.8)
[SOP001, BioVT, TUWien].
4.3.3 Gas Analyzer
Bioreactor off-gas was passed through two gas analyzers (GA-4 DasGip, Bluesens, Jühlich, Germany
for CO2 and Blusens,Jühlich, Germany for H2). Data were recorded by using the Process and
Information Management System Lucullus (Biospectra, Schlieren, Switzerland). For calibration of gas
detection devices the protocols were followed precisely (please refer to relevant manuals). CO2
analyser was calibrated between 0.04 % (with air) and 7 % (with check gas). H2 analyser was
calibrated between 0 % (nitrogen) and 50 % (mixture 50% N2 / 50% H2).

QQuuaannttiiffiiccaattiioo
4.3.4 Quantification of substrates and metabolites
Acetate
Acetate acid produced during the fermentation by
measured by using an enzymatic assay
Germany)(Figure 7). For detection of acetate in supernatant of fermentation samples,
taken and centrifuged in a centrifuge (Eppendorf 5804R, Germany) at 4°C
sure that no cellular debris would interfere
Figure 7: Picture of the CuBiAn XC analyzer. It is a compact version of a benchtop random access
biochemistry analyzer (Innovatis, Bielefeld, Germ
Ethanol, Glucose, Lactate
HPLC analysis was performed in order to quantify the
measurements were performed on an Agilent 1100 HPLC device (Agilent Technologies Inc
Santa Clara, USA) with DAD (Diode Array Detection)
and a Supelcogel column C-610H
used as the mobile phase at a flow rate of
oonn ooff bbiioohhyyddrrooggeenn pprroodduuccttiioonn oonn ddeeffiinneedd mmeedd
Quantification of substrates and metabolites
ate acid produced during the fermentation by Enterobacter aerogenes
enzymatic assay for spectrophotometric detection using CuBiAn XC (
. For detection of acetate in supernatant of fermentation samples,
taken and centrifuged in a centrifuge (Eppendorf 5804R, Germany) at 4°C and 10000 rpm,
lular debris would interfere in spectrophotometric measurement.
Picture of the CuBiAn XC analyzer. It is a compact version of a benchtop random access
biochemistry analyzer (Innovatis, Bielefeld, Germany). It is applied for enzymatic and photometric assays.
HPLC analysis was performed in order to quantify the ethanol, glucose and lactate
measurements were performed on an Agilent 1100 HPLC device (Agilent Technologies Inc
(Diode Array Detection) and RID (Refractive Index Detection)
610H (Sigma-Aldrich Corporation, St Louis, MO, USA)
used as the mobile phase at a flow rate of 0,3 mL/min and a temperature of 41°C.
ddiiaa
20
Enterobacter aerogenes DSM 30053 was
for spectrophotometric detection using CuBiAn XC (Innovatis,
. For detection of acetate in supernatant of fermentation samples, 1 ml of was
and 10000 rpm, to make
spectrophotometric measurement.
Picture of the CuBiAn XC analyzer. It is a compact version of a benchtop random access
for enzymatic and photometric assays.
ethanol, glucose and lactate concentrations. All
measurements were performed on an Agilent 1100 HPLC device (Agilent Technologies Incorporation,
Index Detection) detectors
Aldrich Corporation, St Louis, MO, USA) 0.1% H3PO4 was
and a temperature of 41°C.
QQuuaannttiiffiiccaattiioonn ooff bbiioohhyyddrrooggeenn pprroodduuccttiioonn oonn ddeeffiinneedd mmeeddiiaa
21
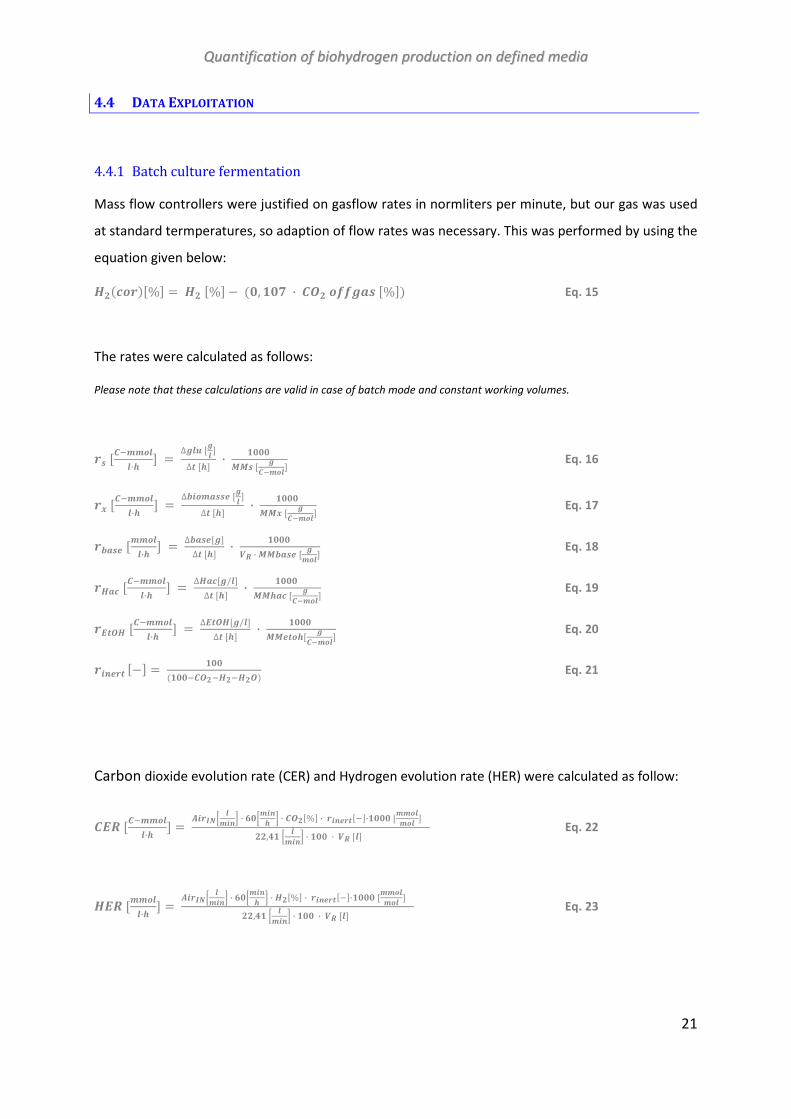
4.4 DATA EXPLOITATION
4.4.1 Batch culture fermentation
Mass flow controllers were justified on gasflow rates in normliters per minute, but our gas was used
at standard termperatures, so adaption of flow rates was necessary. This was performed by using the
equation given below:
��������% = �� �% − ��, ��� ∙ ��� ������ �%� Eq. 15
The rates were calculated as follows:
Please note that these calculations are valid in case of batch mode and constant working volumes.
�� ��������∙� = ∆��� ��� ∆� �� ∙ ���� � � ��!��� Eq. 16
�" ��������∙� = ∆#$�����% ��� ∆� �� ∙ ���� " � ��!��� Eq. 17
�#��% ������∙� = ∆#��%��∆� �� ∙ ���� &' ∙ #��% � ���� Eq. 18
���� ��������∙� = ∆�����/�∆� �� ∙ ���� ��� � ��!��� Eq. 19
�)��� ��������∙� = ∆)�����/�∆� �� ∙ ���� %���� ��!��� Eq. 20
�$*%�� �− = ������������������� Eq. 21
Carbon dioxide evolution rate (CER) and Hydrogen evolution rate (HER) were calculated as follow:
�)' ��������∙� = +$�,-. ��$*/ ∙ 0�.�$*� / ∙ ����% ∙ �$*%����∙���� �������� ��,1� . ��$*/ ∙ ��� ∙ &' �� Eq. 22
�)' ������∙� = +$�,-. ��$*/ ∙ 0�.�$*� / ∙ ���% ∙ �$*%����∙���� �������� ��,1� . ��$*/ ∙ ��� ∙ &' �� Eq. 23

QQuuaannttiiffiiccaattiioonn ooff bbiioohhyyddrrooggeenn pprroodduuccttiioonn oonn ddeeffiinneedd mmeeddiiaa
22
The yields were calculated as follows:
2��/���������� = �)' ������∙� �)'������∙� Eq. 24
2��/� � �������� = �)' ������∙� �3��!�����∙� Eq. 25
24��%/"� �������� = �#��% ������∙� �" ��!�����∙� Eq. 26
2"/������������ = �" ��!�����∙� �3��!�����∙� Eq. 27
The carbon recovery was calculated as follows:
� − #���*�% = �)'5 �"5����5�)����3 Eq. 28

QQuuaannttiiffiiccaattiioonn ooff bbiioohhyyddrrooggeenn pprroodduuccttiioonn oonn ddeeffiinneedd mmeeddiiaa
23
4.4.2 Continuous fermentations
The law of the conservation of the mass can be expressed for a dynamic mass balance where
biological reactions, such as the following ones, may occur:
6 '��% �� ���������$�* �� ���� $* ��% �7��%� 8 = 6'��% �� ���� ���9 $* 8 − 6'��% �� ���� ���9 ��� 8 ± 6 '��% �� ;��<���$�* �� ��*���;�$�* �� ��% ���;�*%*� #7 �%���$�* 8 Eq. 29
<��∙&�<� = =$* ∙ �$* − =��� ∙ ���� + � ∙ & Eq. 30
Assumptions:
That gives the following rates:
�� .�������∙� / = �$*∙=$*&' = =%%<���% .�� / ∙ � ��� &' �� ���� �������� ?� � ��!��� ∙ ����� ��� Eq. 31
@�,#��% .��/ = − ∆#��%��∆� �� Eq. 32
�" .�������∙� / = �A@�,4��%.��/ 5=%%<���% .��/B ∙ �" .�� /&' �� ∙ C" . ��!���/ ������ .������� /���� .�� / � Eq. 33
���� .�������∙� / = �A@�,4��% .��/ 5=%%<���% .��/B ∙ ���� .�� /&' �� ∙ C��� . ��!���/ ������ .������� /���� .�� / � Eq. 34
�)��� .�������∙� / = �A@�,4��%.��/ 5=%%<���% .��/B ∙ �)��� .�� /&' �� ∙ C)��� . ��!���/ ������ .������� /���� .�� / � Eq. 35
�#��% .�����∙� / = D A@�,4��% .��/ B &' �� ∙ C4��% . ����/E ∙ ����� .������� /� Eq. 36
�$*%�� �− = ������������������� Eq. 37
Carbon dioxide evolution rate (CER), Hydrogen evolution rate (HER), and all the yield were calculated
in the same way than in the calculations of the batch cultures.
The carbon recovery was calculated as follows:
� − #���*�% = �"5 ����5 �)���5�)'�3 Eq. 38
1) Rate of accumulation = 0
2) Cout(substrate) = 0
QQuuaannttiiffiiccaattiioonn ooff bbiioohhyyddrrooggeenn pprroodduuccttiioonn oonn ddeeffiinneedd mmeeddiiaa
24
5. RESULTS
Many publications report the ability of microbial strains to produce biohydrogen. However,
hydrogen production is always accomplished by using complex medium. In this work,
hydrogen production by Enterobacter aerogenes DSM 30053 is performed using a defined
medium (please refer to chapter 4.1.4). Quantification of experimental data and comparison
with results obtained from literature using complex medium is performed. Biohydrogen
production of rates, yields, specific productivity, and volumetric productivity are expressed
in different units by researchers, which does not make it easy to quickly compare different
results between different articles. In the following part of this bachelor thesis, all results
obtained during the current work are reported with the units that were given in chapter 4, in
order to allow comparability towards publications from the other working groups.
The results can be divided into three different parts. The first part demonstrates the
suitability of E. aerogenes DSM 30053 using defined medium to produce hydrogen in batch
mode. In the second part results from repetitive batch fermentation are shown. In the third
part results from continuous fermentations are presented.
5.1 SUITABILITY OF THE DEFINED MEDIUM TO PRODUCE HYDROGEN WITH ENTEROBACTER AEROGENES
DSM 30053
In the present work a defined medium, as described by Delisa et al., 1999, has been used for
all fermentations. A batch fermentation of E. aerogenes DSM 30053 glucose (20 g/l) as
substrate is shown in Figure 8.
As shown in Figure 8, hydrogen may effectively be produced by E. aerogenes DSM 30053 by
using defined medium described in part 4.1.4. This figure shows that more CO2 than H2 was
produced, especially at the end the exponential phase of the batch. Production of acetate
and ethanol were also measured.

QQuuaannttiiffiiccaattiioonn ooff bbiioohhyyddrrooggeenn pprroodduuccttiioonn oonn ddeeffiinneedd mmeeddiiaa
25
Figure 8: Batch process with E. aerogenes DSM 30053, using glucose 20 g/l as substrate
Analysis of elementary composition of E. aerogenes DSM 30053 biomass was performed at
the Universität Wien, Fakultät für Chemie, Mikroanalytisches Labor, Vienna, Austria (please
refer to table 1). This sample was taken from a continuous culture fermenting glucose (20
g/l). This biomass composition has been used for calculation of the molecular weight.
Table 2: Elementar analysis of biomass:
Element C H N O Ashes Biomass
[%] 46,72 7,07 12,76 28,55 3 12,65 g/mol
[C-mol] 1,00 0,15 0,27 0,61 0,10 25,78 g/C-mol
0,00
0,50
1,00
1,50
2,00
2,50
3,00
3,50
4,00
4,50
5,00
0,00
5,00
10,00
15,00
20,00
25,00
22,00 27,00 32,00 37,00
Bio
ma
sse
, A
ceta
te,
Eth
an
ol [
g/l
]
CE
R,
HE
R [
mm
ol/
l/h
], G
luco
se [
g/l
]
Time [h]
Enterobacter aerogenes DSM 30053, defined medium, glucose 20 g/l
HER [mmol/l*h]
CER [mmol/l*h]
Glucose [g/l]
Biomasse [g/l]
Acetate [g/l]
Ethanol [g/l]

QQuuaannttiiffiiccaattiioonn ooff bbiioohhyyddrrooggeenn pprroodduuccttiioonn oonn ddeeffiinneedd mmeeddiiaa
26
5.2 HYDROGEN PRODUCTION BY ENTEROBACTER AEROGENES DSM 30053 IN BATCH MODE:
5.2.1 Effect of initial glucose concentration:
The effect of different glucose concentrations on biohydrogen production using E. aerogenes
DSM 30053 was studied. The signals obtained by online and in-line measurements were
recorded by the PIMS (process and information management system) Lucullus. Different
repetitive batch experiments are shown in Figure 9.
Figure 9: Signals from PIMS, for two series of repeated batches using different initial glucose concentrations
or xylose. Graph coloring: blue: H2 offgas [%], black: CO2 offgas [%], red: Redox [mV], brown: N2 ingas flow
[l/min], orange: pH [-], purple: temperature [°C]. Peaks: A: glucose 5 g/l, B: glucose 10 g/l, C: glucose 20 g/l,
D: glucose 40 g/l, E: xylose 10 g/l.
Online and in-line data obtained from distinct and marked peaks from Figure 9 are
presented separately in Figure 10, as well as showing offline data obtained by HPLC and
enzymatic measurements by using CuBiAn (glucose, ethanol and acetate) and biomass
concentration.

QQuuaannttiiffiiccaattiioo
Figure 10: Repeated batch process with
substrate. Purple: glucose [g/l], orange: ethanol [g/l], red: acetate [g/l],
CER, yellow: pH. A: Glucose 5 g/l, B: Glucose 10g/l, C: Glucose 20 g/l, D: Glucose 40
oonn ooff bbiioohhyyddrrooggeenn pprroodduuccttiioonn oonn ddeeffiinneedd mmeedd
ted batch process with E. aerogenes DSM 30053, using different glucose concentrations as
Purple: glucose [g/l], orange: ethanol [g/l], red: acetate [g/l], green: biomass
A: Glucose 5 g/l, B: Glucose 10g/l, C: Glucose 20 g/l, D: Glucose 40 g/l.
ddiiaa
27
DSM 30053, using different glucose concentrations as
biomass [g/l], blue: HER, black

QQuuaannttiiffiiccaattiioonn ooff bbiioohhyyddrrooggeenn pprroodduuccttiioonn oonn ddeeffiinneedd mmeeddiiaa
28
As shown in the upper graphs of figure 10 as well as in Figure 9, at the end of each
exponential phase, the pH increased, as a result of acid utilization by E. aerogenes DSM
30053 until new substrate is applied.
Batches A and B are very similar, with only a difference of height and area.
In the batch C, H2% offgas peak is higher than CO2 % offgas. During this batch C, N2 sparging
stopped. The big H2 peak (batch C) can be explained by an accumulation of hydrogen in the
bioreactor, and a modification of gas composition occurred, which may be due to the lack of
N2.
In the batch D, the CO2 offgas could not be measured in total, because of saturation of the
CO2 analyzer. The shape of the H2 peak, showing a low ascending slope, may be due to a high
concentration of CO2 offgas that may result in a decrease of hydrogen production by CO2
inhibition [Tanisho, 1997].
Batch E, a fermentation using xylose as substrate, will be discussed in chapter 5.2.2.
Product yields, hydrogen evolution rate and maximum specific growth rate have been
calculated using the formula given in chapter 4.4.1 Results for the repeted batches using
glucose are shown in the table 3.
Figure 11 shows comparisons of hydrogen yield. These results show that these four
experiments with different initial substrate concentration all resulted in biohydrogen
production. Among the different concentrations of glucose, the batch with 20 g/l of glucose
showed the maximum yield H2/CO2 with 0.93 mol H2/mol CO2. This substrate concentration
also showed the best yield H2/Glu with 0.17 mol H2/mol glu. If, in both cases, results show no
significant differences, however, these results show a tendency for the 20 g/l concentration
to be the best one for the yields of H2.

QQuuaannttiiffiiccaattiioonn ooff bbiioohhyyddrrooggeenn pprroodduuccttiioonn oonn ddeeffiinneedd mmeeddiiaa
29
0,00
0,05
0,10
0,15
0,20
0,25
5 10 20 40
[mo
l/C
-mo
l]
Concentration [g/l]
B : Yield H2/Glu
0,00
0,20
0,40
0,60
0,80
1,00
1,20
5 10 20 40
[mo
l/C
-mo
l]
Concentration [g/l]
A : Yield H2/CO2
Table 3: Comparison of the hydrogen production performance on different concentrations of glucose
Parameters Units Glucose
5 g/l
Glucose
10 g/l
Glucose
20 g/l
Glucose
40 g/l
Y H2/CO2 mol/C-mol 0,77 0,86 0,93 0,86
Y CO2/glu C-mol/C-mol 0,21 0,11 0,18 0,11
Y H2/glu mol/C-mol 0,16 0,09 0,17 0,09
Y Hac/glu C-mol/C-mol 0,18 0,14 0,11 0,14
Y x/glu C-mol/C-mol 0,11 0,13 0,18 0,13
Y EtOH/glu C-mol/C-mol 0,25 0,20 0,22 0,20
Y base/glu mol/C-mol 3,48 2,89 3,63 2,89
qH2 mmol/g/h 25,23 11,55 8,49 11,40
H2 productivity mmol/l/h 7,06 11,89 7,9 5,13
μ 1/h 0,49 0,51 0,54 0,61
Carbon recovery % 74 89 71 57
Batch duration h 8 6,5 8 13
Figure 11: Comparison of yields of H2. A: Yield H2/CO2 ; B: Yield H2/Glu

QQuuaannttiiffiiccaattiioonn ooff bbiioohhyyddrrooggeenn pprroodduuccttiioonn oonn ddeeffiinneedd mmeeddiiaa
30
0,00
0,05
0,10
0,15
0,20
0,25
5 10 20 40
[C-m
ol/
C-m
ol]
Concentration [g/l]
A: Yield x/Glu
0,00
0,05
0,10
0,15
0,20
0,25
5 10 20 40
[C-m
ol/
C-m
ol]
Concentration [g/l]
B: Yield CO2/Glu
0,00
0,05
0,10
0,15
0,20
5 10 20 40
[C-m
ol/
C-m
ol]
Concentration [g/l]
C: Yield Hac/Glu
0,00
0,05
0,10
0,15
0,20
0,25
0,30
5 10 20 40
[C-m
ol/
C-m
ol]
Concentration [g/l]
D: Yield EtOH/Glu
Yields of the other products as shown in figure 12, are depicting that 20 g/l initial glucose
concentration results in enhanced yield of biomass YX/Glu and in a low yield of YHac/glu. Yields
YCO2/glu and YEtOH/glu seem to decrease among the augmentation of glucose concentrations.
Specific H2 production rate (qH2) shows the best result (25,23 mmol H2/gDW*h) for the initial
substrate concentration of 5 g/l of glucose (see table 3).
Figure 12-Comparison of yields for different products as a function of the initial substrate concentration. A:
Yield x/Glu ; B: Yield CO2/Glu ;C: Yield Hac/Glu; D: Yield EtOH/Glu

QQuuaannttiiffiiccaattiioo
In these batches, C-balances were not closing (see table 3)
acetate, ethanol and lactate were identified as fermentation products. Lactate was
qualitatively identified. Chromatogram
fermentation by E. aerogenes
Figure 13: Chromatogram of supernatant derived f
concentration of 10 g/l. Glucose and ethanol were measured with HPLC, Acetate
Lactate was identified with HPLC.
The sensitivity and the linear response range were checked
established.
oonn ooff bbiioohhyyddrrooggeenn pprroodduuccttiioonn oonn ddeeffiinneedd mmeedd
balances were not closing (see table 3). Hydrogen, carbon dioxide,
acetate, ethanol and lactate were identified as fermentation products. Lactate was
Chromatograms (figure 13) showed peaks for products of glucose
aerogenes DSM 30053 that have not been identified yet.
: Chromatogram of supernatant derived from a repeated batch on glucose
Glucose and ethanol were measured with HPLC, Acetate was measured with CuBiAn,
The sensitivity and the linear response range were checked, therefore a calibra
ddiiaa
31
. Hydrogen, carbon dioxide,
acetate, ethanol and lactate were identified as fermentation products. Lactate was
for products of glucose
that have not been identified yet.
ted batch on glucose with an initial glucose
was measured with CuBiAn,
therefore a calibration was

QQuuaannttiiffiiccaattiioonn ooff bbiioohhyyddrrooggeenn pprroodduuccttiioonn oonn ddeeffiinneedd mmeeddiiaa
32
According to the Figure 14, the linear relation between the area and the concentration was
maintained in the whole measurement range of ethanol. No peak was detected with a 0 g/l
concentration of ethanol; the calibration was forced to zero.
Figure 14: Ethanol calibration with aqueous standards. Concentration values: 0; 5; 10; 20; 40 g/l.
According to the Figure 15, the linear relation between the area and the concentration was
maintained in the whole measurement range of glucose. No peak was detected with a 0 g/l
concentration of glucose; the calibration was forced to zero.
Figure 15: Glucose calibration with aqueous standards. Concentration values: 0; 2,5; 5; 10; 20 [g/l].
y = 68377x
R² = 0,9983
0
500000
1000000
1500000
2000000
2500000
3000000
0 10 20 30 40 50
Are
a
Ethanol concentration [g/l]
y = 160122x
R² = 0,9993
0
500000
1000000
1500000
2000000
2500000
3000000
3500000
0 5 10 15 20 25
Are
a
Glucose concentration [g/l]

QQuuaannttiiffiiccaattiioonn ooff bbiioohhyyddrrooggeenn pprroodduuccttiioonn oonn ddeeffiinneedd mmeeddiiaa
33
5.2.2 Comparison yields and physiological response of E. aerogenes DSM 30053 towards an
initial glucose concentration and initial xylose concentration
The effect of a different substrate on biohydrogen production using E. aerogenes DSM 30053
was studied. Online and in-line data obtained from distinct and marked peaks are presented
separately in figure 16 as well as showing offline data obtained by HPLC and enzymatic
measurements by using CuBiAn (glucose, ethanol and acetate) and biomass concentration. A
main difference between these two batches was the duration of the batches: The duration
of the batch with glucose 10 g/l was 6,5 h. The duration of the batch with xylose 10 g/l was
16 h.
6,0
6,2
6,4
6,6
6,8
7,0
7,2
7,4
0
2
4
6
8
10
12
65 70 75 80 85
pH
[-]
CE
R,
HE
R [
mm
ol/
l/h
]
Time [h]
E: Xylose 10 g/l
0
0,5
1
1,5
2
2,5
3
3,5
4
0
2
4
6
8
10
12
14
65 70 75 80 85 90
Eth
an
ol,
Ace
tate
, B
iom
ass
e [
g/l]
Glu
co
se [
g/l]
Time [h]
0
0,5
1
1,5
2
2,5
3
3,5
4
0
2
4
6
8
10
12
14
16
27 29 31 33 35 37
Eth
an
ol,
Ace
tate
, B
iom
ass
e [
g/l]
Glu
co
se [
g/l]
Time [h]
6,0
6,2
6,4
6,6
6,8
7,0
7,2
7,4
0
5
10
15
20
25
27 29 31 33 35 37
pH
[-]
CE
R,
HE
R, [m
mo
l/l/
h]
Time [h]
B: Glucose 10 g/l
Figure 16: Repeated batch process with E.aerogenes DSM 30053, using two different substrates. The upper
graphs show CER, HER and pH data. The down graphs show glucose, ethanol, acetate and biomass
concentrations.
Peaks: E: Xylose 10 g/l, B: Glucose 10g/l. Purple: glucose [g/l], orange: ethanol [g/l], red: acetate [g/l], green:
biomass [g/l], blue: HER, black CER, yellow: pH.

QQuuaannttiiffiiccaattiioonn ooff bbiioohhyyddrrooggeenn pprroodduuccttiioonn oonn ddeeffiinneedd mmeeddiiaa
34
Product yields, hydrogen evolution rate and maximum specific growth rate for the repeated
batches using glucose 10 g/l and xylose (10 g/l) are shown in the Table 4. As a result of the
long duration of the batch with xylose, these results show that the batch with 10 g/l glucose
gave better results for qH2, with 11,55 mmol/l/h and for H2 productivity, with 11,89
mmol/l/h. Also μ is more than two times higher with the batch using glucose, with 0,51 h-1
.
All results shown in table 4 were calculated from data obtained from graphs of the red
window shown in figure 16.
Table 4: Comparison of the hydrogen production performance on two different substrates.
Parameters Units Xylose
10 g/l
Glucose
10 g/l
Y H2/CO2 mol/C-mol 0,78 0,86
Y CO2/glu C-mol/C-mol 0,23 0,11
Y H2/glu mol/C-mol 0,18 0,09
Y Hac/glu C-mol/C-mol 0,14 0,14
Y x/glu C-mol/C-mol 0,08 0,13
Y EtOH/glu C-mol/C-mol 0,28 0,20
Y base/glu mol/C-mol 2,21 2,89
qH2 mmol/g/h 9,96 11,55
H2 productivity mmol/l/h 4,08 11,89
μ 1/h 0,2 0,51
Carbon recovery % 72 89
Batch duration h 6,5 16
Among the different substrates, the batch with 10 g/l of glucose showed the maximum yield
Y H2/CO2 with 0,86 mol H2/ mol CO2. However, the batch with 10g/l xylose showed the best
yield Y H2/s with 0,18 mol H2/ mol substrate (see figure 17).

QQuuaannttiiffiiccaattiioonn ooff bbiioohhyyddrrooggeenn pprroodduuccttiioonn oonn ddeeffiinneedd mmeeddiiaa
35
0,00
0,05
0,10
0,15
0,20
Xyl (10 g/l) Glu (10 g/l)
[C-m
ol/
C-m
ol]
A: Yield x/Substrate
0,00
0,05
0,10
0,15
0,20
0,25
0,30
Xyl (10 g/l) Glu (10 g/l)
[C-m
ol/
C-m
ol]
B: Yield Hac/Substrate
0,00
0,05
0,10
0,15
0,20
0,25
0,30
Xyl (10 g/l) Glu (10 g/l)
[C-m
ol/
C-m
ol]
C: Yield CO2/Substrate
0,00
0,05
0,10
0,15
0,20
0,25
0,30
0,35
Xyl (10 g/l) Glu (10 g/l)
[mo
l/C
-mo
l]
D: Yield EtOH/Substrate
0,00
0,20
0,40
0,60
0,80
1,00
Xyl (10 g/l) Glu (10 g/l)
[mo
l/C
-mo
l]A: Yield H2/CO2
0,00
0,05
0,10
0,15
0,20
Xyl (10 g/l) Glu (10 g/l)
[mo
l/C
-mo
l]
B: Yield H2/Substrate
Figure 17: Comparison of the yields of hydrogen, among two differents substrates: glucose (10g/l) and xylose
(10g/l). A: Yield H2/CO2 ; B: Yield H2/Substrate.
Figure 18: Comparison of yields for different products as a function of the different substrates.

QQuuaannttiiffiiccaattiioonn ooff bbiioohhyyddrrooggeenn pprroodduuccttiioonn oonn ddeeffiinneedd mmeeddiiaa
36
5.3 HYDROGEN PRODUCTION IN CONTINUOUS CULTURE
5.3.1 Effect of pH
The effect of different pH on biohydrogen production using E. aerogenes DSM 30053 in
continuous culture was studied using defined medium described in chapter 4. Product yields,
hydrogen evolution rate and maximum specific growth rate have been calculated using the
formulas given in chapter 4.4.2. Results for the continuous culture process using glucose are
shown in the Table 5.
Table 5: Comparison of the hydrogen production performance on continuous culture.
Parameters Units pH 6,4 pH 6,6 pH 6,7 pH 6,8 pH 6,8
YH2/CO2 mol/mol 0,37 0,48 0,82 0,70 0,61
Y H2/glu mol/C-mol 0,10 0,17 0,14 0,12
Y CO2/glu mol/C-mol 0,19 0,20 0,20 0,20
Ybase/biomass mol/C-mol 15,75 62,86 15,51 27,31
Yeth/s C-mol/C-mol 0,16 0,15 0,20 0,15
YHAc/s C-mol/C-mol 0,21 0,29 0,23 0,25
Y x/s C-mol/C-mol 0,13 0,13 0,15 0,14
Y base/x+Hac C-mol/C-mol 6,19 18,95 6,33 9,64
Y base/Hac C-mol/C-mol 10,20 27,13 11,93 14,90
qCO2 mmol/(g*h) 15,67 15,23 7,10 6,74 14,44
qH2 mmol/(g*h) 5,73 7,30 5,79 4,73 8,85
H2 productivity mmol/l/h 15,62 16,15 10,60 11,92 19,45
C-Balance % 70 78 78 73
DoR balance % 63 074 76 68
D 1/h 0,25 0,25 0,10 0,13 0,25
As in the case of repeted batches, the C-balances were not completed. This will be discussed
in the chapter 6.

QQuuaannttiiffiiccaattiioonn ooff bbiioohhyyddrrooggeenn pprroodduuccttiioonn oonn ddeeffiinneedd mmeeddiiaa
37
0,00
0,10
0,20
0,30
0,40
0,50
0,60
0,70
6,4 6,6 6,8
Y H
2/C
O2
[m
ol/
mo
l]
pH [-]
A: Yield Y H2/CO2
0,00
0,02
0,04
0,06
0,08
0,10
0,12
0,14
6,6 6,8
Y H
2/g
lu [
mo
l/m
ol]
pH[-]
B: Yield Y H2/Glu
Effect of pH was studied with a dilution rate D of 0,25 h-1
. As shown in Figure 19, the best
specific H2 production, 8,85 mmol/g/h was obtained with a pH of 6,8. The lower value of
specific CO2 production, 14,44 mmol/g/h, was also obtained with a pH of 6,8. These results
also show a tendency to have less CO2 and more H2 production with an increasing pH.
Figure 19: Specific CO2 und H2 production at different pH, with a dilution rate D=0,251/h
As a consequence of the evolution of specific H2 and CO2 production in function of pH, the
yield Y H2/CO2 increased at the different pH tested. The best yield, 0,61 mol/mol was
obtained with pH 6,8 (see figure 20 A). Figures 20 A and B show an increasing of the yield Y
H2/CO2 and Y H2/Glu among the augmentation of pH.
Figure 20: A: Yields Y H2/CO2; B: Yield Y H2/glu at different pH.
0,00
2,00
4,00
6,00
8,00
10,00
12,00
14,00
16,00
18,00
6,4 6,6 6,8
[mm
ol/
(g*
h)]
pH [-]
Specific CO2 und H2 production
qCO2
qH2

QQuuaannttiiffiiccaattiioonn ooff bbiioohhyyddrrooggeenn pprroodduuccttiioonn oonn ddeeffiinneedd mmeeddiiaa
38
Yields of the other products, as shown in figure 22, had a tendency to have a lower yield Y
Hac/substrate with a lower pH, but this figure does not show a significant evolution of the
yield Y eth/substrate and the yield Yx/s at the different pH.
Figure 21: Comparison of yields for different products as a function of the pH
5.3.2 Effect of dilution rate
The effect of different dilution rate on biohydrogen production using E. aerogenes DSM
30053 in continuous culture process with a defined medium could also be studied with a pH
6,8. As shown in figure 23, the best specific H2 production, 8,85 mmol/g/h was obtained with
a dilution rate of 0,25 h-1
. These results show a higher specific H2 production with a higher
dilution rate.
Figure 22: Specific CO2 und H2 production among different dilution rates with pH=6,8 (light-coloured: pH 6,7)
0,00
0,05
0,10
0,15
0,20
0,25
0,30
6,6 6,8
[C-m
ol/
C-m
ol]
pH
Yields
Y Hac/s
Y x/s
Y EtOH/s
0,00
2,00
4,00
6,00
8,00
10,00
12,00
14,00
16,00
0,10 0,15 0,25
[mm
ol/
(g*
h)]
D [1/h]
Specific CO2 und H2 Production
qCO
2

QQuuaannttiiffiiccaattiioonn ooff bbiioohhyyddrrooggeenn pprroodduuccttiioonn oonn ddeeffiinneedd mmeeddiiaa
39
0,00
0,10
0,20
0,30
0,40
0,50
0,60
0,70
0,80
0,90
1,00
0,10 0,15 0,25
Y H
2/C
O2
[m
ol/
mo
l]
D [1/h]
A: Yield Y H2/CO2
0,00
0,02
0,04
0,06
0,08
0,10
0,12
0,14
0,16
0,18
0,20
0,10 0,15 0,25
Y H
2/G
lu [
mo
l/c-
mo
l]
D [1/h]
B: Yield Y H2/Glu
Figure 24 shows that yields Y H2/CO2 and Y H2/glu lower among increasing of the dilution
rate. The best yield Y H2/CO2, (0,82 mol/mol), and the best yield Y H2/glu (0,17 mol/c-mol)
were obtained with a dilution rate of 0,10 (with pH= 6,7).
Yields of the other products, as shown in Figure 24, do not show a tendency towards dilution
rates.
Figure 24: Comparison of yields for different products as a function of the dilution rate, with pH=6,8 (light-
coloured: pH 6,7).
Figure 23: Yields Y H2/CO2 and Y H2/glu at different dilution rate with pH=6,8 (light-coloured: pH 6,7)
0,00
0,05
0,10
0,15
0,20
0,25
0,30
0,35
0,10 0,15 0,25
[C-m
ol/
C-m
ol]
D [1/h]
Yields
Y Hac/s
Y x/s
Y eth/s

QQuuaannttiiffiiccaattiioonn ooff bbiioohhyyddrrooggeenn pprroodduuccttiioonn oonn ddeeffiinneedd mmeeddiiaa
40
6. DISCUSSION
6.1 SUITABILITY OF THE DEFINED MEDIUM TO PRODUCE HYDROGEN WITH E AEROGENES DSM 30053
Figure 8 shows that the defined medium used is suitable for hydrogen production with E.
aerogenes DSM 30053. Our work clearly differs from work conducted by Ren et.al, 2009 and
Kumar et Das, 2001 [Ren, 2009; Kumar, 2001] because in our experiments defined medium
was used lacking for instance of yeast extract and peptone as these substances were used in
the cited works.
6.2 HYDROGEN PRODUCTION BY ENTEROBACTER AEROGENES DSM 30053 IN BATCH MODE:
6.2.1 Effect of initial glucose concentration:
As it was not possible to find similar studies on Enterobacter aerogenes DSM 30053 in the
literature, the comparison will be done with studies on other strains of Enterobacter
aerogenes strains, under similar culture conditions using complex media.
Palazzi et al., 2002, studied Enterobacter aerogenes NCIMB 10102 using complex medium,
with glucose in function of the glucose concentration (30 g/l; 40 g/l, and 50g/l) [Palazzi,
2002]. The pH value was 5.5. No information about yields could be found about these
results. The following specific H2 production rates were obtained:
Table 6: Results obtained by Pallazi 2002 with different glucose concentrations
[glucose]
[g/l]
H2 production rate
[mmol H2/g DW.h]
30 3,2
30 3,9
40 8,3
40 9,8
50 14,5
50 15,8

QQuuaannttiiffiiccaattiioonn ooff bbiioohhyyddrrooggeenn pprroodduuccttiioonn oonn ddeeffiinneedd mmeeddiiaa
41
In these results, a clear increase of specific H2 production rate concomitant to the increase in
initial glucose concentration in the medium is observed. It is not the case in the results of the
present study (see table 3), which shows a decrease of the H2 production rate from 5g/l until
20 g/l. In the present work, different initial concentrations of glucose were lower as in the
experiments of Palazzi et al. [Palazzi, 2002]. For that reason, a very little deviation in the
measure of the glucose, especially in the case of the 5g/l concentration, could have given a
different result. The different results could also be due to the different medium used.
In figure 10, peak D does not have the same shape as the other observed peaks. This peak
shows the batch experiment with the highest glucose concentration (40 g/l). In this culture
high concentrations of CO2 were produced, and not removed from the bioreactor. Some
studies show that the concentration of CO2 affects the rate of synthesis and final yield of H2
[Levin, 2004; Das, 2001]. It was showed that a CO2 removal can increase the production of H2
[Tanisho, 1997]. It can be done for example with a CO2 absorber with aqueous NaOH used to
absorb the by-product CO2 gas [Ren 2009]. As this was not done in this experiment, it can
explain why the yields Y H2/glu, and Y H2/CO2 were less high with this 40 g/l glucose
concentration than with the other concentrations, unlike in other studies [Palazzi, 2002].
As it was mentioned in the result parts, the C-balances were not closing completely. This
may be because some metabolites were not detected. In one of the chromatograms from a
batch with a glucose 10 g/l concentration (figure 13), with calibration lines above (figures 14-
15), glucose, ethanol, lactate, and acetate were measured and/or identified with HPLC or
CuBiAN. Ito et al., 2004, identified H2, CO2, lactate, acetate, formate, succinate and 2,3-
Butanediol as fermentation end-products from glucose with complex medium in batch
culture with Enterobacter aerogenes HU-101 [Ito, 2004]. Nakashimada et al.,2002, identified
H2, CO2, ethanol, lactate, acetate, acetoin and butanediol when Enterobacter aerogenes HU-
101 was cultivated on glucose as substrate in complex medium [Nakashimada, 2002]. It is
possible that such products were also present in the experiments conducted in the present
work but have not been identified. Identifying these products with analytical devices could
help to close the C-balance. Due to the missing components, the yield coefficients respective
to substrates need to be carefully interpreted, when comparing the experiments among
each other.

QQuuaannttiiffiiccaattiioonn ooff bbiioohhyyddrrooggeenn pprroodduuccttiioonn oonn ddeeffiinneedd mmeeddiiaa
42
6.2.2 Comparison yields and physiological response of Enterobacter aerogenes DSM
30053 towards an initial glucose concentration (10 g/l,) and initial xylose
concentration (10 g/l)
To the best of knowledge, fermentative hydrogen production from xylose by using
facultative anaerobe has been reported just once, with complex medium [Ren, 2009]. It can
be seen from figure 16 that hydrogen can be produced effectively by E. aerogenes from
xylose in defined medium, as described in chapter 5. Yield Y H2/xyl of 0,18 mol/C-mol was
obtained in the xylose concentration of 10 g/l. This is comparable to the reported value from
the cultivation with a complex medium for the yield Y H2/xyl of 0,22 mol/C-mol [Ren, 2009].
It is also comparable to the reported value from the hydrogen-producing enrichment culture
such as Clostridium sp. Strain No.2 [Taguchi, 1994].
H2 productivity of 4,08 mmol/l/h was obtained in the xylose concentration of 10 g/l. This is
lower than the reported value for the H2 productivity (12 mmol/l/h), that was obtained with
a complex medium, and with CO2 removal. [Ren, 2009].
It can be seen from figure 17 that the yield Y H2/substrate is two times better with xylose
than with glucose, with a same concentration (10 g/l). In the same time, figure 18-C shows
that the Yield CO2/substrate is also two times higher with xylose than with glucose. Table 4
shows that H2 productivity is fast three times higher for the hydrogen production with
medium containing glucose. This comparable to the reported value from the cultivation with
a complex medium that gave better H2 productivity from hexoses than from pentoses [Ren,
2009].

QQuuaannttiiffiiccaattiioonn ooff bbiioohhyyddrrooggeenn pprroodduuccttiioonn oonn ddeeffiinneedd mmeeddiiaa
43
6.3 HYDROGEN PRODUCTION IN CONTINUOUS CULTURE
In Table 7 results are presented, which were obtained from literature with glucose
concentration of 20g/l and at different pH conditions (between 6.3 and 6.8) from several
Enterobacter aerogenes strains:
Table 7: Results from literature on biohydrogen production with E. aerogenes, with glucose
pH Strain H2 yield H2 productivity Reference
[-] [mol H2/c-mol] mmol H2/l/h
6.8 A-1 0,14 [Rachman, 1998]
6.8 AY-2 0,20 [Rachman, 1998]
6.8 HU-101 0,33 [Rachman, 1998]
6,8 HU-101 0,09 [Rachman, 1998]
6,5 E.82005 0,18 16,6 [Tanischo, 1987]
6,3 AY-2 0,25 [Nakashimada, 2002]
6,3 E.82005 0,14 [Tanischo, 1987]
6,3 E.82005 0,12 [Tanischo, 1987]
6,3 HU-101 0,13 [Rachman, 1998]
As shown in Table 7, there is often only the H2 yield for these experiences trying different pH
conditions. These results were obtained with different strains, and different type of cultures.
It is difficult to compare with results obtained in the table 5 in chapter 5. The yields H2/glu
given in the table 5 with a defined medium in continuous culture are comparable to the
yields given in table 7 with complex media. However, it is difficult to see a tendency among
the pH in the results from the literature between 6.4 and 6.8.
Any literature about production of biohydrogen with E.aerogenes in function of the dilution
rate could not be found. But reported results using E.cloacae showed that H2 production rate
was increased among the dilution rate, and that the yield Y H2/glu was decreasing among the
dilution rate [Kumar, 2001]. The same tendency can be observed in figure 23 and 24 B.
However, it is difficult to confirm a tendency, because only a few different dilution rates
were tested with the same pH value.

QQuuaannttiiffiiccaattiioonn ooff bbiioohhyyddrrooggeenn pprroodduuccttiioonn oonn ddeeffiinneedd mmeeddiiaa
44
7. CONCLUSION AND PERSPECTIVES
From the discussion and results above, it can be concluded that hydrogen may be produced
by E. aerogenes DSM 30053 by using defined medium.
The substrate of 20 g/l glucose, in batch and with a pH of 6.8 resulted in the highest yield of
hydrogen (0.17 mol / C-mol). The maximum hydrogen productivity reaches 19.45 mmol/l/h
with a continuous culture with glucose 20 g/l and pH 6.8. Results show a tendency to have
less CO2 and more H2 production with an increasing pH, between pH 6.4 and 6.8, and a
tendency to have a higher specific H2 production with a higher dilution rate. However, due to
the missing components, the yield coefficients respective to substrates need to be carefully
interpreted, when comparing the experiments among each other.
Some more experiments could be done with E.aerogenes on defined medium with different
substrates, like arabinose, mannose, rhamnose or galactose, to compare the H2 production
rates and yields with results from the literature. Some other defined media could also be
tried. At length, it could be interesting to try to produce biohydrogen on defined medium
with other anaerobe or other facultative anaerobe strains.

QQuuaannttiiffiiccaattiioonn ooff bbiioohhyyddrrooggeenn pprroodduuccttiioonn oonn ddeeffiinneedd mmeeddiiaa
45
8. BIBLIOGRAPHY
Bockris JO’M (2002). The origin of ideas on a hydrogen economy and its solution to the decay of the
environment. Int J Hydrogen Energy. Vol.27, pp 731-40
Cammack R (1999). Hydrogenase sophistication. Nature Vol.397, pp 214-215
Das D, Veziroglu TN (2001). Hydrogen production by biological processes: a survey of literature. International
Journal of Hydrogen Energy. Vol. 26, pp 13-28
Das D, Khanna and Veziroglu TN (2008). Recent developments in biological hydrogen production processes.
Chemical Industry & Chemical Engineering Quarterly . Vol. 14 (2) pp 57-67
Dunn S (2002). Hydrogen futures: toward a sustainable energy system. Int J Hydrogen Energy. Vol.27, pp 235-
264
Hallenbeck PC, Benemann JR (2002).Biological hydrogen production; fundamentals and limiting processes.
International Journal of Hydrogen Energy. Vol. 27, pp 1185-1193
Hallenbeck PC (2005). Fundamentals of the fermentative production of hydrogen. Water
Science and Technology Vol.52(1-2), pp 21-29
Hallenbeck PC, Ghosh and Monika (2009). Microbiological and engineering aspects of biohydrogen production.
Indian J Microbiol Vol. 49, pp 48-59
Hefner RA (2000). The Age of Energy Gases, “Where is Energy Going? The Industrial Physicist, pp 16–19
Hydrogen Technical Advisory Panel (HTAP) (1998). Fuel choice for fuel cell vehicules. National Renewable
Energy Laboratory
Ito T, Nakashimada Y, Senba K, Matsui T, Nishio, N, (2005). Hydrogen and ethanol production from glycerol-
containing wastes discharged after biodiesel manufacturing process. Journal of Bioscience and Bioengineering,
Vol 100(3), pp 260-265
Jensen, MW, Ross, M (2000). The ultimate challenge: developing an infrastructure for fuel cell vehicles.
Environment 2000, Vol 42(7), pp 10-22

QQuuaannttiiffiiccaattiioonn ooff bbiioohhyyddrrooggeenn pprroodduuccttiioonn oonn ddeeffiinneedd mmeeddiiaa
46
Kumar N, Das D (2001). Redirection of biochemical pathways for the enhancement of H2 production by
Enterobacter cloacae. Biotechnol Lett Vol.23 pp 537-541
Levin, Pitt, Love (2004). Biohydrogen production: prospects and limitations to practical application. Int J
Hydrogen Energy. Vol.29, pp 173-185
Li C, Fang HP (2007). Fermentative hydrogen production from wastewater and solid
wastes by mixed cultures. Critical Reviews in Environmental Science and Technology. Vol 37, pp 1-39
Madigan MT, Martinko JM, Parker J (2001). Brock Mikrobiologie. Heidelberg/Berlin,
Spektrum Akademischer Verlag.
Mahyudin AR, Furutani Y, Nakashimada Y, Kakizono T, Nishio (1997). Enhanced hydrogen production in
altered mixed acid fermentation of glucose by Enterobacter aerogenes. J Ferm Bioeng Vol 83(4), pp 358-363
Melis T (2002). Green alga production: process, challenges, and prospects. Int J Hydrogen Energy, Vol 27, pp
1217-1228
Modigell M, Schumacher M, Claassen P.A.M (2007). Hyvolution - Entwicklung eines zweistufigen Bioprocesses
zur Produktion von Wasserstoff aus Biomass; Chemie-Ingenieur-Technik, Vol 79(5) pp 637-641
Nakashimada Y, Rachman MA, Kakizono T, Nishio N, (2002). Hydrogen production of Enterobacter aerogenes
altered by extracellular and intracellular redox states. International Journal of Hydrogen Energy Vol 27 pp
1399-1405
Nandi R, Sengupta S (1998). Microbial Production of Hydrogen: An Overview. Critical Reviews in Microbiology.
Vol. 24(1), pp 61 - 84
Nandi R, Dey S, Sengupta S (2001). Thiosulfate improves yield of hydrogen production from glucose by the
immobilized formate hydrogenlyase system of Escherichia coli. Biotechnology and Bioengineering 75(4), pp
492-494
Nath K, Das D (2004). Byohydrogen production as a potential energy resource - Present state-of-art. Joural of
Scientific & Industrial Research Vol 63 pp 729-738
Nath K, Das D (2004). Improvment of fermentative hydrogen production: various approaches. Appl Microbiol
Biotechnol. Vol. 65, pp 520-529

QQuuaannttiiffiiccaattiioonn ooff bbiioohhyyddrrooggeenn pprroodduuccttiioonn oonn ddeeffiinneedd mmeeddiiaa
47
Oh Y-K, Seol E-H, Yeol Lee E, Park S (2002). Fermentative hydrogen production by a new chemolithotrophic
bacterium Rhodopseudomonas palustris P4. International Journal of Hydrogen Energy Vol. 27, pp 1373-1379
Ren Y, et al. (2009).Hydrogen production from the monomeric sugars hydrolyzed from hemicellulose by
Enterobacter aerogenes. Renewable Energy. Vol. 34, pp 2774-2779
Rachman M. A., Furutani Y., Nakashimada Y., Kakizono T., Nishio N. (1998). Enhanced hydrogen production in
altered mixed acid fermentation of glucose by Enterobacter aerogenes. Journal of Fermentation and
Bioengineering Vol. 83(4) pp 358–363
Rocha JS, Barbosa MJ, Wijffels RH (2001). Hydrogen production by photosynthetic bacteria: culture media,
yields and efficiencies. Biohydrogen II, An approach to Environmentally Acceptable Technology. J. Miyake,
Matsunaga, T., Pietro, A. S.,. Oxford, UK, Pergamon/Elsevier: pp 3-32
Rittmann S (2008). Overview on Fermentative Microorganisms Capable of Biohydrogen Production - a Putative
Comprehensive Survey of Literature.
Suzuki Int. J (1982). International Jouranl of Hydrogen Energy. Vol. 7, pp 227-230
Tanisho S, Suzuki Y, Wakao N, (1987). Fermentative hydrogen evolution byEnterobacter aerogenes strain
E.82005. International Journal of Hydrogen Energy Vol 12(9) pp 623-627
Tanisho S, Kuromoto M, Kadokura N (1997). Effect of CO2removal on hydrogen production by fermentation.
International Jouranl of Hydrogen Energy. Vol. 23 (7), pp 559-563
Tao Yongzhen, Chen Yang, Wu Yongqiang, He Yanling, Zhou Zhihua (2007). High hydrogen yield from a two-
step process of dark- and photo-fermentation of sucrose" International Journal of Hydrogen Energy, Vol 32 (2),
pp 200–206
Winter C-J (2000). On energies of change, the hydrogen solution. Gerling Akademie Verlag, pp 67-82
Woodward J, Orr M, Cordray K, Greenbaum E, (2000). Enzymatic production of biohydrogen. Nature Vol. 405,
pp 1014-1015
Woodward J, Mattingly SM, Danson M, Hough D, Ward N, Adams M (2000). In vitro hydrogen production by
glucose dehydrogenase and hydrogenase. Nat Biotechnol Vol 14, pp 872-874

QQuuaannttiiffiiccaattiioonn ooff bbiioohhyyddrrooggeenn pprroodduuccttiioonn oonn ddeeffiinneedd mmeeddiiaa
48
9. APPENDIX
9.1 STOCK SOLUTION
Table A-1 : Trace elements stock (100-fold).
Chemical substance used amount
MgSO4 H2O 6.2 g
CoCl2∙ 6 H2O 0.025 g
MnCl2∙ 4 H2O 0.150 g
CuCl2 ∙ 2 H2O 0.012 g
H3BO3 0.030 g
NaMoO4 ∙ 2 H2O 0.025 g
Zn(CH3COO) 2 ∙ 2 H2O 0.130 g
Fe(III) citrate 1.0 g
E-H2O add to 100 mL
Table 2: EDTA stock solution (100-fold). *
Chemical substance used amount
EDTA 0.084 g
E-H2O add to 100 mL

QQuuaannttiiffiiccaattiioonn ooff bbiioohhyyddrrooggeenn pprroodduuccttiioonn oonn ddeeffiinneedd mmeeddiiaa
49
Table A-3: Vitamin stock (100 fold)*
Chemical substance used amount
Thiamine HCl 0,025 g
E-H2O add to 50 mL
* Filtered sterilizied
Table A-4:. Nutrient agar
Chemical substance used amount
Peptone 5 g
Meat extract 5 g
Agar 15 g
E-H2O add to 1000 mL,
pH adjust to pH 7 with NaOH 1M