DO5T17S_T5 Thur 430 GilesE_BR_20151114_012422
23
Case Study: University of Chicago Achieves High Availability through a Centralized and Service Centric Approach to IT Monitoring Erik Giles DevOps: Agile Ops The University of Chicago Command Center Manager DO5T17S @ErikGiles Abe Shaker The University of Chicago IT Monitoring Engineer
-
Upload
erik-giles -
Category
Documents
-
view
75 -
download
0
Transcript of DO5T17S_T5 Thur 430 GilesE_BR_20151114_012422
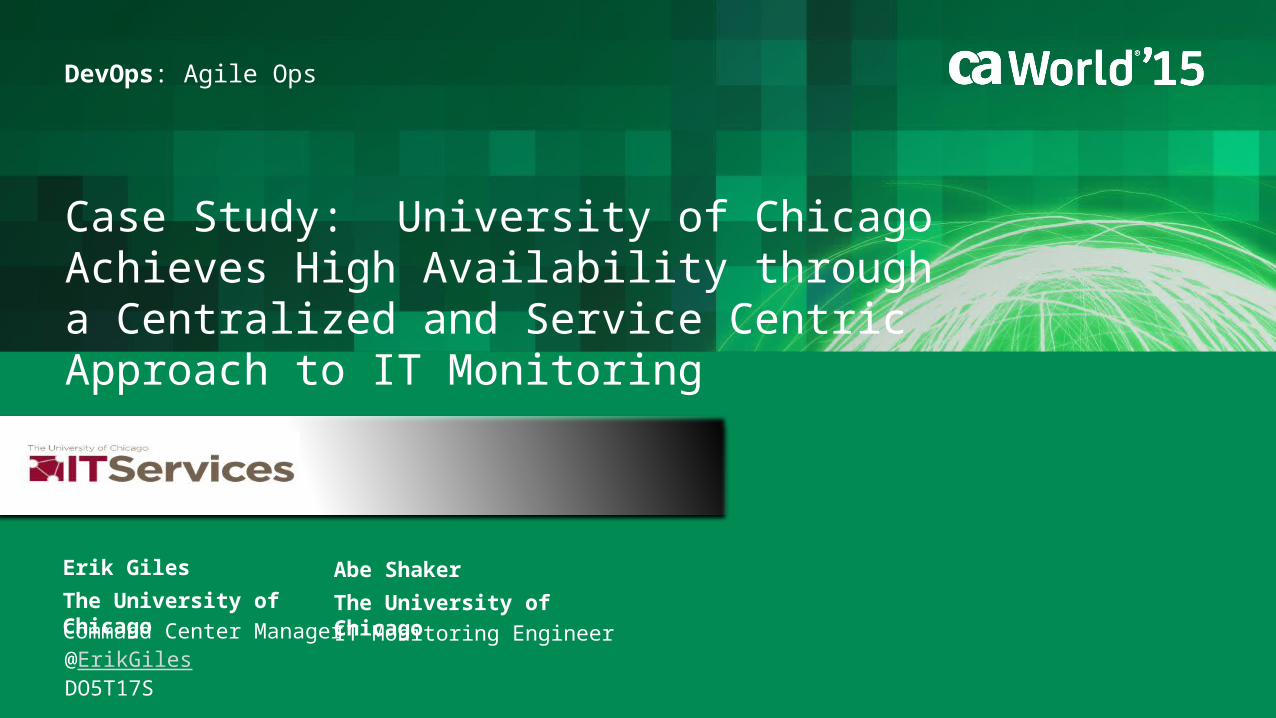
Case Study: University of Chicago Achieves High Availability through a Centralized and Service Centric Approach to IT Monitoring
Erik Giles
DevOps: Agile Ops
The University of ChicagoCommand Center Manager
DO5T17S@ErikGiles
Abe ShakerThe University of ChicagoIT Monitoring Engineer
2 © 2015 CA. ALL RIGHTS RESERVED.@CAWORLD #CAWORLD
© 2015 CA. All rights reserved. All trademarks referenced herein belong to their respective companies.
The content provided in this CA World 2015 presentation is intended for informational purposes only and does not form any type of warranty. The information provided by a CA partner and/or CA customer has not been reviewed for accuracy by CA.
For Informational Purposes Only Terms of this Presentation
3 © 2015 CA. ALL RIGHTS RESERVED.@CAWORLD #CAWORLD
Abstract
Learn how the IT operations team at University of Chicago built a centralized and service centric approach to IT infrastructure monitoring. The University of Chicago is using CA Unified Infrastructure Management (CA UIM) to implement a central, integrated approach for monitoring IT systems, applications, networks, VoIP phones, data center infrastructure and business services. Be it PBX phones or data center water chillers, they are monitoring it all centrally. As breaking down organizational silos is critical to success in this approach, learn insights and tips on how to overcome this barrier. In additional, we will talk about the experience of moving to CA UIM from CA eHealth.
Erik Giles
Abe Shaker
University Of Chicago
4 © 2015 CA. ALL RIGHTS RESERVED.@CAWORLD #CAWORLD
Agenda
BACKGROUND
OUR APPROACH & STRATEGY
THREE PHASES OF IMPLEMENTATION
COMPARING CA UIM AND CA E-HEALTH
QUESTIONS
1
2
3
4
5
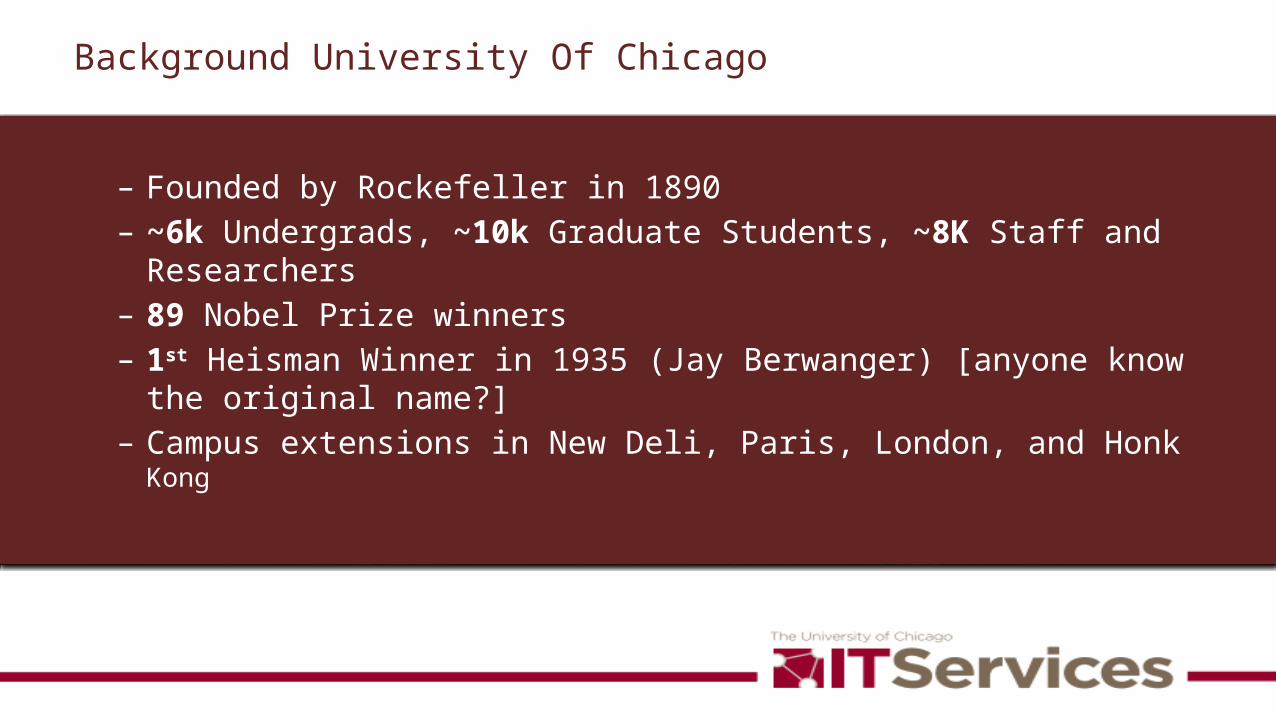
Background University Of Chicago
– Founded by Rockefeller in 1890– ~6k Undergrads, ~10k Graduate Students, ~8K Staff and Researchers– 89 Nobel Prize winners– 1st Heisman Winner in 1935 (Jay Berwanger) [anyone know the original
name?]– Campus extensions in New Deli, Paris, London, and Honk Kong
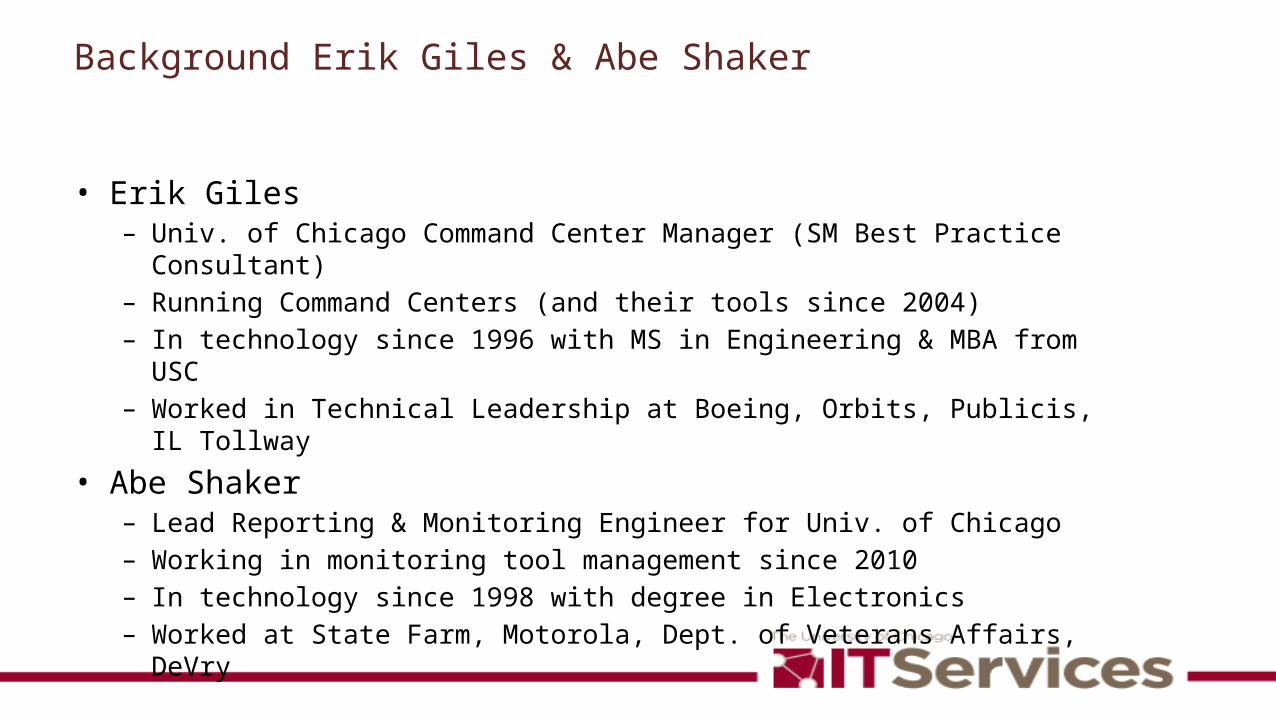
Background Erik Giles & Abe Shaker
• Erik Giles– Univ. of Chicago Command Center Manager (SM Best Practice Consultant)– Running Command Centers (and their tools since 2004)– In technology since 1996 with MS in Engineering & MBA from USC– Worked in Technical Leadership at Boeing, Orbits, Publicis, IL Tollway
• Abe Shaker– Lead Reporting & Monitoring Engineer for Univ. of Chicago– Working in monitoring tool management since 2010– In technology since 1998 with degree in Electronics– Worked at State Farm, Motorola, Dept. of Veterans Affairs, DeVry
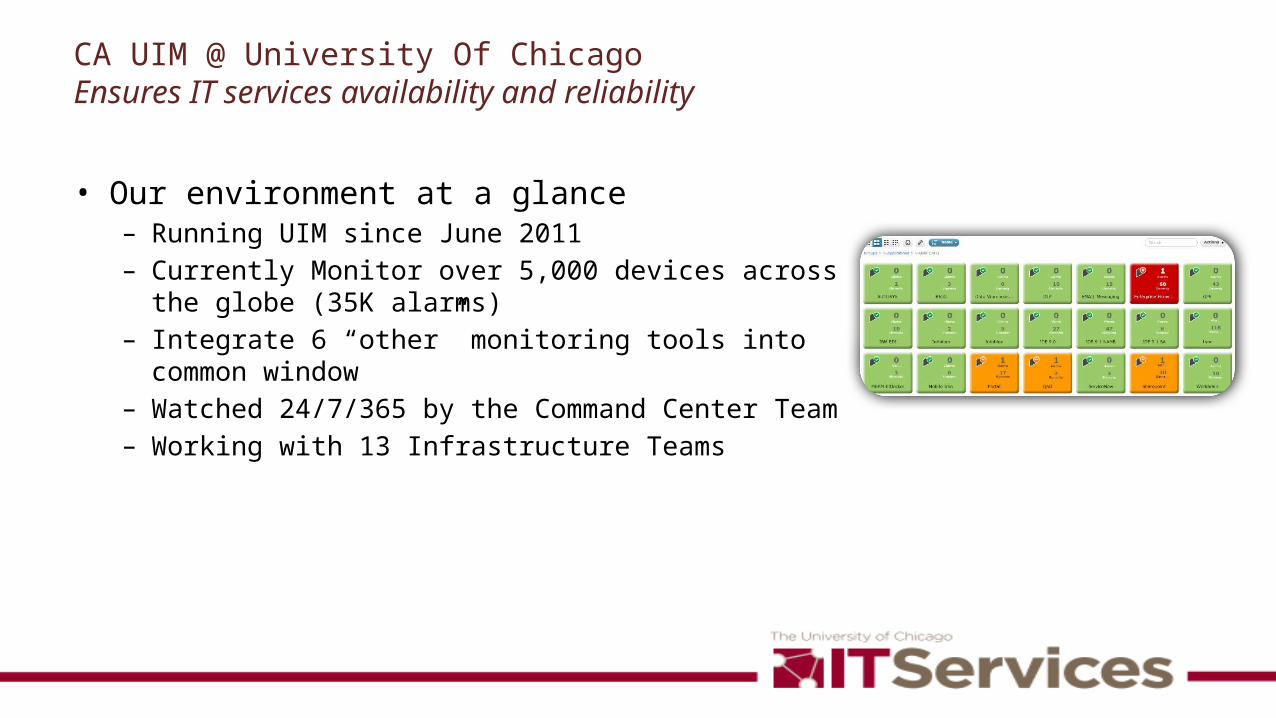
CA UIM @ University Of Chicago Ensures IT services availability and reliability
• Our environment at a glance – Running UIM since June 2011– Currently Monitor over 5,000 devices across the globe
(35K alarms)– Integrate 6 “other” monitoring tools into common window– Watched 24/7/365 by the Command Center Team– Working with 13 Infrastructure Teams
SNMP, ICMP
HTTP, HTTPS
HTTP, HTTPS
VPAPI
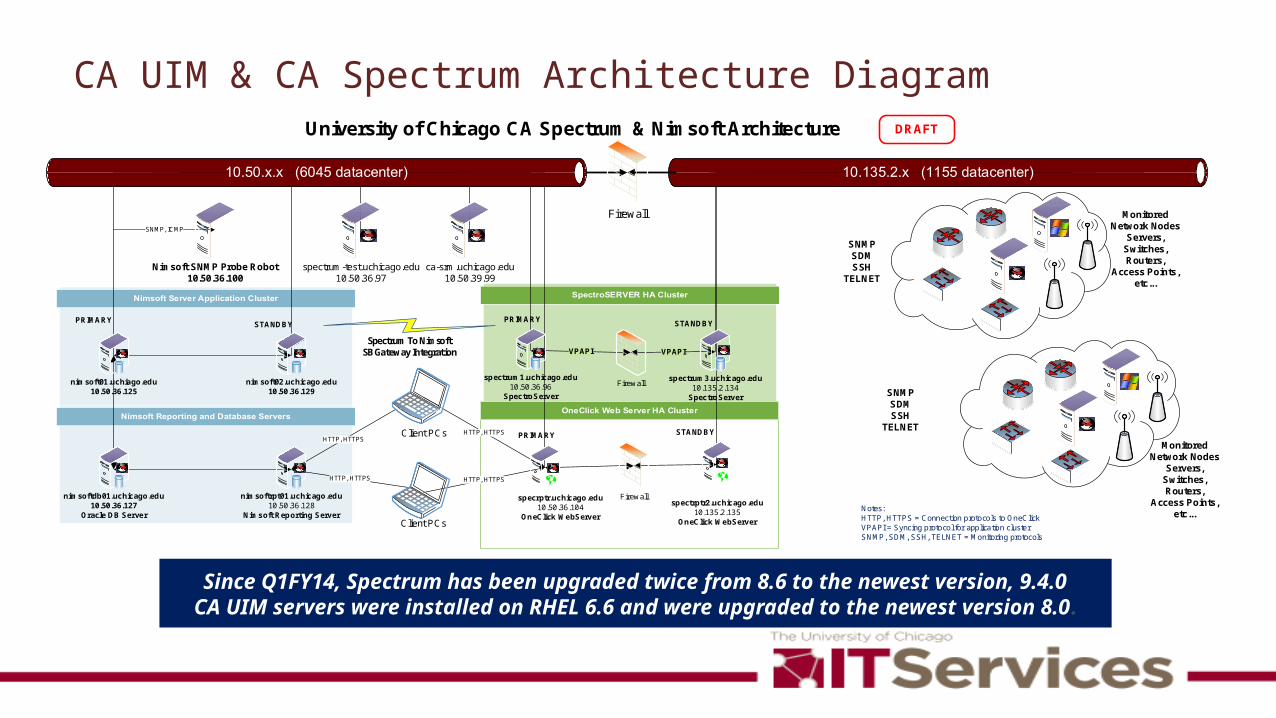
University of Chicago CA Spectrum & Nimsoft Architecture DRAFT
spectrum-test.uchicago.edu10.50.36.97
ca-srm.uchicago.edu10.50.39.99
Firewall
VPAPI
PRIMARY STANDBY
specrptr.uchicago.edu10.50.36.104
OneClick WebServer
PRIMARY STANDBY
spectrptr2.uchicago.edu10.135.2.135
OneClick WebServer
HTTP, HTTPS
HTTP, HTTPSClient PCs
Client PCs
Firewall
FirewallNotes:HTTP, HTTPS = Connection protocols to OneClickVPAPI = Syncing protocol for application clusterSNMP, SDM, SSH, TELNET = Monitoring protocols
spectrum1.uchicago.edu10.50.36.96
SpectroServer
spectrum3.uchicago.edu10.135.2.134
SpectroServer SNMPSDMSSH
TELNET
SNMPSDMSSH
TELNET
Monitored Network Nodes
Servers, Switches, Routers,
Access Points, etc...
Monitored Network Nodes
Servers, Switches, Routers,
Access Points, etc...
PRIMARY STANDBY
nimsoft01.uchiago.edu10.50.36.125
nimsoft02.uchicago.edu10.50.36.129
nimsoftdb01.uchicago.edu10.50.36.127
Oracle DB Server
nimsoftrpt01.uchicago.edu10.50.36.128
Nimsoft Reporting Server
Spectrum To NimsoftSB Gateway Integration
Nimsoft SNMP Probe Robot10.50.36.100
CA UIM & CA Spectrum Architecture Diagram
Since Q1FY14, Spectrum has been upgraded twice from 8.6 to the newest version, 9.4.0CA UIM servers were installed on RHEL 6.6 and were upgraded to the newest version 8.0.
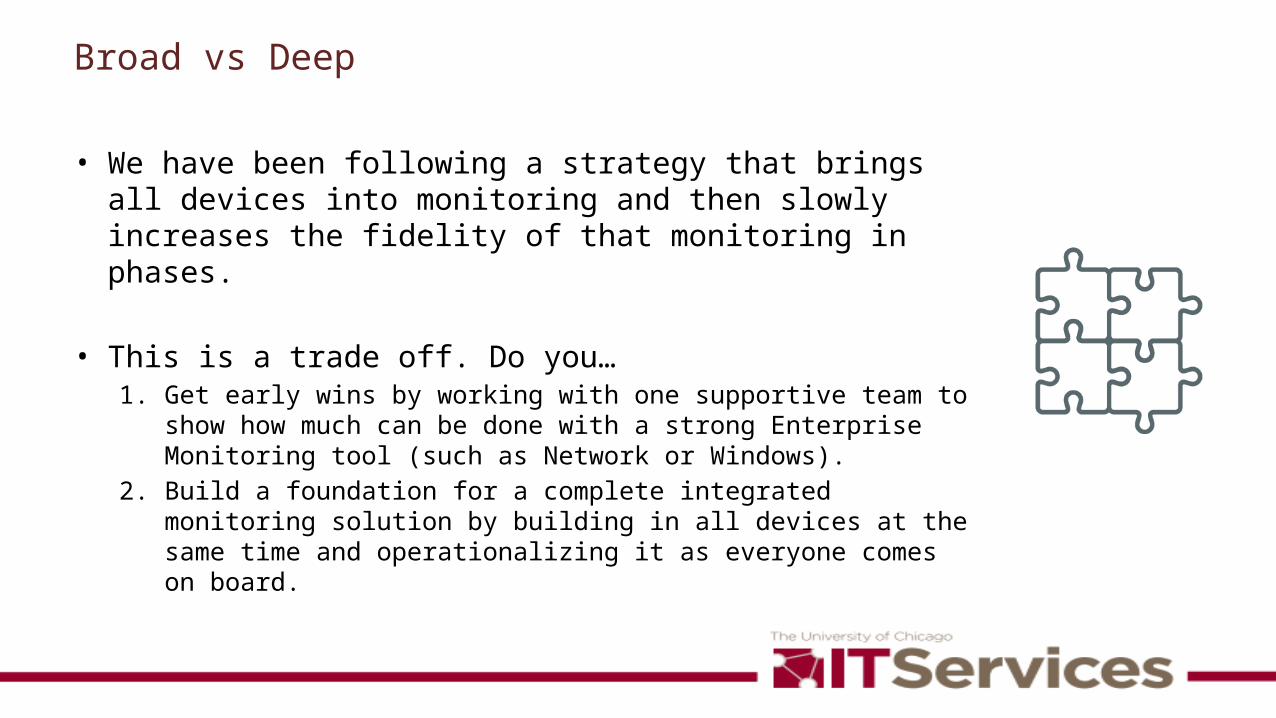
Broad vs Deep
• We have been following a strategy that brings all devices into monitoring and then slowly increases the fidelity of that monitoring in phases.
• This is a trade off. Do you…1. Get early wins by working with one supportive team to show how
much can be done with a strong Enterprise Monitoring tool (such as Network or Windows).
2. Build a foundation for a complete integrated monitoring solution by building in all devices at the same time and operationalizing it as everyone comes on board.
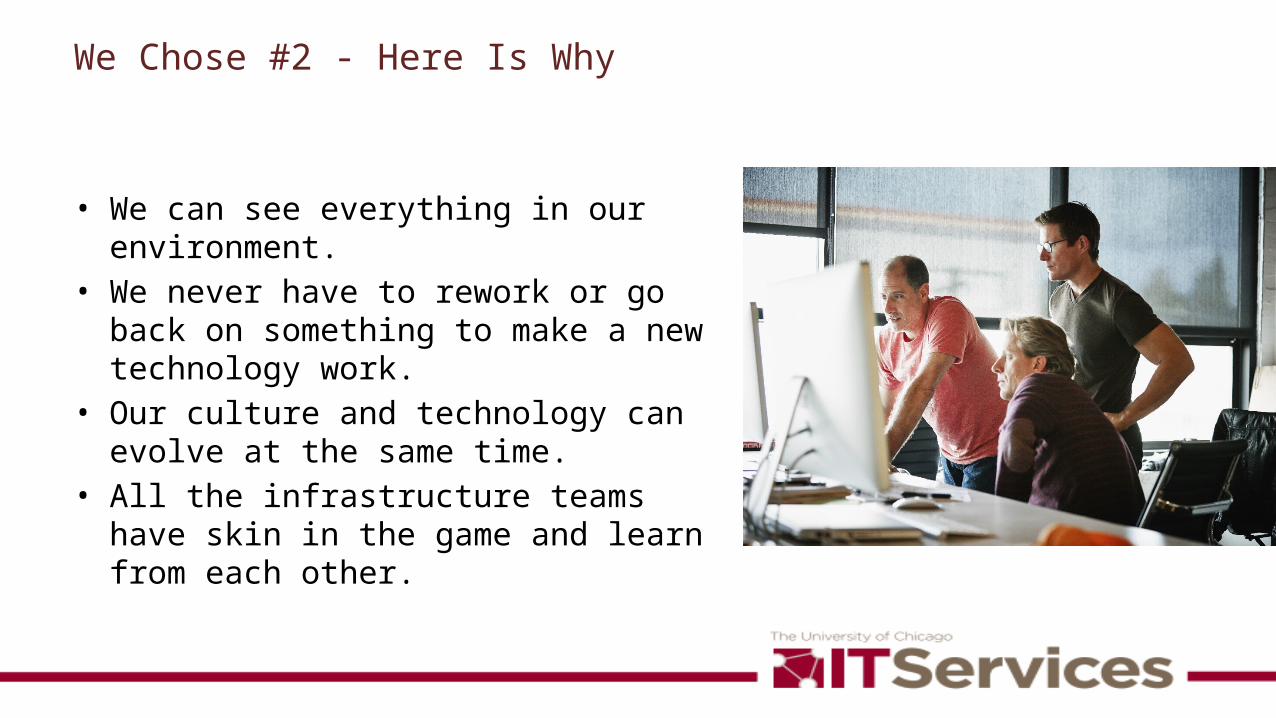
We Chose #2 - Here Is Why
• We can see everything in our environment.• We never have to rework or go back on
something to make a new technology work.• Our culture and technology can evolve at
the same time.• All the infrastructure teams have skin in the
game and learn from each other.
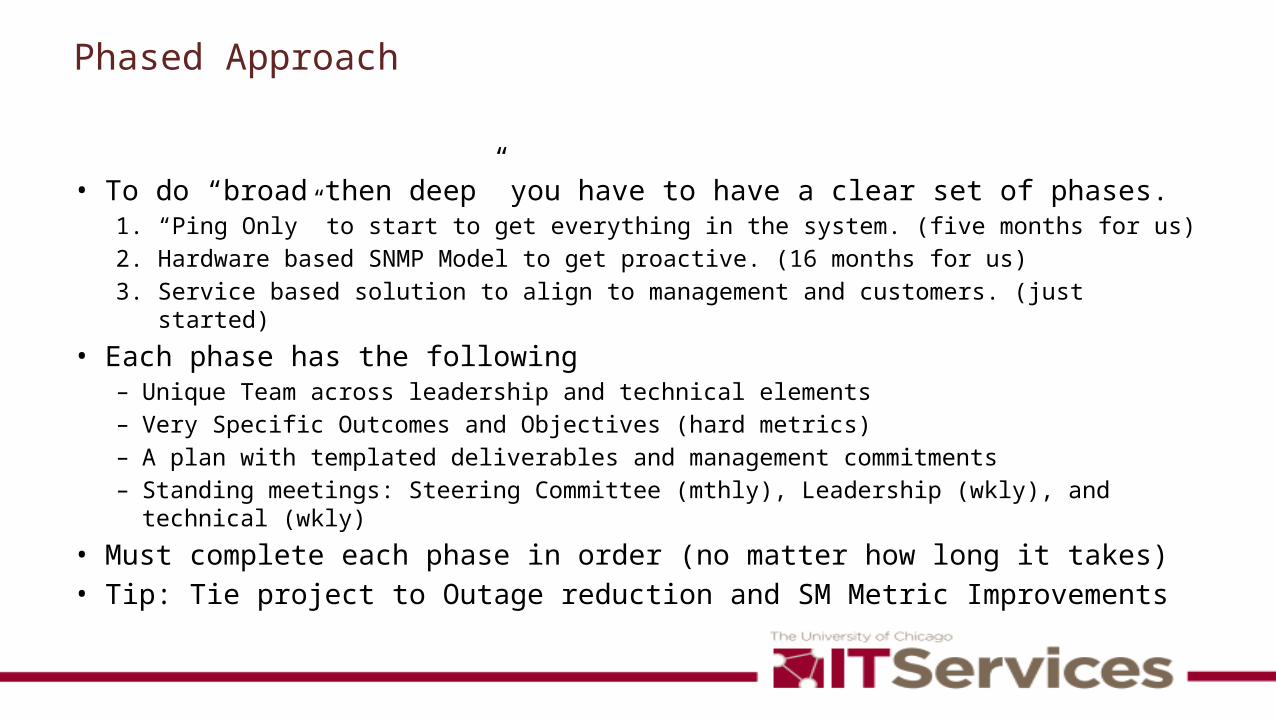
Phased Approach
• To do “broad then deep” you have to have a clear set of phases.1. “Ping Only” to start to get everything in the system. (five months for us)2. Hardware based SNMP Model to get proactive. (16 months for us)3. Service based solution to align to management and customers. (just started)
• Each phase has the following– Unique Team across leadership and technical elements– Very Specific Outcomes and Objectives (hard metrics)– A plan with templated deliverables and management commitments– Standing meetings: Steering Committee (mthly), Leadership (wkly), and technical (wkly)
• Must complete each phase in order (no matter how long it takes)• Tip: Tie project to Outage reduction and SM Metric Improvements
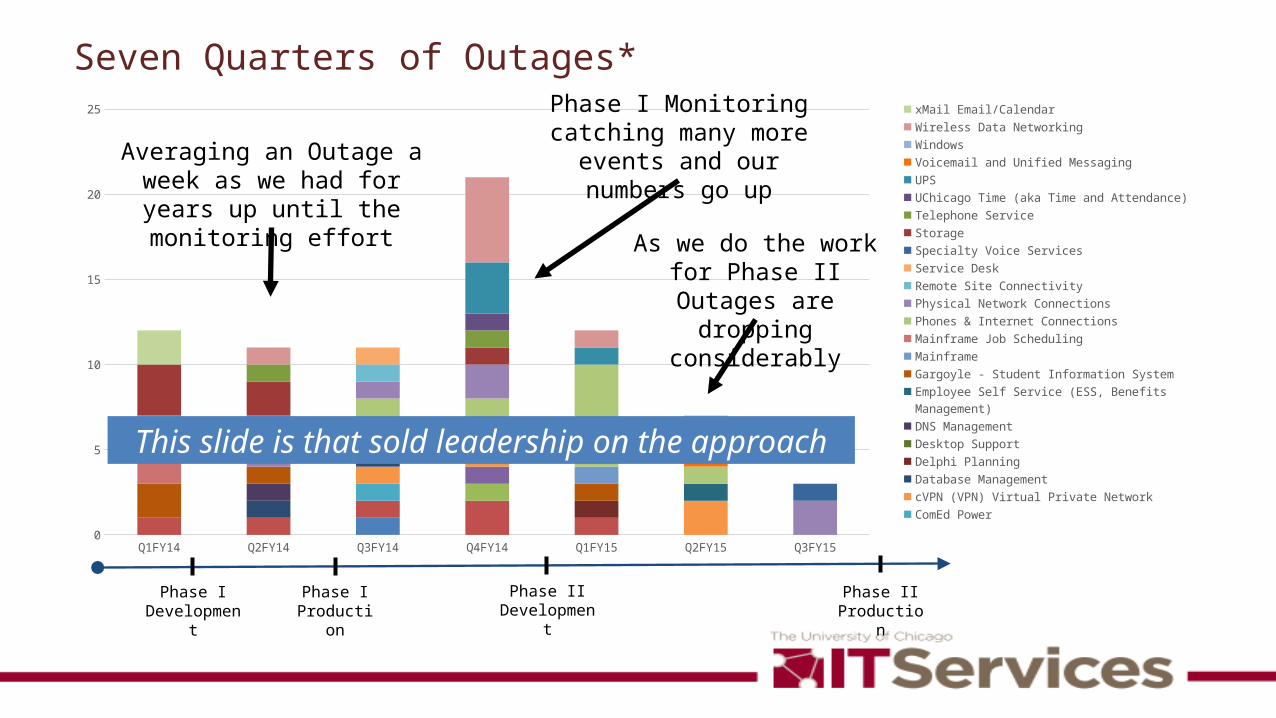
Seven Quarters of Outages*
Q1FY14 Q2FY14 Q3FY14 Q4FY14 Q1FY15 Q2FY15 Q3FY150
5
10
15
20
25 xMail Email/CalendarWireless Data NetworkingWindowsVoicemail and Unified MessagingUPSUChicago Time (aka Time and Attendance)Telephone ServiceStorageSpecialty Voice ServicesService DeskRemote Site ConnectivityPhysical Network ConnectionsPhones & Internet ConnectionsMainframe Job SchedulingMainframeGargoyle - Student Information SystemEmployee Self Service (ESS, Benefits Management)DNS ManagementDesktop SupportDelphi PlanningDatabase ManagementcVPN (VPN) Virtual Private NetworkComEd PowerCisco (VoIP)Chalk Learning Management SystemCall CenterAURA - Grants Reporting (Research/Business Objects)
Averaging an Outage a week as we had for years up until
the monitoring effort
Phase I Monitoring catching many more events and our
numbers go up
As we do the work for Phase II Outages are dropping considerably
Phase I Production
Phase II Development
Phase II Production
Phase I Development
This slide is that sold leadership on the approach
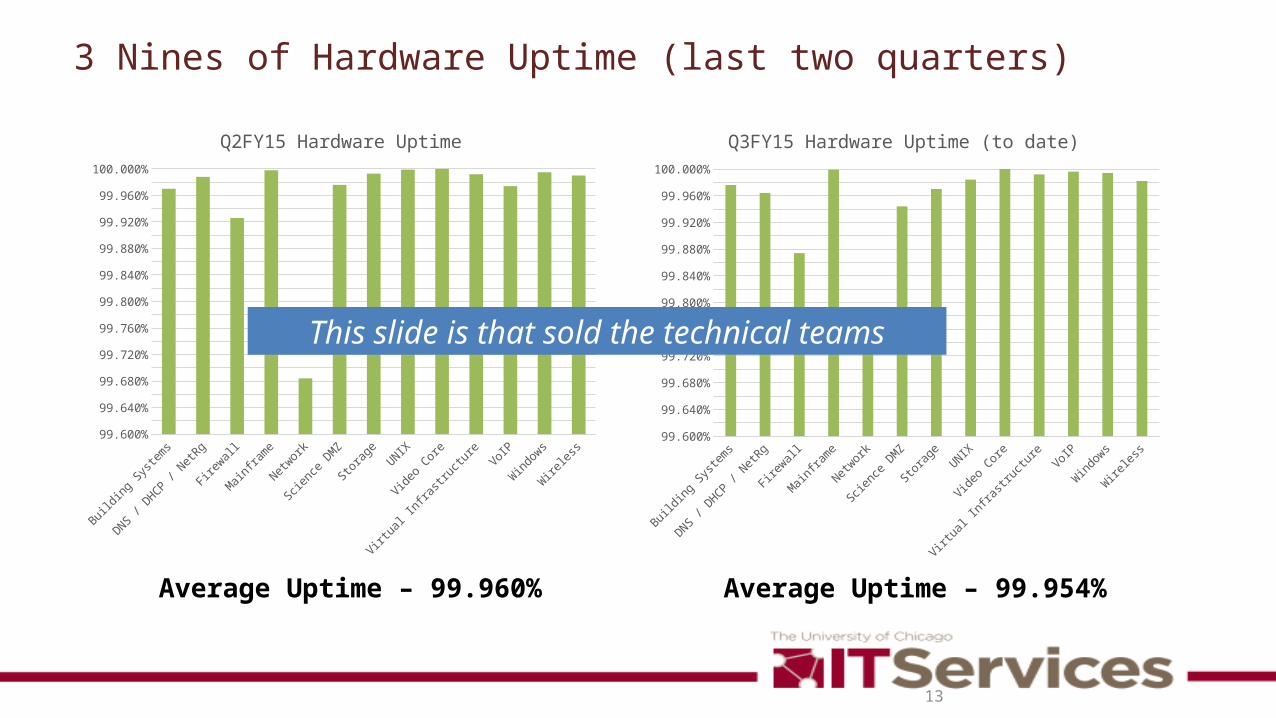
3 Nines of Hardware Uptime (last two quarters)
13
Buildin
g Sys
tems
DNS / DHCP / N
etRg
Firew
all
Mainfra
me
Networ
k
Scienc
e DMZ
Storag
eUNIX
Video C
ore
Virtual In
frastr
uctur
eVoIP
Windows
Wireles
s99.600%99.620%99.640%99.660%99.680%99.700%99.720%99.740%99.760%99.780%99.800%99.820%99.840%99.860%99.880%99.900%99.920%99.940%99.960%99.980%
100.000%
Q3FY15 Hardware Uptime (to date)
Average Uptime – 99.954%Buil
ding S
ystems
DNS / DHCP / N
etRg
Firew
all
Mainfra
me
Networ
k
Scienc
e DMZ
Storag
eUNIX
Video C
ore
Virtual In
frastr
uctur
eVoIP
Window
s
Wireles
s99.600%99.620%99.640%99.660%99.680%99.700%99.720%99.740%99.760%99.780%99.800%99.820%99.840%99.860%99.880%99.900%99.920%99.940%99.960%99.980%
100.000%
Q2FY15 Hardware Uptime
Average Uptime – 99.960%
This slide is that sold the technical teams
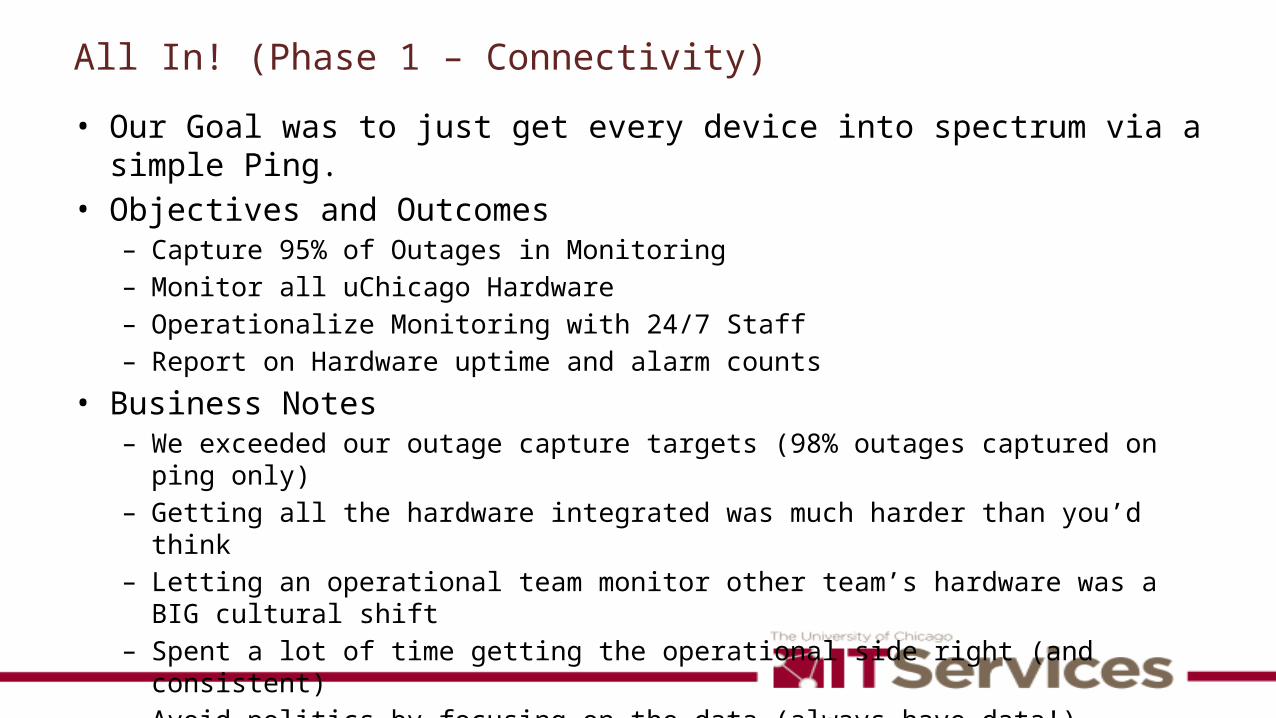
All In! (Phase 1 – Connectivity)
• Our Goal was to just get every device into spectrum via a simple Ping.• Objectives and Outcomes
– Capture 95% of Outages in Monitoring– Monitor all uChicago Hardware– Operationalize Monitoring with 24/7 Staff– Report on Hardware uptime and alarm counts
• Business Notes– We exceeded our outage capture targets (98% outages captured on ping only)– Getting all the hardware integrated was much harder than you’d think– Letting an operational team monitor other team’s hardware was a BIG cultural shift– Spent a lot of time getting the operational side right (and consistent)– Avoid politics by focusing on the data (always have data!)
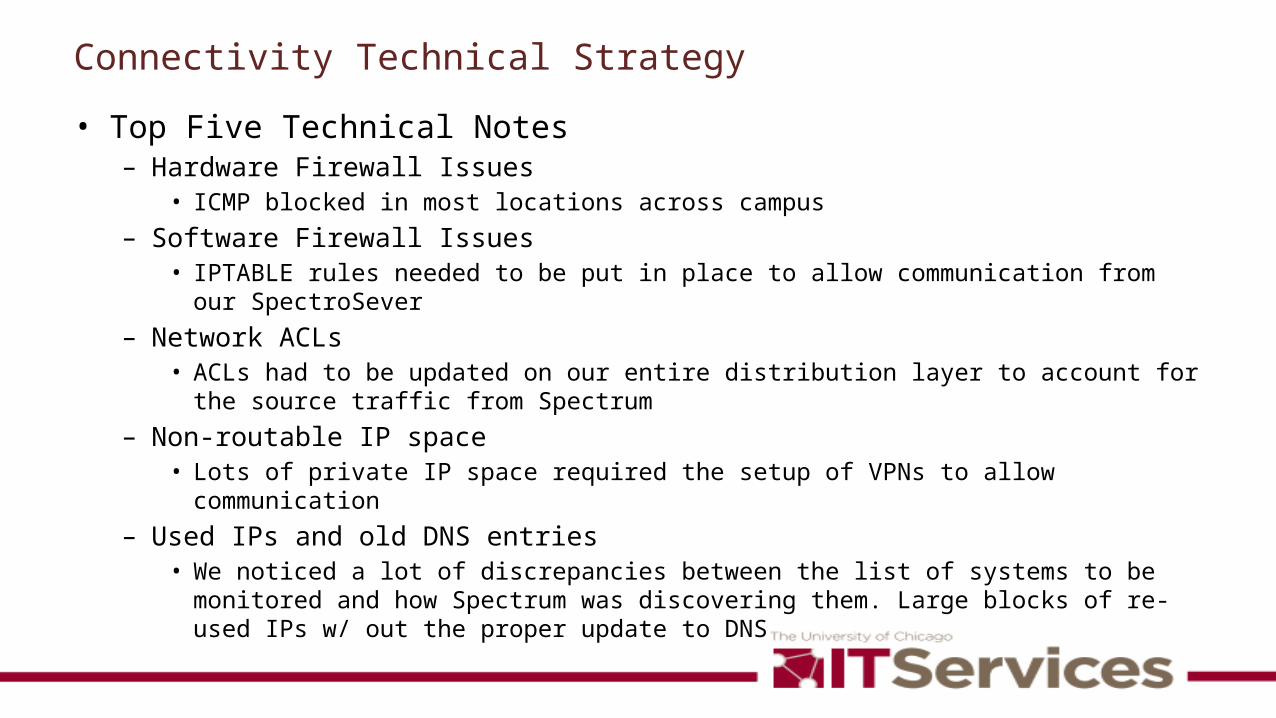
Connectivity Technical Strategy
• Top Five Technical Notes– Hardware Firewall Issues
• ICMP blocked in most locations across campus– Software Firewall Issues
• IPTABLE rules needed to be put in place to allow communication from our SpectroSever– Network ACLs
• ACLs had to be updated on our entire distribution layer to account for the source traffic from Spectrum
– Non-routable IP space• Lots of private IP space required the setup of VPNs to allow communication
– Used IPs and old DNS entries• We noticed a lot of discrepancies between the list of systems to be monitored and how
Spectrum was discovering them. Large blocks of re-used IPs w/ out the proper update to DNS
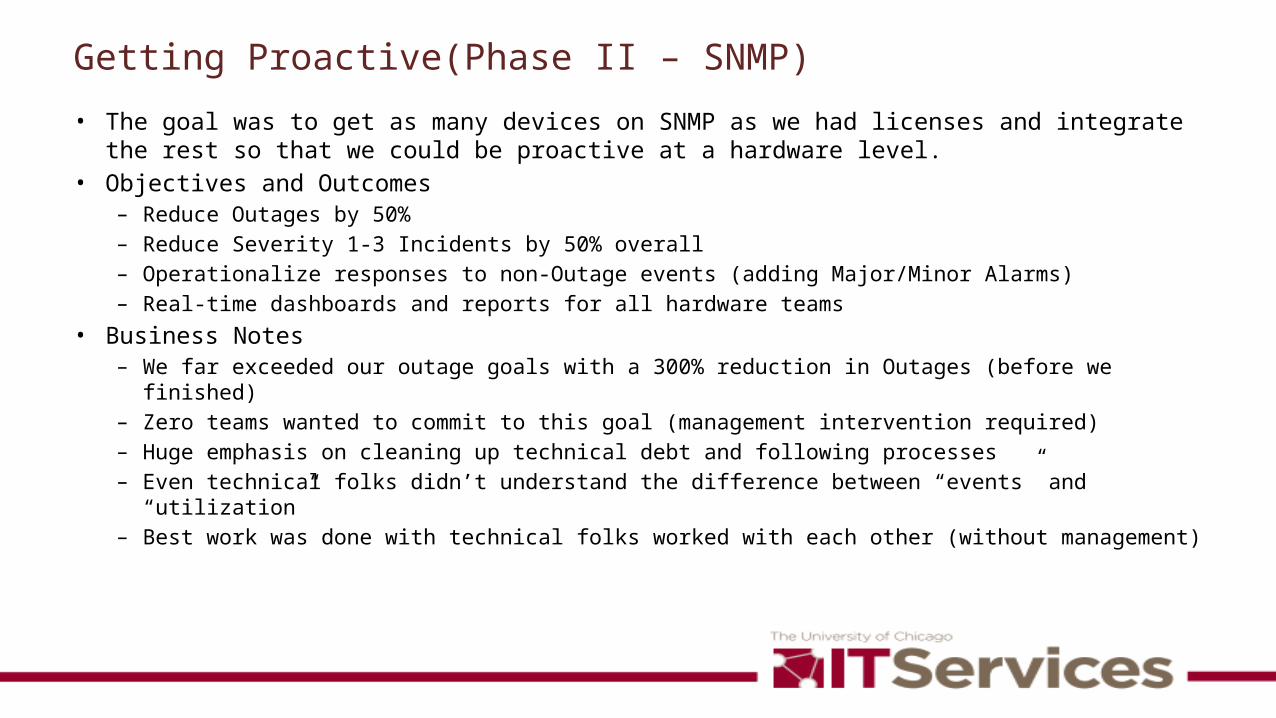
Getting Proactive(Phase II – SNMP)
• The goal was to get as many devices on SNMP as we had licenses and integrate the rest so that we could be proactive at a hardware level.
• Objectives and Outcomes– Reduce Outages by 50%– Reduce Severity 1-3 Incidents by 50% overall– Operationalize responses to non-Outage events (adding Major/Minor Alarms)– Real-time dashboards and reports for all hardware teams
• Business Notes– We far exceeded our outage goals with a 300% reduction in Outages (before we finished)– Zero teams wanted to commit to this goal (management intervention required)– Huge emphasis on cleaning up technical debt and following processes– Even technical folks didn’t understand the difference between “events” and “utilization”– Best work was done with technical folks worked with each other (without management)
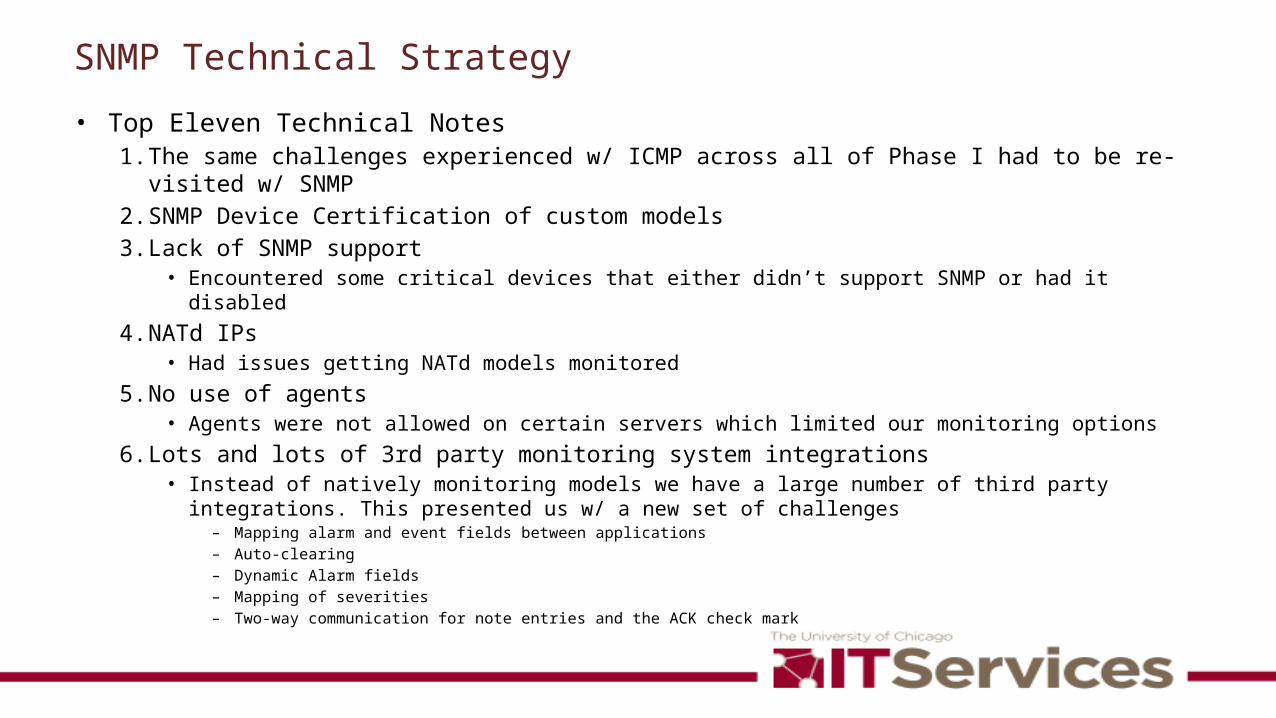
SNMP Technical Strategy
• Top Eleven Technical Notes1. The same challenges experienced w/ ICMP across all of Phase I had to be re-visited w/ SNMP2. SNMP Device Certification of custom models3. Lack of SNMP support
• Encountered some critical devices that either didn’t support SNMP or had it disabled4. NATd IPs
• Had issues getting NATd models monitored5. No use of agents
• Agents were not allowed on certain servers which limited our monitoring options6. Lots and lots of 3rd party monitoring system integrations
• Instead of natively monitoring models we have a large number of third party integrations. This presented us w/ a new set of challenges
– Mapping alarm and event fields between applications– Auto-clearing– Dynamic Alarm fields– Mapping of severities– Two-way communication for note entries and the ACK check mark
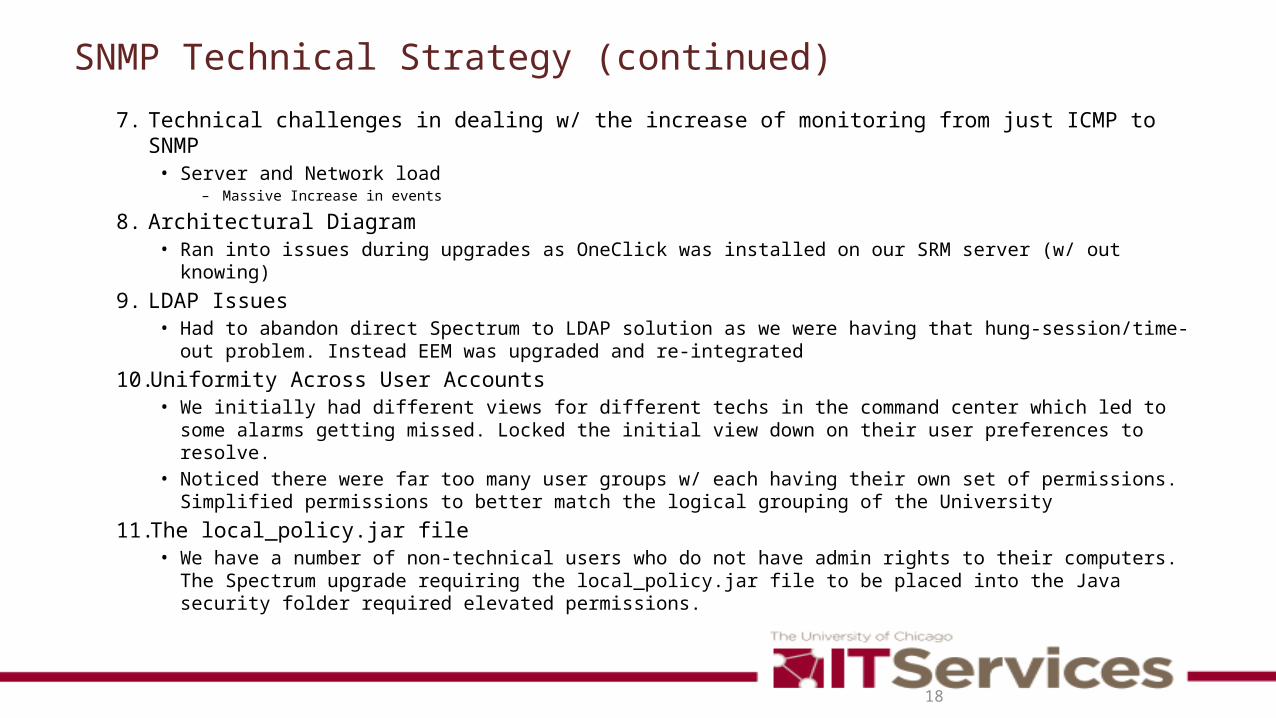
SNMP Technical Strategy (continued)
7. Technical challenges in dealing w/ the increase of monitoring from just ICMP to SNMP• Server and Network load
– Massive Increase in events
8. Architectural Diagram• Ran into issues during upgrades as OneClick was installed on our SRM server (w/ out knowing)
9. LDAP Issues• Had to abandon direct Spectrum to LDAP solution as we were having that hung-session/time-out problem.
Instead EEM was upgraded and re-integrated10.Uniformity Across User Accounts
• We initially had different views for different techs in the command center which led to some alarms getting missed. Locked the initial view down on their user preferences to resolve.
• Noticed there were far too many user groups w/ each having their own set of permissions. Simplified permissions to better match the logical grouping of the University
11. The local_policy.jar file• We have a number of non-technical users who do not have admin rights to their computers. The Spectrum
upgrade requiring the local_policy.jar file to be placed into the Java security folder required elevated permissions.
18
Service Centric (Phase III – Service View)
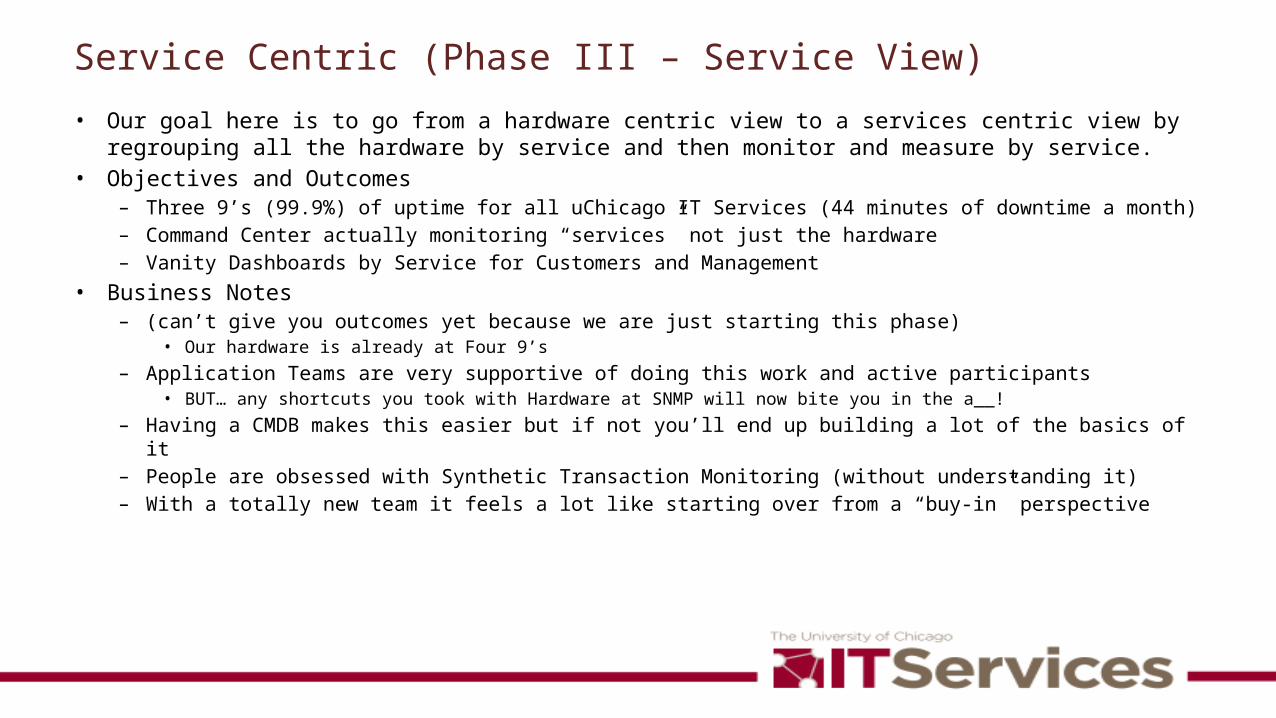
• Our goal here is to go from a hardware centric view to a services centric view by regrouping all the hardware by service and then monitor and measure by service.
• Objectives and Outcomes– Three 9’s (99.9%) of uptime for all uChicago IT Services (44 minutes of downtime a month)– Command Center actually monitoring “services” not just the hardware– Vanity Dashboards by Service for Customers and Management
• Business Notes– (can’t give you outcomes yet because we are just starting this phase)
• Our hardware is already at Four 9’s– Application Teams are very supportive of doing this work and active participants
• BUT… any shortcuts you took with Hardware at SNMP will now bite you in the a__!– Having a CMDB makes this easier but if not you’ll end up building a lot of the basics of it– People are obsessed with Synthetic Transaction Monitoring (without understanding it)– With a totally new team it feels a lot like starting over from a “buy-in” perspective
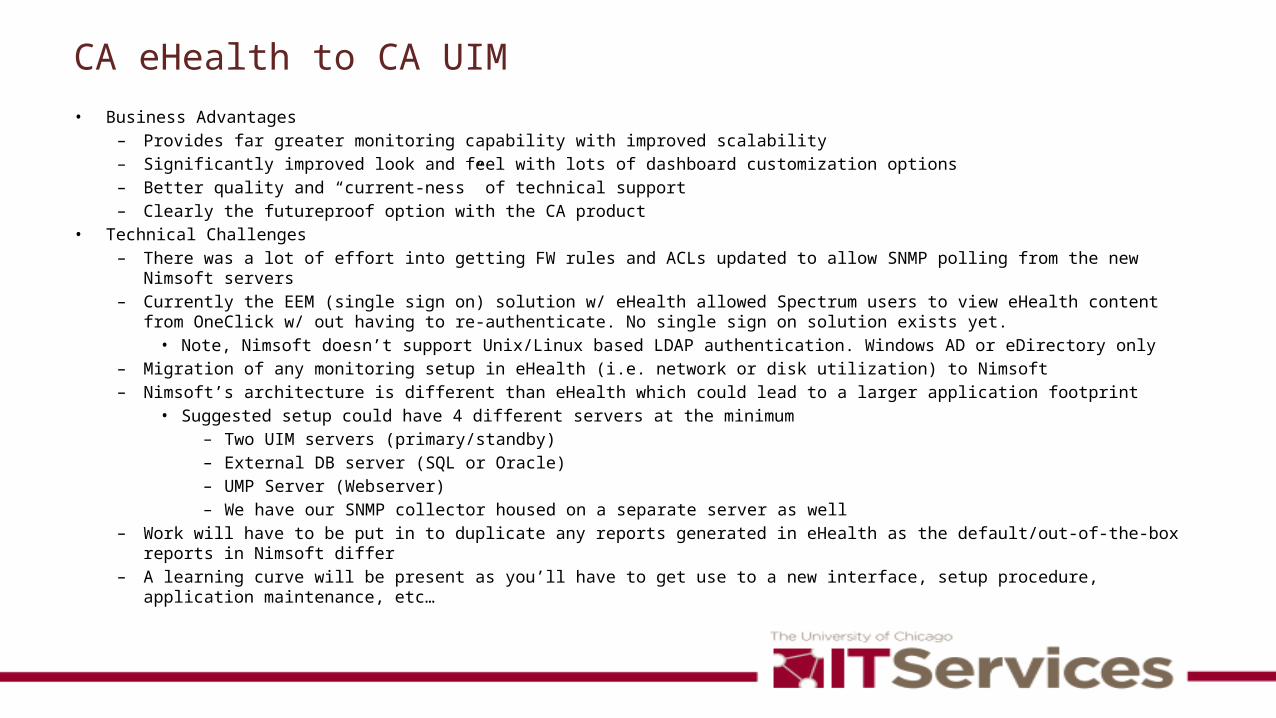
CA eHealth to CA UIM• Business Advantages
– Provides far greater monitoring capability with improved scalability– Significantly improved look and feel with lots of dashboard customization options– Better quality and “current-ness” of technical support– Clearly the futureproof option with the CA product
• Technical Challenges– There was a lot of effort into getting FW rules and ACLs updated to allow SNMP polling from the new Nimsoft servers– Currently the EEM (single sign on) solution w/ eHealth allowed Spectrum users to view eHealth content from OneClick w/ out
having to re-authenticate. No single sign on solution exists yet.• Note, Nimsoft doesn’t support Unix/Linux based LDAP authentication. Windows AD or eDirectory only
– Migration of any monitoring setup in eHealth (i.e. network or disk utilization) to Nimsoft– Nimsoft’s architecture is different than eHealth which could lead to a larger application footprint
• Suggested setup could have 4 different servers at the minimum– Two UIM servers (primary/standby)– External DB server (SQL or Oracle)– UMP Server (Webserver)– We have our SNMP collector housed on a separate server as well
– Work will have to be put in to duplicate any reports generated in eHealth as the default/out-of-the-box reports in Nimsoft differ– A learning curve will be present as you’ll have to get use to a new interface, setup procedure, application maintenance, etc…
Khan, Umair M
This slide to be improved in the final version
Synthetic Transaction Monitoring
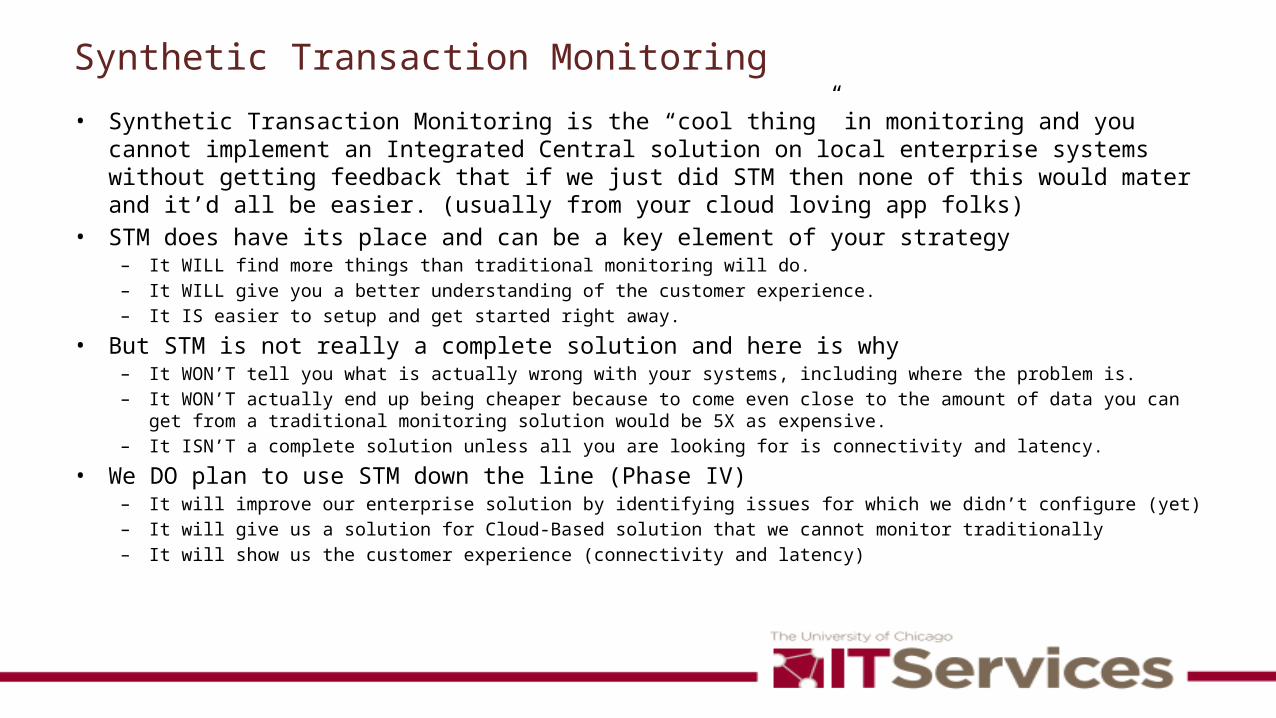
• Synthetic Transaction Monitoring is the “cool thing” in monitoring and you cannot implement an Integrated Central solution on local enterprise systems without getting feedback that if we just did STM then none of this would mater and it’d all be easier. (usually from your cloud loving app folks)
• STM does have its place and can be a key element of your strategy– It WILL find more things than traditional monitoring will do.– It WILL give you a better understanding of the customer experience.– It IS easier to setup and get started right away.
• But STM is not really a complete solution and here is why– It WON’T tell you what is actually wrong with your systems, including where the problem is.– It WON’T actually end up being cheaper because to come even close to the amount of data you can get from a traditional
monitoring solution would be 5X as expensive.– It ISN’T a complete solution unless all you are looking for is connectivity and latency.
• We DO plan to use STM down the line (Phase IV)– It will improve our enterprise solution by identifying issues for which we didn’t configure (yet)– It will give us a solution for Cloud-Based solution that we cannot monitor traditionally– It will show us the customer experience (connectivity and latency)
Khan, Umair M
This slide to be improved in the final version
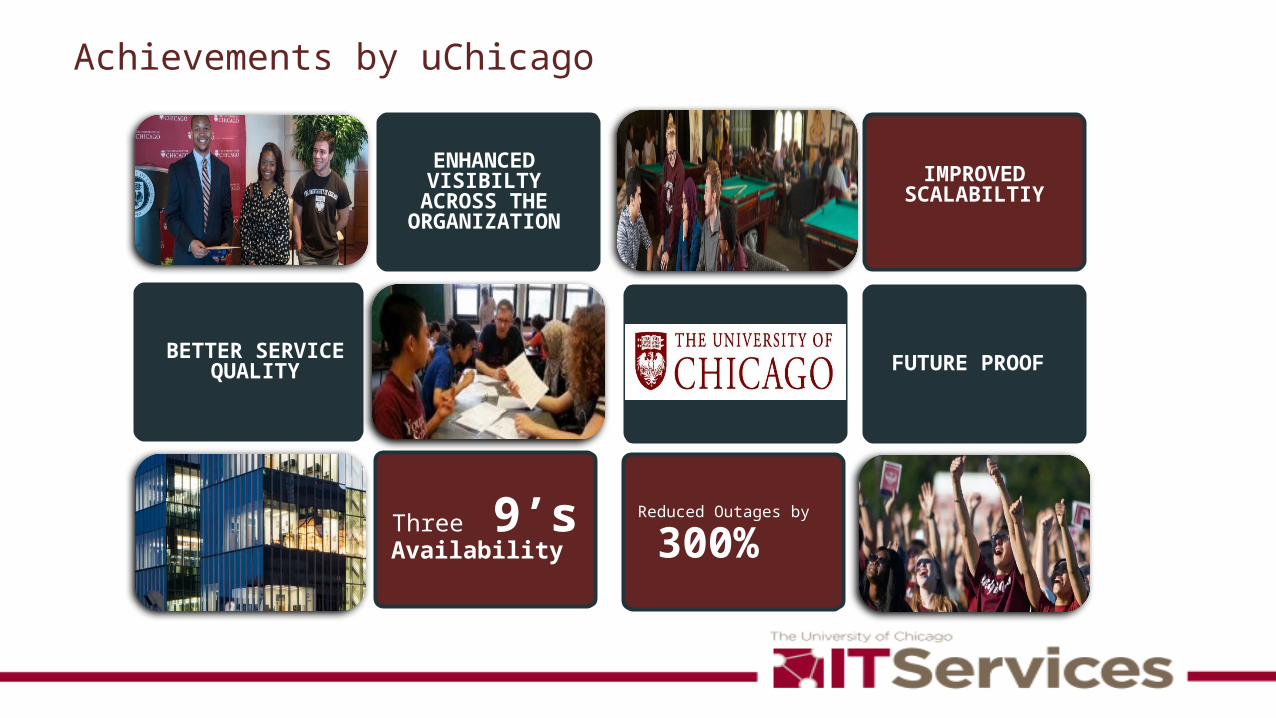
Achievements by uChicago
Three 9’sAvailability
Reduced Outages by 300%
ENHANCED VISIBILTY
ACROSS THE ORGANIZATION
BETTER SERVICE QUALITY
IMPROVED SCALABILTIY
FUTURE PROOF

23 © 2015 CA. ALL RIGHTS RESERVED.@CAWORLD #CAWORLD
Q & A