DOMINÂNCIA, DISTRIBUIÇÃO E DIVERSIDADE DE … · seca do solo, que a afiliação das espécies a...
145
INSTITUTO NACIONAL DE PESQUISAS DA AMAZONIA – INPA PROGRAMA DE PÓS-GRADUAÇÃO EM ECOLOGIA DOMINÂNCIA, DISTRIBUIÇÃO E DIVERSIDADE DE PALMEIRAS AO LONGO DE GRADIENTES AMBIENTAIS NA AMAZÔNIA THAISE EMILIO LOPES DE SOUSA Manaus, Amazonas Novembro, 2013
Transcript of DOMINÂNCIA, DISTRIBUIÇÃO E DIVERSIDADE DE … · seca do solo, que a afiliação das espécies a...

INSTITUTO NACIONAL DE PESQUISAS DA AMAZONIA – INPA
PROGRAMA DE PÓS-GRADUAÇÃO EM ECOLOGIA
DOMINÂNCIA, DISTRIBUIÇÃO E DIVERSIDADE DE PALMEIRAS
AO LONGO DE GRADIENTES AMBIENTAIS NA AMAZÔNIA
THAISE EMILIO LOPES DE SOUSA
Manaus, Amazonas
Novembro, 2013

ii
THAISE EMILIO LOPES DE SOUSA
DOMINÂNCIA, DISTRIBUIÇÃO E DIVERSIDADE DE PALMEIRAS
AO LONGO DE GRADIENTES AMBIENTAIS NA AMAZÔNIA
ORIENTADORA: Dra. FLÁVIA REGINA CAPELLOTTO COSTA
Tese apresentada ao Instituto
Nacional de Pesquisas da Amazônia
como parte dos requisitos para
obtenção do título de Doutor em
Biologia (Ecologia).
Manaus, Amazonas
Novembro, 2013

iii
BANCA EXAMINADORA DA TESE
Nome (Instituição) Parecer
Charles Clement (Instituto Nacional de Pesquisas da Amazônia) Aprovado
Charles Zartman (Instituto Nacional de Pesquisas da Amazônia) Aprovado
Christopher Baraloto (Institut National de la Recherche Agronomique) Aprovado
Henrique Nascimento (Instituto Nacional de Pesquisas da Amazônia) Aprovado
José Luís Camargo (Instituto Nacional de Pesquisas da Amazônia) Aprovado

iv
S725 Sousa, Thaise Emilio Lopes de.
Dominância, distribuição e diversidade de palmeiras ao
longo de gradientes ambientais na Amazônia / Thaise Emilio
Lopes de Sousa. --- Manaus : [s. n.], 2013.
145 f. : il. color.
Tese (Doutorado) --- INPA, Manaus, 2013.
Orientador : Flávia Regina Capellotto Costa.
Área de concentração : Ecologia.
1. Arecaceae. 2. hidrologia. 3. solo. 4. composição
florística. I. Título.
CDD
584.5
Sinopse
Nesta tese usamos a família Arecaceae como modelo de estudo para
entender os mecanismos relacionados com variações na dominância,
distribuição e diversidade ao longo de gradientes ambientais em florestas
tropicais. Foram investigados padrões de área basal, composição florística e
distribuição de espécies em relação aos gradientes de solo, hidrologia, clima,
topografia, estrutura da floresta e regime de distúrbio. Adicionalmente,
investigamos os processos ecológicos e evolutivos relacionados aos padrões
de diversidade local e regional do grupo.
Palavras chave: 1. Arecaceae 2. hidrologia. 3. solo. 4. coexistência. 5.
florestas tropicais. 6. composição florística. 7. estrutura da vegetação. 8.
nicho. 9. diversificação.

v
Dedico esta tese aos meus pais, avós, irmãos,
tios e sobrinhos que nasceram, cresceram,
amadureceram e envelheceram enquanto eu
não estava por perto e que, mesmo não
entendendo direito o que eu tinha vindo buscar
tão longe, me deram todo o amor e apoio que
sempre precisei.

vi
AGRADECIMENTOS
Agradeço ao INPA e ao Programa de Pós-Graduação em Ecologia (PG-ECO) por terem me
oferecido a oportunidade de estudar a Amazônia e também pela infra-estrutura e apoio logístico.
Ao CNPq por pela concessão da minha bolsa e outros recursos fundamentais para o
desenvolvimento da minha tese e a CAPES pela concessão da minha bolsa de doutorado
sanduiche no exterior que permitiu realizer parte dos estudos desta tese na Dinamarca. E a
FAPESP e FAPEAM pelo financiamento de grande parte da coleta dos dados usados para esta
tese.
A minha orientadora, Flávia Costa, por ter me recebido de braços abertos e por ter me
proporcionado um estimulante ambiente de pesquisa na sua família vegetal todos esses anos.
Ao meu orientador na Dinamarca – Jens-Christian Svenning – e a todo Ecoinformatic and
Biodiversity group pela oportunidade de viver uma experiência profissional e pessoal tão
diversa e enriquecedora.
Ao Bill Magnusson, pelo seu incessante esforço de formar massa critica para o desenvolvimento
da Amazônia e pelos seus métódos diversos (e as vezes não muito ortodoxos) de fazer as idéias
das pessoas chegarem onde deveriam.
A Cláudia Keller que foi coordenadora da PG-ECO durante a maior parte do meu tempo por
aqui por sua dedicação para manter o curso como um dos melhores do país.
A Andresa Mello - nossa salvadora no selvagem mundo da burocracia - que nunca mediu
esforços para dar o apoio administrativo necessário para as atividades de pesquisa. E a Rose, e
antes dela Beverly, por estarem a frente da difícil tarefa que é manter a secretaria da PG-ECO
funcionando.
Aos moradores da BR-319 que gentilmente permitiram que conduzissemos nossos estudos nas
suas propriedades e aos demais moradores que ajudaram das mais variadas formas na coleta de
dados. Meus agradecimentos especiais ao Dorival cujos esforços cruzando a BR-319 de norte a
sul diversas vezes por ano na coleta de dados hidrológicos são incomparáreis. Meus
agradecimentos especiais também a Ana Célia que horas acompanha, horas abre mão do seu
marido Dorival para que este importante trabalho seja realizado.
Ao pessoal do Laboratório Temático de Solos e Plantas, em especial ao Orlando, Edvaldo,
Raimundo e Jonas, pela sua ajuda ao longo destes anos dentro do laboratorio. E ao Marcelinho
que sempre torna o nosso trabalho mais fácil no laboratório de triagem.
Às minhas fiéis escudeiras na interminável tarefa de processor e analizar milhares de amostras
de solo – Thainá, Juliana Menezes e Amanda – que desempenharam com com destreza e
dedicação estas tarefas.
A Juliana Schietti, minha grande parceira nesta aventura. Te agradeço por muitos momentos
inspiradores de convivência e por ser tão doida quando eu pra encarar esta empreitada.

vii
Ao Gabriel Moulatlet (valeu Time!) pela sua adorável companhia no campo e na cidade que
sempre tornou tudo mais fácil e pela sua inestimável ajuda assumindo muitas das minhas
responsabilidades quando me ausentei de Manaus.
A toda equipe do Hidroveg – Ju Schietti, Zeca, Gabriel, Bruno, Demétrius, Carol e Pri – e aos
demais pesquisadores da Br-319 pelo seu espírito desbravador e determinação muito maior do
que qualquer dificuldade encontrada no caminho. E aos inúmeros assistentes de campo e
motoristas que nos conduziram durante essa jornada.
Aos colegas de laboratório, irmãos da família vegetal e agregados – em especial ao Cadu,
Nando, Pri, Flavia Santana, Fê Coelho e Karina – que são ótimas companhias para as discussões
de todos os dias, para o cafezinho a qualquer hora, para as tarefas de último minuto, mas que
também verdadeiros amigos para toda a vida.
Ao Helder, pelo amor, amizade, incentivo, apoio e companheirismo nos momentos iniciais desta
tese.
A Manozão que me recebeu de braços abertos na sua casita e me deu mais do que um novo lar;
uma família completa. E ao Bogão por compartilhar a Manozão comigo. Não poderia deixar de
agradecer também a Mel, Cachalote, Paguá, Stevinho, Santinha, Vuvuzela, Ere, Mixirico,
Xorxinho e tambéns aos menos interativos Jabotis (sem nome conhecido) pela companhia dos
ultimos tempos de redação de tese e seu amor incondicional.
Aos amigos de Manaus (e alguns nem tão de Manaus assim) - Pé, Saci, Gabriel, JJ, Victor,
Cintia, Cadu, Pedro Ivo, Fazão, Juju, Nana, Mano, Bogão, Dri, Fe Coelho, Pri, Flavia Costa,
Sants, Cassi, Fe Costa, Zé, Dema, Aninha, João, Lay, Mone – obrigada pelos ótimos momentos
que passamos juntos nesses ultimos anos ou meses. E aos meus amigos de outros cantos –
Mayra, Carol, Pat, Gra, Catalina, Diego, Naya e Ditte –por não terem deixado a distância nos
separar.
Ao Demétrius, meu agradecimento especial por ter tornado as coisas tão mais leves nos
momentos finais com a sua companhia agradabilissima, leveza, bom humor e amor, seja
fazendo trilha sonora para papers submetidos em domingos de manhã ou cuidando para que eu
me alimentasse direito quando esta era a ultima coisa do mundo que eu estava pensando.
Aos meus pais, avós, tios, irmãos e sobrinhos cuja simples companhia recarrega todas as minhas
energias e que me recordam que somos todos feitos de amor só de sentir o amor que eles tem
por mim e eu pore eles. Obrigada por fazerem parte da minha vida, por terem construido esta
família linda que é a nossa e por todo o suporte que vocês me deram ao longo de toda a minha
vida.
Agradeço de todo vocês com todo o meu coração!

viii
"A CIÊNCIA, COMO UM TODO, NÃO É NADA MAIS DO QUE
UM REFINAMENTO DO PENSAR DIÁRIO "
(Albert Einstein)"

ix
RESUMO
O objetivo desta tese foi estudar os padrões de dominância, diversidade e distribuição de
palmeiras na Amazônia. No primeiro capítulo, exploramos os padrões continentais de variação
na dominância de palmeiras relacionando a área basal de palmeiras e árvores com propriedades
físicas do solo. Neste capitulo, mostramos que a área basal de árvores e palmeiras é limitada
pelas condições físicas do solo e que a direção desta relação varia entre os grupos. Quanto maior
a resistência dos solos a penetração de raízes, menor a área basal de árvores e maior a de
palmeiras. Este mecanismo de partição da floresta por árvores e palmeiras está relacionado com
a estrutura da floresta em escala local e com a fisionomia da floresta na escala da bacia. No
segundo capitulo, exploramos os padrões regionais de variação da abundância das espécies de
palmeiras em relação a gradientes ambientais e seus efeitos sobre os padrões de dominância e
composição florística. Neste capítulo, evidenciamos que tanto diferenças sutis, quanto
diferenças abruptas na composição florística podem ser causadas por variações na abundância
das espécies em resposta a condições ambientais. Mostramos ainda que os padrões de
dominância estão relacionados com os padrões de variação florística e sugerimos um possível
mecanismo para explicar a ocorrência de dominância em florestas tropicais. No terceiro
capítulo, testamos a hipótese de que a segregação de espécies em gradientes ambientais sutis
poderia explicar a coexistência de espécies em escala local e regional. Neste capítulo,
mostramos que espécies de palmeiras estão segregadas em eixos hidrológicos de saturação e
seca do solo, que a afiliação das espécies a nichos hidrológicos é um caractere lábil ao longo da
evolução das palmeiras e que a segregação de espécies nestes eixos de nicho está fortemente
relacionada com a riqueza de espécies em escala local e regional na Amazônia.
Palavras-chave: Arecaceae, hidrologia, solo, coexistência, florestas tropicais, composição
florística, estrutura da vegetação, nicho ecológico, diversificação de espécies

x
ABSTRACT
The aim of this thesis was to study the patterns of dominance, diversity and species distribution
in Amazonian palms. In the first chapter we explored the continental patterns of variation in
palm species dominance by relating palm and tree basal area with soil physical properties. In
this chapter, we showed that soil physical properties establish the upper limit for palm and tree
basal area and that the direction of this relationship differs between them. As soil resistance to
root penetration heightens, tree basal area decreases and palm basal area increases. The
mechanism of forest partitioning by palms as trees is related to forest structure at the local scale
and with forest physiognomy at the basin scale. In the second chapter we explored the regional
patterns of palm species abundance variation in relation to environmental gradients and their
effect on dominance and floristic composition patterns. In this chapter we demonstrate that
subtle and abrupt differences in floristic composition may be caused by changes in species
abundance in relation to environmental conditions. We also showed that dominance patterns are
linked with the patterns of floristic variation and suggest a mechanism to explain the occurrence
of dominance in tropical forests. In the third chapter, we tested the hypothesis that species
segregation along subtle environmental gradients will explain species coexistence in local and
regional scale. In this chapter, we showed that palm species are segregated along a hydrological
axis of soil moisture and that the hydrological niche affiliation of the species is a character that
evolved through palm evolution and that niche is strongly related to species richness in local
and regional scales in Amazonia.
Key-words: Arecaceae, hidrology, soil, coexistence, tropical forest, floristic composition, forest
structure, ecological niche, species diversification

xi
SUMÁRIO
xii Lista de Tabelas
xiii Lista de Figuras
pg 01 Introdução geral
pg 07 Objetivos
Capitulo 1
pg 08
Artigo: Soil physical constraints as a limiting factor of palm and tree
basal area in Amazonian forests
EMILIO, T., QUESADA, C.A., COSTA, F. R. C., MAGNUSSON, W. E., SCHIETTI,
J., FELDPAUSCH, T. BRIENEN, R. J. W, BAKER, T. R., CHAVE, J. et. al. Plant
Ecology and Diversity (Special Issue Ecosystem Dynamics of Amazonian and
Andean Forests) vol 7 (1):. 2014.
Capitulo 2
pg 43
Artigo: Species abundance changes along environmental gradients drives
palm floristic variation in lowland Amazonian forests
EMILIO, T., COSTA, F. R. C, SCHIETTI, J., PINTO, J. L. P. V., MOULATLET, G.,
MAGNUSSON, W. E. & TOMASELLA, J. Manuscrito em preparação para
Journal of Ecology
Capitulo 3
pg 90
Artigo: Hydrological control of species coexistence and richness in
Amazonian palms
EMILIO, T., COSTA, F. R. C, SCHIETTI, J., PINTO, J. L. P. V., MAGNUSSON, W.
E., TOMASELLA, J. , FAURBY, S. & SVENNING, J-C. Submetido para PLoS
One
pg 118 Síntese
pg 123 Referências

xii
LISTA DE TABELAS
Capítulo 1
Table 1. Basal area (BA) and environmental data from 74 Amazonian forest plots used in this
study.
Table 2. Soil physical constraint scores modified from Quesada et al. (2010).
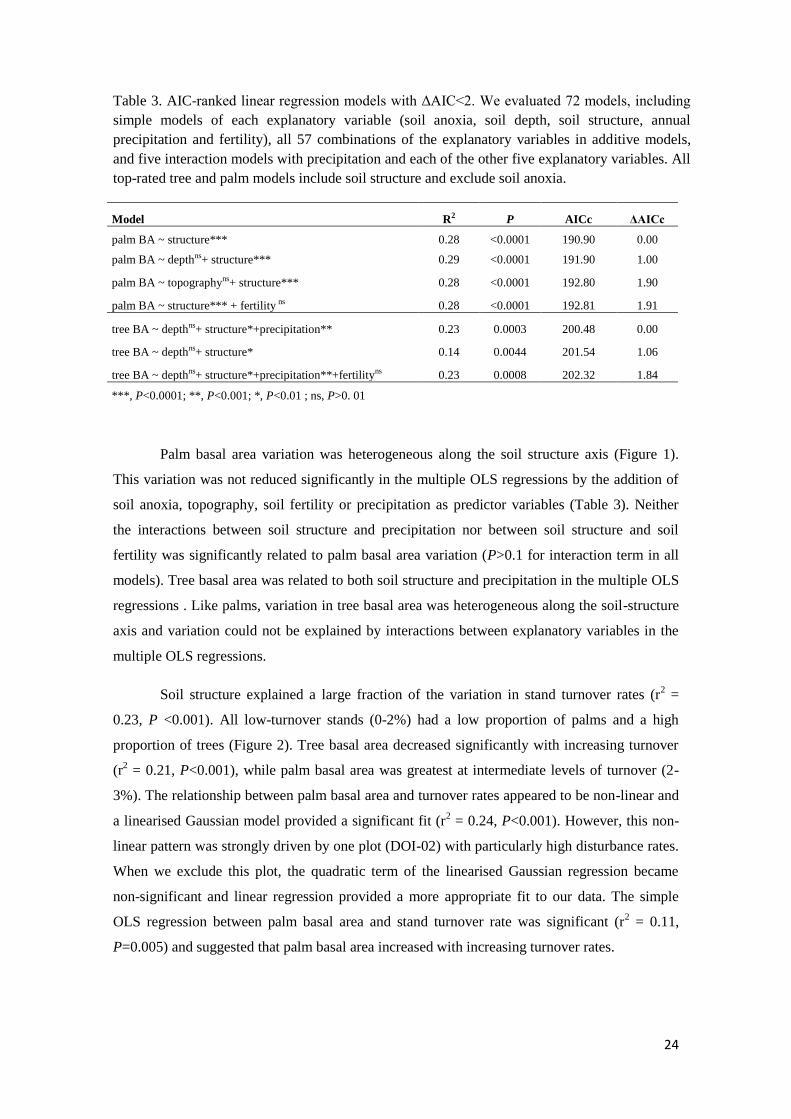
Table 3. AIC-ranked linear regression models with ΔAIC<2. We evaluated 72 models, including
simple models of each explanatory variable (soil anoxia, soil depth, soil structure, annual
precipitation and fertility), all 57 combinations of the explanatory variables in additive models,
and five interaction models with precipitation and each of the other five explanatory variables.
All top-rated tree and palm models include soil structure and exclude soil anoxia.
Capítulo 2
Table S1. Species list, voucher numbers, growth-form (sensu Balslev et al. 2011), habitat
density and the results of individual species models.
Table S2. Results of floristic composition models
Table S3. Results of alternative species turnover models
Table S4. Results of alternative species relative abundance models
Capítulo 3
Table S1. Randomization algorithms (Adapted from Goteli & Graves 1996), assumptions and
segregation definition for the four null models adopted.
Table S2. List of species names, species codes and herbarium access number. Phylogenetic data
source for each species is given in superscript letters before each species name. For the genera
with only one species in our species list, we used genus level phylogenetic data instead species
level for construct our trees.

xiii
LISTA DE FIGURAS
Capítulo 1
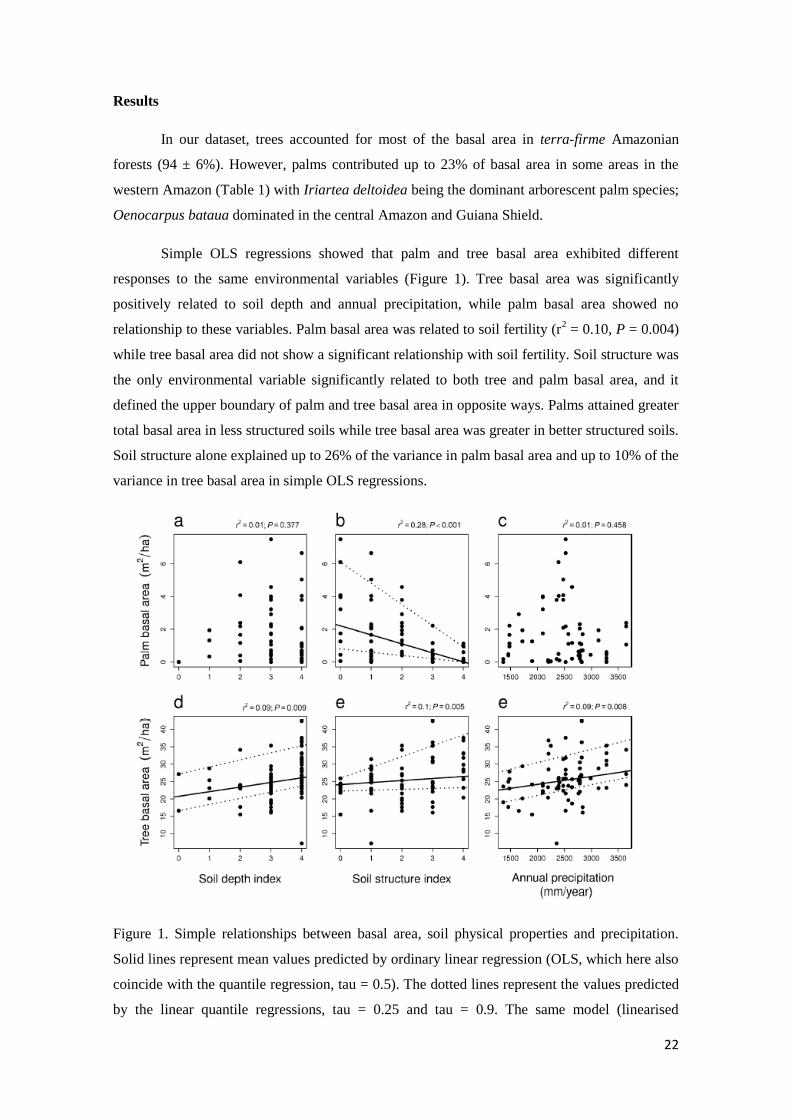
Figure 1. Simple relationships between basal area, soil physical properties and precipitation.
Solid lines represent mean values predicted by ordinary linear regression (OLS, which here also
coincide with the quantile regression, tau = 0.5). The dotted lines represent the values predicted
by the linear quantile regressions, tau = 0.25 and tau = 0.9. The same model (linearised
Gaussian in (c), and linear for the others) was adopted for the ordinary linear and quantile
regressions. Lines are shown only when the OLS model is significant at the 0.05 level. The r2
and P-values of each OLS are presented at the top of each graph.
Figure 2. Relationship between forest stand-turnover rates and (a) palm basal area and (b) tree
basal area for 60 forest plots for which turnover rate data was available. Dashed lines represent
values predicted by quantile regression (tau = 0.9).
Figure 3. Diagram of direct and indirect effects of soil structure and forest turnover on palm and
tree basal area. Arrows point to response variables. Standardised regression coefficients are
shown along the lines. Continuous lines indicate significant coefficients and dashed lines non-
significant ones.
Figure 4. (a) Spatial distribution of palm basal area in 74 forest plots, superimposed on the
Brazilian map of palm-dominated forests (modified from IBGE 1998). (b) Soil structure
variation between forest physiognomies for ALP, CAX, CUZ, JE and TAM sites (n = 23). Soil
structure index follows Quesada et al. (2010) and forest classification follows Anderson et al.
(2009). Lower values for the soil structure index indicate less structured soils (see Table 1 for a
complete description). FAT - forest over alluvial terrace, SW - Mauritia-dominated swamp, TFP
- palm-dominated terra-firme (Anderson’s TF 2 and 3), and TF - terra-firme forest.
Capitulo 2
Figure 1. Floristic variation patterns. (A) Separation of inundate from nun-inundate plots in a
two NMDS ordination axes built from species relative abundance. (B) Relationship between
florist and environmental distance for inundated and non-inundated plots.
Figure 2. Floristic composition variation in relation to envinmental conditions. Left panel.
Partial regression plots for palm species relative abundance relationships. Right panel. Partial
regression plots for palm species turnover.
Figure 3. Link between floristic composition and dominance given by the relationship between
the relative importance of environmental predictors in species turnover model and (A) the

xiv
number of time of a given predictor is significant in individual species models; (B) the number
of individuals belonging to the species significantly related to a given predictor in individual
species models.
Figure 4. Mechanisms of dominance. (A) Relationship between species abundance and
population structure biven by adult;juvenile ratio and (B) Relationship between species
environmental range corrected for abundance-occupance bias and species abundance.
Figure S1. Study site map.
Figure S2. Species relative abundance.
Figure S3.Effect of the upmost dominant species (Lepidocaryum tenue) on the overall palm
abundance.
Capitulo 3
Figure 1. Map of the study area.
Figure 2. Hydrological niche segregation/overlap in Central Amazonia palm species. (A)
Regional scale species segregation along hydrological axes of soil saturation and dryness.
Species were positioned along these axes according to the summation of the weighted
relativized abundances in the hydrological axes. Each one of the 31 two-letter codes represents
one palm species (see table S2 for species codes). Saturation = number of months with water
table depth above 50 cm from the ground. Dryness = number of months with water table depth
below 3 m from the ground. (B) Comparison between observed palm species mean niche
overlap in the combined hydrological axis (PCA1) and the expected mean niche overlap
distribution according to four randomization algorithms. The observed niche overlap was lower
than expected by chance (segregation) in comparison to all null models (see table S1 for
details): RA1, relaxed niche breadth and abundance; RA2, retained niche breadth and relaxed
abundance; RA3, relaxed niche breadth and retained abundance; RA4, retained niche breadth
and abundance.
Figure 3. Relative abundance of Central Amazonian palm species along the hydrological
gradient ordered by their abundance in each level of the hydrological condition. Species in the
bottom-left of the figure are affiliated to dryer conditions and in the top-right are affiliated with
wetter conditions. The black bars show the position species in relation to the combined (PCA1)
hydrological axis obtained from the summation of the weighted relativized abundances of the
species in relation to this axis.

xv
Figure 4. Hydrological niche lability and diversification patterns in Central Amazonia palm
species (A) Phylogenetic distribution of hydrological niche optima. The taxa in grey were
randomly placed 1000 times to generate 1000 partially random trees (one of these is illustrated
here) used for the niche conservantism tests. The position of each taxa in relation to the
combined hydrological axis (PCA1) is represented besides the taxa name, and shows niche
lability (i.e. character states are not more similar in closely related species). (B) Distribution of
Blomberg’s K values for 1000 partially random trees. Blomberg’s K smaller than one indicates
trait lability, while values greater than one suggest trait conservatism. Note that for none of the
trees is there evidence for niche conservatism. (C-H) Species segregation along hydrological
axes within each genus (see table S2 for species codes).
Figure 5. Relationship between the number of co-occurring palm species (alpha-diversity) and
plot-based mean niche overlap along the combined (PCA1) hydrological axis. The small graphs
show the direct relationship between the number of species and the three hydrological axes.
Figure 6. Conceptual model of the implications of increasing niche overlap for alpha diversity.
The number of species will be maximum and equal to the regional species pool when there is
enough segregation to prevent competitive exclusion, but not enough overlap to allow for
species coexistence. Right side: higher amounts of overlap will result in competitive exclusion
and lower alpha-diversity as predicted by Pianka’s Niche Overlap Hypothesis. Left side: higher
amounts of segregation occur by specialization and lowers alpha-diversity because species
restriction to different parts of the gradient will prevent species coexistence.

1
INTRODUÇÃO GERAL
Florestas tropicais conservam grande parte da diversidade biológica do planeta e
desempenham um papel muito importante no controle do clima global. A Amazônia é o maior
remanescente de floresta tropical e o reconhecimento da sua importância se deve principalmente
por duas razões: (1) pela necessidade de conservação da sua biodiversidade e serviços
ecossistêmicos e (2) pela oportunidade de estudar processos ligados à origem e manutenção da
biodiversidade e ao funcionamento de ecossistemas em um espaço que modificações causadas
pelo homem são virtualmente ausentes. As mesmas razões que tornam a Amazônia atrativa são
responsáveis pelos principais desafios da pesquisa na região. A baixa densidade demográfica e
ocupação da região fazem com que a maior parte da Amazônia seja remota e de difícil acesso. O
resultado disso é que o conhecimento que temos acumulado ate então provém em sua maior
parte dos poucos sítios de pesquisa (Pitman 2012). A concentração dos estudos no entorno de
poucas áreas potencialmente sub-representa a diversidade de condições e respostas das florestas
Amazônicas como um todo e limita o nosso poder de extrapolação do entendimento dos
processos para outras regiões. Por outro lado, as perspectivas de desenvolvimento e ocupação da
Amazônia tornam urgente que sejam dadas respostas diretas sobre a representatividade e o
impacto esperado sobre uma biodiversidade e processos ecossistêmicos que ainda ignoramos.
Esta tese surgiu e foi desenvolvida diante deste paradigma e tem como objetivo contribuir para
o entendimento dos padrões e processos relacionados com a diversidade e processos
ecossistêmicos na Amazônia usando como modelo de estudo a família das palmeiras
(Arecaceae).
As palmeiras e a sua importância na Amazônia
As palmeiras estão restritas a regiões tropicais e sub-tropicais e constituem um dos
grupos mais conspícuos nas florestas destas regiões. Por estes motivos, a família Arecaceae foi
recentemente usada como modelo para entender a origem e evolução das florestas tropicais
(Couvrer et al. 2011). As palmeiras divergiram das demais monocotiledôneas por volta de 120-
90 MA (Dransfield et al. 2008), mas a sua diversificação na Amazônia ocorreu principalmente
no Mioceno 25-5 MA (Eiserhardt et al. 2011, Roncal et al. 2011, Roncal et al. 2012). A família
Arecaceae é muito especiosa. Mais de 2.400 espécies reconhecidas atualmente (Govaerts &
Dransfield 2005), 151 destas ocorrendo na Amazônia (Henderson 1995) e 1-28 espécies co-
ocorrendo em parcelas de 0.25 ha (Aarhus 2013). O número de espécies de palmeiras está muito
longe de ser surpreendente diante das 16 mil espécies de árvores estimadas para a região (ter
Steege et al. 2013). No entanto, a sua abundância nas florestas amazônicas atinge níveis
impressionantes. Seis das dez espécies arborescentes mais abundantes da Amazônia são
palmeiras (ter Steege et al. 2013). Palmeiras podem representar até 20% da área basal de

2
florestas na Amazônia (Emilio et al. 2014 – ARTIGO 1), onde florestas dominadas por
palmeiras representam 20% cobertura florestal (IBGE 1997). Mesmo quando não são elemento
dominante no dossel, as palmeiras podem ser muito abundantes no sub-bosque. Na Amazônia
central, por exemplo, a densidade média de palmeiras de sub-bosque é de 1.600 indivíduos por
hectare (Costa et al. 2009), mas esta densidade pode chegar ao impressionante número de 8.000
indivíduos por hectare um pouco mais ao sul no interflúvio Purus-Madeira (Emilio et al. in prep.
– ARTIGO 2). A abundância algumas espécies de palmeiras pode afetar a distribuição das
próprias palmeiras (Emilio et al. in prep. – ARTIGO 2) e também de outras plantas (Farris-
Lopez et al. 2004, Nogueira et al. 2010). Além disso, palmeiras são um recurso-chave para
animais (Peres 1994) e podem influenciar sua distribuição (Zona and Henderson, 1989,
Henderson, 2002). A família das palmeiras está entre as mais uteis para humanos e o seu uso
consiste amplamente em exploração de populações naturais (Balslev et al. 2011). Diversos
produtos provenientes de palmeiras são muito uteis para seres humanos como alimentos (e.g.
palmito, açaí, tucumã, pupunha, buriti, coco, tâmara), óleos (e.g. dendê, coco), fibras (e.g.
tucum), material de construção e medicamentos. Considerando a sua distribuição global e
importância para as florestas tropicais, palmeiras são um excelente modelo para entender não só
como as condições ambientais atuam em diferentes escalas para gerar os padrões de riqueza,
dominância e composição observados na floresta, mas também para gerar subsídios para estimar
a disponibilidade deste e de outros importantes recursos florestais.
Padrões de diversidade, dominância e composição florística na Amazônia
As florestas na Amazônia estão longe de serem floristicamente homogêneas. Terborg &
Andresen (1998) descreveram as diferenças entre florestas alagadas e florestas de terra-firme
mostrando que florestas alagadas distantes eram mais similares floristicamente entre si do que
com florestas de terra-firme adjascentes. Wittmann et al. (2006) mostraram que a riqueza e
distribuição de espécies em florestas alagadas por água branca varia com gradiente de
alagamento e também geograficamente; aumentando a riqueza no sentido leste-oeste na
Amazônia como um todo e sul-norte na Amazônia ocidental. As florestas de terra-firme
apresentam o mesmo padrão em larga escala de aumento da riqueza no sentido leste-oeste, mas
este padrão parece estar mais relacionado com as variações climáticas no passado do que com o
clima atual (Stropp et al 2009). Os padrões de riqueza em escala local são menos evidentes. A
variação de riqueza observada em um único local cobre o gradiente quase completo de riqueza
observado na Amazônia como um todo e somente uma pequena fração desta riqueza pode ser
explicada pelo ambiente (Stropp et al. 2009). Este resultado foi interpretado como evidência de
que deriva ecológica poderia ser um dos principais determinantes da alta diversidade de

3
espécies na Amazônia conforme predito por Hubbell (2001). No entanto, gradientes ambientais
mais sutis do que os estudados até então podem estar relacionados com a co-ocorrência de
espécies e serem importantes para entender os padrões de riqueza em pequena escala na
Amazônia assim como já evidenciado para outras regiões (Silvertown et al 1999, Araya et al
201, Emilio et al 2013 – Capítulo 3).
Cerca de mil espécies diferentes de plantas podem co-ocorrer em um único hectare de
floresta na Amazônia (Balslev et al 1998). Esta enorme riqueza local não está homogeneamente
distribuída entre as espécies e recentemente foi reconhecido que a maioria dos indivíduos de
árvores pertence a poucas espécies hiper-dominantes (ter Steege et al. 2013). Com base na
maior compilação de inventários florestais na Amazônia feita até o momento, estes autores
concluíram que cerca de 40% das árvores em um único inventário pertencem a espécies que são
dominantes regionalmente e especialistas em um ou dois dos cinco principais tipos de floresta
(terra-firme, campinarana, charcos, várzea e igapó) existentes na Amazônia. A idéia de que a
Amazônia poderia ser dominada por um conjunto limitado de espécies não é nova (Pitman et al.
2001), mas foi considerada controversa apesar de ter recebido suporte por diversos estudos
(Pitman et al. 2011). A impopularidade desta hipótese reside em duas principais razões: (1) a
ausência de uma explicação mecanística clara sobre o que levaria ao estabelecimento de
oligarquias (2) a presença de evidências mais consistentes com o senso comum de que a
Amazônia é um mosaico de pequenos pedaços de floresta heterogênea (Tuomisto et al. 1995) e
não de que a Amazonia é dominada por manchas grandes e relativamente homogêneas de
vegetação como originalmente previsto por Pitman et al (2001). Pitman et al. (2011) tenta
reconciliar estas duas visões re-analisando os dados de Tuomisto et al (1995) e mostrando que,
após a correção dos vieses de amostragem impostos pelos métodos originais do trabalho, a
paisagem não é dominada por pequenas manchas de ambientes como sugeriam as análises
originais e sim dominada por grandes manchas de ambientes onde oligarquias de poucas
espécies poderiam ser dominantes.
As causas para a dominância de algumas espécies ainda continuam sem explicação.
Pitman et al. (2001) sugere que espécies e famílias que dominam grandes porções das florestas
tropicais são aquelas para as quais mortalidade denso-dependente, dispersão de longa distância e
tolerância ambiental não são limitações. No entanto, a existência desta categoria de “super-
espécie” não explicaria porque estas super-espécies deixam de ser dominantes em alguns locais.
A hiper-dominância de algumas espécies de árvores nas Amazônia não está relacionada com
características funcionais associadas com reprodução (massa da semente) e crescimento
(densidade da madeira) (ter Steege et al. 2013), mas pode estar relacionada com outras
características funcionais. A dominância da família das palmeiras (Arecaceae) em relação às
demais famílias de plantas arborescentes na Amazônia está relacionada com estratégias

4
funcionais para lidar com limitações nas condições para enraizamento propiciadas pelo solo
(Emilio et al 2013 – ARTIGO 1). Mas os mecanismos que levam a dominância de diferentes
espécies de palmeiras e árvores ainda não são compreendidos.
Os padrões espaciais de composição florística em larga escala são congruentes com
gradientes de fertilidade do solo, duração da estação seca (ter Steege et al. 2008) e com a
distribuição espacial das diferentes fisionomias florestais (Emilio et al. 2010). Generalizações
sobre os padrões florísticos em menores escalas são mais desafiadoras porque existem vieses
nos estudos existentes para determinadas regiões (Eiserhardt et al 2011) e também porque a
importância relativa de um preditor ambiental está relacionada com o tamanho do gradiente e
sua estrutura espacial (Pansonato et al. 2013). Na Amazônia ocidental onde os solos podem ser
mais férteis, diferenças abruptas na composição florística em relação à fertilidade do solo e
topografia foram observadas (Tuomisto et al., 2003; Pitman et al., 2008; Higgins et al 2010). Na
Amazônia central onde os solos são pouco férteis, diferenças na composição florística não são
tão abruptas e estão mais relacionadas com propriedades físicas do solo e hidrologia (Costa et
al. 2005, Schietti et al. 2014, Emilio et al. 2014 –ARTIGO 2). As diferenças nas respostas das
plantas a preditores ambientais entre a Amazônia ocidental e central podem estar relacionadas
com as grandes diferenças no tamanho do gradiente de fertilidade entre as duas regiões.
Mudanças abruptas na fertilidade são associadas com uma grande descontinuidade
geomorfológica poderia representar o limite geográfico entre a Amazônia central e ocidental
Higgins et al. (2011). O reconhecimento deste e outros condicionantes da resposta das plantas a
gradientes ambientais representa um importante avanço em direção à generalização dos padrões
florísticos em escalas menores.
Lacunas no conhecimento e desafios para generalizações
O conhecimento sobre os padrões florísticos da Amazônia avançou muito nos últimos
anos. No entanto, nossa habilidade de responder perguntas simples como quantas espécies de
árvores existem na Amazônia, como elas estão distribuídas, onde essas espécies são raras e onde
são comuns ainda é muito limitada (ter Steege et al 2013). Árvores (incluindo palmeiras
arborescentes) representam entre 30-50% das espécies nas florestas da Amazônia (Balslev et al
1998) e apesar de serem o principal elemento estrutural das florestas, não são seu único
elemento. Os padrões florísticos entre diferentes famílias/formas de vida podem ser bastante
congruentes (Vormisto et al. 2000) porque os mesmos fatores ambientais estão na maioria das
vezes relacionados com a distribuição de diferentes grupos no mesmo local (Schietti et al 2014).
Grupos diferentes de plantas responderem ao mesmo fator não significa que respondam da
mesma forma. No primeiro capítulo desta tese (Emilio et al. 2014 – ARTIGO 1) eu e meus

5
colaboradores mostramos condições de solo restritivas para o desenvolvimento de raízes estão
negativamente relacionadas com a dominância (área basal) de árvores e positivamente
relacionadas com a dominância de palmeiras. Além disso, mostramos que razões diferentes
podem estar relacionadas com a resposta dos diferentes grupos; palmeiras são diretamente
afetadas pelas propriedades físicas do solo, enquanto a resposta das árvores às propriedades
físicas do solo é mediada pela dinâmica da floresta.
Condições ambientais não são independentes entre si e a compreensão dos processos
por trás dos padrões observados passa pelo entendimento sobre quais preditores ambientais são
importantes e por que. As propriedades físicas químicas e físicas dos solos são determinadas
pelo material de origem e grau de desenvolvimento pedogenético (Quesada et al 2010). A
pedogenese do solo está relacionada com clima e relevo que por sua vez também influenciam a
disponibilidade de água para as plantas. A disponibilidade de água está relacionada com a
estrutura da floresta (Jirka et al 2009). A estrutura do dossel determina a entrada de luz no sub-
bosque e controla a produtividade florestal em diferentes locais da Amazônia (Stark et al 2012).
Estrutura da vegetação e composição florística parecem estar ligadas aos mesmos fatores
ambientais através das escalas. Em escala local, os principais determinantes da estrutura da
vegetação são os mesmos fatores relacionados aos maiores eixos de variação na composição de
espécies nestes locais (Castilho et al 2006, Toledo et al 2011, Costa et al 2005, Kinupp &
Magnusson 2005, Schietti et al 2014) e o mesmo acontece em grande escala (Emilio et al 2010).
O entendimento dos padrões florísticos e estruturais das florestas da Amazônia tem sido
historicamente enviesado para características ambientais facilmente mensuradas (e.g. fertilidade
e textura dos solos), enquanto outras condições ambientais que requerem maior investimento
(e.g. hidrologia) tem sido amplamente negligenciadas. No segundo capítulo desta tese
analisamos padrões de riqueza e composição de espécies de palmeiras em escala regional em
relação ao modelo ambiental mais completo analisado até então que inclui todos preditores
ambientais identificados previamente como importantes para o grupo (Eiserhardt et al 2011).
Mais do que os padrões de diversidade em florestas tropicais, precisamos conhecer os
processos que geraram esses padrões para entender como as florestas vão responder a mudanças
naturais ou antrópicas. Ainda existe muita controvérsia a respeito dos mecanismos associados
com a origem e manutenção da biodiversidade em florestas tropicais. Isso por que diferentes
mecanismos podem ser importantes para evitar exclusão competitiva e permitir que um grande
número de espécies coexista (Wrigth 2002). A idéia de que os padrões de diversidade das
florestas tropicais somente poderiam ser gerados por nicho e seleção foi recentemente desafiada
pela proposição da teoria neutra (Hubbell 2001). Esta teoria propõe que muito da diversidade
em florestas tropicais pode ser explicada somente por limitação de dispersão e deriva ecológica,
sem levar em consideração processos relacionados a nicho ou seleção (Hubbell 2001, Rosindell

6
et al 2011). A teoria como originalmente proposta não ignora a existência de nicho e seleção,
mas prescreve uma menor importância ao efeito regulatório do nicho sobre a abundância
relativa e diversidade de espécies (Hubbell 2001). No terceiro capítulo desta tese, mostramos
que a riqueza local de palmeiras está fortemente relacionada com a sobreposição de nicho
hidrológico entre as espécies e que as palmeiras que compõem o pool regional de espécies estão
mais segregadas no nicho hidrológico do que o esperado pelo acaso (Emilio et al. 2013 –
Capitulo 3). Este capítulo discute a importância de eixos ambientais sutis para a riqueza,
coexistência e evolução do grupo na Amazônia e também para o entendimento dos processos de
origem e manutenção da biodiversidade em florestas tropicais.

7
OBJETIVOS
O principal objetivo desta tese foi contribuir para o entendimento dos padrões e
processos relacionados com a diversidade e processos ecossistêmicos na Amazônia. Os
objetivos de cada capítulo foram:
Capítulo 1: Determinar os fatores e processos relacionados com a partição do espaço por
palmeiras e árvores nas florestas da Amazônia.
Capítulo 2: Explorar a relação entre dominância, substituição e abundância relativa de espécies
de palmeiras a gradientes de solo, topografia, clima, hidrologia, estrutura da vegetação e
distúrbios naturais .
Capítulo 3: Testar hipóteses sobre os mecanismos que permitem a coexistência de espécies em
escala local e regional em florestas tropicais.

8
ARTIGO 1
Soil physical constraints as a limiting factor of palm and tree basal area in Amazonian
forests
EMILIO, T., QUESADA, C.A., COSTA, F. R. C., MAGNUSSON, W. E., SCHIETTI, J., FELDPAUSCH,
T. BRIENEN, R. J. W, BAKER, T. R., CHAVE, J. et. al. Plant Ecology and Diversity (Special Issue
Ecosystem Dynamics of Amazonian and Andean Forests) vol 7 (1): 2014.

9
Abstract
Background: Trees and arborescent palms adopt different rooting strategies and responses to
physical limitations imposed by soil structure, depth and anoxia. However, the implications of
these differences for understanding variation in the relative abundance of these groups have not
been explored.
Aims: We analysed the relationship between soil physical constraints and tree and palm basal
area to understand how the physical properties of soil are directly or indirectly related to the
structure and physiognomy of lowland Amazonian forests.
Methods: We analysed inventory data from 74 forest plots across Amazonia, from the
RAINFOR and PPBio networks for which basal area, stand turnover rates and soil data were
available. We related patterns of basal area to environmental variables in ordinary least squares
and quantile regression models.
Results: Soil physical properties predicted the upper limit for basal area of both trees and
palms. This relationship was direct for palms but mediated by forest turnover rates for trees.
Soil physical constraints alone explained up to 24% of palm basal area and, together with
rainfall, up to 18% of tree basal area. Tree basal area was greatest in forests with lower turnover
rates on well-structuredsoils, while palm basal area was high in weakly structured soils.
Conclusions: Our results show that palms and trees are associated with different soil physical
conditions. We suggest that adaptations of these life forms drive their responses to soil structure,
and thus shape the overall forest physiognomy of Amazonian forest vegetation.
Keywords: ecological limiting factors, life-forms, palm-dominated forests, quantile regression,
soil structure, tropical forest, vegetation types

10
Introduction
Amazonian forests play an important role in the global carbon cycle but how much
carbon is stored in these ecosystems is still uncertain. Variation in biomass is directly related to
variation in stand basal area and stand-level wood density. Mean stand-level wood density is
dependent both on species composition (Baker et al. 2004) and environmental factors (Patiño et
al. 2009), such as soil fertility and climate. The environmental correlates of basal area are less
clear. There is important site-to-site variability (Malhi et al. 2006) that appears to be less
correlated with broad-scale regional predictors than with local predictors such as disturbance or
the presence (or absence) of limiting soil properties.
Soil and climate have been widely investigated to understand forest structure and
composition in Amazonia (Laurance et al. 1999; Roggy et al. 1999; Malhi et al. 2006; ter Steege
et al. 2006; Quesada et al. 2012) and elsewhere (Paoli et al. 2007; Slik et al. 2010). Soil physical
conditions in particular, such as water-holding capacity, drainage, and physical structure, are
important factors that affect tree growth, mortality and floristic composition in the tropical
forests worldwide (Dietrich et al. 1996; Ferry et al. 2010; Gourlet-Fleury et al 2011; Quesada et
al. 2012). However, their influence in determining large-scale patterns of forest structure and
composition in the tropics is poorly known.
Structural dominance by palms (and other life forms, such as lianas and bamboos) has
been used in the Brazilian forest classification system (IBGE 2012) to distinguish forest types
(see Appendix 1, Emilio et al. 2010), and to develop improved allometric equations for biomass
calculation in the Brazilian Amazon (Nogueira et al. 2008). Palm-dominated forests cover 20%
of Brazilian Amazonia (IBGE 1998) and large extensions of other Amazonian countries. Given
this widespread occupation of forest by palms, understanding how palms vary in abundance
could help to better understand basal area and biomass variation across Amazonian forests. At a
single site in the Amazon, Castilho et al. (2006) reported that tree biomass was higher in well-
drained clay soils while arborescent palm biomass was higher in poorly drained, sand-rich soils.
This suggests that soil physical conditions may have different effects on these two plant life
forms. The aim of this study was to investigate the relationships between soil physical
properties and the basal area of both trees and palms across Amazonia.
In addition to the direct effect that soil physical properties may exert on plant roots, soil
physical constraints can also indirectly affect forest basal area by increasing turnover. Quesada
et al. (2012) showed that Amazonian forests have greater turnover rates where soil properties
constrain root development (e.g. shallow impediment layers, high bulk density, anoxic horizon).
At local scales, the proportion of stems that die uprooted or snapped off by other falling trees is
generally greater in sandy and waterlogged soils (Toledo et al. 2011). The dominant modes of

11
mortality may also vary depending on whether the plant is a tree or a palm. In Ecuador,
dicotyledoneous trees mostly died uprooted and snapped while arborescent palms mostly died
standing and snapped (Gale and Barfod 1999).
The differences in the response of plant life forms, such as palms and trees, to soil
physical properties and disturbance are likely to be related to differences in their physiological
and morphological adaptations, particularly growth strategies and the root system. Palms lack
vascular cambium and do not show secondary growth. To compensate, primary tissues
continually increase in their mechanical strength with gradual lignification of fibrous and
parenchymatous tissue, resulting in stronger stems as palm height increases (Tomlinson 2006).
The absence of secondary growth in palms may be advantageous against wind damage, but
prevents dormancy, implying that they must have special adaptations (e.g. aerenchyma,
pneumatophores) to deal with seasonally stressful conditions (Tomlinson 2006). In contrast,
cambial dormancy is a common strategy in many tree species (Zuidema et al. 2012) and allows
them to occupy seasonally unfavourable environments, such as seasonally dry or waterlogged
forests, with or without morphological adaptations to such conditions.
Palms and dicotyledonous trees also differ in their root systems. Trees develop roots
that can reach depths of up to 10 m to access water (Nepstad et al. 1994). The development of
deep roots provides mechanical stability and helps trees to prevent water deficit where soils are
deep and well-structured. Palms do not have extensive root systems, but they compensate this
disadvantage by developing high root water pressures (Davis 1961). This may confer a
competitive advantage in shallow or compacted soils. In soils that limit root development, trees
may be more susceptible to anchorage problems, especially if associated with steep topography
(Gale and Barfod 1999; Toledo et al. 2011). In contrast, palms are more stable than trees due to
their stem anatomy (Tomlinson 1990) that allows them to remain strongly anchored to the
ground, even without deep roots. In addition, palms have smaller canopies and large leaves
instead of woody branches. Palm leaves are less carbon expensive to rebuild than tree branches,
so their loss if hit by a falling branch or tree may be expected to have relatively minor impact on
the structure and stability of the plant, and its carbon balance. Hence, palms appear to be better
adapted to grow in highly dynamic forests.
In summary, we would expect that trees are at an advantage in deep, well-drained soils
where their extensive root systems provide good anchorage and are able to extensively exploit
soil resources. On the other hand, palms may outcompete trees in shallow, poorly drained soils,
since they may be able to cope better with water saturated soil and limited rooting space.
Therefore, one could expect that the responses of palms and trees to soil physical properties
shows opposite patterns, and this could result in a significant shift in the relative contribution of

12
trees and palms to forest structure across Amazonia as a function of soil properties. So far, no
attempt has been made to understand what could explain the relative contribution of arborescent
palms and trees to forest structure and physiognomy across Amazonia.
Here, we take advantage of a unique compilation of permanent study plots across
Amazonia to analyse the relationship between soil physical constraints and basal area of trees
and palms in order to better understand how soil physical limitations affect the structure and
physiognomy of Amazonian forests. We also explore the relationship among precipitation, soil
fertility and forest turnover and basal area variation in trees and palms.

13
Methods
Vegetation data
We compiled forest-structure data from the RAINFOR Forest Plots database (Lopez-Gonzalez et
al. 2011, downloaded from http://www.forestplots.net) and the PPBio database (Pezzini et al. 2012,
downloaded from http://ppbio.inpa.gov.br). We used data from 74 Amazonian plots that have both plant
and soil data. Most plots are 1 ha in area (see Table 1 for plot dimensions and data sources). In each of
these plots, all stems (trees and palms) with a diameter at breast height (DBH) ≥ 10 cm were measured and
identified to at least family level. The basal areas of trees and arborescent palms were calculated and used
as response variables in regression analyses.
Soil sampling and determination of chemical and physical properties
Soil sampling and analysis was undertaken by PPBio/HIDROVEG and RAINFOR projects (Malhi
et al. 2002), using equivalent protocols (PPBio/HIDROVEG: http://ppbio.inpa.gov.br/manuais;
RAINFOR: www.geog.leeds.ac.uk/projects/rainfor/projdocs.html). One soil pit was dug in the dominant
soil type, where soil descriptions were made. In addition, samples were taken at five to 10 complementary
points with a hand-held auger adapted to collect undisturbed soil samples (Eijkelkamp Agrisearch
Equipment BV, Giesbeek, The Netherlands). Sampling points followed a random stratified distribution so
as to obtain representative soil collections of each area. The soils were sampled up to 2 m deep, but
chemical data reported here are for surface samples only (0-30 cm), while the entire profile was considered
for soil physical properties. For a detailed description of the methods see Quesada et al. 2010).
Effective cation exchange capacity (IE) is used here as a proxy for general soil fertility since there are
strong relationships between IE (hereafter called fertility), soil P and total elemental composition (Quesada
et al. 2010). Samples were analysed for exchangeable cations by the silver-thiourea method (Pleysier and
Juo 1980), and the sum of concentrations for exchangeable Ca, Mg, K, Na and Al are reported.
Soil descriptions followed a standard protocol (Jahn et al. 2006), with special attention to the
measurement of effective soil depth, depth to C horizon (where possible), horizon distribution (i.e
identification and depth of visible soil diagnostic horizons), colour, distribution of rocks, concretions (i.e.
presence of coarse, hard material in the soil as petroplinthite, gravel, or other hardened material), ironstone
layers or other hardpans, redox features, root distribution, drainage capacity, soil hardness, soil structure
(i.e. aggregate distribution, type and stability), organic matter content and topographic position of the pit.
Three bulk density samples were collected from the pit walls at the same depths as for the soil samples (0 -
5, 5 -10, 10 - 20, 20 - 30, 30 - 50, 50 - 100, 100 - 150, 150 - 200 cm).

14
For quantifying the magnitude of root-limiting soil physical properties (hereafter soil physical
constraints), we used the same approach as in Quesada et al. (2010; 2012), assigning sequential scores to
different levels of physical limitations. This was done by reading the field descriptions of soil and
assigning each category a score (Table 2; see details in Quesada et al. 2010). These scored categories
provide information on topography, soil depth, soil structure and anoxic conditions in a semi-quantitative
form. To aid interpretation, here we inverted Quesada’s original scale for soil depth and structure, so that
shallower, poorly structured soils had lower scores, while deeper, well-structured soils had higher scores
(Table 2). We used each soil physical constraint characteristic as an independent explanatory variable in
regression analyses.

15
Table 1. Basal area (BA) and environmental data from 74 Amazonian forest plots used in this study.
Soil physical constraint scores
Plot code Latitude Longitude
Altitude Plot area Palm BA Palm
BA Tree BA
Tree
BA Soil
Topography
Soil Soil Precipitation
IE
Turnover
rates
(m a.s.l.) (ha) (m2 ha-1) (%) (m2 ha-1) (%) anoxia depth* structure* (mm year-1) Forest class (%)
ALF-01R -9.59830 -55.93690 269 1.00 0.18 2.42 7.27 97.58 0 0 4 1 2356 2.04 1.73
ALF-02R -9.57840 -55.91760 277 1.00 3.79 14.15 22.99 85.85 0 0 4 2 2356 2.23
ALM-01R -11.80000 -71.47000 400 2.00 4.04 13.41 26.08 86.59 2 2 4 1 2395 6.57 2.33
ALP-11R -3.95000 -73.43000 114 0.44 2.31 8.07 26.32 91.93 0 3 3 1 2784 3.62 TF-3 3.09
ALP-12R -3.95000 -73.44000 125 0.4 0.34 1.32 25.37 98.68 3 0 1 1 2784 2.46 TF-2 2.05
ALP-21R -3.95000 -73.44000 114 0.48 1.15 4.49 24.48 95.51 3 3 4 3 2784 0.4 TF-3 2.58
ALP-22R -3.95000 -73.44000 125 0.44 2.04 7.49 25.18 92.51 0 3 4 1 2784 5.13 TF-2 2.12
ALP-30R -3.95000 -73.43000 130 1.00 0.21 0.94 22.1 99.06 0 0 4 3 2784 0.49 TF-1 1.27
BOG-01R -0.70000 -76.48000 257 1.00 1.32 4.39 28.78 95.61 0 3 1 2 3133 12.47 2.65
BOG-02R -0.70000 -76.47000 284 1.00 1.94 7.74 23.12 92.26 0 4 1 2 3133 8.48 3.80
CAX-01R -1.74000 -51.46000 15 1.00 0.01 0.03 33 99.97 0 0 4 4 2206 1.81 TF-11 0.86
CAX-02R -1.74000 -51.46000 15 1.00 0.02 0.07 28.47 99.93 0 0 4 4 2206 1.56 TF-11 1.74
CAX-06R -1.72000 -51.46000 20 1.00 0.02 0.05 36.79 99.95 0 0 4 4 2206 2.28 TF-12 1.27
CRP-01R -14.54000 -61.50000 350 1.00 0 0.00 19.05 100.00 0 3 3 3 1364 7.66 3.03
CRP-02R -14.54000 -61.50000 350 1.00 0.18 0.76 23.62 99.24 0 2 3 3 1364 5.22 3.13
CUZ-01R -12.50000 -68.97000 190 1.00 1.75 7.44 21.77 92.56 2 0 3 0 2098 8.69
FAT-2 2.53
CUZ-02R -12.50000 -68.97000 190 1.00 4.01 14.10 24.42 85.90 2 0 3 0 2098 8.07
FAT-2 2.43
CUZ-03R -12.50000 -68.96000 190 1.00 3.22 12.62 22.29 87.38 3 0 3 0 2098 6.82 FAT-1 2.68
CUZ-04R -12.50000 -68.96000 190 1.00 3.96 14.27 23.8 85.73 2 0 3 0 2098 8.12
FAT-1 2.90
DKE-02P -2.95000 -59.94000 85 1.00 0.11 0.54 20.41 99.46 0 0 4 4 2197 1.75
DKE-03P -2.95000 -59.93000 100 1.00 0.04 0.17 23.39 99.83 0 0 4 3 2197 1.13
DOI-01R -10.57000 -68.31000 203 1.00 1.26 4.95 24.18 95.05 1 0 3 0 1902 2.92 2.00
DOI-02R -10.55000 -68.31000 203 1.00 0.06 0.38 15.54 99.62 3 0 2 0 1902 5.62 4.32
ELD-01R 6.11484 -61.41159 210 0.25 0 0.00 31.82 100.00 0 2 4 4 2522 1.11 0.91

16
Soil physical constraint scores
Plot code Latitude Longitude
Altitude Plot area Palm BA Palm
BA Tree BA
Tree
BA Soil
Topography
Soil Soil Precipitation
IE
Turnover
rates
(m a.s.l.) (ha) (m2 ha-1) (%) (m2 ha-1) (%) anoxia depth* structure* (mm year-1) Forest class (%)
HCC-22R -14.53000 -60.73000 747 1.00 2.22 8.79 23.04 91.21 0 0 3 3 1479 4.74 2.60
ELD-02R 6.11470 -61.41155 180 0.25 0 0.00 37.57 100.00 0 2 4 4 2522 0.76 0.54
ELD-03R 6.40059 -61.08833 380 0.25 0 0.00 16.64 100.00 0 2 0 1 2522 2.07 1.81
ELD-04R 6.08836 -61.40058 350 0.25 0 0.00 27.16 100.00 0 2 0 1 2522 3.27 1.36
FMH-01R 5.17000 -58.69000 98 1.00 0 0.00 42.35 100.00 0 0 4 3 2822 1.09 0.49
FMH-02R 5.17000 -58.69000 122 1.00 0 0.00 36.26 100.00 0 0 4 3 2822 1.00 1.28
FMH-03R 5.18000 -58.70000 115 1.00 0 0.00 31.92 100.00 0 0 4 3 2822 0.34 0.89
HCC-21R -14.53000 -60.74000 729 1.00 1.66 6.73 23.01 93.27 0 0 2 1 1479 7.68 3.76
IPM-82P -5.63000 -62.19000 67 1.00 1.71 8.00 19.66 92.00 1 0 3 2
2574 2.44
IPM-83P -5.64000 -62.18000 67 1.00 1.11 4.46 23.79 95.54 1 1 4 2
2574 3.29
IWO-03R 4.53000 -58.78000 100 1.00 0.04 0.11 35.28 99.89 0 0 4 3 2248 0.78 0.40
IWO-12R 4.73000 -58.72000 61 1.00 0.1 0.40 24.72 99.60 1 0 4 1 2405 1.80 2.91
JAS-02R -1.06981 -77.61631 452 1.00 2.18 8.31 24.05 91.69 0 3 2 2 3645 3.05 2.89
JAS-03R -1.07713 -77.60966 384 1.00 1.06 3.75 27.19 96.25 0 2 3 2 3645 2.66 2.11
JAS-04R -1.07323 -77.61223 430 1.00 2.39 6.55 34.11 93.45 0 3 2 2 3645 3.24 1.95
JEN-11R -4.88000 -73.63000 151 1.00 0.2 0.77 25.66 99.23 0 1 4 4 2642 1.98
TF-1 1.77
JEN-12R -4.90000 -73.63000 122 1.00 1.17 4.76 23.43 95.24 2 0 2 3 2642 1.45
TF-1 1.04
JEN-13R -4.92000 -73.53000 145 1.00 4.58 19.69 18.68 80.31 3 0 3 2 2642 1.78 2.06
LFB-01R -14.58000 -60.83000 245 1.00 0.95 3.56 25.72 96.44 0 0 4 4 1479 1.25 2.70
LFB-02R -14.58000 -60.83000 227 1.00 1.14 3.93 27.89 96.07 0 0 4 4 1479 1.52 2.73
LSL-01R -14.40000 -61.14000 189 1.00 0.4 2.21 17.68 97.79 4 0 2 3 1460 2.08 2.51
LSL-02R -14.40000 -61.14000 190 1.00 0.48 1.89 24.93 98.11 3 0 3 3 1460 2.55 1.39
MNU-03R -11.90000 -71.40000 312 2.00 4.08 14.63 23.8 85.37 0 0 2 0 2477 1.53 3.74
MNU-04R -11.91000 -71.40000 312 2.00 3.8 14.50 22.41 85.50 1 2 3 1 2477 3.63 2.52
MNU-05R -11.88000 -71.41000 312 2.00 2.09 6.24 31.42 93.76 3 0 4 1 2477 8.52 1.91

17
Soil physical constraint scores
Plot code Latitude Longitude
Altitude Plot area Palm BA Palm
BA Tree BA
Tree
BA Soil
Topography
Soil Soil Precipitation
IE
Turnover
rates
(m a.s.l.) (ha) (m2 ha-1) (%) (m2 ha-1) (%) anoxia depth* structure* (mm year-1) Forest class (%)
MNU-06R -11.89000 -71.40000 312 2.25 5.04 16.34 25.81 83.66 3 0 4 1 2477 8.59 2.40
MTH-01R -8.88000 -72.79000 246 1.00 2.92 14.96 16.6 85.04 0 4 3 2 1655 8.04
2.93
NOU-02R 4.08000 -52.67000 110 1.00 0.04 0.12 33.14 99.88 0 0 4 4 3280 1.57 1.27
NOU-10R 4.08000 -52.67000 110 1.00 0 0.00 23.23 100.00 0 0 4 4 3280 1.74 2.01
NOU-12R 4.08000 -52.67000 110 1.00 0.6 1.97 29.84 98.03 0 2 4 4 3280 2.13 1.85
NOU-17R 4.08000 -52.67000 110 1.00 0.47 1.31 35.33 98.69 0 2 3 2 3280 2.40 1.02
NOU-21R 4.08000 -52.67000 110 1.00 0.24 0.77 31.03 99.23 0 2 4 3 3280 1.32 1.27
POR-01R -10.82000 -68.78000 268 1.00 1.26 4.11 29.39 95.89 0 2 3 1 1720 1.41 2.01
POR-02R -10.80000 -68.77000 268 1.00 1.94 8.78 20.15 91.22 0 2 1 2 1720 1.32 2.61
SUC-01R -3.25000 -72.91000 107 1.00 1.09 3.92 26.75 96.08 1 3 4 2 2813 3.77 TF-1 2.12
SUC-02R -3.25000 -72.90000 98 1.00 0.7 2.53 26.93 97.47 0 4 4 1 2813 3.71 TF-1 2.64
SUC-03R -3.25000 -72.92000 118 1.00 0.03 0.11 26.62 99.89 3 0 3 1 2813 6.23 TF-1 2.31
TAM-01R -12.84000 -69.29000 205 1.00 6.66 23.58 21.58 76.42 0 1 4 1 2523 2.96 FAT-3 2.64
TAM-02R -12.83000 -69.29000 210 1.00 6.1 20.90 23.09 79.10 0 0 2 0 2391 3.56 FAT-3 2.01
TAM-04R -12.84000 -69.28000 210 0.42 2.18 7.13 28.41 92.87 3 0 3 1 2523 4.14 SW 2.67
TAM-05R -12.83000 -69.27000 220 1.00 0.5 1.90 25.78 98.10 1 0 3 1 2391 4.47 TF-2 2.61
TAM-06R -12.84000 -69.30000 200 1.00 7.5 22.45 25.91 77.55 1 3 3 0 2523 5.67 FAT-3 2.39
TAM-07R -12.83000 -69.26000 225 1.00 0.49 2.02 23.74 97.98 0 1 4 2 2391 3.38 TF-2 2.67
TIP-03R -0.64000 -76.15000 221 1.00 0.44 1.67 25.95 98.33 3 0 3 0 2987 7.83 3.30
YAN-01R -3.44000 -72.85000 132 1.00 0.64 2.18 28.77 97.82 1 3 4 1 2786 9.21 3.12
YAN-02R -3.43000 -72.84000 109 1.00 0.42 1.36 30.53 98.64 1 2 4 3 2786 5.72 1.65
ZAR-01R -4.01000 -69.91000 126 1.00 0.71 4.22 16.1 95.78 1 0 3 3 2837 0.71 1.14
ZAR-02R -4.00000 -69.90000 126 1.00 1.7 8.79 17.64 91.21 0 0 3 2 2837 3.51 1.10
ZAR-03R -3.99000 -69.90000 130 1.00 0.4 1.82 21.58 98.18 0 1 3 2 2762 1.93 1.41
ZAR-04R -3.99000 -69.91000 146 1.04 0.63 2.43 25.3 97.57 0 1 3 2 2762 2.60 1.22
* Soil depth and structure scores inverted from Quesada et al. (2010). p Data downloaded from http://ppbio.inpa.gov.br; R data downloaded from http:// www.forestplots.net.

18
Table 2. Soil physical constraint scores modified from Quesada et al. (2010).
Soil physical constraint rating categories Score1
(1) Effective soil depth (soil depth, hardpans)
Shallow soils (< 20 cm) 0
Less shallow (20 to 50 cm) 1
Hardpan or rock that allows vertical root growth; other soils between 50 and
100 cm deep.
2
Hardpan, rocks or C horizon ≥100 cm deep 3
Deep soils ≥150 cm 4
(2) Soil structure
Very dense, very hard, very compact, without aggregation, root restrictive 0
Dense, compact, little aggregation, lower root restriction 1
Hard, medium to high density and/or with weak or block like structure 2
Loose sand, slightly dense; well aggregated in sub angular blocks,
discontinuous pans
3
Good aggregation, friable, low density 4
(3) Topography
Flat 0° 0
Gently sloping 1° to 8° 1
Gently undulating 8° to 19 2
Steep 20° to 44° 3
Very steep >45°
4
(4) Anoxic conditions
Unsaturated conditions 0
Deep saturated zone (maximum of high saturation >100 cm deep); deep redox
features
1
Deep saturated zone (maximum of high saturation 50 cm deep); redox features 2
Seasonally flooded; soils with high clay content and very low porosity and/or
dominated by plinthite
3
Constantly flooded; patches of stagnated water 4 1 Soil depth and structure scores inverted from Quesada et al. (2010).

19
Forest turnover
Forest turnover was calculated as the proportion of stems (trees and palms combined) entering
and leaving the plot per year. Annual mortality and recruitment rates were estimated separately
using standard procedures, based on logarithmic models. These models assume a constant
probability of mortality and recruitment through each inventory period (Swaine et al. 1987;
Phillips et al. 2004), and they were corrected for census-interval following the recommendations
by Lewis et al. (2004). We then considered the mean value of mortality and recruitment over the
entire period as the forest turnover rate for each plot, which we present as a percentage of all
stems present.
Data analysis
We used ordinary least square regressions (OLS) to examine the relationships between
tree basal area, palm basal area, environmental predictor variables, and turnover rates.
Environmental variables included the soil chemical and physical properties described above,
and annual precipitation obtained from the interpolated WorldClim dataset (Hijmans et al.
2005), which varied from 1333 to 4113 mm year-1
across our study area. The interpolations of
WorldClim dataset for Amazonia are based on the few meteorological stations that are available
for this region (Hijmans et al. 2005). However, as the stations are well spaced, the interpolation
could well represent the large scale precipitation trends that we analysed.
To select the model that best explained tree and palm basal area variation, we carried
out an exhaustive search including all predictor variable combinations, using additive linear
models. Interactions between soil physical constraints, rainfall and soil fertility, were also
tested. Akaike’s Information Criterion (AIC) was adopted as a measure of goodness of fit. AIC
penalises parameter-rich models to prevent over-fitting. This procedure is preferable to
sequential searching protocols in avoiding Type-I error because the models are not explicitly
compared through statistical tests (MacNally 2000). We then ranked our 74 models from best
(i.e. lowest) to worst (i.e. highest) AIC value. The ΔAIC of a model is the difference between
the AIC of a model to that of the best model. Models with ΔAIC < 2 were considered as
informative as the best model and the importance of explanatory variables in these models was
determined according to their frequency of occurrence in the subset of the best models
(Richards 2005). After the best models were chosen, path analysis was used to determine the
direct and indirect effects of the environmental variables on palm and tree basal area.
Given that soil physical constraints are highly related to forest turnover, some authors
have as assumed a causal the relationship between them (Quesada et al. 2012). Nevertheless, to
untangle the complex relationships between soil properties, stem turnover and forest basal area,

20
simple direct relationships may not adequately describe the system, as both direct and indirect
effects may occur. Therefore, we also built a path model that included the best environmental
predictors selected by the ΔAIC criteria, combined with the turnover rate to better understand
the direct and indirect effects of soil physical properties on palm and tree basal area.
We performed quantile regressions (QR) in addition to OLS, as basal area variation was
not homogeneous in relation to the environmental variables in some cases. Quantile regression
(Koenker and Bassett 1978) is a method for estimating relationships between variables for all
portions of a probability distribution without ignoring any part of the data. This method is robust
to outliers and skewed distributions (Cade et al. 1999). In addition, fitting higher percentiles of
response variables as a function of the independent variable should estimate the upper limit set
by the measured independent factors. This approach was undertaken mainly because, if an
independent variable can be considered a limiting factor, the models estimated for the upper
quantiles should have better predictive values than OLS models (Cade and Noon 2003). To
evaluate for which cases QR should be a better predictive model than OLS, we carried out the
joint test of equality of slopes described by Koenker and Basset (1982). This test evaluates if the
slopes of QR and OLS differ from each other. If so, the distribution is heteroscedastic and the
QR model should be considered instead of the OLS model. We used the QR fitted for each
independent variable separately and the quantiles with tau = 0.25, tau = 0.50 and tau = 0.90, for
this test.
We also attempted to understand the variation in forest physiognomy in response to soil
physical constraints. We adopted the forest classification of Anderson et al. (2009), who used a
region-growing technique and non-supervised classification algorithm to classify forest plots
from Landsat 7/ETM+ and SRTM images and determine forest physiognomy at a local-scale
resolution, and a vegetation map provided by IBGE (1998) for the palm-dominated forests map
presented in Figure 4. The local scale forest classification was used only for small windows
surrounding the ALP, CAX, CUZ, JEN and TAM study areas (Table 1), as it could not be
generalised to other areas. As far as we know, there is no vegetation map available for the entire
Amazon with an appropriate resolution to allow us to distinguish palm-dominated from other
terra-firme forests across all study areas. The Brazilian RADAMBRASIL vegetation map
(Brasil 1978) is not useful to distinguish vegetation types at the local scale because only the
dominant vegetation classes at a scale of 1:250,000 were mapped (Emilio et al. 2010). For other
Amazonian countries, available vegetation maps are not comparable or the vegetation-class
resolution is too coarse. Anderson et al. (2009) distinguished seven forest types in the
RAINFOR sites, including one-third of the plots included here. For this study, we grouped
Anderson’s vegetation units into four classes: terra-firme forests where large palms do not
contribute greatly to the forest canopy (TF), terra-firme forests where large palms do contribute

21
greatly to the forest canopy(TFP), Mauritia swamps (SW), and forests over alluvial terraces
(FAT). There are few examples of the SW and FAT categories and it is difficult to formally test
the relationship between soil conditions and forest structure. Therefore, we only explored these
relationships graphically without use of formal statistical methods.
Statistical analyses were carried out by using the R statistical platform (R Development
Core Team 2011) and the quantreg package (Koenker 2011). Maps were prepared with ArcGis
9.0.
22
Results
In our dataset, trees accounted for most of the basal area in terra-firme Amazonian
forests (94 ± 6%). However, palms contributed up to 23% of basal area in some areas in the
western Amazon (Table 1) with Iriartea deltoidea being the dominant arborescent palm species;
Oenocarpus bataua dominated in the central Amazon and Guiana Shield.
Simple OLS regressions showed that palm and tree basal area exhibited different
responses to the same environmental variables (Figure 1). Tree basal area was significantly
positively related to soil depth and annual precipitation, while palm basal area showed no
relationship to these variables. Palm basal area was related to soil fertility (r2 = 0.10, P = 0.004)
while tree basal area did not show a significant relationship with soil fertility. Soil structure was
the only environmental variable significantly related to both tree and palm basal area, and it
defined the upper boundary of palm and tree basal area in opposite ways. Palms attained greater
total basal area in less structured soils while tree basal area was greater in better structured soils.
Soil structure alone explained up to 26% of the variance in palm basal area and up to 10% of the
variance in tree basal area in simple OLS regressions.
Figure 1. Simple relationships between basal area, soil physical properties and precipitation.
Solid lines represent mean values predicted by ordinary linear regression (OLS, which here also
coincide with the quantile regression, tau = 0.5). The dotted lines represent the values predicted
by the linear quantile regressions, tau = 0.25 and tau = 0.9. The same model (linearised

23
Gaussian in (c), and linear for the others) was adopted for the ordinary linear and quantile
regressions. Lines are shown only when the OLS model is significant at the 0.05 level. The r2-
and P-values of each OLS are presented at the top of each graph.
Multiple linear models showed essentially the same relationships as the simple OLS
models (Table 3). For palms, models including topography, soil depth and fertility were as
informative (ΔAIC<2) as the simple soil-structure model. The inclusion of other environmental
variables in the model for palm basal area only very weakly increased and, in some cases, even
decreased explanatory power. For trees, best models included soil structure, with the P-value for
this factor significant in almost all models. Precipitation was the second best variable in the tree
basal area model. Models that included both soil structure and precipitation explained up to 23%
of tree basal area variance. Topography and soil fertility did not contribute significantly to any
model.
24
Table 3. AIC-ranked linear regression models with ΔAIC<2. We evaluated 72 models, including
simple models of each explanatory variable (soil anoxia, soil depth, soil structure, annual
precipitation and fertility), all 57 combinations of the explanatory variables in additive models,
and five interaction models with precipitation and each of the other five explanatory variables. All
top-rated tree and palm models include soil structure and exclude soil anoxia.
Model R2 P AICc ΔAICc
palm BA ~ structure*** 0.28 <0.0001 190.90 0.00
palm BA ~ depthns+ structure*** 0.29 <0.0001 191.90 1.00
palm BA ~ topographyns+ structure*** 0.28 <0.0001 192.80 1.90
palm BA ~ structure*** + fertility ns 0.28 <0.0001 192.81 1.91
tree BA ~ depthns+ structure*+precipitation** 0.23 0.0003 200.48 0.00
tree BA ~ depthns+ structure* 0.14 0.0044 201.54 1.06
tree BA ~ depthns+ structure*+precipitation**+fertilityns 0.23 0.0008 202.32 1.84
***, P<0.0001; **, P<0.001; *, P<0.01 ; ns, P>0. 01
Palm basal area variation was heterogeneous along the soil structure axis (Figure 1).
This variation was not reduced significantly in the multiple OLS regressions by the addition of
soil anoxia, topography, soil fertility or precipitation as predictor variables (Table 3). Neither
the interactions between soil structure and precipitation nor between soil structure and soil
fertility was significantly related to palm basal area variation (P>0.1 for interaction term in all
models). Tree basal area was related to both soil structure and precipitation in the multiple OLS
regressions . Like palms, variation in tree basal area was heterogeneous along the soil-structure
axis and variation could not be explained by interactions between explanatory variables in the
multiple OLS regressions.
Soil structure explained a large fraction of the variation in stand turnover rates (r2 =
0.23, P <0.001). All low-turnover stands (0-2%) had a low proportion of palms and a high
proportion of trees (Figure 2). Tree basal area decreased significantly with increasing turnover
(r2 = 0.21, P<0.001), while palm basal area was greatest at intermediate levels of turnover (2-
3%). The relationship between palm basal area and turnover rates appeared to be non-linear and
a linearised Gaussian model provided a significant fit (r2 = 0.24, P<0.001). However, this non-
linear pattern was strongly driven by one plot (DOI-02) with particularly high disturbance rates.
When we exclude this plot, the quadratic term of the linearised Gaussian regression became
non-significant and linear regression provided a more appropriate fit to our data. The simple
OLS regression between palm basal area and stand turnover rate was significant (r2 = 0.11,
P=0.005) and suggested that palm basal area increased with increasing turnover rates.

25
Figure 2. Relationship between forest stand-turnover rates and (a) palm basal area and (b) tree
basal area for 60 forest plots for which turnover rate data was available. Dashed lines represent
values predicted by quantile regression (tau = 0.9).
A more complete picture of the relationship between basal area, soil structure and
turnover rate was obtained by path analysis (Figure 3). Palm basal area was not directly affected
by turnover rate, as the simple regressions above had suggested. When we accounted for the
effect of soil structure on turnover rates, the relationship between palm basal area and turnover
rate became non-significant. Conversely, tree basal area remained significantly related to
turnover rate, but the significant relation to soil structure was lost. Our path analysis showed
that the previously observed response of tree basal area to soil structure was indirect and
mediated by forest turnover rates which were, in turn, mediated by soil structure. Despite the
fact that palm and tree basal area presented opposite response patterns to soil structure and

26
turnover rates, our model showed that palm basal area was not significantly affected by tree
basal area.
Figure 3. Diagram of direct and indirect effects of soil structure and forest turnover on palm and
tree basal area. Arrows point to response variables. Standardised regression coefficients are
shown along the lines. Continuous lines indicate significant coefficients and dashed lines non-
significant ones.
At larger scales, the distribution of palm basal area at the plot level was congruent with
mapped large-scale forest physiognomies: plots with greater palm basal area occurred in and
around palm-dominated forests, while plots with lower palm basal area occurred mainly in
regions where mapped palm-dominated forests are uncommon (Figure 4a). At local scales,
physiognomies with high palm dominance occurred mainly over less structured soils (Figure
4b). The soils under alluvial terrace and Mauritia-dominated swamps were less structured than
those under terra-firme sites (Figure 4b). Higher soil structure variation was observed in terra-
firme forests, where soil structure varied from well-structured friable classes that do not impose
much resistance to root penetration to more root restrictive soils. In agreement with the results
suggested by our models, palm-dominated forests (forest over alluvial terraces, Mauritia-
dominated swamp, palm-dominated terra-firme) were mostly found on poorly structured soils
(Figure 4b). Although our models detected a relationship between tree basal area and soil depth,
there were no clear differences in soil depth between forest physiognomies.

27
Figure 4. (a) Spatial distribution of palm basal area in 74 forest plots, superimposed on the
Brazilian map of palm-dominated forests (modified from IBGE 1998). (b) Soil structure
variation between forest physiognomies for ALP, CAX, CUZ, JE and TAM sites (n = 23). Soil
structure index follows Quesada et al. (2010) and forest classification follows Anderson et al.
(2009). Lower values for the soil structure index indicate less structured soils (see Table 1 for a
complete description). FAT - forest over alluvial terrace, SW - Mauritia-dominated swamp,
TFP - palm-dominated terra-firme (Anderson’s TF 2 and 3), and TF - terra-firme forest.

28
Discussion
Basal area partitioning and soil physical constraints
The observed relationship between soil physical constraints and the partitioning of
forest basal area between trees and palms suggest that soil-structure constraints establish the
upper limit to the basal area of palms and trees in Amazonian terra-firme forests. Soil structure
was related in opposite ways to the basal area of trees and palms. In addition, the effect of soil
structure on basal area was direct for palms but mediated by forest turnover rates for trees.
Palm-dominated terra-firme forests occurred over less structured soils, while terra-firme forests
without canopy-palm dominance occurred more frequently over well-structured soils.
Identifying the specific role of different physical constraints imposed by soils and
topography on root development is difficult as geomorphology and soil conditions are related
throughout pedogenesis. For example, in the Amazon region, topography tends to vary
regionally, often following local geological history. Where dissected relief occurs, soils tend to
be rejuvenated by erosion and thus conditions associated with early pedogenetic development
prevail (i.e. limiting physical conditions such as high bulk density and shallow depth), as can be
found in the Andes foothills in Peru and Ecuador (BOG plots). Where more stable, flat
geomorphology dominates, soil conditions are determined by geological history. If the soils are
old and well-drained, a highly weathered soil will occur, such as those occurring on the plateaux
of the Manaus region in Central Amazonia (DKE plots). However, if sediments are young
and/or poorly drained, then undeveloped soils occur, as can be found at the Purus–Madeira
interfluvial zone (IPM plots). In addition to this general trend, there is large variation in soil
physical properties at smaller scales, resulting in a wealth of possible combinations to tease
apart the specific causal factors.
Mechanisms for basal area partitioning
Our best models consistently selected soil structure as a predictor of basal area, but not
the other variables or their interactions. At small scales (i.e. plot level) topography and soil
conditions interact and potentially increase the stress caused by limited anchorage and rooting
space. Other properties, such as soil structure, depth and hydrological properties also interact to
limit water movement and water availability. However, the relative importance of soil structure
compared to topography and soil anoxia in our final models suggests that the process underlying
the partitioning of basal area distribution between palms and trees may not be directly related to
drainage. Our results are more consistent with the hypothesis of self-maintaining forest dynamic
feedback mechanisms initiated by edaphic conditions, originally proposed by Quesada et al.
(2012). This hypothesis suggests that in forest stands where soils are deep and well-structured as

29
a result of millennia of soil weathering, lack of root anchorage will not shorten trees lifetimes
(Quesada et al 2012). Trees growing in these soil conditions are also on average taller
(Feldpausch et al. 2011), which may affect below-canopy light levels and palm abundance. In
contrast, in areas where soils are less developed (i.e., western Amazonia, see Quesada et al.
2010), they are usually less weathered and thus more fertile, but they also have physical
proprieties, such as shallow impediment layers, high bulk density, and anoxic horizons that
restrict root development and anchorage (Quesada et al. 2010). In these sites, mortality rates are
higher and disturbances more frequent, resulting in more dynamic forests. Also, trees are on
average shorter (Feldpausch et al. 2011), tend to grow faster as a result of the more fertile soils
and increased light availability from more open canopies, invest less in wood density, die faster
(Phillips et al. 2004), and are more likely to die broken or fallen than standing (Chao et al.
2009). This is in accordance with our data, which show that palm-dominated forests occur more
frequently in western and southern Amazonia (Figure 4) where soils show higher levels of soil
physical limitation to root development (Quesada et al. 2010) and forests have higher dynamism
(Phillips et al. 2004; Quesada et al. 2012). This finding suggests that, in these environments,
palm morphological adaptations may be more advantageous than those of trees. This means that
soil physical constrains may not only select for different tree growth strategies but also
influence life-form partitioning in Amazonian forests.
Plant functional strategies
While soil structure is an important limiting factor for both trees and palms,
morphological and physiological differences result in trees and palms reaching maximum basal
area at opposite ends of the soil structure gradient. The absence of secondary growth in palms
makes them more susceptible to vascular system disruption. Unlike trees, palms cannot build
new xylem vessels when embolism damages part of their vascular system (Tomlinson 1990).
Therefore, palms must adopt more conservative water-balance strategies, such as rapid stomatal
closure when evaporative demand is greater than the soil water content can supply (Sperry
1986; Renninger and Phillips 2010). This strategy may cause palms to grow slower than trees.
Annual mean adult growth in height varies between 0.08 and 0.8 m in palms (Henderson 2002).
We are not aware of studies that registered the growth in height for adult trees in tropical forest,
but juvenile tropical trees can grow in height between 0.7 to 1.5 m per year on average (Clark
and Clark 2001). This is equivalent to the mean annual juvenile growth rate of the palm specie
Euterpe precatoria Mart. (Zuidema 2000) that is one of the species with the highest adult
growth rates registered for Amazonian palms (Henderson 2002). This slower growth may result
in a competitive disadvantage for palms, so that trees, when not affected by unfavourable soil
conditions, can outperform palms. However, the unbranched crown architecture and hence small
canopy volume associated with high stem mechanical resistance will probably increase the

30
ability of palms to succeed in more dynamic places where soils are also less favourable for
trees.
Beyond the differences in life form, differences among species in functional strategies
could also help explain the observed differences in basal area. Some palm species may
outperform others in their ability to persist and thrive in areas of high turnover (Montufar et al.
2011). Iriartea deltoidea Ruiz & Pav., Attalea butyracea (Mutis ex L.f.) Wess.Boer,
Oenocarpus bataua Mart., Euterpe precatoria Mart., Socratea exorrhiza (Mart.) H.Wendl. and
Astrocaryum murumuru Wallace each contributed at least 10 times more to basal area than any
other palm species recorded in our plots. Four of these dominant species (I. deltoidea, O bataua,
E. precatoria and S. exorrhiza) develop stilt roots. The sparsely distributed stilt roots of S.
exorrhiza allow individuals to physically move across the forest floor - changing their original
rooting position as the plant grows – likely conferring an advantage to this species in a dynamic
environment by avoiding fallen trunks and by acquiring light (Bodley and Beanson 1980). In its
adult phase, the ability of S. exorrhiza to develop a second set of stilt roots may favour this
species, allowing it to re-emerge from coarse woody debris commonly present after disturbance
(Avalos 2004). The clumped stilt root architecture of E. precatoria, O. bataua and I. deltoidea
does not allow for that kind of disturbance avoidance. However, at least in the case of E.
precatoria, stilt roots improve trunk stability and may help the stem to develop extreme
‘slenderness’, with unusually high height-diameter relationships (Avalos and Otarola 2010). As
with buttresses in many trees, stilt roots in palms reduce effective bole length and therefore
reduce the risk of structural failure due to buckling (Young and Perkocha 1994). In shallow, less
structured and/or hydromorphic soils, the presence of stilt roots and buttresses thus help prevent
tree and palm uprooting. Deep roots can also provide anchorage, but shallow or hydromorphic
soils restrict the root growth and prevent their development. Stilt roots may therefore confer an
advantage to species with this adaptation over those species that rely only on deep roots for
anchorage. In addition, the ability of stilt-root palms to generate new adventitious roots at the
stem base (Tomlinson 2006) may allow these palms to obtain water and nutrients more
efficiently than buttressed trees in these environments.
Geographical patterns of palm dominance
Biogeography may also play an important role in palm-species distribution at large
spatial scales (Eiserhardt et al. 2011) and also in overall palm basal area in each region.
Biogeographical factors may also interact with soil factorseven in the absence of clear
biogeographical boundaries for Amazonian palms. The species pool of palms, soil constraints
and disturbance regime in each region should interact to define the relative contribution of
palms to overall forest basal area. In our study plots, Iriartea deltoidea and Attalea butyracea

31
were the most abundant arborescent palm species, so it is not surprising that the spatial pattern
of palm basal area distribution shown here substantially coincides with the spatial distribution of
these two species. These two species were very abundant in our study plots probably because
our survey effort was concentrated along the periphery of the Amazon basin. Along the eastern
and northern edges of the Amazon basin, oligarchic forests dominated by other palm species
occur. Euterpe oleracea stands are common over fluvisols in the Amazonian estuaries of Pará
and Amapá states in Brazil, Attalea speciosa stands occur near to the Amazon borders in the
Brazilian states of Maranhão (north), Piauí (north-east), and Goiás (central Brazil) in forest sites
subject to intensive disturbance, Oenocarpus bataua forms extensive aggregations in seasonal
swamp forests on gleyic podzols in central and western Amazonia and dense stands of Mauritia
flexuosa occur over dystric histosols of the Orinoco, Ucayali and Marañon Rivers (Peters et al.
1989). All these oligarchic forests are associated with young (fluvisols, histosol), low physical
quality (gleyic podzol) soils or high disturbance forests, consistent with our hypothesis that poor
soil-structure and more dynamic forests lead to higher palm basal area. Furthermore, our data
also show that, within the same region, greater palm basal area is usually attained on the more
poorly structured soils (Table 1). Together, these data lead us to suggest that, even though
different palm species may be dominant in regions with distinct species pools and
biogeographical history, palm dominance is also affected by local soil physical constraints.

32
Conclusions
Trees attained highest basal area in deep, well-structured soils that experienced high
rainfall. On the other hand, trees may fail to persist in all available physical space in areas where
limiting soil characteristics occur, making space for other life forms. Our study indicates that
palms are an important life-form and they occupy forest space where soils are less developed
and less structured. In order to understand the complex puzzle of variation in forest structure
across the vast Amazon Basin and beyond, we must identify the various potential environmental
and historical controls on forest ecosystems. Our study identified one piece of this puzzle by
demonstrating that (1) soil physical constraints establish the upper bound for palm and tree basal
area, (2) life forms with contrasting rooting strategies, such as palms and trees, achieve greater
basal area at opposite ends of the soil-structure gradient, (3) forest dynamism may be reflected
by the differences between palm and tree basal area, and (4) distinct combinations of palm and
tree basal areas imposed by soil structure and/or disturbance regimes may be large enough to be
observed in forest physiognomy. What remains to be understood is what determines the
variation in basal area below the limits imposed by soil physical constraints, and how other life
forms, such as herbs, bamboos and lianas deal with soil-rainfall environmental-niche envelopes.
A more complete understanding of this will help develop more realistic models of forest
response to changing land use and climatethat take into account the fact that there are more than
just trees and rainfall in Amazonian forests.

33
Acknowledgements
The National Council for Scientific and Technological Development (CNPq) awarded stipends
to TE, and a major grant from the Gordon and Betty Moore Foundation to RAINFOR supported
collection of much of the data analysed here. Significant funding for fieldwork was also
received from NERC-TROBIT, EU, AMAZONICA, CNPq Universal, CNPq/FAPEAM
PRONEX, PPBio Amazônia oriental and CNPq/FAPESP/FAPEAM HIDROVEG project. OP is
supported by the European Research Council project ‘Tropical Forests in the Changing Earth
System’. We thank the many field workers who collected plant and soil data from the 74
RAINFOR and PPBio study sites distributed across eight countries. Data repositories for PPBio
sites are maintained by PPBio and CENBAM. Our special thanks to S. Almeida, L. Arroyo, J.
G. Barroso, V. Bezard, L. Blanc, P. Castro, W. Castro, F. Cornejo, C. Czimczik, A. Etienne, R.
Farias, S. Fauset, G. van der Heijden, F. Kwasie, A. de la Fuente, B. Leudet de la Vallee, J.
Lloyd, B. Michel, D. Moura de Freitas, P. Naisoo, O. N’Gwete, E.-A. Nicolini, T. Paine, M. C.
Penuela-Mora, A. Roopsind, E. Rutishauser, R. Sante, D. Sasaki, G. da Silva Henicka, G. B. da
Silva Oliveira, J. Teran Aguilar and R. Vásquez who participated in data collection in many
sites and to G. López-Gonzalez for her work curating and managing the ForestPlots database.
We also thank the Flora Program at the Fundação Ecológica Cristalino, Instituto Nacional de
Pesquisas da Amazônia, Medellin Botanical Garden, Museu Goeldi, National University of
Colombia, and University of Acre for their support of field teams and their activities. This
manuscript was partly developed during the 2011 RAINFOR (Gordon and Betty Moore
Foundation-UFAC) workshop in Rio Branco, Acre, Brazil. We thank C. L. Bechtoldt for help
with English revisions.

34
Notes on contributors
Thaise Emilio is a Ph.D. student, working with plant species and vegetation distribution across
Amazonia. Her research interests include palms and how environmental conditions drive their
distribution and abundance.
Carlos A. Quesada is a post-doctoral research associate. His research interests include
biogeochemical cycles, Amazonian soils and their interaction with forest structure and
dynamics.
Flávia Costa is a researcher working on the ecological determinants of plant species and
community distributions, and anthropogenic influences on plant communities.
William Magnusson studies the ecological and evolutionary determinants of Amazonian
organisms.
Juliana Schietti is a Ph.D. candidate. Her research interests focus on understanding tropical
forest structure and functioning and their relations with soil hydrology and climate.
Ted Feldpausch’s research interests include the ecology of tropical forests and savannas; effects
of global change on forest and savanna composition, structure and carbon accumulation; land-
use change, forest disturbance and recovery.
Roel J.W. Brienen is a researcher who is broadly interested in tropical forest dynamics and
impacts of global change on tropical forest functioning.
Tim Baker's research focuses on tropical forests and aims to understand past, current, and future
patterns of carbon storage and biodiversity in these ecosystems.
Jerome Chave is a senior staff member and is the science coordinator of the Nouragues research
station. His field of scientific expertise is spatial patterns of plant diversity in Amazonia and
biogeochemical cycles in tropical rain forests.
Esteban Alvarez is a Ph.D. student and is currently working with forest diversity, biomass, and
dynamics in complex environmental gradients in Colombia.
Alejandro Araujo Murakami is a researcher focusing on Bolivia's floristic diversity, with a
particular interest in ethnobotany and forest ecology. He has worked in Amazonian ecosystems,
Chaco-Amazonia transitions (Chiquitanos), and Andean forests.

35
Olaf Bánki is a conservation biologist and forest ecologist with an interest in drivers of change
in forest composition and tree diversity along ecological and geographical gradients in the
Guiana Shield.
Carolina V. Castilho is a biologist interested in long-term ecological studies, and uses
permanent plots to evaluate changes in biomass, structure, and tree species composition in
tropical forests.
Euridice Honorio is a Ph.D. student and her research focuses on tropical plant taxonomy in Peru
and she is currently interested in phylogeographic patterns of Amazonian trees.
Tim Killeen is a conservation biologist.
Yadvinder Malhi is a professor. His research interests focus on understanding the ecology and
functioning of tropical forests worldwide, and their interactions with climate change.
Erick M. Oblitas Mendoza has been studying the carbon stocks of Amazonian soils. He is
currently looking at carbon stocks along an altitudinal gradient from the Andes to the Amazon.
Abel Monteagudo Mendoza was a M.Sc. student funded by the Amazon Forest Inventory
Network (RAINFOR) at the time of the study; currently he is working on a project to
understand carbon balance in the Amazon. He is particularly interested in the study of the
distribution and diversity of trees in the Amazon.
David A. Neill’s research interests include taxonomic studies of the flora of Ecuador,
particularly in the Amazon and Cordillera del Cóndor regions, and quantitative inventories of
forest composition and structure in one-hectare inventory plots, with a focus on examining
relationships between forest floristic composition, structure and dynamics and geological
substrate and soil characteristics.
Germaine Alexander Parada is currently working on floristic inventories of Andean forests in
Santa Cruz, Bolivia. He is interested in the ecology of the Amazon rainforest and the Andes in
general.
Armando Torres-Lezama is a forester. His main research interests include sustainable rural
development and tropical forest dynamics.
Hirma Ramírez-Angulo’s main research interests include the dynamics of tropical forests, with
a focus on the application of simulation models to predict forest dynamics.

36
Michael Schwarz is a M.Sc. student. His research interests include climate change and tropical
forests, climate mitigation in developing countries, and climate project finance schemes like
REDD and CDM.
Marcos Silveira has been working with plant and forest ecology, with a special interest in
factors driving species composition.
Hans ter Steege is a senior researcher and he works on tree alpha- and beta-diversity in the
Amazon and Guiana Shield and is interested in how local and regional processes drive diversity.
John Terborgh is a research professor. For 36 years, he has operated a research station in the
Manu National Park, Peru where Peruvian and international scientists study a wide range of
basic and applied problems. His current interests lie in the field of plant-animal interactions and
the mechanisms that sustain the high diversity of tropical tree communities.
Emilio Vilanova’s research interests include tropical forest dynamics, with an emphasis on
biomass and carbon estimations, and options for sustainable management of tropical forests.
Oliver Phillips co-ordinates the RAINFOR project. His long-term research goal is to understand
the dynamics of carbon and biodiversity across the world’s tropical forests, how these change
with our changing climate, and how they may feed back on the whole planet.

37
References
Anderson LO, Malhi Y, Ladle RJ, Aragao LEOC, Shimabukuro Y, Phillips O, Baker, TR, Costa
ACL, Espejo JS, Higuchi N, Laurance WF, et al. 2009. Influence of landscape heterogeneity on
spatial patterns of wood productivity, wood specific density and above ground biomass in
Amazonia. Biogesciences 6:1883-1902.
Avalos G. 2004. Production of a second set of stilt roots in arborescent palms: A solution to a
puzzle. Palms 48:83-85.
Avalos G, Otárola MF. 2010. Allometry and stilt root structure of the neotropical palm Euterpe
precatoria (Arecaceae) across sites and successional stages. American Journal of Botany
97:388-394.
Baker TR, Phillips OL, Malhi Y, Almeida S, Arroyo L, Di Fiore A, Erwin T, Killeen TJ,
Laurance SG, Laurance WF, et al. 2004. Variation in wood density determines spatial patterns
in Amazonian forest biomass. Global Change Biology 10:545-562.
Bodley JH, Benson FC. 1980. Stilt-Root walking by and Iriarteoid palm in the peruvian
Amazon. Biotropica 12:67-71.
Brasil. 1978. Projeto RADAMBRASIL. Geologia, geomorfologia, pedologia, vegetação e uso
potencial da terra. Rio de Janeiro (Brazil): Departamento Nacional de Produção Mineral.Cade
BS, Noon BR. 2003. A gentle introduction to quantile regression for ecologists. Frontiers in
Ecology and the Environment 1:412-420.
Cade BS, Terrell JW, Schroeder R. 1999. Estimating effects of limiting factors with regression
quantiles. Ecology 80:311-323.
Castilho CVD, Magnusson WE, R Nazare O de A, Luizao RCC, Luizao FJ, Lima AP, Higuchi
N. 2006. Variation in aboveground tree live biomass in a central Amazonian forest: Effects of
soil and topography. Forest Ecology and Management 234:85-96.
Clark DA, Clark DB. 2001. Getting the canopy: tree height growth in a neotropical rain forest.
Ecology 82:1460-1472.
Chao K-J, Phillips O.L., Monteagudo A., Torres-Lezama A., and Vásquez-Martínez R. (2009)
How do trees die? Mode of death in northern Amazonia. Journal of Vegetation Science 20: 260–
268.
Davis TA. 1961. High Root-Pressures in Palms. Nature 192:277-278.

38
Dietrich WE, Windsor DM, Dunne T. 1996. Geology, climate and hydrology of Barro Colorado
Island. In: Leigh EG, Rand AS, Windsor DM, editors. The Ecology of a Tropical Rain Forest:
Seasonal Rhythms and Long Term Changes. 2nd ed. Washington DC: Smithsonian Institution
Press. pp. 101-108.
Eiserhardt WL, Svenning J-C, Kissling WD, Balslev H. 2011. Geographical ecology of the
palms (Arecaceae): determinants of diversity and distributions across spatial scales. Annals of
Botany 108:1391-1416.
Emilio T, Nelson BW, Schietti J, Desmoulière SJ-M, Espírito Santo HMV, Costa FRC. 2010.
Assessing the relationship between forest types and canopy tree beta diversity in Amazonia.
Ecography 33:738-747.
Feldpausch TR, Banin L, Phillips OL, Baker TR, Lewis SL, Quesada CA, Affum-Baffoe K,
Arets EJMM, Berry NJ, Bird M, et al. 2011. Height-diameter allometry of tropical forest trees.
Biogeosciences 8:1081-1106.
Ferry B, Morneau F, Bontemps J –D., Blanc L, Freycon V. 2010. Higher treefall rates on slopes
and waterlogged soils result in lower stand biomass and productivity in a tropical rain forest.
Journal of Ecology 98:106-116.
Gale N, Barford AS. 1999. Canopy tree mode of death in western Ecuadorian forests. Journal of
Tropical Ecology 15:415-436.
Gourlet-Fleury S, Rossi V, Rejou-mechain M, Freycon V, Fayolle A, Saint-André L, Cornu G,
Gérard J, Sarrailh J-Michel, Flores O, et al. 2011. Environmental filtering of dense-wooded
species controls above-ground biomass stored in African moist forests. Journal of Ecology
99:981–990. Henderson A. 2002. Evolution and Ecology of Palms. Bronx: The New York
Botanical Garden Press
Hijmans RJ, Cameron SE, Parra JL, Jones PG, Jarvis A. 2005. Very high resolution interpolated
climate surfaces for global land areas. International Journal of Climatology 25:1965-
1978.IBGE. 1998. Recursos Naturais e Meio Ambiente: Uma visão do Brasil.
IBGE. 2012. Manual Técnico da Vegetação Brasileira. 2nd edition. Rio de Janeiro (Brazil):
Instituto Brasileiro de Geografia e Estatística: (Manuais técnicos em geociências Series; vol 1)
Jahn R, Blume H-P, Asio VB, Spaargaren O, Schad P. 2006. Guidelines for soil description.
Rome
Koenker R, Basset G. 1982. Robust Tests for Heteroscedasticity based on Regression Quantiles.
Econometrica 50:43-61.

39
Koenker R, Basset G. 1978. Regression Quantiles. Econometrica 46:33-50.
Koenker R. 2011. quantreg: Quantile Regression. Available from: http://cran.r-
project.org/package=quantreg
Laurance WF, Fearnside PM, Laurance SG, Delamonica P, Lovejoy TE, Rankin-de Merona JM,
Chambers JQ, Gascon C. 1999. Relationship between soils and Amazon forest biomass: a
landscape-scale study. Forest Ecology and Management 118:127-138.
Lewis SL, Phillips OL, Sheil D, Vinceti B, Baker TR, Brown S, Graham AW, Higuchi N,
Hilbert DW, Laurance WF, et al. 2004. Tropical forest tree mortality, recruitment and turnover
rates: calculation, interpretation and comparison when census intervals vary. Journal of Ecology
92:929-944.
Lopez-Gonzalez, G, Lewis, S L, Burkitt, M and Phillips, OL. 2011. ForestPlots.net: a web
application and research tool to manage and analyse tropical forest plot data. Journal of
Vegetation Science 22: 610–613.
Lopez-Gonzalez, G., Lewis, S.L., Phillips, O.L., Burkitt, M. Forest Plots Database.
www.forestplots.net. Date of extraction [18,06,2012]
Mac Nally R. 2000. Regression and model-building in conservation biology, biogeography and
ecology: The distinction between – and reconciliation of – “predictive” and “explanatory”
models. Biodiversity & Conservation 8:655-671.
Malhi Y, Phillips OL, Lloyd J, Baker T, Wright J, Almeida S, Arroyo L, Frederiksen T, Grace J,
Higuchi N, et al. 2002. An international network to monitor the structure, composition and
dynamics of Amazonian forests (RAINFOR). Journal of Vegetation Science 13:439-450.
Malhi Y, Wood D, Baker TR, Wright J, Phillips OL, Cochrane T, Meir P, Chave J, Almeida S,
Arroyo L, et al. 2006. The regional variation of aboveground live biomass in old-growth
Amazonian forests. Global Change Biology 12:1107-1138.
Montúfar R, Anthelme F, Pintaud J-C, Balslev H. 2011. Disturbance and Resilience in Tropical
American Palm Populations and Communities. The Botanical Review 77:426-461.
Nepstad DC, Carvalho CR, Davison EA, Jipp PH, Lefebvre PA, Negreiros GH, Silva ED, Stone
TA, Trumbire SE, Vieira S. 1994. The role of deep roots in the hydrological and carbon cycles
of Amazonian forests and pastures. Nature 372:666-669.

40
Nogueira EM, Fearnside PM, Nelson BW, Barbosa RI, Keizer EWH. 2008. Estimates of forest
biomass in the Brazilian Amazon: New allometric equations and adjustments to biomass from
wood-volume inventories. Forest Ecology and Management 256:1853-1867.
Paoli GD, Curran LM, Slik JWF. 2007. Soil nutrients affect spatial patterns of aboveground
biomass and emergent tree density in southwestern Borneo. Oecologia 155:287-299.
Patiño S, Lloyd J, Paiva R, Baker TR, Quesada CA, Mercado LM, Schmerler J, Schwarz M,
Santos AJB, Aguilar A, et al. 2009. Branch xylem density variations across the Amazon Basin.
Biogeosciences 6:545-568.
Peters CM, Balick MJ, Kahn F, Anderson AB, Peters CM, Kahn F, Anderson AB. 1989.
Oligarchic forests of economic plants in Amazonia: Utilization and conservation of an important
tropical resource. Conservation Biology 3:342-349.
Pezzini FF, Hendrigo PHA de M, Oliveira DMS de, Amorim RXD, Figueiredo FOG de,
Drucker DP, Rodrigues FR de O, Zuquim G, Emilio T, Costa FRC, et al. (2012). The Brazilian
Program for Biodiversity Research ( PPBio ) Information System. Biodiversity & Ecology 4:
265–274.
Phillips OL, Baker TR, Arroyo L, Higuchi N, Killeen TJ, Laurance WF, Lewis SL, Lloyd J,
Malhi Y, Monteagudo A, et al. 2004. Pattern and process in Amazon tree turnover, 1976-2001.
Philosophical transactions of the Royal Society of London. Series B, Biological Sciences
359:381-407.
Pleysier JL, Juo ASR. 1980. A single-extraction method using silver-thiourea for measuring
exchangeable cations and effective CEC in soils with variable charges. Soil Science 129:205-
211.
Programa de Pesquisa em Biodiversicade (PPBio). 2012. Repositório de dados do PPBio.
http://ppbio.inpa.gov.br. Date of extraction [18,06,2012]
Quesada CA, Lloyd J, Schwarz M, Patiño S, Baker TR, Czimczik C, Fyllas NM, Martinelli L,
Nardoto GB, Schmerler J, et al. 2010. Variations in chemical and physical properties of Amazon
forest soils in relation to their genesis. Biogeosciences 7:1515-1541.
Quesada CA, Phillips OL, Schwarz M, Czimczik CI, Baker TR, Patiño S, Fyllas NM, Hodnett
MG, Herrera R, Almeida S, et al. 2012. Basin-wide variations in Amazon forest structure and
function are mediated by both soils and climate. Biogeosciences 9: 2203-2246.
41
R Development Core Team. 2011. R: A language and environment for statistical computing.
Available from: http://www.r-project.org/
Renninger HJ, Phillips N. 2010. Wet- vs . Dry-Season Transpiration in an Amazonian Rain
Forest Palm Iriartea deltoidea. Biotropica 42:470-478.
Richards SA. 2005. Testing ecological theory using the information-theoretic approach:
examples and cautionary results. Ecology 86:2805-2814.
Roggy JC, Prevost MF, Garbaye J, Domenach AM. 1999. Nitrogen cycling in the tropical
rainforest of French Guiana: Comparison of two sites with contrasting soil types 15N. Journal of
Tropical Ecology 15:1-22.
Slik JWF, Aiba S-I, Brearley FQ, Cannon CH, Forshed O, Kitayama K, Nagamasu H, Nilus R,
Payne J, Paoli G, et al. 2010. Environmental correlates of tree biomass, basal area, wood
specific gravity and stem density gradients in Borneo’s tropical forests. Global Ecology and
Biogeography 19:50-60.
Sperry JS. 1986. Relationship of xylem embolism to xylem pressure potential, relationship
stomatal closure, and shoot morphology in the palm Rhapis. Plant Physiology 80:110-116.
Swaine MD, Liebermanf D, Putzj FE. 1987. The dynamics of tree populations in tropical forest:
a review. Journal of Tropical Ecology 3: 359-366.
ter Steege H, Pitman NCA, Phillips OL, Chave J, Sabatier D, Duque A, Molino J-F, Prevost M-
F, Spichiger R, Castellanos H, et al. 2006. Continental-scale patterns of canopy tree composition
and function across Amazonia. Nature 443:444-447.
Toledo JJ de, Magnusson WE, Castilho CV, Nascimento HEMM. 2011. Tree mode of death in
Central Amazonia: Effects of soil and topography on tree mortality associated with storm
disturbances. Forest Ecology and Management 263:253-261.
Tomlinson PB. 1990. The structural biology of palms. New York: Oxford University Press
Tomlinson PB. 2006. The uniqueness of palms. Botanical Journal of the Linnean Society 151:5-
14.
Young TP, Perkocha V. 1994. Treefalls, Crown Asymmetry, and Buttresses. Journal of Ecology
82:319-324.
Zuidema PA. 2000. Demography of exploited tree species in the Bolivian Amazon. Riberira
Alta (Bolivia): PROMAB (Scientific series; vol 2)Zuidema PA, Brienen RJW, Schöngart J.

42
2012. Tropical forest warming: looking backwards for more insights. Trends in Ecology &
Evolution 23:11-12.

43
ARTIGO 2
Species abundance changes along environmental gradients drive palm floristic variation in
lowland Amazonian forests. EMILIO, T., COSTA, F. R. C, SCHIETTI, J., PINTO, J. L. P. V.,
MOULATLET, G., MAGNUSSON, W. E. & TOMASELLA, J. Manuscrito em preparação para Journal
of Ecology

44
Summary
1. Most tropical plant communities have some degree of dominance, as recognized in the
S-shape of relative species abundance plots. Despite the recognition of the importance
of dominance for floristic composition in megadiverse tropical forests, the mechanisms
are poorly understood. Moreover, floristic variation patterns and associations to
environmental gradients are usually described without recognition of the influence of
large variations in species abundance for subtle and abrupt changes.
2. In order to understand the roles of dominant species in generating floristic variation
responses to the environment and possible causes of dominance, we used the tropical
palm family as model. From palm inventory data we described patterns of species
turnover, relative abundance and individual species distribution in relation to climate,
hydrology, soil chemistry, vegetation structure, topography and natural disturbance
regime. Additionally, we explore the causes of dominance in our species pool by
relating dominance to environmental range and population structure.
3. Sharp boundaries in composition were related only with the occurrence of prolonged
flood in our dataset. The majority of species found in inundated forest are found in low
abundance in non-inundated forests and exclusive species are rare. Within non-
inundated forests, differences in species turnover and relative abundance are related to
different environmental gradients, but both are strongly related to soil fertility and
hydrology.
4. A strong dominance pattern was detected with nearly 20% of the species accounting for
90% of the individuals. Dominant species are spread within varying growth forms and
are related to different sets of environmental conditions. Surprisingly, dominant species
do not have wider environmental ranges, but intermediate ones. Dominance is sustained
by a proportionally higher number of juveniles and dominant species may not be able to
keep large populations in both extremes of the environmental gradients.

45
5. Synthesis. Variation in abundance may be the main cause of abrupt and subtle floristic
variations even at regional scales where species turnover is expected to be high. Ability
to occupy a wider range of environments does not guarantee that species will become
dominant. To become dominant species have to combine this attribute with others (e.g.
high recruitment success) that allow them to sustain large populations along most of
their distribution.
Key-words. dominance, floristic variation, environmental range, soil, hydrology, disturbance,
vegetation structure, Lepidocaryum tenue, Arecaceae, Tropical forests

46
Introduction
The relationship between abundance, distribution and environmental range of species was early
recognized. The nature of this relationship was generalized by Brown (1984) who linked local
abundance with species range by showing that common species will present a wider
environmental range than rare ones. One of the predictions of this theory is that within species,
the population density tends to be greatest in the center of its range thus resulting in two
expectations. First, local abundance will not be related to species range when discontinuous
changes in one environmental variable abruptly change its abundance. Second, local abundance
will not be related to species range when more subtle environmental patchiness causes
multimodal (i.e. with more that one abundance peak) patterns of abundance.
Not surprisingly, these two exceptions are currently recognized as the drivers of floristic
variation in tropical forests in Amazonia and elsewhere. Abrupt changes in floristic composition
are related to discontinuities in environmental conditions (Higgins et al 2010) and continuous
changes with more subtle environmental heterogeneity (Tuomisto et al. 1995, Svenning et al
2001, Condit et al. 2002, Tuomisto et al. 2003). Despite obvious links between the two,
mechanisms underlying floristic patterns and species abundance variation are not well
understood for Amazonian forests, as demonstrated by the decade long debate over the
existence of oligarchies on Amazonian tree communities (Pitman et al 2013). Pitman and co-
workers (2001) challenged tropical forest ecologists showing that in sites that harbor more than
thousands of species, most of the trees belong to a small set of species that are common among
sites that are as far as 1400 kilometers. Following this finding, many criticisms were raised, but
some important hypotheses about their causes were not properly tested yet (Pitman et al 2013).
The main criticism of the previous tests of range-abundance hypothesis is that the range of
species along edaphic and topographic gradients does not necessarily represent the complete
environmental range of these species (Pitman et al 2013). While this hypothesis is not subjected
to robust tests, the mechanisms linking individual species abundance variation to floristic
composition in megadiverse forests will be unclear.

47
There is no easy explanation for why some species dominate over others in a forest that harbor
thousands of locally co-occuring species (Duivenvooden et al 1994, Balslev et al 1998) and
more than 10 thousand tree species in the entire basin (Hubbell et al. 2008, ter Steege et al
2013). Classical monodominance (i.e. > 60% of canopy-level trees belonging to the same
species) in tropical forests is hypothesized to be attained when a group of traits linked with
positive feedbacks in abundance (i.e. the occurrence of a trait will increase the advantage of
other trait and species abundance) occur together under low exogenous disturbance conditions
(Peh et al. 2010). On the other hand, high number of coexisting species in tropical forests is a
result of different mechanisms acting to avoid competitive exclusion and dominance by few
species (Wright 2002). It is likely that the conciliation of those opposite forces will result in the
broadly recognized corollary “common species are rare and rare species are common” found in
the relative species abundance distribution of many tropical forests (Hubbell et al 2001).
From the ten most hyper-dominant species in Amazonian forests, six belong to the palm family
(ter Steege et al 2013). Palms are also an important structural element contributing up to 20% of
forest basal area (Emilio et al 2013) and dominating at least 20% of Amazonian forests (IBGE
1998). Their geographical ecology worldwide was recently revised (Eiserhardt et al 2011) and
five main environmental drivers - climate, hydrology, soil chemistry, vegetation structure and
topography - of species richness, composition and distribution where highlighted. The relative
importance of each factor varied with the scale, some scale-predictors combinations were not
evaluated yet and an analysis that includes as many of these predictors as possible is claimed to
avoid biased inference (Eiserhardt et al 2011). Using the palm family as model, we tried here to
understand the patterns of floristic variation and dominance in relation to the most complete set
of ground and remote sensed measured variables, which include natural disturbance regime and
at least one environmental predictor of the five main environmental drivers of palm species
richness, composition and distribution. Additionally, we explore the causes of dominance in our
species pool by relating dominance with environmental range and population structure.

48
Methods
Study area
The study was conducted in the interfluve between the Purus, Madeira and Solimões Rivers, in
the state of Amazonas, Brazil (Fig. S1). The study was carried out in mature lowland forests
(but see Levis et al 2012) along the BR-319 Highway in 11 previously established sites of the
Brazilian Biodiversity Research Program (PPBio). The study area crosses headwaters and
higher order tributaries of the Purus and Madeira Rivers, two major Amazon River tributaries.
Most of the headwaters located in the area are intermittent, drying out in the dry season between
July and November to the north of the transect, and between June and October in the southern
part. The number of months with less than 100 mm of precipitation varies from one to four, and
precipitation between 1,500 and 2,700 mm/year according to the WorldClim dataset (Hijmans et
al. 2005). The soils are predominantly Plinthosols, with some patches of Acrisol, Gleysols and
Fluvisols in river terraces (Brasil 1978). Soil texture is mostly loamy and poorly-drained close
to the headwaters, but well-drained soils are found in higher areas near higher order permanent
streams. The terrain is flat or gently undulating (elevation 20-70 m a.s.l. based on Shuttle Radar
Topography Mission – SRTM images) and some areas located close to streams may be
inundated in the wet season. The water table is shallow throughout the entire region, varying
from 0-7 m deep for most sites throughout the year (T. Emilio & J. Schietti unpublished data).
Sites are about 50 km from each other and are spread over 600 km. Each site contains ten plots,
at least 1 km from each other (Fig. S1 inset). We simultaneously collected information about
palm-species composition, ground and remote-sensed environmental variables for all of these
plots. For the floristic analysis presented here we used the 101 plots sampled for vegetation and
for the environmental analyses we used all 84 plots for which the complete dataset was
available at the time of the preparation of this manuscript. More details about the study sites are
available from http://ppbio.inpa.gov.br/sitios/br319/.
Palm survey data

49
In each of the 250 x 2.5 m (~0.065 ha) plots all palms above 0.3m height were counted and
identified to the finest taxonomic level. Ontogenetic stage of each individual was assigned in the
field based on size and reproduction evidences. For clonal species, each stem was counted as
one individual. The identification was done using the most up to date literature at that time
(Henderson 1995, Henderson 2000, Henderson 2011a, 2011b) and a previously available
photographic guide for the palms of the region (Emilio 2007). Plant vouchers were collected for
most of the species and the identification checked with the aid of specialists and comparisons
with herbarium collections at INPA and NYBG. The individuals identified only to genus (1.3%)
were excluded from the analyses.
Environmental data
Climate
The density of rainfall gauges in Amazon is very low and data interpolated from them may be
not very precise for this region depending on the scale of the interest (Hijimans et al 2005).
Alternatively, remote sensed data have been shown to be a viable alternative. Rainfall obtained
from TRMM (Tropical Rainfall Measuring Mission) satellites images is highly correlated with
the rainfall directly measure from rainfall gauges in Amazon (Anderson et al 2013). As the
resolution of this satellite is relatively high (0.25 degrees), we believe that data obtained from
that source will be a more precise estimate of rainfall variation at regional scale than the
interpolate surface of WorldClim (Hijimans et al 2005) and other interpolations from the scarce
network of rainfall gauges in Amazon.
Monthly precipitation from January of 1998 to December of 2010 was integrated from TRMM
satellites images (3B43 product version 6 and 7) with 0.25 degree resolution. More information
about TRMM 3B43 product is available at http://trmm.gsfc.nasa.gov/3b43.html. From this data
we calculated the mean annual precipitation, number of months with precipitation below 50 mm
and accumulated precipitation in the driest quarter of the year. These three climatic proxies were
used as climatic predictors.

50
Hydrology
In areas with superficial groundwater (as our study sites), the water table is expected to
contribute to soil moisture in the dry season (Fan & Miguez-Macho 2010) and cause soil
saturation in the wet season (T Emilio & J Schietti unpublished data). Based on that, we adopted
the water table level as the hydrological predictor. To measure water table depth, a 7m-deep dip
well was installed in each plot. Measurements were taken between March 2011 and July 2013.
The dipwell consisted of a 5.5 cm diameter plastic pipe with holes drilled in the lower portion
(30 cm) to permit water flow. The holes were covered with a thin polyester mesh to avoid
obstruction by mud, and the end of the wells capped to prevent entry of rainwater and litter. A
lateral orifice equilibrated the air pressure in the pipe. The water table depth was manually
monitored every four months using a measuring tape. For analysis we used the measurement
taken in March 2011 that represents the water table level in wet season with the most
comprehensive number of plots monitored until now.
Soil
Variations in physical and chemical properties of the soil are related to innumerous plants
processes and vegetation patterns. In Amazon, there are strong north-south gradients in soil
properties that are related to forest dynamism, productivity and composition (ter Steege 2006,
Aragão et al, 2009, Quesada et al 2012,). Soil physical and chemical properties were analyzed in
a compound sample derived from 24 subsamples from the first 30 cm depth of soil collected
along the central line in each of the 84 plots. The samples were air-dried, sieved through a 2 mm
sieve and bulked to produce composite samples. Percent of clay, silt, and sand (particles <0.002,
0.002–0.05, and 0.05– 2 mm, respectively) were estimate by the hydrometer method
(EMBRAPA 2011). Available Ca+ and Mg
+2 were extracted by KCl 1N method; Available K
+
and P by Mehlich’s I extraction solution, and read by atomic spectrometry. Sum of Ca+, Mg
+2
and K+ is the content of exchangeable bases (Sb). Na
+ concentration was below the
spectrometer detection level and do not contribute here for Sb values. Analyses were conducted
on the Plant and Soil Thematic Laboratory at INPA.

51
We used potassium (K+) and phosphorous (P) as soil chemical properties predictors together in
our models because of the different rule that these two nutrients can play on plants. Phosphorous
is strongly related to forest productivity and is hypothesized to be the major limiting factor of
plant growth in Amazonia. Potassium is more related to plant responses to water deficit given its
important role on stomata regulation.
We used the clay content as a predictor of soil physical properties as it is related to the drainage
potential of the soils (Marshal et al 1996). The choose of clay content over other soil texture
fractions (i.e. silt or sand fractions) was mainly due to its tendency to vary more locally while
the other fractions show a general trend to increase or decrease in regional scale (T Emilio
unpublished data). However, as we were aware that clay content is a complex environmental
variable that may be related to other chemical properties of the soils, we included in our
alternative models other correlated chemical parameters that could be causal factors instead of
clay content, such as Aluminum concentration. The amount of Aluminium in soil solutions is
also largely controlled by clay content and mineralogy (Andersson 1988). Exchangeable
Aluminium in high concentration is toxic for plants and could be an important growth limiting
factor in acid soils (Andersson 1988) as the ones of our study site.
Vegetation structure
Biomass gain and light in Amazon forests are related to variations on canopy structure that are
accurately predicted using LiDAR (Light Detection and Ranging) metrics (Stark et al 2012).
Canopy rugosity and accumulated leaf area density obtained from LiDAR metrics (J Schietti
unpublished data) were used as vegetation structure predictors. Ground-based LiDAR data were
collected walking a uniform velocity thought the central line (i. e. the reference transect along
the longest axis of the plot) of each plot with the sensor pointed to the canopy. The canopy
rugosity was calculated from the mean standard deviation of canopy height (Parker & Russ
2004) for 1.8 meters wide intervals. Leaf area density was calculated from vertical profile
returns adjusting for shadowing of canopy elements further from the sensor by the nearer
elements using MacArthur & Horn (1969) correction method.

52
Topography
Topography is an important factor for plant diversity patterns even in relatively flat lowlands
areas where it probably reflects local patterns of soil moisture (Moeslund et al 2013). The
variation in elevation in our study area is very low (~50 m in 600 km) and increases from north
to south. Hence, differences in elevation are more likely to represent geographic variation than
topography by itself. Alternatively, slope metrics vary both locally and between large patches of
geomorphology. Slope is related to soil drainage and also may better represent the role of
topography on soil hydrology and was used here as our topographical predictor. Slope
measurements obtained in ground were used as topographic predictors. Ground measured slope
was obtained each 50m along the central line of each plot with a clinometer. The standard
deviation of the six measures taken for the plot was used for the analysis.
Historical disturbance
Blowdowns are an important and widespread source of large scale disturbance in Amazon forest
(Nelson et al 1994). We observed one blowdown event during our field work, but others may be
identifiable in the area in satellite images (J. Schietti unpublished data). Locally, the effect of
this kind of disturbance may be catastrophic and large blowdowns may be detectable in satellite
images for up 20 years (Nelson et al 1994). The density of blowdowns coincide with zones of
heaviest rainfall and was shown to be strongly correlated with the number of days with
precipitation ≥ 20 mm (Espírito-Santo et al. 2010). Considering that the effect of blowdowns
events may accumulate along the years generating a mosaic of primary and secondary forests
with different ages, we included frequency of storms in our models as a proxy for historical
disturbance. The frequency of storms was indexed by the number of days with precipitation ≥
20 mm in the year 1999, for which satellite images with higher temporal resolution were
available. Daily precipitation was integrated from NOAA (National Oceanic and Atmospheric
Administration) satellite images with 4 km resolution and 10.7 mm band from NOAA satellites
8 (see Espírito-Santo et al. 2010 for methods details).

53
Data analysis
The dimensionality of species distribution data for our 84 plots was reduced using the Non-
Metric Multidimensional Scaling (NMDS) ordination technique. Exploratory analysis showed
that when the upmost dominant species were included in the ordination, the first axis captured
almost only the variation of this species abundance and the inference models for the ordinations
reflect only the environmental associations of this species. In order to capture the floristic
variation pattern of the remaining species, we decided to exclude the dominant species from
ordinations and from the analysis comparing ordination results with individual species
distribution results. As this ordination based on the entire dataset show a clear separation
between inundated and non-inundated plots, we did an additional ordination including only the
non-inundated plots (N = 93). The following analyses were done only with a subset of non-
inundated plots (N = 84) as the remaining inundated plots are too few for inferential analysis
including multiple predictive factors. An outlier plot (M06_TS_0500 - swamp plot with water
table level above ground the entire year) with high leverage value was excluded after the
exploration of the partial regression plots. Another eight plots for which at least one of the
environmental predictors was missing were also excluded. Ordinations were carried on using
species presence/absence and abundance data in order to understand the patterns of species
composition turnover and relative abundance distribution, respectively, and hereafter will be
referenced using these terms. Species abundances were relativized by the total number of
individuals in each sample unit to minimize the chance of two sites being considered similar
only by having the same overall abundance. Dissimilarities were calculated using Sorensen
index for presence/absence and Bray-Curtis index for abundance data (Legendre & Legendre
1998).
One axis of NMDS was able to capture a large fraction of the variation in composition based on
species turnover and relative abundance (75% and 66%, respectively) and were used for the
following inferential analyses. From the the six main drivers of palm distribution - climate,
hydrology, soil chemistry, vegetation structure, topography and historical disturbance –we
54
selected one or more measured variables that we judge that better represent the limiting
conditions in our study area to build the model. The abundance of a clonal hyper-dominant
species (Lepidocaryum tenue) that is suspected to affect other species’ occurrence and
abundance was also included in the models. As we did not adopt a model selection approach
(sensu Burnham & Anderson 2002), to assess the effect of variable selection over the
community response to environmental gradients we set up models with different combinations
of environmental variables and compared the results of the different models looking to the
adjustment of the model, significance and the direction of the relationships with the predictors.
We did this keeping all the original variables but one, which was replaced by another variable
representing the same environmental driver.
To assess if palm community response to environmental predictors is equivalent to the
summation of hyper-dominant species responses, we adjusted the same environmental model
used for community composition based on species turnover and relative abundance individually
to the five to 10 upmost dominant species and also to the 30 species that occurred in more than
20 plots (those models will be hereafter referred as individual species distribution models).
From this we calculated the number of individuals (regardless of the species) that were related
to each of the environmental factors that were significant at community level. We did this
assuming that if a species is significantly related to a given predictor, all their individuals will
be related to this predictor. Hence, the number of individuals responding to a given factor was
given by the sum of the abundance of all species that were significantly related to this predictor.
We calculated this metric considering all 30 species that occurred in at least 20 sites that we
considered as the minimum to set up the multiple regressions, but also including only the five or
10 upmost dominant species. The relationship between the number of palm individuals
responding to a given predictor for all species and only for the dominant ones in individual
species distribution models was related to the relative contribution (standardized b) of the same
predictor in the species turnover and relative abundance models using linear regressions.

55
To account for the nested design (plots within sites), in addition to the ordinary least square
(OLS) we also adjust linear mixed-effect models (LMM) to palm species turnover, relative
abundance and individual species distribution models using sites in the model as random effect
(Zuur et al. 2009). L. tenue abundance (except for L. tenue models), precipitation in dry season,
water table depth, slope variation, soil clay, soil phosphorous, soil potassium and canopy
heterogeneity were used as predictors in the multiple regression OLS models and as fixed
effects in the LMM model.
To test if dominance is related to species environmental range we first calculated for each
species their multidimensional environmental range. We did this by calculating the area of the
polygon whose vertices where defined by the species range in the eight environmental gradients
included in our best model. The range in each individual gradient was estimated subtracting the
minimum from the maximum value in the gradient where the species were found. Then, we
positioned each individual gradient range from the same origin point in different directions (N,
NE, E, SE, S, SW, W, NE) and calculated the vertices position related to each gradient range
using basic trigonometric procedures. By linking the vertices sequentially we obtained the
minimum convex polygon for which the area was assumed to be the multidimensional species
range over environmental gradients. We repeated this procedure for the all species for which we
built individual species distribution models (i.e. 30 species that occurred in at least 20 sites in
our dataset). As differences in occupancy may affect the detected range, for the species that
occur in more than 20 sites we estimated the range from the mean of multidimensional range
calculated over 10.000 of random samples including only 20 sites. The multidimensional range
for each species was use as dependent variable in linear and quantile regressions to test the
dominance-range hypothesis.
The analyses were undertaken in the R environment (R Core Team 2013) using the packages
vegan (Oksanen et al 2013) for ordinations and lme4 (Bates et al. 2013), MuMIn (Barton 2013)
and languageR (Baayen 2011) for linear mixed-effect models and quantreg for quantile
regressions (Kroenker 2011).

56
Results
In our 101 plots we registered 81,090 palm individuals with height above thirty centimeters and
52 species (see Table S1 for species names and voucher numbers). Juvenile palms comprise
70% of all individuals, while seedlings and adults contribute with around 15% of the individuals
each. Half of the individuals belong to a single species (Lepidocaryum tenue Mart.) and 40% to
other nine species (Fig. S2): Oenocarpus bataua Mart., Astrocaryum gynacanthum Mart.,
Euterpe precatoria Mart., Iriartella setigera (Mart.) H. Wendl., Attalea maripa (Aubl.) Mart.,
Attalea speciosa Mart., Attalea microcarpa Mart., Bactris acanthocarpa Mart. and Geonoma
oligoclona Trail. The other 10% of the individuals are distributed in the remaining 42 species.
Between 6 and 1,715 palms may occur in a single 0.1 ha plot, but densities higher than 600
individuals/0.1 ha were observed only in plots where L. tenue occurs (Fig. S3). The overall
abundance of other palm species is apparently constant, but the proportion of individuals
belonging to other species decreases with the increasing of L. tenue abundance.
Palm species composition is related to the occurrence of flooding. Plots with prolonged flooding
events (inundated plots) show strong floristic separation from non-inundated plots (Fig. 1A).
Environmental distances within and between non-inundated and inundated plots are not
different, but inundated plots share a proportionally lower number of species and individuals
than terra firme plots (Fig. 1B). Only one of species present in inundated forests (Astrocaryum
jauari Mart.) did not occur in non-inundated forests (cf. Table S1). However, half of the shared
species occurs in higher density in inundated than in non-inundated forests.

57
Figure 1. Floristic variation patterns. (A) Separation of inundate from nun-inundate plots in a
two NMDS ordination axes built from species relative abundance. (B) Relationship between
florist and environmental distance for inundated and non-inundated plots.
As we have only few plots on inundated forests, in next section we only explore the
environmental relationships within non-inundated forests. Species turnover between non-
inundated plots is strongly related to L. tenue abundance, which together with dry season
precipitation, water table depth, terrain inclination and soil potassium explain 49% of palm
species turnover (Fig. 2A; Table S2). However, when we consider the community composition
based on relative abundance of species, L. tenue abundance is not a significant factor and a
partially different set of predictors - soil clay, canopy heterogeneity, storm frequency, water
table depth, soil phosphorous and soil potassium - explain together 43% of palm species
composition (Fig 2B. Table S2).
0.0 0.2 0.4 0.6 0.8 1.0
0.0
0.2
0.4
0.6
0.8
1.0
Environmental distance
Flo
ristic d
ista
nce
Non-inundated forest plotsInundated forest plots
-3 -2 -1 0 1
-10
12
Percentage of variation captured by 2 axis: 0.85
NMDS1 axis
NM
DS
2 a
xis
Inundated forest Non-inundated forest
A B

58
Figure 2. Floristic composition variation in relation to envinmental conditions. Left panel. Partial regression plots for palm community composition based on
species relative abundance relationships. Right panel. Partial regression plots for palm species turnover.
-1.5 -0.5 0.5 1.5
-1.5
-0.5
0.5
1.0
1.5
Dry season precipitation
-1 0 1 2
-1.5
-0.5
0.5
1.0
1.5
Water table depth
-2 -1 0 1 2
-1.5
-0.5
0.5
1.0
1.5
Terrain inclination
-1 0 1 2
-1.5
-0.5
0.5
1.0
1.5
Soil clay
-2 -1 0 1 2
-1.5
-0.5
0.5
1.0
1.5
Soil phosphorous
-2 -1 0 1
-1.5
-0.5
0.5
1.0
1.5
Soil potassium
-1 0 1 2
-1.5
-0.5
0.5
1.0
1.5
Canopy heterogeneity
-2.0 -1.0 0.0 1.0
-1.5
-0.5
0.5
1.0
1.5
Storm frequency
-2.0 -1.0 0.0 1.0
-1.5
-0.5
0.5
1.0
1.5
L. tenue abundance
Pa
lm s
pe
cie
s r
ela
tiv
e a
bu
nd
an
ce
(N
MD
S1
)
-1.5 -0.5 0.5 1.5
-1.5
-0.5
0.5
1.0
1.5
Dry season precipitation
-1 0 1 2
-1.5
-0.5
0.5
1.0
1.5
Water table depth
-2 -1 0 1 2
-1.5
-0.5
0.5
1.0
1.5
Terrain inclination
-1 0 1 2
-1.5
-0.5
0.5
1.0
1.5
Soil clay
-2 -1 0 1 2
-1.5
-0.5
0.5
1.0
1.5
Soil phosphorous
-2 -1 0 1
-1.5
-0.5
0.5
1.0
1.5
Soil potassium
-1 0 1 2
-1.5
-0.5
0.5
1.0
1.5
Canopy heterogeneity
-2 -1 0 1
-1.5
-0.5
0.5
1.0
1.5
Storm frequency
-2.0 -1.0 0.0 1.0
-1.5
-0.5
0.5
1.0
1.5
L. tenue abundance
Pa
lm s
pe
cie
s t
urn
ov
er
(NM
DS
1 -
PA
)

59
The sensitivity of species turnover and relative abundance to alternative environmental models
is also different. In species turnover models, the relationship with hydrology, soil chemistry, and
topography factors remains significant in most of the alternative models (see Table S3). The
relative abundance models are less stable and only the relationship with forest structure remains
the same in all alternative models. The other environmental factors loose significance or change
the direction of the relationship depending on which variable is used to build the model (Table
S4).
The instability of relative abundance models could be related to the weight of species individual
responses to environmental predictors given that no congruent pattern in individual species
response to environmental factors was observed. The co-variation between species responses to
the predictors is very weak and each species is responding to a different set of factors (cf. Table
S1). Eighteen species responded to at least one of the predictors and twelve were not related to
any of them. None of the individual species models shown significant relationships for the all
six environmental factors that were significant in the overall community model. However, the
relative importance of each environmental predictor for species turnover and relative abundance
could be predicted by metrics derived from individual species distribution models. The relative
importance of a given environmental predictor for species turnover was related to the number of
species that individually respond to this factor (Fig. 3A). The relative importance of a given
environmental predictor for species relative abundance was more related to the number of
individuals belonging to species that are significantly related to those environmental predictors
(Fig 3B). As hyper-dominant species comprise most of the individuals, the estimate of number
of individuals responding to the predictor calculated only from the 5 or 10 upmost abundant
species do not change this result (cf. gray and white points in Fig. 3).

60
Figure 3. Link between floristic composition and dominance given by the relationship between
the relative importance of environmental predictors in species turnover model and (A) the
number of time of a given predictor is significant in individual species models; (B) the number
of individuals belonging to the species significantly related to a given predictor in individual
species models.
Dominant species hold a proportionally higher number of juveniles and seedlings in the
population (Fig. 4A) and occupy a medium to high range of environmental conditions (Fig. 4B).
The environmental range predicts the upper limit of species abundance, but despite the fact that
abundant species occupy a broader environmental range, not all species with large
B
A
0.14 0.16 0.18 0.20 0.22
12
34
56
78
Relative contribution of the predictors for community model
(|standardized b|)
Fre
quency o
f th
e p
redic
tor
in s
pecie
s m
odels L. tenue
abundance
Water table depth
inclination
[Potassium]
0.2 0.3 0.4 0.5
05
00
01
00
00
15
00
02
00
00
Relative contribution of the predictors for community model
(|standardized b|)
Num
ber
of
indiv
iduals
rela
ted w
ith t
he p
redic
tor
Water table depth
Clay %
[Phosphorous]
[Potassium]
Canopy heteogeneity
Storm Frequency
Overall species relative abundance
10 upmost abundant species
5 upmost abundant species

61
environmental ranges show up as dominant species. The proportion of adults in the populations
varies between species and growth-forms (Fig. 4A) and, as the environmental range, imposes
the upper limit of species abundance.
Figure 4. Mechanisms of dominance. (A) Relationship between species abundance and
population structure biven by adult;juvenile ratio and (B )Relationship between species
environmental range corrected for abundance-occupance bias and species abundance. The linear
regression is showed in both graphs by the continuous line and quantile regressions (tau = 0.9)
by dashed lines.
0.85 0.90 0.95 1.00
56
78
91
0
Species environmental range
(mean over 10.000 random sub-sample combinations
Sp
ecie
s a
bu
nd
an
ce
(lo
g (
no
. in
div
idu
als
)
Lepidorcaryum tenue
Oenocarpus bataua
B
0.4 0.6 0.8 1.0 1.2 1.4
56
78
91
0
Ratio adult : juvenile (including seedlings)
Sp
ecie
s a
bu
nd
an
ce
(lo
g (
no
. in
div
idu
als
)
Large tall-stemmed PalmsLarge short-stemmed PalmsMedium-sized Palms
Large acaulescent PalmsSmall acaulescent PalmsSmall Palms
Climbing Palms
A

62
Discussion
Environmentand variation in palm species abundance
Different mechanisms are expected to influence local and regional diversity. Regional diversity is
mainly controlled by processes related to species sorting (e.g. speciation, immigration, extinction),
whereas local diversity is more controlled by processes related to changes in species abundance (e.g.
stochastic local extinction, interspecific competition and predation) and both scales are linked by
environmental filtering and dispersal limitation (Stropp et al 2009). As such, floristic differences at
local scale are expected to be more related to differences in species abundances, while floristic
differences at regional scale to be more related todifferences in species identity. Surprisingly, we
found that a sharp boundary in floristic composition in regional scale was mainly due to differences in
species abundances, in response to a strong environmental limitation imposed by flooding. Palm
species occurring in flooded forests represented a subset of species occurring in non-inundated forests,
except for one species (Astrocaryum jauari), recognized by its association with seasonally flooded
forests (Henderson et al 1995).
Long periods of flooding and high water column (as observed in inundated forest plots) are likely to
act as environmental filter by causing soil inundation and foliage submersion. Soil inundation may
lead to the decay of the root system by inhibiting root growth and/or inducing root mortality, so when
the water drains, plants may be more susceptible to drought (Kozlowski 1997). In inundated plots, a
several meters deep water column can last many months and submerge young and adult plants.
Amazonian floodplain species are adapted to deal with this situation, escaping from submergence or
tolerating it (Parolin 2002). Astrocarym jauari is one of that species and is well-adapted anatomically
and physiologically to hypoxic conditions and maintain a positive carbon balance via alternative
metabolism when the leaves are submerged (Schlüter et al., 1993). We are not aware of studies that
explored the flood adaptation of other species that occurred in our inundated forests, but we suspect
that at least one more species (Euterpe precatoria) may be adapted to tolerate flooding given the

63
adaptations observed in another species of the same genus (Menezes-Neto et al 1995). Low
photosynthetic rate and/or the increasing of drought sensitivity after root loss after long periods of
flooding may result in negative carbon balance. For species not adapted to flooding, this balance may
be so negative for some individuals that will result in their death. The increase in mortality rates may
have a minor negative effect over some species, but may exert a strong effect in others preventing they
establishment, reproduction and permanently excluding them from inundated forests. We believe that
this mechanism may be the cause of the patterns observed here. However, this hypothesis will benefit
from a better knowledge of physiological and anatomical adaptations in other palm species together
with the monitoring of their population dynamics between inundated and non-inundated forests.
Palm species turnover, relative abundance and environmentalvariation
Within non-inundated forests other environmental gradients will be related to variations in species
abundance and floristic composition. Palm species and community relationships with environmental
variables have been studied across many sites in Amazonia and elsewhere. Eiserhardt et al. (2011)
reviewed the findings of most of these studies, identified the main predictors across scales and
concluded that for a stronger inference all previously identified predictors should be included in the
same model. This was what we did here. From this, we find that all the previously identified predictors
were important for the palm floristic variation, but some of them were more important for species
turnover and other for species relative abundance. Palm species turnover was strongly related to water
availability (given by precipitation dry season, terrain inclination, water table depth) and soil fertility
(given by phosphorous and potassium concentrations). This is to be expected if niche-related processes
are related to species sorting. Indeed, regional species pool segregation along hydrological gradients is
related to local species coexistence in Amazonian palms (Emilio et al 2013 – ARTIGO 3). We do not
have evidence for palm species segregation along soil fertility niche dimensions, instead a weak effect
(Normand et al., 2006; Costa et al., 2009) of soil chemistry in palm composition or an
indistinguishable effect from soil hydrology (Vormisto et al. 2000; Poulsen et al., 2006) are more
common than a significant effect (Vormisto et al 2004) and a test of palm species segregation along

64
edaphic gradients is required for a better understanding of the mechanisms underlying species turnover
along soil gradients.
Palm community composition based on relative abundance is related to soil fertility and hydrology,
but also with canopy structure and historical disturbance. The same factors that are expected to affect
species sorting affect species abundance. In the Purus-Madeira interfluve, plant growth and
survivorship seems to be related to soil chemical properties, hydrology and natural disturbance
gradients. Stand biomass and wood production are positively related to soil phosphorous/potassium
content; tree height and wood production are negatively related tosoil hydrology (Cintra et al 2013;
Schietti et al 2013a, 2014). Besides growth, mortality may also be related to soil hydrology. Biomass
turnover increases with the increasing of anoxia in the soils (Cintra et al 2013). Other important
sources of mortality in the region may be natural disturbance gradients imposed by soil physical
constraints (Quesada et al 2012) or blow-downs (Espírito-Santo et al 2010). Root-restrictive soil
conditions together with high frequency of storms prevent the individual trees to attain high individual
biomass (Schietti et al 2013b) and younger forest stands were observed in more root-restrictive soil
conditions (Cintra et al 2013). Forest structure is linked to all these processes giving rise to the
gradient of forest opening noticeable from north to south of the interfluve (Brasil, 1978; J Schietti
personal communication). The interplay between soil, hydrology and disturbance will result in a
mosaic of environmental conditions that allow for species with different traits to attain dominance.
This is in agreement with our finding that each individual palm species is responding to a different set
of predictors and with the hypothesis that not all species are dominant for the same reason (Pitman et
al 2013).
On the causes and consequences of palm species dominance
Arecaceae family holds 5 times more hyperdominant species in Amazonina tree flora than expected by
chance (ter Steege et al 2013). The dominance of palm family over dycotiledoneous tree families in
Amazon forests may be related to their functional strategies for dealing with soil physical constraints
and disturbance regime (Emilio et al 2013 – ARTIGO 1). However, the mechanisms that lead to the

65
dominance of one species in relation to other within the family remain unknown. Pitman et al (2001;
2013) present three main reasons why some species could become dominant in tropical forests. They
argue that those species that combine high reproductive investment and success, long distance
dispersal abilities and tolerate wide range of environmental conditions will be the dominant ones. For
palms, all three reasons are very likely. Palms may produce large amount of fruits and seeds, one
single arborescent palm may produce up to 2 thousand fruits per year (Miller et al 2002). Palms fruits
are edible and a vast variety of animals - including humans - may disperse them (Zona & Henderson
1989). Seeds can stay dormant in the environment for months (or even years) until find a favorable
condition to germinate (Neves et al 2013). Palm species in general also tolerate a wide range of
environmental conditions from deserts to swamps (Dransfield et al 2008) and the most widespread
Amazonian species tend to be generalist in terms of habitat (Ruokolainen & Vormisto 2000).
However, our results suggest that large environmental ranges together with recruitment success are
more likely to be related to palm species abundance than high reproductive investment and long-
distance dispersal.
The most dominant species in our dataset belong to species varying in size from small to large palms
(c.f. Fig. 4A). As such, their seed production also varies deeply. The difference in fruit production
between palm growth-forms varies one or two orders of magnitude and the reproductive investment is
not proportional to recruitment success in palms (C. Freitas unpublished data). Therefore, we do not
believe that reproductive investment plays a role in palm species dominance, but recruitment success
does. Dominant species are the ones that hold higher amounts of juveniles and seedlings to provide
replacements for a much smaller amount of adults. As most of the populations are made up of
juveniles, we interpret this as evidence that seedlings of those species are having more success in
establishment than seedlings of other species´ populations.
The effect of environmental range on palm species dominance is far from negligible and may interact
with dominant species population dynamics in a way to keep the abundance of the species high at
landscape level. Dominant species occupy a wider range of environmental conditions than non-
dominant ones, but being a habitat generalist alone does not allow a given palm species to be

66
dominant. The effect of long distance dispersal on palm species dominance was not addressed here e
remains to be tested. However, we do not expect a major role of long-distance dispersal on dominance
since within dominants there are species whose seeds are not dispersed farther than 4 meters from the
mother plant (e.g. Bactris acanthocarpa; Silva & Tabarelli 2001) and species that can be dispersed to
more than 2 km from the nearest palm clump (e.g. Attalea maripa as Maximilliana maripa; Fragoso
1997).
One palm species - Lepidocaryum tenue - account for 50% of all sampled palm individuals. L. tenue is
a clonal species whose reproduction relies more heavily on vegetative propagation by stoloniferous
rhizomes than by seed germination. L. tenue is able to produce ramets when it is still juvenile and each
adult ramet may produce up to a hundred of ramets during their lifespan (Navarro et al 2011). Sexual
reproduction occurs when individuals are around 60-68 years old (and near 60 ramets have been
produced vegetatively), but sexually produced seedlings are scarce in the population due to low seed
germination rates (Navarro et al 2011). High investment in vegetative reproduction may be a good
strategy to colonize microsites faster than other species as soon as they become available and avoid the
damage caused by fallen trees and branches. The cost of this strategy for L. tenue may be related to the
lower leaf production rate of this species (Navarro et al 2011) in comparison with other palms
(Henderson 2002). So when colonization advantage and disturbance resilience do not confer a real
benefit, other species may outperform and exclude L.tenue.
Another of the topmost dominant species in our study - Iriartella setigera - also develops stolon-like
rhizomes, but normally only 2-4 and generaly when the first axis is dying (Kahn & Medja 1987).
Other dominant small palms present cespitose growth. In a smaller degree, the cespitose growth
strategy may also confer colonization advantage because plants do not have to rely on a single apical
meristem (Salm et al., 2007) and can be more efficiently established from small initial populations for
being less dependent on sexual reproduction (Balslev et al 2011). The remaining dominant palm
species (except by Attalea microcarpa) are large sized palms. Large sized palms are widespread and
tend to be habitat generalists (Ruokolainen & Vormisto 2000). Better dispersal abilities is the
explanation found by Ruokolainen & Vormisto (2000) for this pattern since it is expected that taller

67
plants will have a broader seed rain and can be dispersed by a wide range of animals and better scape
from density-dependent mortality close to co-specific plants. The causes underlying population growth
and maintenance in large, cespitose and clonal palms are distinct. However, all cases pointed for the
role of colonization over competition in generating a less steep population pyramid that sustains palm
species dominance in Amazonian forests. Apparently there is trade-off between the number of
different environmental conditions that one species can occupy and their ability of sustain large
populations in these conditions that prevent the existence of that kind of “superspecies”, but this
hypothesis remains to be tested.
The high dominance of some palm species has important consequences for floristic variation. First,
because direct competition between species may lead to the increase of dominant species and decrease
of non-dominant ones. Second, because high dominance may change the forest structure and light
environment and affect other species distribution as well, positively (i.e. facilitation) or negatively (i.e.
competition). The variation in abundance of the upmost dominant species in our dataset (L. tenue) was
the most important factor explaining palm species turnover. At least five species were individually
influenced by L. tenue abundance, most of them belonging to the 10 upmost dominant species. I.
setigera and G. deversa were positively related to L. tenue abundance. The abundance of O. bataua, A.
gynacanthum and O. minor was negatively related to L. tenue abundance. Competition or facilitation
may be mediating the relationship between L. tenue abundance and other species abundance. However,
as correlative approaches do not allow us for assure the causes of this co-variation, experiments are
required to certify that this pattern is not due to unmeasured environmental associations common to
the co-occuring species. We consider the finding of less than 10% of sampled species significantly
related to L. tenue abundance conservative. This because other species that normally occur in lower
abundance and are sensible to L. tenue abundance may not be present in enough numbers in our
dataset to allow for inferential tests.
The importance of dominance mechanisms and patterns is important not only for understanding the
actual patterns of floristic variation, but also to predict the future patterns. Changes in rainfall amount
and distribution are expected in the forthcoming years due to climate change (Malhi et al 2008) and

68
also changes in Amazon land cover (Davidson et al 2012). Increasing in the dominance of important
tropical forest life-forms is occurring through the years (Phillips et al 2002) and changes in
environmental conditions and disturbance regimes in the future are expected to affect species
abundance in different scale. One example of this is the invasion of forest fragments by L. tenue,
which is completely absent in the continuous forest near Manaus, but account for 90% of the palm
stems in adjacent small fragments (Scariot et al 2001). Other examples of increasing species
dominance due to direct or indirect anthropogenic changes are known for changing species abundance
and generating dominance patterns and the consequences of this for future plant associations deserves
further attention.
Linking species dominance, rarity and floristic variation
The recognition of sharp boundaries between inundated and non-inundated forest in the Amazon is far
from new (Terborg & Andressen 1998), but the major role environmental mediated abundance
variation is noteworthy. Environmental mediated variations in species abundance are responsible for
both; continuous and sharp floristic differences on vegetation. We suggested that sharp differences in
species composition are related to strong environmental limitation that select more adapted/tolerant
species and exclude or drop the abundance of less adapted/tolerant ones. The most limiting factor (here
prolonged flooding), was superimposed to the other gradients and separate sites in distinct
communities regardless of the similarity between them in the other environmental conditions as
expected from Liebig's law of the minimum (i.e. the availability of the most abundant resource will be
only as good as the availability of the least abundant resource). Abundant species in inundated forests
could be rare in non-inundated forests and vice versa, showing the importance of environmental
variation to dominance and rarity patterns between forest habitats.
Dominance patterns in tropical plant communities have long being recognized (Hubbell et al. 2001),
but the link between dominance mechanisms, environmental and floristic variation remain largely
obscure. A recent analysis of a comprehensive basin-wide tree inventory database demonstrated that
most of Amazonian trees belong to a few hyper-dominant species (ter Steege et al 2013). We believe

69
that this finding will broadly stimulate the debate of causes and consequences of plant species
dominance in tropical forests. We believe that our main contributions for this topic are: (1)
demonstration that the range-abundance relationship is not linear and niche breadth has to interact with
highly successful demographic strategies to allow plant dominance and (2) evidence that
environmental relationships recovered from ordinations - either presence-absence and relative
abundance based - are not different from the joint response of the upmost dominant species to
environmental gradients and rare species signature are silently dismissed. The implication of these
findings is that the reasons of why some species are rare may be linked to the reasons why other
species became dominant. These reasons are certainly related to plant demography. Dealing with the
absolute lack of knowledge about rare species is one of the main challenges of basic and applied
ecology nowadays and deserve more focuses attention (Hubbell 2013). Rare species distribution may
be linked with a complete different set of predictors than dominant species, and in the search for the
predictors of both ecologically important groups, interactions between plants species could not be
dismissed.

70
Acknowledgments
We thank to residents of the BR-319 highway for many years of engagement and help with our
research. The National Council for Scientific and Technological Development (CNPq) awarded
stipends to T.E., and a major grant from the FAPESP/FAPEAM (465/2010) and CNPq (473308/2009-
6) to HIDROVEG project supported collection of much of the data analyzed here. This work was also
supported by PRONEX - FAPEAM (1600/2006), PPBio Manaus (CNPq 558318/2009-6) and INCT
CENBAM. We thank the many field workers who established the PPbio permanent plots and help with
the installation of dip-wells. Our special thanks to Dorival Cruz for help with the water table
monitoring and to Liana Anderson and Fernando Espirito-Santo for processing and sharing remote
sensed data of rainfall of TRMM and NOAA satellites, respectively. T.E. thanks to Friederike
Gnaedinger, Omar Cubas Encinas, Jailson Araújo, José Raimundo Quinderé and Juliana Menezes
Rodrigues for the aid with palm data collection and Andrew Henderson for the aid in palm species
identification. We thank to Flavia Costa’s Plant Ecology lab staff for our fruitful discussions.
Data Accessibility
The data used in this publication is stored in http://ppbio.inpa.gov.br and are available from request to
the database manager or directly to the responsible authors referenced in the metadata website.

71
References
Anderson, L., Aragão, L.E.O. e C. & Arai, E. (2013) Avaliação dos dados de chuva mensal para a
região Amazônica oriundos do satélite Tropical Rainfall Measuring Mission (TRMM) produto
3b43 versões 6 e 7 para o período de 1998 a 2010. Anais XVI Simpósio Brasileiro de
Sensoriamento Remoto - SBSR, 6743–6750.
Antônio, M., Neto, M., Alves, J.D., Oliveira, E.M.D.E., Biologia, D. De & Lavras, U.F. De. (1995)
Anaerobic metabolism of Euterpe oleracea . II- plant tolerance mechanism to anoxia. Rev Bras
Fisiol Veg, 7, 47–51.
Aragao, L.E.O.C., Malhi, Y., Metcalf, D.B., Silva-Espejo, J.E., Jiménez, E., Navarrete, D., Almeida,
S., Costa, A.C.L., Salinas, N., Philiphs, O.L., Anderson, L.O., Baker, T.R., Gonçalves, P.H.,
Huamám-Ovalle, J., Mamani-Solórzano, M., Meir, P., Monteagudo, A., Peñuela, M.C., Prieto,
A., Quesada, C.A., Rozas-Davila, A., Rudas, A., Silva Junior, J.A. & Vásquez, R. (2009) Above-
and below-ground net primary productivity across ten Amazonian forests on contrasting soils.
Biogeosciences Discussions, 6, 2441–2488.
Baayen, R.H. (2011) languageR: Data sets and functions with “Analyzing Linguistic Data: A practical
introduction to statistics.”
Balslev, H., Kahn, F., Millan, B., Svenning, J., Kristiansen, T., Borchsenius, F., Pedersen, D. &
Eiserhardt, W.L. (2011) Species Diversity and Growth Forms in Tropical American Palm
Communities. Bot. Rev., 77, 381–425.
Balslev, H., Valencia, R., Paz y Miño, G., Christensen, H. & Nielsen, I. (1998) Species count of
vascular plants in one hectare of humid lowland forest in Amazonian Ecuador. Forest
biodiversity in north, central and south America and the Caribbean: research and monitoring.
Man and the Biosphere Series 21 pp. 585–594.
Barton, K. (2013) MuMIn: Multi-model inference.
Bates, D., Maechler, M., Bolker, B. & Walker, S. (2013) lme4: Linear mixed-effects models using
Eigen and S4.
Brasil. (1978) Projeto RADAMBRASIL. Vol. (1-34). Geologia, geomorfologia, pedologia, vegetação
e uso potencial da terra.
Brown, J.H. (1984) On the Relationship between Abundance and Distribution of Species. The
American Naturalist, 124, 255–279.
Brown, J.H. (1995) Macroecology. University of Chicago Press.

72
Burnham, K.P. & Anderson., D.R. (2002) Model Selection and Multi-model Inference: a Practical
Information-theoretic Approach. Springer.
Cintra, B.B.L., Schietti, J., Emillio, T., Martins, D., Moulatlet, G., Souza, P., Levis, C., Quesada, C. a.
& Schöngart, J. (2013) Productivity of aboveground coarse wood biomass and stand age related
to soil hydrology of Amazonian forests in the Purus-Madeira interfluvial area. Biogeosciences
Discussions, 10, 6417–6459.
Condit, R., Pitman, N., Leigh Jr, E.G., Chave, J., Terborgh, J., Foster, R.B., Núñez, P. V, Aguilar, S.,
Valencia, R., Villa, G., Muller-landau, H.C., Losos, E. & Hubbell, S.P. (2002) Beta-diversity in
tropical forest trees. Science, 295, 666–669.
Costa, F.R.C., Guillaumet, J.-L., Lima, A. & Pereira, O. (2009) Gradients within gradients: the
mesoscale distribution patterns of palms in a central amazonian forest. Journal of Vegetation
Science, 20, 69–78.
Davidson, E. a, De Araújo, A.C., Artaxo, P., Balch, J.K., Brown, I.F., Bustamante, M.M.C., Coe,
M.T., DeFries, R.S., Keller, M., Longo, M., Munger, J.W., Schroeder, W., Soares-Filho, B.S.,
Souza, C.M. & Wofsy, S.C. (2012) The Amazon basin in transition. Nature, 481, 321–8.
Donagema, G.K. et al. (2011) Manual de métodos de análises de solo. Embrapa Solos, Rio de Janeiro.
Dransfield, J. (2008) Genera Palmarum. Royal Botanic Gardens Kew, Kew.
Duivenvoorden, J.F. (1994) Vascular plant species counts in the rain forests of the middle Caquetá
area, Colombian Amazonia. Biodiversity and Conservation, 3, 685–715.
Eiserhardt, W.L., Svenning, J.-C., Kissling, W.D. & Balslev, H. (2011) Geographical ecology of the
palms (Arecaceae): determinants of diversity and distributions across spatial scales. Annals of
Botany, 108, 1391–1416.
Emilio, T., Costa, F. R. C, Schietti, J., Pinto, J. L. P. V., Magnusson, W. E., Tomasella, J. , Faurby, s.
& Svenning, J-C. 2013. Hydrological control of species coexistence and richness in Amazonian palms
(submitted to PLoS One)
Emilio, T., Nelson, B.W., Schietti, J., Desmoulière, S.J.-M., Espírito Santo, H.M. V. & Costa, F.R.C.
(2010) Assessing the relationship between forest types and canopy tree beta diversity in
Amazonia. Ecography, 33, 738–747.
Emilio, T., Quesada, C.A., Costa, F.R.C., Magnusson, W.E., Schietti, J. & Feldpausch, T.R. (2013)
Soil physical conditions limit palm and tree basal area in Amazonian forests. Plant Ecology and
Diversity, ahead-of-p, 1–15.

73
Espírito-Santo, F.D.B., Keller, M., Braswell, B., Nelson, B.W., Frolking, S. & Vicente, G. (2010)
Storm intensity and old-growth forest disturbances in the Amazon region. Geophysical Research
Letters, 37, 1–6.
Fan, Y. & Miguez-Macho, G. (2010) Potential groundwater contribution to Amazon
evapotranspiration. Hydrology and Earth System Sciences, 14, 2039–2056.
Fragoso, J.M. V. (2011) Tapir-generated seed shadows: scale-dependent patchiness in the Amazon
rain forest. Journal of Ecology, 85, 519–529.
Fragoso, J.M. V. (2011) Tapir-generated seed shadows: scale-dependent patchiness in the Amazon
rain forest. Journal of Ecology, 85, 519–529.
Henderson, A. (1995) The Palms of Amazon. Oxford University Press, New York.
Henderson, A. (2000) Bactris (Palmae), Flora Neot. The New York Bothanical Garden, New York.
Henderson, A. (2002) Evolution and Ecology of Palms. The New York Botanical Garden Press,
Bronx.
Henderson, A. (2011a) A revision of Desmoncus (Arecaceae). Phytotaxa, 88, 1–88.
Henderson, A. (2011b) A revision of Geonoma (Arecaceae). Phytotaxa, 271, 1 – 271.
Higgins, M. a., Ruokolainen, K., Tuomisto, H., Llerena, N., Cardenas, G., Phillips, O.L., Vásquez, R.
& Räsänen, M. (2011) Geological control of floristic composition in Amazonian forests. Journal
of Biogeography, 38, 2136–2149.
Hijmans, R.J., Cameron, S.E., Parra, J.L., Jones, P.G. & Jarvis, A. (2005) Very high resolution
interpolated climate surfaces for global land areas. International Journal of Climatology, 25,
1965–1978.
Hubbell, S.P. (2001) The Unified Neutral Theory of Biodiversity and Biogeography. Princeton
University Press, Princeton.
Hubbell, S.P. (2013) Tropical rain forest conservation and the twin challenges of diversity and rarity.
Ecology and Evolution, 3:3263–3274.
Kahn, F. & Mejía, K. (1987) Notes on the biology , ecology , and use of a small Amazonian palm:
Lepidocaryum tessmannii. Principes, 31, 14–19.
Koenker, R. (2011) quantreg: Quantile Regression.

74
Kozlowski, T.T. (1997) Responses of woody plants to flooding and salinity. Tree Physiology
Monograph, 1, 1–29.
Legendre, P. & Legendre, L. (1998) Numerical Ecology, 2nd ed. Elsevier, Amsterdam.
Levis, C., De Souza, P.F., Schietti, J., Emilio, T., Pinto, J.L.P.D.V., Clement, C.R. & Costa, F.R.C.
(2012) Historical human footprint on modern tree species composition in the Purus-Madeira
interfluve, central Amazonia. PloS one, 7, e48559.
MacArthur, R.H.. & Horn, H.S.. (1969) Foliage Profile by Vertical Measurements. Ecology, 50, 802–
804.
Malhi, Y., Roberts, J.T., Betts, R.A., Killeen, T.J., Li, W. & Nobre, C.A. (2008) Climate change,
deforestation, and the fate of the Amazon. Science, 319, 169–172.
Marshall, T.J., Holmes, J.W. & Rose, C. (1996) Soil Physics, 3rd ed. Cambridge University Press,
New York.
Miguez-Macho, G. & Fan, Y. (2012) The role of groundwater in the Amazon water cycle: 1.
Influence on seasonal streamflow, flooding and wetlands. Journal of Geophysical Research, 117,
D15113.
Miller, C. (2002) Fruit Production of the Ungurahua Palm ( Oenocarpus bataua subsp . bataua ,
Arecaceae ) in an Indigenous Managed Reserve. Economic Botany, 56, 165–176.
Moeslund, J.E., Arge, L., Bøcher, P.K., Dalgaard, T. & Svenning, J.-C. (2013) Topography as a driver
of local terrestrial vascular plant diversity patterns. Nordic Journal of Botany, 31, 129–144.
Navarro, J.A., Galeano, G. & Bernal, R. (2011) Impact of leaf harvest on populations of
Lepidocaryum tenue , an Amazonian understory palm used for thatching. Tropical Conservation
Science, 4, 25–38.
Nelson, B.W., Kapos, V., Adams, J.B., Oliveira, W.J. & Oscar, P.G. (1994) Forest Disturbance by
Large Blowdowns in the Brazilian Amazon. Ecology, 75, 853–858.
Neves, S.D.C., Ribeiro, L.M., Da Cunha, I.R.G., Pimenta, M.A.S., Mercadante-Simões, M.O. &
Lopes, P.S.N. (2013) Diaspore structure and germination ecophysiology of the babassu palm
(Attalea vitrivir). Flora - Morphology, Distribution, Functional Ecology of Plants, 208, 68–78.
Normand, S., Vormisto, J., Svenning, J.-C., Grández, C. & Balslev, H. (2006) Geographical and
environmental controls of palm beta diversity in paleo-riverine terrace forests in Amazonian
Peru. Plant Ecology, 186, 161–176.
75
Oksanen, J., Blanchet, F.G., Kindt, R., Legendre, P., Minchin, P.R., O’Hara, R.B., Simpson, G.L.,
Solymos, P., Stevens, M.H.H. & Wagner, H. (2011) vegan: Community Ecology Package. R
package version 2.0-2.
Parker, G.G. & Russ, M.E. (2004) The canopy surface and stand development: assessing forest canopy
structure and complexity with near-surface altimetry. Forest Ecology and Management, 189,
307–315.
Parolin, P. (2002) Submergence tolerance vs. escape from submergence: two strategies of seedling
establishment in Amazonian floodplains. Environ. Exp. Bot, 48, 177–186.
Peh, K.S.-H., Lewis, S.L. & Lloyd, J. (2011) Mechanisms of monodominance in diverse tropical tree-
dominated systems. Journal of Ecology, 99, 891–898.
Phillips, O.L., Martínez, R.V., Arroyo, L., Baker, T.R., Killeen, T., Lewis, S.L., Malhi, Y., Mendoza,
A.M., Neill, D., Vargas, P.N., Alexlades, M., Cerón, C., Fiore, A. Di, Erwinkk, T., Jardim, A.,
Palacios, W., Saldias, M. & Vinceti, B. (2002) Increasing dominance of large lianas in
Amazonian forests. Nature, 418, 770–774.
Pitman, N.C. a., Silman, M.R. & Terborgh, J.W. (2013) Oligarchies in Amazonian tree communities: a
ten-year review. Ecography, 36, 114–123.
Pitman, N.C., Terborgh, J.W., Silman, M.R., N ez V, P., Neill, D.A. Cer n, C.E. (2001)
Dominance and distribution of tree species in upper Amazonian terra firme forests. Ecology, 82,
2101–2117.
Poulsen, A.D., Garden, R.B., Row, I. & Ehlr, E. (2006) Edaphic and Floristic Variation within a 1-ha
Plot of Lowland Amazonian Rain Forest 1. , 38, 468–478.
Quesada, C.A., Hillips, O.L., Schwarz, C.I. & Czimczik, C.I. et al. (2012) Basin-wide variations in
Amazon forest structure and function are mediated by both soils and climate. Biogeosciences,
2203–2246.
R Core Team. (2013) R: A language and environment for statistical computing.
Ruokolainen, K. & Vormisto, J. (2000) The most widespread Amazonian palms tend to be tall and
habitat generalists. Basic and Applied Ecology, 108, 97–108.
Salm, R., Vicente, N., Alonso, W.J., Schuck-paim, C. & Salles, N.V. De. (2007) Cross-scale
determinants of palm species distribution. Acta Amazonica, 37, 17 – 26.

76
Scariot, A. (2001) Weedy and secondary palm species in central amazonian forest fragments. Acta bot.
bras., 15, 271–280.
Schiett, J., Martins, D., Emilio, T., Souza, P., Levis, C., Pinto, J.L.P. da V., Moulatlet, G., Stark, S.C.,
Baccaro, F.B., Sarmento, K., Araújo, R.N.O. de, Costa, F.R.C., Schöngart, J., Quesada, C.A.,
Saleska, S.R., Tomasella, J. & Magnusson, W.E. (2013a) Linking forest structure and stand
biomass along natural disturbance gradients in central Amazonia. under preparation.
Schietti, J., Emilio, T., Rennó, C.D., Drucker, D.P., Costa, F.R.C., Nogueira, A., Figueiredo, F.,
Baccaro, F.B., Castilho, C. V., Kinupp, V., Guillaumet, J.-L., Garcia, A.R.M., Lima, A.P. &
Magnusson, W.E. (2014) Vertical distance from drainage drives floristic composition changes in
an Amazonian rainforest. Plant Ecology and Diversity.
Schietti, J., Stark, S.C., Souza, P., Martins, D.L., Emilio, T., Levis, C., Pinto, J.L.P.V., Silva, D.C.,
Costa, F.R.C., Schöngart, J., Tomasella, J., Saleska, S.R. & Magnusson, W. (2013b)
Environmental limits to canopy height in Central Amazonia. under preparation.
Schluter, U.B., Furch, B. & Joly, C.A. (2013) Physiological and Anatomical Adaptations by Young
Astrocaryum jauari Mart . ( Arecaceae ) in by Young Adaptations Physiological and Anatomical
( Arecaceae ) in Periodically Astrocaryum jauari Mart . Inundated Biotopes of Central Amazonia.
Biotropica, 25, 384–396.
Silva, M.G. & Tabarelli, M. (2001) Seed dispersal , plant recruitment and spatial distribution of
Bactris acanthocarpa Martius ( Arecaceae ) in a remnant of Atlantic forest in northeast Brazil.
Acta Oecologica, 22, 259–268.
Stark, S.C., Leitold, V., Shimabukuro, T. & Michael, A. (2012) Amazon forest carbon dynamics
predicted by profiles of canopy leaf area and light environment. Ecology Letters, 15, 1406–1414.
Steege, H. ter, Pitman, N.C.A., Sabatier, D. & Baraloto, C. (2013) Hyperdominance in the Amazonian
Tree Flora. Science, in press.
Stropp, J., Ter Steege, H., Malhi, Y., ADTN & RAINFOR. (2009) Disentangling regional and local
tree diversity in the Amazon. Ecography, 32, 46–54.
Svenning, C. (2001) Environmental heterogeneity , recruitment limitation and the mesoscale
distribution of palms in a tropical montane rain forest ( Maquipucuna , Ecuador ). Journal of
Tropical Ecology, 17, 97–113.
Ter Steege, H., Steege, H., Pitman, N.C.A., Phillips, O.L., Chave, J., Sabatier, D., Duque, A., Molino,
J.-F., Prévost, M.-F., Spichiger, R., Castellanos, H., Von Hildebrand, P. & Vásquez, R. (2006)

77
Continental-scale patterns of canopy tree composition and function across Amazonia. Nature,
443, 444–447.
Terborgh, J. & Andresen, E. (1998) The composition of Amazonian forests: patterns at local and
regional scales. Journal of Tropical Ecology, 14, 645–664.
Tuomisto, H., Poulsen, A.D., Ruokolainen, K., Moran, R.C., Quintana, C., Celi, J., Cañas, G.,
Uomisto, H.A.T., Oulsen, A.X.E.L.D.A.P., Uokolainen, K.A.R. & Oran, R.O.C.M. (2003)
Linking floristic patterns with soil heterogeneity and satellite imagery in ecuadorian amazonia.
Ecological Applications, 13, 352–371.
Tuomisto, H., Ruokolainen, K., Kalliola, R., Linna, A., Danjoy, W. & Rodriguez, Z. (1995) Dissecting
Amazonian Biodiversity. Science, 269, 63–66.
Tuomisto, H., Ruokolainen, K., Kalliola, R., Linna, A., Danjoy, W. & Rodriguez, Z. (1995) Dissecting
Amazonian Biodiversity. Science, 269, 63–66.
Vormisto, J., Phillips, O.L., Ruokolainen, K., Tuomisto, H. & Vásquez, R. (2000) A comparison of
fine-scale distribution patterns of four plant groups in an Amazonian rainforest. Ecography, 23,
349–359.
Vormisto, J., Svenning, J., Hall, P. & Balslev. (2004) Diversity and dominance in palm (Arecaceae )
communities in terra firme forests in the western Amazon basin. Journal of Ecology, 92, 577–
588.
Wright, S.J. (2002) Plant diversity in tropical forests: a review of mechanisms of species coexistence.
Oecologia, 130, 1–14.
Zona, S. & Henderson, A. (1989) A review of animal-mediated seed dispersal of palms. Selbyana, 11.
Zuur, A.F. (2009) Mixed Effects Models and Extensions in Ecology with R. Springer.

78
ARTIGO 2 – MATERIAL SUPLEMENTAR
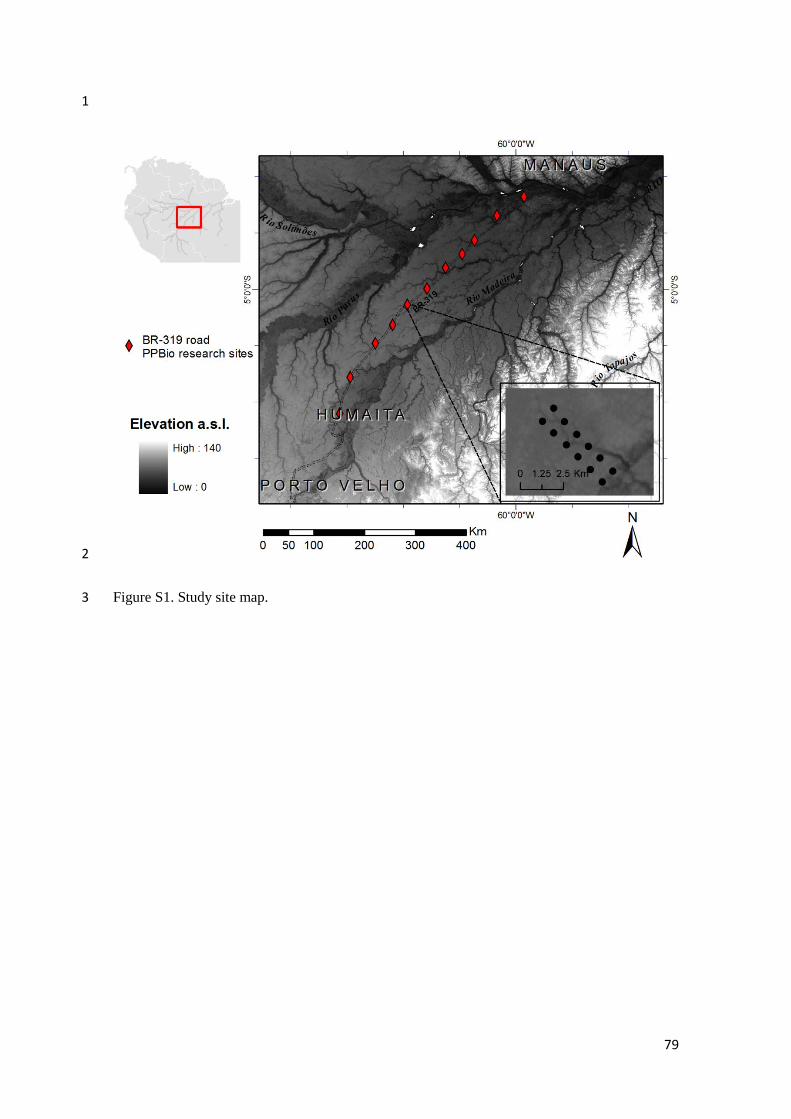
79
1
2
Figure S1. Study site map.3

80
Species rank
Pa
lm s
pe
cie
s a
bu
nd
an
ce
(lo
g(n
o. in
div
idu
als
))
02
46
81
01
2
50% of overall abundance40% of overall abundance10% of overall abundance
4
Figure S2. Species relative abundance. 5

81
0 500 1000 1500
02
00
40
06
00
80
01
00
0
Palm density in 0.1 ha plot
Le
pid
oca
ryu
m te
nu
e d
en
sity in
0.1
ha
plo
t
6
Figure S3. Effect of the upmost dominant species (Lepidocaryum tenue) on the overall palm 7
abundance. 8

82
Table S1. Species list (ordered by overall abundance), voucher numbers, growth-form (sensu Balslev et al. 2011), habitat density and the results of individual 9
species models. 10
Species name
INPA
Herbarium
access
number
Growth-form
Inundated-forest
abundance/
mean density
(n = 8)
Non-inundated
(terra-firme) forest
abundance/
mean density
(n = 93)
R Environmental predictors
(p<0.05)
Lepidocaryum tenue Mart. 240720 Small Palm 0/0 44735/481.02 - ns
Oenocarpus bataua Mart. nc Large tall-stemmed Palm 0/0 11196/120.39 0.64
L. tenue, inclination, soil clay, canopy
heteogeneity
Astrocaryum gynacanthum Mart. 248637 Small Palm 14/1.75 4025/43.28 0.48 L. tenue, soil clay, soil phosphorous
Euterpe precatoria Mart. nc Large tall-stemmed Palm 180/22.5 3544/38.11 0.28 storm frequency
Iriartella setigera (Mart.) H. Wendl. 240736 Small Palm 0/0 2345/25.22 0.48 L. tenue
Attalea maripa (Aubl.) Mart. nc Large tall-stemmed Palm 3/0.38 2160/23.23 0.68 storm frequency
Attalea speciosa Mart. nc Small Palm 16/2 2024/21.76 0.64
precipitation on dry season,inclination,
canopy heteogeneity
Attalea microcarpa Mart. 240737 Large acaulescent Palm 0/0 1466/15.76 0.37 ns
Bactris acanthocarpa Mart. 240718 Small Palm 0/0 809/8.7 0.47 ns
Geonoma oligoclona Trail. 219963 Small Palm 0/0 799/8.59 0.57
precipitation on dry season, water table
depth, inclination
Geonoma maxima (Poit.) Kunth 240740 Small Palm 3/0.38 587/6.31 0.43 water table depth, soil potassium
Bactris hirta Mart. 240749 Small Palm 0/0 571/6.14 0.55 inclination
Socratea exorrhiza (Mart.) H.
Wendl. nc Large tall-stemmed Palm 0/0 498/5.35 0.18 canopy heteogeneity
Leopoldinia pulchra Mart. nc Small Palm 478/59.75 13/0.14
Bactris elegans Barb. Rodr. 248638 Small Palm 0/0 466/5.01 - ns
Astrocaryum acaule Mart. 240733 Large acaulescent Palm 65/8.13 396/4.26 - ns
nc: voucher not collected; collection without herbarium * number
ns: non significant model

83
Cont. Table S1. 11
Species name
INPA
Herbarium
access
number
Growth-form
Inundated-
forest
abundance/
mean
density
(n = 8)
Non-inundated
(terra-firme) forest
abundance/
mean density
(n = 93)
Rc Environmental predictors
(p>0.05)
Oenocarpus minor Mart. 240727 Small Palm 0/0 435/4.68 0.49 L. tenue
Oenocarpus bacaba Mart. nc Large tall-stemmed Palm 0/0 386/4.15 0.27 precipitation on dry season, soil clay
Bactris acanthocarpoides Barb. Rodr. nc Small Palm 0/0 313/3.37 0.57 precipitation on dry season
Astrocaryum murumuru Mart. nc
Large-leaved stemmed
Palm 27/3.38 281/3.02 0.13 ns
Geonoma baculifera (Poit.) Kunth nc Small Palm 111/13.88 180/1.94
Bactris tomentosa Mart. 240746 Small Palm 2/0.25 235/2.53 - ns
Bactris maraja Mart. 248636 Small Palm 33/4.13 193/2.08 0.22 inclination
Attalea insignis (Mart.) |Drude 240731 Large acaulescent Palm 206/25.75 1/0.01 - ns
Bactris simplicifrons Mart. 240715 Small Palm 0/0 205/2.2 - ns
Bactris oligocarpa Barb. Rodr. & Trail 219961 Small Palm 0/0 180/1.94 0.31 soil clay, soil phosphorous
Geonoma deversa (Poit.) Kunth 220005 Small Palm 0/0 177/1.9 0.37 L. tenue, soil phosphorous
Geonoma stricta (Poit.) Kunth 240714 Small Palm 0/0 177/1.9
Bactris syagroides Barb. Rodr. & Trail 220002 Small Palm 0/0 142/1.53
Bactris trailiana Barb. Rodr. nc Small Palm 67/8.38 65/0.7 - ns
Astrocaryum aculeatum G. May nc Large tall-stemmed Palm 0/0 127/1.37
Mauritia carana Wallace * Large tall-stemmed Palm 0/0 123/1.32
Pholidostachys synanthera (Mart.) H.
E. Moore 246353 Small Palm 0/0 114/1.23
Bactris balanophora Spruce 240722 Small Palm 0/0 112/1.2 0.48 water table depth, soil clay
Syagrus sp1 220001 Medium-sized Palm 0/0 110/1.18
nc: voucher not collected; * collection without herbarium number
ns: non significant model

84
12
Cont. Table S1 13
Species name
INPA
Herbarium
access
number
Growth-form
Inundated-forest
abundance/
mean density
(n = 8)
Non-inundated
(terra-firme) forest
abundance/
mean density
(n = 93)
Rc Environmental predictors
(p>0.05)
Geonoma macrostachys Mart. 240712 Small acaulescent Palm 1/0.13 102/1.1 - ns
Desmoncus parvulus Bailey 240748 Climbing Palm 37/4.63 64/0.69 0.20 soil clay, soil phosphorous
Mauritiella aculeata (Kunth) Burret nc Medium-sized Palm 0/0 85/0.91 - ns
Bactris killipii Burret 240717 Small Palm 3/0.38 75/0.81 0.36 inclination, soil clay
Geonoma leptospadix Trail
240716,
240726 Small Palm 0/0 68/0.73
Bactris cf. turbinocarpa Barb. Rodr. 240729 Small Palm 0/0 62/0.67
Desmoncus mitis Mart. nc Climbing Palm 30/3.75 3/0.03
Syagrus inajai (Spruce) Becc. 240708 Medium-sized Palm 0/0 32/0.34
Bactris aubletiana Trail
219992,
220007 Small Palm 0/0 23/0.25
Desmoncus giganteus Henderson nc Climbing Palm 15/1.88 8/0.09
Bactris gastoniana Barb. Rodr.
248639,
240743 Small acaulescent Palm 1/0.13 21/0.23
Astrocaryum jauari Mart. 246328 Large tall-stemmed Palm 18/2.25 0/0
Iriartea deltoidea Ruiz & Pav. nc Large tall-stemmed Palm 0/0 15/0.16
Mauritia flexuosa Mart. * Large tall-stemmed Palm 0/0 14/0.15
Bactris bifida Mart. nc Small Palm 0/0 8/0.09
Elaeis oleifera (Kunth) Cortés nc
Large-leaved stemmed
Palm 0/0 6/0.06
Oenocarpus distichus Mart. nc Large tall-stemmed Palm 0/0 4/0.04
nc: voucher not collected; * collection without herbarium number
ns: non significant model
14

85
Table S2. Results of floristic composition models 15
Model
(percentage of
explanation over
floristic
variation)
R2 p
Relative contribution of the predictors
L. tenue
abundance (0- 1149 ind)
Precipitation
in Dry
Season (136-297 mm)
Water
Table
Depth (0-7 m)
Inclination* (0.3-12.7 sd)
Soil Clay (7.0-32.3
%)
Soil P* (0.4-6.8
mg/kg)
Soil K (0.02-0.09
cmol/kg)
Canopy
Heterogeneity (2.8-7.8 m)
Storm
Frequency (42-60 days)
OLS
Presence-
Absence
(49%)
0.66 <0.001 0.31
(<0.001)
0.47
(<0.001)
0.36
(<0.001)
0.28
(<0.001)
-0.05
(0.418) -0.18
(0.014)
-0.12
(0.128)
-0.01
(0.824)
-0.01
(0.127)
Abundance
(43%) 0.66 <0.001
0.08
(0.308)
0.05
(0.519) -0.17
(0.021)
-0.07
(0.248) -0.53
(<0.001)
-0.19
(0.011)
0.17
(0.032)
-0.32
(<0.001)
-0.22
(0.006)
MIXED MODEL
Presence-
Absence
(50%)
0.67m
0.67c
0.21
(0.003)
0.27
(0.145) 0.15
(0.026)
0.13
(0.014)
0.06
(0.214)
0.01
(0.755) 0.15
(0.016)
-0.01
(0.880)
-0.12
(0.439)
Abundance
(44%) 0.67m
0.67c
0.08
(0.308)
0.05
(0.519) -0.17
(0.021)
-0.07
(0.248) -0.53
(<0.001)
-0.19
(0.011)
0.17
(0.033)
-0.32
(<0.001)
-0.22
(0.006)
* for the models we used the log version of this variable 16

86
Table S3. Results of alternative species turnover models 17
Original
variable
Alternative
variable R
2 p
Relative contribution of the predictors
L. tenue
abundance (0- 1149 ind)
Precipitation
in Dry
Season (136-297 mm)
Water
Table
Depth (0-7 m)
Inclination* (0.3-12.7 sd)
Soil
Clay (7.0-32.3
%)
Soil P* (0.4-6.8 mg/kg)
Soil K (0.02-0.09 cmol/kg)
Canopy
Heterogeneity (2.8-7.8 m)
Storm
Frequency (42-60 days)
Soil clay
Aluminum (0.9-6.2 cmol/kg)
0.64 <0.001
0.3
(0.001)
0.44
(<0.001)
0.35
(<0.001)
0.33
(<0.001)
-0.05
(0.473) -0.17
(0.024)
-0.13
(0.111)
-0.02
(0.756)
-0.07
(0.356)
Soil silt (13.2-76.5 %)
0.65 <0.001 0.33
(<0.001)
0.41
(<0.001)
0.33
(<0.001)
0.35
(<0.001)
0.12
(0.153) -0.15
(0.039)
-0.16
(0.052)
0.02
(0.776)
-0.06
(0.461)
Soil sand (6.0-65.7%)
0.64 <0.001 0.33
(<0.001)
0.43
(<0.001)
0.34
(<0.001)
0.33
(<0.001)
-0.04
(0.581) -0.15
(0.048)
-0.15
(0.072)
-0.01
(0.916)
-0.07
(0.419)
Soil K
Bases
saturation (0.06-0.53
cmol/kg)
0.64 <0.001
0.25
(0.004)
0.39
(<0.001)
0.37
(<0.001)
0.32
(<0.001)
-0.12
(0.107) -0.22
(0.006)
0.01
(0.936)
0.00
(0.954)
-0.07
(0.392)
Precipitation
on dry season
Annual
precipitation (2301-2798 mm)
0.61 <0.001
0.24
(0.018)
0.49
(<0.001)
0.35
(<0.001)
0.36
(<0.001)
-0.05
(0.532)
-0.12
(0.161)
-0.15
(0.097)
-0.06
(0.408) -0.22
(0.022)
Dry season
length (0-2 months)
0.73 <0.001
0.27
(<0.001)
-0.52
(<0.001)
0.28
(<0.001)
0.28
(<0.001)
-0.1
(0.097) -0.14
(0.046)
-0.13
(0.06)
0.01
(0.857)
0.00
(0.968)
Canopy
heterogeneity
Forest
density (2.8-4.6)
0.67 <0.001
0.25
(0.004)
0.42
(<0.001)
0.30
(<0.001)
0.29
(<0.001)
-0.11
(0.116) -0.21
(0.006)
-0.13
(0.14)
0.14
(0.058)
-0.09
(0.242)

87
Table S4. Results of alternative species relative abundance models
Original
variable
Alternative
variable R
2 p
Relative contribution of the predictors
L. tenue
abundance (0- 1149 ind)
Precipitation
in Dry
Season (136-297 mm)
Water
Table
Depth (0-7 m)
Inclination* (0.3-12.7 sd)
Soil
Clay (7.0-32.3
%)
Soil P* (0.4-6.8 mg/kg)
Soil K (0.02-0.09 cmol/kg)
Canopy
Heterogeneity (2.8-7.8 m)
Storm
Frequency (42-60 days)
Soil clay
Aluminum (0.9-6.2 cmol/kg)
0.58 <0.001
0.12
(0.194)
0.11
(0.213)
-0.09
(0.288)
-0.074
(0.326)
-0.429
(<0.001)
-0.107
(0.195)
0.202
(0.029)
-0.359
(<0.001)
-0.205
(0.025)
Soil silt (13.2-76.5 %)
0.40 <0.001 0.24
(0.035)
0.07
(0.533)
-0.17
(0.089)
-0.09
(0.313)
0.11
(0.293)
-0.01
(0.914)
0.1
(0.376) -0.32
(0.004)
-0.16
(0.146)
Soil sand (6.0-65.7%)
0.43 <0.001
0.18
(0.101)
0.14
(0.197)
-0.15
(0.122) -
0.14
(0.107) 0.22
(0.035)
-0.07
(0.467)
0.16
(0.14) -0.44
(<0.001)
-0.21
(0.053)
Soil K
Bases
saturation (0.06-0.53
cmol/kg)
0.60 <0.001
0.21
(0.023)
0.23
(0.008)
-0.23
(0.004)
-0.03
(0.727) -0.54
(<0.001)
-0.21
(0.013)
0.02
(0.844) -0.27
(0.001)
-0.27
(0.003)
Precipitation
on dry season
Annual
precipitation (2301-2798 mm)
0.66 <0.001
0.07
(0.417)
0.08
(0.504) -0.17
(0.022)
-0.07
(0.27) -0.52
(<0.001)
-0.18
(0.019)
0.17
(0.048)
-0.33
(<0.0001)
-0.25
(0.007)
Dry season
length (0-2 months)
0.66 <0.001
0.08
(0.328)
-0.07
(0.353) -0.18
(0.017)
-0.09
(0.208) -0.53
(<0.001)
-0.19
(0.015)
0.17
(0.032)
-0.32
(0.001)
-0.21
(0.01)
Canopy
heterogeneity
Forest
density (2.8-4.6)
0.63 <0.001
0.16
(0.089)
0.18
(0.037)
-0.18
(0.023)
-0.04
(0.545) -0.55
(<0.001)
-0.24
(0.002)
0.2
(0.02)
-0.27
(0.001)
-0.25
(0.003)

88
ARTIGO 3
Hydrological control of species coexistence and richness in Amazonian palms
EMILIO, T., COSTA, F. R. C, SCHIETTI, J., PINTO, J. L. P. V., MAGNUSSON, W. E., TOMASELLA, J. ,
FAURBY, S. & SVENNING, J-C. Submetido para PLoS One

89
Abstract
The mechanisms that allow large numbers of species to coexist in the tropics are still unclear. Here, we
used the palm family as a model to evaluate the importance of niche-related processes for species
coexistence and richness in tropical plant communities. We asked the following questions: (1) Is the
palm species regional pool segregated along hydrologically defined niche axes? (2) Has the affiliation
of species to hydrological niche axes been conserved throughout palm evolution? (3) Can regional
species niche segregation/overlap along hydrological axes explain local patterns of species coexistence
and richness? To address these questions we carried out palm species surveys and monitored water
table depth in 41 plots distributed along a 600 km transect in Central Amazonian lowland forest. We
estimated hydrological niche axes and tested for niche segregation/overlap using randomization
procedures. Additionally, we compiled phylogenetic data and tested for niche conservatism using
Blomberg’s K. Our results showed that palm species segregation along a hydrological niche axis from
soil saturation to dryness was higher than expected by chance, that this segregation was strongly
positively related to local species richness, and that there was no phylogenetic conservatism in the
species’ hydrological niche affiliation. From the latter, we conclude that Central Amazonian palm
species’ hydrological niche segregation reflects repeated adaptive evolutionary diversification across
the palm phylogeny. Hydrological segregation thus appears to be an important mechanism for
explaining diversification, as well as species coexistence, in palms and potentially also in other
species-rich tropical plant groups.

90
Introduction
To avoid competitive exclusion, plant species may segregate along environmental niche axes,
such as soil fertility and availability of water or light. Segregation along some of these niche axes may
allow species coexistence and has been demonstrated in both temperate and tropical plant communities
[1, 2]. The niche separation expected from classical competition theory (i.e. species will stably coexist
if they occupy different niches) is more common on temperate and low diversity forests that in highly
diverse ones [3]. The potential difference in coexistence mechanisms between tropical and temperate
forests could be related to the strength of inter-specific competition in these communities. In low
diversity communities, the probability of interaction between two species is high, while in tropical
forests it is more likely that diffuse competition takes place [4]. If individuals are competitively
equivalent there is no directional selection and low divergence of traits is expected. Individual
equivalency is the base of the controversial Unified Neutral Theory proposed by Hubbell [5] to explain
the predominant diversity patterns in tropical forests based on ecological drift. The search for non-
neutral processes has been the main stream of much of tropical research in the last decade [6]. But
even after so much effort on that, the implications of non-neutral processes to explain species richness
remain as conjectural as they were just after Unified Neutral Theory was first proposed [7]. Studies
that were able to reveal niche differentiation focused in the discrimination of subtle values of basic
environmental resources for plants [2, 8] or in gradients that constrain plant performance [9, 10].
However, none of these has succeeded in demonstrating that species richness in tropical plant
communities is linked to segregation along niche axes as has been shown before for temperate plant
communities [9].
At least in part, the limited number of studies about niche segregation in tropical plant
communities is due to the large number of species which can interact. In a single hectare plot of
tropical forest, there may be up to a thousand plant species coexisting [11, 12]. It is easy to imagine
that many more than three niche dimensions will be necessary to explain the coexistence of a large
number of plant species, unless a very fine segregation occurs. Fine segregation is likely to occur in
tropical plants since there is evidence of very subtle variation in the way plants deal with the same
resources in closely related species [13]. Besides that, seasonal variation in resource availability could
also increase the number of possible niche dimensions that constrain plant performance [14]. Facing
all these unfolding possibilities, niche-based community assembly could still be able to explain a large
amount of tropical species coexistence and richness.
The identification of proper niche axes is a challenge because the absence of segregation along
one niche axis does not mean that significant partitions do not occur along other unidentified niche
axes [3]. Even if one could use all of the ecological datasets now available for evaluating this question
we would be still far from a complete screening of niche axes for virtually any plant species. As an
alternative, taxonomic or functional subsets of important plant groups could give us insights into the

91
mechanisms of niche partitioning in tropical species-rich communities. Recently, the palm family
(Arecaceae) has been used as model group for understanding the evolution of tropical forests [15].
This is because palms are restricted to tropical and subtropical regions and are among the most
conspicuous plant groups in tropical forests. The palm family is species-rich with more than 2,400
species actually recognized [16], 151 of them occurring in the Amazon region [17], of which from 1 to
28 species may co-occur in a 0.25 ha plot [18]. The taxonomy [16] and phylogeny [19] of palms is
relatively well known, making the family a useful group for the study of coexistence mechanisms in
tropical forests.
Water-energy gradients are strongly related to palm-species richness [20, 21] and net
diversification in continental scales in the Americas [22]. The diversification of at least one species-
rich lowland palm genus (Astrocaryum) has been suggested to be associated with changes in the South
American drainage systems [23]. Palm-species distribution and community composition of palms have
been repeatedly associated with water-related gradients at different scales. In a recent revision,
Eiserhardt et al. [24] concluded that climate emerges as an important factor for species distributions at
broader scales, while soil, topography and vegetation structure are important at finer scales. Evidence
of past and actual relationships between water gradients and palms suggest that hydrologically defined
niche axes could be major determinants of palm species richness and coexistence.
The importance of hydrologically defined niches for species coexistence in temperate species
rich regions has been shown for European meadow and African fynbos communities [9, 25]. Later,
Silvertown et al. [26] reported no evidence of niche conservatism (i. e. retention of ancestral ecological
traits along their evolution) related to species segregation along hydrological niches in the European
meadows. They explain this apparent contradiction by proposing – and also testing afterwards [27] -
that the niche axes that allow species coexistence (α niches) have to be labile while the niche axes that
allow species to occupy the different habitat (β niches) have to be conserved. Since deeply conserved
traits are related to remote origins in evolutionary time, this hierarchical interpretation of niche
structure predicts that coexistence is more related to recent events of speciation than with competitive
exclusion based on deeply conserved traits in species rich plant communities. Here, we show species
segregation along hydrological niches, absence of niche conservatism and convergent species
segregation in species-rich genera of the tropical palm family Arecaceae which partially support this
hypothesis. Despite the absence of phylogenetic signal, we observed a trend in richness decay with the
increasing of niche overlap, which is evidence for competitive effects on coexistence patterns. To
provide evidence for these conclusions, we addressed the following questions: (1) Is palm species
regional pool segregated along hydrologically defined niche axes? (2) Has the affiliation of species to
hydrological niche axes been conserved or labile throughout palm evolution? (3) Can regional species
niche segregation/overlap along hydrological axes explain local patterns of species coexistence and
richness?

92
Methods
Study area
The study was conducted in the interfluve between the Purus, Madeira and Solimões Rivers, in the
state of Amazonas, Brazil (Fig. 1). The study was carried out in mature lowland forests along the BR-
319 Highway, in 10 previously established sites of the Brazilian Biodiversity Research Program
(PPBio). The staff of the Research Program in Biodiversity (PPBio) contacted owners prior to install
the studies sites in their private land and obtained their agreement. The study area crosses headwaters
and higher order tributaries of the Purus and Madeira Rivers, two major Amazon River tributaries.
Most of the headwaters located in the area are intermittent, drying out in the dry season between July
and November to the north of the transect, and between June and October in the southern part. The
number of months with less than 100 mm of precipitation varies from one to four, and precipitation
between 1,500 and 2,700 mm/year according to the WorldClim dataset [28]. The soils are
predominantly Plinthosols, with some patches of Acrisol, Gleysols and Fluvisols in river terraces [29].
Soil texture is mostly loamy and poorly-drained close to the headwaters, but well-drained soils are
found in higher areas near higher order permanent streams. The terrain is flat or gently undulating
(elevation 20-70 m a.s.l. based on Shuttle Radar Topography Mission – SRTM images) and some
areas located close to streams may be flooded in the wet season. The water table is shallow throughout
the entire region, varying from 0-7 m deep for most sites throughout the year (T. Emilio & J. Schietti
unpublished data). High to low precipitation, soil with low hydraulic-conductivity, flat terrains and a
shallow water table create a mosaic of hydrological conditions which were convenient for testing our
hypothesis about hydrological control of palm coexistence and richness.
Palm survey data
In each of the 250 x 2.5 m (~0.065 ha) plots all palms above 0.3m height were counted and identified
to the finest taxonomic level viable. For clonal species, each stem was considered as one individual.
The identification was done using the most up to date literature at that time [17, 30, 31, 32] and a
previously available photographic guide for the palms of the region [33]. Plant vouchers were
collected for most of the species and the identification checked with the aid of specialists and
comparisons with herbarium collections at INPA and NYBG. The individuals identified only to genus
(1.3%) were excluded from the analyses. All necessary permits were obtained for the described field
studies. Our field studies did not involve endangered or protected species. The permit to collect
botanical specimens (26079-1) and execute scientific research in the protect areas (24728-1) was given
to TE by ICBIO (Brazilian regulatory body concerned with protection of wildlife).

93
Figure1. Map of the study area.
Sites are about 50km from each other and are spread over 600 km. Each site contains ten plots, at least
1km from each other. We simultaneously collected information about water table depth and palm-
species composition in these plots. For the analyses presented here we used a subset of 41 plots for
which the water table depth data was available from March of 2011 to July of 2012. More details
about the study sites are available from http://ppbio.inpa.gov.br/sitios/br319/.
Hydrological niche axis
Water table depth was used to represent the hydrological niche axes because it determines soil
saturation/flooding and acts as a water source in the dry season. Soil flooding causes decay in root
systems and induces multiple physiological dysfunctions in plants [34]. Shallow water table levels lead
to soil saturation at the rhizosphere level even without the occurrence of surface flooding. Nearly 70%
of root biomass is found in the upper 30 cm of soil [35] and soil saturation above this boundary may
cause as much damage as soil flooding to plants. Water table level can also be related to water
acquisition by plants, especially in dry season when rainfall events are less frequent. The potential

94
contribution of groundwater to plant water uptake decreases with water table depth [36] and model
simulations for the Amazon basin suggest that evapotranspiration could be around 1mm/day higher in
dry season due to the contribution of the shallow water table to soil moisture [37]. Hence, both shallow
and deep water tables can affect plant performance by defining the lower and upper boundaries of soil
saturation and dryness.
Most palm roots are also located in the first 30 centimeters of soil [38], based on which we assumed
that a water table shallower than 0.5 m will potentially saturate the palm rhizosphere and defined this
as the soil saturation boundary. The lower boundary is somewhat arbitrary, since we do not know how
deep the water table needs to be to influence palms’ water uptake, and the water table is not the only
source of water for palms. Precipitation rapidly changes soil moisture in the first 2-3m of soil profile
[39] where the water uptake by Amazonian trees is concentrated according to tracer studies [40].
Direct access to groundwater by plant roots is expected if the water table is above 2-3 m [37]. When
the water table is below this, the water uptake will rely more on water available from rainfall. The
deepest water table levels at our study site occur in the dry season and a shallow water table could act
as a water source for plants in that season. Since palms lack deep tap roots, we assumed that the water
table is less likely to influence soil moisture when it is more than 3 m deep, and defined this as the soil
dryness boundary.
To measure water table depth, a 7m-deep dip well was installed in each plot. Measurements were
taken between March 2011 and July 2012. The dip well consisted of a 5.5 cm diameter plastic pipe
with holes drilled in the lower portion (30 cm) to permit water flow. The holes were covered with a
thin polyester mesh to avoid obstruction by mud, and the end of the wells capped to prevent entry of
rainwater and litter. A lateral orifice equilibrated the air pressure in the pipe. The water table depth was
manually monitored every four months using a measuring tape.
From the soil saturation/dryness boundaries and water table monitoring we calculated the number of
months that each of our plots stayed in soil saturation and soil dryness during our fifteen months of
water table measurements. The response of plants to soil saturation and dryness may not be
independent from each other. Seedlings of flood-tolerant species display variable physiological
responses to drought that indicate desiccation avoidance [41]. However, after flooding plants may be
less tolerant to drought because absorption of water by their depleted root systems cannot adequately
replenish their transpirational losses [37]. To consider both gradients (saturation and dryness) at the
same time we performed a Principal Component Analysis (PCA) between the soil saturation and soil
dryness axes. The first PCA axis (PCA1) captured 69% of the correlation between the two axes and
was used in the further analysis of niche segregation. This axis represents hydrological conditions
from soil saturation to dryness with lower values of PCA1 axis representing the number of months in
dryness and higher values PCA1 better representing the number of months in saturation (Figure S1).

95
As saturation and dryness are not the only possible hydrological states (remember that only conditions
above 0.5 m are considered saturation and only conditions bellow 3 m are considered dryness) and the
correlation between saturation and dryness are not high (Fig S1A) we judged that a better approach
was reduce the dimensionality of these axes to one using PCA. This is equivalent to the procedure
adopted by Silvertown et al (1999) that demonstrated niche segregation along similar gradients in
English meadows, but instead of using arbitrary hydrological envelopes, we decided to reduce the
dimensionality of our data using an ordination technique. Species optimum along hydrological niche
axes
From the palm surveys we selected all species that occurred in more than three plots and more than
one site, and calculated their optima in relation to the hydrological axes. We considered as species
optimum the mean value of the gradient calculated from all individual of the species. This is
equivalent to calculate the weighted average of the species in the gradient - as in an indicator species
analysis - and after that, divide by the total number of individuals of the specie. We used the species
optimum in relation to soil saturation and dryness only to position all species in relation to these two
hydrological axes and visualize whether there was a trade-off in the species optimum segregation. The
combined hydrological axis (PCA1) was used for the following niche segregation and niche
conservancy tests.
Niche segregation/overlap test
To estimate the amount of niche segregation in our community we calculated pairwise values of
Pianka´s index of niche overlap [42] given by:
Okj = Okj = ∑ (pij .pik) / √(∑ pij2 . ∑pik
2)
Where pij e pik represents the proportion of resource i used by the species j and k. The individual values
along the combined hydrological (PCA1) axis were considered as resource states for the calculations
of Pianka’s index. The combined hydrological axis (PCA1) gave us 12 possible hydrological
conditions. For each one of those 12 conditions (or resource states in Pianka’s nomenclature) we
calculated the proportion of the 12 conditions that was occupied by each species. Since most of the
dryness and saturation states occurred more than once in plots, we estimated the proportion of
resources used from the mean abundance of the species in a given resource state. Using these
proportions we calculated Pianka’s index of niche overlap for all species pairs. We did this for all pairs
of species that occurred in more than 10% of our plots (31 spp) and then calculated the mean of all
pairwise niche overlap values to obtain the mean overall niche overlap between all species pairs along
the combined hydrological axis (PCA1). To test for niche segregation, we compared the observed
mean overall niche overlap with different null models to assess if these values represent higher
segregation than expected by chance following the recommendations of Gotelli & Graves [43]. The

96
null expectation about how the mean niche overlap will be in species pool where there is no
segregation depends on the definition of segregation (Table S1). Both, niche breadth and abundance
variation may cause differences in Pianka’s index of niche overlap. Because of that we used four null
models which give different weight to niche breadth and abundance variation to assess if the
segregation that we observed in relation to the combined hydrological axis (PCA1) could be produced
by any of the mechanisms presumed by these algorithms. Technically, the RAs differ in the degree of
data retention in the matrix of resource utilization. RA1 samples abundances from a uniform
distribution and randomizes zero state positions. RA2 samples abundances from a uniform distribution
as RA1, but retains zero states positions. RA3 keeps the original abundances but shuffles the non-zero
abundance positions. RA4 keeps original abundances and shuffles both zero and non-zero abundance
positions. These differences imply different sensitivities of the null models depending on the presence
of specialization, abundance distribution and guild structure. Winemiller and Pianka [44] explored the
performance of RA3 and RA4 using detailed simulations with different idealized community
structures and concluded that the RA3 null model was more sensitive to patterns of internal guild
structure and utilization of core resources, while RA4 was better for discriminating between random
versus overdispersed patterns of resource exploitation in the absence of guild structure. To generate
each null model, the resource matrix was produced following the four randomization algorithms 1000
times. For each run, the mean overall niche overlap of the random community was calculated to
generate the null distribution of niche-overlap. The observed value of mean overall niche overlap was
then compared with the distributions generated by the four null distributions.
In addition to the mean overall niche overlap, we also calculated the plot-based mean niche overlap.
For this, we used the same pairwise Pianka’s niche overlap index calculated before, but for each plot
we included in the mean calculation only the pairs of species that co-occurred in that plot. This mean
niche overlap within each plot allowed us to test for a relationship between niche overlap and the
number of co-occurring species by plots using it in a linear regression against the number of species
co-occurring species in each plot.
Phylogenetic signal
Phylogenetic data is available for all 11 genera present in our inventories, but only for 18 of our 31
species. From the current available phylogenetic data, we constructed a phylogenetic tree for the 31
taxa identified to species level that were present in more than one site and three of our plots. The
relationships were constructed based on a dated phylogeny by Couvreur et al. [25]. For the genera with
species level phylogenies available [23, for Astrocaryum; 46, for Geonoma and 47, for Bactris],
polytomies were solved, taking into account the species relationships in the most parsimonious trees.
We assumed Couvreur’s dating and calculated new dates for species nodes based on the branch length
from the species resolution phylogenies. The species that had not yet been covered by any

97
phylogenetic study at that time (Table S2) were added to the tree in a random position within their
genus. This procedure was repeated 1000 times to generate a number of partially random trees to
account for the effect of phylogenetic uncertainty. We then calculated the Blomberg’s K index of
phylogenetic signal [48] for each of the trees in relation to the species optimum position in relation to
combined hydrological axis (PCA1) 1000 times. Blomberg’s K assumes that the evolution of the trait
occurs under the Brownian motion model and values of Blomberg’s K smaller than one indicate trait
lability while values greater than one suggest trait conservatism.
The analyses were undertaken in the R environment [49] using the packages ape [50], picante [51],
geiger [52], phylobase [53] and vegan [54].

98
Results
In our 41 plots we registered 36,744 palm individuals and 52 species. Twenty-two of these occurred in
less than 3 plots or at only one site and were excluded from our analyses. The remaining 31 taxa (see
Table S2 for species names and voucher numbers) were clearly segregated along the combined
(PCA1) hydrological gradient (Fig. 2). Palms were found in all plots, but only a smaller subset of
species could colonize the extremes of this hydrological gradient (Fig.3). Importantly, only one of the
analyzed species, Astrocaryum acaule Mart., had its hydrological optimum towards the very extreme
(wetter part) of the gradient (Fig. 3).The complete hydrological gradients varied from 0-15 months of
soil dryness and from 0-10 months of soil saturation, with palm species optima located in a small
subset of conditions, namely 5-10 months of soil dryness and 0-2 months of soil saturation. Despite
this clumping of optimum values, the overlap of palm species along the hydrological gradient was
smaller than expected by chance (Fig. 2), indicating that palm species are segregated along the
hydrological niche axis.
Figure 2. Figure 2. Hydrological niche segregation/overlap in Central Amazonia palm species. (A)
Regional scale species segregation along hydrological axes of soil saturation and dryness. Species
were positioned along these axes according to the summation of the weighted relativized abundances
in the hydrological axes. Each one of the 31 two-letter codes represents one palm species (see table S2
for species codes). Saturation = number of months with water table depth above 50 cm from the
ground. Dryness = number of months with water table depth below 3 m from the ground. (B)
Comparison between observed palm species mean niche overlap in the combined hydrological axis
(PCA1) and the expected mean niche overlap distribution according to four randomization algorithms.
The observed niche overlap was lower than expected by chance (segregation) in comparison to all null
models (see table S1 for details): RA1, relaxed niche breadth and abundance; RA2, retained niche
breadth and relaxed abundance; RA3, relaxed niche breadth and retained abundance; RA4, retained
niche breadth and abundance.

99
Figure 3. Relative abundance of Central Amazonian palm species along the hydrological gradient
ordered by their abundance in each level of the hydrological condition. Species in the bottom-left of
the figure are affiliated to dryer conditions and in the top-right are affiliated with wetter conditions.
The black bars show the position species in relation to the combined (PCA1) hydrological axis
obtained from the summation of the weighted relativized abundances of the species in relation to this
axis.

100
Hydrological niche position was not conserved across the palm species phylogeny, as there was no
phylogenetic signal in species’ optima along the soil dryness, soil saturation, or the combined
hydrological (PCA1) gradients (Fig. 4). Importantly, hydrological niche segregation is also evident
within each of the five species-rich genera represented, notably Astrocaryum and Geonoma (Fig. 4C-
H).
Figure 4. Hydrological niche lability and diversification patterns in Central Amazonia palm species
(A) Phylogenetic distribution of hydrological niche optima. The taxa in grey were randomly placed
1000 times to generate 1000 partially random trees (one of these is illustrated here) used for the niche
conservantism tests. The position of each taxa in relation to the combined hydrological axis (PCA1)is
represented besides the taxa name, and shows niche lability (i.e. character states are not more similar
in closely related species). (B) Distribution of Blomberg’s K values for 1000 partially random trees.
Blomberg’s K smaller than one indicates trait lability, while values greater than one suggest trait
conservatism. Note that for none of the trees is there evidence for niche conservatism. (C-H) Species
segregation along hydrological axes within each genus (see table S2 for species codes).

101
Not all species present in the Central Amazonian regional species pool co-occurred locally, with the
number of species per 0.065 ha plot varying between 10 and 24. This local species richness was
strongly linked to plot-based mean niche overlap (cf. Fig. 5), with species richness declining with
overlap in the combined hydrological gradient (PCA1; p<0.001, r2 = 0.41).There was a tendency for
species richness to increase with an increasing number of months with dry conditions (r2 = 0.1; p =
0.047), but no relation with the number of months with saturated conditions (r2 = 0.04; p = 0.239) or
with the combined hydrological gradient (PCA1; r2 = 0.09; p = 0.056).
Figure 5. Relationship between the number of co-occurring palm species (alpha-diversity) and plot-
based mean niche overlap along the combined (PCA1) hydrological axis. The small graphs show the
direct relationship between the number of species and the three hydrological axes.

102
Discussion
Palm species show significant niche segregation in relation to hydrological conditions of soil dryness
and saturation. Palm species segregation along the hydrological niche axis is a product of repeated
evolutionary diversification along this niche axis within palm clades. Surprisingly, the segregation
along the hydrological axis is not a result of strong restriction or specialization of palm species. Most
species occur along the entire hydrological gradient, but they concentrated their abundance in different
portions of this gradient. The segregation of species’ optima seems to be enough to prevent species
exclusion from regional species pool, and allows for the coexistence of a number of palm species at
this scale. At local scales, palm species coexistence could also be explained by hydrological niche
segregation. A higher number of palm species are able to coexist locally when they are more
segregated along hydrological axes at regional scales. Together, our results show that subtle spatio-
temporal hydrological gradients are important for species evolution and coexistence in Amazonia and
that segregation along environmental niches is likely to contribute to richness patterns in species rich
communities in the tropics also.
Mechanisms of species segregation along hydrological gradients
Hydrological gradients may represent both resource and conditions for plant development. Plants may
use and compete for soil water since it is fundamental for several eco-physiological processes.
However, they can also be affected by extreme soil water conditions (e.g. flooded sites) and then
compete for spots with more favorable conditions. In our hydrological gradient both situations are
possible. More than 12 months with a water table below 3 m means that the water availability on upper
soil layers relies on rainfall and hydraulic redistribution. In our transect, rainfall could be less than 100
mm per month in 2-4 months per year. This means that even in soils with low hydraulic conductivity,
soil water could be a valuable resource for plants to compete for. In the extremes of this gradient, soil
water conditions could limit the occurrence of plants. If there is no water available in soils, plants have
to close the stomata and stop photosynthesis to avoid desiccation and/or damage to plant vessels [55].
If this situation persists for a long time, the negative carbon balance may lead to the death of the plant.
The same could occur when soils are subjected to long-term soil saturation since increasing soil
toxicity and anoxia may also prevent gas exchange [34]. So, the hydrological gradient here could
represent two different roles: (1) a condition gradient of anoxia/drought which limit the occurrence of
some species and favor others with special adaptations or (2) a resource gradient of water availability
for which species may compete. Here we show that the balance of these two roles also changes over
time, since the same place may experience both anoxia and drought, but also a gradient of changing
water availability between these two extremes.
103
We do not believe that palms experience a severe drought stress in our gradient, but saturation stress
seems to be a common situation since we observed saturation in at least 25% of our plots. In fact, ten
out of 31 species do not occur in the wettest part of our gradient, while only two species do not occur
in the driest part (cf. Fig. 3). Morphological adaptations to deal with soil saturation such as lenticels
and pneumatophores were observed in Euterpe precatoria Mart., Iriartella setigera (Mart.) H. Wendl,
Lepidocarym tenue Mart., Mauritiella aculeate (Kunth) Burret, Socratea exorrhiza (Mart.) H. Wendl.,
and some Astrocaryum, Bactris and Geonoma species, but not in the 10 species that do not occur in
more saturated soil conditions. Even if some of the species were found in the extremes of the
hydrological axes, only Astrocaryum acaule had its optimum in a very extreme condition. This
reinforces the idea that the more suitable hydrological conditions are the same for all plants - i.e.
absence of anoxic conditions and enough available water - but some species may be displaced to less
favorable conditions and evolved to deal with harsh conditions in order to occupy the available places.
In that sense, our results resemble the seminal experiment of Ellemberg [56] which shows that plants
growing in monoculture tend to show the same optimum, but when they grow in mixture poor
competitors’ optima are displaced to less favorable conditions of water table depth.
Palm diversification along past and future hydrological gradients
Palm species segregation along the hydrological niche axes is a product of repeated evolutionary
diversification along these niche axes within palm clades. Different ancestral genera may have evolved
to colonize different parts of hydrological niches and after that they diversified again to conquest other
parts of the hydrological gradient. The segregation in monospecific genera coupled with the absence of
hydrological niche conservatism in palm phylogeny that we observed is in agreement with that
expected by this scenario. The absence of hydrological niche conservatism at species level could also
be explained by the random noise that results from adding species without phylogenetic data at
random positions in the tree. We addressed the uncertainties about taxa position testing for
phylogenetic signal in hundreds of phylogenetic trees where those taxa were placed at different
positions. Phylogenetic signal was found in none of the tested trees. Hence it is unlike that we will find
a different result when a more complete phylogeny becomes available. Freitas et al. [57] showed using
simulations that when the phylogenetic signal is strong, the addition of randomly placed species to an
incomplete phylogeny did not affect the detection of phylogenetic signal. However, when this signal is
weak the phylogenetic signal could be masked by this solution. The failure to detect a weak
phylogenetic signal by our methods cannot be dismissed, but is very unlikely that we failed to detect a
strong phylogenetic signal. Furthermore, the repeated pattern of species segregation within different
genera observed here makes us believe that the hypothesis of convergence of different species to
occupy the same hydrological niches is more probable than non-detected weak hydrological niche
conservatism.

104
Dated phylogenies for Bactris, Geonoma and Astrocaryum genera suggest that evolution of species
rich Amazonian palm genera is related to the evolution of the Amazon River drainage system [23, 46,
47]. Higher diversification rates in palms [46] occurred after the date associated with the drainage of
Pebas Lake, when a large part of western Amazon is supposed to have changed from a wetland to a
forested system. The landscape evolution initiated by the drainage of the Pebas Lake created new
hydrological habitats in the entire Amazon region [58]. Genus diversification may have been largely
influenced by the novel hydrological conditions. The observed pattern of species segregation in
hydrological niches of saturation and dryness may have derived from the diversification events in
species rich Amazonian genera that happened at this period. Given that hydrological changes in the
past could have caused the evolution of palms to occupy different parts of the hydrological gradient,
hydrological changes in the future may have the same effect. With climate change increased variability
in precipitation, soil moisture and surface water will enhance the importance of groundwater for the
maintenance of natural ecosystems. Here we show that both co-existence and species diversification
are related to a balance in subtle soil hydrological gradients created by groundwater fluctuations.
Expected changes in this delicate balance can both; deeply change the composition of actual plant
communities and/or drive a new cycle of extinction/diversification within palm clades.
Hydrological control on coexistence and richness
For tree communities in tropical forests, no more than 20% of alpha diversity could be explained by
environmental factors at local and/or regional scales [59]. The large amount of local diversity
unexplained by environmental conditions was interpreted as evidence in favor of neutral processes as
main drivers of high diversity, as predicted by Hubbell [5]. Here we show that almost half of the local
co-occurrence of species (i. e. alpha diversity) could be explained by the overlap in their hydrological
niche axis. This was around 30% more than the amount of richness that could be explained by the
hydrological condition per se. It is not negligible that extreme hydrological conditions may prevent
some species from occupying some sites. Indeed, highest number of species coexisting in the same
plot was attained in the absence of soil saturation and/or dryness. However, high or low species
numbers can be found anywhere along the hydrological gradient as well. We did not observe decay in
the number of co-occurring species as the number of months of soil saturation, dryness or both
increased, as expected from environmental limitation as a direct main driver of local species richness.
Instead, we found that more palm species could coexist locally when there is less hydrological niche
overlap.
The classical Pianka’s niche overlap hypothesis [60] predicts that if competition is important for the
stable coexistence of species, the number of co-occurring species will decay with increasing niche
overlap. However, if competition is strong enough to prevent coexistence by complete segregation of
species one could expect the opposite pattern (Fig. 6). The contraction of niche breadth caused by

105
increasing specialization to different parts of the gradient (and therefore segregation) may prevent
species co-occurrence at all and in extreme situations lead to mono-dominance. Pianka’s niche overlap
hypothesis predicts the relationship between alpha-diversity and niche overlap from moderate
segregation to complete overlap, but not between complete and moderate segregation. The number of
species will be maximum and be equal to regional species pool when the there is enough segregation
to prevent competition exclusion, but enough overlap to allow for species coexistence. Higher amounts
of overlap will result in competitive exclusion and decrease of alpha-diversity as predicted by Pianka’s
Niche Overlap Hypothesis. In the opposite direction, higher amounts of segregation will also decrease
alpha-diversity (cf. Fig 6) but because the specialization to occupy different parts of the gradient
prevents species coexistence. Strong specialization caused by repeated diversification occurs for many
taxa in the Amazon and was suggested as one of the explanations for high Amazonian diversity [61,
62, 63]. Interestingly, the direct consequence of strong specialization is that it is only observable in
scales in which species do not co-occur. High specialization will result in higher regional diversity, but
may not be evoked as a cause of local species richness and coexistence for the reasons explained
above.
Figure 6. Conceptual model of the implications of increasing niche overlap for alpha diversity. The
number of species will be maximum and equal to the regional species pool when the there is enough
segregation to prevent competition exclusion, but enough overlap to allow for species coexistence.
Right side: higher amounts of overlap will result in competitive exclusion and decrease of alpha-
diversity as predicted by Pianka’s Niche Overlap Hypothesis. Left side: higher amounts of segregation
occur by specialization and decreases alpha-diversity because species restriction to different parts of
the gradient will prevent species coexistence.

106
Our results suggest that segregation in hydrological niches of soil saturation and dryness is important
for palm species coexistence and is strongly related to the local species richness. But is the
hydrological control of coexistence and richness in tropical forests restricted to palm family? We
believe not. Species composition of other plant groups was shown to be largely explained by local soil
hydrology related metrics [64] meaning that species segregation along hydrological axes could be also
reasonable for other groups. Our species pool here was of 52 palm species. From that, between 22 and
10 species could co-occur locally and 41% of the local co-occurrence was explained by hydrological
niche overlap. Vascular plant species counts shows that the number of species that could co-occur in a
single hectare of Amazonian forest could be as large as a thousand species [11, 12] and this number
challenges any attempt at simple extrapolation of our conclusions for the entire Amazonian flora.
However, if not all species compete with all species, but only with a limited set of them in each
environmental axis one could expect that niche segregation could explain large amounts of species
coexistence also for the complete vascular flora, but this hypothesis remains to be tested. The
increasing availability of large datasets which has in recent years enabled testing of hypotheses about
continental patterns of species richness and diversification could also help us to better understand the
local patterns of species richness and their impressive variation, and shed light on mechanisms of
species coexistence in tropical forests.

107
Acknowledgments
We thank to residents of the BR-319 highway for many years of engagement and help with our
research. The National Council for Scientific and Technological Development (CNPq) awarded
stipends to TE, and a major grant from the FAPESP/FAPEAM (465/2010) and CNPq (473308/2009-6)
to HIDROVEG project supported collection of much of the data analyzed here. This work was also
supported by PRONEX - FAPEAM (1600/2006), PPBio Manaus (CNPq 558318/2009-6) and INCT
CENBAM. We thank the many field workers who established the PPbio permanent plots and help with
the installation of dip-wells. Our special thanks to Dorival Cruz for help with the water table
monitoring and to Thomas Couvreur, Julissa Roncal and Wolf Eiserhardt for making available the
dated phylogenetic data for palm genus and species. TE thanks to Gabriel Moulatlet, Friederike
Gnaedinger, Omar Cubas Encinas, Jailson Araújo, José Raimundo Quinderé and Juliana Menezes
Rodrigues for the aid with palm data collection and Andrew Henderson for the aid in palm species
identification. We thank to Flavia Costa’s Plant Ecology lab staff for our fruitful discussions, Victor
Landeiro for his comments on the first version of our results and to Cintia Freitas and Wolf Eiserhardt
for help with palm phylogenetic information. This manuscript was partly developed during Doctoral
fellowship to TE from PDSE/CAPES program at Aarhus University. We thank David Tonks for help
with English revisions.

108
References
1. McKane RB, Johnson LC, Shaver GR, Nadelhoffer KJ, Rastetter EB, et al. (2002) Resource-based
niches provide a basis for plant species diversity and dominance in arctic tundra. Nature 415: 68–71.
2. Montgomery, R. & Chazdon, R. (2002) Light gradient partitioning by tropical tree seedlings in the
absence of canopy gaps. Oecologia 131: 165–174.
3. Silvertown J (2004) Plant coexistence and the niche. Trends in Ecology & Evolution 19: 605–611.
4. Huston MA (1996) Biological Diversity: The coexistence of species on changing landscapes. New
York: Cambridge University.
5. Hubbell SP (2001) The Unified Neutral Theory of Biodiversity and Biogeography. Princeton:
Princeton University Press.
6. Clark JS (2009) Beyond neutral science. Trends in ecology & evolution 24: 8–15.
7. Wright SJ (2002) Plant diversity in tropical forests: a review of mechanisms of species coexistence.
Oecologia 130: 1–14.
8. Condit R, Engelbrecht BMJ, Pino D, Pérez R, Turner BL (2013) Species distributions in response to
individual soil nutrients and seasonal drought across a community of tropical trees. Proceedings of the
National Academy of Sciences of the United States of America 110: 5064–5068.
9. Silvertown J, Dodd ME, Growing DJG, Mountford O (1999) Hydrologically defined niches reveal a
basis for species richness in plant communities. Nature 400: 61- 63.
10. Engelbrecht BMJ, Comita LS, Condit R, Kursar TA, Tyree MT, et al. (2007) Drought sensitivity
shapes species distribution patterns in tropical forests. Nature 447: 80–92.
11. Duivenvoorden JF (1994) Vascular plant species counts in the rain forests of the middle Caquetá
area, Colombian Amazonia. Biodiversity and Conservation 3: 685–715.
12. Balslev H, Valencia R, Paz y Miño G, Christensen H, Nielsen I (1998) Species count of vascular
plants in one hectare of humid lowland forest in Amazonian Ecuador. Forest biodiversity in north,
central and south America and the Caribbean: research and monitoring. Man and the Biosphere Series
21. pp. 585–594.
13. Andersen KM, Turner BL (2013) Preferences or plasticity in nitrogen acquisition by understorey
palms in a tropical montane forest. Journal of Ecology 101: 819–825.
14. Baraloto C, Morneau F, Bonal D, Blanc L, Ferry B (2007) Seasonal water stress tolerance and
habitat associations within Neotropical tree genera. Ecology 88: 478–489.
15. Couvreur TLP, Baker WJ (2013) Tropical rain forest evolution: palms as a model group. BMC
biology 11-48: 2–4.
16. Govaerts R, Dransfield J (2005) World checklist of palms. Royal Botanic Gardens.
17 Henderson A (1995) The Palms of Amazon. New York: Oxford University Press.

109
18. Department of Bioscience AU (n.d.) Aarhus University Palm Transect Database. Aarhus
University Palm Transect Database. Available: http://data.gbif.org/datasets/resource/14087. Accessed
7 May 2013.
19. Baker WIJ, Savolainen V, Asmussen-Lange CB, Chase MW, Dransfield J, et al. (2009) Complete
Generic-Level Phylogenetic Analyses of Palms ( Arecaceae ) with Comparisons of Supertree and
Supermatrix Approaches. Systematic Biol Biol 58: 240–256.
20. Bjorholm S, Svenning J-C, Skov F, Balslev H (2005) Environmental and spatial controls of palm
(Arecaceae) species richness across the Americas. Global Ecology and Biogeography 14: 423–429.
21. Eiserhardt WL, Bjorholm S, Svenning J, Rangel TF, Balslev H (2011) Testing the Water – Energy
Theory on American Palms ( Arecaceae ) Using Geographically Weighted Regression. PloS one 6:
e27027.
22. Svenning J, Borchsenius F, Bjorholm S (2008) High tropical net diversification drives the New
World latitudinal gradient in palm (Arecaceae) species richness. Journal of Biogeography: 394–406.
23. Roncal J, Kahn F, Millan B, Couvreur TLP, Pintaud J (2012) Cenozoic colonization and
diversification patterns of tropical American palms : evidence from Astrocaryum ( Arecaceae ). The
Botanical Journal of Linnean Society: 120–139.
24. Eiserhardt WL, Svenning J, Kissling WD, Balslev H (2011) Geographical ecology of the palms
(Arecaceae): determinants of diversity and distributions across spatial scales. Annals of Botany 108:
1391–1416.
25. Araya YN, Silvertown J, Gowing DJ, McConway KJ, Linder HP, et al. (2011) A fundamental, eco-
hydrological basis for niche segregation in plant communities. The New phytologist 189: 253–258.
26. Silvertown J, McConway K, Gowing D, Dodd M, Fay MF, et al. (2006) Absence of phylogenetic
signal in the niche structure of meadow plant communities. Proceedings of The Royal Society B 273:
39–44.
27. Silvertown J, Dodd M, Gowing D, Lawson C, McConway K (2006) Phylogeny and the
hierarchical organization of plant diversity. Ecology 87: S39–49.
28. Hijmans RJ, Cameron SE, Parra JL, Jones PG, Jarvis A (2005) Very high resolution interpolated
climate surfaces for global land areas. International Journal of Climatology 25: 1965–1978.
29. Brasil (1978) Projeto RADAMBRASIL. Vol. (1-34). Geologia, geomorfologia, pedologia,
vegetação e uso potencial da terra.
30. Henderson A (2000) Bactris (Palmae). Flora Neotropica Monograph 79. New York: The New
York Bothanical Garden.
31. Henderson A (2011) A revision of Geonoma (Arecaceae). Phytotaxa 271: 1 – 271.
32. Henderson A (2011) A revision of Desmoncus (Arecaceae). Phytotaxa 88: 1–88.
33. Emilio T (2007) Guia Digital de Palmeiras da BR-319. Available:
http://ppbio.inpa.gov.br/sites/default/files/Guia_palmeiras.pdf

110
34. 1. Kozlowski TT (1997) Responses of woody plants to flooding and salinity. Tree Physiology
Monograph 1: 1–29.
35. Jackson RB, Canadell J, Ehleringer JR, Mooney H a., Sala OE, et al. (1996) A global analysis of
root distributions for terrestrial biomes. Oecologia 108: 389–411.
36. Fan Y, Miguez-Macho G (2010) Potential groundwater contribution to Amazon
evapotranspiration. Hydrology and Earth System Sciences 14: 2039–2056.
37. Miguez-Macho G, Fan Y (2012) The role of groundwater in the Amazon water cycle: 1. Influence
on seasonal streamflow, flooding and wetlands. Journal of Geophysical Research 117: D15113.
38. 1. Broschat TK, Donselman H (1987) Factor affecting palm transplant success. Proc Fla State
Hort Soc 100: 396–397.
39. Saleska SR, Didan K, Huete AR, da Rocha HR (2007) Amazon forests green-up during 2005
drought. Science 318: 612-612
40. Romero-Saltos H, Sternberg LDSL, Moreira MZ, Nepstad DC (2005) Rainfall exclusion in an
eastern Amazonian forest alters soil water movement and depth of water uptake. American Journal of
Botanyournal of botany 92: 443–455.
41. Parolin P, Lucas C, Piedade MTF, Wittmann F (2010) Drought responses of flood-tolerant trees in
Amazonian floodplains. Annals of Botany 105: 129 –139.
42. Pianka E (1974) Niche overlap and difuse competition. Proceedings of the National Academy of
Sciences of the United States of America 71: 2141–2145.
43. Gotelli NJ, Graves GG (1996) Null Models in Ecology.
44. Winemiller KO, Pianka ER (1990) Organization in Natural assemblage of desert lizard and topical
fishes. Ecological Monographs 60: 27–55.
45. 1. Couvrer, Couvreur TLP, Forest F, Baker WJ (2011) Origin and global diversification patterns of
tropical rain forests : inferences from a complete genus-level phylogeny of palms. BMC Biology 9: 44.
46. Roncal J, Blach-Overgaard A, Borchsenius F, Balslev H, Svenning J-C (2011) A Dated Phylogeny
Complements Macroecological Analysis to Explain the Diversity Patterns in Geonoma (Arecaceae).
Biotropica 43: 324–334.
47. Eiserhardt WL, Pintaud J, Asmussen-lange C, Hahn WJ, Bernal R, et al. (2011) Phylogeny and
divergence times of Bactridinae (Arecaceae , Palmae) based on plastid and nuclear DNA sequences.
Taxon 60: 485–498.
48. Blomberg SP, Garland T, Ives AR (2003) Testing for phylogenetic signal in comparative data:
behavioral traits are more labile. Evolution 57: 717–745.
49. R Core Team (2013) R: A language and environment for statistical computing. Available:
http://www.r-project.org/.
50. Paradis E., J. C, K. S (2004) APE: analyses of phylogenetics and evolution in R language.
Bioinformatics: 289–290.
111
51. Kembel SW, Cowan PD, Helmus MR, Cornwell WK, Morlon H, et al. (2010) Picante: R tools for
integrating phylogenies and ecology. Bioinformatics 26: 1463–1464.
52. Harmon L, Weir J, Brock C, Glor R, Challenger W, et al. (2009) geiger: Analysis of evolutionary
diversification. R package version 1.3-1. Available: http://cran.r-project.org/package=geiger.
53. Hackathon R (2011) phylobase: Base package for phylogenetic structures and comparative data. R
package version 0.6.5. Available: http://cran.r-project.org/package=phylobase.
54. Oksanen J, Blanchet FG, Kindt R, Legendre P, Minchin PR, et al. (2011) vegan: Community
Ecology Package. R package version 2.0-2. Available: http://cran.r-project.org/package=vegan.
55. Kozlowski TT, Pallardy SG (2002) Acclimation and Adaptive Responses of Woody Plants to
Environmental Stresses. The Botanical Review 68: 270–334.
56. Crawley MJ (1997) Plant Ecology. 2nd ed. Oxford: Blackwell Science.
57. Freitas, CG, Dambros CS, Eiserhardt WL, Costa FRC, Svenning JC, Balslev H. Trait and
Phylogenetic Structure of Palms in the Central Amazon: Neutral and Non-Neutral Processes are
Environment Dependent.
58. Hoorn C, Wesselingth (2010) The Amazonian Craton and its infl uence on past fluvial systems
(Mesozoic-Cenozoic, Amazonia). Amazonia: Landscape and species evolution. pp. 103–122.
59. Stropp J, ter Steege H, Malhi Y, ADTN, RAINFOR (2009) Disentangling regional and local tree
diversity in the Amazon. Ecography 32: 46–54.
60. Pianka E (1972) r and K selection or b and d selection? The American Naturalist 106: 581–588.
61. Schulman L, Koivunen H, Ruokolainen K (2004) Spatio- ecological niche segregation of two
sympatric species of Clidemia (Melastomataceae) in western Amazonian non- flooded rainforests.
Folia Geobot: 143–160.
62. Fine PVA, Daly DC, Muñoz GV, Mesones I, Cameron KM (2005) The contribution of edaphic
heterogeneity to the evolution and diversity of burseraceae trees in the western amazon. Evolution 59:
1464–1478.
63. Tuomisto H (2006) Edaphic niche differentiation among Polybotrya ferns in western Amazonia:
implications for coexistence and speciation. Ecography 29: 273–284.
64. Schietti J, Emilio T, Rennó CD, Drucker DP, Costa FRC, et al. (2013) Vertical distance from
drainage drives floristic composition changes in an Amazonian rainforest. Plant Ecology and
Diversity. doi:10.1080/17550874.2013.783642.

112
ARTIGO 3 – MATERIAL SUPLEMENTAR

113
Table S1. Randomization algorithms (Adapted from Goteli & Graves 1996), assumptions and segregation definition for the four null models adopted.
Randomization algorithms (RA) Null model assumptions Segregation definition
RA1
Niche breadth relaxed
(zero states position randomized)
+
Abundance relaxed
(abundance sampled from an uniform
distribution)
This model assumes that there are no constraints for species
occurrence and abundance. All simulated species can occur
anywhere and all abundance states are equiprobable.
Segregation is detected when species are more dispersed
along the resource/condition axis than expected by a
equiprobable species abundance distribution .
RA2
Niche breadth retained
(zero states position retained)
+
Abundance relaxed
(abundance sampled from an uniform
distribution)
This model assumes that the absences may be generated by
processes other than competitive exclusion (i.e. eco-physiological
or biogeographic limits). Hence, the simulated species are
constrained to occupy only the sites where they originally occur,
but there are no constraints for the species abundance and any
abundance state is equiprobable as in RA1.
Segregation is detected when species are more dispersed
along resource/condition axis than expected by
equiprobable species abundance distribution only in the
resource/condition states where they originally occurs.

114
RA3
Niche breadth relaxed
(zero states position randomized)
+
Abundance retained
(abundance randomized from observed data)
This model assumes that there are no constraints for species
occurrence as in RA1, but the species abundance states are not
equiprobable and some species may be more abundant than others.
Segregation is detected when species are more dispersed
along resource/condition axis than expected by a non-
equiprobable (following observed abundance) species
abundance distribution.
RA4
Niche breadth retained
(zero states position retained)
+
Abundance retained
(abundance randomized from observed data)
This model assumes that the absences may be generated by
processes other than competitive exclusion (i.e. eco-physiological
or biogeographic limits). Simulated species are constrained to
occupy only in the sites where they originally occur as in RA2, but
as in RA3 not all abundance states are equiprobable and some
species may be more abundant than others.
Segregation is detected when species are more dispersed
along resource/condition axis than expected by a non-
equiprobable (following observed abundance) species
abundance distribution only in the resource/condition
states where they originally occurs.

115
Table S2. List of species names, species codes and herbarium access number. Phylogenetic data source
for each species is given in superscript letters before each species name. For the genera with only one
species in our species list, we used genus level phylogenetic data instead species level for construct our
trees.
Species name Species code INPA Herbarium
access number R2
Astrocaryum acaule Mart. Aa 240733 R2
Astrocaryum aculeatum G. May Au nc R2
Astrocaryum murumuru Mart. Au nc R2
Astrocaryum gynacanthum Mart. Ag 248637 nAttalea maripa (Aubl.) Mart. Am nc
nAttalea microcarpa Mart. Ac 240737
CAttalea speciosa Mart. As nc
EBactris acanthocarpa Mart. Ba 240718
nBactris acanthocarpoides Barb. Rodr. Bc nc
nBactris balanophora Spruce Bb 240722
nBactris elegans Barb. Rodr. Be 248638
nBactris hirta Mart. Bh 240749
nBactris killipii Burret Bk 240717
EBactris maraja Mart. Bm 248636
nBactris oligocarpa Barb. Rodr. & Trail Bo 219961
nBactris syagroides Barb. Rodr. & Trail Bs 220002
EBactris tomentosa Mart. Bn 240746
nBactris trailiana Barb. Rodr. Bt nc
nBactris cf. turbinocarpa Barb. Rodr. Bu 240729
CDesmoncus parvulus Bailey Dp 240748
CEuterpe precatoria Mart. Ep nc
R1Geonoma deversa (Poit.) Kunth Gd 220005
R1Geonoma macrostachys Mart. Gm 240712
R1Geonoma maxima (Poit.) Kunth Gx 240740
nGeonoma oligoclona Trail. Go 219963
R1Geonoma stricta (Poit.) Kunth Gs 240714
CIriartella setigera (Mart.) H. Wendl. Is 240736
CLepidocaryum tênue Mart. Lt 240720
CMauritiella aculeata (Kunth) Burret Ma nc
nOenocarpus bacaba Mart. Oc nc
COenocarpus bataua Mart. Ob nc
nOenocarpus minor Mart. Om 240727
CSocratea exorrhiza (Mart.) H. Wendl. Se nc
nc: voucher not collected; C: phylogenetic data from Couvreur et al. 2011; R1: phylogenetic data from Roncal et al. 2011 ;
R2: phylogenetic data from Roncal et al. 2012 ; E: phylogenetic data from Eiserhardt et al. 2011 ; n: phylogenetic data was
not available for this species

116
SÍNTESE
Diferentes fatores afetam a resposta de plantas a fatores ambientais, mas o mesmo
fator também pode afetar plantas por diferentes mecanismos. No primeiro capitulo desta tese,
mostramos que diferenças dominância estrutural de palmeiras arborescentes e árvores em
grande escala está associada com as propriedades físicas dos solos via diferentes mecanismos.
Em solos que apresentam restrições ao enraizamento, árvores apresentam capacidade de
ancoragem diminuída e se tornam mais susceptíveis a quedas e são desfavorecidas nestas
condições. Palmeiras são adaptadas para manter a estabilidade independente do enraizamento
superficial característico das monocotiledôneas e, diferentemente das árvores, são favorecidas
em condições de solos com propriedade físicas mais restritivas. A relação entre área basal de
árvores e propriedades físicas do solo é negativa e mediada pela resposta das árvores ao
dinamismo da floresta. Já a relação entre área basal de palmeiras e propriedades do solo é
direta e positiva.
O padrão observado de relação entre propriedades físicas do solo e a área basal de
árvores e palmeiras pode ser visualizado tanto em escala local, como continental. As
propriedades físicas do solo estão associadas ao seu grau de desenvolvimento pedogenético.
Grande parte da diversidade de propriedades físicas do solo pode ser encontrada numa mesma
região, o que explica a ocorrência do padrão em escala local. No entanto, solos fisicamente
mais restritivos são mais comuns na Amazônia ocidental. Isso faz com palmeiras sejam mais
dominantes nas florestas nesta região, podendo contribuir com até 20% da área basal total. A
maior dominância de palmeiras no oeste da Amazônia coincide espacialmente com a
distribuição mapeada das florestas dominadas por palmeiras no Brasil. Isso é uma importante
evidência de que o controle do solo sobre a dominância da floresta reflete em padrões em
escalas maiores que resultam na fisionomia das florestas que reconhecemos hoje. Duas
principais conclusões são derivadas deste trabalho: (1) mecanismos relacionados à
dominância de palmeiras e árvores definem a fisionomia de uma parcela significativa da
Amazônia e (2) palmeiras não são árvores e não devem se consideradas como tal já que os
seus mecanismos de dominância e determinantes ambientais diferem dos das árvores. Ignorar
as diferenças entre as formas de via ajuda a esconder os verdadeiros determinantes dos
padrões observados para ambos os grupos.
Propriedades físicas do solo parecem estabelecer o limite superior da dominância de
palmeiras arborescentes nas florestas da Amazônia, mas outros mecanismos vão gerar

117
diferenças na abundância de palmeiras abaixo deste limite. No segundo capítulo desta tese,
exploramos os determinantes ambientais da abundância de palmeiras e como estas relações
influenciam os padrões de dominância entre espécies e a composição florística do grupo. Para
isso, restringimos a nossa escala de estudo para uma faixa de aproximadamente 600 km que
corta a porção setentrional do interflúvio Purus-Madeira, dois dos principais afluentes do Rio
Amazonas. Para esta região, consolidamos um extenso banco de dados contendo informações
ambientais que associamos a inventários de espécies palmeiras com diferentes portes e formas
de crescimento (i.e. arborescentes, acaulescentes, escandentes e herbáceas). Os principais
gradientes ambientais explorados por este estudo – clima, hidrologia, propriedades químicas
do solo, estrutura da vegetação, topografia e histórico de perturbação – foram previamente
identificados como importantes para a riqueza, composição e distribuição de espécies de
palmeiras. Existem alguns estudos na Amazonia associando a composição de espécies de
palmeiras com gradientes ambientais. No entanto, como cada estudo explora somente um sub-
conjunto de variáveis ambientais, generalizações sobre os mecanismos afetando a composição
de espécies ainda são raras e esta é uma das lacunas que este estudo visou preencher.
Diferenças abruptas na composição florística na região estão relacionadas com a
ocorrência de alagamento prolongado. A ocorrência de florestas alagadas da região é
relativamente comum. Florestas alagadas são encontradas em áreas mais próximas aos
grandes rios, mas também em áreas sujeitas ao alagamento distantes pelo menos cinco
quilometros de rios secundários. A maioria das espécies encontradas nas florestas alagadas foi
também encontrada nas florestas não alagadas, mas em abundâncias diferentes. Espécies
encontradas em florestas alagadas estão presentes em densidades bem mais baixas nas
florestas não alagadas. Espécies dominantes de florestas não alagadas se tornam raras nas
florestas alagadas. Isso sugere que diferenças na composição estão relacionadas com forte
limitação ambiental que seleciona espécies mais adaptadas/tolerantes e exclui ou diminuiu a
abundância das menos adaptadas/tolerantes. Isso demonstra a importância do controle
ambiental sobre os mecanismos de raridade e dominância em florestas tropicais. Em florestas
não alagadas, gradientes ambientais de solo, hidrologia e distúrbio também estiveram
relacionados com os padrões de variação na abundância relativa das espécies, mas também
com a substituição de espécies.
Um forte padrão de dominância foi observado, com 20% das espécies representando
90% da abundância total de palmeiras. Espécies dominantes pertencem a variadas forma de

118
crescimento e estão relacionadas com diferentes conjuntos de condições ambientais. Um dos
principais mecanismos usados para explicar a dominância de espécies é a relação
amplitude:abundância que prevê que quanto maior a amplitude (espacial ou ambiental) da
espécie, maior será a sua abundância local. Ao contrário do esperado, observamos que
espécies dominantes não tem distribuições ambientais amplas, mas sim intermediárias. Isso
porque a dominância é mantida por um grande número de jovens nas populações e mesmo
espécies dominantes sobre um amplo espectro ambiental podem não ser aptas a manter
populações grandes em ambos extremos de um mesmo gradiente ambiental. Os resultados
deste capítulo trouxeram ainda outro importante avanço para o entendimento dos padrões
florísticos em florestas tropicais. Respostas ambientais individuais das espécies mais
abundantes não se distinguem das respostas da composição florística como um todo,
sumarizada usando técnicas de ordenação. Isso implica que os padrões de variação das
espécies raras não estão sendo captados nesta abordagem. Desconsiderando as espécies raras a
diversidade da Amazônia não se distingue da de uma floresta temperada da América do Norte
ou Europa, para a efetiva conservação da diversidade florística da Amazônia é importante
entender os padrões de variação e mecanismos relacionados também pras espécies raras. A
presença (ou ausência) de espécies raras nas florestas pode não ser independente da
abundância das espécies mais comuns e o papel das interações planta-planta deve ser
considerado.
A hidrologia do solo foi o maior determinante da substituição de espécies e mudanças
na abundância relativa das espécies. Sugerindo que a partição do gradiente hidrológico pode
estar relacionada com a diversidade e distribuição de espécies de palmeiras. O terceiro
capítulo desta tese avalia a existência de segregação de espécies de palmeiras ao longo de
gradientes hidrológicos, quais os processos evolutivos relacionados ao padrão observado e
suas consequências para o padrão de riqueza e coexistência de espécies de palmeiras na
Amazônia. A segregação de nicho é um importante mecanismo para explicar a coexistência de
espécies e consequentemente a riqueza de espécies em um local. Este é um mecanismo
amplamente aceito para florestas temperadas, mas em florestas tropicais a sua importância
tem sido questionada basicamente por duas razões: (1) plantas, diferentemente de animais,
dependem basicamente de água, luz e nutrientes e a segregação de espécies nestes três eixos
não explicaria da imensa diversidade de plantas em florestas tropicais e (2) a natureza séssil
das plantas e o grande número de espécies de plantas coexistindo localmente faz com que
dificilmente as espécies tenham oportunidades de interação suficientes para causar exclusão

119
competitiva e seria mais provável que a competição difusa (i.e. competição entre indivíduos)
fosse o mecanismo de competição preponderante em florestas tropicais. A segregação de
espécies em nichos hidrológicos sutis pode ser responsável por manter a coexistência de um
elevado número de espécies em pradarias da Inglaterra e em florestas de Fynbos na África.
Até o momento não existiam estudos mostrando que a segregação em gradientes ambientais
sutis poderia explicar a riqueza e coexistência também em florestas tropicais e quais os
mecanismos evolutivos envolvidos e este foi o objetivo do ultimo capítulo desta tese.
Espécies de palmeiras estão mais segregadas em eixos de saturação e dessecação do
solo do que esperado pela chance. O trade-off entre esses dois eixos de nicho hidrológico
mostra que as espécies que apresentam maior associação com áreas mais úmidas são as
mesmas que estão menos associadas a áreas mais secas, e vice-versa. Cada espécie de
palmeira está mais associada a uma condição hidrológica e esta associação é algo que
aconteceu diversas vezes ao longo da evolução do grupo. Diferentes espécies de palmeiras,
originárias de diferentes ramos filogenéticos podem estar associadas tanto a condições
hidrológicas de saturação como de dessecação. Esta é uma evidência de que a afiliação a um
nicho hidrológico é um caractere lábil (i.e. não conservado ao longo da evolução) que surgiu
independentemente varias vezes ao longo da evolução do grupo. Outra evidência para esse
processo é que o mesmo padrão de diversificação ao longo dos eixos hidrológicos de
saturação e dessecação pode ser observado independentemente para a maioria dos gêneros de
Arecaceae e também para os gêneros mono-específicos quando considerados conjuntamente.
Ausência de conservação de nicho na presença de convergência é o padrão esperado
quando a competição interespecífica é uma importante força reguladora da coexistência entre
as espécies. Se a competição está relacionada com a coexistência de espécies, é esperado que
o número de espécies que coexistem localmente decresce com o aumento na sobreposição
entre o nicho das espécies. A sobreposição de nicho hidrológico entre as espécies que
estudamos foi capaz de explicar quase 50% da variação no número de espécies coexistindo
localmente. Conjuntamente, nossos resultados sugerem que a segregação de espécies de
palmeiras em gradientes hidrológicos é um importante mecanismo explicando a diversificação
e coexistência em palmeiras. Esta conclusão não pode ser diretamente estendida para outros
grupos, mas a generalidade deste mecanismo nos leva acreditar que a segregação em eixos
sutis de hidrologia e/ou outros gradientes ambientais pode também ser responsável pelos
padrões de co-ocorrência e diversificação em outros grupos diversos de plantas tropicais.

120
Conjuntamente, os resultados desta tese trazem colaborações para o entendimento dos
padrões de dominância, distribuição e diversidade que vão de escalas continentais até escalas
de poucos metros. Demos os primeiros passos na ligação entre determinantes florísticos e
estruturais das diferenças de vegetação estabelecendo a ligação entre dominância de formas de
vida e padrão espacial de tipos de vegetação. Avançamos no entendimento do efeito de
gradientes ambientais na geração de diferenças abruptas e sutis na composição florística.
Testamos importantes hipóteses sobre os mecanismos causadores de dominância em florestas
tropicais e estabelecemos a ligação dominância e variação florística. Por fim, explicamos
como gradientes ambientais sutis podem gerar tanto a diversidade de espécies observada em
escala regional, quando variações locais no número de espécies coexistindo e
consequentemente a diversidade alfa das florestas tropicais.

121
REFERÊNCIAS
Andersen, K. M., and B. L. Turner. 2013. Preferences or plasticity in nitrogen acquisition by
understorey palms in a tropical montane forest. Journal of Ecology 101:819–825.
Anderson, L., L. E. O. e C. Aragão, and E. Arai. 2013. Avaliação dos dados de chuva mensal
para a região Amazônica oriundos do satélite Tropical Rainfall Measuring Mission
(TRMM) produto 3b43 versões 6 e 7 para o período de 1998 a 2010. Anais XVI
Simpósio Brasileiro de Sensoriamento Remoto - SBSR:6743–6750.
Antônio, M., M. Neto, J. D. Alves, E. M. D. E. Oliveira, D. De Biologia, and U. F. De Lavras.
1995. ANAEROBIC METABOLISM OF Euterpe oleracea . II- PLANT TOLERANCE
MECHANISM TO ANOXIA. Rev Bras Fisiol Veg 7:47–51.
Aragao, L. E. O. C., Y. Malhi, D. B. Metcalf, J. E. Silva-Espejo, E. Jiménez, D. Navarrete, S.
Almeida, A. C. L. Costa, N. Salinas, O. L. Philiphs, L. O. Anderson, T. R. Baker, P. H.
Gonçalves, J. Huamám-Ovalle, M. Mamani-Solórzano, P. Meir, A. Monteagudo, M. C.
Peñuela, A. Prieto, C. A. Quesada, A. Rozas-Davila, A. Rudas, J. A. Silva Junior, and R.
Vásquez. 2009. Above- and below-ground net primary productivity across ten
Amazonian forests on contrasting soils. Biogeosciences Discussions 6:2441–2488.
Araya, Y. N., J. Silvertown, D. J. Gowing, K. J. McConway, H. P. Linder, and G. Midgley.
2011. A fundamental, eco-hydrological basis for niche segregation in plant communities.
The New phytologist 189:253–8.
Baayen, R. H. 2011. languageR: Data sets and functions with “Analyzing Linguistic Data: A
practical introduction to statistics.”
Baker, W. I. J., V. Savolainen, C. B. Asmussen-Lange, M. W. Chase, J. Dransfield, F. Forest,
M. M. Harley, N. W. Uhl, and M. Wilkinson. 2009. Complete Generic-Level
Phylogenetic Analyses of Palms ( Arecaceae ) with Comparisons of Supertree and
Supermatrix Approaches. Systematic Biol Biol 58:240–256.
Balslev, H., F. Kahn, B. Millan, J. Svenning, T. Kristiansen, F. Borchsenius, D. Pedersen, and
W. L. Eiserhardt. 2011. Species Diversity and Growth Forms in Tropical American Palm
Communities. Bot. Rev. 77:381–425.
Balslev, H., R. Valencia, G. Paz y Miño, H. Christensen, and I. Nielsen. 1998. Species count
of vascular plants in one hectare of humid lowland forest in Amazonian Ecuador. Pages
585–594 Forest biodiversity in north, central and south America and the Caribbean:
research and monitoring. Man and the Biosphere Series 21.
Baraloto, C., F. Morneau, D. Bonal, L. Blanc, and B. Ferry. 2007. Seasonal water stress
tolerance and habitat associations within Neotropical tree genera. Ecology 88:478–489.
Barton, K. 2013. MuMIn: Multi-model inference.
Bates, D., M. Maechler, B. Bolker, and S. Walker. 2013. lme4: Linear mixed-effects models
using Eigen and S4.

122
Bjorholm, S., J.-C. Svenning, F. Skov, and H. Balslev. 2005. Environmental and spatial
controls of palm (Arecaceae) species richness across the Americas. Global Ecology and
Biogeography 14:423–429.
Blomberg, S. P., T. Garland, and A. R. Ives. 2003. Testing for phylogenetic signal in
comparative data: behavioral traits are more labile. Evolution 57:717–745.
Brasil. 1978. Projeto RADAMBRASIL. Vol. (1-34). Geologia, geomorfologia, pedologia,
vegetação e uso potencial da terra. Departamento Nacional de Producão Mineral.
Broschat, T. K., and H. Donselman. 1987. Factor affecting palm transplant success. Proc Fla
State Hort Soc 100:396–397.
Brown, J. H. 1984. On the Relationship between Abundance and Distribution of Species
124:255–279.
Brown, J. H. 1995. Macroecology. University of Chicago Press.
Burnham, K. P., and D. R. Anderson. 2002. Model selection and multi-model inference: a
practical information-theoretic approach. Springer.
Castilho, C. V. De, W. E. Magnusson, O. de A. R Nazare, R. C. C. Luizao, F. J. Luizao, A. P.
Lima, and N. Higuchi. 2006. Variation in aboveground tree live biomass in a central
Amazonian Forest : Effects of soil and topography. Forest Ecology and Management
234:85–96.
Cintra, B. B. L., J. Schietti, T. Emillio, D. Martins, G. Moulatlet, P. Souza, C. Levis, C. a.
Quesada, and J. Schöngart. 2013. Productivity of aboveground coarse wood biomass and
stand age related to soil hydrology of Amazonian forests in the Purus-Madeira
interfluvial area. Biogeosciences Discussions 10:6417–6459.
Clark, J. S. 2009. Beyond neutral science. Trends in ecology & evolution 24:8–15.
Condit, R., B. M. J. Engelbrecht, D. Pino, R. Pérez, and B. L. Turner. 2013. Species
distributions in response to individual soil nutrients and seasonal drought across a
community of tropical trees. Proceedings of the National Academy of Sciences of the
United States of America 110:5064–5068.
Condit, R., N. Pitman, E. G. Leigh Jr, J. Chave, J. Terborgh, R. B. Foster, P. V Núñez, S.
Aguilar, R. Valencia, G. Villa, H. C. Muller-landau, E. Losos, and S. P. Hubbell. 2002.
Beta-diversity in tropical forest trees. Science 295:666–669.
Costa, F., W. Magnusson, and R. C. Luizao. 2005. Mesoscale distribution patterns of
Amazonian understorey herbs in relation to topography, soil and watersheds. Journal of
Ecology 93:863–878.
Costa, F. R. C., J.-L. Guillaumet, A. Lima, and O. Pereira. 2009. Gradients within gradients:
the mesoscale distribution patterns of palms in a central amazonian forest. Journal of
Vegetation Science 20:69–78.

123
Couvreur, T. L. P., and W. J. Baker. 2013. Tropical rain forest evolution: palms as a model
group. BMC biology 11-48:2–4.
Couvreur, T. L. P., F. Forest, and W. J. Baker. 2011. Origin and global diversification patterns
of tropical rain forests : inferences from a complete genus-level phylogeny of palms.
BMC Biology:9:44.
Crawley, M. J. 1997. Plant Ecology. Page 717, 2nd edition. Blackwell Science, Oxford.
Davidson, E. a, A. C. de Araújo, P. Artaxo, J. K. Balch, I. F. Brown, M. M. C. Bustamante,
M. T. Coe, R. S. DeFries, M. Keller, M. Longo, J. W. Munger, W. Schroeder, B. S.
Soares-Filho, C. M. Souza, and S. C. Wofsy. 2012. The Amazon basin in transition.
Nature 481:321–8.
Department of Bioscience, A. U. (n.d.). Aarhus University Palm Transect Database.
http://data.gbif.org/datasets/resource/14087.
Donagema, G. K. et al. 2011. Manual de métodos de análises de solo. Page 230. Embrapa
Solos, Rio de Janeiro.
Dransfield, J. 2008. Genera palmarum. Royal Botanic Gardens Kew, Kew.
Duivenvoorden, J. F. 1994. Vascular plant species counts in the rain forests of the middle
Caquetá area, Colombian Amazonia. Biodiversity and Conservation 3:685–715.
Eiserhardt, W. L., S. Bjorholm, J. Svenning, T. F. Rangel, and H. Balslev. 2011a. Testing the
Water – Energy Theory on American Palms ( Arecaceae ) Using Geographically
Weighted Regression. PloS one 6:e27027.
Eiserhardt, W. L., J. Pintaud, C. Asmussen-lange, W. J. Hahn, R. Bernal, H. Balslev, and F.
Borchsenius. 2011b. Phylogeny and divergence times of Bactridinae (Arecaceae ,
Palmae) based on plastid and nuclear DNA sequences. Taxon 60:485–498.
Eiserhardt, W. L., J.-C. Svenning, W. D. Kissling, and H. Balslev. 2011c. Geographical
ecology of the palms (Arecaceae): determinants of diversity and distributions across
spatial scales. Annals of Botany 108:1391–1416.
Emilio, T. 2007. Guia Digital de Palmeiras da BR-319.
http://ppbio.inpa.gov.br/sites/default/files/Guia_palmeiras.pdf.
Emilio, T., B. W. Nelson, J. Schietti, S. J.-M. Desmoulière, H. M. V. Espírito Santo, and F. R.
C. Costa. 2010. Assessing the relationship between forest types and canopy tree beta
diversity in Amazonia. Ecography 33:738–747.
Emilio, T., C. A. Quesada, F. R. C. Costa, W. E. Magnusson, J. Schietti, and T. R.
Feldpausch. 2013. Soil physical conditions limit palm and tree basal area in Amazonian
forests. Plant Ecology and Diversity ahead-of-p:1–15.

124
Engelbrecht, B. M. J., L. S. Comita, R. Condit, T. A. Kursar, M. T. Tyree, B. L. Turner, and
S. P. Hubbell. 2007. Drought sensitivity shapes species distribution patterns in tropical
forests. Nature 447:80–83.
Espírito-Santo, F. D. B., M. Keller, B. Braswell, B. W. Nelson, S. Frolking, and G. Vicente.
2010. Storm intensity and old-growth forest disturbances in the Amazon region.
Geophysical Research Letters 37:1–6.
Fan, Y., and G. Miguez-Macho. 2010. Potential groundwater contribution to Amazon
evapotranspiration. Hydrology and Earth System Sciences 14:2039–2056.
Farris-Lopez, K., J. S. Denslow, B. Moser, and H. Passmore. 2004. Influence of a common
palm, Oenocarpus mapora, on seedling establishment in a tropical moist forest in
Panama. Journal of Tropical Ecology, 20.
Fragoso, J. M. V. 2011. Tapir-generated seed shadows: scale-dependent patchiness in the
Amazon rain forest. Journal of Ecology 85:519–529.
Gotelli, N. J., and G. G. Graves. 1996. Null Models in Ecology. Page 368.
Govaerts, R., and J. Dransfield. 2005. World checklist of palms. Royal Botanic Gardens.
Hackathon, R. 2011. phylobase: Base package for phylogenetic structures and comparative
data. R package version 0.6.5.
Harmon, L., J. Weir, C. Brock, R. Glor, W. Challenger, and G. Hunt. 2009. geiger: Analysis
of evolutionary diversification. R package version 1.3-1.
Henderson, A. 1995. The palms of Amazon. Page 362. Oxford University Press, New York.
Henderson, A. 2000. Bactris (Palmae). Page 181Flora Neot. The New York Bothanical
Garden, New York.
Henderson, A. 2002. Evolution and Ecology of Palms. Page 259. The New York Botanical
Garden Press, Bronx.
Henderson, A. 2011a. A revision of Desmoncus (Arecaceae). Phytotaxa 88:1–88.
Henderson, A. 2011b. A revision of Geonoma (Arecaceae). Phytotaxa 271:1 – 271.
Higgins, M. a., K. Ruokolainen, H. Tuomisto, N. Llerena, G. Cardenas, O. L. Phillips, R.
Vásquez, and M. Räsänen. 2011. Geological control of floristic composition in
Amazonian forests. Journal of Biogeography 38:2136–2149.
Hijmans, R. J., S. E. Cameron, J. L. Parra, P. G. Jones, and A. Jarvis. 2005. Very high
resolution interpolated climate surfaces for global land areas. International Journal of
Climatology 25:1965–1978.

125
Hoorn, C., and Wesselingth. 2010. The Amazonian Craton and its infl uence on past fluvial
systems (Mesozoic-Cenozoic, Amazonia). Pages 103–122 Amazonia: Landscape and
species evolution.
Hubbell, S. P. 2001. The Unified Neutral Theory of Biodiversity and Biogeography. Page
448. Princeton University Press, Princeton.
Hubbell, S. P. 2013. Tropical rain forest conservation and the twin challenges of diversity and
rarity. Ecology and Evolution:1–12.
Hubbell, S. P., F. He, R. Condit, L. Borda-de-Água, J. Kellner, and H. ter Steege. 2008. How
many tree species are there in the Amazon and how many of them will go extinct?
Proceedings of the National Academy of Sciences of the United States of America
105:11498–11504.
Huston, M. A. 1996. Biological Diversity: The coexistence of species on changing
landscapes. Page 681. Cambridge University, New York.
Jackson, R. B., J. Canadell, J. R. Ehleringer, H. a. Mooney, O. E. Sala, and E. D. Schulze.
1996. A global analysis of root distributions for terrestrial biomes. Oecologia 108:389–
411.
Jirka, S., A. J. McDonald, M. S. Johnson, T. R. Feldpausch, E. G. Couto, S. J. S. J. S. J. Riha,
T. R. Feldspausch, J. Andrew, S. Mark, R. Ted, G. Eduardo, and J. Susan. 2007.
Relationships between soil hydrology and forest structure and composition in the
southern Brazilian Amazon. Journal of Vegetation Science 18:183–194.
Kahn, F., and K. Mejía. 1987. Notes on the biology , ecology , and use of a small Amazonian
palm: Lepidocaryum tessmannii. Principes 31:14–19.
Kembel, S. W., P. D. Cowan, M. R. Helmus, W. K. Cornwell, H. Morlon, D. D. Ackerly, S. P.
Blomberg, and C. O. Webb. 2010. Picante: R tools for integrating phylogenies and
ecology. Bioinformatics 26:1463–1464.
Kinupp, V. F., and W. E. Magnusson. 2005. Spatial patterns in the understorey shrub genus
Psychotria in central Amazonia: effects of distance and topography. Journal of Tropical
Ecology 21:1–12.
Koenker, R. 2011. quantreg: Quantile Regression.
Kozlowski, T. T. 1997. Responses of woody plants to flooding and salinity. Tree Physiology
Monograph 1:1–29.
Kozlowski, T. T., and S. G. Pallardy. 2002. Acclimation and adaptive responses of woody
plants to environmental stresses. The Botanical Review 68:270–334.
Legendre, P., and L. Legendre. 1998. Numerical ecology. Page 835, 2nd edition. Elsevier,
Amsterdam.

126
Levis, C., P. F. de Souza, J. Schietti, T. Emilio, J. L. P. D. V. Pinto, C. R. Clement, and F. R.
C. Costa. 2012. Historical human footprint on modern tree species composition in the
Purus-Madeira interfluve, central Amazonia. PloS one 7:e48559.
MacArthur, R. H. ., and H. S. . Horn. 1969. Foliage Profile by Vertical Measurements.
Ecology 50:802–804.
Malhi, Y., J. T. Roberts, R. A. Betts, T. J. Killeen, W. Li, and C. A. Nobre. 2008. Climate
change, deforestation, and the fate of the Amazon. Science 319:169–172.
Marshall, T. J., J. W. Holmes, and C. Rose. 1996. Soil Physics. Page 452, 3rd edition.
Cambridge University Press, New York.
McKane, R. B., L. C. Johnson, G. R. Shaver, K. J. Nadelhoffer, E. B. Rastetter, B. Fry, A. E.
Giblin, K. Kielland, B. L. Kwiatkowski, J. a Laundre, and G. Murray. 2002. Resource-
based niches provide a basis for plant species diversity and dominance in arctic tundra.
Nature 415:68–71.
Miguez-Macho, G., and Y. Fan. 2012. The role of groundwater in the Amazon water cycle: 1.
Influence on seasonal streamflow, flooding and wetlands. Journal of Geophysical
Research 117:D15113.
Miller, C. 2002. Fruit Production of the Ungurahua Palm ( Oenocarpus bataua subsp . bataua ,
Arecaceae ) in an Indigenous Managed Reserve. Economic Botany 56:165–176.
Moeslund, J. E., L. Arge, P. K. Bøcher, T. Dalgaard, and J.-C. Svenning. 2013. Topography
as a driver of local terrestrial vascular plant diversity patterns. Nordic Journal of Botany
31:129–144.
Navarro, J. A., G. Galeano, and R. Bernal. 2011. Impact of leaf harvest on populations of
Lepidocaryum tenue , an Amazonian understory palm used for thatching. Tropical
Conservation Science 4:25–38.
Nelson, B. W., V. Kapos, J. B. Adams, W. J. Oliveira, and P. G. Oscar. 1994. Forest
Disturbance by Large Blowdowns in the Brazilian Amazon. Ecology 75:853–858.
Neves, S. D. C., L. M. Ribeiro, I. R. G. da Cunha, M. A. S. Pimenta, M. O. Mercadante-
Simões, and P. S. N. Lopes. 2013. Diaspore structure and germination ecophysiology of
the babassu palm (Attalea vitrivir). Flora - Morphology, Distribution, Functional
Ecology of Plants 208:68–78.
Nogueira, A., F. R. C. Costa, and C. V Castilho. 2010. Liana Abundance Patterns : The Role
of Ecological Filters during Development. Biotropica 43:442–449.
Normand, S., J. Vormisto, J.-C. Svenning, C. Grández, and H. Balslev. 2006. Geographical
and environmental controls of palm beta diversity in paleo-riverine terrace forests in
Amazonian Peru. Plant Ecology 186:161–176.

127
Oksanen, J., F. G. Blanchet, R. Kindt, P. Legendre, P. R. Minchin, R. B. O’Hara, G. L.
Simpson, P. Solymos, M. H. H. Stevens, and H. Wagner. 2011. vegan: Community
Ecology Package. R package version 2.0-2.
Pansonato, M. P., F. R. C. Costa, C. V. de Castilho, F. a. Carvalho, and G. Zuquim. 2013.
Spatial Scale or Amplitude of Predictors as Determinants of the Relative Importance of
Environmental Factors to Plant Community Structure. Biotropica 45:299–307.
Paradis E., C. J., and S. K. 2004. APE: analyses of phylogenetics and evolution in R language.
Bioinformatics:289–290.
Parker, G. G., and M. E. Russ. 2004. The canopy surface and stand development: assessing
forest canopy structure and complexity with near-surface altimetry. Forest Ecology and
Management 189:307–315.
Parolin, P. 2002. Submergence tolerance vs. escape from submergence: two strategies of
seedling establishment in Amazonian floodplains. Environ. Exp. Bot 48:177–186.
Parolin, P., C. Lucas, M. T. F. Piedade, and F. Wittmann. 2010. Drought responses of flood-
tolerant trees in Amazonian floodplains. Annals of Botany 105:129 –139.
Peh, K. S.-H., S. L. Lewis, and J. Lloyd. 2011. Mechanisms of monodominance in diverse
tropical tree-dominated systems. Journal of Ecology 99:891–898.
Peres, C. A. 1994. Composition , Density , and Fruiting Phenology of Arborescent Palms in
an Amazonian Terra Firme Forest ’. Biotropica 26:285–294.
Phillips, O. L., R. V. Martínez, L. Arroyo, T. R. Baker, T. Killeen, S. L. Lewis, Y. Malhi, A.
M. Mendoza, D. Neill, P. N. Vargas, M. Alexlades, C. Cerón, A. Di Fiore, T. Erwinkk,
A. Jardim, W. Palacios, M. Saldias, and B. Vinceti. 2002. Increasing dominance of large
lianas in Amazonian forests. Nature 418:770–774.
Pianka, E. 1972. r and K selection or b and d selection? The American Naturalist 106:581–
588.
Pianka, E. 1974. Niche overlap and difuse competition. Proceedings of the National Academy
of Sciences of the United States of America 71:2141–2145.
Pitman, N. C. a., M. R. Silman, and J. W. Terborgh. 2013. Oligarchies in Amazonian tree
communities: a ten-year review. Ecography 36:114–123.
Pitman, N. C. A., G. Stocks, M. Bruna, J. Widmer, C. N. Jenkins, L. Seales, and F. Paniagua.
2011. Volume and Geographical Distribution of Ecological Research in the Andes and
the Amazon , 1995-2008. Tropical Conservation Science 4:64–81.
Pitman, N. C., J. W. Terborgh, M. R. Silman, P. N ez V, D. A. Neill, and C. E. Cer n. 2001.
Dominance and distribution of tree species in upper Amazonian terra firme forests.
Ecology 82:2101–2117.

128
Poulsen, A. D., R. B. Garden, I. Row, and E. Ehlr. 2006. Edaphic and Floristic Variation
within a 1-ha Plot of Lowland Amazonian Rain Forest 1 38:468–478.
Quesada, C. A., O. L. Hillips, C. I. Schwarz, and C. I. Czimczik. 2012. Basin-wide variations
in Amazon forest structure and function are mediated by both soils and climate.
Biogeosciences:2203–2246.
R., M., and C. R. 2002. Light gradient partitioning by tropical tree seedlings in the absence of
canopy gaps. Oecologia 131:165–174.
Romero-Saltos, H., L. D. S. L. Sternberg, M. Z. Moreira, and D. C. Nepstad. 2005. Rainfall
exclusion in an eastern Amazonian forest alters soil water movement and depth of water
uptake. American Journal of Botanyournal of botany 92:443–455.
Roncal, J., A. Blach-Overgaard, F. Borchsenius, H. Balslev, and J.-C. Svenning. 2011. A
Dated Phylogeny Complements Macroecological Analysis to Explain the Diversity
Patterns in Geonoma (Arecaceae). Biotropica 43:324–334.
Roncal, J., F. Kahn, B. Millan, T. L. P. Couvreur, and J. Pintaud. 2012a. Cenozoic
colonization and diversification patterns of tropical American palms : evidence from
Astrocaryum ( Arecaceae ). The Botanical Journal of Linnean Society:120–139.
Roncal, J., F. Kahn, B. Millan, T. L. P. Couvreur, and J.-C. Pintaud. 2012b. Cenozoic
colonization and diversification patterns of tropical American palms : evidence from
Astrocaryum ( Arecaceae ). The Botanical Journal of Linnean Society.
Rosindell, J., S. P. Hubbell, and R. S. Etienne. 2011. The Unified Neutral Theory of
Biodiversity and Biogeography at Age Ten. Trends in ecology & evolution:1–9.
Ruokolainen, K., and J. Vormisto. 2000. The most widespread Amazonian palms tend to be
tall and habitat generalists. Basic and Applied Ecology 108:97–108.
Salm, R., N. Vicente, W. J. Alonso, C. Schuck-paim, and N. V. De Salles. 2007. Cross-scale
determinants of palm species distribution. Acta Amazonica 37:17 – 26.
Scariot, A. 2001. Weedy and secondary palm species in central amazonian forest fragments.
Acta bot. bras. 15:271–280.
Schiett, J., D. Martins, T. Emilio, P. Souza, C. Levis, J. L. P. da V. Pinto, G. Moulatlet, S. C.
Stark, F. B. Baccaro, K. Sarmento, R. N. O. de Araújo, F. R. C. Costa, J. Schöngart, C.
A. Quesada, S. R. Saleska, J. Tomasella, and W. E. Magnusson. 2013. Linking forest
structure and stand biomass along natural disturbance gradients in central Amazonia.
under preparation.
Schietti, J., T. Emilio, C. D. Rennó, D. P. Drucker, F. R. C. Costa, A. Nogueira, F. Figueiredo,
F. B. Baccaro, C. V. Castilho, V. Kinupp, J.-L. Guillaumet, A. R. M. Garcia, A. P. Lima,
and W. E. Magnusson. 2014. Vertical distance from drainage drives floristic composition
changes in an Amazonian rainforest. Plant Ecology and Diversity.

129
Schietti, J., S. C. Stark, P. Souza, D. L. Martins, T. Emilio, C. Levis, J. L. P. V. Pinto, D. C.
Silva, F. R. C. Costa, J. Schöngart, J. Tomasella, S. R. Saleska, and W. Magnusson.
2013. Environmental limits to canopy height in Central Amazonia. under preparation.
Schluter, U. B., B. Furch, and C. A. Joly. 2013. Physiological and Anatomical Adaptations by
Young Astrocaryum jauari Mart . ( Arecaceae ) in by Young Adaptations Physiological
and Anatomical ( Arecaceae ) in Periodically Astrocaryum jauari Mart . Inundated
Biotopes of Central Amazonia. Biotropica 25:384–396.
Schulman, L., H. Koivunen, and K. Ruokolainen. 2004. Spatio- ecological niche segregation
of two sympatric species of Clidemia (Melastomataceae) in western Amazonian non-
flooded rainforests. Folia Geobot:143–160.
Silva, M. G., and M. Tabarelli. 2001. Seed dispersal , plant recruitment and spatial
distribution of Bactris acanthocarpa Martius ( Arecaceae ) in a remnant of Atlantic forest
in northeast Brazil. Acta Oecologica 22:259–268.
Silvertown, J. 2004. Plant coexistence and the niche. Trends in Ecology & Evolution 19:605–
611.
Silvertown, J., M. E. Dodd, D. J. G. Growing, and O. Mountford. 1999. Hydrologically
defined niches reveal a basis for species richness in plant communities. Nature 400:61–
63.
Silvertown, J., M. Dodd, D. Gowing, C. Lawson, and K. McConway. 2006a. Phylogeny and
the hierarchical organization of plant diversity. Ecology 87:S39–49.
Silvertown, J., K. McConway, D. Gowing, M. Dodd, M. F. Fay, J. A. Joseph, and K. Dolphin.
2006b. Absence of phylogenetic signal in the niche structure of meadow plant
communities. Proceedings of The Royal Society B 273:39–44.
Stark, S. C., V. Leitold, T. Shimabukuro, and A. Michael. 2012. Amazon forest carbon
dynamics predicted by profiles of canopy leaf area and light environment. Ecology
Letters 15:1406–1414.
Steege, H. ter, N. C. A. Pitman, D. Sabatier, and C. Baraloto. 2013. Hyperdominance in the
Amazonian Tree Flora. Science:in press.
Ter Steege, H., H. Steege, N. C. A. Pitman, O. L. Phillips, J. Chave, D. Sabatier, A. Duque, J.-
F. Molino, M.-F. Prévost, R. Spichiger, H. Castellanos, P. von Hildebrand, and R.
Vásquez. 2006. Continental-scale patterns of canopy tree composition and function
across Amazonia. Nature 443:444–447.
Stropp, J., H. ter Steege, Y. Malhi, ADTN, and RAINFOR. 2009. Disentangling regional and
local tree diversity in the Amazon. Ecography 32:46–54.
Svenning, C. 2001. Environmental heterogeneity , recruitment limitation and the mesoscale
distribution of palms in a tropical montane rain forest ( Maquipucuna , Ecuador ). Journal
of Tropical Ecology 17:97–113.

130
Svenning, J., F. Borchsenius, and S. Bjorholm. 2008. High tropical net diversification drives
the New World latitudinal gradient in palm (Arecaceae) species richness. Journal of
Biogeography:394–406.
Team, R. C. 2013. R: A language and environment for statistical computing. R Foundation for
Statistical Computing, Vienna, Austria.
Terborgh, J., and E. Andresen. 1998. The composition of Amazonian forests: patterns at local
and regional scales. Journal of Tropical Ecology 14:645–664.
Toledo, J. J. de, W. E. Magnusson, C. V Castilho, and H. E. M. M. Nascimento. 2011. Tree
mode of death in Central Amazonia: Effects of soil and topography on tree mortality
associated with storm disturbances. Forest Ecology and Management 263:253–261.
Tuomisto, H. 2006. Edaphic niche differentiation among Polybotrya ferns in western
Amazonia: implications for coexistence and speciation. Ecography 29:273–284.
Tuomisto, H., A. D. Poulsen, K. Ruokolainen, R. C. Moran, C. Quintana, J. Celi, G. Cañas, H.
A. T. Uomisto, A. X. E. L. D. A. P. Oulsen, K. A. R. Uokolainen, and R. O. C. M. Oran.
2003. Linking floristic patterns with soil heterogeneity and satellite imagery in
ecuadorian amazonia. Ecological Applications 13:352–371.
Tuomisto, H., K. Ruokolainen, R. Kalliola, A. Linna, W. Danjoy, and Z. Rodriguez. 1995.
Dissecting Amazonian Biodiversity. Science 269:63–66.
Vormisto, J., O. L. Phillips, K. Ruokolainen, H. Tuomisto, and R. Vásquez. 2000. A
comparison of fine-scale distribution patterns of four plant groups in an Amazonian
rainforest. Ecography 23:349–359.
Vormisto, J., J. Svenning, P. Hall, and Balslev. 2004. Diversity and dominance in palm (
Arecaceae ) communities in terra firme forests in the western Amazon basin. Journal of
Ecology 92:577– 588.
Winemiller, K. O., and E. R. Pianka. 1990. Organization in Natural assemblage of desert
lizard and topical fishes. Ecological Monographs 60:27–55.
Wittmann, F., J. Schongart, J. C. Montero, T. Motzer, W. J. Junk, M. T. F. Piedade, H. L.
Queriroz, and M. Worbes. 2006. Tree species composition and diversity gradients in
white-water forests across the Amazon Basin. Journal of Biogeography:1–14.
Wright, S. J. 2002. Plant diversity in tropical forests: a review of mechanisms of species
coexistence. Oecologia 130:1–14.
Zona, S., and A. Henderson. 1989. A review of animal-mediated seed dispersal of palms.
Selbyana 11.
Zuur, A. F. 2009. Mixed effects models and extensions in ecology with R. Springer.