Ecologia de Populações - benderlab.weebly.com · Estrutura da aula de hoje. Tamanho populacional...
35
Ecologia de Populações Prof. Mariana Bender Departamento de Ecologia e Evolução - UFSM
Transcript of Ecologia de Populações - benderlab.weebly.com · Estrutura da aula de hoje. Tamanho populacional...
Ecologia de PopulaçõesProf. Mariana BenderDepartamento de Ecologia e Evolução - UFSM
Ecologia de PopulaçõesAula 4: Natalidade e MortalidadeProf. Mariana BenderDepartamento de Ecologia e Evolução - UFSM
• Parâmetros populacionais• Natalidade e mortalidade• Curvas de sobrevivência• Longevidade
Estrutura da aula de hoje
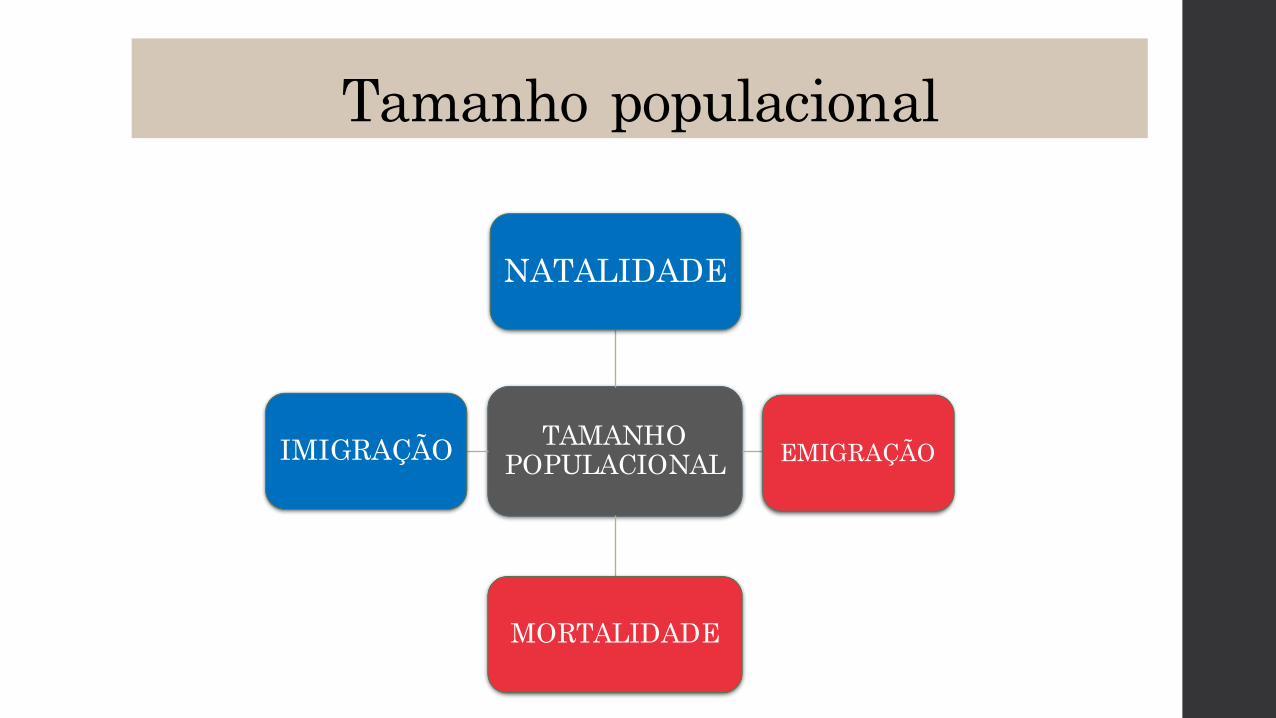
Tamanho populacional
TAMANHOPOPULACIONAL
NATALIDADE
EMIGRAÇÃO
MORTALIDADE
IMIGRAÇÃO
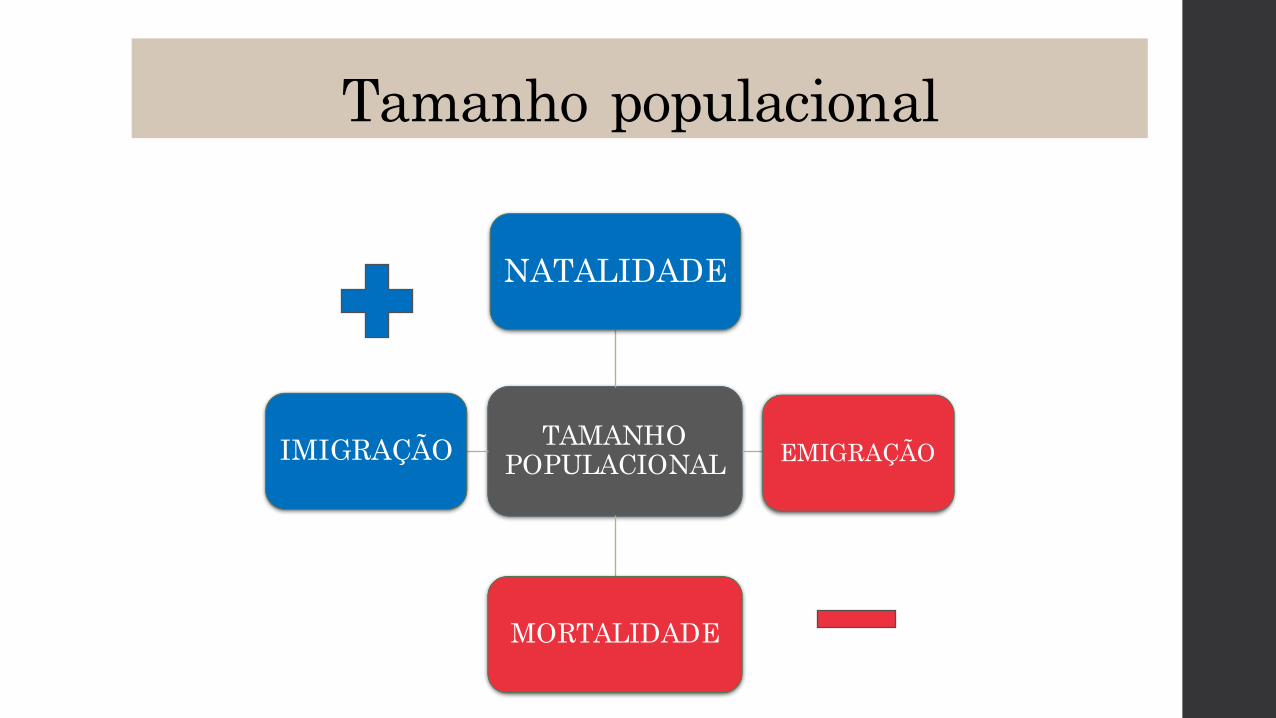
Tamanho populacional
TAMANHOPOPULACIONAL
NATALIDADE
EMIGRAÇÃO
MORTALIDADE
IMIGRAÇÃO
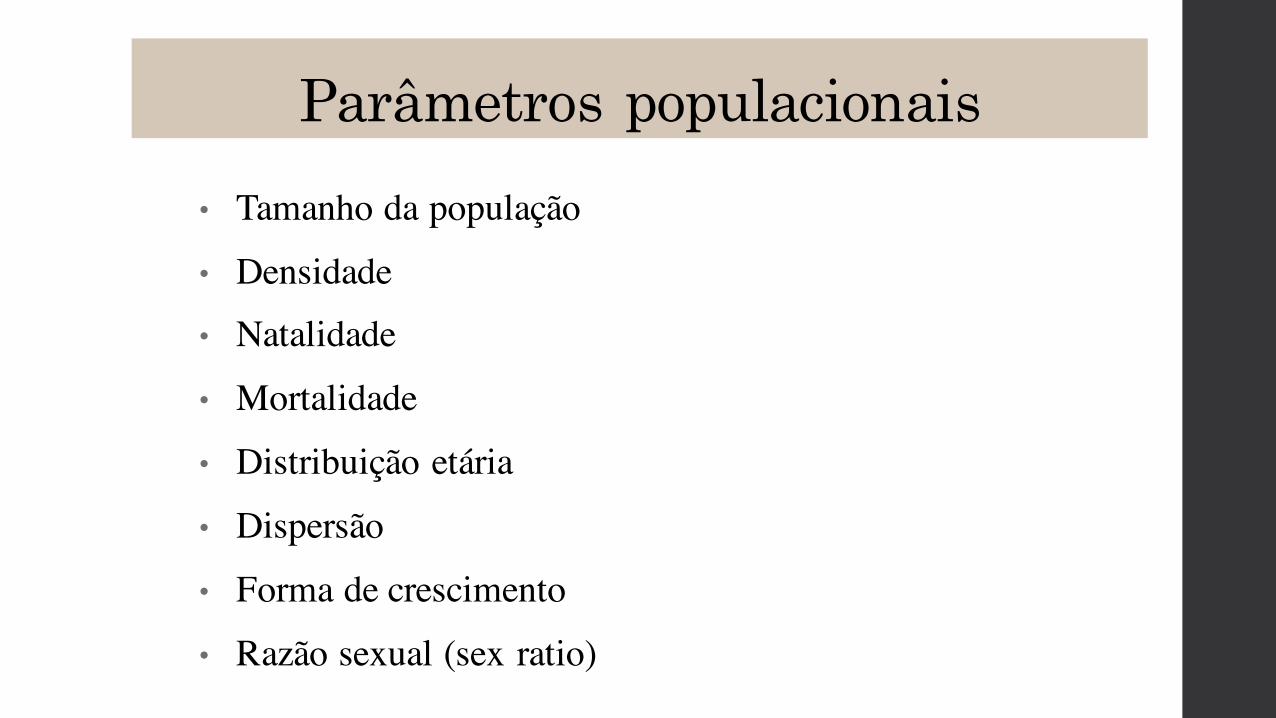
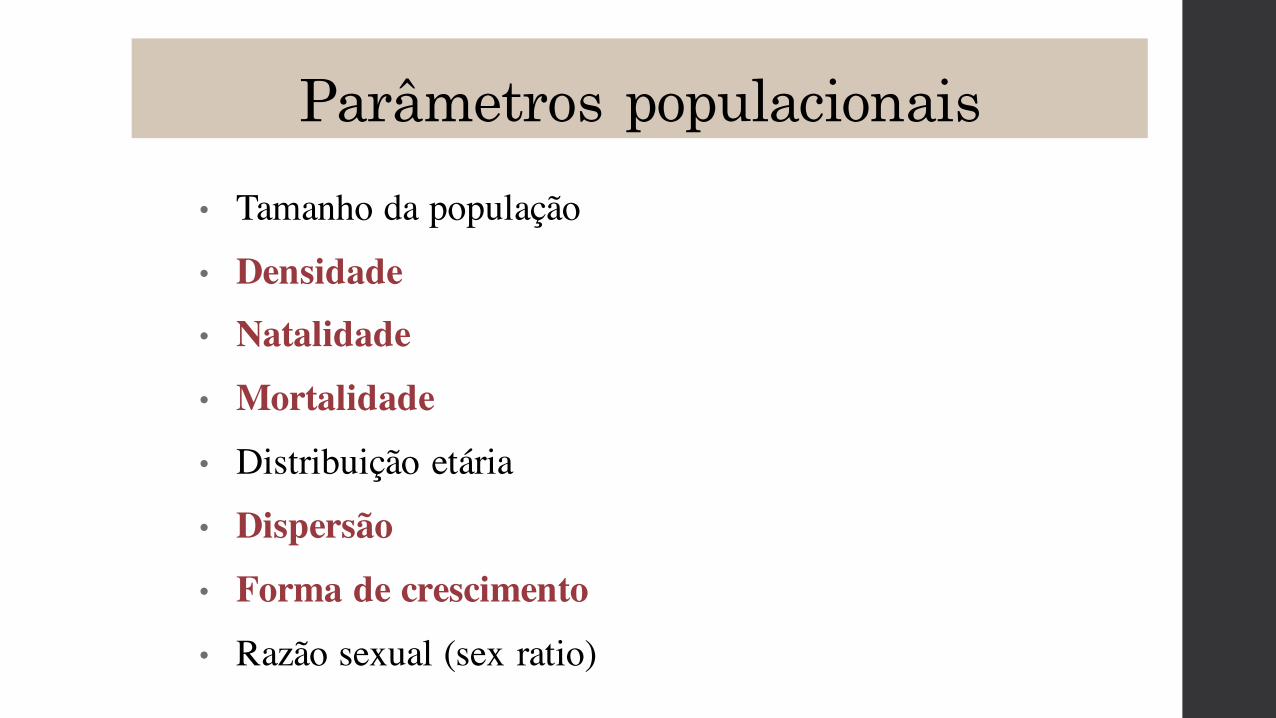
Parâmetros populacionais• Tamanho da população
• Densidade• Natalidade
• Mortalidade
• Distribuição etária
• Dispersão
• Forma de crescimento
• Razão sexual (sex ratio)
Parâmetros populacionais• Tamanho da população
• Densidade• Natalidade
• Mortalidade
• Distribuição etária
• Dispersão
• Forma de crescimento• Razão sexual (sex ratio)
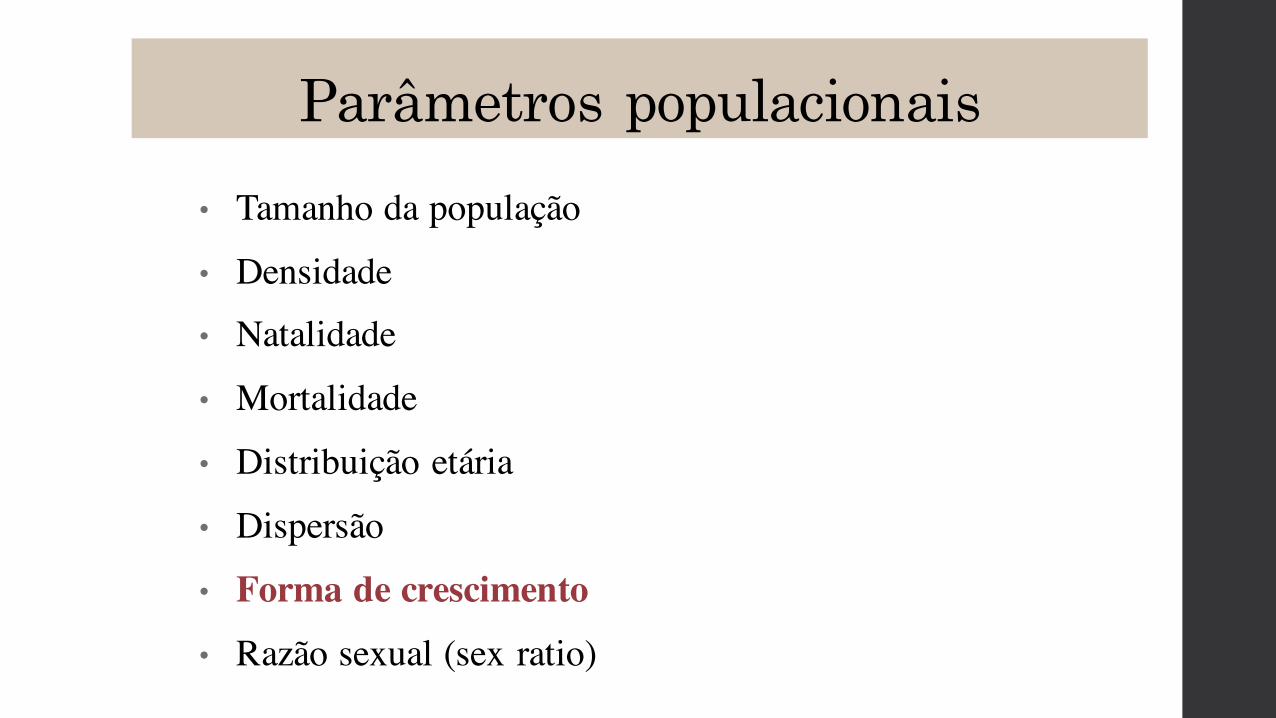
Parâmetros populacionais• Tamanho da população
• Densidade• Natalidade• Mortalidade• Distribuição etária
• Dispersão• Forma de crescimento• Razão sexual (sex ratio)
Densidade
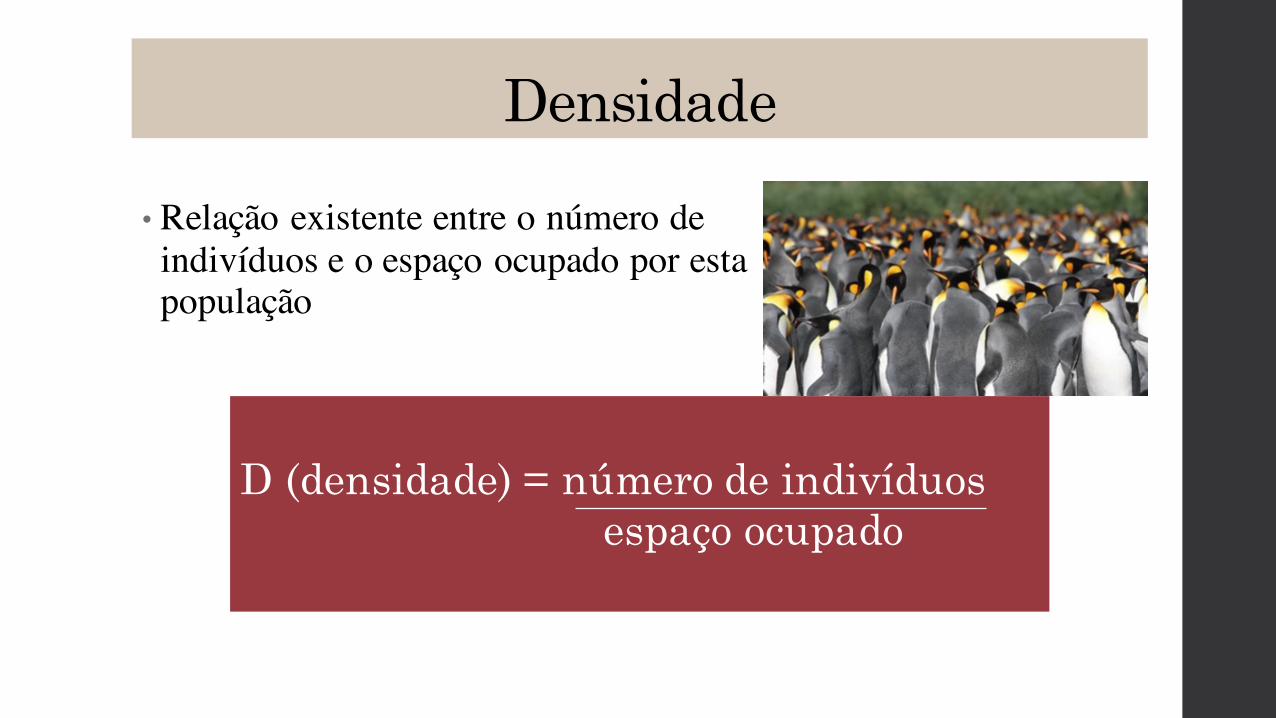
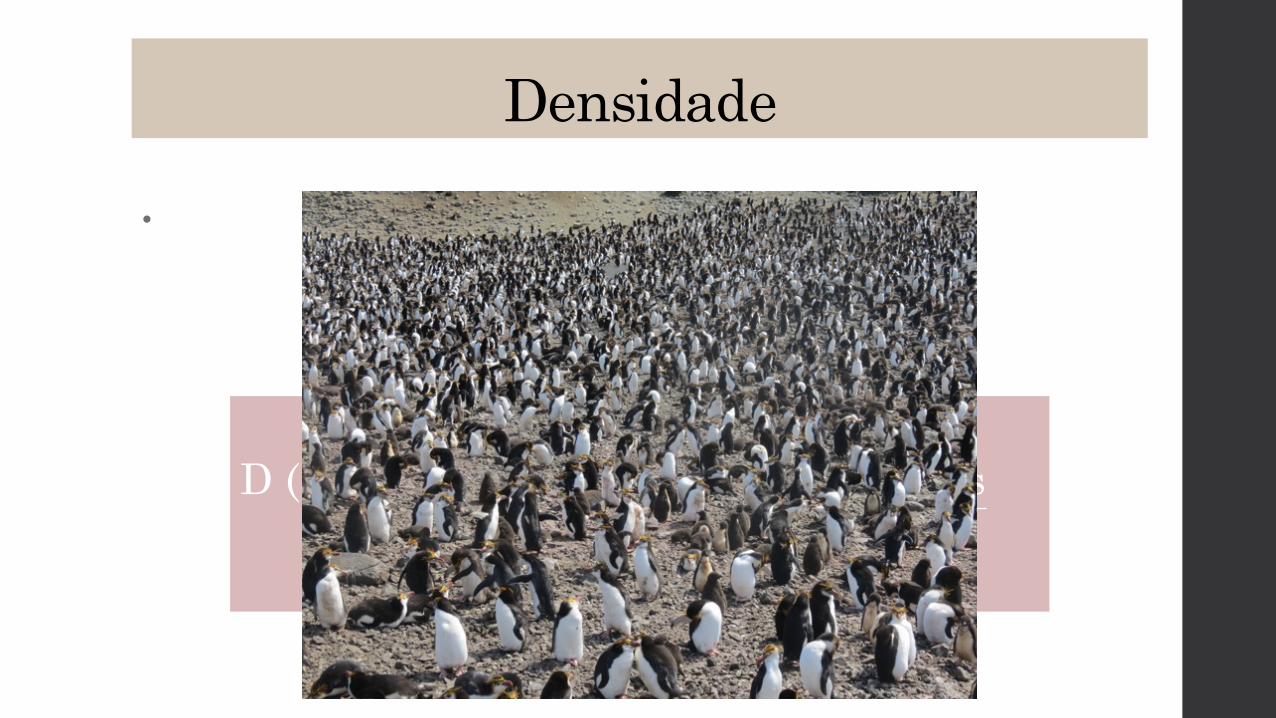
• Relação existente entre o número de indivíduos e o espaço ocupado por estapopulação
D (densidade) = número de indivíduosespaço ocupado
Densidade
• Relação existente entre o número de indivíduos e o espaçoocupado por esta população
D (densidade) = número de indivíduosespaço ocupado

Densidade
• Relação existente entre o número de indivíduos e o espaçoocupado por esta população
D (densidade) = número de indivíduosespaço ocupado

Densidade
• Durante um mergulho em Santa Catarina você realizou um transecto de 20m de comprimento por 2 metros de largura e contabilizou 30 indivíduos de donzelinha, Stegastes fuscus.
• Qual a densidade da espécie neste transecto?
D (densidade) = 30 = 0,75 ind/m2
40
Dispersão
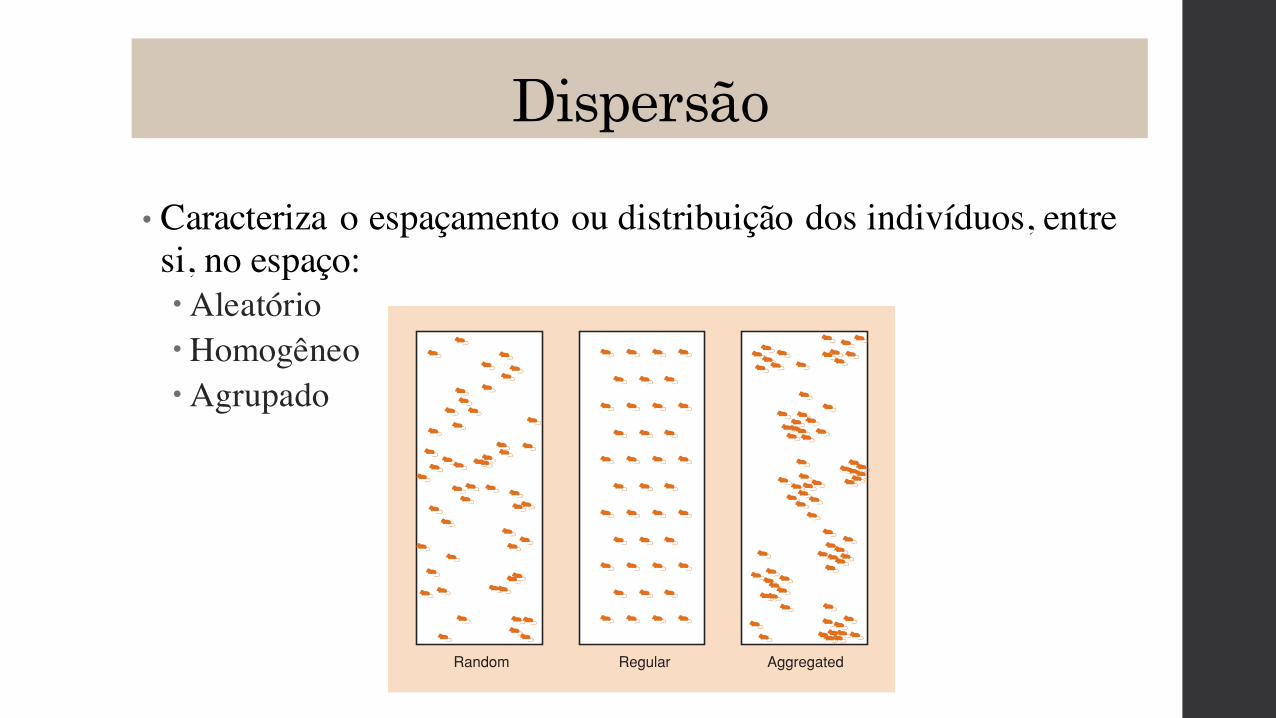
• Caracteriza o espaçamento ou distribuição dos indivíduos, entre si, no espaço:�Aleatório�Homogêneo�Agrupado
166 CHAPTER 6
explore and, if successful, discover, suitable sites within which tolay their eggs: starting, moving and stopping are all under activecontrol.
6.2.4 Clonal dispersal
In almost all modular organisms (see Section 4.2.1), an individualgenet branches and spreads its parts around it as it grows. Thereis a sense, therefore, in which a developing tree or coral activelydisperses its modules into, and explores, the surrounding environ-ment. The interconnections of such a clone often decay, so thatit becomes represented by a number of dispersed parts. This mayresult ultimately in the product of one zygote being representedby a clone of great age that is spread over great distances. Someclones of the rhizomatous bracken fern (Pteridium aquilinum)were estimated to be more than 1400 years old and one extendedover an area of nearly 14 ha (Oinonen, 1967).
We can recognize two extremes ina continuum of strategies in clonal dis-persal (Lovett Doust & Lovett Doust,1982; Sackville Hamilton et al., 1987). At
one extreme, the connections between modules are long and themodules themselves are widely spaced. These have been called‘guerrilla’ forms, because they give the plant, hydroid or coral acharacter like that of a guerrilla army. Fugitive and opportunist,they are constantly on the move, disappearing from some ter-ritories and penetrating into others. At the other extreme are ‘phalanx’ forms, named by analogy with the phalanxes of a Romanarmy, tightly packed with their shields held around them. Here,the connections are short and the modules are tightly packed, andthe organisms expand their clones slowly, retain their original site occupancy for long periods, and neither penetrate readilyamongst neighboring plants nor are easily penetrated by them.
Even amongst trees, it is easy to see that the way in whichthe buds are placed gives them a guerrilla or a phalanx type ofgrowth form. The dense packing of shoot modules in species like cypresses (Cupressus) produces a relatively undispersed andimpenetrable phalanx canopy, whilst many loose-structured,broad-leaved trees (Acacia, Betula) can be seen as guerrilla canopies,bearing buds that are widely dispersed and shoots that interweavewith the buds and branches of neighbors. The twining or clam-bering lianas in a forest are guerrilla growth forms par excellence,dispersing their foliage and buds over immense distances, bothvertically and laterally.
The way in which modular organisms disperse and display theirmodules affects the ways in which they interact with their neigh-bors. Those with a guerrilla form will continually meet and com-pete with other species and other genets of their own kind. Witha phalanx structure, however, most meetings will be between modules of a single genet. For a tussock grass or a cypress tree,competition must occur very largely between parts of itself.
Clonal growth is most effective as a means of dispersal in aquaticenvironments. Many aquatic plants fragment easily, and the partsof a single clone become independently dispersed because theyare not dependent on the presence of roots to maintain their water relations. The major aquatic weed problems of the worldare caused by plants that multiply as clones and fragment and fall to pieces as they grow: duckweeds (Lemna spp.), the waterhyacinth (Eichhornia crassipes), Canadian pond weed (ElodeaCanadensis) and the water fern Salvinia.
6.3 Patterns of distribution: dispersion
The movements of organisms affect the spatial pattern of theirdistribution (their dispersion) and we can recognize three main pat-terns of dispersion, although they too form part of a continuum(Figure 6.3).
Random dispersion occurs whenthere is an equal probability of anorganism occupying any point in space(irrespective of the position of any others). The result is that individuals are unevenly distributedbecause of chance events.
Regular dispersion (also called a uniform or even distribution oroverdispersion) occurs either when an individual has a tendency toavoid other individuals, or when individuals that are especiallyclose to others die. The result is that individuals are more evenlyspaced than expected by chance.
Aggregated dispersion (also called a contagious or clumped dis-tribution or underdispersion) occurs either when individuals tendto be attracted to (or are more likely to survive in) particular partsof the environment, or when the presence of one individual
••••
AggregatedRegularRandom
Figure 6.3 Three generalized spatial patterns that may beexhibited by organisms across their habitats.
guerrillas and
phalanx-formers
random, regular
and aggregated
distributions
EIPC06 10/24/05 1:55 PM Page 166
Fatores que moldam a densidade
TAMANHOPOPULACIONAL
NATALIDADE
EMIGRAÇÃO
MORTALIDADE
IMIGRAÇÃO

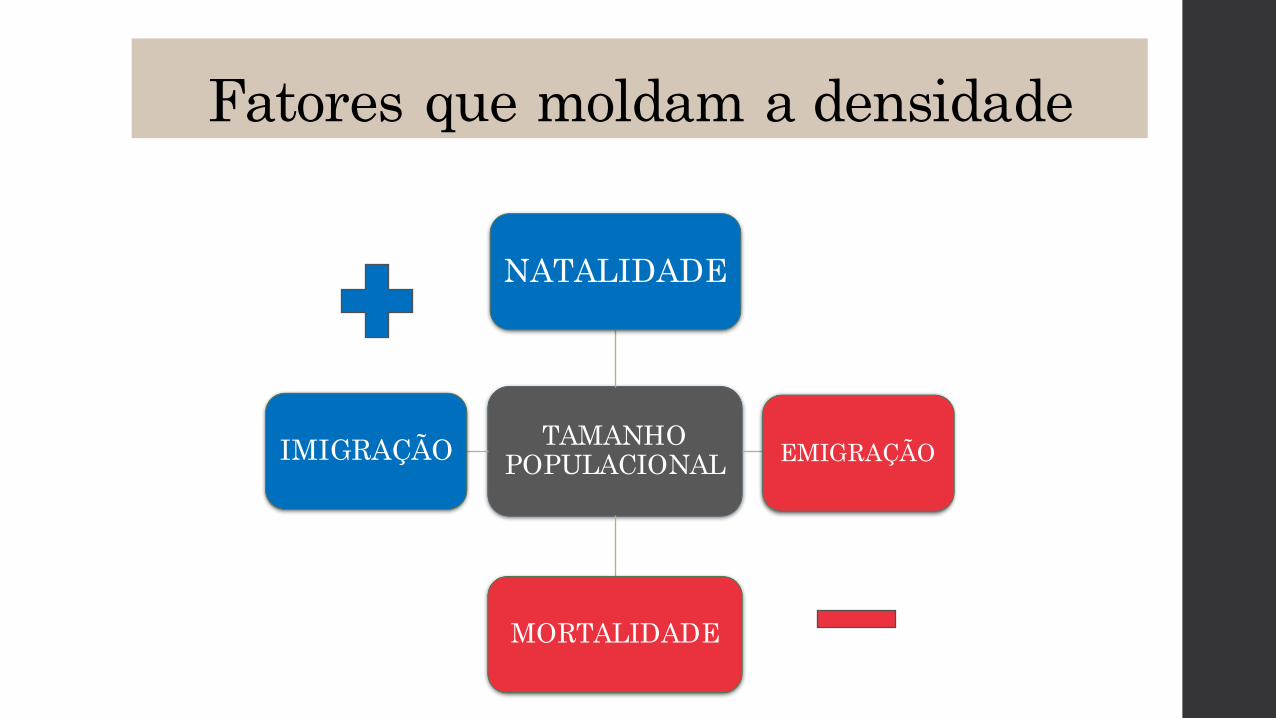
Fatores que moldam a densidade
NATALIDADE IMIGRAÇÃO MORTALIDADE EMIGRAÇÃO
NATALIDADE IMIGRAÇÃO MORTALIDADE EMIGRAÇÃO
NATALIDADE IMIGRAÇÃO MORTALIDADE EMIGRAÇÃO
><
EQUILÍBRIO
CRESCIMENTO
DECLÍNIO
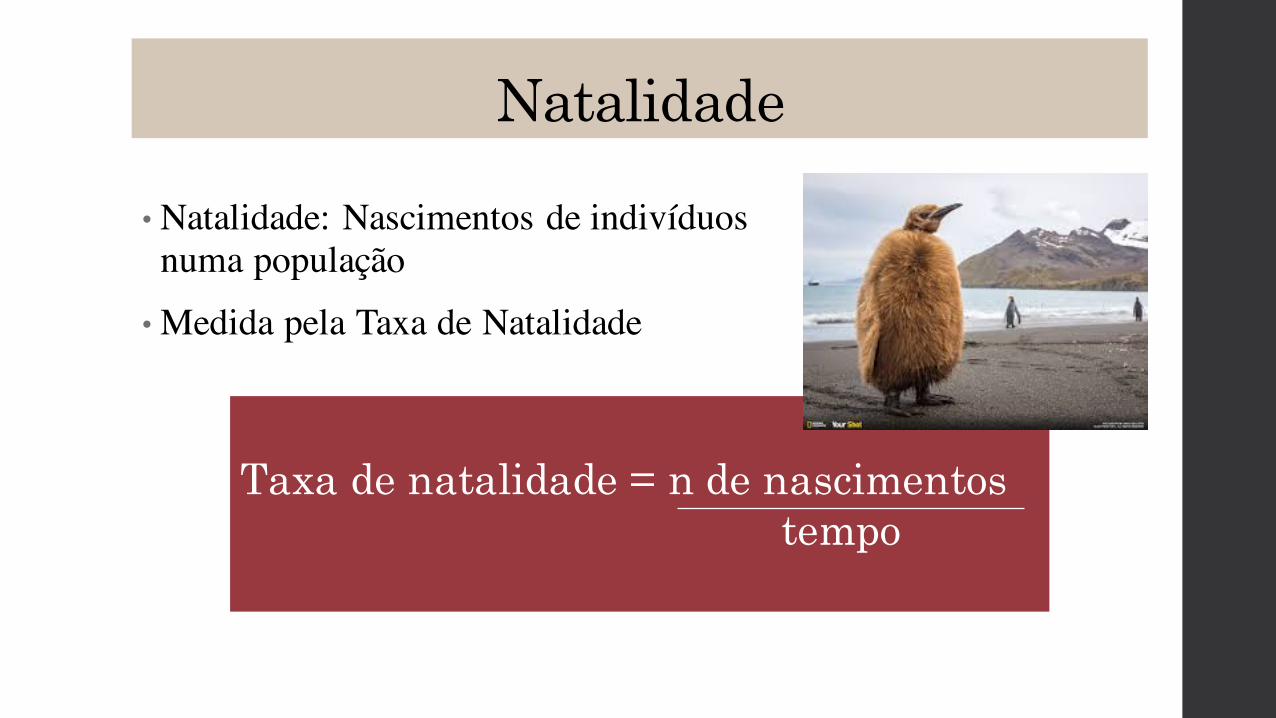
Natalidade
• Natalidade: Nascimentos de indivíduosnuma população• Medida pela Taxa de Natalidade
Taxa de natalidade = n de nascimentostempo
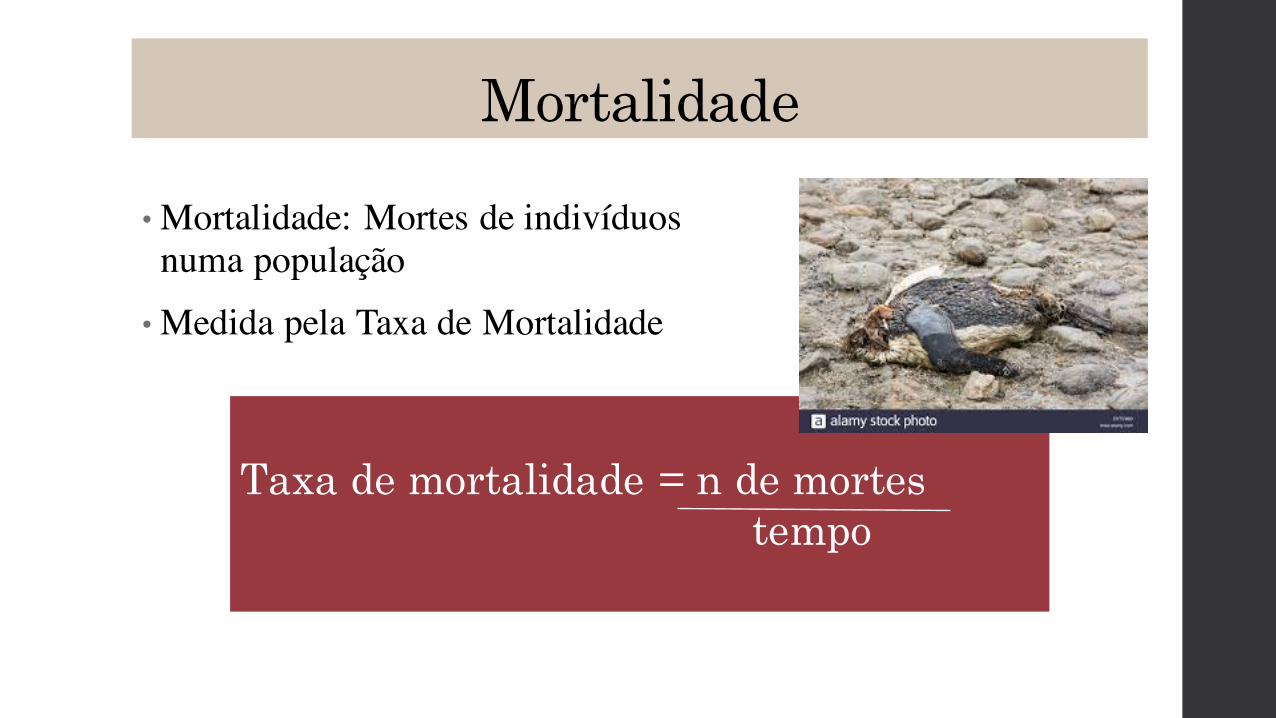
Mortalidade
• Mortalidade: Mortes de indivíduosnuma população• Medida pela Taxa de Mortalidade
Taxa de mortalidade = n de mortestempo

Imigração e Emigração
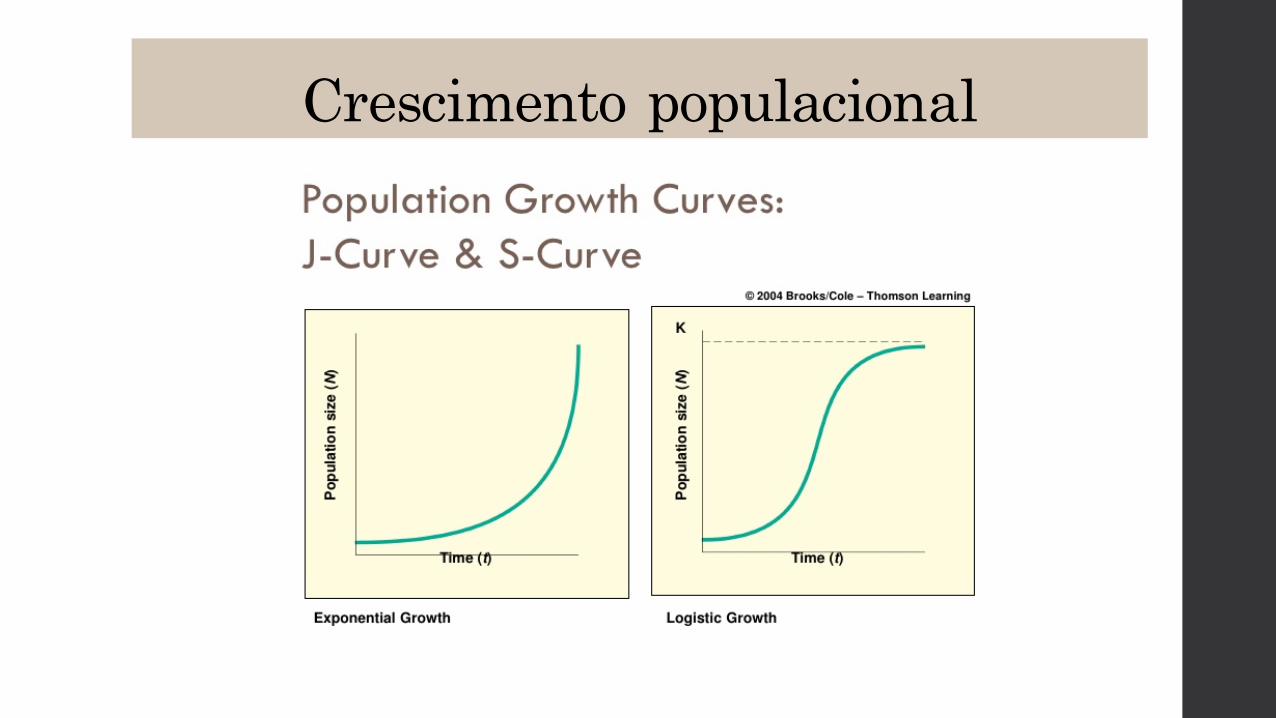
Crescimento populacional
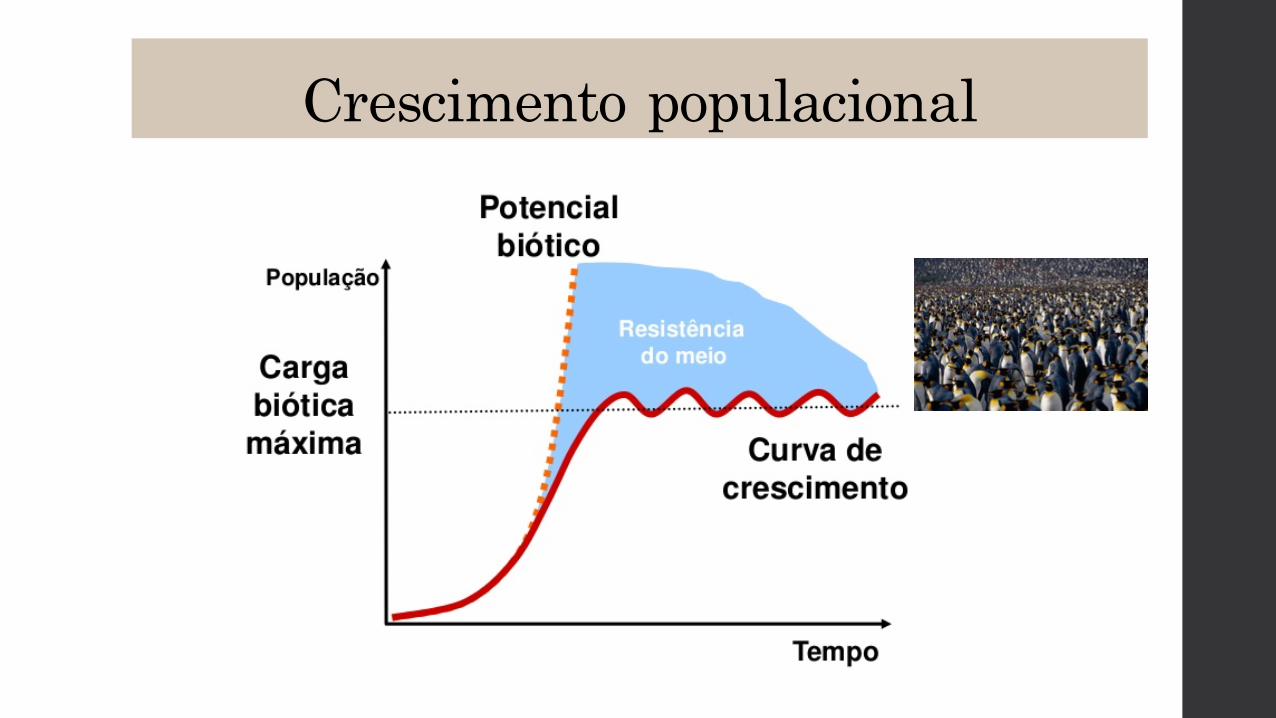
•Quando os recursos são ilimitados, as condiçõesclimáticas são favoráveis e não existe competição que limite o crescimento da população considerada, o crescimento é exponencial a uma taxa máximachamada potencial biótico•As condições impõem limites ao crescimento, a resistência ambiental

Crescimento populacional
•Potencial biótico: capacidade inata de crescimento empopulações sob condições ideais•Resistência ambiental: soma dos fatores limitantes do meio•Diferenças resultam nos modelos de crescimento J e S
Crescimento populacional
Crescimento populacional
Crescimento populacional
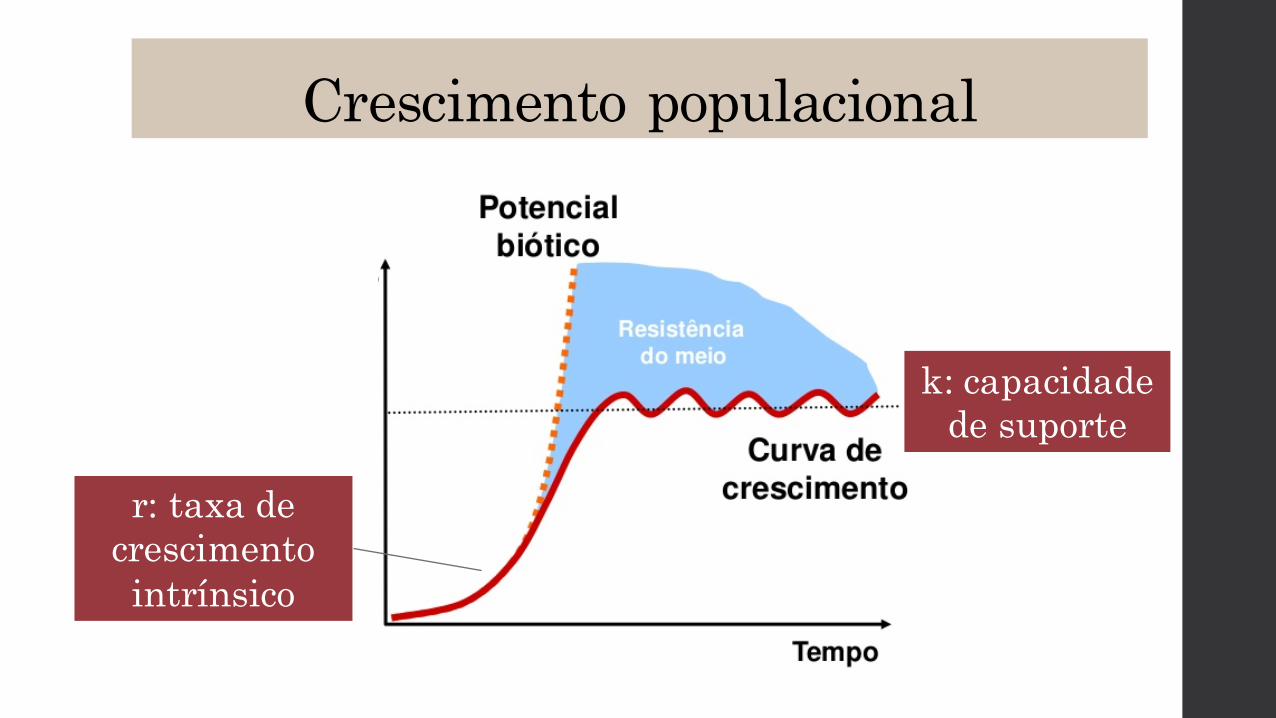
r: taxa de crescimento intrínsico
k: capacidadede suporte
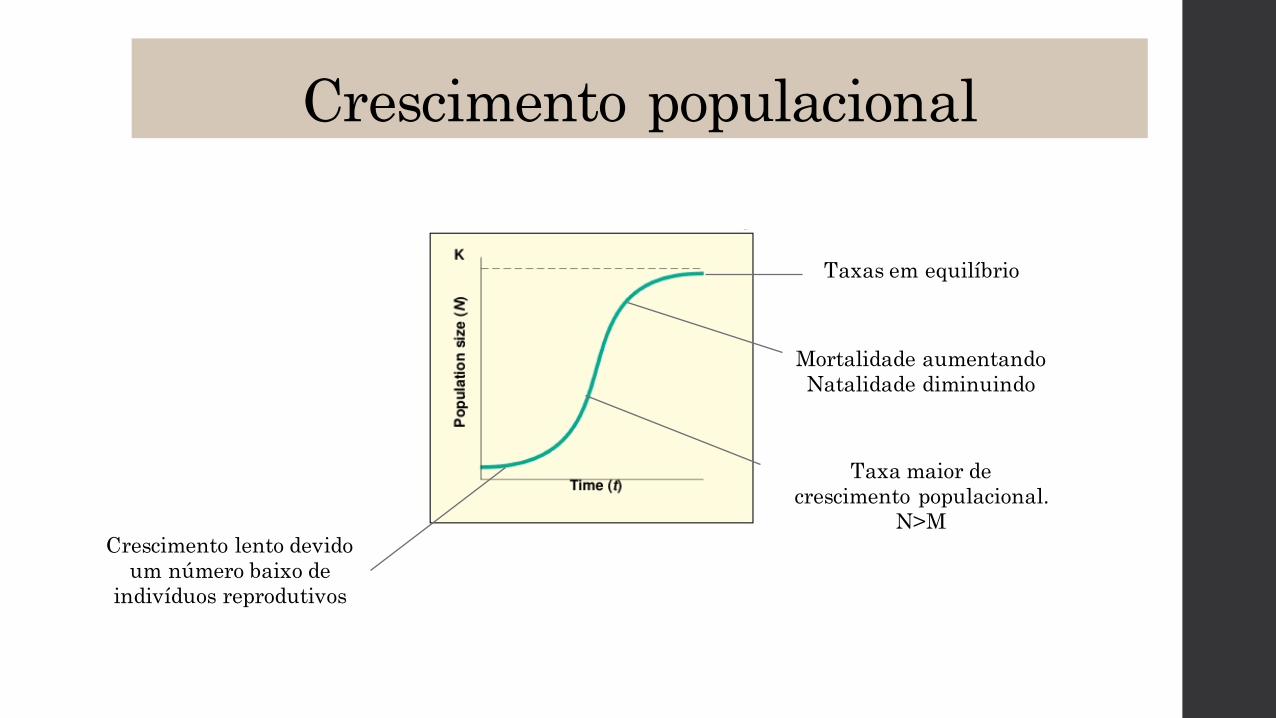
Crescimento populacional
Crescimento lento devidoum número baixo de
indivíduos reprodutivos
Taxa maior de crescimento populacional.
N>M
Mortalidade aumentandoNatalidade diminuindo
Taxas em equilíbrio

Curvas de sobrevivência
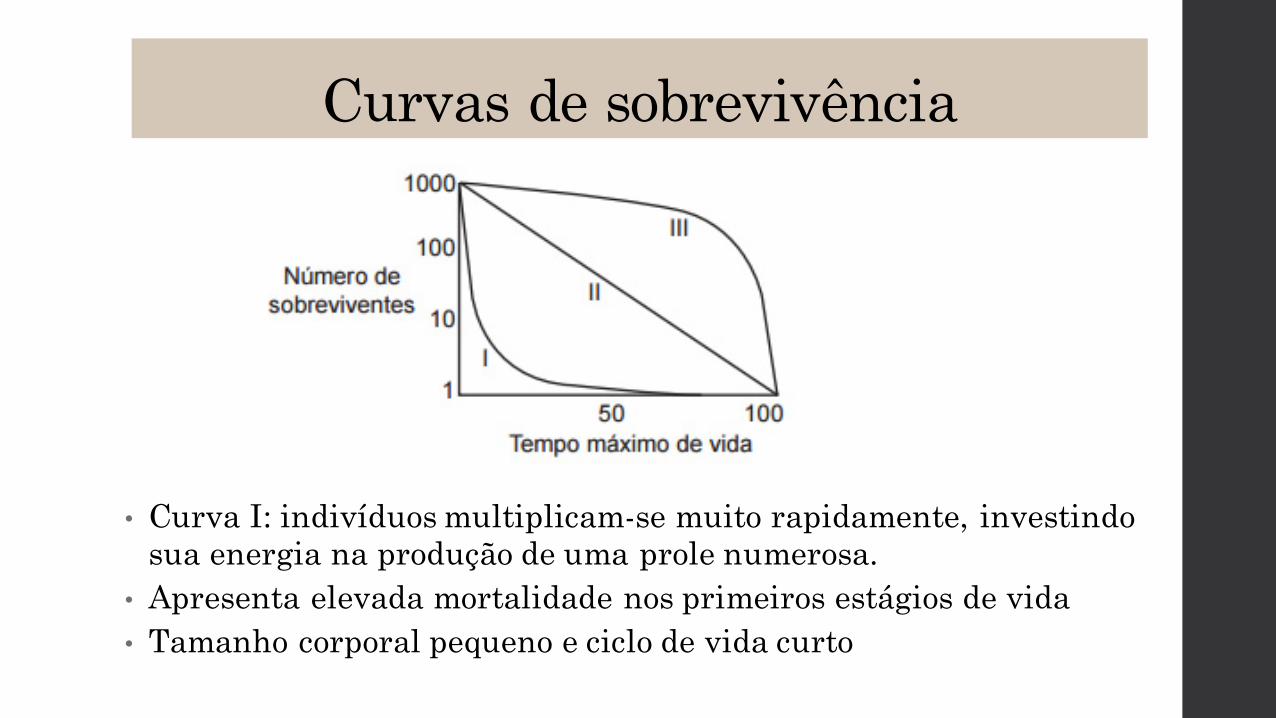
• Curva I: indivíduos multiplicam-se muito rapidamente, investindosua energia na produção de uma prole numerosa.
• Apresenta elevada mortalidade nos primeiros estágios de vida• Tamanho corporal pequeno e ciclo de vida curto
Curvas de sobrevivência
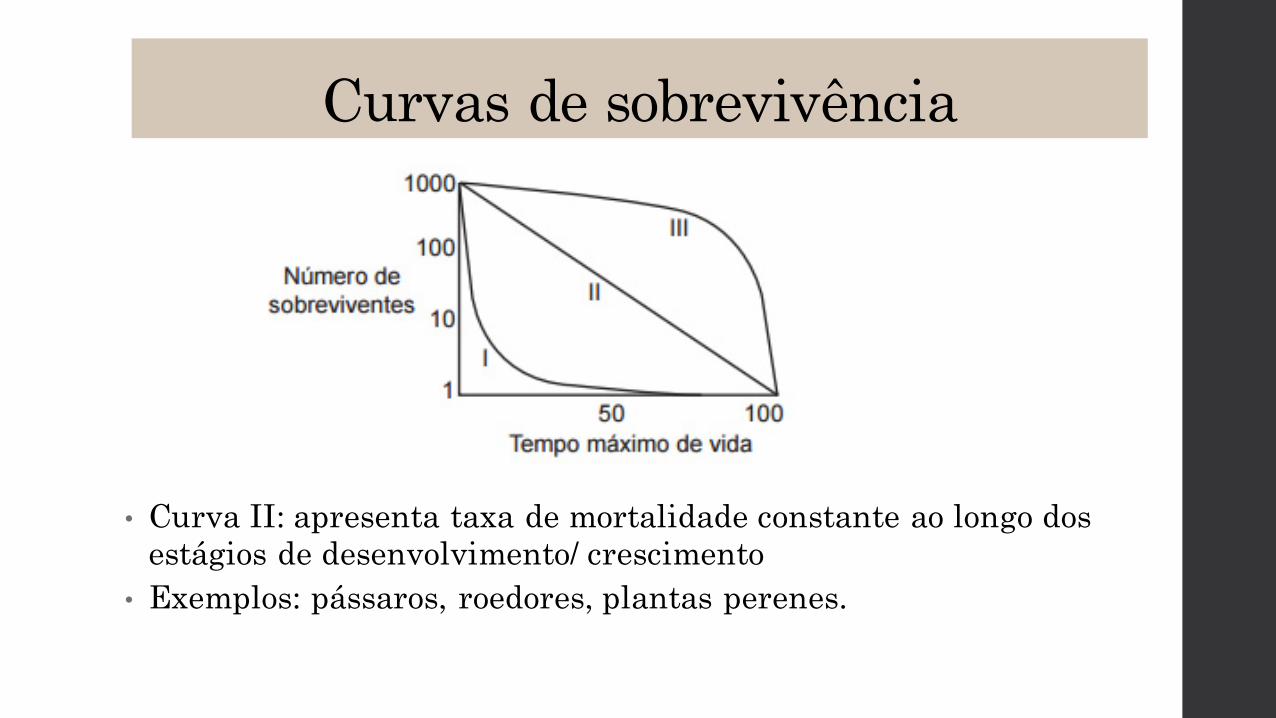
• Curva II: apresenta taxa de mortalidade constante ao longo dos estágios de desenvolvimento/ crescimento
• Exemplos: pássaros, roedores, plantas perenes.
Curvas de sobrevivência
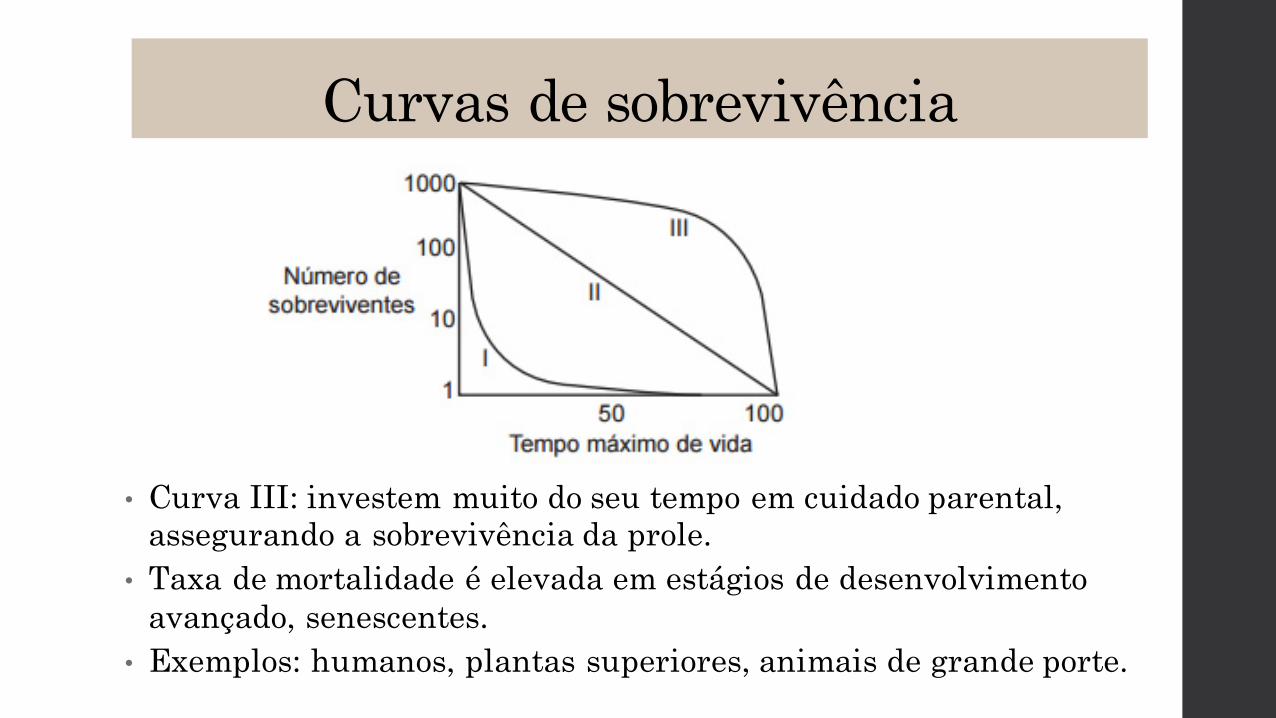
• Curva III: investem muito do seu tempo em cuidado parental, assegurando a sobrevivência da prole.
• Taxa de mortalidade é elevada em estágios de desenvolvimentoavançado, senescentes.
• Exemplos: humanos, plantas superiores, animais de grande porte.
Curvas de sobrevivência
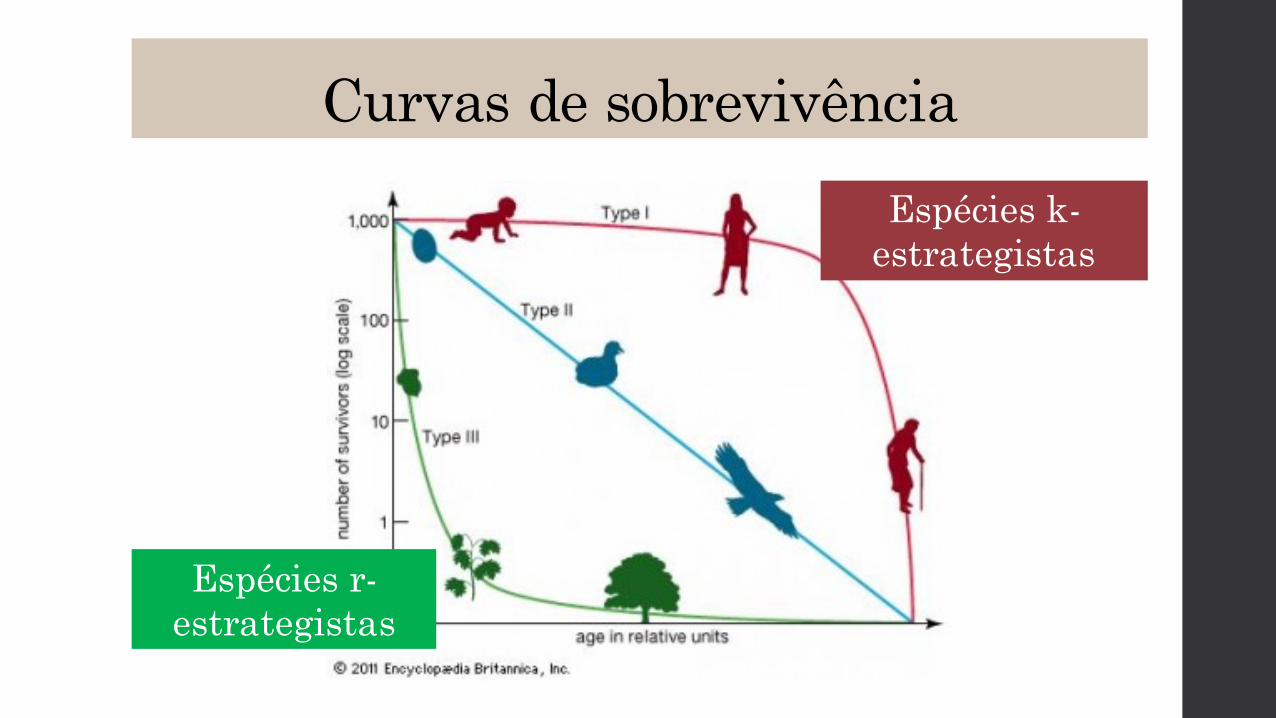
Espécies r-estrategistas
Espécies k-estrategistas
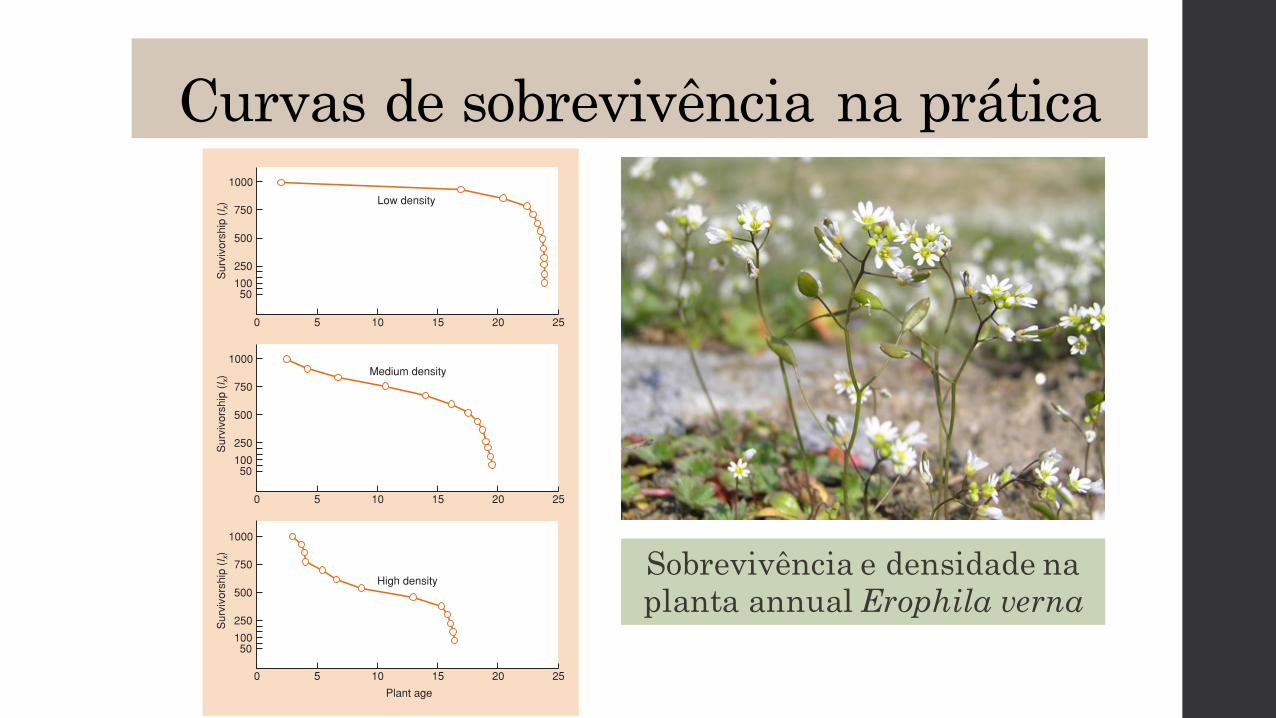
Curvas de sobrevivência na prática
Sobrevivência e densidade naplanta annual Erophila verna
LIFE, DEATH AND LIFE HISTORIES 101
These types of survivorship curve are useful generalizations,but in practice, patterns of survival are usually more complex. Thus,in a population of Erophila verna, a very short-lived annual plantinhabiting sand dunes, survival can follow a type I curve whenthe plants grow at low densities; a type II curve, at least until theend of the lifespan, at medium densities; and a type III curve inthe early stages of life at the highest densities (Figure 4.9).
4.5.5 Seed banks, ephemerals and other not-quite-annuals
Using Phlox as an example of an annual plant has, to a certainextent, been misleading, because the group of seedlings developingin 1 year is a true cohort: it derives entirely from seed set by adultsin the previous year. Seeds that do not germinate in 1 year willnot survive till the next. In most ‘annual’ plants this is not thecase. Instead, seeds accumulate in the soil in a buried seed bank.At any one time, therefore, seeds of a variety of ages are likelyto occur together in the seed bank, and when they germinate theseedlings will also be of varying ages (age being the length of timesince the seed was first produced). The formation of somethingcomparable to a seed bank is rarer amongst animals, but there are
examples to be seen amongst the eggs of nematodes, mosquitoesand fairy shrimps, the gemmules of sponges and the statocysts ofbryozoans.
Note that species commonly referred to as ‘annual’, but witha seed bank (or animal equivalent), are not strictly annual speciesat all, even if they progress from germination to reproduction within1 year, since some of the seeds destined to germinate each yearwill already be more than 12 months old. All we can do, though,is bear this fact in mind, and note that it is just one example of real organisms spoiling our attempts to fit them neatly into clear-cut categories.
••••
100
10
Sur
vivo
rshi
p
Age
1
0.1
Type I
Type II
Type III
1000
Figure 4.8 A classification of survivorship curves. Type I(convex) – epitomized perhaps by humans in rich countries,cosseted animals in a zoo or leaves on a plant – describes thesituation in which mortality is concentrated at the end of themaximum lifespan. Type II (straight) indicates that the probabilityof death remains constant with age, and may well apply to the buried seed banks of many plant populations. Type III(concave) indicates extensive early mortality, with those thatremain having a high rate of survival subsequently. This is true,for example, of many marine fish, which produce millions of eggs of which very few survive to become adults. (After Pearl,1928; Deevey, 1947.)
0 5 10 15 20 25
Sur
vivo
rshi
p (l x
) Low density
1000
750
500
250
50100
0 5 10 15 20 25
Sur
vivo
rshi
p (l x
)
Plant age
High density
1000
750
500
250
50100
Medium density
0 5 10 15 20 25
Sur
vivo
rshi
p (l x
)
1000
750
500
250
50100
Figure 4.9 Survivorship curves (lx, where l0 = 1000) for the sand-dune annual plant Erophila verna monitored at three densities:high (initially 55 or more seedlings per 0.01 m2 plot); medium(15–30 seedlings per plot); and low (1–2 seedlings per plot). Thehorizontal scale (plant age) is standardized to take account of thefact that each curve is the average of several cohorts, which lasteddifferent lengths of time (around 70 days on average). (AfterSymonides, 1983.)
EIPC04 10/24/05 1:49 PM Page 101

Trade-offs
• Um trade-off é uma relação negativa entre duas características da história de vida, em que aumentos em uma estão associados a decréscimos na outra, como resultado do compromisso de alocarrecursos.• Ex: tamanho da ninhada e sobrevivência da prole.
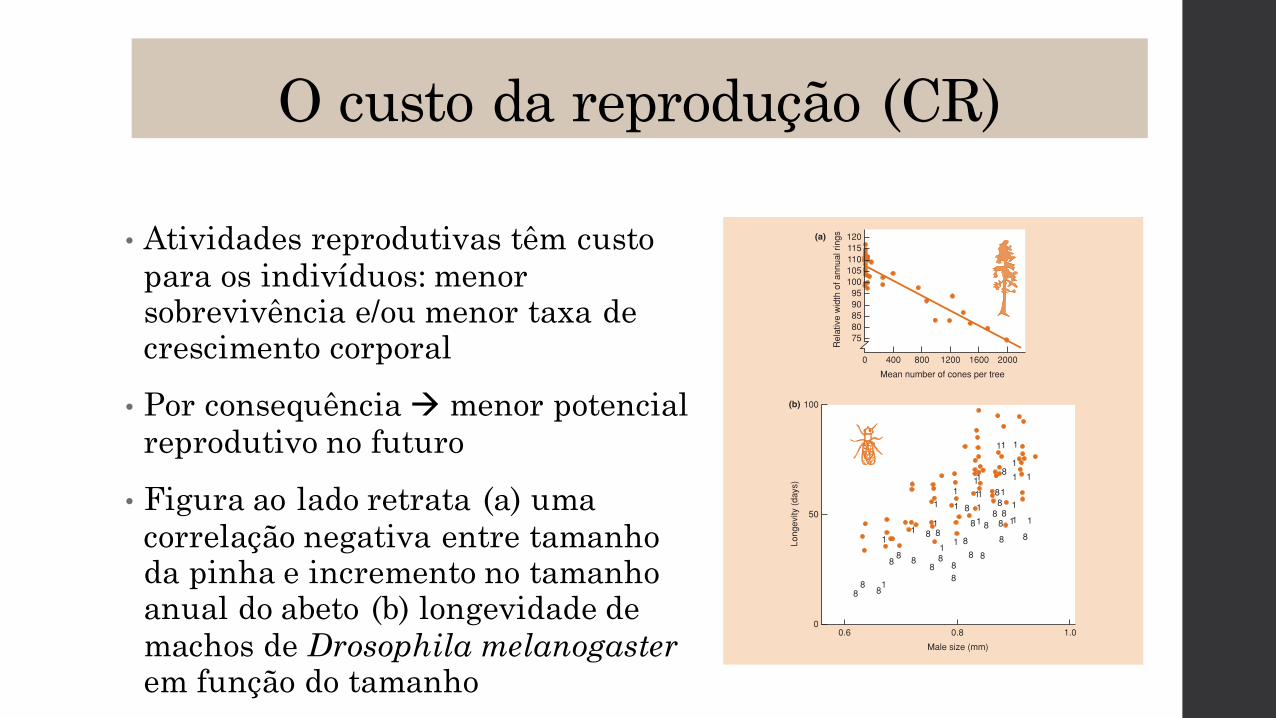
O custo da reprodução (CR)
• Atividades reprodutivas têm custopara os indivíduos: menorsobrevivência e/ou menor taxa de crescimento corporal• Por consequência à menor potencial
reprodutivo no futuro• Figura ao lado retrata (a) uma
correlação negativa entre tamanhoda pinha e incremento no tamanhoanual do abeto (b) longevidade de machos de Drosophila melanogaster em função do tamanho
114 CHAPTER 4
It is important that the manipulation should alter the target traitand nothing else. On the other hand, simple observation may beacceptable if based on the results of a ‘natural’ experiment. Forexample, it is likely that as a result of ‘mast seeding’ (see Section 9.4)
the population of fir trees in Figure 4.19a produced large and small crops of cones in response to factors other than resourceavailability, and that the negative correlation therefore genuinelyrepresented an underlying trade-off.
••••
Rel
ativ
e w
idth
of a
nnua
l rin
gs
0
Mean number of cones per tree
400
120
800 1200 1600 2000
115110105100
9590858075
(b)
Long
evity
(day
s)
Male size (mm)
0
100
50
0.6 0.8 1.0
88
81
88 8
88
881
11
1
88
8 8
8 81
8 8 88 8
8
1
1111 11 1
1
11
88
81
1 1
1
11
11 1
8
(a)
Figure 4.19 Life history trade-offs. (a) The negative correlation between cone crop size and annual growthincrement for a population of Douglas firtrees, Pseudotsuga menziesii. (After Eis et al.,1965.) (b) The longevity of male fruit-flies(Drosophila melanogaster) generally increaseswith size (thorax length). However,longevity was reduced in males providedwith one virgin and seven mated femalesper day (1) compared with those providedwith eight mated famales (!), because ofthe increase in courtship activity, andreduced still further in males provided with eight virgins per day (8). (AfterPartridge & Farquhar, 1981.)
Mas
s re
cove
ry (g
yr–
1 )
–30–20
100
0
20
40
60
80
–20 –10 0 10 20 30
Relative litter mass (residuals)
Figure 4.20 Female aspic vipers (Viperaaspis) that produced larger litters (‘relative’litter mass because total female mass wastaken into account) also recovered morerapidly from reproduction (not ‘relative’because mass recovery was not affected by size) (r = 0.43; P = 0.01). (After Bonnet et al., 2002.)
EIPC04 10/24/05 1:49 PM Page 114
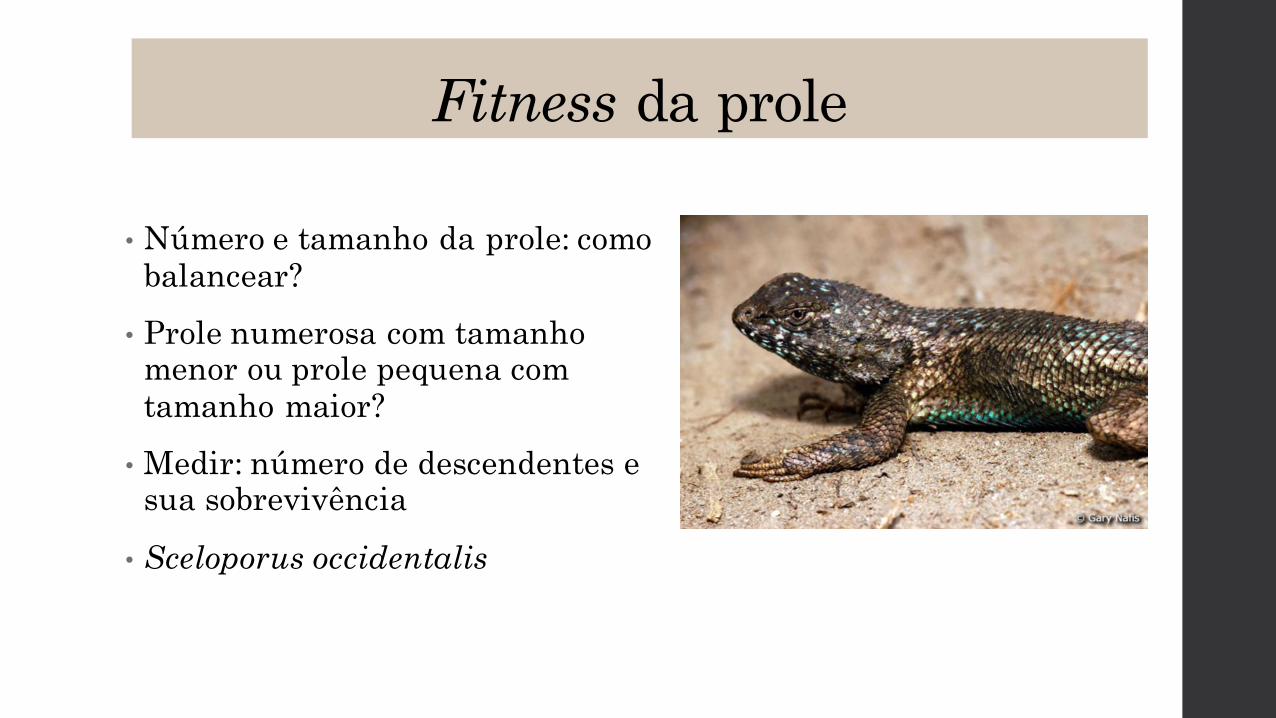
Fitness da prole
• Número e tamanho da prole: comobalancear?• Prole numerosa com tamanho
menor ou prole pequena com tamanho maior?• Medir: número de descendentes e
sua sobrevivência• Sceloporus occidentalis
Take-home messages:• O tamanho das populações é regulado por parâmetros como
natalidade, mortalidade, emigração e emigração• A dispersão caracteriza a distribuição ou espaçamento dos
indivíduos no espaço• O crescimento de populações naturais é influenciado pelo
potencial biótico das populações e pela resistência ambiental• As curvas de crescimento populacional podem apresentar o
formato em S e em J• As curvas de sobrevivência de espécies podem ser comportar de
3 formas distintas (I, II e III)
Take-home messages:• A população humana está fadada à extinção