
Eddy Michael Pedro Domingues Aplicação em Pilhas de ...
224
Universidade de Aveiro Ano 2014 Departamento de Engenharia de Materiais e Cerâmica Eddy Michael Pedro Domingues Organossílicas com Mesoporosidade para Aplicação em Pilhas de Combustível Mesoporous Organosilicas for Application in Fuel Cells
Transcript of Eddy Michael Pedro Domingues Aplicação em Pilhas de ...

Universidade de Aveiro
Ano 2014
Departamento de Engenharia de Materiais e Cerâmica
Eddy Michael Pedro Domingues
Organossílicas com Mesoporosidade para Aplicação em Pilhas de Combustível Mesoporous Organosilicas for Application in Fuel Cells


Universidade de Aveiro
Ano 2014
Departamento de Engenharia de Materiais e Cerâmica
Eddy Michael Pedro Domingues
Organossílicas com Mesoporosidade para Aplicação em Pilhas de Combustível Mesoporous Organosilicas for Application in Fuel Cells
Tese apresentada à Universidade de Aveiro para cumprimento dos requisitos necessários à obtenção do grau de Doutor em Ciência e Engenharia de Materiais, realizada sob a orientação científica do Doutor Filipe Miguel Henriques Lebre Ramos Figueiredo, Investigador Principal do Centro de Investigação em Materiais Cerâmicos e Compósitos da Universidade de Aveiro, e da Doutora Paula Celeste da Silva Ferreira, Investigadora Principal do Centro de Investigação em Materiais Cerâmicos e Compósitos da Universidade de Aveiro.
Trabalho realizado com o apoio financeiro dos projectos PTDC/CTM–CER/109843/2009, PTDC/QUI–QUI/113678/2009 e Pest-C/CTM/LA0011/2013.
Trabalho realizado com o apoio da FCT sob a forma de bolsa individual de doutoramento com a referência SFRH/BD/48043/2008.


Para ti Pedro


o júri
presidente Prof. Doutor João Manuel Nunes Torrão professor catedrático da Universidade de Aveiro
Prof.ª Doutora Verónica Cortés Zea Bermudez
professora catedrática da Universidade de Trás-os-Montes e Alto Douro
Prof. Doutor Jorge Ribeiro Frade professor catedrático da Universidade de Aveiro
Doutora Carmen Mireya Rangel Archila investigadora coordenadora do Laboratório Nacional de Energia e Geologia
Prof.ª Doutora Alexandra Rodrigues Pinto professora associada da Faculdade de Engenharia da Universidade do Porto
Doutor Filipe Miguel Henriques Lebre Ramos Figueiredo investigador principal da Universidade de Aveiro
Prof.ª Doutora Maria de Deus Corceiro de Carvalho professora auxiliar da Faculdade de Ciências da Universidade de Lisboa
Doutora Paula Celeste da Silva Ferreira investigadora principal da Universidade de Aveiro


agradecimentos
Em primeiro lugar quero agradecer à FCT pelo financiamento desta grande viagem de aprendizagem e crescimento, sem o qual não estaria a escrever estas palavras. À Universidade de Aveiro e ao CICECO, pela cedência dos espaços, instalações e aparelhos para o desenvolvimento do meu trabalho. Ao meu orientador Filipe, com quem comecei a trabalhar com uma BIC em 2007, sempre disponível para esclarecer (e duvidar também), ensinar e persistir, nunca deixando na mão e sempre com espírito de equipa. Obrigado por acreditar! À minha orientadora Paula, pelo apoio e esclarecimento, pelas conversas e discussões, de trabalho ou não, e pelos valiosos ensinamentos. Ao LACCO (Universidade de Poitiers) e em especial ao Nicolas Bion pela cedência do espaço e equipamento e pela excelente colaboração. Ao meu pessoal do CICECO, aos que estão e aos que já estiveram, pelo apoio e colaboração, pelo companheirismo, os risos e as conversas parvas (nem sempre!) na cantina ou de volta de um café. A descontracção e alegria que proporcionam aliviam as tensões do dia-a-dia e ajudaram a aligeirar todo este processo. Ao meu pessoal da FCUL, já se passaram alguns anos desde que deixamos os cadernos na sala do aquário e as cartas da sueca na esplanada do C5, mas formou-se um núcleo duro cujas ligações persistem e espero contar convosco até ser velhinho! Ao pessoal de Pombal e em particular ao pessoal e “entourage” da nossa famigerada banda punk rock/psicadélico de putos revoltosos, existem amizades de base que o tempo nunca poderá apagar! Rock on! À nossa “família emprestada” que migrou também para Aveiro, Andreia, Vítor (e a Ritinha claro) e o Flávio, pelo carinho e apoio e pela sua reconfortante presença. Às duas pessoas que me fizeram pessoa, que sempre me proporcionaram a educação, a atenção, o incondicional Amor e carinho e tudo o que sempre precisei para estar aqui hoje, olhando-me sempre orgulhosamente. Obrigado Mãe! Obrigado Pai! À minha vó Maria, minha mãe duas vezes, por ser quem ela é! Ao Lopes, pela amizade, apoio e disponibilidade para ajudar. Ao meu mano Heitor, tás a ficar velho pá! Não preciso descrever a importância que tens para mim! À Sónia, minha mana por afiliação, e à minha linda sobrinha e afilhada Maria só vos digo… que saudades! À minha linda esposa e companheira, namorada e amiga, co-arquitecta do nosso projecto-família, pelo caminho que temos percorrido e quero percorrer, quero-te sempre ao meu lado! AMO-TE profundamente! Pedro, meu pequeno homenzinho, minha mini-pessoa mais linda do mundo, dedico-te esta tese. Tens e terás sempre um lugar cativo, na primeiríssima fila, no âmago do meu ser. Tu és luz na nossa vida, um raio de alegria e maravilhamento. Espero que um dia leias estas palavras e que te façam sorrir! ADORO-TE!


palavras-chave
Mesoporoso, Organossílica, Condutividade Protónica, Nafion®, Compósito
resumo
O objectivo desta dissertação é o de avaliar o potencial de organossílicas mesoporosas periódicas (Ph-PMO) como aditivos para membranas poliméricas de pilhas de combustível, visando um melhor desempenho a baixa humidade relativa (h.r. < 50%) e/ou temperaturas altas (T > 120 ºC). A estrutura dos Ph-PMO mimetiza a do Nafion®, apresentando semelhante tamanho de poro (3 nm) e distância entre grupos ácido (0.8 nm), mas com uma estrutura estável e rígida que reduz o efeito de confinamento protónico à superfície do poro, que ocorre no Nafion®. Este efeito pode potencialmente traduzir-se num aumento da condutividade protónica em condições anidras, para além de melhorar o comportamento visco-elástico. Foram sintetizados Ph-PMO com grupos ácido sulfónico (S-Ph-PMO) e ácido fosfónico (P-Ph-PMO), com características estruturais e microestruturais distintas. A condutividade dos dois tipos de Ph-PMO aumenta com o aumento da área superficial específica e da h.r., confirmando o papel central da superfície e da água de hidratação no transporte protónico. A maior acidez dos S-Ph-PMO resulta em valores de condutividade superiores, da ordem de 0.1 S∙cm
-1 a 94 ºC e 98% de h.r. Os
resultados obtidos com uma série de S-Ph-PMO com diferentes concentrações de grupos funcionais, área superficial específica e ordem estrutural, preparados por reacção hidrotermal em micro-ondas, mostram que a condutividade aumenta com o aumento da concentração de grupos ácidos, não sendo, no entanto, correlacionável com a ordem estrutural. Foram seleccionadas várias amostras de S-Ph-PMO para preparar membranas compósitas à base de Nafion®, avaliando as suas propriedades visco-elásticas e de transporte protónico. Para a membrana com cerca de 36 vol.% de aditivos, o efeito de volume dos aditivos é evidenciado por um módulo de armazenamento (E’) até 10 vezes superior ao do Nafion® puro. O efeito dos aditivos faz-se também sentir na diminuição da dilatação das membranas por absorção de água até 30%, devido à dilatação virtualmente nula dos aditivos. O aumento do E’ e diminuição da dilatação podem vir a ser cruciais para a melhoria da estabilidade termo-mecânica das membranas e da interface eléctrodo/electrólito. A condutividade das membranas compósitas é menos dependente da h.r. e da T, podendo ser até 1 ordem de grandeza superior à condutividade do Nafion® puro a 40 ºC e 20% de h.r. As diferenças são menos significativas a alta h.r., atingindo o valor máximo de 0.2 S∙cm
-1 a 94 ºC e 98 %
h.r. No entanto, contrariamente ao efeito de volume no E’ e na dilatação, a condutividade máxima foi atingida numa membrana com 20 vol.% de aditivos. Verifica-se que a condutividade das membranas tende a aumentar ligeiramente com o aumento da área superficial e da concentração de grupos ácido dos aditivos, sendo o efeito da ordem estrutural muito pouco visível. O aumento da condutividade das membranas compósitas, a baixa h.r., pode ser interpretado considerando a redução do confinamento protónico e, à medida que a h.r. aumenta, assumindo um efeito de superfície, no qual a presença dos aditivos provoca a ruptura de uma estrutura rígida que se forma à superfície da membrana de Nafion®, libertando a pressão interna e facilitando o acesso da água ao interior da membrana e desse modo aumentando a condutividade.

keywords
Mesoporous, Organosilica, Proton Conductivity, Nafion®, Composite
abstract
The objective of this thesis is to assess the potential of acid-functionalized periodic mesoporous organosilicas (Ph-PMO) as fillers for the polymer membrane in polymer electrolyte fuel cells, aiming at improved performance under low relative humidity (r.h.<50%) and/or high temperature (T >120 °C) operation conditions. Ph-PMOs mimic the structure of Nafion®, presenting a similar acid load distributed on pores with similar width (3 nm) and with similar distance between acid sites (0.8 nm), but on a stable, rigid structure preventing the proton confinement to the pore surface that occurs in Nafion®. This offers potentially high protonic conductivity under dry conditions, in addition to improved visco-elastic behaviour. Two protogenic groups based on sulfonic (S-Ph-PMO) and phosphonic (P-Ph-PMO) acids were used to functionalize Ph-PMOs with variable structural and microstructural features. The conductivity of both types of Ph-PMOs increases with increasing specific surface area and r.h., confirming the surface nature of the protonic transport and the key role of the hydration water on the protonic transport. The strongest acid character of S-Ph-PMOs leads to a much higher conductivity, attaining values of up to ~0.1 S∙cm
-1
at 94 °C and 98% r.h. Results obtained for a series of S-Ph-PMO samples with variable acid loadings, surface area and structural order, prepared by a microwave hydrothermal reaction, show that the conductivity increases with increasing acid loading, whereas no clear correlation can be established with structural order parameters. S-Ph-PMOs were selected for the preparation of composite Nafion® membranes and their transport and visco-elastic properties evaluated. The bulk effect of the fillers is demonstrated by a 10 fold increase of the storage modulus (E’) at 140 °C of composite membranes with up to 36 vol.% S-Ph-PMO, in comparison with pure Nafion®. The effect of fillers on the bulk properties is also apparent on the swelling under saturated conditions,
which is reduced by 30% with addition of 36 vol.% of fillers, indicating virtually zero swelling of the fillers. These improvements may be crucial to increase the thermo-mechanical stability of the membrane and of the electrode/electrolyte interface. The conductivity of the composite membranes is less dependent on r.h. and temperature, and can be up to 1 order of magnitude higher than for pure Nafion®, at 20% r.h. and 40 °C. Differences are smaller at high r.h., with the highest conductivity of 0.2 S∙cm
-1 achieved at 94 °C and 98% r.h. However,
and as opposed to the bulk effects on E’ and swelling, a conductivity maximum is observed for the membranes with 20 vol.% of fillers. The use of different fillers in a series of 20 vol.% composite membranes showed that there is a slight increase of the membrane conductivity with increasing acid load and surface area of the fillers, however no direct correlation could be drawn for the structural properties. The increased conductivity at low r.h. can be interpreted considering a reduction of the proton confinement in the rigid pores of the fillers and, as the r.h. increases, by assuming a surface effect, where the presence of the mesoporous fillers disrupts the “skin-like” structure that forms at the surface of Nafion®, releasing the internal pressure and hence facilitating the access of the hydration water to the bulk of the membrane.


i
LIST OF FIGURES
Figure 1.1. Schematic representation of Grove’s gaseous voltaic battery (reproduced from[10]). ............4
Figure 1.2. A) Types of Fuel Cells and specific electrode reactions. B) Schematic representation of a fuel
cell stack. Adapted from[11]. C) Schematic representation of one side of a membrane
electrode assembly. Adapted from[15]. .............................................................................6
Figure 1.3. Scheme of the chemical structure of Nafion® with the sulfonic acid tip solvated by water. ...9
Figure 1.4. Schematic representation of the cluster-network model for Nafion® in the hydrated state.
Adapted from[20]. .......................................................................................................... 12
Figure 1.5. Scheme of the microstructure of Nafion® for intermediate water content. Adapted from[28].
...................................................................................................................................... 14
Figure 1.6. Scheme of Nafion® morphology according to the parallel water-channel model: A)
transversal and cross section view of an inverted micelle cylinder; B) Parallel packing of
inverted micelles cylinders; C) Cross section of the membrane showing the water channels
in white, the crystallite in black and the amorphous Nafion® matrix in grey. .................. 15
Figure 1.7. Schematic representation of the anisotropic dry “skin” formation in Nafion®. A) at low r.h.,
B) as the hydration level increases the anisotropic “skin” tends to form (dotted region) and
C) the internal pressure is released when the surface “skin” is opened by contact with
liquid water. Adapted from[33]. ..................................................................................... 16
Figure 1.8. Scheme of the proton transport between adjacent charged sites in Nafion®. Adapted
from[37]. ........................................................................................................................ 17
Figure 1.9. Schematic representation of the Grotthuss proton hopping mechanism. Star symbols
represent the forming and breaking of hydrogen bonds. Adapted from[37]. ..................... 18
Figure 1.10. Schematic representation of the proton conduction by vehicular mechanism. Adapted
from[37]. ........................................................................................................................ 19
Figure 1.11. A) Representation of a single pore of a PEM used in simulation studies performed by
Eikerling et al.[52] and B) of the pore size and relative permittivity distribution inside
Nafion® as a function of the hydration level.[38]............................................................ 21
Figure 1.12. Molecular structures of popular non-fluorinated PEM materials. The lower-case “s” stands
for sulfonated.[19] .......................................................................................................... 24
ii
Figure 1.13. Proton hopping mechanism for acid doped PBI membranes.Adapted from[64]. ...............26
Figure 1.14. Representation of the A) true liquid-crystal template mechanism and B) cooperative self-
assembly mechanism for the formation of mesoporous silica materials. Adapted from[78].
......................................................................................................................................29
Figure 1.15. TEM images and diffraction patterns of the Ph-PMO in which it is possible to see: A) the
hexagonal array of the pores; B) the molecular scale periodicity in the pore wall; and C is a
schematic representation of the particle microstructure.[89] ............................................31
Figure 1.16. Scheme of the functionalization of PMS and PMO by co-condensation (top) and grafting
(bottom). Adapted from[79] and[118]. ............................................................................32
Figure 1.17. Synthetic route and schematic representation of sulfonic acid functionalized Ph-PMO
particles synthesized via A ) grafting and B) co-condensation. Adapted from[140]. .........33
Figure 2.1. Representation of some of the atomic planes and their d-spacings in a simple cubic crystal
(left) and Miller indices of atomic planes in a simple cubic crystal (right). Adapted from
ref[232]. .........................................................................................................................59
Figure 2.2. Schematic representation of the hexagonal arrangement of pores and the molecular scale
periodicity of the pore walls of Ph-PMO. Adapted from[89]. ..........................................60
Figure 2.3. Typical isotherm adsorption (full)/desorption (dashed) curve for mesoporous materials
(IUPAC isothermal sorption curve of type IV). Adapted from[233].................................61
Figure 2.4. Schematic representation of the applied stress wave (full line) and strain response (dotted
line) of the real material, in a fixed frequency experiment. Adapted from[247]. ...............67
Figure 2.5. Impedance plotted as a planar vector. Adapted from[255]..................................................74
Figure 2.6. Representation of the impedance spectrum of an R1C1-R2C2 equivalent circuit. ..................75
Figure 2.7. Representation of the semi-circle depression affecting the impedance of the electrolyte. .....76
Figure 2.8. Schematic representation and photograph of the tip of the used in this work in the A) TP
and B) IP configurations. C) photograph of the entire sample-holder and D) schematic
representation of the sample-holder, portraying the inner Pt wires connected to the device
under test to the right and to the co-axial cable to the left, which are then connected to the
impedance analyser. Cables I and I0 are twisted around each other to minimize the stray
capacitance Cs.co-ax. ..........................................................................................................78
iii
Figure 2.9. Typical impedance spectra for powder compacts and membranes in TP and IP
configuration. ................................................................................................................. 80
Figure 2.10. Climatic chamber apparatus for EIS measurements as a function of temperature and r.h. 83
Figure 2.11. Setup for the EIS automatic data acquisition system, using the ACS climatic chamber. .... 84
Figure 3.1. XRD diffractograms of a) S-Ph-PMO, b) P-Ph-PMO (P123) and c) P-Ph-PMO (SHS)
samples. ......................................................................................................................... 88
Figure 3.2. 13C and 29Si CP-MAS NMR spectra for sample A) S-C2M3ext and B) S-C2M3ox. Peaks
indicated as * in D are spinning side-bands. .................................................................... 90
Figure 3.3. 13C and 29Si CP-MAS NMR spectra for sample A) P20%-P123 and C) P20%-SHS. 31P
HPDEC NMR spectra for sample B) P20%-P123 acidified for 2h and 24h and D) P20%-
SHS acidified for 2h. Peaks marked with in C are relative to silicone grease used in the
synthesis of the precursors.[265,266] Peaks indicated as * in D are spinning side-bands. . 91
Figure 3.4. N2 adsorption/desorption isotherms collected at -196 °C for the acid-functionalised
materials: A) S-Ph-PMO-SO3H, B) P-Ph-PMO-P123 and C) P-Ph-PMO-SHS samples.
Empty symbols represent the adsorption data while full symbols represent the desorption
data. The insets show the respective pore size distribution. ............................................. 92
Figure 3.5. TEM micrographs of samples: A) S-MS2M3, B) S-C24M3, C) P10%-SHS and D) P20%-
P123. ............................................................................................................................. 94
Figure 3.6. EIS spectra collected at 80 ºC showing the evolution of the shape with increasing r.h. for
several representative samples: A) S-C24M3, B) P10%-P123 and C) P20%-SHS (obtained
with a test signal amlpitude of 0.1 V). D) shows spectra for P-10%-P123 at 98% r.h. with
variable test signal amplitude (numbers represent powers of 10 of frequency in Hz). ....... 95
Figure 3.7. Arrhenius plots of the conductivity of several samples tested in the preliminary study,
measured with increasing temperature at 98% r.h: A) S-Ph-PMO; B) P-Ph-PMO-P123; C)
P-Ph-PMO-SHS. ............................................................................................................ 97
Figure 3.8. Influence of r.h. on the conductivity of ) S-C24M3, ) S-C2M3, ) P10%-P123, )
P20%-SHS and ) no-acid. Lines are for visual guidance. .............................................. 99
Figure 3.9. FTIR spectra of sample S-C12M3 and S-C24C24 before (as) and after (ext) surfactant
extraction. The vanishing peaks after extraction are ascribed to the -CH2- of the alkyl chain
of the surfactant. .......................................................................................................... 102
iv
Figure 3.10. Evolution of [H+] as a function of self-assembly time: () conventional stirring (open
symbols and dotted symbols are for samples with 3 h and 5 h of hydrothermal treatment,
respectively). () MW stirring (all samples where hydrothermally treated in MW for 3 h).
.................................................................................................................................... 104
Figure 3.11. XRD diffractograms for the several oxidized S-Ph-PMO samples: A) conventional heating
and control samples; B) samples with MW heating in the hydrothermal step and C)
samples fully synthesized using MW energy. The triangles identify the pore order
reflection (100) and circles denote the (001) molecular scale periodicity. ....................... 105
Figure 3.12. Evolution of the A) and B) I(001) as a function of self-assembly time: () conventional
stirring (open symbols and dotted symbols are for samples with 3 h and 5 h of
hydrothermal treatment, respectively). () MW stirring (all samples where
hydrothermally treated in MW for 3 h). ........................................................................ 107
Figure 3.13. N2 adsortion/desorption isotherms collected at -196 °C of the several S-Ph-PMO and
control samples. Insets in each graph represent the pore size distribution. ..................... 108
Figure 3.14. Evolution of the pore volume as a function of the specific surface area. .......................... 109
Figure 3.15. TEM images of samples A) no-acid, B) no surf, C) S-C2M3, D) S-C24C24 E) S-MS2M3
and F) S-C12M5. .......................................................................................................... 110
Figure 3.16. SEM micrographs of samples: A, B) S-C2M3; C, D) S-MS2M3; E) S-C24M3 and F) S-
C24C24. ....................................................................................................................... 112
Figure 3.17. 29Si CP-MAS (left) and 13C CP-MAS (right) solid state NMR spectra of representative
samples of the S-Ph-PMO family. ................................................................................. 113
Figure 3.18. TGA (full lines) and derivative (dashed lines) curves for sample A) S-C2M3 and B) S-
MS2M3 in air (black) and N2 (grey) atmospheres. DSC curves in air (black lines) and N2
(grey lines) for sample C) S-C2M3 and D) S-MS2M3. The heat flow was normalized by
the weight of he sample. ............................................................................................... 115
Figure 3.19. Evolution of W with increasing [H+] and pore volume. .................................................. 116
Figure 3.20. Matrices of the original time constants (V) and correspondent simulated values (Rs)
obtained using the parameter matrix (P). The matrix on the right contains the fractional
difference of the simulations with respect to the measured values. ................................. 118
Figure 3.21. 3D plots of the evolution of simulated values of: A) [H+]; B) and C) I(001) as a function of
self-assembly time and hydrothermal treatment time for both self-assembly types (MS in

v
red and C in blue). The dashed lines are projections of the surface edges (values of higher
self-assembly time) on the parameter/hydrothermal time plane. ................................... 119
Figure 3.22. EIS spectra for several representative samples showing the evolution of the shape of the
impedance spectra with increasing r.h. at A) 40 ºC (no-acid), B) 60 ºC (S-MS4M3) and C)
100 ºC (S-C2M3). Please consider Fig. 3.6 A for sample S-C24M3 at 80 ºC. D) Influence
of test signal amplitude on the shape of the impedance spectra for sample S-C2M3 at 60°C
and 60% r.h. (numbers represent powers of 10 of frequency in Hz). .............................. 122
Figure 3.23. Arrhenius plots of several S-Ph-PMO representative samples as a function of r.h. Lines are
for visual guidance. Relative humidity: ) 20%, ) 40%, ) 60%, ) 80% and ) 98%.
The dashed lines are for our Nafion® reference, in the same conditions. ....................... 124
Figure 3.24. Evolution of conductivity as a function of r.h., at different temperatures, for some
representative S-Ph-PMO samples. Lines are for visual guidance. Temperatures: ) 40
ºC, ) 60 ºC, ) 80 ºC, ) 94 ºC and ) 100 ºC. The dashed lines are for our Nafion®
reference, in the same conditions. ................................................................................. 126
Figure 3.25. Graphical representation of log vs log r.h. at different isothermal conditions. ) 40 ºC,
) 60 ºC, ) 80 ºC and ) 94-100ºC. .......................................................................... 128
Figure 3.26. Representation of ln (2/(pH2O)g)T vs. the reciprocal temperature for several representative
samples and different r.h. conditions. ) 20 % r.h., ) 40 % r.h., ) 60% r.h., ) 80 %
and ) 98-100 % r.h. ................................................................................................... 130
Figure 3.27. Protonic conductivity as a function of SBET measured at 94 and 40 °C combined with 40%
and 98% r.h. conditions. Full symbols correspond to samples with similar [H+] within the
range 0.46-0.63 mmol∙g-1. ............................................................................................. 131
Figure 3.28. ASC as a function of A) [H+], B) and C) I(001). Full symbols identify samples with similar
[H+] within the range of 0.46 to 0.63 mmol∙g-1. ............................................................. 132
Figure 3.29. ASC represented as a function of A) a0, B) pore volume and C) average pore size. Full
symbols identify samples with similar [H+] within the range of 0.46 to 0.63 mmol∙g-1. ... 134
Figure 3.30. ASC at 40 ºC and 98% r.h. plotted as a fucntion of W for the S-Ph-PMO samples. Full
symbols are for samples with [H+] in the range 0.46-0.63 mmol∙g-1. ............................... 135
Figure 3.31. Activation energy for the protonic conductivity measured at 98% r.h. plotted as a function
of A) [H+] and B) ASC ................................................................................................. 136
Figure 3.32. Evolution of ASC as a function of enthalpy of solvation. ............................................... 137
vi
Figure 3.33. Comparison of the protonic conductivity (at 98% r.h.) of S-Ph-PMOs synthesized by co-
condensation () in this thesis and literature data for samples obtained........................ 138
Figure 3.34. SEM micrographs of the cross-section and respective EDS mapping of A) S-C24M3-5%
and B) S-C24C24-10%. C) cross section of plain Nafion® membranes. D) top and E)
bottom views of S-C24M3-10% composite membrane. ................................................. 140
Figure 3.35. Nyquist plots for several representative membranes showing the evolution of the shape of
the impedance spectra with increasing r.h. taken in the TP configuration at A) 40 ºC (S-
MS2M3-5%), B) 60 ºC (Nafion®), C) 80 ºC (S-C24M3-10%) and D) 94 ºC (S-MS2M3-
10%). ........................................................................................................................... 144
Figure 3.36. Nyquist plots collected at 80 °C and different r.h., for various membranes. A) 20% r.h., B)
40% r.h., C) 60% r.h., D) 80% r.h. and E) 98% r.h., obtained using the TP configuration.
Numbers represent powers of 10 of frequency in Hz. .................................................... 145
Figure 3.37. Nyquist plots for several representative membrane showing the evolution of the shape of
the impedance spectra with increasing r.h. taken in the IP configuration at A) 40 ºC (S-
MS2M3-10%), B) 60 ºC (S-C24C24-10%), C) 80 ºC (S-C12M3-10%) and D) 94 ºC (S-
C48C24-10%). .............................................................................................................. 146
Figure 3.38. Arrhenius plots of membranes with various types of fillers as a function of r.h.) Nafion®;
) no-acid-10%; ) no surf-10%; ) S-MS2M3-10% ) S-C24C24-10% ) S-C48C24-
10% ) S-C12M3-10% ) S-C24M3-10%. The grey areas represent the conductivity
range for pure Nafion® found in the literature, for the same
conditions.[228,258,271,276,279,280,287-296] ............................................................. 147
Figure 3.39. Conductivity of composite membrane S-C24M3-10% measured at 60 °C upon increasing
(absorption) and decreasing (desorption) of the r.h........................................................ 148
Figure 3.40. Influence of the membranes A) [H+], B) and C) W on their own conductivity (at 40 ºC for
membranes with 10 wt.% of fillers). .............................................................................. 149
Figure 3.41. Evolution of W and [H+] of the membranes (10 wt.% fillers) as a function of the filler
properties A) [H+] and B) SBET. Values inside the dotted oval shapes are for composite
membranes no-acid-10% and no surf-10%. ................................................................... 151
Figure 3.42. Evolution of the protonic conductivity of several 10 wt. % composite membranes as a
function of the S-Ph-PMO fillers characteristics A) [H+], B) and C) I(001). .................... 152
vii
Figure 3.43. Swelling expressed as the fractional increase of the thickness of membranes equilibrated
under different temperature (-94 ºC and -40 ºC at 98 % r.h). The reference value was
obtained with the membrane exposed to 20% r.h. at 40 °C. ........................................... 154
Figure 3.44. SEM micrographs and respective Si EDS mapping taken at the cross-section of composite
membranes samples A) S-C24M3-5%, B) S-C24M3-10% and C) S-C24M3-20% ........... 155
Figure 3.45. SEM micrographs taken at the cross-section of composite membranes A) S-C24M3-5%, B)
S-C24M3-20% and at the surface of C,D and E) S-C24M3-10% with the respective Si EDS
mapping. ...................................................................................................................... 157
Figure 3.46. Comparison of the A) Storage modulus and B) tan obtained by DMA for Nafion® and
Nafion®/S-C24M3 composite membranes (the inset is a zoomed view of sample S-
C24M3-20%. ................................................................................................................ 158
Figure 3.47. Arrhenius plots of Nafion® and Nafion®/S-Ph-PMO composite membranes measured
under variable r.h. ) Nafion® ) S-C24M3-5%; ) S-C24M3-10% and ) S-C24M3-
20%. The grey areas represent several conductivity values for pure Nafion® based in
literature data, for the same conditions.[228,258,271,276,279,280,287-296] .................. 163
LIST OF SCHEMES
Scheme 2.1. Structure of BTEB. .......................................................................................................... 52
Scheme 2.2. Structure of PSiP. ............................................................................................................ 53
Scheme 2.3. Typical synthesis pathway for 1) S-Ph-PMO and 2) P-Ph-PMO. ...................................... 54
LIST OF TABLES
Table 1.1. Protonic conductivity, Ea, SBET and pore size for various types of pure porous silicas. .......... 36
Table 1.2. Protonic conductivity, Ea, SBET and pore size for mesoporous silica with various types of
inorganic acid groups in the pores. ................................................................................. 38
viii
Table 1.3. Protonic conductivity, SBET, pore size, W and [H+] for organic functionalized mesoporous
silicas. ............................................................................................................................40
Table 1.4. Protonic conductivity, W and swelling of Nafion®/SiO2 composite membranes, including
filler properties [H+], SBET and pore size. .........................................................................45
Table 2.1. Predictions of R, C and 0 for the different electrode configurations. ...................................81
Table 3.1. List of prepared Ph-PMO samples functionalised with sulfonic (prefix S-) and phosphonic
(prefix P) acid groups. ....................................................................................................86
Table 3.2. Summary of the main obtained results, including a0, SBET, average pore size, wall thickness,
[H+], W, protonic conductivity at 94 ºC and 98% r.h. and corresponding Ea. ...................87
Table 3.3. List of prepared S-Ph-PMO samples divided in three groups according to the type of self-
assembly and hydrothermal treatments. ........................................................................ 100
Table 3.4. Physico-chemical properties of the prepared S-Ph-PMO samples ....................................... 103
Table 3.5. Values of Ea for the conductivity measured under variable r.h. conditions. The SBET and the
[H+] are given to help the discussion. ............................................................................ 125
Table 3.6. Values for W, swelling, [H+] and of composite membranes synthesized with different
powder fraction. ........................................................................................................... 142
Table 3.7. Ea for the protonic conductivity under variable r.h. for the membranes with different filler
content. ........................................................................................................................ 164
ABBREVIATIONS AND ACRONYMS
AC alternate current
AFC alkaline fuel cell
ASC area-specific conductance
BET Brunauer, Emmett and Teller method for the calculation of specific surface area
BJH Barret, Joyner and Halenda method for to calculate pore size distribution and pore volume
BTEB 1,4-bis(triethoxysilyl)-benzene
C12 dodecyl trimethylammonium bromide
C14 tetradecyl trimethylammonium bromide
C16 cetyl trimethylammonium bromide

ix
C18 octadecyl trimethylammonium bromide
CHP combined heat and power generation
CL catalyst layer
CP cross-polarization
CPE constant phase element
DLS dynamic light scattering
DMA dynamic mechanical analysis
DMAc N,N-dimethylacetamide
DMFC direct methanol fuel cell
DOE U.S. department of energy
DPTS diethyl-phosphatoethyl-trimethoxysilane
DQ double quantum
DSC differential scanning calorimetry
EDS energy dispersive X-ray spectroscopy
EIS electrochemical impedance spectroscopy
Et ethyl group
EW equivalent weight
FCH-JU fuel cell and hydrogen joint undertaking
FTIR Fourier transform infrared spectroscopy
GDL gas diffusion layer
HPA heteropoly acid H5GeW11VO40
HPDEC high-power decoupling technique
HPW heteropoly acid H3PW12O40∙nH2O
HR-TEM high resolution transmission electron microscopy
IP in-plane
IR infrared spectroscopy
IUPAC international union of pure and applied chemistry
KJS Kruk, Jarionec and Sayari method for the calculation of pore size distribution and pore
volume based on BJH, specifically for mesoporous materials
MAS magic angle spinning
MCFC molten carbonate fuel cell
MD molecular dynamics
Me methyl group
MEA membrane electrode assembly
MPTMS 3-mercaptopropyl-trimethoxysilane
MW microwave

x
NMR nuclear magnetic resonance
P123 poly(ethylene glycol)-block-poly(propylene glycol)-block-poly(ethylene glycol)
EO20PO70EO20
PBI polybenzimidazole
PBI poly (benzimidazole)
PEK poly (ether ketone)
PEM proton exchange membranes
PEMFC proton exchange membrane fuel cells
PES poly (ether sulfone)
PFSA perfluorocarbon-sulfonic acid
PIL protic ionic liquid
PMO periodic mesoporous organosilicas
PMS periodic mesoporous silica
PSiP diethyl 4-(trimethoxysilyl)-benzylphosphosphonate
PTFE polytetrafluoroethylene
QENS quasi-elastic neutron scattering
r.h. relative humidity
SANS small-angle neutron scattering
SAXS small-angle X-ray scattering
SDA structure directing agent
SEM scanning electron microscopy
SHS n-hexadecylsulfuric acid sodium salt
SOFC solid-oxide fuel cell
SQ single quantum
SSC short-side-chain
TEM transmission electron microscopy
TEOS tetraethoxysilane
TGA thermogravimetric analysis
TOF turn over frequency
TP through -plane
WAXD wide-angle X-ray diffraction
XRD X-ray diffraction
xi
SYMBOLS
A area of the electrode or the cross-section area of the membrane in the IP configuration
a angle shift between the centre of the semi-circle and the real axis in the complex plane
a0 lattice constant
b universal constant depending on the dimensions of the system
c volume fraction of the aqueous phase
c0 percolation threshold
C capacitor/capacitance
Ceq equivalent capacitance
Cs stray capacitance
D diffusion coefficient
d inter-planar distance (XRD)
dp diameter of the particles (DLS)
E'' loss modulus
E’ storage modulus
Ea activation energy
f frequency
g total number of solvating water molecules
h number of water molecules associated to the sulfonate ion
[H+] acid load
I(001) XRD intensity of the molecular scale periodicity reflection
I(100) XRD intensity of the pore order reflection
j number of water molecules associated to the proton
i(t) alternate current resulting from the applied sinusoidal signal (EIS)
k Boltzmann's constant
K solv(T) solvation constant
l distance between the SO3- sites (Eikerling model)
L Nafion® pore diameter (Eikerling model)
Lel distance between electrodes (thickness of powder pellets)
mp mass of the powder pellet used for EIS
M H2O molar mass of water
n integral multiple of the wavelength
pH2O water vapour partial pressure
xii
q SANS scattering vector
R electrical resistance
Rp spherical particle radius
SBET specific surface area calculated from the Brunauer, Emmett and Teller method
Tg glass transition temperature
VKOH volume of KOH solution added to reach the equivalence point
VL molar volume of the liquid condensate (Kelvin’s eq.)
Vm amplitude of the sinusoidal signal (EIS)
v(t) sinusoidal signal (EIS)
vs terminal velocity (Stoke’s law)
W water uptake capacity
Wd dry weight
Ww wet weight
Y0 admittance
Z impedance
Z’ real part of the impedance
Z’’ imaginary part of the impedance
GREEK SYMBOLS
order factor (ratio I(100)/I(001))
long-range motion of both the main and the sulfonic acid functionalised side chains (visco-
elastic transition in DMA)
segmental motions of the main-chain of the physically cross-linked perfluorocarbon phase
(visco-elastic transition in DMA)
chemical shift
ΔHsolv solvation enthalpy
ΔSsolv solvation entropy
relative permittivity
vacuum permittivity
contact angle between the pore surface and the water molecules
short-range motions of the polytetrafluoroethylene-like backbone (visco-elastic transition in
DMA)
viscosity of the media

xiii
DMA phase shift angle
phase angle between the applied voltage and the resulting current (EIS)
hydration level
Cu wavelength of the XRD Cu K radiation
dynamic viscosity (Stoke’s law)
incident angle (XRD)
f density of the fluid (Stoke’s law)
p density of the spherical particle (Stoke’s law)
protonic conductivity
pre-factor related to the molecular interactions
angle between the centre of the semi-circle and the real axis in the complex plane
radial frequency (EIS)
relaxation frequency (EIS)
surface tension

xiv
xv
INDEX
1 INTRODUCTION 1
1.1 Motivation and Objective 1
1.2 Fuel Cells 3
1.2.1 Brief History 3
1.2.2 PEMFC fundamentals and components 5
1.3 Proton Exchange Membranes (PEM) 8
1.3.1 Nafion® 9
1.3.1.1 Morphology and structure 11
1.3.1.2 Proton transport mechanisms and the role of water 17
1.3.2 Other perfluorinated membranes 22
1.3.3 Aromatic backbone membranes 23
1.3.4 Anhydrous membranes 25
1.4 Periodic Mesoporous Silicas (PMS) and Organosilicas (PMO) 28
1.4.1 Synthesis 28
1.4.2 Surface functionalization methods 31
1.4.3 Microwave synthesis of PMS and PMO 34
1.5 Protonic conductivity in mesoporous silica-based materials 36
1.5.1 Pure mesoporous silica 36
1.5.2 Inorganic functionalized ordered mesoporous silica 37
1.5.3 Organic functionalized ordered mesoporous silica 40
1.6 Composite Nafion®-based membranes 44
2 MATERIALS AND METHODS 51
2.1 Synthesis of the acid functionalized PMO precursors 51

xvi
2.1.1 Synthesis of 1,4-bis(triethoxysilyl)benzene (BTEB) 51
2.1.2 Synthesis of diethyl 4-(trimethoxysilyl)benzylphosphosphonate (PSiP) 52
2.2 Synthesis of acid functionalized Ph-PMO 53
2.2.1 Functionalization with sulfonic acid 53
2.2.2 Functionalization with phosphonic acid 56
2.3 Preparation of composite Nafion® membranes 57
2.4 Characterization of composition, structure and microstructure 58
2.4.1 X-ray diffraction 58
2.4.2 -196 ºC nitrogen sorption isotherms 60
2.4.3 Electron microscopy 63
2.4.4 Solid state nuclear magnetic resonance 65
2.4.5 Dynamic mechanical analysis 67
2.4.6 Fourier transform infrared spectroscopy 69
2.4.7 Thermal analyses 69
2.4.8 Acid load 70
2.4.9 Hydrolytic properties (water uptake, hydration level and swelling) 71
2.4.10 Dynamic light scattering 72
2.5 Electrochemical impedance spectroscopy 72
2.5.1 Fundamentals 73
2.5.2 Measurements with different sample geometries 77
2.5.3 Measurements under variable temperature and relative humidity 82
3 RESULTS AND DISCUSSION 85
3.1 The choice of the protogenic group 86
3.1.1 Composition, structure and microstructure 87
3.1.2 Protonic conductivity 94
3.2 Synthesis and characterization of S-Ph-PMO: effect of microwaves 100
3.2.1 Surfactant extraction and oxidation 101
3.2.2 Self-assembly and hydrothermal treatment 103

xvii
3.2.3 Multivariate analysis of the reaction kinetics 117
3.3 Electrochemical characterization of S-Ph-PMO 121
3.3.1 Influence of extrinsic factors on conductivity: temperature and relative humidity 122
3.3.2 Influence of intrinsic factors on conductivity: structure, acid load and porosity 130
3.3.3 Co-condensation vs. grafting of sulfonic acid groups: effects on conductivity 137
3.4 Synthesis and characterization of composite membranes 139
3.4.1 Optimizing the membrane processing 139
3.4.2 Analysis of impedance spectra: through-plane vs in-plane 143
3.4.3 Effect of the filler characteristics 150
3.4.4 Effect of the filler fraction 153
3.4.4.1 Morphology, hydrolytic properties and acid load 153
3.4.4.2 Visco-elastic properties 158
3.4.4.3 Protonic conductivity 162
4 CONCLUSION AND OUTLOOK 167
5 REFERENCES 173

xviii
1
1 INTRODUCTION
1.1 Motivation and Objective
The energy demand is increasing across the globe, putting pressure on the
governments in order to guarantee to their citizens a secure supply, which is still
satisfied, to a large extent, at the cost of the planet’s concealed carbonaceous
resources. In 2007, the European Council adopted climate and energy related
objectives aiming to reduce the emissions of greenhouse gases in at least 20% with
respect to 1990, to increase at least 20% the share of renewable sources in the energy
mix, to improve in 20% the energy efficiency and to have at least 10% of the energy
consumed in the transportation sector from renewable sources, by the year of 2020.[1]
The latest statistics (2011-2012) show that about one third of the total final energy is
consumed by the transport sector, to which is responsible by one fifth of the total
greenhouse gases emissions. Moreover, less than 4% of the total energy consumption
in the sector is generated from renewable sources.[2] In this energy panorama,
hydrogen, as the energy carrier, and fuel cell technologies, as chemical energy
converter, represent a huge opportunity for the reduction of greenhouse gases and
fossil fuel dependence of the transportation sector. They also allow the delocalized
production of electricity, thus greatly contributing to a more flexible and efficient
distribution grid for stationary applications, offering in addition the possibility for co-
2
generation of heat. Additionally, hydrogen production and fuel cell/electrolysers
technologies can be coupled to renewable energy sources, such as wind or solar,
coping with its characteristic intermittence towards a virtually zero-emission goal for
the energy mix.
Hydrogen and fuel cells have been at the centre of large research programs across the
world. In Europe there is the Fuel Cell and Hydrogen Joint Undertaking (FCH-JU), a
public/private partnership joining the European Commission, the fuel cell and
hydrogen industries represented by the NEW Industry Grouping and the research
community represented by the Research Grouping N.ERGHY. The FCH-JU funds
research, technological support and the rising of public awareness towards hydrogen
and fuel cells in Europe. By 2020, it expects 500 000 fuel cell vehicles in Europe,
powered by hydrogen that should be generated in 50% from renewable energy sources,
1000 fuelling stations and 50 000 households equipped with fuel cells for power
generation and/or combined heat and power generation (CHP).[3] The funded
investigations are mainly focused on the reduction of the cost of Membrane Electrode
Assembly (MEA), the synthesis of new and improved materials for increased working
temperatures (above 100 ºC) and/or reduced relative humidity (r.h.) and the
improvement of cell/stack design for greater lifetime.[4]
The United States Department of Energy (DOE) also has ambitious goals concerning
fuel cells and hydrogen. Regarding transportation, which represents 28% of the total
energy consumption in the U.S., the DOE is focusing its efforts on the development of
proton exchange membrane fuel cell (PEMFC).[5] The DOE has set a series of
ambitious targets for the near future (2017) in order to obtain proton exchange
membranes (PEM) suitable to run at 120 ºC under 25 - 50% r.h. and deliver protonic
conductivity of 0.1 S∙cm-1. The full system should be able to work in environmental
conditions for at least 5 000 hours, at an efficiency of at least 60% and the total cost
should not exceed $30∙kW-1 (less than $8∙kW-1 for the PEM alone).[6]
The emerging paradigm of hydrogen and fuel cells is the driving force for this PhD
thesis in Materials Science and Engineering, focused on the evaluation of the potential
of periodic mesoporous organosilicas (PMO) hybrid materials, with sulfonic or
3
phosphonic acid functional groups, as fillers for polymeric PEM, with enhanced
performance under high temperature or low humidity operating conditions. The major
scientific objective is to identify the correlations between the microstructural features
of the PMOs (acid loading, specific surface area, porosity, structural order, and pore
volume) and their protonic conductivity, and how these can impact the properties of
the respective composite membranes.
1.2 Fuel Cells
Fuel cells are electrochemical devices that directly convert the chemical energy of a
fuel, hydrogen for example, into electricity. Unlike other fuel-based energy conversion
systems such as the internal combustion engine, the fuel cell is a device that does not
have any mechanical moving parts.
This section starts with a brief review of the history of fuel cell science and technology,
placing emphasis on the functional materials used in the polymer electrolyte fuel cells.
1.2.1 Brief History
History is not clear on how to give credit for the finding of the fuel cell principle. In
1839, Christian Friedrich found that a current could be measured between two Pt
plates immersed in sulphuric acid (electrolyte) while H2 and O2 were separately fed to
the electrodes.[7,8] William Grove also made the same observation while
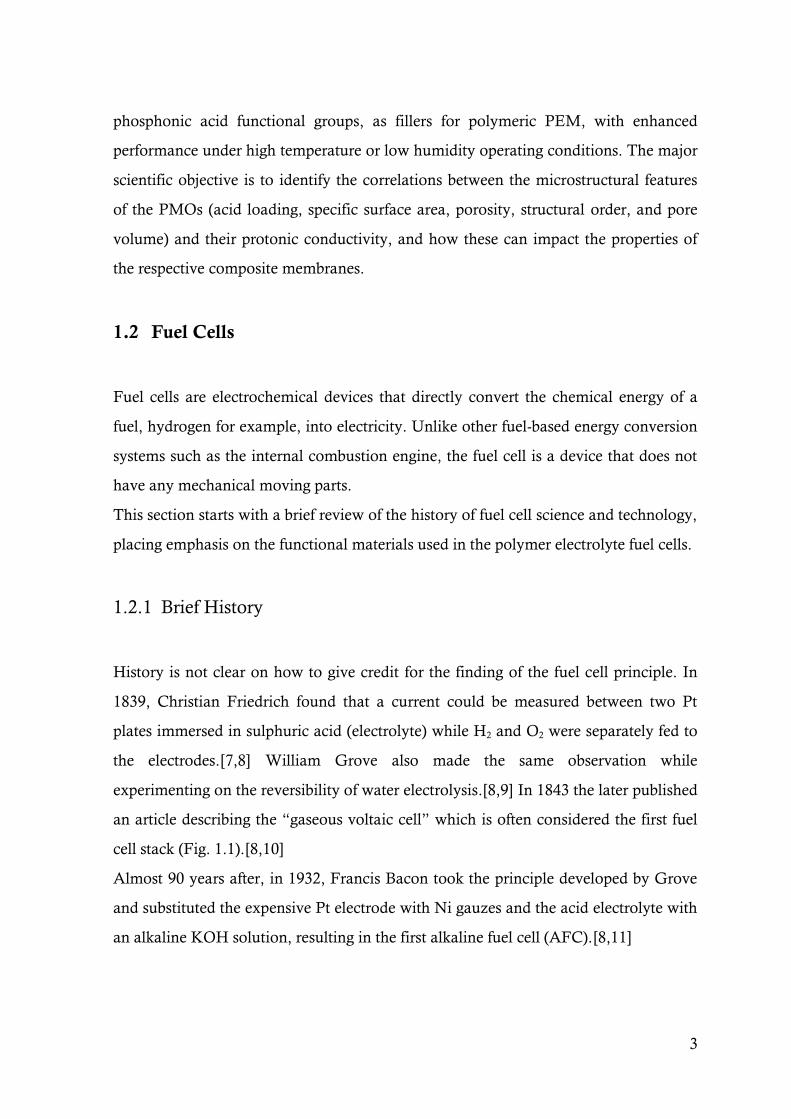
experimenting on the reversibility of water electrolysis.[8,9] In 1843 the later published
an article describing the “gaseous voltaic cell” which is often considered the first fuel
cell stack (Fig. 1.1).[8,10]
Almost 90 years after, in 1932, Francis Bacon took the principle developed by Grove
and substituted the expensive Pt electrode with Ni gauzes and the acid electrolyte with
an alkaline KOH solution, resulting in the first alkaline fuel cell (AFC).[8,11]
4
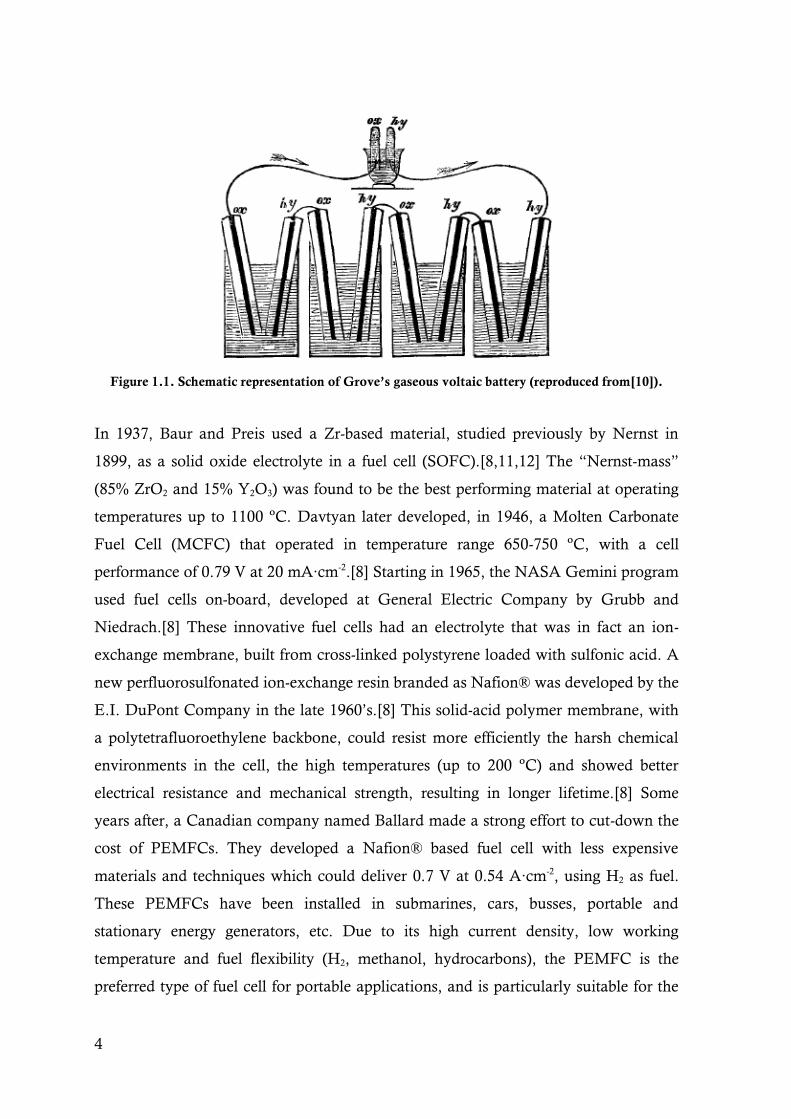
Figure 1.1. Schematic representation of Grove’s gaseous voltaic battery (reproduced from[10]).
In 1937, Baur and Preis used a Zr-based material, studied previously by Nernst in
1899, as a solid oxide electrolyte in a fuel cell (SOFC).[8,11,12] The “Nernst-mass”
(85% ZrO2 and 15% Y2O3) was found to be the best performing material at operating
temperatures up to 1100 ºC. Davtyan later developed, in 1946, a Molten Carbonate
Fuel Cell (MCFC) that operated in temperature range 650-750 ºC, with a cell
performance of 0.79 V at 20 mA∙cm-2.[8] Starting in 1965, the NASA Gemini program
used fuel cells on-board, developed at General Electric Company by Grubb and
Niedrach.[8] These innovative fuel cells had an electrolyte that was in fact an ion-
exchange membrane, built from cross-linked polystyrene loaded with sulfonic acid. A
new perfluorosulfonated ion-exchange resin branded as Nafion® was developed by the
E.I. DuPont Company in the late 1960’s.[8] This solid-acid polymer membrane, with
a polytetrafluoroethylene backbone, could resist more efficiently the harsh chemical
environments in the cell, the high temperatures (up to 200 ºC) and showed better
electrical resistance and mechanical strength, resulting in longer lifetime.[8] Some
years after, a Canadian company named Ballard made a strong effort to cut-down the
cost of PEMFCs. They developed a Nafion® based fuel cell with less expensive
materials and techniques which could deliver 0.7 V at 0.54 A∙cm-2, using H2 as fuel.
These PEMFCs have been installed in submarines, cars, busses, portable and
stationary energy generators, etc. Due to its high current density, low working
temperature and fuel flexibility (H2, methanol, hydrocarbons), the PEMFC is the
preferred type of fuel cell for portable applications, and is particularly suitable for the
5
on-board production of electricity for the second generation of electrical vehicles.[8,
11] Nafion® is still the state-of-the-art membrane material, although it suffers from
several drawbacks.[13,14] These shall be discussed in sub-section 1.3.1.
1.2.2 PEMFC fundamentals and components
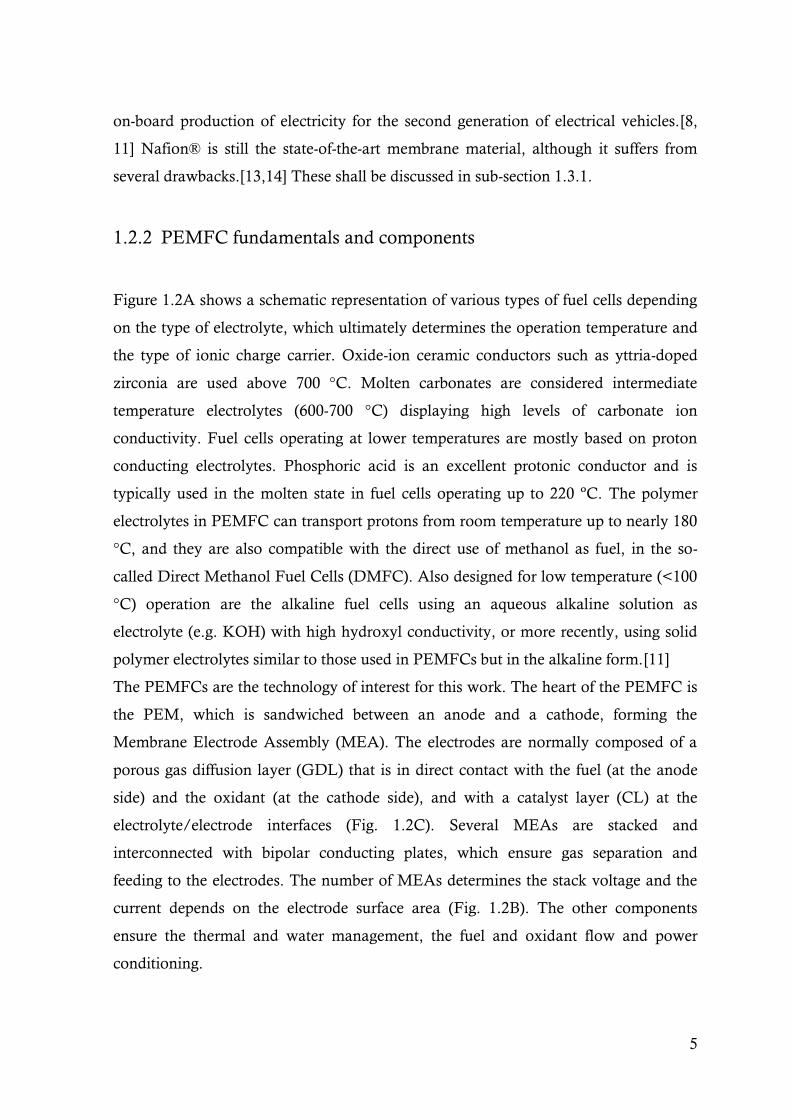
Figure 1.2A shows a schematic representation of various types of fuel cells depending
on the type of electrolyte, which ultimately determines the operation temperature and
the type of ionic charge carrier. Oxide-ion ceramic conductors such as yttria-doped
zirconia are used above 700 °C. Molten carbonates are considered intermediate
temperature electrolytes (600-700 °C) displaying high levels of carbonate ion
conductivity. Fuel cells operating at lower temperatures are mostly based on proton
conducting electrolytes. Phosphoric acid is an excellent protonic conductor and is
typically used in the molten state in fuel cells operating up to 220 ºC. The polymer
electrolytes in PEMFC can transport protons from room temperature up to nearly 180
°C, and they are also compatible with the direct use of methanol as fuel, in the so-
called Direct Methanol Fuel Cells (DMFC). Also designed for low temperature (<100
°C) operation are the alkaline fuel cells using an aqueous alkaline solution as
electrolyte (e.g. KOH) with high hydroxyl conductivity, or more recently, using solid
polymer electrolytes similar to those used in PEMFCs but in the alkaline form.[11]
The PEMFCs are the technology of interest for this work. The heart of the PEMFC is
the PEM, which is sandwiched between an anode and a cathode, forming the
Membrane Electrode Assembly (MEA). The electrodes are normally composed of a
porous gas diffusion layer (GDL) that is in direct contact with the fuel (at the anode
side) and the oxidant (at the cathode side), and with a catalyst layer (CL) at the
electrolyte/electrode interfaces (Fig. 1.2C). Several MEAs are stacked and
interconnected with bipolar conducting plates, which ensure gas separation and
feeding to the electrodes. The number of MEAs determines the stack voltage and the
current depends on the electrode surface area (Fig. 1.2B). The other components
ensure the thermal and water management, the fuel and oxidant flow and power
conditioning.
6
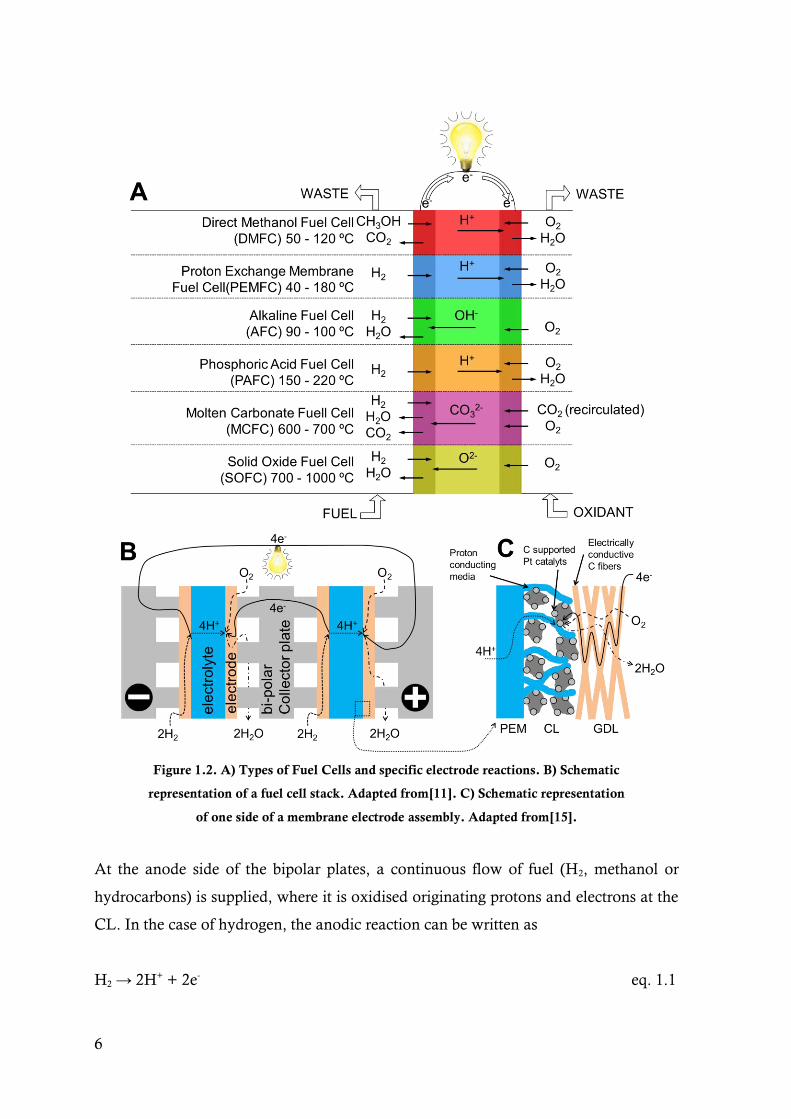
Figure 1.2. A) Types of Fuel Cells and specific electrode reactions. B) Schematic
representation of a fuel cell stack. Adapted from[11]. C) Schematic representation
of one side of a membrane electrode assembly. Adapted from[15].
At the anode side of the bipolar plates, a continuous flow of fuel (H2, methanol or
hydrocarbons) is supplied, where it is oxidised originating protons and electrons at the
CL. In the case of hydrogen, the anodic reaction can be written as
H2 → 2H+ + 2e- eq. 1.1
7
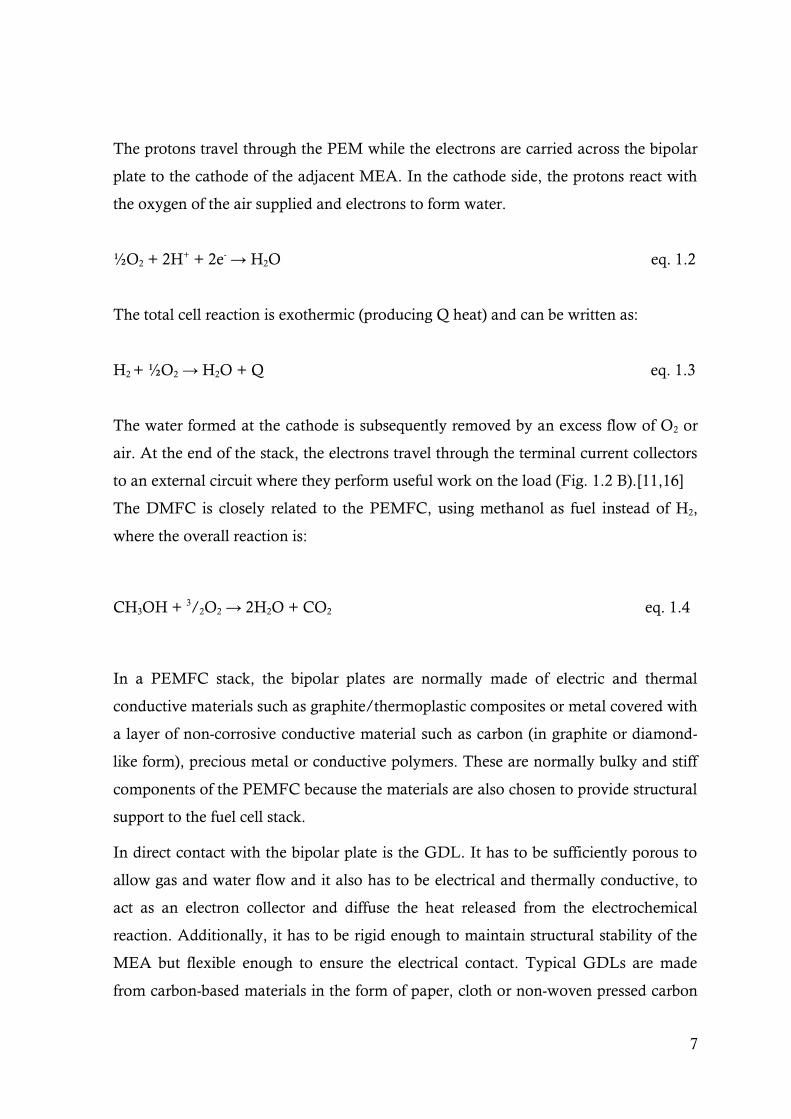
The protons travel through the PEM while the electrons are carried across the bipolar
plate to the cathode of the adjacent MEA. In the cathode side, the protons react with
the oxygen of the air supplied and electrons to form water.
½O2 + 2H+ + 2e- → H2O eq. 1.2
The total cell reaction is exothermic (producing Q heat) and can be written as:
H2 + ½O2 → H2O + Q eq. 1.3
The water formed at the cathode is subsequently removed by an excess flow of O2 or
air. At the end of the stack, the electrons travel through the terminal current collectors
to an external circuit where they perform useful work on the load (Fig. 1.2 B).[11,16]
The DMFC is closely related to the PEMFC, using methanol as fuel instead of H2,
where the overall reaction is:
CH3OH + 3/2O2 → 2H2O + CO2 eq. 1.4
In a PEMFC stack, the bipolar plates are normally made of electric and thermal
conductive materials such as graphite/thermoplastic composites or metal covered with
a layer of non-corrosive conductive material such as carbon (in graphite or diamond-
like form), precious metal or conductive polymers. These are normally bulky and stiff
components of the PEMFC because the materials are also chosen to provide structural
support to the fuel cell stack.
In direct contact with the bipolar plate is the GDL. It has to be sufficiently porous to
allow gas and water flow and it also has to be electrical and thermally conductive, to
act as an electron collector and diffuse the heat released from the electrochemical
reaction. Additionally, it has to be rigid enough to maintain structural stability of the
MEA but flexible enough to ensure the electrical contact. Typical GDLs are made
from carbon-based materials in the form of paper, cloth or non-woven pressed carbon
8
fibres. To avoid water from accumulating inside the pores of the GDL, the region
close to the catalyst layer also contains some amount of a highly hydrophobic material
such as polytetrafluoroethylene (PTFE) in order to promote water removal from the
reaction sites.[16,17]
The CL is the layer between the GDL and the PEM. The CL layer should easily allow
the diffusion of the reactants, possess high ionic and electrical conductivities, show a
reasonable amount of hydrophobicity to avoid water clogging and enough resilience to
the harsh conditions resulting from the electrochemical reactions, which occur at the
triple point void/catalyst/electrolyte.[15] The intimate contact between the CL and
PEM is of crucial importance to ensure that the reaction is effectively occurring on the
entire membrane surface. The CL is normally composed of a Pt catalyst supported by
porous carbon black, which provides bulk electronic conductivity, all bonded with
some amount of polymer of the same (or similar) composition of the electrolyte. This
is important for the creation of a proton conduction pathway from the CL to the PEM
and also to ensure the adhesion of the CL to the membrane.[16] To minimize the
catalyst load and to increase the reaction rate, Pt nano-particles (< 4 nm) have been
used, whereas the carbon support is mesoporous with specific surface area (SBET)
higher than 75 m2∙g-1, to facilitate the access of the reactant gases to the reaction
sites.[17] Efforts to lower the high cost of the Pt/C catalyst include the use of Pt-based
alloys with transition metals (e.g. Ru, Ir, V, Rh, Cr, Co, Ni, Fe, Mn, Pd or Mo),[16,
17] or alternative Pt deposition methods, which seem to be able to lower the catalyst
load from the usual 0.4 mg∙cm-2 down to 0.014 mg∙cm-2.[15]
The PEM is the central component of the MEA and the major focus of this thesis, and
are thus reviewed separately in the following section.
1.3 Proton Exchange Membranes (PEM)
The main property of the membrane is the high protonic conductivity, without which
the cell efficiency is obviously small. Conversely, the electronic conductivity must be
minimal to avoid short-circuit. In addition, it must present adequate mechanical,
chemical and electrochemical stability under working conditions and for long
9
lifetimes, whereas water cross-over and fuel permeability should be minimal. Last but
not least, the dimension stability of membrane upon heating/cooling cycles and water
absorption/desorption (swelling) should be controlled in order to ensure the long term
mechanical integrity of the MEA constrained by the bipolar plates. Of course, the
membrane should desirably be recyclable and affordable. Unfortunately, the available
membranes fail to fulfil all these requirements.[13,18] The state-of-the-art membranes
are since the 1970’s based on perfluorocarbon-sulfonic acid (PFSA) ionomers, with the
most widely used material being know by the commercial designation of Nafion®,
developed by DuPont in the 1960’s.[11]
1.3.1 Nafion®
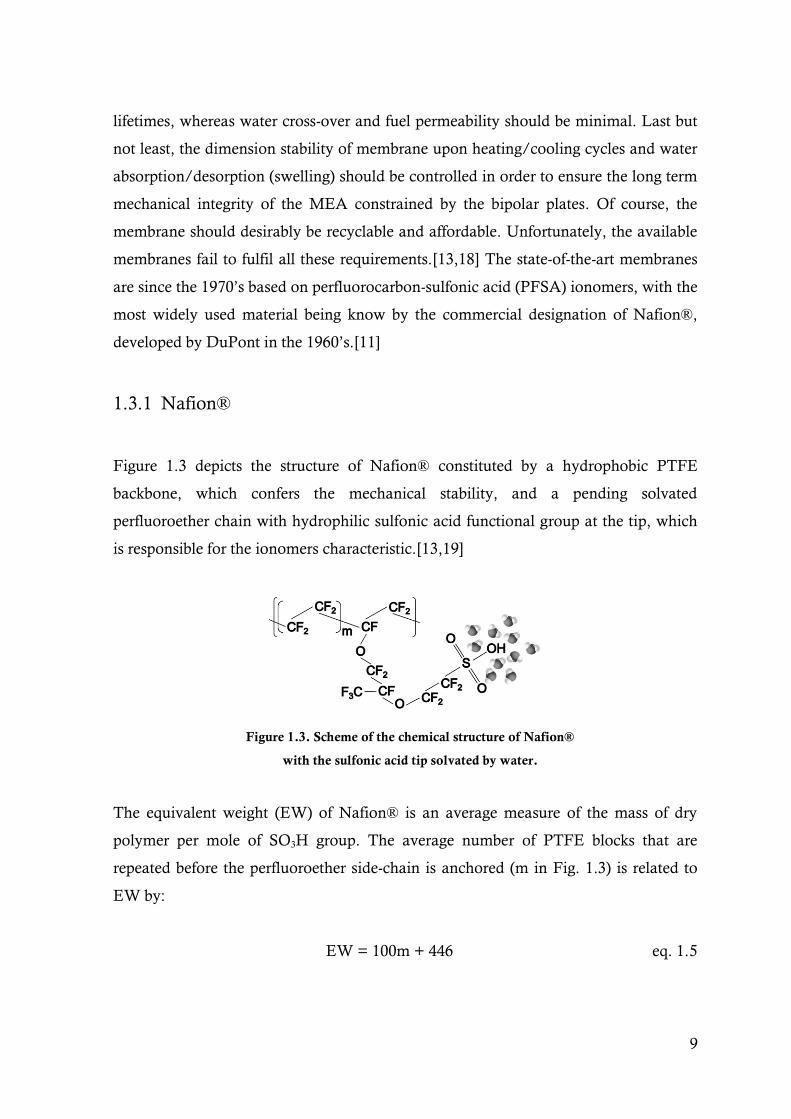
Figure 1.3 depicts the structure of Nafion® constituted by a hydrophobic PTFE
backbone, which confers the mechanical stability, and a pending solvated
perfluoroether chain with hydrophilic sulfonic acid functional group at the tip, which
is responsible for the ionomers characteristic.[13,19]
Figure 1.3. Scheme of the chemical structure of Nafion®
with the sulfonic acid tip solvated by water.
The equivalent weight (EW) of Nafion® is an average measure of the mass of dry
polymer per mole of SO3H group. The average number of PTFE blocks that are
repeated before the perfluoroether side-chain is anchored (m in Fig. 1.3) is related to
EW by:
EW = 100m + 446 eq. 1.5

10
Several extruded Nafion® membranes are available in the market, showing the EW
and thickness in its nomenclature. For example the Nafion® membrane N117 has an
EW of 1100 g∙mol-1 (first two digits multiplied by 100) and a thickness of 0.007 inches
(last digit divided by 1000).[20]
Another important feature of Nafion® (and ultimately all PFSA membranes) is the
hydration level (), which expresses the number of water molecules per SO3H group:
=𝑛 𝐻2𝑂
𝑛 𝑆𝑂3𝐻 eq. 1.6
The value is highly dependent on the physical state of the water used to humidify the
membrane. Nevertheless, water adsorption studies in boiling water seem to put the
limit of = 22, whereas = 14 for a membrane equilibrated in a saturated
atmosphere.[11] The reason for this difference will be discussed in section 1.3.1.1.
The sulfonic acid group is extremely hydrophilic, conferring to the polymer excellent
protonic conductivity of about 0.1 S∙cm-1, but only at low temperatures (< 90 ºC) and
high humidity conditions.[13,20] The proton transport mechanism in Nafion® occurs
by a molecular diffusion of hydronium ions (H3O+) (also known as vehicle
mechanism), and by the structural diffusion (also referred to as the Grotthus
mechanism) of H+ between solvated SO3H pending groups and/or between adjacent
water molecules adsorbed in the structure.[11,13] In both cases, the dissociation and
transport of the proton from the protogenic group is highly dependent on the presence
of liquid water, limiting the working temperatures to T < 100 °C, at atmospheric
pressure.[11,13,17,18] This limit is also imposed by the relatively low glass transition
temperature (Tg) of hydrated Nafion® (80 - 120 °C)[21] above which pinholes start to
appear due to a visco-elastic flow, eventually leading to mechanical failure.[21,22]
The consequence of working at such low temperature translates in the use of a fairly
large Pt catalyst load to ensure reasonable electrode performance. Unfortunately, the
risk of CO-poisoning of the catalyst is very high, if using low-purity H2 fuel. At 80 °C
the CO tolerance of Pt catalysts is as low as 20 ppm.

11
Another drawback found in Nafion® is that the water generated at the cathode (eq.
1.2) can diffuse in the direction of the anode due to water concentration gradient. In
the case of DMFC, the permeation and diffusion of methanol fuel from the anode to
the cathode is also observable, which can severely reduce the efficiency of the fuel cell.
Interestingly, various reports state that the incorporation of fillers in composite
Nafion® can reduce drastically the methanol crossover.[14]
Water molecules can also be transported from the anode to the cathode dragged by the
protons, (the so called “electro-osmotic drag”). All these water molecules moving
inside the membrane frequently lead to the drying of some areas of the anode or the
overflow of the cathode, both occurrences that can lead to cell failure. The water and
temperature management are thus key points for PEMFC operation. From the view
point of system design and hardware, significant benefits can thus arise if the cell is
operated without the presence of liquid water or in non-saturated conditions (above
100 °C and below 50% r.h.).[11,13] In addition, the kinetics at the electrode may be
improved and the tolerance to CO is also higher (up to 1000 ppm at 130 ˚C), enabling
the use of less pure, less expensive H2 as fuel.[13,18]
1.3.1.1 Morphology and structure
To understand the transport mechanism of water and proton inside PFSA membranes,
it is important to understand its morphology. It is widely known that Nafion® shows a
nanoscale separation derived from the presence of hydrophobic and hydrophilic
counterparts. The distribution of these two phases, within the matrix of the membrane,
has been the subject for many debates. Furthermore, the hydration (and resulting
morphological changes due to swelling), the processing conditions (whether if the
membrane was extruded from melt or casted from a dispersion), the thermal and water
sorption history, the random chemical structure of the copolymer and the low degree
of crystallinity make the task of describing the Nafion® morphology very difficult.
Some of the most relevant models are briefly presented hereafter.
Gierke and Hsu proposed the first attempt to correlate structural information with
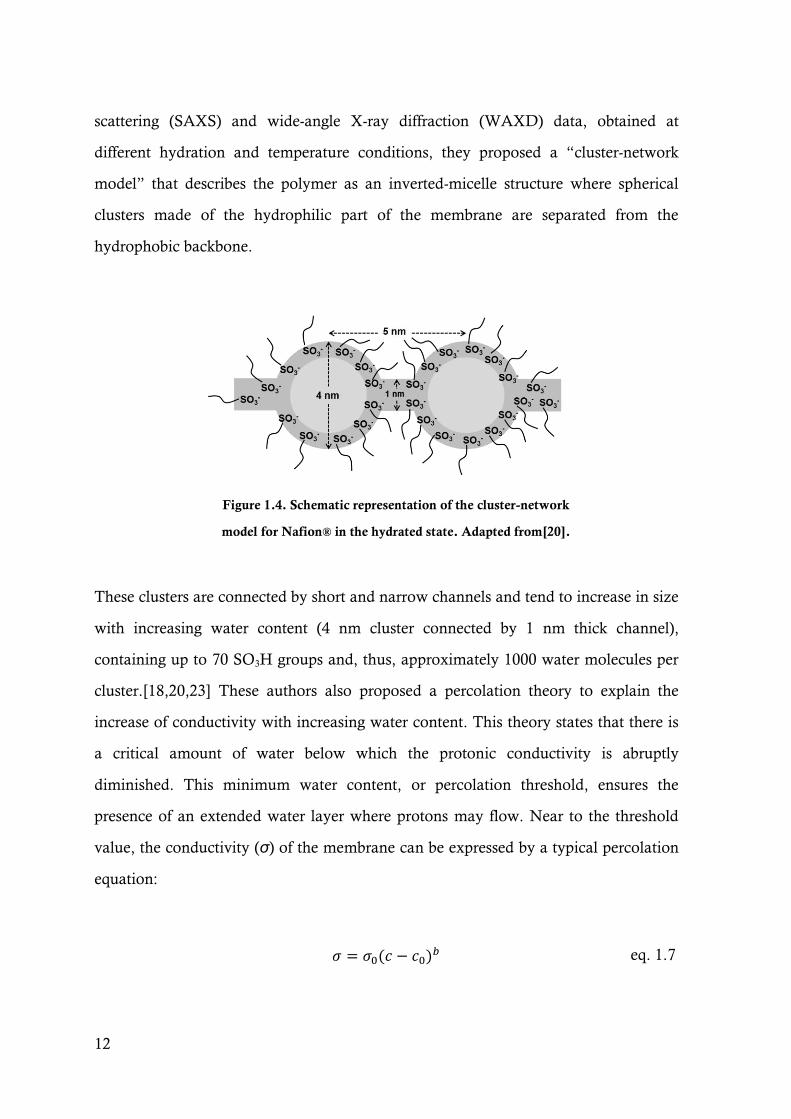
transport properties, depicted in Fig. 1.4.[23] After analysing small-angle X-ray
12
scattering (SAXS) and wide-angle X-ray diffraction (WAXD) data, obtained at
different hydration and temperature conditions, they proposed a “cluster-network
model” that describes the polymer as an inverted-micelle structure where spherical
clusters made of the hydrophilic part of the membrane are separated from the
hydrophobic backbone.
Figure 1.4. Schematic representation of the cluster-network
model for Nafion® in the hydrated state. Adapted from[20].
These clusters are connected by short and narrow channels and tend to increase in size
with increasing water content (4 nm cluster connected by 1 nm thick channel),
containing up to 70 SO3H groups and, thus, approximately 1000 water molecules per
cluster.[18,20,23] These authors also proposed a percolation theory to explain the
increase of conductivity with increasing water content. This theory states that there is
a critical amount of water below which the protonic conductivity is abruptly
diminished. This minimum water content, or percolation threshold, ensures the
presence of an extended water layer where protons may flow. Near to the threshold
value, the conductivity (σ) of the membrane can be expressed by a typical percolation
equation:
𝜎 = 𝜎0(𝑐 − 𝑐0)𝑏 eq. 1.7
13
where “σ0” is a pre-factor related to molecular interactions, “c” is the volume fraction
of the aqueous phase, “c0” is the percolation threshold and “b” is a universal constant
depending on the dimensions of the system. Further work on the percolation theory
performed by Okada et al.[24] showed that half of the water inside the membrane is
bounded to SO3H groups, forming the first hydration layer, while the rest of it
experiences some degree of freedom inside the pore, forming several other hydration
layers.
Although the cluster-network model was widely accepted, it was regarded as too basic
since it assumed a periodic distribution of the clusters. Several structures with various
geometrical and spatial assumptions as how the clusters are distributed have been
proposed since. For example, a lamellar model was proposed by Litt,[25] where
hydrophobic sheets are separated by the hydrophilic domains. A similar model based
on a sandwich-like structure was suggested by Haubold et al.[26] These models are
only focused on the basic structure of Nafion®, lacking a description of the extended
structure. Studies by SAXS and small-angle neutron scattering (SANS) have provided
the basis for morphological models that cover the length scale up to 1 μm. For
example, a study proposed that the microstructure of Nafion® is composed by
elongated structures of polymer aggregates with 4 nm diameter and up to 100 nm in
length, packed into oriented bundles, randomly dispersed in the mesoscale range.[27]
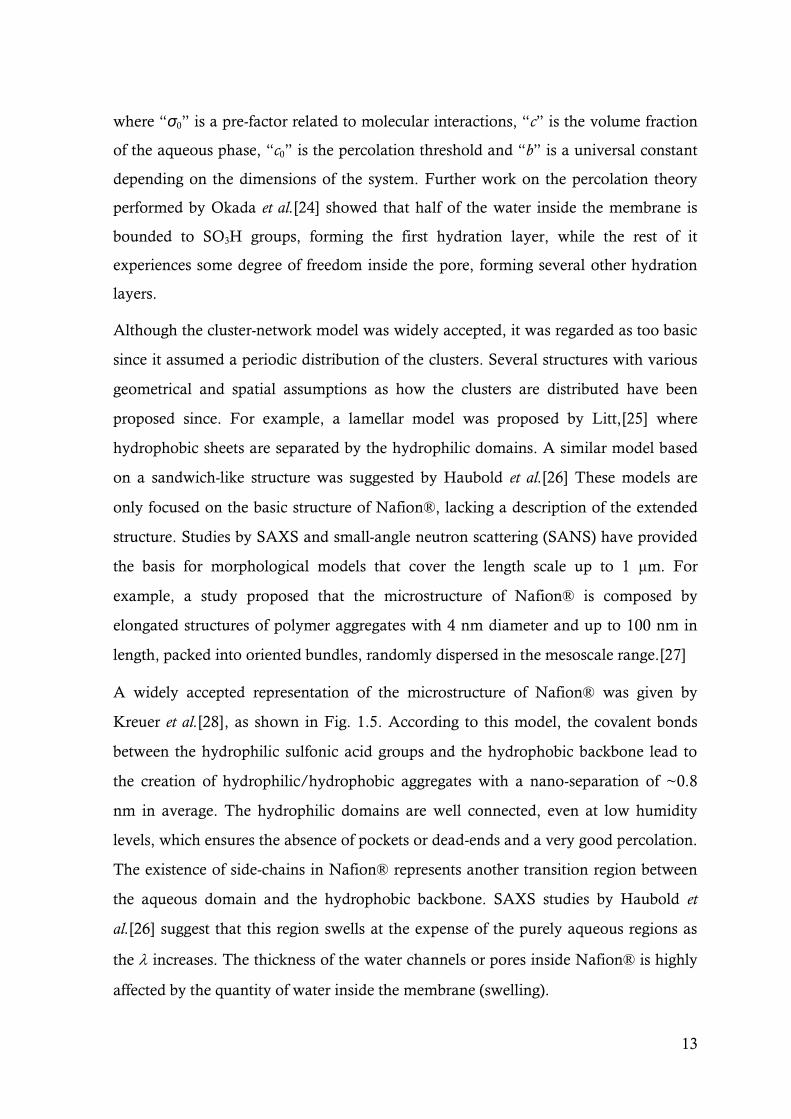
A widely accepted representation of the microstructure of Nafion® was given by
Kreuer et al.[28], as shown in Fig. 1.5. According to this model, the covalent bonds
between the hydrophilic sulfonic acid groups and the hydrophobic backbone lead to
the creation of hydrophilic/hydrophobic aggregates with a nano-separation of ~0.8
nm in average. The hydrophilic domains are well connected, even at low humidity
levels, which ensures the absence of pockets or dead-ends and a very good percolation.
The existence of side-chains in Nafion® represents another transition region between
the aqueous domain and the hydrophobic backbone. SAXS studies by Haubold et
al.[26] suggest that this region swells at the expense of the purely aqueous regions as
the increases. The thickness of the water channels or pores inside Nafion® is highly
affected by the quantity of water inside the membrane (swelling).

14
Figure 1.5. Scheme of the microstructure of Nafion® for
intermediate water content. Adapted from[28].
It has been subsequently suggested that the models discussed above do not fit the
obtained SAXS data. Figure 1.6 depicts the alternative structural model presented by
Schmidt-Rohr and Chen,[29] where the structure of hydrated Nafion® is represented
by parallel rod-like water channels (diameter between 1.8 and 3.5 nm) and length of
approximately 20 nm (Fig 1.6 A and B). The cylindrically shaped inverted micelles,
aligned with hydrophilic groups are supported by the PTFE backbone. The larger
water channel diameter explains more suitably the high water diffusion coefficient of
Nafion® and also the electro-osmotic drag of water inside the membrane.
Additionally, this model incorporates 10 vol. % crystallites that lie parallel to the water
channels (Fig. 1.6 C). Using a newly developed algorithm that simulates SAXS
measurements based on the model, these authors apparently matched previously
published SAXS pattern of Nafion®.[30] This model is quite suitable for hydrated
Nafion®, however, it is not clear if it can represent also the dry or scantily hydrated
membrane.[31]

15
Figure 1.6. Scheme of Nafion® morphology according to the parallel water-channel model:
A) transversal and cross section view of an inverted micelle cylinder; B) Parallel packing of
inverted micelles cylinders; C) Cross section of the membrane showing the water channels
in white, the crystallite in black and the amorphous Nafion® matrix in grey.
A recent paper by Kreuer and Portale[32] focuses on checking the consistency of the
parallel cylinder model for membranes with variable levels of hydration. According to
these authors, the Schmidt-Rohr and Chen’s algorithm[29] is most certainly biased
due to a large uncertainty concerning the measured water content in the membrane.
The data interpretation by Kreuer and Portale[32] suggests a flat morphology for the
pores, as opposed to cylinders. The thin films of water formed at the surface of the
pores may act as electrostatic “glue”, forcing the approximation of the oppositely
charged polymeric structures. The formation of cylindrically shaped pores, with
negative charge at the surface and positive charges inside, would correspond to a
significant separation of the charges and huge accumulation of positive charge in the
structure. The partial collapse of the cylinder into a flatter shape would be more
energetically favourable as long as the separated charges are not totally immersed in
water.
In a companion paper, Kreuer[33] discusses the role of internal pressure as an
additional thermodynamic degree of freedom (to the r.h. and temperature) in the
hydration and transport properties of Nafion®. In the low r.h. conditions (Fig. 1.7 A),
the presence of hydrophilic sulfonic acid groups in a superficial “open” microstructure
A B C

16
may allow the entrance of hydration water (represented by arrows). As the hydration
increases (Fig. 1.7 B), the membrane softens and the internal pressure builds up while
the outermost polymer chains organize in a closed hydrophobic layer (dotted region in
Fig. 1.7 B) with much lower ability to permeate water.
Figure 1.7. Schematic representation of the anisotropic dry “skin” formation in
Nafion®. A) at low r.h., B) as the hydration level increases the anisotropic “skin”
tends to form (dotted region) and C) the internal pressure is released when the
surface “skin” is opened by contact with liquid water. Adapted from[33].
This very low concentration of hydrophilic defects reduces drastically the ability of the
membrane to uptake more water below the dew point. However, direct contact with
liquid water (Fig. 1.7 C) may open the skin, releasing the internal pressure and
allowing the contact between the external water and the water inside the membrane.
This might explain the higher of Nafion® observed when the material is in contact
with liquid water in comparison to when it is exposed to a saturated water vapour
atmosphere, as discussed earlier. This puzzling effect actually occurs in many other
polymers and is known as the Schroeder’s paradox.[34]
17
1.3.1.2 Proton transport mechanisms and the role of water
There are several mechanism by which protons can migrate from the anode to the
cathode inside PFSA membrane and they all depend on the level of hydration.
Protons can be transported via: i) surface diffusion along the functional groups (itself of
structural diffusion type), ii) Grotthus mechanism (structural diffusion via water
molecules) and iii) vehicular mechanism or the molecular diffusion of hydronium
ions.
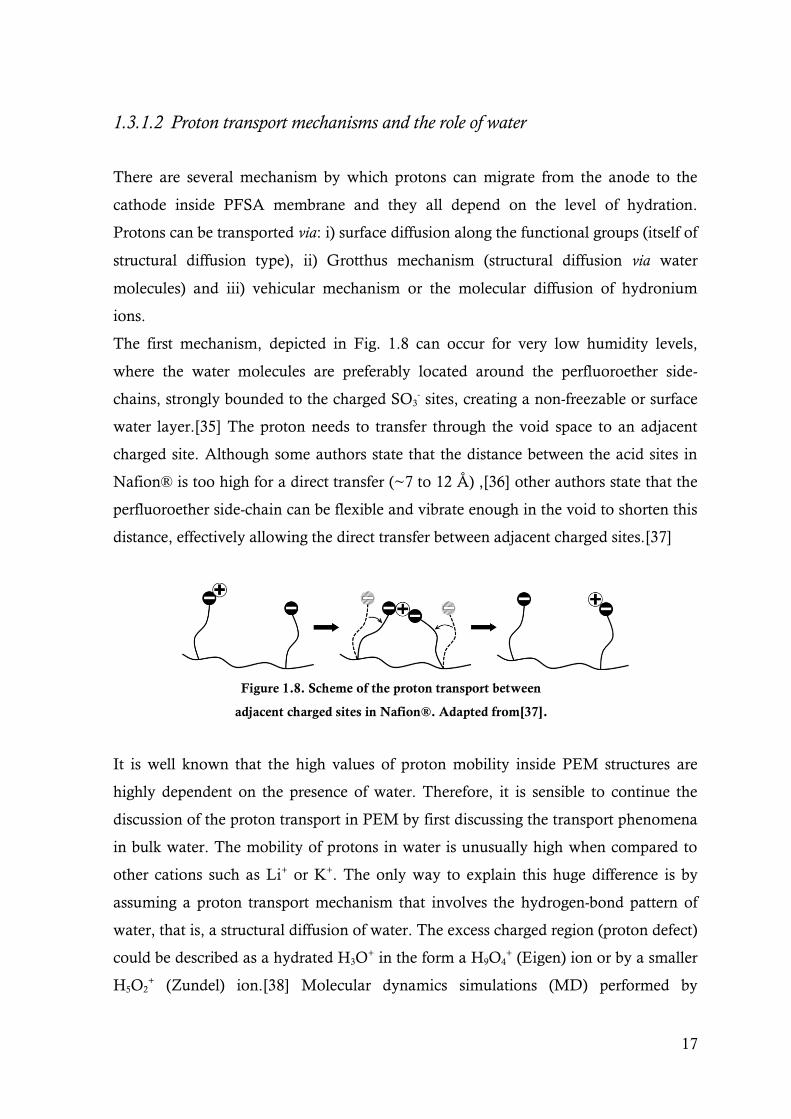
The first mechanism, depicted in Fig. 1.8 can occur for very low humidity levels,
where the water molecules are preferably located around the perfluoroether side-
chains, strongly bounded to the charged SO3- sites, creating a non-freezable or surface
water layer.[35] The proton needs to transfer through the void space to an adjacent
charged site. Although some authors state that the distance between the acid sites in
Nafion® is too high for a direct transfer (~7 to 12 Å) ,[36] other authors state that the
perfluoroether side-chain can be flexible and vibrate enough in the void to shorten this
distance, effectively allowing the direct transfer between adjacent charged sites.[37]
Figure 1.8. Scheme of the proton transport between
adjacent charged sites in Nafion®. Adapted from[37].
It is well known that the high values of proton mobility inside PEM structures are
highly dependent on the presence of water. Therefore, it is sensible to continue the
discussion of the proton transport in PEM by first discussing the transport phenomena
in bulk water. The mobility of protons in water is unusually high when compared to
other cations such as Li+ or K+. The only way to explain this huge difference is by
assuming a proton transport mechanism that involves the hydrogen-bond pattern of
water, that is, a structural diffusion of water. The excess charged region (proton defect)
could be described as a hydrated H3O+ in the form a H9O4
+ (Eigen) ion or by a smaller
H5O2+ (Zundel) ion.[38] Molecular dynamics simulations (MD) performed by
18
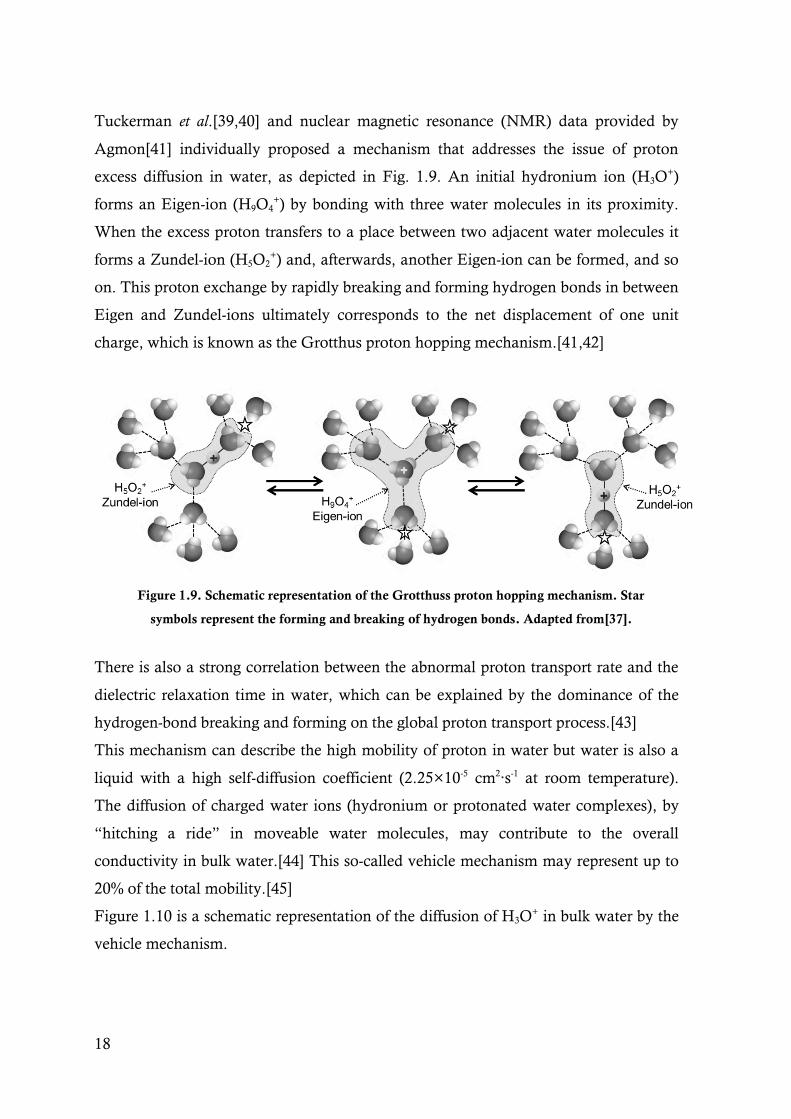
Tuckerman et al.[39,40] and nuclear magnetic resonance (NMR) data provided by
Agmon[41] individually proposed a mechanism that addresses the issue of proton
excess diffusion in water, as depicted in Fig. 1.9. An initial hydronium ion (H3O+)
forms an Eigen-ion (H9O4+) by bonding with three water molecules in its proximity.
When the excess proton transfers to a place between two adjacent water molecules it
forms a Zundel-ion (H5O2+) and, afterwards, another Eigen-ion can be formed, and so
on. This proton exchange by rapidly breaking and forming hydrogen bonds in between
Eigen and Zundel-ions ultimately corresponds to the net displacement of one unit
charge, which is known as the Grotthus proton hopping mechanism.[41,42]
Figure 1.9. Schematic representation of the Grotthuss proton hopping mechanism. Star
symbols represent the forming and breaking of hydrogen bonds. Adapted from[37].
There is also a strong correlation between the abnormal proton transport rate and the
dielectric relaxation time in water, which can be explained by the dominance of the
hydrogen-bond breaking and forming on the global proton transport process.[43]
This mechanism can describe the high mobility of proton in water but water is also a
liquid with a high self-diffusion coefficient (2.25×10⁻⁵ cm2∙s-1 at room temperature).
The diffusion of charged water ions (hydronium or protonated water complexes), by
“hitching a ride” in moveable water molecules, may contribute to the overall
conductivity in bulk water.[44] This so-called vehicle mechanism may represent up to
20% of the total mobility.[45]
Figure 1.10 is a schematic representation of the diffusion of H3O+ in bulk water by the
vehicle mechanism.

19
Figure 1.10. Schematic representation of the proton
conduction by vehicular mechanism. Adapted from[37].
The coexistence of the various mechanisms is very likely and it is a difficult task to
separate their individual contributions to the overall conductivity. Comprehensibly,
both mechanisms are dependent on temperature, pressure and on which and how
much ions are involved in the process.
Applying these observation to the protonic conductivity in well hydrated acidic
polymer membranes, such as Nafion®, one can assume that the structural diffusion is
the only mechanism that can explain the high levels of conductivity measured in these
materials.[38] In order to have efficient water structural diffusion inside Nafion®, a
continuous layer of water must exist between the hydrophilic clusters to successfully
transport the protons from the anode to cathode. The discussion around which value
satisfies the percolation of water inside Nafion® membrane is not consensual.[37,38]
The complex morphology of the polymers associated to the hydrophilic/hydrophobic
domain separation and its strong dependence on the hydration provides a variety of
configurations where the proton mobility may be significantly different. The nanosized
hydrophilic clusters in hydrated Nafion® can adsorb a great amount of water that,
besides promoting the solvation of the sulfonic acid groups, provides additional proton
diffusion paths with higher mobility, as protons become weakly bounded to the SO3-
counter-ion. These hydrated clusters can be regarded as dilute acids, where the SO3-
groups play the role of proton exchange sites.[37]
Several studies were dedicated to understand the distribution and interaction of water
in PFSA membranes. Infrared spectroscopy (IR) measurements of Nafion®
membrane under increasingly humid atmosphere showed that water clusters start to
form inside the membrane for > 3, followed by the aggregation into larger clusters
up to < 6 and eventually forming continuous water layers by coalescence of the

20
clusters beyond this value.[46] In a more recent paper by Lu et al.,[47] dielectric
relaxation spectroscopy was used to study the state of water inside Nafion® as a
function of . They confirmed the presence of three different water states with distinct
dynamics. The study showed the formation of percolated water film between
hydrophilic clusters when = 9, evidenced by a drastic change of the dielectric
constant of the membrane. A quasi-elastic neutron scattering (QENS) study by
Pivovar and Pivovar[48] showed two different hydration regimes with turning point at
around = 7. They found that the fraction of non-diffusing protons rapidly decreased
from 0.85 at = 1 to 0.20 at = 6, reaching a limit of 0.12 for higher . These
observations were in agreement with the increase of protonic conductivity with
increasing water content previously observed.[46,49]. Another QENS study showed a
higher value for the fraction of non-diffusing protons (0.5 at = 6), which may be due
to differences in energy resolution.[50] Perrin et al.[51] also used QENS to study the
molecular proton motion in Nafion® with varying from 3 to 17.5 and found two
different proton carriers for time scales of 160-500 ps and 2-8 ps, which are ascribed to
slow protons closely bond to the SO3- groups, and faster protonic species diffusing in
hydration layers away from the acid-functionalized pore surface, where long range
diffusion takes place. Eikerling et al.[52] performed a simulation study of the protonic
conductivity in the pores of a PEM as a function of the hydration and associated
dimensional changes (swelling or shrinking).
Figure 1.11A represents the model pore used to calculate the electrostatic
contributions to the activation Gibbs energy for the proton migration as a function of
several microstructural parameters, notably the pore diameter (L) or the distance
between the sulfonic acid groups (l). The model distinguishes two different layers of
hydration in the pores: a first monolayer tightly bonded to the pore surface containing
the sulfonic acid groups, and the subsequent hydration layers towards the centre of the
pore, which behave like bulk water. The equilibrium between the surface and bulk
contribution is determined by the distance between the SO3- groups and the pore size.
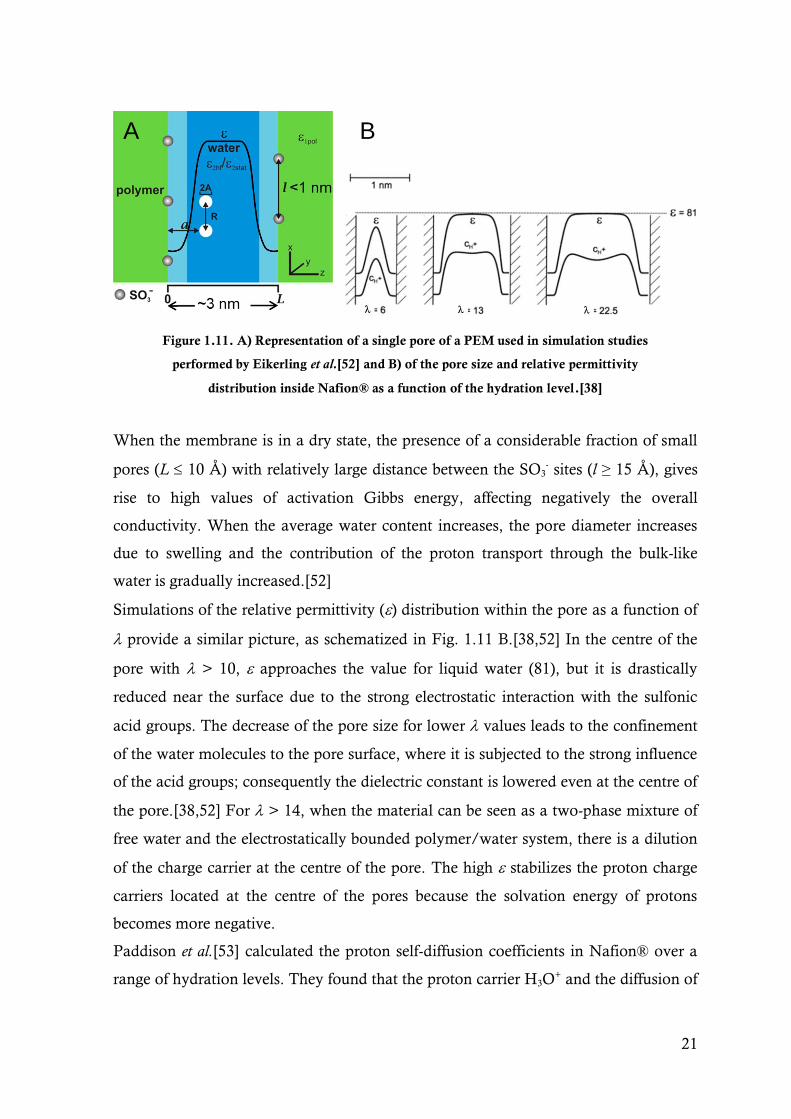
21
Figure 1.11. A) Representation of a single pore of a PEM used in simulation studies
performed by Eikerling et al.[52] and B) of the pore size and relative permittivity
distribution inside Nafion® as a function of the hydration level.[38]
When the membrane is in a dry state, the presence of a considerable fraction of small
pores (L 10 Å) with relatively large distance between the SO3- sites (l ≥ 15 Å), gives
rise to high values of activation Gibbs energy, affecting negatively the overall
conductivity. When the average water content increases, the pore diameter increases
due to swelling and the contribution of the proton transport through the bulk-like
water is gradually increased.[52]
Simulations of the relative permittivity () distribution within the pore as a function of
provide a similar picture, as schematized in Fig. 1.11 B.[38,52] In the centre of the
pore with > 10, approaches the value for liquid water (81), but it is drastically
reduced near the surface due to the strong electrostatic interaction with the sulfonic
acid groups. The decrease of the pore size for lower values leads to the confinement
of the water molecules to the pore surface, where it is subjected to the strong influence
of the acid groups; consequently the dielectric constant is lowered even at the centre of
the pore.[38,52] For > 14, when the material can be seen as a two-phase mixture of
free water and the electrostatically bounded polymer/water system, there is a dilution
of the charge carrier at the centre of the pore. The high stabilizes the proton charge
carriers located at the centre of the pores because the solvation energy of protons
becomes more negative.
Paddison et al.[53] calculated the proton self-diffusion coefficients in Nafion® over a
range of hydration levels. They found that the proton carrier H3O+ and the diffusion of
A B

22
water are retarded by the confinement produced by the presence of a substantial
density of sulfonate groups. With the same calculation method they also showed that
the diffusion of proton for > 13 accounts with the contribution of a structural
mechanism.[54,55]
All things considered, the role and state of water on the protonic conductivity in
Nafion® are very complex subjects and still motives of debate. However one can
surely say that for high water content, the main transport mechanism is surely the
structural diffusion.[38] When the water content decreases, the excess proton
concentration increases in the aqueous phase, leading to a decreasing intermolecular
proton transfer, ultimately affecting the structural diffusion. This was analogously
observed in aqueous solution.[56] Consequently, at intermediate and lower levels of
hydration the protonic conductivity must rely mainly on the vehicle mechanism.
1.3.2 Other perfluorinated membranes
Many other perfluorinated membranes were developed by manufacturers such as
Asahi Glass Co. Ltd (Flemion®), Asahi Chemical Co. Ltd. (Aciplex®), 3M Inc., Dow
Chemical and Solvay Solexis (Aquivion® and Hyflon®). In comparison with
Nafion®, these perfluorinated membranes possess shorter side-chains and lower EW.
The lowering of EW might enhance the acid group concentration and therefore the
protonic conductivity of these membranes tends to be slightly higher than Nafion®.
However, the short-side-chain (SSC) PFSA membranes normally present lower
mechanical integrity and durability due to increased swelling upon water uptake.[13]
Nevertheless, the SSC membranes show higher crystallinity at certain EW and
elevated Tg , which allow higher working temperatures.
Kreuer et al.[57] characterized a PFSA membrane from Dow (EW of 858 with and
1084 with thicknesses of 80 and 90 μm respectively) comparing water sorption and
diffusion, electro-osmotic drag effect, protonic conductivity, microstructure and visco-
elastic behaviour with Nafion® 117. At high (higher than 15) the water diffusion is
similar in all membranes but as it decreases, the water diffusion decrease is more
significant in the Dow membrane than Nafion® 117. Nevertheless, at > 10, the Dow
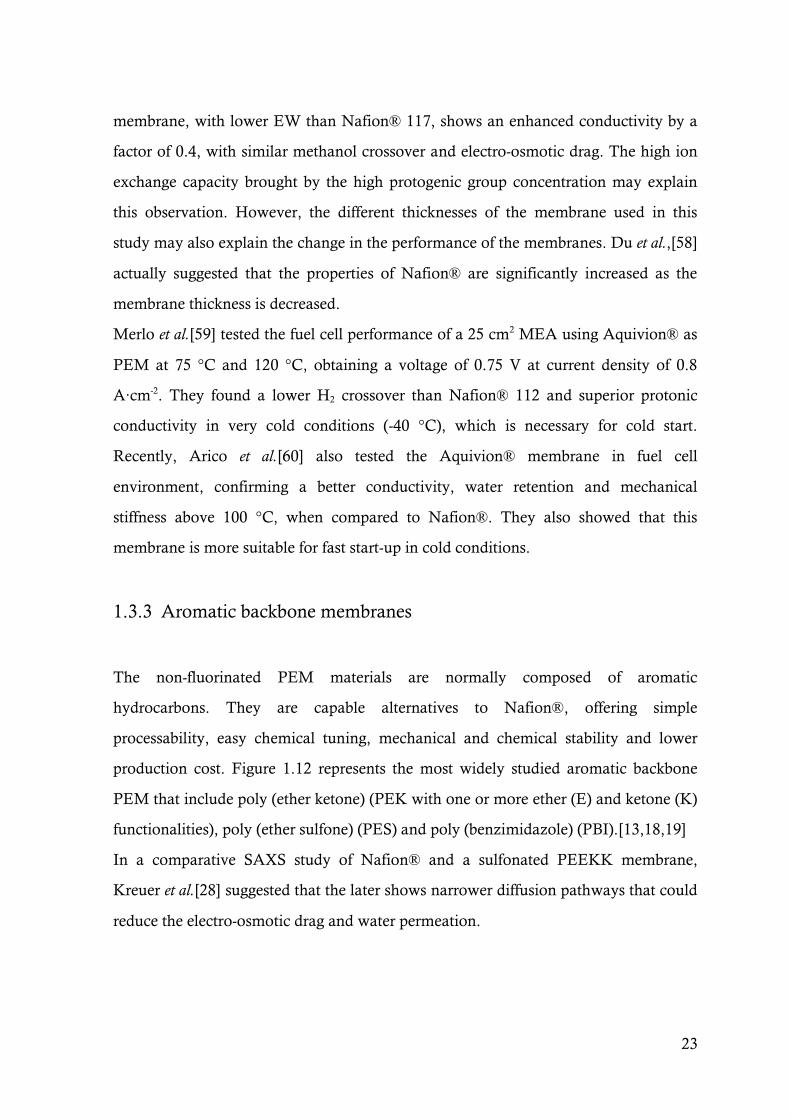
23
membrane, with lower EW than Nafion® 117, shows an enhanced conductivity by a
factor of 0.4, with similar methanol crossover and electro-osmotic drag. The high ion
exchange capacity brought by the high protogenic group concentration may explain
this observation. However, the different thicknesses of the membrane used in this
study may also explain the change in the performance of the membranes. Du et al.,[58]
actually suggested that the properties of Nafion® are significantly increased as the
membrane thickness is decreased.
Merlo et al.[59] tested the fuel cell performance of a 25 cm2 MEA using Aquivion® as
PEM at 75 °C and 120 °C, obtaining a voltage of 0.75 V at current density of 0.8
A∙cm-2. They found a lower H2 crossover than Nafion® 112 and superior protonic
conductivity in very cold conditions (-40 °C), which is necessary for cold start.
Recently, Arico et al.[60] also tested the Aquivion® membrane in fuel cell
environment, confirming a better conductivity, water retention and mechanical
stiffness above 100 °C, when compared to Nafion®. They also showed that this
membrane is more suitable for fast start-up in cold conditions.
1.3.3 Aromatic backbone membranes
The non-fluorinated PEM materials are normally composed of aromatic
hydrocarbons. They are capable alternatives to Nafion®, offering simple
processability, easy chemical tuning, mechanical and chemical stability and lower
production cost. Figure 1.12 represents the most widely studied aromatic backbone
PEM that include poly (ether ketone) (PEK with one or more ether (E) and ketone (K)
functionalities), poly (ether sulfone) (PES) and poly (benzimidazole) (PBI).[13,18,19]
In a comparative SAXS study of Nafion® and a sulfonated PEEKK membrane,
Kreuer et al.[28] suggested that the later shows narrower diffusion pathways that could
reduce the electro-osmotic drag and water permeation.
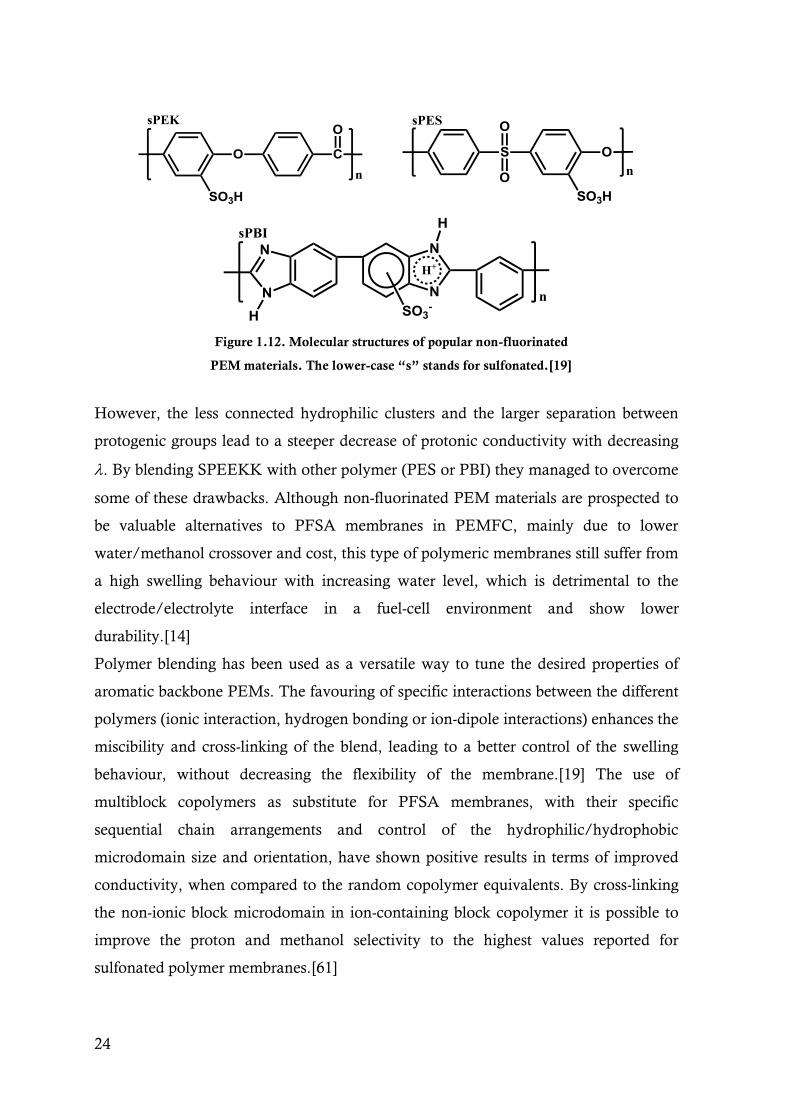
24
Figure 1.12. Molecular structures of popular non-fluorinated
PEM materials. The lower-case “s” stands for sulfonated.[19]
However, the less connected hydrophilic clusters and the larger separation between
protogenic groups lead to a steeper decrease of protonic conductivity with decreasing
. By blending SPEEKK with other polymer (PES or PBI) they managed to overcome
some of these drawbacks. Although non-fluorinated PEM materials are prospected to
be valuable alternatives to PFSA membranes in PEMFC, mainly due to lower
water/methanol crossover and cost, this type of polymeric membranes still suffer from
a high swelling behaviour with increasing water level, which is detrimental to the
electrode/electrolyte interface in a fuel-cell environment and show lower
durability.[14]
Polymer blending has been used as a versatile way to tune the desired properties of
aromatic backbone PEMs. The favouring of specific interactions between the different
polymers (ionic interaction, hydrogen bonding or ion-dipole interactions) enhances the
miscibility and cross-linking of the blend, leading to a better control of the swelling
behaviour, without decreasing the flexibility of the membrane.[19] The use of
multiblock copolymers as substitute for PFSA membranes, with their specific
sequential chain arrangements and control of the hydrophilic/hydrophobic
microdomain size and orientation, have shown positive results in terms of improved
conductivity, when compared to the random copolymer equivalents. By cross-linking
the non-ionic block microdomain in ion-containing block copolymer it is possible to
improve the proton and methanol selectivity to the highest values reported for
sulfonated polymer membranes.[61]
25
Einsla et al.[62] compared the electrochemical properties of an alternating sulfonated
poly(arylene ether ketone) (Ph-PEEKDK), a random sulfonated poly(arylene ether
sulfone) (BPSH-35) and a multiblock copolymer made of hydrophobic polyimide
block and a hydrophilic poly(arylene ether sulfone) (BPSH-15-PI-15). The multiblock
copolymer showed the best performance under fuel cell testing at 100 °C and 40%
relative humidity (r.h.), yielding similar results to Nafion®.
In a more recent study, Meyer et al.[63] studied a family of fully sulfonated hydrophilic
poly (phenylene sulfone) and hydrophobic poly (phenylene ether sulfone) segments.
They obtained materials with [H+] values ranging from 1.2 to 1.7 mmol∙g-1 and a
distinct phase separation with correlation lengths of ~15 nm. This combination results
in high conductivity values with increased visco-elastic properties, especially at higher
temperatures. The well separated microstructure of the multiblock copolymers allow a
superior proton transport and stability of the hydrophilic constituent and the
morphological stability of the hydrophobic phase, showing a great potential to be used
in high temperature PEMFC. Nevertheless, the other state-of-the-art components of
the fuel cell, namely the electrodes, would have to be adjusted to cope with the
different chemical nature and the significantly lower hydrodynamic transport
properties.
1.3.4 Anhydrous membranes
Another approach investigated for the development of high temperature PEMFC
involves the replacement of water by a proton solvent liquid with high boiling point,
on a polymeric matrix with high thermo-chemical resistance. In one of the earlier
reported examples, Bouchet and Siebert[64] compared the conductivity of PBI
membranes doped with H3PO4, H2SO4 and HBr . They found that both H3PO4 and
H2SO4 act as proton solvent in PBI membrane, which provides the necessary
mechanical stability. These membranes showed protonic conductivities of 10-4 S∙cm-1
and 7×10⁻⁶ S∙cm-1, in dry state and at 30 ºC, for (PBI - 3.25 H2SO4) and (PBI - 3.05
H3PO4), respectively. Figure 1.13 depicts the suggested hopping mechanism for proton
transport in these acid functionalized membranes.
26
Figure 1.13. Proton hopping mechanism for acid doped PBI membranes.Adapted from[64].
Since the first studies on this type of composite membrane, extensive research in the
polymer synthesis, casting of the membranes, characterization and fuel cell application
have been made. For example, the use of ionic and covalent cross-linking or
inorganic–organic composites development was extensively reported.[65]
So far, the acid-doped PBI membranes are the most successful membranes for
application in HT-PEMFC, up to 200 ºC, preferably under atmospheric pressure.
However, there are important drawbacks that are still to address such as the difficult
processing, the need for high acid load ([H+]) to have decent conductivity values
(which can ultimately affect the chemical stability of the other fuel cell components),
the leaching of the acid at high temperature, the low conductivity values at low
temperatures (important for cold-start) and the slow oxygen reduction kinetics (caused
by the strong surface adsorption of acid anions and low solubility of oxygen).[14,65]
Ünsal and Kiefer developed a PEM based on a PBI matrix where
polyvinylphosphonic acid (PVPA) is used as the polyelectrolyte, immobilized in the
matrix by interpenetration, cross-linking and covalent bonding, which led to the
development of the commercial PEM Celtec-V.[66,67] The new improved structure of
this membrane prevents the leaching of the electrolyte when in contact with liquid,
which is especially desirable for the application in DMFC. The fuel-cell performance
of these PBI-based membranes can be sustained to a higher methanol flow with half
the methanol cross-over, in comparison to Nafion® 117. However, the ohmic
resistance and the cathode/PEM interface (where higher losses are observed with
increasing current density) could still be improved.
The patent was bought by BASF® which further developed the material delivering a
series of MEAs based on this PBI-H3PO4 membrane under the commercial family
name Celtec-P®. For the membrane Celtec P-1000® a study performed by Boaventura
and Mendes[68] showed conductivity values of 5.6×10⁻² S∙cm-1 at 160 ºC and 5% r.h.

27
Another commercial option available is based on a pyridine containing PES
impregnated with H3PO4 with the commercial name Advent®.[69] The authors claim
that this copolymer, easily processed and with high thermal stability (400 ºC), shows a
conductivity of 0.01 S∙cm-1 at temperature higher than 130 ºC.
More recently, Weber et al.[70] studied the protonic conductivity of H3PO4
impregnated mesoporous crosslinked PBI structures. The mesoporous PBI was
synthesised by a solvent-mediated hard-templating method which yielded PBI
networks with defined pores of ~10 nm and SBET up to 190 m2∙g-1.[71] They observed
that the protonic conductivity of these acid filled mesoporous PBI membranes showed
an important improvement up to ~10-2 S∙cm-1 at 180 °C. The optimal microstructure
was found in PBI membrane with 10 - 20 % mol in cross-linker, which corresponds to
a suficiently stabilized microstructure with connectivity between the pores.
In the quest for anhydrous PEM, protic ionic liquids (PIL) were also incorporated in
polymer matrices. These molten salts mixtures, which usually show low melting point,
allow the transfer of proton from a Brønsted acid to a Brønsted base.[72] One of the
many studies published was performed by Watanabe’s group[73] in which they used
sulfonated polyimides as matrices for the incorporation of PIL
diethylmethylammonium trifluoromethanesulfonate. For a content higher than 67 %
of the protic ionic liquid, the conductivity was in the order of 10-2 S∙cm-1, at 160 ºC and
anhydrous conditions.
Solid acids have also been proposed to raise the working temperatures of PEMFC.
Many of these crystalline materials are also denominated as “superprotonic
conductors” because they normally undergo a phase transition that is translated as a
drastic rising of protonic conductivity of about 2-3 orders of magnitude, reaching
values of up to 0.1 S∙cm-1.[19] These non-polymeric membranes could work at
temperatures between 100 and 300 °C.[13,19]
The most widely studied solid acid for the application in fuel cell is probably CsHSO4.
Early work by Haile et al.[74] evaluated the viability of this solid acid for electrolyte
material in PEMFC. The super-protonic phase of this material is situated above 140
°C with protonic conductivity of ~10-2 S∙cm-1. In a posterior study, membranes of
CsH2PO4 solid acid showed a conductivity of 0.022 S∙cm-1 at 240 °C with the super-
protonic transition occurring at 230 ºC.[75] This particular material undergoes a

28
transition from monoclinic (space group P 21/m) at room temperature to cubic (CsCl-
like of space group Pm-3m) superprotonic phase at 230 ºC. The proton conduction in
oxyanion solid acids is not related to the migration of hydronium ions, which is why
these materials are, in principle, independent from the presence of water. The
transition to super-protonic phase normally implies changes to the network of
hydrogen bonds that connect the oxyanion groups, forming dimers, chains, layers or
three-dimensional structures. The dramatic increase in protonic conductivity is then
caused by a dynamic disordering of the hydrogen bond network.[76]
Some models have been suggested to explain the protonic conductivity in this type of
materials, but much work is needed still to fully understand the underlying
mechanisms and the membrane degradation at elevated temperatures.
1.4 Periodic Mesoporous Silicas (PMS) and Organosilicas (PMO)
1.4.1 Synthesis
Si-based materials with mesoporous structure (IUPAC classifies a material as
mesoporous whenever the pore size ranges between 2-50 nm[77]) have been widely
studied, mainly for their potential of application in catalysis, adsorption, gas
chromatography, sensors and hydrogen storage.[78,79] The synthesis of periodic
mesoporous silicas (PMS) using a template was firstly presented by Kresge, Beck and
co-workers in 1992.[80,81] The MCM-41, a member of the so-called M41S family
developed at Mobil Co. (MCM stands for Mobil Composition of Matter), was
obtained using alkyl trimethylammonium bromide surfactant with a 16 carbon alkyl
chain (C16) as structure directing agent (SDA), and tetraethylorthosilicate (TEOS) as
the silica precursor. This material has a particular highly ordered hexagonal array of
pores (space group P6mm) with very high SBET (> 700 m2∙g-1), whereas the silica pore
walls are amorphous. The pore size distribution is narrow, with the average pore sizes
varying from 2 to 10 nm, depending on the surfactant used.
The assembly of this type of materials can occur by two different mechanisms. In the
true liquid-crystal template mechanism, the SDA molecules are self-organized in

29
micelles above a certain critical micelle concentration (Fig. 1.14 A). Spherical micelles
start to elongate, forming rod-like structures in a lyotropic phase, which is a liquid
crystal-like structure with various possible structural arrangements (hexagonal liquid-
crystal, cubic or lamellar liquid-crystal) depending on the concentration, temperature
and pH, without requiring the presence of precursor framework materials.[78]
Alternatively, the liquid-crystalline phase may be formed at lower SDA concentration
in the presence of inorganic framework precursors in a cooperative self-assembly
process (Fig. 1.14 B).[78]
Figure 1.14. Representation of the A) true liquid-crystal template mechanism and B) cooperative
self-assembly mechanism for the formation of mesoporous silica materials. Adapted from[78].
In 1998, a new family of materials called SBA (from University of Santa Barbara) was
prepared using tri-block copolymers as SDA.[82,83]
These materials show increased pore size compared to M41S materials (up to 30 nm)
and thicker pore walls (up to 6 nm). SBA-15, the best known member of this family, is
synthesised using tri-block copolymer poly(ethylene glycol)-block-poly(propylene
glycol)-block-poly(ethylene glycol) - EO20PO70EO20 (Pluronic® P123) and it is
characterized by an hexagonal array of pores (space group P6mm), with the presence
of interconnecting micropores between the main hexagonally-spaced pores.
After the synthesis of the first mesoporous silicas, much attention was given to the
incorporation of organic functionalities providing useful properties to PMS. This was
primarily achieved by grafting or co-condensing organosiloxilane groups as R’-Si(OR)3
(R’ is the organic functional group) inside the pore wall. However, the homogeneity of

30
the distribution and the conservation of the mesostructure integrity upon the organic
loading were fairly poor.[78] This has been finally demonstrated for the incorporation
of ethane organic moiety in the framework of the pore wall via hydrolysis and
condensation of the bridged organosilane precursor 1,2-bis(trimethoxysilyl)ethane as
(OEt3)Si-CH2-CH2-Si(OEt)3, giving rise to the PMO family.[84-86] The integration of
the organic moiety in the walls of the mesoporous materials through bridged
bissilylated precursors allows higher organic loadings, homogeneously distributed
along the material walls. PMO materials are characterised by narrow distribution of
pore sizes, high stability and a greater flexibility in framework composition and
morphology.[78,87]
Several bridged organosilane molecules were then used to form PMO.[78,88] In an
effort to enhance their functionality, Inagaki et al.[89] studied the incorporation of
benzene as bridging organic moiety of the organosilane (1,4-bis(triethoxysilyl)-
benzene, BTEB), which led to the formation of a phenylene PMO (Ph-PMO). This
new material showed a hierarchical ordering, comprising the well-defined hexagonal
array of pores in the nano-scale (lattice constant of 5.25 nm with mesopores of 3.8 nm
in diameter) and also a molecular scale periodicity along the pore wall (spacing of 0.76
nm). The combination of the hydrophilic character brought by the silica layers, and
hydrophobic behaviour from the benzene layers with high - electron conjugation on
the ring, can explain the crystal-like wall structure of this PMO. Figure 1.15 shows
TEM micrographs collected along directions parallel (Fig. 1.15 A) and perpendicular
(Fig. 1.15 B) to the pore channels of the Ph-PMO and a 3D schematic representation
of the particles microstructure (Fig. 1.15 C).
Bion et al.[90] synthesised Ph-PMO using different alkyl trimethylammonium halide
surfactants from C14 to C18. This showed to be an effective way of tuning the pore
size of the hybrid particles (3.2 to 3.9 nm in diameter) without losing the hexagonal
array of pores and periodicity in the pore wall.
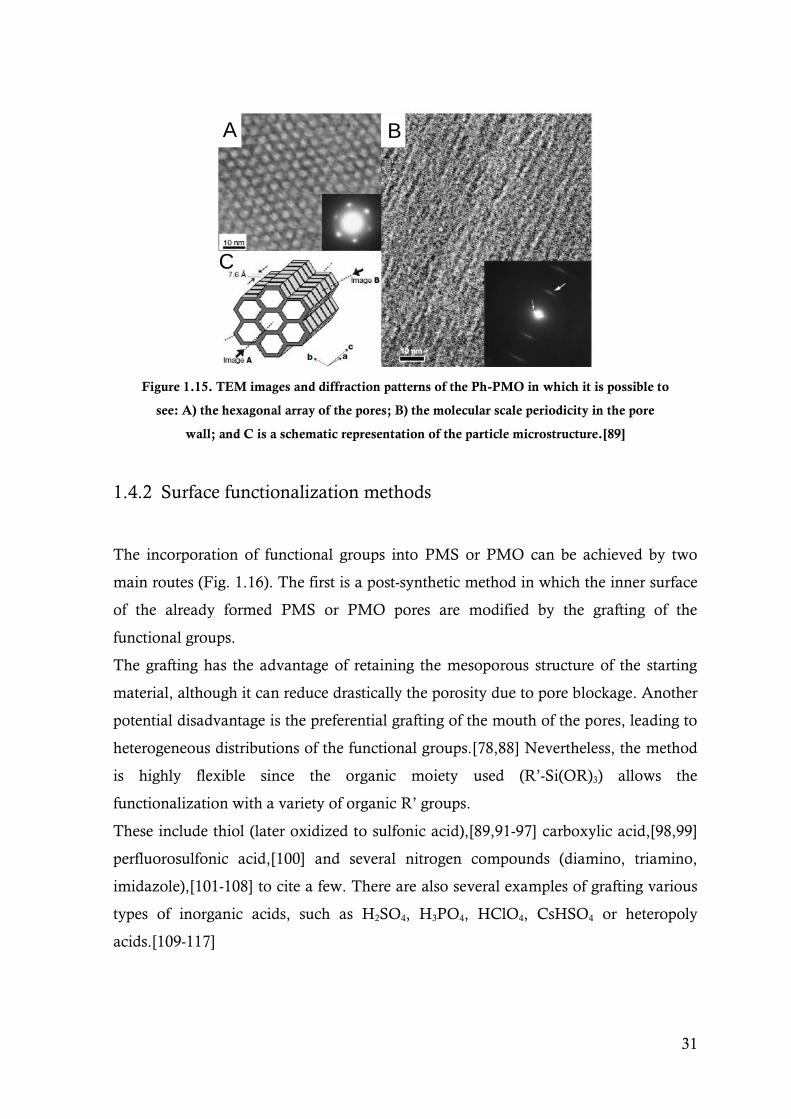
31
Figure 1.15. TEM images and diffraction patterns of the Ph-PMO in which it is possible to
see: A) the hexagonal array of the pores; B) the molecular scale periodicity in the pore
wall; and C is a schematic representation of the particle microstructure.[89]
1.4.2 Surface functionalization methods
The incorporation of functional groups into PMS or PMO can be achieved by two
main routes (Fig. 1.16). The first is a post-synthetic method in which the inner surface
of the already formed PMS or PMO pores are modified by the grafting of the
functional groups.
The grafting has the advantage of retaining the mesoporous structure of the starting
material, although it can reduce drastically the porosity due to pore blockage. Another
potential disadvantage is the preferential grafting of the mouth of the pores, leading to
heterogeneous distributions of the functional groups.[78,88] Nevertheless, the method
is highly flexible since the organic moiety used (R’-Si(OR)3) allows the
functionalization with a variety of organic R’ groups.
These include thiol (later oxidized to sulfonic acid),[89,91-97] carboxylic acid,[98,99]
perfluorosulfonic acid,[100] and several nitrogen compounds (diamino, triamino,
imidazole),[101-108] to cite a few. There are also several examples of grafting various
types of inorganic acids, such as H2SO4, H3PO4, HClO4, CsHSO4 or heteropoly
acids.[109-117]
A
C C
B
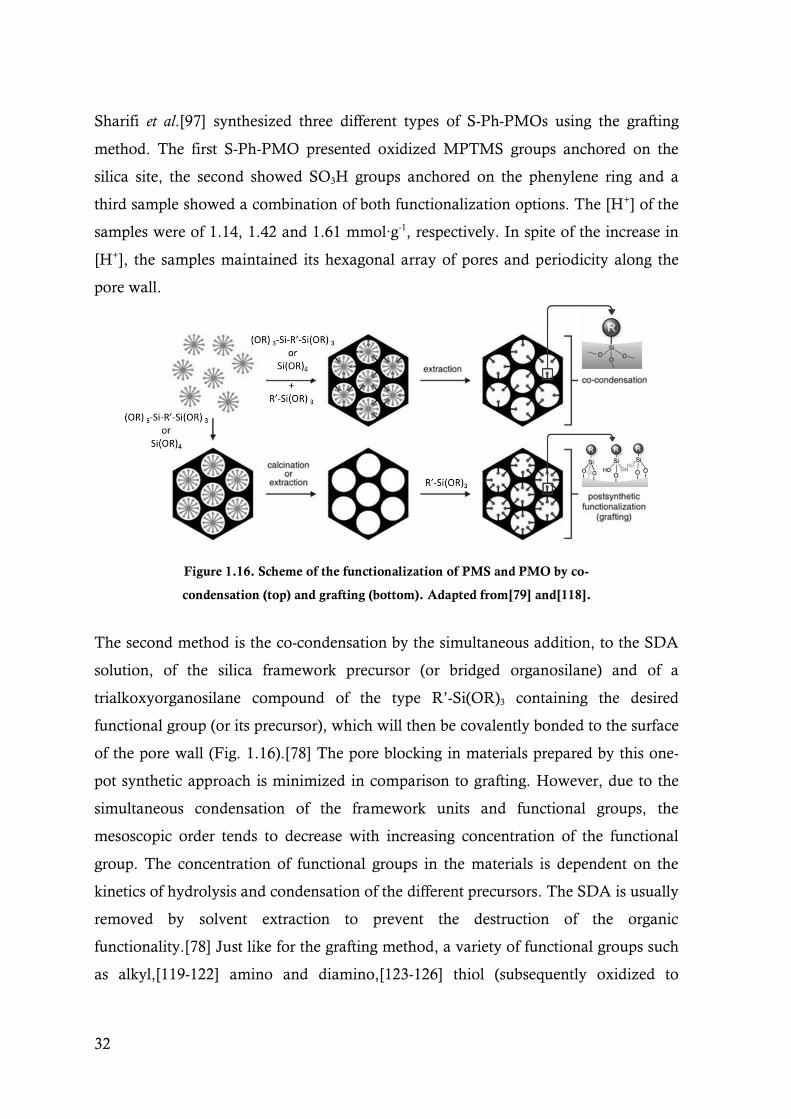
32
Sharifi et al.[97] synthesized three different types of S-Ph-PMOs using the grafting
method. The first S-Ph-PMO presented oxidized MPTMS groups anchored on the
silica site, the second showed SO3H groups anchored on the phenylene ring and a
third sample showed a combination of both functionalization options. The [H+] of the
samples were of 1.14, 1.42 and 1.61 mmol∙g-1, respectively. In spite of the increase in
[H+], the samples maintained its hexagonal array of pores and periodicity along the
pore wall.
Figure 1.16. Scheme of the functionalization of PMS and PMO by co-
condensation (top) and grafting (bottom). Adapted from[79] and[118].
The second method is the co-condensation by the simultaneous addition, to the SDA
solution, of the silica framework precursor (or bridged organosilane) and of a
trialkoxyorganosilane compound of the type R’-Si(OR)3 containing the desired
functional group (or its precursor), which will then be covalently bonded to the surface
of the pore wall (Fig. 1.16).[78] The pore blocking in materials prepared by this one-
pot synthetic approach is minimized in comparison to grafting. However, due to the
simultaneous condensation of the framework units and functional groups, the
mesoscopic order tends to decrease with increasing concentration of the functional
group. The concentration of functional groups in the materials is dependent on the
kinetics of hydrolysis and condensation of the different precursors. The SDA is usually
removed by solvent extraction to prevent the destruction of the organic
functionality.[78] Just like for the grafting method, a variety of functional groups such
as alkyl,[119-122] amino and diamino,[123-126] thiol (subsequently oxidized to
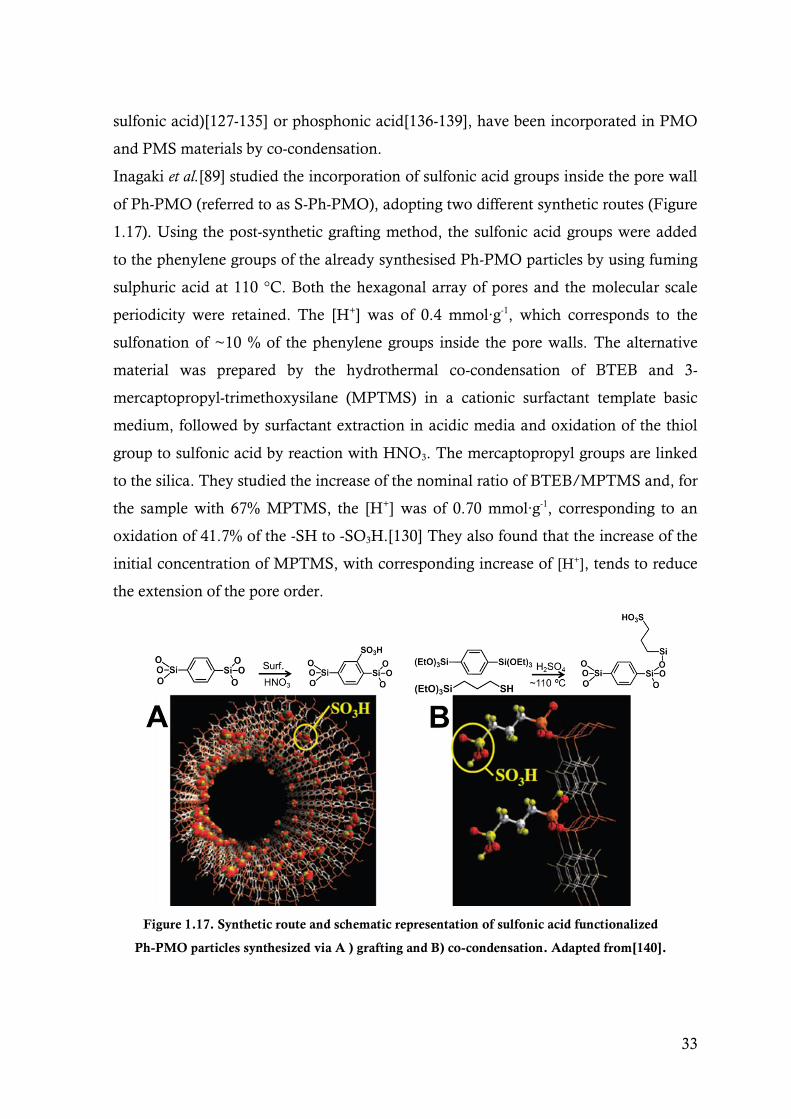
33
sulfonic acid)[127-135] or phosphonic acid[136-139], have been incorporated in PMO
and PMS materials by co-condensation.
Inagaki et al.[89] studied the incorporation of sulfonic acid groups inside the pore wall
of Ph-PMO (referred to as S-Ph-PMO), adopting two different synthetic routes (Figure
1.17). Using the post-synthetic grafting method, the sulfonic acid groups were added
to the phenylene groups of the already synthesised Ph-PMO particles by using fuming
sulphuric acid at 110 °C. Both the hexagonal array of pores and the molecular scale
periodicity were retained. The [H+] was of 0.4 mmol∙g-1, which corresponds to the
sulfonation of ~10 % of the phenylene groups inside the pore walls. The alternative
material was prepared by the hydrothermal co-condensation of BTEB and 3-
mercaptopropyl-trimethoxysilane (MPTMS) in a cationic surfactant template basic
medium, followed by surfactant extraction in acidic media and oxidation of the thiol
group to sulfonic acid by reaction with HNO3. The mercaptopropyl groups are linked
to the silica. They studied the increase of the nominal ratio of BTEB/MPTMS and, for
the sample with 67% MPTMS, the [H+] was of 0.70 mmol∙g-1, corresponding to an
oxidation of 41.7% of the -SH to -SO3H.[130] They also found that the increase of the
initial concentration of MPTMS, with corresponding increase of [H+], tends to reduce
the extension of the pore order.
Figure 1.17. Synthetic route and schematic representation of sulfonic acid functionalized
Ph-PMO particles synthesized via A ) grafting and B) co-condensation. Adapted from[140].
34
Marschall et al.[141] have shown that for SO3H-functionalized MCM-41 materials the
co-condensation method shows higher [H+] and conductivity. The same materials
were analysed by SANS coupled to in-situ adsorption of water (42:58 H2O/D2O).[142]
The neutron scattering length densities of the 42:58 H2O/D2O water and SiO2 are
almost identical, so when the pristine material fills up with water, the SANS signals
are quenched by the presence of the water. In the case of the co-condensed sample, no
quenching was observed, indicating that the SO3H groups are well distributed along he
pores. On the other hand, the grafted SO3H-MCM-41 showed an incomplete
quenching, which means that the distribution of the acid groups was not
homogeneous throughout the pores, probably concentrated at the pore mouth.
1.4.3 Microwave synthesis of PMS and PMO
The complete synthesis cycle of PMS and PMO materials comprising the self-
assembly, hydrothermal treatment, solvent extraction and oxidation steps is a time
consuming process. In the specific case of S-Ph-PMOs the synthesis can last from 66
up to almost 140 h in total.[97,130] From an economical and environmental point of
view, the reduction of synthesis time is obviously of great importance. Microwave
(MW) energy has been successfully used to accelerate chemical reactions since the
early studies developed in 1986 by Gedye et al.[143] for organic chemistry reactions.
Ever since, the use of microwave radiation as a substitute of conventional heating
spread throughout several fields of chemistry including the synthesis of mesoporous
silica materials.[144-147]
In the case of liquid phase synthesis, the conventional procedure of heating the
reactants in a furnace or oil bath leads to slow and somewhat inefficient heating since
heat transfer relies on convection currents and on the thermal conductivity of vessels
and reactants. On the other hand, MW radiation produces a simultaneous and
uniform increase of the temperature throughout the whole volume of the synthesis
vessel, according to the ability of the solvent used to absorb microwave energy and
convert it into heat. However, it also shows some drawbacks like high cost of the MW
devices and reactors, limited size of the reactors (due to the short penetration depths of
the MW radiation, ultimately affecting the scale-up of the reactions) and difficulty to
35
monitor the formation and growth of the nano/mesoporous particles in situ.[146,147]
Nevertheless, the studies of the synthesis of PMS and PMO by MW are numerous, in
particular those assessing the effects on the hydrothermal treatment, template
extraction and functionalization.[148-162]
The first report on the synthesis of PMOs using microwave as heat source was
performed by Ahn and colleagues to produce ethane-bridged PMO by applying MW
heating in the hydrothermal treatment step (with C16 as SDA).[152,157] The synthesis
time was substantially shorter in comparison to conventional heating (4 to 6 h instead
of 21 h), whereas the obtained particles were smaller due to the higher nucleation rate
induced by the MW.
Grabicka and Jaroniec[158] used MW for the synthesis of ethane- and dissulfide-
bridged PMO using P123 as the SDA. The MW energy was used in both the
hydrothermal treatment and in the precedent self-assembly step. The total synthesis
time was reduced from 72 h (24 h of self-assembly and 48 h of hydrothermal
treatment) to 36 h for samples produced under MW (12 h of self-assembly and 24 h
hydrothermal treatment). In the case of the dissulfide-bridged sample, the SBET tends to
decrease slightly (from 1040 to 960 m2∙g-1) with increasing MW time (6 to 24 h) whilst
for the conventional sample it was a bit lower (865 m2∙g-1). The pore size was just
slightly decreased by the MW (from 8.1 to 7.4 nm).
Of special relevance for this thesis is the report from Smeulders et al.[161] on Ph-PMO
produced using MW as heat source in all the steps of the synthesis (self-assembly,
hydrothermal treatment and solvent extraction). The self-assembly step was of 2 h for
both conventional and MW stirring, but the duration of the hydrothermal treatment
could be reduced from 24 h in conventional oven down to 3 h under MW, and the
extraction step could be performed in only 15 min, instead of the several hours
required in a conventional solvent reflux (at least 4). The total synthesis time was
reduced by more than 40 h under MW. The authors observed an increase of SBET by
25% for the MW samples (up to 1000 m2∙g-1), whereas the pore size, the hexagonal
array of pores and the molecular scale periodicity along the pore wall remained
virtually unchanged. The same research group later found that the faster MW heating
profiles of the hydrothermal treatment render sphere-like particles with higher SBET
(around 20%), higher pore volume and more uniform pore size distribution.[152]
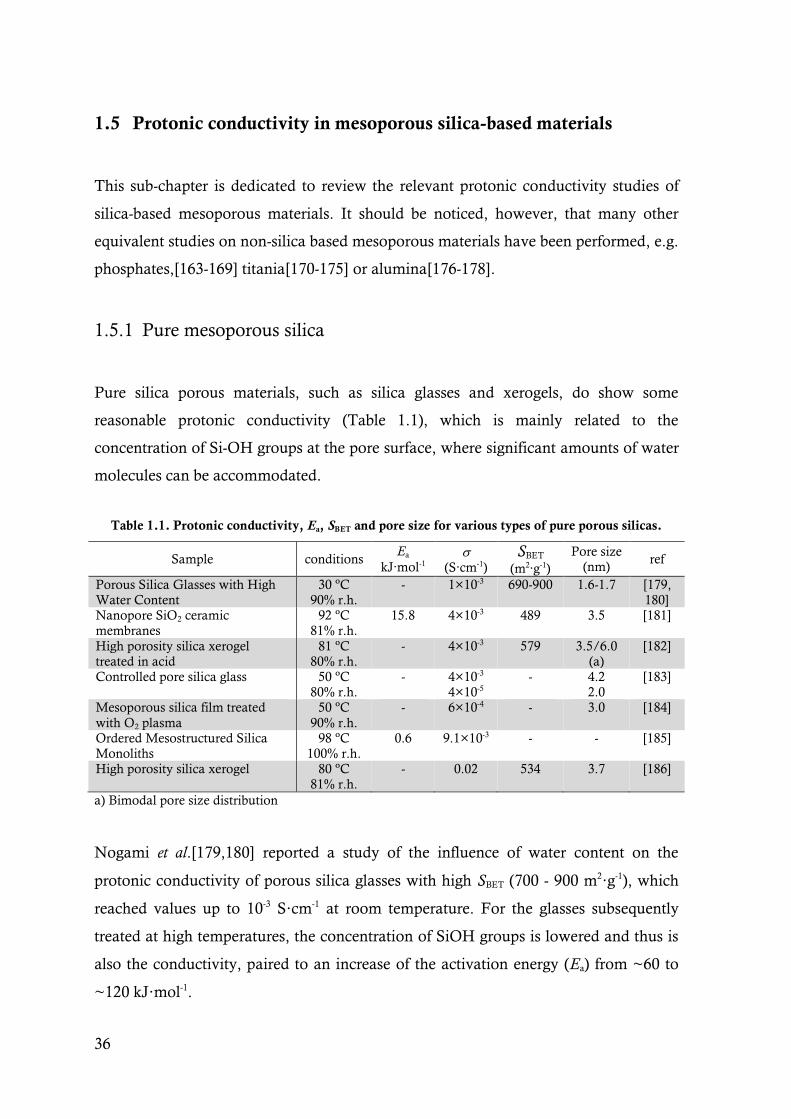
36
1.5 Protonic conductivity in mesoporous silica-based materials
This sub-chapter is dedicated to review the relevant protonic conductivity studies of
silica-based mesoporous materials. It should be noticed, however, that many other
equivalent studies on non-silica based mesoporous materials have been performed, e.g.
phosphates,[163-169] titania[170-175] or alumina[176-178].
1.5.1 Pure mesoporous silica
Pure silica porous materials, such as silica glasses and xerogels, do show some
reasonable protonic conductivity (Table 1.1), which is mainly related to the
concentration of Si-OH groups at the pore surface, where significant amounts of water
molecules can be accommodated.
Table 1.1. Protonic conductivity, Ea, SBET and pore size for various types of pure porous silicas.
Sample conditions Ea
kJ∙mol-1
(S∙cm-1)
SBET
(m2∙g-1)
Pore size
(nm) ref
Porous Silica Glasses with High
Water Content
30 ºC
90% r.h.
- 1×10⁻³ 690-900 1.6-1.7 [179,
180]
Nanopore SiO2 ceramic
membranes
92 ºC
81% r.h.
15.8 4×10⁻³ 489 3.5
[181]
High porosity silica xerogel
treated in acid
81 ºC
80% r.h.
- 4×10⁻³ 579 3.5/6.0
(a)
[182]
Controlled pore silica glass 50 ºC
80% r.h.
- 4×10⁻³
4×10⁻⁵
- 4.2
2.0
[183]
Mesoporous silica film treated
with O2 plasma
50 ºC
90% r.h.
- 6×10⁻⁴ - 3.0
[184]
Ordered Mesostructured Silica
Monoliths
98 ºC
100% r.h.
0.6 9.1×10⁻³ - - [185]
High porosity silica xerogel 80 ºC
81% r.h.
- 0.02 534 3.7 [186]
a) Bimodal pore size distribution
Nogami et al.[179,180] reported a study of the influence of water content on the
protonic conductivity of porous silica glasses with high SBET (700 - 900 m2·g-1), which
reached values up to 10-3 S·cm-1 at room temperature. For the glasses subsequently
treated at high temperatures, the concentration of SiOH groups is lowered and thus is
also the conductivity, paired to an increase of the activation energy (Ea) from ~60 to
~120 kJ·mol-1.
37
Daiko et al.[183] synthesized several silica glasses with different pore sizes (2-24 nm)
and studied their protonic conductivity. They found that the volume fraction of pores
occupied by water in glasses exposed to 80% r.h. at 50 °C drops from 0.95 to 0.11 as
the pore size increases from 2 to 24 nm. This effect is in agreement with Kelvin’s
equation (eq. 2.3), which states that, as the pore size decreases, the r.h. at which water
condenses also decreases. Interestingly, the conductivity of the sample with pore size
of 2 nm is lower than for the sample with 4.3 nm pore size (Table 1.1). The pulse-field
gradient NMR spectroscopy analysis of these samples revealed that the proton
diffusion coefficient is almost twice higher for the sample with larger pores. This
suggests that the diffusion of the proton is somewhat restricted in smaller pores, where
they are strongly chemically bonded to the surface hydroxyl groups.
Colomer et al.[186] studied the protonic conductivity of porous, acid-free silica
xerogels with pore size close to 4 nm and a SBET of 534 m2∙g-1. A water uptake (W)
experiment showed that the water concentration inside the xerogel increases sharply
up to 75% r.h. and moderately afterwards, indicating a two-regime process for the
adsorption of water, in agreement with Dubinin’s theory of volume filling for vapour
adsorption.[187] According to this theory, at low r.h., a layer of clusters of water
molecules is formed at the wall of the interconnected pores and, while the r.h.
increases, new layers of water molecules start to fill the remaining pore space via
capillary condensation, until a saturation effect is observed. Interestingly, the
conductivity increases 4 orders of magnitude with increasing r.h., in a very similar
trend as for the W. The Ea decreased from 31 kJ∙mol-1 at 33% r.h. down to 7.7 kJ·mol-1
at 75% r.h.[41,188]
1.5.2 Inorganic functionalized ordered mesoporous silica
Mesoporous silicas turned out to be satisfactory proton conductors on their own, but
the introduction of acid groups into the pores was regarded as an opportunity to
further increase the conductivity by enhancing proton diffusion. The functionalization
of PMS with inorganic acids, heteropolyacids or solid acids is widely reported in
literature. The conductivity values and other relevant data for several examples are
shown in Table 1.2, some of which are analysed in the following paragraphs.
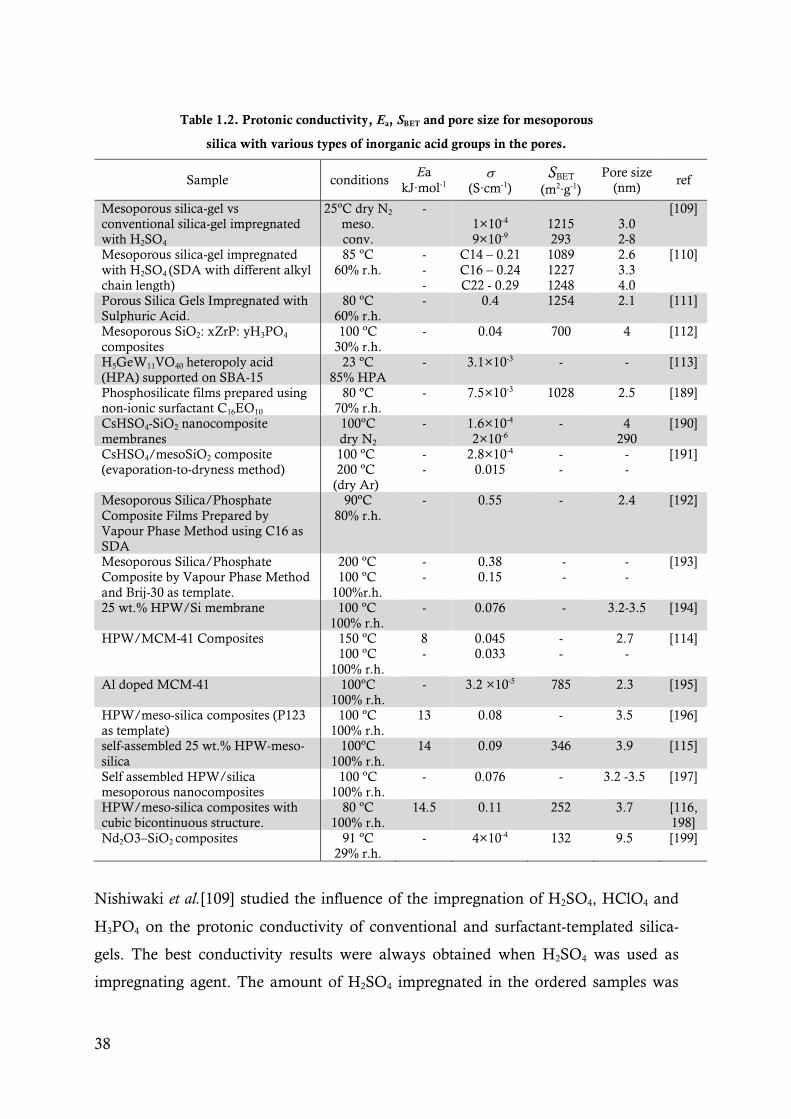
38
Table 1.2. Protonic conductivity, Ea, SBET and pore size for mesoporous
silica with various types of inorganic acid groups in the pores.
Sample conditions Ea
kJ∙mol-1
(S∙cm-1) SBET
(m2∙g-1)
Pore size
(nm) ref
Mesoporous silica-gel vs
conventional silica-gel impregnated
with H2SO4
25ºC dry N2
meso.
conv.
-
1×10⁻⁴
9×10⁻⁹
1215
293
3.0
2-8
[109]
Mesoporous silica-gel impregnated
with H2SO4 (SDA with different alkyl
chain length)
85 ºC
60% r.h.
-
-
-
C14 – 0.21
C16 – 0.24
C22 - 0.29
1089
1227
1248
2.6
3.3
4.0
[110]
Porous Silica Gels Impregnated with
Sulphuric Acid.
80 ºC
60% r.h.
- 0.4 1254 2.1 [111]
Mesoporous SiO2: xZrP: yH3PO4
composites
100 ºC
30% r.h.
- 0.04 700 4 [112]
H5GeW11VO40 heteropoly acid
(HPA) supported on SBA-15
23 ºC
85% HPA
- 3.1×10⁻³ - - [113]
Phosphosilicate films prepared using
non-ionic surfactant C16EO10
80 ºC
70% r.h.
- 7.5×10⁻³
1028
2.5
[189]
CsHSO4-SiO2 nanocomposite
membranes
100ºC
dry N2
- 1.6×10⁻⁴
2×10⁻⁶
- 4
290
[190]
CsHSO4/mesoSiO2 composite
(evaporation-to-dryness method)
100 ºC
200 ºC
(dry Ar)
-
-
2.8×10⁻⁴
0.015
-
-
-
-
[191]
Mesoporous Silica/Phosphate
Composite Films Prepared by
Vapour Phase Method using C16 as
SDA
90ºC
80% r.h.
- 0.55 - 2.4 [192]
Mesoporous Silica/Phosphate
Composite by Vapour Phase Method
and Brij-30 as template.
200 ºC
100 ºC
100%r.h.
-
-
0.38
0.15
-
-
-
-
[193]
25 wt.% HPW/Si membrane
100 ºC
100% r.h.
- 0.076 - 3.2-3.5 [194]
HPW/MCM-41 Composites 150 ºC
100 ºC
100% r.h.
8
-
0.045
0.033
-
-
2.7
-
[114]
Al doped MCM-41 100ºC
100% r.h.
- 3.2 ×10⁻⁵ 785 2.3 [195]
HPW/meso-silica composites (P123
as template)
100 ºC
100% r.h.
13 0.08 - 3.5 [196]
self-assembled 25 wt.% HPW-meso-
silica
100ºC
100% r.h.
14 0.09 346 3.9 [115]
Self assembled HPW/silica
mesoporous nanocomposites
100 ºC
100% r.h.
- 0.076
- 3.2 -3.5 [197]
HPW/meso-silica composites with
cubic bicontinuous structure.
80 ºC
100% r.h.
14.5 0.11 252 3.7 [116,
198]
Nd2O3–SiO2 composites 91 ºC
29% r.h.
- 4×10⁻⁴
132 9.5 [199]
Nishiwaki et al.[109] studied the influence of the impregnation of H2SO4, HClO4 and
H3PO4 on the protonic conductivity of conventional and surfactant-templated silica-
gels. The best conductivity results were always obtained when H2SO4 was used as
impregnating agent. The amount of H2SO4 impregnated in the ordered samples was

39
superior to the one in silica gel (~2.5 times larger), leading to a protonic conductivity
which is 4 orders of magnitude higher than the conductivity of acid functionalized
silica-gel.
Matsuda et al.[110] studied the influence of the alkyl chain length of several alkyl
ammonium bromide surfactants (C14, C16 and C22) on the protonic conductivity of
similar silica-gels. As the alkyl chain length increased, they found materials with
higher SBET (from 1089 to 1248 m2∙g-1) and larger pore size distribution (from 2.6 to 4.0
nm). In terms of conductivity, the result also showed a slight increase with increasing
number of carbon in the alkyl chain. Samples impregnated with H2SO4 and HClO4
have the highest conductivity (up to 2.910-1 S∙cm-1 at 85 °C and 60% r.h., Table 1.2).
The same authors have also found that the conductivity increases with increasing
concentration of H2SO4 in the solution used for the impregnation (5 M H2SO4 yielded
conductivity values up to 410-1 S∙cm-1 at 60% r.h., which is 2 orders of magnitude
higher than for a sample treated with a 0.5 M H2SO4 solution).[111]
Heteropolyacids are known to be good solid conductors at near ambient
temperature.[200] Jin et al.[113] took advantage of this property and introduced
H5GeW11VO40 (HPA) with a Keggin structure into the mesoporous silica molecular
sieve SBA-15.
A conductivity value of 3.110-3 S∙cm-1 was obtained at 23 ºC, which is slightly higher
than for the pure HPA.[201] The provenience of the protonic conductivity could be
from the HPA itself, from the hydrolysis of water molecules connected to both HPA
crystal and the wall of the SBA-15, or from the ionization of the superficial silanol
groups. The large number of micro and mesopores in SBA-15 enhances the good
dispersion of the HPA, allowing the adsorption of more water than for pure HPA and
thus facilitating proton transport. The existence of HPA inside the pores of SBA-15
also led to a strong interaction with the silanol groups, making the ionization of these
groups much easier than for pure SBA-15.
Yet another composite material based on mesoporous silica was prepared by
incorporating CsHSO4.[190] This solid acid undergoes a phase transition at 140 °C
and its conductivity is dramatically increased from 10-6 to 10-2 S∙cm-1. This still
restrains the working temperature for solid acid based fuel cells to temperature above
the phase transition temperature.[74] However, it has been shown that it is possible to

40
stabilize the high temperature phase at low temperature by synthesizing CsHSO4
composite electrolyte with high content of porous oxides (TiO2 or SiO2) and by
assuring that the CsHSO4 is in an amorphous phase, which depends not only on the
oxide content but also on the shape and pore size of the oxides. Interesting XRD and
thermal analysis data showed that the CsHSO4 inside the composite with the smaller
pores (4 nm) was characterized by an amorphous phase with dispersed crystallites,
whereas the sample with bigger pores (290 nm) consisted of crystallized bulk phase
with amorphous interfaces. Comparing to the sample with 290 nm pore size and to
pure CsHSO4, the sample with smaller pores showed an increase of conductivity by 2
orders of magnitude.
Zeng et al.[116,198] studied the protonic conductivity of 12-phosphotungstic acid
(H3PW12O40∙nH2O or HPW) impregnated mesoporous silica materials with a
bicontinuous cubic symmetry. Samples impregnated with up to 80% HPW showed
conductivity levels of 0.07-0.11 S∙cm-1 at 25-90 ˚C and 100% r.h., which is 3 orders of
magnitude higher than for the pure mesoporous silica, and comparable or even higher
than for Nafion®. The relatively low Ea (14.5 kJ∙mol-1) and high conductivity values
are related with proton hopping mechanism mediated by water, avoiding the
formation of the transition state from the rearrangement of the Keggin structure of the
HPW.
1.5.3 Organic functionalized ordered mesoporous silica
The use of organic acid groups (such as sulfonic, phosphonic or carboxylic acid and
imidazole) for the functionalization of mesoporous silica is also heavily present in the
literature. Table 1.3 presents the characteristic data for a few examples.
Table 1.3. Protonic conductivity, SBET, pore size, W and
[H+] for organic functionalized mesoporous silicas.
Sample conditions
(S∙cm-1) SBET
(m2∙g-1)
Pore size
(nm) W (%) [H+]
mmol∙g-1
ref
Functionalized mesoporous silica (SBA
15) with MPTMS. 1) 20% and 2) 10%
90 ºC
100% r.h.
20% - 0.03
10% - 0.01
615
521
12.2
12
56.7
53.8
1.1
0.5
[129]
Meso-SiO2-C12EO10OH-CF3SO3H thin
films
25 ºC
90% r.h.
5×10⁻⁴ - 4.85
- - [202]

41
Table 1.3 (continued)
Mesoporous polyaniline / SBA-15
composites
25 ºC
100% r.h.
0.022
555 3.8
42
- [203]
Mesostructured silica films with
aluminosilica and PFSA
100 ºC
100% r.h.
0.02
- - - - [204]
Surface sulfonated (1-x)PhSiO3/2-
(x)MeSiO3/2 particles with (1) and
without (2) mesoporous structure
80 ºC
80%r.h.
1) 5.5×10⁻³
2) 1.5×10⁻³
-
-
-
-
31
20
1.05
0.90
[205]
Post synthetic sulfonation of MCM-
41(1), SBA-15 (2) and SBA-16 (3) with
MPTMS
100 ºC
100% r.h.
1)9.16×10⁻⁵
2)1.28 ×10⁻⁵
3)4.36×10⁻⁶
1031
769
792
2.7
7.9
7.2
-
-
-
1.16
-
-
[95]
Co-condensation of MCM-41 with 40%
MPTMS. MW energy for template
extraction and oxidation in one step.
100 ºC
100% r.h.
0.016 - - - 2.3 [156]
Immobilized imidazole in MCM-41 100 ºC
100% r.h.
1×10⁻⁶ - - - 0.56 [107]
Functionalized MCM-41 and MCM-48
containing phenyl sulfonic acid (S-PE),
propyl sulfonic acid (S-MP) and ethyl
phosphonic acid (P).
25 ºC
100% r.h.
P-48
S-MP-48
S-PE-48
P-41
S-MP-41
S-PE-41
1.1×10⁻³
2.7×10⁻³
3.9×10⁻³
2.0×10⁻³
4.2×10⁻³
8.3×10⁻³
-
-
-
-
-
-
-
-
-
-
-
-
-
-
-
-
-
-
0.36
0.23
0.28
n.a
0.68
0.87
[206]
Phosphonic acid functionalised porous
silica nanospheres
100 ºC
100% r.h.
0.014 899 0.96
- 1.3 [137]
Phosphonic acid functionalized silicas
100 ºC
100% r.h.
0.026
20
- - - [138]
Nanoparticles of Mesoporous SO3H-
functionalized Si-MCM-41
100 ºC
100% r.h.
3.9×10⁻³ 1135 2.1 - 1.78 [135]
Imidazole functionalized MCM-41 100 ºC
100% r.h.
1×10⁻⁵ 349 2.0 - - [108]
MPTMS functionalized SBA-15 120 ºC
100% r.h.
1×10⁻³ - - - - [207]
P2O5-SiO2-PWA inorganic membrane
matrix functionalized with MPTMS
and glutaraldehyde
100 ºC
50% r.h.
0.085 - - - - [208]
Periodic ordered sulfonated-silica
nanoelectrolytes with 2D hexagonal
structure
100ºC
100% r.h.
0.23
- - - - [209]
Sulfonic acid functionalized MCM-41
(20 wt. %)
100 ºC
100% r.h.
5.7×10⁻³ 428 2.16 - 2.82 [210]
Sulfonic acid functionalized MCM-41
(40 wt. %)
100 ºC
100% r.h.
0.016 380 2.01 - 3.2 [211]
Sulfonated Arene Mesoporous Ethane
silicas using Brij-56 as SDA
25ºC
160 wt.%
H2O
0.016 1040
3.3
- 1.21
[212]
MPTMS functionalized Benzene-PMO
grafted at the 1) silanol site, 2) benzene
ring and 3 ) both locations.
100ºC
100% r.h.
1)3.9×10⁻⁶
2)1.8×10⁻⁴
3)9.8×10⁻³
834
420
348
3.5
2-4
2-4
-
-
-
1.14
1.42
1.61
[97]
Highly ordered mesoporous sílica films
functionalized with MPTMS using
different alkyl chain surfactant.
25 ºC
90 % r.h.
C12) 0.27
C18) 0.21
830
760
2.7
3.4
-
-
1.8
1.5
(theor.)
[213]
42
Mikhailenko et al.[129] pioneered the study of the protonic conductivity in hybrid
functionalized PMS. They synthesised the mesoporous organosilicas by co-condensing
TEOS and different amounts of MPTMS (0, 10 and 20% mol), using P123 as SDA, in
acidic conditions. The protonic conductivity was found to be extremely dependent on
water content, enhancing up to 6 orders of magnitude from dry to fully hydrated state.
At room temperature, the fully hydrated functionalized silica showed conductivity
above 10-2 S∙cm-1. The conductivity in water vapour saturated conditions followed an
Arrhenius tendency, with an apparent Ea of 6.9 kJ∙mol-1 for the membrane with best
protonic conductivity (20% mol. substitution). This value is comparable to the
enthalpy of water diffusion (4.8 kJ∙mol-1).[200]
Marschall et al.[95] studied the conductivity of PMS functionalized with 5 to 20%
mmol∙g-1 of SO3H via the post-synthetic MPTMS grafting of MCM-41, SBA-15 and
SBA-16. For low levels of functionalization, the wide pores of SBA-15 seem to justify
its high conductivity. Interestingly, at high [H+], this material overtakes the others by
one order of magnitude, which can be due to the superior SBET, which allows a high
degree of acid functionalization. The high density of acid groups in the more confined
pores of MCM-41 may facilitate the proton hopping. As expected, the conductivity is
highly dependent on the r.h. reflected as an increase in 4 orders of magnitude from dry
state to fully hydrated. Still, the best result obtained was a modest 9×10⁻⁵ S∙cm-1 at 100
˚C and 100% r.h. The same group published another paper on the conductivity of
highly functionalized PMS (20 to 40 mmol∙g-1) obtained by the co-condensation of
MCM-41 with MPTMS.[156] The 2.3 mmol∙g-1 of [H+] achieved by this method
turned out to be crucial for the enhancement of conductivity. More than one SO3H
group per nm2 was achieved at the inner surface, which promoted the direct proton
diffusion between acid sites. At 100 ˚C and 100% r.h. the best result obtained was of
1.6×10⁻² S∙cm-1. MD simulations showed that the functionalized samples obtained by
grafting are more dependent on the water transport than the co-condensed ones.[141]
Due to the less homogeneous distribution of water in scarcely humidified conditions,
for a sample with a low loading of acid groups, the proton transport barrier varies
greatly with the , whereas for samples with greater level of [H+], the small distance
between the protogenic groups minimizes the effect of the low .
43
As mentioned before, Sharifi et al.[97] studied the protonic conductivity of sulfonic
acid functionalized Ph-PMO. The temperature dependence of the conductivity follows
an Arrhenius behaviour with Ea of 117 kJ∙mol-1 for a material grafted on the silica, 63
kJ∙mol-1 for the sample with SO3H groups at the benzene and 54 kJ∙mol-1 for the
sample with acid groups in both sites. The authors justify the higher Ea of the silica
grafted material because of the inhomogeneous distribution of the MPTMS groups
inside the material, as mentioned in a previous study.[156] The high reactivity of the
acid precursor leads to a preferential anchoring at the pore mouths, hindering the
conductivity along the channels.[78,135,156] The sample with both functionalities
showed the best conductivity result of 0.08 S∙cm-1 at 140 °C and 100% r.h. These
authors also performed computational simulations for the characterization of the
water environment using radial distribution function obtained from MD simulation.
These results suggest that the isolated SO3H acid groups located at the benzene ring
should act as a proton trap under scarcely humidified conditions. However, the
combination with neighbouring flexible propyl chain of the acid functionalities at the
silanol lowers the proton barrier. If sufficient acid groups are provided, the proton
conduction along the pore wall by hopping from adjacent acid functionalities may
compete with the bulk water vehicular mechanism, in dry conditions.[97]
Very recently, Fujita et al.[213] studied the protonic conductivity of several highly
ordered mesoporous silica structures with MPTMS functionalization, and using
cationic surfactants with different alkyl chain lengths (C12, C14 and C18). The
materials were grown over a Si substrate by an evaporation induced self-assembly
process. Materials with pore sizes varying from 2.2 to 3.9 nm and [H+] from 0.78 to
2.3 mmol∙g-1 could be obtained. All samples show a sharp increase of conductivity
with increasing r.h. up to a certain r.h. value, where the subsequent increase is more
moderate. Water sorption measurements are used to explain this sharp increase, which
is related with the adsorption and clustering of water molecules up to a point where
condensation occurs, driven by capillarity. The transition between the two
conductivity regimes is shifted to lower r.h. as the acid functional density increases
and the pore size decreases, in agreement to Kevin’s equation (eq. 2.3). The best
performing sample showed high conductivity values even at low water filling ratio of
the mesopores (20% or = 2).
44
The potential of phosphonic acid functionalized PMO for proton conduction has also
been investigated. Jin et al.[137,138] synthesised porous silica nanospheres
functionalized with phosphonic acid by the co-condensation of variable amounts of
diethylphosphatoethyl trimethoxysilane (DPTS) (in P/Si nominal ratios of 10, 20, 30
and 40%) and TEOS, using C16 as SDA. It was observed that the conductivity
increases with increasing acid content and that the elevated SBET helped raising the
conductivity at low water content. The sample with 40% nominal functionalization
rate exhibited a [H+] of 1.3 mmol∙g-1 and the highest protonic conductivity at 130 °C of
3×10⁻⁴ up to 0.015 S∙cm-1 from 20% to 100 % r.h respectively. The presence of
phosphonic acid groups inside the pore wall may create a continuous pathway for the
proton to diffuse in a Grotthuss mechanism in reduced water content conditions.
Moreover, the amphoteric characteristic of this acid enables intrinsic protonic
conductivity, which can be advantageous comparing to sulfonic acid.[214]
1.6 Composite Nafion®-based membranes
Since Nafion® is still the best choice as electrolyte material for PEMFC in terms of
performance and durability, much effort has been made in order to modify this PEM
with the purpose of rising the working temperature and lessen the chronic dependence
on the presence of water. The incorporation of hygroscopic phases into the polymer
matrix is probably the most explored approach to improve water retention capacity of
the polymer and hence the conductivity. The fillers also contribute to improve the
thermo–mechanical stability of the polymer.[215] A huge variety of filler materials has
been tested including SiO2, TiO2, SnO2, ZrO2, Zr(HPO4)2 and heteropolyacids (e.g.
H3PW12O40 and H4SiW12O40).[13,215]
The following analysis is focused on composite Nafion® membranes with silica-based
fillers. Selected examples of these composites are listed in Table 1.4, including data of
conductivity, W and swelling. The membrane conductivity is preferred over alternative
indicators of performance such as the power output because there is a huge influence

45
of the electrode composition and electrode/electrolyte interface on the fuel cell
measurements, that is difficult to account for and, thus, difficult to compare.
Table 1.4. Protonic conductivity, W and swelling of Nafion®/SiO2
composite membranes, including filler properties [H+], SBET and pore size.
Sample Condit. Conductivity
(S∙cm-1)
W
(wt.%)
Swell.
(%)
Filler properties ref
[H+]
(mmol∙g-1) SBET
(m2∙g-1)
Pore
size(nm)
3 wt.% SiO2 particles in recast Nafion® 100 ºC
in air
0.19 (a) - - - 200 12(b) [216]
SiO2 particles in various % added to
preformed 1)Nafion® 115 and 2) recast
Nafion®
130 ºC
90-100%
r.h.
1) 2% - 0.28
6% - 0.23
10% - 0.26
2) 3% - 0.42
6% - 0.46
(a) 10%-0.26
- - - - - [217]
Composite Nafion® recast membrane
with 1) perfluoroalkyl sulfonic acid
functionalized mesoporous SiO2 and 2)
pristine mesoporous SiO2 (L64
copolymer as SDA).
1) 1% - 0.11
3% - 0.12
6% - 0.11
2) 1% - 0.10
6% - 0.07
79.8
75.8
70.5
48.3
44.1
39.1
1.52
-
304
568
2.4
4.5
[218]
Composite Nafion® membranes with 1)
bulk SiO2 particles, 2) pristine
mesoporous SiO2 and 3) SO3H
functionalized mesoporous SiO2.
80 ºC
95% r.h.
1) 0.08
2) 0.12
3) 0.13
(d)
10.6
15.7
22.3
-
0.06
0.38
0.46
89
837
717
18-84(b)
6.7
6.7
[219]
1 wt.% MCM-41 in recast Nafion® 80 ºC
100% r.h.
0.2 24.2 (e) 970 2.5 [220]
4 wt.% polyelectrolyte grafted SiO2
nanoparticles in recast Nafion®
80 ºC 0.041 9.7 [221]
13 wt.% (in Si) sulfonated organically
modified silicas grown in situ in recast
Nafion.
95 ºC
95% r.h.
0.029 56
=31
16 0.98 (f) [222]
5 wt.% in situ grown SiO2 nanoparticles
in recast Nafion®.
60 ºC
100%r.h.
0.09 =7
60 ºC
[223]
Nafion® recast membranes of 1)
phosphonic acid functionalized porous
SiO2 nanoparticles and 2) colloidal SiO2
85 ºC
50% r.h.
1) 5% - 0.025
10% - 0.026
15% - 0.022
2) 5% - 0.014
10% - 0.009
1.25
1.29
1.39(f)
700 2.5
20 (b)
[224]
10 wt.% Sulfonated SBA-15 in recast
Nafion®.
80 ºC
100% r.h.
0.011
0.36 8 [225]
5 wt.% in situ formed SiO2 in recast
Nafion®
100 ºC
100% r.h.
0.02 27.2 [226]
20 wt. % in situ sol-gel formation of acid-
functionalized Polysilsesquioxane in
recast Nafion®
80 ºC
90% r.h.
0.09 30.2
=13
1.28 (f) [227]
10 wt.% of a SiO2-TiO2-Catechol
sulfonate salt (ratio of 1:01:0.025) in
recast Nafion® (P123 as SDA)
100 ºC
80% r.h.
0.039 17 313 [228]
3 wt.% mesoporous sulfonated-Ph-SiO2
in recast Nafion®
25 ºC
100% r.h.
0.013 60 0.94 (f) 617 6.9 [229]
(a) contact resistance in Ω∙cm2, (b) particle size, (c) without acid functionalization, (d) composite
membranes with 5 wt.% filler, (e) less than Nafion® reference, f) for the membrane.

46
Early work made by Antonucci et al.[216] investigated a 3 wt% SiO2/Nafion®
composite membrane at 145 °C, in which the silica was added to a solution of
Nafion® ionomer before recasting. They reported a cell resistance* of 0.19 Ω∙cm2 at
100 ºC in air with improved water retention and lower methanol cross-over. A
different approach for the synthesis of the composite membranes was introduced by
Adjemian et al.[217], by addition of commercial SiO2 particles (Aerosil 200, Degussa)
to a preformed Nafion® 115 membrane (using an impregnation method via sol-gel
processing of TEOS) and to recast Nafion® membrane, using various amounts of SiO2
fillers. The composite membrane with preformed Nafion® 115 showed, at 130 °C, a
minimum contact resistance of 0.23 Ω∙cm2 for the sample with 6 wt.% SiO2, increased
water retention and thermal durability in comparison to the pristine Nafion® 115
membrane.
The membranes with recast Nafion® showed enhanced properties up to 10 wt.% SiO2
loadings with a minimum resistance observed of 0.26 Ω∙cm2. The optimal filler
content thus seems to be higher for the recast membranes, probably due to the phase-
separated microstructure in the membranes, since in the recast Nafion® the
hydrophilic domains could restructure as the SiO2 polymer was forming, thus
accommodating more filler. The incorporation of more than 10 wt.% fillers led to
mechanical instability of the membranes. An investigation by Lin et al.[218] compares
composite Nafion® membranes using perfluoroalkyl sulfonic acid functionalized
mesoporous silica particles (S-MSiO2) and pristine mesoporous SiO2 particles (MSiO2)
as fillers. The recast S-MSiO2/Nafion® membranes containing up to 6 wt.% hybrid
fillers showed reduced methanol permeability, W and swelling as function of filler
content increase. The authors state that the probable cause of the increase in
conductivity for the composite membranes is due to the increase of [H+] of the
membranes caused by the presence of the functionalized S-MSiO2 in the matrix.
Interestingly, the improvement in conductivity from 0.10 to 0.12 S∙cm-1 is maximized
for 3 wt.% filler. The authors suggest that the conductivity drop for higher filler
contents is mainly due to phase-separated microstructure in the membrane. On the
other, the addition of pristine MSiO2 leads to a quasi-linear decrease in conductivity
from the first 1 wt.% addition up to 6 wt.%.
* - area-specific resistance, which is the cell resistance multiplied by the electrode area.

47
Tominaga et al.[219] studied the incorporation of SiO2 fillers using various types of
silicas: bulk nanosized SiO2 (p-SiO2), pristine mesoporous SiO2 (MSiO2) and
sulfonated mesoporous SiO2 (S-MSiO2). Composite membranes with the S-MSiO2
fillers showed improved conductivity with the increase of filler content up to 5 wt.%,
and decreasing thereafter. Contrary to the observation of Lin et al.,[218] they also
observed an increase of conductivity with additions of pristine M-SiO2. They justify
the higher conductivity in the MSiO2 comparing to pristine Nafion® and composite
with p-SiO2 by the presence of the mesoporosity which can lead to higher W of these
composite membranes (the pristine MSiO2 filler has a SBET more than 50% higher than
for the MSiO2 from Lin et al. – Table 1.4). In the specific case of S-MSiO2, the
presence of hydrophilic sulfonic acid could also contribute to higher migration of
proton in the composites. The visible decline in conductivity from 5 wt.% upwards
was explained by the increasing presence of an insulating phase composed by
agglomerates of mesoporous SiO2 domains, which ultimately hinder the conductive
nature of the Nafion® matrix. On the other hand, the composite membranes with p-
SiO2 particles show a decline in conductivity right from the first addition of 1 wt.% in
filler.
Pereira et al.[222] used an in-situ sol-gel process to synthesise mesoporous hybrid
organic-inorganic SiO2-based particles in a Nafion® matrix. The membranes were
made by the co-condensation of TEOS and 10 mol % of a sulfonated organo-
alkoxysilane, using an organic surfactant as directing agent, in the presence of the
ionomer. The co-condensation reactions and cooperative self-assembly organization
occurred during solvent evaporation of the membrane recast process. This in-situ sol-
gel method allowed a better definition of pore dimension and a homogeneous
distribution of the particles in the polymer matrix. The composite membrane with
hybrid silica particles content of 13 wt.% was found to be the best performing
membrane. The protonic conductivity of the hybrid membrane at 95 °C and 90% r.h.
is 0.029 S∙cm-1, which is more than 5 times the conductivity of Nafion® 112 reference
used in this work (0.006 S∙cm-1). The authors state that the high [H+] of the hybrid
membrane associated to the enhanced W and reduced swelling can explain this
increase. However, when compared to other conductivity values published in the
48
literature, which are usually close to 0.1 S∙cm-1 in similar conditions, the
improvements reported by Pereira et al. seem indeed modest.
Phosphonic acid functionalized mesoporous particles have also been added to
Nafion®. The use of this acid instead of sulfonic acid seems to be advantageous
because of the potentially higher charge carrier concentration, thermal stability and
resistance to oxidation. The dependence on liquid water can also be diminished
because of the amphoteric behaviour of this protogenic group (it can act as a proton
donor and as proton acceptor), forming dynamic hydrogen bond networks where
proton can be transported by the quick formation and breaking of hydrogen
bonds.[214]
A research developed by Wang et al.[224] compared the performance of phosphonic-
acid functionalized silica particles/Nafion® composite membranes with colloidal
silica/Nafion® and pristine Nafion® membranes. The functionalized silica particles
composite membranes with 10 wt.% of loading showed an improvement of 24% in
protonic conductivity at 85 °C/ 50% r.h. As observed by other authors cited above, the
increase of conductivity with increasing filler amount goes through a maximum. The
authors also speculate, as for Lin et al.[218], that this effect is related to the phase-
separated microstructure of the membranes. Changes in the hydrophobic/hydrophilic
domains could thus affect the proton transport in the membrane.
From the analysis made so far, there seems to be a maximum filler content that
renders the greater conductivity increase of the composite membranes conductivity
comparing to pristine Nafion®, normally under the 10 wt. % threshold. Although the
great variability in the structure and microstructure of the different fillers used in the
literature may not allow a straightforward correlation, one can say that there is a limit
to the incorporation of fillers in Nafion®. Several authors seem to agree that this effect
is related to changes if the microstructural phase-separation of the Nafion®
membrane. The majority of the works in the literature used the recast method to
incorporate the fillers inside the polymer matrix with promising results. The composite
membrane where the filler present higher [H+] allied to high SBET tend to show better
conductivity values of the composite membranes.
The majority of the studies of Nafion® composite membranes explain the
enhancements in conductivity solely by the increase in W and water retention ability

49
introduced by the presence of the hygroscopic fillers. Kreuer[33] recently suggested
that the presence of foreign bodies in Nafion®, mainly those that stand at the surface,
could create a perturbation of the observable surface skin, helping to release the built-
up internal pressure and allowing the incorporation of additional water, just like it
happens in membranes that are in direct contact with liquid water (the so-called
Schroeder paradox presented in section 1.2.1.1).
To the best of our knowledge, this thesis reports for the first time the incorporation of
sulfonic acid functionalized benzene-bridged PMO in composite Nafion® membranes.
Moreover, the study of the influence of the characteristics of PMOs ([H+], SBET, pore
volume, pore order) on the conductivity as function of both temperature and relative
humidity is also scarce in the literature. The choice of benzene-bridged PMO as hybrid
filler for composite Nafion® membranes is not arbitrary. It has been chosen because it
offers a stable rigid structure for the conduction of proton which is independent of r.h.
and should not suffer from the confinement effect caused by the shrinkage of the
pores, as it happens in Nafion®.[38,52] Moreover, the structure of the acid
functionalized PMO makes it a good model of the structure of Nafion® pores in its
hydrated form, with similar pore width and distance between acid sites.[52] It is
expectable that the swelling of the composite membrane is reduced as a function of the
filler content because the mesoporous particles can offer the free volume necessary for
the incorporation of excess hydration water, limiting the expansion of the Nafion®
matrix, as observed by other authors.[218] The choice of the protogenic group is also
matter of discussion: sulfonic and phosphonic acids are thus investigated. The former
was chosen because it has been largely used in the functionalization of PMSs and
PMOs, with good results in terms of protonic conductivity and W. Sulfonic acid is
therefore a safe choice as protogenic group.[214] The phosphonic acid group was
selected due to its novelty in the functionalization of Ph-PMO and to some promising
results found in the literature on the phosphonic acid functionalization of mesoporous
silicas.[137,138,206]

50
51
2 MATERIALS AND METHODS
In this chapter the syntheses of the various precursors, of the acid functionalized
periodic mesoporous organosilicas and of the composite Nafion® membranes are
described. The techniques and methods used to characterize the composition,
structure and microstructure of the hybrid mesoporous silica powders and composite
membranes are also described.
2.1 Synthesis of the acid functionalized PMO precursors
Two of the basic precursors for sulfonic and phosphonic acid functionalized PMO
were synthesized in-lab, mainly due to the high cost and relatively low purity of the
products available in the market.
2.1.1 Synthesis of 1,4-bis(triethoxysilyl)benzene (BTEB)
The synthesis of the benzene-bridged organosilane BTEB (scheme 2.1) was prepared
according to the procedure described in the literature.[230]
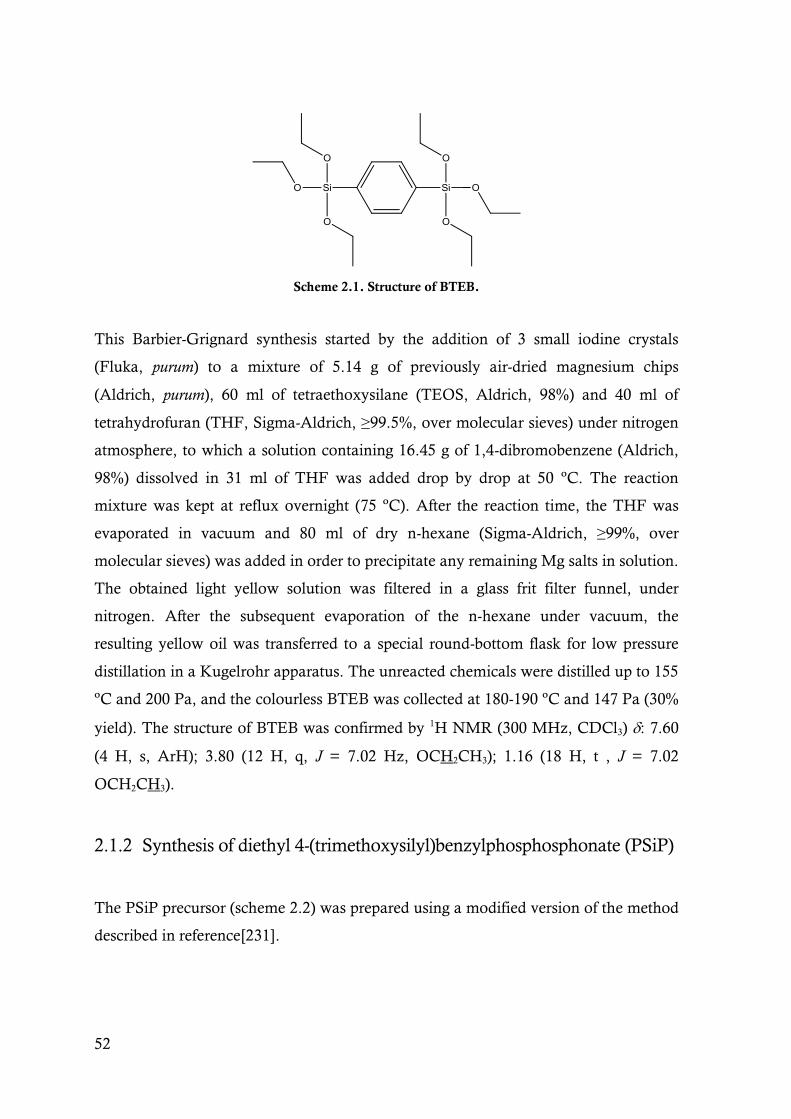
52
Scheme 2.1. Structure of BTEB.
This Barbier-Grignard synthesis started by the addition of 3 small iodine crystals
(Fluka, purum) to a mixture of 5.14 g of previously air-dried magnesium chips
(Aldrich, purum), 60 ml of tetraethoxysilane (TEOS, Aldrich, 98%) and 40 ml of
tetrahydrofuran (THF, Sigma-Aldrich, ≥99.5%, over molecular sieves) under nitrogen
atmosphere, to which a solution containing 16.45 g of 1,4-dibromobenzene (Aldrich,
98%) dissolved in 31 ml of THF was added drop by drop at 50 ºC. The reaction
mixture was kept at reflux overnight (75 ºC). After the reaction time, the THF was
evaporated in vacuum and 80 ml of dry n-hexane (Sigma-Aldrich, ≥99%, over
molecular sieves) was added in order to precipitate any remaining Mg salts in solution.
The obtained light yellow solution was filtered in a glass frit filter funnel, under
nitrogen. After the subsequent evaporation of the n-hexane under vacuum, the
resulting yellow oil was transferred to a special round-bottom flask for low pressure
distillation in a Kugelrohr apparatus. The unreacted chemicals were distilled up to 155
ºC and 200 Pa, and the colourless BTEB was collected at 180-190 ºC and 147 Pa (30%
yield). The structure of BTEB was confirmed by 1H NMR (300 MHz, CDCl3) : 7.60
(4 H, s, ArH); 3.80 (12 H, q, J = 7.02 Hz, OCH2CH3); 1.16 (18 H, t , J = 7.02
OCH2CH3).
2.1.2 Synthesis of diethyl 4-(trimethoxysilyl)benzylphosphosphonate (PSiP)
The PSiP precursor (scheme 2.2) was prepared using a modified version of the method
described in reference[231].
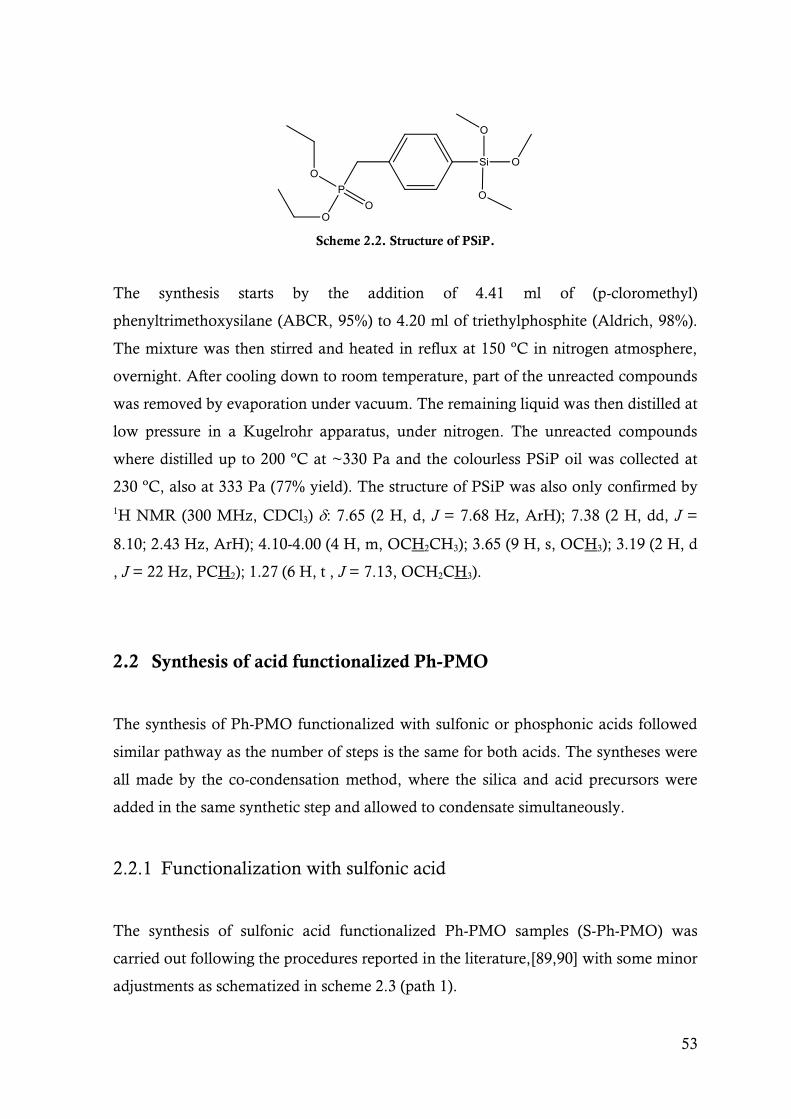
53
Scheme 2.2. Structure of PSiP.
The synthesis starts by the addition of 4.41 ml of (p-cloromethyl)
phenyltrimethoxysilane (ABCR, 95%) to 4.20 ml of triethylphosphite (Aldrich, 98%).
The mixture was then stirred and heated in reflux at 150 ºC in nitrogen atmosphere,
overnight. After cooling down to room temperature, part of the unreacted compounds
was removed by evaporation under vacuum. The remaining liquid was then distilled at
low pressure in a Kugelrohr apparatus, under nitrogen. The unreacted compounds
where distilled up to 200 ºC at ~330 Pa and the colourless PSiP oil was collected at
230 ºC, also at 333 Pa (77% yield). The structure of PSiP was also only confirmed by
1H NMR (300 MHz, CDCl3) : 7.65 (2 H, d, J = 7.68 Hz, ArH); 7.38 (2 H, dd, J =
8.10; 2.43 Hz, ArH); 4.10-4.00 (4 H, m, OCH2CH3); 3.65 (9 H, s, OCH3); 3.19 (2 H, d
, J = 22 Hz, PCH2); 1.27 (6 H, t , J = 7.13, OCH2CH3).
2.2 Synthesis of acid functionalized Ph-PMO
The synthesis of Ph-PMO functionalized with sulfonic or phosphonic acids followed
similar pathway as the number of steps is the same for both acids. The syntheses were
all made by the co-condensation method, where the silica and acid precursors were
added in the same synthetic step and allowed to condensate simultaneously.
2.2.1 Functionalization with sulfonic acid
The synthesis of sulfonic acid functionalized Ph-PMO samples (S-Ph-PMO) was
carried out following the procedures reported in the literature,[89,90] with some minor
adjustments as schematized in scheme 2.3 (path 1).
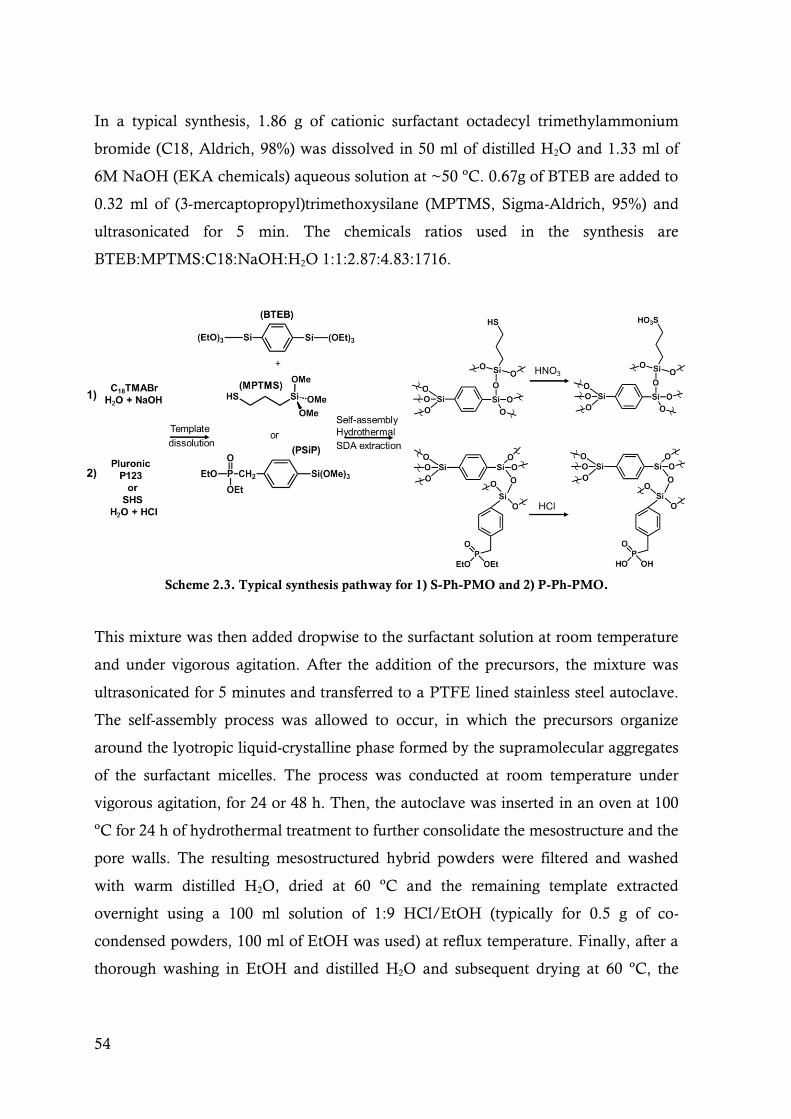
54
In a typical synthesis, 1.86 g of cationic surfactant octadecyl trimethylammonium
bromide (C18, Aldrich, 98%) was dissolved in 50 ml of distilled H2O and 1.33 ml of
6M NaOH (EKA chemicals) aqueous solution at ~50 ºC. 0.67g of BTEB are added to
0.32 ml of (3-mercaptopropyl)trimethoxysilane (MPTMS, Sigma-Aldrich, 95%) and
ultrasonicated for 5 min. The chemicals ratios used in the synthesis are
BTEB:MPTMS:C18:NaOH:H2O 1:1:2.87:4.83:1716.
Scheme 2.3. Typical synthesis pathway for 1) S-Ph-PMO and 2) P-Ph-PMO.
This mixture was then added dropwise to the surfactant solution at room temperature
and under vigorous agitation. After the addition of the precursors, the mixture was
ultrasonicated for 5 minutes and transferred to a PTFE lined stainless steel autoclave.
The self-assembly process was allowed to occur, in which the precursors organize
around the lyotropic liquid-crystalline phase formed by the supramolecular aggregates
of the surfactant micelles. The process was conducted at room temperature under
vigorous agitation, for 24 or 48 h. Then, the autoclave was inserted in an oven at 100
ºC for 24 h of hydrothermal treatment to further consolidate the mesostructure and the
pore walls. The resulting mesostructured hybrid powders were filtered and washed
with warm distilled H2O, dried at 60 ºC and the remaining template extracted
overnight using a 100 ml solution of 1:9 HCl/EtOH (typically for 0.5 g of co-
condensed powders, 100 ml of EtOH was used) at reflux temperature. Finally, after a
thorough washing in EtOH and distilled H2O and subsequent drying at 60 ºC, the
55
oxidation of the SH groups to SO3H was performed by wetting about 0.5 g of the
sample with 1 ml of distilled water, followed by 5 ml of 20 mol % HNO3 solution and
finally by the slow addition of 10 g of concentrated HNO3 (Sigma-Aldrich, 65%). The
mixture was left at room temperature under vigorous stirring during 24 h. The shortest
time spent in this conventional synthesis (discounting filtering and drying inter-steps)
was 84 h.
In order to reduce the synthesis time and the amount of solvent used, a series of
experiments was designed to explore the potential of MW radiation as an alternative
heat source on the various steps of the synthesis (self-assembly, hydrothermal
treatment, extraction and oxidation).
The MW synthesis of S-Ph-PMO was inspired in the MW synthesis of acid-free Ph-
PMO reported in the literature,[161] exploiting the effect of time on the various
synthetic steps. According to the synthesis path in question, different self-assembly
times were performed (2, 6, 12 and 24 h for conventional stirring and 0.5, 1, 2, 4, 6
and 12 h stirring in MW at 40 °C). Subsequently, the mixture was poured into a MW
vial and heated at 100 ºC for the desired hydrothermal treatment time (1, 3 or 5 h).
The remaining surfactant was extracted also in the MW oven at 100 ºC for 15 min
using half of the solvent quantity typically used in the conventional extraction. The
oxidation step was accomplished by reaction with HNO3 for 30 min in MW at 40 °C.
The MW syntheses were performed using microwave systems model MARS-5
(CICECO, University of Aveiro) and MARS-X (LACCO, University of Poitiers), both
from CEM Corporation.
The samples notation system follows the acronym S-AxByZ, where “S” refers to the
sulfonic acid functionalization, “A” refers to the conditions used in the self-assembly
step (“C” for conventional stirring at room temperature or “MS” for microwave
treatment at 40 °C under stirring), “B” is related to the conditions used in the
hydrothermal treatment (“C” for conventional oven and “M” for microwave
treatment) and “Z” denotes the specific sample condition at the moment of
characterization, including (as) as-synthesized and (ext) extracted; when “Z” is not
mentioned, the acronym refers to the final oxidized form. The “x” and “y" indicates
the duration of the specific step, in hours. As an example, S-C24M3 corresponds to a

56
24 h conventional self-assembly step, followed by a 3h hydrothermal treatment with
MW. The sample was then extracted and oxidised.
2.2.2 Functionalization with phosphonic acid
The synthesis of Ph-PMO samples functionalized with phosphonic acid (P-Ph-PMO)
was carried out by the co-condensation of PSiP and BTEB in several proportions using
a triblock-copolymer EO20-PO70-EO20 (Pluronic P123, Aldrich) or anionic surfactant n-
hexadecylsulfuric acid sodium salt (SHS, ABCR, includes 40% sodium stearyl sulfate
salt) as structure directing agents. Although the synthesis of P-Ph-PMO samples was
also attempted with cationic surfactants of the trimethylammonium bromide family
(C14, C16 and C18), these did not result in any condensation of the PSiP group, as
assessed by acid-base titration. These samples are denoted “Px-y”, where x stands for
the nominal molar percentage of PSiP and y represents the acronym of the structure
directing agent (P123 or SHS). The second path in scheme 2.3 represents the synthetic
pathway for the synthesis of P-Ph-PMO using co-polymer P123 as structure directing
agent. For example, P20-SHS corresponds to a sample with a 20 % PSiP and 80 %
BTEB, using SHS as SDA, and synthesised with conventional stirring, hydrothermal
treatment, extraction and acidification steps.
In a typical synthesis 0.75 g of P123 was dissolved in a mixture of 29 ml of distilled
H2O and 0.2 ml of concentrated HCl (37 wt.%). The mixture was stirred and heated at
50 ºC until a clear solution was obtained. A mixture of BTEB and PSiP, in 1:9, 1:4
and 1:1 molar proportion (totalling 2.46×10⁻³ mol of total precursors in each batch and
corresponding to samples P10%-P123, P20%-P123 and P50%-P123 respectively) was
kept for 5 minutes in an ultrasonic bath and added dropwise to the copolymer
solution, under vigorous agitation and at room temperature. After the addition, the
reaction mixture was kept for 5 minutes in an ultrasonic bath, poured in a PTFE
autoclave and left for 24 hours at room temperature, under vigorous agitation for the
self-assembly step. After this time, the vial was placed in an oven at 100 ºC for 24
hours. The solid product was recovered by filtration, washed with hot distilled H2O
57
and dried in the oven at 60 ºC. The remaining surfactant was extracted from the co-
condensed P-Ph-PMO using a mixture of EtOH/HCl (66.6:1) in reflux at 75 ºC and
overnight. The remaining solid was washed with EtOH and distilled H2O, and finally
dried at 60 ºC. The sample was wetted with 2 mol of distilled H2O and the free
phosphonic ether groups were transformed to phosphonic acid groups by the acid-
catalysed hydrolytic dealkylation. This was achieved by addition of 40 ml of
concentrated HCl, leaving the reaction at 80 ºC in reflux for 2 h. This reaction time
was found to yield the highest level of acid incorporation, as assessed by acid-base
titration and 31P high-power decoupling technique (HPDEC) magic-angle spinning
(MAS) NMR.
The synthesis of P-Ph-PMO with the anionic surfactant SHS is in all similar to the
synthesis of P-Ph-PMO with copolymer P123, apart from minor adjustments in the
quantities of the reactants. The molar ratio BTEB:PSiP for the P-SHS used were 1:9,
1:4, 1:2.3 and 1:1, which corresponds to samples P10%-SHS, P20%-SHS, P30%-SHS
and P50%-SHS respectively.
2.3 Preparation of composite Nafion® membranes
An aliquot of Nafion® dispersion (Aldrich, 20 wt.% dispersion in n-propanol, ethanol
and water) was heated up to 45 ºC in order to remove the solvents and redispersed in
N,N-dimethylacetamide (DMAc, Aldrich, ≥ 99%). For a typical composite membrane
with 5 wt.% of S-Ph-PMO in relation to the dry weight of Nafion®, a dispersion was
prepared with 0.3730 g of dry Nafion® polymer in DMA. In parallel, the selected S-
Ph-PMO powder was ultrasonicated for 10 min in 20 ml of EtOH, then thoroughly
ground in an agate mortar and dried in oven at 60 ºC. 0.0196 g of this powder was
then added to the Nafion®-DMA dispersion. The mixture was homogenised in an
ultrasounds bath for 5 min, and vigorously stirred overnight at room temperature.
Adjustments in the quantity of Nafion® and filler were made for composite
membranes with 10 and 20 wt. % S-Ph-PMO powders. The obtained slurry was
poured into a 5 cm in diameter petri dish and, in order to prevent the precipitation of
58
the particles, the viscosity of the mixture was increased by drying some of the solvent
in a hot plate at ~80 ºC and under constant agitation. Vacuum was then applied for 1
h in order to facilitate solvent evaporation and to remove air bubbles. The as-prepared
membranes were fully dried in an oven at 100 ºC for 5 h, and then at 60 ºC overnight.
For comparison purposes, a pure Nafion® membrane was also prepared by the same
method.
All the prepared membranes were hot-pressed at 120 ºC under 10 MPa for 10 minutes
to improve their mechanical robustness. Finally, the membranes were washed and
activated using a series of treatments in boiling 3 vol. % H2O2 (Alfa Aesar, 29-32 wt.
%), 0.5 M H2SO4 (Panreac, 96%) and high purity H2O. The membranes were stored in
high purity H2O.
The composite membranes were denoted as “S-AxBy-C%” where the first part “S-
AxBy” specifies which S-Ph-PMO material was used and “C%” is the nominal wt.%
in relation to the dry weight of Nafion®.
2.4 Characterization of composition, structure and microstructure
2.4.1 X-ray diffraction
X-ray diffraction (XRD) is a key technique for identification and characterization of
the crystalline phases in a material, which relies on the fact that the wavelength is in
the same order of magnitude than the bond distance between atoms in a crystalline
material. The crystal can be regarded as a set of regularly spaced scattering centres,
which can be portrayed as planes of lattice points, as depicted in the left side of Fig.
2.1.[232] The planes of scattering centres that make up the crystal are separated by a
distance d, but there can be several different planes, depending on which atoms are
regarded, each with its specific d inter-planar distance. A diffraction maximum occurs
when the crystal is specifically orientated regarding both the X-ray source and the
detector, in such a way that there is a constructive interference of the X-rays scattered
by the atomic planes of the sample.
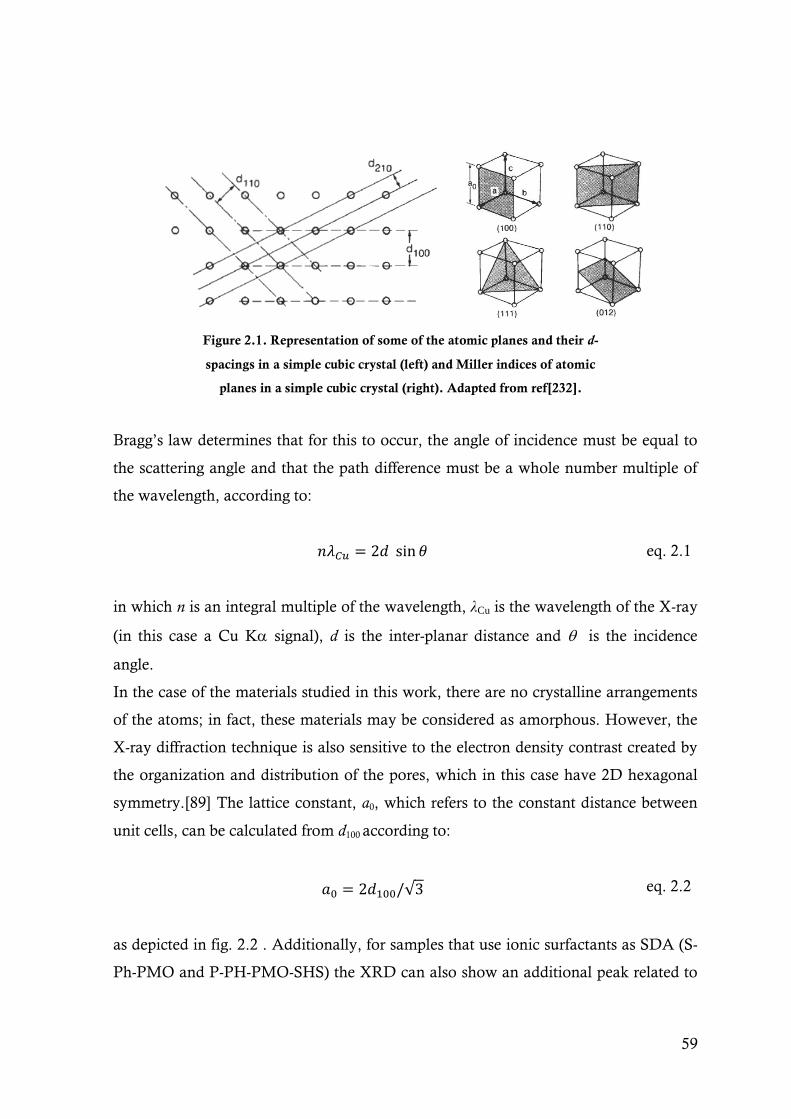
59
Figure 2.1. Representation of some of the atomic planes and their d-
spacings in a simple cubic crystal (left) and Miller indices of atomic
planes in a simple cubic crystal (right). Adapted from ref[232].
Bragg’s law determines that for this to occur, the angle of incidence must be equal to
the scattering angle and that the path difference must be a whole number multiple of
the wavelength, according to:
𝑛𝜆𝐶𝑢 = 2𝑑 sin 𝜃 eq. 2.1
in which n is an integral multiple of the wavelength, λCu is the wavelength of the X-ray
(in this case a Cu K signal), d is the inter-planar distance and is the incidence
angle.
In the case of the materials studied in this work, there are no crystalline arrangements
of the atoms; in fact, these materials may be considered as amorphous. However, the
X-ray diffraction technique is also sensitive to the electron density contrast created by
the organization and distribution of the pores, which in this case have 2D hexagonal
symmetry.[89] The lattice constant, a0, which refers to the constant distance between
unit cells, can be calculated from d100 according to:
𝑎0 = 2𝑑100/√3 eq. 2.2
as depicted in fig. 2.2 . Additionally, for samples that use ionic surfactants as SDA (S-
Ph-PMO and P-PH-PMO-SHS) the XRD can also show an additional peak related to
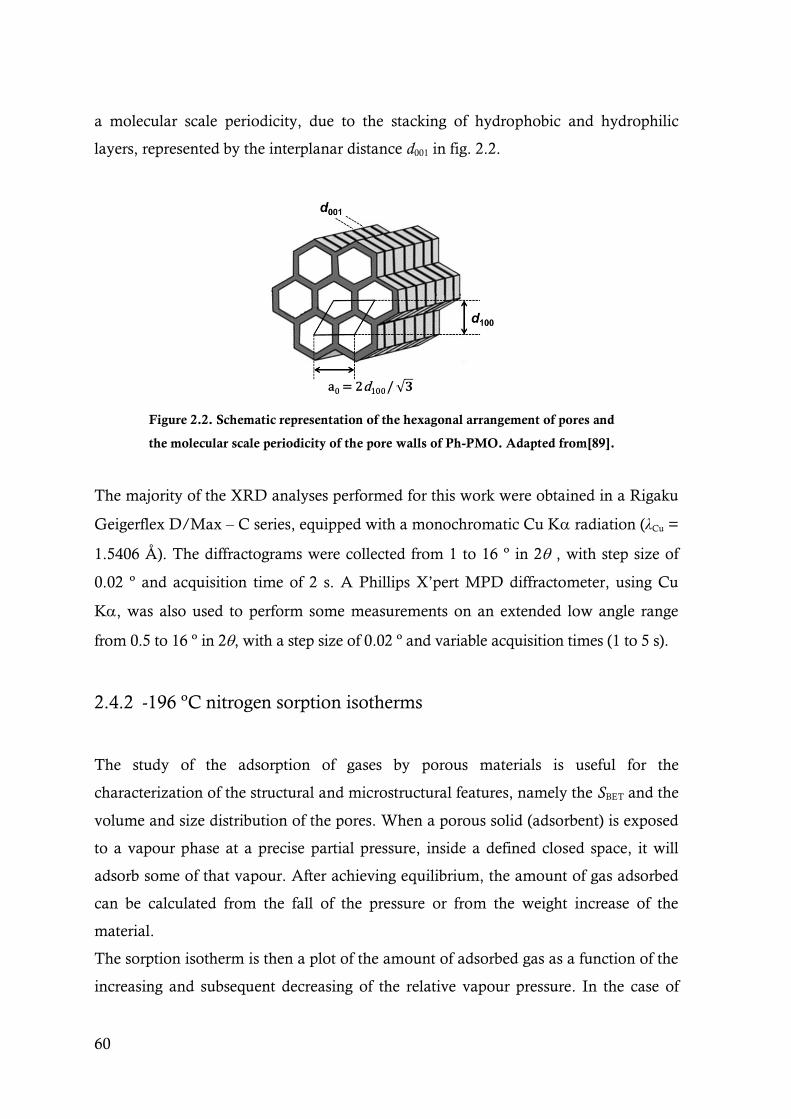
60
a molecular scale periodicity, due to the stacking of hydrophobic and hydrophilic
layers, represented by the interplanar distance d001 in fig. 2.2.
Figure 2.2. Schematic representation of the hexagonal arrangement of pores and
the molecular scale periodicity of the pore walls of Ph-PMO. Adapted from[89].
The majority of the XRD analyses performed for this work were obtained in a Rigaku
Geigerflex D/Max – C series, equipped with a monochromatic Cu K radiation (λCu =
1.5406 Å). The diffractograms were collected from 1 to 16 º in 2 , with step size of
0.02 º and acquisition time of 2 s. A Phillips X’pert MPD diffractometer, using Cu
K, was also used to perform some measurements on an extended low angle range
from 0.5 to 16 º in 2, with a step size of 0.02 º and variable acquisition times (1 to 5 s).
2.4.2 -196 ºC nitrogen sorption isotherms
The study of the adsorption of gases by porous materials is useful for the
characterization of the structural and microstructural features, namely the SBET and the
volume and size distribution of the pores. When a porous solid (adsorbent) is exposed
to a vapour phase at a precise partial pressure, inside a defined closed space, it will
adsorb some of that vapour. After achieving equilibrium, the amount of gas adsorbed
can be calculated from the fall of the pressure or from the weight increase of the
material.
The sorption isotherm is then a plot of the amount of adsorbed gas as a function of the
increasing and subsequent decreasing of the relative vapour pressure. In the case of
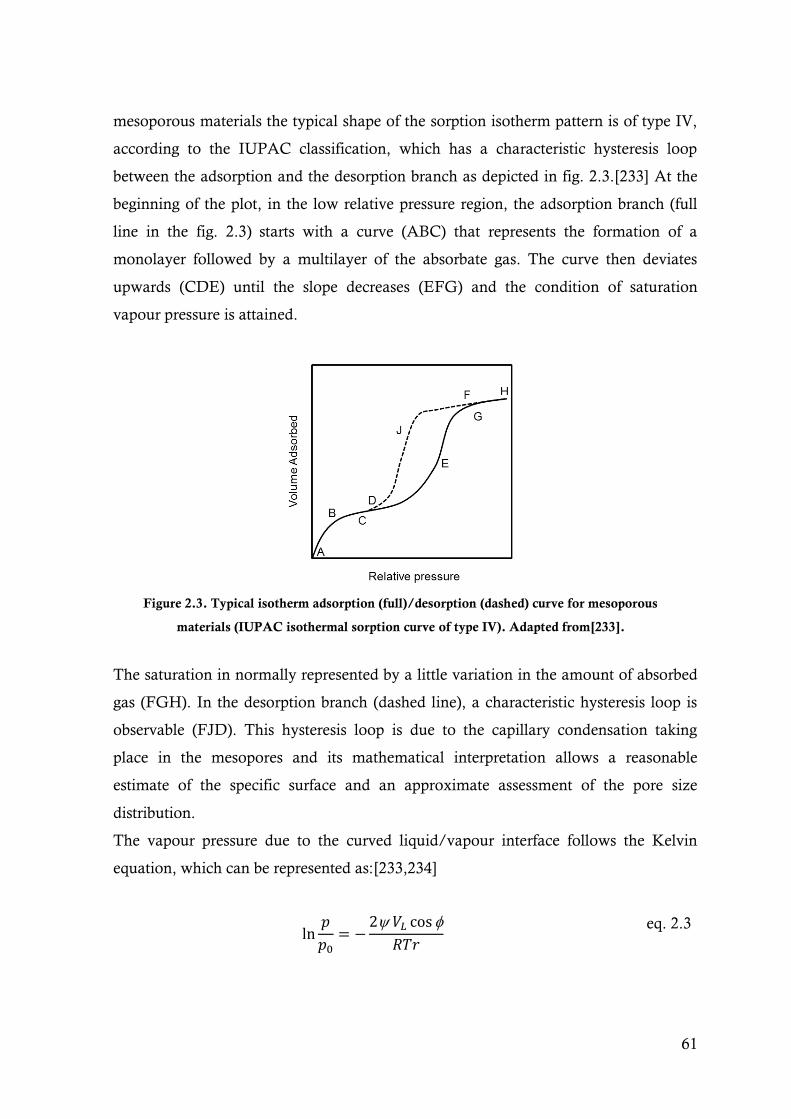
61
mesoporous materials the typical shape of the sorption isotherm pattern is of type IV,
according to the IUPAC classification, which has a characteristic hysteresis loop
between the adsorption and the desorption branch as depicted in fig. 2.3.[233] At the
beginning of the plot, in the low relative pressure region, the adsorption branch (full
line in the fig. 2.3) starts with a curve (ABC) that represents the formation of a
monolayer followed by a multilayer of the absorbate gas. The curve then deviates
upwards (CDE) until the slope decreases (EFG) and the condition of saturation
vapour pressure is attained.
Figure 2.3. Typical isotherm adsorption (full)/desorption (dashed) curve for mesoporous
materials (IUPAC isothermal sorption curve of type IV). Adapted from[233].
The saturation in normally represented by a little variation in the amount of absorbed
gas (FGH). In the desorption branch (dashed line), a characteristic hysteresis loop is
observable (FJD). This hysteresis loop is due to the capillary condensation taking
place in the mesopores and its mathematical interpretation allows a reasonable
estimate of the specific surface and an approximate assessment of the pore size
distribution.
The vapour pressure due to the curved liquid/vapour interface follows the Kelvin
equation, which can be represented as:[233,234]
ln𝑝
𝑝0= −
2 𝑉𝐿 cos
𝑅𝑇𝑟
eq. 2.3

62
where is the surface tension, VL is the molar volume of the liquid condensate, is
the contact angle between the pore surface and the water molecules and r is the radius
of the pore. It is possible to calculate the SBET using the Brunauer, Emmett and Teller
(BET) method, which is based on the multilayer adsorption phenomenon described
above.[235]
The calculation of the pore size distribution and pore volume is usually obtained using
the Barret, Joyner and Halenda (BJH) method, which was initially developed for
absorbents with relatively wide pores and pore size distribution. The algorithm used in
this model assumes that the pores have a cylindrical shape and also uses a modified
Kelvin equation. The discovery of PMS materials brought the opportunity for the
development of gas adsorption measurements since a new family of mesoporous
materials with a simple pore geometry, tuneable pore size, well-defined microstructure
and reproducible surface properties was available.[236] Based on the BJH method,
Kruk, Jarionec and Sayari (KJS) developed a more comprehensive method for pore
size analysis.[236] They used N2 sorption isotherms and XRD measurements of
MCM-41 materials as a way of establishing correlations between the pore width and
the condensation pressure, and between the statistical film thickness and the
equilibrium pressure. They later extended the KJS method to include PMS samples
with a broader pore size range and cylindrical pores interconnected with micropores
(e.g. SBA-15).[237] The pore size distribution curves obtained from the KJS method
were quite similar to the pore size distribution curves calculated using nonlocal density
functional theory (NLDFT), both for large and small pores. Since its development, the
KJS method has been successfully used for the characterization of several ordered
mesoporous materials.
The -196 ºC N2 sorption isotherms measurements of the S-Ph-PMO and P-Ph-PMO
samples presented in this work were performed in a Micromeritics Gemini 2370
equipment. The samples were degassed overnight at 120 ºC and the measurements
were performed at -196 ºC. The SBET was calculated using the BET method and the
pore size distribution was determined by the BJH method with the KJS correction
implemented in the Micromeritics Gemini V2.00 software.

63
2.4.3 Electron microscopy
Scanning and transmission electron microscopies (SEM and TEM, respectively) are
key techniques for the observation of materials at nano and atomic scales. In an
electron microscope, instead of visible light photons, electrons are used as incident
radiation. The electron microscope works by emitting a beam of electrons from an
electron gun through electromagnetic lenses, which are the equivalent of the glass
lenses in the optical microscope. As a result of the interaction of the electron beam
with matter, a large number of scattered signals can emerge. If the incident electrons
conserve their energy, the scattering process is considered elastic, and only their
direction of propagation is modified by the interaction with the samples atoms. Back-
scattered electrons arise from such interaction and can be used for imaging and for
diffraction analysis. Inelastic scattering is the other fundamental scattering process in
which the kinetic energy of the incident particle is lost or gained. A small portion of
the energy lost may escape as characteristic X-rays, secondary electrons or Auger
electrons and these can be extremely useful for imaging and structural analysis.[238]
In SEM mode, the electron beam is focused by the electromagnetic lenses onto the
sample and a deflecting unit controls the beam that scans the selected area line-by-line.
For mesoporous samples, SEM is useful to study the surface, shape, topography, size
and the level of aggregation of the powder particles.
In TEM mode, the electrons that travel through the sample and manage to exit on the
other side are used directly to replicate the pattern onto a screen (e.g. digital sensor or
fluorescent screen). In this work, TEM is used to detect visually the channelled
microstructure of the mesoporous particles as well as perceiving the hexagonal
arrangement of the pores, which may be useful to correlate to the data obtained by
XRD. High-resolution TEM (HR-TEM) allows a theoretical resolution of up to 0.2 Å,
well in the range of atomic bond length. This TEM mode is especially useful to
distinguish and characterize atomic arrangements in crystalline materials, but in the
case of Ph-PMO samples, it is possible to detect the molecular scale periodicity along
the pore wall, as shown also in Fig. 1.15.
64
When an electron of the inner shells of the samples atoms is pulled out by inelastic
scattering process, an electron from the outer shells will fall down to fulfil that electron
hole, emitting an X-ray photon in the process, which is characteristic for the energy
gap between the electron shells and to the element that was interacted with. These
photons can be counted by an energy dispersive X-ray spectroscopy (EDS) detector
and the signals are processed and converted into a plot of number of counts vs. X-ray
energy. The peaks correspond to the specific decays of specific elements, which makes
this a powerful tool for the chemical characterization of the samples, including
mapping areas of different elemental composition.[238,239]
When possible, the interplanar distance d100 was measured on the TEM images and
compared to the XRD result, using the software Image J (version 1.45s).[240] The
measurements were made in samples with observable channelled microstructure by
measuring the distance between peaks in a grayscale profile drawn perpendicularly to
the channels. A minimum amount of 10 measurements were made for each sample,
where the standard deviation was an average of 8% for all measurements.
The TEM used in this work was a Hitachi H-9000 equipped with a Quantax 400 EDS
detector from Bruker. The typical acceleration voltage used in the experiments was
limited to 200 kV (the microscope delivers a maximum of 300 kV), to avoid damaging
the samples and to minimize the drifting caused by charge accumulation. The
preparation of the samples for TEM observation consisted in a simple submersion of
400 mesh holy-carbon coated TEM copper grids (Agar Scientific) in an EtOH
suspension of the mesoporous materials. Prior to making the suspension, the materials
where thoroughly grinded in an agate mortar and ultrasonicated to promote
disaggregation of the particles.
The SEM micrographs were obtained in a Hitachi SU-70 microscope equipped with a
Quantax 400 EDS detector from Bruker. The acceleration voltage was kept between 4
to 10 kV to avoid destruction of the mesoporous materials and composite membranes.
The powder samples were observed by SEM using the same TEM copper grids,
whereas the composite membranes were observed on specific aluminium holder using
carbon conductive tape as adhesive. The membranes were lightly covered with
conductive carbon coating, using a vacuum evaporator (Emitech K 950 x).
65
2.4.4 Solid state nuclear magnetic resonance
Solid-state nuclear magnetic resonance (NMR) is a technique used to structurally
characterize materials that works by measuring the nuclear shielding, or electron
density, of specific elements. The chemical environment affects this nuclear shielding
and different adjacent atoms will perform different influences on a targeted nucleus.
For an element to be seen in NMR it has to present a spin state greater than 0. When a
sample with an eligible nucleus is inserted in the NMR apparatus, the applied
magnetic field will cause the spin state to split. A nucleus with a spin state of ½ splits
into two states, and the number of split states increases with increasing spin (spin of 1
will divide in 3 states and so on).
In solids, and contrary to liquids or gases, the atoms are spatially confined (e.g. in
certain lattice positions) and chemical shift anisotropy can occur due to the different
orientation of the molecules towards the spectrometer. The fact that the atoms in the
lattice are not always equally distanced can also lead to additional noise in the spectra
due to fluctuations in the levels of dipolar interactions. Moreover, nucleus with spin
higher than ½ may display quadrupolar interactions, shifting energy levels and
creating additional resonance frequencies.[241] These interactions may be reduced
using the magic-angle spinning (MAS) technique. There is a simple geometric factor
that is common to the three types of interactions and this it can be reduced to zero
when the sample is tilted 54.74º in relation to the applied magnetic field. By tilting the
sample and spinning it at high frequency, the solid samples will behave similarly to a
liquid. Another important technique, normally coupled to MAS, is the Cross-
Polarization (CP), which is useful to counteract the sensitivity and low natural
abundance of certain targeted atoms analysed by solid state NMR. In this work, these
techniques were applied to obtain the 13C and 29Si NMR spectra. In the case of 31P
spectra the high-power decoupling technique (HPDEC) was applied to eliminate the
heteronuclear dipolar interactions and the heteronuclear scalar coupling
interactions.[242]
The NMR spectrum consists of peaks located at different chemical shifts , in Hz or
ppm, relatively to a reference. This information can elucidate on the chemical
66
environment of the targeted nucleus. For example, in 29Si NMR the spectra are
expected to reveal Tn type signals (according to R-(OSi)nSi(OH)3–n), which are an
indicator of the levels of condensation of the R-SiO3 tetrahedra inside the hybrid
materials. For these signals, the peaks with higher “n” correspond to a better
incorporation of the R-SiO3 tetrahedra in the walls of the structure, whereas structure
with n < 3 correspond to Si nucleus connected to pending OH groups. The relative
intensity of the several peaks could give some insight about the overall level of
structural order of the materials. The expected absence of Qn signals, which are
originated by the presence of substructures (OSi)nSi(OH)4–n would be an indication
that the Si-C bond did not break during the multiple steps of the synthesis of the
PMOs.[86,130,243] The signals expected for the 13C NMR spectra would be an intense
benzene ring carbon nucleus and also carbon signals from the -CH2 and -CH3 groups
of the acid precursor chains. The presence of 4 signals in the oxidized S-Ph-PMO
samples could indicate that the -SH groups were not totally converted to SO3H in the
oxidation step.[128,244] The analysis of P-Ph-PMO samples using 31P NMR
techniques should reveal a peak assigned to the free R-P(O)(OH)2 acid groups and
another peak assigned to the acid bounded to surface silica as R-P(O)(OH)(OSi) or R-
P(O)(OSi)2 where R represents the organic group. The higher relative intensity of the
first peak is desirable because it suggests that the acid groups are pending inside the
pore instead of bonded to the silica surface.[245,246]
In this work, the 29Si, 31P and 13C Solid-State NMR experiments were performed at
79.49 MHz for 29Si and 161.98 MHz for 31P on a Bruker Avance 400 spectrometer and
at 125.76 MHz for 13C on a Bruker Avance 500 spectrometer. 29Si CP-MAS NMR
spectra were recorded with a 4.75 µs 1H 90º pulse, a contact time of 8 ms, a spinning
rate of 5 kHz and 5 s recycle delays. 13C CP-MAS NMR spectra were recorded with
3.5 µs 1H 90º pulses, a contact time of 2 ms, a spinning rate of 12.0 kHz (P-Ph-PMO)
and 15.0 kHz (S-Ph-PMO) and 5 s recycle delays. 31P HPDEC NMR experiments
were recorded with a 6.5 µs 1H decoupling pulse, a spinning rate of 12 kHz, a 3 µs 31P
90 º pulse with a flip angle of 90 º and 60 s recycle delay.
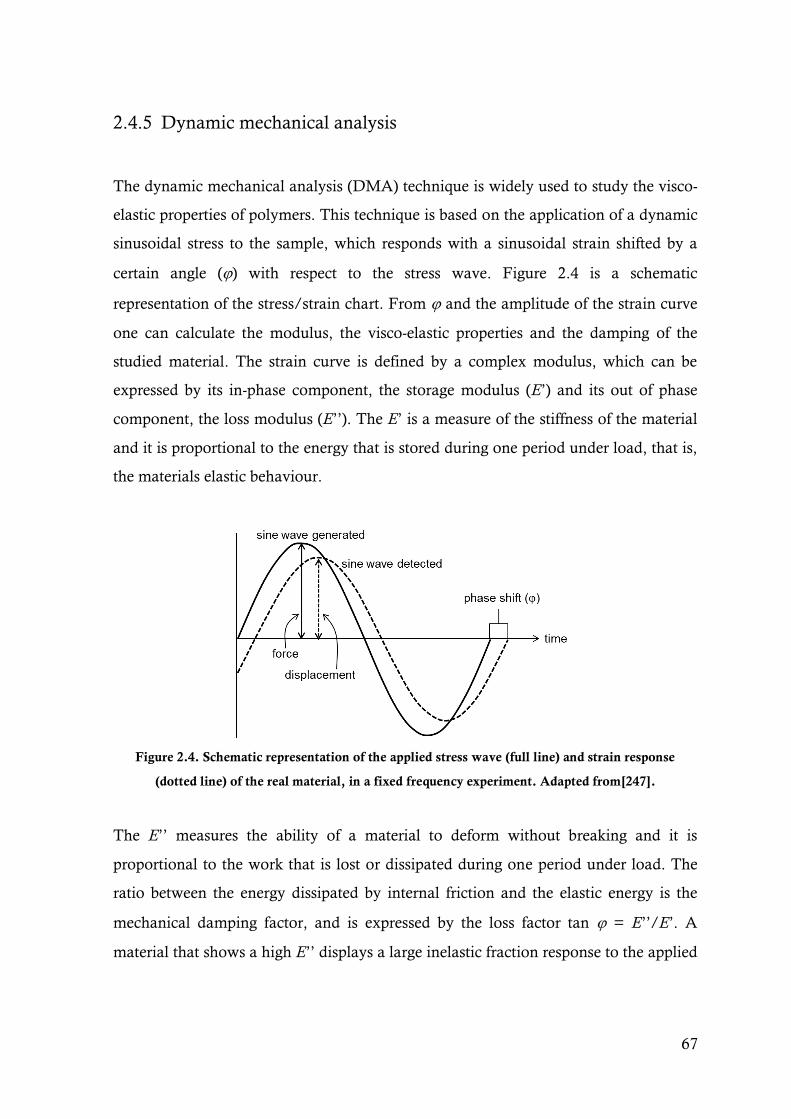
67
2.4.5 Dynamic mechanical analysis
The dynamic mechanical analysis (DMA) technique is widely used to study the visco-
elastic properties of polymers. This technique is based on the application of a dynamic
sinusoidal stress to the sample, which responds with a sinusoidal strain shifted by a
certain angle () with respect to the stress wave. Figure 2.4 is a schematic
representation of the stress/strain chart. From and the amplitude of the strain curve
one can calculate the modulus, the visco-elastic properties and the damping of the
studied material. The strain curve is defined by a complex modulus, which can be
expressed by its in-phase component, the storage modulus (E’) and its out of phase
component, the loss modulus (E’’). The E’ is a measure of the stiffness of the material
and it is proportional to the energy that is stored during one period under load, that is,
the materials elastic behaviour.
Figure 2.4. Schematic representation of the applied stress wave (full line) and strain response
(dotted line) of the real material, in a fixed frequency experiment. Adapted from[247].
The E’’ measures the ability of a material to deform without breaking and it is
proportional to the work that is lost or dissipated during one period under load. The
ratio between the energy dissipated by internal friction and the elastic energy is the
mechanical damping factor, and is expressed by the loss factor tan = E’’/E’. A
material that shows a high E’’ displays a large inelastic fraction response to the applied
68
mechanical stress while a material with a low E’’ refers to a more elastic
behaviour.[247]
Coupling a temperature sweep to the DMA technique is a good way to characterize
the several thermal transformations that occur in polymers, for example the Tg, which
is the temperature above which the materials will show a rubbery behaviour instead of
glassy properties, characterized by a dramatic drop in the stiffness. This is portrayed
by a significant decrease of the E’ and a maximization of E’’ with a consequent peak of
tan . The technique is also useful to characterize other phase shifts, displacements
and modifications that occur while the temperature rises. In the case of Nafion® and
similar perfluorosulfonated polymers, water plays the role of plasticizer inside the
structure, influencing enormously the DMA results.[33,248-250] The segmental
motion of the main chain of physically cross-linked perfluorocarbon phase (the
genuine Tg of Nafion®) is expected at ~20 ºC, but it can occur at 0 ºC or even lower
temperatures, depending on the water content of the material.[248] The weakening of
electrostatic network involving the aqueous domains allows the occurrence of a
relaxation which is attributed to the long-range motion of both the main and the and
sulfonic acid side chains.[33,250]
In this work, the DMA apparatus (Tritec 2000 DMA) was used for the analysis of the
visco-elastic behaviour of the prepared Nafion® and composite membranes upon
heating at constant rate and to study the effect of the filler fraction. The dimensions of
the sample were of ~30 (height) × 5 (width) × 0.1 (thickness) mm. The sinusoidal
tensile deformation applied corresponds to a 20 m displacement. The data were
collected with at 1 Hz during heating from -100 °C to 160 °C at 2 °C∙min-1. The
samples were firstly placed in the DMA chamber and cooled down to -110 °C by
flowing liquid nitrogen within the chamber walls. The cooling rate is not controlled,
but the conditions were selected in order to obtain the fastest cooling time possible
(slightly more than 5 min). There was no control of the r.h. in the chamber. Before the
measurements, all samples were kept in a conditioning cabinet at 30 °C under 50% r.h.
for at least 48 h.
69
2.4.6 Fourier transform infrared spectroscopy
Fourier transform infrared spectroscopy (FTIR) is a characterization technique that
helps to identify the presence of certain functional groups. The basic FTIR experiment
determines intensity changes in an IR beam after interaction with a sample, as a
function of wavelength or frequency. At a specific frequency, and when it matches the
vibrational frequency of a characteristic bond or functional groups, the material will
absorb the IR wave and the amplitude of the molecular vibration will change. This
fluctuation in vibrational energy states as a function of wavelength (or the
wavenumber, as is usually used) is the actual IR spectrum, and the bands that emerge
can be indexed to specific vibrational modes (stretching or bending) of specific bonds
or groups of atoms.[251]
The FTIR spectra were obtained on a FTIR Mattson-7000 infrared spectrometer with
2 cm–1 resolution. The samples in the powder form were mixed with KBr and the
mixture was then shaped into disks on a stainless steel die by applying uniaxial
pressure.
2.4.7 Thermal analyses
Thermogravimetric analysis (TGA) and Differential scanning calorimetry (DSC) are
very useful and common techniques used to study the thermal behaviour and
composition of materials. On a TGA experiment, the weight loss of a sample under
controlled conditions of temperature and atmosphere is measured. This technique is
particularly helpful to study the different thermal stages at which water leaves the
materials and also to study the overall thermal stability.
The DSC technique is based on the difference in heat necessary to change the
temperature between the sample and a reference, which is monitored as the
temperature increases continuously at a fixed rate. This technique is very useful to
study phase transitions in materials and to know if these transitions are exothermic or
endothermic.[252]
70
Before the measurements, the samples (in the form of powder) were kept in a closed
glass desiccator with a aqueous solution saturated in K2SO4, defining an equilibrium
r.h. of 98% r.h. at 25 ºC.[253] The samples were equilibrated in this atmosphere for
about 48 h, then quickly transferred to the TGA/DSC sample holder to carry out the
respective measurements. These were made in TGA-50 Shimadzu apparatus and
DCS-50 Shimadzu apparatus respectively, in both cases using a heating rate of 5
ºC∙min-1 in air and N2 atmospheres.
2.4.8 Acid load
The acid load ([H+]) expressed in mmol of H+ equivalent per gram of dry sample, was
measured by a simple acid-base back titration. For the powder samples, the weighted
amount of dry sample (Wd ≈ 20 mg) was dispersed in 20 ml of 0.1 M KCl,
ultrasonicated for 5 min and vigorously stirred for 30 min to allow the exchange of the
proton for K+. The suspension was then titrated with a 0.01 M KOH aqueous solution,
following the pH evolution with a WTW Sentix 41 pH electrode wired to a WTW pH
330i pocket meter. The [H+] was calculated as:
[𝐻+] =[𝐾𝑂𝐻] × 𝑉𝐾𝑂𝐻
𝑊𝑑 eq. 2.4
where [KOH] and VKOH are the concentration and the volume of the KOH solution
added to reach the equivalence point.
The procedure to measure the [H+] of the membranes was analogous, soaking the
membranes in 2 M NaCl solution at room temperature under magnetic stirring for 24
h in order to promote the exchange of the protons by Na+. After removing the
membrane, the solution was then titrated with a diluted NaOH solution.
71
2.4.9 Hydrolytic properties (water uptake, hydration level and swelling)
The water uptake capacity (W) of the acid functionalized Ph-PMO was measured in
powder compacts by comparing the wet weight Ww of the pellet, after stabilization in a
closed vessel exposed to high r.h., and the dry weight Wd of the sample after drying
under vacuum at 60 ºC for 4 h. It was found that this method provided more
consistent and reproducible results than the TGA data. So this weighting method was
the one chosen for calculating W.
For the membrane materials the method used was in all similar but the Ww was
obtained by soaking the membrane in ultrapure water at room temperature for 24 h.
Before weighing the Ww of the membranes, these were lightly pressed between two
sheets of absorbent paper to remove excessive surface water. The W was then
calculated as:
𝑊 =𝑊𝑤 × 𝑊𝑑
𝑊𝑑× 100
eq. 2.5
The swelling of the membranes (upon adsorption of water) was calculated from the
difference in thickness (measured with a micrometer - precision of 0.01mm) between
the swelled membrane (kept in saturated water vapour conditions until stabilization)
and the dry membrane (dried under vacuum for 4 h at 60 ºC). For the calculation of
the swelling %, an analog to eq. 2.5 was used.
The hydration level () of the membranes, which represents the number of water
molecules per acid group, was calculated based on the measure of W and [H+] of the
membranes as:
=𝑊
𝑀𝐻2𝑂×
1000
[𝐻+]
eq. 2.6
where M H2O is the molar mass of water (18.02 g∙mol-1).
72
2.4.10 Dynamic light scattering
The dynamic light scattering (DLS) technique was used to assess the average particle
size of the acid functionalized Ph-PMO particles. All the suspension of particles or
molecules experiences Brownian motion. Upon the illumination with a laser beam,
the different particles in suspension will scatter the light with different intensities,
which is dependent upon the size of the analysed particles. The analysis of these
intensity variations enables the calculation of the Brownian motion velocity and the
diffusion coefficient can be retrieved using the Stokes-Einstein relationship. The size of
the particles is then calculated using:
𝐷 =𝑘𝑇
6𝜋𝑟 ⟺ 𝑑𝑝 =
𝑘𝑇
3𝜋𝐷
eq. 2.7
where dp is the average diameter of the particles, k is Boltzmann’s constant, is the
viscosity of the media and D is the diffusion coefficient. The particle diameter
estimated from the DLS measurements is in fact a hydrodynamic diameter and it is
related to the way that the particles diffuse within a fluid. The actual value of the
diameter obtained by this technique is that of a spherical particle that shows the same
translational diffusion coefficient as the particle analysed.[254]
The DLS measurements were carried out on a Zetasizer Nano ZS (Malvern
instruments). Prior to the measurements, the samples where thoroughly grinded in an
agate mortar, lightly dispersed in ultrapure water and finally ultrasonicated for 10 min.
DLS measurements where repeated for at least five times for each sample.
2.5 Electrochemical impedance spectroscopy
The electrical behaviour of powder compacts and composite membranes was carried
out by electrochemical impedance spectroscopy (EIS), which was one of the most
extensively used techniques in this work.

73
2.5.1 Fundamentals
Electrochemical impedance spectroscopy is a powerful technique for the
electrochemical characterization of electrolytes and electrolyte/electrode interfaces,
particularly because it allows conveniently separating the contributions of these
processes to the total impedance, each with a distinct time constant (or characteristic
relaxation frequency 0). The use of an alternate current (AC) minimizes the impact of
the electrode polarization.
The basic principle of this technique consists in applying a small sinusoidal signal v(t)
with amplitude Vm
𝑣(𝑡) = 𝑉𝑚 sin(𝜔𝑡) eq. 2.8
at a frequency =/2, resulting in alternate current
𝑖(𝑡) = 𝐼𝑚 sin(𝜔𝑡 + 𝜗) eq. 2.9
where 𝜗 represents the phase angle between the applied voltage and the resulting
current. It is perhaps interesting to notice the analogy between the EIS and DMA.
The concept of impedance is a more general concept than resistance because it takes
into account the differences in phase. A planar vector in an orthogonal system can
have its magnitude and direction represented as a complex number:
𝑍 = 𝑍′ + 𝑖𝑍′′ eq. 2.10
in which 𝑖 = √(−1), Z’ is the real part of Z in the direction of the x axis and Z’’ is the
imaginary part along the y axis. Figure 2.5 represents the impedance as a planar vector
with rectangular and polar coordinates.
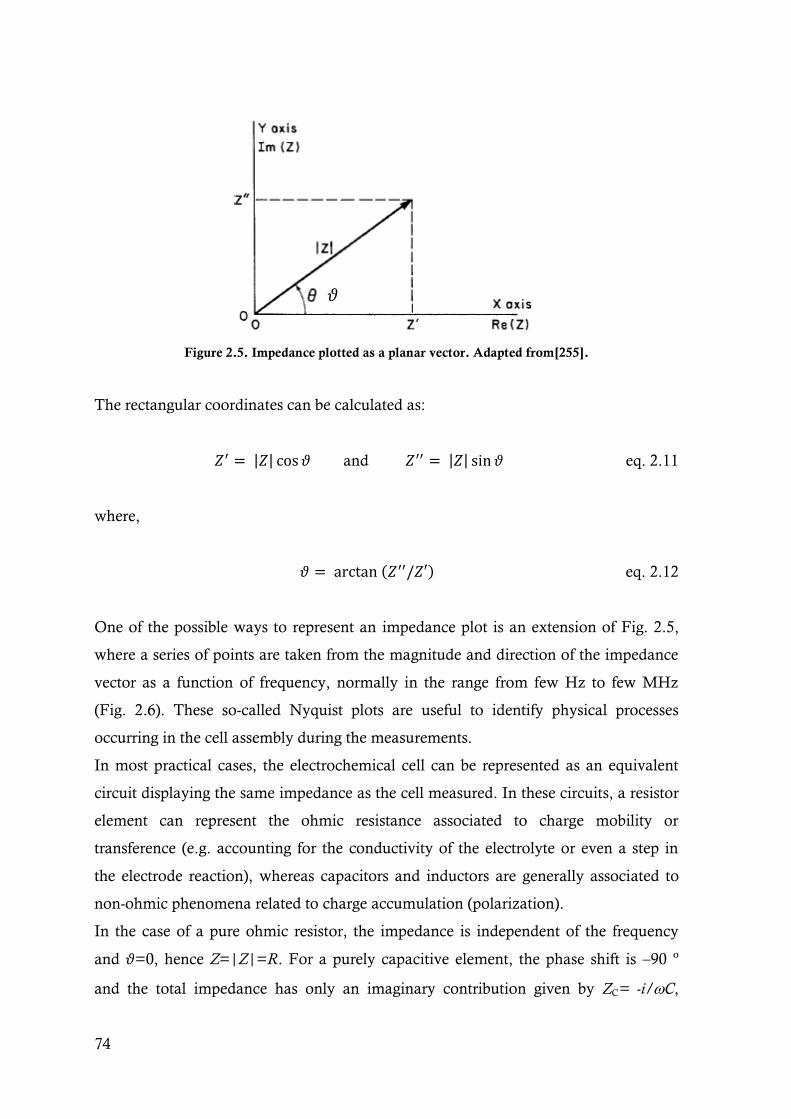
74
Figure 2.5. Impedance plotted as a planar vector. Adapted from[255].
The rectangular coordinates can be calculated as:
𝑍′ = |𝑍| cos 𝜗 and 𝑍′′ = |𝑍| sin 𝜗 eq. 2.11
where,
𝜗 = arctan (𝑍′′/𝑍′) eq. 2.12
One of the possible ways to represent an impedance plot is an extension of Fig. 2.5,
where a series of points are taken from the magnitude and direction of the impedance
vector as a function of frequency, normally in the range from few Hz to few MHz
(Fig. 2.6). These so-called Nyquist plots are useful to identify physical processes
occurring in the cell assembly during the measurements.
In most practical cases, the electrochemical cell can be represented as an equivalent
circuit displaying the same impedance as the cell measured. In these circuits, a resistor
element can represent the ohmic resistance associated to charge mobility or
transference (e.g. accounting for the conductivity of the electrolyte or even a step in
the electrode reaction), whereas capacitors and inductors are generally associated to
non-ohmic phenomena related to charge accumulation (polarization).
In the case of a pure ohmic resistor, the impedance is independent of the frequency
and 𝜗=0, hence Z=|Z|=R. For a purely capacitive element, the phase shift is –90 º
and the total impedance has only an imaginary contribution given by ZC= -i/C,
𝜗
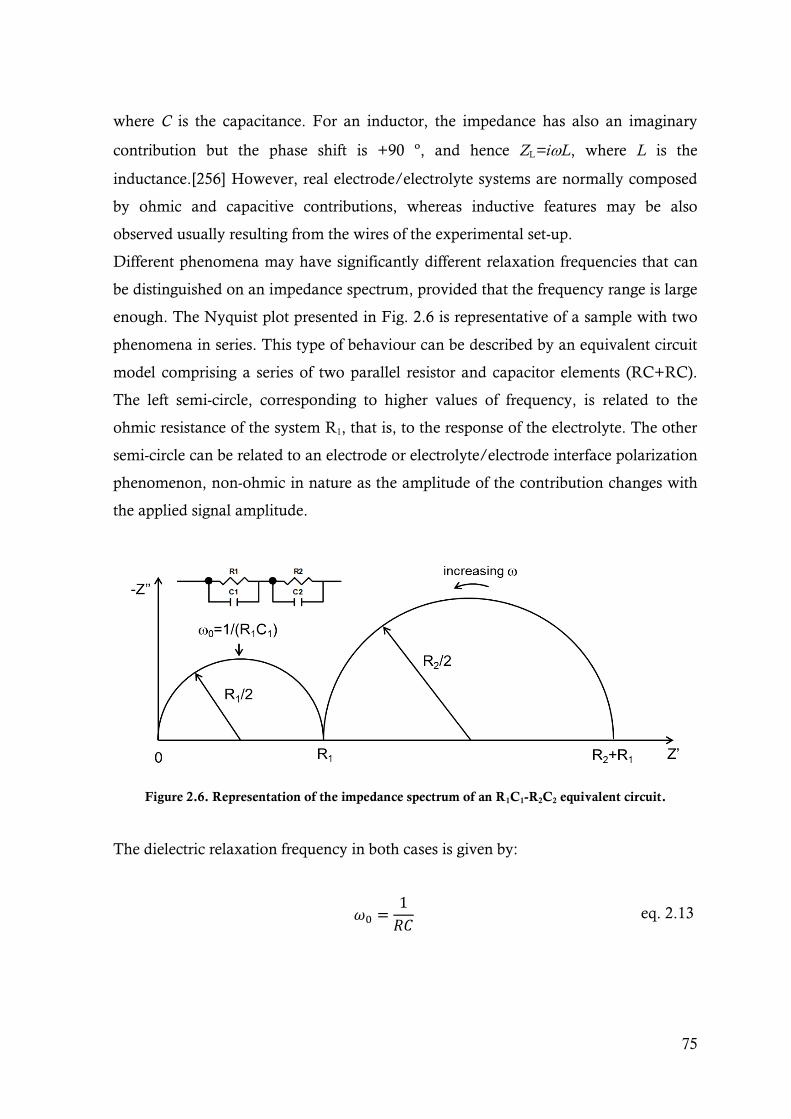
75
where C is the capacitance. For an inductor, the impedance has also an imaginary
contribution but the phase shift is +90 º, and hence ZL=iL, where L is the
inductance.[256] However, real electrode/electrolyte systems are normally composed
by ohmic and capacitive contributions, whereas inductive features may be also
observed usually resulting from the wires of the experimental set-up.
Different phenomena may have significantly different relaxation frequencies that can
be distinguished on an impedance spectrum, provided that the frequency range is large
enough. The Nyquist plot presented in Fig. 2.6 is representative of a sample with two
phenomena in series. This type of behaviour can be described by an equivalent circuit
model comprising a series of two parallel resistor and capacitor elements (RC+RC).
The left semi-circle, corresponding to higher values of frequency, is related to the
ohmic resistance of the system R1, that is, to the response of the electrolyte. The other
semi-circle can be related to an electrode or electrolyte/electrode interface polarization
phenomenon, non-ohmic in nature as the amplitude of the contribution changes with
the applied signal amplitude.
Figure 2.6. Representation of the impedance spectrum of an R1C1-R2C2 equivalent circuit.
The dielectric relaxation frequency in both cases is given by:
𝜔0 =1
𝑅𝐶 eq. 2.13
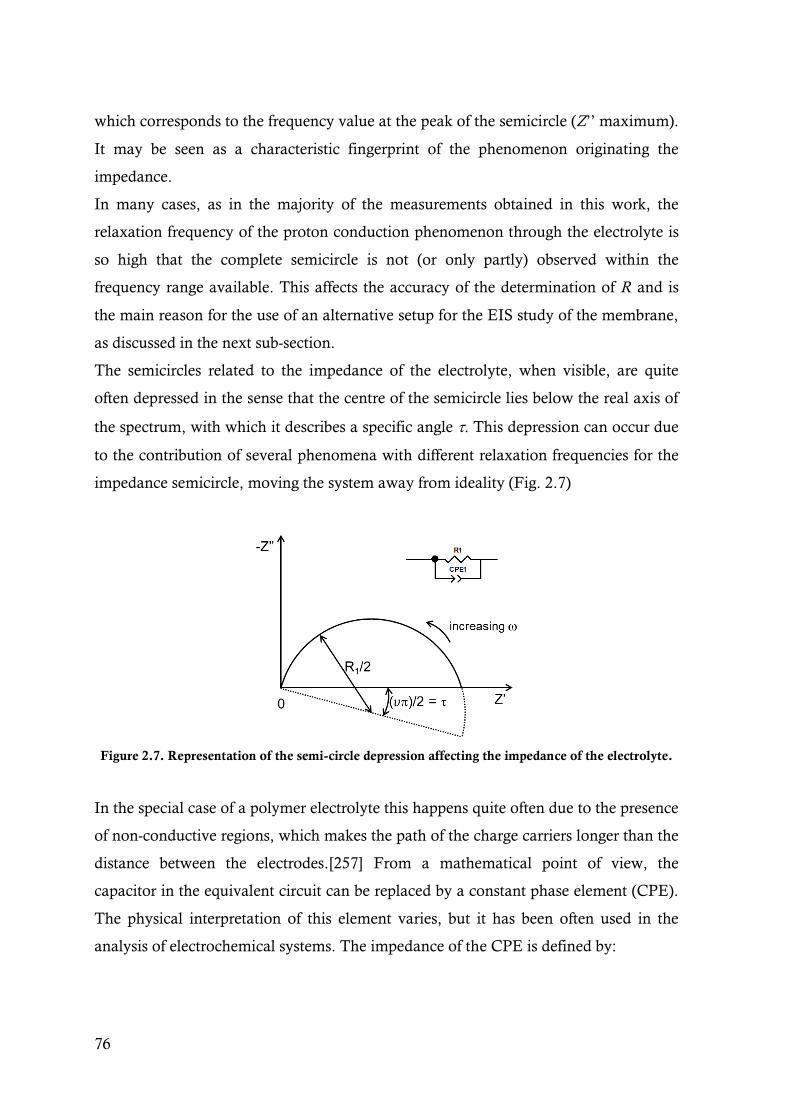
76
which corresponds to the frequency value at the peak of the semicircle (Z’’ maximum).
It may be seen as a characteristic fingerprint of the phenomenon originating the
impedance.
In many cases, as in the majority of the measurements obtained in this work, the
relaxation frequency of the proton conduction phenomenon through the electrolyte is
so high that the complete semicircle is not (or only partly) observed within the
frequency range available. This affects the accuracy of the determination of R and is
the main reason for the use of an alternative setup for the EIS study of the membrane,
as discussed in the next sub-section.
The semicircles related to the impedance of the electrolyte, when visible, are quite
often depressed in the sense that the centre of the semicircle lies below the real axis of
the spectrum, with which it describes a specific angle . This depression can occur due
to the contribution of several phenomena with different relaxation frequencies for the
impedance semicircle, moving the system away from ideality (Fig. 2.7)
Figure 2.7. Representation of the semi-circle depression affecting the impedance of the electrolyte.
In the special case of a polymer electrolyte this happens quite often due to the presence
of non-conductive regions, which makes the path of the charge carriers longer than the
distance between the electrodes.[257] From a mathematical point of view, the
capacitor in the equivalent circuit can be replaced by a constant phase element (CPE).
The physical interpretation of this element varies, but it has been often used in the
analysis of electrochemical systems. The impedance of the CPE is defined by:

77
𝑍𝐶𝑃𝐸 =1
𝑌0(𝑖𝜔)𝑎 eq. 2.14
where Y0 is the admittance and
𝑎 = 1 −2
𝜋= 1 − 𝜐 eq. 2.15
represents the angle shift between the centre of the semicircle and the real axis of the
complex plane. The relaxation frequency is related to these two parameters as:
𝜔0 = (𝑅𝑌0)1𝑎 eq. 2.16
It is possible to calculate the true capacitance:
𝐶 = 𝑅1−𝑎
𝑎 𝑌0
1𝑎
eq. 2.17
and the impedance of an equivalent circuit composed by a CPE and a resistor can be
described as:
𝑍𝜔 =𝑅
1 + (𝑖𝜔𝜔0
)1−𝜐
eq. 2.18
where 0 𝜐 1.
2.5.2 Measurements with different sample geometries
The electrochemical impedance spectroscopy analysis of the acid-functionalized Ph-
PMO was carried out in disc-shaped powder compacts obtained by pressing ~50 mg of
powder in a 1 cm dye using 150 MPa of uniaxial pressure, and then with 300 MPa of
isostatic pressure to enhance the mechanical stability and the density of the pellets.
The apparent density of the compacts was ~0.9 g∙cm-3, calculated from the mass and

78
geometry of the pellets. Electrodes were applied to both sides of the pellets by painting
a conductive silver paste (Agar Scientific) and drying in an oven at 60 ºC overnight, to
evaporate the organic solvents and to cure the paint. The area of the electrodes was
calculated from a scaled photography, using the software Image J (version 1.45s).[240]
The pellets with the silver electrodes were sandwiched between two pieces of carbon
paper GDL and two carved graphite pieces (for better distribution of water vapour)
before being installed between the two platinum current collectors (see Fig. 2.8 A).
Figure 2.8. Schematic representation and photograph of the tip of the used in this work in the A) TP
and B) IP configurations. C) photograph of the entire sample-holder and D) schematic
representation of the sample-holder, portraying the inner Pt wires connected to the device under test
to the right and to the co-axial cable to the left, which are then connected to the impedance
analyser. Cables I and I0 are twisted around each other to minimize the stray capacitance Cs.co-ax.
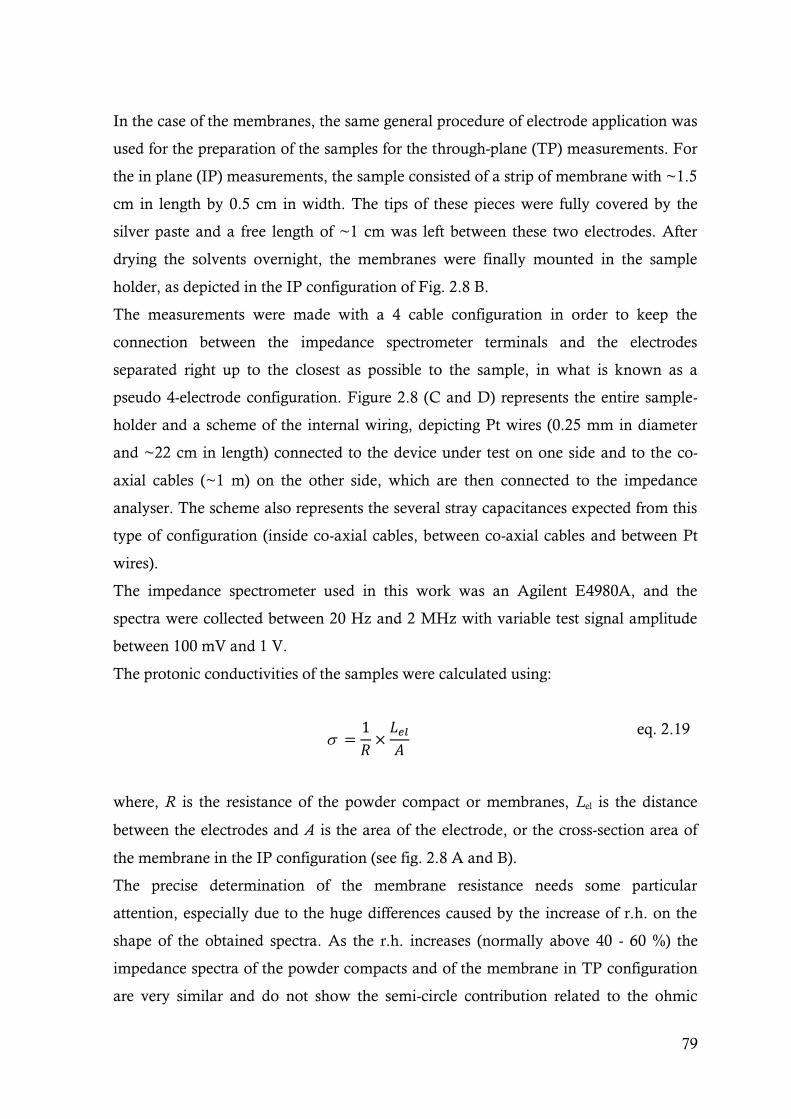
79
In the case of the membranes, the same general procedure of electrode application was
used for the preparation of the samples for the through-plane (TP) measurements. For
the in plane (IP) measurements, the sample consisted of a strip of membrane with ~1.5
cm in length by 0.5 cm in width. The tips of these pieces were fully covered by the
silver paste and a free length of ~1 cm was left between these two electrodes. After
drying the solvents overnight, the membranes were finally mounted in the sample
holder, as depicted in the IP configuration of Fig. 2.8 B.
The measurements were made with a 4 cable configuration in order to keep the
connection between the impedance spectrometer terminals and the electrodes
separated right up to the closest as possible to the sample, in what is known as a
pseudo 4-electrode configuration. Figure 2.8 (C and D) represents the entire sample-
holder and a scheme of the internal wiring, depicting Pt wires (0.25 mm in diameter
and ~22 cm in length) connected to the device under test on one side and to the co-
axial cables (~1 m) on the other side, which are then connected to the impedance
analyser. The scheme also represents the several stray capacitances expected from this
type of configuration (inside co-axial cables, between co-axial cables and between Pt
wires).
The impedance spectrometer used in this work was an Agilent E4980A, and the
spectra were collected between 20 Hz and 2 MHz with variable test signal amplitude
between 100 mV and 1 V.
The protonic conductivities of the samples were calculated using:
=1
𝑅×
𝐿𝑒𝑙
𝐴
eq. 2.19
where, R is the resistance of the powder compact or membranes, Lel is the distance
between the electrodes and A is the area of the electrode, or the cross-section area of
the membrane in the IP configuration (see fig. 2.8 A and B).
The precise determination of the membrane resistance needs some particular
attention, especially due to the huge differences caused by the increase of r.h. on the
shape of the obtained spectra. As the r.h. increases (normally above 40 - 60 %) the
impedance spectra of the powder compacts and of the membrane in TP configuration
are very similar and do not show the semi-circle contribution related to the ohmic

80
resistance of the electrolyte (inset in fig. 2.9) due to a high 0, well above the upper
limit of the meter used in this work. The spectra are characterized by a dominant
contribution assigned to the impedance of the electrode, which can be projected in the
high frequency region to intercept the real axis, defining the value of R for the
electrolyte. Additionally, the high conductivity of the materials combined with the
reduced thickness of the samples (~0.1 cm for the powder compacts and ~100 m for
the membranes) leads to R values in the order of few , or even less than 1 in the
membranes under high r.h. This is regarded as an important limitation that ultimately
can affect the precision of the measurement.[258] A more precise determination of the
resistance of the membranes is possible by using the IP measurement configuration.
Due to higher Lel and lower A (eq. 2.19) the expected R is up to 2-3 orders of
magnitude higher in the same temperature and r.h. conditions, which can be
determined without the need to extrapolate high frequency data. In fig. 2.9 one can see
the typical impedance spectra for powder compacts and membranes in the TP and for
the membranes in IP configuration at 80ºC and 40 % r.h.
Figure 2.9. Typical impedance spectra for powder
compacts and membranes in TP and IP configuration.
The IP spectra are constituted by a semicircle in the high frequency regions followed
by a large contribution related to the impedance of the electrode. The values of R were
calculated by fitting the spectra with an equivalent circuit model consisting of a series
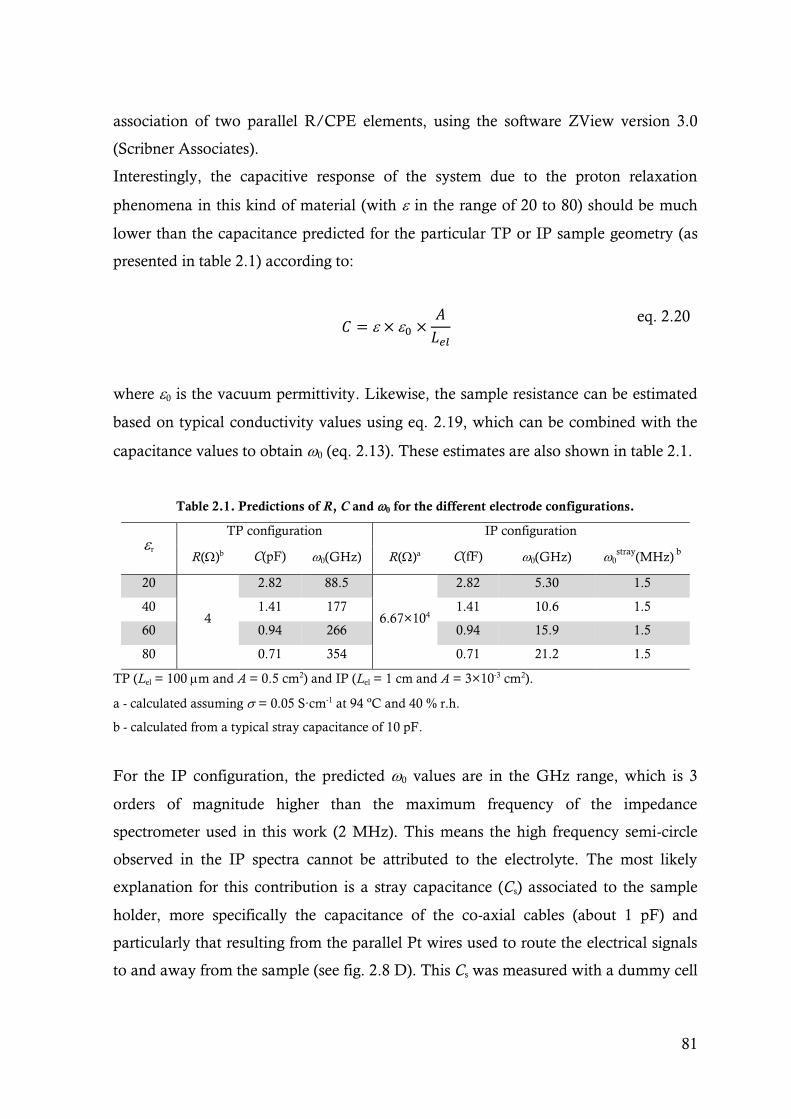
81
association of two parallel R/CPE elements, using the software ZView version 3.0
(Scribner Associates).
Interestingly, the capacitive response of the system due to the proton relaxation
phenomena in this kind of material (with in the range of 20 to 80) should be much
lower than the capacitance predicted for the particular TP or IP sample geometry (as
presented in table 2.1) according to:
𝐶 = × 0 ×𝐴
𝐿𝑒𝑙
eq. 2.20
where 0 is the vacuum permittivity. Likewise, the sample resistance can be estimated
based on typical conductivity values using eq. 2.19, which can be combined with the
capacitance values to obtain 0 (eq. 2.13). These estimates are also shown in table 2.1.
Table 2.1. Predictions of R, C and 0 for the different electrode configurations.
r TP configuration IP configuration
R()b C(pF) 0(GHz) R()a C(fF) 0(GHz) 0stray
(MHz) b
20
4
2.82 88.5
6.67×10⁴
2.82 5.30 1.5
40 1.41 177 1.41 10.6 1.5
60 0.94 266 0.94 15.9 1.5
80 0.71 354 0.71 21.2 1.5
TP (Lel = 100 m and A = 0.5 cm2) and IP (Lel = 1 cm and A = 3×10⁻³ cm2).
a - calculated assuming = 0.05 S∙cm-1 at 94 ºC and 40 % r.h.
b - calculated from a typical stray capacitance of 10 pF.
For the IP configuration, the predicted 0 values are in the GHz range, which is 3
orders of magnitude higher than the maximum frequency of the impedance
spectrometer used in this work (2 MHz). This means the high frequency semi-circle
observed in the IP spectra cannot be attributed to the electrolyte. The most likely
explanation for this contribution is a stray capacitance (Cs) associated to the sample
holder, more specifically the capacitance of the co-axial cables (about 1 pF) and
particularly that resulting from the parallel Pt wires used to route the electrical signals
to and away from the sample (see fig. 2.8 D). This Cs was measured with a dummy cell

82
and it was found to be ~10 pF which is very similar to the capacitance measured for
the membranes with the IP configuration. Since Cs is in parallel and much higher than
the expected sample capacitance (Table 2.1), the equivalent capacitance of the system
(Ceq=Cs+C) will be dominated by Cs. As the IP resistance is much higher than the TP
measurement, the resulting 0 related to the Cs is found in the frequency range of the
impedance spectrometer (1.5 MHz, see table 2.1), resulting in the observable
semicircle. The spectra obtained in the TP configuration, without detectable bulk
capacitive contribution (inset in fig. 2.9), are in agreement with the predictions (table
2.1).
In some cases, normally at lower r.h., the TP membrane and powder compact
measurements can also show a semicircle in the high frequency region, but in this case
it can be actually related to the electrolyte because R is a few orders of magnitude
higher. For these contributions, the R values are retrieved using the same equivalent
circuits as for the membranes in IP configuration.
2.5.3 Measurements under variable temperature and relative humidity
As said in the first chapter, the conductivity of the acid functionalized Ph-PMO and
the Nafion® based membranes is highly dependent on the and on temperature,
showing typical Arrhenius behaviour. Therefore, the study of the conductivity in
different temperature and r.h. conditions is crucial to fully characterize the transport
properties of these materials. The samples were analysed by EIS in the temperature
range from 40 ºC up to 140 ºC and r.h. from 20% up to 98%.
Two climatic chambers were used for these measurements. One specially assembled
in-lab, as depicted in Fig. 2.10, consisting of a stainless steel cylindrical chamber
surrounded by a heating cartridge controlled by a proportional-integral-derivative
controller (Eurotherm 3216). Next to this chamber, and connected to it by a series of
Swagelok type 1/8’’ tubing and fittings, are two stainless steel vessels mounted on a
rack, being one of these vessels filled with a desiccating agent (silica-gel, Panreac), and
the other with distilled water (Fig. 2.10).
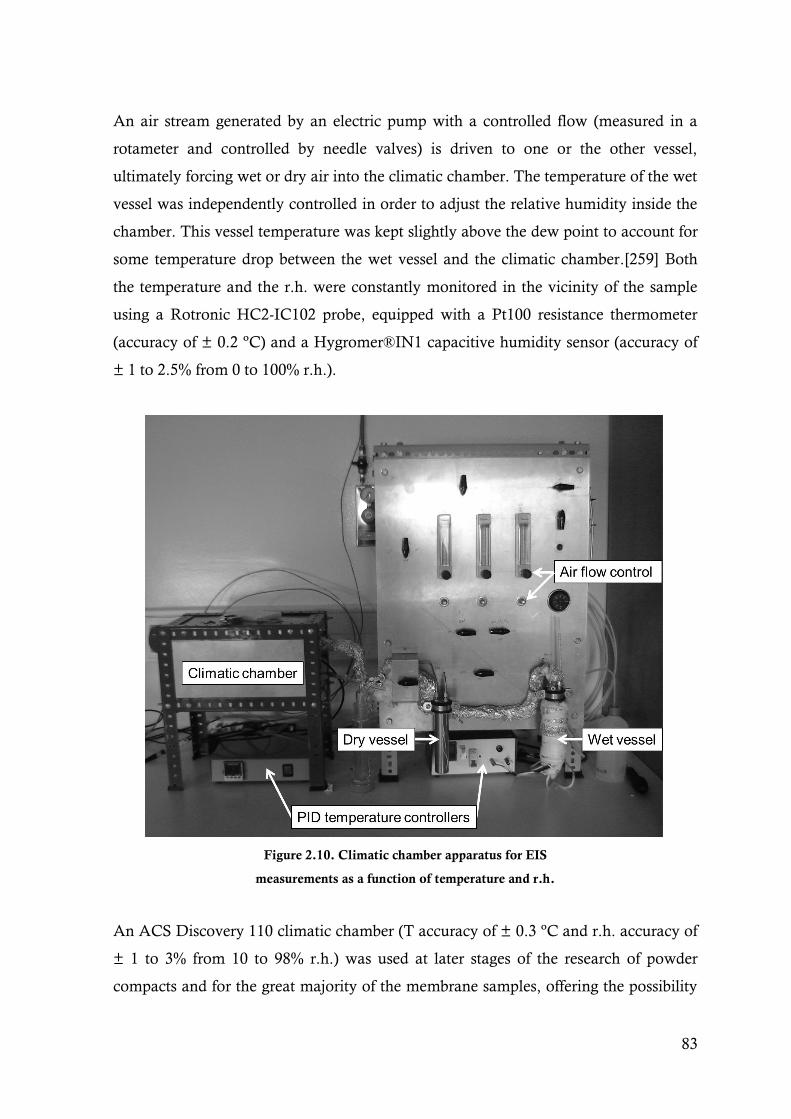
83
An air stream generated by an electric pump with a controlled flow (measured in a
rotameter and controlled by needle valves) is driven to one or the other vessel,
ultimately forcing wet or dry air into the climatic chamber. The temperature of the wet
vessel was independently controlled in order to adjust the relative humidity inside the
chamber. This vessel temperature was kept slightly above the dew point to account for
some temperature drop between the wet vessel and the climatic chamber.[259] Both
the temperature and the r.h. were constantly monitored in the vicinity of the sample
using a Rotronic HC2-IC102 probe, equipped with a Pt100 resistance thermometer
(accuracy of ± 0.2 ºC) and a Hygromer®IN1 capacitive humidity sensor (accuracy of
± 1 to 2.5% from 0 to 100% r.h.).
Figure 2.10. Climatic chamber apparatus for EIS
measurements as a function of temperature and r.h.
An ACS Discovery 110 climatic chamber (T accuracy of ± 0.3 ºC and r.h. accuracy of
± 1 to 3% from 10 to 98% r.h.) was used at later stages of the research of powder
compacts and for the great majority of the membrane samples, offering the possibility

84
of measuring 3 samples simultaneously (Fig. 2.11). The sample holders are connected
to the impedance analyser via an electronic switch and the acquisition of data (with
varying temperature and r.h.) can be made automatically.
Both systems are not adapted to operate under pressurized conditions, and thus the
measurements above 100 °C were carried out only at the maximum possible r.h.,
corresponding to a water vapour partial pressure (pH2O) of 1 atm (~40% and ~20%
r.h. for 120 ºC and 140 ºC, respectively).
Figure 2.11. Setup for the EIS automatic data acquisition system, using the ACS climatic chamber.
85
3 RESULTS AND DISCUSSION
This chapter is divided in four main sub-chapters. The process of the choice of the
protogenic group to functionalize the Ph-PMO, to be posteriorly used in composite
membranes, is presented and discussed in the first sub-chapter. The second sub-
chapter is dedicated to the structural and microstructural characterization of the S-Ph-
PMO synthesized by both conventional and microwave heating methods, including a
multivariate analysis of the influence of microwaves on the reaction kinetics. The
relationships between the structure, microstructure and the protonic conductivity of S-
Ph-PMO are analysed in the third sub-chapter, as a function of temperature and
relative humidity. The most conductive fillers were used to prepare composite S-Ph-
PMO/Nafion® membranes and their microstructure/property relationships are
analysed in the last sub-chapter, again as a function of temperature and relative
humidity.
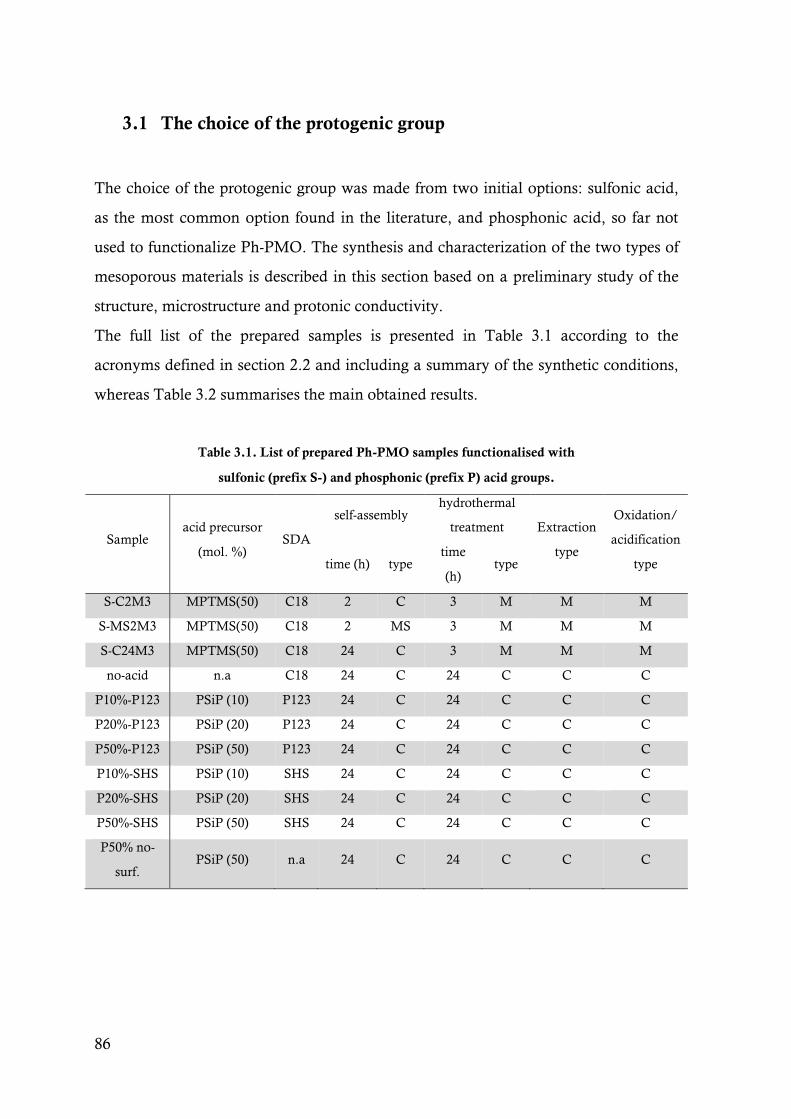
86
3.1 The choice of the protogenic group
The choice of the protogenic group was made from two initial options: sulfonic acid,
as the most common option found in the literature, and phosphonic acid, so far not
used to functionalize Ph-PMO. The synthesis and characterization of the two types of
mesoporous materials is described in this section based on a preliminary study of the
structure, microstructure and protonic conductivity.
The full list of the prepared samples is presented in Table 3.1 according to the
acronyms defined in section 2.2 and including a summary of the synthetic conditions,
whereas Table 3.2 summarises the main obtained results.
Table 3.1. List of prepared Ph-PMO samples functionalised with
sulfonic (prefix S-) and phosphonic (prefix P) acid groups.
Sample acid precursor
(mol. %) SDA
self-assembly hydrothermal
treatment Extraction
type
Oxidation/
acidification
type time (h) type time
(h) type
S-C2M3 MPTMS(50) C18 2 C 3 M M M
S-MS2M3 MPTMS(50) C18 2 MS 3 M M M
S-C24M3 MPTMS(50) C18 24 C 3 M M M
no-acid n.a C18 24 C 24 C C C
P10%-P123 PSiP (10) P123 24 C 24 C C C
P20%-P123 PSiP (20) P123 24 C 24 C C C
P50%-P123 PSiP (50) P123 24 C 24 C C C
P10%-SHS PSiP (10) SHS 24 C 24 C C C
P20%-SHS PSiP (20) SHS 24 C 24 C C C
P50%-SHS PSiP (50) SHS 24 C 24 C C C
P50% no-
surf. PSiP (50) n.a 24 C 24 C C C
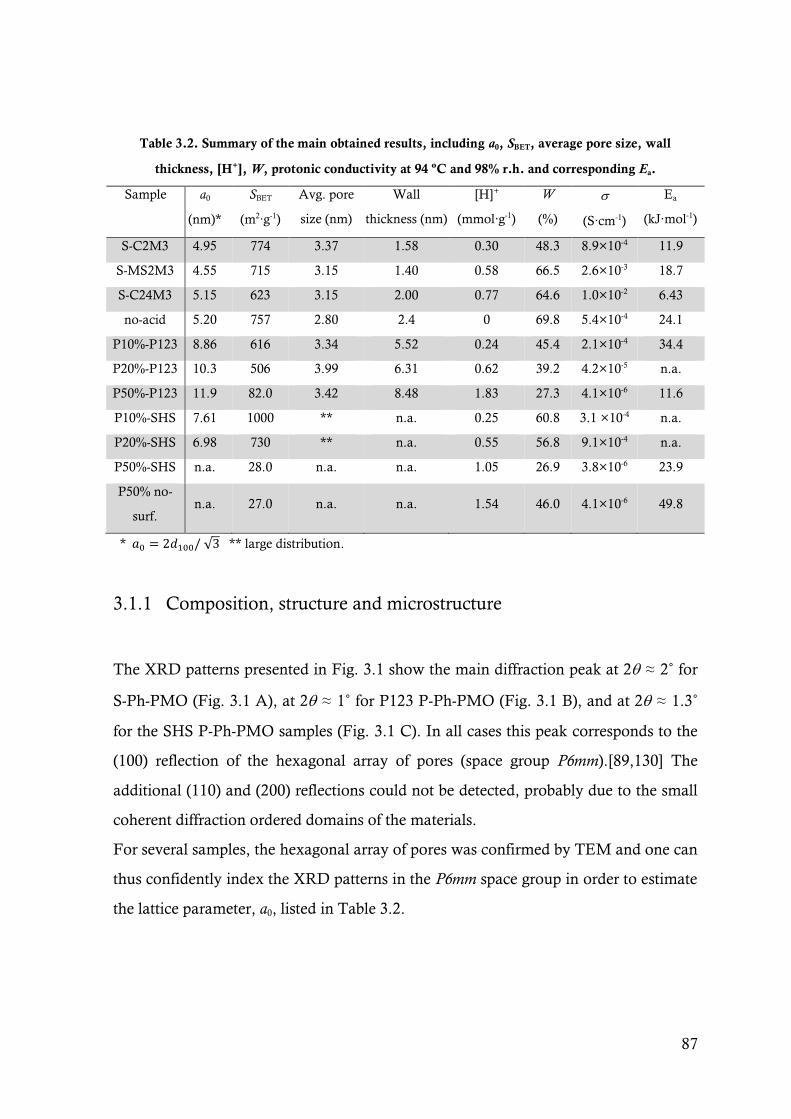
87
Table 3.2. Summary of the main obtained results, including a0, SBET, average pore size, wall
thickness, [H+], W, protonic conductivity at 94 ºC and 98% r.h. and corresponding Ea.
Sample a0
(nm)*
SBET
(m2∙g-1)
Avg. pore
size (nm)
Wall
thickness (nm)
[H]+
(mmol∙g-1)
W
(%)
(S∙cm-1)
Ea
(kJ∙mol-1)
S-C2M3 4.95 774 3.37 1.58 0.30 48.3 8.9×10⁻⁴ 11.9
S-MS2M3 4.55 715 3.15 1.40 0.58 66.5 2.6×10⁻³ 18.7
S-C24M3 5.15 623 3.15 2.00 0.77 64.6 1.0×10⁻² 6.43
no-acid 5.20 757 2.80 2.4 0 69.8 5.4×10⁻⁴ 24.1
P10%-P123 8.86 616 3.34 5.52 0.24 45.4 2.1×10⁻⁴ 34.4
P20%-P123 10.3 506 3.99 6.31 0.62 39.2 4.2×10⁻⁵ n.a.
P50%-P123 11.9 82.0 3.42 8.48 1.83 27.3 4.1×10⁻⁶ 11.6
P10%-SHS 7.61 1000 ** n.a. 0.25 60.8 3.1 ×10⁻⁴ n.a.
P20%-SHS 6.98 730 ** n.a. 0.55 56.8 9.1×10⁻⁴ n.a.
P50%-SHS n.a. 28.0 n.a. n.a. 1.05 26.9 3.8×10⁻⁶ 23.9
P50% no-
surf. n.a. 27.0 n.a. n.a. 1.54 46.0 4.1×10⁻⁶ 49.8
* 𝑎0 = 2𝑑100/ √3 ** large distribution.
3.1.1 Composition, structure and microstructure
The XRD patterns presented in Fig. 3.1 show the main diffraction peak at 2 ≈ 2˚ for
S-Ph-PMO (Fig. 3.1 A), at 2 ≈ 1˚ for P123 P-Ph-PMO (Fig. 3.1 B), and at 2 ≈ 1.3˚
for the SHS P-Ph-PMO samples (Fig. 3.1 C). In all cases this peak corresponds to the
(100) reflection of the hexagonal array of pores (space group P6mm).[89,130] The
additional (110) and (200) reflections could not be detected, probably due to the small
coherent diffraction ordered domains of the materials.
For several samples, the hexagonal array of pores was confirmed by TEM and one can
thus confidently index the XRD patterns in the P6mm space group in order to estimate
the lattice parameter, a0, listed in Table 3.2.
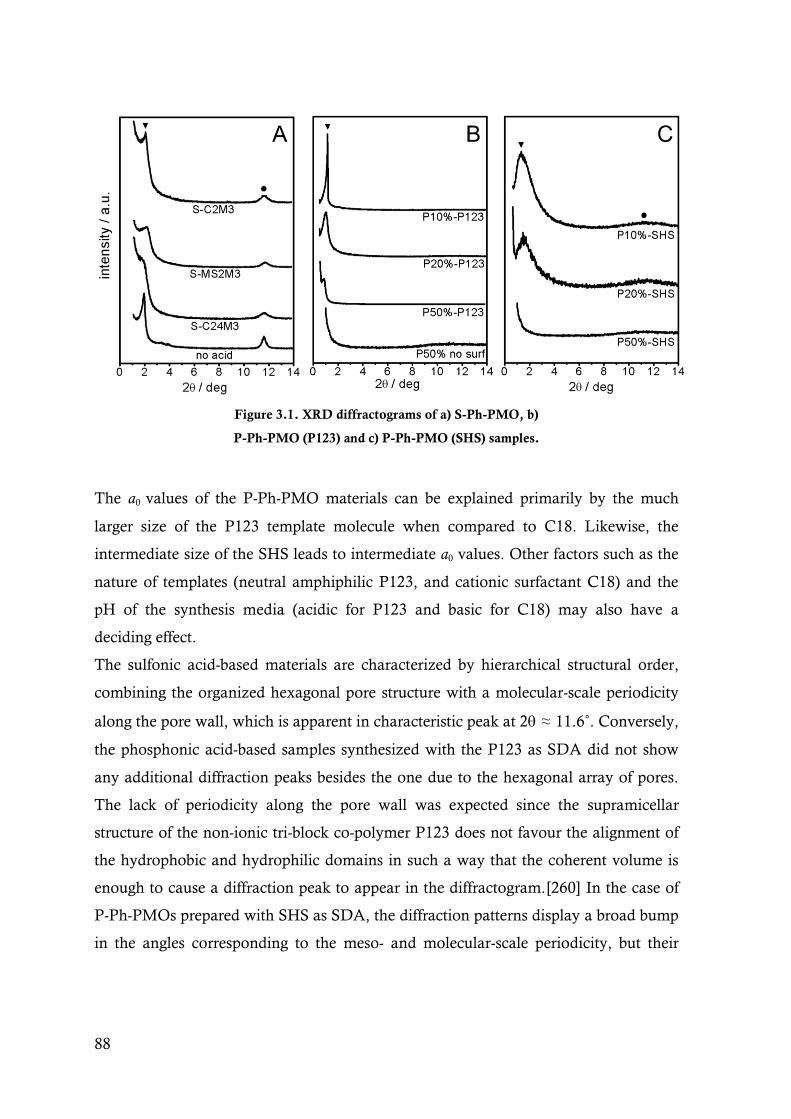
88
Figure 3.1. XRD diffractograms of a) S-Ph-PMO, b)
P-Ph-PMO (P123) and c) P-Ph-PMO (SHS) samples.
The a0 values of the P-Ph-PMO materials can be explained primarily by the much
larger size of the P123 template molecule when compared to C18. Likewise, the
intermediate size of the SHS leads to intermediate a0 values. Other factors such as the
nature of templates (neutral amphiphilic P123, and cationic surfactant C18) and the
pH of the synthesis media (acidic for P123 and basic for C18) may also have a
deciding effect.
The sulfonic acid-based materials are characterized by hierarchical structural order,
combining the organized hexagonal pore structure with a molecular-scale periodicity
along the pore wall, which is apparent in characteristic peak at 2 ≈ 11.6˚. Conversely,
the phosphonic acid-based samples synthesized with the P123 as SDA did not show
any additional diffraction peaks besides the one due to the hexagonal array of pores.
The lack of periodicity along the pore wall was expected since the supramicellar
structure of the non-ionic tri-block co-polymer P123 does not favour the alignment of
the hydrophobic and hydrophilic domains in such a way that the coherent volume is
enough to cause a diffraction peak to appear in the diffractogram.[260] In the case of
P-Ph-PMOs prepared with SHS as SDA, the diffraction patterns display a broad bump
in the angles corresponding to the meso- and molecular-scale periodicity, but their
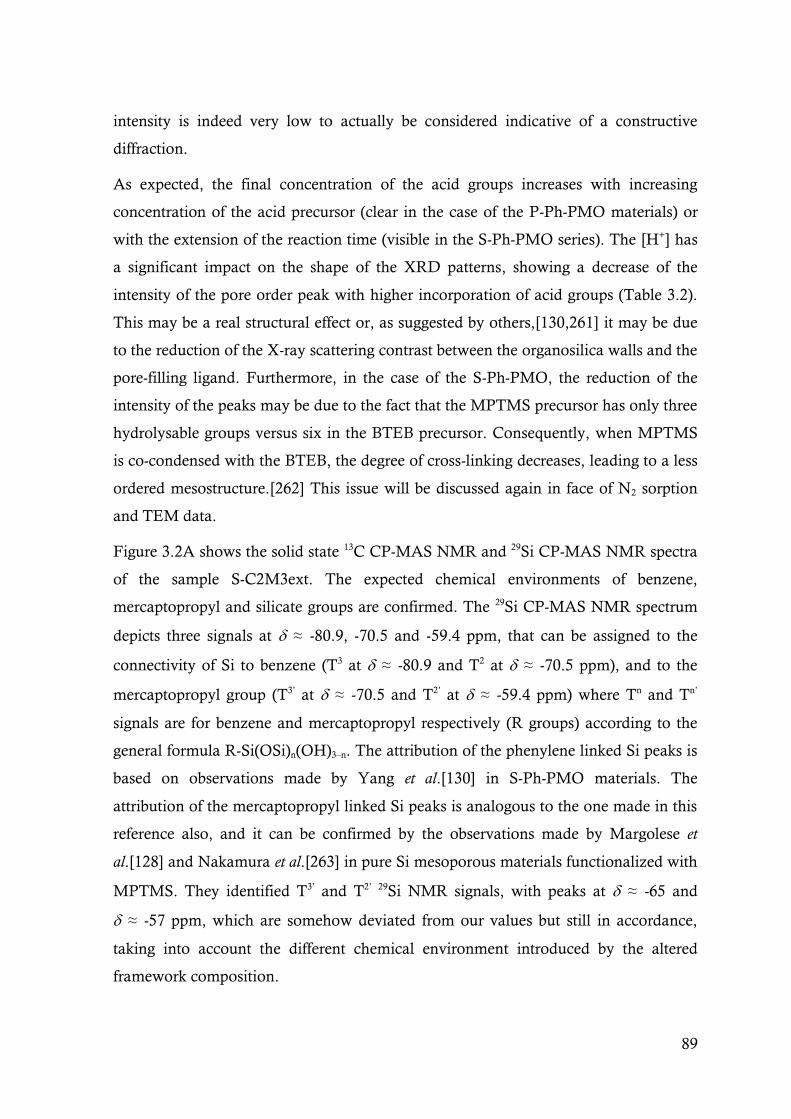
89
intensity is indeed very low to actually be considered indicative of a constructive
diffraction.
As expected, the final concentration of the acid groups increases with increasing
concentration of the acid precursor (clear in the case of the P-Ph-PMO materials) or
with the extension of the reaction time (visible in the S-Ph-PMO series). The [H+] has
a significant impact on the shape of the XRD patterns, showing a decrease of the
intensity of the pore order peak with higher incorporation of acid groups (Table 3.2).
This may be a real structural effect or, as suggested by others,[130,261] it may be due
to the reduction of the X-ray scattering contrast between the organosilica walls and the
pore-filling ligand. Furthermore, in the case of the S-Ph-PMO, the reduction of the
intensity of the peaks may be due to the fact that the MPTMS precursor has only three
hydrolysable groups versus six in the BTEB precursor. Consequently, when MPTMS
is co-condensed with the BTEB, the degree of cross-linking decreases, leading to a less
ordered mesostructure.[262] This issue will be discussed again in face of N2 sorption
and TEM data.
Figure 3.2A shows the solid state 13C CP-MAS NMR and 29Si CP-MAS NMR spectra
of the sample S-C2M3ext. The expected chemical environments of benzene,
mercaptopropyl and silicate groups are confirmed. The 29Si CP-MAS NMR spectrum
depicts three signals at ≈ -80.9, -70.5 and -59.4 ppm, that can be assigned to the
connectivity of Si to benzene (T3 at ≈ -80.9 and T2 at ≈ -70.5 ppm), and to the
mercaptopropyl group (T3’ at ≈ -70.5 and T2’ at ≈ -59.4 ppm) where Tn and Tn’
signals are for benzene and mercaptopropyl respectively (R groups) according to the
general formula R-Si(OSi)n(OH)3–n. The attribution of the phenylene linked Si peaks is
based on observations made by Yang et al.[130] in S-Ph-PMO materials. The
attribution of the mercaptopropyl linked Si peaks is analogous to the one made in this
reference also, and it can be confirmed by the observations made by Margolese et
al.[128] and Nakamura et al.[263] in pure Si mesoporous materials functionalized with
MPTMS. They identified T3’ and T2’ 29Si NMR signals, with peaks at ≈ -65 and
≈ -57 ppm, which are somehow deviated from our values but still in accordance,
taking into account the different chemical environment introduced by the altered
framework composition.

90
Figure 3.2. 13C and 29Si CP-MAS NMR spectra for sample A) S-C2M3ext
and B) S-C2M3ox. Peaks indicated as * in D are spinning side-bands.
No Qn signals, corresponding to silicon atoms connected entirely to the OSi and/or
OH units are detected, which indicates that the Si–C bond cleavage did not take place
during synthesis.[86, 130] The 13C CP-MAS NMR spectrum displays the main peak at
133.4 ppm due to the carbon atoms of the benzene ring, and three other peaks at 29.8,
22.8 and 11.9 ppm that can be assigned, respectively, to the -CH2- linked to the thiol
group; -CH2- in the middle of the propyl chain and the -CH2- bonded to the Si atom of
the mercaptopropyl ligand.[128,130,264]. Looking at Fig. 3.2 B, which shows the
solid state 13C CP-MAS NMR and 29Si CP-MAS NMR spectra of the sample S-
C2M3ox, the only obvious difference is the presence of an extra peak on the 13C CP-
MAS NMR spectrum due to a high chemical shift of the terminal -CH2- ( ≈ 54.1
ppm) in this case linked to a -SO3H group instead of -SH. However, the enduring peak
at ≈ 29.6 can be assigned to the resonance of the -CH2- connected to the remaining -
SH groups which is an indication that the oxidation process did not occur
completely.[128]
Typical solid-state NMR spectra for the P-Ph-PMO acidified samples are shown in
Fig. 3.3, again for few representative examples (A and B - P20%-P123; C and D –
P20%-SHS).
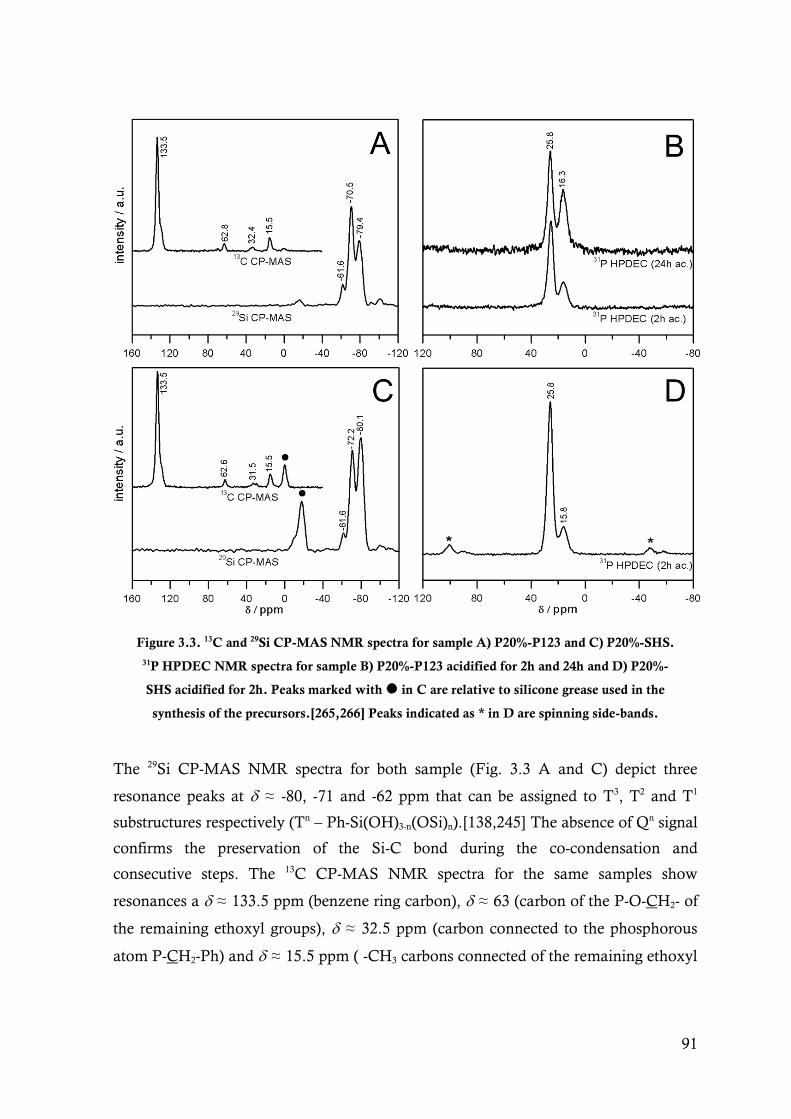
91
Figure 3.3. 13C and 29Si CP-MAS NMR spectra for sample A) P20%-P123 and C) P20%-SHS.
31P HPDEC NMR spectra for sample B) P20%-P123 acidified for 2h and 24h and D) P20%-
SHS acidified for 2h. Peaks marked with in C are relative to silicone grease used in the
synthesis of the precursors.[265,266] Peaks indicated as * in D are spinning side-bands.
The 29Si CP-MAS NMR spectra for both sample (Fig. 3.3 A and C) depict three
resonance peaks at ≈ -80, -71 and -62 ppm that can be assigned to T3, T2 and T1
substructures respectively (Tn – Ph-Si(OH)3-n(OSi)n).[138,245] The absence of Qn signal
confirms the preservation of the Si-C bond during the co-condensation and
consecutive steps. The 13C CP-MAS NMR spectra for the same samples show
resonances a ≈ 133.5 ppm (benzene ring carbon), ≈ 63 (carbon of the P-O-CH2- of
the remaining ethoxyl groups), ≈ 32.5 ppm (carbon connected to the phosphorous
atom P-CH2-Ph) and ≈ 15.5 ppm ( -CH3 carbons connected of the remaining ethoxyl
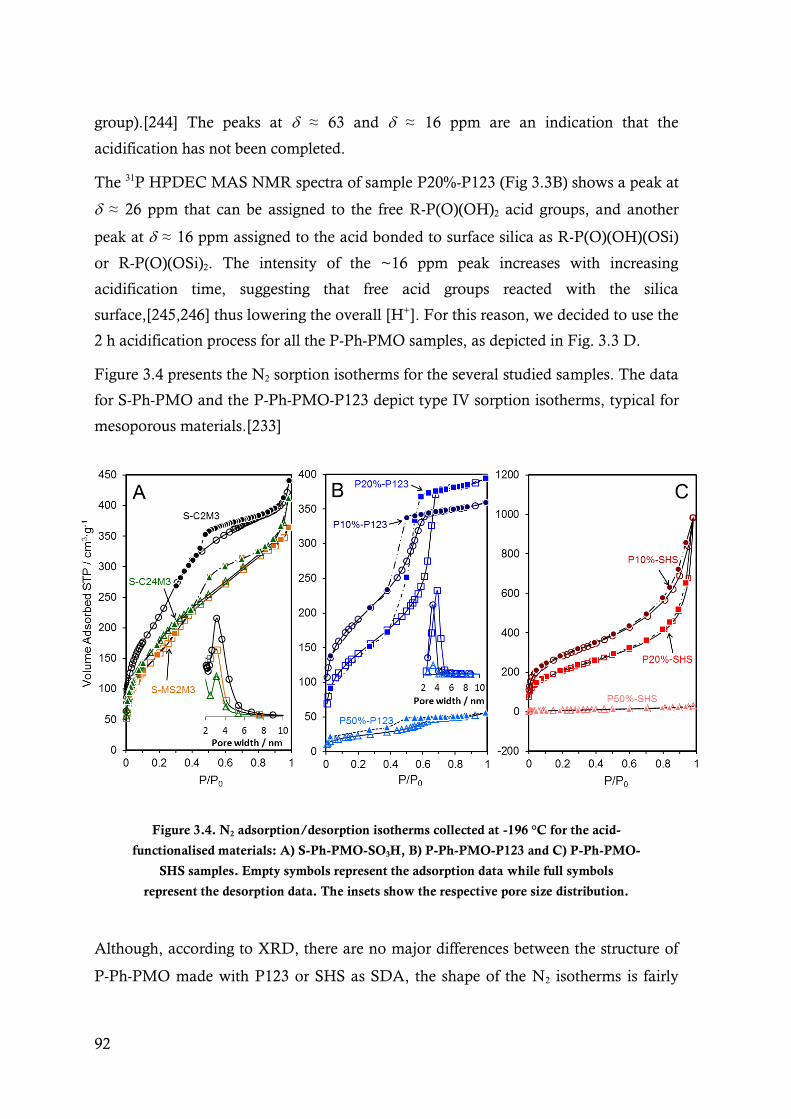
92
group).[244] The peaks at ≈ 63 and ≈ 16 ppm are an indication that the
acidification has not been completed.
The 31P HPDEC MAS NMR spectra of sample P20%-P123 (Fig 3.3B) shows a peak at
≈ 26 ppm that can be assigned to the free R-P(O)(OH)2 acid groups, and another
peak at ≈ 16 ppm assigned to the acid bonded to surface silica as R-P(O)(OH)(OSi)
or R-P(O)(OSi)2. The intensity of the ~16 ppm peak increases with increasing
acidification time, suggesting that free acid groups reacted with the silica
surface,[245,246] thus lowering the overall [H+]. For this reason, we decided to use the
2 h acidification process for all the P-Ph-PMO samples, as depicted in Fig. 3.3 D.
Figure 3.4 presents the N2 sorption isotherms for the several studied samples. The data
for S-Ph-PMO and the P-Ph-PMO-P123 depict type IV sorption isotherms, typical for
mesoporous materials.[233]
Figure 3.4. N2 adsorption/desorption isotherms collected at -196 °C for the acid-
functionalised materials: A) S-Ph-PMO-SO3H, B) P-Ph-PMO-P123 and C) P-Ph-PMO-
SHS samples. Empty symbols represent the adsorption data while full symbols
represent the desorption data. The insets show the respective pore size distribution.
Although, according to XRD, there are no major differences between the structure of
P-Ph-PMO made with P123 or SHS as SDA, the shape of the N2 isotherms is fairly
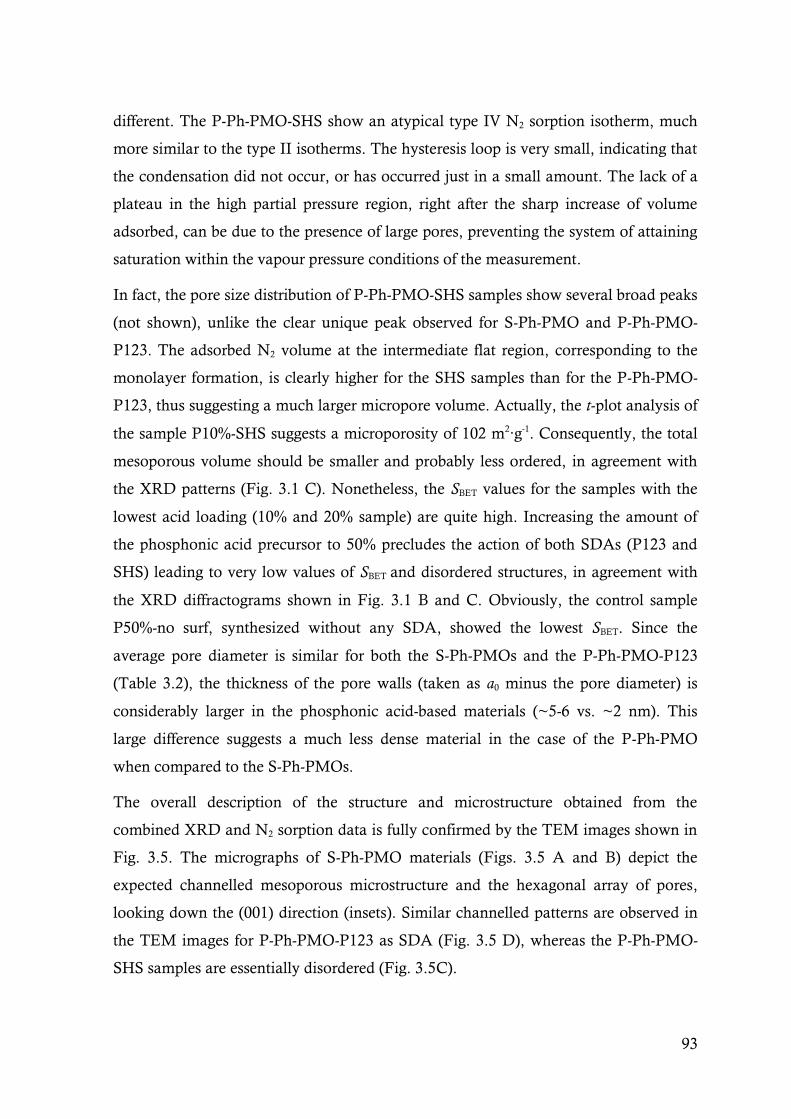
93
different. The P-Ph-PMO-SHS show an atypical type IV N2 sorption isotherm, much
more similar to the type II isotherms. The hysteresis loop is very small, indicating that
the condensation did not occur, or has occurred just in a small amount. The lack of a
plateau in the high partial pressure region, right after the sharp increase of volume
adsorbed, can be due to the presence of large pores, preventing the system of attaining
saturation within the vapour pressure conditions of the measurement.
In fact, the pore size distribution of P-Ph-PMO-SHS samples show several broad peaks
(not shown), unlike the clear unique peak observed for S-Ph-PMO and P-Ph-PMO-
P123. The adsorbed N2 volume at the intermediate flat region, corresponding to the
monolayer formation, is clearly higher for the SHS samples than for the P-Ph-PMO-
P123, thus suggesting a much larger micropore volume. Actually, the t-plot analysis of
the sample P10%-SHS suggests a microporosity of 102 m2∙g-1. Consequently, the total
mesoporous volume should be smaller and probably less ordered, in agreement with
the XRD patterns (Fig. 3.1 C). Nonetheless, the SBET values for the samples with the
lowest acid loading (10% and 20% sample) are quite high. Increasing the amount of
the phosphonic acid precursor to 50% precludes the action of both SDAs (P123 and
SHS) leading to very low values of SBET and disordered structures, in agreement with
the XRD diffractograms shown in Fig. 3.1 B and C. Obviously, the control sample
P50%-no surf, synthesized without any SDA, showed the lowest SBET. Since the
average pore diameter is similar for both the S-Ph-PMOs and the P-Ph-PMO-P123
(Table 3.2), the thickness of the pore walls (taken as a0 minus the pore diameter) is
considerably larger in the phosphonic acid-based materials (~5-6 vs. ~2 nm). This
large difference suggests a much less dense material in the case of the P-Ph-PMO
when compared to the S-Ph-PMOs.
The overall description of the structure and microstructure obtained from the
combined XRD and N2 sorption data is fully confirmed by the TEM images shown in
Fig. 3.5. The micrographs of S-Ph-PMO materials (Figs. 3.5 A and B) depict the
expected channelled mesoporous microstructure and the hexagonal array of pores,
looking down the (001) direction (insets). Similar channelled patterns are observed in
the TEM images for P-Ph-PMO-P123 as SDA (Fig. 3.5 D), whereas the P-Ph-PMO-
SHS samples are essentially disordered (Fig. 3.5C).
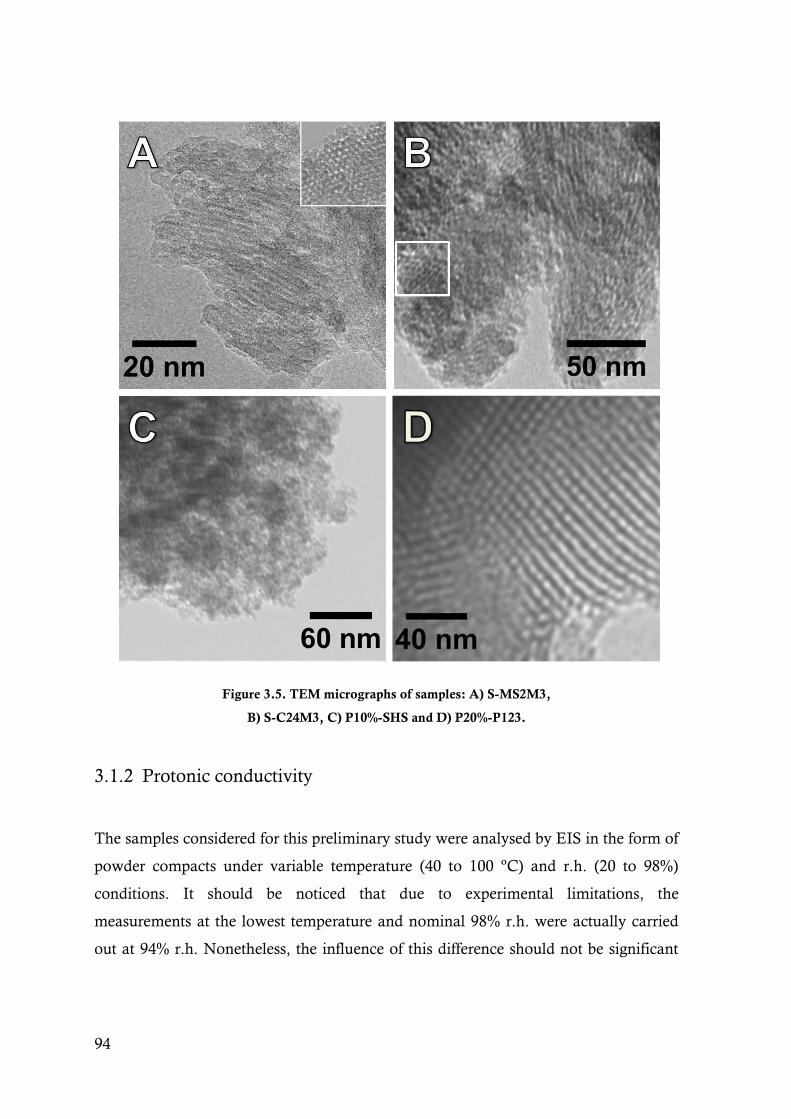
94
Figure 3.5. TEM micrographs of samples: A) S-MS2M3,
B) S-C24M3, C) P10%-SHS and D) P20%-P123.
3.1.2 Protonic conductivity
The samples considered for this preliminary study were analysed by EIS in the form of
powder compacts under variable temperature (40 to 100 ºC) and r.h. (20 to 98%)
conditions. It should be noticed that due to experimental limitations, the
measurements at the lowest temperature and nominal 98% r.h. were actually carried
out at 94% r.h. Nonetheless, the influence of this difference should not be significant
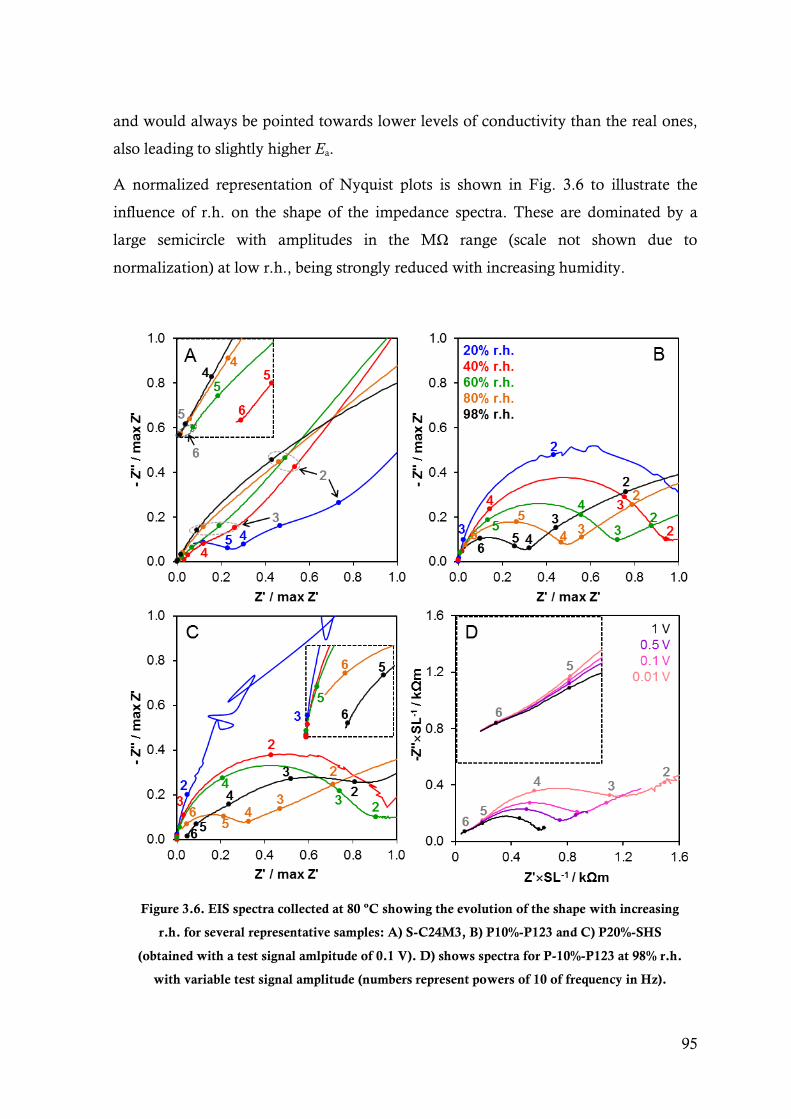
95
and would always be pointed towards lower levels of conductivity than the real ones,
also leading to slightly higher Ea.
A normalized representation of Nyquist plots is shown in Fig. 3.6 to illustrate the
influence of r.h. on the shape of the impedance spectra. These are dominated by a
large semicircle with amplitudes in the MΩ range (scale not shown due to
normalization) at low r.h., being strongly reduced with increasing humidity.
Figure 3.6. EIS spectra collected at 80 ºC showing the evolution of the shape with increasing
r.h. for several representative samples: A) S-C24M3, B) P10%-P123 and C) P20%-SHS
(obtained with a test signal amlpitude of 0.1 V). D) shows spectra for P-10%-P123 at 98% r.h.
with variable test signal amplitude (numbers represent powers of 10 of frequency in Hz).
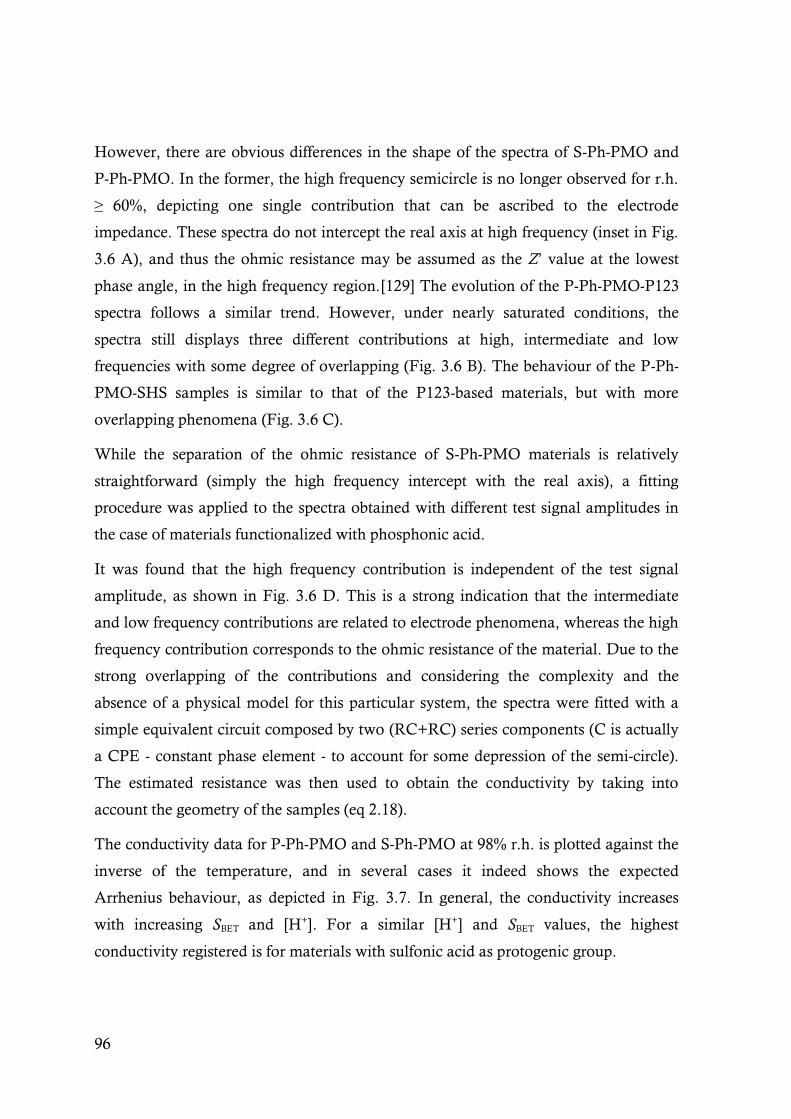
96
However, there are obvious differences in the shape of the spectra of S-Ph-PMO and
P-Ph-PMO. In the former, the high frequency semicircle is no longer observed for r.h.
≥ 60%, depicting one single contribution that can be ascribed to the electrode
impedance. These spectra do not intercept the real axis at high frequency (inset in Fig.
3.6 A), and thus the ohmic resistance may be assumed as the Z’ value at the lowest
phase angle, in the high frequency region.[129] The evolution of the P-Ph-PMO-P123
spectra follows a similar trend. However, under nearly saturated conditions, the
spectra still displays three different contributions at high, intermediate and low
frequencies with some degree of overlapping (Fig. 3.6 B). The behaviour of the P-Ph-
PMO-SHS samples is similar to that of the P123-based materials, but with more
overlapping phenomena (Fig. 3.6 C).
While the separation of the ohmic resistance of S-Ph-PMO materials is relatively
straightforward (simply the high frequency intercept with the real axis), a fitting
procedure was applied to the spectra obtained with different test signal amplitudes in
the case of materials functionalized with phosphonic acid.
It was found that the high frequency contribution is independent of the test signal
amplitude, as shown in Fig. 3.6 D. This is a strong indication that the intermediate
and low frequency contributions are related to electrode phenomena, whereas the high
frequency contribution corresponds to the ohmic resistance of the material. Due to the
strong overlapping of the contributions and considering the complexity and the
absence of a physical model for this particular system, the spectra were fitted with a
simple equivalent circuit composed by two (RC+RC) series components (C is actually
a CPE - constant phase element - to account for some depression of the semi-circle).
The estimated resistance was then used to obtain the conductivity by taking into
account the geometry of the samples (eq 2.18).
The conductivity data for P-Ph-PMO and S-Ph-PMO at 98% r.h. is plotted against the
inverse of the temperature, and in several cases it indeed shows the expected
Arrhenius behaviour, as depicted in Fig. 3.7. In general, the conductivity increases
with increasing SBET and [H+]. For a similar [H+] and SBET values, the highest
conductivity registered is for materials with sulfonic acid as protogenic group.
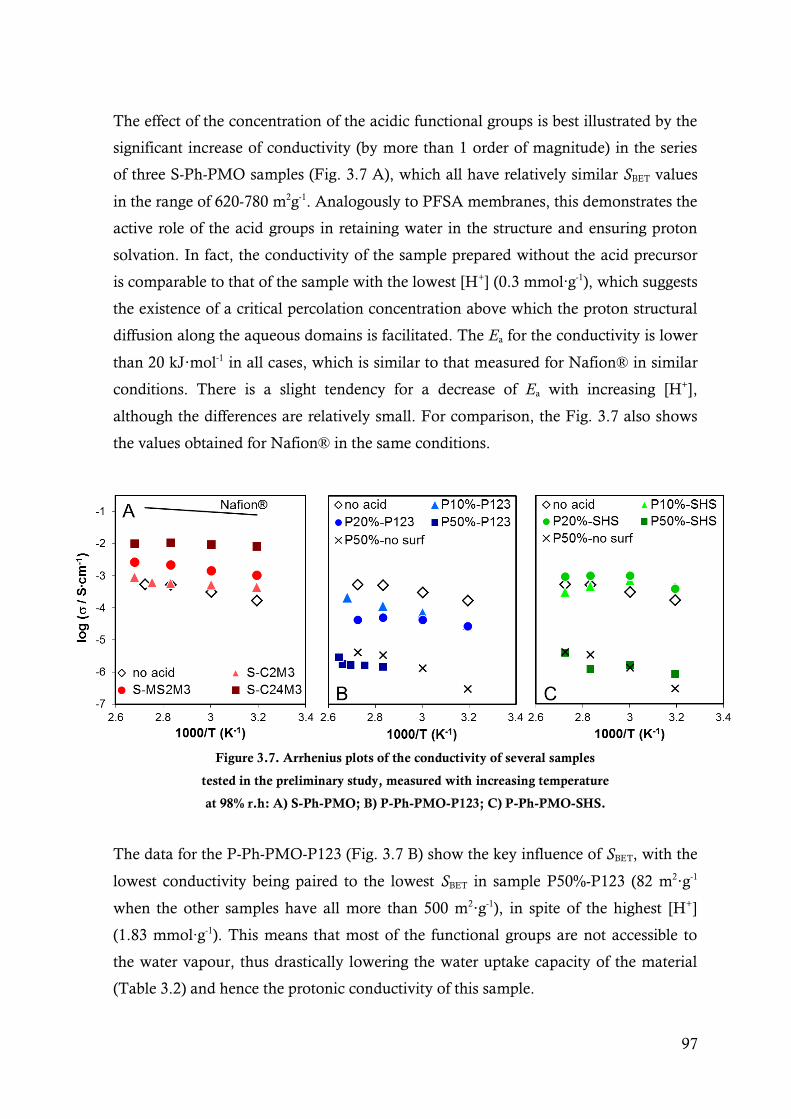
97
The effect of the concentration of the acidic functional groups is best illustrated by the
significant increase of conductivity (by more than 1 order of magnitude) in the series
of three S-Ph-PMO samples (Fig. 3.7 A), which all have relatively similar SBET values
in the range of 620-780 m2g-1. Analogously to PFSA membranes, this demonstrates the
active role of the acid groups in retaining water in the structure and ensuring proton
solvation. In fact, the conductivity of the sample prepared without the acid precursor
is comparable to that of the sample with the lowest [H+] (0.3 mmol∙g-1), which suggests
the existence of a critical percolation concentration above which the proton structural
diffusion along the aqueous domains is facilitated. The Ea for the conductivity is lower
than 20 kJ·mol-1 in all cases, which is similar to that measured for Nafion® in similar
conditions. There is a slight tendency for a decrease of Ea with increasing [H+],
although the differences are relatively small. For comparison, the Fig. 3.7 also shows
the values obtained for Nafion® in the same conditions.
Figure 3.7. Arrhenius plots of the conductivity of several samples
tested in the preliminary study, measured with increasing temperature
at 98% r.h: A) S-Ph-PMO; B) P-Ph-PMO-P123; C) P-Ph-PMO-SHS.
The data for the P-Ph-PMO-P123 (Fig. 3.7 B) show the key influence of SBET, with the
lowest conductivity being paired to the lowest SBET in sample P50%-P123 (82 m2·g-1
when the other samples have all more than 500 m2·g-1), in spite of the highest [H+]
(1.83 mmol∙g-1). This means that most of the functional groups are not accessible to
the water vapour, thus drastically lowering the water uptake capacity of the material
(Table 3.2) and hence the protonic conductivity of this sample.
98
The data in Fig. 3.7 C, for the P-Ph-PMO-SHS, also illustrates this effect, with
samples P50%-SHS and P50%-no surf showing the lowest levels of conductivity due to
the low SBET, in spite on the considerably high [H+].
Surprisingly, the sample P20%-P123 does not show any increase in conductivity when
compared to P10%-P123, although it has twice the [H+] and similar SBET. Moreover,
there is a clear deviation from the Arrhenius behaviour for r.h.> 40% for the sample
with higher [H+], displaying an apparent decrease of Ea. One possible explanation for
this somewhat unexpected behaviour is the degradation of the particle-particle contact
with increasing r.h., negatively impacting the phase contiguity necessary for the ionic
transport. However, no obvious modification of the sample microstructure could be
detected after the measurements, and alternative explanations for this behaviour
should be considered. Indeed, a similar trend is observed in the behaviour of the P-Ph-
PMO-SHS, although with slightly higher conductivity values. The conductivity
enhancement of the sample P20%-SHS with respect to P10%-SHS is surprisingly
small, in spite of the much higher [H+]. A deviation from the Arrhenius behaviour
with apparent negative activation energy for r.h. higher than 40% is also observed, but
in this case for both the P10%-SHS and P20%-SHS samples.
It is important to notice the slight advantage of the conductivity values of the SHS-
based samples, very likely resulting from their higher SBET in comparison to the P123-
based materials, since the [H+] is similar.
All the mesoporous materials have been found to be difficult to press into handleable
pellets. On the other hand, the densities of these pellets are all rather low at around 0.9
g∙cm-3, certainly due to high volume of macro, meso and micropores. So, it is sensible
to say that the conductivity values obtained for pelletized samples are underestimated.
Nonetheless, the comparison of S-Ph-PMO and P-Ph-PMO samples with similar [H+]
and SBET (e.g., S-C2M3 and P10%-P123) shows considerably better transport
properties for the S-Ph-PMO. This may be due to the higher water retention capacity
and to the strongest acidic characteristics of the sulfonic acid group, which is able to
provide more extensive proton solvation in the presence of large amounts of
water.[214]
The potential advantage of the more amphoteric character of phosphonic acid under
low humidity conditions is here severely limited by the difficulties in obtaining
materials with sufficiently high acid concentrations and high specific surface areas. In
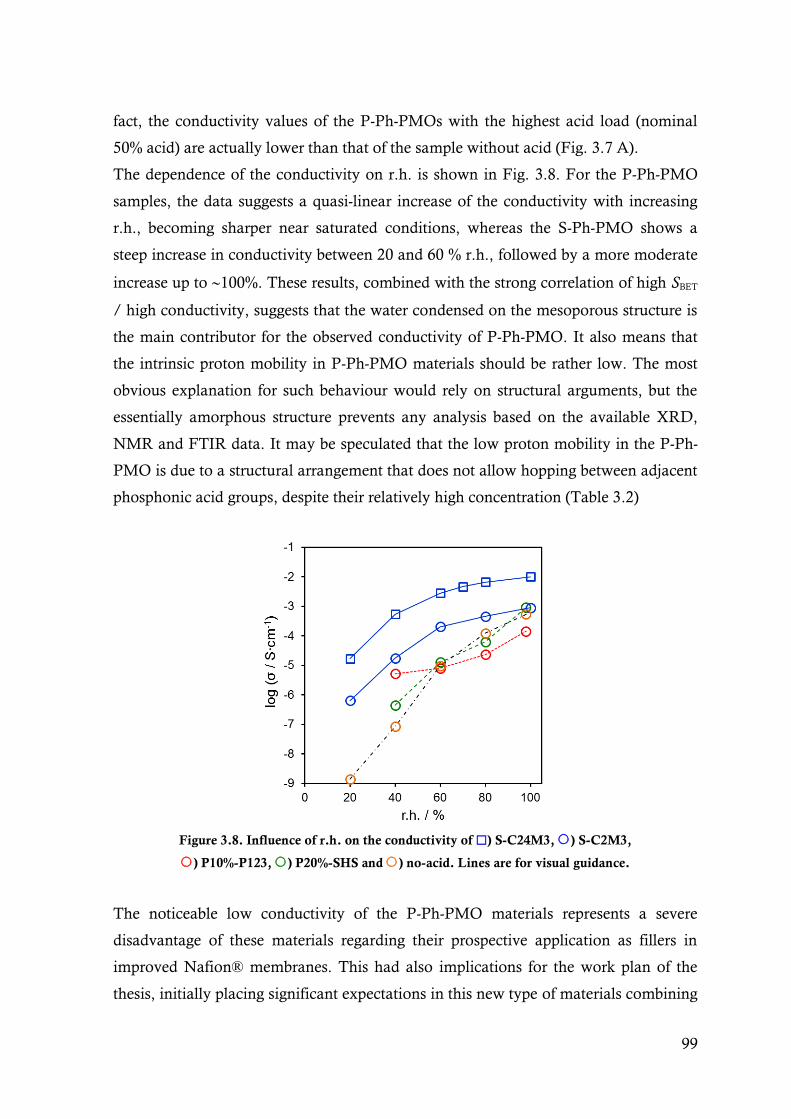
99
fact, the conductivity values of the P-Ph-PMOs with the highest acid load (nominal
50% acid) are actually lower than that of the sample without acid (Fig. 3.7 A).
The dependence of the conductivity on r.h. is shown in Fig. 3.8. For the P-Ph-PMO
samples, the data suggests a quasi-linear increase of the conductivity with increasing
r.h., becoming sharper near saturated conditions, whereas the S-Ph-PMO shows a
steep increase in conductivity between 20 and 60 % r.h., followed by a more moderate
increase up to 100%. These results, combined with the strong correlation of high SBET
/ high conductivity, suggests that the water condensed on the mesoporous structure is
the main contributor for the observed conductivity of P-Ph-PMO. It also means that
the intrinsic proton mobility in P-Ph-PMO materials should be rather low. The most
obvious explanation for such behaviour would rely on structural arguments, but the
essentially amorphous structure prevents any analysis based on the available XRD,
NMR and FTIR data. It may be speculated that the low proton mobility in the P-Ph-
PMO is due to a structural arrangement that does not allow hopping between adjacent
phosphonic acid groups, despite their relatively high concentration (Table 3.2)
Figure 3.8. Influence of r.h. on the conductivity of ) S-C24M3, ) S-C2M3,
) P10%-P123, ) P20%-SHS and ) no-acid. Lines are for visual guidance.
The noticeable low conductivity of the P-Ph-PMO materials represents a severe
disadvantage of these materials regarding their prospective application as fillers in
improved Nafion® membranes. This had also implications for the work plan of the
thesis, initially placing significant expectations in this new type of materials combining
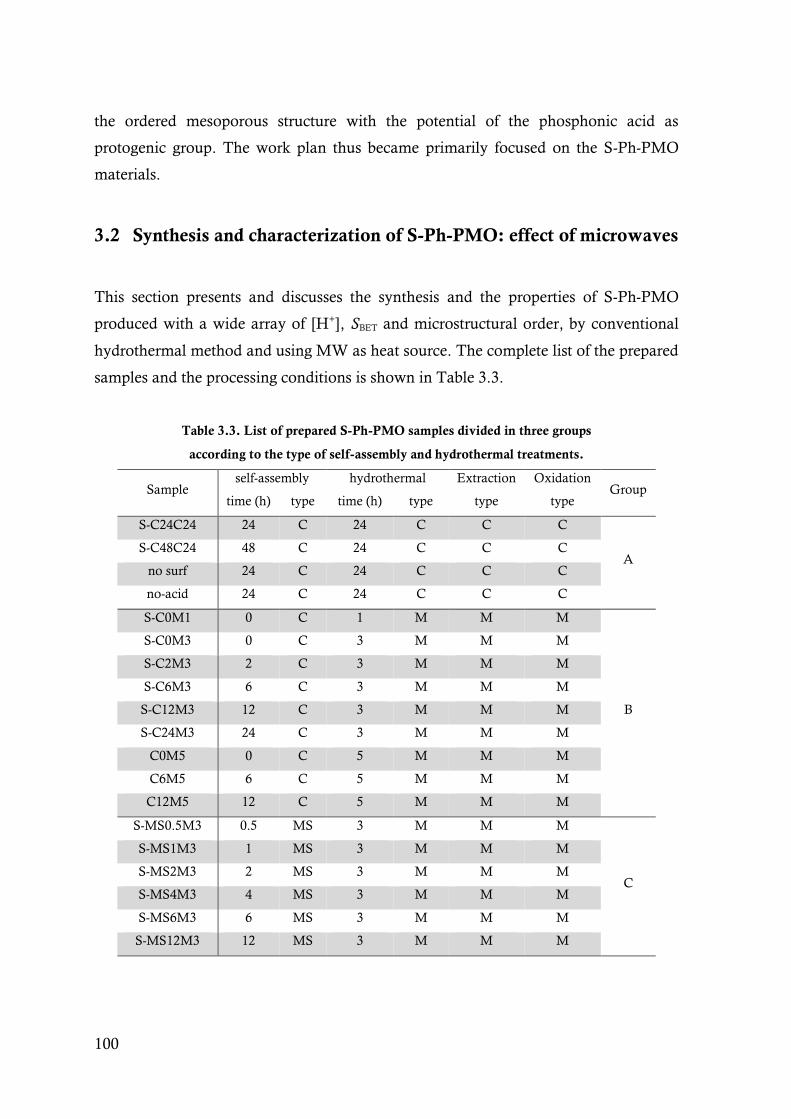
100
the ordered mesoporous structure with the potential of the phosphonic acid as
protogenic group. The work plan thus became primarily focused on the S-Ph-PMO
materials.
3.2 Synthesis and characterization of S-Ph-PMO: effect of microwaves
This section presents and discusses the synthesis and the properties of S-Ph-PMO
produced with a wide array of [H+], SBET and microstructural order, by conventional
hydrothermal method and using MW as heat source. The complete list of the prepared
samples and the processing conditions is shown in Table 3.3.
Table 3.3. List of prepared S-Ph-PMO samples divided in three groups
according to the type of self-assembly and hydrothermal treatments.
Sample self-assembly hydrothermal Extraction
type
Oxidation
type Group
time (h) type time (h) type
S-C24C24 24 C 24 C C C
A S-C48C24 48 C 24 C C C
no surf 24 C 24 C C C
no-acid 24 C 24 C C C
S-C0M1 0 C 1 M M M
B
S-C0M3 0 C 3 M M M
S-C2M3 2 C 3 M M M
S-C6M3 6 C 3 M M M
S-C12M3 12 C 3 M M M
S-C24M3 24 C 3 M M M
C0M5 0 C 5 M M M
C6M5 6 C 5 M M M
C12M5 12 C 5 M M M
S-MS0.5M3 0.5 MS 3 M M M
C
S-MS1M3 1 MS 3 M M M
S-MS2M3 2 MS 3 M M M
S-MS4M3 4 MS 3 M M M
S-MS6M3 6 MS 3 M M M
S-MS12M3 12 MS 3 M M M
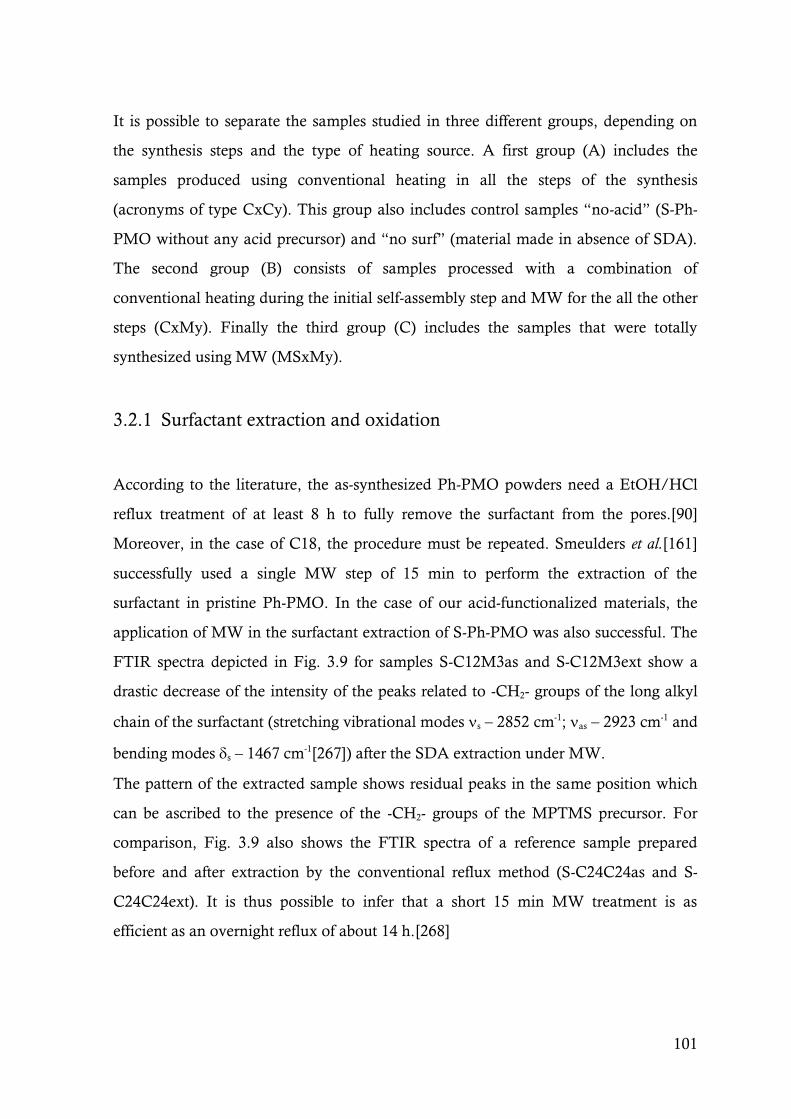
101
It is possible to separate the samples studied in three different groups, depending on
the synthesis steps and the type of heating source. A first group (A) includes the
samples produced using conventional heating in all the steps of the synthesis
(acronyms of type CxCy). This group also includes control samples “no-acid” (S-Ph-
PMO without any acid precursor) and “no surf” (material made in absence of SDA).
The second group (B) consists of samples processed with a combination of
conventional heating during the initial self-assembly step and MW for the all the other
steps (CxMy). Finally the third group (C) includes the samples that were totally
synthesized using MW (MSxMy).
3.2.1 Surfactant extraction and oxidation
According to the literature, the as-synthesized Ph-PMO powders need a EtOH/HCl
reflux treatment of at least 8 h to fully remove the surfactant from the pores.[90]
Moreover, in the case of C18, the procedure must be repeated. Smeulders et al.[161]
successfully used a single MW step of 15 min to perform the extraction of the
surfactant in pristine Ph-PMO. In the case of our acid-functionalized materials, the
application of MW in the surfactant extraction of S-Ph-PMO was also successful. The
FTIR spectra depicted in Fig. 3.9 for samples S-C12M3as and S-C12M3ext show a
drastic decrease of the intensity of the peaks related to -CH2- groups of the long alkyl
chain of the surfactant (stretching vibrational modes s – 2852 cm-1; as – 2923 cm-1 and
bending modes s – 1467 cm-1[267]) after the SDA extraction under MW.
The pattern of the extracted sample shows residual peaks in the same position which
can be ascribed to the presence of the -CH2- groups of the MPTMS precursor. For
comparison, Fig. 3.9 also shows the FTIR spectra of a reference sample prepared
before and after extraction by the conventional reflux method (S-C24C24as and S-
C24C24ext). It is thus possible to infer that a short 15 min MW treatment is as
efficient as an overnight reflux of about 14 h.[268]
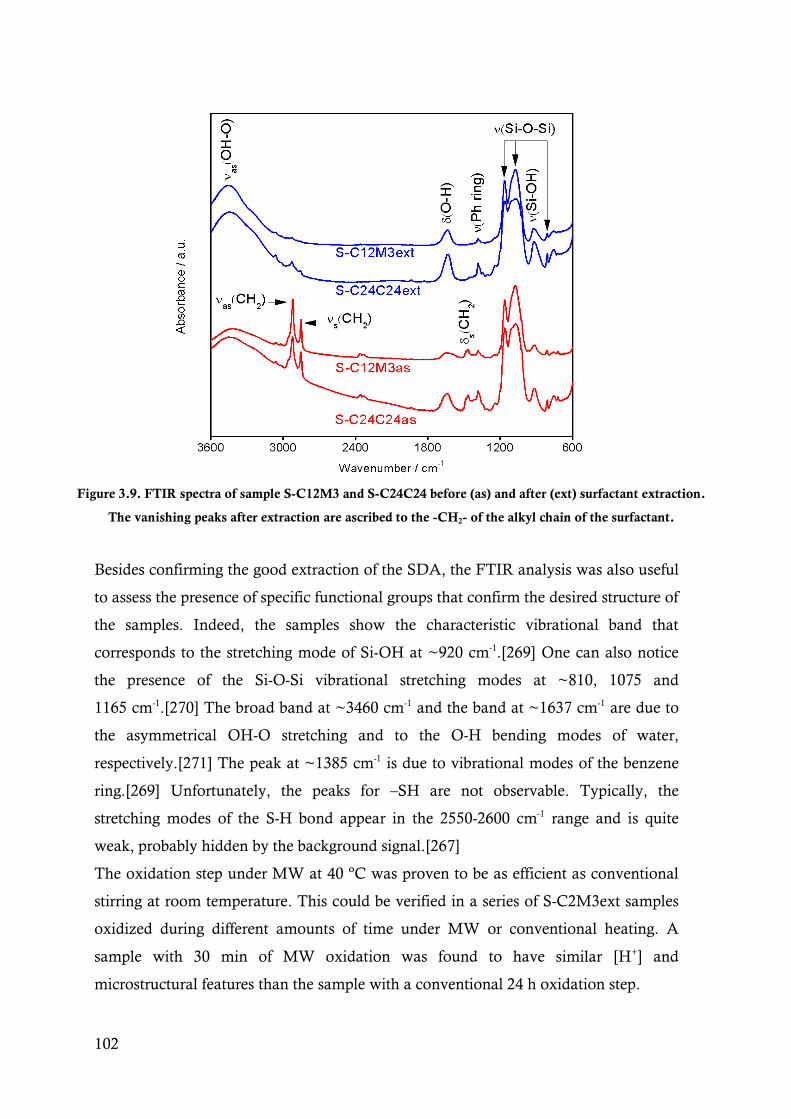
102
Figure 3.9. FTIR spectra of sample S-C12M3 and S-C24C24 before (as) and after (ext) surfactant extraction.
The vanishing peaks after extraction are ascribed to the -CH2- of the alkyl chain of the surfactant.
Besides confirming the good extraction of the SDA, the FTIR analysis was also useful
to assess the presence of specific functional groups that confirm the desired structure of
the samples. Indeed, the samples show the characteristic vibrational band that
corresponds to the stretching mode of Si-OH at ~920 cm-1.[269] One can also notice
the presence of the Si-O-Si vibrational stretching modes at ~810, 1075 and
1165 cm-1.[270] The broad band at ~3460 cm-1 and the band at ~1637 cm-1 are due to
the asymmetrical OH-O stretching and to the O-H bending modes of water,
respectively.[271] The peak at ~1385 cm-1 is due to vibrational modes of the benzene
ring.[269] Unfortunately, the peaks for –SH are not observable. Typically, the
stretching modes of the S-H bond appear in the 2550-2600 cm-1 range and is quite
weak, probably hidden by the background signal.[267]
The oxidation step under MW at 40 ºC was proven to be as efficient as conventional
stirring at room temperature. This could be verified in a series of S-C2M3ext samples
oxidized during different amounts of time under MW or conventional heating. A
sample with 30 min of MW oxidation was found to have similar [H+] and
microstructural features than the sample with a conventional 24 h oxidation step.
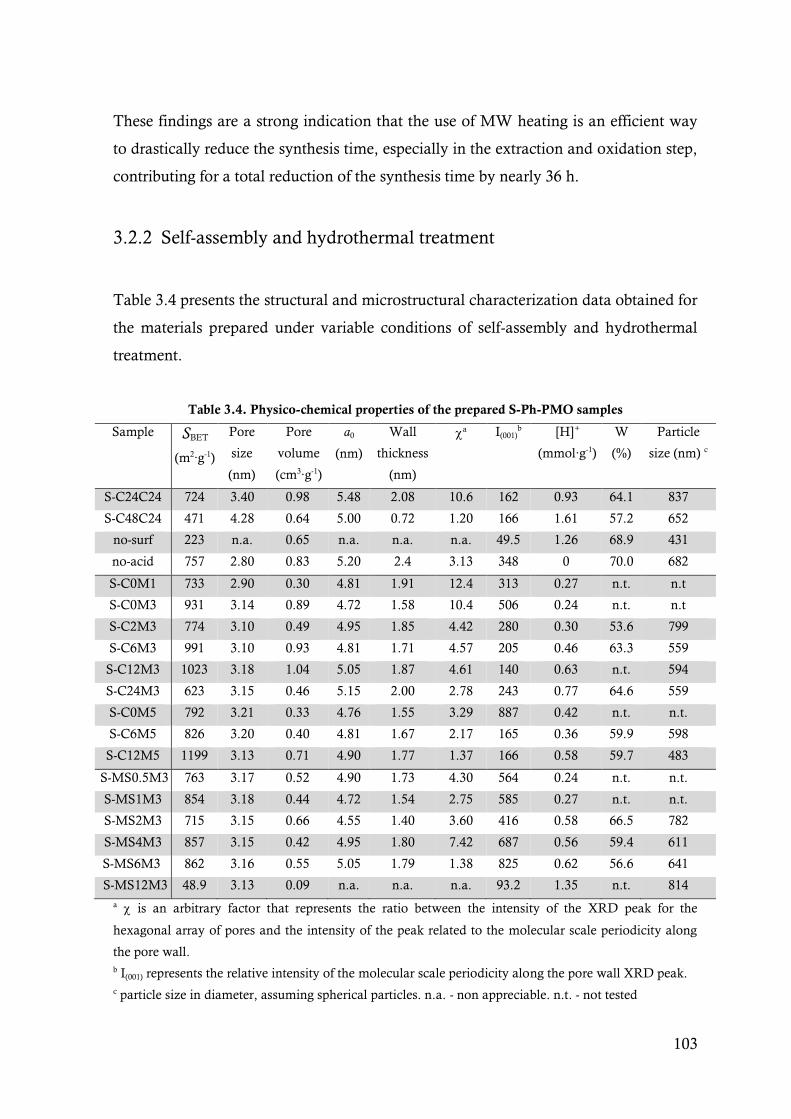
103
These findings are a strong indication that the use of MW heating is an efficient way
to drastically reduce the synthesis time, especially in the extraction and oxidation step,
contributing for a total reduction of the synthesis time by nearly 36 h.
3.2.2 Self-assembly and hydrothermal treatment
Table 3.4 presents the structural and microstructural characterization data obtained for
the materials prepared under variable conditions of self-assembly and hydrothermal
treatment.
Table 3.4. Physico-chemical properties of the prepared S-Ph-PMO samples
Sample SBET
(m2∙g-1)
Pore
size
(nm)
Pore
volume
(cm3∙g-1)
a0
(nm)
Wall
thickness
(nm)
a
I(001)b [H]+
(mmol∙g-1)
W
(%)
Particle
size (nm) c
S-C24C24 724 3.40 0.98 5.48 2.08 10.6 162 0.93 64.1 837
S-C48C24 471 4.28 0.64 5.00 0.72 1.20 166 1.61 57.2 652
no-surf 223 n.a. 0.65 n.a. n.a. n.a. 49.5 1.26 68.9 431
no-acid 757 2.80 0.83 5.20 2.4 3.13 348 0 70.0 682
S-C0M1 733 2.90 0.30 4.81 1.91 12.4 313 0.27 n.t. n.t
S-C0M3 931 3.14 0.89 4.72 1.58 10.4 506 0.24 n.t. n.t
S-C2M3 774 3.10 0.49 4.95 1.85 4.42 280 0.30 53.6 799
S-C6M3 991 3.10 0.93 4.81 1.71 4.57 205 0.46 63.3 559
S-C12M3 1023 3.18 1.04 5.05 1.87 4.61 140 0.63 n.t. 594
S-C24M3 623 3.15 0.46 5.15 2.00 2.78 243 0.77 64.6 559
S-C0M5 792 3.21 0.33 4.76 1.55 3.29 887 0.42 n.t. n.t.
S-C6M5 826 3.20 0.40 4.81 1.67 2.17 165 0.36 59.9 598
S-C12M5 1199 3.13 0.71 4.90 1.77 1.37 166 0.58 59.7 483
S-MS0.5M3 763 3.17 0.52 4.90 1.73 4.30 564 0.24 n.t. n.t.
S-MS1M3 854 3.18 0.44 4.72 1.54 2.75 585 0.27 n.t. n.t.
S-MS2M3 715 3.15 0.66 4.55 1.40 3.60 416 0.58 66.5 782
S-MS4M3 857 3.15 0.42 4.95 1.80 7.42 687 0.56 59.4 611
S-MS6M3 862 3.16 0.55 5.05 1.79 1.38 825 0.62 56.6 641
S-MS12M3 48.9 3.13 0.09 n.a. n.a. n.a. 93.2 1.35 n.t. 814
a is an arbitrary factor that represents the ratio between the intensity of the XRD peak for the
hexagonal array of pores and the intensity of the peak related to the molecular scale periodicity along
the pore wall.
b I(001) represents the relative intensity of the molecular scale periodicity along the pore wall XRD peak.
c particle size in diameter, assuming spherical particles. n.a. - non appreciable. n.t. - not tested

104
As expected, the concentration of sulfonic acid groups increases with increasing self-
assembly time for both conventional and MW heating. However, the reaction kinetics
is strongly enhanced by the MW in comparison to conventional heating, allowing a
reduction of up to ~80% of the time necessary to attain similar acid loads.
Figure 3.10 depicts the evolution of [H+] as a function self-assembly time for both
conventional and MW routes. The [H+] is showed normalized to the maximum acid
incorporation, defined by the stoichiometry of the reaction (~1.77 mmol.g-1). The
samples with 5 h (dotted circles) and 3h (solid lines) of hydrothermal treatment show a
similar tendency.
Figure 3.10. Evolution of [H+] as a function of self-assembly time: () conventional stirring
(open symbols and dotted symbols are for samples with 3 h and 5 h of hydrothermal treatment,
respectively). () MW stirring (all samples where hydrothermally treated in MW for 3 h).
The XRD patterns of several oxidized samples are shown in Fig. 3.11. The
diffractograms are presented as raw data, but to effectively retrieve diffraction angles
and the relative intensities of the two peaks, the baselines were subtracted. Most
patterns are typical of ordered mesoporous materials, with the diffraction maxima at
2 ≈ 2° being assigned to the (100) reflection of the hexagonal distribution of the
pores, and the smaller (001) reflection at 2 ≈ 11.6° due to the molecular scale
periodicity in the pore wall.

105
Figure 3.11. XRD diffractograms for the several oxidized S-Ph-PMO samples: A)
conventional heating and control samples; B) samples with MW heating in the hydrothermal
step and C) samples fully synthesized using MW energy. The triangles identify the pore order
reflection (100) and circles denote the (001) molecular scale periodicity.
As expected, the “no-acid” control sample shows a clear pattern with high intensity
peaks due to the absence of the acid precursor, whereas the sample “no surf” does not
show any evidence of organized pores due to the lack of SDA in the synthesis. The
hexagonal cell parameter a0 (Table 3.4) increases slightly with increasing self-assembly
time for the samples of group B and C. This effect can be related to the increasing
incorporation of the acid precursor inside the pore wall. A slight increase of a0 with
increasing [H+] was also observed by Inagaki et al.[130] for Ph-PMO samples prepared
with conventional heating.
One of the major differences between the patterns of samples prepared with at least
one MW step (B and C) and those prepared by the conventional method (A) is the
marked decrease of the intensity of the pore order reflection (I(100)) for the samples S-
C6M5 and S-C12M5. This suggests that the use of MW during the hydrothermal step
for more than 3 h tends to decrease the coherent ordered volume that causes the
diffraction.
C B A
106
One can also notice the decrease of I(100) with increasing [H+] in the materials of group
B, suggesting a decrease of the extension of the pore order due the acid incorporation,
also in agreement with the literature.[97,130,213,268] The behaviour of the group C
samples does not follow exactly the same trend, with sample S-MS4M3 (with
intermediate MW self-assembly step duration) showing an apparent higher order than
sample S-MS2M3, although the [H+] is lower in S-MS4M3 than in S-MS2M3 (Table
3.4). Nevertheless, sample S-MS6M3 follows the trend observed for group B, clearly
displaying the lowest I(100) of the C samples. The causes for this apparent dispersion
may be related to the lack of control on the MW energy delivered to the samples.
Since the self-assembly temperature (40 ºC) is quickly attained under MW, significant
differences may indeed occur between the nominal duration of the treatment and the
time that MW were effectively targeting the reactants.
In order to rationalise the observed correlations, it is useful to introduce an order
factor representing the ratio between I(100) and I(001). In Fig. 3.12A these values are
presented normalized to the highest value of all samples (ref=12.4 for sample S-
C0M1). Likewise, it is also useful to consider I(001) as an indication of the extension of
the molecular scale order along the pore walls, also presented in Fig. 3.12B,
normalized to the highest I(001) from all samples (I(001)ref = 887 for S-C0M5).
For the samples of group B (circles in Fig. 3.12), both and I(001) tend to decrease with
increasing self-assembly time. The values of I(001) for sample S-C24M3 is a bit off the
tendency, probably due to the long self-assembly time (24h), enabling significant
molecular periodicity, but not the long range hexagonal order.
For the samples in group C (square symbols), the trend is similar for (Fig.3.12A),
which essentially is linked to the increase of [H+]. As noticed above, the exception for
S-MS4M3 may be related to the uncertainty on the effective MW dosage.
Interestingly, the I(001)/I(001)ref ratio in group C samples (squares in Fig. 3.12 B) seems to
deviate from this trend for intermediate MW stirring times (4 and 6 h). In the absence
of plausible and reasonable explanation for this apparent maximum, one could invoke
the effect of uncontrolled parameters during the XRD analysis. Besides differences in
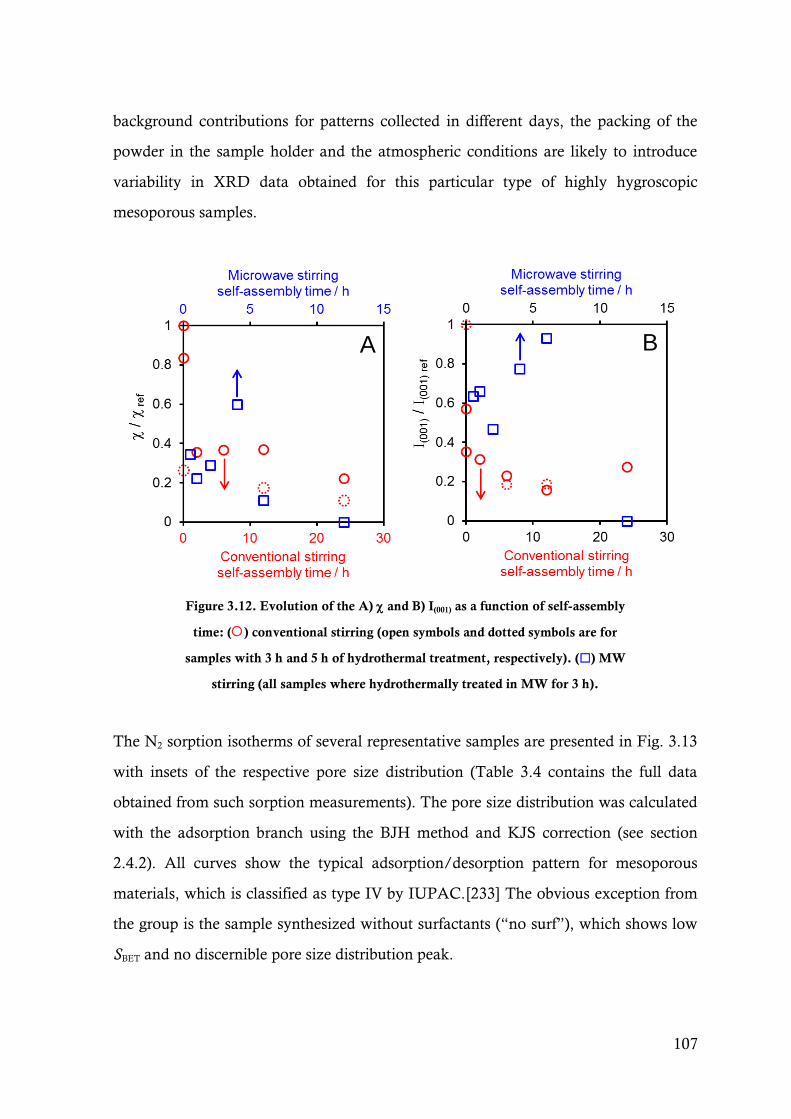
107
background contributions for patterns collected in different days, the packing of the
powder in the sample holder and the atmospheric conditions are likely to introduce
variability in XRD data obtained for this particular type of highly hygroscopic
mesoporous samples.
Figure 3.12. Evolution of the A) and B) I(001) as a function of self-assembly
time: () conventional stirring (open symbols and dotted symbols are for
samples with 3 h and 5 h of hydrothermal treatment, respectively). () MW
stirring (all samples where hydrothermally treated in MW for 3 h).
The N2 sorption isotherms of several representative samples are presented in Fig. 3.13
with insets of the respective pore size distribution (Table 3.4 contains the full data
obtained from such sorption measurements). The pore size distribution was calculated
with the adsorption branch using the BJH method and KJS correction (see section
2.4.2). All curves show the typical adsorption/desorption pattern for mesoporous
materials, which is classified as type IV by IUPAC.[233] The obvious exception from
the group is the sample synthesized without surfactants (“no surf”), which shows low
SBET and no discernible pore size distribution peak.
A B

108
Figure 3.13. N2 adsortion/desorption isotherms collected at -196 °C of the several S-Ph-PMO
and control samples. Insets in each graph represent the pore size distribution.
The SBET values of the samples synthesized in the presence of surfactant are much
higher, but also quite variable (from 470 up to 1200 m2∙g-1). The pore size distribution
is less affected by the processing conditions, with average pore size between 2.9 and
3.2 for samples processed with MW (Fig. 3.13 B1, B2 and C).
The samples synthesized using the conventional heat source in all steps (group A)
show somewhat larger pores than samples made with MW (3.40 and 4.28 nm,

109
increasing with increasing self-assembly time). This may be due to the higher [H+] in
these samples, leading to more open structures.
The wall thickness, calculated by the difference between the cell parameter a0 and the
pore size, for samples of groups B and C (Table 3.4), are all in the interval between 1.5
and 2.0 nm.
As expected and in agreement with literature,[97] there is a general tendency for
increasing pore volume with increasing SBET, as depicted by Fig. 3.14.
Figure 3.14. Evolution of the pore volume as a function of the specific surface area.
Figure 3.15 shows TEM micrographs of some representative S-Ph-PMO samples to
complement the examples already provided in Fig. 3.5. As expected, the sample “no-
acid” (Fig. 3.15A) shows a clear channelled microstructure, with long, organized
channels, while sample “no surf” (Fig. 3.15B) is completely disordered with no
perceivable presence of mesoporous channels. This observation is in agreement with
the XRD and N2 sorption results.
A reduction of the size of the ordered channels is perceptible with the increase of the
self-assembly time and the consequent increase of [H+] (Fig. 3.15C and D for samples
S-C2M3 and S-C24C24, respectively), confirming the observed progressive decrease of
and I(001) with increasing conventional self-assembly time (Fig. 3.12B).
It should be noticed that only for a few samples was it possible to find particles
oriented in the [001] direction in such a way that it would allow to verify the
hexagonal array of pores.
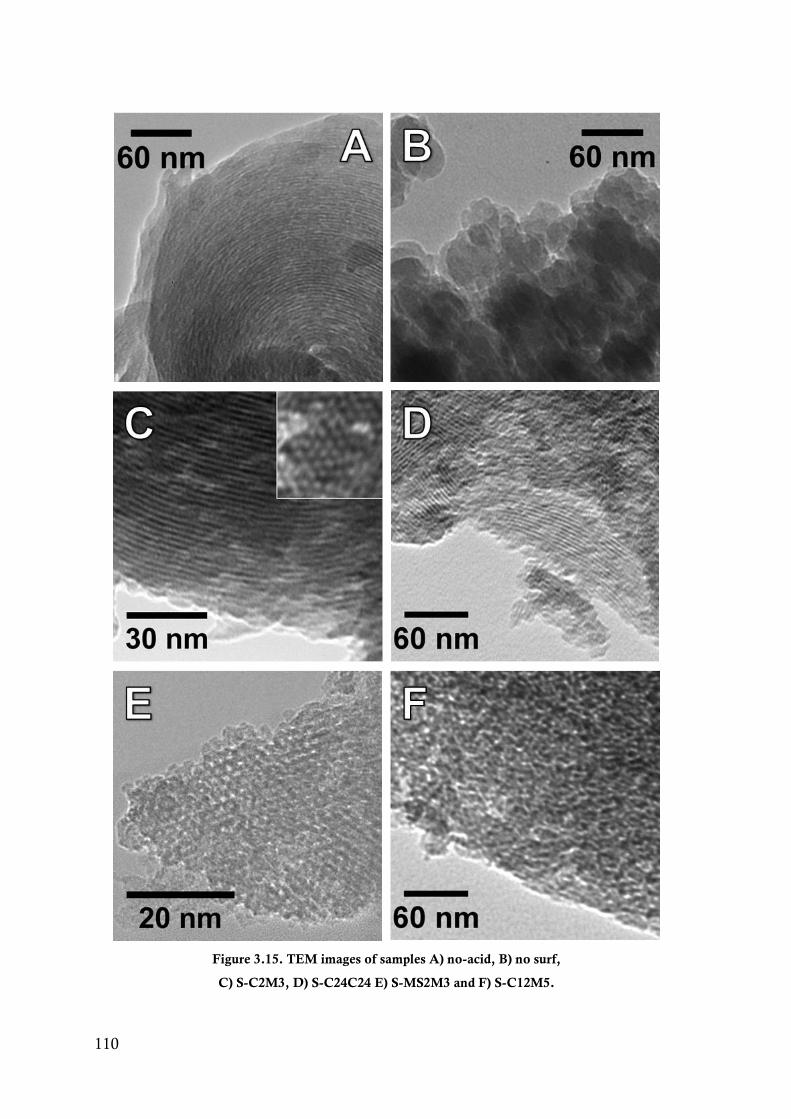
110
Figure 3.15. TEM images of samples A) no-acid, B) no surf,
C) S-C2M3, D) S-C24C24 E) S-MS2M3 and F) S-C12M5.
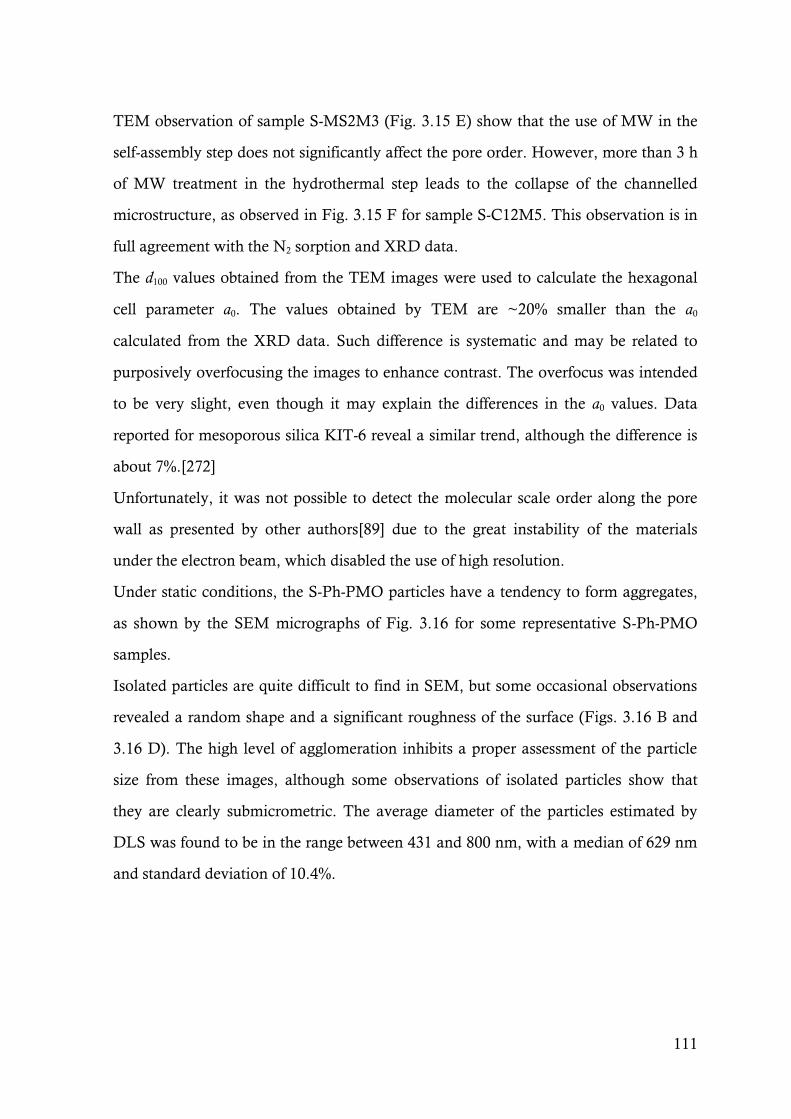
111
TEM observation of sample S-MS2M3 (Fig. 3.15 E) show that the use of MW in the
self-assembly step does not significantly affect the pore order. However, more than 3 h
of MW treatment in the hydrothermal step leads to the collapse of the channelled
microstructure, as observed in Fig. 3.15 F for sample S-C12M5. This observation is in
full agreement with the N2 sorption and XRD data.
The d100 values obtained from the TEM images were used to calculate the hexagonal
cell parameter a0. The values obtained by TEM are ~20% smaller than the a0
calculated from the XRD data. Such difference is systematic and may be related to
purposively overfocusing the images to enhance contrast. The overfocus was intended
to be very slight, even though it may explain the differences in the a0 values. Data
reported for mesoporous silica KIT-6 reveal a similar trend, although the difference is
about 7%.[272]
Unfortunately, it was not possible to detect the molecular scale order along the pore
wall as presented by other authors[89] due to the great instability of the materials
under the electron beam, which disabled the use of high resolution.
Under static conditions, the S-Ph-PMO particles have a tendency to form aggregates,
as shown by the SEM micrographs of Fig. 3.16 for some representative S-Ph-PMO
samples.
Isolated particles are quite difficult to find in SEM, but some occasional observations
revealed a random shape and a significant roughness of the surface (Figs. 3.16 B and
3.16 D). The high level of agglomeration inhibits a proper assessment of the particle
size from these images, although some observations of isolated particles show that
they are clearly submicrometric. The average diameter of the particles estimated by
DLS was found to be in the range between 431 and 800 nm, with a median of 629 nm
and standard deviation of 10.4%.

112
Figure 3.16. SEM micrographs of samples: A, B) S-
C2M3; C, D) S-MS2M3; E) S-C24M3 and F) S-C24C24.
113
Solid state NMR results are presented in Fig. 3.17 showing basically the same features
regardless of the heating source used during synthesis. The 29Si CP-MAS spectra (Fig.
3.17, left) of the S-Ph-PMO and control samples “no-acid” and “no surf” depict three
signals at ≈ -80.8, -69.2 and -58.9 ppm, with minor shifts for the different samples.
These signals, based on the report of Yang et al.[130], can be assigned to the Si
connectivity to benzene (T3 at ≈ -80.8 and T2 at ≈ -69.2 ppm) and to the
connectivity of Si to the mercaptopropyl group (T3’ at ≈ -69.2 and T2’ at ≈ -58.9
ppm where Tn = C-Si(OSi)n(OH)3–n). The predominance of T3 and T3’ signals are a
good indication that the majority of the ethoxy groups are well condensed into the
walls of the PMO, with few connections to -OH groups. Qn signals corresponding to
silicon environments = Si(OH)4-n(OSi)n atoms connected entirely to OSi and/or OH
units were not detected, which indicates that the Si–C bond cleavage did not take
place during the materials formation. The 13C CP-MAS NMR spectra (Fig. 3.17, right)
show a resonance peak at ≈ 54.1 ppm that can be assigned to the -1CH2- linked to the
SO3H group.
Figure 3.17. 29Si CP-MAS (left) and 13C CP-MAS (right) solid state
NMR spectra of representative samples of the S-Ph-PMO family.
13C CP-MAS 29Si CP-MAS
114
The resonance at ≈ 18.2 ppm is related to the -3CH2- bonded to the Si atom and the
signal at ≈ 12.3 ppm corresponds to the -2CH2- resonance in the middle of the propyl
chain (-Si-3CH2-2CH2-
1CH2-SO3H). The enduring peak at ≈ 29.6 can be assigned to
the resonance of the -CH2- connected to the remaining -SH groups, here indicating
that the oxidation process did not occur completely.[128] As expected, the sample
“no-acid” did not show any resonance peaks in the 13C CP-MAS besides the peak
related to the benzene carbons, due to the absence of any other source of carbon.
In a parallel investigation in collaboration with the Solid State NMR research group of
the Chemistry Department of the University of Aveiro, a study of hydrated and
dehydrated S-Ph-PMOs with variable acid loading (from 0.21 up to 1.30 mmol∙g-1) by
advanced high-resolution solid state magic-angle spinning (MAS) NMR was
conducted. The objective of such work was to attempt an explanation for the high
catalytic activity of these materials in the acid condensation of indole with
benzaldehyde in water.[273] The observed displacement of the propyl sulfonic –SO3H
protons to high chemical shifts with increase of the sulfonic acid strength suggested the
formation of hydrogen bonds involving neighbouring –SO3H groups. The acid strength
of the materials was lowered by the presence of water for [H+]> 0.40 mmol∙g-1,
whereas samples with low [H+] were very little affected. A plausible explanation for
this negligible effect was advanced based on the proximity of the hydrophobic phenyl
ring to the sulfonic site, with the former playing an important role in protecting the
acid sites against solvation by water. For higher acid loads, the protection is no longer
efficient and the extensive proton solvation occurs. For loadings above 0.40 mmol∙g-1,
there is a linear relationship between the turn over frequency and the [H+], which in
turn is proportional to the 1H chemical shift of the SO3H. The formation of
increasingly strong intermolecular –SO3H∙∙∙O3(H)S hydrogen bonds for S-Ph-PMOs
with [H+] above 0.4 mmol∙g-1 may explain the enhancement of the catalytic activity
with increasing [H+]. The higher catalytic activity in the presence of water may also be
related to the percolation of the aqueous domains stabilized around sulfonic acid
groups, which tend to increase significantly when the concentration of acid groups is
high enough to enable percolation. The enhanced mobility of the protons in these
domains may thus favour the oxidation of the indole. Here it is perhaps interesting to
recall the above mentioned effect of the acid load on the protonic conductivity of S-

115
PMOs (section 3.1.2), where percolation was also invoked to explain the enhanced
protonic conductivity above a certain [H+] value, which is essential for a good
conductivity, very much as it happens in PFSA polymers.[23,24,26] The fact that the
conductivity increases slightly between the sample with no acid and the sample with
[H+] = 0.3 mmol∙g-1 suggests that there is a critical percolation concentration above
which the proton structural diffusion along the aqueous domains is facilitated.
Figure 3.18 shows the TGA and DSC results for samples S-C2M3 and S-MS2M3,
obtained under air and N2 atmospheres.
Figure 3.18. TGA (full lines) and derivative (dashed lines) curves for sample A) S-C2M3 and B) S-
MS2M3 in air (black) and N2 (grey) atmospheres. DSC curves in air (black lines) and N2 (grey lines)
for sample C) S-C2M3 and D) S-MS2M3. The heat flow was normalized by the weight of he sample.

116
The TGA data depict a rapid weight loss at ~100 ºC, which corresponds to the loss of
physisorbed water. The lack of appreciable weight loss from 100 to ~250 ºC, similarly
to S-Ph-PMO grafted materials from Yang et al.[274], is a good indication that the
surfactant was completely removed in the extraction step.
A slight weight loss and shallow exothermal peaks in the DSC from ~250 ºC up to
~550 ºC can be assigned to the decomposition of the propylsulfonic acid functionality,
as mentioned for MPTMS functionalized SBA-15[128] and S-Ph-PMO[274] materials,
together with the decomposition of the residual SDA.
The decomposition of the phenyl rings lodged in the pore wall can be pointed to start
at ~550 ºC, alongside with the decomposition of the propylsulfonic acid residue.[274]
As expected, these decompositions are enhanced and occur at lower temperature in
the presence of oxygen.[90]
The water uptake capacity of the prepared materials (data also listed in Table 3.4) is
represented in Fig. 3.19 as a function of the acid load and the volume of pores. The W
values are quite high and they tend to increase with increasing [H+] and pore volume.
The apparent scatter in the representation of Fig. 3.19 reflects the large variety of
structural and microstructural characteristics of the prepared S-Ph-PMO materials.
Figure 3.19. Evolution of W with increasing [H+] and pore volume.

117
3.2.3 Multivariate analysis of the reaction kinetics
It has been shown that that MW can indeed speed up the production of S-Ph-PMOs
with similar acid load and specific surface area, allowing a reduction of the synthesis
time by ~80%. However, MW also has a tremendous impact on the structure and
microstructure of the materials, namely by decreasing the length scale of the pore
order. In addition, the synthesis of S-Ph-PMO is a complex process, involving various
reaction steps, where MW can be used independently. The quantification of the
influence of each variable on the kinetics of such processes is thus extremely
challenging, implying a large number of experiments with a much larger combination
of conditions than those explored in this thesis.
This section describes a first attempt to parameterize the kinetics of the multi-step
synthetic reactions of S-Ph-PMO. The underlining model assumes linear dependencies
between the type and time of the self-assembly and hydrothermal steps on three
selected characteristics of the final material, which are the acid concentration and the
two order parameters extracted from the XRD data ( and I(001)).
The objective is to obtain a set of time constants based on a limited number of
experiments, which allow predicting the optimal conditions for the synthesis of a
specific S-Ph-PMO (with a given [H+] and pore order) using MW energy. This
approach implies the calculation of a parameter matrix P with the kinetic coefficients
from a matrix V containing the time variables for the different experiments made (a
combination of self-assembly time and type - C or MS - and microwave hydrothermal
treatment time), and a matrix R, with the obtained experimental results of [H+], and
I(001), according to[275]:
P = (V’ V)-1 (V’ R) eq. 3.1
where V’ is the transpose of V. Predictions of a results matrix Rs with [H+], χ and I(001)
can then be made for a given set of experimental conditions defined by the duration
(in hours) of the self-assembly and hydrothermal steps, simply by using:
Rs = V P. eq. 3.2
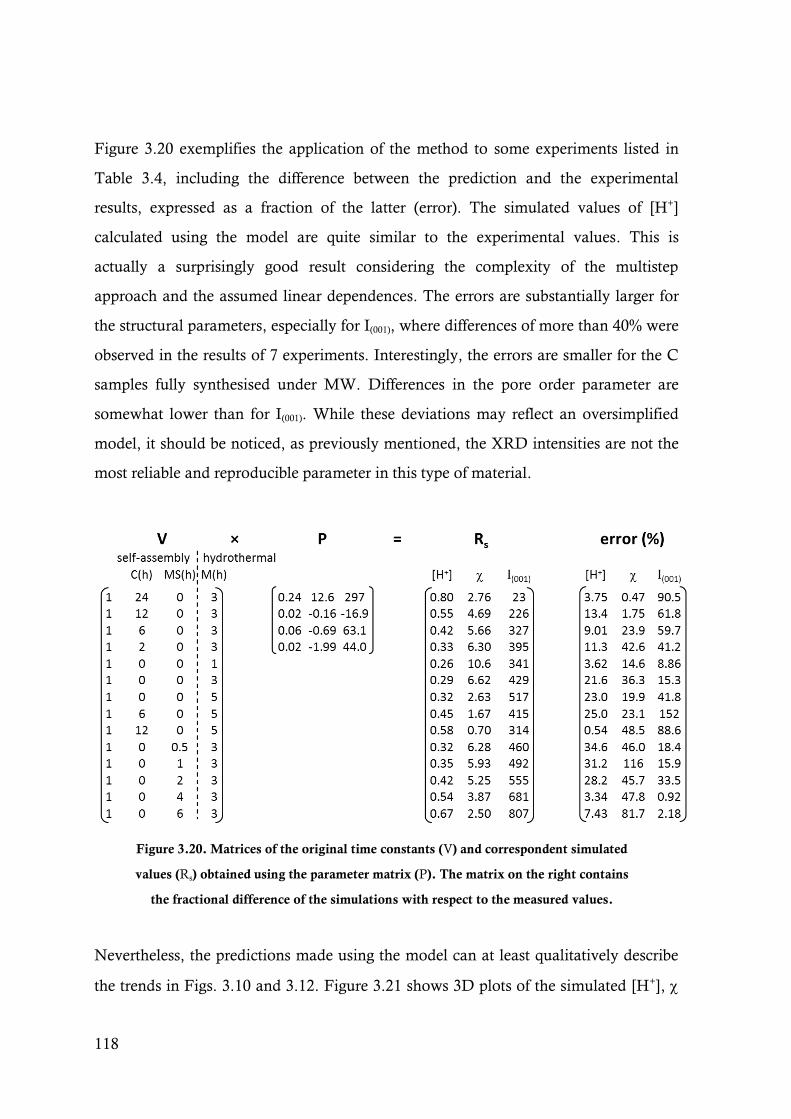
118
Figure 3.20 exemplifies the application of the method to some experiments listed in
Table 3.4, including the difference between the prediction and the experimental
results, expressed as a fraction of the latter (error). The simulated values of [H+]
calculated using the model are quite similar to the experimental values. This is
actually a surprisingly good result considering the complexity of the multistep
approach and the assumed linear dependences. The errors are substantially larger for
the structural parameters, especially for I(001), where differences of more than 40% were
observed in the results of 7 experiments. Interestingly, the errors are smaller for the C
samples fully synthesised under MW. Differences in the pore order parameter are
somewhat lower than for I(001). While these deviations may reflect an oversimplified
model, it should be noticed, as previously mentioned, the XRD intensities are not the
most reliable and reproducible parameter in this type of material.
Figure 3.20. Matrices of the original time constants (V) and correspondent simulated
values (Rs) obtained using the parameter matrix (P). The matrix on the right contains
the fractional difference of the simulations with respect to the measured values.
Nevertheless, the predictions made using the model can at least qualitatively describe
the trends in Figs. 3.10 and 3.12. Figure 3.21 shows 3D plots of the simulated [H+],
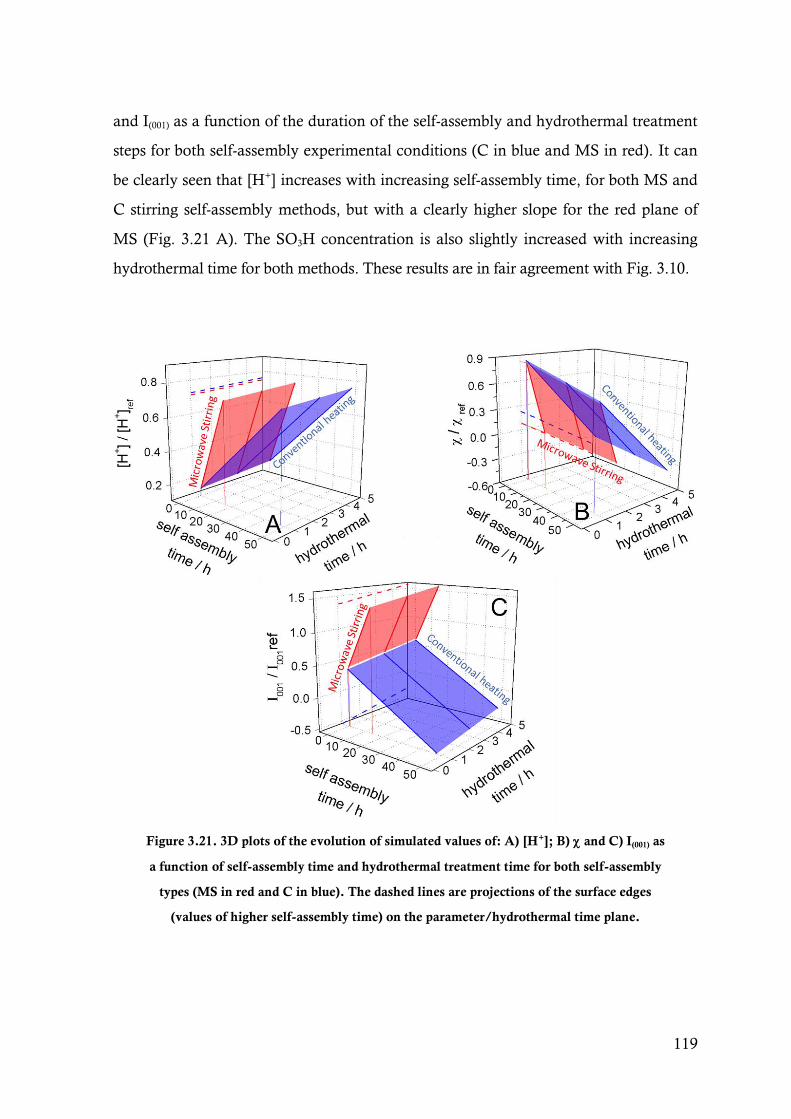
119
and I(001) as a function of the duration of the self-assembly and hydrothermal treatment
steps for both self-assembly experimental conditions (C in blue and MS in red). It can
be clearly seen that [H+] increases with increasing self-assembly time, for both MS and
C stirring self-assembly methods, but with a clearly higher slope for the red plane of
MS (Fig. 3.21 A). The SO3H concentration is also slightly increased with increasing
hydrothermal time for both methods. These results are in fair agreement with Fig. 3.10.
Figure 3.21. 3D plots of the evolution of simulated values of: A) [H+]; B) and C) I(001) as
a function of self-assembly time and hydrothermal treatment time for both self-assembly
types (MS in red and C in blue). The dashed lines are projections of the surface edges
(values of higher self-assembly time) on the parameter/hydrothermal time plane.
120
These projected results show that S-Ph-PMO with a concentration of sulfonic acid
groups in excess of 70% of nominal stoichiometry (1.77 mmol∙g-1) can be obtained
after about 16 h of self-assembly and 3 h of hydrothermal treatment under MW. A
similar material would only be obtained after 48 h of self-assembly using conventional
heating. In terms of the total duration of synthesis, the MW sample could be obtained
in less than 20% of the time.
Fig. 3.21 B predicts a progressive decrease of with increasing self-assembly time and
increasing hydrothermal treatment for both MS and C heating sources, with a larger
effect for the microwave method. These trends are also in agreement with the
experimental data (Fig. 3.12).
Likewise, and despite the significant errors, the trends projected for I(001) (Fig. 3.21 C)
are also consistent with the observed results (Fig. 3.12), showing the increase of I(001)
with increasing MW self-assembly time and a decrease of I(001) with increasing
conventional self-assembly time. Additionally, there is a slight increase in I(001) with
increasing hydrothermal treatment time.
To validate the model projections of the effect of MW, a sample S-MS12M3 was
synthesized according to the conditions in Table 3.4. The [H+] = 1.35 mmol∙g-1
obtained for this sample is somewhat higher than the predicted value (1.04 mmol∙g-1),
but still a fair agreement overall. This sample revealed a totally disordered pore
structure by XRD and TEM, in excellent agreement with the predicted 0.
However, the model fails when predicting a material with considerably more order at
the molecular level (I(001)=1185) than the actual experimental result (I(001)= 93). This
result confirms that the assumed linear dependence is able to provide reasonably
accurate predictions of the acid load and the pore order as a function of the reaction
time under MW.
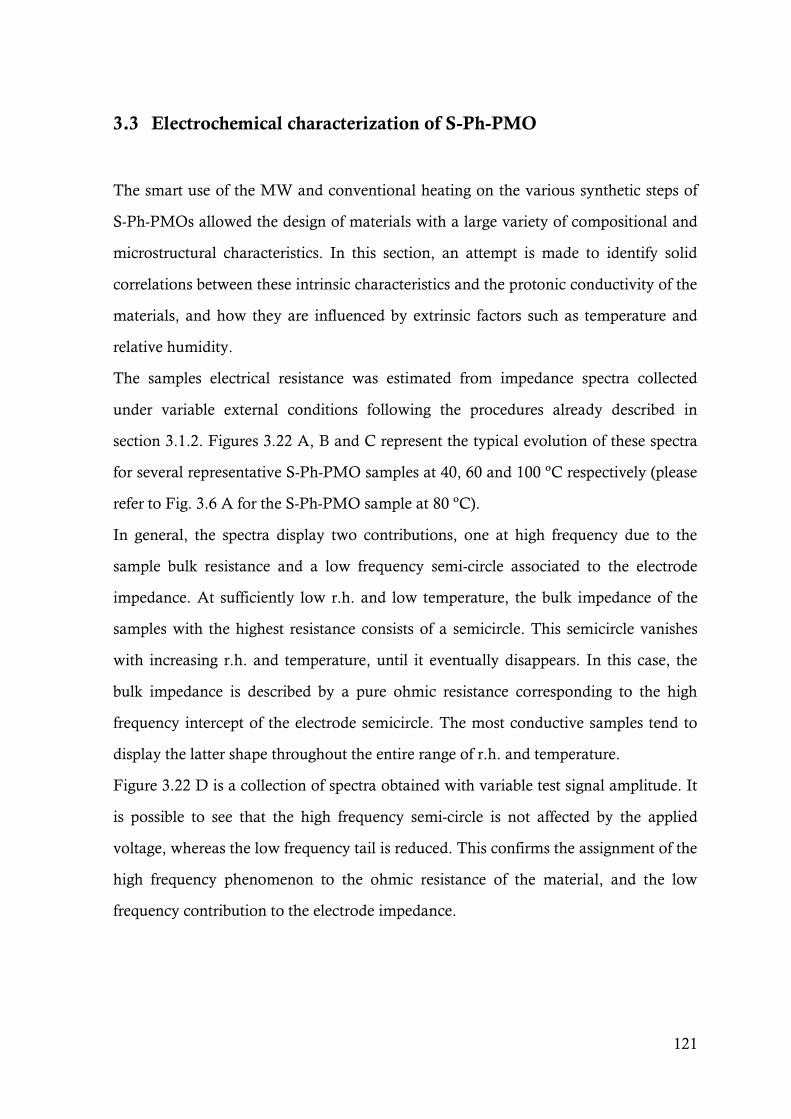
121
3.3 Electrochemical characterization of S-Ph-PMO
The smart use of the MW and conventional heating on the various synthetic steps of
S-Ph-PMOs allowed the design of materials with a large variety of compositional and
microstructural characteristics. In this section, an attempt is made to identify solid
correlations between these intrinsic characteristics and the protonic conductivity of the
materials, and how they are influenced by extrinsic factors such as temperature and
relative humidity.
The samples electrical resistance was estimated from impedance spectra collected
under variable external conditions following the procedures already described in
section 3.1.2. Figures 3.22 A, B and C represent the typical evolution of these spectra
for several representative S-Ph-PMO samples at 40, 60 and 100 ºC respectively (please
refer to Fig. 3.6 A for the S-Ph-PMO sample at 80 ºC).
In general, the spectra display two contributions, one at high frequency due to the
sample bulk resistance and a low frequency semi-circle associated to the electrode
impedance. At sufficiently low r.h. and low temperature, the bulk impedance of the
samples with the highest resistance consists of a semicircle. This semicircle vanishes
with increasing r.h. and temperature, until it eventually disappears. In this case, the
bulk impedance is described by a pure ohmic resistance corresponding to the high
frequency intercept of the electrode semicircle. The most conductive samples tend to
display the latter shape throughout the entire range of r.h. and temperature.
Figure 3.22 D is a collection of spectra obtained with variable test signal amplitude. It
is possible to see that the high frequency semi-circle is not affected by the applied
voltage, whereas the low frequency tail is reduced. This confirms the assignment of the
high frequency phenomenon to the ohmic resistance of the material, and the low
frequency contribution to the electrode impedance.

122
Figure 3.22. EIS spectra for several representative samples showing the evolution of the
shape of the impedance spectra with increasing r.h. at A) 40 ºC (no-acid), B) 60 ºC (S-
MS4M3) and C) 100 ºC (S-C2M3). Please consider Fig. 3.6 A for sample S-C24M3 at 80
ºC. D) Influence of test signal amplitude on the shape of the impedance spectra for sample
S-C2M3 at 60°C and 60% r.h. (numbers represent powers of 10 of frequency in Hz).
3.3.1 Influence of extrinsic factors on conductivity: temperature and relative humidity
Figure 3.23 depicts Arrhenius type plots of the conductivity of several representative
samples obtained with increasing r.h. The highest conductivity value is 0.11 S∙cm-1 for

123
S-C48C24 at 80 ºC and 98 % r.h., which is comparable to Nafion® in similar
conditions.
As expected, the conductivity increases with increasing r.h. for all samples, regardless
of the temperature, due to an increasing amount of the proton concentration in the
material. However, it is also immediately apparent that in some cases the data for low
humidity and low temperature tend to deviate from the Arrhenius behaviour.
This is particularly obvious for the sample prepared without any acid, which nicely
illustrates the trend observed for other samples. Since this sample has no acid
functionalization, the protonic conductivity is in principle only due to water molecules
physisorbed at the surface of the material. Increasing the temperature will naturally
decrease the concentration of the adsorbed water, hence decreasing the conductivity.
The magnitude of this effect is expected to be larger for low r.h. conditions, when
pH2O is lower.
Conversely, increasing the r.h. at a fixed temperature increases the driving force for
the physisorption, and thus the conductivity increases. Therefore, the apparently
positive slope in the Arrhenius plot at 20% r.h. becomes progressively less positive as
r.h. increases, eventually becoming negative for 98% r.h. The Ea in these humidity
conditions, close to 25 kJ∙mol-1 (Table 3.5), is in the range reported for the structural
diffusion of protons as the underlining transport mechanism.[38,41,188]
On the other hand, the sulfonic acid groups in the sample processed without SDA (no
surf) are solvated by the adsorbed water molecules, which in this case are also
chemisorbed to the surface of the material. Consequently, the water molecules can be
retained in the structure up to much higher temperatures than in the acid-free material.
This enables levels of protonic conductivity similar to those measured for Nafion®
even at temperatures close to 100 °C. In fact, the Arrhenius behaviour is observed for
the entire range of r.h., with similar activation energy (30 kJ.mol-1) for r.h. 60%.
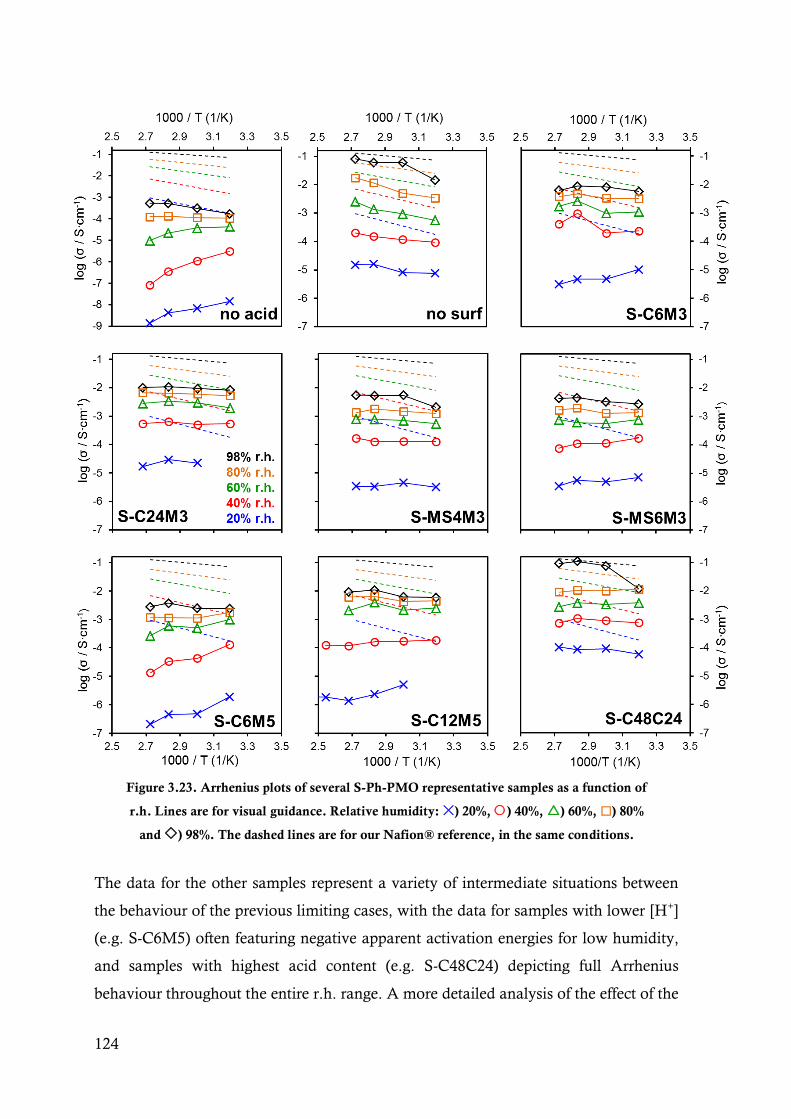
124
Figure 3.23. Arrhenius plots of several S-Ph-PMO representative samples as a function of
r.h. Lines are for visual guidance. Relative humidity: ) 20%, ) 40%, ) 60%, ) 80%
and ) 98%. The dashed lines are for our Nafion® reference, in the same conditions.
The data for the other samples represent a variety of intermediate situations between
the behaviour of the previous limiting cases, with the data for samples with lower [H+]
(e.g. S-C6M5) often featuring negative apparent activation energies for low humidity,
and samples with highest acid content (e.g. S-C48C24) depicting full Arrhenius
behaviour throughout the entire r.h. range. A more detailed analysis of the effect of the

125
[H+] and other physico-chemical characteristics of the S-Ph-PMO on the protonic
conductivity is provided in sub-section 3.3.2.
Table 3.5. Values of Ea for the conductivity measured under variable
r.h. conditions. The SBET and the [H+] are given to help the discussion.
Sample SBET (m2∙g-1) [H]+
(mmol∙g-1) (S∙cm-1)a
Ea (kJ∙mol-1)
98% r.h 80% r.h. 60% r.h. 40% r.h 20% r.h.
S-C2M3 774 0.30 8.9×10⁻⁴ 11.9 3.41 10.8 16.8 b
S-C6M3 991 0.46 6.3×10⁻³ 5.80 7.80 15.5 21.4 b
S-C12M3 1023 0.63 1.6×10⁻² 14.5 9.60 3.60 b b
S-C24M3 623 0.77 1.0×10⁻² 6.40 6.90 9.00 3.90 b
S-C6M5 826 0.36 2.8×10⁻³ 12.5c b b b b
S-C12M5 1199 0.58 9.3×10⁻³ 12.3 9.70 3.30 b b
S-MS2M3 715 0.58 2.6×10⁻³ 18.7 23.6 27.9 16.3 --
S-MS4M3 857 0.56 5.5×10⁻³ 19.1 5.70 9.50 6.60 2.70
S-MS6M3 862 0.62 4.2×10⁻³ 11.6 8.70 2.60 b b
S-C24C24 724 0.93 2.6×10⁻³ 32.7 - 3.88 b b
S-C48C24 471 1.61 9.0×10⁻² 39.1 0.40c 2.853 4.05 11.4
no-surf 223 1.26 8.0×10⁻² 30.6 32.9 28.0 15.8 17.7
no-acid 757 0 5.4×10⁻⁴ 24.1 6.02 b b b
a – at 94 ºC and 98% r.h.; b – apparent Ea are negative;
c – in the range 25-80 °C .
The data in the Arrhenius plots (Fig. 3.23) are replotted in Fig.3.24 to illustrate the
effect of r.h. on the conductivity.
For the samples with [H+] lower than 1 mmol∙g-1 and SBET higher than 600 m2∙g-1 the
conductivity increases sharply with increasing r.h. up to ~60% r.h., and more
moderately thereafter. The behaviour of the “no-surf” and “no-acid” samples again
represent the two limiting situations, with the remaining materials showing
intermediate behaviour.
This bending of the r.h. plots was also noticed by Hamoudi et al. for SO3H
functionalized ethane bridged organosilicas,[212,262] and very recently by Inagaki’s
group on SO3H functionalized PMS thin films.[213] Based on water sorption
isothermal measurements, the later study correlates the sharp increase of conductivity
at low r.h. with the adsorption and clustering of water molecules around the acid sites,

126
which eventually condensate in the mesopores, driven by capillarity, and on the
surface of the films above a certain r.h. The humidity threshold leading to
condensation is shifted to lower r.h. values with increasing [H+] and decreasing pore
size, in agreement with the Kelvin’s equation (eq. 2.3).
Figure 3.24. Evolution of conductivity as a function of r.h., at different temperatures, for some
representative S-Ph-PMO samples. Lines are for visual guidance. Temperatures: ) 40 ºC, ) 60 ºC, )
80 ºC, ) 94 ºC and ) 100 ºC. The dashed lines are for our Nafion® reference, in the same conditions.
127
While the water vapour sorption measurements could not be performed in this work,
the conductivity vs. r.h. profiles can be nicely explained by the condensation
hypothesis. Indeed, the “no surf” sample shows an almost linear dependence for r.h.
lower than 98%, in agreement with the much lower volume of mesopores. Proton
transport in this case is mostly occurring along the SO3H-water domains on the surface
of the particles, without major changes in the proton mobility. On the other hand, a
transition at around 60% r.h. is observed for the material without acid
functionalization, suggesting a change of mechanism, possibly due to changes in
proton mobility made possible by the water condensed in the pores.
The S-Ph-PMO samples with higher [H+] (>1 mmol∙g-1) and lower SBET (<500 m2∙g-1)
(e.g. S-C48C24) tend to show a more linear increase of conductivity with increasing
r.h. This difference can be due to the high concentration of acid groups combined with
a somewhat low mesoporosity. Conversely, samples with high mesoporous volume,
which, as discussed earlier, is usually paired to low [H+] and high SBET, tend to depict
clearer 2-step vs. r.h. dependences.
Considering the T and r.h. ranges corresponding to Arrhenius behaviour in Fig. 3.23,
(essentially data for r.h. greater than 60% for the majority of samples – see table 3.5)
the proton mobility is likely to be constant and the conductivity is thus essentially
determined by the proton concentration. As described analogously for Nafion® 117 by
Maréchal et al.[276], the interaction of the sulfonic acid groups with the hydration
water can be described by the solvation equilibrium
SO3H+ + gH2O SO3
hH2O + H+jH2O eq. 3.3
where g is the total number of solvating water molecules, and h and j are the number
of water molecules associated to the sulfonate anion and the proton, respectively. If
[SO3hH2O] = [H+jH2O], the corresponding solvation constant is
K solv(T) = [H+jH2O]2/pH2O
g eq. 3.4
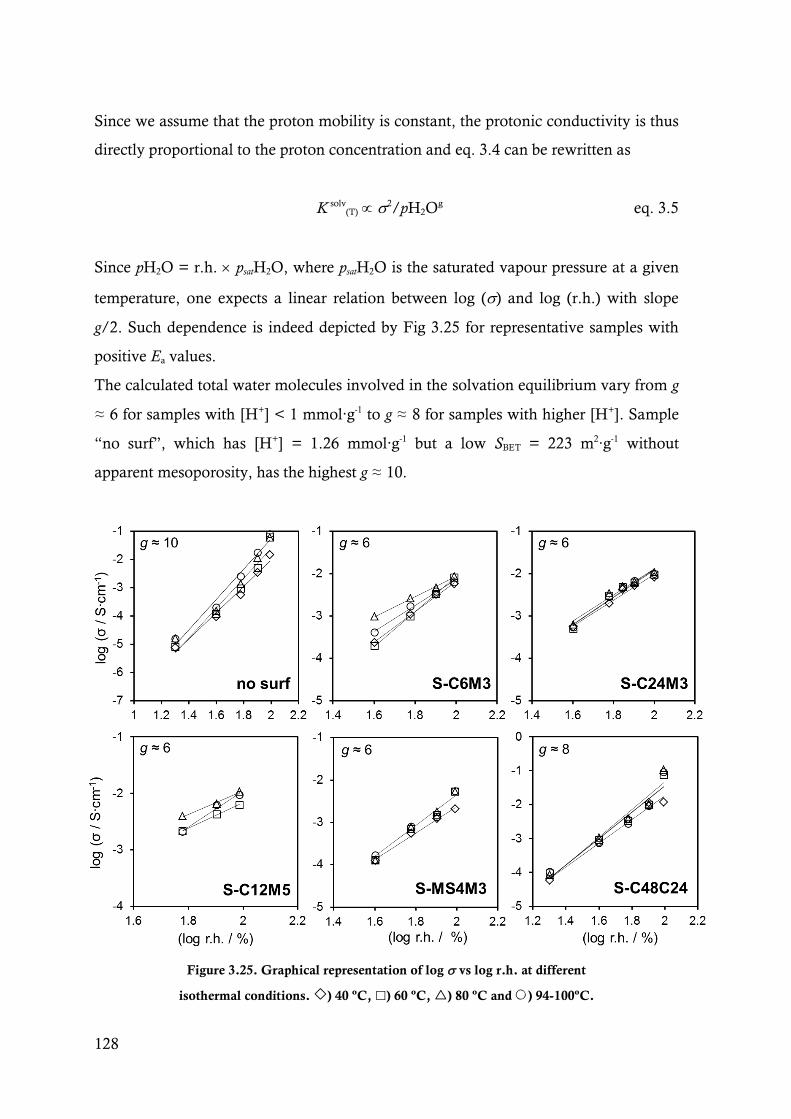
128
Since we assume that the proton mobility is constant, the protonic conductivity is thus
directly proportional to the proton concentration and eq. 3.4 can be rewritten as
K solv(T) 2/pH2O
g eq. 3.5
Since pH2O = r.h. psatH2O, where psatH2O is the saturated vapour pressure at a given
temperature, one expects a linear relation between log () and log (r.h.) with slope
g/2. Such dependence is indeed depicted by Fig 3.25 for representative samples with
positive Ea values.
The calculated total water molecules involved in the solvation equilibrium vary from g
≈ 6 for samples with [H+] < 1 mmol∙g-1 to g ≈ 8 for samples with higher [H+]. Sample
“no surf”, which has [H+] = 1.26 mmol∙g-1 but a low SBET = 223 m2∙g-1 without
apparent mesoporosity, has the highest g ≈ 10.
Figure 3.25. Graphical representation of log vs log r.h. at different
isothermal conditions. ) 40 ºC, ) 60 ºC, ) 80 ºC and ) 94-100ºC.

129
A similar analysis performed on literature data of MCM-41 materials with 40 %
nominal SO3H ([H+] = 2.3 mmol∙g-1) showed values of g ≈ 6 at 80 and 100 ºC, in the
r.h. range of 50 to 100 %.[156] From the data of Fujita et al.[213] on a SO3H
functionalized mesoporous silica oriented film with [H+] = 1.8 mmol∙g-1 we calculated
g ≈ 4 for room temperature and r.h. between 45 and 90 % r.h. A value of g ≈ 4 was
also found for Nafion® 117 membranes in a similar range of conditions.[276]
The higher g values obtained with the S-Ph-PMO materials prepared in this work, or
those estimated from literature data on similar structures, may be explained by the
additional empty space within the rigid, open mesoporous network, in contrast to the
soft structure of Nafion®, dimensionally-dependent on the water content.
Equation 3.5 can be used to estimate the solvation enthalpy (Hsolv) assuming a
dependence with the reciprocal temperature
ln(2/pH2Og) (Ssolv/R) – (Hsolv/RT ) eq. 3.6
where the Ssolv is an entropy term. Figure 3.26 shows the data represented according
to this equation.
The ΔHsolv values estimated for our S-Ph-PMO samples tend to become more negative
with increasing [H+], spanning from an average -220 kJ∙mol-1 for the sample with less
[H+] (S-C6M3) to -300 kJ∙mol-1 for the sample with the highest [H+] (S-C48C24). This
suggests that the solvation of the proton on the acid sites is facilitated by the presence
of more acid sites, justifying also the increase amount of water molecules involved in
the solvation process (g values) observed in Fig. 3.25.
A theoretical study on the solvation of SO3H in a Nafion®/H3O+/H2O system
calculated the enthalpy of formation of the complex –SO3-∙∙∙H3O+– (H2O)n to be -44.3
kJ∙mol-1[277] while in the experimental study by Maréchal et al.[276] the calculated
value was of -135 kJ∙mol-1. Nevertheless, this means that that the proton solvation is
more favourable inside our mesoporous materials than in Nafion®.
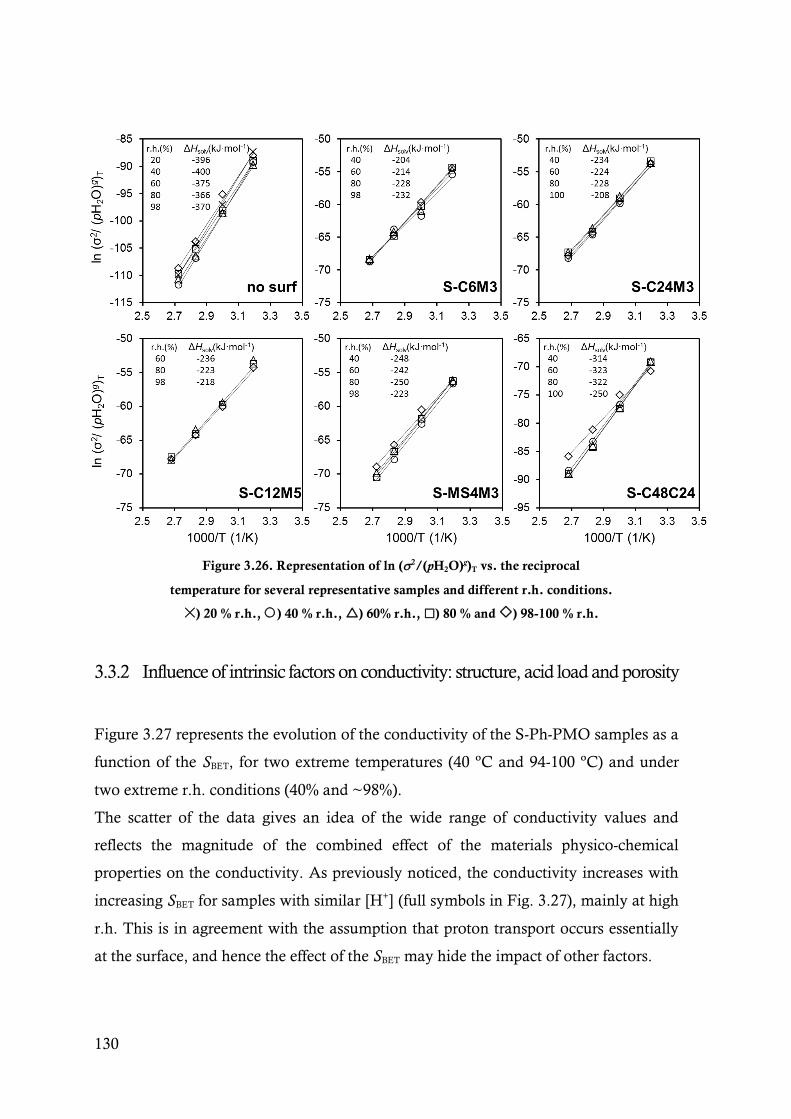
130
Figure 3.26. Representation of ln (2/(pH2O)g)T vs. the reciprocal
temperature for several representative samples and different r.h. conditions.
) 20 % r.h., ) 40 % r.h., ) 60% r.h., ) 80 % and ) 98-100 % r.h.
3.3.2 Influence of intrinsic factors on conductivity: structure, acid load and porosity
Figure 3.27 represents the evolution of the conductivity of the S-Ph-PMO samples as a
function of the SBET, for two extreme temperatures (40 ºC and 94-100 ºC) and under
two extreme r.h. conditions (40% and ~98%).
The scatter of the data gives an idea of the wide range of conductivity values and
reflects the magnitude of the combined effect of the materials physico-chemical
properties on the conductivity. As previously noticed, the conductivity increases with
increasing SBET for samples with similar [H+] (full symbols in Fig. 3.27), mainly at high
r.h. This is in agreement with the assumption that proton transport occurs essentially
at the surface, and hence the effect of the SBET may hide the impact of other factors.
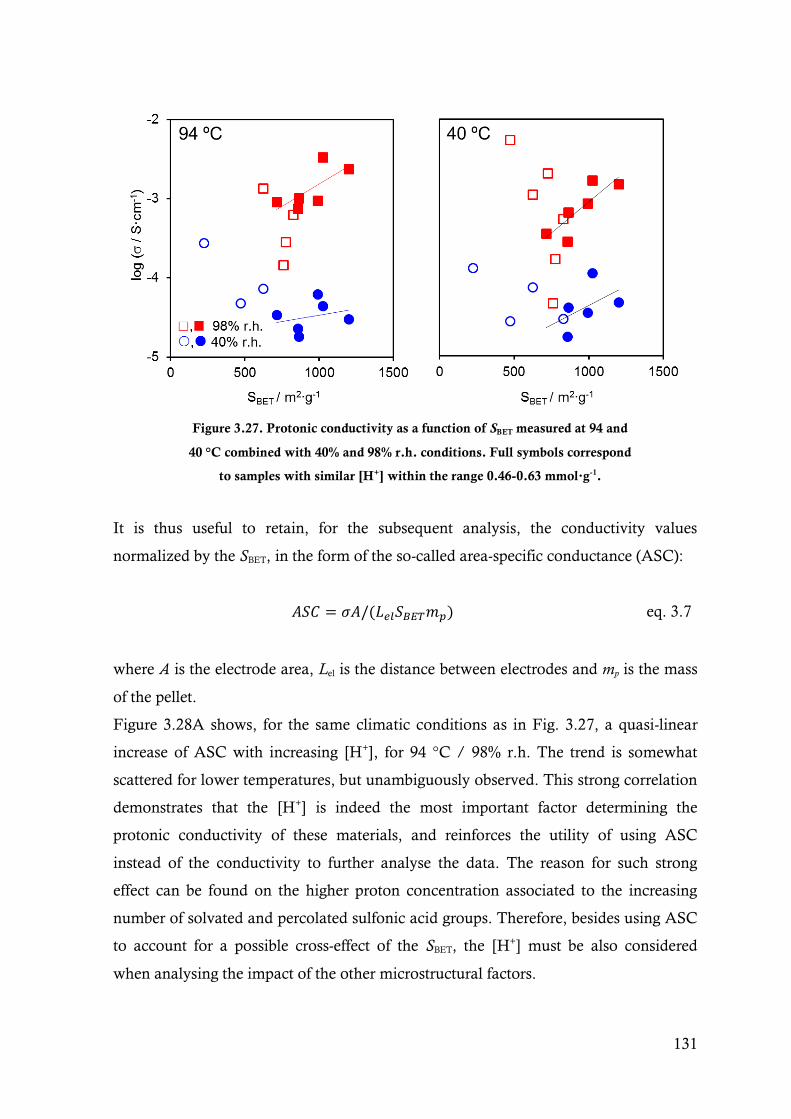
131
Figure 3.27. Protonic conductivity as a function of SBET measured at 94 and
40 °C combined with 40% and 98% r.h. conditions. Full symbols correspond
to samples with similar [H+] within the range 0.46-0.63 mmol∙g-1.
It is thus useful to retain, for the subsequent analysis, the conductivity values
normalized by the SBET, in the form of the so-called area-specific conductance (ASC):
𝐴𝑆𝐶 = 𝜎𝐴/(𝐿𝑒𝑙𝑆𝐵𝐸𝑇𝑚𝑝) eq. 3.7
where A is the electrode area, Lel is the distance between electrodes and mp is the mass
of the pellet.
Figure 3.28A shows, for the same climatic conditions as in Fig. 3.27, a quasi-linear
increase of ASC with increasing [H+], for 94 °C / 98% r.h. The trend is somewhat
scattered for lower temperatures, but unambiguously observed. This strong correlation
demonstrates that the [H+] is indeed the most important factor determining the
protonic conductivity of these materials, and reinforces the utility of using ASC
instead of the conductivity to further analyse the data. The reason for such strong
effect can be found on the higher proton concentration associated to the increasing
number of solvated and percolated sulfonic acid groups. Therefore, besides using ASC
to account for a possible cross-effect of the SBET, the [H+] must be also considered
when analysing the impact of the other microstructural factors.

132
Figure 3.28. ASC as a function of A) [H+], B) and C) I(001). Full symbols
identify samples with similar [H+] within the range of 0.46 to 0.63 mmol∙g-1.

133
The B plots in Fig. 3.28 show highly scattered ASC data for the highly variable pore
order factor (table 3.4), regardless of temperature and r.h., suggesting that the pore
distribution has little or no effect on the conductivity of these materials. This
observation is reinforced by the ASC values for samples with similar [H+], as
illustrated by the full symbols located along a quasi-horizontal line parallel to the
abscissa of Fig 3.28 B.
Although it was already observed that the I(100) tends to decrease with increasing [H+]
(and ASC thereof),[97,130,213,268] there is no indication in the literature for the use
of a similar order factor such as .
Figure 3.28 C represents the influence of I(001) on the ASC. Since this peak represents
the molecular scale order along the pore wall defined by the alternate stacking of
hydrophilic and hydrophobic domains inside the structure,[89] of which one could
infer a possible correlation between the conductivity and the distance between
adjacent acid groups at the inner surface of the pores. This could ultimately affect the
percolation between adjacent acid groups and undermine the protonic conductivity.
There is indeed a very weak tendency of decreasing I(001) with increasing ASC for
samples with similar acid load (full symbols), specially at high r.h., but this is certainly
related to the observed decrease in I(001) with increasing [H+] (Fig. 3.12 B).
Due to the relatively low distribution of the a0 cell parameter it is difficult to draw
tendencies on the effect of this parameter on the ASC (Fig. 3.29 A). Based on the
behaviour of samples with similar [H+] (full symbols in Fig. 3.29 A), it can be said that
the conductivity values are independent of the lattice parameter, within the natural
dispersion evidenced by this type of data.
Figure 3.29 B shows the evolution of ASC as a function of the pore volume, calculated
from the N2 isothermal analysis. Focusing again in the samples with similar [H+] (full
symbols), the data show a slight increase of ASC with increasing pore volume. At
present there is no study available that compares the protonic conductivity of S-PMO
samples with similar [H+] and largely different microstructural features created by
using different synthetic approaches in the self-assembly and hydrothermal treatment
steps. The SO3H functionalized mesoporous silica oriented films explored by Fujita et
al.,[213] did not show any meaningful effect of the pore volume on the conductivity.

134
Figure 3.29. ASC represented as a function of A) a0, B) pore volume and C) average pore size. Full
symbols identify samples with similar [H+] within the range of 0.46 to 0.63 mmol∙g-1.
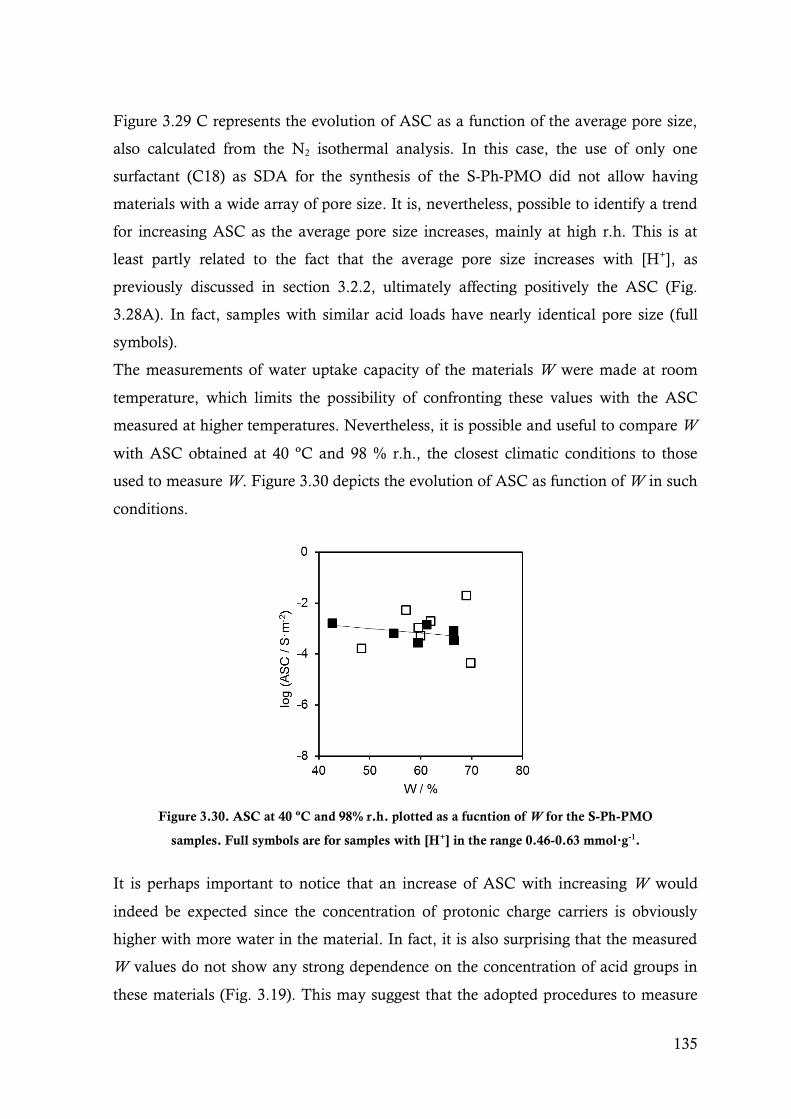
135
Figure 3.29 C represents the evolution of ASC as a function of the average pore size,
also calculated from the N2 isothermal analysis. In this case, the use of only one
surfactant (C18) as SDA for the synthesis of the S-Ph-PMO did not allow having
materials with a wide array of pore size. It is, nevertheless, possible to identify a trend
for increasing ASC as the average pore size increases, mainly at high r.h. This is at
least partly related to the fact that the average pore size increases with [H+], as
previously discussed in section 3.2.2, ultimately affecting positively the ASC (Fig.
3.28A). In fact, samples with similar acid loads have nearly identical pore size (full
symbols).
The measurements of water uptake capacity of the materials W were made at room
temperature, which limits the possibility of confronting these values with the ASC
measured at higher temperatures. Nevertheless, it is possible and useful to compare W
with ASC obtained at 40 ºC and 98 % r.h., the closest climatic conditions to those
used to measure W. Figure 3.30 depicts the evolution of ASC as function of W in such
conditions.
Figure 3.30. ASC at 40 ºC and 98% r.h. plotted as a fucntion of W for the S-Ph-PMO
samples. Full symbols are for samples with [H+] in the range 0.46-0.63 mmol∙g-1.
It is perhaps important to notice that an increase of ASC with increasing W would
indeed be expected since the concentration of protonic charge carriers is obviously
higher with more water in the material. In fact, it is also surprising that the measured
W values do not show any strong dependence on the concentration of acid groups in
these materials (Fig. 3.19). This may suggest that the adopted procedures to measure

136
W are not suitable for this type of extremely reactive materials. Measurements of
water vapour adsorption−desorption isotherms would certainly be more appropriate,
but the lack of suitable equipment prevented this type of studies.
Figure 3.31 represents the Ea for the protonic conductivity at 98% r.h. of the S-Ph-
PMO materials as a function of A) [H+] and B) ASC.
Figure 3.31. Activation energy for the protonic conductivity
measured at 98% r.h. plotted as a function of A) [H+] and B) ASC
The values span from about 5 kJ∙mol-1 to 40 kJ∙mol-1, with the most conductive
samples in the upper range of 30-40 kJ∙mol-1, in line with what is usually reported for
proton structural diffusion in similar hybrid structures[213,278] or in
Nafion®.[258,279,280] Although the error bars may be significant in some cases, one
can notice that Ea tends to increase with increasing [H+], and the same observation can
be made for ASC. Since the correlation of [H+] with ASC is quite linear, one would
expect such an observation. The high concentration of hygroscopic sulfonic acid group
enhances the hydration capacity of the material, hence providing a higher
concentration of protons in the bulk. This can lead to a higher fraction of structural
diffusion of protons through hopping from neighbouring solvated acid anchor points,
which typically shows higher Ea values than the vehicular mechanism.[38,41,188]
A B
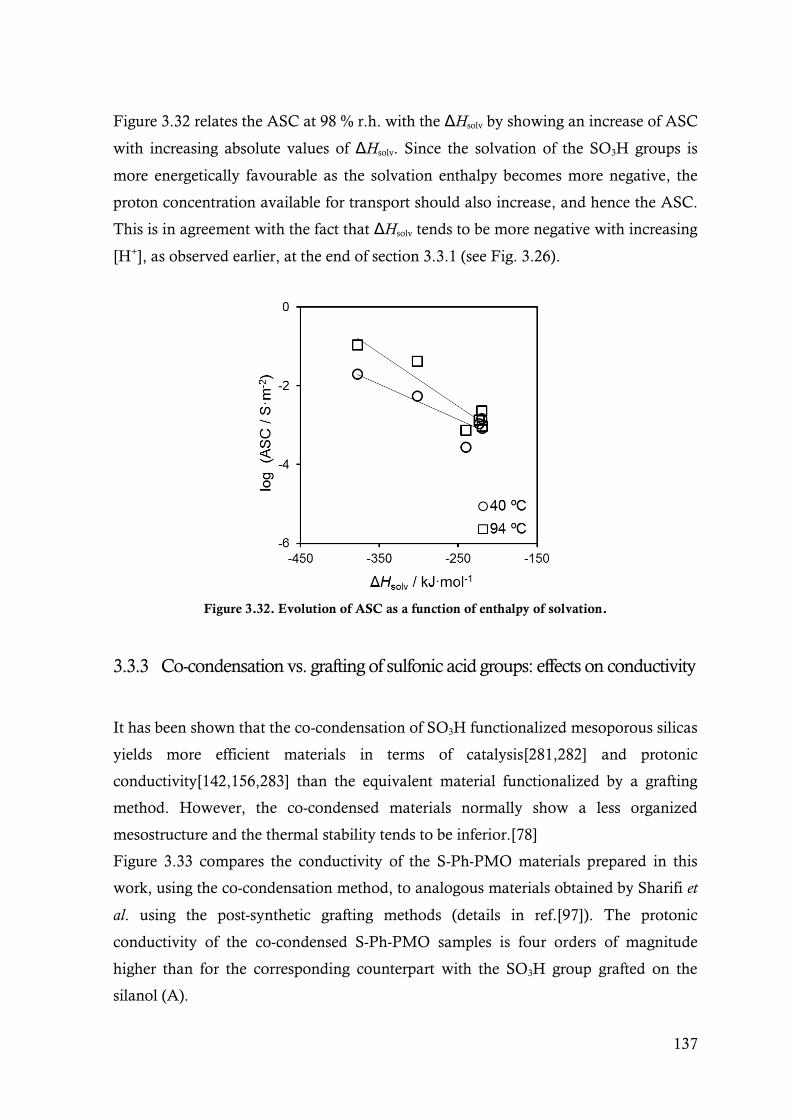
137
Figure 3.32 relates the ASC at 98 % r.h. with the ΔHsolv by showing an increase of ASC
with increasing absolute values of ΔHsolv. Since the solvation of the SO3H groups is
more energetically favourable as the solvation enthalpy becomes more negative, the
proton concentration available for transport should also increase, and hence the ASC.
This is in agreement with the fact that ΔHsolv tends to be more negative with increasing
[H+], as observed earlier, at the end of section 3.3.1 (see Fig. 3.26).
Figure 3.32. Evolution of ASC as a function of enthalpy of solvation.
3.3.3 Co-condensation vs. grafting of sulfonic acid groups: effects on conductivity
It has been shown that the co-condensation of SO3H functionalized mesoporous silicas
yields more efficient materials in terms of catalysis[281,282] and protonic
conductivity[142,156,283] than the equivalent material functionalized by a grafting
method. However, the co-condensed materials normally show a less organized
mesostructure and the thermal stability tends to be inferior.[78]
Figure 3.33 compares the conductivity of the S-Ph-PMO materials prepared in this
work, using the co-condensation method, to analogous materials obtained by Sharifi et
al. using the post-synthetic grafting methods (details in ref.[97]). The protonic
conductivity of the co-condensed S-Ph-PMO samples is four orders of magnitude
higher than for the corresponding counterpart with the SO3H group grafted on the
silanol (A).

138
Figure 3.33. Comparison of the protonic conductivity (at 98% r.h.) of S-Ph-PMOs
synthesized by co-condensation () in this thesis and literature data for samples obtained
via post-grafting () in reference [97]. Black full symbols are for Nafion® in the same
conditions. The values presented in the graph are the [H+] of each sample, in mmol∙g-1.
The difference is smaller for samples grafted on the benzene ring by treatment under
fuming H2SO4, but still more than two orders of magnitude. Even the S-Ph-PMO
grafted on both the silanol and the benzene ring, showing a [H+] of 1.61 mmol∙g-1, is
almost one order of magnitude less conductive. The Ea values for the grafted samples
are abnormally high (54, 63 and 117 kJ∙mol-1), and clearly larger than for the co-
condensed samples (see Table 3.4). One possible reason for this increased conductivity
might be related to a more homogeneous distribution of the acid groups along the pore
wall in co-condensed samples. This has been suggested to explain similar behaviour
for SO3H functionalized MCM-41, in which the co-condensed samples showed higher
[H+] and also higher conductivity.[141,142] Rác et al.[132] studied the influence of the
synthetic method on the catalytic performance of several SO3H functionalized silica-
based mesoporous materials and also reported better results for the co-condensed
samples. They attributed the worst results of the grafted samples to the non-random
distribution of the acid groups, which are surrounded by hydrophilic regions
ultimately resulting in the blocking of the active sites by strong adsorption of reactants
and intermediates.
As a last note to this section, it is perhaps interesting to highlight the fact that the
presented conductivity values are likely to be underestimated, due to the
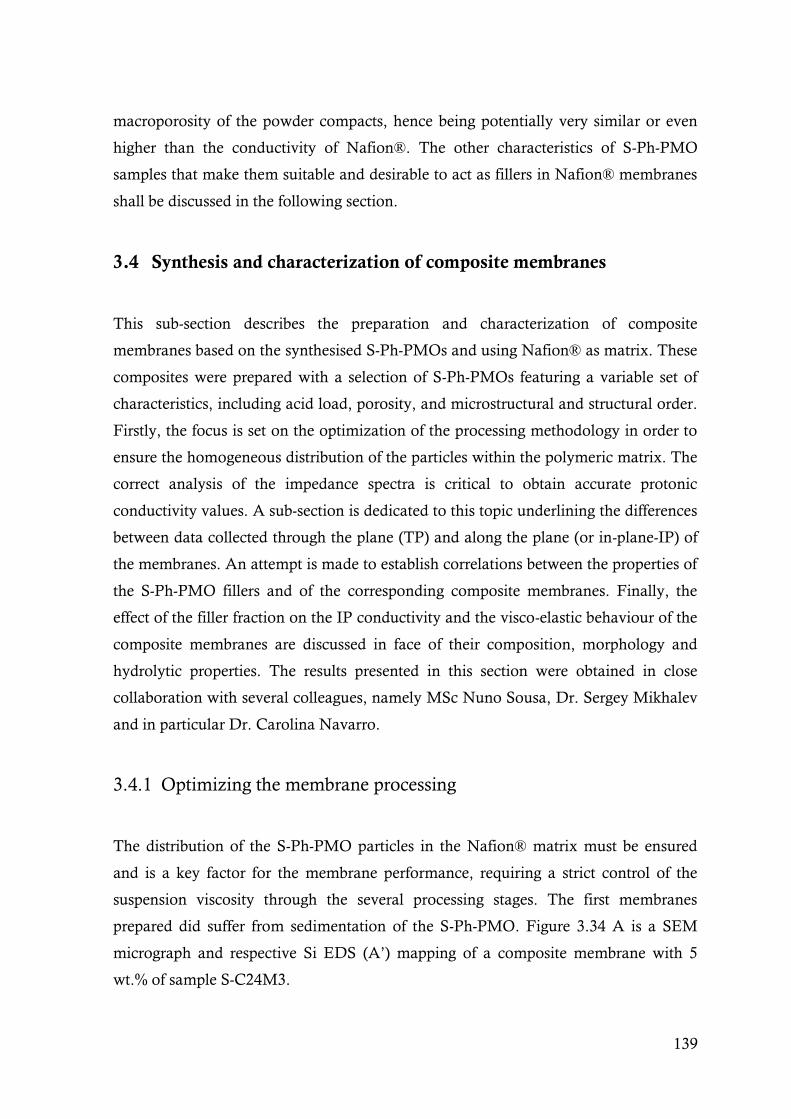
139
macroporosity of the powder compacts, hence being potentially very similar or even
higher than the conductivity of Nafion®. The other characteristics of S-Ph-PMO
samples that make them suitable and desirable to act as fillers in Nafion® membranes
shall be discussed in the following section.
3.4 Synthesis and characterization of composite membranes
This sub-section describes the preparation and characterization of composite
membranes based on the synthesised S-Ph-PMOs and using Nafion® as matrix. These
composites were prepared with a selection of S-Ph-PMOs featuring a variable set of
characteristics, including acid load, porosity, and microstructural and structural order.
Firstly, the focus is set on the optimization of the processing methodology in order to
ensure the homogeneous distribution of the particles within the polymeric matrix. The
correct analysis of the impedance spectra is critical to obtain accurate protonic
conductivity values. A sub-section is dedicated to this topic underlining the differences
between data collected through the plane (TP) and along the plane (or in-plane-IP) of
the membranes. An attempt is made to establish correlations between the properties of
the S-Ph-PMO fillers and of the corresponding composite membranes. Finally, the
effect of the filler fraction on the IP conductivity and the visco-elastic behaviour of the
composite membranes are discussed in face of their composition, morphology and
hydrolytic properties. The results presented in this section were obtained in close
collaboration with several colleagues, namely MSc Nuno Sousa, Dr. Sergey Mikhalev
and in particular Dr. Carolina Navarro.
3.4.1 Optimizing the membrane processing
The distribution of the S-Ph-PMO particles in the Nafion® matrix must be ensured
and is a key factor for the membrane performance, requiring a strict control of the
suspension viscosity through the several processing stages. The first membranes
prepared did suffer from sedimentation of the S-Ph-PMO. Figure 3.34 A is a SEM
micrograph and respective Si EDS (A’) mapping of a composite membrane with 5
wt.% of sample S-C24M3.

140
Figure 3.34. SEM micrographs of the cross-section and respective EDS mapping of
A) S-C24M3-5% and B) S-C24C24-10%. C) cross section of plain Nafion®
membranes. D) top and E) bottom views of S-C24M3-10% composite membrane.
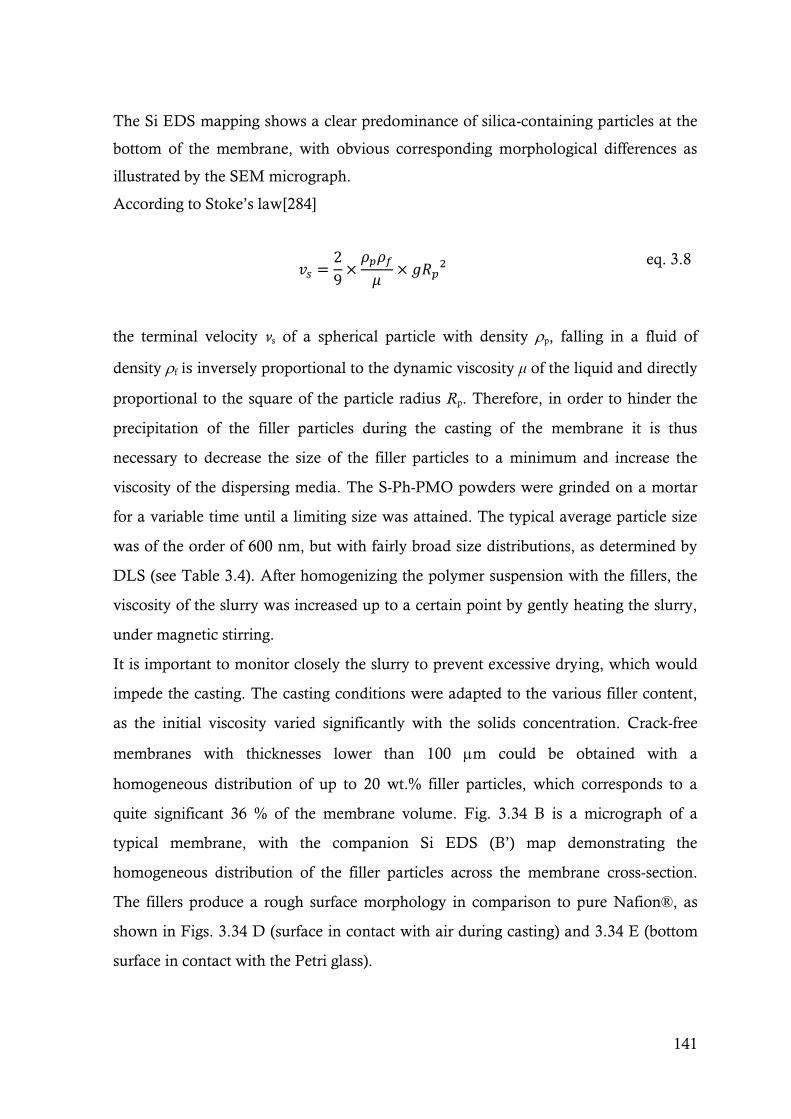
141
The Si EDS mapping shows a clear predominance of silica-containing particles at the
bottom of the membrane, with obvious corresponding morphological differences as
illustrated by the SEM micrograph.
According to Stoke’s law[284]
𝑣𝑠 =2
9×
𝜌𝑝𝜌𝑓
𝜇× 𝑔𝑅𝑝
2 eq. 3.8
the terminal velocity vs of a spherical particle with density p, falling in a fluid of
density f is inversely proportional to the dynamic viscosity μ of the liquid and directly
proportional to the square of the particle radius Rp. Therefore, in order to hinder the
precipitation of the filler particles during the casting of the membrane it is thus
necessary to decrease the size of the filler particles to a minimum and increase the
viscosity of the dispersing media. The S-Ph-PMO powders were grinded on a mortar
for a variable time until a limiting size was attained. The typical average particle size
was of the order of 600 nm, but with fairly broad size distributions, as determined by
DLS (see Table 3.4). After homogenizing the polymer suspension with the fillers, the
viscosity of the slurry was increased up to a certain point by gently heating the slurry,
under magnetic stirring.
It is important to monitor closely the slurry to prevent excessive drying, which would
impede the casting. The casting conditions were adapted to the various filler content,
as the initial viscosity varied significantly with the solids concentration. Crack-free
membranes with thicknesses lower than 100 m could be obtained with a
homogeneous distribution of up to 20 wt.% filler particles, which corresponds to a
quite significant 36 % of the membrane volume. Fig. 3.34 B is a micrograph of a
typical membrane, with the companion Si EDS (B’) map demonstrating the
homogeneous distribution of the filler particles across the membrane cross-section.
The fillers produce a rough surface morphology in comparison to pure Nafion®, as
shown in Figs. 3.34 D (surface in contact with air during casting) and 3.34 E (bottom
surface in contact with the Petri glass).
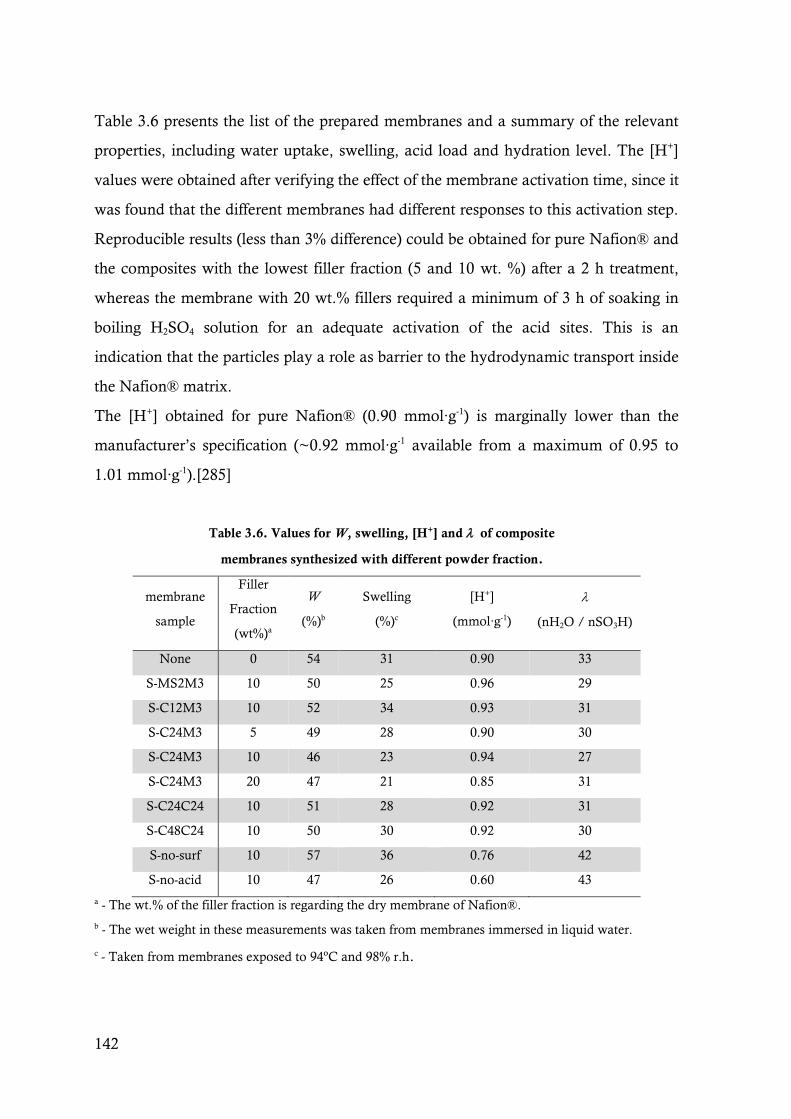
142
Table 3.6 presents the list of the prepared membranes and a summary of the relevant
properties, including water uptake, swelling, acid load and hydration level. The [H+]
values were obtained after verifying the effect of the membrane activation time, since it
was found that the different membranes had different responses to this activation step.
Reproducible results (less than 3% difference) could be obtained for pure Nafion® and
the composites with the lowest filler fraction (5 and 10 wt. %) after a 2 h treatment,
whereas the membrane with 20 wt.% fillers required a minimum of 3 h of soaking in
boiling H2SO4 solution for an adequate activation of the acid sites. This is an
indication that the particles play a role as barrier to the hydrodynamic transport inside
the Nafion® matrix.
The [H+] obtained for pure Nafion® (0.90 mmol∙g-1) is marginally lower than the
manufacturer’s specification (~0.92 mmol∙g-1 available from a maximum of 0.95 to
1.01 mmol∙g-1).[285]
Table 3.6. Values for W, swelling, [H+] and of composite
membranes synthesized with different powder fraction.
membrane
sample
Filler
Fraction
(wt%)a
W
(%)b
Swelling
(%)c
[H+]
(mmol∙g-1)
(nH2O / nSO3H)
None 0 54 31 0.90 33
S-MS2M3 10 50 25 0.96 29
S-C12M3 10 52 34 0.93 31
S-C24M3 5 49 28 0.90 30
S-C24M3 10 46 23 0.94 27
S-C24M3 20 47 21 0.85 31
S-C24C24 10 51 28 0.92 31
S-C48C24 10 50 30 0.92 30
S-no-surf 10 57 36 0.76 42
S-no-acid 10 47 26 0.60 43
a - The wt.% of the filler fraction is regarding the dry membrane of Nafion®.
b - The wet weight in these measurements was taken from membranes immersed in liquid water.
c - Taken from membranes exposed to 94ºC and 98% r.h.
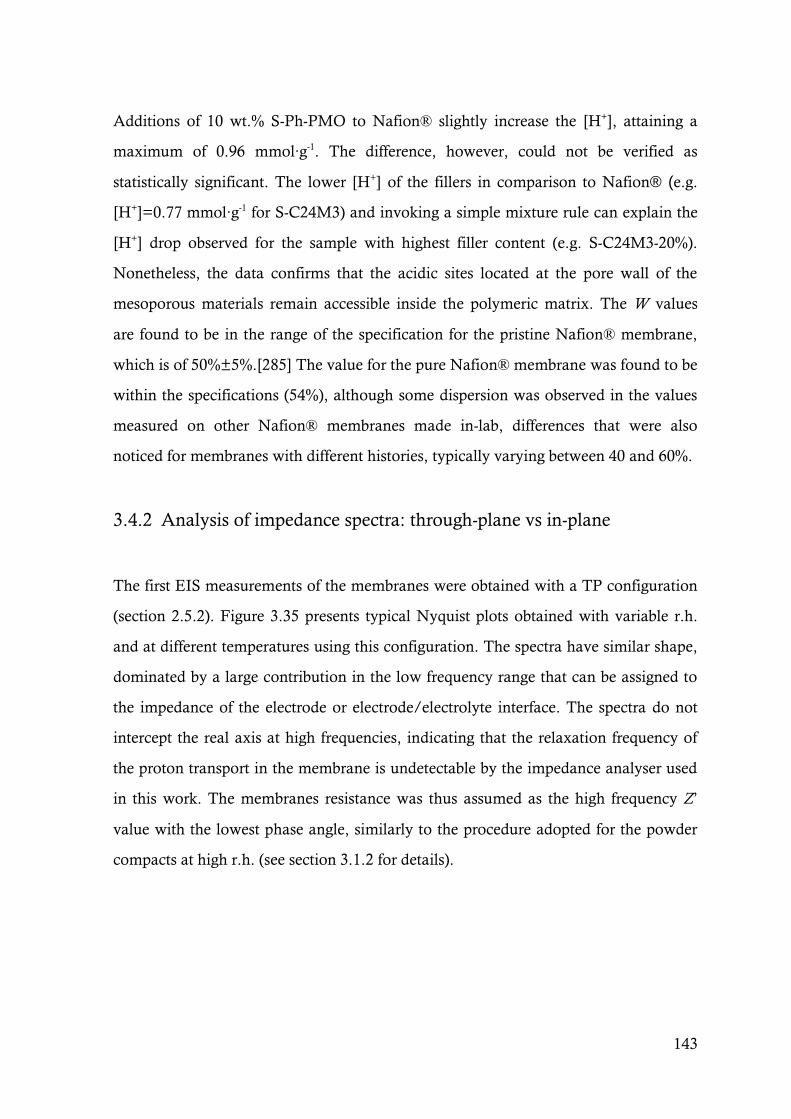
143
Additions of 10 wt.% S-Ph-PMO to Nafion® slightly increase the [H+], attaining a
maximum of 0.96 mmol∙g-1. The difference, however, could not be verified as
statistically significant. The lower [H+] of the fillers in comparison to Nafion® (e.g.
[H+]=0.77 mmol∙g-1 for S-C24M3) and invoking a simple mixture rule can explain the
[H+] drop observed for the sample with highest filler content (e.g. S-C24M3-20%).
Nonetheless, the data confirms that the acidic sites located at the pore wall of the
mesoporous materials remain accessible inside the polymeric matrix. The W values
are found to be in the range of the specification for the pristine Nafion® membrane,
which is of 50%±5%.[285] The value for the pure Nafion® membrane was found to be
within the specifications (54%), although some dispersion was observed in the values
measured on other Nafion® membranes made in-lab, differences that were also
noticed for membranes with different histories, typically varying between 40 and 60%.
3.4.2 Analysis of impedance spectra: through-plane vs in-plane
The first EIS measurements of the membranes were obtained with a TP configuration
(section 2.5.2). Figure 3.35 presents typical Nyquist plots obtained with variable r.h.
and at different temperatures using this configuration. The spectra have similar shape,
dominated by a large contribution in the low frequency range that can be assigned to
the impedance of the electrode or electrode/electrolyte interface. The spectra do not
intercept the real axis at high frequencies, indicating that the relaxation frequency of
the proton transport in the membrane is undetectable by the impedance analyser used
in this work. The membranes resistance was thus assumed as the high frequency Z’
value with the lowest phase angle, similarly to the procedure adopted for the powder
compacts at high r.h. (see section 3.1.2 for details).
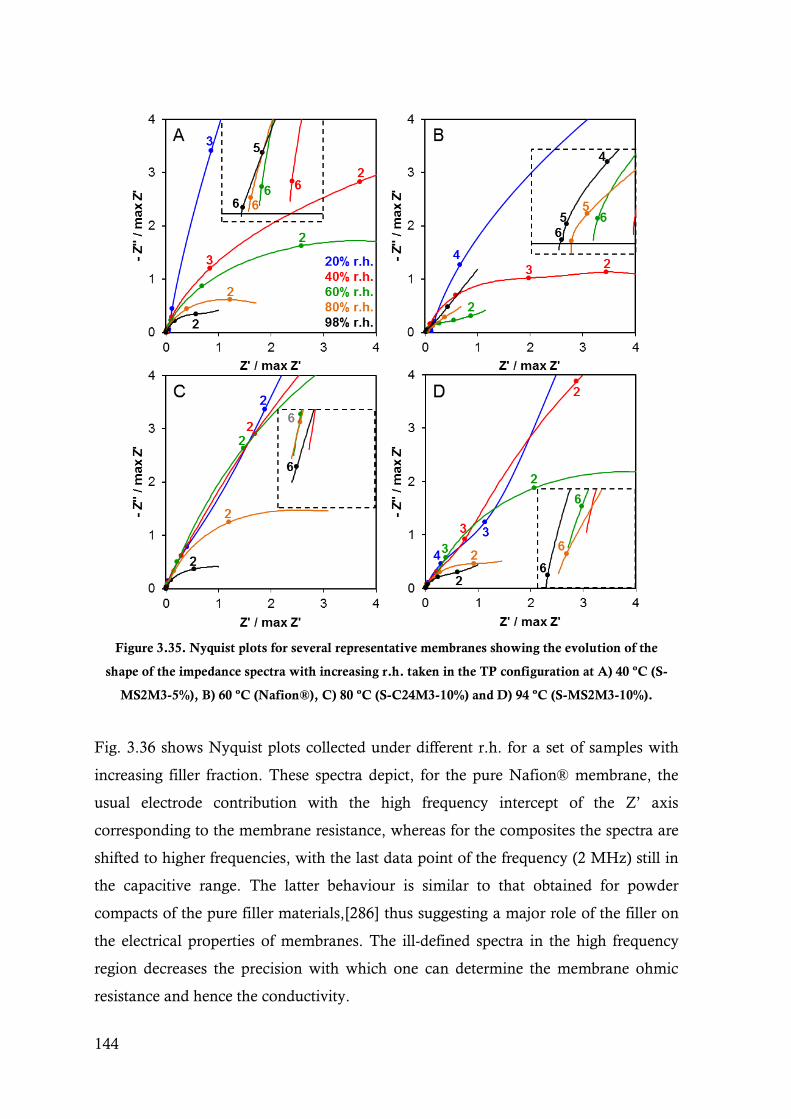
144
Figure 3.35. Nyquist plots for several representative membranes showing the evolution of the
shape of the impedance spectra with increasing r.h. taken in the TP configuration at A) 40 ºC (S-
MS2M3-5%), B) 60 ºC (Nafion®), C) 80 ºC (S-C24M3-10%) and D) 94 ºC (S-MS2M3-10%).
Fig. 3.36 shows Nyquist plots collected under different r.h. for a set of samples with
increasing filler fraction. These spectra depict, for the pure Nafion® membrane, the
usual electrode contribution with the high frequency intercept of the Z’ axis
corresponding to the membrane resistance, whereas for the composites the spectra are
shifted to higher frequencies, with the last data point of the frequency (2 MHz) still in
the capacitive range. The latter behaviour is similar to that obtained for powder
compacts of the pure filler materials,[286] thus suggesting a major role of the filler on
the electrical properties of membranes. The ill-defined spectra in the high frequency
region decreases the precision with which one can determine the membrane ohmic
resistance and hence the conductivity.
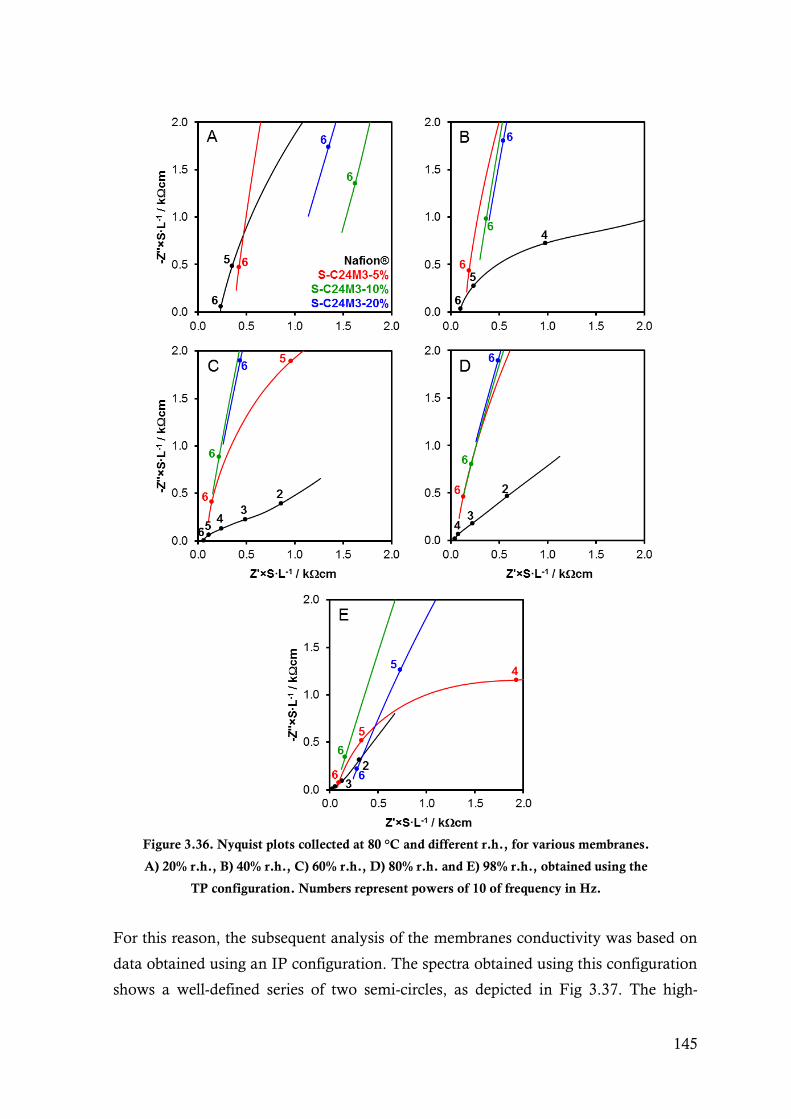
145
Figure 3.36. Nyquist plots collected at 80 °C and different r.h., for various membranes.
A) 20% r.h., B) 40% r.h., C) 60% r.h., D) 80% r.h. and E) 98% r.h., obtained using the
TP configuration. Numbers represent powers of 10 of frequency in Hz.
For this reason, the subsequent analysis of the membranes conductivity was based on
data obtained using an IP configuration. The spectra obtained using this configuration
shows a well-defined series of two semi-circles, as depicted in Fig 3.37. The high-
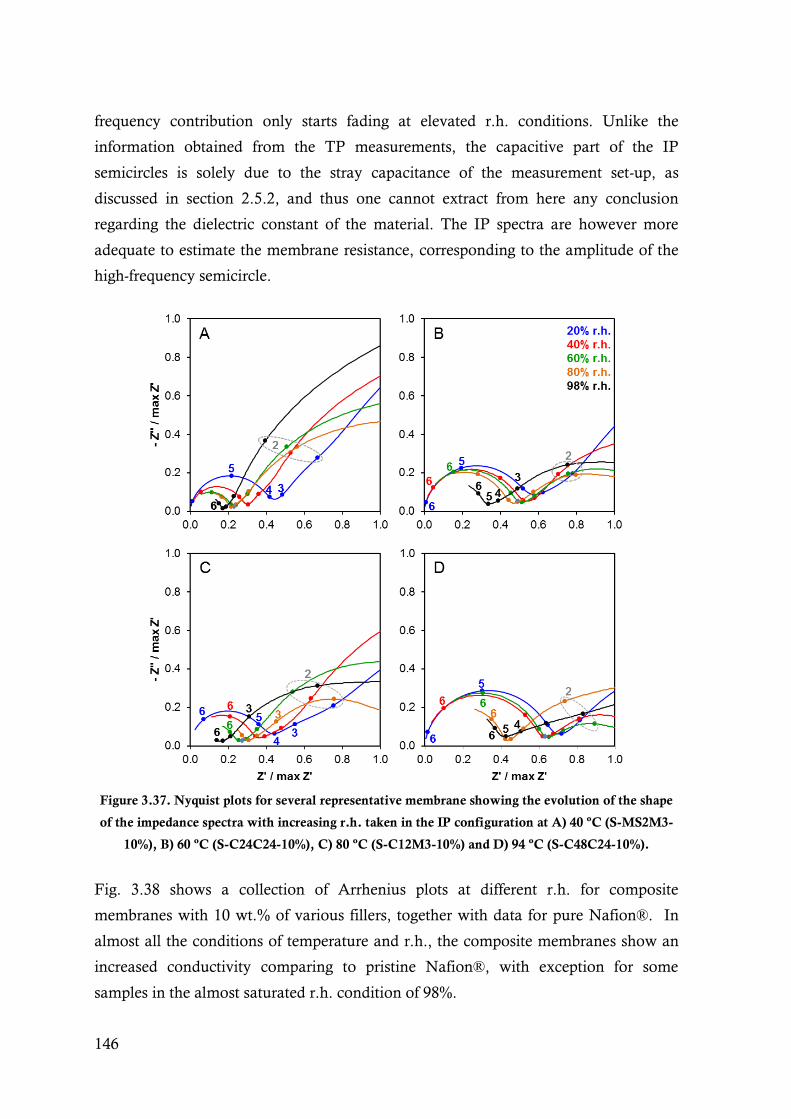
146
frequency contribution only starts fading at elevated r.h. conditions. Unlike the
information obtained from the TP measurements, the capacitive part of the IP
semicircles is solely due to the stray capacitance of the measurement set-up, as
discussed in section 2.5.2, and thus one cannot extract from here any conclusion
regarding the dielectric constant of the material. The IP spectra are however more
adequate to estimate the membrane resistance, corresponding to the amplitude of the
high-frequency semicircle.
Figure 3.37. Nyquist plots for several representative membrane showing the evolution of the shape
of the impedance spectra with increasing r.h. taken in the IP configuration at A) 40 ºC (S-MS2M3-
10%), B) 60 ºC (S-C24C24-10%), C) 80 ºC (S-C12M3-10%) and D) 94 ºC (S-C48C24-10%).
Fig. 3.38 shows a collection of Arrhenius plots at different r.h. for composite
membranes with 10 wt.% of various fillers, together with data for pure Nafion®. In
almost all the conditions of temperature and r.h., the composite membranes show an
increased conductivity comparing to pristine Nafion®, with exception for some
samples in the almost saturated r.h. condition of 98%.

147
Figure 3.38. Arrhenius plots of membranes with various types of fillers as a function of r.h.)
Nafion®; ) no-acid-10%; ) no surf-10%; ) S-MS2M3-10% ) S-C24C24-10% ) S-C48C24-
10% ) S-C12M3-10% ) S-C24M3-10%. The grey areas represent the conductivity range for pure
Nafion® found in the literature, for the same conditions.[228,258,271,276,279,280,287-296]

148
Indeed, at 20% r.h. the conductivity of the composite membrane S-C24M3-10% is
more than 19 times larger than the conductivity of the Nafion® reference at 40 ºC.
The difference decreases with increasing temperatures (almost 4 times at 140 °C) and
particularly with increasing r.h. In fact, the data tend to converge above 80% r.h.,
although almost all the composite membranes display slightly better performance than
Nafion®. Experimentally, it was difficult to control the r.h. at 98% in the ACS
Discovery 110 climatic chamber, mainly at T < 60 ºC. This may explain some slight
deviation from the expected linearity at lower temperature and 98% r.h.
The measurements were made during heating and with increasing r.h. in order to
reduce the duration of the experiments. Nevertheless, a series of preliminary
measurements were conducted in order to verify that equilibrium was effectively
attained with the adopted protocol, as illustrated by the example in Fig. 3.39.
Figure 3.39. Conductivity of composite membrane S-C24M3-10% measured at
60 °C upon increasing (absorption) and decreasing (desorption) of the r.h.
The differences between the data collected during humidification and
dehumidification are actually quite low, suggesting that the conductivity values were
indeed obtained with the samples in equilibrium with the surrounding atmosphere.
Analogously to the calculations made for the powder compacts in section 3.3.1, the
total number of solvating water molecules (g) and the Hsolv where calculated for the
composite membranes and the Nafion® reference. The g and Hsolv values of the
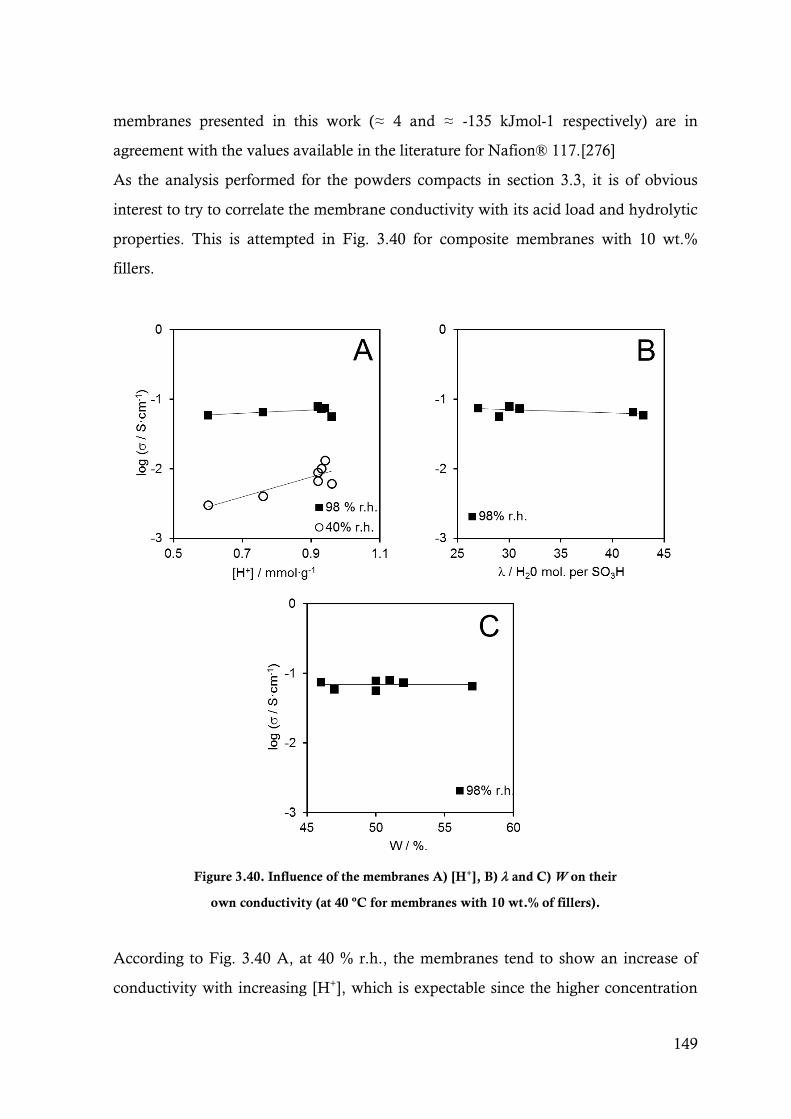
149
membranes presented in this work (≈ 4 and ≈ -135 kJmol-1 respectively) are in
agreement with the values available in the literature for Nafion® 117.[276]
As the analysis performed for the powders compacts in section 3.3, it is of obvious
interest to try to correlate the membrane conductivity with its acid load and hydrolytic
properties. This is attempted in Fig. 3.40 for composite membranes with 10 wt.%
fillers.
Figure 3.40. Influence of the membranes A) [H+], B) and C) W on their
own conductivity (at 40 ºC for membranes with 10 wt.% of fillers).
According to Fig. 3.40 A, at 40 % r.h., the membranes tend to show an increase of
conductivity with increasing [H+], which is expectable since the higher concentration
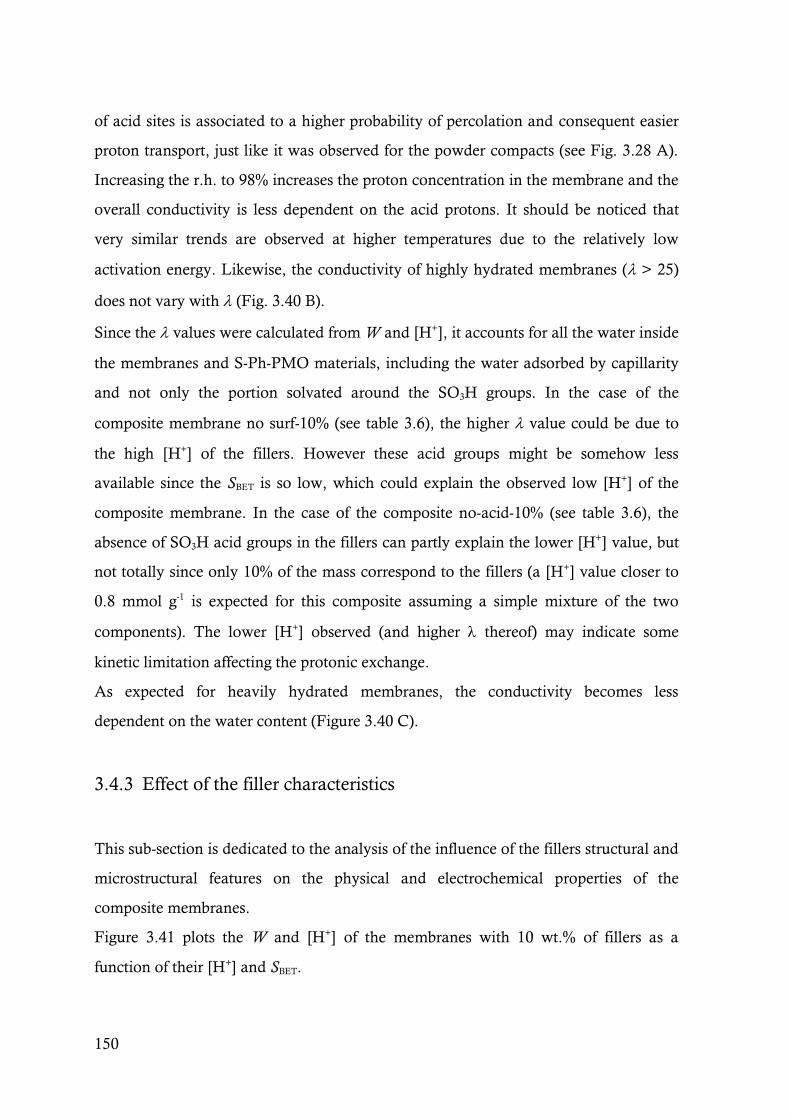
150
of acid sites is associated to a higher probability of percolation and consequent easier
proton transport, just like it was observed for the powder compacts (see Fig. 3.28 A).
Increasing the r.h. to 98% increases the proton concentration in the membrane and the
overall conductivity is less dependent on the acid protons. It should be noticed that
very similar trends are observed at higher temperatures due to the relatively low
activation energy. Likewise, the conductivity of highly hydrated membranes ( > 25)
does not vary with (Fig. 3.40 B).
Since the values were calculated from W and [H+], it accounts for all the water inside
the membranes and S-Ph-PMO materials, including the water adsorbed by capillarity
and not only the portion solvated around the SO3H groups. In the case of the
composite membrane no surf-10% (see table 3.6), the higher value could be due to
the high [H+] of the fillers. However these acid groups might be somehow less
available since the SBET is so low, which could explain the observed low [H+] of the
composite membrane. In the case of the composite no-acid-10% (see table 3.6), the
absence of SO3H acid groups in the fillers can partly explain the lower [H+] value, but
not totally since only 10% of the mass correspond to the fillers (a [H+] value closer to
0.8 mmol g-1 is expected for this composite assuming a simple mixture of the two
components). The lower [H+] observed (and higher thereof) may indicate some
kinetic limitation affecting the protonic exchange.
As expected for heavily hydrated membranes, the conductivity becomes less
dependent on the water content (Figure 3.40 C).
3.4.3 Effect of the filler characteristics
This sub-section is dedicated to the analysis of the influence of the fillers structural and
microstructural features on the physical and electrochemical properties of the
composite membranes.
Figure 3.41 plots the W and [H+] of the membranes with 10 wt.% of fillers as a
function of their [H+] and SBET.

151
Figure 3.41. Evolution of W and [H+] of the membranes (10 wt.% fillers) as a
function of the filler properties A) [H+] and B) SBET. Values inside the dotted oval
shapes are for composite membranes no-acid-10% and no surf-10%.
There is no direct correlation between the [H+] of the powder and the [H+] of the
composite membranes. Ignoring the values for composites no-surf-10% and no-acid-
10% one can observe that the acid load of the S-Ph-PMO powders (Fig 3.41 A) does
not imply significant changes on the [H+] of the membranes, as expected, considering
that only 10% of the membrane mass is replaced by fillers. Similar conclusions can be
drawn from the evolution of the [H+] as a function of the fillers SBET (Fig. 3.41 B).
On the contrary, a slight increase of the water uptake is suggested by an increasing
surface area of the fillers (Fig.3.41 B). This indicates that the fillers can indeed
accommodate a significant amount of water in their mesoporous structure.
Figure 3.42 correlates the conductivity of composite membranes with 10 wt.% fillers
with structural and microstructural features ([H+], and I(001)) of the filler powders.
The trends are the expected in face of the behaviour of the fillers themselves, with a
slight increase of conductivity with increasing [H+], whereas the structural orders (of
pores and pore walls) have no significant effects.
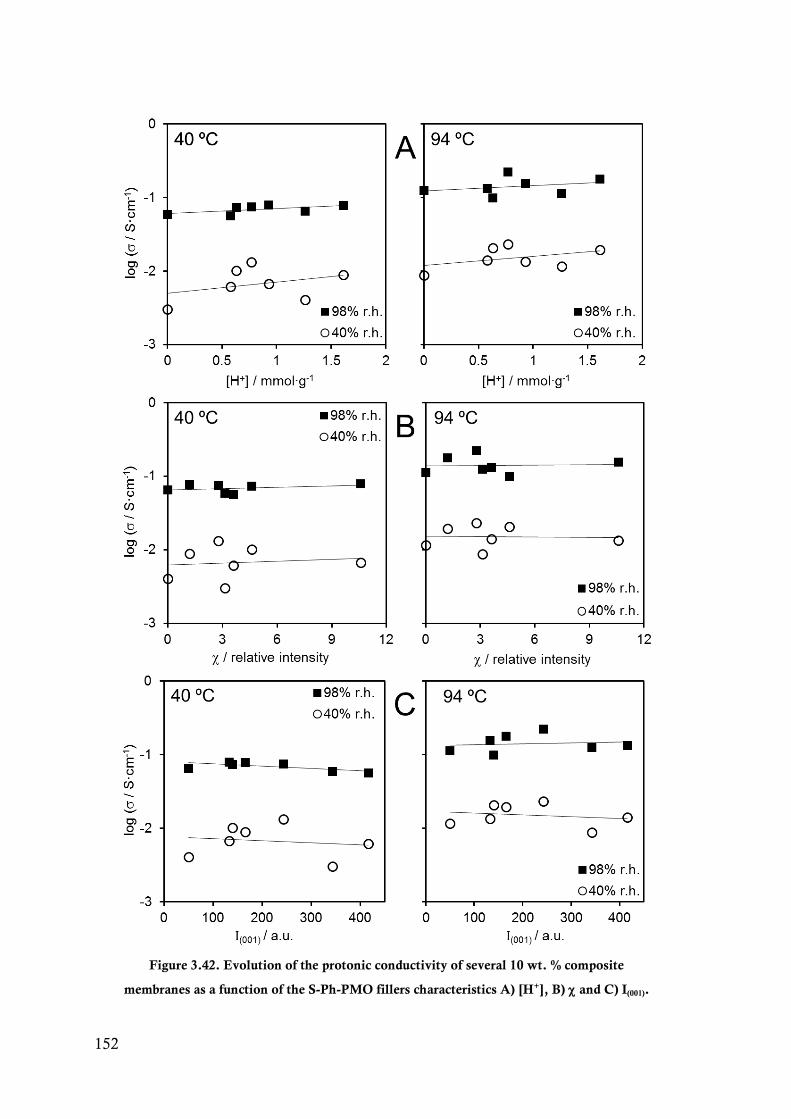
152
Figure 3.42. Evolution of the protonic conductivity of several 10 wt. % composite
membranes as a function of the S-Ph-PMO fillers characteristics A) [H+], B) and C) I(001).
153
3.4.4 Effect of the filler fraction
So far, the composite sample S-C24M3-10% showed the highest conductivity in low
and high r.h. conditions, although the major differences were found at the lower r.h.
This sub-chapter presents a study of the effect of the fraction (up to 20 wt.%) of this
particular filler on the morphology, hydrolytic properties, [H+], visco-elastic properties
and protonic conductivity of Nafion®-based composite membranes.
3.4.4.1 Morphology, hydrolytic properties and acid load
Looking back to Table 3.6, the data suggest a slight decrease of W with increasing
filler content until 10 wt.%, with further additions having no meaningful effect (within
the natural dispersion on these kind of measurements). The hydration number reflects
this tendency as well, but differences amongst the various membranes are indeed
small, with all values found on a narrow interval averaged by = 30.
The swelling of the membranes upon hydration show a decrease with increasing filler
fraction, as depicted in Fig. 3.43. The trend is somewhat scattered for the data
collected at lower temperature, which may be the combined result of insufficient
measuring precision (1 m) and some heterogeneity of the membrane thickness. These
limitations are less severe at high temperature, when the membranes expand
considerably more, and the data allows a confident linear fit of the dependence of the
membrane thickness on the volume fraction of the fillers (circle symbol in Fig. 3.43).
This can be explained by the rigid and open mesoporous structure of the S-Ph-PMO
which provides the free volume necessary to accommodate the hydration water
without expanding the Nafion® matrix, and again confirming that the acidic sites in
the pores of the filler are easily accessible in all membranes. The projection of the
trend line towards the total substitution of the matrix for the filler suggests that the
swelling of the fillers should indeed be virtually inexistent.
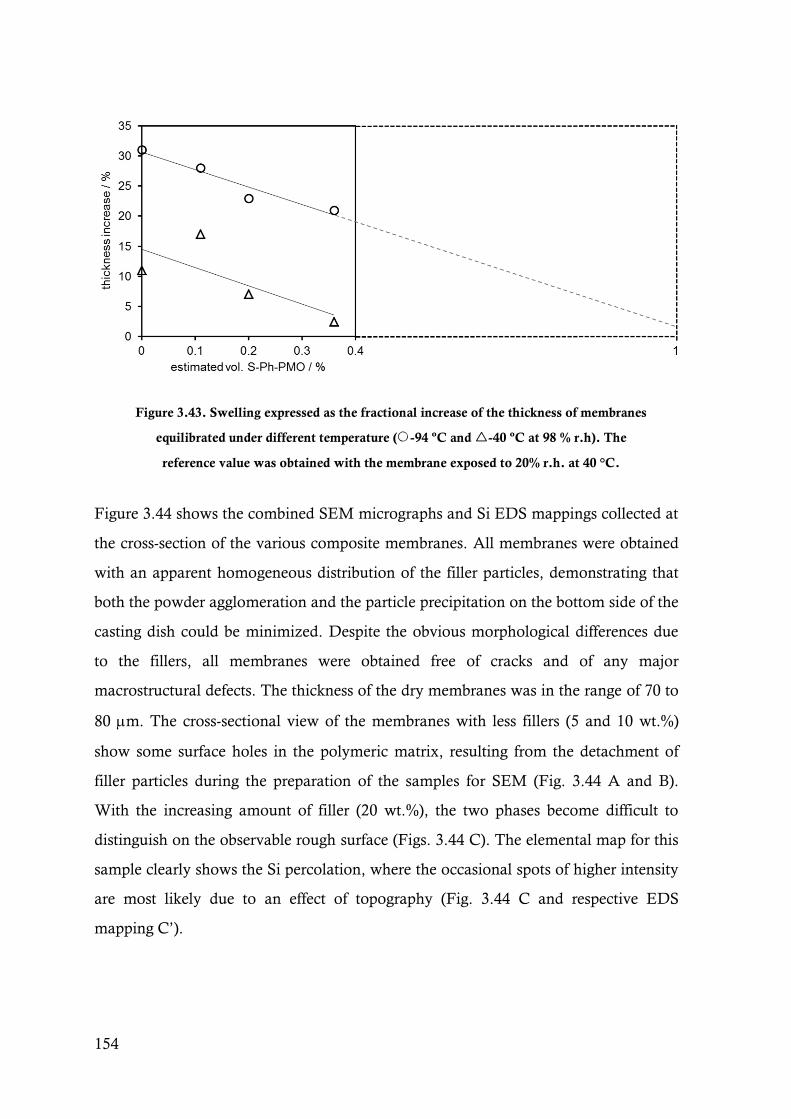
154
Figure 3.43. Swelling expressed as the fractional increase of the thickness of membranes
equilibrated under different temperature (-94 ºC and -40 ºC at 98 % r.h). The
reference value was obtained with the membrane exposed to 20% r.h. at 40 °C.
Figure 3.44 shows the combined SEM micrographs and Si EDS mappings collected at
the cross-section of the various composite membranes. All membranes were obtained
with an apparent homogeneous distribution of the filler particles, demonstrating that
both the powder agglomeration and the particle precipitation on the bottom side of the
casting dish could be minimized. Despite the obvious morphological differences due
to the fillers, all membranes were obtained free of cracks and of any major
macrostructural defects. The thickness of the dry membranes was in the range of 70 to
80 m. The cross-sectional view of the membranes with less fillers (5 and 10 wt.%)
show some surface holes in the polymeric matrix, resulting from the detachment of
filler particles during the preparation of the samples for SEM (Fig. 3.44 A and B).
With the increasing amount of filler (20 wt.%), the two phases become difficult to
distinguish on the observable rough surface (Figs. 3.44 C). The elemental map for this
sample clearly shows the Si percolation, where the occasional spots of higher intensity
are most likely due to an effect of topography (Fig. 3.44 C and respective EDS
mapping C’).
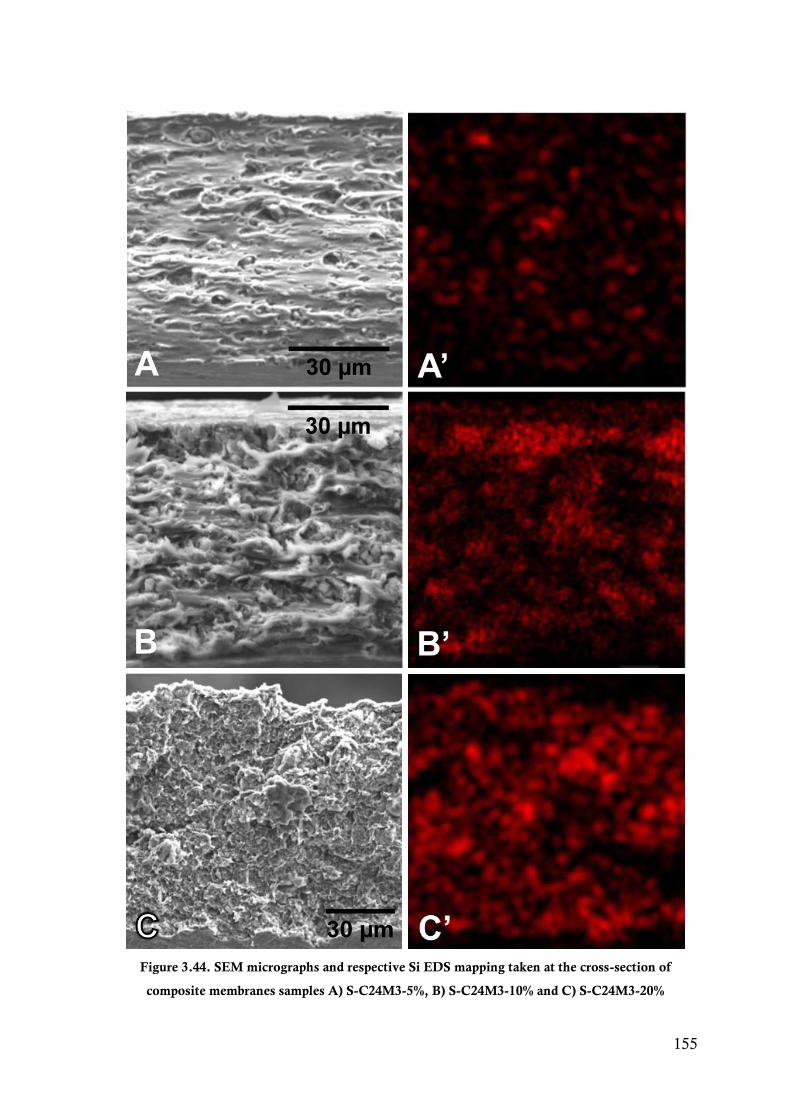
155
Figure 3.44. SEM micrographs and respective Si EDS mapping taken at the cross-section of
composite membranes samples A) S-C24M3-5%, B) S-C24M3-10% and C) S-C24M3-20%
156
Fig. 3.44 B, taken for the 10 wt.% S-Ph-PMO sample, also shows very intense Si-rich
regions, but most of them are surrounded by dark regions, denoting a clearly less
percolated structure than in the 20 wt.% membrane. Images of the membrane with 5
wt.% fillers taken at high magnification (Fig. 3.45 A) reveal the presence of
agglomerates of the initial submicrometric particles (~0.5 m) with typical sizes in the
range 2-5 m, although a large faction of the powder remains dispersed in the polymer
(see Fig. 3.44 A’). These agglomerates are no longer discernible on the microstructure
of the 20 wt.% membrane, which is perhaps better described by a network of
interconnecting submicrometric particles with the spaces filled by the polymer (Fig.
3.45 B).
The microstructural features observed on the cross-sections are also apparent on
images of the surface of the membranes. Figure 3.45 C (membrane with 10 wt.%)
depicts a quite rough surface due to the presence of the fillers within the polymer
matrix, shown in detail by Fig. 3.45 D. The Si distribution map shows again the
presence of Si regions surrounded by dark areas (Fig. 3.45 E and respective EDS
mapping E’), a pattern similar to that observed at the cross-section (Fig. 3.44 B). Some
small pore-like voids are topographic features that do not percolate inwards to the bulk
of the membrane.
In face of the large impact of the fillers on the membrane morphology, it is important
to notice that the moderate weight fractions of fillers (5, 10 and 20%) actually
correspond to approximately the double in terms of volume fraction (11, 20 and 36
vol.%), if one considers the usual density of Nafion® of ~2 g∙cm-3 and ~0.9 g∙cm-3 for
the density of the powders. The latter is an assumption based on the geometric density
of the powder compacts, and should thus be an upper value, since the sample volume
is somewhat overestimated due to the contribution of macropores inherent to powder
packing. In fact, slightly higher densities are reported for ordered mesoporous silica
with similar microstructural characteristics, but processed as films with well-defined
geometries allowing reasonably accurate estimates of the density.[213]

157
Figure 3.45. SEM micrographs taken at the cross-section of composite
membranes A) S-C24M3-5%, B) S-C24M3-20% and at the surface of
C,D and E) S-C24M3-10% with the respective Si EDS mapping.

158
3.4.4.2 Visco-elastic properties
The visco-elastic behaviour of the various membranes was investigated by DMA. The
temperature dependence of the storage modulus (E’) depicts essentially the same
features for the 4 membranes, but the 20 wt.% S-Ph-PMO composite shows clearly
higher E’ values than the other samples throughout most of the used temperature
range, as depicted in Fig. 3.46 A.
Figure 3.46. Comparison of the A) Storage modulus and B) tan
obtained by DMA for Nafion® and Nafion®/S-C24M3 composite
membranes (the inset is a zoomed view of sample S-C24M3-20%.
The modulus is close to 1-2 GPa at -100 °C, decreasing almost linearly with increasing
temperature until ~0 °C, where significant differences between this and the other

159
membranes are already apparent. While this composite clearly detaches from the other
membranes, the positive impact of lower filler quantities on the mechanical properties
is also apparent on the progressive increase of E’ with increasing filler content above
120-130 °C.
A sudden decrease of E’ is observed above the melting point of water, which is
particularly abrupt for the composites with 5 and 10 wt.%. The data show an
impressive recovery of E’ at ~40 °C, depicting a plateau-like behaviour in the range 50-
80 °C. Further heating leads to a second linear decrease of E’ until another plateau is
attained above 130-140 °C. The modulus of the 20 wt.% composite is half to one order
of magnitude higher than for the other membranes (0.2 GPa at 100 °C, or 0.05 GPa at
140 °C), thus suggesting enhanced mechanical performance of this membrane
comparing to the pristine Nafion®. Such type of sudden transition for the sample with
the highest filler content is typical of percolation-type behaviour, which is to some
extent expected in face of the approximate volume fraction of S-Ph-PMO (36%) and
the SEM/EDS observations (Fig. 3.44 C). The existence of a percolating network of
the more rigid S-Ph-PMO mesoporous structure (compared to Nafion®) would very
likely counteract the destabilization of the electrostatic network responsible for the
degradation of the visco-elastic behaviour of Nafion® at these
temperatures.[32,33,248-250]
The following analysis of the loss tangent (tan ) data seems to support this
hypothesis. However, some previous remarks about the possible influence of the
uncontrolled presence of water in the membranes or in the DMA apparatus (the
chamber of the DMA apparatus used in this work does not allow the control of r.h.)
are necessary in order to justify the somewhat confusing trends observed for the low
temperatures, particularly in the interval between 0 and 50 °C. The water has a
plasticizer role and hence an enormous influence on the DMA results.[33,248,249]
Since it would have been impossible to maintain the membranes dry during the
manipulation and the measurements, a pre-treatment in temperature and r.h.
conditions close to normal laboratory environment was carried out.

160
All samples were thus equilibrated at 25 °C under 50% r.h., which for the Nafion®
corresponds to ≈ 5 (the exothermally absorbed water).[33,213] Similar hydration
values are expected for the composite membranes, as suggested by the observed W
(Table 3.6). The DMA studies were performed upon heating, and hence some of the
water existing in the chamber may condensate on the membrane surface, since not all
the water should be adsorbed due to the kinetic limitations during the fast cooling.
This water melts at 0 °C during the slow heating and can be immediately adsorbed by
the membrane, with expected drastic effects on the elastic behaviour. Above room
temperature, the r.h. decreases and the membranes start to dehydrate until the elastic
behaviour is drastically recovered and the normal effect of temperature becomes
dominating again. The rigid mesoporous fillers can rapidly accommodate the liquid
water at 0 °C, thus limiting potential impacts on the Nafion® matrix when the volume
fraction of fillers is sufficiently high, as in the membrane with 20 wt.% S-Ph-PMO.
The composites with less filler content seem to be the most sensitive to this effect,
judging by the extremely sharp drop, and equally sharp recovery of E’ between 0 °C
and 40 °C. One can understand this assuming the existence of the already discussed
dry and compact hydrophobic “skin” at the surface of Nafion®.[33] The mesoporous
materials, functioning as permanently open channels, can perturb this “skin” and
ensure a direct access of the surface water to the bulk of the membrane. For the low
filler contents, the percolation is either deficient (sample with 10 wt.%) or inexistent (5
wt.%), and hence most of the water is absorbed by the Nafion® matrix, leading to the
sharp drop of E’. The higher filler content (20 wt.% 36 vol.%) ensures percolation
and simultaneously a larger mesoporous volume that can accommodate the additional
hydration water, thus minimizing the impact of the adsorption on the visco-elastic
behaviour of the matrix. The hardly perceived E’ minimum at ~0 °C for this
membrane puts into evidence a second minimum at approximately 35 °C, which can
also be distinguished for Nafion®, although as a much broader peak.
The possible origins of the relaxations observed are better discussed by analysing the
tan data shown in Fig. 3.46 B. Two well defined peaks are observed, one centred at
~ -50 °C, and the other at ~120 °C. The data in the intermediate temperature interval
161
between 0 and 50 °C depict a series of spikes. The first spike appearing above 0 °C
corresponds to the sharp drop in E’, whereas the subsequent, more or less random
spikes exceeding the maximum displacement fixed by the instrument (20 m),
correlate with the small oscillations of the signal response (see Fig. 3.46A). The data
for the stronger, less strained 20 wt.% S-Ph-PMO composite are less sensitive to this
limitation and display a well-defined peak at approximately 35 °C, with the additional
small lump at 0 °C (see Fig. 3.46B, inset) suggesting minimum disturbance of the
structure by the absorption of the water melted at the surface. These 2 maxima are
overlapped in the samples with 5 and 10 wt.% fillers due to the onset of the strong
relaxation at 0 °C, whereas Nafion® represents an intermediate situation, still
displaying the small peak at 0 °C.
All in all, the same features are present in the 4 samples to various degrees and are
thus features of the visco-elastic behaviour of Nafion®. According to previous detailed
DMA studies of protonated Nafion®, the peak at around -50 °C (the relaxation) is
due to short-range motions of the polytetrafluoroethylene-like backbone, and is
unaffected by the presence of water.[248,250] The second () relaxation at ~20 °C is
assigned to the segmental motions of the main-chain of the physically cross-linked
perfluorocarbon phase (the genuine Tg of Nafion®). Water (even residual) has a strong
influence on the relaxation by decreasing the temperature down to values close to 0
°C, or lower.[18] Finally, the relaxation, denoted by a tan peak at ~120 °C, is
ascribed to the increasing long-range motion of both the main and the sulfonic acid
functionalised side chains, made possible by the weakening of the electrostatic
network involving the aqueous domains.[33,250] Since all peaks can be ascribed to
Nafion®, the overall lower intensity of the tan peaks for the 20 wt.% S-Ph-PMO
composite can be explained by the lower Nafion® volume contributing to the overall
visco-elastic behaviour of this composite membrane. This is also nicely illustrated by
the progressive decrease of the intensity of the relaxation with increasing filler
fraction. The fact that the temperature does not change, even for 20 wt.% S-Ph-
PMO, strongly suggests that the softening of the membranes is exclusively due to the

162
Nafion® matrix. Indeed, one would not expect the long-range motion of any of the
structural entities of the hybrid S-Ph-PMO structure within this temperature range.
The massive impact of the on the behaviour between 0 and 50 °C prevents a
similarly solid conclusion, but the observed trends are coherent with the dominating
role of the relaxation of Nafion®, which is strongly dependent on the water content.
The peak at negative temperatures is also little affected by the presence of small
amounts of filler and should thus be due to the short-range motion of the Nafion® -
CF2- backbone. The peak is hardly discernible for the highest filler content, in
agreement with the decreasing volume of Nafion® in the composite.
The overall positive role of the fillers on the elastic properties of the composite
Nafion®/S-Ph-PMO membranes seems to be a simple bulk effect where the
percolation of the particles (and hence of the mesopores) plays an important role.
Surprisingly, this is not the case for the protonic conductivity.
3.4.4.3 Protonic conductivity
The previous analysis and observations made for the impedance spectra of Nafion®
composite membranes remain valid for the present data. The conductivity of the 3
composite membranes is higher than for Nafion® but the effect of the filler content is
not linear across the compositional range, showing a maximum for the sample with 10
wt.% of filler. The Arrhenius plots presented in Figure 3.47 confirm the
aforementioned tendency from 40 to 94 °C, and on extended ranges of up to 120 or
140 °C for 40% and 20% r.h., respectively. The important increase of the conductivity
of the best composite membrane was already compared to Nafion® and described
previously (sample S-C24M3-10%, Fig. 3.38).
The Ea values for the protonic conductivity estimated from the Arrhenius plots are
listed in Table 3.7. Conversely to the powder compacts presented in section 3.3, the
composite membrane show consistent Ea values over the whole range of r.h.
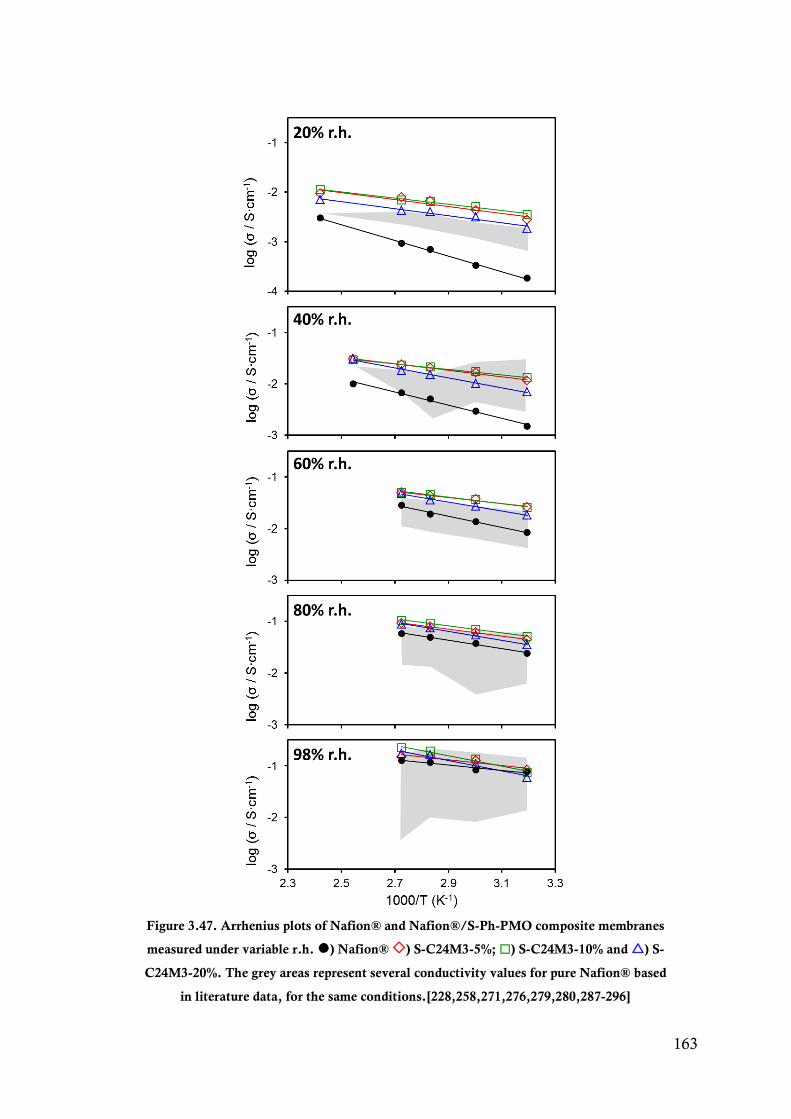
163
Figure 3.47. Arrhenius plots of Nafion® and Nafion®/S-Ph-PMO composite membranes
measured under variable r.h. ) Nafion® ) S-C24M3-5%; ) S-C24M3-10% and ) S-
C24M3-20%. The grey areas represent several conductivity values for pure Nafion® based
in literature data, for the same conditions.[228,258,271,276,279,280,287-296]
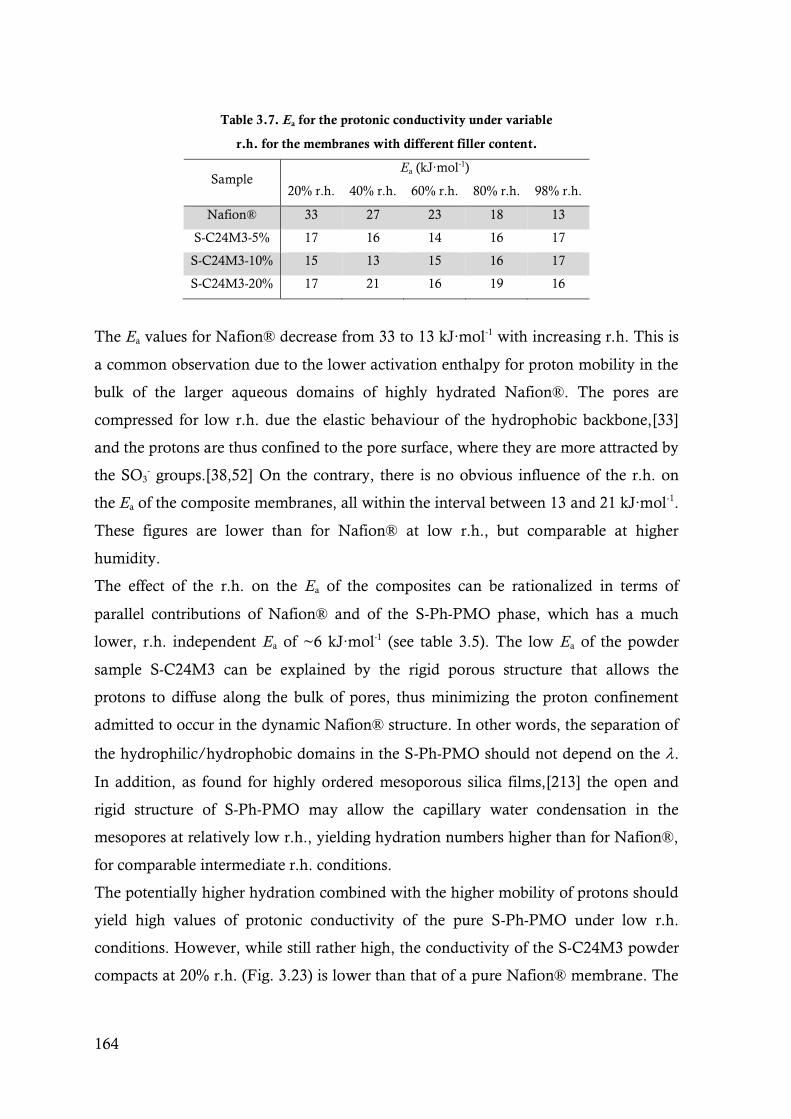
164
Table 3.7. Ea for the protonic conductivity under variable
r.h. for the membranes with different filler content.
Sample Ea (kJ∙mol-1)
20% r.h. 40% r.h. 60% r.h. 80% r.h. 98% r.h.
Nafion® 33 27 23 18 13
S-C24M3-5% 17 16 14 16 17
S-C24M3-10% 15 13 15 16 17
S-C24M3-20% 17 21 16 19 16
The Ea values for Nafion® decrease from 33 to 13 kJ∙mol-1 with increasing r.h. This is
a common observation due to the lower activation enthalpy for proton mobility in the
bulk of the larger aqueous domains of highly hydrated Nafion®. The pores are
compressed for low r.h. due the elastic behaviour of the hydrophobic backbone,[33]
and the protons are thus confined to the pore surface, where they are more attracted by
the SO3- groups.[38,52] On the contrary, there is no obvious influence of the r.h. on
the Ea of the composite membranes, all within the interval between 13 and 21 kJ∙mol-1.
These figures are lower than for Nafion® at low r.h., but comparable at higher
humidity.
The effect of the r.h. on the Ea of the composites can be rationalized in terms of
parallel contributions of Nafion® and of the S-Ph-PMO phase, which has a much
lower, r.h. independent Ea of ~6 kJ∙mol-1 (see table 3.5). The low Ea of the powder
sample S-C24M3 can be explained by the rigid porous structure that allows the
protons to diffuse along the bulk of pores, thus minimizing the proton confinement
admitted to occur in the dynamic Nafion® structure. In other words, the separation of
the hydrophilic/hydrophobic domains in the S-Ph-PMO should not depend on the .
In addition, as found for highly ordered mesoporous silica films,[213] the open and
rigid structure of S-Ph-PMO may allow the capillary water condensation in the
mesopores at relatively low r.h., yielding hydration numbers higher than for Nafion®,
for comparable intermediate r.h. conditions.
The potentially higher hydration combined with the higher mobility of protons should
yield high values of protonic conductivity of the pure S-Ph-PMO under low r.h.
conditions. However, while still rather high, the conductivity of the S-C24M3 powder
compacts at 20% r.h. (Fig. 3.23) is lower than that of a pure Nafion® membrane. The
165
differences may be much smaller because the S-Ph-PMO values are certainly
underestimated due to the sample macroporosity, as discussed at the end of sub-
section 3.3. Nevertheless, one would expect a progressive increase in the membranes
conductivity with increasing filler content, which is contradicted by the data for the 20
wt.% composite (Fig 3.47). The same reasoning applies to the Ea, which should
progressively decrease with increasing S-Ph-PMO content, at least for low r.h. In fact,
the data in Table 3.7 suggests that from the view point of the conduction mechanism,
there are no significant differences between membranes with 5, 10 or 20 wt.% filler.
The reason for the important conductivity enhancement induced by the fillers is
indeed quite complex and cannot be interpreted assuming simple bulk phenomena.
The usually invoked arguments of higher W and the closely related higher [H+]
(e.g.[222] and references therein) are not valid in the present case. The formation of
ionic cross-links between the Nafion® SO3H groups and the fillers, promoting long–
range proton transport,[297] is also unlikely because the S-Ph-PMO are not chemically
bonded to Nafion®, and the particle size is well above the nano-range.
The underlining advantage of the large S-Ph-PMO particles must be related to their
percolating mesopore structure. The main reasons for the use the S-Ph-PMO fillers
were the minimization of protonic confinement and the resulting higher mobility
along the stable filler mesopores, mainly in dryer conditions. This can indeed provide
a possible explanation for the effect of the r.h. on the conductivity of the composites.
However, it cannot explain the weak dependence of the conductivity on the filler
content, which in turn suggests that the membrane surface plays a restrictive role on
the conductivity.
One possible explanation is related to the already mentioned anisotropic dry surface of
the Nafion® membrane, where the water diffusion and protonic conductivity should
be strongly reduced compared to the membrane bulk.[33] The formation of this poorly
conductive film-like layer, consisting of packed polymer structures aligned along the
membrane surfaces, is induced by the increase in internal pressure associated to the
elastic contribution of the membrane swelling. The addition of S-Ph-PMO particles to
Nafion® can lower the internal pressure by facilitating the access of the hydration
water across the membrane surface, hence disrupting the poorly conductive “dry skin”
structure, and locally reducing the swelling (due to the rigid mesostructure). Moreover,
166
the internal pressure is estimated to increase with decreasing temperature for a fixed
r.h. due to the more rigid polymer structure,[33] which agrees with the observation of
a stronger filler effect at low temperature. The modification of the surface morphology
can indeed explain the higher conductivity of the composite membranes as a surface
effect compatible with nominally low bulk filler concentrations (10 wt.% or less).
Much higher filler volumes may disturb also the bulk of the membrane (typically
above the percolation threshold), with bulk effects expected to show up if the
conductivity of the filler is different from the Nafion® matrix. Indeed, the somewhat
lower conductivity of the powder S-C24M3 (Fig. 3.23) in comparison to Nafion® may
explain the slight decrease of the conductivity when the filler content is increased from
10 wt.% to 20 wt.%. As said before, the latter corresponds to about 36 vol.%, very
likely above the percolation threshold, as suggested by the DMA (Fig.3.46) and SEM
(Fig 3.44 C) data.
167
4 CONCLUSION AND OUTLOOK
This last chapter summarizes the principal outcomes and observations made
throughout the PhD thesis. There is also a focus on the expectable and desirable future
work to further deepen the knowledge and applicability of the materials studied in this
thesis.
One of the main research focus in PEMFC development is to obtain a PEM with
increased conductivity (0.1 S∙cm-1) at higher temperature (T>120 ºC) and lower r.h. (<
50%), to avoid several drawbacks brought by the use of low working temperatures of
the state-of-the-art PEM material. With this in mind, the strategy used in this thesis
was of incorporating hygroscopic phases inside a Nafion® matrix, in the form of acid-
functionalised mesoporous organosilicas, with benzene as bridging moiety. These
materials are optimal candidates to be used as fillers because they offer a stable rigid
structure for the conduction of proton which is independent of r.h. and should not
suffer from the confinement effect caused by the shrinkage of the pores, as it happens
in Nafion®. Moreover, the structure of the acid functionalized PMO makes a good
model of the structure of Nafion® pores in its hydrated form, with similar pore width
and distance between acid sites.
For this work we prepared several mesoporous organosilica materials containing
sulfonic or phosphonic acid functionalities.
Preliminary EIS studies show that the P-Ph-PMO samples do not show sufficient
conductivity to be used as fillers in a composite Nafion® membrane. For this reason,
only the S-Ph-PMO materials were used for this purpose.
168
The S-Ph-PMO samples were synthesised using conventional and MW heating
sources in the several steps of the synthesis. By varying the time of self-assembly and
hydrothermal steps and the type of heat source it was possible to obtain a set of
materials with a great variety of values in several structural and microstructural
characteristics, namely acid load, surface area, pore volume, pore order and molecular
scale order. This enabled the study of the influence of such characteristics upon the
protonic conductivity. The use of MW heating source instead of the conventional
allowed the reduction of synthesis time in ~80% for sample with similar [H+], SBET and
structural order. However, an excess of MW energy in the hydrothermal step (> 3 h)
leads to a dramatic decrease of structural order. There is a tendency for the decrease of
the (100) peak intensity with increasing [H+], which can be related to the progressive
diminution of the coherent diffraction volume. This is translated as an overall decrease
of the pore order factor () with increasing [H+].
The influence of the use of MW in the synthesis of S-Ph-PMO was evaluated by a
multivariate analysis of the reaction kinetics. A model that predicts the acid load, pore
order and molecular scale order, using the self-assembly and hydrothermal treatment
time constant and type of heating as variables, was thus elaborated, based on
experimental data. The [H+] values simulated by the model are in good agreement
with the experimentally observed values while the predicted values for and I(001)
show substantially higher errors. Remarkably, these errors are quite smaller for the
samples synthesised using MW in both steps. Further analysis shows that the MW
self-assembly step is responsible for the quickest increase of [H+] in all the synthesis
process.
The S-Ph-PMO materials were analysed by EIS, in the form of powder pellets, as a
function of temperature and r.h. The samples with the lowest [H+] tend to deviate
from the Arrhenius behaviour at low r.h. This may be due to a fraction of physisorbed
water molecules higher than the fraction of solvated water molecules around SO3H
groups. At low r.h., the driving force for the physisorption must be surpassed by the
evaporation rate as the temperature increases, ultimately lowering the conductivity.
However, as the r.h. increases, the driving force for the physisorption also increases,
taking the conductivity upwards. This explains the observed trend of the samples with
the lowest [H+] where the slope of the Arrhenius-type plots goes progressively from

169
positive to negative as r.h. increases. Samples with high [H+] show Arrhenius-type
behaviour starting even at low values of r.h. as the fraction of chemisorbed water
molecules (solvated around the SO3H) is always high enough. The condensation of
water inside the pores may thus occur for lower r.h., hence contributing for the
increased conductivity and observable Arrhenius behaviour across the entire r.h.
range.
For samples with [H+] lower than 1 mmol∙g-1 and SBET higher than 600 m2∙g-1 the
conductivity increases sharply with increasing r.h. up to ~60%, and more moderately
thereafter. This effect is more pronounced for samples with low [H+] and tends to fade
away with increasing [H+], being completely undetectable for samples with [H+] above
1 mmol∙g-1. According to the literature,[213] the sharp increase in conductivity is
related to the adsorption and clustering of water molecules around the acid sites,
which eventually tends to condensate, driven by capillarity. By increasing the [H+] and
according to Kelvin’s equation (eq. 2.3) the humidity threshold leading to
condensation is shifted to lower r.h. values, explaining why the sharp increase tends to
fade away with increasing [H+] in our case, since there are no conductivity values
under 20% r.h.
One of the major topics of this thesis is the study of the correlations between intrinsic
factors and the protonic conductivity of the mesoporous materials. The conductivity
values were analysed as an ensemble instead of individually for each sample, to
minimize the impact of the apparent scatter of the data.
Data clearly show that the conductivity is increased for samples with increasing [H+],
demonstrating that higher charge carrier concentration, associated to the higher
number of solvated and percolated SO3H groups, leads to an increased conductivity.
On the other hand, it was observed that the hierarchical order (typical of Ph-PMO
materials) which is defined by the hexagonal order of the nano-scale pores and the
molecular scale periodicity along the pore wall, have little or no influence on the
protonic conductivity of S-Ph-PMOs.
When comparing the values of Ea at 98% r.h., an increase of Ea with increasing [H+]
and ASC is observed. This happens probably because the concentration of protons in
the bulk is also increased, leading to a higher fraction of structurally diffusing protons,
which typically shows Ea values up to 40 kJ∙mol-1.
170
The S-Ph-PMO materials obtained by co-condensation show conductivity values four
orders of magnitude higher than the reported for materials made by grafting.[97] This
should be related to a more homogeneous distribution of acid sites allowing better
diffusion of proton through the pore channels.
The highest conductivity value obtained was of 0.11 S∙cm-1 for the sample S-C48C24
at 80 ºC and 98% r.h., which is comparable to Nafion® in similar conditions.
The composite Nafion®/S-Ph-PMO membranes were analysed by EIS as a function
of r.h. and temperature. By comparing a set of composite membranes with 10 wt.% of
fillers, the Arrhenius-type plots show that for all the conditions of temperature and r.h.
up to 80%, all the composite membranes show an enhanced conductivity compared to
Nafion®. At 20% r.h. and 40 ºC the conductivity of the composite membrane S-
C24M3-10% shows a value 19 times higher than the Nafion® reference. With
increasing temperature the difference of conductivity between composite and reference
membranes is smaller but still almost 4 times higher at 140 ºC. As the r.h. increases,
and particularly at 98%, the data tend to converge. Nevertheless, almost all the
composite membranes display a slightly better conductivity values than pure Nafion®.
Upon water uptake, one can observe a decrease of the membrane swelling with
increasing fraction of the filler that can be explained by the presence of the rigid
mesoporous structure of the S-Ph-PMO, which provides a certain free volume to
accommodate water molecules without expanding, as it happens for the Nafion®
matrix.
The EDS mapping of the cross-section of the membrane with less fillers (5 and 10
wt.%) show that the microstructure consists of particles dispersed in a polymer matrix
whereas the microstructure of the 20 wt.% membrane can be defined by a network of
interconnecting submicrometric particles with the spaces filled by the polymer.
There is a progressive positive impact of the increase in filler content on the storage
modulus (E’), mainly above 120 ºC. The 20 wt.% composite membrane shows an E’ of
0.05 GPa at 140 °C, which is one order of magnitude higher than Nafion®, suggesting
enhanced mechanical performance. The existence of a percolating network of rigid
mesoporous structures could neutralize the destabilization of the electrostatic network
responsible for the degradation of the visco-elastic behaviour of Nafion® when
temperature rises. The mesoporous structures, operating as permanently open

171
channels, can perturb the dry and compact anisotropic “skin” that is formed at the
surface of Nafion® when the r.h. is increased,[33] ensuring a direct access of the
surface water to the bulk of the membrane. For the low filler contents, because the
percolation is either deficient (sample with 10 wt.%) or inexistent (5 wt.%), most of the
water is absorbed by the Nafion® matrix. On the other hand, the highest filler content
ensures the percolation and offers a large mesoporous volume that can accommodate
the additional hydration water, minimizing the impact of the adsorption on the visco-
elastic behaviour of the matrix.
The composite membranes with increasing S-C24M3 filler content show conductivity
values higher than Nafion® with a maximum for the sample with 10 wt.%. The low
dependence of the composites Ea on the r.h. can be understood as a sum of the
contributions of Nafion® and the S-C24M3. The mesoporous material shows an Ea
independent of the r.h. due to the rigid pore structure that allows the protons to diffuse
along the bulk of pores with minimized confinement. The disruption of the dry surface
“skin” can explain the increase in conductivity up to a filler content of 10 wt.% as it
reduces the internal pressure when the r.h. increases and allows the hydration water to
enter the bulk of the membrane. However, when the filler content is augmented to 20
wt.%, the bulk effect of the percolated S-Ph-PMO powders may disturb the bulk of the
membrane and the lower conductivity of the hybrid particles may start to show on the
overall conductivity.
In terms of future work, it would be interesting to return to the lab and perform some
more adjustments to the synthesis of P-Ph-PMO, namely by modifying the acid
precursor used, in order to obtain P-Ph-PMO with greater [H+] (closer to 1 mmol∙g-1),
while maintaining a high SBET.
It is known that the capillarity threshold is affected by the pore size, according to
Kelvin’s equation (eq. 2.3) so the synthesis of new S-Ph-PMO materials with
decreasing pore size (using surfactants C16 or C14 for example) could be interesting to
assess the influence of this parameter on the conductivity of S-Ph-PMO and probably
further improve the performance of these materials at low r.h.
The complexity of interfaces inside the measured pellets, with low densities, the
presence of macroporosity, water and the actual bulk of the material is certainly high
and hardly accountable. For this reason, one could easily state that the measured

172
conductivities are certainly under estimated. The synthesis of these materials in the
form of thin films, much like the recent work done by Fujita et al.,[213] would allow a
much more organized microstructure, with regular interfaces and higher densities,
leading certainly to higher values of conductivity.
It could also be interesting to identify intermediary compositions for composite
membranes (between 10 and 20 wt.%) that could be more conductive than the
membrane with 10 wt.% of S-C24M3.
Naturally, the next logical step, which is already ongoing, is the characterization of the
composite membranes in a fuel cell station test, where the membranes performance as
a proton exchange membrane will be characterized as a function of temperature, r.h.
and gas composition, using H2 as fuel and O2 of air as oxidant.
The international target of 0.1 S∙cm-1 at 120 ºC and r.h.< 50% was not achieved yet,
but the result of 0.03 S∙cm-1 at 120 ºC and 40 % r.h. is quite promising. Moreover the
reduced swelling and the enhanced storage modulus may be crucial to improve the
thermo-mechanical stability of the membrane and of the electrode/electrolyte interface
in a fuel cell environment.
173
5 REFERENCES
1. Union, E., Energy 2020 - A strategy for competitive, sustainable and secure energy,
2011, Publication of the Office of the European Union: Luxembourg.
2. http://epp.eurostat.ec.europa.eu/portal/page/portal/eurostat/home/. 7 March
2014.
3. http://www.new-ig.eu/uploads/pdf/111026FCHtechnologiesinEurope-
Financialandtechnologyoutlook2014-2020_000.pdf. 9 January 2013.
4. http://www.fch-
ju.eu/sites/default/files/188213_2012_2640_FUEL_CELLS_AND_HYDROGEN1.p
df. 9 January 2013.
5. http://www.hydrogen.energy.gov/fuel_cells.html. 9 January 2013.
6. Houchins, C., G. Kleen, J. Spendelow, J. Kopasz, D. Peterson, N. Garland, D.
Ho, J. Marcinkoski, K. Martin, R. Tyler and D. Papageorgopoulos, U.S. DOE Progress Towards Developing Low-Cost, High Performance, Durable Polymer
Electrolyte Membranes for Fuel Cell Applications. Membranes, 2012. 2(4). p. 855-
878. 7. Schœnbein, C.F., On the voltaic polarization of certain solid and fluid substances.
Philosophical Magazine Series 3, 1839. 14(85). p. 43-45. 8. Chen, E., History, in Fuel Cell Technology Handbook, G. Hoogers, Editor 2003,
CRC Press: Boca Raton. 9. Grove, W.R., On voltaic series and the combination of gases by platinum.
Philosophical Magazine Series 3, 1839. 14(86). p. 127-130. 10. Grove, W.R., On a Gaseous Voltaic Battery. Philosophical Magazine and Journal
of Science, 1843. 21. p. 417-420.
11. Barbir, F., PEM Fuel Cells - Theory and practice. Academic Press Sustainable
World, ed. R.C. Dorf 2005, Elsevier Academic Press, Burlington.
12. Baur, E. and H. Preis, Über Brennstoff-Ketten mit Festleitern. Zeitschrift für
Elektrochemie und angewandte physikalische Chemie, 1937. 43(9). p. 727-732.
13. Devanathan, R., Recent developments in proton exchange membranes for fuel cells.
Energy & Environmental Science, 2008. 1(1). p. 101-119.

174
14. Zhang, H.W. and P.K. Shen, Recent Development of Polymer Electrolyte Membranes
for Fuel Cells. Chemical Reviews, 2012. 112(5). p. 2780-2832.
15. Litster, S. and G. McLean, PEM fuel cell electrodes. Journal of Power Sources,
2004. 130(1–2). p. 61-76.
16. EG&G Technical Services, I.U.S., Fuel Cell Handbook 2004, US Deparment of
Energy, Morgantown, West Virginia.
17. Barbir, F. and S. Yazici, Status and development of PEM fuel cell technology.
International Journal of Energy Research, 2008. 32(5). p. 369-378. 18. Smitha, B., S. Sridhar and A.A. Khan, Solid polymer electrolyte membranes for fuel
cell applications - a review. Journal of Membrane Science, 2005. 259(1-2). p. 10-
26.
19. Dupuis, A.C., Proton exchange membranes for fuel cells operated at medium
temperatures: Materials and experimental techniques. Progress in Materials Science,
2011. 56(3). p. 289-327. 20. Mauritz, K.A. and R.B. Moore, State of understanding of Nafion. Chemical
Reviews, 2004. 104(10). p. 4535-4585. 21. Shao, Y.Y., G.P. Yin, Z.B. Wang and Y.Z. Gao, Proton exchange membrane fuel
cell from low temperature to high temperature: Material challenges. Journal of Power
Sources, 2007. 167(2). p. 235-242.
22. Hickner, M.A., H. Ghassemi, Y.S. Kim, B.R. Einsla and J.E. McGrath, Alternative polymer systems for proton exchange membranes (PEMs). Chemical
Reviews, 2004. 104(10). p. 4587-4611.
23. Gierke, T.D. and W.Y. Hsu, The Cluster-network model of ion clustering in
perfluorosulfonated membranes. Acs Symposium Series, 1982. 180. p. 283-307.
24. Okada, T., G. Xie, O. Gorseth, S. Kjelstrup, N. Nakamura and T. Arimura, Ion and water transport characteristics of Nafion membranes as electrolytes.
Electrochimica Acta, 1998. 43(24). p. 3741-3747.
25. Litt, M., A reevaluation of Nafion(R) morphology. Abstracts of Papers of the
American Chemical Society, 1997. 213. p. 33-POLY.
26. Haubold, H.G., T. Vad, H. Jungbluth and P. Hiller, Nano structure of Nafion: a
SAXS study. Electrochimica Acta, 2001. 46(10-11). p. 1559-1563.
27. Gebel, G. and O. Diat, Neutron and x-ray scattering: Suitable tools for studying
ionomer membranes. Fuel Cells, 2005. 5(2). p. 261-276.
28. Kreuer, K.D., On the development of proton conducting polymer membranes for
hydrogen and methanol fuel cells. Journal of Membrane Science, 2001. 185(1). p.
29-39. 29. Schmidt-Rohr, K. and Q. Chen, Parallel cylindrical water nanochannels in Nafion
fuel-cell membranes. Nature Materials, 2008. 7(1). p. 75-83.
30. Rubatat, L., A.L. Rollet, G. Gebel and O. Diat, Evidence of elongated polymeric
aggregates in Nafion. Macromolecules, 2002. 35(10). p. 4050-4055.
31. Diat, O. and G. Gebel, Proton channels. Nat Mater, 2008. 7(1). p. 13-4.
32. Kreuer, K.-D. and G. Portale, A Critical Revision of the Nano-Morphology of Proton
Conducting Ionomers and Polyelectrolytes for Fuel Cell Applications. Advanced
Functional Materials, 2013. p. n/a-n/a. 33. Kreuer, K.-D., The role of internal pressure for the hydration and transport properties
of ionomers and polyelectrolytes. Solid State Ionics, 2013(0).
175
34. Schroder, P., Über Erstarrungs–und Quellungserscheinungen von Gelatine.
Zeitschrift für Physikalische Chemie, 1903. 45. p. 75-117.
35. Eikerling, M., Y.I. Kharkats, A.A. Kornyshev and Y.M. Volfkovich, Phenomenological theory of electro-osmotic effect and water management in polymer
electrolyte proton-conducting membranes. Journal of the Electrochemical Society,
1998. 145(8). p. 2684-2699. 36. Eikerling, M., A.A. Kornyshev, A.M. Kuznetsov, J. Ulstrup and S. Walbran,
Mechanisms of proton conductance in polymer electrolyte membranes. Journal of
Physical Chemistry B, 2001. 105(17). p. 3646-3662.
37. Jiao, K. and X.G. Li, Water transport in polymer electrolyte membrane fuel cells.
Progress in Energy and Combustion Science, 2011. 37(3). p. 221-291.
38. Kreuer, K.D., S.J. Paddison, E. Spohr and M. Schuster, Transport in proton
conductors for fuel-cell applications: Simulations, elementary reactions, and
phenomenology. Chemical Reviews, 2004. 104(10). p. 4637-4678.
39. Tuckerman, M., K. Laasonen, M. Sprik and M. Parrinello, Ab-initio molecular-dynamics simulation of the solvation and transport of hydronium and hydroxyl ion in
water. Journal of Chemical Physics, 1995. 103(1). p. 150-161.
40. Tuckerman, M.E., D. Marx, M.L. Klein and M. Parrinello, On the quantum
nature of the shared proton in hydrogen bonds. Science, 1997. 275(5301). p. 817-
820. 41. Agmon, N., The Grotthuss mechanism. Chemical Physics Letters, 1995. 244(5-6).
p. 456-462. 42. Marx, D., M.E. Tuckerman, J. Hutter and M. Parrinello, The nature of the
hydrated excess proton in water. Nature, 1999. 397(6720). p. 601-604.
43. Cohen, B. and D. Huppert, Connection between proton abnormal conductivity in
water and dielectric relaxation time. Journal of Physical Chemistry A, 2003.
107(19). p. 3598-3605.
44. Kreuer, K.D., A. Rabenau and W. Weppner, Vehicle mecahnism, a new model for
the interpretation of the conductivity of fast proton conductors. Angewandte Chemie-
International Edition in English, 1982. 21(3). p. 208-209.
45. Agmon, N., Hydrogen bonds, water rotation and proton mobility. Journal De
Chimie Physique Et De Physico-Chimie Biologique, 1996. 93(10). p. 1714-
1736. 46. Laporta, M., M. Pegoraro and L. Zanderighi, Perfluorosulfonated membrane
(Nafion): FT-IR study of the state of water with increasing humidity. Physical
Chemistry Chemical Physics, 1999. 1(19). p. 4619-4628.
47. Lu, Z., G. Polizos, D.D. Macdonald and E. Manias, State of water in
perfluorosulfonic ionomer (Nafion 117) proton exchange membranes. Journal of the
Electrochemical Society, 2008. 155(2). p. B163-B171. 48. Pivovar, A.A. and B.S. Pivovar, Dynamic behavior of water within a polymer
electrolyte fuel cell membrane at low hydration levels. Journal of Physical Chemistry
B, 2005. 109(2). p. 785-793. 49. Zawodzinski, T.A., M. Neeman, L.O. Sillerud and S. Gottesfeld, Determination
of water diffusion coeficients in perfluorosulfonate ionomeric membranes. Journal of
Physical Chemistry, 1991. 95(15). p. 6040-6044.
50. Paciaroni, A., M. Casciola, E. Cornicchi, M. Marconi, G. Onori, M. Pica and R. Narducci, Temperature-dependent dynamics of water confined in Nafion
membranes. Journal of Physical Chemistry B, 2006. 110(28). p. 13769-13776.
176
51. Perrin, J.-C., S. Lyonnard and F. Volino, Quasielastic neutron scattering study of
water dynamics in hydrated nafion membranes. Journal of Physical Chemistry C,
2007. 111(8). p. 3393-3404. 52. Eikerling, M. and A.A. Kornyshev, Proton transfer in a single pore of a polymer
electrolyte membrane. Journal of Electroanalytical Chemistry, 2001. 502(1-2). p.
1-14.
53. Paddison, S.J. and R. Paul, The nature of proton transport in fully hydrated Nafion
(R). Physical Chemistry Chemical Physics, 2002. 4(7). p. 1158-1163.
54. Paddison, S.J., The modeling of molecular structure and ion transport in sulfonic acid
based ionomer membranes. Journal of New Materials for Electrochemical
Systems, 2001. 4(4). p. 197-207.
55. Paddison, S.J., Proton conduction mechanisms at low degrees of hydration in sulfonic
acid-based polymer electrolyte membranes. Annual Review of Materials Research,
2003. 33. p. 289-319. 56. Dippel, T. and K.D. Kreuer, Proton transport mechanism in concentrated aqueous
solutions and solid hydrates of acids. Solid State Ionics, 1991. 46(1-2). p. 3-9.
57. Kreuer, K.D., M. Schuster, B. Obliers, O. Diat, U. Traub, A. Fuchs, U. Klock,
S.J. Paddison and J. Maier, Short-side-chain proton conducting perfluorosulfonic acid
ionomers: Why they perform better in PEM fuel cells. Journal of Power Sources,
2008. 178(2). p. 499-509. 58. Du, X.Z., J.R. Yu, B.L. Yi, M. Han and K.W. Bi, Performances of proton
exchange membrane fuel cells with alternate membranes. Physical Chemistry
Chemical Physics, 2001. 3(15). p. 3175-3179. 59. Merlo, L., A. Ghielmi, L. Cirillo, M. Gebert and V. Arcella, Membrane electrode
assemblies based on HYFLON (R) ion for an evolving fuel cell technology. Separation
Science and Technology, 2007. 42(13). p. 2891-2908.
60. Arico, A.S., A. Di Blasi, G. Brunaccini, F. Sergi, G. Dispenza, L. Andaloro, M. Ferraro, V. Antonucci, P. Asher, S. Buche, D. Fongalland, G.A. Hards,
J.D.B. Sharman, A. Bayer, G. Heinz, N. Zandona, R. Zuber, M. Gebert, M. Corasaniti, A. Ghielmi and D.J. Jones, High Temperature Operation of a Solid
Polymer Electrolyte Fuel Cell Stack Based on a New Ionomer Membrane. Fuel Cells,
2010. 10(6). p. 1013-1023.
61. Elabd, Y.A. and M.A. Hickner, Block Copolymers for Fuel Cells. Macromolecules,
2010. 44(1). p. 1-11. 62. Einsla, M.L., Y.S. Kim, M. Hawley, H.S. Lee, J.E. McGrath, B.J. Liu, M.D.
Guiver and B.S. Pivovar, Toward improved conductivity of sulfonated aromatic
proton exchange membranes at low relative humidity. Chemistry of Materials, 2008.
20(17). p. 5636-5642. 63. Titvinidze, G., K.-D. Kreuer, M. Schuster, C.C. de Araujo, J.P. Melchior and
W.H. Meyer, Proton Conducting Phase-Separated Multiblock Copolymers with Sulfonated Poly(phenylene sulfone) Blocks for Electrochemical Applications:
Preparation, Morphology, Hydration Behavior, and Transport. Advanced Functional
Materials, 2012. 22(21). p. 4456-4470. 64. Bouchet, R. and E. Siebert, Proton conduction in acid doped polybenzimidazole.
Solid State Ionics, 1999. 118(3-4). p. 287-299. 65. Li, Q., J.O. Jensen, R.F. Savinell and N.J. Bjerrum, High temperature proton
exchange membranes based on polybenzimidazoles for fuel cells. Progress in Polymer
Science, 2009. 34(5). p. 449-477.
177
66. Ünsal, O. and J. Kiefer, Polymer electrolyte membrane, method for the production
thereof, and application thereof in fuel cells, (Celanese Ventures GmbH), Patent
WO03096465, 2003 67. Gubler, L., D. Kramer, J. Belack, O. Ünsal, T.J. Schmidt and G.G. Scherer,
Celtec-V - A polybenzimidazole-based membrane for the direct methanol fuel cell.
Journal of the Electrochemical Society, 2007. 154(9). p. B981-B987. 68. Boaventura, M. and A. Mendes, Activation procedures characterization of MEA
based on phosphoric acid doped PBI membranes. International Journal of Hydrogen
Energy, 2010. 35(20). p. 11649-11660.
69. Pefkianakis, E.K., V. Deimede, M.K. Daletou, N. Gourdoupi and J.K. Kallitsis, Novel Polymer Electrolyte Membrane, Based on Pyridine Containing
Poly(ether sulfone), for Application in High-Temperature Fuel Cells. Macromolecular
Rapid Communications, 2005. 26(21). p. 1724-1728. 70. Weber, J., K.D. Kreuer, J. Maier and A. Thomas, Proton conductivity
enhancement by nanostructural control of poly(benzimidazole)-phosphoric acid adducts.
Advanced Materials, 2008. 20(13). p. 2595-2598.
71. Weber, J., M. Antonietti and A. Thomas, Mesoporous poly(benzimidazole)
networks via solvent mediated templating of hard spheres. Macromolecules, 2007.
40(4). p. 1299-1304. 72. Greaves, T.L. and C.J. Drummond, Protic ionic liquids: Properties and
applications. Chemical Reviews, 2008. 108(1). p. 206-237.
73. Lee, S.-Y., T. Yasuda and M. Watanabe, Fabrication of protic ionic
liquid/sulfonated polyimide composite membranes for non-humidified fuel cells. Journal
of Power Sources, 2010. 195(18). p. 5909-5914. 74. Haile, S.M., D.A. Boysen, C.R.I. Chisholm and R.B. Merle, Solid acids as fuel
cell electrolytes. Nature, 2001. 410(6831). p. 910-913.
75. Boysen, D.A., S.M. Haile, H.J. Liu and R.A. Secco, High-temperature behavior of
CsH2PO4 under both ambient and high pressure conditions. Chemistry of Materials,
2003. 15(3). p. 727-736.
76. Haile, S.M., C.R.I. Chisholm, K. Sasaki, D.A. Boysen and T. Uda, Solid acid
proton conductors: from laboratory curiosities to fuel cell electrolytes. Faraday
Discussions, 2007. 134. p. 17-39. 77. Rouquerol, J., D. Avnir, F.C. W., D.H. Everett, J.H. Haynes, N. Pernicope,
J.D.F. Ramsay, K.S.W. Sing and K.K. Unger, Recommendations for the
characterization of porous solids (technical report). Pure & Applied Chemistry, 1994.
66(8). p. 1739-1758.
78. Hoffmann, F., M. Cornelius, J. Morell and M. Froba, Silica-based mesoporous
organic-inorganic hybrid materials. Angewandte Chemie-International Edition,
2006. 45(20). p. 3216-3251. 79. Hoffmann, F. and M. Froba, Vitalising porous inorganic silica networks with organic
functions-PMOs and related hybrid materials. Chemical Society Reviews, 2011.
40(2). p. 608-620.
80. Kresge, C.T., M.E. Leonowicz, W.J. Roth, J.C. Vartuli and J.S. Beck, Ordered mesoporous molecular sieves synthesized by a liquid-crystal template mechanism.
Nature, 1992. 359(6397). p. 710-712.
81. Beck, J.S., J.C. Vartuli, W.J. Roth, M.E. Leonowicz, C.T. Kresge, K.D. Schmitt, C.T.W. Chu, D.H. Olson, E.W. Sheppard, S.B. McCullen, J.B.
Higgins and J.L. Schlenker, A new family of mesoporous molecular sieves prepared
178
with liquid-crystal templates. Journal of the American Chemical Society, 1992.
114(27). p. 10834-10843.
82. Zhao, D.Y., J.L. Feng, Q.S. Huo, N. Melosh, G.H. Fredrickson, B.F. Chmelka and G.D. Stucky, Triblock copolymer syntheses of mesoporous silica with
periodic 50 to 300 angstrom pores. Science, 1998. 279(5350). p. 548-552.
83. Zhao, D.Y., Q.S. Huo, J.L. Feng, B.F. Chmelka and G.D. Stucky, Nonionic
triblock and star diblock copolymer and oligomeric surfactant syntheses of highly ordered,
hydrothermally stable, mesoporous silica structures. Journal of the American
Chemical Society, 1998. 120(24). p. 6024-6036.
84. Asefa, T., M.J. MacLachan, N. Coombs and G.A. Ozin, Periodic mesoporous
organosilicas with organic groups inside the channel walls. Nature, 1999. 402(6764).
p. 867-871. 85. Melde, B.J., B.T. Holland, C.F. Blanford and A. Stein, Mesoporous sieves with
unified hybrid inorganic/organic frameworks. Chemistry of Materials, 1999. 11(11).
p. 3302-3308. 86. Inagaki, S., S. Guan, Y. Fukushima, T. Ohsuna and O. Terasaki, Novel
mesoporous materials with a uniform distribution of organic groups and inorganic oxide
in their frameworks. Journal of the American Chemical Society, 1999. 121(41). p.
9611-9614. 87. Hatton, B., K. Landskron, W. Whitnall, D. Perovic and G.A. Ozin, Past,
present, and future of periodic mesoporous organosilicas - The PMOs. Accounts of
Chemical Research, 2005. 38(4). p. 305-312. 88. Mizoshita, N., T. Tani and S. Inagaki, Syntheses, properties and applications of
periodic mesoporous organosilicas prepared from bridged organosilane precursors.
Chemical Society Reviews, 2011. 40(2). p. 789-800.
89. Inagaki, S., S. Guan, T. Ohsuna and O. Terasaki, An ordered mesoporous
organosilica hybrid material with a crystal-like wall structure. Nature, 2002.
416(6878). p. 304-307. 90. Bion, N., P. Ferreira, A. Valente, I.S. Goncalves and J. Rocha, Ordered benzene-
silica hybrids with molecular-scale periodicity in the walls and different mesopore sizes.
Journal of Materials Chemistry, 2003. 13(8). p. 1910-1913. 91. Das, D., J.F. Lee and S.F. Cheng, Sulfonic acid functionalized mesoporous MCM-
41 silica as a convenient catalyst for Bisphenol-A synthesis. Chemical
Communications, 2001(21). p. 2178-2179.
92. Das, D., J.F. Lee and S.F. Cheng, Selective synthesis of Bisphenol-A over
mesoporous MCM silica catalysts functionalized with sulfonic acid groups. Journal of
Catalysis, 2004. 223(1). p. 152-160. 93. Sow, B., S. Hamoudi, M.H. Zahedi-Niaki and S. Kaliaguine, 1-Butanol
etherification over sulfonated mesostructured silica and organo-silica. Microporous and
Mesoporous Materials, 2005. 79(1-3). p. 129-136. 94. Rac, B., P. Hegyes, P. Forgo and A. Molnar, Sulfonic acid-functionalized
phenylene-bridged periodic mesoporous organosilicas as catalyst materials. Applied
Catalysis a-General, 2006. 299. p. 193-201.
95. Marschall, R., I. Bannat, J. Caro and M. Wark, Proton conductivity of sulfonic
acid functionalised mesoporous materials. Microporous and Mesoporous Materials,
2007. 99(1-2). p. 190-196. 96. Wilhelm, M., M. Jeske, R. Marschall, W.L. Cavalcanti, P. Tolle, C. Kohler,
D. Koch, T. Frauenheim, G. Grathwohl, J. Caro and M. Wark, New proton
179
conducting hybrid membranes for HT-PEMFC systems based on polysiloxanes and
SO3H-functionalized mesoporous Si-MCM-41 particles. Journal of Membrane
Science, 2008. 316(1-2). p. 164-175.
97. Sharifi, M., C. Kohler, P. Tolle, T. Frauenheim and M. Wark, Proton Conductivity of SO3H-Functionalized Benzene-Periodic Mesoporous Organosilica.
Small, 2011. 7(8). p. 1086-1097. 98. Ho, K.Y., G. McKay and K.L. Yeung, Selective adsorbents from ordered
mesoporous silica. Langmuir, 2003. 19(7). p. 3019-3024.
99. Lei, C.H., Y.S. Shin, J. Liu and E.J. Ackerman, Entrapping enzyme in a
functionalized nanoporous support. Journal of the American Chemical Society,
2002. 124(38). p. 11242-11243. 100. Alvaro, M., A. Corma, D. Das, V. Fornes and H. Garcia, Single-step preparation
and catalytic activity of mesoporous MCM-41 and SBA-15 silicas functionalized with
perfluoroalkylsulfonic acid groups analogous to Nafion (R). Chemical
Communications, 2004(8). p. 956-957. 101. Khatri, R.A., S.S.C. Chuang, Y. Soong and M. Gray, Carbon dioxide capture by
diamine-grafted SBA-15: A combined Fourier transform infrared and mass spectrometry
study. Industrial & Engineering Chemistry Research, 2005. 44(10). p. 3702-
3708.
102. Yokoi, T., H. Yoshitake and T. Tatsumi, Synthesis of amino-functionalized MCM-41 via direct co-condensation and post-synthesis grafting methods using mono-, di- and
tri-amino-organoalkoxysilanes. Journal of Materials Chemistry, 2004. 14(6). p.
951-957. 103. Kang, T., Y. Park, K. Choi, J.S. Lee and J. Yi, Ordered mesoporous silica (SBA-
15) derivatized with imidazole-containing functionalities as a selective adsorbent of
precious metal ions. Journal of Materials Chemistry, 2004. 14(6). p. 1043-1049.
104. Armatas, G.S., C.E. Salmas, M. Louloudi, G.P. Androutsopoulos and P.J.
Pomonis, Relationships among pore size, connectivity, dimensionality of capillary condensation, and pore structure tortuosity of functionalized mesoporous silica.
Langmuir, 2003. 19(8). p. 3128-3136. 105. Liang, Y., E.S. Erichsen, C. Song and R. Anwander, Organozinc- and Imidazole-
Modified Periodic Mesoporous Organosilicas by Means of Molecular Grafting.
European Journal of Inorganic Chemistry, 2012(34). p. 5741-5751. 106. Ohashi, M., M.P. Kapoor and S. Inagaki, Chemical modification of crystal-like
mesoporous phenylene-silica with amino group. Chemical Communications,
2008(7). p. 841-843.
107. Cavalcanti, W.L., R. Marschall, P. Tolle, C. Kohler, M. Wark and T. Frauenheim, Insight into proton conduction of immobilised imidazole systems via
simulations and impedance spectroscopy. Fuel Cells, 2008. 8(3-4). p. 244-253.
108. Marschall, R., M. Sharifi and M. Wark, Proton conductivity of imidazole functionalized ordered mesoporous silica: Influence of type of anchorage, chain length
and humidity. Microporous and Mesoporous Materials, 2009. 123(1-3). p. 21-
29.
109. Nishiwaki, S., K. Tadanaga, M. Tatsumisago and T. Minami, Preparation and proton conductivity of surfactant-templated mesoporous silica gels impregnated with
protonic acids. Journal of the American Ceramic Society, 2000. 83(12). p. 3004-
3008.
180
110. Matsuda, A., Y. Nono, T. Kanzaki, K. Tadanaga, M. Tatsumisago and T. Minami, Proton conductivity of acid-impregnated mesoporous silica gels prepared using
surfactants as a template. Solid State Ionics, 2001. 145(1-4). p. 135-140.
111. Matsuda, A., T. Kanzaki, K. Tadanaga, T. Kogure, M. Tatsumisago and T.
Minami, Sol-gel derived porous silica gels impregnated with sulfuric acid - Pore
structure and proton conductivities at medium temperatures. Journal of the
Electrochemical Society, 2002. 149(8). p. E292-E297. 112. Armento, P., M. Casciola, M. Pica, F. Marmottini, R. Palombari and F.
Ziarelli, Silica-zirconium phosphate-phosphoric acid composites: preparation, proton
conductivity and use in gas sensors. Solid State Ionics, 2004. 166(1-2). p. 19-25.
113. Jin, H.X., Q.Y. Wu and W.Q. Pang, Preparation and conductivity of
tungstovanadogermanic heteropoly acid supported on mesoporous silicate SBA-15.
Materials Letters, 2004. 58(29). p. 3657-3660. 114. Lu, S., D. Wang, S.P. Jiang, Y. Xiang, J. Lu and J. Zeng, HPW/MCM-41
Phosphotungstic Acid/Mesoporous Silica Composites as Novel Proton-Exchange
Membranes for Elevated-Temperature Fuel Cells. Advanced Materials, 2010. 22(9).
p. 971-+. 115. Lu, J., H. Tang, S. Lu, H. Wu and S.P. Jiang, A novel inorganic proton exchange
membrane based on self-assembled HPW-meso-silica for direct methanol fuel cells.
Journal of Materials Chemistry, 2011. 21(18). p. 6668-6676. 116. Zeng, J., Y. Zhou, L. Li and S.P. Jiang, Phosphotungstic acid functionalized silica
nanocomposites with tunable bicontinuous mesoporous structure and superior proton
conductivity and stability for fuel cells. Physical Chemistry Chemical Physics, 2011.
13(21). p. 10249-10257.
117. Zeng, J., P.K. Shen, S. Lu, Y. Xiang, L. Li, R. De Marco and S.P. Jiang, Correlation between proton conductivity, thermal stability and structural symmetries in
novel HPW-meso-silica nanocomposite membranes and their performance in direct
methanol fuel cells. Journal of Membrane Science, 2012. 397. p. 92-101.
118. Bruhwiler, D., Postsynthetic functionalization of mesoporous silica. Nanoscale, 2010.
2(6). p. 887-892. 119. Burkett, S.L., S.D. Sims and S. Mann, Synthesis of hybrid inorganic-organic
mesoporous silica by co-condensation of siloxane and organosiloxane precursors.
Chemical Communications, 1996(11). p. 1367-1368. 120. Mercier, L. and T.J. Pinnavaia, Direct synthesis of hybrid organic-inorganic
nanoporous silica by a neutral amine assembly route: Structure-function control by
stoichiometric incorporation of organosiloxane molecules. Chemistry of Materials,
2000. 12(1). p. 188-196. 121. Wan, Y., D.Q. Zhang, N. Hao and D.Y. Zhao, Organic groups functionalised
mesoporous silicates. International Journal of Nanotechnology, 2007. 4(1-2). p.
66-99. 122. Wang, X.M., X.Z. Du, C.L. Li and X. Cao, Preparation and characterization of
different alkyl-modified SBA-15 by a single-step synthesis. Materials Letters, 2008.
62(17-18). p. 3232-3235.
123. Chong, A.S.M. and X.S. Zhao, Functionalization of SBA-15 with APTES and
characterization of functionalized materials. Journal of Physical Chemistry B, 2003.
107(46). p. 12650-12657.

181
124. Yokoi, T., H. Yoshitake and T. Tatsumi, Synthesis of anionic-surfactant-templated
mesoporous silica using organoalkoxysilane-containing amino groups. Chemistry of
Materials, 2003. 15(24). p. 4536-4538. 125. Che, S., A.E. Garcia-Bennett, T. Yokoi, K. Sakamoto, H. Kunieda, O.
Terasaki and T. Tatsumi, A novel anionic surfactant templating route for synthesizing
mesoporous silica with unique structure. Nature Materials, 2003. 2(12). p. 801-805.
126. Wang, X., J.C.C. Chan, Y.-H. Tseng and S. Cheng, Synthesis, characterization and catalytic activity of ordered SBA-15 materials containing high loading of diamine
functional groups. Microporous and Mesoporous Materials, 2006. 95(1-3). p. 57-
65. 127. Lim, M.H., C.F. Blanford and A. Stein, Synthesis of ordered microporous silicates
with organosulfur surface groups and their applications as solid acid catalysts.
Chemistry of Materials, 1998. 10(2). p. 467-+. 128. Margolese, D., J.A. Melero, S.C. Christiansen, B.F. Chmelka and G.D.
Stucky, Direct syntheses of ordered SBA-15 mesoporous silica containing sulfonic acid
groups. Chemistry of Materials, 2000. 12(8). p. 2448-2459.
129. Mikhailenko, S., D. Desplantier-Giscard, C. Danumah and S. Kaliaguine, Solid electrolyte properties of sulfonic acid functionalized mesostructured porous silica.
Microporous and Mesoporous Materials, 2002. 52(1). p. 29-37.
130. Yang, Q.H., M.P. Kapoor and S. Inagaki, Sulfuric acid-functionalized mesoporous
benzene-silica with a molecular-scale periodicity in the walls. Journal of the American
Chemical Society, 2002. 124(33). p. 9694-9695. 131. Feng, Y.F., X.Y. Yang, Y. Di, Y.C. Du, Y.L. Zhang and F.S. Xiao, Mesoporous
silica materials with an extremely high content of organic sulfonic groups and their comparable activities with that of concentrated sulfuric acid in catalytic esterification.
Journal of Physical Chemistry B, 2006. 110(29). p. 14142-14147.
132. Rac, B., A. Molnar, P. Forgo, M. Mohai and I. Bertoti, A comparative study of solid sulfonic acid catalysts based on various ordered mesoporous silica materials.
Journal of Molecular Catalysis a-Chemical, 2006. 244(1-2). p. 46-57.
133. Shylesh, S., P.P. Samuel, C. Srilakshmi, R. Parischa and A.P. Singh, Sulfonic acid functionalized mesoporous silicas and organosilicas: Synthesis, characterization and
catalytic applications. Journal of Molecular Catalysis a-Chemical, 2007. 274(1-2).
p. 153-158. 134. Cho, E.B. and D. Kim, Direct synthesis of sulfonic acid-functionalized periodic
mesoporous benzene-silicas with large pores. Journal of Physics and Chemistry of
Solids, 2008. 69(5-6). p. 1142-1146.
135. Marschall, R., I. Bannat, A. Feldhoff, L.Z. Wang, G.Q. Lu and M. Wark, Nanoparticles of Mesoporous SO3H-Functionalized Si-MCM-41 with Superior Proton
Conductivity. Small, 2009. 5(7). p. 854-859.
136. Corriu, R.J.P., L. Datas, Y. Guari, A. Mehdi, C. Reye and C. Thieuleux, Ordered SBA-15 mesoporous silica containing phosphonic acid groups prepared by a
direct synthetic approach. Chemical Communications, 2001(8). p. 763-764.
137. Jin, Y.G., S.Z. Qiao, Z.P. Xu, J.C.D. da Costa and G.Q. Lu, Porous Silica
Nanospheres Functionalized with Phosphonic Acid as Intermediate-Temperature Proton
Conductors. Journal of Physical Chemistry C, 2009. 113(8). p. 3157-3163.
138. Jin, Y.G., S.Z. Qiao, Z.P. Xu, Z.M. Yan, Y.N. Huang, J.C.D. da Costa and
G.Q. Lu, Phosphonic acid functionalized silicas for intermediate temperature proton
conduction. Journal of Materials Chemistry, 2009. 19(16). p. 2363-2372.
182
139. Wang, P.Y., L. Zhao, R. Wu, H. Zhong, H.F. Zou, J. Yang and Q.H. Yang, Phosphonic Acid Functionalized Periodic Mesoporous Organosilicas and Their Potential
Applications in Selective Enrichment of Phosphopeptides. Journal of Physical
Chemistry C, 2009. 113(4). p. 1359-1366. 140. Kapoor, M.P. and S. Inagaki, Highly ordered mesoporous organosilica hybrid
materials. Bulletin of the Chemical Society of Japan, 2006. 79(10). p. 1463-1475.
141. Marschall, R., P. Tolle, W.L. Cavalcanti, M. Wilhelm, C. Kohler, T.
Frauenheim and M. Wark, Detailed Simulation and Characterization of Highly Proton Conducting Sulfonic Acid Functionalized Mesoporous Materials under Dry and
Humidified Conditions. Journal of Physical Chemistry C, 2009. 113(44). p.
19218-19227. 142. Sharifi, M., R. Marschall, M. Wilhelm, D. Wallacher and M. Wark, Detection
of Homogeneous Distribution of Functional Groups in Mesoporous Silica by Small
Angle Neutron Scattering and in Situ Adsorption of Nitrogen or Water. Langmuir,
2011. 27(9). p. 5516-5522. 143. Gedye, R., F. Smith, K. Westaway, H. Ali, L. Baldisera, L. Laberge and J.
Rousell, The use microwave ovens for rapid organic synthesis. Tetrahedron Letters,
1986. 27(3). p. 279-282. 144. Galema, S.A., Microwave chemistry. Chemical Society Reviews, 1997. 26(3). p.
233-238. 145. Kappe, C.O., Controlled microwave heating in modern organic synthesis.
Angewandte Chemie-International Edition, 2004. 43(46). p. 6250-6284. 146. Tompsett, G.A., W.C. Conner and K.S. Yngvesson, Microwave synthesis of
nanoporous materials. Chemphyschem, 2006. 7(2). p. 296-319.
147. Bilecka, I. and M. Niederberger, Microwave chemistry for inorganic nanomaterials
synthesis. Nanoscale, 2010. 2(8). p. 1358-1374.
148. Wu, C.G. and T. Bein, Microwave synthesis of molecular sieve MCM-41. Chemical
Communications, 1996(8). p. 925-926. 149. Park, S.E., D.S. Kim, J.S. Chang and W.Y. Kim. Synthesis of MCM-41 using
microwave heating with ethylene glycol. in 1st Asia-Pacific Catalysis Congress. 1997.
Kyongju, South Korea: Elsevier Science Bv. 150. Newalkar, B.L., S. Komarneni and H. Katsuki, Rapid synthesis of mesoporous
SBA-15 molecular sieve by a microwave-hydrothermal process. Chemical
Communications, 2000(23). p. 2389-2390.
151. Tian, B.Z., X.Y. Liu, C.Z. Yu, F. Gao, Q. Luo, S.H. Xie, B. Tu and D.Y. Zhao, Microwave assisted template removal of siliceous porous materials. Chemical
Communications, 2002(11). p. 1186-1187. 152. Kim, D.J., J.S. Chung, W.S. Ahn, G.W. Kam and W.J. Cheong, Morphology
control of organic-inorganic hybrid mesoporous silica by microwave heating. Chemistry
Letters, 2004. 33(4). p. 422-423. 153. Newalkar, B.L., H. Katsuki and S. Komarneni, Microwave-hydrothermal synthesis
and characterization of microporous-mesoporous disordered silica using mixed-micellar-
templating approach. Microporous and Mesoporous Materials, 2004. 73(3). p.
161-170. 154. Park, S.E., J.S. Chang, Y.K. Hwang, D.S. Kim, S.H. Jhung and J.S. Hwang,
Supramolecular interactions and morphology control in microwave synthesis of
nanoporous materials. Catalysis Surveys from Asia, 2004. 8(2). p. 91-110.

183
155. Bandyopadhyay, A. and H. Gies, Synthesis of MCM-48 by microwave-hydrothermal
process. Comptes Rendus Chimie, 2005. 8(3-4). p. 621-626.
156. Marschall, R., J. Rathousky and M. Wark, Ordered functionalized silica materials
with high proton conductivity. Chemistry of Materials, 2007. 19(26). p. 6401-6407.
157. Yoon, S.S., W.J. Son, K. Biswas and W.S. Ahn, Synthesis of periodic mesoporous
organosilica by microwave heating. Bulletin of the Korean Chemical Society, 2008.
29(3). p. 609-614. 158. Grabicka, B.E. and M. Jaroniec, Microwave-assisted synthesis of periodic
mesoporous organosilicas with ethane and disulfide groups. Microporous and
Mesoporous Materials, 2009. 119(1-3). p. 144-149. 159. Yu, H. and Q.Z. Zhai, Microwave-Assisted Hydrothermal Synthesis of SBA-15
Molecular Sieve. Asian Journal of Chemistry, 2009. 21(4). p. 2745-2754.
160. Procopio, A., G. De Luca, M. Nardi, M. Oliverio and R. Paonessa, General
MW-assisted grafting of MCM-41: Study of the dependence on time dielectric heating
and solvent. Green Chemistry, 2009. 11(6). p. 770-773.
161. Smeulders, G., V. Meynen, G. Van Baelen, M. Mertens, O.I. Lebedev, G. Van Tendeloo, B.U.W. Maes and P. Cool, Rapid microwave-assisted synthesis of
benzene bridged periodic mesoporous organosilicas. Journal of Materials Chemistry,
2009. 19(19). p. 3042-3048. 162. Smeulders, G., C.J. Van Oers, K. Van Havenbergh, K. Houthoofd, M.
Mertens, J.A. Martens, S. Bals, B.U.W. Maes, V. Meynen and P. Cool, Smart heating profiles for the synthesis of benzene bridged periodic mesoporous organosilicas.
Chemical Engineering Journal, 2011. 175. p. 585-591. 163. Alberti, G., M. Casciola, S. Cavalaglio and R. Vivani, Proton conductivity of
mesoporous zirconium phosphate pyrophosphate. Solid State Ionics, 1999. 125(1-4).
p. 91-97. 164. Rodriguez-Castellon, E., J. Jimenez-Jimenez, A. Jimenez-Lopez, P. Maireles-
Torres, J.R. Ramos-Barrado, D.J. Jones and J. Roziere, Proton conductivity of
mesoporous MCM type of zirconium and titanium phosphates. Solid State Ionics,
1999. 125(1-4). p. 407-410. 165. Hogarth, W.H.J., J.C.D. da Costa, J. Drennan and G.Q. Lu, Proton conductivity
of mesoporous sol-gel zirconium phosphates for fuel cell applications. Journal of
Materials Chemistry, 2005. 15(7). p. 754-758.
166. Mal, N.K., A. Bhaumik, M. Matsukata and M. Fujiwara, Syntheses of mesoporous hybrid iron oxophenyl phosphate, iron oxophosphate, and sulfonated
oxophenyl phosphate. Industrial & Engineering Chemistry Research, 2006.
45(23). p. 7748-7751. 167. Nishiyama, Y., S. Tanaka, H.W. Hillhouse, N. Nishiyama, Y. Egashira and K.
Ueyama, Synthesis of ordered mesoporous zirconium phosphate films by spin coating
and vapor treatments. Langmuir, 2006. 22(23). p. 9469-9472.
168. Mal, N.K., M. Fujiwara and A. Bhaumik, New organic-inorganic hybrid mesoporous tantalum oxophosphate and sulfonated tantalum oxophenylphosphate.
Journal of Non-Crystalline Solids, 2007. 353(44-46). p. 4116-4120.
169. Chai, Z., D. Dong, C. Wang, H. Zhang, P.A. Webley, D. Zhao and H. Wang, Nanoporous niobium phosphate electrolyte membrane for low temperature fuel cell.
Journal of Membrane Science, 2010. 356(1-2). p. 147-153.
184
170. Vichi, F.M., M.I. Tejedor-Tejedor and M.A. Anderson, Effect of pore-wall
chemistry on proton conductivity in mesoporous titanium dioxide. Chemistry of
Materials, 2000. 12(6). p. 1762-1770. 171. Garcia-Belmonte, G., V. Kytin, T. Dittrich and J. Bisquert, Effect of humidity on
the ac conductivity of nanoporous TiO2. Journal of Applied Physics, 2003. 94(8). p.
5261-5264.
172. Yamada, M., D.L. Li, I. Honma and H.S. Zhou, A self-ordered, crystalline glass, mesoporous nanocomposite with high proton conductivity of 2 x 10(-2) S cm(-1) at
intermediate temperature. Journal of the American Chemical Society, 2005.
127(38). p. 13092-13093. 173. Colomer, M.T., Proton conductivity of nanoporous anatase xerogels prepared by a
particulate sol-gel method. Journal of Solid State Electrochemistry, 2006. 10(1). p.
54-59.
174. Colomer, M.T., Nanoporous anatase ceramic membranes as fast-proton-conducting
materials. Journal of the European Ceramic Society, 2006. 26(7). p. 1231-1236.
175. Jun, Y., H. Zarrin, M. Fowler and Z. Chen, Functionalized titania nanotube composite membranes for high temperature proton exchange membrane fuel cells.
International Journal of Hydrogen Energy, 2011. 36(10). p. 6073-6081.
176. Shen, H.Y., H. Maekawa, Y. Fujimaki, K. Kawada and T. Yamamura, High
proton conductivity of mesoporous Al2O3. Solid State Ionics: The Science and
Technology of Ions in Motion, ed. B.V.R. Chowdari, H.L. Yoo, G.M. Choi, and J.H. Lee 2004: 187-193.
177. Shen, H., H. Maekawa, J. Kawamura and T. Yamamura, Development of high
protonic conductors based on amorphous mesoporous alumina. Solid State Ionics,
2006. 177(26-32). p. 2403-2406.
178. Shen, H., B. Guo, H. Maekawa, J. Guo and K. Shu, Effect of chloride doping
concentration on enhancement of protonic conductivity of mesoporous Al2O3. Solid
State Ionics, 2011. 192(1). p. 105-107. 179. Nogami, M., R. Nagao and C. Wong, Proton conduction in porous silica glasses
with high water content. Journal of Physical Chemistry B, 1998. 102(30). p. 5772-
5775.
180. Nogami, M. and Y. Abe, Evidence of water-cooperative proton conduction in silica
glasses. Physical Review B, 1997. 55(18). p. 12108-12112.
181. Vichi, F.M., M.T. Colomer and M.A. Anderson, Nanopore ceramic membranes as
novel electrolytes for proton exchange membranes. Electrochemical and Solid State
Letters, 1999. 2(7). p. 313-316. 182. Colomer, M.T. and M.A. Anderson, High porosity silica xerogels prepared by a
particulate sol-gel route: pore structure and proton conductivity. Journal of Non-
Crystalline Solids, 2001. 290(2-3). p. 93-104. 183. Daiko, Y., T. Kasuga and M. Nogami, Pore size effect on proton transfer in sol-gel
porous silica glasses. Microporous and Mesoporous Materials, 2004. 69(3). p.
149-155.
184. Li, H. and T. Kunitake, Efficient proton conduction of nanometer-thick film of porous
silica as prepared by oxygen plasma treatment. Microporous and Mesoporous
Materials, 2006. 97(1-3). p. 42-48. 185. Xiong, L. and M. Nogami, Proton-conducting ordered mesostructured silica
monoliths. Chemistry Letters, 2006. 35(8). p. 972-973.
185
186. Colomer, M.T., F. Rubio and J.R. Jurado, Transport properties of fast proton
conducting mesoporous silica xerogels. Journal of Power Sources, 2007. 167(1). p.
53-57. 187. Bering, B.P., M.M. Dubinin and Serpinsk.Vv, Theory of volume fillng for vapor
adsorption. Journal of Colloid and Interface Science, 1966. 21(4). p. 378-393.
188. Colomban, P. and A. Novak, Hydrogen bond and protonic species, in Proton
Conductors, P. Colomban, Editor 1992, Cambridge University Press:
Cambridge. 189. Nogami, M., H.B. Li, Y. Daiko and T. Mitsuoka, Proton-conducting
phosphosilicate films prepared using template for pore structure. Journal of Sol-Gel
Science and Technology, 2004. 32(1-3). p. 185-188.
190. Wang, S.Q., J. Otomo, M. Ogura, C. Wen, H. Nagamoto and H. Takahashi, Preparation and characterization of proton-conducting CsHSO4-SiO2 nanocomposite
electrolyte membranes. Solid State Ionics, 2005. 176(7-8). p. 755-760.
191. Otomo, J., H. Shigeoka, H. Nagamoto and H. Takahashi, Phase transition
behavior and proton conduction mechanism in cesium hydrogen sulfate/silica composite.
Journal of Physics and Chemistry of Solids, 2005. 66(1). p. 21-30. 192. Nishiyama, N., J. Kaihara, Y. Nishiyama, Y. Egashira and K. Ueyama, Vapor-
phase synthesis of mesoporous SiO2-P2O5 thin films. Langmuir, 2007. 23(9). p.
4746-4748.
193. Nishiyama, Y., K. Ochi, N. Nishiyama, Y. Egashira and K. Ueyama, Proton-conducting mesoporous Silica/Phosphate composite films prepared by vapor phase
method. Electrochemical and Solid State Letters, 2008. 11(1). p. B6-B9.
194. Tang, H. and S.P. Jiang, Inorganic Electrolyte Membrane for High-temperature PEM
fuel cell: Conception, Preparation and Performance, in Proton Exchange Membrane
Fuel Cells 8, Pts 1 and 2, T. Fuller, K. Shinohara, V. Ramani, P. Shirvanian, H.
Uchida, S. Cleghorn, M. Inaba, S. Mitsushima, P. Strasser, H. Nakagawa,
H.A. Gasteiger, T. Zawodzinski, and C. Lamy, Editors. 2008. p. 719-728. 195. Sharifi, M., R. Marschall, M. Wilkening and M. Wark, Proton conductivity of
ordered mesoporous materials containing aluminium. Journal of Power Sources,
2010. 195(23). p. 7781-7786. 196. Tang, H., M. Pan, S. Lu, J. Lu and S.P. Jiang, One-step synthesized HPW/meso-
silica inorganic proton exchange membranes for fuel cells. Chemical
Communications, 2010. 46(24). p. 4351-4353.
197. Tang, H., M. Pan and S.P. Jiang, Self assembled 12-tungstophosphoric acid-silica
mesoporous nanocomposites as proton exchange membranes for direct alcohol fuel cells.
Dalton Transactions, 2011. 40(19). p. 5220-5227. 198. Zeng, J. and S.P. Jiang, Characterization of High-Temperature Proton-Exchange
Membranes Based on Phosphotungstic Acid Functionalized Mesoporous Silica
Nanocomposites for Fuel Cells. Journal of Physical Chemistry C, 2011. 115(23). p.
11854-11863.
199. Yue, W., X. Xu, Z. Su, J.T.S. Irvine, Y. Zou, Y. Liu and W. Zhou, Syntheses and proton conductivity of mesoporous Nd2O3-SiO2 and NdOCl-SiO2 composites.
Journal of Materials Science, 2012. 47(5). p. 2146-2154.
200. Kreuer, K.D., Proton conductivity: Materials and applications. Chemistry of
Materials, 1996. 8(3). p. 610-641.
201. Wu, Q.Y. and G.Y. Meng, Preparation and conductivity of vanadotungstogermanic
heteropoly acid. Solid State Ionics, 2000. 136. p. 273-277.
186
202. Halla, J.D., M. Mamak, D.E. Williams and G.A. Ozin, Meso-SiO(2)-
C(12)EO(10)OH-CF(3)SO(3)H - A novel proton-conducting solid electrolyte. Advanced
Functional Materials, 2003. 13(2). p. 133-138. 203. Coutinho, D., Z.W. Yang, J.P. Ferraris and K.J. Balkus, Proton conducting
polyaniline molecular sieve composites. Microporous and Mesoporous Materials,
2005. 81(1-3). p. 321-332.
204. Athens, G.L., Y. Ein-Eli and B.F. Chmelka, Acid-functionalized mesostructured
aluminosilica for hydrophilic proton conduction membranes. Advanced Materials,
2007. 19(18). p. 2580-+.
205. Daiko, Y., K. Katagiri, K. Ogura, M. Sakai and A. Matsuda, Preparation and characterization of surface-sulfonated phenylsilsesquioxane-methylsilsesquioxane
particles. Solid State Ionics, 2007. 178(7-10). p. 601-605.
206. McKeen, J.C., Y.S. Yan and M.E. Davis, Proton Conductivity of Acid-
Functionalized Zeolite Beta, MCM-41, and MCM-48: Effect of Acid Strength.
Chemistry of Materials, 2008. 20(16). p. 5122-5124. 207. Wang, C.M., E. Chalkova, C.D. Lute, M.V. Fedkin, S. Komarneni, T.C.M.
Chung and S.N. Lvov, Proton Conductive Inorganic Materials for Temperatures Up
to 120 degrees C and Relative Humidity Down to 5%. Journal of the Electrochemical
Society, 2010. 157(11). p. B1634-B1642. 208. Thanganathan, U., Structural study on inorganic/organic hybrid composite
membranes. Journal of Materials Chemistry, 2011. 21(2). p. 456-465.
209. Jiang, B., H. Tang and M. Pan, Well-ordered sulfonated silica electrolyte with high
proton conductivity and enhanced selectivity at elevated temperature for DMFC.
International Journal of Hydrogen Energy, 2012. 37(5). p. 4612-4618. 210. Sharifi, M., J. Schneider and M. Wark, Investigation on the optimal oxidation agent
for a maximum yield of sulfonic acid groups in MCM-41. Microporous and
Mesoporous Materials, 2012. 151. p. 506-510.
211. Sharifi, M., M. Wark, D. Freude and J. Haase, Highly proton conducting sulfonic acid functionalized mesoporous materials studied by impedance spectroscopy, MAS
NMR spectroscopy and MAS PFG NMR diffusometry. Microporous and
Mesoporous Materials, 2012. 156. p. 80-89. 212. Hamoudi, S., S. Royer and S. Kaliaguine, Propyl- and arene-sulfonic acid
functionalized periodic mesoporous organosilicas. Microporous and Mesoporous
Materials, 2004. 71(1-3). p. 17-25.
213. Fujita, S., A. Koiwai, M. Kawasumi and S. Inagaki, Enhancement of Proton Transport by High Densification of Sulfonic Acid Groups in Highly Ordered Mesoporous
Silica. Chemistry of Materials, 2013. 25(9). p. 1584-1591.
214. Schuster, M., T. Rager, A. Noda, K.D. Kreuer and J. Maier, About the choice of the protogenic group in PEM separator materials for intermediate temperature, low
humidity operation: A critical comparison of sulfonic acid, phosphonic acid and
imidazole functionalized model compounds. Fuel Cells, 2005. 5(3). p. 355-365.
215. Laberty-Robert, C., K. Valle, F. Pereira and C. Sanchez, Design and properties of
functional hybrid organic-inorganic membranes for fuel cells. Chemical Society
Reviews, 2011. 40(2). p. 961-1005.
216. Antonucci, P.L., A.S. Arico, P. Creti, E. Ramunni and V. Antonucci, Investigation of a direct methanol fuel cell based on a composite Nafion (R)-silica
electrolyte for high temperature operation. Solid State Ionics, 1999. 125(1-4). p. 431-
437.

187
217. Adjemian, K.T., S.J. Lee, S. Srinivasan, J. Benziger and A.B. Bocarsly, Silicon oxide Nafion composite membranes for proton-exchange membrane fuel cell operation at
80-140 degrees C. Journal of the Electrochemical Society, 2002. 149(3). p. A256-
A261. 218. Lin, Y.F., C.Y. Yen, C.C.M. Ma, S.H. Liao, C.H. Lee, Y.H. Hsiao and H.P.
Lin, High proton-conducting Nafion (R)/-SO3H functionalized mesoporous silica
composite membranes. Journal of Power Sources, 2007. 171. p. 388-395.
219. Tominaga, Y., I.C. Hong, S. Asai and M. Sumita, Proton conduction in Nafion
composite membranes filled with mesoporous silica. Journal of Power Sources, 2007.
171(2). p. 530-534. 220. Jin, Y.G., S.Z. Qiao, L. Zhang, Z.P. Xu, S. Smart, J.C.D. da Costa and G.Q.
Lu, Novel Nafion composite membranes with mesoporous silica nanospheres as
inorganic fillers. Journal of Power Sources, 2008. 185(2). p. 664-669.
221. Tay, S.W., X. Zhang, Z. Liu, L. Hong and S.H. Chan, Composite Nafion (R) membrane embedded with hybrid nanofillers for promoting direct methanol fuel cell
performance. Journal of Membrane Science, 2008. 321(2). p. 139-145.
222. Pereira, F., K. Valle, P. Belleville, A. Morin, S. Lambert and C. Sanchez, Advanced mesostructured hybrid silica-nafion membranes for high-performance PEM
fuel cell. Chemistry of Materials, 2008. 20(5). p. 1710-1718.
223. Tang, H.L. and M. Pan, Synthesis and characterization of a self-assembled nafion/silica nanocomposite membrane for polymer electrolyte membrane fuel cells.
Journal of Physical Chemistry C, 2008. 112(30). p. 11556-11568. 224. Wang, K.P., S. McDermid, J. Li, N. Kremliakova, P. Kozak, C.J. Song, Y.H.
Tang, J.L. Zhang and J.J. Zhang, Preparation and performance of nano
silica/Nafion composite membrane for proton exchange membrane fuel cells. Journal of
Power Sources, 2008. 184(1). p. 99-103.
225. Ojeda, M.C., C. del Rio, P.G. Escribano, F. Sanchez and J.L. Acosta, Study of Hybrid Membranes with Sulfonated-organomodified Fillers. Systems Based on
Sulfonated-phenyl SBA-15. Journal of New Materials for Electrochemical
Systems, 2009. 12(2-3). p. 127-131. 226. Sahu, A.K., S.D. Bhat, S. Pitchumani, P. Sridhar, V. Vimalan, C. George, N.
Chandrakumar and A.K. Shukla, Novel organic-inorganic composite polymer-
electrolyte membranes for DMFCs. Journal of Membrane Science, 2009. 345(1-2).
p. 305-314. 227. Xu, K., C. Chanthad, M.R. Gadinski, M.A. Hickner and Q. Wang, Acid-
Functionalized Polysilsesquioxane-Nafion Composite Membranes with High Proton
Conductivity and Enhanced Selectivity. Acs Applied Materials & Interfaces, 2009.
1(11). p. 2573-2579.
228. Hong, L.-Y., S.-Y. Oh, A. Matsuda, C.-S. Lee and D.-P. Kim, Hydrophilic and mesoporous SiO2-TiO2-SO3H system for fuel cell membrane applications.
Electrochimica Acta, 2011. 56(9). p. 3108-3114. 229. Tsai, C.-H., H.-J. Lin, H.-M. Tsai, J.-T. Hwang, S.-M. Chang and Y.-W.
Chen-Yang, Characterization and PEMFC application of a mesoporous sulfonated
silica prepared from two precursors, tetraethoxysilane and phenyltriethoxysilane.
International Journal of Hydrogen Energy, 2011. 36(16). p. 9831-9841.
230. Shea, K.J., D.A. Loy and O. Webster, Arylsilsesquioxane gels and related materials
- new hybrids of organic and inorganic networks. Journal of the American Chemical
Society, 1992. 114(17). p. 6700-6710.
188
231. Bohmer, V., W. Vogt, S. Chafaa, J. Meullemeestre, M.J. Schwing and F. Vierling, (O-hydroxyphenyl)methylphosphonic acids - Synthesis and potentiometric
determinations of their pKa values. Helvetica Chimica Acta, 1993. 76(1). p. 139-
149.
232. Toney, M.F., X-ray Diffraction, in Encyclopedia of Materials Characterization, C.R.
Brundle, C.A. Evans, and S. Wilson, Editors. 1992, Butterworth-Heinemann: Boston.
233. Gregg, S.J. and K.S.W. Sing, Adsorption, Surface Area and Porosity. 2nd ed 1982,
Academic Press, London.
234. Mitropoulos, A.C., The Kelvin equation. Journal of Colloid and Interface
Science, 2008. 317(2). p. 643-648.
235. Brunauer, S., P.H. Emmett and E. Teller, Adsorption of gases in multimolecular
layers. Journal of the American Chemical Society, 1938. 60. p. 309-319.
236. Kruk, M., M. Jaroniec and A. Sayari, Application of large pore MCM-41 molecular
sieves to improve pore size analysis using nitrogen adsorption measurements. Langmuir,
1997. 13(23). p. 6267-6273. 237. Jaroniec, M. and L.A. Solovyov, Improvement of the Kruk-Jaroniec-Sayari method
for pore size analysis of ordered silicas with cylindrical mesopores. Langmuir, 2006.
22(16). p. 6757-6760. 238. Williams, D.B. and C.B. Carter, Transmission Electron Microscopy, A Textbook for
Materials Science. 2nd ed 2009, Springer, New York.
239. Geiss, R.H., Energy-Dispersive X-ray Spectroscopy, in Encyclopedia of Materials
Characterization, C.R. Brundle, C.A. Evans, and S. Wilson, Editors. 1992,
Butterworth-Heinemann: Boston.
240. Rasband, W.S., Image J. v.1.45s, U.S. National Institutes of Health, Bethesda,
Maryland, USA, 1997-2004.
241. Grimmer, A.-R. and B. Blümich, Introduction to Solid-State NMR, in Solid-State
NMR I Methods, B. Blümich, Editor 1994, Springer Berlin Heidelberg. p. 1-62.
242. Engelhardt, G. and D. Michel, High-esolution Solid-State NMR of Silicates and
Zeolites 1987, John Wiley & Sons, New York.
243. Sel, O., T. Azais, M. Marechal, G. Gebel, C. Laberty-Robert and C. Sanchez, Sulfonic and Phosphonic Acid and Bifunctional Organic-Inorganic Hybrid Membranes
and Their Proton Conduction Properties. Chemistry-an Asian Journal, 2011. 6(11).
p. 2992-3000. 244. Aliev, A., D.L. Ou, B. Ormsby and A.C. Sullivan, Porous silica and
polysilsesquioxane with covalently linked phosphonates and phosphonic acids. Journal
of Materials Chemistry, 2000. 10(12). p. 2758-2764.
245. Pan, Y.-C., H.-H.G. Tsai, J.-C. Jiang, C.-C. Kao, T.-L. Sung, P.-J. Chiu, D. Saikia, J.-H. Chang and H.-M. Kao, Probing the Nature and Local Structure of
Phosphonic Acid Groups Functionalized in Mesoporous Silica SBA-15. Journal of
Physical Chemistry C, 2012. 116(2). p. 1658-1669. 246. Yang, Q.H., J. Yang, J. Liu, Y. Li and C. Li, Synthesis and characterization of
phosphonic acid functionalized organosilicas with bimodal nanostructure. Chemistry of
Materials, 2005. 17(11). p. 3019-3024.
247. Menard, K.P., Dynamic Mechanical Analysis - A Practical Introduction. 2 nd ed
1999, CRC Press, Boca Raton.
189
248. Kyu, T., M. Hashiyama and A. Eisenberg, Dynamic mechanical studies of partially
ionized and neutralized Nafion polymers. Canadian Journal of Chemistry, 1983.
61. p. 680-687. 249. Yeo, S.C. and A. Eisenberg, Physical properties and supramolecular structure of
perfluorinated ion-containing (nafion) polymers. Journal of Applied Polymer
Science, 1977. 21. p. 875-898.
250. Page, K.A., K.M. Cable and R.B. Moore, Molecular Origins of the Thermal Transitions and Dynamic Mechanical Relaxations in Perfluorosulfonate Ionomers.
Macromolecules, 2005. 38. p. 6472-6484.
251. Cox, J.N., Fourier Transform Infrared Spectroscopy, in Encyclopedia of Materials
Characterization, C.R. Brundle, C.A. Evans, and S. Wilson, Editors. 1992,
Butterworth-Heinemann: Boston. 252. Hatakeyama, T. and Z. Liu, Handbook of thermal analysis 1998, Wiley,
Chichester. 253. Greenspan, L., Humidity fixed points of binary saturated aqueous solutions. Journal
of Research of the National Bureau of Standards Section a-Physics and
Chemistry, 1977. 81(1). p. 89-96. 254. Berne, B.J. and R. Pecora, Dynamic Light Scattering 1976, Jonh Wiley & Sons,
New York. 255. Barsoukov, E. and J.R. Macdonald, Impedance Spectroscopy: Theory, Experiment,
and Applications. 2 ed 2005, Wiley, Hoboken.
256. Yuan, X., C. Song, H. Wang and J. Zhang, Electrochemical impedance
spectroscopy in PEM fuel cells: Fundamentals and applications 2010, Springer, New
York.
257. Macdonald, J.R., Impedance Spectroscopy: Emphasizing Solid Materials and Systems
1987, Wiley, New York. 258. Yadav, R. and P.S. Fedkiw, Analysis of EIS Technique and Nafion 117 Conductivity
as a Function of Temperature and Relative Humidity. Journal of the
Electrochemical Society, 2012. 159(3). p. B340-B346.
259. Buck, A.L., New equations for computing vapor-pressure and enhancement factor.
Journal of Applied Meteorology, 1981. 20(12). p. 1527-1532.
260. Goto, Y. and S. Inagaki, Synthesis of large-pore phenylene-bridged mesoporous
organosilica using triblock copolymer surfactant. Chemical Communications,
2002(20). p. 2410-2411. 261. Marler, B., U. Oberhagemann, S. Vortmann and H. Gies, Influence of the sorbate
type on the XRD peak intensities of loaded MCM-41. Microporous Materials, 1996.
6(5-6). p. 375-383.
262. Hamoudi, S. and S. Kaliaguine, Sulfonic acid-functionalized periodic mesoporous
organosilicas. Nanotechnology in Mesostructured Materials, 2003. 146. p. 473-
476. 263. Nakamura, T., Y. Yamada and K. Yano, Direct synthesis of monodispersed thiol-
functionalized nanoporous silica spheres and their application to a colloidal crystal
embedded with gold nanoparticles. Journal of Materials Chemistry, 2007. 17(35).
p. 3726-3732.
264. Yang, Q.H., M.P. Kapoor, N. Shirokura, M. Ohashi, S. Inagaki, J.N. Kondo and K. Domen, Ethane-bridged hybrid mesoporous functionalized organosilicas with
terminal sulfonic groups and their catalytic applications. Journal of Materials
Chemistry, 2005. 15(6). p. 666-673.
190
265. Lourenco, M.A.O., R. Siegel, L. Mafra and P. Ferreira, Microwave assisted N-
alkylation of amine functionalized crystal-like mesoporous phenylene-silica. Dalton
Transactions, 2013. 42(16). p. 5631-5634. 266. Blinka, T.A., B.J. Helmer and R. West, Polarization Transfer NMR Spectroscopy
for Silicon-29: The INEPT and DEPT Techniques, in Advances in Organometallic
Chemistry, F.G.A. Stone and W. Robert, Editors. 1984, Academic Press. p. 193-
218. 267. Silverstein, R.M., F.X. Webster and D.J. Kiemle, Spectrometric identification of
organic compounds. 7th ed 2005, Jonh Wiley & Sons, New York.
268. Domingues, E.M., N. Bion, P. Ferreira and F.M. Figueiredo, Synthesis of sulfonic acid-functionalized mesoporous benzene-silica hybrids assisted with microwave
radiation. Ciência e Tecnologia dos Materiais, 2011. 23(1-2). p. 20-24.
269. Onida, B., L. Borello, C. Busco, P. Ugliengo, Y. Goto, S. Inagaki and E.
Garrone, The surface of ordered mesoporous benzene-silica hybrid material: An infrared
and ab initio molecular modeling study. Journal of Physical Chemistry B, 2005.
109(24). p. 11961-11966. 270. Sasidharan, M., K. Nakashima, N. Gunawardhana, T. Yokoi, M. Ito, M.
Inoue, S.-i. Yusa, M. Yoshio and T. Tatsumi, Periodic organosilica hollow
nanospheres as anode materials for lithium ion rechargeable batteries. Nanoscale,
2011. 3(11). p. 4768-4773.
271. Lu, J., H. Tang, C. Xu and S.P. Jiang, Nafion membranes with ordered mesoporous
structure and high water retention properties for fuel cell applications. Journal of
Materials Chemistry, 2012. 22(12). p. 5810-5819. 272. Hudson, S., D.A. Tanner, W. Redington, E. Magner, K. Hodnett and S.
Nakahara, Quantitative TEM analysis of a hexagonal mesoporous silicate structure.
Physical Chemistry Chemical Physics, 2006. 8. p. 3467-3474.
273. Siegel, R., E. Domingues, R. De Sousa, F. Jerome, C.M. Morais, N. Bion, P. Ferreira and L. Mafra, Understanding the high catalytic activity of propylsulfonic acid-functionalized periodic mesoporous benzenesilicas by high-resolution (1)H solid-state
NMR spectroscopy. Journal of Materials Chemistry, 2012. 22(15). p. 7412-7419.
274. Yang, Q.H., J. Liu, J. Yang, M.P. Kapoor, S. Inagaki and C. Li, Synthesis,
characterization, and catalytic activity of sulfonic acid-functionalized periodic
mesoporous organosilicas. Journal of Catalysis, 2004. 228(2). p. 265-272.
275. Lu, Q.Y., B. Yang, L. Zhuang and J.T. Lu, Pattern recognition on the structure-
activity relationship of nano Pt-Ru catalysts: Methodology and preliminary
demonstration. Journal of Physical Chemistry B, 2005. 109(18). p. 8873-8879.
276. Marechal, M., J.L. Souquet, J. Guindet and J.Y. Sanchez, Solvation of sulphonic acid groups in Nafion (R) membranes from accurate conductivity measurements.
Electrochemistry Communications, 2007. 9(5). p. 1023-1028.
277. Li, T., A. Wlaschin and P.B. Balbuena, Theoretical studies of proton transfer in
water and model polymer electrolyte systems. Industrial & Engineering Chemistry
Research, 2001. 40(22). p. 4789-4800. 278. Toelle, P., C. Koehler, R. Marschall, M. Sharifi, M. Wark and T. Frauenheim,
Proton transport in functionalised additives for PEM fuel cells: contributions from
atomistic simulations. Chemical Society Reviews, 2012. 41(15). p. 5143-5159.
279. Matos, B.R., E.I. Santiago, J.F.Q. Rey, A.S. Ferlauto, E. Traversa, M. Linardi
and F.C. Fonseca, Nafion-based composite electrolytes for proton exchange membrane

191
fuel cells operating above 120 degrees C with titania nanoparticles and nanotubes as
fillers. Journal of Power Sources, 2011. 196(3). p. 1061-1068.
280. Blumenthal, G., M. Cappadonia and M. Lehmann, Investigation of the Proton
Transport in Nafion (R) Membranes as a Function of Direction, Temperature and
Relative Humidity. Ionics, 1996. 2(2). p. 102-106.
281. Lim, M.H. and A. Stein, Comparative studies of grafting and direct syntheses of
inorganic-organic hybrid mesoporous materials. Chemistry of Materials, 1999.
11(11). p. 3285-3295. 282. Mondal, J., M. Nandi, A. Modak and A. Bhaumik, Functionalized mesoporous
materials as efficient organocatalysts for the syntheses of xanthenes. Journal of
Molecular Catalysis a-Chemical, 2012. 363. p. 254-264.
283. Domingues, E.M., M.A. Salvador, P. Ferreira and F.M. Figueiredo, Proton
conductivity of acid-functionalised periodic mesoporous organosilicas. Ciência e
Tecnologia dos Materiais, 2012. 24(3/4). p. 180-183.
284. Lamb, S.H., Hydrodynamics 6th Ed. 1945, Dover, New York.
285. Nemours, D.P.d., DuPont Fuel Cells - DuPont Nafion PFSA membranes, 2009.
286. Domingues, E.M., M.A. Salvador, P. Ferreira and F.M. Figueiredo, Acid-
functionalised periodic mesoporous benzenosilica proton conductors. Solid State Ionics,
2012. 225(0). p. 308-311. 287. Baradie, B., C. Poinsignon, J.Y. Sanchez, Y. Piffard, G. Vitter, N. Bestaoui, D.
Foscallo, A. Denoyelle, D. Delabouglise and M. Vaujany, Thermostable
ionomeric filled membrane for H-2/O-2 fuel cell. Journal of Power Sources, 1998.
74(1). p. 8-16. 288. Bauer, B., D.J. Jones, J. Roziere, L. Tchicaya, G. Alberti, M. Casciola, L.
Massinelli, A. Peraio, S. Besse and E. Ramunni, Electrochemical characterisation
of sulfonated polyetherketone membranes. Journal of New Materials for
Electrochemical Systems, 2000. 3(2). p. 93-98.
289. Lufrano, F., I. Gatto, P. Staiti, V. Antonucci and E. Passalacqua, Sulfonated
polysulfone ionomer membranes for fuel cells. Solid State Ionics, 2001. 145(1-4). p.
47-51. 290. Bae, J.M., I. Honma, M. Murata, T. Yamamoto, M. Rikukawa and N. Ogata,
Properties of selected sulfonated polymers as proton-conducting electrolytes for polymer
electrolyte fuel cells. Solid State Ionics, 2002. 147(1-2). p. 189-194.
291. Jung, D.H., S.Y. Cho, D.H. Peck, D.R. Shin and J.S. Kim, Preparation and
performance of a Nafion (R)/montmorillonite nanocomposite membrane for direct
methanol fuel cell. Journal of Power Sources, 2003. 118(1-2). p. 205-211.
292. He, R.H., Q.F. Li, G. Xiao and N.J. Bjerrum, Proton conductivity of phosphoric acid doped polybenzimidazole and its composites with inorganic proton conductors.
Journal of Membrane Science, 2003. 226(1-2). p. 169-184.
293. Kim, Y.S., F. Wang, M. Hickner, T.A. Zawodzinski and J.E. McGrath, Fabrication and characterization of heteropolyacid (H3PW12O40)/directly polymerized sulfonated poly(arylene ether sulfone) copolymer composite membranes for higher
temperature fuel cell applications. Journal of Membrane Science, 2003. 212(1-2). p.
263-282.
294. Yang, C., S. Srinivasan, A.B. Bocarsly, S. Tulyani and J.B. Benziger, A comparison of physical properties and fuel cell performance of Nafion and zirconium
phosphate/Nafion composite membranes. Journal of Membrane Science, 2004.
237(1-2). p. 145-161.
192
295. Xie, L., E.-B. Cho and D. Kim, Sulfonated PEEK/cubic (Im3m) mesoporous
benzene-silica composite membranes operable at low humidity. Solid State Ionics,
2011. 203(1). p. 1-8. 296. Li, J.R., H.L. Tang, L.T. Chen, R. Chen, M. Pan and S.P. Jiang, Highly ordered
and periodic mesoporous Nafion membranes via colloidal silica mediated self-assembly
for fuel cells. Chemical Communications, 2013. 49(58). p. 6537-6539.
297. Di Noto, V., M. Piga, G.A. Giffin, K. Vezzù and T.A. Zawodzinski, Interplay
between mechanical, electrical and thermal relaxations in naocomposite proton conducting membranes based on nafion and a [(ZrO2)-(Ta2O5)0.119] core-shell
nanofiller. Journal of the American Chemical Society, 2012. 134. p. 19099-
19107.