
Escola Superior de Saúde Egas Moniz Mestrado em Biologia … Lara... · de futuro se utilize um...
85
Escola Superior de Saúde Egas Moniz Mestrado em Biologia Molecular em Saúde Purification of antimicrobial peptides secreted by Saccharomyces cerevisiae and proteomic analysis of cell membrane-associated proteins Lara Andreia Brito dos Santos Supervisor Maria Gabriela Machado de Almeida, PhD Co-supervisor Maria Helena Whytton da Terra Soares de Albergaria, PhD Thesis submitted to Escola Superior de Saúde Egas Moniz to attain the Master Degree on Molecular Biology in Health September 2015
Transcript of Escola Superior de Saúde Egas Moniz Mestrado em Biologia … Lara... · de futuro se utilize um...
Escola Superior de Saúde Egas Moniz
Mestrado em Biologia Molecular em Saúde
Purification of antimicrobial peptides secreted by Saccharomyces
cerevisiae and proteomic analysis of cell membrane-associated
proteins
Lara Andreia Brito dos Santos
Supervisor
Maria Gabriela Machado de Almeida, PhD
Co-supervisor
Maria Helena Whytton da Terra Soares de Albergaria, PhD
Thesis submitted to Escola Superior de Saúde Egas Moniz to attain the Master
Degree on Molecular Biology in Health
September 2015
2
Agradecimentos
Em primeiro lugar, gostaria de agradecer à Professora Doutora Maria Gabriela
Almeida pela oportunidade em participar neste projecto, pela sua orientação e pelos
valiosos conhecimentos que me transmitiu para a realização deste trabalho.
Em segundo lugar, gostaria de expressar a minha gratidão à Doutora Helena
Albergaria pela partilha dos seus preciosos ensinamentos e conhecimentos a nível
científico, mas acima de tudo, pelo seu incansável apoio, pela disponibilidade e pela
imensa compreensão que demonstrou ao longo deste tempo e que me motivaram a
continuar e a não desistir. Agradeço-lhe, ainda, pelas valiosas correcções deste
trabalho e pelas suas carinhosas “chamadas de atenção”: “Oh moça, a cabecinha
serve para pensar!”.
À Professora Doutora Alexandra Maia e Silva, coordenadora do mestrado de
Biologia Molecular em Saúde, que sempre se mostrou disponível para me receber e
que demonstrou uma enorme compreensão em relação a todos os dilemas
profissionais e pessoais por que passei.
Ao Doutor Francisco Gírio, director da Unidade de Bioenergia do LNEG, pela
disponibilidade deste espaço para a realização deste projecto.
Ao Doutor José Moura e à Doutora Isabel Moura, dos grupos
BIOIN/BIOPROT da FCT, UNL, pela cedência do espaço no laboratório para a
realização desta tese.
Gostaria de agradecer à mestre Patrícia Branco pelo apoio e pela transmissão
de conhecimentos.
Em especial à Mestre Diana Francisco por ter-me ensinado tudo o que sei de
microbiologia, pela sua orientação incansável ao nível de bancada, pela paciência
que demonstrou em relação aos meus erros de principiante numa área para mim, até
então, completamente desconhecida. Agradeço os bons e alegres momentos por que
passámos dentro e fora do laboratório e não esquecerei a forma carinhosa como me
tratava por “Larinha”.
Aos colegas do LNEG que me apoiaram e que ofereceram dicas e ajudas
preciosas sempre que precisei dentro do laboratório. Foram uma constante motivação
pela alegria, pelo companheirismo, pela disponibilidade e pelo gosto que
demonstravam diariamente em trabalhar numa área tão difícil como a da
investigação. Tornaram-se bons amigos.
3
Agradeço à Doutora Célia Silveira por todo o conhecimento a nível científico
na área da proteómica transmitido e pelo esclarecimento das variadíssimas dúvidas
que me surgiram durante o trabalho.
Gostaria de agradecer em especial à Mestre Joana Sousa por toda a orientação
ao nível de bancada na área da proteómica, foi a pessoa a quem recorri várias vezes e
que sempre se mostrou disponível para me ajudar em todas as questões. Agradeço o
apoio, o companheirismo e a compreensão que sempre demonstrou. Tornou-se uma
boa amiga.
Aos colegas de laboratório e de gabinete: Luís Fonseca, Raquel Amador,
Francisco Oliveira e Tiago Monteiro pela sua disponibilidade em ajudar-me sempre
que precisei e pelas questões debatidas sobre os projectos que alargaram o meu
conhecimento e ajudaram-me a compreender melhor o meu próprio trabalho.
Aos restantes membros do grupo BIOIN/BIOPROT por todo o apoio técnico e
científico oferecido.
Aos meus amigos pelo seu apoio, pelo seu afecto e pela sua verdadeira
amizade. Estiveram sempre presentes nas alturas mais difíceis por que passei ao
longo deste tempo. À Lucy Calisto da Silva, que me conhece melhor do que
ninguém, pelo seu afectuoso “Loquitas” e por ser uma grande e carinhosa amiga, a
minha cúmplice. À Ana Carina Julião pela preocupação, pela atenção e pelo carinho
que sempre demonstrou e pelo alento que me deu a sua constante presença. Ao
Miguel Marreiro, pelos raros mas sábios conselhos e por ser aquela figura serena e
silenciosa que me reconfortava sempre que desabafava os meu problemas. Aos bons
momentos que passámos juntos. Muitos estarão, ainda, por vir!
Ao M. por tudo o que passámos juntos.
Aos meus queridos pais. Ao seu amor, à sua amizade, ao seu carinho. Por
serem o meu porto de abrigo, os meus pilares. Pela educação que me deram, pelos
valores que me transmitiram e pela oportunidade de ter uma formação superior,
apesar de todas as dificuldades por que passaram. Pelo seu apoio durante toda a
minha vida. Acreditaram sempre em mim.
Ao meu falecido avó que me deu a oportunidade de continuar os meus estudos
e que sem ele eu não poderia ter empreendido tamanho desafio. Deixou muitas
saudades.
4
Resumo
Durante fermentações vínicas efectuadas com culturas mistas, a levedura
Saccharomyces cerevisiae liberta péptidos antimicrobianos, que derivam da enzima
gliceraldeído 3-fosfato desidrogenase (GAPDH) e provocam a morte prematura de
leveduras não-Saccharomyces. Considerando o potencial destes péptidos
antimicrobianos para serem usados como conservantes naturais do vinho, o primeiro
objectivo deste trabalho consistiu na sua produção e purificação a uma escala
preparativa, de forma a poderem ser aplicados em fermentações de adega.
Primeiramente, produziram-se 3 L de sobrenadantes de fermentações efectuadas com
S. cerevisiae que, em seguida, foram sujeitos a uma cromatografia de troca iónica
utilizando um coluna preparativa DEAE-Sephadex. Foi obtida uma fracção bioactiva
que exibia um perfil cromatográfico semelhante ao exibido pelos péptidos
antimicrobianos previamente identificados. Embora tenha sido possível purificar os
referidos péptidos com a coluna cromatográfica preparativa, os resultados deste
trabalho mostraram que o sistema cromatográfico utilizado não foi suficientemente
eficiente para isolar os péptidos de interesse num único passo. Assim propõe-se que
de futuro se utilize um passo adicional de cromatografia de exclusão molecular que
permita isolar a fração péptica (proteínas <10 kDa) antes da utilização da coluna de
troca iónica.
Vários estudos têm demonstrado que a morte prematura de leveduras não-
Saccharomyces durante fermentações vínicas é induzida por S. cerevisiae através de
diferentes mecanismos: contacto célula-a-célula e secreção de péptidos bioactivos.
Adicionalmente, um trabalho ainda não publicado mostrou que células de S.
cerevisiae crescidas durante 48 h são capazes de induzir a morte de Hanseniaspora
guilliermondii por contacto célula-a-célula, enquanto células crescidas durante 12 h
não apresentaram o mesmo efeito. Tendo em consideração estes dados e sabendo que
a GAPDH é uma proteína da parede celular da S. cerevisiae, formulou-se a hipótese
destes péptidos bioactivos estarem presentes na parede celular de células crescidas
durante 48 h e desta forma induzirem a morte de não-Saccharomyces por contacto
célula-a-célula. Assim, o segundo objectivo deste trabalho consistiu na análise das
proteínas de membrana de células de S. cerevisiae crescida durante 12 h e 48 h,
respetivamente. A análise das proteínas de membrana por eletroforese bidimensional
em géis de poliacrilamida revelou em ambos os proteomas a presença de dois spots,
5
exibindo pesos moleculares e pontos isoeléctricos muito semelhantes ao dos péptidos
bioactivos previamente identificados. Para além disso, no proteoma das células
crescidas durante 48 h os referidos spots mostraram estar sobre-expressos. Os
referidos spots foram analisados por espectrometria de massa, o que confirmou a
presença de péptidos derivados do GAPDH. Assim, este trabalho forneceu evidência
experimental de que a morte de leveduras não-Saccharomyces por contacto célula-a-
célula com S. cerevisiae pode resultar da presença dos péptidos antimicrobianos
derivados do GAPDH. Porém, para confirmar definitivamente esta hipótese serão
necessários ainda estudos futuros.
Palavras-chave: péptidos antimicrobianos; cromatografia preparativa; proteoma da
membrana celular; morte celular
6
Abstract
Saccharomyces cerevisiae secretes antimicrobial peptides (AMPs) during mixed
culture fermentations that are derived from the glyceraldehyde 3-phosphate
dehydrogenase (GAPDH) enzyme and induce the early death of non-Saccharomyces
yeasts. Considering the potential of AMPs to be used as natural preservatives in
wine, the first aim of the present work was to produce and purify them in a
preparative scale so that they could be applied in winery fermentations. Firstly, we
produced 3 L of S. cerevisiae fermentation supernatants and subjected those to ion-
exchange chromatography using a preparative DEAE-Sephadex column. One
bioactive fraction, exhibiting a chromatographic profile similar to that exhibited by
the previously found AMPs, was obtained. However, our work showed that the
chromatographic system used was not fully efficient to purify the AMPs in a single
step, requiring an additional size-exclusion chromatographic step.
Several studies have shown that early death of non-Saccharomyces yeasts during
wine fermentations is induced by S. cerevisiae through cell-cell contact and secretion
of AMPs. Moreover, unpublished work showed that S. cerevisiae cells pre-grown for
48 h are able to induce death of Hanseniaspora guilliermondii by cell-cell contact,
while 12 h-grown cells are not. Considering these findings and knowing that
GAPDH is a cell wall-associated protein in S. cerevisiae, we hypothesized that these
AMPs could be present in the membranes of S. cerevisiae and in this way induce
death of non-Saccharomyces by cell-cell contact. The second aim of our work was to
analyze membrane proteins of S. cerevisiae cells grown for 12 h and 48 h, using two
dimensional polyacrylamide gel electrophoresis. Proteomic analysis revealed the
presence of two spots of molecular weight and isoelectric point similar to the
previously found AMPs, which were differentially expressed in the two growth
stages. The spots were analysed by mass spectrometry, confirming the presence of
GAPDH-derived peptides. Thus, our work raised evidence that death of non-
Saccharomyces yeasts by cell-cell contact might be due to the presence of GAPDH-
derived AMPs in the membranes of S. cerevisiae cells. However, to definitively
confirm this hypothesis further work is required.
Keywords: antimicrobial peptides; preparative chromatography; proteome of cell
membrane; cell death
7
Table of contents
Agradecimentos ........................................................................................................... 2
Resumo ........................................................................................................................ 4
Abstract ........................................................................................................................ 6
Table of contents .......................................................................................................... 7
Figure Index ................................................................................................................. 9
Table Index ................................................................................................................ 11
Abbreviations ............................................................................................................. 12
1 Introduction ........................................................................................................ 14
1.1 Winemaking process and alcoholic fermentation ....................................... 14
1.1.1 Microorganisms associated with winemaking ..................................... 15
1.1.2 Yeast population dynamics during wine fermentations ....................... 16
1.1.3 Lactic acid bacteria and the malolactic fermentation .......................... 18
1.1.4 Factors underlying dominance of Saccharomyces cerevisiae ............. 19
1.2 Antimicrobial peptides: their nature, function and mode of action ............ 22
1.2.1 Purification methods of AMPs ............................................................ 23
1.2.2 Characterization of AMPs ................................................................... 27
1.3 Proteomic analysis of Saccharomyces cerevisiae during wine fermentations
28
1.3.1 2D-PAGE ............................................................................................. 28
1.3.2 Saccharomyces cerevisiae proteome and surfome analysis ................ 29
2 Materials and methods ........................................................................................ 36
2.1 Microorganisms........................................................................................... 36
2.2 Culture media and inocula .......................................................................... 36
2.3 Purification of antimicrobial peptides (AMPs) secreted by S. cerevisiae
during alcoholic fermentation ................................................................................ 37
2.3.1 Production of alcoholic fermentations supernatants ............................ 37
2.3.2 Purification of the AMPs from the fermentation supernatants using a
preparative anion-exchange column ................................................................... 38
2.3.3 Antimicrobial activity of the protein fractions obtained in the
preparative anion-exchange DEAE-Sephadex column ...................................... 39
2.3.4 Analysis of the bioactive fractions obtained in the preparative DEAE-
Sephadex column by gel filtration and ion-exchange chromatography ............. 40
8
2.4 Proteomic analysis of the cell wall-associated proteins (surfome) of S.
cerevisiae cells during alcoholic fermentation ....................................................... 40
2.4.1 Extraction of S. cerevisiae cell-wall associated proteins ..................... 40
2.4.2 Two dimensional polyacrylamide gel electrophoresis ......................... 42
3 Results and discussion ........................................................................................ 44
3.1 Purification of antimicrobial peptides from wine fermentation supernatants
44
3.1.1 Production of supernatants from alcoholic fermentations ................... 44
3.1.2 Purification of the AMPs from the fermentation supernatants using a
preparative anion-exchange column ................................................................... 46
3.1.3 Antimicrobial activity of the protein fractions obtained in the
preparative anion-exchange DEAE-Sephadex column ...................................... 49
3.1.4 Analysis of the bioactive fractions obtained in the preparative DEAE-
Sephadex column by gel filtration and ion-exchange chromatography ............. 52
3.2 Proteomic analysis of membrane-proteins of S. cerevisiae cells grown for
12 and 48 h ............................................................................................................. 55
4 Final remarks and future work ........................................................................... 63
5 Bibliography ....................................................................................................... 66
Appendix 1 – Relative volumes of intensity of spots ................................................ 75
Appendix 2 – Statistical analysis ............................................................................... 82
Appendix 3 – Relative molecular masses of the spots ............................................... 83
Appendix 4 – Protocol optimization .......................................................................... 85

9
Figure Index
Figure 1.1 – The main steps of wine production (Pretorius, 2000)………………...15
Figure 3.1 - Viable cells of S. cerevisiae (a) and sugars consumption (blue filled
diamonds – glucose; red filled squares-fructose) and ethanol production (green filled
triangles) (b) during alcoholic fermentation. Data presented are mean values of three
independent experiments……………………………………………………………45
Figure 3.2 - Absorbance spectra (UV-visible) of the supernatant protein fractions FI,
FII, FIII, FIV and FV collected from the DEAE-Sephadex ion-exchange
chromatographic column……………………………………………………………47
Figure 3.3 - Chromatogram of the protein fractions collected from the DEAE-
Sephadex chromatographic column. Sample: 500 ml of alcoholic fermentation
supernatant (diluted 1:2; pH=8.0).Gradient elution of 2 mM-2 M ammonium acetate.
Absorbance at 280 nm………………………………………………………………48
Figure 3.4 - Optical density of H. guilliermondii cultures in the antimicrobial tests
performed using fractions FS (red filled squares), FI (green filled triangles), FII
(purple filled circles), F85 (yellow filled dots) and control (blue filled diamonds) in
YEPD medium at pH 3.5. Absorbance measurements ate 590 nm. Data presented are
mean values of three independent assays....................................................................51
Figure 3.5 - Viable cell profiles of H. guilliermondii during the antimicrobial tests
performed with fractions FS (red, filled squares), FI (green, filled triangles), FII
(purple, crosses) and control (blue, filled diamonds) in YEPD medium at pH 3.5....51
Figure 3.6 - Chromatographic profiles of FS (red), FI (green) and 2-10 kDa fractions
(blue) fractionated by HPLC gel filtration using a Superdex Peptide column. Elution
of the fractions with 0.1 M ammonium acetate at a flow rate of 0.7 ml/min.
Absorbance measured at 280 nm...............................................................................52
Figure 3.7 - Chromatographic ion-exchange (Q-Resource column) profiles of the 8.0
kDa fractions (F8) obtained from gel filtration of the three bioactive fractions: F8
[FS] (red); F8 [FI] (green) and F8 [2-10 kDa] (blue). Elution of the fractions using a
gradient of ammonium acetate (ranging from 5–500 mM) at a flow rate of 1 ml/min.
Absorbance measured at 280 nm................................................................................53
Figure 3.8 - 2D-PAGE map of S. cerevisiae membrane-associated proteins extracted
from cells grown for 12 h (a, b are replicates). 35 µg of protein sample. IPG strip 4-7
pH gradient, 7 cm. 4-12% Bis-Tris gel. Gels were silver stained. 1x MES running
buffer. M – molecular weight marker (kDa). + acidic end; - basic end.....................56
Figure 3.9 - 2D-PAGE map of S. cerevisiae membrane-associated proteins extracted
from cells grown for 48 h (a, b are replicates; c is a replicate with addition of
GAPDH and d is a replicate with addition of GAPDH and GAPDH-derived AMPs.
70 µg of protein sample. IPG strip 4-7 pH gradient, 7 cm. 4-12% Bis-Tris gel. The
10
gels were silver stained. 1x MES running buffer. M – molecular weight marker
(kDa). + acidic end; - basic end……………………………………………………..56
Figure 3.10 - Scatter plots of 2DEgels……………………………………………...58
Figure 3.11 a, b – 2DE gels of S. cerevisiae membrane-associated proteins extracted
from cells grown for 12 h and at 48 h, respectively. Spots 1- identified as GAPDH
and spots 2, 3 identified by MALDI-TOF/TOF as GAPDH-derived AMPs………..59
Figure 3.12 - 2D-PAGE map of S. cerevisiae membrane-associated proteins
extracted from cells grown for 12 h. IPG strip 4-7 pH gradient, 7 cm. Silver stained
4-12% Bis-Tris gel a) without addition of GAPDH; b) with GAPDH and c) with
GAPDH and GAPDH as molecular marker. M – molecular weight marker………..60
Figure A.1 Spot 1 - GAPDH is not in the statistical analysis; spot 2 is not
overexpressed; spot 3 is overexpressed……………………………………………..82
Figure A.2 Relative molecular masses of spots 1, 2, 3 in 2DE gel of membrane
proteins extracted from cells at 12 h of growth. Replicate a)……………………….83
Figure A.3 Relative molecular masses of spots 1, 2, 3 in 2DE gel of membrane
proteins extracted from cells at 12 h of growth. Replicate b)……………………….83
Figure A.4 Relative molecular masses of spots 1, 2, 3 in 2DE gel of membrane
proteins extracted from cells at 48h of growth. Replicate a)………………………..84
Figure A.5 Relative molecular masses of spots 1, 2, 3 in 2DE gel of membrane
proteins extracted from cells at 48h of growth. Replicate b)………………………..84
11
Table Index
Table 1 Silver Staining Protocol 43
Table 2 Statistical analysis of the S. cerevisiae membrane-associated proteins
extracted from cells grown for 12 h and 48 h, respectively (these are mean values of
2 replicates of cells grown for 12 h and 4 replicates of cells grown for 48 h). 58
Table 3 Results from mass spectrometry analysis. Method used MALDI-TOF/TOF.
Protein score is -10*Log(P), where P is the probability that the observed match is a
random event. Protein scores greater than 52 are significant (p<0.05). Protein scores
are derived from ions scores as a non-probabilistic basis for ranking protein hits. 61
Table A.1 Relative volumes of the spots, means of relative volumes and 48/12h ratio
75
Table A.2 Fold and p-value 82
Table A.3 ANOVA values and spots overexpressed 82
Table A.4 ANOVA values and spots underexpressed 82
12
Abbreviations
2D-PAGE - two dimensional polyacrylamide gel electrophoresis
2DE - two dimensional electrophoresis
AcAm - ammonium acetate
AMPs - antimicrobial peptides
AAMPs - anionic antimicrobial peptides
Cell/ml - cell per milliliter
CFU/ml - colony-forming unit per milliliter
CFU/g - colony-forming unit per gram
CHAPS - 3-[(3-cholamidopropyl)dimethylammonio]-1-propanesulfonate
DEAE - diethylaminoethyl
DTT - Dithiothreitol
EDTA - Ethylenediamine tetraacetic acid
ESI - electrospray ionization g/l - grams per liter
GAPDH - glyceraldehyde-3-phosphate dehydrogenase enzyme
GF - gel filtration or size exclusion chromatography
IEC - ion-exchange chromatography
IEF - isoelectric focusing
IPG - immobilized pH gradient
kDa - kilo Daltons
LAB - lactic acid bacteria
MALDI - matrix assisted laser desorption/ionization
MLF - malolactic fermentation
MS - mass spectrometry
MW - molecular weight
nm - nanometer
NMR - nuclear magnetic resonance
rpm - revolutions per minute
Phe - phenylalanine
pI - isoelectric point
RP-HPLC - reversed-phase high-performance liquid chromatography
SDS - sodium dodecyl sulfate
SGJ - synthetic Grape Juice
13
TCA - trichloroacetic
tdh3p - glyceraldehyde-3-phosphate dehydrogenase protein
Trp - tryptophan
TOF - time of flight
Tyr - tyrosine
YPD - yeast protein database
YEPD - yeast extract peptone dextrose
14
1 Introduction
1.1 Winemaking process and alcoholic fermentation
Winemaking process relies in some basic principles, mainly in the
transformation of grape sugars into ethanol and carbon dioxide -alcoholic
fermentation- by the yeasts belonging to the natural microflora of grape musts. After
alcoholic fermentation, an additional fermentation process –malolactic fermentation–
may take place in both red and white wines, which occurs by the intervention of
lactic acid bacteria.
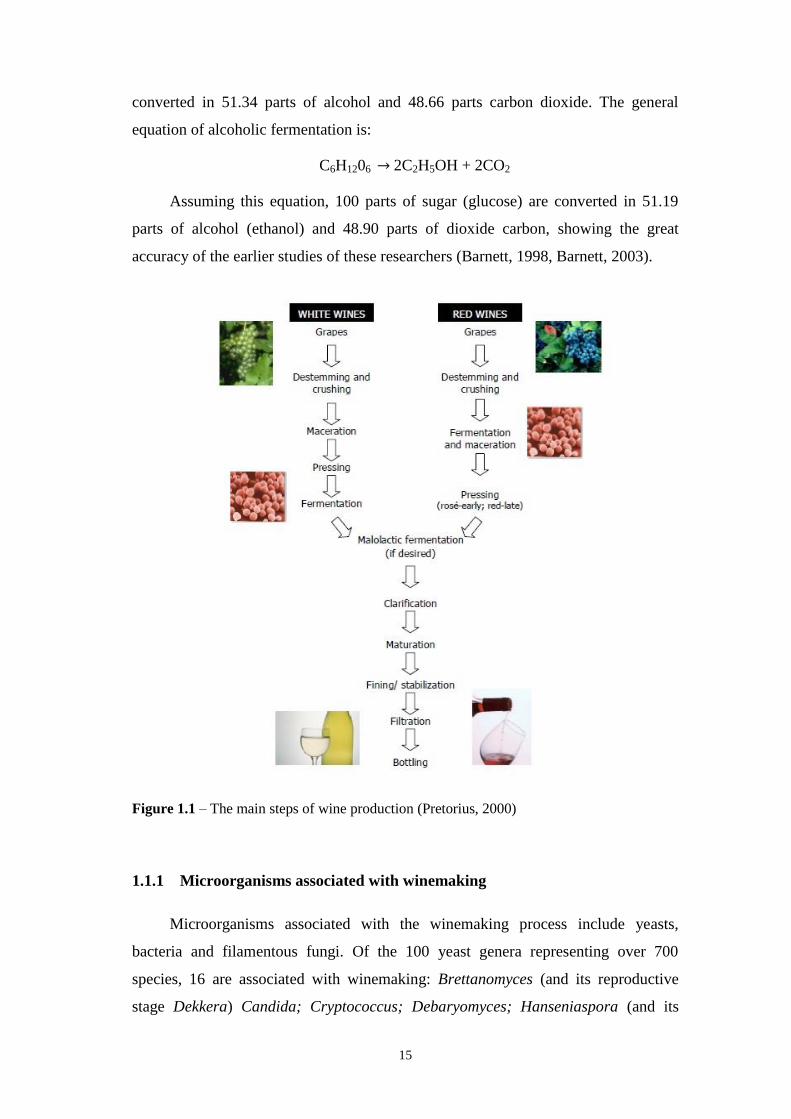
Depending on the process used, there are three types of wines: red, rosé and
white wine. Following harvesting, grapes are destemmed and crushed and then the
process diverges for white and red wines: white wine undergoes fermentation in the
absence of grape skins and lees; while in red wine fermentation follows maceration
and occurs in the presence of grape skins and lees. Since the red pigments of the red
grape berries, the anthocyanins are located in the skin of grape berries, that
difference on the winemaking process introduces a major distinction in the
composition and taste of white and red wines. After vinification, fermented grape
juice undergoes through several final operations: clarification, maceration, fining or
stabilization, filtration and finally bottling (Pretorius, 2000, Bisson, 2004). The main
steps of the production of red and white wines are represented in Fig. 1.1.
Wine is the result of the action of a diversity of microbiological interactions
and, consequently, of a number of biochemical reactions, being the alcoholic
fermentation the major and the most important biotransformation taking place during
the process (Lambrechts and Pretorius, 2000, Fleet, 2003, Romano, 2003).
Yeasts have the ability of conducting alcoholic fermentation by fermenting
grape sugars to ethanol and carbon dioxide in order to obtain the energy and
biosynthetical material required for growth. This biotransformation was first studied
and described by the well-known chemist Antoine Lavoisier in 1789. Lavoisier
discovered that 100 parts by weight of sugar were converted to 60.17 parts of
alcohol, 36.81 parts of carbon dioxide and 2.61 parts of acetic acid, being the first
describing the chemical equation as “grape must = carbonic acid + alcohol”. In 1819,
Joseph Gay-Lussac revised Lavoisier’s work, estimating that 100 parts of sugar were
15
converted in 51.34 parts of alcohol and 48.66 parts carbon dioxide. The general
equation of alcoholic fermentation is:
C6H1206 → 2C2H5OH + 2CO2
Assuming this equation, 100 parts of sugar (glucose) are converted in 51.19
parts of alcohol (ethanol) and 48.90 parts of dioxide carbon, showing the great
accuracy of the earlier studies of these researchers (Barnett, 1998, Barnett, 2003).
Figure 1.1 – The main steps of wine production (Pretorius, 2000)
1.1.1 Microorganisms associated with winemaking
Microorganisms associated with the winemaking process include yeasts,
bacteria and filamentous fungi. Of the 100 yeast genera representing over 700
species, 16 are associated with winemaking: Brettanomyces (and its reproductive
stage Dekkera) Candida; Cryptococcus; Debaryomyces; Hanseniaspora (and its
16
reproductive stage Kloeckera); Kluyveromyces; Metschnikowia; Pichia;
Rhodotorula; Saccharomyces; Saccharomycides; Schizosaccharomyces;
Torulaspora and Zygosaccharomyces (Heard and Fleet, 1985, Pretorius, 2000,
Lambrechts and Pretorius, 2000, Esteves-Zarzoso et al., 1998). The predominant
species in the grape berries are apiculated yeasts, such as Hanseniaspora uvarum and
its anamorphic form Kloeckera apiculata, and oxidative ones, such as Candida,
Pichia, Rhodotorula and Kluyveromyces (Fleet, 2003). Contrary to popular belief,
fermentative species of Saccharomyces (e.g. S. cerevisiae) occur at extremely low
numbers on healthy, undamaged grapes and are rarely isolated from intact berries
and vineyard soils (Frezier and Dubourdieu, 1992; Martini et al., 1996). In fact, the
origin of S. cerevisiae is quite controversial. While some researchers believe that
damaged grapes are an important source of S. cerevisiae (Mortimer and Polsinelli,
1999), others point to a direct association with artificial, man-made environments
such as wineries and fermentation plants (Vaughan-Martini and Martini, 1995;
Martini et al., 1996; Deak, 1998; Sabate et al., 2002).
1.1.2 Yeast population dynamics during wine fermentations
Yeast population on the surface of immature grape berries is low (ca 10-103
CFU/g), increasing to about 104-10
6 CFU/g as grapes mature to harvest. Apiculate
yeasts of the genus Hanseniaspora are predominant on the surface of grape berries
and in lower numbers appear other yeast genera such as Candida, Brettanomyces,
Cryptococcus, Kluyveromyces; Metschnikowia and Pichia are also present.
Fermentative species of Saccharomyces (e.g. S. cerevisiae) are frequently not
isolated from intact grape berries being generally found at densities of ca 10-102
CFU/g (Pretorius, 2000, Fleet, 2003).
The wine fermentation process may occur spontaneously, being conducted by
the yeast belonging to the natural microflora of grape musts or it might start with the
inoculation of a commercial strain. Spontaneous vinifications (without inoculation)
are the result of the combined action of several yeast species, which grow more or
less in succession throughout the fermentation process (Lambrechts and Pretorius,
2000, Esteves-Zarzoso et al., 1998). In the early stages, wine fermentations are
conducted by the low fermentative yeasts such as Hanseniaspora, Candida and
Metschnikowia, reaching a density of about 106-10
7 CFU/ml. At this stage, other
17
yeasts such as Kluyveromyces and Pichia and wine spoilage yeasts Brettanomyces
and Zygosaccharomyces can also grow and ferment sugars. At mid-fermentation
stages (with 3-4% of ethanol produced), non-Saccharomyces species begin to die-off
giving way to the strongly fermentative S. cerevisiae strains which become
predominant (107-10
8 CFU/ml) and complete the fermentation process (Pretorius,
2000, Fleet, 2003, Bisson, 2004).
Saccharomyces cerevisiae
S. cerevisiae is the most important and well-known yeast species due to its
worldwide application in the production of wine, beer and bread. This species, also
known as the “wine yeast”, is the first choice in the formulation of yeast starters for
winemaking due to its high fermentation capacity and high tolerance to the harsh
environmental conditions of this process, i.e.: high levels of ethanol and other
organic compounds, low pH values, low oxygen and scarce nutrient availability.
Moreover, S. cerevisiae is the best physiologically and genetically characterized
eukaryotic organism and a great biological model for multidisciplinary studies.
S. cerevisiae are dimorphic ascomycetous fungi that can occur in two forms: a
unicellular oval-elliptic form and, under conditions of nitrogen deficiency, in a
multicellular filamentous form, named pseudohyphae. S. cerevisiae can grow as
diploid cells (where division is carried out through budding or fission) or as haploid
cells forming ascopores (under starvation conditions) (Gimeno et al., 1992,
Kurtzman and Piškur, 2005, Bergman, 2001, Bisson, 2004).
Fungal cell walls are rigid structures required for maintaining cellular shape
and integrity by protecting cells against osmotic changes in the environment. They
also act as selectively permeable membranes and play a role in processes such as
flocculation, cell adhesion and pathogenicity. The cell wall exhibits a dynamic
nature, undergoing profound changes during budding, apical extension of hypha,
mating and dimorphic transition. (Klis, 2006; Pardo et al., 1999; Braconi et al.,
2011).
S. cerevisiae has approximately 6000 functional genes, most of them encoding
proteins of the plasmatic membrane (Goffeau et al., 1996). This membrane consists
of a mixture of proteins and lipids which form an impermeable barrier to hydrophilic
molecules. The major components of the cell wall are β-glucans, chitin (both are
18
responsible for cell wall strength) and mannoproteins that act as structural proteins or
as enzymes involved in biogenesis. There are a variety of other specialized proteins
that play a role in processes of solute transport, signal transduction, cytoskeleton
anchoring and in glycolytic pathways such as the enzyme glyceraldehyde-3-
phosphate (GAPDH; tdh3p) (Aliverdieva et al., 2004, Bisson, 2004; Delom et al.,
2006).
1.1.3 Lactic acid bacteria and the malolactic fermentation
Lactic acid bacteria (LAB) are Gram-positive, non-sporing and non-respiring
bacteria that are able to transform malic acid into lactic acid – malolactic
fermentation. LAB isolated from wine include species of the genera Oenococcus,
Lactobacillus and Pediococcus. Oenococcus oeni is the preferred species used to
conduct malolactic fermentation due to its tolerance to the extreme harsh conditions
of the wine environment and the flavour profile they produce (Lerm, 2010).
Malolactic fermentation (MLF) is a secondary wine fermentation carried out by
LAB that consists in an enzymatic-mediated reaction in which L-malic acid is
decarboxylated into L-lactic acid and carbon dioxide. It promotes a desirable
reduction of wine acidity an improvement in the microbial stability and in the
organoleptic quality of the wine. MLF might occur spontaneously, concomitant with,
or at the end of the alcoholic fermentation and its duration depends on the amount of
malic acid in the medium. After the completion of MLF, the remaining LAB
(Lactobacillus and Pediococcus) are still able to metabolize residual sugar, which
could result in wine spoilage.
Since LAB are very susceptible to various nutrient limitations, too acidic pH
values, low temperatures, high levels of ethanol and sulfur dioxide, MLF are difficult
to control. Thus nowadays, inoculation of wine fermentations with commercial
malolactic starter cultures (Oenococcus oeni) is becoming a common oenological
practice in wineries to better control MLF (Liu, 2002, Alexandre et al., 2003,
Comitini et al., 2005, Osborne and Edwards, 2007, Lerm, 2010, Izquierdo Cañas et
al., 2012).
19
1.1.4 Factors underlying dominance of Saccharomyces cerevisiae
As mentioned before, non-Saccharomyces yeasts grow during the early stages
of wine fermentation but then begin to die-off, leaving way to S. cerevisiae strains to
complete the fermentation process (Heard and Fleet, 1985). The ability of S.
cerevisiae to displace other microbial species during wine fermentation has been
always attributed to its higher fermentative power and capacity to withstand the
increasingly adverse conditions established in the medium as the fermentation
progresses, i.e.: high levels of ethanol and organic acids, low pH values, scarce
oxygen availability and depletion of certain nutrients (Bisson 1999; Bauer and
Pretorius 2000; Hansen et al., 2001).
The increasing levels of ethanol are known to inhibit cell growth. Ethanol
modifies plasma membrane fluidity, stimulates the activity of plasma membrane H+-
ATPase and inhibits glucose transport (Ansanay-Galeote et al., 2001). Ethanol also
triggers a stress response in S. cerevisiae cells consisting in the formation of heat
shock proteins (Piper et al,. 1994).
The early death of non-Saccharomyces yeasts such as Candida,
Hanseniaspora, Kluyveromyces, Metschnikowia, Pichia and Torulaspora has always
been attributed to their incapacity to tolerate ethanol concentrations higher than 5-7%
(v/v) (Fleet and Heard, 1993; Fleet, 2003). However, subsequent studies showed that
some non-Saccharomyces species such as Candida zemplinina and Kluyveromyces
thermotolerans exhibit similar ethanol tolerance to S. cerevisiae strains, especially
under fermentations performed at temperatures lower than 20 ºC (Gao and Fleet,
1988). Other work on ethanol tolerance showed that the survival of H. guilliermondii
at 25% (v/v) ethanol was strongly influenced by the conditions of cultivation prior to
the ethanol challenge and a small increase in survival was observed for H. uvarum
and T. delbrueckii in the cultures grown in aerobiosis (Pina et al., 2004).
It is generally recognized that some S. cerevisiae strains are more ethanol-
tolerant than others: cells of a given strain grown in the presence of ethanol are more
ethanol-tolerant than the same cells grown in the absence of ethanol. The high
ethanol tolerance of S. cerevisiae is based in the so-called survival factors
(unsaturated long chain fatty acids and sterols) that play an essential role in the
adaptive response of S. cerevisiae to ethanol: wine yeast strains usually contain
higher levels of survival factors than non-wine Saccharomyces strains and their
20
physiological response to ethanol challenge is also greater than non-wine strains
(Loureiro and van Uden, 1986; Lloyd et al., 1991; Ansanay-Galeote et al., 2001
Mishra and Kaur, 1991; Sajbidor, 1997).
During wine fermentations, oxygen and assimilable nitrogen can be rapidly
depleted due to both semi-anaerobic growth conditions and poor initial nitrogen
contents of grape musts. In the presence of oxygen, the increasing survival rate of
yeasts is related to the enrichment of unsaturated long chain fatty acids and
ergosterol in the phospholipid membrane (Alexandre and Charpentier, 1998; Chi and
Arneborg, 1999).
Throughout the different stages of wine fermentation, several types of nutrients
may become limited or exhausted which results in a decreasing in both the growth
rate and the fermentation efficiency or even in a complete arrest of fermentation.
Nutrient limitation and starvation are stress inducing conditions and result in a
number of stress-associated responses (Bauer and Pretorius 2000). A study carried
out with three strains of H. uvarum, H. guilliermondii and C. stellata (Albergaria et
al., 2003) showed that the limited fermentation capacity exhibited by those yeast
strains was, partially, due to nutritional limitations.
The killer phenomenon consists in the production of specific extracellular
glycoproteins by certain killer yeast strains that are able to kill other sensitive yeast
strains. The killer strains themselves are immune to their own toxin but remain
susceptible to the toxins secreted by other killer yeasts (Schmitt and Breinig, 2002).
Since first discovered in S. cerevisiae, killer strains have been isolated from several
yeast genera, including Candida, Cryptococcus, Hanseniaspora, Kluyveromyces,
Pichia and Torulopsis (Chen et al., 2000). S. cerevisiae produces three types of killer
toxins K1, K2 and K28, but only K2 and K28 are functional during wine
fermentations due to the low pH of grape must and wine. However, the killer toxins
produced by S. cerevisiae strains have shown to be active only against strains of the
same species. Thus, they cannot explain the antagonistic effect exerted by S.
cerevisiae against non-Saccharomyces yeasts during wine fermentations.
Beside the above-mentioned factors usually reported to explain the yeast
population dynamics of wine fermentations, more recent studies have shown that
there are other causes for the early disappearance of non-Saccharomyces yeasts,
namely: growth arrest mediated by a cell–cell contact mechanism (Nissen and
Arneborg 2003; Nissen et al., 2003; Arneborg et al., 2005) and death mediated by
21
killer-like toxins (Chen et al., 2000; Comitini et al., 2005; Pérez-Nevado et al., 2006;
Osborne and Edwards 2007; Albergaria et al., 2010).
Death mediated by cell–cell contact is another mechanism that has been
reported to explain the early death of some non-Saccharomyces during wine
fermentations. In a pioneer work, Nissen and Arneborg (2003) demonstrated that the
early death of K. thermotolerans and T. delbrueckii in mixed culture fermentations
performed with S. cerevisiae was not due to ethanol or any other toxic compound but
rather to a cell-cell contact-mediated inhibition. More recent studies (Renauld et al.,
2013, Kemsawasd et al., 2015) confirmed that S. cerevisiae cells at high cell density
induce the early death of wine-related yeasts, although the exact death-inducing
mechanism remains unclear.
Other studies (Comitini et al., 2005; Pérez-Nevado et al., 2006; Osborne and
Edwards 2007; Albergaria et al., 2010) found evidences that certain S. cerevisiae
strains produce killer-like toxins that are involved in the yeast–yeast and yeast–
bacteria interactions established during wine fermentations. Pérez-Nevado et al.
(2006) conducted a study with two non-Saccharomyces wine strains (H.
guilliermondii and H. uvarum) performing enological fermentation both in single and
in mixed culture with S. cerevisiae. Results showed that after the first 3 days of
fermentation the non-Saccharomyces yeasts begun to die off in the mixed cultures,
while in the single cultures the number of viable cells of non-Saccharomyces
remained high (ranging 107–10
8 CFU/ml), regardless the increasing levels of ethanol.
Furthermore, they also showed that death of the non-Saccharomyces strains was not
induced by cell-cell contact but rather by one or more toxic compounds produced by
S. cerevisiae. Subsequent studies (Albergaria et al., 2010) revealed the proteinaceous
nature of the toxic compounds secreted by S. cerevisiae CCMI 885 and protein
analysis demonstrated that the toxic compounds corresponded to antimicrobial
peptides (<10 kDa) active against several wine-related non-Saccharomyces yeasts (
i.e. K. marxianus, K. thermotolerans, T. delbrueckii and H. guilliermondii). Later,
Branco et al. (2014) showed that S. cerevisiae CCMI 885 secretes antimicrobial
peptides (AMPs) during alcoholic fermentation that are active against a wide variety
of wine-related yeasts and bacteria (e.g. Oenococcus oeni). Mass spectrometry
analyses revealed that those AMPs correspond to fragments of the S. cerevisiae
glyceraldehyde 3-phosphate dehydrogenase (GAPDH) protein. Two main peptides
with molecular weights of 1.638 and 1.622 kDa and the following amino acid
22
residues VSWYDNEYGYSTR and ISWYDNEYGYSAR were identified. The
theoretical isoelectric point (pI) of these peptides (4.37) defines these peptides as
anionic.
The involvement of GAPDH-derived peptides in wine microbial interactions
was further sustained by results obtained in mixed cultures performed with S.
cerevisiae single mutants deleted in each of the GAPDH codifying genes (TDH1-3).
Yeast-bacteria interactions in wine fermentations were also investigated by
some authors. Comitini et al. (2005) found that certain S. cerevisiae strains produce
proteinaceous compounds active against the malolactic bacteria. Also Osborne and
Edwards (2007) found that a S. cerevisiae strain (Ruby.Ferm) secretes a peptide
active against Oenococcus oeni bacteria that affected the malolactic fermentation
process. However, neither of those AMPs were fully characterized.
1.2 Antimicrobial peptides: their nature, function and mode of action
AMPs are small biologically active molecules typically composed of fewer
than 50 amino acid residues. They are evolutionary conserved components of the
innate immune response and constitute the first line of antimicrobial defense for
organisms across the eukaryotic kingdom. AMPs show a wide range of secondary
structures such as 𝛼-helices and 𝛽-strands with one or more disulphide bridges, loop
and extended structures, which are highly essential for the broad spectrum of
antimicrobial activity they exhibit. Besides these properties, other factors such as
size, charge, hydrophobicity, amphipathic stereo geometry and peptide self-
association to the biological membrane of microbial cells are also important for their
diverse mechanisms of action. In the vast majority of cases, AMPs are cationic and
kill microorganisms through mechanisms that predominantly involve interactions
between the peptide’s positively charged residues and the anionic components of
target membrane cells. There are also a number of cationic AMPs that appear to
target internal anionic cell constituents such as DNA and RNA (Harris et al, 2009;
Cézard et al, 2011; Pushpanathan et al., 2013).
Although most AMPs are cationic in nature, anionic AMPs (AAMPs) have also
been isolated from different organisms (Zasloff, 1987; López-García et al., 2006;
Dang et al., 2006; Vera Pingitore et al., 2007; Kong et al., 2010.). AAMPs are
23
common to vertebrates and invertebrates, playing a role in their innate immune
systems, which shows the ancient nature of these peptides and their important
defense function. Structural characterization shows that AAMPs to generally range in
net charge from -1 to -7 and in length from 5 residues to approx. 70 residues. Some
AAMPs can be produced constitutively while others appear to be induced in
response to microbial infection. A number of inducible AAMPs are encrypted within
the primary structures of precursor proteins and require cleavage by proteolytic
cleavage. The AAMPs have a broad spectrum of antimicrobial activity against
bacteria, fungi, viruses, nematodes and insects. Their mechanism of action seems to
rely mainly in membrane interactions. In general, AAMPs adopt amphiphilic
conformations for membrane interaction; while some appear to interact via the use of
receptors, others appear to use metal ions to form cationic salt bridges with
negatively charged components of microbial membranes, thereby facilitating
interaction with their target organisms (Harris et al., 2009).
1.2.1 Purification methods of AMPs
Adequate purification of AMPs is necessary for their subsequent
characterization.
For purification of AMPs it is often difficult to use methods similar to those
applied in the purification of other organic compounds, mainly due to their
complexity. The methods most commonly used in peptide purification usually utilize
various principles of chromatography such as ion-exchange chromatography, gel
filtration chromatography and reverse-phase high-performance liquid
chromatography (RP-HPLC) (Andersson and Persson, 2000). Chromatography is a
technique in which solutes are resolved by their different elution rates as they pass
through a chromatographic column. The separation is governed by their partitioning
between the mobile phase and the stationary phase.
The common purification strategy consists in a sequence of procedures which
include several steps: (1) sample preparation that consists in clarification before the
first chromatographic separation step and may include extraction and/or
concentration procedures; (2) capture of target molecules- initial purification in order
to concentrate and isolate the target molecule; (3) intermediate purification - removal
24
of bulk contaminants; (4) polishing - removal of trace contaminants in order to obtain
high level of purity.
Gel filtration or size exclusion chromatography (GF)
Gel filtration (GF) chromatography separates proteins according to differences
in molecular size. The technique is highly efficient for separation of polymeric forms
of peptides and for desalting of sample solutions. GF is a non-binding method, is
independent of sample concentration and since buffer composition does not directly
affect resolution, buffer conditions can be varied to suit the sample type or the
requirements for the next purification or analysis step. Polyacrylamide matrices that
separate molecules with a molecular weight lower than 10 kDa have been most
useful in antimicrobial peptide purification. Disadvantages with gel filtration
chromatography are the low capacity and the relatively slow flow-rates that can be
applied for optimal separation on such columns (Cole and Ganz, 2000).
Ion-exchange chromatography (IEC)
Ion-exchange chromatography (IEC) technique is dependent on the ionic
interaction between the support surface and charged groups of the peptide: the
separation is based on the reversible interaction between a charged protein and an
oppositely charged chromatography matrix. Target proteins are concentrated during
binding and collected in a concentrated form. The mobile phase is typically an
aqueous buffer solution and the stationary phase into which the mixture to be
resolved is introduced is usually an inert organic matrix chemically derivatized with
ionizable functional groups that carry a displaceable oppositely charged counter-ion.
These counter-ions are in a state of equilibrium between the mobile and stationary
phases, giving rise to two possible IEC formats, namely anion- and cation-exchange.
Both cation and anion exchangers have been used with success for peptide
purifications.
The net surface charge of proteins is dependent of the surrounding pH: if the
net charge of a protein is above its pI it will bind to a positively charged anion
exchanger; if it is below its pI the protein will bind to a negatively charged cation
exchanger. Proteins bind as they are loaded onto a column at low ionic strength. The
conditions are then altered so that bound substances are eluted differentially. Elution
is usually performed by changing pH or altering the ionic strength. Changing the
25
mobile phase pH alters the net charge of the bound protein and its binding capacity to
the matrix. Increasing salt concentration in the mobile phase alters affinity resulting
in the displacement of the bound ionic species.
Exchangeable matrix counter-ions may include protons (H+), hydroxide groups
(OH-), single charged monoatomic ions (Na
+, K
+, Cl
-), double charged monoatomic
ions (Ca2+
, Mg2+
), and polyatomic inorganic ions (SO42-
, PO43-
), as well as organic
bases (NR2H+) and acids (COO
-). A strong ion exchange medium has the same
charge density on its surface over a broad pH range, whereas the charge density of a
weak ion exchanger changes with pH. The selectivity and the capacity of a weak ion
exchanger are different at different pH values (Cummins et al., 2011; Andersson and
Persson).
Reversed-phase high-performance liquid chromatography (RP-HPLC)
The most powerful method for peptide purification is reversed-phase high
performance liquid chromatography (RP-HPLC) that uses hydrophobic interactions
as the main separation principle. Separation depends on the hydrophobic binding-
capacity of the solute molecule towards the mobile phase or towards the immobilized
hydrophobic ligands attached to the stationary phase. It is characterized by the use of
a stationary phase (sorbent) and an aqueous mobile phase containing an organic
solvent. The solute mixture is initially applied to the sorbent in the presence of
aqueous buffers, and the solutes are eluted by the addition of organic solvent to the
mobile phase. Elution is usually performed by an increasing organic solvent
concentration, in order to increase molecular hydrophobicity. Acetonitrile, methanol,
ethanol and propanol are common used organic solvents. RP-HPLC exhibits an
excellent resolution that can be achieved under a wide range of chromatographic
conditions for very closely related molecules as well as structurally quite distinct
molecules; its chromatographic selectivity can be manipulated through changes in
mobile phase characteristics; gives the generally high recoveries, shows high
productivity and reproducibility. However, RP-HPLC can cause the irreversible
denaturation of protein samples resulting in the loss of protein activity (Marie-Isabel
Aguilar, 2004).
In the purification of AMPs from biological samples such chromatographic
techniques are commonly used to isolate the peptides of interest to further
26
characterization. In order to isolate and characterize a class of AMPs, magainins
from Xenopus skin, Zasloff (1987) performed a series of purification steps that
included: a sample clarification process by centrifugation to prepare sample for an
initial ion-exchange chromatography in a carboxymethyl-cellulose matrix
(CM52column); the fraction recovered was further concentrated and fractionated by
gel filtration (Gel P-30); finally, active fractions were purified in a Vydac C4 HPLC
column, eluted with a gradient of organic solvent acetonitrile. The two active forms
purified showed growth inhibition activity against bacteria and fungi. In a 2006 study
performed on oriental fruit fly, Bactrocera dorsalis (Hendel), one antibacterial
fraction was isolated and purified by a pre-purification step, followed by cation-
exchange chromatography, gel filtration chromatography and RP-HPLC. Results of
physical and biological analysis revealed that this AMP is heat stable and showed
strong activities against Gram-positive bacterial growth. Pingitore and colleagues
(2007) described different techniques applied to purify some bacteriocins from LAB.
Bacteriocins are natural peptides secreted by several bacteria that exert bactericidal
activity against other bacterial species. The applied techniques involved salt
precipitation followed by various combinations of ion-exchange and reverse phase
C18 solid phase extraction, absorption-desorption (AD) and RP-HPLC. The authors
emphasized the importance of knowing the characteristics of the different
bacteriocins to apply the best purification strategy possible.
The identification of a novel GAPDH-derived AMPs secreted by S. cerevisiae
during wine fermentation was achieved following two main purification steps:
fractionation by GF and then purification using a ion-exchange chromatography and
by mass spectrometry analysis. The fermentation supernatants containing the
secreted peptides were first ultrafiltered with 10 kDa membranes and then
concentrated with 2 kDa membranes. The concentrated fraction was first fractionated
by gel filtration chromatography, using a Superdex-Peptide column (10/300 GL)
coupled to a High-Performance Liquid Chromatography (HPLC) system equipped
with an UV detector. The fractions were eluted with ammonium acetate 0.1 M. All
fractions were collected, freeze-dried and screened for antimicrobial activity and an
active fraction was then further purified using a strong anion-exchange column
(QResource). Peptides were eluted at neutral pH using a gradient of ammonium
acetate of 5–500 mM. All the collected fractions showed antimicrobial activity.
Active fractions followed sequencing by liquid chromatography electrospray
27
ionization-tandem mass spectrometry (LC-ESI-MS/MS). Sequence analysis revealed
that all peptides present in each anionic fraction correspond to fragments of the S.
cerevisiae GAPDH isoenzymes, GAPDH2/3 and GAPDH1which are encoded by the
TDH2, TDH3 and TDH1 genes, respectively. This work demonstrated that these
AMPs identified are anionic (at neutral pH) and are active against several wine-
related yeasts (e.g. D. bruxellensis) and bacteria (e.g. O. oeni) (Branco et al., 2014).
1.2.2 Characterization of AMPs
Peptide characterization is the following step in the process of analyzing
AMPs. Peptide mass fingerprinting is the identification of a protein (or a peptide)
sequence after its cleavage into small fragments by tryptic digestion followed by
mass spectrometry (MS). Mass spectrometry relies on the formation of gas-phase
ions (positively or negatively charged) that can be isolated electrically (or
magnetically) based on their mass-to-charge ratio (m/z). Two main ionization
techniques, electrospray ionization (ESI) and matrix assisted laser
desorption/ionization (MALDI), are commonly used in MS (Henzel and Watanabe,
2003; Thiede et al., 2005; El-Aneed et al., 2012). Regardless of the ionization
source, the sensitivity of a mass spectrometer is related to the mass analyzer where
ion separation occurs. Both quadrupole and time of flight (TOF) mass analyzers are
commonly used and they can be configured together as QToF tandem mass
spectrometric instruments. Tandem mass spectrometry (MS/MS), as the name
indicates, is the result of performing two or more sequential separations of ions
usually coupling two or more mass analyzers (El-Aneed et al., 2012).
The structural and dynamical characterization of peptides can be performed
using a variety of standard techniques as X-ray crystallography, electron diffraction,
nuclear magnetic resonance (NMR) and circular dichroism.
28
1.3 Proteomic analysis of Saccharomyces cerevisiae during wine fermentations
Proteomic analysis aims the characterization of all proteins present within a
given biological sample. The standard methodology that has been used is the
combination of 2 procedures: protein separation by two–dimensional polyacrylamide
gel electrophoresis (2D-PAGE/ 2DE) and mass spectrometry (MS) based methods
for identification of the resolved proteins. Due to its high resolution and sensitivity,
2D-PAGE is a powerful tool for the analysis and detection of proteins from complex
biological sources with the ability to separate thousands of proteins at once.
Applications include: whole proteome analysis, post- and co-translational
modifications, which cannot be predicted from the genomic sequence; cell
differentiation, detection of biomarkers and disease markers; bacterial pathogenesis,
purity checks, microscale protein purification and product characterization (O'Farrell,
1975, Bond and Blomberg, 2006, Rabilloud et al., 2009, Sameh Magdeldin et al.,
2014).
1.3.1 2D-PAGE
In 1975, O’Farrell and Klose (1975) established a technology for the global
study of protein expression: by the two–dimensional polyacrylamide gel
electrophoresis (2DE). They applied this method to the analysis of proteins of
Escherichia coli and to complex protein mixtures of animal extracts. The method
consists of two steps of protein separation according with two independent
properties: in the first dimension (isoelectric focusing) protein molecules are
resolved according to the charge of proteins (i.e. their isoelectric point), while in the
second dimension the focused proteins are fractionated according to their molecular
weight (O'Farrell, 1975, Klose, 1975).
The principle of isoelectric focusing (IEF) is that electrophoresis is carried out
in a pH gradient, allowing each protein to migrate to its isoelectric point (pI). The
second dimension begins with the equilibration of the isoelectric-focusing gel in a
solution of sodium dodecylsulfate (SDS), which is an amphipathic detergent that
binds non-specifically to all proteins and confers a uniform negative charge, thereby
allowing proteins to be separated only by their molecular mass, under an electric
field (O'Farrell, 1975, Klose, 1975).
29
The 2D-PAGE principle has remained basically the same throughout time,
although new improves have been introduced to overcome reproducibility problems
with this methodology. Initially, the first dimension was performed in glass tubes and
the process of taking out the gels and transferring them onto the slab gel for the
second dimension was very difficult, sometimes damaging the gels. Moreover, IEF
with carrier ampholytes had reproducibility problems because ampholytes are mobile
synthetic molecules with tendency to drift towards the cathode (causing the
progressive loss of the basic portions) and distorting the gels. Later on, two main
events improved the 2D-PAGE technology such as the replacement of glass tube gels
by strip gels (i.e. easier to handle) and the introduction of immobilized pH gradient
gels (IPG) in which buffering groups are attached to the gel matrix. There was also
developments in sample preparation that helped achieving reproducibility and
decreasing variability such the different extraction buffers for specific samples and
protein precipitation to clean interfering substances and concentrate samples
(Primrose and Twyman, 2008; Rabilloud et al., 2009; Sameh Magdeldin et al.,
2014).
For protein visualization, there is a variety of staining methods such as the
Coomassie brilliant blue, silver nitrate and fluorescent stains and specific methods as
immunodetection and glycoprotein detection (Primrose and Twyman, 2008;
Rabilloud et al., 2009).
Gel image analysis is performed with 2D gel image softwares, like
ImageMaster™ 2D Platinum, which allows us to know the total number of spots in a
given gel; the corresponding pI and molecular weight (MW) and analyze different
protein expression levels between two or more gels.
1.3.2 Saccharomyces cerevisiae proteome and surfome analysis
Proteomics is recognized as one of the most important tools in numerous areas
of research, namely in the study of S. cerevisiae, since this is one of the best
physiologically and genetically characterized eukaryotic organism. Thus, proteomic
analysis allows an understanding of the global protein expression, as well as the
identification and quantitation of proteins. Besides it also gives information
regarding proteins function and localization, the biological systems in which a
protein is involved and also allows the comparison of different developing stages and
30
of the physiological responses towards changes in environmental conditions (Pham
and Wright, 2007).
Proteome
In the 1990s and early 2000s, numerous studies were conducted in order to
construct the whole proteome of S. cerevisiae, using 2DE gel-based techniques. In an
attempt to construct a gene-protein map, Boucherie et al. (1995) were able to
correlate proteins of S. cerevisiae resolved on 2DE gels with their corresponding
genes. They used the 2DE protein map of S. cerevisiae strain S288C as a reference
map and 200 polypeptides spots were detected after the experiment. The pI of the
separated proteins ranged between 4.2 and 6.8 and their relative MW between 15
kDa and 150 kDa. They reported the identification of 36 novel polypeptides on the
yeast protein map, which corresponded to the products of 26 genes. The proteins
identified concerned with four major areas of yeast cellular physiology: carbon
metabolism, heat shock proteins, amino acid biosynthesis and purine biosynthesis.
One year later, another project with the aim of linking genome-proteome, with the
same yeast strain S288C, used a combination of 2DE gels and MALDI and nano-
ESI-MS/MS to analyze the proteins. Although a substantial number of proteins were
found in the 2DE gel coordinates different from the ones expected based on their
sequence, they stated that a total of 150 gel spots were successfully analysed, greatly
enlarging the yeast 2DE gel data base. Besides, more than 32 proteins were novel
and matched to previously uncharacterized open reading frames in the yeast genome
(Shevchenko et al., 1996). In the same year, Sanchez and coworkers (1996)
performed 2DE of S. cerevisiae proteins with the intention of describing the yeast
SWISS-2D-PAGE database. Therefore, they used S. cerevisiae X2180-1A and
X2180-2B strains as 2D-PAGE reference map. The innovative aspect of that work
consisted in the use of IPGs for the IEF separation, since several yeast 2D-PAGE
databases already established by that time were based in first dimension separation
using carrier ampholyte pH gradients. They reported the identification of more than
100 polypeptides that were identified by gel comparison, amino acid composition
analysis and/or microsequencing; several of those proteins were newly mapped. The
identified spots included among others: alchohol dehydrogenase, enolases, fructose-
biphosphate aldolase, phosphoglycerate mutase, pyruvate decarboxylase isoenzyme,
heat shock proteins and glyceraldehyde 3-phosphate dehydrogenases 1,2,3 (Sanchez
31
et al., 1996). Proteome studies in S. cerevisiae conducted by Garrels and colleagues
(1997) aimed the identification and characterization of abundant proteins in order to
complete the yeast 2DE map of abundant proteins. The results obtained extended the
yeast 2DE protein map to 169 identified spots based on the yeast genome sequence
and showed that methods of spot identification based on predicted pI, predicted MW
and determination of partial amino acid composition from radiolabeled gels were
powerful enough for the identification of at least 80% of the spots representing
abundant proteins. Comparison of proteins predicted by the Yeast Protein Database
(YPD) to be detectable on 2DE gels based on calculated MW, pI and codon bias (a
predictor of abundance) with proteins identified in this study, suggested that many
glycoproteins and integral membrane proteins were missing from the 2DE gel
patterns. The authors also performed 2DE gel experiments to analyse and
characterize the yeast proteins associated with:(i) an environmental change (heat
shock), (ii) a temperature-sensitive mutation, (iii) a mutation affecting post-
translational modification (N-terminal acetylation) and (iv) a purified subcellular
fraction (the ribosomal proteins), using the 2DE gel map and the information
available in the YPD. Another work extended the yeast 2DE protein map with 92
novel protein spots, which were identified by three methods: gene overexpression,
amino acid composition and mass spectrometry. The results were recorded in the
Yeast Protein Map server (Perrot et al., 1999). In 2002, a 2DE reference map of very
alkaline yeast cell proteins was established by using IPGs up to pH 12 (IPG 6–12,
IPG 9–12 and IPG 10–12) for 2DE and by using MALDI-TOF peptide mass
fingerprinting for spot identification. 106 proteins with theoretical pI up to pH 11.15
and MW between 7.5 and 115 kDa were localized and identified. Most of the
proteins (66 spots) were identified from the IPG 6–12 gel due to the improved
resolution of narrow IPGs. In addition 37 spots were analysed using IPG 9–12 and 29
spots using the IPG 10–12. 49 of the 106 spots identified were ribosomal proteins.
The remaining 57 were eight of unknown function, 17 oxidoreductases, 7 lyases, 6
transferases, 4 hydrolases, 3 isomerases (including 2 chaperones), 3 ligases, 2 heat
shock proteins/chaperones, 3 DNA binding proteins including histones H2B and
H2A-1, 2 transcription factors, 1 protein conjugation factor and 1 transporter channel
protein (Wildgruber et al., 2002).
Several comparative proteomic analysis studies have been carried out in an
attempt to study the yeast response to different environmental conditions such as:
32
induced fermentation stress conditions in a wild-type wine strain of S. cerevisiae
(Trabalzini et al., 2003); studies in yeast growth in chemostat cultures limited by
glucose and ethanol (Kolkman et al., 2005); comparative proteomic analysis of
transition of S. cerevisiae from glucose-deficient medium to glucose-rich medium
(Giardina et al., 2012); proteome analysis of recombinant xylose-fermenting yeast
strain, comparing conditions in which glucose or xylose was the carbon source
(Salusjarvi et al., 2003); proteomic response to amino acid starvation in S. cerevisiae
(Yin et al., 2004) and several other studies on changes in the yeast proteome as a
function of the stimuli in the environment, such as cadmium, lithium, hydrogen
peroxide, sorbic acid, amongst others.
Surfome
Yeast’s cells are delimited by a membrane structure that is composed by a
cytoplasmatic membrane and a cell wall that are separated by the periplasmic space.
The rigid cell wall is an essential structure required for maintaining cellular shape
and integrity by protecting cells against osmotic changes in the environment. Cell
membranes act as filters, permitting the passage of some molecules while excluding
others. The cell membrane is not an inert structure and undergoes profound changes
as a consequence of cellular processes such as budding, apical extension of hypha,
dimorphic transitions and mating. Membranes also play an important role in cellular
processes such as flocculation, adhesion and pathogenicity (Pardo et al., 1999; Pardo
et al., 2000; Braconi et al., 2011). The cell wall of S. cerevisiae is composed by an
internal layer consisting of a flexible network of β-1,3-glucan molecules with
covalently attached β-1,6-glucan and chitin, and an external fibrillar layer of
mannoproteins, which are mannose-containing glycoproteins (Braconi et al., 2011).
Synthesis of S. cerevisiae cell wall components could take place in two steps. First,
chitin and β-1,3-glucan are synthesized by the cytoplasmatic membrane bound
enzyme complexes through a vectorial process in which the formed chains are
extruded through the cytoplasma membrane. Mannoproteins are synthesized and
secreted through the secretory pathway. Part of β-1,6-glucan synthesis may take
place in the endoplasmic reticulum or Golgi. Following this, all components will
then interact and assemble to form a functional cell wall (Pardo et al., 1999). β-1,3-
glucan and chitin are responsible for the cell wall strength while mannoproteins
determine its porosity, act as structural proteins and as enzymes involved in cell wall
33
biogenesis. The complex nature of the cell wall is emphasized by the fact that
approximately 20% of the S. cerevisiae genome is required for the biogenesis of this
structure (Braconi et al., 2011).
Cytoplasmatic membrane is composed mainly by an amphoteric bilayer of
phospholipids that form an impermeable barrier to hydrophilic molecules and within
which are enclosed proteins. Membrane proteins are highly specialized and mediate a
variety of crucial cellular functions such as sensing/signaling external environmental
conditions, transport of nutrients, endocytosis/exocytosis, cytoskeleton anchoring,
generation of membrane potential and cell wall synthesis and maintenance.
Membrane phospholipids are, in their majority, composed by
phosphatidylethanolamine, phosphatidylcholine and phosphatidylinositol
(Aliverdieva et al., 2004, Bisson, 2004; Delom et al., 2006).
Several studies have been performed in order to analyze the protein
composition of the cytoplasmatic membrane and of the cell wall using different
protein separation and identification strategies such as 2DE and mass spectrometry.
Two main works conducted by Pardo et al. (1999; 2000) analysed the proteins
secreted by regenerating protoplasts as a way to understand the cell wall biogenesis
and identify cell wall proteins. They reported the identification of several proteins
with different functions: proteins involved in cell wall construction (β-1,3-glucanosyl
transferase; GPI cell wall protein; exoglucanase); enzymes involved in glycolysis or
fermentation (alcohol dehydrogenase, enolases, fructose biphosphate aldolase,
pyruvate decarboxylase, pyruvate kinase, and glyceraldehyde-3-phosphate
dehydrogenase (TDH 1,2,3)); heat shock proteins (PIR proteins and Hsp70 family);
amongst others. Aliverdieva et al., (2004) designed a simplified method for the
isolation of cell membranes fractions for the evaluation of their protein composition
and they were able to identify several spots in 2DE gels that in their majority
corresponded to protein transporters (high-affinity hexose transporter, cation
transporter, phosphate transporter, lactate and pyruvate transporter,
sodium/phosphate symporter, low-affinity iron transporter, ammonium ion
transporter, general amino acid transporter and others).
The surfome corresponds to the cell surface proteome i.e. proteins that are
exposed at the surface of the cell. A relevant study (for the aim of the present work)
on the analysis of the surfome of a wild-type wine S. cerevisiae strain during wine
fermentation was performed by Braconi et al. (2011). In that work cell surface-
34
exposed proteins were extracted by trypsin “shaving” of intact cells and the 2DE
resolved proteins were identified by nLC-ESI-LIT-MS/MS. Those authors reported a
total of 42 identified proteins, out of which 16 were specifically expressed at the
beginning of the fermentation and 14 at the end of the process. Carbon metabolism-
related proteins (particularly involved in glycolysis and fermentation) accounted for
21% of the 42 identified and the following information can be summarized:
GAPDH was detected both at the beginning and at the end of fermentation.
GAPDH (an enzyme involved in the glycolysis pathway) incorporation into the
cell wall is considered responsive to environmental factors and not requiring de
novo protein synthesis, i.e. stress conditions cause the incorporation of pre-
existing GAPDH into the yeast cell wall.
Hexokinase 2 (Hxk2p, catalyzing glucose phosphorylation in the cytosol) was
detected as surface-expressed proteins at the beginning of fermentation.
Phosphogluconate dehydrogenase catalyzes the second oxidative reduction of
NADP+
to NADPH. It is also important for protecting yeast from oxidative
stress, since NADPH is an essential cofactor for several enzymes involved in the
cell protection against oxidative damages
Enolase is among the most abundant enzymes in S. cerevisiae cytosol. It
catalyzes the conversion of 2-phosphoglycerate to phosphoenolpyruvate in the
fourth glycolytic step.
Pyruvate decarboxylase isozyme, Pdc1p is a key enzyme in alcoholic
fermentation, decarboxylates pyruvate to acetaldehyde; subjected to glucose-,
ethanol-, and autoregulation, it is involved in amino acid catabolism.
Stress response proteins (14%) were also detected: heat shock proteins (Hsp),
SSA1 and SSA2 that are ATPases involved in protein folding and nuclear
localization signal and members of the 70 heat shock proteins family. SSA1 protein
was found at the end and SSA2 at the beginning of fermentation. Two other stress
responsive proteins were collected at the end of fermentation: Hsp82p, belonging to
the Hsp90 family, and Sod1p (cytosolic superoxide dismutase). Related to protein
biosynthesis (48% of the total protein), the authors reported several ribosomal and
elongation factors in both stages of fermentation. 10% of the proteins identified were
involved in the control of cellular organization: protein BMH1, exo-1,3-bglucanase
(Exg1p), and cell wall mannoprotein PST1 exclusively at the end of fermentation.

35
Bmh1p is involved in yeast physiology regulation through a variety of cell signaling
pathways, including chitin synthesis at the cell wall and Pst1p is known to be
involved in a repair mechanism activated upon cell damage (Braconi et al., 2011).
36
2 Materials and methods
2.1 Microorganisms
In this study two yeast species were used: Saccharomyces cerevisiae strain
CCMI 885 (Culture Collection of Industrial Microorganisms, ex-INETI, Lisbon
Portugal) originally isolated form the indigenous microflora of grape musts of
Alentejo region and Hanseniaspora guilliermondii strain NCYC 2380 (National
Collection of Yeasts Cultures, Norwich, United Kingdom) originally isolated from
grapes of Douro region. All strains were maintained in YEPD-agar slants, stored at
4°C and reactivated periodically.
2.2 Culture media and inocula
Alcoholic fermentations were performed in a Synthetic Grape Juice (SGJ),
which has a chemical composition similar to the natural grape musts. The SGJ was
prepared by mixing three solutions (A, B and C), as described in Pérez-Nevado et al.
(2006). The final composition of the SGJ was (per litre): (from solution A) D-
glucose, 110 g; D-fructose, 110 g; (from solution B) L-(1)-tartaric acid, 6.0 g; L-(2)-
malic acid, 3.0 g; citric acid, 0.5 g; (from solution C) YNB (yeast nitrogen base), 1.7
g; CAA (vitamin-free Casamino Acids), 2.0 g; CaCl2, 0.2 g; arginine-HCl, 0.8 g; L-
(2)-proline, 1.0 g; L-(2)-tryptophan, 0.1 g. Solutions B and C were buffered at pH 3.5
with NH4OH and H3PO4, respectively.
Inocula of S. cerevisiae and H. guilliermondii were prepared by transferring
biomass from one YEPD-agar slant (pre-grown with each strain at 30ºC for 48 h)
into 250 ml Erlenmeyer-flasks containing 100 ml of YEPD medium (10 g/l yeast
extract, 20 g/l peptone and 20 g/l glucose). The respective single cultures were
incubated in an orbital shaker (G25 Incubator Shaker, New Jersey, USA) at 30º C
and 150 rpm of agitation for 16 h.
37
2.3 Purification of antimicrobial peptides (AMPs) secreted by S. cerevisiae
during alcoholic fermentation
2.3.1 Production of alcoholic fermentations supernatants
To obtain large amounts of AMPs secreted by S. cerevisiae during alcoholic
fermentation, we performed three microvinifications in 2-L Erlenmeyer flasks
containing each 1000 ml of SGJ. Each flask was inoculated with 105 cells/ml of S.
cerevisiae (inoculum prepared as described in section 2.2.) and incubated in an
orbital shaker (G25 Incubator Shaker, New Jersey, USA) at 30ºC and 150 rpm of
agitation, for 7 days. Microvinifications were controlled by measuring cell growth, as
well as sugars consumption and ethanol production.
Daily samples were taken from each microvinification and cell growth was
evaluated by the number of colony forming units (CFU), determined by the classical
plating method. Briefly, 100 µl of culture sample were diluted in deionized water and
after appropriated dilutions (decimal serial dilution method) inoculated in YEPD-
agar plates. The plates were incubated at 30 ºC in a vertical incubator (Infors,
Canada) and the number of CFU enumerated after 2-3 days.
Sugars (glucose and fructose) and ethanol concentrations were determined by
High Performance Liquid Chromatography (HPLC) in cell-free samples obtained by
filtration with 0.45 um Millipore membranes (Merck Millipore, Algés, Portugal).
The HPLC system (Merck Hitachi, Darmstadt, Germany) was coupled with a
refractive index detector (HPLC, Merck Hitachi, Darmstadt, Germany). Samples
were injected (20 µl) into a Sugar-PakTM
column (Waters, Milford, USA) and eluted
with a degassed mobile phase (50 mg/ml of CaEDTA) at 90ºC with a flow rate of 0.5
ml/min. Glucose, fructose and ethanol standards at concentrations of 15, 7.5 and 3.75
g/l were used for calibration curves.
At the end of the alcoholic fermentation process (residual sugars <2 g/l), the
whole culture media (1000 ml for each fermentation) was collected and filtrated
twice by 0.45 µm Millipore membranes (Merck Millipore, Algés, Portugal). The
cell-free supernatants were then sterilized by filtration through 0.22 µm membranes
(Merck Millipore, Algés, Portugal). Total protein concentration of the supernatants
was quantified by spectrometry using a NanoDropTM
2000 spectrophotometer
(Thermo Scientific, Delaware, USA) and measuring absorbance at 280 nm. Sterile
38
supernatants (3000 ml in total) were stored at 4 ºC until utilization in the preparative
anion-exchange chromatographic column (DEAE-Sephadex).
In order to confirm the presence of the bioactive peptides (2-10 kDa)
previously found in alcoholic fermentation supernatants (Branco et al, 2014). 45 ml
of the cell-free supernatants were ultrafiltered through centrifugal filter units
(Vivaspin 15R, Sartorius, Göttingen, Germany) equipped with 10 kDa membranes
and 2 kDa membranes. First, the supernatant was ultrafiltered through the 10 kDa
membranes and then the permeate (<10 kDa) was concentrated (10-fold) by passing
through the 2 kDa membranes. Ultrafiltration was performed at 20 ºC and 6000 x g
in a bench centrifuge (Sigma 2-16 K, Sartorius, Germany) and the concentrated
fraction (2-10 kDa) was frozen and kept at -80ºC.
2.3.2 Purification of the AMPs from the fermentation supernatants using a
preparative anion-exchange column
Proteins of the alcoholic fermentation supernatants (approx. 3000 ml) were
fractionated in a preparative chromatographic system using an anion-exchange resin
diethylaminoethyl (DEAE) Sephadex A-25 (GE Healthcare, Uppsala, Sweden). This
gravity-flow chromatographic system was composed of a preparative glass column
(34 cm long x1.5 cm inner diameter) filled with the 588 ml of DEAE-Sephadex
resin. A gradient elution system composed of two 2-L Erlenmeyer flasks (of 2-L
each), one containing 2000 ml of 2 M ammonium acetate and the other 2000 ml of 2
mM ammonium acetate, was coupled to the column. Both Erlenmeyer flasks were
connected by a plastic tube, with the low salt concentration flask being agitated to
ensure that the gradient was reached. Elution was carried out by gravimetric force.
Each purification procedure was performed by loading the preparative column
with 500 ml of alcoholic fermentation supernatant (diluted 1:2 with deionized water
and pH adjusted to 8) and proteins eluted with the ammonium acetate salt gradient
above-mentioned. Protein fractions collected into glass tubes, (approx. 25 ml in each
tube), until the elution gradient was finished. Subsequently, all protein fractions
collected were analysed by spectrophotometry and the spectrum of absorbance range
from 250 to 800 nm (UV-1800, Shimadzu UV-Vis Spectrophotometer). Samples (25
ml each) exhibiting similar absorbance spectra were grouped in major fractions.
39
These major DEAE-Sephadex-protein fractions were frozen and kept at -80ºC for
further analysis.
2.3.3 Antimicrobial activity of the protein fractions obtained in the
preparative anion-exchange DEAE-Sephadex column
In order to search for the previously found AMPs (Albergaria et al., 2010;
Branco et al., 2014), the antimicrobial effect of each DEAE-Sephadex-protein
fraction was evaluated in growth assays performed with a sensitive yeast strain.
Antimicrobial active fractions have 2-10 kDa AMPs (Albergaria et al., 2010; Branco
et al., 2014) and yellow color (data not published), therefore 100 ml of only yellow-
colored fractions (obtained from DEAE-Sephadex column) were ultrafiltered using
centrifugal filter units (Vivaspin 15R, Sartorius, Göttingen, Germany) equipped with
10 kDa membranes. The <10 kDa fractions were then concentrated 10-fold by
passing through the 2 kDa membranes. Ultrafiltration was performed at 20 ºC and
6000 x g in a bench centrifuge (Sigma 2-16 K, Sartorius, Germany). The protein
concentration of the 2-10 kDa fractions was determined by spectrometry using a
NanoDropTM
2000 spectrophotometer (Thermo Scientific, Delaware, USA) and
measuring absorbance at 280 nm and concentrated fractions were then vacuum–dried
until further use.
Antimicrobial activity of the 2-10 kDa fractions was tested against the sensitive
strain H. guilliermondii and performed in 96-well microplates. Lyophilized fractions
were resuspended in a total volume of 100 µl of YEPD with 30 g/l of ethanol and a
pH 3.5, to a final protein concentration of 1 mg/ml. Control assay was performed
without addition of any fraction. Each well was inoculated with 105 cells/ml of H.
guilliermondii (inocula prepared as described in section 2.2) and the microplates
were incubated in a thermo-shaker (Infors HT, Bottmingen, Switzerland) at 30 °C
and 700 rpm of agitation. The inhibitory activity was evaluated by means of growth
measurements using a microplate reader (Dinex Technologies Inc., Chantilly, USA).
Growth was followed by absorbance measurements at 590 nm and by CFU counts in
YEPD-agar plates using the classical plating method. All antimicrobial tests were
performed in triplicates.
40
2.3.4 Analysis of the bioactive fractions obtained in the preparative DEAE-
Sephadex column by gel filtration and ion-exchange chromatography
In order to compare analytic profiles of bioactive fractions against the sensitive
strain H. guilliermondii (Branco et al., 2014), the protein fractions were purified and
analysed by filtration followed by ion-exchange chromatography using the same
procedure as Branco et al. (2013). First, protein fractions were subjected to gel
filtration chromatography, using an HPLC system (Merck Hitachi, Darmstadt,
Germany) equipped with an UV detector (Merck Hitachi, Darmstadt, Germany). 200
µm of each fraction were loaded into a Superdex Peptide column (10/300 GL, GE
Healthcare, London, UK) and eluted with 0.1 M ammonium acetate at a flow rate of
0.7 ml/min. The fraction of interest, which exhibits an apparent molecular weight
(MW) of 8 kDa, was collected after approx. 25 min of sample running. This 8 kDa
gel filtration fraction was first lyophilized and then further analysed in a strong
anion-exchange column (QResource 6 ml, GE Healthcare, London, UK). Samples
were eluted at neutral pH using a gradient of ammonium acetate (ranging from 5–500
mM) between 10 and 40 min at a flow rate of 1 ml/min.
2.4 Proteomic analysis of the cell wall-associated proteins (surfome) of S.
cerevisiae cells during alcoholic fermentation
2.4.1 Extraction of S. cerevisiae cell-wall associated proteins
In order to extract the proteins associated to the plasma membrane of S.
cerevisiae cells, four cultures were prepared in 2-L Erlenmeyer-flasks containing
1000 ml of SGJ medium. Each flask inoculated with 105 cells/ml of S. cerevisiae
inoculum and incubated in an orbital shaker (G25 Incubator Shaker, New Jersey,
USA) at 30º C and 150. Two flasks were incubated for 12 h and the other two for 48
h, respectively, and daily samples were taken from each culture to determine the
number of viable cells (CFU/ml). After 12 h and 48 h of incubation, respectively, the
entire culture broth was centrifuged for 5 min at 4 ºC at 10000 g in a bench
centrifuge and the cell pellets separated were collected while the supernatants were
discarded.
41
Isolation of plasma membranes from 12 h and 48 h grown cells for extraction
of proteins was performed as described by Van Leeuwen et al. (1991) with slight
modifications. Grown S. cerevisiae cells were centrifuge to separate supernatants
from the cell pellet. The cell pellet was washed twice with ice-cold distilled water
and once with buffer A (0.1 M glycine, 0.3 mM KC1 at pH 7.0) in a Sigma
centrifuge (Sigma 2-16K, Sartorius, Germany) for 20 min at 4˚C and 9000 rpm of
agitation. S. cerevisiae cells were resuspended in a proportion of 15 g cells per 15 ml
of buffer A containing a protease inhibitor cocktail (Complete Protease Inhibitor
Cocktail Tablets, Roche, USA). The cell lysis was carried out in a French press
(Thermo Scientific, Delaware, USA) at 20000 psi.
Then, 50 ml of buffer A was added to the lysate and centrifuged for 10 min at
2100 x g, 4˚C, in a Sigma centrifuge (Sigma 2-16K, Sartorius, Germany). The
supernatant was filtered with a 0.22 µm membrane (Merck Millipore, Algés,
Portugal) and centrifuged with the conditions mentioned above. By slowly addition
of 1 M HCl and at constant stirring, the supernatant (kept on ice) was adjusted to pH
4.9 to aggregate mitochondrial membranes and centrifuged straightaway. The
supernatant was adjusted to pH 7.0 with 1 M KOH, immediately after, and the pellet
was resuspended in 10 ml of buffer A, repeating the last procedure (pH adjustment to
4.9 followed by centrifugation). The supernatants with the plasma membranes
combined supernatants with the plasma membranes were adjusted to pH 5.0 and
centrifuged for 3 min at 7700 x g and 4˚C. The final supernatant was again adjusted
to pH 7 and kept at -80˚C.
The purified plasma membranes were defrosted at room temperature and
centrifuged for 20 min at 100000 x g, 4˚C, in an ultracentrifuge (Beckman Coulter,
OptimaTM LE-80K, California, USA). The supernatant was discarded and the pellet
resuspended in 30 ml of buffer B (1 mM EDTA, 10 mM Tris, pH 7.4) and
centrifuged once again, with the same conditions. The final pellet was resuspended
and in 0.5 ml sample buffer (7 M urea, 2 M thiourea, 4% CHAPS, 0.5% IPG buffer
pH 3-10), aliquoted and stored at -80˚C.
42
2.4.2 Two dimensional polyacrylamide gel electrophoresis
Prior to 2D electrophoresis, the samples were cleaned from contaminants by a
precipitation method using a 2D Clean-Up Kit (GE, Healthcare, London, UK). The
obtained pellet was air-dried for 5 minutes and the proteins were resuspended in the
rehydration solution (7 M urea, 2 M thiourea, 2% (m/V) CHAPS, 0.5% (V/V) IPG
buffer (pH 3-10), 0.002% (m/V) bromophenol blue and 0.28% (m/V) dithiothreitol
(DTT)). The protein concentration was determined by the Bradford method (BIO-
RAD Protein assay, California, USA).
Rehydration of Immobiline DryStrip gel strips with linear 4-7 pH gradient, 7
cm in length, (GE Healthcare, London, UK) was performed with 125 µl of
rehydration solution (containing 35 µg of sample proteins), for 16 h.
The first dimension was run in the Ettan IPGphor III system (GE Healthcare,
London, UK) with in the following conditions: 200 V for 1 h; 500 V for 30 min;
voltage gradient up until 1000 V for 30 min; voltage gradient up until 5000 V for
1h30; 5000 V for 1h30; for a total of 12825 Vh at 20 ˚C.
After isoelectric focusing, equilibration of the strips was performed in two
steps. In the first one, strips were equilibrated in equilibration buffer (6 M urea, 50
mM tris-HCl pH 8.8, 30% (V/V) glycerol, 2% (m/V) SDS and bromophenol blue) with
10 mg/ml of DTT for 20 min. In the second step, the procedure was repeated with 25
mg/ml of iodoacetamide instead of DTT. Both equilibration steps were performed in
a rocking platform shaker (VWR International, USA).
In the second dimension, the strips were placed onto gradient 4-12% Bis-Tris
SDS-PAGE gels (NuPAGE® NOVEX® Zoom® Protein Gels, 1.0 mm, IPG well,
Life Technologies, Thermo Fisher Scientific, USA). The gel was also loaded with
weight molecular markers (diluted 1:10) (Mark12™ Unstained Standard, Life
Technologies, Thermo Fisher Scientific, USA). The electrophoresis was run at 150 V
for 1h25 in a XCell SureLock™ Mini-Cell Electrophoresis System (Life
Technologies, Thermo Fisher Scientific, USA), using MES running buffer (1 M
MES, 1 M Tris Base, 69.3 mM SDS, 20.5 mM EDTA, pH 7.3 – stock solution).

43
After SDS-PAGE electrophoresis, gels were silver-stained using the following
protocol.
Table 1 Silver Staining Protocol
Steps Reagents Time
Fixing
1st step
2nd
step
40% methanol, 10% trichloroacetic acid (TCA),
120 ml deionized water
Overnight
30 min
Sensitization
30% methanol, 0.632 g thiosulfate sodium
pentahydrate, 6.8 g sodium acetate, 70 ml
deionized water
30 min
Washing 100 ml deionized water 5 x 5 min
Silver
staining
100 mg silver nitrate, 100 ml deionized water
20 min
Washing 100 ml deionized water 2 x 1 min
Development
5 g sodium carbonate, 200 µl formaldehyde 37%,
100 ml deionized water
~ 5 min
Stopping 3.7 g Titriplex III; 100 ml deionized water 10 min
Washing 100 ml deionized water 3 x 5 min
All steps were performed in a rocking platform shaker (VWR International,
USA) at room temperature.
Image and statistical analysis of proteins was performed using ImageMaster
7.0 software (GE Healthcare). The intensity level of the spots was determined by the
relative spot volume of each protein compared to the normalized volume of proteins.
The relative abundance of each protein spot was compared between the cell wall-
associated protein at 12 h and 48 h; the spots with an intensity ratio higher than 5
were considered significantly different.
44
3 Results and discussion
3.1 Purification of antimicrobial peptides from wine fermentation
supernatants
Albergaria et al. (2010) found that S. cerevisiae secretes AMPs during mixed
culture fermentation which cause the early death of non-Saccharomyces yeasts.
Afterwards, Branco et al. (2014) purified those AMPs by gel filtration and ion-
exchange chromatography. The isolated peptides were then sequenced by mass
spectrometry showing that these peptides correspond to fragments of the S.
cerevisiae GAPDH protein. The AMPs revealed to possess a great potential as
natural preservatives against spoilage microorganisms in several industrial food
processes, such as in winemaking.
Considering the potential of application of the above-mentioned AMPs, the
aim of the present work was to produce and isolate them in a preparative scale so that
sufficient amounts of purified AMPs could be obtained and applied in winery
fermentations.
3.1.1 Production of supernatants from alcoholic fermentations
To obtain large amounts of AMPs, we performed three microvinifications in 2-
L Erlenmeyer flasks containing each 1000 ml of SGJ. Alcoholic fermentations with
S. cerevisiae were performed under enological growth conditions (slow agitation)
during a seven-day period. Culturability as well as sugars consumption (glucose and
fructose) and ethanol production were determined during the whole fermentation
period (Fig. 3.1-a,b). Analysis of yeast growth (Fig. 3.1a) shows that there was an
initial exponential growth phase during the first day of fermentation, where cell
density reached a maximum of about 107 cells/ml. The apparent absence of a lag
phase was most likely due to lack of sampling analysis in the initial hours after
inoculation and to the pre-inoculum status that allowed a rapid initiation of cell
division. In the following days a stationary growth phase was observed up to the 3rd
day of fermentation. After the 3rd
day of fermentation no CFU values were obtained
due to technical problems with the plating method. Although there was no data
related to cell viability for the last days of fermentation, analysis of sugars
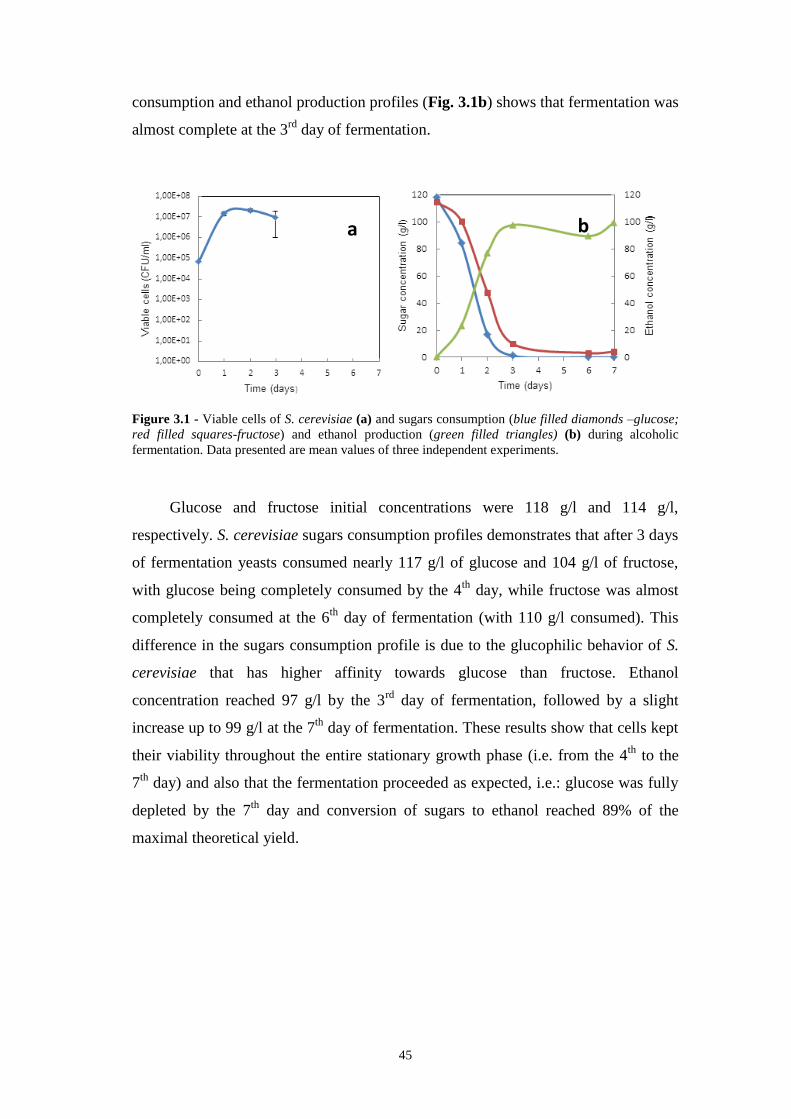
45
consumption and ethanol production profiles (Fig. 3.1b) shows that fermentation was
almost complete at the 3rd
day of fermentation.
Figure 3.1 - Viable cells of S. cerevisiae (a) and sugars consumption (blue filled diamonds –glucose;
red filled squares-fructose) and ethanol production (green filled triangles) (b) during alcoholic
fermentation. Data presented are mean values of three independent experiments.
Glucose and fructose initial concentrations were 118 g/l and 114 g/l,
respectively. S. cerevisiae sugars consumption profiles demonstrates that after 3 days
of fermentation yeasts consumed nearly 117 g/l of glucose and 104 g/l of fructose,
with glucose being completely consumed by the 4th
day, while fructose was almost
completely consumed at the 6th
day of fermentation (with 110 g/l consumed). This
difference in the sugars consumption profile is due to the glucophilic behavior of S.
cerevisiae that has higher affinity towards glucose than fructose. Ethanol
concentration reached 97 g/l by the 3rd
day of fermentation, followed by a slight
increase up to 99 g/l at the 7th
day of fermentation. These results show that cells kept
their viability throughout the entire stationary growth phase (i.e. from the 4th
to the
7th
day) and also that the fermentation proceeded as expected, i.e.: glucose was fully
depleted by the 7th
day and conversion of sugars to ethanol reached 89% of the
maximal theoretical yield.
a b
46
3.1.2 Purification of the AMPs from the fermentation supernatants using a
preparative anion-exchange column
Branco et al. (2014) found that the AMPs produced by S. cerevisiae during
alcoholic fermentation are anionic (at neutral pH), with a theoretical pI of 4.37.
Therefore, to isolate and purify these AMPs we used a preparative scale ion-
exchange chromatographic column.
Cell-free supernatants obtained from the previously described alcoholic
fermentations were fractionated using an anion-exchange resin constituted by a
cross-linked dextran matrix (Sephadex A-25), with positively charged groups of
diethylaminoethy (DEAE). Since the pH of the fermentation supernatants was 3.5, it
was necessary to raise the pH to a value of 8.0 before loading the chromatographic
column in order to retain the anionic peptides (pI of 4.37) in the ion-exchange resin.
Then, 500 ml of a 1:2 diluted supernatant (pH=8.0) were loading into the
chromatographic system and proteins eluted with a mobile phase of ammonium
acetate using a salt gradient of 2 mM-2 M. First, the column was washed with 2 mM
ammonium acetate and the respective liquid fraction recovered. That fraction, front
solvent (FS), contained all the supernatant proteins that did not bind to the resin. In
the end of the salt gradient elution, a final fraction eluted with 2 M of ammonium
acetate was also recovered for further analysis (F85).
Fractions (25 ml each) collected from the chromatographic column were
analysed by spectrophotometry in the absorbance spectra of 250-800 nm. It is well-
known that proteins absorb light at 280 nm but also between 200-220 nm due to
strong absorption of peptidic bonds at those wavelengths. However, salts can also
absorb light between 200-220 nm, and thus we found high absorbance in all samples
at these wavelengths due to the presence of ammonium acetate in the samples. Thus,
after analyzing the absorbance spectra of all the 85 protein fractions (25 ml each) we
grouped those fractions exhibiting similar absorbance spectra and strong absorbance
at 280 nm.
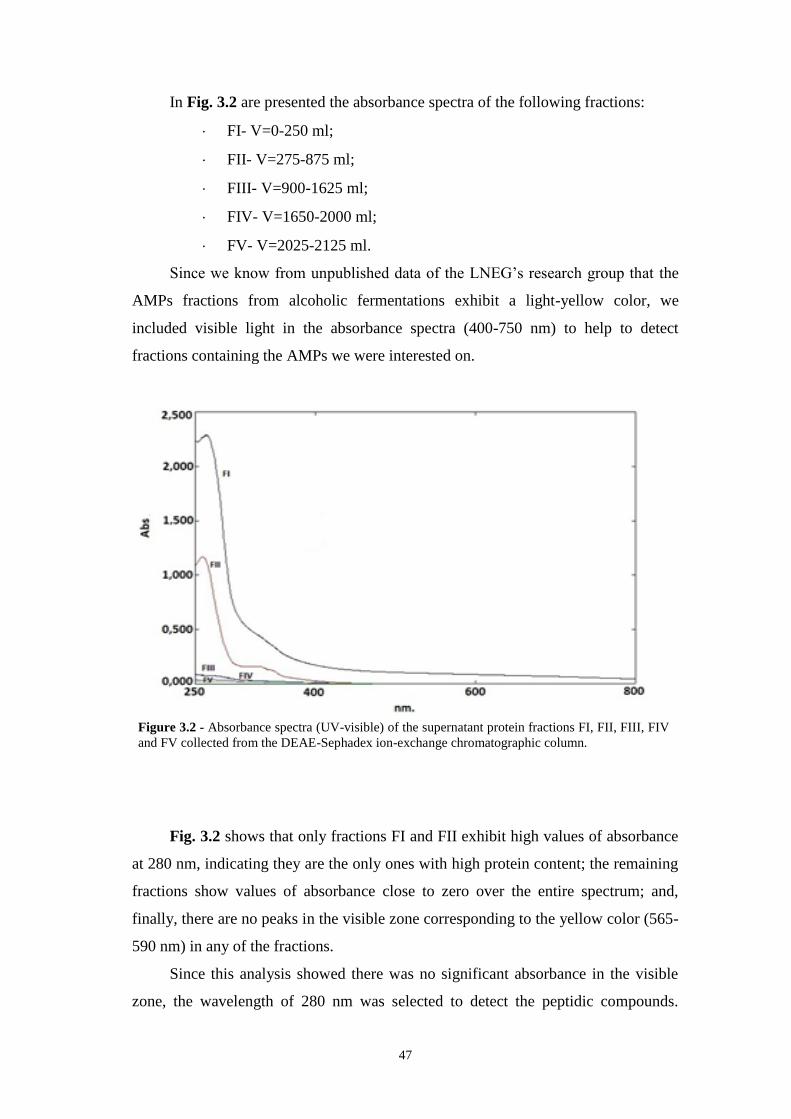
47
In Fig. 3.2 are presented the absorbance spectra of the following fractions:
FI- V=0-250 ml;
FII- V=275-875 ml;
FIII- V=900-1625 ml;
FIV- V=1650-2000 ml;
FV- V=2025-2125 ml.
Since we know from unpublished data of the LNEG’s research group that the
AMPs fractions from alcoholic fermentations exhibit a light-yellow color, we
included visible light in the absorbance spectra (400-750 nm) to help to detect
fractions containing the AMPs we were interested on.
Fig. 3.2 shows that only fractions FI and FII exhibit high values of absorbance
at 280 nm, indicating they are the only ones with high protein content; the remaining
fractions show values of absorbance close to zero over the entire spectrum; and,
finally, there are no peaks in the visible zone corresponding to the yellow color (565-
590 nm) in any of the fractions.
Since this analysis showed there was no significant absorbance in the visible
zone, the wavelength of 280 nm was selected to detect the peptidic compounds.
Figure 3.2 - Absorbance spectra (UV-visible) of the supernatant protein fractions FI, FII, FIII, FIV
and FV collected from the DEAE-Sephadex ion-exchange chromatographic column.

48
Thus, we plotted the absorbance values of samples at 280 nm in function of the
volume collected from the chromatographic column (Fig. 3.3). Besides, peptides
containing aromatic amino acid residues such as tryptophan (W), Tyrosine (Y) and
Phenylalanine (F) are known to strongly absorb light at 275-280 nm. And, we know
from Branco et al. (2014) that the AMPs we are searching for contain these amino
acids in their sequences (VSWYDNEYGYSTR/ ISWYDNEYGYSAR).
Figure 3.3 - Chromatogram of the protein fractions collected from the DEAE-Sephadex
chromatographic column. Sample: 500 ml of alcoholic fermentation supernatant (diluted 1:2;
pH=8.0).Gradient elution of 2 mM-2 M ammonium acetate. Absorbance at 280 nm
Fig. 3.3 shows that the first band eluted corresponds to FI (V=25-250 ml) and
the second one to fraction FII (V=275-875 ml). At 280 nm, fraction FI shows a high
absorbance peak (of approx. 6 AU), whereas fraction FII has a maximum absorbance
of approx. 0.5 AU. The following fractions show no significant absorbance at 280
nm, which means they do not contain proteic compounds.
Since there are only two visible peaks along the entire chromatogram, we can
conclude that the anionic proteins present in the supernatants were not properly
resolved by this anion-exchange chromatographic system. Therefore, purification
with this DEAE-Sephadex A-25 column does not seem to be completely efficient
since a single large peak with abundant protein content was obtained, indicating that
fraction FI probably contains more than one protein in it.
FI
FII
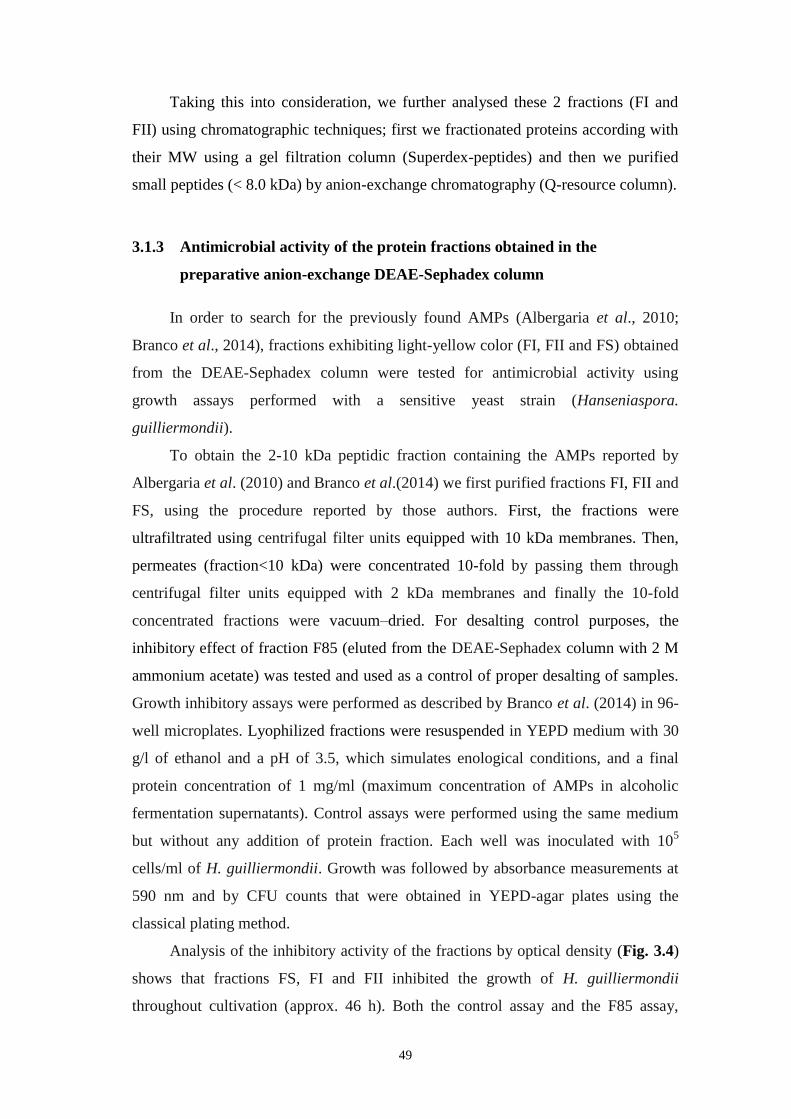
49
Taking this into consideration, we further analysed these 2 fractions (FI and
FII) using chromatographic techniques; first we fractionated proteins according with
their MW using a gel filtration column (Superdex-peptides) and then we purified
small peptides (< 8.0 kDa) by anion-exchange chromatography (Q-resource column).
3.1.3 Antimicrobial activity of the protein fractions obtained in the
preparative anion-exchange DEAE-Sephadex column
In order to search for the previously found AMPs (Albergaria et al., 2010;
Branco et al., 2014), fractions exhibiting light-yellow color (FI, FII and FS) obtained
from the DEAE-Sephadex column were tested for antimicrobial activity using
growth assays performed with a sensitive yeast strain (Hanseniaspora.
guilliermondii).
To obtain the 2-10 kDa peptidic fraction containing the AMPs reported by
Albergaria et al. (2010) and Branco et al.(2014) we first purified fractions FI, FII and
FS, using the procedure reported by those authors. First, the fractions were
ultrafiltrated using centrifugal filter units equipped with 10 kDa membranes. Then,
permeates (fraction<10 kDa) were concentrated 10-fold by passing them through
centrifugal filter units equipped with 2 kDa membranes and finally the 10-fold
concentrated fractions were vacuum–dried. For desalting control purposes, the
inhibitory effect of fraction F85 (eluted from the DEAE-Sephadex column with 2 M
ammonium acetate) was tested and used as a control of proper desalting of samples.
Growth inhibitory assays were performed as described by Branco et al. (2014) in 96-
well microplates. Lyophilized fractions were resuspended in YEPD medium with 30
g/l of ethanol and a pH of 3.5, which simulates enological conditions, and a final
protein concentration of 1 mg/ml (maximum concentration of AMPs in alcoholic
fermentation supernatants). Control assays were performed using the same medium
but without any addition of protein fraction. Each well was inoculated with 105
cells/ml of H. guilliermondii. Growth was followed by absorbance measurements at
590 nm and by CFU counts that were obtained in YEPD-agar plates using the
classical plating method.
Analysis of the inhibitory activity of the fractions by optical density (Fig. 3.4)
shows that fractions FS, FI and FII inhibited the growth of H. guilliermondii
throughout cultivation (approx. 46 h). Both the control assay and the F85 assay,
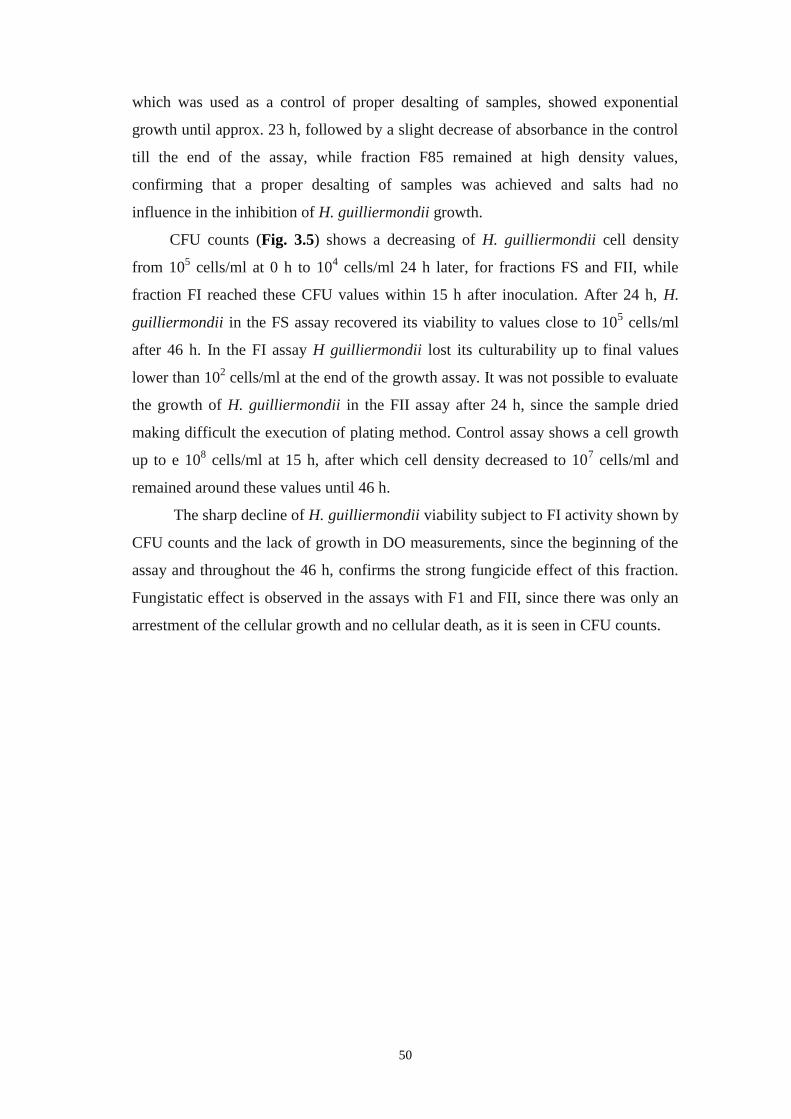
50
which was used as a control of proper desalting of samples, showed exponential
growth until approx. 23 h, followed by a slight decrease of absorbance in the control
till the end of the assay, while fraction F85 remained at high density values,
confirming that a proper desalting of samples was achieved and salts had no
influence in the inhibition of H. guilliermondii growth.
CFU counts (Fig. 3.5) shows a decreasing of H. guilliermondii cell density
from 105 cells/ml at 0 h to 10
4 cells/ml 24 h later, for fractions FS and FII, while
fraction FI reached these CFU values within 15 h after inoculation. After 24 h, H.
guilliermondii in the FS assay recovered its viability to values close to 105 cells/ml
after 46 h. In the FI assay H guilliermondii lost its culturability up to final values
lower than 102 cells/ml at the end of the growth assay. It was not possible to evaluate
the growth of H. guilliermondii in the FII assay after 24 h, since the sample dried
making difficult the execution of plating method. Control assay shows a cell growth
up to e 108 cells/ml at 15 h, after which cell density decreased to 10
7 cells/ml and
remained around these values until 46 h.
The sharp decline of H. guilliermondii viability subject to FI activity shown by
CFU counts and the lack of growth in DO measurements, since the beginning of the
assay and throughout the 46 h, confirms the strong fungicide effect of this fraction.
Fungistatic effect is observed in the assays with F1 and FII, since there was only an
arrestment of the cellular growth and no cellular death, as it is seen in CFU counts.
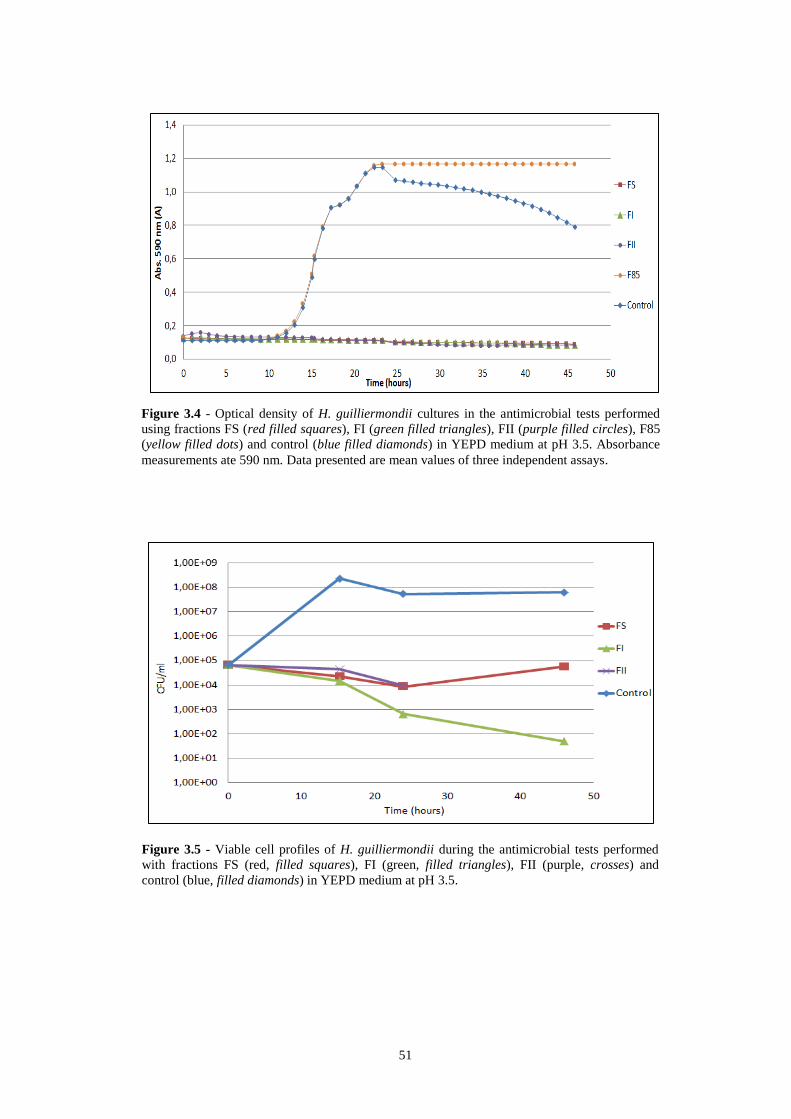
51
Figure 3.4 - Optical density of H. guilliermondii cultures in the antimicrobial tests performed
using fractions FS (red filled squares), FI (green filled triangles), FII (purple filled circles), F85
(yellow filled dots) and control (blue filled diamonds) in YEPD medium at pH 3.5. Absorbance
measurements ate 590 nm. Data presented are mean values of three independent assays.
Figure 3.5 - Viable cell profiles of H. guilliermondii during the antimicrobial tests performed
with fractions FS (red, filled squares), FI (green, filled triangles), FII (purple, crosses) and
control (blue, filled diamonds) in YEPD medium at pH 3.5.
52
3.1.4 Analysis of the bioactive fractions obtained in the preparative DEAE-
Sephadex column by gel filtration and ion-exchange chromatography
In order to compare the chromatographic profiles of the bioactive fractions (i.e.
fractions FI and FS) obtained in the DEAE-Sephadex column with the ones
previously identified by Branco et al. (2014), we purified those fractions using
exactly the same chromatographic procedure as used by Branco et al. (2014). It was
not possible to analyse fraction FII due to unavailability of the sample. For
comparative purposes, we also analysed the chromatographic profiles of the 2-10
kDa fraction from the original alcoholic fermentation supernatants. First, protein
fractions were subjected to gel filtration chromatography coupled to a HPLC system,
using a Superdex Peptide column and eluted with 0.1 M ammonium acetate.
Gel filtration chromatographic profiles (Fig. 3.6) show that 2-10 kDa fraction
exhibits much higher protein content than DEAE-Sephadex-column fractions, i.e. FS
and FI. This difference in protein concentrations results from the treatment of the
samples obtained in the preparative DEAE-Sephadex column for injection in the
SuperdexPeptide column. This fraction, and also fraction FS, show a peak at about
45 min that is not seen in fraction FI. This probably indicates the presence of cationic
Figure 3.6 - Chromatographic profiles of FS (red), FI (green) and 2-10 kDa fractions
(blue) fractionated by HPLC gel filtration using a Superdex Peptide column. Elution of the
fractions with 0.1 M ammonium acetate at a flow rate of 0.7 ml/min. Absorbance measured
at 280 nm.
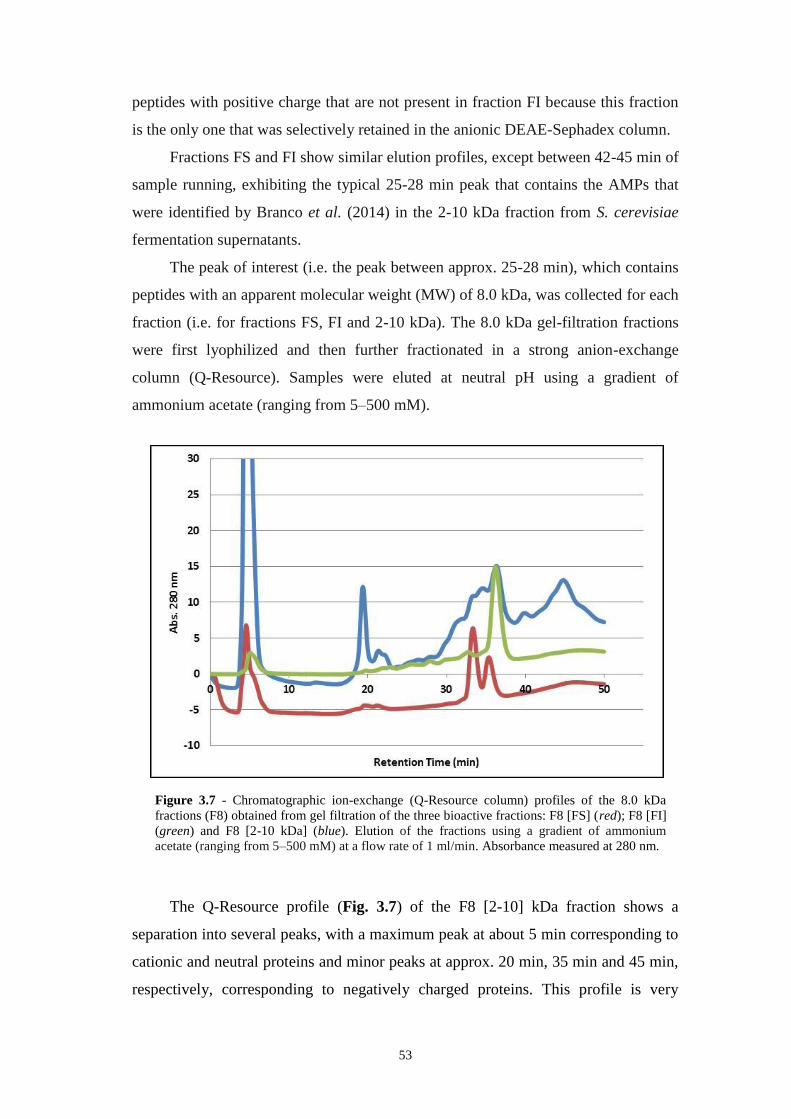
53
peptides with positive charge that are not present in fraction FI because this fraction
is the only one that was selectively retained in the anionic DEAE-Sephadex column.
Fractions FS and FI show similar elution profiles, except between 42-45 min of
sample running, exhibiting the typical 25-28 min peak that contains the AMPs that
were identified by Branco et al. (2014) in the 2-10 kDa fraction from S. cerevisiae
fermentation supernatants.
The peak of interest (i.e. the peak between approx. 25-28 min), which contains
peptides with an apparent molecular weight (MW) of 8.0 kDa, was collected for each
fraction (i.e. for fractions FS, FI and 2-10 kDa). The 8.0 kDa gel-filtration fractions
were first lyophilized and then further fractionated in a strong anion-exchange
column (Q-Resource). Samples were eluted at neutral pH using a gradient of
ammonium acetate (ranging from 5–500 mM).
The Q-Resource profile (Fig. 3.7) of the F8 [2-10] kDa fraction shows a
separation into several peaks, with a maximum peak at about 5 min corresponding to
cationic and neutral proteins and minor peaks at approx. 20 min, 35 min and 45 min,
respectively, corresponding to negatively charged proteins. This profile is very
Figure 3.7 - Chromatographic ion-exchange (Q-Resource column) profiles of the 8.0 kDa
fractions (F8) obtained from gel filtration of the three bioactive fractions: F8 [FS] (red); F8 [FI]
(green) and F8 [2-10 kDa] (blue). Elution of the fractions using a gradient of ammonium
acetate (ranging from 5–500 mM) at a flow rate of 1 ml/min. Absorbance measured at 280 nm.
54
similar to the one reported by Branco et al. (2014) where the GAPDH-derived AMPs
were identified. The profile of the F8 [FS] fraction shows two peaks between 30 and
40 min, beyond an initial peak (at about 5 min) containing the positively charged
proteins. Meanwhile the Q-resource profile of the F8 [FI] fraction shows only one
intense peak at about 35-36 min, which means that this sample is highly purified.
This analysis allows us to conclude that the purification procedure of the AMPs
secreted by S. cerevisiae during alcoholic fermentation can be successfully achieved
with the DEAE-Sephadex ion-exchanger if a first and additional gel filtration step is
used to retain the small peptides (< 8.0 kDa) from the supernatants.
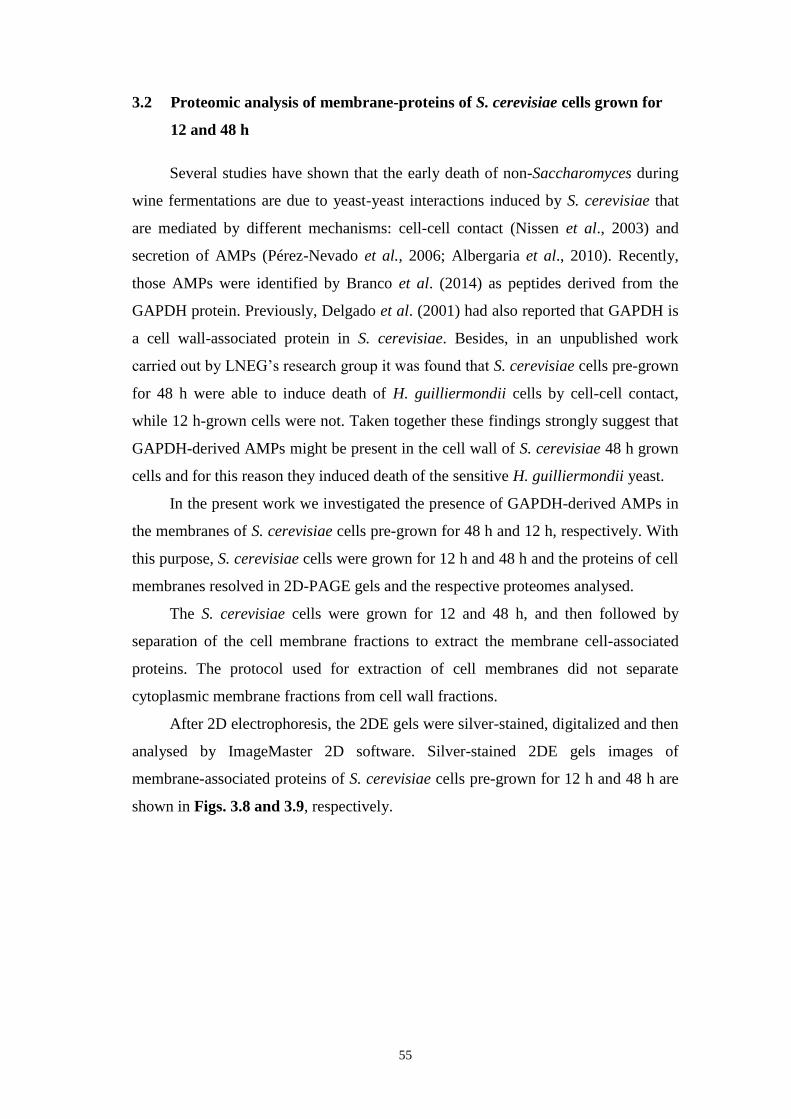
55
3.2 Proteomic analysis of membrane-proteins of S. cerevisiae cells grown for
12 and 48 h
Several studies have shown that the early death of non-Saccharomyces during
wine fermentations are due to yeast-yeast interactions induced by S. cerevisiae that
are mediated by different mechanisms: cell-cell contact (Nissen et al., 2003) and
secretion of AMPs (Pérez-Nevado et al., 2006; Albergaria et al., 2010). Recently,
those AMPs were identified by Branco et al. (2014) as peptides derived from the
GAPDH protein. Previously, Delgado et al. (2001) had also reported that GAPDH is
a cell wall-associated protein in S. cerevisiae. Besides, in an unpublished work
carried out by LNEG’s research group it was found that S. cerevisiae cells pre-grown
for 48 h were able to induce death of H. guilliermondii cells by cell-cell contact,
while 12 h-grown cells were not. Taken together these findings strongly suggest that
GAPDH-derived AMPs might be present in the cell wall of S. cerevisiae 48 h grown
cells and for this reason they induced death of the sensitive H. guilliermondii yeast.
In the present work we investigated the presence of GAPDH-derived AMPs in
the membranes of S. cerevisiae cells pre-grown for 48 h and 12 h, respectively. With
this purpose, S. cerevisiae cells were grown for 12 h and 48 h and the proteins of cell
membranes resolved in 2D-PAGE gels and the respective proteomes analysed.
The S. cerevisiae cells were grown for 12 and 48 h, and then followed by
separation of the cell membrane fractions to extract the membrane cell-associated
proteins. The protocol used for extraction of cell membranes did not separate
cytoplasmic membrane fractions from cell wall fractions.
After 2D electrophoresis, the 2DE gels were silver-stained, digitalized and then
analysed by ImageMaster 2D software. Silver-stained 2DE gels images of
membrane-associated proteins of S. cerevisiae cells pre-grown for 12 h and 48 h are
shown in Figs. 3.8 and 3.9, respectively.
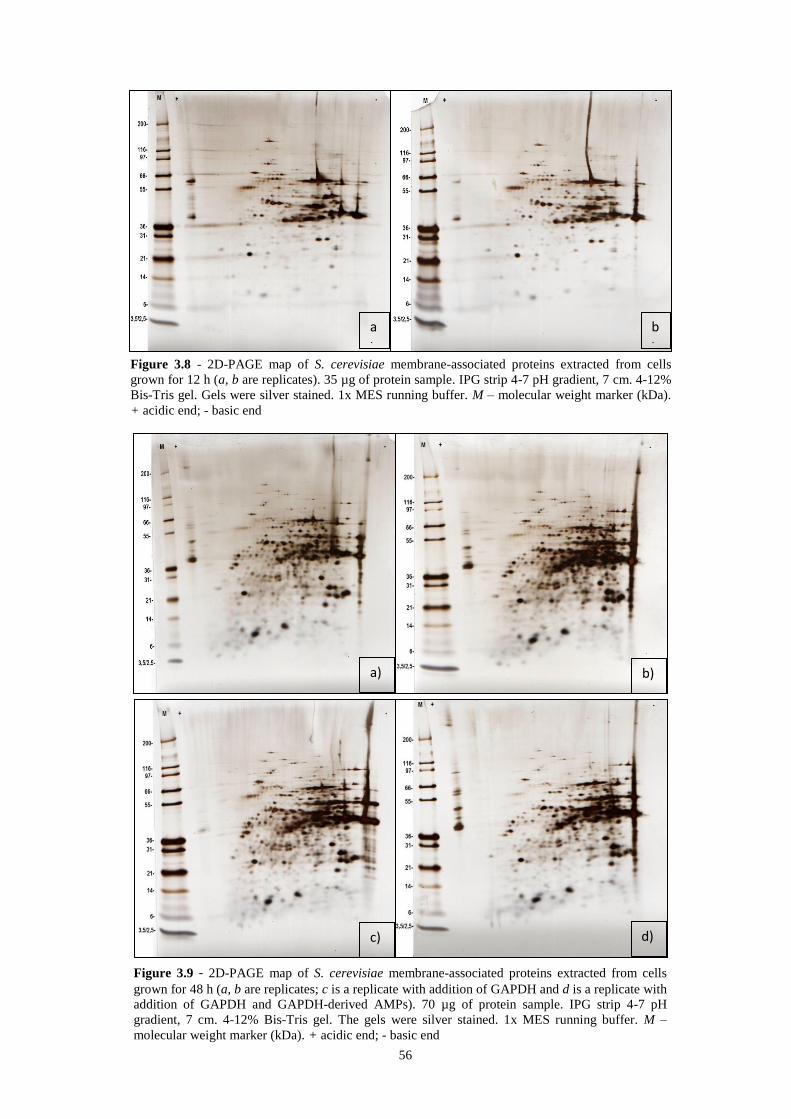
56
a
)
b
)
a) b)
c) d)
Figure 3.8 - 2D-PAGE map of S. cerevisiae membrane-associated proteins extracted from cells
grown for 12 h (a, b are replicates). 35 µg of protein sample. IPG strip 4-7 pH gradient, 7 cm. 4-12%
Bis-Tris gel. Gels were silver stained. 1x MES running buffer. M – molecular weight marker (kDa).
+ acidic end; - basic end
Figure 3.9 - 2D-PAGE map of S. cerevisiae membrane-associated proteins extracted from cells
grown for 48 h (a, b are replicates; c is a replicate with addition of GAPDH and d is a replicate with
addition of GAPDH and GAPDH-derived AMPs). 70 µg of protein sample. IPG strip 4-7 pH
gradient, 7 cm. 4-12% Bis-Tris gel. The gels were silver stained. 1x MES running buffer. M –
molecular weight marker (kDa). + acidic end; - basic end
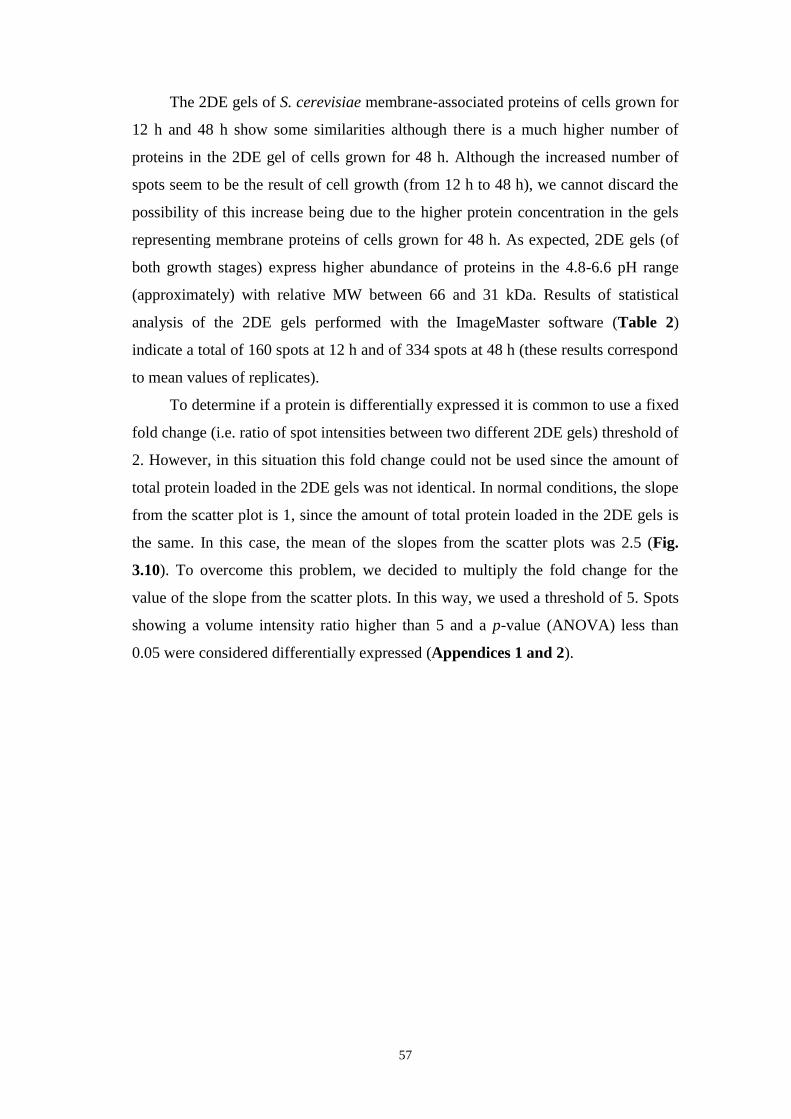
57
The 2DE gels of S. cerevisiae membrane-associated proteins of cells grown for
12 h and 48 h show some similarities although there is a much higher number of
proteins in the 2DE gel of cells grown for 48 h. Although the increased number of
spots seem to be the result of cell growth (from 12 h to 48 h), we cannot discard the
possibility of this increase being due to the higher protein concentration in the gels
representing membrane proteins of cells grown for 48 h. As expected, 2DE gels (of
both growth stages) express higher abundance of proteins in the 4.8-6.6 pH range
(approximately) with relative MW between 66 and 31 kDa. Results of statistical
analysis of the 2DE gels performed with the ImageMaster software (Table 2)
indicate a total of 160 spots at 12 h and of 334 spots at 48 h (these results correspond
to mean values of replicates).
To determine if a protein is differentially expressed it is common to use a fixed
fold change (i.e. ratio of spot intensities between two different 2DE gels) threshold of
2. However, in this situation this fold change could not be used since the amount of
total protein loaded in the 2DE gels was not identical. In normal conditions, the slope
from the scatter plot is 1, since the amount of total protein loaded in the 2DE gels is
the same. In this case, the mean of the slopes from the scatter plots was 2.5 (Fig.
3.10). To overcome this problem, we decided to multiply the fold change for the
value of the slope from the scatter plots. In this way, we used a threshold of 5. Spots
showing a volume intensity ratio higher than 5 and a p-value (ANOVA) less than
0.05 were considered differentially expressed (Appendices 1 and 2).
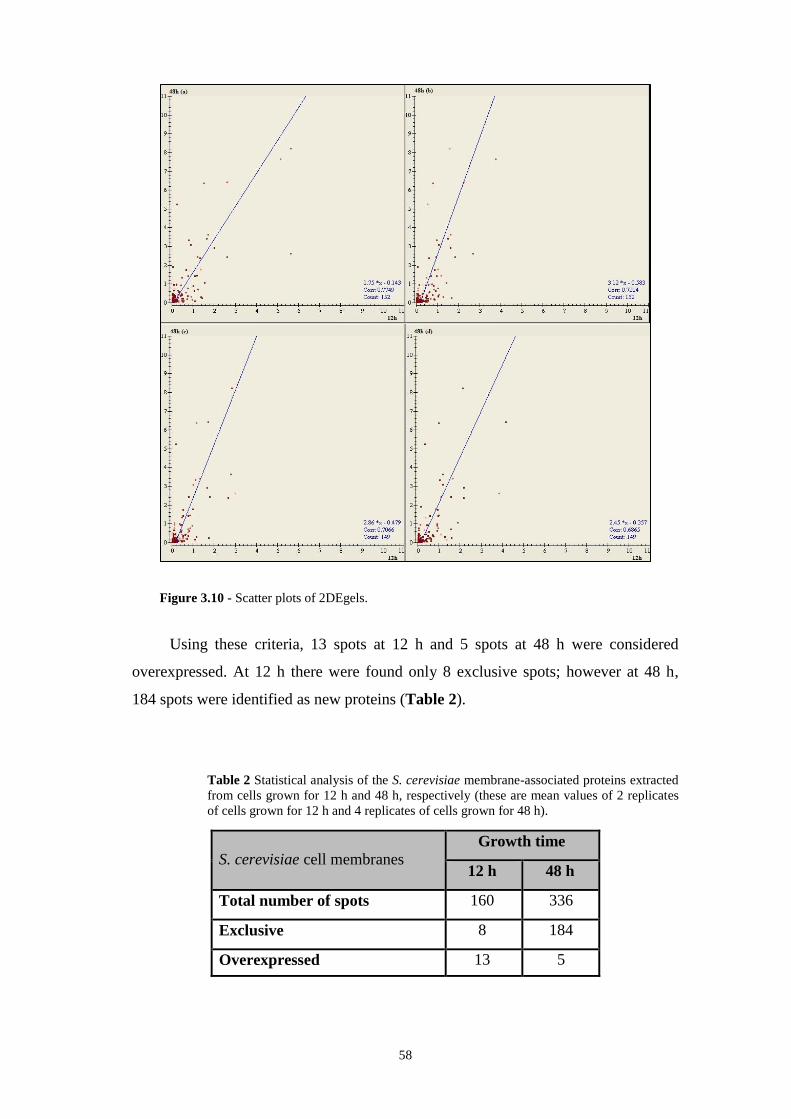
58
Using these criteria, 13 spots at 12 h and 5 spots at 48 h were considered
overexpressed. At 12 h there were found only 8 exclusive spots; however at 48 h,
184 spots were identified as new proteins (Table 2).
Table 2 Statistical analysis of the S. cerevisiae membrane-associated proteins extracted
from cells grown for 12 h and 48 h, respectively (these are mean values of 2 replicates
of cells grown for 12 h and 4 replicates of cells grown for 48 h).
S. cerevisiae cell membranes Growth time
12 h 48 h
Total number of spots 160 336
Exclusive 8 184
Overexpressed 13 5
Figure 3.10 - Scatter plots of 2DEgels.
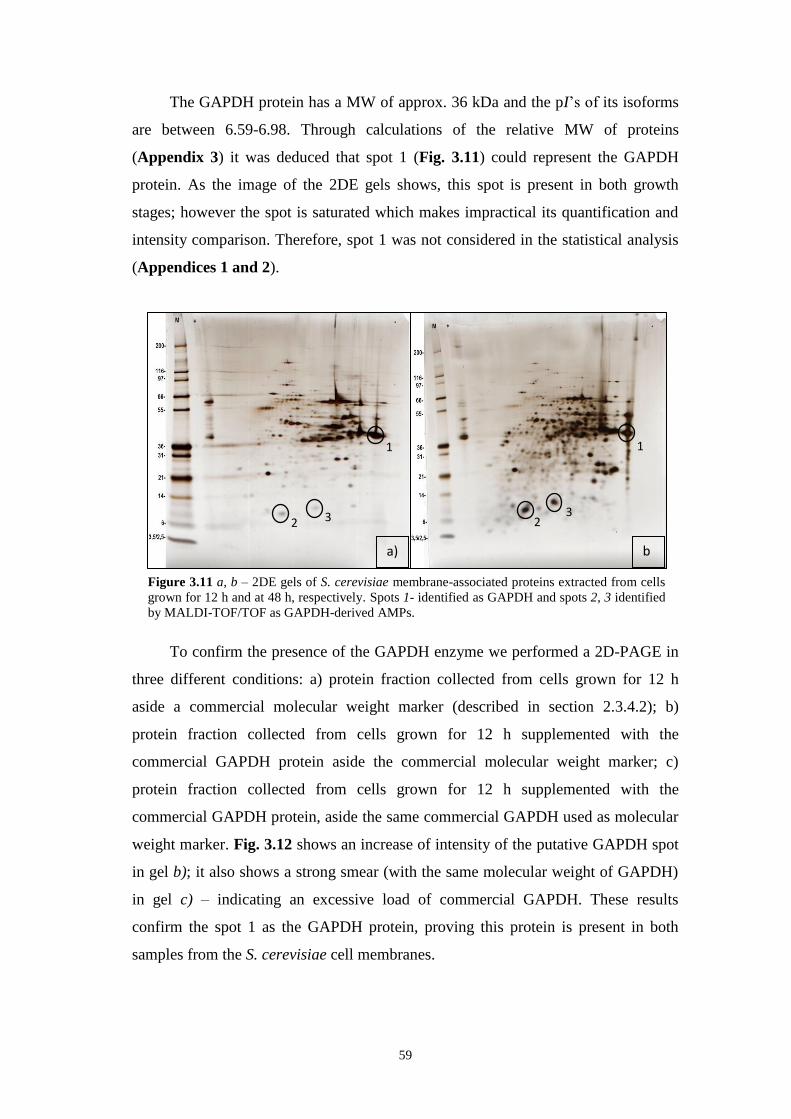
59
The GAPDH protein has a MW of approx. 36 kDa and the pI’s of its isoforms
are between 6.59-6.98. Through calculations of the relative MW of proteins
(Appendix 3) it was deduced that spot 1 (Fig. 3.11) could represent the GAPDH
protein. As the image of the 2DE gels shows, this spot is present in both growth
stages; however the spot is saturated which makes impractical its quantification and
intensity comparison. Therefore, spot 1 was not considered in the statistical analysis
(Appendices 1 and 2).
To confirm the presence of the GAPDH enzyme we performed a 2D-PAGE in
three different conditions: a) protein fraction collected from cells grown for 12 h
aside a commercial molecular weight marker (described in section 2.3.4.2); b)
protein fraction collected from cells grown for 12 h supplemented with the
commercial GAPDH protein aside the commercial molecular weight marker; c)
protein fraction collected from cells grown for 12 h supplemented with the
commercial GAPDH protein, aside the same commercial GAPDH used as molecular
weight marker. Fig. 3.12 shows an increase of intensity of the putative GAPDH spot
in gel b); it also shows a strong smear (with the same molecular weight of GAPDH)
in gel c) – indicating an excessive load of commercial GAPDH. These results
confirm the spot 1 as the GAPDH protein, proving this protein is present in both
samples from the S. cerevisiae cell membranes.
1
.
2
.
3
1
.
2
.
3
a) b
) Figure 3.11 a, b – 2DE gels of S. cerevisiae membrane-associated proteins extracted from cells
grown for 12 h and at 48 h, respectively. Spots 1- identified as GAPDH and spots 2, 3 identified
by MALDI-TOF/TOF as GAPDH-derived AMPs.
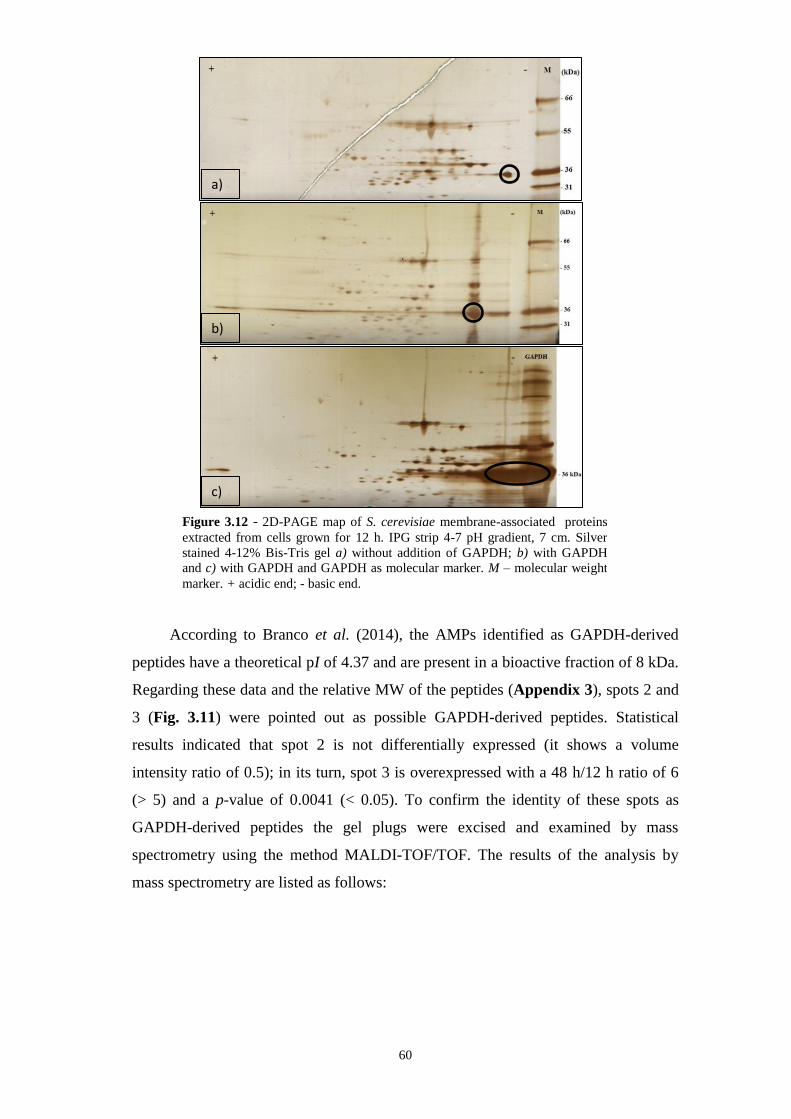
60
According to Branco et al. (2014), the AMPs identified as GAPDH-derived
peptides have a theoretical pI of 4.37 and are present in a bioactive fraction of 8 kDa.
Regarding these data and the relative MW of the peptides (Appendix 3), spots 2 and
3 (Fig. 3.11) were pointed out as possible GAPDH-derived peptides. Statistical
results indicated that spot 2 is not differentially expressed (it shows a volume
intensity ratio of 0.5); in its turn, spot 3 is overexpressed with a 48 h/12 h ratio of 6
(> 5) and a p-value of 0.0041 (< 0.05). To confirm the identity of these spots as
GAPDH-derived peptides the gel plugs were excised and examined by mass
spectrometry using the method MALDI-TOF/TOF. The results of the analysis by
mass spectrometry are listed as follows:
a)
b)
c)
Figure 3.12 - 2D-PAGE map of S. cerevisiae membrane-associated proteins
extracted from cells grown for 12 h. IPG strip 4-7 pH gradient, 7 cm. Silver
stained 4-12% Bis-Tris gel a) without addition of GAPDH; b) with GAPDH
and c) with GAPDH and GAPDH as molecular marker. M – molecular weight
marker. + acidic end; - basic end.
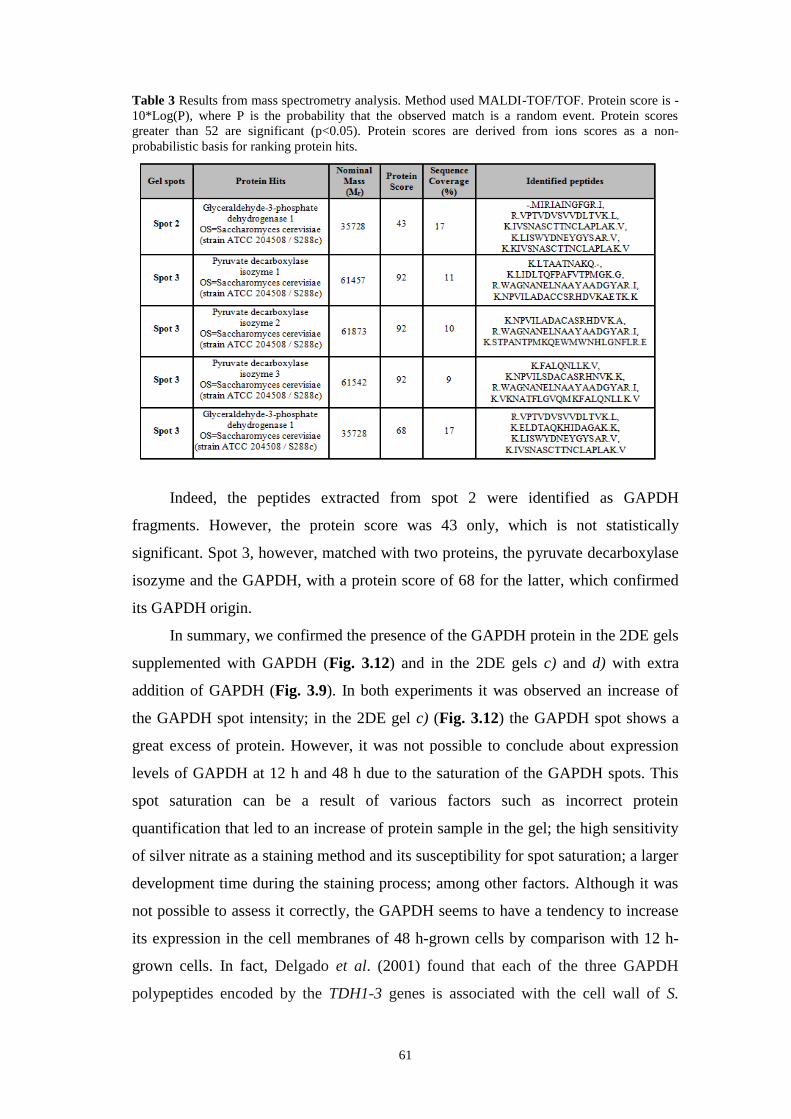
61
Table 3 Results from mass spectrometry analysis. Method used MALDI-TOF/TOF. Protein score is -
10*Log(P), where P is the probability that the observed match is a random event. Protein scores
greater than 52 are significant (p<0.05). Protein scores are derived from ions scores as a non-
probabilistic basis for ranking protein hits.
Indeed, the peptides extracted from spot 2 were identified as GAPDH
fragments. However, the protein score was 43 only, which is not statistically
significant. Spot 3, however, matched with two proteins, the pyruvate decarboxylase
isozyme and the GAPDH, with a protein score of 68 for the latter, which confirmed
its GAPDH origin.
In summary, we confirmed the presence of the GAPDH protein in the 2DE gels
supplemented with GAPDH (Fig. 3.12) and in the 2DE gels c) and d) with extra
addition of GAPDH (Fig. 3.9). In both experiments it was observed an increase of
the GAPDH spot intensity; in the 2DE gel c) (Fig. 3.12) the GAPDH spot shows a
great excess of protein. However, it was not possible to conclude about expression
levels of GAPDH at 12 h and 48 h due to the saturation of the GAPDH spots. This
spot saturation can be a result of various factors such as incorrect protein
quantification that led to an increase of protein sample in the gel; the high sensitivity
of silver nitrate as a staining method and its susceptibility for spot saturation; a larger
development time during the staining process; among other factors. Although it was
not possible to assess it correctly, the GAPDH seems to have a tendency to increase
its expression in the cell membranes of 48 h-grown cells by comparison with 12 h-
grown cells. In fact, Delgado et al. (2001) found that each of the three GAPDH
polypeptides encoded by the TDH1-3 genes is associated with the cell wall of S.
62
cerevisiae. The same authors also demonstrated that GAPDH accumulates in the cell
wall of S. cerevisiae in response to starvation and temperature upshift (Delgado et al.
2003). This could explain the increase of the GAPDH expression since at 48 h of
fermentation the environmental stress is much higher than at 12 h. Further work must
be carried out to prove that the expression of GAPDH is actually increased in the
membranes of cells at 48 h of fermentation.
It was shown that AMPs are differentially expressed in the membranes of S.
cerevisiae cells at 48 h by comparison with cells at 12 h of growth. It was also
confirmed that the AMPs are derived from GAPDH proteolysis. These results are in
line with a previous work published by Albergaria et al. (2010) that showed that S.
cerevisiae begins to secrete AMPs to the extracellular medium at the end of the
exponential growth phase (1–2 days) in alcoholic fermentations, as well as with the
new findings by Branco et al. (2014) revealing that these AMPs correspond to
fragments of the S. cerevisiae GPADH protein. Moreover, Silva et al. (2011)
identified GAPDH as a specific target of metacaspases in S. cerevisiae, thus proving
that GAPDH is associated with apoptosis, which is sustained by the results obtained
by Branco et al. (2014) showing that a mutant strain of S. cerevisiae deleted in the
metacaspase YCA1 gene significantly prevents death of H. guilliermondii during
alcoholic fermentation.
Taken together, these findings suggest that the presence of GAPDH-derived
peptides in the cell membranes of S. cerevisiae at the end of the exponential growth
phase might be due to apoptotic cells inducing the cleavage of GAPDH by
metacaspases. However, to definitively establish the connection between apoptosis
and secretion of AMPs further investigation must be carried out.
63
4 Final remarks and future work
The present work is comprised of two parts: the first part consisted in the
production and purification in a preparative scale of AMPs, so that they can be used
in winery fermentations in a purified form; the second part aimed to analyze the
membrane proteome of S. cerevisiae cells pre-grown for 12 and 48 h, respectively,
and to verify the presence of the previously identified GAPDH-derived AMPs in this
cell structure.
In the first part we produced 3000 ml of S. cerevisiae fermentation
supernatants and purified the cell-free supernatants in a preparative chromatographic
system using an anion-exchange resin (DEAE-Sephadex A-25). Proteins were eluted
using a 2-2000 mM gradient of ammonium acetate and protein fractions were
collected and analyzed by spectrophotometry. Two fractions (fraction FI and FII)
exhibiting significant protein content were tested for antimicrobial activity against
the sensitive yeast H. guilliermondii. Fraction FI exhibited highest antimicrobial
activity and thus was further analysed by chromatographic methods (i.e. gel filtration
and anion exchange chromatography) and the respective profiles were compared
with those exhibited by the 2-10 kDa peptidic fraction of S. cerevisiae supernatants
where Branco et al. (2014) found the GAPDH-derived AMPs.
From all the work performed we can conclude that purification of the AMPs
secreted by S. cerevisiae during alcoholic fermentation can be successfully achieved
using the preparative DEAE-Sephadex ion-exchanger if a first and additional gel
filtration step is used to retain small peptides (< 8.0 kDa) from the supernatants.
To improve the efficiency of the purification procedure of AMPs, the
chromatographic system should be coupled to an absorbance detector, in order to
monitorize the whole process and obtain elution profiles for each fraction, and a
pumping system should be used to control not only the flow rate of the eluent but
also to obtain a consistent elution gradient of the mobile phase.
In the second part of this work, S. cerevisiae cells were grown for 12 and 48 h,
respectively, the cell membranes were isolated and membrane-associated proteins
extracted. The proteomes of these cell membranes were analysed by 2D-PAGE. We
detected a total of 160 spots in the membrane-proteome of S. cerevisiae cells grown
for 12 h and 336 spots in the membrane-proteome of S. cerevisiae cells grown for 48
64
h; Statistical analysis of the membrane-proteomes revealed that 13 spots were
overexpressed in cells grown for 12 h by comparison with cells grown for 48 h and 8
spots were exclusively found in 12 h-grown cell membranes. In the membrane-
proteome of S. cerevisiae cells grown for 48 h 5 proteins were overexpressed and
184 were identified as new proteins. Proteomic analysis also allowed detecting the
presence of two spots of low MW (ca 10 kDa) and pI (4-5) that were overexpressed
in the membranes of 48 h-grown cells. These spots were excised from the 2DE gel
and identified by mass spectrometry to be GAPDH-derived peptides.
Concluding, the proteomic analysis demonstrated that the GAPDH-derived
AMPs previously identified by Branco et al. (2014) are present in cell membranes of
S. cerevisiae and overexpressed in 48 h-grown cells by comparison 12 h-grown cells.
These findings suggest that death mediated by cell-cell contact reported by Nissen et
al. (2003) could be the result of the presence of AMPs in cell membranes of S.
cerevisiae. Moreover, overexpression of these AMPs in membranes of S. cerevisiae
cells grown for 48 h is in agreement with previous work carried out by LNEG’s
research group that found that S. cerevisiae cells pre-grown for 48 h are able to
induce death of H. guilliermondii cells by cell-cell contact, while 12 h-grown cells
are not. It is possible that these two different death-inducing mechanisms (i.e. cell-
cell contact and AMPs) are connected and that one mechanism (cell-to-cell
mechanism) could rely in the other (AMPs present in cell membranes) mechanism.
Further work must be carried out in order to understand the mechanisms underlying
cell-cell contact death and the role of AMPs in this phenomenon.
It was also demonstrated that the AMPs are derived from GAPDH proteolysis.
Moreover, Silva et al. (2011) identified GAPDH as a specific target of metacaspases
in S. cerevisiae, thus proving GAPDH is associated with apoptosis in S. cerevisiae.
Albergaria et al. (2010) showed that S. cerevisiae begins to secrete AMPs to the
extracellular medium at the end of the exponential growth phase (1–2 days) in
alcoholic fermentations. In addition, Branco et al. (2014) also showed that a mutant
strain of S. cerevisiae deleted in the metacaspase YCA1 gene significantly prevents
death of H. guilliermondii during alcoholic fermentation. Taken together, these
findings suggest that the presence of GAPDH-derived peptides in the cell membranes
of S. cerevisiae at the end of the exponential growth phase might be due to apoptotic
cells inducing the cleavage of GAPDH by metacaspases.
65
We also confirmed the presence of GAPDH in the membrane-proteome of S.
cerevisiae cells by performing 2D-PAGE gels with membrane proteins to which a
commercial GAPDH protein was added to verify the exact position of this protein in
the 2DE gel. However, it was not possible to include the GAPDH in the statistical
analysis since the spots were too saturated. Although it was not possible to determine
statistically, it seems that GAPDH is overexpressed in the membranes of S.
cerevisiae cells grown for 48 h by comparison with 12 h-grown cells. Delgado et al.
(2003) demonstrated that GAPDH accumulates in the cell-wall of S. cerevisiae cells
in response to starvation and temperature upshift. Thus, the increase of GAPDH in
the membranes of S. cerevisiae cells grown for 48 h could explain why GAPDH-
derived peptides are also increased in the membranes of those cells.
Future work of these AMPs secreted by S. cerevisiae during alcoholic
fermentations should include:
Further 2D-PAGE analysis to confirm the overexpression of the GAPDH-
derived AMPs and of GAPDH protein.
Structural characterization of these AMPs using a variety of techniques such
as X-ray crystallography or nuclear magnetic resonance, in order to
understand its structure and mode of action.
Cell-cell contact assays involving S. cerevisiae mutant strains deleted in the
TDH1-3 genes (GAPDH) or with mutant strains deleted in the YCA1 gene
(metacaspase) that prevent the production of GAPDH-derived peptides in
order to verify if there are still any death of non-Saccharomyces yeasts.
Further identification of proteins associated with cell membranes of S.
cerevisiae that showed to be new proteins and differentially expressed in
2DE gels in both 12 h and 48 h-growth cells.
66
5 Bibliography
Aguilar, M. (2004) Reversed-Phase High-Performance Liquid Chromatography, in
M.I. Aguilar (Ed) Methods in Molecular Biology, HPLC of Peptides and
Proteins: Methods and Protocols, 251, pp. 9-23, Humana Press Inc., USA
Albergaria, H., Torrão, A. R., Hogg, T., and Gírio, F. M. (2003) “Physiological
behaviour of Hanseniaspora guilliermondii in aerobic glucose-limited
continuous cultures”, FEMS Yeast Research, 3(2), pp. 211–216.
Albergaria, H. (2007) “Physiological Studies of non-Saccharomyces Wine-Related
Strains in Single and Mixed Cultures with S. Cerevisiae”, PhD Thesis,
Universidade Católica Portuguesa, Portugal.
Albergaria, H., Francisco, D., Gori, K. Arneborg, N., Gírio, F. (2010)
“Saccharomyces cerevisiae CCMI 885 secretes peptides that inhibit the growth
of some non-Saccharomyces wine-related strains”, Applied Microbiology and
Biotechnology, 86, pp. 965 –972.
Alexandre, H., Rousseaux, I., Charpentier, C., (1993) “Ethanol adaptation
mechanisms in Saccharomyces cerevisiae”, Biotechnology and Applied
Biochemistry, 20, pp. 173-183.
Alexandre, H., Costello P.J., Remize, F., Guzzo, J., Guilloux-Benatier M (2004)
“Saccharomyces cerevisiae-Oenococcus oeni interactions in wine: current
knowledge and perspectives”, International Journal Food Microbiology, 93,
pp. 141-154.
Aliverdieva, D. A., Malygin, A. G., Lagutina, L. S., Sholtz, K. F. (2004) “Isolation of
Cell Membranes from Saccharomyces cerevisiae for Evaluation of Their
Protein Composition”, Applied Biochemistry and Microbiology, 40, pp. 296–
299.
Andersson, L. and Persson, J. (2000) “Aspects of industrial purification of peptides
using large-scale chromatography” Biopolymers (Peptide Science), 55, pp.
227-250
Andorrà, I. (2010) ―Adaptation and development of culture-independent techniques
for the identification and enumeration of microorganisms in wine
fermentations‖, Ph.D. Thesis, Universidade Rovira i Virgili.
Arneborg N, Siegumfeldt H, Andersen GH, Nissen P, Daria VR, Rodrigo PJ,
Gluckstad J (2005) “Interactive optical trapping shows that confinement is a
67
determinant of growth in a mixed yeast culture”, FEMS Microbiol Lett, 245,
pp. 155–159.
Ansanay-Galeote, V., Blondin, B., Dequin, S., Sablayrolles, J.M., (2001) “Stress
effect of ethanol on fermentation kinetics by stationary-phase cells of
Saccharomyces cerevisiae”, Biotechnology Letters, 23, pp. 677-681.
Barnett, J. A. (1998) “A history of research on yeasts 1: Work by chemists and
biologists 1789–1850”, Yeast, 14, pp. 1439–1451.
Barnett, J. A. (2003) “A history of research on yeasts 5: The fermentation pathway.
Yeast, 20(6), pp. 509–543.
Bauer, F.F. and Pretorius, I.S., (2000) “Yeast stress response and fermentation
efficiency: how to survive the making of wine-a review”, South African
Journal of Enology and Viticulture 21, pp. 27-51.
Bergman L. W. (2001) “Growth and maintenance of yeast”, Methods Mol Biol. 177,
pp. 9-39.
Bisson, L.F., (1999) “Stuck and sluggish fermentations”, American Journal of
Enology and Viticulture, 50, pp. 107-119
Bisson, L. F. (2004) “The Biotechnology of Wine Yeast”, Food Biotechnology, 18,
pp. 63-96.
Bond, U., and Blomberg, A. (2006) “Principles and applications of genomics and
proteomics in the analysis of industrial yeast strains”, The Yeast Handbook, pp.
175–213.
Boucherie, H., Dujardin, G., Kermorgant, M., Monribot, C., Slonimski, P., & Perrot,
M. (1995) “Two-dimensional protein map of Saccharomyces cerevisiae:
Construction of a gene-protein index”, Yeast, 11(7), pp. 601–613.
Braconi, D., Amato, L., Bernardini, G., Arena, S., Orlandini, M., Scaloni, A., and
Santucci, A. (2011) “Surfome analysis of a wild-type wine Saccharomyces
cerevisiae strain”, Food Microbiology, 28(6), pp. 1220–1230.
Branco, P., Francisco, D., Chambon, C., Hébraud, M., Arneborg, N., Almeida, M.
G., Albergaria, H. (2014) “Identification of novel GAPDH-derived
antimicrobial peptides secreted by Saccharomyces cerevisiae and involved in
wine microbial interactions”, Applied Microbiology and Biotechnology, 98(2),
pp. 843–853.
68
Esteve-Zarzoso, B., Manzanares, P., Ramón, D., Querol, A. (1998) “The role of non-
Saccharomyces yeasts in industrial winemaking”, Internatl Microbiol, 1, pp.
143–148.
Cézard, C., Silva-pires, V., Mullié, C., and Sonnet, P. (2011) “ Antibacterial
peptides: A review”, in A. Méndez-Vilas (Ed), Science against microbial
pathogens: communicating current research and technological advances, pp.
926–937.
Chen, W. B., Han, Y. F., Jong, S. C., & Chang, S. C. (2000) “Isolation, purification,
and characterization of a killer protein from Schwanniomyces occidentalis”,
Applied and Environmental Microbiology, 66(12), pp. 5348–52.
Chi, Z. and Arneborg, N. (2000) “Saccharomyces cerevisiae strains with different
degrees of ethanol tolerance exhibit different adaptive responses to produced
etanol”, Journal of Industrial Microbiology and Biotechnology, 24, pp. 75–78.
Cole, A. M., and Ganz, T. (2000) “Human antimicrobial peptides: Analysis and
application”, BioTechniques, 29(4), pp. 822–831.
Comitini, F., Ferretti, R., Clementi, F., Mannazzu, I., Ciani, M. (2005) “Interactions
between Saccharomyces cerevisiae and malolactic bacteria: preliminary
characterization of a yeast proteinaceous compound(s) active against
Oenococcus oeni”, Journal of Applied Microbiology, 99, pp. 105–111.
Cummins, P. M., Dowling, O., and O’Connor, B. F. (2011) “Ion-exchange
chromatography: basic principles and application to the partial purification of
soluble mammalian prolyl oligopeptidase”, Methods in Molecular Biology,
681, pp. 215–228.
Dang, X.-L., Tian, J.-H., Yi, H.-Y., Wang, W.-X., Zheng, M., Li, Y.-F., Wen, S.-Y.
(2006) “Inducing and isolation of antibacterial peptides from oriental fruit fly,
Bactrocera dorsalis Hendel”, Insect Science, 13(4), pp. 257–262.
Deak, T., (1998) “Biodiversity of yeasts in man-made environments”, Food
Technology and Biotechnology, 36, pp. 279-283.
Delgado, M. L., Gil, M. L., & Gozalbo, D. (2003) “Candida albicans TDH3 gene
promotes secretion of internal invertase when expressed in Saccharomyces
cerevisiae as a glyceraldehyde-3-phosphate dehydrogenase-invertase fusion
protein”, Yeast, 20(8), pp. 713–722.
Delom, F., Szponarski, W., Sommerer, N., Boyer, J. C., Bruneau, J. M., Rossignol,
M., and Gibrat, R. (2006) “The plasma membrane proteome of Saccharomyces
69
cerevisiae and its response to the antifungal calcofluor”, Proteomics, 6(10), pp.
3029–3039.
El-Aneed, A., Cohen, A., & Banoub, J. (2009) “Mass Spectrometry, review of the
basics: electrospray, MALDI, and commonly used mass analyzers”, Applied
Spectroscopy Reviews, 44(3), pp. 210–230.
Fleet, G. (2003) “Yeast interactions and wine flavour”, International Journal of
Food Microbiology, 86(1-2), pp.11–22.
Heard, G. M., and Fleet, G. H. (1985) “Growth of natural yeast flora during the
fermentation of inoculated wines”, Applied and Environmental Microbiology,
50(3), 727–728.
Gimeno C. J., Ljungdahl P. O., Styles C. A.,. Fink G. R (1992) “Unipolar cell
divisions in the yeast S. cerevisiae lead to filamentous growth: Regulation by
starvation and RAS”, Cell, 68(6), pp. 1077-90.
Kurtzman, C. P. and Piškur J. (2005) “Taxonomy and phylogenetic diversity among
the yeasts “ , Topics in Current Genetics, 15, pp. 29-46
Fleet, G.H. and Heard, G.M. (1993) “Yeast growth during fermentation”, in Fleet,
G.H. (Ed), Wine Microbiology and Biotechnology, pp. 27-54, Harwood
Academic Publishers, Switzerland,
Frezier, V. and Dubourdieu, D. (1992) “Ecology of yeast strain Sacchaomyces
cerevisiae during spontaneous AF in a Bordeaux winery”, American Journal of
Enology and Viticulture, 43, pp.375-380.
Gao, C.X. and Fleet, G.H., (1988) “The effects of temperature and PH on the ethanol
tolerance of the wine yeasts, Saccharomyces cerevisiae, Candida stellata and
Kloeckera apiculata”, Journal of Applied Bacteriology, 65, pp. 405-409.
Garrels, J. I., McLaughlin, C. S., Warner, J. R., Futcher, B., Latter, G. I., Kobayashi,
R., Payne, W. E. (1997) “Proteome studies of Saccharomyces cerevisiae:
Identification and characterization of abundant proteins”, Electrophoresis,
18(8), pp. 1347–1360.
Giardina, B. J., Stanley, B. A, and Chiang, H.L. (2012) “Comparative proteomic
analysis of transition of Saccharomyces cerevisiae from glucose-Deficient
medium to glucose-rich medium”, Proteome Science, 10(1), pp. 40.
Goffeau A., Barrell B.G, Bussey H., Davis R.W., Dujon B., Feldmann, H., Galibert,
F., Hoheisel, J.D, Jacq, C., Johnston, M., Louis, E.J, Mewes, H.W, Murakami,
70
Y., Philippsen, P., Tettelin, H., Oliver, S.G. (1996) “Life with 6000 Genes”,
Science, 274, pp. 546-567.
Hansen, E.H., Nissen, P., Sommer, P., Nielsen, J.C., Arneborg, N., (2001) “The
effect of oxygen on the survival of non-Saccharomyces yeasts during mixed
culture fermentations of grape juice with Saccharomyces cerevisiae”, Journal
of Applied Microbiology, 91, pp. 541-547.
Harris, F., Dennison, S. R., & Phoenix, D. a. (2009) “Anionic antimicrobial peptides
from eukaryotic organisms” Current Protein & Peptide Science, 10(6),pp.
585–606.
Henzel, W. J., Watanabe, C., & Stults, J. T. (2003) “Protein identification: The
origins of peptide mass fingerprinting”, Journal of the American Society for
Mass Spectrometry, 14(9), pp. 931–942.
Izquierdo Cañas, P. M., Garcia Romero, E., Perez Marlin, F., Seseña Prieto, S.,
Heras Manso, J. M., and Palop Herreros, M. L. (2013) “Behaviour during
malolactic fermentation of three strains of oenococcus oeni used as direct
inoculation and acclimatisation cultures”, South African Journal of Enology
and Viticulture, 34(1), pp. 1–9.
Kemsawasd, V., Viana, T., Ardo, Y., Arneborg, N. (2015) “Influence of nitrogen
sources on growth and fermentation performance of different wine yeast
species during alcoholic fermentation”, Appl Microbiol Biotechnol.
Klis, M.A and Boorsma, A. (2006) “Cell wall construction in Saccharomyces
cerevisiae”, Yeast, 23, pp. 185–202.
Klose, J. (1975) “Protein mapping by combined isoelectric focusing and
electrophoresis of mouse tissues. A novel approach to testing for induced point
mutations in mammals”, Humangenetik, 26(3), pp. 231–243.
Kolkman, A., Slijper, M., & Heck, A. J. R. (2005) “Development and application of
proteomics technologies in Saccharomyces cerevisiae”, Trends in
Biotechnology, 23(12), pp. 598–604.
Kong, M., Chen, X. G., Xing, K., & Park, H. J. (2010) “Antimicrobial properties of
chitosan and mode of action: a state of the art review”, International Journal of
Food Microbiology, 144(1), pp. 51–63.
Lambrechts, M. G., and Pretorius, I. S. (2000) “Yeast and its Importance to Wine
Aroma - A Review”, South African Journal of Enology and Viticulture,
21(Special Issue), pp. 97–129.
71
Lerm, E., Engelbrecht, L., and Toit, M. (2010) “Malolactic Fermentation : The ABC
’s of MLF. South African Society for Enology and Viticulture”, 31(2), pp. 186–
212.
Liu, S. Q. (2002) “Malolactic fermentation in wine - Beyond deacidification”,
Journal of Applied Microbiology, 92(4), pp. 589–601.
López-García, B., Lee, P. H. a, & Gallo, R. L. (2006) “Expression and potential
function of cathelicidin antimicrobial peptides in dermatophytosis and tinea
versicolor”, The Journal of Antimicrobial Chemotherapy, 57(5), pp. 877–82.
Loureiro, V., and van Uden, N., (1986) “Roles of the specific growth-rate and the
ethanol concentration in the adaptation of Saccharomyces cerevisiae to etanol”,
Biotechnology and Bioengineering, 28, pp. 1443-1445.
Magdeldin, S., Enany, S., Yoshida, Y., Xu, B., Zhang, Y., Zureena, Z., Yamamoto,
T. (2014) “Basics and recent advances of two dimensional- polyacrylamide gel
electrophoresis”, Clinical Proteomics, 11(1), pp. 16.
Martini, A., Ciani, M., Scorzetti, G. (1996) “Direct enumeration and isolation of
wine yeasts from grape surfaces”, American Journal of Enology and
Viticulture, 47, pp. 435-440.
Mishra, P., and Kaur, S., (1991) “Lipids as modulators of ethanol tolerance in yeast”
Applied Microbiology and Biotechnology, 34, pp. 697-702.
Mortimer, R. and Polsinelli, M. (1999) “On the origins of wine yeast”, Research in
Microbiology, 150, pp. 199-204.
Nissen, P. and Arneborg, N. (2003) “Characterization of early death of non-
Saccharomyces yeasts in mixed cultures with Saccharomyces cerevisiae”,
Archives on Microbiology, 180, pp. 257-263.
Nissen, P., Nielsen, D., Arneborg N. (2003) “Viable Saccharomyces cerevisiae cells
at high concentrations cause early growth arrest of non-Saccharomyces yeasts
in mixed cultures by a cell-cell contact-mediated mechanism”, Yeast, 20, pp.
331-341.
O’Farrell, P. H. (1975) “High resolution two-dimensional electrophoresis of
proteins”, The Journal of Biological Chemistry, 250(10), pp. 4007–4021.
Osborne, J.P. and Edwards, C.G (2007) “Inhibition of malolactic fermentation by a
peptide produced by Saccharomyces cerevisiae during alcoholic fermentation”,
International Journal of Food Microbiology, 118, pp. 27–34.
72
Pardo, M., Monteoliva, L., Pla, J., Sánchez, M., Gil, C. and Nombela, C. (1999)
“Two-dimensional analysis of proteins secreted by Saccharomyces cerevisiae
regenerating protoplasts: A novel approach to study the cell wall”, Yeast, 15,
pp. 459–472.
Pardo, M., Ward, M., Bains, S., Molina, M., Blackstock, W., Gil, C. and Nombela,
C. (2000) “A proteomic approach for the study of Saccharomyces cerevisiae
cell wall biogenesis”, Proteomics and 2-DE, 21, pp. 3396–3410.
Pérez-Nevado, F., Albergaria H., Hogg T., Girio F. (2006) “Cellular death of two
non-Saccharomyces wine-related yeasts during mixed fermentations with
Saccharomyces cerevisiae”, International Journal of Food Microbiology, 108,
pp. 336–345.
Perrot, M., Sagliocco, F., Mann, M., & Jenö, P. (1999) “Two-dimensional gel protein
database of Saccharomyces cerevisiae”,Molecular Biology, pp. 2280–2298.
Pham, T. K., Wright, P. C. (2007) “Proteomic analysis of Saccharomyces
cerevisiae”, Expert Rev Proteomics, 4(6), pp. 793-813.
Pina, C., Santos, C., Couto, J.A., Hogg, T., (2004) “Ethanol tolerance of five non-
Saccharomyces wine yeasts in comparison with a strain of Saccharomyces
cerevisiae - influence of different culture conditions”, Food Microbiology, 21,
pp. 439-447.
Piper, P.W., Talreja, K., Panaretou, B., Moradas-Ferreira, P., Byrne, K., Praekelt,
U.M., Meacock, P., Boucherie, H., (1994) “Induction of major heat-shock
proteins of Saccharomyces cerevisiae, including plasma membrane Hsp30, by
ethanol levels above a critical threshold”, Microbiology, 140, pp. 3031-3038.
Pretorius I.S. (2000) “Tailoring wine yeast for the new millennium: novel
approaches to the ancient art of winemaking”, Yeast, 16, pp. 677-729.
Primrose, S.B. and Twyman, R. M. (2006) “Principles of gene manipulation and
genomics”, 7th edition, Blackwell Publishing, MA,USA
Rabilloud, T., Chevallet, M., Luche, S., & Lelong, C. (2010) “Two-dimensional gel
electrophoresis in proteomics: Past, present and future”, Journal of Proteomics,
73(11), pp. 2064–2077.
Renaults, P. E., Albertin W., Bely, M (2013) “An innovative tool reveals interaction
mechanisms among yeast populations under oenological conditions”, Appl
Microbiol Biotechnol, 97(9), pp. 4105-4119.

73
Romano, P. Fiore, C., Paraggio, M., Caruso, M., Capece A. (2003) “Function of
yeast species and strains in wine flavour”, International Jounarl of Food
Microbiology, 86 , pp. 169-180.
Sabate, J., Cano, J., Esteve-Zarzoso, B., Guillamon, J.M. (2002) “Isolation and
identification of yeasts associated with vineyard and winery by RFLP analysis
of ribosomal genes and mitochondrial DNA”, Microbiological Research, 157,
pp. 267–274.
Sajbidor J., (1997) “Effect of some environmental factors on the content and
composition of microbial membrane lipids”, Critical Reviews in
Biotechnology, 17, pp. 87-103.
Salusjarvi, L., Poutanen, M., Pitkanen, JP., Koivistoinen, H., Aristidou, A.,
Kalkkinen, N., Ruohonen, L., Penttila, M. (2003) “Proteome analysis of
recombinant xylose-fermenting Saccharomyces cerevisiae”,Yeast, 20(4), pp.
295-314
Sanchez, J., Golaz, O., Schalel, D., Appel, R. D., Bairoch, A., Hughes, G. J. (1996)
“The yeast SWISS-2DPAGE database”, Electrophoresis, 17, pp. 556–565.
Schmitt, M.J., Breinig, F., (2002) “The viral killer system in yeast: from molecular
biology to application”, FEMS Microbiol.Rev, 26, pp. 257-276.
Shevchenko, a, Jensen, O. N., Podtelejnikov, a V, Sagliocco, F., Wilm, M., Vorm,
O., Mann, M. (1996) “Linking genome and proteome by mass spectrometry:
large-scale identification of yeast proteins from two dimensional gels”,
Proceedings of the National Academy of Sciences of the United States of
America, 93(25), pp. 14440–14445.
Silva, A, Almeida, B., Sampaio-Marques, B., Reis, M. I. R., Ohlmeier, S., Rodrigues,
F., Ludovico, P. (2011) Glyceraldehyde-3-phosphate dehydrogenase (GAPDH)
is a specific substrate of yeast metacaspase”, Biochimica et Biophysica Acta,
1813(12), pp. 2044–2049.
Thiede, B., Höhenwarter, W., Krah, A., Mattow, J., Schmid, M., Schmidt, F., &
Jungblut, P. R. (2005) “Peptide mass fingerprinting”, Methods, 35, pp. 237–
247.
Van Leeuwen, C. C. M., Postma, E., Van den Broek, P. J. a, and Van Steveninck, J.
(1991) “Proton-motive force-driven D-galactose transport in plasma membrane
vesicles from the yeast Kluyveromyces marxianus”, Journal of Biological
Chemistry, 266 (19), pp. 12146–12151.

74
Vaughan-Martini, A. and Martini, A., (1995) “Facts, myths and legends on the prime
industrial microorganism”, Journal of Industrial Microbiology , 14, pp. 514-
522.
Vera Pingitore. E., Salvucci, E., Sesma, F., Nader-Macías M. E. (2007) “Different
strategies for purification of antimicrobial peptides from Lactic Acid Bacteria
(LAB)”, in A. Méndez-Villas (Ed), Communicating Current Research and
Educational Topics and Trends in Applied Microbiology, pp. 557–568.
Wildgruber, R., Reil, G., Drews, O., Parlar, H., & Görg, A. (2002) “Web-based two-
dimensional database of Saccharomyces cerevisiae proteins using immobilized
pH gradients from pH 6 to pH 12 and matrix-assisted laser
desorption/ionization-time of flight mass spectrometry”, Proteomics, 2(6), pp.
727–732.
Yin, Z., Stead, D., Selway, L., Walker, J., Riba-Garcia, I., McLnerney, T., Gaskell,
S., Oliver, S. G., Cash, P., Brown, A. (2004) “Proteomic response to amino
acid starvation in Candida albicans and Saccharomyces cerevisiae”,
Proteomics, 4(8), pp. 2425-36.
Zasloff, M. (1987) “Magainins, a class of antimicrobial peptides from Xenopus skin:
isolation, characterization of two active forms, and partial cDNA sequence of a
precursor”, Proceedings of the National Academy of Sciences of the United
States of America, 84(15), pp. 5449–5453.
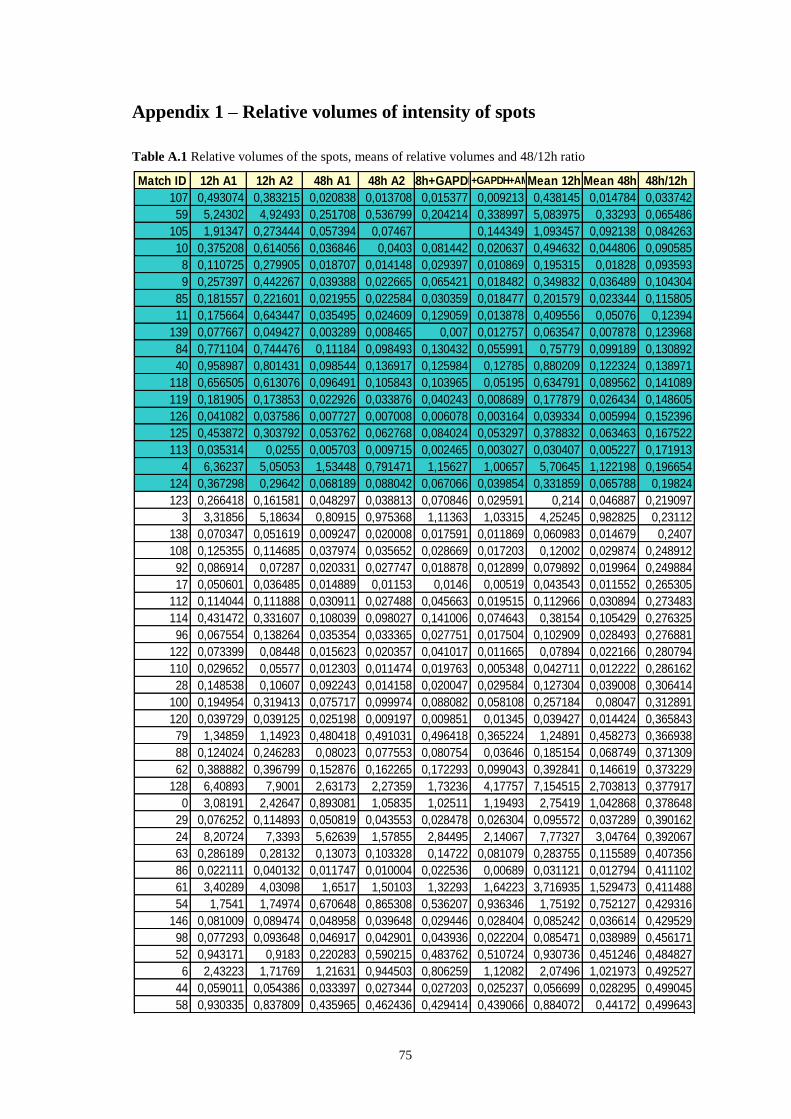
75
Appendix 1 – Relative volumes of intensity of spots
Table A.1 Relative volumes of the spots, means of relative volumes and 48/12h ratio
Match ID 12h A1 12h A2 48h A1 48h A2 48h+GAPDH48h+GAPDH+AMPsMean 12h Mean 48h 48h/12h
107 0,493074 0,383215 0,020838 0,013708 0,015377 0,009213 0,438145 0,014784 0,033742
59 5,24302 4,92493 0,251708 0,536799 0,204214 0,338997 5,083975 0,33293 0,065486
105 1,91347 0,273444 0,057394 0,07467 0,144349 1,093457 0,092138 0,084263
10 0,375208 0,614056 0,036846 0,0403 0,081442 0,020637 0,494632 0,044806 0,090585
8 0,110725 0,279905 0,018707 0,014148 0,029397 0,010869 0,195315 0,01828 0,093593
9 0,257397 0,442267 0,039388 0,022665 0,065421 0,018482 0,349832 0,036489 0,104304
85 0,181557 0,221601 0,021955 0,022584 0,030359 0,018477 0,201579 0,023344 0,115805
11 0,175664 0,643447 0,035495 0,024609 0,129059 0,013878 0,409556 0,05076 0,12394
139 0,077667 0,049427 0,003289 0,008465 0,007 0,012757 0,063547 0,007878 0,123968
84 0,771104 0,744476 0,11184 0,098493 0,130432 0,055991 0,75779 0,099189 0,130892
40 0,958987 0,801431 0,098544 0,136917 0,125984 0,12785 0,880209 0,122324 0,138971
118 0,656505 0,613076 0,096491 0,105843 0,103965 0,05195 0,634791 0,089562 0,141089
119 0,181905 0,173853 0,022926 0,033876 0,040243 0,008689 0,177879 0,026434 0,148605
126 0,041082 0,037586 0,007727 0,007008 0,006078 0,003164 0,039334 0,005994 0,152396
125 0,453872 0,303792 0,053762 0,062768 0,084024 0,053297 0,378832 0,063463 0,167522
113 0,035314 0,0255 0,005703 0,009715 0,002465 0,003027 0,030407 0,005227 0,171913
4 6,36237 5,05053 1,53448 0,791471 1,15627 1,00657 5,70645 1,122198 0,196654
124 0,367298 0,29642 0,068189 0,088042 0,067066 0,039854 0,331859 0,065788 0,19824
123 0,266418 0,161581 0,048297 0,038813 0,070846 0,029591 0,214 0,046887 0,219097
3 3,31856 5,18634 0,80915 0,975368 1,11363 1,03315 4,25245 0,982825 0,23112
138 0,070347 0,051619 0,009247 0,020008 0,017591 0,011869 0,060983 0,014679 0,2407
108 0,125355 0,114685 0,037974 0,035652 0,028669 0,017203 0,12002 0,029874 0,248912
92 0,086914 0,07287 0,020331 0,027747 0,018878 0,012899 0,079892 0,019964 0,249884
17 0,050601 0,036485 0,014889 0,01153 0,0146 0,00519 0,043543 0,011552 0,265305
112 0,114044 0,111888 0,030911 0,027488 0,045663 0,019515 0,112966 0,030894 0,273483
114 0,431472 0,331607 0,108039 0,098027 0,141006 0,074643 0,38154 0,105429 0,276325
96 0,067554 0,138264 0,035354 0,033365 0,027751 0,017504 0,102909 0,028493 0,276881
122 0,073399 0,08448 0,015623 0,020357 0,041017 0,011665 0,07894 0,022166 0,280794
110 0,029652 0,05577 0,012303 0,011474 0,019763 0,005348 0,042711 0,012222 0,286162
28 0,148538 0,10607 0,092243 0,014158 0,020047 0,029584 0,127304 0,039008 0,306414
100 0,194954 0,319413 0,075717 0,099974 0,088082 0,058108 0,257184 0,08047 0,312891
120 0,039729 0,039125 0,025198 0,009197 0,009851 0,01345 0,039427 0,014424 0,365843
79 1,34859 1,14923 0,480418 0,491031 0,496418 0,365224 1,24891 0,458273 0,366938
88 0,124024 0,246283 0,08023 0,077553 0,080754 0,03646 0,185154 0,068749 0,371309
62 0,388882 0,396799 0,152876 0,162265 0,172293 0,099043 0,392841 0,146619 0,373229
128 6,40893 7,9001 2,63173 2,27359 1,73236 4,17757 7,154515 2,703813 0,377917
0 3,08191 2,42647 0,893081 1,05835 1,02511 1,19493 2,75419 1,042868 0,378648
29 0,076252 0,114893 0,050819 0,043553 0,028478 0,026304 0,095572 0,037289 0,390162
24 8,20724 7,3393 5,62639 1,57855 2,84495 2,14067 7,77327 3,04764 0,392067
63 0,286189 0,28132 0,13073 0,103328 0,14722 0,081079 0,283755 0,115589 0,407356
86 0,022111 0,040132 0,011747 0,010004 0,022536 0,00689 0,031121 0,012794 0,411102
61 3,40289 4,03098 1,6517 1,50103 1,32293 1,64223 3,716935 1,529473 0,411488
54 1,7541 1,74974 0,670648 0,865308 0,536207 0,936346 1,75192 0,752127 0,429316
146 0,081009 0,089474 0,048958 0,039648 0,029446 0,028404 0,085242 0,036614 0,429529
98 0,077293 0,093648 0,046917 0,042901 0,043936 0,022204 0,085471 0,038989 0,456171
52 0,943171 0,9183 0,220283 0,590215 0,483762 0,510724 0,930736 0,451246 0,484827
6 2,43223 1,71769 1,21631 0,944503 0,806259 1,12082 2,07496 1,021973 0,492527
44 0,059011 0,054386 0,033397 0,027344 0,027203 0,025237 0,056699 0,028295 0,499045
58 0,930335 0,837809 0,435965 0,462436 0,429414 0,439066 0,884072 0,44172 0,499643
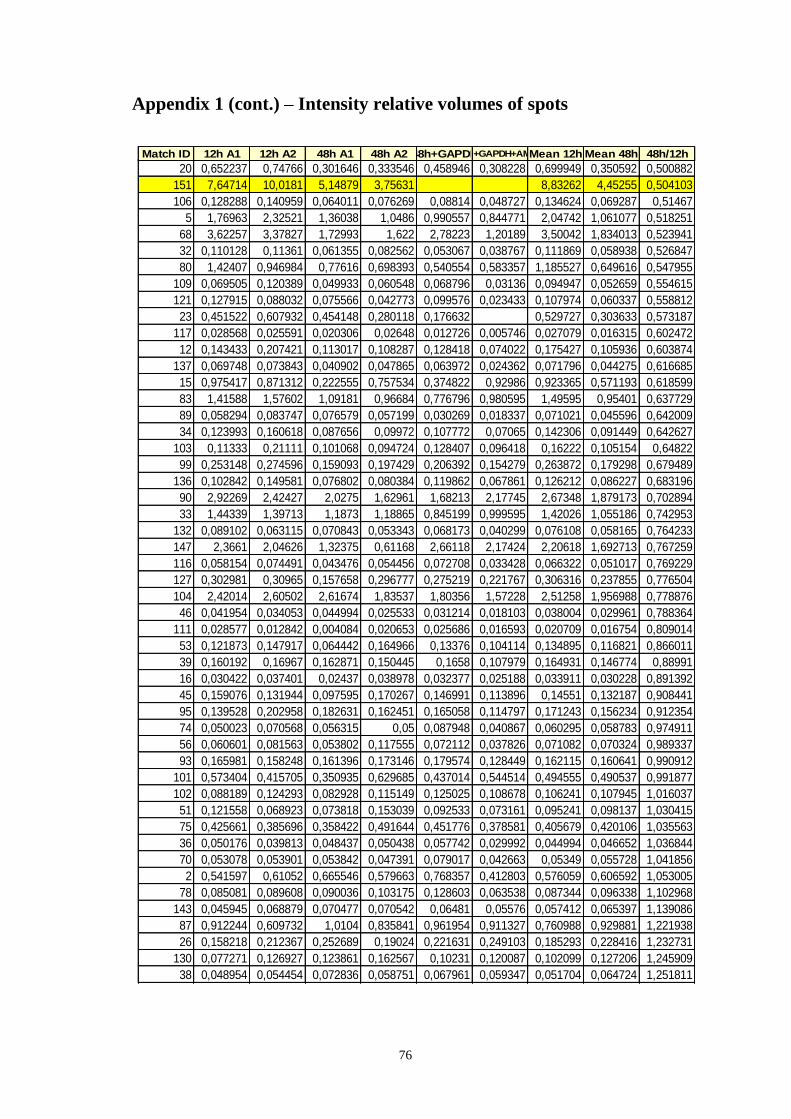
76
Appendix 1 (cont.) – Intensity relative volumes of spots
20 0,652237 0,74766 0,301646 0,333546 0,458946 0,308228 0,699949 0,350592 0,500882
151 7,64714 10,0181 5,14879 3,75631 8,83262 4,45255 0,504103
106 0,128288 0,140959 0,064011 0,076269 0,08814 0,048727 0,134624 0,069287 0,51467
5 1,76963 2,32521 1,36038 1,0486 0,990557 0,844771 2,04742 1,061077 0,518251
68 3,62257 3,37827 1,72993 1,622 2,78223 1,20189 3,50042 1,834013 0,523941
32 0,110128 0,11361 0,061355 0,082562 0,053067 0,038767 0,111869 0,058938 0,526847
80 1,42407 0,946984 0,77616 0,698393 0,540554 0,583357 1,185527 0,649616 0,547955
109 0,069505 0,120389 0,049933 0,060548 0,068796 0,03136 0,094947 0,052659 0,554615
121 0,127915 0,088032 0,075566 0,042773 0,099576 0,023433 0,107974 0,060337 0,558812
23 0,451522 0,607932 0,454148 0,280118 0,176632 0,529727 0,303633 0,573187
117 0,028568 0,025591 0,020306 0,02648 0,012726 0,005746 0,027079 0,016315 0,602472
12 0,143433 0,207421 0,113017 0,108287 0,128418 0,074022 0,175427 0,105936 0,603874
137 0,069748 0,073843 0,040902 0,047865 0,063972 0,024362 0,071796 0,044275 0,616685
15 0,975417 0,871312 0,222555 0,757534 0,374822 0,92986 0,923365 0,571193 0,618599
83 1,41588 1,57602 1,09181 0,96684 0,776796 0,980595 1,49595 0,95401 0,637729
89 0,058294 0,083747 0,076579 0,057199 0,030269 0,018337 0,071021 0,045596 0,642009
34 0,123993 0,160618 0,087656 0,09972 0,107772 0,07065 0,142306 0,091449 0,642627
103 0,11333 0,21111 0,101068 0,094724 0,128407 0,096418 0,16222 0,105154 0,64822
99 0,253148 0,274596 0,159093 0,197429 0,206392 0,154279 0,263872 0,179298 0,679489
136 0,102842 0,149581 0,076802 0,080384 0,119862 0,067861 0,126212 0,086227 0,683196
90 2,92269 2,42427 2,0275 1,62961 1,68213 2,17745 2,67348 1,879173 0,702894
33 1,44339 1,39713 1,1873 1,18865 0,845199 0,999595 1,42026 1,055186 0,742953
132 0,089102 0,063115 0,070843 0,053343 0,068173 0,040299 0,076108 0,058165 0,764233
147 2,3661 2,04626 1,32375 0,61168 2,66118 2,17424 2,20618 1,692713 0,767259
116 0,058154 0,074491 0,043476 0,054456 0,072708 0,033428 0,066322 0,051017 0,769229
127 0,302981 0,30965 0,157658 0,296777 0,275219 0,221767 0,306316 0,237855 0,776504
104 2,42014 2,60502 2,61674 1,83537 1,80356 1,57228 2,51258 1,956988 0,778876
46 0,041954 0,034053 0,044994 0,025533 0,031214 0,018103 0,038004 0,029961 0,788364
111 0,028577 0,012842 0,004084 0,020653 0,025686 0,016593 0,020709 0,016754 0,809014
53 0,121873 0,147917 0,064442 0,164966 0,13376 0,104114 0,134895 0,116821 0,866011
39 0,160192 0,16967 0,162871 0,150445 0,1658 0,107979 0,164931 0,146774 0,88991
16 0,030422 0,037401 0,02437 0,038978 0,032377 0,025188 0,033911 0,030228 0,891392
45 0,159076 0,131944 0,097595 0,170267 0,146991 0,113896 0,14551 0,132187 0,908441
95 0,139528 0,202958 0,182631 0,162451 0,165058 0,114797 0,171243 0,156234 0,912354
74 0,050023 0,070568 0,056315 0,05 0,087948 0,040867 0,060295 0,058783 0,974911
56 0,060601 0,081563 0,053802 0,117555 0,072112 0,037826 0,071082 0,070324 0,989337
93 0,165981 0,158248 0,161396 0,173146 0,179574 0,128449 0,162115 0,160641 0,990912
101 0,573404 0,415705 0,350935 0,629685 0,437014 0,544514 0,494555 0,490537 0,991877
102 0,088189 0,124293 0,082928 0,115149 0,125025 0,108678 0,106241 0,107945 1,016037
51 0,121558 0,068923 0,073818 0,153039 0,092533 0,073161 0,095241 0,098137 1,030415
75 0,425661 0,385696 0,358422 0,491644 0,451776 0,378581 0,405679 0,420106 1,035563
36 0,050176 0,039813 0,048437 0,050438 0,057742 0,029992 0,044994 0,046652 1,036844
70 0,053078 0,053901 0,053842 0,047391 0,079017 0,042663 0,05349 0,055728 1,041856
2 0,541597 0,61052 0,665546 0,579663 0,768357 0,412803 0,576059 0,606592 1,053005
78 0,085081 0,089608 0,090036 0,103175 0,128603 0,063538 0,087344 0,096338 1,102968
143 0,045945 0,068879 0,070477 0,070542 0,06481 0,05576 0,057412 0,065397 1,139086
87 0,912244 0,609732 1,0104 0,835841 0,961954 0,911327 0,760988 0,929881 1,221938
26 0,158218 0,212367 0,252689 0,19024 0,221631 0,249103 0,185293 0,228416 1,232731
130 0,077271 0,126927 0,123861 0,162567 0,10231 0,120087 0,102099 0,127206 1,245909
38 0,048954 0,054454 0,072836 0,058751 0,067961 0,059347 0,051704 0,064724 1,251811
Match ID 12h A1 12h A2 48h A1 48h A2 48h+GAPDH48h+GAPDH+AMPsMean 12h Mean 48h 48h/12h
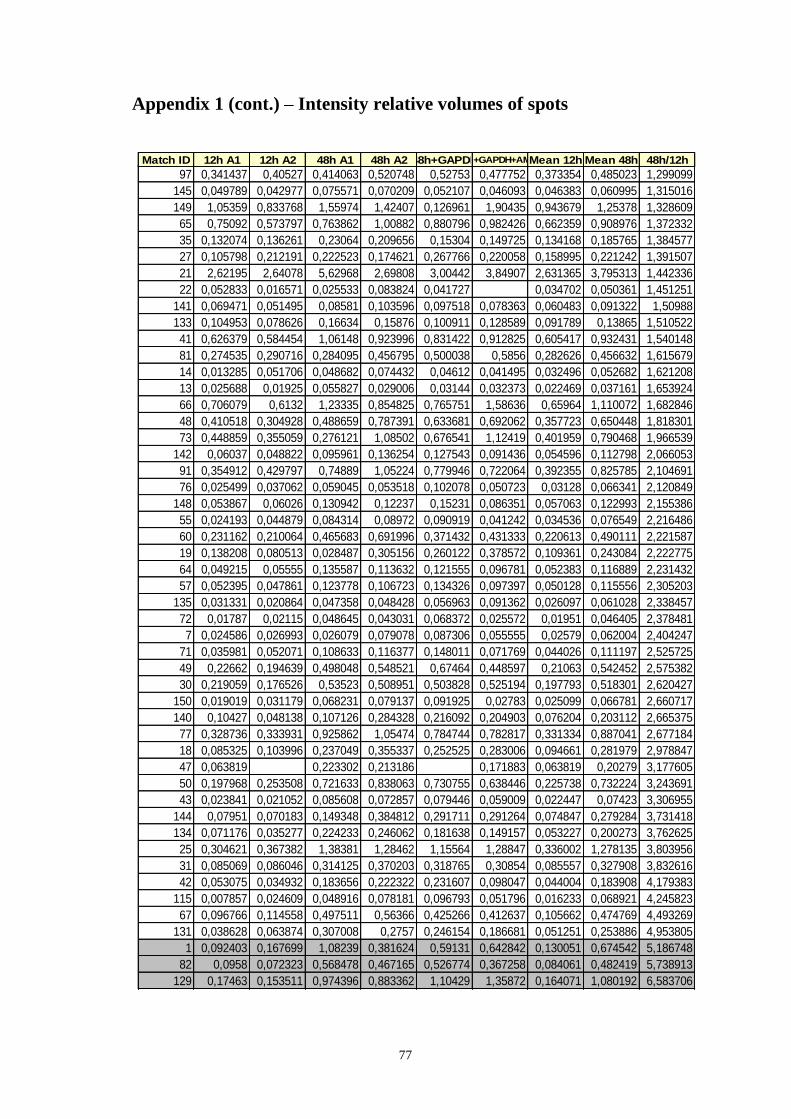
77
Appendix 1 (cont.) – Intensity relative volumes of spots
97 0,341437 0,40527 0,414063 0,520748 0,52753 0,477752 0,373354 0,485023 1,299099
145 0,049789 0,042977 0,075571 0,070209 0,052107 0,046093 0,046383 0,060995 1,315016
149 1,05359 0,833768 1,55974 1,42407 0,126961 1,90435 0,943679 1,25378 1,328609
65 0,75092 0,573797 0,763862 1,00882 0,880796 0,982426 0,662359 0,908976 1,372332
35 0,132074 0,136261 0,23064 0,209656 0,15304 0,149725 0,134168 0,185765 1,384577
27 0,105798 0,212191 0,222523 0,174621 0,267766 0,220058 0,158995 0,221242 1,391507
21 2,62195 2,64078 5,62968 2,69808 3,00442 3,84907 2,631365 3,795313 1,442336
22 0,052833 0,016571 0,025533 0,083824 0,041727 0,034702 0,050361 1,451251
141 0,069471 0,051495 0,08581 0,103596 0,097518 0,078363 0,060483 0,091322 1,50988
133 0,104953 0,078626 0,16634 0,15876 0,100911 0,128589 0,091789 0,13865 1,510522
41 0,626379 0,584454 1,06148 0,923996 0,831422 0,912825 0,605417 0,932431 1,540148
81 0,274535 0,290716 0,284095 0,456795 0,500038 0,5856 0,282626 0,456632 1,615679
14 0,013285 0,051706 0,048682 0,074432 0,04612 0,041495 0,032496 0,052682 1,621208
13 0,025688 0,01925 0,055827 0,029006 0,03144 0,032373 0,022469 0,037161 1,653924
66 0,706079 0,6132 1,23335 0,854825 0,765751 1,58636 0,65964 1,110072 1,682846
48 0,410518 0,304928 0,488659 0,787391 0,633681 0,692062 0,357723 0,650448 1,818301
73 0,448859 0,355059 0,276121 1,08502 0,676541 1,12419 0,401959 0,790468 1,966539
142 0,06037 0,048822 0,095961 0,136254 0,127543 0,091436 0,054596 0,112798 2,066053
91 0,354912 0,429797 0,74889 1,05224 0,779946 0,722064 0,392355 0,825785 2,104691
76 0,025499 0,037062 0,059045 0,053518 0,102078 0,050723 0,03128 0,066341 2,120849
148 0,053867 0,06026 0,130942 0,12237 0,15231 0,086351 0,057063 0,122993 2,155386
55 0,024193 0,044879 0,084314 0,08972 0,090919 0,041242 0,034536 0,076549 2,216486
60 0,231162 0,210064 0,465683 0,691996 0,371432 0,431333 0,220613 0,490111 2,221587
19 0,138208 0,080513 0,028487 0,305156 0,260122 0,378572 0,109361 0,243084 2,222775
64 0,049215 0,05555 0,135587 0,113632 0,121555 0,096781 0,052383 0,116889 2,231432
57 0,052395 0,047861 0,123778 0,106723 0,134326 0,097397 0,050128 0,115556 2,305203
135 0,031331 0,020864 0,047358 0,048428 0,056963 0,091362 0,026097 0,061028 2,338457
72 0,01787 0,02115 0,048645 0,043031 0,068372 0,025572 0,01951 0,046405 2,378481
7 0,024586 0,026993 0,026079 0,079078 0,087306 0,055555 0,02579 0,062004 2,404247
71 0,035981 0,052071 0,108633 0,116377 0,148011 0,071769 0,044026 0,111197 2,525725
49 0,22662 0,194639 0,498048 0,548521 0,67464 0,448597 0,21063 0,542452 2,575382
30 0,219059 0,176526 0,53523 0,508951 0,503828 0,525194 0,197793 0,518301 2,620427
150 0,019019 0,031179 0,068231 0,079137 0,091925 0,02783 0,025099 0,066781 2,660717
140 0,10427 0,048138 0,107126 0,284328 0,216092 0,204903 0,076204 0,203112 2,665375
77 0,328736 0,333931 0,925862 1,05474 0,784744 0,782817 0,331334 0,887041 2,677184
18 0,085325 0,103996 0,237049 0,355337 0,252525 0,283006 0,094661 0,281979 2,978847
47 0,063819 0,223302 0,213186 0,171883 0,063819 0,20279 3,177605
50 0,197968 0,253508 0,721633 0,838063 0,730755 0,638446 0,225738 0,732224 3,243691
43 0,023841 0,021052 0,085608 0,072857 0,079446 0,059009 0,022447 0,07423 3,306955
144 0,07951 0,070183 0,149348 0,384812 0,291711 0,291264 0,074847 0,279284 3,731418
134 0,071176 0,035277 0,224233 0,246062 0,181638 0,149157 0,053227 0,200273 3,762625
25 0,304621 0,367382 1,38381 1,28462 1,15564 1,28847 0,336002 1,278135 3,803956
31 0,085069 0,086046 0,314125 0,370203 0,318765 0,30854 0,085557 0,327908 3,832616
42 0,053075 0,034932 0,183656 0,222322 0,231607 0,098047 0,044004 0,183908 4,179383
115 0,007857 0,024609 0,048916 0,078181 0,096793 0,051796 0,016233 0,068921 4,245823
67 0,096766 0,114558 0,497511 0,56366 0,425266 0,412637 0,105662 0,474769 4,493269
131 0,038628 0,063874 0,307008 0,2757 0,246154 0,186681 0,051251 0,253886 4,953805
1 0,092403 0,167699 1,08239 0,381624 0,59131 0,642842 0,130051 0,674542 5,186748
82 0,0958 0,072323 0,568478 0,467165 0,526774 0,367258 0,084061 0,482419 5,738913
129 0,17463 0,153511 0,974396 0,883362 1,10429 1,35872 0,164071 1,080192 6,583706
Match ID 12h A1 12h A2 48h A1 48h A2 48h+GAPDH48h+GAPDH+AMPsMean 12h Mean 48h 48h/12h
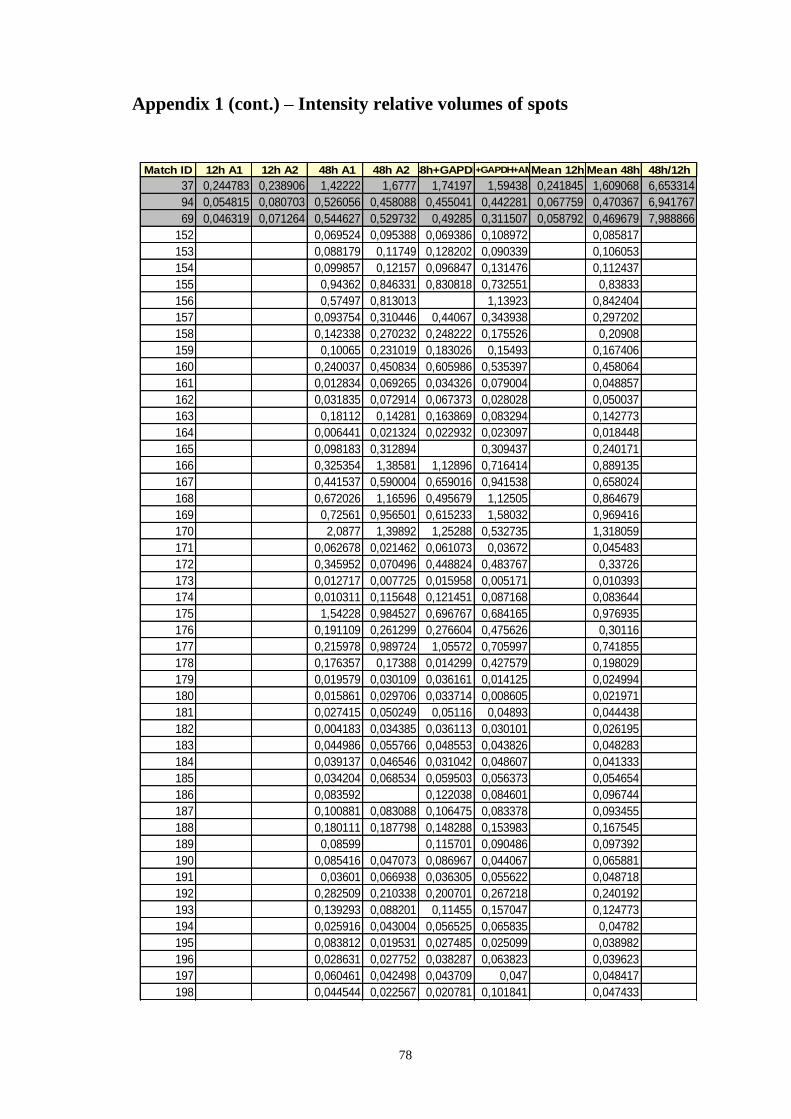
78
Appendix 1 (cont.) – Intensity relative volumes of spots
37 0,244783 0,238906 1,42222 1,6777 1,74197 1,59438 0,241845 1,609068 6,653314
94 0,054815 0,080703 0,526056 0,458088 0,455041 0,442281 0,067759 0,470367 6,941767
69 0,046319 0,071264 0,544627 0,529732 0,49285 0,311507 0,058792 0,469679 7,988866
152 0,069524 0,095388 0,069386 0,108972 0,085817
153 0,088179 0,11749 0,128202 0,090339 0,106053
154 0,099857 0,12157 0,096847 0,131476 0,112437
155 0,94362 0,846331 0,830818 0,732551 0,83833
156 0,57497 0,813013 1,13923 0,842404
157 0,093754 0,310446 0,44067 0,343938 0,297202
158 0,142338 0,270232 0,248222 0,175526 0,20908
159 0,10065 0,231019 0,183026 0,15493 0,167406
160 0,240037 0,450834 0,605986 0,535397 0,458064
161 0,012834 0,069265 0,034326 0,079004 0,048857
162 0,031835 0,072914 0,067373 0,028028 0,050037
163 0,18112 0,14281 0,163869 0,083294 0,142773
164 0,006441 0,021324 0,022932 0,023097 0,018448
165 0,098183 0,312894 0,309437 0,240171
166 0,325354 1,38581 1,12896 0,716414 0,889135
167 0,441537 0,590004 0,659016 0,941538 0,658024
168 0,672026 1,16596 0,495679 1,12505 0,864679
169 0,72561 0,956501 0,615233 1,58032 0,969416
170 2,0877 1,39892 1,25288 0,532735 1,318059
171 0,062678 0,021462 0,061073 0,03672 0,045483
172 0,345952 0,070496 0,448824 0,483767 0,33726
173 0,012717 0,007725 0,015958 0,005171 0,010393
174 0,010311 0,115648 0,121451 0,087168 0,083644
175 1,54228 0,984527 0,696767 0,684165 0,976935
176 0,191109 0,261299 0,276604 0,475626 0,30116
177 0,215978 0,989724 1,05572 0,705997 0,741855
178 0,176357 0,17388 0,014299 0,427579 0,198029
179 0,019579 0,030109 0,036161 0,014125 0,024994
180 0,015861 0,029706 0,033714 0,008605 0,021971
181 0,027415 0,050249 0,05116 0,04893 0,044438
182 0,004183 0,034385 0,036113 0,030101 0,026195
183 0,044986 0,055766 0,048553 0,043826 0,048283
184 0,039137 0,046546 0,031042 0,048607 0,041333
185 0,034204 0,068534 0,059503 0,056373 0,054654
186 0,083592 0,122038 0,084601 0,096744
187 0,100881 0,083088 0,106475 0,083378 0,093455
188 0,180111 0,187798 0,148288 0,153983 0,167545
189 0,08599 0,115701 0,090486 0,097392
190 0,085416 0,047073 0,086967 0,044067 0,065881
191 0,03601 0,066938 0,036305 0,055622 0,048718
192 0,282509 0,210338 0,200701 0,267218 0,240192
193 0,139293 0,088201 0,11455 0,157047 0,124773
194 0,025916 0,043004 0,056525 0,065835 0,04782
195 0,083812 0,019531 0,027485 0,025099 0,038982
196 0,028631 0,027752 0,038287 0,063823 0,039623
197 0,060461 0,042498 0,043709 0,047 0,048417
198 0,044544 0,022567 0,020781 0,101841 0,047433
Match ID 12h A1 12h A2 48h A1 48h A2 48h+GAPDH48h+GAPDH+AMPsMean 12h Mean 48h 48h/12h
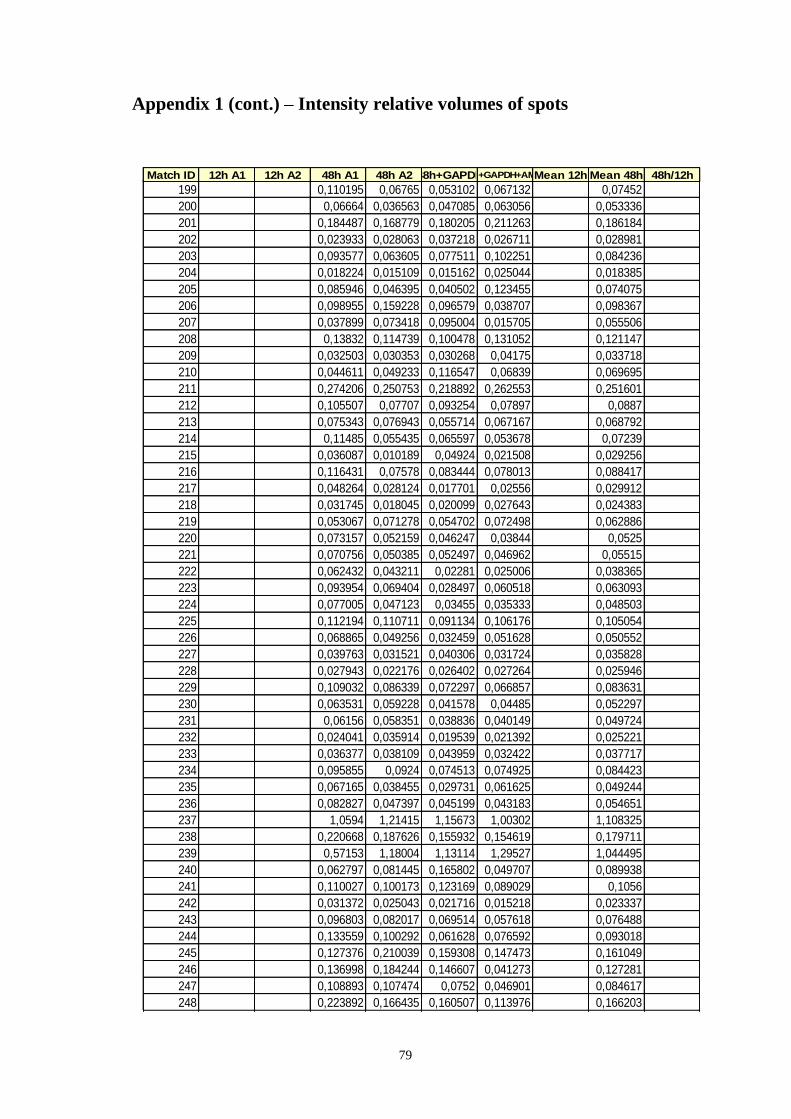
79
Appendix 1 (cont.) – Intensity relative volumes of spots
199 0,110195 0,06765 0,053102 0,067132 0,07452
200 0,06664 0,036563 0,047085 0,063056 0,053336
201 0,184487 0,168779 0,180205 0,211263 0,186184
202 0,023933 0,028063 0,037218 0,026711 0,028981
203 0,093577 0,063605 0,077511 0,102251 0,084236
204 0,018224 0,015109 0,015162 0,025044 0,018385
205 0,085946 0,046395 0,040502 0,123455 0,074075
206 0,098955 0,159228 0,096579 0,038707 0,098367
207 0,037899 0,073418 0,095004 0,015705 0,055506
208 0,13832 0,114739 0,100478 0,131052 0,121147
209 0,032503 0,030353 0,030268 0,04175 0,033718
210 0,044611 0,049233 0,116547 0,06839 0,069695
211 0,274206 0,250753 0,218892 0,262553 0,251601
212 0,105507 0,07707 0,093254 0,07897 0,0887
213 0,075343 0,076943 0,055714 0,067167 0,068792
214 0,11485 0,055435 0,065597 0,053678 0,07239
215 0,036087 0,010189 0,04924 0,021508 0,029256
216 0,116431 0,07578 0,083444 0,078013 0,088417
217 0,048264 0,028124 0,017701 0,02556 0,029912
218 0,031745 0,018045 0,020099 0,027643 0,024383
219 0,053067 0,071278 0,054702 0,072498 0,062886
220 0,073157 0,052159 0,046247 0,03844 0,0525
221 0,070756 0,050385 0,052497 0,046962 0,05515
222 0,062432 0,043211 0,02281 0,025006 0,038365
223 0,093954 0,069404 0,028497 0,060518 0,063093
224 0,077005 0,047123 0,03455 0,035333 0,048503
225 0,112194 0,110711 0,091134 0,106176 0,105054
226 0,068865 0,049256 0,032459 0,051628 0,050552
227 0,039763 0,031521 0,040306 0,031724 0,035828
228 0,027943 0,022176 0,026402 0,027264 0,025946
229 0,109032 0,086339 0,072297 0,066857 0,083631
230 0,063531 0,059228 0,041578 0,04485 0,052297
231 0,06156 0,058351 0,038836 0,040149 0,049724
232 0,024041 0,035914 0,019539 0,021392 0,025221
233 0,036377 0,038109 0,043959 0,032422 0,037717
234 0,095855 0,0924 0,074513 0,074925 0,084423
235 0,067165 0,038455 0,029731 0,061625 0,049244
236 0,082827 0,047397 0,045199 0,043183 0,054651
237 1,0594 1,21415 1,15673 1,00302 1,108325
238 0,220668 0,187626 0,155932 0,154619 0,179711
239 0,57153 1,18004 1,13114 1,29527 1,044495
240 0,062797 0,081445 0,165802 0,049707 0,089938
241 0,110027 0,100173 0,123169 0,089029 0,1056
242 0,031372 0,025043 0,021716 0,015218 0,023337
243 0,096803 0,082017 0,069514 0,057618 0,076488
244 0,133559 0,100292 0,061628 0,076592 0,093018
245 0,127376 0,210039 0,159308 0,147473 0,161049
246 0,136998 0,184244 0,146607 0,041273 0,127281
247 0,108893 0,107474 0,0752 0,046901 0,084617
248 0,223892 0,166435 0,160507 0,113976 0,166203
Match ID 12h A1 12h A2 48h A1 48h A2 48h+GAPDH48h+GAPDH+AMPsMean 12h Mean 48h 48h/12h

80
Appendix 1 (cont.) – Intensity relative volumes of spots
249 0,063323 0,207964 0,08391 0,127255 0,120613
250 0,680465 0,706116 0,46956 0,69812 0,638565
251 0,058758 0,127891 0,071794 0,049967 0,077102
252 0,062959 0,070518 0,07022 0,053297 0,064248
253 0,366692 0,424111 0,396813 0,369508 0,389281
254 0,210266 0,175685 0,171661 0,130613 0,172056
255 0,043598 0,057432 0,059941 0,064599 0,056392
256 0,131485 0,131044 0,12549 0,091699 0,119929
257 0,070356 0,08017 0,100888 0,093327 0,086185
258 0,112772 0,071272 0,090661 0,074322 0,087257
259 0,120333 0,082231 0,07374 0,054061 0,082591
260 0,080765 0,103352 0,081785 0,036507 0,075602
261 0,225023 0,3155 0,226486 0,215842 0,245713
262 0,078329 0,180191 0,231958 0,147515 0,159498
263 0,022296 0,172356 0,111013 0,101296 0,10174
264 0,089451 0,042946 0,070416 0,050925 0,063434
265 0,035186 0,04793 0,047713 0,054778 0,046401
266 0,103888 0,092149 0,091862 0,05054 0,08461
267 0,08182 0,085237 0,057278 0,080327 0,076166
268 0,049143 0,067656 0,088017 0,064463 0,06732
269 0,063312 0,03596 0,043933 0,031994 0,0438
270 0,162706 0,291701 0,253456 0,140405 0,212067
271 0,081404 0,05395 0,067669 0,045352 0,062094
272 0,258204 0,261784 0,216633 0,347075 0,270924
273 0,025594 0,01805 0,015988 0,019878
274 0,058143 0,062853 0,101003 0,033623 0,063906
275 0,037801 0,056486 0,051333 0,024558 0,042545
276 0,02011 0,280572 0,143156 0,249899 0,173434
277 0,233709 0,27594 0,191134 0,163912 0,216174
278 0,058904 0,060052 0,025113 0,030057 0,043531
279 0,051029 0,082958 0,061657 0,04921 0,061213
280 0,14859 0,125632 0,156523 0,107933 0,13467
281 0,039806 0,025515 0,039452 0,025203 0,032494
282 0,080936 0,063182 0,046317 0,071273 0,065427
283 0,073123 0,112073 0,118147 0,110621 0,103491
284 0,073531 0,159348 0,123478 0,104261 0,115154
285 0,145313 0,135195 0,133612 0,092589 0,126677
286 0,066667 0,102153 0,111732 0,062298 0,085713
287 0,064385 0,042872 0,059371 0,031466 0,049523
288 0,190773 0,205945 0,267854 0,146181 0,202688
289 0,126809 0,352968 0,18922 0,211203 0,22005
290 0,166282 0,197502 0,122332 0,106504 0,148155
291 0,375717 0,553378 0,529248 0,755257 0,5534
292 1,25509 0,984332 0,964018 0,544832 0,937068
293 0,423328 0,980192 0,42212 0,681847 0,626872
294 0,431192 0,575933 0,40414 0,369414 0,44517
295 0,304862 0,968695 0,540502 0,629838 0,610974
296 0,85034 1,42237 1,0981 1,18353 1,138585
297 0,375733 0,347992 0,434246 0,26908 0,356763
298 0,036677 0,04391 0,040741 0,008663 0,032498
Match ID 12h A1 12h A2 48h A1 48h A2 48h+GAPDH48h+GAPDH+AMPsMean 12h Mean 48h 48h/12h
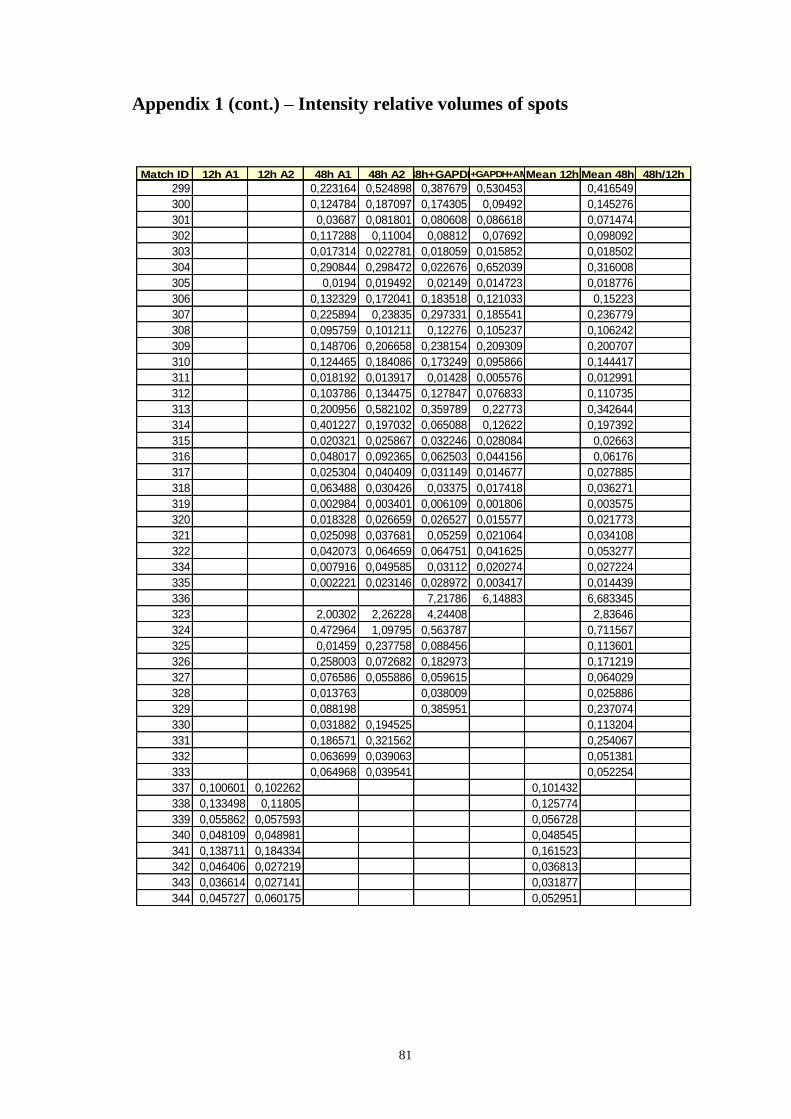
81
Appendix 1 (cont.) – Intensity relative volumes of spots
Match ID 12h A1 12h A2 48h A1 48h A2 48h+GAPDH48h+GAPDH+AMPsMean 12h Mean 48h 48h/12h
299 0,223164 0,524898 0,387679 0,530453 0,416549
300 0,124784 0,187097 0,174305 0,09492 0,145276
301 0,03687 0,081801 0,080608 0,086618 0,071474
302 0,117288 0,11004 0,08812 0,07692 0,098092
303 0,017314 0,022781 0,018059 0,015852 0,018502
304 0,290844 0,298472 0,022676 0,652039 0,316008
305 0,0194 0,019492 0,02149 0,014723 0,018776
306 0,132329 0,172041 0,183518 0,121033 0,15223
307 0,225894 0,23835 0,297331 0,185541 0,236779
308 0,095759 0,101211 0,12276 0,105237 0,106242
309 0,148706 0,206658 0,238154 0,209309 0,200707
310 0,124465 0,184086 0,173249 0,095866 0,144417
311 0,018192 0,013917 0,01428 0,005576 0,012991
312 0,103786 0,134475 0,127847 0,076833 0,110735
313 0,200956 0,582102 0,359789 0,22773 0,342644
314 0,401227 0,197032 0,065088 0,12622 0,197392
315 0,020321 0,025867 0,032246 0,028084 0,02663
316 0,048017 0,092365 0,062503 0,044156 0,06176
317 0,025304 0,040409 0,031149 0,014677 0,027885
318 0,063488 0,030426 0,03375 0,017418 0,036271
319 0,002984 0,003401 0,006109 0,001806 0,003575
320 0,018328 0,026659 0,026527 0,015577 0,021773
321 0,025098 0,037681 0,05259 0,021064 0,034108
322 0,042073 0,064659 0,064751 0,041625 0,053277
334 0,007916 0,049585 0,03112 0,020274 0,027224
335 0,002221 0,023146 0,028972 0,003417 0,014439
336 7,21786 6,14883 6,683345
323 2,00302 2,26228 4,24408 2,83646
324 0,472964 1,09795 0,563787 0,711567
325 0,01459 0,237758 0,088456 0,113601
326 0,258003 0,072682 0,182973 0,171219
327 0,076586 0,055886 0,059615 0,064029
328 0,013763 0,038009 0,025886
329 0,088198 0,385951 0,237074
330 0,031882 0,194525 0,113204
331 0,186571 0,321562 0,254067
332 0,063699 0,039063 0,051381
333 0,064968 0,039541 0,052254
337 0,100601 0,102262 0,101432
338 0,133498 0,11805 0,125774
339 0,055862 0,057593 0,056728
340 0,048109 0,048981 0,048545
341 0,138711 0,184334 0,161523
342 0,046406 0,027219 0,036813
343 0,036614 0,027141 0,031877
344 0,045727 0,060175 0,052951
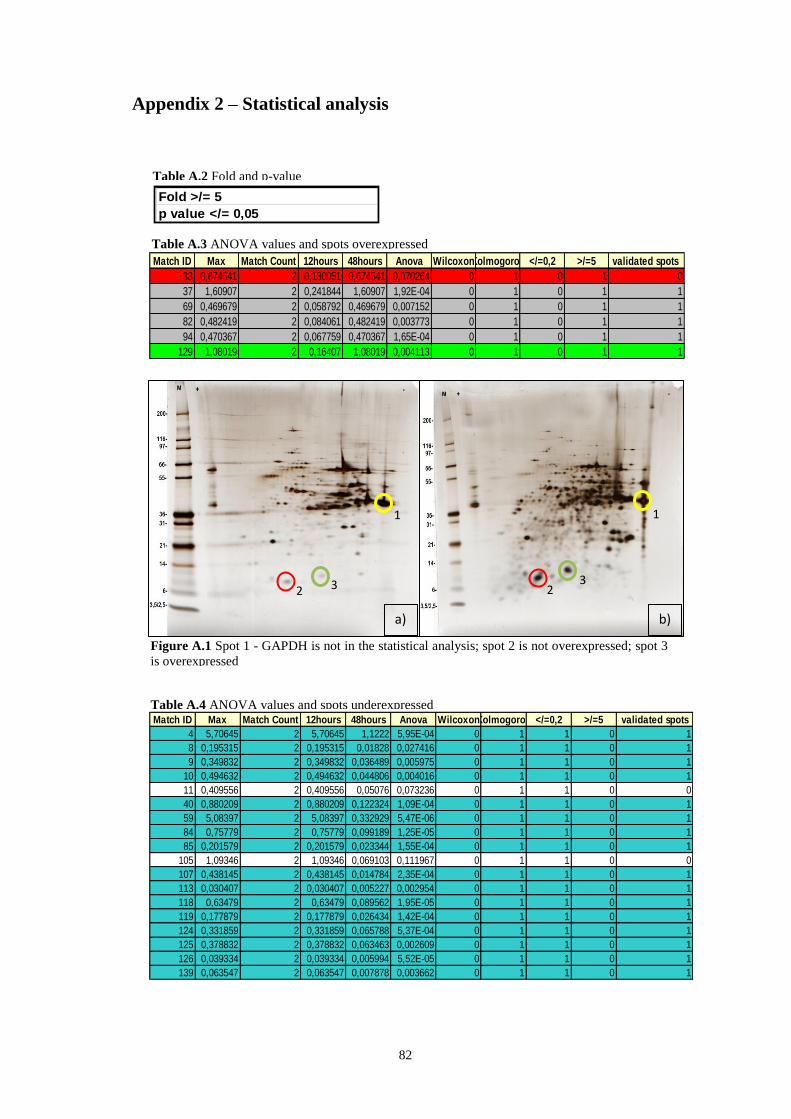
82
Appendix 2 – Statistical analysis
Fold >/= 5
p value </= 0,05
1
.
2
.
3
1
.
2
.
3
a) b)
Match ID Max Match Count 12hours 48hours Anova WilcoxonKolmogorov </=0,2 >/=5 validated spots
4 5,70645 2 5,70645 1,1222 5,95E-04 0 1 1 0 1
8 0,195315 2 0,195315 0,01828 0,027416 0 1 1 0 1
9 0,349832 2 0,349832 0,036489 0,005975 0 1 1 0 1
10 0,494632 2 0,494632 0,044806 0,004016 0 1 1 0 1
11 0,409556 2 0,409556 0,05076 0,073236 0 1 1 0 0
40 0,880209 2 0,880209 0,122324 1,09E-04 0 1 1 0 1
59 5,08397 2 5,08397 0,332929 5,47E-06 0 1 1 0 1
84 0,75779 2 0,75779 0,099189 1,25E-05 0 1 1 0 1
85 0,201579 2 0,201579 0,023344 1,55E-04 0 1 1 0 1
105 1,09346 2 1,09346 0,069103 0,111967 0 1 1 0 0
107 0,438145 2 0,438145 0,014784 2,35E-04 0 1 1 0 1
113 0,030407 2 0,030407 0,005227 0,002954 0 1 1 0 1
118 0,63479 2 0,63479 0,089562 1,95E-05 0 1 1 0 1
119 0,177879 2 0,177879 0,026434 1,42E-04 0 1 1 0 1
124 0,331859 2 0,331859 0,065788 5,37E-04 0 1 1 0 1
125 0,378832 2 0,378832 0,063463 0,002609 0 1 1 0 1
126 0,039334 2 0,039334 0,005994 5,52E-05 0 1 1 0 1
139 0,063547 2 0,063547 0,007878 0,003662 0 1 1 0 1
Match ID Max Match Count 12hours 48hours Anova WilcoxonKolmogorov </=0,2 >/=5 validated spots
33 0,674541 2 0,130051 0,674541 0,070264 0 1 0 1 0
37 1,60907 2 0,241844 1,60907 1,92E-04 0 1 0 1 1
69 0,469679 2 0,058792 0,469679 0,007152 0 1 0 1 1
82 0,482419 2 0,084061 0,482419 0,003773 0 1 0 1 1
94 0,470367 2 0,067759 0,470367 1,65E-04 0 1 0 1 1
129 1,08019 2 0,16407 1,08019 0,004113 0 1 0 1 1
Table A.2 Fold and p-value
Table A.3 ANOVA values and spots overexpressed
Figure A.1 Spot 1 - GAPDH is not in the statistical analysis; spot 2 is not overexpressed; spot 3
is overexpressed
Table A.4 ANOVA values and spots underexpressed
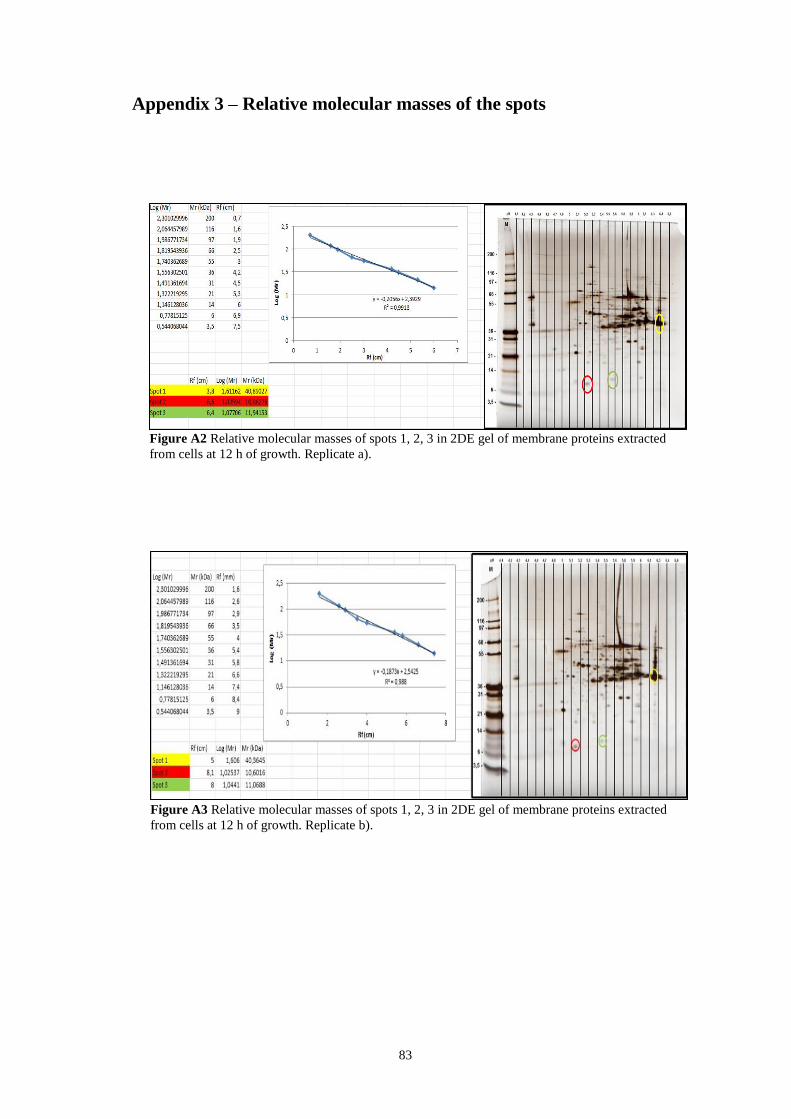
83
Appendix 3 – Relative molecular masses of the spots
Figure A2 Relative molecular masses of spots 1, 2, 3 in 2DE gel of membrane proteins extracted
from cells at 12 h of growth. Replicate a).
Figure A3 Relative molecular masses of spots 1, 2, 3 in 2DE gel of membrane proteins extracted
from cells at 12 h of growth. Replicate b).
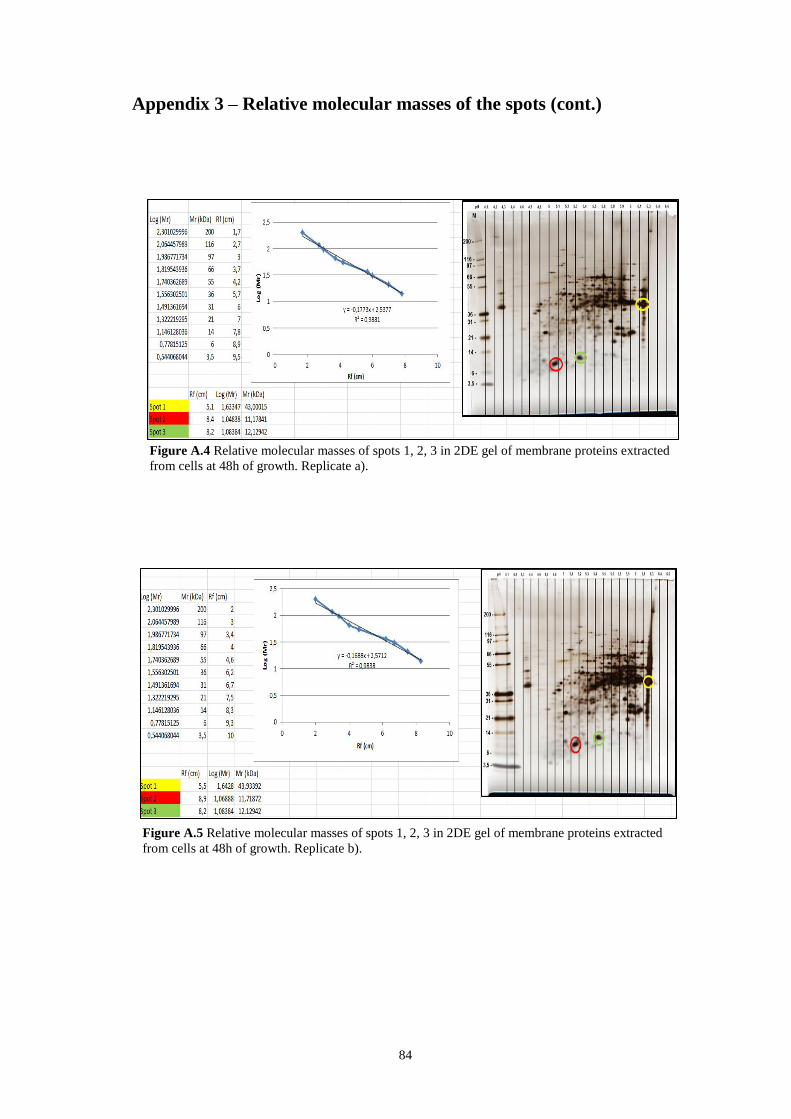
84
Appendix 3 – Relative molecular masses of the spots (cont.)
Figure A.5 Relative molecular masses of spots 1, 2, 3 in 2DE gel of membrane proteins extracted
from cells at 48h of growth. Replicate b).
Figure A.4 Relative molecular masses of spots 1, 2, 3 in 2DE gel of membrane proteins extracted
from cells at 48h of growth. Replicate a).
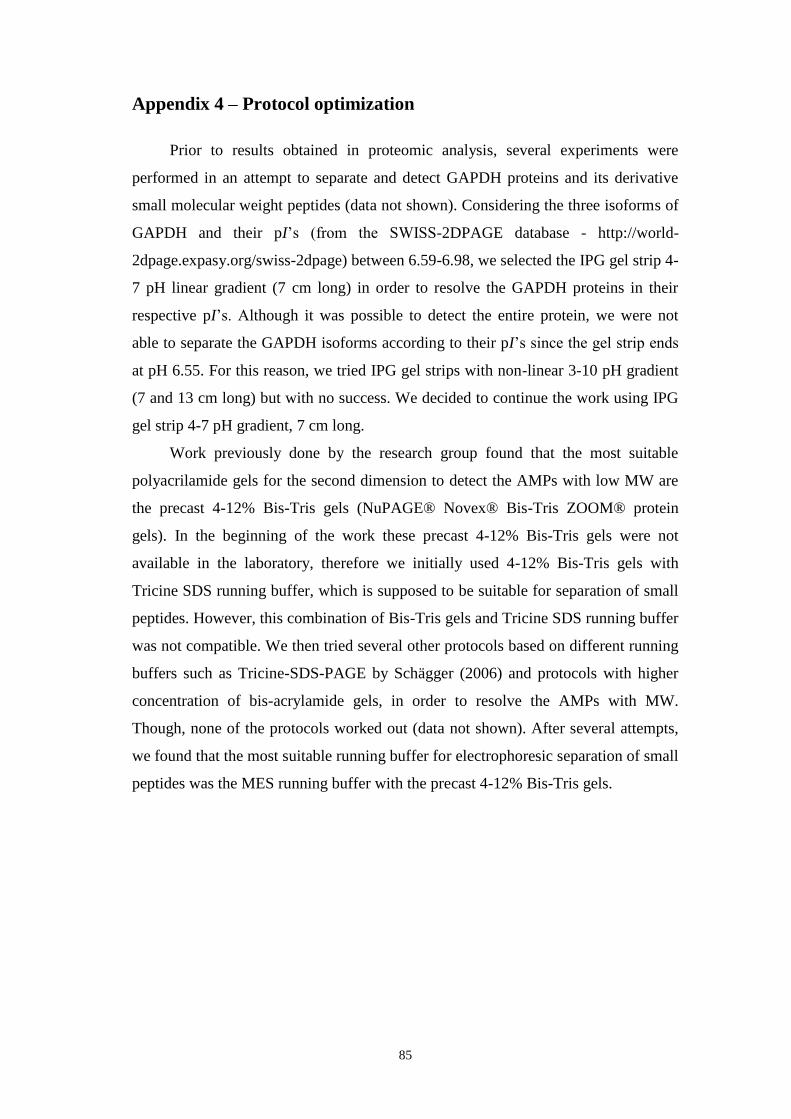
85
Appendix 4 – Protocol optimization
Prior to results obtained in proteomic analysis, several experiments were
performed in an attempt to separate and detect GAPDH proteins and its derivative
small molecular weight peptides (data not shown). Considering the three isoforms of
GAPDH and their pI’s (from the SWISS-2DPAGE database - http://world-
2dpage.expasy.org/swiss-2dpage) between 6.59-6.98, we selected the IPG gel strip 4-
7 pH linear gradient (7 cm long) in order to resolve the GAPDH proteins in their
respective pI’s. Although it was possible to detect the entire protein, we were not
able to separate the GAPDH isoforms according to their pI’s since the gel strip ends
at pH 6.55. For this reason, we tried IPG gel strips with non-linear 3-10 pH gradient
(7 and 13 cm long) but with no success. We decided to continue the work using IPG
gel strip 4-7 pH gradient, 7 cm long.
Work previously done by the research group found that the most suitable
polyacrilamide gels for the second dimension to detect the AMPs with low MW are
the precast 4-12% Bis-Tris gels (NuPAGE® Novex® Bis-Tris ZOOM® protein
gels). In the beginning of the work these precast 4-12% Bis-Tris gels were not
available in the laboratory, therefore we initially used 4-12% Bis-Tris gels with
Tricine SDS running buffer, which is supposed to be suitable for separation of small
peptides. However, this combination of Bis-Tris gels and Tricine SDS running buffer
was not compatible. We then tried several other protocols based on different running
buffers such as Tricine-SDS-PAGE by Schägger (2006) and protocols with higher
concentration of bis-acrylamide gels, in order to resolve the AMPs with MW.
Though, none of the protocols worked out (data not shown). After several attempts,
we found that the most suitable running buffer for electrophoresic separation of small
peptides was the MES running buffer with the precast 4-12% Bis-Tris gels.