FUNDAÇÃO GETULIO VARGAS ESCOLA DE … · 1 fundaÇÃo getulio vargas escola de administraÇÃo de...
93
1 FUNDAÇÃO GETULIO VARGAS ESCOLA DE ADMINISTRAÇÃO DE EMPRESAS DE SÃO PAULO RAFAEL FELIPE SCHIOZER ESSAYS IN CORPORATE RISK MANAGEMENT SÃO PAULO 2006
Transcript of FUNDAÇÃO GETULIO VARGAS ESCOLA DE … · 1 fundaÇÃo getulio vargas escola de administraÇÃo de...
1
FUNDAÇÃO GETULIO VARGAS
ESCOLA DE ADMINISTRAÇÃO DE EMPRESAS DE SÃO PAULO
RAFAEL FELIPE SCHIOZER
ESSAYS IN CORPORATE RISK MANAGEMENT
SÃO PAULO
2006
2
RAFAEL FELIPE SCHIOZER
ESSAYS IN CORPORATE RISK MANAGEMENT
Tese apresentada à Escola de
Administração de Empresas de São Paulo da Fundação Getulio Vargas, como requisito para obtenção do título de Doutor em Administração de Empresas Campo de conhecimento: Administração Contábil e Financeira Orientador: Prof. Dr. Richard Saito
SÃO PAULO
2006
3
Schiozer, Rafael Felipe.
Essays in Corporate Risk Management / Rafael Felipe Schiozer - 2006. f. Orientador: Richard Saito. Tese (doutorado) - Escola de Administração de Empresas de São Paulo. 1. Risk Management. 2. Financial Derivatives. 3. Foreign currency. 4. Latin America. I. Saito, Richard. II. Tese (doutorado) - Escola de Administração de Empresas de São Paulo. III. Título.
CDU 336.722.8
4
RAFAEL FELIPE SCHIOZER
ESSAYS IN CORPORATE RISK MANAGEMENT
Tese apresentada à Escola de Administração de Empresas de São Paulo da Fundação Getulio Vargas, como requisito para obtenção de título de Mestre em Administração de Empresas Campo de conhecimento: Administração Contábil e Financeira Data de aprovação: ____/____/________ Banca examinadora: ________________________________Prof. Dr. Richard Saito (Orientador) FGV-EAESP ________________________________Prof. Dr. Afonso de Campos Pinto FGV-EAESP ________________________________Prof. Dr. Newton C. A. da Costa Jr. UFSC Prof. Dr. Jairo Laser Procianoy UFRGS Prof. Dr. Hudson Fernandes Amaral UFMG

5
This work is dedicated to my wife Ludmila.
6
ACKNOWLEDGEMENTS:
I thank Prof. Richard Saito for all the helpful insights, orientation and patience
towards me during these four years. He has been a great source of knowledge in
Finance since I first applied for the doctoral program at FGV/EAESP and has tutored
me with excellence during the whole time. His efforts have made all the hard work of
obtaining a doctoral degree a little less burdening to me than it would have been
otherwise.
I am also indebted to Prof. Afonso de Campos Pinto and Prof. Antonio Gledson de
Carvalho for all the valuable suggestions to this text made in the occasion of my
qualification exam. I am sure their suggestions helped a lot in improving the quality
of this text. I would also like to acknowledge the contribution of several anonymous
referees who have read the draft versions of this work at some point in time, and to
thank the comments received from the participants of the Enanpad meetings in
2004, 2005 and 2006, the Global Finance Conference, BALAS, EFMA and the FMA
meetings in 2006.
I express my deepest acknowledgements to Prof. Jefferson Duarte, who agreed on
supervising my research while I was a visiting student at the University of
Washington. He also gave several tips and advices that contributed a lot to this work.
I also thank all the professors at FGV/EAESP and University of Washington from
whom I have learned a lot in their courses. I make a special reference to Prof. Jarrad
Harford and Prof. Luiz Felipe P. de Andrade, who were very important for my
understanding of Finance in a broader sense. I also make a reference to all my
fellow professors at the Finance Department of FGV/EAESP. I would also like to
thank Prof. Saul Suslick at UNICAMP who guided my first steps as a researcher
when I was a MSc student. Saul has been a great friend since then.
The students at FGV/EAESP and UW turned these years into a lot more fun than it
could be without them. I can mention Sônia, Sheng, João André, Brasil, Florence
and Rob, who were special friends and good guys to work, study and have fun with. I
would also like to mention my friends Ricardo Furtado and Gabriel Lima at
UNICAMP, whose expertise in Statistics and Economics helped me in being a better
student in Finance. My band mates (“non-academic” friends), Moisés, André, Pita

7
and Ricardo were also crucial in making these four years a lot easier and more fun to
go through.
I am also truly indebted to the graduate committee of the Central Bank of Brazil that
allowed me to leave my activities at Bacen to pursue my graduate studies. Francisco
da Silva Coelho gave important tips and insights to my proposal and has been
overseeing my work towards the completion of the doctoral program at FGV since it
first started. Virgínio Santos Neto, José Antonio Marciano, Luiz Fernando Maciel and
Emilio Dantas were also very important in helping me. It has been good to have all
the support from my friends at Bacen, specially Mario, Carlos, Daniel, Alexandre,
Luiz Maurício and Malu.
I also acknowledge the financial support received from CAPES for my visiting
student term at the University of Washington.
It is an honor to thank the support received from my family, specially my parents
Dayr and Wanda. Their love and kindness is hard to be described in words. Thanks
also to my brothers Ivan, Denis and Wandir.
And last, but by no means least, Ludmila, my wife, was the greatest source of energy
and motivation to start and complete this work. I could not even imagine going
through these last four years without her love, patience, helpfulness and
understanding. Thank you so much!

8
Derivatives are like finely tuned racing cars… Untutored users can crash and burn.
Nonusers cannot win the race.
René M. Stulz
9
ABSTRACT:
This research investigates the factors that lead Latin American non-financial firms to
manage risks using derivatives. The main focus is on currency risk management.
With this purpose, this thesis is divided into an introductory chapter that brings the
main motivations for this work and reviews the extant literature regarding financial
risk management, two main chapters, and a conclusion.
The second chapter describes the results of a survey on derivatives usage and risk
management responded by the CFOs of 74 Brazilian non-financial firms listed at the
São Paulo Stock Exchange (BOVESPA), and the main evidence found is: i) larger
firms are more likely to use financial derivatives; ii) foreign exchange risk is the most
managed with derivatives; iii) Brazilian managers are more concerned with legal and
institutional aspects in using derivatives, such as the taxation and accounting
treatment of these instruments, than with issues related to implementing and
maintaining a risk management program using derivatives.
The third chapter studies the determinants of risk management with derivatives in
four Latin American countries (Argentina, Brazil, Chile and Mexico). I investigate not
only the decision of whether to use financial derivatives or not, but also the
magnitude of risk management, measured by the notional value of outstanding
derivatives contracts. This is the first study, to the best of my knowledge, to use
derivatives holdings information in emerging markets. The use of a multi-country
setting allows the analysis of institutional and economic factors, such as foreign
currency indebtedness, the high volatility of exchange rates, the instability of political
and institutional framework and the development of financial markets, which are
issues of second-order importance in developed markets.
The main contribution of this thesis is on the understanding of the relationship
among currency derivatives usage, foreign debt and the sensitivity of operational
earnings to currency fluctuations in Latin American countries. Unlike previous
findings for US firms, my evidence shows that derivatives held by Latin American
firms are capable of producing cash flows comparable to financial expenses and
investments, showing that derivatives are key instruments in their risk management
strategies.
10
It is also the first work to show strong and robust evidence that firms that benefit
from local currency devaluation (e.g. exporters) have a natural currency hedge for
foreign debt that allows them to bear higher levels of debt in foreign currency. This
implies that firms under this revenue-cost structure require lower levels of hedging
with derivatives. The findings also provide evidence that large firms are more likely
to use derivatives, but the magnitude of derivatives holdings seems to be negatively
related to the size of the firm, consistent with findings for US firms.
11
RESUMO:
Este trabalho investiga quais são os fatores que levam empresas não financeiras da
América Latina a gerenciar seus riscos usando derivativos. O foco principal é a
gestão de risco cambial. Para tal, a pesquisa foi escrita dividindo-se em um capítulo
introdutório, contendo a motivação da pesquisa e uma revisão da literatura sobre
gestão de riscos financeiros, dois capítulos principais e uma conclusão.
O segundo capítulo mostra os resultados de um questionário respondido pelos
diretores financeiros de 74 empresas listadas na Bolsa de Valores de São Paulo
(BOVESPA), em que se constatou que: i) empresas maiores são mais propensas a
usar derivativos; ii) o risco cambial é o mais freqüentemente gerenciado com
derivativos; iii) as questões relativas ao arcabouço jurídico-institucional, tais como a
tributação sobre uso de derivativos e o tratamento contábil das operações de hedge
preocupam mais os gestores financeiros do que as questões relacionadas à
implementação, operacionalização e manutenção dos programas de hedge usando
derivativos.
O terceiro capítulo estuda os determinantes da gestão de risco nos quatro países
mais importantes da América Latina (Argentina, Brasil, Chile e México). Investiga-se
não apenas a decisão de utilizar derivativos, como uma variável binária, mas
também a intensidade de utilização de derivativos, medida pelo valor nominal dos
contratos em aberto. Trata-se do primeiro estudo a utilizar informações sobre as
carteiras de derivativos de empresas de países emergentes. O uso de um conjunto
de países permite que se compreenda a influência de fatores econômicos e
institucionais, em especial o maior endividamento em moeda estrangeira, a maior
volatilidade das taxas de câmbio e juros nos países latinoamericanos, a menor
estabilidade político-institucional e o menor desenvolvimento dos mercados
financeiros, questões que têm uma importância menor em mercados desenvolvidos.
A contribuição principal deste trabalho está em auxiliar o entendimento da relação
entre o uso de derivativos cambiais e a sensibilidade dos resultados operacionais às
flutuações cambiais. Distintamente do que mostram trabalhos anteriores para
empresas norte-americanas, a evidência obtida nesse trabalho mostra que as
carteiras de derivativos de câmbio das empresas latinoamericanas são capazes de
12
gerar fluxos de caixa comparáveis, em ordem de magnitude, às despesas
financeiras e aos investimentos, mostrando que os derivativos são instrumentos-
chave nas estratégias de gestão de risco das empresas.
Também se trata do primeiro trabalho a mostrar evidência forte e robusta que firmas
cujos lucros operacionais se beneficiam da desvalorização da moeda local (por
exemplo, exportadores), têm uma proteção natural contra o risco de dívida em
moeda estrangeira, que permite a essa empresas captar mais dívida externa. Isso
implica que empresas que possuem essa estrutura de receitas e custos precisam de
menos derivativos para fazer hedge. Também se mostra que empresas maiores são
mais propensas a usar derivativos, mas a magnitude das carteiras de derivativos
está negativamente relacionada ao tamanho da empresa, o que é consistente com a
teoria financeira e está em linha com os resultados obtidos para empresas dos
Estados Unidos.

13
Figure Index
Figure 1.1: Tax function convexity ............................................................................. 18
Figure 2.1 Exposure to Foreign Currency: users and non users .............................. 31
14
Tables Index:
Table 2.1: Derivatives usage across countries and year of research ....................... 26
Table 2.2: Derivatives usage across risk classes and instruments........................... 27
Table 2.3: Main issues of concern for managers....................................................... 28
Table 2.4: Derivatives usage compared to previous year: 2003/2002 and 2002/2001................................................................................................................................... 29
Table 2.5: Impacts of a market view.......................................................................... 31
Table 2.6: Assessment of risk management function................................................ 32
Table 3.1: Risk classes managed with derivatives by country .................................. 38
Table 3.2A: Descriptive statistics: Derivatives users x non-users............................. 39
Table 3.2B: Descriptive statistics: FX users x non-users of currency derivatives..... 40
Table 3.2C: Descriptive statistics: FX users x users of derivatives other than currency ..................................................................................................................... 42
Table 3.2D: Descriptive statistics: split by country .................................................... 42
Table 3.3A: Sensitivity of derivatives holdings relative to hedging objectives – split by year ............................................................................................................................ 45
Table 3.3B: Sensitivity of derivatives holdings relative to hedging objectives – split by country ....................................................................................................................... 46
Table 3.4: LOGIT tests............................................................................................... 52
Table 3.5: Estimation of the TOBIT tests................................................................... 60
15
Table of Contents
1 Motivation and Literature Review ....................................................................... 16
1.1 Rationales for risk management and extant empirical evidence ................ 17
2 Derivatives usage in Brazil. A survey ................................................................. 23
2.1 Description of the survey............................................................................. 25
2.2 Results and analysis ................................................................................... 25
3 Determinants of risk management in Latin American non-financial firms.......... 35
3.1 Derivatives data and sample....................................................................... 37
3.2 Cash flow sensitivities of derivatives contracts ........................................... 44
3.3 The determinants of corporate hedging – empirical analysis ..................... 47
4 Conclusions ........................................................................................................ 63
5 References cited in the text ................................................................................ 70
Appendix A: Survey questionnaire and response tallies ........................................... 76
Appendix B: Sensitivity analysis of cash flow from derivatives ................................. 87
16
1 Motivation and Literature Review
A company can manage its financial risks in several different manners, using
financial derivatives or not. For example, an exporting company is able to mitigate its
foreign exchange exposure by obtaining funds in the same currency in which its
revenues are denominated. Petersen and Thiagarajan (2000) classify this type of
risk management as an operational hedge, and show evidence that this strategy is
able to produce better results for long-term exposures, while financial hedging, that
uses derivatives and other instruments to mitigate financial risks, is more efficient in
the management of short-term fluctuations in foreign exchange rates, interest rates
and commodity prices.
In Latin America, however, large firms have several incentives beyond operational
hedge to obtain funding overseas, specially in developed markets. Fundamentally,
the availability of funding is limited in their domestic markets, which makes funds
overseas easier and cheaper for firms with a minimum of international visibility. With
a few exceptions, due to foreign indebtedness, cash outflows in foreign currency are
larger than inflows, creating currency exposure for these firms. In addition, foreign
debt produces an exposure to international interest rates, such as the London
Interbank Offered Rate (LIBOR), the Japanese Interbank Offered Rate (JIBOR) etc.
This work investigates empirically which of the factors pointed by financial theory as
rationales for risk management are relevant to the decision of using derivatives and
how these factors influence the magnitude of derivatives holdings in Latin American
firms. The main focus is on currency risk management, since, as shown in chapters
2 and 3, this is by far the most managed with financial derivatives. The first part of
this research (chapter 2), shows the results of a survey on risk management and
derivatives usage responded by financial managers of 74 non-financial Brazilian
firms listed at São Paulo Stock Exchange (BOVESPA) in 2004. In the second part of
this research (chapter 3), I investigate the determinants of the decision of whether to
use derivatives or not and the magnitude of financial hedging of non-financial firms
from Argentina, Brazil, Chile and Mexico, that are constituents of the Bank of New
York Latin American ADR Index, using a sample of 186 firm-years, in a panel from
2001 to 2004. The rationale for using only firms that have issued ADRs (American
Depositary Receipts) is that financial statements and reports are relatively uniform,
17
using USGAAP (United States Generally Accepted Accounting Principles) allowing
to obtain information on derivatives holdings for each firm. Restricting the sample to
firms with ADRs is also necessary due to disclosure requirements for derivatives
usage to be different in each country.
The decision of investigating three countries other than Brazil (which was chosen for
an in-deep study described in chapter 2) is fundamentally related to the possibility of
comprehending and identifying determinant factors for risk management under
different institutional and legal frameworks, albeit having many economic, legal and
cultural similarities. Besides, increased sample size is able to improve the quality of
statistical inferences. As far as I was able to find, there is no study on the
determinants of risk management for any country in Latin America. With the
exception of Bartram, Brown and Fehle (2003), that investigates only the binary
decision of using derivatives or not in more than 40 countries, I was not capable of
identifying any study on risk management in a multi-country setting.
1.1 Rationales for risk management and extant empirical evidence
In the absence of market imperfections, risk management – as the choice of capital
structure and dividend policy - is unable to create value. In a world with no taxes,
agency costs, information asymmetry or transaction costs, there would be no
demand for hedging instruments. The existence of a huge derivatives market is only
explained if some of the assumptions of perfect markets are relaxed. In a broad
sense, financial literature has built two main explanations for risk management. The
first focuses on risk management as a way to maximize firm value by reducing the
costs of financial distress and expected taxes and mitigating informational
asymmetry problems, and the second finds reasons for risk management in
managers’ utility maximization. These theories and their main empirical implications,
in terms of how individual firm characteristics are determinant for the decision of
managing financial risks, are described below.
A – Costs of financial distress
Smith and Stulz (1985) and Stulz (1984) show that risk management can reduce the
costs of financial distress. This allows the firm to increase debt capacity and raise
funds at a lower cost than would be possible without hedging. Interest coverage is
18
widely used by previous papers to measure financial distress. Many of these studies
(e.g. Dolde (1995), Geczy, Minton and Schrand (1997), and Haushalter (2000)),
define interest coverage as the average EBIT (Earnings before interest and taxes) of
the last 3 years, divided by interest expenses in the last fiscal year. In chapter 3, I
use this indicator and, alternatively, also define interest coverage as the EBIT of a
given fiscal year divided by interest expenses in the same year. The greater the
interest coverage, the less financially distressed the firm is, and, thus, the less are
the incentives to hedge. The level of indebtedness and the debt attached to foreign
currency are also expected to be positively related to hedging, since foreign debt is
almost always a source of exposure.
B - Tax Benefits
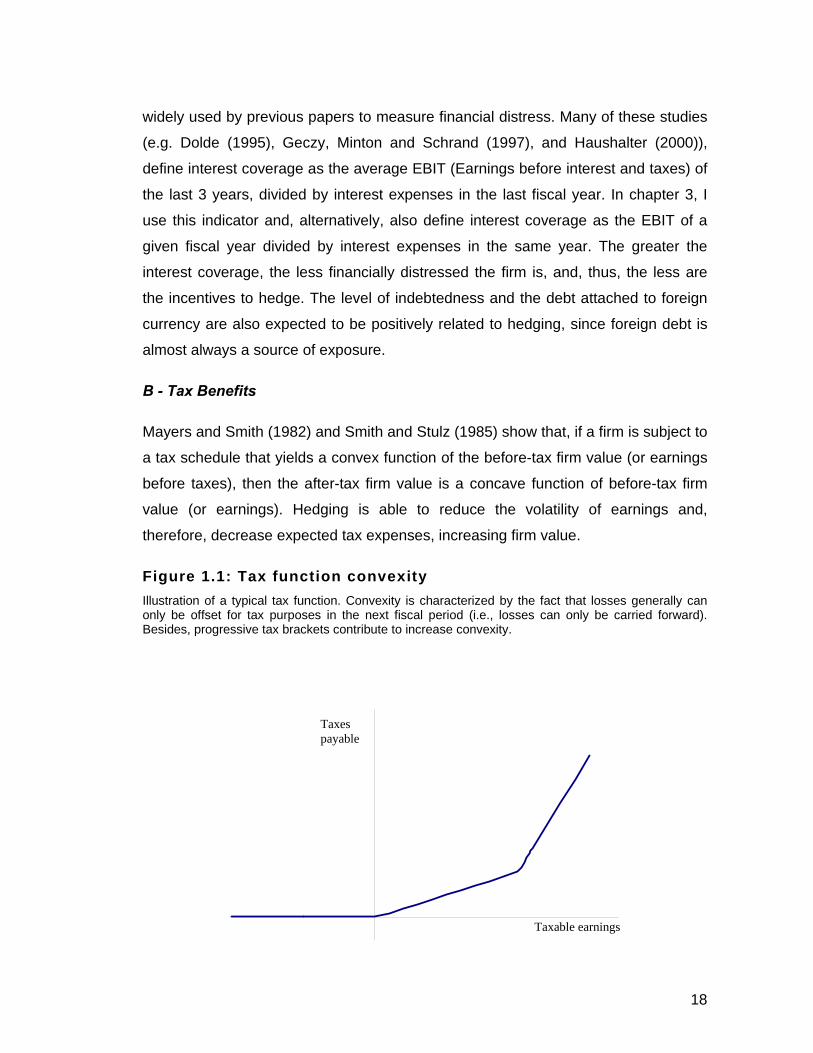
Mayers and Smith (1982) and Smith and Stulz (1985) show that, if a firm is subject to
a tax schedule that yields a convex function of the before-tax firm value (or earnings
before taxes), then the after-tax firm value is a concave function of before-tax firm
value (or earnings). Hedging is able to reduce the volatility of earnings and,
therefore, decrease expected tax expenses, increasing firm value.
Figure 1.1: Tax function convexity Illustration of a typical tax function. Convexity is characterized by the fact that losses generally can only be offset for tax purposes in the next fiscal period (i.e., losses can only be carried forward). Besides, progressive tax brackets contribute to increase convexity.
Taxes payable
Taxable earnings
19
Source: the author
A progressive corporate tax schedule is the classical case of a convex tax function,
as shown in figure 1. In addition, the possibility of carrying losses from one period to
another also increases the convexity of the tax function. For example, in Brazil, the
amount of earnings exceeding 240,000 BRL (Brazilian Reais, equivalent to about
USD106,000 as of December 2005) is subject to an additional rate of 10%, creating
a clear convexity in the tax schedule. To characterize whether or not a firm is subject
to this convexity, I build a proxy similar to what was used by Nance, Smith and
Smithson (1993) and Mian (1996): the standard deviations of earnings before taxes
(in domestic currency) is estimated for a 4-year period, and a 95% confidence
interval is built around the observed value for each year’s taxable income. If this
interval includes the threshold tax values (values for which the tax rate changes, i.e.,
at least one of the “kinks” illustrated in figure 1), the dummy of tax convexity
assumes value 1. This dummy also assumes 1 if the firm has had any negative
earnings carried to subsequent fiscal years in the last 4 years. Otherwise, the
dummy assumes zero1. Graham and Smith (1999) show that, for firms with convex
tax schedules, hedging may decrease expected taxes by 5.4% on average, reaching
40% in extreme cases, under the US fiscal regime.
Since, ceteris paribus, debt financing creates tax gains, increased debt capacity
created by hedging is also able to generate indirect tax benefits (Ross (1997) and
Leland (1998)). Graham and Rogers (2002) show that, for US firms, this gain is
superior to tax benefits caused by decreased volatility in earnings. Hence, a positive
relation between debt ratio and hedging is expected.
C - Costly external financing, information asymmetry and underinvestment
Froot, Scharfstein and Stein (1993) show that risk management may guarantee
optimal investment when cash flows of current activities are uncertain to generate
enough cash to internally fund all positive NPV projects. If external financing is costly
1Irecognize that this is an imperfect measure to proxy for whether a firm is subject to a convex tax schedule. Hedging may be used exactly to decrease volatility in earnings, so the perfect measure is the earnings that firms would have experimented, had they not hedged, which is obviously non-observable.I return to this issue during the discussion of results.
20
or inexistent (for example, due to information asymmetry), hedging creates value by
transferring resources from one state of the world where resources are abundant to
another where resources are scarce. Without hedging, the firm might have to bypass
some valuable investment opportunities (in other words, underinvest) if an
unfavorable state of the world occurs. On the other hand, if a favorable state of the
world occurs, the firm would have to deal with the excess of cash, what might also
be non-optimal, considering the agency costs of free cash flow described by Jensen
(1986).
Tufano (1998) argues that managers will have incentives to hedge to guarantee
funding for their “pet” projects. The absence of the discipline imposed by the capital
markets can lead to investment in negative NPV projects that bring private benefits
to managers. In this sense, hedging can also be value-destroying. For this purpose,
managers may be willing to increase information asymmetry to avoid market
scrutiny.
Regardless of the purpose of hedging (i.e. to guarantee funding for value-creating or
value-destroying projects), a positive relationship between information asymmetry
and hedging is expected. To distinguish between value-creating and value-
destroying hedge, one has to assess the set of investment opportunities available to
the firm. The most common proxies for investment opportunities are market-to-book
ratio and R&D expenditures scaled by size (e.g. Mian, 1996 and Nance et al, 1993).
Unfortunately, R&D is not available for most of the firms in the sample, and market-
to-book also tends to be highly correlated with proxies used for information
asymmetry. Following Mian (1996) and Allayannis and Ofek (2001), I use an
alternative measure for information asymmetry, which is a dummy that returns 1 if
the firm is from a regulated industry and zero otherwise. The reason for regulated
industries to have less informational asymmetries than firms in non-regulated
economic sectors is that its investment projects are generally subject to
governmental approval and therefore must be made public, at least in part. This
argument is equally valid in the US as it is in Latin America.
Related to Froot, Scharfstein and Stein’s (1993) costly external finance problem is
the classical underinvestment problem described by Myers (1977), in which
shareholders may decide not to accept projects even if they are value-enhancing, if
21
they assess that a significant fraction of the economic rent of low-risk projects go to
creditors. Debtholders anticipate this behavior, adding this factor to borrowing costs.
Deriving from the ideas of Myers and Majluf (1984) and Mayers and Smith (1982 and
1987), risk management mitigates the underinvestment problem by equalizing high
and low-risk projects. If the firm is able to credibly commit to risk management at the
time of its financing decision, the value of debt should be less sensitive to investment
decisions not yet taken (Bessembinder (1991)), and then hedging might create
value. With an analogous effect to Froot, Scharfstein and Stein’s implications,
Myers’s underinvestment problem is more likely to affect firms with high investment
opportunities and, therefore, the expected relation between hedging and investment
opportunities is positive.
D - Transaction costs
Using derivatives implies incurring in variable transaction costs, such as brokerage
fees. Most of the costs, however, should be understood as fixed rather than variable:
the necessity of specialized personnel, investments in software, hardware, etc.
Therefore, there may be economies of scale associated to risk management using
derivatives. The development of tailor-made over-the-counter derivatives is also
associated to high fixed costs that make the use of small contracts uneconomic. This
implies that there is a positive relationship between firm size and derivatives usage.
On the other hand, small firms are more likely to be financially constrained, which
makes them more susceptible to financial risks and, thus, more likely to manage
these risks. The relationship between size and risk management is, therefore, an
empirical issue. In their vast majority, empirical studies have found a positive relation
between size and derivatives usage, as a binary variable. The studies that
investigate the magnitude of hedging (e.g. Guay and Kothari (2003), Graham and
Rogers (2002)) find negative or no relation between hedging and the amounts
hedged, what may show that size is a constraining, but not determinant, factor for
risk management.
E - Rationales for risk management in Emerging Markets
There are reasons to believe that the factors that lead firms to manage risks in
emerging economies are different from the determinants found for US firms and
22
other mature economies. An especially important difference is the ubiquitous high
volatility of exchange and interest rates in emerging countries (except in those that
adopt fixed or crawling exchange rate regimes). In addition, the relative scarcity of
domestic funding faced by firms in emerging economies leads firms to raise funds
overseas to finance investment projects. The portion of debt denominated in foreign
currency is almost always a source of great exposure for large Latin American firms.
It has been shown that currency depreciation may produce important balance sheet
effects for Brazilian, Mexican and Chilean firms (respectively, Bonomo et al., 2003 ,
Pratap et al., 2003 and Benavente et al., 2003) with direct impacts on earnings, cash
flow and investment.
A second important difference between mature and emerging economies to be
considered is the availability of hedging instruments, which depends fundamentally
on the development of domestic financial markets and access to international
markets. I return to these issues in detail in Chapter 3.
23
2 Derivatives usage in Brazil. A survey
Derivatives usage has been increasing dramatically in the last few years. Data by the
Bank of International Settlements – BIS (2006) show, for example, that the amounts
outstanding of over the counter (OTC) derivatives has grown from US$197.2 trillion
in December 2003 to US$284.8 trillion in December of 2005, an increase of nearly
45% in 2 years. In organized exchanges, the growth was of 61% for option contracts
and 42% for future contracts from June 2001 to June 2003 (BIS, 2004). Although a
major share of these amounts refer to contracts between financial institutions, non-
financial firms respond for about 25% of commodities-linked (CM) derivatives, 20%
of foreign exchange (FX) contracts and 10% of interest rate (IR) contracts. This
tendency of growth in the use of derivatives can also be observed in Brazil, where
the overall traded volume of the Brazilian Mercantile and Futures Exchange (BM&F)
has been reaching records day after day.
Despite the fact that firms have been using derivatives for decades, little is known
about managerial practices in the use of derivatives, the attitudes and perceptions of
managers toward different classes of risk exposure and the formal evaluation
procedures of risk management activities in non financial firms.
The main motivation for this study is to understand: 1) what are the economic and
financial rationales that lead managers to use financial derivatives; fundamentally,
whether these instruments are being used to mitigate risks, as the common sense
suggests and financial theory recommends or for speculative purposes; 2) what are
the risk classes most managed with derivatives, comparing to international evidence;
3) what are the concerns of financial managers in using derivatives, and what
importance is given to institutional / legal aspects and to economic and financial
issues.
Even in developed markets, only in the last ten years or so these issues have been
studied in a systematic manner, and one of the path breaking works is the survey
made by Bodnar et al (1995), with financial managers of American firms, which was
the first of a series that is known as the Wharton Derivatives Survey. This survey
was twice re-edited by Bodnar, Hayt and Marston (1996 and 1998). A study by
24
Bodnar and Gebhardt (1998) reports the same survey responded by German
financial managers, comparing the results of US and German firms.
The evidence obtained in these surveys indicates that companies use derivatives
mostly with the purpose of hedging rather than speculating. There is also strong
evidence that, in both countries, the risk classes most managed with derivatives are
foreign exchange (FX), interest rate (IR), and commodities (CM) in this order.
Although it may be impossible to fully dissociate legal and institutional from
economic and financial issues of concern in using derivatives, it was possible to
identify that US managers are equally concerned with legal aspects (such as
accounting treatment of derivatives) and economic problems (such as market and
liquidity risks, in addition to the evaluation of hedge programs), whereas German
managers showed more concern with investor perceptions in using derivatives. The
concern of US managers with accounting treatment may be explained by the rules
that guide how derivatives should be disclosed, namely instructions SFAS
(Statement of Financial Accounting Standard) 119 and SFAS 133, that were being
discussed at the time the US surveys were done.
The Wharton Survey was then replicated in many countries, such as Downie,
McMilan and Nosal (1996) in Canada, Alckeback and Hagelin (1999) re-edited by
Alckeback, Hagelin and Pramborg (2003) in Sweden, Sheedy (2002) in Singapore
and Hong Kong, El-Masry (2003) in the United Kingdom and others. There are also
some comparative studies such as Bodnar, Jong and Macrae (2002) comparing
Dutch to American firms, Pramborg (2003) comparing Swedish to Korean firms and
Bodnar and Gebhardt (1998), that compares American to German firms.
The questionnaire applied for Brazilian firms contained basically the same questions
of the 1998 Wharton survey, with only a few adaptations for Brazilian market.
However, differently from the other surveys, where paper questionnaires were sent
and received by mail, the Brazilian survey was completely electronic. Managers were
invited by e-mail to access the survey web page using a password and username,
allowing for a quicker process (feeding of the database and response tallies).
I show in this chapter a summary of the results and, when appropriated, make
comparisons between the results obtained for Brazil with those of other countries,
25
specially US and Germany, since the consolidated data for these surveys is almost
completely public, and the German and US surveys have already been compared in
Bodnar and Gebhardt (1998). A comparative study, however, would involve the full
access to analytical data of other surveys, which is not available. Because of that,
caution is in order in interpreting the comparisons.
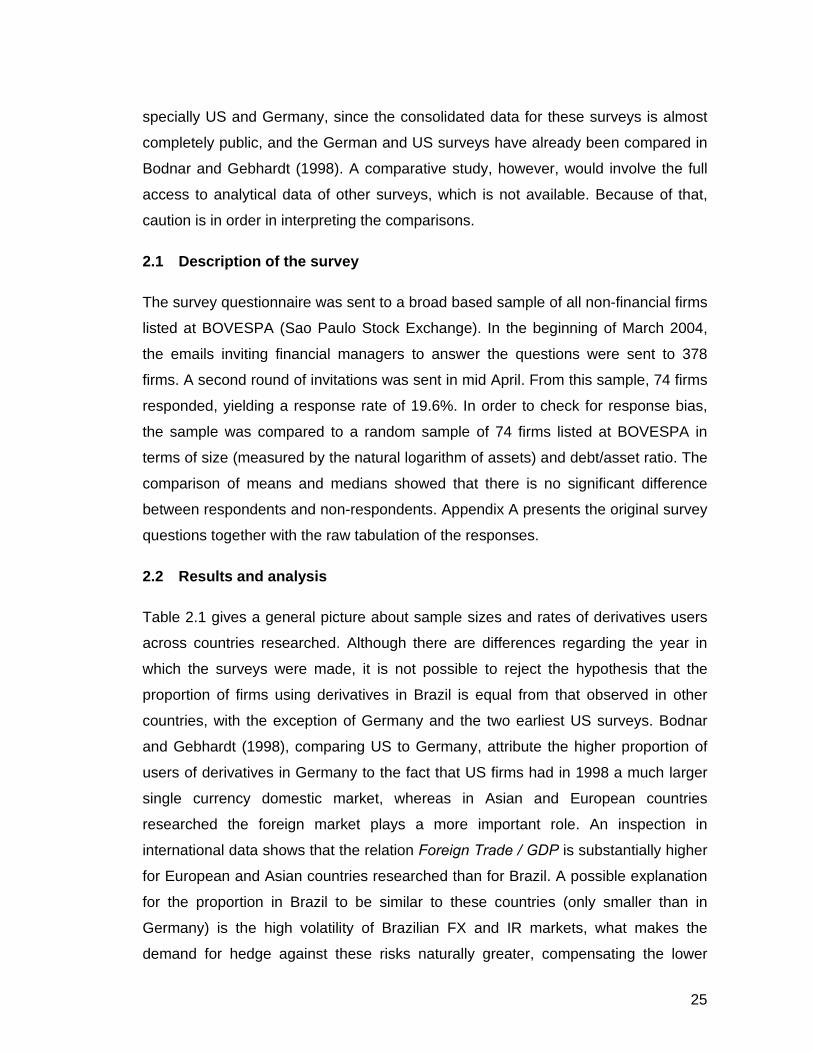
2.1 Description of the survey
The survey questionnaire was sent to a broad based sample of all non-financial firms
listed at BOVESPA (Sao Paulo Stock Exchange). In the beginning of March 2004,
the emails inviting financial managers to answer the questions were sent to 378
firms. A second round of invitations was sent in mid April. From this sample, 74 firms
responded, yielding a response rate of 19.6%. In order to check for response bias,
the sample was compared to a random sample of 74 firms listed at BOVESPA in
terms of size (measured by the natural logarithm of assets) and debt/asset ratio. The
comparison of means and medians showed that there is no significant difference
between respondents and non-respondents. Appendix A presents the original survey
questions together with the raw tabulation of the responses.
2.2 Results and analysis
Table 2.1 gives a general picture about sample sizes and rates of derivatives users
across countries researched. Although there are differences regarding the year in
which the surveys were made, it is not possible to reject the hypothesis that the
proportion of firms using derivatives in Brazil is equal from that observed in other
countries, with the exception of Germany and the two earliest US surveys. Bodnar
and Gebhardt (1998), comparing US to Germany, attribute the higher proportion of
users of derivatives in Germany to the fact that US firms had in 1998 a much larger
single currency domestic market, whereas in Asian and European countries
researched the foreign market plays a more important role. An inspection in
international data shows that the relation Foreign Trade / GDP is substantially higher
for European and Asian countries researched than for Brazil. A possible explanation
for the proportion in Brazil to be similar to these countries (only smaller than in
Germany) is the high volatility of Brazilian FX and IR markets, what makes the
demand for hedge against these risks naturally greater, compensating the lower
26
volume of foreign trade compared to domestic market. In the Netherlands, Germany
and Sweden, the introduction of the Euro may have reduced the currency exposure
of non-financial firms, and it is thus difficult to compare the results of surveys made
in 1998 with more recent surveys.
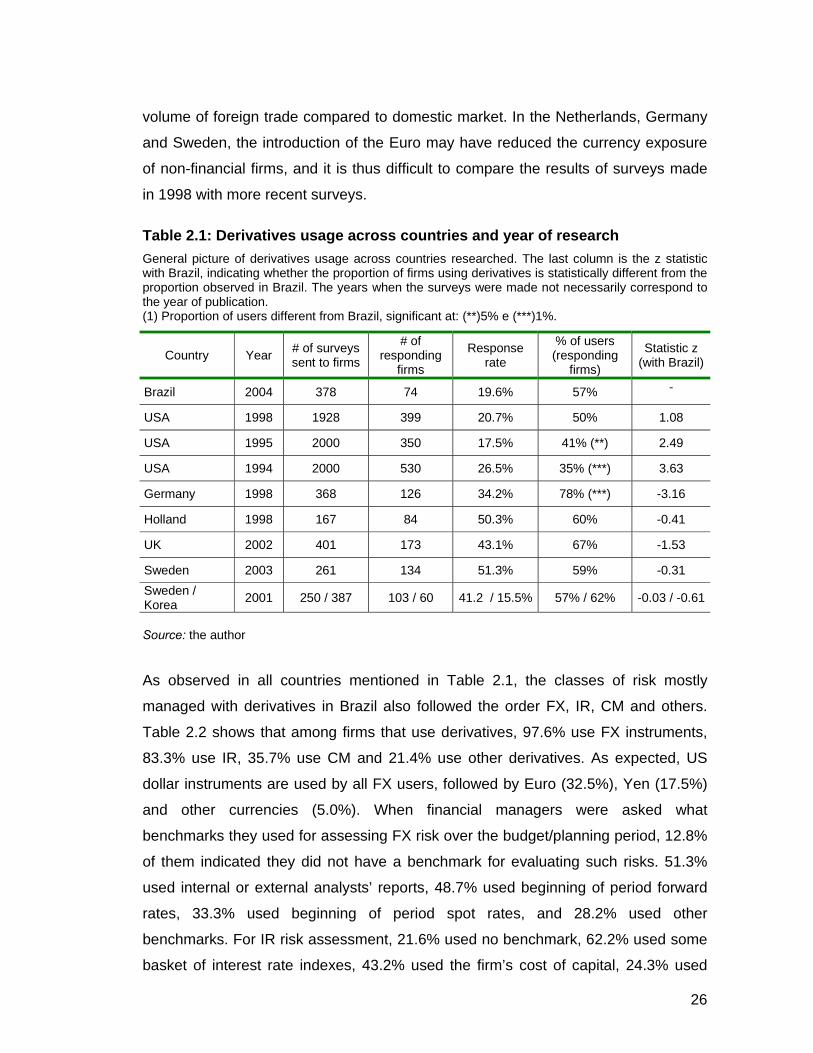
Table 2.1: Derivatives usage across countries and year of research General picture of derivatives usage across countries researched. The last column is the z statistic with Brazil, indicating whether the proportion of firms using derivatives is statistically different from the proportion observed in Brazil. The years when the surveys were made not necessarily correspond to the year of publication. (1) Proportion of users different from Brazil, significant at: (**)5% e (***)1%.
Country Year # of surveys sent to firms
# of responding
firms
Response rate
% of users (responding
firms)
Statistic z (with Brazil)
Brazil 2004 378 74 19.6% 57% -
USA 1998 1928 399 20.7% 50% 1.08
USA 1995 2000 350 17.5% 41% (**) 2.49
USA 1994 2000 530 26.5% 35% (***) 3.63
Germany 1998 368 126 34.2% 78% (***) -3.16
Holland 1998 167 84 50.3% 60% -0.41
UK 2002 401 173 43.1% 67% -1.53
Sweden 2003 261 134 51.3% 59% -0.31 Sweden / Korea 2001 250 / 387 103 / 60 41.2 / 15.5% 57% / 62% -0.03 / -0.61
Source: the author
As observed in all countries mentioned in Table 2.1, the classes of risk mostly
managed with derivatives in Brazil also followed the order FX, IR, CM and others.
Table 2.2 shows that among firms that use derivatives, 97.6% use FX instruments,
83.3% use IR, 35.7% use CM and 21.4% use other derivatives. As expected, US
dollar instruments are used by all FX users, followed by Euro (32.5%), Yen (17.5%)
and other currencies (5.0%). When financial managers were asked what
benchmarks they used for assessing FX risk over the budget/planning period, 12.8%
of them indicated they did not have a benchmark for evaluating such risks. 51.3%
used internal or external analysts’ reports, 48.7% used beginning of period forward
rates, 33.3% used beginning of period spot rates, and 28.2% used other
benchmarks. For IR risk assessment, 21.6% used no benchmark, 62.2% used some
basket of interest rate indexes, 43.2% used the firm’s cost of capital, 24.3% used
27
inflation indexes and 16.2% used other benchmarks. Another relevant result is that
29% of firms using derivatives indicated doing more than 50% of their hedge
overseas.
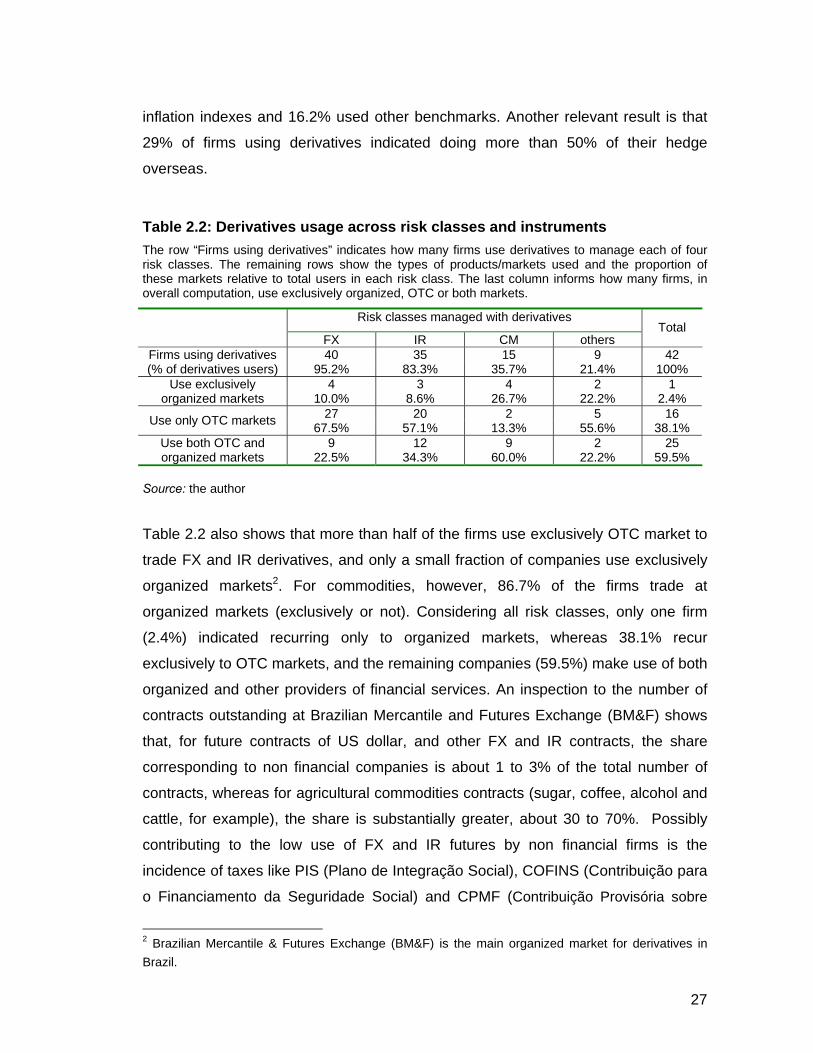
Table 2.2: Derivatives usage across risk classes and instruments The row “Firms using derivatives” indicates how many firms use derivatives to manage each of four risk classes. The remaining rows show the types of products/markets used and the proportion of these markets relative to total users in each risk class. The last column informs how many firms, in overall computation, use exclusively organized, OTC or both markets.
Risk classes managed with derivatives
FX IR CM others Total
40 35 15 9 42 Firms using derivatives (% of derivatives users) 95.2% 83.3% 35.7% 21.4% 100%
4 3 4 2 1 Use exclusively organized markets 10.0% 8.6% 26.7% 22.2% 2.4%
27 20 2 5 16 Use only OTC markets 67.5% 57.1% 13.3% 55.6% 38.1% 9 12 9 2 25 Use both OTC and
organized markets 22.5% 34.3% 60.0% 22.2% 59.5%
Source: the author
Table 2.2 also shows that more than half of the firms use exclusively OTC market to
trade FX and IR derivatives, and only a small fraction of companies use exclusively
organized markets2. For commodities, however, 86.7% of the firms trade at
organized markets (exclusively or not). Considering all risk classes, only one firm
(2.4%) indicated recurring only to organized markets, whereas 38.1% recur
exclusively to OTC markets, and the remaining companies (59.5%) make use of both
organized and other providers of financial services. An inspection to the number of
contracts outstanding at Brazilian Mercantile and Futures Exchange (BM&F) shows
that, for future contracts of US dollar, and other FX and IR contracts, the share
corresponding to non financial companies is about 1 to 3% of the total number of
contracts, whereas for agricultural commodities contracts (sugar, coffee, alcohol and
cattle, for example), the share is substantially greater, about 30 to 70%. Possibly
contributing to the low use of FX and IR futures by non financial firms is the
incidence of taxes like PIS (Plano de Integração Social), COFINS (Contribuição para
o Financiamento da Seguridade Social) and CPMF (Contribuição Provisória sobre
2 Brazilian Mercantile & Futures Exchange (BM&F) is the main organized market for derivatives in Brazil.
28
Movimentação ou Transmissão de Valores e de Créditos e Direitos de Natureza
Financeira), that were charged over daily margin calls3. The higher the volatility and
maturity of the contracts, the higher is the tax burden, making the use of these
instruments less likely.
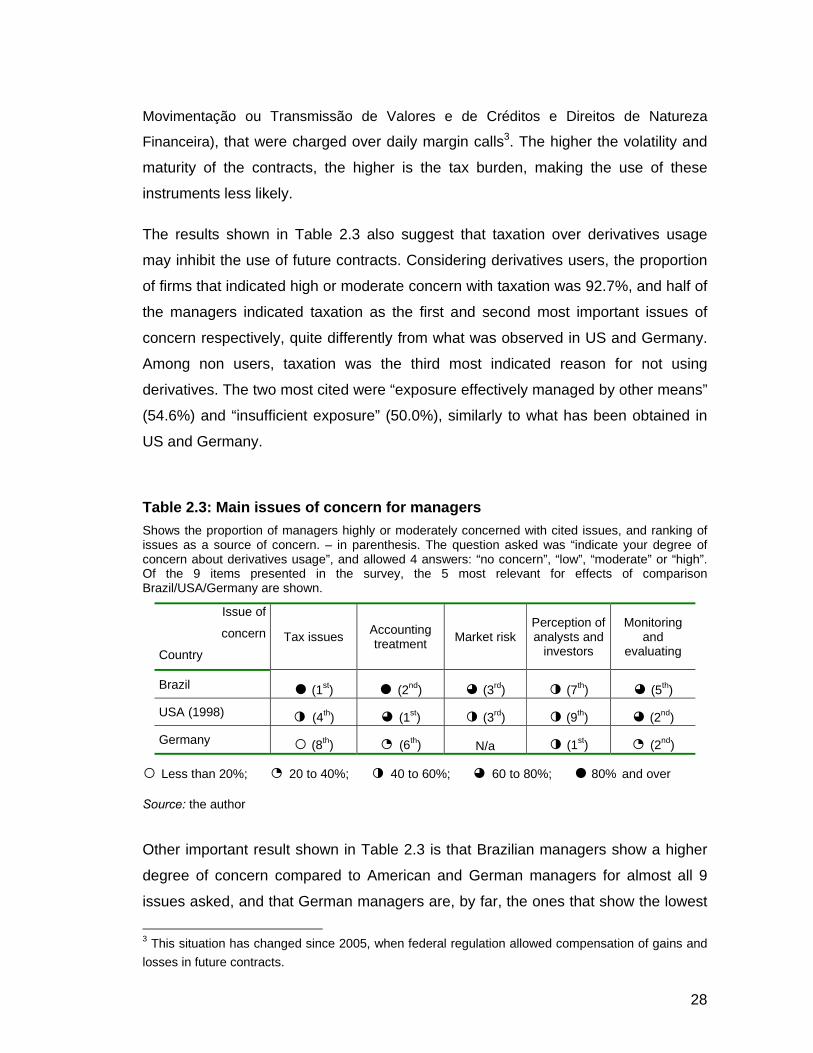
The results shown in Table 2.3 also suggest that taxation over derivatives usage
may inhibit the use of future contracts. Considering derivatives users, the proportion
of firms that indicated high or moderate concern with taxation was 92.7%, and half of
the managers indicated taxation as the first and second most important issues of
concern respectively, quite differently from what was observed in US and Germany.
Among non users, taxation was the third most indicated reason for not using
derivatives. The two most cited were “exposure effectively managed by other means”
(54.6%) and “insufficient exposure” (50.0%), similarly to what has been obtained in
US and Germany.
Table 2.3: Main issues of concern for managers Shows the proportion of managers highly or moderately concerned with cited issues, and ranking of issues as a source of concern. – in parenthesis. The question asked was “indicate your degree of concern about derivatives usage”, and allowed 4 answers: “no concern”, “low”, “moderate” or “high”. Of the 9 items presented in the survey, the 5 most relevant for effects of comparison Brazil/USA/Germany are shown.
Issue of
concern
Country Tax issues Accounting
treatment Market risk Perception of analysts and
investors
Monitoring and
evaluating
Brazil ● (1st) ● (2nd) ◕ (3rd) ◑ (7th) ◕ (5th)
USA (1998) ◑ (4th) ◕ (1st) ◑ (3rd) ◑ (9th) ◕ (2nd)
Germany ○ (8th) ◔ (6th) N/a ◑ (1st) ◔ (2nd)
○ Less than 20%; ◔ 20 to 40%; ◑ 40 to 60%; ◕ 60 to 80%; ● 80% and over
Source: the author
Other important result shown in Table 2.3 is that Brazilian managers show a higher
degree of concern compared to American and German managers for almost all 9
issues asked, and that German managers are, by far, the ones that show the lowest
3 This situation has changed since 2005, when federal regulation allowed compensation of gains and losses in future contracts.
29
degree of concern. For example, the issue of less relevance for Brazilian managers,
“secondary market liquidity”, was indicated by 30.8% of Brazilian managers as an
aspect of high or moderate concern, greater than the second item most cited by
German managers (“monitoring and evaluating”, with less than 30%). This fact leads
us to ask whether German managers ignore the risks of using derivatives. Bodnar
and Gebhardt (1998) consider this highly improbable. In this way, such disparity
between German and US managers makes any comparison between Brazilian and
US/German managers based upon these proportions very difficult to be trusted.
Hence, the ranking of issues of concern seems to bring much more information than
the proportions themselves.
The results of Table 2.3 also indicate that, despite the high volatility of Brazilian
markets, the two major concerns of Brazilian managers are much more linked to
legal and institutional aspects (“taxation” and “accounting treatment”). If concern with
taxation may be explained by the incidence of taxes on future contracts and by the
complex Brazilian tax structure, the concern shown with accounting treatment is
especially surprising. Although the degree of disclosure on derivatives usage
regarded by US authorities is much greater than what is regarded in Brazil, there is
no significant difference between the proportion of Brazilian and US managers
concerned with this issue. Hence, the results obtained indicate that legal and
institutional aspects are the most important in Brazil, differently from what was
observed in US and Germany.
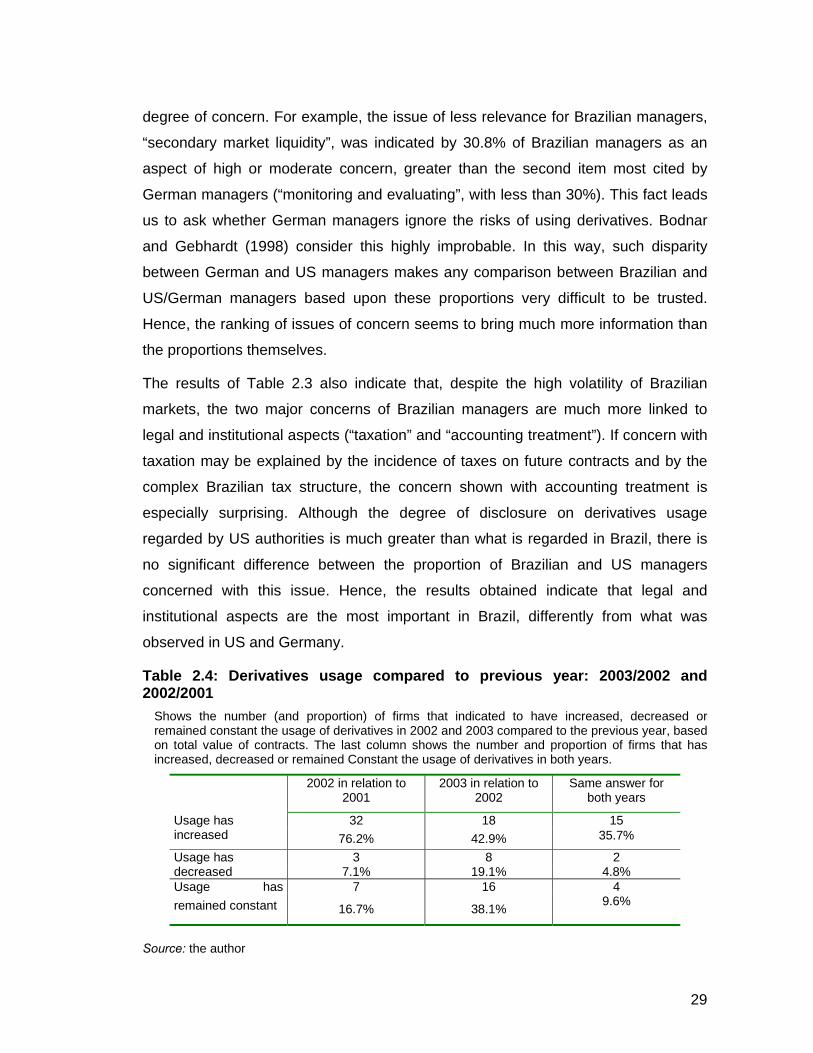
Table 2.4: Derivatives usage compared to previous year: 2003/2002 and 2002/2001
Shows the number (and proportion) of firms that indicated to have increased, decreased or remained constant the usage of derivatives in 2002 and 2003 compared to the previous year, based on total value of contracts. The last column shows the number and proportion of firms that has increased, decreased or remained Constant the usage of derivatives in both years.
2002 in relation to
2001 2003 in relation to
2002 Same answer for
both years
32 18 15 Usage has increased 76.2% 42.9% 35.7%
3 8 2 Usage has decreased 7.1% 19.1% 4.8%
7 16 4 Usage has remained constant 16.7% 38.1% 9.6%
Source: the author
30
The presidential elections of 2002 caused great oscillations in Brazilian financial
markets compared to 2003. For example, the exchange rate (in BRL - Brazilian
Reais - to USD – US Dollar) in 2002 varied in the interval [2.2701; 3.9544], whereas
in 2003 the interval was [2.8211; 3.6615], which means that the range observed in
2002 is almost the double of what was observed in 2003. Table 2.4 shows the
proportion, among users, of firms that increased, decreased or remained the usage
of derivatives constant (based on total notional value of contracts), from 2001 to
2002 and from 2002 to 2003. In 2002, 76.2% of firms increased the use of
derivatives, against 35.7% in 2003. There was also a greater proportion of firms
(17.5%) that decreased the usage from 2002 to 2003 than from 2001 to 2002 (7.5%).
This indicates that a perception of increasing risk leads managers to increase
derivatives usage (although it is impossible to say whether this increase in
derivatives usage is motivated by hedging or speculation). The proportion of firms
that increased derivatives usage in both years was 42.5%, suggesting that there is,
independently of macroeconomic factors, a tendency of increasing derivatives
usage.
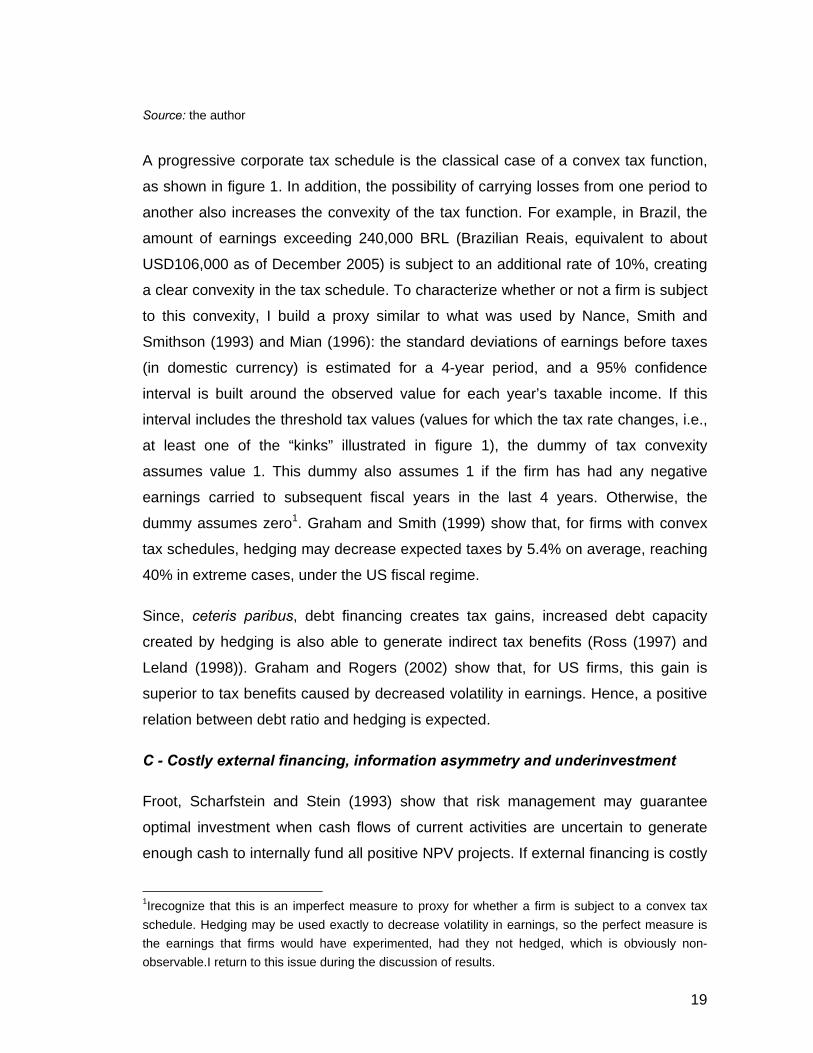
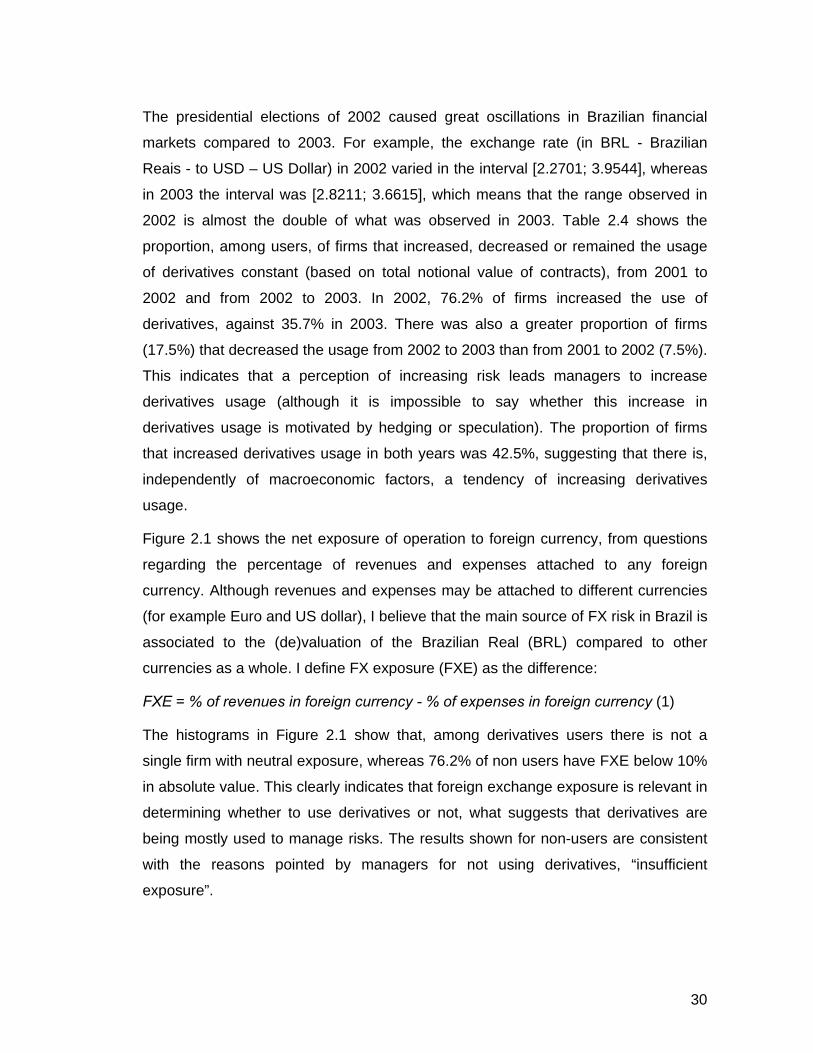
Figure 2.1 shows the net exposure of operation to foreign currency, from questions
regarding the percentage of revenues and expenses attached to any foreign
currency. Although revenues and expenses may be attached to different currencies
(for example Euro and US dollar), I believe that the main source of FX risk in Brazil is
associated to the (de)valuation of the Brazilian Real (BRL) compared to other
currencies as a whole. I define FX exposure (FXE) as the difference:
FXE = % of revenues in foreign currency - % of expenses in foreign currency (1)
The histograms in Figure 2.1 show that, among derivatives users there is not a
single firm with neutral exposure, whereas 76.2% of non users have FXE below 10%
in absolute value. This clearly indicates that foreign exchange exposure is relevant in
determining whether to use derivatives or not, what suggests that derivatives are
being mostly used to manage risks. The results shown for non-users are consistent
with the reasons pointed by managers for not using derivatives, “insufficient
exposure”.
31
Figure 2.1 Exposure to Foreign Currency: users and non users This figure shows FX exposure to which users and non users are subject. The level of FX exposure as defined in Equation 1 is shown on the horizontal axis, and the vertical axis shows the proportion of firms in each of the classes. The classes to the left (right) indicate firms with negative (positive) FXE, which means that they have a percentage of expenses (revenues) greater than the percentage of revenues (expenses) in foreign currency. The class “neutral” contains the firms with FXE equal to zero.
Source: the author
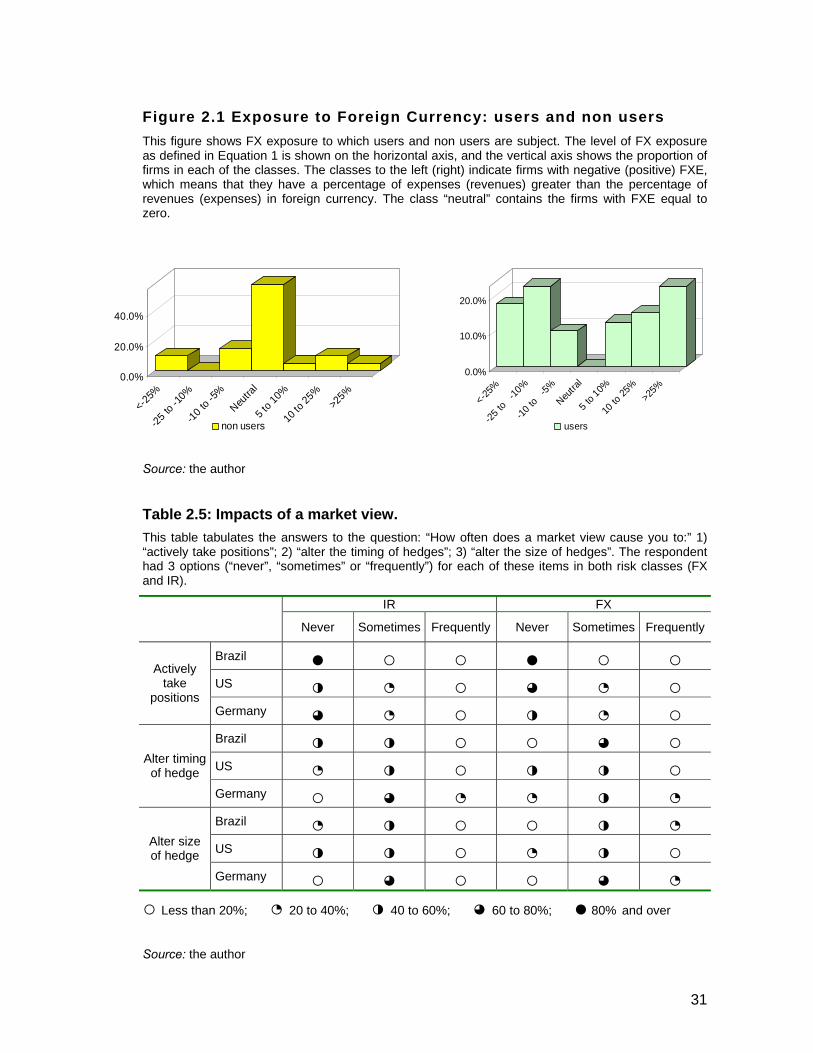
Table 2.5: Impacts of a market view. This table tabulates the answers to the question: “How often does a market view cause you to:” 1) “actively take positions”; 2) “alter the timing of hedges”; 3) “alter the size of hedges”. The respondent had 3 options (“never”, “sometimes” or “frequently”) for each of these items in both risk classes (FX and IR).
IR FX
Never Sometimes Frequently Never Sometimes Frequently
Brazil ● ○ ○ ● ○ ○ US ◑ ◔ ○ ◕ ◔ ○
Actively take
positions Germany ◕ ◔ ○ ◑ ◔ ○ Brazil ◑ ◑ ○ ○ ◕ ○ US ◔ ◑ ○ ◑ ◑ ○
Alter timing of hedge
Germany ○ ◕ ◔ ◔ ◑ ◔ Brazil ◔ ◑ ○ ○ ◑ ◔ US ◑ ◑ ○ ◔ ◑ ○
Alter size of hedge
Germany ○ ◕ ○ ○ ◕ ◔ ○ Less than 20%; ◔ 20 to 40%; ◑ 40 to 60%; ◕ 60 to 80%; ● 80% and over
Source: the author
0.0%
10.0%
20.0%
<-25%
-25 to
-10
%
-10 to
-5%
Neutra
l
5 to 1
0%
10 to
25%
>25%
users
0.0%
20.0%
40.0%
<-25%
-25 to
-10%
-10 to
-5%
Neutra
l
5 to 10
%
10 to
25%
>25%
non users
32
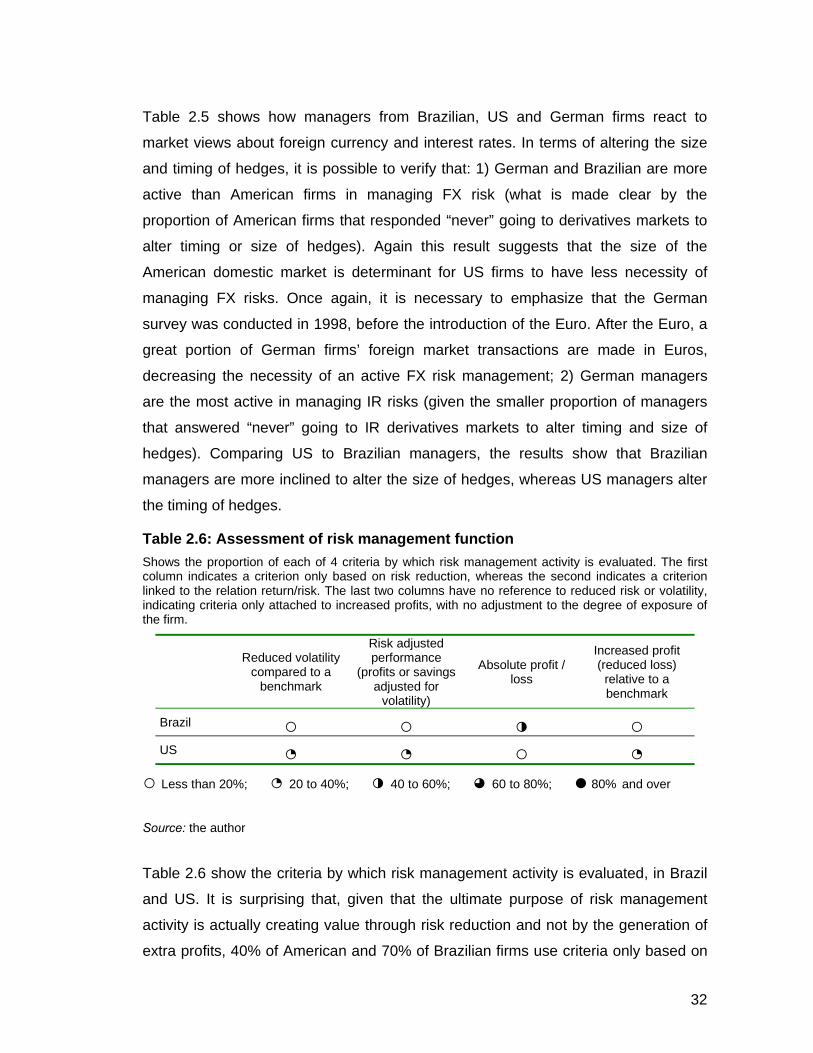
Table 2.5 shows how managers from Brazilian, US and German firms react to
market views about foreign currency and interest rates. In terms of altering the size
and timing of hedges, it is possible to verify that: 1) German and Brazilian are more
active than American firms in managing FX risk (what is made clear by the
proportion of American firms that responded “never” going to derivatives markets to
alter timing or size of hedges). Again this result suggests that the size of the
American domestic market is determinant for US firms to have less necessity of
managing FX risks. Once again, it is necessary to emphasize that the German
survey was conducted in 1998, before the introduction of the Euro. After the Euro, a
great portion of German firms’ foreign market transactions are made in Euros,
decreasing the necessity of an active FX risk management; 2) German managers
are the most active in managing IR risks (given the smaller proportion of managers
that answered “never” going to IR derivatives markets to alter timing and size of
hedges). Comparing US to Brazilian managers, the results show that Brazilian
managers are more inclined to alter the size of hedges, whereas US managers alter
the timing of hedges.
Table 2.6: Assessment of risk management function Shows the proportion of each of 4 criteria by which risk management activity is evaluated. The first column indicates a criterion only based on risk reduction, whereas the second indicates a criterion linked to the relation return/risk. The last two columns have no reference to reduced risk or volatility, indicating criteria only attached to increased profits, with no adjustment to the degree of exposure of the firm.
Reduced volatility
compared to a benchmark
Risk adjusted performance
(profits or savings adjusted for
volatility)
Absolute profit / loss
Increased profit (reduced loss)
relative to a benchmark
Brazil ○ ○ ◑ ○ US ◔ ◔ ○ ◔
○ Less than 20%; ◔ 20 to 40%; ◑ 40 to 60%; ◕ 60 to 80%; ● 80% and over
Source: the author
Table 2.6 show the criteria by which risk management activity is evaluated, in Brazil
and US. It is surprising that, given that the ultimate purpose of risk management
activity is actually creating value through risk reduction and not by the generation of
extra profits, 40% of American and 70% of Brazilian firms use criteria only based on
33
profits (corresponding to the last two columns of Table 2.6). If these are also
compensation criteria, this may create incentives for managers to take speculative
positions with derivatives. Also surprising is the fact that, despite receiving incentives
to speculate, evidence suggests that the great majority of Brazilian managers use
derivatives as a manner of hedging.
This chapter shows the results obtained from a survey on derivatives usage and risk
management practices made from a sample of 74 Brazilian non financial firms,
stating comparisons with similar surveys made in other countries, specially USA and
Germany. However, this is not a complete comparative study, once this would imply
access to analytical data obtained by these other surveys. Hence, in stating
comparisons, it is only possible to obtain indicators of different and similar
characteristics of Brazilian and other managers.
The proportion of Brazilian firms using derivatives is not significantly different from
the majority of countries researched, with the exception of Germany, where the
proportion of users is greater. However the time lag existent between this and other
surveys may distort this result. As observed in most countries where surveys were
conducted, the classes of risk most managed with derivatives in Brazil are foreign
currency, exchange rates, commodities and others, in this order.
Despite the high volatility of foreign currency and exchange rate markets in Brazil
and the susceptibility of Brazilian economy to internal and external crises, Brazilian
managers are more concerned with legal and institutional aspects than with financial
and economic issues, contrarily to what was observed in US and Germany. The
taxation on derivatives is the main issue of concern by Brazilian managers, followed
by accounting treatment. The impacts of taxation on derivatives can be a good issue
for further studies.
Also similarly to what was observed internationally, and in line with what the
Financial Theory prescribes, the evidence suggests that Brazilian financial managers
use derivatives mainly for hedging against risks, and not with speculative purposes,
although the majority of managers responded that risk management activities are
evaluated based upon profits and not risk reduction, what could incentive
speculation.
34
The main limitations of my results refer to the sample used. The relatively small
number of firms responding the survey made controlling the results by size and/or
industry impossible. Besides, the great majority of firms responding the survey are
companies listed at Sao Paulo Stock Exchange (BOVESPA), what can be a source
of bias, once it is known that there are a great number of important privately held
companies in Brazil.
35
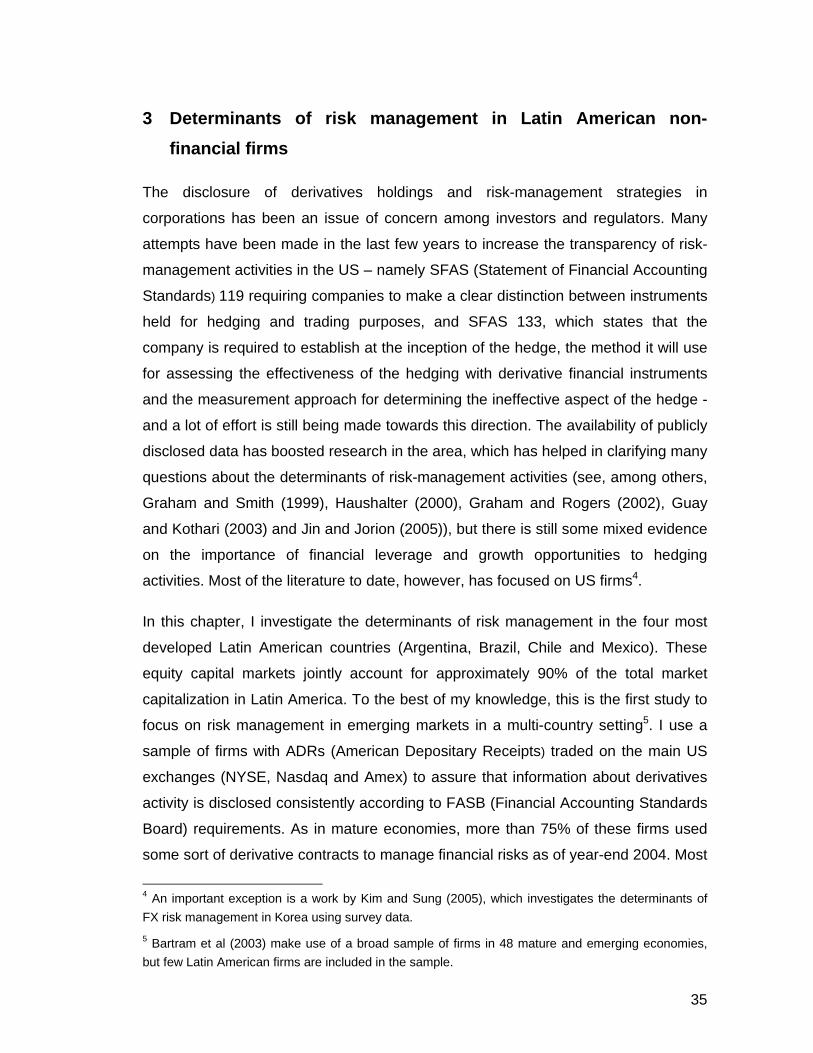
3 Determinants of risk management in Latin American non-financial firms
The disclosure of derivatives holdings and risk-management strategies in
corporations has been an issue of concern among investors and regulators. Many
attempts have been made in the last few years to increase the transparency of risk-
management activities in the US – namely SFAS (Statement of Financial Accounting
Standards) 119 requiring companies to make a clear distinction between instruments
held for hedging and trading purposes, and SFAS 133, which states that the
company is required to establish at the inception of the hedge, the method it will use
for assessing the effectiveness of the hedging with derivative financial instruments
and the measurement approach for determining the ineffective aspect of the hedge -
and a lot of effort is still being made towards this direction. The availability of publicly
disclosed data has boosted research in the area, which has helped in clarifying many
questions about the determinants of risk-management activities (see, among others,
Graham and Smith (1999), Haushalter (2000), Graham and Rogers (2002), Guay
and Kothari (2003) and Jin and Jorion (2005)), but there is still some mixed evidence
on the importance of financial leverage and growth opportunities to hedging
activities. Most of the literature to date, however, has focused on US firms4.
In this chapter, I investigate the determinants of risk management in the four most
developed Latin American countries (Argentina, Brazil, Chile and Mexico). These
equity capital markets jointly account for approximately 90% of the total market
capitalization in Latin America. To the best of my knowledge, this is the first study to
focus on risk management in emerging markets in a multi-country setting5. I use a
sample of firms with ADRs (American Depositary Receipts) traded on the main US
exchanges (NYSE, Nasdaq and Amex) to assure that information about derivatives
activity is disclosed consistently according to FASB (Financial Accounting Standards
Board) requirements. As in mature economies, more than 75% of these firms used
some sort of derivative contracts to manage financial risks as of year-end 2004. Most
4 An important exception is a work by Kim and Sung (2005), which investigates the determinants of FX risk management in Korea using survey data. 5 Bartram et al (2003) make use of a broad sample of firms in 48 mature and emerging economies, but few Latin American firms are included in the sample.
36
of these firms have a high proportion of their indebtedness attached to foreign
currency, which explains why currency risk is by far the exposure most commonly
managed with derivatives.
The relatively good disclosure of derivatives activities allows us to study not only the
decision on whether to use derivatives or not, but also the decision of the magnitude
of risk being managed with derivatives. I find that the factors that determine the
decision of whether to use derivatives or not may differ from the reasons that
determine the magnitude of risk being managed with derivatives. I show evidence
that, while larger firms are, ceteris paribus, more likely to use derivatives, there is a
negative relationship between size and the magnitude of risk management. Unlike
what was found by Guay and Kothari (2003) for US firms, I find that derivative
contracts held by Latin American firms are capable of producing cash flows
comparable in magnitude to investment expenditures and earnings in the event of
shocks in the prices of the underlying assets. These cash flows may also alter firm
value by about 3% for the median firm.
An alternative to the use of derivative contracts is the operational hedge, in which the
firm matches the values of assets and liabilities to the same risk factor (for example,
an exporter may raise debt attached to the same currency in which its revenues are
denominated). My evidence also shows that this “natural” currency hedge reduces
the magnitude of derivatives holdings for risk-management purposes. Firms that
have operational results positively sensitive to local currency devaluation hold
smaller derivatives portfolios than firms whose operational results are negatively or
not sensitive to currency devaluation, controlling for the level of foreign debt. I also
find strong evidence that the costs of financial distress, either measured by financial
leverage, coverage ratio or debt in foreign currency, are the main determinant of risk
management for the firms of our sample and, as a second-order determinant, firms
engage in derivatives programs to be able to assure funding for valuable investment
opportunities. There is no empirical support for the hypothesis that firms use
derivatives to gain with the tax advantages of hedging due to reduced volatility of
taxable income. I find evidence that hedging is able to reduce taxes, however, as
long as it increases firms’ debt capacity.
37
Since the extant theoretical rationales for risk management presented by the
financial literature and the main results of empirical studies so far have already been
presented in the introductory chapter, the remainder of this chapter is divided into
four sections as follows: section 1 presents the sample, the procedures used to
collect data, and description of most relevant statistics. In section 2, the sensitivities
of currency and interest rate derivatives holdings to changes in the prices of the
underlying assets are estimated, comparing the potential cash flows produced by the
derivatives to relevant measures, such as investments, earnings, and firm value.
Section 3 presents the methodology and the results of the panel data LOGIT and
TOBIT analyses used to test the hypotheses related to the determinants of
derivatives usage and the magnitude of foreign exchange (FX) derivatives holdings.
Section 4 concludes.
3.1 Derivatives data and sample
My sample is composed of firms from 4 different countries (Argentina, Brazil, Chile
and Mexico) that belonged to the Bank of New York Latin American ADR Index as of
year-end 2004, excluding financial firms and firms that are subsidiaries of other firms
in the sample. I exclude financial firms since it is often hard to distinguish between
derivatives used for trading purposes from derivatives used for asset-liability
management. Data on derivatives holdings as of year-end 2001 to 2004 are obtained
from the 20-F files submitted to the Securities and Exchange Commission (SEC).
The total number of firms is 55 (26 from Brazil, 14 from Mexico, 12 from Chile and 3
from Argentina), and since some 20-F forms were unavailable for the years 2001
and 2002, I end up with a total of 183 firm-year observations. Although ADR firms
represent a small portion of the total number of publicly traded firms in these
countries, the sample is truly representative in terms of market capitalization and
stock negotiability in Latin America. The firms in the sample represent more than
50% of total market capitalization in these countries. Specifically for Brazil, for
instance, the 26 firms that are present in the sample constituted more than 75% of
the BOVESPA index as of year end 2004, which is the main stock index in Brazil,
and represents roughly 80% of the stock market trading in the Brazilian market6. The
6 Roughly 10% of the Bovespa index portfolio is constituted by stocks of financial firms, so the 26 Brazilian firms in the sample respond for nearly 85% of the non-financial firms in the index.
38
Chilean and Mexican firms in the sample also correspond to more than 50% of the
IPSA (Índice de Precios Selectivo de Acciones) and IPC (Indice de Precios y
Cotizaciones), respectively, the main stock indexes of these countries.
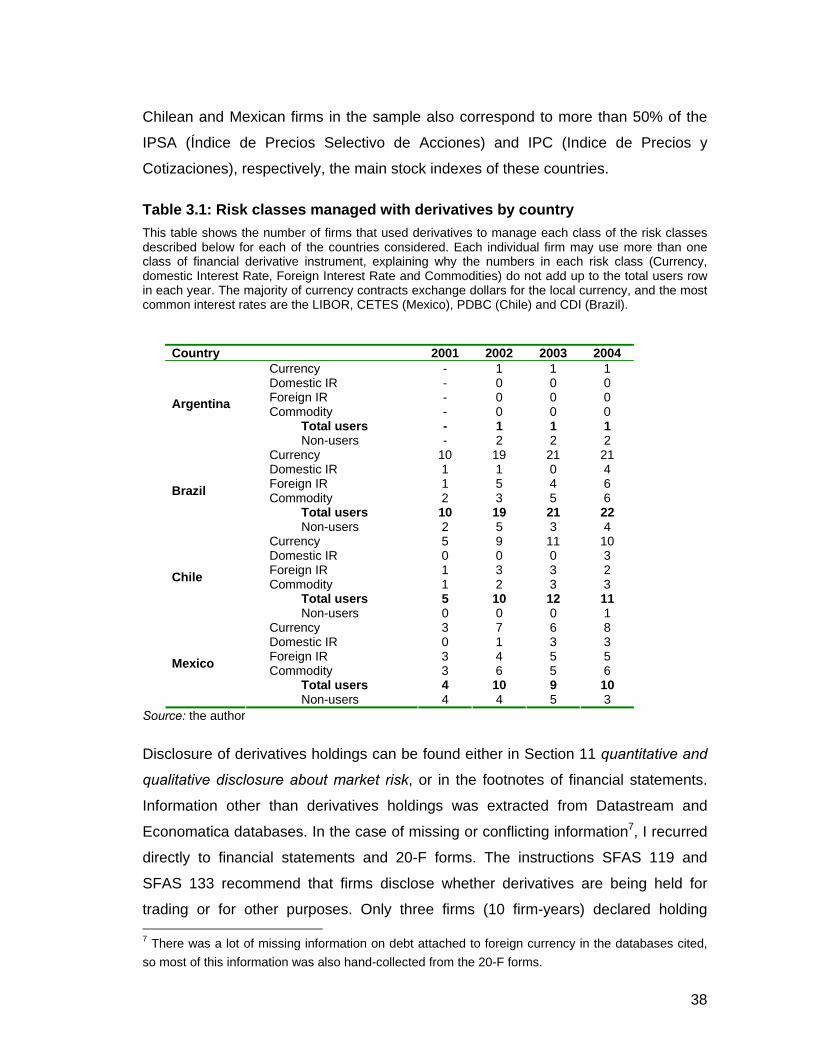
Table 3.1: Risk classes managed with derivatives by country This table shows the number of firms that used derivatives to manage each class of the risk classes described below for each of the countries considered. Each individual firm may use more than one class of financial derivative instrument, explaining why the numbers in each risk class (Currency, domestic Interest Rate, Foreign Interest Rate and Commodities) do not add up to the total users row in each year. The majority of currency contracts exchange dollars for the local currency, and the most common interest rates are the LIBOR, CETES (Mexico), PDBC (Chile) and CDI (Brazil).
Country 2001 2002 2003 2004
Currency - 1 1 1 Domestic IR - 0 0 0 Foreign IR - 0 0 0
Commodity - 0 0 0 Total users - 1 1 1
Argentina
Non-users - 2 2 2 Currency 10 19 21 21 Domestic IR 1 1 0 4 Foreign IR 1 5 4 6
Commodity 2 3 5 6 Total users 10 19 21 22
Brazil
Non-users 2 5 3 4 Currency 5 9 11 10 Domestic IR 0 0 0 3 Foreign IR 1 3 3 2
Commodity 1 2 3 3 Total users 5 10 12 11
Chile
Non-users 0 0 0 1 Currency 3 7 6 8 Domestic IR 0 1 3 3 Foreign IR 3 4 5 5
Commodity 3 6 5 6 Total users 4 10 9 10
Mexico
Non-users 4 4 5 3 Source: the author
Disclosure of derivatives holdings can be found either in Section 11 quantitative and
qualitative disclosure about market risk, or in the footnotes of financial statements.
Information other than derivatives holdings was extracted from Datastream and
Economatica databases. In the case of missing or conflicting information7, I recurred
directly to financial statements and 20-F forms. The instructions SFAS 119 and
SFAS 133 recommend that firms disclose whether derivatives are being held for
trading or for other purposes. Only three firms (10 firm-years) declared holding 7 There was a lot of missing information on debt attached to foreign currency in the databases cited, so most of this information was also hand-collected from the 20-F forms.
39
derivatives for trading purposes, but it is still possible to distinguish the part of their
portfolio that was being used for hedging, since SFAS 119 and 133 require firms to
clearly disclose hedging instruments. In section 3, the tests were performed both
including and excluding these firms for robustness.
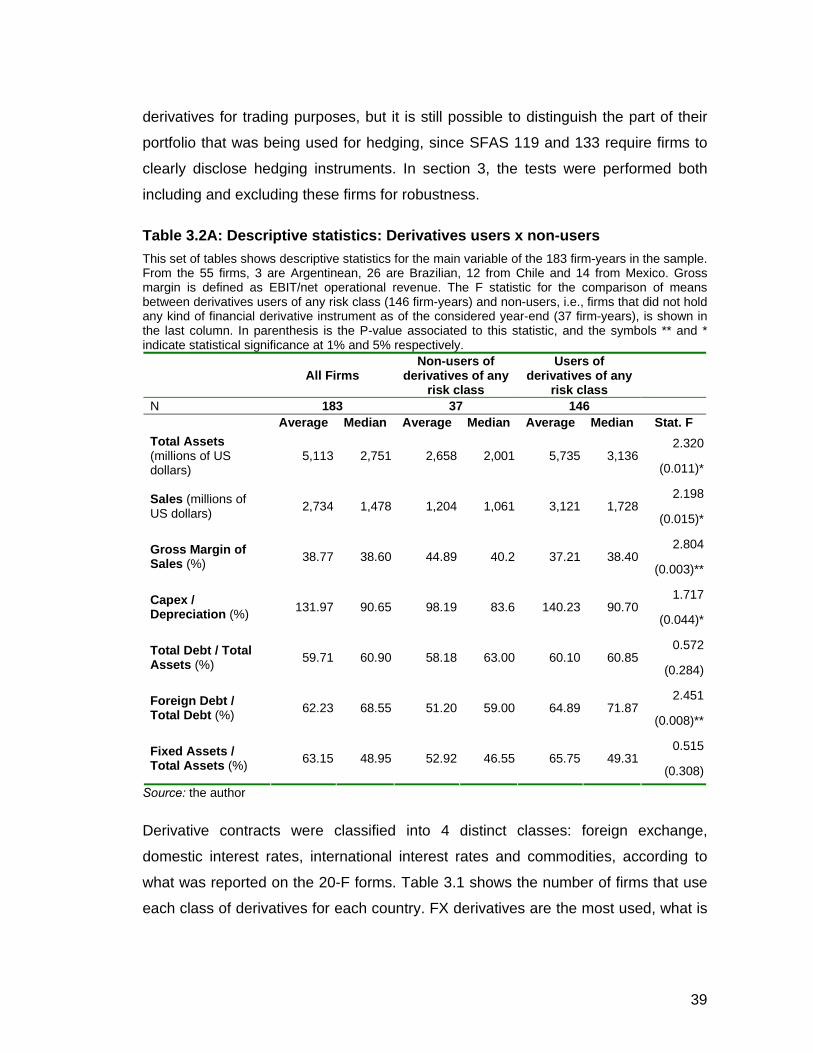
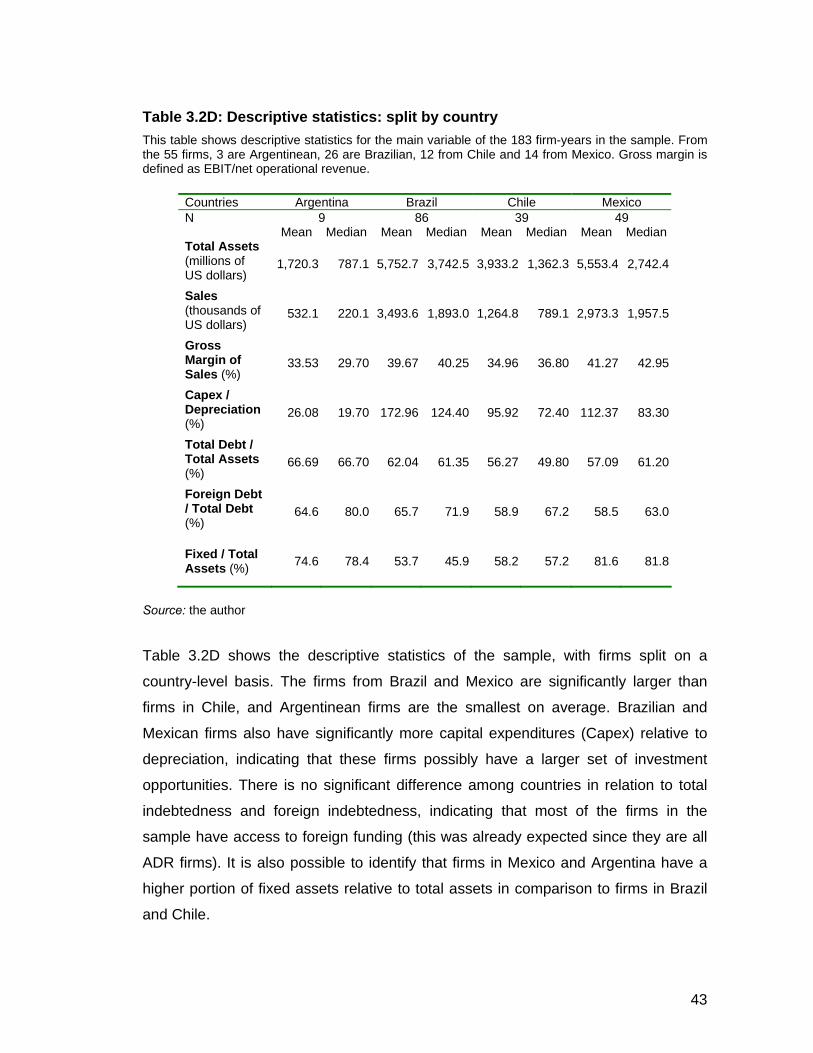
Table 3.2A: Descriptive statistics: Derivatives users x non-users This set of tables shows descriptive statistics for the main variable of the 183 firm-years in the sample. From the 55 firms, 3 are Argentinean, 26 are Brazilian, 12 from Chile and 14 from Mexico. Gross margin is defined as EBIT/net operational revenue. The F statistic for the comparison of means between derivatives users of any risk class (146 firm-years) and non-users, i.e., firms that did not hold any kind of financial derivative instrument as of the considered year-end (37 firm-years), is shown in the last column. In parenthesis is the P-value associated to this statistic, and the symbols ** and * indicate statistical significance at 1% and 5% respectively.
All Firms
Non-users of derivatives of any
risk class
Users of derivatives of any
risk class
N 183 37 146 Average Median Average Median Average Median Stat. F
2.320Total Assets (millions of US dollars)
5,113 2,751 2,658 2,001 5,735 3,136 (0.011)*
2.198Sales (millions of US dollars) 2,734 1,478 1,204 1,061 3,121 1,728
(0.015)*
2.804Gross Margin of Sales (%) 38.77 38.60 44.89 40.2 37.21 38.40
(0.003)**
1.717Capex / Depreciation (%) 131.97 90.65 98.19 83.6 140.23 90.70
(0.044)*
0.572Total Debt / Total Assets (%) 59.71 60.90 58.18 63.00 60.10 60.85
(0.284)
2.451Foreign Debt / Total Debt (%) 62.23 68.55 51.20 59.00 64.89 71.87
(0.008)**
0.515Fixed Assets / Total Assets (%) 63.15 48.95 52.92 46.55 65.75 49.31
(0.308)
Source: the author
Derivative contracts were classified into 4 distinct classes: foreign exchange,
domestic interest rates, international interest rates and commodities, according to
what was reported on the 20-F forms. Table 3.1 shows the number of firms that use
each class of derivatives for each country. FX derivatives are the most used, what is
40
consistent with a number of surveys on derivatives usage performed worldwide8.
Swaps are the most common instruments used to manage currency and interest-rate
risks. It was not possible to gather information on the maturities of all contracts but,
for those for which this information was available, swaps typically have original
maturities ranging from 3 to 6 years, with cash exchange every 6 months, although
there were a number of contracts with quarterly exchange of cash. Futures and
forwards are generally short-term contracts, with maturities up to 6 months.
The majority of currency contracts involved the exchange of the local currency
against the US dollar. The interest rate swaps were mainly plain vanilla exchanging
fixed for floating rates, and the most widely used rates were the LIBOR
(international), CDI (Certificados de Depósitos Interbancários - Brazil), CETES
(Certificados de la Tesoreria de la Federacion - Mexico) and PDBC (Pagarés
Descontables del Banco Central - Chile). No Argentinean firm used domestic interest
rate derivatives.
Tables 3.2A and 3.2B show the descriptive statistics of relevant variables for firms in
our sample. Table 3.2A splits the sample into users (146 firm-years) and non-users
(37 firm-years) of financial derivatives of any class (currency, interest rates or
commodities), and Table 3.2B splits the sample into users (133 firm-years) and non-
users (50 firm-years) of currency derivatives (hereafter called FX users and FX non-
users). FX users (statistics shown in Table 3.2B) obviously form a subset of the
users of any class of derivatives (listed in Table 3.2A), and thus there are 13 firm-
years that use exclusively derivatives unrelated to currency (10 firm-years use only
CM derivatives, 2 use only IR derivatives and 1 uses both IR and CM – but not FX -
instruments).
Tables 3.2A and 3.2B show that derivatives users are, on average, larger than non-
users, whichever is the definition used for size (total assets or sales). Derivatives
users have significantly more debt attached to foreign currency and more investment
opportunities, as measured by capital expenditures (Capex) per dollar of
depreciation, consistent with Froot, Scharfstein and Stein’s (1993) theory. However, 8 To name a few, Bodnar et al (1995, 1996 and 1998) in the US, Saito and Schiozer (2004) in Brazil, Alkeback et al (2003) in Sweden, Bodnar and Gebhardt (1998) in Germany, and El-Masry (2002) in the UK.
41
this relation may also be showing that financially constrained firms have, at the same
time, little funding for their projects and difficulty in finding counterparts for
derivatives transactions due to credit risk, as Mello and Parsons (2000) suggest. I
return to this issue in the next sections.
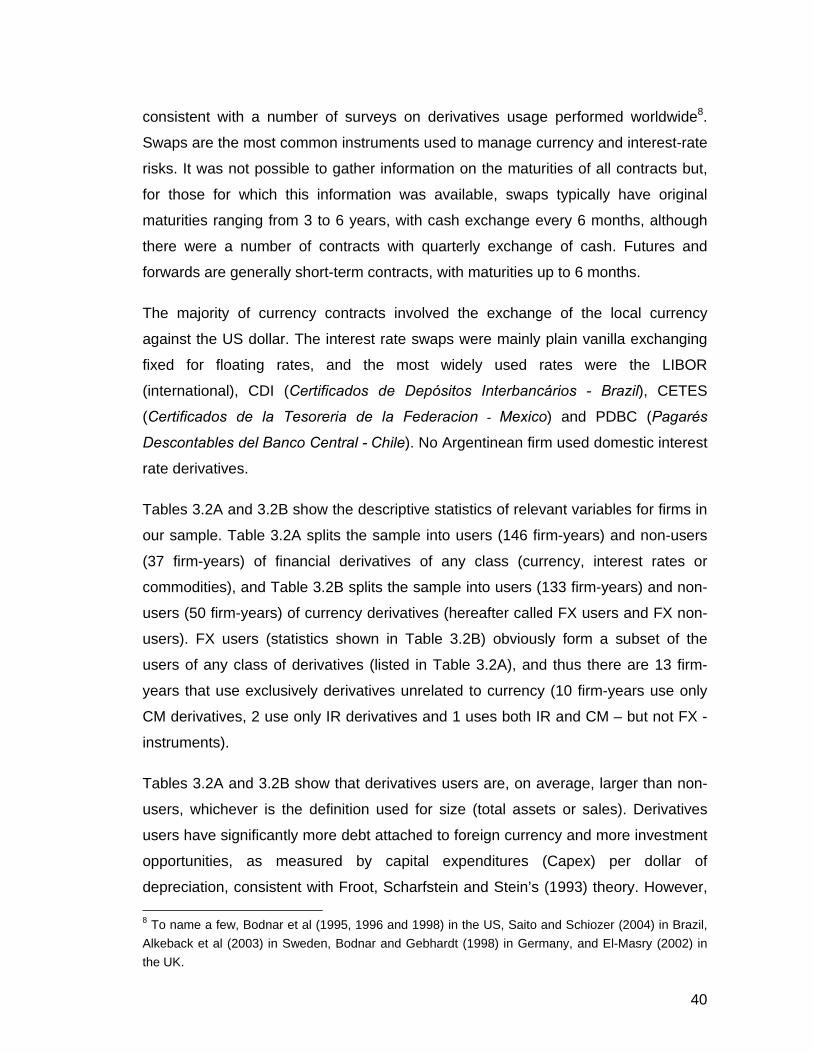
Table 3.2B: Descriptive statistics: FX users x FX non-users This set of tables shows descriptive statistics for the main variable of the 183 firm-years in the sample. From the 55 firms, 3 are Argentinean, 26 are Brazilian, 12 from Chile and 14 from Mexico. Gross margin is defined as EBIT/net operational revenue. The F statistic for the comparison of means between users of currency derivatives (133 firm-years) and non-users of currency derivatives, i.e., firms that did not hold any kind of financial derivative instrument as of the considered year-end plus firms that used derivatives other than currency (50 firm-years) is shown in the last column. In parenthesis is the P-value associated to this statistic, and the symbols ** and * indicate statistical significance at 1% and 5% respectively.
All Firms
Non-users of currency
derivatives Users of currency
derivatives
N 183 50 133 Average Median Average Median Average Median Stat. F
2.656Total Assets (millions of US dollars)
5,113 2,751 2,816 1,864 5,977 3,401 (0.004)**
2.303Sales (millions of US dollars) 2,734 1,478 1,419 1,018 3,228 1,821
(0.011)*
0.884Gross Margin of Sales (%) 38.77 38.60 40.39 37.20 38.17 38.70
(0.189)
1.774Capex / Depreciation (%)
131.97 90.65 103.57 83.45 142.46 92.8 (0.039)*
1.178Total Debt / Total Assets (%)
59.71 60.90 57.13 60.90 60.68 60.9 (0.120)
2.180Foreign Debt / Total Debt (%) 62.23 68.55 54.21 60.12 65.15 71.76
(0.015)*
2.113Fixed Assets / Total Assets (%)
63.15 48.95 87.26 52.21 50.34 48.63 (0.018)*
Source: the author
Although the difference is not statistically significant, derivatives users have more
debt financing than non users as measured by total debt / total assets. The gross
margin of sales is smaller for derivatives users. However, Table 3.2B shows that,
when the sample is split between FX users and non-users, the gross margin of sales
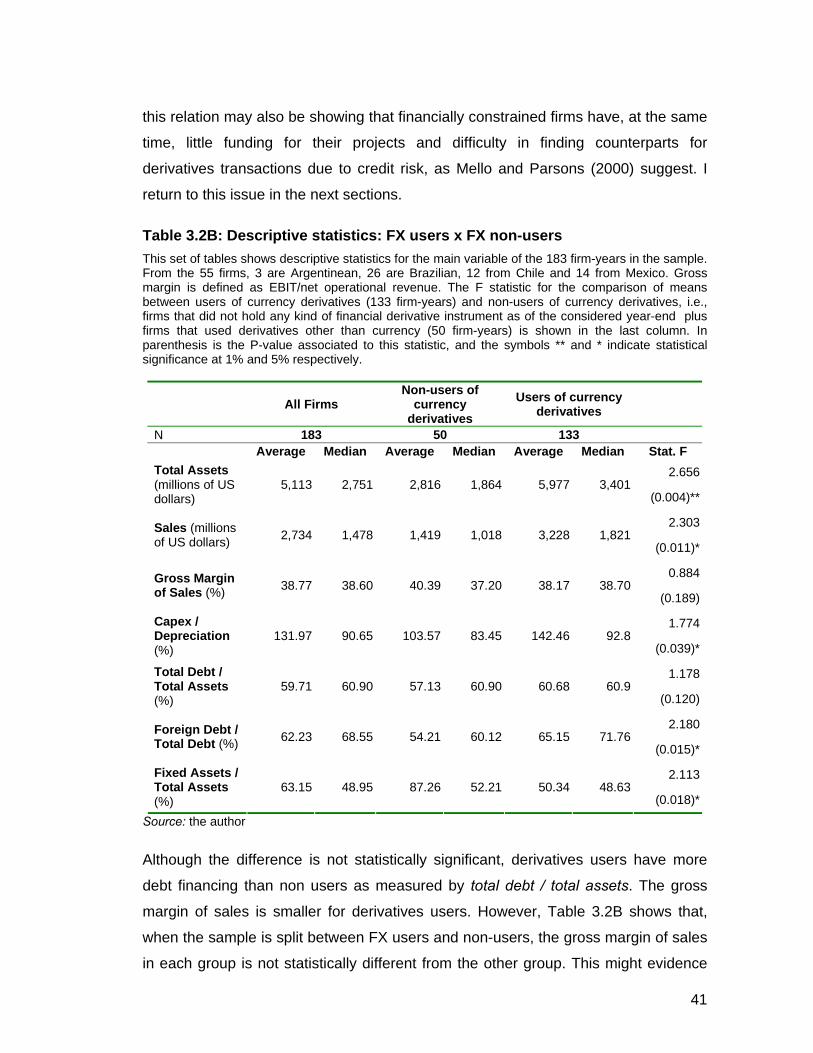
in each group is not statistically different from the other group. This might evidence
42
that commodity producers, which account for a great part of the 13 firms that use
derivatives but do not use FX derivatives, typically operate with lower gross margins,
due to the characteristics of their products and the low prices of commodities
observed in the period of this study. This is confirmed in Table 3.2C, where only
derivatives users are shown, and then are split into FX users and users of other
classes of derivatives. The gross margin of sales of non FX users is lower than that
of FX users. It is also evidenced in Table 3.2C that these commodity producers have
a greater portion of their total assets in the form of fixed assets, which is a
characteristic of commodities producers.
Table 3.2C: Descriptive statistics: FX users x users of derivatives other than currency This set of tables shows descriptive statistics for the main variable of the 183 firm-years in the sample. From the 55 firms, 3 are Argentinean, 26 are Brazilian, 12 from Chile and 14 from Mexico. Gross margin is defined as EBIT/net operational revenue. The F statistic for the comparison of means between users of currency derivatives (133 firm-years) and firms that used derivatives other than currency (13 firm-years) is shown in the last column. In parenthesis is the P-value associated to this statistic, and the symbols ** and * indicate statistical significance at 1% and 5% respectively.
Derivatives Users
Users of currency
derivatives Users of
derivatives other than currency
N 146 133 13 Average Median Average Median Average Median Stat. F
1.171Total Assets (millions of US dollars)
5,735 3,136 5,976 3,401 3,266 1,438 (0.122)
0.779Sales (millions of US dollars) 3,121 1,728 3,227 1,820 2,033 811
(0.218)
2.853Gross Margin of Sales (%) 37.22 38.40 38.17 38.70 27.58 26.20
(0.003)**
0.595Capex / Depreciation (%) 140.23 90.70 142.46 92.80 118.02 82.30
(0.276)
1.523Total Debt / Total Assets (%) 60.10 60.85 60.68 60.90 54.14 57.30
(0.065)
0.340Foreign Debt / Total Debt (%) 64.90 71.87 65.15 71.76 62.31 79.00
(0.367)
4.235Fixed Assets / Total Assets (%) 65.75 49.32 50.34 48.63 83.43 60.00
(0.000)**
Source: the author
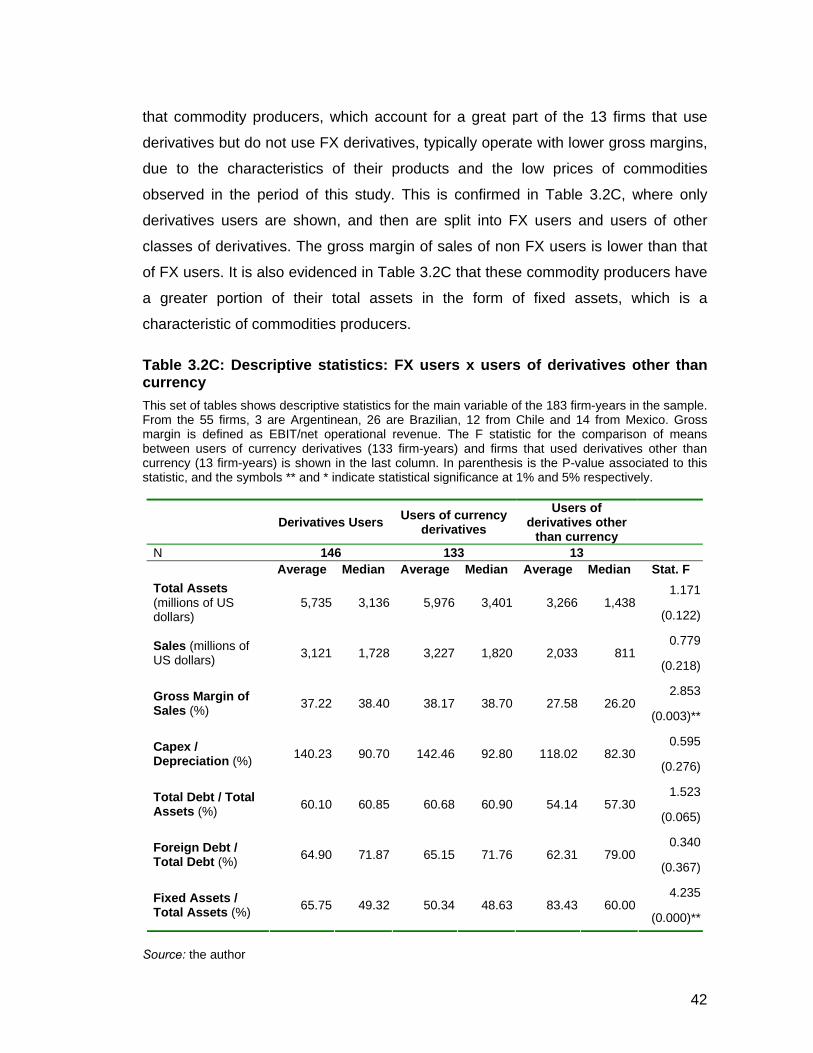
43
Table 3.2D: Descriptive statistics: split by country This table shows descriptive statistics for the main variable of the 183 firm-years in the sample. From the 55 firms, 3 are Argentinean, 26 are Brazilian, 12 from Chile and 14 from Mexico. Gross margin is defined as EBIT/net operational revenue.
Countries Argentina Brazil Chile Mexico N 9 86 39 49 Mean Median Mean Median Mean Median Mean MedianTotal Assets (millions of US dollars)
1,720.3 787.1 5,752.7 3,742.5 3,933.2 1,362.3 5,553.4 2,742.4
Sales (thousands of US dollars)
532.1 220.1 3,493.6 1,893.0 1,264.8 789.1 2,973.3 1,957.5
Gross Margin of Sales (%)
33.53 29.70 39.67 40.25 34.96 36.80 41.27 42.95
Capex / Depreciation (%)
26.08 19.70 172.96 124.40 95.92 72.40 112.37 83.30
Total Debt / Total Assets (%)
66.69 66.70 62.04 61.35 56.27 49.80 57.09 61.20
Foreign Debt / Total Debt (%)
64.6 80.0 65.7 71.9 58.9 67.2 58.5 63.0
Fixed / Total Assets (%) 74.6 78.4 53.7 45.9 58.2 57.2 81.6 81.8
Source: the author
Table 3.2D shows the descriptive statistics of the sample, with firms split on a
country-level basis. The firms from Brazil and Mexico are significantly larger than
firms in Chile, and Argentinean firms are the smallest on average. Brazilian and
Mexican firms also have significantly more capital expenditures (Capex) relative to
depreciation, indicating that these firms possibly have a larger set of investment
opportunities. There is no significant difference among countries in relation to total
indebtedness and foreign indebtedness, indicating that most of the firms in the
sample have access to foreign funding (this was already expected since they are all
ADR firms). It is also possible to identify that firms in Mexico and Argentina have a
higher portion of fixed assets relative to total assets in comparison to firms in Brazil
and Chile.
44
3.2 Cash flow sensitivities of derivatives contracts
I investigate whether derivatives held by firms are capable of generating cash flows
with magnitude similar to that of variables that are the potential objects of hedging
(financial expenses, investments and profits). In other words, I check if the potential
cash flows generated by derivatives are economically significant when compared to
those variables. I focus the analysis on interest rate and currency derivatives.
Guay and Kothari (2003) show that potential cash flows produced by US firms’
derivatives holdings have a much smaller order of magnitude than capital
expenditures, taxable earnings and financial expenses, and therefore conclude that
derivatives holdings may be understood only as a fine-tune portion of risk
management.
In order to estimate the magnitude of risk being managed with derivatives, I follow
the methodology used by Guay and Kothari (2003), where three assumptions are
made: 1) the cash flow generated by each derivative security is perfectly negatively
correlated with the firms’ unhedged cash flow (i.e., derivatives manage the firm’s
downside risk exposure); 2) the cash flow sensitivity of the derivatives portfolio is the
potential cash flow generated by the derivatives portfolio in an extreme change in the
price of the underlying asset. Extreme changes are defined as 3 times the
annualized volatility of the movements in the asset prices in each year; 3) There are
no offsetting positions within the portfolio of derivatives, i.e. I use the gross notional
principal value of derivatives holdings for each risk class9. Since the main purpose is
to estimate the order of magnitude of the cash flow sensitivity of derivatives holdings,
it is arguable that there is no substantial error due to these assumptions. The assets
chosen to represent each risk class are the exchange rate of the US dollar versus
local currency (for currency risk), LIBOR (international interest-rate risk) and the CDI,
PDBC and CETES rates respectively for Brazilian, Chilean and Mexican domestic
interest-rate risk.
9 I use this procedure even for firms that disclose derivatives activities on a contract-by-contract basis. The amount of offsetting long and short positions has not reached 15% of the nominal value of derivatives holdings. Graham and Rogers (2002) report that, for their sample of American firms, after netting out long and short positions, firms’ net notional principal is about 70% of gross notional principal.
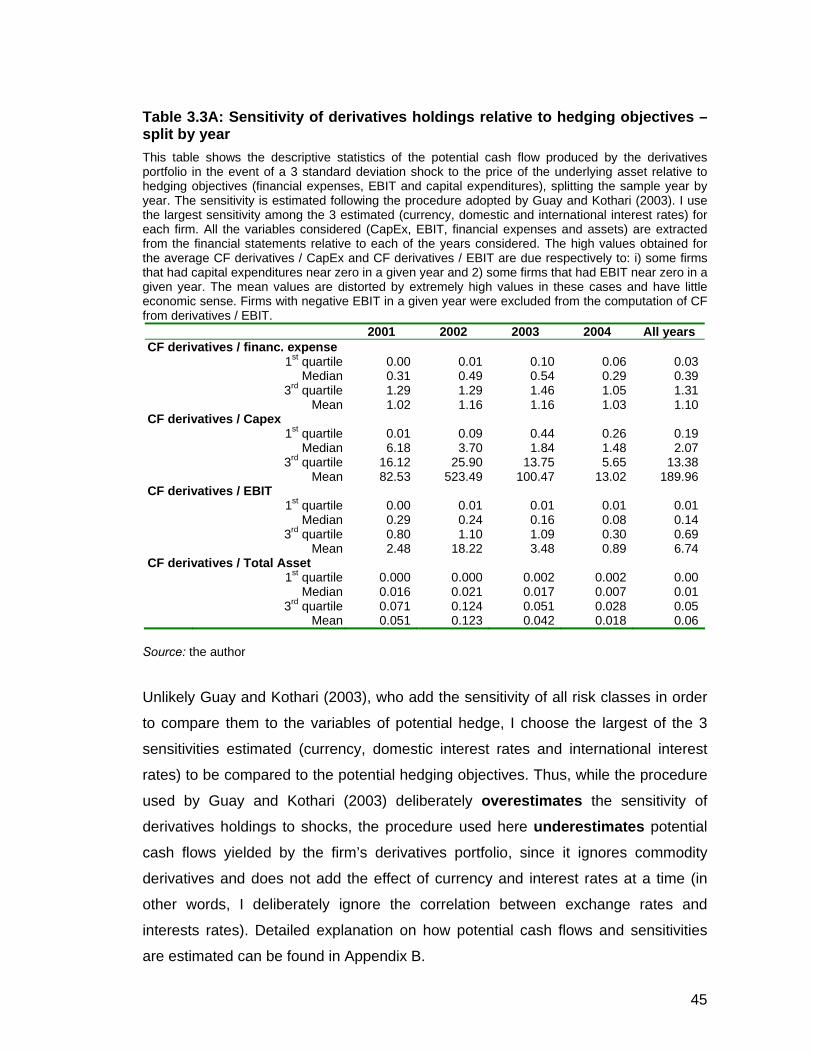
45
Table 3.3A: Sensitivity of derivatives holdings relative to hedging objectives – split by year This table shows the descriptive statistics of the potential cash flow produced by the derivatives portfolio in the event of a 3 standard deviation shock to the price of the underlying asset relative to hedging objectives (financial expenses, EBIT and capital expenditures), splitting the sample year by year. The sensitivity is estimated following the procedure adopted by Guay and Kothari (2003). I use the largest sensitivity among the 3 estimated (currency, domestic and international interest rates) for each firm. All the variables considered (CapEx, EBIT, financial expenses and assets) are extracted from the financial statements relative to each of the years considered. The high values obtained for the average CF derivatives / CapEx and CF derivatives / EBIT are due respectively to: i) some firms that had capital expenditures near zero in a given year and 2) some firms that had EBIT near zero in a given year. The mean values are distorted by extremely high values in these cases and have little economic sense. Firms with negative EBIT in a given year were excluded from the computation of CF from derivatives / EBIT.
2001 2002 2003 2004 All years CF derivatives / financ. expense 1st quartile 0.00 0.01 0.10 0.06 0.03 Median 0.31 0.49 0.54 0.29 0.39 3rd quartile 1.29 1.29 1.46 1.05 1.31 Mean 1.02 1.16 1.16 1.03 1.10CF derivatives / Capex 1st quartile 0.01 0.09 0.44 0.26 0.19 Median 6.18 3.70 1.84 1.48 2.07 3rd quartile 16.12 25.90 13.75 5.65 13.38 Mean 82.53 523.49 100.47 13.02 189.96CF derivatives / EBIT 1st quartile 0.00 0.01 0.01 0.01 0.01 Median 0.29 0.24 0.16 0.08 0.14 3rd quartile 0.80 1.10 1.09 0.30 0.69 Mean 2.48 18.22 3.48 0.89 6.74CF derivatives / Total Asset 1st quartile 0.000 0.000 0.002 0.002 0.00 Median 0.016 0.021 0.017 0.007 0.01 3rd quartile 0.071 0.124 0.051 0.028 0.05 Mean 0.051 0.123 0.042 0.018 0.06
Source: the author
Unlikely Guay and Kothari (2003), who add the sensitivity of all risk classes in order
to compare them to the variables of potential hedge, I choose the largest of the 3
sensitivities estimated (currency, domestic interest rates and international interest
rates) to be compared to the potential hedging objectives. Thus, while the procedure
used by Guay and Kothari (2003) deliberately overestimates the sensitivity of
derivatives holdings to shocks, the procedure used here underestimates potential
cash flows yielded by the firm’s derivatives portfolio, since it ignores commodity
derivatives and does not add the effect of currency and interest rates at a time (in
other words, I deliberately ignore the correlation between exchange rates and
interests rates). Detailed explanation on how potential cash flows and sensitivities
are estimated can be found in Appendix B.
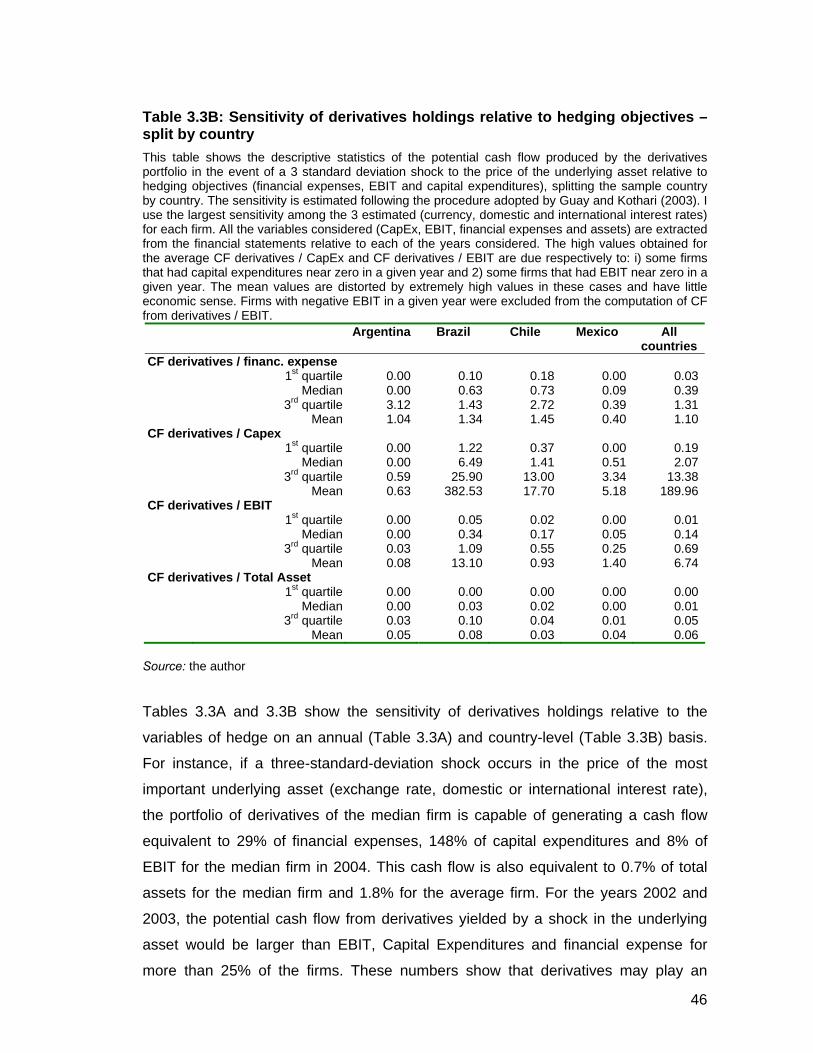
46
Table 3.3B: Sensitivity of derivatives holdings relative to hedging objectives – split by country This table shows the descriptive statistics of the potential cash flow produced by the derivatives portfolio in the event of a 3 standard deviation shock to the price of the underlying asset relative to hedging objectives (financial expenses, EBIT and capital expenditures), splitting the sample country by country. The sensitivity is estimated following the procedure adopted by Guay and Kothari (2003). I use the largest sensitivity among the 3 estimated (currency, domestic and international interest rates) for each firm. All the variables considered (CapEx, EBIT, financial expenses and assets) are extracted from the financial statements relative to each of the years considered. The high values obtained for the average CF derivatives / CapEx and CF derivatives / EBIT are due respectively to: i) some firms that had capital expenditures near zero in a given year and 2) some firms that had EBIT near zero in a given year. The mean values are distorted by extremely high values in these cases and have little economic sense. Firms with negative EBIT in a given year were excluded from the computation of CF from derivatives / EBIT.
Argentina Brazil Chile Mexico All countries
CF derivatives / financ. expense 1st quartile 0.00 0.10 0.18 0.00 0.03 Median 0.00 0.63 0.73 0.09 0.39 3rd quartile 3.12 1.43 2.72 0.39 1.31 Mean 1.04 1.34 1.45 0.40 1.10CF derivatives / Capex 1st quartile 0.00 1.22 0.37 0.00 0.19 Median 0.00 6.49 1.41 0.51 2.07 3rd quartile 0.59 25.90 13.00 3.34 13.38 Mean 0.63 382.53 17.70 5.18 189.96CF derivatives / EBIT 1st quartile 0.00 0.05 0.02 0.00 0.01 Median 0.00 0.34 0.17 0.05 0.14 3rd quartile 0.03 1.09 0.55 0.25 0.69 Mean 0.08 13.10 0.93 1.40 6.74CF derivatives / Total Asset 1st quartile 0.00 0.00 0.00 0.00 0.00 Median 0.00 0.03 0.02 0.00 0.01 3rd quartile 0.03 0.10 0.04 0.01 0.05 Mean 0.05 0.08 0.03 0.04 0.06
Source: the author
Tables 3.3A and 3.3B show the sensitivity of derivatives holdings relative to the
variables of hedge on an annual (Table 3.3A) and country-level (Table 3.3B) basis.
For instance, if a three-standard-deviation shock occurs in the price of the most
important underlying asset (exchange rate, domestic or international interest rate),
the portfolio of derivatives of the median firm is capable of generating a cash flow
equivalent to 29% of financial expenses, 148% of capital expenditures and 8% of
EBIT for the median firm in 2004. This cash flow is also equivalent to 0.7% of total
assets for the median firm and 1.8% for the average firm. For the years 2002 and
2003, the potential cash flow from derivatives yielded by a shock in the underlying
asset would be larger than EBIT, Capital Expenditures and financial expense for
more than 25% of the firms. These numbers show that derivatives may play an
47
important role in firm’s risk management strategies, differently from what was found
by Guay and Kothari (2003) for US firms, even though the potential cash flows
yielded by derivatives holdings are underestimated by the procedure adopted here.
I believe that there are two main reasons for finding evidence different from that
obtained by Guay and Kothari (2003) for their sample of US firms. First, the volatility
of exchange and interest rates in Latin American countries are significantly greater
than in the US, what makes the sensitivity to three-standard-deviation shocks higher
in this study compared to Guay and Kothari’s. This is evidenced by the fact that the
ratios shown in Table 3.3B are larger in 2002 and 2003 than in 2004 due to the
volatility of interest and exchange rates in Brazil in 2002 and of Mexico in 2003.
The second reason for finding results different from Guay and Kothari (2003), is that
there is a 4 to 7-year difference between the data used in the two studies, since
Guay and Kothari use data from 1997. There is no doubt that risk-management
practices using derivatives have become more common in the last years, what
means that, if Guay and Kothari’s study had been performed using data of 2004, the
results would probably be different. BIS (2004) data show that the gross notional
value of outstanding over-the-counter derivatives more than tripled between 1998
and 2004.
It is shown in Table 3.3B that the potential cash flow yielded by derivatives is larger
for Brazilian and Chilean firms than it is for Mexican firms. Caution is in order when
interpreting the results for Argentina, since only 9 observations are from Argentinean
firms. There is also little economic sense in the average values observed for both
Table 3.3A and 3.3B, since there are a few firm-years with Capex or EBIT near zero,
what makes the ratios Cash Flow from Derivatives / Capex and Cash Flow from
Derivatives / EBIT extremely high for these observations. Observations in which
EBIT is negative were excluded for the computation of the Cash Flow from
Derivatives / EBIT ratio.
3.3 The determinants of corporate hedging – empirical analysis
In this section, I investigate what the driving forces for using derivatives are, and also
what determines the magnitude of risk being managed with derivatives. Since the
bulk of firms use mainly FX derivatives, I focus on this class of instrument.
48
In order to answer the first question, I use a binary variable that indicates whether or
not the firm had currency derivatives as of December of each year, and LOGIT tests
are performed. For the second question, I use, as the dependent variable, the gross
notional value of derivatives holdings per total assets and perform TOBIT tests. As
observed by Graham and Rogers (2002), a more precise measure of the magnitude
of the exposure being managed with derivatives would be the netted value of
derivatives holdings (offsetting long and short positions), but this information is only
available for a few firms in the sample. Even in Graham and Rogers’s paper, they
admit that using net positions as apposed to gross notional values is only marginally
important to identify the determinants of corporate hedging decisions. Besides, when
attempting to identify short and long positions in derivatives holdings, a great part of
the contracts are classified as unsure in their sample. Apparently, the measurement
error associated to this variable, caused by the use of notional gross value rather
than netted positions, is small.
As pointed out in the previous sections, risk management is likely associated with
managerial compensation, for which there is no data. Since this unobservable firm
characteristic is possibly correlated with some of the independent variables in the
model, inference made from a standard single-year or pooled estimation would de
flawed. Using a panel random effects specification to estimate the decision to use
derivatives (LOGIT tests) and the magnitude of hedging (TOBIT tests) controls for
the unobserved heterogeneity. Running fixed-effect regressions is ruled out since
many of the variables used, such as the country and regulated industry dummies
specified below, are time constant (i.e., their values are repeated in subsequent
years). It is also clear that the panel is unbalanced in terms of not having the same
cross section units over time, as it is easy to find from the statistics described in
section 2. However, I have strong reasons to believe that the sample selection bias
due to this issue, if there is any, is minimal10.
10 The unavailability of data for some firms in 2001 is mostly related to the fact that the 20-F forms
could be sent in their paper versions (as opposed to the electronic version) in that year. This is what
Wooldridge (2002) calls a rotating panel, and software estimation of these panels automatically
account for the necessary corrections in the estimation process. From 2002 on, firms were compelled
to send the electronic 20-F forms, which are readily available at the EDGAR database.
49
Since the decisions on level of foreign indebtedness and derivatives usage are
intertwined, I use a two step estimation procedure for both the LOGIT and TOBIT
tests, similarly to Geczy et al (1997) and Graham and Rogers (2002), respectively.
This two-step procedure is able to address the endogenous relationship between
derivatives usage and foreign debt.
The dependent and independent variables are described below. For obvious
reasons, all the monetary variables (such as assets and sales) are converted into the
same currency (US dollars):
FX Use: Dummy variable indicating whether a firm held derivatives or not as of the
end of each fiscal year considered. It is used as the dependent variable in the LOGIT
tests;
FX derivatives / Assets: Gross principal notional value of currency derivatives held
by the firm divided by total assets in a given year. It is used to measure the
magnitude of currency hedging with financial derivatives and is the dependent
variable for the TOBIT tests;
Foreign to total debt: debt attached to foreign currency divided total debt as of each
year-end, including both long and short-term liabilities. It is understood as one of the
exposures to currency fluctuations, and a possible cause of financial distress. It is
used as the dependent variable in one of the structural equations of the model as
well as an independent variable in the first step of the estimation procedure. For
robustness, I also use foreign debt / total assets (results not tabulated) as a measure
of currency exposure due to debt.
Asset: Natural logarithm of the total assets as of each year-end, used to proxy for
firm size;
Sales: Natural log of sales in each year, an alternative proxy for firm size;
Tax convexity: a dummy indicating whether the firm is subject to a convex tax
function or not. A 95% confidence interval is built around each year’s pre-tax
50
operating income11 for each firm, using the standard deviation estimated from the 5
previous years, and assuming normality. If this interval contains the progressive
region, the dummy assumes value 1. It also assumes 1 if there was a tax credit
transferred from one year to another during the period in the previous 5 years (i.e.,
for an observation in 2001, I use the period 1996-2000, for an observation in 2002, I
use the period 1997-2001 and so on). Otherwise, the dummy assumes value 0. I
excluded firms with less than 3 valid observations of pre-tax operating income.
Coverage ratio: defined as pre-tax operating profit divided by financial expenses in
each year. I excluded firms for which data was unavailable from 2001 to 2004. For
robustness, I also use a second definition of coverage ratio: instead of using the
single-year operating profit, I use the 3-year average pre-tax operating profit in the
numerator.
Regulation: dummy that returns 1 if the firm is from a regulated industry (oil & gas,
pharmaceuticals, energy and transportation), and 0 otherwise. It is used to proxy for
informational asymmetry, since regulated industries are subject to intense regulatory
enforcement, and thus there is less informational asymmetry regarding their
operations. I exclude telecom firms because, albeit being strongly regulated, the
rapid growth of telecommunication services and the intense M&A activity in the last
few years contribute to increasing informational asymmetry in this industry.
Capex / Depreciation: this variable captures the degree of investment opportunities
for the firm. I do not use the traditional market-to-book ratio, since it may be affected
by country and market-specific factors, such as local crises and political uncertainty.
Liquidity: defined as the natural logarithm of the ratio current assets / current
liabilities. I use the logarithm to mitigate right-tail asymmetry in the observed values
of this ratio in its natural form;
Country dummies: four dummy variables corresponding to the country of origin,
assuming 1 when the firm is from Argentina, Brazil, Chile, and Mexico, respectively,
and 0 otherwise.
11 For this specific variable, pre-tax operating income is denominated in local currency, since the values have to be compared to the “kinks” of the tax function for each country.

51
Since the existence of operational hedge mitigates currency exposure, it is
imperative that I control for this factor. An operational hedge for foreign debt is
characterized when the operation of the firm produces results denominated in foreign
currency, mitigating the currency exposure due to foreign debt. To identify the
existence of operational hedge, I perform a regression of the earnings before interest
and taxes (EBIT) against the exchange rate (measured in US dollars / local
currency), as shown below12:
∑=
− +∆+=∆n
ltiltliiti ecEBIT
0,,, εβ , (1) where
∆EBITi,t is the first difference for the 12-month EBIT for firm i in quarter t, measured
in domestic currency;
ci is the intercept of the regression equation;
∆et is the first difference of the 12-month average exchange rate in quarter t,
measured in local currency relative to the US dollar;
n is the number of quarterly lags between observed earnings and exchange rate13;
βi,l are the regression coefficients;
εi,t are the regression residuals.
I use the operational earnings, since this measure is not affected by capital structure
or hedging operations, and I choose a 12-month period to avoid seasonal adjustment
issues. A positive βi,l coefficient indicates that the operational profit varies in the
same direction as the exchange rate, i.e. profits are higher when local currency is
depreciated. In this case, if the firm has debt in foreign currency, this exposure is
being mitigated by its operation that produces results that are sensitive to the
exchange rate. Based on these regressions, I build a dummy variable that assumes
value 0 if any of the coefficients βi,t are positive and statistically significant at 10% in
12 I use quarterly data from 2000-Q1 to 2004-Q4 for this regression; 13 The number of lags used for each firm was based on the Akaike criterion and, in all regressions, stayed between 1 and 3.
52
a given year, and 1 otherwise. Thus, this dummy measures the inexistence of
operational hedge in a given year and is called no operational hedge. I argue that
this measure is superior to other simple proxies often used in the literature for
operational exposure (such as dummies indicating whether the firm is an importer or
an exporter etc) because: 1) it is actually capable of addressing possible netting
between imports and exports; 2) takes into account the importance of exchange
rates in the domestic product market (i.e., even if a firm buys and sells exclusively in
the domestic market, currency devaluation may favor the entrance of imported
substitutes for its products, for example); 3) foreign-currency-denominated sales in
the domestic market (which is the case of many commodities producers.
The decision on whether to use currency derivatives
A two-stage procedure is used in the estimation of the foreign debt and derivatives-
hedging decisions. In the first stage, I run two separate regressions: the first is a
GLS random-effects regression that uses foreign to total debt as the dependent
variable, and in the second, a random-effects LOGIT regression, the dependent
variable is the FX use dummy. The foreign debt equation uses size, fixed to total
assets, liquidity, country and the no operational hedge dummies, beyond the FX use
dummy. While the first four (size, fixed to total assets, liquidity and country dummies)
are standard variables in the foreign-debt-related literature, I use a different measure
of operational hedge and include currency derivatives usage to explore whether
derivatives usage is determinant for the decision of issuing foreign debt. The second
equation (LOGIT) uses the standard proxies for financial distress (including foreign
debt), tax gains and informational asymmetry, and the operational hedge dummy.
In the second stage, I run structural random effects GLS and LOGIT equations using
as explanatory variables the predicted values obtained for the dependent variables in
the first stage (the predicted value of FX use is “plugged” as an explanatory variable
to the GLS equation and the predicted value of foreign to total debt is “plugged” into
the LOGIT equation). There is a discussion on whether non-significant variables
should be dropped from the first stage estimations to obtain the predicted values to
be “plugged” into the second stage. The results reported in Tables 3.4 and 3.5 do not
drop those variables. However, unreported tests indicate that my conclusions are not
qualitatively affected by dropping these variables. Hereafter this two-step approach
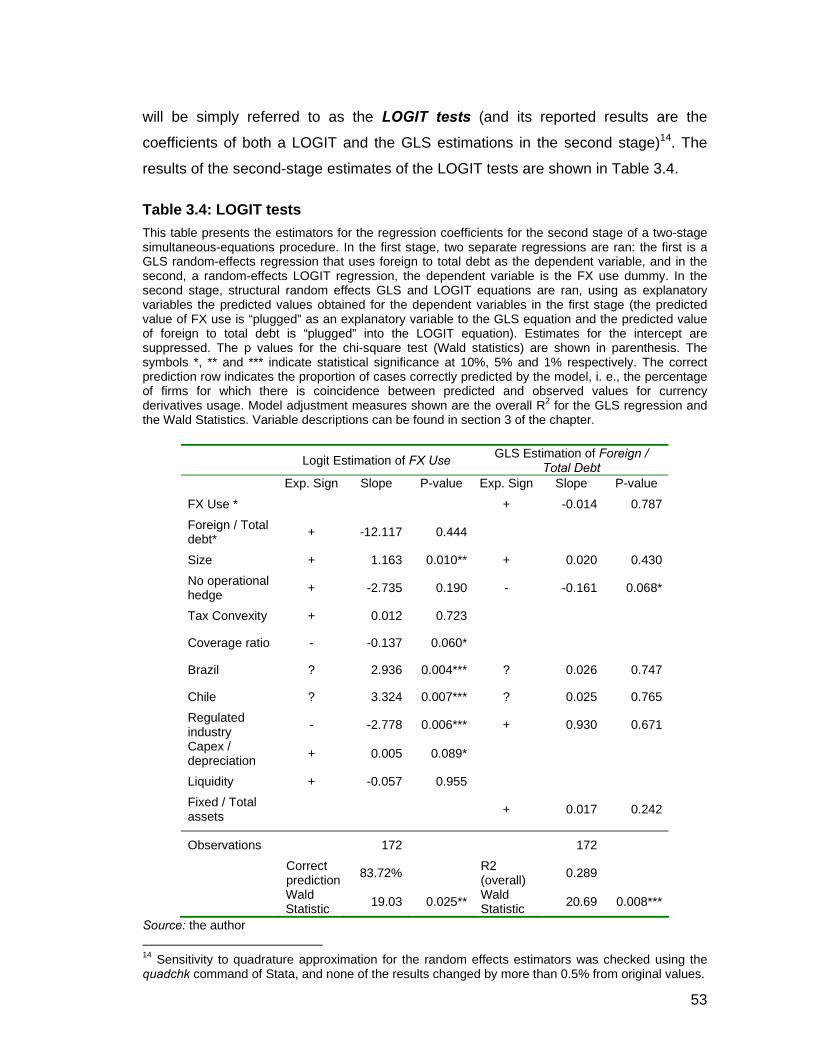
53
will be simply referred to as the LOGIT tests (and its reported results are the
coefficients of both a LOGIT and the GLS estimations in the second stage)14. The
results of the second-stage estimates of the LOGIT tests are shown in Table 3.4.
Table 3.4: LOGIT tests This table presents the estimators for the regression coefficients for the second stage of a two-stage simultaneous-equations procedure. In the first stage, two separate regressions are ran: the first is a GLS random-effects regression that uses foreign to total debt as the dependent variable, and in the second, a random-effects LOGIT regression, the dependent variable is the FX use dummy. In the second stage, structural random effects GLS and LOGIT equations are ran, using as explanatory variables the predicted values obtained for the dependent variables in the first stage (the predicted value of FX use is “plugged” as an explanatory variable to the GLS equation and the predicted value of foreign to total debt is “plugged” into the LOGIT equation). Estimates for the intercept are suppressed. The p values for the chi-square test (Wald statistics) are shown in parenthesis. The symbols *, ** and *** indicate statistical significance at 10%, 5% and 1% respectively. The correct prediction row indicates the proportion of cases correctly predicted by the model, i. e., the percentage of firms for which there is coincidence between predicted and observed values for currency derivatives usage. Model adjustment measures shown are the overall R2 for the GLS regression and the Wald Statistics. Variable descriptions can be found in section 3 of the chapter.
Logit Estimation of FX Use GLS Estimation of Foreign / Total Debt
Exp. Sign Slope P-value Exp. Sign Slope P-value
FX Use * + -0.014 0.787Foreign / Total debt* + -12.117 0.444
Size + 1.163 0.010** + 0.020 0.430No operational hedge + -2.735 0.190 - -0.161 0.068*
Tax Convexity + 0.012 0.723
Coverage ratio - -0.137 0.060*
Brazil ? 2.936 0.004*** ? 0.026 0.747
Chile ? 3.324 0.007*** ? 0.025 0.765Regulated industry - -2.778 0.006*** + 0.930 0.671
Capex / depreciation + 0.005 0.089*
Liquidity + -0.057 0.955 Fixed / Total assets + 0.017 0.242
Observations 172 172
Correct prediction 83.72% R2
(overall) 0.289
Wald Statistic 19.03 0.025** Wald
Statistic 20.69 0.008***
Source: the author 14 Sensitivity to quadrature approximation for the random effects estimators was checked using the quadchk command of Stata, and none of the results changed by more than 0.5% from original values.
54
It is shown in Table 3.4 that, the larger is the firm, the more likely it is to use currency
derivatives. This is consistent with almost every research on derivatives usage to
date in developed markets, indicating that the economies of scale effect is more
relevant than the financial distress effect for the decision of using currency
derivatives. In the GLS regression, although the coefficient of size is positive as
expected, it is not significant at usual levels. Table 3.4 also shows that there is no
causality between currency derivatives usage and the level of foreign debt in neither
direction at significant levels (actually the relationship between foreign debt and
derivatives usage was expected to be positive, but the obtained coefficient is
negative, although insignificant). The coefficient for the tax convexity dummy also
show that firms do not decide to use currency derivatives in response to tax
incentives.
It can also be seen that, while the level of foreign debt of Brazilian and Chilean
companies is not significantly different from Mexican firms15 (which is the benchmark
in the reported regressions), the firms in these countries are more likely to use
currency derivatives. I return to these results when analyzing the results of the
TOBIT regressions. Firms in regulated industries are less likely to use currency
derivatives, even controlling for all other factors. This may be showing that firms with
lower degree of informational asymmetry in their operations, which is consistent with
Froot, Scharfstein and Stein (1993). However, there is only weak evidence that firms
with higher levels of investment opportunities (as measured by capex / depreciation)
are more likely to use FX derivatives, since this coefficient is only significant at 8.9%.
I also return to this issue in the next section.
The estimates of no operational hedge in the GLS regression indicate that firms
whose operational earnings are positively sensitive to local currency devaluation
decide to issue more debt attached to foreign currency. However, the estimates on
the LOGIT equation shows that this operational hedge is not a complete substitute
for financial hedging (i.e., there is no evidence that firms decide not to use currency
15 Mexican firms are used as the benchmarks in the reported results. The coefficient for Argentina is not reported, but is not significantly different from zero. When the benchmark is switched to Brazil or Chile, negative coefficients are obtained for Mexico and Argentina and non-significant coefficients are obtained for the third country (Brazil or Chile).
55
derivatives just because they have a natural operational hedge, which is shown by
the non-significance of the coefficient for no operational hedge).
The decision on the magnitude of currency derivatives holdings
In the second series of empirical testing, I want to analyze the determinants of the
magnitude of firms’ hedging. For this case, our dependent variable is the gross
notional value of currency derivatives holdings divided by total assets in a giver year
end. For this purpose, I use again the same two-step procedure as in the previous
section. The main difference is that, since nearly one fourth of the observations are
censored at zero for the dependent variable, TOBIT tests are used, and hereafter I
refer to this whole two-step approach as the TOBIT tests.
I classify the firms that use currency derivatives in three different groups, according
to the purposes for holding derivatives stated in their 20-F forms: 1) those that
declared holding derivatives for trading purposes as of any year-end in the period of
this study are classified as “traders” (10 firm-years); 2) those firms that stated not to
be currently holding derivatives for trading as of the end of period of that report, but
could eventually hold derivatives for trading were classified as “unsure”; 3) All other
firms were classified as “non-traders” (independently of using currency derivatives or
not). It is important to note that, regardless of the group a firm is classified into, the
dependent variable (FX derivatives / Assets) in the TOBIT tests includes exclusively
the portfolios stated to be used for hedging purposes in the forms 20-F.
Table 3.5 shows the results of the TOBIT tests, using 3 different samples: i) all firms;
ii) all firms except those who were classified as unsure and; iii) exclusively non-
traders. The results obtained for these tests are only marginally different from each
other. For the second sample, I include a dummy variable for the traders, in order to
check whether firms that deliberately trade derivatives also hold more derivatives for
hedging purposes (or whether these firms disclose as hedging instruments some of
the derivatives eventually used for trading). There is no clear indication that this is
the case because, although the coefficient for the traders in the TOBIT estimation is
positive, it is not statistically significant at usual levels.
While issuing foreign debt is determinant for the magnitude of currency derivatives
holdings (what can be seen by the estimate for the foreign / total debt in the TOBIT
56
equation in Table 3.5), derivatives holdings seem not to affect the level of foreign
debt significantly, as shown by the FX derivatives / asset in the GLS Equation. Thus,
the decision to issue foreign debt seems to occur in priority relative to the degree of
derivatives hedging, i.e., firms seem to decide how much foreign debt they should
issue, and then, as a consequence of this decision, the magnitude of derivatives
holdings is set. One possible explanation for this result is that it is easier and
cheaper to obtain access to financial derivatives instruments than it is to issue
foreign debt overseas, even for firms that have ADRs traded in major US exchanges
and thus are more visible to investors than non-ADR firms. Once again, the fixed
costs of using derivatives play an important role in the hedging / funding decision.
While the level of foreign debt had no impact on the decision of using derivatives
(LOGIT tests), it is directly related to the magnitude of derivatives holdings, i.e., once
the firm has decided to use derivatives, increasing the size of its portfolio has a low
marginal cost.
Firm size is negatively related to the magnitude of currency hedging. Therefore,
while firm size is positively determinant for the decision of using derivatives or not
(LOGIT tests), indicating the existence of economies of scale in derivatives usage,
the hypothesis that larger firms have proportionally less costs of financial distress is
confirmed. Our results for currency hedging in Latin American firms are identical to
those of Haushalter (2000) for oil-price hedging in US oil companies. Graham and
Rogers, using a broad sample of US firms, conclude that larger firms are more likely
to use derivatives, but there is no relationship between firm size and the magnitude
of derivatives holdings.
The GLS estimations shown in Table 3.5 also confirm, although with a significance of
only around 7% for the no operational hedge dummy, the results already obtained in
the LOGIT tests, that there is a relationship between the proportion of foreign debt
issued and having operational results positively sensitive to local currency
devaluation (i.e., an operational hedge for this debt). The estimates of the no
operational hedge variable in the TOBIT equation indicate that operational hedging
decreases the necessity of hedging with financial derivatives. Thus, while the LOGIT
tests show that operational hedge is almost irrelevant for the decision on whether to
use currency derivatives or not, it is very important for the decision on the magnitude
57
of financial derivatives hedging. Firms that have a natural hedge for foreign debt
(e.g., exporters) hold significantly less currency derivatives. This might indicate that,
firms that do not face a high sensitivity to currency devaluation in their operational
earnings are less concerned with (or less aware of) the risks represented by
currency volatility and may be less likely to use financial derivatives than firms whose
sensitivity to FX is high. Thus, while among the firms that use derivatives, the ones
that have a natural hedge use less currency derivatives (what is consistent with
theory), there is a number of firms in the sample that decide not to use financial
derivatives as part of their risk management strategies, even if they have an
exposure due to foreign debt which is unhedged by operations.
There is no evidence that the magnitude of derivatives holdings is smaller for firms
with lower informational asymmetry (proxied by the regulated industries dummy), as
Froot, Scharfstein and Stein’s (1993) theory would suggest. Thus, although it is less
probable that these firms use derivatives (as shown in the LOGIT tests), the
magnitude of derivatives holdings for these firms is not different from of that of
unregulated firms. It is also possible that this dummy may be capturing some firm
characteristic other than simply less informational asymmetry. A great part of these
firms are utilities that are still owned by the central or local governments16. It is
possible that investors see a higher degree of informational asymmetry due to this
issue. Similar to the LOGIT tests, the coefficient for capex / depreciation, that is the
proxy for investment opportunities, is only significant at the 10% level in the TOBIT
tests. Therefore, there is evidence (although weak), that firms with higher degrees of
investment opportunities hedge more.
Firm liquidity does nor play an important role in explaining the magnitude of
derivatives hedging. Mello and Parson’s (2000) theory, firms with low liquidity have
difficulty in finding counterparts for issuing financial derivatives and for using
exchange-traded derivatives due to the necessity of margin calls. In fact, it would
also be expectable that liquidity would influence the decision of whether or not to use
16 For example Vale do Rio Doce has been privatized recently, and Eletrobras, Sabesp, Cemig and Copel are still owned by the central government and the state governments of Sao Paulo, Minas Gerais and Parana, respectively.

58
derivatives, but the LOGIT tests show that this is not the case, since derivatives
usage and liquidity are almost unrelated.
There is also strong evidence that firms in Brazil and Chile not only are more likely to
use currency derivatives (as shown by the signs of the country dummies in Table
3.4), but also hold significantly more FX derivatives than Mexican and Argentinean
firms. The reasons for these results are not straightforward, since there are many
differences in the financial systems, micro and macroeconomic conditions in these
countries. Although the number of Argentinean firms is small to draw any conclusive
inference, the adoption of a fixed exchange rate regime by the central government
until late 2001 caused corporations to fail to hedge their foreign exchange risk, as
mentioned by Bustelo (2004). Burnside et al (1999) and McKinnon and Pill (1999)
mention that firms tend to overborrow in foreign currency relative to their hedging
capacity under fixed exchange rate regimes (this was the case of Russia, Mexico
and Brazil before their crises). In the period 2002 - 2004, the aftereffects of the
currency collapse were still present, since the Argentinean economy faced an
enormous slowdown right after the crisis. Low liquidity and financial distress may
have prevented Argentinean firms from starting a risk management or derivatives
program even after identifying a clear necessity to hedge. Another plausible reason
for less derivatives usage in Argentina is that it is the country with the less developed
financial market among the four studied, what makes hedging instruments less
readily and easily available to local companies.
It is also not obvious to explain why Brazilian and Chilean firms use more FX
derivatives than their Mexican counterparts. I find two possible reasons, both relating
to institutional and macroeconomic differences between Mexico, Brazil and Chile.
The first is that firms in Mexico have less foreign ownership in their shares due to the
use of segmented share classes, as shown by Davis-Friday and Frecka (2004).
International investors may be less willing to run currency risk, what increases the
incentives to hedge currency risks in Brazil and Chile. The second reason for less
derivatives hedging in Mexico is that it is the country with the lowest exchange rate
volatility among the four countries examined in the period of this study, what
naturally decreases the necessity of derivatives for hedging currency risks.
59
Similarly to the results obtained in the LOGIT tests, tax incentives seem not to be
important to the size of the derivatives portfolio, as shown by coefficients obtained
for the tax convexity dummy in Table 3.5. There are two main factors that may be an
issue of concern before drawing conclusions from this result. First, the dummy used
to proxy for tax convexity is an improper measure of actual tax convexity, since it
relies on observed pre-tax earnings over time. The major problem is that observed
taxable income already includes the results of hedging operations, causing the
volatility of taxable earnings to be underestimated. A more precise measure of tax
convexity would be the volatility of taxable earnings had the firm not hedged, which
is unobservable. Second, since pre-tax earnings used to build this dummy are from
the period 1996-2004, these values may be skewed due to the several emerging
markets crises occurred in this period. Other studies (Nance et al (1993), Mian
(1996) and Haushalter (2000)) also find similar results.
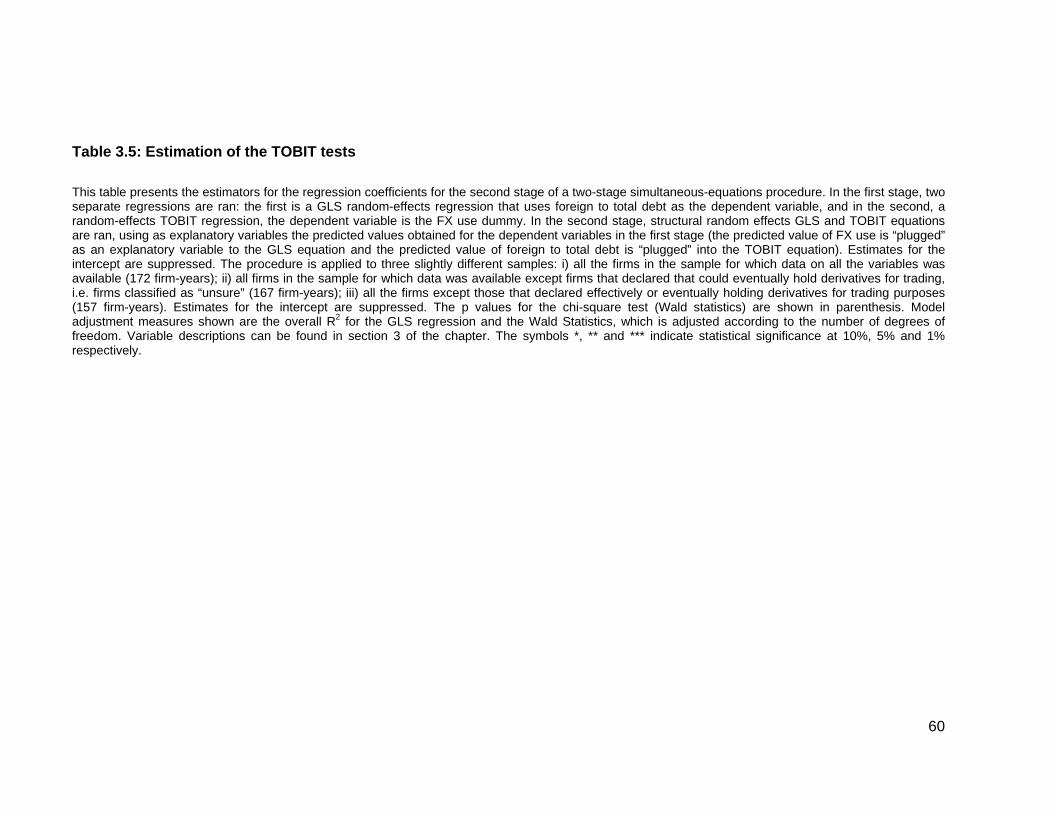
60
Table 3.5: Estimation of the TOBIT tests This table presents the estimators for the regression coefficients for the second stage of a two-stage simultaneous-equations procedure. In the first stage, two separate regressions are ran: the first is a GLS random-effects regression that uses foreign to total debt as the dependent variable, and in the second, a random-effects TOBIT regression, the dependent variable is the FX use dummy. In the second stage, structural random effects GLS and TOBIT equations are ran, using as explanatory variables the predicted values obtained for the dependent variables in the first stage (the predicted value of FX use is “plugged” as an explanatory variable to the GLS equation and the predicted value of foreign to total debt is “plugged” into the TOBIT equation). Estimates for the intercept are suppressed. The procedure is applied to three slightly different samples: i) all the firms in the sample for which data on all the variables was available (172 firm-years); ii) all firms in the sample for which data was available except firms that declared that could eventually hold derivatives for trading, i.e. firms classified as “unsure” (167 firm-years); iii) all the firms except those that declared effectively or eventually holding derivatives for trading purposes (157 firm-years). Estimates for the intercept are suppressed. The p values for the chi-square test (Wald statistics) are shown in parenthesis. Model adjustment measures shown are the overall R2 for the GLS regression and the Wald Statistics, which is adjusted according to the number of degrees of freedom. Variable descriptions can be found in section 3 of the chapter. The symbols *, ** and *** indicate statistical significance at 10%, 5% and 1% respectively.
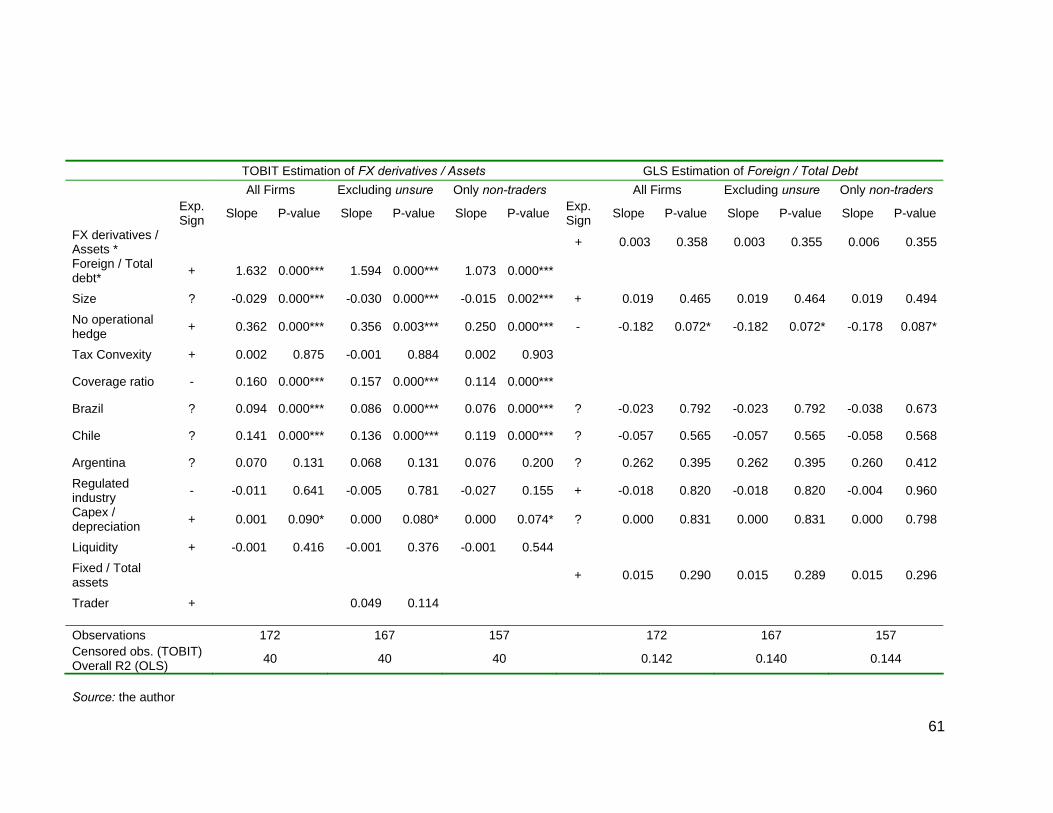
61
TOBIT Estimation of FX derivatives / Assets GLS Estimation of Foreign / Total Debt All Firms Excluding unsure Only non-traders All Firms Excluding unsure Only non-traders
Exp. Sign Slope P-value Slope P-value Slope P-value Exp.
Sign Slope P-value Slope P-value Slope P-value
FX derivatives / Assets * + 0.003 0.358 0.003 0.355 0.006 0.355
Foreign / Total debt* + 1.632 0.000*** 1.594 0.000*** 1.073 0.000***
Size ? -0.029 0.000*** -0.030 0.000*** -0.015 0.002*** + 0.019 0.465 0.019 0.464 0.019 0.494No operational hedge + 0.362 0.000*** 0.356 0.003*** 0.250 0.000*** - -0.182 0.072* -0.182 0.072* -0.178 0.087*
Tax Convexity + 0.002 0.875 -0.001 0.884 0.002 0.903
Coverage ratio - 0.160 0.000*** 0.157 0.000*** 0.114 0.000***
Brazil ? 0.094 0.000*** 0.086 0.000*** 0.076 0.000*** ? -0.023 0.792 -0.023 0.792 -0.038 0.673
Chile ? 0.141 0.000*** 0.136 0.000*** 0.119 0.000*** ? -0.057 0.565 -0.057 0.565 -0.058 0.568
Argentina ? 0.070 0.131 0.068 0.131 0.076 0.200 ? 0.262 0.395 0.262 0.395 0.260 0.412Regulated industry - -0.011 0.641 -0.005 0.781 -0.027 0.155 + -0.018 0.820 -0.018 0.820 -0.004 0.960
Capex / depreciation + 0.001 0.090* 0.000 0.080* 0.000 0.074* ? 0.000 0.831 0.000 0.831 0.000 0.798
Liquidity + -0.001 0.416 -0.001 0.376 -0.001 0.544 Fixed / Total assets + 0.015 0.290 0.015 0.289 0.015 0.296
Trader + 0.049 0.114
Observations 172 167 157 172 167 157 Censored obs. (TOBIT) Overall R2 (OLS) 40 40 40 0.142 0.140 0.144
Source: the author
62
Robustness issues
The replacement of foreign debt / total debt with foreign debt / total assets yields
similar results (not shown), but with lower fit and significance. An alternative to
capture the joint effect of the exposure due to foreign debt and its mitigation with
operational hedge is to build a variable that is the product of foreign to total debt by
no operational hedge. The regressions adding this variable yield positive but non
significant coefficients (results not shown), and the fit is also not improved relative to
the specifications shown in Table 3.5.
Replacing the log of assets with the log of sales to proxy for firm size also causes the
results (unreported) to be unaltered qualitatively. The significance and fit of the
model is similar to what was obtained in the TOBIT tests, but overall fit and
significance is a little worse in the LOGIT tests than those shown in Table 3.4.
63
4 Conclusions
Financial risk management has increasingly been managed with derivative
instruments by firms in mature and emerging economies. Derivatives usage has also
been the main cause of financial distress and even bankruptcy in several widely
known cases, such as Mettalgeselschaft, Barings, Enron, WorldCom and many
others. Risk managers are introduced to new risk management products all the time,
and investors and regulators are increasingly trying to make sure that risk managers
are able to evaluate company exposure and suitability of financial derivatives to
mitigate such risks. Instructions SFAS 119 and 133 attempt to increase disclosure on
derivatives usage and risk management strategies. More recently, the passing of the
Sarbanes-Oxley Act, with the intent of improving the reliability of financial statements
and control procedures within companies with stocks traded in the US, provides for
new levels of auditor independence, and personal accountability for CEOs and CFOs
of these companies. All those changes have direct impacts not only to the end-users
of financial derivatives, but also to the providers of financial services, be it expertise
or new financial products.
This research contributes to a better understanding of the economic factors that lead
firms to use derivatives in four Latin America countries (Argentina, Brazil, Chile and
Mexico), with a deeper view drawn into Brazil, where I investigate not only the
determinants of corporate risk management, but also the perceptions and attitudes
of risk managers. Latin American economies have faced severe difficulties in the last
decade, which resulted in increased volatility in exchange and interest rates
compared to the 70s and the 80s. After a period of relative stability in the 80s and
early 90s, the prices of commodities also started to present higher volatility since the
second half of the nineties. Because many among the largest firms in these
countries are producers of commodities, this also resulted in increased uncertainty in
the cash flows of companies, with major impacts in financing and investment
decisions.
Although the four countries studied share many similarities in terms of culture and
legal system, there are many macro and microeconomic peculiarities to each of
them. While Brazil and Argentina are founder members of the Mercosur since 1991,
64
Chile only partially joined the trading group as an associate member in 1996, and
Mexico reinforced its trading partnership with the US and Canada joining the NAFTA
(North American Free Trade Agreement) in 1994. Also, while Brazil and Argentina
have both been struggling to beat inflation in the last 15 years, Chile and Mexico
have been facing less problems with price stability.
Because it was not practical to survey risk managers in the four countries, I chose
Brazil for an in-deep study of risk management practices and concerns of financial
managers regarding derivatives. Chapter 2 shows the results obtained from a survey
on derivatives usage and risk management practices made from a sample of 74
Brazilian non financial firms, stating comparisons with similar surveys made in other
countries, specially USA and Germany. However, this is not a complete comparative
study, since this would imply access to analytical data obtained by these other
surveys. Hence, in stating comparisons, it is only possible to obtain indicators of
different and similar characteristics of Brazilian and other managers.
The proportion of Brazilian firms using derivatives is not significantly different from
the majority of countries researched, with the exception of Germany, where the
proportion of users is greater. However the time lag existent between this and other
surveys may distort this result. As observed in most countries where surveys were
conducted, the classes of risk most managed with derivatives in Brazil are foreign
currency, exchange rates, commodities and others, in this order.
Despite the high volatility of foreign currency and exchange rate markets in Brazil
and the susceptibility of Brazilian economy to internal and external crises, Brazilian
managers are more concerned with legal and institutional aspects than with financial
and economic issues, contrarily to what was observed in US and Germany. The
taxation on derivatives is the main issue of concern by Brazilian managers, followed
by accounting treatment. The fact of taxation being pointed as the main issue of
concern of financial managers in Brazil is probably related to its intricate tax structure
and the charge of CPMF, PIS and COFINS over daily margin calls of future contracts
when the survey was performed. This has changed only in 2005, when federal
regulation allowed the compensation of gains and losses with derivative contracts.
The impacts of taxation on derivatives, specially the effect of the federal regulation
which allowed compensation in future contracts, can be a good issue for further
studies.
65
Also similarly to what was observed internationally, and in line with what the
Financial theory prescribes, the evidence suggests that Brazilian financial managers
use derivatives mainly for hedging financial risks, and not with speculative purposes,
although the majority of managers responded that risk management activities are
evaluated based upon profits and not risk reduction, what could incentive
speculation. I also find that more than one third of the firms surveyed do more than
50% of their currency hedging outside Brazil. This is probably related to the fact that
the issuance of foreign debt is combined with hedging instruments, i.e., funding and
hedging may come as a “package”.
Chapter 3 uses publicly disclosed data on derivatives of Latin American ADR firms to
study the determinants of corporate hedging in these countries, using a panel
sample of 55 firms with ADRs traded on major US exchanges, in the period 2001-
2004, totaling 183 firm-years. I investigate not only derivatives usage as a binary
variable, but also the magnitude of currency hedging with derivatives. Data on
derivatives holdings was hand collected directly from the 20-F files submitted to the
Securities and Exchange Commission (SEC). Foreign exchange risk is the most
commonly managed with derivatives, consistent with virtually all surveys conducted
on derivatives usage worldwide.
I find that derivatives are capable of producing cash flows comparable in order of
magnitude to the potential variables of hedging (earnings, financial expenses and
investment). For the median firm, in the period 2001 to 2004 the portfolio of
derivatives is able to produce a cash flow equivalent to 30-50% of financial
expenses, 8-30% of earnings before tax and interest and more than 100% of capital
expenditures in the event of a 3 standard deviation shock in the price of the
underlying asset. This result is different from that found by Guay and Kothari (2003)
for US firms. I offer two main explanations for finding different results. First, Guay
and Kothari use data from 1997 as opposed to our study that uses data from 2001 to
2004. There is a 4 to 7 years period of difference between this and that studies, and
derivatives have probably become more common in corporate hedging strategies,
given BIS data showing that the value of OTC derivatives more than tripled in this
period. Second, Latin American economies face substantially more volatility in their
66
exchange and interest rates, which may explain why Latin American firms could
proportionally hold more derivatives to hedge against these sources of exposure.
I use a method to account for the endogeneity between hedging and financing
decisions, and show that derivatives holdings are more affected by foreign debt than
vice-versa. The use of a panel data is able to deal with unobservable firm
characteristics, such as managerial compensation and ownership.
Consistent with the findings of Haushalter (2000) and Jin and Jorion (2005) for US oil
firms, and Graham and Rogers (2002) for a broad range of US firms, I find that the
decision on whether to use derivatives or not has distinct determinants from the
decision on the magnitude of risk to be managed with derivatives in Latin America.
My results show that firm size is positively related to the decision of using
derivatives, but negatively related to the magnitude of hedging. These findings are
consistent with both the economies-of-scale hypothesis and the costs of financial
distress hypothesis, i.e., larger firms are more likely to use derivatives, since there
are economies of scale in derivative usage. In other words, there are fixed costs in
using derivatives that only large firms can bear. On the other hand, larger firms face
less costs of financial distress, what may explain why the relation between the
magnitude of derivatives holdings and firm size, if there is any, is negative.
I find that the costs of financial distress related to currency exposure are the main
driving force for both the decision of using derivatives and the magnitude of
derivatives holdings, which is consistent with most of the empirical studies on
corporate hedging. Debt in foreign currency is positively related to the magnitude of
hedging, but seems to be unrelated to the decision of using currency derivatives. I
also find the operational currency hedge (the mitigation of risk by matching of debt
and earnings in foreign currency) is an important substitute for derivatives, i.e., firms
that hedge debt with their operations use proportionally less currency derivatives.
Consistent with financial theory, I find that firms hedge to mitigate underinvestment
problems. Informational asymmetry and growth opportunities are both positively
related to hedging decisions, but the first is more related to the decision of using FX
derivatives than to the magnitude of hedging. This shows that firms hedge to assure
the internal generation of cash flows for future investment (Bessembinder (1991) and
67
Froot, Scharfstein and Stein (1993)) and also try to mitigate agency disincentives to
invest in low-risk projects, equalizing the potential exposure of low and high-risk
projects (Myers (1977) and Myers and Majluf (1984)).
I found no evidence of firms hedging to decrease expected taxes. Tax-function
convexity has shown to be unimportant for both the decision of using derivatives and
the magnitude of derivatives holdings. I recognize, however, that the variable used to
proxy for convexity of the tax function may be an imperfect measure of actual
convexity. The proper variable would consider what the firm’s pre-tax income would
be, had it not hedged, which is clearly unavailable. In most of the studies that use
similar proxies for tax convexity, the results were similar to ours. Another possible
cause for this result is that, due to several crises occurred in the last 10 years, past
earnings do not necessarily reflect future expectations on earnings of Latin American
firms.
On a country-level basis, I find that Brazilian and Chilean firms are not only more
likely to use derivatives but also hedge more in terms of magnitude. Although the
reasons for this result would require further investigation, I believe that this result is
mainly explained by the fact that the Argentinean government adopted a pegged
exchange rate regime up until late 2001, which caused the supply of hedging
instruments to be scarce, also affecting hedging practices and the culture of hedging
in non-financial firms, still incipient relative to other major Latin American countries. A
possible explanation for Chilean and Brazilian firms hedging more than their Mexican
peers is the lower volatility of exchange rates in Mexico or the low level of foreign
ownership in Mexican firms. It cannot be ignored, however, that the fact of Mexico
being more tied to the US economy due to the NAFTA may be a reason for less
derivatives usage. The availability of hedging products, be it in organized or OTC
markets (which is clearly related to the development of financial systems), may also
be important in explaining these results, but I leave this issue for future studies.
I believe there are two main limitations to this study. The first is related to sample
size, which makes it impossible to control for industry, and limits the results to a
selected group of firms with relatively good conditions in terms of liquidity, corporate
governance, international visibility, access to capital markets and financial health
(with a few exceptions). Benavente et al (2003) show evidence that larger Chilean
68
firms have more dollar-denominated debt than their smaller peers and Bonomo et al
(2003) show that, in Brazil, larger firms are able to react faster than smaller
companies to a shift in exchange-rate risk by reducing debt in foreign currency.
Unfortunately, disclosure on derivatives is worse for smaller firms, even for those
listed in US exchanges. The random effects estimation adopted here, is able to
mitigate this problem, washing out the effect on hedging behavior of the
characteristics (better governance, visibility, etc) that made those firms able to issue
ADRs. The second limitation is the lack of tests on managerial risk aversion as a
hedging determinant. Although the results obtained here are not biased by omitting
this unobservable firm characteristic (since I use random effects that captures these
unobservables), Tufano (1996) shows, using a sample of gold-mining firms, that risk
management is strongly associated to managerial characteristics and their
compensation packages (managers who have a greater portion of their pay in the
form of stock options tend to manage less risk than those who receive stocks). It
would be desirable to be able to identify how managerial ownership and
compensation affects hedging behavior, but compensation data is unavailable for
most of the firms, and, when disclosed, there is no clear pattern that would allow a
valid comparison among compensation packages. Non-public information (e.g.,
collected by survey or other means) could help in understanding the managerial
rationales for risk management, but I leave this issue for future studies.
It is also important to note that this research was based on data from the period
2001-2004, which was a period of relative economic instability in the countries
studied (perhaps less pronounced in Chile than in Brazil, Argentina and Mexico).
Argentina faced a severe currency crisis in 2001, Mexico and Brazil were still facing
the aftereffects of their currency crises from 1995 and 1999, respectively, and the
presidential elections of 2002 in Brazil also contributed for increased volatility.
Events external to the countries studied, such as the Russian crisis of 1998/99 and
the September 11th of 2001 also had important impacts in the economies of Latin
America. It would be interesting to study how risk management determinants and
attitudes of managers towards risks evolve over time. Latin American ADR firms will
have to comprise with Sarbanes-Oxley requirements, which will probably modify
perception of managers, investors and regulators towards risks. The costs of
implementing control procedures to adhere to Sarbanes-Oxley may also cause
69
smaller firms to unlist their ADRs from major US exchanges (i.e., firms may
downgrade from levels 2 and 3 to level 1). Future surveys, not only in Brazil, but also
in other Latin American countries would further improve on the evidence found here.
Macroeconomic conditions also point to a more stable business environment in the
coming years, such as 2005/06 have been, and future studies investigating the
evolvement of the determinants of risk management as well as perceptions of
managers would shed more light on the understanding of risk management. I hope
that the database generated by the Brazilian survey and the inferences made from
the research with ADR firms can be helpful for future studies in corporate risk
management, broadening the knowledge of corporate finance in emerging
economies.
The results of this research have implications not only for non-financial firms, but
also to the providers of financial services, especially those that supply financial
products for hedging and or expertise in risk management. It is important for these
players to understand what the real sources of exposure in non-financial firms are,
and how operational hedge is able to mitigate currency risks without the need of
financial derivatives. Regulators and financial authorities may also benefit from a
better understanding of how and why firms manage risks, and what are the
perceptions of managers towards the different sources of risks faced by companies
in Latin America.
70
5 References cited in the text
Adam, T. R., Fernando, C. S., Are There Speculative Components in Corporate
Hedging and Do They Add Value? Working Paper, 2003. Available at
<www.ssrn.com>, acessed May 31st, 2005.
Alkeback, P., Hagelin, N. Derivative Usage by Nonfinancial Firms in Sweden with an
International Comparison, Journal of International Financial Management and Accounting, New York, 10, 2, p105-121, jun. 1999.
Alkeback, P., Hagelin, N. Pramborg, B., Derivative Usage by Non-Financial Firms in
Sweden 1996 and 2003: What Has Changed?, 2003. Working Paper. Available at
<www.ssrn.com>, acessed March 31st, 2006.
Allayannis, G., Ofek, E., Exchange Rate Exposure, Hedging, and the Use of Foreign
Currency Derivatives, Journal of International Money and Finance, 20, p 273-
296, 2001.
Allayannis, G., Lel, U., Miller, D. Corporate Governance and The Hedging Premium
Around the World, Working Paper, 2003. Available at <www.ssrn.com>, acessed
October 31st, 2004.
Bank for International Settlements, BIS Quarterly Review, March 2004, Basle, pA99-
A104, 2004.
Bartram, S.M., Brown, G.M. Fehle, F.R. International Evidence on Financial
Derivatives Usage, Working Paper, 2003. Available at <www.ssrn.com>, acessed
May 31st, 2005.
Baxter, N.D., Leverage, Risk of Ruin and the Cost of Capital, Journal of Finance,
V22, p395-403, 1967
71
Benavente, J.M., Johnson, C.A., Morandé, F.G., Debt composition and balance
sheet effects of exchange rate depreciations: a firm-level analysis for Chile,
Emerging Markets Review 4, p 397-416, 2003.
Bessembinder, H., Forward Contracts and Firm Value: Investment Incentive and
Contracting Effects, Journal of Financial and Quantitative Analysis, 26, p519-
532, 1991.
Bodnar, G. M., Hayt, G. H., Marston, R.C. Smithson, C.W., Wharton Survey of
derivatives usage by U.S. Non-Finacial Firms, Financial management, 24, 2,
p104-114, Summer 1995.
Bodnar, G. M., Hayt, G. H., Marston, R.C. Wharton Survey of derivatives usage by
U.S. Non-Finacial Firms, 25, 4, p113-133, Winter 1996.
Bodnar, G. M., Hayt, G. H., Marston, R.C. 1998 Survey of derivatives usage by U.S.
Non-Finacial Firms, Wharton School of the University of Pennsylvania,
Philadelphia, 1998.
Bodnar, G. M., Gebhardt, G., Derivatives Usage in Risk Management by U.S. and
German Non-Financial Firms: A Comparative Survey, CFS Working Paper 98/17,
1998.
Bodnar, G.M., Jong, A., Macrae, V., The Impact of Institutional Differences on
Derivatives Usage: a Comparative Survey of American and Dutch Firms, Working
Paper, 2002. available at <www.ssrn.com>, accessed on September 30th, 2006.
Bonomo, M., Martins, B., Pinto, R., Debt composition and exchange rate balance
sheet effects in Brazil: a firm level analysis, Emerging Markets Review 4, p368-
396, 2003.
Brown, G., Managing Foreign Exchange Risk with Derivatives, Journal of Financial Economics, 60 2, p401-449, 2001
Brown, G., Khoker, Z., Corporate risk, Market Imperfections and Speculative
Motives, Working Paper, 2001, available at <www.ssrn.com>, accessed on
September 30th, 2006.
72
Bulow, Jeremy and J. B. Shoven, The Bankruptcy Decision, Bell Journal of Economics 9: 437–56, 1978.
Burnside, C., Eichenbaum, M., Rebelo, S., Hedging and Financial Fragility in Fixed
Exchange Rate Regimes, National Bureau of Economic Research (NBER)
Working Paper, 1999, available at <www.ssrn.com>, accessed on September 30th,
2006.
Bustelo, P., Capital Flows and Financial Crises: a Comparative Analysis of East Asia
(1997-98) and Argentina (2001-02), working paper, 2004, available at
<www.ssrn.com>, accessed on September 30th, 2006.
Castanias, R., Bankruptcy Risk and Optimal Capital Structure”, Journal of Finance
38, p1671-1706, 1986
Davis-Friday, P. Y. and Frecka, T. J., Which Firms Choose to List as American
Depositary Receipts (ADRs)?: Evidence from Mexican Cross Listings, 2004.
Available at <www.ssrn.com>, accessed July 31st, 2006.
Dolde, W., Hedging, Leverage and primitive risk, Journal of Financial Engineering, 4, 187-216, 1995
Downie, D., McMilan, J., Nosal, E., The University of Waterloo Survey of Canadian
Derivatives Use and Hedging Activities. In Smithson, Charles W. Managing Financial Risk, Yearbook 1996, p.214-233, 1996.
El-Masry, A.A., A Survey of Derivatives Use by UK Nonfinancial Companies,
Working Paper, 2003. Available at <www.ssrn.com>, acessed March 31st, 2006.
Froot, K. A., Scharfstein, D. S., Stein, J. C., Risk Management: Coordinating
Corporate Investment and Financing Policies, Journal of Finance, 48, p1629-
1658, 1993.
Geczy, C., Minton, B., Schrand, C., Why Firms Use Currency Derivatives, Journal of Finance, 52, p1323-1354, 1997.
Gertner, R., Scharfstein D., A Theory of Workouts and the Effects of Reorganization
Law, Journal of Finance, 46: 1189-1222, 1991
73
Graham, J. R., Rogers, D. A., Is Corporate Hedging Consistent with Value
Maximization: An Empirical Analysis, Working Paper, 1999. Available at
<www.ssrn.com>, accessed July 31st, 2006.
Graham, J. R., Rogers, D. A, Do firms hedge in response to Tax Incentives, Journal of Finance, 57, p815-839, 2002.
Graham, J. R., Smith, C. W, Tax Incentives to Hedge, Journal of Finance, 54,
p2241-2262, 1999.
Guay, W., Kothari, S.P., “How Much Do Firms Hedge With Derivatives?”, Journal of Financial Economics, 70, 3, 2003
Haushalter, G. D., Financing Policy, Basis Risk, and Corporate Hedging: Evidence
from Oil and Gas Producers, Journal of Finance, V55, p107-152, 2000.
Jensen, M.C., Meckling, W.H. Theory of the Firm: Managerial Behavior, Agency
Costs and Ownership Structure, Journal of Financial Economics, v3, n4, p305-
360, 1976.
Jensen, M. C., Agency Costs of Free Cash Flow, Corporate Finance and Takeover,
American Economic Review, 1986.
Jin, J., Jorion, P., Firm Value and Hedging: Evidence from US Oil and Gas Producers, Journal of Finance, V 61, 2, 2005.
Krawiec, K. D., Derivatives, Corporate Hedging and Shareholder Wealth: Modigliani-
Miller Forty Years Later, working paper, 2001, available at <www.ssrn.com>,
accessed September 30th, 2006.
Leland, H.E., Agency Costs, Risk Management and Capital Structure, Journal of Finance, V53, p1213-1243, 1998.
Mayers, D., Smith, C. W., On the Corporate Demand for Insurance, Journal of Business, v55, p281-296, 1982.
Mayers, D., Smith, C. W., Corporate Insurance and the Underinvestment Problem,
Journal of Risk and Insurance, V 54, 45-54, 1987.
74
McKinnon, R. I., Pill, H., Exchange rate regimes for emerging markets: moral hazard
and international overborrowing, working paper, 1999, available at
<www.ssrn.com>, accessed September 30th, 2006.
Mello, A. S., Parsons, J.E., Hedging and Liquidity, The Review of Financial Studies, Vol. 13, n. 1, pp 127-153, 2000.
Mian, S. L., Evidence on Corporate Hedging Policy, Journal of Financial and Quantitative Analysis, V31, p419-439, 1996.
Myers, S. C., Determinants of Corporate Borrowing, Journal of Financial Economics, v5, p147-175, 1977.
Myers, S. C., Majluf, N. S., Corporate Financing and Investment Decisions When
Firms Have Information that Investors Do Not Have, Journal of Financial Economics, v13, p187-221, 1984.
Nance, D. R., Smith, C. W., Smithson, C. W., On the Determinants of Corporate
Hedging, Journal of Finance, V48, p267-284, 1993.
Petersen, M. A., Thiagarajan, S.R., Risk Management and Hedging: With and
Without Derivatives, Financial Management, 29, Vol. 4, pp 5-30, 2000.
Pramborg, B. Foreign Exchange Risk Management by Swedish and Korean non
Financial Firms: a Comparative Survey, Working Paper, 2004. Available at
<www.ssrn.com>, acessed March 31st, 2006.
Pratap, S., Lobato, I., Somuano, A., Debt composition and balance sheet effects of
exchange rate volatility in Mexico: a firm level analysis, Emerging Markets Review 4, p 450-471, 2003.
Ross, M. P., Corporate Hedging: what, why and how, working paper, 1997, available
at www.haas.berkeley.edu/finance/WP/rpf280.pdf, accessed September 30th,
2006.
Saito, R., Schiozer, R.F.., Uso de Derivativos e Gerenciamento de Risco em
Empresas Não Financeiras: Uma Comparação entre Evidências Brasileiras e
Internacionais, XXVIII ENANPAD, 2004.
75
Schiozer, R. F., Saito, R., Fatores Determinantes da Gestão de Risco em Empresas
não-financeiras Brasileiras, XXIX ENANPAD, 2005.
Sheedy, E., Corporate Use of Derivatives in Hong Kong and Singapore: a Survey,
Working Paper, 2002. Available at <www.ssrn.com>, acessed March 31st, 2006.
Smith, C.W, Stulz, R.M., The determinants of Firms’ Hedging Policies, Journal of Financial and Quantitative Analysis, 20, 4, p391-405, 1985
Stulz, R.M., Optimal Hedging Policies, Journal of Financial and Quantitative Analysis, 19, 2, p127-140, 1984.
Stulz, R.M., Managerial Discretion and Optimal Financing Policies, Journal of Financial Economics, 26, 1, p3-27, 1990.
Stulz, R.M., Rethinking Risk Management, Journal of Applied Corporate Finance,
9, 3, p8-24, 1996.
Titman, S., Wessels, R., The Determinants of Capital Structure Choices, Journal of Finance, 43, 1, p1-19, 1988.
Tufano, P., Who Manages Risk? An Empirical examination of Risk management
Practices in the Gold Mining Industry, Journal of Finance, 51, p1097-1137, 1996.
Tufano, P., Agency Costs of Corporate Risk Management, Financial Management, 27, p67-77, 1998.
Wooldridge, J. M., Econometric Analysis of Cross Section and Panel Data, MIT Press, Cambridge, MA, 2002.

76
Appendix A: Survey questionnaire and response tallies
Note: The original questionnaire was applied in Portuguese. The questions shown here are a free translation to English made by the author. Screen #1 Derivatives Usage 1.1 Does your firm use derivatives? Yes 42 No 33
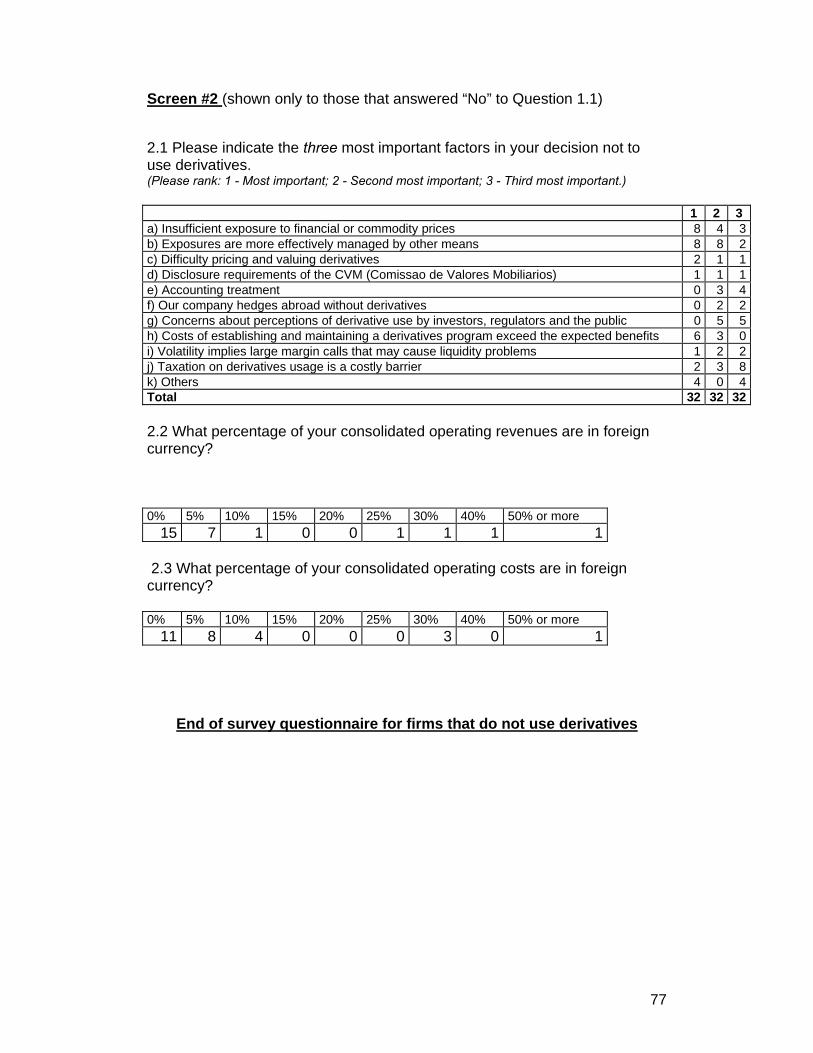
77
Screen #2 (shown only to those that answered “No” to Question 1.1) 2.1 Please indicate the three most important factors in your decision not to use derivatives. (Please rank: 1 - Most important; 2 - Second most important; 3 - Third most important.) 1 2 3 a) Insufficient exposure to financial or commodity prices 8 4 3b) Exposures are more effectively managed by other means 8 8 2c) Difficulty pricing and valuing derivatives 2 1 1d) Disclosure requirements of the CVM (Comissao de Valores Mobiliarios) 1 1 1e) Accounting treatment 0 3 4f) Our company hedges abroad without derivatives 0 2 2g) Concerns about perceptions of derivative use by investors, regulators and the public 0 5 5h) Costs of establishing and maintaining a derivatives program exceed the expected benefits 6 3 0i) Volatility implies large margin calls that may cause liquidity problems 1 2 2j) Taxation on derivatives usage is a costly barrier 2 3 8k) Others 4 0 4Total 32 32 32 2.2 What percentage of your consolidated operating revenues are in foreign currency?
0% 5% 10% 15% 20% 25% 30% 40% 50% or more
15 7 1 0 0 1 1 1 1 2.3 What percentage of your consolidated operating costs are in foreign currency? 0% 5% 10% 15% 20% 25% 30% 40% 50% or more
11 8 4 0 0 0 3 0 1
End of survey questionnaire for firms that do not use derivatives
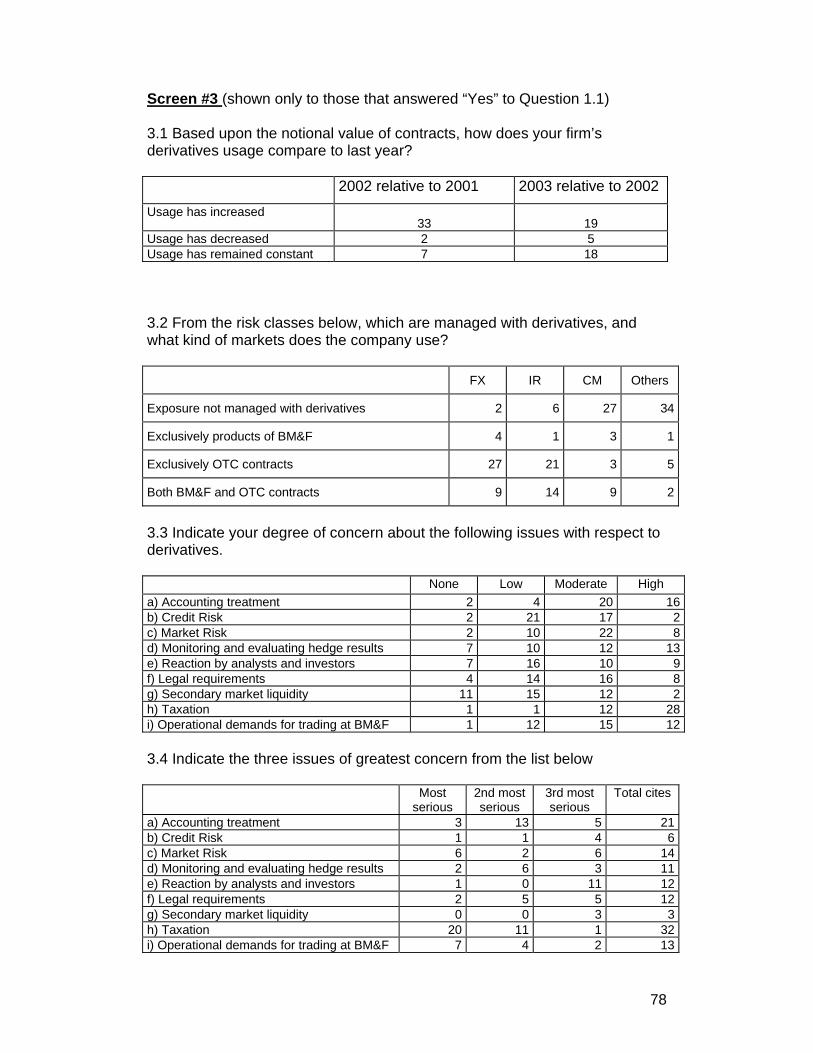
78
Screen #3 (shown only to those that answered “Yes” to Question 1.1) 3.1 Based upon the notional value of contracts, how does your firm’s derivatives usage compare to last year? 2002 relative to 2001 2003 relative to 2002Usage has increased
33 19 Usage has decreased 2 5 Usage has remained constant 7 18 3.2 From the risk classes below, which are managed with derivatives, and what kind of markets does the company use? FX IR CM Others
Exposure not managed with derivatives 2 6 27 34
Exclusively products of BM&F 4 1 3 1
Exclusively OTC contracts 27 21 3 5
Both BM&F and OTC contracts 9 14 9 2
3.3 Indicate your degree of concern about the following issues with respect to derivatives. None Low Moderate High a) Accounting treatment 2 4 20 16b) Credit Risk 2 21 17 2c) Market Risk 2 10 22 8d) Monitoring and evaluating hedge results 7 10 12 13e) Reaction by analysts and investors 7 16 10 9f) Legal requirements 4 14 16 8g) Secondary market liquidity 11 15 12 2h) Taxation 1 1 12 28i) Operational demands for trading at BM&F 1 12 15 12 3.4 Indicate the three issues of greatest concern from the list below Most
serious 2nd most serious
3rd most serious
Total cites
a) Accounting treatment 3 13 5 21b) Credit Risk 1 1 4 6c) Market Risk 6 2 6 14d) Monitoring and evaluating hedge results 2 6 3 11e) Reaction by analysts and investors 1 0 11 12f) Legal requirements 2 5 5 12g) Secondary market liquidity 0 0 3 3h) Taxation 20 11 1 32i) Operational demands for trading at BM&F 7 4 2 13

79
3.5 Does your firm calculate the “value-at-risk” for some or all of its derivatives portfolio? The firms does not use any kind of V@R approach 18V@R is calculated for specific portfolios (derivatives, financial investments, etc) 15V@R is calculated globally, for all securities held by the firm 8
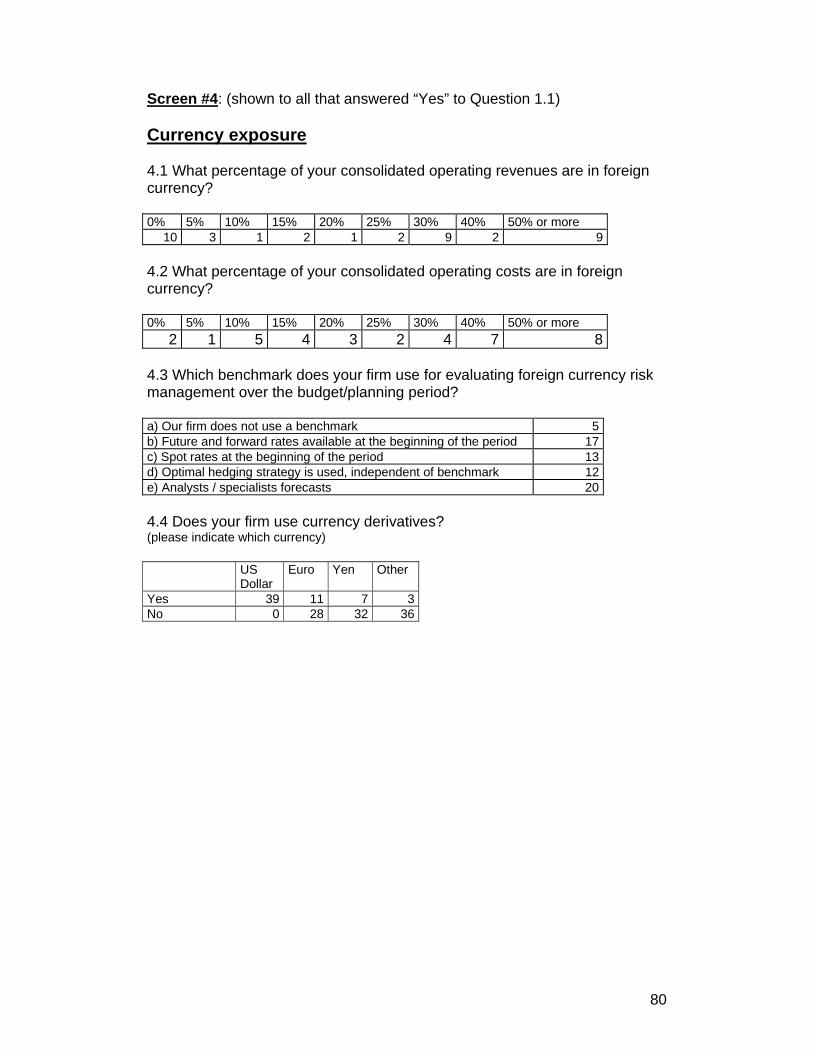
80
Screen #4: (shown to all that answered “Yes” to Question 1.1) Currency exposure 4.1 What percentage of your consolidated operating revenues are in foreign currency? 0% 5% 10% 15% 20% 25% 30% 40% 50% or more
10 3 1 2 1 2 9 2 9 4.2 What percentage of your consolidated operating costs are in foreign currency? 0% 5% 10% 15% 20% 25% 30% 40% 50% or more
2 1 5 4 3 2 4 7 8 4.3 Which benchmark does your firm use for evaluating foreign currency risk management over the budget/planning period? a) Our firm does not use a benchmark 5 b) Future and forward rates available at the beginning of the period 17 c) Spot rates at the beginning of the period 13 d) Optimal hedging strategy is used, independent of benchmark 12 e) Analysts / specialists forecasts 20 4.4 Does your firm use currency derivatives? (please indicate which currency) US
Dollar Euro Yen Other
Yes 39 11 7 3No 0 28 32 36
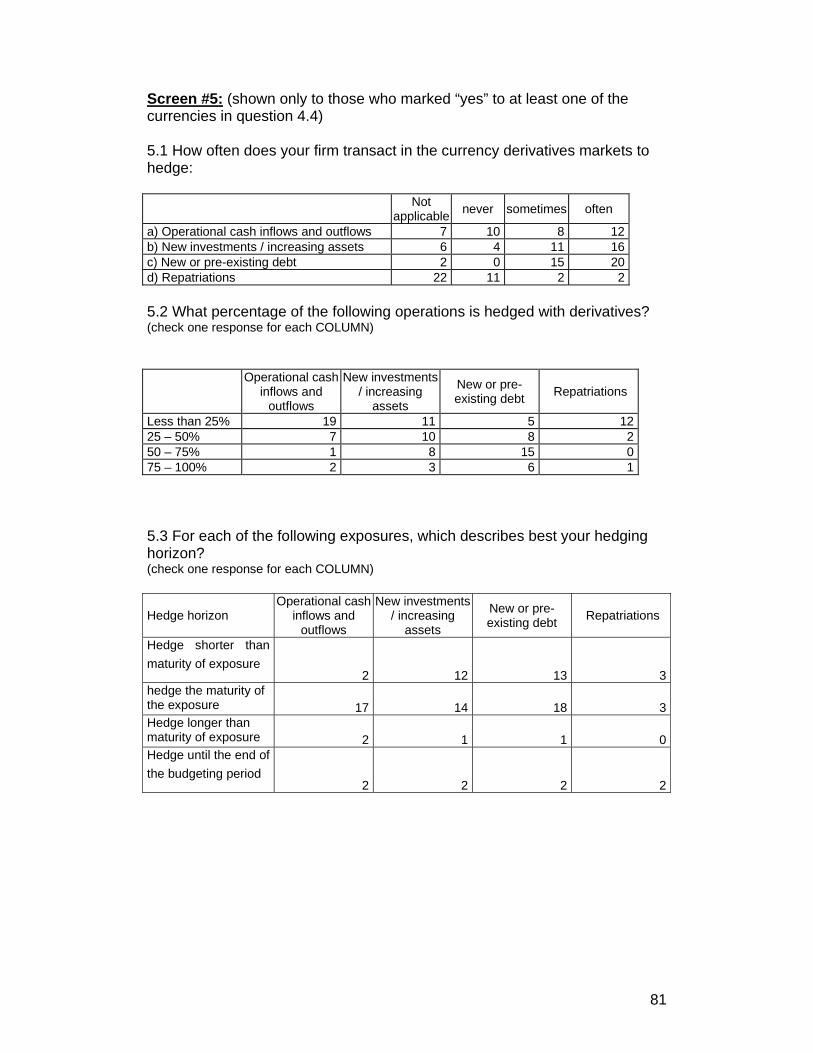
81
Screen #5: (shown only to those who marked “yes” to at least one of the currencies in question 4.4) 5.1 How often does your firm transact in the currency derivatives markets to hedge: Not
applicable never sometimes often
a) Operational cash inflows and outflows 7 10 8 12 b) New investments / increasing assets 6 4 11 16 c) New or pre-existing debt 2 0 15 20 d) Repatriations 22 11 2 2 5.2 What percentage of the following operations is hedged with derivatives? (check one response for each COLUMN) Operational cash
inflows and outflows
New investments / increasing
assets
New or pre-existing debt Repatriations
Less than 25% 19 11 5 12 25 – 50% 7 10 8 2 50 – 75% 1 8 15 0 75 – 100% 2 3 6 1 5.3 For each of the following exposures, which describes best your hedging horizon? (check one response for each COLUMN)
Hedge horizon Operational cash
inflows and outflows
New investments / increasing
assets
New or pre-existing debt Repatriations
Hedge shorter than maturity of exposure
2 12 13 3hedge the maturity of the exposure 17 14 18 3Hedge longer than maturity of exposure 2 1 1 0Hedge until the end of the budgeting period
2 2 2 2
82
5.4 How often does your market view of exchange rates cause you to (check one response for each COLUMN) Never sometimes Often a) Alter the maturity of hedges 3 26 6b) Alter the size of hedges 2 21 12c) Take positions in currency derivatives 31 3 0 5.5 What percent of your total foreign currency derivatives (by face value of contracts) have the following original maturities? (check one response for each COLUMN) Less than 90
days From 90 to 180 days
From 180 to 360 days
More than 360 days
0% 4 0 3 13 1% to 25% 12 4 6 4 25 to 50% 3 17 9 1 50 to 75% 1 1 6 6 75 to 100% 0 1 2 1
5.6 What proportion of your currency hedging is done:
In Brazil Using BM&F derivatives
Using OTC markets Abroad
Up to 50% 33 24 2850 to 75% 3 1 275 to 100% 3 14 9
83
Screen #6 (shown only to those firms that answered “Yes” to question 1.1) Interest Rate Exposure 6.1 Which benchmark does your firm use to evaluate interest rate exposure on the debt portfolio? (indicate as many as you want) a) Our firm does not use a benchmark for the debt portfolio 6b) A single interest rate or a basket of interest rates (Libor, CDI, TJLP etc) 27c) A single inflation index or a basket of inflation indexes (IPCA, IGP-M etc) 8d) Company cost of capital 19e) Other 6
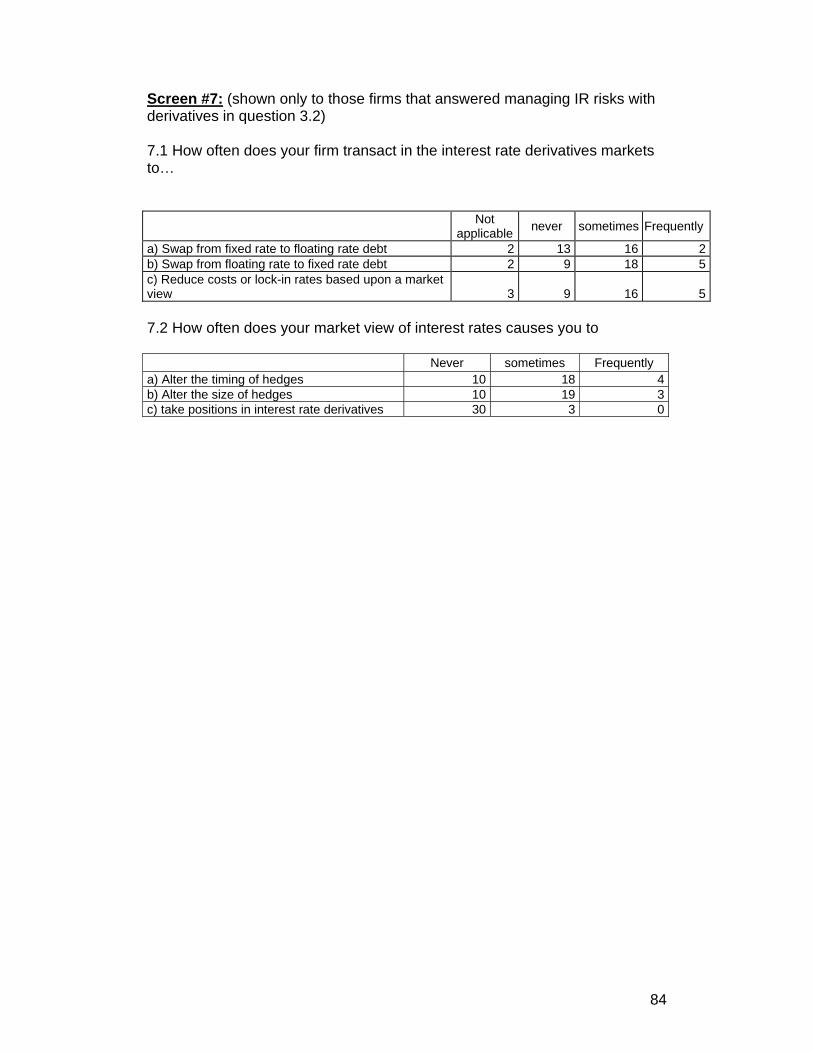
84
Screen #7: (shown only to those firms that answered managing IR risks with derivatives in question 3.2) 7.1 How often does your firm transact in the interest rate derivatives markets to… Not
applicable never sometimes Frequently
a) Swap from fixed rate to floating rate debt 2 13 16 2b) Swap from floating rate to fixed rate debt 2 9 18 5c) Reduce costs or lock-in rates based upon a market view 3 9 16 5 7.2 How often does your market view of interest rates causes you to Never sometimes Frequently a) Alter the timing of hedges 10 18 4b) Alter the size of hedges 10 19 3c) take positions in interest rate derivatives 30 3 0
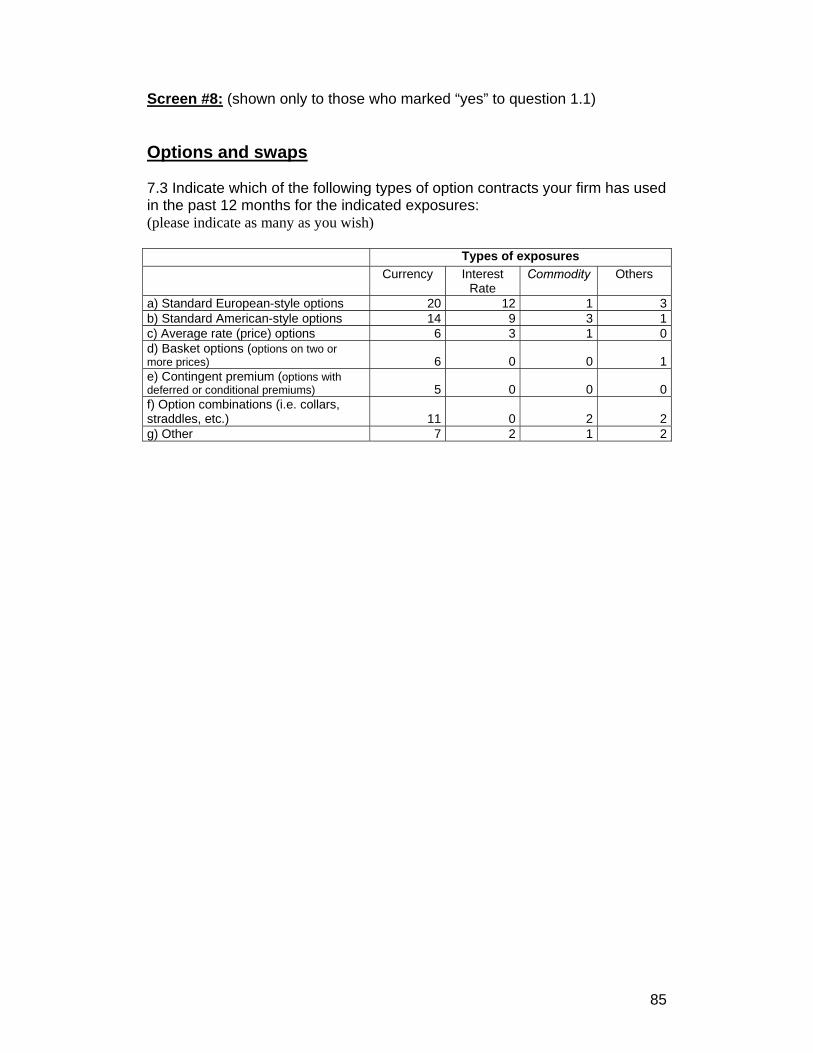
85
Screen #8: (shown only to those who marked “yes” to question 1.1) Options and swaps 7.3 Indicate which of the following types of option contracts your firm has used in the past 12 months for the indicated exposures: (please indicate as many as you wish) Types of exposures Currency Interest
Rate Commodity Others
a) Standard European-style options 20 12 1 3b) Standard American-style options 14 9 3 1c) Average rate (price) options 6 3 1 0d) Basket options (options on two or more prices) 6 0 0 1e) Contingent premium (options with deferred or conditional premiums) 5 0 0 0f) Option combinations (i.e. collars, straddles, etc.) 11 0 2 2g) Other 7 2 1 2
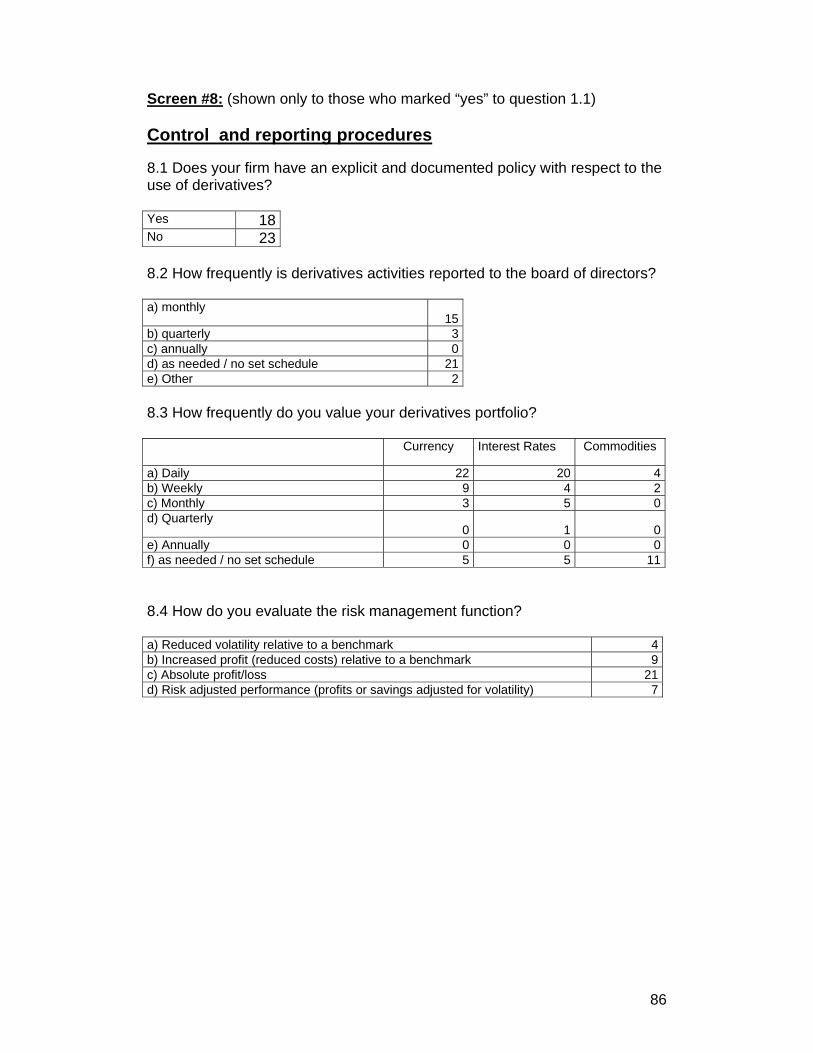
86
Screen #8: (shown only to those who marked “yes” to question 1.1) Control and reporting procedures 8.1 Does your firm have an explicit and documented policy with respect to the use of derivatives? Yes 18 No 23 8.2 How frequently is derivatives activities reported to the board of directors? a) monthly
15b) quarterly 3c) annually 0d) as needed / no set schedule 21e) Other 2 8.3 How frequently do you value your derivatives portfolio? Currency Interest Rates Commodities
a) Daily 22 20 4b) Weekly 9 4 2c) Monthly 3 5 0d) Quarterly
0 1 0e) Annually 0 0 0f) as needed / no set schedule 5 5 11 8.4 How do you evaluate the risk management function? a) Reduced volatility relative to a benchmark 4b) Increased profit (reduced costs) relative to a benchmark 9c) Absolute profit/loss 21d) Risk adjusted performance (profits or savings adjusted for volatility) 7
87
Appendix B: Sensitivity analysis of cash flow from derivatives
The analysis contained in section 3.3 uses as its basic element the sensitivity
of derivatives holdings to 3 standard deviation shocks in the prices of the
underlying assets. These sensitivities and the comparison to potential hedging
variables were built as described in this appendix.
The sensitivity of cash flow from a given derivative instrument is defined as
the cash flow yielded by this contract when a 3 standard deviation shock in
the price of the underlying asset occurs. The sensitivity of a portfolio is
defined as the sum of the cash flows produced by each individual contract
that belongs to the portfolio in each risk class (FX, domestic IR and
international IR). I deliberately ignore commodities derivatives. Thus, it is
assumed that there are no offsetting positions (long and short contracts of the
same asset, for example) in the portfolio. I use the gross notional value (i.e.
the sum of the notional values of all the contracts) instead of a netted value
since, for most of the firms, it is impossible to make a clear distinction
between long and short positions. For the firms in which it was possible to
identify the nature (long or short) of each contract, the offsetting effect is less
than 15% of total notional value, and for a great part of the firms, there is no
offsetting at all, indicating that the measurement error associated to this
variable is small.
Because the aim of this analysis is to compare the order of magnitude of
potential cash flows yielded from derivatives with hedging variables (such as
CapEx, EBIT and financial expenses), some simplifications are made:
1 – To estimate the annualized standard deviation of the underlying assets,
the simple standard deviation of exchange rates against the US dollar (in first
differences), domestic and international interest rates are calculated using
monthly data from the 2 previous years, and this result is multiplied by the
square root of 12 (i.e., for year-end 2001, the data used is from 2000 and
88
2001 and so on1) This simplified procedure assumes that FX and IR returns
are independent from previous returns. First order autocorrelations are 0.13, -
0.14, -0,10 and 0.12 for Argentinean, Brazilian, Chilean and Mexican
exchange rates respectively, and 0.21 for Brazilian interest rates (90-day
Swap-CDI), 0.09 for Chilean IR (90-day PDBC) 0.23 for Mexican IR (90-day
CETES rate) and 0.40 for the LIBOR. With the exception of the last 2, all
these autocorrelations are not significant at usual levels.
2 – It is assumed that contracts have full liquidity, i.e., the change in the value
of the contracts due to the change in the price of the underlying asset can be
immediately converted into cash, with the exception of contracts maturing in
more than one year (which is the case of most of the currency swaps in the
sample). For swaps maturing in more than 1 year, only the cash yielded by
the exchange in cash flows in the next 12 months are considered, since it is
natural to consider that, since most of these contracts have financial
institutions as counterparts, they are not willing to settle the contract paying its
fair value immediately.
A – Currency contracts
A.1 – Futures and forwards:
The cash flows yielded by FX futures and forwards for a 3 standard deviation
shock in the price of the underlying asset is given by:
CF = NV x 3σ x ∆t1/2 , where
CF is the cash flow yielded by the derivative contract, NV is the notional
value in domestic currency, σ is the annualized standard deviation of
exchange rate and ∆t is the minimum between 1 year and the maturity of the
contract measured in years (this avoids the overestimation of cash flows
yielded by contracts with maturity over 1 year – which was very seldom
observed). In the many cases where the maturity of contracts was unreported,
1 For the Argentinean exchange rate as of the end of 2002, I use solely the data from this year, since in 2001 Argentina faced a fixed exchange rate relative to the US dollar.
89
a 3 month maturity was assumed for forwards and futures. Sinve NV is
measured in local currency, CF also results in local currency.
A.2 – FX Swaps:
The value V of a swap contract is given by: (see Hull (1998), Portuguese
version, page 140):
V = SBF - BD , where S is the exchange rate and BF and BD are the values of
the contract denominated in foreign and domestic currency, respectively.
Assuming that the values SBF and BD are equivalent and thus equal to the
notional value of the contract (what is approximately true at least in the
beginning of a contract), the change in the value of the swap when a 3
standard deviation in the exchange rate occurs is:
CF = NV x 3σ x ∆t1/2, where CF, NV, σ and ∆t are defined as above. For the
contracts with unreported maturity, a 1 year maturity was assumed.
For many swaps, the reports are not clear on whether they are old or recent
contracts, and as they mature, the relationship between BF and BD may be
uneven. Still, the formula above is expected to be approximately valid.
In general, swaps that include the exchange of both interest and exchange
rates are classified as currency hedges in the 20-F forms. Although the value
of these contracts are sensitive to both interest and exchange rates, the effect
of IR fluctuations in these contracts was not considered since the main
objective of these contracts is FX hedge. Besides, FX is greater than IR
volatility in all 4 countries, what makes the sensitivity (in absolute value) of
these contracts larger when the shock considered is in the exchange rate.
A.3 – Options
It is assumed that all the options are enough deep in the money for the cash
flow sensitivity of these options to FX be linear (i.e., options have delta = 1).
The violation of this assumption has a small impact in the overall results since
options are the less used type of instrument. Still, sensitivities were estimated
disconsidering option contracts (what is equivalent to assuming that they are
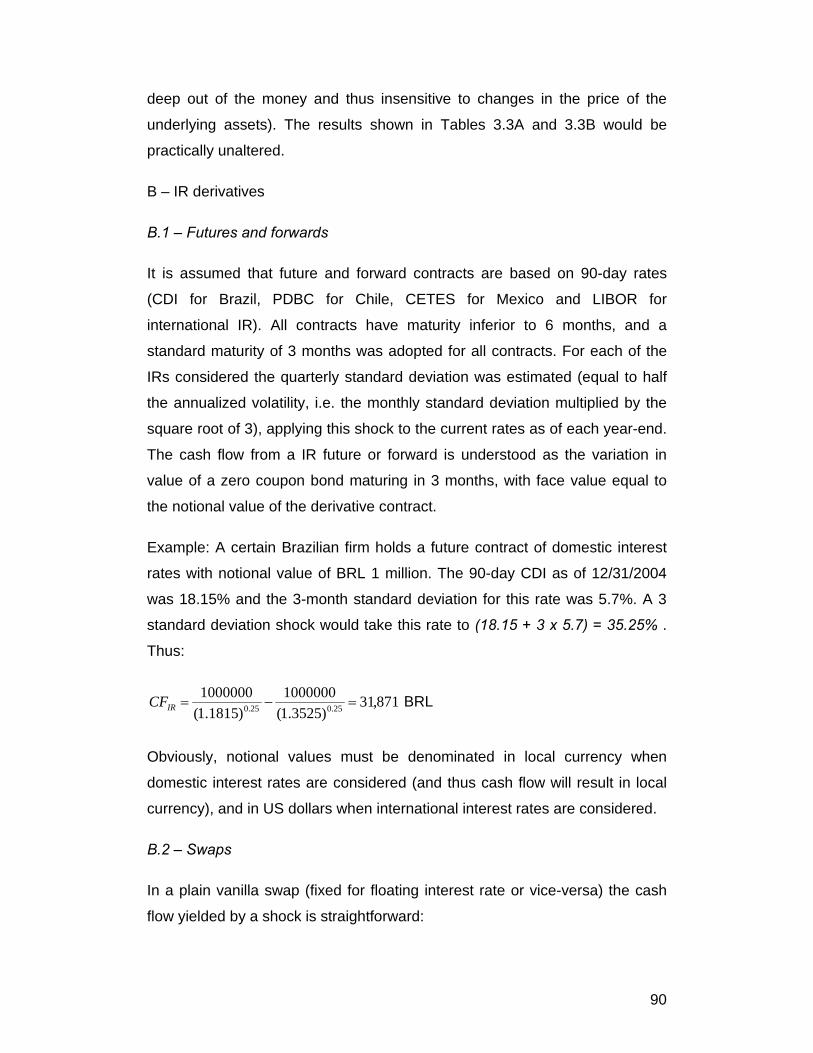
90
deep out of the money and thus insensitive to changes in the price of the
underlying assets). The results shown in Tables 3.3A and 3.3B would be
practically unaltered.
B – IR derivatives
B.1 – Futures and forwards
It is assumed that future and forward contracts are based on 90-day rates
(CDI for Brazil, PDBC for Chile, CETES for Mexico and LIBOR for
international IR). All contracts have maturity inferior to 6 months, and a
standard maturity of 3 months was adopted for all contracts. For each of the
IRs considered the quarterly standard deviation was estimated (equal to half
the annualized volatility, i.e. the monthly standard deviation multiplied by the
square root of 3), applying this shock to the current rates as of each year-end.
The cash flow from a IR future or forward is understood as the variation in
value of a zero coupon bond maturing in 3 months, with face value equal to
the notional value of the derivative contract.
Example: A certain Brazilian firm holds a future contract of domestic interest
rates with notional value of BRL 1 million. The 90-day CDI as of 12/31/2004
was 18.15% and the 3-month standard deviation for this rate was 5.7%. A 3
standard deviation shock would take this rate to (18.15 + 3 x 5.7) = 35.25% .
Thus:
871,31)3525.1(
1000000)1815.1(
100000025.025.0 =−=IRCF BRL
Obviously, notional values must be denominated in local currency when
domestic interest rates are considered (and thus cash flow will result in local
currency), and in US dollars when international interest rates are considered.
B.2 – Swaps
In a plain vanilla swap (fixed for floating interest rate or vice-versa) the cash
flow yielded by a shock is straightforward:
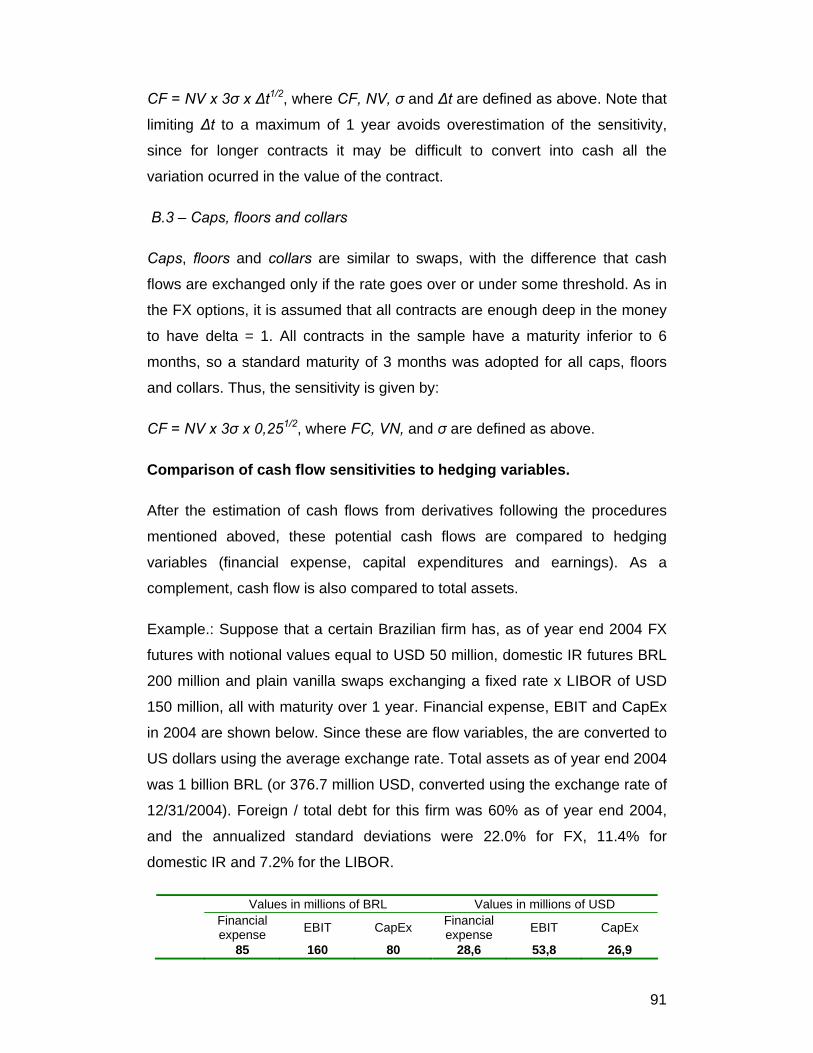
91
CF = NV x 3σ x ∆t1/2, where CF, NV, σ and ∆t are defined as above. Note that
limiting ∆t to a maximum of 1 year avoids overestimation of the sensitivity,
since for longer contracts it may be difficult to convert into cash all the
variation ocurred in the value of the contract.
B.3 – Caps, floors and collars
Caps, floors and collars are similar to swaps, with the difference that cash
flows are exchanged only if the rate goes over or under some threshold. As in
the FX options, it is assumed that all contracts are enough deep in the money
to have delta = 1. All contracts in the sample have a maturity inferior to 6
months, so a standard maturity of 3 months was adopted for all caps, floors
and collars. Thus, the sensitivity is given by:
CF = NV x 3σ x 0,251/2, where FC, VN, and σ are defined as above.
Comparison of cash flow sensitivities to hedging variables.
After the estimation of cash flows from derivatives following the procedures
mentioned aboved, these potential cash flows are compared to hedging
variables (financial expense, capital expenditures and earnings). As a
complement, cash flow is also compared to total assets.
Example.: Suppose that a certain Brazilian firm has, as of year end 2004 FX
futures with notional values equal to USD 50 million, domestic IR futures BRL
200 million and plain vanilla swaps exchanging a fixed rate x LIBOR of USD
150 million, all with maturity over 1 year. Financial expense, EBIT and CapEx
in 2004 are shown below. Since these are flow variables, the are converted to
US dollars using the average exchange rate. Total assets as of year end 2004
was 1 billion BRL (or 376.7 million USD, converted using the exchange rate of
12/31/2004). Foreign / total debt for this firm was 60% as of year end 2004,
and the annualized standard deviations were 22.0% for FX, 11.4% for
domestic IR and 7.2% for the LIBOR.
Values in millions of BRL Values in millions of USD Financial expense EBIT CapEx Financial
expense EBIT CapEx
85 160 80 28,6 53,8 26,9
92
- Step 1: Estimation of sensitivities:
CFFX = 50 x 2.6544 x 3 x 0.22 = 87.6 million BRL
CFIRD = 200 x 3 x 0.114 = 68.4 million BRL
CFIRL = 150 x 3 x 0.072 = 32.4 million USD ~ 86 million BRL
- Step 2: Comparison to hedging objectives:
From the 3 classes derivativos portfolios (FX, domestic IR and international
IR), the one with larger sensitivity is chosen2. In the example above, it is the
FX derivatives portfolio. This sensitivity is then compared to potential hedging
variables.
It is questionable whether the values obtained should be compared to the
hedging variables in local currency or in US dollars3. Since one of the hedging
objectives may be to reduce expected taxes, and taxes are charged over
earnings in local currency, cash flow from derivatives is compared to EBIT in
local currency. For CapEx, it would be necessary to know what is the
proportion of imported goods in capital expenditures, or if investments are
being made abroad. For simplification, the CapEx in local currency is used.
For financial expenses, the following criterion was adopted: if the proportion of
foreign debt / total debt is superior to 50%, expenses in USD are considered,
otherwise, expenses are denominated in local currency.
Thus, I have:
CFFX/Fin. Exp. = (87.6/2.6544)/28.6 = 1.15
FCFX/EBIT = 87.6/160 = 0.55
2 This is the main difference between my and Guay and Kothari’s (2003) procedures. In that paper, the authors added the sensitivities of all risk classes, whereas I choose the largest. Adding all potential cash flows admits the occurrence of a simultaneous 3 standard deviation shock to all underlying assets, what is very unlikely. Thus, their procedure deliberately overestimates cash flows yielded from derivatives, while my procedure deliberately underestimates the cash flows. 3 The results are not the same, since potential cash flows from derivatives are converted using spot exchange rate as of each year end, and flow variables are converted using yearly average exchange rate.
93
FCFX/CapEx = 87.6/80 = 1.09
FCFX/Assets = 87.6/1000 = 0.087
The results above indicate that, in the occurrence of a 3 standard deviation
shock in the exchange rate, derivatives holdings would produce a cash flow
equivalent to 115% of financial expenses, 55% of EBIT, 109% of CapEx and
8.7% of total assets.
The portfolio of currency derivatives is almost always the one that produces
higher cash flows. Only in two firm-years, the international IR derivatives were
the ones to yield the highest cash flows and none of the Mexican CETES
derivatives were the ones to yield the highest cash flows. This indicates that
the high autocorrelation identified in the LIBOR and CETES series should not
be an issue of concern.