Hábitos alimentares e peso corporal no envelhecimento: um … · é determinante para o estado de...
153
Hábitos alimentares e peso corporal no envelhecimento: um estudo em idosos europeus Eating habits and weight status in old age: a study of european elderly Cláudia Isabel Pontes Neves Afonso 2011 Dissertação para obtenção de grau de Doutor em Ciências do Consumo Alimentar e Nutrição apresentada à Faculdade de Ciências da Nutrição e Alimentação da Universidade do Porto Orientadora: Maria Daniel Vaz de Almeida Faculdade de Ciências da Nutrição e Alimentação da Universidade do Porto Co-Orientadora: Carla Maria de Moura Lopes Faculdade de Medicina da Universidade do Porto
-
Upload
duongduong -
Category
Documents
-
view
215 -
download
0
Transcript of Hábitos alimentares e peso corporal no envelhecimento: um … · é determinante para o estado de...
Hábitos alimentares e peso corporal no envelhecimento:
um estudo em idosos europeus
Eating habits and weight status in old age: a study of european elderly
Cláudia Isabel Pontes Neves Afonso
2011
Dissertação para obtenção de grau de Doutor em Ciências do Consumo Alimentar e Nutrição
apresentada à Faculdade de Ciências da Nutrição e Alimentação da
Universidade do Porto
Orientadora: Maria Daniel Vaz de Almeida
Faculdade de Ciências da Nutrição e Alimentação da Universidade do Porto
Co-Orientadora: Carla Maria de Moura Lopes
Faculdade de Medicina da Universidade do Porto

1
Índice
Agradecimentos
Resumo 5
Abstract 9
1. Introdução 11
2. Objetivos 51
3. População e Métodos 55
4. Resultados
4.1 ǀ Food related perceived goals among European elderly 67
4.2 ǀ Adherence to Mediterranean food pattern in Portuguese elderly 83
4.3 ǀ The use of meal providers by European elderly 103
4.4 ǀ Prevalence and sociodemographic determinants of obesity in
European elderly 119
5. Conclusão 135
6. Bibliografia 145

2

3
Agradecimentos
Gostaria de expressar o meu profundo agradecimento a todos os que de alguma forma me apoiaram
e auxiliaram durante o período de elaboração deste trabalho.
Com especial estima e consideração… À Professora Doutora Maria Daniel Vaz de Almeida,
Por toda a vivência partilhada, pelos valiosos ensinamentos e pela referência profissional e humana.
À Prof. Doutora Carla Lopes,
Agradeço a forma pertinente e rigorosa com que me orientou e pela amizade sincera.
Aos estatistas Rui Poínhos e Bruno Oliveira,
Que simplificaram o incompreensível de forma generosa e amiga.
Às amigas (por ordem alfabética…),
Ada, Bela, Meibel (Dr.ª), Patrícia, Rosa Maria e Sara.
Pelo suporte e companheirismo.
Aos colegas do coração da FCNAUP,
Pela boa disposição e encorajamento constantes.
Às jovens colegas, Cecília e Margarida,
Pelo prestimoso contributo direto e indireto neste projeto.
E por fim, mas não menos importante,
Aos queridos idosos que pela sua autenticidade e generosidade muito contribuíram para o meu
crescimento pessoal e profissional.
À minha família por estar sempre presente e também aqueles que já não estão presentes.
Muito obrigada!

4

5
Resumo
O envelhecimento crescente da população é uma das características mais relevantes da
última metade do século XX das sociedades desenvolvidas, fenómeno que tem originado um
elevado número de estudos tendo em vista o seu melhor conhecimento e a identificação de
fatores de risco modificáveis para o seu não desenvolvimento.
A alimentação e a nutrição, assim como outros fatores ambientes têm um enorme impacto
na saúde e bem-estar, condicionante da qualidade de vida dos idosos. A alimentação não só
é determinante para o estado de saúde mas também para a qualidade de vida numa
perspetiva holística: cultural, social e psicológica e a adesão a estilos de vida saudáveis pode
desempenhar um papel mais importante que a própria genética do envelhecimento.
A presente tese insere-se maioritariamente no Projeto Europeu Food in Later Life, choosing
foods, eating meals: sustaining independence and quality of life, “Alimentação em Idade
Senior, escolha de alimentos e refeições para manter a independência e qualidade de vida”,
nomeadamente do seu Work Package 7 (WP7), designado – avaliar a qualidade de vida
relacionada com a alimentação.
É finalidade desta investigação contribuir para um melhor conhecimento das expetativas em
relação à alimentação, dos recursos alimentares disponíveis e do estado nutricional da
população idosa, identificando as suas principais determinantes.
A população alvo deste estudo foram idosos Europeus residentes dos seguintes países
Dinamarca, Alemanha, Itália, Polónia, Portugal, Espanha, Suécia e Reino Unido com idade
igual ou superior a 65 anos. Foram inquiridos cerca de 400 indivíduos por país a viverem nos
seus domicílios, constituindo uma amostra comunitária representativa da população
Europeia atendendo à diversidade sociodemográfica de cada país (nível de educação e
rendimento, urbanização) e colhida em pelo menos três localizações geográficas distintas. A
recolha desta informação decorreu no Outono de 2005, tendo sido inquiridos 3291 idosos no
total.
Mediante os objetivos propostos pelo WP7 do Projeto Food in Later Life procedeu-se à
elaboração de um questionário estruturado de administração indireta, com perguntas de
6
resposta simples ou múltipla, em língua Inglesa. Posteriormente, cada país, adaptou-o à sua
língua de origem.
Os idosos Europeus elencam como tendo maior relevância para a sua alimentação aspetos
relacionados com a saúde e com aspetos sensoriais, do que aspetos sociais e económicos. Os
idosos com maiores níveis de escolaridade tendem a enfatizar em maior proporção os
primeiros aspetos e os idosos com menores rendimentos, os segundos. Idosos mais
satisfeitos dão mais importância aos objetivos de saúde e sensoriais e os com mais
comprometimentos físicos e mentais, objetivos sociais e económicos.
A adesão ao padrão alimentar Mediterrânico foi superior à média do índice, porém aquém do
esperado pelas particularidades geográficas que caracterizam Portugal sendo que se
identificou grupos de risco de uma baixa adesão: idosos de baixo rendimentos, com
condicionantes de saúde, fumadores, a residirem no Norte do país e que recorrem à aquisição
de refeições fora dos seus domicílios.
Estes idosos provenientes da comunidade recorriam em maior proporção a suportes informais
(família) para obter a sua alimentação do que a suportes formais, sendo que as mulheres e os
mais idosos se destacam pelo seu não uso e os idosos de maior escolaridade e maiores
rendimentos, os que mais recorriam a alimentação fora de casa.
A prevalência de obesidade foi superior no Reino Unido (20%) e na Polónia (15.8%) nos
idosos e também na Polónia (26.7%) e Alemanha (25.3%) para as idosas. Resultados desta
investigação permitem identificar os grupos de risco de intervenção para a prevenção da
obesidade idosos com menor escolaridade e idosas com menores rendimentos.
Sendo o envelhecimento populacional uma realidade em todo mundo, deverá este facto
constituir simultaneamente desafio e oportunidade. Pretende o presente estudo contribuir à
sustentação da evidência acerca da relevância da alimentação num contexto de promoção de
uma sociedade inclusiva na realidade Europeia.
O parlamento Europeu, escolheu 2012 como o Ano Europeu dedicado ao Envelhecimento
Ativo, com o objetivo geral de incentivar e apoiar esforços dos Estados-Membros, das
autoridades, dos parceiros sociais e da sociedade civil no sentido de promover o
envelhecimento ativo usufruindo do potencial desta população, reforçando e preservando
desta forma a solidariedade entre gerações (Comissão Europeia, 2010). Esperamos de alguma

7
forma ter contribuído para o melhor conhecimento dos aspetos relacionados com a
alimentação no contexto Europeu.

8
9
Abstract
In developed societies, the aging of the population is one of the most relevant features of the
second half of the twentieth century. This phenomenon has led to numerous studies aiming
to identify modifiable risk factors in order to prevent chronic diseases.
Food and nutrition, as well as other environmental factors have a high impact on health and,
wellbeing, therefore determining the quality of life of the elderly. In a holistic perspective,
food is not only a contributor to the health status but is also a quality of life determinant.
Moreover, cultural, social and psychological factors and the adherence to healthy lifestyles
can play a more important role than the genetics of aging itself.
This thesis was developed within the European Project Food in Later Life, choosing foods,
eating meals: sustaining independence and quality of life, "Alimentação em Idade Senior,
escolha de alimentos e refeições para manter a independência e qualidade de vida", namely
from its Work Package 7 (WP7), - measuring food-related quality of life.
The purpose of this research is to contribute to a better understanding of the expectations in
relation to food, food resources available and the nutritional status of elderly people,
identifying the respective main determinants.
European elderly people living in the following countries: Denmark, Germany, Italy, Poland,
Portugal, Spain, Sweden and the United Kingdom (UK), aged equal or over 65 years
constitute the study population. Around 400 individuals, living in their own homes, were
interviewed which constituted a community sample representative of the European
population given the socio-demographic diversity of each country (level of education, income
and urbanization) and collected in at least three distinct geographic locations in each
country. Data collection took place in the autumn of 2005, involving 3291 older people in
total.
According to the objectives, we proceeded to the development of a structured interview-
assisted questionnaire which included close ended questions with single or multiple answers,
in English. Thereafter, each country translated it to it is native language.
The elderly Europeans identified as the food features related to health and sensory aspects
having higher relevance, rather than the social and economic aspects. Older people with

10
higher levels of education tend to emphasize in to a higher extent the former first aspects
and the elders with lower income, the latter. The more satisfied elderly gave more
importance to health and sensory objectives, whereas those with more physical and mental
impairments were more likely to identify social and economic objectives.
Adherence to Mediterranean dietary pattern was above the index average, but lower than
the expected from the geographical characteristics of Portugal. Low-income elderly, with a
poor health condition, smokers, residing in the North of the country and who purchase meals
outside their homes were identified as at risk for poor adherence to Mediterranean diet.
These seniors living in the community used to a higher extent the informal support networks
for food (family) than the formal ones; women and the older group stand out for not using
these networks; and more educated elderly with a higher incomes used to eat out more
often.
The prevalence of obesity was higher in the UK (20%) and Poland (15.8%) for the older men
and also in Poland (26.7%) and Germany (25.3%) for the older women. Groups requiring
intervention for obesity prevention are the older men with less education and older women
with lower income.
The worldwide ageing of the population should constitute both a challenge and an
opportunity. 2012 was chosen by the European Parliament as the European Year dedicated
to Active Aging. The overall purpose of this decision was to encourage and support the
efforts of Member States, local and regional authorities, social partners and the society as a
whole, to promote active ageing and to make the most of this population, thereby enhancing
and maintaining intergenerational solidarity.
The current research has shed light on several aspects of the food-related domains in old age
within the European setting, therefore constituting a valuable contribution to this field of
knowledge.

11
1 ǀ Introdução

12

13
1 ǀ Introdução
Partes desta introdução encontram-se no capítulo do livro in press ada autoria da estudante.
“Age is a case of mind over matter; if you don’t mind it, it doesn’t matter”
Mark Twain
“Food, fun and fitness, to promote quality of life and positive aging”
American Dietetic Association, 2000
O envelhecimento crescente da população é uma das características mais relevantes da
última metade do século XX das sociedades desenvolvidas, fenómeno que tem provocou um
interesse especial, tem originado um elevado número de estudos tendo em vista o seu
melhor conhecimento e a identificação de fatores de risco modificáveis para o seu não
progresso.
Embora inicialmente o envelhecimento tenha sido um fenómeno das sociedades mais
desenvolvidas, foi progressivamente ocorrendo nas menos desenvolvidas, em virtude do
aumento da esperança de vida à nascença. Consequentemente, a população considerada
“idosa”b, não apenas constitui uma proporção importante da população geral como tem
também aumentado em números absolutos.
Segundo o Departamento de Estatística da União Europeia (Eurostat)1, na Europa em 2008 a
esperança de vida à nascença era de 79.4 anos (76.2 para homens e 82.4 para mulheres). Em
Portugal, a esperança de vida média era exatamente igual é média europeia, no caso das
mulheres e nos homens era de 76.2 anos, ligeiramente inferior. Para Portugal em 20091 esta
média subiu para 79.6 anos (76.5 anos para homens e 82.6 anos para mulheres). Quanto à
relação entre a população idosa e a população jovem, definida pelo Índice de
Envelhecimento (quociente entre o número de pessoas com 65 ou mais anos e o número de
a Afonso C, de Morais C, de Almeida MDV. Alimentação e Nutrição em Gerontologia in Manual de Gerontologia. Constança Paúl, Óscar Riberiro (Coordenadores). Lidel Edições Técnicas. In press bConsiderado como os indivíduos com 60 anos (United Nations, 2007) ou 65 e mais anos (WHO, 2002).

14
pessoas com idades compreendidas entre os 0 e os 14 anos) mostra que na Europa desde
1990 cresceu de 71.3 para 109.4 e em 2008 e concretamente em Portugal subiu de 65.7 para
114.5 no mesmo período de tempo sendo em 2009, 116.5.
Mais ainda, um maior número de pessoas vive até mais tarde pelo o que inicialmente se
poderia considerar um grupo relativamente “homogéneo” deve ser encarado como
constituindo pelo menos dois grupos: um, dos 60 ou 65 até 80 e outro, acima de 80 anos,
sugerido pelo Índice de Longevidade (relação entre a população mais idosa e a população
idosa, definida como o quociente entre o número de pessoas com 80 ou mais anos e o
número de pessoas com 65 ou mais anos). Este índice mostra também uma evolução ao
longo do tempo1, em 1990 era de 22.7 na Europa e 18.8 em Portugal e em 2008 cresce para
26.1 e 24.4 respetivamente, sendo que para Portugal em 2009 era de 24.81.
Esta crescente diferenciação está assim associada a diferentes capacidades físicas, cognitivas,
psicológicas que, por sua vez, influenciam as necessidades nutricionais destes indivíduos.
Na História da Humanidade, estão descritos diferentes formas de encarar e tratar os “mais
velhos”. Do abandono ou mesmo gerontocídio (por exemplo, no Mezozóico, na Idade Média)
ao respeito e consideração pela sua experiência e sabedoria (Paleolítico, Antigo Egipto,
Antiga Babilónia, Império Romano). Em 1601, em Inglaterra, publicou-se a primeira lei que
conferia proteção aos mais velhos e, no século XIX foram criadas as “cozinhas móveis” que
serviam para alimentar os mais carenciados, os deficientes e os idosos2.
Só a partir da 4ª década do século XX, surgiram as primeiras publicações que se referem a
recomendações alimentares e nutricionais para idosos nomeadamente as de Cathcart and
Murray (1931), as da Liga das Nações (1935) e, em 1944 as Atas da Sociedade de Nutrição.
No final do século XX, início do século XXI, a nutrição é reconhecida como uma preocupação
de saúde pública, para todos de uma forma geral e para os idosos em particular, sendo que a
relação entre nutrição e envelhecimento sobressai como questão de saúde pública no século
XX e XXI2.

15
Evidências epidemiológicas demonstraram, de forma segura, que o risco de inúmeras
patologias associadas ao envelhecimento pode ser minimizado por uma intervenção
adequada ao nível dos estilos de vida nomeadamente da alimentação/nutrição e atividade
física3; 4.
O crescimento cessa na idade adulta pelo que no idoso, a nutrição contribui para o
metabolismo do organismo e exerce funções reparadoras, capazes de retardar o
envelhecimento. Fisiologicamente, com o avançar da idade, há uma diminuição dos
mecanismos de ingestão, digestão, absorção, transporte e excreção de substâncias, o que se
traduz em necessidades nutricionais particulares neste estádio do ciclo de vida3.
Por outro lado, situações patológicas relacionadas com o envelhecimento podem afetar
também as necessidades alimentares/nutricionais. Também a interação fármaco-
nutrimentos, problemas sociais e culturais deverão ser tidos em consideração ao analisar os
determinantes do estado nutricional deste grupo etário5.
Na impossibilidade de modificar a situação biológica do envelhecimento, nomeadamente as
limitações devidas a incapacidades e condicionalismos de saúde, é fundamental otimizar a
maximização dos recursos associados aos estilos de vida não esquecendo a dimensão familiar
e sociocultural, de forma a promover a qualidade de vida e o bem-estar psicológico, de forma
a manter um desempenho físico, intelectual e social máximo6; 7.
Em 2002, na II Assembleia Mundial sobre o Envelhecimento, foi definido um Plano de Ação
que visa assegurar que todos possam envelhecer com segurança e dignidade continuando a
participar ativamente na sociedade. Todas as orientações traçadas têm como objetivo a
criação de uma sociedade inclusiva, em que a população mais velha possa gozar plenamente
de todos os seus direitos (civis, políticos, económicos, sociais, culturais), combatendo a
discriminação8.
16
As recomendações do Programa Nacional para a Saúde das Pessoas Idosas centram-se na
necessidade de formar os cidadãos mais velhos sobre estilos de vida nos quais se destacam a
atividade física e a alimentação, promovendo como estratégia a identificação dos
determinantes da saúde e estilos de vida bem como as principais barreiras de acesso à
“saúde”9.
1.1 ǀ Determinantes do estado nutricional e qualidade de vida em idosos
A alimentação e a nutrição, assim como outros fatores ambientes têm um enorme impacto
na saúde e bem-estar, condicionante da qualidade de vida dos idosos3; 7. A qualidade de vida
associada ao envelhecimento é descrita pela Organização Mundial de Saúde como um
“conceito amplo e subjetivo que inclui de forma complexa a saúde física da pessoa, o seu
estado psicológico, o nível de independência, as relações sociais, as crenças e convicções
pessoais e a sua relação com aspetos importantes do meio ambiente”8. Para esta entidade o
conceito de envelhecimento ativo é o processo de otimização das oportunidades para a
saúde, participação e segurança para melhorar a qualidade de vida das pessoas que
envelhecem. Baseia-se fundamentalmente em três pilares: diminuição do risco de doença
e/ou incapacidade, promoção do estado de saúde mental e uma perfeita integração na
sociedade7.
Nesta perspetiva, a alimentação não só é determinante para o estado de saúde mas também
para a qualidade de vida numa perspetiva holística: cultural, social e psicológica e a adesão a
estilos de vida saudáveis pode desempenhar um papel mais importante que a própria
genética do envelhecimento7. Apesar desta orientação, pouco tem sido investigado de forma
a suportar esta evidência10.
Se a escolha alimentar afeta de forma decisiva o envelhecimento, não é menos verdade que
o envelhecimento determina a escolha de alimentos assim condicionando o padrão
alimentar11. Com o avançar da idade as condições de vida sofrem transformações; por
exemplo a reforma pode ocasionar uma diminuição do nível de vida e a rede social de

17
contatos poderá diminuir; com o aparecimento de incapacidades o acesso a determinados
estabelecimentos poderá estar condicionado; a perda do cônjuge ou a saída de casa dos
filhos, e pode ocasionar perda de interesse e afetar também as circunstâncias em que
cozinham e se alimentam. Além do mais o significado das refeições e dos alimentos altera-se
com a idade12; 13. É o caso das mulheres que ao longo do ciclo de vida passam de prestadoras
a usufrutuárias de cuidados alimentares14.
As expetativas e objetivos pretendidos com a alimentação a par dos recursos disponíveis
para a sua concretização alteram-se com o envelhecimento. Em simultâneo, fatores
condicionantes da saúde, incapacidades, existência (ou não) de redes sociais de suporte e até
alteração de competências para desempenhar tarefas como as de adquirir e preparar
refeições, poderão condicionar os consumos alimentares e, por sua vez, influenciando o
estado nutricional10.
Os fatores sociais e económicos são decisivos para a satisfação com a vida e
consequentemente da adequação do comportamento alimentar/nutricional. Promover
pretextos para um maior convívio em torno da mesa e de refeições nutricionalmente
adequadas, em ambiente agradável, pela promoção de sentimentos de pertença a um grupo
ou comunidade, parece ser melhor estratégia para promover adequado estado nutricional de
idosos, e consequentemente, da sua qualidade de vida15;16. Está descrito que idosos que
consomem as suas refeições na companhia de amigos e família têm melhor qualidade de
vida e são mais felizes10.
Em idosos, o isolamento social é um aspeto preocupante14, não só pela privação de contatos
humanos como também pelo seu efeito no estado nutricional. Esta associação não
condiciona diretamente situações de malnutrição, mas leva a um desinteresse pelos
alimentos e refeições. No entanto, a partilha de refeições aquando de uma doença ou
incapacidade em contexto de internamento, poderá ter exatamente o mesmo efeito
negativo.

18
Outro aspeto pertinente é o papel do género nas tarefas relacionadas com a preparação das
refeições. Em diversas culturas a mulher relega para segundo plano as suas preferências
alimentares em detrimento da família (marido, filhos) tomando iniciativa e responsabilidades
na alimentação, pelo que numa situação de viuvez deixa de ter motivação para a preparação
de refeições. Por outro lado, para os homens idosos que ficaram sós, estas tarefas são tidas
como um desafio que necessita de ser incorporado na sua identidade. Destes, um grupo
aceita o desafio como se se tratasse de um novo trabalho, outros há que tentam encontrar
alguém para fazer estas tarefas, certificando-se que os papéis sociais se mantêm. Mas os
idosos do sexo masculino que sempre viveram sozinhos já interiorizaram esta tarefa17.
O número crescente de idosos na população tem levado ao desenvolvimento redes formais
de prestação de cuidados a idosos, nos quais se incluem os alimentares. Estes serviços
podem atuar de per si ou como suporte aos cuidadores informais, contribuindo assim para a
manutenção do estado funcional e de independência dos idosos18.
1.1.1ǀ Idosos, alimentação e saúde
A escolha alimentar é influenciada por aspetos biológicos (como a fome, o apetite, o sabor),
por condicionantes económicas (custo dos alimentos, rendimento, disponibilidade),
determinantes estruturais (acesso, educação, competências e recursos culinários, tempo),
características sociais (cultura, família, relações sociais, padrões alimentares) atitudes,
crenças e conhecimentos sobre alimentos e alimentação19.
Em 2001 um projeto Europeu multicêntrico, identificou, as atitudes de idosos europeus
(n=1843) em relação à alimentação, nutrição e saúde.
Entre os fatores identificados por esta população como tendo influência na sua escolha
alimentar destacam-se aspetos relacionados com a qualidade e frescura (54%), seguido da
tentativa de comer de forma saudável em simultâneo com a preocupação com o preço dos
alimentos (8%). Para estes idosos a alimentação saudável era definida como tendo "menos

19
gordura" (37%) "mais hortícolas e frutas frescas" (34%), e incluindo "alimentos naturais"
(11%). Manterem saudáveis (36%), evitarem doenças (26%) e promoverem a qualidade de
vida (10%) foram os principais benefícios associados à alimentação saudável referidos por
estes idosos. No entanto a adoção de uma alimentação saudável enfrenta diversos
obstáculos, nomeadamente a dificuldade de autocontrole (27%), a resistência à mudança
(23%) e o preço atribuído à alimentação saudável (15%). De salientar no entanto que 86%
dos idosos Europeus acreditavam não precisar de mudar seus hábitos alimentares pois já
comia de forma saudável20.
Em idosos Ingleses, Locher e colaboradores21 identificam aspetos sensoriais, de conveniência
e preço como determinantes importantes para a seleção de alimentos. Neste estudo, as
preocupações emocionais (humor) e o uso de produtos naturais desempenhavam uma
menor relevância do que os primeiros.
A conveniência na preparação da refeição é considerada como um importante determinante
da escolha alimentar descrito por Scholderer e Grunert. 200522, contudo Saba e
colaboradores23, mostraram que idosos Europeus não parecem ver benefícios no consumo
de alimentos de conveniência e também nem têm intenção de consumir esses produtos23.
Manter a independência foi a prioridade de vida mencionada por idosos escoceses que
consideravam os alimentos como um fator que contribuía para manter a saúde reduzindo
assim a dependência de outros. Outra preocupação assinalada por aqueles idosos era evitar
o isolamento social, assumindo como primordial importância manter a ida às compras diárias
e de deslocação a cafés ou a outros locais de forma a fazerem as suas refeições24.
Noutro estudo britânico, os contatos sociais são indicados como os principais componentes
de uma boa qualidade de vida25. Locher26; 27 mostrou a preocupação dos idosos em consumir
refeições em ambiente confortável e seguro. Um estudo Europeu mostra que preocupações
económicas com as refeições principalmente salientadas pelos idosos Portugueses e
Polacos28.

20
Em Portugal, a alimentação é identificada pelos seus idosos como um dos principais
determinantes da saúde, seguida de check-up médicos regulares e redução dos hábitos
tabágicos. Alinhada com esta perceção encontra-se a preocupação em fazer uma
“alimentação saudável” e o preço dos alimentos como principais determinantes da escolha
alimentar29. A identificação do custo dos alimentos distinguia-nos dos idosos de outros países
da União Europeia20.
Mais recentemente, em 2009, o estudo Estilos de Vida da população Portuguesa incluiu
também portugueses com mais de 65 anos (712 indivíduos) e revelou as perceções dos
diferentes grupos etários em relação a vários aspetos da sua vida. Em comparação com os
mais novos, os portugueses mais velhos consideram o apoio da família e amigos, o meio
ambiente e o peso como determinantes da saúde, assim como identificam o preço dos
alimentos, aspetos culturais, religiosos ou étnicos e ainda a dieta aconselhada pelo médico
como determinantes major da escolha alimentar. Este mesmo estudo encontrou uma
proporção de idosos com atividade física reduzida, sendo esta baixa adesão mais prevalente
nas idosas (49.7%)30.
Na sequência da realização de entrevistas em profundidadec, obtivemos uma riqueza de
informação qualitativa que nos permite compreender a complexidade dos fatores que
interferem com a ingestão alimentar e nutricional dos idosos (Europeus em geral e
Portugueses, em particular).
Uma conjugação de diferentes fatores confere aos idosos Portugueses características
específicas: escolaridade e rendimentos reduzidos, problemas de visão e de saúde oral e
atividade física reduzida. Em termos de saúde geral referiam problemas cardíacos,
gastrointestinais, nos membros inferiores, reumatismo, tonturas, insónias, dores de cabeça,
entre outros problemas. Todos sofriam de pelo menos uma doença crónica: diabetes mellitus
tipo 2, dislipidemias e hipertensão arterial (HTA). Consequentemente, mais de 50% dos
c Informação colhida no âmbito do Projecto Europeu Food in Later Life (WP3-6), que decorreu em 9 instituições de ensino e investigação da UE em que a Faculdade de Ciências da Nutrição e Alimentação da Universidade do Porto (FCNAUP) foi a representante Portuguesa.
21
idosos tomava mais do que três medicamentos por dia. No entanto, a toma de suplementos
não era frequente e só as mulheres referiam a ingestão de cálcio31.
As condicionantes socioculturais, escolaridade e rendimento, bem como o relato de um
passado de fome, mostraram ser alguns dos motivos pelos quais os intervenientes se
mostraram relutantes em aceitar novidades e a experimentar novos alimentos. Perante este
cenário, retratam-se os idosos Portugueses como muito tradicionais, não só no seu modo de
vida em geral, mas também no que se refere às suas refeições. Havia uma rotina muito rígida
com as refeições, consumidas na sua maior parte no domicílio, sendo que comer fora de
casa, por rotina, só com a família e ao fim de semana32.
Os conselhos alimentares veiculados pelo médico assistente levam a que os idosos alterem a
sua alimentação, quer excluindo, quer incluindo determinados alimentos. Tristeza e, por
vezes, depressão além de sentimentos de marginalização e solidão, foram visíveis
principalmente em idosos a viverem sós, relacionados com a perda de conjugue ou outros,
revelavam-se num marcado desinteresse pela alimentação. O passado era então lembrado
com saudade, nostalgia e mágoa. Convidar familiares ou outros para comer em casa deixou
de ser um prazer devido a problemas de saúde. No entanto, algumas idosas ainda tinham a
cargo a alimentação dos netos e/ou filhos, bem como ainda convidam a família a fazerem as
suas refeições ao fim de semana32.
Os homens idosos, principalmente os que viviam sós, recorriam aos suportes formais de
aquisição de refeições como aos centros de dia, bares, cafés, restaurantes, clubes sociais
e/ou aos informais como a casa dos filhos, principalmente para o jantar31.
Quando comparavam a alimentação atual com a de tempos passados, embora referissem
maiores disponibilidades no presente, consideravam os alimentos mais saborosos e puros no
passado31.

22
A aquisição de géneros alimentícios para as suas refeições era efetuada maioritariamente no
comércio de proximidade: padarias, frutarias, peixarias, talhos e/ou supermercados e de
baixo custo. Por vezes a família auxiliava em compras de maior vulto com uma periodicidade
mensal e/ou quinzenal. No entanto, os idosos relatavam problemas físicos (dores de costas,
joelhos, pés, dificuldade em andar, cansaço, falta de força, patologias crónicas como
osteoporose, reumatismo, perda de equilíbrio...) que impediam ou condicionavam a ida às
compras ou ao seu transporte para o domicílio33.
Outros, porém, referiram a não existência de estabelecimentos na vizinhança assim como a
fraca acessibilidade, a impossibilidade de deslocação a pé, além da escassez de transportes.
Estavam, muitos deles, condicionados ao que os familiares lhes cediam33.
Independentemente de todas as condicionantes relatadas, notou-se uma enorme
preocupação com a aquisição de géneros a baixo custo e a necessidade de recorrerem a lojas
onde se sentiam familiarizados com os circuitos e onde já conheciam as/os funcionárias/os
que por vezes os auxiliavam nas dúvidas quanto a preços, promoções e localização dos
produtos desejados33.
Quanto à preparação e confeção de alimentos verificou-se que apesar de se sentir algumas
limitações no manuseamento de alguns utensílios, como por exemplo facas, a forma de
preparar e cozinhar não sofreu grandes alterações ao longo dos anos e mantém-se de modo
tradicional, mencionando sempre os ensinamentos das respetivas progenitoras. Apesar da
disponibilidade de equipamento facilitador da preparação/confeção de alimentos, como o
microondas (usualmente em 2º mão, cedido pelos filhos), os idosos recusavam-se a utilizá-lo
que não para aquecer alimentos ou bebidas33.
As idosas Portuguesas assumem que à medida que o seu estado de saúde se vai degradando,
a forma de preparar e/ou confecionar as refeições se altera e identificam uma maior
dificuldade e morosidade em todas as tarefas, bem como um perda de confiança nas suas
capacidades. O que, de certa forma, justifica os padrões alimentares em que o almoço é a

23
refeição mais elaborada e o jantar algo mais leve, composto por exemplo por sopa, sandes e
fruta. Quando os condicionalismos de saúde se acentuam, sentem a necessidade de recorrer
à ajuda de redes de suporte disponíveis33.
A forma de cozinhar destes idosos, era a tradicional Portuguesa, porém algumas idosas
referem alterações nos procedimentos culinários de forma a se ajustarem às circunstâncias
da sua saúde e assim referem preparar as suas refeições com menos sal e gordura e
recorrem principalmente ao método de confeção grelhado33.
Muitos dos idosos do sexo masculino aprenderam e principiaram a cozinhar nesta fase da
vida, por necessidade (incapacidade ou morte da esposa ou devido à inexistência de suporte
informal). Geralmente preparam refeições simples; alguns apenas sabem preparar
merendas; é um grupo mais heterogéneo que o das mulheres, no que se refere às aptidões
culinárias33.
De uma forma conclusiva este estudo destaca o facto que os determinantes da aquisição,
preparação dos géneros, sua confeção e consumo eram marcadamente determinados por
características socioeconómicas (preço, disponibilidade de locais e géneros, hábitos
alimentares, tradições, presença de suportes formais ou informais) a par de condicionantes
físicas e de saúde (condicionalismos inerentes ao próprio processo de envelhecimento,
presença de patologia crónica e consequentes modificação de hábitos alimentares) e realça-
se a importância dos fatores psicológicos (solidão, perda do conjugue), que era
absolutamente condicionante da forma de expressar a ausência de qualidade de vida
relacionada com a alimentação.
1.2 ǀ Ingestão alimentar/nutricional
Informação proveniente do European Nutrition and Health Report 200934 para idosos
Europeus, mostra uma ingestão diária de energia entre 1696 kcal (Espanha) e 3105 kcal

24
(Roménia) nos homens idosos e entre 1385 kcal e 2003 Kcal nas mulheres dos mesmos países
respetivamente.
A ingestão de proteínas oscilou entre 13.6-19,0% do valor energético total (VET) nos homens
e 13.2% (Polónia) a 20.0% (Espanha) do VET nas mulheres, superiores em alguns países às
recomendações da Organização Mundial de Saúde (OMS), 2003 que ditam valores deste
nutriente a oscilar entre 10 a 15% do VET). Quanto à ingestão de hidratos de carbono e
assumindo as recomendações da OMS35; 36 de 50-75% do VET, verifica-se que este valor só foi
atingido por idosos da Noruega (51.0% em homens e 52.0% em mulheres) e da Polónia
(50.0% em homens e 52.6% em mulheres), bem como por mulheres idosas da Finlândia
(51.2%) e da Irlanda (50.0%). A proporção proveniente dos lípidos oscilou entre 26.7%
(Portugal) a 43.9% (Grécia) no sexo masculino e entre 28,0% a 45,3% em idosos do sexo
feminino provenientes exatamente dos mesmos países e, portanto, em geral acima das
recomendações (15 a 30% do VET)36. De uma forma geral verificaram-se ingestões abaixo das
recomendações para a vitamina D, α-tocoferol, folatos, cálcio, magnésio e ferro (apenas
mulheres).
Os resultados mais abrangentes sobre a situação alimentar de idosos na Europa é
proveniente do estudo longitudinal Survey in Europe on Nutrition and Elderly, a Concerted
Action (SENECA)37; 38. Teve o seu inicio em 1988 em 19 cidades Europeias (definidas com
tendo ente 10000-30000 habitantes) em: Hamme (Bélgica), Roskilde (Dinamarca), Pádua
(Itália), Culemborg (Holanda), Vila Franca de Xira e Coimbra (Portugal), Betanzos (Espanha) e
Yverdon, Burgdorf e Bellinzona (Suíça) Marki (Polónia), B-L- Portstewart (Irlanda). O número
de participantes foi de 2586 indivíduos nascidos entre 1913 e 1918. No primeiro follow up
em 1993, participaram cerca de 1125 indivíduos, sendo que no final, em 1999 cerca de um
quarto dos participantes 627, foi reavaliado.
A este estudo presidiu com objetivo geral a melhoria do conhecimento do estado nutricional
e das suas consequências numa população idosa, com idades compreendidas entre os 70 e
os 75 anos a residir no seu domicílio, bem como o impacto da alimentação sobre a evolução

25
do estado de saúde física e psíquica. Este estudo é ainda hoje um marco na área da nutrição
geriátrica.
Outros estudos pontuais com informação alimentar da qual se extraem resultados para
idosos oriundos de cidades de diferentes países Europeus, com diversos tamanhos amostrais
e com recurso a metodologias distintas, encontram-se sistematizados no European Nutrition
and Health Report 200934.
Posteriormente em 2001, o projeto Healthy Ageing: Longitudinal Study in Europe (HALE)39,
permitiu reunir informação proveniente dos três estudos longitudinais feitos em idosos
Europeus: the Seven Countries Study; the Finland, Italy, Netherlands Elderly (FINE) e o
SENECA, de forma a obter informação mais alargada e consistente. O primeiro estudo (the
Seven Countries Study) incluiu 7047 homens com idades compreendidas entre 40 e 99 anos
da Finlândia, Grécia, Itália, Holanda e Sérvia, colhidos no período de 1959-2000; e 3805
idosos homens e mulheres seguidos durante 10 anos, originários de 12 países Europeus,
provinham dos estudos FINE e SENECA.
Este projeto teve como objetivo geral estudar as alterações nos estilos de vida, demográficas
e biológicas no envelhecimento normal e saudável e a sua relação com dados de mortalidade
e morbidade, com alterações físicas, psicológicas, cognitivas, e sociais em países europeus.
Informação disponível para a caraterização dos hábitos alimentares dos idosos Europeus e
Americanos é originada do pelo projeto SENECA e pelo Framingham Heart Study40. A
população incluída tinha idades compreendidas entre 70 e 77 anos, sendo 828 indivíduos de
Framingham (EUA), e 1282 indivíduos europeus. A informação sobre o consumo alimentar
permite fazer uma distinção entre Norte e Sul em que por exemplo se verifica que o maior
consumo de cereais e derivados e pescado é superior em Espanha e Portugal do que outros
países. O consumo de fruta e de bebidas alcoólicas é superior em Itália e Espanha, e o
consumo de açúcar e produtos açucarados pelos idosos Belgas e Holandeses. Quanto à
ingestão de bebidas não alcoólicas, oscilou entre uma ingestão baixa pelos Portugueses e a
26
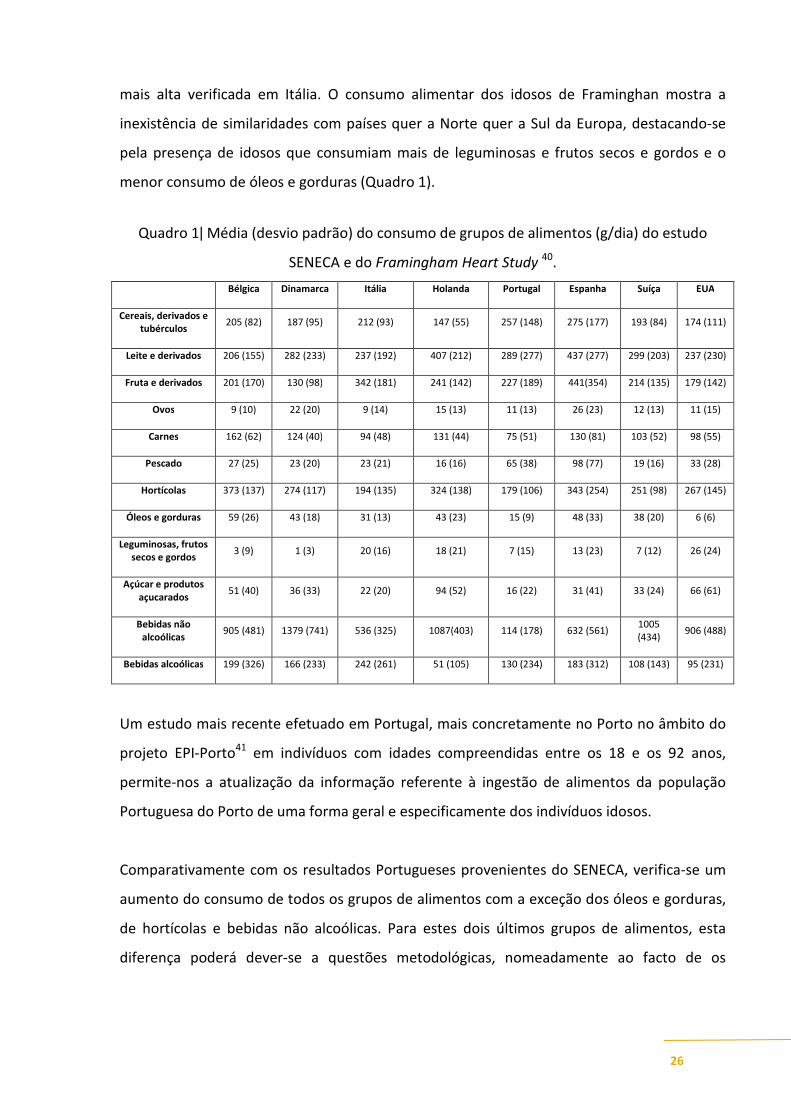
mais alta verificada em Itália. O consumo alimentar dos idosos de Framinghan mostra a
inexistência de similaridades com países quer a Norte quer a Sul da Europa, destacando-se
pela presença de idosos que consumiam mais de leguminosas e frutos secos e gordos e o
menor consumo de óleos e gorduras (Quadro 1).
Quadro 1ǀ Média (desvio padrão) do consumo de grupos de alimentos (g/dia) do estudo
SENECA e do Framingham Heart Study 40.
Bélgica Dinamarca Itália Holanda Portugal Espanha Suíça EUA
Cereais, derivados e tubérculos
205 (82) 187 (95) 212 (93) 147 (55) 257 (148) 275 (177) 193 (84) 174 (111)
Leite e derivados 206 (155) 282 (233) 237 (192) 407 (212) 289 (277) 437 (277) 299 (203) 237 (230)
Fruta e derivados 201 (170) 130 (98) 342 (181) 241 (142) 227 (189) 441(354) 214 (135) 179 (142)
Ovos 9 (10) 22 (20) 9 (14) 15 (13) 11 (13) 26 (23) 12 (13) 11 (15)
Carnes 162 (62) 124 (40) 94 (48) 131 (44) 75 (51) 130 (81) 103 (52) 98 (55)
Pescado 27 (25) 23 (20) 23 (21) 16 (16) 65 (38) 98 (77) 19 (16) 33 (28)
Hortícolas 373 (137) 274 (117) 194 (135) 324 (138) 179 (106) 343 (254) 251 (98) 267 (145)
Óleos e gorduras 59 (26) 43 (18) 31 (13) 43 (23) 15 (9) 48 (33) 38 (20) 6 (6)
Leguminosas, frutos secos e gordos
3 (9) 1 (3) 20 (16) 18 (21) 7 (15) 13 (23) 7 (12) 26 (24)
Açúcar e produtos açucarados
51 (40) 36 (33) 22 (20) 94 (52) 16 (22) 31 (41) 33 (24) 66 (61)
Bebidas não alcoólicas
905 (481) 1379 (741) 536 (325) 1087(403) 114 (178) 632 (561) 1005 (434)
906 (488)
Bebidas alcoólicas 199 (326) 166 (233) 242 (261) 51 (105) 130 (234) 183 (312) 108 (143) 95 (231)
Um estudo mais recente efetuado em Portugal, mais concretamente no Porto no âmbito do
projeto EPI-Porto41 em indivíduos com idades compreendidas entre os 18 e os 92 anos,
permite-nos a atualização da informação referente à ingestão de alimentos da população
Portuguesa do Porto de uma forma geral e especificamente dos indivíduos idosos.
Comparativamente com os resultados Portugueses provenientes do SENECA, verifica-se um
aumento do consumo de todos os grupos de alimentos com a exceção dos óleos e gorduras,
de hortícolas e bebidas não alcoólicas. Para estes dois últimos grupos de alimentos, esta
diferença poderá dever-se a questões metodológicas, nomeadamente ao facto de os

27
alimentos incluídos em cada grupo serem distintos. Por exemplo, a água estava incluída no
grupo das bebidas não alcoólicas no estudo SENECA, mas não neste último. No SENECA não
estava contemplado o item sopa de hortícolas, o que provavelmente faz com que a
quantidade de hortícolas seja superior nos idosos Portugueses deste estudo,
comparativamente com o estudo mais atual (Quadro 2).
Quadro 2ǀ Média (desvio padrão) do consumo de grupos de alimentos (g/dia) por género do
estudo EPI-Porto em indivíduos com mais de 65 anos41.
Homens Mulheres
Cereais e derivados e tubérculos
335.1 (112.2) 291.4 (80.4)
Leite e derivados 333.8 (232.4) 400.4 (253.2)
Fruta e derivados 295.2 (159.5) 276.6 (141.1)
Ovos ND ND
Carnes 118.5 (51.0) 105.1 (43.2)
Pescado 79.6 (36.3) 74.4 (32.4)
Hortícolas 108.8 (68.5) 114.1 (83.3)
Sopa de legumes 287.7 (209.8) 281.5 (194.4)
Óleos e gorduras 8.7 (6.0) 9.5 (6.1)
Leguminosas, frutos secos e gordos
ND ND
Açúcar e produtos açucarados
53.6 (45.2) 48.5 (42.4)
Bebidas não alcoólicas (expecto água)
27.5 (103.5) 24.5 (75.5)
Bebidas alcoólicas 328.7 (306.2) 75.7 (130.5)
ND Informação não disponível
Relativa à publicação atrás referida40, as autoras aplicaram 3 índices (Healthy Diet Indicator,
Greek Mediterranean Diet Score, FS-Mediterranean Diet Score) de forma a avaliar a qualidade
de ingestão alimentar. De uma forma geral os países do sul da Europa demonstram ter
valores mais elevados o que sugere uma melhor qualidade alimentar, principalmente no que
se refere aos índices relativos à Dieta Mediterrânica, em, Portugal, Espanha e Itália.

28
O padrão alimentar Mediterrânico caraterizado pelo elevado consumo de produtos de
origem vegetal, elevado consumo de hortícolas crus e cozinhados, fruta fresca, uso de
cereais não refinados, azeite, consumo moderado de leite e derivados, especialmente sob a
forma de queijo, baixo consumo de carne e consumo de bebidas alcoólicas, principalmente
sob a forma de vinho, parece ser um padrão alimentar relevante até para os idosos42; 43; 44. O
consumo de pescado, é também uma caraterística desejável deste padrão alimentar porém o
seu consumo depende essencialmente da proximidade ao mar45.
Uma revisão sistemática efetuada em estudos de coorte analisou a relação entre o padrão
alimentar Mediterrânico, mortalidade e incidência de doenças crónicas, comprovando que
este padrão se associava significativamente a uma melhoria da saúde mais baixa com
significativamente mais baixa mortalidade por todas as causas (9%), por doença
cardiovascular (9%), incidência e mortalidade por cancro (6%), e incidência das doenças de
Parkinson e Alzheimer (13%). Estes resultados são relevantes para a saúde pública
particularmente para a promoção deste padrão alimentar na prevenção primária da maioria
das doenças crónicas46 (Sofi et al, 2008). A atualização desta meta-análise confirma, a
consistência desta proteção conferida pelo padrão alimentar Mediterrânico47.
1.3 ǀ Necessidades nutricionais do idoso
As necessidades de energia e nutrimentos específicas para idosos são apresentadas para dois
grupos distintos: para indivíduos dos 50 aos 70 anos e para os de mais de 70 anos de idade.
Estas recomendações, embora não consensuais, continuam a ser utilizadas como linha de
orientação. As recomendações para a ingestão (RDA: Recommended Dietary Allowance)
definem-se como a quantidade de nutrimentos necessários para suprir 97 a 98% das
necessidades nutricionais dos indivíduos saudáveis de uma determinada faixa etária. São
calculadas para grupos específicos. Quando não se dispõe de dados que permitam a
determinação das RDA podem utilizar-se as AI (Adequate Intake) que representam valores
médios recomendados para pessoas aparentemente saudáveis48.

29
Os resultados da investigação não evidenciam de forma clara que as necessidades
nutricionais diminuam com a idade; pelo contrário, a absorção e a utilização eficaz de certos
nutrimentos pode estar comprometida com o avançar da idade, o que significa que as
necessidades podem estar aumentadas, sem contudo se definir a ordem de grandeza desse
aumento49.
A investigação nutricional mostra um declínio gradual da ingestão energética à medida que a
idade avança, principalmente à custa da redução da ingestão de hidratos de carbono e de
lípidos. O decréscimo da ingestão proteico-lipídica nos idosos está associado a um aumento
da mortalidade, enquanto o de hidratos de carbono tem um efeito ténue em idosos frágeis2.
De acordo com as RDA, o valor energético recomendado para homens com mais do que 50
anos é 2300 kcal, e para mulheres, 1900 kcal48. As necessidades energéticas diárias de uma
pessoa com mais do que 50 anos, diferem entre os sexos e também dependem do nível de
atividade praticada (Quadro 3).
Quadro 3ǀ Necessidades energéticas para maiores de 50 anos, por género e nível de atividade
física.
Nível de atividade Homens
(kcal)
Mulheres
(kcal)
Sedentário 2000 1600
Moderado 2200-2400 1800
Alto 2400-2800 2000-2200
De um modo geral assume-se que as necessidades energéticas poderão eventualmente
diminuir com o aumento da idade essencialmente devido a um eventual decréscimo da
atividade física e da consequente redução da massa muscular. Uma ingestão energética
adequada deverá manter um peso corporal adequado e suprir as necessidades em
micronutrimentos. Para tal, torna-se essencial a elaboração cuidada e personalizada de um
plano alimentar3; 49.

30
Em termos de necessidades proteicas, as recomendações assemelham-se às de adultos
saudáveis, desde que a função renal se mantenha inalterada. Também as necessidades em
lípidos se mantêm, realçando-se a promoção da ingestão de lípidos monoinsaturados e
adequada de ácidos gordos essenciais ómega-3 e 6. A ingestão de água deverá ser mantida
entre 1.5 a 2 litros/dia, independentemente da perda da sensação de sede49; 50.
Ao compararmos as recomendações para a população adulta com as da população com mais
do que 50 anos, verificamos um acréscimo das necessidades em vitamina D, B6, cálcio,
magnésio e um decréscimo em cloro, sódio, fibra, ácido linoleico assim como de ferro nas
mulheres48.
No Quadro 4 podem observar-se os valores das recomendações de ingestão para indivíduos
com idade superior a 50 anos48 (DRI: Dietary Reference Intake).

31
Quadro 4ǀ Recomendações nutricionais para Idosos48.
Vitamina A
(µg)
Vitamina C
(mg)
Vitamina D
(µg)
Vitamina E
(mg)
Vitamina K
(mg)
Tiamina
(mg)
Riboflavina
(mg)
Niacina
(mg)
Vitamina B6
(mg)
Folato
(µg)
Idade 51-70
Masculino 900 90 10 15 120 1.2 1.3 16 1.7 400
Feminino 700 75 10 15 90 1.1 1.1 14 1.5 400
Idade 70+
Masculino 900 90 15 15 120 1.2 1.3 16 1.7 400
Feminino 700 75 15 15 90 1.1 1.1 14 1.5 400
Idade 51-70
Masculino 3000 2000 50 1000 ND ND ND 35 100 1000
Feminino 3000 2000 50 1000 ND ND ND 35 100 1000
Idade 70+
Masculino 3000 2000 50 1000 ND ND ND 35 100 1000
Feminino 3000 2000 50 1000 ND ND ND 35 100 1000
Vitamina
B12 (µg)
Ácido
Pantoténico
(mg)
Biotina (µg)Colina
(mg)
Boro
(µg)
Cálcio
(mg)
Crómio
(µg)
Cobre
(µg)
Flúor
(mg)Iodo (µg)
Idade 51-70
Masculino 2.4 5 30 550 ND 1200 30 900 4 150
Feminino 2.4 5 30 425 ND 1200 20 900 3 150
Idade 70+
Masculino 2.4 5 30 550 ND 1200 30 900 4 150
Feminino 2.4 5 30 425 ND 1200 20 900 3 150
Idade 51-70
Masculino ND ND ND 3500 20 2500 ND 10000 10 1100
Feminino ND ND ND 3500 20 2500 ND 10000 10 1100
Idade 70+
Masculino ND ND ND 3500 20 2500 ND 10000 10 1100
Feminino ND ND ND 3500 20 2500 ND 10000 10 1100
RDA ou AI
RDA ou AI
Níveis Superiores de Ingestão Toleráveis
Níveis Superiores de Ingestão Toleráveis
Vitaminas e Minerais
32
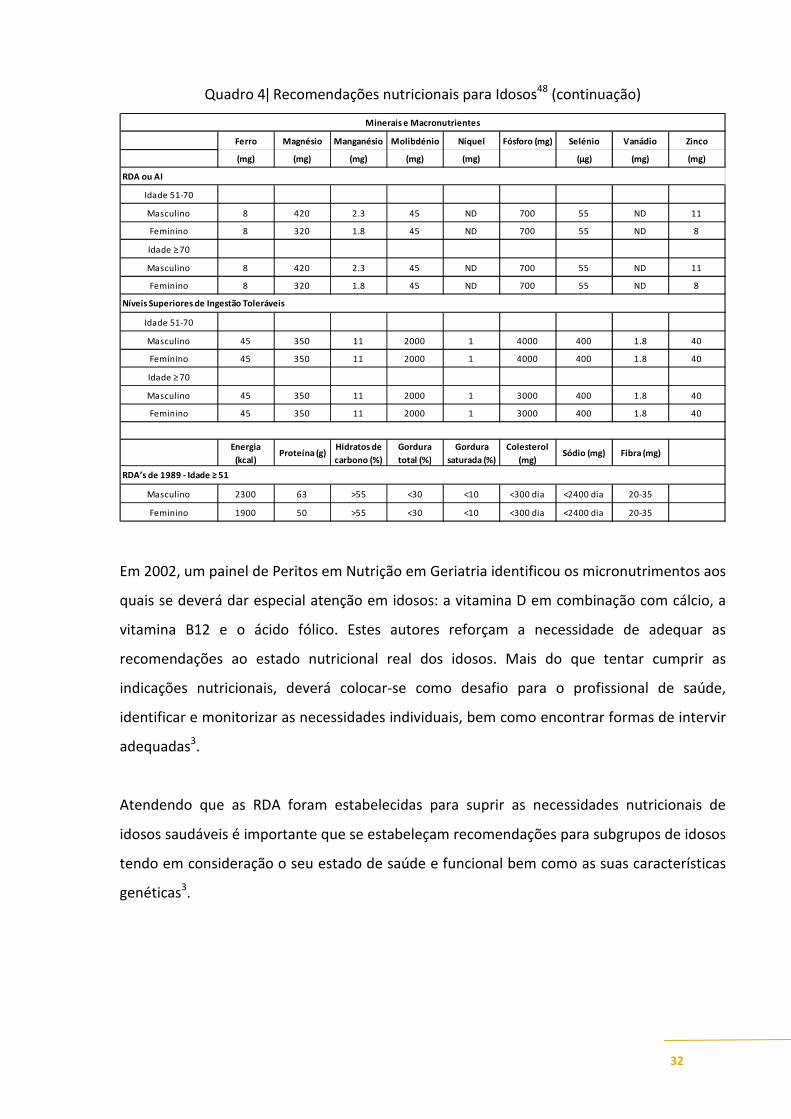
Quadro 4ǀ Recomendações nutricionais para Idosos48 (continuação)
Ferro Magnésio Manganésio Molibdénio Níquel Fósforo (mg) Selénio Vanádio Zinco
(mg) (mg) (mg) (mg) (mg) (µg) (mg) (mg)
Idade 51-70
Masculino 8 420 2.3 45 ND 700 55 ND 11
Feminino 8 320 1.8 45 ND 700 55 ND 8
Idade ≥ 70
Masculino 8 420 2.3 45 ND 700 55 ND 11
Feminino 8 320 1.8 45 ND 700 55 ND 8
Idade 51-70
Masculino 45 350 11 2000 1 4000 400 1.8 40
Feminino 45 350 11 2000 1 4000 400 1.8 40
Idade ≥ 70
Masculino 45 350 11 2000 1 3000 400 1.8 40
Feminino 45 350 11 2000 1 3000 400 1.8 40
Energia
(kcal)Proteína (g)
Hidratos de
carbono (%)
Gordura
total (%)
Gordura
saturada (%)
Colesterol
(mg)Sódio (mg) Fibra (mg)
Masculino 2300 63 >55 <30 <10 <300 dia <2400 dia 20-35
Feminino 1900 50 >55 <30 <10 <300 dia <2400 dia 20-35
RDA ou AI
RDA’s de 1989 - Idade ≥ 51
Níveis Superiores de Ingestão Toleráveis
Minerais e Macronutrientes
Em 2002, um painel de Peritos em Nutrição em Geriatria identificou os micronutrimentos aos
quais se deverá dar especial atenção em idosos: a vitamina D em combinação com cálcio, a
vitamina B12 e o ácido fólico. Estes autores reforçam a necessidade de adequar as
recomendações ao estado nutricional real dos idosos. Mais do que tentar cumprir as
indicações nutricionais, deverá colocar-se como desafio para o profissional de saúde,
identificar e monitorizar as necessidades individuais, bem como encontrar formas de intervir
adequadas3.
Atendendo que as RDA foram estabelecidas para suprir as necessidades nutricionais de
idosos saudáveis é importante que se estabeleçam recomendações para subgrupos de idosos
tendo em consideração o seu estado de saúde e funcional bem como as suas características
genéticas3.

33
1.4 ǀ Avaliação do estado nutricional
Em 2003 a British Association for Parenteral and Enteral Nutrition (BAPEN), 51 e a European
Society for Clinical Nutrition and Metabolism52
(ESPEN), alertaram para a necessidade de
identificar a população idosa em risco de desnutrição, por excesso ou por carência, pelas
consequências negativas daí advindas sobre a capacidade imunológica, a redução da força
muscular e a capacidade respiratória, com fadiga, desregulação dos mecanismos de
termorregulação e, consequentemente, hipotermia. Apatia, estados depressivos e
negligência em relação a si próprio, podem também ser consequência da malnutrição. Estas
situações aumentam o risco de doença e o recurso à hospitalização ou à institucionalização 5;
51; 52; 53.
A malnutrição tem elevados custos de saúde para os países, mas a investigação desta
temática na velhice centra-se essencialmente apenas já em ambiente hospitalar. Porém, a
raiz do problema encontra-se na comunidade, altura em que seria possível e vantajoso evitar
o seu agravamento54 52; 55; 56.
Na Europa e nos Estados Unidos, cerca de 25 a 60% dos idosos hospitalizados e 10 a 85% dos
idosos institucionalizados sofrem de malnutrição com diferentes graus de severidade2. Em
Portugal, em 2005 identificou-se através do instrumento de rastreio malnutrition universal
screening tool (MUST) que 9% de idosos do sexo masculino e 15% do sexo feminino a viver
na comunidade estavam em risco médio ou alto de malnutrição57.
Torna-se assim fulcral estabelecer os parâmetros a utilizar na identificação de desnutrição,
por deficiência ou por excesso, de modo a fazer-se um diagnóstico precoce, proceder à
intervenção individualizada, controlar e reverter a situação58; 59.
A avaliação do estado nutricional em idosos tem como objetivos primordiais60; 61.
- Determinar a adequação da ingestão alimentar/nutricional às necessidades individuais;

34
- Identificar fatores de risco de desnutrição;
- Diagnosticar situações de malnutrição;
- Identificar a etiologia dos défices nutricionais;
- Elaborar e aplicar estratégias terapêuticas e;
- Avaliar a efetividade da estratégia aplicada.
De acordo com Enzi e colaboradores62, na 3ª idade a malnutrição pode ser devida à
diminuição da ingestão alimentar/nutricional, ao aumento das perdas nutricionais, à
alteração do metabolismo dos nutrimentos e ao aumento das necessidades nutricionais
(Quadro 5).
Quadro 5ǀ Eventuais condicionantes de alterações nutricionais62.
↓ Ingestão ↑↑↑↑ Perdas Alteração do
metabolismo dos nutrimentos
↑↑↑↑ Necessidades nutricionais
anorexia hipogeusia
disfagia atrofia gástrica polimedicação
demência depressão
patologias neurológicas artroses pobreza
isolamento social …
vómitos, diarreia
malabsorção fistulas
úlceras de pressão síndrome nefrótica
glicosúria diálise…
interacção com fármacos diabetes
hiperuricemia hipertiroidismo hepatopatias …
traumatismos queimaduras
intervenções cirúrgicas febre
úlceras de pressão patologias múltiplas
medicação …
A avaliação do estado nutricional pode ser feita a quatro grandes níveis:
1. Avaliação clínica e funcional;
2. Avaliação da ingestão alimentar;
3. Avaliação antropométrica e da composição corporal;
4. Avaliação bioquímica e imunológica.
1. Avaliação Clínica e Funcional
História Clínica
Pela recolha da história clínica deverão obter-se antecedentes pessoais e familiares; rotinas
de atividades diárias; prática de atividade física, capacidade de mastigação, insalivação e

35
deglutição; medicação; alterações de peso; problemas gastrointestinais; dependências e
patologias crónicas58; 60; 61; 63.
Exame Físico
Frequentemente os sinais clínicos de desnutrição são subvalorizados por serem confundidos
com alterações físicas do envelhecimento. Assim, um exame físico meticuloso ao nível da
face, cabelo, mucosas, pele, membros inferiores e superiores, tórax e abdómen permitirá
diagnosticar desnutrição e identificar os nutrimentos que lhe estarão associados (Quadro 6).
Deve pesquisar-se a perda de gordura subcutânea (a nível bicipital, tricipital, nas regiões
suborbitais, tórax...), a perda de massa muscular (nas têmporas, ombros, clavícula, escápula,
costelas, músculo do dorso da mão, joelho, barriga da perna...) e eventual presença de
edema e ascite60; 61; 63 (Quadro 6).
Quadro 6ǀ Sinais clínicos de desnutrição e nutrimentos associados61
Sinais Clínicos de Desnutrição Nutrimentos associados
Face Despigmentação difusa
Dermatite seborreica nasolabial Niacina, vitaminas B2 e B6
Cabelo Seco, frágil, opaco, sem brilho e despigmentado Proteínas, vitaminas B6 e B12, biotina,
ferro, zinco
Olhos Conjuntiva pálida e seca.
Cegueira nocturna. Xeroftalmia Vitaminas A e B6, niacina
Unhas Em forma de colher e frágeis Ferro, vitamina B12
Pele Xerose cutânea, dermatite, palidez Niacina, vitaminas A e B6, biotina,
proteínas e zinco
Lábios Estomatite angular, queilose Vitaminas B2 e B12
Língua Glossite, fissuras, atrofia das papilas, aspecto liso e
vermelho vivo Vitaminas B6, B2 e B12, ácido fólico
Gengivas Hemorragias Vitamina C
Estado neurológico
Alterações da sensibilidade vibratória e postural
Demência, depressão Vitamina B12, ácido fólico, cálcio
Aspeto geral Letargia, apatia, irritabilidade, desorientação, transtornos
do padrão do sono Ferro, vitaminas B1 e B12
36
Para avaliar a capacidade funcional dos idosos foram desenvolvidos e validados índices de
actividade de vida diária como o Activities of Daily Living (ADL) e o Instrumental Activities of
Daily Living (IADL) e, a capacidade cognitiva pode ser apreciada através do Mini Mental State
Examination (MMSE) e da Geriatric Depression Scale (GDS)60; 61; 63.
Força muscular
A redução da força muscular que ocorre com a idade poderá comprometer a execução das
atividades diárias normais e/ou reduzir a intensidade dessas atividades. A força muscular da
mão, medida através de dinamometria, representa um índice concreto da funcionalidade dos
membros superiores, pode ser utilizada na monitorização da função motora e é indicadora
do estado de saúde e nutricional.
A utilidade da dinamometria como componente da avaliação nutricional da população idosa
comprovada por Guerra e Amaral64, mostra um elevado valor preditivo de morbilidade,
aumento de risco de complicações e mortalidade.
2. Avaliação da Ingestão Alimentar
Para a seleção do método a utilizar para a avaliação da ingestão alimentar em idosos deve
ter-se em consideração as respetivas capacidades intelectuais, literacia e a motivação para
colaborar de forma a obtermos informação válida.
Independentemente do método a selecionar é fundamental que seja aplicado por
profissionais treinados para o efeito, de forma a obter-se a precisão desejada65; 66.
No caso dos idosos a informação colhida através dos diversos métodos pode apresentar
limitações devidas ao comprometimento da memória recente o que dificulta uma correta
identificação do alimento consumido e a respetiva quantidade. A identificação da quantidade
consumida é difícil no caso dos idosos que não preparam as suas refeições nem se servem.
Para a população idosa em Portugal esta condicionante poderá ser ainda mais evidente nos
homens do que nas mulheres65; 66.

37
As limitações das capacidades visuais e auditivas poderão também dificultar, por exemplo, a
aplicação de métodos que necessitem de recorrer a entrevista. Na presença de alterações
cognitivas a informação deverá ser colhida através de um prestador de cuidados conhecedor
do idoso65.
Resumidamente apresentam-se os diversos métodos de avaliação da ingestão alimentar:
Registo/diário alimentar66: método em que cada indivíduo é ensinado a descrever
criteriosamente, tudo o que come e bebe durante um período de tempo definido. Este
método está descrito como apropriado para pessoas motivadas e com elevada literacia.
Inquérito às 24 horas anteriores66: o inquirido é convidado, através de uma série sistemática
de questões (abertas/estruturadas) a recordar e a descrever todos os alimentos e bebidas
que consumiu nas 24 horas anteriores à entrevista. O facto de apelar à memória recente que
poderá estar comprometida nesta faixa etária, poderá condicionar a validade da informação
obtida.
Frequência de consumo alimentar66: este método consiste na aplicação de um inquérito que
consta de uma lista de alimentos e bebidas previamente elaborada de acordo com os hábitos
alimentares da população em causa. Os inquiridos têm que ter a capacidade de estimar a
frequência de consumo habitual de cada alimento da lista num determinado período de
tempo. Apesar de estar descrito que os idosos apresentam uma boa memória referente a
factos passados a memória pode também ser uma limitação à escolha deste método.
História alimentar66: O inquirido é convidado, através de uma entrevista estruturada, a
descrever o seu padrão habitual de consumo alimentar, incluindo o seu dia-a-dia e também
as variações à rotina (fins-de-semana, férias, estações do ano, turnos de trabalho…). De uma
forma geral, o tempo máximo descrito para a obtenção de informação válida é de um ano.
Mais uma vez, o recurso à memória é o condicionante para este grupo.

38
Independentemente do método selecionado este deverá ser adaptado ao grupo de idosos a
inquirir avaliando previamente as suas capacidades de memória e o facto do tempo da sua
atenção estar limitado, a presença de doenças crónicas e mentais, condições
socioeconómicas além de alterações fisiológicas. No entanto, os idosos têm, em geral,
hábitos alimentares muito rígidos e monótonos, o que facilita a colheita deste tipo de
informação65.
3. Avaliação Antropométrica e da Composição Corporal
A avaliação antropométrica é considerada não invasiva, segura, de fácil execução e baixo
custo operacional, e permite objetivamente identificar populações em risco nutricional. Na
população mais velha as alterações fisiológicas do envelhecimento e as condicionantes
patológicas, de estilos de vida e fatores socioeconómicos, poderão comprometer a
informação obtida60; 63.
As limitações ao uso da antropometria em idosos podem ser devidas a:
- Falta de cooperação do indivíduo;
- Inexperiência do examinador (das técnicas e da população em causa);
- Equipamento mal calibrado;
- Padrões de referência desajustados.
Assim, é essencial o recurso a equipamentos calibrados e precisos e a aplicação de técnicas já
validadas.
Das limitações de ordem técnica que poderão condicionar este tipo de avaliação destacam-se
dificuldades de deslocação, manter o equilíbrio postural durante o tempo necessário para a
avaliação ou dificuldades de posicionamento. De entre as dificuldades fisiológicas, destacam-
se fatores inerentes ao próprio processo de envelhecimento como a redução da massa
muscular e óssea, diminuição da estatura, alterações na quantidade e distribuição do tecido
adiposo subcutâneo, alterações da compressão e elasticidade dos tecidos assim como
39
estreitamento das cartilagens intervertebrais. Todos estes fatores poderão afetar a precisão
da medição e a interpretação das medidas antropométricas. Sugere-se, assim, precaução no
uso e interpretação das estimativas da composição corporal em idosos para evitar erro de
classificação59; 60; 63; 67.
Estatura
Esta medida é discutível na prática geriátrica atendendo às limitações na sua interpretação
devido a condicionantes fisiológicas do envelhecimento como: o achatamento das vértebras,
a redução dos discos intervertebrais, deformidades como a acentuação da cifose dorsal,
escoliose, entre outras deformidades da coluna e arqueamento dos membros inferiores.
Em alternativa à medição da altura, podem ser medidos outros parâmetros como altura do
joelho (distância joelho-calcanhar), extensão e semi extensão do braço, altura deitado e
altura sentado. A altura joelho-calcanhar apresenta-se como a mais válida na prática
geriátrica e, recorrendo às fórmulas de Chumlea68 pode-se inferir a altura real vertebral58; 60;
63; 67.
Peso
É a medida base e um indicador do estado de saúde que permite a monitorização com
facilidade. Perdas de 5% de peso em menos de 1 mês ou 10% ou mais em 6 meses, poderão
ser consideradas um sinal de malnutrição nos idosos2; 58. No entanto esta medida não
permite distinguir os diversos componentes do peso.
Para pesar idosos poderá ser necessário adquirir uma balança estável, grande ou
eventualmente uma balança cadeira ou que se aplique a uma cama, para idosos
dependentes ou mesmo acamados. Na impossibilidade de realizar esta medição Chumlea69
estabeleceram fórmulas que estimam o peso através de medições alternativas como o
perímetro da barriga da perna, altura do joelho e prega cutânea sub escapular.

40
De uma forma geral, a partir dos 65 anos, poderá ocorrer redução da água corporal, do peso
visceral, do tecido muscular e uma estrutura óssea mais leve, e, consequentemente redução
do peso corporal65.
Índice de massa corporal (IMC)
Calculado através da relação entre o peso (em kg) e o quadrado da altura (em m), é um
indicador muito utilizado e recomendado na avaliação do estado nutricional em todas as
faixas etárias. No entanto como não reflete a distribuição da gordura, deve ser associado a
outras medidas como por exemplo a prega cutânea tricipital60.
Há dúvidas quanto aos critérios ou pontos de classificação do IMC em idosos. De acordo com
Hajjar e colaboradores70, o IMC desejável é 24-29 kg e um IMC abaixo de 24 kg/m2 é
considerado pelo autor como um indicador de malnutrição70. No quadro abaixo pode
observar-se os diferentes pontos de corte sugeridos por diferentes autores para classificação
do IMC em idosos (Quadro 7).
Quadro 7ǀ Diferentes pontes de corte de IMC considerados para avaliação do estado
nutricional de idosos.
Classificação IMC (kg/m2)
Referências Baixo peso Peso normal Excesso de peso
CDC,199171
- - >27.3 (mulheres)
>27.8 (homens)
WHO, 200072
(= à população adulta)
<18.5 18.5 a 24.9
25 a 29.9 (sobrecarga ponderal)
≥ 30 (obesidade)
Lipchitz, 199473
<22 22 a 27 >27
Hajjar e colaboradores,
200470
<24 24 a 29 >29

41
Perímetros
Os perímetros muscular do braço e da barriga da perna, avaliam a reserva de tecido
muscular. No entanto, a interpretação do primeiro parâmetro pode estar limitada por não se
ter em consideração a irregularidade dos tecidos do braço. O perímetro da barriga da perna
mostra ser um indicador sensível a alterações musculares que ocorrem com a idade e com a
redução da atividade. A OMS (1995) refere como perda de massa muscular valores deste
parâmetro inferiores a 31 cm60.
O perímetro da cintura tem sido descrito como o melhor preditor antropométrico de gordura
visceral. No entanto não existem pontos de corte específicos para idosos o que é uma
limitação por não serem consideradas as alterações da composição corporal inerentes ao
processo de envelhecimento60.
Pregas cutâneas
A redistribuição fisiológica da gordura subcutânea, a redução da água corporal e do tecido
muscular inerentes ao envelhecimento poderão condicionar perda da elasticidade e
aumento da compressão dos tecidos. Em termos práticos, as medições tornam-se mais
difíceis de executar pois é mais problemático separar o tecido muscular do adiposo. Em
geriatria as pregas cutâneas tricipital e subescapular correlacionam-se significativamente
com a gordura subcutânea corporal, além de serem as menos afetadas pelo estado de
hidratação58; 63.
O Grupo Francófono de Geriatria e Nutrição, sugere cinco medições essenciais na avaliação
geriátrica: altura do joelho, perímetro da barriga da perna, perímetro muscular do braço,
prega cutânea tricipital e prega cutânea subescapular60. Consideramos ainda o peso como
parâmetro de monitorização do estado geral de saúde de idosos.
Impedância bioelétrica
A análise da composição corporal pela impedância bioelétrica tem como base a resistência
total do corpo à passagem de uma corrente elétrica, assumido que os diferentes

42
componentes corporais oferecem uma resistência diferenciada à corrente elétrica. É um
método preciso, simples de aplicar, pouco invasivo e aplicável à comunidade idosa. As
medições obtidas devem ser ajustadas pelas equações de Baugartner74, desenvolvidas para
esta faixa etária.
Dados de referência
Atendendo à inexistência de padrões de referência específicos para a população idosa no
que se refere a parâmetros antropométricos, a OMS recomenda o recurso à informação
colhida pelo National Health and Nutrition Examination Survey III (NHANES III) que consiste
numa amostra de 5700 idosos Norte Americanos provenientes da comunidade, sem limite de
idade (superior a 80 anos) e com uso de metodologia padronizada71.
No que se refere o estado nutricional aferido pelo IMC e para a população idosa Europeia, o
European Nutrition and Health Report 200934 mostra um perfil heterogéneo. Valores de IMC
mais elevados foram encontrados nos idosos Austríacos (29.6±3.9) e nas idosas Gregas
(30.6±4.9) e mais baixos nos idosos Polacos (26.3±3.9) e nas idosas Francesas (26.4±0.4).
Assumindo que os valores desejáveis para a população idosa são superiores aos da
população adulta e que parece consensual75 estarem estes valores compreendidos entre 24 e
29Kg/m2, só nas idosas provenientes da Grécia é que surge este valor. No que se refere à
prevalência da obesidade esta é superior nos idosos Austríacos (40%) e nas idosas Gregas
(52%) (Quadro 8).

43
Quadro 8ǀ IMC medido em idosos Europeus e prevalência de obesidade34.
Homens Mulheres
IMC
(kg/m2)
Mediana
IMC
(kg/m2)
Média (dp)
Prevalência de obesidade (IMC>30)
%
IMC
(kg/m2)
Mediana
IMC
(kg/m2)
Média (dp)
Prevalência de obesidade
(IMC>30)
%
Áustria 29.1 29.6 (3.9) 40 28.0 28.7 (4.9) 36
Chipre 28.6 - 18 26.8 - 26
Finlândia - 28.0 (2.8) 25 - 28.5 (5.0) 34
França 28.0 28.0 (0.4) 27 25.4 26.4 (0.4) 22
Alemanha 28.1 28.4 (3.7) 29 27.8 28.3 (5.0) 34
Grécia 28.1 28.8 (4.0) 30 30.3 30.6 (4.9) 52
Irlanda 27.5 27.8 (4.0) 24 28.0 28.1 (5.0) 33
Polónia 26.3 26.3 (2.9) 23 28.0 28.1 (5.0) 35
Portugal 27.4 27.2 (3.8) 28 27.7 27.8 (4.5) 29
Espanha 27.6 27.6 (3.6) 30 28.6 28.4 (4.3) 33
Perfil antropométricos de idosos Portugueses
Em 2005, uma avaliação feita em idosos Portugueses permitiu constatar que de acordo com
o esperado os homens eram mais altos (166.3 ± 6,82 cm vs 155.8 cm ± 8,23) e pesados (75.2
± 11.7 kg vs 66.9 ± 11.73 kg) do que as mulheres. É de realçar que pela comparação dos
valores medidos com informação auto reportada pelos próprios idosos verificou-se uma forte
correlação entre ambas. Assim na impossibilidade de proceder à medição, a informação auto
reportada pode ser utilizada para estimar o estado nutricional através do peso e estatura57.
Cerca de metade (51.5%) dos idosos Portugueses do sexo masculino eram pré-obesos, 19%
obesos, 27.8% normais e, 1.5% tinha baixo peso. Nas mulheres idosas, 41.7% eram pré-
obesas, 29.1% obesas, enquanto 28.6% estavam dentro da faixa da normalidade e 0.5% baixo
peso57.

44
O risco de perda de massa muscular aferido através da medição da circunferência da barriga
da perna (inferior a 31 cm) foi encontrado em 9% dos homens e 15% das mulheres. A
mediana do perímetro da cintura foi de 99.00 cm (homens) e 96.00 cm (mulheres). Quanto
ao risco cardiovascular (perímetro da cintura superior a 102 cm em homens e 88 cm em
mulheres) foi encontrada em 42.3% dos idosos do sexo masculino e em 74.3% das mulheres
idosas57.
Utilizando os pontos de corte da OMS72, Poínhos e colaboradoresl30, encontraram também
em idosos Portugueses, uma prevalência de obesidade de 18.9% em idosos do sexo
masculino, e 15.2% no sexo feminino. Foi encontrada pré-obesidade em 37.0% dos
indivíduos do sexo masculino e em 64.9% das idosas. Este autor não encontrou baixo peso
nesta amostra de idosos.
4. Avaliação Bioquímica e Imunológica
Os indicadores bioquímicos são parâmetros utilizados para aferir o estado nutricional na
prática clínica assim como na investigação. No entanto, a doença, a inflamação, a medicação
ou situações geradoras de stresse podem alterar estes valores58; 59; 60.
De entre os indicadores bioquímicos, a albumina sérica é considerada um bom marcador das
proteínas viscerais e da saúde global, sendo que níveis inferiores a 3.5 g/dL são sugestivos de
malnutrição proteico-energética. Níveis abaixo de 3.2 g/dL são preditores de mortalidade e
morbilidade nos idosos. No entanto, a sua interpretação pode não refletir com exatidão o
estado nutricional pois poderá estar condicionada pela presença de inflamação causada por
exemplo por doença crónica. A pré-albumina, tal como a albumina é produzida pelo fígado e
é um marcador utilizado por ter uma semi vida curta e uma boa sensibilidade no diagnóstico
de situações de malnutrição. A redução do ferro sérico, associada à elevação da transferrina
e redução da ferritina (marcador de depósito de ferro), é um indicador de carência de ferro,
muitas vezes descrito como importante marcador em idosos fragilizados por poder estar

45
relacionado com perdas de sangue. A baixa de hemoglobina e do hematócrito, indicador de
anemias, também devem ser considerados58; 59.
A contagem total de linfócitos, também é um parâmetro sugerido. Apesar da resposta imune
poder ser alterada por fatores não-nutricionais, a relação entre desnutrição e o
comprometimento imunológico estão bem estabelecidos. Uma contagem de linfócitos
abaixo de 800/m3 é indicadora de malnutrição severa e está altamente correlacionada com
morbilidade e mortalidade58; 59.
A proteína transportadora do retinol está relacionada com a pré-albumina e pode ser
utilizada como indicador de alteração do estado nutricional.
A proteína C-reativa, só deverá ser utilizada como um indicador indireto de desnutrição em
conjunto com a pré-albumina ou com a albumina, pode indicar em que medida as alterações
da pré-albumina se poderão dever à atividade das citoquinas ou a alterações do estado
nutricional.
Níveis baixos de colesterol revelam redução da sua síntese hepática e na secreção de
lipoproteínas e está altamente correlacionado com o aumento da mortalidade. A creatinina
urinária é o indicador mais utilizado para aferir perda de massa muscular59.
Mais do que em qualquer outro grupo etário é fundamental ter presente que a avaliação do
estado nutricional do idoso não pode ser efetuada através de um único método pois nenhum
tem sensibilidade e especificidade para, por si só, diagnosticar o tipo e gravidade da
desnutrição. Assim o recurso a uma combinação de indicadores é recomendado por diversos
autores62 (Quadro 9).

46
Quadro 9ǀ Indicadores de malnutrição62.
Com o objetivo de facilitar a monitorização do estado nutricional foram desenvolvidos
métodos de avaliação que conjugam diversos tipos de indicadores, dos quais se destacam:
1. Mini Nutritional Assessment (MNA)76: é o instrumento de rastreio mais fundamentado sob
o ponto de vista de investigação, motivo pelo qual é o mais utilizado pelos profissionais de
saúde que trabalham em geriatria. Este instrumento inclui questões gerais, antropométricas,
alimentares e outras, auto reportadas. O seu uso regular permite uma intervenção
nutricional precoce, a correção de fatores de risco de desnutrição e consequente melhoria
do estado nutricional. É referido como a ferramenta de maior especificidade e sensibilidade.
Esta ferramenta dispõe ainda da sua versão curta, também validada e utilizada por vários
autores.
2. Subjective Global Assessment (SGA)59: inclui informação sobre a história clínica do idoso,
exame físico e avaliação médica.
3. Nutritional Screening Initiative nível I (DETERMINE)77: desenvolvido para
rastrear/sensibilizar a necessidade de recurso a programas comunitários que prestam
cuidados a idosos.
4. Malnutrition Risk Scale (SCALES)59: foi desenvolvido para uso em ambulatório e inclui
parâmetros tais como níveis de colesterol, albumina, perda de peso, problemas de ingestão
alimentar, dificuldades na aquisição de géneros alimentícios e tristeza.
5. O Nutritional Risk Index (NRI)61 composto por dezasseis questões sobre hábitos
alimentares, dentição, alterações gastrointestinais e modificações da ingestão alimentar.
Clínicos Bioquímicos Antropométricos
Perda de peso Palidez
Desidratação Secura cutânea
Sarcopenia Edema
Deficiência cognitiva
Leucócitos < 1 200 mmc Glóbulos vermelhos < 4 000 000 mmc Volume globular médio < 80 ou > 96
Albumina < 3.5 g/dl Pré-albumina < 15 mg/dl Transferrina < 180 mg/dl
Plaquetas < 2.6 mg /dl
Índice de massa corporal < 20 kg/m2 Perda de peso > 10% em 6 meses
Prega cutânea tricipital < 3 cm Perímetro do braço < 21 cm
Circunferência da barriga da perna < 31cm
47
6. Nutritional Risk Screening (NRS)52: é o instrumento de rastreio sugerido pela ESPEN para
rastreio em meio hospitalar. Avalia o IMC, perda de peso, alteração da ingestão alimentar e
presença de doença crónica
7. Malnutrition Universal Screening Tool (MUST)51 inclui o IMC, perda de peso e questões do
foro alimentar, é recomendado para ser utilizado na comunidade.
1.5 ǀ Promoção do estado nutricional do idoso
Para responder ao desafio demográfico da Europa, é imperativo promover ativamente estilos
de vida saudáveis, a fim de reduzir a prevalência das maiores causas de morte e incapacidade
que assentam os seus fatores de risco em variáveis relacionadas com estilos de vida.
Promover estilos de vida saudáveis significa: a) fornecer os meios necessários para permitir a
todos, incluindo aos idosos uma participação ativa e independente na sociedade; b)
promover uma abordagem positiva e integrada para a saúde que promova variedade de
atividades sociais, económicas, de infraestruturas, planeamento, transporte e outras políticas
relevantes e; c) criar um ambiente propício para promover um estilo de vida saudável78.
Promover a saúde através da promoção de hábitos alimentares obriga assim a uma
intervenção delineada de forma a atingir objetivos assentes nos principais eixos
estruturantes do seu comportamento, gostos, expetativas, preferências, de matriz cultural
que definem o individuo como membro de uma determinada comunidade tendo em
consideração as características sociais79.
Programas/formas de auxílio alimentar/nutricional, deverão ser assim concebidos tendo
como base uma identificação das reais necessidades nutricionais dos diferentes grupos de
idosos e adequados sob ponto de vista gastronómico e cultural56; 61.
Mais do que atenuar as incapacidades causadas pelo envelhecimento, os serviços de saúde
deverão procurar monitorizar o estado de saúde e nutricional dos idosos de modo a evitar

48
que este se degrade, propiciando assim a sua manutenção e autonomia na comunidade e
fomentando a sua qualidade de vida56.
Os profissionais de saúde deverão ser proativos adotando uma postura holística face ao
envelhecimento, demonstrando abertura e compreensão não só para questões
alimentares/nutricionais, mas também tendo em consideração o suporte emocional,
tentando preservar ao máximo a integração deste grupo tão válido na sociedade e
consequentemente a sua independência7; 56.
1.6 ǀ O Projeto Europeu Food in Later Life, choosing foods, eating meals: sustaining
independence and quality of life ,
A maior parte do presente trabalho insere-se no Projeto Europeu Food in later life, choosing
foods, eating meals: sustaining independence and quality of life, “Alimentação em Idade
Senior, escolha de alimentos e refeições para manter a independência e qualidade de vida”15;
80, nomeadamente do seu Work Package 7 (WP7), designado - determinar a qualidade de
vida relacionada com a alimentação.
Decorreu em oito países da União Europeia (Dinamarca, Alemanha, Itália, Polónia, Portugal,
Espanha, Suécia e Reino Unido), e foi coordenado pelo Reino Unido pela Professora Margaret
Lumbers da Universidade de Surrey.
Os objetivos gerais do projeto Food in Later Life foram:
(1) estudar a relação entre a ingestão alimentar, estado nutricional, saúde e qualidade de
vida e;
(2) compreender os fatores que determinam a escolha alimentar em pessoas idosas e
estabelecer comparações entre diferentes países, faixas etárias, sexos e circunstâncias de
vida.

49
Genericamente este projeto visa suportar de forma científica, ferramentas de intervenção
aos vários prestadores de cuidados formas e informais de idosos. Especificamente o WP7
teve como objetivo geral o desenvolvimento e validação de um questionário que permitisse
determinar a qualidade de vida relacionada com a alimentação em idosos.

50

51
2 ǀ Objetivos

52

53
2 ǀ Objetivos
2.1 | Objetivo Geral
É finalidade desta investigação contribuir para um melhor conhecimento das expetativas em
relação à alimentação, recursos alimentares disponíveis e estado nutricional da população
idosa, identificando os seus principais determinantes.
2.2 | Objetivos Específicos
São objetivos específicos desta investigação, atendendo às desigualdades sociais,
económicas, culturais e condições de vida dos idosos:
- Conhecer as principais expetativas em relação à alimentação e seus determinantes;
- Avaliar hábitos e padrões de consumo alimentares explorando a sua relação com os
seus estilos de vida e saúde;
- Reconhecer os principais fornecedores de refeições fora do domicílio e identificar os
seus determinantes;
- Identificar a prevalência de inadequação do estado nutricional por excesso e sua
relação com determinantes sociodemográficas.

54

55
3 ǀ População e Métodos

56
57
3 ǀ População e Métodos
Tal como foi referido na Introdução, parte deste trabalho insere-se no WP7 do Projeto
Europeu Food in Later Life.
3.1 | Desenho do estudo
Trata-se de um estudo epidemiológico descritivo observacional, de desenho transversal.
3.2 | População
A população alvo deste estudo foram idosos Europeus residentes dos seguintes países
Dinamarca, Alemanha, Itália, Polónia, Portugal, Espanha, Suécia e Reino Unido com idade
igual ou superior a 65 anos.
3.3| Amostra
Foram inquiridos cerca de 400 indivíduos com idade igual ou superior a 65 anos de cada pais
a viverem nos seus domicílios, constituindo uma amostra comunitária representativa da
população Europeia atendendo à diversidade sociodemográfica do pais (nível de educação,
rendimento e urbanização) e colhida em pelo menos três localizações geográficas distintas.
Posteriormente e de acordo com a metodologia do projeto, foram definidas quotas,
dividindo a amostra em oito grupos de aproximadamente 50 em cada país, com base na
idade (65-74 anos e ≥ 75 anos), sexo e circunstâncias de vida (vive sozinho ou se vive
acompanhado).
As entrevistas bem como a digitação dos dados no programa informático foram feitos em
conjunto com uma empresa de estudos de mercado sedeada em cada país. Em Portugal esta
função esteve a cargo da empresa TNS - Euroteste - Marketing & Opinião, S.A. A recolha
58
desta informação decorreu no Outono de 2005, tendo sido inquiridos um total de 3291
idosos.
3.4| Métodos
Mediante os objetivos propostos pelo WP7 do Projeto Food in Later Life procedeu-se à
elaboração de um questionário estruturado de administração indireta, com perguntas de
resposta simples ou múltipla, em língua Inglesa. Posteriormente, cada país, adaptou-o à sua
língua de origem.
De seguida procedeu-se à realização do estudo piloto em 20 idosos de cada país, com o
intuito de testar as perguntas, o seu fraseamento e compreensão e tornou-se a retraduzir de
forma garantir uma correta uniformização com os inquéritos oriundos dos vários países.
No questionário final incluíram-se para além de questões relativas às atitudes,
conhecimentos e comportamentos dos inquiridos face à sua saúde (Quadro 10), alimentação,
recursos para a mesma, informações sobre as suas características sociodemográficas entre
outras, que abaixo se apresentam.
3.4.1| Características pessoais e sociodemográficas:
- idade, sexo, habilitações literárias, estado civil, rendimentos, rendimento
gasto em alimentação (Quadro 10).
3.4.2| Situação de saúde (subjetiva):
- perceção subjetiva geral sobre a sua saúde81;
- perceção subjetiva do estado de saúde físico e mental/emocional através do
SF8 82.
3.4.3| Ambiente social e ingestão alimentar:
- objetivos em relação à alimentação;
- recurso a redes formais e/ou informais de suporte alimentar.

59
3.4.4| Qualidade de vida relacionada com a alimentação:
- aplicação de escala realizada e validada no âmbito do projeto Food in Later
Life15.
3.4.5| Parâmetros antropométricos:
- avaliação do peso e altura auto-reportados.

60
Quadro 10ǀ Parâmetros avaliados.
Grupos etários (anos) 65 -74 anos; ≥75 anos.
Sexo Feminino, Masculino
Nível educacional
Nenhum grau de ensino, < que o ensino básico, ensino básico completo, completou
o ensino secundário ou ensino técnico, completou o ensino superior, completou
formação pós-graduada
Estado civil Solteiro, casado/união de facto, viúvo/divorciado.
Rendimento mensal líquido (€) <366€; 366-433, 434-646, 647-864, 865-1078, 1079-1291, 1292-1622, 1623-1942,
1943-2161, 2162-2481, 2794-3578, >3578, não sabe
Gastos em alimentação
(pessoa/semana, com exceção
bebidas alcoólicas) (€)
< 14, 15-21, 22-28, 29-35, >35, não sabe
Circunstâncias de vida Vive acompanhado / vive só
Objetivos em relação à
alimentação
Sendo a escala de resposta:
Nada importante
Ligeiramente importante
Moderadamente importante
Muito importante
Extremamente importante
Não sei
Em que medida é importante para si…?
…gastar o menos possível na alimentação;
…ter uma alimentação saudável;
…escolher alimentos e pratos que são rápidos e fáceis de preparar;
…controlar o seu peso a partir dos alimentos que escolhe;
…alimentos e pratos que gosta de comer;
…variar a ementa;
…fazer refeições na companhia de outras pessoas;
…conseguir organizar-se no que respeita à comprar de alimentos e preparação de
refeições de modo a não precisar da ajuda dos outros;
…manter as tradições culturais do seu pais ou região em relação aos alimentos e
refeições;
…fazer as suas refeições num ambiente agradável;
…ser capaz de cozinhar para outras pessoas (família, amigos)
Frequência de utilização de redes
de suporte alimentar formais e
informais
Sendo a escala de resposta:
Nunca/quase nunca
< 1 vez por mês
2- 3 vezes por mês
1 vez por semana
2-3 vezes por semana
4-5 vezes por semana
Todos os dias/quase todos os dias
Com que frequência faz refeições em… ou provenientes de…
…restaurantes de fast-food;
…restaurantes de comida pronta a levar;
…bares ou tascas;
…casas de chá ou cafés;
…restaurantes;
…clubes, centros de caridade, associações recreativas;
…familiares ou amigos;
…centros de dia;
…comida pronta a levar congelada;
…apoio domiciliário.
61
Posteriormente na amostra Portuguesa acrescentou-se informação adicional,
concretamente:
3.4.6| Estilos de vida:
- avaliação dos hábitos tabágicos (fumador, ex-fumador, não fumador);
- atividade física (andar a pé e/ou exercício estruturado tipo e frequência
semanal).
3.4.7| Ingestão alimentar:
- avaliação do consumo alimentar através da utilização de um questionário
semi quantitativo de frequência de consumo alimentar referente ao período
de 12 meses antecedentes à data da avaliação83; 84. A conversão dos alimentos
em nutrientes foi executada recorrendo ao software Food Processor Plus©,
que utiliza uma base com informação nutricional proveniente dos Estados
Unidos da América, adaptada à composição de alimentos tipicamente
portugueses (ESHA Research, Salem, OR);
- para avaliar a adesão ao padrão alimentar mediterrânico (MDP), utilizou-se o
índice desenvolvido por González e colaboradores43. Este índice é composto
por nove grupos de alimentos: produtos hortícolas, frutas, leguminosas,
cereais, carne vermelha, peixe, azeite, leite e produtos lácteos e vinhos.
3.4.8| Parâmetros antropométricos medidos:
- peso, altura, perímetro da cintura, circunferência do braço85 e circunferência
da barriga da perna86.

62
3.5| Caraterização da amostra
Tal como referido anteriormente foram inquiridos 3291 indivíduos com idade igual ou
superior a 65 anos de cada país a viverem nos seus domicílios (Quadro 11).
Quadro 11ǀ Caraterização sociodemográfica da amostra Europeia.
A informação adicional colhida na amostra Portuguesa permite-nos traçar o perfil nutricional
descrito no quadro abaixo (Quadro 12). A ingestão energética média (desvio-padrão) foi de
1930.05±751.06 kcal/dia para os homens idosos e 1809.57±788.19 kcal/dia para as mulheres
idosas.
Idosos Europeus
n %
Género Homens
Mulheres
3291 1629 1662
49.5 50.5
Idade (anos) 65-74 ≥ 75
3290 1661 1629
50.5 49.5
Educação < primária Primária
Secundária Terciária
3286 701 823
1286 476
21.3 25.0 39.1 14.5
Estado cívil Casado/União de facto
Viuvo/separado Solteiro
3291 1618 1470 203
49.2 44.7 6.2
Condições de vida Vivem acompanhados
Vivem sozinhos
3291 1638 1653
49.8 50.2
Rendimento mensal (€) ≤ 433
434 - 1078 1079 - 1942
≥ 1943
2929 557 961 816 429
20.2 34.8 29.5 15.5
Gasto semanal em alimentação per capita (€) ≤ 14
15 – 28 29 – 35
>35
2929 214 683 472
1560
7.3
23.3 16.1 53.3
País Dinamarca Alemanha
Itália Polónia Portugal Espanha Suécia
Reino Unido
3291 417 430 409 422 400 413 400 400
12.7 13.1 12.4 12.8 12.2 12.5 12.2 12.2

63
Face às recomendações da OMS36, em ambos os sexos verificou-se que a ingestão
ligeiramente aumentada do consumo de lípidos totais, de proteínas e de cloreto de sódio.
Aumentada também de ácidos gordos da série n-3 e açúcares simples. Relativamente aos
hidratos de carbono e fibras alimentares a proporção encontrada foi abaixo da
recomendada.
Quadro 12ǀ Ingestão nutricional dos idosos Portugueses (por género) e respetiva comparação
com as recomendações da OMS
Objetivos36
(% do valor energético
total exceto quando referido)
Ingestão nutricional
Homens (mediana da % do valor
energético total exceto quando referido)
Mulheres (mediana da % do valor energético total exceto
quando referido)
Gordura total 15 - 30% 31.21 32.99
Gordura saturada <10% 9.02 9.25
Acidos gordos polinsaturados (PUFAs)
6 - 10% 5.46 5.73
n-6 (PUFAs) 5 - 8% 4.09 4.21
n-3 (PUFAs) 1 - 2% 5.46 5.73
Acidos gordos trans <1% 0.38 0.40
Hidratos de carbono totais 55 - 75% 44.26 48.21
Açucares simples <10% 16.07 17.80
Proteína 10 - 15% 17.91 19.17
Colesterol <300 mg por dia 266.77mg 250.84mg
Cloreto de sódio (sodio) <5 g por dia 15.56g 14.15g
Fibra > 25g 20.97 19.66
Energia Media (desvio padrão)
Mediana 25
th percentil
75th
percentil
1930.05±751.06
1852.08 1424.62 2285.44
1809.57±788.19
1747.07 1227.95 2270.46
Os parâmetros antropométricos aferidos permitem-nos traçar o perfil antropométrico da
população idosa Portuguesa descrito no quadro abaixo (Quadro 13).
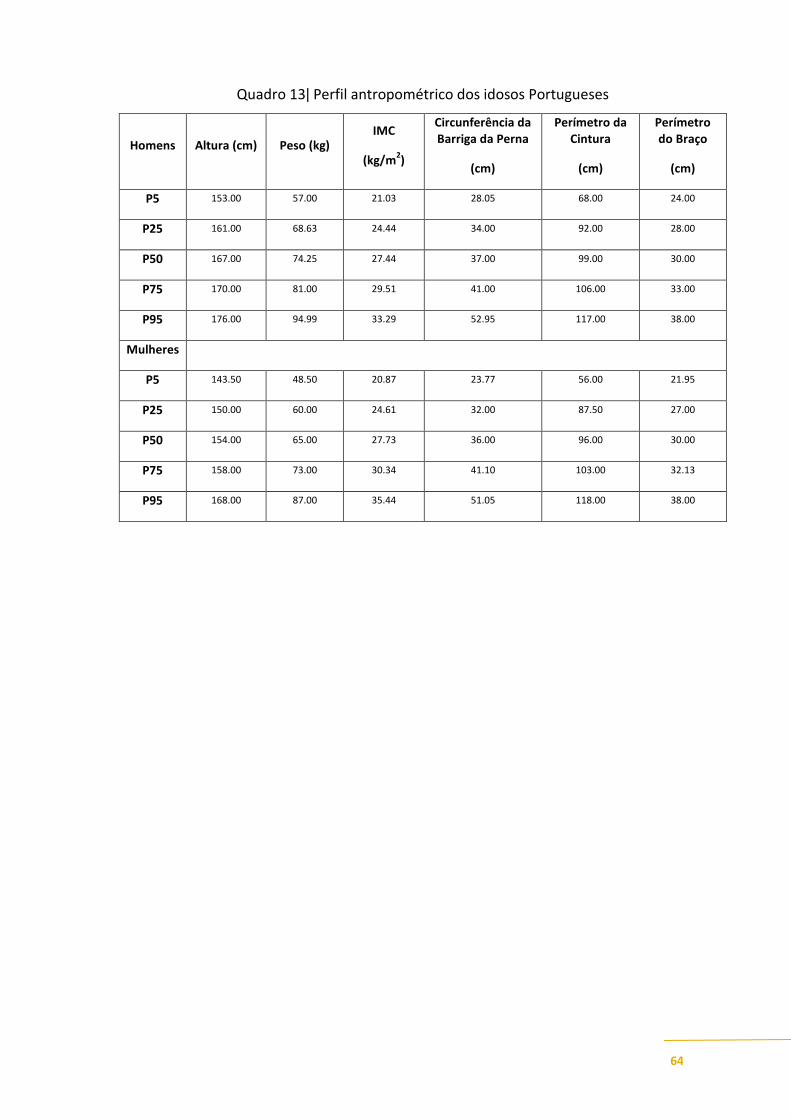
64
Quadro 13ǀ Perfil antropométrico dos idosos Portugueses
Homens Altura (cm) Peso (kg) IMC
(kg/m2)
Circunferência da Barriga da Perna
(cm)
Perímetro da Cintura
(cm)
Perímetro do Braço
(cm)
P5 153.00 57.00 21.03 28.05 68.00 24.00
P25 161.00 68.63 24.44 34.00 92.00 28.00
P50 167.00 74.25 27.44 37.00 99.00 30.00
P75 170.00 81.00 29.51 41.00 106.00 33.00
P95 176.00 94.99 33.29 52.95 117.00 38.00
Mulheres
P5 143.50 48.50 20.87 23.77 56.00 21.95
P25 150.00 60.00 24.61 32.00 87.50 27.00
P50 154.00 65.00 27.73 36.00 96.00 30.00
P75 158.00 73.00 30.34 41.10 103.00 32.13
P95 168.00 87.00 35.44 51.05 118.00 38.00
65
4 ǀ Resultados
4.1 ǀ Food related perceived goals among European elderly

66

67
FOOD RELATED PERCEIVED GOALS AMONG EUROPEAN ELDERLY
AFONSO C
1, LOPES C
2,DE MORAIS C
1, POINHOS R
1, OLIVEIRA BMPM
1,3, RAATS M
4, LUMBERS M
4,
GRUNERT K5, DE ALMEIDA MDV
1, FOOD IN LATER LIFE TEAM
id
1 Universidade do Porto, Faculdade de Ciências da Faculty of Nutrition and Food Sciences of - Rua Dr. Roberto Frias 4200 – 465 Porto - Portugal
([email protected]) 2 Universidade do Porto, Medical School, Department of Clinical Epidemiology, Predictive Medicine and Public
Health – Portugal, Universidade do Porto, Institute of Public Health 3 LAID – INESC, Porto, LA, 4University of Surrey, UNIS, School of
Management – UK 5 The Mapp Centre; The Aarhus School of Business – Denmark
[SUBMITED FOR PUBLICATION]
Abstract
Objectives: To identify in a free-living European elderly population, the main food related perceived goals and
the sociodemographic and health determinants associated to them. Design: A structured questionnaire was
performed to identify food related goals, using two five points’ scales. To ascertain if the items associated with
food related goals, could be aggregated in different subdomains, factor analysis was carried out. General Linear
Model was performed to obtain adjusted mean and 95% CI as well as to compare the main effects, and all two-
way interactions of the independent variables on both scales. Linear regression was used to estimate the
association between scores, satisfaction with food-related life, physical and mental health as measured by the SF8
Health Survey. Participants: Within the European Project “Food in Later Life” 3290 European citizens aged 65+
years from 8 EU countries (Denmark, Germany, Italy Poland, Portugal, Spain, Sweden and the UK) were
interviewed with a structured questionnaire in a face-to-face situation. Results: The five most important food-
related goals in the elderly were: ‘to choose foods that they enjoy eating (3.87±0.831), followed by ‘to try to eat
healthier’ (3.77±0.93), Overall, Portuguese and Spanish elderly highlighted the ambiance when eating, as well as
the need to keep food expenditures low. On the other side, for Danish and Swedish seniors, expenditures revealed
to be less important. Factor analysis identifies two subdomains related to health and sensorial aspects of food
(Health/Sensorial) and another, associated with socialization and economics (Social/Economic). In general,
European elderly gave more emphasis to goals related to health and sensorial items (64.0±16.8) than to social and
economic matters (55.5±18.7). Health/Sensorial aspects were more selected by more educated elders and
AAcckknnoowwlleeddggeemmeennttss TThhee ddaattaa uusseedd iinn tthhiiss aarrttiiccllee bbeelloonngg ttoo tthhee EEuurrooppeeaann RReesseeaarrcchh PPrroojjeecctt FFoooodd iinn LLaatteerr LLiiffee.. CChhoooossiinngg ffooooddss,, eeaattiinngg mmeeaallss:: ssuussttaaiinniinngg iinnddeeppeennddeennccee
aanndd qquuaalliittyy ooff lliiffee ((22000044––22000055)) ccoooorrddiinnaatteedd bbyy DDrr.. MMaarrggaarreett LLuummbbeerrss aanndd DDrr.. MMoonniiqquuee RRaaaattss ffrroomm tthhee UUnniivveerrssiittyy ooff SSuurrrreeyy ((UUnniitteedd KKiinnggddoomm)) aanndd ffiinnaanncceedd bbyy tthhee
EEuurrooppeeaann CCoommmmiissssiioonn ((QQLLKK11CCTT220000220022444477))..
5 Food in Later Life Team:
Denmark: Klaus Grunert, Niels Asger Nielsen
Germany: Ulrich Oltersdorf, Birgit Schuhmacher,Cornelie Pfau
Italy: Anna Saba; Aida Turrini, Laura D’Addezio, Fabrizia Maccati
Poland: Katarzyna Kozłowska, Wojciech Roszkowski, Anna Szczecińska, Marzena Danowska-Oziewicz, Lidia Wądolowska, Bozenna Kozikowska, Roman Cichon, Ewa
Szymelfejnik, Anna Waluś, Magdalena Kozikowska, Dariusz Słowiński
Portugal: Cecilia de Morais, Cláudia Afonso, Maria Daniel Vaz de Almeida
Spain: Jesús Contreras, Silvia Bofill, Yolanda Lacasta
Sweden: Per-Olow Sjödén, Christina Fjellström, Margaretha Nydahl, Jenny Ekblad
United Kingdom: Sara Arber, Kate Davidson, Monique Raats, Margaret Lumbers, Wendy Hunter, Anita Eves, Richard Shepherd
68
Social/Economic by those with lower education level and a monthly income between 433 and 1078€.
Conclusion: This study showed a very heterogeneous picture of food related goals according to country of
residence and other sociodemographic aspects. More educated elderly referred mostly Health/Sensorial aspects
and lower educated ones tended to emphasize Social/Economic matters. In general, more satisfied elder were
more likely to emphasise health/sensorial aspects and those with physical and mental constrains emphasized
social/economic aspects.
Keywords: Elderly, food-related goals, sociodemographic, health determinants.
Introduction
The dynamics of demographic changes, namely the greying of the world’s population require
the identification of the main determinants of healthy ageing, a concept understood by the
WHO “a process of optimising opportunities for physical, social and mental health to enable
older people to take an active part in society without discrimination and to enjoy an
independent and good quality of life 1 it constitutes a challenge for societies aiming to
contribute to the elderly’s health and quality of life maintenance2.
In order to promote Healthy Ageing it is crucial to recognize that “the elderly” do not
constitute a homogeneous group, neither biologically, nor psychologically or socially. Their
values, attitudes, motivations and behaviours differ and these change across the life stages 3; 4
.
Scientific evidence increasingly supports that a good nutrition is essential to health and self-
sufficiency, being considered one of the major determinants of successful ageing 5; 6; 7
.
Epidemiological research has shown that healthy behaviours such as healthy eating, physical
activity and not smoking play a more important role than genetic factors in helping individuals
to avoid the decline that occurs with ageing 6.
Dietary habits may change with aging but the causes of these various changes are still under
debate. If physiological changes affect eating behaviour, what is eaten also affects
physiological functions 8.
Any efforts to change eating behaviours, namely by community-based interventions involving
self-management approaches, must take into account the individuals’ self-perceived
motivations and barriers to food selection9; 10
. The European diversity also occurs amongst the
elderly populations in what their concepts, benefits and barriers to healthy eating are
concerned. Previous research showed that the European elderly population (EU-15) identified
quality and freshness, trying to eat healthy and price as the most important factors influencing
69
their food choice. Healthy eating was viewed as eating “less fat”, “more fresh vegetables and
fruit” and “natural foods”. Healthy eating was also perceived to have several benefits, namely
to stay healthy, to prevent disease and to promote quality of life. However, self-control,
resistance to change and price, were recognised as barriers to the adoption of healthy eating.
Moreover, the majority believed their diet to be already healthy and therefore did not perceive
the need to change their eating habits 11
.
Locher et al, identified sensory appeal (i.e., tastes good), convenience, and price as important
motivations for food selection in the elderly whereas ethical concerns, mood and natural
content played a less important role 10
.
Eating is not an involuntary process; on the contrary, as a bio-social and cultural phenomenon,
the promotion of healthy ageing through healthy eating is more likely to be effective if based
on the understanding of the main determinants of food choice as well as the motivations,
expectations and perceived food related goals. Contrary to the study of the determinants of
food choice, food related perceived goals as well as food expectations have never been studied
in a cross cultural situation in which elderly from eight European countries were investigated.
Objectives
To identify in a free-living European elderly population, the main food related perceived goals
and the sociodemographic and health determinants associated to them.
Participants and procedures
3291 elderly above 65 years of age and living independently in their own homes in 8 EU
countries (Denmark, Germany, Italy Poland, Portugal, Spain, Sweden and the United
Kingdom) participated in the Project Food in Later Life 12
.
In each country, the sample (around 400 people) was quota controlled according to three
sampling characteristics: gender, age (65 to 74 years and over 75 years) and living
circumstances (living alone versus living with others). In addition, the sample should reflect
the diversity of each national population based on education level, income and urbanization of
living environment (urban/suburban/rural) and was drawn from at least three geographical
regions in each participant country.

70
The information was collected in a face-to-face situation by trained interviewers from
marketing research companies, using a structured questionnaire designed by the Food in Later
Life team according to the previously defined objectives. The questionnaire was developed in
English, translated to each national language and back-translated before it was piloted in each
country.
Respondents were asked to provide information about:
- Highest level of education achieved (no formal education; first level or basic: less than
primary school/primary school completed; secondary: secondary school completed; tertiary:
college/university completed/postgraduate degree completed);
- Total income in euros, into 13 categories (less than 366€; 366-433€; 434-646€; 647-864€;
865-1078€; 1079-1291€; 1292-1622€; 1623-1942€; 1943-2161€; 2162-2481€; 2482-2793€;
2794-3578€; more than 3578€). Due to a low frequency of some categories, this measure was
subsequently re-coded into four categories: less than 433€ per month, 433 to 1078 €/month,
1079 to 1943 €/month and above 1943€/month;
- Marital status (married/cohabiting, widow/separated or single).
Participants were asked to provide information about the importance attributed to eleven food-
related perceived goals, scoring from 1 (not important) to 5 (extremely important), developed
in a previous qualitative research 13
.
Satisfaction with food related life was measured by the 5 item satisfaction with food related
life (SWFL) scale developed by Grunert et al, 2007 and physical (PCS8) and mental health
(MCS8) were measured by the SF8 Health Survey 14
.
Overall subjective life satisfaction was also assessed using a 1 (completely unsatisfied) to 10
(completely satisfied) point scale.
Statistical analysis
Data were stored and analysed using SPSSWIN 17.0. Mean and standard deviation (S.D.)
were used to describe continuous variables.
To ascertain if the items associated with food related goals, could be aggregated in different
subdomains, factor analysis was performed. The principal component analysis was done to
estimate the number of factors emerging and to assess the appropriateness of the correlation
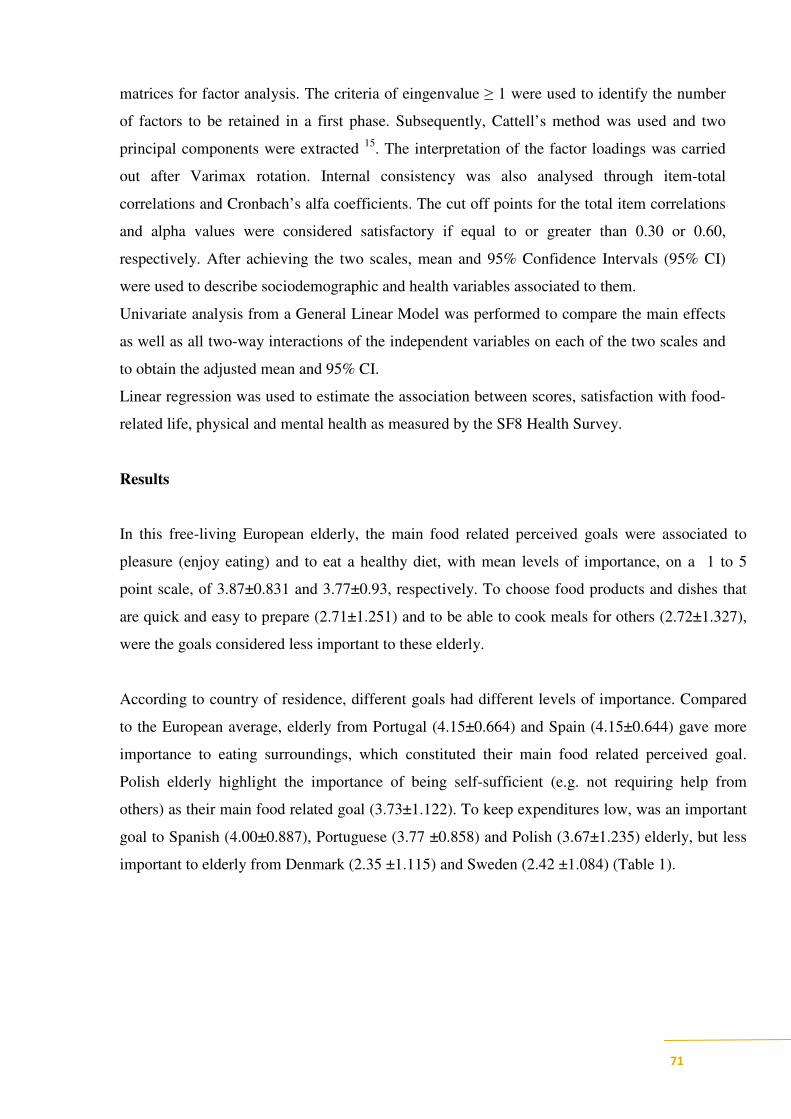
71
matrices for factor analysis. The criteria of eingenvalue ≥ 1 were used to identify the number
of factors to be retained in a first phase. Subsequently, Cattell’s method was used and two
principal components were extracted 15
. The interpretation of the factor loadings was carried
out after Varimax rotation. Internal consistency was also analysed through item-total
correlations and Cronbach’s alfa coefficients. The cut off points for the total item correlations
and alpha values were considered satisfactory if equal to or greater than 0.30 or 0.60,
respectively. After achieving the two scales, mean and 95% Confidence Intervals (95% CI)
were used to describe sociodemographic and health variables associated to them.
Univariate analysis from a General Linear Model was performed to compare the main effects
as well as all two-way interactions of the independent variables on each of the two scales and
to obtain the adjusted mean and 95% CI.
Linear regression was used to estimate the association between scores, satisfaction with food-
related life, physical and mental health as measured by the SF8 Health Survey.
Results
In this free-living European elderly, the main food related perceived goals were associated to
pleasure (enjoy eating) and to eat a healthy diet, with mean levels of importance, on a 1 to 5
point scale, of 3.87±0.831 and 3.77±0.93, respectively. To choose food products and dishes that
are quick and easy to prepare (2.71±1.251) and to be able to cook meals for others (2.72±1.327),
were the goals considered less important to these elderly.
According to country of residence, different goals had different levels of importance. Compared
to the European average, elderly from Portugal (4.15±0.664) and Spain (4.15±0.644) gave more
importance to eating surroundings, which constituted their main food related perceived goal.
Polish elderly highlight the importance of being self-sufficient (e.g. not requiring help from
others) as their main food related goal (3.73±1.122). To keep expenditures low, was an important
goal to Spanish (4.00±0.887), Portuguese (3.77 ±0.858) and Polish (3.67±1.235) elderly, but less
important to elderly from Denmark (2.35 ±1.115) and Sweden (2.42 ±1.084) (Table 1).

72
Table 1. Mean and standard deviation of food related perceived goal importance by
European elderly
8 country
mean (SD)
3291
1. To choose food products
and dishes that enjoy
eating
3.87 (0.831) 3.75 (0.848) 4.11 (0.772) 3.86 (0.812) 3.61 (0.975) 3.94 (0.701) 3.94 (0.656) 3.53 (0.915) 4.18 (0.690)
2. To eat an healthy diet 3.77 (0.93) 3.65 (0.954) 4.03 (0.776) 3.70 (0.952) 3.48 (1.109) 4.08 (0.652) 3.97 (0.747) 3.32 (1.030) 3.90 (0.842)
3. To vary menu and
have a wide range of food
and dishes
3.65 (0.908) 3.43 (0.982) 3.97 (0.812) 3.62 (0.908) 3.62 (0.906) 3.74 (0.808) 3.89 (0.752) 3.27 (0.944) 3.68 (0.936)
5. To arranje shopping and
preparation of meals that
don’t need help from
others
3.41 (1.256) 2.85 (1.471) 3.78 (1.141) 3.23 (1.218) 3.73 (1.122) 3.83 (0.832) 3.59 (1.029) 3.01 (1.372) 3.13 (1.387)
6. To keep expenditures
on food as low as possible3.22 (1.213) 2.35 (1.115) 3.29 (1.032) 3.48 (1.030) 3.67 (1.235) 3.77 (0.858) 4.00 (0.887) 2.42 (1.084) 2.79 (1.200)
7. To eat meals in the
company of other people3.15 (1.298) 2.66 (1.304) 3.35 (1.270) 3.50 (1.032) 3.16 (1.302) 3.68 (0.983) 3.83 (0.994) 2.63 (1.282) 2.38 (1.355)
8. To maintain the
cultural traditions of
country or region in
relation to food and meals
3.09 (1.307) 2.16 (1.215) 3.03 (1.300) 3.42 (1.142) 3.60 (1.129) 3.57 (0.852) 3.77 (1.035) 2.31 (1.241) 2.82 (1.434)
9. To control weight 2.95 (1.259) 2.72 (1.324) 3.09 (1.242) 3.06 (1.177) 2.65 (1.349) 3.56 (0.885) 3.28 (1.121) 2.35 (1.235) 2.89 (1.270)
11. To choose food
products and dishes that are
quick and easy to
prepare
2.71 (1.251) 2.37 (1.177) 3.00 (1.48) 2.44 (1.226) 2.51 (1.306) 3.53 (0.929) 3.04 (1.173) 2.02 (1.102) 2.74 (1.270)
2.78 (1.267) 2.58 (1.256) 2.41 (1.367)2.48 (1.283) 2.68 (1.385) 3.10 (1.278) 2.61 (1.417) 3.12 (1.160)
Spain
3.36 (1.081)
10. To be able to cook
meals for others
Sweden UK
4. To eat daily meals in
nice surroundings3.64 (0.970) 3.45 (0.968) 3.62 (1.025) 3.64 (0.972) 3.57 (1.052) 4.15 (0.644) 3.40 (0.952)4.15 (0,664)
2.72 (1.327)
Denmark Germany Italy Poland Portugal
Scale: 1 (low importance) to 5 (high importance)
Factor analysis was performed to evaluate if the food related perceived goals, could be
aggregated in different subdomains. Firstly, the principal component analysis identified a three
component solution that accounted for 50.6% of total variance. However from these 11 items,
one of them (to choose food products and dishes that are quick and easy to prepare) did not fit
with any of the components. After it’s exclusion, a solution of two fixed components,
explained 42.2% of the total variance. This solution presents two components with an alpha of
Cronbach's coeficient of 0.660 for the first component and 0.608 for the second (Table 2).
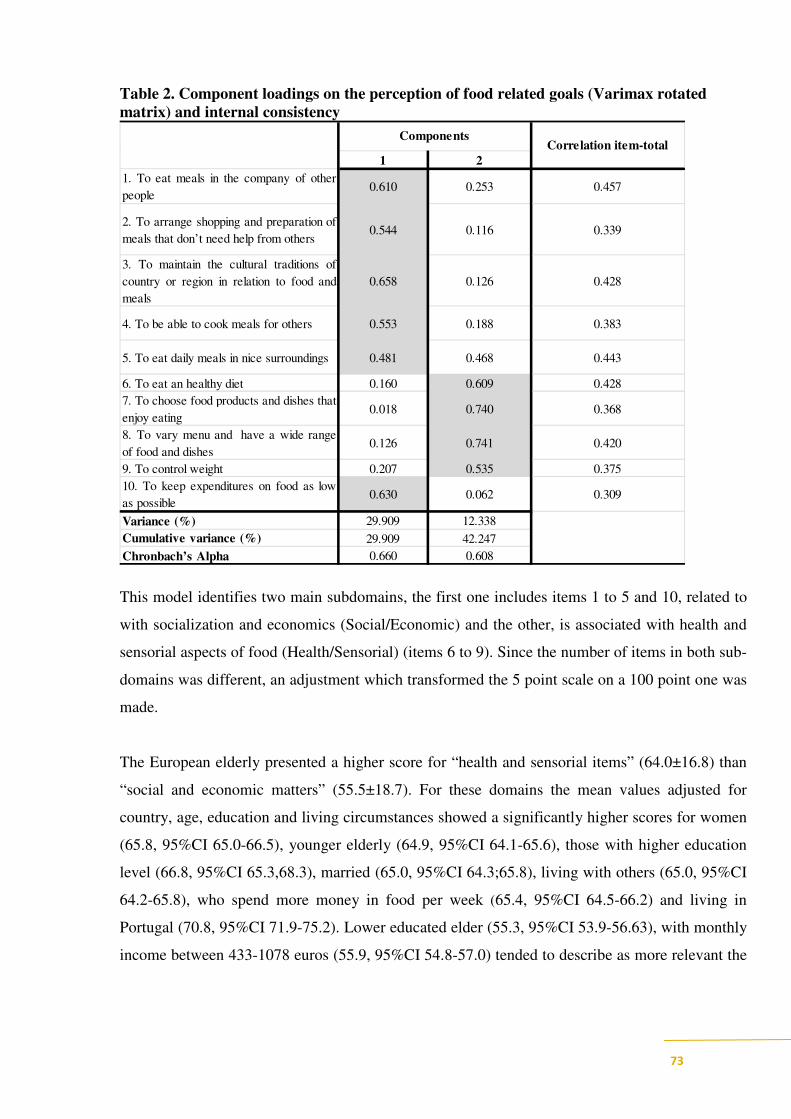
73
Table 2. Component loadings on the perception of food related goals (Varimax rotated
matrix) and internal consistency
1 2
1. To eat meals in the company of other
people0.610 0.253 0.457
2. To arrange shopping and preparation of
meals that don’t need help from others0.544 0.116 0.339
3. To maintain the cultural traditions of
country or region in relation to food and
meals
0.658 0.126 0.428
4. To be able to cook meals for others 0.553 0.188 0.383
5. To eat daily meals in nice surroundings 0.481 0.468 0.443
6. To eat an healthy diet 0.160 0.609 0.428
7. To choose food products and dishes that
enjoy eating0.018 0.740 0.368
8. To vary menu and have a wide range
of food and dishes0.126 0.741 0.420
9. To control weight 0.207 0.535 0.375
10. To keep expenditures on food as low
as possible0.630 0.062 0.309
Variance (%) 29.909 12.338
Cumulative variance (%) 29.909 42.247
Chronbach’s Alpha 0.660 0.608
ComponentsCorrelation item-total
This model identifies two main subdomains, the first one includes items 1 to 5 and 10, related to
with socialization and economics (Social/Economic) and the other, is associated with health and
sensorial aspects of food (Health/Sensorial) (items 6 to 9). Since the number of items in both sub-
domains was different, an adjustment which transformed the 5 point scale on a 100 point one was
made.
The European elderly presented a higher score for “health and sensorial items” (64.0±16.8) than
“social and economic matters” (55.5±18.7). For these domains the mean values adjusted for
country, age, education and living circumstances showed a significantly higher scores for women
(65.8, 95%CI 65.0-66.5), younger elderly (64.9, 95%CI 64.1-65.6), those with higher education
level (66.8, 95%CI 65.3,68.3), married (65.0, 95%CI 64.3;65.8), living with others (65.0, 95%CI
64.2-65.8), who spend more money in food per week (65.4, 95%CI 64.5-66.2) and living in
Portugal (70.8, 95%CI 71.9-75.2). Lower educated elder (55.3, 95%CI 53.9-56.63), with monthly
income between 433-1078 euros (55.9, 95%CI 54.8-57.0) tended to describe as more relevant the
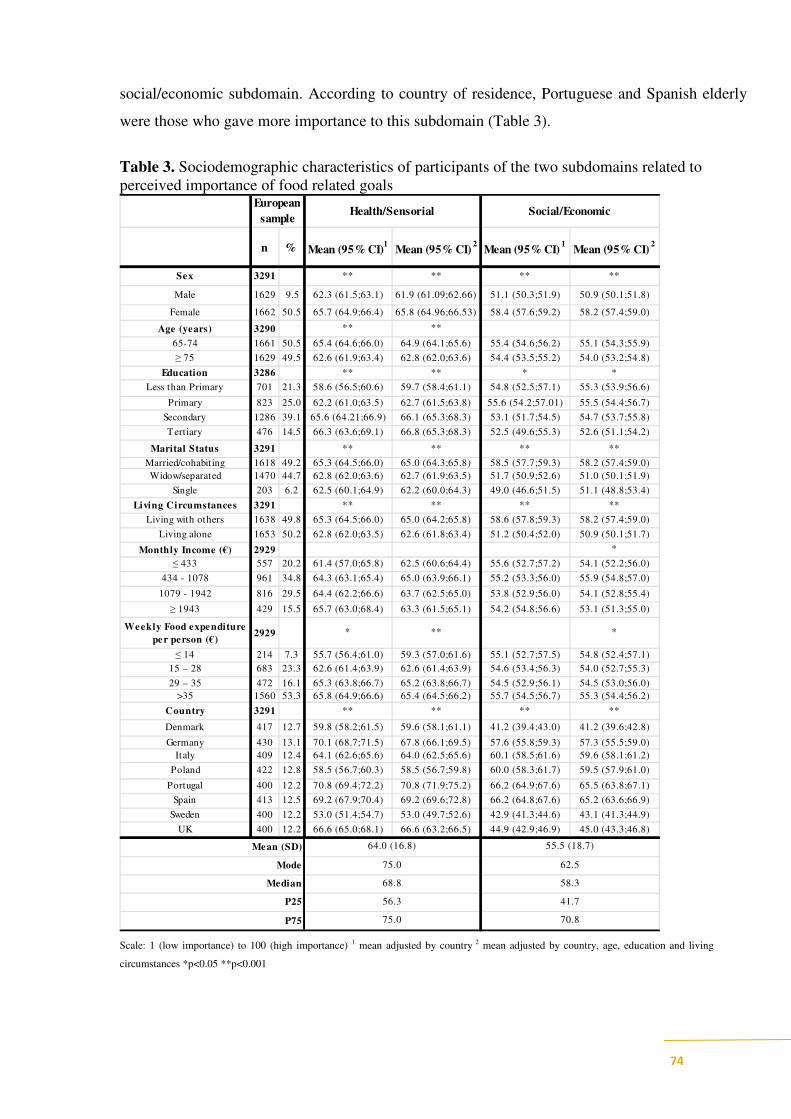
74
social/economic subdomain. According to country of residence, Portuguese and Spanish elderly
were those who gave more importance to this subdomain (Table 3).
Table 3. Sociodemographic characteristics of participants of the two subdomains related to
perceived importance of food related goals
n % Mean (95% CI)1
Mean (95% CI) 2
Mean (95% CI) 1
Mean (95% CI) 2
Sex 3291 ** ** ** **
Male 1629 9.5 62.3 (61.5;63.1) 61.9 (61.09;62.66) 51.1 (50.3;51.9) 50.9 (50.1;51.8)
Female 1662 50.5 65.7 (64.9;66.4) 65.8 (64.96;66.53) 58.4 (57.6;59.2) 58.2 (57.4;59.0)
Age (years) 3290 ** **
65-74 1661 50.5 65.4 (64.6;66.0) 64.9 (64.1;65.6) 55.4 (54.6;56.2) 55.1 (54.3;55.9)
≥ 75 1629 49.5 62.6 (61.9;63.4) 62.8 (62.0;63.6) 54.4 (53.5;55.2) 54.0 (53.2;54.8)
Education 3286 ** ** * *
Less than Primary 701 21.3 58.6 (56.5;60.6) 59.7 (58.4;61.1) 54.8 (52.5;57.1) 55.3 (53.9;56.6)
Primary 823 25.0 62.2 (61.0;63.5) 62.7 (61.5;63.8) 55.6 (54.2;57.01) 55.5 (54.4;56.7)
Secondary 1286 39.1 65.6 (64.21;66.9) 66.1 (65.3;68.3) 53.1 (51.7;54.5) 54.7 (53.7;55.8)
Tertiary 476 14.5 66.3 (63.6;69.1) 66.8 (65.3;68.3) 52.5 (49.6;55.3) 52.6 (51.1;54.2)
Marital Status 3291 ** ** ** **
Married/cohabiting 1618 49.2 65.3 (64.5;66.0) 65.0 (64.3;65.8) 58.5 (57.7;59.3) 58.2 (57.4;59.0)
Widow/separated 1470 44.7 62.8 (62.0;63.6) 62.7 (61.9;63.5) 51.7 (50.9;52.6) 51.0 (50.1;51.9)
Single 203 6.2 62.5 (60.1;64.9) 62.2 (60.0;64.3) 49.0 (46.6;51.5) 51.1 (48.8;53.4)
Living Circumstances 3291 ** ** ** **
Living with others 1638 49.8 65.3 (64.5;66.0) 65.0 (64.2;65.8) 58.6 (57.8;59.3) 58.2 (57.4;59.0)
Living alone 1653 50.2 62.8 (62.0;63.5) 62.6 (61.8;63.4) 51.2 (50.4;52.0) 50.9 (50.1;51.7)
Monthly Income (€) 2929 *
≤ 433 557 20.2 61.4 (57.0;65.8) 62.5 (60.6;64.4) 55.6 (52.7;57.2) 54.1 (52.2;56.0)
434 - 1078 961 34.8 64.3 (63.1;65.4) 65.0 (63.9;66.1) 55.2 (53.3;56.0) 55.9 (54.8;57.0)
1079 - 1942 816 29.5 64.4 (62.2;66.6) 63.7 (62.5;65.0) 53.8 (52.9;56.0) 54.1 (52.8;55.4)
≥ 1943 429 15.5 65.7 (63.0;68.4) 63.3 (61.5;65.1) 54.2 (54.8;56.6) 53.1 (51.3;55.0)
Weekly Food expenditure
per person (€)2929 * ** *
≤ 14 214 7.3 55.7 (56.4;61.0) 59.3 (57.0;61.6) 55.1 (52.7;57.5) 54.8 (52.4;57.1)
15 – 28 683 23.3 62.6 (61.4;63.9) 62.6 (61.4;63.9) 54.6 (53.4;56.3) 54.0 (52.7;55.3)
29 – 35 472 16.1 65.3 (63.8;66.7) 65.2 (63.8;66.7) 54.5 (52.9;56.1) 54.5 (53.0;56.0)
>35 1560 53.3 65.8 (64.9;66.6) 65.4 (64.5;66.2) 55.7 (54.5;56.7) 55.3 (54.4;56.2)
Country 3291 ** ** ** **
Denmark 417 12.7 59.8 (58.2;61.5) 59.6 (58.1;61.1) 41.2 (39.4;43.0) 41.2 (39.6;42.8)
Germany 430 13.1 70.1 (68.7;71.5) 67.8 (66.1;69.5) 57.6 (55.8;59.3) 57.3 (55.5;59.0)
Italy 409 12.4 64.1 (62.6;65.6) 64.0 (62.5;65.6) 60.1 (58.5;61.6) 59.6 (58.1;61.2)
Poland 422 12.8 58.5 (56.7;60.3) 58.5 (56.7;59.8) 60.0 (58.3;61.7) 59.5 (57.9;61.0)
Portugal 400 12.2 70.8 (69.4;72.2) 70.8 (71.9;75.2) 66.2 (64.9;67.6) 65.5 (63.8;67.1)
Spain 413 12.5 69.2 (67.9;70.4) 69.2 (69.6;72.8) 66.2 (64.8;67.6) 65.2 (63.6;66.9)
Sweden 400 12.2 53.0 (51.4;54.7) 53.0 (49.7;52.6) 42.9 (41.3;44.6) 43.1 (41.3;44.9)
UK 400 12.2 66.6 (65.0;68.1) 66.6 (63.2;66.5) 44.9 (42.9;46.9) 45.0 (43.3;46.8)
European
sampleHealth/Sensorial Social/Economic
Mean (SD)
Mode
55.5 (18.7)
62.5
41.7
70.8
P25
P75
64.0 (16.8)
75.0
68.8
56.3
75.0
Median 58.3
Scale: 1 (low importance) to 100 (high importance) 1 mean adjusted by country 2 mean adjusted by country, age, education and living
circumstances *p<0.05 **p<0.001

75
The health/sensorial scale increased significantly with SWFL, subjective satisfaction of
overall life and decreased when mental health increased. The social/economic scale was also
significantly related with SWFL, subjective satisfaction of overall life and decreased when
SF8-physical and mental health increased (Table 4).
Table 4. β Coeficients (95%CI) of the two scales related to perceived importance of food
related goals by satisfaction with food related life (SWFL), satisfaction with life and SF-8
sub-scales
β 95%CI β 95%CI β 95%CI β 95%CI
Health/Sensorial 5.8 4.9;6.7 ** 0.8 0.5;1.1** 0.02 -0.1;0.03 -0.06 -0.1; -0.01*
0.2; 0.8
*
-0.03; -
0.02*-0.04 -0.1;0.02
SWFL Satisfaction with Life SF-8 Physical health SF-8 Mental health
Social/Economic 5.6 4.7;6.5** 0.5 -0.1
1 adjusted by country, age, education and living circumstances
*p<0.05 **p<0.001
Discussion
This study has shown that the European elderly population is quite diverse in what their
perceived food related goals are concerned. This diversity has to be taken into consideration
when healthy ageing promotion programmes are to be designed.
A first analysis revealed that the main food related perceived goals were associated to pleasure
and to eat a healthy diet. To choose food products and dishes that are quick and easy to prepare
and to be able to cook meals for others, were less important to these elderly. Previously a
European study has shown that the most important factors influencing elderly’s food choice were
quality and freshness, trying to eat healthy and price. In both studies, health aspects were relevant
but economic matters ranked third in the former whereas in the latter only ranked 6th
. In this
previous study11
, to stay healthy, to prevent disease and to promote quality of life, were the major
benefits associated to healthy eating.
In the UK, motivations underlying food selection frequently reported sensory appeal (i.e., tastes
good), convenience, and price 10
. Sensory aspects were also relevant in the present results, but
convenience was viewed as the less important goal to our sample. Convenience in meal

76
preparation is regarded as an important determinant of food choice by Scolderer and Grunert 16
,
but Saba et al 17
, showed that European elderly did not seem to view benefits in the consumption
of convenience foods and did not intend to consume these products.
Maintaining independence was the priority for Scottish elderly who perceived food as a
contributing factor to keep health and to limit dependence on others. Another concern
indicated by those elderly was to avoid social isolation. They referred the importance of going
to the shops daily and were involved in “social eating” through going to local cafes/lunch
clubs 18
. In another UK study, social contacts appear to be as valued as the major components
of a good quality of life as health status, indicated by elderly 19
.
Compared to the European average, elderly from Portugal and Spain gave more importance to
eating surroundings. Locher had also emphasised the concern about the importance of eating
foods in a social, comfortable, safe, and stable environment, enhancing not only food intake but
health-related quality of life 20; 21
.
To keep expenditures low was an important goal to Spanish, Portuguese and Polish elderly,
whereas data from the SENECA project showed that budget problems were identified only in
these latter countries 22
. De Almeida et al, also reported this concern in Portuguese elderly but not
in Spanish ones 11
.
Food habits and consequently nutritional status of the elders is more likely to be determined by
education, income, marital status and socioeconomic status rather than chronological age 6; 23
.
To summarize the different perceived goals and to understand their relevance as a whole, factor
analysis was performed. Through this solution, two main subdomains were identified, the first
one related to health and sensorial aspects of food (Health/Sensorial) and the other one with
socialization and economics (Social/Economic). Except for Polish that scored higher in
social/economic aspects of food, most European elderly emphasized health and sensorial items as
more important goals
The social economic disparities on health and diet have long been reported and sociodemographic
variables associated to food perceived goals were also found in this group.

77
Women are reported to have better knowledge and health beliefs and consequently better food
habits than men9; 24
. On the other hand, women as well as older citizens, were also those with
more budgets constrains 9; 25
. This fact could be a justification for the relevance of Social
/Economic aspects by these elderly females.
The more educated elderly attached more importance to Health/Sensorial aspects and lower
educated elderly and those with lower income tend to emphasise Social/Economic matters.
Similar results were found in homebound less educated English older adults, which were more
likely to be motivated by price in their food choices and identified money problems as a
barrier to food choice 10
. In the Scottish study, financial constraints on food choices were
implicit amongst low income household participants 18
.
Hern discusses the influence of general education, level of nutrition knowledge and healthy
behaviour and described a consistent positive association amongst these variables 9. Howarth
26 reinforced that English working-class elderly were more likely to use food and cooking as
means of social support, saving money and combatting loneliness.
Elderly people who live with others tend to attribute more importance in both sub-domains
than those who live alone. However, health aspects were more likely to be selected by those
living with others. Brownie 27
underlines that eating without company can profoundly
influence eating practices and therefore have an impact in nutritional status and other study 28
revealed that loneliness is a significant predictor of malnutrition risk.
However contradictory results by Mathey 29
, suggested that food intake of healthy elderly
subjects was not influenced by the social environment of the lunch.
The analysis of satisfaction with food related life, subjective satisfaction with life and the two
dimensions of SF-8 physical and mental health and the two subdomains, provided interesting
data. The health/sensorial sub-domain increased significantly with increasing satisfaction with
food related life, overall life and physical health. Furthermore, it decreased when mental health
also decreased. In a broad sense, satisfied elderly were more likely to emphasise health/sensorial
aspects. The social/economic sub-domain was also significantly related with satisfaction with

78
food life and overall life, and it decreased when SF8-physical and mental health increased.
Physical and mental constrains in health, probably with the loss of independence could explain
the importance attributed to social/economic aspects by those elderly.
In health promotion interventions, it is important to understand the whole involvement in which
food choices and food intake are done, as well as to realise to what extent they were controlled by
beliefs and motivations established over the life-span. These may help to maintain an adequate
food intake despite the age-related physiological process 24; 30
. Food and nutrition support should
take into account the elderly’s desired goals and expectation from life and aspects related to food,
rather than only to medical or nutritional approaches to deficits 31
The community should be
proactive and promote feed-back suggestions and complaints about meals to the elderly 32
.
Conclusion
This study showed a very heterogeneous picture of food related goals according to country
provenience and sociodemographic aspects. In this free-living European elderly, the main food
related perceived goals were associated to pleasure (enjoy eating) and to eat a healthy diet 33
.
The European elderly score higher for “health and sensorial items” than for “social and economic
matters”. More educated elderly mostly identified Health/Sensorial aspects whereas lower
educated and with a lower income ones tend to emphasised Social/Economic matters. Satisfied
elder were more likely to emphasise health/sensorial aspects and those with physical and mental
constrains highlight /economic aspects.
References
1. European Comission & Health and Consumer Protection Directorate-General (2007)
Healthy ageing: keystone for a sustainable Europe.
2. World Health Organization (2008) Atlas of health in Europe. 2nd ed. Copenhagen,
Denmark.
3. Volkert D (2005) Nutrition and lifestyle of the elderly in Europe. J Public Health 13, 56-61.
4. Unilever Food and Health Research Institute (2005) Healthy for longer. Vlaardingen, The
Netherlands: Unilever Food and Health Research Institute, .
5. Rush D, Russell R & Rosenberg I (1997) Nutrition policy for the elderly. In Nutrition
Policy and Public Health, [Bronner F, editor]: Springer Publishing Company.
6. Niedert KC & American Dietetic Association (2005) Position paper of the American
Dietetic Association: nutrition across the spectrum of aging. J Am Diet Assoc 105, 616-633.

79
7. American Dietetic Association (2000) Position of the American Dietetic Association:
nutrition, aging and the continuum of care. J Am Diet Assoc 100, 580-595.
8. Elsner RJF (2002) Changes in eating behavior during the aging process. Eat Behav 3, 15-
43.
9. Herne S (1995) Research on food choice and nutritional status in elderly people: a review.
British Food Journal 97, 17
10. Locher JL, Ritchie CS, Roth DL et al. (2009) Food choice among homebound older adults:
motivations and perceived barriers. J Nutr Health Aging 13, 659-664.
11. de Almeida MDV, Graça P, Afonso C et al. (2001) Healthy eating in European elderly:
concepts, barriers and benefits. J Nutr Health Aging 5, 217-219.
12. Grunert KG, Dean M, Raats MM et al. (2007) A measure of satisfaction with food-related
life. Appetite 49, 486-493.
13. Dean M, Grunert KG, Raats MM et al. (2008) The impact of personal resources and their
goal relevance on satisfaction with food-related life among the elderly. Appetite 50, 308-315.
14. Ware JE, Kosinski M, Dewey JE et al. (2001) How to score and interpret single-item
health status measures: A manual for users of the SF-8TM health survey.
15. Cattell RB (1966) The scree test for the number of factors. Multivariated Behaviour
Research, 31-245.
16. Scholderer J & Grunert KG (2005) Consumers, food and convenience: the long way from
resource constraints to actual consumption patterns. J Econ Psychol 26, 105-128.
17. Saba A, Messina F, Turrini A et al. (2008) Older people and convenience in meal
preparation. Int J Consum Stud 32, 147-156.
18. McKie L (1999) Older people and food: independence, locality and diet. British Food
Journal 101, 8.
19. Morag F (1995) Elderly people's definitions of quality of life. Social Science &
Medicine 41, 1439-1446.
20. Locher JL, Robinson CO, Roth DL et al. (2005) The effect of the presence of others on
caloric intake in homebound older adults. J Gerontol A Biol Sci Med Sci. 60, 1475-1478.
21. Locher JL, Ritchie CS, Roth DL et al. (2008) Food choice among homebound older adults:
motivations and perceived barriers. Food choice among homebound older adults: motivations
and perceived barriers 13, 5.
22. Schlettwein-Gsell D, Barclay D, Osler M et al. (1991) Dietary habits and attitudes.
Euronut SENECA investigators. Eur J Clin Nutr 45, 83-98.
23. Drewnowski A & Shultz JM (2001) Impact of aging on eating behaviors, food choices,
nutrition, and health status. J Nutr Health Aging. 5, 4.
24. Westenhoefer J (2005) Age and gender dependent profile of food choice. Forum Nutr. 57,
7.
25. Silverman P, Hecht L & Mcmillin JD (2002) Social support and dietary change among
older adults. Ageing & Society 22, 29-59.
26. Howarth G (1993) Food consumption, social roles and personal identity. In Ageing,
Independence and the Life Couse, [ASaE M, editor]. London: Jessica Kingsley.
27. Brownie S (2006) Why are elderly individuals at risk of nutritional deficiency? Int J Nurs
Pract 12, 110-118.
28. Ramic E, Pranjic N, Batic-Mujanovic O et al. (2011) The effect of loneliness on
malnutrition in elderly population. Med Arh. 65, 3.
29. Mathey MF, Zandstra EH, de Graaf C et al. (2000) Social and physiological factors
affecting food intake in elderly subjects: an experimental comparative study. Food Qual
Prefer 11, 397-403.

80
30. Steptoe A, Pollard TM & Wardle J (1995) Development of a measure of the motives
underlying the selection of food: the food choice questionnaire. Appetite 25, 267-284.
31. Bryant LL, Corbett KK & Kutner JS (2001) In their own words: a model of healthy aging.
Soc Sci Med 53, 927-941.
32. Food in later life Project (2005) The food in later life team suggests that those working in
health and social services. Surrey: Food, Consumer Behaviour and Health Research Center,
University of Surrey.
33. Payette H & Shatenstein B (2005) Determinants of healthy eating in community-dwelling
elderly people. Canadian journal of public health. Revue canadienne de sante publique 96
Suppl 3, S27-31, S30-35.

81
4 ǀ Resultados
4.2 ǀ Adherence to Mediterranean food pattern in Portuguese elderly

82

83
Adherence to Mediterranean food pattern among Portuguese
Elderly
Afonso C1, Lopes C2, de Morais C1, Poinhos R1, Oliveira BMPM1,3, de Almeida MDV1
1 Universidade do Porto, Faculdade de Ciências da Nutrição e Alimentação - Rua Dr. Roberto Frias 4200
– 465 Porto - Portugal ([email protected]) 2 Universidade do Porto, Faculdade de Medicina,
Departamento de Epidemiologia Clínica, Medicina Preditiva e Saúde Pública – Portugal, Universidade do
Porto, Instituto de Saúde Pública 3 LAID – INESC, Porto.
[SUBMITED FOR PUBLICATION]
Abstract
Objective: To identify in a free-living population the adherence and main determinants of the Mediterranean food
pattern (MDP) among Portuguese Elderly.
Design: Cross-sectional study to evaluate the adherence to the Mediterranean food pattern (MDP), the diet index
developed by González, et al 1, was computed. Descriptive analysis consisted on computing for each gender, the
median, 25th percentile and 75th percentile of consumption for each type of food included in the index
(vegetables and garden products, fruits, pulses, cereals, red meat, fish, olive oil, milk and milk products and
wine) adjusted for sociodemographics, age, education, living circumstances and geographical area of residence.
General Linear Model was performed to compare the main effects as well as all two-way interactions of the
independent variables on MDP in addition to obtain the adjusted mean and 95% CI. Multiple linear regression
was used to estimate the association between MDP scores, satisfaction with food-related life, physical and mental
health as measured by the SF8 Health Survey. Means were adjusted by gender, age, education and living
circumstances.
Setting: Free living elderly from all Portuguese regions.
Subjects: 400 Portuguese aged 65+ years, were interviewed with a structured questionnaire in a face-to-face
situation.
Results: Adherence to the MDP was above the mean among the free-living Portuguese elderly (mean 22.2±3.9
points), from a maximum of 36 points. 83% of the participants were above the mean. Those with higher scores
were more frequently men [mean 22.3 (95%CI 21.8;22.9)], old elderly [mean 22.2 (95%CI 21.7;22.8)] and with a
higher educational level [mean 22.13 (95%CI 22.1;23.4)]. Elderly with significant lower adherence to the MDP
were more likely to have a lower monthly income [mean 21.52 (95%CI 22.7-22.4)], tend to live in the North
[mean 21.1 (95%CI 20.4;21.8)], being smokers [mean 20.5 (95%CI 19.1;21.9)] and use family and restaurants to
obtain their meals. The MDP score increased significantly with better self-perceived physical health (SF-8).
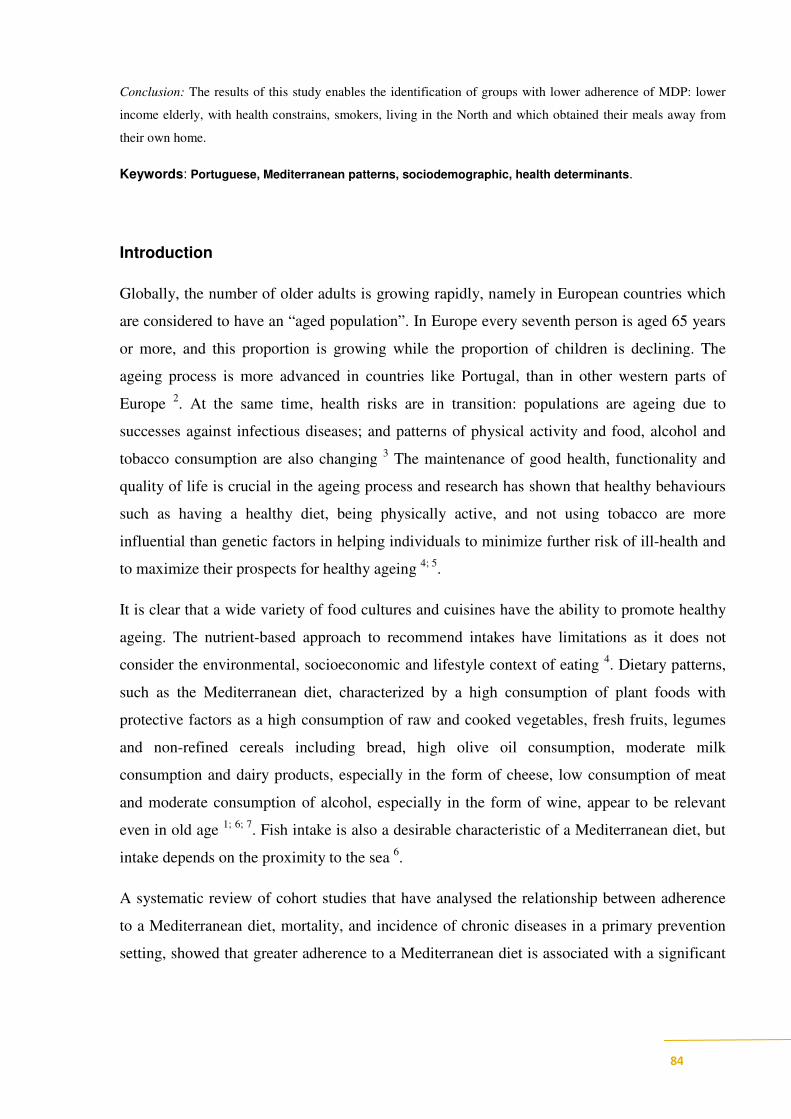
84
Conclusion: The results of this study enables the identification of groups with lower adherence of MDP: lower
income elderly, with health constrains, smokers, living in the North and which obtained their meals away from
their own home.
Keywords: Portuguese, Mediterranean patterns, sociodemographic, health determinants.
Introduction
Globally, the number of older adults is growing rapidly, namely in European countries which
are considered to have an “aged population”. In Europe every seventh person is aged 65 years
or more, and this proportion is growing while the proportion of children is declining. The
ageing process is more advanced in countries like Portugal, than in other western parts of
Europe 2. At the same time, health risks are in transition: populations are ageing due to
successes against infectious diseases; and patterns of physical activity and food, alcohol and
tobacco consumption are also changing 3 The maintenance of good health, functionality and
quality of life is crucial in the ageing process and research has shown that healthy behaviours
such as having a healthy diet, being physically active, and not using tobacco are more
influential than genetic factors in helping individuals to minimize further risk of ill-health and
to maximize their prospects for healthy ageing 4; 5
.
It is clear that a wide variety of food cultures and cuisines have the ability to promote healthy
ageing. The nutrient-based approach to recommend intakes have limitations as it does not
consider the environmental, socioeconomic and lifestyle context of eating 4. Dietary patterns,
such as the Mediterranean diet, characterized by a high consumption of plant foods with
protective factors as a high consumption of raw and cooked vegetables, fresh fruits, legumes
and non-refined cereals including bread, high olive oil consumption, moderate milk
consumption and dairy products, especially in the form of cheese, low consumption of meat
and moderate consumption of alcohol, especially in the form of wine, appear to be relevant
even in old age 1; 6; 7
. Fish intake is also a desirable characteristic of a Mediterranean diet, but
intake depends on the proximity to the sea 6.
A systematic review of cohort studies that have analysed the relationship between adherence
to a Mediterranean diet, mortality, and incidence of chronic diseases in a primary prevention
setting, showed that greater adherence to a Mediterranean diet is associated with a significant
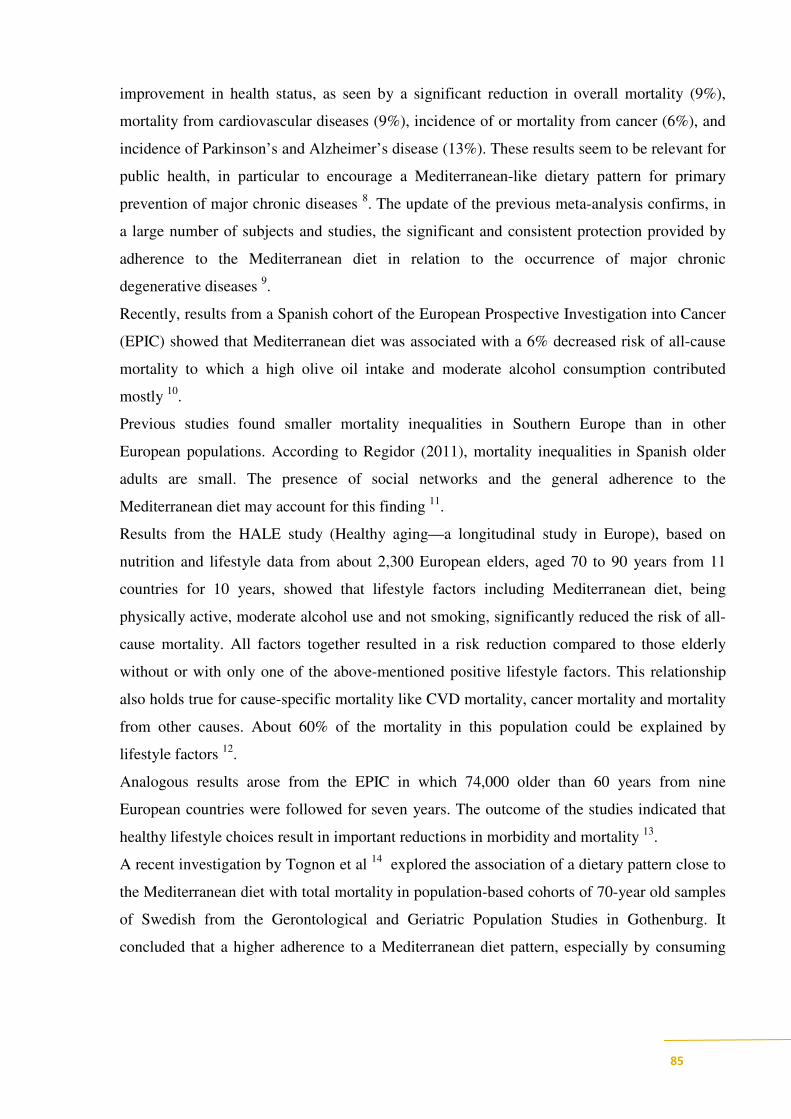
85
improvement in health status, as seen by a significant reduction in overall mortality (9%),
mortality from cardiovascular diseases (9%), incidence of or mortality from cancer (6%), and
incidence of Parkinson’s and Alzheimer’s disease (13%). These results seem to be relevant for
public health, in particular to encourage a Mediterranean-like dietary pattern for primary
prevention of major chronic diseases 8. The update of the previous meta-analysis confirms, in
a large number of subjects and studies, the significant and consistent protection provided by
adherence to the Mediterranean diet in relation to the occurrence of major chronic
degenerative diseases 9.
Recently, results from a Spanish cohort of the European Prospective Investigation into Cancer
(EPIC) showed that Mediterranean diet was associated with a 6% decreased risk of all-cause
mortality to which a high olive oil intake and moderate alcohol consumption contributed
mostly 10
.
Previous studies found smaller mortality inequalities in Southern Europe than in other
European populations. According to Regidor (2011), mortality inequalities in Spanish older
adults are small. The presence of social networks and the general adherence to the
Mediterranean diet may account for this finding 11
.
Results from the HALE study (Healthy aging—a longitudinal study in Europe), based on
nutrition and lifestyle data from about 2,300 European elders, aged 70 to 90 years from 11
countries for 10 years, showed that lifestyle factors including Mediterranean diet, being
physically active, moderate alcohol use and not smoking, significantly reduced the risk of all-
cause mortality. All factors together resulted in a risk reduction compared to those elderly
without or with only one of the above-mentioned positive lifestyle factors. This relationship
also holds true for cause-specific mortality like CVD mortality, cancer mortality and mortality
from other causes. About 60% of the mortality in this population could be explained by
lifestyle factors 12
.
Analogous results arose from the EPIC in which 74,000 older than 60 years from nine
European countries were followed for seven years. The outcome of the studies indicated that
healthy lifestyle choices result in important reductions in morbidity and mortality 13
.
A recent investigation by Tognon et al 14
explored the association of a dietary pattern close to
the Mediterranean diet with total mortality in population-based cohorts of 70-year old samples
of Swedish from the Gerontological and Geriatric Population Studies in Gothenburg. It
concluded that a higher adherence to a Mediterranean diet pattern, especially by consuming

86
wholegrain cereals, foods rich in polyunsaturated fatty acids, and a limited amount of alcohol,
predicts increased longevity in the elderly. In that study, single food groups were not always
found to be associated either inversely or directly with mortality risk. This fact suggests that
the use of scores in nutritional epidemiology is indeed an advantageous approach for
investigation.
Portugal, situated by the Atlantic is under the influence of the Mediterranean sea and has been
considered Mediterranean by nature and climate as well as for cultural and social practices 15
including food patterns 16; 17; 18; 19; 20
. However recent data showed that the adherence to a
Mediterranean diet was poor in all Portuguese regions; and that it had decreased over time in
the North, Centre, Lisbon and Tejo valley. The investigators concluded that between 1990 and
2000, the decreasing adherence to a Mediterranean food pattern and the diminishing
compliance with World Health Organization dietary goals suggest that Portuguese households
have reduced their diet quality 21
.
One of the recommendations for healthy ageing based on results from the HALE project,
highlight the importance of Mediterranean type of diet as a key component of nutrition
education, even in later life 22
. Ensuring that older persons continue to contribute productively
to society as workers and providers instead of being only recipients of care and services
enhances their social and economic involvement and overall well-being 4
Many studies investigate the adherence to Mediterranean patterns, but the relationship with
satisfaction with life, food related quality of life, health variables (physical and mental), as
well as food-related perceived goals, constrains related to food acquisition and preparation and
the use of meal providers has scarcely been investigated. Eating patterns are not isolated
phenomena, free-living people eat combinations of foods and these arrangements reflect
individual food preferences modulated by a mixture of genetic, cultural, social, health,
environmental, lifestyle, and economic determinants. Understanding this behaviour in a broad
sense is essential to community intervention 23
.
Objectives
To identify in a free-living population the adherence and main determinants of the
Mediterranean food pattern (MDP) among Portuguese Elderly.

87
Methods
Participants
400 elderly above 65 years of age and living in their own homes were selected. The sample
was quota controlled according to three sampling characteristics: gender, age (65 to 74 years
and over 75 years) and living circumstances (living alone versus living with others). The
sample reflects the diversity of the national population based on education level, income and
urbanization of living environment (urban/suburban/rural).
The trained interviewers collected information in a face-to-face situation, using a structured
questionnaire previously piloted.
Data collection
The questionnaire was structured to obtain data on social, demographic and behavioural (food
consumption, physical activity, smoking and alcohol intake) characteristics.
Respondents were asked to provide information about:
- Highest level of education achieved (no formal education; first level or basic: less than
primary school/primary school completed; secondary: secondary school completed; tertiary:
college/university completed/postgraduate degree completed) later recoded into 3 categories:
without any educational level, less than primary and above primary level, due to the low
frequency in some categories);
- Total monthly income in euros, into 13 categories. Due to low frequency of some categories,
this measure was subsequently re-coded into four: less than 366€ per month, 366 to 433
€/month, 433 to 865 €/month and above 866€/month;
- Food expenditure per person in euros into four categories: less than 14€/week, 15 to
28€/week, 29 to 35€/week, more than 36€/week. Due to a low frequency of some categories,
this measure was subsequently re-coded into three categories in which the two last categories
were grouped.
- Marital status (married/cohabiting, widow/separated or single).

88
Mediterranean diet index
Food consumption was assessed using a semi-quantitative food-frequency questionnaire
previously validated for the Portuguese population 24
. Food consumption was converted in
total energy intake with the software Food Processor Plus (ESHA Research, Salem, OR),
which has been updated with traditional Portuguese foods.
To evaluate the adherence to the Mediterranean food pattern (MDP), the diet index developed
by González, et al 1, was computed. This index comprises 9 food groups: vegetables and
garden products, fruit, pulses, cereals, red meat, fish, olive oil, milk and milk products and
wine. For fruit, vegetables, fish, pulses, cereals and olive oil, 4 to 1 points are assigned to the
following intakes: more than 75th
percentile (75P), 50P to 75P; 25P to 50P; less 25P. For red
meat, milk and milk products, reverse scores are assigned. For wine (men/women), 1 point is
assigned to consumptions above 40/20 g of ethanol; 4 points to consumption between 1 and
100/200 ml wine; 3 points to consumptions more than 100/200 ml of wine, but less than 20/40
g ethanol; 0 points to nil consumption of wine or alcohol. The final index ranges between 9
points (lower adherence) to 36 points (higher adherence).
Lifestyles, health, satisfaction with life and food, food acquisition and preparation, meal
providers (family and restaurants), food related perceived goals
Physical activity was evaluated by self-reported information according to the items:
- walking (time/week) and/or;
- regular physical exercise (kind of exercise, time/week). These variables were
subsequently transformed into dichotomous variables (if a person did or not exercise and/or
usually walk). Smoking habits were recorded and subjects were classified, as never-smokers,
current smokers (at least one cigarette a day) and ex-smokers (quit smoking for at least 6
months).
Satisfaction with food related life was measured by the 5 item satisfaction with food related
life (SWFL) scale developed by 25
and physical (PCS8) and mental health (MCS8) was
measured by the SF8 Health Survey 26
. Overall subjective life satisfaction was also assessed
with a 10 point scale, from 1 (completely unsatisfied) to 10 (completely satisfied).

89
Further information related to food acquisition and preparation/cooking were also collected as
well as the use of meals providers (family or restaurants). Additionally, participants were
asked to provide information on perceived importance of food-related perceived goals: one
relates to health and sensorial aspects of food (Health/Sensorial) and the other associated with
socialization and economics (Social/Economic). These scales range between 1 (low
importance) to 100 (high importance).
Statistical analysis
The statistical analysis was performed using SPSSWIN 17.0.
Descriptive analysis consisted on computing for each gender, the median, 25th
percentile and
75th
percentile of consumption for each type of food (measured in grams per 1000 kcal per
day) included in the Mediterranean food pattern (MDP) adjusted for sociodemographic data,
(age, education, living circumstances and geographical area).
The MDP score was computed according to the reference 1, with the consumption of each
food group, adjusted for the logarithm of energy intake.
Analysis from a General Linear Model was performed to compare the main effects, as well as
all two-way interactions of the independent variables on MDP index and to obtain the adjusted
mean and 95% CI.
Multiple linear regression was used to estimate the association between MDP scores, with
satisfaction with food-related life, physical and mental health as measured by the SF8 Health
Survey.
Results
In this Portuguese elderly sample, men appeared to eat more fish and fish products and to
drink more wine than women. Older men (aged plus 75 years old) tend to consume more fruit,
vegetables, cereals, milk and milk products and olive oil. Olive oil was also more consumed
by older women, as well as fish and fish products. More educated men tend to eat more

90
vegetables, fish and fish products, wine and fruit. Fruit and pulses were more frequently
consumed by more educated women.
Elderly men who live with others consume a higher amount of fruits and olive oil compared to
those living alone. Vegetables and red meat were consumed by those living with others
independently of gender. Women living with others also ate fish and fish products, pulses and
milk and milk products.
Across the country, elder men from the Centre ate more fruit, fish, pulses, and women from
this region, ate more vegetables. Women from Alentejo and Algarve tend to mention a higher
consumption of fish and fish products, olive oil and milk. Milk products and red meat are
more indicated by elder men from this region. Cereals were consumed in a higher prevalence
by elderly from Lisbon and Tejo valley, both men and women, and this region had the higher
men consumers of olive oil, milk and milk products. Independently of gender, the higher
amount of wine was found in the North region (Tables 1,2).
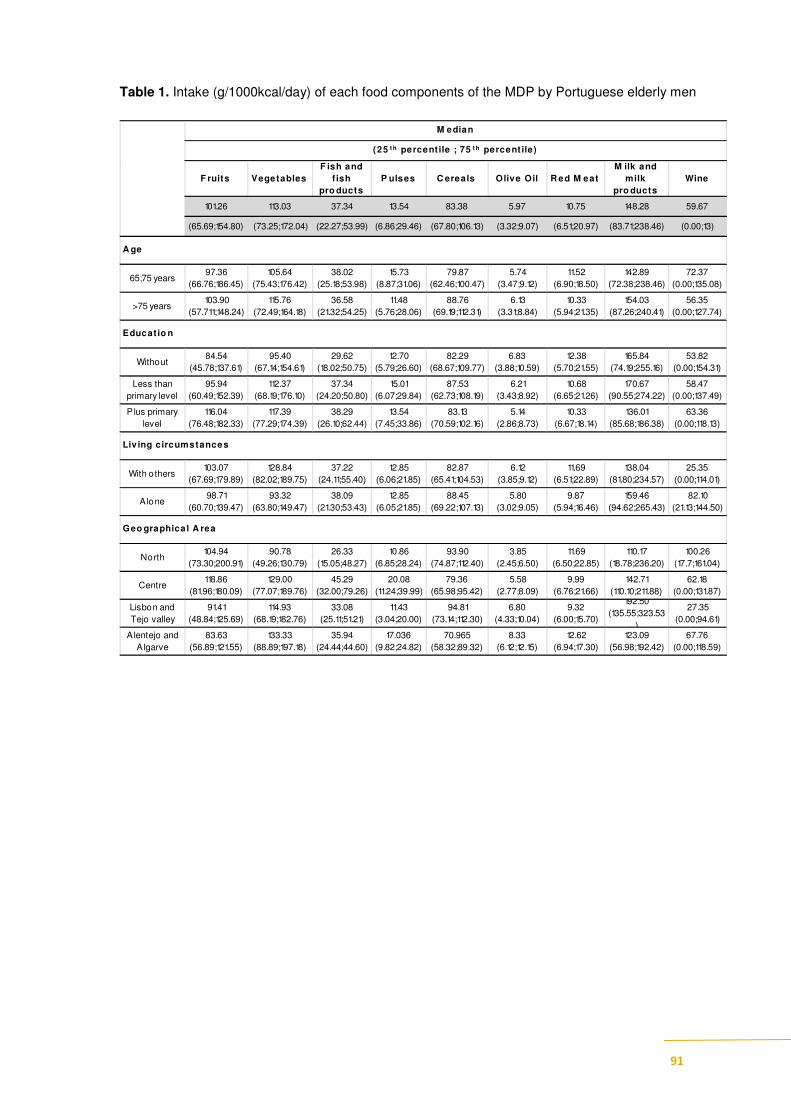
91
Table 1. Intake (g/1000kcal/day) of each food components of the MDP by Portuguese elderly men
F ruits VegetablesF ish and
f ish pro ducts
P ulses C ereals Olive Oil R ed M eatM ilk and
milk pro ducts
Wine
101.26 113.03 37.34 13.54 83.38 5.97 10.75 148.28 59.67
(65.69;154.80) (73.25;172.04) (22.27;53.99) (6.86;29.46) (67.80;106.13) (3.32;9.07) (6.51;20.97) (83.71;238.46) (0.00;13)
65;75 years97.36
(66.76;186.45)
105.64
(75.43;176.42)
38.02
(25.18;53.98)
15.73
(8.87;31.06)
79.87
(62.46;100.47)
5.74
(3.47;9.12)
11.52
(6.90;18.50)
142.89
(72.38;238.46)
72.37
(0.00;135.08)
>75 years103.90
(57.711;148.24)
115.76
(72.49;164.18)
36.58
(21.32;54.25)
11.48
(5.76;28.06)
88.76
(69.19;112.31)
6.13
(3.31;8.84)
10.33
(5.94;21.35)
154.03
(87.26;240.41)
56.35
(0.00;127.74)
Without84.54
(45.78;137.61)
95.40
(67.14;154.61)
29.62
(18.02;50.75)
12.70
(5.79;26.60)
82.29
(68.67;109.77)
6.83
(3.88;10.59)
12.38
(5.70;21.55)
165.84
(74.19;255.16)
53.82
(0.00;154.31)
Less than
primary level
95.94
(60.49;152.39)
112.37
(68.19;176.10)
37.34
(24.20;50.80)
15.01
(6.07;29.84)
87.53
(62.73;108.19)
6.21
(3.43;8.92)
10.68
(6.65;21.26)
170.67
(90.55;274.22)
58.47
(0.00;137.49)
P lus primary
level
116.04
(76.48;182.33)
117.39
(77.29;174.39)
38.29
(26.10;62.44)
13.54
(7.45;33.86)
83.13
(70.59;102.16)
5.14
(2.86;8.73)
10.33
(6.67;18.14)
136.01
(85.68;186.38)
63.36
(0.00;118.13)
With o thers103.07
(67.69;179.89)
128.84
(82.02;189.75)
37.22
(24.11;55.40)
12.85
(6.06;21.85)
82.87
(65.41;104.53)
6.12
(3.85;9.12)
11.69
(6.51;22.89)
138.04
(81.80;234.57)
25.35
(0.00;114.01)
A lone98.71
(60.70;139.47)
93.32
(63.80;149.47)
38.09
(21.30;53.43)
12.85
(6.05;21.85)
88.45
(69.22;107.13)
5.80
(3.02;9.05)
9.87
(5.94;16.46)
159.46
(94.62;265.43)
82.10
(21.13;144.50)
North104.94
(73.30;200.91)
90.78
(49.26;130.79)
26.33
(15.05;48.27)
10.86
(6.85;28.24)
93.90
(74.87;112.40)
3.85
(2.45;6.50)
11.69
(6.50;22.85)
110.17
(18.78;236.20)
100.26
(17.7;161.04)
Centre118.86
(81.96;180.09)
129.00
(77.07;189.76)
45.29
(32.00;79.26)
20.08
(11.24;39.99)
79.36
(65.98;95.42)
5.58
(2.77;8.09)
9.99
(6.76;21.66)
142.71
(110.10;211.88)
62.18
(0.00;131.87)
Lisbon and
Tejo valley
91.41
(48.84;125.69)
114.93
(68.19;182.76)
33.08
(25.11;51.21)
11.43
(3.04;20.00)
94.81
(73.14;112.30)
6.80
(4.33;10.04)
9.32
(6.00;15.70)
192.50
(135.55;323.53
)
27.35
(0.00;94.61)
A lentejo and
A lgarve
83.63
(56.89;121.55)
133.33
(88.89;197.18)
35.94
(24.44;44.60)
17.036
(9.82;24.82)
70.965
(58.32;89.32)
8.33
(6.12;12.15)
12.62
(6.94;17.30)
123.09
(56.98;192.42)
67.76
(0.00;118.59)
M edian
(25 t h percent ile ; 75 t h percent ile)
Geo graphica l A rea
Liv ing circumstances
Educat io n
A ge
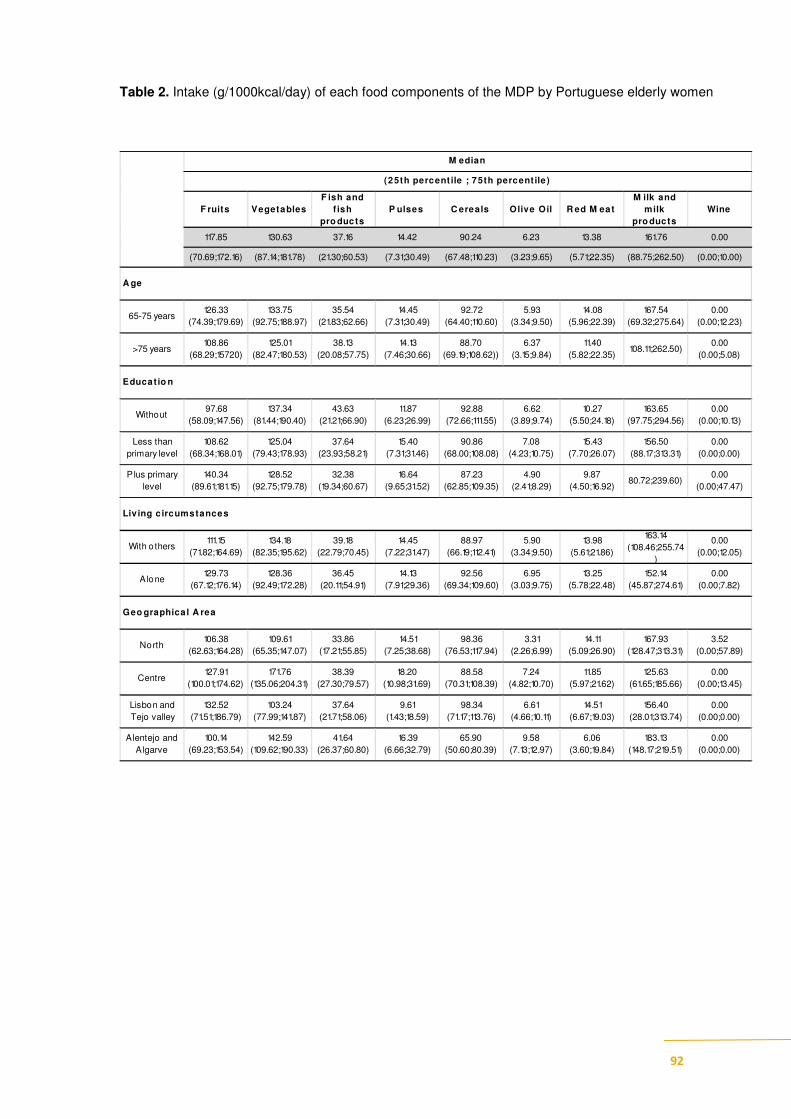
92
Table 2. Intake (g/1000kcal/day) of each food components of the MDP by Portuguese elderly women
F ruits VegetablesF ish and
f ish pro ducts
P ulses C ereals Olive Oil R ed M eatM ilk and
milk pro ducts
Wine
117.85 130.63 37.16 14.42 90.24 6.23 13.38 161.76 0.00
(70.69;172.16) (87.14;181.78) (21.30;60.53) (7.31;30.49) (67.48;110.23) (3.23;9.65) (5.71;22.35) (88.75;262.50) (0.00;10.00)
65-75 years126.33
(74.39;179.69)
133.75
(92.75;188.97)
35.54
(21.83;62.66)
14.45
(7.31;30.49)
92.72
(64.40;110.60)
5.93
(3.34;9.50)
14.08
(5.96;22.39)
167.54
(69.32;275.64)
0.00
(0.00;12.23)
>75 years108.86
(68.29;15720)
125.01
(82.47;180.53)
38.13
(20.08;57.75)
14.13
(7.46;30.66)
88.70
(69.19;108.62))
6.37
(3.15;9.84)
11.40
(5.82;22.35)108.11;262.50)
0.00
(0.00;5.08)
Without97.68
(58.09;147.56)
137.34
(81.44;190.40)
43.63
(21.21;66.90)
11.87
(6.23;26.99)
92.88
(72.66;111.55)
6.62
(3.89;9.74)
10.27
(5.50;24.18)
163.65
(97.75;294.56)
0.00
(0.00;10.13)
Less than
primary level
108.62
(68.34;168.01)
125.04
(79.43;178.93)
37.64
(23.93;58.21)
15.40
(7.31;31.46)
90.86
(68.00;108.08)
7.08
(4.23;10.75)
15.43
(7.70;26.07)
156.50
(88.17;313.31)
0.00
(0.00;0.00)
P lus primary
level
140.34
(89.61;181.15)
128.52
(92.75;179.78)
32.38
(19.34;60.67)
16.64
(9.65;31.52)
87.23
(62.85;109.35)
4.90
(2.41;8.29)
9.87
(4.50;16.92)80.72;239.60)
0.00
(0.00;47.47)
With o thers111.15
(71.82;164.69)
134.18
(82.35;195.62)
39.18
(22.79;70.45)
14.45
(7.22;31.47)
88.97
(66.19;112.41)
5.90
(3.34;9.50)
13.98
(5.61;21.86)
163.14
(108.46;255.74
)
0.00
(0.00;12.05)
A lone129.73
(67.12;176.14)
128.36
(92.49;172.28)
36.45
(20.11;54.91)
14.13
(7.91;29.36)
92.56
(69.34;109.60)
6.95
(3.03;9.75)
13.25
(5.78;22.48)
152.14
(45.87;274.61)
0.00
(0.00;7.82)
North106.38
(62.63;164.28)
109.61
(65.35;147.07)
33.86
(17.21;55.85)
14.51
(7.25;38.68)
98.36
(76.53;117.94)
3.31
(2.26;6.99)
14.11
(5.09;26.90)
167.93
(128.47;313.31)
3.52
(0.00;57.89)
Centre127.91
(100.01;174.62)
171.76
(135.06;204.31)
38.39
(27.30;79.57)
18.20
(10.98;31.69)
88.58
(70.31;108.39)
7.24
(4.82;10.70)
11.85
(5.97;21.62)
125.63
(61.65;185.66)
0.00
(0.00;13.45)
Lisbon and
Tejo valley
132.52
(71.51;186.79)
103.24
(77.99;141.87)
37.64
(21.71;58.06)
9.61
(1.43;18.59)
98.34
(71.17;113.76)
6.61
(4.66;10.11)
14.51
(6.67;19.03)
156.40
(28.01;313.74)
0.00
(0.00;0.00)
Alentejo and
A lgarve
100.14
(69.23;153.54)
142.59
(109.62;190.33)
41.64
(26.37;60.80)
16.39
(6.66;32.79)
65.90
(50.60;80.39)
9.58
(7.13;12.97)
6.06
(3.60;19.84)
183.13
(148.17;219.51)
0.00
(0.00;0.00)
Geo graphica l A rea
M edian
(25th percent ile ; 75th percent ile )
Liv ing c ircumstances
A ge
Educat io n

93
Adherence to the MDP was above the mean among the free-living Portuguese elderly (mean
22.2±3.9 points), more frequently in men [mean 22.3 (95%CI 21.8;22.9)], old elderly [mean
22.2 (95%CI 21.7;22.8)] and by those with a higher educational level [mean 22.13 (95%CI
22.1;23.4)]. They also reported being married [mean 22.3 (95%CI 21.8;22.9)] and living with
others [mean 22.3 (95%CI 21.7;22.8)]. However, these differences were not statistically
significant.
Elderly with significant lower adherence to the MDP were more likely to have a lower
monthly income [mean 21.52 (95%CI 20.7-22.4)], tend to live in the North [mean 21.1
(95%CI 20.4;21.8)] and are more frequently smokers [mean 20.5 (95%CI 19.1;21.9)]. Those,
with lower MDP score, mention the use of informal meal providers as family, or formal as
restaurants (Table 4).

94
Table 3. Mediterranean diet pattern (MDP) by sociodemographic characteristics, lifestyle’s, shopping
and cooking skills, related food goals and meals providers
Sample MDP score1 Adjusted MDP score1,2
n % Mean (95%CI) Mean (95%CI) Sex Men
Women
399 199 200
50.0 50.0
22.5 (21.9;23.0) 22.0 (21.5;22.5)
22.3 (21.8;22.9) 22.0 (21.5;22.5)
Age (years) 65-75 +75
399 199 200
50.5 49.5
22.2 (21.7;22.8) 22.3 (21.7;22.8)
22.1 (21.6;22.7) 22.2 (21.7;22.8)
Education Without
Less than Primary Plus Primary
399 109 132 158
27.3 33.3 39.5
21.8 (21.1;22.5) 22.0 (21.3;22.7) 22.8 (22.2;23.4)
21.8 (21.1;22.6) 22.0 (21.3;22.6) 22.1 (22.1;23.4)
Marital Status Married/cohabiting
Widow/separated/Single
399 202 197
50.8 49.3
22.4 (21.9;23.0) 22.0 (21.5;22.6)
22.3 (21.8;22.9) 22.0 (21.5;22.5)
Living Circumstances Living with others
Living alone
399 199 200
49.8 50.2
22.4 (21.8;22.9) 22.1 (21.6;22.7)
22.3 (21.7;22.8) 22.1 (21.5;22.6)
Monthly Income (€) <366
366 – 433 434 – 865
>866
399 102 82 108 107
25.5 20.8 27.0 26.8
21.4(20.7;22.2) 22.8 (22.0;23.5) 21.8 (21.0;22.6) 23.0 (22.2;23.7)
* 21.5 (20.7;22.4) 22.8 (22.0;23.7) 21.7 (20,9;22.5) 22.8 (22.0;23.6)
Weekly Food expenditure per person (€) < 15
15 – 28 > 28
304 69 113 122
22.6 37.0 40.3
22.3 (21.4;23.3) 22.1 (21.3;22.8) 22.0 (21.2;22.7)
22.4 (21.4;23,4) 22.1 (21.3;22.8) 21.8 (21.0;22.6)
Geographical Area North Center
Lisbon and Tejo valley Alentejo and Algarve
399 128 111 102 58
32.0 28.0 25.5 14.5
21.2 (20.9;22.0) 23.4 (22.7;24.1) 22.2 (21.5;22.8) 22.4 (21.6;22.6)
* 21.1 (20.4;21.8) 23.4 (22.7;24.1) 22.0 (21.3;22.8) 22.5 (21.4;23.4)
Physical Activity (walking) Yes No
396 80 316
20.3 79.0
22.2 (21.8;22.7) 22.3 (21.4;23.1)
22.1 (21.6;22.6) 21.7 (20.8;22.6)
Physical Activity (exercise) Yes No
394 35 359
9.0
89.8
22.8 (21.4;24.2) 22.2 (21.8;22.6)
22.6 (21.3;23.9) 22.1 (21.7;22.5)
Smoking status Non-smoker Ex-smoker
Smoker
381 261 87 33
65.5 22.8 8.6
22.3 (21.8;22.8) 22.56 (21.7;23.4) 20.8 (19.9;22.2)
* 22.4 (21.9;22.9) 22.3 (21.3;23.1) 20.5 (19.1;21.9)
Involvement in food shopping Yes No
399 293 106
73.5 26.5
22.2 (21.8;23.0) 22.2 (21.4;22.7)
22.2 (21.8;22.7) 22.0 (21.2;22.8)
Involvement in food preparation/cooking Yes No
399 334 65
83.8 16.3
22.2 (21.8;23.0) 22.2 (21.4;22.7)
22.3 (21.8;22.7) 21.8 (20.8;22.8)
Meal providers (family) Yes No
399 167 232
41.8 58.3
22.2 (21.8;22.7) 22.2 (21.2;23.1)
* 21.3 (20.5;22.17) 22.4 (22.0;22.82)
Meal providers (restaurants) Yes No
399 83 316
20.8 79.3
21.7 (21.1;22.4) 22.6 (22.1;23.1)
* 22.1 (21.6;22.5) 22.7 (20.8;22.6)
Total MDP Mean (SD) 22.2 (3.9)
Median 22.0 P25 20.0 ;P75 25.0
1 Score ranges between 9 points (lower adherence) and 36 points (higher adherence)
1
2 adjusted by gender, age, education and living circumstances *p<0.05
The MDP index increased significantly as physical health increased (SF-8), and it was
negatively associated, but without statistical significance, with mental health, subjective
satisfaction with life and satisfaction with food life. The MDP index was also significantly
positively related with Health/Sensorial aspects related to food related perceived goals as well
as with Social/Economics (Table 5).

95
Table 4. Parameter Estimates of MDP by satisfaction with life, SF-8 sub-scales, satisfaction with food
life and perceived goals related to food.
Sample median
MDP score1 Adjusted MDP score1, 2
β 95%CI β 95%CI
Health perceived status
SF-8 Physical health
SF-8 Mental health
Satisfaction with Life
43.90
39.92
6.00
0.03
-0.027
-0.06
-0.0; 0.7
-0.06;-0.007
-0.77; 0.65
0.05
-0.022
-0.20
0.009;0.90*
-0.057;0.13
-0.43;0.023
Satisfaction with food life (SWFL)
3.80 -0.13 -0.35;0.85 -0.17 -0.90;0.55
Perceived goals related to food
Health/Sensorial
Social/Economics
75.00
66.66
0.52
0.45
0.025;0.07*
0.018;0.07*
0.05
0.05
0.02;0.078*
0.019;0.08*
1 Score ranges between 9 points (lower adherence) and 36 points (higher adherence) 1
2 adjusted by gender, age, education and living circumstances *p<0.05
Discussion
The Mediterranean diet has been consistently associated with positive health outcomes and a
better quality of life. It is recognized that focusing on single nutrients ignores the important
and complex interactions between components of a diet and, more significantly because
people do not eat nutrients but they do eat foods and meals. Consequently, dietary scores
estimating the adherence to specific food patterns as the Mediterranean diet have been
developed 27
To evaluate adherence to Mediterranean food pattern, numerous indexes have
been developed, among which the Mediterranean Diet Score (MDS) proposed by 13; 28
is the
most extensively employed29
. In the current study, the MDP proposed by 1, based on
30 and
28
was chosen as its wide range, between 9 (lower adherence) and 36 points (higher adherence),
would enable to identify variability between groups. Firstly the consumption of some food
groups was evaluated and subsequently their combination was obtained according to the MDP
score 1
In the present study Portuguese elderly, men were found to eat more fish and fish products and
wine than women. In EpiPorto study the elderly men appeared to eat more milk and milk
products, red meat, fish and fish products, cereals, fruits and wine, than elderly women 31
.

96
Results from the Portuguese National Health Surveys of 1989/1999, from adults plus 65 years
old, showed that consumption of meat, fish, potato/rice and vegetables was higher in older
men and milk and fruit were more consumed among older female.
Older elderly tend to consume more fruit, vegetables, cereals, milk and milk products and
olive oil than the younger old. Olive oil also more consumed by older women, as well as fish
and fish products. Data from Lopes et al, indicated that with increasing age, the consumption
of the majority of food groups decrease: milk and milk products (only for women), red meats,
fish and fish products (just for men) and fats and oils, alcoholic beverages (just for women) 31
.
This same tendency was shown by Marques Vidal et al with the exception of milk for both
genders and fruits for men 32
More educated elder men tend to eat more vegetables, fish and fish products, wine and fruit
than lower educated ones. Fruit and pulses are consumed by more educated elderly women
than by those with a lower education level.
Independently of age, data from the Portuguese National Health Surveys of 1989/1999,
revealed that as the education increased, the consumption of meat, fish, vegetables also
increased in both genders, and fruit consumption in women 32
. Data collected through the
Portuguese Household Budget Surveys (HBS) of 2000/2001 showed that as education level
increased, the mean availability in quantity/person per day decreased for cereals, potatoes,
pulses, olive oil and the availability of fruits, milk and milk products increased 32
.
In the present study, adherence to the MDP was above the mean among the free-living
Portuguese elderly (mean 22.23±3.91 points). The same score 1 applied to Spanish adults
revealed that the MDP seems to be fairly uniform, around 22.5, similar to present study. In
spite of the small, differences, elderly with significant higher adherence to the MDP were
more frequently men and old elderly in both studies.
The present data suggests that elderly with significant higher adherence to the MDP were
more likely to have higher educational level and monthly income and tend to live more
frequently in the Centre of Portugal. In the Spanish study no variations were found according
to educational level, but adherence was lowest in young adults and women and was slightly
higher in the south than in the north of Spain 1.
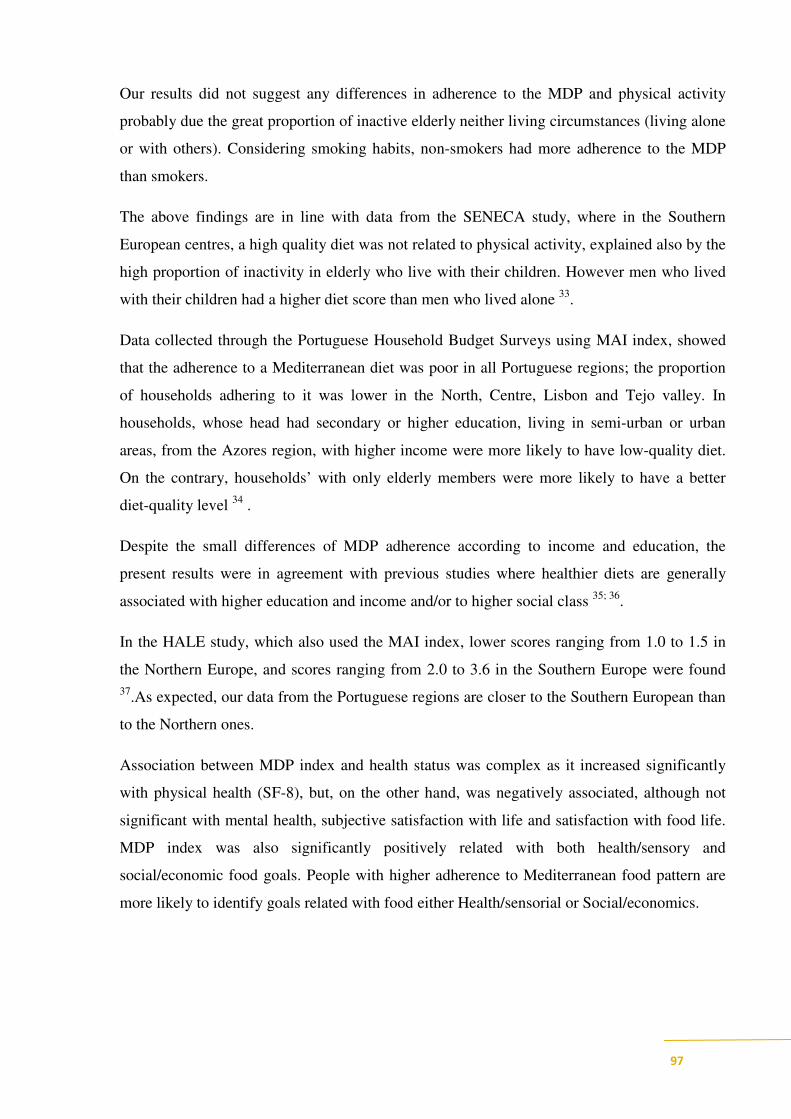
97
Our results did not suggest any differences in adherence to the MDP and physical activity
probably due the great proportion of inactive elderly neither living circumstances (living alone
or with others). Considering smoking habits, non-smokers had more adherence to the MDP
than smokers.
The above findings are in line with data from the SENECA study, where in the Southern
European centres, a high quality diet was not related to physical activity, explained also by the
high proportion of inactivity in elderly who live with their children. However men who lived
with their children had a higher diet score than men who lived alone 33
.
Data collected through the Portuguese Household Budget Surveys using MAI index, showed
that the adherence to a Mediterranean diet was poor in all Portuguese regions; the proportion
of households adhering to it was lower in the North, Centre, Lisbon and Tejo valley. In
households, whose head had secondary or higher education, living in semi-urban or urban
areas, from the Azores region, with higher income were more likely to have low-quality diet.
On the contrary, households’ with only elderly members were more likely to have a better
diet-quality level 34
.
Despite the small differences of MDP adherence according to income and education, the
present results were in agreement with previous studies where healthier diets are generally
associated with higher education and income and/or to higher social class 35; 36
.
In the HALE study, which also used the MAI index, lower scores ranging from 1.0 to 1.5 in
the Northern Europe, and scores ranging from 2.0 to 3.6 in the Southern Europe were found
37.As expected, our data from the Portuguese regions are closer to the Southern European than
to the Northern ones.
Association between MDP index and health status was complex as it increased significantly
with physical health (SF-8), but, on the other hand, was negatively associated, although not
significant with mental health, subjective satisfaction with life and satisfaction with food life.
MDP index was also significantly positively related with both health/sensory and
social/economic food goals. People with higher adherence to Mediterranean food pattern are
more likely to identify goals related with food either Health/sensorial or Social/economics.

98
In the present study, lower adherence to MDP was associated to the use of formal (as
restaurants) or informal (as family) meal providers.
In spite of the fact that adherence to the MDP was above the medium range score in this
Portuguese elderly, this study results are in line with others reporting the “westernization of
Mediterranean countries” food habits even in the old age group 38
21
. A publication 39
from
Chen & Marques Vidal, (2007) showed that Portugal is consistently and rapidly moving away
from the traditional Mediterranean diet much faster than any other Mediterranean country.
It is essential that elderly maintain dietary and lifestyle practices that prevent and manage
chronic conditions, thereby maximizing their chances for successful aging. Elderly should be
encouraged to eat a healthy diet as varied as possible 40
. Interventions aimed at supporting the
individual and promoting healthier environments will often lead to increased independence in
older age. Improving multiple healthy behaviours such as eating habits, increasing levels of
physical activity and avoid smoking as well as encouraging the extensive social interaction
will certainly reduce chronic disease risks of death and disability and, consequently increase
longevity and healthy ageing 4 12
. Results of the present study suggest that the Mediterranean
type of diet should be promoted to improve health and wellbeing in older age.
The study weaknesses must be pointed out. First, even if the sample reflects the diversity of
the national population based on education level, income and urbanization of living
environment (urban/suburban/rural) and regions, the number of participants was small. Second
its cross-sectional nature does not allow direct assessment of the determinants of MDP.
Obtaining reliable data on food consumption is prone to various types of error associated to
the instrument used to assess food intake. However the food-frequency questionnaire used has
good reproducibility and validity (Lopes, 2000, Lopes et al, 2007), which may have
minimized the expected underestimation of intake, frequent in food consumption studies.
Conclusion
The results of this study enables the identification of groups with lower adherence of MDP:
lower income elderly, with health constrains, smokers, living in the North and which obtained
their meals away from their own home. The present study illustrates the importance of a
lifestyle approach, in which the Mediterranean Diet is included, to promote the elderly’s

99
health and wellbeing. As a consequence, food based dietary recommendations within the
Mediterranean Diet should be established for the elderly.
References:
1. González CA, Argilaga S, Agudo A et al. (2002) Sociodemographic differences in adherence to the Mediterranean dietary pattern in Spanish populations. Gac Sanit 16, 214-221. 2. World Health Organization (2008) Atlas of health in Europe. 2nd ed. Copenhagen, Denmark. 3. World Health Organization (2009) Global health risks: mortality and burden of disease attributable to selected major risks. Geneva 4. World Health Organization (2003) Diet, nutrition and the prevention of chronic diseases. 5. Centers for Disease Control and Prevention (2011) Healthy aging: preventing disease and improving quality of life among older Americans.: Available at: http://www.cdc.gov/nccdphp/aag/aag_aging.htm (accessed: june 2011). 6. Trichopoulou A (2004) Traditional Mediterranean diet and longevity in the elderly: a review. Public Health Nutr 7, 943-947. 7. de Groot LCPGM & van Staveren W (2010) Nutritional concerns, health and survival in old age. Biogerontology 11, 597-602. 8. Sofi F, Cesari F, Abbate R et al. (2008) Adherence to Mediterranean diet and health status: meta-analysis. BMJ 337. 9. Sofi F, Abbate R, Gensini GF et al. (2010) Accruing evidence on benefits of adherence to the Mediterranean diet on health: an updated systematic review and meta-analysis. Am J Clin Nutr 92, 1189-1196. 10. Buckland G, Agudo A, Travier N et al. (2011) Adherence to the Mediterranean diet reduces mortality in the Spanish cohort of the European Prospective Investigation into Cancer and Nutrition (EPIC-Spain). . Br J Nutr 106, 1581-1591. 11. Regidor E, Kunst AE, Rodríguez-Artalejo F et al. (2011) Small socio-economic differences in mortality in Spanish older people Eur J Public Health Apr 29. 12. Knoops KT, de Groot LC, Kromhout D et al. (2004 ) Mediterranean diet, lifestyle factors, and 10-year mortality in elderly european men and women. The HALE Project. JAMA 292, 1433-1439. 13. Trichopoulou A, Orfanos P, Norat T et al. (2005) Modified Mediterranean diet and survival: EPIC-elderly prospective cohort study. BMJ 330, 991. 14. Tognon G, Rothenberg E, Eiben G et al. (2011) Does the Mediterranean diet predict longevity in the elderly? A Swedish perspective. AGE 33, 439-450. 15. Ribeiro O (1998) Portugal, o Mediterrâneo e o Atlântico. 7th ed. Lisboa: Livraria Sá da Costa Editora. 16. Nestle M (1995 ) Mediterranean diets: historical and research overview. Am J Clin Nutr 61, 1313S-1320S. 17. Willett WC, Sacks F, Trichopoulou A et al. (1995) Mediterranean diet pyramid: a cultural model for healthy eating. Am J Clin Nutr 61, 1402S-1406S. 18. Serra-Majem L, Ferro-Luzzi A, Bellizzi M et al. (1997) Nutrition policies in Mediterranean Europe. Nutr Rev 55, S42-S57. 19. Peres E (1996) Prodigiosa alimentação mediterrânica. Alim Hum 11, 5-7. 20. Assman G, Sacks F, Awad AB et al. (2000) International consensus statement: dietary fat, the
Mediterranean diet, and lifelong good health.

100
21. Rodrigues SSP, Caraher M, Trichopoulou A et al. (2007) Portuguese households’ diet quality (adherence to Mediterranean food pattern and compliance with WHO population dietary goals): trends, regional disparities and socioeconomic determinants). Eur J Clin Nutr, 1-10. 22. Bogers RP, Tijhuis M, van Gelder BM et al. (2005) Final report of the HALE (Healthy Ageing: a
longitudinal study in europe). 23. Ashima K K (2004) Dietary patterns and health outcomes. J Am Diet Assoc 104, 615-635. 24. Lopes C, Aro A, Azevedo A et al. (2007) Intake and adipose tissue composition of fatty acids and risk of myocardial infarction in a male Portuguese community sample. J Am Diet Assoc 107, 276-286. 25. Grunert KG, Dean M, Raats MM et al. (2007) A measure of satisfaction with food-related life. Appetite 49, 486-493. 26. Ware JE, Kosinski M, Dewey JE et al. (2001) How to score and interpret single-item health status
measures: A manual for users of the SF-8TM health survey.
27. Sofi F (2009) The Mediterranean diet revisited: evidence of its effectiveness grows. Curr Opin
Cardiol 24, 442-446 410.1097/HCO.1090b1013e32832f32056e. 28. Trichopoulou A, Kouris-Blazos A, Wahlqvist MK et al. (1995) Diet and overall survival in elderly people. BMJ 311, 1457-1460. 29. Bach A, Serra-Majem L, Carrasco JL et al. (2006) The use of indexes evaluating the adherence to the Mediterranean diet in epidemiological studies: a review. Public Health Nutr 9, 132-146. 30. Osler M & Schroll M (1997) Diet and mortality in a cohort of elderly people in a north European community. Int J Epidemiol 26, 155-159. 31. Lopes C, Oliveira A, Santos A-C et al. (2006) Consumo alimentar no Porto. Porto: Faculdade de Medicina da Universidade do Porto,. 32. Marques-Vidal P, Ravasco P, Dias CM et al. (2006) Trends of food intake in Portugal, 1987-1999: results from the National Health Surveys. Eur J Clin Nutr 60, 1414-1422. 33. Haveman-Nies A TK, de Groot LC, Wilson PW, van Staveren WA, (2001) Evaluation of dietary quality in relationship to nutritional and lifestyle factors in elderly people of the US Framingham Heart Study and the European SENECA study. Eur J Clin Nutr 55, 870-880. 34. Rodrigues SSP, Caraher M, Trichopoulou A et al. (2007) Portuguese households/' diet quality (adherence to Mediterranean food pattern and compliance with WHO population dietary goals): trends, regional disparities and socioeconomic determinants. Eur J Clin Nutr 62, 1263-1272. 35. Moreira P & Padrão P (2006) Educational, economic and dietary determinants of obesity in Portuguese adults: A cross-sectional study. Eat Behav 7, 220-228. 36. Marmot MG & Wilkinson RG (2006) Social determinants of health. 2sd ed. New York: Oxford University Press. 37. Knoops KTB, Groot de LC, Fidanza F et al. (2006) Comparison of three different dietary scores in relation to 10-year mortality in elderly European subjects: the HALE project. Eur J Clin Nutr 60, 746-755. 38. Trichopoulos D & Lagiou P (2004) Mediterranean diet and overall mortality differences in the European Union. Public Health Nutr 7, 949-951. 39. Chen Q & Marques-Vidal P (2007) Trends in food availability in Portugal in 1966–2003. Eur J Nutr 46, 418-427. 40. Niedert KC & American Dietetic Association (2005) Position paper of the American Dietetic Association: nutrition across the spectrum of aging. J Am Diet Assoc 105, 616-633.

101
4 ǀ Resultados
4.3 ǀ The use of meal providers by European elderly

102

103
The use of meal providers by European elderly
Cláudia Afonso1, Cecília Morais1, Carla Lopes 2, Monique Raats3, Margaret Lumbers M3, Klaus Grunert 4, Maria Daniel Vaz de Almeida MDV1, Food in Later Life teamiiiii 1 Universidade do Porto, Faculdade de Ciências da Nutrição e Alimentação - Rua Dr. Roberto Frias 4200 – 465
Porto - Portugal ([email protected]) 2 Universidade do Porto, Faculdade de Medicina, Departamento
de Epidemiologia Clínica, Medicina Preditiva e Saúde Pública – Portugal, Universidade do Porto, Instituto de
Saúde Pública 3 University of Surrey, UNIS, School of Management – UK
4 The Mapp Centre; The Aarhus
School of Business – Denmark
[SUBMITED FOR PUBLICATION]
Abstract
The aim of the present study was to evaluate the use of meal providers and the main sociodemographic
determinants associated to this use in free-living European elderly. Within the European Project “Food in Later
Life 3290 European citizens aged 65+ years from 8 EU countries (Denmark, Germany, Italy Poland, Portugal,
Spain, Sweden and the UK) were interviewed with a structured face-to-face questionnaire. To estimate the
magnitude of the association between the use of meal provider and socio demographic factors, adjusted odds ratio
(OR) and 95% confidence intervals (95%CI) were computed using logistic regression. These European elderly
obtained their provide meals from a variety of sources with an average of 0.81 times a week in Portuguese elderly
to 1.71 times a week, from 3 times a week in Italian elderly. Nearly half of the Portuguese elderly never used any
kind of meal provider (46.8%) in contrast to most Danish and Italians who rely on outside providers to obtain
their meals. With the exception of Sweden the main meal providers used by the European elderly, were the
family (70.9%), followed by restaurants (47.4%), cafés (28.8%), bar (28.6%) and take away (26.5%). Men were
more likely than women to obtain meals from all kinds of meal providers with exception of the family (71.4%)
and cafés (31.5%) that were mainly selected by women. The oldest groups obtain their meals generally from
family (71.1%) and luncheon clubs (13.4%). The remaining types of meal providers were selected by the younger
group. As expected, as education and income increased, more elderly obtained their meals from providers.
Conclusion: European elderly relied more on the informal network (family) than in the formal sector (be it
restaurants and alike, or day care centers and meals on wheels) to obtain their meals. The present study showed
that women and the older ones were those who referred less frequently use meal providers. Living circumstances
did not seem to be a strong determinant of meal procurement. The relationship between education attainment and
income were straightforward concerning the use of almost all kinds of meal providers.
Keywords: Elderly, meal providers, sociodemographic determinants, Europe.
Introduction
Food habits are determined by a variety of factors, which include internal and external ones
like psychological, biological, cultural, economic, political, environmental, religious and
social. These influences contribute to the development, maintenance or modification of dietary
patterns across the life cycle1,2
.

104
The external factors influencing food choice differ across the life span and these changes
affect food habits in different ways. Internal, personal factors are also influenced by age. In
the past decades, research has identified negative changes such as loss of cognition, disease
and disruption of the social network to have a large influence in dietary patterns. It is also
considered that the magnitude of age-related decline in very old people is a risk for adaptation
problems, since most of the domains of living are affected3.
It is important to identify adaptation strategies that people use to fulfill alone some of their
basic necessities, they are no longer able to manage due to modifications of their life situation
(loss of partner, loneliness, among others), health status or other kind of situations that
interfere with their autonomy.
The increasing number of old people in the population has led to the development of long-
term services to meet the needs of older people, with minor or major disabilities. These
services can act as a support to informal caregivers, or as a unique source of support for some
elders, and contributes to their maintenance, as independent living person 4.
When many of the usual domestic tasks become a burden for the older people and informal
networks cannot provide the required support, one of the most common alternatives is the
search of formal network services, such as meal/food service providers. Many of the food
providers are directed towards a frail older population, while others target the older
population, in general. Search and use of food services by the elderly might be affected by
many living conditions, including to the expectations people have in their living context5.
Scientific evidence supports that good nutrition is one of the major determinants of successful
ageing not only by a physiological perspective but also by the contribute to social, cultural and
psychological quality of life 6, benefitting both the individual and the society: health is
improved, dependence is decreased and the utilization of health care resources is contained 7.
The US Administration on ageing focuses on the need to improve the access to safe and
adequate food in communities emphasizing the importance of food assistance programs to
help to reduce the cost of use of nursing homes by the elder. As computed 1 month in a
nursing home equals that of providing mid-day meals, 5 days a week, for about 7 years 8.
Investigation to identify where the elderly get their meals and to understand the relative
importance of this provision to their nutritional wellbeing is of the highest importance since
efficient policies are needed to enable older populations to maintain their independence in the
society.

105
Research on determinants of use of home care services, especially in what concerns food, is
important since new efficient policies are needed to enable older populations to maintain their
independence and a good satisfaction with food-related life. As far as we know this is the first
project which investigated the use of meal providers by elderly living in the community across
8 different European countries.
The aim of the present study was to evaluate the use of meal providers and the main
sociodemographic determinants associated to this utilization in free-living European elderly.
Methods
Participants
Within the Project Food in Later Life, 3291 elderly above 65 years of age and living in their
own homes were interviewed at home. The study was conducted in 8 EU countries (Denmark,
Germany, Italy Poland, Portugal, Spain, Sweden and the United Kingdom) with around 400
participants from each country.
The sample was quota controlled according to three characteristics gender, age (65 to 74 years
and over 75 years) and living circumstances (living alone versus living with others). In
addition, the sample was chosen to reflect the diversity of each national population based on
education level, income and urbanization of living environment (urban/suburban/rural) and
was taken from at least three geographical regions in each participant country.
The interviews were conducted in a face-to-face situation by trained interviewers from
marketing companies, using a structured questionnaire designed to accomplish the objectives.
The questionnaire was developed in English, translated and back-translated to each national
language before it was piloted and subsequently carried out in each country.
Measures
Respondents were asked to provide information about:
- Highest level of education achieved (no formal education; first level or basic: less than
primary school/primary school completed; secondary: secondary school completed; tertiary:
college/university completed/postgraduate degree completed);

106
- Total income in euros, into 13 categories (less than 366€; 366-433€; 434-646€; 647-864€;
865-1078€; 1079-1291€; 1292-1622€; 1623-1942€; 1943-2161€; 2162-2481€; 2482-2793€;
2794-3578€; more than 3578€). Due to a low frequency of some categories, this measure was
subsequently re-coded into four categories: less than 433€ per month, 433 to 1078 €/month,
1079 to 1943 €/month and above 1943€/month;
- Marital status.
Frequency of use of meal providers (never, less than once a month, once a month, 2-3 times
per month, once a week, 2-3 times per week, 4-5 times per week, almost daily or daily) to
obtain meals, was assessed from a list including informal providers as family or formal
providers, as restaurant, bar, take away, café, luncheon clubs, fast food, service day center,
take away frozen foods and meal on wheels.
As a preliminary analysis showed a low frequency of use meal providers, these variables were
subsequently recoded into bivariate variables (use vs not use)
Statistical analysis
Data were stored in SPSSWIN® 17.0. We performed a descriptive analysis to characterize the
study sample. To estimate the magnitude of the association between the meal provider and
socio demographic factors, adjusted odds ratio (OR) and 95% confidence intervals (95%CI)
were computed using logistic regression. OR were adjusted for country, age, education and
living circumstances.
Results
These European elderly obtained their outside meals from a variety of sources, on average
1.71 times a week, ranging from 3 times a week by Italian elderly to 0.81 times a week by
Portuguese elderly. Portugal had the higher prevalence of elderly who never use any kind of
meal provider (46.8%), the opposite of Denmark (97.8%) and Italy (97.1%). For those elderly
who make use of any kind of meal providers family emerges as the most important meal
provider of European elderly (with the exception of Sweden), selected by 70.9% of the
elderly, followed by restaurants (47.4%), cafés (28.8%), bar (28.6%) and take away outlets
(26.5%). In Sweden, the first choice of meal providers was restaurants (66.9%) followed by

107
cafés (48.3%) and bars (46.0%). The less frequently used providers were meals on wheels
(2.6%), take away frozen food (4.6%) and service day centre (4.8%).
Different meal providers were obtaining according to country. Compared to the European
average German elderly were more likely to obtain meals from restaurants (77.0%) as well as
from take away frozen foods (22.4); whereas the UK senior citizens relied in cafés (49.5%)
and bars (54.8%). The family (94.9%) and take away (44%), were the most important
providers to Italian elders. Luncheon clubs were inditified mainly by Danish elder (25.2%),
service day center (11.0%) and meals on wheels (7.4%) too. Fast food was a meal provider in
35.3% of the Swedish elderly (Table 1).
Table 1. Use of providers to obtain meals by European elderly
Non-use of any kind of meal providers
[n(%)]397 (12.1) 9 (2.2) 14 (3.3) 12 (2.9) 60 (14.2) 187 (46.8) 57 (13.8) 34 (8.5) 24 (6.0)
Use a meal provider [n(%)]
2894 (87.9) 408 (97.8) 416 (96.7) 397 (97.1) 362 (85.8) 213 (53.3) 356 (86.2) 366 (91.5) 376(94.0)
Use of meal providers: average
number of times per w eek
Means (SD)
FAMILY 2334 (70.9) 395 (94.7) 361 (84.0) 387 (94.9) 337 (79.9) 167 (41.8) 268 (64.9) 123 (30.8) 296 (74.0)
RESTAURANTS 1159 (47.4) 224 (53.7) 331 (77.0) 289 (70.7) 21 (5.0) 83 (20.8) 164 (39.7) 267 (66.9) 180 (45.0)
CAFÉS 946 (28.8) 64 (15.3) 164 (38.2) 58 (14.2) 132 (31.3) 17 (4.3) 120 (29.1) 193 (48.3) 198 (49.5)
BARS 940 (28.6) 79 (18.9) 231 (54.0) 41 (10.0) 9 (2.1) 22 (5.5) 155 (37.5) 184 (46.0) 219 (54.8)
TAKE AWAY 871 (26.5) 70 (16.8) 120 (28.0) 180 (44.0) 15 (3.6) 17 (4.3) 105 (25.4) 142 (35.6) 222 (55.5)
LUNCHEON CLUBS 428 (13.0) 105 (25.2) 49 (11.4) 40 (9.8) 9 (2.1) 15 (3.8) 37 (9.0) 85 (21.3) 88 (22.0)
FAST FOOD 390 (11.9) 69 (16.5) 44 (10.3) 41 (10.0) 15 (3.6) 6 (1.5) 16 (3.9) 141 (35.3) 58 (14.5)
SERVICE DAY CENTRE 158 (4.8) 46 (11.0) 22 (5.1) 2 (0.5) 17 (4.0) 12 (3.0) 30(7.3) 9 (2.3) 20 (5.0)
TAKE AWAY FROZEN FOODS
145 (4.6) 8 (1.9) 96 (22.4) 14 (3.4) 3 (0.7) 8 (2.0) 4 (1.0) 1 (0.4) 8 (2.0)
M EALS ON WHEELS 84 (2.6) 31 (7.4) 22 (5.1) 8 (2.0) 1 (0.2) 5 (1.3) 7 (1.7) 9 (3.1) 4 (1.0)
[n(%)]*
Denmark Germany Italy Poland Portugal Spain Sweden UK
2.21 (2.82) 0.81 (2.23) 1.64 (2.69) 1.40 (1.83) 1.80 (1.85)
TYPE OF MEAL PROVIDER*
8 Country average
1.71 (2.41) 1.03 (1.46) 1.74 (2.47) 3.00 (2.79)
*The sum of the % of the meal providers is above 100% because elderly can choose more than one option at the same time.
The European elderly who never use meal providers were mainly women (55.7%), aged equal
or above to 75 years old (53.7%), married (49.1%). This proportion increased when education
level and income decreased.
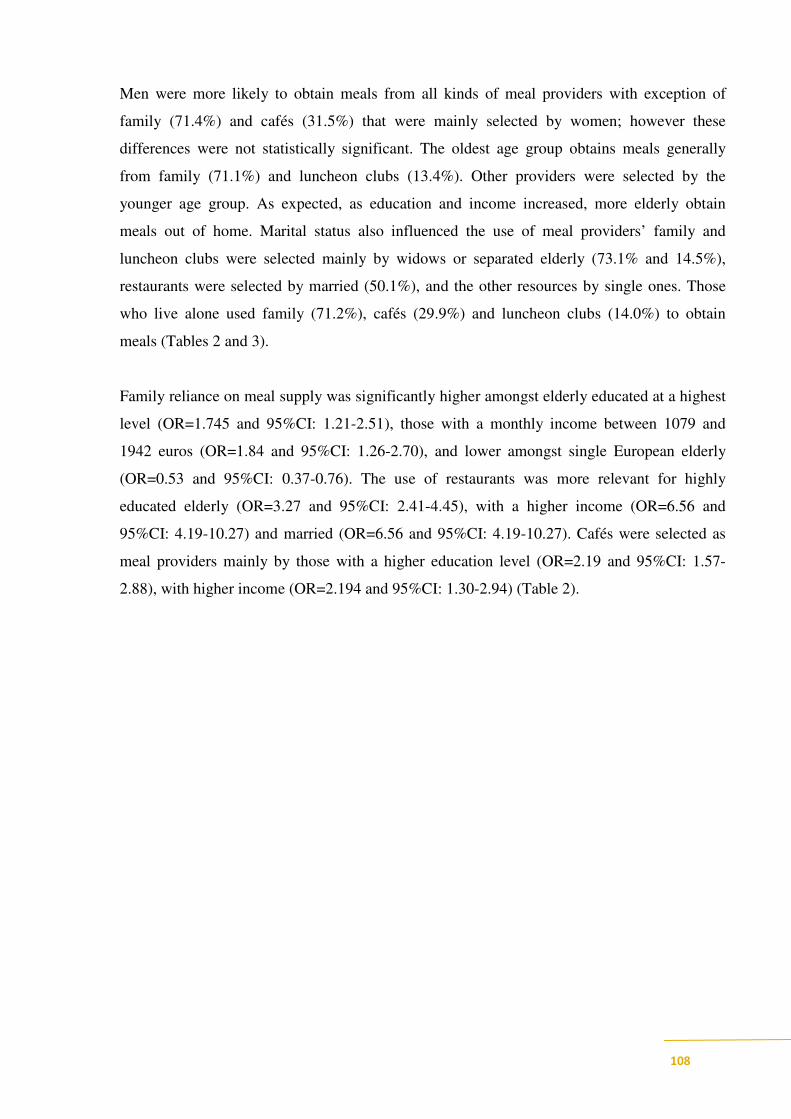
108
Men were more likely to obtain meals from all kinds of meal providers with exception of
family (71.4%) and cafés (31.5%) that were mainly selected by women; however these
differences were not statistically significant. The oldest age group obtains meals generally
from family (71.1%) and luncheon clubs (13.4%). Other providers were selected by the
younger age group. As expected, as education and income increased, more elderly obtain
meals out of home. Marital status also influenced the use of meal providers’ family and
luncheon clubs were selected mainly by widows or separated elderly (73.1% and 14.5%),
restaurants were selected by married (50.1%), and the other resources by single ones. Those
who live alone used family (71.2%), cafés (29.9%) and luncheon clubs (14.0%) to obtain
meals (Tables 2 and 3).
Family reliance on meal supply was significantly higher amongst elderly educated at a highest
level (OR=1.745 and 95%CI: 1.21-2.51), those with a monthly income between 1079 and
1942 euros (OR=1.84 and 95%CI: 1.26-2.70), and lower amongst single European elderly
(OR=0.53 and 95%CI: 0.37-0.76). The use of restaurants was more relevant for highly
educated elderly (OR=3.27 and 95%CI: 2.41-4.45), with a higher income (OR=6.56 and
95%CI: 4.19-10.27) and married (OR=6.56 and 95%CI: 4.19-10.27). Cafés were selected as
meal providers mainly by those with a higher education level (OR=2.19 and 95%CI: 1.57-
2.88), with higher income (OR=2.194 and 95%CI: 1.30-2.94) (Table 2).

109
Table 2. European elderly meal providers by demographics: family, restaurants and cafés
Total Sample
Family Restaurants Cafés
n=2334 (70.9%) n=1159 (47.4%) n=946 (28.8%)
n (%) OR* (95% CI) n (%) OR* (95% CI) n (%) OR* (95% CI)
Sex 3291 (100%)
Men 1629 (49.5) 1148 (70.5)
1 808 (49.6) 1 466 (28.6) 1
Women 1662 (50.5) 1186 (71.4)
1.05 (0.88-1.25)
751 (45.2) 0.85 (0.72-0.99) 480 (28.9) 1.085 (0.92-1.28)
Age (years) 3290 (100%)
65-74 1661 (50.5) 1176 (70.8)
1 861 (51.8) 1 523 (31.5) 1
≥ 75 1629 (49.5) 1157 (71.1)
1.05 (0.88-1.25)
697 (42.8) 0.69 (0.59-0.81) 422 (25.9) 0.81 (0.68-0.95)
Education 3286 (100%)
Less than Primary 701 (21.3) 431 (61.6) 1 204 (29.1) 1 98 (14.0) 1
Primary 823 (25.0) 583 (70.8) 1.20 (0.93-
1.55) 289 (35.1) 1.40 (1.10-1.79) 159 (19.3) 1.22 (0.91-1.64)
Secondary 1286 (39.1) 977 (76.0) 1.58 (1.17-
2.13) 760 (59.1) 2.59 (1.99-3.39) 493 (38.4) 2.13 (1.57-2.88)
Tertiary 476 (14.5) 340 (71.4) 1.74 (1.21-
2.51) 303 (63.8) 3.27 (2.41-4.45) 193 (40.5) 2.59 (1.57-2.88)
Monthly Income 2929 (100%)
≤ 433 557 (20.2) 350 (62.8) 1 62 (11.1) 1 96 (17.2) 1
434 - 1078 961 (34.8) 683 (71.1) 1.28 (0.96-
1.73) 375 (39.0) 1.96 (1.38-2.78) 257 (26.7) 1.82 (1.27-2.59)
1079 - 1942 816 (29.5) 627 (76.8) 1.84 (1.26-
2.70) 515 (63.1) 3.24 (2.21-4.78) 265 (32.5) 1.96 (1.28-2.59)
≥ 1943 429 (15.5) 271 (63.2) 1.44 (0.92-
2.25) 338 (79.0) 6.56 (4.19-10.27) 169 (39.4) 2.19 (1.30-2.94)
Marital Status 3291 (100%)
Married/cohabiting 1618 (49.2) 1142 (70.6)
1 810 (50.1) 1 447 (27.6) 1
Widow/separated 1470 (44.7) 1074 (73.1)
1.09 (0.91-1.31)
651 (44.3) 1.16 (0.97-1.37) 432 (29.4) 1.16 (0.98-1.37)
Single 203 (50.2) 118 (58.1) 0.53 (0.37-
0.76) 98 (48.3) 1.04 (0.74-1.46) 67 (33.0) 1.04 (0.74-1.46)
Living Circumstances
3291 (100%)
Living with others 1653 (50.2) 1157 (70.7)
1 814 (49.7) 1 451 (27.6) 1
Living alone 1638 (49.8) 1177 (71.2)
1.01 (0.85-1.20)
745 (45.1) 0.83 (0.71-0.972) 495 (29.9) 1.17 (0.99-1.38)
*OR adjusted for age, education, living circumstances and country
Bars were significantly related with gender as elderly women were less likely than men to
select this kind of meal provider (OR=0.59 and 95%CI: 0.50-0.71) as well as the older group
(OR=0.68 and 95%CI: 0.57-0.82). Also as education and income increased more elderly
selected bar as a provider to obtain their meals. The same tendencies occurred with “take
away”.
Elderly men with a higher education level relied more on luncheon clubs. On the other hand,
fast food was less likely to be used by women (OR=0.70 and 95%CI: 0.56-0.89), the older

110
elderly (OR=0.56 and 95%CI: 0.44-0.71) and those who lived alone (OR=0.98 and 95%CI:
0.30-0.72) (Table 3).
Table 3. European elderly providers to obtain meals by demographics: Bar, take-away, luncheon clubs
and fast food
n (%) OR* (95% CI) n (%) OR* (95% CI) n (%) OR* (95% CI) n (%) OR* (95% CI)
Sex
Men 540 (33.2) 1 500 (30.7) 1 245 (15.0) 1 113 (57.2) 1
Women 400 (24.1) 0.59 (0.50-0.71) 371 (22.3) 0.62 (0.52-0.74) 183 (11.0) 0.73 (0.59-0.90) 167 (42.8) 0.70 (0.56-0.89)
Age (years)
65-74 536 (32.3) 1 522 (31.4) 1 209 (12.6) 1 245 (62.8) 1
≥ 75 403 (24.8) 0.68 (0.57-0.82) 348 (21.4) 0.58 (0.48-0.68) 219 (13.4) 1.17 (0.95-1.45) 145 (37.2) 0.56 (0.44-0.71)
Education
Less than Primary 128 (18.3) 1 109 (15.5) 1 52 (7.4) 1 34 (8.8) 1
Primary 112 (13.6 0.81 (0.60-1.11) 150 (18.2) 1.23 (0.84-1.52) 65 (7.9) 1.09 (0.74-1.62) 56 (14.4) 1.02 (0.64-1.62)
Secondary 509 (39.6) 1.50 (1.10-2.04) 451 (35.1) 1.60 (1.18-2.15) 202 (15.7) 1.99 (1.36-2.93) 190 (49.0) 1.67 (1.08-2.59)
Tertiary 190 (39.9) 181 (1.28-2.55) 159 (33.4) 1.68 (1.19-2.36) 109 (22.9) 2.29 (1.52-3.44) 388 (27.8) 1.73 (1.09-2.73)
Monthly Income
≤ 433 38 (6.8) 1 38 (6.8) 1 23 (4.1) 1 25 (7.5) 1
434 - 1078 220 (22.9) 1.20 (0.77-1.87) 224 (23.3) 1.41 (0.91-2.20) 100 (10.4) 1.03 (0.59-1.80) 64 (19.2) 0.61 (0.33-1.13)
1079 - 1942 319 (39.1) 2.17 (1.35-3.49) 304 (37.3) 2.04 (1.28-3.24) 143 (17.5) 1.15 (0.64-2.07) 142 (42.6) 0.81 (0.43-1.52)
≥ 1943 199 (46.4) 2.66 (1.59-4.45) 167 (38.9) 2.11 (1.27-3.50) 96 (22.4) 1.28 (0.69-2.38) 102 (30.6) 0.72 (0.37-1.41)
Marital Status
Married/cohabiting 491 (30.4) 1 457 (28.3) 1 194 (12.0) 1 200 (51.3) 1
Widow /separated 377 (25.7) 0.85 (0.71-1.01) 348 (23.7) 0.88 (0.74-1.05) 213 (14.5) 1.37 (1.11-1.71) 161 (41.3) 1.01 (0.80-1.28)
Single 72 (35.5) 0.97 (0.68-1.38) 66 (32.5) 0.83 (0.58-1.17) 10.3 (10.3) 0.75 (0.46-1.23) 29 (7.4) 0.88 (0.56-1.39)
Living Circumstances
Living w ith others 496 (30.3) 1 457 (27.9) 1 196 (12.0) 1 201 (51.5) 1
Living alone 444 (26.9) 0.84 (0.71-1.00) 414 (25.0) 0.87 (0.73-1.03) 232 (14.0) 1.26 (1.02-1.55) 198 (48.5) 0.98 (0.30-0.72)
Fast food
n=390 (11.9%)
Bars
n=940 (28.6%)
Take away
n=871 (26.5%)
Luncheon clubs
n=871 (26.5%)
*OR adjusted for age, education, living circumstances and country
Discussion The continuous growth of the population over 60 years of age and over, will reqest an effort
from the community to provide an adequate support to the older citizens which includes food
provision 7; 9; 10
.

111
In this study, the profile of European elderly who use meal providers across countries showed
a very heterogeneous picture. Free-living elderly from countries like Denmark, Italy and
Germany tended to obtain more frequently their meals out of the home, but, on the contrary, in
Portugal far less elderly mentioned to obtain meals from meal providers. This fact can be
related to sociodemographic characteristics of Portuguese elderly, namely low education level
and low income11
.
Across 7 of the 8 countries (Sweden being the exception) the informal network (family) is
identified as more important than the formal sector (be it restaurants and alike, or day care
centers and meals on wheels) to provide meals to the elderly.
Traditionally, family is recognized as vital informal caregivers and health resource. The
caregiving role involves providing personal care to older adults for the activities of daily
living such as bathing and tasks related to food acquisition, preparation and consumption 8,5, 12,
13. Nevertheless the role of non-kin carers, as informal caregivers can also be significant in
supporting older people 14
. This was shown by Turrini 15
in relation to food shopping in this
same European sample.
In Canada, as in the United States, day care centers have assumed an important role in the
continuum of long-term care services. In addition to allowing older persons to remain in their
homes, adult day care programs provide support and relief to informal caregivers4. In the
current study, only a small proportion of the elderly use day center to obtain their meals.
A Swedish study found that social networks seemed to prevent low quality of life, which
should be taken into account by professional helpers, especially in collaboration with relatives
with regard to planning and providing care 16
. In our study Swedish elderly were also found to
be less likely to require support from the family than other Europeans which may be due to the
fact that in Northern European countries the formal networks are usually widely available and
active. On the contrary, in Italy where multi-generational households occur, the family,
relatives or friends are the main caregiver 15
in agreement with our findings.

112
Roy & Payette evaluating the effect of meals on wheels on dietary intakes of frail Canadian
elderly showed the improvement of dietary intakes of recipients of this program 17
. Contrary to
what we expected, this type of provider was the least used by European elderly (2.6% EU
average), except in the case of Denmark (7.4%).
Large socio-demographic differences amongst older Europeans can influence the procurement
of other strategies of food supply outside home. The current study showed that women and the
older elderly were less likely to ever use any type of meal providers The opposite was shown
in an WHO report, in which a vast majority of cases, as ageing proceeds, women are more
likely to be both caregivers and care recipients 18
. It is worth noticing that we did not find
living circumstances to be strong determinants of meal procurement but the relationship
between education attainment and income were straightforward concerning the use of almost
all kinds of meal providers.
Several studies have described differences in food choice by gender, as women have been
found to have healthier food choices than men, due to more knowledge and beliefs about the
importance of nutrition care to health 19
. Our findings may be explained by the fact that more
traditional women may associate eating out or ask for meal from outside sources as less
healthy choices. Also, in similar living conditions, women are usually more independent than
men concerning for example their cooking skills. Engler-Stringer reviewed studies focusing
on cooking practices and their contribution to health and suggested that the relationship
between home cooking and dietary quality should be a matter for more investigation (Engler-
Striger, 2010). In young adults, Larson20
, found a higher quality of diet in those who cooked
their meals. Another possible explanation to this difference according to gender is because
women are more economically disadvantaged in the old age, have less access to
transportation, and are more likely to spend part of their retirement living alone. In a study
performed by Garry, 10% of men and 45% in women eat diner alone 21,22
.
Social support and material circumstances still play an important role in independence in old
age 23
. Studies carried out in different populations found higher income and education
associated with large social networks 24,25
. On the other hand, lower income elderly were
found to face physiological and social obstacles to obtain healthy diets 26
.

113
The literature indicates that social determinants as eating without company can profoundly
influence the nutritional practices, mainly of men27
and Ramic28
et al revealed that loneliness
is a significant predictor of the risk of malnutrition. The SOLINUT study, analyzed the
interaction between loneliness and nutrition, highlighted the extreme importance of preventive
intervention, which could avoid a decline of nutritional status 29
. The findings from the HALE
project, showed that having few social contacts was associated with a higher mortality risk in
women 30
.
In Scotland, a free living older group stated that their main priority was to remain in their own
homes and to maintain a good nutritional status. These elderly highlight the importance to give
attention to food shopping and preparation as key dimensions of what they define as
‘independent living'. These elderly developed strategies to avoid loneliness, the most
important of which was shopping on a daily basis just to see people, followed by being
involved in “social eating” through going to local cafes/lunch clubs31
.
Eating with others may increase social interaction and food consumption, and women tend to
eat more 13% when men are present and, the couple consume more 23% when dining with
family or friends 32
. However our data did not show significant differences in living
circumstances (living or not alone) or marital status on the use of meal providers.
Nutritional status of the older people is more likely to be determined by education, income,
marital status and socioeconomic status rather than chronological age 9,33
. In a position paper
from ADA it is stated that the social aspects of eating are important pleasures of life that
persist throughout life.
In the UK, increasing age, not owing a car, being a widow(er) and worse self-reported overall
health were associated with greater use of both statutory and private home care services. Other
conditions, such as older age on leaving full-time education were also associated with the use
of private services5.
Our findings, suggest that it is important to improve interventions involving informal networks
to provide adequate meals (families, relatives…) and formal providers (restaurants, take-away,
bars…), that help older persons to have an independent and healthier life in the community for

114
a long period (ADA, 2010). In the line of the present study it is essential, first of all, to
identify those who use the providers, which are the main meal providers, as well as to
understand the main determinants to select them to promote a healthy service through food
meals.
Understanding the social determinants of eating behavior are so important, or sometimes more
important, than to treat physical disability or disease 34,35,36
. Eating in a social, comfortable,
safe and familiar environment enhances not only food intake but also health-related quality of
life 37,38
.
The access in the community independently of the existence of food and nutrition assistance
by formal sectors should be promoted 9. Caregivers (formal or informal) should be aware of
the nutrition needs of older people, should apply national guidelines/codes of practice and
should be proactive, establishing reflective feed-back suggestions and compliance about foods
and meals 9.
Community meal providers should encourage training for food service providers to produce
more nutritionally adequate, tasty and safe menus tailored to the elderly, employing friendly
staff to increase social interaction and sense of community belonging 35
.
Conclusion In the present study, most European elderly living in the community relied mainly on the
informal network (family) than in the formal sector (be it restaurants and alike, day care
centers and meals on wheels) to obtain their meals. Contrary to what was expected living
circumstances did not influence the use of meal providers but educational level and income
were strongly related to the use of meal providers and to obtain meals out.
An ageing population brings new challenges to policy-makers and planners to promote health
related quality of life. Appropriate and coordinated care from meal providers should be
available, understanding through investigation the socio demographic determinants of the
major meal providers, to adequate nutrition programs interventions trough the life course 10
.
References 1. Eertmans A, Baeyens F & Van den Bergh O (2001) Food likes and their relative importance in human eating
behavior: review and preliminary suggestions for health promotion. Health Educ Res 16, 443-456.
2. Fieldhouse P (1995) Food and nutrition. Customs and culture. London.

115
3. Jopp D & Rott C (2006) Adaptation in very old age: Exploring the role of resources, beliefs, and attitudes for
centenarians' happiness. . Psychol Aging 21, 266-280.
4. Baumgarten M, Lebel P, Leclerc C et al. (2002) Adult day care for the frail elderly: outcomes, satisfaction and
cost. J Aging Health 14, 237-259.
5. Stoddart H, Whitley E, Harvey I et al. (2002) What determines the use of home care services by elderly
people? Health Soc Care Community 10, 348-360.
6. Centers for Disease Control and Prevention (2011) Healthy aging: preventing disease and improving quality of
life among older Americans.: Available at: http://www.cdc.gov/nccdphp/aag/aag_aging.htm (accessed: june
2011).
7. American Dietetic Association (2000) Position of the American Dietetic Association: nutrition, aging and the
continuum of care. J Am Diet Assoc 100, 580-595.
8. US Administration on Aging Web site (2007) 2007 State program report: Available at:
http://www.aoa.gov/AoARoot/Program_Results/SPR/2007/Index (accessed: august 2011).
9. Niedert KC & American Dietetic Association (2005) Position paper of the American Dietetic Association:
nutrition across the spectrum of aging. J Am Diet Assoc 105, 616-633.
10. Dorner B, Friedrich EK, Posthauer ME et al. (2010) Position of the American Dietetic Association:
individualized nutrition approaches for older adults in health care communities. J Am Diet Assoc. 110, 1549-
1553.
11. Instituto Nacional de Estatística (2002) O Envelhecimento em Portugal. Situação demográfica e socio-
económica recente das pessoas idosas: INE.
12. Silverman P, Hecht L & Mcmillin JD (2002) Social support and dietary change among older adults. Ageing &
Society 22, 29-59.
13. Arno PS, Levine C & Memmott MM (1999) The economic value of informal caregiving. Health Aff 18, 182-
188.
14. Nocon A & Pearson M (2000) The roles of friends and neighbours in providing support for older people.
Ageing and Society 20, 341-367.
15. Turrini A, D’Addezio L, Maccati F et al. (2010) The informal networks in food procurement
by older people. A cross European comparison. Ageing Int 35, 253-275.
16. Hellström Y, Andersson M & Hallberg I (2004) Quality of life among older people in Sweden receiving help
from informal and/or formal helpers at home or in special accommodation. Health Soc Care Community 12, 504-
516.
17. Roy MA & Payette H (2006) Meals-on-wheels improves energy and nutrient intake in a frail free-living
elderly population. J Nutr Health Aging 10, 554-560.
18. World Health Organization & Tufts University School of Nutrition and Policy (2002) Keep fit for life.
Meeting the nutritional needs of older persons. Geneva: World Health Organization,
Tufts University School of Nutrition and Policy,.
19. Westenhoefer J (2005) Age and gender dependent profile of food choice. Forum Nutr 57, 44-51.
20. Larson NI, Perry CJ, Story M et al. (2006) Food preparation by young adults is associated with better diet
quality. J Am Diet Assoc 106, 2001-2007.
21. Herne S (1995) Research on food choice and nutritional status in elderly people: a review. British Food
Journal 97, 12-31
22. Garry P, Goodwin J, Hunt W et al. (1982) Nutritional status in a healthy elderly population: dietary and
supplemental intakes. Am J Clin Nutr 36, 319-331.
23. Marmot MG & Wilkinson RG (2006) Social determinants of health. 2sd ed. New York: Oxford University
Press.
24. Stansfeld SA, Head J & Marmot MG (1998) Explaining social class differences in depression and well-being.
Soc Psychiatry Psychiatr Epidemiol. 33, 1-9.
25. Turner RJ & Marino F (1994) Social support and social structure: a descriptive epidemiology. J Health Soc
Behav. 35, 193-212.
26. Guthrie JF & Lin BH (2002 ) Overview of the diets of lower- and higher-income elderly and their food
assistance options.
. J Nutr Educ Behav 34, S31-41.
27. Brownie S (2006) Why are elderly individuals at risk of nutritional deficiency? Int J Nurs Pract 12, 110-118.
28. Ramic E, Pranjic N, Batic-Mujanovic O et al. (2011) The effect of loneliness on malnutrition in elderly
population. Med Arh. 65, 92-95.
29. Ferry M, Sidobre B, Lambertin A et al. (2005) The SOLINUT study: analysis of the interaction between
nutrition and loneliness in persons aged over 70 years. J Nutr Health Aging 9, 261-268.

116
30. Bogers RP, Tijhuis M, van Gelder BM et al. (2005) Final report of the HALE (Healthy Ageing: a
longitudinal study in europe).
31. McKie L (1999) Older people and food: independence, locality and diet. British Food Journal 101, 528-536.
32. Thomas DR & Morley JE (2011) Regulation of apetite in older adults: Available at:
http://www.ltcnutrition.org/PDF/Apetite Regulation.pdf.
33. Drewnowski A & Shultz JM (2001) Impact of aging on eating behaviors, food choices, nutrition, and health
status. J Nutr Health Aging. 5, 75-79.
34. Horwath C K-BA, Savige GS, Wahlqvist ML, (1999) Eating your way to a successful old age, with special
reference to older women. Asia Pacific J Clin Nutr 8, 216-225.
35. Food in later life Project (2005) The food in later life team suggests that caterers/community meal providers.
Surrey: Food, Consumer Behaviour and Health Research Center,
University of Surrey,.
36. Delormier T, Frohlich KL & Potvin L (2009) Food and eating as social practice – understanding eating
patterns as social phenomena and implications for public health. Sociol Health Illn 31, 215-228.
37. Kemmer D (2000) Tradition and change in domestic roles and food preparation. Sociology 34, 323-333.
38. Stroebele N & De Castro JM (2004) Effect of ambience on food intake and food choice. Nutrition 20, 821-
838.

117
4 ǀ Resultados
4.4 ǀ Prevalence and sociodemographic determinants of obesity in European
elderly

118

119
PREVALENCE AND SOCIODEMOGRAPHIC DETERMINANTS OF
OBESITY IN EUROPEAN ELDERLY AFONSO C
1, LOPES C
2, DE MORAIS C
1, RAATS M
3, LUMBERS M
3, GRUNERT K
4 , DE ALMEIDA MDV
1
AND THE FOOD IN LATER LIFE TEAM5
1 Universidade do Porto, Faculdade de Ciências da Nutrição e Alimentação - Rua Dr. Roberto Frias 4200 – 465 Porto -
Portugal ([email protected]) 2 Universidade do Porto, Faculdade de Medicina, Departamento de Epidemiologia
Clínica, Medicina Preditiva e Saúde Pública – Portugal, Universidade do Porto, Instituto de Saúde Pública 3 University of
Surrey, UNIS, School of Management – UK 4 The Mapp Centre; The Aarhus School of Business – Denmark
[SUBMITED FOR PUBLICATION]
Abstract
Objective: To evaluate the prevalence of obesity and its sociodemographic determinants in European
seniors.
Design and participants: This study includes 3291 free-living European citizens aged 65 years and
plus, from 8 EU countries (Denmark, Germany, Italy Poland, Portugal, Spain, Sweden and the UK).
Data was collected in 2005, by a structured questionnaire in a face-to-face interview. Body mass index
(BMI) was calculated by a self-reported weight and height and classified according to World Health
Organization’s criteria. Adjusted odds ratio (OR) and confidence intervals (95%CI) were computed
using logistic regression models.
Results: The prevalence of overweight and obesity was 49.8% and 13.3%, in men and 39.5% and
17.8% in women, respectively. Independently of gender, BMI decreased with age, nevertheless this
tendency is not similar across countries. The higher obesity prevalence was observed for English
(20.5%) and Polish (15.8%) men and Polish (26.7%) and German women (25.3%). Obesity was higher
among younger (OR=0.60 and 95%CI: 0.44-0.81) and in less educated men (OR=0.35 and 95%CI:
0.19-0.62). In women, obesity was lower in the older group (OR=0.53 and 95%CI: 0.40-0.69) and in
those with higher monthly income (OR=0.50 and 95%CI: 0.25-0.99). Conclusions: This study supports
that obesity in elderly people is a public health concern in Europe. The younger elderly and those with
low socioeconomic status should be considered as target groups for weight management programs.
Keywords: Elderly, Obesity, Sociodemographic determinants, Europe.
Introduction
Worldwide the proportion of older people defined as 60 years and over, has risen from 8% in
1950 to 11% in 2007 and is expected to reach 22% in 2050 1; 2
. In European Union during the
last 10 years, life expectancy at birth increased by nearly 3 years and the percentage of those
aged 65 years and older represented about 17% of the population in 2003 3.

120
In an analogous way, prevalence of overweigh and obesity is increasing in all age groups,
including in older people 4; 5; 6; 7; 8; 9; 10
.
The recognition of this health problem in the elderly is quite recent and contrasts to the
commonly accepted idea that ageing leads to weight loss and malnutrition 11
. The longitudinal
and multicentric SENECA study showed higher obesity prevalence in the elderly in European
countries, independently of gender 12
.
The epidemic of obesity is a major public health problem and a continuum challenge to health
professionals. In elderly, obesity can exacerbate the age-related decline in physical function
and lead to frailty, doubtless a risk factor for mortality 8; 10; 13; 14
. Controversy remains about
the health consequences of overweight in old age, according some investigators this condition
does not represent a serious problem in this age group 11; 15; 16; 17; 18
.
The ideal BMI has been reported to shift upwards with age, if for adults the BMI with lowest
absolute risk of mortality is between 18.5 kg/m2 and 25 kg/m
2, for elderly has been reported to
be among 24 and 29 kg/m2
19. Data from the National Health and Nutrition Examination
Survey studies indicated that a BMI of 25–29.9 kg/m2 was not associated with increased risks
of mortality in cohorts in the United States 20
. However, BMI higher than 30 kg/m2
is
certainly, a risk factor for disability, morbidity and mortality 18
.
With the increasing prevalence of obesity worldwide and the need for targeted action,
numerous studies highlight the relevance between socioeconomic status even in the elderly 18;
21
Socioeconomic differences in the prevalence of overweight and obesity can be a factor
through which inequalities in health emerge. In affluent societies, obesity levels tend to be
higher in the lower socio-economic classes, especially among 4. WHO MONICA Project
concludes that lower education level were associated to higher BMI in half of the men and
almost all women adult population 22
. Obesity is an extremely costly health problem and the
solution requires a profound understanding of major determinants that are driving to this
condition namely in elderly people 4. It is important to recognise that elderly people are a very
heterogeneous group, not only according to physiological characteristics but also with respect
to sociodemographic conditions, and living situations 23
.
The aim of this study was to evaluate the prevalence of obesity in free living European Seniors
and the sociodemographic variables associated to it.

121
Methods
Participants and procedures
Within the Project “Food in Later Life”, data collection took place in September 2005, 3291
elderly above 65 years of age and living in their own homes were selected. The study was
conducted in 8 countries (Denmark, Germany, Italy Poland, Portugal, Spain, Sweden and the
United Kingdom) and around 400 participants of each country were included.
In each country the sample was quota controlled according three sampling points: gender, age
(65 to 74 years and over 75 years) and living circumstances (living alone, versus living with
others in their homes). In addition, the sample should reflected the diversity of each national
population based on education level, income and urbanization of living environment
(urban/suburban/rural) and was taken from at least three geographical regions in each
participant country.
The interviewers collected information in a face-to-face situation by trained interviewers from
marketing companies, using a structured questionnaire comprising data according to the
objectives. The questionnaire was developed in English, translated and back-translated before
it was piloted in each country.
Respondents were asked to provide information about education level, marital status, total
income and weekly food expenditure per person.
Educational level (highest level of education achieved) was divided into: no formal education;
First level or basic: less than primary school/primary school completed); secondary: secondary
school completed; tertiary: college/university completed/postgraduate degree completed.
Elderly were asked to estimate the total income received by in euros, into 13 categories (less
than 366€; 366-433€; 434-646€; 647-864€; 865-1078€; 1079-1291€; 1292-1622€; 1623-
1942€; 1943-2161€; 2162-2481€; 2482-2793€; 2794-3578€; more than 3578€). Due to a low
frequency of some categories, this measure was subsequently re-coded into four categories:
less than 433€ per month, 433 to 1078 €/month, 1079 to 1943 €/month and above
1943€/month.
Further BMI was calculated by self-assessed weight and height (wh/ht2) and World Health
Organization’s classification was used to determine the prevalence of overweight and obesity
24.
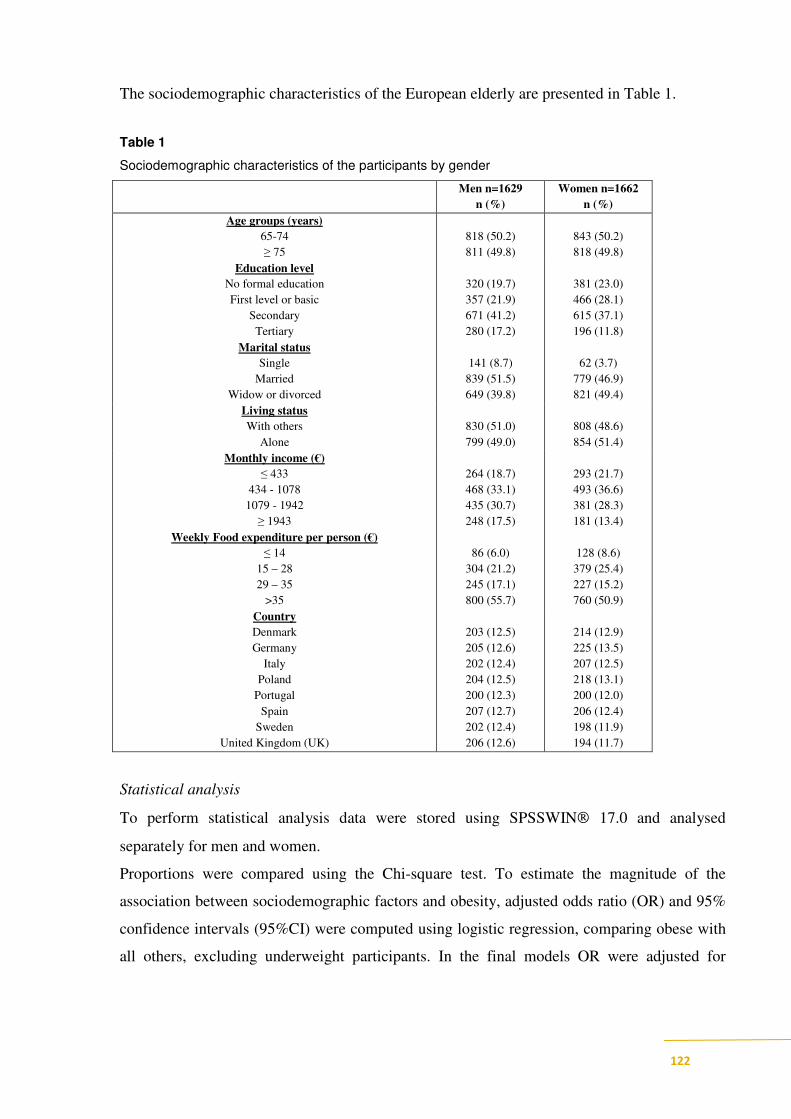
122
The sociodemographic characteristics of the European elderly are presented in Table 1.
Table 1
Sociodemographic characteristics of the participants by gender
Men n=1629
n (%)
Women n=1662
n (%)
Age groups (years)
65-74
≥ 75
818 (50.2)
811 (49.8)
843 (50.2)
818 (49.8)
Education level
No formal education
First level or basic
Secondary
Tertiary
320 (19.7)
357 (21.9)
671 (41.2)
280 (17.2)
381 (23.0)
466 (28.1)
615 (37.1)
196 (11.8)
Marital status
Single
Married
Widow or divorced
141 (8.7)
839 (51.5)
649 (39.8)
62 (3.7)
779 (46.9)
821 (49.4)
Living status
With others
Alone
830 (51.0)
799 (49.0)
808 (48.6)
854 (51.4)
Monthly income (€)
≤ 433
434 - 1078
1079 - 1942
≥ 1943
264 (18.7)
468 (33.1)
435 (30.7)
248 (17.5)
293 (21.7)
493 (36.6)
381 (28.3)
181 (13.4)
Weekly Food expenditure per person (€)
≤ 14
15 – 28
29 – 35
>35
86 (6.0)
304 (21.2)
245 (17.1)
800 (55.7)
128 (8.6)
379 (25.4)
227 (15.2)
760 (50.9)
Country
Denmark
Germany
Italy
Poland
Portugal
Spain
Sweden
United Kingdom (UK)
203 (12.5)
205 (12.6)
202 (12.4)
204 (12.5)
200 (12.3)
207 (12.7)
202 (12.4)
206 (12.6)
214 (12.9)
225 (13.5)
207 (12.5)
218 (13.1)
200 (12.0)
206 (12.4)
198 (11.9)
194 (11.7)
Statistical analysis
To perform statistical analysis data were stored using SPSSWIN 17.0 and analysed
separately for men and women.
Proportions were compared using the Chi-square test. To estimate the magnitude of the
association between sociodemographic factors and obesity, adjusted odds ratio (OR) and 95%
confidence intervals (95%CI) were computed using logistic regression, comparing obese with
all others, excluding underweight participants. In the final models OR were adjusted for

123
country, afterwards for age, education and country in men and for age, income and country in
women, according to the the findings from the preceding analysis.
Results
In this free-living European elderly the prevalence of obesity was 13.3% in men and 17.8% in
women. Overweight was present in 49.8% and 39.5%, respectively in men and women.
Underweight prevalence was higher in women (2.3%) than in men (0.4%) (Table 2).
The prevalence of obesity ranged from 20.5% in English men to 7.5% in Italian ones. In
women this prevalence ranged from 26.7% in Poland to 9.6% in Sweden.
Table 2
Prevalence within BMI categories by gender and European Country
< 18.5 18.5 – 24.99 25.0 – 29.99 ≥≥≥≥ 30.0 < 18.5 18.5 – 24.99 25.0 – 29.99 ≥≥≥≥ 30.0
Denmark 0 (0) 73 (36.0) 106 (52.2) 24 (11.8) 8 (3.8) 106 (49.8) 72 (33.8) 27 (12.7)
Germany 1 (0.5) 60 (29.3) 117 (57.1) 27 (13.2) 2 (0.9) 67 (29.8) 99 (44.0) 57 (25.3)
Italy 1 (0.5) 86 (42.8) 99 (49.3) 15 (7.5) 6 (2.9) 80 (39.0) 94 (45.9) 25 (12.2)
Poland 0 (0) 66 (32.5) 105 (51.7) 32 (15.8) 4 (1.8) 67 (30.9) 88 (40.6) 58 (26.7)
Portugal 2 (1.2) 61 (35.5) 82 (47.7) 27 (15.7) 2 (1.5) 50 (36.5) 58 (42.3) 27 (19.7)
Spain 1 (0.5) 55 (26.6) 123 (59.4) 28 (13.5) 4 (1.9) 65 (31.6) 103 (50.0) 34 (16.5)
Sweden 1 (0.9) 90 (44.8) 92 (45.8) 18 (9.0) 6 (3.0) 123 (62.4) 49 (24.9) 19 (9.6)
UK 1 (0.9) 88 (45.1) 66 (33.8) 40 (20.5) 5 (2.7) 78 (42.6) 63 (34.4) 37 (20.2)
Total 7 (0.4) 579 (36.5) 790 (49.8) 211 (13.3) 37 (2.3) 636 (42.5) 626 (39.5) 284 (17.8)
Men n (%) Women n (%)
Compared to European average the prevalence of obesity is higher in UK, Portugal and Poland
and lower in Sweden, Italy and Denmark, for both men and women. Overweight prevalence
was higher in Danish, Germans, Polish and Spanish and lower in English, Swedish,
Portuguese and Italian men. In women, the prevalence of this BMI category was higher in
Spain and Germany, as well as in men, and in Portugal, Italy, and lower in Danish, Swedish
and English women (Graph 1 and 2).
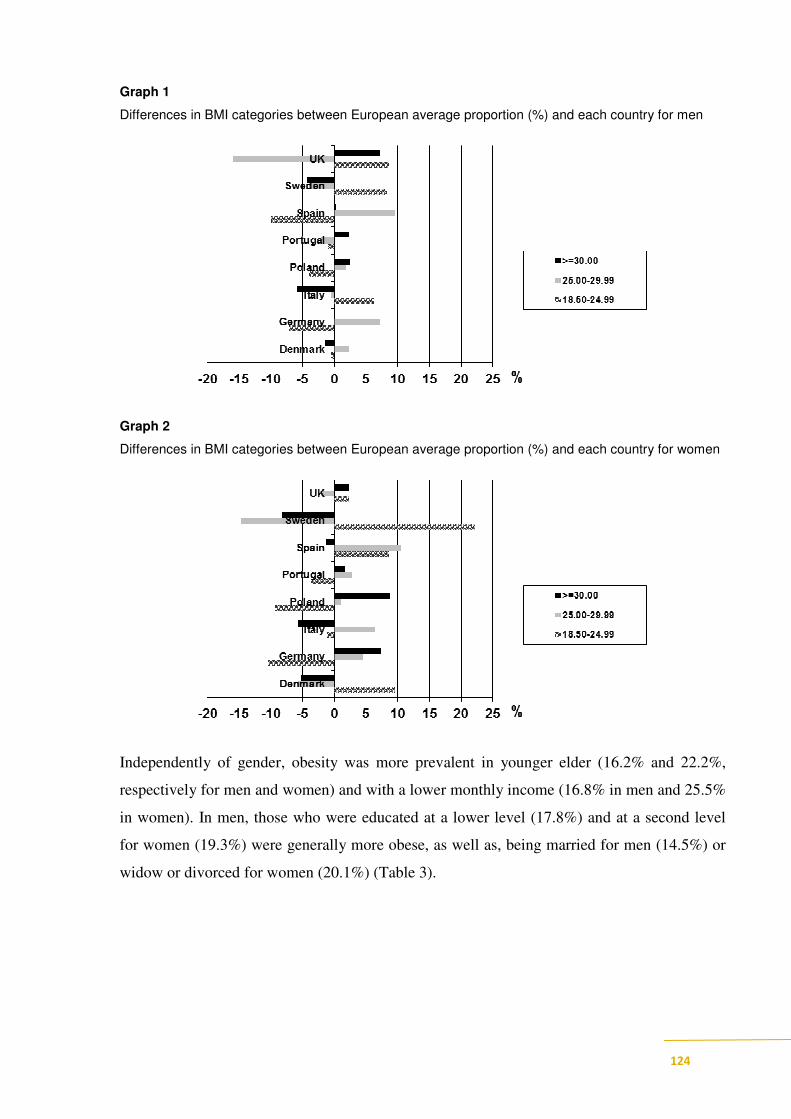
124
Graph 1
Differences in BMI categories between European average proportion (%) and each country for men
Graph 2
Differences in BMI categories between European average proportion (%) and each country for women
Independently of gender, obesity was more prevalent in younger elder (16.2% and 22.2%,
respectively for men and women) and with a lower monthly income (16.8% in men and 25.5%
in women). In men, those who were educated at a lower level (17.8%) and at a second level
for women (19.3%) were generally more obese, as well as, being married for men (14.5%) or
widow or divorced for women (20.1%) (Table 3).

125
Table 3
BMI categories distribution according to sociodemographic characteristics of elderly participants, by
gender
Characteristics 18.5 – 24.99 25.0 – 29.99 ≥≥≥≥ 30.0 p 18.5 – 24.99 25.0 – 29.99 ≥≥≥≥ 30.0 p
Age
65 - 74 274 (34.2) 394 (49.2) 130 (16.2) 299 (37.1) 314 (39.0) 179 (22.2)
≥75 305 (38.8) 396 (50.4) 81 (10.3) 337 (43.4) 312 (40.2) 104 (13.4)
Education level
No formal
education96 (32.2) 146 (49.0) 53 (17.8) 121 (36.6) 145 (43.8) 58 (17.5)
First level or basic 121(34.7) 185 (53.0) 42 (12.0) 161 (35.9) 188 (42.0) 86 (19.2)
Secondary 249 (37.7) 315 (47.7) 94 (14.2) 242 (39.9) 234 (38.6) 117 (19.3)
Tertiary 112 (40.3) 144 (51.8) 22 (7.9) 108 (55.7) 59 (30.4) 23 (11.9)
Living Status
With others 281 (34.4) 414 (50.7) 118 (14.4) 321 (41.3) 319 (41.1) 124 (16.0)
Alone 298 (38.7) 376 (48.8) 93 (12.1) 315 (39.1) 307 (38.1) 160 (19.9)
Marital Status
Single 57 (41.6%) 59 (43.1) 19 (13.9) 32 (51.6) 18 (29.0) 9 (14.5)
Married 282 (34.1) 420 (50.8) 120 (14.5) 307 (41.0) 309 (41.3) 120 (16.0)
Widow/divorced 240 (38.5) 240 (38.5) 72 (11.5) 297 (38.4) 299 (38.7) 155 (20.1)
Monthly income (€)
≤ 433 79 (32.4) 123 (50.4) 41 (16.8) 77 (30.2) 108 (42.4) 65 (25.5)
434 - 1078 163 (35.4) 233 (50.5) 61 (13.2) 170 (36.1) 197 (41.8) 93 (19.7)
1079 - 1942 167 (38.5) 208 (47.9) 58 (13.4) 160 (42.4) 147 (39.0) 62 (16.4)
≥ 1943 97 (39.6) 124 (50.6) 23 (9.4) 99 (54.7) 58 (32.0) 22 (12.2)
Weekly Food
expenditure per
person (€)
≤ 14 1 (0.3) 1 (0.4) 4 (0.5) 7 (2.0) 4 (1.9) 19 (2.6)
15 – 28 96 (33.1) 80 (33.9) 296 (37.4) 117 (32.9) 83 (38.4) 324 (43.6)
29 – 35 152 (52.4) 125 (53.0) 390 (49.3) 157 (44.1) 83 (38.4) 278 (37.4)
> 35 41 (14.1) 30 (12.7) 101 (12.8) 75 (21.1) 46 (21.3) 122 (16.4)
Total 579 (36.5) 790 (49.8) 211 (13.3) 636 (42.5) 626 (39.5) 284 (17.8)
0.246 <0.001
0.0130.797
0.013 <0.001
0.139 0.098
0.150 0.060
Men (n=1629)
BMI Categories n (% )
Women (n=1662)
BMI Categories n (% )
0.002 <0.001
In men, obesity significantly decreased with age (OR=0.60 and 95%CI: 0.44-0.81, for older
versus younger), education level (OR=0.35 and 95%CI: 0.19-0.62, for those with a higher
education against lower). After adjustment for age, education and country, a higher prevalence
of obesity still remains.
In European elderly women, the prevalence of obesity was significantly associated with age,
monthly income and after adjustment for age, income and country, older women tend to be

126
less obese (OR=0.53 and 95%CI: 0.40-0.69, versus younger ones), as well as for those with a
higher income (OR=0.50 and 95%CI: 0.25-0.99, against lower) (Table 4).
Table 4
Association between obesity and sociodemographic characteristics in elderly participants (obese vs.
normal and overweight)
Age
(65 – 74) 1 1 1 1
≥75 0.60 (0.44-0.81) 0.56 (0.36-0.74) 0.53 (0.41-0.69) 0.48 (0.35-0.66)
Education level
(No formal
education)1 1 1 1
First level or basic 0.58 (0.37-0.92) 0.53 (0.31-0.91) 1.07 (0.73-1.59) 0.94 (0.60-1.49)
Secondary 0.64 (0.40-1.02) 0.49 (0.28-0.87) 0.82 (0.52-1.31) 0.65 (0.38-1.13)
Tertiary 0.35 (0.19-0.63) 0.30 (0.15-0.60) 0.71 (0.39-1.28) 0.20 (0.32-1.27)
Marital status
(Married) 1 1 1 1
Single 0,8 (0.57–1.03) 0.56 (0.16-1.91) 1.27 (0.974–1.67) 0.48 (0.16-1.47)
Widow/divorced 1.00 (0.58–1.71) 0.71 (0.19-2.68) 0,97 (0.46–2.05) 0.34 (0.09-1.31)
Living
circumstances
(With others) 1 1 1 1
alone 0.81 (0.60-1.08) 1.28 (0.38-4.35) 1.32 (1.01-1.71) 2.28 (0.74-6.98)
Monthly income
(€)
(≤ 433) 1 1 1 1
434 - 1078 0.82 (0.49-1.38) 0.90 (0.48-1.67) 0. 80 (0.50-1.29) 0.65 (0.39- 1.10)
1079 - 1942 0.89 (0.48-1.64) 1.03 (0.49-2.16) 0.65 (0.37-1.13) 0.53 (0.28- 1.00)
≥ 1943 0.64 (0.31-1.32) 0.70 (0.28-1.72) 0.50 (0.25-0.99) 0.38 (0.17-0.86)
Weekly Food
expenditure per
person (€)
(≤ 14) 1 1 1 1
15 – 28 1.43 (0.66-3.14) 1.47 (0.65-3.31) 1.73 (0.79 -2.38) 1.66 (0.90-3.06)
29 – 35 1.39 (0.60-3.18) 1.72 (0.71-4.18) 1.63 (0.87-3.05) 1.99 (0.98-4.05)
> 35 1.60 (0.74-3.50) 1.47 (0.63-3.45) 1.50 (0.82-2.72) 1.97 (0.99-3.88)
Men Women
OR adjusted1
(95% CI)
OR adjusted2
(95% CI)
OR adjusted1
(95)% CI)
OR adjusted2
(95% CI)
OR adjusted1 for country
OR adjusted2 for age, education and country in men and for age, income and country in women.
127
Discussion
The obesity epidemic has received considerable attention around the world. Many studies
indicate that BMI increases amongst middle-aged elderly people, who are at the greatest risk
of health complications 25
. Our findings draw attention to the differences in obesity prevalence
across the European countries, with 15.6% (13.3% in men and 17.8% in women) of the elderly
being obese, this prevalence ranged from 7.5% (Italy) to 20.5% (UK) in men and 9.6%
(Sweden) to 26.7% (Poland) in women. The prevalence of underweight was only present
among 0.4% of elderly men and 2.3% of elderly female.
Contrary to what has been observed in children a north-south gradient was not found for
elderly 26
.
Data from SENECA finale, showed ranged from 8% (Italy), similar to our results, to 32%
(France) in men; and 10% (Denmark) (a higher prevalence was found in our data) to 46%
(Belgium) in women 12
.
According to the SHARE study, collected self-report data from individuals aged 50 plus the
occurrence of obesity ranged from 13.1% (Switzerland) to 20.2% (Spain) in men, higher than
our results, and 12.7%, lower than present data, to 26.9% in women, respectively in the same
countries 10
.
Results from the Gothenburg cohort in Sweden, presented prevalence of obesity in 11% of
men and 16% of women 27
, higher than the present results in both genders, nevertheless in the
self-report measures from European Nutrition and Health Report it was found similar results
26.
According to the WHO in 2005, the prevalence of obesity in the UK were among the highest
in Europe, and in 2004 in England, 46.8% of elderly and 49.3% of elderly women were obese
28, data from the last European Nutrition and Health Report showed the same tendency
26. The
present study presented a lower prevalence probably because of our self-reported data,
nevertheless the prevalence in this country were above the European average.
In an Irish elderly sample, almost one-fifth had a BMI over 30 kg/m2 (17% of men and 20% of
woman) 29
.
In a Portuguese study the prevalence of obesity in the oldest groups varied from 17.2% in 60-
69 years old group to 14.1 in the oldest (more than 70) in men, similar results were performed
by the present study; and 31.1% in 60-69 years old group to 31.7% in those women with more
than 70 years old 30
, a higher proportion than our results from the Portuguese sample.

128
In a free-living elderly Spanish study showed a prevalence of obesity in men of 31.5% and
40.8% for women 31
, these data contrast with our findings regarding this country where the
proportions were much more lower. The Italian Longitudinal Study on Ageing found a
prevalence of obesity of 15% for men and 28% for women 11; 32
also greater than Italian data
from our study. Data from the European Nutrition and Health Report26
showed similar data
from this country to present, due the equal methods of data collection (Table 5).
Table 5
Comparison between prevalence of obesity (BMI≥ 30.0kg/m2) in elderly by gender: present study vs.
data from other previous European studies.
Men Women Men Women Men Women Men Women Men Women
Denmark 24 (11.8) 27 (12.7) 14.4 13.8 12 12 16 10 - -
Germany 27 (13.2) 57 (25.3) 17.1 17.5 23 29 - - - -
Italy 15 (7.5) 25 (12.2) 16.2 18.1 13 13 8 14 15 28
Poland 32 (15.8) 58 (26.7) - - 29 8 - - - -
17.2 (60-69 y) 31.1 (60-69 y)
14.1 (≥70 y) 31.7 (≥70 y)
Spain 28 (13.5) 34 (16.5) 20.2 26.9 - - 17 26 31.5 40.8
Sweden 18 (9.0) 19 (9.6) 13.4 15.8 9 11 - - 11 16
31 (65-74 y) 35 (65-74 y)
18 (≥74 y) 27 (≥74 y)
Total 211 (13.3) 284 (17.8) 16.5 18.5 - - 20 20 - -
46.8 49.3
21 22 20
UK 40 (20.5) 37 (20.2) - - - -
Portugal 27 (15.7) 27 (19.7) - - 18
SENECA
finale
(de Groot
CPGM et al
2002)
Other studies
(British Nutrition
Foundation 2009, Dey DK
et al 2001 , Inelman E et al
2003, Perissinotto E et al
2002, Santos AC and
Barros H 2003)
Self-reported Measured
Present
SHARE
(Peytremann-
Bridevaux I
and Santos-
Eggimann B
2008)
European Nutrition and
Health Report
(Elmadfa I et al 2009)
In a recent publication obtained from a national representative sample of US population, the
prevalence of obesity was 37.1% in men, aged plus 60 years and 33.6% in women with the
same age, 33
, this reported proportion is higher than the mean average of European studies
above.

129
The preliminary findings from SABE confirms that Latin American and Caribbean display
differences across obesity prevalence varied from the higher prevalence found in Uruguay and
Chile to the lower, found in Brazil and Cuba. In this study, 20.3% of elderly men and 41.6% in
elderly women in Uruguay were obese, as well as in 26.4% in men and 33.6% in women from
Chile. In Brazil and Cuba the obesity prevalence was found in 9.8% and 13.8% of elderly
men, and in 25.8% and 28.2% of the older female, respectively 34
.
Regarding gender, epidemiological data suggested that the obesity was in general higher in
women than in men 11; 27; 29; 30; 31; 32; 35; 36
, as well as observed in the present study, exception to
the study performed in the United States, and from some particular countries in the European
studies 10; 12; 26; 33; 37
.
In both genders the odds favouring obesity significantly decreased with age as well as in other
studies across the world 9; 13; 26; 29; 32; 38; 39; 40
In our sample we found differences in obesity prevalence related to education level in men
and with income in women. In men, obesity is significantly related with education and in
elderly women with monthly income. Older less educated men tend to be more obese and
older women with a higher income tend to be less obese.
In general the most consistent association previously described in the literature is that the
educational level and income is inversely related to physical disability and health status,
accompany worse health outcomes in older age 21; 41
. In relation to obesity, many studies have
investigated the relationship between socioeconomic status and obesity and in general an
inverse association has been observed 18; 22; 30; 36; 42; 43; 44
. This fact could be attributed to food
insecurity (limited or uncertain availability to eat nutritional-dense and safety food in a social
accepted form), limited medical care access, decreased the opportunities to engage in healthy
behaviours like physical activity, and a limited access to community resources 5; 45
.
The report compiled by the Working Group of the International Obesity Task Force (IOTF),
shows that as the socioeconomic conditions of a country improve, the average weight of the
population rises and the number of people who are obese increases. As a transition proceeds,
overweight and obesity also begin to increase among the poor, especially among women. In
affluent societies, obesity levels tend to be highest in the lower socioeconomic classes, as in
the transition countries, mainly among women but in the ethnic minorities population still
persist in the affluent women 4.
130
Prevalence of obesity in SHARE study was strongly related with lower socioeconomic status
across countries and gender regarding education level and income, as well as in our findings 9.
Results from the European project ZENITH, also confirm this fact, the results were similar
regarding the fact that obesity was more associated with low educational level and low
sociodemographic profile 46
. In a Spanish study differences by educational level were seen
only in women. The increase of obesity in this population was justified by the authors through
socioeconomic conditions in Spain during the years these cohorts were born 31
. Among
Portuguese, higher prevalence of obesity in elderly and less educated men has been reported
30.
In the US population, the prevalence of obesity showed significant variation by racial and
ethnic groups 33
and in Brazilian elderly the prevalence of obesity was significantly related to
income, but in the opposite way, obesity was prevalent in those elderly with higher income 47
and in Bambuí, study education level was significantly related to a low prevalence of obesity
38.
In the present study living alone or with others, marital status and weekly food expenditure
per person were not significantly associated to obesity, however some investigators highlight
the relevance of marital status to nutritional status among the elderly 48; 49
.
Our research is based on a large representative sample of free-living European elderly, but
some limitations of this study should be pointed out. The mainly was obviously the fact of
BMI was calculated by self-assessed weight and height, which eventually explains the
differences in obesity prevalence from other studies that used objective measures.
Assuming that self-reported weight and height may be unreliable indicators of body mass, due
to the general trend to overestimate height and to underestimate weight, consequently leading
to an underestimation of BMI, this occurrence is usual in the elderly. Ramos et al, confirm this
fact identifying that the proportion of unawareness was higher not only in women but also in
the older 50
.
In elderly people, physiological changes due to ageing affect body shape, size and
composition, consequently it is common that this fact interfere with self-perception of
measures of weight and height 11; 13; 19; 28; 32; 51
In 2007, a reviewed performed by Lin on this subject found a poor validity of self-report
measures 52
and some authors agree in considering a poor indicator of risk in elderly 11; 32
.
Nevertheless, BMI represents an easier and most frequently used index to identify subjects at

131
risk of under or over nutrition, and it was described as an important indicator of mortality for
adults of all ages 39
.
In spite of these limitations our findings were in line with other investigations 11; 13; 28; 32
that
reveal that obesity is a public health problem around this age group and the true percentage of
obesity may therefore be higher than our estimates.
The strengths of the present study were that limited studies are available on how obesity
patterns differ across countries, using the same methodology, and considered the
sociodemographic factors as a determinant of obesity in the free-living elderly.
Conclusion
In spite of the fact that BMI was calculated by self-reported weight and height we found a
high prevalence of obesity across free-living European elderly, and if malnutrition predisposes
delays recovery from illness and adversely affects body function, while being obese increases
the risk of many chronic diseases and interfere with quality of life in the elderly. Being obese
was more prevalent in English (20%) and Polish (15.8%) elderly men, and Polish (26.7%) and
German (25.3%) elderly women.
If socioeconomic differences in the prevalence of obesity may act as one factor through which
these inequalities in health emerge, health promotion activities need to be tailored not only to
the different countries but also according to the different sociodemographic aspects. Scientific
evidence highlighting the importance of applying a life-course approach to the prevention
obesity. Results of this study identify target groups for weight management programs to avoid
obesity in the elderly, less educated men and elderly women with lower income.
References
1. European Comission & Health and Consumer Protection Directorate-General (2007)
Healthy ageing: keystone for a sustainable Europe.
2. World Health Organization (2002) Active ageing. A policy framework. Geneva: World
Health Organization,.
3. Eurostat (2004) Proportion of population aged 65 and over (% of total population).
4. Kumanyika S (2002) The minority factor in the obesity epidemic. Ethn Dis 12, 316-319.
5. Niedert KC & American Dietetic Association (2005) Position paper of the American
Dietetic Association: nutrition across the spectrum of aging. J Am Diet Assoc 105, 616-633.
6. Solerte SB, Precerutti S, Gazzaruso C et al. (2005) Defect of a subpopulation of natural
killer immune cells in Graves' disease and Hashimoto's thyroiditis: normalizing effect of
dehydroepiandrosterone sulfate. Eur J Endocrinol 152, 703-712.
132
7. Zamboni M, Mazzali G, Zoico E et al. (2005) Health consequences of obesity in the
elderly: a review of four unresolved questions. Int J Obes (Lond) 29, 1011-1029.
8. Adams KF, Schatzkin A, Harris TB et al. (2006) Overweight, obesity, and mortality in a
large prospective cohort of persons 50 to 71 years old. N Engl J Med 355, 763-778.
9. Andreyeva T (2006) An international comparation of obesity in older adults: effects and
risk factors United States: ProQuest Information and Learning Company
10. Peytremann-Bridevaux I & Santos-Eggimann B (2008) Health correlates of overweight
and obesity in adults aged 50 years and over: results from the Survey of Health, Ageing and
Retirement in Europe (SHARE). Obesity and health in Europeans aged > or = 50 years. Swiss
Med Wkly 138, 261-266.
11. Inelman E, Sergi G, Coin A et al. (2003) Can obesity be a risk factor in elderly people?
Obes Rev 2, 147-155.
12. de Groot LCPGM, Enzi G, Matthys C et al. (2002) Ten-year changes in anthropometric
characteristics of elderly Europeans. J Nutr Health Aging 6, 4-8.
13. Villareal D, Apovian CM, Kushner RF et al. (2005) Obesity in older adults: technical
review and position statement of the American Society for Nutrition and NAASO, The
Obesity Society. Am J Clin Nutr 82, 923-934.
14. Rössner S (2001) Obesity in the elderly – a future matter of concern? Obes Rev 2, 183-
188.
15. Takata Y, Ansai T, Soh I et al. (2007) Association between body mass index and mortality
in an 80-year-old population. J Am Geriatr Soc 55, 913-917.
16. Kulminski AM, Arbeev KG, Kulminskaya IV et al. (2008) Body mass index and nine-year
mortality in disabled and nondisabled older U.S. individuals. J Am Geriatr Soc 56, 105-110.
17. van Kan GA, Rolland YM, Morley JE et al. (2008) Frailty: toward a clinical definition. J
Am Med Dir Assoc 9, 71-72.
18. World Health Organization (2007) The challenge of obesity in the WHO European Region
and the strategies for response. Copenhagen: WHO Library Cataloguing in Publication Data.
19. Lipschitz DA (1994) Screening for nutritional status in the elderly. Prim Care 21, 55-67.
20. Flegal KM, Graubard BI, Williamson DF et al. (2005) Excess deaths associated with
underweight, overweight and obesity. JAMA 293, 1861-1867.
21. Marmot MG & Wilkinson RG (2006) Social determinants of health. 2sd ed. New York:
Oxford University Press.
22. Molarius A, Seidell JC, Sans S et al. (2000) Educational level, relative body weight, and
changes in their association over 10 years: an international perspective from the WHO
MONICA Project. Am J Public Health 90, 1260-1268.
23. Volkert D (2005) Nutrition and lifestyle of the elderly in Europe. J Public Health 13, 56-
61.
24. World Health Organization (2000) Obesity: preventing and managing the global epidemic.
Report of a WHO consultation.: World Health Organnization Tech Rep Ser.
25. World Health Organization (2003) Diet, nutrition and the prevention of chronic diseases.
26. Elmadfa I, Meyer A, Nowak V et al. (2009) European nutrition and health report 2009.
Ann Nutr Metab 55 1-40.
27. Dey DK, Rothenberg E, Sundh V et al. (2001 ) Body mass index, weight change and
mortality in the elderly. A 15 y longitudinal population study of 70 y olds. Eur J Clin Nutr 55,
482-492.
28. British Nutrition Foundation (2009) Healthy ageing: the role of nutrition and lifestyle
Oxford: Wiley-Blackwell.
133
29. Corish CA & Kennedy NP (2003) Anthropometric measurements from a cross-sectional
survey of Irish free-living elderly subjects with smoothed centile curves. Br J Nutr 89, 137-
145.
30. Santos AC & Barros H (2003) Prevalence and determinants of obesity in an urban sample
of Portuguese adults. Public Health 117, 430-437.
31. Gutierrez-Fisac JL, Lopez E, Banegas JR et al. (2004) Prevalence of overweight and
obesity in elderly people in Spain. Obes Res 12, 710-715.
32. Perissinotto E, Cl P, Sergi G et al. (2002) Antropometric measurements in the elderly: age
and gender differences Br J Nutr 87, 177-186.
33. Flegal KM, Carroll MD, Ogden CL et al. (2010) Prevalence and trends in obesity among
US adults, 1999-2008. JAMA 303, 235-241.
34. Wong R, Peláez M & Palloni A (2005) Self-reported general health in older adults in Latin
America and the Caribbean: usefulness of the indicator [Article in Spanish]. Rev Panam Salud
Publica 17, 323-332.
35. Heitmann BL (1999) Women health and obesity. Int J Obes 23, S5.
36. Monteiro CA, Moura EC, Conde WL et al. (2004) Socioeconomic status and obesity in
adult populations of developing countries: a review. Bull World Health Organ 82, 940-946.
37. de Groot LCPGM & van Staveren WA (2004) The status of nutrition in older adults. In
Handbook of Clinical Nutrition and Aging, pp. 63-76 [Bales CW and Ritchie CS, editors].
New Jersey: Humana Press.
38. Barreto SM, Passos VM & Lima-Costa MF (2003) Obesity and underweight among
Brazilian elderly: the Bambui Health and Aging Study. Cad Saude Publica 19, 605-612.
39. Coqueiro RS, Barbosa AR & Borgatto AF (2009) Anthropometric measurements in the
elderly of Havana, Cuba: age and sex differences. Nutrition 25, 33-39.
40. Sulander TT & Uutela AK (2007) Obesity and education: Recent trends and disparities
among 65- to 84-year-old men and women in Finland. Prev Med 45, 153-156.
41. Administration on Aging (2010) Healthy people 2010: Available at:
www.aoa.gov/prof/aoaprog/healthpromo/healthpromo-pf_asp. (accessed: july 2011).
42. Sarlio-Lähteenkorva S & Lahelma E (1999) The association of body mass index with
social and economic disadvantage in women and men. Int J Epidemiol 28, 445-449.
43. Marques-Vidal P & Dias CM (2005) Trends in overweight and obesity in Portugal: the
National Health Surveys 1995-6 and 1998-9. Obes Res 13, 1141-1145.
44. Moreira P & Padrão P (2006) Educational, economic and dietary determinants of obesity
in Portuguese adults: A cross-sectional study. Eat Behav 7, 220-228.
45. Guthrie JF & Lin BH (2002) Overview of the diets of lower- and higher-income elderly
and their food assistance options. J Nutr Educ Behav 34, S31-41.
46. Intorre F, Maiani G, Cuzzolaro M et al. (2007) Descriptive data on lifestyle,
anthropometric status and mental health in italian elderly people. J Nutr Health Aging 11, 165-
174.
47. Campos MAG, Pedroso ERP, Lamounier JA et al. (2006) Estado nutricional e fatores
associados em idosos. Revista da Associação Médica Brasileira 52, 214-221.
48. Brownie S (2006) Why are elderly individuals at risk of nutritional deficiency? Int J Nurs
Pract 12, 110-118.
49. Drewnowski A & Shultz JM (2001) Impact of aging on eating behaviors, food choices,
nutrition, and health status. J Nutr Health Aging 5, 75-79.
50. Ramos E, Lopes C, Oliveira A et al. (2009) Unawareness of weight and height--the effect
on self-reported prevalence of overweight in a population-based study. J Nutr Health Aging
13, 310-314.

134
51. Rössner S (2001) Obesity in the elderly – a future matter of concern? Obesity Reviews 2,
183-188.
52. Lin DC (2007) Actual measurements of body weight and height are essential: most sef-
reportede weights and heights are unrealiable. Nutr Today 42, 263-266.

135
5 ǀ Conclusão

136

137
5 ǀ Conclusão
Para a promoção da saúde através da alimentação, tão importante quanto identificar o
consumo alimentar real, é entender os fatores que o determina, compreendendo todo o
envolvimento que os condiciona e hierarquizando-os de acordo com a sua importância assim
como auscultando em cada fase da vida, quais as expectativas e objetivos em relação a este
aspeto vital da vida dos seres humanos87.
O presente estudo ilustra a diversidade de objetivos face à alimentação nos idosos Europeus.
Esta diversidade deverá ser tida em consideração quando se delineiam programas de
promoção da saúde nesta faixa etária.
Uma análise inicial permitiu-nos compreender que os idosos Europeus realçavam aspetos
relacionados com o prazer e preocupações com a sua saúde. Pelo contrário, fatores
relacionados com a conveniência na preparação e confeção de alimentos e manter as suas
competências para cozinhar para os outros, foram os fatores menos referidos pela amostra.
Comparativamente com a média Europeia, os idosos provenientes de Portugal e Espanha
deram grande importância ao ambiente envolvente no ato de se alimentarem. Para além
destes dois países também a Polónia destacava preocupações em controlar os gastos com a
alimentação.
De forma a sistematizar os diferentes objetivos e compreender a sua relevância como um
todo, efetuou-se uma análise fatorial na qual se extraíram 2 subdomínios, o primeiro
relacionado com aspetos de saúde e sensoriais (saúde/sensorial) e outro enfatizando
questões sociais e económicas (social/económica). Com a exceção da Polónia, maiores
proporções de idosos provenientes dos demais países salientaram aspetos relacionados com o
primeiro subdomínio.
138
Os idosos que apresentavam maior nível de escolaridade foram os que mais revelaram
preocupações inseridas no primeiro subdomínio, enquanto os menos escolarizados e com
menores rendimentos destacaram preocupações incluídas no segundo subdomínio.
A proporção de idosos a destacar aspetos relacionados com a saúde e sensoriais aumentava
significativamente à medida que aumentava a sua satisfação com a alimentação, com a sua
saúde de uma forma global e com a sua saúde física, e decrescia quando a sua saúde mental
aumentava. De uma forma geral, idosos satisfeitos realçavam aspetos de saúde/sensoriais.
Aspetos sociais e económicos estavam também relacionados com maior satisfação em relação
à alimentação e com a vida no geral, mas decresciam com o aumento da saúde física e
mental.
Informação proveniente da amostra Portuguesa permitiu-nos caracterizar estes idosos quanto
à adesão ao padrão alimentar de tipo “Mediterrânico”.
A escolha deste tipo de padrão alimentar tem vindo a ser consistentemente associado a
resultados positivos de saúde e qualidade de vida. Em concordância, vários índices têm vindo a
ser concebidos para estimar a adesão ao padrão alimentar Mediterrânico.
Neste estudo, os idosos Portugueses surgem como maiores consumidores de pescado e vinho
do que as idosas. Os mais velhos ingeriam em maior proporção fruta, hortícola, cereais, leite e
derivados e azeite que os idosos mais novos, sendo que este último alimento era mais
consumido pelas idosas mais velhas, tal como o pescado.
Os idosos com maior nível de escolaridade consumiam mais hortícolas, pescado, vinho e fruta
que os menos escolarizados. As leguminosas e a fruta foram os alimentos que se destacaram
em termos de consumos entre idosas mais escolarizadas.

139
Quanto à adesão ao padrão alimentar Mediterrânico, foi encontrado um valor superior à
média do índice, porém aquém do esperado atendendo à geografia do país e à faixa etária da
amostra.
A maior adesão a este padrão foi registada nos indivíduos mais escolarizados, que auferiam
maiores rendimentos e residentes na região Centro de Portugal.
Considerando a relação da adesão ao padrão alimentar Mediterrânico aos demais
componentes do estilo de vida (atividade física e hábitos tabágicos), não apresentavam
diferenças significativas quanto à prática de atividade física, provavelmente devido à enorme
proporção de idosos inativos. Quanto aos hábitos tabágicos, os não fumadores aderiam em
proporção significativa a este padrão alimentar.
A adesão ao padrão alimentar Mediterrânico aumentava significativamente com o aumento
da saúde física e com os objetivos relacionados com a saúde e sensoriais. Porém quanto maior
era a aquisição de alimentos em suportes formais (restaurantes) ou informais (família), menor
era a adesão a este padrão.
Os resultados referentes à ingestão alimentar ilustram a necessidade de incluir/reforçar
conceitos inerentes ao padrão alimentar mediterrânico de forma a promover o bem estar e a
saúde nesta faixa etária.
A par de compreender a que é que os idosos aspiram em termos de alimentação, de
conceptualizar sobre o que realmente comem, importa também perceber onde adquirem as
suas refeições.
O presente estudo mostra um cenário muito heterogéneo entre os diferentes idosos
provenientes dos diferentes países Europeus. Os idosos da Dinamarca, Itália e Alemanha
tendem a obter mais frequentemente as suas refeições fora de casa ao contrário do referido
pelos idosos Portugueses.
140
À exceção da Suécia, a família é identificada como o suporte mais importante no que se refere
à alimentação, em comparação com o setor formal. Dentro deste setor o que mais se
destacou foi o recurso a restaurantes, seguido de cafés e bares. Na Suécia o recurso mais
referido foram os restaurantes, sendo a família elencada apenas em 4º lugar.
Foram identificadas as variáveis sociodemográficas determinantes da procura de suportes
alimentares fora de casa, sendo que foram as idosas e os mais velhos, aqueles que menos
referiam recorrer a alimentação fora de casa. Por outro lado os indivíduos mais escolarizados
e com maiores rendimentos eram aqueles que mais referiam recorrer à obtenção de
alimentos fora de casa.
Em consequência das expetativas, do local onde se adquirem as refeições, do consumo,
importa compreender o impacto em termos de estado nutricional. Assumindo que a
obesidade é uma epidemia de consequências nefastas em todas as faixas etárias, e sendo os
estilos de vida incluindo os hábitos alimentares os seus principais fatores de risco, torna-se
relevante caraterizar esta amostra de idosos quanto a esta patologia crónica.
Encontramos diferenças na prevalência da obesidade nos países avaliados com uma média de
15.6% (13.3% homens e 17.8% mulheres) que oscilava entre um mínimo na Itália e um
máximo no Reino Unido nos idosos, e um mínimo na Suécia e um máximo na Polónia nas
idosas. A prevalência de magreza foi de 0.4% nos idosos e de 2.3% nas idosas.
Para ambos os sexos, a prevalência de obesidade decrescia significativamente com o aumento
da idade. Foram observadas diferenças na prevalência de obesidade relacionadas com os
níveis educacionais para idosos e com o rendimento para idosas, idosos com menor
escolaridade tendem a ter uma maior prevalência de obesidade e idosas com maiores
rendimentos revelam menor prevalência de obesidade.

141
5.1 ǀ Considerações metodológicas
A presente investigação, apesar da sua relevância, pelo facto de incluir uma amostra
considerável de idosos provenientes da comunidade de 8 países da União Europeia, inquiridos
com o mesmo instrumento, em iguais circunstâncias e em simultâneo, encerra também
limitações que passamos a discutir.
A amostragem deste estudo foi feita pelo método das quotas, um método não probabilístico.
Este tipo de amostragem tem como vantagem a facilidade e rapidez com que se obtém uma
amostra de grandes dimensões, representativa nacionalmente, atendendo aos parâmetros
selecionados e a baixo custo 88.
Nesta amostragem a proporção de elementos que possuem uma determinada característica é
aproximadamente igual à proporção de indivíduos do universo para essa mesma característica,
tentando assim garantir a sua representatividade. Porém este método também tem
desvantagens pois esta amostra pode não refletir aspetos que, a não terem sido tomados em
consideração na definição das quotas, poderiam ter afetado a sua representatividade.
Pensamos não ser esse o caso uma vez que os parâmetros usados na definição das quotas (nível
de educação e rendimento, urbanização e colhida em pelo menos três localizações geográficas
distintas de cada pais) constituem os aspetos fundamentais de um estudo com estes objetivos
88.
O facto dos dados terem sido colhidos por uma empresa de estudos de mercado obrigou à
organização de manual de inquiridor para que as questões fossem colocadas uniformemente
não sendo passíveis de má interpretação. Além do mais foi também ministrada formação aos
inquiridores e controlado o processo de recolha de informação.
Tratando-se de um estudo exploratório optou-se por proceder à recolha da informação quanto
ao peso e estatura por autoavaliação dos inquiridos. Apesar de se poder comprometer a

142
precisão, considerou-se que para os objetivos pretendidos, as vantagens suplantam os
inconvenientes.
A autodeclararão do peso e da estatura e posterior cálculo do IMC também pode resultar numa
imagem distorcida da realidade, sendo a população idosa descrita como a que apresenta maior
erro89; 90; 91. Quanto ao peso, as mulheres têm tendência a sobrevalorizar valores baixos e a
subvalorizar valores elevados enquanto os homens valorizam um peso corporal acima do real
92. A altura é habitualmente sobrestimada. No entanto, para grandes amostras populacionais
alguns autores referem grande concordância entre os valores autodeclarados e os medidos 93.
Na amostra Portuguesa o facto de ser um estudo transversal pode não aferir diretamente os
determinantes do padrão alimentar Mediterrânico. Também a obtenção de dados reais de
consumo alimentar por si só, acarreta erros um dos quais pelo tipo de instrumento utilizado,
no entanto o questionário semi-quantitativo de frequência de consumo alimentar utilizado
apresentou boa validade e reprodutibilidade83; 84, que poderá minimizar o subestimativa da
ingestão alimentar frequente nos estudos de consumo alimentar.
5.2 ǀ Implicações para a investigação e para comunidade
É fundamental e urgente contribuir para a construção e manutenção de um papel social do
cidadão mais velho, como alguém útil e imprescindível, promovendo assim um
envelhecimento feliz e uma sociedade mais rica e inclusiva.
Procurámos evidenciar o papel da alimentação numa perspetiva abrangente mais do que
simplesmente entender o estado nutricional e prescrever diretrizes alimentares tendo como
base objetivos nutricionais.
Em suma, entender, valorizar e respeitar as normas, valores e formas de estar em relação à
sua vida e, claro, à sua alimentação. Não o deixar à deriva orientá-lo para que na comunidade

143
muitas possam ser as respostas de várias índoles, sem a conotação de instituição de suporte
“a incapazes”.
O que espera o idoso autónomo? Manter-se com saúde, de forma a manter a sua
independência. O que come o idoso Português? Menos bem que o esperado num país com
influências Mediterrânicas, em que a ocidentalização dos hábitos alimentares parece estar a
chegar às gerações mais velhas. Onde come o idoso? Inserido na comunidade, opta por
realizar na maior parte das vezes as suas refeições em casa, escolhendo a família e os
restaurantes, nas situações em que não o faz. Como está o idoso? A engordar tal como as
demais faixas etárias em Portugal.
A nível comunitário deverão ser estabelecidos programas/formas de auxílio
alimentar/nutricional, concebidos tendo por base a identificação das necessidades
nutricionais reais dos diferentes grupos de idosos e adequados sob o ponto de vista
gastronómico e cultural61;5.
Mais do que atenuar as incapacidades causadas pelo envelhecimento, os programas
comunitários deverão procurar monitorizar o estado de saúde e nutricional dos idosos de
modo a evitar que este se degrade, propiciando assim a sua manutenção e autonomia na
comunidade e fomentando a sua qualidade de vida5. Em condições de identificação de
enfraquecimento, criando estruturas comunitárias de suporte para vários graus de exigência
desde a realização de tarefas simples até níveis mais elevados de dependência.
Os profissionais de saúde deverão ser proactivos adotando uma postura holística face ao
envelhecimento, demonstrando abertura e compreensão não só para questões
alimentares/nutricionais, mas também tendo em consideração o suporte emocional, tentando
preservar ao máximo a integração deste grupo tão válido na sociedade e consequentemente a
sua independência5; 56.

144
O parlamento Europeu, estabeleceu que 2012 será o Ano Europeu dedicado ao
Envelhecimento Ativo, com o objetivo geral de incentivar e apoiar esforços dos Estados-
Membros, das autoridades, dos parceiros sociais e da sociedade civil no sentido de promover
o envelhecimento ativo usufruindo do potencial desta população, reforçando e preservando
desta forma a solidariedade entre gerações94.
Torna-se assim urgente contribuir para a construção de um papel social do cidadão sénior,
como alguém útil e imprescindível entre todos nós. Porque o envelhecimento não é uma
escolha é um privilégio, e envelhecer bem é uma necessidade. Ninguém ensina outra pessoa a
viver, mas a sociedade fica mais enfraquecida sem a sabedoria do velho, a prudência do
adulto, o impulso da juventude, a espontaneidade da criança95.

145
6 ǀ Biliografia

146

147
6 ǀ Bibliografia
1. Fundação Francisco Manuel dos Santos (2011) PORDATA: Disponivel em http://www.pordata.pt (accessed:
september 2011).
2. Kravchenko JS (2008) Nutrition and the elderly. In Encyclopedia of Human Nutrition, pp. 578-587 [Caballero
B and Allen L (Editor-in-Chief), editors]: Elsevie. Prentice A.
3. Bates CJ, Benton D, Biesalski HK et al. (2002) Nutrition and aging: a consensus statement. J Nutr Health
Aging 6, 103-116.
4. Chernoff R (2001) Nutrition and health promotion in older adults. J Gerontol 56A, 47-53.
5. Kamp BJ, Wellman NS, Russell C et al. (2010) Position of the American Dietetic Association, American
Society for Nutrition, and Society for Nutrition Education: Food and nutrition programs for community-residing
older adults. . J Am Diet Assoc. 110, 463-472.
6. Pául C (2001) Envelhecimento bem sucedido e qualidade de vida urbana, [Comunicação Pessoal no Fórum
Sénior, editor]. Porto.
7. Niedert KC & American Dietetic Association (2005) Position paper of the American Dietetic Association:
nutrition across the spectrum of aging. J Am Diet Assoc 105, 616-633.
8. World Health Organization (2002) Active ageing. A policy framework. Geneva: World Health Organization,.
9. Direcção Geral da Saúde (2004) Programa nacional para a saúde das pessoas idosas: Direcção Geral da
Saúde.
10. Dean M, Raats MM & Grunert K (2009) Older peolpe, food and satisfaction with life. In Food for the ageing
population, 1st ed., pp. 3-19 [Raats MM, de Groot L and van Staveren W, editors]. Cambridge: Woodhead
Publishing
11. Wahlqvist ML (2009) Demographic and cultural differences in older people's food choice and meal patterns.
In Food for the ageing population, 1st ed., pp. 20-42 [Raats MM, de Groot L and van Staveren W, editors].
Cambridge: Woodhead Publishing
12. de Castro JM & de Castro E (1989) Spontaneous meal patterns of humans: Influence of the presence of older
people. Am J Clin Nutr 50, 237-247.
13. Meiselman HL (1996) The contextual basis for food acceptance, food choice and food intake: the food, the
situation and the individual. In Food choice, acceptance and consumption, [Meiselman HL and MacFie HJH,
editors]. London: Chapman & Hall.
14. Fjellström C (2009) The social significance of older people's meals. In Food for the ageing population, 1st
ed., pp. 95-109 [Raats MM, de Groot L and van Staveren W, editors]. Cambridge: Woodhead Publishing
15. Grunert KG, Dean M, Raats MM et al. (2007) A measure of satisfaction with food-related life. Appetite 49,
486-493.
16. Berg GV, Sarvimäki A & Hedelin B (2006) Hospitalized older people’v views of health and health
promotion. Int j Older People Nurs 1, 25-33.
17. Davidson K, Arber S & Marshall S (2009) Gender and food in later life: shifting roles and relationships. In
Food for the ageing population, 1st ed., pp. 110-127 [Raats MM, de Groot L and van Staveren W, editors].
Cambridge: Woodhead Publishing
18. Baumgarten M, Lebel P, Leclerc C et al. (2002) Adult day care for the frail elderly: outcomes, satisfaction
and cost. J Aging Health 14, 237-259.
19. EUFIC (2005) The determinants of food choice. EUFIC Review 17.
20. de Almeida MDV, Graça P, Afonso C et al. (2001) Healthy eating in European elderly: concepts, barriers and
benefits. J Nutr Health Aging 5, 217-219.
21. Locher JL, Ritchie CS, Roth DL et al. (2009) Food choice among homebound older adults: motivations and
perceived barriers. J Nutr Health Aging 13, 659-664.
22. Scholderer J & Grunert KG (2005) Consumers, food and convenience: the long way from resource
constraints to actual consumption patterns. J Econ Psychol 26, 105-128.
23. Saba A, Messina F, Turrini A et al. (2008) Older people and convenience in meal preparation. Int J Consum
Stud 32, 147-156.
24. McKie L (1999) Older people and food: independence, locality and diet. British Food Journal 101, 8.
25. Farquhar M (1995) Elderly people's definitions of quality of life. Soc Sci Med 41, 1439-1446.
26. Locher JL, Robinson CO, Roth DL et al. (2005) The effect of the presence of others on caloric intake in
homebound older adults. J Gerontol A Biol Sci Med Sci. 60, 1475-1478.
27. Locher JL, Ritchie CS, Robinson CO et al. (2008) A multidimensional approach to understanding under-
eating in homebound older adults: the importance of social factors. Gerontologist. 48, 223-234.

148
28. Schlettwein-Gsell D, Barclay D, Osler M et al. (1991) Dietary habits and attitudes. Euronut SENECA
investigators. Eur J Clin Nutr 45, 83-98.
29. Afonso C, Graça P & de Almeida MDV (2004) Factors influencing food choice by Portuguese seniors. J Nutr
Health Aging 8, 461.
30. Poínhos R, Franchini B, Afonso C et al. (2009) Alimentação e estilos de vida da porpulação portuguesa:
metodologia e resultados preliminares. Alim Hum 15, 43-61.
31. de Morais C, Afonso C & de Almeida MDV (2005) Hábitos de compra dos idosos portugueses, [Workshop
Alimentação em Idade Sénior, editor]. Porto.
32. de Almeida MDV, Afonso C & de Morais C (2005) O significado das refeições na população sénior,
[Workshop Alimentação em Idade Sénior, editor]. Porto.
33. Afonso C, de Morais C & de Almeida MDV (2005) Preparação e confecção de alimentos e refeições,
[Workshop Alimentação em Idade Sénior, editor]. Porto.
34. Elmadfa I, Meyer A, Nowak V et al. (2009) European nutrition and health report 2009. Ann Nutr Metab 55 1-
40.
35. World Health Organization (WHO) & FAO/WHO (2007) Scientific update on carbohydrates in human
nutrition. Eur J Clin Nutr 61.
36. World Health Organization (2003) Diet, nutrition and the prevention of chronic diseases.
37. de Groot LCPGM & van Staveren W (1991) Description of survey towns and populations. Euronut SENECA
investigators. Eur J Clin Nutr 45 Suppl 3, 23-29.
38. de Groot LCPGM, van Staveren WA, Dirren H et al. (1996) SENECA: nutrition and the elderly in Europe.
Follow up study and longitudinal alnlysis. Eur J Clin Nutr 50, S1-S12.
39. Bogers RP, Tijhuis M, van Gelder BM et al. (2005) Final report of the HALE (Healthy Ageing: a
longitudinal study in europe).
40. Haveman-Nies A TK, de Groot LC, Wilson PW, van Staveren WA, (2001) Evaluation of dietary quality in
relationship to nutritional and lifestyle factors in elderly people of the US Framingham Heart Study and the
European SENECA study. Eur J Clin Nutr 55, 870-880.
41. Lopes C, Oliveira A, Santos A-C et al. (2006) Consumo alimentar no Porto. Porto: Faculdade de Medicina
da Universidade do Porto,.
42. Trichopoulos D & Lagiou P (2004) Mediterranean diet and overall mortality differences in the European
Union. Public Health Nutr 7, 949-951.
43. González CA, Argilaga S, Agudo A et al. (2002) Sociodemographic differences in adherence to the
Mediterranean dietary pattern in Spanish populations. Gac Sanit 16, 214-221.
44. de Groot LCPGM & van Staveren W (2010) Nutritional concerns, health and survival in old age.
Biogerontology 11, 597-602.
45. Trichopoulou A (2004) Traditional Mediterranean diet and longevity in the elderly: a review. Public Health
Nutr 7, 943-947.
46. Sofi F, Cesari F, Abbate R et al. (2008) Adherence to Mediterranean diet and health status: meta-analysis.
BMJ 337.
47. Sofi F, Abbate R, Gensini GF et al. (2010) Accruing evidence on benefits of adherence to the Mediterranean
diet on health: an updated systematic review and meta-analysis. Am J Clin Nutr 92, 1189-1196.
48. Food and Nutrition Board, Institute of Medicine & National Academics (2004) Dietary Reference Intakes
(DRIs): Recommended Intakes for Individuals, Vitamins. Recommended Intakes for Individual, Elements.
Recommended Intakes for Individuals, Macronutrients. At:
http://www.iom.edu/object.file/master/21/372/0.pdf./Institute
49. Pfimer K & Ferriolli E (2009) Recomendações nutricionais para idosos. In Nutrição: da gestação ao
envelhecimento, pp. 451-457 [Vitolo MR, editor]. Rio de Janeiro: Editora Rubio.
50. Masa IR & Hornillos MM (2006) Ingestas dietéticas recomendadas. Modelo de consumo saludable. In Libro
Blanco de la Alimentación de los Mayores, pp. 67-80 [Muñoz M, Aranceta J and Guijarro JL, editors]. Madrid:
Editorial Médica Panamericana.
51. British Association for Parenteral and Enteral Nutrition (BAPEN) (2003) The “Must”. Explanory booklet.
52. Kondrup J, Allison SP, Elia M et al. (2003) ESPEN guidelines for nutrition screening. Clinical Nutrition 22,
415 -421.
53. Weekes CE, Elia M & Emery PW (2004) The development, validation and reliability of a nutrition screening
tool based on the recommendations of the British Association for Parenteral and Enteral Nutrition (BAPEN).
Clinical Nutrition 23, 1104-1112.
54. Vellas B, Lauque S, Andrieu S et al. (2001) Nutrition assessment in the elderly. Curr Opin Clin Nutri Met 4,
5-8.
55. Azad N (2002) Nutrition in the elderly. The Canadian Journal of Diagnosis March, 83-93.

149
56. Dorner B, Friedrich EK, Posthauer ME et al. (2010) Position of the American Dietetic Association:
individualized nutrition approaches for older adults in health care communities. J Am Diet Assoc. 110, 1549-
1553.
57. Afonso C, Morais C, Oliveira BMPM et al. (2010) Nutritional status among free-living Portuguese Elderly.
Public Health Nutr 13, 146.
58. Wilson MMG & Morley JE (2004) Nutritional assessment and suport in chronic disease managment. In
Handbook of Clinical Nutrition and Aging, pp. 77-101 [Bales CW and Ritchie CS, editors]. New Jersey: Humana
Press.
59. Morley JE (2009) Undernutrition: diagnosis, causes, consequences and treatment. In Food for the ageing
population, 1st ed., pp. 153-168 [Raats MM, de Groot L and van Staveren W, editors]. Cambridge: Woodhead
Publishing
60. Ferry M, Alix E, Brocker P et al. (2004) A nutrição da pessoa idosa. Aspectos fundamentais, clínicos e
psicossociais. Loures: Lusociência;.
61. Mesa RM & Dapchich V (2006) Evaluación del estado nutricional del anciano. In Libro Blanco de la
Alimentación de los Mayores, pp. 67-80 [Muñoz M, Aranceta J and Guijarro JL, editors]. Madrid: Editorial
Médica Panamericana.
62. Enzi G, Sergi G, Coin A et al. (2001) Clinical aspects of malnutrition. J Nutr Health Aging 5, 284 - 287.
63. Coelho MASC, Pereira RS & Coelho KSC (2004) Antropometria e composição corporal. In Nutrição no
Envelhecer, pp. 13-44 [Frank AA and Soares EA, editors]. São Paulo: Editora Atheneu.
64. Guerra RS & Amaral TF (2009) Comparasion of hand dynamometrs in elderly people. J Nutr Health Aging
13, 907-912.
65. Silveira EA, Lopes ACS & Caiaffa WT (2007) Avaliação do estado nutricional de idosos. In Epidemiologia
Nutricional, pp. 105-125 [Kac G, Sichieri R and Gigante DP, editors]. Rio de Janeiro: Editora FioCruz.
66. European Food Safety Authority (EFSA) (2009) General principles for the collection of national food
consumption data in the view of a pan-European dietary survey. EFSA Journal 7.
67. Sampaio LR (2004) Avaliação nutricional e envelhecimento. Revista de Nutrição de Campinas 17, 507-514.
68. Chumlea WC, Roche AF & Steinbaugh M (1985) Estimating stature from knee height for persons 60 to 90
years of age. J Am Geriatr Soc 33, 116-120.
69. Chumlea WC, Guo S, Roche AF et al. (1988) Prediction of body weight for the nonambulatory elderly from
anthropometry. J Am Diet Assoc 88, 564-568.
70. Hajjar RR, Kamel HK & Denson K (2004) Malnutrition in aging. The Internet Journal of Geriatrics and
Gerontology 1.
71. Centers for Disease Control and Prevention (CDC) & National Center for Health Statistics (NCHS) (1991)
National Health and Nutrition Examination Survey (NHANES III). Atlanta: National Heart, Lung and Blood
Institute.
72. World Health Organization (2000) Obesity: preventing and managing the global epidemic. Report of a WHO
consultation.: World Health Organnization Tech Rep Ser.
73. Lipschitz DA (1994) Screening for nutritional status in the elderly. Prim Care 21, 55-67.
74. Baumgartner R, Heymsfield SB, Lichtman S et al. (1991) Effect of criterion estimates on predictive
equations. Am J Clin Nutr 53, 1-9.
75. National Research Council (NRC) (1989) Diet and health: implication for reducing chronic disease risk.
Washington: National Academy Press,.
76. Guigoz Y (2006) The Mini Nutritional Assessment (MNA) review of the literature: what does it tell us? J
Nutr Health Aging 10, 466-485.
77. American Academy of Family Physicians, American Dietetic Association & The National Council on the
Aging The Nutrition Screening Initiative Washington: Available at
http://www.cdaaa.org/images/Nutritional_Checklist.pdf (accessed: september 2011).
78. European Comission & Health and Consumer Protection Directorate-General (2007) Healthy ageing:
keystone for a sustainable Europe.
79. Sahyoun NR & Anderson AL (2009) Developing nutrition education programs for older peolple. In Food for
the ageing population, 1st ed., pp. 525-538 [Raats MM, de Groot L and van Staveren W, editors]. Cambridge:
Woodhead Publishing
80. Dean M, Grunert KG, Raats MM et al. (2008) The impact of personal resources and their goal relevance on
satisfaction with food-related life among the elderly. Appetite 50, 308-315.
81. Diener E, Emmons RA, Larsen RJ et al. (1985) The satisfaction with life scale. J Pers Assess 49, 71-75.
82. Ware JE, Kosinski M, Dewey JE et al. (2001) How to score and interpret single-item health status measures:
A manual for users of the SF-8TM health survey.

150
83. Lopes C (2000) Reprodutibilidade e validação de um questionário semiquantitativo de frequência alimentar.
Em: Alimentação e enfarte agudo do miocárdio: um estudo caso-controlo de base populacional. [Reproducibility
and validity of a semi-quantitative food-frequency questionnaire.]. PhD Dissertation (in Portuguese),
Universidade do Porto.
84. Lopes C, Aro A, Azevedo A et al. (2007) Intake and adipose tissue composition of fatty acids and risk of
myocardial infarction in a male Portuguese community sample. J Am Diet Assoc 107, 276-286.
85. Gibson RS (1990) Principles of nutritional assessment. Oxford: Oxford University Press
86. Lee RC, Wang Z, Heo M et al. (2000) Total-body skeletal muscle mass: development and cross-validation of
anthropometric prediction models. Am J Clin Nutr 72, 796-803.
87. Fieldhouse P (1995) Food and nutrition. Customs and culture. London.
88. Cochran S (1977) Sampling techniques. New York: Wiley.
89. Hill A & Roberts J (1998) Body mass index: a comparation between self-reported and measured height and
weight. J Public Health Med 20, 206-210.
90. Ramos E & Barros H (1998) Self-reporting of weight and height. Effects in risk assessment. Rev Epidemiol
Sante Publique.
91. Ramos E, Lopes C, Oliveira A et al. (2009) Unawareness of weight and height--the effect on self-reported
prevalence of overweight in a population-based study. J Nutr Health Aging 13, 310-314.
92. Perry G, Byers TE & Mokad AH (1995) The validity self report of past body by U.S. adults. Epidemiology 6.
93. Jeffery RW (1996) Bias in reported body weight as a function of education, occupation, health and weight
concern. Addict Behaviour 21, 217-222.
94. Comissão Europeia (2010) Proposta de decisão do Parlamento Europeu do Conselho relativa ao Ano
Europeu do Envelhecimento Activo 2012: (SEC) 1002.
95. Mota J (2000) Promoção da actividade física nos idosos: uma perspectiva global. In Actas do Seminário A
qualidade de vida no idoso: o papel da actividade física, [Mota J and Carvalho J, editors]: Gabinete de Desporto
de Recreação e Tempos Livres da Faculdade de Ciências do Desporto e de Educação Física da Universidade do
Porto.

151

152
ii
Acknowledgements The data used in this article belong to the European Research Project Food in Later Life. Choosing foods,
eating meals: sustaining independence and quality of life (2004–2005) coordinated by Dr. Margaret Lumbers and Dr. Monique
Raats from the University of Surrey (United Kingdom) and financed by the European Commission (QLK1CT200202447).
5 Food in Later Life Team: Denmark: Klaus Grunert, Niels Asger Nielsen
Germany: Ulrich Oltersdorf, Birgit Schuhmacher,Cornelie Pfau
Italy: Anna Saba; Aida Turrini, Laura D’Addezio, Fabrizia Maccati
Poland: Katarzyna Kozłowska, Wojciech Roszkowski, Anna Szczecińska, Marzena Danowska-Oziewicz, Lidia Wądolowska,
Bozenna Kozikowska, Roman Cichon, Ewa Szymelfejnik, Anna Waluś, Magdalena Kozikowska, Dariusz Słowiński
Portugal: Cecilia de Morais, Cláudia Afonso, Maria Daniel Vaz de Almeida
Spain: Jesús Contreras, Silvia Bofill, Yolanda Lacasta
Sweden: Per-Olow Sjödén, Christina Fjellström, Margaretha Nydahl, Jenny Ekblad
United Kingdom: Sara Arber, Kate Davidson, Monique Raats, Margaret Lumbers, Wendy Hunter, Anita Eves, Richard Shepherd