
Hugo folgado doutorado
115
Universidade de Trás-os-Montes e Alto Douro Movement synchronisation during training and competition of elite footballers Tese de Doutoramento em Ciências do Desporto Candidato: Hugo Miguel Cardinho Alexandre Folgado Orientador: Professor Doutor António Jaime da Eira Sampaio Vila Real, 2014
-
Upload
fabio-eiras-garcia -
Category
Sports
-
view
57 -
download
1
Transcript of Hugo folgado doutorado
Universidade de Trás-os-Montes e Alto Douro
Movement synchronisation during training and
competition of elite footballers
Tese de Doutoramento em Ciências do Desporto
Candidato: Hugo Miguel Cardinho Alexandre Folgado
Orientador: Professor Doutor António Jaime da Eira Sampaio
Vila Real, 2014
Universidade de Trás-os-Montes e Alto Douro
Movement synchronisation during training and
competition of elite footballers
Tese de Doutoramento em Ciências do Desporto
Candidato: Hugo Miguel Cardinho Alexandre Folgado
Orientador: Professor Doutor António Jaime da Eira Sampaio
Composição do Júri:
Presidente: Professor Doutor Luís Herculano Melo de Carvalho
Vogais: Professor Doutor António Jaime da Eira Sampaio
Professor Doutor Bruno Filipe Rama Travassos
Professor Doutor Pedro Tiago Matos Esteves
Professor Doutor Rui Marcelino Maciel Oliveira
Vila Real, 2014
III
AGRADECIMENTOS
Numa viagem, o caminho que percorremos é muitas vezes mais importante que o destino a que chegamos. A todos quantos fizeram parte deste meu percurso, o meu obrigado. A caminhada não termina ainda...
À minha mãe, por ter sempre depositado a maior das confianças em tudo quanto fiz. Por me ter ensinado que para colher, temos que semear. Ao meu pai. Que me passou o hábito de questionar e o carácter racional.
Aos meus irmãos, André e Miguel. Como somos melhor todos juntos!
À Dora, pelo tempo que lhe roubei. Sei que estás sempre comigo...
Ao Luís Laranjo, ao Jorge Bravo e ao Ricardo Duarte, pela amizade e pelo companheirismo de sempre.
Ao Armando Raimundo, Nuno Batalha e José Marmeleira, por sempre terem acreditado e estimulado o meu trabalho.
Ao Orlando Fernandes, que me ensinou muito de Matlab, mas também que não há rotinas que nos organizem a vida...
À Guida Veiga, que tem partilhado comigo as angústias e sucessos deste processo. Faltas tu...
A todos os restantes colegas do Departamento de Desporto e Saúde da Universidade de Évora. Tem sido uma caminhada larga desde 2001. Que o futuro traga ainda mais conquistas!
A todos os colegas do CreativeLab, e em particular ao Bruno Gonçalves, por tão bem me saberem receber sempre que visito a UTAD. Esta tese faz muito mais sentido aqui!
À Faculdade de Motricidade Humana, pela colaboração e cedência pronta dos GPS para as nossas recolhas.
Ao Pedro Marques, pelo apoio que nos deu para chegarmos a estes dados. Mas também por toda a colaboração técnica e científica ao logo deste percurso.
A todos os meus alunos, principalmente aos que fazem perguntas para as quais não tenho resposta.
A todos os meus professores, por me mostrarem o caminho. Mas muito particularmente ao Professor Jaime Sampaio. Será sempre a referência neste mundo académico. Pela competência científica, mas acima de tudo pelas qualidades humanas. Obrigado por tudo!
IV
ABSTRACT
Recent technology allows capturing football players’ positioning during the game with a high
degree of accuracy. This information has provided relevant insights for performance analysis,
particularly related to physical performance. Very scarce attention has been given to the
interaction process between players within the game, or tactical behaviour, identified as an
important football performance indicator. One possible method to assess this interaction
process is to measure players’ interpersonal synchronisation, a characteristic present in
several human behaviour manifestations. As such, the aim of this thesis was to understand the
role of movement synchronisation in elite football performance. First, we addressed the
methodological procedures for the study of players’ interpersonal coordination using Global
Positioning System devices. The accuracy and error measured between two units positioned at
a known distance was evaluated, followed by the calculating the relative phase of the units’
displacement. Results revealed the usability of these devices, based in adequate procedures.
Afterwards, we assessed players’ movement synchronisation during matches, according to
different factors – match final outcome; opposition level; and the number of days between
fixtures. Positional data in these studies were collected using either GPS or semi-automatic
video tracking systems. Players’ presented higher levels of movement synchronisation in
winning matches. Similar results were observed when the team was facing higher-level
opponents. A smaller interval between matches impaired players’ movement synchronisation
results, with the evaluated team presenting a lower level of synchronisation during congested
fixtures. Finally, players’ movement synchronisation was assessed in large-sided games,
played during the first four weeks of the preseason. Players’ performance was compared
according to the initial two weeks or the later two weeks training sessions. Results revealed a
trend for a development of players’ movement synchronisation during the preseason. In
conclusion our results support the use of players’ movement synchronisation as a tactical
performance indicator, based on their interaction within the game, and able to depict
performance variations during matches and training sessions.
Keywords: Performance analysis; tactical performance; match performance; synchronisation;
football; team sports; GPS.
V
RESUMO
Os recentes desenvolvimentos tecnológicos permitem capturar as posições dos jogadores de
futebol durante a sua prática, tanto em treino como em jogo, com um elevado grau de precisão
e baseado em procedimentos simples. Esta informação tem proporcionado o acesso a
conhecimento relevante para a análise da performance, particularmente relacionado com a
performance física. Pouca atenção tem sido dada ao processo de interação que os jogadores
estabelecem durante o jogo, ou comportamento táctico, identificado como um indicador de
performance importante no futebol. Um dos possíveis métodos de controlo deste processo de
interação é a medição da sincronização interpessoal entre os jogadores, uma característica
presente em diversas manifestações do comportamento humano. Assim, o objectivo desta tese
foi compreender o papel da sincronização de movimentos na performance em futebol de elite.
Primeiro, foram abordados os procedimentos metodológicos para o estudo da coordenação
interpessoal de jogadores através de aparelhos de Sistema de Posicionamento Global. Foram
avaliados o grau de precisão e o erro medidos entre dois aparelhos colocados a uma distância
conhecida, seguidos do cálculo da fase relativa entre o deslocamento dos equipamentos. Os
resultados revelaram a possibilidade de uso destes aparelhos, baseado em procedimentos
adequados. Seguidamente, avaliámos a sincronização do movimento de jogadores durante
jogos, em função de diferentes factores – o resultado final do jogo; o nível da equipa
opositora; e o tempo entre jogos. Os dados posicionais destes estudos foram capturados
recorrendo ao sistema GPS ou a um sistema de captura de posicionamento semiautomático
baseado em vídeo. Os jogadores apresentaram níveis mais elevados de sincronização do
movimento quando ganharam. Resultados semelhantes foram observados quando uma equipa
era confrontada com opositores de nível mais elevado. Um menor tempo de intervalo entre
jogos reduziu os resultados da sincronização do movimento entre jogadores, com a equipa a
apresentar valores de sincronização inferiores durante um período congestionado de jogos.
Finalmente, a sincronização do movimento entre jogadores foi avaliada durante situações de
treino baseadas em jogo, desenvolvidas durante as primeiras quatro semanas de treino do
período preparatório. A performance dos jogadores foi comparada entre os treinos realizados
nas duas primeiras semanas e os treinos realizados nas duas semanas subsequentes. Os
resultados revelaram uma tendência para o desenvolvimento da sincronização do movimento
entre jogadores durante o período preparatório. Em conclusão, os nossos resultados suportam
o uso da sincronização do movimento entre jogadores como um indicador da performance

VI
táctica, baseado na sua interação durante o jogo, e capaz de diferenciar variações de
performance durante o jogo e o treino.
Palavras chave: Análise da performance; performance táctica; performance em jogo;
sincronização; futebol; jogos desportivos colectivos; GPS.
VII
LIST OF PUBLICATIONS AND COMMUNICATIONS
Peer-reviewed papers in international journals
Folgado, H., Duarte, R., Fernandes, O., & Sampaio, J. (2014). Competing with lower level
opponents decreases intra-team movement synchronisation and time-motion demands during
pre-season soccer matches. PLoS ONE, 9(5), e97145. doi:10.1371/journal.pone.0097145
Folgado, H., Duarte, R., Marques, P., & Sampaio, J. (Under Review). The effects of
congested fixtures on tactical and physical performance in elite soccer.
In preparation
Folgado, H., Fernandes, O., & Sampaio, J. Accuracy and error measurements between
individual GPS units - Methodological approach for working with GPS data in the analysis of
players’ interpersonal coordination in team sports.
Folgado, H., Duarte, R., Marques, P., & Sampaio, J. Intra-team movement synchronisation as
a measure of teams’ tactical performance in professional football
Folgado, H., & Sampaio, J. Physical, physiological and tactical responses to large-sided
games during preseason of elite footballers.
VIII
Comunications
2012 – Lecture: “Métodos de tracking para o estudo do comportamento dos desportistas: o
sistema GPS” at the Human Kinetics PhD course of the Faculdade de Motricidade Humana,
Universidade Técnica de Lisboa.
2012 – Oral Presentation “A coordenação diádica intra-equipa durante o período preparatório
e de acordo com o nível de oposição em futebol” at the seminar "O Comportamento Coletivo
em Equipas de Futebol: Estudos e aplicações", during the XIII Jornadas da Sociedade
Portuguesa de Psicologia do Deporto, at Universidade Lusófona de Humanidades e
Tecnologias, Lisboa
2013 – Oral Presentation: “O Período Preparatório e Competitivo: Mitos e Realidades” at the
seminar “O Dia do Futebol na FMH – A Teoria e a Prática no Futebol Profissional”,
organized by the Faculdade de Motricidade Humana, Universidade Técnica de Lisboa.
IX
ÍNDICE GERAL
Agradecimentos ........................................................................................................................ III
Abstract .................................................................................................................................... IV
Resumo ...................................................................................................................................... V
List of Publications and Communications ............................................................................. VII
Índice Geral .............................................................................................................................. IX
List of tables ........................................................................................................................... XII
List of figures ........................................................................................................................ XIII
1. General Introduction ............................................................................................................ 1
Performance analysis in football ............................................................................................ 1
Physical performance in football ............................................................................................ 1
Tactical performance in football ............................................................................................ 3
Synchronisation ...................................................................................................................... 4
Measuring synchronisation in football ................................................................................... 5
Thesis outline ......................................................................................................................... 6
References .............................................................................................................................. 9
2. Accuracy and error measurements between individual GPS units - Methodological
approach for working with GPS data in the analysis of players’ interpersonal coordination in
team sports ................................................................................................................................ 12
Abstract ................................................................................................................................ 12
Introduction .......................................................................................................................... 13
Methods ................................................................................................................................ 14
Results .................................................................................................................................. 17
Discussion ............................................................................................................................ 20
Conclusion ............................................................................................................................ 22
References ............................................................................................................................ 23
3. Intra-team movement synchronisation as a measure of teams’ tactical performance in
professional football ................................................................................................................. 25
Abstract ................................................................................................................................ 25
Introduction .......................................................................................................................... 26
Methods ................................................................................................................................ 28
X
Results .................................................................................................................................. 29
Discussion ............................................................................................................................ 33
Conclusions .......................................................................................................................... 35
References ............................................................................................................................ 36
4. Competing with lower level opponents decreases intra-team movement synchronisation
and time-motion demands during pre-season football matches ............................................... 38
Abstract ................................................................................................................................ 38
Introduction .......................................................................................................................... 39
Methods ................................................................................................................................ 41
Results .................................................................................................................................. 44
Discussion ............................................................................................................................ 49
Conclusions .......................................................................................................................... 52
5. The effects of congested fixtures on tactical and physical performance in elite football. 56
Abstract ................................................................................................................................ 56
Introduction .......................................................................................................................... 57
Methods ................................................................................................................................ 59
Results .................................................................................................................................. 62
Discussion ............................................................................................................................ 67
Practical Applications ........................................................................................................... 69
Conclusions .......................................................................................................................... 70
References ............................................................................................................................ 71
6. Physical, physiological and tactical responses to large-sided games during preseason of
elite footballers. ........................................................................................................................ 74
Abstract ................................................................................................................................ 74
Introduction .......................................................................................................................... 75
Methods ................................................................................................................................ 78
Results .................................................................................................................................. 80
Discussion ............................................................................................................................ 84
Conclusion ............................................................................................................................ 87
References ............................................................................................................................ 88
7. General Discussion ............................................................................................................ 91
Overview .............................................................................................................................. 92
Theoretical and Methodological considerations ................................................................... 94

XI
Practical applications ............................................................................................................ 96
References ............................................................................................................................ 99
XII
LIST OF TABLES
Table 2.1 Overall RMSE results for both GPS models at a static position by distance and type
of data treatment. .............................................................................................................. 18
Table 2.2 Overall RMSE results for both GPS models while in motion at a walking speed by
distance and type of data treatment. ................................................................................. 18
Table 4.1 Total distance covered (m) and distance covered at several intensities by opposition
level. ................................................................................................................................. 44
Table 5.1 Total distance covered (m) and distance covered per speed categories according the
number of days since the previous fixture. ....................................................................... 62
Table 6.1 Physical and tactical variables comparison by training period ................................ 81
Table 6.2 Physical variables comparison by position .............................................................. 82
XIII
LIST OF FIGURES
Figure 1.1. Players’ movement during 10 seconds of a match. The central defenders presented
in different colours will serve for synchronisation procedures exemplification. ............... 5
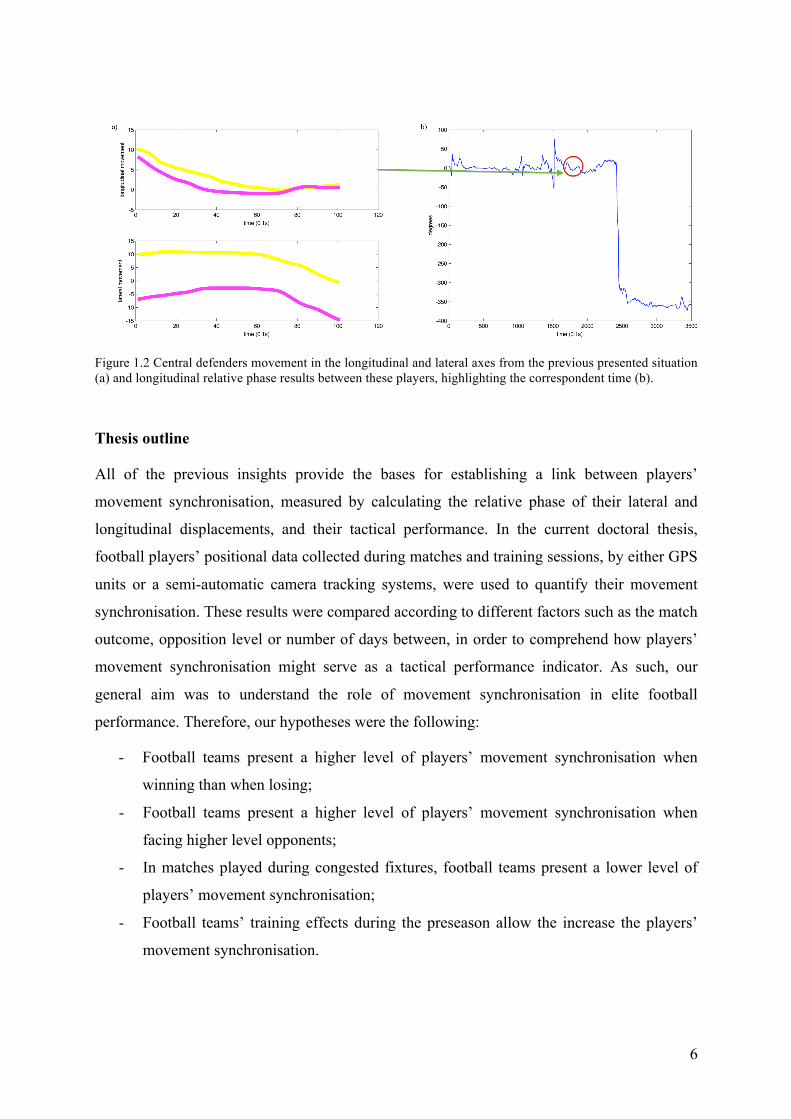
Figure 1.2 Central defenders movement in the longitudinal and lateral axes from the previous
presented situation (a) and longitudinal relative phase results between these players,
highlighting the correspondent time (b). ............................................................................ 6
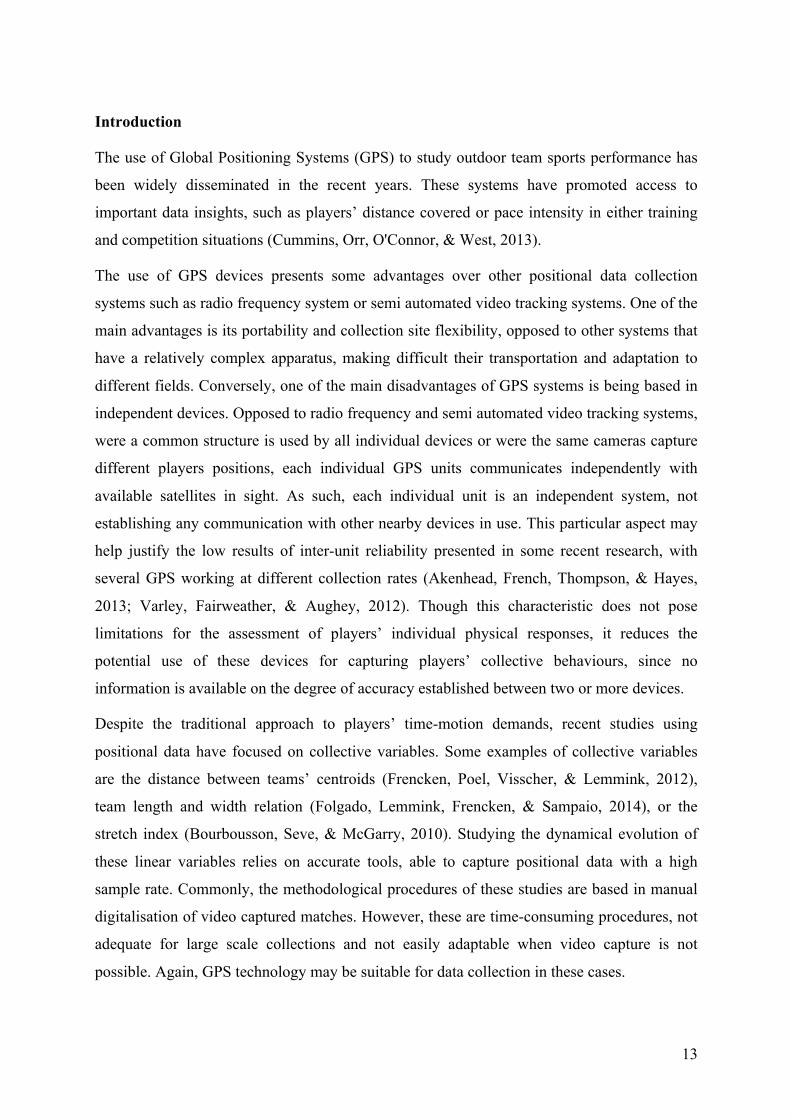
Figure 2.1 Schematic representation of the custom trolley build for GPS accommodation and
predetermined distances between units. ........................................................................... 15
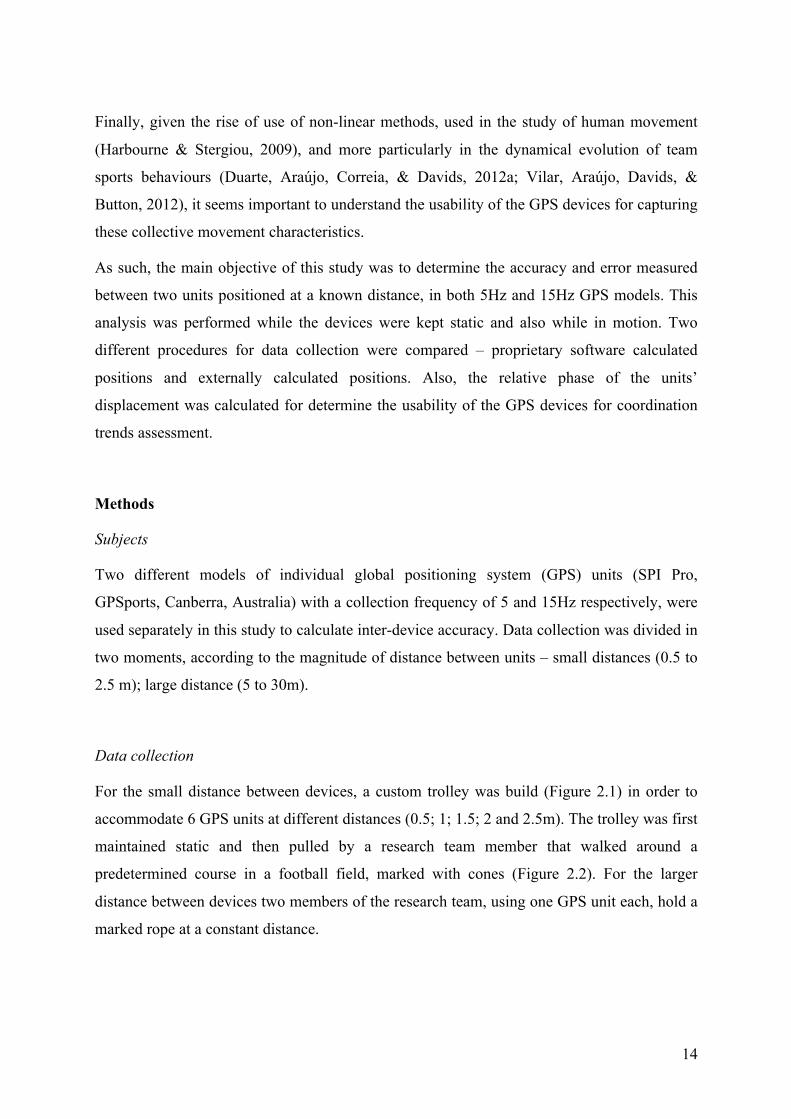
Figure 2.2 Schematic representation of the course used for the small distances data collection.
.......................................................................................................................................... 15
Figure 2.3 VAF results for both GPS models in static (a) and in motion (b) conditions, by
distance and type of data treatment. ................................................................................. 19
Figure 2.4 Relative phase results for 5Hz (a- longitudinal; b- lateral) and 15Hz GPS model (c-
longitudinal; d- lateral) by type of data treatment. ........................................................... 20
Figure 3.1 Pairwise comparison of longitudinal and lateral intra-team movement
synchronisation between opposing teams. ....................................................................... 30
Figure 3.2 Synchronisation results difference between opposing teams during the lost (panels
a, b, c and d) and won matches (panels e, f, g and h), for each displacement axis, in a
moving window of two minutes. The analysed team is displayed by the blue colour and
the opposing teams are displayed by the red colour. Traced vertical lines represent the
goals of each team. ........................................................................................................... 31
Figure 3.3 Pairwise comparison of longitudinal and lateral intra-team movement
synchronisation between offensive and defensive positions dyads. ................................. 32
Figure 4.1 A rotation matrix was calculated from the field vertices and applied to the players’
positions, rotating the data through an angle θ in order that the longitudinal
displacements were aligned with the x-axis and the lateral displacements were aligned
with the y-axis. ................................................................................................................. 42
XIV
Figure 4.2 Standardised effect sizes and 95% CI of pairwise differences between opposition
levels for time motion (a) and intra-team synchronisation (b) variables. Positive values
represent superior results in matches opposing the higher-level team. ............................ 45
Figure 4.3. Percentage of time of dyadic synchronisation according to the opposition level. a)
Longitudinal and b) lateral displacements for the whole analysed half and by different
movement speed categories. *: Significant differences at p<0.05 ................................... 46
Figure 4.4 . K-means clustering of players’ according to the percentage of time of dyadic
synchronisation. a) Longitudinal and b) lateral displacements of defenders (D),
midfielders (M) and forwards (F). Solid lines represent the higher synchronisation group;
dashed lines represent the intermediate synchronisation group; dotted lines represent the
low synchronisation group. .............................................................................................. 47
Figure 4.5 Clustering groups’ percentage of time of dyadic synchronisation according to the
opposition level. a) Longitudinal and b) lateral displacements. Solid lines represent the
higher synchronisation group; dashed lines represent the intermediate synchronisation
group; dotted lines represent the low synchronisation group. *: Significant differences at
p<0.05 ............................................................................................................................... 48
Figure 5.1 Percentage of time of dyadic movement synchronisation for the whole match and
by different speed categories, according to the fixtures periods – a) longitudinal; b)
lateral displacements. ....................................................................................................... 63
Figure 5.2 Standardised effect sizes and 95% confidence intervals for physical (time-motion)
and tactical (movement synchronisation) variables. Negative values represent lower
results during congested fixtures. ..................................................................................... 65
Figure 5.3 Percentage of time of movement synchronisation for each dyad in longitudinal (a)
and lateral (b) displacements, according to the fixtures periods (DR – right defender; DL
– left defender; DCR –right centre defender; DCL - left centre defender; DMC -
defensive centre midfielder; MC - centre midfielder; AMF – attacking midfielder; FWR
– right forward; FWL – left forward; FWC – centre forward). ........................................ 66
Figure 6.1 Movement synchronisation results by training period, according to dyads positions
.......................................................................................................................................... 83
Figure 6.2 Movement synchronisation results by training period, according to dyads
professional experience. ................................................................................................... 84

XV
Figure 7.1 General effect sizes of players’ movement synchronisation, according to the
studied factors (a – match outcome; b – opposition level; c – congested fixtures; d –
training effect) in the present thesis. Positive results indicate higher synchronisation
results. .............................................................................................................................. 91
1
1. GENERAL INTRODUCTION
Performance analysis in football
“Performance analysis is an area of sport and exercise
science concerned with actual sports performance rather
than self-reports by athletes or laboratory experiments.”
Peter O’Donoghue, 2010
Performance analysis in sports is the study of athletes, players and/or teams performance,
assessed during their actual competition or training (O’Donoghue, 2010). For this analysis,
several performance indicators may be measured based in technical, physical, physiological
or tactical variables (Hughes & Bartlett, 2002) displayed by the performers during their
activity. All of this process serves the well-defined purpose of performance analysis – to
improve sports performance, by providing to coaches and players relevant information about
their performance (Hughes & Franks, 2008; O’Donoghue, 2010). Team sports, such as
football, rely on particular time motion and notational analysis performance indicators for
training and competition (e.g. see Carling, Williams, & Reilly, 2005). However, the recent
advances in technology, particularly in the capture of players’ positioning (Castellano,
Alvarez-Pastor, & Bradley, 2014; Cummins, Orr, O'Connor, & West, 2013), have provided
new insights to players’ performance, leading the way to an innovative and distinctive
performance analysis approach (Carling, 2013; Glazier, 2010; Travassos, Davids, Araújo, &
Esteves, 2013). In this chapter we will address some of the notational and time motion
approaches to performance analysis, and how this process is evolving based in new theoretical
frameworks and data collection tools.
Physical performance in football
One of the most commonly used performance indicator in football, either in training or
competition, is the study of the players’ physical demands imposed by the match or drill
situation (Carling, Bloomfield, Nelsen, & Reilly, 2008). This is achieved both by quantifying
match demands and by characterising the fitness impact of different training situations
2
(Bangsbo, Mohr, & Krustrup, 2006; Dellal, Drust, & Lago-Penas, 2012). The major benefit
from this information is a better preparation of the training sessions, which improves the
physiological adaptations considered relevant for the match performance. Following this line
of study, several researchers have approached the relation between players’ physical
performance and their competitive level or competition outcomes, establishing that higher
levels of physical performance were related to the highest levels of play (Mohr, Krustrup, &
Bangsbo, 2003; Vigne et al., 2013).
However, some recent investigations have provided contradictory information about this
relation. For instance, top-level players in matches of the Premier League have presented a
lower amount of distance covered and distanced covered at high intensity than lower level
leagues (Bradley et al., 2013). Despite this change, all players from the different competitive
leagues presented similar fitness levels, measured by an endurance test. In another approach,
the Italian teams classified in the top-5 final ranking of the Serie A league, also covered less
distance and distanced covered at high intensity than the bottom-5 teams (Rampinini,
Impellizzeri, Castagna, Coutts, & Wisloff, 2009). Also, despite the measured effects of
fatigue on players’ performance (Nedelec et al., 2012), their time motion result does not seem
to be affected by lower recovery periods during congested fixtures. In fact, players’ tend to
present similar physical performance results during congested and non-congested fixtures
(Carling, Le Gall, & Dupont, 2012; Dellal, Lago-Penas, Rey, Chamari, & Orhant, 2013;
Lago-Penas, Rey, Lago-Ballesteros, Casais, & Dominguez, 2011).
These results highlight that the relation between physical variables and performance needs to
be reviewed (Carling, 2013), changing the common “more is better” to a more context
depending approach, where different factors may effect players’ physical responses during the
match (McGarry, 2009). Existing studies approaching the effects of different playing
formations (Bradley et al., 2011), an early dismissal (Carling & Bloomfield, 2010) or the
score line (Bradley & Noakes, 2013), pave the way for this line of data interpretation.
3
Tactical performance in football
Tactics are adaptations to new configurations of play and to
the circulation of the ball. They build up during action, with
players moving according to the events of the game.
Jean-Francis Gréhaigne, 1999 (adapted)
In contrast to the majority of individual sports, where there is a relatively direct link between
athletes’ skills and conditioning to their performance outcome, football performance depends
mostly on an interaction process between both opposing teams/sides, rather than players’
individual characteristics (Lames & McGarry, 2007). This characteristic strengthens the
previous consideration for physical performance, but also highlights the need to consider the
interaction process a performance indicator itself. In this way, tactical performance in football
may be understood as the individual and collective behaviours, emerging from the opposing
sides interactions, while attempting to gain advantage over the adversary, both attacking and
defending (Gréhaigne, Godbout, & Bouthier, 1999).
A common approach for studying this interaction process is to consider sports performance as
a non-linear dynamical system (McGarry, Anderson, Wallace, Hughes, & Franks, 2002).
Previous studies have identified football as a dynamical system, by characterising
coordination patterns emerging from the players’ interaction (see Travassos et al., 2013). The
characterization of different trends of coordination as enabled to differentiate the pre and post
levels of tactical performance in non-professional football, participating in football tactical-
based practical lessons (Sampaio & Maçãs, 2012). Finally, a recent approach identified
players’ movement synchronisation as a characteristic of competitive football performance
(Duarte et al., 2012). It was observed that players tended to be more synchronised in the
longitudinal direction of the pitch, and suggested that the higher levels of synchronisation
were related to the creation and prevention of attacking and defending instabilities. Given
these findings, it may be considered that players’ will exhibit different synchronisation results
according to different factors that might promote or impair their tactical performance.
4
Synchronisation
“For reasons we don’t yet understand, the tendency to
synchronise is one of the most pervasive drives in the
universe (…)”
Steven Strogatz, 2003
Synchronisation may be defined as the process of rhythm adjustment between two oscillators,
which represent the time evolution of any given signal, in order to operate with the same
frequency (adapted from Tass, Popovych, & Hauptmann, 2009, p. 627). As stated by Strogatz
(2003), this is a rather common phenomenon, manifested in several observable and
measurable events. For instance, fireflies tend to synchronise their light flash during the night
and pendulum clocks, hanged in the same wall, tend to synchronise their pendulum swing
(Strogatz & Stewart, 1993). Several manifestations of human behaviour have been shown to
promote the synchronisation between individuals. For instance, reading at the same time tends
to promote an evenly paced temporal pattern between words (Bowling, Herbst, & Fitch,
2013). Some investigation go even further, suggesting not only behavioural, but also brain
function synchronisation in interpersonal interactions (Hari, Himberg, Nummenmaa,
Hamalainen, & Parkkonen, 2013)
However, one of the most interesting aspects of synchronisation is that it seems to be related
to performance enhancement strategies and to the performer skill level. In a study of animal
groups collective behaviour, the presence of a threat promoted a more synchronised
movement (Bode, Faria, Franks, Krause, & Wood, 2010). This behaviour was identified as
strategic for reducing the risk of being captured by a predator. Also, in a study evolving a
specific Aikido task and a non-specific hand-clapping task, the performance of skilled and
unskilled participants level revealed that the higher level of expertise promoted a stronger
dynamic synchronisation between participants in the specific task, though results were not
generalised for the non-specific task (Schmidt, Fitzpatrick, Caron, & Mergeche, 2011).
5
Measuring synchronisation in football
Measuring synchronisation in football may be achieved by analysing player movement during
the match. As seen earlier, recent technological advances in positional, computational and
imaging tools have allowed the collection of players’ in-field position data, either in
competition or training scenarios, with a higher degree of accuracy and a small time demand
for the data analysis and interpretation. This technological advances are mostly based in
individual GPS units (Johnston et al., 2012; Varley, Fairweather, & Aughey, 2012), radio
frequency systems (Frencken, Lemmink, & Delleman, 2010) and/or semi-automated video
tracking systems (Di Salvo, Collins, McNeill, & Cardinale, 2006). These systems provide the
bases to analyse tactical behaviour, as they deliver players’ in-field position in each moment
relative to their teammates and opponents.
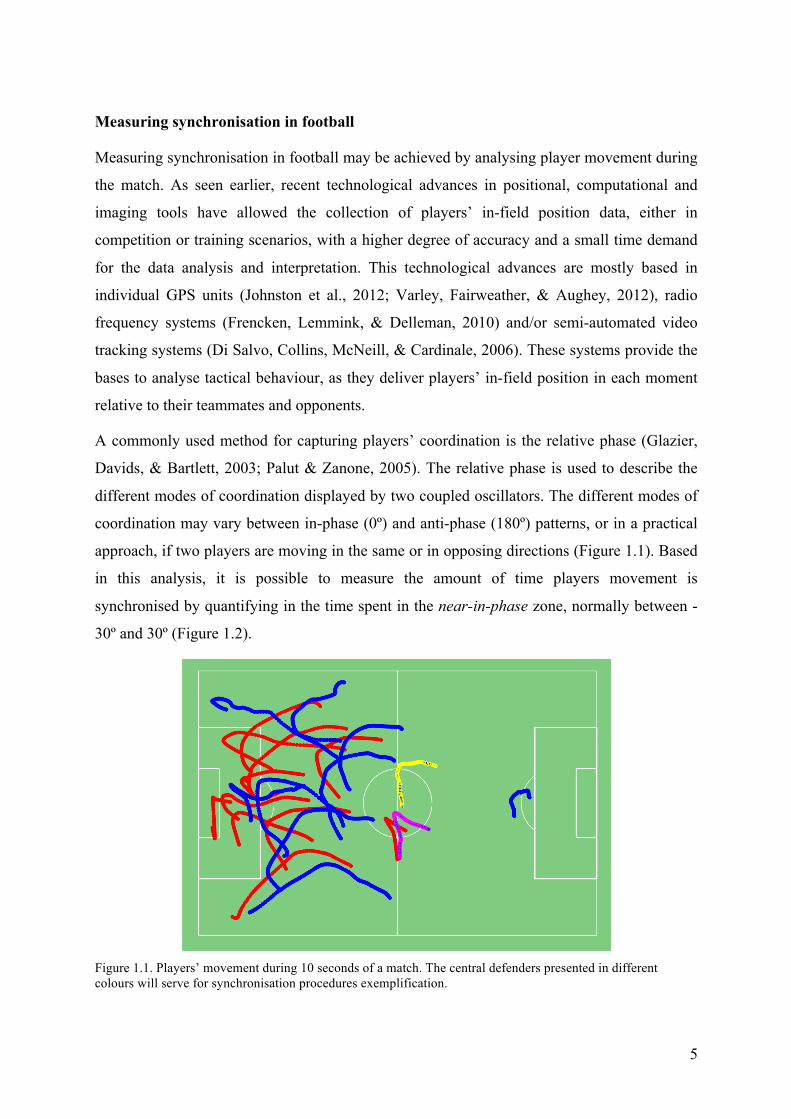
A commonly used method for capturing players’ coordination is the relative phase (Glazier,
Davids, & Bartlett, 2003; Palut & Zanone, 2005). The relative phase is used to describe the
different modes of coordination displayed by two coupled oscillators. The different modes of
coordination may vary between in-phase (0º) and anti-phase (180º) patterns, or in a practical
approach, if two players are moving in the same or in opposing directions (Figure 1.1). Based
in this analysis, it is possible to measure the amount of time players movement is
synchronised by quantifying in the time spent in the near-in-phase zone, normally between -
30º and 30º (Figure 1.2).
Figure 1.1. Players’ movement during 10 seconds of a match. The central defenders presented in different colours will serve for synchronisation procedures exemplification.
6
Figure 1.2 Central defenders movement in the longitudinal and lateral axes from the previous presented situation (a) and longitudinal relative phase results between these players, highlighting the correspondent time (b).
Thesis outline
All of the previous insights provide the bases for establishing a link between players’
movement synchronisation, measured by calculating the relative phase of their lateral and
longitudinal displacements, and their tactical performance. In the current doctoral thesis,
football players’ positional data collected during matches and training sessions, by either GPS
units or a semi-automatic camera tracking systems, were used to quantify their movement
synchronisation. These results were compared according to different factors such as the match
outcome, opposition level or number of days between, in order to comprehend how players’
movement synchronisation might serve as a tactical performance indicator. As such, our
general aim was to understand the role of movement synchronisation in elite football
performance. Therefore, our hypotheses were the following:
- Football teams present a higher level of players’ movement synchronisation when
winning than when losing;
- Football teams present a higher level of players’ movement synchronisation when
facing higher level opponents;
- In matches played during congested fixtures, football teams present a lower level of
players’ movement synchronisation;
- Football teams’ training effects during the preseason allow the increase the players’
movement synchronisation.
7
A total of 5 original research manuscripts were prepared, which constitute the main body of
this document. All of these studies account for a methodological and practical approach for
the use of movement synchronisation results as a performance indicator.
In the first chapter we addressed the theoretical foundations of synchronised behaviour and
established the relation between synchronisation and performance.
Chapter 2 – Accuracy and error measurements between individual GPS units -
Methodological approach for working with GPS data in the analysis of players’
interpersonal coordination in team sports – aimed to determine the error and accuracy
measured between two individual Global Positioning Systems units, developed for outdoor
team sports analysis. In this chapter we also addressed the use of this tools to measure
players’ interpersonal coordination, by quantifying synchronisation results between devices,
while displacing in a custom trolley. The bases for the methodological procedures intended to
the study of synchronisation were established in this article. More particularly, the procedures
used for the relative phase calculation, replicated in all of the following chapters.
Chapter 3 is entitled: Intra-team movement synchronisation as a measure of teams’
tactical performance in professional football. In this study we aimed to identify if the
outcome of professional football matches is affected by intra-team movement
synchronisation. Two levels of analysis were measured – comparing intra-team movement
synchronisation results between two opposing teams during a match; and comparing intra-
team movement synchronisation results of several matches of the same team, ending with
different outcomes. Finally, synchronisation trends according to players’ positions were also
presented in this study.
In chapter 4 – Competing with lower level opponents decreases intra-team movement
synchronisation and time-motion demands during pre-season football matches – our
main goal was to quantify the intra-team movement synchronisation of a professional football
team, while playing against different level opponents in their preseason matches. Match time-
motion demands presented by the different level opponents were also measured in this study,
and interrelated with synchronisation results, by analysing the relative phase results according
to players’ displacement intensities. Finally, a method for players’ functional classification,
based in their synchronisation results, was presented in this chapter.
In chapter 5 – The effects of congested fixtures on tactical and physical performance in
elite football – we aimed to compare the intra-team movement synchronisation results of a
8
professional team, under congested (i.e. matches distancing three days from the previous
fixture) and non-congested (i.e. matches distancing six or more days from the previous
fixture) fixture periods. Similar to the previous, this study also analysed the match time-
motion demands and synchronisation results according to players’ displacement intensities.
Chapter 6 – Physical, physiological and tactical responses to large-sided games during
preseason of elite footballers – aimed to identify changes in tactical, physical and
physiological performances during large-sided games during the preseason of elite
footballers. This study focused on players’ movement synchronisation as a measure of tactical
development by analysing a large-sided game, including time-motion demands, heart rate
measures, overall movement synchronisation and movement synchronisation according to
players’ displacement intensities.
Finally, in chapter 7 we combined all of the movement synchronisation results according to
the studied factors and presented the overall effect sizes results. A general discussion,
theoretical and methodological considerations, and practical applications were also addressed
in this chapter.
9
References
Bangsbo, J., Mohr, M., & Krustrup, P. (2006). Physical and metabolic demands of training and match-play in the elite football player. J Sports Sci, 24(7), 665-674. doi: 10.1080/02640410500482529
Bode, N. W., Faria, J. J., Franks, D. W., Krause, J., & Wood, A. J. (2010). How perceived threat increases synchronization in collectively moving animal groups. Proc Biol Sci, 277(1697), 3065-3070. doi: 10.1098/rspb.2010.0855
Bowling, D. L., Herbst, C. T., & Fitch, W. T. (2013). Social origins of rhythm? Synchrony and temporal regularity in human vocalization. PLoS One, 8(11), e80402. doi: 10.1371/journal.pone.0080402
Bradley, P. S., Carling, C., Archer, D., Roberts, J., Dodds, A., Di Mascio, M., . . . Krustrup, P. (2011). The effect of playing formation on high-intensity running and technical profiles in English FA Premier League soccer matches. J Sports Sci, 29(8), 821-830. doi: 10.1080/02640414.2011.561868
Bradley, P. S., Carling, C., Gomez Diaz, A., Hood, P., Barnes, C., Ade, J., . . . Mohr, M. (2013). Match performance and physical capacity of players in the top three competitive standards of English professional soccer. Hum Mov Sci, 32(4), 808-821. doi: 10.1016/j.humov.2013.06.002
Bradley, P. S., & Noakes, T. D. (2013). Match running performance fluctuations in elite soccer: indicative of fatigue, pacing or situational influences? J Sports Sci, 31(15), 1627-1638. doi: 10.1080/02640414.2013.796062
Carling, C. (2013). Interpreting physical performance in professional soccer match-play: should we be more pragmatic in our approach? Sports Med, 43(8), 655-663. doi: 10.1007/s40279-013-0055-8
Carling, C., & Bloomfield, J. (2010). The effect of an early dismissal on player work-rate in a professional soccer match. J Sci Med Sport, 13(1), 126-128. doi: 10.1016/j.jsams.2008.09.004
Carling, C., Bloomfield, J., Nelsen, L., & Reilly, T. (2008). The role of motion analysis in elite soccer: contemporary performance measurement techniques and work rate data. Sports Med, 38(10), 839-862.
Carling, C., Le Gall, F., & Dupont, G. (2012). Are physical performance and injury risk in a professional soccer team in match-play affected over a prolonged period of fixture congestion? Int J Sports Med, 33(1), 36-42. doi: 10.1055/s-0031-1283190
Carling, C., Williams, A. M., & Reilly, T. (2005). Handbook of soccer match analysis: A systematic approach to improving performance. New York, NY: Routledge.
Castellano, J., Alvarez-Pastor, D., & Bradley, P. S. (2014). Evaluation of research using computerised tracking systems (Amisco and Prozone) to analyse physical performance in elite soccer: a systematic review. Sports Med, 44(5), 701-712. doi: 10.1007/s40279-014-0144-3
Cummins, C., Orr, R., O'Connor, H., & West, C. (2013). Global positioning systems (GPS) and microtechnology sensors in team sports: a systematic review. Sports Med, 43(10), 1025-1042. doi: 10.1007/s40279-013-0069-2
10
Dellal, A., Drust, B., & Lago-Penas, C. (2012). Variation of activity demands in small-sided soccer games. Int J Sports Med, 33(5), 370-375. doi: 10.1055/s-0031-1295476
Dellal, A., Lago-Penas, C., Rey, E., Chamari, K., & Orhant, E. (2013). The effects of a congested fixture period on physical performance, technical activity and injury rate during matches in a professional soccer team. Br J Sports Med. doi: 10.1136/bjsports-2012-091290
Di Salvo, V., Collins, A., McNeill, B., & Cardinale, M. (2006). Validation of Prozone ®: A new video-based performance analysis system. Int J Perform Anal Spor, 6(1), 108-119.
Duarte, R., Araújo, D., Freire, L., Folgado, H., Fernandes, O., & Davids, K. (2012). Intra- and inter-group coordination patterns reveal collective behaviors of football players near the scoring zone. Hum Mov Sci, 31(6), 1639-1651. doi: 10.1016/j.humov.2012.03.001
Frencken, W. G., Lemmink, K. A., & Delleman, N. J. (2010). Soccer-specific accuracy and validity of the local position measurement (LPM) system. J Sci Med Sport, 13(6), 641-645. doi: 10.1016/j.jsams.2010.04.003
Glazier, P., Davids, K., & Bartlett, R. (2003). Dynamical systems theory: a relevant framework for performance-oriented sports biomechanics research. Sportscience, 7(retrieved from sportsci. org/jour/03/psg. htm).
Glazier, P. S. (2010). Game, set and match? Substantive issues and future directions in performance analysis. Sports Med, 40(8), 625-634. doi: 10.2165/11534970-000000000-00000
Gréhaigne, J., Godbout, P., & Bouthier, D. (1999). The Foundations of Tactics and Strategy in Team Sports. J Teach Phys Educ, 18(2), 159-174.
Hari, R., Himberg, T., Nummenmaa, L., Hamalainen, M., & Parkkonen, L. (2013). Synchrony of brains and bodies during implicit interpersonal interaction. Trends Cogn Sci, 17(3), 105-106. doi: 10.1016/j.tics.2013.01.003
Hughes, M., & Franks, I. (2008). The Essentials of Performance Analysis. New York, NY: Routledge.
Hughes, M. D., & Bartlett, R. M. (2002). The use of performance indicators in performance analysis. J Sports Sci, 20(10), 739-754. doi: 10.1080/026404102320675602
Johnston, R. J., Watsford, M. L., Pine, M. J., Spurrs, R. W., Murphy, A. J., & Pruyn, E. C. (2012). The validity and reliability of 5-Hz global positioning system units to measure team sport movement demands. J Strength Cond Res, 26(3), 758-765. doi: 10.1519/JSC.0b013e318225f161
Lago-Penas, C., Rey, E., Lago-Ballesteros, J., Casais, L., & Dominguez, E. (2011). The influence of a congested calendar on physical performance in elite soccer. J Strength Cond Res, 25(8), 2111-2117. doi: 10.1519/JSC.0b013e3181eccdd2
Lames, M., & McGarry, T. (2007). On the search for reliable performance indicators in game sports. Int J Perform Anal Spor, 7(1), 62-79.
McGarry, T. (2009). Applied and theoretical perspectives of performance analysis in sport: Scientific issues and challenges. Int J Perform Anal Spor, 9(1), 128-140.
11
McGarry, T., Anderson, D. I., Wallace, S. A., Hughes, M. D., & Franks, I. M. (2002). Sport competition as a dynamical self-organizing system. J Sports Sci, 20(10), 771-781. doi: 10.1080/026404102320675620
Mohr, M., Krustrup, P., & Bangsbo, J. (2003). Match performance of high-standard soccer players with special reference to development of fatigue. J Sports Sci, 21(7), 519-528. doi: 10.1080/0264041031000071182
Nedelec, M., McCall, A., Carling, C., Legall, F., Berthoin, S., & Dupont, G. (2012). Recovery in soccer: part I - post-match fatigue and time course of recovery. Sports Med, 42(12), 997-1015. doi: 10.2165/11635270-000000000-00000
O’Donoghue, P. (2010). Research Methods for Sports Performance Analysis New York, NY: Routledge.
Palut, Y., & Zanone, P. G. (2005). A dynamical analysis of tennis: concepts and data. J Sports Sci, 23(10), 1021-1032. doi: 10.1080/02640410400021682
Rampinini, E., Impellizzeri, F. M., Castagna, C., Coutts, A. J., & Wisloff, U. (2009). Technical performance during soccer matches of the Italian Serie A league: effect of fatigue and competitive level. J Sci Med Sport, 12(1), 227-233. doi: 10.1016/j.jsams.2007.10.002
Sampaio, J., & Maçãs, V. (2012). Measuring tactical behaviour in football. Int J Sports Med, 33(5), 395-401. doi: 10.1055/s-0031-1301320
Schmidt, R. C., Fitzpatrick, P., Caron, R., & Mergeche, J. (2011). Understanding social motor coordination. Hum Mov Sci, 30(5), 834-845. doi: 10.1016/j.humov.2010.05.014
Strogatz, S. (2003). Sync. New York: Hyperion. Strogatz, S. H., & Stewart, I. (1993). Coupled oscillators and biological synchronization. Sci
Am, 269(6), 102-109. doi: 10.1038/scientificamerican1293-102 Tass, P. A., Popovych, O. V., & Hauptmann, C. (2009). Brain Pacemaker. In R. A. Meyers
(Ed.), Encyclopedia of Complexity and Systems Science (pp. 626-644). New York, NY: Springer New York.
Travassos, B., Davids, K., Araújo, D., & Esteves, P. T. (2013). Performance analysis in team sports: Advances from an Ecological Dynamics approach. Int J Perform Anal Spor, 13(1), 83-95.
Varley, M. C., Fairweather, I. H., & Aughey, R. J. (2012). Validity and reliability of GPS for measuring instantaneous velocity during acceleration, deceleration, and constant motion. J Sports Sci, 30(2), 121-127. doi: 10.1080/02640414.2011.627941
Vigne, G., Dellal, A., Gaudino, C., Chamari, K., Rogowski, I., Alloatti, G., . . . Hautier, C. (2013). Physical outcome in a successful Italian Serie A soccer team over three consecutive seasons. J Strength Cond Res, 27(5), 1400-1406. doi: 10.1519/JSC.0b013e3182679382
12
2. ACCURACY AND ERROR MEASUREMENTS BETWEEN INDIVIDUAL GPS UNITS -
METHODOLOGICAL APPROACH FOR WORKING WITH GPS DATA IN THE ANALYSIS OF
PLAYERS’ INTERPERSONAL COORDINATION IN TEAM SPORTS
Abstract
The main objective of this study was to determine the accuracy and error measured between
two GPS units positioned at a known distance, in both 5 and 15Hz GPS models. Two
different procedures for data collection were compared – proprietary software calculated
positions and externally calculated positions. Also, the relative phase of the units’
displacement was calculated for determine the usability of the GPS devices for coordination
trends assessment. Root mean square error (RMSE) and variance accounted for (VAF) were
used as accuracy measures. Data collection was divided by small (0.5 to 2.5m) and large
distances (5 to 30m), and performed while the devices were static and in motion. Results
showed that GPS devices presented a considerable low degree of accuracy for small distances
(lower than 5 meters), however, the proposed procedures for externally calculated positioning
improved the accuracy of both 5 and 15Hz models. Finally, despite the measured accuracy
results, GPS devices seem to be adequate instruments for capturing coordination process
between two players, as the relative phase results revealed a clear trend for in-phase pattern.
In conclusion, GPS technology provides a functional tool for the study of interpersonal
process in team sports. However, researches should be aware that when measuring small
distances tasks, the accuracy of the GPS devices is not sufficiently precise to depict
movement variations.
13
Introduction
The use of Global Positioning Systems (GPS) to study outdoor team sports performance has
been widely disseminated in the recent years. These systems have promoted access to
important data insights, such as players’ distance covered or pace intensity in either training
and competition situations (Cummins, Orr, O'Connor, & West, 2013).
The use of GPS devices presents some advantages over other positional data collection
systems such as radio frequency system or semi automated video tracking systems. One of the
main advantages is its portability and collection site flexibility, opposed to other systems that
have a relatively complex apparatus, making difficult their transportation and adaptation to
different fields. Conversely, one of the main disadvantages of GPS systems is being based in
independent devices. Opposed to radio frequency and semi automated video tracking systems,
were a common structure is used by all individual devices or were the same cameras capture
different players positions, each individual GPS units communicates independently with
available satellites in sight. As such, each individual unit is an independent system, not
establishing any communication with other nearby devices in use. This particular aspect may
help justify the low results of inter-unit reliability presented in some recent research, with
several GPS working at different collection rates (Akenhead, French, Thompson, & Hayes,
2013; Varley, Fairweather, & Aughey, 2012). Though this characteristic does not pose
limitations for the assessment of players’ individual physical responses, it reduces the
potential use of these devices for capturing players’ collective behaviours, since no
information is available on the degree of accuracy established between two or more devices.
Despite the traditional approach to players’ time-motion demands, recent studies using
positional data have focused on collective variables. Some examples of collective variables
are the distance between teams’ centroids (Frencken, Poel, Visscher, & Lemmink, 2012),
team length and width relation (Folgado, Lemmink, Frencken, & Sampaio, 2014), or the
stretch index (Bourbousson, Seve, & McGarry, 2010). Studying the dynamical evolution of
these linear variables relies on accurate tools, able to capture positional data with a high
sample rate. Commonly, the methodological procedures of these studies are based in manual
digitalisation of video captured matches. However, these are time-consuming procedures, not
adequate for large scale collections and not easily adaptable when video capture is not
possible. Again, GPS technology may be suitable for data collection in these cases.
14
Finally, given the rise of use of non-linear methods, used in the study of human movement
(Harbourne & Stergiou, 2009), and more particularly in the dynamical evolution of team
sports behaviours (Duarte, Araújo, Correia, & Davids, 2012a; Vilar, Araújo, Davids, &
Button, 2012), it seems important to understand the usability of the GPS devices for capturing
these collective movement characteristics.
As such, the main objective of this study was to determine the accuracy and error measured
between two units positioned at a known distance, in both 5Hz and 15Hz GPS models. This
analysis was performed while the devices were kept static and also while in motion. Two
different procedures for data collection were compared – proprietary software calculated
positions and externally calculated positions. Also, the relative phase of the units’
displacement was calculated for determine the usability of the GPS devices for coordination
trends assessment.
Methods
Subjects
Two different models of individual global positioning system (GPS) units (SPI Pro,
GPSports, Canberra, Australia) with a collection frequency of 5 and 15Hz respectively, were
used separately in this study to calculate inter-device accuracy. Data collection was divided in
two moments, according to the magnitude of distance between units – small distances (0.5 to
2.5 m); large distance (5 to 30m).
Data collection
For the small distance between devices, a custom trolley was build (Figure 2.1) in order to
accommodate 6 GPS units at different distances (0.5; 1; 1.5; 2 and 2.5m). The trolley was first
maintained static and then pulled by a research team member that walked around a
predetermined course in a football field, marked with cones (Figure 2.2). For the larger
distance between devices two members of the research team, using one GPS unit each, hold a
marked rope at a constant distance.
15
Figure 2.1 Schematic representation of the custom trolley build for GPS accommodation and predetermined distances between units.
The research team members were first maintained motionless and then walked in a random
pattern in a football field, while keeping the marked rope stretched at specific distances (5;
10; 20 and 30m). Two courses were completed for data collection with each GPS model (5Hz
and 15Hz devices), for both small and large distances.
Figure 2.2 Schematic representation of the course used for the small distances data collection.
Data Preparation
After the data collection for both GPS models, the positional data was retrieved from the
devices using the provided proprietary software (TEAM AMS R1 2011.8, GPSports,
Canberra, Australia). This software allows transferring positional data from the GPS devices
16
in two different measurement units, based in the latitude and longitude geographic
coordinates collected – as meters and as decimal degrees. In the provided user manual no
information is specified on how the positional data is converted into meters by the proprietary
software, nor how the spatial referential is defined.
After gathering the positional data from the GPS devices, two separate datasets were prepared
for accuracy analysis. One dataset was created containing the positional data for each
evaluated distance, collected from both GPS device models, and retrieved from the
proprietary software in meters. The only alteration performed to this dataset before the
accuracy analysis, was the resampling of missing data gaps using an interpolation method.
This procedure was performed to unsure equal time series length between units.
Other dataset was created containing latitude and longitude positional data for each evaluated
distance, collected from both GPS device models in decimal degrees. Similar to the first
dataset, missing data gaps were resampled using an interpolation method. Then, positional
data were converted from decimal degrees to meters, using the Universal Transverse Mercator
(UTM) coordinate system (Palacios, 2006). This procedure ensured all GPS data shared a
common spatial referential with equal units in both axes. Lastly, the positional data were
smoothed using a 3 Hz Butterworth low pass filter. This is a common procedure executed to
positional data, intending to deal with error produced by instrumentation noise (Winter, 2009,
p. 35 to 38). These procedures were performed using MATLAB 2011b (The Mathworks Inc.,
Natick, MA, USA).
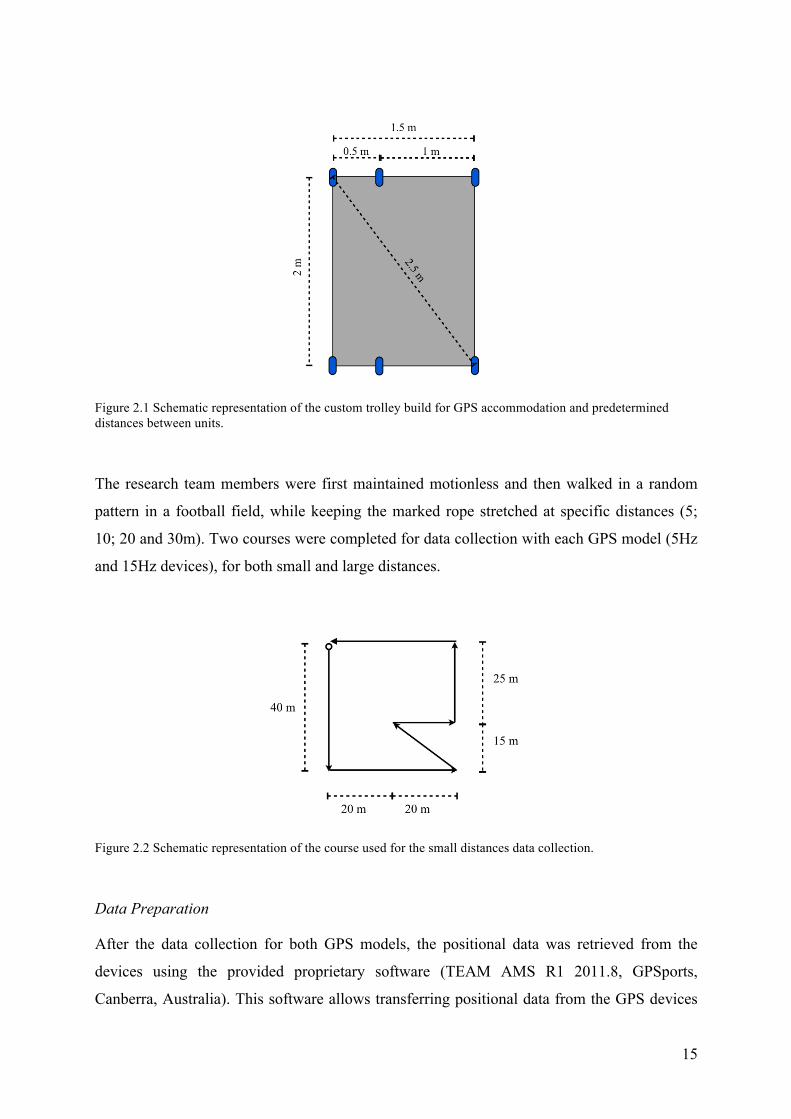
Methodology
Based in the datasets of both 5 and 15Hz GPS devices, inter-unit accuracy was calculated by
the root mean square error (RMSE) and the percentage of variance accounted for (VAF) for
each measured distance:
𝑅𝑀𝑆𝐸 =Σt=1
n GPS distancest − real distancest
2
n
% 𝑉𝐴𝐹 = 100×(1 − Σt=1n (GPS distancest − real distancest)2
Σt=1n (GPS distancest)2
17
The RMSE was used to quantify the inter-unit GPS linear error. The VAF was used to
quantify how close to the expected values the inter-unit GPS measures were.
Finally, in order to determine the usability of positional data gathered using GPS devices for
measuring non-linear variables, the relative phase of the units’ displacement was calculated.
The relative phase quantifies the position relations between two signals by measuring the
phase differences between them (Travassos, Araújo, Duarte, & McGarry, 2012). Different
modes of coordination may vary between in-phase (0º), when both signals are displacing in
the same way; and anti-phase (180º), when signals are displacing in opposite directions. For
this analysis, only the data collected using the trolley was used, to ensure the GPS units were
displacing at the same pace and direction. Relative phase analysis was divided by
displacement axes – lateral and longitudinal displacements.
Statistical analysis
Paired samples T-test were used to compare accuracy measures calculated from the
proprietary software positions and from the externally computed positions, according to each
GPS model. Statistical calculations were done using IBM SPSS Statistics (version 20.0, IBM
Corporation, Somers, New York, USA) and the statistical significance was maintained at 5%.
Results
Within some degree of variation, each model of GPS tended to present similar RMSE for all
of the measured distances. Also, no particular trend of error alteration was observed according
to different distances, while the GPS units were static or in motion (see 2.1 and 2.2).
However, the procedures used for externally calculate the positional data revealed a lower
RMSE in both static and in motion conditions, for the 5Hz model (static: t(29)= -6.96, p<0.001;
in motion: t(29)= -7.07, p<0.001) and the 15Hz model (static: t(29)= -6.80, p<0.001; in motion:
t(29)= -6.40, p<0.001).
18
Table 2.1 Overall RMSE results for both GPS models at a static position by distance and type of data treatment.
Distances (m) Software
calculated 5Hz data
Software calculated 15Hz
data
Externally calculated 5Hz
data
Externally calculated 15Hz
data 0.5 2.64 3.08 1.35 0.91 1 1.77 2.72 0.71 1.30
1.5 4.04 5.60 1.21 1.67 2 1.23 0.84 0.68 1.07
2.5 3.43 4.95 0.91 1.84 5 0.35 3.15 0.13 1.14
10 2.45 6.59 0.93 0.33 20 3.79 6.32 0.76 0.21 30 3.77 6.72 0.56 0.01
Table 2.2 Overall RMSE results for both GPS models while in motion at a walking speed by distance and type of data treatment.
Distances (m) Software
calculated 5Hz data
Software calculated 15Hz
data
Externally calculated 5Hz
data
Externally calculated 15Hz
data 0.5 2.21 2.21 1.38 1.12 1 1.77 2.11 1.13 1.25
1.5 3.04 3.98 1.30 1.87 2 1.13 1.02 0.79 0.83
2.5 2.35 3.78 1.03 1.69 5 3.15 5.75 0.72 1.61
10 3.86 5.82 1.26 0.56 20 3.90 5.77 0.60 1.20 30 4.03 6.60 0.68 1.19
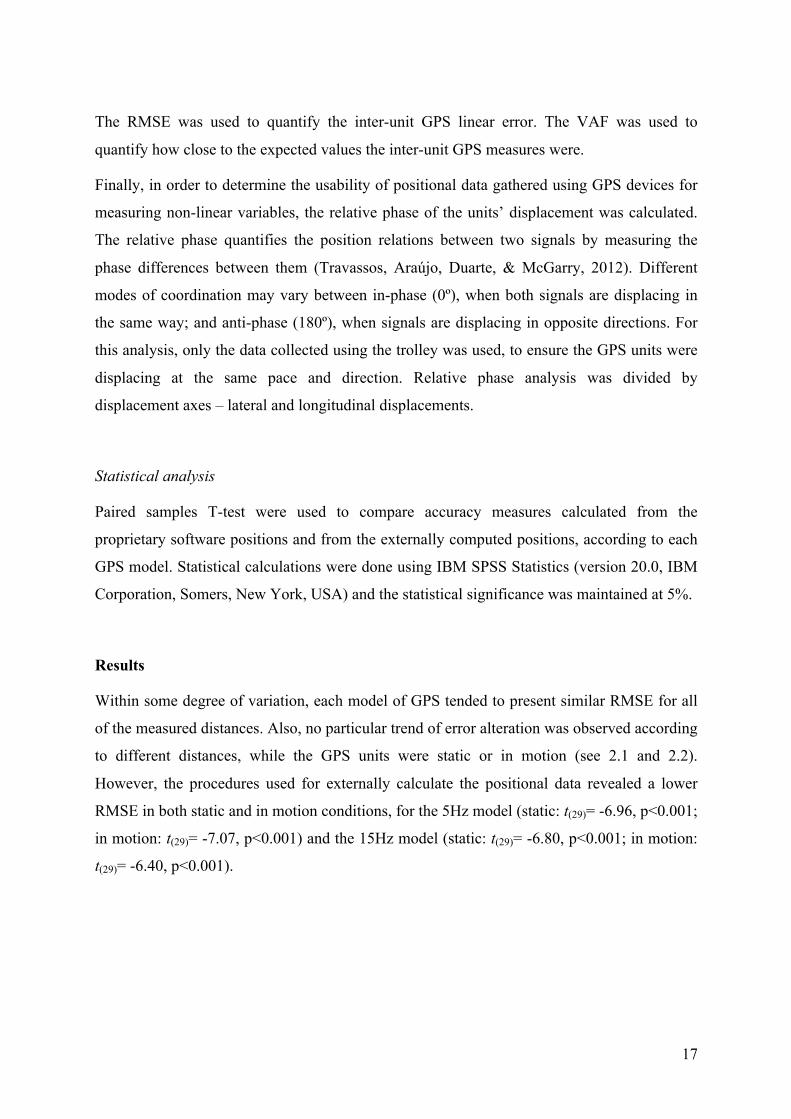
The VAF analysis revealed a tendency for higher accuracy results as the distance between
units increased (Figure 2.3). This trend was observed for both models and for both positional
data calculation procedures.
19
Figure 2.3 VAF results for both GPS models in static (a) and in motion (b) conditions, by distance and type of data treatment.
Again, externally calculated positional data revealed higher VAF values than the proprietary
software data – 5Hz model (static: t(29)= 3.86, p=0.001; in motion: t(29)= -5.50, p<0.001);15Hz
model (static: t(29)= 7.65, p<0.001; in motion: t(29)= -9.45, p<0.001).
20
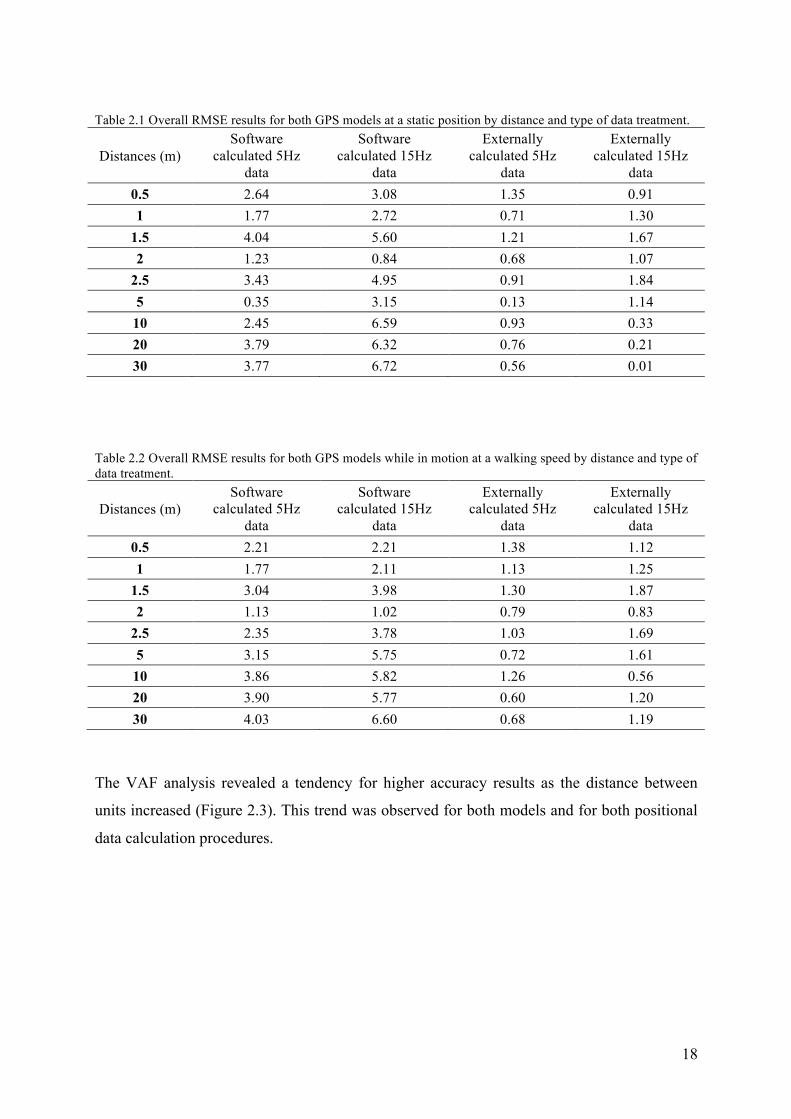
Figure 2.4 Relative phase results for 5Hz (a- longitudinal; b- lateral) and 15Hz GPS model (c- longitudinal; d- lateral) by type of data treatment.
Finally, the relative phase analysis showed a high percentage of in-phase result between GPS
units (Figure 2.4). Results were very similar for both calculation procedures. The total
percentage of time spent in the -30º to 30º bin was the following: 5Hz model, software
calculated positions – 99.7% (longitudinal) and 93.9% (lateral); 5Hz model, externally
calculated positions – 99.7% (longitudinal) and 94.9% (lateral); 15Hz model, software
calculated positions – 99.4% (longitudinal) and 97.6% (lateral); 15Hz model, externally
calculated positions – 99.4% (longitudinal) and 98.0% (lateral). No statistical differences
between procedures were revealed.
Discussion
The main objective of this study was to determine the accuracy and error measured between
two units positioned at a known distance, in both 5Hz and 15Hz GPS models. Since existing
studies on GPS accuracy measures do not follow similar methods, no equivalent results for
direct comparison were available. Still, our results are in line with the 3 to 5 meters absolute
positioning error indicated by the manufacturer (GPSports).
21
The 5Hz units revealed higher accuracy results for both RMSE and VAF measures when
comparing proprietary software results. Other studies have reported higher inter-unit
reliability for lower sample units, while comparing distinct GPS models (Duffield, Reid,
Baker, & Spratford, 2010). However, higher accuracy has been systematically reported in
higher sample models (Jennings, Cormack, Coutts, Boyd, & Aughey, 2010; Portas, Harley,
Barnes, & Rush, 2010; Varley et al., 2012). Some authors relate these results to the
inadequacy of lower sample units to collect high intensity displacements (Akenhead et al.,
2013; Rawstorn, Maddison, Ali, Foskett, & Gant, 2014). As such, our results may be limited
to the specific task assessed in this study, which did not consider displacements at different
speeds.
One important finding of our study is the possible optimisation of positional data by
externally processing the latitude and longitude measures, rather than using the proprietary
software data in meters. This procedure ensured a lower error and higher accuracy for both
5Hz and 15Hz models. Given the classical use of these devices in the quantification of
distances covered by an individual athlete (Cummins et al., 2013), existing software does not
consider the possibility of assessing relative positioning of players, measured by the GPS. So,
software calculated positional data, exported in meters, seems to not always share a common
spatial referential between two individual devices, given that this is not a required procedure
for individual measures calculations. This software characteristic limits the possibilities for
the study of interpersonal behaviours, and promotes an increase in the relative error between
units, diminishing the accuracy. Our suggested approach, for externally conversion of the
positional data to meters, seems to overcome this limitation by ensuring positional data shares
a common referential. This adaptation promotes a lower relative error and increases the
relative accuracy in both GPS models, as observed in the VAF results (Figure 2.3).
Our data also suggests that RMSE measures are independent of the GPS devices distances,
considering scales relevant for team sports scenarios (0.5 to 30 m). As such, when considering
a relative measure, such as VAF, the absolute error tends to dissipate as the distance between
units rises. This aspect promotes a higher relative accuracy for larger distances. Taking into
account this setting, a cut point of about 5-10 meters may be determined for the study of
relative positioning in team sports. Researchers should be aware that GPS might not be an
adequate instrument for the study of tasks involving distances smaller than 5 meters, such as
the interpersonal distance between attacker and defender (Duarte et al., 2010b). The level of
22
accuracy provided by these devices is not sufficiently developed for capture small changes in
players’ behaviour, and different approaches should be considered for data collection, such as
video tracking or other types of electronic tracking systems (Duarte et al., 2010a; Frencken,
Lemmink, & Delleman, 2010).
Finally, the relative phase analysis results showed a clear trend for an in-phase pattern. These
were expected results, as the devices were all attached to a common structure, displacing
conjointly. However, opposing to the evaluation of accuracy in linear distances, there was no
difference in the positional data calculation procedures. These results are a consequence of the
relative phase, commonly to other non-linear methods, use of the direction and magnitude of
the time-series to calculate dynamical coordination patterns, rather than using absolute values.
As such, differences in accuracy are not relevant for this technique, which is more dependent
in the validity of the device for capturing players’ displacements.
Conclusion
GPS devices are accurate tools for capturing players’ behaviour in outdoor team sports. Given
the presented accuracy, it is recommended not to use this tool in for less than 5 meters
distance calculation. However, this aspect does not compromise capturing of players direction
and magnitude of displacement, particularly for non-linear methods calculations, such as the
relative phase. Researchers should consider the use of this tool in tasks were the distance
between players is typically greater than 5 meters, such as small-sided games (Sampaio &
Maçãs, 2012), or when focusing in pattern formation aspects (Duarte et al., 2012b).
23
References
Akenhead, R., French, D., Thompson, K. G., & Hayes, P. R. (2013). The acceleration dependent validity and reliability of 10Hz GPS. J Sci Med Sport. doi: 10.1016/j.jsams.2013.08.005
Bourbousson, J., Seve, C., & McGarry, T. (2010). Space-time coordination dynamics in basketball: Part 2. The interaction between the two teams. J Sports Sci, 28(3), 349-358. doi: 10.1080/02640410903503640
Cummins, C., Orr, R., O'Connor, H., & West, C. (2013). Global positioning systems (GPS) and microtechnology sensors in team sports: a systematic review. Sports Med, 43(10), 1025-1042. doi: 10.1007/s40279-013-0069-2
Duarte, R., Araújo, D., Correia, V., & Davids, K. (2012a). Sports teams as superorganisms: implications of sociobiological models of behaviour for research and practice in team sports performance analysis. Sports Med, 42(8), 633-642. doi: 10.2165/11632450-000000000-00000
Duarte, R., Araújo, D., Fernandes, O., Fonseca, C., Correia, V., Gazimba, V., . . . Lopes, J. (2010a). Capturing complex human behaviors in representative sports contexts with a single camera. Medicina (Kaunas), 46(6), 408-414.
Duarte, R., Araújo, D., Freire, L., Folgado, H., Fernandes, O., & Davids, K. (2012b). Intra- and inter-group coordination patterns reveal collective behaviors of football players near the scoring zone. Hum Mov Sci, 31(6), 1639-1651. doi: 10.1016/j.humov.2012.03.001
Duarte, R., Araújo, D., Gazimba, V., Fernandes, O., Folgado, H., Marmeleira, J., & Davids, K. (2010b). The ecological dynamics of 1v1 sub-phases in association football. Open Sports Sci J, 3, 16-18.
Duffield, R., Reid, M., Baker, J., & Spratford, W. (2010). Accuracy and reliability of GPS devices for measurement of movement patterns in confined spaces for court-based sports. J Sci Med Sport, 13(5), 523-525. doi: 10.1016/j.jsams.2009.07.003
Folgado, H., Lemmink, K. A., Frencken, W., & Sampaio, J. (2014). Length, width and centroid distance as measures of teams tactical performance in youth football. Eur J Sport Sci, 14 Suppl 1(sup1), S487-492. doi: 10.1080/17461391.2012.730060
Frencken, W., Poel, H., Visscher, C., & Lemmink, K. (2012). Variability of inter-team distances associated with match events in elite-standard soccer. J Sports Sci, 30(12), 1207-1213. doi: 10.1080/02640414.2012.703783
Frencken, W. G., Lemmink, K. A., & Delleman, N. J. (2010). Soccer-specific accuracy and validity of the local position measurement (LPM) system. J Sci Med Sport, 13(6), 641-645. doi: 10.1016/j.jsams.2010.04.003
GPSports. Global Satellite Systems Positional Accuracy. from http://gpsports.com/gpsports_website/faqs/GPS_Positioning_Accuracy.pdf
Harbourne, R. T., & Stergiou, N. (2009). Movement variability and the use of nonlinear tools: principles to guide physical therapist practice. Phys Ther, 89(3), 267-282. doi: 10.2522/ptj.20080130
24
Jennings, D., Cormack, S., Coutts, A. J., Boyd, L. J., & Aughey, R. J. (2010). The validity and reliability of GPS units for measuring distance in team sport specific running patterns. Int J Sports Physiol Perform, 5(3), 328-341.
Palacios, R. (2006). deg2utm. MATLAB Central File Exchange. Retrieved October 20 2012, 2011, from http://www.mathworks.com/matlabcentral/fileexchange/10915
Portas, M. D., Harley, J. A., Barnes, C. A., & Rush, C. J. (2010). The Validity and Reliability of 1-Hz and 5-Hz Global Positioning Systems for Linear, Multidirectional, and Soccer-Specific Activities. Int J Sports Physiol Perform, 5(4), 448-458.
Rawstorn, J. C., Maddison, R., Ali, A., Foskett, A., & Gant, N. (2014). Rapid Directional Change Degrades GPS Distance Measurement Validity during Intermittent Intensity Running. PLoS One, 9(4), e93693. doi: 10.1371/journal.pone.0093693
Sampaio, J., & Maçãs, V. (2012). Measuring tactical behaviour in football. Int J Sports Med, 33(5), 395-401. doi: 10.1055/s-0031-1301320
Travassos, B., Araújo, D., Duarte, R., & McGarry, T. (2012). Spatiotemporal coordination behaviors in futsal (indoor football) are guided by informational game constraints. Hum Mov Sci, 31(4), 932-945. doi: 10.1016/j.humov.2011.10.004
Varley, M. C., Fairweather, I. H., & Aughey, R. J. (2012). Validity and reliability of GPS for measuring instantaneous velocity during acceleration, deceleration, and constant motion. J Sports Sci, 30(2), 121-127. doi: 10.1080/02640414.2011.627941
Vilar, L., Araújo, D., Davids, K., & Button, C. (2012). The role of ecological dynamics in analysing performance in team sports. Sports Med, 42(1), 1-10. doi: 10.2165/11596520-000000000-00000
Winter, D. (2009). Biomechanics and motor control of human movement. Hoboken, NJ, USA: John Wiley & Sons, Inc.
25
3. INTRA-TEAM MOVEMENT SYNCHRONISATION AS A MEASURE OF TEAMS’ TACTICAL
PERFORMANCE IN PROFESSIONAL FOOTBALL
Abstract
The aim of the present study was to identify if the outcome of professional football matches is
affected by intra-team movement synchronisation. Positional data from 77 players were
collected during four matches of an English Premier League team (season 2010/11) by using
the ProZone® tracking system. Intra-team movement synchronisation was calculated using the
relative phase from all possible pairing combination of outfield players (dyads), by
quantifying the percentage of time spent in-phase (-30º to 30º bin). A 2x2 mixed-model
ANOVA was used to compare the dyads movement synchronisation per displacement axes
for each confronting team and according to the match final outcome. For complementary
description purposes, each match movement synchronisation results were plotted across time
in a moving window of two minutes. A two-way ANOVA was used to compare movement
synchronisation according to dyads’ in-field position (defensive or offensive) and match final
outcome. Despite singular dynamical trends during each match, the analysed team tended to
exhibit lower movement synchronisation when losing. Also, defensive role dyads seem to
present a more synchronised behaviour during the match than the offensive role dyads.
Results suggest that movement synchronisation may serve as a tactical performance indicator,
reflecting the dynamical interaction between teammates and opponents during the match.
26
Introduction
The search for valid performance indicators in sport is a major concern for both researchers
and coaches. These are defined as action variables able to report or depict aspects of a sports
performance, in some cases specifically related to successful outcomes (Hughes & Bartlett,
2002). In this sense, different sports may use specific variables that are able to capture
athletes or teams’ level of performance. Performance during individual sports can be directly
measurable as time or distance (Atkinson, 2002), providing a relative straightforward relation
between the athletes’ skills or capacities and their competitive performance. In team sports,
however, this search is quite more complex and the available research often presents
contradictory and misleading approaches and results (see Lames & McGarry, 2007).
Nevertheless, the available research in football, for example, has been able to identify
technical performance indicators related to positive match outcomes or higher-level
performances, such as recovering ball possession at specific field zones (Gómez, Gómez-
Lopez, Lago, & Sampaio, 2012), the total number of passes (Bradley et al., 2013), or total
number of shoots (Castellano, Casamichana, & Lago, 2012). This new information is useful,
but there is also a need to establish a stronger link to environmental context, allowing to
understand the tactical approaches to the match (Carling, Wright, Nelson, & Bradley, 2014).
In fact, football performance depends not only on the players’ individual skills, but also on
the interaction process established between players, either teammates and opponents, during
the match (Lames & McGarry, 2007). This interaction process represents the measurable
behaviour of the collective system. Research advances in motion analysis has provided the
bases for dynamically capture players’ relative positioning throughout the match (Barris &
Button, 2008; Cummins, Orr, O'Connor, & West, 2013). These variables of players’ relative
positioning are classically used to perform time-motion analysis (Reilly, 2001) and more
scarcely to measure the players’ dynamical interaction (Duarte, Araújo, Correia, & Davids,
2012a; McGarry, 2009). These measures are described as contributors to the construct of
tactical behaviour or tactical performance, and are based in the dynamical evolution of
distances, angles and/or areas calculated from individual or compound players’ relative
positioning throughout the match (for e.g. see Duarte et al., 2012a; Vilar, Araújo, Davids, &
Button, 2012).
In general terms the available research has identified new variables, such as the oscillations of
centroid position (i.e. the team geometrical centre), which captures the flow of attacking and
27
defending during the game (Frencken, Lemmink, Delleman, & Visscher, 2011). Furthermore,
the relative distance between opposing teams centroid positions in the longitudinal direction
(i.e. considering the distance to the goal) seems to be related to goal scoring opportunities.
This happens when the attacking team centroid crosses the defending team centroid, and
becomes nearer to the goal during scoring situation. Other example is the area occupied by the
team, which seems to be related with performance during scoring opportunities (Duarte et al.,
2012b), as teams tend to increase the difference between the area of the attacking and
defending team before a pass leading to a scoring situation.
The previous studies attempted to capture and compare dynamical behavioural patterns during
particular match sub-phases represented by small-sided games, and were focused in specific
match events such as shooting or passing. Therefore, they are often unrepresentative for
application in formal matches (Frencken, Poel, Visscher, & Lemmink, 2012), by failing to
provide relevant information at the macro levels of organisation. In fact, capturing movement
synchronisation of players at the match level has been suggested as an adequate measure of
the continuous interactions during the game (Duarte et al., 2013). This measure was able to
discriminate different synchronisation trends during pre-season preparation matches in a
professional football team (Folgado, Duarte, Fernandes, & Sampaio, 2014). When facing
higher-level opponents, the examined team revealed a more synchronised behaviour than
when playing against lower level teams. This variation was attributed to a superior level of
collaborative work, elicited by greater demands in matches confronting higher-level teams.
Given the relevance of cooperative behaviour in several manifestations of collective
performance, and particularly in team sports (Duarte et al., 2012a) it seems relevant to
examine the relation between movement synchronisation and performance in football.
One commonly used method to quantify coordination trends of football players is the relative
phase (Palut & Zanone, 2005). This method quantifies the interaction of two oscillators, or in
a sport settings approach, the interaction of players’ displacements. When both players move
in the same direction and at the same velocity, an in-phase mode of coordination (0º) is
identified as a synchronised behaviour. On the other hand, when players move in opposite
directions, an anti-phase mode of coordination is identified (180º).
As such, the aim of the present study was to identify if the outcome of professional football
matches is affected by intra-team movement synchronisation. The intra-team movement
synchronisation will be measured by calculating the relative phase of all possible
28
combinations of outfield players’ pairs (dyads) in two levels: (i) between opposing teams, by
comparing the winning and losing team in each match; and (ii) within the analysed team, by
comparing different matches according to the final outcome. Also, the synchronisation results
of the analysed team will be compared according to the offensive or defensive role of outfield
players’ dyads.
Methods
Data collection
A total of 77 players participated in 4 matches during the 2010/11 English Premier League.
The analysed team (n=21) was kept constant throughout the 4 matches while the opponents
differed (n=56). The players’ positional data were collected using the ProZone® tracking
system (Prozone®, ProZone Holdings Ltd, UK), a semi-automated system that uses several
video cameras to capture players’ positioning during the match at a collection rate of 10Hz
(Di Salvo, Collins, McNeill, & Cardinale, 2006). The analysed team ended the season in the
top quarter of the classification, while the opponents were classified mid-table. During the
four analysed matches no player was sent off from either side, and the final results were two
wins and two losses for the analysed team. Whenever a substitution took place, the substituted
player was exchanged in the analysis by the teammate who assured his position in the team
formation. Matches were categorised according to the final outcome relative to the analysed
team (win or loss) and outfield players were categorised according to their specific in-field
position (defender, midfielder, forward).
Synchronisation calculation
The players’ movement synchronisation was calculated for all possible pairing combination
of outfield players per team (n=45 pairs) using the relative phase with the Hilbert Transform
(Palut & Zanone, 2005). Given that players from each team were sharing the same
environment and intentionality, by pursuing common goal-directed behaviours, it was
considered that each pair of players could form a dyad. Therefore, the movement
synchronisation was quantified by the percentage of time spent in the -30º to 30º bin (near-in-
phase mode of coordination), calculated for each dyad in each match, for both longitudinal
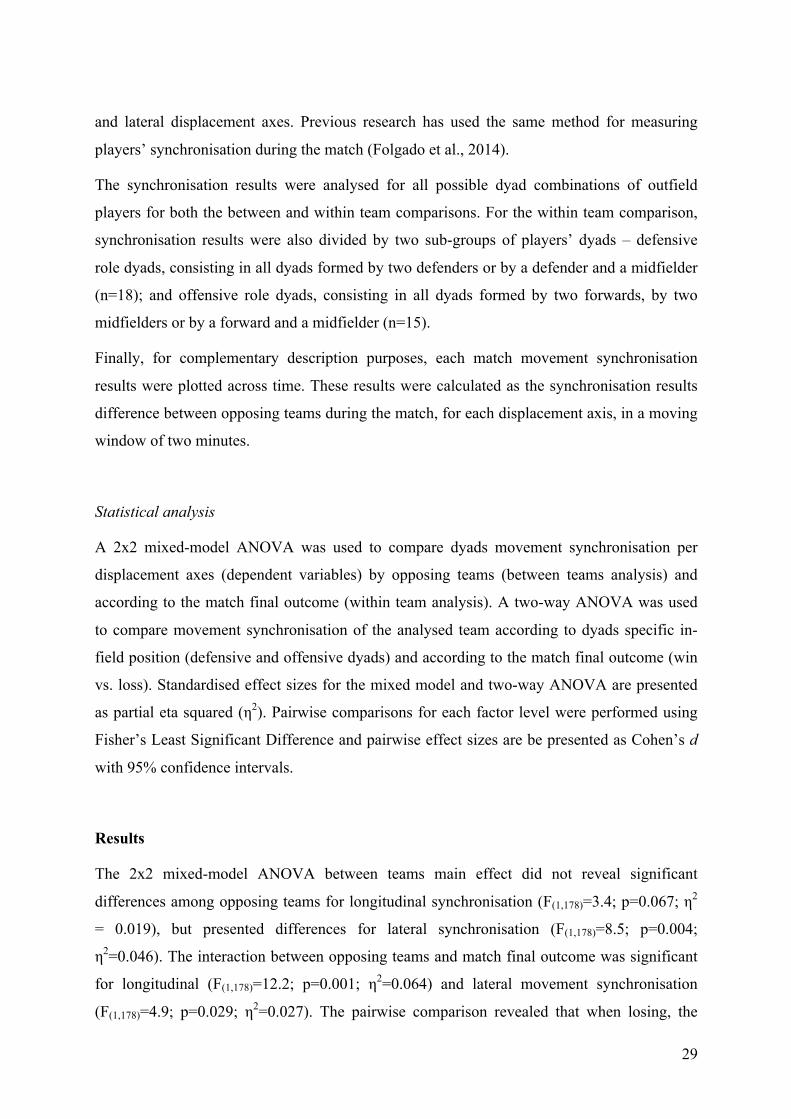
29
and lateral displacement axes. Previous research has used the same method for measuring
players’ synchronisation during the match (Folgado et al., 2014).
The synchronisation results were analysed for all possible dyad combinations of outfield
players for both the between and within team comparisons. For the within team comparison,
synchronisation results were also divided by two sub-groups of players’ dyads – defensive
role dyads, consisting in all dyads formed by two defenders or by a defender and a midfielder
(n=18); and offensive role dyads, consisting in all dyads formed by two forwards, by two
midfielders or by a forward and a midfielder (n=15).
Finally, for complementary description purposes, each match movement synchronisation
results were plotted across time. These results were calculated as the synchronisation results
difference between opposing teams during the match, for each displacement axis, in a moving
window of two minutes.
Statistical analysis
A 2x2 mixed-model ANOVA was used to compare dyads movement synchronisation per
displacement axes (dependent variables) by opposing teams (between teams analysis) and
according to the match final outcome (within team analysis). A two-way ANOVA was used
to compare movement synchronisation of the analysed team according to dyads specific in-
field position (defensive and offensive dyads) and according to the match final outcome (win
vs. loss). Standardised effect sizes for the mixed model and two-way ANOVA are presented
as partial eta squared (η2). Pairwise comparisons for each factor level were performed using
Fisher’s Least Significant Difference and pairwise effect sizes are be presented as Cohen’s d
with 95% confidence intervals.
Results
The 2x2 mixed-model ANOVA between teams main effect did not reveal significant
differences among opposing teams for longitudinal synchronisation (F(1,178)=3.4; p=0.067; η2
= 0.019), but presented differences for lateral synchronisation (F(1,178)=8.5; p=0.004;
η2=0.046). The interaction between opposing teams and match final outcome was significant
for longitudinal (F(1,178)=12.2; p=0.001; η2=0.064) and lateral movement synchronisation
(F(1,178)=4.9; p=0.029; η2=0.027). The pairwise comparison revealed that when losing, the
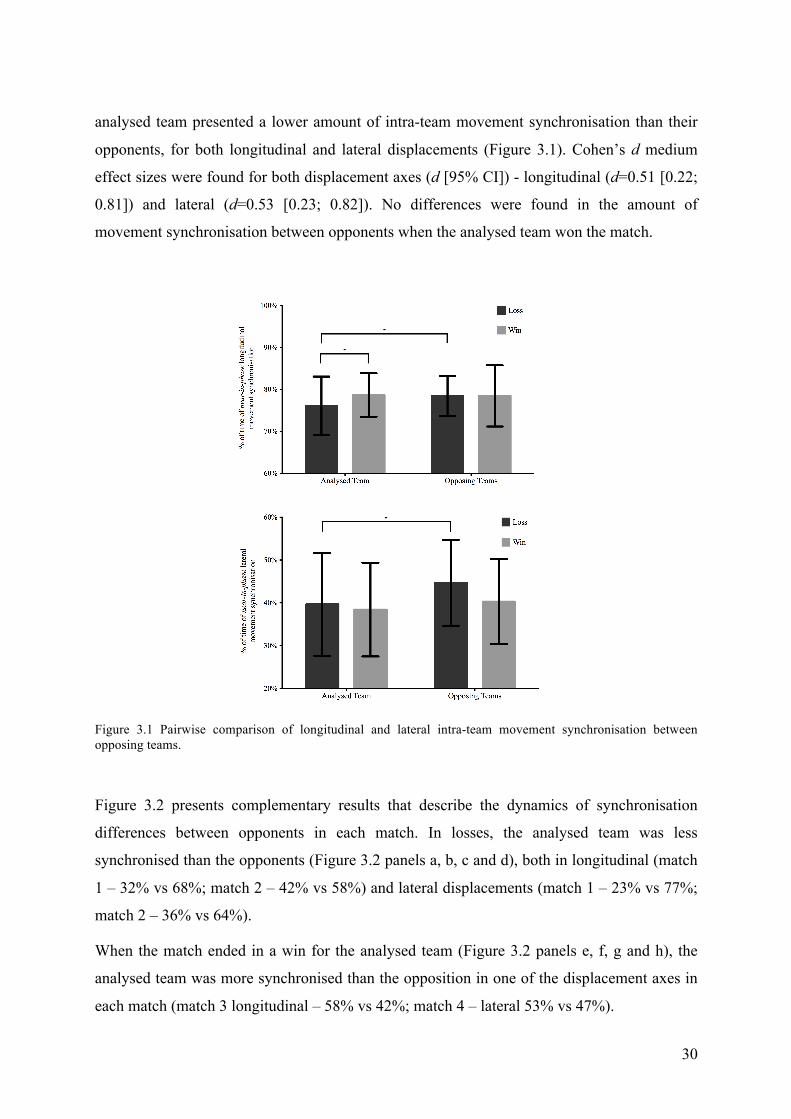
30
analysed team presented a lower amount of intra-team movement synchronisation than their
opponents, for both longitudinal and lateral displacements (Figure 3.1). Cohen’s d medium
effect sizes were found for both displacement axes (d [95% CI]) - longitudinal (d=0.51 [0.22;
0.81]) and lateral (d=0.53 [0.23; 0.82]). No differences were found in the amount of
movement synchronisation between opponents when the analysed team won the match.
Figure 3.1 Pairwise comparison of longitudinal and lateral intra-team movement synchronisation between opposing teams.
Figure 3.2 presents complementary results that describe the dynamics of synchronisation
differences between opponents in each match. In losses, the analysed team was less
synchronised than the opponents (Figure 3.2 panels a, b, c and d), both in longitudinal (match
1 – 32% vs 68%; match 2 – 42% vs 58%) and lateral displacements (match 1 – 23% vs 77%;
match 2 – 36% vs 64%).
When the match ended in a win for the analysed team (Figure 3.2 panels e, f, g and h), the
analysed team was more synchronised than the opposition in one of the displacement axes in
each match (match 3 longitudinal – 58% vs 42%; match 4 – lateral 53% vs 47%).
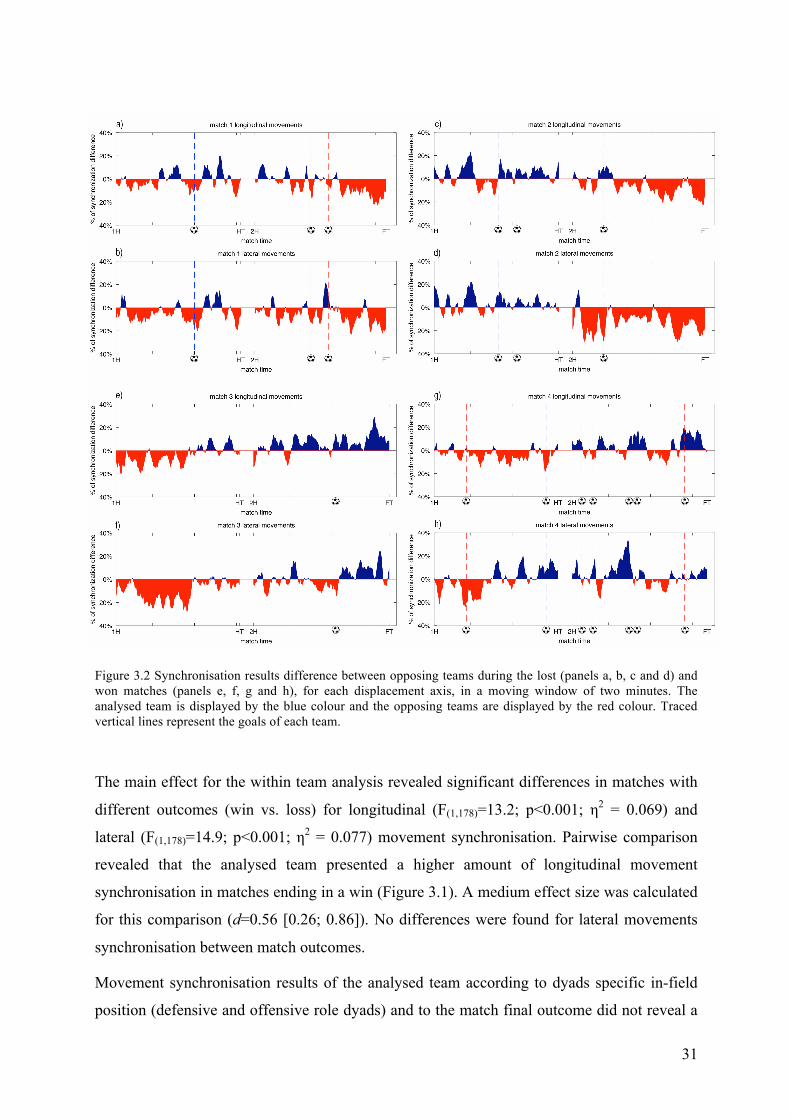
31
Figure 3.2 Synchronisation results difference between opposing teams during the lost (panels a, b, c and d) and won matches (panels e, f, g and h), for each displacement axis, in a moving window of two minutes. The analysed team is displayed by the blue colour and the opposing teams are displayed by the red colour. Traced vertical lines represent the goals of each team.
The main effect for the within team analysis revealed significant differences in matches with
different outcomes (win vs. loss) for longitudinal (F(1,178)=13.2; p<0.001; η2 = 0.069) and
lateral (F(1,178)=14.9; p<0.001; η2 = 0.077) movement synchronisation. Pairwise comparison
revealed that the analysed team presented a higher amount of longitudinal movement
synchronisation in matches ending in a win (Figure 3.1). A medium effect size was calculated
for this comparison (d=0.56 [0.26; 0.86]). No differences were found for lateral movements
synchronisation between match outcomes.
Movement synchronisation results of the analysed team according to dyads specific in-field
position (defensive and offensive role dyads) and to the match final outcome did not reveal a
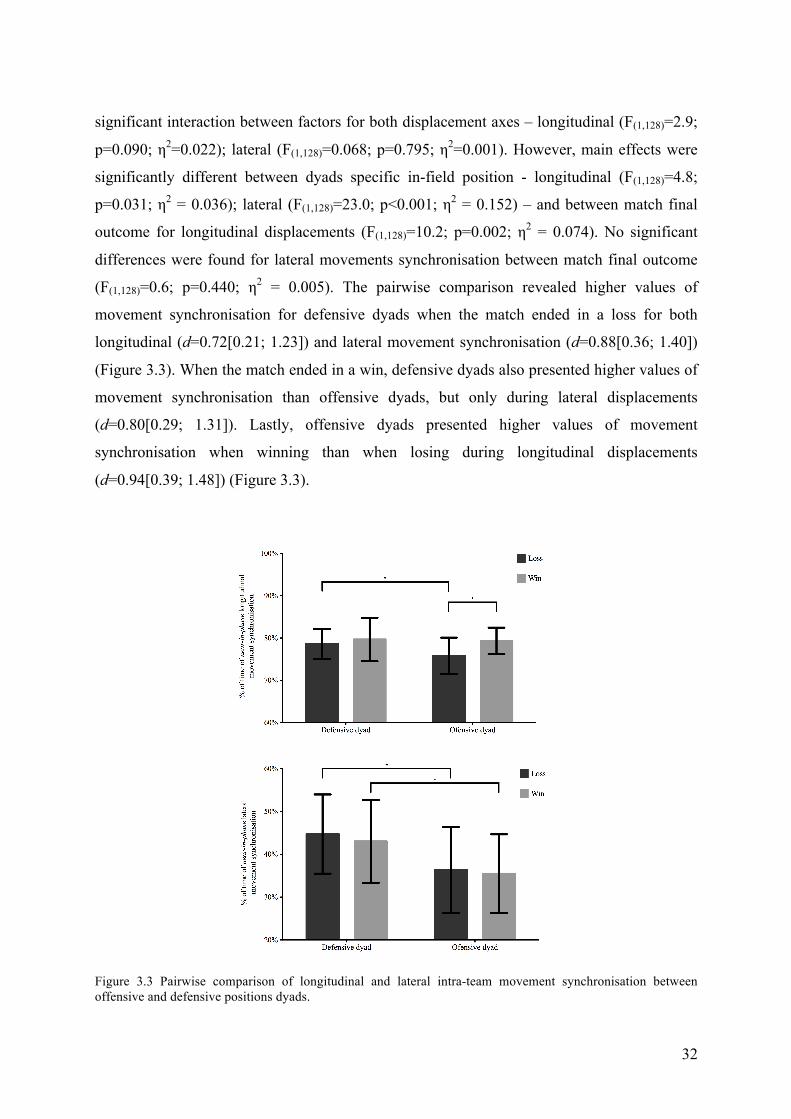
32
significant interaction between factors for both displacement axes – longitudinal (F(1,128)=2.9;
p=0.090; η2=0.022); lateral (F(1,128)=0.068; p=0.795; η2=0.001). However, main effects were
significantly different between dyads specific in-field position - longitudinal (F(1,128)=4.8;
p=0.031; η2 = 0.036); lateral (F(1,128)=23.0; p<0.001; η2 = 0.152) – and between match final
outcome for longitudinal displacements (F(1,128)=10.2; p=0.002; η2 = 0.074). No significant
differences were found for lateral movements synchronisation between match final outcome
(F(1,128)=0.6; p=0.440; η2 = 0.005). The pairwise comparison revealed higher values of
movement synchronisation for defensive dyads when the match ended in a loss for both
longitudinal (d=0.72[0.21; 1.23]) and lateral movement synchronisation (d=0.88[0.36; 1.40])
(Figure 3.3). When the match ended in a win, defensive dyads also presented higher values of
movement synchronisation than offensive dyads, but only during lateral displacements
(d=0.80[0.29; 1.31]). Lastly, offensive dyads presented higher values of movement
synchronisation when winning than when losing during longitudinal displacements
(d=0.94[0.39; 1.48]) (Figure 3.3).
Figure 3.3 Pairwise comparison of longitudinal and lateral intra-team movement synchronisation between offensive and defensive positions dyads.
33
Discussion
The aim of the present study was to identify if the outcome of professional football matches is
affected by intra-team movement synchronisation. Previous research showed players’ higher
degrees of longitudinal synchronisation, when compared to lateral synchronisation (Duarte et
al., 2013; Siegle & Lames, 2013). The current results add important information linking
synchronisation with different match outcomes, suggesting that lower values of
synchronisation might be associated with unfavourable match outcome. This trend was also
confirmed while comparing synchronisation between two opposing teams, and while
comparing synchronisation results in different matches from the same team. The dynamics of
synchronisation differences between opponents also seems to support this trend.
Previous research carried with non-professional players have also identified improvements in
coordinated behaviour between players after a football tactical learning program of 13 weeks
(Sampaio & Maçãs, 2012). The authors suggested that results reflected a change in players’
behaviour as a consequence of higher tactical expertise. Despite the relative low sample of
matches examined in this study, it seems that intra-team dyadic synchronisation may serve as
a tactical performance indicator, reflecting at some extent the teams’ performance outcome.
While comparing movement synchronisation between opposing teams according to the match
final outcome, the analysed team revealed a lower amount of synchronisation when losing.
However, no differences were found between teams when the match ended with a win. In this
sense, it seems that higher synchronisation results are not a condition directly related to a
more successful outcome, though a lack of synchronisation seems to be associated to a
negative result. Research in futsal (i.e. 5-a-side indoor football) has identified a more
coordinated movement between players during the defensive phases of the match, in order to
decrease opponent players opportunities for attacking (Travassos, Araújo, Vilar, & McGarry,
2011; Vilar, Araújo, Travassos, & Davids, 2014). Despite our study have not distinguished
between attacking and defending phases of the match, other approaches showed that teams’
presented similar synchronisation during the match, independently of being with or without
ball possession (Duarte et al., 2013). In this way, the lower amount of synchronisation
identified in the present study when the analysed team ended losing, though present in the
whole match, may be also evidenced during the defending phases. As such, a lower amount of
synchronisation may result in more opportunities for the opponent team to achieve a goal-
scoring situation, being therefore connected to a negative outcome.
34
Moreover, it is important to consider that the measure of movement synchronisation used in
the present study considered the whole match and not only the scoring situations. In fact,
when either team scored a goal, the synchronisation differences between opponents did not
always presented a higher result for the scoring team (Figure 3.2). In this sense, movement
synchronisation alone may not be considered as a direct outcome indicator, but a mean to
improve the teams’ probability of achieving a positive match outcome. The plotted dynamics
of synchronisation reinforced this idea, by exposing periods of synchronisation dominance of
either team. While some matches seemed to be completely dominated by one team (Figure
3.2a and b), other showed a specific half of superiority, which changed throughout the match
(Figure 3.2c, d and e, f). As such, the idiosyncratic qualities of each team, related to strategic
and tactical approaches to the match, must be taken into account in order to understand their
influence over synchronisation results. Ball possession, often suggested as an important
performance indicator, is an illustrative example of this aspect. Some studies identified this
variable as discriminant of match outcomes in football, with successful teams presenting
higher values of ball possession (Castellano et al., 2012). However, when controlling the
effect of match status, the losing team presented consistently a higher value of ball possession
(Lago, 2009; Lago & Martin, 2007). Despite seeming contradictory at first, these results are
dependent of important contextual information, such as team quality, type of competition or
strategic approaches, as they change the relation between ball possession and success (Collet,
2013).
Within-team synchronisation analysis revealed a lower amount of synchronisation when
losing than when winning. These results provide evidence to consider movement
synchronisation as a measure of teams’ tactical performance, considering the overall players’
interaction during the match. The defending dyads tended to present higher values of
synchronisation during the match than offensive dyads. This difference between specific
positions seems to be greater for the lateral displacements. Previous research showed similar
trends (Travassos et al., 2011), reflecting the functional order resulting from different
cooperating strategies implemented during the match. Again, despite our study not having
distinguished attacking and defending phases, it seems that defending dyads adopted a more
coordinated behaviour in order to refrain the opponents’ attacking attempts and disrupt their
organisation. The study of different synchronisation characteristics between players and teams
may provide the bases for pattern recognition based in players’ interactions (Grunz,
Memmert, & Perl, 2012). Identifying which defenders are more prone to present a
35
synchronised behaviour, or how a group of midfielders tends to relate during the match may
help coaches to select and adopt optimal strategies.
Lastly, our results indicate that offensive dyads presented lower synchronisation when losing
than when winning. This result may indicate a less supportive behaviour of these players to
their defensive teammates during some moments of the match. In these instances, the
attacking players may adopt a more individual behaviour in order to disturb the opponents’
defensive organisation. This aspect may also be amplified by a greater pace adopted by the
losing team, which seems to impair players’ coordination (Sampaio, Lago, Gonçalves, Maçãs,
& Leite, 2014). Further investigation is needed in order to understand which subsets of
players are more prone to present lower synchronisation results during specific match
moments and scenarios.
Conclusions
Elite players’ movement synchronisation during the match may serve as a performance
indicator, reflecting the dynamical interaction between teammates and being related to the
match final outcome. When losing, the analysed teams tended to exhibit a lower result of
movement synchronisation. These trends were present in both between (opposing teams) and
within (same team) comparisons, although they are likely to be more useful when comparing
the same team, so that a similar team formation may be used. Also, defensive dyads presented
a more synchronised behaviour during the match than the offensive dyads, reflecting different
cooperating strategies across the pitch location during the match.
36
References
Atkinson, G. (2002). Sport performance: variable or construct? J Sports Sci, 20(4), 291-292. doi: 10.1080/026404102753576053
Barris, S., & Button, C. (2008). A review of vision-based motion analysis in sport. Sports Med, 38(12), 1025-1043. doi: 10.2165/00007256-200838120-00006
Bradley, P. S., Carling, C., Gomez Diaz, A., Hood, P., Barnes, C., Ade, J., . . . Mohr, M. (2013). Match performance and physical capacity of players in the top three competitive standards of English professional soccer. Hum Mov Sci, 32(4), 808-821. doi: 10.1016/j.humov.2013.06.002
Carling, C., Wright, C., Nelson, L. J., & Bradley, P. S. (2014). Comment on 'Performance analysis in football: a critical review and implications for future research'. J Sports Sci, 32(1), 2-7. doi: 10.1080/02640414.2013.807352
Castellano, J., Casamichana, D., & Lago, C. (2012). The Use of Match Statistics that Discriminate Between Successful and Unsuccessful Soccer Teams. J Hum Kinet, 31, 139-147. doi: 10.2478/v10078-012-0015-7
Collet, C. (2013). The possession game? A comparative analysis of ball retention and team success in European and international football, 2007-2010. J Sports Sci, 31(2), 123-136. doi: 10.1080/02640414.2012.727455
Cummins, C., Orr, R., O'Connor, H., & West, C. (2013). Global positioning systems (GPS) and microtechnology sensors in team sports: a systematic review. Sports Med, 43(10), 1025-1042. doi: 10.1007/s40279-013-0069-2
Di Salvo, V., Collins, A., McNeill, B., & Cardinale, M. (2006). Validation of Prozone ®: A new video-based performance analysis system. Int J Perform Anal Spor, 6(1), 108-119.
Duarte, R., Araújo, D., Correia, V., & Davids, K. (2012a). Sports teams as superorganisms: implications of sociobiological models of behaviour for research and practice in team sports performance analysis. Sports Med, 42(8), 633-642. doi: 10.2165/11632450-000000000-00000
Duarte, R., Araújo, D., Correia, V., Davids, K., Marques, P., & Richardson, M. J. (2013). Competing together: Assessing the dynamics of team-team and player-team synchrony in professional association football. Hum Mov Sci, 32(4), 555-566. doi: 10.1016/j.humov.2013.01.011
Duarte, R., Araújo, D., Freire, L., Folgado, H., Fernandes, O., & Davids, K. (2012b). Intra- and inter-group coordination patterns reveal collective behaviors of football players near the scoring zone. Hum Mov Sci, 31(6), 1639-1651. doi: 10.1016/j.humov.2012.03.001
Folgado, H., Duarte, R., Fernandes, O., & Sampaio, J. (2014). Competing with Lower Level Opponents Decreases Intra-Team Movement Synchronization and Time-Motion Demands during Pre-Season Soccer Matches. PLoS One, 9(5), e97145. doi: 10.1371/journal.pone.0097145
Frencken, W., Lemmink, K., Delleman, N., & Visscher, C. (2011). Oscillations of centroid position and surface area of soccer teams in small-sided games. Eur J Sport Sci, 11(4), 215-223. doi: Doi 10.1080/17461391.2010.499967
37
Frencken, W., Poel, H., Visscher, C., & Lemmink, K. (2012). Variability of inter-team distances associated with match events in elite-standard soccer. J Sports Sci, 30(12), 1207-1213. doi: 10.1080/02640414.2012.703783
Gómez, M. A., Gómez-Lopez, M., Lago, C., & Sampaio, J. (2012). Effects of game location and final outcome on game-related statistics in each zone of the pitch in professional football. Eur J Sport Sci, 12(5), 393-398.
Grunz, A., Memmert, D., & Perl, J. (2012). Tactical pattern recognition in soccer games by means of special self-organizing maps. Hum Mov Sci, 31(2), 334-343. doi: 10.1016/j.humov.2011.02.008
Hughes, M. D., & Bartlett, R. M. (2002). The use of performance indicators in performance analysis. J Sports Sci, 20(10), 739-754. doi: 10.1080/026404102320675602
Lago, C. (2009). The influence of match location, quality of opposition, and match status on possession strategies in professional association football. J Sports Sci, 27(13), 1463-1469. doi: 10.1080/02640410903131681
Lago, C., & Martin, R. (2007). Determinants of possession of the ball in soccer. J Sports Sci, 25(9), 969-974. doi: 10.1080/02640410600944626
Lames, M., & McGarry, T. (2007). On the search for reliable performance indicators in game sports. Int J Perform Anal Sport, 7(1), 62-79.
McGarry, T. (2009). Applied and theoretical perspectives of performance analysis in sport: Scientific issues and challenges. Int J Perform Anal Spor, 9(1), 128-140.
Palut, Y., & Zanone, P. G. (2005). A dynamical analysis of tennis: concepts and data. J Sports Sci, 23(10), 1021-1032. doi: 10.1080/02640410400021682
Reilly, T. (2001). Assessment of sports performance with particular reference to field games. Eur J Sport Sci, 1(3), 1-12. doi: 10.1080/17461390100071306
Sampaio, J., & Maçãs, V. (2012). Measuring tactical behaviour in football. Int J Sports Med, 33(5), 395-401. doi: 10.1055/s-0031-1301320
Sampaio, J. E., Lago, C., Gonçalves, B., Maçãs, V. M., & Leite, N. (2014). Effects of pacing, status and unbalance in time motion variables, heart rate and tactical behaviour when playing 5-a-side football small-sided games. J Sci Med Sport, 17(2), 229-233. doi: 10.1016/j.jsams.2013.04.005
Siegle, M., & Lames, M. (2013). Modeling soccer by means of relative phase. J Syst Sci Complex, 26(1), 14-20. doi: 10.1007/s11424-013-2283-2
Travassos, B., Araújo, D., Vilar, L., & McGarry, T. (2011). Interpersonal coordination and ball dynamics in futsal (indoor football). Hum Mov Sci, 30(6), 1245-1259. doi: 10.1016/j.humov.2011.04.003
Vilar, L., Araújo, D., Davids, K., & Button, C. (2012). The role of ecological dynamics in analysing performance in team sports. Sports Med, 42(1), 1-10. doi: 10.2165/11596520-000000000-00000
Vilar, L., Araújo, D., Travassos, B., & Davids, K. (2014). Coordination tendencies are shaped by attacker and defender interactions with the goal and the ball in futsal. Hum Mov Sci, 33, 14-24. doi: 10.1016/j.humov.2013.08.012
38
4. COMPETING WITH LOWER LEVEL OPPONENTS DECREASES INTRA-TEAM MOVEMENT
SYNCHRONISATION AND TIME-MOTION DEMANDS DURING PRE-SEASON FOOTBALL
MATCHES
Abstract
This study aimed to quantify the time-motion demands and intra-team movement
synchronisation during the pre-season matches of a professional football team according to
the opposition level. Positional data from 20 players were captured during the first half of six
pre-season matches of a Portuguese first league team. Time-motion demands were measured
by the total distance covered and distance covered at different speed categories. Intra-team
coordination was measured by calculating the relative phase of all pairs of outfield players.
Afterwards, the percentage of time spent in the -30º to 30º bin (near-in-phase mode of
coordination) was calculated for each dyad as a measure of space-time movement
synchronisation. Movement synchronisation data were analysed for the whole team,
according to each dyad average speed and by groups of similar dyadic synchronisation
tendencies. Then, these data were compared according to the opponent team level (first
league; second league; amateurs). Time-motion demands showed no differences in total
distance covered per opposition levels, while matches opposing teams of superior level
revealed more distance covered at very high intensity. Competing against superior level teams
implied more time in synchronised behaviour for the overall displacements and displacements
at higher intensities. These findings suggest that playing against higher-level opponents (1st
league teams) increased time-motion demands at high intensities in tandem with intra-team
movement synchronisation tendencies.
39
Introduction
During the pre-season period, professional football teams focus on developing both physical
fitness and tactical aspects. A common strategy used during this period is to promote friendly
preparation matches against opponents of different levels, in addition to the training sessions.
However, there is scarce information about the physical and tactical requirements of these
preparation matches.
Physical demands of competitive matches have been extensively studied revealing a total
distance covered of around 10-12 km by the outfield players mostly by walking and running
at low intensities (Bangsbo, Mohr, & Krustrup, 2006), with high intensity running accounting
for about 10% of the total distance covered (Carling, Le Gall, & Dupont, 2012). Mohr et al.
(2003) studied the seasonal variation of total distance covered and distance covered at high-
intensity running during competition, with top-class players having greater results in both
variables at the end of the season. Curiously, no differences were found between matches at
the beginning and middle of the season. However, some studies have found differences in the
fitness of players, as measured by aerobic fitness and sprint speed, between the beginning and
middle of the season (Caldwell & Peters, 2009; Casajus, 2001). This suggests contradictory
results between physical performance during the actual match and the players’ maximum
physiological capabilities. One might speculate that despite being physically fit, players do
not operate at their physiological maximum due to the collective game pace imposed to each
player (Carling, 2013).
Football is a team sport where two opposing teams dynamically interact in order to gain
advantage over the other team (McGarry, Anderson, Wallace, Hughes, & Franks, 2002). In
this sense, performance should be understood in terms of space-time interaction dynamics and
not only in terms of the players’ individual time-motion demands. As such, the analysis of
tactical performance in football should capture how players individually and collectively
adapt to the ever-changing configurations of play, in order to gain advantage over their
opponents (Gréhaigne, Godbout, & Bouthier, 1999). Such analysis approach can be based on
non-linear dynamical systems theory and uses measures such as relative phase. This measure
has enabled the identification of coordinative states in physical, biological and social systems
(Davids, Glazier, Araújo, & Bartlett, 2003). Several studies have used these techniques to
examine player interactions and their relation with performance outcomes, particularly in
football. For instance, Sampaio and Maçãs (2012) used a pre-post test design to assess tactical
40
behaviours in small-sided games, by calculating the relative phase of the distances between
each player and their team centroid position. The pre-test values revealed no predominant
intra-team coordination mode. However the post-test measurements revealed increased
stability towards anti-phase and in-phase modes of coordination, suggesting that stable
coordinated movements arise from increased tactical expertise. Also using relative phase
analysis, Travassos et al. (2011) measured the dyadic intra-team coordination tendencies of
futsal (5-a-side indoor football) teams. This study showed a strong attraction to in-phase
behaviours for the defending team, but a weaker attraction for the attacking team, suggesting
that attackers explore various dynamical interactions to disrupt the defensive structure.
Additionally, Folgado et al. (2014) used the teams’ length per width ratio to compare the
tactical behaviour of young football players of different age and expertise levels. The
variability of this ratio decreased with increases in the players’ age and expertise level. These
findings reinforced the notion that a more stable mode of coordination may be linked to the
players’ increased tactical expertise and subsequent better performance.
Despite the important theoretical and practical contributions promoted by the aforementioned
studies, to our knowledge, no research has investigated intra-team coordination combined
with time-motion variables in 11-a-side football. A related approach (Sampaio & Maçãs,
2012) using approximate entropy (ApEn) to quantify the regularity of the players’ distance to
the team centre, suggested that players presented a more regular behaviour at lower speeds
(<13 km · h-1), having more difficulty in adjusting their position at higher speeds. As such, we
propose that the assessment of the players’ movement synchronisation tendencies should also
consider different speed categories, to allow the understanding of its effects on match
performance.
In summary, the findings mentioned above suggest that intra-team measures and time-motion
demands might be used to provide complementary insights about contextualised player
performance in team sports. In particular, they can reveal how individual and collective
performances emerge in the face of different contextual constraints, such as the level of the
opponent team. Indeed, the quality of opposition has been proposed as an important factor
associated with match performance indicators (Taylor, Mellalieu, James, & Shearer, 2008).
For instance, when playing against stronger opposition, a team tends to present less
percentage of ball possession (Lago, 2009) and higher distance covered by walking and
jogging (Lago, Casais, Dominguez, & Sampaio, 2010), than when playing against a weaker
41
opponent. Therefore, the aim of the present study was to quantify the time-motion demands
and intra-team movement synchronisation tendencies of a professional football team during
the pre-season, according to the level of the opponents. We hypothesise that the level of the
opponent team may promote different time-motion demands and that variations in the speed
of the players’ movement should have a distinct influence in the intra-team synchronisation
tendencies.
Methods
Participants and data collection
A total of 20 professional players (age=24.8±3.9 yrs; professional playing
experience=7.1±4.0 yrs) participated in 6 pre-season matches of a Portuguese first league
football team. Positional data from the outfield players of the analysed team in each match
were collected using 5Hz GPS units (SPI Pro, GPSports, Canberra, Australia). Previous
verifications have established the validity and reliability of this instrumentation (coefficient of
variation <5%) (Coutts & Duffield, 2010).
The team faced opponents of different level during the analysed fixtures, contesting two
matches against each opposition level (first league, second league and amateur teams). We
only collected positional data from outfield players during each match. Due to the
characteristics of the pre-season fixtures, all of the players’ in the analysed team were
substituted in the majority of the matches at half time. To ensure a more constant team
formation between matches, only the first half of each match was analysed. During the
collected first halves no player was substituted.
Prior to the start of this study, formal authorisation was cleared by the club technical staff.
Players were instructed about the procedures that would ensue and gave their verbal informed
consent to participate in the study. Verbal consent was preferred due to practicality reasons. A
research team member documented the players’ consent using a checklist, in the presence of
an external witness to the study. All procedures were approved by the Ethics Committee of
the Research Centre for Sport Sciences, Health and Human Development, based at Vila Real
(Portugal).
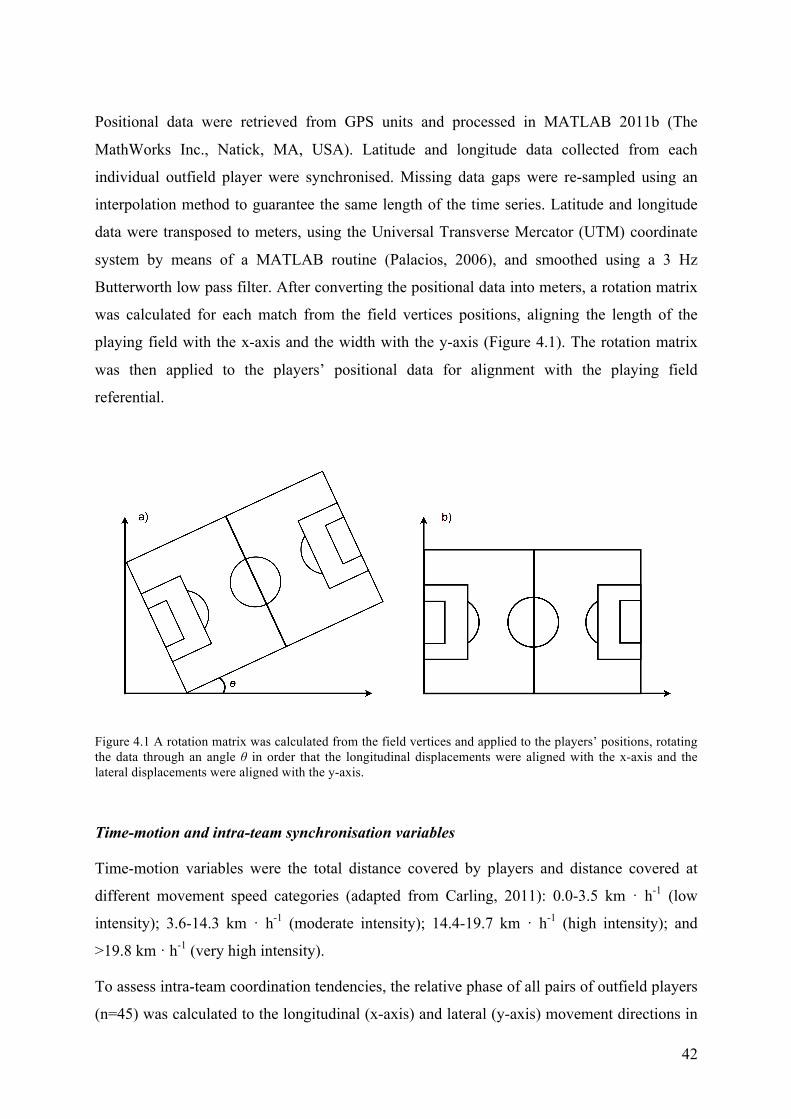
42
Positional data were retrieved from GPS units and processed in MATLAB 2011b (The
MathWorks Inc., Natick, MA, USA). Latitude and longitude data collected from each
individual outfield player were synchronised. Missing data gaps were re-sampled using an
interpolation method to guarantee the same length of the time series. Latitude and longitude
data were transposed to meters, using the Universal Transverse Mercator (UTM) coordinate
system by means of a MATLAB routine (Palacios, 2006), and smoothed using a 3 Hz
Butterworth low pass filter. After converting the positional data into meters, a rotation matrix
was calculated for each match from the field vertices positions, aligning the length of the
playing field with the x-axis and the width with the y-axis (Figure 4.1). The rotation matrix
was then applied to the players’ positional data for alignment with the playing field
referential.
Figure 4.1 A rotation matrix was calculated from the field vertices and applied to the players’ positions, rotating the data through an angle θ in order that the longitudinal displacements were aligned with the x-axis and the lateral displacements were aligned with the y-axis.
Time-motion and intra-team synchronisation variables
Time-motion variables were the total distance covered by players and distance covered at
different movement speed categories (adapted from Carling, 2011): 0.0-3.5 km · h-1 (low
intensity); 3.6-14.3 km · h-1 (moderate intensity); 14.4-19.7 km · h-1 (high intensity); and
>19.8 km · h-1 (very high intensity).
To assess intra-team coordination tendencies, the relative phase of all pairs of outfield players
(n=45) was calculated to the longitudinal (x-axis) and lateral (y-axis) movement directions in
43
every match, using the Hilbert Transform (for the application of this technique see Palut &
Zanone, 2005). We considered that by sharing a common goal, each pair of teammates could
potentially form a dyad, i.e., a pair of two players who share the same environment and
intentionality, pursuing common goal-directed behaviours (McGarry et al., 2002). To quantify
the movement synchronisation of each dyad, we calculated the percentage of time spent
between -30º to 30º of relative phase (near-in-phase synchronisation mode). This interval was
selected based on previous research, which identified in-phase relations between players as
the most common mode of coordination (Travassos, Araújo, Duarte, & McGarry, 2012;
Travassos et al., 2011). This assumption was also confirmed in our data. Such analysis was
first calculated for the overall half and then divided according to each dyad average speed,
using the aforementioned movement speed categories.
To classify each dyad into one of three groups according to their synchronisation level, a k-
means cluster analysis was subsequently applied to the percentage of time of dyadic
synchronisation. This classification intended to represent a functional clustering method,
which captured intra-team dyads with similar levels of synchronisation. This method allowed
for a more detailed understanding of the hypothesised opposition level effects on different
sub-groups of players within the team.
Statistical analysis
Both time-motion and intra-team synchronisation data were considered as dependent variables
and compared according to the three levels of opposition (first league, second league and
amateurs teams). One-way ANOVA was used to compare time-motion variables and the
percentage of time of dyadic synchronisation according to opposition level. Synchronisation
analysis was also divided by dyad average speeds and by cluster classification groups,
comparing each group according to the opposing team level using one-way ANOVAs. Effect
sizes are presented as partial eta-squared (η2). Pairwise comparisons were calculated using
Fisher's least significant difference (LSD) tests and Cohen’s d effect sizes with 95%
confidence intervals (Nakagawa & Cuthill, 2007).
Statistical calculations were done using IBM SPSS Statistics (version 20.0, IBM Corporation,
Somers, New York, USA) and the package compute.es in R (Del Re, 2013). Statistical
significance was maintained at 5%.
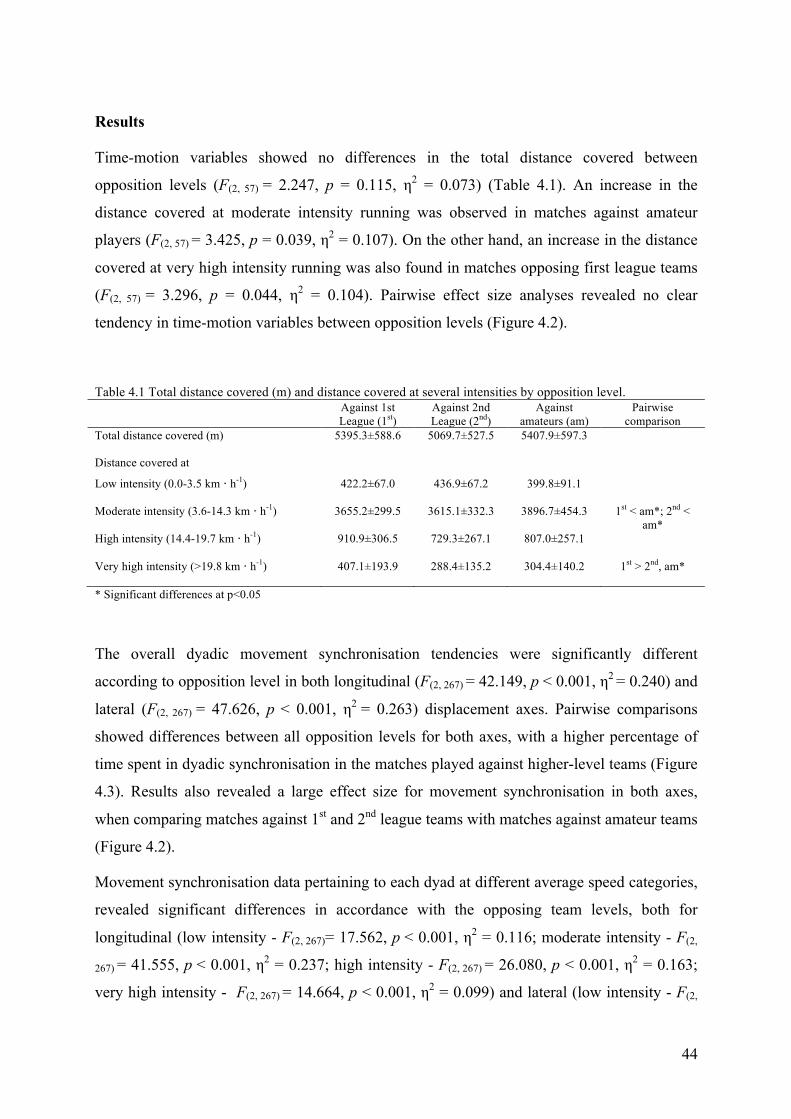
44
Results
Time-motion variables showed no differences in the total distance covered between
opposition levels (F(2, 57) = 2.247, p = 0.115, η2 = 0.073) (Table 4.1). An increase in the
distance covered at moderate intensity running was observed in matches against amateur
players (F(2, 57) = 3.425, p = 0.039, η2 = 0.107). On the other hand, an increase in the distance
covered at very high intensity running was also found in matches opposing first league teams
(F(2, 57) = 3.296, p = 0.044, η2 = 0.104). Pairwise effect size analyses revealed no clear
tendency in time-motion variables between opposition levels (Figure 4.2).
Table 4.1 Total distance covered (m) and distance covered at several intensities by opposition level.
Against 1st League (1st)
Against 2nd League (2nd)
Against amateurs (am)
Pairwise comparison
Total distance covered (m) 5395.3±588.6 5069.7±527.5 5407.9±597.3
Distance covered at
Low intensity (0.0-3.5 km · h-1) 422.2±67.0 436.9±67.2 399.8±91.1
Moderate intensity (3.6-14.3 km · h-1) 3655.2±299.5 3615.1±332.3 3896.7±454.3 1st < am*; 2nd < am*
High intensity (14.4-19.7 km · h-1) 910.9±306.5 729.3±267.1 807.0±257.1
Very high intensity (>19.8 km · h-1) 407.1±193.9 288.4±135.2 304.4±140.2 1st > 2nd, am*
* Significant differences at p<0.05
The overall dyadic movement synchronisation tendencies were significantly different
according to opposition level in both longitudinal (F(2, 267) = 42.149, p < 0.001, η2 = 0.240) and
lateral (F(2, 267) = 47.626, p < 0.001, η2 = 0.263) displacement axes. Pairwise comparisons
showed differences between all opposition levels for both axes, with a higher percentage of
time spent in dyadic synchronisation in the matches played against higher-level teams (Figure
4.3). Results also revealed a large effect size for movement synchronisation in both axes,
when comparing matches against 1st and 2nd league teams with matches against amateur teams
(Figure 4.2).
Movement synchronisation data pertaining to each dyad at different average speed categories,
revealed significant differences in accordance with the opposing team levels, both for
longitudinal (low intensity - F(2, 267)= 17.562, p < 0.001, η2 = 0.116; moderate intensity - F(2,
267) = 41.555, p < 0.001, η2 = 0.237; high intensity - F(2, 267) = 26.080, p < 0.001, η2 = 0.163;
very high intensity - F(2, 267) = 14.664, p < 0.001, η2 = 0.099) and lateral (low intensity - F(2,
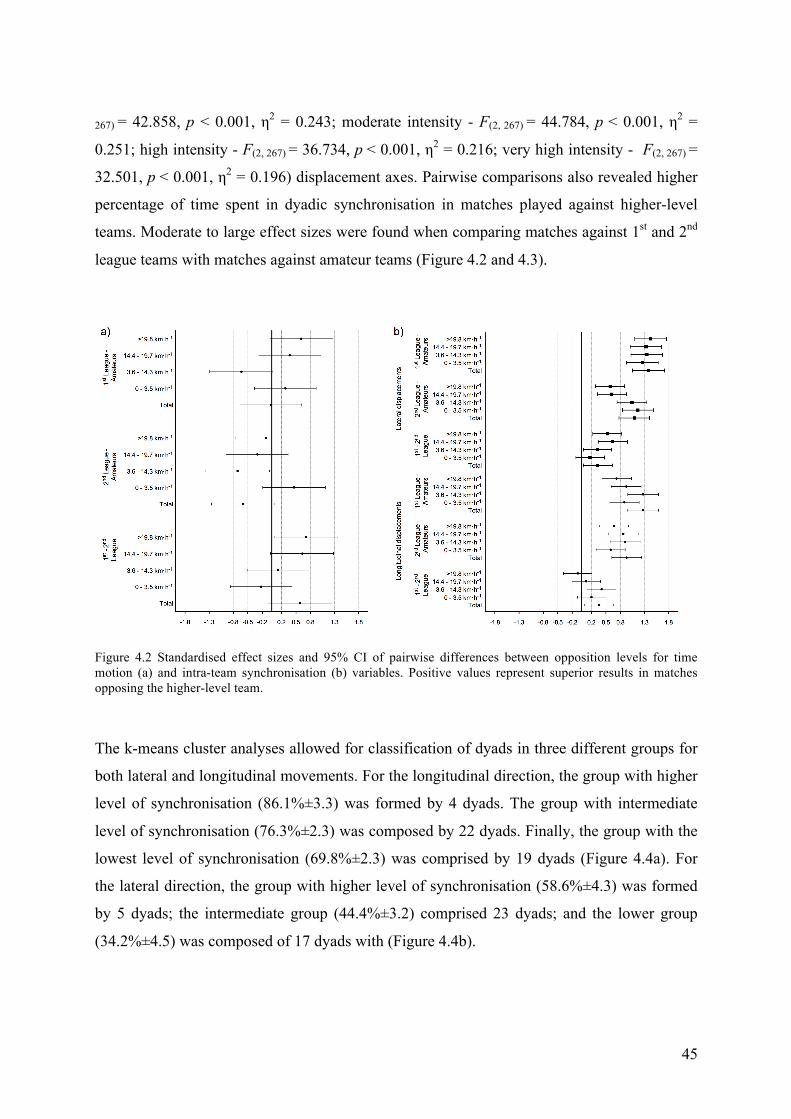
45
267) = 42.858, p < 0.001, η2 = 0.243; moderate intensity - F(2, 267) = 44.784, p < 0.001, η2 =
0.251; high intensity - F(2, 267) = 36.734, p < 0.001, η2 = 0.216; very high intensity - F(2, 267) =
32.501, p < 0.001, η2 = 0.196) displacement axes. Pairwise comparisons also revealed higher
percentage of time spent in dyadic synchronisation in matches played against higher-level
teams. Moderate to large effect sizes were found when comparing matches against 1st and 2nd
league teams with matches against amateur teams (Figure 4.2 and 4.3).
Figure 4.2 Standardised effect sizes and 95% CI of pairwise differences between opposition levels for time motion (a) and intra-team synchronisation (b) variables. Positive values represent superior results in matches opposing the higher-level team.
The k-means cluster analyses allowed for classification of dyads in three different groups for
both lateral and longitudinal movements. For the longitudinal direction, the group with higher
level of synchronisation (86.1%±3.3) was formed by 4 dyads. The group with intermediate
level of synchronisation (76.3%±2.3) was composed by 22 dyads. Finally, the group with the
lowest level of synchronisation (69.8%±2.3) was comprised by 19 dyads (Figure 4.4a). For
the lateral direction, the group with higher level of synchronisation (58.6%±4.3) was formed
by 5 dyads; the intermediate group (44.4%±3.2) comprised 23 dyads; and the lower group
(34.2%±4.5) was composed of 17 dyads with (Figure 4.4b).
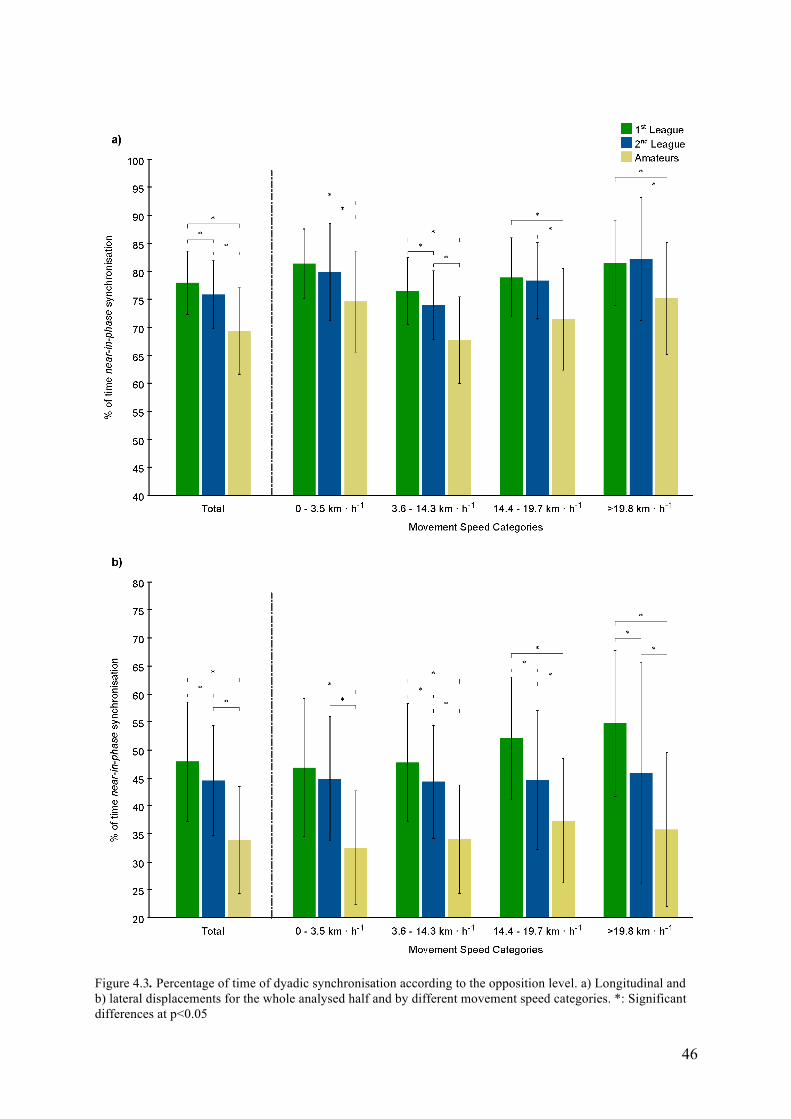
46
Figure 4.3. Percentage of time of dyadic synchronisation according to the opposition level. a) Longitudinal and b) lateral displacements for the whole analysed half and by different movement speed categories. *: Significant differences at p<0.05
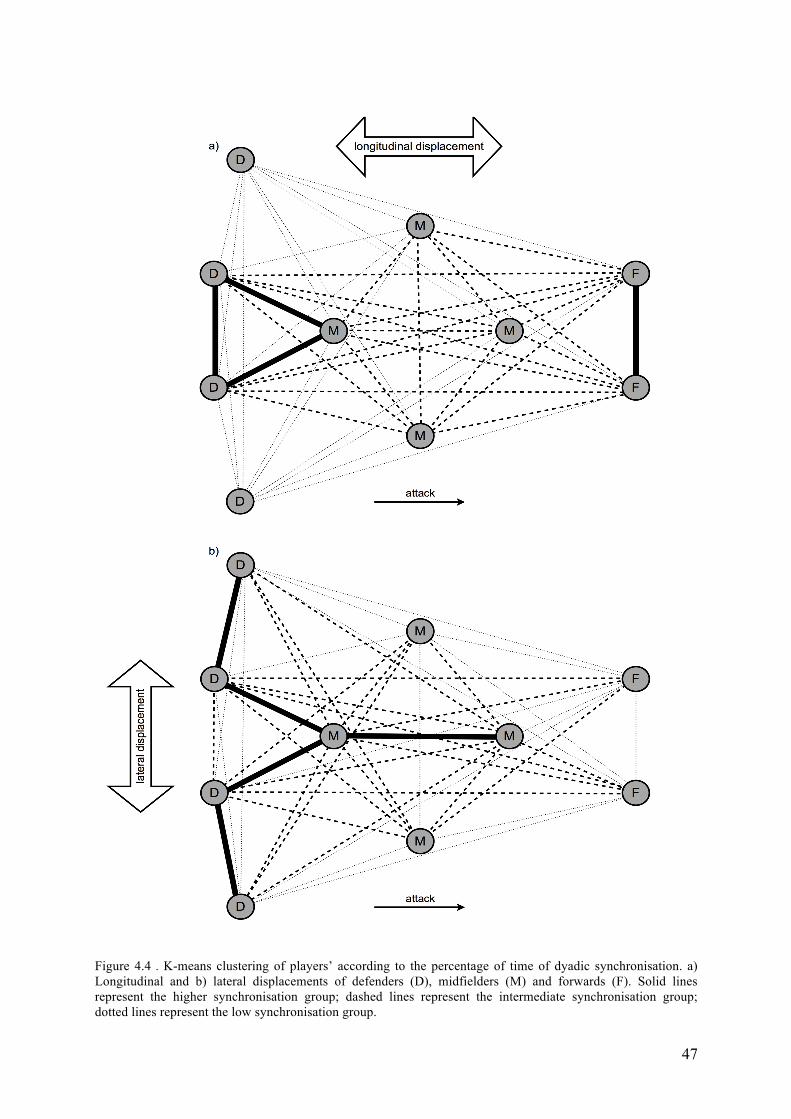
47
Figure 4.4 . K-means clustering of players’ according to the percentage of time of dyadic synchronisation. a) Longitudinal and b) lateral displacements of defenders (D), midfielders (M) and forwards (F). Solid lines represent the higher synchronisation group; dashed lines represent the intermediate synchronisation group; dotted lines represent the low synchronisation group.
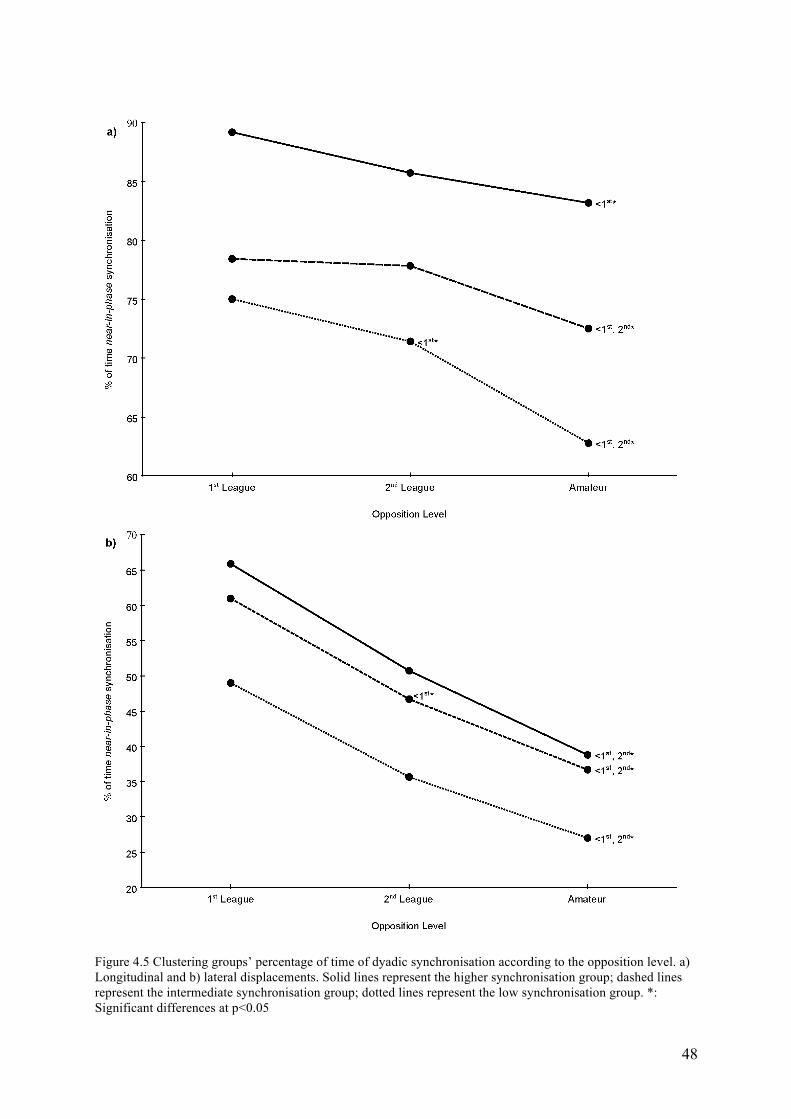
48
Figure 4.5 Clustering groups’ percentage of time of dyadic synchronisation according to the opposition level. a) Longitudinal and b) lateral displacements. Solid lines represent the higher synchronisation group; dashed lines represent the intermediate synchronisation group; dotted lines represent the low synchronisation group. *: Significant differences at p<0.05
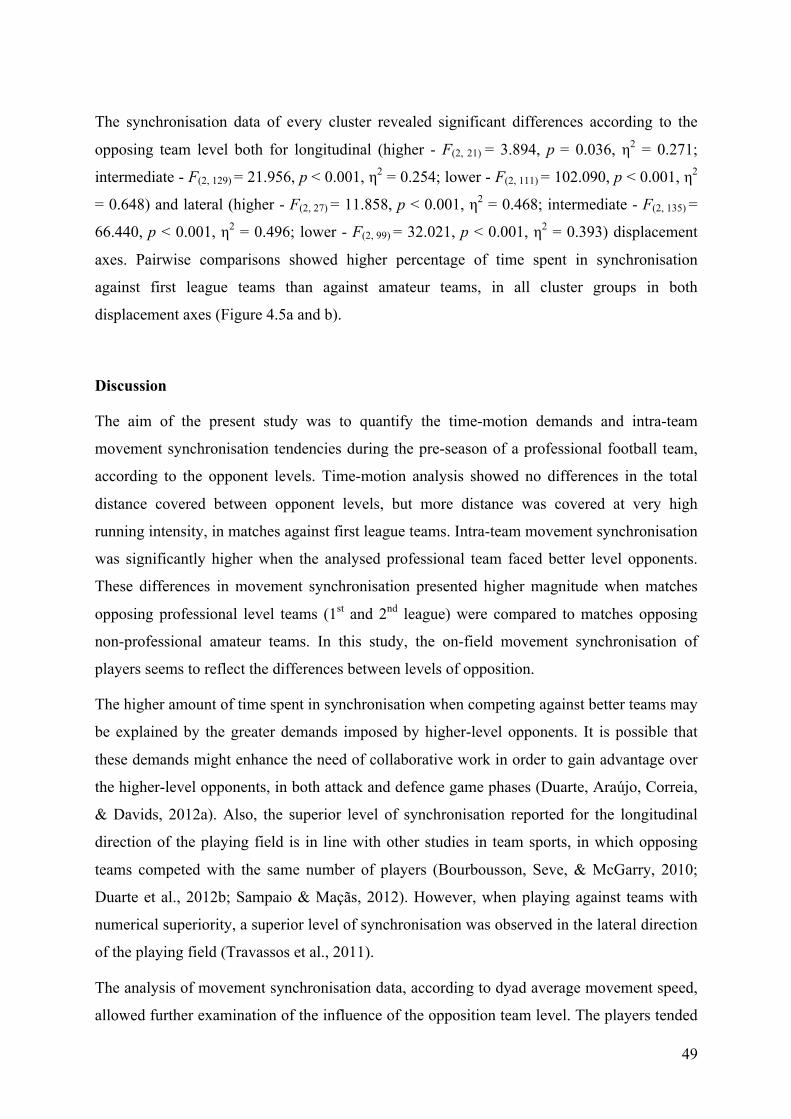
49
The synchronisation data of every cluster revealed significant differences according to the
opposing team level both for longitudinal (higher - F(2, 21) = 3.894, p = 0.036, η2 = 0.271;
intermediate - F(2, 129) = 21.956, p < 0.001, η2 = 0.254; lower - F(2, 111) = 102.090, p < 0.001, η2
= 0.648) and lateral (higher - F(2, 27) = 11.858, p < 0.001, η2 = 0.468; intermediate - F(2, 135) =
66.440, p < 0.001, η2 = 0.496; lower - F(2, 99) = 32.021, p < 0.001, η2 = 0.393) displacement
axes. Pairwise comparisons showed higher percentage of time spent in synchronisation
against first league teams than against amateur teams, in all cluster groups in both
displacement axes (Figure 4.5a and b).
Discussion
The aim of the present study was to quantify the time-motion demands and intra-team
movement synchronisation tendencies during the pre-season of a professional football team,
according to the opponent levels. Time-motion analysis showed no differences in the total
distance covered between opponent levels, but more distance was covered at very high
running intensity, in matches against first league teams. Intra-team movement synchronisation
was significantly higher when the analysed professional team faced better level opponents.
These differences in movement synchronisation presented higher magnitude when matches
opposing professional level teams (1st and 2nd league) were compared to matches opposing
non-professional amateur teams. In this study, the on-field movement synchronisation of
players seems to reflect the differences between levels of opposition.
The higher amount of time spent in synchronisation when competing against better teams may
be explained by the greater demands imposed by higher-level opponents. It is possible that
these demands might enhance the need of collaborative work in order to gain advantage over
the higher-level opponents, in both attack and defence game phases (Duarte, Araújo, Correia,
& Davids, 2012a). Also, the superior level of synchronisation reported for the longitudinal
direction of the playing field is in line with other studies in team sports, in which opposing
teams competed with the same number of players (Bourbousson, Seve, & McGarry, 2010;
Duarte et al., 2012b; Sampaio & Maçãs, 2012). However, when playing against teams with
numerical superiority, a superior level of synchronisation was observed in the lateral direction
of the playing field (Travassos et al., 2011).
The analysis of movement synchronisation data, according to dyad average movement speed,
allowed further examination of the influence of the opposition team level. The players tended
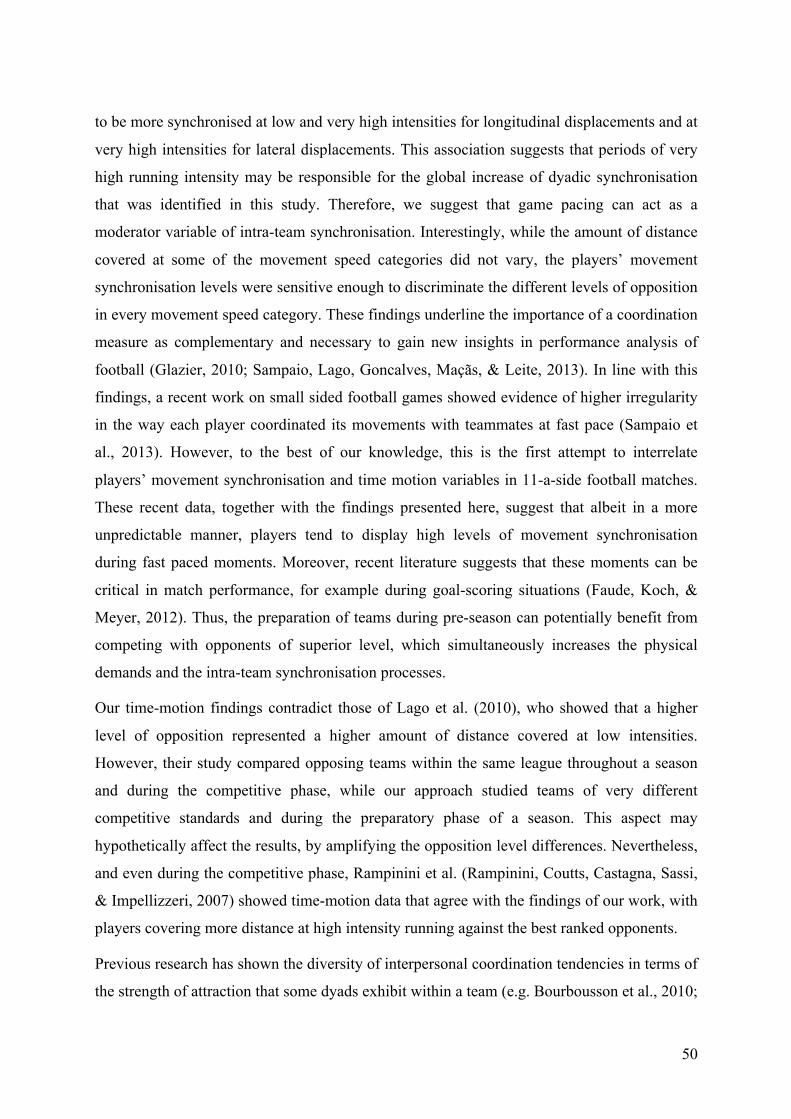
50
to be more synchronised at low and very high intensities for longitudinal displacements and at
very high intensities for lateral displacements. This association suggests that periods of very
high running intensity may be responsible for the global increase of dyadic synchronisation
that was identified in this study. Therefore, we suggest that game pacing can act as a
moderator variable of intra-team synchronisation. Interestingly, while the amount of distance
covered at some of the movement speed categories did not vary, the players’ movement
synchronisation levels were sensitive enough to discriminate the different levels of opposition
in every movement speed category. These findings underline the importance of a coordination
measure as complementary and necessary to gain new insights in performance analysis of
football (Glazier, 2010; Sampaio, Lago, Goncalves, Maçãs, & Leite, 2013). In line with this
findings, a recent work on small sided football games showed evidence of higher irregularity
in the way each player coordinated its movements with teammates at fast pace (Sampaio et
al., 2013). However, to the best of our knowledge, this is the first attempt to interrelate
players’ movement synchronisation and time motion variables in 11-a-side football matches.
These recent data, together with the findings presented here, suggest that albeit in a more
unpredictable manner, players tend to display high levels of movement synchronisation
during fast paced moments. Moreover, recent literature suggests that these moments can be
critical in match performance, for example during goal-scoring situations (Faude, Koch, &
Meyer, 2012). Thus, the preparation of teams during pre-season can potentially benefit from
competing with opponents of superior level, which simultaneously increases the physical
demands and the intra-team synchronisation processes.
Our time-motion findings contradict those of Lago et al. (2010), who showed that a higher
level of opposition represented a higher amount of distance covered at low intensities.
However, their study compared opposing teams within the same league throughout a season
and during the competitive phase, while our approach studied teams of very different
competitive standards and during the preparatory phase of a season. This aspect may
hypothetically affect the results, by amplifying the opposition level differences. Nevertheless,
and even during the competitive phase, Rampinini et al. (Rampinini, Coutts, Castagna, Sassi,
& Impellizzeri, 2007) showed time-motion data that agree with the findings of our work, with
players covering more distance at high intensity running against the best ranked opponents.
Previous research has shown the diversity of interpersonal coordination tendencies in terms of
the strength of attraction that some dyads exhibit within a team (e.g. Bourbousson et al., 2010;
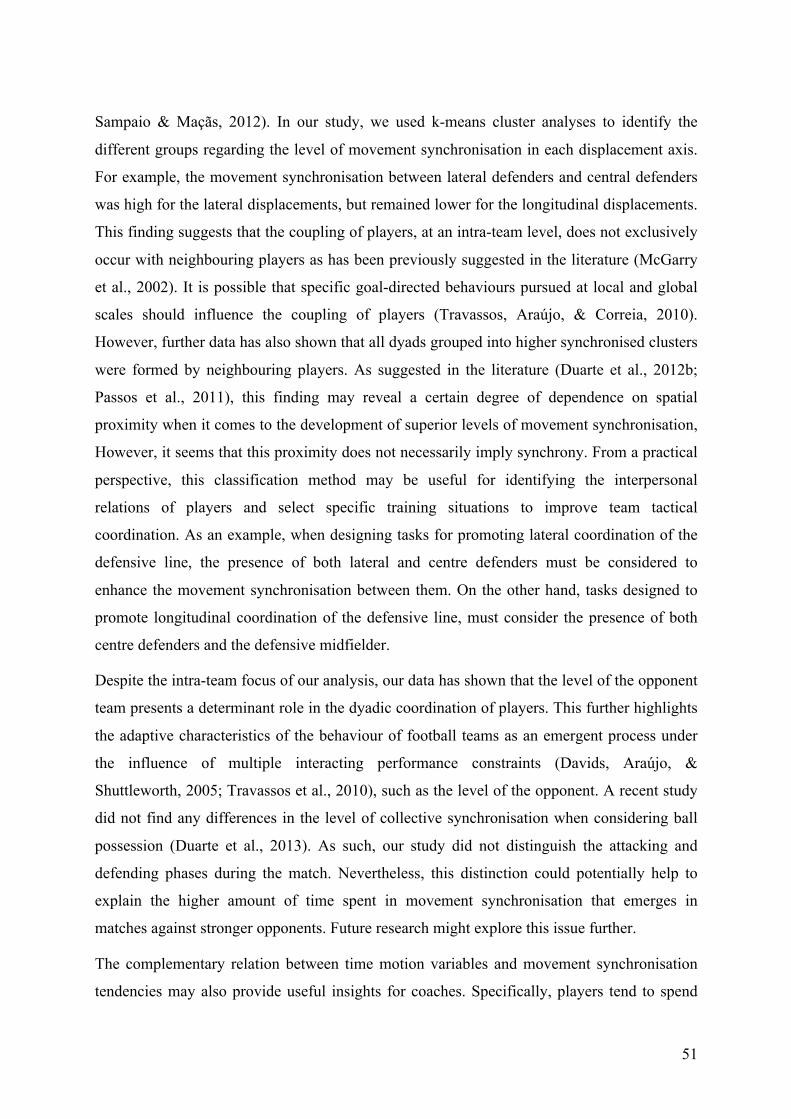
51
Sampaio & Maçãs, 2012). In our study, we used k-means cluster analyses to identify the
different groups regarding the level of movement synchronisation in each displacement axis.
For example, the movement synchronisation between lateral defenders and central defenders
was high for the lateral displacements, but remained lower for the longitudinal displacements.
This finding suggests that the coupling of players, at an intra-team level, does not exclusively
occur with neighbouring players as has been previously suggested in the literature (McGarry
et al., 2002). It is possible that specific goal-directed behaviours pursued at local and global
scales should influence the coupling of players (Travassos, Araújo, & Correia, 2010).
However, further data has also shown that all dyads grouped into higher synchronised clusters
were formed by neighbouring players. As suggested in the literature (Duarte et al., 2012b;
Passos et al., 2011), this finding may reveal a certain degree of dependence on spatial
proximity when it comes to the development of superior levels of movement synchronisation,
However, it seems that this proximity does not necessarily imply synchrony. From a practical
perspective, this classification method may be useful for identifying the interpersonal
relations of players and select specific training situations to improve team tactical
coordination. As an example, when designing tasks for promoting lateral coordination of the
defensive line, the presence of both lateral and centre defenders must be considered to
enhance the movement synchronisation between them. On the other hand, tasks designed to
promote longitudinal coordination of the defensive line, must consider the presence of both
centre defenders and the defensive midfielder.
Despite the intra-team focus of our analysis, our data has shown that the level of the opponent
team presents a determinant role in the dyadic coordination of players. This further highlights
the adaptive characteristics of the behaviour of football teams as an emergent process under
the influence of multiple interacting performance constraints (Davids, Araújo, &
Shuttleworth, 2005; Travassos et al., 2010), such as the level of the opponent. A recent study
did not find any differences in the level of collective synchronisation when considering ball
possession (Duarte et al., 2013). As such, our study did not distinguish the attacking and
defending phases during the match. Nevertheless, this distinction could potentially help to
explain the higher amount of time spent in movement synchronisation that emerges in
matches against stronger opponents. Future research might explore this issue further.
The complementary relation between time motion variables and movement synchronisation
tendencies may also provide useful insights for coaches. Specifically, players tend to spend
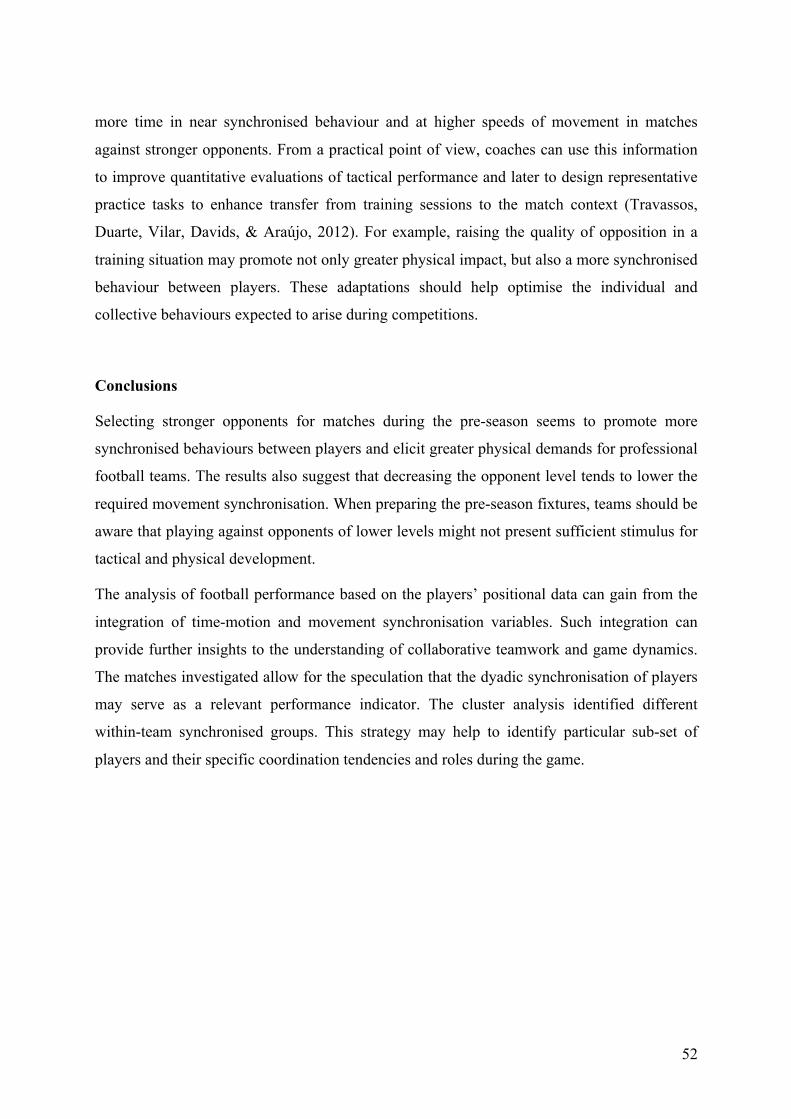
52
more time in near synchronised behaviour and at higher speeds of movement in matches
against stronger opponents. From a practical point of view, coaches can use this information
to improve quantitative evaluations of tactical performance and later to design representative
practice tasks to enhance transfer from training sessions to the match context (Travassos,
Duarte, Vilar, Davids, & Araújo, 2012). For example, raising the quality of opposition in a
training situation may promote not only greater physical impact, but also a more synchronised
behaviour between players. These adaptations should help optimise the individual and
collective behaviours expected to arise during competitions.
Conclusions
Selecting stronger opponents for matches during the pre-season seems to promote more
synchronised behaviours between players and elicit greater physical demands for professional
football teams. The results also suggest that decreasing the opponent level tends to lower the
required movement synchronisation. When preparing the pre-season fixtures, teams should be
aware that playing against opponents of lower levels might not present sufficient stimulus for
tactical and physical development.
The analysis of football performance based on the players’ positional data can gain from the
integration of time-motion and movement synchronisation variables. Such integration can
provide further insights to the understanding of collaborative teamwork and game dynamics.
The matches investigated allow for the speculation that the dyadic synchronisation of players
may serve as a relevant performance indicator. The cluster analysis identified different
within-team synchronised groups. This strategy may help to identify particular sub-set of
players and their specific coordination tendencies and roles during the game.
53
References
Bangsbo, J., Mohr, M., & Krustrup, P. (2006). Physical and metabolic demands of training and match-play in the elite football player. J Sports Sci, 24(7), 665-674. doi: 10.1080/02640410500482529
Bourbousson, J., Seve, C., & McGarry, T. (2010). Space-time coordination dynamics in basketball: Part 1. Intra- and inter-couplings among player dyads. J Sports Sci, 28(3), 339-347. doi: 10.1080/02640410903503632
Caldwell, B. P., & Peters, D. M. (2009). Seasonal variation in physiological fitness of a semiprofessional soccer team. J Strength Cond Res, 23(5), 1370-1377. doi: 10.1519/JSC.0b013e3181a4e82f
Carling, C. (2011). Influence of opposition team formation on physical and skill-related performance in a professional soccer team. Eur J Sport Sci 11(3), 155-164. doi: Pii 937351360
Doi 10.1080/17461391.2010.499972 Carling, C. (2013). Interpreting physical performance in professional soccer match-play:
should we be more pragmatic in our approach? Sports Med, 43(8), 655-663. doi: 10.1007/s40279-013-0055-8
Carling, C., Le Gall, F., & Dupont, G. (2012). Analysis of repeated high-intensity running performance in professional soccer. J Sports Sci, 30(4), 325-336. doi: 10.1080/02640414.2011.652655
Casajus, J. A. (2001). Seasonal variation in fitness variables in professional soccer players. J Sports Med Phys Fitness, 41(4), 463-469.
Coutts, A. J., & Duffield, R. (2010). Validity and reliability of GPS devices for measuring movement demands of team sports. J Sci Med Sport, 13(1), 133-135. doi: 10.1016/j.jsams.2008.09.015
Davids, K., Araújo, D., & Shuttleworth, R. (2005). Applications of Dynamical Systems Theory to Football. In J. Cabri, T. Reilly & D. Araújo (Eds.), Science and football V: The Proceedings of the Fifth World Congress on Science and Football (pp. 537-550). Abingdon: Routledge.
Davids, K., Glazier, P., Araújo, D., & Bartlett, R. (2003). Movement systems as dynamical systems: the functional role of variability and its implications for sports medicine. Sports Med, 33(4), 245-260.
Del Re, A. C. (2013). compute.es: Compute Effect Sizes. Retrieved from http://cran.r-project.org/web/packages/compute.es
Duarte, R., Araújo, D., Correia, V., & Davids, K. (2012a). Sports teams as superorganisms: implications of sociobiological models of behaviour for research and practice in team sports performance analysis. Sports Med, 42(8), 633-642. doi: 10.2165/11632450-000000000-00000
Duarte, R., Araújo, D., Correia, V., Davids, K., Marques, P., & Richardson, M. J. (2013). Competing together: Assessing the dynamics of team-team and player-team synchrony in professional association football. Hum Mov Sci, 32(4), 555-566. doi: 10.1016/j.humov.2013.01.011
54
Duarte, R., Araújo, D., Freire, L., Folgado, H., Fernandes, O., & Davids, K. (2012b). Intra- and inter-group coordination patterns reveal collective behaviors of football players near the scoring zone. Hum Mov Sci, 31(6), 1639-1651. doi: 10.1016/j.humov.2012.03.001
Faude, O., Koch, T., & Meyer, T. (2012). Straight sprinting is the most frequent action in goal situations in professional football. J Sports Sci, 30(7), 625-631. doi: 10.1080/02640414.2012.665940
Folgado, H., Lemmink, K. A., Frencken, W., & Sampaio, J. (2014). Length, width and centroid distance as measures of teams tactical performance in youth football. Eur J Sport Sci, 14 Suppl 1, S487-492. doi: 10.1080/17461391.2012.730060
Glazier, P. S. (2010). Game, set and match? Substantive issues and future directions in performance analysis. Sports Med, 40(8), 625-634. doi: 10.2165/11534970-000000000-00000
Gréhaigne, J., Godbout, P., & Bouthier, D. (1999). The Foundations of Tactics and Strategy in Team Sports. J Teach Phys Educ, 18(2), 159-174.
Lago, C. (2009). The influence of match location, quality of opposition, and match status on possession strategies in professional association football. J Sports Sci, 27(13), 1463-1469. doi: 10.1080/02640410903131681
Lago, C., Casais, L., Dominguez, E., & Sampaio, J. (2010). The effects of situational variables on distance covered at various speeds in elite soccer. Eur J Sport Sci, 10(2), 103-109. doi: Pii 919150447
Doi 10.1080/17461390903273994 McGarry, T., Anderson, D. I., Wallace, S. A., Hughes, M. D., & Franks, I. M. (2002). Sport
competition as a dynamical self-organizing system. J Sport Sci, 20(10), 771-781. doi: Doi 10.1080/026404102320675620
Mohr, M., Krustrup, P., & Bangsbo, J. (2003). Match performance of high-standard soccer players with special reference to development of fatigue. J Sports Sci, 21(7), 519-528. doi: 10.1080/0264041031000071182
Nakagawa, S., & Cuthill, I. C. (2007). Effect size, confidence interval and statistical significance: a practical guide for biologists. Biol Rev Camb Philos Soc, 82(4), 591-605. doi: 10.1111/j.1469-185X.2007.00027.x
Palacios, R. (2006). deg2utm. MATLAB Central File Exchange. Retrieved October 20 2012, 2011, from http://www.mathworks.com/matlabcentral/fileexchange/10915
Palut, Y., & Zanone, P. G. (2005). A dynamical analysis of tennis: concepts and data. J Sports Sci, 23(10), 1021-1032. doi: 10.1080/02640410400021682
Passos, P., Milho, J., Fonseca, S., Borges, J., Araújo, D., & Davids, K. (2011). Interpersonal distance regulates functional grouping tendencies of agents in team sports. J Mot Behav, 43(2), 155-163. doi: 10.1080/00222895.2011.552078
Rampinini, E., Coutts, A. J., Castagna, C., Sassi, R., & Impellizzeri, F. M. (2007). Variation in top level soccer match performance. Int J Sports Med, 28(12), 1018-1024. doi: 10.1055/s-2007-965158
Sampaio, J., & Maçãs, V. (2012). Measuring tactical behaviour in football. Int J Sports Med, 33(5), 395-401. doi: 10.1055/s-0031-1301320
55
Sampaio, J. E., Lago, C., Goncalves, B., Maçãs, V. M., & Leite, N. (2013). Effects of pacing, status and unbalance in time motion variables, heart rate and tactical behaviour when playing 5-a-side football small-sided games. J Sci Med Sport, 1-5. doi: 10.1016/j.jsams.2013.04.005
Taylor, J. B., Mellalieu, S. D., James, N., & Shearer, D. A. (2008). The influence of match location, quality of opposition, and match status on technical performance in professional association football. J Sports Sci, 26(9), 885-895. doi: 10.1080/02640410701836887
Travassos, B., Araújo, D., & Correia, V. (2010). Eco-Dynamics Approach to the study of Team Sports Performance. Open Sports Sci J 3, 56-57.
Travassos, B., Araújo, D., Duarte, R., & McGarry, T. (2012). Spatiotemporal coordination behaviors in futsal (indoor football) are guided by informational game constraints. Hum Mov Sci, 31(4), 932-945. doi: 10.1016/j.humov.2011.10.004
Travassos, B., Araújo, D., Vilar, L., & McGarry, T. (2011). Interpersonal coordination and ball dynamics in futsal (indoor football). Hum Mov Sci, 30(6), 1245-1259. doi: 10.1016/j.humov.2011.04.003
Travassos, B., Duarte, R., Vilar, L., Davids, K., & Araújo, D. (2012). Practice task design in team sports: representativeness enhanced by increasing opportunities for action. J Sports Sci, 30(13), 1447-1454. doi: 10.1080/02640414.2012.712716
56
5. THE EFFECTS OF CONGESTED FIXTURES ON TACTICAL AND PHYSICAL PERFORMANCE IN
ELITE FOOTBALL.
Abstract
Purpose: The aim of this study was to examine the physical and tactical performances of a
professional football team under congested and non-congested fixture periods. Methods: Six
home matches of an English professional football team were analysed during competitive
season (3 matches distancing three days from the previous fixture and 3 matches distancing
six or more days from the previous fixture). Players’ physical performances were measured
by the total distance covered and distance covered at different speed categories. Tactical
performances were measured by the percentage of time of movement synchronisation of all
the possible pairs of outfield players, for the overall match and at different speed categories.
Results: Results showed no differences in the physical performance, but higher levels of
movement synchronisation in the non-congested fixtures compared to congested fixtures, both
for lateral (41.26% to 38.51%, ES: -0.3, p < 0.001) and longitudinal displacements (77.22% to
74.48%, ES: -0.5, p < 0.001). These coordination differences were particularly evident at the
lower speed categories and in dyads composed by positions that tend to be further apart
during the match. Conclusion: Tactical performance seems to be affected by fixtures
distribution, with players’ spending more time synchronised during the non-congested
fixtures. As players’ cover the same amount of distance at similar intensities in both fixtures
distribution, this reduction of synchronisation may be associated with an increased perception
of fatigue and consequent adaptation strategies.
57
Introduction
Contemporary professional football teams are confronted with a large number of fixtures
throughout the season, including league, cup and international matches(Carling, Le Gall, &
Dupont, 2012; Nedelec et al., 2012). These fixtures distribution demands playing more than a
match per week, with consecutive matches distancing less than three to four days between
each other and lacking the recommended 72 hours of recovery period (Ispirlidis et al., 2008).
The effect of this particular type of fixture distribution on football performance has been
approached in several investigations. However, no study was able to discriminate
performance decreases in professional football, while comparing different periods of time
between matches. No differences were identified between congested and non-congested
periods in the total distance covered and distance covered at different intensities, when
analysing matches from the English Premier League (Odetoyinbo, Wooster, & Lane, 2008),
the Spanish La Liga (Lago-Penas, Rey, Lago-Ballesteros, Casais, & Dominguez, 2011; Rey,
Lago-Penas, Lago-Ballesteros, Casais, & Dellal, 2010) and the French Ligue 1 (Carling &
Dupont, 2011; Carling et al., 2012; Dellal, Lago-Penas, Rey, Chamari, & Orhant, 2013).
Technical performance has also been compared according to different fixtures distribution.
Similarly to physical performance, results did not revealed any differences between congested
and non-congested periods (Carling & Dupont, 2011; Dellal et al., 2013), with players
exhibiting similar technical profiles in several indicators, such as number of passes,
percentage of duels won and number of touches per possession.
The available literature allows assuming that high-level players cover a consistent amount of
distance, at identical intensity and with a similar technical performance, independently of the
fixtures distribution. However, coaches often perceive a decline in players and teams’ overall
performance under congested fixtures conditions. For example, when asked to evaluate the
performance of 65 players during the FIFA 2002 World Cup (Ekstrand, Walden, & Hagglund,
2004), several international coaches assigned lower rates to the players who were involved in
more matches during the preparation of the competition. At some extent, these findings seem
to be counterintuitive with a perceived decline of players and teams’ overall performance
during congested fixtures condition. However, this possible decline may not be related to the
amount of distance covered or the technical performance of players, but rather to the players’
interpersonal coordination tendencies that underlie the tactical performance of teams
throughout the match (Glazier, 2010; Vilar, Araújo, Davids, & Button, 2012).
58
According to several authors, tactical performance in football may be identified as players’
interpersonal space-time interactions emerging during team game performance (Gréhaigne,
Godbout, & Bouthier, 1999; McGarry, Anderson, Wallace, Hughes, & Franks, 2002;
Travassos, Davids, Araújo, & Esteves, 2013). This understanding about the tactical
performance is based on self-organising dynamical systems and uses methods such as relative
phase analysis (Palut & Zanone, 2005). This method quantifies the space-time relation
between two signals, or in a sports practical approach, two players’ relative positions time-
series (McGarry et al., 2002). The different modes of coordination may vary between in-phase
(0º) and anti-phase (180º) patterns. Previous research used relative phase analysis to capture
intra-team coordination tendencies between players in football (Siegle & Lames, 2013) and
futsal (i.e. 5-a-side indoor football) (Travassos, Araujo, Duarte, & McGarry, 2012; Travassos,
Araujo, Vilar, & McGarry, 2011). In all cases, players tended to present a strong attraction to
synchronised (in-phase) behaviours, suggesting that players use this mode of coordination to
disrupt the opponent team organisation. Also using this approach, Sampaio and Maçãs (2012)
examined football tactical expertise in 5vs.5 small-sided games, by measuring the relative
phase of pairs of players concerning the coupling of their distances to the team centroid.
While the pre-test results showed no evident trend in interpersonal coordination, the post-test
measures showed an increased stability in players relative movements on the pitch. Authors
suggested that this change in coordination tendencies was associated with a higher awareness
of football principles of play promoted during the intervention protocol, reflecting a change in
players’ expertise. Since elite football teams tend to be composed of players with enhanced
tactical expertise, it may be hypothesised that higher levels of movement synchronisation
reflect a better tactical performance.
Interestingly, the aforementioned studies using the relative phase method do not focus on the
match final outcomes to measure performance, but rather in match actions such as shots on
goal (Travassos et al., 2012; Travassos et al., 2011), or players’ level of expertise (Sampaio &
Maçãs, 2012). This tactical performance indicator is presented as a mean to improve teams
probability of a favourable match outcome. Given that observable behaviour in game sports
emerges from the interaction process between two opposing teams, a more synchronised
behaviour does not imply a direct link to winning a match, but rather serves as performance
indicator of the interaction process (Lames & McGarry, 2007). In this sense, it is necessary to
maintain the stability in some situational variables, such as opposition level, match status,
59
team formation and home condition, as they may present an important influence over football
performance, measured by the match final outcome (Mackenzie & Cushion, 2013).
Also, recent data suggests that non-professional players tend to reveal different behaviours
depending on the displacement speeds, with faster paced displacements associated to more
irregular individual movement trajectories (Sampaio, Lago, Goncalves, Maçãs, & Leite, 2013;
Sampaio & Maçãs, 2012). As so, analysing the interpersonal movement synchronisation
tendencies at different displacement speeds may also contribute to understand the effect of
congested fixture periods, as they represent a compound indicator of both tactical and
physical performances.
As such, the aim of the present study was to examine physical and tactical performance of an
elite football team under congested and non-congested fixtures conditions. The physical
performance was measured by the total distance covered and distance covered at different
movement speed categories. The tactical performance was measured by the movement
synchronisation of all possible pairs of outfield players, in both displacement axes. In
addition, we assessed the level of movement synchronisation in each speed category in
congested and non-congested periods. We hypothesised that players would present higher
levels of movement synchronisation during congested fixture periods, while maintaining
similar physical performance.
Methods
Subjects
A total of 23 professional players (age=25.5±3.6 yrs; professional playing
experience=9.0±3.7 yrs) participated in 6 matches during the Premier League 2010-11 season.
From the total number, 14 players participated in 4 or more of the analysed matches, and 6
players participated in only 1 match. In the 3 matches during the congested fixtures, a total of
8.0±1.0 players were selected in the initial squad in both the analysed match and the previous
match. Considering substitutes, a total of 10.7±0.6 players were used during the analysed
match, having also played in the previous match.
60
Design
A cross-sectional design was used to compare teams’ tactical and physical match
performances according to the number of days distancing from the previous fixture
(congested – 3 days; non-congested – 6 or more days).
Methodology
Players’ positional data were collected using a semi-automatic tracking system (Prozone®,
ProZone Holdings Ltd, UK). This system uses several video cameras to capture players
positioning during the match at 10Hz, and has been previously validated (Di Salvo, Collins,
McNeill, & Cardinale, 2006). All 6 matches were played in the same stadium, in home
condition, against similar level opponents (opponents presented a regular bottom half final
classification in the premier league or a first half classification in the league championship,
during the three previous seasons). The analysed team presented a GK-4-3-3 playing
formation and won all the 6 matches. No dismissal occurred in either team during the
matches. Matches were classified according to the number of days distancing from the
previous fixture, resulting in 3 matches played during congested periods (3 days from the
previous fixture) and 3 matches played during non-congested periods (6 or more days from
the previous fixture). All procedures were approved by the Ethics Committee of the Research
Centre for Sport Sciences, Health and Human Development.
Total distance covered and distance covered at different movement speed categories were
measured as physical performance indicators. The following categories were used: 0.0-3.5 km
· h-1 (low-intensity); 3.6-14.3 km · h-1 (moderate intensity); 14.4-19.7 km · h-1 (high
intensity); and >19.8 km · h-1 (very high intensity). For the analysis of physical performance
indicators only non-substituted outfield players were considered. During congested fixtures,
physical performance was measured considering only non-substituted outfield players who
participated in both the analysed match and the previous match.
For assessing tactical performance, the relative phase of players’ displacements was
calculated for all possible pairs of outfield players (n=45) using the Hilbert transform (Palut
& Zanone, 2005). By sharing a common objective, each pair of outfield players of the
analysed team could potentially form a dyad. When a substitution occurred, the team
formation was revised and the substituted player was replaced in the analysis by the teammate
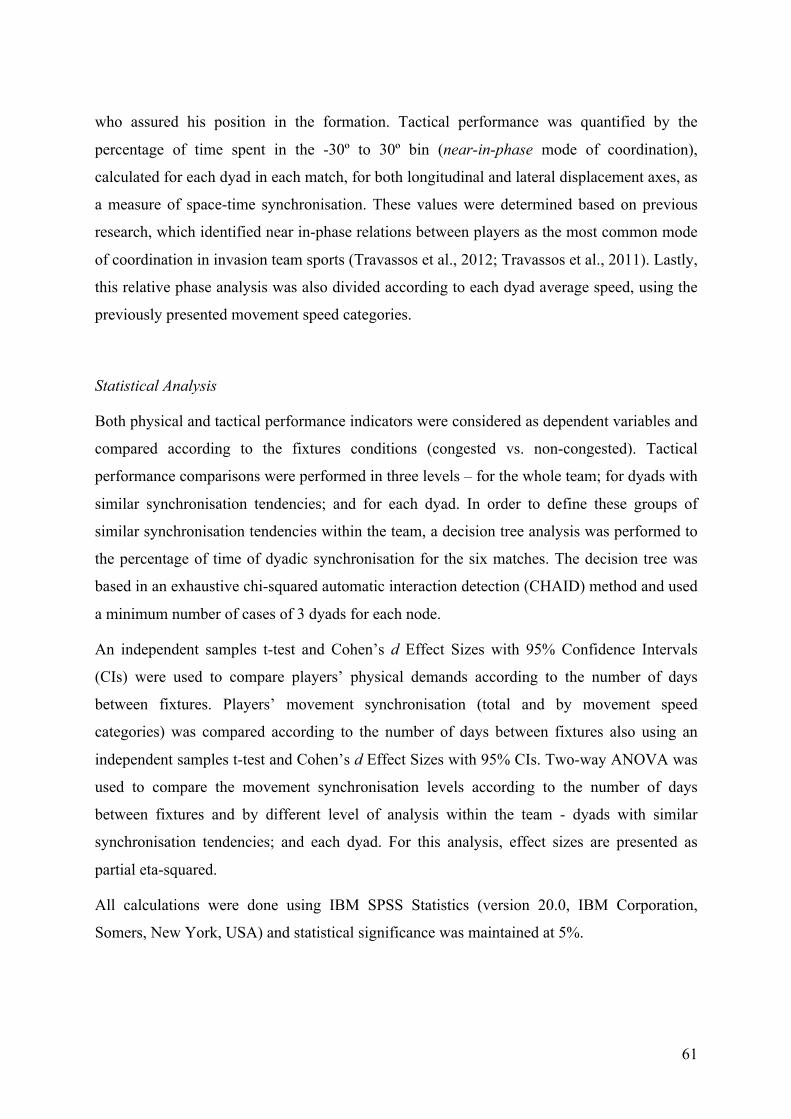
61
who assured his position in the formation. Tactical performance was quantified by the
percentage of time spent in the -30º to 30º bin (near-in-phase mode of coordination),
calculated for each dyad in each match, for both longitudinal and lateral displacement axes, as
a measure of space-time synchronisation. These values were determined based on previous
research, which identified near in-phase relations between players as the most common mode
of coordination in invasion team sports (Travassos et al., 2012; Travassos et al., 2011). Lastly,
this relative phase analysis was also divided according to each dyad average speed, using the
previously presented movement speed categories.
Statistical Analysis
Both physical and tactical performance indicators were considered as dependent variables and
compared according to the fixtures conditions (congested vs. non-congested). Tactical
performance comparisons were performed in three levels – for the whole team; for dyads with
similar synchronisation tendencies; and for each dyad. In order to define these groups of
similar synchronisation tendencies within the team, a decision tree analysis was performed to
the percentage of time of dyadic synchronisation for the six matches. The decision tree was
based in an exhaustive chi-squared automatic interaction detection (CHAID) method and used
a minimum number of cases of 3 dyads for each node.
An independent samples t-test and Cohen’s d Effect Sizes with 95% Confidence Intervals
(CIs) were used to compare players’ physical demands according to the number of days
between fixtures. Players’ movement synchronisation (total and by movement speed
categories) was compared according to the number of days between fixtures also using an
independent samples t-test and Cohen’s d Effect Sizes with 95% CIs. Two-way ANOVA was
used to compare the movement synchronisation levels according to the number of days
between fixtures and by different level of analysis within the team - dyads with similar
synchronisation tendencies; and each dyad. For this analysis, effect sizes are presented as
partial eta-squared.
All calculations were done using IBM SPSS Statistics (version 20.0, IBM Corporation,
Somers, New York, USA) and statistical significance was maintained at 5%.
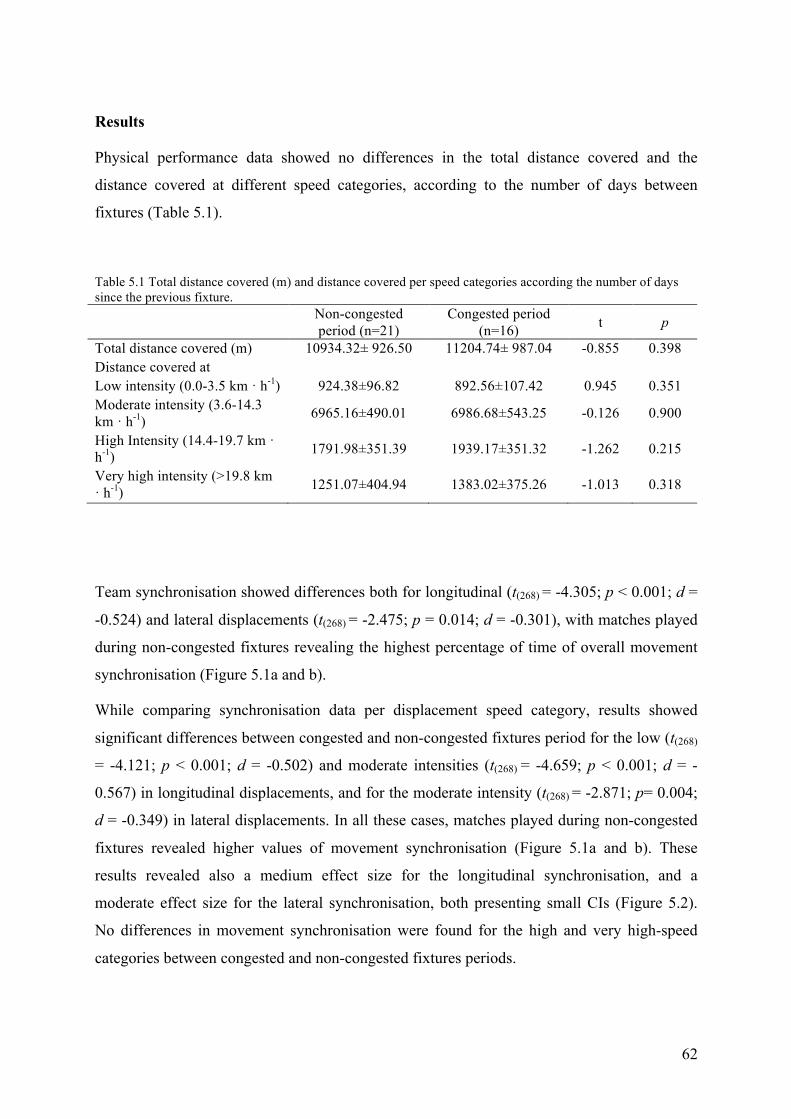
62
Results
Physical performance data showed no differences in the total distance covered and the
distance covered at different speed categories, according to the number of days between
fixtures (Table 5.1).
Table 5.1 Total distance covered (m) and distance covered per speed categories according the number of days since the previous fixture.
Non-congested period (n=21)
Congested period (n=16) t p
Total distance covered (m) 10934.32± 926.50 11204.74± 987.04 -0.855 0.398 Distance covered at Low intensity (0.0-3.5 km · h-1) 924.38±96.82 892.56±107.42 0.945 0.351 Moderate intensity (3.6-14.3 km · h-1) 6965.16±490.01 6986.68±543.25 -0.126 0.900
High Intensity (14.4-19.7 km · h-1) 1791.98±351.39 1939.17±351.32 -1.262 0.215
Very high intensity (>19.8 km · h-1) 1251.07±404.94 1383.02±375.26 -1.013 0.318
Team synchronisation showed differences both for longitudinal (t(268) = -4.305; p < 0.001; d =
-0.524) and lateral displacements (t(268) = -2.475; p = 0.014; d = -0.301), with matches played
during non-congested fixtures revealing the highest percentage of time of overall movement
synchronisation (Figure 5.1a and b).
While comparing synchronisation data per displacement speed category, results showed
significant differences between congested and non-congested fixtures period for the low (t(268)
= -4.121; p < 0.001; d = -0.502) and moderate intensities (t(268) = -4.659; p < 0.001; d = -
0.567) in longitudinal displacements, and for the moderate intensity (t(268) = -2.871; p= 0.004;
d = -0.349) in lateral displacements. In all these cases, matches played during non-congested
fixtures revealed higher values of movement synchronisation (Figure 5.1a and b). These
results revealed also a medium effect size for the longitudinal synchronisation, and a
moderate effect size for the lateral synchronisation, both presenting small CIs (Figure 5.2).
No differences in movement synchronisation were found for the high and very high-speed
categories between congested and non-congested fixtures periods.
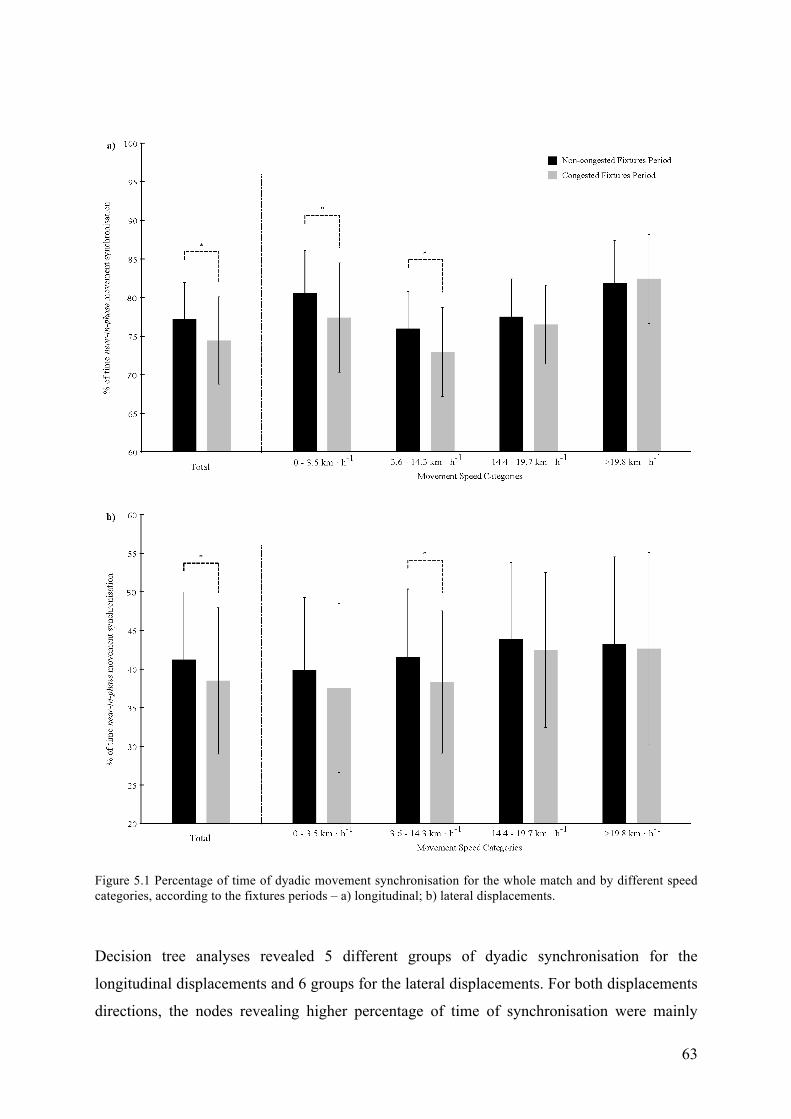
63
Figure 5.1 Percentage of time of dyadic movement synchronisation for the whole match and by different speed categories, according to the fixtures periods – a) longitudinal; b) lateral displacements.
Decision tree analyses revealed 5 different groups of dyadic synchronisation for the
longitudinal displacements and 6 groups for the lateral displacements. For both displacements
directions, the nodes revealing higher percentage of time of synchronisation were mainly
64
composed of dyads of players with defensive roles (centre defenders and defensive centre
midfielder). Also, these more synchronised nodes usually implicated players from positions
that tend to be closer to each other in the team formation. The nodes presenting a lower
percentage of time of synchronisation were constituted by dyads of offensive players, or
players which tend to be further apart during the match (Figure 5.3a and b). Two-way
ANOVAs revealed significant differences between congested and non-congested fixtures
(longitudinal - F(1,260) = 17.608; p < 0.001; η2 = 0.063; lateral - F(1,258) = 10.321; p = 0.001; η2
= 0.038), and between decision tree groups (longitudinal - F(4,260) = 50.787; p < 0.001; η2 =
0.439; lateral - F(5,258) = 93.377; p < 0.001; η2 = 0.644), but not for the interaction of factors
(longitudinal - F(4,260) = 2.310; p = 0.058; η2 = 0.034; lateral - F(5,258) = 1.345; p = 0.246; η2 =
0.025). Pairwise comparisons according to fixtures periods revealed significant differences in
the nodes composed by the larger number of dyads, for both longitudinal displacement (Node
2 - F(1,260) = 21.560; p < 0.001; η2 = 0.077; Node 3 - F(1,260) = 15.637; p < 0.001; η2 = 0.057)
and lateral displacement (Node 3 - F(1,258) = 15.222; p < 0.001; η2 = 0.056). In all cases,
groups revealed higher percentage of time of dyadic synchronisation when involved in non-
congested fixtures (Figure 5.3a and b).
Two-way ANOVA analyses on movement synchronisation values revealed significant
differences between dyads (longitudinal - F(44,180) = 4.738; p < 0.001; η2 = 0.537; lateral -
F(44,180) = 11.249; p < 0.001; η2 = 0.733) and between fixtures congestion (longitudinal -
F(1,180) = 29.585; p < 0.001; η2 = 0.141; lateral - F(1,180) = 16.835; p < 0.001; η2 = 0.086), but
not for the interaction of factors (longitudinal - F(44,180) = 0.895; p = 0.660; η2 = 0.180; lateral -
F(44,180) =1.399; p = 0.067; η2 = 0.255), in both displacement directions. Pairwise comparisons
by fixtures congestion revealed five and seven dyads in the longitudinal and lateral
displacements, respectively, with all cases showing higher values of synchronisation in non-
congested fixtures (Figure 5.3a and b).
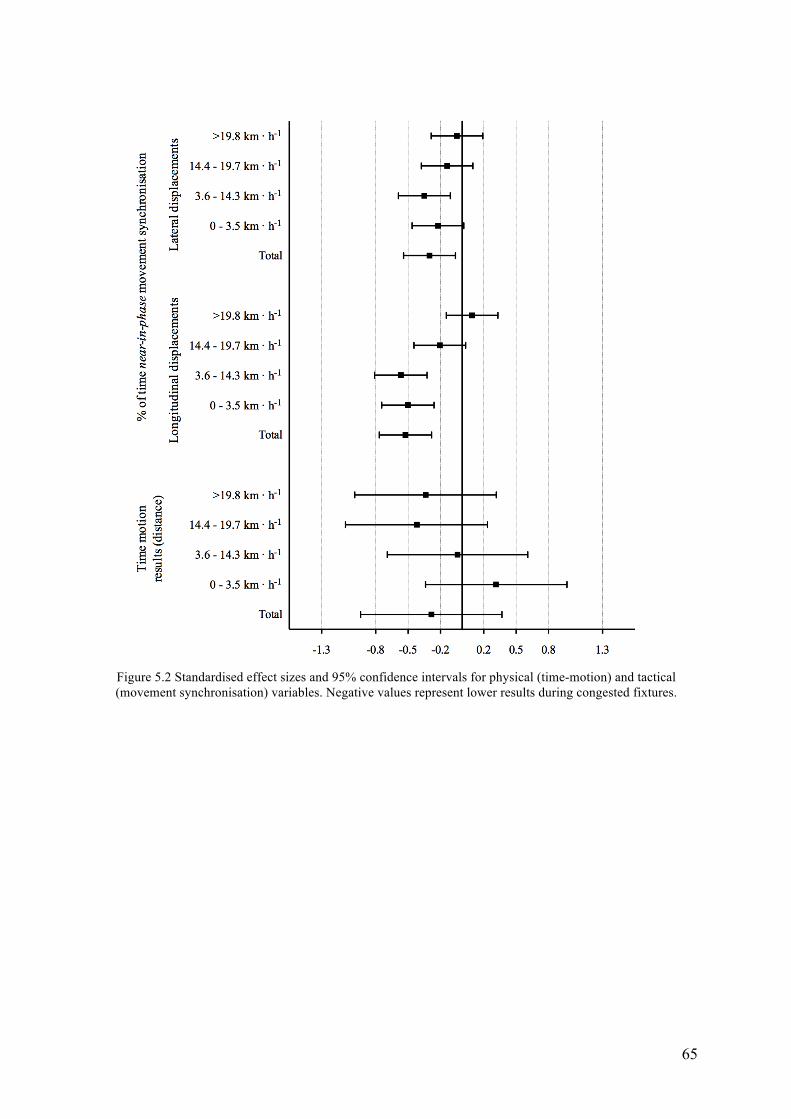
65
Figure 5.2 Standardised effect sizes and 95% confidence intervals for physical (time-motion) and tactical (movement synchronisation) variables. Negative values represent lower results during congested fixtures.
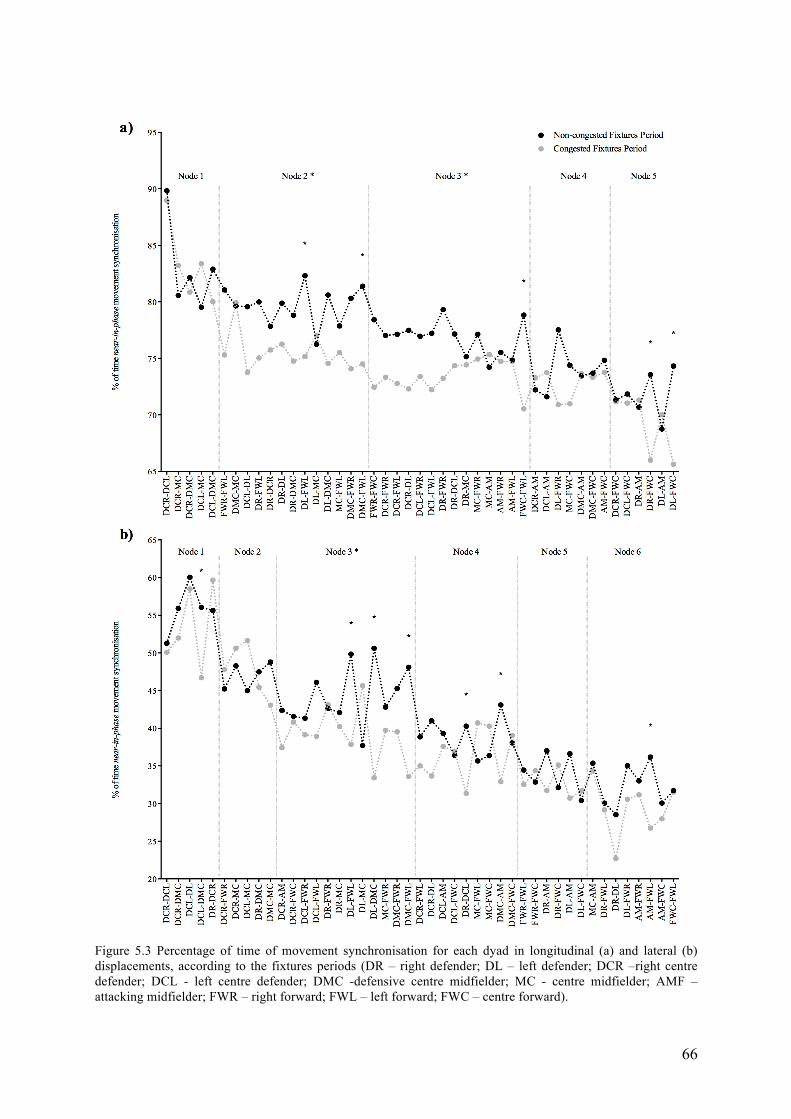
66
Figure 5.3 Percentage of time of movement synchronisation for each dyad in longitudinal (a) and lateral (b) displacements, according to the fixtures periods (DR – right defender; DL – left defender; DCR –right centre defender; DCL - left centre defender; DMC -defensive centre midfielder; MC - centre midfielder; AMF – attacking midfielder; FWR – right forward; FWL – left forward; FWC – centre forward).
67
Discussion
The aim of the present study was to examine whether the physical and tactical performances
varied under congested and non-congested fixtures conditions in a professional football team.
Findings exposed the absence of differences in physical performance between fixtures,
confirming previous studies (Carling et al., 2012; Dellal et al., 2013; Lago-Penas et al., 2011).
However, tactical performance was significantly different, revealing lower values of
movement synchronisation after smaller inter-match recovery periods. In the present study we
aimed to control several factors, such as the match outcome, opponent level, game location
and team formation, in order to properly quantify the effect of different fixtures distribution.
This aspect may limit the generalisation of our results, since a lower synchronisation result is
not related to a different match outcome. However, existing literature supports establishing a
link between synchronisation and performance (Sampaio & Maçãs, 2012; Travassos et al.,
2013), as a characterisation of the interaction processes within a match (Lames & McGarry,
2007). In this sense, despite all matches ended with a win for the analysed team, there seems
to be an effect of lower recovery periods on players’ tactical performance. Nevertheless, there
is still a need to investigate the relation between football match outcomes and players’
synchronisation tendencies.
The invariance of physical performance data between fixtures reported in prior studies
strengthens the idea that there is great stability in time-motion demands in professional
football. Our results also support this notion. Interestingly, one of the few studies revealing
differences in time-motion demands compared a match played by 10 players, due to an early
dismissal, with matches played by 11 players (Carling & Bloomfield, 2010). The 10-player
match revealed higher total distance covered and higher distance covered at moderate
intensities, as a consequence of players positioning adaptations. In this sense, running more
distance or at higher work-rate is not always related to higher performances, but rather to
strategic and positional adaptations to the match contextual demands, considering the
functional relations players need to re-establish with teammates and opponents.
The movement synchronisation levels displayed by players were generally high, particularly
in the longitudinal displacements (75.85±5.40%), but also in the lateral displacements
(39.88±9.21%). These results revealed that, taking into account the entire match, the players
tended to spend much time performing in a synchronised manner. Further analyses revealed
also higher amount of time of movement synchronisation for the defensive dyads than for the
68
offensive dyads. Indeed, players’ positioning presents an important factor influencing
interpersonal coordination tendencies among players, with offensive roles demanding a more
irregular behaviour in order to break the opponent defensive organisation (Gonçalves,
Figueira, Maçãs, & Sampaio, 2013).
While comparing the percentage of time of movement synchronisation per displacement
speed category, results showed demarcated differences at the lower intensities. The lower
percentage of dyadic synchronisation of players during congested fixtures at low and
moderate intensities (Figure 5.1 and 5.2) might hypothetically be explained by accumulated
mental fatigue (Nedelec et al., 2012), which impairs the capacity to be synchronised with
neighbour teammates during periods of low intensity. Indeed, Marcora et al. (2009) revealed
that although mental fatigue does not affect the physiological responses to exercise, it limits
the tolerance to exercise due to increased perception of fatigue. As such, although players
might be able to deal with the match physical demands, they probably detune their movement
synchronisation in moments of low risk as a result of accumulated mental fatigue. Further
investigation is needed to clarify this relation between the congested fixtures and different
aspects of fatigue. Worthwhile, players seemed to be able to keep a synchronised behaviour at
the higher displacement speeds, independently of fixtures distribution. High intensity
displacements are commonly related to decisive actions, as they enable gaining advantage
over opponents (Carling, Bloomfield, Nelsen, & Reilly, 2008) and are the most common
action in goal scoring situations (Faude, Koch, & Meyer, 2012). In order to maintain a high
level of performance in these game scenarios, players seem to mentally relax in lower
intensity and lower risk situations. These results highlight the need to interrelate the physical
and tactical requirements of the game (Glazier, 2010), once they add complementary
information about performance.
The decision trees analyses revealed different groups for each displacement direction,
although with a certain degree of similarity. The nodes with the highest value of
synchronisation for both directions presented common dyads, particularly composed by
players with defensive roles and playing in neighbouring areas. This result reveals that certain
sub-units of football teams are more prone to present higher synchronised behaviours than
others. These groups of players seem to constitute a stable foundation for other sub-units that
attempt to break the opponent team organisation, exploring less stable modes of interpersonal
coordination. Also, this classification technique allowed detecting which groups of players are
69
more affected by fixtures distribution, in terms of movement synchronisation tendencies.
Particularly in the longitudinal displacements, the intermediate groups presented higher
differences between fixtures, with matches played in non-congested fixtures revealing higher
synchronised behaviours. This group identification may be useful in terms of specific training
during congested fixtures, in order to promote training tasks involving this set of players.
However, further research is needed to analyse the effectiveness of training interventions
using this group identification during congested fixtures, as well as the more appropriate
recovery strategies that must be employed in these contexts (Nedelec et al., 2013).
Finally, the interaction effects between factors (fixtures distribution and groups of
synchronisation level) revealed no significant differences. These results showed that team
players’ presented consistent movement synchronisation tendencies between matches, despite
establishing different relations between each other and being affected by the fixtures
distribution. This consistency may be interpreted as the team, considered as an individual
organism, exhibiting a consistent playing style or relatively stable behavioural characteristics,
which fluctuates within a limited range of variability (Duarte, Araujo, Correia, & Davids,
2012). Further investigation is needed to understand whether different teams present distinct
synchronisation tendencies between players, for which the current data and the
methodological approach may provide a valuable platform for team sports performance
analysis.
Practical Applications
This data constitutes an interesting point for coaches, as players may need specific recovery
interventions for dealing with match demands beyond individual physical recovery. For
instance, players’ dyads groups who presented a lower synchronisation level during congested
fixtures might benefit from specific positioning and group coordination training sessions,
complementary or interrelated to the physical recovery, during this period. This aspect seems
particularly relevant for recovery sessions between matches, since movement synchronisation
data decreased particularly at low intensities of displacement. However, the fact that only
matches ending in a win were analysed may pose a limitation on the generalisation of our
results. Different situational variables must be taken into account in future studies.
70
Conclusions
This study presented evidence that although the physical performance was not impaired in
congested fixtures, the tactical performance measured by players’ movement dyadic
synchronisation decreased during these matches. These differences in synchronisation were
particularly demarcated when displacing at lower intensities, which suggests that players may
detune their synchronised movements during low risk situations.
71
References
Carling, C., & Bloomfield, J. (2010). The effect of an early dismissal on player work-rate in a professional soccer match. J Sci Med Sport, 13(1), 126-128. doi: 10.1016/j.jsams.2008.09.004
Carling, C., Bloomfield, J., Nelsen, L., & Reilly, T. (2008). The role of motion analysis in elite soccer: contemporary performance measurement techniques and work rate data. Sports Med, 38(10), 839-862.
Carling, C., & Dupont, G. (2011). Are declines in physical performance associated with a reduction in skill-related performance during professional soccer match-play? J Sports Sci, 29(1), 63-71. doi: 10.1080/02640414.2010.521945
Carling, C., Le Gall, F., & Dupont, G. (2012). Are physical performance and injury risk in a professional soccer team in match-play affected over a prolonged period of fixture congestion? Int J Sports Med, 33(1), 36-42. doi: 10.1055/s-0031-1283190
Dellal, A., Lago-Penas, C., Rey, E., Chamari, K., & Orhant, E. (2013). The effects of a congested fixture period on physical performance, technical activity and injury rate during matches in a professional soccer team. Br J Sports Med, 1-5. doi: 10.1136/bjsports-2012-091290
Di Salvo, V., Collins, A., McNeill, B., & Cardinale, M. (2006). Validation of Prozone ®: A new video-based performance analysis system. Int J Perform Anal Spor, 6(1), 108-119.
Duarte, R., Araujo, D., Correia, V., & Davids, K. (2012). Sports teams as superorganisms: implications of sociobiological models of behaviour for research and practice in team sports performance analysis. Sports Med, 42(8), 633-642. doi: 10.2165/11632450-000000000-00000
Ekstrand, J., Walden, M., & Hagglund, M. (2004). A congested football calendar and the wellbeing of players: correlation between match exposure of European footballers before the World Cup 2002 and their injuries and performances during that World Cup. Br J Sports Med, 38(4), 493-497. doi: 10.1136/bjsm.2003.009134
Faude, O., Koch, T., & Meyer, T. (2012). Straight sprinting is the most frequent action in goal situations in professional football. J Sports Sci, 30(7), 625-631. doi: 10.1080/02640414.2012.665940
Glazier, P. S. (2010). Game, set and match? Substantive issues and future directions in performance analysis. Sports Med, 40(8), 625-634. doi: 10.2165/11534970-000000000-00000
Gonçalves, B. V., Figueira, B. E., Maçãs, V., & Sampaio, J. (2013). Effect of player position on movement behaviour, physical and physiological performances during an 11-a-side football game. J Sports Sci, 1-9. doi: 10.1080/02640414.2013.816761
Gréhaigne, J., Godbout, P., & Bouthier, D. (1999). The Foundations of Tactics and Strategy in Team Sports. J Teach Phys Educ 18(2), 159-174.
Ispirlidis, I., Fatouros, I. G., Jamurtas, A. Z., Nikolaidis, M. G., Michailidis, I., Douroudos, I., . . . Taxildaris, K. (2008). Time-course of changes in inflammatory and performance responses following a soccer game. Clin J Sport Med, 18(5), 423-431. doi: 10.1097/JSM.0b013e3181818e0b
72
Lago-Penas, C., Rey, E., Lago-Ballesteros, J., Casais, L., & Dominguez, E. (2011). The influence of a congested calendar on physical performance in elite soccer. J Strength Cond Res, 25(8), 2111-2117. doi: 10.1519/JSC.0b013e3181eccdd2
Lames, M., & McGarry, T. (2007). On the search for reliable performance indicators in game sports. Int J Perform Anal Spor 7(1), 62-79.
Mackenzie, R., & Cushion, C. (2013). Performance analysis in football: a critical review and implications for future research. J Sports Sci, 31(6), 639-676. doi: 10.1080/02640414.2012.746720
Marcora, S. M., Staiano, W., & Manning, V. (2009). Mental fatigue impairs physical performance in humans. J Appl Physiol, 106(3), 857-864. doi: 10.1152/japplphysiol.91324.2008
McGarry, T., Anderson, D. I., Wallace, S. A., Hughes, M. D., & Franks, I. M. (2002). Sport competition as a dynamical self-organizing system. J Sports Sci, 20(10), 771-781. doi: 10.1080/026404102320675620
Nedelec, M., McCall, A., Carling, C., Legall, F., Berthoin, S., & Dupont, G. (2012). Recovery in soccer: part I - post-match fatigue and time course of recovery. Sports Med, 42(12), 997-1015. doi: 10.2165/11635270-000000000-00000
Nedelec, M., McCall, A., Carling, C., Legall, F., Berthoin, S., & Dupont, G. (2013). Recovery in soccer : part ii-recovery strategies. Sports Med, 43(1), 9-22. doi: 10.1007/s40279-012-0002-0
Odetoyinbo, K., Wooster, B., & Lane, A. (2008). The effect of a succession of matches on the activity profiles of professional soccer players. . In T. Reilly & F. Korkusuz (Eds.), Science and Football VI - The Proceedings of the Sixth World Congress on Science and Football (pp. 105-111).
Palut, Y., & Zanone, P. G. (2005). A dynamical analysis of tennis: concepts and data. J Sports Sci, 23(10), 1021-1032. doi: 10.1080/02640410400021682
Rey, E., Lago-Penas, C., Lago-Ballesteros, J., Casais, L., & Dellal, A. (2010). The Effect of a Congested Fixture Period on the Activity of Elite Soccer Players. Biol Sport 27(3), 181-185.
Sampaio, J., Lago, C., Goncalves, B., Maçãs, V. M., & Leite, N. (2013). Effects of pacing, status and unbalance in time motion variables, heart rate and tactical behaviour when playing 5-a-side football small-sided games. J Sci Med Sport, 1-5. doi: 10.1016/j.jsams.2013.04.005
Sampaio, J., & Maçãs, V. (2012). Measuring tactical behaviour in football. Int J Sports Med, 33(5), 395-401. doi: 10.1055/s-0031-1301320
Siegle, M., & Lames, M. (2013). Modeling soccer by means of relative phase. J Syst Sci Complex, 26(1), 14-20. doi: Doi 10.1007/S11424-013-2283-2
Travassos, B., Araujo, D., Duarte, R., & McGarry, T. (2012). Spatiotemporal coordination behaviors in futsal (indoor football) are guided by informational game constraints. Hum Mov Sci, 31(4), 932-945. doi: 10.1016/j.humov.2011.10.004
Travassos, B., Araujo, D., Vilar, L., & McGarry, T. (2011). Interpersonal coordination and ball dynamics in futsal (indoor football). Hum Mov Sci, 30(6), 1245-1259. doi: 10.1016/j.humov.2011.04.003

73
Travassos, B., Davids, K., Araújo, D., & Esteves, P. T. (2013). Performance analysis in team sports: Advances from an Ecological Dynamics approach. Int J Perform Anal Spor, 13(1), 83-95.
Vilar, L., Araújo, D., Davids, K., & Button, C. (2012). The role of ecological dynamics in analysing performance in team sports. Sports Med, 42(1), 1-10. doi: 10.2165/11596520-000000000-00000
74
6. PHYSICAL, PHYSIOLOGICAL AND TACTICAL RESPONSES TO LARGE-SIDED GAMES DURING
PRESEASON OF ELITE FOOTBALLERS.
Abstract
The aim of this study was to identify changes in tactical, physical and physiological
performances during large-sided games during the preseason of elite footballers. Thirty
professional football players participated in several GK+8vs.8+GK large-sided games played
in half-pitch, during the first four weeks of the season. Players used individual GPS units and
hear rate monitors to measure physical, physiological and tactical performances, as measured
by: total distance covered and distance covered at different intensities (per minute); exertion
index per minute; maximal heart rate percentage; modified training impulse; percentage of
longitudinal and lateral movement synchronisation; and percentage of longitudinal and lateral
movement synchronisation at different intensities. The large-sided games were grouped into
the first or the later two weeks of preseason training. The players were also grouped according
to their field positions (defenders, midfielders and forwards) and according to their
professional playing experience (low, medium and high). A factorial ANOVA was used to
compare the variables according to the preseason period, players’ position and professional
experience. Results revealed that the large-sided game situation promoted similar
physiological responses during the first and the later training period. However, players
showed improved tactical performance, by displaying higher levels of synchronisation, during
the later preseason period. Tactical variables seem to express a measure of training progress,
measuring players’ synchronisation increase. The midfield players presented the lowest
longitudinal synchronisation results, covered more distance and at higher paces than
defenders and forwards. Finally, the more experienced players seem to benefit more from the
training, as their tactical evolution was more pronounced than less experienced players. These
results highlight the potential for assessing positioning derived variables when concurring to
physical and physiological variables during football preseason.
75
Introduction
Football training is a complex activity depending on multiple factors to optimise players and
teams’ performance. Coaches must take into account physical, technical and tactical
development, while dealing with players of different positions, presenting different levels of
expertise and with specific training requirements. Several methodologies may be used to
develop players’ performance, based in either specific training exercises (Bloomfield,
Polman, O'Donoghue, & McNaughton, 2007), or sided games (SG) situations (Aguiar,
Botelho, Lago, Maçãs, & Sampaio, 2012; Hill-Haas, Dawson, Impellizzeri, & Coutts, 2011;
Owen, Wong, Paul, & Dellal, 2014). However, given the short time for teams’ preparation,
coaches often chose to focus their attentions on technical and tactical training (Jeong, Reilly,
Morton, Bae, & Drust, 2011). In this sense, the use of SG is the most frequent choice, as they
promote the simultaneous development of physical, technical and tactical skills in football
players (Aguiar et al., 2012; Owen et al., 2014).
There is a large amount of research using different formats of SG and their effects on players’
physical, physiological and technical performances, by changing the number of players, the
pitch area or the game rules (Hill-Haas et al., 2011; Stolen, Chamari, Castagna, & Wisloff,
2005). The tactical performances, however, are scarcely explored by the available research. In
opposition to physical variables, that can be monitored throughout external devices and
validated field tests (Stolen et al., 2005), the tactical variables are only possible to measure
during actual game like situations, as they are dependent on the dynamical and complex
relations between the players, the tasks and the environment (Araújo, Travassos, & Vilar,
2010). Some studies have focused on assessing players’ tactical performance, in both match
and SG conditions. Considering the evaluation of teams’ tactical performance during the
match, one of the most recently used performance indicator is the players’ movement
synchronisation. This performance indicator is based in the functional behaviour of a team,
where players try to coordinate themselves in order to gain advantage over their opponents
(Duarte et al., 2013). In fact, players from the same team present higher levels of
synchronisation during the match when facing higher-level opposition, than when facing
lower level opponents (Folgado, Duarte, Fernandes, & Sampaio, 2014a). In essence, it is very
likely that higher levels of synchronisation during the match may be related to higher levels of
tactical performance. In another approach, based in SG conditions of GK+3vs.3+GK, older
players presented a more stable relation between team length and width distances throughout
76
the game, while compared to younger and less experienced players (Folgado, Lemmink,
Frencken, & Sampaio, 2014b). This difference was identified as a higher awareness of the
football game tactical principles. Using a pre to post-test design in a GK+5vs.5+GK situation,
another study identified an improvement of players’ interpersonal coordination after a
succession of football tactical-based practical lessons (Sampaio & Maçãs, 2012). Based in
this knowledge, researchers started to manipulate SG conditions, in order to understand the
emergent behaviour promoted by different task constraints. For example, it was identified that
game pace seems to impair tactical performance during a GK+5vs.5+GK situation (Sampaio,
Lago, Gonçalves, Maçãs, & Leite, 2014). In this approach, non-professional players presented
a higher degree of randomness in their distance to team centroid at higher game paces. Again,
this behavioural adaptation was associated to a decrease in tactical performance, despite the
higher physical demands measured during this exercise adaptation. All the previous create a
solid background that allows establishing a connection between players’ dynamical
behaviour, such as their levels of synchronisation, and tactical performance. This knowledge
enables the control of players’ tactical development, based in the dynamical analysis of their
positioning during the match or SG situations.
The control of players’ tactical, but also technical and physical performance is particularly
important to be addressed during the pre-season (Di Salvo et al., 2007; Ostojic, 2004;
Rampinini, Coutts, Castagna, Sassi, & Impellizzeri, 2007), when new players and coaches
integrate the team and have to adapt to a whole new and different process. At the beginning of
the preseason, players present lower performance levels of physical fitness levels, particularly
the agility, aerobic fitness, speed and strength (Caldwell & Peters, 2009). The training
promoted during this period improves their physical response as the preseason progressed,
measured by fitness tests, of aerobic capacity (Castagna, Impellizzeri, Chaouachi, & Manzi,
2013), strength (Loturco, Ugrinowitsch, Tricoli, Pivetti, & Roschel, 2013) and technical
performance (Tessitore et al., 2011). However, physical response during the match does not
reflect this improvement, as players cover the same total distance and at the same distance at
high intensity between the beginning and the middle of the season (Mohr, Krustrup, &
Bangsbo, 2003). These results support the notion that other factors are limiting players’
physical response during the match, as they present improved fitness levels between
moments. Interestingly, a similar incongruence may be observed in players’ physical response
according to the competition level (Carling, 2013). Despite some authors identify higher
levels of performance as more physical demanding (Rampinini et al., 2007) other approaches
77
present divergent results. A comparison of different professional English leagues revealed
that Premier League players covered less distance at high intensity running than players from
lower leagues (Bradley et al., 2013). It seems that players’ level of technical and tactical
characteristics, exhibited in lower level leagues, may promote greater physical demands
during the match. As such, it may be speculated that a different levels of tactical performance
may be related to distinct players physical demands during SG or match situations. Given the
relevance of players’ development during the preseason, the control of tactical performance
during this moment presents a particular importance.
Based in the previous considerations, the aim of this study was to identify changes in tactical
and physical performances during large-sided games during the preseason of elite footballers.
In addition, the results will be inspected according to the players’ specific positions and their
professional experience.
78
Methods
Data collection
A total of 30 professional football players (age = 23.7±4.2 years; professional playing
experience = 4.8±4.2 years) participated in several GK+8vs.8+GK large-sided games played
in half-pitch (55x50m), during their regular preseason training sessions. This drill was
performed during seven sessions distributed by four weeks of the team preseason, starting
from the second day of training. In the first day of the preseason, players were submitted to
physical fitness tests, including the Yo-Yo intermittent recovery test level 2, which was used
to determine their maximal heart rate. Throughout the evaluated four weeks of preseason,
players participated in a total of twenty-eight training sessions and played four friendly
preparation matches.
During each of the seven evaluated sessions, different teams of eight players participated in
one to three bouts of the GK+8vs.8+GK situations. An aggregate of two to five bouts of the
presented large-sided game condition were evaluated per session. The bout duration varied
between 6 to 10 minutes (mean duration=7.67±1.15 min) interspersed with a 3-minute break.
The time of application of this SG was always constant between sessions.
Each player carried an individual global positioning system unit (SPI-PRO 5Hz, GPSports,
Canberra, ACT, Australia) for both positional and heart rate recording during the training
session. All procedures were approved by the Ethics Committee of the Research Centre for
Sport Sciences, Health and Human Development.
The Positional data were retrieved from GPS units and processed in MATLAB 2013a (The
MathWorks Inc., Natick, MA, USA) replicating existing methodological procedures (Folgado
et al., 2014a). All data collected from each player were synchronised and the missing data
gaps were re-sampled using an interpolation method to guarantee the same length of the time
series. Latitude and longitude data were transposed to meters, using the Universal Transverse
Mercator (UTM) coordinate system by means of a MATLAB routine (Palacios, 2006), and
smoothed using a 3 Hz Butterworth low pass filter. After converting the positional data into
meters, a rotation matrix was calculated for each training session from the field vertices
positions, aligning the length of the playing field with the x-axis and the width with the y-
axis. The rotation matrix was then applied to the players’ positional data for alignment with
the field referential.
79
Movement synchronisation
The movement synchronisation was quantified by calculating the relative phase of all dyads
of outfield players (n=28 dyads per team) during the duration of each exercise, for both
displacement axes. This calculation was based in the Hilbert transform applied to players’
positional time-series (Palut & Zanone, 2005). From these results, synchronised movement
was quantified as the percentage of time each dyad spent in the between -30º to 30º of relative
phase (near-in-phase synchronisation mode) (Folgado et al., 2014a). Synchronisation results
were also divided according to each dyad average speed, using the following speed
categories: 0.0-3.5 km · h-1 (low intensity); 3.6-14.3 km · h-1 (moderate intensity); 14.4-19.7
km · h-1 (high intensity); and >19.8 km · h-1 (very high intensity).
Physical and physiological variables
Players’ physical and physiological responses were quantified by external and internal load
during the large-sided game situation. External load was measured by the total distance
covered by minute; distance covered by minute at the low, moderate, high and very high
intensities; and exertion index per minute. Speed categories were determined using the
aforementioned intervals, used previously for synchronisation analysis. Exertion index was
based in a validated formula (Wisbey, Montgomery, Pyne, & Rattray, 2010), which accounts
for players’ instantaneous speed, speed over 10 seconds and speed over 60 seconds.
Internal load was calculated from players’ heart rate response during the exercise, by
quantifying their mean percentage of maximal heart (%HRmax). Based in this measures, a
modified training impulse (TRIMPMOD) (Stagno, Thatcher, & van Someren, 2007) was also
calculated. For this analysis, bout duration was normalised to 8 minutes for comparison
purposes. This measure was obtained by calculating the product between the time spent in
five heart rate (HR) zones by a corresponding weighting factor: zone 1 (65–71% HRmax) *
1.25; zone 2 (72–78% HRmax) * 1.71; zone 3 (79– 85% HRmax) * 2.54; zone 4 (86–92%
HRmax) * 3.61; and zone 5 (93–100% HRmax) * 5.16. The total TRIMPMOD result is equal to
the sum of all heart zones.
80
Statistical analysis
Large-sided game situations were compared across preseason period with two levels: during
the first two weeks of training (3 sessions with a total of 11 bouts) and during the later two
weeks of training (4 sessions with a total of 14 bouts). The players were classified into their
field positions (defenders; midfielders; forward) and their professional playing experience –
low (no previous professional experience); medium (between 1 and 4 years of professional
experience); and high (more than 4 years of professional experience). For movement
synchronisation analysis, the dyads were organised as follows: defensive dyads, consisting in
all dyads formed by two defenders; midfield dyads, consisting in all dyads formed by two
midfielders; and offensive dyads, consisting in all dyads formed by two forwards or by a
forward and a midfielder. The dyads’ grouping by professional playing experience were
organised considering the less experienced player: low experience dyads, when at least one
player did not present previous professional experience; medium experience dyads, when both
players had at least between 1 and 4 years of professional experience; and higher experience
dyads, when both players had more than 4 years of professional experience.
Factorial ANOVAs were used to compare the effect of training (preseason period), field
positions and professional experience (independent variables) on teams’ tactical, physical and
physiological performances (dependent variables). Standardised effect sizes are presented as
partial eta squared (η2). Pairwise comparisons for field positions and players professional
experience factors were performed using Fisher’s Least Significant Difference and pairwise
effect sizes are presented as Cohen’s d with 95% confidence intervals.
Results
The factorial ANOVA results revealed a main effect of training in total distance per minute
(F(1, 176)= 44.2; p <0.001; η2 = 0.20), and distance per minute at low (F(1, 176)= 55.2; p <0.001;
η2 = 0.24) and moderate intensities (F(1, 176)= 26.2; p <0.001; η2 = 0.13). This main effect was
also identified for longitudinal movement synchronisation (F(1, 348)= 15.6; p <0.001; η2 =
0.04), and longitudinal movement synchronisation at low (F(1, 348)= 11.3; p =0.001; η2 = 0.03),
moderate (F(1, 348)= 13.7; p <0.001; η2 = 0.04), high (F(1, 348)= 5.0; p =0.026; η2 = 0.02) and
very high intensities (F(1, 348)= 17.6; p <0.001; η2 = 0.05). The results were similar for lateral
movement synchronisation (F(1, 348)= 5.7; p =0.018; η2 = 0.02), and lateral movement
synchronisation at low (F(1, 348)= 4.2; p =0.041; η2 = 0.01) and moderate intensities (F(1, 348)=
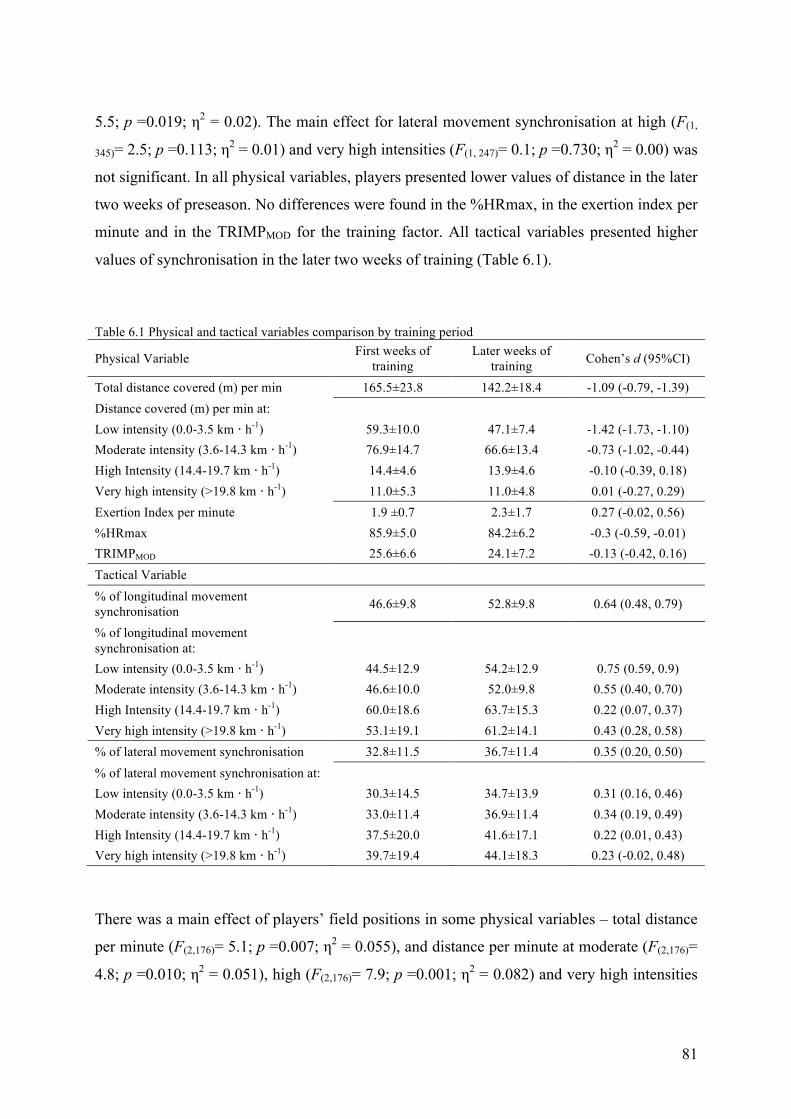
81
5.5; p =0.019; η2 = 0.02). The main effect for lateral movement synchronisation at high (F(1,
345)= 2.5; p =0.113; η2 = 0.01) and very high intensities (F(1, 247)= 0.1; p =0.730; η2 = 0.00) was
not significant. In all physical variables, players presented lower values of distance in the later
two weeks of preseason. No differences were found in the %HRmax, in the exertion index per
minute and in the TRIMPMOD for the training factor. All tactical variables presented higher
values of synchronisation in the later two weeks of training (Table 6.1).
Table 6.1 Physical and tactical variables comparison by training period
Physical Variable First weeks of training
Later weeks of training Cohen’s d (95%CI)
Total distance covered (m) per min 165.5±23.8 142.2±18.4 -1.09 (-0.79, -1.39) Distance covered (m) per min at: Low intensity (0.0-3.5 km · h-1) 59.3±10.0 47.1±7.4 -1.42 (-1.73, -1.10) Moderate intensity (3.6-14.3 km · h-1) 76.9±14.7 66.6±13.4 -0.73 (-1.02, -0.44) High Intensity (14.4-19.7 km · h-1) 14.4±4.6 13.9±4.6 -0.10 (-0.39, 0.18) Very high intensity (>19.8 km · h-1) 11.0±5.3 11.0±4.8 0.01 (-0.27, 0.29) Exertion Index per minute 1.9 ±0.7 2.3±1.7 0.27 (-0.02, 0.56) %HRmax 85.9±5.0 84.2±6.2 -0.3 (-0.59, -0.01) TRIMPMOD 25.6±6.6 24.1±7.2 -0.13 (-0.42, 0.16) Tactical Variable % of longitudinal movement synchronisation 46.6±9.8 52.8±9.8 0.64 (0.48, 0.79)
% of longitudinal movement synchronisation at:
Low intensity (0.0-3.5 km · h-1) 44.5±12.9 54.2±12.9 0.75 (0.59, 0.9) Moderate intensity (3.6-14.3 km · h-1) 46.6±10.0 52.0±9.8 0.55 (0.40, 0.70) High Intensity (14.4-19.7 km · h-1) 60.0±18.6 63.7±15.3 0.22 (0.07, 0.37) Very high intensity (>19.8 km · h-1) 53.1±19.1 61.2±14.1 0.43 (0.28, 0.58) % of lateral movement synchronisation 32.8±11.5 36.7±11.4 0.35 (0.20, 0.50) % of lateral movement synchronisation at: Low intensity (0.0-3.5 km · h-1) 30.3±14.5 34.7±13.9 0.31 (0.16, 0.46) Moderate intensity (3.6-14.3 km · h-1) 33.0±11.4 36.9±11.4 0.34 (0.19, 0.49) High Intensity (14.4-19.7 km · h-1) 37.5±20.0 41.6±17.1 0.22 (0.01, 0.43) Very high intensity (>19.8 km · h-1) 39.7±19.4 44.1±18.3 0.23 (-0.02, 0.48)
There was a main effect of players’ field positions in some physical variables – total distance
per minute (F(2,176)= 5.1; p =0.007; η2 = 0.055), and distance per minute at moderate (F(2,176)=
4.8; p =0.010; η2 = 0.051), high (F(2,176)= 7.9; p =0.001; η2 = 0.082) and very high intensities
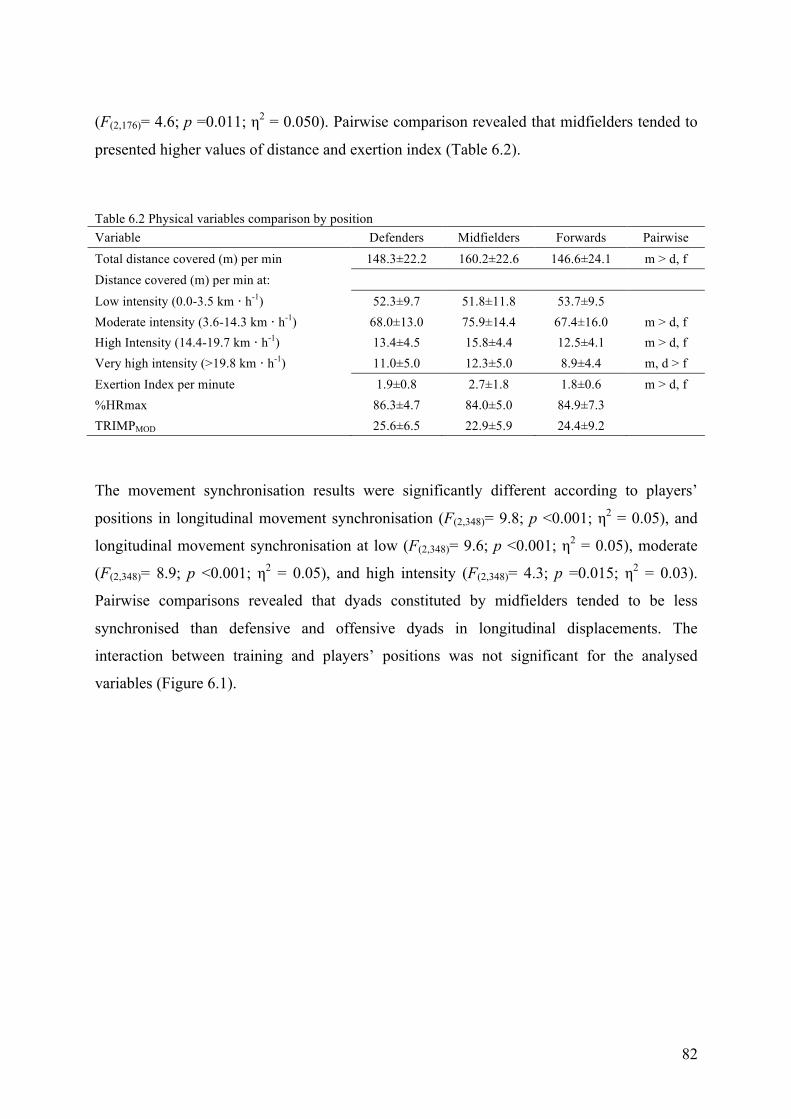
82
(F(2,176)= 4.6; p =0.011; η2 = 0.050). Pairwise comparison revealed that midfielders tended to
presented higher values of distance and exertion index (Table 6.2).
Table 6.2 Physical variables comparison by position Variable Defenders Midfielders Forwards Pairwise Total distance covered (m) per min 148.3±22.2 160.2±22.6 146.6±24.1 m > d, f Distance covered (m) per min at: Low intensity (0.0-3.5 km · h-1) 52.3±9.7 51.8±11.8 53.7±9.5 Moderate intensity (3.6-14.3 km · h-1) 68.0±13.0 75.9±14.4 67.4±16.0 m > d, f High Intensity (14.4-19.7 km · h-1) 13.4±4.5 15.8±4.4 12.5±4.1 m > d, f Very high intensity (>19.8 km · h-1) 11.0±5.0 12.3±5.0 8.9±4.4 m, d > f Exertion Index per minute 1.9±0.8 2.7±1.8 1.8±0.6 m > d, f %HRmax 86.3±4.7 84.0±5.0 84.9±7.3 TRIMPMOD 25.6±6.5 22.9±5.9 24.4±9.2 The movement synchronisation results were significantly different according to players’
positions in longitudinal movement synchronisation (F(2,348)= 9.8; p <0.001; η2 = 0.05), and
longitudinal movement synchronisation at low (F(2,348)= 9.6; p <0.001; η2 = 0.05), moderate
(F(2,348)= 8.9; p <0.001; η2 = 0.05), and high intensity (F(2,348)= 4.3; p =0.015; η2 = 0.03).
Pairwise comparisons revealed that dyads constituted by midfielders tended to be less
synchronised than defensive and offensive dyads in longitudinal displacements. The
interaction between training and players’ positions was not significant for the analysed
variables (Figure 6.1).
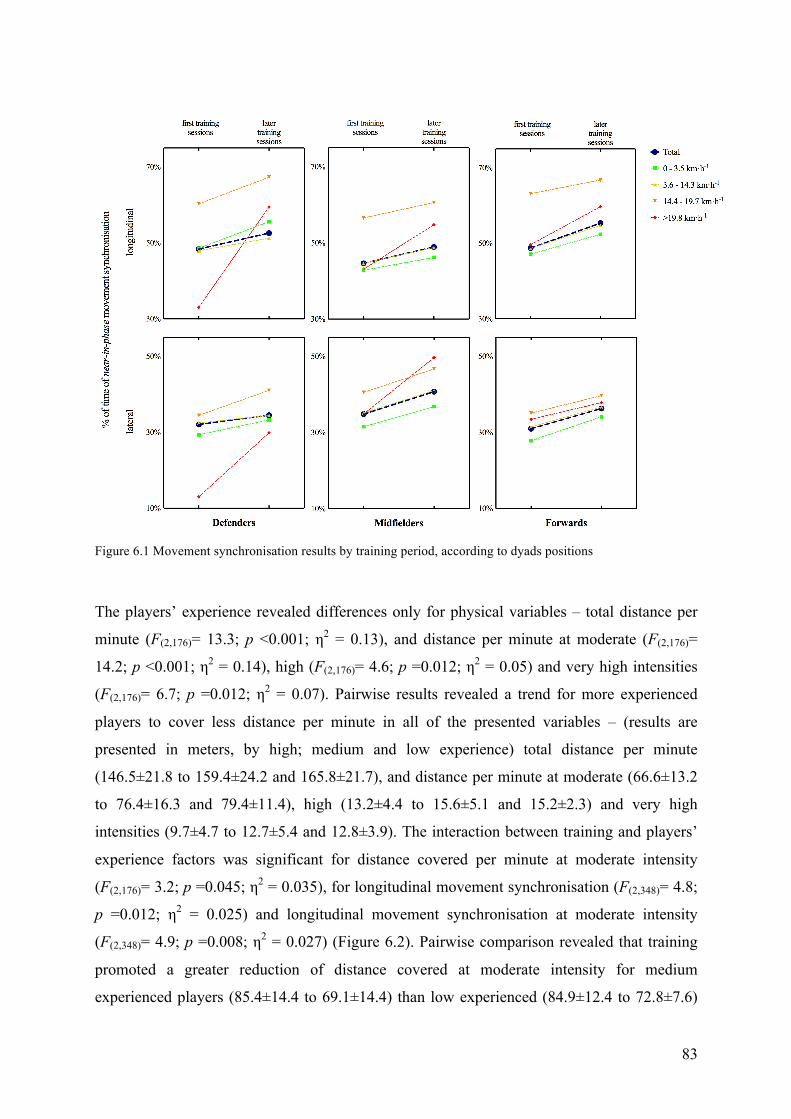
83
Figure 6.1 Movement synchronisation results by training period, according to dyads positions
The players’ experience revealed differences only for physical variables – total distance per
minute (F(2,176)= 13.3; p <0.001; η2 = 0.13), and distance per minute at moderate (F(2,176)=
14.2; p <0.001; η2 = 0.14), high (F(2,176)= 4.6; p =0.012; η2 = 0.05) and very high intensities
(F(2,176)= 6.7; p =0.012; η2 = 0.07). Pairwise results revealed a trend for more experienced
players to cover less distance per minute in all of the presented variables – (results are
presented in meters, by high; medium and low experience) total distance per minute
(146.5±21.8 to 159.4±24.2 and 165.8±21.7), and distance per minute at moderate (66.6±13.2
to 76.4±16.3 and 79.4±11.4), high (13.2±4.4 to 15.6±5.1 and 15.2±2.3) and very high
intensities (9.7±4.7 to 12.7±5.4 and 12.8±3.9). The interaction between training and players’
experience factors was significant for distance covered per minute at moderate intensity
(F(2,176)= 3.2; p =0.045; η2 = 0.035), for longitudinal movement synchronisation (F(2,348)= 4.8;
p =0.012; η2 = 0.025) and longitudinal movement synchronisation at moderate intensity
(F(2,348)= 4.9; p =0.008; η2 = 0.027) (Figure 6.2). Pairwise comparison revealed that training
promoted a greater reduction of distance covered at moderate intensity for medium
experienced players (85.4±14.4 to 69.1±14.4) than low experienced (84.9±12.4 to 72.8±7.6)
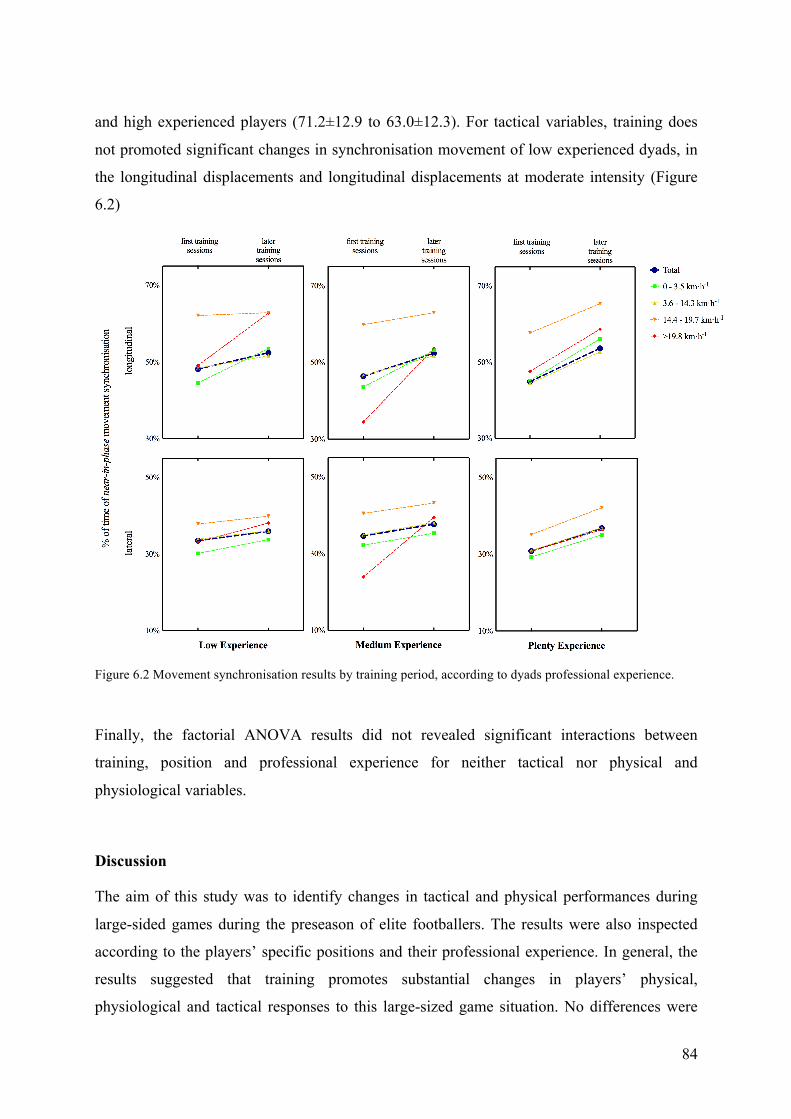
84
and high experienced players (71.2±12.9 to 63.0±12.3). For tactical variables, training does
not promoted significant changes in synchronisation movement of low experienced dyads, in
the longitudinal displacements and longitudinal displacements at moderate intensity (Figure
6.2)
Figure 6.2 Movement synchronisation results by training period, according to dyads professional experience.
Finally, the factorial ANOVA results did not revealed significant interactions between
training, position and professional experience for neither tactical nor physical and
physiological variables.
Discussion
The aim of this study was to identify changes in tactical and physical performances during
large-sided games during the preseason of elite footballers. The results were also inspected
according to the players’ specific positions and their professional experience. In general, the
results suggested that training promotes substantial changes in players’ physical,
physiological and tactical responses to this large-sized game situation. No differences were
85
identified for %HRmax, TRIMPMOD and exertion index results between preseason training
periods. Yet, the players covered less distance in the later training sessions, particularly at low
and moderate intensities. Based in these results, it seems the physical demands of the large-
sized game condition were similar between the two periods. However, all of the evaluated
tactical variables presented higher results of synchronisation in the later preseason period
(Table 6.1). Moreover, this improvement was observed in dyads constituted by players of
different positions (Figure 6.2) and expertise levels (Figure 6.3). In this sense, the players’
responses during the game situation depicted their tactical development, as a consequence of
the systematically training occurred during the first four weeks of the preseason. Similar
results were identified in amateur players, enrolled in a 13-week of football lessons assessed
in a GK+5vs.5+GK game situation (Sampaio & Maçãs, 2012). In this study, players’
interpersonal relations measured using the relative phase, changed from no particular mode of
coordination in the pre-test, to exhibiting patterns of in-phase and anti-phase coordination in
the post-test. This adaptation was attributed to higher levels of expertise, resulting from an
increased awareness of football tactical principles exhibited during the SSG situation. It
seems that current results show similar training functional adaptations in professional players,
thus providing complementary information for coaches to control players’ performances. The
ecological approach to this study, by measuring players response during their regular
preseason sessions, poses a limitation to this study as it lacks to control all of the training
promoted during this period. However it is important to consider that this works was based in
professional players and coaches, working specifically for performance objectives.
Curiously, the players’ physical adaptations identified during the later training period, was to
cover less distance during the game situation, particularly at lower intensities. Given that
players covered the same distance at high and very high intensities in both preseason training
periods, we may consider that the higher amount of distance covered in the first training
period was not an exercise demand response, but rather players correcting their tactical
positioning relative to their teammates. Interestingly, the more experienced players from our
study also presented a lower amount of distance covered than their less experienced
teammates. Other studies have also revealed lower amounts of distance covered by higher-
level teams during match play, compared to lower level counterparts (Bradley et al., 2013).
Given these results, it seems that running more is not a performance indicator per se in either
formal matches or other game situations. In fact, higher levels of expertise seem to eliminate
the need for constant positioning corrections, as expert players are more tuned to the
86
information presented in the exercise or match situation (Travassos et al., 2013a). These
considerations seem to highlight the importance of considering players’ interactions as a
measure of sports performance (Travassos, Davids, Araújo, & Esteves, 2013b). The tactical
results presented in our study help accentuate this fact, by showing that greater levels of
players’ synchronisation may be obtained with less amounts of displacements.
Despite the aforementioned, we are not suggesting that physical fitness is a less important
factor to football performance. The exertion index revealed no differences between training
periods, it seems that the heart rate results are a consequence of higher level of physical
fitness, which is a common and expected players’ adaptation during the pre season (Castagna
et al., 2013). The players’ %HRmax responses to the game condition is in line with previous
studies using the same number of players and similar pitch dimensions (Hill-Haas et al.,
2011). Comparing the game results to formal match demands in the pre season (Folgado et
al., 2014a), we can consider that players tend to cover more distance per minute at low and
very high intensities during the training situation. Inversely, during match situations, the
players cover more distance per minute at moderate and high intensities. The pitch size and
duration of the large-sized game condition may be accounted for these differences, as players
are confronted with less individual space than in a formal match situations (due to a
considerable reduction of the pitch width). This adaptation may promote less longitudinal
displacements, which is considered the predominant direction of play (Frencken, Lemmink,
Delleman, & Visscher, 2011). Similarly, differences between training and match conditions
(Folgado et al., 2014a) are also present for tactical variables, with players spending less
percentage of time synchronised during the game conditions. Again, the reduction of the pitch
width may explain this decrease in synchronisation, since previous research suggests that
players’ are more likely to coordinate their movements in this direction (Duarte et al., 2013;
Frencken, Poel, Visscher, & Lemmink, 2012).
Comparing the game responses by players’ positions revealed that midfielders were the
players who covered more distance per minute during the exercise. Also, midfielders cover
more distance at moderate, high and very high intensities. These results replicate both match
demands (Bradley et al., 2013; Carling, Le Gall, & Dupont, 2012; Vigne et al., 2013) and
small-sided games’ demands per position (Dellal et al., 2012), observed in previous studies.
The midfielders are commonly considered players with a wider range of motion in the pitch,
providing defensive and offensive support to other teammates, characteristics that elate their
87
physical demands. Curiously, tactical results seem to support this fact, as midfielders
presented the lowest longitudinal synchronisation result, and the highest lateral
synchronisation result per position. It seems that different positions exhibited distinctive
synchronisation patters during the match (Folgado et al., 2014a), but also during the large-
sided game situations. In this way, there is the need to explore different SG conditions to
understand their effects on players’ movement synchronisation.
Again, physical results according to players experience revealed that less experienced players
tend to cover more distance during the exercise. As stated earlier, these results seem to be
related to the players need to adjust more often their positioning. However, tactical variables
also revealed that low experienced dyads did not presented the same overall synchronisation
gains, as the experienced dyads. Also, higher experienced dyads seem to benefit more from
training, as their synchronisation increased from the first to the later training sessions. It
seems that the level of expertise facilitated players’ coordination development, rather than
provide a higher level of synchronisation from the start (Araújo & Davids, 2011). In this
sense, experienced players without a meaningful training setting might not benefit from the
same development. On the other hand, a less experienced player that shows greater tactical
improvement might be reflecting more their individual talent.
Conclusion
In conclusion, monitoring players’ development during the pre season using large-sided
games seems to provide very relevant information for coaches. More particularly the use of
tactical variables, interrelated with the more common physical and physiological variables,
strengthens the information retrieved from players’ responses to the training process. In fact,
players’ evolution seems to be more pronounced in their movement synchronisation rather
that in their physical responses to the drills, which may be interpreted as a better tactical
performance. Finally, different pitch positions and different experience players respond
distinctly during the drill.
88
References
Aguiar, M., Botelho, G., Lago, C., Maçãs, V., & Sampaio, J. (2012). A review on the effects of soccer small-sided games. J Hum Kinet, 33(-1), 103-113. doi: 10.2478/v10078-012-0049-x
Araújo, D., & Davids, K. (2011). What Exactly is Acquired During Skill Acquisition? J Consciousness Stud, 18(3-4), 7-23.
Araújo, D., Travassos, B., & Vilar, L. (2010). Tactical skills are not verbal skills: a comment on Kannekens and colleagues. Percept Mot Skills, 110(3 Pt 2), 1086-1088. doi: 10.2466/05.07.25.28.PMS.110.C.1086-1088
Bloomfield, J., Polman, R., O'Donoghue, P., & McNaughton, L. (2007). Effective speed and agility conditioning methodology for random intermittent dynamic type sports. J Strength Cond Res, 21(4), 1093-1100. doi: 10.1519/R-20015.1
Bradley, P. S., Carling, C., Gomez Diaz, A., Hood, P., Barnes, C., Ade, J., . . . Mohr, M. (2013). Match performance and physical capacity of players in the top three competitive standards of English professional soccer. Hum Mov Sci, 32(4), 808-821. doi: 10.1016/j.humov.2013.06.002
Caldwell, B. P., & Peters, D. M. (2009). Seasonal variation in physiological fitness of a semiprofessional soccer team. J Strength Cond Res, 23(5), 1370-1377. doi: 10.1519/JSC.0b013e3181a4e82f
Carling, C. (2013). Interpreting physical performance in professional soccer match-play: should we be more pragmatic in our approach? Sports Med, 43(8), 655-663. doi: 10.1007/s40279-013-0055-8
Carling, C., Le Gall, F., & Dupont, G. (2012). Analysis of repeated high-intensity running performance in professional soccer. J Sports Sci, 30(4), 325-336. doi: 10.1080/02640414.2011.652655
Castagna, C., Impellizzeri, F. M., Chaouachi, A., & Manzi, V. (2013). Preseason variations in aerobic fitness and performance in elite-standard soccer players: a team study. J Strength Cond Res, 27(11), 2959-2965. doi: 10.1519/JSC.0b013e31828d61a8
Dellal, A., Owen, A., Wong, D. P., Krustrup, P., van Exsel, M., & Mallo, J. (2012). Technical and physical demands of small vs. large sided games in relation to playing position in elite soccer. Hum Mov Sci, 31(4), 957-969. doi: 10.1016/j.humov.2011.08.013
Di Salvo, V., Baron, R., Tschan, H., Calderon Montero, F. J., Bachl, N., & Pigozzi, F. (2007). Performance characteristics according to playing position in elite soccer. Int J Sports Med, 28(3), 222-227. doi: 10.1055/s-2006-924294
Duarte, R., Araújo, D., Correia, V., Davids, K., Marques, P., & Richardson, M. J. (2013). Competing together: Assessing the dynamics of team-team and player-team synchrony in professional association football. Hum Mov Sci, 32(4), 555-566. doi: 10.1016/j.humov.2013.01.011
Folgado, H., Duarte, R., Fernandes, O., & Sampaio, J. (2014a). Competing with Lower Level Opponents Decreases Intra-Team Movement Synchronization and Time-Motion Demands during Pre-Season Soccer Matches. PLoS One, 9(5), e97145. doi: 10.1371/journal.pone.0097145
89
Folgado, H., Lemmink, K. A., Frencken, W., & Sampaio, J. (2014b). Length, width and centroid distance as measures of teams tactical performance in youth football. Eur J Sport Sci, 14 Suppl 1, S487-492. doi: 10.1080/17461391.2012.730060
Frencken, W., Lemmink, K., Delleman, N., & Visscher, C. (2011). Oscillations of centroid position and surface area of soccer teams in small-sided games. Eur J Sport Sci, 11(4), 215-223. doi: 10.1080/17461391.2010.499967
Frencken, W., Poel, H., Visscher, C., & Lemmink, K. (2012). Variability of inter-team distances associated with match events in elite-standard soccer. J Sports Sci, 30(12), 1207-1213. doi: 10.1080/02640414.2012.703783
Hill-Haas, S. V., Dawson, B., Impellizzeri, F. M., & Coutts, A. J. (2011). Physiology of small-sided games training in football: a systematic review. Sports Med, 41(3), 199-220. doi: 10.2165/11539740-000000000-00000
Jeong, T. S., Reilly, T., Morton, J., Bae, S. W., & Drust, B. (2011). Quantification of the physiological loading of one week of "pre-season" and one week of "in-season" training in professional soccer players. J Sports Sci, 29(11), 1161-1166. doi: 10.1080/02640414.2011.583671
Loturco, I., Ugrinowitsch, C., Tricoli, V., Pivetti, B., & Roschel, H. (2013). Different loading schemes in power training during the preseason promote similar performance improvements in Brazilian elite soccer players. J Strength Cond Res, 27(7), 1791-1797. doi: 10.1519/JSC.0b013e3182772da6
Mohr, M., Krustrup, P., & Bangsbo, J. (2003). Match performance of high-standard soccer players with special reference to development of fatigue. J Sports Sci, 21(7), 519-528. doi: 10.1080/0264041031000071182
Ostojic, S. (2004). Elite and Nonelite Soccer Players: Preseasonal Physical and Physiological Characteristics. Res Sports Med, 12(2), 143-150. doi: 10.1080/15438620490460495
Owen, A. L., Wong, D. P., Paul, D., & Dellal, A. (2014). Physical and technical comparisons between various-sided games within professional soccer. Int J Sports Med, 35(4), 286-292. doi: 10.1055/s-0033-1351333
Palacios, R. (2006). deg2utm. MATLAB Central File Exchange. Retrieved October 20 2012, 2011, from http://www.mathworks.com/matlabcentral/fileexchange/10915
Palut, Y., & Zanone, P. G. (2005). A dynamical analysis of tennis: concepts and data. J Sports Sci, 23(10), 1021-1032. doi: 10.1080/02640410400021682
Rampinini, E., Coutts, A. J., Castagna, C., Sassi, R., & Impellizzeri, F. M. (2007). Variation in top level soccer match performance. Int J Sports Med, 28(12), 1018-1024. doi: 10.1055/s-2007-965158
Sampaio, J., & Maçãs, V. (2012). Measuring tactical behaviour in football. Int J Sports Med, 33(5), 395-401. doi: 10.1055/s-0031-1301320
Sampaio, J. E., Lago, C., Gonçalves, B., Maçãs, V. M., & Leite, N. (2014). Effects of pacing, status and unbalance in time motion variables, heart rate and tactical behaviour when playing 5-a-side football small-sided games. J Sci Med Sport, 17(2), 229-233. doi: 10.1016/j.jsams.2013.04.005
90
Stagno, K. M., Thatcher, R., & van Someren, K. A. (2007). A modified TRIMP to quantify the in-season training load of team sport players. J Sports Sci, 25(6), 629-634. doi: 10.1080/02640410600811817
Stolen, T., Chamari, K., Castagna, C., & Wisloff, U. (2005). Physiology of soccer: an update. Sports Med, 35(6), 501-536.
Tessitore, A., Perroni, F., Cortis, C., Meeusen, R., Lupo, C., & Capranica, L. (2011). Coordination of soccer players during preseason training. J Strength Cond Res, 25(11), 3059-3069. doi: 10.1519/JSC.0b013e318212e3e3
Travassos, B., Araújo, D., Davids, K., O'Hara, K., Leitão, J., & Cortinhas, A. (2013a). Expertise effects on decision-making in sport are constrained by requisite response behaviours – A meta-analysis. Psychol Sport Exerc, 14(2), 211-219. doi: 10.1016/j.psychsport.2012.11.002
Travassos, B., Davids, K., Araújo, D., & Esteves, P. (2013b). Performance analysis in team sports: Advances from an Ecological Dynamics approach. Int J Perform Anal Sport(13), 83-95.
Vigne, G., Dellal, A., Gaudino, C., Chamari, K., Rogowski, I., Alloatti, G., . . . Hautier, C. (2013). Physical outcome in a successful Italian Serie A soccer team over three consecutive seasons. J Strength Cond Res, 27(5), 1400-1406. doi: 10.1519/JSC.0b013e3182679382
Wisbey, B., Montgomery, P. G., Pyne, D. B., & Rattray, B. (2010). Quantifying movement demands of AFL football using GPS tracking. J Sci Med Sport, 13(5), 531-536. doi: 10.1016/j.jsams.2009.09.002
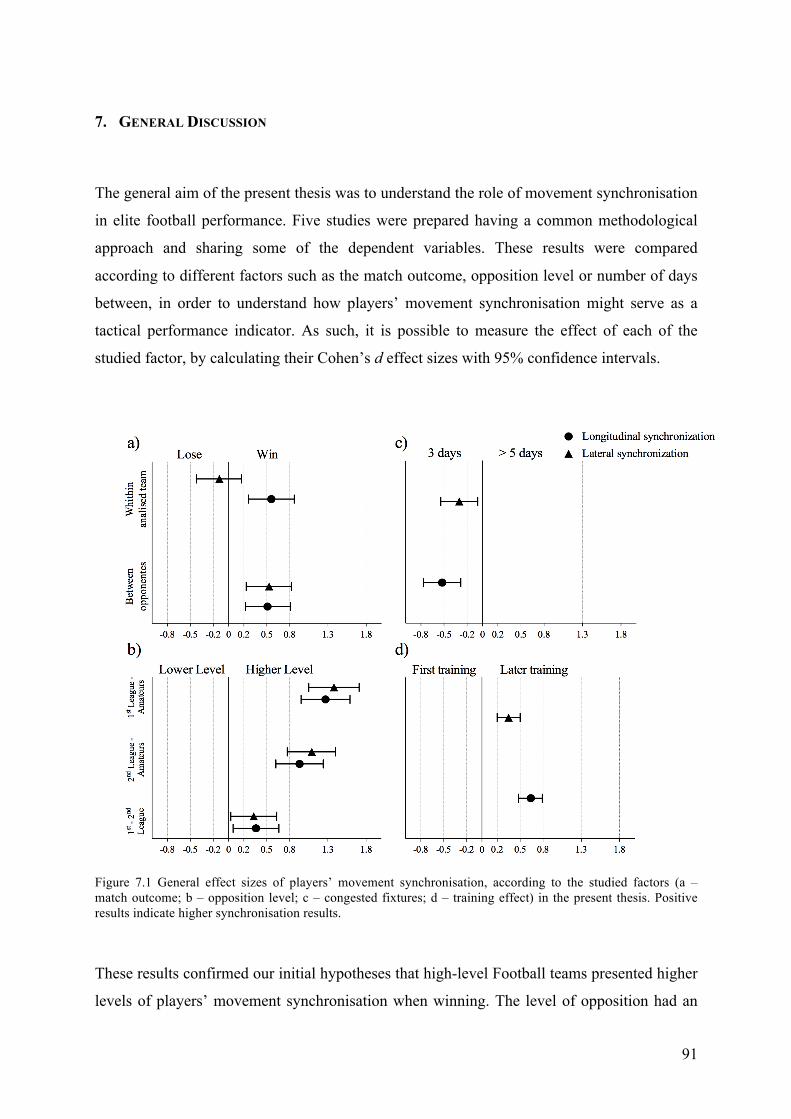
91
7. GENERAL DISCUSSION
The general aim of the present thesis was to understand the role of movement synchronisation
in elite football performance. Five studies were prepared having a common methodological
approach and sharing some of the dependent variables. These results were compared
according to different factors such as the match outcome, opposition level or number of days
between, in order to understand how players’ movement synchronisation might serve as a
tactical performance indicator. As such, it is possible to measure the effect of each of the
studied factor, by calculating their Cohen’s d effect sizes with 95% confidence intervals.
Figure 7.1 General effect sizes of players’ movement synchronisation, according to the studied factors (a – match outcome; b – opposition level; c – congested fixtures; d – training effect) in the present thesis. Positive results indicate higher synchronisation results.
These results confirmed our initial hypotheses that high-level Football teams presented higher
levels of players’ movement synchronisation when winning. The level of opposition had an
92
effect on players’ movement synchronisation, presenting higher results when facing higher-
level opponents. The congested fixtures impaired players’ movement synchronisation, when
compared to a non-congested fixture. And finally, training during the preseason allowed the
increase of players’ movement synchronisation. Added all up, these global outcomes support
the use of players’ movement synchronisation as a performance indicator in football matches,
reflecting the interaction process established between players’, previously identified as
tactical performance.
Overview
On the second chapter we intended to test the Global Positioning Systems (GPS) devices as
suitable tools for collecting interpersonal distances and coordination trends between players.
Despite the used GPS model were not originally prepared for this type of players’ relative
positioning measurements, our findings revealed that with an adequate methodology approach
it is possible do diminish the amount of error and improve the devices accuracy in this
analysis. Also, it was demonstrated that it is possible to measure players’ coordination trends,
by calculating their relative phase based in GPS positional data. Given the nature of the
relative phase calculation, based in the direction and magnitude of the signal (or in our case,
the time series evolution), it seems that the level of accuracy is somewhat independent of the
relative phase results. As such, collecting players positioning using GPS devices was
considered to be an appropriate method for using in our research.
On chapter 3 we intended to establish a link between performance outcomes, identified by the
match ending in a win or a loss, to players’ movement synchronisation results. This study
demonstrated that when comparing movement synchronisation between opposing teams, the
most synchronised tends to be more successful and win the game (Figure 7.1). However,
based in a dynamical analysis of the synchronisation difference, a higher amount of
synchronisation was not always related to goal scoring situations. Given that our following
works would focus on the intra-team level of synchronisation, the same team was compared
within several different match outcomes. Following the previous results, in this level of
analysis there is a similar tendency for the team to be more synchronised in the matches
ending in a win than those ending a loss. The findings in this chapter highlighted that
presenting a high degree of synchronisation is related to a higher level of football
performance, establishing this variable as a suitable tactical performance indicator.
93
Based in the previous results, the following chapters addressed different factors that might
impair or promote synchronisation results. On the fourth chapter our main goal was to
compare players’ movement synchronisation results during pre season matches, opposing
different levels of opponents. Our results showed that while playing against stronger
opponents, the analysed team tended to be more synchronised (Figure 7.1). As the level of
difficulty faced during the match increased, players’ were more synchronised in order to deal
with the match demands. In this study we also started to relate tactical variables, based in
players’ movement synchronisation, and physical variables, based in players’ time motion
results. These variables helped to understand that the movement synchronisation results
varied according to the dyad displacement intensity. Again, playing against higher-level
opposition demanded greater synchronisation results at the higher displacement intensities.
Moreover, in this study we also used dyads’ synchronisation results to categorise different
groups of players within the team. This approach resulted in a novel method of characterising
teams functional relations during the match, revealing how strongly players’ behaviour
depends on the behaviour of their teammates. These findings highlighted once again the
existing relation between synchronisation and performance, while also supporting the use of
this methodology for characterising teams’ functional organisation.
On chapter 5 we used the measurement of players’ movement synchronisation to address the
effects from the number of matches played during a week. Though existing studies were not
able to capture performance differences between congested and non-congested fixtures by
measuring players’ physical responses, our approach depicted tactical performance
impairments, measured by a decrease in players’ movement synchronisation (Figure 7.1). The
results from this study reinforced the importance of consider tactical variables, based in the
measurement of players’ dynamical interaction, as performance indicators used concurrently
to physical and technical variables. Our physical results also supported this fact, as no
differences were detected in distances covered between congested and non-congested fixtures.
Finally, players’ movement synchronisation per displacement intensity revealed that the
differences of synchronisation between fixtures distribution happen at low intensities of
displacement. This result seems to indicate that players detune their attention during low
intensity periods of the match played during congested period. Based in this results we can
suggest that a smaller recovery time between matches does promote coordination changes in
players’ collective behaviour during the match.
94
Finally, in chapter 6 we addressed the training effect on players’ movement synchronisation
results, by measuring the tactical and physical performance of a team during the first 4 weeks
of the pre-season. Results in this study revealed that players’ synchronisation change with
training, as the their tactical performance during a GK+8vs.8+GK large-sided game tended to
increase as the training progressed. In this study we also compared synchronisation results
according to players’ positions and level of expertise. Different positions presented different
synchronisation trends, related to their in-game tasks, with midfielders exhibiting a
performance profile based in more distance covered and lower levels of longitudinal
synchronisation. Results according to players’ expertise level also revealed that more expert
players’ tend to run less during the large-sided game, but presented higher levels of
synchronisation development from the first to the later training sessions. This study showed
that during the pre-season, identified as a critical moment for teams’ preparation, it is possible
to control players’ tactical evolution, analogously to the control of physical and physiological
variables.
Theoretical and Methodological considerations
The studies presented in the chapters 3 to 6 were based in the conceptual understanding of
football as a dynamical system (McGarry, Anderson, Wallace, Hughes, & Franks, 2002). This
framework considers that the emergent behaviour exhibited by the elements compromising in
the system is dependent on the continuous interaction between themselves and their
environment (Davids, Araújo, & Shuttleworth, 2005; Davids, Araújo, Shuttleworth, & Button,
2003). Several previous studies have supported team sports as dynamical systems and the
current thesis reinforces this idea. Players’ behaviour, measured by their dyadic movement
synchronisation, revealed different performances according to several contextual constraints,
such as the opponents’ level, the number of days between matches or even the amount of
training players had been enduring. But beyond supporting this framework, this doctoral
thesis aimed to establish a connection between players’ movement synchronisation results and
their performance level. Some existing work supported this notion, with higher results of
synchronised behaviour having been measured during higher levels of performance in several
domains, including football (Bode, Faria, Franks, Krause, & Wood, 2010; Sampaio & Maçãs,
2012; Schmidt, Fitzpatrick, Caron, & Mergeche, 2011). The study presented in chapter 3
revealed that players’ exhibited a more synchronised behaviour when their teams won the
95
match, which allows suggesting this relation. Also, the study presented in chapter 4, though
not directly associated with the match outcome, reinforces this relation, as a more
synchronised behaviour was a characteristic the analysed team presented when facing higher-
level opponents. More studies using these variables are needed.
It is important to consider that in every study presented in this doctoral thesis, the
synchronisation assessment was performed during the whole match or training situation, and
not only in specific situations of the game. This positions our approach in different level of
analysis than most studies in this field of research. A common topic for studying team sports
as a dynamical system is the identification of key-events that shift the coordinative state of the
team (Davids et al., 2005). For instance, the identification of the transition from when the
defender is closest to the target to when the attacker is able to pass the defender, becoming
closest to the target has been approached in several sports (Passos, Araújo, & Davids, 2013).
These studied events are normally associated with goal scoring situations. However, in
football, a “team must coordinate its actions to recapture, conserve and move the ball so as to
bring it within the scoring zone and to score a goal” (Gréhaigne, Bouthier, & David, 1997).
Also, football matches tends to present a rather low rate of shots per possession (Hughes &
Franks, 2005). As such, it seems important to consider not just specific moments of
destabilisation during the game, but also the moments that precede and support those
situations. The measurement of players’ synchronisation intends to focus in these moments,
quantifying players’ functional organisation during the match (Duarte, Araújo, Correia, &
Davids, 2012).
Another conceptual issue approached during this doctoral thesis is the need for a new
approach on the interpretation of players’ physical performance during the match (Carling,
2013). In the study presented in chapter 5, our results suggest that players’ physical
performance during congested fixtures is not impaired by a lower recovery time between
matches, in accordance to several other studies (Carling, Le Gall, & Dupont, 2012; Dellal,
Lago-Penas, Rey, Chamari, & Orhant, 2013). The physical demands imposed by the match
play seem to relatively stable, independently on players physical level due to small recovery
periods. This poses a challenge for coaches and sport scientists. The differentiation of
different levels of performance between players, teams or leagues will not be achieved by
taking into account only physical indicators (Bradley et al., 2013). As such, there is the need
for interrelated indicators, which consider not only players’ physical level, but also their
96
tactical performance level, measured during the match play. The measurement of players’
movement synchronisation poses as a strong candidate for this assessment, as it is able to
differentiate players’ performance under distinct contexts.
In terms of methodological procedures, both used systems for players’ positioning collection
proven to be suitable for the analysis of players’ movement synchronisation. Tracking
systems based in semi-automatic video collection are the most common systems used in
official matches, as they do not require players to wear any device. Also, they present a high
degree of accuracy (Di Salvo, Collins, McNeill, & Cardinale, 2006), somewhat contrasting to
the GPS systems. However, in the study presented in chapter 2 of this thesis, we presented a
methodological procedure that allowed reducing the error measured between devices, and
proven the usability of these devices for the study of coordination trends. This allowed for
using GPS devices both in training and match situations. The general results present in this
thesis seem to corroborate the use of both systems, as they seem comparable in terms of
magnitude and effect.
Practical applications
Based in our results, the methodology used in this thesis for measuring players’ movement
synchronisation presents several potential practical applications. First is the use of these
measures as a mean to control teams’ and players’ performance. As our general results
suggested that players’ movement synchronisation is affected by the training, tending to
improve during the preseason, coaches might use this method to assess players’ development
during this season period. Also, during the competitive season, coaches might use this method
the control of teams’ performance throughout the matches. As observed in chapters 3, 4 and
5, teams tended to exhibit lower movement synchronisation results when losing, though these
results are also dependent on the match context, particularly on the stimulus posed by the
level of their adversary and the number of days between matches. Based in this information, it
may be assumed that a high level team, having played a high demanding midweek match
followed by a weekend fixture against a lower raking opponent, will present lower levels of
synchronisation in this last competition. According to our results, this decrease will promote
the possibility for a worse result in the weekend fixture. By controlling their teams’
movement synchronisation, as a tactical performance measure, coaches could predict these
variations and adopt strategies accordantly.
97
A second practical application is the support for player selection. In chapter 4 and 5 we
presented a functional classification method of the players relations within the team, based in
their dyadic movement synchronisation. Both these studies revealed that central defenders and
the most defensive midfielder tended to present between them the highest levels of
synchronisation of the whole team. In both studies we identified this attribute as a more stable
group of players that serves as a foundation for that other more offensive role players
attempted to break the opposing team organisation. Based in this consideration, a high level
of synchronisation is an essential characteristic of the players within that particular group. As
such, the evaluation of these variables provides information about which pair of central
defenders presents the highest level of longitudinal synchronisation, potentially helping
coaches to build their team from the available players. Also, as observed in chapter 6,
different levels of expertise present distinctive adaptations on their movement synchronisation
development. As such, coaches and practitioners may also use this method in order to
discriminate potentially talented players, as it may be speculated that they present higher
levels of tactical performance.
The third practical application is the use of these methods for teams tactical recognition and
classification. The classification methods aforementioned, also seem to be somewhat specific
of each team and, probably, of their particular organisation and strategy. Despite the common
trait of higher synchronisation results between the central defenders, the two evaluated teams
in chapter 4 and 5 presented different synchronisation trends between similar in-field
positions. This idiosyncratic relation between players seems to be fairly stable during
different matches. In both studies, the interaction effect between the identified groups of
similar synchronisation level and each of the manipulated factors (opposition level or fixtures
distribution) was not statistically significant. As such, the classification methods presented
may serve as way to identify particular traits of each team, revealing the stronger and weaker
interdependence levels presented by different sub-groups of players.
Another possible practical application is the interrelation of the synchronisation results with
time-motion variables, measured from players’ match or training performance. As observed in
the chapters 4, 5 and 6, the movement synchronisation results vary according to dyads
displacement intensities. Higher levels of synchronisation evidenced at higher displacement
intensities seem to be related to more challenging contexts. Also, as observed throughout this
thesis, physical variables alone do not represent the whole demand imposed by the match.
98
Running more is not always running better. In this particular, the quantification of players’
movement synchronisation may help understanding the physical performance results, by
establishing a relational measure of players’ behaviour.
Finally, given the common generalisation of the use of GPS technology for controlling
players’ performance during the training, coaches and performance analysts might benefit
from the introduction these tactical variables within the proprietary software, provided by the
manufacturer. The study presented on chapter 2 revealed that with the adequate procedure, it
is possible to accurately measure players’ interpersonal dynamics using GPS technology. The
integration of these measures would simplify the calculation process, disseminate and
generalise the use of tactical performance indicators and consequently support more detailed
information about the football teams’ preparation process.
99
References
Bode, N. W., Faria, J. J., Franks, D. W., Krause, J., & Wood, A. J. (2010). How perceived threat increases synchronization in collectively moving animal groups. Proc Biol Sci, 277(1697), 3065-3070. doi: 10.1098/rspb.2010.0855
Bradley, P. S., Carling, C., Gomez Diaz, A., Hood, P., Barnes, C., Ade, J., . . . Mohr, M. (2013). Match performance and physical capacity of players in the top three competitive standards of English professional soccer. Hum Mov Sci, 32(4), 808-821. doi: 10.1016/j.humov.2013.06.002
Carling, C. (2013). Interpreting physical performance in professional soccer match-play: should we be more pragmatic in our approach? Sports Med, 43(8), 655-663. doi: 10.1007/s40279-013-0055-8
Carling, C., Le Gall, F., & Dupont, G. (2012). Are physical performance and injury risk in a professional soccer team in match-play affected over a prolonged period of fixture congestion? Int J Sports Med, 33(1), 36-42. doi: 10.1055/s-0031-1283190
Davids, K., Araújo, D., & Shuttleworth, R. (2005). Applications of Dynamical Systems Theory to Football. In J. Cabri, T. Reilly & D. Araújo (Eds.), Science and football V: The Proceedings of the Fifth World Congress on Science and Football (pp. 537-550). Abingdon: Routledge.
Davids, K., Araújo, D., Shuttleworth, R., & Button, C. (2003). Acquiring skill in sport: A constraints-led perspective. Int J Comp Sci Sport, 2(2), 31-39.
Dellal, A., Lago-Penas, C., Rey, E., Chamari, K., & Orhant, E. (2013). The effects of a congested fixture period on physical performance, technical activity and injury rate during matches in a professional soccer team. Br J Sports Med. doi: 10.1136/bjsports-2012-091290
Di Salvo, V., Collins, A., McNeill, B., & Cardinale, M. (2006). Validation of Prozone ®: A new video-based performance analysis system. Int J Perform Anal Spor, 6(1), 108-119.
Duarte, R., Araújo, D., Correia, V., & Davids, K. (2012). Sports teams as superorganisms: implications of sociobiological models of behaviour for research and practice in team sports performance analysis. Sports Med, 42(8), 633-642. doi: 10.2165/11632450-000000000-00000
Gréhaigne, J.-F., Bouthier, D., & David, B. (1997). Dynamic-system analysis of opponent relationships in collective actions in soccer. J Sports Sci, 15(2), 137-149. doi: 10.1080/026404197367416
Hughes, M., & Franks, I. (2005). Analysis of passing sequences, shots and goals in soccer. J Sports Sci, 23(5), 509-514. doi: 10.1080/02640410410001716779
McGarry, T., Anderson, D. I., Wallace, S. A., Hughes, M. D., & Franks, I. M. (2002). Sport competition as a dynamical self-organizing system. J Sports Sci, 20(10), 771-781. doi: 10.1080/026404102320675620
Passos, P., Araújo, D., & Davids, K. (2013). Self-organization processes in field-invasion team sports : implications for leadership. Sports Med, 43(1), 1-7. doi: 10.1007/s40279-012-0001-1

100
Sampaio, J., & Maçãs, V. (2012). Measuring tactical behaviour in football. Int J Sports Med, 33(5), 395-401. doi: 10.1055/s-0031-1301320
Schmidt, R. C., Fitzpatrick, P., Caron, R., & Mergeche, J. (2011). Understanding social motor coordination. Hum Mov Sci, 30(5), 834-845. doi: 10.1016/j.humov.2010.05.014