Humberto Salazar Amorim Varum Avaliação, reparação e reforço sísmico de edifícios existentes
546
Universidade de Aveiro 2003 Secção Autónoma de Engenharia Civil Humberto Salazar Amorim Varum Avaliação, reparação e reforço sísmico de edifícios existentes Seismic assessment, strengthening and repair of existing buildings
Transcript of Humberto Salazar Amorim Varum Avaliação, reparação e reforço sísmico de edifícios existentes

Universidade de Aveiro 2003
Secção Autónoma de Engenharia Civil
Humberto Salazar Amorim Varum
Avaliação, reparação e reforço sísmico de edifícios existentes Seismic assessment, strengthening and repair of existing buildings

Universidade de Aveiro 2003
Secção Autónoma de Engenharia Civil
Humberto Salazar Amorim Varum
Avaliação, reparação e reforço sísmico de edifícios existentes Seismic assessment, strengthening and repair of existing buildings
dissertação apresentada à Universidade de Aveiro para cumprimento dos requisitos necessários à obtenção do grau de Doutor em Engenharia Civil, realizada sob a orientação científica do Prof. Doutor Aníbal Costa, Professor Associado com Agregação da Faculdade de Engenharia da Universidade do Porto e do Prof. Doutor Paulo Vila Real, Professor Associado com Agregação da Universidade de Aveiro

o júri
presidente Profª. Doutora Maria Helena Vaz de Carvalho Nazaré Reitora da Universidade de Aveiro
vogais Prof. Doutor Aníbal Guimarães da Costa professor associado com agregação da Faculdade de Engenharia da Universidade do Porto
Prof. Doutor Paulo Jorge de Melo Matias Faria de Vila Real professor associado com agregação da Universidade de Aveiro
Doutor Artur Vieira Pinto chefe do sector de Construção e Engenharia Sísmica do Laboratório ELSA do Centro Comum de Investigação da Comissão Europeia, Ispra, Itália
Prof. Doutor Raimundo Moreno Delgado professor catedrático da Faculdade de Engenharia da Universidade do Porto
Prof. Doutor João José Rio Tinto de Azevedo professor catedrático do Instituto Superior Técnico da Universidade Técnica de Lisboa
Prof. Doutor José Claudino de Pinho Cardoso professor associado da Universidade de Aveiro
Prof. Doutor Paulo Barreto Cachim professor auxiliar da Universidade de Aveiro

acknowledgements
The present work has been developed at the Civil Engineering Department of Aveiro University and at the ELSA laboratory of the Joint Research Centre at Ispra, in Italy. I gratefully acknowledge the generous help of the following organisations and many individuals, for their generous support, which made this work possible: To Professor Aníbal Costa and Professor Paulo Vila Real for their invaluable supervision. To Professor Aníbal Costa I would like to express my gratitude for the encouragement over these years. Without his constructive advice on the contents, I would have never got to finish the thesis. To Dr. Artur Pinto for directing me towards such an interesting project, and for making my work at JRC so stimulating. He was largely responsible for the conception and success of this project. His contribution, comments and patient supervision are gratefully acknowledged. The financial support provided by the Portuguese Science and Technology Foundation (PRAXIS XXI BD/15875/98 grant) is gratefully acknowledged. Thanks go to Dr. Javier Molina, Dr. Rui Pinho, Professor Michael Griffith, Dr. Pierre Pegon, Dr. José Jara, Dr. António Arêde, Dr. João Guedes, Dr. Rui Fariaand Professor Raimundo Delgado for their friendship, supportive interest and constructive comments to my work. The contributions from European institutions and researchers involved in the ICONS TMR-Network research programme are also acknowledged. Special thanks are due to Dr. Eduardo Carvalho and Dr. Ema Coelho from LNEC. The successful preparation and execution of the complex testing campaign is a result of the exceptional joint effort of the ELSA laboratory staff and researchers. Their technical assistance, professionalism and welcoming environment are gratefully acknowledged. Particular thanks to Professor Michael Geradin, Mr. Guido Verzeletti, Ms. Jeanne-Paule Ambrosetti and Ms. Paola Schaack. I would like to address special thanks to all my undergraduate and master professors from the Engineering Faculty of University of Porto. Their example was always a precious positive reference to me. My work reflects what I have learned from them, from an academic, professional and human point of view. To my colleagues from the Civil Engineering Department at University of Aveiro, I express my thanks for their friendship, comments and suggestions. Particular thanks to Professor Claudino Cardoso, Professor Luís Magalhães, Mr. Celestino Quaresma, Nuno Lopes and Ms. Ana Maria. Thanks are due to Mr. Manuel Carvalho for his assistance in the final arrangement of the figures. To the great friends I have made while at the JRC, I am also very grateful for their genuine friendship. I am also eternally indebted to my sincere friends in Portugal, particularly to Paulo Fidalgo and Daniel Oliveira for their endless friendship, tolerance and encouragement. Lastly, I would also like express my sincere appreciation to my dear parents, brothers and my sweet fiancée Celeste Amorim, for their unfailing patience, support, encouragement, affection and love, that made this experience to happen. I wish to dedicate this thesis to them all, with appreciation for patiently enduring and sharing these years of preparation with me. This work is also dedicated to the memory of those who lost their lives and those that have been injured as a result of earthquakes.

resumo
Sismos recentemente ocorridos em todo o mundo têm demonstrado de forma dramática que a investigação na engenharia sísmica deve ser direccionada para a avaliação da vulnerabilidade das construções existentes, desprovidas de adequadas características resistentes. O seu reforço deve ser realizado, reduzindo a sua vulnerabilidade e consequentemente risco para níveis aceitáveis. O estudo e desenvolvimento de novas técnicas de reforço tem um papel principal no sentido de evitar a perda de vidas humanas e económicas. Os principais objectivos desta tese são: a avaliação experimental de edifícios existentes de betão armado, o desenvolvimento de modelos numéricos refinados capazes de reproduzir rigorosamente a sua resposta estrutural, o desenvolvimento de metodologias simplificadas para a análise não-linear dinâmica de estruturas irregulares, e o desenvolvimento de ferramentas numéricas para a optimização de reforço para este tipo de estruturas. São apresentadas as mais comuns causas de dano ou colapso de estruturas existentes, bem como as técnicas de reparação e reforço adequadas. Em muitas cidades do sul da Europa, os edifícios existentes, dimensionados e construídos até finais dos anos 70, sem considerar a acção sísmica, constituem um elevado risco para as populações. Dois pórticos de 4 pisos à escala real, representativos da prática de projecto e construção até finais dos anos 70 na maioria dos países do sul da Europa, foram dimensionados, construídos e testados para crescentes intensidades de acção. Os principais objectivos desta série de ensaios foram a avaliação da capacidade original destes edifícios, com e sem alvenaria, e ainda a validação experimental da eficiência de várias técnicas de reparação e reforço. Os ensaios realizados demonstraram que a vulnerabilidade destas construções, dimensionadas sem características sismo-resistentes, que constituem uma parte importante dos edifícios existentes na Europa, são uma fonte de alto risco para as populações. Foi ainda comprovado que soluções de reforço adequadamente seleccionadas, podem reduzir consideravelmente este risco para níveis aceitáveis de acordo com a actual filosofia dos códigos de dimensionamento e avaliação da segurança estrutural. Foram utilizados modelos numéricos refinados para o pórtico e para a alvenaria. Os modelos foram calibrados com os resultados dos ensaios à escala real. Especial atenção foi dedicada ao escorregamento das armaduras de aderência normal, dada a sua influência na resposta de estruturas existentes. Os modelos calibrados demonstraram ser adequados na determinação da resposta não-linear de estruturas existentes. Adicionalmente é proposta uma metodologia simplificada para a análise dinâmica não-linear de edifícios baseada no cálculo espectral multi-modal da resposta sísmica. Esta metodologia apresenta a possibilidade de análise de estruturas irregulares e constitui-se como uma ferramenta essencial para a optimização do reforço de edifícios existentes que se desenvolveu no âmbito da presente tese.

abstract
Recent major earthquakes around the world have evidenced that research in earthquake engineering must be directed to the assessment of vulnerability of existing constructions lacking appropriate seismic resisting characteristics. Their retrofit or replacement should be made in order to reduce vulnerability, and consequent risk, to currently accepted levels. The development of retrofitting techniques represents a key issue in order to avoid both human casualties and economic losses. The aims of this thesis are to experimentally study the behaviour of existing reinforced concrete buildings, to calibrate a refined numerical model in order to reproduce rigorously their structural behaviour, to develop a simplified methodology for non-linear dynamic analysis of irregular buildings, and to propose a methodology for optimum strengthening. As a background, a theoretical summary on the most common causes of damage and failure and on repair and strengthening techniques for existing reinforced concrete buildings is presented. Older buildings, designed and constructed until the late 1970's, without considering earthquake provisions, constitute a significant hazard in many cities of southern Europe. Two full-scale four-storey frame models, representative of the common practice of construction until the late 1970's in most southern European countries, were designed, constructed and tested pseudo-dynamically. This experimental study aimed at assessing the original capacity of existing structures, with and without infill masonry, and to compare performances of different retrofitting solutions. The tests have shown that the vulnerability of existing reinforced concrete frames designed without specific seismic resisting characteristics, which are an important part of the existing buildings in Europe, constitute a source of high risk for human life. Furthermore, it was demonstrated that advanced retrofitting methods, solutions and techniques substantially reduce that risk to levels currently considered in modern design. Refined finite element models for the frame and infill masonry were calibrated with the results of the full-scale tests. Special attention was devoted to bond-slip phenomenon, which is likely to influence the behaviour of existing reinforced concrete structures with round smooth reinforcing. The improved models were found capable to analyse existing reinforced concrete structures, reproducing accurately their non-linear response. Additionally, it is proposed a simplified methodology for non-linear dynamic analysis of buildings based on the multi-modal spectral seismic response. This methodology is a valuable tool to analyse irregular structures and constitutes an important tool for the optimum strengthening design of existing buildings, which was also developed in this thesis.
i
Keywords
• Assessment, strengthening and repair of structures
• Existing reinforced concrete buildings
• Structural deficiencies
• Seismic retrofitting
• Pseudo-dynamic earthquake testing
• Global refined non-linear numerical modelling and analysis
• Masonry infilled frames
• Bond-slip
• Performance-based earthquake engineering
• Simplified assessment methods
• Optimum strengthening

iii
List of Abbreviations
Here are catalogued the abbreviations used in this thesis, which can be pronounced as
whole words, abbreviations that do not form a word, as well as, codes which constituents
do not derive from words. Generally speaking the database entries are retrieved from
English language sources but the acronym itself does not necessarily need to be of English
origin. Their meaning are listed in the following:
2D two-dimensional
3D three-dimensional
AASHTO American Association of State Highway and Transportation Officials
ACI American Concrete Institute
AIJ Architectural Institute of Japan
AISC American Institute of Steel Construction
ADRS Acceleration-Displacement Response Spectra
ASCE American Society of Civil Engineers
ASR Assessment, Strengthening and Repair
ASTM American Society for Testing Materials
ATC Applied Technology Council
BF Bare Frame
BS Base-Shear
BS British Standards
CALTRANS California Department of Transportation (USA)
CBC alifornia Building Code
CEA Commissariat à l'Energie Atomique (France) - (French Atomic Energy Commission)
CEB Comité Euro-International du Béton (Euro-International Concrete Committee)
CEN European Committee for Standardization
CFRP Carbon Fibre Reinforced Polymers
CNS Council of the National Seismic System (USA)
CONLIN CONvex LINearization method
CPU Central Processing Unit
CSM Capacity Spectrum Method
CUREE California Universities for Research in Earthquake Engineering (USA)
DBD Displacement Based Design
DC Ductility Class
DCM Displacement Coefficient Method

Abbreviations
iv
DE Design Earthquake
DI Damage Index
DOF Degree-Of-Freedom
EASY Earthquake engineering slide information system
EC European Commission
EC2 Eurocode 2
EC6 Eurocode 6
EC8 Eurocode 8
ECEE European Conference on Earthquake Engineering
ECOEST European Consortium of Earthquake Shaking Tables (Access to LSF research project)
EDD Energy Dissipation Device
EDS Energy Dissipation System
EE Earthquake Engineering
EERC Earthquake Engineering Research Center (USA)
EERI Earthquake Engineering Research Institute (USA)
ELSA European Laboratory for Structural Assessment
EN Norme Européenne (European Standard)
ENV Prénorme Européenne (European Prestandard)
EQ Earthquake
EQGM Earthquake Ground Motion
ERA European Research Area
ESC European Seismological Commission
ESD European Strong-motion Database
FE Finite Element
FEM Finite Element Method
FEMA Federal Emergency Management Agency
FEUP Faculty of Engineering - University of Porto (Portugal)
FFT Fast Fourier Transform
FIB Fédération Internationale du Béton (International Federation for Structural Concrete)
FIP Fédération Internationale de la Précontrainte (International Federation for Prestressing)
FP Framework Program
FRP Fibre Reinforced Polymers
GECoRPA Portuguese Society for Conservation and Rehabilitation of the Architectural Heritage
GIS Geographic Information Systems
HCM Human Capital and Mobility programme of the European Commission
IABSE International Association for Bridge and Structural Engineering
IBC International Building Code
ICONS Innovative seismic design CONcepts for new and existing Structures (EC funded programme of research network)
ICT Information and Communication Technology
ID Inter-storey Drift

Abbreviations
v
IN Infilled frame
IPSC Institute for the Protection and the Security of the Citizen (JRC)
IRIS Incorporated Research Institutions for Seismology
ISIS Institute for Systems, Informatics and Safety (JRC)
ISPMNH International Society for the Prevention and Mitigation of Natural Hazards
IT Information Technology
JBC Japanese Building Code
JBDPA Japan Building Disaster Prevention Association
JMA Japanese Meteorological Agency
JRC Joint Research Centre
JSCE Japan Society of Civil Engineers
KB K-Bracing
KOERI Kandilli Observatory & Earthquake Research Institute (Turkey)
LNEC Laboratório Nacional de Engenharia Civil (Portugal)
LSF Large-Scale Facilities
MAE Mid-America Earthquake Center
max maximum
MCE Maximum Capable Earthquake
MCEER Multidisciplinary Center for Earthquake Engineering Research (USA)
MDOF Multiple-Degree-of-Freedom system
ME Maximum Earthquake
min minimum
MMA Method of Moving Asymptotes
NAHB National Association of Home Builders
NEHRP National Earthquake Hazard Reduction Program (USA)
NEIC National Earthquake Information Center
NISEE National Information Service for Earthquake Engineering - University of California, Berkeley (USA)
NIST National Institute of Standards and Technology (USA)
NSF National Science Foundation (USA)
NZ New Zealand
NZCS New Zealand Concrete Society
NZS New Zealand Standard Code of Practice for General Structural Design and Design Loading for Buildings
NZNSEE New Zealand National Society for Earthquake Engineering
OECD Organisation for Economic Co-operation and Development
OSHA Occupational Safety and Health Administration (USA)
PA Park and Ang Damage Index
PBD Performance Based Design
PBE Performance Based Engineering
PBEE Performance Based Earthquake Engineering

Abbreviations
vi
PBSD Performance Based Seismic Design
PBSE Performance Based Seismic Engineering
PC Personal Computer
PEER Pacific Earthquake Engineering Research Center (USA)
PGA Peak Ground Acceleration
PGV Peak Ground Velocity
PO Performance Objective (or Performance design Objective)
PP Performance Point
PREC8 Prenormative Research in support of Eurocode 8 project (preceded the ICONS project)
PSA Pseudo Acceleration Spectrum
PsD Pseudo-Dynamic
PSV Pseudo Velocity Spectrum
RC Reinforced Concrete
R&D Research and Development
REBAP Regulamento de Estruturas de Betão Armado e Pré-esforçado (Portuguese code for RC structures)
RILEM International Union of Laboratories and Experts in Construction Materials, Systems and Structures
RSA Regulamento de Segurança e Acções para estruturas de edifícios e pontes (Portuguese code for actions on structures)
SAFERR Safety Assessment For Earthquake Risk Reduction (European Research Training Network)
SC Infill strengthened frame ('Shotcrete')
SCP Sequential Convex Programming
SDOF Single-Degree-Of-Freedom system
SE Serviceability Earthquake
SEAOC Structural Engineers Association Of California
SI Système International d'unités (International System of Units)
SLP Sequential Linear Programming
SPES Sociedade Portuguesa de Engenharia Sísmica (Portuguese Society for Earthquake Engineering)
SR Selective Retrofitted frame
SRC Steel Reinforced Concrete
TD Top-Displacement
TMR Training and Mobility of Researchers
UBC Uniform Building Code
UK United Kingdom
URM Un-Reinforced Masonry
USA United States of America
USGS United States Geological Survey
WCEE World Conference on Earthquake Engineering
yrp Years Return Period
vii
TABLE OF CONTENTS
CHAPTER 1 – INTRODUCTION, MAIN OBJECTIVES AND PLAN OF THE
THESIS
1.1 – INTRODUCTION......................................................................................................................1
1.2 – MAIN OBJECTIVES OF THE THESIS .................................................................................10
1.3 – PLAN OF THE THESIS ..........................................................................................................11
CHAPTER 2 – SEISMIC VULNERABILITY AND REHABILITATION OF
EXISTING RC STRUCTURES
2.1 – INTRODUCTION....................................................................................................................15
2.2 – STRUCTURAL ASSESSMENT AND RETROFITTING......................................................16
2.2.1 – Structural assessment.....................................................................................................16
2.2.2 – Structural retrofitting .....................................................................................................18
2.2.3 – Seismic assessment and redesign criteria and codes: Overview ...................................19
2.3 – METHODOLOGIES FOR ASSESSMENT AND REDESIGN ..............................................22
2.3.1 – Performance-based design and assessment ...................................................................23
2.3.2 – Displacement coefficient method ..................................................................................25
2.3.3 – N2 method .....................................................................................................................25
2.3.4 – Capacity spectrum method ............................................................................................26
2.3.4.1 – Capacity curve ...............................................................................................27
2.3.4.2 – Demand spectrum ..........................................................................................27
2.3.4.3 – Performance point..........................................................................................28

Table of Contents
viii
2.3.4.4 – Performance objective .................................................................................. 28
2.3.4.5 – Procedure to calculate the performance point............................................... 29
2.3.4.6 – Conversion of the capacity curve to the capacity spectrum.......................... 30
2.3.5 – Equivalent damping ratio.............................................................................................. 31
2.4 – FIELD EVIDENCE: OBSERVED DAMAGE IN RC BUILDINGS AND
CASUALTIES DURING RECENT EARTHQUAKES .......................................................... 34
2.4.1 – The 24th March 2001 Geiyo earthquake, southwest Japan ........................................... 35
2.4.2 – The 20th February 2001 Nisqually earthquake, Seattle-Olympia, US .......................... 36
2.4.3 – The 7th September 1999 Athens earthquake, Greece.................................................... 37
2.4.4 – The 17th August 1999 Izmit earthquake, Kocaeli, Turkey............................................ 39
2.4.5 – The 25th January 1999 Armenia earthquake, Colombia ............................................... 43
2.4.6 – The 26th January 1995 Great Hanshin-Awaji earthquake, Kobe, Japan ....................... 45
2.4.7 – The 17th January 1994 Northridge earthquake, Los Angeles, US................................. 49
2.4.8 – Conclusion and discussion............................................................................................ 50
2.5 – TYPICAL CAUSES OF DAMAGE AND FAILURE OF EXISTING NON–
DUCTILE RC BUILDINGS .................................................................................................... 50
2.5.1 – Stirrups/hoops, confinement and ductility.................................................................... 52
2.5.2 – Bond, anchorage, lap-splices and bond splitting .......................................................... 53
2.5.3 – Inadequate shear capacity and failure........................................................................... 56
2.5.4 – Inadequate flexural capacity and failure....................................................................... 59
2.5.5 – Inadequate shear strength of the joints ......................................................................... 60
2.5.6 – Influence of the infill masonry on the seismic behaviour of frames............................. 61
2.5.7 – Vertical and horizontal irregularities ............................................................................ 63
2.5.8 – Higher modes effect...................................................................................................... 66
2.5.9 – Strong-beam weak-column mechanism........................................................................ 66
2.5.10 – Structural deficiencies due to architectural requirements........................................... 67
2.6 – COMMON RETROFITTING STRATEGIES AND TECHNIQUES OF EXISTING
RC BUILDINGS ...................................................................................................................... 68
2.6.1 – Global structural system intervention techniques......................................................... 69
2.6.1.1 – Addition of RC structural shear walls........................................................... 71
2.6.1.2 – Addition of steel bracing or post-tensioned cable systems ........................... 73
2.6.1.3 – Base seismic isolation................................................................................... 74
2.6.1.4 – Passive energy dissipation systems............................................................... 76

Table of Contents
ix
2.6.1.5 – Mass reduction...............................................................................................77
2.6.1.6 – Other techniques ............................................................................................77
2.6.2 – Member intervention techniques for RC elements ........................................................78
2.6.2.1 – Epoxy resin injection .....................................................................................78
2.6.2.2 – Jacketing of existing members.......................................................................79
2.6.2.3 – Shotcrete ........................................................................................................82
2.6.2.4 – Other techniques ............................................................................................83
CHAPTER 3 – DESCRIPTION OF THE EXPERIMENTAL TESTS
3.1 – INTRODUCTION....................................................................................................................85
3.2 – CHARACTERISATION OF THE RC FRAMES....................................................................89
3.2.1 – Reinforced concrete frame structure: geometry and section detailing ..........................89
3.2.2 – Modern codes requirements for earthquake resisting structures ...................................92
3.2.3 – Construction of the frames and loading devices............................................................95
3.2.4 – Transportation of the frame models...............................................................................97
3.2.5 – Materials properties .......................................................................................................98
3.2.6 – Vertical loads...............................................................................................................101
3.2.7 – Earthquake input..........................................................................................................102
3.3 – SELECTIVE STRENGTHENING SOLUTION FOR THE BARE FRAME .......................104
3.4 – MASONRY INFILL WALLS AND MASONRY STRENGTHENING;
CONSTRUCTION DETAILS AND MATERIALS ...............................................................107
3.4.1 – Masonry infill walls.....................................................................................................108
3.4.2 – Strengthening of the infill panels.................................................................................110
3.4.3 – Material properties.......................................................................................................113
3.4.3.1 – Mortar used in joints and plaster..................................................................113
3.4.3.2 – Compression tests on infill block units........................................................114
3.4.3.3 – Compression tests on masonry wallets in the directions parallel and
perpendicular to the bed joints ....................................................................114
3.4.3.4 – Concrete used for the shotcrete of the infill walls .......................................115
3.4.3.5 – Diagonal compression tests on masonry wallets .........................................116

Table of Contents
x
3.4.3.6 – Mechanical properties of the masonry walls obtained from diagonal
compression tests........................................................................................ 121
3.4.3.7 – Comparison of the results obtained for the masonry materials and
masonry wallets.......................................................................................... 124
3.4.4 – Empirical estimation of the masonry strength ............................................................ 126
3.4.4.1 – Infilled frames without apertures ................................................................ 126
3.4.4.2 – Reduction of strength and stiffness of the panels due to the
presence of apertures .................................................................................. 129
3.4.4.3 – Drift limits for masonry infill walls ............................................................ 131
3.4.4.4 – Storey strength of the infilled frame ........................................................... 132
3.5 – K-BRACING WITH SHEAR-LINK .................................................................................... 134
3.6 – REPAIR AND STRENGTHENING OF THE FRAMES ..................................................... 136
3.6.1 – Damage-state after the pseudo-dynamic tests............................................................. 136
3.6.2 – Repair and retrofitting using composite carbon fibre materials.................................. 137
3.6.3 – Material properties...................................................................................................... 138
3.6.4 – Application to repair and strengthening of the frames ............................................... 139
3.6.4.1 – Overview..................................................................................................... 139
3.6.4.2 – Concrete repair and crack injection ............................................................ 139
3.6.4.3 – Carbon fibre application ............................................................................. 140
3.6.5 – Remarks ...................................................................................................................... 141
3.7 – TESTING PROGRAMME AND TEST SET–UP ................................................................ 142
3.7.1 – Additional masses....................................................................................................... 143
3.7.2 – Reaction-wall.............................................................................................................. 145
3.7.3 – Pseudo-dynamic test method ...................................................................................... 146
3.7.4 – Horizontal loading system.......................................................................................... 147
3.7.5 – Instrumentation of the RC frames............................................................................... 149
3.7.5.1 – Rotations: inclinometers ............................................................................. 150
3.7.5.2 – Beam deformation at first floor level.......................................................... 152
3.7.5.3 – Slab-participation........................................................................................ 153
3.7.5.4 – Strong-column ............................................................................................ 154
3.7.6 – Instrumentation of the infilled frame.......................................................................... 154
3.7.7 – Instrumentation for the K-bracing test........................................................................ 156
3.7.8 – Instrumentation for the final capacity tests................................................................. 157

Table of Contents
xi
3.7.8.1 – Relative displacement transducers at the repaired joints .............................158
3.7.8.2 – Relative displacement transducers at the strong-column.............................158
3.7.8.3 – Storey displacement transducers (PSITRONIX) .........................................159
3.7.9 – Data acquisition system and post-processing ..............................................................159
3.8 – NON–DESTRUCTIVE TESTS: FREQUENCIES IDENTIFICATION ...............................160
3.8.1 – Non-infilled frame .......................................................................................................161
3.8.2 – Infilled frame...............................................................................................................165
3.9 – REMARKS ............................................................................................................................165
CHAPTER 4 – ANALYSIS OF EXPERIMENTAL TEST RESULTS
4.1 – INTRODUCTION..................................................................................................................167
4.2 – RESULTS FROM THE TESTS ON THE BARE FRAME...................................................170
4.2.1 – Storey displacement, drift and shear............................................................................170
4.2.2 – Observed damages.......................................................................................................173
4.2.3 – Maximum absolute and relative rotations measured at the critical zones ...................175
4.2.4 – Strong-column: 3rd storey ............................................................................................176
4.2.5 – Local ductility and damage indices .............................................................................178
4.2.6 – Energy dissipation .......................................................................................................180
4.2.7 – Damage index..............................................................................................................182
4.2.7.1 – Park and Ang damage index ........................................................................182
4.2.7.2 – Calculation of the PA damage index for the bare frame tests......................185
4.2.8 – Deformation at the beam extremities...........................................................................188
4.2.9 – Remarks.......................................................................................................................189
4.3 – RESULTS FROM THE TESTS ON THE SELECTIVE STRENGTHENED
FRAME ...................................................................................................................................189
4.3.1 – Storey displacement, drift and shear............................................................................190
4.3.2 – Observed damages.......................................................................................................195
4.3.3 – Maximum absolute and relative rotations measured at the critical zones ...................196
4.3.4 – Energy dissipation .......................................................................................................197
4.3.5 – Deformation at the beam extremities...........................................................................199

Table of Contents
xii
4.4 – COMPARISON BETWEEN BF AND SR TESTS............................................................... 200
4.4.1 – Storey displacement, drift and shear........................................................................... 200
4.4.2 – Maximum absolute and relative rotations measured at the critical zones .................. 204
4.4.3 – Energy dissipation ...................................................................................................... 206
4.4.4 – Deformation at the beam extremities.......................................................................... 207
4.4.5 – Vulnerability analyses ................................................................................................ 209
4.4.5.1 – Maximum inter-storey drift and global drift ............................................... 209
4.4.5.2 – Maximum rotation ...................................................................................... 210
4.4.5.3 – Energy dissipation....................................................................................... 211
4.5 – RESULTS FROM THE TESTS ON THE INFILLED FRAME........................................... 212
4.5.1 – Storey displacement, drift and shear........................................................................... 213
4.5.2 – Observed damages...................................................................................................... 218
4.5.3 – Damage intensity classification for infill masonry panels.......................................... 221
4.5.4 – Maximum absolute and relative rotations measured at the critical zones .................. 222
4.5.5 – Energy dissipation ...................................................................................................... 224
4.6 – COMPARISON BETWEEN BF AND IN TESTS ............................................................... 226
4.7 – RESULTS FROM THE TESTS ON INFILL STRENGTHENED FRAME ........................ 228
4.7.1 – Storey displacement, drift and shear........................................................................... 229
4.7.2 – Observed damages...................................................................................................... 232
4.7.3 – Maximum absolute and relative rotations measured at the critical zones .................. 234
4.7.4 – Energy dissipation ...................................................................................................... 235
4.8 – COMPARISON BETWEEN IN AND SC TESTS ............................................................... 238
4.9 – K-BRACING WITH SHEAR-LINK TEST.......................................................................... 240
4.9.1 – Test program............................................................................................................... 240
4.9.2 – Test results.................................................................................................................. 240
4.10 – FINAL CAPACITY CYCLIC TESTS................................................................................ 245
4.10.1 – Description of cyclic loading history........................................................................ 246
4.10.2 – Selective strengthened frame cyclic test results ....................................................... 248
4.10.2.1 – Maximum absolute and relative rotations measured at the
instrumented points .................................................................................... 251
4.10.2.2 – Analyses of the repaired top-columns....................................................... 252

Table of Contents
xiii
4.10.3 – Bare frame cyclic test results.....................................................................................253
4.10.4 – Remarks.....................................................................................................................256
4.11 – LOCAL MEASUREMENTS...............................................................................................257
4.11.1 – Plastic hinge length....................................................................................................257
4.11.2 – Shear cracks at the base of the 1st storey's strong-column.........................................258
4.11.3 – Slab-participation ......................................................................................................260
4.11.4 – Diagonal deformation of the short external panel .....................................................264
4.12 – FINAL REMARKS AND CONCLUSIONS .......................................................................272
4.12.1 – Bare and selective strengthened frames.....................................................................273
4.12.2 – Infilled and infill strengthened frames.......................................................................275
4.12.3 – K-bracing...................................................................................................................278
4.12.4 – Final capacity cyclic tests ..........................................................................................279
4.12.5 – Remarks.....................................................................................................................279
CHAPTER 5 – REFINED AND SIMPLIFIED MODELS FOR EARTHQUAKE
SIMULATION, ASSESSMENT AND OPTIMAL REDESIGN OF
EXISTING RC STRUCTURES
5.1 – INTRODUCTION AND MAIN OBJECTIVES....................................................................281
5.2 – NUMERICAL TOOLS: CASTEM........................................................................................284
5.3 – STRUCTURAL MODELLING ASPECTS...........................................................................287
5.3.1 – Description of the building frame model.....................................................................289
5.3.2 – Improved element model .............................................................................................291
5.3.3 – Plastic hinge length......................................................................................................293
5.3.4 – Non-linear behaviour of RC elements .........................................................................295
5.3.4.1 – Concrete model............................................................................................299
5.3.4.2 – Steel model ..................................................................................................301
5.3.5 – Bond–slip modelling of the longitudinal reinforcing steel plain bars .........................302
5.3.6 – Slab–participation........................................................................................................309
5.3.7 – Infill masonry modelling .............................................................................................313
5.3.8 – Retrofitting solutions modelling..................................................................................318
5.3.8.1 – X- and K-bracing with dissipator retrofitting ..............................................318
Table of Contents
xiv
5.3.8.2 – Selective strengthening ............................................................................... 322
5.3.9 – Vertical static loads, earthquake actions, masses and damping.................................. 324
5.3.10 – Shear strength verification for the bare frame .......................................................... 325
5.4 – NATURAL FREQUENCIES AND VIBRATION MODES ................................................ 328
5.5 – NUMERICAL PREDICTIONS OF THE PSEUDO-DYNAMIC TESTS............................ 329
5.6 – RESULTS OF THE NUMERICAL NON-LINEAR DYNAMIC ANALYSES................... 331
5.6.1 – Bare frame numerical results ...................................................................................... 332
5.6.2 – Strengthened frame numerical results ........................................................................ 338
5.6.3 – Infilled frame numerical results.................................................................................. 343
5.6.4 – Discussion of the numerical results with refined FE models...................................... 349
5.7 – STRUCTURAL RESPONSE AND ASSESSMENT USING SIMPLIFIED
METHODS............................................................................................................................. 351
5.7.1 – Equivalent viscous damping from the experimental hysteretic curves....................... 352
5.7.2 – Capacity spectrum method ......................................................................................... 355
5.7.2.1 – Capacity curve and capacity spectra ........................................................... 355
5.7.2.2 – Verification of the earthquake tests ............................................................ 359
5.7.2.3 – Assessment of the bare and strengthened structures................................... 361
5.7.2.4 – Final remarks .............................................................................................. 365
5.7.3 – Improved MDOF non-linear dynamic model for structural assessment..................... 366
5.7.3.1 – Description of the implemented algorithm ................................................. 368
5.7.3.2 – Verification of the earthquake tests ............................................................ 371
5.7.3.3 – Assessment of the bare frame structure ...................................................... 373
5.7.4 – Observed seismic performance in the earthquake tests .............................................. 374
5.8 – STRUCTURAL OPTIMIZATION PROBLEM IN SUPPORT OF BUILDING
RETROFITTING DECISION................................................................................................ 377
5.8.1 – Introduction ................................................................................................................ 377
5.8.2 – Theoretic mathematical background........................................................................... 378
5.8.3 – Structural strengthening optimization problems' formulation .................................... 381
5.8.3.1 – Problem I: storey yielding strength............................................................. 383
5.8.3.2 – Problem II: storey yielding stiffness (initial stiffness)................................ 384
5.8.3.3 – Problem III: yielding strength of the energy dissipator devices ................. 385
5.8.4 – Implementation of the optimization problems............................................................ 387

Table of Contents
xv
5.8.5 – Illustrative examples....................................................................................................389
5.8.5.1 – Existing structure .........................................................................................390
5.8.5.2 – Optimum design of the existing structure....................................................390
5.8.5.3 – Multiple optimum strengthening design ......................................................393
5.8.6 – Final remarks ...............................................................................................................397
CHAPTER 6 – SUMMARY AND CONTRIBUTIONS, CONCLUSIONS,
IMPLICATIONS AND FUTURE RESEARCH
6.1 – SUMMARY AND CONTRIBUTIONS ................................................................................399
6.2 – CONCLUSIONS....................................................................................................................401
6.3 – IMPLICATIONS FOR RESEARCHERS, POLICY MAKERS AND OWNERS ................410
6.3.1 – Implications for academic community, practitioner engineers and code
makers.........................................................................................................................411
6.3.2 – Implications for policy makers and government agencies ..........................................413
6.3.3 – Implications for building owners.................................................................................414
6.4 – FUTURE RESEARCH LINES ..............................................................................................415
APPENDIX A – PHOTOGRAPHIC DOCUMENTATION AND
STRENGTHENING DETAILS.......................................................................421
APPENDIX B – TEST RESULTS AND PHYSICAL DAMAGE PATTERNS
Visual inspection and photographic documentation......................................443
APPENDIX C – GLOSSARY ......................................................................................................463
REFERENCES AND RECOMMENDED READING ..............................................................477

xvii
TABLE OF FIGURES
CHAPTER 2 – SEISMIC VULNERABILITY AND REHABILITATION OF
EXISTING RC STRUCTURES
Figure 2.1 – Seismic performance design objective matrix (VISION-2000, SEAOC, 1995).............................................................................................................................24
Figure 2.2 – Capacity spectrum method (adapted from ATC-40, 1996) ..........................................27
Figure 2.3 – Modal participation factors and modal mass coefficients (ATC-40, 1996)..................30
Figure 2.4 – Equivalent viscous damping for reinforced concrete structures (adapted from Priestley, 1997).............................................................................................................31
Figure 2.5 – Energy dissipated ED in a cycle of harmonic vibration determined from an experiment (Chopra, 2001)...........................................................................................32
Figure 2.6 – Damping for an hysteretic cycle ...................................................................................33
Figure 2.7 – Partial collapse of a three-storey residential building in Imabari (EQE, 2001)............35
Figure 2.8 – Chevron eccentrically braced steel frame used to seismically upgrade building (Filiatrault et al., 2001)...................................................................................36
Figure 2.9 – Yielding of the chevron eccentrically braced frame in the east–west direction of the building (Filiatrault et al., 2001) ........................................................................36
Figure 2.10 – Extent of the damage (KOERI, 1999)........................................................................39
Figure 2.11 – General buildings damage and collapse in Gölcük, Adapazari and Yalova (KOERI, 1999; EQE, 1999; Sucuoglu, 2000)............................................................40
Figure 2.12 – Damage in buildings due to inappropriate detailing (KOERI, 1999).........................42
Figure 2.13 – Damage in RC buildings under construction after the Izmit earthquake (EQE, 1999) ...............................................................................................................43
Figure 2.14 – Typical middle rise RC frame building with brick infill walls (Kagami, 1999) ..........................................................................................................................44

Table of Figures
xviii
Figure 2.15 – Damage in an ordinary RC moment-resistant infilled RC frame (Kagami, 1999) ......................................................................................................... 44
Figure 2.16 – Poor reinforcing details in RC joints (Kagami, 1999)............................................... 45
Figure 2.17 – RC frame structures with a mid-height collapse (KOBEnet, 1995): a) collapsed 6th storey of an eight-storey high office building; b) intermediate storey damage of a moderately high building; c) 5th storey collapse of hospital.................................................................................................... 46
Figure 2.18 – RC frame structures with a mid–height collapse (EQE, 1995; KOBEnet, 1995)........................................................................................................ 47
Figure 2.19 – Soft-storey building' collapses (EQE, 1995; KOBEnet, 1995) ................................. 47
Figure 2.20 – Badly damaged irregular RC building in Sannomiya (EQE, 1995) .......................... 48
Figure 2.21 – Damages on buildings of different type in central Kobe (EQE, 1995) ..................... 48
Figure 2.22 – Damaged RC columns without transverse reinforcement (Saatcioglu et al., 1999) ............................................................................................ 52
Figure 2.23 – Damaged RC columns with inadequate transverse reinforcement (Saatcioglu et al., 1999) ............................................................................................ 52
Figure 2.24 – Inadequate lap–splice and lack of stirrups (Saatcioglu et al., 1999) ......................... 54
Figure 2.25 – Typical deficiencies in buildings: a) beam bars terminate with tight 180º hooks in the joint; b) yielding of the longitudinal steel adjacent to the floor slab (Aschheim, 2001) .............................................................................................. 54
Figure 2.26 – Column lap-splice details (Aschheim, 2001) ............................................................ 55
Figure 2.27 – Bar pullout-columns (Aschheim, 2001) .................................................................... 55
Figure 2.28 – Column shear failure examples: a) 1979 Montenegro earthquake (EASY, 1997); b) 1999 Izmit earthquake (note the to lack of transverse reinforcement - Saatcioglu et al., 1999) .................................................................... 58
Figure 2.29 – Shear and bond failure at the mid-height of a RC column during the 1985 Mexico city earthquake (EASY, 1997) ..................................................................... 58
Figure 2.30 – Damaged RC corner column at the 1st storey (Bertero, 1997) .................................. 58
Figure 2.31 – Column shear failure (Aschheim, 2001) ................................................................... 58
Figure 2.32 – Shear cracks at the RC column of an old school building (Yamazaki, 1993)........... 58
Figure 2.33 – Column shear failures (Aschheim, 2001): a) strong-axis behaviour; b) oblique column shear failure; c) captive column shear failure ............................. 59
Figure 2.34 – Typical flexural failure: column hinging (Aschheim, 2001)..................................... 60

Table of Figures
xix
Figure 2.35 – Lack of proper design of beam-column connections (Saatcioglu et al., 1999) .............................................................................................61
Figure 2.36 – Inadequate strength of joints (Aschheim, 2001): a) joint damages; b) joint failures ...........................................................................................................61
Figure 2.37 – Damages on masonry infill walls (Saatcioglu et al., 1999): a) RC frame building with almost fully damaged masonry infills; b) diagonal tension failure of a masonry wall............................................................................................62
Figure 2.38 – Short column effect caused by: window opening; masonry walls; and, landing slabs of staircases (Saatcioglu et al., 1999; Aschheim, 2001) ......................63
Figure 2.39 – Partial masonry infill in concrete frame (Paulay and Priestley, 1992).......................63
Figure 2.40 – Damage on infill walls (Aschheim, 2001): a) infill cracking; b) in-plane infill failure ................................................................................................................63
Figure 2.41 – Soft-storeys (Aschheim, 2001)...................................................................................64
Figure 2.42 – Building failure due to the higher modes effect during the 1985 Mexico city earthquake (EASY, 1997) ...................................................................................66
Figure 2.43 – Strong-beam weak-column mechanism (Aschheim, 2001; Saatcioglu et al., 1999) ..............................................................................................67
Figure 2.44 – Typical buildings in Turkey (Aschheim, 2001): a) view; b) typical beam details .........................................................................................................................68
CHAPTER 3 – DESCRIPTION OF THE EXPERIMENTAL TESTS
Figure 3.1 – Plan and elevation views of concrete frame plus masonry infill building....................90
Figure 3.2 – Beam reinforcement details ..........................................................................................91
Figure 3.3 – Column reinforcement details.......................................................................................91
Figure 3.4 – Transverse reinforcement for lap-splice zones (EC2) ..................................................94
Figure 3.5 – Attachment system at floor level ..................................................................................96
Figure 3.6 – Best–fit of steel constitutive law (Carvalho et al., 1999) ...........................................100
Figure 3.7 – Scheme of vertical static loads ...................................................................................101
Figure 3.8 – Ground motion acceleration time histories for 475, 975 and 2000-yrp......................103
Figure 3.9 – Response linear-elastic spectra for 475, 975 and 2000-yrp (5% damping): a) displacement; b) pseudo-acceleration.........................................................................103

Table of Figures
xx
Figure 3.10 – Selective strengthening of the RC frame: a) strength-only intervention in strong-column; and, b) ductility-only intervention in strong-column (Elnashai and Pinho, 1999) ..................................................................................... 105
Figure 3.11 – Selective strengthened RC frame ............................................................................ 105
Figure 3.12 – Elevation view of the infilled concrete frame (frame A): infill openings (location and dimensions) ............................................................... 108
Figure 3.13 – Infill block units ...................................................................................................... 108
Figure 3.14 – Detail of the infill walls construction...................................................................... 108
Figure 3.15 – Reconstruction of the 1st storey infill panels and infill strengthening (shotcrete) of the short external bay at all storeys (elevation): a) south view; b) north view ................................................................................................. 110
Figure 3.16 – Constructive details (layout and dimensions) of the infill strengthening................ 111
Figure 3.17 – Infill strengthening: a) light connection between masonry and steel mesh (nine connection points); b) reinforcement detailing (lateral overlapping of 0.50 m) ................................................................................................................ 112
Figure 3.18 – Diagonal compression tests: typology and nomenclature of the tested specimens ................................................................................................................ 117
Figure 3.19 – Diagonal compression test: a) testing set-up; b) instrumentation and loading shoe detail................................................................................................... 118
Figure 3.20 – Diagonal compression tests: generic scheme .......................................................... 118
Figure 3.21 – Diagonal compression tests on specimens without plaster...................................... 119
Figure 3.22 – Diagonal compression tests on specimens with plaster in both sides ..................... 120
Figure 3.23 – Diagonal compression tests on specimens with plaster in both sides and strengthened ............................................................................................................ 120
Figure 3.24 – Diagonal compression tests: specimens without plaster (red), with plaster in both sides (blue) and with plaster in both sides and strengthened (black) .......... 120
Figure 3.25 – Reference stress on diagonal compression tests: specimens without plaster (red), with plaster in both sides (blue) and with plaster in both sides and strengthened (black) ................................................................................................ 124
Figure 3.26 – Masonry model: a) simplified pattern of distribution of interactive forces between infill and frame; b) tri-linear non-symmetric envelope and hysteretic rules ........................................................................................................ 126
Figure 3.27 – Nomenclature: a) aperture and panel dimensions; b) identification of four panel-types .............................................................................................................. 131
Figure 3.28 – Empirical shear-drift curves for the 1st storey confined masonry panels................. 133

Table of Figures
xxi
Figure 3.29 – Simplified tensile behaviour curves for the concrete and masonry..........................133
Figure 3.30 – K-bracing with shear-link system: possible layouts.................................................135
Figure 3.31 – K-bracing with shear-link system test assembly......................................................136
Figure 3.32 – Failure (shear-out) of the column/joint interface .....................................................137
Figure 3.33 – Distribution of the additional loads..........................................................................144
Figure 3.34 – Reaction wall/floor facility (dimensions in m) at the ELSA laboratory (Pinto, 1998).............................................................................................................145
Figure 3.35 – General layout of the pseudo-dynamic test: reaction-wall, structure, pistons and reference steel-frame.............................................................148
Figure 3.36 – General layout of the 2nd storey cyclic test: reaction-wall, structure, pistons and reference steel-frame.............................................................149
Figure 3.37 – Location of the 64 inclinometers..............................................................................151
Figure 3.38 – Inclinometers location scheme: a) strong-column; b) slender-column ....................151
Figure 3.39 – 1st floor beam instrumentation: general layout, dimensions and detail of the zone nearest to the strong-column............................................................................152
Figure 3.40 – Instrumentation for the slab-participation monitoring .............................................153
Figure 3.41 – Strong–column instrumentation: 1st storey, joint and base of the 2nd storey............154
Figure 3.42 – Infill masonry instrumentation (general layout): 1st and 2nd storeys ........................155
Figure 3.43 – Infill masonry instrumentation (numbering): 1st and 2nd storeys..............................156
Figure 3.44 – K-bracing test instrumentation: bracing and shear-link instrumentation .................157
Figure 3.45 – K-bracing test instrumentation: location of the 22 inclinometers ............................157
Figure 3.46 – K-bracing test instrumentation: infill relative-displacement transducers.................157
Figure 3.47 – Instrumentation at the repaired joints: a) frame A; b) frame B; c) detail.................158
Figure 3.48 – Strong-column instrumentation for the final capacity cyclic test: frame A .............159
Figure 3.49 – Evolution of the four eigenfrequencies ....................................................................162
Figure 3.50 – Evolution of the four eigenfrequencies (relative values: measured frequencies divided by the initial frequency)...........................................................163

Table of Figures
xxii
CHAPTER 4 – ANALYSIS OF EXPERIMENTAL TEST RESULTS
Figure 4.1 – BF tests: storey displacement time histories.............................................................. 170
Figure 4.2 – BF tests: top-displacement evolution......................................................................... 171
Figure 4.3 – BF tests: storey shear versus inter-storey drift........................................................... 171
Figure 4.4 – BF tests: base-shear versus top-displacement............................................................ 172
Figure 4.5 – BF tests: envelope storey shear versus inter-storey drift ........................................... 172
Figure 4.6 – BF tests: a) maximum inter-storey drift profiles; b) maximum storey shear profiles ....................................................................................................................... 172
Figure 4.7 – Damage observed on the 3rd storey strong-column after BF tests: a) at the bar termination zone (note reinforcement detail); b) at the top of the column ................ 174
Figure 4.8 – BF tests: maximum absolute and relative rotation demands...................................... 175
Figure 4.9 – Strong-column at the base of the 3rd storey: lap-splice reinforcement detail (70 cm length) ............................................................................................................ 176
Figure 4.10 – Evolution of the rotations at the 3rd storey strong-column during the BF975 test ........................................................................................................................... 177
Figure 4.11 – 3rd storey strong-column: a) scheme of reinforcement; b) moments distribution .............................................................................................................. 178
Figure 4.12 – Local rotation ductility demand and damage for the bare frame tests .................... 179
Figure 4.13 – BF tests: storey and total energy dissipation........................................................... 181
Figure 4.14 – BF tests: relative energy dissipation profiles .......................................................... 181
Figure 4.15 – Calculated damage index versus observed damage (Park et al., 1987)................... 184
Figure 4.16 – BF tests: evolution of the storey damage index ...................................................... 187
Figure 4.17 – BF tests: influence of the energy dissipation on the evolution of the storey damage index .......................................................................................................... 187
Figure 4.18 – BF tests: beam 1st floor: a) maximum relative rotation; b) maximum uniform strain .......................................................................................................... 188
Figure 4.19 – SR tests: storey displacement time histories ........................................................... 191
Figure 4.20 – SR tests: top-displacement evolution ...................................................................... 192
Figure 4.21 – SR tests: base-shear versus top-displacement ......................................................... 192
Figure 4.22 – SR tests: storey shear versus inter-storey drift ........................................................ 193
Table of Figures
xxiii
Figure 4.23 – SR tests: envelope storey shear versus inter-storey drift..........................................193
Figure 4.24 – SR tests: a) maximum inter-storey drift profiles; b) maximum storey shear profiles .....................................................................................................................194
Figure 4.25 – SR tests: maximum absolute and relative rotation demands....................................196
Figure 4.26 – SR tests: storey and total energy dissipation............................................................198
Figure 4.27 – SR tests: relative energy dissipation profiles ...........................................................199
Figure 4.28 – SR tests: beam 1st floor: a) maximum relative rotation; b) maximum uniform strain...........................................................................................................199
Figure 4.29 – BF and SR tests: maximum inter-storey drift profiles .............................................202
Figure 4.30 – BF and SR tests: maximum inter-storey drift profiles .............................................202
Figure 4.31 – BF and SR 975-yrp tests: storey shear versus inter-storey drift...............................203
Figure 4.32 – BF and SR tests: storey shear versus inter-storey drift ............................................204
Figure 4.33 – BF and SR tests: maximum relative rotation demands for the 975-yrp tests ...........205
Figure 4.34 – BF and SR tests: relative energy dissipation profiles...............................................206
Figure 4.35 – BF and SR tests: relative energy dissipation profiles (475-yrp and 975-yrp tests).....................................................................................................207
Figure 4.36 – BF and SR 475-yrp tests (beam 1st floor): a) maximum relative rotation; b) maximum uniform strain .....................................................................................207
Figure 4.37 – BF and SR 975-yrp tests (beam 1st floor): a) maximum relative rotation; b) maximum uniform strain .....................................................................................208
Figure 4.38 – BF and SR tests: a) maximum inter-storey drift; b) maximum global drift .............209
Figure 4.39 – BF and SR tests: local rotation maximum demands ................................................211
Figure 4.40 – BF and SR tests: total energy dissipation.................................................................212
Figure 4.41 – IN tests: storey displacement time histories.............................................................214
Figure 4.42 – IN tests: top-displacement evolution........................................................................214
Figure 4.43 – IN tests: base-shear versus top-displacement...........................................................215
Figure 4.44 – IN tests: envelope storey shear versus inter-storey drift ..........................................215
Figure 4.45 – IN tests: storey shear versus inter-storey drift..........................................................216
Figure 4.46 – IN tests: a) maximum inter-storey drift profiles; b) maximum storey shear profiles .....................................................................................................................216

Table of Figures
xxiv
Figure 4.47 – Types of damage in masonry infill panels (Sortis et al., 1999)............................... 221
Figure 4.48 – IN tests: maximum absolute and relative rotation demands.................................... 223
Figure 4.49 – IN tests: relative energy dissipation profiles ........................................................... 224
Figure 4.50 – IN tests: storey and total energy dissipation............................................................ 225
Figure 4.51 – BF and IN tests: 1st and 2nd storey shear versus inter-storey drift and respective envelope curves...................................................................................... 227
Figure 4.52 – BF and IN tests (475 and 975-yrp): maximum inter-storey drift profiles ............... 228
Figure 4.53 – SC tests: storey displacement time histories ........................................................... 229
Figure 4.54 – SC tests: top-displacement evolution ...................................................................... 230
Figure 4.55 – SC tests: base-shear versus top-displacement ......................................................... 230
Figure 4.56 – SC tests: storey shear versus inter-storey drift ........................................................ 231
Figure 4.57 – SC tests: envelope storey shear versus inter-storey drift......................................... 231
Figure 4.58 – SC tests: a) maximum inter-storey drift profiles; b) maximum storey shear profiles..................................................................................................................... 232
Figure 4.59 – SC tests: maximum absolute and relative rotation demands................................... 234
Figure 4.60 – SC tests: storey and total energy dissipation........................................................... 236
Figure 4.61 – SC tests: relative energy dissipation profiles .......................................................... 237
Figure 4.62 – IN and SC tests: base-shear versus global drift....................................................... 238
Figure 4.63 – IN and SC tests: base-shear versus global drift and respective envelope curves ...................................................................................................................... 238
Figure 4.64 – IN and SC tests: storey shear versus inter-storey drift and respective envelope curves....................................................................................................... 239
Figure 4.65 – IN and SC tests: maximum inter-storey drift profiles ............................................. 239
Figure 4.66 – KB-cyclic test: total storey shear versus relative storey displacement.................... 241
Figure 4.67 – KB-cyclic test: damage inspection.......................................................................... 242
Figure 4.68 – KB-cyclic test: shear force versus relative lateral displacement at the shear-link .......................................................................................................................... 243
Figure 4.69 – KB-cyclic test: total lateral storey resistance and shear-link shear resistance ........ 244
Figure 4.70 – KB-cyclic test: energy dissipation for retrofitted frame and shear-link .................. 244

Table of Figures
xxv
Figure 4.71 – KB-cyclic test: total storey shear versus relative storey displacement and shear force versus relative lateral displacement at the shear-link ............................245
Figure 4.72 – Controlled force pattern and top-displacement: a) schematic representation; b) history of imposed lateral displacements.............................................................246
Figure 4.73 – SR and SR-cyclic tests: storey shear versus inter-storey drift .................................249
Figure 4.74 – SR and SR-cyclic tests: base-shear versus top-displacement...................................250
Figure 4.75 – SR2000 and SR-cyclic tests (frame B): maximum absolute rotation demands ...................................................................................................................251
Figure 4.76 – SR2000 and SR-cyclic tests (frame B): maximum relative rotation demands ...................................................................................................................251
Figure 4.77 – Nomenclature of the repaired external top-column (1st and 2nd storeys)..................252
Figure 4.78 – Frame B (evolution of N2 and D2 top-columns dislocation): a) test L33 (before repair), b) test L38 (after repair) ..................................................................253
Figure 4.79 – Frame B (joints N2 and D2): top-columns dislocation versus inter-storey drift before repair (test L33) and after repair (test L38)...........................................253
Figure 4.80 – BF and BF-cyclic tests: storey shear versus inter-storey drift .................................255
Figure 4.81 – BF and BF-cyclic tests: base–shear versus top-displacement ..................................256
Figure 4.82 – Maximum uniform strain for positive and negative bending at the plastic hinge zone for the BF and SR tests ..........................................................................258
Figure 4.83 – BF475 test (1st storey strong-column): a) ID; b) elongation in transducer #105..........................................................................................................................259
Figure 4.84 – IN975 test (1st storey strong-column): a) ID; b) elongation in transducer #105..........................................................................................................................259
Figure 4.85 – Scheme of the slab-participation..............................................................................261
Figure 4.86 – Scheme of the slab-participation..............................................................................261
Figure 4.87 – BF tests: maximum deformation distribution (mm) at the internal long-bay ...........262
Figure 4.88 – SR tests: maximum deformation distribution (mm) at the internal long-bay ...........262
Figure 4.89 – Nomenclature for diagonal deformation (six zones) in the short external panel.........................................................................................................................264
Figure 4.90 – IN tests: 1st storey strain of the short external panel (total mean diagonal strain) .......................................................................................................................266
Figure 4.91 – IN tests: 2nd storey strain of the short external panel (total mean diagonal strain) .......................................................................................................................266
Table of Figures
xxvi
Figure 4.92 – IN tests: 1st storey strain of the short external panel (middle)................................. 266
Figure 4.93 – IN tests: 2nd storey strain of the short external panel (middle)................................ 266
Figure 4.94 – IN tests: 1st storey strain of the short external panel (diagonal ascendant /) ........... 267
Figure 4.95 – IN tests: 1st storey strain of the short external panel (diagonal descending \) ......... 267
Figure 4.96 – IN tests: 2nd storey strain of the short external panel (diagonal ascendant /) .......... 267
Figure 4.97 – IN tests: 2nd storey strain of the short external panel (diagonal descending \) ........................................................................................................... 267
Figure 4.98 – SC tests: 1st storey strain of the short external panel (total mean diagonal strain)....................................................................................................................... 269
Figure 4.99 – SC tests: 2nd storey strain of the short external panel (total mean diagonal strain)....................................................................................................................... 269
Figure 4.100 – SC tests: 1st storey strain of the short external panel (middle) ............................. 270
Figure 4.101 – SC tests: 2nd storey strain of the short external panel (middle)............................. 270
Figure 4.102 – SC tests: 1st storey strain of the short external panel (diagonal ascendant /) ........................................................................................... 270
Figure 4.103 – SC tests: 1st storey strain of the short external panel (diagonal descending \)........................................................................................ 270
Figure 4.104 – SC tests: 2nd storey strain of the short external panel (diagonal ascendant /) ........................................................................................... 271
Figure 4.105 – SC tests: 2nd storey strain of the short external panel (diagonal descending \)......................................................................................... 271
CHAPTER 5 – REFINED AND SIMPLIFIED MODELS FOR EARTHQUAKE
SIMULATION, ASSESSMENT AND OPTIMAL REDESIGN OF
EXISTING RC STRUCTURES
Figure 5.1 – Schematic flow chart of modelling procedures adopted for the RC frames .............. 288
Figure 5.2 – Model of the plane bare frame ................................................................................... 290
Figure 5.3 – Generic element model: association of sub-elements with elastic linear (joints and central elements) and non-linear behaviour (plastic hinge zones) ........... 292
Figure 5.4 – Length of the non-linear fibre element ...................................................................... 295

Table of Figures
xxvii
Figure 5.5 – General fibre method: section, discrete elements and curvature (adapted from CEB-161, 1983)..........................................................................................................297
Figure 5.6 – Discrete elements for the fibre model.........................................................................298
Figure 5.7 – Concrete axial stress-strain constitutive law: envelope monotonic curves for concrete under tension and compression with the effects of confinement and cyclic curves (Guedes, 1997)......................................................................................300
Figure 5.8 – Uniaxial constitutive model for steel (Guedes, 1997).................................................301
Figure 5.9 – Bond-slip deformation of the constituent materials....................................................303
Figure 5.10 – Correction of the steel reinforcing constitutive law..................................................304
Figure 5.11 – Bond stress-slip relationship (CEB-217, 1993) ........................................................305
Figure 5.12 – Bond stress-slip relationship for smooth reinforcing steel........................................306
Figure 5.13 – Comparison of the bond stress-slip behaviour of plain and deformed bars (Rehm, 1961; CEB-217, 1993) ................................................................................307
Figure 5.14 – Bond stress-slip behaviour of plain bars (Rehm studies, 1961; and, MC-90, 1990) ........................................................................................................................307
Figure 5.15 – Computed relative steel strain function of the total ('concrete') strain......................307
Figure 5.16 – Computed steel strain function of the total ('concrete') strain...................................307
Figure 5.17 – Proposed bond stress-slip relationship for smooth reinforcing bars .........................309
Figure 5.18 – Variation of sectional properties along the span of a beam (Paulay and Priestley, 1992) ........................................................................................................310
Figure 5.19 – Variation of sectional properties along the span of a beam (Paulay and Priestley, 1992) ........................................................................................................311
Figure 5.20 – Effective flange width of T-beam.............................................................................312
Figure 5.21 – Slab geometry and reinforcement details..................................................................313
Figure 5.22 – Equivalent bracing action of masonry infill in the frame behaviour (Paulay and Priestley, 1992) ....................................................................................314
Figure 5.23 – Equivalent strut for the infill masonry model: a) geometric support of the strut diagonals; b) envelope and cyclic curves of the uniaxial behaviour law (Combescure and Pegon, 1996) ...............................................................................316
Figure 5.24 – Model of the plane infilled frame .............................................................................318
Figure 5.25 – Typical diagrams for a device: a) schematic, and b) typical diagram for a device tested at ELSA in the framework of the project REEDS (Molina et al., 2000.a) ...............................................................................................................319
Table of Figures
xxviii
Figure 5.26 – Bracing system in the central bay: device details and general layout...................... 320
Figure 5.27 – Bracing system in the shorter-external bay: device details and general layout....................................................................................................................... 320
Figure 5.28 – Vulnerability functions: a) top-displacement; b) base-shear ................................... 321
Figure 5.29 – Evolution of energy dissipation ............................................................................... 321
Figure 5.30 – Loading and modelling sequence for the SR numerical analyses ........................... 323
Figure 5.31 – Natural first four modal frequencies and mode shapes numerically evaluated for the BF and IN structures.................................................................... 329
Figure 5.32 – BF: storey displacement time histories (4th, 3rd, 2nd and 1st storeys) ........................ 333
Figure 5.33 – BF: inter-storey drift time histories (4th, 3rd, 2nd and 1st storeys).............................. 334
Figure 5.34 – BF: storey shear time histories (4th, 3rd, 2nd and 1st storeys)..................................... 335
Figure 5.35 – BF: storey shear versus inter-storey drift (4th, 3rd, 2nd and 1st storeys) ..................... 336
Figure 5.36 – BF: dissipated energy at storey level (4th, 3rd, 2nd and 1st storeys) ........................... 336
Figure 5.37 – BF: base-shear versus top-displacement .................................................................. 337
Figure 5.38 – BF: total dissipated energy....................................................................................... 337
Figure 5.39 – BF: maximum drift profile....................................................................................... 337
Figure 5.40 – BF: maximum shear profile ..................................................................................... 337
Figure 5.41 – SR: storey displacement time histories (4th, 3rd, 2nd and 1st storeys) ........................ 339
Figure 5.42 – SR: inter-storey drift time histories (4th, 3rd, 2nd and 1st storeys).............................. 340
Figure 5.43 – SR: storey shear time histories (4th, 3rd, 2nd and 1st storeys)..................................... 341
Figure 5.44 – SR: storey shear versus inter-storey drift (4th, 3rd, 2nd and 1st storeys) ..................... 342
Figure 5.45 – SR: dissipated energy at storey level (4th, 3rd, 2nd and 1st storeys) ........................... 342
Figure 5.46 – SR: base-shear versus top-displacement .................................................................. 343
Figure 5.47 – SR: total dissipated energy....................................................................................... 343
Figure 5.48 – SR: maximum drift profile....................................................................................... 343
Figure 5.49 – SR: maximum shear profile ..................................................................................... 343
Figure 5.50 – IN: storey displacement time histories (4th, 3rd, 2nd and 1st storeys)......................... 345
Figure 5.51 – IN: inter-storey drift time histories (4th, 3rd, 2nd and 1st storeys) .............................. 346

Table of Figures
xxix
Figure 5.52 – IN: storey shear time histories (4th, 3rd, 2nd and 1st storeys) ......................................347
Figure 5.53 – IN: storey shear versus inter-storey drift (4th, 3rd, 2nd and 1st storeys).......................348
Figure 5.54 – IN: dissipated energy at storey level (4th, 3rd, 2nd and 1st storeys) .............................348
Figure 5.55 – IN: base-shear versus top-displacement....................................................................349
Figure 5.56 – IN: total dissipated energy ........................................................................................349
Figure 5.57 – IN: maximum drift profile ........................................................................................349
Figure 5.58 – IN: maximum shear profile.......................................................................................349
Figure 5.59 – Equivalent storey damping (%) for the earthquake and cyclic tests on the BF and SR structures................................................................................................352
Figure 5.60 – Equivalent global damping (%) versus global drift for the earthquake and cyclic tests on the BF and SR structures ..................................................................354
Figure 5.61 – Pushover capacity curves for the BF and SR structures ...........................................355
Figure 5.62 – BF structure: pushover capacity curve (blue), PsD tests (green), and cyclic test (red) ...................................................................................................................357
Figure 5.63 – BF storey shear-drift curves: pushover (blue), PsD tests (green), and cyclic test (red) ...................................................................................................................357
Figure 5.64 – SR structure: pushover capacity curve (blue) and PsD tests (green) ........................358
Figure 5.65 – BF response estimation with the CSM......................................................................359
Figure 5.66 – SR response estimation with the CSM......................................................................360
Figure 5.67 – ADRS: for the earthquake input motions and EC8 (5% damping)...........................362
Figure 5.68 – Assessment of the BF with the CSM (subsoil class A; response spectra type I) for input motions: a) ag = 2.180 m/s2; b) ag = 2.884 m/s2 .............................362
Figure 5.69 – Assessment of the SR with the CSM (subsoil class A; response spectra type I) for input motions: a) ag = 2.180 m/s2; b) ag = 2.884 m/s2; c) ag = 3.728 m/s2 .....................................................................................................363
Figure 5.71 – Assessment of the SR with the CSM (subsoil class A; response spectra type I) for input motions: ag = 2.180 m/s2, ag = 2.884 m/s2 and ag = 3.728 m/s2...................................................................................................364
Figure 5.72 – MDOF structural simplified model with concentrated masses at storey levels being connected by shear beam elements: a) damping defined for each storey, b) global first mode structural damping...............................................367
Figure 5.73 – Reduced spectral seismic demand ............................................................................370
Figure 5.74 – Inter-storey drift profile computed and PsD test results for the BF structure...........372

Table of Figures
xxx
Figure 5.75 – Inter-storey drift profile computed and PsD test results for the SR structure .......... 372
Figure 5.76 – Vulnerability functions of the top-displacement and storey drift for the BF structure calculated with the multi-mode model ..................................................... 374
Figure 5.77 – BF capacity curves: multi-mode method (black), pushover (blue), PsD tests (green) and cyclic test (red) ..................................................................... 374
Figure 5.78 – Lateral storey shear versus inter-storey drift behaviour (exact and idealized bilinear behaviour) .................................................................................................. 382
Figure 5.79 – Control variable: strength (yielding shear force - Fy) .............................................. 383
Figure 5.80 – Problem I: a) yielding displacement constant; b) yielding stiffness constant .......... 384
Figure 5.81 – Control variable: pre-yielding stiffness (Ky) ............................................................ 384
Figure 5.82 – Control variable: yielding force of the dissipator device ......................................... 386
Figure 5.83 – Iterative optimization procedure .............................................................................. 388
Figure 5.84 – First order derivatives - Numerical evaluation......................................................... 389
Figure 5.85 – Storey Shear-drift curves adopted from the experimental tests ............................... 390
Figure 5.86 – Storey strength (N) ................................................................................................... 392
Figure 5.87 – Objective function (N) ............................................................................................. 392
Figure 5.88 – Storey displacements (m) ......................................................................................... 392
Figure 5.89 – Inter–storey drift (m)................................................................................................ 392
Figure 5.90 – Converged solution: shear-drift storey response...................................................... 392
Figure 5.91 – Storey yielding strength of the existing structure and optimum strengthening distribution ........................................................................ 393
Figure 5.92 – Total additional strength .......................................................................................... 394
Figure 5.93 – 1st storey additional strength..................................................................................... 395
Figure 5.94 – 2nd storey additional strength ................................................................................... 395
Figure 5.95 – 3rd storey additional strength.................................................................................... 396
Figure 5.96 – Vulnerability function of the structure designed for 2% drift and 2500-yrp ........... 396
Table of Figures
xxxi
APPENDIX A – PHOTOGRAPHIC DOCUMENTATION AND STRENGHTENING
DETAILS
Figure A.1 – Base foundation reinforcement (general view) and reinforcement of the columns (lap-splice at the columns base).................................................................423
Figure A.2 – Base foundation (detail): slender-column reinforcement and tubes to apply the vertical jacks (for structure uplift)......................................................................423
Figure A.3 – General view of the base foundation (concrete casting) ..........................................423
Figure A.4 – Base foundation (concrete casting) and column longitudinal reinforcement at the base with 180º bends ......................................................................................423
Figure A.5 – Slab reinforcement, reinforcement added in the attachment zone and plastic tubes for connection to the steel loading frame........................................................423
Figure A.6 – Joint detail ................................................................................................................423
Figure A.7 – Casting of the 1st floor (general view) ......................................................................424
Figure A.8 – Casting of the 1st floor (general view): the 1st to 2nd floor transition without lap–splice in the columns reinforcement..................................................................424
Figure A.9 – Joints and columns reinforcement details ................................................................424
Figure A.10 – Construction at various phases (general views) ......................................................425
Figure A.11 – Transport: vertical jacks..........................................................................................425
Figure A.12 – Transport: general view of the frames at the external area of the ELSA laboratory ................................................................................................................426
Figure A.13 – Frames transportation..............................................................................................426
Figure A.14 – Vertical connectors pre–stressing (to attach the actuators at the steel load frame) ......................................................................................................................427
Figure A.15 – Steel frames: a) pined bars connecting the two frames and fixings to the reaction-wall; b) frame to control out-of-plane deformation in the frame extremity opposite to the reaction-wall...................................................................427
Figure A.16 – Fixings to the reaction-wall, steel pined bars connecting the two frames and actuators ...........................................................................................................427
Figure A.17 – Additional loads (2.7 ton concrete blocks and 1.2 ton steel plates) and floor attachment steel bars system with pre–stressed connectors ...........................428
Figure A.18 – Actuators (double acting servo-hydraulic actuator linked at the extremity to piezoresistive load cell).......................................................................................428
Figure A.19 – Displacement controllers (HEIDENHEIN optical transducers)..............................428

Table of Figures
xxxii
Figure A.20 – Acquisition, control and monitoring system .......................................................... 428
Figure A.21 – Instrumentation: strong-column at 1st storey .......................................................... 429
Figure A.22 – Instrumentation: slab (below)................................................................................. 429
Figure A.23 – Instrumentation: inclinometers............................................................................... 429
Figure A.24 – 1st storey strong-column: selective retrofitting (ductility and shear resistance improvement) and instrumentation (strong-column, slab, joint and beam deformation)........................................................................................... 429
Figure A.25 – Strength improvement: connection of the steel bars to columns............................ 429
Figure A.26 – Construction of the infill masonry walls: sequential phases and detail.................. 430
Figure A.27 – Four-storey full-scale reinforced concrete infilled frame: a) construction of the masonry infill walls; b) general views of the structure .................................... 430
Figure A.28 – Infill strengthening construction: sequential operations and details of the reinforcing steel mesh ............................................................................................ 431
Figure A.29 – Infills instrumentation installed for the IN and SC tests: panels and local instrumentation at the panel corners of the short external panel ............................ 431
Figure A.30 – Concrete specimens extraction from the frame structure ....................................... 432
Figure A.31 – Additional masses (water reservoirs) ..................................................................... 432
Figure A.32 – Instrumentation in repaired external joints (relative displacement transducer).............................................................................................................. 432
Figure A.33 – Instrumentation at the 1st storey strong-column for the final capacity cyclic test .......................................................................................................................... 432
Figure A.34 – Storey displacement measurement systems: HEIDENHEIN and PSITRONIX displacement transducers.................................................................. 432
Figure A.35 – K-bracing and shear-link: summary table .............................................................. 433
Figure A.36 – K-bracing and shear-link: general layout ............................................................... 433
Figure A.37 – K-bracing and shear-link: shear-link details .......................................................... 434
Figure A.38 – K-bracing and shear-link: details of shear-link and adjacent connections ............. 434
Figure A.39 – K-bracing and shear-link: detail of braces ............................................................. 434
Figure A.40 – K-bracing and shear-link: detail of the bottom braces connection......................... 434
Figure A.41 – K-bracing and shear-link: detail of Pos. 8.............................................................. 435
Figure A.42 – K-bracing and shear-link: detail of Pos. 14............................................................ 435

Table of Figures
xxxiii
Figure A.43 – K-bracing and shear-link: detail of Pos. 15.............................................................435
Figure A.44 – K-bracing and shear-link: detail of Pos. 16.............................................................435
Figure A.45 – K-bracing and shear-link: detail of Pos. 17 and Pos. 2 ...........................................435
Figure A.46 – Columns drilling: strong-column (left) and weak column (right)...........................436
Figure A.47 – Anchoring of the top-beam to the existing RC frame .............................................437
Figure A.48 – Bottom-beams: drilling ...........................................................................................438
Figure A.49 – Shear-link with the surrounding beam and braces ..................................................438
Figure A.50 – Bracing instrumentation (strain-gauges) .................................................................438
Figure A.51 – Instrumentation: relative displacement transducer (detail of the zone nearest to the shear-link) .........................................................................................439
Figure A.52 – Repair operations (steps): 4 – remove concrete at the top of the damaged column; 5 – relocation of the column; 6 – concreting of the column/joint; 7 – strengthening with carbon fibre ........................................................................439
Figure A.53 – Repair intervention: frame B...................................................................................440
Figure A.54 – Repair intervention: frame A ..................................................................................440
Figure A.55 – Damages on the first storey strong-column: frame A .............................................440
Figure A.56 – Column repaired with carbon fibre materials..........................................................440
Figure A.57 – Strong-column (frame B) repair intervention (schematic sequential operations): 1– longitudinal fibres; 2 – confinement of the column upper-part; 3 – confinement of the column low part (including bar termination zone)........................................................................................................................441
Figure A.58 – Joints repair intervention: schematic sequential operations....................................441
Figure A.59 – Sequential operation phases for the joints intervention ..........................................442
APPENDIX B – TESTS RESULTS AND PHYSICAL DAMAGE PATTERNS:
Visual inspection and photographic documentation
Figure B.1 – Plots of the time-domain identified frequency and damping ratio for the first two vibration modes of BF475 (L05), BF975 (L06), SR475 (L10), SR975 (L11) and SR2000 (L12) ..............................................................................445
Figure B.2 – Equivalent modal frequency and damping for the virgin bare frame (10% intensity of 475-yrp earthquake) ..............................................................................446

Table of Figures
xxxiv
Figure B.3 – Equivalent modal frequency and damping for the BF 475-yrp test ........................ 447
Figure B.4 – Equivalent modal frequency and damping for the BF 975-yrp test ........................ 448
Figure B.5 – Equivalent modal frequency and damping for the BF after 975-yrp earthquake test (5% intensity of 475-yrp earthquake)............................................. 449
Figure B.6 – Equivalent modal frequency and damping for the SR - 5% intensity of 475-yrp earthquake (before full-intensity earthquake tests).................................... 450
Figure B.7 – Equivalent modal frequency and damping for the SR 475-yrp test ........................ 451
Figure B.8 – Equivalent modal frequency and damping for the SR 975-yrp test ........................ 452
Figure B.9 – Equivalent modal frequency and damping for the SR 2000-yrp test ...................... 453
Figure B.10 – Equivalent modal frequency and damping for the SR after 2000-yrp earthquake test (5% intensity of 475-yrp earthquake)............................................ 454
Figure B.11 – Damage pattern after the bare frame tests (general layout).................................... 455
Figure B.12 – Slab damage pattern after the bare frame tests....................................................... 455
Figure B.13 – BF975: the horizontal storey displacement is evidenced (comparing the relative position of the transversal beams of the two frames) ................................ 456
Figure B.14 – BF975: Damage (spalling) at the top of the 3rd storey strong-column (beginning) ............................................................................................................. 456
Figure B.15 – BF975: damage (spalling) at the bar termination zone of the 3rd storey strong-column ........................................................................................................ 456
Figure B.16 – BF975: damage (spalling) at the top of the 3rd storey strong-column.................... 456
Figure B.17 – BF975: damage (spalling) at the bar termination zone of the 3rd storey strong-column ........................................................................................................ 456
Figure B.18 – Damage pattern after the selective strengthened frame tests (general layout) .................................................................................................................... 457
Figure B.19 – Damage pattern after the infill frame tests (general layout)................................... 457
Figure B.20 – Slab damage pattern after the infill frame tests...................................................... 458
Figure B.21 – IN975: damages at the 1st storey infill panels and RC strong-column at the base......................................................................................................................... 458
Figure B.22 – Damage pattern after the infill strengthened frame tests (general layout) ............. 459
Figure B.23 – Damage on the reinforced concrete frame, infill and infill strengthened panels after the SC earthquake tests....................................................................... 459
Figure B.24 – KB-cyclic test: damage pattern in the shear-link ................................................... 460
Table of Figures
xxxv
Figure B.25 – KB-cyclic test: damaged external columns ('shear-out') .........................................460
Figure B.26 – KB-cyclic test: details of the damaged external columns ('shear-out') ...................460
Figure B.27 – Frame A (brick infilled frame): damaged joints after the PsD tests........................461
Figure B.28 – Frame B (brick infilled 2nd storey and K-bracing with shear-link in the internal bay): damaged joints after cyclic tests .......................................................461

xxxvii
TABLE OF TABLES
CHAPTER 2 – SEISMIC VULNERABILITY AND REHABILITATION OF
EXISTING RC STRUCTURES
Table 2.1 – Earthquake hazard level (according to SEAOC, 1995) ................................................24
Table 2.2 – Earthquake hazard level (according to ATC-40, 1996) ................................................24
Table 2.3 – Definition of a performance objective (according to ATC-40, 1996) ..........................29
CHAPTER 3 – DESCRIPTION OF THE EXPERIMENTAL TESTS
Table 3.1 – Testing programme.......................................................................................................87
Table 3.2 – EC8 and EC2 requirements in terms of transversal reinforcement spacing (in mm) .........................................................................................................................93
Table 3.3 – Volumetric ratio of the columns transversal reinforcement (%) ..................................93
Table 3.4 – Volumetric ratio of the columns longitudinal reinforcement (%) ................................95
Table 3.5 – C16/20 (nominal strength values).................................................................................98
Table 3.6 – Tests on concrete specimens (average compressive strength)......................................98
Table 3.7 – Fe B22k (nominal properties) .......................................................................................99
Table 3.8 – Test on steel specimens (mean mechanical properties) ..............................................100
Table 3.9 – Hazard curves for the moderate-high European scenario ...........................................102
Table 3.10 – Quantities used in masonry construction by meter square of wall (reference values) ........................................................................................................................109
Table 3.11 – Mortar used in the joints and plaster (proportioning).................................................109

Table of Tables
xxxviii
Table 3.12 – Flexural and compressive strength of the mortar ...................................................... 113
Table 3.13 – Compressive strength test on the block units ............................................................ 114
Table 3.14 – Compression strength test on the infill specimens (loading perpendicular to the bed joints) ............................................................................................................ 115
Table 3.15 – Compression strength test on the infill specimens (loading parallel to the bed joints)......................................................................................................................... 115
Table 3.16 – Concrete used in the strengthening (proportioning).................................................. 116
Table 3.17 – Concrete compressive strength (average and characteristic values) ......................... 116
Table 3.18 – Diagonal compression tests: shear strength (Su) and shear modulus (G) .................. 122
Table 3.19 – Diagonal compression tests (average values): shear strength (Su) and shear modulus (G)............................................................................................................... 122
Table 3.20 – Diagonal compression tests: vertical (εv) and horizontal (εk) deformation at collapse...................................................................................................................... 124
Table 3.21 – Summary table of materials (brick units and plaster) and masonry specimens test results.................................................................................................................. 125
Table 3.22 – Reduction strength and stiffness coefficient for the panels....................................... 131
Table 3.23 – Repair operations (general steps) .............................................................................. 138
Table 3.24 – Repair and strengthening (works timetable) ............................................................. 139
Table 3.25 – PsD testing programme of RC frames (bare and infilled)......................................... 142
Table 3.26 – Final capacity cyclic testing programme of RC frames ............................................ 143
Table 3.27 – Characteristics of the ELSA reaction-wall (adapted from Pinto, 1998).................... 145
Table 3.28 – Evolution of the four modal frequencies of RC frame (frame B) ............................. 162
Table 3.29 – Natural frequencies of frame B evaluated with an impact hammer .......................... 164
Table 3.30 – Modal frequencies of the original infilled frame (frame A)...................................... 165
CHAPTER 4 – ANALYSIS OF EXPERIMENTAL TEST RESULTS
Table 4.1 – BF tests: response maximum values (summary table)............................................... 173
Table 4.2 – BF tests: damage inspection and damage states (ATC–40, 1996) ............................. 174
Table 4.3 – Calculated damage index versus observed damage ................................................... 185
Table of Tables
xxxix
Table 4.4 – Parameters estimated for the PA damage index for the RC columns .........................185
Table 4.5 – BF tests: Park & Ang damage indicator .....................................................................186
Table 4.6 – SR tests: response maximum values (summary table)................................................194
Table 4.7 – SR tests: damage inspection and damage states (ATC-40, 1996) ..............................195
Table 4.8 – IN tests: response maximum values (summary table) ................................................217
Table 4.9 – IN tests: damage inspection .......................................................................................218
Table 4.10 – Damage severity evaluation in masonry infill panels (Sortis et al., 1999).................222
Table 4.11 – Damage severity evaluation in the IN earthquake tests .............................................222
Table 4.12 – SC tests: response maximum values (summary table) ...............................................232
Table 4.13 – SC tests: damage inspection.......................................................................................233
Table 4.14 – Peak horizontal top–displacement imposed in the BF-cyclic and SR-cyclic tests.............................................................................................................................247
Table 4.15 – Imposed shear profile.................................................................................................247
Table 4.16 – Shear profiles (obtained from the earthquake tests and imposed in the cyclic tests) ...........................................................................................................................248
Table 4.17 – SR–cyclic test: response maximum values (summary table) .....................................250
Table 4.18 – BF–cyclic test: response maximum values (summary table) .....................................254
Table 4.19 – BF and SR tests: evaluation of the slab-participation for the internal long-bay .....................................................................................................................263
Table 4.20 – Estimation of the slab-participation according to EC8 provisions.............................263
Table 4.21 – IN tests: maximum positive (elongation) and negative (shortenning) strain (‰) in the short external panel at the 1st storey .........................................................265
Table 4.22 – IN tests: maximum positive (elongation) and negative (shortenning) strain (‰) in the short external panel at the 2nd storey.........................................................265
Table 4.23 – SC tests: maximum positive (elongation) and negative (shortenning) strain (‰) in the short external panel at the 1st storey..........................................................271
Table 4.24 – SC tests: maximum positive (elongation) and negative (shortenning) strain (‰) in the short external panel at the 2nd storey.........................................................272

Table of Tables
xl
CHAPTER 5 – REFINED AND SIMPLIFIED MODELS FOR EARTHQUAKE
SIMULATION, ASSESSMENT AND OPTIMAL REDESIGN OF
EXISTING RC STRUCTURES
Table 5.1 – Columns cross-sections (m×m) and reinforcement detailing ...................................... 291
Table 5.2 – Beams cross-sections (m×m) and reinforcement detailing.......................................... 291
Table 5.3 – Concrete: parameters to the numerical model ............................................................. 300
Table 5.4 – Steel: parameters to the numerical model ................................................................... 301
Table 5.5 – Parameters for defining the bond stress–slip relationship of smooth bars (CEB-217, 1993)........................................................................................................ 306
Table 5.6 – Parameters for the Zarnic and Gostic numerical model .............................................. 317
Table 5.7 – Properties of the energy dissipation devices ............................................................... 319
Table 5.8 – Maximum calculated shear forces (kN) in columns (BF calculations)........................ 326
Table 5.9 – Maximum estimated shear strength (kN) of the columns.................................... 328
Table 5.10 – Non-linear dynamic analyses of the BF, SR and IN structures ................................. 331
Table 5.11 – Maximum equivalent global damping (%) for the earthquake tests.......................... 354
Table 5.12 – Modal parameters for assessment of the BF and SR with the CSM ......................... 358
Table 5.13 – Summary table of the response point (estimated with the CSM and PsD experimental results) ................................................................................................. 361
Table 5.14 – Summary table of the assessment response point (estimated with the CSM) ........... 365
Table 5.15 – Representative damage descriptions for elements in non-ductile RC frame buildings (adapted from ATC-40, 1996)................................................................... 375
Table 5.16 – Storey deformation limits (adapted from ATC-40, 1996)......................................... 376
Table 5.17 – Matrix of the observed seismic performance for the BF and SR tests ...................... 376
Table 5.18 – Bi-linear storey shear-drift curves adopted ............................................................... 390
Table 5.19 – Converged solution: optimum distribution of the additional yielding strength (3 cm drift limit and earthquake 975-yrp) ................................................................. 393

CHAPTER 1
INTRODUCTION, MAIN OBJECTIVES AND PLAN OF THE THESIS
'Thousands of people live in older homes that can and should be seismically strengthened... An earthquake can throw an entire frame off the foundation and turn a house into a heap of rubble. The good news is that this is probably preventable.' (Los Angeles Times editorial, 21st March 1994)
1.1 - INTRODUCTION
The magnitude of the damage caused by all natural disasters is infinite. But it is
earthquakes which demonstrate the greatest power of destruction and, at the same time,
take the heaviest toll in human life (Pichard, 1984), as evidenced in the 1st November 1755
Lisbon earthquake, in Portugal, where more than half of the constructions in town were
destroyed or heavily damaged, and 10% of the population was killed (SPES, 2001).
Earthquakes in 1950 and 1971 seriously damaged the beautiful old towns of Cuzco and
Trujillo respectively, both in Peru. The 1975 earthquake in Burma devastated Pagan, an
ancient city of 2000 Buddhist pagodas. Antigua Guatemala and Friuli, in Italy, were rocked
by earthquakes in 1976. The Algerian town of El-Asnam has been struck by strong
earthquakes three times in forty-six years. The last, in 1980, damaged archaeological sites
in the surrounding region. The Republic of Montenegro was ravaged in 1979 by one of the
most violent earthquakes occurred in the last few years. The Popayan earthquake of 1983
razed to the ground this historic town, jewel of Colombian colonial architecture. These are
but a few dated examples of the terrible destructive power of earthquakes.

Introduction, main objectives and plan of the thesis
2
When the 1989 Loma Prieta earthquake struck the San Francisco bay area, it revealed the
vulnerability of a major metropolitan area to the damage and death that can result from a
major earthquake. Unfortunately, Loma Prieta did not reduce the chances for future large
earthquakes and even more devastation in the bay area, as demonstrated in 1994 by the
Northridge earthquake.
More recently, earthquakes occurring in highly populated zones have shown that existing
buildings constructed without appropriate seismic resisting characteristics constitute the
main source of risk and are the cause of most of the casualties. The tragedy in Kobe, Japan
(17th January 1995), one year after the Northridge earthquake (17th January 1994),
painfully warned us that the best building codes in the world do nothing for buildings built
before the codes were enforced.
The very recent earthquakes in Europe (e.g. Bucharest, Romania, 1977; Montenegro,
Yugoslavia, 1979; Azores, Portugal, 1980; Campania, Italy, 1980; Kalamata, Greece,
1986; Umbria/Marche, Italy, 1997; Azores, Portugal, 1998; Kocaeli, Turkey, 1999;
Athens, Greece, 1999; Molise, Italy, 2002) confirm and highlight that also Europe may
suffer from the vulnerability of the existing building stock.
Firstly, the vast majority of buildings in earthquake prone areas in Europe constructed
before the 1980's are seismic deficient. In fact, until the 1960's no specific seismic design
provisions were included in the codes and, from that period on, only seismic equivalent
lateral loading has been considered in their design. Provisions for design and detailing of
members and structures resembling those of modern codes only appeared in Europe in the
1980's in the national codes (e.g.: Portuguese design code - RSA, 1983) (Fardis, 1998).
Secondly, worldwide experience from past and present seismic activity shows that by far
non-ductile reinforced concrete (RC) frame buildings are one of the most vulnerable
structures and, therefore, represent overall the largest threat to human life and property in
future earthquakes. Furthermore, RC is the most common construction material in southern
Europe. For example, a survey on the Portuguese residential park recently conducted by
LNEC (2000) based on the 1991 CENSUS results, reveals the predominance of RC
buildings. First, the study shows that 56% of the total residential buildings had been
constructed between 1961 and 1991. Moreover, it reveals that 62% of the family
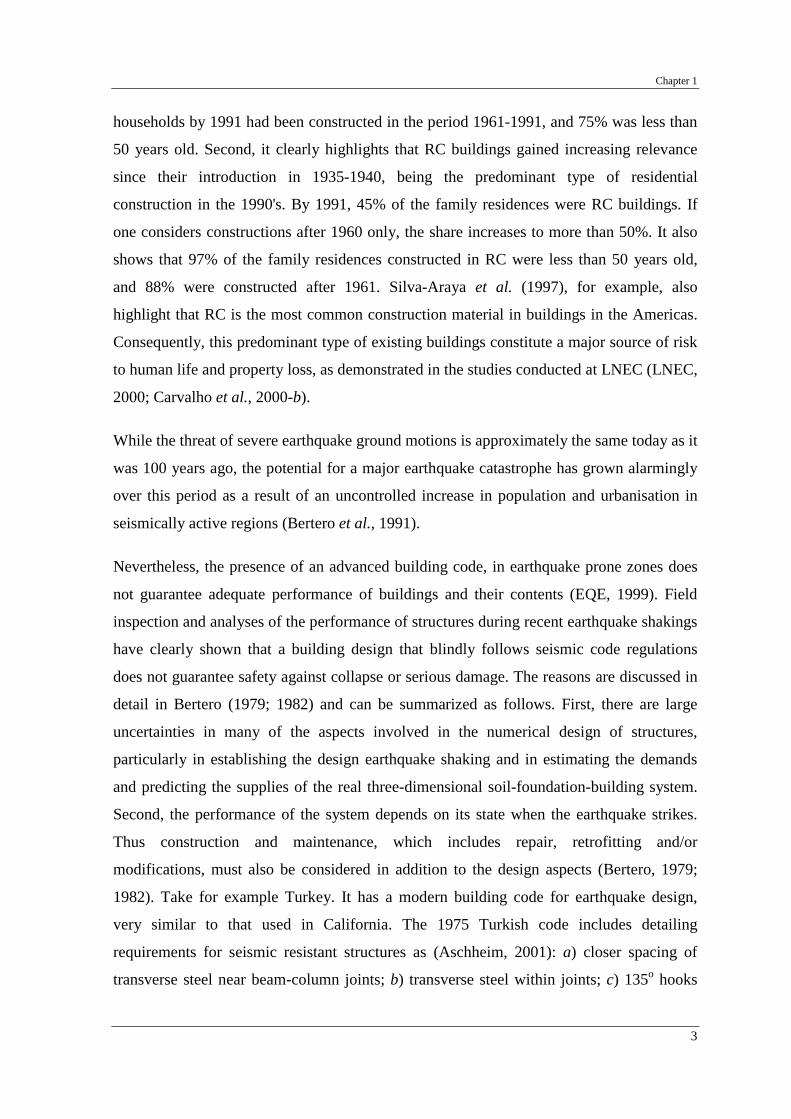
Chapter 1
3
households by 1991 had been constructed in the period 1961-1991, and 75% was less than
50 years old. Second, it clearly highlights that RC buildings gained increasing relevance
since their introduction in 1935-1940, being the predominant type of residential
construction in the 1990's. By 1991, 45% of the family residences were RC buildings. If
one considers constructions after 1960 only, the share increases to more than 50%. It also
shows that 97% of the family residences constructed in RC were less than 50 years old,
and 88% were constructed after 1961. Silva-Araya et al. (1997), for example, also
highlight that RC is the most common construction material in buildings in the Americas.
Consequently, this predominant type of existing buildings constitute a major source of risk
to human life and property loss, as demonstrated in the studies conducted at LNEC (LNEC,
2000; Carvalho et al., 2000-b).
While the threat of severe earthquake ground motions is approximately the same today as it
was 100 years ago, the potential for a major earthquake catastrophe has grown alarmingly
over this period as a result of an uncontrolled increase in population and urbanisation in
seismically active regions (Bertero et al., 1991).
Nevertheless, the presence of an advanced building code, in earthquake prone zones does
not guarantee adequate performance of buildings and their contents (EQE, 1999). Field
inspection and analyses of the performance of structures during recent earthquake shakings
have clearly shown that a building design that blindly follows seismic code regulations
does not guarantee safety against collapse or serious damage. The reasons are discussed in
detail in Bertero (1979; 1982) and can be summarized as follows. First, there are large
uncertainties in many of the aspects involved in the numerical design of structures,
particularly in establishing the design earthquake shaking and in estimating the demands
and predicting the supplies of the real three-dimensional soil-foundation-building system.
Second, the performance of the system depends on its state when the earthquake strikes.
Thus construction and maintenance, which includes repair, retrofitting and/or
modifications, must also be considered in addition to the design aspects (Bertero, 1979;
1982). Take for example Turkey. It has a modern building code for earthquake design,
very similar to that used in California. The 1975 Turkish code includes detailing
requirements for seismic resistant structures as (Aschheim, 2001): a) closer spacing of
transverse steel near beam-column joints; b) transverse steel within joints; c) 135o hooks
Introduction, main objectives and plan of the thesis
4
with cross-ties; d) joint shear calculations; e) strong-column weak-beam provisions; etc.
Therefore, modern buildings should have had moderate-to-light damage during the 1999
Kocaeli earthquake, given that the intensities of shaking in this earthquake were moderate.
In fact, new buildings performed very poorly because they were not properly designed, not
properly constructed, or located on ground that failed from shaking or faulting. This is a
fact that building owners around the world need to clearly understand.
Even if the building's vulnerability is diminishing, with the evolution of codes and
strengthening measures for existing constructions, pushing the risk to values that prevent
human losses, we have to deal with the crescent society complexity, which makes the
capital losses increase. The so-called knowledge-based economy (OECD, 2001), based on
growth of high technology industries, crescent sophistication of the phone communication,
Internet, electronic networks, among others, makes our economies and cities increasingly
fragile and complex. Consequently, the economic consequences associated with a
hypothetical earthquake also grow exponentially. Take, for example: loss of information in
banks, hospitals, companies, research institutes, costs of the inoperative factories and
companies, schools and universities closed, etc.
From the discussion above, it follows that the two most effective ways to mitigate the
human, social and economical losses due to earthquakes are the improvement of current
methods and development of new methods of designing, constructing and maintaining new
structures, and of seismic upgrading of existing hazardous facilities (Anderson et al.,
1991). Engineers are confronted with the continuous challenge of developing new methods
to build, repair, replace or rehabilitate existing structures (Silva-Araya et al., 1997).
According to USGS (1995), odds are 2-in-3 that at least one disastrous earthquake will
strike the San Francisco bay area before 2020. Faced with this threat, corporations,
government and other agencies have, in the last years, stepped up notable efforts intending
to reduce future human, social and economical losses. In the US, considerable effort and
millions of dollars are being spent now to save lives and billions later (USGS, 1995).
Summarising, recent major earthquakes around the world have dramatically evidenced that
research in earthquake engineering (EE) must be directed to the assessment of seismic
vulnerability of existing constructions lacking appropriate seismic resisting characteristics.
The development of retrofitting techniques represent also a key issue in order to mitigate

Chapter 1
5
the effects of future earthquakes and avoid both human casualties and economic losses.
Their retrofit or replacement should be made in order to reduce vulnerability and
consequently risk to currently accepted levels. The issue of retrofitting existing
constructions is complex and difficult and involves many factors, namely, at political,
decision-making, economical, scientific and technical levels. The increasing interest in the
structural seismic redesign, to reach optimum structural behaviour, under earthquake
actions, has led to the development of new retrofitting techniques, such as base isolation,
eccentric steel bracing coupled with energy dissipators concepts, controlled behaviour
mechanisms, passive damped systems, and composite solutions, reaching innovative and,
for certain cases, economically attractive retrofitting solutions. However, providing new
buildings with seismic resisting characteristics is presently easy and inexpensive, whereas
the seismic rehabilitation of existing buildings involves considerable costs, including those
of disruption of use, and poses several specific problems (Pinto et al., 2001-b). Both the
scientific and technical community should play a key role in the process of developing and
assessing effective solutions and techniques for the seismic retrofitting of those existing
vulnerable constructions. Transport infrastructures, such as bridges, should also be taken
into account, as well as the priceless architectural heritage, which may suffer very heavy
and/or irreversible damages from earthquakes.
Considering the devastating effects of past recent earthquakes, particularly evidenced in
non-ductile RC structures and the predominance of that kind of structures in Europe, the
study developed in this thesis concentrates on the seismic assessment and rehabilitation of
RC constructions.
The relevance of the topic has been clearly acknowledged by policy makers, researchers
and academics, as one can understand from the development and number of studies on
seismic engineering. In the past few years much attention has been focussed on the
structures assessment and strengthening design. The current growing number of national
and international conferences and workshops (SPES, 2001; Geradin and Pinto, 2000;
among others), bilateral cooperative research programmes and the emergent number of
research papers published and specialized publications dedicated to the assessment,
strengthening and repair of existing buildings, as well as application of new materials and
innovative construction techniques, proves the actuality and vital importance of the topic.

Introduction, main objectives and plan of the thesis
6
Several state-of-the-art reviews on repair and strengthening have been published
confirming the importance of the topic. Nevertheless, this literature presents a number of
shortcomings, which need to be addressed.
First, a considerable amount of research work has been carried-out on the behaviour of
new (designed and constructed according to recent seismic resistant codes) RC structures
subjected to static and earthquake dynamic loads. However, there is a need of experimental
results and numerical analyses dedicated to the study of old (designed without any specific
seismic resistant rule) RC structures. As largely recognised by several authors (e.g.
Fardis, 1998; Pinto et al., 2001-b), the challenge to the scientific EE community is to
define appropriate criteria to retrofit existing structures, to develop rational redesign
methods and to investigate and assess innovative cost-effective strengthening solutions and
techniques. Particular attention should be devoted to RC buildings because most of public
critical facilities (schools, hospitals and local or state administrative services, among other
essential facilities), as well as buildings with high rates and duration of occupancy
(commercial and office buildings, hotels, etc.) belong to this class of buildings. Different
approaches are followed for assessment and retrofit existing buildings in different
countries, with different degrees of success. Still, much research is needed to evaluate the
performance, response and reliability of existing and rehabilitated structures. Our
knowledge of the capacities of rehabilitation schemes and procedures for retrofitting
structures must be improved, as expressed by Silva-Araya et al. (1997). The work
developed and presented in this thesis emerges as consequence of these identified needs,
and adding to the theoretical and empirical literature by addressing old RC structures.
Second, there is still a lack of experimental research on seismic performance of existing
RC buildings. The scarce experimental studies focus on isolated elements or in reduced
scale structures. Data on the real characteristics of buildings that have been subjected to
earthquakes are in general difficult to obtain. This thesis attempts to push research a step
further by conducting experimental tests on full-scale structure models. The work
conducted in this thesis benefits from being part of the ICONS network project financed by
the TMR (Training and Mobility of Researchers) programme (access to Large-Scale
Facilities, LSF) of the European Commission (EC), which focuses on Innovative seismic
design CONcepts for new and existing Structures (see ICONS WebPages, 1999, for

Chapter 1
7
details). Two full-scale RC frames representative of the building's design and construction
practice until the late 1970's in most of south European countries, and currently needing
seismic retrofit, were constructed and tested pseudo-dynamically, at the ELSA laboratory
(European Laboratory for Structural Assessment). The test frames had been designed
without specifically considering seismic action (non-seismic resistant constructions).
Furthermore, an extensive testing campaign, comprised of several pseudo-dynamic (PsD)
tests on bare, infilled and retrofitted frames for several earthquake intensity levels, was
performed. A detailed description of the test frames, materials and test campaign will be
presented in Chapter 3, while Chapter 4 will deeply analyse the test results.
Third, much of the past research follows either a numerical or experimental work. The
research approach followed in this thesis combines numerical and experimental work. The
experimental tests on full-scale structure models assisted the calibration of those numerical
models and sustain in the assessment of proportioning and detailing rules for the different
structural sub-assemblages. This complementary numerical and experimental approach
emphasise the important role of the research for the mitigation of the seismic risk.
Forth, and concerning scientific aspects, there is a need for more rational assessment
methods able to predict seismic response and to identify local deficiencies leading to
failure, as well as to find effective and economic retrofitting solutions and techniques.
Considering this weakness in existing knowledge, the main objective of the theoretical,
experimental and analytical work conducted in the thesis is to achieve a reliable numerical
methodology, experimentally calibrated, able to reproduce with rigour the structural
behaviour of existing RC buildings, which can be used for subsequent verification of
simplified assessment-methods.
Finally, as far as technical issues are concerned, in Europe, there is still a lack of codified
criteria for redesign, as well as, a specific code for assessment and redesign of seismic
vulnerable buildings. Hence, the work developed in this thesis, in the framework of the
ICONS project, intends to contribute to the calibration and development of the European
seismic codes, as well as, development of innovative assessment, design and redesign
methods. Results from this study may help building owners, research teams, government
and other agencies involved in design codes and policy action start with action plans in
order to avoid human and economical losses in future earthquakes. Recall that in 1977 it
Introduction, main objectives and plan of the thesis
8
was published in Japan the first document on assessment and retrofit of structures, later
revised in 1990 (see Pinto, 2000), developed by the Japan Building Disaster Prevention
Association (JBDPA, 1977). In the United States, Japan and New Zealand, several
dedicated research programmes have been set-up and a series of documents on this matter
were issued recently (e.g. FEMA-274, FEMA-273, 1997; FEMA-310, 1998;
ATC-40, 1996; CALTRANS, 1998; JSCE, 1996; NZNSEE, 1996, etc.). In Europe, there is
still a lack of appropriate codes for the retrofitting of existing structures in particular for
RC structures. Most European national codes neglect the subject. Eurocode 8 (EC8, 1994)
comprises a dedicated chapter drafted recently (EC8 Part 1-3, 2003) but there are
difficulties in obtaining agreement on several aspects of the code. In fact, it involves
several actors namely the EE community, policy makers and building owners who must
work together for a successful end. To the EE community the following tasks should be
assigned: development of effective retrofitting solutions and techniques and development
of codified redesign methods and rules allowing their widespread application by the
technical community.
As mentioned above, this thesis is conducted within the framework of the ICONS network
project. Details on this research programme of relevance to this thesis are presented next.
ICONS Research Programme
The ICONS cooperative research program was contracted by LNEC, and coordinated at
the Joint Research Centre (JRC, in Ispra, Italy), with the participation of a Working Group,
involving researchers from several European Universities, the JRC and Industry. A total of
twelve partners from eight countries with complementary expertise were engaged in the
project. The ICONS network project extends the seismic research into new concepts and
subjects in EE, which should be developed further to convert EC8 into a truly state-of-the-
art standard, for the safe and economic design of earthquake resistant new structures and
for the seismic upgrading of existing ones. Therefore, ICONS contributes indirectly to the
development of the European construction industry and to the realisation of the European
engineering and construction industry open market. The project constitutes an important
contribution to the calibration and development of the European seismic design codes, as
well as, development of innovative assessment and design and redesign methods.

Chapter 1
9
ICONS extended across the main pillars of seismic design, covering five research topics,
namely: 1) the design seismic action; 2) methodologies for the assessment of the seismic
vulnerability of existing structures and development of strengthening and repair
techniques; 3) innovative design concepts and methods (this task comprises: base isolation
and energy dissipation in structures, uplifting/rocking as base isolation and displacement-
based-design); 4) steel/concrete composite structures and sub-assemblages; and, 5) shear-
wall structures.
The work developed in this thesis was concentrated in the topic 2 of the ICONS project
(methodologies for the assessment of the seismic vulnerability of existing structures and
development of strengthening and repair techniques; in short: Assessment, Strengthening
and Repair - ASR). Structures built prior to the introduction of seismic design codes were
commonly designed for gravity loads only, not possessing specific earthquake resistant
provisions, and thus constitute a considerable earthquake risk source. The vast PsD testing
campaign of the topic ASR aims at: a) the seismic assessment of the original capacity of
existing RC buildings, with and without infill masonry panels, representative of buildings
design and construction until the late 1970's; b) the investigation of the effectiveness of
current assessment methods (including those proposed in EC8 Part 1-3) to predict seismic
vulnerability/performance of buildings; and, c) investigating and comparing performances
of different common seismic retrofitting (repair and strengthening) solutions and
techniques, for the seismic upgrading of existing RC buildings, namely: a selective
retrofitting scheme, which provides either strength, or ductility, or stiffness; shotcrete of
infill walls; and, k-bracing with dissipative devices. The ASR topic addresses also the
development of rapid screening methods and refined analytical methods and procedures for
the assessment of existing structures. For test purposes, in order to study several retrofit
concepts, and to provide optimum test conditions, two identical parallel full-scale RC
frame structures, four storey height and with three bays, with an overall length of 12.50 m
and a height of 10.80 m, had been constructed at the ELSA facility (one as a bare frame
and one as a frame with hollow brick-masonry infill walls), representative of the
'non-seismic' design practice until the late 1970's. It must be highlighted that the research
work presented in this thesis, as well as the ICONS network project, took advantage of the
co-operation between ICONS and the ECOEST II (European Consortium of Earthquake
Shaking Tables) large-scale facilities consortium in EE (shaking-tables laboratories and

Introduction, main objectives and plan of the thesis
10
ELSA reaction wall laboratory of the JRC, see for example Carvalho and Bairrão, 2000;
Severn, 2000), in defining and following the necessary experimental programme to reach
the project objectives.
1.2 - MAIN OBJECTIVES OF THE THESIS
The main objective of the theoretical, experimental and analytical work subject of this
thesis is to achieve a numerical methodology, which is experimentally calibrated and able
to reproduce rigorously the structural behaviour of existing reinforced concrete buildings.
Therefore, it can be used in the systematic vulnerability assessment of this kind of
structures. The experimental work consists on assessing the original capacity of frames,
with and without infill masonry, and to compare performances of different retrofitting
solutions.
In order to achieve the main objectives, the work is organised in three main blocks. First, a
summary of the most common causes of damage and failure and of repair and
strengthening techniques for existing RC buildings is described in Chapter 2. Second, a
vast experimental programme to obtain the local and global vulnerabilities of this kind of
structures was developed. In this regard, the author and a team of researchers involved in
the ICONS research programme conducted a series of PsD tests on two four storey
full-scale planar frames, which are described in Chapters 3 and 4. And, finally, evaluation
of the available refined models in analysing the seismic performance of existing buildings,
proposing improvements to reach a reliable numerical methodology to predict their seismic
response.
Initial calculations were performed based on the available refined models commonly used
to model the new structures. Due to the unsatisfactory results, parametric analyses were
performed, and confirmed with the experimental full-scale test results to identify the
discrepancies. The detailed parametric analyses reveal inadequacies of the current models
when applied to the existing structures. This effort led to fine-tuning of the model
parameters' (as plastic hinge length, slab-participation, etc.), as well as to the inclusion of
the bond-slip effect, which is presented in Chapter 5.
Chapter 1
11
Various analysis methods, either linear elastic or non-linear, static or dynamic, are
available for the performance analysis of existing reinforced concrete buildings. Despite its
advantages, it must be admitted that non-linear time history analysis can frequently
become overly complex and impractical for general use as a first assessment. Simplified
non-linear static methods, as the Capacity Spectrum Method (CSM), are unable to
accurately assess irregular structures, as will be presented in Section 5.7.2. Considering
these limitations, in this thesis it is proposed a simplified MDOF non-linear dynamic
model for the assessment of structures. For structural redesign, it is judged appropriate to
have a methodology that generates optimal distribution of the strengthening in the structure
components. Therefore are proposed optimization algorithms to achieve optimum storey
strengthening levels of existing vulnerable structures.
1.3 - PLAN OF THE THESIS
This thesis is structured into six chapters. Following the introduction, the seismic
vulnerability of existing RC structures and the common retrofitting techniques for this kind
of structures are presented in Chapter 2. Chapters 3 and 4 are devoted to the experimental
work performed in the framework of this thesis. Chapter 5 deals with the numerical
analyses performed. Finally, Chapter 6 draws the main contributions and conclusions of
the research work, derives implications for agents with an interest on the topic and
identifies possible future research directions.
Chapter 2 reviews the current state of knowledge in the assessment of seismic vulnerability
of existing RC structures, discussing further the motivation and the current problems with
retrofitting of these buildings. Various methodologies for the assessment and redesign of
existing structures are reviewed. Lessons from significant recent earthquakes are also
presented. In this regard, are emphasised the common causes of seismic damage and
failure modes of existing RC buildings designed and/or constructed without specific
seismic capacity. Finally, the strengthening techniques adequate to improve the seismic
performance of the existing RC structures are summarised.
Chapter 3 describes all aspects related to the test campaign, namely details on the structure,
on the construction of the RC frame and materials' mechanical properties, testing

Introduction, main objectives and plan of the thesis
12
programme, loading system, additional loads, instrumentation and data acquisition system,
as well as on the construction of the infill masonry walls and infill strengthening technique
applied. The extensive test campaign performed to evaluate the mechanical properties of
the materials is also discussed in this chapter. The retrofitting techniques applied are
reviewed, namely: selective retrofitting, K-bracing with shear-link, and a retrofitting
technique based on carbon fibre materials. Finally, based on non-destructive tests, the
dynamic characterisation of the frames is presented and discussed.
Chapter 4 provides an analysis of a series of pseudo-dynamic and cyclic tests on the two
frames. It starts by presenting the test results from the first testing model, bare frame, and
on the strengthened frame using selective retrofitting techniques. It follows results on the
second frame model, a masonry infilled frame, which was subjected to a series of PsD
earthquake tests in order to assess its seismic performance and ultimate capacity. The
effects of the masonry on the global response of the structure are also evaluated,
comparing the test results of the infilled frame with the previous campaign of tests carried
out on the bare frame structure. Then, the most damaged infill panels were replaced, one
bay of the frame was strengthened using 'shotcrete' and the structure was subsequently
tested up to collapse. Results of the strengthened infilled frame are analysed and compared
to the non-strengthened infilled frame. Results of the K-bracing with shear-link cyclic
tests, as well as, on the frames repaired with carbon fibre materials are commented. The
principal aspects on the local behaviour such as slab-participation, plastic hinge length and
joint deformation are also addressed in this chapter.
In Chapter 5, the refined non-linear numerical modelling of the structures is described.
First, the computer software used in these analyses (CASTEM) is briefly presented. Then,
the most significant results of a series of non-linear dynamic numerical studies conducted
to reproduce the seismic response of the four-storey RC planar frame are shown. In this
chapter, the numerical models adopted, as well as the material and model parameters
involved are explained. The numerical results are compared to the previous PsD
earthquake experimental ones. With this procedure, it was possible to calibrate and confirm
the accuracy of the analytical models. The efficiency of the selective retrofitting solution,
outlined in previous chapters, is numerically evaluated with inelastic structural models.
Inelastic models were developed for the strengthened structure, and implemented in

Chapter 1
13
CASTEM. Both original and strengthened configurations are modelled independently.
Masonry infill walls, which play an important role especially in the original (non-
strengthened) frame, are modelled as diagonal struts. In Section 5.7 the tested structure is
assessed with the capacity spectrum method reviewed in Section 2.3.4. It is also proposed
and tested a MDOF non-linear dynamic displacement-based assessment method. Finally, in
Section 5.8, it is proposed a methodology to estimate the optimum distribution of
strengthening needs in existing buildings.
The last chapter of the thesis collects and further discusses the main contributions from the
research work and identifies key results, which can be considered relevant for the seismic
assessment and retrofitting of existing RC frame structures. Possible research directions are
also suggested.
Finally, Appendices A and B, report on the instrumentation details, test results, damage
observed during the tests and include a photographic documentation of the tests.
Definitions of certain terms related with the subjects herein studied and used in the thesis
are given in Appendix C.
CHAPTER 2
SEISMIC VULNERABILITY AND REHABILITATION OF EXISTING
RC STRUCTURES
'If we lose our origin, we will lose our identity.' (UNESCO, 1968)
2.1 - INTRODUCTION
There has been an increasing attention to the topic of seismic retrofit of existing buildings
in recent years. Griffith (1999-a), for example, highlighted the growing number of research
papers published in this field. Pinho (2000) also recalls the extensive literature on repair
and strengthening methods for RC structures. Several state-of-the-art reviews on repair and
strengthening published confirm the importance of the topic (e.g. Pinho, 2000;
Griffith, 1999-a; Dyngeland, 1998; Fardis, 1998; Sugano, 1996; Varum and
Oliveira, 1994; Bertero, 1992; Jirsa and Kreger, 1989). The current growing number of
national and international conferences and workshops, multi-partner and bilateral
cooperative research programmes and specialized publications dedicated to the assessment,
strengthening and repair of existing buildings, prove the actuality and vital importance of
the issue (see, for example, SPES, 2003; SPES, 2001; Geradin and Pinto, 2000;
Karadogan, 1998; EERI, 1996; Hanson, 1981).
The interest in the topic does not come as a surprise considering that past and recent
seismic activity show that, by far, the major damages and collapses of structures and
human life losses come from deficiencies in existing buildings. Recall the widespread
damage to older buildings and bridge structures in the relatively recent Loma Prieta,
Seismic vulnerability and rehabilitation of existing RC structures
16
Northridge, Kobe and Izmit earthquakes. As a result, in the US and Japan, in particular,
owners have begun to take action to prevent similar damage to existing structures in future
earthquakes. Similar actions should be encouraged in Europe.
This chapter overviews the current state of knowledge in the assessment and retrofitting of
seismically vulnerable existing RC structures (Section 2.2). Section 2.3 reviews the
methodologies for the assessment and redesign of existing structures. Lessons from recent
earthquakes are reviewed in Section 2.4. The analysis reveals the enormous amount of life
and property losses, which were mainly caused by the collapse or heavily damaged multi-
storey RC buildings. The seismic risk in urban areas is still worth considering, specially in
Europe where this type of building structures are so widespread. Section 2.5 identifies the
main causes of seismic damage and failure of existing RC buildings designed and/or
constructed without specific seismic capacity. Finally, strengthening techniques for the
existing RC structures are summarised in Section 2.6.
2.2 - STRUCTURAL ASSESSMENT AND RETROFITTING
As already stated in Chapter 1, seismic assessment and retrofit of existing constructions is
a complex and difficult issue evolving political, social, economic, technical and scientific
aspects. In particular, it was stated that the challenge to the scientific earthquake
engineering community is: a) to develop rational assessment and redesign methods; b) to
define appropriate decision criteria for retrofit of existing structures; and, c) to investigate
and assess innovative cost-effective strengthening solutions and techniques.
2.2.1 - Structural assessment
Seismic assessment of an existing structure can be defined as the detailed investigation to
determine the characteristics of the structure as it stands. It tries to identify the particular
structural weakness and deficiencies. Ersoy (1998) recalls that data collected at the
assessment stage is used to evaluate the seismic performance of the structure. As a result of
this evaluation, the structural engineer decides whether to repair or strengthen.

Chapter 2
17
The engineer should try to estimate the structural characteristics as accurately as possible.
However, as stated by Ersoy (1998), no matter how detailed the collected data is, the
structural characteristics estimated are not exact values. It involves numerous uncertainties,
such as the strength of the materials, reinforcement detailing of members, reduction of
stiffness due to time effect and cracking. In the seismic assessment of an existing structure,
the engineer should consider the possible variations of the estimated structural
characteristics. Since the construction type and quality are not the same in different
countries, such criteria should be calibrated using the data obtained for each country. The
effect of non-structural elements, such as infill walls, should also be taken into
consideration.
The structural assessment is highly relevant not only for old structures. As pointed out in
Bertero et al. (1991) and Anderson et al. (1991), most of the human injury and economic
loss due to moderate or severe earthquake ground motions are caused by failures of civil
engineering facilities, particularly buildings, many of which presumably were designed and
constructed to provide protection against such natural hazards. This has been confirmed
dramatically during recent earthquakes around the world (the 1985 Mexico, the 1988
Armenia, the 1989 Loma Prieta, the 1990 Iran, and the 1990 Philippines earthquakes).
The current available methods for evaluating the structural characteristics are quite
primitive and time consuming. When the building stock to be evaluated is very large, the
classical comprehensive evaluation methods become unfeasible. Also, the rehabilitation of
a large group of buildings may require investments beyond the budget. In such cases, it is
necessary to prioritize buildings by their vulnerability. Obtaining detailed data for a
comprehensive evaluation is highly time consuming and expensive. Furthermore, decisions
related to vulnerability can only be taken by the judgement of experienced engineers.
Therefore, the need for simple criteria and methods to select buildings with high
vulnerability (screening) and assign rehabilitation priorities of the building inventory is
obvious (Ersoy, 1998). Research leading to more accurate and faster evaluation tools and
rapid screening methods, such for example, the displacement-based method proposed by
Varum and Pinto (2001-b), Abrams (2000), Fajfar (2000), Taucer (2000), Calvi (1999),
Priestley (1998), Calvi and Pavese (1997), Kowalsky et al. (1994), as well as, the
development of instrumentation for assessment of old structures should be encouraged.
Seismic vulnerability and rehabilitation of existing RC structures
18
2.2.2 - Structural retrofitting
Structural retrofitting can be defined as the operation to bring the structural system or some
of the structural members to a specified performance level. Depending on the state of the
structure and on the purpose, rehabilitation can simply be classified as: a) repair; or b)
strengthening. Structural repair is the rehabilitation of a damaged structure, or of a
structural member with the objective of regaining the capacity back to the pre-damage
state. Structural strengthening is increasing the existing capacity (in strength, ductility or
stiffness) of an undamaged structure or of a structural member to a specified higher
performance level (Ersoy, 1998).
Before making any retrofitting intervention (repair or strengthening), a detailed assessment
should be made (as discussed in previous Section 2.2.1). Using the data obtained from the
assessment, the engineer decides whether repair or strengthening is needed or not. As
referred by Ersoy (1998), in the redesign for repair or strengthening, the engineer should
first define the performance level expected from the structure. Then, he should decide,
using design codes and data obtained from the assessment, what to use as design loads
and/or deformation limits, load factors, material strength and material factors. The
retrofitting strategy depends on the degree of the deficiencies identified in the assessment
analysis (Fardis, 1998):
• If the structural deficiencies are found just in a few scattered components, then the
strategy of local modification of these components can be sufficient to guaranty the
structural performance objectives.
• When the deficiencies are concentrated in one part of the structure (may be due to
an irregularity of the structural configuration as a weak-storey or a torsionally
unbalanced structure), then it is required to strengthen some vertical elements
(those of the weak-storey or of the weak and flexible side of the building), to add
some new elements which are strong and stiff enough to remove or overshadow the
irregularity, or to remove material to weaken some elements. For strongly 3D
irregular structural configuration, vertical joints could be introduced at selected
locations in plan, cutting the building into a set of structurally independent but
regular units.
Chapter 2
19
• But, if the preliminary evaluation reveals a generalised deficiency in the building, a
more radical intervention may be necessary (addition of shear walls or bracing
systems, upgrading most existing elements, especially vertical elements).
Although repair and strengthening are made to provide satisfactory performance of the
structure under different load effects, seismic action becomes the main concern of the
engineer at the redesign stage in countries located in seismic regions. Nevertheless, since
the costs of seismic repair are quite high, seismic strengthening of existing buildings to
reduce hazards of probable future earthquakes is finding support in many countries
(Ersoy, 1998).
2.2.3 - Seismic assessment and redesign criteria and codes: Overview
Seismic design of buildings has slowly evolved over the time by a trial and error process.
The trend in the early 1900's was to use conventional building technology methods with
minor modifications to account for earthquakes, in response to previous observed damage.
In recent decades, the primary focus has been the study and enhancement of conventional
systems and element connections performed in structural laboratories and institutes
(Elsesser, 2002).
Fardis (2000) recalls that worldwide experience from past earthquakes shows that non-
ductile RC frame buildings are one of the most vulnerable and represent, overall, the
largest threat to human life and property in future earthquakes (as illustrated in
Section 2.4).
As recalled by Fardis (1998), the design of new buildings for earthquake actions is
relatively recent in Europe. Until the 1950's in the US and until the 1960's in Europe, there
were essentially no formal seismic design provisions in design codes. It was only in the
mid-1970's that provisions for design and detailing of members and structures came out in
the US standards. Yet, it was not before the mid-1980's that these provisions were included
in the European national codes.
Since the 1926 code, Japan's seismic codes have typically been as advanced as any in the
world. The regulations have been reviewed and amended several times over the years as
Seismic vulnerability and rehabilitation of existing RC structures
20
the result of damage during strong-motion earthquakes (EQE, 1995). Japan applies since
1977 a very practical three-level seismic assessment procedure. The first level screens out
strong buildings. Application of the two higher levels to the questionable buildings is easy
and fast and gives fairly realistic assessment results. The higher level assessment procedure
is enforced since 1996 as a law for the promotion of strengthening of private vulnerable
buildings (Fardis, 2000).
After a well coordinated effort during at least one decade, the US Federal Management
Emergency Agency (FEMA) came up since 1996 with seismic assessment and
rehabilitation guidelines (ATC-40, 1996; FEMA-273, 1997; FEMA-274, 1997;
FEMA-310, 1998) that produce more economic and rational results than earlier ad-hoc
procedures based on adaptation of design codes for new buildings. These guidelines are
essentially displacement-based. They employ linear or equivalent static or multimodal
analysis, or non-linear static (pushover) or dynamic (time-history) analysis, depending on
the (strength and stiffness) regularity of the structure and the choice of the engineer
between the opposite extremes of sophistication on one hand and conservatism on the
other. Instead of a global behaviour factor (q) they use demand-supply comparisons for the
deformation capacities of individual elements, existing, retrofitted or new (Fardis, 2000).
The Eurocodes, originally aiming at the unification of the European codes in the field of
constructions, nowadays introduce innovations and improvements in the quality of design
of new structures. Regarding safety, they point at ductile buildings in order to provide
strength even under heavy but localised loading. The ductility demand is particularly
important under seismic loading and the competent EC8 is wholly innovative in relation to
the codes in force in the European Community.
Reinforced concrete and masonry are, by far, the most common structural materials in the
seismic regions of Europe. The average size and occupancy of individual RC buildings
exceed by far those of masonry buildings. Moreover, facilities that are crucial in the post-
earthquake emergency period (police station, fire station, hospitals, schools, banks, hotels,
administrative and government centres, power and telecommunication facilities) are
typically RC buildings. For these reasons, it is argued that European pre-normative and
normative research in seismic assessment and rehabilitation of existing buildings should

Chapter 2
21
primarily focus on these two structural materials, with some priority to RC buildings
(Fardis, 2000).
Policy- and code-makers in Europe recognised the seriousness of the problem and decided
to address strengthening of existing structures within the system of Eurocodes for the
seismic action alone. Eurocode 8 Part 1-3, strengthening and repair of buildings, was one
of the first seismic assessment and rehabilitation standards in the world to be applied. To
encourage its use by practitioners familiar with codified seismic design, and in particular
with the parts of EC8 applicable to new structures, EC8 Part 1-3 tries to bring the problem
of seismic assessment and rehabilitation as close as possible to that of new designs. To this
end, the engineer is asked to determine first the value of the global behaviour factor, which
is compatible with the available ductility of the structure. Members are then assessed by
comparing their design resistance to seismic internal forces, determined from linear
analysis, and the design spectrum entered with the above global q-factor. Strengthening
should be such that this verification is fulfilled throughout the existing structure and should
employ a q-factor consistent with the global configuration and strength hierarchy in the
modified system and the local ductility of all it's members: new, modified and old ones
(Fardis, 2000).
The current state of practice in Europe makes difficult to introduce some of the current
scientific knowledge into the EN for 'Strengthening and Repair'. Moreover, there are many
open questions on several issues, such as those regarding the performance of members and
structures of existing buildings designed only for gravity loads (Fardis, 2000).
To resolve some of these questions, further research is required at the European level.
Moreover, the development of rational, simple and practical seismic assessment procedures
is required for low-to-medium-rise regular buildings. Such procedures should be
influenced by the spirit of the recent US documents (FEMA, ATC) and by the
displacement-based philosophy (see Varum and Pinto, 2001-b, for example), but should
entail less sophistication and engineering effort than required by ATC-40 (1996) and
FEMA-274 (1997). Last but not least, complete and clear provisions for the design and
detailing of the strengthening of existing elements need to be developed for EC8, including
simple procedures for designing of the retrofitting for the most common and effective
strengthening techniques (Fardis, 2000).

Seismic vulnerability and rehabilitation of existing RC structures
22
2.3 - METHODOLOGIES FOR ASSESSMENT AND REDESIGN
The seismic vulnerability of a building or other structure may be defined as its
susceptibility to damage during an earthquake having a specified level of ground shaking.
This damage may result in physical injury or death to occupants, temporary or permanent
loss of function of the building, and associated economic impact. The degree of seismic
vulnerability of a building will depend upon its general configuration, load transfer system,
design specifics, and the quality of materials and construction. By carefully examining
these factors, it is possible to estimate the level of vulnerability of a class of buildings or a
specific building structure (Imanbekov et al., 1999).
Various analysis methods, either linear elastic or non-linear are available for the
performance analysis of existing reinforced concrete buildings. Elastic analysis methods
include code static lateral force procedures, code dynamic lateral force procedures and
elastic procedures using demand capacity ratios (ATC-40, 1996). The most popular non-
linear analysis methods are the non-linear time history analysis and simplified non-linear
static analysis.
The non-linear time history analysis method, with recorded or simulated ground motion
records, provides the most accurate means for predicting seismic demands (Fajfar, 1998).
This inelastic dynamic method is widely used to model specimens tested in laboratory and
real structures with a reduced number of elements. Despite its advantages, it must be
admitted that non-linear time history analysis can frequently become overly complex and
impractical for general use as a first assessment. An alternative is to use simplified non-
linear static analysis methods.
In Section 2.3.1 are recalled some concepts on performance-based design, performance
design objective matrix, and earthquake hazard levels according to the VISION-2000
committee (SEAOC, 1995) and ATC-40 (1996). In the following Sections 2.3.2 to 2.3.4
are described three of the most popular simplified non-linear static procedures, namely: a)
the displacement coefficient method, which uses pushover analysis and a modified version
of the equal displacement approximation; b) the N2 method, that uses non-linear analysis
and two mathematical models; and, c) the capacity spectrum method. The capacity
spectrum method (CSM) is described in more detail, because it is used in Chapter 5 to

Chapter 2
23
assess the structural response. Finally, in Section 2.3.5 it is described the procedure
adopted to estimate the damping from the experimental tests, as will be presented in
Chapter 5.
2.3.1 - Performance-based design and assessment
Performance-based design (PBD) procedures intend to design and redesign structures to
perform at appropriate levels for all earthquakes. In Europe, the concept is usually called
Limit State Design (Fajfar, 1998). PBD involves the design of structures that will resist
earthquakes of different severities within specified limiting levels of damage.
A performance level is a damage state or a limit state. It is a measure of the maximum
desired extent of damage to a facility given that a specific earthquake design level affects it
(Fajfar, 1998). Each performance level is defined for the structural system (structural
performance level), the non-structural system (non-structural performance level) and
facility content (content performance level).
The VISION-2000 committee (SEAOC, 1995) has selected and defined four individual
performance levels (see also Figure 2.1), namely:
• 'Fully Operational' or 'Serviceable' (facility continues in operation with negligible
damage);
• 'Operational' or 'Functional' (facility continues in operation with minor damage and
minor disruption in non-essential services);
• 'Life Safety' (life safety is substantially protected, damage is moderate to extensive);
and,
• 'Near Collapse' or 'Impending Collapse' (life safety is at risk, damage is severe, and
structural collapse is prevented).
In ATC-40 (1996) are also proposed four performance levels, namely: 'Operational',
'Immediate Occupancy', 'Life Safety', and 'Structural Stability'.
The seismic hazard at a given site is represented as a set of earthquake ground motions and
associated hazards with specified probabilities of occurrence. The VISION-2000

Seismic vulnerability and rehabilitation of existing RC structures
24
committee has proposed four levels of probabilistic events (SEAOC, 1995), as presented in
Table 2.1 (see also Figure 2.1).
Table 2.1 - Earthquake hazard level (according to SEAOC, 1995)
Event Recurrence interval Probability of exceedance
Frequent 43 years 50% in 30 years
Occasional 72 years 50% in 50 years
Rare 475 years 10% in 50 years
Very Rare 970 years 10% in 100 years
In Table 2.2 are presented the three hazard levels of earthquake ground motion defined at
ATC-40 (1996), namely: the 'Serviceability Earthquake' (SE), the 'Design Earthquake'
(DE), and the 'Maximum Earthquake' (ME).
Table 2.2 - Earthquake hazard level (according to ATC-40, 1996)
Event Recurrence interval Probability of exceedance
SE 75 years 50% in 50 years
DE 500 years 10% in 50 years
ME 1000 years 5% in 50 years
In Figure 2.1 is presented the matrix of seismic performance objectives for buildings
recommended by the VISION-2000 committee (SEAOC, 1995).
Earthquake Performance LevelFully Operational Operational Life Safe Near Collapse
UnacceptablePerformance
(for new construction)
Frequent(43 year)
Occasional(72 year)
(475 year)Rare
Very Rare(970 year)Ea
rthqu
ake
Des
ign
Leve
l
SAFETY CRITICAL OBJECTIVE
ESSENTIAL/HAZARDOUS OBJECTIVE
BASIC OBJECTIVE
Figure 2.1 - Seismic performance design objective matrix (VISION-2000, SEAOC, 1995)

Chapter 2
25
2.3.2 - Displacement coefficient method
The displacement coefficient method (DCM), proposed in FEMA-273 (1997), estimates
the structural performance point in terms of maximum expected top-displacement (δt) of a
building. It combines the pushover analysis with a modified version of the equal
displacement approximation. The linear elastic spectral displacement, Sd, or spectral
acceleration, Sa, corresponding to the effective fundamental period Teff and damping of the
linear equivalent SDOF system, is corrected by some factors as follows (Albanesi et
al., 2002)
2
2
32103210 4πδ eff
adt
TSCCCCSCCCC ⋅⋅⋅⋅=⋅⋅⋅⋅= (2.1)
where: C0 is the modification factor to relate spectral displacement and likely building
expected maximum top-displacement, C1 is the modification factor to relate expected
maximum inelastic top-displacement to the displacement calculated for linear elastic
response, C2 is the modification factor to represent the effect of hysteresis shape on the
maximum displacement response, and C3 is the modification factor to represent increased
displacements due to second order effects (FEMA-273, 1997). These corrective factors
were obtained for regular frame buildings. The determination of these factors for structures
with irregularities in terms of mass distribution, stiffness and strength is under
investigation, as referred by Albanesi et al. (2002). The DCM provides a direct numerical
procedure to define displacement demand and does not need conversion into spectral
format, by contrast to the capacity spectrum method.
2.3.3 - N2 method
The N2 method was initially influenced by the Q-model developed by Saiidi and
Sozen (1981). From the original version, Fajfar (2002, 2000, 1998), Fajfar et al. (1997)
developed the method, which is adopted in the most recent draft of the Eurocode 8.
The N2 method combines pushover analysis with response spectrum approach and
provides tools for a rational and practical evaluation procedure for multiple performance
objectives (Fajfar, 1998). This performance evaluation method, described in detail by
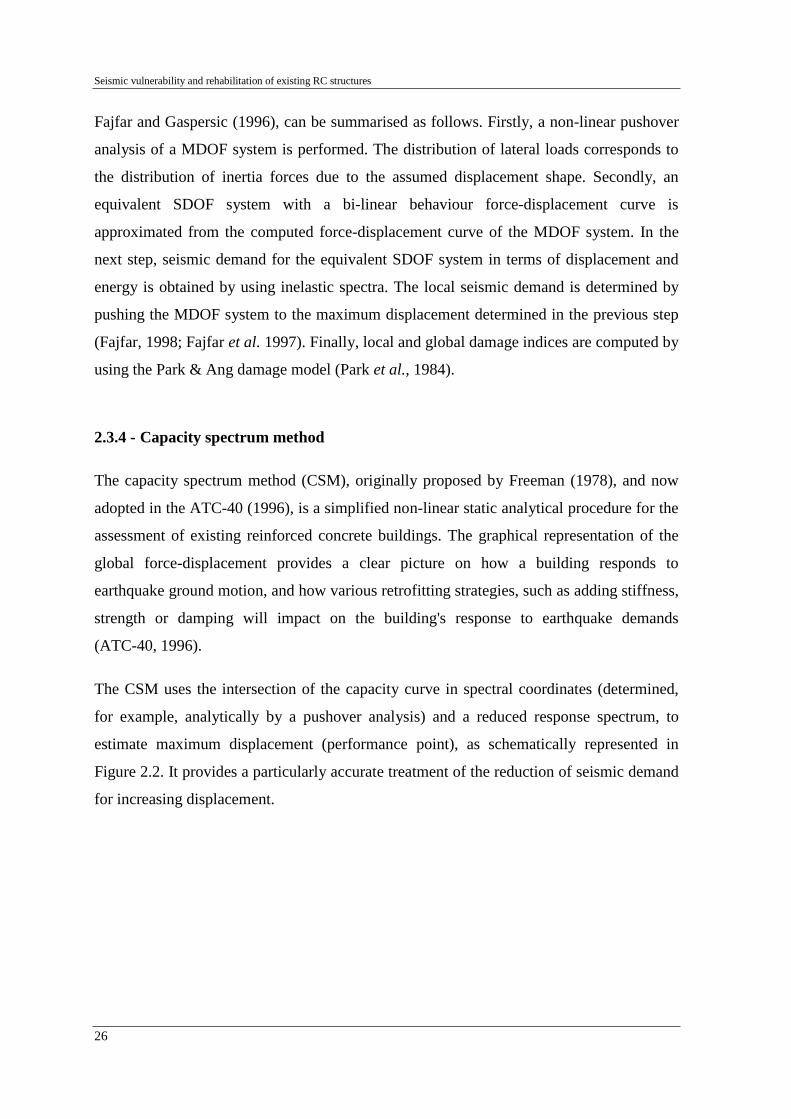
Seismic vulnerability and rehabilitation of existing RC structures
26
Fajfar and Gaspersic (1996), can be summarised as follows. Firstly, a non-linear pushover
analysis of a MDOF system is performed. The distribution of lateral loads corresponds to
the distribution of inertia forces due to the assumed displacement shape. Secondly, an
equivalent SDOF system with a bi-linear behaviour force-displacement curve is
approximated from the computed force-displacement curve of the MDOF system. In the
next step, seismic demand for the equivalent SDOF system in terms of displacement and
energy is obtained by using inelastic spectra. The local seismic demand is determined by
pushing the MDOF system to the maximum displacement determined in the previous step
(Fajfar, 1998; Fajfar et al. 1997). Finally, local and global damage indices are computed by
using the Park & Ang damage model (Park et al., 1984).
2.3.4 - Capacity spectrum method
The capacity spectrum method (CSM), originally proposed by Freeman (1978), and now
adopted in the ATC-40 (1996), is a simplified non-linear static analytical procedure for the
assessment of existing reinforced concrete buildings. The graphical representation of the
global force-displacement provides a clear picture on how a building responds to
earthquake ground motion, and how various retrofitting strategies, such as adding stiffness,
strength or damping will impact on the building's response to earthquake demands
(ATC-40, 1996).
The CSM uses the intersection of the capacity curve in spectral coordinates (determined,
for example, analytically by a pushover analysis) and a reduced response spectrum, to
estimate maximum displacement (performance point), as schematically represented in
Figure 2.2. It provides a particularly accurate treatment of the reduction of seismic demand
for increasing displacement.
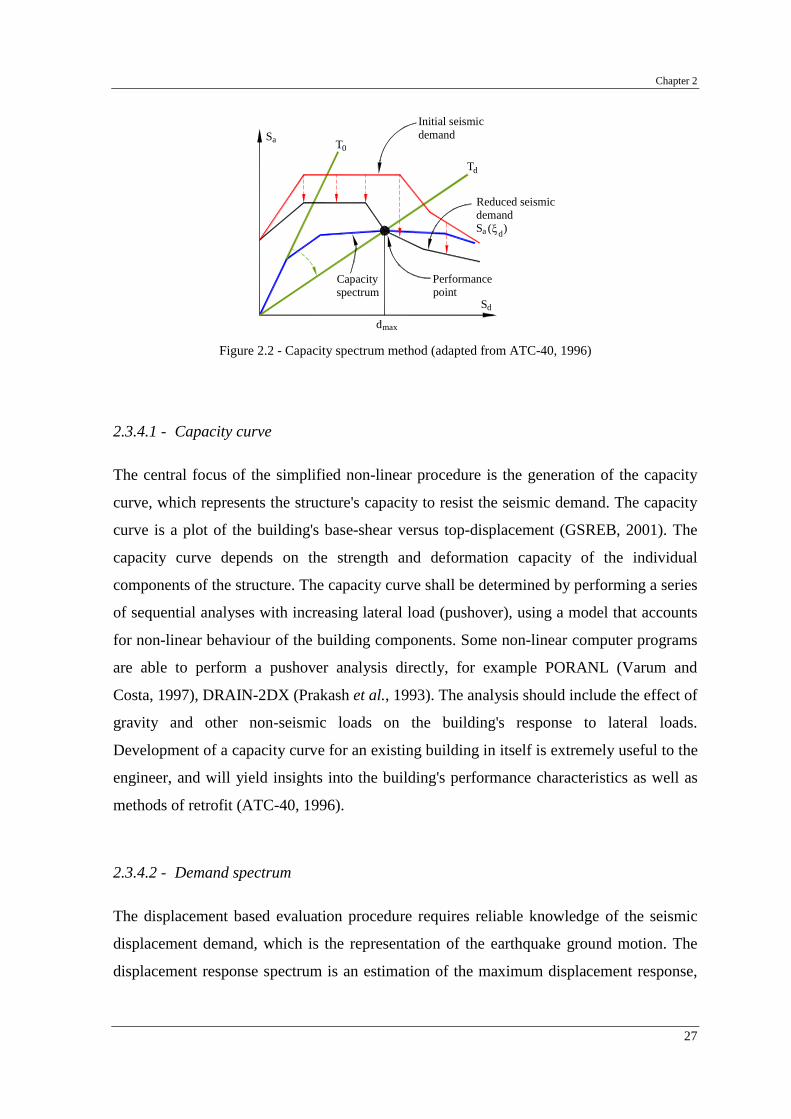
Chapter 2
27
Capacity spectrum
Performance point
Reduced seismic demand
ξd
0aS
Sd
maxd
Initial seismic demand
T
dT
Sa ( )
Figure 2.2 - Capacity spectrum method (adapted from ATC-40, 1996)
2.3.4.1 - Capacity curve
The central focus of the simplified non-linear procedure is the generation of the capacity
curve, which represents the structure's capacity to resist the seismic demand. The capacity
curve is a plot of the building's base-shear versus top-displacement (GSREB, 2001). The
capacity curve depends on the strength and deformation capacity of the individual
components of the structure. The capacity curve shall be determined by performing a series
of sequential analyses with increasing lateral load (pushover), using a model that accounts
for non-linear behaviour of the building components. Some non-linear computer programs
are able to perform a pushover analysis directly, for example PORANL (Varum and
Costa, 1997), DRAIN-2DX (Prakash et al., 1993). The analysis should include the effect of
gravity and other non-seismic loads on the building's response to lateral loads.
Development of a capacity curve for an existing building in itself is extremely useful to the
engineer, and will yield insights into the building's performance characteristics as well as
methods of retrofit (ATC-40, 1996).
2.3.4.2 - Demand spectrum
The displacement based evaluation procedure requires reliable knowledge of the seismic
displacement demand, which is the representation of the earthquake ground motion. The
displacement response spectrum is an estimation of the maximum displacement response,

Seismic vulnerability and rehabilitation of existing RC structures
28
during the ground motion, as a function of the fundamental period of the building. The
seismic displacement demand is site-dependent, therefore investigations of the dynamic
soil behaviour are important in many cases.
The demand spectrum is a plot of the spectral acceleration and spectral displacement of the
earthquake ground motion in the Acceleration-Displacement Response Spectra (ADRS)
format (GSREB, 2001), for a given damping ratio. For any point of the acceleration
response spectrum, the corresponding spectral displacement can be computed as follows
224
1 TSS ad ⋅⋅=π
(2.2)
where: T represents the period, Sa and Sd are the spectral acceleration and the spectral
displacement, respectively.
2.3.4.3 - Performance point
The performance point (PP) represents the maximum top-displacement expected for the
demand earthquake ground motion. When the displacement corresponding to the
intersection of the capacity spectrum and the demand spectrum are of the same damping
value, this intersection point is considered the performance point.
2.3.4.4 - Performance objective
A seismic performance objective (PO) is defined by selecting a desired building
performance level for a given level of earthquake ground motion, as represented in
Table 2.3. According to ATC-40 (1996), three levels of earthquake hazard are used to
define ground shaking, namely: the 'Serviceability Earthquake' (SE), the 'Design
Earthquake' (DE), and the 'Maximum Earthquake' (ME). They are defined probabilistically
as the level of ground shaking that has respectively a 50%, 10% and 5%, probability of
exceedance in 50-years.
A dual- or multiple-level performance objective can be created by selecting two or more
different desired performances, each for a different level of ground motion.
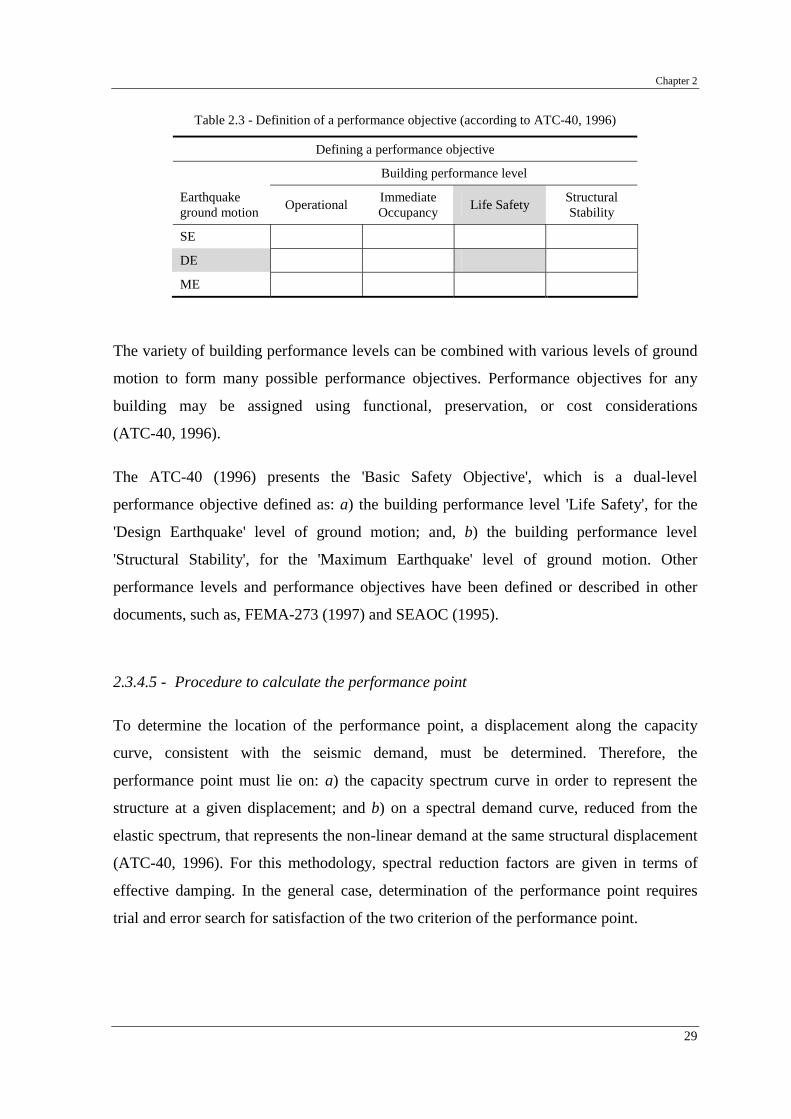
Chapter 2
29
Table 2.3 - Definition of a performance objective (according to ATC-40, 1996)
Defining a performance objective
Building performance level
Earthquake ground motion Operational Immediate
Occupancy Life Safety Structural Stability
SE
DE
ME
The variety of building performance levels can be combined with various levels of ground
motion to form many possible performance objectives. Performance objectives for any
building may be assigned using functional, preservation, or cost considerations
(ATC-40, 1996).
The ATC-40 (1996) presents the 'Basic Safety Objective', which is a dual-level
performance objective defined as: a) the building performance level 'Life Safety', for the
'Design Earthquake' level of ground motion; and, b) the building performance level
'Structural Stability', for the 'Maximum Earthquake' level of ground motion. Other
performance levels and performance objectives have been defined or described in other
documents, such as, FEMA-273 (1997) and SEAOC (1995).
2.3.4.5 - Procedure to calculate the performance point
To determine the location of the performance point, a displacement along the capacity
curve, consistent with the seismic demand, must be determined. Therefore, the
performance point must lie on: a) the capacity spectrum curve in order to represent the
structure at a given displacement; and b) on a spectral demand curve, reduced from the
elastic spectrum, that represents the non-linear demand at the same structural displacement
(ATC-40, 1996). For this methodology, spectral reduction factors are given in terms of
effective damping. In the general case, determination of the performance point requires
trial and error search for satisfaction of the two criterion of the performance point.

Seismic vulnerability and rehabilitation of existing RC structures
30
2.3.4.6 - Conversion of the capacity curve to the capacity spectrum
In order to use the capacity spectrum method, it is necessary to convert the capacity curve,
which is in terms of base-shear versus top-displacement, to a capacity spectrum. The
capacity spectrum is a representation of the capacity curve in the Acceleration-
Displacement Response Spectra (ADRS) format.
In order to calculate the capacity spectrum from the capacity curve, it is necessary to do a
point-by-point conversion to spectral coordinates. Any point of the curve base-shear (V)
versus top-displacement (∆roof) on the capacity curve is converted to the corresponding
point (Sa ; Sd) in the capacity spectrum using the following equations (ATC-40, 1996)
α1
⋅=WVSa
1,1 roof
roofd PF
Sφ⋅
∆= (2.3, 2.4)
where, Sa and Sd are respectively the spectral acceleration and the spectral displacement, α
and 1PF are respectively the modal mass coefficient and the modal participation factor, for
the first natural mode of the structure, and 1,roofφ is the roof level amplitude of the first
mode (see Figure 2.3). W represents the building dead load weight plus likely live loads.
φroof,1PF1 ~~ 1.6
roof∆ ∆roof ∆roof ∆roof
1.4~~roof,11φPF 1.2~~roof,11φPF 1.0~~roof,11φPF
Sd SdSd
Sd
αV= aS W α 0.7~~ ~~ 0.8α ~~ 0.9α ~~ 1.0α
Figure 2.3 - Modal participation factors and modal mass coefficients (ATC-40, 1996)
To convert the capacity curve to the capacity spectrum, that is, converting the capacity
curve into the ADRS format, the following expressions are used to calculate the modal
participation factor and the modal mass coefficient
Chapter 2
31
∑
∑
=
=
⋅
⋅= N
iii
N
iii
gw
gwPF
1
21
11
1
)(
)(
φ
φ
⋅⋅
⋅
=
∑∑
∑
==
=N
iii
N
ii
N
iii
gwgw
gw
1
21
1
2
11
1
)(
)(
φ
φα (2.5, 2.6)
where: gwi represents the mass assign to the level i, 1iφ is the amplitude of mode 1 at
level i, and N is the uppermost level of the structure.
2.3.5 - Equivalent damping ratio
As stated by Priestley (1997), the equivalent damping, for concrete structures, depends on
the structural displacement ductility demand ( yd ∆∆=∆ /µ , as the ratio between maximum
displacement, d∆ , and the displacement corresponding to the yielding, y∆ ) and the
predominant location (in beams or columns) of plastic hinging developed in the structure,
as shown in Figure 2.4. The energy dissipated in beam plastic hinges is typically larger
than in column plastic hinges, and this should be recognized in the estimation of equivalent
viscous damping.
(% cr)ξ
Beam
Column
2 4 6 8 10
µ∆
10
20
30
40
50
Figure 2.4 - Equivalent viscous damping for reinforced concrete structures (adapted from Priestley, 1997)
The simplest definition of equivalent viscous damping is based on the measured response
of a system to harmonic force at exciting frequency (ω ) equal to the natural frequency
( nω ) of the system. This is the equivalent viscous damping since it accounts for all the
energy-dissipating mechanisms (Chopra, 2001).

Seismic vulnerability and rehabilitation of existing RC structures
32
The most common method for defining equivalent viscous damping is to equate the energy
dissipated in a vibration cycle of the actual structure and an equivalent viscous system. For
an actual structure the force-displacement relation obtained from an experiment under
cyclic loading with displacement amplitude u0 is determined; such a relation of arbitrary
shape is shown schematically in Figure 2.5.
S0E
DE
D
0D
F
Figure 2.5 - Energy dissipated ED in a cycle of harmonic vibration determined from an experiment (Chopra, 2001)
The energy dissipated in the structure is given by the area ED enclosed by the hysteresis
loop. Equating this to the energy dissipated in viscous damping leads to
0
141
S
D
neq E
E⋅⋅=
ωωπξ (2.7)
where the strain energy, 2200 ukES ⋅= , is calculated from the stiffness (k) determined by
experiment.
The experiment leading to the force-deformation curve of Figure 2.5, and hence ED, should
be conducted at nωω = , where the response of the system is most sensitive to damping.
Under these conditions Equation (2.7) gives
04
1
S
Deq E
E⋅=
πξ (2.8)
The equivalent damping ratio ( eqξ ) of a general structural system determined from a test at
nωω = would not be correct at any other exciting frequency, but it would be a satisfactory

Chapter 2
33
approximation (Chopra, 2001). Iwan and Gates (1979) present a summary of equivalent
damping ratios for different behaviour models.
To estimate the equivalent damping from experimental PsD tests, first it is calculated the
damping at storey level, and subsequently it is computed the global damping for the
structural system, as explained next.
For each storey, the equivalent damping is evaluated for each half-cycle of the curves
force-displacement, as represented in Figure 2.6. The damping is calculated for each
degree of freedom, considered at storey level. From the force-displacement half-cycle the
equivalent linear viscoelastic damping is identified as described in the following steps:
i) The absorbed energy ( DE ) is computed by performing the integral of the force-
displacement curve (by the differential displacement);
ii) From each force-displacement half-cycle is evaluated the maximum generalised force
( maxF ) and the maximum generalised displacement ( maxD ), which allows to calculate
the strain energy ( 0SE ); and,
iii) Finally, the equivalent linear viscous damping ratio ( eqξ ) is computed with the
Expression (2.9), for each half-cycle, characterised by it displacement amplitude
( maxD ).
Aloop
F
Arig
D
Ahalf-loop
Dmax
maxF
Figure 2.6 - Damping for an hysteretic cycle
maxmax0 8
141
DFA
EE loophalf
S
Deq ⋅
⋅=⋅= −
ππξ (2.9)

Seismic vulnerability and rehabilitation of existing RC structures
34
For a MDOF system, the global structural equivalent damping can be computed, as stated
by Priestley (1997), as a function of the effective damping estimated for each component
(storey the case of buildings) weighted with the storey potential energy, given by
∑
∑
=
=
×= ns
ii
ns
iii
G
E
E
1
1
ξξ (2.10)
where: Gξ is the equivalent damping of the global system; iξ is the equivalent damping of
the component i of the system (column, beam or storey); iE is the potential energy in the
component i and for the level of damping iξ ; ns is the number of components of the
system.
This methodology will be used to estimate the structural equivalent damping from the
results of the pseudo-dynamic tests in Section 5.7.1.
2.4 - FIELD EVIDENCE: OBSERVED DAMAGE IN RC BUILDINGS AND
CASUALTIES DURING RECENT EARTHQUAKES
'Buildings were toppled, houses were in rubbles, infernos swallowed entire towns, elevated highways and railways collapsed and crumbled cliffs buried houses. Everywhere people died...' (Asahi Evening News, 18th January 1995, on the day after the Kobe earthquake)
Observations on the performance of structures during strong earthquakes have served as a
mean of teaching builders and engineers on proper and improper construction of
earthquake load resisting systems. In regions that have long been inhabited, and that are
subjected to relatively frequent strong ground shaking, design procedures have evolved,
resulting in relatively good performance of engineered structures (Moehle and
Mahin, 1991). Although such design procedures are not universally applicable because of
regional differences in construction materials and techniques, structural engineers can learn
much by studying such procedures.

Chapter 2
35
Next, the disastrous consequences resulting from recent seismic activity are reviewed,
based on reconnaissance documentation, and drawing on examples from the March 2001
Geiyo earthquake in southwest Japan, to the 1994 Northridge earthquake in Los Angeles.
Particular attention is drawn to the 17th August 1999 Izmit earthquake, in Turkey, because
the affected structures are representative of the construction practice in southern Europe
until the late 1970's. The analysis highlights the vulnerability of RC buildings, the type of
structures investigated in the studies conducted in this thesis. The devastation, human
casualties and economic losses resulting from seismic activity in a recent past around the
world confirm that research on repair and strengthening of RC structures is urgently
needed.
2.4.1 - The 24th March 2001 Geiyo earthquake, southwest Japan
An earthquake of magnitude 6.9 struck Hiroshima, 580 km southwest of Tokyo, in Japan,
on Saturday, 24th March 2001. The earthquake occurred on the Philippine Sea Plate, close
to the subduction zone interface with the Eurasian Plate. While ground shaking was intense
in certain localized areas, the magnitude reflects a moderate earthquake. The epicentre is
estimated offshore in Hiroshima Bay, some 51 km deep. There were no reports of tsunami.
Two people were reported dead, and nearly 200 injured. The most severe damage in
Imabari City was the partial collapse of a RC three-storey residential building, in which the
first-storey columns failed, as shown in Figure 2.7. The damage was indicative of soft-
storey effects and non-ductile detailing of reinforced concrete (EQE, 2001).
Figure 2.7 - Partial collapse of a three-storey residential building in Imabari (EQE, 2001)
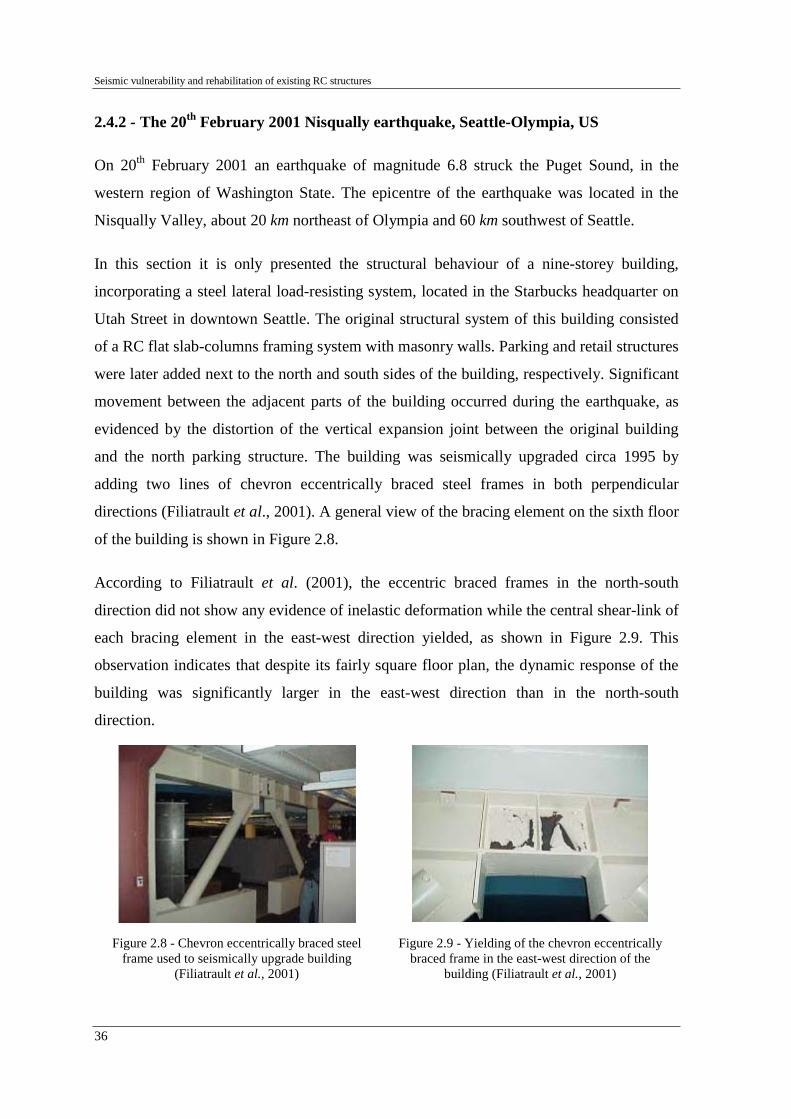
Seismic vulnerability and rehabilitation of existing RC structures
36
2.4.2 - The 20th February 2001 Nisqually earthquake, Seattle-Olympia, US
On 20th February 2001 an earthquake of magnitude 6.8 struck the Puget Sound, in the
western region of Washington State. The epicentre of the earthquake was located in the
Nisqually Valley, about 20 km northeast of Olympia and 60 km southwest of Seattle.
In this section it is only presented the structural behaviour of a nine-storey building,
incorporating a steel lateral load-resisting system, located in the Starbucks headquarter on
Utah Street in downtown Seattle. The original structural system of this building consisted
of a RC flat slab-columns framing system with masonry walls. Parking and retail structures
were later added next to the north and south sides of the building, respectively. Significant
movement between the adjacent parts of the building occurred during the earthquake, as
evidenced by the distortion of the vertical expansion joint between the original building
and the north parking structure. The building was seismically upgraded circa 1995 by
adding two lines of chevron eccentrically braced steel frames in both perpendicular
directions (Filiatrault et al., 2001). A general view of the bracing element on the sixth floor
of the building is shown in Figure 2.8.
According to Filiatrault et al. (2001), the eccentric braced frames in the north-south
direction did not show any evidence of inelastic deformation while the central shear-link of
each bracing element in the east-west direction yielded, as shown in Figure 2.9. This
observation indicates that despite its fairly square floor plan, the dynamic response of the
building was significantly larger in the east-west direction than in the north-south
direction.
Figure 2.8 - Chevron eccentrically braced steel frame used to seismically upgrade building
(Filiatrault et al., 2001)
Figure 2.9 - Yielding of the chevron eccentrically braced frame in the east-west direction of the
building (Filiatrault et al., 2001)
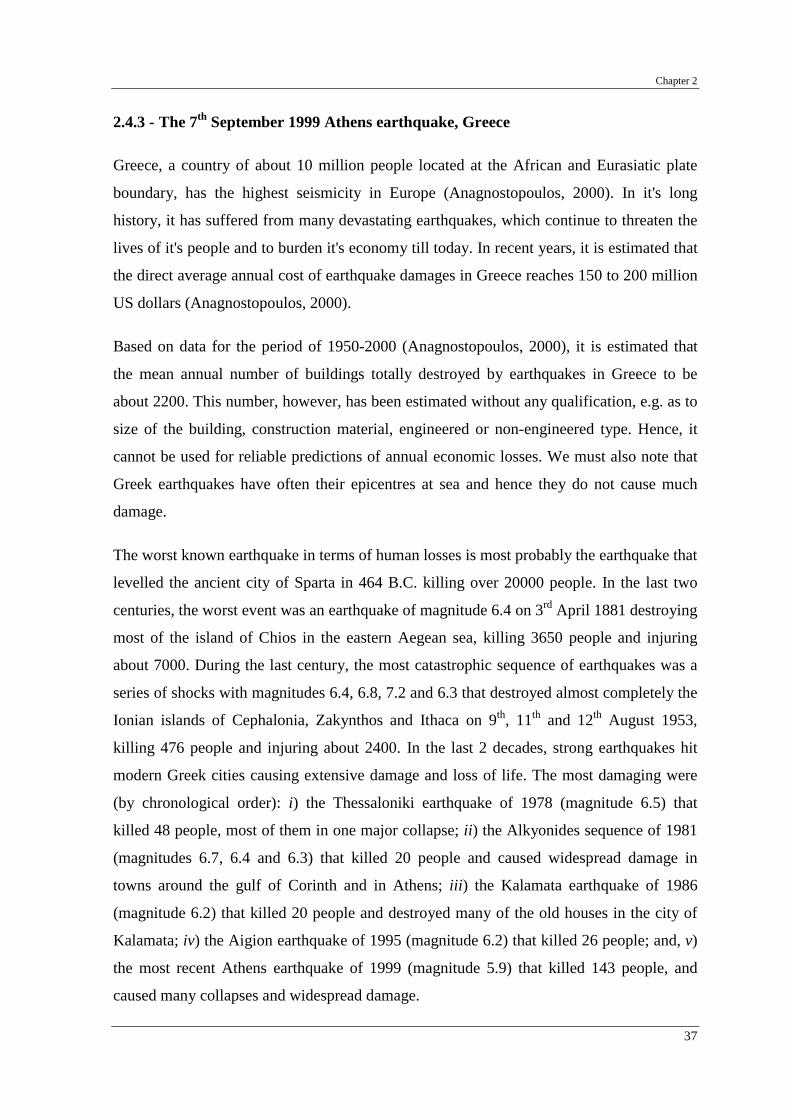
Chapter 2
37
2.4.3 - The 7th September 1999 Athens earthquake, Greece
Greece, a country of about 10 million people located at the African and Eurasiatic plate
boundary, has the highest seismicity in Europe (Anagnostopoulos, 2000). In it's long
history, it has suffered from many devastating earthquakes, which continue to threaten the
lives of it's people and to burden it's economy till today. In recent years, it is estimated that
the direct average annual cost of earthquake damages in Greece reaches 150 to 200 million
US dollars (Anagnostopoulos, 2000).
Based on data for the period of 1950-2000 (Anagnostopoulos, 2000), it is estimated that
the mean annual number of buildings totally destroyed by earthquakes in Greece to be
about 2200. This number, however, has been estimated without any qualification, e.g. as to
size of the building, construction material, engineered or non-engineered type. Hence, it
cannot be used for reliable predictions of annual economic losses. We must also note that
Greek earthquakes have often their epicentres at sea and hence they do not cause much
damage.
The worst known earthquake in terms of human losses is most probably the earthquake that
levelled the ancient city of Sparta in 464 B.C. killing over 20000 people. In the last two
centuries, the worst event was an earthquake of magnitude 6.4 on 3rd April 1881 destroying
most of the island of Chios in the eastern Aegean sea, killing 3650 people and injuring
about 7000. During the last century, the most catastrophic sequence of earthquakes was a
series of shocks with magnitudes 6.4, 6.8, 7.2 and 6.3 that destroyed almost completely the
Ionian islands of Cephalonia, Zakynthos and Ithaca on 9th, 11th and 12th August 1953,
killing 476 people and injuring about 2400. In the last 2 decades, strong earthquakes hit
modern Greek cities causing extensive damage and loss of life. The most damaging were
(by chronological order): i) the Thessaloniki earthquake of 1978 (magnitude 6.5) that
killed 48 people, most of them in one major collapse; ii) the Alkyonides sequence of 1981
(magnitudes 6.7, 6.4 and 6.3) that killed 20 people and caused widespread damage in
towns around the gulf of Corinth and in Athens; iii) the Kalamata earthquake of 1986
(magnitude 6.2) that killed 20 people and destroyed many of the old houses in the city of
Kalamata; iv) the Aigion earthquake of 1995 (magnitude 6.2) that killed 26 people; and, v)
the most recent Athens earthquake of 1999 (magnitude 5.9) that killed 143 people, and
caused many collapses and widespread damage.
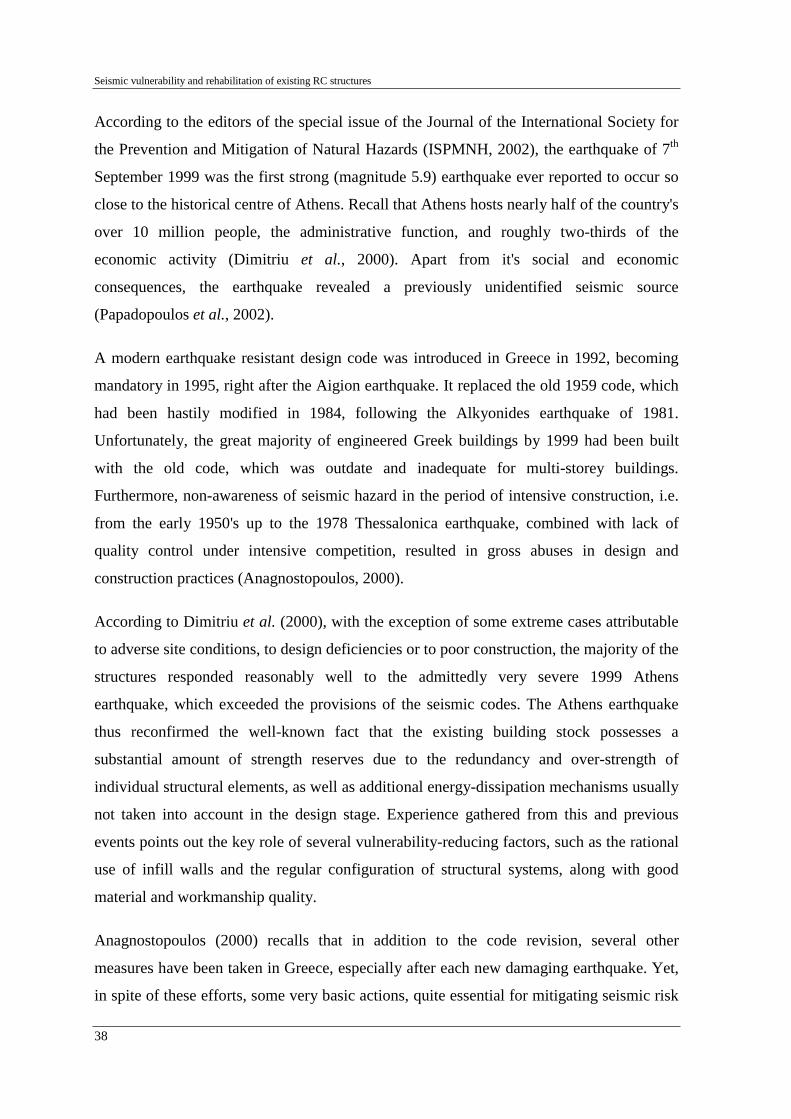
Seismic vulnerability and rehabilitation of existing RC structures
38
According to the editors of the special issue of the Journal of the International Society for
the Prevention and Mitigation of Natural Hazards (ISPMNH, 2002), the earthquake of 7th
September 1999 was the first strong (magnitude 5.9) earthquake ever reported to occur so
close to the historical centre of Athens. Recall that Athens hosts nearly half of the country's
over 10 million people, the administrative function, and roughly two-thirds of the
economic activity (Dimitriu et al., 2000). Apart from it's social and economic
consequences, the earthquake revealed a previously unidentified seismic source
(Papadopoulos et al., 2002).
A modern earthquake resistant design code was introduced in Greece in 1992, becoming
mandatory in 1995, right after the Aigion earthquake. It replaced the old 1959 code, which
had been hastily modified in 1984, following the Alkyonides earthquake of 1981.
Unfortunately, the great majority of engineered Greek buildings by 1999 had been built
with the old code, which was outdate and inadequate for multi-storey buildings.
Furthermore, non-awareness of seismic hazard in the period of intensive construction, i.e.
from the early 1950's up to the 1978 Thessalonica earthquake, combined with lack of
quality control under intensive competition, resulted in gross abuses in design and
construction practices (Anagnostopoulos, 2000).
According to Dimitriu et al. (2000), with the exception of some extreme cases attributable
to adverse site conditions, to design deficiencies or to poor construction, the majority of the
structures responded reasonably well to the admittedly very severe 1999 Athens
earthquake, which exceeded the provisions of the seismic codes. The Athens earthquake
thus reconfirmed the well-known fact that the existing building stock possesses a
substantial amount of strength reserves due to the redundancy and over-strength of
individual structural elements, as well as additional energy-dissipation mechanisms usually
not taken into account in the design stage. Experience gathered from this and previous
events points out the key role of several vulnerability-reducing factors, such as the rational
use of infill walls and the regular configuration of structural systems, along with good
material and workmanship quality.
Anagnostopoulos (2000) recalls that in addition to the code revision, several other
measures have been taken in Greece, especially after each new damaging earthquake. Yet,
in spite of these efforts, some very basic actions, quite essential for mitigating seismic risk

Chapter 2
39
and which can produce tangible results at insignificant costs have been, unfortunately,
overlooked.
2.4.4 - The 17th August 1999 Izmit earthquake, Kocaeli, Turkey
A 45-second earthquake of 7.4 Richter magnitude struck the north-west of Turkey on 17th
August 1999. The epicentre occurred approximately 11 km southeast of Izmit, the capital
of the province of Kocaeli, an industrial city approximately 90 km east of Istanbul. The
epicentral region was directly under Gölcük, with a focal depth of 17 km (Aschheim, 2001;
USGS, 2000; EQE, 1999; Saatcioglu et al., 1999; KOERI, 1999).
The most heavily damaged area was around the gulf of Izmit and the city of Adapazari.
The towns of Gölcük and Yalova along the south shore of the gulf, the harbor city of Izmit
at the eastern end of the gulf, the town of Sapanca about 50 km east of Izmit, and the city
of Adapazari 60 km east of Izmit were sites of massive structural destruction and extensive
ground failures. There was also extensive damage in the Avcilar district of Istanbul, which
is located approximately 100 km north-west of the epicentre (Saatcioglu et al., 1999).
Figure 2.10 illustrates the location of the epicentre and the areas that sustained heavier
damage.
Figure 2.10 - Extent of the damage (KOERI, 1999)
According to Aschheim (2001), it were confirmed 15135 deaths, more than 24000 injured
and approximately 500000 homeless. A large number of buildings either collapsed or
sustained heavy damage, leaving an estimated 750 thousand people in need of housing.
Saatcioglu et al. (1999) estimate 77000 severely damaged or collapsed buildings. An

Seismic vulnerability and rehabilitation of existing RC structures
40
estimated 80000 buildings registered moderate damage, and 90000 were lightly damaged.
Furthermore, the earthquake affected approximately 35% of the industrial base in Turkey,
creating a total financial loss of approximately 15000 to 20000 million US dollars. The
downtown of Adaparazi area was severely affected, with up to 3/4 of the buildings
damaged beyond repair (Aschheim, 2001).
The enormous amount of life and property losses during the Kocaeli earthquake was
mainly caused by the collapse or heavily damage observed in multi-storey RC buildings,
typically four- to eight-storey height, either under construction or built within the last few
years (EQE, 1999; KOERI, 1999; Saatcioglu et al., 1999), as shown in Figure 2.11.
The predominant buildings in Turkey are typically multi-storey RC commercial and
residential structures with non-structural masonry infill walls (EQE, 1999). Aschheim
(2001) highlights that much of the larger apartment buildings were built in the 1990's.
Figure 2.11 - General buildings damage and collapse in Gölcük, Adapazari and Yalova (KOERI, 1999; EQE, 1999; Sucuoglu, 2000)
The inspection of collapsed and damaged buildings indicates that, proportionally, the
newest buildings suffered the most collapses. This is surprising considering that these
buildings are supposed to be designed and built in accordance to a modern code that

Chapter 2
41
incorporates sophisticated earthquake-resistant provisions (EQE, 1999). The Turkish code
includes detailing requirements for seismic resistant structures as (Aschheim, 2001): a)
closer spacing of transverse steel near beam-column joints; b) transverse steel within
joints; c) 135o hooks with cross-ties; d) joint shear calculations; e) strong-column
weak-beam provisions; etc. Therefore, modern buildings should have had moderate-to-
light damage, given that the intensities of shaking in this earthquake were moderate.
However, as observed by Sucuoglu (2000) and Saatcioglu et al. (1999), new buildings
performed very poorly, mostly due to the repetition of well-known mistakes of the past in
the design, detailing and construction of RC buildings, as well as location on ground that
failed from shaking or faulting. Although most of them were relatively new, less than 10
years old, none of them satisfy the minimum seismic safety requirements, prescribed by
the seismic design codes, and therefore the inelastic deformation capacity needed to save
the structures was inadequate. Post-earthquake reports, by several researchers in the field,
highlight the following main causes for the observed damages or collapses in buildings
(see Figures 2.12 and 2.13):
• Improper construction site (buildings constructed on active faults, in areas of high
liquefaction potential, or on soft soils which amplifies the seismic demands to
critical values).
• Typically, the structural design engineer, who is an employee of the contractor,
does not inspect the on-going construction to verify that the contractor has built the
building according to the intent of the design drawings. This lack of construction
oversight by the design engineer allows for on-the-spot field design modifications,
which compromises the earthquake resistance of the buildings. Many of the
buildings were built with poor and inappropriate construction materials (poor
concrete quality) and used poor workmanship.
• Structural alterations (added floor, long cantilevers with heavy load).
• Inadequate longitudinal and transversal reinforcement detailing in beams, columns
and joints, widespread use of smooth reinforcing steel, lack of concrete
confinement, and, inadequate lap-splice length. Beam-column connections in many
buildings did not contain any transverse reinforcement, as showed in Figure 2.12.
The transverse reinforcement in columns consisted, typically, of 8.0 mm diameter

Seismic vulnerability and rehabilitation of existing RC structures
42
smooth reinforcement, generally placed at 300 mm spacing (or even some hoops
were omitted, see Figure 2.12), and limited to perimeter hoops with 90o hooks,
which are insufficient. This resulted in widespread column shear failures.
• Strong-beam weak-column mechanism.
• No employment of desirable shear walls or bracing elements.
• Undesirable short column mechanism created around window and similar openings,
or produced by the landing slabs of staircases connected to columns (see
Figure 2.12).
• In-plane irregularities (although most floor plans had symmetric layouts, there were
cases where torsional effects were created by asymmetry in structural elements).
• Extensive use of soft-storeys was verified (brittle behaviour of the masonry infill
walls in structures, or open space at the first floors to accommodate commercial
spaces), typically formed at the bottom storey or in the bottom two storeys, placing
excessive deformation demands on the highly critical first storeys' columns.
Figure 2.12 - Damage in buildings due to inappropriate detailing (KOERI, 1999)
The Izmit earthquake has wide-ranging lessons for the earthquake engineering, building
code development and application in earthquake regions, construction quality, risk
management, and insurance. Almost all of the damage caused by the earthquake, and most
of the deaths were caused by the collapse of inadequately designed and constructed
buildings. However, as stated in EQE (1999), some buildings in the most heavily damaged
areas survived without significant damage. Typically, these buildings were properly
designed with earthquake-resistant features, were well-constructed with obviously good
quality materials, and were on firm ground or rock, which sustains the idea that loss of life
and building' collapse were avoidable.
Chapter 2
43
Figure 2.13 - Damage in RC buildings under construction after the Izmit earthquake (EQE, 1999)
2.4.5 - The 25th January 1999 Armenia earthquake, Colombia
An earthquake occurred in 25th January 1999 in the Colombian town of Córdoba, in the
Quindio Prefecture. The earthquake caused severe damages in buildings and casualties in
the cities of Armenia, the capital of Quindio, and Pereira. The focal depth was as shallow
as 10 km. In spite of its rather small magnitude of 6.2, it caused severe disaster in Armenia,
the central capital city of quarter million people. This earthquake caused 1171 dead and
4795 injured. Collapsed and heavily damaged buildings exceeded 45000 and the total
amount of monetary loss reached up to 2000 million US dollars. In the north zone of
Armenia, where new buildings predominate, damage was limited, while in the central zone
nearly 10% of the buildings collapsed. In the south, dwelling houses of low-income people
are concentrated. Here the collapse reached 95% (Kagami, 1999; Jaramillo and
Campos, 2000).
Typical structures in Armenia and Pereira city are of bamboo (or timber) frame wall
structures, unreinforced masonry (URM) wall structures, and confined masonry wall

Seismic vulnerability and rehabilitation of existing RC structures
44
structures (Kagami, 1999). Figure 2.14 depicts a middle rise RC frame building with brick
infill walls, illustrating a typical building in Pereira.
During the earthquake, not only low-rise popular traditional buildings but also medium-rise
or relatively high-rise buildings in Armenia city were structurally damaged. Among these,
there are important buildings such as the police station (five-storey RC), fire station,
telecommunications office (six-storey RC), hospitals, schools, banks, churches and hotels.
Figure 2.15 shows the damages of a building of ordinary RC moment-resistant frame in
Armenia. The extensive damage observed is mainly due to an inadequate structural design
resulting, in many cases, in extremely irregular frame structures (Kagami, 1999).
Figure 2.14 - Typical middle rise RC frame building with brick infill walls (Kagami, 1999)
Figure 2.15 - Damage in an ordinary RC moment-resistant infilled RC frame (Kagami, 1999)
In addition, extensive structural and non-structural damage was observed in buildings with
inadequate structural design (e.g. Figure 2.16, buildings in Armenia), such as, extremely
irregular structures configuration, buildings with abrupt changes in lateral resistance and/or
lateral stiffness, buildings with unusual size and shape, buildings constructed on steep
hillsides or constructed on soft soils (Kagami, 1999).
Regarding masonry filled RC frame structures in particular, Kagami (1999) observed that
most of the walls were separated from the surrounding RC column, beam or slab members,
and that some masonry walls completely collapsed. As a result, RC columns became
independent from the walls, and, consequently, some of them buckled or failed, losing
their gravity load-carrying capacity that results in partial or total collapse of the buildings.

Chapter 2
45
Typically, the columns lost their vertical and lateral load-carrying capacity due to the
relatively small section of the RC columns and to the inadequate reinforcing provided.
Other structural damage to RC columns, beams and beam-to-columns connections of the
masonry filled RC frame structures were due to the lack of concrete sections or the
discontinuity of concrete at and around the beam-to-column connections. This is due to
frequent use of improper formwork materials. Furthermore, poor reinforcement details
were also observed especially in RC beam-to-column connections (see Figure 2.16).
Figure 2.16 - Poor reinforcing details in RC joints (Kagami, 1999)
2.4.6 - The 26th January 1995 Great Hanshin-Awaji earthquake, Kobe, Japan
Considering the development of the Japanese Building Code, and the Japanese advance in
earthquake engineering research and technology at the time, it was hard to imagine
structures collapsing in such miserable manners as during the 26th January 1995 Great
Hanshin-Awaji (Hyogoken-Nanbu, Kobe) earthquake (Katayama, 1996). In the EQE report
(1995) it is referred that age of construction, soil and foundation condition, proximity to
the fault, and type of structural system were major determinant factors in the performance
of structures in the Kobe earthquake.
The number of buildings destroyed by the earthquake exceeded 100000, that is,
approximately 20% of buildings in the strongly shaken area, and further 80000 buildings
were badly damaged. In a portion of the Kobe city centre 22% of office buildings were
unusable, while an additional 66% need more than six months for complete restoration.
After the earthquake, approximately 50% of the multifamily dwellings in Kobe were
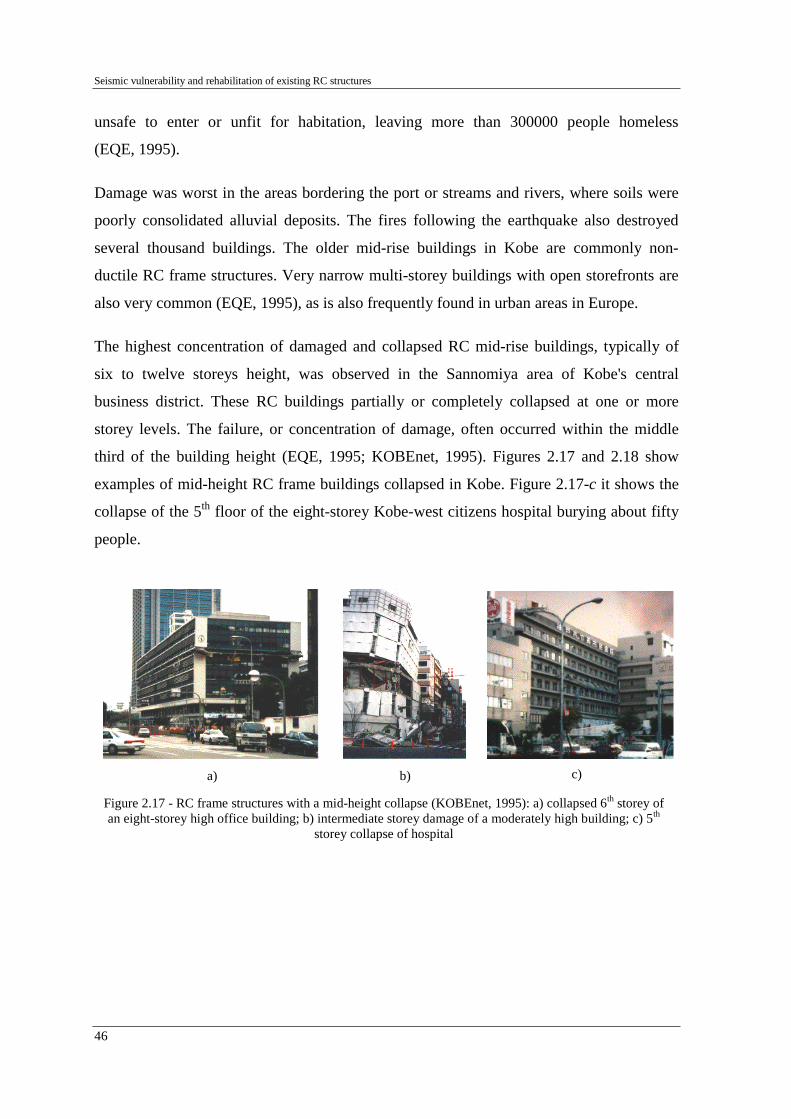
Seismic vulnerability and rehabilitation of existing RC structures
46
unsafe to enter or unfit for habitation, leaving more than 300000 people homeless
(EQE, 1995).
Damage was worst in the areas bordering the port or streams and rivers, where soils were
poorly consolidated alluvial deposits. The fires following the earthquake also destroyed
several thousand buildings. The older mid-rise buildings in Kobe are commonly non-
ductile RC frame structures. Very narrow multi-storey buildings with open storefronts are
also very common (EQE, 1995), as is also frequently found in urban areas in Europe.
The highest concentration of damaged and collapsed RC mid-rise buildings, typically of
six to twelve storeys height, was observed in the Sannomiya area of Kobe's central
business district. These RC buildings partially or completely collapsed at one or more
storey levels. The failure, or concentration of damage, often occurred within the middle
third of the building height (EQE, 1995; KOBEnet, 1995). Figures 2.17 and 2.18 show
examples of mid-height RC frame buildings collapsed in Kobe. Figure 2.17-c it shows the
collapse of the 5th floor of the eight-storey Kobe-west citizens hospital burying about fifty
people.
a)
b) c)
Figure 2.17 - RC frame structures with a mid-height collapse (KOBEnet, 1995): a) collapsed 6th storey of an eight-storey high office building; b) intermediate storey damage of a moderately high building; c) 5th
storey collapse of hospital

Chapter 2
47
Figure 2.18 - RC frame structures with a mid-height collapse (EQE, 1995; KOBEnet, 1995)
As stated in KOBEnet report (1995), possible reasons for the high incident of damages at
intermediate floors are: strong vertical ground motion, extremely high intensity of the
impact due to the closeness of the hypocenter, reduced density of walls in a particular floor
due to office space use, changes in building strength or stiffness at these floor levels. A
badly damaged RC building is represented in Figure 2.20, where the irregular structural
configuration induces the concentration of serious damage at structural discontinuity.
A common type of RC buildings collapse in Kobe city was due to the failure of the lower
storeys, as shown in Figure 2.19 (EQE, 1995; KOBEnet, 1995). These failures typically
resulted from soft or weak storeys created for garages and from the desire to have
numerous large open windows for storefronts at the bottom floor. The high land costs and
general congestion in Japan exacerbated this problem. In many cases, an irregular
distribution of shear walls or concrete frames resulted in substantial torsion, causing the
structure to twist as well as sway due to earthquake loading (EQE, 1995).
Figure 2.19 - Soft-storey building' collapses (EQE, 1995; KOBEnet, 1995)

Seismic vulnerability and rehabilitation of existing RC structures
48
The damage mode most commonly observed was a brittle shear failure of concrete column
elements in old buildings, leading to a pancake collapse of the floor level above. These
brittle failures resulted from inadequate reinforcing details. In general, damaged columns
were observed to have transversal reinforcing with relatively large spacing. These hoops
typically had hooks at their ends, which were bent only 90o. Many of the damaged
buildings in Kobe were also constructed with undeformed reinforcing bars. Current
Japanese code requirements include closer and larger hoops of deformed steel, 135o hooks
that extend into the confined concrete, and cross-ties to supplement the rectangular hoops
around the perimeter bars. In addition, according to recent codes, hoops must be closely
spaced and extend through the joint created by the beams and columns (EQE, 1995).
The developments in engineering in Japan and the evolution of seismic design methods
and codes for buildings contributed to reduce the effects of the earthquakes on structures.
Figure 2.21 reports damages on different types of buildings. At the bottom of the picture is
a two- or three-storey traditional Japanese wood-frame building with a heavy tile roof
completely collapsed. On the right hand side of the picture is a six- or seven-storey office
building of the 1960's or 1970's. This RC building is a typical example of a mid-height
storey collapse. The high rise to the left is a post-1981 office building that has no apparent
damage.
Figure 2.20 - Badly damaged irregular RC building in Sannomiya (EQE, 1995)
Figure 2.21 - Damages on buildings of different type in central Kobe (EQE, 1995)
The most severely damaged buildings generally appeared to be of older construction,
dating from about 1950 to 1980. In general, newer buildings constructed using the current
code provisions with not too irregular configurations performed relatively well and ensured

Chapter 2
49
life safety. Many older houses, smaller commercial buildings of both concrete and steel,
and mid-rise concrete structures designed and constructed prior to the early 1980's behaved
poorly (EQE, 1995). Millions of RC buildings had been designed and constructed using the
same non-ductile details that had been employed in high-seismic regions around the world
up until the early 1970's, which are an enormous potential source of casualties and
economic losses in the future.
2.4.7 - The 17th January 1994 Northridge earthquake, Los Angeles, US
As the population of the US continues to expand in areas of high seismic activity, the
increasing exposure to personal injury and property damage from earthquakes demands our
attention. The destruction caused by California's 1994 Northridge earthquake remind this
concern. The destruction reached far beyond physical damage, leaving lasting emotional
and economic changes for people and communities during a long and difficult
reconstruction process (NAHB, 1994).
The Northridge earthquake occurred on 17th January 1994. Its epicentre was located in a
densely populated area of Los Angeles county near the community of Northridge. Over 30
deaths were reported as a direct result of the tremor, and a total death toll of 58 was
attributed to both direct and indirect causes (NIST, 1994). Current estimates of the severity
of this earthquake place it at a magnitude of 6.4 on the Richter scale (Hall, 1994).
Uncorrected peak horizontal ground accelerations were recorded at 0.9g near the epicentre.
In terms of the effective peak horizontal ground accelerations, the 475 years return period
(475-yrp) design estimate of 0.4g was exceeded by a factor of 1.5 to 2 at several locations
(Naeim, 1994). A large 'pulse' of ground movement produced during the 15 and 20 second
duration by this earthquake is among the worst recorded in the US history (Naeim, 1994).
Large ground movements from the earthquake were felt as far as Las Vegas
(NAHB, 1994).
In US earthquakes (e.g. southern California's 1971 San Fernando and 1994 Northridge
earthquakes) non-ductile RC construction has been the source of collapse of buildings,
elevated highways and overpasses. In the recent Northridge earthquake, office and
residential buildings as well as hotels had generally a satisfactory behaviour. Yet, a
Seismic vulnerability and rehabilitation of existing RC structures
50
considerable number of buildings, particularly the ones designed before the recent codes in
force, suffered significant damage. Many were demolished or extensively repaired
(Oliveira et al., 1995). The soft-storey mechanism, insufficient transverse reinforcement in
columns, excessive concrete cover, short columns and other deficiencies of reinforcement
detailing were the most frequent causes of building's collapse. As stated by Oliveira et
al. (1995), deficient connection to the surrounding frame elements caused unsatisfactory
behaviour of the external infill walls in many cases.
2.4.8 - Conclusion and discussion
The review above indicates that seismic risk in urban areas is still high and worth
considering. The disastrous consequences, in terms of damages on RC buildings, and
consequent human casualties, resulting from seismic activity in a recent past all around the
world reveal that research on assessment and retrofitting of existing structures is urgently
needed. Next, the typical causes of damage and failure of existing non-ductile construction
are reviewed.
2.5 - TYPICAL CAUSES OF DAMAGE AND FAILURE OF EXISTING NON-
DUCTILE RC BUILDINGS
'A chain breaks at its weakest link.' (Anonym)
Structures should be provided with balanced stiffness, strength and ductility between its
members, connections and supports (Bertero, 1997). As already stated, frame type RC
structures were the most commonly structural system used until the late 1970's in the
southern European countries, especially in buildings. Consequently, the seismic
rehabilitation practice for constructions of that period is concentrated on that kind of
structures. In spite of the current rather strict seismic code requirements (see
Section 2.2.3), serious deficiencies/weaknesses still take place in the design and
construction of most buildings. Tankut and Ersoy (1998) and Sasani et al.'s (1999) work,
for example, point out major sources of seismic weakness in buildings, which can be
grouped in four main categories, as follow:

Chapter 2
51
• Design deficiencies, such as: insufficient lateral stiffness and strength, horizontal
and vertical irregularities, soft-storeys, short columns, weak-column strong-beam
mechanism, critical torsional response, not adequate spacing between adjacent
structures, etc.
• Detailing deficiencies, such as: insufficient confinement, insufficient and
improper anchorage of the longitudinal reinforcement at the joints and footings,
inexistence or inadequate beam-column joint reinforcement, lack of adequate
amount and detailing of the longitudinal and transverse reinforcement along the
beams and columns, inadequate lap-splice in column longitudinal reinforcement,
etc.
• Construction deficiencies, such as: poor workmanship, poor quality concrete,
construction of the structures not following the design and detailing prescriptions,
etc.
• Deterioration and structural modifications. As stated by Souza and Ripper (1998),
'a lie that we tell for ourselves for willing to believe that all of which we make,
build, or in which creation we take part, is meant to glow forever in the infinity'.
However, it should be noted that these categories couldn't be looked at separately. In fact,
design, detailing and construction of a structure are intimately related, and the achievement
of good workmanship depends, to a large degree, on the simplicity of the detailing of the
members, and of their connections and supports. As referred by Bertero (1982), in the case
of a RC structure, it is possible to detail complex reinforcement on paper and even to
realize it in laboratory specimens so that seismic behaviour is improved. Nevertheless,
such design details may not be economically feasible in the field. Bertero (1982) defends
that a design is only effective if it can be constructed and maintained.
Next the most common causes of failure or damage of RC buildings are overviewed: i)
stirrups/hoops, confinement and ductility; ii) bond, anchorage, lap-splices and bond
splitting; iii) inadequate shear capacity and failure; iv) inadequate flexural capacity and
failure; v) inadequate shear strength of the joints; vi) influence of the infill masonry on the
seismic behaviour of frames; vii) vertical and horizontal irregularities: abrupt change in
structural and/or element properties; viii) higher modes effect; ix) strong-beam weak-

Seismic vulnerability and rehabilitation of existing RC structures
52
column mechanism; and, finally, x) structural deficiencies due to architectural
requirements. Emphasis is placed on effectively integrating the description of each cause
of damage with photographic documentation.
2.5.1 - Stirrups/hoops, confinement and ductility
As mentioned in EASY (1997), the philosophy behind confining seems nowadays very
simple and self-understood. Concrete in compression crushes in a very brittle manner
perpendicular to the direction of the principal compression stresses (the particles are
simply pushed out of the stressed zone in the perpendicular direction). Yet, confining this
concrete region with stirrups precludes or at least postpones the push-out. In this way, the
strength and ductility of concrete is enhanced considerably. The confinement effect
depends on the stirrup diameter, on the spacing between the stirrups and longitudinal bars,
on the steel quality, and on the shape of the cross-section and stirrups.
This simple principle was not fully understood until a few decades ago, and, even now, it
has not been applied to all designs. Therefore, many deficient structures with respect to
confinement exist. And some of them are not old at all. An illustrative example is the better
behaviour of buildings in Kobe earthquake. Those designed after 1981, when Japanese
engineers had started to use much stronger confinement, behaved better in comparison to
those designed prior to this year (EASY, 1997). Figures 2.22 and 2.23 shows examples of
earthquake damaged RC columns without adequate transverse reinforcement.
Figure 2.22 - Damaged RC columns without
transverse reinforcement (Saatcioglu et al., 1999) Figure 2.23 - Damaged RC columns with inadequate
transverse reinforcement (Saatcioglu et al., 1999)

Chapter 2
53
In the columns' plastic hinging region the concrete core must be adequately confined to
prevent deterioration of the shear and flexural strength of these columns. This confinement
requirement is more severe because of the high axial load and shear that typically needs to
be carried through the plastic hinging region (FEMA-274, 1997).
During earthquake, failures of beams and beam-to-column connections are most
commonly related to inadequate use of transverse reinforcement for shear strength and
confinement. These are typically local beam failures and will not necessarily lead to
collapse of the building (FEMA-274, 1997). A common structural problem in buildings is
inadequate transverse confinement reinforcement in the beam plastic hinging zones.
Ductility is defined in EASY (1997) as the ability of a certain material, of a structural
element or of a structure as a whole to sustain inelastic deformations without collapse,
having a decisive effect on the energy dissipation capacity of a building (see also the
Glossary, in Appendix C). Shear behaviour (see inadequate shear capacity and failure, in
Section 2.5.3) is typically non-ductile and flexural behaviour (see inadequate flexural
capacity and failure, in Section 2.5.4) can be made ductile. In general, designers are much
more concerned about strength than ductility. In fact, strength appears to be more
important to static vertical loading in everyday design. But, as earthquakes happen from
time to time, we have been gradually realizing the importance of ductility in preventing
structural collapse in such events. Unfortunately, this development has been rather slow,
and the principle of ductility in earthquake engineering was understood only a few decades
ago. Therefore, a large number of older buildings and their structural elements are non-
ductile, which represents a serious risk.
2.5.2 - Bond, anchorage, lap-splices and bond splitting
When efficiently developed, bond enables the concrete and reinforcement to form a
composite structure. Thus, the attainment of satisfactory performance in bond is the most
important aim of the detailing of reinforcement in structural components (Park and
Paulay, 1975). As stated in EASY (1997), bond is even more vital problem in the case of
dynamic loading and when plain reinforcement bars are used. Bond is developed by
friction, wedging action of small-dislodged sand particles between the bar and the
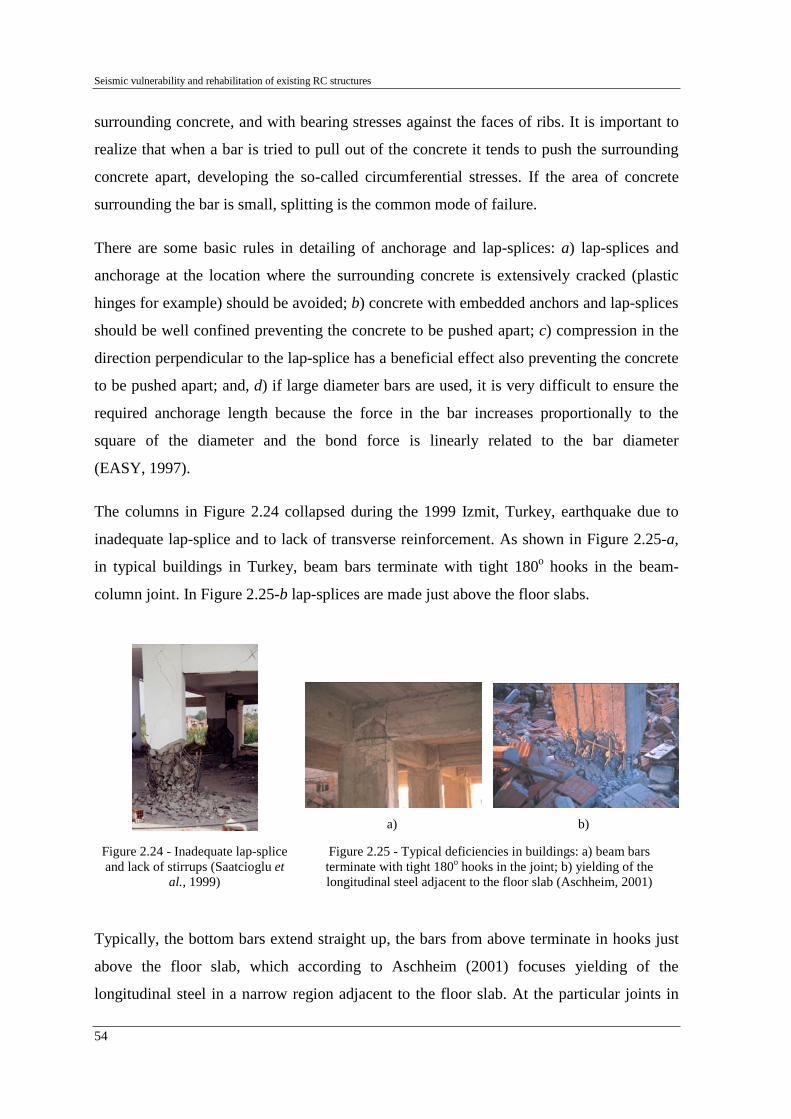
Seismic vulnerability and rehabilitation of existing RC structures
54
surrounding concrete, and with bearing stresses against the faces of ribs. It is important to
realize that when a bar is tried to pull out of the concrete it tends to push the surrounding
concrete apart, developing the so-called circumferential stresses. If the area of concrete
surrounding the bar is small, splitting is the common mode of failure.
There are some basic rules in detailing of anchorage and lap-splices: a) lap-splices and
anchorage at the location where the surrounding concrete is extensively cracked (plastic
hinges for example) should be avoided; b) concrete with embedded anchors and lap-splices
should be well confined preventing the concrete to be pushed apart; c) compression in the
direction perpendicular to the lap-splice has a beneficial effect also preventing the concrete
to be pushed apart; and, d) if large diameter bars are used, it is very difficult to ensure the
required anchorage length because the force in the bar increases proportionally to the
square of the diameter and the bond force is linearly related to the bar diameter
(EASY, 1997).
The columns in Figure 2.24 collapsed during the 1999 Izmit, Turkey, earthquake due to
inadequate lap-splice and to lack of transverse reinforcement. As shown in Figure 2.25-a,
in typical buildings in Turkey, beam bars terminate with tight 180o hooks in the beam-
column joint. In Figure 2.25-b lap-splices are made just above the floor slabs.
a) b)
Figure 2.24 - Inadequate lap-splice and lack of stirrups (Saatcioglu et
al., 1999)
Figure 2.25 - Typical deficiencies in buildings: a) beam bars terminate with tight 180o hooks in the joint; b) yielding of the longitudinal steel adjacent to the floor slab (Aschheim, 2001)
Typically, the bottom bars extend straight up, the bars from above terminate in hooks just
above the floor slab, which according to Aschheim (2001) focuses yielding of the
longitudinal steel in a narrow region adjacent to the floor slab. At the particular joints in
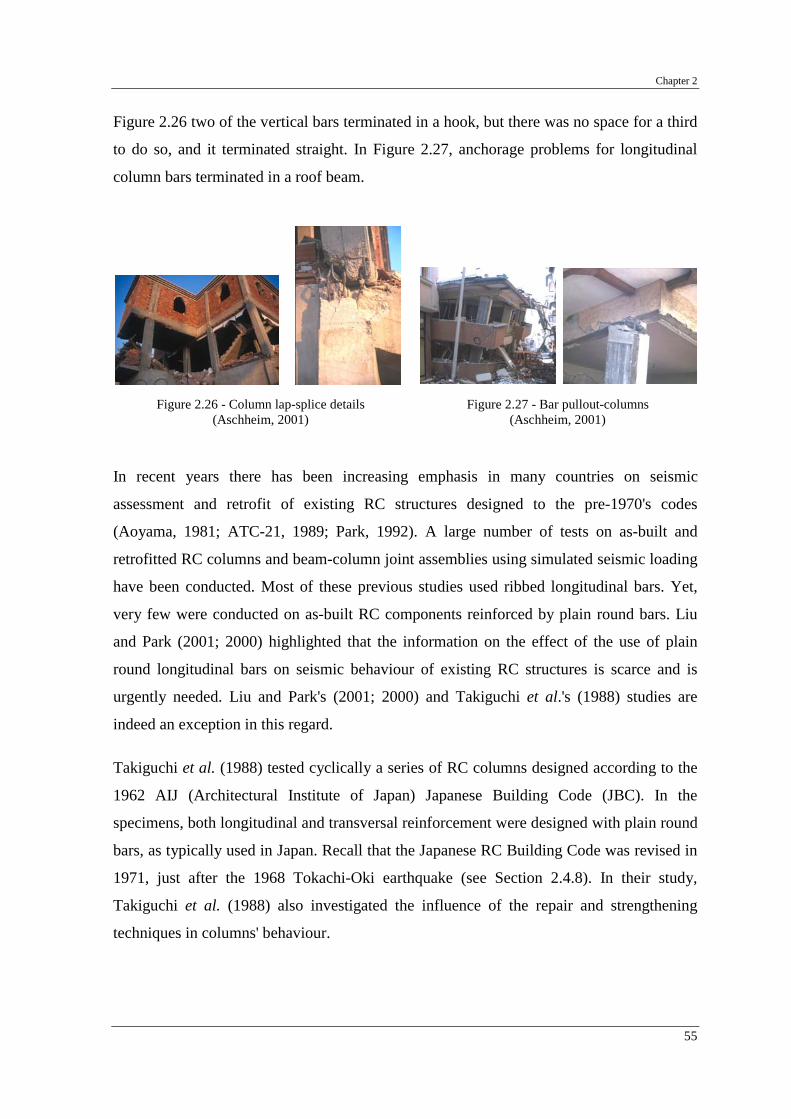
Chapter 2
55
Figure 2.26 two of the vertical bars terminated in a hook, but there was no space for a third
to do so, and it terminated straight. In Figure 2.27, anchorage problems for longitudinal
column bars terminated in a roof beam.
Figure 2.26 - Column lap-splice details (Aschheim, 2001)
Figure 2.27 - Bar pullout-columns (Aschheim, 2001)
In recent years there has been increasing emphasis in many countries on seismic
assessment and retrofit of existing RC structures designed to the pre-1970's codes
(Aoyama, 1981; ATC-21, 1989; Park, 1992). A large number of tests on as-built and
retrofitted RC columns and beam-column joint assemblies using simulated seismic loading
have been conducted. Most of these previous studies used ribbed longitudinal bars. Yet,
very few were conducted on as-built RC components reinforced by plain round bars. Liu
and Park (2001; 2000) highlighted that the information on the effect of the use of plain
round longitudinal bars on seismic behaviour of existing RC structures is scarce and is
urgently needed. Liu and Park's (2001; 2000) and Takiguchi et al.'s (1988) studies are
indeed an exception in this regard.
Takiguchi et al. (1988) tested cyclically a series of RC columns designed according to the
1962 AIJ (Architectural Institute of Japan) Japanese Building Code (JBC). In the
specimens, both longitudinal and transversal reinforcement were designed with plain round
bars, as typically used in Japan. Recall that the Japanese RC Building Code was revised in
1971, just after the 1968 Tokachi-Oki earthquake (see Section 2.4.8). In their study,
Takiguchi et al. (1988) also investigated the influence of the repair and strengthening
techniques in columns' behaviour.

Seismic vulnerability and rehabilitation of existing RC structures
56
Liu and Park (2001; 2000) tested the response of full-scale beam-column joints with plain
round reinforcement bars, designed according to the pre-1970's codes. In the studies
conducted by Liu and Park (2001) the main test variables were the manner the longitudinal
beam bars were hooked in the joint core, and the level of the axial load applied to the
columns. The amount of transverse reinforcement used in the beams, columns and joint
cores was very small, as was typical of the pre-1970's. Similar units using deformed bars
were also tested. Comparing the experimental results obtained on the units with plain
round reinforcement bars with those with deformed bars, the former have shown less joint
shear distortion but high opening of beam bar hooks in tension, and column bar buckling.
As a result, premature concrete tension cracking failure along the outer layer of column
bars adjacent to the beam bar hooks was enhanced. The attained stiffness, in particular, and
the strength were significantly lower, especially the stiffness.
Concerning the beam and column behaviour, Liu and Park (2001) observed that the
measured steel strains along the longitudinal reinforcement of the members (beams and
columns) were generally larger than the values estimated by conventional flexural theory at
the beam-column interfaces. Hence, conventional flexural theory overestimates the
member moments, because severe bond degradation along the longitudinal reinforcement
greatly violated the assumption of plane sections. The observed beam and column
performance was dominated by degrading flexural behaviour for all units, and the steel
strains measured on the transverse reinforcement were well bellow the steel yield strain.
This suggests that the code approach and the procedure in the current seismic assessment
method for shear strength greatly underestimate the available member shear resistance
when plain bars are used. The measured member flexural deformations concentrated
mainly in the member fixed-end regions, and were similar to that observed for tests on
interior beam-column joint units with plain bar reinforcement.
2.5.3 - Inadequate shear capacity and failure
Typical gravity and wind load designs normally result in a design shear force significantly
lower than the shear force that could be developed in a column during seismic loading.
Moreover, recent seismic design procedures for structures rely on ductility. Therefore,

Chapter 2
57
shear limit states should be avoided in seismic resistant structures. For this goal, the shear
demand should be limited or shear capacity should be enhanced.
Shear demand is better controlled by capacity design procedures. Since capacity design has
been introduced in the last 25 years or so, and is still not adopted by all designers, there are
many structures in the field which are deficient in shear. Consequently, shear failure is one
of the most frequent during earthquakes. What actually happens is that designers have used
a global seismic force reduction factor affecting equally flexural (ductile behaviour) and
shear (brittle behaviour) forces. Hence, the shear capacity is reached soon after yielding
starts, and, therefore, energy dissipation is precluded (EASY, 1997).
To enhance shear capacity: a) use suitable amount of stirrups and ties to enhance truss
mechanism; b) use enough stirrups to ensure concrete integrity and enhance aggregate
interlock mechanism; c) avoid the combination of shear and tension; d) use better quality
of concrete; and, e) use diagonal reinforcement to prevent sliding shear in deep elements
(EASY, 1997).
The problem of shear strength and confinement is commonly more severe in corner
columns, especially if the building has significant eccentricity between the centre of mass
and the centre of resistance. Corner columns need to have a higher degree of confinement
(FEMA-274, 1997). Figure 2.30 shows the first storey RC columns of the Medical
Treatment and Care Unit of the Olive View Hospital after the 1971 (9th February) San
Fernando earthquake (M = 6.5). As can be observed in the figure, while the spirally
confined central columns remained structurally sound, the unconfined concrete at the
corner columns disintegrated (Bertero, 1997).
Column transverse steel in existing buildings typically consists of hoops with 90o hooks at
20 to 25 cm spacing and no cross-ties. Figures 2.28 to 2.33 show examples of damaged RC
columns in shear due to insufficient transversal reinforcement.

Seismic vulnerability and rehabilitation of existing RC structures
58
a)
b)
Figure 2.28 - Column shear failure examples: a) 1979 Montenegro earthquake (EASY, 1997); b) 1999 Izmit earthquake (note the to lack of transverse reinforcement - Saatcioglu et al., 1999)
Figure 2.29 - Shear and bond failure at the mid-height of a RC column during the 1985 Mexico city earthquake (EASY, 1997)
Figure 2.30 - Damaged RC corner column at the 1st storey (Bertero, 1997)
Figure 2.31 - Column shear failure (Aschheim, 2001) Figure 2.32 - Shear cracks at the RC column of an old school building (Yamazaki, 1993)
During the 1993 (15th January) earthquake at Hokkaido, Japan, the Kushiro Technical High
School, a 30-year old building, developed extensive shear cracks on the RC columns, as
shown in Figure 2.32.

Chapter 2
59
a)
b)
c)
Figure 2.33 - Column shear failures (Aschheim, 2001): a) strong-axis behaviour; b) oblique column shear failure; c) captive column shear failure
When loaded in the strong axis direction, columns often fail in shear, as illustrated in
Figure 2.33-a. As shown at the image in the centre, in this isolated case, the shear failure
was oblique, extending down the length of the column, fracturing the transverse steel in
various places. Another common problem is to artificially shorten a column, provoking
stiffer ones, attracting much higher shear forces than they were designed to carry, as
discussed in Section 2.5.6. Short columns are vulnerable to shear failure as shown in
Figure 2.33-c, where a column shear failure induced by the partial infill walls is shown.
2.5.4 - Inadequate flexural capacity and failure
As recalled by Bertero (1997), the proper amount and correct detailing of the reinforcing
steel plays an important role in the seismic response of a RC structure. Therefore, for
regions of moderate to high seismic risk it is necessary to reinforce the concrete structural
members adequately.
Seismic design nowadays relies on ductile behaviour of flexural elements, i.e. beams and
columns. As recalled in EASY (1997), flexural behaviour can be made ductile if some
basic rules are followed. The designer's goal is to prevent the brittle crushing of concrete in
compression prior to the stage when substantial yielding in tension reinforcement occurs.
This can be done if the demand on the compression zone is lowered and/or the capacity of
this zone is enhanced. To this end, one can: a) limit the compression axial forces or
increase the area of the cross-section; b) limit the area of the tensile reinforcement. The
force in this reinforcement should be namely in equilibrium with the force in the
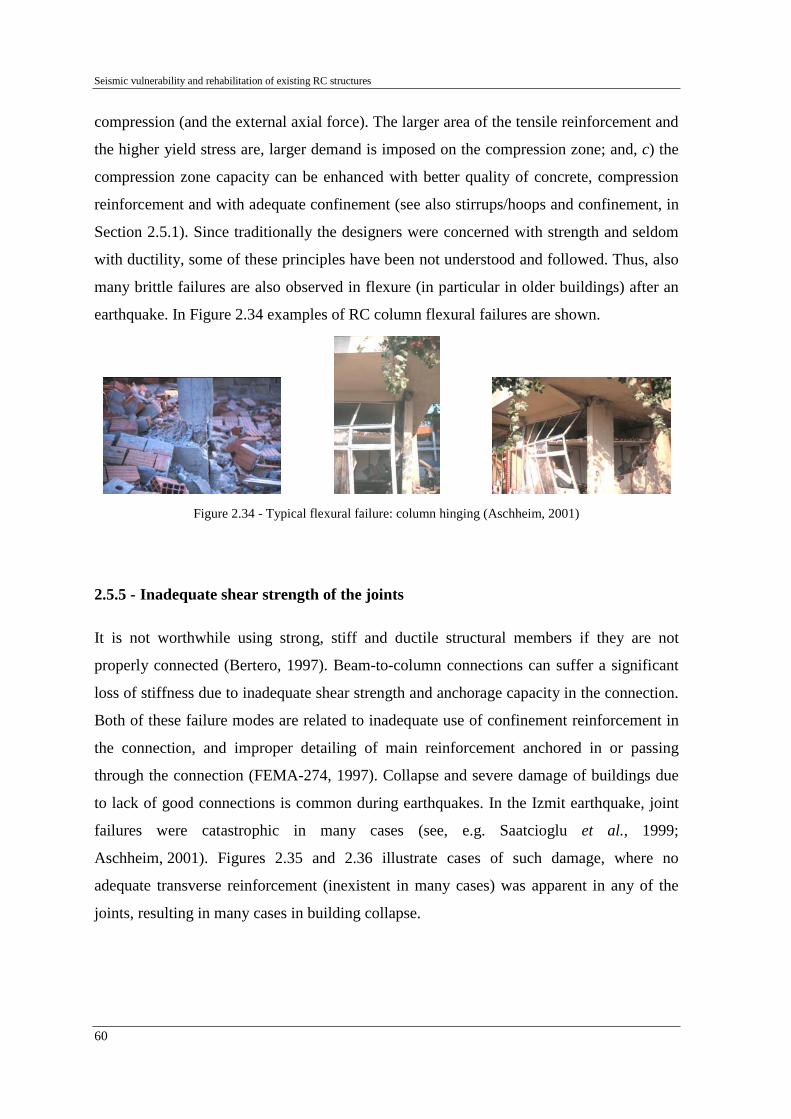
Seismic vulnerability and rehabilitation of existing RC structures
60
compression (and the external axial force). The larger area of the tensile reinforcement and
the higher yield stress are, larger demand is imposed on the compression zone; and, c) the
compression zone capacity can be enhanced with better quality of concrete, compression
reinforcement and with adequate confinement (see also stirrups/hoops and confinement, in
Section 2.5.1). Since traditionally the designers were concerned with strength and seldom
with ductility, some of these principles have been not understood and followed. Thus, also
many brittle failures are also observed in flexure (in particular in older buildings) after an
earthquake. In Figure 2.34 examples of RC column flexural failures are shown.
Figure 2.34 - Typical flexural failure: column hinging (Aschheim, 2001)
2.5.5 - Inadequate shear strength of the joints
It is not worthwhile using strong, stiff and ductile structural members if they are not
properly connected (Bertero, 1997). Beam-to-column connections can suffer a significant
loss of stiffness due to inadequate shear strength and anchorage capacity in the connection.
Both of these failure modes are related to inadequate use of confinement reinforcement in
the connection, and improper detailing of main reinforcement anchored in or passing
through the connection (FEMA-274, 1997). Collapse and severe damage of buildings due
to lack of good connections is common during earthquakes. In the Izmit earthquake, joint
failures were catastrophic in many cases (see, e.g. Saatcioglu et al., 1999;
Aschheim, 2001). Figures 2.35 and 2.36 illustrate cases of such damage, where no
adequate transverse reinforcement (inexistent in many cases) was apparent in any of the
joints, resulting in many cases in building collapse.

Chapter 2
61
Figure 2.35 - Lack of proper design of beam-column connections (Saatcioglu et al., 1999)
a)
b)
Figure 2.36 - Inadequate strength of joints (Aschheim, 2001): a) joint damages; b) joint failures
2.5.6 - Influence of the infill masonry on the seismic behaviour of frames
It is a common misconception that masonry infill in structural RC frames can only increase
the overall lateral load capacity, and that, therefore, must always be beneficial to seismic
performance. In fact, Section 2.4 shows numerous examples of earthquake damages that
can be traced to structural modification of the basic frame by the so-called non-structural
masonry partitions and infill panels. Even if they are relatively weak, masonry infill can
drastically modify the intended structural response, attracting forces to parts of the
structure that have not been designed to resist them (Paulay and Priestley, 1992). The
examples provided below illustrate the relevant influence of the infill masonry in the
behaviour of the frames.
Masonry infill panels can increase substantially the global stiffness of the structure.
Consequently, the natural period of the structure will decrease and, depending on the

Seismic vulnerability and rehabilitation of existing RC structures
62
spectrum shape at the natural period of the bare structure, the seismic forces will
correspondingly increase. The higher shear forces generated in the infilled frames are
transmitted primarily by shear stresses in the panels. Shear failure commonly results, with
shedding of masonry into streets below, or into stairwells, with great hazard to life (see
Figure 2.37).
a)
b)
Figure 2.37 - Damages on masonry infill walls (Saatcioglu et al., 1999): a) RC frame building with almost fully damaged masonry infills; b) diagonal tension failure of a masonry wall
Situations in which masonry walls extend only to part of the storey height (short columns),
leaving a relatively short portion of the columns exposed, may also induce vulnerable
behaviour. Frequently, a column is shortened by elements which have not been taken into
account in design. For example, infills, window openings or landing slabs of staircases.
In some cases, when the earthquake occurs only portions of the infill fail and fall out, and
the remained infill can cause the shortened column effect (as shown in Figure 2.38). If the
frame is designed for ductile response to the design-level earthquake, without
consideration of the infill effects, plastic hinges can be expected at the top and bottom of
the columns, or preferably, in beams at the column faces. The influence of the infill will be
to inhibit beam hinges, to stiffen the centre and one face of the column (depending on the
direction of the lateral load), causing plastic hinges to form at top of the column and top of
the infill, as schematically shown in Figure 2.39. If the design has not considered this
effect of the infill, the consequence will be a dramatic increase in column shears and,
consequently, shear failure of the columns will appear. Complete collapse of the column
and, consequently, of the building can occur if such column is not well furnished with
transverse reinforcement. However, as referred in EASY (1997), for strong earthquakes,
even if very strong stirrups are used, it is difficult to save such short columns. Therefore,
such collapses have been very frequent in past earthquakes (see examples in Figures 2.38

Chapter 2
63
and 2.40). The only solution is to use different structural concepts. As shown in
Figure 2.40-a, diagonal cracking seemed to precede out-of-plane failure in many cases. In
Figure 2.40-b is represented an in-plane infill failure at the Sakarya telephone building.
Figure 2.38 - Short column effect caused by: window opening; masonry walls; and, landing slabs of staircases (Saatcioglu et al., 1999; Aschheim, 2001)
Figure 2.39 - Partial masonry infill in concrete frame (Paulay and Priestley, 1992)
a)
b)
Figure 2.40 - Damage on infill walls (Aschheim, 2001): a) infill cracking; b) in-plane infill failure
2.5.7 - Vertical and horizontal irregularities
Abrupt changes in stiffness, strength or mass in structural and/or element properties of a
building, either in plant or in elevation, can result in distributions of lateral loads and

Seismic vulnerability and rehabilitation of existing RC structures
64
deformations very different from those that are anticipated for uniform structures (Moehle
and Mahin, 1991). As evidenced by several recent earthquakes, structural configuration
plays an important role in the building behaviour. Several authors (e.g. Costa, 1989; Bento
and Azevedo, 2000, among others) argue that a large number of the structural collapses are
to some extent related to configuration problems or wrong conceptual design (see
Figure 2.41, for example).
Common equivalent elastic procedures rely on the supposition that inelastic behaviour
(damage) is uniformly distributed to all ductile elements of the structure. If structural
characteristics (geometry, mass, stiffness or strength) are not uniform or they are not
continuously changing (e.g. setbacks, abrupt diminishing of cross-section column
dimensions, change in the storey height, change in materials, sudden change on the
column's cross sections, interruption of a shear wall at certain storey, change of structural
system at a particular storey, sudden change of non-structural partition walls, etc.) it is very
difficult to avoid damage concentrations at the locations of these abrupt changes. In some
situations, there is even a combination of these negative aspects. Since damage tends to
concentrate in a limited number of locations, around the discontinuities, it follows that it is
difficult to provide enough capacity to these elements. To make the situation worse, usual
elastic design procedures are often unable to predict locations of damage concentration.
The most serious problem of this type in earthquake engineering is the problem of soft-
storey (EASY, 1997).
a)
b) c)
Figure 2.41 - Soft-storeys (Aschheim, 2001)
Many examples where discontinuity apparently resulted in severe damage or collapse are
frequent in the earthquake reconnaissance literature. A very common irregularity in
buildings appears at the lower storey levels, resulting from the absence of infills, contrary

Chapter 2
65
to the other upper storeys with the common larger height of the columns at this storey
level. Buildings with mixed-use occupancies (commercial at the lowest storeys and offices
or residential above) have typically large clear spaces in order to accommodate stores, for
example. Thus, the resulting structural frame system is irregular and, if not accurately
designed, inadequate to resist earthquakes.
As stated by Moehle and Mahin (1991), another common form of vertical discontinuity
arises from unintended effects of non-structural elements. The problem is more severe in
structures having relatively flexible lateral load resisting systems because in that case the
non-structural component can compose a significant portion of the total stiffness. A
common cause of failure occurs in infilled frames. Soft-storeys can result if infills are
omitted in a single storey (often the first storey), as has occurred in several earthquakes
(e.g. 1985 Mexico, 1999 Kocaeli). Even if placed continuously and symmetrically
throughout the structure, a soft-storey mechanism can form if one or more infill panels fail
(Rosenblueth and Meli, 1986).
In the 1999 Izmit, Turkey, earthquake soft-storeys were apparent in many collapsed
buildings. The photos in Figures 2.41-a and 2.41-b illustrate the effect of column
orientation. Weak axis orientations (to maximize storefront glazing) led to soft-storey
mechanisms. Strong axis orientations (Figure 2.41-b, see the building on the right hand)
appeared to do better. In Figure 2.41-c weak axis bending, again, appears to be the
problem.
Apparent vertical irregularities can also occur due to the interaction between adjacent
structures having inadequate separation. A tall building adjacent to a shorter building may
experience irregular response due to effects of impact between the two structures. The
effect can be exacerbated by local column damage due to pounding of the roof of the small
building against the columns of the taller one (Moehle and Mahin, 1991). Rosenblueth and
Meli (1986) refer examples of distress due to this phenomenon during the 1985 Mexico
earthquake.
Another relevant aspect is the possible seismic torsional response because of the shift in
the centre of rigidity due to the presence of a non-symmetric distribution of the infill
panels. A consequent increase of shear forces can appear, especially in the external frames.
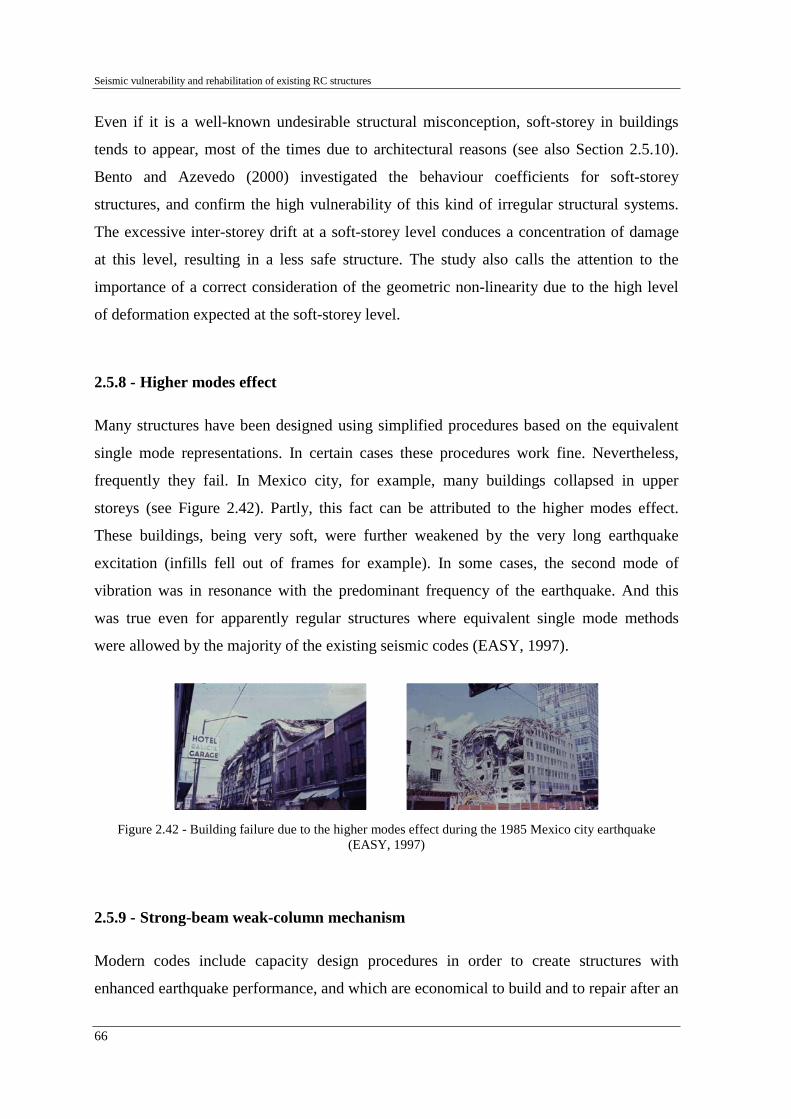
Seismic vulnerability and rehabilitation of existing RC structures
66
Even if it is a well-known undesirable structural misconception, soft-storey in buildings
tends to appear, most of the times due to architectural reasons (see also Section 2.5.10).
Bento and Azevedo (2000) investigated the behaviour coefficients for soft-storey
structures, and confirm the high vulnerability of this kind of irregular structural systems.
The excessive inter-storey drift at a soft-storey level conduces a concentration of damage
at this level, resulting in a less safe structure. The study also calls the attention to the
importance of a correct consideration of the geometric non-linearity due to the high level
of deformation expected at the soft-storey level.
2.5.8 - Higher modes effect
Many structures have been designed using simplified procedures based on the equivalent
single mode representations. In certain cases these procedures work fine. Nevertheless,
frequently they fail. In Mexico city, for example, many buildings collapsed in upper
storeys (see Figure 2.42). Partly, this fact can be attributed to the higher modes effect.
These buildings, being very soft, were further weakened by the very long earthquake
excitation (infills fell out of frames for example). In some cases, the second mode of
vibration was in resonance with the predominant frequency of the earthquake. And this
was true even for apparently regular structures where equivalent single mode methods
were allowed by the majority of the existing seismic codes (EASY, 1997).
Figure 2.42 - Building failure due to the higher modes effect during the 1985 Mexico city earthquake (EASY, 1997)
2.5.9 - Strong-beam weak-column mechanism
Modern codes include capacity design procedures in order to create structures with
enhanced earthquake performance, and which are economical to build and to repair after an

Chapter 2
67
earthquake. In order to create the most desirable and stable energy dissipating mechanism,
a hierarchic formation of plastic hinges should be enforced by design, as recalled by Bento
and Lopes (2000). It is widely recognised that the most desirable location for plastic hinges
in moment resisting frames is the beams' extremities. Thus, modern codes recommend, to
obtain ductile moment frames and to ensure inelastic action in the beams, thereby
localizing damage and controlling drift, the preference for the weak-beam strong-column
mechanism. Accordingly, the strength of the column at any joint must be greater than those
of the beams.
Existing RC frame structures were designed without having this concept in attention, as
they were constructed before the current codes enter into force. Furthermore, even today, it
is often difficult to adopt some code prescriptions due to architectural requirements.
In recent earthquakes, many RC structures have collapsed or were severely damaged due to
the development of the strong-beam weak-column mechanism, confirming the importance
of this code prescription. Figure 2.43 illustrates examples of buildings' collapses during
earthquakes, and where the strong-beam weak-column behaviour mechanism is evident.
Figure 2.43 - Strong-beam weak-column mechanism (Aschheim, 2001; Saatcioglu et al., 1999)
2.5.10 - Structural deficiencies due to architectural requirements
As observed by Moehle and Mahin (1991), past earthquakes have repeatedly proved that
proper selection of the load carrying system is essential to good structural performance
under any loading. They also recall that a properly selected structural system tends to be
relatively forgiving of lapses in analysis, detail and construction. But, extra attention to

Seismic vulnerability and rehabilitation of existing RC structures
68
analysis and detail is not likely to improve significantly the performance of a poorly
conceived structural system. More caution should be put on structures that can be subjected
to earthquake actions, since the intensity and orientation of loading are highly uncertain.
Thus, architecture makes sometimes much more difficult (and expensive) to properly
design the structural system for earthquakes.
Figure 2.44-a shows a typical building in Turkey (Aschheim, 2001), with columns oriented
to satisfy architectural requirements. The column sections have large aspect ratios
(typically 25 cm by 60 cm) with infill built up to the narrow sides of the columns. Thus, the
columns are located and oriented to fit within the partition walls. In Figure 2.44-b are
shown beams eccentric to joints as consequence of a more convenient architectural
solution.
a)
b)
Figure 2.44 - Typical buildings in Turkey (Aschheim, 2001): a) view; b) typical beam details
Recapitulating, citing Moehle and Mahin (1991), buildings having simple, regular and
compact layouts incorporating a continuous and redundant lateral force resisting system
tend to perform well. Complex structural systems that introduce uncertainties in the
analysis and detailing or that rely on effectively non-redundant load paths can lead to
unanticipated and potentially undesirable structural behaviour.
2.6 - COMMON RETROFITTING STRATEGIES AND TECHNIQUES OF
EXISTING RC BUILDINGS
Efficient seismic-resistant behaviour of buildings can be achieved by a proper selection of
the building configuration and its structural layout and by the proper proportioning and
detailing of the structural and non-structural components (Bertero, 1997).

Chapter 2
69
The selection of the retrofitting strategy and its implementation should be guided by results
of a detailed assessment or evaluation of the structure. As recalled by Ersoy (1998), the
seismic rehabilitation of structures is based on two general approaches: a) system
rehabilitation or improvement; and, b) member rehabilitation or strengthening. The former
approach is sufficient when individual members are not too weak and they are expected to
perform satisfactorily under the reduced seismic effects as a result of the improvement in
the system behaviour. Very rarely the later approach may be suitable if the seismic
weakness is local and can be eliminated by strengthening a limited number of individual
members. However, in the majority of cases, both approaches need to be combined.
Fardis (1998) advocates that, 'any retrofitting intervention should not prejudice the safety
or the capacity of any part of the building in any aspect'. Therefore, the designer should
make sure that: a) upgrading the flexural capacity of an element does not make it critical in
shear; b) strengthening of a beam does not shift plastic hinging to columns; and, c)
consequences of discontinuing the retrofitting (i.e. the new shear walls or bracing, or
upgrading of existing columns, at a certain storey can concentrate the damage in the storey
just above the retrofitted level). As recalled by Fardis (1998), the designer should guaranty
the 'continuity of the load path(s)'. Indeed, regardless of the particular rehabilitation
strategy chosen, the designer should check carefully the existing and the retrofitted
structure in terms of safe transfer of inertia forces, from the masses (where they originate)
to the elements of the lateral-load-resisting system and from there to the foundation.
Therefore, the safety of connections within the floor system, between the floors and the
lateral-load-resisting elements, and, between existing and new components should be
verified.
In the next sections the most common techniques of rehabilitation of structures are
presented. One should bear in mind that rehabilitation of buildings may use more than one
strategy in order to avoid failures in the system.
2.6.1 - Global structural system intervention techniques
Global intervention methods may represent a more cost-effective strategy than universal
upgrading of the existing components, especially if the disruption of occupancy and the
Seismic vulnerability and rehabilitation of existing RC structures
70
demolition and replacement of partitions, architectural finishes and other non-structural
components are considered (Fardis, 1998). This is particularly true for structures where no
horizontal load-path is available, or when all structural members are extremely flexible. In
such cases the methods described below may indeed provide an optimum solution
(Pinho, 2000).
Stiffness, mass, and strength irregularities, such as soft or weak-storeys and torsional
irregularities, are common causes of undesirable earthquake performance
(FEMA-273, 1997). Effective corrective measures for removal or reduction of these
irregularities and discontinuities include: a) partial demolition (this measure obviously has
significant impact on the appearance and utility of the building); b) addition of moment
frames, braced frames or shear walls within the soft/weak storey or to balance the
distribution of stiffness and mass within a storey; and, c) creation of expansion joints (a
single irregular building can be transformed into multiple regular structures, however, care
must be taken to avoid the potential problems associated with pounding).
Some flexible structures behave poorly in earthquakes because critical components and
elements do not have adequate ductility to resist the large lateral deformations that ground
shaking induces in the structure. Global structural stiffening can be realised with the
construction of new braced frames or shear walls within an existing structure. As recalled
by Ersoy (1998), inadequate lateral stiffness has been found to be the major cause of
damage in buildings in recent earthquakes.
Some existing buildings have inadequate strength to resist lateral forces. To provide
supplemental strength to such a building's lateral-force resisting system new shear walls or
braced frames can be constructed. A major drawback of these retrofitting measures is that
usually they may be significantly stiffer than the structure to which they are added,
requiring to be designed to provide nearly all of the structure's lateral resistance.
In the 1990's the development and use of seismic energy dissipation mechanisms, such as
link devices, dampers and base isolation, have gained widespread interest, and are
increasingly being used to protect buildings from earthquakes (Elsesser, 2002). These
seismic retrofitting techniques are viable design strategies for seismic rehabilitation of
buildings. Other special seismic protective systems, including active control, hybrid

Chapter 2
71
combinations of active and passive energy devices, tuned mass and liquid dampers, may
also provide practical solutions in the near future. These retrofitting systems enhance the
structural performance during an earthquake by modifying the building's response
characteristics.
Each of the most common global structural system improvement techniques are exposed in
detail in the next section.
2.6.1.1 - Addition of RC structural shear walls
As recalled by Ersoy (1998), Fardis (1998) and Pinho (2000), one of the most common
methods of improving the behaviour of buildings where unsatisfactory seismic behaviour
is inherent in the system is to provide adequate number of structural RC shear walls. The
new structural walls protect the existing elements by controlling the global lateral drift.
Such shear walls not only increase the lateral stiffness significantly, but also relieve the
existing frames from the lateral loads. Adding shear walls to complete the load path can
also correct discontinuities. The new elements provide most of the resistance to lateral
loads. If the walls have adequate stiffness and strength to take the total lateral load, the
weaknesses in frames (such as soft-storey, short column, etc.) usually do not lead to
undesirable behaviour. However, it should also be pointed out that adding infill shear walls
will decrease the natural period, which can increase the demand considerably.
If interventions at the perimeter of the building are feasible, addition of shear walls or
bracing (see Sections 2.6.1.1 and 2.6.1.2) at the façades is favoured over general upgrading
of (vertical) elements throughout the building (especially if occupancy needs to be
continued during retrofitting) (Fardis, 1998).
As referred by Pinho (2000), several studies (e.g. Higashi et al., 1984; Aoyama et
al., 1984; Frosh et al., 1996) on variations of this popular retrofitting technique have been
carried out. Full continuity between different levels increases strength, whilst proper
anchorage or re-bars to delimiting beams and closely spaced mesh provides high
deformation abilities. By contrast, poor detailing and lack of proper load-paths between old
and new members may load to global ductility reduction or brittle failure of infill panels.

Seismic vulnerability and rehabilitation of existing RC structures
72
In rehabilitating existing non-ductile framed structures, this technique usually involves
partial or total infilling of one of the bays of the existing framed buildings. If the wall takes
up the full width of the bay, it incorporates the beams and the two columns (that acting as
its boundary elements). Then, only the web of the new wall needs to be added, normally by
shotcreting against a light formwork or a partition wall. Sometimes, the use of precast
panels as infills becomes very convenient (recent examples applied after the 1995 Kobe
earthquake are given by Sugano, 2000), reducing construction period and cost of the
intervention, provided that adequate connection is made between the precast panels and the
frame members (Pinho, 2000; Ersoy, 1998; Fardis, 1998).
This retrofitting technique becomes very feasible when: a) framed structure does not have
adequate lateral stiffness; b) structural system has important weaknesses, such as soft-
storey, short column, etc.; and, c) the number of frame members to be rehabilitated is
beyond feasible limits (Ersoy, 1998). To ensure proper wall behaviour, the infill should be
connected to the surrounding frame, so as to fasten the new web to the frame members.
The most effective way of connecting the infill to the frame members is placing dowel bars
into the drilled holes in the members. Bonding of dowel bars is usually accomplished by
using epoxy-based adhesives. However, as stated by Ersoy (1998), such technique can be
questioned when fire resistance is considered. Also, anchorage of dowels in beams and
columns with poor concrete may cause problems. Alternatively, the new wall may be thick
enough to encapsulate the existing beams and columns. In this case, holes should be drilled
through the slab so that the vertical bars pass from one storey to the next.
A major drawback of this retrofitting method relies on the fact that sometimes it may
require strengthening of the foundation system so as to resist the increased overturning
moment and the larger weight structure. This type of work is usually costly, quite
disruptive, and a technically challenging operation, rendering the application of this
retrofitting technique unsuitable sometimes, particularly for buildings without an adequate
foundation system. Another disadvantage is the disruptive characteristic of the procedure.
Indeed, the use of shotcrete may require building evacuation.
Since the lateral stiffness of infilled frames is high as compared to bare frames, significant
floor torsion can be induced if such retrofitting infill shear walls are placed without
considering this effect (Ersoy, 1998). Application of this technique as a repairing measure

Chapter 2
73
to a single previously damaged storey can cause hazardous vertical strength irregularities.
Nakano (1995), for example, reports how a three-storey building repaired with shear walls
at the first storey only, after the 1968 Tokachi-oki earthquake, suffered heavy damage at
the second storey during a subsequent event in 1994 (Pinho, 2000).
Infilled frames were commonly used in Turkey for rehabilitation of buildings located in
seismic zones. From the 1970's, this retrofitting technique was used to strengthen buildings
showing several weaknesses, such as, inadequate lateral stiffness, inadequate confinement,
or inadequate anchorage length of reinforcing bars. Infilled frames were preferentially used
to repair and strengthen the damaged framed buildings after 1992 Erzincan earthquake
(Ersoy, 1998).
2.6.1.2 - Addition of steel bracing or post-tensioned cable systems
Global structural behaviour improvement can also be made by placing bracing consisting
of steel structural shapes, or it can be accomplished by post-tensioned cables. Ersoy (1998)
defends that bracing is not as effective as the infill in upgrading the lateral stiffness.
Moreover, since bracing is traditionally made from steel, fire resistance has to be
considered. As stated by Fardis (1998), the global stiffening effect of the bracing is rather
limited and it is likely that significant lateral displacements may need to develop before
full mobilisation of the bracing.
However, Fardis (1998) and Pinho (2000) also advocate that this global strengthening
method can be very effective. Concentric or eccentric steel bracing schemes may be used
in selected bays of an RC frame to provide a significant increase in horizontal capacity of
the structure. Diagonal bracing is normally completed with horizontal and vertical steel
members continuously fastened to the existing beams and columns around the braced bays.
These additional members transfer the lateral loads from the floors to the diagonal bracing
and are proportioned to play the role of the vertical chords and the horizontal ties of the
vertical cantilever truss. The shear connectors between the horizontal or vertical steel
members and the existing beams or columns should be proportioned conservatively as
force-controlled components.

Seismic vulnerability and rehabilitation of existing RC structures
74
Normally, no intervention to foundations is required and its installation is not as disruptive
as that of shear walls. Nevertheless, connection between existing concrete elements and
bracing system may be laborious and expensive. Bracing is usually placed for convenience
at the façades, causing the installation minimal disruption. Also, architectural constraints
are likely to condition the positioning of the bracers due to the effects that these have on
existing openings.
Several researchers have reported successful results on the use of steel bracing to
upgrading RC structures (Jara et al., 2001; Higashi et al., 1984). Register also the series of
RC buildings retrofitted with steel bracing have been reported to withstand the 1985
Michoacán earthquake with practically no structural damage (Calderón, 1980; Foutch et
al., 1988; Jara et al., 2000).
Passive energy dissipation devices or shear-links may also be used in conjunction with the
bracing to efficiently increase dynamic damping (Martinez-Romero, 1993; Okada et
al., 1992). However, if the bracing system increases the stiffness of the frame considerably,
the efficiency of the damping mechanism is compromised. This follows because the
damping mechanisms, normally, require large levels of displacement to be cost-effective
(Fardis, 1998). A thorough review of passive devices installed within steel bracing systems
can be found in the work of Martinez-Rueda (1997), and referred by Pinho (2000).
Post-tensioned steel bracing has also been successfully used to upgrade the response of
low-rise school buildings in Mexico (Miranda and Bertero, 1990). This system involves the
addition of post-tensioned rods that will yield for small levels of deformation, allowing
energy dissipation at an early stage of a large event. However, the initial brace pre-
stressing induces additional forces in the structure modifying the internal force distribution.
This needs to be considered, especially for serviceability limit states (Pinho, 2000).
2.6.1.3 - Base seismic isolation
One promising retrofitting method is the use of base isolation techniques including energy
absorbing devices in the system (Kelly et al., 1979). The conceptual idea is to control the
input to the structure' foundation, suppressing the interaction between soil and the
superstructure. Thus, vibration of the superstructure and consequent damage is reduced.
Chapter 2
75
This technique consists on providing the structure with a double foundation system,
separated by an isolation layer that grants discontinuity between the superstructure and the
foundation of the entire structure. In this way, the structure is decoupled from the input
motion and the majority of the seismic energy is absorbed by the isolation device, which
may consist on a thin sliding surface, rubber bearings or flexible members (Pinho, 2000;
Fardis, 1998; EQE, 1995). These bearings are designed to limit forces transferred from the
foundation to the building. The three basic properties of an isolation system are
(FEMA-274, 1997): a) horizontal flexibility to increase structural period and reduce
spectral demands; b) energy dissipation (damping) to reduce displacements; and, c)
sufficient stiffness at small displacements to provide adequate rigidity for service-level
environmental loadings.
Typical isolation reduces forces transmitted to the superstructure by lengthening the period
of the building and adding some amount of damping. Under favourable conditions, the
isolation system reduces drift in the superstructure by a factor of at least two (sometimes
by as much as a factor of five) from that which would occur if the building was not
isolated. Accelerations are also reduced in the structure, although the amount of reduction
depends on the force-deflection characteristics of the isolators and may not be as
significant as the reduction of drift. Reduction of drift in the superstructure protects
structural components and elements, as well as non-structural components sensitive to
drift-induced damage. Reduction of acceleration protects non-structural components that
are sensitive to acceleration-induced damage (FEMA-274, 1997).
The philosophy or purpose of seismic rehabilitation using isolation is directly dependent on
the owner's motivation to upgrade the building, and expectations of upgraded building's
performance during and following an earthquake (FEMA-274, 1997). As referred by
Pinho (2000) and Fardis (1998), seismic isolation is gaining wide acceptance as an
attractive and alternative means of upgrading structures with minimal disturbance to
architectural significant features, such as in historic monuments. Its application to
upgrading of RC structures is also feasible, particularly in the case of critical buildings that
need to remain open and operational or to be available for immediate occupancy after
seismic events. Take for example, hospitals, museums and other buildings in which
important contents must be protected against damage due to earthquake shacking.

Seismic vulnerability and rehabilitation of existing RC structures
76
Seismic isolation is very effective for retrofitting stiff buildings with low profiles and large
mass. It can offer safety to the buildings and occupants (under very strong earthquakes),
but also protection to buildings' contents (under any earthquake). Such methods are
extremely efficient in reducing response acceleration and inter-storey drift thus minimising
structural and non-structural damage. Examples of successful applications can be found in
Allen and Bailey's (1988) and Mokha et al.'s (1996) work. However, it is also an extremely
expensive solution and it's application to general purpose buildings is non-cost effective
(Pinho, 2000). As stated in FEMA-274 (1997), owners that are only interested in collapse
prevention should probably consider other more economical design strategies than seismic
isolation.
Seismic isolation and energy dissipation systems will not be appropriate design strategies
for most buildings, particularly for buildings that have only limited rehabilitation
objectives. In general, these systems will be most applicable to the rehabilitation of
buildings whose owners desire superior earthquake performance and can afford the special
costs associated to the design, fabrication, and installation of seismic isolators and/or
energy dissipation devices. These costs are typically offset by the reduced need for
stiffening and strengthening measures that would otherwise be required to meet
rehabilitation objectives (FEMA-274, 1997).
Furthermore, seismic isolation and energy dissipation systems are relatively new and
sophisticated concepts that require more extensive design and detailed analysis than do
most conventional rehabilitation schemes. Similarly, design (peer) review is required for
all rehabilitation schemes that use either seismic isolation or energy dissipation systems
(FEMA-274, 1997).
2.6.1.4 - Passive energy dissipation systems
Passive energy dissipation is an emerging technology that enhances the performance of the
building by adding damping (and in some cases stiffness) to the building. Fardis (1998)
refers that energy dissipation systems can be used combined with base-isolation, or can be
inserted in the braces of a steel bracing system added to the existing structure for
strengthening. The primary use of energy dissipation devices is to reduce earthquake

Chapter 2
77
displacement of the structure, provided the structure is responding elastically. Special
devices dissipate energy in a controlled manner, generally through frictional, hysteretic, or
viscoelastic processes. Under favourable conditions, passive energy dissipation devices
reduce drift of the structure by a factor of two or three if no stiffness is added, and by
larger factors if the devices also add stiffness to the structure. Energy dissipation devices
will also reduce force in the structure, but would not be expected to reduce force in
structures that are responding beyond yield (FEMA-274, 1997).
This solution is effective in structures that are relatively flexible and that have some
inelastic deformation capacity because it requires the development of significant lateral
displacements. The dissipative systems are commonly installed in structures as
components of braced frames. In some cases, the forces induced in the structure can
actually be increased. Sugano (2000) refers to examples of buildings in Japan retrofitted
with supplemental damping systems. The energy dissipating devices used were steel
elasto-plastic dampers and were installed on the top of braces or wall panels.
2.6.1.5 - Mass reduction
Stiffness and mass control the amount of force and deformation induced in a structure by a
ground motion (FEMA-273, 1997). Therefore, mass reduction of the building can be
considered as an efficient retrofitting technique, namely through: a) demolition of upper
storeys and penthouses; b) replacement of heavy cladding interior partitions and finishes;
and, c) removal of heavy storage and equipment loads.
2.6.1.6 - Other techniques
Methods and techniques to reduce the seismic inertia forces on building caused by
earthquake actions are being developed (response control methods). Other special seismic
protective systems, including active control, hybrid combinations of active and passive
energy dissipation devices, tuned mass and liquid dampers, may also provide practical
solutions for the seismic retrofitting of existing structures in the near future. These systems
enhance the performance during an earthquake by modifying the buildings' response
characteristics (FEMA-274, 1997). As argued by Ersoy (1998), these techniques were used
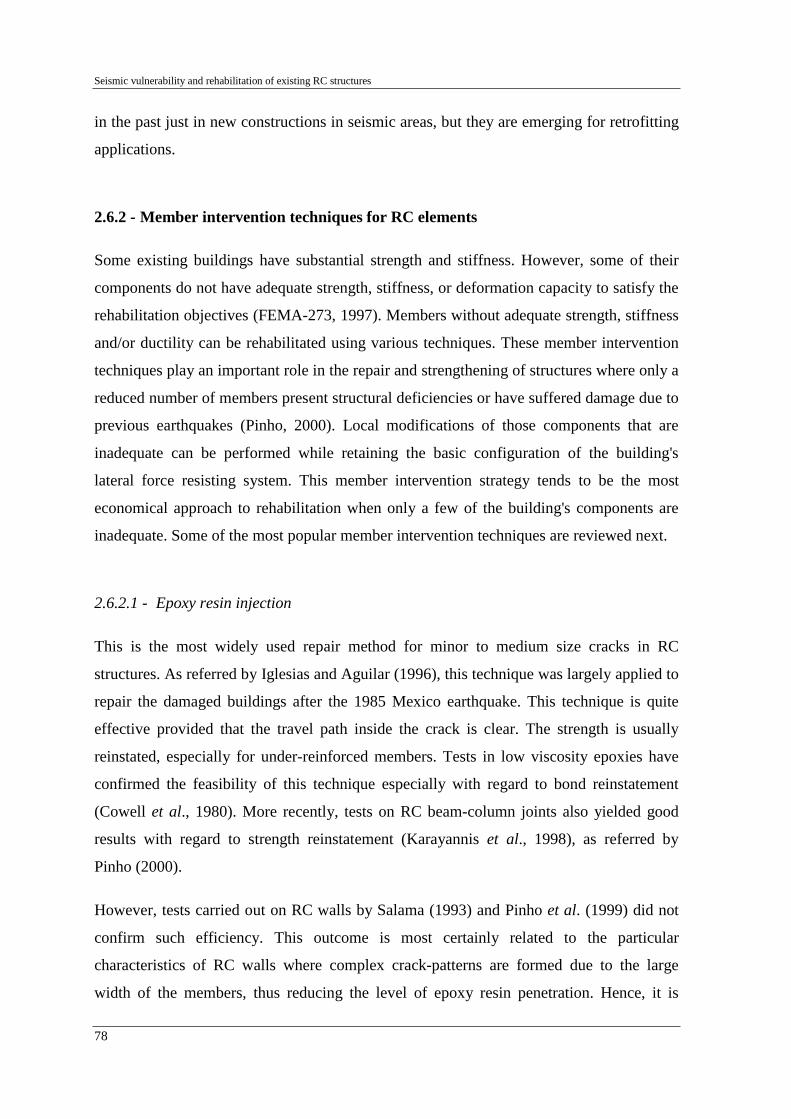
Seismic vulnerability and rehabilitation of existing RC structures
78
in the past just in new constructions in seismic areas, but they are emerging for retrofitting
applications.
2.6.2 - Member intervention techniques for RC elements
Some existing buildings have substantial strength and stiffness. However, some of their
components do not have adequate strength, stiffness, or deformation capacity to satisfy the
rehabilitation objectives (FEMA-273, 1997). Members without adequate strength, stiffness
and/or ductility can be rehabilitated using various techniques. These member intervention
techniques play an important role in the repair and strengthening of structures where only a
reduced number of members present structural deficiencies or have suffered damage due to
previous earthquakes (Pinho, 2000). Local modifications of those components that are
inadequate can be performed while retaining the basic configuration of the building's
lateral force resisting system. This member intervention strategy tends to be the most
economical approach to rehabilitation when only a few of the building's components are
inadequate. Some of the most popular member intervention techniques are reviewed next.
2.6.2.1 - Epoxy resin injection
This is the most widely used repair method for minor to medium size cracks in RC
structures. As referred by Iglesias and Aguilar (1996), this technique was largely applied to
repair the damaged buildings after the 1985 Mexico earthquake. This technique is quite
effective provided that the travel path inside the crack is clear. The strength is usually
reinstated, especially for under-reinforced members. Tests in low viscosity epoxies have
confirmed the feasibility of this technique especially with regard to bond reinstatement
(Cowell et al., 1980). More recently, tests on RC beam-column joints also yielded good
results with regard to strength reinstatement (Karayannis et al., 1998), as referred by
Pinho (2000).
However, tests carried out on RC walls by Salama (1993) and Pinho et al. (1999) did not
confirm such efficiency. This outcome is most certainly related to the particular
characteristics of RC walls where complex crack-patterns are formed due to the large
width of the members, thus reducing the level of epoxy resin penetration. Hence, it is

Chapter 2
79
difficult to guarantee the degree of penetration of the resin, and the level of reinstatement
of stiffness remains equally ambiguous. Moreover, the displacement at which the repaired
parts of the structural member start 'pickhing-up' lead is uncertain due to the impossibility
of injecting cracks smaller than 0.5 mm (Pinho, 2000).
2.6.2.2 - Jacketing of existing members
The most commonly used technique to improve the performance of existing RC elements
(columns, walls, beams or joints) is jacketing. Jacketing is effective in correcting specific
deficiencies in strength and/or deformation capacity, to improve longitudinal reinforcement
development or lap-splices, identified during the detailed evaluation (Fardis, 1998). It is
normally not a cost-effective strategy for global strengthening and stiffening, because it
may entail intervention to practically all vertical elements of the structure increasing not
only direct costs but also occupancy disruption. Jacketing can be made either using steel
structural shapes or fibre wrap overlays, or by enlarging the cross-section of the existing
member with a new RC shell. The new materials shall be designed and constructed to act
compositely with the existing concrete.
When the objective is the flexural capacity improvement of columns and beams, the jacket
should extend into the beam-column joint region and hoops should be placed there through
horizontal holes drilled in the beams so that the enhanced strength can be transferred to
adjacent framing components. However, past experience has shown that interior joints with
all four faces confined by beams are much less vulnerable than exterior ones, even when
unreinforced. So the laborious task of placing hoops in such joints is not absolutely
necessary (Fardis, 1998). Appropriate measures should be implemented to provide shear
transfer between new and existing materials. If the jacket's only aim is to improve shear
strength, confinement, ductility and lap-splices (but not the flexural strength), it does not
need to be continuous through the slab. The longitudinal reinforcement in concrete jackets,
and steel in steel jackets should be discontinued at a short distance from the connection
with adjacent components (FEMA-274, 1997).
To increase the shear strength, steel, concrete, or other types of jackets can be added to the
deficient sections. When proper connections between old and new materials are achieved,
Seismic vulnerability and rehabilitation of existing RC structures
80
it is usually appropriate to calculate the nominal shear strength as if the section were
composite (FEMA-274, 1997).
The interventions using thin jackets employ steel or composite (fibre reinforced polymers)
jackets to the column. Hence, no significant change to the original flexural capacity of the
member is introduced. Similarly, using thin steel plates or high-strength composite
materials also prevents significant modifications of the columns stiffness. The later will
induce changes in pre-yielding stiffness of up to a maximum of 5%, as opposed to a 75%
change if conventional concrete jacketing is used (Priestley et al., 1996; Pinho, 2000;
Ersoy, 1998).
When the member is heavily damaged or considered to be of insufficient strength, a RC
jacket may be used to enhance stiffness, strength and ductility. This is one of the most
commonly applied methods of repair and strengthening of RC members and, apart from the
welding of the links between the new and existing reinforcement bars, it does not require
specialist knowledge. Concrete jackets can accommodate longitudinal and transverse
reinforcement to increase the flexural and shear strength, enhance the deformation capacity
(through confinement and anti-buckling action) and improve the strength of deficient
lap-splices. Being one of the objectives of the concrete jacket to increase flexural strength,
the surface of the existing concrete has to be roughened prior to concrete placement, and
the shear connection using dowels to improve shear transfer between the old and the new
concrete should be assured. Good results have been observed by Rodriguez and
Park (1991) in terms of upgrading all three design parameters of the member (Pinho, 2000;
Fardis, 1998).
a) Steel jacketing: Steel jacket can be used to improve the confinement. Normally, a non-
shrink grout is used to effectively bond the materials, filling the gap between the steel
jacket and the old concrete column. The effectiveness of thin rectangular steel jackets for
seismic retrofit (to enhance shear and flexural performance) of large rectangular and
circular non-ductile RC columns was investigated by Aboutaha et al. (1996), Priestley et
al. (1994), Chai et al. (1991), for example. The major feature of the work conducted by
Aboutaha et al. (1996) is the use of anchor bolts to provide extra confinement to lap-
splices in the centre of the column. This is an essential issue since in wide columns the
steel collars can only provide confinement to the lap-splices close to the corners of the

Chapter 2
81
member. Aboutaha et al. (1996) results indicate significant increase in the ductility and
strength of the RC members, whilst minimum change in their stiffness was observed.
Moreover, the tests revealed that the use of long jackets increases ductility supply by
providing better lap-splice confinement. Aviles et al.'s (1996) experiments on nineteen
column specimens have shown that retrofitting with thick steel plate wrapping combined
with anchor bolts increased deformation capacity of the specimens, whilst no change in
stiffness or strength was evident (Pinho, 2000).
It should be pointed out that one of the weaknesses of the rehabilitation carried out by
bonding steel strips to the members is its poor fire resistance. Also the long-term
performance of the bonding material (epoxy) is not well known (Ersoy, 1998).
b) Fibre Reinforced Polymers (FRP) jacketing: Strengthening of RC structures using FRP's
has found numerous field applications around the world (Triantafillou, 1998; Meier, 1992).
These applications include wrapping of columns in seismic zones and flexural
strengthening of beams and slabs.
Saadatmanesh et al. (1997) carried out experimental work on the application of high-
strength FRP composite straps to retrofit rectangular columns. Both oval and rectangular
shapes were used, and active confinement was applied in the specimens by means of
pressure injection of epoxy resin. The increase in the level of ductility of the upgraded
models was evidenced in their work. Saadatmanesh et al. (1994) summarise the benefits of
the strengthening concrete columns with FRP's, namely, the capability to increase the
ductility (depending on the degree of confinement, significant increases in ductility can be
achieved) and the strength. The lateral pressure exerted by the straps increases the
compressive strength of the concrete in both the core and shell regions, resulting in higher
load-carrying capacity. The lateral confinement provided by the straps also provides
additional support against buckling of the longitudinal bars. The flexibility of the straps
allows wrapping around circular as well as rectangular columns. The low density of
composites (typically one-fifth that of steel) simplifies the construction procedure and
reduces cost. The proposed method will cause no disturbance to the integrity of the
existing structure, i.e. no anchor bolts, dowels, etc., will be required. The straps are very
thin, therefore, they will not alter the appearance of the structure. Because of their
resistance to electrochemical deterioration, FRP's do not corrode and they are not affected

Seismic vulnerability and rehabilitation of existing RC structures
82
by salt spray and other aggressive environmental factors. Ultraviolet light, however, can
adversely affect some FRP's. Providing a protective coating for the straps during or after
the manufacturing process can eliminate this problem.
Seible et al. (1997; 1995) also performed a series of tests on large-scale bridge columns,
for the three modes of failure: shear, plastic-hinge confinement and lap-splice de-bonding.
Circular and rectangular columns geometries and different levels of column reinforcement
ratios were investigated. From the large-scale tests, they conclude that column retrofit
jacket with advanced composite materials can be just as effective structurally as
conventional steel jacketing, in improving the seismic response characteristics of
substandard reinforced concrete columns.
The basic concept of the most commonly used technique of jacketing is simple, but the
actual behaviour involves many uncertainties, as recalled by Ersoy (1998). First of all,
there is the uncertainty regarding load sharing between the original existing member and
the jacket. As also pointed out by Pinho (2000), if jacking-up of the slab is not undertaken
prior to the construction of the jacket, load sharing does not take place until after some
measurable seismic displacement has occurred. Experimental research at the 1990's has
improved our knowledge on the behaviour of jacketed members. However, further research
is needed to clarify the behaviour of jacketed columns, especially for jacketing made under
load (Ersoy, 1998).
2.6.2.3 - Shotcrete
Not only is this method used in its own right, but is also often applied as part of repair by a
RC jacket. It comprises the spraying of a high cement content and fine aggregate concrete
mix onto de surface of the affected member. Warner (1996) carried out a thorough review
of the features of this method, as referred by Pinho (2000).
The strength of the applied layer of concrete is usually very high, and the technique may be
applied in situations where the use of formwork is not possible (such as for a beam-column
connection). It is also often applied to masonry structures. However, there are several
drawbacks. For example, considerable waste in materials is inevitable due to rebound, and
Chapter 2
83
wire mesh is required to avoid shrinkage cracks of the high cement concrete mix
(Pinho, 2000).
2.6.2.4 - Other techniques
Apart from the techniques previously presented, the following member retrofitting
solutions can be also envisaged (FEMA-274, 1997):
• Post-tensioning existing beams, columns, or joints using external post-tensioned
reinforcement. Lateral deformations of slender walls may result in significant
tension force requirements for boundary columns, which may lead to unacceptable
behaviour of reinforcement lap-splices. Post-tensioning can be considered as an
option for pre-compressing columns to avoid excessive tension forces. When this
approach is adopted, the design needs also to consider the possible negative effects
on column behaviour when the lateral forces reverse and the column becomes
loaded in compression. Anchorages shall be located away from regions where
inelastic action is anticipated, and shall be designed considering possible force
variations due to earthquake loading.
• Modification of the element by selective material removal from the existing
element. This is a primary method of rehabilitating existing infilled frames. Either
the infill can be completely removed from the frame, or gaps can be provided
between the frame and the infill. In general, removal of existing infills should not
result in vertical or plan irregularities in the structural system.
• Improvement of deficient existing reinforcement details. This approach involves
removal of cover concrete, modification of existing reinforcement details, and
casting of new cover concrete. This approach may also be useful for improving
tension lap strength of existing columns lap-splices. When this option is selected,
chipping of concrete cover may be required. Care should be exercised to ensure that
core concrete, and bond with existing transverse reinforcement, are not damaged
excessively. New cover concrete shall be designed and constructed to achieve fully
composite action with the existing materials.
CHAPTER 3
DESCRIPTION OF THE EXPERIMENTAL TESTS
'If you want a description of scientific method in three syllables, I propose: guess and test' (George Pólya, Mathematical Discovery, Vol. II)
3.1 - INTRODUCTION
As previously referred in Chapter 1, the vast majority of buildings in earthquake prone
areas in Europe constructed before the 1980's are seismic deficient in light of our current
knowledge. In fact, until the 1960's no specific seismic design provisions were included in
the codes and, from that period on, only seismic equivalent lateral loading has been
considered in their design. Provisions for design and detailing of members and structures
resembling those of modern codes only appeared in European national codes in the 1980's
(e.g. Portuguese design code – RSA, 1983). Consequently, most of the existing buildings
constitute a major source of risk to human life and property loss. Therefore, their
retrofitting or replacement should be made in order to reduce vulnerability and
consequently risk to current accepted levels.
The research programme of research network ICONS (presented in Chapter 1), topic 2 –
Assessment, Strengthening and Repair, addresses the issues of seismic assessment and
retrofitting of existing structures covering several aspects of the problem (see Section 1.1
for details). In particular, the assessment of reinforced concrete buildings with and without
infill panels and several strengthening solutions and techniques are investigated through
numerical and experimental work. The experimental research work includes several studies
carried out at the ELSA reaction-wall laboratory, at the JRC. In order to evaluate the

Description of the experimental tests
86
efficiency of different retrofitting solutions and to investigate bare and infilled frame test
conditions, two representative identical full-scale four-storey, three-bay reinforced
concrete frames (one as a bare frame and one as a frame with brick infilled walls), were
designed, constructed and placed parallel to each other and were tested in sequence using
pseudo-dynamic testing procedures.
For the experimental model, one degree-of-freedom (DOF), corresponding to a
longitudinal horizontal displacement, was considered per floor. The experimental seismic
response was obtained by means of application of the continuous PsD test method.
The main objectives of the test campaign were: a) calibration of numerical models capable
of predicting the non-linear behaviour of existing RC structures; b) experimental
evaluation of seismic vulnerability of existing RC structures; c) experimental verification
of the infill walls influence on the global structural response; and d) experimental
evaluation of retrofitting solutions.
The test program was divided into four phases. In the first phase, the frames were
subjected separately to pseudo-dynamic tests to assess the earthquake performance of both,
the bare concrete frame and the frame structure with infilled walls.
In the second phase of the research program, the tests were repeated, now to evaluate
retrofitting techniques. The non-infilled frame had been retrofitted, with selective
retrofitting techniques, which balance strength, stiffness and ductility according to the
requirements for increased seismic performance. For the infilled frame, the infills were
strengthened with a grouted mesh reinforcement ('shotcrete').
The third study dealt with the design and assessment of a retrofitting solution involving the
introduction of a ductile eccentrically steel braced frame (K-bracing with a vertical shear-
link). This retrofitting was applied just to one storey and a cyclic test was performed to
evaluate the efficiency of this retrofitting technique.
The local damages inflicted to the structures, after the PsD tests, inhibited the final
capacity tests (fourth phase), which were required to assess their ultimate global capacity.
Therefore, in order to assess the ultimate capacity of the bare frame and of the selective
repaired frame, after their repair and strengthening using composite carbon fibre materials,

Chapter 3
87
final capacity cyclic tests were performed. The repair and strengthening operations allowed
the frames to recover their vertical load carrying capacity, as well as most of their seismic
resistance.
The complete set of tests performed on the two RC frames is given in Table 3.1.
Table 3.1 - Testing programme
Test series Label
Bare frame
BF
PsD
Strengthened frame (selective retrofit techniques)
SR
K-bracing with steel shear-link dissipator at the 2nd storey
KB-cyclic
Fram
e B
Cyclic
Final capacity on strengthened frame
SR-cyclic
Infilled frame
IN
PsD
Shotcrete infilled frame (infill strengthened frame)
SC
Fram
e A
Cyclic Final capacity on bare frame (recovered from the infilled frame, removing the infill walls)
BF-cyclic

Description of the experimental tests
88
The author, involved in the team of the ICONS research programme, followed the
experimental tests on the four storey full-scale frames. In this study full-scale models are
used, representative of existing RC buildings, and there is a full knowledge of the
materials' properties and structural topology. Normally, these details are not fully known in
current assessment engineering practice. Instead, when the engineer has to evaluate the
vulnerability of an existing structure he faces a major barrier that is the inexistence of the
original drawings. Moreover, in many cases, those drawings exist but changes to the
original design during the construction phase or during the subsequent interventions are not
inventoried. Therefore, in the majority of the cases, the engineer has to investigate the
structure carefully so as to verify its topology and eventual degradation degree, as well as
to take material samples (steel and concrete) to estimate their mechanical properties.
To achieve the experimental purposes, two full-scale four-storey reinforced concrete
frames were constructed and tested for several earthquake intensities. The efficiency of
various repair and retrofitting techniques were also experimentally evaluated. The tests
carried out within the research programme are presented in two chapters, namely 3 and 4.
Chapter 3 provides the background to Chapter 4 by detailing the experimental research
work carried out at the ELSA laboratory. Chapter 4 presents and discusses the
experimental results from all the pseudo-dynamic and cyclic tests performed.
Appendices A and B gather all the instrumentation details, test results, damage observed
during the tests and a photographic documentation.
This chapter is organised as follows. First it provides details on the structure, on the
construction of the RC frame, materials' mechanical properties and loads. Next, it presents
the properties of the masonry infill and of the masonry strengthening. Then, it reviews the
retrofitting solutions tested, namely the selective retrofitting technique, the K-bracing with
shear-link system and the retrofitting using composite carbon fibre materials. All the
aspects related to the test campaign and test set-up are discussed. Section 3.8 focuses on
the non-destructive tests aimed at the dynamic characterisation of the frames, and discuss
the related aspects. Finally, this chapter closes with final remarks.

Chapter 3
89
3.2 - CHARACTERISATION OF THE RC FRAMES
3.2.1 - Reinforced concrete frame structure: geometry and section detailing
The two reinforced concrete frames tested at ELSA laboratory can be considered
representative of the design and construction common practice until the late 1970's in
southern European countries such as Italy, Portugal and Greece. They were designed to
withstand vertical loads only. Previous numerical analyses of the designed frames found
that they have a resistance to horizontal loads, in terms of ultimate limit state, of
approximately 8% of their weight. Similar analysis in terms of allowable stresses, as was
common practice at the time, would lead to a lateral resistance of 5% of the frame weight
(Carvalho et al., 1999). The reinforcement details were specified in accordance to the
normative available and to the construction practice at that time. Thus, no specific seismic
detailing provisions were considered, preferential inelastic dissipation mechanisms were
not assumed and no specific ductility or strength provisions were provided.
Figure 3.1 shows the general layout of the structure. It is a reinforced concrete four-storey
frame with three bays: two of 5.0 m span and one of 2.5 m span. The inter-storey height is
2.7 m and a 0.15 m thick slab of 2.0 m on each side is cast together with the beams. Equal
beams (geometry and reinforcement) were considered on all floors. All but the wider
interior column (column 2) have equal geometric characteristics along the height of the
structure. It should be noted that only column 2 is working in its stronger axis. Therefore,
this column plays a dominant role in the structural response of the frame and is hereafter
referred as 'strong-column'. The other columns (1, 3 and 4) are referred as 'slender-
columns'. The strong-column is characterized by a rectangular cross-section with
dimensions of 0.60 m × 0.25 m on the first and second storeys and 0.50 m × 0.25 m on the
third and fourth storeys.
Geometric characteristics of the beams and reinforcement details are shown in Figure 3.2.
It should be noted that smooth round bars, which were commonly used some years ago,
constitute the longitudinal reinforcing steel. All beams in the direction of loading are
250 mm wide and 500 mm deep, while transverse beams are 200 mm wide and 500 mm
deep. Figure 3.3 shows the columns reinforcement details and their geometric dimensions.

Description of the experimental tests
90
The column reinforcement splicing, joints and stirrup detailing should be noted in
particular, as they are representative of the lack of confinement common in non-ductile
reinforced concrete structures constructed until the late 1970's.
The longitudinal reinforcement of all (four) columns has a lap-splice (70 cm) at the base of
the 1st storey and another at the base of the 3rd storey. Therefore, at the base of the 1st
storey's column, duplication of the reinforcement occurs. A superposition of the nominal
reinforcement exists also at the base of the 3rd storey.
Figure 3.1 - Plan and elevation views of concrete frame plus masonry infill building
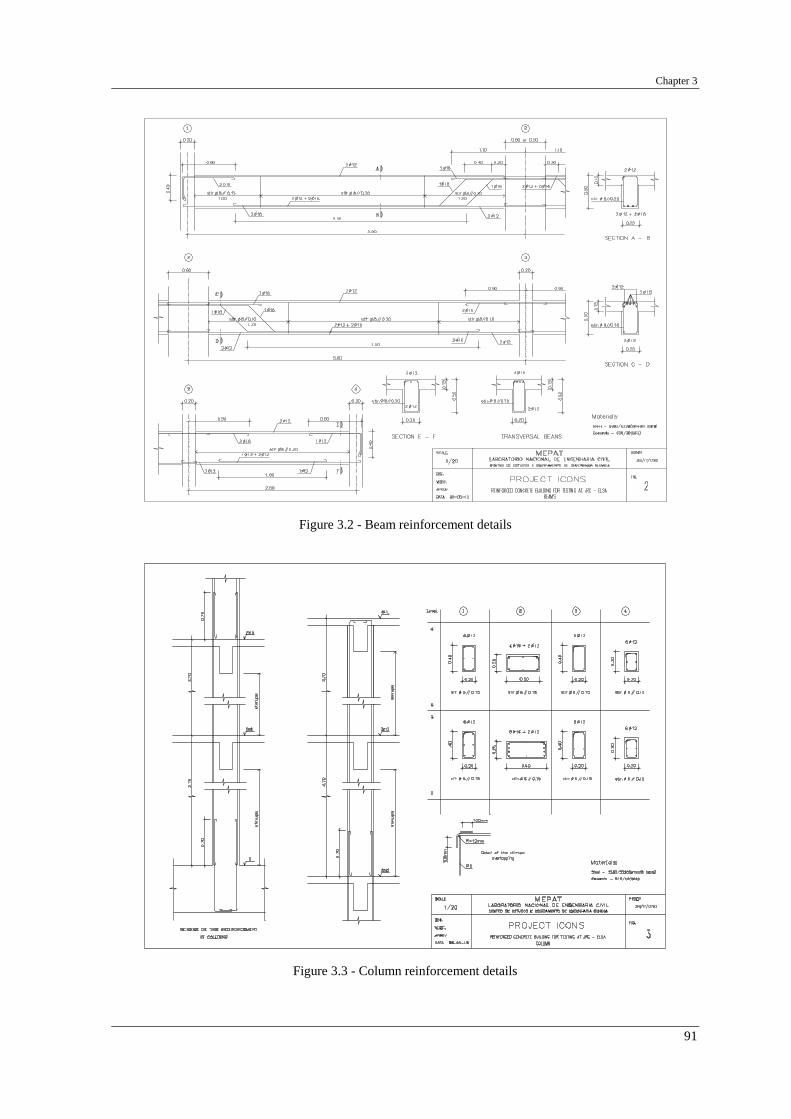
Chapter 3
91
Figure 3.2 - Beam reinforcement details
Figure 3.3 - Column reinforcement details
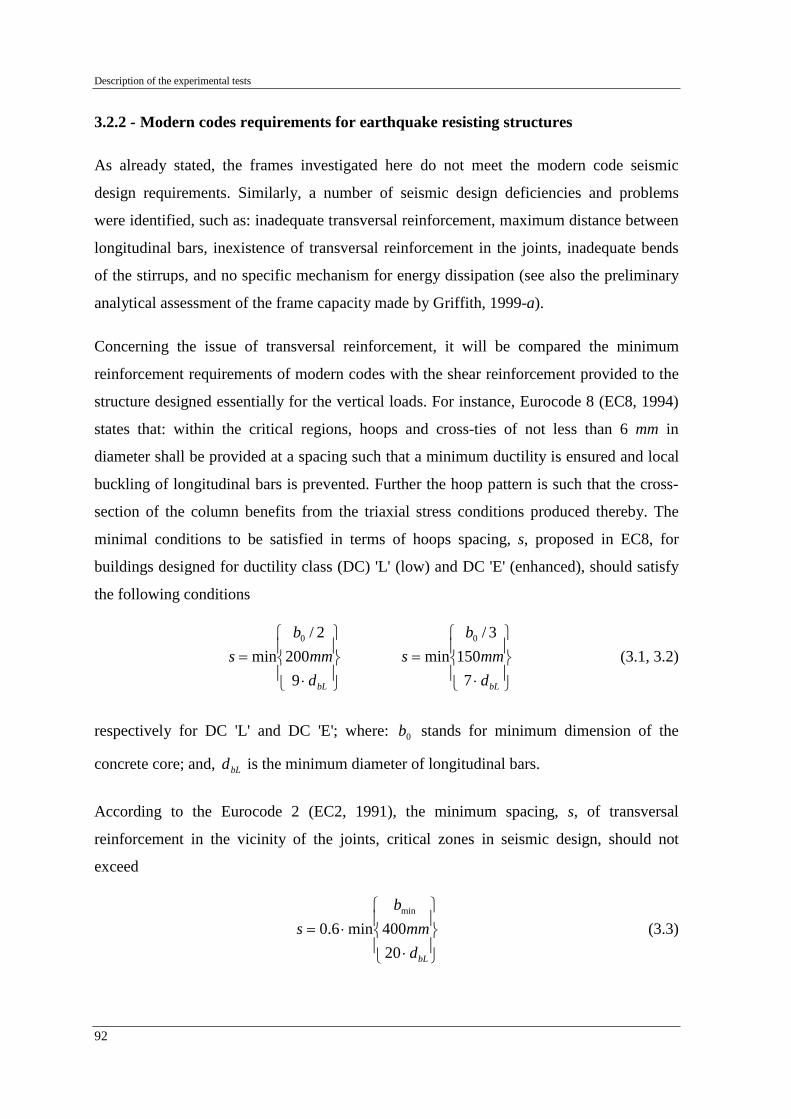
Description of the experimental tests
92
3.2.2 - Modern codes requirements for earthquake resisting structures
As already stated, the frames investigated here do not meet the modern code seismic
design requirements. Similarly, a number of seismic design deficiencies and problems
were identified, such as: inadequate transversal reinforcement, maximum distance between
longitudinal bars, inexistence of transversal reinforcement in the joints, inadequate bends
of the stirrups, and no specific mechanism for energy dissipation (see also the preliminary
analytical assessment of the frame capacity made by Griffith, 1999-a).
Concerning the issue of transversal reinforcement, it will be compared the minimum
reinforcement requirements of modern codes with the shear reinforcement provided to the
structure designed essentially for the vertical loads. For instance, Eurocode 8 (EC8, 1994)
states that: within the critical regions, hoops and cross-ties of not less than 6 mm in
diameter shall be provided at a spacing such that a minimum ductility is ensured and local
buckling of longitudinal bars is prevented. Further the hoop pattern is such that the cross-
section of the column benefits from the triaxial stress conditions produced thereby. The
minimal conditions to be satisfied in terms of hoops spacing, s, proposed in EC8, for
buildings designed for ductility class (DC) 'L' (low) and DC 'E' (enhanced), should satisfy
the following conditions
⋅=
bLdmm
bs
9200
2/min
0
⋅=
bLdmm
bs
7150
3/min
0
(3.1, 3.2)
respectively for DC 'L' and DC 'E'; where: 0b stands for minimum dimension of the
concrete core; and, bLd is the minimum diameter of longitudinal bars.
According to the Eurocode 2 (EC2, 1991), the minimum spacing, s, of transversal
reinforcement in the vicinity of the joints, critical zones in seismic design, should not
exceed
⋅⋅=
bLdmm
bs
20400min6.0
min
(3.3)

Chapter 3
93
where: minb stands for the minimum dimension of the column cross-section.
Applying the stirrups spacing requirements to the frame, the values shown in Table 3.2 for
the strong-column (column 2 in Figure 3.3) and for the slender-columns (columns 1, 3 and
4 in Figure 3.3) were obtained. These results should be compared with the 150 mm stirrup
spacing provided.
Table 3.2 - EC8 and EC2 requirements in terms of transversal reinforcement spacing (in mm)
EC8 Columns
DC 'L' DC 'E' EC2 Used in the tested
frame
Strong-column (all storeys) 100 67 144 150
Slender-columns (all storeys) 75 50 120 150
Therefore, it can be concluded that the transversal reinforcement does not satisfy the EC8
requirements for any of the columns. Furthermore, not even the EC2 requirements are
fulfilled in terms of hoops spacing.
Table 3.3 summarises the volumetric ratio of the transversal reinforcement used for the
columns. It was calculated as the ratio of the transversal reinforcement volume to the
volume of the concrete core. The hoops volumetric ratio is less than 0.1% for all the
columns, being 0.06% for the strong-column at the first storey.
Table 3.3 - Volumetric ratio of the columns transversal reinforcement (%)
Column (according to the nomenclature in Figure 3.3) Storeys
1 2 3 4
3rd and 4th 0.09 0.07 0.09 0.10
1st and 2nd 0.09 0.06 0.09 0.10
According to EC8, the distance between consecutive longitudinal bars restrained by hoop
bends or cross-ties, should not exceed 250 mm for the DC 'L' and 200 mm for the DC 'E'. In
the frame tested, only the external slender-column with dimensions 0.30 m × 0.20 m
satisfies the Eurocode requirements.

Description of the experimental tests
94
The frame is not provided with transversal reinforcement in the joints. It should be noted
that the EC8 for the DC 'L' states that: a) the horizontal confinement reinforcement in the
beam column joints shall not be less than that provided along the column critical regions;
and, b) at least one intermediate (between column corner bars) vertical bar shall be
provided on each side of the joint.
EC8 also states that hoops should be made as closed stirrups with 135° bends, and 10dbw
long bends should be used, whereby dbw represents the hoop diameter. However, stirrups
with 90° bend were used in the frame under investigation.
The anchorage of longitudinal reinforcing bars is achieved by hooks with 180° bends, and
no supplementary transverse reinforcement is provided in the lap-splice zone. EC2 requires
that the reinforcing bars shall be anchored so that the internal forces imposed on them are
transmitted to the concrete, and that longitudinal cracking or spalling of the concrete is
avoided. Transverse reinforcement should also be provided, according to the rules
presented in Figure 3.4. Furthermore, it is considered that bends and hooks do not
contribute to compression anchorages.
a) bars in tension b) bars in compression
Figure 3.4 - Transverse reinforcement for lap-splice zones (EC2)
Concerning longitudinal reinforcement, EC2 refers that bars should have a diameter not
smaller than 8 mm, and that the minimum amount of total longitudinal reinforcement
(As,min) should be derived from the following conditions
⋅⋅
=c
ydsds A
fNA
002.0)10.0(
maxmin, (3.4)
where: Nsd is the design axial compression force; fyd is the design yield strength of the
reinforcement; and, Ac is the total cross-sectional area of the column. As shown in

Chapter 3
95
Table 3.4, the percentage of longitudinal reinforcement in relation to the total cross-section
of the columns (longitudinal reinforcement volumetric ratio) complies with the minimum
requirements of 0.2%, which prevails in equation (3.4).
Table 3.4 - Volumetric ratio of the columns longitudinal reinforcement (%)
Column (according to the nomenclature in Figure 3.3) Storeys
1 2 3 4
3rd and 4th 0.85 0.82 0.85 1.13
1st and 2nd 0.85 1.22 1.13 1.13
Another important aspect considered in modern codes is the global dissipation mechanism
for which capacity design provisions are required. The frame is not provided with any of
those requirements, and then premature storey mechanisms are highly probable to develop.
As a result, the studied frame does not satisfy most of the current requirements in terms of
detailing and global deformation mechanisms, therefore poor seismic performance is
expected.
3.2.3 - Construction of the frames and loading devices
As previously mentioned, the design of the two four-storey full-scale reinforced concrete
frames was carried out at LNEC (Carvalho et al., 1999) within the framework of the
ICONS project. The design of the RC frames was dictated by several objectives and
constraints. The frames are completely disconnected, allowing for testing one on one,
independently. They have a common base foundation, and are braced with lateral steel
pinned bars in order to avoid out-of-plane deformation during transportation and testing, as
showed in Figures A.15 and A.16. A strong foundation, consisting of a thick continuous
slab and high foundation beams, was provided with the aim of fixing the structure to the
laboratory strong floor (with prestressed Diwidag steel bars). This procedure would avoid
sliding and overturning during testing and damage during the transportation and lift of the
frames from the construction area to the testing floor.

Description of the experimental tests
96
The final design also included provisions for the attachment of the transducers and for the
load application fixtures. In particular, the connections for the attachment of the actuators
were located at each floor level on the slab at the mid-span central bay, through a V-
loading steel frame. Figure 3.5 represents, in plan view, the attachment system employed at
each floor. In order to ensure better distribution of the applied horizontal forces, additional
reinforcement was provided in the slab zone where the V-loading frame were attached to
the structure.
Figure 3.5 - Attachment system at floor level
The steel square-hollow bars transfer the loads to the slab by friction, which is guaranteed
by the vertical pre-stressing applied to the five connectors on each bar (see Figure A.17).
Figure A.14 shows the pre-stressing intervention. The hollow steel bars have a square
cross-section with 200 mm side and 10 mm thickness, and were filled with concrete to
avoid local deformations during pre-stressing. The actuators, or rather the actuators and
corresponding load cells (in series), are directly connected to the thick steel plates, labelled
in Figure 3.5 as 'actuator-link', on one side and to the reaction wall on the other.
The frames were constructed in the east-side working area, outside of the ELSA
laboratory. By doing so, it was possible to carry out other tests in the laboratory
simultaneously, and to better reproduce the real curing conditions. Traditional wood
formwork and workmanship were adopted to reproduce the common practice construction
more accurately. The concrete was ready-mixed and vibrated with a vibrating needle. The
total weight of the specimens is 277 tons, which includes 75 tons for the foundation and
101 tons for each frame.

Chapter 3
97
The construction was supervised in order to achieve the design specifications in terms of
materials, structural geometry and reinforcement detailing. Therefore, the common
uncertainties that occur in real existing structures are reduced. Indeed, aspects such as
variance in material properties and reinforcement detailing relatively to the designed
structure, non-documented structural modifications, difficulties to find the original
drawings and materials degradation make the assessment of existing structures difficult.
Hence, in this particular case, the constructed frames reproduce well the designed
structure.
In Appendix A, Figures A.1 to A.10 show pictures with relevant details of the different
phases of the construction of frame models, namely: foundation reinforcement and casting,
slab, columns and joint reinforcement details, casting of the first floor and general views of
the construction at various phases.
3.2.4 - Transportation of the frame models
As stated earlier, provisions for the transportation of the frames were defined and designed
at the Joint Research Centre, namely: the slab, the base foundation and the attachment
location of the vertical jacks necessary for lifting the frames. The procedure used to move
the structure into the laboratory in front of the ELSA reaction-wall was already used in
previous test campaigns to transport other test specimens (Negro et al., 1994), which is
summarized herewith.
The frame specimens' foundation was raised 120 mm by means of 16 hydraulic jacks (see
Figure A.11) acting at equal oil flux in order to avoid deformation at the base. A set of
polythene plastic tubes connected to form a sort of roller 'ladder' was then placed
underneath the foundation, and then pulled to its final destination, in front of the reaction
wall. The plastic tube system was designed in order that the material of the tubes is
stressed at a level close to its apparent elastic limit, so that the irregularities of the floor
could have been compensated by plastic deformation of the tubes, without transmitting any
significant deformation to the upper part of the structure. The transportation and
positioning of the frames took two days, and due care was taken to assure the integrity of
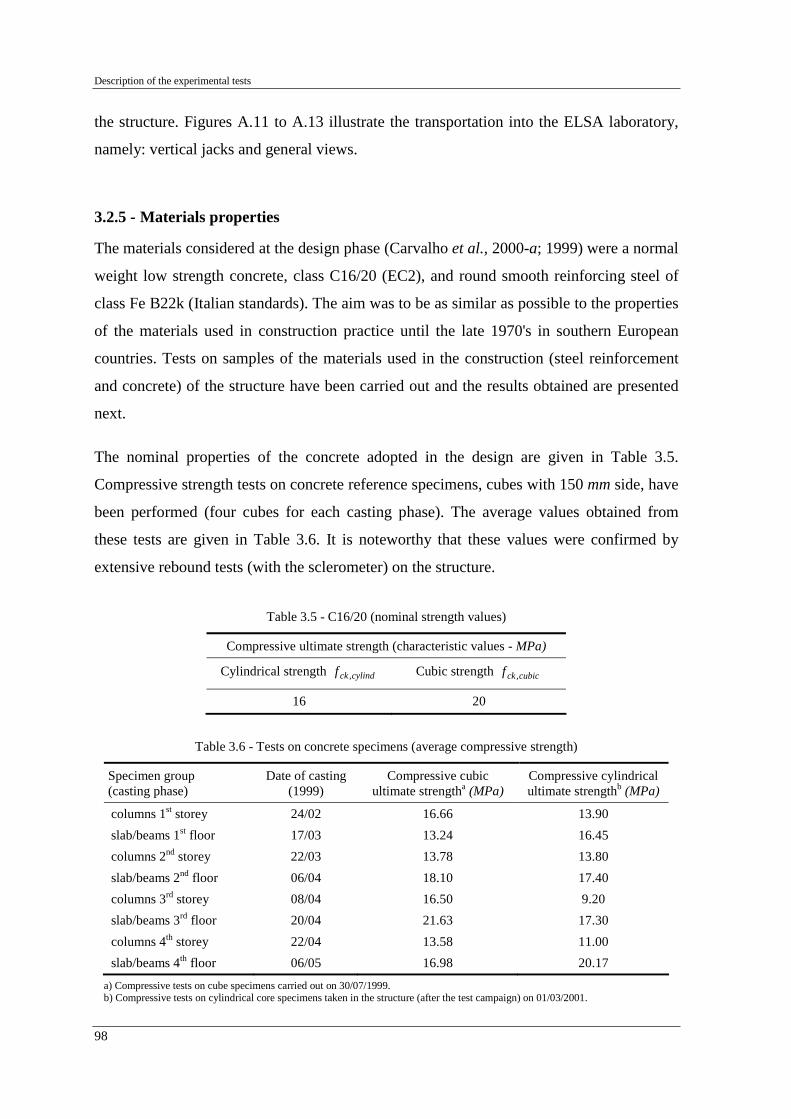
Description of the experimental tests
98
the structure. Figures A.11 to A.13 illustrate the transportation into the ELSA laboratory,
namely: vertical jacks and general views.
3.2.5 - Materials properties
The materials considered at the design phase (Carvalho et al., 2000-a; 1999) were a normal
weight low strength concrete, class C16/20 (EC2), and round smooth reinforcing steel of
class Fe B22k (Italian standards). The aim was to be as similar as possible to the properties
of the materials used in construction practice until the late 1970's in southern European
countries. Tests on samples of the materials used in the construction (steel reinforcement
and concrete) of the structure have been carried out and the results obtained are presented
next.
The nominal properties of the concrete adopted in the design are given in Table 3.5.
Compressive strength tests on concrete reference specimens, cubes with 150 mm side, have
been performed (four cubes for each casting phase). The average values obtained from
these tests are given in Table 3.6. It is noteworthy that these values were confirmed by
extensive rebound tests (with the sclerometer) on the structure.
Table 3.5 - C16/20 (nominal strength values)
Compressive ultimate strength (characteristic values - MPa)
Cylindrical strength cylindckf , Cubic strength cubicckf ,
16 20
Table 3.6 - Tests on concrete specimens (average compressive strength)
Specimen group (casting phase)
Date of casting (1999)
Compressive cubic ultimate strengtha (MPa)
Compressive cylindrical ultimate strengthb (MPa)
columns 1st storey 24/02 16.66 13.90 slab/beams 1st floor 17/03 13.24 16.45 columns 2nd storey 22/03 13.78 13.80 slab/beams 2nd floor 06/04 18.10 17.40 columns 3rd storey 08/04 16.50 9.20 slab/beams 3rd floor 20/04 21.63 17.30 columns 4th storey 22/04 13.58 11.00 slab/beams 4th floor 06/05 16.98 20.17
a) Compressive tests on cube specimens carried out on 30/07/1999. b) Compressive tests on cylindrical core specimens taken in the structure (after the test campaign) on 01/03/2001.

Chapter 3
99
The concrete compression tests on twenty-eight cubes cast during construction led to a
mean strength of 16 MPa, thus indicating that the concrete is of rather poor quality. In
order to confirm the real properties of the concrete, further tests were performed by an
external company using concrete core specimens (carrots) after the test campaign has been
completed. The carrots were taken from both columns and slab/beams elements, located at
no damaged zones. The picture in Figure A.30 shows the operation of specimens'
extraction in the frame structure. Results of the compressive tests on the cylindrical
specimens taken from the structure are also listed in Table 3.6. A good relation was found
between the test results of the cubes specimens and of the cylindrical specimens.
A small variance was found for each casting phase, whilst large differences corresponded
to the various casting phases. This variability shall be taken into account in the refined
non-linear numerical analyses.
Table 3.7 presents the nominal (mean and characteristic) values for the mechanical
properties of the steel adopted in the frame's construction. The steel is Fe B22k, smooth
bars (Italian standards: Gazzetta Ufficiale, n. 176; Decreto del 28 Giugno 1980; 'Acciai in
barre tonde lisce').
Table 3.7 - Fe B22k (nominal properties)
Relevant properties Characteristic values
Yield stress MPaf syk 215=
Ultimate strength MPaf suk 335=
Ultimate strain %0.24=sukε
Tensile strength tests on steel bar specimens have been carried out at LNEC, in Lisbon
(Carvalho et al., 2000-a; 1999). The variance found was very small. From a best-fit of
experimental diagrams for the reinforcing bars, the mean mechanical properties were
estimated. The values obtained are summarised in Table 3.8. The best-fit was based on a
linear regression for the elastic initial branch and on a non-linear regression using the
Mander model for the hardening branch (scheme of the stress-strain curve in Figure 3.6).
The LNEC test results are in line with the results obtained in other series of tests (see
Pinto et al., 1999-c).
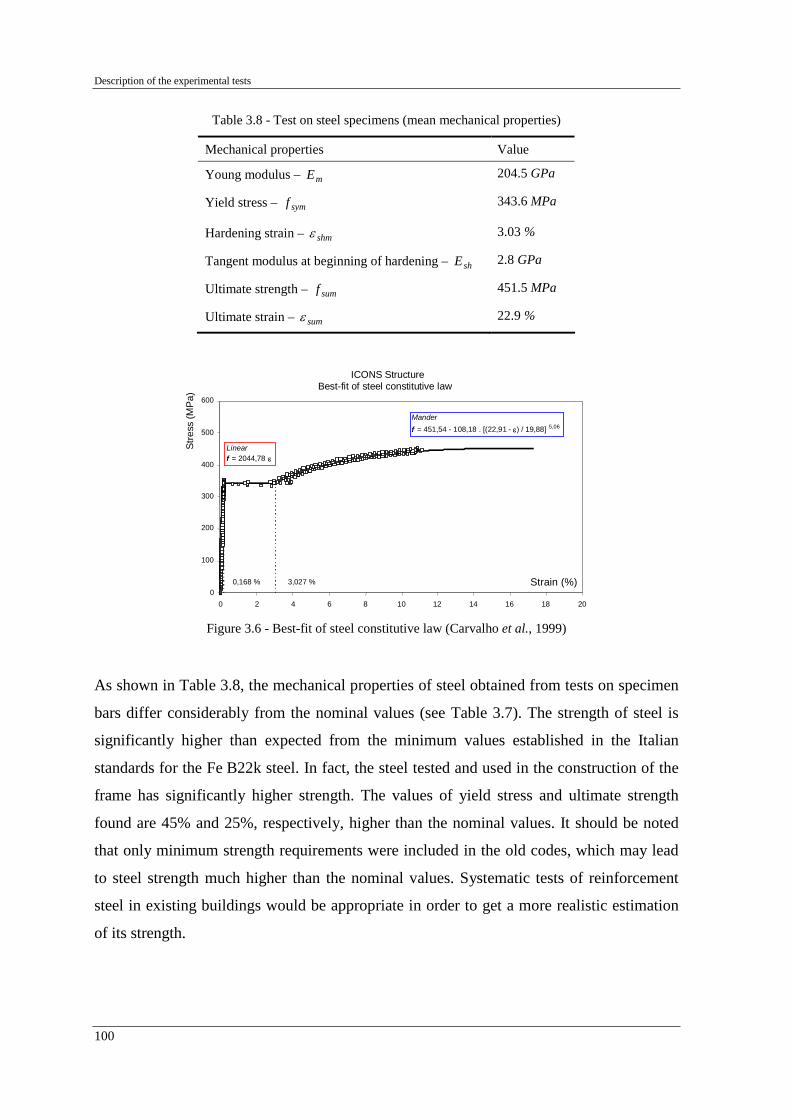
Description of the experimental tests
100
Table 3.8 - Test on steel specimens (mean mechanical properties)
Mechanical properties Value
Young modulus – mE 204.5 GPa
Yield stress – symf 343.6 MPa
Hardening strain – shmε 3.03 %
Tangent modulus at beginning of hardening – shE 2.8 GPa
Ultimate strength – sumf 451.5 MPa
Ultimate strain – sumε 22.9 %
ICONS StructureBest-fit of steel constitutive law
0
100
200
300
400
500
600
0 2 4 6 8 10 12 14 16 18 20
Stre
ss (M
Pa)
Linear f = 2044,78 ε
Manderf = 451,54 - 108,18 . [(22,91 - ε) / 19,88]
5,06
0,168 % 3,027 %
Figure 3.6 - Best-fit of steel constitutive law (Carvalho et al., 1999)
As shown in Table 3.8, the mechanical properties of steel obtained from tests on specimen
bars differ considerably from the nominal values (see Table 3.7). The strength of steel is
significantly higher than expected from the minimum values established in the Italian
standards for the Fe B22k steel. In fact, the steel tested and used in the construction of the
frame has significantly higher strength. The values of yield stress and ultimate strength
found are 45% and 25%, respectively, higher than the nominal values. It should be noted
that only minimum strength requirements were included in the old codes, which may lead
to steel strength much higher than the nominal values. Systematic tests of reinforcement
steel in existing buildings would be appropriate in order to get a more realistic estimation
of its strength.
Strain (%)
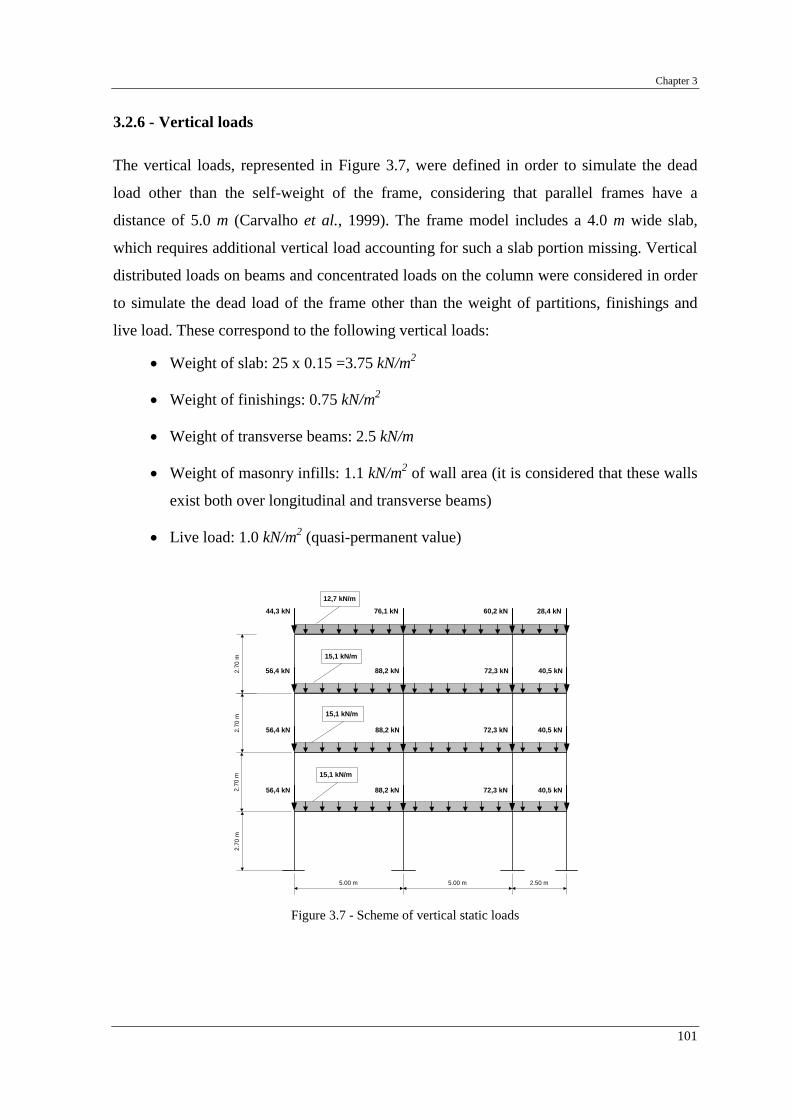
Chapter 3
101
3.2.6 - Vertical loads
The vertical loads, represented in Figure 3.7, were defined in order to simulate the dead
load other than the self-weight of the frame, considering that parallel frames have a
distance of 5.0 m (Carvalho et al., 1999). The frame model includes a 4.0 m wide slab,
which requires additional vertical load accounting for such a slab portion missing. Vertical
distributed loads on beams and concentrated loads on the column were considered in order
to simulate the dead load of the frame other than the weight of partitions, finishings and
live load. These correspond to the following vertical loads:
• Weight of slab: 25 x 0.15 =3.75 kN/m2
• Weight of finishings: 0.75 kN/m2
• Weight of transverse beams: 2.5 kN/m
• Weight of masonry infills: 1.1 kN/m2 of wall area (it is considered that these walls
exist both over longitudinal and transverse beams)
• Live load: 1.0 kN/m2 (quasi-permanent value)
2.70
m2.
70 m
2.70
m2.
70 m
2.50 m5.00 m5.00 m
44,3 kN 60,2 kN76,1 kN 28,4 kN
56,4 kN 72,3 kN88,2 kN 40,5 kN
56,4 kN 72,3 kN88,2 kN 40,5 kN
56,4 kN 72,3 kN88,2 kN 40,5 kN
12,7 kN/m
15,1 kN/m
15,1 kN/m
15,1 kN/m
Figure 3.7 - Scheme of vertical static loads

Description of the experimental tests
102
The distribution of vertical loads applied to the infilled frame to simulate the dead load
other than the self-weight of the frame was identical to the one used for the bare frame, and
imposing the same load distribution for all the tests. The scheme of the loads considered
can be found in Pinto et al. (1999-c).
3.2.7 - Earthquake input
The input seismic motions were defined in order to be representative of a moderate-high
European seismic hazard scenario (Campos-Costa and Pinto, 1999; Carvalho et al., 1999).
Hazard consistent time series of acceleration (with 15 seconds duration) were artificially
generated yielding a set of twelve uniform hazard response spectra for increasing return
periods. The time increment considered to generate the records was 0.01 seconds, giving
input accelerograms with 1500 points. The return periods considered, and the
corresponding values of peak acceleration are given in Table 3.9. The acceleration time
histories (accelerograms) considered for the PsD tests correspond to the 475, 975 and
2000-yrp, which are depicted in Figure 3.8. In Figure 3.9, the 5% damping displacement
and pseudo-acceleration linear-elastic response spectra for 475, 975 and 2000-yrp are
plotted.
Table 3.9 - Hazard curves for the moderate-high European scenario
Return period (years)
Peak acceleration
(m/s2) 73 0.889 (0.09g)
100 1.060 (0.11g) 170 1.402 (0.14g) 300 1.796 (0.18g) 475 2.180 (0.22g) 700 2.543 (0.26g) 975 2.884 (0.29g)
1370 3.265 (0.33g) 2000 3.728 (0.38g) 3000 4.273 (0.44g) 5000 5.036 (0.51g)
0,0
1,0
2,0
3,0
4,0
5,0
6,0
7,0
0 2000 4000 6000 8000 10000 12000
Return Period (years)
Acc
eler
atio
n (m
/s2)
9980 6.213 (0.63g)
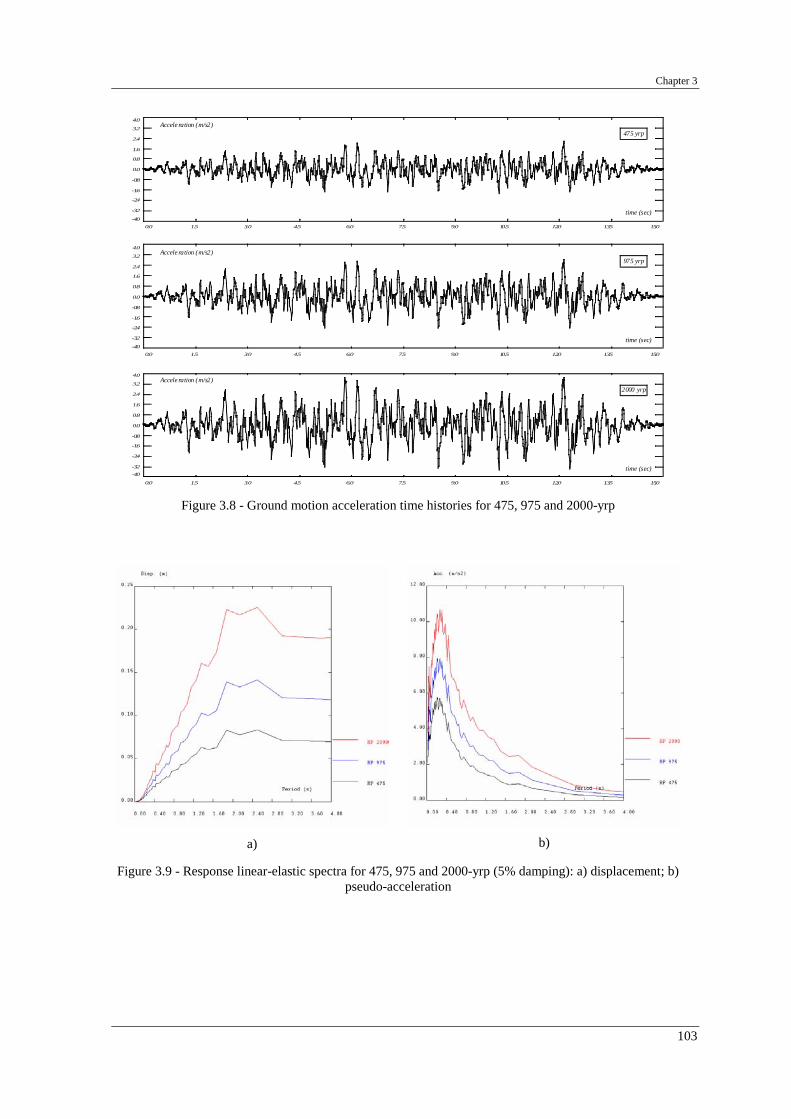
Chapter 3
103
time (sec)
Accele ration (m/s2)
0.0 1.5 3.0 4.5 6.0 7.5 9.0 10.5 12.0 13.5 15.0
-4.0 -3.2
-2.4
-1.6
-0.8
0.0
0.8
1.6
2.4
3.2
4.0
time (sec)
Accele ration (m/s2)
0.0 1.5 3.0 4.5 6.0 7.5 9.0 10.5 12.0 13.5 15.0 -4.0
-3.2
-2.4
-1.6
-0.8
0.0
0.8
1.6
2.4
3.2
4.0
time (sec)
Accele ration (m/s2)
0.0 1.5 3.0 4.5 6.0 7.5 9.0 10.5 12.0 13.5 15.0 -4.0
-3.2
-2.4
-1.6
-0.8
0.0
0.8
1.6
2.4
3.2
4.0
975 yrp
475 yrp
2000 yrp
Figure 3.8 - Ground motion acceleration time histories for 475, 975 and 2000-yrp
a)
b)
Figure 3.9 - Response linear-elastic spectra for 475, 975 and 2000-yrp (5% damping): a) displacement; b) pseudo-acceleration

Description of the experimental tests
104
3.3 - SELECTIVE STRENGTHENING SOLUTION FOR THE BARE FRAME
It is expected that the four-storey RC bare frame (frame B) will not perform satisfactorily.
This was confirmed during the assessment tests (475 followed by 975-yrp earthquake
motions). In order to improve the seismic performance of such a structure, a selective
strengthening intervention was designed at Imperial College of London. The selective
intervention scheme used was defined on the basis of the observed experimental behaviour
for the structure tested without retrofit, and covered different design strategies within the
same structure, namely strength-only and ductility-only solutions. These solutions were
applied to different elements and regions of the structure aiming at improving its global
and local seismic behaviour. Details of the selective intervention are given in Elnashai and
Pinho (1999) and Pinho (2000). The retrofitting scheme was slightly revised after
completion of the first series of tests (bare frame tests) because important damage was
observed in the 3rd storey strong-column.
The damaged parts of frame B were repaired in the first phase. The repair consisted of the
roughening of cracked surfaces and the sealing of cracks, the injection of epoxy resin in the
opened cracks and the reinstatement of the spalled concrete using concrete similar to the
original one.
Afterwards, the selective retrofitting solution involved two types of interventions in the
internal strong-column. A strength-only intervention was implemented in the
strong-column at the 3rd and 4th storeys to reduce the large flexural capacity differential
verified at level 3. This intervention scheme is illustrated in Figure 3.10-a and consisted of
using external re-bars embedded in a non-structural concrete (for protection purposes).
Moreover, a ductility-only intervention was accomplished at the first three storeys in the
strong-column, where large inelastic deformation demand is expected. This intervention is
also depicted in Figure 3.10-b and was achieved by adding external confining steel plates
at the critical zones, i.e. at the base and at the top of the member. Furthermore, additional
plates were also added at mid-height of the columns in order to minimize the risk of shear
failure. The final configuration of the RC strengthened frame is represented in Figure 3.11.
Figure A.24 shows the strong-column repaired and strengthened, at the first storey level,
according to the scheme described.

Chapter 3
105
50
A
A' Section A-A'
4φ16
External re-bars (S500)
200
200
B B'
Protection concrete (fc=10 MPa) 500
600
350
150
2200
A
A' Section A-A'
Steel Plates (Fe430)
60
120
60
1 90
B B'
120
190
a) b)
Figure 3.10 - Selective strengthening of the RC frame: a) strength-only intervention in strong-column; and, b) ductility-only intervention in strong-column (Elnashai and Pinho, 1999)
Figure 3.11 - Selective strengthened RC frame
Ductility and strength intervention
Ductility-only intervention
Strength-only intervention

Description of the experimental tests
106
To summarize, the selective intervention targeted the strong-column only, i.e. ductility-
only on the first three storeys and strength-only on the upper two. In the particular case of
the third storey, where both interventions were applied, the work had the following
sequence: i) roughening of cracked surfaces and sealing of cracks; ii) injection of epoxy
resin in opened cracks; iii) reinstate spalled concrete using concrete similar to the existing
one; iv) apply ductility-only intervention; and, v) apply strength-only intervention.
Regarding practical application of the techniques, the following is observed:
a) Strength-only intervention:
• On the two top-levels (storeys three and four), the beams were drilled
throughout their height so as to allow for introduction of the re-bars (from the
top level downwards). At level four, the opening was executed from the top
and is only 200 mm deep.
• Following insertion of the bars in the respective openings, the full-height holes
at the two top beams were sealed at the base using fast-hardening paste. Epoxy
resin was then injected from the top, fixing the bars to the beams.
• To allow the new re-bars to work mutually with the existing reinforced
concrete section, at three different levels, steel connectors were bolted on to the
existing column concrete and welded on these new external longitudinal re-
bars (see Figure A.25).
• The re-bars were coated with grease to minimize adherence to the protective
concrete.
• Formwork was placed at a distance of 80 mm from the column, leaving an
opening at the top from which the weak concrete (fc = 10 MPa) was poured in.
Manual finishing of the surface was applied, though this is not crucial to the
outcome of the intervention.
b) Ductility-only intervention:
• Mechanical chiselling was applied to roughen the surfaces where plates are to
be applied.

Chapter 3
107
• The steel plates were temporarily fixed to the wall using metallic clamps. The
confinement plates, initially split into pairs of U-shape plates, were welded
together.
• A quick-hardening paste was applied to seal the plates, leaving only a limited
number of openings for the introduction of plastic hoses, required for the
injection of the resin. This sealing cement was then brushed with acetone to
ensure the closure of all pores.
• Injection of the resin started at the lowest hose, progressed upwards as the
hoses started leaking. Adequate pressure (ideal values fluctuate according to
equipment characteristics, dimension of plates and number of hoses) was
required to ensure uniform contact between plates and retrofitted members.
• Where large gaps between plates and concrete element (greater than 3-5 mm)
was detected, micro-silica was used for filling the cavities, optimising the
behaviour of the epoxy-resin.
• A minimum period of 24 hours was allowed for curing of the resin.
3.4 - MASONRY INFILL WALLS AND MASONRY STRENGTHENING;
CONSTRUCTION DETAILS AND MATERIALS
The masonry infilled reinforced concrete frame was constructed with the same detailing
and materials as for the bare frame. Figure 3.12 shows the general layout of the infilled
structure, where the locations and dimensions of the infill openings are shown. The infill
walls (non-load bearing) were constructed after the reinforced concrete frame. The long
external bay infill contains a window opening (1.2 m × 1.0 m) at each of the four levels.
The central bay contains a doorway (2.0 m × 1.75 m) at ground level and window openings
(2.0 m × 1.0 m) in each of the upper three levels of the building. The external short (2.5 m
span) bay contains solid infill panels, i.e. without openings (Pinto et al., 2001-c; 2000-a).
The construction of the infill walls was carried out inside the ELSA laboratory in order to
avoid damage of the infills due to even small inter-storey deformation during the structure
transport into the laboratory.

Description of the experimental tests
108
Figure 3.12 - Elevation view of the infilled concrete frame (frame A): infill openings (location and dimensions)
3.4.1 - Masonry infill walls
In order to be representative of the construction techniques and materials commonly used
in Mediterranean countries, hollow blocks where chosen for the construction of infill walls.
These blocks are horizontally perforated, and have the following dimensions: 0.12 m thick,
0.245 m base-length and 0.245 m height (see Figure 3.13).
Figure 3.13 - Infill block units Figure 3.14 - Detail of the infill walls construction
According to the classification of masonry units presented in Eurocode 6 (EC6, 1995), the
hollow blocks are included in Group 3, because they have 62% of voids (less than 70%) by
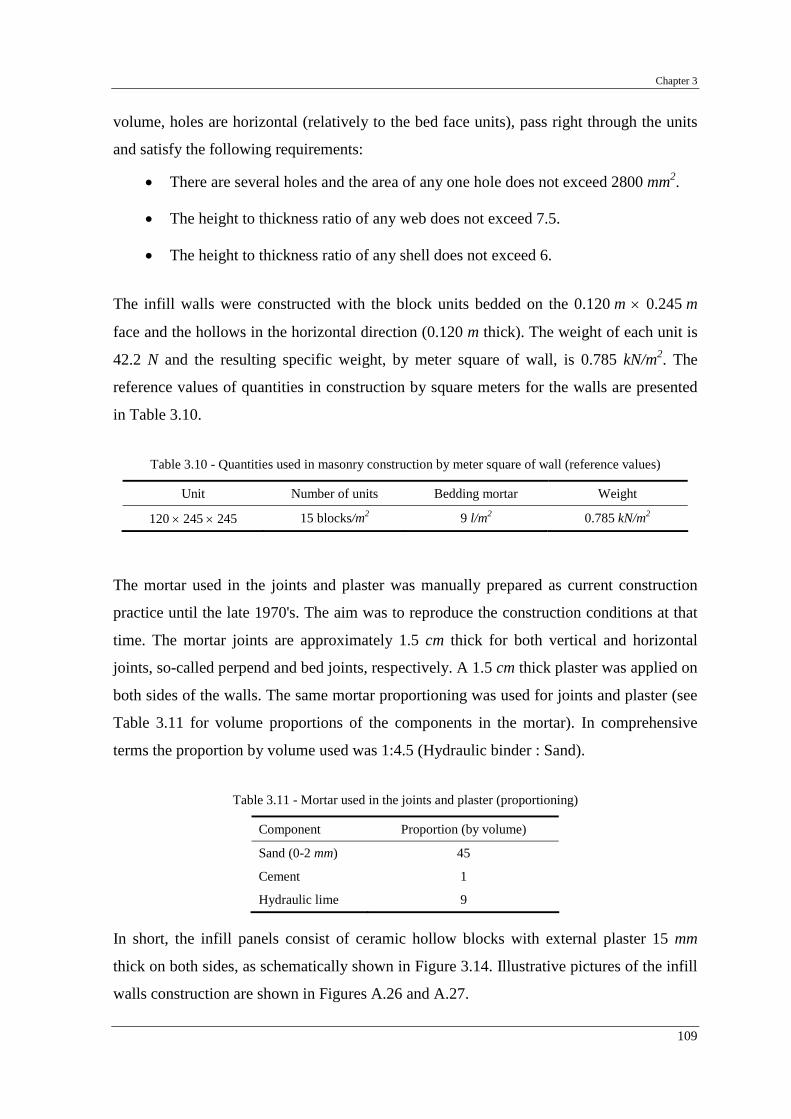
Chapter 3
109
volume, holes are horizontal (relatively to the bed face units), pass right through the units
and satisfy the following requirements:
• There are several holes and the area of any one hole does not exceed 2800 mm2.
• The height to thickness ratio of any web does not exceed 7.5.
• The height to thickness ratio of any shell does not exceed 6.
The infill walls were constructed with the block units bedded on the 0.120 m × 0.245 m
face and the hollows in the horizontal direction (0.120 m thick). The weight of each unit is
42.2 N and the resulting specific weight, by meter square of wall, is 0.785 kN/m2. The
reference values of quantities in construction by square meters for the walls are presented
in Table 3.10.
Table 3.10 - Quantities used in masonry construction by meter square of wall (reference values)
Unit Number of units Bedding mortar Weight
120 × 245 × 245 15 blocks/m2 9 l/m2 0.785 kN/m2
The mortar used in the joints and plaster was manually prepared as current construction
practice until the late 1970's. The aim was to reproduce the construction conditions at that
time. The mortar joints are approximately 1.5 cm thick for both vertical and horizontal
joints, so-called perpend and bed joints, respectively. A 1.5 cm thick plaster was applied on
both sides of the walls. The same mortar proportioning was used for joints and plaster (see
Table 3.11 for volume proportions of the components in the mortar). In comprehensive
terms the proportion by volume used was 1:4.5 (Hydraulic binder : Sand).
Table 3.11 - Mortar used in the joints and plaster (proportioning)
Component Proportion (by volume)
Sand (0-2 mm) 45
Cement 1
Hydraulic lime 9
In short, the infill panels consist of ceramic hollow blocks with external plaster 15 mm
thick on both sides, as schematically shown in Figure 3.14. Illustrative pictures of the infill
walls construction are shown in Figures A.26 and A.27.

Description of the experimental tests
110
3.4.2 - Strengthening of the infill panels
The retrofitting solution applied to the walls in the infilled frame (see Figure 3.1) was
proposed by Carvalho et al. (1999) and consists of a concrete layer with an embedded
reinforced steel mesh, which is deemed to improve the post-peak behaviour of the walls.
Shotcrete (SC) of the walls was initially foreseen. However, due to difficulties in finding a
company to carry out the shotcrete works (namely: non-existing local company with
appropriate tools, a job too small for a company with the appropriate tools) it was decided
to apply the concrete manually (traditional method). The label 'shotcrete' (SC) is retained
because it expresses better the strengthening operation.
a) b)
Figure 3.15 - Reconstruction of the 1st storey infill panels and infill strengthening (shotcrete) of the short external bay at all storeys (elevation): a) south view; b) north view
The general layout of the frame with the strengthened infills is shown in Figure 3.15, and
comprises:
• At the 1st storey: a) a short panel with a new infill wall (with plaster in both sides)
and a shotcrete layer (with 26 mm thickness and a steel mesh embedded); b) a
central long-panel with a new infill wall (with a door opening, with plaster at both
sides); and, c) an external long-panel with a new infill wall (with a window
opening, with plaster at both sides).

Chapter 3
111
At the 2nd, 3rd and 4th storeys: a) a short panel with an existing infill wall (with plaster in
both sides) and a new shotcrete layer (with 26 mm thickness and a steel mesh embedded);
b) a central long-panel with an existing infill wall (with a centred window opening, with
plaster at both sides); and, c) an external long-panel with an existing infill wall (with a
window opening, with plaster at both sides). It is noted that the existing infills at the 2nd, 3rd
and 4th storeys were already subjected to the previous earthquake tests, suffering minor
damage.
The shotcrete applied to the shorter external panels (one side/face only) at all storey levels
consists of a 26 mm thick concrete layer, with an embedded welded steel mesh (S500,
ribbed, grade 500 MPa), with 5 mm wire diameter and 10×10 cm spacing (# φ5 // 0.10), as
shown in Figures 3.16 and 3.17. No specific connection (e.g. dowels) was provided
between the shotcrete layer and the existing surrounding RC frame. A light connection
(clamps) between the shotcrete layer and the masonry walls was provided in nine points, as
shown in Figure 3.17. It is noted that these clamps were not specifically designed for that
purpose, but they were used to keep in place the steel reinforcing mesh for the shotcrete
works. It is believed that these 'connectors' will have a beneficial effect on the behaviour of
the final wall-shotcrete system, avoiding premature buckling of the shotcrete layer.
0.40 m
0.20 m
2.30 m
0.30 m
0.12 m 0.015 m
0.20 m plaster surface
0.026 m
masonry wall
steel reinforced (5 mm diameter and10 cm spacing)
external column interiorcolumn
Figure 3.16 - Constructive details (layout and dimensions) of the infill strengthening
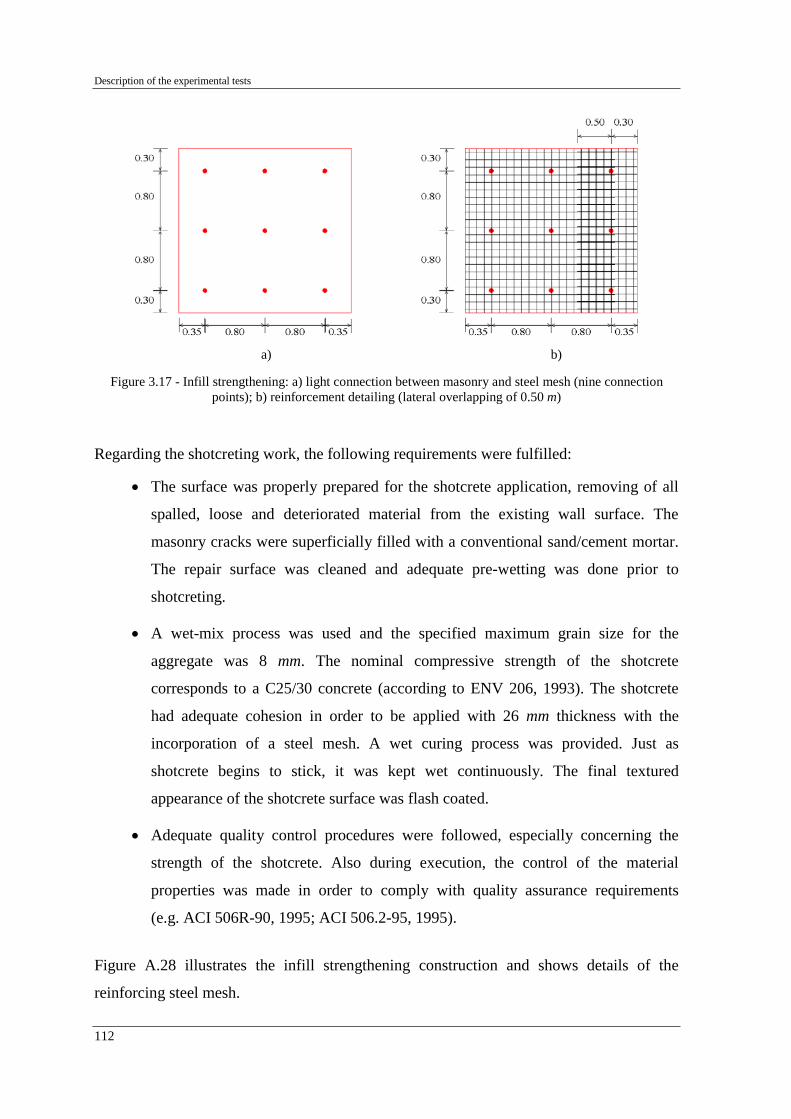
Description of the experimental tests
112
a) b)
Figure 3.17 - Infill strengthening: a) light connection between masonry and steel mesh (nine connection points); b) reinforcement detailing (lateral overlapping of 0.50 m)
Regarding the shotcreting work, the following requirements were fulfilled:
• The surface was properly prepared for the shotcrete application, removing of all
spalled, loose and deteriorated material from the existing wall surface. The
masonry cracks were superficially filled with a conventional sand/cement mortar.
The repair surface was cleaned and adequate pre-wetting was done prior to
shotcreting.
• A wet-mix process was used and the specified maximum grain size for the
aggregate was 8 mm. The nominal compressive strength of the shotcrete
corresponds to a C25/30 concrete (according to ENV 206, 1993). The shotcrete
had adequate cohesion in order to be applied with 26 mm thickness with the
incorporation of a steel mesh. A wet curing process was provided. Just as
shotcrete begins to stick, it was kept wet continuously. The final textured
appearance of the shotcrete surface was flash coated.
• Adequate quality control procedures were followed, especially concerning the
strength of the shotcrete. Also during execution, the control of the material
properties was made in order to comply with quality assurance requirements
(e.g. ACI 506R-90, 1995; ACI 506.2-95, 1995).
Figure A.28 illustrates the infill strengthening construction and shows details of the
reinforcing steel mesh.

Chapter 3
113
3.4.3 - Material properties
Tests on mortar specimens and block units were carried out in order to characterize the
masonry infill wall components. Wallets representative of the masonry infill walls were
constructed and tested in compression, in the horizontal, vertical and diagonal directions.
In this section, results of the tests on specimens of block units, mortar and infill wallets are
presented. A more detailed description of the infill' properties can be found elsewhere
(Pinto et al., 2001-c).
3.4.3.1 - Mortar used in joints and plaster
The same materials and respective proportioning were used for the mortar employed in the
joints and plaster of the infill masonry walls construction. Representative samples of
mortar (prisms with dimensions 4 cm × 4 cm × 16 cm) were prepared and subsequently
tested. Flexural and compressive tests, according to the procedures and specifications in
EN-196-1 (1987), were performed on the mortar specimens at the University of Pavia
laboratory.
A low value was found for the mortar strength. A flexural (indirect tensile) strength of
0.59 MPa and a compressive strength of 1.33 MPa were obtained from the tests (see
Table 3.12), which is deemed to represent a typical mortar used in masonry infill walls of
existing buildings. The standard deviation values are 38% for flexural strength and 36% for
the compressive strength, which are typical values for these materials. According to EC6
the mechanical properties of the mortar fall into the range of characteristics of a mortar
type M1 and type M2. The standard deviations found for the flexural and compressive
strength for each group of specimens are also presented in Table 3.12.
Table 3.12 - Flexural and compressive strength of the mortar
Ultimate strength Average values (MPa) Standard deviation (%)
Flexural 0.59 38%
Compressive 1.33 36%

Description of the experimental tests
114
3.4.3.2 - Compression tests on infill block units
Tests on infill block units were performed at the University of Pavia. Thirty units were
tested in each direction (parallel and perpendicular to the bed joints). Table 3.13,
summarises the compressive resistance test results for the block units. The gross area
considered to determine the compressive stress (strength) is 29400 mm2, which
corresponds to the total surface area (0.245 m height or base × 0.120 m thickness). For the
direction parallel to the bed joints, a predictably higher strength was found, with a mean
value of 15.36 MPa and a corresponding characteristic value of 12.35 MPa. In the
compression tests perpendicular to the bed joints, the mean and characteristic values
evaluated were 2.80 MPa and 2.05 MPa, respectively.
Table 3.13 - Compressive strength test on the block units
Collapse stress (MPa) Parallel to the bed joints
(30 specimens) Perpendicular to the bed joints
(30 specimens)
Minimum value 12.00 2.06
Maximum value 19.30 3.48
Average (fm) 15.36 2.80
s.q.m. 1.84 0.46
Characteristic value (fk) 12.35 2.05
3.4.3.3 - Compression tests on masonry wallets in the directions parallel and
perpendicular to the bed joints
Five infill masonry specimens (1.00 m × 1.00 m wallets without plaster) were constructed
and tested in compression for each direction (perpendicular and parallel to the bed joints)
at the University of Pavia. The specimens were constructed using the same materials
(block units and mortar) and with the same geometry (joints thickness, fabric) as the ones
used for the infill walls.
A detailed description of the series of tests performed in Pavia can be found in Pinto et
al. (2001-c). Next, the test results are summarised in Tables 3.14 and 3.15, in terms of
strength, Young modulus and Poisson ratio for each tested specimen and the resulting
average and characteristic values.

Chapter 3
115
Due to the substantially higher strength of the block units in the direction of the bed joints,
a higher strength of the wallet in this direction would be expected. However, the strength
of the wallets in this direction was found to be extremely low. This is justified by the fact
that the specimens were constructed placing the blocks horizontally and filling the vertical
joints. This construction process leads to poor vertical joints and, consequently, dictates
poor strength of the masonry walls in the direction parallel to the bed joints. Obviously,
this also implies poor shear strength of the masonry.
Table 3.14 - Compression strength test on the infill specimens (loading perpendicular to the bed joints)
Test No. Area (mm2) Max. force (kN) maxσ (MPa) sec,⊥E (MPa) ν
1 86825 -136.50 -1.57 2540 0.070
2 86825 -97.00 -1.12 2341 -
3 86825 -81.60 -0.94 950 0.076
4 86825 -122.00 -1.41 2490 -
5 86825 -42.00 -0.48 1042 0.046
Average -95.82 -1.10 1873 0.064
s.q.m. 36.88 0.42 804 0.02
C.V. (%) 38 38 43 25
Table 3.15 - Compression strength test on the infill specimens (loading parallel to the bed joints)
Test No. Area (mm2) Max. force (kN) maxσ (MPa) sec//,E (MPa) ν
1 86825 -93.00 -1.07 1340 -
2 86825 -105.00 -1.21 1170 -
3 86825 -87.00 -1.00 266 -
4 86825 -84.00 -0.97 947 -
5 86825 -112.00 -1.29 1230 -
Average -96.20 -1.11 991 -
s.q.m. 11.95 0.14 430 -
C.V. (%) 12 12 43 -
3.4.3.4 - Concrete used for the shotcrete of the infill walls
The concrete considered in the design phase (Carvalho et al., 1999) was a C25/30 concrete
(EC2; ENV 206, 1993), which corresponds to a characteristic cubic strength of 30 MPa.

Description of the experimental tests
116
Table 3.16 presents the proportioning of the components adopted for the concrete. Tests on
the concrete samples of the shotcrete have been carried out and the results are presented in
Table 3.17. For the 1st, 3rd and 4th casting phases, the required characteristic compressive
cubic ultimate strength (30 MPa) is guaranteed. The strength achieved in the test
specimens for the 2nd casting phase is lower than the nominal value, but the difference is
very small (5.5%).
Table 3.16 - Concrete used in the strengthening (proportioning)
Component Proportion (by volume)
Cement 1
Sand (0-3 mm) 2
Table 3.17 - Concrete compressive strength (average and characteristic values)
Compressive cubic ultimate strength (MPa) Specimen group (casting phase) Average value Characteristic value
1st storey 40.55 39.57
2nd storey 28.75 28.34
3rd storey 37.35 35.38
4th storey 32.20 31.50
3.4.3.5 - Diagonal compression tests on masonry wallets
Diagonal compression tests on masonry wallets aim at evaluating the conventional tensile
strength, which can be related to the shear strength of the masonry walls. The standard
diagonal tension (shear) test was performed in several wallets according to the RILEM
recommendations (1992) and ASTM standards (1997). Using these standards the shear
strength in the centre of the panel and the respective shear modulus (modulus of elasticity
in shear) were determined, for each specimen tested. According to the standards, such
tensile strength is typically evaluated from the load at failure of the specimen assuming
that the material is elastic, isotropic and homogeneous.
A square masonry panel is subjected to a compressive force applied at two opposite
corners along a diagonal until the panel cracks. The shear strength is inferred from the
measured diagonal compressive force based on a theoretical distribution of shear and

Chapter 3
117
normal stresses for a homogeneous and elastic continuum. Using the same concept, shear
modulus is inferred from measured diagonal compressive stress and strain.
The wallets were constructed at the same time, using the same materials (block units and
mortar) and with the same geometrical requirements in terms of joint and plaster thickness
as the infill walls. The specimens were constructed at the ELSA laboratory and tested at
the laboratory of University of Pavia.
Twelve masonry wallets with nominal dimensions of 1.00 m × 1.00 m were tested in
diagonal compression, namely: five specimens without plaster, four with plaster in both
faces and three with plaster in both faces which were strengthened (see Figure 3.18).
The specimens were instrumented according to the scheme given in Figure 3.18 and
illustrated in Figure 3.19. Four relative displacement transducers were used to measure the
deformation, two in each direction (vertical and horizontal).
Wallet 1
Wallet 2
Wallet 3
Wallet 4
Wallet 5
Wallet 10
Wallet 11
Wallet 12
Wallet 14
Wallet 6
Wallet 7
Wallet 9
Figure 3.18 - Diagonal compression tests: typology and nomenclature of the tested specimens

Description of the experimental tests
118
a) b)
Figure 3.19 - Diagonal compression test: a) testing set-up; b) instrumentation and loading shoe detail
The results from the diagonal compression tests are represented by two curves, one with
the vertical force versus vertical deformation (left) and the other versus the horizontal
deformation (right), as schematically shown in Figure 3.20. The deformations correspond
to the average of the two signals recorded in the associated directions.
Figure 3.20 - Diagonal compression tests: generic scheme
Test results for the specimens without plaster, with plaster in the two faces and with plaster
and strengthening layer are plotted in Figures 3.21, 3.22 and 3.23, respectively. Figure 3.24
represents the test results obtained for all test specimens grouped (and represented by
colour) by each test series. From the results, the following features are underlined:
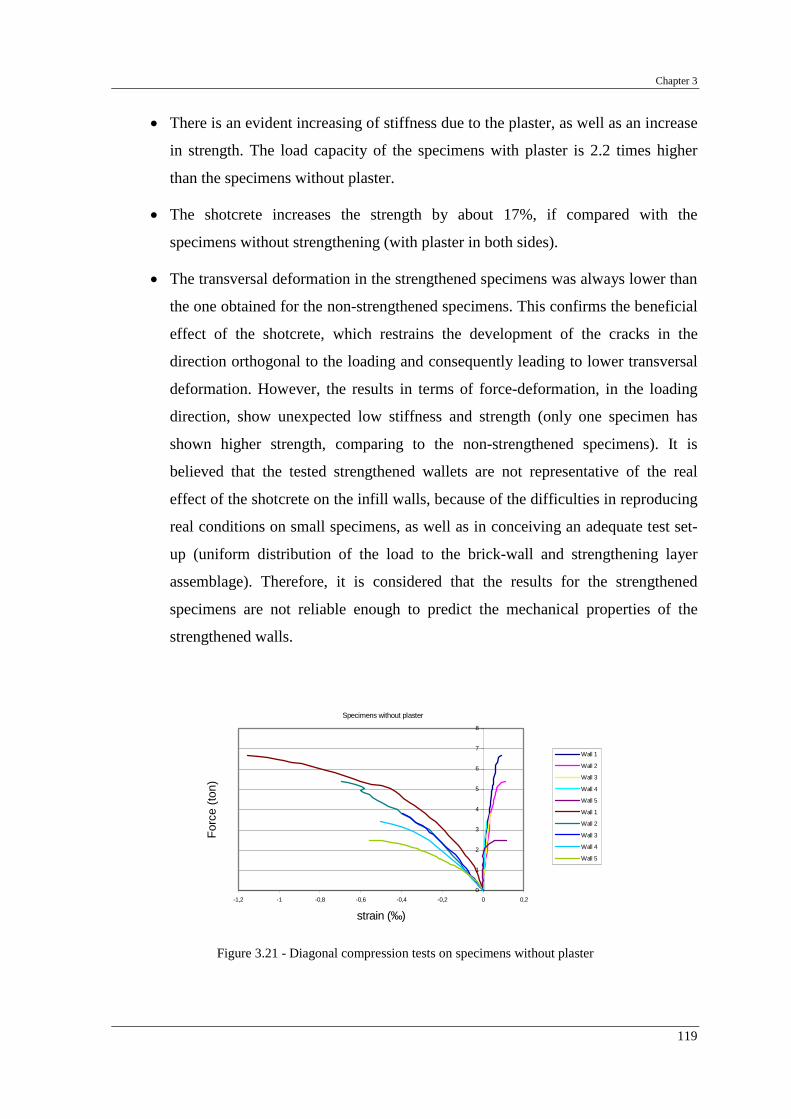
Chapter 3
119
• There is an evident increasing of stiffness due to the plaster, as well as an increase
in strength. The load capacity of the specimens with plaster is 2.2 times higher
than the specimens without plaster.
• The shotcrete increases the strength by about 17%, if compared with the
specimens without strengthening (with plaster in both sides).
• The transversal deformation in the strengthened specimens was always lower than
the one obtained for the non-strengthened specimens. This confirms the beneficial
effect of the shotcrete, which restrains the development of the cracks in the
direction orthogonal to the loading and consequently leading to lower transversal
deformation. However, the results in terms of force-deformation, in the loading
direction, show unexpected low stiffness and strength (only one specimen has
shown higher strength, comparing to the non-strengthened specimens). It is
believed that the tested strengthened wallets are not representative of the real
effect of the shotcrete on the infill walls, because of the difficulties in reproducing
real conditions on small specimens, as well as in conceiving an adequate test set-
up (uniform distribution of the load to the brick-wall and strengthening layer
assemblage). Therefore, it is considered that the results for the strengthened
specimens are not reliable enough to predict the mechanical properties of the
strengthened walls.
Specimens without plaster
0
1
2
3
4
5
6
7
8
-1,2 -1 -0,8 -0,6 -0,4 -0,2 0 0,2
strain (‰)
Forc
e (to
n)
Wall 1
Wall 2
Wall 3
Wall 4
Wall 5
Wall 1
Wall 2
Wall 3
Wall 4
Wall 5
Figure 3.21 - Diagonal compression tests on specimens without plaster

Description of the experimental tests
120
Specimens with plaster in both sides
0
2
4
6
8
10
12
14
16
-1 -0,8 -0,6 -0,4 -0,2 0 0,2
strain (‰)
Forc
e (to
n)Wall 10
Wall 11
Wall 12
Wall 14
Wall 10
Wall 11
Wall 12
Wall 14
Figure 3.22 - Diagonal compression tests on specimens with plaster in both sides
Specimens with plaster in both sides and strengthened
0
2
4
6
8
10
12
14
16
18
-1,75 -1,5 -1,25 -1 -0,75 -0,5 -0,25 0 0,25
strain (‰)
Forc
e (to
n)
Wall 6
Wall 7
Wall 9
Wall 6
Wall 7
Wall 9
Figure 3.23 - Diagonal compression tests on specimens with plaster in both sides and strengthened
0
2
4
6
8
10
12
14
16
18
-1,75 -1,5 -1,25 -1 -0,75 -0,5 -0,25 0 0,25
strain (‰)
Forc
e (to
n)
Figure 3.24 - Diagonal compression tests: specimens without plaster (red), with plaster in both sides (blue)
and with plaster in both sides and strengthened (black)

Chapter 3
121
3.4.3.6 - Mechanical properties of the masonry walls obtained from diagonal compression
tests
From the force-deformation curves obtained in the diagonal tests, and presented in the
previous section, the mechanical properties of the infills are calculated, according to the
applicable normative. The shear stress (Ss), which corresponds to the principal tensile
stress, is calculated for specimens on the basis of net area (An), by
n
s APS ⋅
=707.0 (3.5)
where: P represents the load at failure and the net area (An) is calculated by
nthlAn ⋅⋅+
=2
(3.6)
where: l, stands for the width of the specimen; h is the height of the specimen; t is the total
thickness of the specimen; and, n is the fraction of the gross area of the solid part of the
specimen.
The shear strain (γ) is obtained from
g
HV ∆∆γ += (3.7)
where: ∆V represents the vertical shortening; ∆H is the horizontal extension; and, g is the
vertical gage length assumed equal to the horizontal gage length (as required in the ASTM
standards, 1997).
The shear modulus (G) is calculated as the quotient between the shear stress and the shear
strain as follows
γ
sSG = (3.8)
The shear stress and rigidity (initial stiffness) for each tested specimen were calculated
with the net area and with the nominal area (with the total thickness of the specimen).
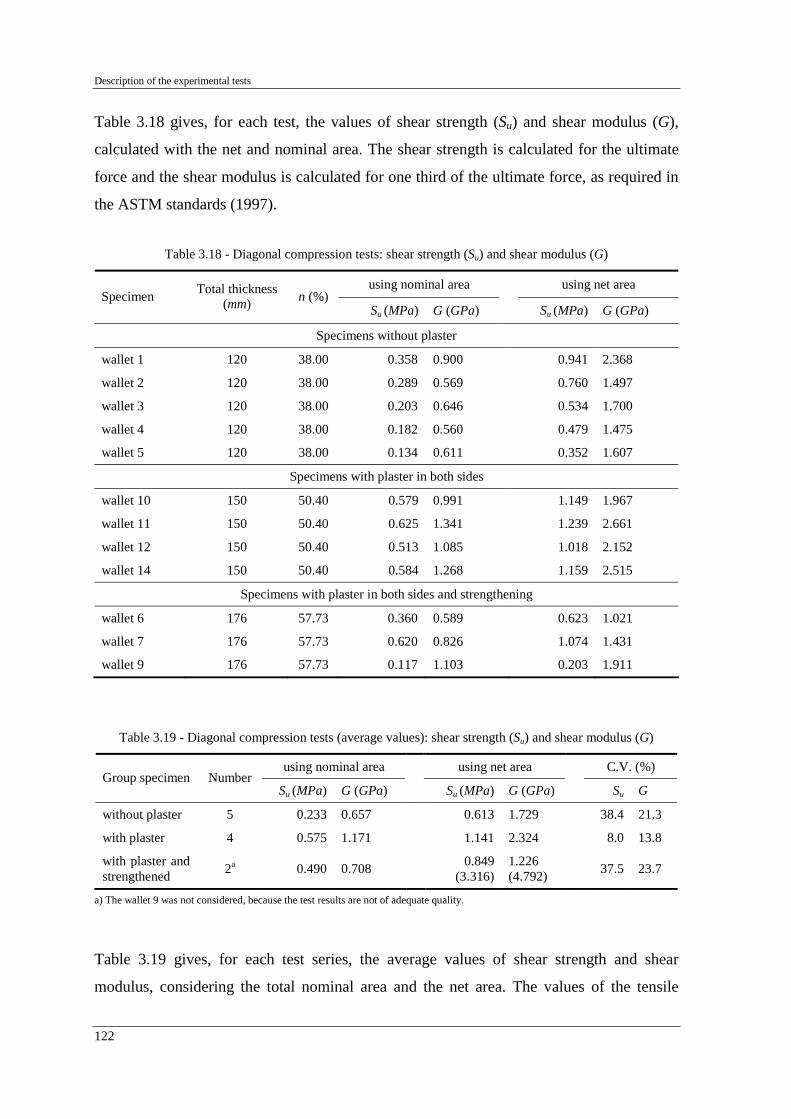
Description of the experimental tests
122
Table 3.18 gives, for each test, the values of shear strength (Su) and shear modulus (G),
calculated with the net and nominal area. The shear strength is calculated for the ultimate
force and the shear modulus is calculated for one third of the ultimate force, as required in
the ASTM standards (1997).
Table 3.18 - Diagonal compression tests: shear strength (Su) and shear modulus (G)
using nominal area using net area Specimen Total thickness
(mm) n (%) Su (MPa) G (GPa) Su (MPa) G (GPa)
Specimens without plaster
wallet 1 120 38.00 0.358 0.900 0.941 2.368
wallet 2 120 38.00 0.289 0.569 0.760 1.497
wallet 3 120 38.00 0.203 0.646 0.534 1.700
wallet 4 120 38.00 0.182 0.560 0.479 1.475
wallet 5 120 38.00 0.134 0.611 0.352 1.607
Specimens with plaster in both sides
wallet 10 150 50.40 0.579 0.991 1.149 1.967
wallet 11 150 50.40 0.625 1.341 1.239 2.661
wallet 12 150 50.40 0.513 1.085 1.018 2.152
wallet 14 150 50.40 0.584 1.268 1.159 2.515
Specimens with plaster in both sides and strengthening
wallet 6 176 57.73 0.360 0.589 0.623 1.021
wallet 7 176 57.73 0.620 0.826 1.074 1.431
wallet 9 176 57.73 0.117 1.103 0.203 1.911
Table 3.19 - Diagonal compression tests (average values): shear strength (Su) and shear modulus (G)
using nominal area using net area C.V. (%) Group specimen Number
Su (MPa) G (GPa) Su (MPa) G (GPa) Su G
without plaster 5 0.233 0.657 0.613 1.729 38.4 21.3
with plaster 4 0.575 1.171 1.141 2.324 8.0 13.8
with plaster and strengthened 2a 0.490 0.708 0.849
(3.316) 1.226 (4.792) 37.5 23.7
a) The wallet 9 was not considered, because the test results are not of adequate quality.
Table 3.19 gives, for each test series, the average values of shear strength and shear
modulus, considering the total nominal area and the net area. The values of the tensile

Chapter 3
123
strength and shear modulus, for the strengthened specimens, considering the net area as
just the strengthening thickness (assuming that only the strengthening layer is carrying the
load applied during the test) are also presented in Table 3.19 (values in brackets). From the
analyses of the Table 3.19, the following comments can be made:
• The plaster increases substantially the strength. In fact, comparing the shear
strength obtained in the specimens without plaster with the ones with plaster in
both sides, an increase of about 2.5 times was verified considering the total
reference area (1.9 times for the net area). In terms of shear modulus the increase
is of 1.8 times and 1.4 times, considering the total and net area, respectively.
• For the tests on the strengthened specimens, a lightly decrease of the strength and
a considerable decrease of the shear modulus were observed. However, it should
be noted that the test conditions (inadequate test set-up for uniform share of forces
between the wall and strengthening layer) and due to the large stiffness difference
between wall and shotcrete concrete, it can be assumed that just the shotcrete is
carrying the load. Therefore, the smaller strength and stiffness can be justified, as
well as the premature rupture of the shotcrete layer and subsequently of the
strengthened wallet.
In Figure 3.25 new stress-strain curves are plotted for the diagonal compression tests and
for each specimen, using as reference area the one corresponding to their net thickness.
The net thickness is 0.0456 m, 0.0756 m and 0.026 m, for the specimens without plaster,
with plaster and strengthened, respectively. It is underlined that for the strengthened
specimens, a net thickness of 0.026 m was used, which corresponds to the shotcrete
thickness. In fact, the results in terms of reference stress (see Figure 3.25) show, for all the
strengthened specimens, a higher strength than the strength obtained for the non-
strengthened specimens. It is concluded, therefore, that the results from strengthened
specimens, calculated with the total net area, are not reliable.
It is interesting to look at the Figure 3.25, where the stress-strain curve, for one of the
strengthened specimens, shows that after premature failure or separation of the concrete
strengthening layer, the curve tends to the ones obtained for the specimens without
strengthening.

Description of the experimental tests
124
The average, minimum and maximum values of horizontal and vertical measured
deformation at the failure point (ultimate deformation) are given in Table 3.20, for all the
test series.
0
1
2
3
4
5
6
7
-2 -1,5 -1 -0,5 0 0,5
strain (‰)
Ref
Stre
ss (M
Pa)
Figure 3.25 - Reference stress on diagonal compression tests: specimens without plaster (red), with plaster in both sides (blue) and with plaster in both sides and strengthened (black)
Table 3.20 - Diagonal compression tests: vertical ( vε ) and horizontal ( hε ) deformation at collapse
vε (‰) hε (‰)
Number
average min. max. average min. max.
without plaster 5 0.661 0.395 1.156 0.073 0.017 0.114
with plaster 4 0.759 0.544 0.969 0.075 0.039 0.120
with plaster and strengthened 3 0.929 0.359 1.676 0.082 -0.001 0.235
3.4.3.7 - Comparison of the results obtained for the masonry materials and masonry
wallets
Table 3.21 summarises the results obtained for the tests on brick units, mortar and masonry
panels (parallel and perpendicular to the bed joints and diagonal compression tests, for the
nominal areas).
Group specimen
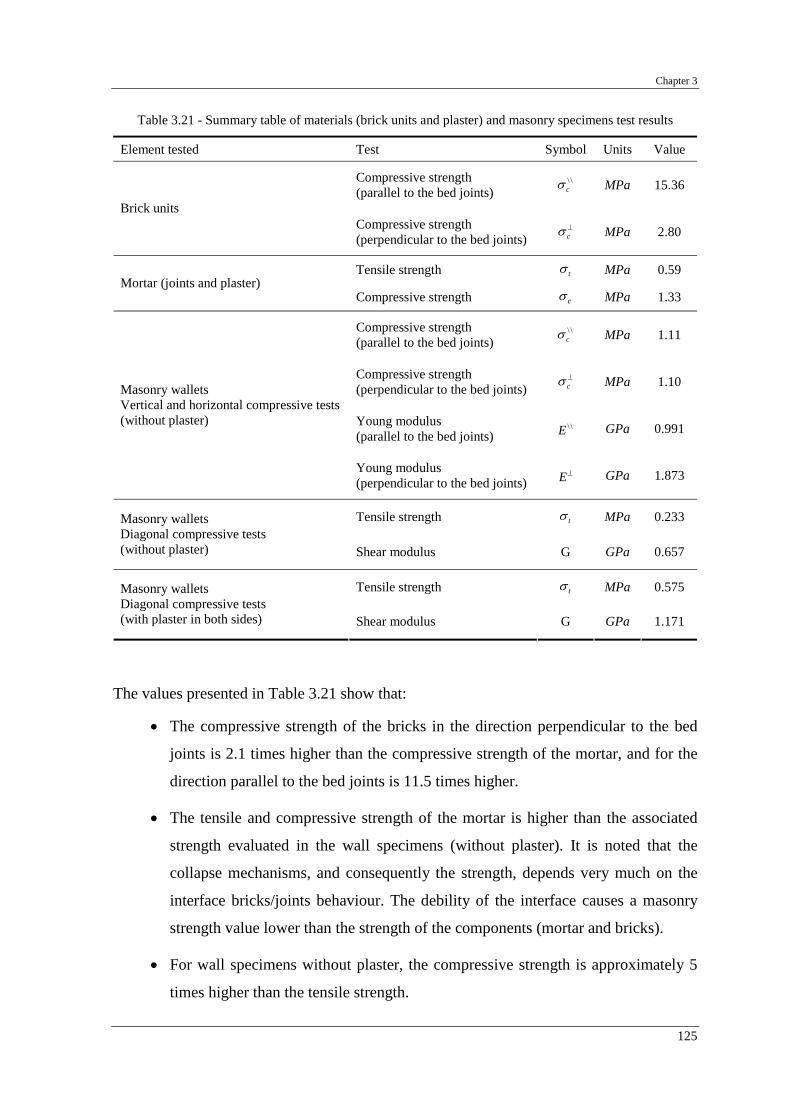
Chapter 3
125
Table 3.21 - Summary table of materials (brick units and plaster) and masonry specimens test results
Element tested Test Symbol Units Value
Compressive strength (parallel to the bed joints)
\\cσ MPa 15.36
Brick units Compressive strength (perpendicular to the bed joints)
⊥cσ MPa 2.80
Tensile strength tσ MPa 0.59 Mortar (joints and plaster)
Compressive strength cσ MPa 1.33
Compressive strength (parallel to the bed joints)
\\cσ MPa 1.11
Compressive strength (perpendicular to the bed joints)
⊥cσ MPa 1.10
Young modulus (parallel to the bed joints)
\\E GPa 0.991
Masonry wallets Vertical and horizontal compressive tests (without plaster)
Young modulus (perpendicular to the bed joints)
⊥E GPa 1.873
Tensile strength tσ MPa 0.233 Masonry wallets Diagonal compressive tests (without plaster) Shear modulus G GPa 0.657
Tensile strength tσ MPa 0.575 Masonry wallets Diagonal compressive tests (with plaster in both sides) Shear modulus G GPa 1.171
The values presented in Table 3.21 show that:
• The compressive strength of the bricks in the direction perpendicular to the bed
joints is 2.1 times higher than the compressive strength of the mortar, and for the
direction parallel to the bed joints is 11.5 times higher.
• The tensile and compressive strength of the mortar is higher than the associated
strength evaluated in the wall specimens (without plaster). It is noted that the
collapse mechanisms, and consequently the strength, depends very much on the
interface bricks/joints behaviour. The debility of the interface causes a masonry
strength value lower than the strength of the components (mortar and bricks).
• For wall specimens without plaster, the compressive strength is approximately 5
times higher than the tensile strength.

Description of the experimental tests
126
• The shear modulus, for the specimens without plaster, is 0.45 times the elasticity
modulus value obtained for the masonry specimens (considering the average value
for the direction perpendicular and parallel to the bed joints). In EC6 it is
considered that, in the absence of a more precise value, it may be assumed that the
shear modulus, G, is 40% of the elastic modulus, E. The value obtained in the
experimental tests is in accordance with this standard assumption.
• The tensile strength, in terms of nominal area, for the specimens with plaster, is
2.5 times higher than the one for the specimens without plaster, which confirms
the strong influence of the plaster on the panels strength.
3.4.4 - Empirical estimation of the masonry strength
3.4.4.1 - Infilled frames without apertures
There are several empirical models to estimate the strength of masonry infill panels. One
of them has been recently proposed by Zarnic and Gostic (1998, 1997) and was calibrated
against experimental results of masonry infilled reinforced concrete frames similar to the
frames under testing in this study. Therefore, aiming to estimate the infill panels strength
of the testing frame (presented in Section 3.4.4.4), the empirical expressions suggested by
Zarnic and Gostic (1998, 1997) are used (see Figure 3.26).
1y
*H
H
VN*
ph
*Npl
2x
ϕ
x1
u
F
crP-
Py-
-uPK -
ycr-K
0K -
uu- uy- ucr
-
P+y
uP+
Pcr+
+crK
Ky+
u+K
cr+u yu+
u+u u2u+
a) b)
Figure 3.26 - Masonry model: a) simplified pattern of distribution of interactive forces between infill and frame; b) tri-linear non-symmetric envelope and hysteretic rules

Chapter 3
127
For a confined infill masonry panel, the shear strength ( )spH can be evaluated by the
following expression
+
+⋅+⋅
⋅
⋅⋅= 111 2
tp
ozI
I
tppRsp f
CbCfA
CH σ (3.9)
where
p
pI h
lbC ⋅⋅⋅= α2
( )p
p
lyhxx
⋅
⋅−=
1
21α (3.10, 3.11)
ep
p
epF
pe
AGh
IECh
K
⋅
⋅+
⋅⋅
=2.1
13
p
ffEpe G
GACAA ⋅⋅⋅+= 2 (3.12, 3.13)
( )
+⋅+⋅⋅⋅+=
42
2pc
ffp
fEpe
lhAI
EE
CII (3.14)
ycr HH ⋅=31
e
crcr K
H=δ (3.15, 3.16)
spy HH = e
yy K
H⋅=δ 1,1 (3.17, 3.18)
( )( )µ−⋅ν−⋅= 11yu HH yu δµδ ⋅= (3.19, 3.20)
the parameters appearing in equations (3.9) to (3.20) represent:
• For the dimensions and elastic parameters of the panel: pl is the length, ph the
height and pe the thickness of the infill panel; pE is the Young modulus and pG
is the shear modulus of the masonry; pA is the horizontal cross sectional area and
pI is the moment of inertia of the horizontal cross-section of the infill panel; dϕ
is the inclination of the equivalent strut (used in numerical simulations of infill
panels by diagonal struts).
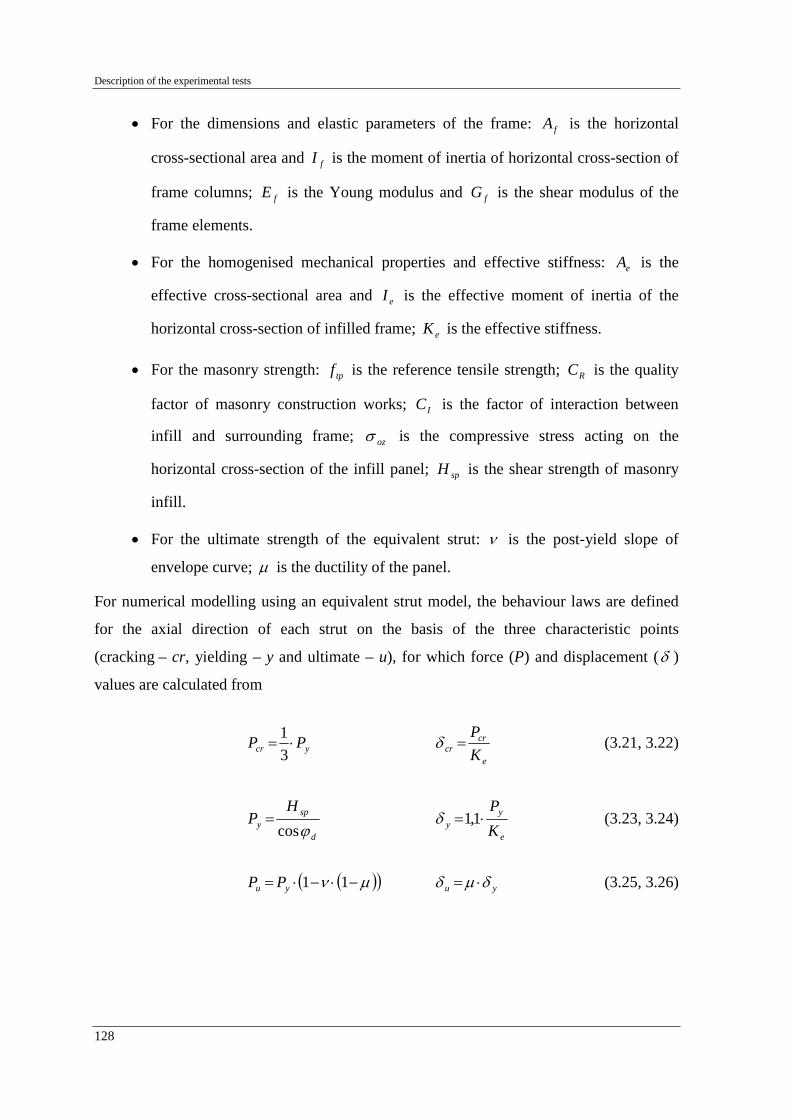
Description of the experimental tests
128
• For the dimensions and elastic parameters of the frame: fA is the horizontal
cross-sectional area and fI is the moment of inertia of horizontal cross-section of
frame columns; fE is the Young modulus and fG is the shear modulus of the
frame elements.
• For the homogenised mechanical properties and effective stiffness: eA is the
effective cross-sectional area and eI is the effective moment of inertia of the
horizontal cross-section of infilled frame; eK is the effective stiffness.
• For the masonry strength: tpf is the reference tensile strength; RC is the quality
factor of masonry construction works; IC is the factor of interaction between
infill and surrounding frame; ozσ is the compressive stress acting on the
horizontal cross-section of the infill panel; spH is the shear strength of masonry
infill.
• For the ultimate strength of the equivalent strut: ν is the post-yield slope of
envelope curve; µ is the ductility of the panel.
For numerical modelling using an equivalent strut model, the behaviour laws are defined
for the axial direction of each strut on the basis of the three characteristic points
(cracking – cr, yielding – y and ultimate – u), for which force (P) and displacement (δ )
values are calculated from
ycr PP ⋅=31
e
crcr K
P=δ (3.21, 3.22)
d
spy
HP
ϕcos=
e
yy K
P⋅= 1,1δ (3.23, 3.24)
( )( )µν −⋅−⋅= 11yu PP yu δµδ ⋅= (3.25, 3.26)

Chapter 3
129
3.4.4.2 - Reduction of strength and stiffness of the panels due to the presence of apertures
The presence of apertures (windows or doors) in the infill masonry panels modify their
structural behaviour, having the following implications (Sortis et al., 1999):
• Ultimate strength reduction.
• Stiffness reduction for the different deformation stages.
• Reduction of the loading corresponding to the initial cracking stage, with
premature development of cracks due to the stress concentration in the aperture
corners.
• Acceleration of the damage and loss of panel integrity, when no adequate
strengthening of the aperture contour is provided.
• Reduction of the energy dissipation capacity.
The parameters characterizing the strength and stiffness reduction of the infill masonry due
to the apertures are: a) ratio between aperture area and panel area (Aa); b) ratio between the
aperture width and panel width (Ac); and, c) existence and type of strengthening in the
aperture.
The ratio between aperture area and panel area (Aa) and the ratio between the aperture
width and panel width (Ac) are given by
100(%) ⋅⋅⋅
=hlbaAa 100(%) ⋅=
laAc (3.27, 3.28)
where l and h are the width and height of the panel, and a and b represent the width and
height of the aperture, respectively (see Figure 3.27-a).
Three classes of strengthening at the aperture (opening) sides are considered, namely:
• NS – non-strengthened aperture – when elements of reinforced concrete or steel
profiles do not exist in any side of the aperture.
• SS – semi-strengthened aperture – when elements of reinforced concrete or steel
profiles exist in the upper side of the aperture.

Description of the experimental tests
130
• AS – strengthened aperture – when elements of reinforced concrete, steel profiles
or steel reinforcement exist at least at two opposite aperture sides.
An infill panel with aperture can be considered effective in terms of the influence in the
structural behaviour, if the following conditions are verified (Sortis et al., 1999)
%25≤aA %40≤cA (3.29, 3.30)
For numerical applications, the following reduction coefficient (rac) for strength and
stiffness can be computed (Sortis et al., 1999)
NS case ca AAac eer ln762.0ln322.0 93.078.0 −− ⋅+⋅= (3.31)
SS case ca AAac eer ln762.0ln322.0 51.104.1 −− ⋅+⋅= (3.32)
AS case ca AAac eer ln762.0ln322.0 97.125.1 −− ⋅+⋅= (3.33)
The previous expressions are applicable if all the following conditions are verified
1≤acr %25≤aA %40≤cA (3.34, 3.35, 3.36)
The infilled frame under study has four different infill panels, three of them with apertures.
Figure 3.27-b represents schematically the different types of panels, identified according to
the presence and type of aperture. Table 3.22 contains the calculations of the reduction
strength and stiffness coefficient for the different panels with aperture. All the panels with
aperture are of non-strengthened (NS) type, because no special strengthening was provided
in any side of the apertures. From the results in Table 3.22, it can be concluded that:
• The applicability restrictions of the reduction factor approach are generally
satisfied, with the exception of the parameter Aa for the panel type 2.
• Even the apparent small aperture in panel type 4 induces a drop of 57% in terms
of strength and stiffness.
• The presence of apertures in panel types 2 and 3 causes a reduction of
approximately 2/3 of the stiffness and strength, when compared with the solid
panel.

Chapter 3
131
a)
b)
Figure 3.27 - Nomenclature: a) aperture and panel dimensions; b) identification of four panel-types
Table 3.22 - Reduction strength and stiffness coefficient for the panels
1 2 3 4
Panel type
Aa (%) --- 34.6 19.8 11.9
Ac (%) --- 43.5 43.5 26.1
rac 1.00 0.30 0.35 0.43
3.4.4.3 - Drift limits for masonry infill walls
Experimental results from tests on confined masonry walls (Pinto, 1998) indicate that the
infill panels can accommodate inter-storey drifts up to 0.1% without any significant
damage and assume full collapse for inter-storey drifts higher than 0.4%.
Zarnic and Gostic (1998) obtained in a series of cyclic tests performed on a two-storey
infilled reinforced concrete frame, constructed in 1:4 reduced scale, the peak lateral load
resistance for a drift of about 0.15%.
Recently, Lafuente et al. (2000) on a basis of a series of tests on half-scale masonry infilled
reinforced concrete frames subject to in-plane cyclic loads, suggested a lateral drift limit
(∆), in order to limit the damage in confined masonry walls, without important loss of
strength. This limit is calculated from

Description of the experimental tests
132
700
eH
<∆ (3.37)
where: H represents the wall height and e the panel aspect ratio ( LHe /= ), being L the
length of the infill panel.
For the frame under study, and considering that the storey behaviour strongly depends on
the behaviour of the short external panel (without openings), the limit in terms of drift,
using the expression proposed by Lafuente et al. (2000) is 3 mm (0.11%).
3.4.4.4 - Storey strength of the infilled frame
Using the empirical expressions to estimate the masonry strength given in Section 3.4.4.1,
the correction due to the presence of openings (according to the methodology exposed in
Section 3.4.4.2) and the average mechanical properties obtained from the infill masonry
test specimens (Section 3.4.3.7), the strength of the first storey infill panels was computed.
The procedure was conducted for each panel and for the complete storey. The curves have
been derived assuming that the infill behaviour is represented by a multi-linear curve
defined by four characteristic points, namely: cracking, yielding, collapse and ultimate.
The cracking and yielding points are calculated by the empirical expressions given in
Section 3.4.4.1 (expressions 3.22 to 3.25). The collapse point was assumed for an inter-
storey drift of 1.2 times the yielding drift and with a post-yielding slope of 5% of the initial
slope. The ultimate point corresponds to a drift 10 times higher than the collapse and the
ultimate strength is 7% of the peak strength (collapse strength).
The resulting curves are given in Figure 3.28. They show that the short infill panel controls
the storey stiffness and strength. The apertures reduce the initial stiffness and strength, as
well as increase the inter-storey drift corresponding to the peak strength of the panel. The
resulting storey shear-drift curve has a peak strength of approximately 750 kN, for a inter-
storey drift of 0.11%, which is in line with the proposed value by Lafuente et al. (2000).

Chapter 3
133
0
100
200
300
400
500
600
700
800
0,00 0,10 0,20 0,30 0,40 0,50 0,60 0,70 0,80 0,90
Inter-storey drift (%)
She
ar s
treng
th (k
N)
Short panelCentral long panelExternal long panelTotalLafuente et al. (2000)
Figure 3.28 - Empirical shear-drift curves for the 1st storey confined masonry panels
The diagonal compression test results on the shotcrete wallets cannot be used to derive the
empirical curves of the strengthened panel, because they are not reliable as discussed in
Section 3.4.3.6. An alternative solution to estimate the mechanical properties and
characteristics of the behaviour curve of the strengthened panel is to assume that there is
deformation compatibility between the infill panel and the shotcrete layer. Assuming the
simplified (bi-linear) tensile stress-strain curves (for the concrete and for the masonry
wall), given in Figure 3.29-a, and weighting each component with its effective area, the
resulting curves, in terms of reference strength, are represented in Figure 3.29-b. They
show that the concrete tensile strength does not increase the peak strength of the
strengthened wall, but increases the initial stiffness.
0
0.5
1
1.5
2
2.5
3
0 0.5 1 1.5 2 2.5 3
St r ain ( / 1000)
Masonr y
Concr ete
a)
0
50
100
150
200
0 0.2 0.4 0.6 0.8 1
Strain (/1000)
Ref
eren
ce S
treng
th (k
N/m
)
Masonry
Concrete
Masonry + Concrete
b)
Figure 3.29 - Simplified tensile behaviour curves for the concrete and masonry
Strain (‰) Strain (‰)
Ref
eren
ce s
treng
th (k
N/m
)
Stre
ss (M
Pa)

Description of the experimental tests
134
Therefore, it is concluded that the maximum strength of the strengthened frame is not
increased by the application of the shotcrete. Nevertheless, an improved ductility capacity
is expected due to the presence of the steel wire mesh, as well as lower stress levels for the
same drift, due to the mobilization of a wider panel strut.
According to the behaviour curves of each infill panel, reflected in Figure 3.28, the
resulting shear strength of the first storey infilled frame is approximately 750 kN.
Assuming that the strength of the first storey of the bare frame is 200 kN and that it
develops for an inter-storey drift of 0.55% (which is confirmed by the bare frame test
results, see Section 4.2.1), the additional frame strength for a storey drift of 0.11% is
40 kN. Therefore, the maximum first storey shear capacity of the infilled frame is
calculated by the sum of the infills strength (750 kN) and the bare frame strength (40 kN)
for 0.11% drifts, which leads to a strength value of 790 kN.
The first storey shear capacity of shotcrete infilled frame should be similar to the infilled
frame, as expressed in Figure 3.29.
3.5 - K-BRACING WITH SHEAR-LINK
Retrofitting of buildings often leads to a significant increase in the lateral load resistance.
Consequently, such solutions increase foundation loads under future earthquakes. Also,
considerable disturbance for the occupants may occur. In comparison, the installation of a
K-bracing with shear-link system causes relatively little disturbance and results in a design
with a lateral load resistance similar to the initial resistance but with a significantly
increased energy dissipating capacity. Hence, the risk of overloading the foundation can be
significantly reduced (Bouwkamp et al., 2000).
In fact, the retrofit work at each floor would be limited to only one bay, namely calling for:
i) the removal of the brick infill wall in a single bay; ii) the installation of the specially
designed pre-fabricated K-bracing system; and, iii) the placement of partition walls to
cover the steel work (timber or metal studs with plasterboard sheeting). The proposed
retrofit procedure may require strengthening of the columns of the bay in which the
K-bracing is being placed, particularly at lower floor levels. However, such strengthening

Chapter 3
135
can be incorporated in the K-bracing design and does not need strengthening of the column
itself.
Specifically, the K-bracing with shear-link system consists of an eccentrically braced steel
assembly with a vertical shear-link located at mid-span of either the upper or bottom floor
beam (see Figure 3.30). The brace assembly consists of a set of diagonal braces, arranged
in a V or inverted-V like fashion, and two horizontal steel beams, one of which with a
short steel beam stub in the middle of the beam serving as vertical shear-link. In addition,
vertical steel straps or actual steel sections connected to the adjacent columns are part of
the assembly. The steel beams and straps are installed first in the open bay and anchored,
respectively, to the beams, floor slab and columns. Subsequently, the vertical steel straps
are welded to the ends of the steel beams to provide a closed force resisting system.
Finally, the braces are installed and welded to the gussets plates (one at the end of the
shear-link and one on each end of the opposite beam).
shear-link
brace
beam
beam
strap
shear-link
Figure 3.30 - K-bracing with shear-link system: possible layouts
The K-bracing with shear-link retrofit design concept, summarised above, was applied to
the full-scale structure at the second storey of the masonry-brick infilled test frame shown
in Figure 3.31. A detailed description of the design process can be found in Bouwkamp et
al. (2000). The effectiveness of the retrofitting system will be assessed subsequently by
studying the response of the retrofitted second floor frame/wall system under increasing
cyclic displacement-controlled loads (holding the lateral displacement of the second floor
constant throughout the test and imposing identical displacements at the third and upper
floor levels, see Figure 3.36). In order to maintain structurally a symmetric layout, it was
decided to retrofit the second storey frame by replacing the infilled wall of the 5.00 m wide
middle bay by the k-bracing with shear-link (see Figure 3.31). In order to allow a
fundamental assessment of the proposed retrofitting procedure the outer 2.50 m and 5.00 m

Description of the experimental tests
136
wide bays were filled completely with hollow-brick masonry of the type used in the other
test series (see Section 3.4.3).
Figure 3.31 - K-bracing with shear-link system test assembly
Details of the bracing, shear-link, beams, straps and templates are given in Appendix A
(Figures A.35 to A.45). The shear-link is shown in Figure A.49. For anchoring the steel
beams and metal side straps to the surrounding concrete, new chemical HVZ M16 anchors
from HILTI, placed in pairs, one on each side of the beam webs and centrelines of the
metal straps were used (see Figures A.46, A.47 and A.48, for details on anchoring the steel
beams and straps to the concrete columns, top and bottom beams, respectively).
3.6 - REPAIR AND STRENGTHENING OF THE FRAMES
3.6.1 - Damage-state after the pseudo-dynamic tests
The testing campaign comprised several pseudo-dynamic earthquake tests on the bare,
infilled and retrofitted frames for several earthquake intensity levels. In order to assess the
ultimate capacity of the bare frame (BF) and of the selective repaired frame (SR), a final
capacity cyclic test was foreseen. However, the local damages inflicted on the structures
inhibited these final capacity tests, which required repair of the local damages as well as
strengthening using carbon reinforced composites.
The tests performed on the frames with masonry infill walls led to several local damage
(shear-out) of a few columns (top part) with lateral dislocations of the external columns of
50 mm, approximately 25% of the column cross-section characteristic height (see
HEA260 HEA120
2U100
1st floor
2nd floor

Chapter 3
137
Figures 3.32, B.27 and B.28). Relocation, repair and strengthening of the column/joint
parts were required to carry out the final capacity tests.
Figure 3.32 - Failure (shear-out) of the column/joint interface
A detailed description of the repair and strengthening of the two frames for the final
capacity tests, including photographic documentation, materials used and their properties
can be found elsewhere in Pinto and Varum (2000). Next, a summary of the materials used
in the repair works is presented, as well as a photographic documentation and further
relevant details of repair strengthening operation.
3.6.2 - Repair and retrofitting using composite carbon fibre materials
In order to recover the vertical load carrying capacity of the external dislocated columns,
repair of these columns/joints was carried-out following the steps listed in Table 3.23.
Figure A.52 shows the schemes and pictures of the intervention at different phases of the
repair work as defined in Table 3.23.

Description of the experimental tests
138
Table 3.23 - Repair operations (general steps)
Step Repair operation
1 Unload frame (remove additional vertical loads in the external bays)
2 Remove infill walls and bracing system
3 Up-lift floors (1st and 2nd) near to the external column
4 Remove concrete at the top of the damaged column (20 cm)
5 Positioning/Relocation of the columnsa to its original vertical position
6 Concreting of the columns/joints
7 Apply, in each column/joint, external carbon fibre repair system (column upper part and joint)
a) Marked in Figures A.53 and A.54.
3.6.3 - Material properties
The repair and strengthening materials were special concrete (to replace existing crushed
concrete and the parts destroyed to allow relocation of the columns) and carbon fibre
composites to reinforce and confine the new concrete and weak parts of the existing
structure (e.g. joints and columns heavily damaged). The repair works were carried out by
the ELSA laboratory and an external company using SIKA products.
To repair the joints and other damaged zones (spalling in the columns) a mortar type Sika
MonoTop-622 was used, which nominal technical properties are given in Pinto and
Varum (2000).
The carbon fibre strengthening composite material used is a registered trademark of SIKA,
with commercial mark: SikaWrap Hex-230C/Sikadur-330 LVP. This composite material is
appropriate for strengthening/repair of the structural members composed of reinforced
concrete and is an externally applied technique. The composite components are: carbon
fibre fabric SikaWrap Hex-230C with the epoxy based impregnation resin Sikadur-330
LVP. A technical description of the materials used in the repair of the heavy damaged
elements is given in Pinto and Varum (2000).

Chapter 3
139
3.6.4 - Application to repair and strengthening of the frames
3.6.4.1 - Overview
The preparation and execution of the repair and strengthening works (see Figure A.52 to
A.59) for the six external top-columns/joints and for one internal strong-column at the first
storey (in shear) were carried-out in four working days. The time elapsed being a period of
two weeks between the application of the first repair products and when the final operation
was carried out. Detailed information on the progress is given in Table 3.24.
Table 3.24 - Repair and strengthening (works timetable)
Dates (2000) Repair work Executed by
11/7 Remove concrete at the top of the damaged column (20 cm). Positioning of columnsa to its original vertical position ELSA laboratory
18/7 Concreting of the external heavy damaged joints and column (1st storey, strong-column, frame A). Lightly cover reconstruction (columns 1st storey). Injection of cracks on beams (with resin)
External companyb
31/7 Roughening of the external superficies (column and joints) for application of carbon fibre system. External carbon fibre repair system of the strong-column
External companyb
1/8 External carbon fibre repair system of the heavy damaged joints External companyb
a) Marked in Figures A.53 and A.54. b) External company with large experience in the employment of composite materials.
3.6.4.2 - Concrete repair and crack injection
Most of the large cracks in critical zones were injected with epoxy resin (Sikafix 50 E). The
parts of spalled concrete were removed and new concrete was used to replace it. Figures
A.53 and A.54 schematically show the location of the interventions and also specify the
type of these interventions. It should be underlined that many other zones would require
light interventions (mainly crack injections), but they were considered not particularly
relevant for the tests to be carried out (the final capacity tests).
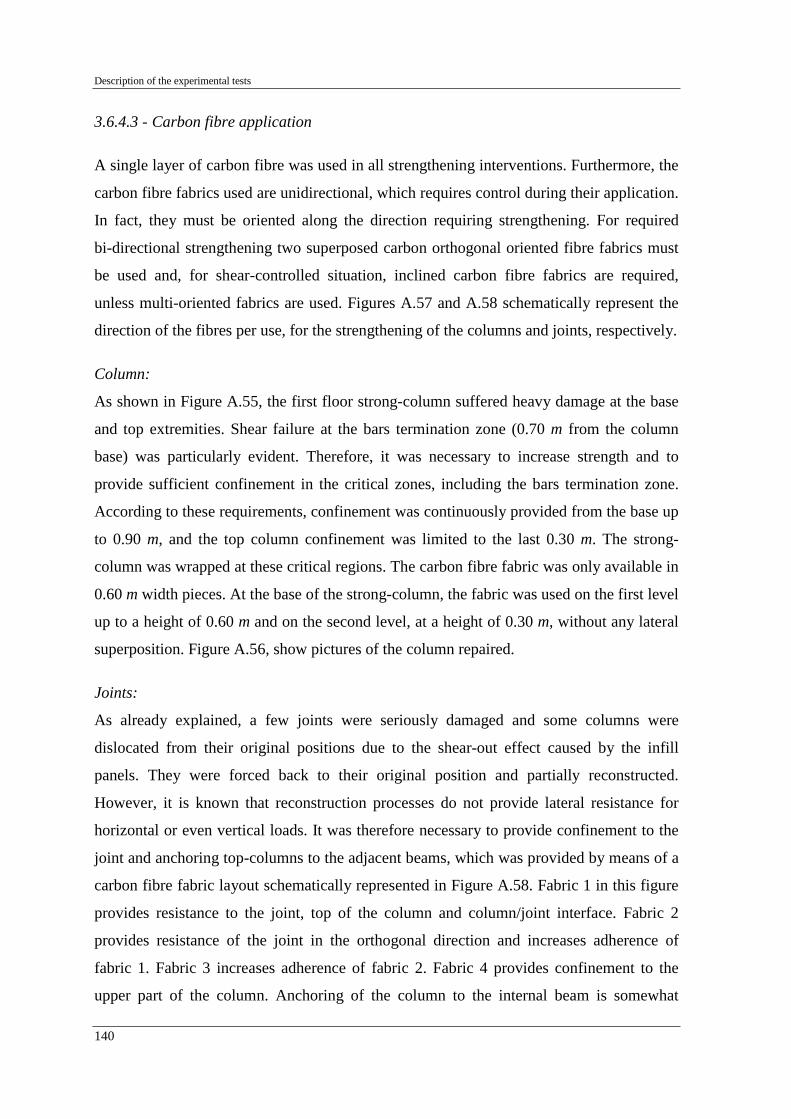
Description of the experimental tests
140
3.6.4.3 - Carbon fibre application
A single layer of carbon fibre was used in all strengthening interventions. Furthermore, the
carbon fibre fabrics used are unidirectional, which requires control during their application.
In fact, they must be oriented along the direction requiring strengthening. For required
bi-directional strengthening two superposed carbon orthogonal oriented fibre fabrics must
be used and, for shear-controlled situation, inclined carbon fibre fabrics are required,
unless multi-oriented fabrics are used. Figures A.57 and A.58 schematically represent the
direction of the fibres per use, for the strengthening of the columns and joints, respectively.
Column:
As shown in Figure A.55, the first floor strong-column suffered heavy damage at the base
and top extremities. Shear failure at the bars termination zone (0.70 m from the column
base) was particularly evident. Therefore, it was necessary to increase strength and to
provide sufficient confinement in the critical zones, including the bars termination zone.
According to these requirements, confinement was continuously provided from the base up
to 0.90 m, and the top column confinement was limited to the last 0.30 m. The strong-
column was wrapped at these critical regions. The carbon fibre fabric was only available in
0.60 m width pieces. At the base of the strong-column, the fabric was used on the first level
up to a height of 0.60 m and on the second level, at a height of 0.30 m, without any lateral
superposition. Figure A.56, show pictures of the column repaired.
Joints:
As already explained, a few joints were seriously damaged and some columns were
dislocated from their original positions due to the shear-out effect caused by the infill
panels. They were forced back to their original position and partially reconstructed.
However, it is known that reconstruction processes do not provide lateral resistance for
horizontal or even vertical loads. It was therefore necessary to provide confinement to the
joint and anchoring top-columns to the adjacent beams, which was provided by means of a
carbon fibre fabric layout schematically represented in Figure A.58. Fabric 1 in this figure
provides resistance to the joint, top of the column and column/joint interface. Fabric 2
provides resistance of the joint in the orthogonal direction and increases adherence of
fabric 1. Fabric 3 increases adherence of fabric 2. Fabric 4 provides confinement to the
upper part of the column. Anchoring of the column to the internal beam is somewhat

Chapter 3
141
disregarded, but it is too difficult to perform (due to the geometry of the joint) and it is
believed that such a carbon fibre layout is sufficiently strong for a bare frame configuration
(sufficient to avoid the dislocation of the columns during the final capacity tests). For the
phase 4, illustrated in Figure A.58 (upper part of the column), the carbon fibre was applied
with a longitudinal superposition of 10-12 cm. Figure A.59, show pictures with the
operation phases of the joint retrofitting.
3.6.5 - Remarks
The use of fibre reinforced polymers in seismic repair and retrofit seems to be an
economical alternative to traditional materials and technologies allowing addressing most
of the deficiencies commonly found in non-seismic resisting structures. However, there is a
lack of experimental evidence on the performance of structures and elements repaired or
retrofitted with FRP's. Moreover, there is a lack of specific codified rules for design
(redesign), which represents a major drawback and delays a much wider use and
application of FRP's in seismic retrofit.
It should be noted that specialized companies, producers of composite materials or their
associates carried out most of the repair and strengthening works using fibre composite
materials. Technical characteristics of the products, including nominal values for
'adherence' between fabrics and concrete are not systematically made available, which
could be a commercial strategy or a consequence of lacking of fundamental reliable data
for civil engineering applications. This fact creates serious problems for the widespread
use of these materials in repair and strengthening of existing structures. Urgent actions
should be taken by universities and technical communities to teach and update technical
background in the field. Furthermore, appropriate norms and design guidelines for
strengthening of existing structures with FRP's should be developed (Pinto et al., 2001-b;
Pinto and Varum, 2000).
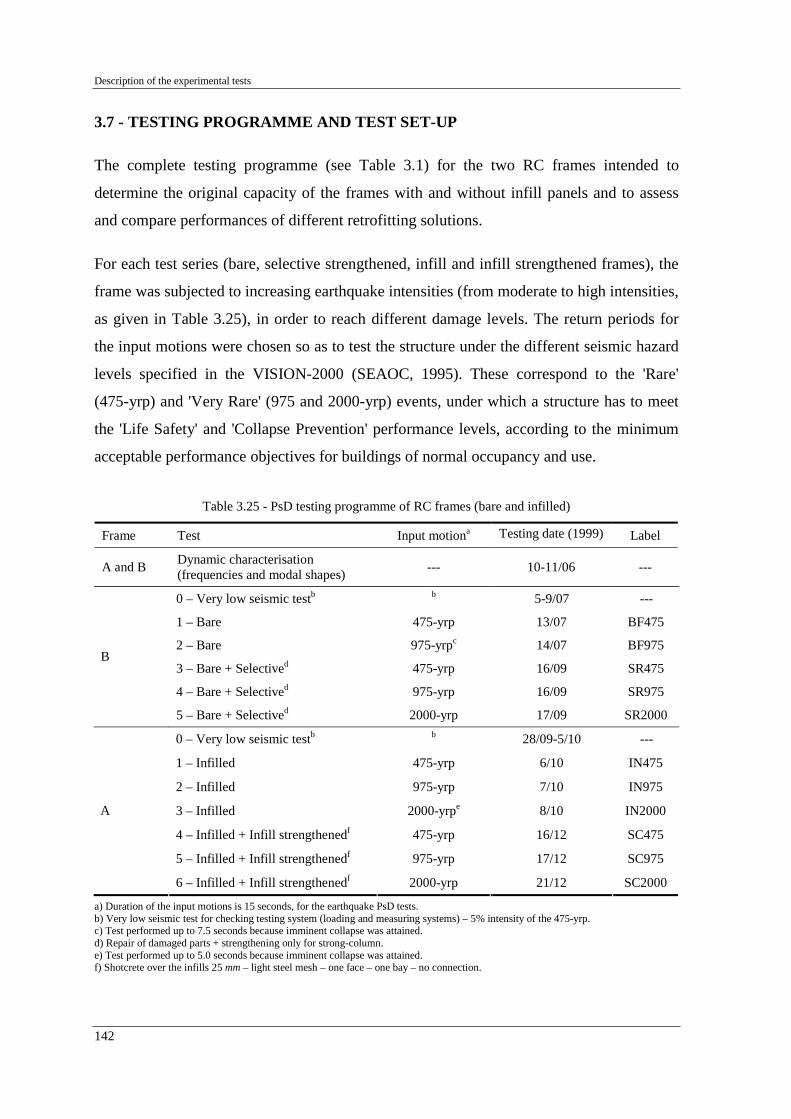
Description of the experimental tests
142
3.7 - TESTING PROGRAMME AND TEST SET-UP
The complete testing programme (see Table 3.1) for the two RC frames intended to
determine the original capacity of the frames with and without infill panels and to assess
and compare performances of different retrofitting solutions.
For each test series (bare, selective strengthened, infill and infill strengthened frames), the
frame was subjected to increasing earthquake intensities (from moderate to high intensities,
as given in Table 3.25), in order to reach different damage levels. The return periods for
the input motions were chosen so as to test the structure under the different seismic hazard
levels specified in the VISION-2000 (SEAOC, 1995). These correspond to the 'Rare'
(475-yrp) and 'Very Rare' (975 and 2000-yrp) events, under which a structure has to meet
the 'Life Safety' and 'Collapse Prevention' performance levels, according to the minimum
acceptable performance objectives for buildings of normal occupancy and use.
Table 3.25 - PsD testing programme of RC frames (bare and infilled)
Frame Test Input motiona Testing date (1999) Label
A and B Dynamic characterisation (frequencies and modal shapes) --- 10-11/06 ---
0 – Very low seismic testb b 5-9/07 ---
1 – Bare 475-yrp 13/07 BF475
2 – Bare 975-yrpc 14/07 BF975
3 – Bare + Selectived 475-yrp 16/09 SR475
4 – Bare + Selectived 975-yrp 16/09 SR975
B
5 – Bare + Selectived 2000-yrp 17/09 SR2000
0 – Very low seismic testb b 28/09-5/10 ---
1 – Infilled 475-yrp 6/10 IN475
2 – Infilled 975-yrp 7/10 IN975
3 – Infilled 2000-yrpe 8/10 IN2000
4 – Infilled + Infill strengthenedf 475-yrp 16/12 SC475
5 – Infilled + Infill strengthenedf 975-yrp 17/12 SC975
A
6 – Infilled + Infill strengthenedf 2000-yrp 21/12 SC2000
a) Duration of the input motions is 15 seconds, for the earthquake PsD tests. b) Very low seismic test for checking testing system (loading and measuring systems) – 5% intensity of the 475-yrp. c) Test performed up to 7.5 seconds because imminent collapse was attained. d) Repair of damaged parts + strengthening only for strong-column. e) Test performed up to 5.0 seconds because imminent collapse was attained. f) Shotcrete over the infills 25 mm – light steel mesh – one face – one bay – no connection.

Chapter 3
143
The pseudo-dynamic tests on the bare frame and on the strengthened frame using selective
methods are deeply described in Pinto et al. (2001-a; 1999-a; 1999-c), and on the infill
frame and infill strengthened frame in Pinto et al. (2002; 2001-c).
The cyclic test on the RC infilled retrofitted frame, with the K-bracing with shear-link
dissipative device, was labelled as KB-cyclic test. The final capacity cyclic tests
programme performed on the bare and selective strengthened frames is summarised in
Table 3.26 (see also Table 3.1).
Table 3.26 - Final capacity cyclic testing programme of RC frames
Frame Test Testing date (2000) Label
A Barea 7/11 BF-cyclic
B Bare + Selective 10/10 SR-cyclic
a) The bare frame was recovered from the infilled frame, removing the infills.
3.7.1 - Additional masses
The masses used in the PsD algorithm are introduced numerically, and were considered
44.6 ton for the first three storeys and 40.0 ton for the fourth storey (in accordance to the
load distribution, see Section 3.2.6). These masses are assumed to be concentrated at each
DOF (storey). For the PsD test algorithm, it is enough to consider numerically this
distribution of masses. However, in order to correctly consider the internal forces in the
frame, corresponding to the idealised force distribution, it was necessary to use additional
masses in the tested structures.
Hence, additional masses were placed in each floor by means of concrete blocks, steel
plates, big sandbags and large water containers. These additional masses simulate live
loads, finishings, partitions and other self-weights. Their distribution, shown in
Figure 3.33, is such as to represent as closely as possible a real scenario (in terms of load
distribution in the floors and in terms of distribution between columns and beams). In the
figure, additional masses are represented in tons.
The additional vertical loads used in the tests were obtained by subtracting the weight of
the specimen (including provisory stairs, jacks and respective attachment system) from the
loads represented in the scheme shown in Figure 3.7. Also the lateral equilibrium of the

Description of the experimental tests
144
frames was assured with the adopted distribution of additional masses (it should be
underlined that the slab is not symmetric: 1.80 m on one side, versus 1.95 m on the other).
Other constraints were the additional loads available in the laboratory and the distribution
of the testing equipment, as well as, all the instrumentation installed in the frames.
Examples of the additional loads used are shown in Figure A.17.
The same distribution of additional loads was considered for the bare frame and for the
infilled frame, meaning that the weight of the infill panels was neglected.
1st, 2nd and 3rd floors
4th floor
Figure 3.33 - Distribution of the additional loads
To perform the final capacity cyclic tests, removal of the masonry walls and removal of the
K-bracing system required dislocation and/or removal of great part of the additional loads
from the three first floors. Using the water reservoirs acquired in the meantime by the
ELSA laboratory, which allow for faster and safer operations, a slightly different scheme
for the floor distribution of the additional masses was adopted, but the initial distribution of
the axial loads in columns was guaranteed. Figure A.31 illustrates the additional water
reservoirs system adopted.

Chapter 3
145
3.7.2 - Reaction-wall
The European Laboratory for Structural Assessment (ELSA) is a large-scale facility of the
Joint Research Centre of the European Commission. It consists of a 16 m high, 21 m wide
reaction-wall hollow core with a total thickness of 4 m, and it is designed to resist the
forces, which are necessary to deform and seriously damage full-scale models of structures
(see technical data summarized in Figure 3.34 and Table 3.27). In addition to static and
cyclic testing capabilities, the facility is equipped to perform tests utilizing the pseudo-
dynamic (PsD) testing method which enables, for instance, the simulation of earthquake
loading of full-scale buildings.
16
4.2
54
2521Testing Floor
Reaction Wall
Anchors (1 meter spacing)
New Testing Floor
Figure 3.34 - Reaction wall/floor facility (dimensions in m) at the ELSA laboratory (Pinto, 1998)
Table 3.27 - Characteristics of the ELSA reaction-wall (adapted from Pinto, 1998)
Bending moment 200 MN⋅m Reaction wall
Base-shear 20 MN
Reaction floor Bending moment 240 MN⋅m Load capacity
Anchor load Axial force 500 kN
Flow 1500 l/min.
Pressure 210 bar
Load 0.5 to 1.0 MN Hydraulic characteristics
Actuators Stroke ± 0.25 to ± 1.0 m

Description of the experimental tests
146
Many of the advantages of the PsD implementation at ELSA laboratory are due to the fully
digital, in-house designed, system architecture. The system is based on distributed control
units, connected via optical fibre to the master PsD computer. Measurements are done by
optical digital transducers, interfaced to the control units without the need of analog
conversion (Pinto, 1998).
3.7.3 - Pseudo-dynamic test method
The PsD testing technique is based on the modelling of a system by a discrete equation of
motion
)()( tpdrvCaM =+⋅+⋅ (3.38)
where: M is the mass matrix, C is the viscous damping matrix, a, v, d and p are the vectors
of acceleration, velocity, displacement and external load, respectively, which are functions
of time t, and r is the vector of restoring forces, which is a non-linear function of the
displacements. Within this model, M, C and p(t) are known data, while r(d) is directly
measured on line (Donea et al., 1996; Molina et al., 1999-b).
In PsD testing, the inertia and viscous damping forces are simulated numerically and the
corresponding matrices may be calculated from the preliminary dynamic identification
tests performed on the structure (e.g. free vibration and stiffness tests). Alternatively, these
matrices are computed by the static condensation of the matrices corresponding to the
complete structure to the degrees of freedom of interest. The numerically modelled inertia
and viscous damping forces are a relatively straightforward matter compared to the non-
linear structural restoring forces, which are measured experimentally because of the
difficulty in modelling them accurately. The process automatically accounts for the
hysteretic damping due to inelastic deformation and damage of the structural materials,
which is the major source of energy dissipation. Typically, the viscous damping matrix C
is considered null in a PsD test (Pinto et al., 1996).
Usually, an explicit integration scheme is used by means of which, at every step, the
computed displacement is quasi-statically imposed to the specimen and the required forces
are simultaneously measured. By using many actuators of the required capacity, the

Chapter 3
147
method can be applied to test large structures with clear advantages with respect to a
shaking table test (Donea et al., 1996; Molina et al., 1999-b).
To simulate the earthquake response of a structure, a record of an actual or artificially
generated earthquake ground acceleration history is given as input data to the computer
running the pseudo-dynamic algorithm. The displacements of the controlled horizontal
degrees of freedom (where the mass of the structure can be considered concentrated) are
calculated for a small time step using a suitable time integration algorithm. These
displacements are then applied to the structure by servo-controlled hydraulic actuators
fixed to the reaction wall. Load cells mounted in series with the actuators measure the
forces necessary to achieve the required displacements and these structural restoring forces
are returned to the computer for use in the next time-step calculation (Pinto et al., 1996).
In a classic PsD test, every integration time step typically takes at least one second of time,
which allows for the imposing of the ramp of incremental displacements, followed by the
stabilisation of the system, before the forces are measured, after which the next
displacement is computed. However, in an 'accelerated' continuous PsD test, as currently
implemented at the ELSA laboratory (Magonette et al., 1998), every integration time step
takes just 2 ms, which is also the sampling period of the closed-loop controllers of the
actuators. Within that time-lapse, the same CPU, which is in charge of the control
algorithm, reads the force, integrates one step in the equation of motion and corrects the
target according to the new computed displacement. The accelerogram history is
subdivided into very small time increments (0.02 ms, for example) so that the displacement
increments can appropriately be followed by the pistons in just 2 ms. Thus, for a real size
specimen with several DOF's, a typical test time scale of λ = 2 / 0.02 = 100 can be reached,
which mean being around ten times faster and still rendering results much more accurate
than those obtained by means of a classic PsD test performed using the same hardware.
3.7.4 - Horizontal loading system
In the PsD test of a building, one horizontal displacement (one DOF) is considered per
floor. Displacements are applied to the structure, at each floor-level, by means of an
actuator, as shown in Figure 3.35, which is, in the present case, a double-acting servo-
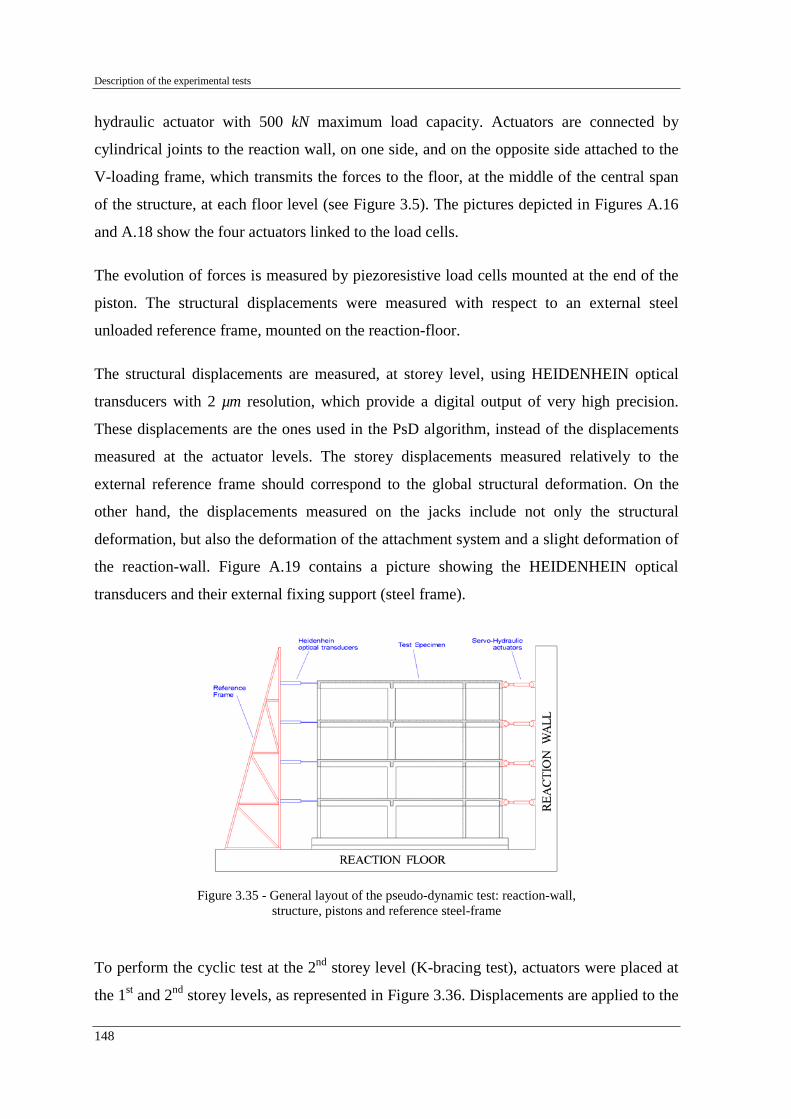
Description of the experimental tests
148
hydraulic actuator with 500 kN maximum load capacity. Actuators are connected by
cylindrical joints to the reaction wall, on one side, and on the opposite side attached to the
V-loading frame, which transmits the forces to the floor, at the middle of the central span
of the structure, at each floor level (see Figure 3.5). The pictures depicted in Figures A.16
and A.18 show the four actuators linked to the load cells.
The evolution of forces is measured by piezoresistive load cells mounted at the end of the
piston. The structural displacements were measured with respect to an external steel
unloaded reference frame, mounted on the reaction-floor.
The structural displacements are measured, at storey level, using HEIDENHEIN optical
transducers with 2 µm resolution, which provide a digital output of very high precision.
These displacements are the ones used in the PsD algorithm, instead of the displacements
measured at the actuator levels. The storey displacements measured relatively to the
external reference frame should correspond to the global structural deformation. On the
other hand, the displacements measured on the jacks include not only the structural
deformation, but also the deformation of the attachment system and a slight deformation of
the reaction-wall. Figure A.19 contains a picture showing the HEIDENHEIN optical
transducers and their external fixing support (steel frame).
Figure 3.35 - General layout of the pseudo-dynamic test: reaction-wall, structure, pistons and reference steel-frame
To perform the cyclic test at the 2nd storey level (K-bracing test), actuators were placed at
the 1st and 2nd storey levels, as represented in Figure 3.36. Displacements are applied to the

Chapter 3
149
structure at the 2nd floor-level, imposing constant zero displacement at the 1st storey. The
double-acting servo-hydraulic actuators used in this test can develop 1000 kN maximum
load.
Figure 3.36 - General layout of the 2nd storey cyclic test: reaction-wall, structure, pistons and reference steel-frame
The plane frames have a very low strength in their orthogonal direction. But, out-of-plane
deformation is controlled through a system of hinged steel members which connect, at each
floor, the frame being tested, to the other frame. The frame that is not being tested is fixed
to the reaction-wall (at one end) and to an out-of-plane steel frame (at the other end), as
shown in Figures A.15 and A.16.
3.7.5 - Instrumentation of the RC frames
The instrumentation used in the ELSA laboratory tests is usually divided into two groups.
The first group is reserved to measurements related to the pseudo-dynamic algorithm and
comprises storey displacements and forces. All the other measurements (labelled standard
acquisition), constituting the second group, are treated and recorded separately.
For the tests on the bare and selective strengthened frame, a total of 151 acquisition
channels were used. Eight of the 151 channels were used for the PsD algorithm
measurements, which include four optical transducers used to measure displacements at
each storey level, with the corresponding four restoring forces measured by calibrated load

Description of the experimental tests
150
cells mounted in series with the actuators. The remaining 143 channels are reserved for the
standard acquisition.
Standard measurements include the acquisition of the rotation at several points (sections)
in the structure and other three groups of relative displacements. These three relative
displacement groups were defined having in mind the purpose of the measurements. The
relative displacements are measured using a set of displacement transducers
(potentiometers) with measuring capacities of 25, 50 and 100 mm, depending on the
maximum deformation expected at each measuring point. The sensitivity of these
potentiometers is 2.66, 5.14 and 10.14 mm/V for the 25, 50 and 100 mm, respectively when
powered at 5 Volts.
All transducers are connected in groups of 16 channels to the data acquisition system,
where data from all channels are sampled and averaged for each step. Each relative
displacement transducer, inclinometer and strain-gauge is associated with two reference
numbers (see figures with instrumentation), namely: i) the file number where the test
results are recorded; and, ii) in brackets, the board channel in the data acquisition system.
The positive signal is associated to elongation of the transducers, to clock-wise rotation at
inclinometers, and to tension at strain-gauges.
In what follows, each group of instrumentation used is presented individually, including
the respective location schemes and the conventions adopted. The pictures in Figures A.18
and A.19 show the actuators and displacement controllers at floor levels, whilst
Figures A.21, A.22 and A.23 show the instrumentation, namely: instrumentation on the
strong-column (1st storey), instrumentation on the slab and inclinometers.
3.7.5.1 - Rotations: inclinometers
The distribution of inclinometers was maintained for all the PsD tests. Rotations are
measured at columns, beams and joints and are achieved by means of sixty-four digital
inclinometers. Inclinometers with five-degrees measurement capacity were used for the
columns and joints/beams in the strong-column vicinity (forty-six inclinometers) and one-
degree capacity for the remaining inclinometers (located at the other beams and joints).
The definition of the inclinometers capacity was prescribed according to the expected

Chapter 3
151
maximum rotation at each point on the structure. In Figure 3.37 is represented the location
and numbering of the inclinometers used in the testing campaign. Such configuration
provides important information regarding the response of structural members, such as
global rotation at the beam and column ends, relative rotation between sections,
deformation along the strong-column line and joint deformation. Figure 3.38 gives location
details of the inclinometers layout at two of the structure zones. Figure A.23 depicts
examples of inclinometers.
Figure 3.37 - Location of the 64 inclinometers
a)
b)
Figure 3.38 - Inclinometers location scheme: a) strong-column; b) slender-column

Description of the experimental tests
152
3.7.5.2 - Beam deformation at first floor level
A series of thirteen pairs of potentiometer displacement transducers (13 top and 13 bottom)
were used to measure longitudinal deformation at the first floor beam. Figure 3.39
represents the instrumentation used to measure the beam deformation. With this
instrumentation, it is possible to capture the rotation of all the sections monitored and the
axial deformation of the beam can also be investigated. The base length for the plastic
hinge was assumed with 350 mm (which corresponds to approximately 2/3 of the beam
depth, H). In order to study the plastic hinge length, the distribution of the instrumentation
in the zones nearest to the strong-column was increased.
Detail I
Figure 3.39 - 1st floor beam instrumentation: general layout, dimensions and detail of the zone nearest to the strong-column

Chapter 3
153
3.7.5.3 - Slab-participation
In order to measure the contribution of the slab (slab-participation), twenty-six transducers
were placed at the top and bottom of the first floor slab, in critical zones, with a base length
of 350 mm from the column face, as shown in Figure 3.40. Figure A.22 shows a picture
with the transducers arrangement in the slab. With the selected locations for the
instrumented slab zones it is possible to contrast the slab-participation in a long span-bay
versus a short span-bay, as well as, between interior and exterior joint zones. Two of the
foreseen transducers on the top slab (#112 and #119) were not used, because the respective
positions coincide with the attachment system used to impose the storey displacement.
Above the slab
Below the slab
Figure 3.40 - Instrumentation for the slab-participation monitoring
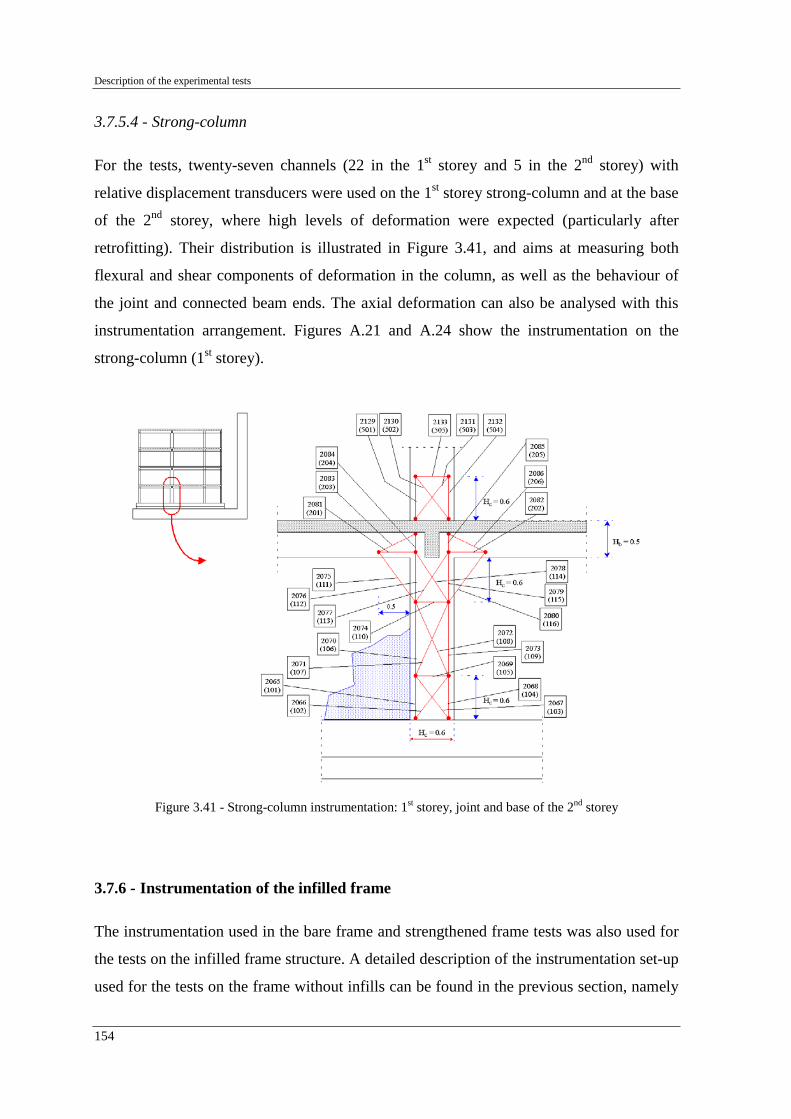
Description of the experimental tests
154
3.7.5.4 - Strong-column
For the tests, twenty-seven channels (22 in the 1st storey and 5 in the 2nd storey) with
relative displacement transducers were used on the 1st storey strong-column and at the base
of the 2nd storey, where high levels of deformation were expected (particularly after
retrofitting). Their distribution is illustrated in Figure 3.41, and aims at measuring both
flexural and shear components of deformation in the column, as well as the behaviour of
the joint and connected beam ends. The axial deformation can also be analysed with this
instrumentation arrangement. Figures A.21 and A.24 show the instrumentation on the
strong-column (1st storey).
Figure 3.41 - Strong-column instrumentation: 1st storey, joint and base of the 2nd storey
3.7.6 - Instrumentation of the infilled frame
The instrumentation used in the bare frame and strengthened frame tests was also used for
the tests on the infilled frame structure. A detailed description of the instrumentation set-up
used for the tests on the frame without infills can be found in the previous section, namely
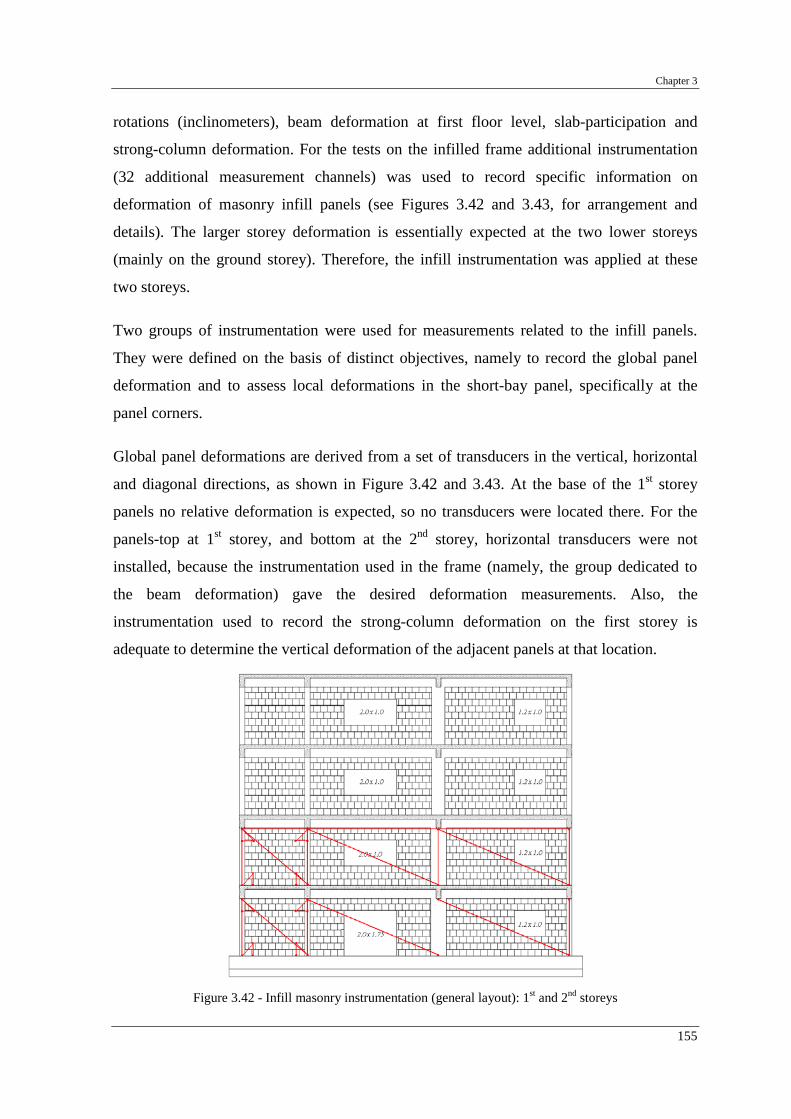
Chapter 3
155
rotations (inclinometers), beam deformation at first floor level, slab-participation and
strong-column deformation. For the tests on the infilled frame additional instrumentation
(32 additional measurement channels) was used to record specific information on
deformation of masonry infill panels (see Figures 3.42 and 3.43, for arrangement and
details). The larger storey deformation is essentially expected at the two lower storeys
(mainly on the ground storey). Therefore, the infill instrumentation was applied at these
two storeys.
Two groups of instrumentation were used for measurements related to the infill panels.
They were defined on the basis of distinct objectives, namely to record the global panel
deformation and to assess local deformations in the short-bay panel, specifically at the
panel corners.
Global panel deformations are derived from a set of transducers in the vertical, horizontal
and diagonal directions, as shown in Figure 3.42 and 3.43. At the base of the 1st storey
panels no relative deformation is expected, so no transducers were located there. For the
panels-top at 1st storey, and bottom at the 2nd storey, horizontal transducers were not
installed, because the instrumentation used in the frame (namely, the group dedicated to
the beam deformation) gave the desired deformation measurements. Also, the
instrumentation used to record the strong-column deformation on the first storey is
adequate to determine the vertical deformation of the adjacent panels at that location.
Figure 3.42 - Infill masonry instrumentation (general layout): 1st and 2nd storeys

Description of the experimental tests
156
The second group of instrumentation (to capture local deformation) is composed of two
transducers at each corner of the external short-bay panel, and are placed to measure local
deformation of the infill masonry corners and relative deformation between masonry and
surrounding concrete frame (see Figures 3.42 and 3.43).
The instrumentation used for the infilled frame tests was maintained for the strengthened
infill tests. Photographic documentation of the instrumentation of the infill panels is shown
in Figure A.29.
Storey 1 (at the panel corners) Storey 2 (at the panel corners)
Figure 3.43 - Infill masonry instrumentation (numbering): 1st and 2nd storeys
3.7.7 - Instrumentation for the K-bracing test
The instrumentation used in the previous PsD tests at the second storey was maintained for
this cyclic test, namely: rotations at columns, beams and joints (Figure 3.45) and relative
displacement transducers used to record the deformation of the masonry infill panels
(Figure 3.46). In Figure 3.44 is represented the bracing and shear-link instrumentation. The
relative displacement transducer #190 was set-up to measure the distortion of the shear-
link, and one strain-gauge was set-up for each steel profile in the bracing (#185 to #188).
Figures A.50 and A.51 show the instrumentation adopted for the bracing system.
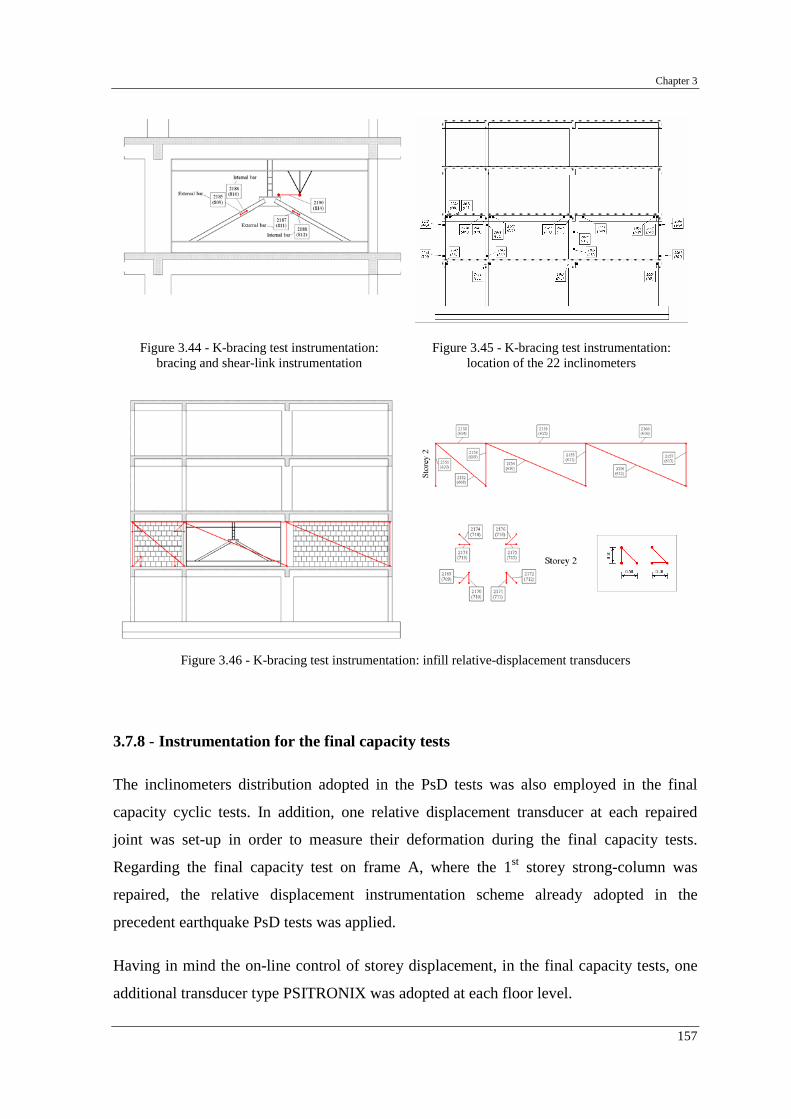
Chapter 3
157
Figure 3.44 - K-bracing test instrumentation: bracing and shear-link instrumentation
Figure 3.45 - K-bracing test instrumentation: location of the 22 inclinometers
Figure 3.46 - K-bracing test instrumentation: infill relative-displacement transducers
3.7.8 - Instrumentation for the final capacity tests
The inclinometers distribution adopted in the PsD tests was also employed in the final
capacity cyclic tests. In addition, one relative displacement transducer at each repaired
joint was set-up in order to measure their deformation during the final capacity tests.
Regarding the final capacity test on frame A, where the 1st storey strong-column was
repaired, the relative displacement instrumentation scheme already adopted in the
precedent earthquake PsD tests was applied.
Having in mind the on-line control of storey displacement, in the final capacity tests, one
additional transducer type PSITRONIX was adopted at each floor level.

Description of the experimental tests
158
3.7.8.1 - Relative displacement transducers at the repaired joints
One transducer was used at each repaired joint, to measure their deformation during the
final capacity tests. Specifically, it was intended to record the possible relative horizontal
dislocation between the joint and the top of the external repaired column (see Figure 3.47-c
and picture in Figure A.32). Therefore, for the bare frame final capacity cyclic test
(frame A), four transducers were used and for the selective repaired frame (frame B), two
transducers were used, as shown in Figure 3.47. The relative displacements at the repaired
joints were measured using a potentiometer (displacement transducers) with measuring
capacity of 50 mm.
a)
b)
c)
Figure 3.47 - Instrumentation at the repaired joints: a) frame A; b) frame B; c) detail
3.7.8.2 - Relative displacement transducers at the strong-column
The transducers arrangement adopted for the strong-column at the base (tests on frame A)
and their numeration is represented in Figure 3.48. Figure A.33 shows the instrumentation
used.

Chapter 3
159
Figure 3.48 - Strong-column instrumentation for the final capacity cyclic test: frame A
3.7.8.3 - Storey displacement transducers (PSITRONIX)
For the final capacity cyclic tests was important to control on-line the storey behaviour,
especially for the cyclic tests performed at storey level. For this purpose four additional
displacement transducers were installed at storey levels, type PSITRONIX with 500 mm
measurement capacity, allowing during the test for the on-line visualisation of the storey
shear versus inter-storey drift curves. With these transducers was possible to follow the
storey response and consequently control the damage and decide about levels of drift to be
imposed. Another reason to adopt this additional storey displacement measurement system
was the need to control and prevent the eventual full collapse of the structure. Figure A.34
shows simultaneously the HEIDENHEIN transducers used in all the tests and the
additional PSITRONIX transducers adopted in the final capacity tests. The transducers
numeration adopted was #2073 until #2076 for the 1st until 4th storey, respectively.
3.7.9 - Data acquisition system and post-processing
Finally, input data, acquisition control and monitoring of the tests were accomplished by
means of a cluster of 10 PC's, shown in Figure A.20. This allows for real-time monitoring
the frame response during each test, and the control system allows for halting at any time,

Description of the experimental tests
160
especially at the point of peak deformation for close damage inspection, or to prevent full
collapse.
All the data is saved in Voltage units. The post-processing begins with the conversion from
Voltage units to physical units (in terms of force and displacement). Following conversion,
all measurements are kept in a database for later use. Within the ELSA laboratory work
environment, two groups of measurements are taken and recorded. As already mentioned,
one group of measurements is related to the pseudo-dynamic algorithm and the other is
related to standard measurements. Consequently, two result data files are created for each
test.
3.8 - NON-DESTRUCTIVE TESTS: FREQUENCIES IDENTIFICATION
In order to provide data for modal identification of the structure before and after each test
series, a very low intensity earthquake (non-destructive test) was applied to the structure
allowing exciting all the modes. This input corresponds to 5% intensity referring to the
475-yrp earthquake (0.109 m/s2 peak acceleration) employed in the previous pseudo-
dynamic tests. The frequency and viscous-equivalent damping ratio were obtained by
applying an identification method to the experimental response. These methods, based on
time-domain linear models (Molina et al., 1999-a), are extensively applied to the results of
PsD tests at the ELSA laboratory. The simplest and more robust of those models is a
spatial model, which is described here next. Within this model, the measured restoring
forces )(nr and the corresponding displacements )(nd and velocities )(nv are assumed to
be linked as
)()()( nvCndKnr ⋅+⋅= (3.39)
for every discrete time n. K and C are the stiffness and damping matrixes, respectively.
More precisely, the model can be formulated as
[ ] )(0
1)()( nrCK
nvnd T
T
T
T
TT =
(3.40)

Chapter 3
161
where a constant force offset term 0 has been added. Here, if NDOF is the number of
DOF's in the structure, K, C and 0 contain NDOFNDOF +⋅ 22 unknowns and the number
of available equations is NDOFN ⋅ , so that, the required number of discrete-time data sets
is
12 +⋅≥ NDOFN (3.41)
Once K and C have been estimated by a least squares solution, the complex eigen-
frequencies and mode shapes can be obtained by solving the generalised eigen-value
problem
00
00
=
−
+
ϖϖ
MK
MMC
s (3.42)
where M is the theoretical mass matrix. The conjugate couples of eigen-values can be
written as
)1(, 2*nnnnn jss ζζω −±−= (3.43)
where: nω is the natural frequency and nζ the damping ratio. The corresponding mode
shape is also given by the first NDOF rows of the associated eigen-vector nϖ .
Since this model assumes an invariant system, at any selected time instant, the
identification may be done based on a data time window of duration roughly the period of
the first mode, centred on that instant. The adopted time window has to be narrow enough
so that the system does not change too much inside of it, but, at the same time, it has to
contain enough data to allow the compensation of different existing data noises and
nonlinearities. The selection of the most appropriate window length is done by trial and
error. Working like that, it is possible to obtain the eigen-frequencies and damping ratios of
all the modes at any time instant (Molina et al., 1999-a).
3.8.1 - Non-infilled frame
From the analyses of the non-destructive tests, the modal parameters listed in Table 3.28
were obtained for the non-infilled frame (frame B) using the procedure described before. A
more detailed analysis of these results can be found in Molina et al. (2001; 2000-b).
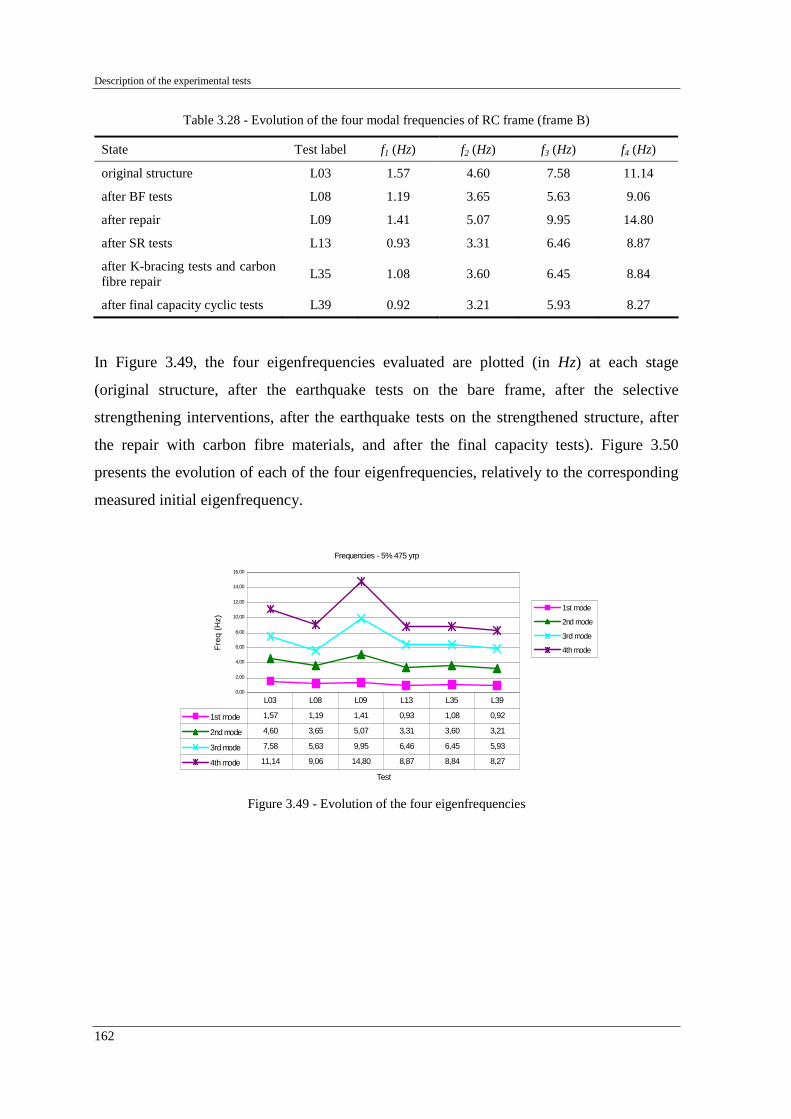
Description of the experimental tests
162
Table 3.28 - Evolution of the four modal frequencies of RC frame (frame B)
State Test label f1 (Hz) f2 (Hz) f3 (Hz) f4 (Hz)
original structure L03 1.57 4.60 7.58 11.14
after BF tests L08 1.19 3.65 5.63 9.06
after repair L09 1.41 5.07 9.95 14.80
after SR tests L13 0.93 3.31 6.46 8.87
after K-bracing tests and carbon fibre repair L35 1.08 3.60 6.45 8.84
after final capacity cyclic tests L39 0.92 3.21 5.93 8.27
In Figure 3.49, the four eigenfrequencies evaluated are plotted (in Hz) at each stage
(original structure, after the earthquake tests on the bare frame, after the selective
strengthening interventions, after the earthquake tests on the strengthened structure, after
the repair with carbon fibre materials, and after the final capacity tests). Figure 3.50
presents the evolution of each of the four eigenfrequencies, relatively to the corresponding
measured initial eigenfrequency.
Frequencies - 5% 475 yrp
0,00
2,00
4,00
6,00
8,00
10,00
12,00
14,00
16,00
Test
Freq
(Hz)
1st mode
2nd mode
3rd mode
4th mode
1st mode 1,57 1,19 1,41 0,93 1,08 0,92
2nd mode 4,60 3,65 5,07 3,31 3,60 3,21
3rd mode 7,58 5,63 9,95 6,46 6,45 5,93
4th mode 11,14 9,06 14,80 8,87 8,84 8,27
L03 L08 L09 L13 L35 L39
Figure 3.49 - Evolution of the four eigenfrequencies
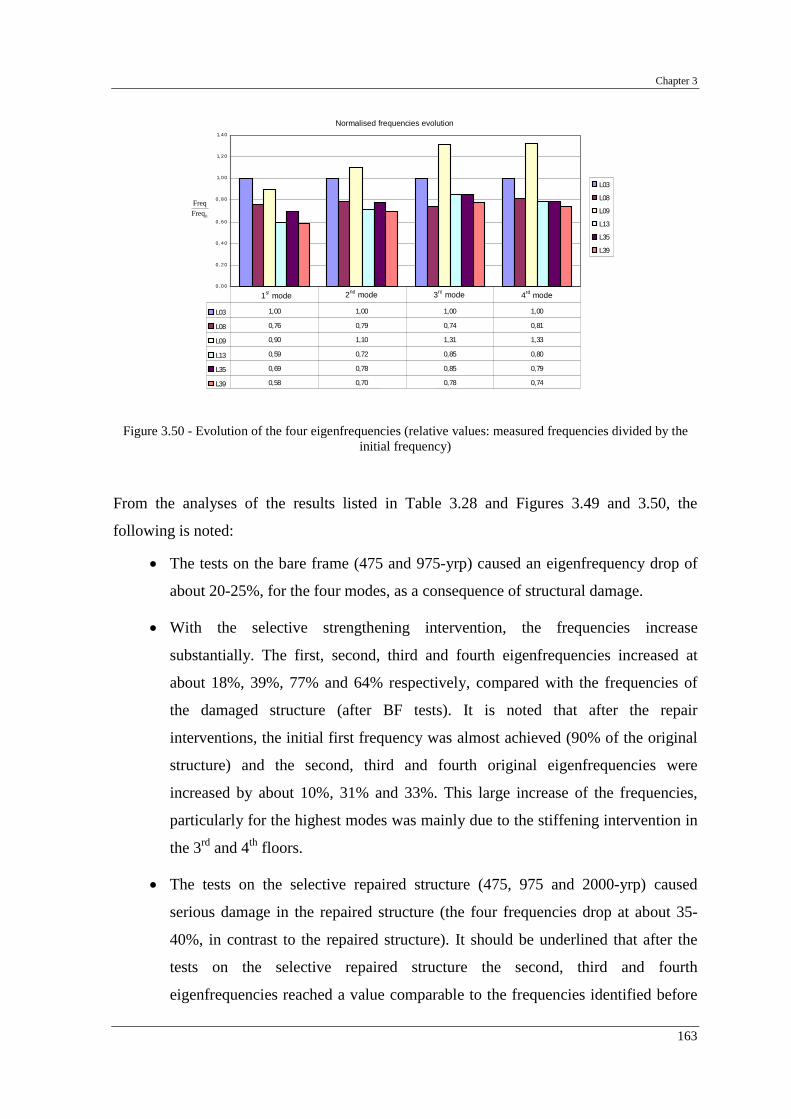
Chapter 3
163
Normalised Frequencies evolution
0, 0 0
0, 2 0
0, 4 0
0, 6 0
0, 8 0
1, 0 0
1, 2 0
1, 4 0
Mode
L03
L08
L09
L13
L35
L39
L03 1,00 1,00 1,00 1,00
L08 0,76 0,79 0,74 0,81
L09 0,90 1,10 1,31 1,33
L13 0,59 0,72 0,85 0,80
L35 0,69 0,78 0,85 0,79
L39 0,58 0,70 0,78 0,74
1 2 3 4
Figure 3.50 - Evolution of the four eigenfrequencies (relative values: measured frequencies divided by the initial frequency)
From the analyses of the results listed in Table 3.28 and Figures 3.49 and 3.50, the
following is noted:
• The tests on the bare frame (475 and 975-yrp) caused an eigenfrequency drop of
about 20-25%, for the four modes, as a consequence of structural damage.
• With the selective strengthening intervention, the frequencies increase
substantially. The first, second, third and fourth eigenfrequencies increased at
about 18%, 39%, 77% and 64% respectively, compared with the frequencies of
the damaged structure (after BF tests). It is noted that after the repair
interventions, the initial first frequency was almost achieved (90% of the original
structure) and the second, third and fourth original eigenfrequencies were
increased by about 10%, 31% and 33%. This large increase of the frequencies,
particularly for the highest modes was mainly due to the stiffening intervention in
the 3rd and 4th floors.
• The tests on the selective repaired structure (475, 975 and 2000-yrp) caused
serious damage in the repaired structure (the four frequencies drop at about 35-
40%, in contrast to the repaired structure). It should be underlined that after the
tests on the selective repaired structure the second, third and fourth
eigenfrequencies reached a value comparable to the frequencies identified before
0FreqFreq
1st mode 2nd mode 3rd mode 4rd mode
Normalised frequencies evolution
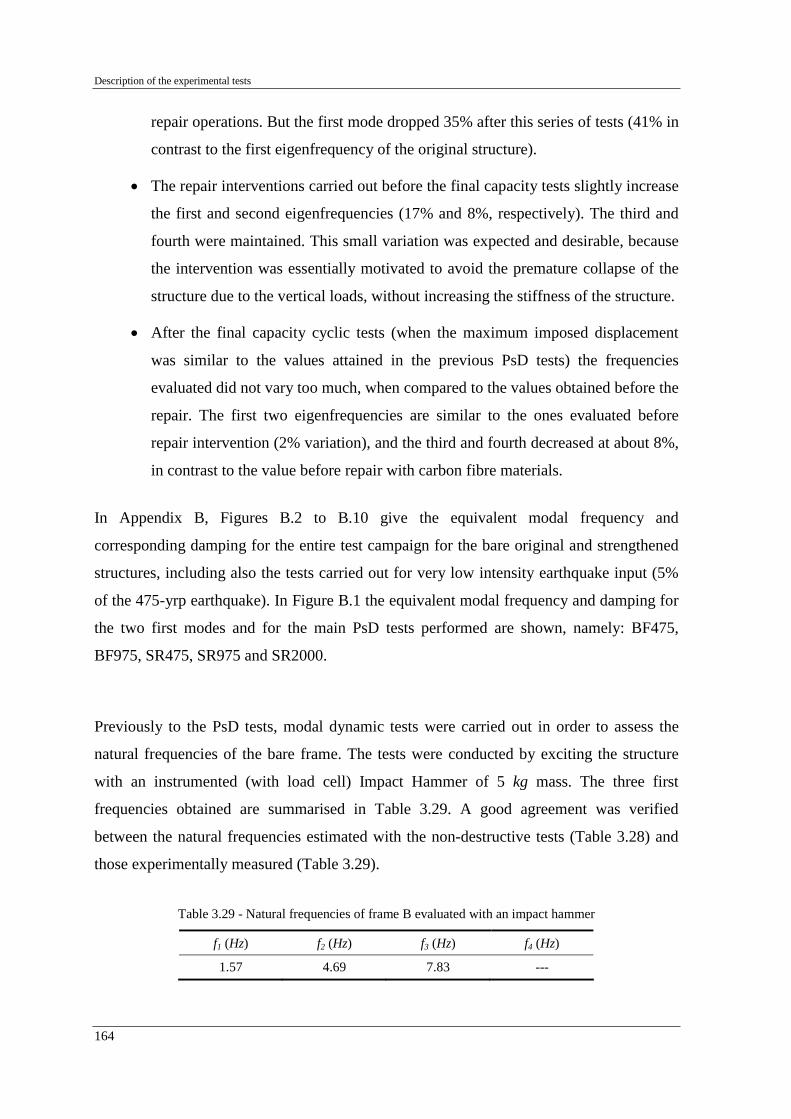
Description of the experimental tests
164
repair operations. But the first mode dropped 35% after this series of tests (41% in
contrast to the first eigenfrequency of the original structure).
• The repair interventions carried out before the final capacity tests slightly increase
the first and second eigenfrequencies (17% and 8%, respectively). The third and
fourth were maintained. This small variation was expected and desirable, because
the intervention was essentially motivated to avoid the premature collapse of the
structure due to the vertical loads, without increasing the stiffness of the structure.
• After the final capacity cyclic tests (when the maximum imposed displacement
was similar to the values attained in the previous PsD tests) the frequencies
evaluated did not vary too much, when compared to the values obtained before the
repair. The first two eigenfrequencies are similar to the ones evaluated before
repair intervention (2% variation), and the third and fourth decreased at about 8%,
in contrast to the value before repair with carbon fibre materials.
In Appendix B, Figures B.2 to B.10 give the equivalent modal frequency and
corresponding damping for the entire test campaign for the bare original and strengthened
structures, including also the tests carried out for very low intensity earthquake input (5%
of the 475-yrp earthquake). In Figure B.1 the equivalent modal frequency and damping for
the two first modes and for the main PsD tests performed are shown, namely: BF475,
BF975, SR475, SR975 and SR2000.
Previously to the PsD tests, modal dynamic tests were carried out in order to assess the
natural frequencies of the bare frame. The tests were conducted by exciting the structure
with an instrumented (with load cell) Impact Hammer of 5 kg mass. The three first
frequencies obtained are summarised in Table 3.29. A good agreement was verified
between the natural frequencies estimated with the non-destructive tests (Table 3.28) and
those experimentally measured (Table 3.29).
Table 3.29 - Natural frequencies of frame B evaluated with an impact hammer
f1 (Hz) f2 (Hz) f3 (Hz) f4 (Hz)
1.57 4.69 7.83 ---

Chapter 3
165
3.8.2 - Infilled frame
From the analyses of the non-destructive tests on the infilled frame (frame A), the modal
parameters listed in Table 3.30 were obtained.
Unfortunately it was not possible to make the frequency identification test after the IN tests
(and before the strengthening with shotcrete technique). Therefore, here are just presented
the eigenfrequencies of the original (uncracked stiffness) infilled RC frames. Comparing
the frequencies of the original bare frame (L03, frame B) with the infilled frame (L15) it is
observed that masonry infill panels increased the frequencies about four times.
Table 3.30 - Modal frequencies of the original infilled frame (frame A)
State Test label f1 (Hz) f2 (Hz) f3 (Hz) f4 (Hz)
original structure (frame with infill masonry walls L15 7.22 20.83 24.93 45.35
3.9 - REMARKS
This chapter provides the background for the test result's analysis in the next chapter. It
details the experimental research work carried out at the ELSA laboratory, including
analyses of the material properties. It is noted that a small variance was found for the
concrete properties for each casting phase, and a large variance was noted between the
various casting phases. This variability will be taken into account in the refined non-linear
numerical analyses to be conducted in Chapter 5. Otherwise, the analysis of the steel
reveals that the steel used in the construction of the frames has significantly higher strength
than the nominal values. From these preliminary analyses of the specimens, one moves
into Chapter 4, which presents the pseudo-dynamic (PsD) and cyclic tests in order to assess
the vulnerability of this kind of structures and to evaluate the efficiency of the different
retrofit solutions.

CHAPTER 4
ANALYSIS OF EXPERIMENTAL TEST RESULTS
4.1 - INTRODUCTION
In the previous chapter were presented the characteristics of the test frames, infill masonry,
vertical static loads, earthquake input motions, repair and strengthening techniques and
materials properties. This chapter presents and discusses all the results of the earthquake
PsD and cyclic tests. Figure 3.1 summarised schematically the complete set of tests
performed in this study. Next it is presented an overview on the general experimental
results as a preliminary step to guide into the posterior extensive analysis of the test results.
The first part of the test campaign focussed on the bare frame (BF) and on the selective
strengthened frame (SR) tests. Two PsD test series were carried out. In the first test series,
the frame was subjected to two earthquake input signals, represented by two artificial
15-second duration accelerograms. The earthquakes of 475-yrp (PGA = 2.180 m/s2) and
975-yrp (PGA = 2.884 m/s2) were generated for a moderately high-risk scenario in Europe
(see input signals in Figure 3.8 and Table 3.9). As predicted by the numerical pre-test
analysis, the frame did not perform satisfactorily and the strong-column suffered severe
damage at the third level. In fact, the 975-yrp earthquake was applied only for the first 7.5
seconds in order to avoid collapse. During the 975-yrp test of the BF series, the third storey
(strong-column) experienced severe deformations and reached eminent collapse. Hinging
occurring at the top, bottom and at the bars termination zone (lap-splice). However, only
spalling and yielding took place. Neither buckling nor rupture of the rebars occurred. Also,
Experimental work: analysis of test results
168
no stirrups disclosure or rupture occurred, except at the bars termination zone where slight
yielding/disclosure of stirrups occurred. Therefore, repair of the column was feasible. In
order to improve the seismic performance of such structure, selective repair and
strengthening interventions were applied to the frame. Afterwards, the retrofitted structure
was submitted again to the 475, 975 and additionally to the 2000-yrp accelerograms
(PGA = 3.728 m/s2). After this second series of earthquakes, the frame had developed
larger global displacements and some limited damages, but its stability was not
compromised thanks to the applied retrofitting. The results from the SR tests have shown a
clear benefit from the strengthening intervention.
Frame A (infilled frame) was also object of two series of tests. First, the original infilled
frame (IN) was subjected to the same three earthquake input motions as the previous
campaign on frame B (labelled 475, 975 and 2000-yrp earthquake input motions). During
the 2000-yrp test the infilled frame reached imminent collapse. The infills at the first storey
reached collapse, and the soft-storey mechanism was nearly to appear. After reconstruction
of the infills on this storey, and strengthening on the external short panel at the four
storeys, the frame was subjected to the same three earthquake inputs. This test series was
labelled SC (shotcrete). Infills reconstruction and strengthening was applied to the frame,
following good practice techniques. The repaired and strengthened structure (SC) was also
subjected to three PsD tests (475, 975 and 2000-yrp), which revealed some benefit from
the strengthening operation.
Prior to the K-bracing with shear-link test, infill hollow brick-masonry walls with two-
sided plaster were constructed in the outer bays of the second floor. Subsequently, the
K-bracing with shear-link assembly was inserted into the middle bay of the second floor
and anchored to the beams and columns of this bay. The second storey was subjected to
quasi-static cyclic tests with imposed increasing amplitude displacements. The test results
in terms of total lateral-load (storey shear) versus storey-displacement, confirmed that the
maximum shear capacity was about 600 kN. The actual limiting cause was not a failure of
the infilled walls, but rather the premature development of a shearing failure in the outer
frame column of the short external bay. In fact, the failure resulted from the transverse slip
of a joint between the top of the column and the bottom of the beam. The cyclic response
of the vertical shear-link, as reflected by the lateral displacement of the link and the link
Chapter 4
169
shear force, shows a typical ductile stable behaviour with the resistance steadily increasing
under repeated displacement cycles. The results clearly show that under increasing number
of displacement cycles (and associated progressive failure) the participation of the shear-
link in resisting the total lateral load becomes more pronounced. The progressively
increasing energy absorbing capacity of the shear-link and the continually deteriorating
energy dissipation of the infilled concrete frame was observed.
Final capacity cyclic tests on the four-storey frames were performed to estimate the
ultimate structural displacement and to investigate the post-peak structural behaviour,
which are important parameters, for example to define damage indices, and to verify
numerical simulations. The collapse test campaign on the four-storey concrete frames
includes two cyclic tests series. The first part of this test campaign was carried out on the
selective strengthened frame (frame B). The second series of cyclic tests was performed on
the bare frame that was recovered from the infilled frame tests (frame A), removing the
infill masonry walls. Cycles with increasing amplitude, up to the capacity of the structure
were imposed to the frames. These cyclic tests were performed with imposed
displacements on the fourth floor, being the three lower floors force-controlled, according
to a constant-pattern, inverted-triangular storey-wise force distribution.
This chapter presents and discusses the results from the tests above summarized and is
organised as follows. The test results are presented and discussed, first for the bare frame
(BF) test series (Section 4.2) and subsequently for the strengthened frame (SR)
(Section 4.3). Comparison between the most relevant results from BF and SR tests is made
in a separate subsequent section (Section 4.4). In Section 4.5 are presented and discussed
the test results for the original infilled frame (IN) and for the strengthened infilled frame
(SC) (Section 4.7). One section is dedicated to compare the most relevant results between
IN and the previous BF test series (Section 4.6). Results for the IN and SC test series are
compared in Section 4.8 and results of the K-bracing with shear-link cyclic tests appear in
Section 4.9. Final capacity cyclic tests are analysed in Section 4.10. The main results and
issues concerned with shear and flexural deformations/failure of the strong-column, slab-
participation, plastic hinge length and joint deformation are dealt in Section 4.11. A
summary of the most relevant experimental results is collected in Section 4.12.

Experimental work: analysis of test results
170
4.2 - RESULTS FROM THE TESTS ON THE BARE FRAME
The bare frame (BF) was subjected to one earthquake corresponding to 475-yrp and
subsequently to a 975-yrp input motion.
4.2.1 - Storey displacement, drift and shear
In Figure 4.1, the time histories of storey displacement are plotted for the two earthquake
pseudo-dynamic tests performed on the bare frame structure, namely for 475 and 975-yrp.
Figure 4.2 shows the top-displacement curves for the two tests and Figure 4.4 presents the
curves base-shear versus top-displacement. In Figure 4.3, the storey shear-drift curves are
presented (for the four storey levels) and the respective envelope curves are plotted in
Figure 4.5. Figure 4.6 represents the maximum inter-storey drift profile and the maximum
storey shear profile. Table 4.1 collects the maximum values of the characteristic response
variables for the BF tests.
475-yrp
975-yrp
Figure 4.1 - BF tests: storey displacement time histories

Chapter 4
171
Figure 4.2 - BF tests: top-displacement evolution
1st storey 2nd storey
3rd storey 4th storey
Figure 4.3 - BF tests: storey shear versus inter-storey drift

Experimental work: analysis of test results
172
475-yrp
975-yrp
Figure 4.4 - BF tests: base-shear versus top-displacement
Figure 4.5 - BF tests: envelope storey shear versus inter-storey drift
a)
b)
Figure 4.6 - BF tests: a) maximum inter-storey drift profiles; b) maximum storey shear profiles

Chapter 4
173
Table 4.1 - BF tests: response maximum values (summary table)
Testa Top-displacement (mm) Global drift (%)
BF475 60.8 0.56
BF975b 116.7 1.08
Inter-storey drift (%)
storey 1 storey 2 storey 3 storey 4
BF475 0.44 0.74 0.80 0.46
BF975b 0.63 1.03 2.41 0.91
Storey shear (kN)
storey 1 storey 2 storey 3 storey 4
BF475 209.0 188.2 139.0 95.8
BF975b 216.7 202.7 153.9 111.1
Max. hinge rotation (mRad)
(mRad) Location
BF475 10.0 strong-column 3rd storey
BF975b 31.0 strong-column 3rd storey
a) Duration of the input motions is 15 seconds for the earthquake tests. b) Test performed up to 7.5 seconds because imminent collapse was attained.
It is apparent that the deformation demands tend to concentrate in the 3rd storey for the
475-yrp earthquake test and for the 975-yrp earthquake test the 3rd storey almost collapsed.
This test was stopped after 7.5 seconds in order to allow for repair and subsequent
strengthening.
4.2.2 - Observed damages
A detailed description of the visual damage for each test and an attempt at categorising it
according to the ATC-40 (1996) damage states are included in Table 4.2. Figure 4.7 shows
the damage observed on the strong-column at the 3rd storey after the earthquake pseudo-
dynamic tests. It shows the concrete cover spalling at the top of the column and the bar
termination zone (70 cm from the base). Figure B.11 shows a general layout of the damage
observed at the end of the bare frame tests and in Figure B.12 the damage in the slabs is
schematically represented. More pictures can be found in Appendix B (Figures B.13
to B.17).

Experimental work: analysis of test results
174
Table 4.2 - BF tests: damage inspection (see damage patterns in Figures B.11 and B.12) and damage states (ATC-40, 1996)
Test Damages Damage state
Repair required?
BF475 • Cracking (not clearly visible at the end of the test) Slight No
BF975
• Cracking: Top and bottom of the columns
• Failure at the 3rd storey (spalling and crushing of the strong-column at top, bottom and bars termination zone (700 mm from the base). Flexural and shear cracking at top and bars termination zone
• Shear cracking (slight) at the bars termination zone of the 1st storey strong-column
• Cracking of the beams at 1st and 2nd floors for negative moments
Heavy Yes
a)
b)
Figure 4.7 - Damage observed on the 3rd storey strong-column after BF tests: a) at the bar termination zone (note reinforcement detail); b) at the top of the column
The spalling observed on the bar's termination zone at the third storey (see Figure 4.7)
indicates the loss of the anchorage of such reinforcing bars. Recall that, based on tests on
column specimens with anchorage made by hooks, Hassan and Hawkins (1977) concluded
that in buildings surviving an earthquake, the loss of cover from behind the hook should be
interpreted as a possible loss of the anchorage for such reinforcing bars. This phenomenon
was frequently observed in reinforced concrete buildings damaged by earthquakes (see for
example Figures 2.24 to 2.27).

Chapter 4
175
4.2.3 - Maximum absolute and relative rotations measured at the critical zones
Figure 4.8 presents the maximum absolute and relative rotations measured during the tests
performed on the bare frame structure. Note that absolute rotations stands for the values
obtained directly from the inclinometers, while relative rotations stands for the values
calculated from the difference of two adjacent inclinometers (the effective relative section
rotation). Results for the two earthquake pseudo-dynamic tests carried out (475 and 975
years return periods) are presented.
BF475 – max. abs. rotation = 9.6 mRad BF475 – max. relat. rotation = 10.0 mRad
BF975 – max. abs. rotation = 34.2 mRad BF975 – max. relat. rotation = 31.0 mRad
Figure 4.8 - BF tests: maximum absolute and relative rotation demands
From the analyses of Figure 4.8, it can be concluded that:
• Comparing the absolute and relative rotations for the slender-columns, it is clear
that the relative rotations are similar to the absolute ones. This is justified by the
low ratio between stiffness of these columns and those beams (much larger for the

Experimental work: analysis of test results
176
beam). Therefore, in the vicinity of the slender-columns, the beam practically
does not rotate and the storey deformation is concentrated in the columns.
• From visual inspections, confirmed by the results, it was perceived that in the
columns the deformation is mainly concentrated at their extremities (top and
bottom).
• It was in the vicinity of the strong-column that the beams reached their maximum
rotation, due to the large stiffness and strength of the strong-column, when
compared with the other columns.
• The strong-column reaches its maximum relative rotation at the 3rd storey, where
severe damage was detected.
4.2.4 - Strong-column: 3rd storey
As mentioned previously, the 975-yrp test performed after the 475-yrp test was stopped at
7.5 seconds because failure of the 3rd storey was imminent (see damages in Figure 4.7,
Section 4.2.2). In fact, clear hinging of the strong-column at the 3rd storey at the base, top
and also at the bar's termination zone (700 mm from the base of the column) developed
with severe damage (yielding, spalling and yielding of the stirrups at the bars termination
zone). Disclosure of the 90 degrees bent stirrups was not observed but it would certainly
have occurred if the test had been continued. Figure 4.9 contains a picture illustrative of
the reinforcing details at the 3rd storey strong-column.
Figure 4.9 - Strong-column at the base of the 3rd storey: lap-splice reinforcement detail (70 cm length)

Chapter 4
177
Figure 4.10 shows the evolution of the relative rotation between two consecutive sections
at the 3rd storey strong column during the 975-yrp test.
Top Sup.
Top Inf. .
Mid.
Base
3rd Floor250
250
1200
500700
Rebars600
500
4 ∅ 16 – nominal reinforcement
8 ∅ 16 – bars termination zone (column-base)
(4 + 8) ∅ 16 – lap-splice zone
Figure 4.10 - Evolution of the rotations at the 3rd storey strong-column during the BF975 test
Looking at Figure 4.10, four slices can be identified: a) Top-Sup (0.25 m length),
corresponding to the critical zone at the top of the column; b) Top-Inf (0.25 m length),
adjacent to Top-Sup; c) Base (0.50 m length), corresponding to the critical zone at the
bottom of the column; and, d) Mid (1.20 m length), corresponding to the column middle
part, where a plastic hinge developed at the final part of the 975-yrp earthquake test.
Figure 4.11-b schematically represents the following: a) the distribution of moments in the
column at two stages, i.e. stage 1, in blue, before yielding of the mid-section, and stage 2,
in red, when yielding of the mid-section occurs; b) the moment-curvature diagrams for the
three sections, i.e. one at the column base which has higher strength due to higher
longitudinal reinforcement, and at the top and mid-section of the column with the same
moment-curvature diagrams. From measurements and visual observation of the column
during test, the following can be concluded. First, plastic hinging develops at the top and
bottom of the column, without yielding of the mid-section. At a certain demand stage (red
in Figure 4.11-b), softening starts at the top-section. From that stage forward, moments
increase at the bottom and mid-section, being constant at the top-section. At a particular
point, a hinge develops at the mid-section, which would lead to failure of the 3rd storey if
the test had continued.
Top Inf.
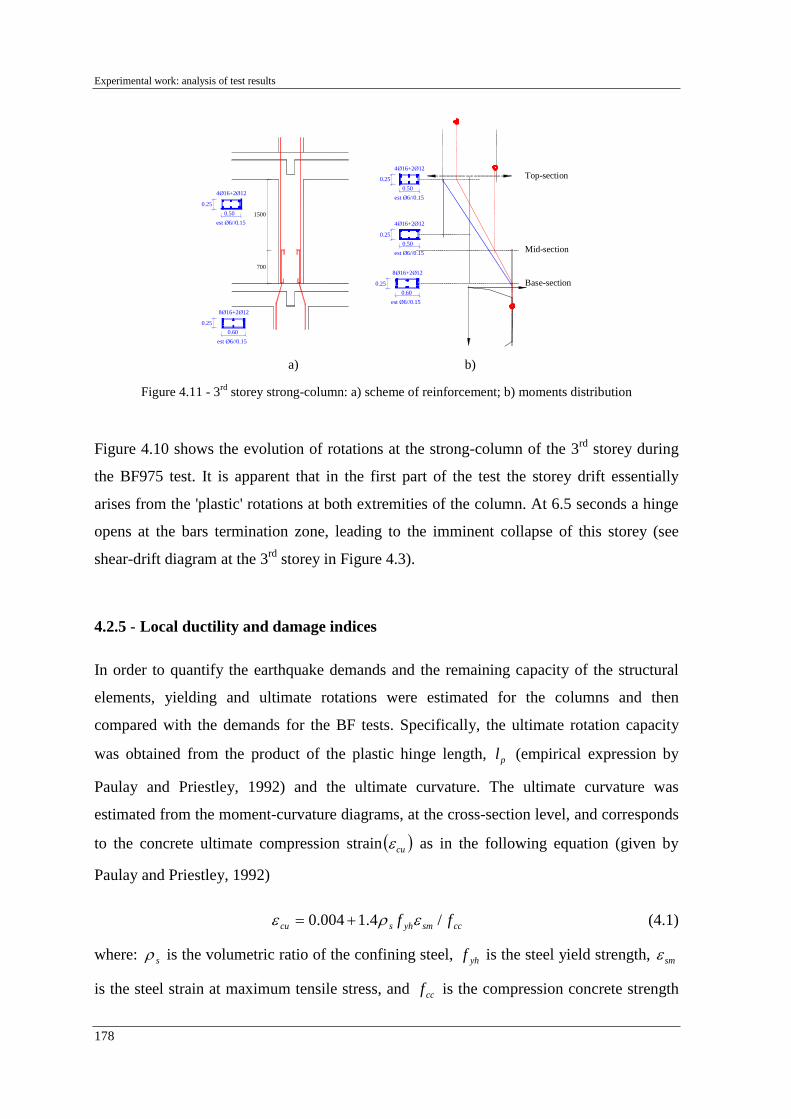
Experimental work: analysis of test results
178
700
1500
0.250.50
4Ø16+2Ø12
est Ø6//0.15
est Ø6//0.15
8Ø16+2Ø12
0.250.60
est Ø6//0.15
4Ø16+2Ø12
0.500.25
est Ø6//0.15
4Ø16+2Ø12
0.500.25
8Ø16+2Ø12
est Ø6//0.150.60
0.25
Top-section
Mid-section
Base-section
a) b)
Figure 4.11 - 3rd storey strong-column: a) scheme of reinforcement; b) moments distribution
Figure 4.10 shows the evolution of rotations at the strong-column of the 3rd storey during
the BF975 test. It is apparent that in the first part of the test the storey drift essentially
arises from the 'plastic' rotations at both extremities of the column. At 6.5 seconds a hinge
opens at the bars termination zone, leading to the imminent collapse of this storey (see
shear-drift diagram at the 3rd storey in Figure 4.3).
4.2.5 - Local ductility and damage indices
In order to quantify the earthquake demands and the remaining capacity of the structural
elements, yielding and ultimate rotations were estimated for the columns and then
compared with the demands for the BF tests. Specifically, the ultimate rotation capacity
was obtained from the product of the plastic hinge length, pl (empirical expression by
Paulay and Priestley, 1992) and the ultimate curvature. The ultimate curvature was
estimated from the moment-curvature diagrams, at the cross-section level, and corresponds
to the concrete ultimate compression strain ( )cuε as in the following equation (given by
Paulay and Priestley, 1992)
ccsmyhscu ff /4.1004.0 ερε += (4.1)
where: sρ is the volumetric ratio of the confining steel, yhf is the steel yield strength, smε
is the steel strain at maximum tensile stress, and ccf is the compression concrete strength

Chapter 4
179
of the confined sections. According to Paulay and Priestley (1992), typical values for εcu
range from 0.012 to 0.05, a 4- to 16-fold increase over the traditionally assumed value for
unconfined concrete.
In this analysis, the plastic hinge length, pl , was estimated based on the empirical
expression given by Paulay and Priestley (1992)
sylp fll ⋅⋅+⋅= φ022.008.0 (4.2)
where: pl stands for the equivalent plastic hinge length; l for the length of the element; lφ
for the diameter of the main longitudinal reinforcing bars; and syf for the yielding strength
of reinforcement (in MPa).
BF475 – max. rot. ductility = 2.3 BF475 – max. rot./rot_ult. = 0.23
BF975 – max. rot. ductility = 8.0 BF975 – max. rot./rot_ult. = 0.80
Figure 4.12 - Local rotation ductility demand and damage for the bare frame tests
Figure 4.12 shows the local rotation ductility demands in columns as well as the damage
indices estimated as the ratio between the rotation demand and the ultimate rotation
Experimental work: analysis of test results
180
capacity. The maximum ductility values found at the top of the 3rd storey strong-column
(ductility = 8) is in line with the values implied by the shear-drift diagrams of the 3rd storey
(see Figure 4.3). In fact, ductility 8 should imply a high damage level, which is confirmed
by the apparent strength degradation in the 3rd storey shear-drift diagram. Furthermore, the
maximum damage index is also in line with the damage, which occurred at the end of each
test. The BF475 test with a maximum damage index (DI) of about 0.2 indicates slight
damage and a DI of 0.8 (no energy contribution was included) would correspond to the
imminent collapse attained during the BF975 test.
4.2.6 - Energy dissipation
Figure 4.13 plots the evolution of energy dissipation at the storey levels and the evolution
of the total energy dissipated in the structure, for the earthquake tests on the bare frame.
The total dissipated energy for each test, at the storey level, is represented in the schematic
storey profile in Figure 4.14.
From the analyses of the energy dissipation plots, it can be concluded that:
• For the 475-yrp test, the contribution of the three first storeys to the total energy
dissipated, is similar. But for the subsequent 975-yrp test, a considerable increase
of the 3rd storey contribution is verified, associated with the extensive damage
induced in the strong-column on this storey. Consequently, the ratio of energy
dissipated at the other storeys decreases significantly.
• The low percentage of energy dissipated at the 4th storey (15% for the 475-yrp
test), justified by the low non-linearity verified on this storey. This value drops to
12% in the 975-yrp test.
• Regarding the evolution of the energy dissipated, a quasi-linear variation in time
was observed for the 475-yrp test. Yet, for the 975-yrp test, an exponential-like
variation is verified, which is related to rapid damage increase.

Chapter 4
181
Storey energy dissipation Total energy dissipation
BF475 BF475
BF975 BF975
Figure 4.13 - BF tests: storey and total energy dissipation
Figure 4.14 - BF tests: relative energy dissipation profiles

Experimental work: analysis of test results
182
4.2.7 - Damage index
The requirements for a good damage assessment method can be formulated, for example,
as advocated by Stephens and Yao (1987): a) the index should have general applicability,
i.e. it should be valid for a variety of structural systems; b) it should be based on a simple
formulation and be easy to use; and, c) it should generate easily interpretable results.
Commonly, damage evaluation methods are devised for assessment of storey damage or
global damage in a framed structure. The formulation presented here for the damage index
is based on the methodology proposed by Park and Ang (1985). Next we present this index
and apply it to our case.
4.2.7.1 - Park and Ang damage index
Park and Ang damage index (PA) combine the contributions from maximum deformation
damage and from dissipated energy as
∫⋅⋅+= i
iuiyiu
ii dE
uPuu
PA,,,
max, β (4.3)
where: iPA is the Park and Ang damage index for the storey i; iumax, is the maximum inter-
storey displacement of storey i; iuu , is the ultimate inter-storey deformation (under
monotonic loading); β is the strength deterioration parameter (non-negative); iyP , is the
yielding strength; and ∫ idE is the incremental hysteretic dissipated energy.
The seismic structural damage index proposed by Park and Ang (1985) is expressed as a
linear combination of the damages caused: by excessive deformation; and, by repeated
cyclic loading effect. Theoretically, the value of PA should be zero under elastic response.
Concerning the damage index, a value larger than 1.0 correspond to complete collapse or
to total damage.
The literature based on a great amount of experimental test results suggest numerous
empirical expressions for the strength deterioration parameter ( β ). Typical average value
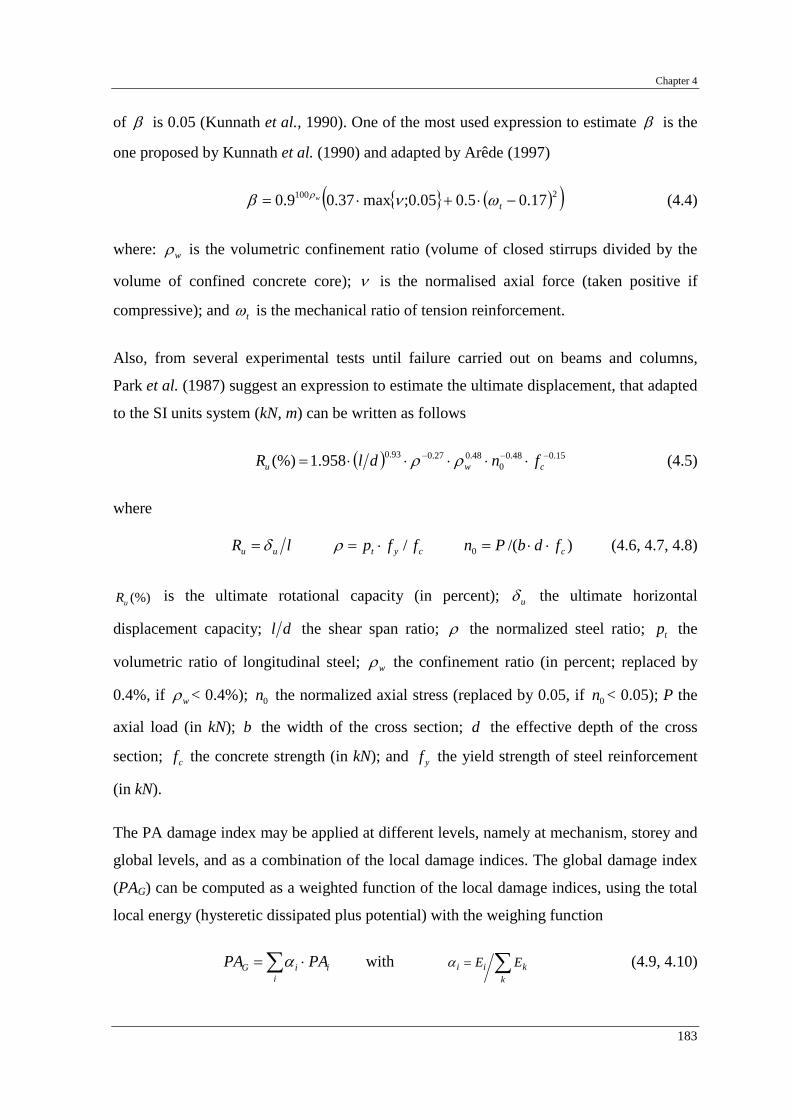
Chapter 4
183
of β is 0.05 (Kunnath et al., 1990). One of the most used expression to estimate β is the
one proposed by Kunnath et al. (1990) and adapted by Arêde (1997)
{ } ( )( )2100 17.05.005.0;max37.09.0 −⋅+⋅= tw ωνβ ρ (4.4)
where: wρ is the volumetric confinement ratio (volume of closed stirrups divided by the
volume of confined concrete core); ν is the normalised axial force (taken positive if
compressive); and tω is the mechanical ratio of tension reinforcement.
Also, from several experimental tests until failure carried out on beams and columns,
Park et al. (1987) suggest an expression to estimate the ultimate displacement, that adapted
to the SI units system (kN, m) can be written as follows
( ) 15.048.00
48.027.093.0958.1(%) −−− ⋅⋅⋅⋅⋅= cwu fndlR ρρ (4.5)
where
lR uu δ= cyt ffp /⋅=ρ )/(0 cfdbPn ⋅⋅= (4.6, 4.7, 4.8)
(%)uR is the ultimate rotational capacity (in percent); uδ the ultimate horizontal
displacement capacity; dl the shear span ratio; ρ the normalized steel ratio; tp the
volumetric ratio of longitudinal steel; wρ the confinement ratio (in percent; replaced by
0.4%, if wρ < 0.4%); 0n the normalized axial stress (replaced by 0.05, if 0n < 0.05); P the
axial load (in kN); b the width of the cross section; d the effective depth of the cross
section; cf the concrete strength (in kN); and yf the yield strength of steel reinforcement
(in kN).
The PA damage index may be applied at different levels, namely at mechanism, storey and
global levels, and as a combination of the local damage indices. The global damage index
(PAG) can be computed as a weighted function of the local damage indices, using the total
local energy (hysteretic dissipated plus potential) with the weighing function
∑ ⋅=i
iiG PAPA α with ∑=k
kii EEα (4.9, 4.10)

Experimental work: analysis of test results
184
The application of this 'combination rule', or of another similar one, for seismic reliability
analyses has to be done carefully. Shortcomings of these global indices are presented in
Pinto (1998), for example.
The damage calculated using the model proposed by Park et al. (1987) was calibrated with
respect to observed damage of nine reinforced concrete buildings moderately or severely
damaged during the 1971 San Fernando earthquake and the 1978 Miyagiken-Oki
earthquake in Japan. Based on this calibration, a damage criterion was developed for
specifying the tolerable damage state as well as the extreme damage state that corresponds
to collapse (Park et al., 1984). From the calibration work, authors categorised damages
into 5 damage states according to physical appearance in buildings. These are: slight,
minor, moderate, severe and collapse. Results of the analyses of the nine buildings are
plotted in Figure 4.15.
Figure 4.15 - Calculated damage index versus observed damage (Park et al., 1987)
In light of the calibration results and the subsequent decisions on the respective buildings
after the earthquake, it was concluded that an overall damage index of 4.0≤GPA may be
considered to be reparable, whereas 4.0>GPA represents damage beyond repair, and
1>GPA represents total collapse. Based on the results of the work carried out by Park et
al. (1987), damage indices boundaries for each degree of damage observed after an
earthquake event are proposed in Table 4.3. In the table are also included proposals for
local (L) and global (G) damage indices limits for each state.

Chapter 4
185
Table 4.3 - Calculated damage index versus observed damage
Damage inspection Calculated damage index
Degree of damage Physical appearance Local Global
Collapse Total or partial collapse of building >1.0 >1.0
Severe Extensive crushing of concrete. Disclosure of buckled reinforcements 0.75-1.0 0.50-1.0
Moderate Extensive large cracks. Spalling of concrete in weaker elements 0.35-0.75 0.30-0.50
Minor Minor cracks throughout building. Partial crushing of concrete columns 0.10-0.35 0.10-0.30
Slight Sporadic occurrence of cracking 0.0-0.10 0.0-0.10
4.2.7.2 - Calculation of the PA damage index for the bare frame tests
The damage indices presented in Section 4.2.7.1 were computed and analysed for the
pseudo-dynamic tests on the four-storey full-scale reinforced concrete frame tested at the
ELSA laboratory. Expressions (4.4) and (4.5) were applied to the RC bare frame to
estimate β and uδ parameters. A detailed description of the frame characteristics and
loads was provided in Chapter 3. The results obtained for the sixteen RC columns are listed
in Table 4.4.
Table 4.4 - Parameters estimated for the PA damage index for the RC columns
Alignment Storey Parameter
1 2 (strong-column) 3 4
β 0.029 0.028 0.039 0.025 4
δu (m) 0.300 0.117 0.258 0.340
β 0.060 0.060 0.084 0.054 3
δu (m) 0.207 0.081 0.177 0.214
β 0.092 0.080 0.135 0.085 2
δu (m) 0.168 0.055 0.133 0.168
β 0.124 0.106 0.179 0.115 1
δu (m) 0.146 0.047 0.115 0.144
For the frame under analysis, the behaviour of each storey is dominated by the
characteristics of the column in the second alignment (strong-column). Therefore, to
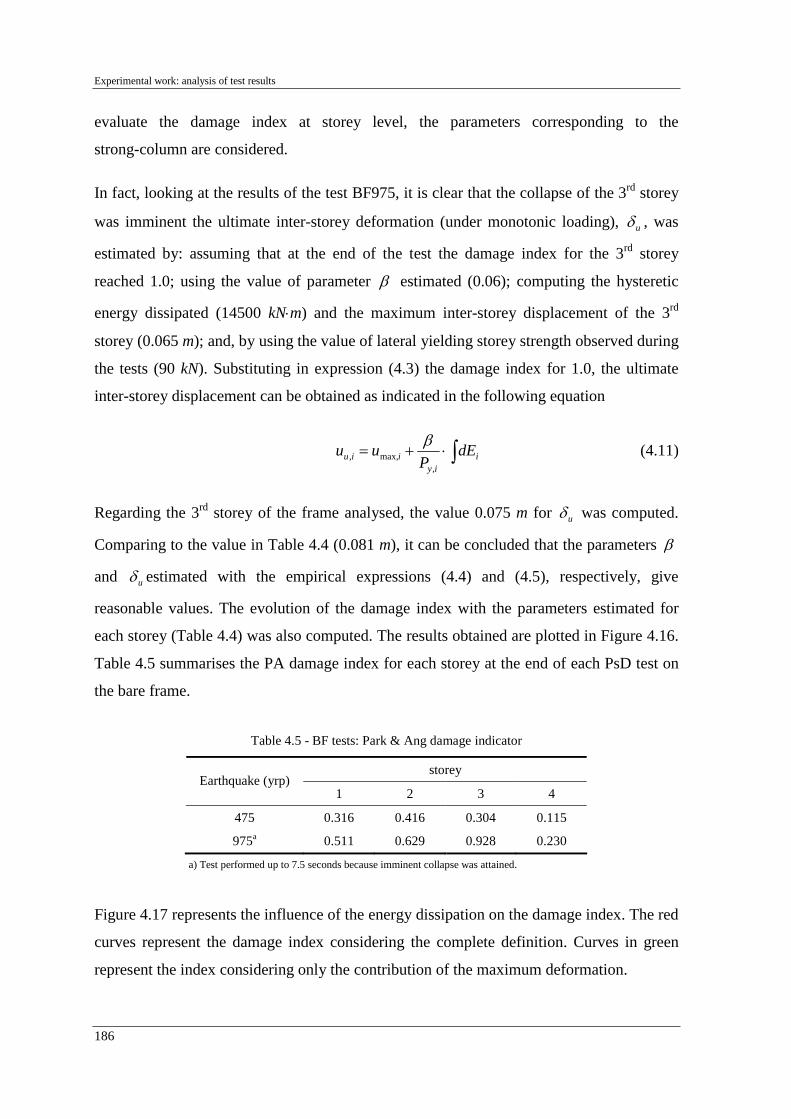
Experimental work: analysis of test results
186
evaluate the damage index at storey level, the parameters corresponding to the
strong-column are considered.
In fact, looking at the results of the test BF975, it is clear that the collapse of the 3rd storey
was imminent the ultimate inter-storey deformation (under monotonic loading), uδ , was
estimated by: assuming that at the end of the test the damage index for the 3rd storey
reached 1.0; using the value of parameter β estimated (0.06); computing the hysteretic
energy dissipated (14500 kN⋅m) and the maximum inter-storey displacement of the 3rd
storey (0.065 m); and, by using the value of lateral yielding storey strength observed during
the tests (90 kN). Substituting in expression (4.3) the damage index for 1.0, the ultimate
inter-storey displacement can be obtained as indicated in the following equation
∫⋅+= iiy
iiu dEP
uu,
max,,β (4.11)
Regarding the 3rd storey of the frame analysed, the value 0.075 m for uδ was computed.
Comparing to the value in Table 4.4 (0.081 m), it can be concluded that the parameters β
and uδ estimated with the empirical expressions (4.4) and (4.5), respectively, give
reasonable values. The evolution of the damage index with the parameters estimated for
each storey (Table 4.4) was also computed. The results obtained are plotted in Figure 4.16.
Table 4.5 summarises the PA damage index for each storey at the end of each PsD test on
the bare frame.
Table 4.5 - BF tests: Park & Ang damage indicator
storey Earthquake (yrp)
1 2 3 4
475 0.316 0.416 0.304 0.115
975a 0.511 0.629 0.928 0.230
a) Test performed up to 7.5 seconds because imminent collapse was attained.
Figure 4.17 represents the influence of the energy dissipation on the damage index. The red
curves represent the damage index considering the complete definition. Curves in green
represent the index considering only the contribution of the maximum deformation.
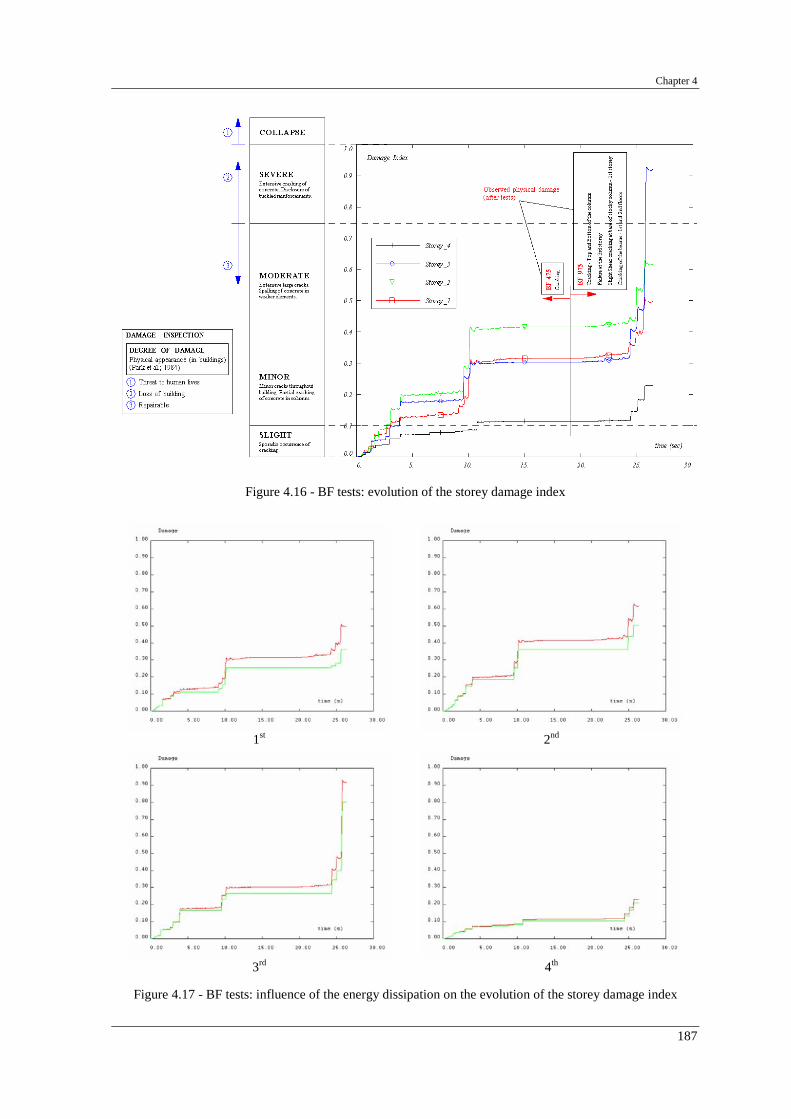
Chapter 4
187
Figure 4.16 - BF tests: evolution of the storey damage index
1st
2nd
3rd
4th
Figure 4.17 - BF tests: influence of the energy dissipation on the evolution of the storey damage index

Experimental work: analysis of test results
188
From the analyses of Figure 4.17, it can be concluded that the influence of the energy
dissipation on the damage index is not negligible, but it is of minor importance when
compared to the maximum deformation contribution.
4.2.8 - Deformation at the beam extremities
Figure 4.18-a plots the envelope of maximum relative rotation for the bare frame tests,
measured at the 1st storey beam adjacent to the strong-column's joint. In the figure, beam
length stands for distance from the column face. The relative rotation is computed as the
maximum relative value measured between two consecutive inclinometers. In
Figure 4.18-b, the maximum uniform strain at the top and bottom beam fibres measured
during the tests are represented. It is apparent that most of the rotation and deformation
concentrate in a very narrow beam slice (75 mm length) adjacent to the beam/column
interface. Moreover, the uniform strain values indicate that no rebars yielding takes place
out-side of this beam slice and the reinforcement only experienced deformation lower than
the hardening strain (maximum of about 1.5%).
a)
b)
Figure 4.18 - BF tests: beam 1st floor: a) maximum relative rotation; b) maximum uniform strain

Chapter 4
189
4.2.9 - Remarks
From the tests carried out on the bare frame, it is possible to confirm the storey
mechanism, which were expected to develop during the earthquake response due to the
vertical irregularity induced by the sudden change in the cross-section of the strong-
column at the 3rd storey. In fact, the structure represents design that was common practice
until the late 1970's, when seismic loading was only roughly considered or even not taken
into account. Consequently, this structural misconception induces commonly the collapse
of buildings when an earthquake occurs, as reviewed in Section 2.5.7. From the shear-drift
diagrams for the 475-yrp test, it is apparent that a rather limited non-linear behaviour
(storey ductility of about 2 at the 3rd storey) and quite limited damage occurred during the
test. Slight cracking at column extremities, as well as in the girders (at the slabs – for
negative moments) could be observed and no spalling of cover concrete occurred.
However, it was possible to confirm the high vulnerability of these structures. In fact, in
spite of the very limited damages for the 475-yrp earthquake, it was demonstrated that, the
demands for a slightly higher intensity earthquake (1.3 times the maximum acceleration of
the 475-yrp input motion) led to an imminent storey failure, and to consequent collapse of
the structure. Therefore, development and validation of effective (and also economic)
retrofitting solutions and techniques for this type of structures urges.
4.3 - RESULTS FROM THE TESTS ON THE SELECTIVE STRENGTHENED
FRAME
Following the two tests on the bare frame, the damaged parts of the structure were repaired
(strong-column of the 3rd storey). The spalled concrete was removed and the cracks were
injected with epoxy, the surfaces were cleaned and the selective retrofitting scheme
(described in Section 3.3) proposed by the research group at the Imperial College of
London (Elnashai and Pinho, 1999) was applied. Figure 3.11 shows the strong-column
strengthened according to the scheme proposed.
The initial testing programme for the selective strengthened frame (SR) was similar to the
BF programme. However, considering that the SR975 test led to rather small demands and

Experimental work: analysis of test results
190
damage, it was decided to perform an additional test with higher intensity. This test was
expected to inflict more significant damage on the structure but it was also necessary to
guarantee structural integrity for the next strengthening solution foreseen for this frame (K-
bracing with shear-link test). A 2000-yrp earthquake was adopted for this high-level test.
In the next sections is given a compilation of the results from these tests in terms of storey
displacement, maximum inter-storey drift profiles for positive and negative deformations,
energy dissipation, and shear-drift diagrams.
4.3.1 - Storey displacement, drift and shear
In Figure 4.19 the time histories of storey displacement are plotted for the three earthquake
pseudo-dynamic tests performed on the selective strengthened structure, namely 475, 975
and 2000-yrp. Figure 4.20 shows the top-displacement curves for the three earthquake
tests, and Figure 4.21 plots the curves base-shear versus top-displacement for the SR tests.
In Figure 4.22 the curves storey shear versus inter-storey drift are presented, and in
Figure 4.23 the respective envelope curves of these storey shear-drift diagrams are plotted.
Figure 4.24 represents the maximum inter-storey drift profile and the maximum storey
shear profile. Table 4.6 presents the maximum values for characteristic response variables
for the SR tests.
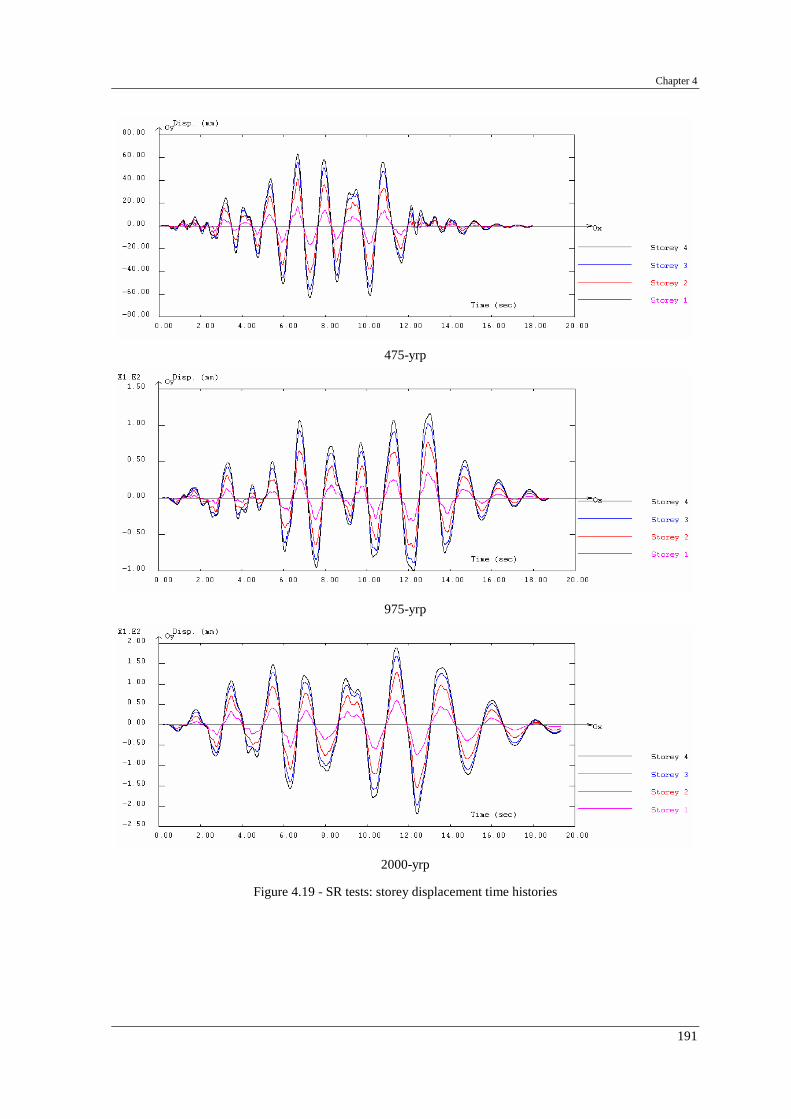
Chapter 4
191
475-yrp
975-yrp
2000-yrp
Figure 4.19 - SR tests: storey displacement time histories

Experimental work: analysis of test results
192
Figure 4.20 - SR tests: top-displacement evolution
475-yrp
975-yrp
2000-yrp
Figure 4.21 - SR tests: base-shear versus top-displacement

Chapter 4
193
1st storey 2nd storey
3rd storey 4th storey
Figure 4.22 - SR tests: storey shear versus inter-storey drift
Figure 4.23 - SR tests: envelope storey shear versus inter-storey drift
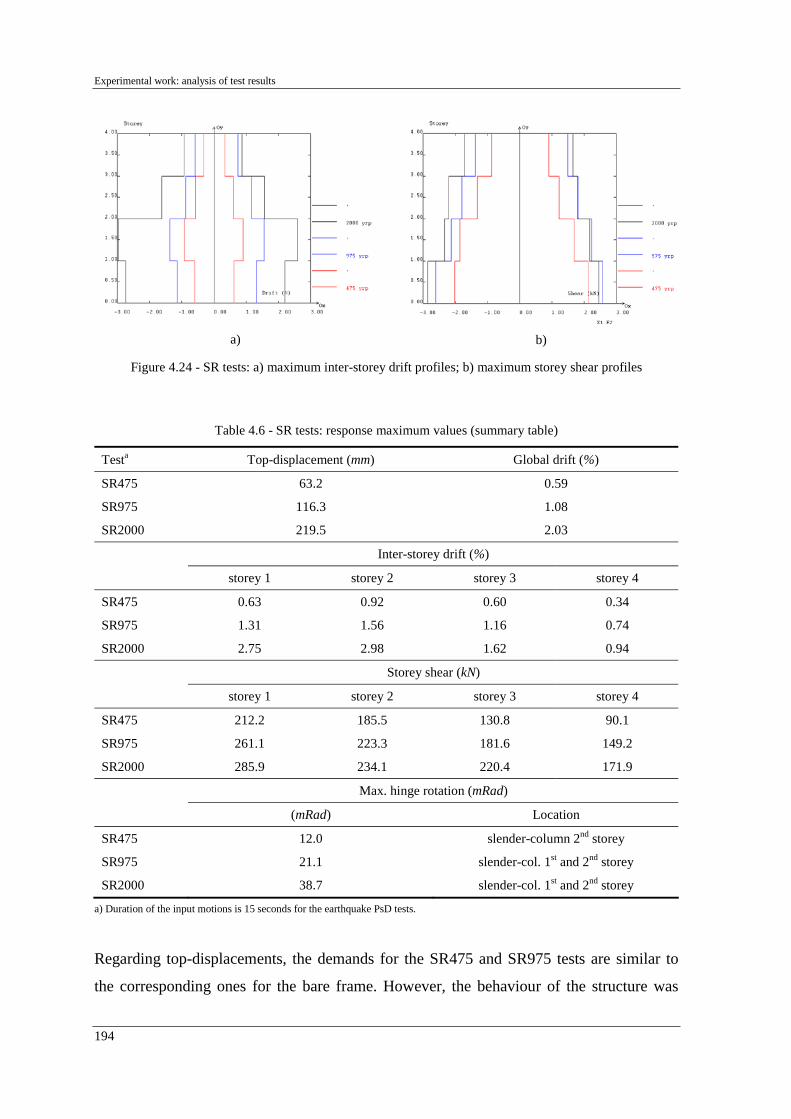
Experimental work: analysis of test results
194
a)
b)
Figure 4.24 - SR tests: a) maximum inter-storey drift profiles; b) maximum storey shear profiles
Table 4.6 - SR tests: response maximum values (summary table)
Testa Top-displacement (mm) Global drift (%)
SR475 63.2 0.59
SR975 116.3 1.08
SR2000 219.5 2.03
Inter-storey drift (%)
storey 1 storey 2 storey 3 storey 4
SR475 0.63 0.92 0.60 0.34
SR975 1.31 1.56 1.16 0.74
SR2000 2.75 2.98 1.62 0.94
Storey shear (kN)
storey 1 storey 2 storey 3 storey 4
SR475 212.2 185.5 130.8 90.1
SR975 261.1 223.3 181.6 149.2
SR2000 285.9 234.1 220.4 171.9
Max. hinge rotation (mRad)
(mRad) Location
SR475 12.0 slender-column 2nd storey
SR975 21.1 slender-col. 1st and 2nd storey
SR2000 38.7 slender-col. 1st and 2nd storey
a) Duration of the input motions is 15 seconds for the earthquake PsD tests.
Regarding top-displacements, the demands for the SR475 and SR975 tests are similar to
the corresponding ones for the bare frame. However, the behaviour of the structure was

Chapter 4
195
significantly improved by the strengthening scheme. As shown in Figure 4.24, the
strengthened structure became rather regular, and the storey drift demands were quite
uniformly shared by the three lower storeys. Moreover, this regular drift profile pattern
was maintained for the higher intensity test (SR2000).
4.3.2 - Observed damages
A detailed description of the damage on the strengthened frame (visual damage inspection)
for each test is included in Table 4.7. It also attempts at categorising them according to the
ATC-40 (1996) damage states. Figure B.18 shows a general layout of the damage observed
on the strengthened frame at the end of the tests.
Table 4.7 - SR tests: damage inspection (see damage patterns in Figure B.18) and damage states (ATC-40, 1996)
Test Damages Damage state
Repair required?
SR475
• Cracking – Strong-column – base of 1st storey, base and top of 2nd storey
• Slight cracking of the beams at 1st and 2nd floors for positive moments
Slight No
SR975
• Cracking – Strong-column – 1st storey – Between the first and the second confining plates and at the bars termination zone (between the 3rd and 4th confining plates)
• Cracking of the beams (near the strong-column joint – only one side) at all floors for positive moments
Light No
SR2000
• Cracking at the strong-column – 1st storey – Additional cracking between confining plates; Crushing at the base; Crushing (slight) at the bars termination zone
• Additional cracking of the beams (near the strong-column joint – Both sides) at 1st and 2nd floors for positive moments
• Spalling of cover (beams of the 1st and 2nd floors)
• Spalling of cover at the ends of the slender-columns (1st, 2nd and 3rd storeys)
• Confining plates peeling from concrete (plastic deformation of the plates) at all storeys: 1st storey – 1st and 4th plate; 2nd storey – upper plate; 3rd storey – 6th and last (upper) plates
Moderate Yes

Experimental work: analysis of test results
196
4.3.3 - Maximum absolute and relative rotations measured at the critical zones
Figure 4.25 presents the maximum absolute and relative rotations measured during the
tests performed on the strengthened structure. Results are presented for the three pseudo-
dynamic tests. Concerning the relative deformation of the beams and columns, it is
apparent from Figure 4.25 that similar comments to the ones for the BF can be made.
However, the SR frame shows a much uniform distribution of demands in the frame
height. In addition, the slight strong-column retrofit leads to higher demands in the beams.
SR475 – max. abs. rotation = 11.9 mRad SR475 – max. relat. rotation = 12.0 mRad
SR975 – max. abs. rotation = 20.0 mRad SR975 – max. relat. rotation = 21.1 mRad
SR2000 – max. abs. rotation = 37.3 mRad SR2000 – max. relat. rotation = 38.7 mRad
Figure 4.25 - SR tests: maximum absolute and relative rotation demands

Chapter 4
197
From the analyses of the Figure 4.25, the following can be observed:
• Comparing the absolute and relative rotations for the weak-columns, it is clear
that the relative rotations are similar to the absolute ones. This is justified with the
stiffness difference between these columns and the beam (greater for the beam).
Therefore, in the vicinity of the weak-columns, the beam practically does not
rotate and the storey deformation is concentrated in the columns.
• From the results analysis and test observations it was perceived that, in the weak-
columns, all the deformation is concentrated in the column extremities.
Contrarily, for the strong-column the deformation is spread along its height.
• Looking at the results for the strong-column it can be observed that its greater
stiffness, compared with the beam, force the beam to deform. In fact, it is in the
vicinity of this column that the beams reached their maximum relative rotation.
• The strong-column reaches its maximum relative rotation at the first two storeys,
namely: base of the first and top of the second storeys.
4.3.4 - Energy dissipation
Figure 4.26 plots the evolution of energy dissipation at the storey levels and the evolution
of the total energy dissipated in the structure for the PsD tests on the strengthened frame.
The total dissipated energy storey profiles are represented in Figure 4.27.
From the analyses of the energy dissipation plots, it can be concluded:
• The total dissipated energy at the 2000-yrp test is approximately the double than
at the 975-yrp test, and six times the dissipated at the 475-yrp test.
• As observed in the dissipated energy profiles in Figure 4.27, the relative energy
dissipated between storeys is roughly equal for the three earthquake tests.
• For all earthquake tests, the two first storeys dissipate about the same amount of
energy, contributing each storey to approximately 40% of the total energy
dissipated by the structure.
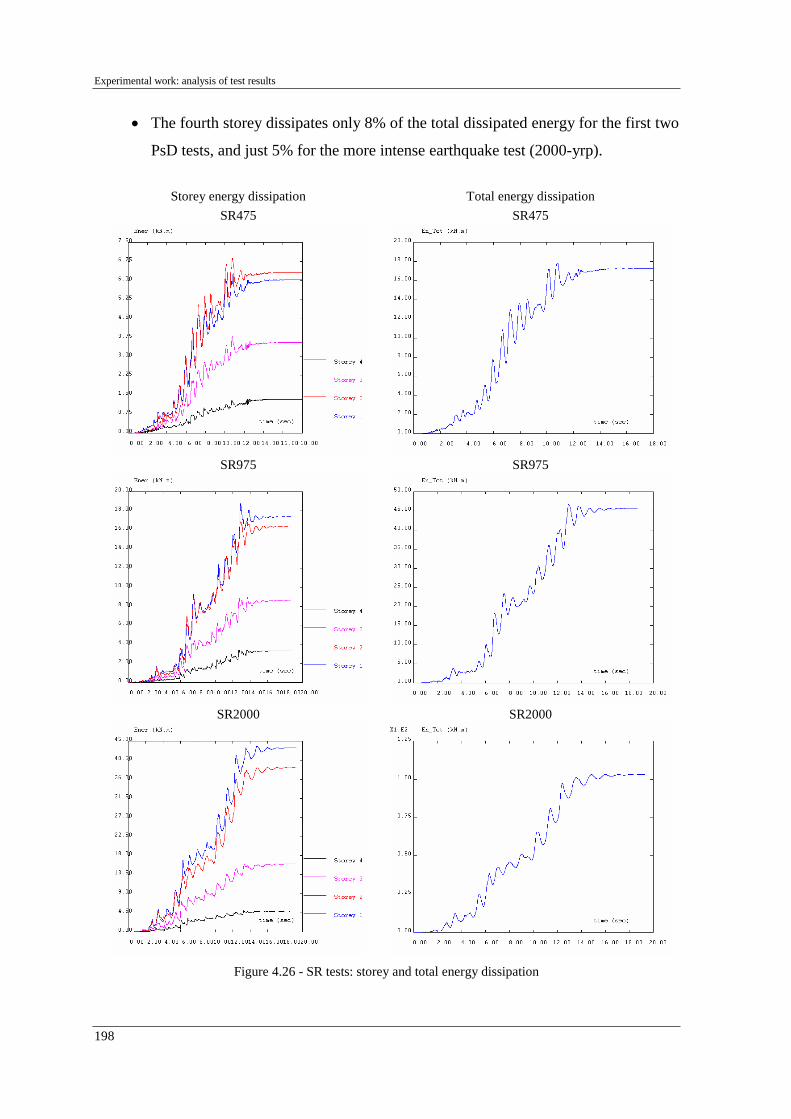
Experimental work: analysis of test results
198
• The fourth storey dissipates only 8% of the total dissipated energy for the first two
PsD tests, and just 5% for the more intense earthquake test (2000-yrp).
Storey energy dissipation Total energy dissipation SR475
SR475
SR975
SR975
SR2000
SR2000
Figure 4.26 - SR tests: storey and total energy dissipation

Chapter 4
199
Figure 4.27 - SR tests: relative energy dissipation profiles
4.3.5 - Deformation at the beam extremities
Figure 4.28-a plots the envelope of relative rotation for the SR tests, measured at the 1st
storey beam adjacent to the strong-column's joint. The relative rotation is computed as the
maximum relative value measured between two consecutive inclinometers. In
Figure 4.28-b, the maximum uniform strain at the top and bottom beam fibres measured
during the tests are represented.
a)
b)
Figure 4.28 - SR tests: beam 1st floor: a) maximum relative rotation; b) maximum uniform strain

Experimental work: analysis of test results
200
The comments for the BF case are extendable to this strengthened frame case because no
intervention was made in the beam. Thus, it is apparent that most of the rotation and
deformation concentrate in a very narrow beam slice (75 mm length) adjacent to the
beam/column face. Moreover, the uniform strain values indicate that no rebars yielding
takes place outside of this beam slice and the reinforcement only experienced deformation
(maximum of about 7%) lower than the hardening strain. However, for the 975-yrp test,
the uniform strain values are approximately twice the values for the bare frame.
Section 4.4.4 further discusses and compares the results obtained for the BF and SR tests.
4.4 - COMPARISON BETWEEN BF AND SR TESTS
The results from the BF and SR tests were presented in the previous sections without direct
comparison between them. It is important to quantify both the BF and SR demands and
ultimate capacities, but it is also very useful to highlight the effectiveness of the retrofit
provided to the frame. This section aims at a direct comparison between the performances
of the two frames underlining the potential benefits of such a selective retrofitting
intervention.
4.4.1 - Storey displacement, drift and shear
Although a building with an irregular configuration may be designed to meet all code
requirements, irregular buildings generally do not perform as well as regular buildings
under similar earthquake loading. Typical building configuration deficiencies include
irregular geometry, weakness in a given storey, soft-storey phenomenon in a given storey,
a concentration of mass, discontinuity in the lateral force resisting system, or torsion effect
due to the irregularities in the plan. Horizontal irregularities involve the horizontal
distribution of lateral forces to the resisting frames or shear walls. Vertical irregularities are
defined in terms of strength, stiffness, geometry and mass.
After recent earthquakes, important level of damage was observed in a considerable
number of buildings that suffered mid-height collapses. The reduction in strength and/or

Chapter 4
201
stiffness coupled with unexpected higher mode effects may have the potential to cause
such mid-height collapses (FEMA-310, 1998).
In the structure tested at ELSA laboratory, the change in cross-section size and
reinforcement of the strong central column (from 60 to 50 cm cross-section height) at the
3rd storey level strongly affect its strength and stiffness, making the original
non-strengthened frame an irregular structure in elevation. The selective strengthening
solution, applied at the 3rd storey, intended to correct these deficiencies, increasing storey
stiffness and strength at appropriate levels.
The tests performed on the bare frame show a concentration of inter-storey drift demand,
and consequently damage in the 3rd storey. The mechanism developed in the structure was
due to its vertical irregularity in terms of stiffness and strength. The selective strengthening
addressed and solved the irregularity problem of the structure. The maximum storey drift
profiles plotted in Figures 4.29 and 4.30 confirm the effectiveness of the strengthening.
For the 475-yrp test, no substantial differences exist between the BF and SR drift demands.
For the 975-yrp earthquake test on the SR frame, the drift profile is considerably more
uniform. The retrofit intervention vanishes the structural irregularity at the 3rd storey,
which has caused large drift demand of this storey for the bare frame 975-yrp test. Recall
that for the 975-yrp tests, similar value of top-displacement was observed for BF and SR,
but more uniform distribution of drift demands was found for the SR frame. Furthermore,
the strengthened frame is able to withstand an input motion intensity twice as much as the
nominal one without collapse and with reparable damages, while the bare frame collapsed
for an input motion 1.3 times the nominal intensity. For the strengthened structure, it
should also be noted the uniformity of the inter-storey drift profile pattern for different
input motion intensities. In fact, as shown in Figure 4.30 (on the right), the drift demands
increase proportionally to the input motion maintaining the drift pattern. This confirms that
the selective strengthening prevented the storey mechanism. In addition, the drift demands
are rather uniformly shared between the three lower storeys.

Experimental work: analysis of test results
202
475-yrp tests
975-yrp tests
Figure 4.29 - BF and SR tests: maximum inter-storey drift profiles
BARE FRAME (BF)
0
1
2
3
4
0 0.5 1 1.5 2 2.5 3
Drift (%)
Sto
rey
475 yrp
975 yrp
RETROFITTED FRAME (SR)
0
1
2
3
4
0 0.5 1 1.5 2 2.5 3 3.5
Drift (%)
Sto
rey
475 yrp975 yrp2000 yrp
Figure 4.30 - BF and SR tests: maximum inter-storey drift profiles
The series of diagrams (shear-drift) given in Figure 4.31 include the diagrams for the BF
and SR test for the 975-yrp earthquake, reflecting the effects of the strengthening
operation. There was an increase of the stiffness and strength (see for peak drifts) at the 3rd
and 4th storeys, and an increase of strength at the 1st and 2nd storeys (substantially higher
confinement and shear resistance).
BARE FRAME (BF)
RETROFFITED FRAME (SR)

Chapter 4
203
1st storey
2nd storey
3rd storey
4th storey
Figure 4.31 - BF and SR 975-yrp tests: storey shear versus inter-storey drift
The series of diagrams (shear-drift) given in Figure 4.32 cover all tests and give a good
idea of the envelope curves for each storey as well as the storey ductility reached during
the SR2000 test. It is also apparent from these diagrams the strength degradation, i.e.
crushing of concrete in the strong-column, spalling of cover in the slender-columns, and in
the beams, and a very pronounced pinching effect due to slippage of rebars in the central
beam-column joints occurred.

Experimental work: analysis of test results
204
1st storey
2nd storey
3rd storey
4th storey
BF475 BF975 SR475 SR975 SR2000
Figure 4.32 - BF and SR tests: storey shear versus inter-storey drift
4.4.2 - Maximum absolute and relative rotations measured at the critical zones
Modern codes support the strong-column weak-beam concept (EC8; FEMA-310, 1998),
presupposing that beams will develop hinges before the columns at locations distributed
throughout the structure. It is expected that the combined action of gravity loads and
seismic forces will cause the formation of plastic hinges first in the beams, distributing the
yielding, and further dispersing the ductility demand throughout the structure.
Existing structures not designed for earthquake loads do not have the performance required
by modern codes. A concentration of plastic hinge formation at undesirable locations can
severely undermine the stability of the structure. For example, in a weak-column situation,
hinges can form at the tops and bottoms of all the columns in a particular storey, and a
storey mechanism develops. This results in a concentration of ductility demand and
displacement in a single storey, which can lead to collapse.

Chapter 4
205
Figure 4.33 shows for the same earthquake intensity (975-yrp) the response of BF and SR
frames in terms of relative rotations. Yet, recall that the BF structure was just subjected
to 7.5 seconds earthquake ground motion.
BF975 – max. relat. rotation = 31.0 mRad SR975 – max. relat. rotation = 21.1 mRad
Figure 4.33 - BF and SR tests: maximum relative rotation demands for the 975-yrp tests
Analysing the Figure 4.33, the improved performance of the strengthened structure can be
perceived. Again, only the strong-column will be analysed, because the slender ones are
not preponderant to the structure response. Comparing the behaviour of the strong-column
and the beam in its vicinity, the beams of the BF practically do not deform, being the
deformation demand concentrated in the strong-column. For the retrofitted structure, a
larger deformation demand develops in the beams, protecting the columns and,
consequently, improving the structure performance.
From the rotation patterns for the 975-yrp tests given in Figure 4.33, it can be observed a
much more uniform distribution of the rotation demands at the member end-sides
(potential plastic hinge zones) for the retrofitted frame. Furthermore, it is also apparent that
the demands are higher in the girders compared to the BF frame tests. This is a very
important result. It confirms that a slight increase on the column strength can increase its
performance. This kind of strong-beam weak-column structures designed without
appropriate seismic provisions (for example: capacity design), can be significantly
protected if a rational strengthening operation is carried out.

Experimental work: analysis of test results
206
4.4.3 - Energy dissipation
The dissipated energy profiles given in Figures 4.34 and 4.35 confirm the benefits gained
from the SR operation:
• For the low level test on the bare frame (BF475), the significant and balanced
contribution of the first three storeys to the energy dissipation is evident.
• For the BF975 test, the higher contribution of the 3rd storey for the energy
dissipation is evident. This is due to the high concentration of damage in the
strong-column at this storey.
• All the tests on the selective strengthened frame produced an energy dissipation
profile with almost the same configuration. Yet, it was clearly shown in
Section 4.3.4 for the case of SR tests that the amount of energy dissipated in each
test is very different.
BF tests
SR tests
Figure 4.34 - BF and SR tests: relative energy dissipation profiles

Chapter 4
207
475-yrp tests
975-yrp tests
Figure 4.35 - BF and SR tests: relative energy dissipation profiles (475-yrp and 975-yrp tests)
4.4.4 - Deformation at the beam extremities
Figures 4.36 and 4.37 show the envelope of relative rotation and the maximum uniform
strain at the top and bottom beam fibres for the bare and strengthened frames for the
475-yrp and 975-yrp tests.
a)
b)
Figure 4.36 - BF and SR 475-yrp tests (beam 1st floor): a) maximum relative rotation; b) maximum uniform strain

Experimental work: analysis of test results
208
Figure 4.37 - BF and SR 975-yrp tests (beam 1st floor): a) maximum relative rotation; b) maximum uniform strain
Relative rotations measured at 75 mm, 150 mm and 350 mm from the column faces (left
and right column faces) are plotted in Figures 4.36 and 4.37 (on the left), for the 475-yrp
and the 975-yrp tests, respectively. On the right-hand side of these figures, the maximum
uniform strains for the beam slices 0-75, 75-150 and 150-350 mm for the bare and
strengthened frames are compared.
The deformation pattern along the beam is similar for the bare and strengthened frames for
all tests. However, it is noted that the beam rotational deformation demands for the
strengthened frames is much higher. In fact, the earthquake drift demand at the respective
1st storey has also increased. The ratios between the first inter-storey drifts (SR compared
with BF tests) are
43.144.063.0
475,
475,475, ===
BF
SRratio ID
IDID 07.2
63.031.1
975,
975,975, ===
BF
SRratio ID
IDID (4.12, 4.13)
And the maximum relative rotation ratios (SR compared with BF tests) are
6.1475,
475,475, ≈=
BF
SRratio RotMax
RotMaxRot 2.2
975,
975,975, ≈=
BF
SRratio RotMax
RotMaxRot (4.14, 4.15)
This shows that the beam rotation demands are almost proportional to the inter-storey drift
demands, and, therefore, the dissipation and deformation mechanisms for the BF and SR
frames are similar, with a slight increase in the beam demands for the SR case. Once more

Chapter 4
209
it can be observed that the additional strength given by the confinement steel hoop plates
should have contributed to increased beam demands.
4.4.5 - Vulnerability analyses
4.4.5.1 - Maximum inter-storey drift and global drift
Figure 4.38-a shows the vulnerability function in terms of maximum inter-storey drift, and
Figure 4.38-b represents the maximum global drift, for the tests carried out on the bare and
strengthened frames.
0
0,4
0,8
1,2
1,6
2
2,4
2,8
1 1,2 1,4 1,6 1,8 2
Input Intensity (Acc_max/Acc_ref)
Max
. Sto
rey
Drif
t (%
)
a)
0
0,25
0,5
0,75
1
1,25
1,5
1,75
2
1 1,2 1,4 1,6 1,8 2
Input Intensity (Acc_max/Acc_ref)
Glo
bal D
rift (
%)
b)
Bare Frame (BF)
Collapse of BF
Selective Retrofit (SR)
Figure 4.38 - BF and SR tests: a) maximum inter-storey drift; b) maximum global drift
As illustrated in the Figure 4.38-a, regarding maximum inter-storey drift, the demands for
the SR structure are less than those for the original BF structure. This was due to the
retrofitting intervention, carried out to correct the irregularity at the third storey. In
addition, the strengthened structure was able to withstand much higher input intensity (1.8
times the nominal one) without collapsing and maintaining its load carrying capacity.
Therefore, the benefits gained from the retrofitting operation were clearly demonstrated.
Looking in depth at the vulnerability functions, the following can be observed:
• For both, bare and strengthened frames, the 475-yrp earthquake test induces a
similar magnitude of maximum inter-storey drift (ID) in the frames. However, it is

Experimental work: analysis of test results
210
noted that the maximum ID reached occurs at different storeys: on the 3rd for the
bare frame and on the 2nd for the strengthened one.
• For the 975-yrp earthquake tests, the strengthened frame stands for the complete
15 seconds earthquake input motion without structure collapse, reaching
maximum ID of 1.56% at the 2nd storey. At 7.5 seconds of the 975-yrp input
motion, the bare frame reached its maximum ID of 2.41% at the 3rd storey. This
made imminent the storey collapse and, consequently, the test was interrupted.
• For the 2000-yrp test, the strengthened frame reached a maximum ID of 2.98% at
the 2nd storey and 2.75% at the 1st storey, both greater than 2.41%, which
corresponds to the ID at imminent collapse of the 3rd storey in the 975-yrp test on
the bare frame.
• BF and SR tests reached a very similar global drift for each earthquake intensity.
Consequently, the influence of the retrofit in the global drift is not evident.
However, recall that the previous tests carried out on the bare frame induced
considerable damage in the structure, and that test on the BF for the 975-yrp
earthquake stopped at 7.5 seconds.
An important conclusion is the noticeable non-influence of the retrofitting in the global
drift vulnerability function. It seems that global measurements, such as global drift, for
example, can be no sensitive to local large damage/deformation. Therefore, caution is
recommended when analysing structures based on one global parameter only (like the
displacement based design, DBD). This is particularly so for structures with high
irregularity.
4.4.5.2 - Maximum rotation
Figure 4.39 shows the vulnerability functions in terms of maximum local relative rotation
for the tests on the BF and on the SR frame. The beneficial effects of the strengthening
regarding local demands are visible.
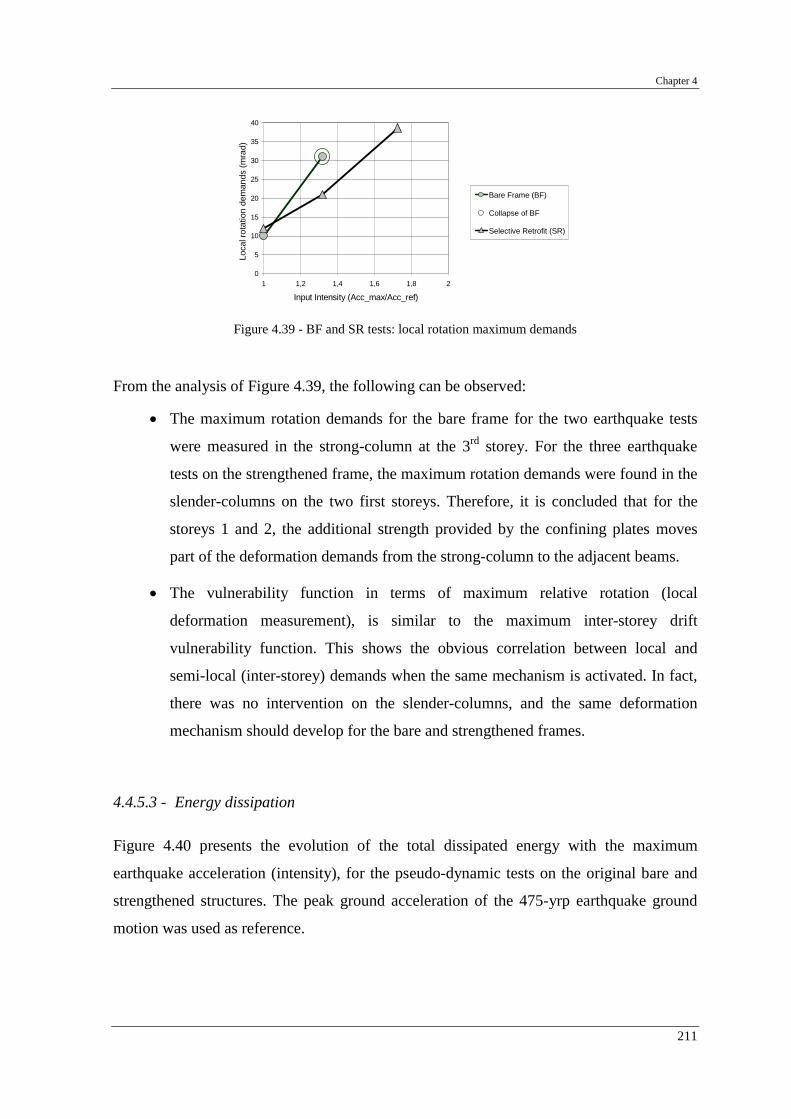
Chapter 4
211
0
5
10
15
20
25
30
35
40
1 1,2 1,4 1,6 1,8 2
Input Intensity (Acc_max/Acc_ref)
Loca
l rot
atio
n de
man
ds (m
rad)
.
Bare Frame (BF)
Collapse of BF
Selective Retrofit (SR)
Figure 4.39 - BF and SR tests: local rotation maximum demands
From the analysis of Figure 4.39, the following can be observed:
• The maximum rotation demands for the bare frame for the two earthquake tests
were measured in the strong-column at the 3rd storey. For the three earthquake
tests on the strengthened frame, the maximum rotation demands were found in the
slender-columns on the two first storeys. Therefore, it is concluded that for the
storeys 1 and 2, the additional strength provided by the confining plates moves
part of the deformation demands from the strong-column to the adjacent beams.
• The vulnerability function in terms of maximum relative rotation (local
deformation measurement), is similar to the maximum inter-storey drift
vulnerability function. This shows the obvious correlation between local and
semi-local (inter-storey) demands when the same mechanism is activated. In fact,
there was no intervention on the slender-columns, and the same deformation
mechanism should develop for the bare and strengthened frames.
4.4.5.3 - Energy dissipation
Figure 4.40 presents the evolution of the total dissipated energy with the maximum
earthquake acceleration (intensity), for the pseudo-dynamic tests on the original bare and
strengthened structures. The peak ground acceleration of the 475-yrp earthquake ground
motion was used as reference.

Experimental work: analysis of test results
212
0
20
40
60
80
100
120
1 1,2 1,4 1,6 1,8 2
Input Intensity (Acc_max/Acc_ref)
Tota
l ene
rgy
diss
ip. (
kN.m
)
.
Bare Frame (BF)
Collapse of BF
Selective Retrofit (SR)
Figure 4.40 - BF and SR tests: total energy dissipation
Analysing the Figure 4.40, it can be concluded that:
• For the 475-yrp earthquake, the original bare frame and the strengthened frame
structures dissipated approximately the same amount of energy.
• For the 975-yrp earthquake test, the SR frame dissipated twice as much as the
energy dissipated by the BF structure. It should be highlighted that the BF
structure was subjected to 7.5 seconds of the input motion only, because imminent
collapse was attained at the 3rd storey. Collapse would imply no further significant
dissipation capacity. Thus, it can be stated that retrofitting interventions were very
effective also in terms of energy dissipation capacity. In fact, this results from a
much more uniform dissipation of energy throughout the structure, which is
confirmed by the amount of energy dissipated in the 2000-yrp earthquake test.
4.5 - RESULTS FROM THE TESTS ON THE INFILLED FRAME
The original full-scale four-storey infilled frame (IN) was subjected to three consecutive
earthquake tests corresponding to 475, 975 and 2000-yrp. During the 2000-yrp test, the
masonry infills at the first storey collapsed, stopping the test at 5 seconds. In the next are
provided results from these tests in terms of storey displacement, maximum inter-storey
drift profiles for positive and negative deformations, energy dissipation, storey shear-drift
curves and base-shear versus top-displacement.
Chapter 4
213
4.5.1 - Storey displacement, drift and shear
Time histories of storey displacement for the three earthquake pseudo-dynamic tests
performed on the IN structure are given in Figure 4.41. Figure 4.42 collects the top-
displacement time histories for the three tests performed on the infilled frame. Analysing
the Figure 4.41, it is apparent the soft-storey mechanism. In fact, storey displacements for
2000-yrp test are similar for the four floors, which leads to inter-storey drifts at the 1st
storey much higher than ones for the three upper storeys. The soft-storey mechanism
develops from the failure of the infill panels at the first storey and is a direct consequence
of the storey softening behaviour characteristics of these infills after failure. This will be
also emphasized in the drift profiles in Figure 4.46.
The curves base-shear-top-displacement for the three earthquake tests are given in
Figure 4.43 and show that quasi-linear elastic behaviour was exhibited during the 475-yrp
test. The 975-yrp test inflicted severe damage to the infills which reached deformation
beyond its peak strength with considerable loss of strength. The short test, with the first
part of the 2000-yrp earthquake (5 seconds) only, prompted the infill panels to failure. In
Figure 4.44 are plotted the respective envelope curves of these storey shear-drift diagrams.
The curves storey shear versus storey drift presented in Figure 4.45, are also indicative of
the infilled frame behaviour during the three consecutive earthquake tests. Moreover, these
curves give a clear idea of the damage distribution and intensity. In fact, most of demands
and consequently damage, concentrate in the first storey. The second storey also shows
relatively high demands. The third and fourth storeys show typical quasi-linear behaviour
for all tests. Figure 4.46 represents the maximum inter-storey drift profile and the
maximum storey shear profile.

Experimental work: analysis of test results
214
475-yrp
975-yrp
2000-yrp
Figure 4.41 - IN tests: storey displacement time histories
Figure 4.42 - IN tests: top-displacement evolution

Chapter 4
215
475-yrp
975-yrp
2000-yrp
Figure 4.43 - IN tests: base-shear versus top-displacement
Figure 4.44 - IN tests: envelope storey shear versus inter-storey drift

Experimental work: analysis of test results
216
1st storey 2nd storey
3rd storey 4th storey
Figure 4.45 - IN tests: storey shear versus inter-storey drift
a)
b)
Figure 4.46 - IN tests: a) maximum inter-storey drift profiles; b) maximum storey shear profiles

Chapter 4
217
The storey shear-drift envelope curves (Figure 4.44), illustrative of the storey demands and
behaviour, show that the first storey residual strength tends to approach the strength of the
bare frame (approximately 200 kN). The drift profiles presented in Figure 4.46-a show that
the storey demands for the 475-yrp test are fairly uniform along the height of the structure,
and for the 975-yrp test demands concentrate in the first two storeys with predominance of
the first storey. The 2000-yrp test showed a clear soft-storey mechanism with demands
strongly concentrated in the first storey which is not capable to develop further strength. In
fact, the storey shear profiles presented in Figure 4.46-b show that the maximum base-
shear for the 2000-yrp is practically equal to the second storey shear.
Table 4.8 - IN tests: response maximum values (summary table)
Testa Top-displacement (mm) Global drift (%)
IN475 10.2 0.09
IN975 22.3 0.21
IN2000b 40.6 0.38
Inter-storey drift (%)
storey 1 storey 2 storey 3 storey 4
IN475 0.12 0.12 0.08 0.06
IN975 0.43 0.27 0.15 0.11
IN2000b 1.29 0.22 0.12 0.09
Storey shear (kN)
storey 1 storey 2 storey 3 storey 4
IN475 754.0 680.8 512.4 288.4
IN975 846.5 749.1 635.5 388.1
IN2000b 529.2 543.2 446.2 256.5
a) Duration of the input motions is 15 seconds for the earthquake PsD tests. b) Test performed up to 5.0 seconds in order to reach full collapse of the 1st storey infill panels.
Maximum values of the response for the three earthquake tests on the infilled frame are
collected in Table 4.8 in terms of top-displacement, global drift, storey drift and storey
shear. Results in terms of maximum storey deformation show that:
• For the 475-yrp earthquake test, the deformation demands in the first and second
storeys are similar.
• For the 975-yrp test beginning of concentration of deformation is verified at the
first storey.
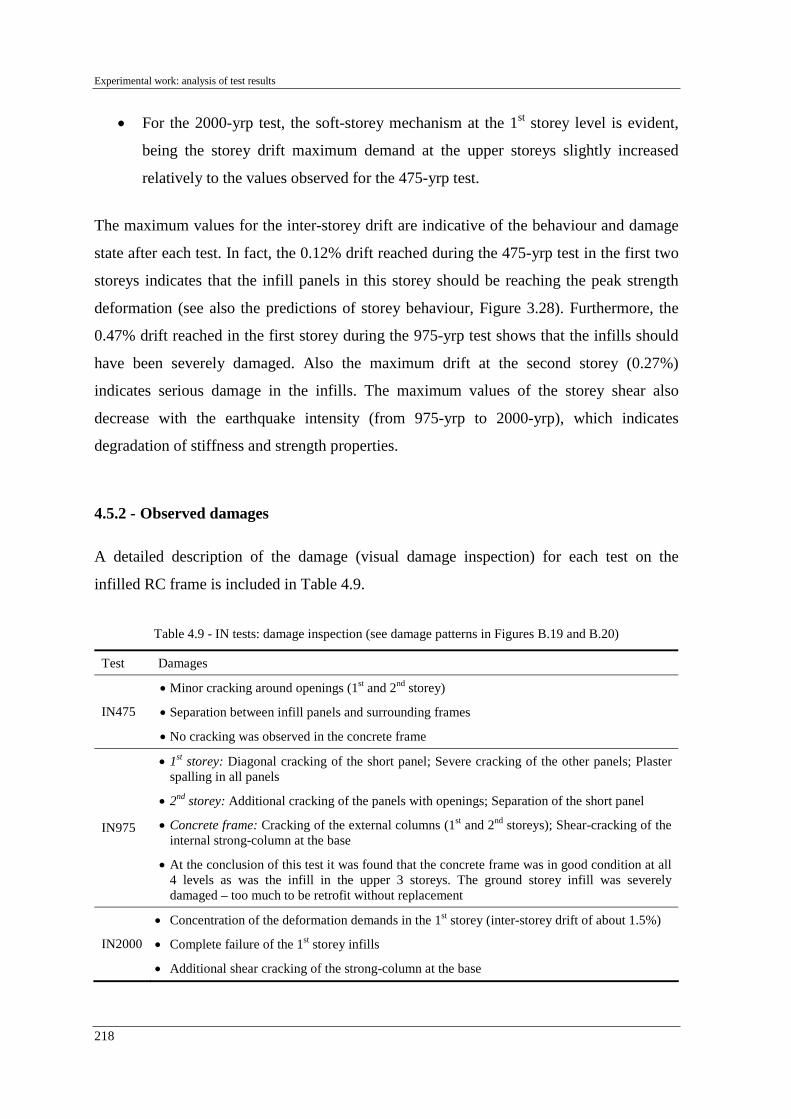
Experimental work: analysis of test results
218
• For the 2000-yrp test, the soft-storey mechanism at the 1st storey level is evident,
being the storey drift maximum demand at the upper storeys slightly increased
relatively to the values observed for the 475-yrp test.
The maximum values for the inter-storey drift are indicative of the behaviour and damage
state after each test. In fact, the 0.12% drift reached during the 475-yrp test in the first two
storeys indicates that the infill panels in this storey should be reaching the peak strength
deformation (see also the predictions of storey behaviour, Figure 3.28). Furthermore, the
0.47% drift reached in the first storey during the 975-yrp test shows that the infills should
have been severely damaged. Also the maximum drift at the second storey (0.27%)
indicates serious damage in the infills. The maximum values of the storey shear also
decrease with the earthquake intensity (from 975-yrp to 2000-yrp), which indicates
degradation of stiffness and strength properties.
4.5.2 - Observed damages
A detailed description of the damage (visual damage inspection) for each test on the
infilled RC frame is included in Table 4.9.
Table 4.9 - IN tests: damage inspection (see damage patterns in Figures B.19 and B.20)
Test Damages
IN475
• Minor cracking around openings (1st and 2nd storey)
• Separation between infill panels and surrounding frames
• No cracking was observed in the concrete frame
IN975
• 1st storey: Diagonal cracking of the short panel; Severe cracking of the other panels; Plaster spalling in all panels
• 2nd storey: Additional cracking of the panels with openings; Separation of the short panel
• Concrete frame: Cracking of the external columns (1st and 2nd storeys); Shear-cracking of the internal strong-column at the base
• At the conclusion of this test it was found that the concrete frame was in good condition at all 4 levels as was the infill in the upper 3 storeys. The ground storey infill was severely damaged – too much to be retrofit without replacement
IN2000
• Concentration of the deformation demands in the 1st storey (inter-storey drift of about 1.5%)
• Complete failure of the 1st storey infills
• Additional shear cracking of the strong-column at the base
Chapter 4
219
Griffith's (1999-b) detailed damage description for each test performed on the block
masonry infilled frame is presented below.
475-yrp test
Overall, the infilled frame structure behaved very well. A maximum base-shear force of
about 700 kN occurred at a lateral drift of 0.08% global drift only (roof-displacement
divided by frame height). The maximum inter-storey drift occurred at the 1st storey
(0.12%). It decreased with increasing storey level up to a value of about 0.07% at the 4th
storey.
As could be expected, the level of damage corresponding to these levels of drift was minor.
Some cracking was visible in the masonry infill around the door and window openings in
the 1st and 2nd storey, with most occurring in the 1st storey. The 1st storey hysteresis loops
(shear force versus drift) suggest that significant damage had just started to occur, and that
the maximum storey shear strength was nearly attained in this test. For the lower two
storeys, the maximum storey shear force recorded was about 600 kN in the positive
direction and nearly 800 kN in the negative direction.
In the concrete frame, the small shear cracks were also observed in the bottom metre of 1st
storey's column 2 (strong-column). Small flexural cracking was noted in column 1, over
the height of the window opening, and in column 4 at the 1st storey. Small cracks also
developed in the exterior beam-column joints for columns 1 and 4 at the 1st floor level.
Even though the observable damage was slight, there was a substantial amount of noise
coming from the masonry walls as they were sheared back and forth. Primarily, the bond
between the infill panels and the surrounded concrete frame was 'broken' at the bottom of
the two storeys during this test. The majority of energy dissipation in the brickwork
probably occurred along these interfaces.
975-yrp test
This level of earthquake input caused a significant amount of damage to the block infill in
the bottom storey of the concrete frame with some minor damage to the concrete beam-
column joints and several columns at this level. Smaller amounts of damage in similar
locations were noted in the 2nd storey. No significant damage was observable in the upper

Experimental work: analysis of test results
220
two stories. For example, the small cracks in the exterior beam-column joints in the bottom
two stories developed further but not severely. A small flexural crack also appeared in the
1st floor beam at the end of the door opening closest to column 2. A crack also appeared in
the 1st floor slab, running parallel to the transverse beam on the side opposite to the loading
arm, penetrating to about 1/3 of the slab depth from the top. Shear cracking at the base of
column 2 in the first storey also developed further. The main difference, however, was
observed in the infill panels. During the 975-yrp test, shear cracking became significant in
all three of the first storey infill panels. This is also evident in the storey shear force versus
drift hysteresis loops. The first storey shear strength of approximately 800 kN was reached
at a storey drift of 0.15% and had reduced to approximately 650 kN at a drift of 0.4%. The
second storey hysteresis loops also indicate that the ultimate storey shear strength was
reached (approximately 800 kN) but little softening was observed since the storey drifts at
this level never exceeded 0.2% in the negative direction and 0.3% in the positive direction.
Storey drifts in the upper two stories essentially never exceeded 0.1% drift, hence there
was no significant inelastic behaviour exhibited in the storey hysteresis loops which is
consistent with the lack of observable damage in those two storeys at the conclusion of
testing.
In summary, at the end of this test, the concrete frame was found in good condition at all
four levels, as was the infill in the upper three storeys. The ground storey infill was
severely damaged, too much to be retrofit without replacement.
2000-yrp test
It was recognised that the infill frame had become a soft-storey infill frame structure.
Nevertheless, it was subjected to the 2000-yrp earthquake signal in order to study how
gradually the lateral strength dropped off with increasing drift. To protect the frame and
ensure that subsequent tests on retrofit techniques could be performed on the structure, the
2000-yrp test was stopped once the structure reached a first storey drift of approximately
1%. Consequently the test terminated at 5 seconds earthquake duration, and once the
ground storey drift reached approximately 1.5%. The storey shear versus drift hysteresis
loops illustrate clearly that the load deflection characteristics approach those of the bare
frame as the drifts increase to values over 1%.

Chapter 4
221
The damage patterns at the end of this test were essentially more severe versions of what
had been observed in the 975-yrp test. On one hand, significant shear cracks of
approximately 4 mm wide developed in the bottom metre of the 1st storey's of column 2.
Spalling of cover concrete also occurred in column 2 at this location. However, the
previous cracking patterns in the other frame elements showed no significant change. On
the other hand, what remained from the 1st storey infill after the 975-yrp test was severely
damaged during this test. Wide diagonal cracks developed in the solid infill panel. The
infill panels with openings also cracked badly. When this test was terminated, the 1st storey
shear strength had dropped by more than 50% to less than 400 kN. The maximum inter-
storey drift was nearly 35 mm (or, roughly, 1.5% drift). The overall structural behaviour
was definitely that of a soft-storey structure. The maximum drift at the top of the structure
was 40 mm, and, as mention above, almost all of it (35 mm) occurred at the 1st storey. Most
of the remaining 5 mm of drift occurred at the 2nd storey. Consequently, very little new
damage occurred in the upper three storeys of the structure.
Figures B.19 and B.20 show the damage observed on the RC frame structure, slabs and in
the masonry infills after the earthquake pseudo-dynamic tests. Pictures of the damage
observed in the infills and in the RC structure also appear in Figure B.21.
4.5.3 - Damage intensity classification for infill masonry panels
Sortis et al. (1999) proposed a methodology of damage intensity evaluation. As shown in
Figure 4.47, five types of damage are considered. For each type of damage, the damage
level is defined on the basis of the amplitude of the damage, namely the crack opening and
crushing (see Table 4.10).
Figure 4.47 - Types of damage in masonry infill panels (Sortis et al., 1999)
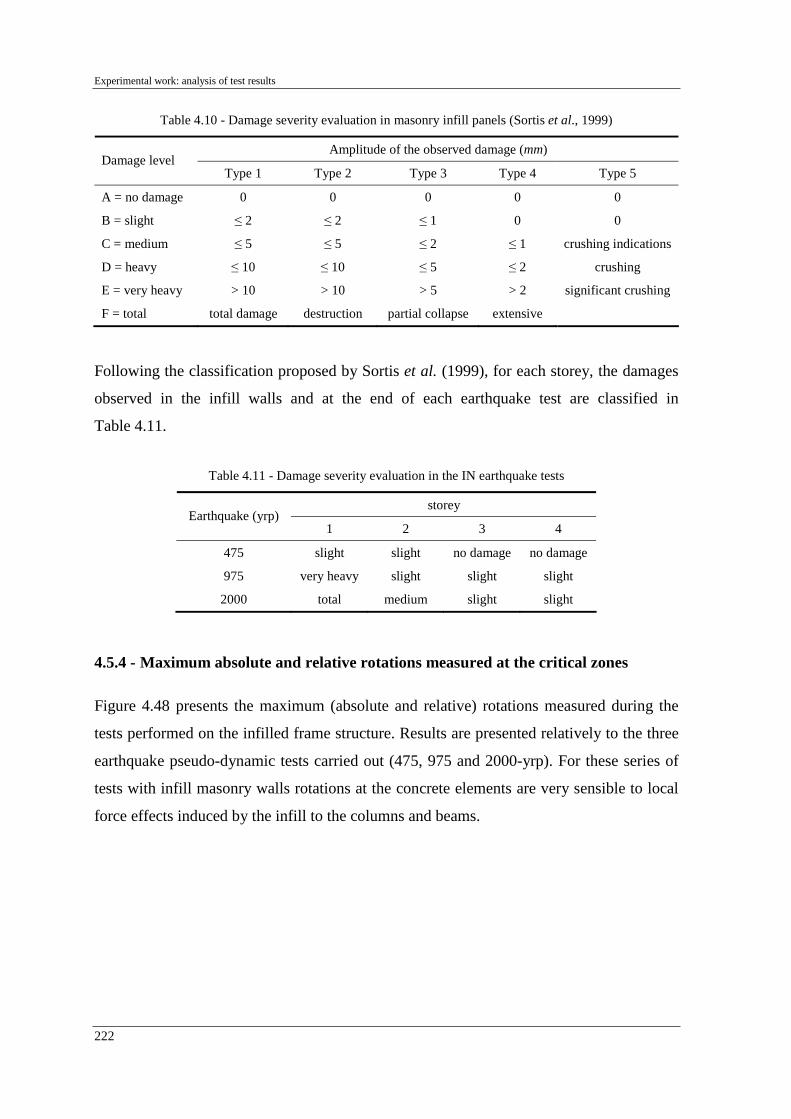
Experimental work: analysis of test results
222
Table 4.10 - Damage severity evaluation in masonry infill panels (Sortis et al., 1999)
Amplitude of the observed damage (mm) Damage level
Type 1 Type 2 Type 3 Type 4 Type 5
A = no damage 0 0 0 0 0
B = slight ≤ 2 ≤ 2 ≤ 1 0 0
C = medium ≤ 5 ≤ 5 ≤ 2 ≤ 1 crushing indications
D = heavy ≤ 10 ≤ 10 ≤ 5 ≤ 2 crushing
E = very heavy > 10 > 10 > 5 > 2 significant crushing
F = total total damage destruction partial collapse extensive
Following the classification proposed by Sortis et al. (1999), for each storey, the damages
observed in the infill walls and at the end of each earthquake test are classified in
Table 4.11.
Table 4.11 - Damage severity evaluation in the IN earthquake tests
storey Earthquake (yrp)
1 2 3 4
475 slight slight no damage no damage
975 very heavy slight slight slight
2000 total medium slight slight
4.5.4 - Maximum absolute and relative rotations measured at the critical zones
Figure 4.48 presents the maximum (absolute and relative) rotations measured during the
tests performed on the infilled frame structure. Results are presented relatively to the three
earthquake pseudo-dynamic tests carried out (475, 975 and 2000-yrp). For these series of
tests with infill masonry walls rotations at the concrete elements are very sensible to local
force effects induced by the infill to the columns and beams.

Chapter 4
223
IN475 – max. abs. rotation = 2.2 mRad IN475 – max. relat. rotation = 1.8 mRad
IN975 – max. abs. rotation = 7.9 mRad IN975 – max. relat. rotation = 7.9 mRad
IN2000 – max. abs. rotation = 18.1 mRad IN2000 – max. relat. rotation = 17.2 mRad
Figure 4.48 - IN tests: maximum absolute and relative rotation demands
From the analyses of the Figure 4.48, it can be concluded that:
• As observed earlier on the bare frame tests, it is clear that relative rotations are
similar to the absolute ones for the weak-columns, specially for the tests with

Experimental work: analysis of test results
224
stronger earthquake excitation (2000-yrp). This was also visually observed during
the tests.
• For the high intensity earthquake, the 1st storey strong-column does not rotate at
the top, which is contrary to what was observed for the tests on the bare frame.
This effect is due to the high stiffness and strength of the second storey. In fact,
for the 2000-yrp test, it was confirmed the soft-storey mechanism at the ground
storey, being the second storey much stronger, which does not allow the top
columns to rotate.
• The soft-storey mechanism for the 2000-yrp test, already noticed in the analysis of
the storey displacements, is confirmed in the rotations plots.
4.5.5 - Energy dissipation
The total dissipated energy at the storey level for each test is represented in the schematic
storey profile in Figure 4.49. Figure 4.50 plots the evolution of energy dissipation at the
storey levels and the evolution of the total energy dissipated in the infilled structure.
Figure 4.49 - IN tests: relative energy dissipation profiles
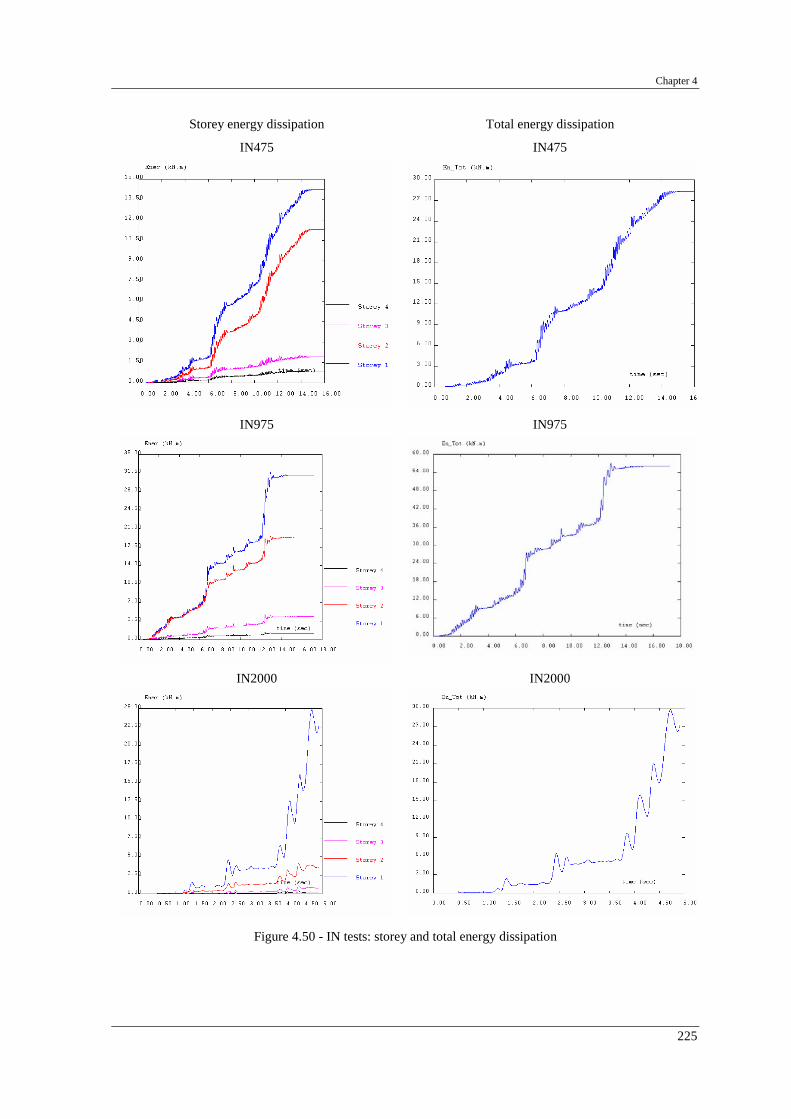
Chapter 4
225
Storey energy dissipation Total energy dissipation
IN475
IN475
IN975
IN975
IN2000
IN2000
Figure 4.50 - IN tests: storey and total energy dissipation

Experimental work: analysis of test results
226
From the analysis of the energy dissipation graphics, it can be observed:
• The fourth storey practically does not dissipate energy: 3% for the 475-yrp test,
reducing to 2% in the 975-yrp, and to 1% in the 2000-yrp test.
• The third storey has also low energy dissipation: 7-8% for the first two tests,
reducing its participation in the energy dissipation to 3% for the stronger
earthquake.
• For every earthquake test, the first storey is the most dissipative, increasing its
relative quota with the accumulation of damage. The first storey is responsible for
50%, 55% and 83% of the total dissipated energy for the 475, 975 and 2000-yrp
test, respectively. The soft-storey at the ground storey level explains the high
dissipation of energy at this storey.
• In the second storey, the quantity of energy dissipated in the first five seconds for
the 975-yrp test is superior to the energy dissipated, for the same period, in the
2000-yrp test. This fact follows from the demand concentration at the first storey,
and can be observed in Figure 4.50.
4.6 - COMPARISON BETWEEN BF AND IN TESTS
This section emphasizes the effects of infill masonry walls in response of the structure.
The series of diagrams (1st and 2nd storey shear-drift) given in Figure 4.51 include the
diagrams for the tests, for the BF and IN, and reflect the effects of the infill panels in the
structural response. The infill panels increase substantially the initial stiffness and strength
at the storey level, and, consequently, the global stiffness and strength of the structure. The
maximum strength reached for the 1st storey infilled frame is about four times the value for
the bare structure. The infills also increased significantly the initial stiffness. It is also
outlined the brittleness of the infilled structure after reaching the maximum strength. In
fact, the 1st storey shear-drift diagram for the infilled structure shows a rapid decrease of
the strength after reaching its maximum value.

Chapter 4
227
The tests performed on the bare frame showed a concentration of damage, and
consequently a large amount of inter-storey drift, in the 3rd storey. Figures 4.52 compare
the inter-storey drift profile for the BF and IN tests. The presence of infills changed
entirely the structural response. The concentration of damage at the third storey in the
irregular RC frame observed for the BF tests was not verified in the IN earthquake tests. In
this particular case, the infill panels prevent the development of an irregular response.
1st storey
2nd storey
BF475 BF975 IN475 IN975 IN2000
Figure 4.51 - BF and IN tests: 1st and 2nd storey shear versus inter-storey drift and respective envelope curves

Experimental work: analysis of test results
228
BF tests
IN tests
Figure 4.52 - BF and IN tests (475 and 975-yrp): maximum inter-storey drift profiles
4.7 - RESULTS FROM THE TESTS ON INFILL STRENGTHENED FRAME
The original RC infilled frame was subjected to three consecutive earthquake tests. These
tests induced severe damage to the infill panels. During the 2000-yrp test on the infilled
frame, the infills at the first storey reached collapse. Maximum inter-storey drifts of 1.29%,
0.27%, 0.15% and 0.11% were experienced at 1st, 2nd, 3rd and 4th storeys respectively. This
drift demand led to complete failure of the 1st storey walls and inflicted some (supposing
minor) damage to the 2nd storey panels. Based on the test results and on visual inspection,
it was decided to reconstruct the infill walls at the 1st storey and to apply the strengthening
(shotcrete) just in the external short infill panels of each storey level. The new infill panels
were rebuilt with the same geometry and materials as the original walls. Details on the
infills strengthening were presented in Section 3.4.3.
After replacement of the infills at the 1st storey and strengthening in the external short
panel of each storey, the infill strengthened frame (SC) was subjected to the three
earthquake input motions (475, 975 and 2000-yrp earthquakes), as for the infilled frame.
Next are compiled the results in terms of storey displacement, maximum inter-storey drift
profiles for positive and negative deformations, energy dissipation and shear-drift diagrams
(at storey and global levels).

Chapter 4
229
4.7.1 - Storey displacement, drift and shear
In Figure 4.53 are plotted the time histories of storey displacement for the three earthquake
pseudo-dynamic tests (475, 975 and 2000-yrp) performed on the SC structure. Figure 4.54
shows the top-displacement curves for the tests performed on the infill strengthened frame.
Figure 4.55 plots the curves base-shear versus top-displacement for the three earthquake
tests performed on the SC frame. In Figure 4.56 are presented the curves storey shear
versus inter-storey drift, and, in Figure 4.57 are plotted the respective envelope curves for
these storey shear-drift diagrams. Figure 4.58 represents the maximum inter-storey drift
profile and the maximum storey shear profile. Table 4.12 summarises the maximum values
for characteristic response variables for the SC tests.
475-yrp
975-yrp
2000-yrp
Figure 4.53 - SC tests: storey displacement time histories

Experimental work: analysis of test results
230
Figure 4.54 - SC tests: top-displacement evolution
475-yrp
975-yrp
2000-yrp
Figure 4.55 - SC tests: base-shear versus top-displacement

Chapter 4
231
1st storey 2nd storey
3rd storey 4th storey
Figure 4.56 - SC tests: storey shear versus inter-storey drift
Figure 4.57 - SC tests: envelope storey shear versus inter-storey drift
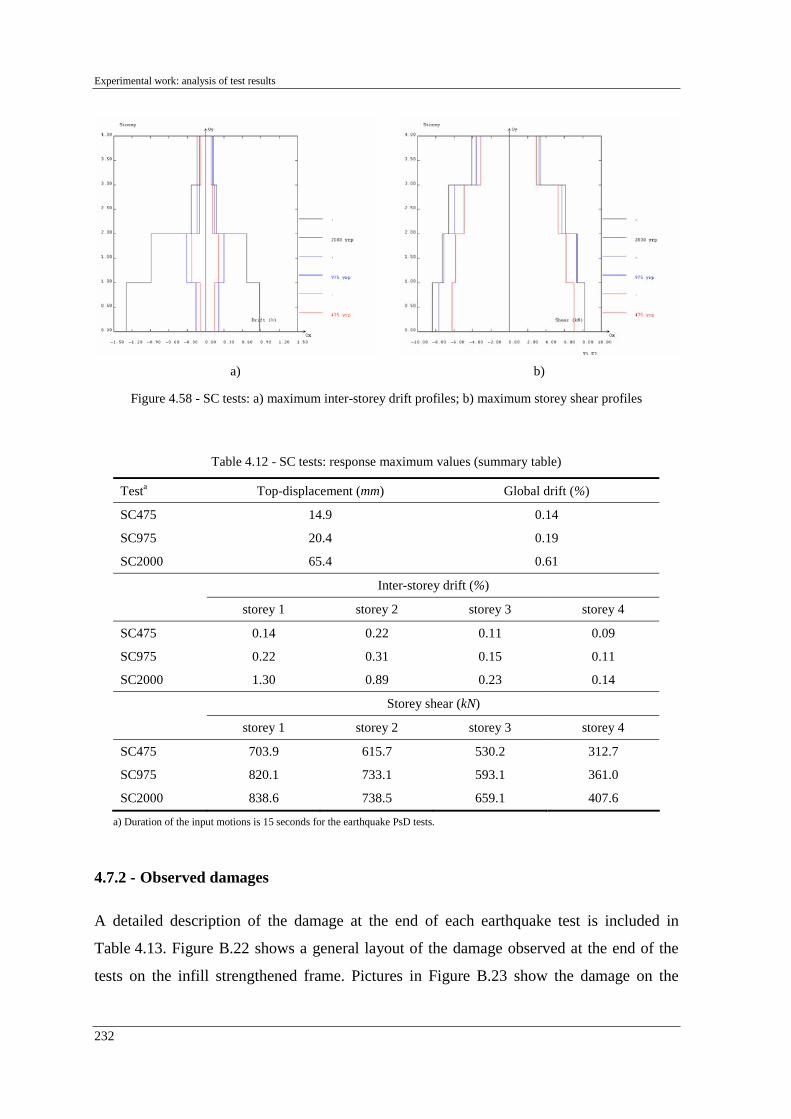
Experimental work: analysis of test results
232
a)
b)
Figure 4.58 - SC tests: a) maximum inter-storey drift profiles; b) maximum storey shear profiles
Table 4.12 - SC tests: response maximum values (summary table)
Testa Top-displacement (mm) Global drift (%)
SC475 14.9 0.14
SC975 20.4 0.19
SC2000 65.4 0.61
Inter-storey drift (%)
storey 1 storey 2 storey 3 storey 4
SC475 0.14 0.22 0.11 0.09
SC975 0.22 0.31 0.15 0.11
SC2000 1.30 0.89 0.23 0.14
Storey shear (kN)
storey 1 storey 2 storey 3 storey 4
SC475 703.9 615.7 530.2 312.7
SC975 820.1 733.1 593.1 361.0
SC2000 838.6 738.5 659.1 407.6
a) Duration of the input motions is 15 seconds for the earthquake PsD tests.
4.7.2 - Observed damages
A detailed description of the damage at the end of each earthquake test is included in
Table 4.13. Figure B.22 shows a general layout of the damage observed at the end of the
tests on the infill strengthened frame. Pictures in Figure B.23 show the damage on the

Chapter 4
233
reinforced concrete frame, on the infills and on the infills strengthened at the end of the
tests.
Table 4.13 - SC tests: damage inspection (see damage patterns in Figure B.22)
Test Damages
SC475 • Separation of panels 2nd storey (short). The other panels were already separated
• 1st storey – separation short panel, partial separation of the large panels. Slight cracking of the masonry in the corners of the openings
SC975
• Complete separation of the 1st storey panels
• Increased cracking in the 1st storey opening (corners)
• Crushing of concrete wall (short panel) in the bottom-left / top-right direction
• 2nd storey: crushing short panel bottom-left / top-right (diagonal corners)
• 2nd storey: increased crushing in the other panels (critical regions)
• 3rd storey: slight cracking central zones of the panels with openings
SC2000
• 1st and 2nd storeys: failure of the non- strengthened panels
• 1st storey – short panel: slight crushing in the corners. No additional cracking of the panel
• Effects on the frame (warning): 1. Shear-out of the external columns (1st and 2nd storey) – (more pronounced in the
external column adjacent to the strengthened panel) 2. Spalling of the beam cover in the zone of the added 26 mm wall
• Short- strengthened infill panel (side opposite to the shotcrete): diagonal cracking of the wall
• Slight crushing in the corners
Two main aspects should be highlighted:
• The beneficial effects of the shotcrete on the behaviour of the infill panels were
evident. Shotcrete avoided premature cracking and crushing of the ceramic block
infill walls (positive effect).
• The shear-out of the external columns in their upper part leading to local collapse
(warning – negative dangerous effect). Shear-out resulted from a combination of
shear forces developed in the infill panel and overturning moment effects (up-lift
of the upper beam inhibits transmission of shear forces between the panel and the
beam, leading to direct shear-out of the top of the column).
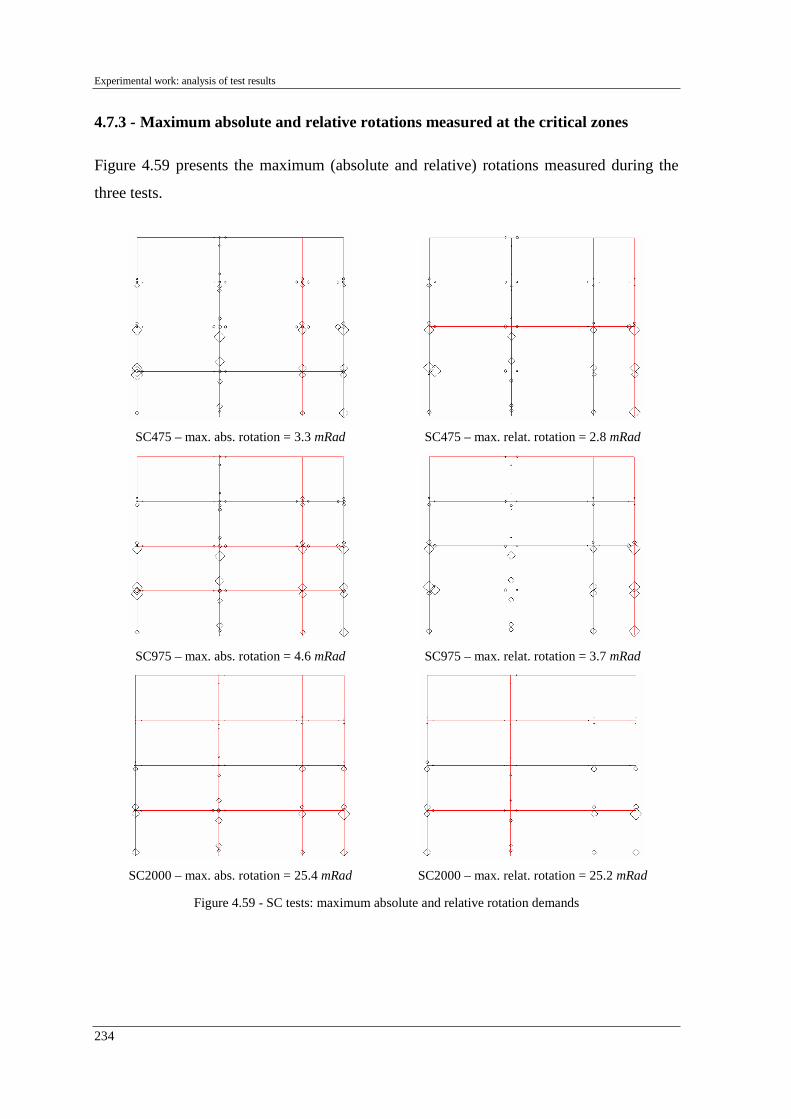
Experimental work: analysis of test results
234
4.7.3 - Maximum absolute and relative rotations measured at the critical zones
Figure 4.59 presents the maximum (absolute and relative) rotations measured during the
three tests.
SC475 – max. abs. rotation = 3.3 mRad SC475 – max. relat. rotation = 2.8 mRad
SC975 – max. abs. rotation = 4.6 mRad SC975 – max. relat. rotation = 3.7 mRad
SC2000 – max. abs. rotation = 25.4 mRad SC2000 – max. relat. rotation = 25.2 mRad
Figure 4.59 - SC tests: maximum absolute and relative rotation demands
Chapter 4
235
From the analyses of the Figure 4.59, it can be concluded:
• For the two lower intensity earthquakes, the maximum deformation (relative
rotation) for every column is observed at the second storey, which is in line with
the maximum inter-storey drift at this storey. This happens because after the
previous tests on the IN frame, the infill panels at the ground storey were replaced
and the ones in the second storey were not. Therefore, the SC tests started with a
considerable higher initial stiffness of the first storey when compared to the
second storey.
• For the first two tests, the maximum deformation occurs in the outer columns of
the first two storeys. This indicates the tendency for shear-out of these columns
generated by the stresses induced by the adjacent masonry panels.
• For the stronger earthquake, the maximum deformation occurred at the external 1st
storey' top-column adjacent to the short panel. This is in accordance to the verified
shear-out of this external column, as shown in Table 4.13.
• In the two upper storeys, a very low deformation was recorded for all the
earthquakes. For all the tests, the beams had little deformation.
4.7.4 - Energy dissipation
Figure 4.60 plots the evolution of energy dissipation at the storey levels and the evolution
of the total energy dissipated in the structure for the earthquake tests on the SC frame. The
total dissipated energy for each test, at the storey level, is represented in the schematic
storey profile in Figure 4.61.

Experimental work: analysis of test results
236
Storey energy dissipation Total energy dissipation
SC475 SC475
SC975 SC975
SC2000 SC2000
Figure 4.60 - SC tests: storey and total energy dissipation

Chapter 4
237
Figure 4.61 - SC tests: relative energy dissipation profiles
From the analysis of Figures 4.60 and 4.61, it can be concluded:
• For the SC tests, the fourth storey practically does not dissipate energy: 3%, 2.5%
and 1.5% of the total dissipated energy, for the 475, 975 and 2000-yrp earthquake
test, respectively. The third storey also dissipates a small amount of energy: 9%,
7% and 5%, for earthquake intensity corresponding to 475, 975 and 2000-yrp.
• For the first two earthquake intensities, the second storey is the one dissipating
more energy. This tendency is dropped down as the earthquake intensity
increases. For the most intense earthquake, it is the first storey the one which
dissipates more energy.
• For every earthquake test (see Figure 4.61), the energy dissipation profile is in
line with the inter-storey drift profile (Figure 4.58-a).
• The total dissipated energy at the 2000-yrp test is approximately three times the
one dissipated for the 975-yrp test, and six times the dissipated for the 475-yrp
test.

Experimental work: analysis of test results
238
4.8 - COMPARISON BETWEEN IN AND SC TESTS
This section collects the principal structural effects of the infill strengthening in the
response of the RC infilled frame, in terms of storey displacement, inter-storey drift and
shear-drift behaviour curves. Figure 4.62 plots the curves base-shear versus top-
displacement for the three earthquake tests performed on the IN and SC frame. Figure 4.63
collects all curves base-shear versus top-displacement for the IN and SC tests, and includes
the envelope curves for the two series of tests.
IN tests
SC tests
Figure 4.62 - IN and SC tests: base-shear versus global drift
Figure 4.63 - IN and SC tests: base-shear versus global drift and respective envelope curves

Chapter 4
239
1st storey
2nd storey
Figure 4.64 - IN and SC tests: storey shear versus inter-storey drift and respective envelope curves
It is apparent from the base-shear versus top-displacement (Figure 4.63) that an equivalent
strength develops for the IN and SC frames, and the deformation capacity of the SC frame
is moderately improved. Similar conclusions can be drawn from the diagrams storey shear
versus storey drift shown in Figure 4.64 for the 1st and 2nd storeys, respectively.
The drift profiles for the IN and the SC frames for the different earthquake tests are given
in Figure 4.65. Analysing the results, it is apparent that the 2nd storey drift demands are
much higher for the shotcrete infilled frame tests. This relies on the fact that the infill
panels at this storey have not been replaced after the previous tests (an inter-storey drift of
0.27% was experienced at this storey, which induced quite important damage in the infill
panels).
IN tests
SC tests
Figure 4.65 - IN and SC tests: maximum inter-storey drift profiles
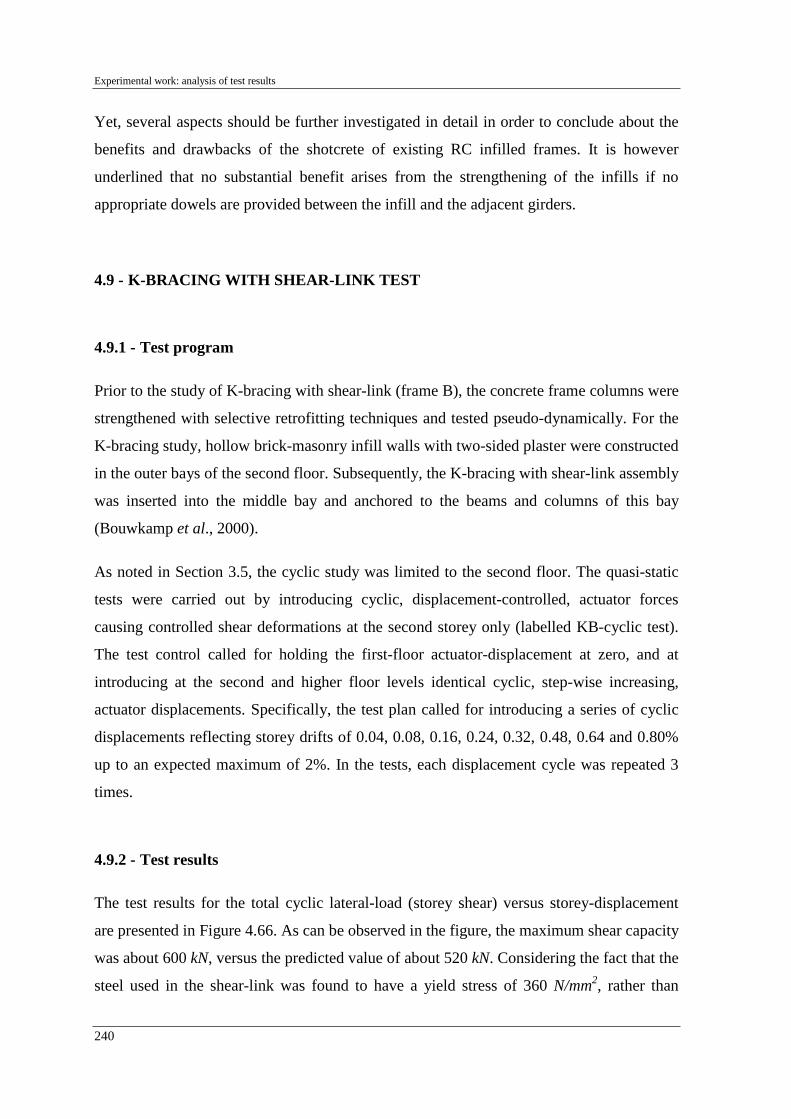
Experimental work: analysis of test results
240
Yet, several aspects should be further investigated in detail in order to conclude about the
benefits and drawbacks of the shotcrete of existing RC infilled frames. It is however
underlined that no substantial benefit arises from the strengthening of the infills if no
appropriate dowels are provided between the infill and the adjacent girders.
4.9 - K-BRACING WITH SHEAR-LINK TEST
4.9.1 - Test program
Prior to the study of K-bracing with shear-link (frame B), the concrete frame columns were
strengthened with selective retrofitting techniques and tested pseudo-dynamically. For the
K-bracing study, hollow brick-masonry infill walls with two-sided plaster were constructed
in the outer bays of the second floor. Subsequently, the K-bracing with shear-link assembly
was inserted into the middle bay and anchored to the beams and columns of this bay
(Bouwkamp et al., 2000).
As noted in Section 3.5, the cyclic study was limited to the second floor. The quasi-static
tests were carried out by introducing cyclic, displacement-controlled, actuator forces
causing controlled shear deformations at the second storey only (labelled KB-cyclic test).
The test control called for holding the first-floor actuator-displacement at zero, and at
introducing at the second and higher floor levels identical cyclic, step-wise increasing,
actuator displacements. Specifically, the test plan called for introducing a series of cyclic
displacements reflecting storey drifts of 0.04, 0.08, 0.16, 0.24, 0.32, 0.48, 0.64 and 0.80%
up to an expected maximum of 2%. In the tests, each displacement cycle was repeated 3
times.
4.9.2 - Test results
The test results for the total cyclic lateral-load (storey shear) versus storey-displacement
are presented in Figure 4.66. As can be observed in the figure, the maximum shear capacity
was about 600 kN, versus the predicted value of about 520 kN. Considering the fact that the
steel used in the shear-link was found to have a yield stress of 360 N/mm2, rather than
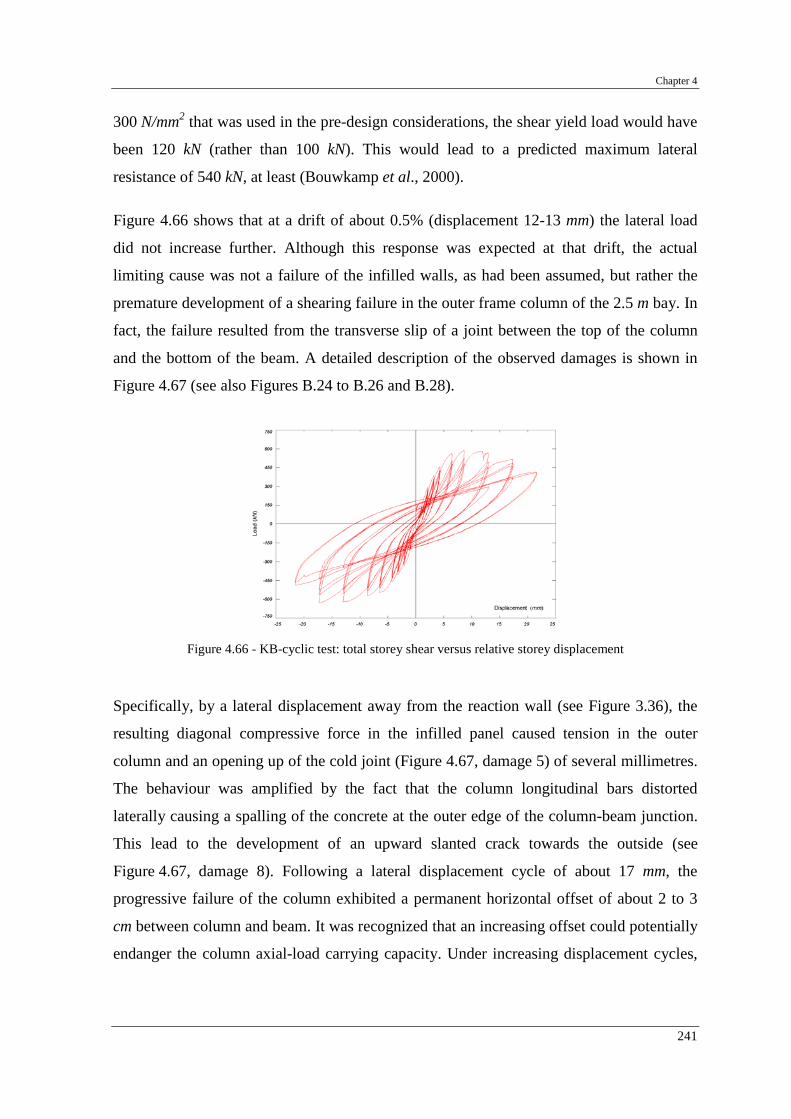
Chapter 4
241
300 N/mm2 that was used in the pre-design considerations, the shear yield load would have
been 120 kN (rather than 100 kN). This would lead to a predicted maximum lateral
resistance of 540 kN, at least (Bouwkamp et al., 2000).
Figure 4.66 shows that at a drift of about 0.5% (displacement 12-13 mm) the lateral load
did not increase further. Although this response was expected at that drift, the actual
limiting cause was not a failure of the infilled walls, as had been assumed, but rather the
premature development of a shearing failure in the outer frame column of the 2.5 m bay. In
fact, the failure resulted from the transverse slip of a joint between the top of the column
and the bottom of the beam. A detailed description of the observed damages is shown in
Figure 4.67 (see also Figures B.24 to B.26 and B.28).
Figure 4.66 - KB-cyclic test: total storey shear versus relative storey displacement
Specifically, by a lateral displacement away from the reaction wall (see Figure 3.36), the
resulting diagonal compressive force in the infilled panel caused tension in the outer
column and an opening up of the cold joint (Figure 4.67, damage 5) of several millimetres.
The behaviour was amplified by the fact that the column longitudinal bars distorted
laterally causing a spalling of the concrete at the outer edge of the column-beam junction.
This lead to the development of an upward slanted crack towards the outside (see
Figure 4.67, damage 8). Following a lateral displacement cycle of about 17 mm, the
progressive failure of the column exhibited a permanent horizontal offset of about 2 to 3
cm between column and beam. It was recognized that an increasing offset could potentially
endanger the column axial-load carrying capacity. Under increasing displacement cycles,

Experimental work: analysis of test results
242
the above deterioration had been associated to a loss of resistance of about 15% (from
about 600 kN to 500 kN).
End of cycle 0.48% drift (12.96 mm)
End of cycle 0.64% drift (17.28 mm)
Figure 4.67 - KB-cyclic test: damage inspection
At that stage the test was stopped. Expecting that a separation between the infill wall and
the column would prevent further deterioration, the brick infilled walls immediately
End of cycle 0.24% drift (6.48 mm)
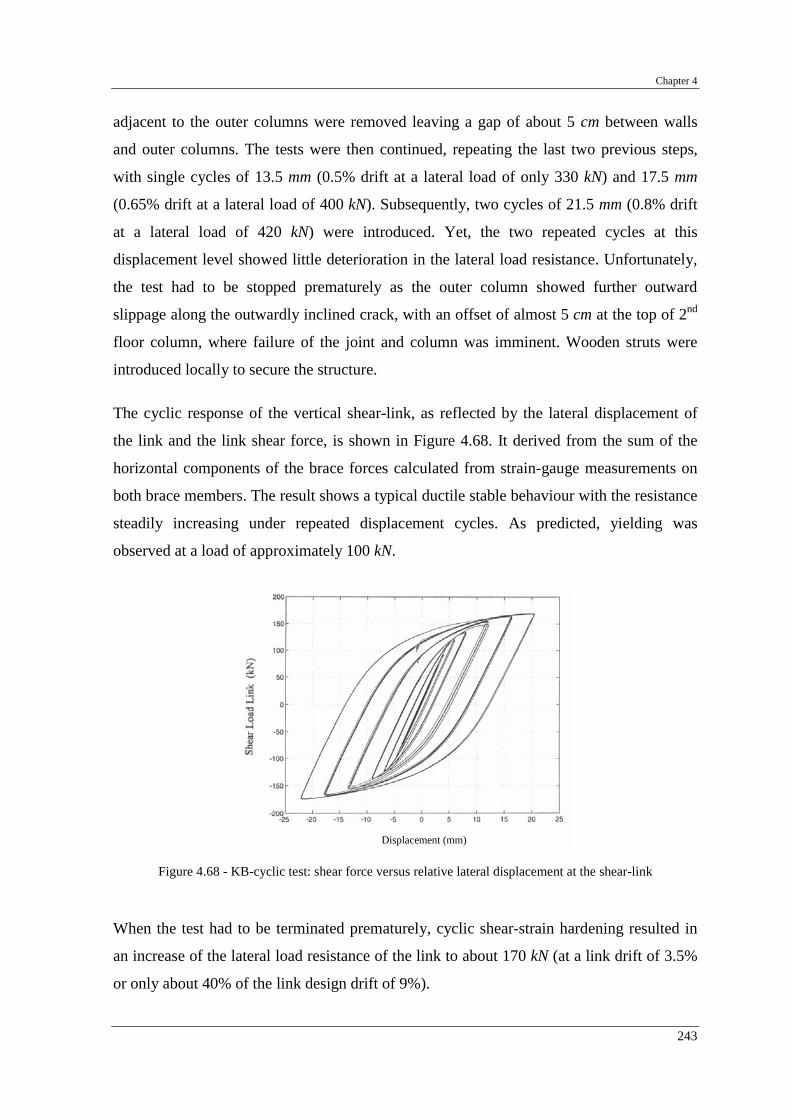
Chapter 4
243
adjacent to the outer columns were removed leaving a gap of about 5 cm between walls
and outer columns. The tests were then continued, repeating the last two previous steps,
with single cycles of 13.5 mm (0.5% drift at a lateral load of only 330 kN) and 17.5 mm
(0.65% drift at a lateral load of 400 kN). Subsequently, two cycles of 21.5 mm (0.8% drift
at a lateral load of 420 kN) were introduced. Yet, the two repeated cycles at this
displacement level showed little deterioration in the lateral load resistance. Unfortunately,
the test had to be stopped prematurely as the outer column showed further outward
slippage along the outwardly inclined crack, with an offset of almost 5 cm at the top of 2nd
floor column, where failure of the joint and column was imminent. Wooden struts were
introduced locally to secure the structure.
The cyclic response of the vertical shear-link, as reflected by the lateral displacement of
the link and the link shear force, is shown in Figure 4.68. It derived from the sum of the
horizontal components of the brace forces calculated from strain-gauge measurements on
both brace members. The result shows a typical ductile stable behaviour with the resistance
steadily increasing under repeated displacement cycles. As predicted, yielding was
observed at a load of approximately 100 kN.
Figure 4.68 - KB-cyclic test: shear force versus relative lateral displacement at the shear-link
When the test had to be terminated prematurely, cyclic shear-strain hardening resulted in
an increase of the lateral load resistance of the link to about 170 kN (at a link drift of 3.5%
or only about 40% of the link design drift of 9%).
Displacement (mm)

Experimental work: analysis of test results
244
Both the cyclic resistance of the shear-link and the total-lateral load resistance of the
retrofitted frame at the 2nd floor level are presented in Figure 4.69. On one hand, the results
clearly show that under increasing number of displacement cycles and associated
progressive failure, the participation of the shear-link in resisting the total lateral load
becomes more pronounced. At the same time, a distinct drop in the overall shear resistance
of the frame under repeated displacements is clearly illustrated. On the other hand, as a
result of the cyclic shear-strain hardening in the link, both the gradual increase of the
shear-link resistance within each series of repeated displacements as well as the increase of
the resistance under progressively increasing displacements can be noted. The overall
energy dissipating characteristics of both the retrofitted single-storey (including the shear-
link) and the shear-link are illustrated by the results presented in Figure 4.70 (Varum and
Pinto, 2001-a). The figure clearly shows the progressively increasing energy absorbing
capacity of the shear-link, and the continually deteriorating energy dissipation of the
infilled concrete frame. In fact, at the end of the tests, the link had dissipated 50% of the
total energy absorbed. Figure 4.71 presents the test results in a load versus displacement
format for both the shear-link and the overall retrofitted 2nd storey frame.
Figure 4.69 - KB-cyclic test: total lateral storey resistance and shear-link shear resistance
Figure 4.70 - KB-cyclic test: energy dissipation for retrofitted frame and shear-link

Chapter 4
245
Figure 4.71 - KB-cyclic test: total storey shear versus relative storey displacement and shear force versus
relative lateral displacement at the shear-link
Finally, the test results have clearly shown that the anchor bolts were effective and that
slippage did not occur. Because of the basically rigid steel parts, it can be speculated that
the anchor bolts forces in each part were fairly well distributed uniformly. Hence, in case
that the deterioration of the frame would not have forced terminating the test prematurely,
it could be expected that up to a (design) drift of 2%, which reflects a shear distortion
of 9% of the 600 mm long link, the inter-welded braced frame assembly would have
functioned well without showing distress in the bolted interface.
4.10 - FINAL CAPACITY CYCLIC TESTS
Final capacity cyclic tests on the four-storey frames were performed to estimate the
ultimate structural displacement and to investigate the post-peak structural behaviour.
These are important parameters, for example, to define damage indices, and to verify
numerical simulations (Pinto et al., 2000-b).
The final capacity test campaign on the full-scale four-storey concrete frames includes two
cyclic tests. The first part of the test campaign focuses on the selective repaired frame (SR-
cyclic, frame B). The second cyclic test concentrates on the bare frame that was recovered
from the infilled frame (BF-cyclic, frame A) removing the infill masonry walls.

Experimental work: analysis of test results
246
4.10.1 - Description of cyclic loading history
For the analyses of the cyclic inelastic behaviour of structures, controlled displacements
instead of forces should be enforced. This follows because instability is associated with the
descending strength branch (after maximum strength point) when the control is based on
forces. The number of equal amplitude cycles for each level of imposed displacement is
defined in order to characterize the hysteretic stability, i.e. the strength and stiffness
degradation.
The last test series was decided to be cyclic with increasing amplitude up to the capacity of
the structure. The cyclic tests were performed with imposed displacements on the top of
the structure (fourth floor), being the three lower floors force-controlled, according to a
inverted-triangular storey-wise distribution (see Figure 4.72). Such force distribution
should result in a first-mode-like deformed shape.
The applied load cycles had symmetric and gradually increasing peak displacement, and
were generally repeated once at each peak displacement in order to observe the hysteretic
stability. The imposed lateral displacement time histories for both tests (frames A and B)
are composed by two equal complete symmetric cycles for each displacement level, as
shown in Figure 4.72. The displacement amplitudes (peak horizontal displacement) for
each series of cycles were defined on the basis of the maximum top-displacement reached
during the previous pseudo-dynamic test for each earthquake level. Figure 4.72 also shows
a schematic representation of the force pattern.
a)
b)
Figure 4.72 - Controlled force pattern and top-displacement: a) schematic representation; b) history of imposed lateral displacements
Step

Chapter 4
247
Table 4.14 gives the peak horizontal top-displacement imposed for each cycle and for each
test (BF and SR). The maximum top-displacement obtained for each experimental
earthquake test is displayed in brackets. Therefore, the displacement history imposed at the
roof of the structure consisted on: two cycles of 60 mm, two cycles of 120 mm, and two
cycles of 200 mm, as stated in Table 4.14.
Table 4.14 - Peak horizontal top-displacement imposed in the BF-cyclic and SR-cyclic tests
Displacements (mm) Test
D1 D2 D3
BF-cyclic 60 (60.8) 120 (116.7) ---
SR-cyclic 60 (63.2) 120 (116.3) 200 (219.5)
From the idealized conditions in terms of storey restoring forces, results an invariant
relative storey shear profile, illustrated in Table 4.15.
Table 4.15 - Imposed shear profile
Storey Shear force Shear profile
4 4 F1
3 7 F1
2 9 F1
1 10 F1
Comparing the imposed shear profile with the profiles obtained in the earthquake tests
performed on the bare frame and on the selective repaired frame, a good agreement is
achieved with the proposed linear distribution of forces (triangular inverted), see
Table 4.16. In the table, the relative shear profiles are defined as the maximum shear at
each storey divided by the maximum base-shear. However, it should be noted that the
shear profiles from the earthquake tests are the envelope of the developed storey shear
forces. These storey shear maximum forces do not necessarily develop concomitantly.

Experimental work: analysis of test results
248
Table 4.16 - Shear profiles (obtained from the earthquake tests and imposed in the cyclic tests)
Maximum storey shear / Maximum base-shear Storey
BF475 BF975 SR475 SR975 SR2000 Cyclic test
4 0.46 0.51 0.42 0.57 0.60 0.4
3 0.67 0.71 0.62 0.70 0.77 0.7
2 0.90 0.94 0.87 0.86 0.82 0.9
1 1 1 1 1 1 1
4.10.2 - Selective strengthened frame cyclic test results
The results for the cyclic quasi-static test on the selective strengthened frame in terms of
storey displacements, maximum drift profiles, maximum shear profiles, storey shear-drift,
total energy dissipation, and base-shear versus top-displacement are given next.
Table 4.17 summarizes the maximum values for characteristic response variables, i.e. top-
displacement, global drift, inter-storey drift and storey shear, for the SR-cyclic test. The
corresponding values for the SR frame earthquake tests were given in Table 4.6.
Figures 4.73 and 4.74 compare the responses obtained for the earthquake pseudo-dynamic
tests with the final capacity quasi-static cyclic test. For each figure on the left, the curves
shear-drift achieved for the PsD earthquake tests (black curve), the respective envelope
curve (blue curves), and the corresponding shear-drift curve obtained for the cyclic quasi-
static test (red curve) are represented. On the right, only the envelope earthquake test curve
and the curve obtained for the cyclic quasi-static tests are represented.

Chapter 4
249
4th storey
3rd storey
2nd storey
1st storey
Figure 4.73 - SR and SR-cyclic tests: storey shear versus inter-storey drift

Experimental work: analysis of test results
250
Figure 4.74 - SR and SR-cyclic tests: base-shear versus top-displacement
Table 4.17 - SR-cyclic test: response maximum values (summary table)
Top-displacement (mm) Global drift (%)
201.53 1.87
storey 1 storey 2 storey 3 storey 4
Inter-storey drift (%) 2.77 2.72 1.75 1.05
Storey shear (kN) 193.6 175.3 132.7 79.5
From the analyses of the storey shear-drift curves, it can be concluded that:
• For the 3rd and 4th storeys, it is observed an increase in stiffness ('hardening') after
certain inter-storey drift level (of about 1% drift). The strengthening technique
applied in these two storeys, consisted on the addition of external steel bars that
work only after certain drift level, which explains this effect. Recall that this
effect was already evident in the precedent earthquake pseudo-dynamic tests. The
required level of drift at which this effect appears seems to increase with the
accumulation of damage after each test.
• The maximum drift obtained at the first and second storeys was rather
non-symmetric, but, nevertheless, this difference is very similar to the one
observed in the previous earthquake tests.

Chapter 4
251
4.10.2.1 - Maximum absolute and relative rotations measured at the instrumented points
Figures 4.75 and 4.76 present the maximum (absolute and relative) rotations measured
during the tests performed on the selective repaired structure (earthquake and cyclic tests).
Only results for the 2000-yrp PsD test are presented because this is the test that achieved
storey drift levels comparable with the final capacity cyclic test on this frame.
From the analysis of Figures 4.75 and 4.76, it can be observed that the rotations achieved
in the dynamic and cyclic tests are identical. This similarity is verified in terms of
maximum rotation values and distribution in the structure.
SR2000 – max. abs. rotation = 37.3 mRad SR-cyclic – max. abs. rotation = 36.2 mRad
Figure 4.75 - SR2000 and SR-cyclic tests (frame B): maximum absolute rotation demands
SR2000 – max. relat. rotation = 38.7 mRad SR-cyclic – max. relat. rotation = 37.0 mRad
Figure 4.76 - SR2000 and SR-cyclic tests (frame B): maximum relative rotation demands

Experimental work: analysis of test results
252
4.10.2.2 - Analyses of the repaired top-columns
This section is devoted to the analyses of the external top-columns of the 1st and 2nd
storeys. As said in Section 3.7.8.1, a relative displacement transducer was arranged at each
repaired joint intending to control the relative horizontal dislocation of the top-column
during each test. To help the analyses and interpretation of the results, the top-columns
studied were labelled as described in Figure 4.77.
Figure 4.77 - Nomenclature of the repaired external top-column (1st and 2nd storeys)
Figure 4.78 shows the evolution of the relative displacements measured at the instrumented
exterior top-columns, for the test on the original structure (PsD earthquake test, L33,
before repair), and for the test on the repaired structure (cyclic test, L38, after repair).
Figure 4.79 plots the relative displacement versus the correspondent inter-storey drift, for
the earthquake and cyclic tests.
From the analyses of Figures 4.78 and 4.79, it can be concluded that:
• For the final capacity cyclic test it was observed deformation related just to the
elastic behaviour of the structure, i.e., no permanent deformation was installed in
the top-columns during the cyclic test.
• The maximum inter-storey drift reached at the 2nd storey during the test L33 was
3.4 times inferior to the value obtained in the L38 test. Even for this much larger
value of drift obtained in L38 test, the lateral dislocation of the external columns
was prevented with the repair technique adopted.

Chapter 4
253
a)
b)
Figure 4.78 - Frame B (evolution of N2 and D2 top-columns dislocation): a) test L33 (before repair), b) test L38 (after repair)
N2
D2
Figure 4.79 - Frame B (joints N2 and D2): top-columns dislocation versus inter-storey drift before repair (test L33) and after repair (test L38)
4.10.3 - Bare frame cyclic test results
The frame A had considerable damage induced by the previous earthquake tests (which
was tested with infills). Due to the heavy damage inflicted during these previous tests, the
strong-column on the 1st storey and the external top-columns on 1st and 2nd storeys had to
be repaired. As already stated, the final capacity test on frame A was planned to be

Experimental work: analysis of test results
254
performed with values of top-displacement listed in Table 4.14. However, the predicted
collapse at the 3rd storey (reached in the bare frame earthquake test) for approximately
120 mm top-displacement was not reached in this cyclic test. The structure was slightly
damaged at the first two storeys during precedent earthquake tests, and, consequently, the
concentration of storey drift at the 3rd storey was not so pronounced.
The results for the cyclic quasi-static test on the bare frame in terms of storey
displacements, maximum drift profiles, maximum shear profiles, storey shear-drift, total
energy dissipation, and base-shear versus top-displacement are given next.
Table 4.18 summarizes the maximum values for characteristic response variables, i.e. top-
displacement, global drift, inter-storey drift and storey shear, for the BF-cyclic test. The
corresponding values for the BF frame earthquake tests were given in Table 4.1.
Figures 4.80 and 4.81 compare the response obtained for the earthquake tests (475, 975
and 2000-yrp) with the final cyclic test performed on the BF structure. For each figure, on
the left, are represented the curves shear-drift achieved for the earthquake tests (black
curve), the respective envelope curve (blue curves), and the corresponding shear-drift
curve obtained for the cyclic quasi-static test (red curve). On the right are represented only
the envelope earthquake tests curve and the curve obtained for the cyclic quasi-static tests.
Table 4.18 - BF-cyclic test: response maximum values (summary table)
Top-displacement (mm) Global drift (%)
249.7 2.31
storey 1 storey 2 storey 3 storey 4
Inter-storey drift (%) 1.75 2.21 4.35 1.07
Storey shear (kN) 219.9 196.9 152.6 87.2

Chapter 4
255
4th storey
3rd storey
2nd storey
1st storey
Figure 4.80 - BF and BF-cyclic tests: storey shear versus inter-storey drift

Experimental work: analysis of test results
256
Figure 4.81 - BF and BF-cyclic tests: base-shear versus top-displacement
From the analysis of the storey shear-drift curves, it can be observed that the earthquake
and cyclic test results are in conformity. For the bare frame and for all the storeys, the
envelope of the shear-drift diagrams of the earthquake tests involves the diagrams of the
cyclic tests. For the 3rd storey, the PsD envelope results are tangent to the response for the
cyclic tests. For the other three storeys this correspondence is not observed. But, it has to
be considered that the frame tested cyclically was already pseudo-dynamically tested with
infills. Moreover, during these tests, the frame experienced considerable drifts and
consequently damage, especially at the first and second storeys. The maximum inter-storey
drift observed during PsD tests was of 1.30%, 0.89%, 0.23%, and 0.14%, for the 1st, 2nd, 3rd
and 4th storey respectively. However, from the plots it can be observed that the cyclic
curves tend to the PsD envelope curves.
4.10.4 - Remarks
The results from the tests performed at ELSA laboratory on full-scale structures repaired
with FRP's demonstrate that by using advanced composites it is possible to significantly
improve the seismic behaviour/performance of vulnerable structures.
It is shown that a very effective (cost/benefit) repair or strengthening operation can be used
to repair local heavy damages, like the ones resulting from the effects of infill panels on
external columns and joints.
Chapter 4
257
It has been shown that the application of carbon fibre wraps on the critical regions of
damaged structural elements can recover an important part of the loss in stiffness and
strength of those members. In addition, improvement in energy dissipation capacity and the
global ductility of the structure can be achieved.
4.11 - LOCAL MEASUREMENTS
The measuring system designed for the tests presented in Chapter 3 includes several
inclinometers and displacement transducers. It was aimed at complete instrumentation of
the structure, to record both global and local responses. The rotations at potential plastic
hinge zones were recorded by the inclinometers and the displacement transducers recorded
slab-participation, total elongation of the girders, distribution of demands in the plastic
hinge zone and deformation of the 1st storey strong-column and beam-column joint.
Furthermore, it was possible to cross-check measurements from different systems placed at
the same zones of the model.
A more detailed discussion on the aspects of shear and flexural deformations of the strong-
column, slab-participation, plastic hinge length and joint deformation are dealt with in
specific dedicated reports. However, the principal aspects and main results are briefly
discussed herewith.
4.11.1 - Plastic hinge length
Displacement transducers were placed at the upper and lower parts of the girder in the
central joint at distances of 75, 150 and 350 mm from the column face in both the left and
the right column sides (see Figure 3.39). Figure 4.82 shows the results from these
transducers, in terms of uniform strain, i.e. displacement divided by the measuring length,
for the BF and SR tests. Figure 4.82-a compares the maximum strain envelopes, for the
975-yrp tests, between the bare frame and the strengthened frame, and Figure 4.82-b
summarizes the maximum uniform strain reached during the tests on the strengthened
frame.

Experimental work: analysis of test results
258
a)
b)
Figure 4.82 - Maximum uniform strain for positive and negative bending at the plastic hinge zone for the BF and SR tests
It is apparent that, as the response amplitude increases most of the deformation
concentrates in the first instrumented slice 0-75 mm (80% for the SR2000 test for positive
bending). Therefore, the plastic hinge length is very small compared to the values given by
common empirical expressions.
The empirical expression (4.2) proposed by Paulay and Priestley (1992) for the plastic
hinge length, lp, gives, at the instrumented beam herein studied, a value of 0.52 m, which is
higher than the values reached in the experimental tests (less than 0.20 m).
4.11.2 - Shear cracks at the base of the 1st storey's strong-column
In the PsD test, the analyses of the deformation measured at the horizontal relative
displacement transducer #105, in the strong-column at the base of the 1st storey, indicates
that the first development of the shear crack in that region corresponds to an inter-storey
drift of 0.4% (see Figures 4.83 and 4.84). In fact, the sudden change in the average
deformation, i.e. at 10 seconds for the bare frame test (see Figure 4.83), and at 12 seconds
for the infilled frame test (see Figure 4.84), corresponds to a permanent deformation due to
the aperture of a shear crack. The visual observations of the damage in the column confirm
this occurrence (see Figures B.19 and B.21).

Chapter 4
259
a)
b)
Figure 4.83 - BF475 test (1st storey strong-column): a) ID; b) elongation in transducer #105
a)
b)
Figure 4.84 - IN975 test (1st storey strong-column): a) ID; b) elongation in transducer #105

Experimental work: analysis of test results
260
4.11.3 - Slab-participation
In order to derive the contribution of the slab to the stiffness and strength of the girder
(slab-participation), displacement transducers were arranged in three critical zones, as
presented in Section 3.7.5.3 (see Figure 3.40). The three slab zones instrumented are: one
external short-bay, one internal short-bay and one internal long-bay. With the selected
locations for the instrumented slab zones, it is possible to compare the slab-participation in
a long span-bay versus a short span-bay as well as between interior and exterior joint
zones.
It is anticipated that, for tests where small deformations were reached, the results in terms
of deformation profile and, consequently, the computation of the slab-participation, do not
allow for sustainable detailed conclusions. Nevertheless, it was possible to find reasonable
indications of the slab-participation for the higher intensity tests.
The slab-participation, during the time response, SP(t), can be computed by the following
equation (see also Figure 4.85)
∫ ∫ ∆′+∆∆′+∆
=∆∆
=x x static
static dxtxx
txxdx
txtxtSP
),()(),()(
),(),()(
000
(4.16)
where the variables involved represent: )(tSP slab-participation; ),( tx∆ the deformation
measured at a generic point / fibre ( x ), function of time ( t ); and, ),( 0 tx∆ the deformation
measured at the beam level ( 0x ), function of time (t). The total deformation, ),( tx∆ ,
involves two components, namely the deformation due to static loads ),( txstatic∆ and the
deformation due to the time varying response, as represented in Figure 4.85.
If the deformation due to the static loads is negligible, the slab-participation can be
calculated as
∫ ′′
=x
dxtxtxtSP
),(),()(
0∆∆ (4.17)

Chapter 4
261
Figure 4.85 - Scheme of the slab-participation
For the discrete problem (see Figure 4.86), the slab-participation is computed as the
coefficient between the sum of the product of each slice area by the corresponding average
deformation and the maximum value of the deformation (deformation of the fibre closest
to the longitudinal beam)
∑ ⋅=i beam
ii t
tAtSP
)()(
)(∆∆
(4.18)
where: iA represents the characteristic length for slice i; )(ti∆ , the deformation measured
at point/fibre i of the slab; and, )(tbeam∆ , the deformation measured at point/fibre i of the
slab.
Figure 4.86 - Scheme of the slab-participation

Experimental work: analysis of test results
262
Equation (4.18) was used to compute the slab-participation (including the beam width) for
all PsD tests at the higher, lower and central fibre levels, and for the elongation and
shortening states. Figures 4.87 and 4.88 give the peak values results in terms of
elongation/shortening displacement (mm) computed at the mid-thickness of the slab, for
the internal long-bay, and for the BF and SR frames, respectively. They are indicative of
the noticeable concentration of deformation in the vicinity of the longitudinal beam.
Table 4.19 gives the calculated equivalent slab-participation width, at the medium fibre of
the slab, for elongation and for the internal long-bay.
elongation
shortening
Figure 4.87 - BF tests: maximum deformation distribution (mm) at the internal long-bay
elongation
shortening
Figure 4.88 - SR tests: maximum deformation distribution (mm) at the internal long-bay

Chapter 4
263
Table 4.19 - BF and SR tests: evaluation of the slab-participation for the internal long-bay
Test Slab-participation (m)
BF475 1.09
BF975 0.94
SR475 0.97
SR975 0.93
SR2000 1.08
It is important to refer to the values proposed in design codes, having in mind that those
values are intended for design/analysis purposes. For example, EC8 proposes:
• For exterior columns: 'the slab-width considered should be within the column
width, in the absence of a transversal beam. In the presence of a transversal beam
with similar dimensions to the longitudinal beam, the slab-width with a length
twice that of the slab thickness, on each side of beam should be considered'.
• For interior columns: 'the slab-width may be increased by twice the slab
thickness'.
Applying these code provisions to our case, where the slab thickness is 0.15 m, the beam-
width is 0.25 m, and column-widths are 0.30, 0.40 and 0.25 m, for joints 1, 2 and 3,
respectively, the slab-participation, for each zone, was calculated and is given in
Table 4.20.
Table 4.20 - Estimation of the slab-participation according to EC8 provisions
Joint / Bay Slab-participation (m)
1 (external-short) 0.90
2 (internal-short) 1.60
3 (internal-long) 1.45
Comparing the values of slab-participation, estimated from the experimental PsD tests,
with the values proposed in EC8, it can be observed that the value recommended for
analyses in the EC8 for the interior long-bay studied is 1.45 m, which is 45% higher than
the value obtained from experimental tests (approximately 1.00 m). This might indicate
that slab collaborating width, for structures with smooth round rebars, is quite smaller than

Experimental work: analysis of test results
264
the values proposed in the design codes, and also smaller than the values estimated from
other experimental tests on new structures constructed with improved-bond steel (e.g.
Tjebbes, 1994).
4.11.4 - Diagonal deformation of the short external panel
The short external panel was instrumented with transducers in order to catch the total
deformation in the diagonal direction of the panels, and, short (0.50 m) transducers were
setting-up in the corners, accordingly with schemes presented in Section 3.7.6, to capture
the deformation in these corners. With the instrumentation in the corners it was intended to
measure the deformation due to the separation between the infill panel and the frame
(when in tension) and the crushing deformation (when in compression). As shown in
Figure 4.89, three zones (central, inferior and superior) for each diagonal were identified
(ascending and descending, considering from left to right). Subtracting the diagonal
deformation measured in the corners to the total diagonal panel deformation, it is computed
the diagonal deformation in the central zone of the panel. For the long diagonal
non-instrumented, the deformation is calculated from the deformation in the transducer in
the adjacent panel (mid-panel).
Figure 4.89 - Nomenclature for diagonal deformation (six zones) in the short external panel
In Figures 4.90 to 4.97, are plotted the average strain evolution measured during the
earthquake tests on the infilled frame structure. In Tables 4.22 and 4.23 are listed the
maximum (positive and negative) deformation measured at each zone, for the three zones
(central, inferior and superior) for each diagonal (ascendant and descendent). It is also
presented the mean deformation calculated for the total diagonal. The number in brackets
corresponds to the zone label represented in schematic Figure 4.89.

Chapter 4
265
Table 4.21 - IN tests: maximum positive (elongation) and negative (shortenning) strain (‰) in the short external panel at the 1st storey
ascendant descending Test total
(2+1+3) central
(1) inf. (2)
sup. (3)
total (5+4+6)
central (4)
inf. (5)
sup. (6)
+ 0.660 0.158 1.410 1.497 0.727 0.139 1.291 1.045 IN 475
- -0.815 -0.368 -1.135 -0.908 -0.328 -0.111 -0.321 -0.597
+ 2.671 4.446 3.988 6.928 3.615 2.025 1.637 7.102 IN 975
- -2.850 -0.457 -7.959b -3.404 -1.461 -0.577 -1.287 -3.150
+ 5.387 3.199 9.423c 3.791 2.906 1.713 0.521 5.629 IN 2000a
- -2.792 -5.649 -0.002 -4.417 -5.311 -4.946 -0.687 -6.044
a) Due to the high level of deformation reached in the 2000-yrp test at the 1st storey, the instrumentation located in the masonry infill panels was removed, during the test (to 4.26 seconds), in order to avoid their deterioration.
b) It was verified the capacity saturation, in negative deformation, of the transducer located at the bottom of the ascendant diagonal.
c) The signal captured in the transducer located at the bottom of the ascendant diagonal, during the 2000-yrp test, is not of good quality, provably due to the damage of this transducer in the previous test.
Table 4.22 - IN tests: maximum positive (elongation) and negative (shortenning) strain (‰) in the short external panel at the 2nd storey
ascendant descending Test total
(2+1+3) central
(1) inf. (2)
sup. (3)
total (5+4+6)
central (4)
inf. (5)
sup. (6)
+ 0.615 0.273 1.234 0.603 0.753 0.621 0.618 0.511 IN 475
- -0.670 -0.463 -0.868 -0.370 -0.514 -0.464 -0.253 -0.460
+ 1.226 0.218 1.866 2.905 2.818 2.134 2.370 2.327 IN 975
- -1.679 -0.796 -2.761 -1.424 -1.205 -1.056 -0.453 -1.350
+ 1.354 0.071 2.976 2.663 2.186 1.711 1.815 1.661 IN 2000a
- -1.281 -0.467 -2.113 -1.407 -1.712 -1.586 -0.691 -1.409
Considering the maximum deformation at the 1st storey for the IN tests (Table 4.8) for the
475-yrp test, the relative deformation at the corners (zones 2, 3, 5 and 6) is 5 to 10 times
higher than at the central part of the diagonal (zones 1 and 4). For earthquakes of higher
intensity, the average strain observed at the corners and in the central part tends to be of
comparable magnitude. This is the normal infilled masonry frames behaviour under
horizontal loads. In fact, for smaller load intensities, the separation between the panels and
the surrounding frame (deformation concentrated in the interface infill/frame) starts. For
higher intensities, the mechanism of diagonal strut appears and the panel deformation
pattern implies deformation also into the interior of the panel (central part, zones 1 and 4).

Experimental work: analysis of test results
266
IN475 IN975
IN2000
Figure 4.90 - IN tests: 1st storey strain of the short external panel (total mean diagonal strain)
IN475 IN975
IN2000
Figure 4.91 - IN tests: 2nd storey strain of the short external panel (total mean diagonal strain)
IN475
IN975 IN2000
Figure 4.92 - IN tests: 1st storey strain of the short external panel (middle)
IN475 IN975
IN2000
Figure 4.93 - IN tests: 2nd storey strain of the short external panel (middle)
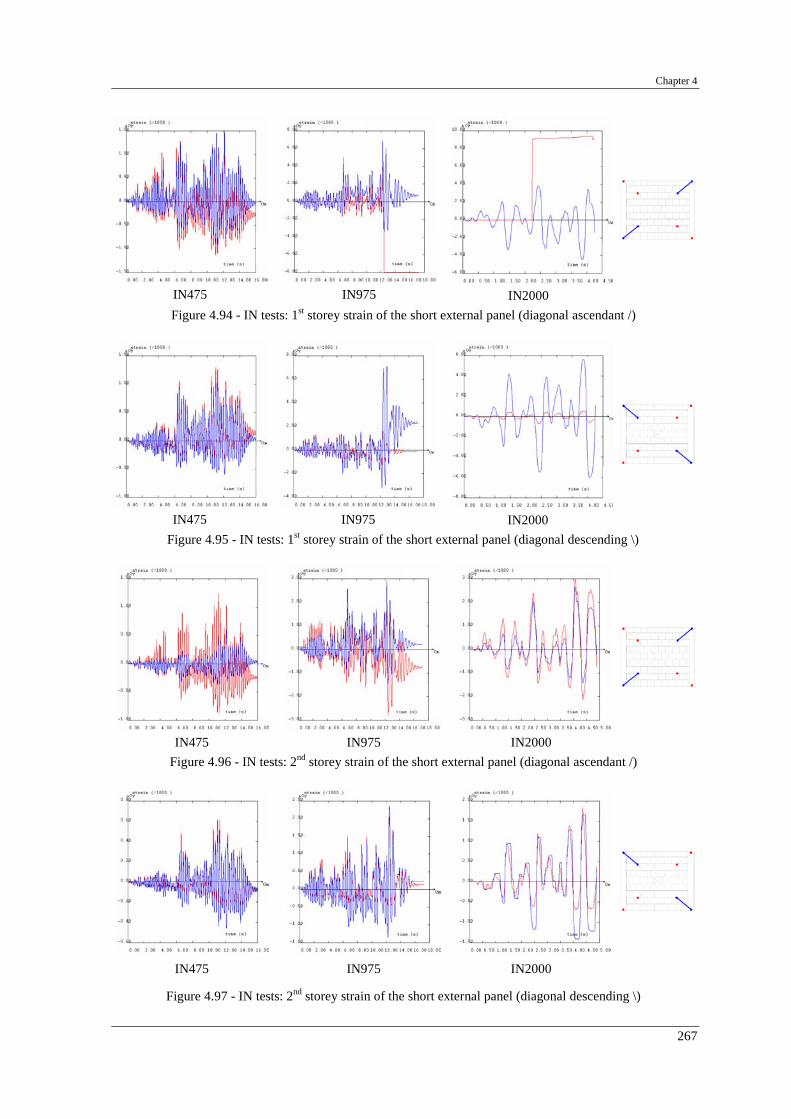
Chapter 4
267
IN475
IN975 IN2000
Figure 4.94 - IN tests: 1st storey strain of the short external panel (diagonal ascendant /)
IN475
IN975 IN2000
Figure 4.95 - IN tests: 1st storey strain of the short external panel (diagonal descending \)
IN475
IN975
IN2000
Figure 4.96 - IN tests: 2nd storey strain of the short external panel (diagonal ascendant /)
IN475
IN975
IN2000
Figure 4.97 - IN tests: 2nd storey strain of the short external panel (diagonal descending \)

Experimental work: analysis of test results
268
From the analyses of the previous figures, where the average strain in the external short
infill panel for the PsD tests on the IN frame was depicted, the following should be noted:
• The analyses of the strain (deformation) in the total diagonal gives more
information, particularly to the compression state, than the observed in the central
and extremities zones of the diagonal, because it contains the deformation observed
at the joint plus the panel deformation. It should be said that in compression
direction, it is not expected high deformation in the joint, since these joints are
closed. For the particular case of this external panel, pseudo-dynamic earthquake
tests can be compared with the small wallets tested in diagonal compression.
• In Figure 4.95, for the 2000-yrp test, it is noted a quite large increase of the
deformation at the 1st storey external top-corner, when compared with the opposite
internal bottom-corner. This is due to the larger separation experienced between the
masonry panel and the frame observed at the external top-corner. In fact, looking at
the same results at the end of the 975-yrp test, it is noted a considerable residual
deformation in this corner. This is the first indication of shear-out of the external 1st
storey column at the top, as will be deeply analysed in the next test results analysis.
• The maximum diagonal average strain observed for the 475-yrp test is
approximately equal to the ultimate value reached in the diagonal compression
wallet tests. For the 975-yrp test this ultimate value is clearly over passed at around
6.5 seconds, which corresponds exactly to the first evident crack observed in the
infill panel (see damage description in Section 4.5.2 during infill masonry frame
tests). This crack appears in the direction corresponding to the compression in the
strut ascendant, which is confirmed by the plots in Figure 4.90.
• In Figure 4.90 it is also observed at the first storey a tendency (475 and 975-yrp
tests) to bigger development of compression deformation in the ascendant diagonal,
when compared with the other diagonal. This is due to the higher rigidity of the
bottom part of the external column, when compared with the top part. After 12
seconds of ground motion test, a much higher deformation was observed, which is
in correlation with the considerable propagation of damage observed in the infill
panel (see damage description in Section 4.5.2).

Chapter 4
269
• For the second storey (Figure 4.91), it is observed a global diagonal compressive
deformation bigger than the ultimate limit, which is in correlation with the
observed initiation of crushing in the external top corner of the 2nd storey external
infill panel. The maximum deformation observed during the 975-yrp test is not
over-passed in the 2000-yrp test. It should be also said that this maximum
deformation observed at the 2nd storey for the 2000-yrp test is almost half the
maximum value reached at the first storey for the 975-yrp test.
In Figures 4.98 to 4.105 are plotted the average strain evolution measured during the PsD
tests on the infill strengthened frame structure. In Tables 4.24 and 4.25 are listed the
maximum (positive and negative) deformation measured at each zone, for the three zones
(central, inferior and superior) for each diagonal (ascendant and descendent). It is also
presented the mean deformation calculated for the total diagonal. The number in brackets
corresponds to the zone label represented in the scheme of Figure 4.89.
SC475
SC975
SC2000
Figure 4.98 - SC tests: 1st storey strain of the short external panel (total mean diagonal strain)
SC475 SC975
SC2000
Figure 4.99 - SC tests: 2nd storey strain of the short external panel (total mean diagonal strain)

Experimental work: analysis of test results
270
SC475
SC975
SC2000
Figure 4.100 - SC tests: 1st storey strain of the short external panel (middle)
SC475 SC975
SC2000
Figure 4.101 - SC tests: 2nd storey strain of the short external panel (middle)
SC475
SC975
SC2000
Figure 4.102 - SC tests: 1st storey strain of the short external panel (diagonal ascendant /)
SC475
SC975
SC2000
Figure 4.103 - SC tests: 1st storey strain of the short external panel (diagonal descending \)

Chapter 4
271
SC475
SC975
SC2000
Figure 4.104 - SC tests: 2nd storey strain of the short external panel (diagonal ascendant /)
SC475
SC975
SC2000
Figure 4.105 - SC tests: 2nd storey strain of the short external panel (diagonal descending \)
Table 4.23 - SC tests: maximum positive (elongation) and negative (shortenning) strain (‰) in the short external panel at the 1st storey
ascendant descending Test total
(2+1+3) central
(1) inf. (2)
sup. (3)
total (5+4+6)
central (4)
inf. (5)
sup. (6)
+ 0.538 0.102 1.501 2.531 1.010 0.142 1.793 1.589 SC475
- -1.057 -0.780 -0.947 -2.342 -0.200 -0.021 -0.196 -0.565
+ 0.944 0.681 2.536 3.982 1.579 0.193 2.766 2.597 SC975
- -1.565 -1.128 -1.938 -4.770 -0.501 -0.093 -0.466 -1.278
+ 5.408 10.677 6.157 26.520a 12.503 0.428 22.082 24.556 SC2000
- -3.043 -8.889 -9.381 -11.104 -2.577 -0.811 -1.850 -5.526
a) It was verified the capacity saturation, in positive deformation, of the transducer located at the top of the ascendant diagonal.

Experimental work: analysis of test results
272
Table 4.24 - SC tests: maximum positive (elongation) and negative (shortenning) strain (‰) in the short external panel at the 2nd storey
ascendant descending Test total
(2+1+3) central
(1) inf. (2)
sup. (3)
total (5+4+6)
central (4)
inf. (5)
sup. (6)
+ 1.370 0.127 2.703 2.550 1.065 0.167 1.864 1.654 SC475
- -1.455 -0.871 -1.922 -1.124 -0.711 -0.095 -0.738 -1.736
+ 1.906 0.194 3.463 3.909 1.711 0.184 2.728 3.172 SC975
- -2.023 -1.038 -3.013 -2.051 -0.900 -0.141 -0.861 -2.154
+ 5.946 0.175 5.008 20.076 8.898 0.625 16.486 20.136 SC2000
- -4.499 -1.253 -9.812 -5.785 -1.425 -0.185 -1.291 -3.727
From the analyses of the previous figures, where the average strain in the external short
infill panel for the earthquake tests on the SC frame was depicted, the following should be
noted:
• In Figure 4.98 it is observed that the limit of compressive deformation in the
strengthened masonry is reached. However, contrary to the immediate increase of
the tension deformation in the orthogonal direction (due to the crack opening)
observed in the previous infill tests, here in the SC tests, it is not verified. This is an
important effect of the masonry strengthening that provides a significant increase of
the tension strength, preventing the crack opening and propagation.
4.12 - FINAL REMARKS AND CONCLUSIONS
The main findings from the experimental campaign are summarised here. These
conclusions are presented for: i) the PsD tests on the bare and strengthened frames; ii) the
PsD tests on the infilled and infill strengthened frames; iii) the cyclic tests performed at the
2nd storey of the frame retrofitted with the K-bracing technique; and finally, iv) the final
capacity cyclic tests on the bare and strengthened frames. A conclusive section presents
final remarks of the entire PsD and cyclic test campaigns.

Chapter 4
273
4.12.1 - Bare and selective strengthened frames
A series of pseudo-dynamic tests on a full-scale model of a four-storey RC frame
representative of existing structures designed without specific seismic resisting
characteristics were carried out at the ELSA laboratory.
Two testing campaigns were performed aiming at: a) a vulnerability assessment of the bare
frame; and, b) assessment of the earthquake performance of the frame retrofitted using
selective retrofit methods. The BF was subjected to two earthquakes of increasing intensity
reaching imminent collapse at the 3rd storey during the second earthquake test. It was then
repaired and strengthened using the selective techniques and subsequently was subjected to
three earthquake input motions with increasing intensity.
The bare frame was tested first for an earthquake corresponding to a 475-yrp, when no
significant damage was observed. Subsequently, the frame was subjected to an earthquake
corresponding to a 975-yrp, and for this test a heavy level of damage was reached. In fact,
imminent collapse was attained for 7.5 seconds of the accelerogram. The significant
change in stiffness and strength from the 2nd to the 3rd storey, coupled with the inadequate
lap-splice, induced the development of a soft-storey mechanism at the 3rd storey.
The analysis of the test results from the BF confirmed the high vulnerability of the original
(non-strengthened) frame. In fact, in spite of 'a satisfactory performance' for the nominal
input motion test corresponding to a return period of 475 years (BF475) (slight damage
observed), the structure reached imminent collapse for an input intensity slightly higher
than the nominal one (1.3 times, in terms of PGA and corresponding to a 975-yrp input
motion).
The rather uniform distribution of demands for the BF475 test (maximum drifts of 0.4, 0.7,
0.8 and 0.5% were reached at the first, second, third and fourth storeys, respectively) was
completely altered for the BF975 test (maximum drifts of 0.63, 1.0, 2.4 and 0.9% were
reached at the first, second, third and fourth storeys respectively). From the shear-drift
diagrams, it is apparent that the peak shear force at the 3rd storey is reached for a drift of
1.8% with subsequent important strength decreasing (imminent collapse). Furthermore,
there was evidence of premature shear cracking in the strong-column at the 1st and 3rd
storeys (where lap-splice exists) for storey drifts of approximately 0.4%. Tests on a similar

Experimental work: analysis of test results
274
frame with infill panels have also shown shear crack initiation for 0.4% drift in the 1st
storey, while severe (dangerous) shear cracking was apparent for storey drifts of 1.3%.
The results from the SR tests have shown a rather improved seismic performance. In fact,
the SR frame was subjected to the same input motions as the BF with limited structural
damage, and was able to withstand an input motion with intensity 1.8 times the nominal
one (corresponding to a return period of 2000 years) maintaining its load carrying capacity
with repairable damages. The retrofitting operation addressed and solved the irregularity
problem and the confining steel plates definitively increased the limited deformation
capacity of the central strong-column. In fact, drift demands were rather uniformly
distributed in the first three storeys for the three earthquake tests and reached values much
higher than the values of the bare frame tests. Inter-storey drifts of 2.8, 3.0, 1.6 and 0.9%
were reached at the first, second, third and fourth storeys, respectively, without loss of load
carrying capacity. It is noted that 2.8% drift in the first storey is twice the ultimate drift
identified from the original (non-strengthened) frame. Therefore, it is concluded that the
deformation capacity of the first storey is, at least, the double of the original structure.
There are other aspects that should be highlighted from the test campaigns on the original
and strengthened frames, namely:
• As expected, the strong-beam weak-column deformation/dissipation mechanism
(storey mechanism) is the only one activated for all tests. However, slight higher
demands in the beams were apparent for the retrofitted frame.
• There is a strong concentration of the inelastic demands at the member ends,
leading to equivalent plastic hinge lengths much lower than the empirical values
proposed in the literature (calculated plastic hinge lengths are 40% of the
empirical values). This is a direct consequence of the poor bond characteristics of
the smooth round rebars, which leads to extremely high slippage with
concentration of the deformation at the member (beam and column) extremities.
• The values calculated for the slab-participation are also much lower than the
values proposed in the design codes and also lower than the values estimated from
tests on building structures with improved bond steel (approximately 45% lower).
This is also a direct consequence of the poor bond characteristics of the smooth
round steel reinforcement also used in the slabs.

Chapter 4
275
• The test results confirmed that lap-splice at the base of the columns, particularly
in existing structures with smooth round rebars with extremity hooks and poor
detailing and amount of shear/confinement reinforcement, develop premature
shear cracks at the bar termination zones for inter-storey drifts of approximately
0.4%. These shear cracks dictate dangerous shear failure of the columns for inter-
storey drifts in the range of 1.3-1.8%.
4.12.2 - Infilled and infill strengthened frames
The experimental pseudo-dynamic research programme on the infilled four-storey RC
frame, performed at the ELSA laboratory, involved tests on the original infilled frame and
on the same infilled frame with the infill panels uniformly strengthened at all the frame
storeys using shotcrete. Previous tests on a similar (nominally equal) bare frame had been
carried out with increasing intensity of the input earthquake motions bringing the structure
to collapse.
The aims of these testing campaigns were to assess the seismic performance of the bare
and infilled frames and to check the possible benefits from strengthening of the brittle infill
masonry panels (ceramic bricks with horizontal hollows and plaster). In fact, it is well
known that infill panels protect the frames for low/medium earthquake levels but its failure
for medium/high levels of the input motions prompts soft-storey mechanisms and
consequently premature failure of the entire structure. Therefore, strengthening of the infill
panels, improving its deformation capacity maintaining its horizontal load carrying
capacity would improve seismic performance of the entire structure also for severe levels
of the input motions.
Qualitative and quantitative analysis of the test results and considerations on the behaviour
of the frames were already made in the previous sections. However, a few important
aspects should be now underlined:
• The bare frame structure was subjected to two earthquakes corresponding to
return periods of 475 and 975 years (10% and 5% exceeding probability in 50
years). The first input motion caused slight damage to the frame (essentially

Experimental work: analysis of test results
276
cracking) but the second earthquake (only 1.3 times higher than the first one)
brought the frame to collapse. In fact, the second test was stopped at 7.5 seconds
(15 seconds was the duration of the earthquake) because imminent collapse was
reached at the 3rd storey. It was verified that the strong beam weak-column
mechanism is the only one activated and it was demonstrated that this type of
structures effectively represent a major source of risk for human life. It is recalled
that structures designed according to new design codes are deemed to withstand
earthquake input motions higher more than 2 times the design ones without
collapse (see Pinto, 1998).
• The tests on the IN structure confirmed that infill panels protect the frame
structure for low and medium intensity input motions. However, failure of the
infills with consequent abrupt loss of resistance prompts a soft-storey mechanism.
It however, underlined that the infilled frame was able to withstand part of the
earthquake corresponding to 2000-yrp (1.8 times higher the nominal one in terms
of PGA) while the bare frame failed during the 975-yrp earthquake test.
• Another important aspect that should be noted is the strong influence of the infills
on the behaviour of the structure. In fact, the drift demands during the high level
earthquake test on the bare frame concentrated in the 3rd storey where an
important change on stiffness and strength exists (irregularity). Otherwise, the
drift demands during the high level earthquake tests on the infilled frame
concentrated in the first two storeys with predominance at the ground storey
during the 2000-yrp earthquake test and without any excessive demands at the 3rd
storey. It is confirmed that infills substantially alter the behaviour of frame
structures and therefore, they must be taken into account in the assessment and
redesign of existing structure as well as in the design of new ones.
• It is known that infills have a beneficial effect on frame structures but it is also
recognized that its brittle failure (post-peak strength) with abrupt loss of loading
carrying capacity (softening) prompts dangerous storey mechanisms and rapid
collapse of the structure. Any strengthening of the infills panels 'preventing'
failure of the walls or conferring additional deformation capacity without abrupt
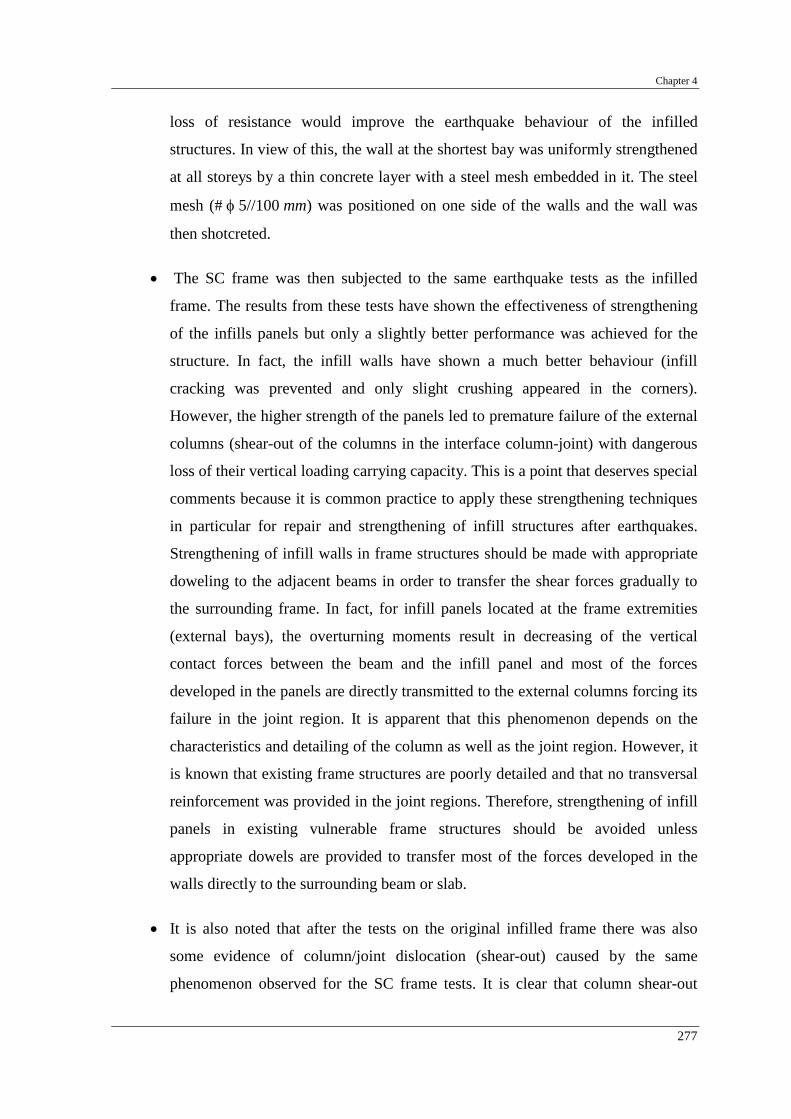
Chapter 4
277
loss of resistance would improve the earthquake behaviour of the infilled
structures. In view of this, the wall at the shortest bay was uniformly strengthened
at all storeys by a thin concrete layer with a steel mesh embedded in it. The steel
mesh (# φ 5//100 mm) was positioned on one side of the walls and the wall was
then shotcreted.
• The SC frame was then subjected to the same earthquake tests as the infilled
frame. The results from these tests have shown the effectiveness of strengthening
of the infills panels but only a slightly better performance was achieved for the
structure. In fact, the infill walls have shown a much better behaviour (infill
cracking was prevented and only slight crushing appeared in the corners).
However, the higher strength of the panels led to premature failure of the external
columns (shear-out of the columns in the interface column-joint) with dangerous
loss of their vertical loading carrying capacity. This is a point that deserves special
comments because it is common practice to apply these strengthening techniques
in particular for repair and strengthening of infill structures after earthquakes.
Strengthening of infill walls in frame structures should be made with appropriate
doweling to the adjacent beams in order to transfer the shear forces gradually to
the surrounding frame. In fact, for infill panels located at the frame extremities
(external bays), the overturning moments result in decreasing of the vertical
contact forces between the beam and the infill panel and most of the forces
developed in the panels are directly transmitted to the external columns forcing its
failure in the joint region. It is apparent that this phenomenon depends on the
characteristics and detailing of the column as well as the joint region. However, it
is known that existing frame structures are poorly detailed and that no transversal
reinforcement was provided in the joint regions. Therefore, strengthening of infill
panels in existing vulnerable frame structures should be avoided unless
appropriate dowels are provided to transfer most of the forces developed in the
walls directly to the surrounding beam or slab.
• It is also noted that after the tests on the original infilled frame there was also
some evidence of column/joint dislocation (shear-out) caused by the same
phenomenon observed for the SC frame tests. It is clear that column shear-out

Experimental work: analysis of test results
278
depends on the relative strength of the infill panel and the surrounding
columns/joints. But for existing structures, with poor column/joint detailing, this
serious damage is likely to occur. Therefore, seismic assessment of this kind of
structures shall take into account the possible negative effects of the infill in the
resisting frame. Moreover, any strengthening intervention (even renewal of walls
plaster may increase substantially the strength of the infill walls) should provide
adequate doweling systems to transfer the forces developed in the walls directly
from them to the surrounding beam/gird.
4.12.3 - K-bracing
A ductile steel eccentrically braced system has been presented for retrofitting brick-
masonry infilled reinforced concrete frames. The K-bracing with shear-link system is
formed by an assembly of steel beams, diagonal braces and a centrally located ductile
vertical shear-link which is designed to replace the infilled masonry in a single bay of a
concrete infilled frame. The assemblies are typically placed in one or more vertical arrays
over the height of the building. Conceptually, the design aims at developing a retrofit
system, which has a total storey shear resistance more or less equal to the lateral resistance
of the original infilled system but with a substantially increased ductile energy absorbing
capacity. The basically similar shear capacities prevent the development of a retrofitted
system, which may otherwise introduce excessively increased foundation loads. Other
significant characteristics of the K-bracing system are the extremely effective energy
dissipating properties of the shear-link, with drift capacities of up to 9%, and the
fundamental fact that cyclic shear-strain hardening of the web of the shear-link under
earthquake loads, leads under increasing displacements to a cyclic plastic shear resistance
of the link equal to about twice the initial lateral resistance at yield. This development
allows the shear-links, under increasing cyclic displacements, to compensate for the
progressive failure and loss of resistance of the non-retrofitted infilled walls.
The results of the tests on the retrofitted structure with a K-bracing with shear-link, in
which the retrofitted storey was subjected to cyclic displacement-controlled deflections of
increasing magnitude, showed the effectiveness of the solution. An excellent agreement
between the predicted response and experimental results could be observed. Also, the

Chapter 4
279
technology used to anchor a steel retrofit assemblage to the surrounding concrete elements
(beams and columns) was proven to be effective.
4.12.4 - Final capacity cyclic tests
A series of cyclic tests on the four-storey RC frames (bare frame and strengthened frame
with selective retrofitting techniques) were performed. The local failure of the external
columns/joints at the 1st and 2nd storeys, reached in the previous earthquake tests, would
not allow to perform a final capacity test on the frames to obtain their global ultimate
capacity. After repair and strengthening, with carbon fibre techniques, the frames were
subjected to the final capacity cyclic tests, consisting of imposed top-displacement cycles
with increasing amplitude and assuming a triangular inverted force distribution. It is noted
that the repaired frames were able to withstand storey deformations higher than the ones
reached in the previous PsD tests, maintaining its load carrying capacity.
The results from the tests performed at ELSA laboratory on full-scale structures repaired
and strengthened with FRP's demonstrate that by using advanced composites it is possible
to significantly improve the seismic behaviour/performance of vulnerable structures.
It is shown that a very effective (cost/benefit) repair or strengthening operation can be used
to repair local heavy damages, like the ones resulting from the effects on infill panels on
external columns and joints.
It has been shown that the application of carbon fibre wraps on the critical regions of
damaged structural elements can recover an important part of the loss in stiffness and
strength of those members. In addition, improvement in energy dissipation capacity and the
global ductility of the structure can be achieved. However, it is recognized that design of
the retrofitting schemes with FRP's requires a more rigorous scientific and technical basis.
4.12.5 - Remarks
The tests have shown that the vulnerability of existing RC frames designed without
specific seismic resisting characteristics, which are an important part of the existing

Experimental work: analysis of test results
280
buildings in European earthquake prone regions, constitute a source of high risk for human
life. Furthermore, it was demonstrated that advanced retrofitting methods, solutions and
techniques substantially reduce that risk to levels currently considered in modern seismic
design.
These tests produced a vast data set, which will be very useful as reference, and in setting-
up guidelines for the assessment and redesign of structures in earthquake prone zones. In
particular, these results serve as a basis for the calibration of EC8 Part 1-3. Moreover,
several authors have used these experimental results to calibrate and to improve numerical
models for various complexity levels (e.g. Pinho et al., 2000; Dolsek and Fajfar, 2001;
Delgado et al., 2002).

CHAPTER 5
REFINED AND SIMPLIFIED MODELS FOR EARTHQUAKE SIMULATION,
ASSESSMENT AND OPTIMAL REDESIGN OF EXISTING RC STRUCTURES
'... it must be recognised that the results of any analysis will be only an approximation to the true condition…' (Paulay and Priestley, 1992)
5.1 - INTRODUCTION AND MAIN OBJECTIVES
The purpose of structural analysis is to determine the stresses, strains, reaction forces, and
displacements of a given structure under given loading conditions. Based on the structural
analysis results, engineers are able to check whether a proposed design meets the
requirements regarding resistance to a combination of loading conditions, and, if
necessary, to revise its design until all requirements are met. At the present time, linear
elastic analysis remains the instrument of the design profession, for the calculation of
forces and stresses, as well as for the proportioning of structural members.
Nevertheless, linear elastic analysis' inability to reflect the real behaviour of structures
under abnormal or ultimate loading conditions has been pointed out. This follows because
almost all structures behave in some non-linear manner prior to reaching their limit of
resistance. As advocated by Yang and Kuo (1994), a more realistic evaluation of the
strength of structures against the failure conditions, or the factor of safety, can only be
achieved by analyses that take into account various non-linear effects. Also, from a review
of numerous analytical and experimental studies, Borges and Ravara (1969) have drowned
a general conclusion: the forces that develop in current buildings under the action of a

Refined and simplified models for earthquake simulation, assessment and optimal redesign of existing RC structures
282
strong earthquake generally exceed the elastic limits. Thus, it becomes necessary to study
the dynamic behaviour of buildings considering the non-linear properties of materials and
structures. For this reason, most modern codes based on the ultimate strength design
concept have incorporated certain provisions for structural engineers to consider the non-
linear and/or second order effects using either exact or approximate analysis techniques
(AISC, 1986; EC8).
In this regard, during the last decades, remarkable progress has been made towards a better
understanding of the performance of reinforced concrete buildings when subjected to
earthquake ground motions. Several authors, such as Umemura and Takizawa (1982),
Costa (1989), Coelho (1992), Varum (1995) and Arêde (1997), among others, developed
models and conducted studies on non-linear behaviour of RC buildings.
Two different classes of non-linearities can be identified. On the one hand, the geometric
non-linearity standing for the second order effects produced by finite deformations coupled
with change in stiffness of a structure under applied loading. On the other hand, the
material non-linearity standing for the changes in the physical response of a material to
stress or deformations, and appears in the form of path-dependent and non-unique
constitutive laws. In brief, the essential computational task in the analysis of problems
involving material non-linearity is that equations of equilibrium must be solved for the
structure using material properties that depend on strains (Yang and Kuo, 1994).
The study of the non-linear behaviour of RC frame structures requires knowledge of the
non-linear relationships between bending moments and curvatures at section level, based
on a fibre model, for example. These relationships can be established by assuming that the
transverse sections of the elements remain plane after deformation, and by adopting
idealised stress-strain diagrams for both concrete and steel (Borges and Ravara, 1969). The
monotonic stress-strain diagrams and hysteretic rules, for steel and concrete, are
established from experimental tests on material specimens or from theoretical laws.
Furthermore, based on field evidence of existing RC structures' behaviour during
earthquakes, and on experimental tests, it is known that those structures experience shear
failure, failure at the beam-column joints, and phenomena such as slippage of rebars
(specially when steel rounded rebars are used) and strain penetration. Therefore,

Chapter 5
283
appropriate models that take into account most of the mentioned phenomena should be
used.
Data on the real characteristics of buildings that have been subjected to earthquakes are in
general difficult to obtain. Hence, the experimental pseudo-dynamic test results on the full-
scale RC frame (presented in previous Chapters 3 and 4) generated an immense amount of
records, that were used to corroborate the numerical models adopted and improved in this
thesis. Therefore, the calibrated analytical models can be extensively used in reproducing
the real behaviour of existing RC buildings.
The numerical analyses performed in this thesis and presented in this chapter are based in a
non-linear fibre model, and take into account the material non-linearity according to the
specific materials properties presented in Section 3.2.5. Towards a realistic description of
the cyclic and the ultimate behaviour of existing RC structures, the studies conducted in
this thesis proved to be necessary the inclusion of the bond-slip of reinforcing bars.
Therefore, the bond-slip of smooth reinforcing bars was investigated, and the non-linear
numerical models were enhanced by the introduction of a slippage factor to account for it.
This chapter is divided into eight sections. Section 5.2 presents the computer software
CASTEM used in the non-linear numerical analyses of structures. Section 5.3 gives details
on the structure, on the numerical models adopted, on the materials parameters, loads and
retrofitting solutions' modelling. The description of the structural and materials models
used, and the corresponding model parameters is also reviewed in Section 5.3. In addition,
Section 5.3 describes the method of analysis used, as well as the fundamental assumptions
and the general formulation of the models. Section 5.3.5 dedicates special attention to the
improved representation of bond-slip for plain reinforcing steel bars, including a review of
previous work. Section 5.4 presents the natural frequencies and mode shapes numerically
evaluated. The experimental campaign, exposed in Chapters 3 and 4, was preceded by a set
of numerical analyses. Section 5.5 provides a short discussion on the numerical analyses
performed prior to the PsD earthquake tests.
Section 5.6 contains a description of the most significant numerical non-linear seismic
analyses of the four-storey RC planar bare frame (BF). The selective strengthening
solution applied to the central strong-column (selective strengthening based technique, SR)
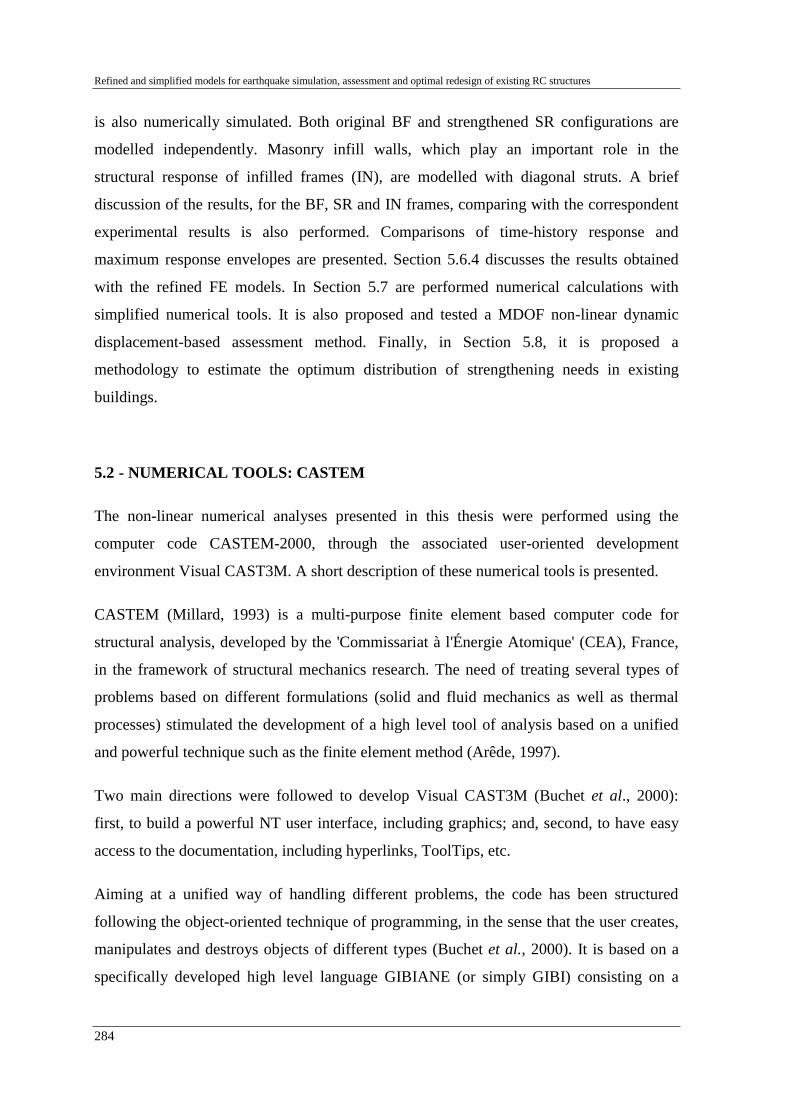
Refined and simplified models for earthquake simulation, assessment and optimal redesign of existing RC structures
284
is also numerically simulated. Both original BF and strengthened SR configurations are
modelled independently. Masonry infill walls, which play an important role in the
structural response of infilled frames (IN), are modelled with diagonal struts. A brief
discussion of the results, for the BF, SR and IN frames, comparing with the correspondent
experimental results is also performed. Comparisons of time-history response and
maximum response envelopes are presented. Section 5.6.4 discusses the results obtained
with the refined FE models. In Section 5.7 are performed numerical calculations with
simplified numerical tools. It is also proposed and tested a MDOF non-linear dynamic
displacement-based assessment method. Finally, in Section 5.8, it is proposed a
methodology to estimate the optimum distribution of strengthening needs in existing
buildings.
5.2 - NUMERICAL TOOLS: CASTEM
The non-linear numerical analyses presented in this thesis were performed using the
computer code CASTEM-2000, through the associated user-oriented development
environment Visual CAST3M. A short description of these numerical tools is presented.
CASTEM (Millard, 1993) is a multi-purpose finite element based computer code for
structural analysis, developed by the 'Commissariat à l'Énergie Atomique' (CEA), France,
in the framework of structural mechanics research. The need of treating several types of
problems based on different formulations (solid and fluid mechanics as well as thermal
processes) stimulated the development of a high level tool of analysis based on a unified
and powerful technique such as the finite element method (Arêde, 1997).
Two main directions were followed to develop Visual CAST3M (Buchet et al., 2000):
first, to build a powerful NT user interface, including graphics; and, second, to have easy
access to the documentation, including hyperlinks, ToolTips, etc.
Aiming at a unified way of handling different problems, the code has been structured
following the object-oriented technique of programming, in the sense that the user creates,
manipulates and destroys objects of different types (Buchet et al., 2000). It is based on a
specifically developed high level language GIBIANE (or simply GIBI) consisting on a

Chapter 5
285
wide set of commands and operators used to control and to define the program flow by
object manipulation in a specific environment or shell. The macrolanguage GIBI permits to
define the usual operations characteristic of finite element analysis, by means of simple
instruction involving commands or operators acting on input objects and, possibly,
generating new output objects.
The object-oriented features of CASTEM (Millard, 1993) lead to a high level of versatility
and flexibility in the sense that it can be adjusted to the particular problem to be solved. By
contrast to classical codes designed for the analysis of certain well-defined type of
problems, to which specific cases have to be adjusted, CASTEM allows the user to build-
up the program flow by himself, to follow the analysis task-by-task, to modify the task
sequence, to re-define tasks and to check their outputs. Summarising, CASTEM allows
adapting it to user's own needs.
Objects are defined as pieces of information grouped according to specific well-defined
rules characterising the object type. Arêde (1997) refers a list of main object types.
Commands and operators are used in the first case to perform operations on input objects
allowing to manipulate them by modifying them or not, and to generate new objects in the
second case. The available commands and operators in the GIBI language can cover a wide
range of purposes. Commands and operators can be organised following a user-defined
sequence of tasks in order to perform the desired analysis. Such sequence constitutes the
so-called GIBI input for CASTEM running session, either in interactive or batch mode.
Arêde (1997) illustrates with a comprehensive example how CASTEM works. He also
shows that for complex problems, the use of procedures becomes extremely advantageous;
procedures are sequences of operators cast in independent GIBI segments and acting as
higher-level operators to accomplish well-defined purposes. CASTEM provides a set of
built-in procedures to accomplish some usual tasks in structural analysis, which cannot be
handled by a single operator, but other procedures can be easily designed and implemented
by the user. Thus, concerning tool implementation or improvement, Arêde (1997)
highlights that the code offers two ways, viz:
• Development of procedures, written in GIBI (thus, strictly relying upon existing
operators) when the envisaged tasks do not involve new elements, models or
formulations; in these conditions, this is a low cost option from the implementation

Refined and simplified models for earthquake simulation, assessment and optimal redesign of existing RC structures
286
standpoint since it allows a very fast development and on-line testing, without the need
of modifications at the basic CASTEM software level.
• Development of new operators, based on existing and new sub-routines constituting the
code source software; new operators are required when not available elements. Models
or formulations are to be incorporated, and may be appropriate for efficiency purposes
when certain algorithms, despite also implementable at GIBI level, would lead to
cumbersome and computationally heavy procedures; the implementation cost of
operators is obviously higher than that of procedures, since it requires a more in-depth
knowledge of the code data structure in order to provide the adequate operator
interface.
In the present work, developments have been made at both procedure and operator levels.
The main contribution consisted on new improvements on existing operators in order to
incorporate the proposed Displacement-Based Assessment method and strengthening
optimization tools, presented in Sections 5.7 and 5.8 (see also Varum and Pinto, 2001-b).
In addition, several pre- and post-processing procedures for result analyses and
visualisation were developed.
Concerning the programming feature, it is worth mentioning that the source code is written
in an extended FORTRAN77 language, the so-called ESOPE language, which includes a
few additional instructions for management and data structures. Basically, arrays of data
are grouped into larger data segments, which are initialised, activated, de-activated or
surpassed according to the code flows needs. The required data for subroutines to perform
their tasks is made available by some of those extra instructions; once the data is no more
needed, other instructions are used to make it unavailable again. Each operator is supported
by a driver, i.e. a subroutine (written in ESOPE) where the input and output objects (fields,
models, tables, etc.) are decoded into segment-based data structures managed by ESOPE
instructions. The data is then transferred to lower level subroutines where the structural
calculations are performed. Typically, the lowest level subroutines just handle data in
traditional way of FORTRAN, which renders more transparent and easy the core of
implementations where the basic structure-related operations are performed (Arêde, 1997).
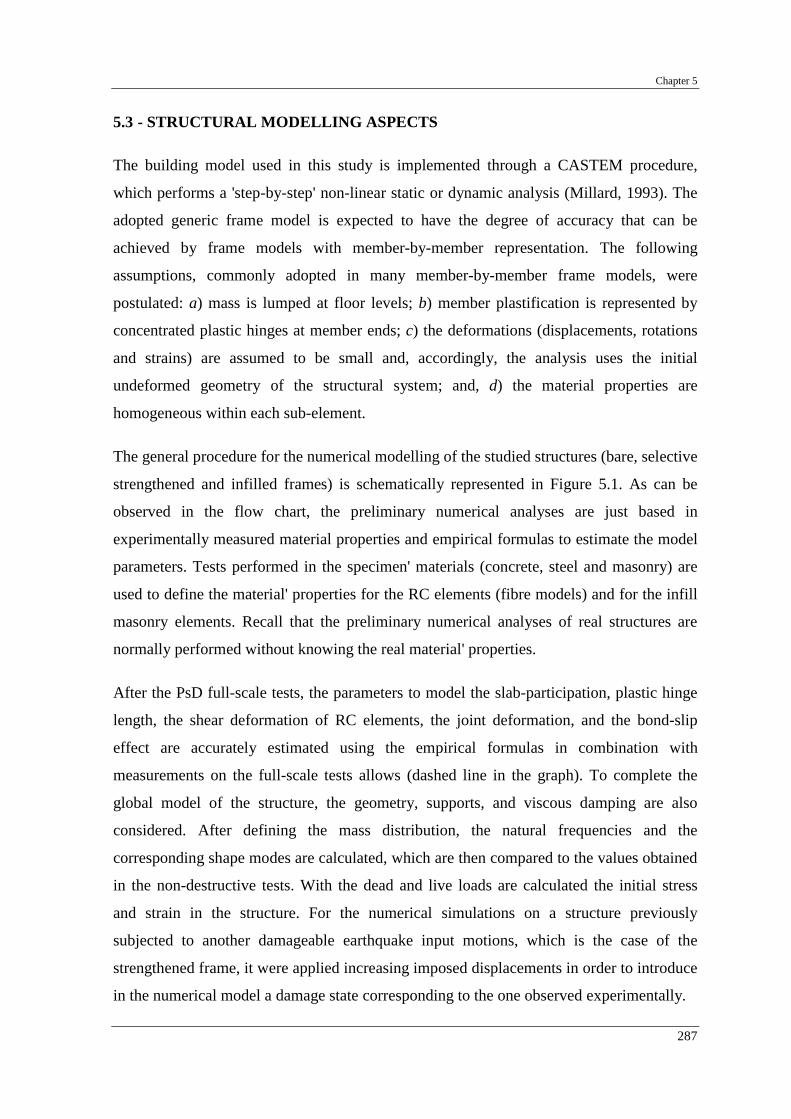
Chapter 5
287
5.3 - STRUCTURAL MODELLING ASPECTS
The building model used in this study is implemented through a CASTEM procedure,
which performs a 'step-by-step' non-linear static or dynamic analysis (Millard, 1993). The
adopted generic frame model is expected to have the degree of accuracy that can be
achieved by frame models with member-by-member representation. The following
assumptions, commonly adopted in many member-by-member frame models, were
postulated: a) mass is lumped at floor levels; b) member plastification is represented by
concentrated plastic hinges at member ends; c) the deformations (displacements, rotations
and strains) are assumed to be small and, accordingly, the analysis uses the initial
undeformed geometry of the structural system; and, d) the material properties are
homogeneous within each sub-element.
The general procedure for the numerical modelling of the studied structures (bare, selective
strengthened and infilled frames) is schematically represented in Figure 5.1. As can be
observed in the flow chart, the preliminary numerical analyses are just based in
experimentally measured material properties and empirical formulas to estimate the model
parameters. Tests performed in the specimen' materials (concrete, steel and masonry) are
used to define the material' properties for the RC elements (fibre models) and for the infill
masonry elements. Recall that the preliminary numerical analyses of real structures are
normally performed without knowing the real material' properties.
After the PsD full-scale tests, the parameters to model the slab-participation, plastic hinge
length, the shear deformation of RC elements, the joint deformation, and the bond-slip
effect are accurately estimated using the empirical formulas in combination with
measurements on the full-scale tests allows (dashed line in the graph). To complete the
global model of the structure, the geometry, supports, and viscous damping are also
considered. After defining the mass distribution, the natural frequencies and the
corresponding shape modes are calculated, which are then compared to the values obtained
in the non-destructive tests. With the dead and live loads are calculated the initial stress
and strain in the structure. For the numerical simulations on a structure previously
subjected to another damageable earthquake input motions, which is the case of the
strengthened frame, it were applied increasing imposed displacements in order to introduce
in the numerical model a damage state corresponding to the one observed experimentally.

Refined and simplified models for earthquake simulation, assessment and optimal redesign of existing RC structures
288
Finally, the earthquake input motions corresponding to the test series are applied. From the
results of the non-linear numerical analysis, the time-histories of storey displacements,
inter-storey drifts, storey shear, dissipated energies, etc. are obtained, which are
subsequently compared to the results of the PsD tests performed in the corresponding full-
scale frame structure.
empirical calculations
accounting for the slabparticipation, plastichinge length, shear/bending deformation, joint deformation, bond-slippage
material tests on concrete, steel and masonry
parameters for the non-linear modelling of materials
modelling of the RC elements at the cross-section level (fibre model)
modelling of the infills
2D global structural model
other modelling aspects: geometry, bearings, viscous damping
intact natural frequencies and shape modes
NON-LINEAR STATIC ANALYSIS:initial stress and strain due to dead and live loads
consideration of the previous damage state, when previous tests where performed on the structure
NON-LINEAR DYNAMIC ANALYSIS:time-history response (displacements and internal forces)
mass characterization
dead and live loads distribution
earthquake input motion
compare with non-destructive tests
COMPARES?
observations from the full-scale PsD tests
Figure 5.1 - Schematic flow chart of modelling procedures adopted for the RC frames

Chapter 5
289
The non-linear numerical analysis is performed in two steps. Firstly, the static loads are
imposed. Then, the displacements for pushover analyses or base acceleration for
earthquake input motion analyses are imposed.
The analysis is currently performed by 'step-by-step' integration procedures, which
comprise the following main phases: i) to divide the accelerogram in elementary short
duration pulses (about 1/10 of the smaller structural period that contributes to the dynamic
structural response); ii) to consider that while a certain pulse is acting the structural
behaviour is linear; and, iii) to compute the successive increments of displacements,
velocities and seismic forces due to the acceleration pulses, considering the actual stiffness
of the structure. In this way, time series corresponding to displacements, velocities,
accelerations and seismic forces defining the response of the structure are obtained.
The standard Newmark integration algorithm (currently one of the most widely accepted
integration techniques) is used in the static and dynamic non-linear calculations by means
of a common scheme. The non-linear dynamic problem is transformable into a pseudo-
static problem (in each load step). The dynamic equilibrium equations are integrated 'step-
by-step' using well-established algorithms, as presented in Arêde (1997).
5.3.1 - Description of the building frame model
As stated in Chapter 1, one of the aims of this study is to investigate possible seismic
retrofit schemes to use in the seismic upgrade of existing reinforced concrete frames, with
and without brick masonry infill walls, and with and without openings. The concrete frame
under study in this thesis was essentially designed for gravity loads only. The
reinforcement details were specified in order to be representative of buildings constructed
until the late 1970's in European Mediterranean countries, such as Italy, Portugal, Greece,
Turkey, etc.
The general layout and dimensions of the investigated structure were given in Figure 3.1. It
is a four-storey frame with three bays, two with a 5.00 m span and one external with
a 2.50 m span. Inter-storey height is 2.70 m for all four storeys, and a concrete slab 2.00 m
wide on each side and 0.15 m thick cast together with the beams. Equal beams (geometry
and reinforcement details) were considered in all floors (see Figure 3.2). All beams in the

Refined and simplified models for earthquake simulation, assessment and optimal redesign of existing RC structures
290
direction of loading are 0.25 m wide and 0.50 m deep. The columns have equal geometric
characteristics, except for the stocky column, which develops on the 1st and 2nd storeys
with dimensions of 0.60 m × 0.25 m and on the 3rd and 4th storeys with dimensions of
0.50 m × 0.25 m (see Figure 3.3 for reinforcement details). Further details on this plane
frame were presented in Section 3.2.1.
For the infilled frame, brick masonry panels (0.20 m thick) were constructed according to
the following specifications (see also Figure 3.12): a) the left-hand bay infill contains a
window (1.20 m × 1.10 m) at each level; b) the central bay contains a doorway (2.00 m ×
1.90 m) at ground level and at window openings (2.00 m × 1.10 m) at each of the upper
three levels of the building; and, c) the right-hand (2.50 m span) bay contains solid infill,
i.e., without openings.
The building studied in the present numerical analysis is represented by a plane frame
model (considering three DOF's per node, i.e. two translations and one rotation) with four
storeys and three bays, as represented in Figure 5.2. The cross-sections' geometrical
characteristics and the reinforcement detailing of the columns and beams are summarised
in Tables 5.1 and 5.2, respectively, while the reinforcement detailing were presented in
Figures 3.2 and 3.3.
Figure 5.2 - Model of the plane bare frame

Chapter 5
291
Table 5.1 - Columns cross-sections (m×m) and reinforcement detailing
Column alignment Columns
1 2 (strong-column) 3 4
3rd and 4th
Storey
1st and 2nd
Table 5.2 - Beams cross-sections (m×m) and reinforcement detailing
Bay (span length) Left Middle Right
1 (5.00 m)
2 (5.00 m)
3 (2.50 m)
5.3.2 - Improved element model
From local to more global models, many analytical models have been proposed to simulate
the behaviour of reinforced concrete structures.
The structure under study has been modelled as a planar frame, with Timoshenko finite
elements, using the computer program CASTEM. The evident advantage of a member-by-
member analysis lies in the quantitative assessment of overall structural safety with a direct

Refined and simplified models for earthquake simulation, assessment and optimal redesign of existing RC structures
292
reference to the process of the damage sustained by each constituent element (Umemura
and Takizawa, 1982).
Members of the planar-framed structure herein studied are slender elements and are
conventionally represented by line elements in the finite element analysis. Columns and
beams length are specified with centreline dimensions. The joints of planar frame are
assumed to be rigidly connected.
In order to have a more realistic model of the reinforced concrete frame, each element
(beam or column) has been modelled using five sub-elements, with one Gauss integration
point. As shown in Figure 5.3, in addition to the end stiff zones (sub-elements 2 in
Figure 5.3), which represent the joints, each beam/column is modelled by other three sub-
elements. Therefore, the structure has been modelled by Timoshenko elements with non-
linear behaviour at the potential plastic-hinge zones (vicinity of the frame joints), with
length lp, and elements with linear elastic behaviour in the internal sub-element of the
structural elements. Furthermore, a stiff linear elastic element was also considered to
simulate the joint rigidity. The non-linear elements are modelled by a fibre model with
uniaxial non-linear behaviour constitutive laws for the constituent materials (concrete and
steel). l
lp pl
312 21
2Sub-elements with linear behaviour
Sub-elements with non-linear behaviour - Fibre model1
3Joints (high stiffness) - Linear behaviour
Figure 5.3 - Generic element model: association of sub-elements with elastic linear (joints and central elements) and non-linear behaviour (plastic hinge zones)
The non-linear sub-elements (zone 1 in Figure 5.3) are modelled using the fibre-model
implemented by Guedes (1997). Each sub-element with non-linear behaviour is sub-

Chapter 5
293
divided into longitudinal fibres and each fibre behaves according to the material law it
represents.
In framed structures, joints are frequently modelled as an undeformable block of suitable
dimensions. Models that take into consideration concentrated rotations at the beam to
column interface provide flexural strength degradation. In the numerical analyses
performed in this thesis, the joints were modelled with stiff linear elastic elements (zone 2
in Figure 5.3). To accurately simulate the higher strength and stiffness of the joint due to
the confinement provided by the adjacent beams or columns, and by the transversal beams,
a high value for the mechanical characteristics of the elements representative of the joints
is considered. In the analyses, the Young modulus of each joint was considered to be three
times its original value.
Fifty-seven type-sections with non-linear behaviour were considered for a refined
modelling of the structure. Three type- sections were used for each of the sixteen columns
of the structure, plus three type-sections for each of the three beam bays. Using this
refinement, it is possible to define different material properties for each casting phase of
the columns corresponding to each storey level. In fact, a considerable difference in
strength was found for each casting phase of the columns. For the beams, it were
considered similar type-sections for all storeys, because the beams have the same
geometrical characteristics, as well as steel quantities and detailing, and, even though the
beams were casting in different phases (one phase for each storey), an analogous concrete
strength value was found for the four beams/slab casting phases (as presented in
Section 3.2.5).
5.3.3 - Plastic hinge length
To estimate the equivalent plastic hinge length (lp), see Figure 5.3, many expressions based
on experimental results have been suggested. One of the most commonly used expressions
to estimate the plastic hinge length, already presented in Chapter 4, was proposed by
Paulay and Priestley (1992)
sylp fll ⋅⋅+⋅= φ022.008.0 (5.1)

Refined and simplified models for earthquake simulation, assessment and optimal redesign of existing RC structures
294
where: l is the length of the RC element, lφ is the diameter of the main longitudinal
reinforcing bars, and fsy is the yielding strength of the reinforcement (in MPa). For typical
beam and columns proportions, the expression (5.1) results in
……………………………………. hl p ⋅≅ 5.0 (5.2)
where h is the section depth.
In the preliminary numerical analyses, the length of the non-linear fibre element (plastic
hinge length) was estimated based on the empirical formulae (5.1), the mean value of the
yielding steel stress (see Table 3.8), the steel bar diameter corresponding to each reinforced
concrete section, and considering that the used finite element is a Timoshenko element
with constant curvature (one integration point only), through a correction factor, as
justified in the next.
Assuming that the effective plastic hinge length can be estimated from the
expression (5.1), and that the curvature in the plastic hinge zone has a parabolic
distribution with extremity values given by mφ and yφ , the equivalent length hinge-
element, *pl , calculated for the same chord rotation, depends on the ductility. The evolution
of the ratio between the hinge element-length, *pl , and the plastic-hinge length, pl , is
plotted in Figure 5.4 as a function of the curvature and displacement ductilities. From the
plots in Figure 5.4, it is apparent that this factor tends to an asymptotic value, which is 0.4
(Varum and Pinto, 1999). In the preliminary analyses, this factor was taken as equal to 0.5,
which may be representative of an intermediate ductility demand level, as represented in
the expression
pp ll ⋅= 5.0* (5.3)
The plastic hinge lengths estimated from the PsD earthquake tests (less than 0.20 m, see
Section 4.11.1) are much lower than the values obtained from the empirical expressions. In
the earthquake tests, cracks opened at the extremity of the elements (base and top, for the
columns) and controlled the structural flexibility. It was concluded that the empirical
expressions do not properly evaluate the plastic hinge length for existing RC structures

Chapter 5
295
with smooth rebars (poor bond conditions). The insufficient ability to properly model the
real behaviour of the RC elements without considering a small value of the plastic hinge
length was noted from the results of the preliminary analyses. Therefore, the final
numerical analyses were performed considering a reduced length for the plastic hinges of
the slender columns to better account for the concentration of the deformation at the
elements' extremities in existing RC structures.
φy
φm
l *p
l p
l
0
0,2
0,4
0,6
0,8
1
1,2
1 3 5 7 9 11
Curvature ductility
lp*
/ lp
0
0,2
0,4
0,6
0,8
1
1,2
1 1,5 2 2,5 3 3,5 4
Displacement ductility
lp* /
lp
Figure 5.4 - Length of the non-linear fibre element
5.3.4 - Non-linear behaviour of RC elements
The numerical analyses were performed using a fibre model at section level, being the non-
linearities concentrated at the element extremities. As recalled by Guedes (1997), the fibre
model can be regarded as a step further in the refinement of standard beam models. In fact,
it uses the same cinematic formulation to compute the deformation of the longitudinal axis
of an element: two displacements and one rotation at each node. The difference to the
standard beam models relies on the procedure that it follows to calculate the resisting
forces: instead of considering a global constitutive law at the level of the transverse
sections, the fibre model computes the deformation and the stress of a set of points

Refined and simplified models for earthquake simulation, assessment and optimal redesign of existing RC structures
296
describing a mesh in the transverse section. The structure is thus divided not only in planar
beam type elements, but each of these elements is also sub-divided into longitudinal fibres.
One of the major limitations in this kind of model is the huge amount of computation
required. However, it is considered that a refined model would provide more detailed
results for a laboratory prototype.
A limitation that commonly appears in element models is the inability to consider the
effect of variation of axial loads in the flexural behaviour. In fact, several models do not
allow for considering the effects of varying axial forces (due to overturning). Instead, the
fibre model explicitly considers the variation of the flexural inelastic properties of the
columns according to the change of axial force. Axial load variation may lead to important
changes in the flexural behaviour of the columns, especially in the external ones, where the
axial load varies more significantly (overturning forces).
Fibre type models are in between the local and the global formulations. Although the
algorithm computes the global deformations at the level of the Gauss points of the
structural elements, the response is given by integration of the local forces calculated at
different points representing different materials and locations in the transverse section.
Fibre type models, such as the one used in this numerical analysis, are associated with
axial stress versus strain constitutive laws of the constituent materials (concrete and steel).
The shear and the axial stresses are uncoupled, and the Poisson effect is neglected or taken
into account through simplified models that consider the confinement effect of the stirrups
in the concrete core (Guedes, 1997). Nevertheless, fibre models are powerful tools in the
analysis of the behaviour of structural elements. In particular, RC columns are composite
elements particularly suited to being modelled by these fibre models.
The fibre model assumes the following simplifications (see Figure 5.5):
• The strain distribution across the section is assumed linear (the section remains
plain).
• Cracking of concrete occurs mainly perpendicular to the axis of bending.
• It is expected that shear failure does not occur, so that the effect of shear force on
the moment-curvature relations is not considered.

Chapter 5
297
d'
dh
M
N
b
snd
s1d
ih cixcid
ε
εcr
1/r
steel element 1 concrete el. 1
concreteelement i
concrete el. ncssteel element n
Figure 5.5 - General fibre method: section, discrete elements and curvature (adapted from CEB-161, 1983)
The general procedure to compute the internal forces at the section level consists on the
following steps:
i) for the confined and unconfined concrete and for the steel positions the section is
divided into an adequate number of elements, as shown in Figure 5.5;
ii) for a given curvature (εcr) and an assumed linear strain distribution, the average
strain in each element is computed and subsequently the strain is obtained from the
assumed stress-strain material models;
iii) in the case of cyclic loading, the stress-strain history of each element has to be
stored in order to calculate the stress corresponding to the given strain, employing
the rules of the cyclic stress-strain material model;
iv) the total internal forces are obtained by summing up the element forces over the
section;
v) the equilibrium of the forces in the section is checked. In general, this is achieved
by means of an iterative process with a new start in the assumed strain distribution
and the above steps are repeated until the equilibrium equation has been satisfied,
for the given moment and axial load.
The fibre model used in the numerical analyses was implemented by Guedes (1997) in the
computer code CASTEM. The fibre model has been implemented in a Timoshenko beam
element so that the distortional effect due to shear forces could be taken into account.
However, classical fibre models, as the one used in CASTEM, do not consider non-linear
behaviour laws for shear and this is the most important restriction of this model. If shear

Refined and simplified models for earthquake simulation, assessment and optimal redesign of existing RC structures
298
strain exists and assumes an important role in the global behaviour of a structure, some
attention must be taken in the numerical analysis. A detailed description of the used model
can be found in Guedes (1997), namely the algorithm, the compatibility and equilibrium
equations, the constitutive laws adopted for the materials, for monotonic and cyclic
loading.
To reduce the computational effort involved in obtaining the moment-curvature diagram in
the fibre method in the numerical analyses, and because we are working with 2D (plane)
frames, the sections are considered to be composed of a number of horizontal element
fibres, as illustratively represented in Figure 5.6 for a T-beam and for two column elements
of the frame. As shown in the figure, a higher refinement was adopted for the columns
when compared to the beams. This assumption is dictated by their relative importance in
the structure response, and keeps in mind the inherent computational effort, without loss of
accuracy. For the beams, the slab-participation with the respective significant slab
reinforcement was considered, at its top and bottom layers. The concrete in the slab was
considered as non-confined. For each steel group just one fibre element centred at its
resultant position was considered.
strong-column slender-column T-beam
Figure 5.6 - Discrete elements for the fibre model
Concerning the concrete, different stress-strain relationships are used to differentiate
between the confined concrete core of the sections and the unconfined concrete cover. In
CEB-161 (1983) it is stated that once the concrete cover strain reaches the spalling strain,
the concrete cover becomes ineffective. In addition, it is recommended a strain limit value
of 0.004 for the limit since the concrete cover must be neglected. In the numerical analysis,

Chapter 5
299
for all the elements (beams and columns), 2.5 cm for the concrete cover was considered, as
employed in the construction of the frames. Therefore, the longitudinal steel reinforcement
in beams and columns is centred at a level distant of about 4.0 cm of the external surface of
the RC elements. For the Poisson ratio (ν) was considered the value of 0.3 for all the RC
structural elements.
An exhaustive description of the material behaviour rules and models used in the
numerical analyses can be found in Guedes (1997) and Menegotto and Pinto (1973) for the
concrete and steel models, respectively. In the next section, the steel and concrete models
for the cyclic stress-strain behaviour are summarised.
5.3.4.1 - Concrete model
Figure 5.7 represents schematically the uniaxial concrete model. In compression, a
parabolic curve is assumed from the initial unloaded stage up to the peak stress values,
with initial tangent modulus equal to the concrete Young modulus. A straight line, which
slope depends on the confinement degree, describes the softening branch. Under tensile
stresses, the behaviour is described by a linear elastic branch with a subsequent softening
branch, which accounts for tension stiffening effects.
The model representing the main features of the concrete behaviour under cyclic loading,
takes secondary effects, such as crack closing, into account. The constitutive law for cyclic
loading is sketched in Figure 5.7 together with the various loading-unloading-reloading
paths. Analytical formulae and a detailed description of this model can be found in
Guedes (1997).
For the concrete in the full-scale RC frames, relevant differences of strength were found
between each casting phase. Therefore, in the numerical model different concrete
mechanical properties and specific model parameters were adopted for each casting phase
(storey columns and beams-girder floor levels). The mean value of the compressive
strength was taken for the peak strength of the unconfined concrete. For the corresponding
strain it was adopted 2.5‰. In the numerical models, the tensile ultimate strength was
assumed to be 1/10 of the corresponding compressive ultimate strength. The residual

Refined and simplified models for earthquake simulation, assessment and optimal redesign of existing RC structures
300
compressive strength is assumed to be 1/5 of the compressive ultimate strength for the
confined concrete and zero for the unconfined concrete. Table 5.3 summarises the average
relevant mechanical properties values of the concrete used in the numerical model
(obtained from the concrete tests presented in Table 3.6, in Section 3.2.5).
Figure 5.7 - Concrete axial stress-strain constitutive law: envelope monotonic curves for concrete under
tension and compression with the effects of confinement and cyclic curves (Guedes, 1997)
Table 5.3 - Concrete: parameters to the numerical model
zone (different casting phases)
columns Mechanical parameter
1st 2nd 3rd 4th beamsa
Compressive ultimate strength, cuf (MPa) 13.90 13.80 9.20 11.00 17.00
Compressive ultimate strain, cuε (%) 0.3 0.3 0.3 0.3 0.3
Young's modulus, cE (GPa) 22.8 22.8 19.9 21.1 24.4
confined 2.78 2.76 1.84 2.20 3.40 Residual compressive strength, rescf , (MPa)
unconfined 0.00 0.00 0.00 0.00 0.00
Tensile ultimate strength, tuf (MPa) 1.39 1.38 0.92 1.10 1.70
a) For the beams and girders it was used the average values of this different casting phases, because they do not differ substantially and their minor influence in the structural response.

Chapter 5
301
5.3.4.2 - Steel model
The steel model used supports an algebraic explicit stress-strain law, formulated on the
basis of experimental tests on bars under cyclic load (Menegotto and Pinto, 1973). The
steel model illustrated in Figure 5.8 includes typical curves for monotonic and cyclic
loading, valid for tension and compression. The monotonic curve is characterised by an
initial linear branch followed by a plateau and a hardening branch leading up to their
failure point. The cyclic behaviour is described by the explicit formulation proposed by
Giuffré and Pinto and implemented by Menegotto and Pinto (1973). A detailed description
of this model can be found in Guedes (1997).
Figure 5.8 - Uniaxial constitutive model for steel (Guedes, 1997)
The mechanical properties (mean values) for the steel reinforcement adopted in the model
for the numerical analyses are shown in Table 5.4 (based on the experimental results, see
Table 3.8).
Table 5.4 - Steel: parameters to the numerical model
Mechanical parameters Value
Yield stress, syf 343.6 MPa
Ultimate strength, suf 451.5 MPa
Ultimate strain, suε 22.9 %
Elastic Young's modulus, sE 204.5 GPa
Hardening strain, shε 3.03 %

Refined and simplified models for earthquake simulation, assessment and optimal redesign of existing RC structures
302
5.3.5 - Bond-slip modelling of the longitudinal reinforcing steel plain bars
Bond plays a fundamental role in the response of reinforced concrete members by allowing
the stress transfer from the steel bars to the surrounding concrete. Perfect bond is usually
assumed in the analyses of reinforced concrete structures. This implies full compatibility
between concrete and reinforcement strains. This assumption is only valid in regions where
negligible stress transfer occurs between the two components. Perfect bond between
reinforcing steel and concrete can only exist at early loading stages and at low strain levels.
As the load increases, cracking as well as breaking of bond unavoidably occurs and a
certain amount of bond-slip takes place in the element, all of which will in turn affect the
stress distributions in both steel and concrete. Near the cracks, high bond stresses develop
at the steel-concrete interface causing relative displacements between concrete and
reinforcement. Due to this bond-slip, different strains are observed in the steel rebars and
in the surrounding concrete (Monti and Spacone, 1998; Keuser and Mehlhorn, 1987;
Soleimani et al., 1979). Berra et al. (1994) stated that the steel to concrete bond in RC
structural elements subjected to cyclic loading can deteriorate, even before the stress state
has attained the yield stress of the steel or the stress strength of the concrete.
Thoroughly reliable analytical models are needed to analyse reinforced concrete building
frames subjected to strong earthquake motions. Indeed, one of the shortcomings of the
current models is their inability to include the relative slippage of the main reinforcing bars
in the joints. Since this effect causes fixed-end rotations of the elements, the stiffness of a
structure is overestimated. Moreover, slippage of reinforcing bars within the joints
increases the flexibility of the structure causing additional lateral displacements, which
may contribute to frame instability (Sasani et al., 1999; Soleimani et al., 1979). As stated
by Monti and Spacone (1998), the introduction of bond-slip of reinforcing bars in the
numerical models proves to be a necessary enhancement towards a realistic description of
the cyclic and the ultimate behaviour of reinforced concrete structures.
Several authors (e.g. Youssef and Ghobarah, 2001; 1999; Monti and Spacone, 1998;
Abrishami and Mitchell, 1996; Murayama et al., 1996; Berra et al., 1994; Rodriguez and
Park, 1994; Hawkins et al., 1987; Keuser and Mehlhorn, 1987; Adham et al., 1975; among
countless others) developed work in the bond-slip of RC elements under cyclic loading.
However, there is practically no investigation, experimental and numerical, on the cyclic

Chapter 5
303
behaviour of RC members with smooth reinforcing steel bars. The bond-slip of smooth
plain round bars gains vast significance considering that an important number of existing
reinforced concrete structures in southern Europe (see for example LNEC, 2000) were
constructed in the 1960's using these reinforcement steel bars.
The fibre element state determination is carried out at three levels: element, section and
fibre. Stresses and corresponding stiffness are determined at all the three levels. In
particular, the section state determination computes the axial forces N and bending
moments M (generalised forces) corresponding to prescribed section deformations (see
Figure 5.9), namely the average strain ( ε ) and the section curvature (φ ). Assuming linear
strain along the section, and that the deformed sections remain perpendicular to the
longitudinal element axis, the strain at a fibre located at a distance y from the reference
axis can be determined as follows
y⋅+= φεε (5.4)
N
M
h d
d'
b
concrete
ε
lip
c
s
c
s
εc= ε
(< ε)sε
ε = εslip c s− ε
(initial)
(deformed)
steel
Figure 5.9 - Bond-slip deformation of the constituent materials
When perfect bond is assumed between concrete and steel longitudinal rebars, both
concrete and steel fibres located at the same depth y have the same strain
εεε == cs (5.5)
This assumption is no longer valid when the effect of longitudinal reinforcing bars slippage
is observed (see Figure 5.9). The steel reinforcing constitutive laws are adjusted with
slippage factors (λ) in order to account for the slippage of the reinforcing steel bars
relatively to the concrete

Refined and simplified models for earthquake simulation, assessment and optimal redesign of existing RC structures
304
s
c
εελ = (5.6)
Basically, the correction is carried out by purely adjusting the characteristics of the
monotonic steel behaviour laws. considering the smaller steel strain for a certain level of
concrete strain. Therefore, in the fibre model used, the bond-slip is modelled explicitly
using a correction of the steel reinforcement constitutive law. Considering that steel
hardening strain in not reached, the steel constitutive law can be assumed as a bi-linear law
with an elastic perfect plastic behaviour (see Figure 5.10 and expressions 5.7 to 5.10).
Eσs,y
sσ
's,yσ=
s,0
Es'
s,yε εs,y'
εs
perfect bond
corrected behaviour law
Figure 5.10 - Correction of the steel reinforcing constitutive law
ysys ,', ελε ⋅= ysys ,
', σσ = 0,
' 1ss EE ⋅=
λ (5.7, 5.8, 5.9)
( )
( )
( )
( )
⋅⋅=←
=←≥
⋅=←<
=
sosss
ysssyss
ssssyss
ss
Eoccurssteelyieldingnotnotif
Ebondperfectif
ελ
εσ
σεσεε
εεσεε
εσ
,
,,
0,,
1)(
(5.10)
The bond-slip is accounted for by the slippage factor λ in the equations (5.7), (5.9) and
(5.10), which is a correction factor of the strain in the steel stress-strain behaviour curve.
The correction factor λ expresses the correction of the average steel strain in a RC finite
element. The parameter λ assumes the value 1.0 when perfect adherence between steel and
concrete is verified.

Chapter 5
305
For analytical applications, several constant, linear and non-linear approximations of the
bond stress-slip relationship are already published. Based on the bond stress-slip
relationship proposed by Eligehausen et al. (1983), the CEB-FIP Model Code 90 (1990)
adopts the model hereafter described. In the next, τ stands for bond stress and s for bond-
slip. It consists on an initial non-linear relationship ( )αττ 1max ss⋅= valid for s ≤ s1,
followed by a plateau maxττ = , then a linearly decreasing branch and finally a constant line
fττ = (see Figure 5.11 and expression 5.11). Details on this model can also be found in
CEB-217 (1993). In this model, the unloading branch of the bond stress-slip relationship is
linear and valid for all parts of the diagram. The unloading modulus is independent of the
bond-slip (Eligehausen et al., 1983) and has an average value of 200 N/mm3. The same
bond stress-slip relationship is assumed regardless of whether the bar is pulled or pushed
(CEB-217, 1993).
unloading branch
τmax
τfs
s3s2s1
1ss= τmaxτ
S
ατ
S
Figure 5.11 - Bond stress-slip relationship (CEB-217, 1993)
( )
( )
<
≤<
−−
⋅−−
≤<≤≤⋅
=
ss
sssssss
sssssss
f
f
3
3223
2maxmax
21max
11max 0
τ
τττ
ττ
τ
α
(5.11)
Table 5.5 gives the proposal of CEB-217 (1993) for the model parameters of the bond
stress-slip relationship for the case of smooth steel plain bars. The parameters depend on
roughness of the bar surface, bond conditions and concrete strength. They are valid for
both confined and unconfined concrete. Assuming s1 = s2 = s3, as proposed in
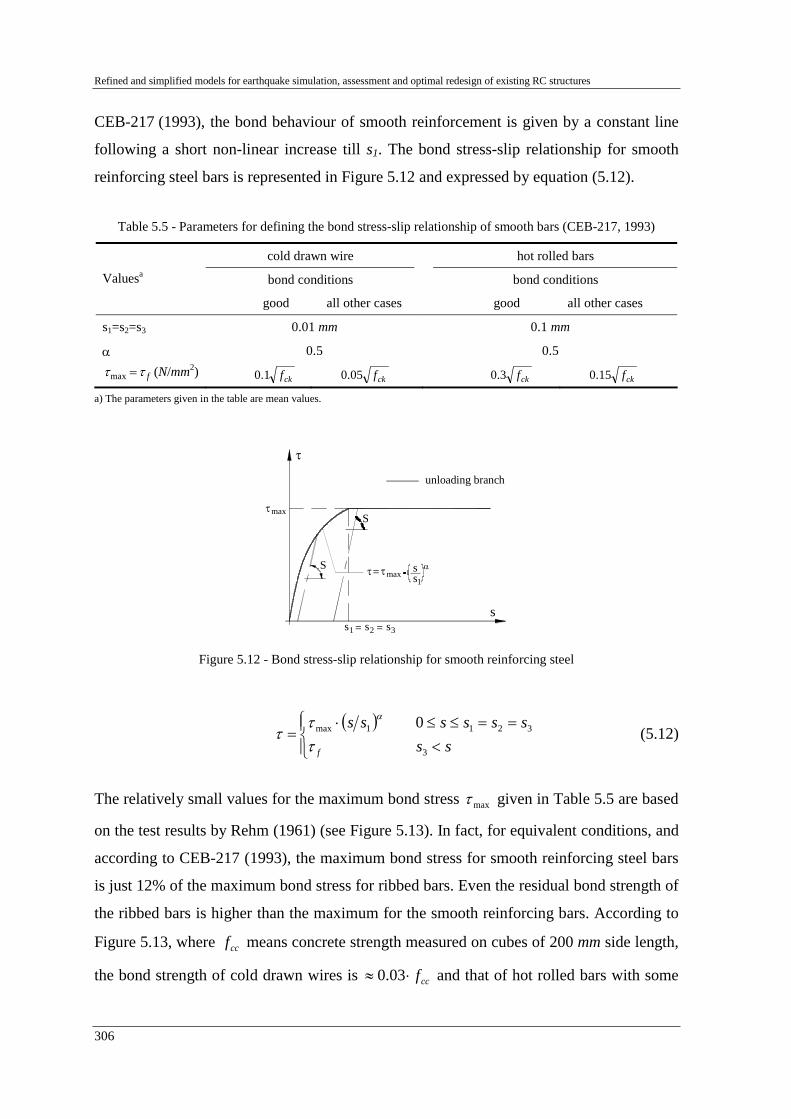
Refined and simplified models for earthquake simulation, assessment and optimal redesign of existing RC structures
306
CEB-217 (1993), the bond behaviour of smooth reinforcement is given by a constant line
following a short non-linear increase till s1. The bond stress-slip relationship for smooth
reinforcing steel bars is represented in Figure 5.12 and expressed by equation (5.12).
Table 5.5 - Parameters for defining the bond stress-slip relationship of smooth bars (CEB-217, 1993)
cold drawn wire hot rolled bars
bond conditions bond conditions Valuesa
good all other cases good all other cases
s1=s2=s3 0.01 mm 0.1 mm
α 0.5 0.5
fττ =max (N/mm2) ckf1.0 ckf05.0 ckf3.0 ckf15.0
a) The parameters given in the table are mean values.
ss1 2
maxτ
S
= s3=
τ1
ατmax ss=
unloading branch
S
τ
s
Figure 5.12 - Bond stress-slip relationship for smooth reinforcing steel
( )
<==≤≤⋅
=ss
ssssss
f 3
3211max 0ττ
τα
(5.12)
The relatively small values for the maximum bond stress maxτ given in Table 5.5 are based
on the test results by Rehm (1961) (see Figure 5.13). In fact, for equivalent conditions, and
according to CEB-217 (1993), the maximum bond stress for smooth reinforcing steel bars
is just 12% of the maximum bond stress for ribbed bars. Even the residual bond strength of
the ribbed bars is higher than the maximum for the smooth reinforcing bars. According to
Figure 5.13, where ccf means concrete strength measured on cubes of 200 mm side length,
the bond strength of cold drawn wires is ccf⋅≈ 03.0 and that of hot rolled bars with some

Chapter 5
307
scars is ccf⋅≈ 09.0 . As defended by Rehm (1961), the bond strength is proportional to ccf ,
while in the CEB-FIP Model Code 90 (1990) it is assumed proportional to 32ckf . In
Figure 5.14 are represented the results from Rehm (1961), as well as the curve proposed in
MC-90 (1990) for the bond stress-slip of plain reinforcing bars.
From cyclic tests on RC columns, both longitudinal and transversal reinforcement with
plain round bars as typically used in Japan, Takiguchi et al. (1988) concluded that the bond
stresses of the longitudinal bars were almost zero (less than fcm/50), when the specimens
reaches their strength. The maximum stress founded by Takiguchi et al. (1988) for the
maximum specimen's strength is inferior to the maximum bond stress proposed in the
CEB-217 (1993).
0,00
0,02
0,04
0,06
0,08
0,10
0,12
0,14
0,16
0,18
0,001 0,01 0,1 1
s (mm )
τ / f
cc
Rehm (1961)
MC-90 (1990)
Figure 5.13 - Comparison of the bond stress-slip behaviour of plain and deformed bars
(Rehm, 1961; CEB-217, 1993)
Figure 5.14 - Bond stress-slip behaviour of plain bars (Rehm studies, 1961; and, MC-90, 1990)
0.00
0.05
0.10
0.15
0.20
0.25
0.30
0.35
0.01 0.1 1 10 100
εc (‰)
s /
c
0
0.01
0.02
0.03
0.04
0.05
0.06
0.01 0.1 1 10 100
εc (‰)
ε s (‰
)
Figure 5.15 - Computed relative steel strain function
of the total ('concrete') strain Figure 5.16 - Computed steel strain function of the
total ('concrete') strain

Refined and simplified models for earthquake simulation, assessment and optimal redesign of existing RC structures
308
Based on experimental data from Rehm (1961), the variation of the parameter λ (see
equation 5.6) was estimated, and the results are represented in Figure 5.15. Further
refinements in this relation, including taking into account spacing between cracks, the
effect of cyclic loading and concrete strength, would be probably required from a
theoretical point of view.
For the structure under study, a mean concrete strength of 16 MPa was found (see
Section 3.2.5). Assuming good bond conditions for hot rolled bars, according to
CEB-217 (1993), see Table 5.5, it was estimated a maximum bond stress MPa10.1~maxτ .
Finally, from Rehm (1961) results, it was derived the variation of steel strain with the
concrete strain. The results are plotted in Figure 5.16, where can be observed that for the
range of strain studied, the maximum calculated steel strain is about 0.005%, which is
much smaller than the yielding strain of the steel ( syε = 0.168%). These calculations are
based on the hypothesis that steel yielding is not reached, which is here verified. The bond-
slip does not allow the steel to mobilise its capacity. Furthermore, for poor bond conditions
it is preferable to have smaller rebar diameters, for the same steel reinforcement, which
conducts to higher bond strength.
In the numerical analyses with the refined finite element method, it was assumed for each
element (beam or column), and for each earthquake, a constant value of λ in accordance to
the maximum deformation experimentally observed at this element during the
corresponding PsD test. A low slippage factor value was adopted for regions where low
deformation was measured, while for regions with higher demands the slippage factor
adopted reached values larger than 20. These high values of the slippage factor are
corroborated by the experimental results of Rehm (1961). In fact, it can be observed in
Figure 5.15 that for concrete deformation of about 1‰, the reinforcing plain steel bars
deformation is expected to be less than 5% of the concrete deformation. This corresponds
to slippage factors bigger than 20. It was considered equal slippage correction factor λ for
tension and compression.
As will be seen in Section 5.6, the numerical results obtained with the constant slippage
factor λ are judged to be of good quality. However, it is presumed that more precise

Chapter 5
309
numerical approximation can be achieved with a bond-slip model capable of adjusting the
slippage factor to the maximum steel strain observed at each element. In fact, the bond-slip
model should provide full bond at the beginning of loading (for tension and compression)
being increased the slippage factor with the maximum strain observed. This model
improvement is left to future research work. Figure 5.17 sketches a suitable function and
expression (5.13) gives the slippage factor as a function of the maximum deformation,
λ(εs).
sσ
sεεs
εs( )
Es,0 εs = σs )(εs
'sσ )(εs
perfect bond
s,0E
εs
1ε
)s (εE s
slippage
?
Es,res
sE ε(s ) = 1λ )(εs s,0E
Es,0
)s (εE s
Figure 5.17 - Proposed bond stress-slip relationship for smooth reinforcing bars
( ) ( ) ( ) sss
sssss EE εελ
εεεσ ⋅⋅=⋅=′ 0,1 (5.13)
5.3.6 - Slab-participation
When reinforced concrete slab and beam floors are cast monolithically, the beam and the
slab will act integrally with each other, contributing to both the strength and to the stiffness
of the beams (Paulay and Priestley, 1992). As stated by Park and Paulay (1975), when the
beam is subjected to positive bending moments, part of the slab will act as the flange of the
beam, resisting the longitudinal compression, balancing the tensile force in the web
reinforcement. When the spacing between the beams is large, it is evident that simple
bending theory does not strictly apply because the longitudinal compressive stress in the
flange will vary in accordance to the distance from the beam web, the flange being more
highly stressed over the web than in the extremities. This variation in flange compressive
stress, illustrated in Figure 5.18, occurs because of shear deformations in the flange (shear
lag). The longitudinal compressive strain reduces with increasing distance from the web.

Refined and simplified models for earthquake simulation, assessment and optimal redesign of existing RC structures
310
Figure 5.18 - Variation of sectional properties along the span of a beam (Paulay and Priestley, 1992)
The actual distribution of the beam compressive stress in the elastic range may be
calculated using the theory of elasticity, and it depends on the relative dimensions of the
cross section and of the span, and on the type of loading. At the flexural strength of the
member, the distribution of longitudinal compressive stress across the flange will be more
uniform than implied by the theory of elasticity. This happens because at near-maximum
stress, the concrete stress-strain curve shows a smaller variation of stress with strain. In
addition, the slab will usually bend transversely because of the load supported between the
beams, and can cause cracking in the top of the flange parallel to the beam over the web-
flange junction. Transverse reinforcement in the slab and shear-friction along the crack
will allow longitudinal compression to be transferred out into the flange. Nevertheless,
there are grounds for using a conservatively low effective width, as referred by Park and
Paulay (1975).
Park and Paulay (1975) also advocate that in order to take into account the variation of
compressive stress across the flange, it is convenient in design to use an effective flange
width that may be smaller than the actual width, but uniformly stressed. The present code-
specified effective widths are conservative estimates based on approximations to the elastic
theory.
When the beam is subjected to negative bending moment, some of the longitudinal
reinforcement in the flange clearly acts as tension steel, in parallel with the web main steel
(see Figure 5.19). The tensile force is transferred across the flange into the web by shear in
flange, much as the compressive force in the case of positive bending is transferred. Codes
do not specify effective widths over which slab steel may be considered to be acting as
tension reinforcement. Nevertheless, it is evident that a realistic appraisal of the beam
strength for negative bending moment would include the effect of the slab steel. As an
approximation, the slab steel within a width of four times the slab thickness each side of
the web could be included with the tension steel of the beam (Park and Paulay, 1975).

Chapter 5
311
During an earthquake action, the flange of a T-beam abutting against the two opposite
faces of a column will be subjected to tension and compression, as illustrated in the
moment distribution in Figure 5.19. In this figure, a typical variation of the sectional
properties is shown along the beam span (Paulay and Priestley, 1992). As already stated,
for monolithic slab-beam construction, the effective flange width and the stiffening effect
of the slab depend on whether the slab is in tension or compression, and on the moment
pattern along the beam. Diagonal cracking of a member due to shear, intensity and
direction of axial load, and reversed cyclic loading are additional phenomena affecting
member stiffness.
Figure 5.19 - Variation of sectional properties along the span of a beam (Paulay and Priestley, 1992)
Flange contribution to stiffness in T- and L-beams is typically lower than the contribution
to flexural strength. This results from the moment reversal occurring across beam-column
joints and of the low contribution of tension flanges to flexural stiffness. Consequently, it
is recommended that for load combinations including seismic actions, the effective flange
contribution to stiffness should be 50% of that commonly adopted for gravity load strength
design (Paulay and Priestley, 1992).
Pantazopoulou et al. (1988) also developed a theoretical model to estimate the effective
slab width. These authors proposed an effective slab width on each side of the beam equal
to 1.5 times the beam depth up to yielding. For severe earthquake loading, they propose a
slab width approximately 3 times the beam depth. Rodríguez and Díaz's (1987) study on

Refined and simplified models for earthquake simulation, assessment and optimal redesign of existing RC structures
312
the development of buildings design codes in Mexico highlights the changes regarding
slab-participation.
For the numerical analyses herein conducted, and in accordance to the geometrical section
properties and to the reinforcing steel quantities previously presented in Chapter 3
(Figures 3.2 and 3.3), a total of seventeen different type-sections (fibre model) were
identified and considered in the model. More specifically, eight for the columns and nine
for the beams.
From the experimental PsD tests it was calculated a slab-participation width of
approximately 1.00 m (see Section 4.11.3). Therefore, in order to numerically account for
the slab-participation, 1.00 m was considered for the effective flange width bs for all beam
sections (see Figure 5.20) bs
b
h
hsc
c
as1
s2a
Figure 5.20 - Effective flange width of T-beam
where: b stands for beam width, h for beam height, bs for slab-participation (if section
rectangular: bs = b), hs for slab height (if the section is rectangular thus: hs = 0), c
represents the distance from the external beam face to the geometrical centre of the
reinforcing steel (concrete cover plus half diameter of the longitudinal reinforcing steel
bars; 4 cm was considered as an average value), as1 the inferior steel area (positive
moment), and as2 the superior steel area (negative moment).
As recommended by Park and Paulay (1975), in order to account for the contribution of the
steel reinforcement existing in the slab, the steel within a width of four times the slab
thickness (0.60 m) each side of the beam was included with the tension steel of the beam.
The steel detailing of the slab is represented in Figure 5.21.

Chapter 5
313
Figure 5.21 - Slab geometry and reinforcement details
5.3.7 - Infill masonry modelling
As stated in Section 2.4, the series of earthquakes in Turkey and Greece in 1999 have
shown that seismic risk is still high in Europe. These earthquakes also emphasised the
vulnerability of masonry infilled structures. In a recent workshop on the mitigation of
seismic risk in Europe, Geradin and Pinto (2000), for example, concluded that the most
vulnerable buildings to seismic risk are the masonry buildings and the infills of the
unprotected frames.
As referred in Eurocode 8, the determination of the seismic effects on the structure shall be
based on an idealised mathematical model, which is adequate for representing the actual
behaviour. Moreover, the model shall also account for all non-structural elements that can
influence the response of the main resisting system. Therefore, the modified response of a
RC structure because of the stiffening effect of the infills shall be considered, taking
however into account the 'some-how alleatoric' behaviour of the infills, namely the
variability of their mechanical properties, the possible modifications of their integrity
during the use of the building, as well as the non-uniform degree of their damage during
the earthquake itself.
Infilled frame structures consist of brick masonry panels interconnected by a RC horizontal
and vertical bracing (Borges and Ravara, 1969). At low levels of in-plane lateral force, the
frame and infill panel will act in a fully composite fashion, as a structural wall with
boundary elements (Paulay and Priestley, 1992), and the overall stiffness is very high. As
lateral deformations increase, the behaviour becomes more complex because the frame
attempts to deform in a flexural mode while the panel attempts to deform in a shear mode,
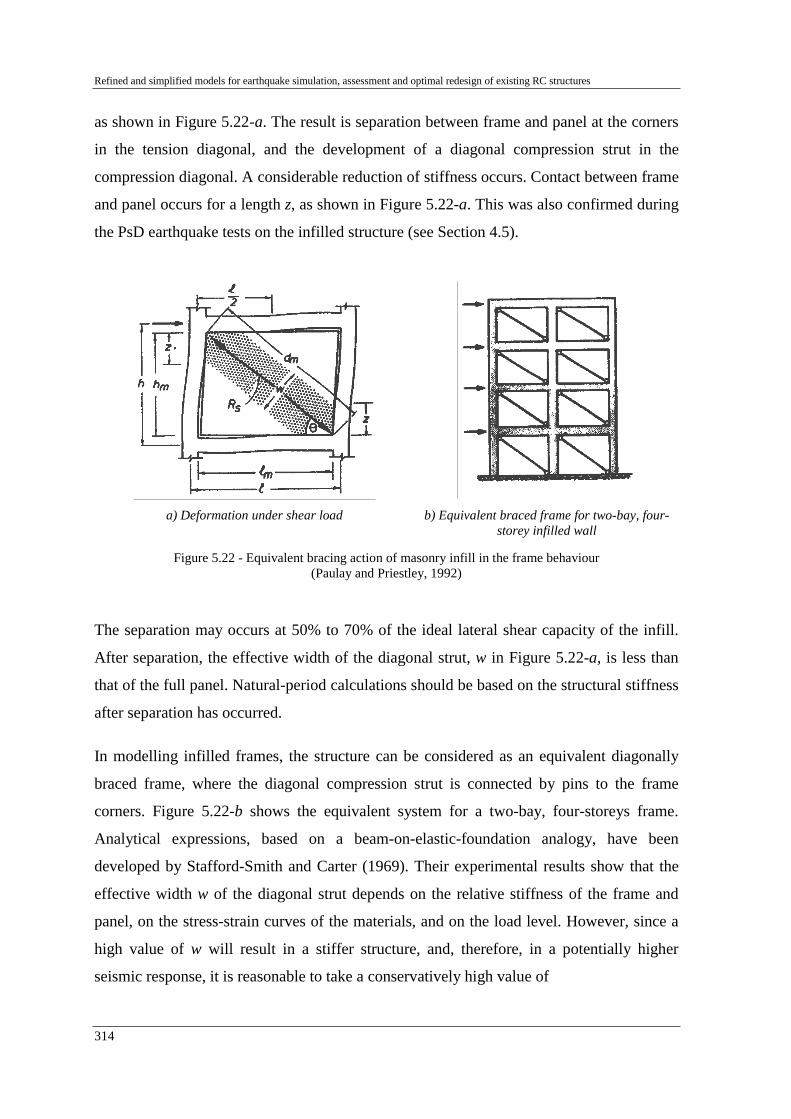
Refined and simplified models for earthquake simulation, assessment and optimal redesign of existing RC structures
314
as shown in Figure 5.22-a. The result is separation between frame and panel at the corners
in the tension diagonal, and the development of a diagonal compression strut in the
compression diagonal. A considerable reduction of stiffness occurs. Contact between frame
and panel occurs for a length z, as shown in Figure 5.22-a. This was also confirmed during
the PsD earthquake tests on the infilled structure (see Section 4.5).
a) Deformation under shear load b) Equivalent braced frame for two-bay, four-
storey infilled wall
Figure 5.22 - Equivalent bracing action of masonry infill in the frame behaviour (Paulay and Priestley, 1992)
The separation may occurs at 50% to 70% of the ideal lateral shear capacity of the infill.
After separation, the effective width of the diagonal strut, w in Figure 5.22-a, is less than
that of the full panel. Natural-period calculations should be based on the structural stiffness
after separation has occurred.
In modelling infilled frames, the structure can be considered as an equivalent diagonally
braced frame, where the diagonal compression strut is connected by pins to the frame
corners. Figure 5.22-b shows the equivalent system for a two-bay, four-storeys frame.
Analytical expressions, based on a beam-on-elastic-foundation analogy, have been
developed by Stafford-Smith and Carter (1969). Their experimental results show that the
effective width w of the diagonal strut depends on the relative stiffness of the frame and
panel, on the stress-strain curves of the materials, and on the load level. However, since a
high value of w will result in a stiffer structure, and, therefore, in a potentially higher
seismic response, it is reasonable to take a conservatively high value of
Chapter 5
315
mdw ⋅= 25.0 (5.14)
where: dm is the diagonal length. Paulay and Priestley (1992) advocate that this expression
agrees reasonably well with published charts, such as those by Stafford-Smith and
Carter (1969), assuming typical masonry-infill properties and a lateral force level of 50%
of the ultimate capacity of the infilled frame.
As stated by Paulay and Priestley (1992), there are several different possible failure modes
for masonry infilled frames, including: a) tension failure of the tension column resulting
from applied overturning moments; b) sliding shear failure of the masonry along horizontal
mortar courses generally at or close mid-height of the panel; c) diagonal tensile cracking of
the panel (this does not generally constitute a failure condition, as higher lateral forces can
be supported by the following failure modes); d) compression failure of the diagonal strut;
and, e) flexural or shear failure of the columns. In many cases, the failure may be a
sequential combination of some of the failure modes above. For example, flexural or shear
failure of the columns will generally follow a sliding shear failure, or a diagonal
compression failure of the masonry.
As recalled by Borges and Ravara (1969), the dimensions and the reinforcement of the
bracing system have a direct influence on the value of the force for which rupture occurs.
In fact, slender bracing systems concentrate rupture in a small region. On the contrary, a
stiff bracing system enlarges the rupture region and, consequently, increases the rupture
force. Rupture can be caused not only by the crushing of the panels but also by the forces
developed in the surrounding RC frame. The forces in the columns and beams and shear
forces near the panel corners can be of particular relevance.
Modelling of infills has bounteous literature: Combescure et al. (1995), Oliveira (1995),
Schuller et al. (1994), Abrams et al. (1993), Altin et al. (1992), Gavrilovic and
Sendova (1992), Zarnic and Tomazevic (1985), Klingner and Bertero (1976) and Fiorato et
al. (1970), among many others. Since the work performed by Klingner and Bertero (1976),
the non-liner analysis of infilled frames is typically performed by replacing each individual
panel by two or more diagonal struts with an uniaxial compressive law. Eurocode 8 also
considers this model.

Refined and simplified models for earthquake simulation, assessment and optimal redesign of existing RC structures
316
In order to model masonry infill panels it was used the strut model (equivalent bi-diagonal
struts) represented in Figure 5.23, and implemented by Combescure and Pegon (1996) in
CASTEM. The phenomena reproduced by the masonry law are: a) the stiffness
degradation due to cracking mainly at the surface between the frame and the panel; b) the
development of plastic strain due to crushing; c) the strength degradation under cyclic
loading; and, d) the pinching associated with sliding. The behaviour law is described
hereafter, considering positive strain and stress values for compression. In short, it is a
general multi-linear model, which accounts for cracking, compression failure and strength
degradation due to either monotonic or cyclic loading as well as for the pinching effects
due the crack closing.
Axial displacement (d)dplastic
intd
dsliding
pinchingd
de( , )eF
dc( , cF )
Axial force (F)
E( 0 )tan
Vxx
Vyy
L
H
Fmax
β maxF
a) b)
Figure 5.23 - Equivalent strut for the infill masonry model: a) geometric support of the strut diagonals; b) envelope and cyclic curves of the uniaxial behaviour law (Combescure and Pegon, 1996)
The model used assumes no tensile resistance, and the behaviour for monotonic
compression is described by a multi-linear curve including a primary linear elastic
behaviour, a second branch approximating the cracking process, and two final branches
representing two phases of the masonry behaviour, which can be considered as plastic
behaviour (crushing of the masonry panel) with positive and subsequently negative strain
hardening. Cyclic behaviour is characterised by a linear unloading-reloading law without
plastic displacement in the primary branches, before attaining the plastic point (dc, Fc).
This hysteretical behaviour, after having reached the plastic point, is also governed by a
multi-linear curve with specific rules to account for plastic deformations (dplastic), crack

Chapter 5
317
closing (dsliding), and strength degradation (dpinching). Comberscure and Pegon (1996)
provide full details on the cyclic behaviour model.
The equivalent axial stiffness and strength of each diagonal strut were calculated according
to the empirical expressions suggested by Zarnic and Gostic (1998, 1997). This empirical
model was already described in Section 3.4.4.1.
As already said, the infill panels in the investigated building were made from hollow bricks
of 12 cm thickness laid with cement-lime mortar. Specimens were prepared in the
laboratory by stacking five bricks joined with similar mortar, and tested under
compression. The mean gross compressive strength obtained was 1.1 MPa and the mean
modulus of elasticity was 991 MPa for the direction parallel to the holes, and 1873 MPa
for perpendicular. A detailed description of the masonry properties has been provided in
Section 3.4.3. The mechanical properties experimentally evaluated and empirical
parameters for the Zarnic and Gostic (1998, 1997) model listed in Table 5.6 were
considered in the numerical analyses. The meaning of these parameters was also given in
Section 3.4.4.1.
Table 5.6 - Parameters for the Zarnic and Gostic numerical model
RC ν µ
0.9 0.05 2.5
The structure has twelve infill panels, being each panel modelled by two diagonal struts.
Therefore, twenty-four strut elements constitute the masonry mesh in the model, as
represented in Figure 5.24. According to the presence, dimensions and location of the
panel aperture in the infilled frame, four different infill panels, including three of them
with apertures, can be identified. Strength and stiffness reduction for each panel due to the
presence of apertures were modelled according to the methodology given in
Section 3.4.4.2.

Refined and simplified models for earthquake simulation, assessment and optimal redesign of existing RC structures
318
Figure 5.24 - Model of the plane infilled frame
5.3.8 - Retrofitting solutions modelling
One of the retrofitting solutions studied in the preliminary analysis was based on a strategy
to improve the structural damping of the bare and infilled structures. More specifically, it
was proposed to use a bracing system with rubber dissipation devices, which can increase
stiffness and damping of the system, consequently reducing the deformation demands. This
retrofitting solution was not experimentally verified but just numerical simulations were
carried out. Section 5.3.8.1 provides details on this retrofitting technique and summarises
the main results. It is underlined that the modelling of this solution is similar to the K-
bracing with shear-link.
Another retrofitting technique that was successfully tested is based on the selective
strengthening philosophy and was also numerically simulated. Relevant details on the
modelling are presented in Section 5.3.8.2.
5.3.8.1 - X- and K-bracing with dissipator retrofitting
Two alternative layouts were proposed for the bracing. One located in the central bay
(K-bracing, see Figure 5.26), which leads to better distribution of the storey forces but
interferes with the existing openings door and windows, and the other located in the
shorter-external bay (X-bracing, see Figure 5.27).
The design of the bracing system, including the dissipation devices, was performed
assuming 1% drift (27 mm inter-storey drift) as the ultimate limit state for the frame (see
Griffith, 1999-a). It was also assumed that for these deformation levels the effects of the

Chapter 5
319
infill panels are negligible. Furthermore, it was assumed that the peak base-shear strength
of the frame for 1% drift was 150 kN, and that the effective stiffness (secant stiffness) of
the equivalent SDOF system with the mass located at 2/3 of the total height of the building
leads to a period (Ts = 1.8 sec).
The design displacement spectra for the different damping ratios were derived from a basic
5% damping (assumed to increase linearly from 0 for T = 0 sec, to 200 mm for T = 2 sec,
and being constant for higher periods) using ξ5 as 'correction factor'.
For a 50-years period non-exceeding probability of 10%, a device with the properties given
in Table 5.7 is required on each storey (see also Figure 5.25).
Table 5.7 - Properties of the energy dissipation devices
1% ID Locationa DLF Fu (kN) Du (mm) Fy K1
storeys 1 2 80 25 10% non-exceeding probability
storeys 3 4 0.35
50 25 Fu / 3 K0 / 10
Energy dissipation device loss factor - DLF
DLF = tan δ; δ = sin-1 (2W/(π∆W))
W – area surrounded by the hysteresis loop
∆W – half of the area of the rectangle that inscribes the hysteresis loop ( = 2Fmax·Dmax)
Note: The devices are able to accommodate displacements and forces up to 140% of their nominal capacity (Fu, Du )
a) One device per storey (see Figures 5.26 and 5.27).
a) b)
Figure 5.25 - Typical diagrams for a device: a) schematic, and b) typical diagram for a device tested at ELSA in the framework of the project REEDS (Molina et al., 2000-a)

Refined and simplified models for earthquake simulation, assessment and optimal redesign of existing RC structures
320
Figure 5.26 - Bracing system in the central bay: device details and general layout
Figure 5.27 - Bracing system in the shorter-external bay: device details and general layout
The bracing system was simulated by bar elements (bracing), and a non-linear spring
element was used to model the dissipator. As schematically represented in Figure 5.25-a, a
bi-linear model simulated the dissipators. The steel uniaxial model was used to represent
the constitutive uniaxial law of the dissipator, setting the model parameters according to
the relevant requirements, namely a sharp transition between the linear and the 'post-
yielding' curves and the tangent of the asymptotic curve defining the post-yielding range.
In Figures 5.28 and 5.29 are represented for the original bare and infilled frames, both with
and without retrofitting, the vulnerability functions obtained in the preliminary analyses for
increasing input motion of the top-displacement, base-shear and total energy dissipation.

Chapter 5
321
Accel (m/s2)
Disp.(m)
1.00 1.50 2.00 2.50 3.00 3.50
0.00
1.00
2.00
3.00
4.00
5.00
6.00
7.00
8.00
X1.E-2
a)
Accel (m/s2)
Shear (MN)
1.00 1.50 2.00 2.50 3.00 3.50
0.10
0.15
0.20
0.25
0.30
0.35
0.40
0.45
0.50
0.55
0.60
Frame
Frame + Inf
Frame + Inf + Ret
Frame + Ret
b)
Figure 5.28 - Vulnerability functions: a) top-displacement; b) base-shear
Accel (m/s2)
Energy (MN m)
1.00 1.50 2.00 2.50 3.00 3.50
0.00
1.00
2.00
3.00
4.00
5.00
6.00
X1.E2
BF
Inf
Ret
Total
Figure 5.29 - Evolution of energy dissipation
The numerical analyses for the retrofitted frame case (K- and X-bracing with rubber
dissipator) allow us to conclude that:
• The numerically studied light retrofitting solution seems to be effective for low,
medium and high intensities, but not particularly effective for very high intensities
when infill panels exist. This retrofitting system was designed for the bare frame
and it is very effective for this case. However, a more accurate design shall
consider the infill panels.
• The retrofitting system leads only to a small increase of storey shear forces.

Refined and simplified models for earthquake simulation, assessment and optimal redesign of existing RC structures
322
• Important increase on energy dissipation capacity was observed. The contribution
of the RC frame, of the infill panels and of the retrofitting devices to the total
energy dissipation was approximately equal.
5.3.8.2 - Selective strengthening
It was found a scarcity of rules and recommendations as well as of numerical models for
modelling upgraded structures previously damaged by earthquakes. The insufficient
experimental work and the difficulty in modelling the interaction and compatibility
between existing elements and added retrofit ones might contribute to this circumstance.
Compared to previous work, the numerical analysis conducted in this thesis models more
precisely the sequence of damage and retrofitting.
Figure 5.30 represents the steps followed to model the sequence of loading and retrofitting
applied to the non-infilled frame in the numerical analyses (static loading, earthquake input
motions on the original structure, repair and strengthening, and finally, new earthquake
input motions on the strengthened structure, see also Table 3.1).
Firstly, it were calculated the initial stresses and strains in the structure' elements with the
dead and live loads (step 1).
Afterwards (step 2), in order to introduce in the numerical frame model a damage
distribution corresponding to that observed experimentally during the previous damageable
earthquake series (bare frame PsD earthquake tests), it were imposed increasing cyclic
displacements. It was imposed a cyclic distribution of lateral displacements (storey
displacement profile) up to the maximum inter-storey drift profile reached in the
earthquake PsD tests of the non-retrofitted frame structure. The imposed displacement
time-histories are composed by series of two equal complete symmetric cycles for
displacement levels corresponding to 25%, 50%, 75% and 100% of the maximum storey
displacement in the BF tests, as schematically represented in Figure 5.30. The maximum
inter-storey drift for the PsD tests on the BF were 0.63%, 1.03%, 2.41% and 0.91%, for
the 1st to 4th storeys, respectively. These values were given in Table 4.1 and are recalled in
Figure 5.30.

Chapter 5
323
1) S
tatic
load
s
2.70
m2.
70 m
2.70
m2.
70 m
2.50 m5.00 m5.00 m
44,3 kN 60,2 kN76,1 kN 28,4 kN
56,4 kN 72,3 kN88,2 kN 40,5 kN
56,4 kN 72,3 kN88,2 kN 40,5 kN
56,4 kN 72,3 kN88,2 kN 40,5 kN
12,7 kN/m
15,1 kN/m
15,1 kN/m
15,1 kN/m
⇓
2) Im
pose
d di
spla
cem
ents
0.91%
2.41%
1.03 %
0.63%
Displ. 100%
75%
50%
25%
⇓
3) M
odel
ling
of th
e re
trofit
ting
⇓
4) E
arth
quak
e in
put m
otio
ns
-400
-300
-200
-100
0
100
200
300
400
0 5 10 15 20 25 30 35 40 45 50
time (sec)
4759752000
Figure 5.30 - Loading and modelling sequence for the SR numerical analyses
After accounting for the damage induced by the PsD tests, the repair and strengthening
interventions are modelled (strengthened frame) at section level as represented in step 3 of
Figure 5.30. An improved confinement effect of the strong-column at the first three storeys

Refined and simplified models for earthquake simulation, assessment and optimal redesign of existing RC structures
324
is activated in the model of the strengthened structure accordingly to the scheme presented
in Figure 5.30, where are presented the cross-section strengthening details (see also
Section 3.3). It is assumed that the repair operations in the strong-column reinstate the
original capacity of the concrete. Therefore, after the cyclic tests, the concrete properties
for the strong-column are changed to the original non-damaged ones. As the reinforcing
steel was not replaced, the steel properties are not altered. The parameters to model the
retrofitting solutions adopted; i.e. improved ductility, flexural and shear strength of RC
strong-column, are accurately estimated using the empirical formulas (see Pinho and
Elnashai, 1999) in combination with measurements on the full-scale tests. For the
remaining columns and all the beams, the damaged state for the steel and concrete was
induced by the cyclic imposed displacements.
Finally, in step 4, the strengthened structure was numerically modelled, considering the
same earthquake input motions as in the experimental test series on the SR.
5.3.9 - Vertical static loads, earthquake actions, masses and damping
For the numerical analyses, constant vertical distributed loads on beams and concentrated
loads on the column nodes were considered in order to simulate the dead load other than
the self-weight of the frame (live-load, weight of partitions and finishings). Figure 3.7
gives details of the vertical static loads applied to the test experiments and considered in
the numerical analysis.
The artificial accelerograms used in the PsD earthquake tests are also considered in the
numerical analyses. It were considered accelerograms with 15 seconds duration and peak
accelerations of 0.22g, 0.29g and 0.38g for 475, 957 and 2000 years return period,
respectively (see Table 3.9 and Figure 3.8).
To assure that the numerically simulated structure considers the same conditions as in the
PsD tests, the mass of the structure was assumed condensed at the storey level. Floor
masses of 44.6 ton and 40.0 ton were considered for the three first storeys and for the roof
storey, respectively. These masses were assumed to be uniformly distributed on the floors,
and correspond to the weight of the slabs, beams, columns, masonry infill walls and

Chapter 5
325
finishings, as well as to the correspondent quasi-permanent value of the live loads (as
presented in Section 3.2.6). The mass matrix of the structure is diagonal.
A viscous damping ratio of 1.5% was considered in the numerical analysis for each mode
of vibration. This value is smaller than those normally used in the linear dynamic analyses.
This follows from considering that the damping values measured in real buildings increase
with increasing amplitude of vibration mainly due to hysteretic phenomena (hysteretic
damping) and not just to viscous forces (viscous damping). On the other hand, as referred
by Tilly (1986), the values measured for small amplitude vibration are not much different
from 1.0%. Thus, the adopted value for the damping of 1.5% is considered to represent the
viscous component, while the hysteretic component is taken into account by the non-linear
models of the structural members and components. As observed by Duarte and Campos-
Costa (1988), this approach would be perhaps not totally adequate for vibrations with
amplitudes bellow the elastic limits. Nevertheless, considering that in the present analysis a
non-linear concrete model is activated from the beginning, and that much larger
deformation amplitudes are expected, this value is judged to reproduce fairly well the
reality.
The damping matrix, [C], adopted in the experiments was also considered in the numerical
analysis. Damping matrix was computed assuming Rayleight damping and considering
1.5% damping ratio for the first two periods, for each structure, according with
[ ] [ ] [ ]KMC ⋅+⋅= βα (5.15)
where the coefficients α and β are calculated such that 1.5% damping ratio in the first
two modes of vibration is achieved. [M] and [K] are the mass and stiffness matrices of the
structure, respectively.
5.3.10 - Shear strength verification for the bare frame
The fibre model is able to reproduce the non-linearity due to flexural and axial
deformations. However it does not consider the non-linear shear behaviour. The model
considers axial stress versus strain constitutive laws uncoupled with linear elastic shear
behaviour at each fibre. The basic assumption is that plane sections remain plane

Refined and simplified models for earthquake simulation, assessment and optimal redesign of existing RC structures
326
(Bernoulli's kinematic) allowing to consider a uniaxial behaviour of each fibre. This is no
longer satisfactory when shear strains take a major role. In this particular case, shear strains
have to be introduced in the model. However, in the studied frames shear failure did not
occur except at the extremities of the third storey strong-column at the end of the 975-yrp
earthquake test (see Section 4.2.2).
Since the inelastic frame models are based on flexural capacities of the frame members, it
is implicitly assumed that the shear capacities of the members are sufficient to develop
flexural hinging. This assumption is verified here by performing shear control in the
critical members of the columns. Maximum calculated values of the shear forces
developed in the columns for the BF structure are summarised in Table 5.8.
Table 5.8 - Maximum calculated shear forces (kN) in columns (BF calculations)
Column alignment Storey
1 2 (strong-column) 3 4
4 11.14 53.82 11.55 8.34
3 20.77 100.42 21.71 15.42
2 25.30 148.85 30.27 19.17
1 28.80 203.84 33.42 21.82
Code equations for shear strength are excessively conservative, in many cases, and show a
wide scatter when used to predict test results (CEB-240, 1998). As recommended in the
CEB-240 (1998), the columns shear strength should be assessed using a more realistic
formulation, than those incorporated in design codes, and it should reflect the dependence
of shear strength on flexural ductility. Therefore, in this study, shear capacities of the
columns are calculated by using the model proposed by Priestley and Xiao (1994). The
shear strength of the columns VR can be computed as the sum of the contributions of
concrete Vc, steel Vs and the horizontal component of the inclined axial force Vp
pscR VVVV ++= (5.16)
For the columns, rectangular cross sections with dimensions b and d are considered (see
Table 5.1). The shear carried by the concrete is calculated from the equation

Chapter 5
327
cc fkdbV ⋅⋅⋅⋅= 8.0 (5.17)
where the value of k depends on the curvature ductility demand and varies from 0.29 to
0.05 (see Priestley, 1997; Priestley and Xiao, 1994), cf is the mean compressive concrete
strength (is taken as the measured value of 16 MPa, see Section 3.2.5).
The shear carried by the 6 mm diameter shear reinforcement stirrups at 15 cm spacing (s) at
the rectangular columns are calculated from the expression
s
fAdV ywsw
s
⋅⋅= (5.18)
where ywf equals 343.6 MPa, the mean yielding stress of the steel (see Table 3.8), and Asw
is the cross sectional area of the shear reinforcement crossing the inclined shear crack.
The contribution of the inclined axial force, considered only for the strong-column and
calculated by Combescure (2000), is based on the assumption that part of the shear is
transmitted by the axial force, which can be represented by an inclined strut with an
angle α (Priestley, 1997)
αtan⋅= PVp (5.19)
For the columns, the sum of the two shear strength components (three for the strong-
column), listed in Table 5.9, guarantees the demanded shear capacities for the BF structure,
given in Table 5.8. Therefore preventing shear failure, even when the flexural ductility
demand becomes high. As already observed by Combescure (2000) for the slender-
columns, the contribution of concrete and steel is sufficient to resist to the shear demand.
The risk of shear failure of the strong column is minor for the BF structure. Although being
insufficient the contribution of the concrete and steel, the inclination of the axial force
increases significantly the shear strength of the columns (see Table 5.9), as verified during
the PsD tests.

Refined and simplified models for earthquake simulation, assessment and optimal redesign of existing RC structures
328
Table 5.9 - Maximum estimated shear strength (kN) of the columns
Column alignment Storey Ductility
demand 1 2 (strong-column) 3 4
low 80.12 190.05 80.12 65.27 4th
high 30.96 101.73 30.96 28.40
low 80.12 220.05 80.12 65.27 3rd
high 30.96 131.73 30.96 28.40
low 80.12 317.96 80.12 65.27 2nd
high 30.96 210.44 30.96 28.40
low 80.12 359.96 80.12 65.27 1st
High 30.96 252.44 30.96 28.40
5.4 - NATURAL FREQUENCIES AND VIBRATION MODES
Well-established experimental techniques are available for determining the dynamic
characteristics of structures. Moreover, numerous experimental and analytical
determinations of natural frequencies of buildings have been performed. As argued by
Borges and Ravara (1969), the comparison between experimental and analytical
frequencies results allows the validity of the mathematical model, in the linear range,
assumed to represent the structure to be assessed.
Computations of the elastic initial natural frequencies and of the corresponding mode
shapes were performed with CASTEM. The four initial (undamaged) natural frequencies
of the plane frame were numerically calculated and the obtained values for the bare and
infilled frames are summarised in Figure 5.31, as well as, the shape of the first four natural
vibration modes for the bare and infilled frames. The computed frequencies are compared
with the experimentally obtained values.
Comparing the experimental frequencies measured before the PsD earthquake tests (see
Tables 3.28 to 3.30) to the frequencies evaluated with the numerical model (Figure 5.31) a
very good agreement was observed. From the results, it can be concluded that:
• The frequencies computed for the BF and IN frames are in accordance to the
experimentally measured values (see Tables 3.28 to 3.30). This constitutes a first

Chapter 5
329
confirmation of the model validity. For the BF structure, the eigenfrequencies
calculated and experimentally measured coincide.
• The values of the eigenfrequencies registered in the tests on the IN frame for the
four modes are slightly higher than those numerically obtained. For the first mode,
the difference between them is 2% but it increases for higher modes (8%, 15%
and 39% difference for the subsequent modes).
• The inclusion of the infill panels increases substantially the global stiffness of the
structure, and, consequently, increases the modal frequencies, as can be observed
in Figure 5.31. The ratio between the natural frequency for the infilled frame and
for the bare frame for the first mode is 4.52. Experimental tests performed by
other authors (e.g. Vintzeleou, 1987) confirm that this ratio usually assumes
values between 3 and 5.
1st mode 2nd mode 3rd mode 4th mode
BF
Hzf BF 56.11 =
Hzf BF 61.42 =
Hzf BF 74.73 =
Hzf BF 92.104 =
IN
Hzf IN 05.71 =
Hzf BF 14.192 =
Hzf IN 07.213 =
Hzf BF 54.274 =
Figure 5.31 - Natural first four modal frequencies and mode shapes numerically evaluated for the BF and IN structures
5.5 - NUMERICAL PREDICTIONS OF THE PSEUDO-DYNAMIC TESTS
Each frame, with and without infill masonry walls, was pseudo-dynamically tested for
increasing input motion intensities. Each PsD earthquake test was preceded by a predictive
numerical calculation of the structural response. In this section, the relevant objectives of
the predictive analyses are exposed. These calculations were performed with the models

Refined and simplified models for earthquake simulation, assessment and optimal redesign of existing RC structures
330
and parameters described in the previous sections. The aim of the preliminary numerical
studies were:
• To predict the response of the structures, and to establish which failure
mechanisms are most likely to occur under seismic loading.
• To define an appropriate testing programme (testing sequence).
• To select the zones in the structure, where more damage is expected, and
therefore, decide the density of the instrumentation to be used, in order to catch
the local behaviour.
• To design the experimental test devices, actuators, load cells and instrumentation
(transducers and inclinometers). Particularly, the capacity of load actuators (in
terms of displacement and force) was defined from the maximum lateral storey
capacity and deformation estimated. The capacity of each inclinometer or relative
displacement transducer was selected based on the maximum deformation
expected on the region it will be installed. The measurement capacity of the
inclinometers located at the columns was five degrees, and for the beams and
joints one degree. The measurement capacity of the relative displacement
transducers for each location (slab, strong-column and beams) was defined from
maximum deformation estimated with the preliminary analyses.
• To estimate the maximum forces, displacements and other parameters needed in
the control system for the PsD and cyclic tests.
• To assist in the definition of suitable retrofitting solutions for the bare and infilled
structures.
A comparison between experimental results and analytical predictions is not conducted
here. Details on this comparison can be found in Varum et al. (2000; 1999). The
comparison of the preliminary results with the experimental ones enabled to detect the
inadequacies of the available numerical models, which were then improved for the
posterior analysis (presented in Section 5.6).
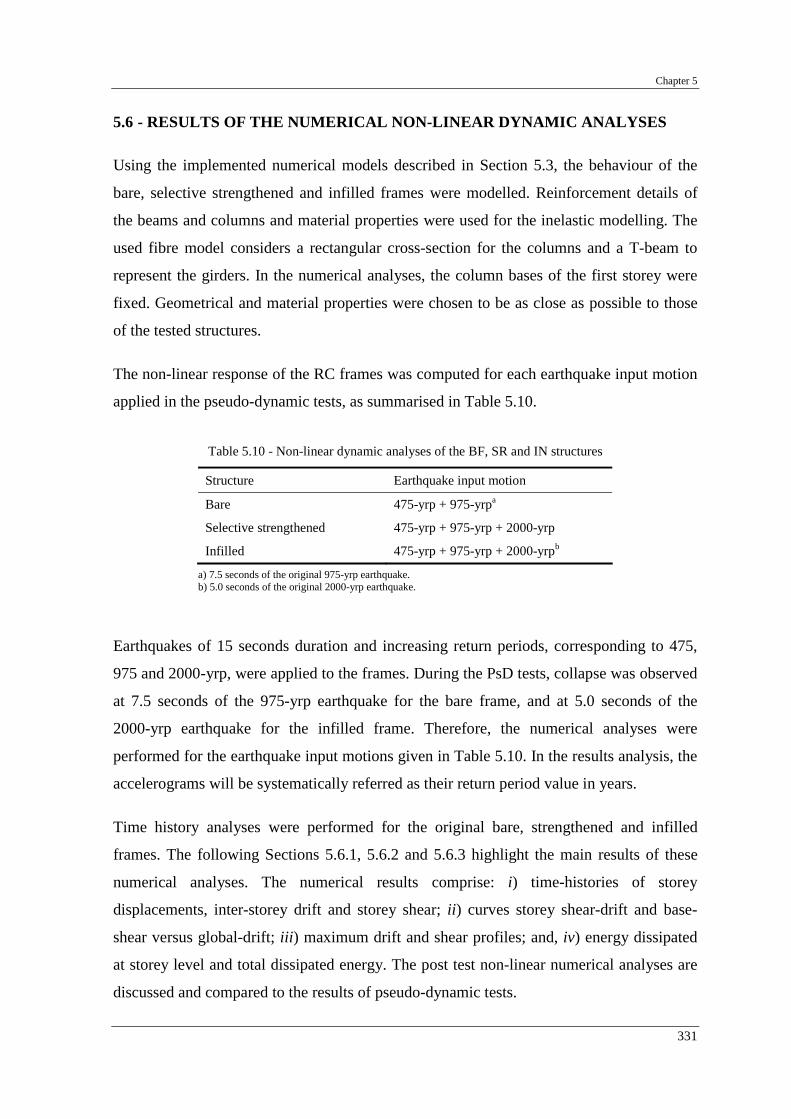
Chapter 5
331
5.6 - RESULTS OF THE NUMERICAL NON-LINEAR DYNAMIC ANALYSES
Using the implemented numerical models described in Section 5.3, the behaviour of the
bare, selective strengthened and infilled frames were modelled. Reinforcement details of
the beams and columns and material properties were used for the inelastic modelling. The
used fibre model considers a rectangular cross-section for the columns and a T-beam to
represent the girders. In the numerical analyses, the column bases of the first storey were
fixed. Geometrical and material properties were chosen to be as close as possible to those
of the tested structures.
The non-linear response of the RC frames was computed for each earthquake input motion
applied in the pseudo-dynamic tests, as summarised in Table 5.10.
Table 5.10 - Non-linear dynamic analyses of the BF, SR and IN structures
Structure Earthquake input motion
Bare 475-yrp + 975-yrpa
Selective strengthened 475-yrp + 975-yrp + 2000-yrp
Infilled 475-yrp + 975-yrp + 2000-yrpb
a) 7.5 seconds of the original 975-yrp earthquake. b) 5.0 seconds of the original 2000-yrp earthquake.
Earthquakes of 15 seconds duration and increasing return periods, corresponding to 475,
975 and 2000-yrp, were applied to the frames. During the PsD tests, collapse was observed
at 7.5 seconds of the 975-yrp earthquake for the bare frame, and at 5.0 seconds of the
2000-yrp earthquake for the infilled frame. Therefore, the numerical analyses were
performed for the earthquake input motions given in Table 5.10. In the results analysis, the
accelerograms will be systematically referred as their return period value in years.
Time history analyses were performed for the original bare, strengthened and infilled
frames. The following Sections 5.6.1, 5.6.2 and 5.6.3 highlight the main results of these
numerical analyses. The numerical results comprise: i) time-histories of storey
displacements, inter-storey drift and storey shear; ii) curves storey shear-drift and base-
shear versus global-drift; iii) maximum drift and shear profiles; and, iv) energy dissipated
at storey level and total dissipated energy. The post test non-linear numerical analyses are
discussed and compared to the results of pseudo-dynamic tests.
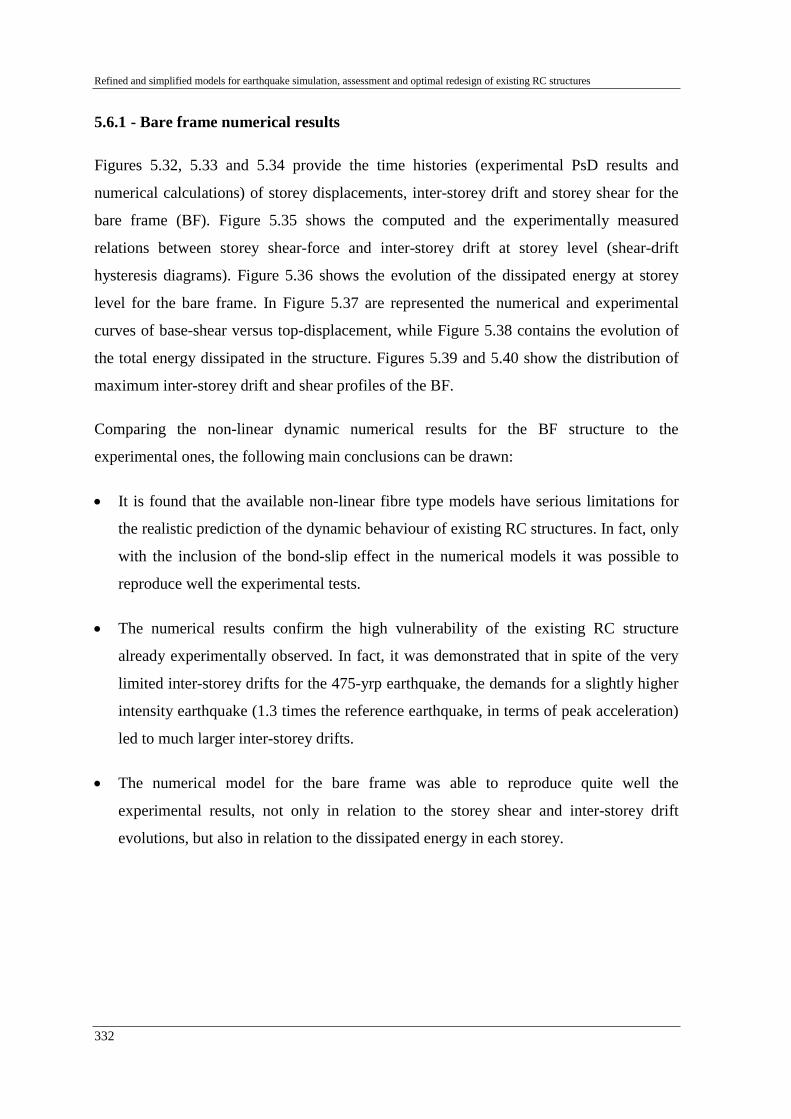
Refined and simplified models for earthquake simulation, assessment and optimal redesign of existing RC structures
332
5.6.1 - Bare frame numerical results
Figures 5.32, 5.33 and 5.34 provide the time histories (experimental PsD results and
numerical calculations) of storey displacements, inter-storey drift and storey shear for the
bare frame (BF). Figure 5.35 shows the computed and the experimentally measured
relations between storey shear-force and inter-storey drift at storey level (shear-drift
hysteresis diagrams). Figure 5.36 shows the evolution of the dissipated energy at storey
level for the bare frame. In Figure 5.37 are represented the numerical and experimental
curves of base-shear versus top-displacement, while Figure 5.38 contains the evolution of
the total energy dissipated in the structure. Figures 5.39 and 5.40 show the distribution of
maximum inter-storey drift and shear profiles of the BF.
Comparing the non-linear dynamic numerical results for the BF structure to the
experimental ones, the following main conclusions can be drawn:
• It is found that the available non-linear fibre type models have serious limitations for
the realistic prediction of the dynamic behaviour of existing RC structures. In fact, only
with the inclusion of the bond-slip effect in the numerical models it was possible to
reproduce well the experimental tests.
• The numerical results confirm the high vulnerability of the existing RC structure
already experimentally observed. In fact, it was demonstrated that in spite of the very
limited inter-storey drifts for the 475-yrp earthquake, the demands for a slightly higher
intensity earthquake (1.3 times the reference earthquake, in terms of peak acceleration)
led to much larger inter-storey drifts.
• The numerical model for the bare frame was able to reproduce quite well the
experimental results, not only in relation to the storey shear and inter-storey drift
evolutions, but also in relation to the dissipated energy in each storey.

Chapter 5
333
Figure 5.32 - BF: storey displacement time histories (4th, 3rd, 2nd and 1st storeys)
475-yrp 975-yrp

Refined and simplified models for earthquake simulation, assessment and optimal redesign of existing RC structures
334
Figure 5.33 - BF: inter-storey drift time histories (4th, 3rd, 2nd and 1st storeys)
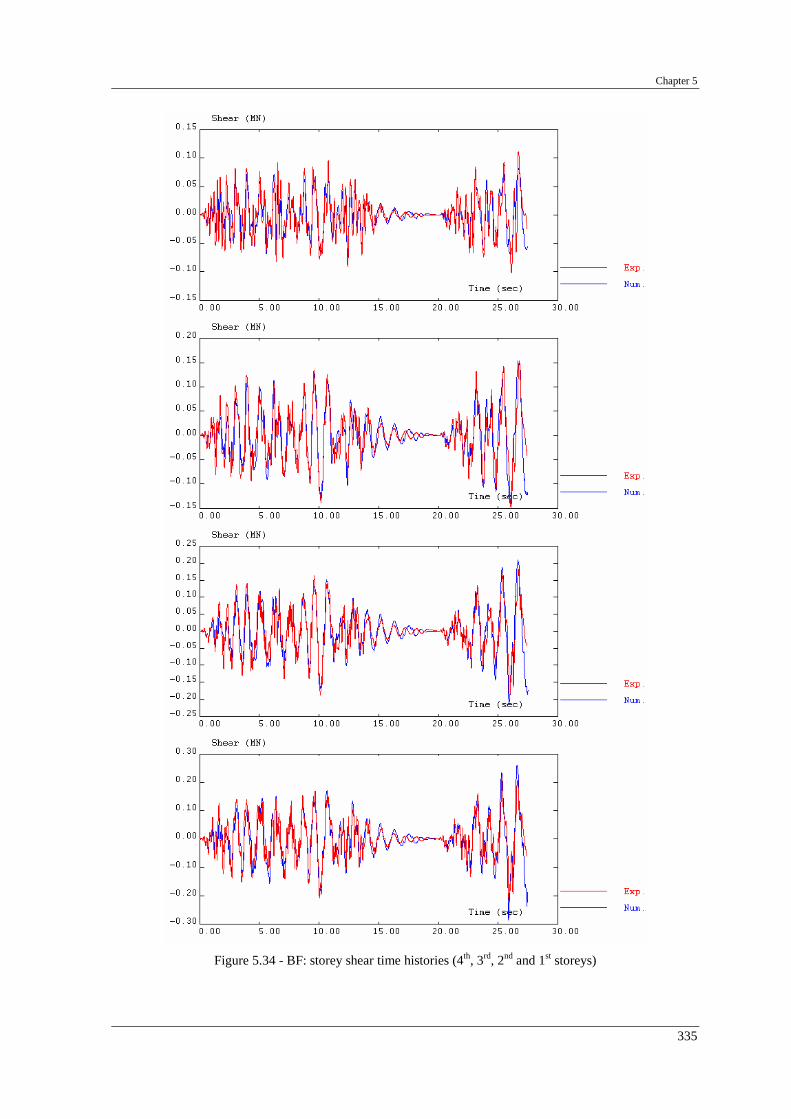
Chapter 5
335
Figure 5.34 - BF: storey shear time histories (4th, 3rd, 2nd and 1st storeys)

Refined and simplified models for earthquake simulation, assessment and optimal redesign of existing RC structures
336
Figure 5.35 - BF: storey shear versus inter-storey
drift (4th, 3rd, 2nd and 1st storeys) Figure 5.36 - BF: dissipated energy at storey level
(4th, 3rd, 2nd and 1st storeys)

Chapter 5
337
Figure 5.37 - BF: base-shear versus top-displacement
Figure 5.38 - BF: total dissipated energy
Figure 5.39 - BF: maximum drift profile Figure 5.40 - BF: maximum shear profile

Refined and simplified models for earthquake simulation, assessment and optimal redesign of existing RC structures
338
5.6.2 - Strengthened frame numerical results
Figures 5.41, 5.42 and 5.43 give the experimental and numerical time histories of storey
displacements, inter-storey drift and storey shear for the strengthened frame (SR).
Figure 5.44 shows the computed and the experimentally measured relations between storey
shear force and inter-storey drift at storey levels (shear-drift hysteresis diagrams).
Figure 5.45 shows the evolution of the dissipated energy at storey level of the strengthened
frame. In Figure 5.46 are represented the numerical and experimental curves of base-shear
versus top-displacement, while Figure 5.47 contains the evolution of the total energy
dissipated in the structure. Figures 5.48 and 5.49 show the distribution of maximum inter-
storey drift and shear profiles for the SR case.
Comparing the non-linear dynamic numerical results for SR structure to the experimental
ones, the following main conclusions can be drawn:
• The beneficial effect of the strengthening solution was also well caught numerically.
As can be observed in Figure 5.48, substantial reduction of the displacement demands,
as well as a more uniform demands distribution were verified.
• The numerical model for the strengthened frame was able to reproduce well the
experimental results, not only in relation to the storey shear and inter-storey drift
evolutions, but also regarding the dissipated energy in each storey. The damage and
respective changes in the structural behaviour induced during previous earthquake tests
were also well reproduced numerically by the cyclic imposed storey displacement
profile.

Chapter 5
339
Figure 5.41 - SR: storey displacement time histories (4th, 3rd, 2nd and 1st storeys)
475-yrp 975-yrp 2000-yrp

Refined and simplified models for earthquake simulation, assessment and optimal redesign of existing RC structures
340
Figure 5.42 - SR: inter-storey drift time histories (4th, 3rd, 2nd and 1st storeys)
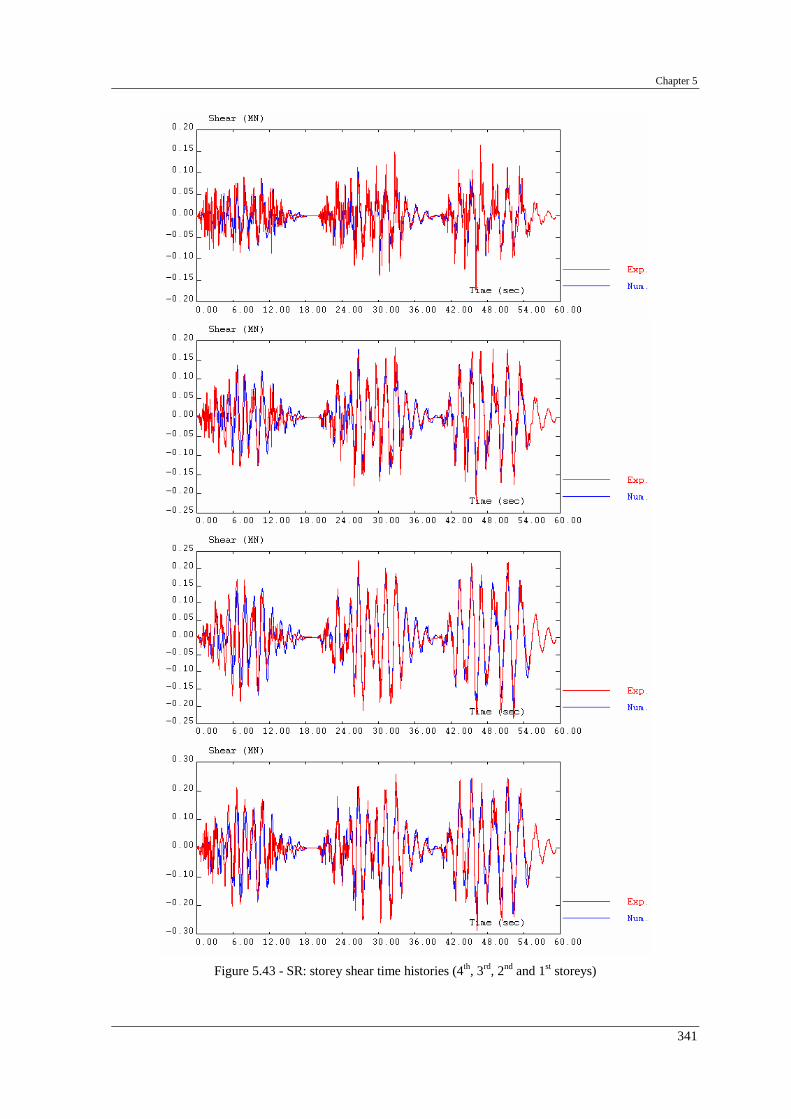
Chapter 5
341
Figure 5.43 - SR: storey shear time histories (4th, 3rd, 2nd and 1st storeys)

Refined and simplified models for earthquake simulation, assessment and optimal redesign of existing RC structures
342
Figure 5.44 - SR: storey shear versus inter-storey
drift (4th, 3rd, 2nd and 1st storeys) Figure 5.45 - SR: dissipated energy at storey level
(4th, 3rd, 2nd and 1st storeys)
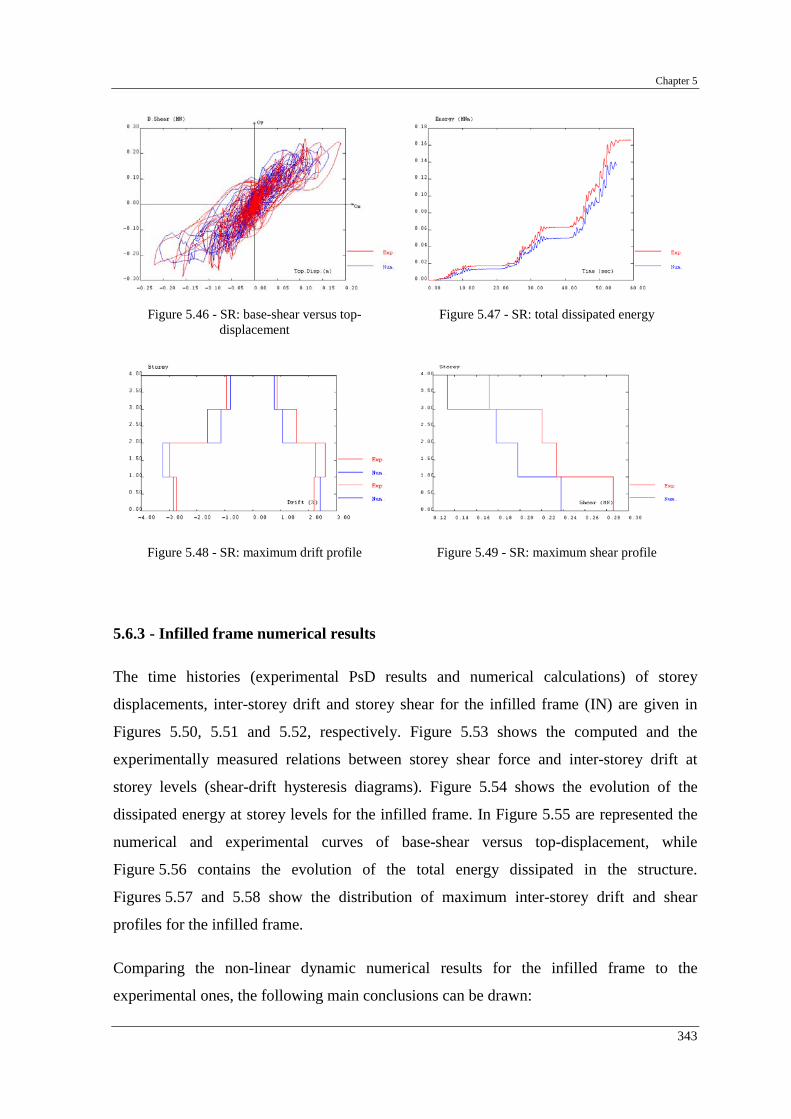
Chapter 5
343
Figure 5.46 - SR: base-shear versus top-
displacement Figure 5.47 - SR: total dissipated energy
Figure 5.48 - SR: maximum drift profile Figure 5.49 - SR: maximum shear profile
5.6.3 - Infilled frame numerical results
The time histories (experimental PsD results and numerical calculations) of storey
displacements, inter-storey drift and storey shear for the infilled frame (IN) are given in
Figures 5.50, 5.51 and 5.52, respectively. Figure 5.53 shows the computed and the
experimentally measured relations between storey shear force and inter-storey drift at
storey levels (shear-drift hysteresis diagrams). Figure 5.54 shows the evolution of the
dissipated energy at storey levels for the infilled frame. In Figure 5.55 are represented the
numerical and experimental curves of base-shear versus top-displacement, while
Figure 5.56 contains the evolution of the total energy dissipated in the structure.
Figures 5.57 and 5.58 show the distribution of maximum inter-storey drift and shear
profiles for the infilled frame.
Comparing the non-linear dynamic numerical results for the infilled frame to the
experimental ones, the following main conclusions can be drawn:

Refined and simplified models for earthquake simulation, assessment and optimal redesign of existing RC structures
344
• The results of the numerical analyses confirm that the models adopted (elements with
non-linearity concentrated at their extremities for the RC elements and equivalent strut
elements for the infill panels) are adequate to simulate the non-linear seismic response
of masonry infilled RC frames. The numerical analyses confirm that the infill panels
protect the reinforced concrete frame for low intensity seismic input.
• The presence of infill panels increases the strength and the initial stiffness of the
structure, as well as the total energy dissipated. The numerical model was able to
reproduce the modifications in structural response induced by the infills. The natural
frequencies of the infilled structure were considerably increased, when compared to the
original bare frame. As already observed in Section 5.4, the numerical model also
reproduces well the frequencies of the structural system.
• The numerical model was able to predict well the failure of the infill walls. In fact, the
soft-storey mechanism is well identified with the numerical models.
• The numerical model for the infilled frame was able to reproduce well the experimental
results, for the storey shear and inter-storey drift time-histories and envelopes.
Nevertheless, significant differences were found for the dissipated energy at storey
level. In fact, for the first and second storeys, the numerical model gives a dissipated
energy approximately 20% lower than the experimental one. A possible justification
for this effect is the non-smoothness of the spectrum in the zone of the frequencies
corresponding to the infilled frame (see Figure 3.9). The equivalent bi-diagonal struts
model adopted for the infills considers independent behaviour of the diagonal bars, i.e.,
the deterioration induced in one strut does not influence the behaviour of the other. For
an infill wall, damage influences the global behaviour of the panel. As can be noted in
Figure 5.53, for the first storey shear-drift numerical diagram, the curve indicates that
when the global storey reached the maximum strength in one direction, corresponding
to failure of the infill panels, the deformation in the other direction is protected, due to
the conserved high stiffness. This effect can also be observed in Figure 5.57. The inter-
storey drift at the first storey is dislocated towards the first damage direction.

Chapter 5
345
Figure 5.50 - IN: storey displacement time histories (4th, 3rd, 2nd and 1st storeys)
475-yrp 975-yrp 2000-yrp

Refined and simplified models for earthquake simulation, assessment and optimal redesign of existing RC structures
346
Figure 5.51 - IN: inter-storey drift time histories (4th, 3rd, 2nd and 1st storeys)

Chapter 5
347
Figure 5.52 - IN: storey shear time histories (4th, 3rd, 2nd and 1st storeys)
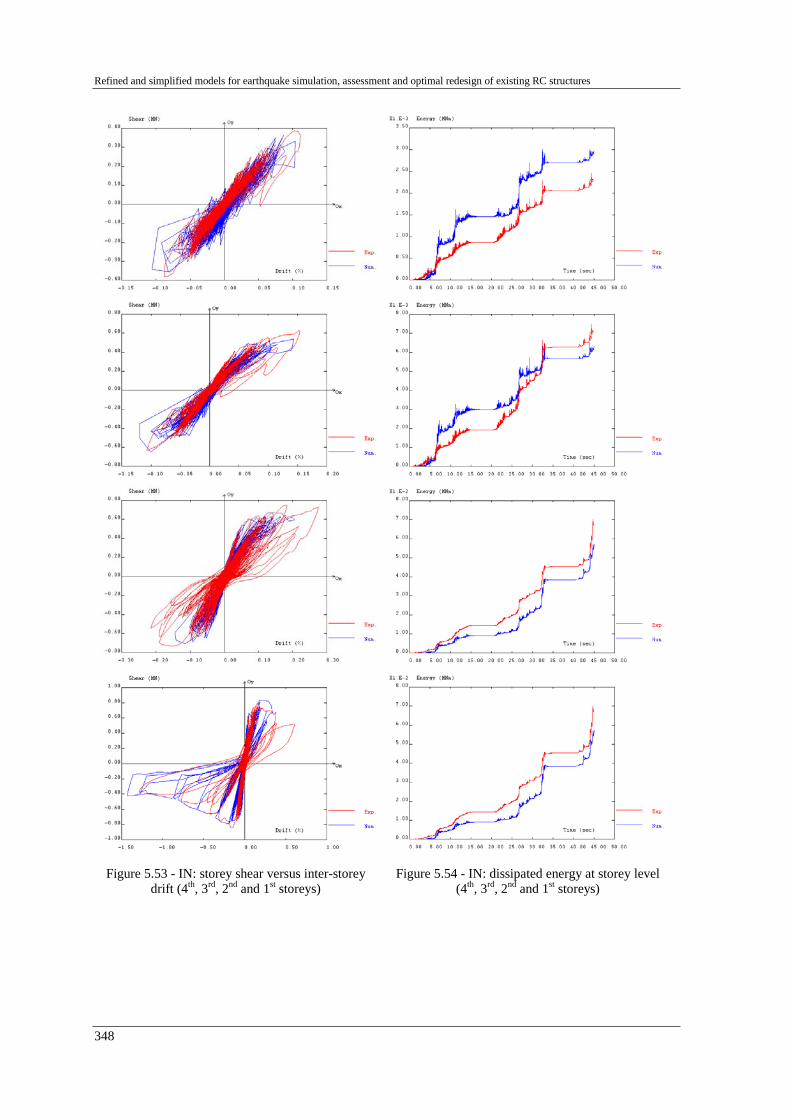
Refined and simplified models for earthquake simulation, assessment and optimal redesign of existing RC structures
348
Figure 5.53 - IN: storey shear versus inter-storey
drift (4th, 3rd, 2nd and 1st storeys) Figure 5.54 - IN: dissipated energy at storey level
(4th, 3rd, 2nd and 1st storeys)
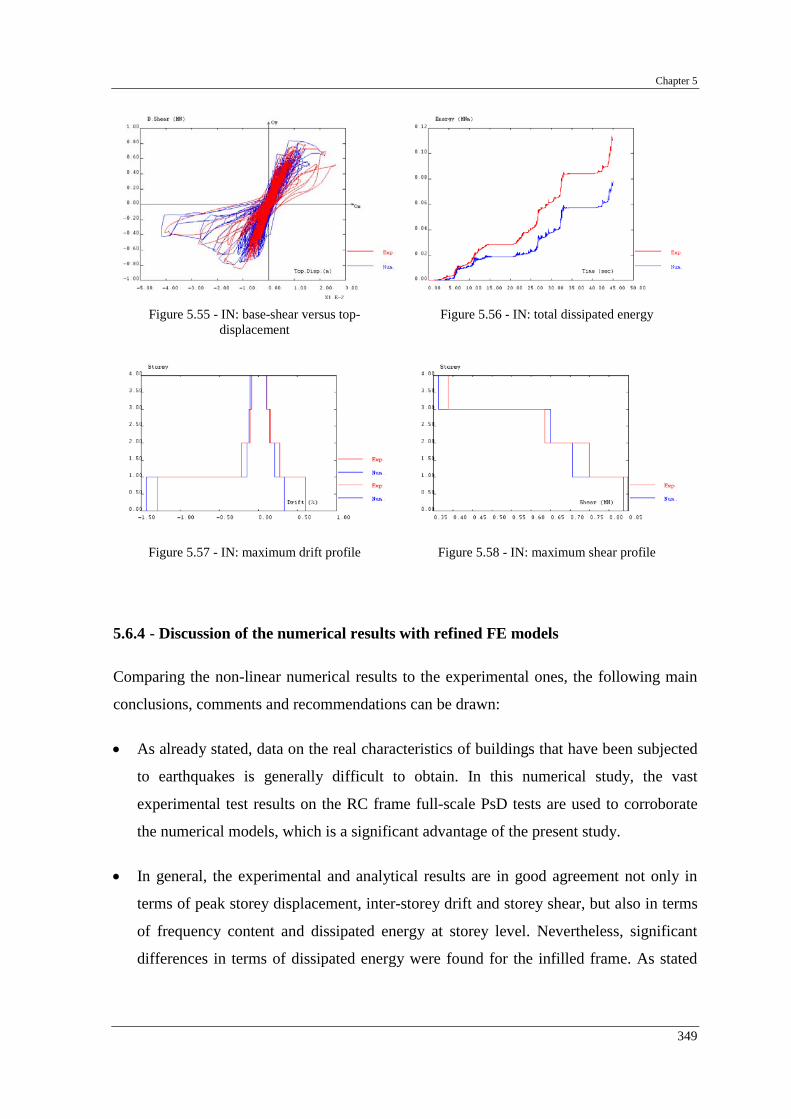
Chapter 5
349
Figure 5.55 - IN: base-shear versus top-
displacement Figure 5.56 - IN: total dissipated energy
Figure 5.57 - IN: maximum drift profile Figure 5.58 - IN: maximum shear profile
5.6.4 - Discussion of the numerical results with refined FE models
Comparing the non-linear numerical results to the experimental ones, the following main
conclusions, comments and recommendations can be drawn:
• As already stated, data on the real characteristics of buildings that have been subjected
to earthquakes is generally difficult to obtain. In this numerical study, the vast
experimental test results on the RC frame full-scale PsD tests are used to corroborate
the numerical models, which is a significant advantage of the present study.
• In general, the experimental and analytical results are in good agreement not only in
terms of peak storey displacement, inter-storey drift and storey shear, but also in terms
of frequency content and dissipated energy at storey level. Nevertheless, significant
differences in terms of dissipated energy were found for the infilled frame. As stated

Refined and simplified models for earthquake simulation, assessment and optimal redesign of existing RC structures
350
earlier, this may result from considering independent behaviour between the two
diagonal bars representing each infill panel.
• The original models used in the preliminary non-linear analyses do not take into
account phenomena such as slippage of the steel rounded bars. As stated by Monti and
Spacone (1998), the introduction of bond-slip of reinforcing bars in the numerical
models proves to be a necessary enhancement towards a realistic description of the
cyclic and the ultimate behaviour of reinforced concrete structures. As proven by the
improved refined numerical results, including the proposed model for the bond-slip of
the steel bars (slippage factor), this effect is crucial for proper modelling the structural
response of the existing RC structures.
• The non-linear behaviour of the previously damaged structures (e.g. by precedent
earthquakes) was well represented. Moreover, the numerical analyses demonstrate also
that the upgraded models are able to well reproduce the non-linear structural behaviour
of the repaired and strengthened structures.
• A higher slab-participation may dictate lower demands in the beams and higher
demands in the columns, and, consequently, prompt the storey mechanism expected for
these types of structures.
• Although the experimental tests are the best way to understand the behaviour of a
structure and to check its capacity, the costs of such campaigns are very high. The
numerical analyses are complementary to the experimental tests. The experimental
results should be used to calibrate the numerical models, which should be then
exploited in more extensive analyses.
• It is important to underline that much care should be taken in the modelling of these
structures. In fact, due to the vast number of model parameters and rules, the use of
refined models may lead to unrealistic results if the model parameters are not correctly
chosen. It is also clear that the sensitivity of the response to such model parameters
increases with the complexity of the models.
• Non-linear numerical analyses are in the line of use of several research groups around
the World to study and assess the behaviour of structures subjected to earthquake
Chapter 5
351
ground motions. In the academic and research communities, on the one hand, there is
no doubt about the utility of these refined models in the structural assessment and
design of retrofitting solutions. On the other hand, it is recognised that these powerful
tools depend on a large amount of parameters not yet well calibrated. These powerful
tools, if not carefully used, can be dangerous if in the hands of a common engineer.
Therefore, work has to be done in order to produce and to implement calibrated non-
linear models and related parameters that can be used safely and easily in the structural
assessment and design by the technical community.
5.7 - STRUCTURAL RESPONSE AND ASSESSMENT USING SIMPLIFIED
METHODS
As already said, in Europe, many structures are potentially seismically vulnerable due to
the late introduction of seismic loading into building codes. Therefore, there is a need to
investigate the seismic behaviour of existing buildings and ultimately to assess their
seismic vulnerability. As remarked by Peter and Badoux (1998), the seismic evaluation of
buildings requires the prediction of the seismic performance, and, in consequence, the
prediction of the inelastic deformations of the RC structures.
Despite the advantages of a refined non-linear dynamic structural fibre modelling, it must
be admitted that this approach can frequently become elaborated and costly. This fact
sustains the development of less complicated structural models without debasing the
essential features of dynamic response. As remarked by Anderson et al. (1991), one main
question is whether very sophisticated FE models are required or whether acceptable
predictions can be obtained using simplified models. Many simplified non-linear models
have been investigated in the past few years (see, for example, Calvi et al., 2000;
Calvi, 1998, Priestley, 1998).
This section is dedicated to structural assessment using simplified methods. In
Section 5.7.1 are presented results of the equivalent damping evaluation, with the
methodology exposed in Section 2.3.5, from the experimental tests.

Refined and simplified models for earthquake simulation, assessment and optimal redesign of existing RC structures
352
In Section 5.7.2 it is verified the structural response and it is assessed the capacity of the
bare original and of the strengthened structures, with the Capacity Spectrum Method
(CSM). In Section 5.7.3 it is proposed and assessed a MDOF non-linear dynamic model
for the assessment of irregular structures. Finally, in Section 5.7.4 are analysed the
structural response for the BF and SR tests, in terms of seismic performance according to
the performance levels proposed in the ATC-40.
5.7.1 Equivalent viscous damping from the experimental hysteretic curves
To perform a structural assessment, it is essential to define accurately the damping as a
function of the deformation demand, as recalled in Section 2.3. There are some proposals
for the damping of new buildings, but not for existing structures. In this study, it was
possible to obtain, from the experimental tests, an estimation of the damping for the
existing and strengthened structures.
For each test performed on the BF and SR structures, the structural equivalent damping
was calculated, according to the methodology exposed in Section 2.3.5. Firstly, the
equivalent viscous damping was evaluated at storey level from the curves inter-storey drift
versus storey shear. Subsequently, the equivalent viscous damping of the global structure
was computed as a function of the damping at storey level, weighted by the storey potential
energy. The best-fit curves in terms of storey equivalent damping, as a function of the
maximum inter-storey drift, obtained from the earthquake and cyclic tests on the bare and
strengthened frames are plotted in Figure 5.59.
BF structure
0
2
4
6
8
10
12
14
16
18
20
0 0.5 1 1.5 2 2.5 3
Inter-Storey Drift (%)
Dam
ping
(%)
1st
2nd
3rd
4th
SR structure
0
2
4
6
8
10
12
14
16
0 0.5 1 1.5 2 2.5 3 3.5
Inter-Storey Drift (%)
Dam
ping
(%)
1st
2nd
3rd
4th
Figure 5.59 - Equivalent storey damping (%) for the earthquake and cyclic tests on the BF and SR structures

Chapter 5
353
From Figure 5.59, the following can be observed:
• Generally, for smaller displacement amplitudes, the equivalent damping increases
rapidly, while for larger displacement amplitudes the evolution is smoother, as
confirmed by Priestley (1997).
• The minor cyclic hysteretic deformation detected in the 4th storey for the BF tests,
and in the upper two storeys for the SR tests does not give enough data to estimate
the damping function. Larger inter-storey drift would be very informative.
However, the curves presented above are representative of the damping functions in
the range of deformation reached during the tests.
• For the tests on the BF structure, larger damping values were observed at the 3rd
storey level, where a concentration of drift was induced due to the structural
irregularity.
• For the SR structure, a larger participation of the lower two storeys in terms of
damping was observed, because the structure is more regular than the BF. The very
low value of deformation reached at the 4th storey during the tests on the SR
structure, was inadequate to estimate the damping function. Therefore, a constant
average value was assumed.
The structural global equivalent damping, for the BF and SR test series, was computed as a
function of the damping evaluated at storey level, weighted by the storey potential energy,
as exposed in Section 2.3.5. In Figure 5.60 are plotted, for the BF and SR earthquake and
cyclic tests, the estimated damping as a function of the global drift. The global drift is
defined as the ratio between the top-displacement and the total height of the structure
(10.80 m). The best-fit logarithmic curves were adjusted and are also represented in
Figure 5.60. In Figure 5.60, are also represented, for each earthquake test, a point
corresponding to the maximum global drift and global equivalent damping (see also
Table 5.11).
From the Figure 5.60 and Table 5.11, it can be observed:
• For a specific global drift, the estimated equivalent global damping is higher for the
bare original than for the strengthened structure, which can be explained by the
more regular response of the last, which induces less non-linear demand at storey
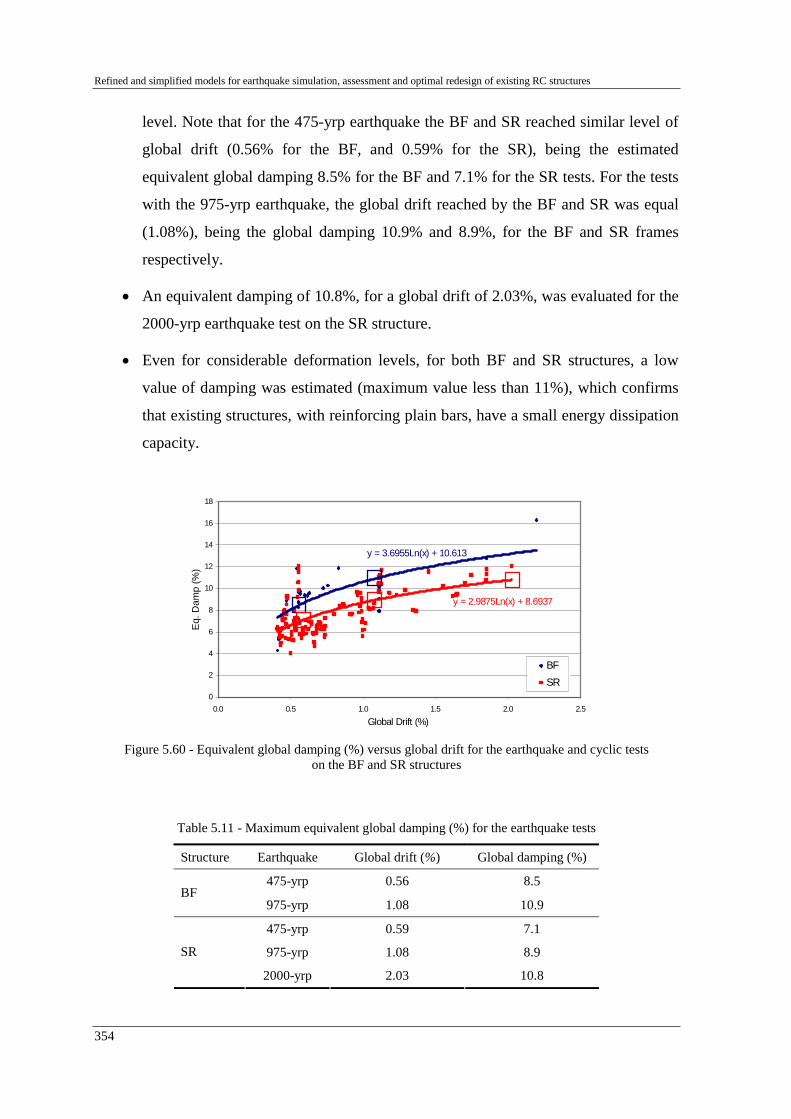
Refined and simplified models for earthquake simulation, assessment and optimal redesign of existing RC structures
354
level. Note that for the 475-yrp earthquake the BF and SR reached similar level of
global drift (0.56% for the BF, and 0.59% for the SR), being the estimated
equivalent global damping 8.5% for the BF and 7.1% for the SR tests. For the tests
with the 975-yrp earthquake, the global drift reached by the BF and SR was equal
(1.08%), being the global damping 10.9% and 8.9%, for the BF and SR frames
respectively.
• An equivalent damping of 10.8%, for a global drift of 2.03%, was evaluated for the
2000-yrp earthquake test on the SR structure.
• Even for considerable deformation levels, for both BF and SR structures, a low
value of damping was estimated (maximum value less than 11%), which confirms
that existing structures, with reinforcing plain bars, have a small energy dissipation
capacity.
y = 3.6955Ln(x) + 10.613
y = 2.9875Ln(x) + 8.6937
0
2
4
6
8
10
12
14
16
18
0.0 0.5 1.0 1.5 2.0 2.5
Global Drift (%)
Eq.
Dam
p (%
)
BFSR
Figure 5.60 - Equivalent global damping (%) versus global drift for the earthquake and cyclic tests on the BF and SR structures
Table 5.11 - Maximum equivalent global damping (%) for the earthquake tests
Structure Earthquake Global drift (%) Global damping (%)
475-yrp 0.56 8.5 BF
975-yrp 1.08 10.9
475-yrp 0.59 7.1
975-yrp 1.08 8.9 SR
2000-yrp 2.03 10.8

Chapter 5
355
5.7.2 Capacity spectrum method
The capacity spectrum method, summarized in Section 2.3.4, is here applied to the original
bare and strengthened structures under analysis. The capacity curves and the capacity
spectra are presented. The structural response is verified with the CSM, for the demand
spectra of the earthquakes considered. Finally, the BF and SR structures are assessed using
the elastic acceleration-displacement response spectra, proposed in the EC8.
5.7.2.1 Capacity curve and capacity spectra
As stated in Section 2.3.4.1, the capacity curves are usually determined by performing a
pushover analysis of the building, with a numerical model accounting for the non-linear
behaviour of the structure. Pushover analysis for the BF and SR structures was performed
with the refined numerical model used is Section 5.6 to simulate the PsD tests. The
pushover analysis was carried out imposing displacements at the roof level of the building
and with a triangular-inverted distribution of forces.
Figure 5.61 - Pushover capacity curves for the BF and SR structures
As can be observed from Figure 5.61, comparing the pushover capacity curves for the
original structure to the strengthened structure, the strengthening intervention practically
did not change the initial stiffness, but increased significantly its resistance, as was
observed from the tests (see Section 4.4).

Refined and simplified models for earthquake simulation, assessment and optimal redesign of existing RC structures
356
In Figure 5.62 are compared, for the BF structure and in terms of base-shear versus top-
displacement, the pushover capacity curve (plot in blue) to the PsD tests results (plots in
green) and to the results of the final capacity cyclic test (see plot in red). In Figure 5.63 are
represented the storey shear-drift curves, also from the pushover analysis, from the PsD
and from the cyclic tests on the BF structure. Finally, in Figure 5.64 are plotted the
pushover capacity curve and the PsD test results in terms of base-shear versus top-
displacement for the SR structure.
From the analysis of Figures 5.62 to 5.64, the following can be observed:
• The BF pushover capacity curve of the structure, in terms of base-shear versus top-
displacement, follows the envelope of the cyclic tests, but not the envelope of the
PsD tests (see Figure 5.62). Regarding the experimental results, the PsD and cyclic
curves of base-shear versus top-displacement (Figure 5.62) are not comparable. But,
looking at the results at storey level (see Figure 5.63), a better accordance is verified.
The main differences are observed for the initial stiffness. Actually, the frame tested
cyclically was previously tested with infills (see Section 4.5), and therefore, it was
already installed a level of damage corresponding to each maximum inter-storey drift
(see Table 4.8). Nevertheless, the storey envelope curves for the PsD and cyclic tests,
do agree thoroughly.
• Regarding the SR structure, as can be observed in the plots of Figure 5.64, a better
agreement between the PsD envelope test results and the pushover capacity curve
was verified.
• Therefore, the pushover capacity curve could be representative of the global dynamic
behaviour of regular buildings, as the studied SR structure, but it is believed that
might be inappropriate to characterise the dynamic response of irregular buildings, as
the studied bare frame. It is noted that a large number of existing buildings have
irregular structures.
• Finally, the agreement verified between the PsD results (for the SR) and the cyclic
test results (for the BF) with the pushover analysis illustrate (as already observed in
Section 5.6) the ability of the refined FE numerical models in modelling these
irregular structures.
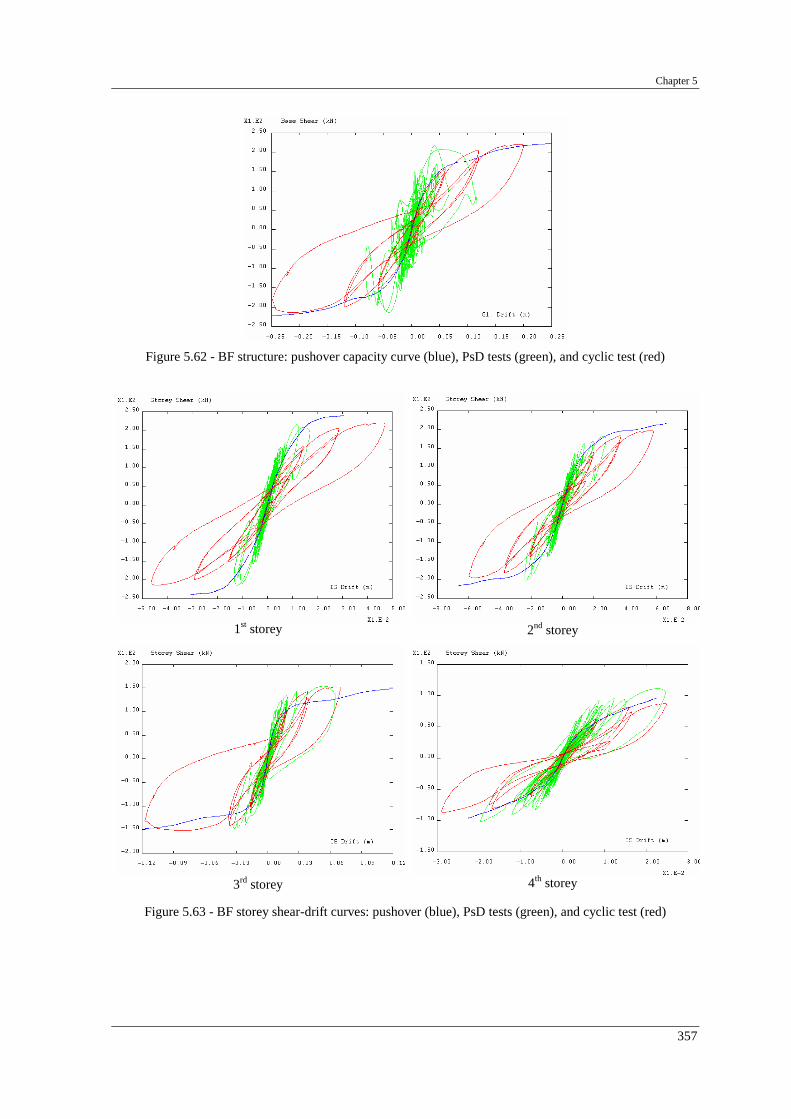
Chapter 5
357
Figure 5.62 - BF structure: pushover capacity curve (blue), PsD tests (green), and cyclic test (red)
1st storey 2nd storey
3rd storey 4th storey
Figure 5.63 - BF storey shear-drift curves: pushover (blue), PsD tests (green), and cyclic test (red)

Refined and simplified models for earthquake simulation, assessment and optimal redesign of existing RC structures
358
Figure 5.64 - SR structure: pushover capacity curve (blue) and PsD tests (green)
The capacity spectral curves for the BF and SR structures were calculated from the
envelope of the base-shear top-displacement diagrams (in the positive and negative
directions) of the PsD earthquake tests and from the pushover curve using the
expressions (2.3) and (2.4). As refereed in ATC-40 (1996), the modal coefficients (modal
participation factor and modal mass coefficient) should be selected in order to better
correlate with the shape of the deformed structure at the maximum top-displacement.
Therefore, using the maximum top-displacements verified in the PsD tests (see Table 4.1
for the BF, and Table 4.6 for the SR) and the expressions (2.5) and (2.6), the modal
parameters were calculated (see Table 5.12).
Table 5.12 - Modal parameters for assessment of the BF and SR with the CSM
Structure Modal parameter
BF SR
Modal participation factor (PF1) BFPF1 =1.26 SRPF1 =1.23
Modal mass coefficient (α1) BFα =0.72 SRα =0.89

Chapter 5
359
5.7.2.2 Verification of the earthquake tests
In this section it is applied the CSM to estimate the response point for each PsD test
performed on the BF and SR structures. The response estimation is represented in the
ADRS spectral coordinates. The structures are represented by their pushover capacity
curve (CC), represented in Figure 5.61, reduced to the corresponding capacity spectra, as
presented in Section 5.7.2.1. The acceleration-displacement response spectra (ADRS) were
computed for the earthquake time histories (corresponding to 475, 975 and 2000-yrp), and
for several damping values. For the global structural damping, the curves represented in
Figure 5.60 were assumed.
In Figures 5.65 and 5.66 are represented for the BF and SR structures the response
estimation. In the figures are also represented, for comparison, the CC obtained from the
envelope of the PsD tests (plots in red). Two curves are represented, one for each direction
(positive and negative).
475-yrp
975-yrp
Figure 5.65 - BF response estimation with the CSM
Disp.(m)
Disp.(m)

Refined and simplified models for earthquake simulation, assessment and optimal redesign of existing RC structures
360
475-yrp
975-yrp
2000-yrp
Figure 5.66 - SR response estimation with the CSM
In Table 5.13 the estimated with the CSM and the observed structural response in the PsD
tests are compared, in terms of base-shear, top-displacement and global damping, for each
test performed on the BF and SR structures.
Disp.(m)
Disp.(m)
Disp.(m)

Chapter 5
361
Table 5.13 - Summary table of the response point (estimated with the CSM and PsD experimental results)
Base-shear (kN) Top-displacement (mm) Global damping (%) Structure Input earthquake CSM exp. CSM exp. CSM exp.
475-yrp 149.3 209.0 50.4 60.8 7.8 8.5 BF
975-yrp 175.1 216.7 94.0 116.7 10.1 10.9
475-yrp 187.1 212.2 63.4 63.2 7.1 7.1
975-yrp 224.3 261.1 97.9 116.3 8.4 8.9 SR
2000-yrp 264.5 285.9 197.7 219.5 10.5 10.8
As already observed in Section 5.7.2.1, and from the analysis of Figures 5.65 and 5.66, and
Table 5.13, it is confirmed that the CSM does not reproduce accurately the response of
irregular structures. In fact, for the BF structure, despite a good approximation for the
damping and for the global displacement, the base shear estimated with the CSM is very
different than that measured in the PsD tests. Nevertheless, the CSM for the regular
structure (SR) gives a better approximation, even in terms of base shear.
5.7.2.3 Assessment of the bare and strengthened structures
In this section, the BF and SR structures are assessed with the CSM. The structures are
represented by their pushover capacity spectra (see Section 5.7.2.1). For the global
structural damping it were assumed the functions represented in Figure 5.60. The seismic
action is defined by the elastic acceleration-displacement response spectra (ADRS)
proposed in the recent draft version of the Eurocode 8 (2003), where, for structures of long
vibration period, it is proposed a revised form for the displacement response spectra.
In the analysis it was considered subsoil class A and response spectra type I. For the peak
ground acceleration it was considered the maximum acceleration of the earthquake used
for each PsD test (i.e. 2.180, 2.884 and 3.728 m/s2, for the return periods corresponding
to 475, 975 and 2000 years, respectively). In Figure 5.67 are represented, for comparison,
the ADRS (5% damping) obtained from the earthquake input motions and the ones
proposed in the EC8 (and used in the assessment of the structures).
In Figures 5.68 and 5.69 are represented graphically the performance assessment of the BF
and SR structures, respectively. The BF is assessed for two levels of demand (ag = 2.180

Refined and simplified models for earthquake simulation, assessment and optimal redesign of existing RC structures
362
and 2.884 m/s2), while the SR structure is assessed for three levels of demand (ag = 2.180,
2.884 and 3.728 m/s2).
475-yrp (ag=2.180 m/s2) 975-yrp (ag=2.884 m/s2) 2000-yrp (ag=3.728 m/s2)
Figure 5.67 - ADRS: for the earthquake input motions and EC8 (5% damping)
a)
b)
Figure 5.68 - Assessment of the BF with the CSM (subsoil class A; response spectra type I) for input
motions: a) ag = 2.180 m/s2; b) ag = 2.884 m/s2

Chapter 5
363
a)
b)
c)
Figure 5.69 - Assessment of the SR with the CSM (subsoil class A; response spectra type I) for input
motions: a) ag = 2.180 m/s2; b) ag = 2.884 m/s2; c) ag = 3.728 m/s2
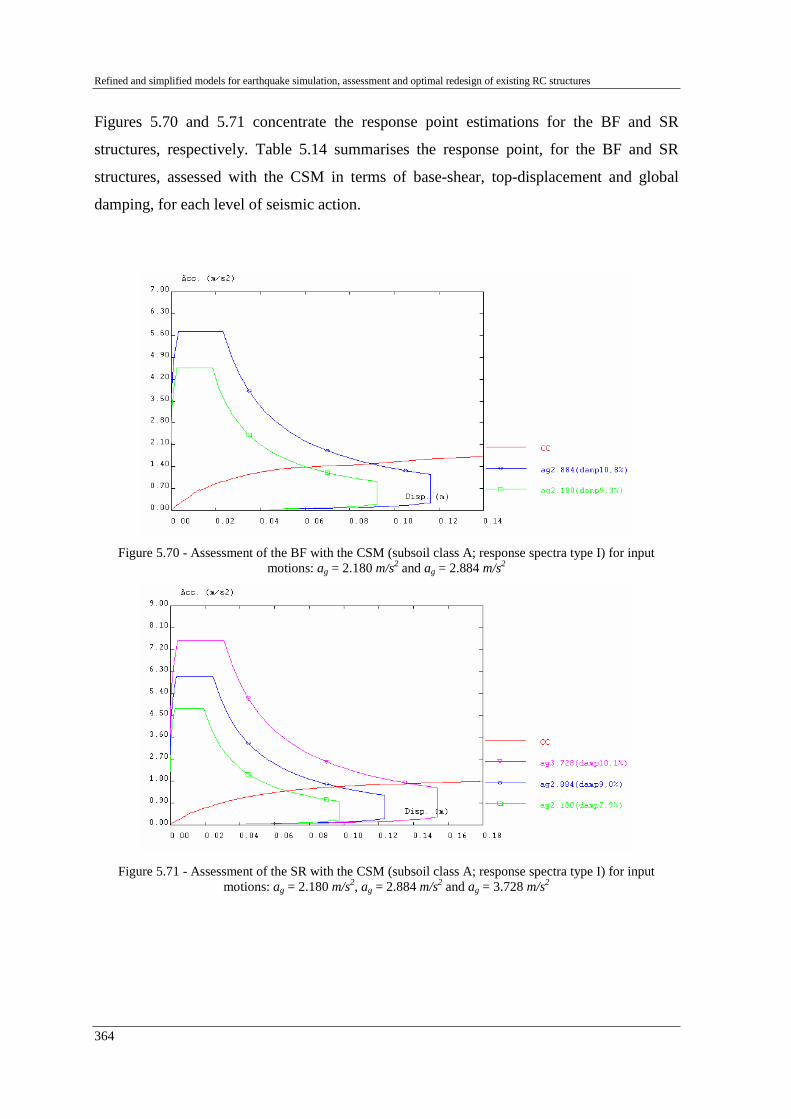
Refined and simplified models for earthquake simulation, assessment and optimal redesign of existing RC structures
364
Figures 5.70 and 5.71 concentrate the response point estimations for the BF and SR
structures, respectively. Table 5.14 summarises the response point, for the BF and SR
structures, assessed with the CSM in terms of base-shear, top-displacement and global
damping, for each level of seismic action.
Figure 5.70 - Assessment of the BF with the CSM (subsoil class A; response spectra type I) for input
motions: ag = 2.180 m/s2 and ag = 2.884 m/s2
Figure 5.71 - Assessment of the SR with the CSM (subsoil class A; response spectra type I) for input motions: ag = 2.180 m/s2, ag = 2.884 m/s2 and ag = 3.728 m/s2
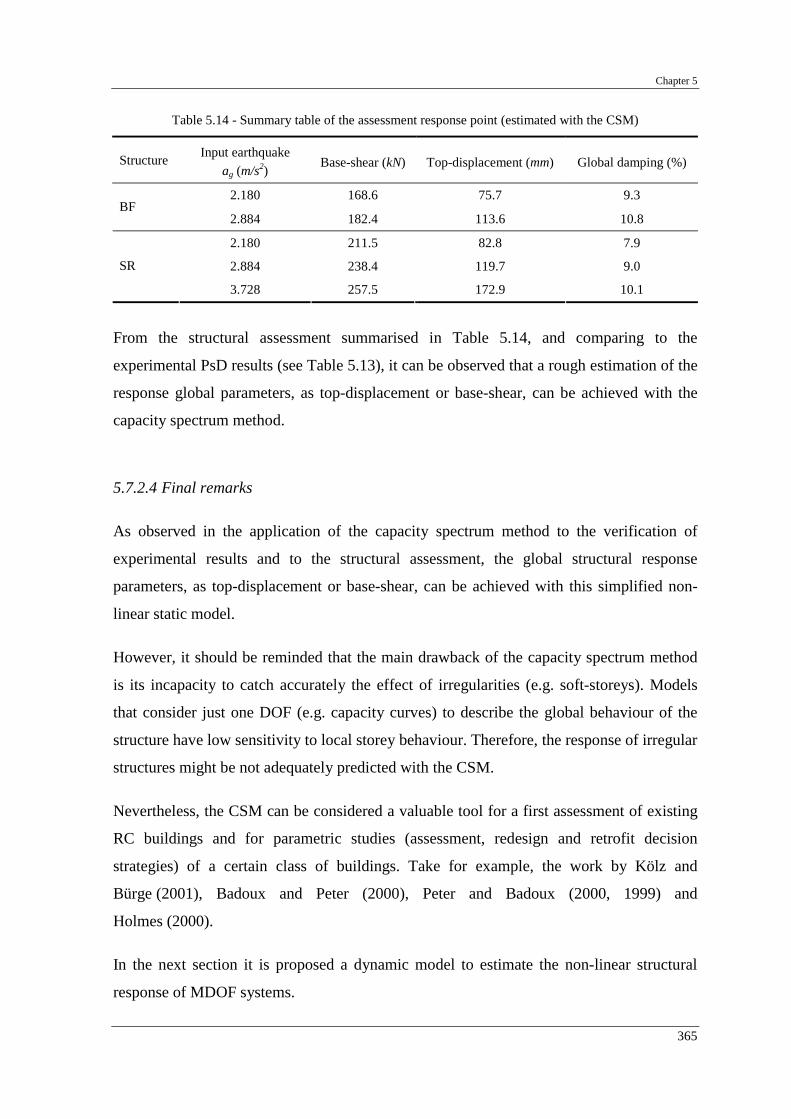
Chapter 5
365
Table 5.14 - Summary table of the assessment response point (estimated with the CSM)
Structure Input earthquake ag (m/s2) Base-shear (kN) Top-displacement (mm) Global damping (%)
2.180 168.6 75.7 9.3 BF
2.884 182.4 113.6 10.8
2.180 211.5 82.8 7.9
2.884 238.4 119.7 9.0 SR
3.728 257.5 172.9 10.1
From the structural assessment summarised in Table 5.14, and comparing to the
experimental PsD results (see Table 5.13), it can be observed that a rough estimation of the
response global parameters, as top-displacement or base-shear, can be achieved with the
capacity spectrum method.
5.7.2.4 Final remarks
As observed in the application of the capacity spectrum method to the verification of
experimental results and to the structural assessment, the global structural response
parameters, as top-displacement or base-shear, can be achieved with this simplified non-
linear static model.
However, it should be reminded that the main drawback of the capacity spectrum method
is its incapacity to catch accurately the effect of irregularities (e.g. soft-storeys). Models
that consider just one DOF (e.g. capacity curves) to describe the global behaviour of the
structure have low sensitivity to local storey behaviour. Therefore, the response of irregular
structures might be not adequately predicted with the CSM.
Nevertheless, the CSM can be considered a valuable tool for a first assessment of existing
RC buildings and for parametric studies (assessment, redesign and retrofit decision
strategies) of a certain class of buildings. Take for example, the work by Kölz and
Bürge (2001), Badoux and Peter (2000), Peter and Badoux (2000, 1999) and
Holmes (2000).
In the next section it is proposed a dynamic model to estimate the non-linear structural
response of MDOF systems.

Refined and simplified models for earthquake simulation, assessment and optimal redesign of existing RC structures
366
5.7.3 Improved MDOF non-linear dynamic model for structural assessment
As observed in Section 5.7.2.4, simplified non-linear static models considering just one
DOF (such the CSM) are frequently not able to assess accurately irregular structural
systems.
A simplified non-linear MDOF dynamic procedure, for structural assessment is here
proposed and evaluated. The model accounts for two levels of non-linearities, namely: a)
storey behaviour in terms of shear-drift; and, b) damping as a function of deformation. The
procedure assumes that a non-linear MDOF system can be represented by an equivalent
linearized system with element stiffness given the secant stiffness. Consequently, linear
spectral analysis can be used and multi-modal response methods can be applied. The
procedure is based on a generalization of the substitute-structure method, proposed by
Shibata and Sozen (1976), which states that the response of a non-linear SDOF system can
be accurately approximated by the response of an equivalent linear system with an
equivalent period corresponding to the secant stiffness. The substitute-structure method
constitutes the basis of the recently proposed direct displacement-based design methods
(see for example Calvi, 1998).
The non-linear damping relationships can be modelled in two different ways, namely: a)
variable (with damping functions defined for different structural components, e.g. for each
DOF, storey); and, b) modal (global structural level). It was included the possibility of
participation of several natural modes (multi-mode) for the structural response, with their
quadratic combination.
The building structure is idealised as a bi-dimensional (2D) cantilever model (shear
building), with a number of horizontal translational DOF's equal to the number of storeys.
The structural model is fixed at the base, as represented in Figure 5.72, and the rotation of
each node is fixed against rotation. The shear force-displacement relationship of each
beam-element represents the curves storey shear versus inter-storey drift.

Chapter 5
367
Fi
Di
Di
iξ
fi
ih
1f1y
NDOFf
im
NDOFy
2f
mNDOF
m2
1m
2y
yi
globalD
globalξ
s,iK (Di)
a) b)
Figure 5.72 - MDOF structural simplified model with concentrated masses at storey levels being connected by shear beam elements: a) damping defined for each storey, b) global first mode structural damping
In this model, represented schematically in Figure 5.72, the mass distribution of the
building is defined for each floor level accounting for the mid-height storey masses and
lumped at floor level (equivalent total storey masses). Therefore, the i-th storey mass (mi)
concentrates the total storey mass at node (storey) i, and these nodes are connected by
shear-beam elements. The storey damping is labelled ξi. The force vector {F} is expressed
in terms of the shear forces acting on the beam elements (storey shear), and the relative
inter-node displacement vector {D} is expressed in terms of lateral deformation of the
beam element (inter-storey drift). The storey shear force (Fi) acting on a beam element and
the inter-storey drift (Di) are related by the non-linear Fi-Di curve.
In the iterative step-by-step procedure, for each step, the calculations are made with
constant secant stiffness and damping at the storey levels.
The required mechanical non-linear relationships can be obtained and calibrated from one
or more of the following: a) experimental tests on structural specimens; b) simplified
empirical expressions; and c) analytical calculations from a detailed structural model
(pushover numerical analysis).
The proposed simplified MDOF non-linear dynamic method for assessment of multi-storey
building structures calls for a relatively small number of DOF's (one per floor), compared
to a detailed FE model. Evident advantages come out, for example, fast parametric studies
with a good level of confidence can be carried out with the model. A practical application
of this simplified method is made in the next section. Section 5.8 describes an optimization

Refined and simplified models for earthquake simulation, assessment and optimal redesign of existing RC structures
368
algorithm for redesign of existing structures, which takes full advantage of the proposed
simplified dynamic method. The method is described in the next section.
5.7.3.1 Description of the implemented algorithm
The basic steps of the proposed MDOF non-linear dynamic assessment iterative step-by-
step procedure with two levels of non-linearities are:
1st step: data, initial model and demand parameters
• Structure geometry: number of DOF, inter-storey height, hi.
• Set non-linear curves: monotonic storey shear-drift constitutive behaviour curves,
Fi(Di), variable damping curves at storey, ξi(Di), or global level, ξGlobal(DGlobal) -
(see Figure 5.72).
• Compute the non-linear storey behaviour curves for the uniform column with two
ends fixed against rotation, which secant stiffness (see Figure 5.72), as a function of
deformation )(, iiS Dk is
3,)(12
)(i
iiiiS h
DEIDk
⋅= (5.20)
where the coefficient iEI is a non-linear function of the level of deformation Di as
12
)()(
3i
i
iiii
hDDFDEI ⋅= (5.21)
• Set storey masses, mi.
• Define elastic seismic demand (see Figure 5.73), Sa(T, ξ0), smoothed response
spectra (e.g.: according to the spectra proposed in EC8).
2nd step: starting point
• Set the number of fundamental modes to be considered in the structural response,
NMOD.
• Set the iteration index, k=0.

Chapter 5
369
• Select the initial values for: the storey secant stiffness ( 0,iSK ) and for the storey
( 0iξ ) or global ( 0
Globalξ ) damping coefficient, on the basis of the constitutive
relations.
3rd step: determine the seismic response
• Compute and assemble the stiffness matrix [K] and the diagonal mass matrix [M] of
the MDOF system
• Compute the structural natural periods {T} and modal shapes [Φ], solving the
eigenproblem
[ ] [ ] 02 =⋅− MK ϖ (5.22)
Solving the polynomial equation (characteristic equation) resulting from
expression (5.22) of degree NDOF in 2ϖ , are obtained NDOF values of 2ϖ , which
provide the natural frequencies jϖ (and corresponding natural periods,
jjT ϖπ2= ).
For each value of ),...,2,1(2 NDOFjj =ϖ satisfying the characteristic
equation (5.22), it is solved the equation (5.23) for jNDOFjj ,,2,1 ,...,, φφφ in terms of
arbitrary constant, obtaining the modal shapes (eigenvectors) of the dynamic
system
[ ] [ ]( ) { } { }02 =⋅⋅− jj aMK ϖ (5.23)
And dividing the components of the vector { }ja by { } [ ]{ }jTj aMa , we obtain the
normalized eigenvectors { }jφ
{ } { }{ } [ ]{ }j
Tj
jj
aMa
a=φ (5.24)
• Compute the structural effective damping, ξeff .
• Compute the reduced elastic seismic response spectra Sa(T, ξeff), according to EC8,
with the damping correction factor, η
55.0)5(10 ≥+= ξη (5.25)

Refined and simplified models for earthquake simulation, assessment and optimal redesign of existing RC structures
370
T
Sa (T)
(Sa ξ )0
effξ(aS )
Figure 5.73 - Reduced spectral seismic demand
• Determine the structural response from the modal analysis with quadratic
combination
∑=
=NMOD
jiji uu
1
2max,max, (5.26)
• Determine storey shear forces {F}, from the storey restoring forces {f}, and the
inter-storey drifts, {D}, from the storey lateral displacements {y}, for the MDOF
system
∑=
=NDOF
ijji fF
=>−
= −
1;1;1
iyiyy
Di
iii (5.27, 5.28)
4th step: check for convergence at two levels
• Check for convergence: in terms of storey shear-drift, and in terms of damping (at
storey or global level)
?1
ε<−+
k
kk
X
XX (5.29)
• If convergence is not satisfied, prepare new values for the next iteration point (for
the secant stiffness and/or damping, on the basis of the constitutive relations and
deformation demand), increase the iteration index k by one, and return to step 3.
5th step: graphical output of the converged response
• Graphical representation of the storey shear-drift response point, inter-storey drift
profile, and damping.

Chapter 5
371
5.7.3.2 Verification of the earthquake tests
In order to calibrate and verify the method in predicting global parameters (such as top-
displacement, maximum inter-storey drift, maximum storey shear, and equivalent
damping), the proposed MDOF non-linear dynamic seismic analysis methodology
(described in Section 5.7.3.1) is applied to simulate the PsD tests performed on the bare
and strengthened structures.
The structures were analysed for input motions corresponding to the maximum
accelerations of the earthquakes considered in the tests, namely 2.180 and 2.884 m/s2 for
the BF (corresponding to 475 and 975-yrp), and 2.180, 2.884 and 3.728 m/s2 for the SR
(475, 975 and 2000-yrp). The description of the structure can be found in Section 3.2.
Experimental results concerning these tests were given in Sections 4.2 and 4.3, for the BF
and SR, respectively.
For the structure under analysis, four DOF are considered, being the storey masses
considered for the first three storeys (m1, m2 and m3) 44.6 ton, and for the fourth
storey (m4) 40.0 ton (as presented in Section 3.7.1). The envelope storey shear-drift
behaviour curves, obtained from the PsD earthquake tests for the BF and SR structures,
were here adopted as capacity curves (see Figure 4.5 and 4.23, for the BF and SR,
respectively). As noted in Section 5.7.2.1, it is recalled that the storey shear-drift envelope
curves of the PsD tests are in good agreement with the storey behaviour curves obtained
with the pushover analysis. In these numerical analyses, it was considered the structural
damping at storey level (see Figure 5.59).
The inter-storey drift profiles obtained from the numerical analyses performed with the
proposed simplified MDOF non-linear dynamic method are plotted in Figures 5.74
and 5.75, for the BF and SR structures, respectively. In these figures are also plotted, for
comparison, the maximum inter-storey drift profiles observed in the corresponding PsD
tests.
The structural response was estimated considering the participation of one and four natural
modes of the equivalent linear system, in order to analyse the influence of the number of
natural modes in the global response. These two situations are also represented in the plots.

Refined and simplified models for earthquake simulation, assessment and optimal redesign of existing RC structures
372
475-yrp
1
2
3
4
0 0.2 0.4 0.6 0.8 1
Inter-storey drift (%)
Sto
rey
Num (1 mode)
Num (4 modes)
Experimental
975-yrp
1
2
3
4
0.0 0.5 1.0 1.5 2.0 2.5
Inter-storey drift (%)
Sto
rey
Num (1 mode)
Num (4 modes)
Experimental
Figure 5.74 - Inter-storey drift profile computed and PsD test results for the BF structure
475-yrp
1
2
3
4
0 0.2 0.4 0.6 0.8 1 1.2
Inter-storey drift (%)
Sto
rey
Num (1 mode)Num (4 modes)Experimental
975-yrp
1
2
3
4
0 0.5 1 1.5 2
Inter-storey drift (%)
Sto
rey
Num (1 mode)Num (4 modes)Experimental
2000-yrp
1
2
3
4
0 0.5 1 1.5 2 2.5 3 3.5
Inter-storey drift (%)
Stor
ey
Num (1 mode)Num (4 modes)Experimental
Figure 5.75 - Inter-storey drift profile computed and PsD test results for the SR structure
From the analyses of the results in Figures 5.74 and 5.75, the following can be observed:
• The results obtained with the proposed MDOF non-linear dynamic methodology
are in good agreement with the maximum inter-storey drift demands observed in
the PsD tests. This accordance was verified not only for the regular SR structure,
but also for the irregular BF structure. Furthermore, with this model it is possible to
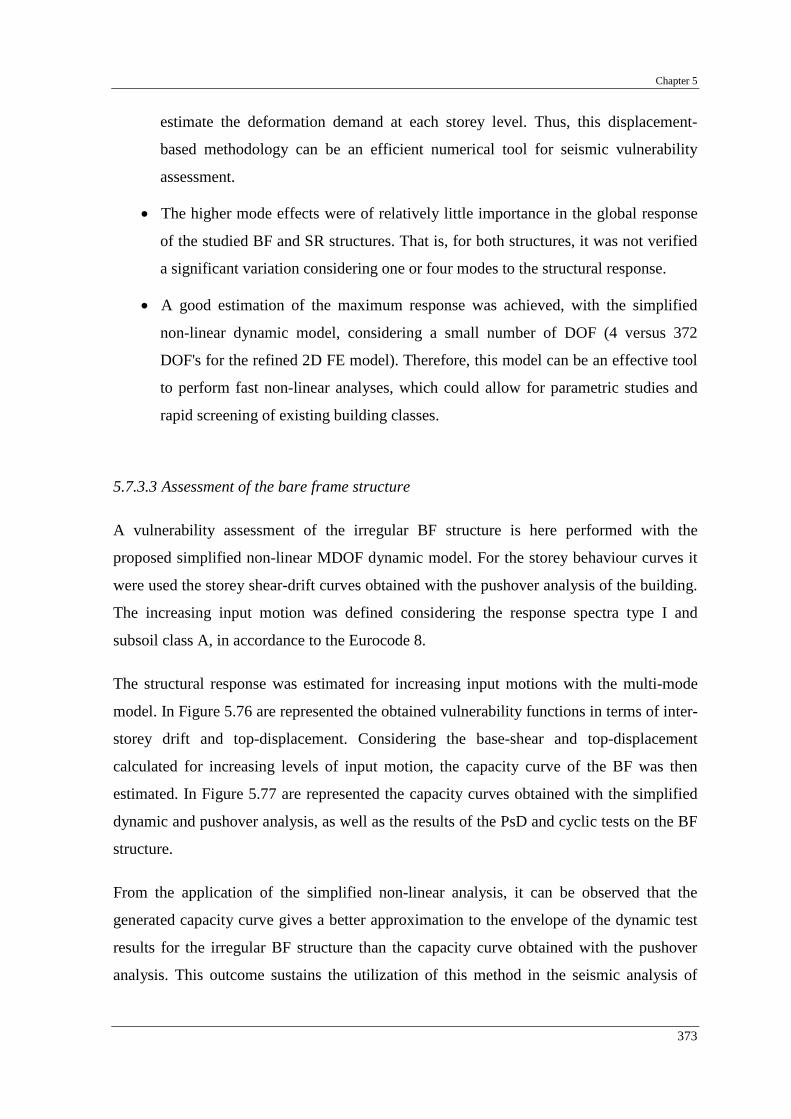
Chapter 5
373
estimate the deformation demand at each storey level. Thus, this displacement-
based methodology can be an efficient numerical tool for seismic vulnerability
assessment.
• The higher mode effects were of relatively little importance in the global response
of the studied BF and SR structures. That is, for both structures, it was not verified
a significant variation considering one or four modes to the structural response.
• A good estimation of the maximum response was achieved, with the simplified
non-linear dynamic model, considering a small number of DOF (4 versus 372
DOF's for the refined 2D FE model). Therefore, this model can be an effective tool
to perform fast non-linear analyses, which could allow for parametric studies and
rapid screening of existing building classes.
5.7.3.3 Assessment of the bare frame structure
A vulnerability assessment of the irregular BF structure is here performed with the
proposed simplified non-linear MDOF dynamic model. For the storey behaviour curves it
were used the storey shear-drift curves obtained with the pushover analysis of the building.
The increasing input motion was defined considering the response spectra type I and
subsoil class A, in accordance to the Eurocode 8.
The structural response was estimated for increasing input motions with the multi-mode
model. In Figure 5.76 are represented the obtained vulnerability functions in terms of inter-
storey drift and top-displacement. Considering the base-shear and top-displacement
calculated for increasing levels of input motion, the capacity curve of the BF was then
estimated. In Figure 5.77 are represented the capacity curves obtained with the simplified
dynamic and pushover analysis, as well as the results of the PsD and cyclic tests on the BF
structure.
From the application of the simplified non-linear analysis, it can be observed that the
generated capacity curve gives a better approximation to the envelope of the dynamic test
results for the irregular BF structure than the capacity curve obtained with the pushover
analysis. This outcome sustains the utilization of this method in the seismic analysis of

Refined and simplified models for earthquake simulation, assessment and optimal redesign of existing RC structures
374
structures. It is an accurate tool to determine the structural response even for irregular
structures.
0.00
0.02
0.04
0.06
0.08
0.10
0.12
0.14
0.16
0.0 1.0 2.0 3.0 4.0 5.0
Earthquake spectra (ag - m/s2 )
Drif
t (m
)
Top displ.
1st storey drift
2nd storey drift
3rd storey drift
4th storey drift
Figure 5.76 - Vulnerability functions of the top-displacement and storey drift for the BF structure
calculated with the multi-mode model
Figure 5.77 - BF capacity curves: multi-mode method (black), pushover (blue),
PsD tests (green) and cyclic test (red)
5.7.4 Observed seismic performance in the earthquake tests
For each test series (bare and strengthened frames) the structure was subjected to
increasing earthquake intensities (from moderate to high intensities, as given in
Table 3.25), in order to reach different damage levels. As already stated in Chapter 3, the
return periods for the input motions were chosen so as to test the structure under different
seismic hazard levels specified in the VISION-2000 (SEAOC, 1995) and
FEMA-273 (1997) documents. These correspond to the 'Rare' (475-yrp) and 'Very Rare'

Chapter 5
375
(975 and 2000-yrp) events, under which a structure has to meet the 'Life Safety' and
'Collapse Prevention' performance levels, according to the minimum acceptable basic
performance objectives for buildings of normal occupancy and use, proposed in the
VISION-2000 (see Figure 2.1).
In Table 5.15 are presented for each performance level the representative damage in
columns and beams, for non-ductile RC frame buildings (according to the ATC-40, 1996).
In Table 5.16 are presented the storey deformation limits, also for each performance level,
proposed at the ATC-40.
Table 5.15 - Representative damage descriptions for elements in non-ductile RC frame buildings (adapted from ATC-40, 1996)
Performance level Element Nature of damage Immediate
Occupancy Damage Control Life Safety Structural
Stability
Flexural and shear cracking Very limited Limited --- ---
Hinges formed in the lower portions of the building --- --- Yes Yes
Spalling (above and below beam-column joints) No No Yes Significant
Pulverizing of concrete within the core --- --- --- Yes
Permanent horizontal offset No No ~2% a ~3.5% a
Columns
Gravity capacity maintained Yes Yes Yes Yesb
Spalling around beam-column joint Very limited Limited Yes Extensive
Spalling around hinge region --- --- Yes Extensive
Flexural cracking in hinge region Very limited Very limited Yes Extensive
Shear cracking in hinge region --- --- Yes Extensive
Cracking progressing into the beam column-joint --- --- Yes Yes
Damage of the shear stirrups adjacent to joint --- --- Elongation Rupture
Permanent deflection No No ~L/175 ~L/75
Beams
Gravity capacity maintained Yes Yes Yes Yes
a) ID (%) with small areas marginally higher. b) Throughout nearly all of the structure.

Refined and simplified models for earthquake simulation, assessment and optimal redesign of existing RC structures
376
Table 5.16 - Storey deformation limits (adapted from ATC-40, 1996)
Performance level ID limit
Immediate Occupancy Damage Control Life Safety Structural Stabilitya
Maximum total drift 1% 1-2% 2% i
i
PV
33.0
a) Vi is the total lateral shear force in the storey i, and Pi is the total gravity load (i.e., dead load plus likely live load) at storey i.
The structural performance response for each PsD test on BF and SR structures is indicated
in the seismic matrix of performance objectives in Table 5.17. In this table are also
indicated the basic performance objectives for buildings of normal occupancy and use,
proposed in the VISION-2000.
The performance response was classified according to the observed damage in beams and
columns (see Tables 4.2 and 4.7, for BF and SR respectively) and to the maximum inter-
storey drift (see Tables 4.1 and 4.6 for BF and SR respectively) verified for each pseudo-
dynamic test. The classification of damages and drift limits, for each performance level,
was based in the proposal of ATC-40 (1996), summarised in Tables 5.15 and 5.16,
respectively.
From the analysis of Table 5.17, it is observed that for the 975-yrp test the original bare
frame does not satisfy the VISION-2000 (SEAOC, 1995) basic design performance
objective. For the strengthened structure the basic performance objectives are verified.
Table 5.17 - Matrix of the observed seismic performance for the BF and SR tests
Fully Operational Operational Life Safe Collapse
Prevention Collapse
Frequent (43-yrp)
Occasional (72-yrp)
Rare (475-yrp) BF475
SR475
Earth
quak
e de
sign
leve
l
Very Rare (970-2000-yrp) SR975
SR2000 BF975

Chapter 5
377
5.8 - STRUCTURAL OPTIMIZATION PROBLEM IN SUPPORT OF BUILDING
RETROFITTING DECISION
5.8.1 Introduction
Structural optimization problems consist on determining the configurations of structures
that obey assigned constraints, and produce an extremum for a chosen objective function.
In order to solve them, they are normally transformed into a mathematical form that can be
solved by general optimization tools. Since structural optimization problems are
characterized by computationally expensive function evaluations, it is common to generate
a sequence of convex, separable sub-problems, which are then solved iteratively
(Chickermane and Gea, 1996-a).
For structural strengthening, optimization is an obligatory stage, as stated by Verpeaux et
al. (1991). It is therefore judged appropriate to have a methodology that can address the
strengthening design of MDOF structural systems, generating optimal distribution
(location) of the strengthening in the structure components (at storey level).
In this study, three methodologies for optimum redesign of existing structures are proposed
and programmed. The optimization algorithms are based on the convex approximation
methods, such as the CONvex LINearization method (CONLIN) developed by
Fleury (1989; 1979) and Braibant (1985), and the Method of Moving Asymptotes (MMA).
These optimization algorithms can deal with non-linear objective functions (minimum cost
of intervention) and allows to impose constrains on the design variables (strength, stiffness
or damping) and on any other response variable depending on the design variables, such as
inter-storey drift, top-displacement, etc.
The optimization procedure requires several structural response evaluations, namely of the
objective function, of constraints, and of their derivatives. The calculation of the structural
response is required many times during the optimization process, which would be
unfeasible with a refined FE model. The simplified model allows for spectral analysis,
which constitutes a great advantage over the multi-series analyses. The model is able to
estimate the response of irregular structures those we address with the optimization of the

Refined and simplified models for earthquake simulation, assessment and optimal redesign of existing RC structures
378
retrofit. Therefore, the simplified MDOF dynamic method, presented in Section 5.7.3, was
incorporated in the redesign optimization algorithms here proposed.
In these three structural optimization problems, the design variables, or control variables,
are defined at storey level, and they are:
• The additional strength (Problem I);
• The additional pre-yielding stiffness (Problem II); and,
• The yielding strength of the energy dissipation device (Problem III).
In the next are revised the theoretical concepts related with the optimization problem. The
three implemented optimization problems are explained. Strengthening design examples
based on the structure under analysis are used to illustrate the capability of the proposed
methodology. Finally, comments on the implemented methodology are given.
5.8.2 Theoretic mathematical background
As exposed by Chickermane and Gea (1996-a; 1996-b), in structural optimization
problems, the performance and constraint functions can be selected from integral functions
such as weight, mean compliance or natural frequency, and from local functions such as
maximum Von Mises stress or maximum deflection. The design vector can consist of
material properties or shape defining parameters, such as coordinates of vertices or control
points of spline curve boundaries.
Consider { }nxxxx ,...,, 21= a vector of design variables and dimension n, and ( )xf0 the
function to be minimized. Here, the objective function ( )xf0 represents the structural
characteristic, and the additive inequalities ( ) ),...,1( mjgxg jj =≤ are the behaviour
constraints. The lower and upper bounds of the design variables ix are ix and ix ,
respectively. The structural optimization problem can be stated mathematically as
Minimize ( )xf0
(5.30)
Subject to
( )
=≤≤
=≤
nixxx
mjgxg
iii
jj
,...,1
,...,1
(5.31)

Chapter 5
379
For structure optimization, functions ( )xf0 and ( )xg j are not always known in an explicit
way, generally are non-linear and very expensive to evaluate (Verpeaux et al., 1991). To
reduce the computational cost, a general procedure is to generate a sequence of convex,
explicit sub-problems and solve them in an iterative fashion (Fleury, 1989), i.e. a
Sequential Convex Programming (SCP) approach is used. Various approximation schemes
have been developed for this purpose.
The approximation schemes of interest to us are local function approximations
(Barthelemy and Haftka, 1993), which generate an approximated formulation of the
problem in the vicinity of the current design point. One of the earliest of such schemes is
Sequential Linear Programming (SLP). In SLP, a linear approximation of the function is
formulated using the first order derivative term of the Taylor Series expansion as
( ) ( )∑ ∂∂
−+=i xi
ii xfxxfxf
0
00~ (5.32)
In truss design problems, where the design variables are often chosen as the cross sectional
areas of the bar structure, it is advantageous to use reciprocals of the design variables to
formulate the approximation. This procedure was followed by the CONvex LINearization
(CONLIN) method (Fleury and Braibant, 1986). This method linearizes each function
using a properly selected mix of direct ix and reciprocal ix/1 variables. The selection of
the variables is made based on the signs of the first partial derivatives, that is, direct
variables for positive first derivative and reciprocal for negative first derivatives. It is of
the form
( ) ∑∑∑−+ ∂
∂−
∂∂
+∂∂
−=ixi
iixi
ixi xx
fxxxfx
xffxf 1~
000
2000 (5.33)
where the symbols ∑+
and ∑−
mean summation over the positive and negative terms,
respectively. The first two terms are the contribution of the zero-th order terms in the
Taylor series expansion. This method yields convex and separable approximations.
CONLIN employs conservative approximations and has shown good convergence
properties in dealing with some structural optimization problems. However, in certain

Refined and simplified models for earthquake simulation, assessment and optimal redesign of existing RC structures
380
problems, this convex approximation is either too conservative or not sufficiently
conservative (Chickermane and Gea, 1996-a).
Svanberg (1987) proposed the Method of Moving Asymptotes (MMA), which is a
modification of CONLIN method. In MMA method, the linearization variables can be used
to adjust the degree of convexity and conservativeness depending on the problem. The
variables take the form ( )ii Lx −/1 and ( )ii xU −/1 where iU and iL are user selected
variables called the moving asymptotes. The approximation is of the form
( ) ∑∑−+ −
−−
+=ii
i
ii
i
Lxb
xUb
dxf 0~ (5.34)
where
( )
( )
<∂∂
∂∂
−
>∂∂
∂∂
−
=
0;
0;
00
00
20
20
xixiii
xixiii
i
xf
xfLx
xf
xfxU
b (5.35)
In this expression 0d collects the zero-th order terms. The moving asymptotes iL and iU
can be used to control the optimization process. If the process oscillates, it can be
stabilized by moving the asymptotes closer to the current iteration point. If it converges
slowly, the asymptotes are moved away. On taking 0=iL and +∞=iU MMA is reduced
to the CONLIN method, while if −∞=iL and +∞=iU MMA is the same as SLP. MMA
offers a great deal of flexibility in matching the curvature of the approximated function
through the choice of iL and iU . However, empirical techniques have to be used to
determine their values after each iteration.
A further extension of MMA was proposed by Fleury (1989). This method uses
intermediate linearization variables of the form ( )iji dx −/1 . The approximated function is
expressed as
( ) ( ) ( )∑= ∂
∂−
−−
−+=
n
j xj
iij
kj
ijkjijj
kii
kxfdx
dxdxxfxf
1
211~ (5.36)

Chapter 5
381
The moving asymptote, ijd determined from the second order derivative is
kxji
jikjij xf
xfxd 22 /
/2
∂∂
∂∂+= (5.37)
In any structural optimization problem, an important consideration from the computational
point of view is the number of function evaluations required to formulate the approximated
problem. Besides this, to evaluate the quality of the approximation obtained it is crucial to
determine the rate of convergence to the optimal solution (Chickermane and Gea, 1996-a).
5.8.3 Structural strengthening optimization problems' formulation
For the optimization problems here proposed, it is assumed that the behaviour of a multi-
storey RC existing building (non-seismically designed) subjected to a certain earthquake
action level can be represented by the multi-modal model proposed in Section 5.7.3.
Buildings are modelled with one DOF per storey, linked by beam elements that represent
the storey behaviour. The beam elements have an equivalent secant stiffness corresponding
to the maximum deformation point in the non-linear storey constitutive curve.
Furthermore, response spectra modal analysis with concentrated and/or distributed
damping is used to compute the seismic response for each step of the optimization
procedure.
The optimization procedure requires previous identification of simplified (bilinear) storey
shear-drift constitutive relations made on the basis of pushover analysis, as represented in
Figure 5.78.

Refined and simplified models for earthquake simulation, assessment and optimal redesign of existing RC structures
382
F
D
Structural behaviourIdealized behaviour
Kp
Ky
Dy
Fy
Figure 5.78 - Lateral storey shear versus inter-storey drift behaviour (exact and idealized bilinear
behaviour)
As recalled in Section 2.3, a seismic performance objective is formed by combining a
desired building performance level (a damage limit-state) with a given earthquake ground
motion (level of hazard). The objective of this analysis is to find the optimum retrofitting
solution in order to comply with a certain seismic demand-level defined for each limit-
state.
The optimization problem, in generic terms, is to minimise the total strengthening
requirements in the structure, whilst satisfying the limits for the inter-storey drifts and
maximum strengthening at each storey, as given in the following
Minimise The total strengthening costs
Upper limits of storey strengthening; and, Subject to
Upper limits of storey lateral deformation (inter-storey drift)
The objective function for each problem is the sum of the control variables (additional
strengthening costs) at each storey level. The inequality constraints are upper inter-storey
drift limits (to restrain the damage at storey level) and upper storey strengthening limits (to
restrict the strengthening within acceptable values).
As already said, three design optimization structural strengthening problems were
established in this work. They were conceptually based on the strengthening strategies
commonly used in practice, which call for the control variables: the strength (controlled by

Chapter 5
383
the yielding shear force, yF∆ ), the pre-yielding stiffness ( yK∆ ), and the yielding strength
of the energy dissipator devices ( devyF ), as will be explained in the subsequent sections.
5.8.3.1 Problem I: storey yielding strength
F
D
F*y
yF
Figure 5.79 - Control variable: strength (yielding shear force – Fy)
Problem I (control variables: strength, yF∆ , see Figure 5.79) can be described in the
following mathematical form
Find { }NDOFyyyy FFFF ,2,1, ;...;; ∆∆∆=∆ (5.38)
Minimise ∑∑==
−=∆=∆NDOF
iiyiy
NDOF
iiyy FFFFCost
1
0,,
1, )()( (5.39)
NDOFiFFF iyiyiy ,...,2,1max,,
min, =∆≤∆≤∆ (5.40)
NDOFiDD ii ,...,2,1max =≤ (5.41)
in which: 0,iyF , iyF ,∆ and iyF , are the initial, incremental and total yielding strength of the
storey i, respectively. NDOF represents the number of degrees of freedom of the problem,
i.e. number of storeys. min,iyF∆ and max
,iyF∆ are the lower and upper bound limits for each
control variable ( iyF ,∆ ). iD is the inter-storey drift at storey-level i. maxiD is the maximum
admissible inter-storey drift for each storey-level.
Subject to

Refined and simplified models for earthquake simulation, assessment and optimal redesign of existing RC structures
384
In this problem, it were studied two possibilities for the variation of the curves force-
displacement, namely (see schemes represented in Figure 5.80): I-a) yielding displacement
constant; and, I-b) yielding stiffness constant.
D
F
D
F
Fy*
Fy,0
Dy,0*yD Dy,0
*Dy
y,0F
Fy*
*Ky
Ky,0*yKKy,0
≡
≡
a) b)
Figure 5.80 - Problem I: a) yielding displacement constant; b) yielding stiffness constant
For the pos-yielding stiffness (Kp), two different possibilities were implemented in this
optimization problem. The first option maintains constant the pos-yielding stiffness
(expression 5.42), and in the second option it is imposed a constant ratio between the
yielding stiffness (Ky) and pos-yielding stiffness (expression 5.43)
pp KK =* y
p
y
p
KK
KK
=*
*
(5.42, 5.43)
5.8.3.2 Problem II: storey yielding stiffness (initial stiffness)
D
F
K
K
y
y*
0
Figure 5.81 - Control variable: pre-yielding stiffness (Ky)

Chapter 5
385
In Problem II, the task is to minimize the total pre-yielding stiffness, yK∆ , strengthening
(see Figure 5.81). This optimum strengthening design problem can be mathematically
stated in the form of
Find { }NDOFyyyy KKKK ,2,1, ;...;; ∆∆∆=∆ (5.44)
Minimise ∑∑==
−=∆=∆NDOF
iiyiy
NDOF
iiyy KKKKCost
1
0,,
1, )()( (5.45)
NDOFiKKK iyiyiy ,...,2,1max,,
min, =∆≤∆≤∆ (5.46)
NDOFiDD ii ,...,2,1max =≤ (5.47)
in which: 0,iyK , iyK ,∆ and iyK , are the initial, incremental and total pre-yielding stiffness
of the storey i, respectively. NDOF represents the number of degrees of freedom of the
problem, i.e. number of storeys. min,iyK∆ and max
,iyK∆ are the lower and upper bound limits
for each control variable ( iyK ,∆ ). iD is the inter-storey drift at storey-level i. maxiD is the
maximum admissible inter-storey drift for each storey-level.
For the pos-yielding stiffness (Kp), this optimization problem, considers also the two
different possibilities referred to in the Problem I (see expressions 5.42 and 5.43). It was
also developed a strengthening intervention strategy defined as a combination of strength
and stiffness upgrading.
5.8.3.3 Problem III: yielding strength of the energy dissipator devices
The Problem III (control variables: yielding force of the dissipator device, devyF , see
Figure 5.82) can be described in the following mathematical form
Find { }devNDOFy
devy
devy
devy FFFF ,2,1, ;...;;= (5.48)
Minimise ∑=
=NDOF
i
deviy
devy FFCost
1,)( (5.49)
Subject to
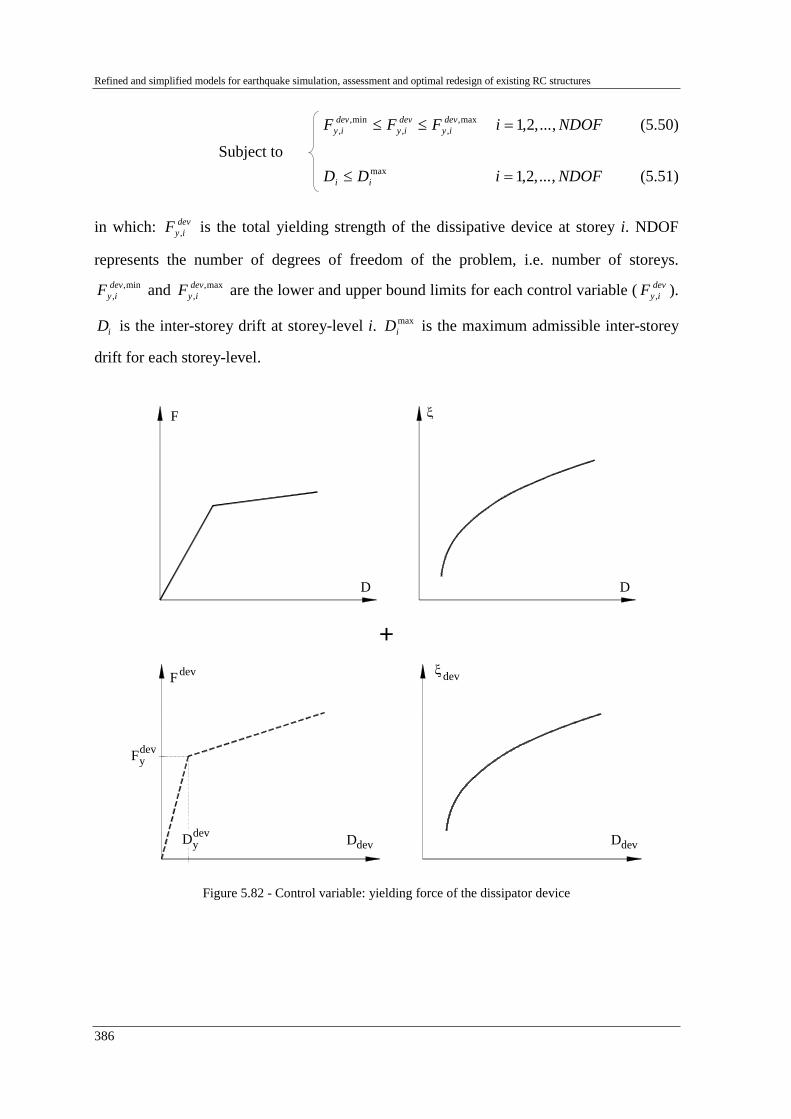
Refined and simplified models for earthquake simulation, assessment and optimal redesign of existing RC structures
386
NDOFiFFF deviy
deviy
deviy ,...,2,1max,
,,min,
, =≤≤ (5.50)
NDOFiDD ii ,...,2,1max =≤ (5.51)
in which: deviyF , is the total yielding strength of the dissipative device at storey i. NDOF
represents the number of degrees of freedom of the problem, i.e. number of storeys. min,
,dev
iyF and max,,
deviyF are the lower and upper bound limits for each control variable ( dev
iyF , ).
iD is the inter-storey drift at storey-level i. maxiD is the maximum admissible inter-storey
drift for each storey-level.
D
F
D
ξ
+
Fydev
devD
F dev ξ
Ddev
dev
ydevD
Figure 5.82 - Control variable: yielding force of the dissipator device
Subject to

Chapter 5
387
5.8.4 Implementation of the optimization problems
The optimization problems proposed in the previous section were implemented in the finite
element code CASTEM (Millard, 1993). In CASTEM it is available an operator
implemented by Verpeaux et al. (1991), called EXCE, which permits to solve numerically
practical problems of optimization. The EXCE operator computes the minimum of a
function with n independent variables, subjected to restrictions of the control variables and
to other generic restrictions.
In this operator three methods of optimization are implemented, namely: a) 'LIN' – Method
of Convex Linearization (without moving asymptotes) proposed by Braibant (1985). With
the introduction of the moving asymptotes method (due to Svanberg, 1987), two different
methods are implemented in CASTEM, for two different alternatives of the L and U
functions, namely: b) 'STA'; and, c) 'MOV'.
The EXCE operator optimises the minimum of an approximate linear problem. The
objective function and the restrictions are replaced with the linearized functions. With the
linearized functions, the operator EXCE computes the converged minimum, which is
employed to start with the next iteration. A more detailed description can be found in the
CASTEM manual of the EXCE operator.
The philosophy of CASTEM is modular. Therefore, the optimization methodology was
implemented in separate modules for pre-processing, structural analyses, optimization,
pos-processing and graphical results visualisation. The basic steps of the iterative
optimization process implemented can be summarised as follows (see also the schematic
flowchart in Figure 5.83):
1) Select the design control variables, i.e. strengthening intervention strategy (strength,
stiffness, or damping).
2) Define the structure geometry (NDOF storeys and inter-storey heights, hi), the
original bilinear storey shear-drift behaviour curves, Fi(Di), and variable damping
curves at storey, ξi(Di), or global level, ξGlobal(DGlobal). Set storey masses, mi.
3) Define design performance objective (design seismic demand, Sa(T, ξ0), and inter-
storey drift limit, maxiD , for each storey-level), based on commonly accepted values

Refined and simplified models for earthquake simulation, assessment and optimal redesign of existing RC structures
388
for exceedance probabilities, as for example the given by ATC-40 (1996) or
VISON-2000 (SEAOC, 1995).
4) Choose a starting point { }0x and let the iteration index 0=k .
5) Given an iteration point { }kx calculate the first order derivatives of the objective and
constraint functions with respect to the design variables.
6) Generate the approximated sub-problems using one of the approximation methods
available in CASTEM. Then the convex optimization problem is formulated and
solved iteratively.
7) Get optimum design variables for the limit-state considered: yF∆ for additional
yielding strength, yK∆ for additional yielding stiffness, or devyF for K-bracing with
dissipator device intervention.
8) With the obtained optimal design point { }*x , the convergence is verified. If the
solution does not converge, this solution is used as the next iteration point. The
iteration index k is increased by one and the iterative process continues (go to
step 5).
9) With converged solution (which minimizes the strengthening costs for a specific
limit-state requirement), graphical output of the solution is prepared.
T
a
CONTROL VARIABLES:
NON-LINEARSIMPLIFIED
MODEL
D
{ }Fy∆ PROBLEM I
}{∆ yK PROBLEM II
Fy{ } PROBLEM IIIdev
SINPUT MOTION
INTER-STOREY DRIFT LIMIT
max}{
OPTIMIZATION ALGORITHM OPTIMUM DESIGNVARIABLES
}
∆
∆
devy
y
y
F
F
{
{
{
K
}
}*
*
*
Figure 5.83 - Iterative optimization procedure

Chapter 5
389
For the numerical optimization problem, the value of the objective function and of the
restrictions as well as the respective first order derivatives at the starting point { }0x are
computed and given to start the optimization algorithm. At any design point, the
implemented algorithm calculates the first order derivative information to formulate the
approximation. The points chosen to calculate the derivatives in the vicinity of the current
design point have to give a good approximation of the functions in the vicinity of the
design point. In each of the structural optimization problems implemented, the first order
derivatives are numerically calculated. Therefore, to calculate the first order derivatives for
each design variable it is necessary to numerically evaluate each function (objective
function and constraints functions) at two points in the vicinity of the current design point,
as schematically represented in Figure 5.84. Then, the derivative value is calculated as
generically expressed in equation (5.52).
y
kx∆xk- xk x ∆+k
kx( )y=f
Figure 5.84 - First order derivatives – Numerical evaluation
∆∆−−∆+
≅∂
∂2
)()()( kk
x
xfxfxxf
k
(5.52)
5.8.5 Illustrative examples
Numerical examples are herein presented in order to illustrate the proposed optimal retrofit
design methodology. For each example, the computational optimal results are summarised
in a table and the evolution of the control variables, objective function, storey
displacement, inter-storey drift, and storey shear are provided graphically. The converged
solution for each storey is also represented graphically in the storey shear-drift diagram.
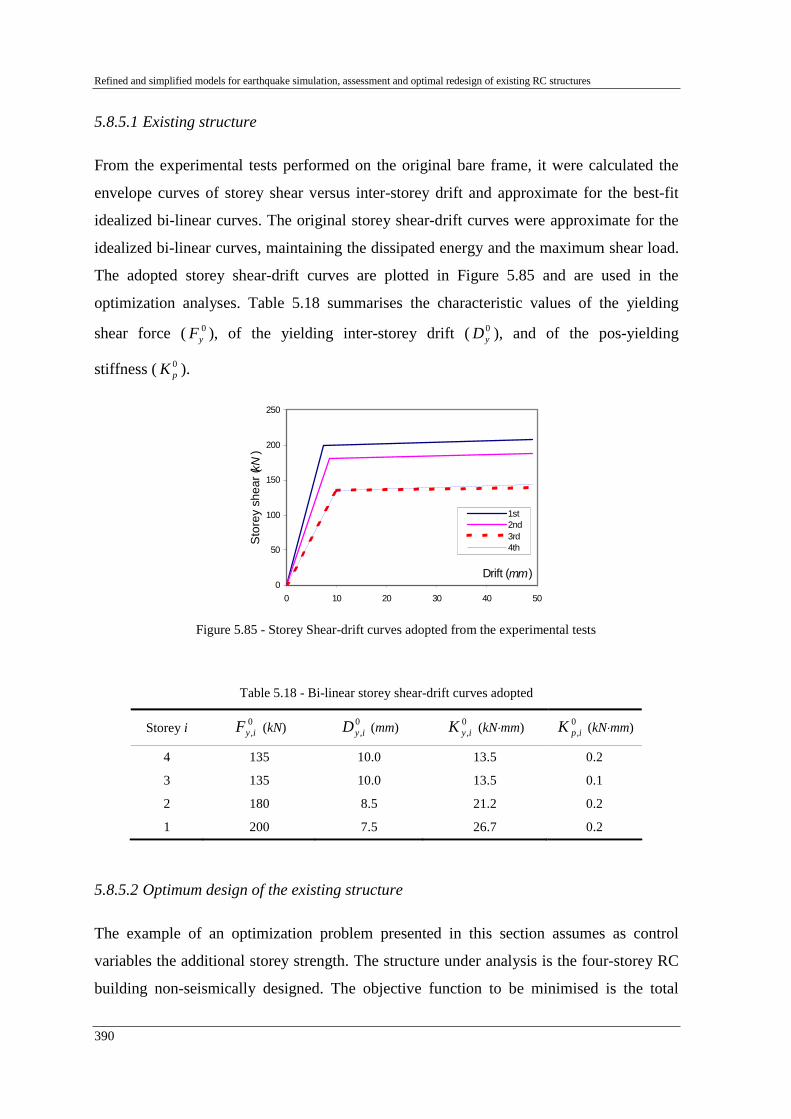
Refined and simplified models for earthquake simulation, assessment and optimal redesign of existing RC structures
390
5.8.5.1 Existing structure
From the experimental tests performed on the original bare frame, it were calculated the
envelope curves of storey shear versus inter-storey drift and approximate for the best-fit
idealized bi-linear curves. The original storey shear-drift curves were approximate for the
idealized bi-linear curves, maintaining the dissipated energy and the maximum shear load.
The adopted storey shear-drift curves are plotted in Figure 5.85 and are used in the
optimization analyses. Table 5.18 summarises the characteristic values of the yielding
shear force ( 0yF ), of the yielding inter-storey drift ( 0
yD ), and of the pos-yielding
stiffness ( 0pK ).
0
50
100
150
200
250
0 10 20 30 40 50
Drift (mm)
Sto
rey
shea
r (kN
)
1st2nd3rd4th
Figure 5.85 - Storey Shear-drift curves adopted from the experimental tests
Table 5.18 - Bi-linear storey shear-drift curves adopted
Storey i 0,iyF (kN) 0
,iyD (mm) 0,iyK (kN⋅mm) 0
,ipK (kN⋅mm)
4 135 10.0 13.5 0.2
3 135 10.0 13.5 0.1
2 180 8.5 21.2 0.2
1 200 7.5 26.7 0.2
5.8.5.2 Optimum design of the existing structure
The example of an optimization problem presented in this section assumes as control
variables the additional storey strength. The structure under analysis is the four-storey RC
building non-seismically designed. The objective function to be minimised is the total
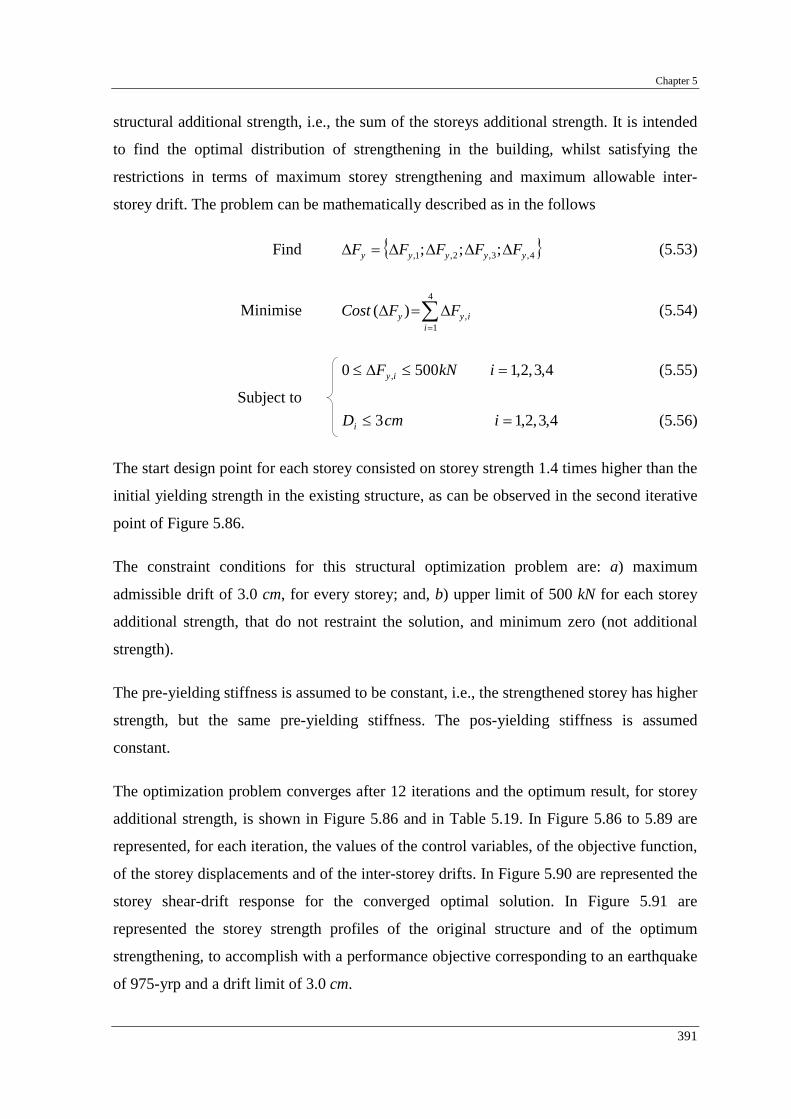
Chapter 5
391
structural additional strength, i.e., the sum of the storeys additional strength. It is intended
to find the optimal distribution of strengthening in the building, whilst satisfying the
restrictions in terms of maximum storey strengthening and maximum allowable inter-
storey drift. The problem can be mathematically described as in the follows
Find { }4,3,2,1, ;;; yyyyy FFFFF ∆∆∆∆=∆ (5.53)
Minimise ∑=
∆=∆4
1,)(
iiyy FFCost (5.54)
4,3,2,15000 , =≤∆≤ ikNF iy (5.55)
4,3,2,13 =≤ icmDi (5.56)
The start design point for each storey consisted on storey strength 1.4 times higher than the
initial yielding strength in the existing structure, as can be observed in the second iterative
point of Figure 5.86.
The constraint conditions for this structural optimization problem are: a) maximum
admissible drift of 3.0 cm, for every storey; and, b) upper limit of 500 kN for each storey
additional strength, that do not restraint the solution, and minimum zero (not additional
strength).
The pre-yielding stiffness is assumed to be constant, i.e., the strengthened storey has higher
strength, but the same pre-yielding stiffness. The pos-yielding stiffness is assumed
constant.
The optimization problem converges after 12 iterations and the optimum result, for storey
additional strength, is shown in Figure 5.86 and in Table 5.19. In Figure 5.86 to 5.89 are
represented, for each iteration, the values of the control variables, of the objective function,
of the storey displacements and of the inter-storey drifts. In Figure 5.90 are represented the
storey shear-drift response for the converged optimal solution. In Figure 5.91 are
represented the storey strength profiles of the original structure and of the optimum
strengthening, to accomplish with a performance objective corresponding to an earthquake
of 975-yrp and a drift limit of 3.0 cm.
Subject to
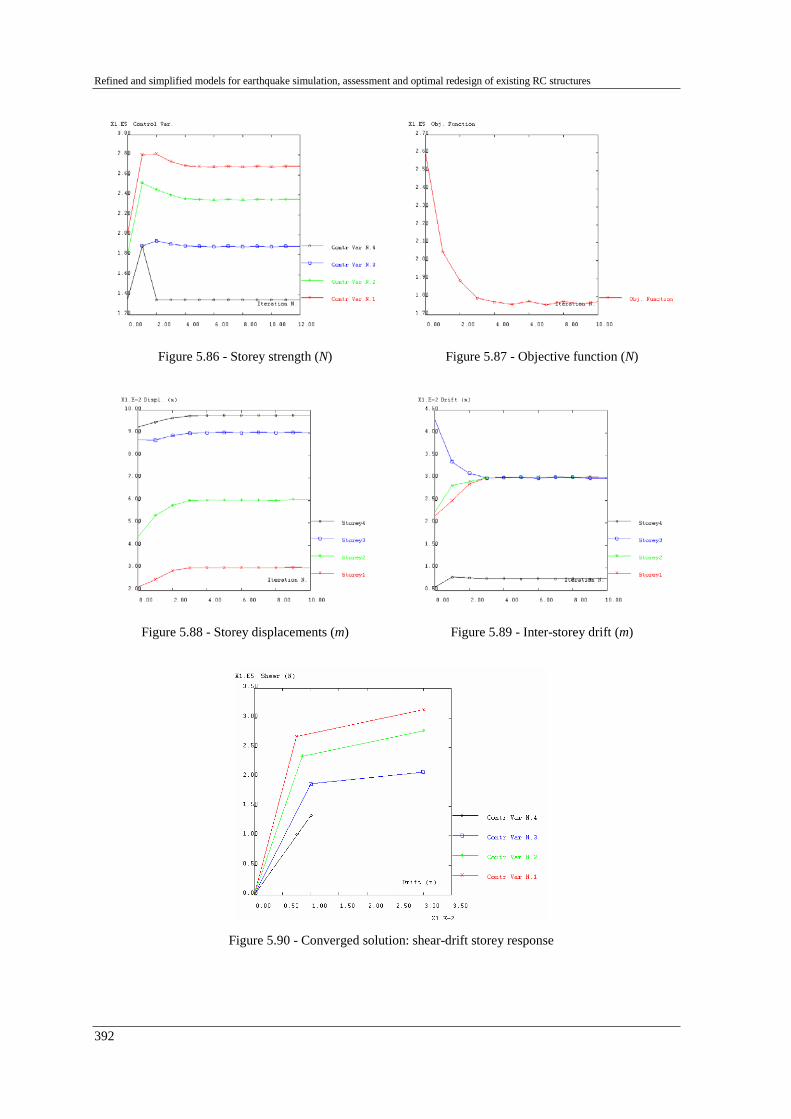
Refined and simplified models for earthquake simulation, assessment and optimal redesign of existing RC structures
392
Figure 5.86 - Storey strength (N) Figure 5.87 - Objective function (N)
Figure 5.88 - Storey displacements (m) Figure 5.89 - Inter-storey drift (m)
Figure 5.90 - Converged solution: shear-drift storey response

Chapter 5
393
Table 5.19 - Converged solution: optimum distribution of the additional yielding strength (3 cm drift limit and earthquake 975-yrp)
Storey i 0,iyF (kN) iyF ,∆ (kN)
4 135 0.0
3 135 51.5
2 180 53.8
1 200 66.8
Total 172.1
0
1
2
3
4
0 50 100 150 200 250 300Strength (kN)
Sto
rey
Strengthening
Original
Optimum
Figure 5.91 - Storey yielding strength of the existing structure and optimum strengthening distribution
5.8.5.3 Multiple optimum strengthening design
To illustrate the methodology proposed, a series of retrofitting design examples based on
the non-seismic designed existing structure under analysis are presented here. The strength
is the control variable used (Problem I). In this problem it was considered constant yielding
displacement and constant pos-yielding stiffness. Regarding the damping, the curves storey
damping-drift, presented in Figure 5.59 were used. Additionally, it was considered that the
storey damping functions do not change with the strengthening.
The optimal retrofit was calculated for a vast series of performance objectives (multiple
performance objectives). Particularly, for the input motion, it were considered the seismic
hazard levels corresponding to return periods of 73, 475, 975 and 2500 years
(corresponding to the 'Serviceability Earthquake', SE, 'Design Earthquake', DE, 'Maximum

Refined and simplified models for earthquake simulation, assessment and optimal redesign of existing RC structures
394
Earthquake', ME, and, 'Maximum Considered Earthquake', MCE, see Table 2.2), as
recommended in the ATC-40 (1996). For the inter-storey drift limit (limit-states) it were
considered several values. In this analysis, no upper limits were imposed for the
strengthening.
In Figures 5.92 to 5.95 are represented for each redesign performance objective the results
in terms of total and storey (1st, 2nd and 3rd) strengthening. For all redesign performance
objectives, the obtained optimum strengthening distribution does not involve strengthening
at the 4th storey level.
In Figure 5.96 are presented, as an example, the vulnerability performance functions for
one designed optimum retrofitting structure. The strengthening was optimized using the
storey strength as control variable, 2% as allowable drift limit, and a design seismic action
corresponding to a return period of 2500 years (see also the optimum retrofitting solution
signalled in Figure 5.92).
0.4%
0.5%
0.6%
0.7%
0.8%
0.9%
1.0%
1.1%
1.2%
1.3%
1.4%
1.5%
1.6%
1.7%
1.8%
1.9%
2.0%
2.1%
2.2%
2.3%
2.4%
2.5%
2.6%
2.7%
2.8%
0
50
100
150
200
250
300
350
400
450
Add
it. s
treng
th ( k
N)
Drift limit
73-yrp475-yrp975-yrp2500-yrp
Figure 5.92 - Total additional strength

Chapter 5
395
0.4%
0.5%
0.6%
0.7%
0.8%
0.9%
1.0%
1.1%
1.2%
1.3%
1.4%
1.5%
1.6%
1.7%
1.8%
1.9%
2.0%
2.1%
2.2%
2.3%
0
20
40
60
80
100
120
140
160
180
200Ad
dit.
stre
ngth
( kN
)
Drift limit
73-yrp475-yrp975-yrp2500-yrp
Figure 5.93 - 1st storey additional strength
0.4%
0.5%
0.6%
0.7%
0.8%
0.9%
1.0%
1.1%
1.2%
1.3%
1.4%
1.5%
1.6%
1.7%
1.8%
1.9%
2.0%
2.1%
2.2%
2.3%
0
20
40
60
80
100
120
140
Add
it. s
treng
th ( k
N)
Drift limit
73-yrp475-yrp975-yrp2500-yrp
Figure 5.94 - 2nd storey additional strength

Refined and simplified models for earthquake simulation, assessment and optimal redesign of existing RC structures
396
0.4%
0.5%
0.6%
0.7%
0.8%
0.9%
1.0%
1.1%
1.2%
1.3%
1.4%
1.5%
1.6%
1.7%
1.8%
1.9%
2.0%
2.1%
2.2%
2.3%
2.4%
2.5%
2.6%
2.7%
2.8%
0
20
40
60
80
100
120
Add
it. s
treng
th ( k
N)
Drift limit
73-yrp475-yrp975-yrp2500-yrp
Figure 5.95 - 3rd storey additional strength
0.0
0.5
1.0
1.5
2.0
2.5
3.0
3.5
4.0
4.5
5.0
0 1 2 3 4 5 6 7
Max. input ground acceleration (m/s2 )
Max
. int
er-s
tore
y dr
ift (%
) 1st2nd3rd4thDesign
Figure 5.96 - Vulnerability function of the structure designed for 2% drift and 2500-yrp

Chapter 5
397
5.8.6 Final remarks
From the optimum strengthening results for the existing structure, obtained with the
proposed optimization methodology, the following can be observed:
• The proposed optimization methodology involves reduced computational costs. As
observed in the studied strengthening structural optimization problems, this
methodology leads to fast convergence (reduced number of iterations are required
for convergence).
• The methodology can be a useful design tool, as a preliminary step, in the global
structural strengthening decision, generating the optimum strengthening (strength,
stiffness or damping) storey distribution, for one or multiple performance
objectives.
• With this optimization procedure, it is possible to define optimum strengthening
needs for different limit-states ('Fully Operational', 'Operational', 'Life Safe' and
'Collapse Prevention') as well as to achieve probabilistic sensitivity functions for
specific limit-states, in terms of the basic design variables (storey strength, storey
stiffness or additional damping). This procedure leads to a retrofit design, for each
limit-state considered, which requires further considerations and possibly recourse
to life-cycle cost analyses to identify the optimum design (see for example, the
procedure proposed by Pinto, 1998).

CHAPTER 6
SUMMARY AND CONTRIBUTIONS, CONCLUSIONS,
IMPLICATIONS AND FUTURE RESEARCH
'It is a bitter and humiliating thing to see works, which have cost men so much time and labour, overthrown in one minute; yet compassion for the inhabitants is almost instantly forgotten, from the interest excited in finding that state of things produced in a moment of time, which one is accustomed to attribute to a succession of ages.' (Charles Darwin, March 1835, reporting the ruin of Concepción in Chile by an earthquake)
6.1 - SUMMARY AND CONTRIBUTIONS
As recalled in Chapter 1, there is a lack of experimental results and associated calibrated
numerical models for existing reinforced concrete structures designed without specific
seismic resistance. The experimental work reported and discussed in the thesis intends to
reduce this shortcoming.
A specific feature of this thesis relies on the combination of numerical and experimental
work. The numerical models are calibrated against experimental PsD test results on RC
full-scale structures (see Chapter 5). The tests on full-scale models of existing structures
constitute an exceptional opportunity for improvement of knowledge on behaviour and
capacity of RC structures designed and constructed in Europe until the late 1970's.
As reiterated by Coelho et al. (2000), seismic testing assumes a key role in the policies of
earthquake risk mitigation. In this regard, the experimental programme defined and set-up
by the ICONS researchers constitutes a major effort and can be considered as one of the
largest co-ordinated experimental works performed in the world. In this thesis, conducted

Summary and contributions, conclusions, implications and future research
400
within the ICONS project, a series of large-scale PsD seismic tests, described in Chapters 3
and 4, have been successfully carried out in the European reaction-wall facility (ELSA
laboratory, of the Joint Research Centre, in Ispra, Italy). The experimental tests on the full-
scale frames, representative of the construction practice until the late 1970's, aimed at: i) to
assess the original capacity of bare structures; ii) to evaluate the influence of infill masonry
in the structural response; iii) to assess different retrofitting solutions.
The results from these reference experimental PsD earthquake tests on full-scale structures
produced a vast data set, useful to calibrate methodologies for the assessment of seismic
fragility of buildings (as made by Coelho et al., 2000), to calibrate refined non-linear
numerical models (as made by the author in this thesis; Delgado et al., 2002; Dolsek and
Fajfar, 2001; Candeias, 2000; Combescure, 2000; Pinho, 2000; among others), and to
design adequate retrofitting measures in order to enhance the seismic performance of
existing RC structures (Elnashai and Pinho, 1999). The procedures for seismic assessment
described in the literature require validation against experimental results from structures
with typical reinforcement detailing, as those used a few decades ago. This data set is
expected to contribute to set-up guidelines for the assessment and redesign of these
structures in earthquake prone zones. In particular, the findings of the research can
contribute as a basis for the calibration and further revision of EC8 Part 1-3. From the
experimental PsD tests, slab-participation, plastic hinge length, damage indices and drift
limits for each limit state, for existing and retrofitted RC structures, were studied.
The influence of physical phenomena and model parameters (such as the bond-slip, plastic
hinge length and slab-participation) in the structural response was thoroughly understood
due to the integrated numerical and experimental research approach. In the numerical
study, it was proposed a simplified model to account for the slippage of the reinforcement
in existing RC structures. The numerical models were able to properly simulate the
retrofitted RC elements, even for the case of structures previously damaged by
earthquakes. The refined model provides a valuable basis to simulate the behaviour of
existing RC buildings and to adequately characterize strengthening solutions.
From the structural assessment performed with the Capacity Spectrum Method (CSM), it
was concluded about the inadequacy of this method to predict the response of irregular
structures. Therefore, it was proposed a simplified MDOF non-linear dynamic method for

Chapter 6
401
the assessment of irregular structures. Based on the proposed MDOF non-linear model, it
were developed optimization algorithms for the redesign of existing vulnerable structures.
The proposed optimization procedure searches for the optimum storey strengthening
distribution (strength, stiffness or damping) in order to meet specific performance
requirements, in terms of maximum inter-storey drift for a given earthquake demand.
Maximum strengthening values are also considered for each storey. With the proposed
redesign methodology it is possible to define optimum retrofitting solutions for different
limit-states.
The main conclusions drawn from the performed studies are here summarised.
Implications for researchers, policy makers and owners are underlined. The chapter closes
up suggesting possible future research topics and approaches.
6.2 - CONCLUSIONS
Chapter 2 reviewed the worldwide experience from past and recent earthquakes showing
that, by far, the major damages and even collapses of structures and human life losses
come from deficiencies in existing non-ductile reinforced concrete buildings. Frame type
RC structures were the most commonly structural system used until the late 1970's in the
southern European countries, especially for buildings. Thus, this thesis concentrated in the
study of seismic assessment and rehabilitation of RC constructions of that period.
Mentioning the recent earthquake occurred in 1999 in Izmit, Turkey (EQE, 1999), it has
wide-ranging lessons for the earthquake engineering, building code development and
application in earthquake regions, construction quality, risk management, and insurance.
As declared in EQE (1999), almost all of the damage caused by the earthquake, and almost
all of the deaths caused by the collapse of inadequately designed, detailed and constructed
buildings were avoidable. The major sources of seismic weakness in old buildings were
identified and studied. In spite of the current rather strict earthquake-resistant code
requirements, on all continents around the world, serious deficiencies still take place in the
design and construction of most buildings.

Summary and contributions, conclusions, implications and future research
402
Another experience deeply analysed in Chapter 2 comes from the 1995 Kobe earthquake,
in Japan. It was verified that pre-1981 concrete frame buildings performed very poorly,
with many collapses. Post-1981 buildings performed much better. Many concrete
buildings, similar to those that collapsed, have not been strengthened in other earthquake-
prone regions in the world and are expected to collapse in future seismic events. For such
buildings, similar damage and collapses have been reported in many recent earthquakes.
As stated in EQE (1995), one of the most dangerous buildings' classes is the older non-
ductile RC structure. From the performance of these buildings, it is obvious that a major
strengthening and rehabilitation program also needs to be initiated in earthquake-prone
regions.
In spite of the current knowledge in earthquake engineering, there are still many
unidentified seismic sources and uncertainties. The damages caused by the 1999
earthquake that stroke Athens, a highly populated city and the heart of the economic and
administrative activity of Greece, proves it.
A review of the lessons learned from these and others significant earthquakes that have
occurred recently have led to the conclusion that the seismic risk in urban areas is
increasing rather than decreasing. The disastrous consequences in terms of damages on RC
buildings and human casualties resulting from seismic activity in a recent past, all around
the world, reveal that research on repair and strengthening of structures is urgently needed.
One of the most effective ways to reverse this situation in future significant earthquakes is,
first, through the development of more reliable seismic standards and code provisions than
those currently available. Secondly, through their stringent implementation for the
complete engineering of new civil engineering facilities and also for the evaluation of the
seismic vulnerability and upgrading of existing hazardous facilities. A comprehensive
approach for development and implementation of the next generation standards and codes
must include consideration of all the main aspects involved in engineering of facilities to
resist the effects of earthquakes. These main aspects involve not only those concerning the
conceptual and numerical designs but also the proper structural detailing and construction
of such conceptual and numerical designs, and the monitoring of the occupancy and
maintenance of the whole facility.

Chapter 6
403
The challenge to the scientific earthquake engineering community is: a) to develop rational
assessment and redesign methods; b) to define appropriate decision criteria for retrofit of
existing structures; and, c) to investigate and assess innovative cost-effective strengthening
solutions and techniques.
As stated in Chapter 2, the selection of the retrofitting strategy and its implementation
should be guided by results of a detailed assessment or evaluation of the structure. The
seismic rehabilitation of structures is based on two general approaches, namely system and
member rehabilitation. In the majority of the retrofitting cases, both approaches need to be
combined.
To study the vulnerability of existing RC structures a vast pseudo-dynamic and
displacement cyclically imposed test campaign on a full-scale RC frame was performed
(Pinto et al., 2002). The efficiency of several retrofitting techniques was also
experimentally evaluated (as exposed in Chapters 3 and 4). The experimental campaign
was preceded by a set of preliminary numerical analyses performed with a refined fibre
model. With the experimental results, the non-linear model was improved. It was
concluded that bond-slip, slab-participation and lap-splices location and details are crucial
in the structural response, and models have to accurately consider them. The improved
refined numerical model proves to be very effective in reproducing the non-linear dynamic
behaviour of existing RC structures, as demonstrated in Section 5.6. The main conclusions
and the principal lessons learned from the experimental and numerical work performed in
this thesis are summarised next.
Experimental results
Analyses of the PsD earthquake test results and comparison between the behaviour and
earthquake vulnerability and performance of the different structures were deeply examined
in Chapters 3 and 4. The main results from these test campaigns can be summarised as
follows:
• The high vulnerability of the original bare frame was confirmed, which
demonstrates that this type of structures effectively represents a major source of
risk for human life. In spite of 'a satisfactory performance' for the nominal input

Summary and contributions, conclusions, implications and future research
404
motion test corresponding to a return period of 475 years (10% exceeding
probability in 50 years), where slight damage was observed, the structure reached
imminent collapse for an input intensity slightly higher than the nominal one (1.3
times, in terms of PGA and corresponding to a 975-yrp input motion). The rather
uniform distribution of demands for the nominal earthquake test was completely
altered for the 975-yrp (5% exceeding probability in 50 years) earthquake. A drop
of 20-25% for the four main eigenfrequencies was observed. The significant change
in stiffness and strength from the 2nd to the 3rd storey, coupled with the inadequate
lap-splice, induced the development of a soft-storey mechanism at the 3rd storey
(2.4% inter-storey drift). Premature opening shear cracking in the strong-column at
the 1st and 3rd storeys (where lap-splice exists) for storey drifts of approximately
0.4% were observed. Tests on a similar frame with infill panels have also shown
shear crack initiation for 0.4% inter-storey drift, while severe (dangerous) shear
cracking was apparent for drifts of 1.3%.
• The strengthened frame (SR frame) has shown rather improved seismic
performance. In fact, it was subjected to the same input motions as the BF with
limited structural damage and was able to withstand an input motion with intensity
1.8 times the nominal one (corresponding to a return period of 2000 years)
maintaining its load carrying capacity with repairable damages (the four
frequencies drop at about 35-40%, in contrast to the repaired structure). It should be
noted that after repair and strengthening interventions, the initial first frequency
was almost achieved (90% of the virgin structure) and the highest second, third and
fourth eigenfrequencies were slightly enlarged due to the stiffening intervention in
the 3rd and 4th floors. The strengthening operation addressed and solved the
irregularity problem, and the confining steel plates definitively increased the
limited deformation capacity of the central strong-column.
• The strong concentration of the inelastic demands at very small member ends
observed during the tests leads to equivalent plastic hinge lengths much lower than
the empirical values proposed in the literature (40% of the proposed values), due to
the poor bond characteristics of the smooth round rebars.

Chapter 6
405
• The slab-participation is also much lower (approximately 45% lower) than the
values proposed in the design codes and calculated from tests on building structures
with improved bond steel, consequence also of the poor bond characteristics of the
smooth round reinforcement of the slabs.
• The test results confirmed that, for existing structures, with smooth round rebars
with extremity hooks and poor detailing and amount of shear/confinement
reinforcement, lap-splice at the base of the columns develop premature shear cracks
at the bar termination zones for inter-storey drifts of approximately 0.4%. This
shear cracks dictate dangerous shear failure of the columns for inter-storey drifts in
the range of 1.3-1.8%.
• The final capacity cyclic tests on the critical regions of the strengthened structure
demonstrated that by using advanced composites (FRP's) the member strength and
stiffness were recovered. The small variation of structural eigenfrequencies with
the repair interventions with FRP's was expected and desirable considering the
slight intervention without increasing the global stiffness of the structure. The
strengthened frames were able to withstand storey deformations higher than the
ones reached in the previous PsD earthquake tests, maintaining its load carrying
capacity. Furthermore, improvement of energy dissipation capacity and the global
ductility of the structure were also observed. It was shown that a very effective
(cost/benefit) repair and/or strengthening operation can be used to repair local
heavy damages.
• It is well known that infills cause a completely different structural behaviour, when
compared to the behaviour of a similar bare frame structure, and, therefore, infills
must be taken into account in the assessment and redesign of existing structures.
The masonry infill panels increase the frequencies about four times, comparing
with the bare structure. The tests on the infilled frame confirmed that infill panels
protect the RC frame structure for low and medium intensity earthquake input
motions. The IN structure was able to withstand part of an earthquake
corresponding to 2000-yrp, while the BF failed during the 975-yrp earthquake test.
However, their abrupt (brittle) failure, with abrupt loss of loading carrying capacity
(softening), for medium/high input levels, prompts dangerous soft-storey

Summary and contributions, conclusions, implications and future research
406
mechanisms and consequently premature failure of the entire structure. In addition,
infill walls cause shear-out of the external columns in the joint region. Any
strengthening of the infills panels 'preventing' failure of the walls or conferring
additional deformation capacity without abrupt loss of resistance would improve
the earthquake behaviour of the infilled structures.
• The results from the tests on the infilled frame with strengthened infill walls
(shotcrete) demonstrate better behaviour. Infill cracking was prevented and only
slight crushing appeared in the corners. However, the higher strength of the panels
led to premature shear failure of the external columns (shear-out of the columns in
the interface column-joint) with dangerous loss of their vertical loading carrying
capacity. This is a point that deserves special concern because it is a common
practice to apply these strengthening techniques to repair and strengthening the
infilled frame structures after earthquakes. Even renewals of walls plaster may
increase substantially the strength of infill walls. Any strengthening intervention of
infill walls in existing frame structures should provide appropriate doweling
systems to transfer the shear forces developed in the walls directly from them to the
surrounding beam/gird.
• It was also noted that after the tests on the original infilled frame, there was
evidence of column/joint dislocation (shear-out) caused by the same phenomenon
as in the SC frame tests. For existing structures, with poor column/joint detailing,
this serious damage is likely to occur. Therefore, seismic assessment of this kind of
structures shall take into account the possible negative effects of the infill in the
global behaviour.
• Retrofitting solutions based on K-bracing with dissipative devices, such as a shear-
link, can substantially improve storey behaviour and increase energy dissipation
capacity. The basically similar shear capacities design objective (of the original and
retrofitted structures) prevent the development of a retrofitted system, which may
otherwise introduce excessively increased foundation loads. Other significant
characteristics of this retrofitting system are the extremely effective energy
dissipating properties of the shear-link, and the fundamental fact that cyclic shear-
strain hardening of the shear-link web, under earthquake loads, leads to shear

Chapter 6
407
resistance of the link equal to about twice the initial lateral resistance at its yield.
Under increasing cyclic displacements, this development allows the shear-links, to
compensate for the progressive failure and loss of resistance of the non-retrofitted
walls. The technology used to anchor the steel retrofit assemblage to the
surrounding concrete beams and columns of a retrofitted bay, was proven to be
effective.
Results with the refined numerical model
From the non-linear dynamic numerical analyses, conducted in Chapter 5, the following
was observed:
• The preliminary dynamic numerical analysis was very valuable, allowing to predict the
behaviour of the structures, to evaluate the testing and instrumentation devices, and to
investigate possible suitable retrofitting solutions for the bare and infilled structures.
• Comparing the experimental eigenfrequencies measured before the PsD earthquake
tests to the frequencies evaluated with the refined numerical model, a very good
agreement was observed, which constitutes a first confirmation of the model validity
(in terms of stiffness).
• In general, the analytical results were in good agreement with the experimental ones in
terms of peak storey displacement, inter-storey drift, storey shear, and storey dissipated
energy.
• The numerical analyses performed demonstrate also that the upgraded refined
numerical models are able to well reproduce the non-linear structural behaviour of the
existing RC structures, as well as the repaired and retrofitted structures, and structures
damaged by precedent earthquakes.
• The original models used in the preliminary non-linear analyses do not take into
account the slippage of the steel rounded bars. As proven by the improved numerical
results, including the proposed model for the bond-slip of the steel bars, this effect is
crucial to the proper modelling of the structural response. Therefore, appropriate
models should be used to consider the bond-slip.

Summary and contributions, conclusions, implications and future research
408
• From the several analyses performed, it is important to underline that much care should
be taken in the modelling of existing structures. Furthermore, due to the vast number of
parameters and rules involved, the use of refined models may lead to unrealistic results,
if the model parameters are not correctly chosen. It is also clear that the sensitivity of
the response to such model parameters increases with the complexity of the models.
Estimation of the equivalent damping
The equivalent global damping was estimated from the experimental PsD tests for existing
structures (bare original and strengthened) according to the procedure exposed in
Section 2.3.5. Higher values of damping were observed for the original than for the
strengthened structure. This finding can be explained by the fact that a more regular
response of the strengthened structure induces less non-linear demand at storey level.
However, even for the strengthened structure, a low value of damping was observed, which
confirms that existing structures with reinforcing plain bars have a smaller energy
dissipation capacity.
Response estimation and assessment with the capacity spectrum method
The capacity spectrum method was applied to the original bare and strengthened structures.
First, a comparison to the experimental PsD test results for the demand spectra of the
earthquakes allows to verify the method. Second, the BF and SR structures were assessed
using the elastic acceleration-displacement response spectra proposed in the EC8.
From the application of the capacity spectrum method to the verification of experimental
results and to the structural assessment, it was observed that an approximation of global
structural response parameters, as top-displacement or base-shear, can be achieved.
However, this simplified non-linear equivalent static model is not able to estimate
accurately the response of irregular structures due to the low sensitive of the global
structure behaviour curves (capacity curves) to the local storey behaviour.

Chapter 6
409
Results with the proposed simplified MDOF non-linear model
In this line, it was proposed a simplified non-linear MDOF dynamic procedure for
structural assessment of multi-storey building accounting for non-linear storey behaviour
and storey damping.
The proposed MDOF non-linear seismic analysis methodology was applied to simulate the
PsD tests performed on the bare and strengthened structures. A good agreement was
verified between the numerical results given by the simplified method and the
experimental results. These numerical results were verified not only in terms of global
parameters (such as top-displacement, base-shear and equivalent damping) but also in
terms of maximum inter-storey drift, and maximum storey shear. The proposed model calls
for a relatively smaller number of DOF's (one per floor) compared to a detailed FE model,
and proved to be able to predict accurately the response, even for irregular systems.
Therefore, this model can be an effective tool to perform fast non-linear analyses, which
allows for parametric studies and rapid seismic vulnerability assessment of existing
building classes. The dynamic method was incorporated in the optimization algorithms
proposed for the redesign of existing structures.
Building retrofitting decision based on the optimization problems
In this study, it were proposed and programmed three problems for optimum redesign of
existing structures based on the convex linearization method and on the method of moving
asymptotes. The three problems implemented have as storey design variables: a) the
additional strength; b) the additional pre-yielding stiffness; and, c) the yielding strength of
the energy dissipation device. These optimization algorithms deal with non-linear objective
functions and allow to impose constrains on the design variables (strength, stiffness or
damping) and on any other response variable depending on the design variables, such as
inter-storey drift, top-displacement, etc.
With this optimization procedure, it is possible to define optimum strengthening needs in
terms of the basic design variables (storey strength, storey stiffness or additional damping)
for different limit-states ('Fully Operational', 'Operational', 'Life Safe' and 'Collapse
Prevention').

Summary and contributions, conclusions, implications and future research
410
From the redesign examples of the non-seismically designed structure under analysis, it
was illustrated the capability of the proposed optimization methodology. The proposed
optimization methodology involves reduced computational costs, and, therefore, can be a
useful tool, as a preliminary step, in the global structural strengthening decision for one or
multiple performance objectives.
Lastly, the tests have shown that the vulnerability of existing RC frames designed without
specific seismic resisting characteristics, which are an important part of the existing
buildings in European earthquake prone regions, constitute a source of high risk for human
life. Furthermore, it was demonstrated that advanced retrofitting methods, solutions and
techniques substantially reduce that risk to levels currently considered in modern seismic
design. The improved refined numerical model proves to be very effective in reproducing
the non-linear dynamic behaviour of existing RC structures. Simplified tools can be
systematically used in the vulnerability assessment and optimum strengthening design for
this kind of structures.
6.3 - IMPLICATIONS FOR RESEARCHERS, POLICY MAKERS AND OWNERS
There is a wide agreement that an extensive action is necessary in order to reduce the
seismic risk. The studies conducted in this thesis, summarised in the previous section, have
shown that the vulnerability of existing non-ductile buildings, which are an important part
of the existing buildings in seismically active areas throughout the world, constitute a
source of high risk for human life. As recalled in EQE (1995), unless these buildings are
retrofitted, many lives will be needlessly lost in future major earthquakes.
From the experimental tests presented in Chapter 4, it was demonstrated that advanced
retrofitting methods, solutions and techniques could reduce substantially that risk to levels
currently considered in modern seismic design.
In spite of some activities oriented in this sense, which led to positive results, there is a
wide discontent due to the too low actual volume and results of these activities. The first
reason for this relies on the lack of appropriate financial resources aimed at supporting risk

Chapter 6
411
reduction activities, as has been widely emphasised. Nevertheless, a more in-depth
examination shows that there are several cases when the severely limited financial
resources available could not be properly used due to other obstacles. In this regard, it is
clear that the practical implementation of possible solutions certainly presents challenges.
The best way to promote standards of safety of the existing constructions is based on the
complementary work of the researchers, policy makers and the citizens' communities.
Therefore, a global partnership between international organizations, national governments,
academic institutions (universities and research centres), the private industrial sector, and
civil society organizations should be arranged aiming at reducing earthquake disaster
impacts in society, through the implementation of rehabilitation plans. The involved parts
must become more dynamic, share the same goals and upgrade their efforts, as clearly
encouraged by the concept of the European Research Area (ERA - Busquin, 2002). The
main tasks of each agent are presented and discussed below.
6.3.1 - Implications for academic community, practitioner engineers and code makers
Over the past years, researchers have put together a more complete picture of how the new
structures behave during earthquakes. This increased knowledge over time has enabled
engineers to improve earthquake requirements in actual building design standards, so that
new structures are more able to survive strong earthquakes. The prime responsibility for
researchers is to conduct studies on structural safety of building stock, industrial facilities
and infrastructures constructed before the implementation of new codes, particularly in the
development of appropriate upgrading and strengthening techniques for the different types
of constructions.
World researchers involved in vulnerability assessment and retrofitting studies, working
directly with city officials and building owners, and in order to develop a consistent
structural evaluation and rehabilitation action plan for our cities, should systematically
work on the following subjects: a) classification and inventory of various types of existing
constructions (structural and architectural characterization); b) development of a
comprehensive data file on inventory of buildings of the populated centres (towns and
cities); c) preparation of vulnerability zoning maps (towns and cities) of vulnerable

Summary and contributions, conclusions, implications and future research
412
structures; d) vulnerability analysis of buildings, giving particular attention to important
and vital facilities (as hospitals, fire stations, schools, hotels, and many other major
buildings) for the purpose of future strengthening; e) improvement of solutions for seismic
strengthening, conducting both full-scale and component tests to determine the effects of
retrofitting scheme; and, f) definition of adequate strategies for seismic strengthening of
each type of buildings.
On the education side, researchers should prepare instruction manuals on various general
and cost-effective strengthening solutions for different types of structures and for low-
income constructions. Research institutes and organisations, university departments and
enterprises should promote the exchange of information through the organization of
scientific meetings, workshops, technical courses and conferences, specialist scientific
journals, technical reports and dynamic websites.
Setting standards for the education, training and competence for those entering the
profession of structural engineering and maintaining a policy of continuing professional
development for those already qualified. Thus, improving knowledge of structural
engineers in fields of structural assessment and retrofitting.
Building codes are the public's first line of defence against earthquakes, as reiterated by
Celebi et al. (1995). As already stated, structures built to modern seismic standards are
much safer in earthquakes than structures built 50 or even 25 years ago. In recent
earthquakes, buildings built to modern codes have generally sustained relatively little
damage. Nonetheless, it will still be necessary to refine the earthquake requirements in
building codes in the future. Each major earthquake produces new strong-motion records
that expand our knowledge of ground shaking. For example, observations from the
devastating 1994 Northridge, California, earthquake and other recent temblors have led
engineers to propose an increase in the seismic standards for structures built near
dangerous faults (Celebi et al., 1995). Furthermore, the lack of codified criteria and rules
for redesign of buildings increase the average rehabilitation costs.
Although many seismic assessment procedures have been proposed worldwide in the last
decades for RC buildings, none of them has been codified. To facilitate the stringent
implementation of the code or standards, Bertero and Bertero (2002) suggest that the

Chapter 6
413
vulnerability assessment strategies and techniques included in these codes must be simple
enough so that they can be applied effectively according to the education of the
professionals involved, as well as, the owners. Thus, radical changes should be included in
the present code by incorporating the most reliable and user-friendly procedure that can be
developed according to the state-of-the-art in seismic engineering.
6.3.2 - Implications for policy makers and government agencies
The ultimate objective of the vulnerability assessment and retrofitting studies is to assist in
obtaining seismically safer structures. As previously stated, RC buildings represent a
considerable percentage of the worldwide inventory of seismically deficient buildings.
Rehabilitation of existing constructions is urgent. It is cost effective, as the potential
economic losses are much higher than the cost of retrofit. Therefore, policy makers should
encourage and support programmes to reduce seismic risk, as the one proposed by the
Portuguese Society for Earthquake Engineering (SPES, 2001) in cooperation with the
Society for Conservation and Rehabilitation of the Architectural Heritage (GECoRPA).
The following key-actions could be taken by policy makers, at national and local levels, for
mitigation of seismic risk in existing hazardous buildings: a) instruction of competent
professionals (engineers, architects) linked to the seismic risk reduction; b) gathering
information on owners' needs and on major barriers (such as renting policies and funding
costs) for their engagement in rehabilitation, so that a better policy framework can be
designed; c) analyse and introduce incentives for the retrofitting of buildings, as tax
incentives; d) development and divulgation of the adequate legislative framework for
retrofitting of city safety; e) make the population aware of about the economical and social
importance of the seismic upgrading of buildings; f) pre-earthquake preparation of
emergency response plans, as well as pos-earthquake search and rescue capabilities; and,
g) planning, execution and accompaniment control of the strengthening works.
These tasks cannot be enforced without an appropriate supporting configuration. At the
local level, a technical office with appropriate responsibilities and authority should be
designed. These offices should also ensure the coordination between local authorities,
national governments and international institutions.

Summary and contributions, conclusions, implications and future research
414
Demographic forecast analysis indicate that probably 70-80% of humanity will live in just
a few dozen large metropolis by 2030-2050 and even Western countries will have to cope
with continuous changes in environmental and social conditions in the large cities that can
weaken the relationship between citizens and the town or city in which they live (Anselmi
and Mocci, 2002). In this context, policy makers need better monitoring systems in order
to acquire a fuller knowledge of their city’s building problems, contributing to a more
effective provisions for safety constructions assessment and to an economic definition of
strengthening techniques for each class of buildings structural system. Therefore,
applications of ICTs (Information and Communication Technology), such as the Internet,
can be used in order to provide rapid and efficient solutions to citizen’s global safety
information. The implementation of advanced web-based interactive systems for city
monitoring (e.g. the project in progress 'Aveiro digital city', in Portugal) can create a new
opportunity, giving the citizens an active and central role in the city safety information and
evaluation, as well in finding optimal buildings retrofit solutions.
6.3.3 - Implications for building owners
Owners have the main responsibility on the buildings upgrade. In the majority of the cases,
owners give exclusive attention to the non-structural aspects, such as aesthetics and
functionality of the construction. As stated by Brenner (2001), many 'obsolete' buildings
can be successfully upgraded for contemporary use. The addition of multiple computers,
servers, networks, and peripherals, as well as, poor lighting, insufficient vertical and
horizontal cabling infrastructures, and inadequate HVAC systems are common afflictions
nowadays.
By contrast, it is well known that the market is prepared to pay a low premium for higher
safety, which makes difficult the seismic vulnerability reduction. Nevertheless, the high
cost of retrofitting or upgrade of existing buildings, including those of disruption of use
and of removal and/or replacement of non-structural parts, makes the cost of seismic
retrofitting diminutive. Owners should consider this in their strategy for buildings upgrade.

Chapter 6
415
6.4 - FUTURE RESEARCH LINES
'Science has no limits, the horizons get wider and wider. There are no boundaries, they outgrow up to the infinite.' (Egas Moniz, Nobel Prize of Medicine and Physiology, 1949)
As expressed above by Egas Moniz, we cannot consider in anyway that the research is at
its end. In fact, in the fields of the seismic engineering and structural rehabilitation we are
just at the first step of a long way. There are many exciting and new directions for future
research related to the evaluation of seismic performance of existing structures and to the
optimum retrofit design. A few potential research topics believed to be relevant to protect
citizens from loss of life and property in future earthquakes, are outlined:
• Information gained from past (see Chapter 2) and future earthquakes should be used to
study the factors that affect the seismic capacity of different types of existing
structures, to estimate the losses in economic terms and human life, and to study the
most efficient retrofitting technique for each structural type system. In fact, strong
earthquakes put to a severe test the existing building stock, as well as, assess the
adequacy of the seismic code of each époque and the efficiency of the common
structural retrofitting techniques. After earthquakes, meticulous report on the ground in
the damaged area should be done, investigating and researching the damage,
documenting the lessons learned to prevent catastrophic losses in future earthquakes.
• Strong-motion data collected around the world have contributed to the improvement of
building codes over the decades (as stated in Section 2.4). These improved codes have
saved many lives and reduced damage in recent earthquakes. A growing network of
instruments will provide even more extensive and reliable data in earthquakes to come.
Using this information, scientists and engineers will be able to suggest further
improvements to building codes.
• As stated by Anderson et al. (1991), the best experiment is when earthquakes occur and
there are properly instrumented structures which can record the actual building
response to ground motions recorded at its base. Instrumentation in representative
existing RC buildings (original and retrofitted) should be set up. The potential benefits
of the structural measurements express inferior costs in the installing of
instrumentation.

Summary and contributions, conclusions, implications and future research
416
• The vast experimental data obtained from the PsD and cyclic full-scale tests (presented
and discussed in Chapter 4) should be exhaustively exploited. Particularly, numerical
models have to be implemented to model: a) the infill strengthened PsD tests; b) the
cyclic tests on the frame retrofitted with K-bracing with shear-link; c) the final capacity
cyclic tests on the BF and SR frames repaired with FRP's; d) modelling of the repaired
column with FRP's.
• The bond-slip reveals to have an important influence in the structural behaviour of
ancient RC structures, as commented in Sections 5.3.5 and 5.6. However, there is a
lack of relevant experimental studies on the bond-slip for this kind of RC elements.
Therefore, calibration of the bond-slip effect in the numerical models for old RC
structures based on experimental results is vital. It is considered of extreme importance
the development of an experimental research programme on a series of specimens
(columns, beams and joints) made with smooth reinforcing bars, in order to better
investigate the bond-slip for this kind of ancient structures.
• The shear failure mode (due to the lack of confining reinforcement) proves to be
important in a significant number of buildings damaged by earthquakes (as referred in
Section 2.5.5). The damage mechanisms of the used model are entirely based on
flexural capacities of frame members, not including the inelastic behaviour in shear
(see Section 5.3.4). Therefore, further experimental research is needed to develop and
calibrate the shear behaviour of RC members of existing structures.
• Experimental calibration of empirical formulae to estimate the plastic hinge length in
RC elements with smooth reinforcing steel bars should be developed, as already
commented in Section 5.3.3.
• From comparisons of the load-deformations relationships in a series of tests on
specimens with different end anchorage detailing, Hassan and Hawkins (1977)
conclude that the presence of hook caused a marked deterioration in behaviour. The
effect of the standard 180º hook on the end anchorage of the bar, traditionally used in
the existing RC buildings, needs to be further investigated.
• The equivalent bi-diagonal struts model is commonly adopted to simulate the effect of
infill panels in the structural response. However, the behaviour laws and hysteretic
rules of each diagonal do not influence the other. Since damage of an infill panel in one

Chapter 6
417
direction, reduces the global stiffness and strength of the panel for any direction, there
is a need to obtain an improved infill model that accounts for a connected behaviour of
both struts, as recalled in Section 5.6.3.
• Experimental research done in the 1990's decade has improved our knowledge on the
behaviour of jacketed members. As referred by Ersoy (1998), most of the questions
related to jacketed beams have been answered by the research work. However, such a
statement cannot be made for columns. Further experimental research is needed to
clarify the behaviour of jacketed columns, especially for jacketing made under load, as
already referred in Section 5.3.8.2. Analytical studies to predict the strength of
rehabilitated member and structures should also be enforced.
• As already exposed in Section 2.5.6.4, common structural conceptions lead to a
presence of a soft-storey at the ground storey, which induces excessive inter-storey
drift at this storey level when earthquake happens. Regardless of the need for a
structural detailing accounting for this intensity of inelastic deformation, a correct
consideration of the geometric non-linearity should be considered. Therefore, it is
considered of vital importance the inclusion of the P-∆ effect in the non-linear models
and a meticulous sensibility analysis should be developed for these kind of irregular
structures.
• Numerical evaluation of the effect of the vertical component of seismic action in
existing structures, non-seismically designed, should be considered.
• Several research groups around the world are currently using extensively refined non-
linear numerical analyses to study the real behaviour of structures subjected to
earthquake ground motions. In the academic community, on the one hand, there is no
doubt about the utility of these refined models in the structural assessment and design
of retrofitting solutions. Yet, on the other hand, it is recognised that these powerful
tools depend on a large amount of parameters not yet well calibrated (as in the
examples studied in Chapter 5). Therefore, work has to be done in order to produce and
to implement calibrated refined non-linear models and related parameters that can be
used in the structural assessment and design.
• The dilemma of the inclusion of non-linear numerical analyses methods for structural
design in engineering education studies plan, at the graduate and post-graduate levels,

Summary and contributions, conclusions, implications and future research
418
also needs to be resolved. It is recognised that the available models are quite complex
and time consuming, and, consequently, difficult to put into practice in teaching at the
graduate level. Fortunately, today we can take advantage of the interminable facilities
given by the Information Technology (IT) to enhance the learning practice. Using, for
example, dynamic figures and practical examples, the concepts and ideas can be
conveyed instantly, as sustained by Shepherdson (2001). Traditional teaching methods
delay the learning process. Additionally, learning based on IT allows access to so many
more users and to the handicaps, with the convenience of continual access and
repeatability, what makes the e-learning possible. Such sophistication is extremely
challenging and can be the source of much research. In summary, Information
Technology offers exciting opportunities, and its influence on the future of education is
welcome.
• However, it is recognised that refined models for rapid assessment of existing
structures are quite unfeasible and time consuming. Rapid seismic assessment
procedures are required for low-to-medium-rise regular buildings. Such procedures
should be influenced by the spirit of the recent US documents (e.g. ATC-40, 1996;
FEMA-274, 1997) and by the displacement-based philosophy (Calvi, 1999;
Fajfar, 2000). Development and calibration of numerical tools, as the MDOF simplified
non-linear model, proposed in Section 5.7, that allow doing a preliminary screening
and empirical evaluation methods to the existing structures, yet still maintaining an
adequate accuracy, is and will be an area of rich research.
• Parametric studies with the MDOF simplified non-linear model should be enforced to
determine the priority for strengthening intervention in the building stock.
• The proposed MDOF simplified non-linear model for the response evaluation and
assessment was developed for plane frames. To account for the in plan building
irregularities, an extension of the method to structures modelled by three DOF's per
storey (one rotation and two horizontal displacements) should be developed and
calibrated.
• The decision related to vulnerability can only be made by the judgement of
experienced engineers. Therefore, we need to develop some simple methods and

Chapter 6
419
criteria for initial screening of the building inventory. Such methods and criteria should
not be time consuming and should not require expert opinion.
• Currently, highly efficient mathematical programming and analysis capabilities are
available to the designer (as the methodology proposed in Section 5.8). However, the
widespread use of optimization techniques to real life engineering problems is still not
a reality. One area that has shown tremendous progress in the past few years is the
optimal design of new structural systems. The optimal design of structural retrofitting
systems is a relatively new area and is still not extensively addressed. This is a subject
of great relevance, since an increasing number of real life engineering design problems
involve retrofitting of structures. Furthermore, the structural changes made in the
redesign of one component (storey) may influence the global behaviour of the
structure. So, it may not be possible to divide properly the design of a multi-component
structural system into design of single components (storeys). It is therefore necessary to
use a methodology that can tackle the optimal multi-component system as a whole,
while generating designs for the optimal layouts of the retrofit components. In this line,
a simplified tool to determine the optimum retrofit need for each storey, in order to
comply with certain performance objectives was proposed in Section 5.8. As already
said, the optimal design of retrofitting is still not extensively researched. Further
evaluation of the proposed methodology, with experimental results, will allow further
refinement and the development of specific and practical guidelines for its use by
engineers enrolled in the retrofitting design of existing structures.
• As stated by Fardis (2000), complete and clear provisions for the design and detailing
of the strengthening of existing elements need to be developed for EC8, including
simple procedures for dimensioning of the retrofitting for the most common and
effective strengthening techniques.

Summary and contributions, conclusions, implications and future research
420
Lastly, in order to encourage balanced and sustained retrofitting decision to preserve our
patrimony, our lives and of the successive generations, it is salutary to recognise that
policy makers, engineers and building owners should remain the focus on the task and not
on the tools. A quote found in the Izmit (Turkey) post-earthquake report (EQE, 1999) is
herein used as conclusive thought:
'Loss of life and building collapse was avoidable.'

Appendix A
PHOTOGRAPHIC DOCUMENTATION AND STRENGTHENING DETAILS

Photographic documentation and strengthening details
422
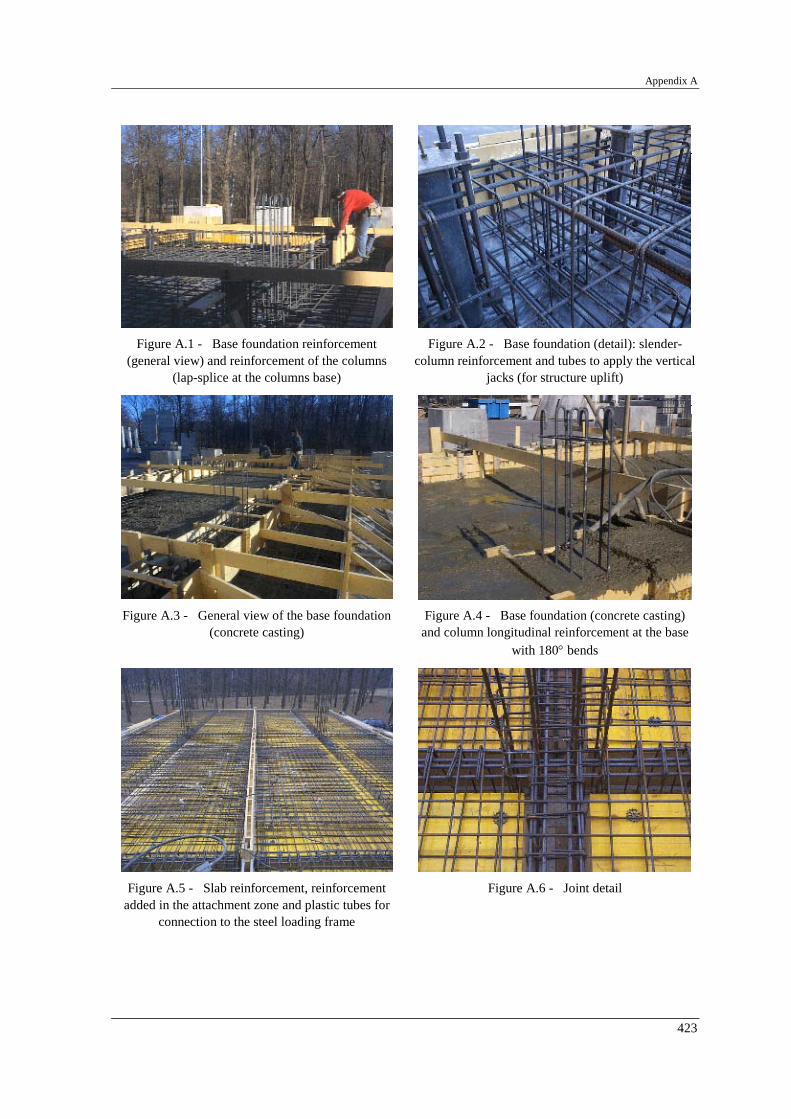
Appendix A
423
Figure A.1 - Base foundation reinforcement
(general view) and reinforcement of the columns (lap-splice at the columns base)
Figure A.2 - Base foundation (detail): slender-column reinforcement and tubes to apply the vertical
jacks (for structure uplift)
Figure A.3 - General view of the base foundation
(concrete casting) Figure A.4 - Base foundation (concrete casting)
and column longitudinal reinforcement at the base with 180° bends
Figure A.5 - Slab reinforcement, reinforcement
added in the attachment zone and plastic tubes for connection to the steel loading frame
Figure A.6 - Joint detail

Photographic documentation and strengthening details
424
Figure A.7 - Casting of the 1st floor (general view) Figure A.8 - Casting of the 1st floor (general view):
the 1st to 2nd floor transition without lap-splice in the columns reinforcement.
Figure A.9 - Joints and columns reinforcement details

Appendix A
425
Figure A.10 - Construction at various phases (general views)
Figure A.11 - Transport: vertical jacks

Photographic documentation and strengthening details
426
Figure A.12 - Transport: general view of the frames at the external area of the ELSA laboratory
Figure A.13 - Frames transportation

Appendix A
427
Figure A.14 - Vertical connectors pre-stressing (to attach the actuators at the steel load frame)
a)
b)
Figure A.15 - Steel frames: a) pined bars connecting the two frames and fixings to the reaction-wall; b) frame to control out-of-plane deformation in the frame extremity opposite to the reaction-wall
Figure A.16 - Fixings to the reaction-wall, steel pined bars connecting the two frames and actuators

Photographic documentation and strengthening details
428
Figure A.17 - Additional loads (2.7 ton concrete blocks and 1.2 ton steel plates) and floor attachment steel
bars system with pre-stressed connectors
Figure A.18 - Actuators (double acting servo-hydraulic actuator linked at the extremity to piezoresistive
load cell)
Figure A.19 - Displacement controllers
(HEIDENHEIN optical transducers) Figure A.20 - Acquisition, control and monitoring
system

Appendix A
429
Figure A.21 - Instrumentation: strong-column at 1st storey
Figure A.22 - Instrumentation: slab (below) Figure A.23 - Instrumentation: inclinometers
Figure A.24 - 1st storey strong-column: selective
retrofitting (ductility and shear resistance improvement) and instrumentation (strong-column,
slab, joint and beam deformation)
Figure A.25 - Strength improvement: connection of the steel bars to columns
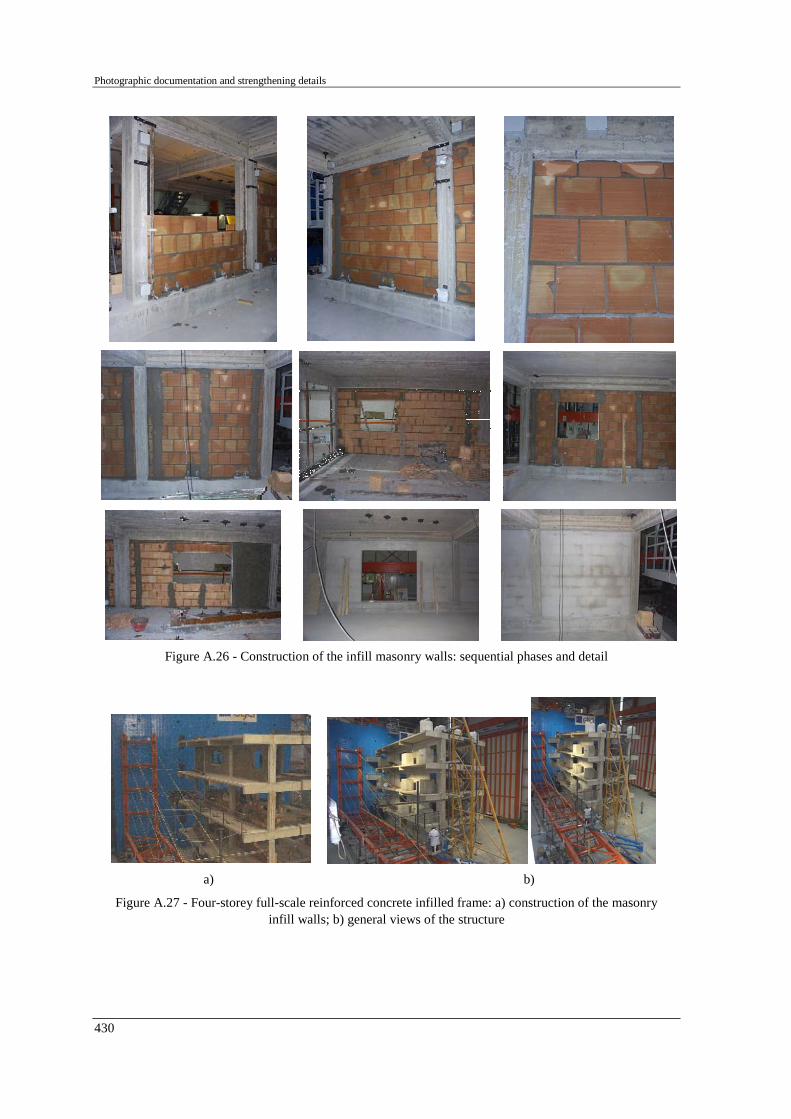
Photographic documentation and strengthening details
430
Figure A.26 - Construction of the infill masonry walls: sequential phases and detail
a)
b)
Figure A.27 - Four-storey full-scale reinforced concrete infilled frame: a) construction of the masonry infill walls; b) general views of the structure

Appendix A
431
Figure A.28 - Infill strengthening construction: sequential operations and details of the reinforcing steel
mesh
Figure A.29 - Infills instrumentation installed for the IN and SC tests: panels and local instrumentation at
the panel corners of the short external panel

Photographic documentation and strengthening details
432
Figure A.30 - Concrete specimens extraction from
the frame structure Figure A.31 - Additional masses (water reservoirs)
Figure A.32 - Instrumentation in repaired external
joints (relative displacement transducer) Figure A.33 - Instrumentation at the 1st storey strong-
column for the final capacity cyclic test
Figure A.34 - Storey displacement measurement systems: HEIDENHEIN and PSITRONIX displacement
transducers

Appendix A
433
Position Units Dimensions/description Material
1 1 HEA120 (L=600) ST37 2 6 97×55×10 ST37 3 1 500×200×20 ST37 4 1 605×205×20 ST37
4a1 8 205×50×10 ST37 5 2 100×85×10 ST37 6 4 U100 (L=1880) ST37 6a 2 130×100×20 ST37 7 4 M24-10.9 8.8 8 1 HEA260 L=4500 ST37 9 --- bolts HILTI ---
10 2 458×268×20 (cut diagonally) ST37 11 2 440×180×10 ST37 12 2 68×180×10 ST37 13 --- bolts HILTI --- 14 2 2160×250×20 ST37 15 2 HEA260 (L=2250) ST37 16 16 200×100×10 (8 plates cut diag.) ST37 17 4 223×100×12 ST37 18 2 400×200×15 ST37 19 8 100×80×10 ST37
1) Note Figure A.38 with shear-link and adjacent connections.
Figure A.35 - K-bracing and shear-link: summary table
Figure A.36 - K-bracing and shear-link: general layout

Photographic documentation and strengthening details
434
Figure A.37 - K-bracing and shear-link: shear-
link details Figure A.38 - K-bracing and shear-link: details of shear-
link and adjacent connections
Figure A.39 - K-bracing and shear-link: detail of braces
Figure A.40 - K-bracing and shear-link: detail of the bottom braces connection
Pos. 6 Pos. 6a

Appendix A
435
Figure A.41 - K-bracing and shear-link: detail of Pos. 8
Figure A.42 - K-bracing and shear-link: detail of Pos. 14
Figure A.43 - K-bracing and shear-link: detail of Pos. 15
Figure A.44 - K-bracing and shear-link: detail of
Pos. 16 Figure A.45 - K-bracing and shear-link: detail of Pos.
17 and Pos. 2
A A´

Photographic documentation and strengthening details
436
Figure A.46 - Columns drilling: strong-column (left) and weak column (right)

Appendix A
437
Figure A.47 - Anchoring of the top-beam to the existing RC frame

Photographic documentation and strengthening details
438
Figure A.48 - Bottom-beams: drilling
Figure A.49 - Shear-link with the surrounding beam and braces
Figure A.50 - Bracing instrumentation (strain-gauges)

Appendix A
439
Figure A.51 - Instrumentation: relative displacement transducer (detail of the zone nearest to the shear-link)
Figure A.52 - Repair operations (steps): 4 – remove concrete at the top of the damaged column; 5 – relocation of the column; 6 – concreting of the column/joint; 7 – strengthening with carbon fibre

Photographic documentation and strengthening details
440
Figure A.53 - Repair intervention: frame B Figure A.54 - Repair intervention: frame A
Figure A.55 - Damages on the first storey strong-column: frame A
Figure A.56 - Column repaired with carbon fibre materials

Appendix A
441
1
2
3
Figure A.57 - Strong-column (frame B) repair intervention (schematic sequential operations): 1– longitudinal fibres; 2 – confinement of the column upper-part; 3 – confinement of the column low part
(including bar termination zone)
Figure A.58 - Joints repair intervention: schematic sequential operations

Photographic documentation and strengthening details
442
Figure A.59 - Sequential operation phases for the joints intervention

Appendix B
TEST RESULTS AND PHYSICAL DAMAGE PATTERNS
Visual inspection and photographic documentation

Test results and physical damage patterns – Visual inspection and photographic documentation
444

Appendix B
445
D
amp.
(%)
F
req.
(Hz)
Dam
p. (%
)
F
req.
(Hz)
BF475 BF975 SR475 SR975 SR2000
1
1
2
Figure B.1 - Plots of the time-domain identified frequency and damping ratio for the first two vibration
modes of BF475 (L05), BF975 (L06), SR475 (L10), SR975 (L11) and SR2000 (L12)

Test results and physical damage patterns – Visual inspection and photographic documentation
446
L04: ASR PsD 10% 475-yrp 13/07/99
Figure B.2 - Equivalent modal frequency and damping for the virgin bare frame (10% intensity of 475-yrp
earthquake)

Appendix B
447
L05: ASR PsD 100% 475-yrp 13/07/99
Figure B.3 - Equivalent modal frequency and damping for the BF 475-yrp test

Test results and physical damage patterns – Visual inspection and photographic documentation
448
L06: ASR PsD 100% 975-yrp 14/07/99
Figure B.4 - Equivalent modal frequency and damping for the BF 975-yrp test

Appendix B
449
L08: ASR PsD 5% 475-yrp 20/07/99
Figure B.5 - Equivalent modal frequency and damping for the BF after 975-yrp earthquake test (5% intensity of
475-yrp earthquake)

Test results and physical damage patterns – Visual inspection and photographic documentation
450
L09: ASR REPAIRED PsD 5% 475-yrp 14/09/99
Figure B.6 - Equivalent modal frequency and damping for the SR - 5% intensity of 475-yrp earthquake (before
full-intensity earthquake tests)
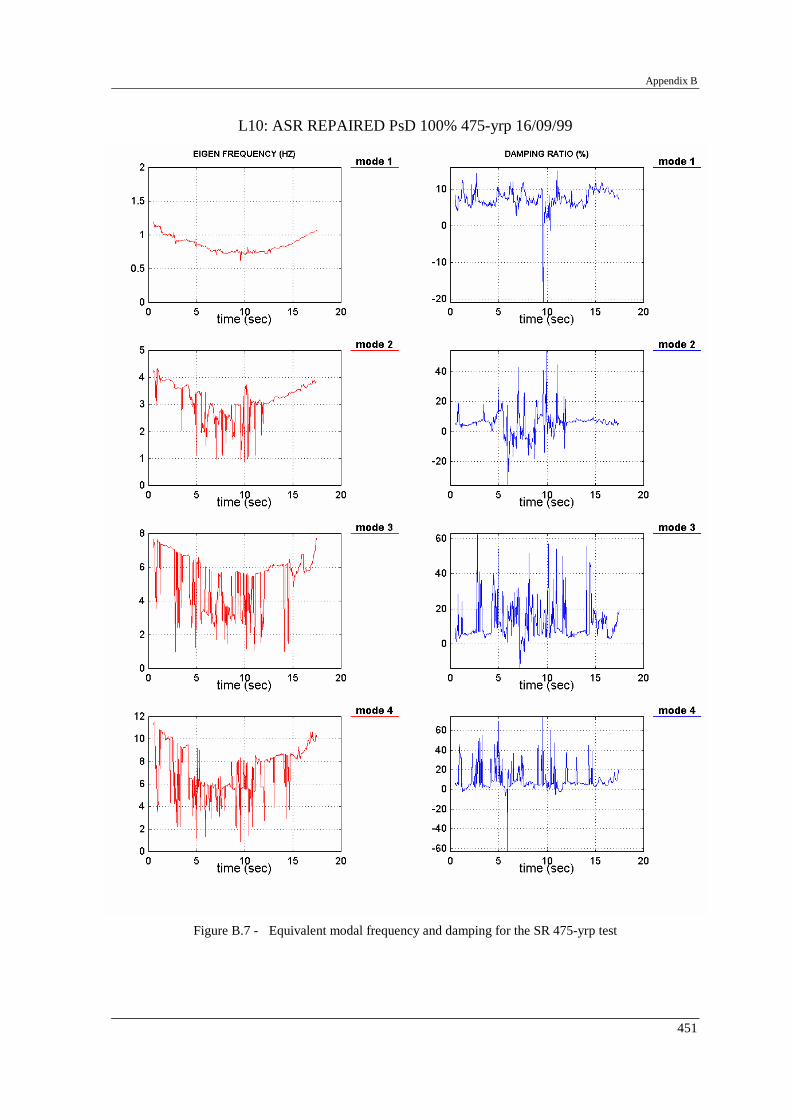
Appendix B
451
L10: ASR REPAIRED PsD 100% 475-yrp 16/09/99
Figure B.7 - Equivalent modal frequency and damping for the SR 475-yrp test

Test results and physical damage patterns – Visual inspection and photographic documentation
452
L11: ASR REPAIRED PsD 100% 975-yrp 16/09/99
Figure B.8 - Equivalent modal frequency and damping for the SR 975-yrp test
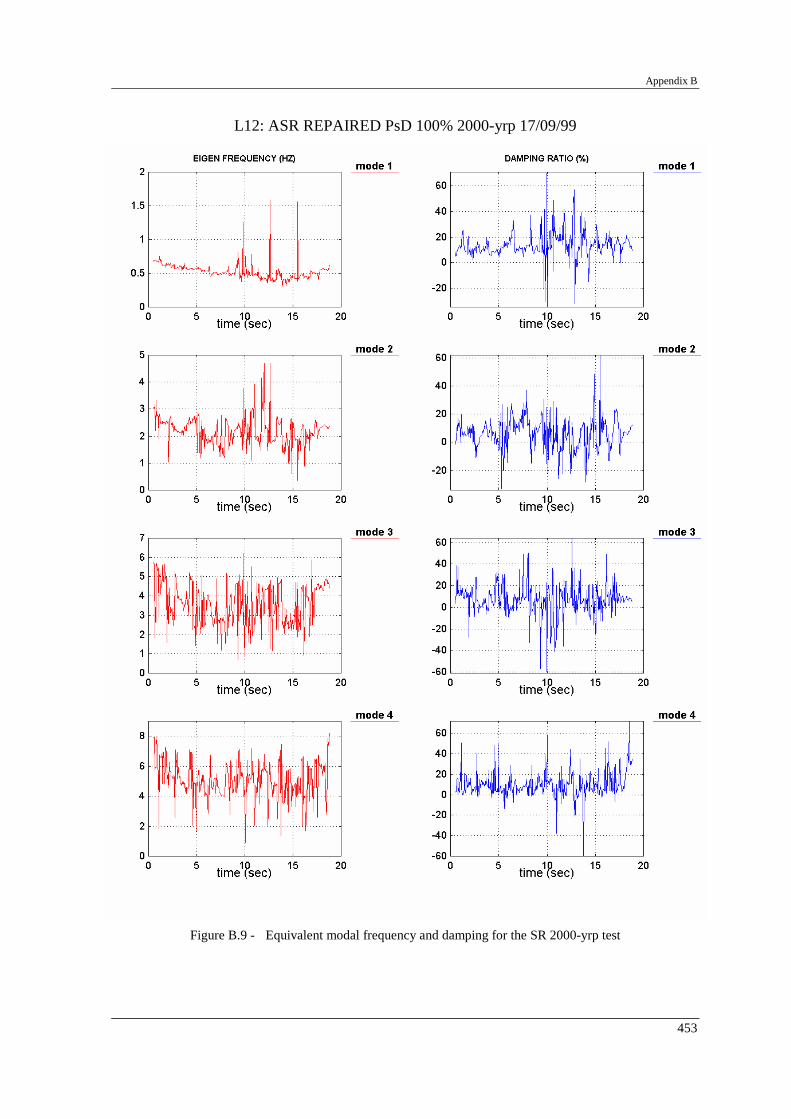
Appendix B
453
L12: ASR REPAIRED PsD 100% 2000-yrp 17/09/99
Figure B.9 - Equivalent modal frequency and damping for the SR 2000-yrp test
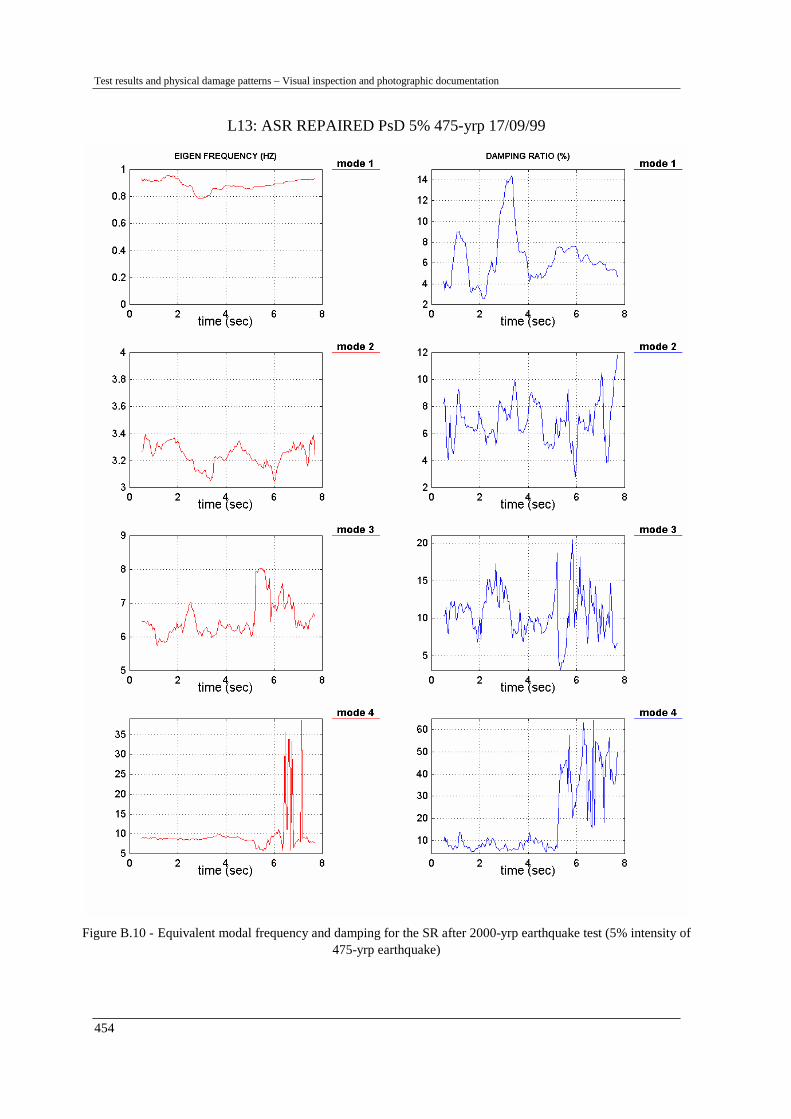
Test results and physical damage patterns – Visual inspection and photographic documentation
454
L13: ASR REPAIRED PsD 5% 475-yrp 17/09/99
Figure B.10 - Equivalent modal frequency and damping for the SR after 2000-yrp earthquake test (5% intensity of
475-yrp earthquake)

Appendix B
455
Figure B.11 - Damage pattern after the bare frame tests (general layout)
2nd Floor
1st Floor
Figure B.12 - Slab damage pattern after the bare frame tests

Test results and physical damage patterns – Visual inspection and photographic documentation
456
Figure B.13 - BF975: the horizontal storey
displacement is evidenced (comparing the relative position of the transversal beams of the two frames)
Figure B.14 - BF975: Damage (spalling) at the top of the 3rd storey strong-column (beginning)
Figure B.15 - BF975: damage (spalling) at the bar termination zone of the 3rd storey strong-column
Figure B.16 - BF975: damage (spalling) at the top of
the 3rd storey strong-column Figure B.17 - BF975: damage (spalling) at the bar termination zone of the 3rd storey strong-column

Appendix B
457
Figure B.18 - Damage pattern after the selective strengthened frame tests (general layout)
Figure B.19 - Damage pattern after the infill frame tests (general layout)
See detail A (Figure B.20) Se
e de
tail
B
(Fig
ure
B.20
)

Test results and physical damage patterns – Visual inspection and photographic documentation
458
Detail A (floor 1, bellow)
Detail B (floor 1, above)
Figure B.20 - Slab damage pattern after the infill frame tests
Panel with window opening
Panel with door opening
Short panel (south view)
Short panel (north view)
Short panel (detail)
Figure B.21 - IN975: damages at the 1st storey infill panels and RC strong-column at the base
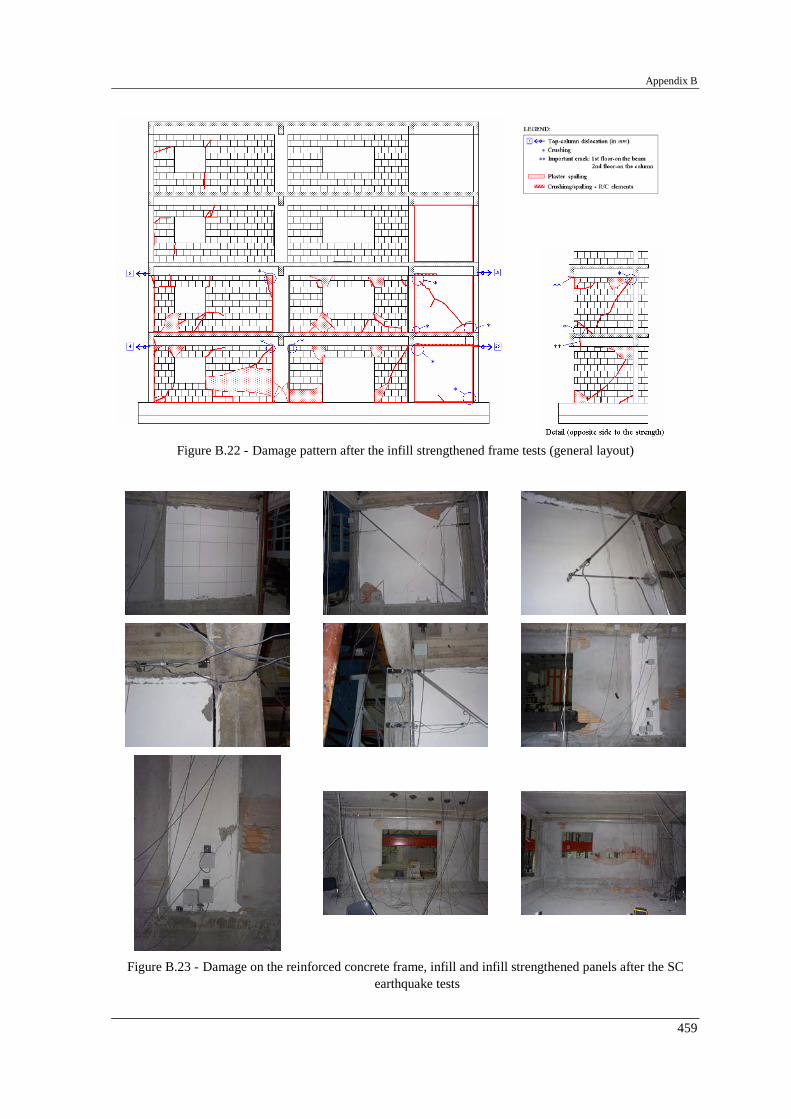
Appendix B
459
Figure B.22 - Damage pattern after the infill strengthened frame tests (general layout)
Figure B.23 - Damage on the reinforced concrete frame, infill and infill strengthened panels after the SC earthquake tests

Test results and physical damage patterns – Visual inspection and photographic documentation
460
Figure B.24 - KB-cyclic test: damage pattern in the shear-link
Figure B.25 - KB-cyclic test: damaged external columns ('shear-out')
Figure B.26 - KB-cyclic test: details of the damaged external columns ('shear-out')
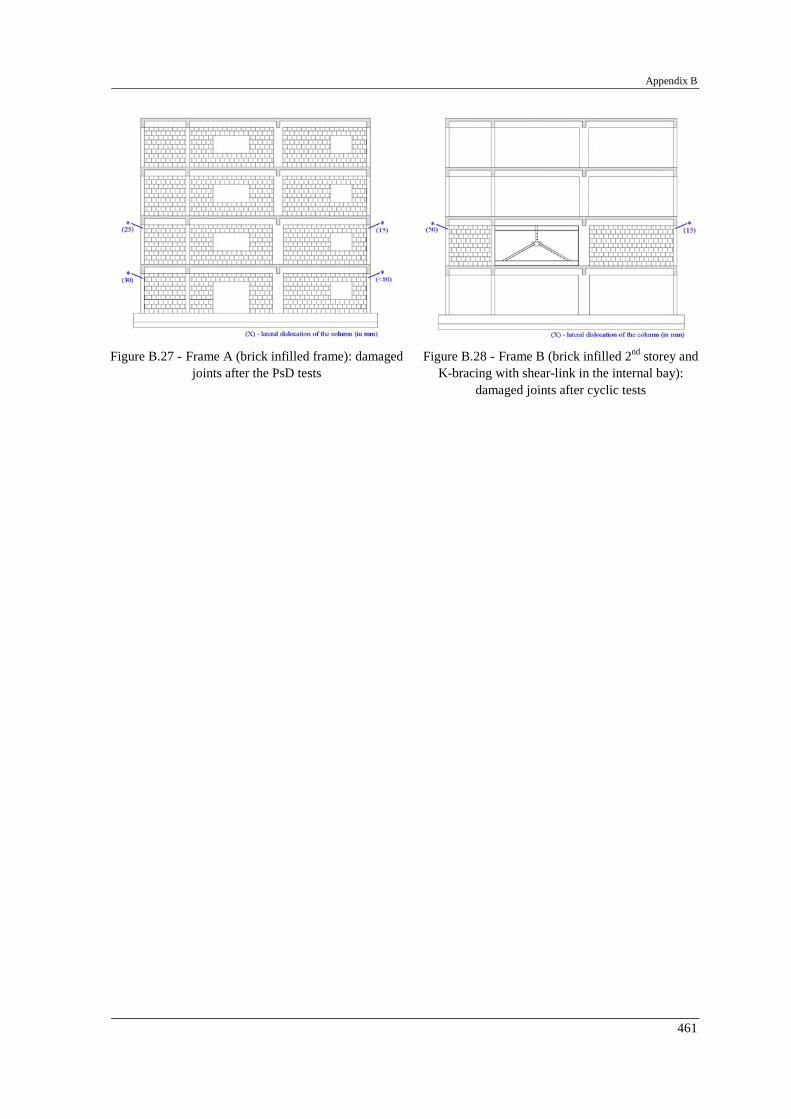
Appendix B
461
Figure B.27 - Frame A (brick infilled frame): damaged
joints after the PsD tests Figure B.28 - Frame B (brick infilled 2nd storey and
K-bracing with shear-link in the internal bay): damaged joints after cyclic tests

Appendix C
GLOSSARY

Glossary
464

Appendix C
465
At the outset, some basic concepts and information are necessary in order to better
understand the contents of this thesis. These are a number of terms that are used, or are
particularly related to the studied field, in the thesis. The terms themselves have been
chosen, bent or created in order to describe something that our common language and
thought pattern is incapable of describing. Also, the connotations of each term described
would be the far better understood when viewed as a part of a whole, therefore is suggested
to browse through the entire glossary and text if you wish to understand the concept of any
individual term. Where as volumes could be written on any one of these terms, are briefly
offered here a few hopefully clarifying paragraphs for explanation on the vocabulary used
on this thesis (terms related with the studied topics).
Assessment
Consists on the verification of the resistance of an existing damaged or undamaged
building, taking into account both non-seismic and seismic actions, for the period of its
intended lifetime (EC8 Part 1-3).
Bond-slip
Slip (relative displacement) occurs along a reinforcing bar under loading, relatively to the
contiguous concrete, and the produced bond stress is a function of the slip. The bond
behaviour of reinforcement is usually described by the bond stress-slip relationship. The
magnitude of bond stress is influenced by a large number of parameters, such as: the rib
pattern of rebar, concrete strength, concrete cover, position of bar during casting, rate and
type of loading (CEB-217, 1993).
Building Performance Level
A limiting damage state, considering structural and non-structural building components,
used in the definition of Rehabilitation Objectives (FEMA-274, 1997).
Capacity
The permissible strength or deformation for a component action (FEMA-274, 1997).

Glossary
466
Capacity design method
Design method in which elements of the structural system are chosen and suitably
designed and detailed for energy dissipation under severe deformations while all other
structural elements are provided with sufficient strength so that the chosen means of
energy dissipation can be maintained (EC8).
Civil engineering structural damage
Any natural disaster can destroy or severely damage civil engineering structures: buildings;
water structures (such as pipelines, pumping stations, intake structures, and dams);
retaining walls; electrical poles; roads; and platforms. Damage of these structures can
cause casualties to nearby individuals, and it may lead to either partial or total disruption of
lifeline services to the communities they serve. Making advance preparations for the
possibility of destruction and modifying existing facilities are major ways in which the
damage can be reduced or eliminated. Structures can be reinforced to withstand the impact
of a disaster. Likewise, the anchorage and support of machinery, equipment, and storage
tanks can be improved. Bypass facilities can be provided; for example, in preparation for
the possibility that a water plant, its equipment, or processes may fail, the plant can be
bypassed to a point where raw water can be chlorinated. Finally, the adoption of standard
operating rules and procedures will maximize readiness for any disaster. Another way to
reduce the impact of disaster on civil engineering structures is to improve the planning of
the database and of design standards. Conducting meteorological, topographical,
hydrological, geological, and soil engineering studies in newly chosen sites wild enable
planners to avoid vulnerable locations. Vital structures can be located in areas known to be
protected from the impact of disasters. Specific design methods can be prepared, used, and
updated to protect structures, equipment, and supplies from disaster. For example, water
distribution reservoirs can be sized with a storage factor of 1 1/2 to 2 times their normal
capacity in order to guarantee emergency supplies.
Composites
A matrix of polymeric material reinforced by fibres with a discernable aspect ratio of
length to thickness (Wabo MBrace, 2002).
Appendix C
467
Constraints
Limitations on the range over which the objective function may be minimized, represented
as equality or inequality relations (Richards, 1995).
Corrective measure
Any modification of a component or element, or the structure as a whole, intended to
reduce building vulnerability (FEMA-274, 1997).
Critical regions
Predetermined parts of a dissipative structure where the dissipative capabilities are mainly
located (also called dissipative zones, EC8).
Deformability
Capability of a material, structural component, or entire structure to deform before rupture
(Bertero et al., 1991).
Demand
The amount of force or deformation imposed on an element or component (FEMA-274,
1997).
Design variables
The entities which may be modified during the optimization process. If the values of the
design variables are known the design is fully defined (Richards, 1995).
Dissipative structure
Structure, which is able to dissipate energy by means of ductile hysteretic behaviour
(EC8).
Drift
Relative lateral displacement between two points (e.g.: two floors).

Glossary
468
Ductility
Capability of a material, structural component, or entire structure to undergo deformation
after its initial yield without any significant reduction in yield strength. While ductility is a
useful concept, it has a precise definition and quantitative meaning only for the idealised
case of monotonic, linear elasto-perfectly plastic behaviour. Its use in real cases where
behaviour significantly differs from this idealised case leads to much ambiguity and
confusion. It is thus difficult to make valid comparisons of 'available' ductility values
reported by different researchers because they are often based on different response
parameters or on yielding values determined using definitions that are different or
unexplained or both. These experimentally obtained 'available' ductility values are also
often misused in analytical studies of the 'demand' or 'required' ductility due to the
difficulty of establishing realistic values for the 'linear-elastic stiffness and yielding
strength'. Attempts should be made to integrate the definitions of response parameters that
are used in experimental test programs and in analytical investigations. Furthermore, it is
highly questionable whether the performance of different building systems can be properly
described and evaluated on the sole basis of elastic stiffness, yielding strength, and
ductility. Consequently, there is a need to introduce additional parameters for describing
the total hysteretic energy dissipation, number of cycles of reversed deformations, and the
degradation in stiffness and strength that has been observed under seismic conditions
(Bertero et al., 1991).
Ductility ratio or ductility factor
The ratio of the maximum deformation that a structure or element can undergo without a
significant loss of initial yielding resistance to the initial yield deformation (Bertero et al.,
1991).
Durability
The ability of a material or system to maintain its physical and mechanical properties over
time (Wabo MBrace, 2002).

Appendix C
469
Effective damping
The value of equivalent viscous damping corresponding to the energy dissipated by the
building, or element thereof, during a cycle of response (FEMA-274, 1997).
Energy dissipation device
Non-gravity-load supporting element designed to dissipate energy in a stable manner
during repeated cycles of earthquake demand (FEMA-274, 1997).
Energy dissipation system
Complete collection of all energy dissipation devices, their supporting framing, and
connections (FEMA-274, 1997).
Evaluation
(see Assessment).
Exposure
Quality and distribution of goods over the area.
Failure
The termination of the ability of an item to perform a required function (BS-4778, 1987).
Framed structure
Consist of members that are long in comparison with their cross-sectional dimensions,
such as width and depth (Yang and Kuo, 1994).
Global drift
Roof-displacement divided by the frame height.
Hazard
Nature, number and intensity of seismic events occurring in a given area over a given
period of time. A hazard is a phenomenon which, when it manifests itself in a given area

Glossary
470
over a specific period of time, has the potential for severe social disruption, trauma,
property damage and loss. The potential impact of a hazard is normally expressed in terms
of its magnitude or intensity, which are expressed as a probability function over a specified
time period according to hazard type. Hazard functions can be derived for different sites if
there are sufficient relevant records going back over a significant period of time. For
example, if we analyse the known history of earthquake occurrences in the Eastern
Caribbean countries, and we measure their size in terms of the intensities given by the
Modified Mercalli Intensity Scale, we will find that not all countries are under the same
seismic hazards.
Hazard level
Earthquake shaking demands of specified severity, determined on either a probabilistic or
deterministic basis (FEMA-274, 1997).
Hollow masonry unit
A masonry unit whose net cross-sectional area in every plane parallel to the bearing
surface is less than 75% of the gross cross-sectional area in the same plane (FEMA-274,
1997).
Inter-storey drift
The relative horizontal displacement of two adjacent floors in a building. Inter-storey drift
can also be expressed as a percentage of the storey height separating the two adjacent
floors (FEMA-274, 1997).
Jacketing
A method in which a concrete column or beam is covered with a steel or concrete 'jacket'
in order to strengthen and/or repair the member by confining the concrete (FEMA-274,
1997).
Appendix C
471
Load path
A path that seismic forces pass through to the foundation of the structure and, ultimately,
to the soil. Typically, the load travels from the diaphragm through connections to the
vertical lateral-force resisting elements, and then proceeds to the foundation by way of
additional connections (FEMA-274, 1997).
Masonry
The assemblage of masonry units, laid in a specified pattern, joined together with mortar
and possibly grout and/or reinforcement. Types of masonry can be classified with respect
to the type of the masonry units such as clay-unit masonry, concrete masonry, or hollow-
clay tile masonry (EC6; FEMA-274, 1997).
Masonry infill
An unreinforced or reinforced panel of masonry wall construction placed within a steel or
reinforced concrete frame. Panels separated from the surrounding frame by a gap are
termed 'isolated infills'. Panels that are in tight contact with a frame around its full
perimeter are termed 'shear infills' (FEMA-274, 1997; GSREB, 2001).
Moment frame
A building frame system in which seismic shear forces are resisted by shear and flexure in
members and joints of the frame (FEMA-274, 1997).
Mortar
A mixture of inorganic binders, aggregates and water, together with additions and
admixtures if required (EC6).
Non-dissipative structure
Structure designed for the seismic load case without taking into account the non-linear
material behaviour (EC8).

Glossary
472
Non-linear modelling
Analysis based on and including both elastic and post-yield force-versus-displacement
relationships (FEMA-274, 1997).
Non-structural elements
The non-structural elements of a building include every part of it and all of its contents
with the exception of the structure. Architectural, mechanical, plumbing or electrical
element, system and component or item of interior equipment and furnishing, permanently
installed in the building which, whether due to lack of strength or to the way it is connected
to the structure, is not considered in the seismic design as load carrying element. Common
non-structural items include ceilings, windows, laboratory equipment, inventory stored on
shelves, computers, electrical equipment, furnishings and light fittings. (EC8; FEMA-274,
1997).
Optimization
The act or process of making something as fully functional or effective as possible
(Richards, 1995).
Performance-based engineering
Is defined as consisting of the selection of the design criteria, of the appropriate structural
systems, of the layout, proportioning, and detailing for a structure and its non-structural
components and contents, and the assurance and control of construction quality and long-
term maintenance, such that at specified levels of all the excitations (that can act on the
buildings) and with defined levels of reliability, the building or facility will not be
damaged beyond certain limit states. The PBE process begins with the first concepts of a
project and lasts throughout the life of the building (Bertero and Bertero, 2002).
Performance-based seismic engineering
Is defined as the application of PBE to the case that seismic hazard controls the design.
Hence, PBSE involves the complete design, construction and control (monitoring) of the
maintenance and function of the building to assure that the constructed buildings will resist
Appendix C
473
the effects of earthquake ground motions of different severities within specified limiting
levels of damage (Bertero and Bertero, 2002).
Performance-based seismic design
Is the subset of activities of PBSE that focus on the design process. Therefore, it includes
identification of seismic hazards, selection of the performance levels and performance
design objectives, determination of the site suitability, conceptual design, numerical
preliminary design, final design, acceptability checks during design, design review,
specification of quality assurance during the construction and of monitoring of the
maintenance and occupancy (function) during the life of the building. The term design
applying to the whole building system, including the foundation, non-structural
components, contents, equipment and the utility lines serving the facility (Bertero and
Bertero, 2002).
Performance design objectives
Expected levels of damage resulting from expected levels of earthquake ground motions
(Bertero and Bertero, 2002).
Pseudo-dynamic testing
A testing methodology that uses on-line computer calculation and control together with the
experimental measurement of the structure restoring forces providing a realistic simulation
of the dynamic structural response, which enables, for, instance, the simulation of
earthquake loading of full-scale structures (Pegon and Pinto, 2000; Donea et al., 1996).
Rehabilitation method
A procedural methodology for the reduction of building earthquake vulnerability (FEMA-
274, 1997).

Glossary
474
Rehabilitation objective
A statement of the desired limits of damage or loss for a given seismic demand, which is
usually selected by the owner, engineer, and/or relevant public agencies (FEMA-274,
1997).
Rehabilitation strategy
A technical approach for developing rehabilitation measures for a building to reduce its
earthquake vulnerability (FEMA-274, 1997).
Reliability
The ability of an item to perform a required function under stated conditions for a stated
period of time (BS-4778, 1987).
Repair
Any operations to recover the original performance (or capacity) of a damaged structural
element or structure.
Resistance
The capacity of a structure, component, or connection to resist the effects of loads. It is
determined by computations using specified material strengths, dimensions, and formulas
derived from accepted principles of structural mechanics, or by field or laboratory tests of
scaled models, allowing for modelling effects and differences between laboratory and field
conditions (FEMA-274, 1997).
Restoration
Making the building or its part to be usable by repairing or strengthening.
Retrofitting
Structural retrofitting can be defined as the operation to bring the structural system or some
of the structural members to a specified performance level. Depending on the state of the

Appendix C
475
structure and in the purpose, rehabilitation can simply be classified as repair strengthening
(Ersoy, 1998).
Risk
Risk is a measure of the probability of expected loss for a given hazardous event.
Softening
The reduction in the strength capacity under cyclic loading after reaching the ultimate
strength limit (Ghobarah et al., 1999).
Shotcrete
Mortar or concrete pneumatically projected at high velocity onto a surface (ACI 506R-90,
1995).
Strengthening
Any operations to increase the performance or capacity (in strength, ductility or stiffness),
of an undamaged element or structure, over the original performance to a specified higher
performance level.
Strong-column weak-beam
The capacity of the column at any moment frame joint must be greater than those of the
beams, in order to ensure inelastic action in the beams, thereby localizing damage and
controlling drift (FEMA-274, 1997).
Structural elements
The portions of a building that support it and resist gravity, earthquakes, hurricane winds
and other type of loads are said to be the structural elements. The structural elements of
buildings include columns, beams (girders and joints), floor or roof sheeting, slabs or
decking, load bearing walls and foundations.

Glossary
476
Structural model
The idealisation of the structural system used for the purposes of analysis and design
(EC8).
Vertical irregularity
A discontinuity of strength, stiffness, geometry, or mass in one storey with respect to
adjacent storeys (FEMA-274, 1997).
Vulnerability
Propensity of any given good to be damaged or lost by any of the occurring events.
Vulnerability is a measure of the intrinsic susceptibility of structures, contents and
processes to fail once they are exposed to potentially damaging natural phenomena.
Vulnerability is generally expressed as the degree of expected damage or loss, given in a
certain scale, as a function of hazard intensity.
Yield storey drift
The lateral displacement of one level relative to the level above or below at which yield
stress is first developed in a frame member (GSREB, 2001).
Zero-th order
An optimization method that does not use derivatives (Richards, 1995).

REFERENCES AND RECOMMENDED READING
- 'Who's been repeating all that hard stuff to you?' - 'I read it in a book' - said Alice. (Lewis Carrol, Through the Looking Glass)
1. REFERENCES
A Aboutaha, R.S.; Engelhardt, M.D.; Jirsa, J.O.; Kreger, M.E. (1996) - Retrofit of concrete
columns with inadequate lap splices by the use of rectangular steel jackets - Earthquake Spectra, Vol. 12, No. 4, pp. 693-714.
Abrams, D. (2000) - Performance-based rehabilitation of unreinforced masonry buildings - International Seminar on Evaluation of Seismic Risk and Reduction of Vulnerability of Historical Structures, Pavia, 18th-30th June.
Abrams, D.; Angel, R.; Uzarski, J. (1993) - Transverse strength of damaged URM infills - Journal of The Masonry Society, Boulder, Colorado - Vol. 12, No. 1, pp. 45-52.
Abrishami, H.H.; Mitchell, D. (1996) - Analysis of bond stress distributions in pullout specimens - Journal of Structural Engineering, Vol. 122, No. 3, pp. 255-261, March.
ACI-318 (1971) - Building code requirements for reinforced concrete - American Concrete Institute, Detroit, 78 pp.
ACI 506R-90 (1995) - Guide to shotcrete - Reported by ACI Committee 506, Reapproved 1995.
ACI 506.2-95 (1995) - Specification for shotcrete - Reported by ACI Committee 506.
Adham, S.; Bhaumik, A.; Isenberg, J. (1975) - Reinforced concrete constitutive relations - Agbabian Associates, AD-A007 886, US Department of Commerce, National Technical Information Services, Springfield, VA.
AISC (1986) - Manual of steel construction-load & resistance factor design - 1st edition - American Institute of Steel Construction, Inc., Chicago, IL.
Albanesi, T.; Nuti, C.; Vanzi, I. (2002) - State-of-the-art on non-linear static methods - 12th ECEE, London, UK, Paper No. 602, Elsevier Science Ltd., 9th-13th September.
Allen, E.W.; Bailey, J.S. (1988) - Seismic rehabilitation of the Salt Lake City and County building using base isolation - 9th WCEE, Tokyo-Kyoto, Japan, Vol. 5, pp. 639-644.

References and recommended reading
478
Altin, S.; Ersoy, U.; Tankut, T. (1992) - Hysteretic response of reinforced concrete infilled frames - Journal of the Structural Engineering Division, ASCE, New York, New York, Vol. 118, No. 8, pp. 2133–2150.
Anagnostopoulos, S.A. (2000) - Policy issues for seismic risk mitigation - Workshop on Mitigation of Seismic Risk: Support to Recently Affected European Countries, JRC, Belgirate, Italy, November.
Anderson, J.C.; Miranda, E.; Bertero, V.V.; The Kajima Project Research team (1991) - Evaluation of the seismic performance of a thirty-storey RC building - Report No. UCB/EERC-91/16, EERC, University of California, Berkeley, July.
Anselmi, G.; Mocci, U. (2002) - Applying ICTs to public participation in enhancing the urban environment - IPTS, No. 69, JRC, Seville, November.
Aoyama, H. (1981) - A method for the evaluation of the seismic capacity of existing reinforced concrete buildings in Japan - Bulletin of the New Zealand National Society for Earthquake Engineering, Vol. 14, No. 3, September, pp. 105-130.
Aoyama, H.; Kato, D.; Katsumata, H.; Hosokawa, Y. (1984) - Strength and behaviour of postcast shear walls for strengthening of existing reinforced concrete buildings - 8th WCEE, San Francisco, US, Vol. 4, pp. 485-492.
Arêde, A. (1997) - Seismic assessment of reinforced concrete frame structures with a new flexibility based element - PhD thesis, FEUP, University of Porto, October.
Aschheim, M. (2001) - The Izmit (Kocaeli) earthquake of 17th August 1999: Preliminary observations - EERI Reconnaissance Team - Mid-America Earthquake Center - University of Illinois at Urbana-Champaign.
ASTM-97 (1997) - Standard test method for diagonal tension (shear) in masonry assemblages - E 519-81 (reapproved 1993) - ASTM Standards on Masonry - ASTM Publication code: 03-315097-60.
ATC-13 (1985) - Earthquake damage evaluation data for California - Applied Technical Council - Redwood City, California, US.
ATC-21 (1989) - A handbook for seismic evaluation of existing buildings - Applied Technology Council, Redwood City, California, US.
ATC-40 (1996) - Seismic evaluation and retrofit of concrete buildings - Applied Technical Council - California Seismic Safety Commission, Report No. SSC 96-01 (two volumes), Redwood City, California, US.
Aviles, N.B.; Maruyama, K.; Rojas, L.E. (1996) - Improving strength and ductility by using steel plate wrapping - 11th WCEE, Acapulco, Mexico, Paper No. 742.
Ayala, A.G.; Tayebi, A.K.; Ye, X.G. (1996) - Dynamic response of a reinforced concrete frame compared with observed earthquake damage - 11th WCEE, Acapulco, Mexico, Paper No. 697.
References and recommended reading
479
B Badoux, M.; Peter, K. (2000) - Seismic vulnerability of older Swiss RC buildings - 12th
WCEE, Auckland, New Zealand, January.
Barthelemy, J.-F.M.; Haftka, R.T. (1993) - Approximation concepts for optimum structural design - A review - Structural Optimization, Vol. 5, pp. 129-144.
Bento, R.; Azevedo, J. (2000) - Behaviour coefficient assessment for soft storey structures - 12th WCEE, Auckland, New Zealand, January.
Bento, R.; Lopes, M. (2000) - Evaluation of the need for weak-beam strong-column design in dual frame-wall structures - 12th WCEE, Auckland, New Zealand, January.
Berra, M.; Castellani, A.; Ciccotelli, S.; Coronelli, D. (1994) - Bond slip effects on reinforced concrete elements under earthquake loading - European Earthquake Engineering, Vol. 8, No. 3, pp. 3-10.
Bertero, V.V. (1997) - Earthquake engineering - Structural Engineering Slide Library - (available at http://nisee.berkeley.edu/bertero/html/earthquake-resistant_construction.html) - W.G. Godden (ed.), Godden Collection, Earthquake Engineering Library, University of California, Berkeley.
Bertero, V.V. (1992) - Seismic upgrading of existing structures - 10th WCEE, Madrid, Spain, Vol. 9, pp. 5101-5106.
Bertero, V.V. (1982) - State-of-the-art in seismic resistant construction of structures - 3rd International Earthquake Microzonation Conference, University of Washington, Seattle, Washington, Vol. II, pp. 767-805.
Bertero, V.V. (1979) - Seismic performance of reinforced concrete structures - Anales de la Academia Nacional de Ciencias Exactas, Física y Naturales, Buenos Aires, Argentina, Tomo 31, pp. 75-144.
Bertero, R.D.; Bertero, V.V. (2002) - Performace-based seismic engineering: the need for a reliable conceptual comprehensive approach - Earthquake Engineering and Structural Dynamics, Vol. 31, pp. 627-652, March.
Bertero, V.V.; Anderson, J.C.; Krawinkler, H.; Miranda, E.; The CUREe and The Kajima Research Teams (1991) - Design guidelines for ductility and drift limits: Review of state-of-the-practice and state-of-the-art in ductility and drift-based earthquake-resistant design of buildings - Report No. UCB/EERC-91/15, EERC, University of California, Berkeley, July.
Borges, J.F.; Ravara, A. (1969) - Earthquake engineering: Seismic design of reinforced concrete buildings - Course 113, LNEC, Lisbon, November.
Bouwkamp, J.; Pinto, A.V.; Molina, F.J.; Varum, H. (2000) - Cyclic tests on RC frame retrofitted with K-bracing and shear-link dissipator - EUR Report No. 20136 EN, ELSA, JRC-Ispra, EC, Italy.

References and recommended reading
480
Braibant V. (1985) - Optimisation de forme des structures en vue de la conception assistée par ordinateur - Publication de la Faculté des Sciences Appliquées, No. 102, Liège, Belgique (in French).
Brenner, P. (2001) - Reclaiming buildings: Strategies for change - Buildings.com - @ the moment (available at http://www.buildings.com/Articles/detail.asp?ArticleID=445), 28th November.
BS-4778 (1987) - Glossary of terms used in quality assurance (including reliability and maintainability) - British Standards Institution, London.
Buchet, P.; Capéran, P.; Pegon, P. (2000) - Visual Cast3m for Windows NT: User manual - JRC Special Publication No.I.00.142, ELSA, JRC-Ispra, EC, Italy, December.
Busquin, P. (2002) - Message from EU Research Commissioner - CORDIS focus, Community Research and Development Information Service, Office for Official Publications, EC, Luxemburg.
C Calderón, E.V. (1980) - Some lessons from the March 14, 1979 earthquake in Mexico City
- 7th WCEE, Istanbul, Turkey, Vol. 4, pp. 545-552.
CALTRANS (1998) - Bridge design specifications manual - California Department of Transportation, Division of Structures, Sacramento, California, US.
Calvi, G.M. (1999) - A displacement-based approach for vulnerability evaluation of classes of buildings - Journal of Earthquake Engineering, Imperial College Press, Vol. 3, No. 3, pp. 411-438.
Calvi, G.M. (1998) - Performance-based approaches for seismic assessment of existing structures - 11th ECEE, Paris, France, Invited lecture, ISBN 90 5809 027 2, A.A. Balkema, Rotterdam, 6th-11th September.
Calvi, G.M.; Pavese, A. (1997) - Conceptual design of isolation system for bridge structures - journal of Earthquake Engineering, Vol. 1, pp. 193-218.
Calvi, G.M.; Pampanin, S.; Ward, J.; Fajfar, P. (2000) - New methods for assessment and design of structures in seismic zones: Present state and research needs - Workshop on Mitigation of Seismic Risk: Support to Recently Affected European Countries, JRC, Belgirate, Italy, November.
Campos-Costa, A.; Pinto, A.V. (1999) - European seismic hazard scenarios - an approach to the definition of input motions for testing and reliability assessment of civil engineering structures - JRC Special Publication No. X.99.XX, ELSA, JRC-Ispra, EC, Italy.
Candeias, P. (2000) - Avaliação sísmica de edifícios existentes: Contribuíção para a avaliação da Vulnerabilidade em Portugal - Master thesis, IST, Technical University of Lisbon, December (in Portuguese).
References and recommended reading
481
Carvalho, E.C.; Bairrão, R. (2000) - Experimental activity at LNEC under ECOEST II - Workshop on Mitigation of Seismic Risk: Support to Recently Affected European Countries, JRC, Belgirate, Italy, November.
Carvalho, E.C.; Coelho, E.; Campos-Costa, A. (1999) - Preparation of the full-scale tests on reinforced concrete frames - Characteristics of the test specimens, materials and testing conditions. ICONS report, Innovative Seismic Design Concepts for New and Existing Structures, European TMR Network - LNEC, Lisbon.
Carvalho, E.C.; Coelho, E.; Pinto, A.V.; Molina, F.J.; Varum, H. (2000-a) - Avaliação e reforço sísmico de estruturas de betão armado - Encontro Nacional Betão Estrutural 2000 - FEUP, Porto, 22-24 de Novembro (in Portuguese).
Carvalho, E.C.; Coelho, E.; Campos-Costa, A.; Sousa, M.L.; Candeias, P.; Carvalho, A.; Massena, B.; Castro, S. (2000-b) - Seismic risk mitigation in Portugal - Workshop on Mitigation of Seismic Risk: Support to Recently Affected European Countries, JRC, Belgirate, Italy, November.
CEB-131 (1979) - Bulletin d'Information N. 131 - Structural concrete under seismic actions - Comité Euro-International du Béton.
CEB-161 (1983) - Bulletin d'Information N. 161 - Response of RC critical regions under large amplitude reversed actions - Comité Euro-International du Béton.
CEB-217 (1993) - Bulletin d'Information N. 217 - Selected justification notes - Comité Euro-International du Béton, April.
CEB-240 (1998) - Bulletin d'Information N. 236 - Seismic design of reinforced concrete structures for controlled inelastic response - Comité Euro-International du Béton, Thomas Telford Ltd, ISBN 0-7277-2641-2.
CEB-FIP MC-90 (1990) - Model code for concrete structures - Comité Euro-International du Béton.
Celebi, M.; Spudich, P.A.; Page, R.A.; Stauffer, P.H. (1995) - Saving lives through better design standards - USGS Fact Sheet-176-95 (available at http://quake.usgs.gov/prepare/factsheets/BetterDesign/).
CEN (2003) - Eurocode 8: Design of structures for earthquake resistance - Part 1-3: Strengthening and repair of buildings - European prEN 1998-1-3, European Committee for Standardization, Brussels, Belgium.
CEN (1995) - Eurocode 6: Design of masonry structures - Part 1-1: Rules for reinforced and unreinforced masonry - European prENV 1996-1-1, European Committee for Standardization, Brussels, Belgium.
CEN (1994) - Eurocode 8: Design provisions for earthquake resistance of structures - Part 1-1 and 1-2 - European prENV 1998-1-1, 1-2, European Committee for Standardization, Brussels, Belgium.
CEN (1991) - Eurocode 2: Design of concrete structures - European prENV 1992-1-1, CEN/TC 250/SC 2, European Committee for Standardization, Brussels, Belgium.

References and recommended reading
482
Chai, Y.H.; Priestley, M.J.N.; Seible, F. (1991) - Seismic retrofit of circular bridge columns for enhanced flexural performance - ACI Structural Journal, Vol. 88, No. 5, pp. 572-584.
Chickermane, H.; Gea, H.C. (1996-a) - A new local approximation method for structural optimization problems - International Journal for Numerical Methods in Engineering, Vol. 39, pp. 829-846 (available at http://www.rci.rutgers.edu/~hemant/ijnme/paper.html).
Chickermane, H.; Gea, H.C. (1996-b) - Design of multi-component structural systems for optimal layout topology and joint locations - ASME Design Automation Conference, Irvine, CA, August (available at http://www.rci.rutgers.edu/~hemant/ijnme/paper.html).
Chopra, A.K. (2001) - Dynamics of structures: Theory and applications to earthquake engineering (2nd edition) - Englewood Cliffs, New Jersey: Prentice Hall, Inc.
Coelho, E. (1992) - Comportamento sísmico de estruturas em pórtico de betão armado: Avaliação da resposta não-linear histerética - PhD thesis, Instituto Superior Técnico, Lisbon (in Portuguese).
Coelho, E.; Campos-Costa, A.; Carvalho, E.C. (2000) - Assessment of experimental seismic response through damage evaluation - 12th WCEE, Auckland, New Zealand, January.
Combescure, D. (2000) - Étude d’une structure portique de 4 étages en béton armé ayant de mauvaises dispositions constructives (portique Ispra) - Influence des remplissages en maçonnerie sur le comportement sismique - Rapport DMT, SEMT/EMSI/RT/00-009/A, CEA - Laboratoire d’Études de Mécanique Sismique (in French).
Combescure, D. (1996) - Modélisation du comportement sous chargement sismique des structures de bâtiment comportant des murs de remplissage en maçonnerie - PhD thesis (in French).
Combescure, D.; Pegon, P. (1996) - Introduction of two new global models in CASTEM-2000 for seismic analysis of civil engineering structures - Special Publication No. I.96.34, ELSA, JRC-Ispra, EC, Italy.
Combescure, D.; Pegon, P.; Anthoine, A. (1995) - Modelling of the in-plane behaviour of masonry infilled frames - Proceedings of the European Seismic Design Practice Conference, Chester, October.
Costa, A.G. (1989) - Análise sísmica de estruturas irregulares - PhD thesis, FEUP, University of Porto (in Portuguese).
Cowell, A.D.; Popov, E.P.; Bertero, V.V. (1980) - Repair of bond in RC structures by epoxy injection - 1st Seminar on Repair and Retrofit of Structures - US/Japan Co-operative Earthquake Engineering Research Program, Department of Civil Engineering, University of Michigan, Ann Arbor, Vol. 1, pp. 234-240.

References and recommended reading
483
D Delgado, P.; Silva, B.; Ribeiro, D.; Delgado, R.M. (2002) - Análise numérica da
reabilitação sísmica de uma estrutura de betão armado - Congresso Nacional da Engenharia de Estruturas, Estruturas 2002, LNEC, Lisbon (in Portuguese).
Delgado, R.M. (1984) - O método dos elementos finitos na análise dinâmica de barragens incluindo a interacção sólido-liquido - PhD thesis, FEUP, University of Porto (in Portuguese).
Dimitriu, P.; Karakostas, C.; Lekidis, V. (2000) - The Athens (Greece) earthquake of 7 September 1999: The event, its effects and the response - 2nd Euro-Conference on Global Change and Catastrophe Risk Management: Earthquake Risks in Europe, IIASA, Laxenburg, Austria, 6th-9th July.
Dolsek, M.; Fajfar, P. (2001) - Soft storey effects in uniformly infilled reinforced concrete frames - Journal of Earthquake Engineering, Imperial College Press, Vol. 5, No. 1, pp. 1-12.
Donea, J.; Magonette, G.; Negro, P.; Pegon, P.; Pinto, A.V.; Verzeletti, G. (1996) - Pseudo-dynamic capabilities of the ELSA laboratory for earthquake testing of large structures - Earthquake Spectra, Vol. 12, No. 1, pp. 163-180.
Duarte, R.T.; Campos-Costa, A. (1988) - Earthquake behaviour of reinforced concrete frame structures infilled with masonry panels - LNEC Report (contract No. 86/7750/023), Lisbon.
Dyngeland, T. (1998) - Retrofitting of bridges and building structures: A literature survey - Special Publication No. I.98.33, ISIS, SSMU, ELSA, JRC-Ispra, EC, Italy.
E EASY (1997) - (available at http://www.ikpir.fgg.uni-lj.si/easy/tour.htm) - Earthquake
engineering slide information system.
EERI (1996) - Spectra theme issue: Repair and rehabilitation research for seismic resistance of structures - Jirsa, J.O. (ed.), Earthquake Spectra, Vol. 12, No. 4.
Eligehausen, R.; Popov, E.P.; Bertero, V.V. (1983) - Local bond stress-slip relationships of deformed bars under generalized excitations - Report No. UCB/EERC 83-23, Earthquake Engineering Research Center, University of California, Berkeley, California, October.
Elnashai, A.S. (2000) - The Kocaeli (Turkey) earthquake of 17th August 1999: Assessment of Spectra and Structural Response Analysis - Personal PowerPoint Presentation. (7.5Mb, 117 slides). (available at http://www.isesd.cv.ic.ac.uk/esd/frameset.htm).
Elnashai, A.S.; Pinho, R. (1999) - ICONS Topic 2 - Pseudo-dynamic testing of RC frames - Proposal for selective repair/strengthening of specimen B - Report Imperial College of London.
References and recommended reading
484
Elsesser, E. (2002) - The search for the perfect seismic protection system - Forell/Elsesser Engineers, Inc. - San Francisco.
EN-196-1 (1987) - Methods of testing cement. Determination of strength (Portuguese version: NP-1990).
ENV-206 (1993) - Concrete: Performance, production, placing and compliance criteria - European Standards, CEN, European Committee for Standardisation, Brussels.
EQE (2001) - (available at http://www.eqe.com/revamp/HiroshimaEQ.htm). Report of the M6.9 Geiyo earthquake, southwest Japan, March 24th.
EQE (1999) - (available at http://www.eqe.com/revamp/izmitreport/index.html). Report of the M7.4 Izmit earthquake, Turkey, August 17th.
EQE (1995) - (available at http://www.eqe.com/publications/kobe/building.htm). The January 17, 1995 Kobe earthquake - An EQE summary report.
Ersoy, U. (1998) - Seismic rehabilitation - Second Japan-Turkey Workshop on Earthquake Engineering: Repair & Strengthening of Existing Buildings - Istanbul.
F Fajfar, P. (2002) - Structural analysis in earthquake engineering: A breakthrough of
simplified non-linear methods - 12th ECEE, London, UK, Paper No. 843, Elsevier Science Ltd., 9th-13th September.
Fajfar, P. (2000) - A non-linear analysis method for performance based seismic design - Earthquake Spectra, Vol. 16, No. 3, pp. 573-592, August.
Fajfar, P. (1998) - Trends in seismic design and performance evaluation approaches - Bisch, Ph.; Labbé, P.; Pecker, A. (eds.), 11th ECEE, Paris, France, Invited lecture, ISBN 90 5809 027 2, A.A. Balkema, Rotterdam, 6th-11th September.
Fajfar, P.; Gaspersic, P. (1996) - The N2 method for the seismic damage analysis of RC buildings - Earthquake Engineering & Structural Dynamics, Vol. 25, pp. 31-46.
Fajfar, P.; Krawinkler, H. (eds.) (1997) - Seismic design methodologies for the next generation of codes - Proceedings of the International Workshop, Bled, Slovenia, Roterdam, Balkema, 24-27 June.
Fajfar, P.; Krawinkler, H. (eds.) (1992) - Nonlinear seismic analysis and design of reinforced concrete buildings - Proceedings of the Workshop, Bled, Slovenia, Yugoslavia, Elsevier Applied Science, 13-16 July.
Fajfar, P.; Gaspersic, P.; Drobnic, D. (1997) - A simplified nonlinear method for seismic damage analysis of structures - Proceedings of the International Workshop Seismic design methodologies for the next generation of codes, Fajfar, P. and Krawinkler, H. (eds.), Slovenia, Roterdam, Balkema, 24-27 June.

References and recommended reading
485
Fardis, M.N. (2000) - Eurocode 8: Present state, pre-normative and co-normative research needs (including design seismic actions) - Workshop on Mitigation of Seismic Risk: Support to Recently Affected European Countries, JRC, Belgirate, Italy, November.
Fardis, M.N. (1998) - Seismic assessment and retrofit of RC structures - Bisch, Ph.; Labbé, P.; Pecker, A. (eds.), 11th ECEE, Paris, France, Invited lecture, ISBN 90 5809 027 2, A.A. Balkema, Rotterdam, 6th-11th September.
FEMA-273 (1997) - NHERP Guidelines for the seismic rehabilitation of buildings - Federal Emergency Management Agency, Applied Technology Council, Washington, DC, October.
FEMA-274 (1997) - NHERP Commentary on the guidelines for the seismic rehabilitation of buildings - Federal Emergency Management Agency, Applied Technology Council, Washington, DC, October.
FEMA-310 (1998) - Handbook for the seismic evaluation of buildings: A prestandard - American Society of Civil Engineers.
Filiatrault, A.; Uang, C.M.; Folz, B.; Christopoulos, C.; Gatto, K. (2001) - Reconnaissance report of the February 28, 2001 Nisqually (Seattle-Olympia) earthquake - Report No. SSRP-2001/02, Department of Structural Engineering, University of California, San Diego, La Jolla, California.
Fiorato, A.E.; Sozen, M.A.; Gamble, W.L. (1970) - Investigation of the interaction of reinforced concrete frames with masonry filler walls - Report UILU, Structural Research Series 370, University of Illinois, Urbana, Illinois.
Fleury, C. (1989) - CONLIN: An efficient dual optimizer based on convex approximation concepts - Structural Optimization, Vol. 1, pp. 81-89.
Fleury, C. (1979) - Structural weight optimization by dual methods of convex programming - International Journal for Numerical Methods in Engineering, Vol. 14, pp. 1761-1783.
Fleury, C.; Braibant, V. (1986) - Structural optimization: a new dual method using mixed variables - International Journal of Numerical Methods in Engineering, Vol. 23, No 3, pp. 409-429.
Foutch, D.A.; Hjelmstad, K.D.; Calderón, E.V. (1988) - Seismic retrofit of a RC building: A case study - 9th WCEE, Tokyo-Kyoto, Japan, Vol. 7, pp. 451-456.
Freeman, S.A. (1978) - Prediction of response of concrete buildings to severe earthquake motion - Proceedings of Douglas McHenry International Symposium on Concrete Structures, Detroit, pp. 589-605.
Frosch, R.J.; Li, W.; Jirsa, J.O.; Kreger, M.E. (1996) - Retrofit of non-ductile moment-resisting frames using precast infill wall panels - Earthquake Spectra, Vol. 12, No. 1, pp. 163-180.

References and recommended reading
486
G Gavrilovic, P.; Sendova, V. (1992) - Experimental and analytical studies of infill walls in
reinforced concrete structures - 10th WCEE, A.A. Balkema, Rotterdam, The Netherlands, Vol. 6, pp. 3309-3315.
Geradin, M.; Pinto, A.V. (eds.) (2000) - Workshop on mitigation of seismic risk: Support to recently affected European countries - JRC, Belgirate, Italy, November.
Ghobarah, A. (2000) - Seismic assessment of existing RC structures - Progress in Structural Engineering and Materials, Vol. 2, No. 1, pp. 60-71, January-March.
Ghobarah, A.; Aziz, T.; Abou-Elfath, H. (1999) - Softening effects on the seismic response of non-ductile concrete frame - Journal of Earthquake Engineering, Imperial College Press, Vol. 3, No. 1, pp. 59-81.
Griffith, M. (1999-a) - Seismic retrofit of RC frame buildings with masonry infill walls - Literature review and preliminary case study - JRC-Special Publication (in print).
Griffith, M. (1999-b) - Description of damage in block masonry infill frame - (personal notes).
GSREB (2001) - Guidelines for the seismic retrofit of existing building - International Conference of Building Officials, US, ISBN 1-58001-076-8, July.
Guedes, J. (1997) - Seismic behaviour of reinforced concrete bridges. Modelling, numerical analysis and experimental assessment - PhD thesis, FEUP, University of Porto.
H Hall, J. (1994) - Northridge earthquake January 17, 1994: Preliminary reconnaissance
report - Earthquake Engineering Research Institute, Oakland, CA, March.
Hanson, R.D. (ed.) (1981) - Proceedings of the first seminar on repair and retrofit of structures - US-Japan Co-operative Earthquake Engineering Research Program, Dept. of Civil Engineering, University of Michigan, Ann Arbor, Vol. 1.
Hassan, F.M.; Hawkins, N.M. (1977) - Anchorage of reinforced bars for seismic forces - ACI Special Publication, SP 53-15, pp. 387-416.
Hawkins, N.M.; Lin, I.; Ueda, T. (1987) - Anchorage of reinforced bars for seismic forces - ACI Structural Journal, Technical Paper, Title No. 84-S43, pp. 407-418, September-October.
Higashi, Y.; Endo, T.; Shimizy, Y. (1984) - Experimental studies on retrofitting of reinforced concrete buildings - 8th WCEE, San Francisco, US, Vol. 4, pp. 477-484.
Holmes, W.T. (2000) - Risk assessment and retrofit of existing buildings - 12th WCEE, Auckland, New Zealand, January.

References and recommended reading
487
I ICONS WebPages (1999) - available at http://elsa.jrc.it/ICONS/ - WebPages of the project
ICONS - Developed and maintained by Varum, H. and Pinto, A.V.
Iglesias, J.; Aguilar, J. (1996) - Rehabilitation of buildings after the 1985 Mexico city earthquake - 11th WCEE, Acapulco, Mexico, Paper No. 2091.
Imanbekov, S.; Uranova, S.; Iwan, W. (1999) - Earthquake resistance of multi-storey residential buildings in Central Asian capital cities - Seismic Hazard and Building Vulnerability in Post-Soviet Central Asian Republics, King, S.A.; Khalturin, V.I.; Tucker, B.E. (eds.), Kluwer Academic Publishers, pp. 45-65.
ISO-1000 - SI Units and recommendations for the use of their multiples and of certain other units.
ISPMNH (2002) - Catastrophic Athens (Greece) earthquake of 7 September 1999: An unexpected event in a low seismicity region - Special Issue of the Journal of the International Society for the Prevention and Mitigation of Natural Hazards, Vol. 27, No. 1 and 2, October.
Iwan, W.D.; Gates, N.C. (1979) - Estimating earthquake response of simple hysteretic structures - Journal of engineering Mechanics, ASCE, Vol. 105, No. EM3, pp. 391-405, June.
J Jara, J.M.; Miranda, E.; Ayala, A.G. (2001) - Limit states of behaviour for structures with
energy dissipating systems in Mexico - 7th International Seminar on Seismic Isolation, Passive Energy Dissipation and Active Control of Vibration of Structures - Assisi, Italy, 2-5 October.
Jara, J.M.; Ayala, A.G.; Miranda, E. (2000) - Seismic behaviour of structures with energy dissipating systems in Mexico - 12th WCEE, Auckland, New Zealand, January.
Jaramillo, J.D.; Campos, A. (2000) - Seismic vulnerability of Pereira city, Colombia - 12th WCEE, Auckland, New Zealand, January.
JBDPA (1977) - Standard for evaluation of seismic capacity and guidelines for seismic retrofit design of existing reinforced concrete buildings - Japan Building Disaster Prevention Association.
Jirsa, J.O.; Kreger, M.E. (1989) - Recent research on repair and strengthening of reinforced concrete structures - Seismic Engineering, ASCE, pp.679-688.
JSCE (1996) - Standard specification for design and construction of concrete structures - Japanese Society of Civil Engineers (in Japanese).
References and recommended reading
488
K Kagami, H. (1999) - Reconnaissance report on the 1999 Quindio, Central Western
Colombia, earthquake and its disasters - Hokkaido University, Japan.
Karadogan, F. (ed.) (1998) - Repair and strengthening of existing buildings - 2nd Japan-Turkey Workshop on Earthquake Engineering, Istanbul, Turkey, Vol. 1.
Karayannis, C.G.; Chalioris, C.E.; Sideris, K.K. (1998) - Effectiveness of RC beam-column connection repair using epoxy resin injections - Journal of Earthquake engineering, Vol. 2, No. 2, pp. 217-240.
Katayama, T. (1996) - Lessons from the 1995 Great Hanshin earthquake of Japan with emphasis on urban infrastructure systems - Structural Engineering in consideration of Economy Environment Energy, 15th Congress, Copenhagen, Denmark (available at http://rattle.iis.u-tokyo.ac.jp/kobenet/report/pub1/pub1-1.html).
Kelly, J.M. et al. (1979) - Aseismic base isolation: A review - 2nd US National Conference on Earthquake Engineering, Stanford University, Stanford, California, pp. 823-837.
Keuser, M.; Mehlhorn, G. (1987) - Finite elements models for bond problems - Journal of Structural Engineering, ASCE, Vol. 113, No. 10, pp. 2160-2173.
Klingner, R.E.; Bertero, V.V. (1976) - Infilled frames in earthquake-resistant construction - Report 76-32, University of California, Berkeley.
KOBEnet (1995) - Buildings collapsed in many ways - (available at http://rattle.iis.u-tokyo.ac.jp/kobenet/picture/damage6/Building.html).
KOERI (1999) - Izmit earthquake (Turkey) - Kandilli Observatory & Earthquake Research Institute, Boğaziçi University, Istanbul - (available at http://www.eas.slu.edu/Earthquake_Center/TURKEY/).
Kölz, E.; Bürge, M. (2001) - Priorities in earthquake upgrading of existing structures - Structural Engineering International, IABSE, Vol. 11, No. 3.
Kowalsky, M.J.; Priestley, M.J.N.; MacRae, G.A. (1994) - Displacement-based design: A methodology for seismic design applied to single degree of freedom reinforced concrete structures - Structural Systems Research, University of California, San Diego, La Jolla, California, Report No. SSRP-94/16, October.
Kunnath, S.K.; Reinhorn, A.M.; Park, Y.J. (1990) - Analytical modelling of inelastic seismic response of RC structures - Journal of Structural Engineering, ASCE, Vol. 116, No. 4.
L Lafuente, M.; Molina, A.; Genatios, C. (2000) - Seismic-resistant behaviour of minor
reinforced concrete frames with masonry infill walls - 12th WCEE, Auckland, New Zealand, January.

References and recommended reading
489
Leuchars, J.M.; Scrivener, J.C. (1976) - Masonry infill panels subjected to cyclic in-plane loading - Bulletin of the NZSEE, Vol. 9, No. 2, pp. 122-131.
Liu, A.; Park, R. (2001) - Seismic behaviour and retrofit of pre-1970´s as-built exterior beam-column joints reinforced by plain round bars - Bulletin of the New Zealand Society for Earthquake Engineering, Vol. 34, No. 1, pp. 68-81, March.
Liu, A.; Park, R. (2000) - Seismic behaviour of existing moment-resisting frames with plain round reinforcing bars designed to pre-1970's codes - 12th WCEE, Auckland, New Zealand, January.
LNEC (2000) - Levantamento do parque habitacional de Portugal continental para o estudo da sua vulnerabilidade sísmica com base nos CENSOS-91 - Relatório 260/00 - C3ES, LNEC, Lisbon, October (in Portuguese).
M Magonette, G.; Pegon, P.; Molina, F.J.; Buchet, P. (1998) - Development of fast continuous
substructuring tests - 2nd World Conference on Structural Control, Kyoto.
Martinez-Romero, E. (1993) - Experiences on the use of supplementary energy dissipators on building structures - Earthquake Spectra, Vol. 9, No. 3, pp. 581-626.
Martinez-Rueda, J.E. (1997) - Energy dissipation devices for seismic upgrading of RC structures - PhD thesis, Imperial College, University of London, UK.
Meier, U. (1992) - Carbon fiber-reinforced polymers: Modern materials in bridge engineering - Structural Engineering International, IABSE, Vol. 1, pp. 7-12.
Menegotto, M.; Pinto, P.E. (1973) - Methods of analysis for cyclically loaded reinforced concrete plane frames including changes in geometry and non-elastic behaviour of elements under combined normal force and bending - IABSE Symposium on Resistance and Ultimate Deformability of Structures acted on by well-defined repeated loads, Lisbon.
Millard, A. (1993) - CASTEM-2000 - Guide d’utilisation - Rapport CEA 93/007, Saclay, France.
Miranda, E.; Bertero, V.V. (1990) - Post-tensioning technique for seismic upgrading of existing low-rise buildings - 4th US National Conference on Earthquake Engineering, Palm Springs, California, Vol. 3, pp. 393-402.
Moehle, J.P.; Mahin, S.A. (1991) - Observations on the behaviour of reinforced concrete buildings during earthquakes - ACI publication SP-127, Earthquake-Resistant Concrete Structures: Inelastic Response and Design - Ghosh, S.K. (ed.).
Mokha, A.S.; Amin, N.; Constantinou, M.C.; Zayas, V. (1996) - Seismic isolation retrofit of large historic building - Journal of Structural Engineering, Vol. 122, No. 3, pp. 298-308.
Molina, F.J.; Pegon, P.; Verzeletti, G. (1999-a) - Time-domain identification from seismic pseudodynamic test results on civil engineering specimens - 2nd International
References and recommended reading
490
Conference on Identification in Engineering Systems, University of Wales Swansea, Cromwell Press Ltd.
Molina, F.J.; González, M.P.; Varum, H.; Pinto, A.V. (2001) - Frecuencias propias y índices de amortiguamiento durante la respuesta de un pórtico de cuatro pisos en diferentes estados de daño o reparación - 2º Congreso Iberoamericano de Ingeniería Sísmica, Madrid, 16-19 October (in Spanish).
Molina, F.J.; Verzeletti, G.; Magonette, G.; Taucer, F. (2000-a) - Dynamic and pseudo-dynamic responses in a two storey building retrofitted with rate-sensitive rubber dissipators - 12th WCEE, Auckland, New Zealand, January.
Molina, F.J.; Gonzalez, M.P.; Pegon, P.; Varum, H.; Pinto, A.V. (2000-b) - Frequency and damping evolution during experimental seismic response of civil engineering structures - COST F3 Conference on System Identification & Structural Health Monitoring, Madrid, 6th-9th June.
Molina, F.J.; Verzeletti, G.; Magonette, G.; Buchet, P.; Géradin, M. (1999-b) - Bi-directional pseudo-dynamic test of a full-size 3-storey building - Journal of Earthquake Engineering and Structural Dynamics, No. 28, pp. 1541-1566.
Monti, G.; Spacone, E. (1998) - Insertion of bond-slip into RC beam fiber finite elements - 11th ECEE, Paris, France, ISBN 90-5410-982-3, A.A. Balkema, Rotterdam, 6th-11th September.
Murayama, Y.; Suda, K.; Toshimichi, I.; Shimbo, H. (1996) - Stress-slip model of the longitudinal reinforcing bars in a reinforced concrete column joint - 11th WCEE, Acapulco, Mexico, Elsevier Science, Paper No. 1750, ISBN 0-08-042822-3.
N Naeim, F. (1994) - Northridge earthquake ground motions: Implications for seismic design
of tall buildings - 3rd Conference on Tall Buildings in Seismic Regions, Los Angeles, Los Angeles Tall Buildings Structural Design Council, May.
NAHB (1994) - Assessment of damage to residential buildings caused by the Northridge earthquake - NAHB Research Center, Upper Marlboro, Maryland, US Department of Housing and Urban Development Office of Policy Development and Research, July.
Nakano, Y. (1995) - Damage to buildings due to 1994 Sanriku-harukaoki earthquake - Building disaster, Japan Building Disaster Prevention Association, Vol. 211, pp. 6-15 (in Japanese).
Negro, P.; Verzeletti, G.; Magonette, G.; Pinto, A.V. (1994) - Tests on a four-storey full-scale RC frame designed according to Eurocodes 8 and 2: Preliminary Report - EUR 15879 EN, ELSA, JRC-Ispra, EC, Italy.
NIST (1994) - 1994 Northridge earthquake: Performance of structures, lifelines, and fire protection systems - National Institute of Standards and Technology, Washington.

References and recommended reading
491
NZNSEE (1996) - The assessment and improvement of the structural performance of earthquake risk buildings: Draft for general release - New Zealand National Society for Earthquake Engineering.
O OECD (2001) - OECD science, technology and industry scoreboard: Towards a
knowledge-based economy - Organisation for Economic Co-operation and Development, ISBN 92-64-18648-4.
Okada, T.; Nakano, Y.; Kumazawa, F. (1992) - Experimental study of 1/10 scaled RC frames retrofitted with steel framed Y-shaped bracing system - International Symposium on Earthquake Disaster Prevention, Mexico City, pp. 200-209.
Oliveira, D.V.C. (1995) - Comportamento de pórticos de betão armado preenchidos com paredes de alvenaria - MSc thesis, FEUP, University of Porto (in Portuguese).
Oliveira, C.S.; Azevedo, J.; Delgado, R.; Costa, A.G.; Campos-Costa, A. (1995) - O sismo de Northridge, Los Angeles, 17 de Janeiro de 1994: Ensinamentos para Portugal - Edition of IST and FEUP, ISBN 972-96893-0-X (in Portuguese).
P Pantazopoulou, S.J.; Moehle, J.P.; Shahrooz, B.M. (1988) - Simple analytical model for T-
beams in flexure - Journal of Structural Engineering, ASCE, Vol. 114, No. 7, pp. 1507-1523, July.
Papadopoulos, G.A.; Ganas, A.; Pavlides, S. (2002) - The problem of seismic potential assessment: Case study of the unexpected earthquake of 7 September 1999 in Athens, Greece - Earth Planets Space, Vol. 54, pp. 9-18.
Park, R. (1992) - Seismic assessment and retrofit of concrete structures - United States and New Zealand developments - Technical Conference of New Zealand Concrete Society, Wairakei, pp. 18-25.
Park, R.; Paulay, T. (1975) - Reinforced concrete structures - John Wiley & Sons, Inc.
Park, Y.J.; Ang, A.H.S. (1985) - Mechanistic seismic damage model for reinforced concrete - Journal of Structural Engineering, Vol. 111, No. 4, ISSN 0733-9445/85/0004-0722, Paper No. 19670, April.
Park, Y.J.; Ang, A.H.S.; Wen, Y.K. (1987) - Damage-limiting aseismic design of buildings - Earthquake Spectra, Vol. 3, No. 1.
Park, Y.J.; Ang, A.H.S.; Wen, Y.K. (1984) - Seismic damage analysis and damage-limiting design of RC buildings - Technical Report of Research, University of Illions at Urbana-Champaign, ISSN 0069-4274, October.
Paulay, T.; Priestley, M.J.N. (1992) - Seismic design of reinforced concrete and masonry buildings - John Wiley & Sons, Inc., ISBN 0-471-54915-0.
References and recommended reading
492
Pegon, P. (1998) - The numerical simulation of buildings subjected to seismic loading: Application of an integrated modelling strategy - 11th ECEE, Paris, France, Invited lecture, ISBN 90 5809 027 2, A.A. Balkema, Rotterdam, 6th-11th September.
Pegon, P.; Pinto, A.V. (2000) - Pseudo-dynamic testing with substructuring at the ELSA laboratory - Earthquake Engineering and Structural Dynamics, Vol. 29, pp. 905-925.
Perera, R.; Carnicero, A.; Alarcón, E.; Gomez, S. (2000) - A fatigue damage model for seismic response of RC structures - Computers and Structures, Elsevier Science, Vol. 78, pp. 293-302.
Peter, K.; Badoux, M. (2000) - Application of the capacity spectrum method to RC buildings with bearing walls - 12th WCEE, Auckland, New Zealand, January.
Peter, K.; Badoux, M. (1999) - Seismic evaluation of existing reinforced concrete buildings in Switzerland - 11th ECEE, Paris, France, ISBN 90-5410-982-3, A.A. Balkema, Rotterdam, 6th-11th September.
Pichard, P. (1984) - Emergency measures and damage assessment after an earthquake - Studies and documents on the cultural heritage - UNESCO, CLT/84/WS/14.
Pinho, R. (2000) - Selective retrofitting of RC structures in seismic areas - PhD thesis, Imperial College, London, UK.
Pinho, R.; Elnashai, A.S. (1999) - Analytical assessment of multi-storey RC frame before and after repair - ICONS-Topic 2 Report, Imperial College, London, UK.
Pinho, R.; Elnashai, A.S.; Pinto, A.V.; Varum, H. (2000) - Pseudo-dynamic testing of a selectively retrofitted full-scale RC frame - ESEE-00/8, December.
Pinto, A.V. (1998) - Earthquake performance of structures: Behaviour, safety and economical aspects - PhD thesis, JRC-Special Publication, No. I.98.111, September.
Pinto, A.V.; Varum, H. (2000) - Repair of two RC frames at the ELSA laboratory (external joints and column: Fibre carbon based technique) - Personal Notes, ELSA, JRC-Ispra, EC, Italy.
Pinto, A.V.; Molina, F.J.; Varum, H. (2000-a) - Tests on the shotcrete infilled frame: Short presentation of the test results - ELSA, JRC-Ispra, EC, Italy (internal document).
Pinto, A.V.; Molina, F.J.; Varum, H. (2000-b) - Final capacity cyclic tests on non-seismic resisting RC frames: Bare and selective retrofitted frames - EUR Report, ELSA, JRC-Ispra, EC, Italy.
Pinto, A.V.; Molina, F.J.; Varum, H. (1999-a) - Assessment, strengthening and repair (tests on the shotcrete infilled frame) - Short presentation of the test results - ELSA, JRC-Ispra, EC, Italy, December.
Pinto, A.V.; Varum, H.; Molina, F.J. (2002) - Experimental assessment and retrofit of full-scale models of existing RC frames - 12th ECEE, London, UK, Paper No. 855, Elsevier Science Ltd., 9th-13th September.

References and recommended reading
493
Pinto, A.V.; Molina, F.J.; Pegon, P.; Varum, H. (2001-a) - Actividades do laboratório ELSA no domínio da avaliação e reforço de estruturas em zonas sísmicas - SISMICA2001, Açores, Portugal, 24-27 October (in Portuguese).
Pinto, A.V.; Negro, P.; Colombo, A.; Varum, H. (2001-b) - The use of FRP's in seismic repair and retrofit: Experimental verification - CCC2001-International Conference on Composites in Construction, 10-12 October, FEUP, Porto.
Pinto, A.V.; Verzeletti, G.; Molina, F.J.; Varum, H.; Carvalho, E.C.; Coelho, E. (2001-c) - Pseudo-dynamic tests on non-seismic resisting RC frames (infilled frame and infill strengthened frame tests) - EU Special Publication (in preparation), ELSA, JRC-Ispra, EC, Italy.
Pinto, A.V.; Verzeletti, G.; Molina, F.J.; Varum, H.; Coelho, E.; Pinho, R. (1999-c) - Pseudo-dynamic tests on non-seismic resisting RC frames (bare and selective retrofit frames) - EUR Report 20244 EN, ELSA, JRC-Ispra, EC, Italy.
Pinto, A.V.; Verzeletti, G.; Pegon, P.; Magonette, G.; Negro, P.; Guedes, J. (1996) - Pseudo-dynamic testing of large-scale RC bridges - Report EUR 16378 EN, ELSA, JRC-Ispra, EC, Italy.
Pinto, P. (2000) - Seismic assessment of existing structures: Present state and research needs - Workshop on Mitigation of Seismic Risk: Support to Recently Affected European Countries, JRC, Belgirate, Italy, November.
Prakash, V.; Powell, G.H.; Campbell, S. (1993) - DRAIN-2DX (static and dynamic analysis of inelastic plane structures): Basic program description and user guide - Report No UCB/SEMM-93/ 17, University California, Berkeley.
Priestley, M.J.N. (1998) - Displacement-based approaches to rational limit states design of new structures - 11th ECEE, Paris, France, Invited lecture, ISBN 90 5809 027 2, A.A. Balkema, Rotterdam, 6th-11th September.
Priestley, M.J.N. (1997) - Displacement-based seismic assessment of reinforced concrete buildings - Journal of Earthquake Engineering, Imperial College of London, Vol. 1, No. 1, pp. 157-192.
Priestley, M.J.N.; Xiao, R.V. (1994) - Seismic shear strength of reinforced concrete columns - ASCE, Journal of Structural Engineering, Vol. 120, No. 8, pp. 2310-2329.
Priestley, M.J.N.; Seible, F.; Calvi, G.M. (1996) - Seismic design and retrofit of bridges - Wiley-Interscience.
Priestley, M.J.N.; Seible, F.; Xiao, Y.; Verma, R. (1994) - Steel jacket retrofitting of reinforced concrete bridge columns for enhanced shear strength - Part 1: Theoretical considerations and test design - ACI Structural Journal, Vol. 91, No. 4, pp. 394-405.
R Rehm, G. (1961) - Über die grundlagen des verbundes zwischen stahl und beton -
Deutscher Ausschuβ für Stahlbeton, Heft 138 (in German).
References and recommended reading
494
Richards, R. (1995) - Zero-th order shape optimization utilizing a learning classifier system - Ph.D. dissertation, Mechanical Engineering Department, Stanford University (available at http://www.stanford.edu/~buc/SPHINcsX/book.htm#RTFToC0).
RILEM (1992) - Technical recommendations for the testing and use of construction materials - International Union of testing and Research Laboratories for Materials and Structures, E&FN SPON.
Rodríguez, M.; Díaz, C. (1987) - Análisis sísmico de edificios de concreto reforzado - Revista IMCYC, Vol. 25, No. 198, pp. 15-30 (in Spanish).
Rodríguez, M.; Park, R. (1994) - Seismic lead tests on reinforced concrete columns strengthened by jacketing - ACI Structural Journal, Technical Paper, Title No. 91-S116, pp. 150-159, March-April.
Rodríguez, M.; Park, R. (1991) - Repair and strengthening of reinforced concrete buildings for seismic resistance - Earthquake Spectra, Vol. 7, No. 3, pp. 439-459.
Rosenblueth, E.; Meli, R. (1986) - The 1985 earthquake: Causes and effects in Mexico city - Concrete International, Vol. 8, No. 5, May, pp. 23-34.
RSA (1983) - Regulamento de segurança e acções para estruturas de edifícios e pontes - Decreto-Lei N.º 235/83, Imprensa Nacional, Casa da Moeda, Lisbon, Portugal (in Portuguese).
S Saadatmanesh, H.; Ehsani, M.R.; Jin, L. (1997) - Seismic retrofitting of rectangular bridge
columns with composite straps - Earthquake Spectra, Vol. 13, No. 2, pp. 281-304.
Saadatmanesh, H.; Ehsani, M.R.; Li, M.W. (1994) - Strength and ductility of concrete columns externally reinforced with fiber composite straps - American Concrete Institute, Structures Journal, Vol. 91, No. 4, pp. 434-447.
Saatcioglu, M.; Gardner, N.J.; Ghobarah, A. (1999) - The Kocaeli earthquake of August 17, 1999 in Turkey - (available at http://www.genie.uottawa.ca/profs/murat/KocaeliEQ.html).
Saiidi, M.; Sozen, M.A. (1981) - Simple nonlinear seismic analysis of RC structures - Journal of Structural Division, ASCE, Vol. 107, pp. 937-952.
Salama, A.I. (1993) - Repair of earthquake-damaged RC structures - PhD thesis, Imperial College, University of London, London.
Sasani, M.; Bertero, V.; Anderson, J. (1999) - Rehabilitation of non-ductile RC frame building using encasement plates and energy-dissipating devices - PEER Report 1999/12, Pacific Earthquake Engineering Research Center, University of California, Berkeley.
Schuller, M.; Mehrabi, A.B.; Noland, J.L.; Shing, P.B. (1994) - Performance of masonry-infilled RC frames under in-plane lateral loads: experiments - NCEER Workshop on Seismic Response of Masonry Infills, San Francisco, California.
References and recommended reading
495
SEAOC (1995) - Performance based seismic engineering of buildings, Part 2: Conceptual framework - Vision 2000 Committee, Structural Engineers Association of California, Sacramento, Califoria.
Seible, F.; Hegemier, G.A.; Innamorato, D. (1995) - Developments in bridge column jacketing using advanced composites - National Seismic Conference on Bridges and Highways: Progress in Research and Practice, Federal Highway Administration, California Department of Transportation, San Diego, California, 10th-13th December.
Seible, F.; Priestley, M.J.N.; Hegemier, G.A.; Innamorato, D. (1997) - Seismic retrofit of RC columns with continuous carbon fiber jackets - Journal of Composites for Construction, ASCE, Vol. 1, No. 2, pp. 52-62, May.
Severn, R.T. (2000) - Earthquake engineering research infrastructures - Workshop on Mitigation of Seismic Risk: Support to Recently Affected European Countries, JRC, Belgirate, Italy, November.
Severn, R.T.; Juhasova, E.; Franchioni, G.; Popa, G.; Sofronie, R.A. (2000) - Mitigation of seismic risk by composing masonry structures - Workshop on Mitigation of Seismic Risk: Support to Recently Affected European Countries, JRC, Belgirate, Italy, November.
Shepherdson, E. (2001) - Teaching concepts utilizing active learning computer environments - PhD thesis, Massachusetts Institute of Technology, February.
Shibata, A.; Sozen, M.A. (1976) - Substitute-structure method for seismic design in reinforced concrete - Journal of Structural Division, ASCE, Vol. 102, pp. 1-18.
Silva-Araya, W.F.; Rincón, O.T.; O’Neill, L.P. (eds.) (1997) - Repair and rehabilitation of reinforced concrete structures: The state-of-the-art - International Seminar, Workshop and Exhibition, Maracaibo, Venezuela, April 28th-May 1st, Published by ASCE.
Soleimani, D.; Popov, E.; Bertero, V. (1979) - Hysteretic behaviour of reinforced concrete beam-column subassemblages - ACI Journal, Technical paper, Title No. 76-48.
Sortis, A.; Pasquale, G.; Nasini, U. (1999) - Criteri di calcolo per la progettazione degli interventi - Terremoto in Umbria e Marche del 1997 - Servizio Sismico Nazionale, Editrice Sallustiana, Roma (in Italian).
Souza, V.C.M.; Ripper, T. (1998) - Patologia, recuperação e reforço de estruturas de concreto - PINI, São Paulo, Brazil (in Portuguese).
SPES (2003) - Políticas de reconstrução sísmica nos Açores: Lições para o continente - IST, Lisbon, Portuguese Society for Earthquake Engineering, February (in Portuguese).
SPES (2001) - Encontro sobre redução da vulnerabilidade sísmica do edificado em Portugal - LNEC, Lisbon, SPES/GECoRPA, April (in Portuguese).
Stafford-Smith, B.; Carter, C. (1969) - A method of analysis for infilled frames - Proceedings ICE, Vol. 44, pp. 31-44.

References and recommended reading
496
Stephens, J.E.; Yao, J.P.T. (1987) - Damage assessment using response measurements - ASCE Journal of Structural Engineering, Vol. 113, No. 4, pp.787-801, April.
Sucuoglu, H. (2000) - The 1999 Kocaeli and Düzce-Turkey earthquakes - Workshop on Mitigation of Seismic Risk: Support to Recently Affected European Countries, JRC, Belgirate, Italy, November.
Sugano, S. (2000) - Seismic rehabilitation of existing concrete buildings in Japan - 12th WCEE, Auckland, New Zealand, January.
Sugano, S. (1996) - State-of-the-art in techniques for rehabilitation of buildings - 11th WCEE, Acapulco, Mexico, Paper No. 2178.
Svanberg, K. (1987) - The method of moving asymptotes - A new method for structural optimization - International Journal for Numerical Methods in Engineering, Vol. 24, pp. 359-373.
T Tamijani, M.H.V. (1998) - Seismic behaviour, analysis and design of eccentrically braced
frames with vertical shear-links - Dissertation CE Department, University of Technology Darmstadt, Darmstadt.
Takiguchi, K.; Ichinose, T.; Hotta, H. (1988) - Earthquake damage evaluation and repair techniques of RC columns with round bars - 9th WCEE, Tokyo-Kyoto, Japan, Vol. VII, pp. 285-291, 2nd-9th August.
Tankut, T.; Ersoy, U. (1998) - Seismic repair/strengthening of RC structures - METU research and practice - Second Japan-Turkey Workshop on Earthquake Engineering: Repair & Strengthening of Existing Buildings, Istanbul.
Taucer, F. (2000) - Performance based design of infilled frames protected with energy dissipation devices - Personal presentation at the ELSA, JRC-Ispra, EC, Italy.
Tilly, G.P. (ed.) (1986) - Dynamic behaviour of concrete structures - Elsevier, Amsterdam.
Tjebbes, M.R. (1994) - Determination of the equivalent slab width from experimental data - Technical Note No. I.94.139, JRC-Ispra, EC, Italy.
Triantafillou, T.C. (1998) - Strengthening of structures with advanced FRP's - Progress in Structural Engineering and Materials, Vol. 1, No. 2, pp. 126-134 - Construction Research Communications Limited, ISSN 1365-0556.
Trigo, J.A. (1968) - Estruturas de painéis sob acção de solicitações horizontais - LNEC, Lisbon (in Portuguese).
U UBC-97 (1997) - Uniform Building Code: Structural engineering design provision -
International Conference of Building Officials, 1997 Edition, Whittier, California.

References and recommended reading
497
Umemura, H.; Takizawa, H. (1982) - Dynamic response of reinforced concrete buildings - Structural Engineering Documents, ISBN 3 85748 029 7, IABSE, Zürich, Switzerland.
UNESCO (1968) - Recommendations concerning the preservation of cultural property endangered by public and private works - Adopted on 10th November (available at http://www.unesco.org/whc/nwhc/pages/part/main.htm).
USGS (2000) - Implications for earthquake risk reduction in the United States from the Kocaeli, Turkey, earthquake of August 17, 1999 - US Geological Survey Circular 1193.
USGS (1995) - Reducing earthquake losses throughout the United States - US Geological Survey Fact Sheet-169-95 - (available at http://quake.wr.usgs.gov/QUAKES/FactSheets/BayArea/).
V Varum, H. (1995) - Modelo numérico para a análise sísmica de pórticos planos de betão
armado - MSc thesis, FEUP, University of Porto (in Portuguese).
Varum, H.; Costa, A.G. (1997) - Modelo não-linear para a análise estática e/ou dinâmica de pórticos de betão armado - 3º Encontro de Sismologia e Engenharia Sísmica, Instituto Superior Técnico, Lisbon, 3rd-5th December (in Portuguese).
Varum, H.; Costa, A.G. (1996) - Modelo numérico para a análise de pórticos planos de betão armado - XXVIII Jornadas Sul-Americanas de Engenharia de Estruturas, Escola de Engenharia de S. Carlos, University of S. Paulo, Brasil, 1st-5th September (in Portuguese).
Varum, H.; Oliveira, D. (1994) - Métodos de reabilitação e reforço de estruturas: State-of-the-art - Human Capital and Mobility Programme, Laboratory of Reinforced Concrete, National Technical University of Athens, Greece (in Portuguese).
Varum, H.; Pinto, A.V. (2001-a) - Utilização do aço na reabilitação e reforço de edifícios existentes: Avaliação da sua eficiência em testes à escala real - III Encontro de Construção Metálica e Mista, organized by Associação Portuguesa de Construção Metálica e Mista (CMM) and SAECivil of University of Aveiro, Aveiro, Portugal, 6th-7th December (in Portuguese).
Varum, H.; Pinto, A.V. (2001-b) - Simplified methods for the assessment and redesign of existing structures - EU Special Publication (in preparation), ELSA, JRC-Ispra, EC, Italy.
Varum, H.; Pinto, A.V. (1999) - Dynamic non-linear analyses for the 4-storey RC frame: Bare, infilled and retrofitted frames - Special Publication No. I.00.132, ISIS, SSMU, ELSA, JRC-Ispra, EC, Italy.
Varum, H.; Pinto, A.V.; Coelho, E.; Carvalho, E.C. (2000) - Seismic analyses of a RC building: Study of a retrofitting solution - Conference on Abnormal Loading on Structures: Experimental and Numerical Modelling - Joint Institution of Structural
References and recommended reading
498
Engineers/City University London International - London - Virdi, K.S.; Mathews, R.S.; Clarke, J.L.; Garas, F.K. (eds.) - Spon Press; ISBN 0419259600 - March.
Varum, H.; Carvalho, E.C.; Coelho, E.; Pinto, A.V. (1999) - Dynamic non-linear analyses for the 4-storey infilled RC frame: Study of a retrofitting solution - 4º Encontro Nacional sobre Sismologia e Engenharia Sísmica and 2.éme Rencontre en Génie Parasismique des Pays Méditerranéens - SISMICA 99 - University of Algarve - Faro - 28th-30th October.
Verpeaux, P.; Millard, A.; Charras, T. (1991) - A modern solution of optimization problem using CASTEM-2000 - European Conference on New Advances in Computational Structural Mechanics, Ladeveze, P.; Zienkiewicz, O.C. Chairmans), Giens (Var), France, 2nd-5th April.
Vintzeleou, E. (1987) - Behaviour of infilled frames subject to lateral actions (a state-of-the-art report).
W Wabo MBrace (2002) - Composite strengthening system: Engineering design guidelines -
Third Edition, May.
Warner, J. (1996) - Shotcrete in seismic repair and retrofit - Seismic rehabilitation of concrete structures, ACI, Sabnis, G.M.; Shroff, A.C.; Kahn, L.F. (eds.), Farmington Hills, Michigan, pp. 299-313.
Y Yamazaki, F. (1993) - The January 15, 1993 Kushiro-Oki earthquake: A quick look report
- (available at http://incede.iis.u-tokyo.ac.jp/Newsletter/1.3sp/1-3-2sp.htm), INCEDE Newsletter, Supplement to Vol. 1, No. 3.
Yang, Y.B.; Kuo S.R. (1994) - Theory & analysis of non-linear framed structures - Prentice Hall, ISBN 0-13-109224-3.
Youssef, M.; Ghobarah, A. (2001) - Modelling of RC beam-column joints and structural walls - Journal of Earthquake Engineering, Imperial College Press, Vol. 5, No. 1, pp. 93-111.
Z Zarnic, R.; Gostic, S. (1998) - Non-linear modelling of masonry infilled frames - 11th
ECEE; Paris, France, ISBN 90 5410 982 3, A.A. Balkema, Rotterdam, 6th-11th September.
Zarnic, R.; Gostic, S. (1997) - Masonry infilled frames as an effective structural sub-assemblage - Proceedings of the International Workshop Seismic design methodologies for the next generation of codes, Fajfar, P. and Krawinkler, H. (eds.), Slovenia, Roterdam, Balkema, 24-27 June.
References and recommended reading
499
Zarnic, R.; Tomazevic, M. (1985) - Study of behaviour of masonry infilled reinforced concrete frames subjected to seismic loading - 7th International Brick Masonry Conference, Brick Dev. Res. Inst. & Dept. of Arch. and Bldg., University of Melbourne, Vol. 2, pp. 1315-1325.
2. RECOMMENDED READING
Next are listed other references, not necessarily quoted in the thesis, of particular interest and complementary to better comprehend the subjects herein studied.
Ang, A.H.-S.; Tang, W.H. (1984) - Probability concepts in engineering planning and design - Vol. II, John Wiley and sons, Inc., New York.
Balendran, R.V.; Rana, T.M.; Nadeem, A. (2001) - Strengthening of concrete structures with FRP sheets and plates - Structural Survey, Vol. 19, No. 4, pp. 185-192.
Campos-Costa, A. (1993) - A acção dos sismos e o comportamento das estruturas - PhD thesis, FEUP, University of Porto, Oporto, October (in Portuguese).
Castellani, B.M.; Ciccotelli, A.; Coronelli, D. (1994) - Bond slip effects on reinforced concrete elements under earthquake loading - European Engineering Earthquake, Vol. 8, No. 3, pp. 3-10.
Castellani, A.; Negro, P.; Colombo, A.; Castellani, M. (2000) - Experimental response of a non-ductile RC building rehabilitated by means of fibre-reinforced polymers - 12th WCEE, Auckland, New Zealand, January.
Chai, Y.H.; Romstad, K.M.; Bird, S.M. (1995) - Energy-based linear damage model for high-intensity seismic loading - Journal of Structural Engineering, pp. 857-864, May.
Chen, J.-J.; Duan, B.-Y. (1999) - Reliability aspects in dynamic and structural optimization - Structural Dynamic Systems Computational Techniques and Optimization: Reliability and Damage Tolerance, C. Leondes (ed.), Gordon and Breach Science Publishers, ISBN 90-5699-652-5.
Christopher, A. (1998) - The nature of ground motion and its effect on buildings - (available at http://nisee.ce.berkeley.edu/lessons/arnold.html) - General Lessons in Earthquake Engineering (NISEE).
Chung, Y.S.; Meyer, C.; Shinozuka, M. (1987) - Seismic damage assessment of reinforced concrete members - Technical Report NCEER-87-0022, National Center for Earthquake Engineering Research.
Clark, P.W.; Higashino, M.; Kelly, J.M. (2002) - Performance of seismically isolated structures in the January 17, 1994 Northridge earthquake - NISEE online library, University of California, Berkeley.

References and recommended reading
500
COLA (1995) - Earthquake hazard reduction in existing reinforced concrete buildings and concrete frame buildings with masonry infills - City of Los Angeles, January.
Cosenza, E.; Manfredi, G.; Verderame, G.M. (1999) - Problemi di verifica sismica di telai progettati per carichi verticali - 9th Convegno Nazionale L’Ingegneria Sismica in Italia, Torino, 20-23 September (in Italian).
Costa, A.G. (2003) - Aspectos técnicos da reconstrução dos Açores - Políticas de Reconstrução Sísmica nos Açores: Lições para o Continente - IST, Lisbon, SPES, February (in Portuguese).
Delgado, P. (2000) - Vulnerabilidade sísmica de pontes - MSc thesis, FEUP, University of Porto (in Portuguese).
DiPasquale, E.; Cakmak, A.S. (1990) - Detection of seismic structural damage using parameter-based global damage indices - Probabilistic Engineering Mechanics, Vol. 5, No. 2, pp. 60-65.
Ellingwood, B.; Hwang, H. (1985) - Probabilistic descriptions of resistance of safety-related structures in nuclear power plants - Nuclear Engineering and Design, Vol. 88, pp. 169-178.
Fardis, M.N. (1996) - Experimental and numerical investigations on the seismic response of RC infilled frames and recommendations for code provisions - ECOEST/PREC8, Report No. 6.
Fardis, M.N.; Bousias, S.N. (1999) - Engineering aspects of the Mt. Parnes (Athens) earthquake of 7/9/99 - Structures Laboratory, Department of Civil Engineering, University of Patras, Greece.
Faria, R. (1994) - Avaliação do comportamento sísmico de barragens de betão através de um modelo de dano contínuo - PhD thesis, FEUP, University of Porto (in Portuguese).
Faza, S.S.; Gangarao, H.V.S. (1994) - Fiber composite wrap for rehabilitation of concrete structures - Infrastructures: New Materials Engineering Conference, San Diego, CA, US.
Fletcher, R. (1995) - Practical methods of optimization - John Willey & Sons, ISBN 0-471-91547-5.
Ghobarah, A.; Abou-Elfath, H. (1998) - Damage assessment of non-ductile reinforced concrete frames - 11th ECEE, Paris, France, ISBN 90-5410-982-3, A.A. Balkema, Rotterdam, 6th-11th September.
Ghobarah, A.; El-Attar, M. (1998) - Seismic performance evaluation of reinforced concrete buildings - 11th ECEE, Paris, France, ISBN 90-5410-982-3, A.A. Balkema, Rotterdam, 6th-11th September.
Ghobarah, A; Youssef, M. (1999) - Response of an existing RC building including concrete crushing and bound slip effects - 8th Canadian Conference on Earthquake Engineering, Vancouver.

References and recommended reading
501
Ghobarah, A.; Aly, N.M.; El-Attar, M. (1997) - Performance level criteria and evaluation - International Workshop on Seismic Design Methodologies for the Next Generation of Codes, Bled, Slovenia, pp. 207-215.
Guedes, J.; Pegon, P.; Pinto, A.V. (1994) - A fibre-Timoshenko beam element in CASTEM-2000 - JRC-Special Publication, No. I.94.31, ELSA, JRC-Ispra, EC, Italy.
Haftka, R.; Grandhi, R. (1986) - Structural shape optimization: A survey - Computer Methods in Applied Mechanics and Engineering, Vol. 57, pp. 91-106.
Hamburger, R.O.; Cole, C.A. (2001) - Seismic upgrading of existing structures - Naeim, F. (ed.) - The seismic design handbook - Kluwer Academic Publishers, ISBN 0-7923-7301-4.
Hoskin, C.B.; Baker, A.A. (1986) - AIAA education series - American Institute of Aeronautics and Astronautics, Inc., New York.
Hwang, H.; Jaw, J.-W.; Shau, H.-J. (1988) - Seismic performance assessment of code-designed structures - Technical Report NCEER-88-0007, National Center for Earthquake Engineering Research, State University of New York at Buffalo.
Krawinkler, H. (1996) - Pushover analysis: why, how, when, and when not to use it - 65th Annual Convention of the Structural Engineers Association of California, Maui, Hawaii, pp. 17-36.
Kunnath, S.K.; El-Bahy, A.; Taylor, A.W.; Stone, W.C. (1997) - Cumulative seismic damage of reinforced concrete bridge piers - NISTIR 6075, National Institute of Standards and Technology, US Department of Commerce Technology Administration, October.
Leite, A.N.; Lopes, M. (2003) - Viabilidade económica do reforço sísmico das construções - Políticas de Reconstrução Sísmica nos Açores: Lições para o Continente - IST, Lisbon, SPES, February (in Portuguese).
LNEC (1993) - Cooperative research on the seismic response of reinforced concrete structures - Contract No. 4504-91-10 ED ISP P, Final Report, Lisbon, Proc. 035/11/10778, October.
Mahin, S.A.; Bertero, V.V. (1976) - Problems in establishing and predicting ductility in aseismic design - International Symposium on Earthquake Structural Engineering, St. Louis, Missouri, August.
Mainstone, R.J. (1971) - On the stiffness and strength of infilled frames - Institution of Civil Engineers, Supplement iv.
Manfredi, G.; Peccem M. (1998) - Effectiveness of the plastic hinge in the assessment of the rotation capacity of RC columns - 11th ECEE, Paris, France, ISBN 90-5410-982-3, A.A. Balkema, Rotterdam, 6th-11th September.
Maxwell, J. (1872) - On reciprocal figures, frames, and diagrams of force - Transactions of the Royal Society of Edinburgh, Vol. 26.

References and recommended reading
502
Meier, U.; Deuring, M. (1991) - The application of fiber composites in bridge repair - Strasse and Verkehr, No. 9.
Meier, U.; Kaiser, H.P. (1991) - Strengthening of structures with CFRP laminates - Advanced Composite Materials in Civil Engineering Structures, MT Div/ASCE/ Las Vegas.
Melchers, R. (1999) - Structural reliability analysis and prediction - ISBN 0-471-98324-1, John Willey & Sons, Inc.
Michell, A. (1904) - The limits of economy of material in frame structures - Phil Mag, Vol. 8, pp. 589-597.
Miranda, E.; Ruiz-García, J. (2002) - Evaluation of approximate methods to estimate maximum inelastic displacement demands - Journal of Earthquake Engineering and Structural Dynamics, No. 31, pp. 539-560.
Mola, E.; Tsionis, G.; Taucer, F.; Pinto, A.V. (2003) - The Molise (Italy) earthquakes of 31 October and 1 November 2002: Report and analysis from a field mission - Draft report, ELSA, JRC-Ispra, EC, Italy.
Monti, G.; Pinto P.E. (1999) - Deterministic assessment of a multi-storey reinforced concrete frame though pushover - ICONS Report, Dipartimento di Ingegneria Strutturale e Geotecnia, Università di Roma 'La Sapienza', Rome, Italy.
Negro, P.; Pinto, A.V.; Verzeletti, G.; Magonette, G. (1996) - PsD test on four-storey RC building designed according to Eurocodes - Journal of Structural Engineering.
Nielsen, S.R.K.; Cakmak, A.S. (1992) - Evaluation of maximum softening damage indicator for reinforced concrete under seismic excitation - 1st International Conference on Computational Stochastic Mechanics, Spanos and Brebbia (eds.), pp. 169-184.
Nunez, I.L. (2000) - Compound growth or compound seismic risk of destruction? Some vulnerability lessons from the Izmit, Turkey earthquake of 17 August 1999 - 2nd Euro-Conference on Global Change and Catastrophe Risk Management: Earthquake Risks in Europe - IIASA, Laxenburg, Austria, 6th-9th July.
Oliveira, D.V.C. (2002) - Experimental and numerical analysis of blocky masonry structures under cyclic loading - PhD thesis, University of Minho, October.
Pinto, A.V.; Pegon, P.; Campos-Costa, A. (1999-b) - Pseudo-dynamic testing of bridges with asynchronous input motions - JRC-Special Publication.
Powell, G.H.; Allahabadi, R. (1988) - Seismic damage prediction by deterministic methods: Concepts and procedures - Earthquake Engineering and Structural Dynamics, Vol. 16, pp. 719-734.
REBAP (1984) - Regulamento de estruturas de betão armado e pré-esforçado - Decreto-Lei N.º 349-C/83, Imprensa Nacional, Casa da Moeda, Lisbon (in Portuguese).
Recla, M; Calvi, G.M. (1999) - Oral presentation - ICONS-Topic 2 Meeting.

References and recommended reading
503
Romão, X.N. (2002) - Novos modelos de dimensionamento sísmico de estruturas - Master thesis, FEUP, University of Porto, April (in Portuguese).
Rossetto, T.; Elnashai, A. (2002) - Derivation of vulnerability functions for RC buildings based on observational data - SAFFER research report, EC (available at http://www.saferr.net/reports/Vulnerability_Paper2.pdf).
Saadatmanesh, H. (1999) - Seismic retrofitting of concrete columns with fiber composite wrap: An analytical and experimental study - Structural Dynamic Systems Computational Techniques and Optimization: Reliability and Damage Tolerance, C. Leondes (ed.), Gordon and Breach Science Publishers, ISBN 90-5699-652-5.
Sabetta, F. (2000-a) - Elements of seismology - International Seminar on Evaluation of Seismic Risk and Reduction of Vulnerability of Historical Structures, Pavia, Italy, 18th-30th June.
Sabetta, F. (2000-b) - Seismic risk assessment and reduction in Italy - International Seminar on Evaluation of Seismic Risk and Reduction of Vulnerability of Historical Structures, Pavia, Italy, 18th-30th June.
Schmit, L. (1960) - Structural design by systematic synthesis - 2nd ASCE Conference Electr Comp (Pittsburg, PA), pp. 105-122.
Seidel, M.J.; Reinhorn, A.M.; Park, Y.J. (1989) - Seismic damageability assessment of RC buildings in eastern US - Journal of Structural Engineering, Vol. 115, No. 9, September.
Singh, M.P.; Moreschi, L.M. (2001) - Optimal seismic response control with dampers - Earthquake Engineering and Structural Dynamics, Vol. 30, pp. 553-572.
Skjaerbaek, P.S.; Nielsen, S.R.K.; Kirkegaard, P.H. (1997) - Earthquake tests on scale 1:5 RC-frames - Fracture & Dynamics, Paper No. 86, ISSN 1395-7953 R9713, Department of Building Technology and Structural Engineering, Aalborg University, Aalborg, Denmark.
Skjaerbaek, P.S.; Nielsen, S.R.K.; Kirkegaard, P.H.; Cakmak, A.S. (1997) - Experimental study of damage indicators for a 2-bay, 6-storey RC-frame - Journal of Structural Engineering, ASCE.
Tanabe, T.A. (1999) - Comparative performances of seismic design codes for concrete structures (two volumes) - Elsevier Publisher, ISBN 0 08 043021 X.
Tasai, A. (1992) - Effective repair with resin for bond failure of RC members - 10th WCEE, Balkema, Rotterdam, ISBN 90-5410-060-5, pp. 5211-5216.
Taucer, F. (1999) - A displacement based design methodology for retrofitting of frame structures using dissipation devices - JRC-Publication.
Tsionis, G.; Negro, P.; Molina, F.J.; Colombo, A. (2001) - Pseudo-dynamic tests on a 4-storey RC dual frame building - Report EUR 19902 EN, ISIS, SSMU, ELSA, JRC-Ispra, EC, Italy.
References and recommended reading
504
Varum, H.; Neves, A.S. (1995) - Modelo linear para a optimização de estruturas articuladas - XVI Congresso Ibero-Latino-Americano sobre Métodos Computacionais para Engenharia (CILAMCE), Curitiba, Brasil, 29th November to 1st December (in Portuguese).
Vitiello, E.; Pister, K.S. (1974) - Application of reliability-based global cost optimization to design of earthquake resistant structures - Report No. EERC 74-10, EERC, Berkeley, California, August.
Williams, M.S.; Sexsmith, R.G. (1995) - Seismic damage indices for concrete structures: A state-of-the-art review - Earthquake Spectra, Vol. 11, No. 2, pp. 319-349, May.
Youssef, M.; Ghobarah, A. (1999) - Strength deterioration due to bond slip and concrete crushing in modelling of reinforced concrete members - ACI Structural Journal, Technical Paper, Title No. 96-S105, pp. 956-966, November-December.
Zarnic, R. (1994) - Inelastic model of RC frame with masonry infill: Analytical approach - Engineering Modelling, Vol. 1, No. 2, pp. 47-54.
Zerbe, H.E.; Durrani, A.J. (1990) - Seismic response of connections in two-bay reinforced concrete frame subassemblies with a floor slab - ACI Structural Journal, Vol. 87, No. 4.
3. WEB RESOURCES
Apart from those cited in the references list, here are listed a series of web-sites related to the subject herein studied (links to earthquake engineering related web-sites, news groups, general and specific information applications, etc.). These web-pages were last visited in October 2002.
Advanced Technology for Large Structural Systems (Lehigh University, Pennsylvania, US) http://www.atlss.lehigh.edu/
All about Earthquake Engineering http://users.hol.gr/~tbp/ee/
Applied Technology Council (Structural Engineers Association of California, US) http://www.atcouncil.org/
Automatic monitoring of regional seismic events http://www.fi.uib.no/~antonych/IRIS.html
Building Seismic Safety Council (Washington, US) http://www.bssconline.org/
California Seismic Safety Commission (CSSC) http://www.seismic.ca.gov/

References and recommended reading
505
Civil and Mechanical Systems (US) http://www.eng.nsf.gov/cms/default.htm
Computational Structural Mechanics (NCSA, US) http://archive.ncsa.uiuc.edu/EP/CSM/
Concrete Repair Association (UK) http://www.concreterepair.org.uk/cra/
Council of the National Seismic System (CNSS, US) http://www.cnss.org/
Earthquake Database http://www.mysteries-megasite.com/main/bigsearch/earth-1.html
Earthquake Engineering Research Centre (Bristol University, UK) http://www.cen.bris.ac.uk/civil/research/eerc/
Earthquake Engineering Research Centre (University of California, Berkeley) http://eerc.berkeley.edu/
Earthquake Engineering Research Institute (EERI) http://www.eeri.org/
Electronic Journal of Structural Engineering (University of Melbourne, Australia) http://www.civag.unimelb.edu.au/ejse/
Engineering Consultation & 3D Finite Element Structural Analysis Software (CADRE) http://www.cadreanalytic.com/
EQ Prediction http://users.otenet.gr/~thandin/index.htm
EQECAT http://www.eqecat.com/
EQNET - Earthquake Information Network http://www.eqnet.org/
European Laboratory for Structural Assessment (ELSA, JRC, EC, Italy) http://elsa.jrc.it/
European Macro-Seismic Scale http://www.gfz-potsdam.de/pb5/pb53/projekt/ems/index.html
European School of Advanced Studies in Reduction of Seismic Risk (ROSE School) http://www.roseschool.it/
European Seismological Commission http://www.gsrg.nmh.ac.uk/esc
European Strong-Motion Database (ESD) http://www.isesd.cv.ic.ac.uk/

References and recommended reading
506
European School of Advanced Studies in Preservation of the Architectural Heritage (Italy) http://www.unipv.it/iuss/esascpsa/
GALBIS (Spain) http://www.galbis.org/
GEOCID (Portugal) http://geocid-snig.igeo.pt/Portugues/sismos.html
Global Earthquake Response Center http://www.earthquakes.com/
IDARC - Computer Program for Seismic Inelastic Structural Analysis http://civil.eng.buffalo.edu/idarc2d50/
INFILTEC - Inexpensive Seismometer Project http://www.infiltec.com/seismo/
Information Technology in Construction (Slovenia) http://itc.fgg.uni-lj.si/
Institute of Earthquake Engineering and Engineering Seismology (Republic of Macedonia) http://www.iziis.ukim.edu.mk/
Institute of Geological and Nuclear Sciences (New Zealand) http://www.gns.cri.nz/
International Association of Seismology & Physics of the Earth's Interior http://www.seismo.com/iaspei/
International Centre for the Preservation of the Architectural Heritage (Italy) http://soalinux.comune.firenze.it/cicop/
International Council on Monuments and Sites http://www.international.icomos.org/
International Networks http://wwwneic.cr.usgs.gov/neis/station_book/NETWORK.html
International Seismological Centre (UK) http://www.isc.ac.uk/
IRIS Headquarters http://www.iris.edu/
ITSAK (Greece) http://www.itsak.gr/index.html
John A. Blume Earthquake Engineering Center http://blume.stanford.edu/
Laboratory of Earthquake Engineering (Athens, Greece) http://frida.transport.civil.ntua.gr/earthquake/index.htm

References and recommended reading
507
Mid-America Earthquake Center (MAE, US) http://mae.ce.uiuc.edu/
Multidisciplinary Center for Earthquake Engineering Research (MCEER, US) http://mceer.buffalo.edu/
National Information Center of Earthquake Engineering (NICEE, Kanpur, India) http://www.nicee.org/
National Information Service for Earthquake Engineering (NISEE, California) http://nisee.berkeley.edu/
National Research Institute for Earth Science and Disaster Prevention (NIED, Japan) http://www.bosai.go.jp/
Natural Disaster Reference Database (NASA) http://ndrd.gsfc.nasa.gov/
Network for Earthquake Engineering Simulation (NEES) http://www.eng.nsf.gov/nees/
New Zealand Society for Earthquake Engineering (NZSEE) http://www.nzsee.org.nz/index.htm
NOAA - National Geophysical Data Center (US) http://www.ngdc.noaa.gov/seg/hazard/earthqk.html
Pacific Earthquake Engineering Research Centre (PEER, California, US) http://peer.berkeley.edu/
Prototype International Data Centre (US) http://www.pidc.org/
Queensland University Advanced Centre for Earthquake Studies (QUAKES) http://quakes.earth.uq.edu.au/
Reinforced Concrete Column Tests Database http://maximus.ce.washington.edu/~peera1/
Safety Assessment for Earthquake Risk Reduction (SAFERR, EC) http://www.saferr.net/scope.htm
Saving Lives Through Better Design Standards (US Geological Survey) http://geopubs.wr.usgs.gov/fact-sheet/fs176-95/
Seismic stations around the world http://www.pidc.org/web-gsett3/Network/seismic.shtml
Seismograph Station Codes and Coordinates http://wwwneic.cr.usgs.gov/neis/station_book/
SeismoLinks http://www.seismolinks.com/

References and recommended reading
508
SeismoSoft http://www.seismosoft.com/
Seismosurfing (Pacific Northwest Seismograph Network) http://www.geophys.washington.edu/seismosurfing.html
SISMO - Spanish thematic portal http://www.sismo.info/
Spanish Association of Earthquake Engineering http://www.aeis.es/
Structural Dynamics Control & Earthquake Engineering Laboratory (Indiana, US) http://www.nd.edu/~quake/
Swiss Seismological Service list of worldwide AutoDRM sites http://seismo.ethz.ch/autodrm/
Techdata - Engineering technical data sources http://ourworld.compuserve.com/homepages/MJVanVoorhis/techdata.htm
The Masonry Society http://www.masonrysociety.org/
The Worldwide Earthquake Locator http://www.geo.ed.ac.uk/quakexe/quakes
TNO Building and Construction Research (Holland) http://www.bouw.tno.nl/homepage.html
USGS - United States Strong Motion Program (US) http://nsmp.wr.usgs.gov/
USGS Earthquake Hazards Program (US) http://earthquake.usgs.gov/
USGS National Earthquake Information Center (NEIC, US) http://wwwneic.cr.usgs.gov/
Washington University Structural Control & Earthquake Engineering Laboratory (WUSCEEL) http://wusceel.cive.wustl.edu/quake/
Workshop on Mitigation of Seismic Risk in Europe (2000, ELSA) http://elsa.jrc.it/workshop2000/