JOÃO PAULO GUTIERREZ MALANDRINO -...
114
JOÃO PAULO GUTIERREZ MALANDRINO A FINANCIAL AND STRATEGIC CASE STUDY ABOUT THE LARGEST BREWERY IN THE WORLD Trabalho de Formatura apresentado a Escola Politécnica da Universidade de São Paulo para obtenção do Diploma de Engenheiro de Produção. São Paulo 2017
-
Upload
nguyenkiet -
Category
Documents
-
view
226 -
download
1
Transcript of JOÃO PAULO GUTIERREZ MALANDRINO -...

JOÃO PAULO GUTIERREZ MALANDRINO
A FINANCIAL AND STRATEGIC CASE STUDY ABOUT
THE LARGEST BREWERY IN THE WORLD
Trabalho de Formatura apresentado a
Escola Politécnica da Universidade de São
Paulo para obtenção do Diploma de
Engenheiro de Produção.
São Paulo
2017


JOÃO PAULO GUTIERREZ MALANDRINO
A FINANCIAL AND STRATEGIC CASE STUDY ABOUT
THE LARGEST BREWERY IN THE WORLD
Trabalho de Formatura apresentado à
Escola Politécnica da Universidade de São
Paulo para obtenção do Diploma de
Engenheiro de Produção.
Orientador: Prof. Dr. João Amato Neto
São Paulo
2017


ACKNOWLEDGEMENTS
First, I show my deepest gratitude to my parents, Claudia and Alviro, and my brother,
André, for their instruction and care during my life. I thank my parents for all the opportunities
and advices they have given me and wish to make them proud. I am grateful to my brother, for
motivating me to apply for an Engineering Degree at Escola Politécnica da USP and for a
Double Degree in Italy. Furthermore, I praise the rest of my family for the affection and
comprehension.
I also thank Giuliana, for being by my side in every moment, everywhere. Her love and
support were crucial to my graduation.
I am also grateful to my colleagues and professors from Colégio Mater Dei, Colégio
Bandeirantes, Politecnico di Milano and Escola Politécnica da USP. Their friendship and the
moments of study and joy we shared were essential to my academic and personal development.
Finally, I show my special appreciation to Professor João Amato Neto, from Escola
Politécnica da USP, in Brazil and Professor Giancarlo Giudici, from Politecnico di Milano, in
Italy, for their guidance during the realization of the present work.


I always say, to have a big dream requires the same
effort as having a small dream. Dream big!
(Jorge Paulo Lemann)


ABSTRACT
The purpose of the present thesis is to assess and draw recommendations regarding to
financial and strategic aspects of AB InBev SA/NV. The suggestions are developed through the
use of analytical methodologies, based on information provided on documents officially
disclosed by the breweries involved in the study, academic articles, books and websites.
This case study is divided in two broad parts. In the first, an introduction about AB InBev
SA/NV is presented and open issues are raised. Afterwards, a discussion is realized.
The introduction includes information about history, growth, investors, the CEO, notion of
size, culture, corporate governance, geographic segmentation, shareholding, voting rights,
listings, bonds, Income Statement and Balance Sheet of the company. The open issues are
related to the selection of the best geographic segments to invest in, the most adequate way to
expand the business (organically or inorganically) in each one of them, the most suitable
financing strategies (internal, debt and equity financing) and the valuation of another cross-
listing. In the discussion, the issues raised previously are addressed one by one and the
recommendations are drawn.
The analyses give the impression that the brewery should focus investments in EMEA
(Europe, Middle East and Africa) and Asia Pacific segments. The suggested way to expand
differs depending on the country of the segments, however, the largest move would be in Japan,
where the Brazilian-Belgium firm should consider the acquisition of Kirin Holdings. Regarding
to the sources of funds, AB InBev SA/NV should resort firstly to its own retained earnings and
then, to one or more equity financing solutions, according to the intentions of the firm for the
future. With respect to a new cross-listing, the firm could consider the Tokyo Stock Exchange
only if it wishes to acquire Kirin Holdings, otherwise, it should not proceed with another listing.
Keywords: brewery; geographical expansion; growth strategies; financing strategies;
cross-listing.


RESUMO
O objetivo da presente tese é avaliar e elaborar recomendações sobre aspectos financeiros
e estratégicos da AB InBev SA/NV. As sugestões são desenvolvidas através do uso de
metodologias analíticas, com base em informações fornecidas em documentos divulgados
oficialmente pelas cervejarias envolvidas no estudo, artigos acadêmicos, livros e sites.
Este estudo de caso está dividido em duas partes amplas. Na primeira, uma apresentação
sobre AB InBev SA/NV é feita e questões abertas são levantadas. Em seguida, uma discussão
é realizada.
A introdução inclui informações sobre história, crescimento, investidores, o CEO, noção
de tamanho, cultura, governança corporativa, segmentação geográfica, participação acionária,
direitos de voto, listagens, títulos, demonstração do resultado do exercício e balanço patrimonial
da empresa. As questões abertas estão relacionadas à seleção dos melhores segmentos
geográficos para investir, a maneira mais adequada de expandir o negócio (organicamente ou
inorganicamente) em cada um deles, as estratégias de financiamento mais adequadas
(financiamento interno, dívida e capital acionário) e a avaliação de outra cross-listing. Na
discussão, as questões levantadas anteriormente são abordadas uma a uma e as recomendações
são elaboradas.
As análises dão a impressão de que a cervejaria deve concentrar os investimentos nos
segmentos EMEA (Europe, Middle East and Africa) e Ásia Pacífico. A maneira sugerida de
expandir difere dependendo do país dos segmentos, no entanto, a maior mudança seria no Japão,
onde a empresa brasileira-belga deveria considerar a aquisição da Kirin Holdings. Em relação
às fontes de recursos, a AB InBev SA/NV deve recorrer em primeiro lugar aos seus próprios
lucros retidos e, em seguida, a uma ou mais soluções de financiamento através de capital
acionário, de acordo com as intenções da empresa para o futuro. Com respeito a uma cross-
listing, a empresa só poderia considerar a Bolsa de Valores de Tóquio se desejar adquirir a Kirin
Holdings, caso contrário, não deveria prosseguir com outra listagem.
Palavras-chave: cervejaria; expansão geográfica; estratégias de crescimento; estratégias
de financiamento; cross-listing.


LIST OF FIGURES
Figure 1 - Company´s Synthetized M&A history .................................................................... 15
Figure 2 - Company´s Timeline................................................................................................ 16
Figure 3 - Scenario of the Beer Global Market ........................................................................ 17
Figure 4 - Market Capitalization from 2004 to 2016................................................................ 20
Figure 5 - Company´s Key Facts .............................................................................................. 21
Figure 6 - Company´s Revenues and EBITDA from 2012 to 2016 ......................................... 24
Figure 7 - Company´s Geographical Segments ........................................................................ 25
Figure 8 - Geographic Footprint of the Combination with SABMiller .................................... 27
Figure 9 - Company´s Shareholder Structure ........................................................................... 29
Figure 10 - Income Statement .................................................................................................. 37
Figure 11 - Balance Sheet ......................................................................................................... 38
Figure 12 - Corporate Governance ........................................................................................... 40
Figure 13 - Case Studies Dimensions and Classifications ....................................................... 46
Figure 14 - Case Study Designs ............................................................................................... 46
Figure 15 - Case Study Process ................................................................................................ 48
Figure 16 - Total Volume and AB InBev SA/NV Share per Segment ..................................... 53
Figure 17 - Top 20 Stock Exchanges in the World in Terms of Market Cap ........................... 84

LIST OF TABLES
Table 1 - Company´s Revenue Breakdown by Region ............................................................ 26
Table 2 - Company´s Quantities of Each Type of Share .......................................................... 27
Table 3 - Company´s Holding Percentage of Each Type of Shareholder ................................ 28
Table 4 - Company´s Relevant Information from Reports from 2012 to 2016 ........................ 31
Table 5 - Company´s Important Indicators from 2012 to 2016 ................................................ 32
Table 6 - Distribution of 2015 Beer Volume per Region ......................................................... 51
Table 7 - Beer Volumes of the Top 25 Consuming Countries in 2015 .................................... 52
Table 8 - Beer Market, Company´s Performance and Potential per Segment .......................... 53
Table 9 - Relevant Local Brands in Western and Center Europe ............................................. 58
Table 10 - Participation and Market Share Ranking of African Breweries .............................. 59
Table 11 - Top 15 African Countries by Population ................................................................ 60
Table 12 - Top 15 Asian Countries by Population ................................................................... 62
Table 13 - Qualitative Aspects of Target Companies ............................................................... 65
Table 14 - Key Facts about Asahi, Kirin and AB InBev .......................................................... 69
Table 15 - Relevant Information from Asahi, Kirin and AB InBev Reports ........................... 69
Table 16 - Important Indicators about Asahi, Kirin and AB InBev ......................................... 69
Table 17 - Pros and Cons about Asahi Group and Kirin Holdings .......................................... 71
Table 18 - Equity and Enterprise Values of Asahi, Kirin and AB InBev................................. 72
Table 19 - Retained Earnings and Dividend Information from 2012 to 2016 .......................... 76
Table 20 - Net Financial Debt/EBITDA from 2012 to 2016 .................................................... 79
Table 21 Relevant Information about Stock Exchanges where AB InBev is Listed ............... 83
Table 22 - Advantages and Disadvantages of Cross-listing ..................................................... 85


LIST OF ABBREVIATIONS AND ACRONYMS
AB Anheuser-Busch
ADR American Depositary Receipt
ADS American Depositary Share
CAGR Compound Annual Growth Rate
CEO Chief Executive Officer
E Equity Value or Equity
EBIT Earnings before Interest and Tax
EBITDA Earnings before Interest, Tax,
Depreciation and Amortization
EMEA Europe, Middle East and Africa
EPS Earnings per Share
EV Enterprise Value
D Debt
Market Cap Market Capitalization
M&A Mergers and Acquisitions
ROA Return on Assets
ROE Return on Equity
SAB South African Breweries


SUMMARY
1 INTRODUCTION .......................................................................................................... 13
1.1 Objective................................................................................................................... 13
1.2 About the Company .................................................................................................. 13
1.2.1 History and Growth .......................................................................................... 13
1.2.2 Investors and the CEO ...................................................................................... 17
1.2.3 Figures and Notion of Size ............................................................................... 19
1.2.4 Culture and Building a Better World ................................................................ 21
1.2.5 Corporate Governance ...................................................................................... 22
1.2.6 Revenues and Geographic Segmentation ......................................................... 24
1.2.7 Shareholding and Voting Rights....................................................................... 27
1.2.8 Listings on Stock Exchanges ............................................................................ 29
1.2.9 Bonds ................................................................................................................ 30
1.2.10 Income Statement and Balance Sheet ............................................................... 30
1.3 Definition of Open Issues for Discussion ................................................................. 33
1.4 Motivation ................................................................................................................ 34
1.5 Document Structure .................................................................................................. 34
2 LITERATURE REVIEW .............................................................................................. 37
2.1 Accounting and Annual Report ................................................................................ 37
2.2 Corporate Governance .............................................................................................. 39
2.3 Financing and Leverage ........................................................................................... 41
2.4 Growth Strategies ..................................................................................................... 42
3 METHODOLOGY ......................................................................................................... 45
3.1 Selection and Dimensions of a Case Study .............................................................. 45
3.2 Case Study Process ................................................................................................... 48
4 DISCUSSION .................................................................................................................. 51
4.1 In which geographic segments would it make more sense to focus investments? ... 51
4.2 Which is the best way for the company to expand its business? Should AB InBev
SA/NV choose organic or inorganic growth? If organic, how? If inorganic, which would be
interesting companies to acquire? ........................................................................................ 56
4.3 Which would be the best financing strategies for the investments? ......................... 74
4.4 Would a listing in another Stock Exchange make sense? If yes, in which one? ...... 82
5 CONCLUSION............................................................................................................... 89
5.1 Synthesis about the Company .................................................................................. 89
5.2 Recommendations Drawn ........................................................................................ 90
5.3 Proposals for Future Studies .................................................................................... 91
6 REFERENCES ............................................................................................................... 93
APPENDIX A ......................................................................................................................... 99
APPENDIX B ....................................................................................................................... 100
APPENDIX C ....................................................................................................................... 101
APPENDIX D ....................................................................................................................... 102
APPENDIX E ....................................................................................................................... 103
APPENDIX F........................................................................................................................ 104
APPENDIX G ....................................................................................................................... 105
APPENDIX H ....................................................................................................................... 106

13
1 INTRODUCTION
1.1 Objective
The present work aims to assess, discuss and draw recommendations related to financial
and strategic aspects of AB InBev SA/NV, considering the information provided by various
sources, the company current situation and the global context.
1.2 About the Company
1.2.1 History and Growth
Anheuser-Busch InBev SA/NV is the largest brewery in the world. The Brazilian-Belgium
group has offices and operations worldwide and owns approximately 500 brands, reaching over
150 countries with its products. The history of the firm is full of M&A deals and can be
described through the establishment of four major breweries: AmBev, Interbrew, Anheuser-
Busch and SABMiller.
Even though the global headquarters are currently located is in Leuven, Belgium, the
history of this conglomerate started in Brazil in the year 1885. It was this year that Antarctica
was founded in São Paulo and 3 years later it’s most relevant national competitor, Brahma, was
established in Rio de Janeiro. Both companies have acquired many other smaller breweries in
South and Central Americas and after more than 100 years competing for the leadership in the
Brazilian market, in 1999, they merged after the sale of some plants and brands as imposed by
the Brazilian market authority. At that moment, the fifth largest brewery in volume of the world
was born and named AmBev.
Many years before the beginning of AmBev, the history of Interbrew started. The company
was created in 1988, through the merger of two Belgium breweries: Artois, which is the
producer of Stella Artois (registered in 1366) and Piedboeuf (established in 1812), producer of
Jupiler. Interbrew by itself also has a successful expansion background, including the
acquisition of the Beck’s (German) and the Labatt (Canadian), which was the owner of
breweries, sport teams and even a communication network in Canada.
In Belgium, 2004, AmBev and Interbrew merged creating InBev. Before the deal, the beer
market, in volume, was led by Anheuser-Busch, followed by SABMiller, Interbrew, Heineken

14
and AmBev. The merger of the fifth and the third largest breweries created a new global market
leader: InBev, a Belgium company controlled by Brazilians.
It is important to clarify that, in Brazil, AmBev has continued to exist as a subsidiary of
AB InBev SA/NV, even after the merger with Interbrew in Belgium. In fact, AmBev S/A is the
most valuable company on the São Paulo Stock Exchange (BM&FBOVESPA: ABEV3) as of
January 2, 2017, with a market capitalization of roughly US$80 billion1. The company is also
listed on the New York Stock Exchange (NYSE: ABEV) via American Depositary Receipts
(ADRs). AB InBev SA/NV is a controlling shareholder of AmBev S/A with approximately
62%2 ownership. The two entities are independent and each one has its own management. They
have signed agreements referring to production and commercialization of beers.
Meanwhile, in the United States, the Anheuser-Busch company was growing. The
American brewery has its roots in Missouri since 1852, and is the owner of well-known brands
such as Budweiser, Bud Light and Michelob. At the time, AB had 12 plants in the US and 17
overseas.
Nonetheless, the leading position did not stop InBev owners from expanding and
controlling the beer market even more. In 2008, InBev and Anheuser-Busch merged, creating
Anheuser-Busch InBev (AB InBev). The company, at that moment, had around 200 brands and
reinforced InBev’s previous status of world’s largest beer producer. AB InBev became one of
the largest Fast Market Consumer Good companies, together with Nestlé, P&G, Unilever,
PepsiCo and others.
In 2012 AB InBev made another deal acquiring the Mexican group Modelo, owner of the
famous brand Corona. After 4 years of operations and consolidation, AB InBev decided to make
another big move: the target now was its largest competitor, the UK-based SABMiller.
SABMiller was created 1999 through the merger of South African Breweries (founded in
1895) and the US-based Miller (founded in 1855), was the owner of key brands like Miller and
Foster and more importantly, had a good penetration in markets where AB InBev did not.
By the end of 2015, AB InBev made a bid for its rival. SABMiller accepted the offer of
more than US$100 billion3 but the deal still required the approval of regulatory agencies,
especially the US Department of Justice. Due to its size, SABMiller had to spin off a part of
its holdings, which resulted in the sale of many brands (including Miller) to different brewery
groups.
1 São Paulo Stock Exchange (2017) 2 AB InBev SA/NV Full Annual Report (2016) 3 Wall Street Journal (2016)

15
In October, 2016, the third-largest M&A deal in history4 was completed and Anheuser-
Busch InBev SA/NV was created as the absolute global leader in the beer market, with a
combined annual revenue of US$55.55 billion (about 30% of the global market6) and
approximately 500 brands.
The synthetized M&A history and the timeline of the company are in Figure 1 and Figure
2:
Figure 1 - Company´s Synthetized M&A history
Source: Author, based on company´s information
4 Financial Times (2016) 5 AB InBev SA/NV Analyst Call Presentation (2016) 6 Business Insider (2016)

16
Figure 2 - Company´s Timeline
Source: Author, based on company´s information
17
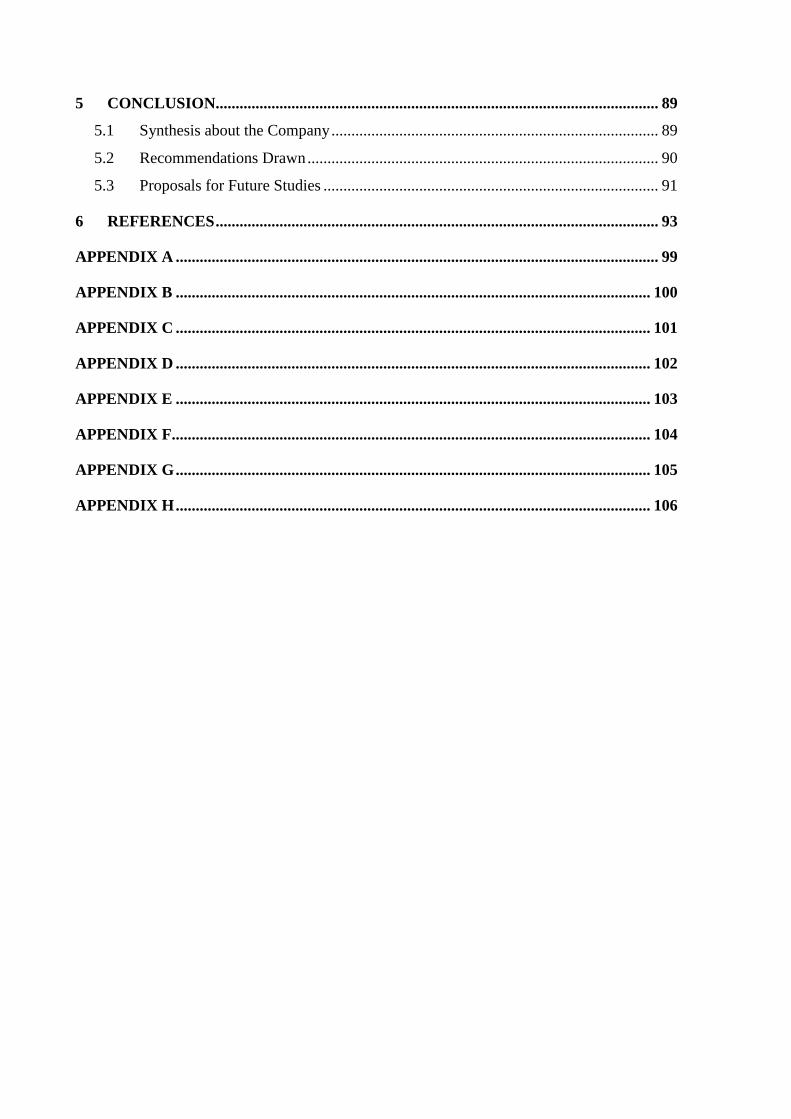
Currently, AB InBev SA/NV’s main competitors are The Heineken Company, Carlsberg
Group, MolsonCoors and other Asian breweries. The competitors and the brands they possess
are in Figure 3:
Figure 3 - Scenario of the Beer Global Market
Source: Equities (2016)
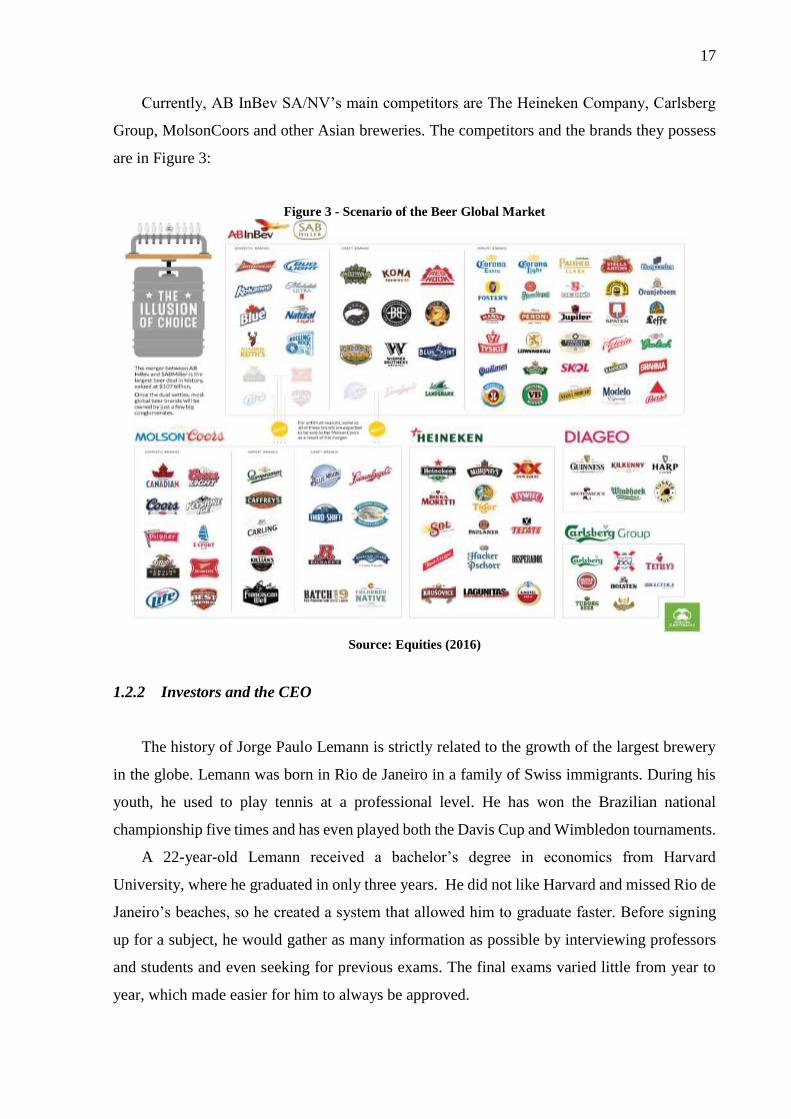
1.2.2 Investors and the CEO
The history of Jorge Paulo Lemann is strictly related to the growth of the largest brewery
in the globe. Lemann was born in Rio de Janeiro in a family of Swiss immigrants. During his
youth, he used to play tennis at a professional level. He has won the Brazilian national
championship five times and has even played both the Davis Cup and Wimbledon tournaments.
A 22-year-old Lemann received a bachelor’s degree in economics from Harvard
University, where he graduated in only three years. He did not like Harvard and missed Rio de
Janeiro’s beaches, so he created a system that allowed him to graduate faster. Before signing
up for a subject, he would gather as many information as possible by interviewing professors
and students and even seeking for previous exams. The final exams varied little from year to
year, which made easier for him to always be approved.

18
According to Lemann, going to Harvard was worthwhile for two main reasons. First,
because it motivated him to be creative in reaching his goals, and second because he developed
the crucial skill of choosing excellent partners. The career of a natural winner and a goal-driven
entrepreneur began to be drawn.
After working as a trainee in Credit Suisse in Switzerland, Lemann returned to Brazil in
1971, partnering with Carlos Alberto Sicupira and Marcel Herrmann Telles to found the
investment bank Garantia. The firm was ahead of its time and it is still known for being one of
the most innovative and prestigious investment banks in Brazilian history, described by Forbes
as the “Brazilian version of Goldman Sachs”.
Among other nationally relevant deals such as Lojas Americanas (a large retailer), Garantia
acquired Brahma in 1989. This was the first moment when Jorge Paulo Lemann invested in a
brewery. The seed of one the largest corporate groups in the world had been planted.
Due to a series of personal and economic reasons, Garantia was sold to Credit Suisse First
Boston in 1998. Of course, Lemann and his partners would not stop investing and expanding
their businesses. Through the first Brazilian private equity fund, GP Investments, Lemann and
his partners orchestrated the merger of the two largest national breweries, creating AmBev in
1999.
Under a complex ownership structure involving the Brazilian private owners (Lemann,
Sicupira and Telles), Belgium families, funds and holdings, AmBev merged with Interbrew and
then with Anheuser-Busch. More recently, in 2016, AB InBev acquired SABMiller, creating
AB InBev SA/NV.
In 2004, Lemann, Sicupira and Telles founded 3G Capital: a Brazilian private equity fund
with headquarters in Brazil and US, through which investments in breweries were made. 3G
Capital has become even more famous after partnering up with Warren Buffet’s Berkshire
Hathaway for some acquisitions. Lemann and Buffet are friends and together they have invested
in world famous companies unrelated to the beer market such as Burger King, Tim Hortons and
Kraft Foods.
Under the management of the two funds, in 2015, Kraft merged with Heinz, creating The
Kraft Heinz Company, a new giant in the Fast Market Consumer Good. Following the
expansion spirit of the beer tycoons, Kraft Heinz placed a takeover bid in February, 2017, for
Unilever. The Dutch-British company’s shareholders refused the US$143 billion7 offer. This
would have potentially been one of the largest corporate deals in history.
7 Financial Times (2017)
19
Besides the three Brazilian investors who founded Garantia, another key character of the
group’s development is Carlos de Alves Brito, who joined Brahma back in 1989. After holding
several positions in AmBev, Brito became its CEO. Afterwards, he became North America
Zone President of InBev, CEO of AB InBev and is currently the CEO of AB InBev SA/NV. He
is known for cost efficiency strategies like zero-based budgeting, high performance
requirements, strong corporate culture implementation, massive layoffs and for supporting
aggressive bonuses for top managers. One example of compensation plan is the 2020 Dream
Incentive Plan, which was designed to pay out a bonus pool of around US$350 million to 65
senior managers if annual revenue reaches US$100billion between 2020 and 20228.
Even though Lemann is often seen as an overly ambitious businessperson, he supports
many social and entrepreneurial initiatives in Brazil. Among others, he is the founder of
Fundação Lemann and co-founder of Fundação Estudar and Instituto Tênis: the first two being
foundations focused on education and the third focused on sports. The other Brazilian
shareholders of the conglomerate also support social projects in the country.
According to Forbes 2017, Jorge Paulo Lemann is the twenty-second richest person the
world and first in Brazil, with a net worth of US$29.2billion9. Telles is the third and Sicupira
is the forth in the national ranking. The sources of wealth of the three are mainly participations
in AB InBev SA/NV, 3G Capital and Lojas Americanas.
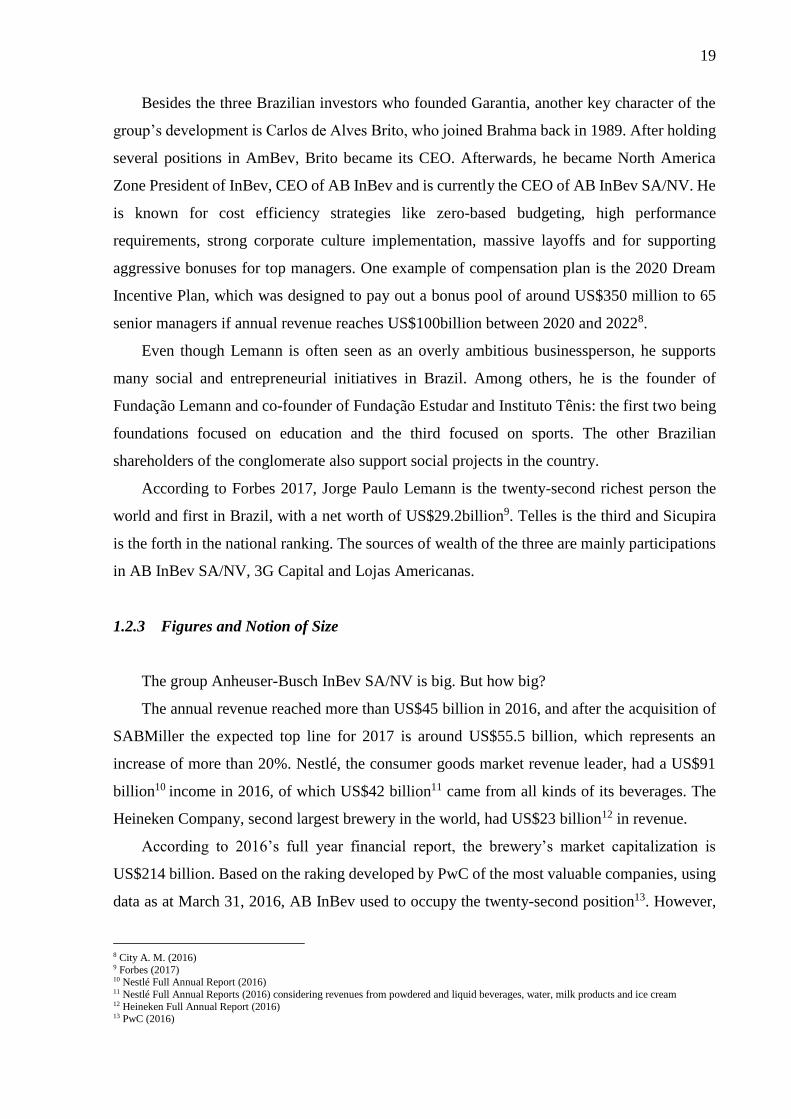
1.2.3 Figures and Notion of Size
The group Anheuser-Busch InBev SA/NV is big. But how big?
The annual revenue reached more than US$45 billion in 2016, and after the acquisition of
SABMiller the expected top line for 2017 is around US$55.5 billion, which represents an
increase of more than 20%. Nestlé, the consumer goods market revenue leader, had a US$91
billion10 income in 2016, of which US$42 billion11 came from all kinds of its beverages. The
Heineken Company, second largest brewery in the world, had US$23 billion12 in revenue.
According to 2016’s full year financial report, the brewery’s market capitalization is
US$214 billion. Based on the raking developed by PwC of the most valuable companies, using
data as at March 31, 2016, AB InBev used to occupy the twenty-second position13. However,
8 City A. M. (2016) 9 Forbes (2017) 10 Nestlé Full Annual Report (2016) 11 Nestlé Full Annual Reports (2016) considering revenues from powdered and liquid beverages, water, milk products and ice cream 12 Heineken Full Annual Report (2016) 13 PwC (2016)

20
it is important to remember that the group tends to increase its value and improve its position
due the acquisition of SABMiller. In fact, in the moment of the writing of this chapter, on May
11, 2017, AB InBev SA/NV is valued at US$229 billion and occupies the sixteenth position14.
Figure 4 considers the market capitalization since 2004, when InBev was created,
according to annual reports disclosed by the group from 2004 to 2016:
Figure 4 - Market Capitalization from 2004 to 2016
Source: Author, based on company´s information
It is clear that the acquisitions of the conglomerate have a direct impact on the market
capitalization. The largest percentage increases were from 2008 to 2009 and from 2012 to 2013,
respectively at 127.5% and 63.8%. In 2008, the merger with Anheuser-Busch occurred and in
2012, the Modelo group was acquired. Overall, from 2004 to 2016, the market cap increased
more than 10 times and the compound annual growth rate (CAGR) was 21.6%.
AB InBev SA/NV reaches more than ¾ of all the countries in the world and has operations
in more than ¼ of them. The number of plants is around 15515, with approximately 26% in
Asia, 25% in Latin America and 16% in North America. The Brazilian-Belgium group counts
on more than 200,000 collaborators, which is equivalent to the population of a medium-large
Italian city such as Brescia or Parma.
The volume of beer produced in 2016 disclosed was more than 43.4 billion liters. The
Heineken Company produced 22.8 billion liters, Carlsberg Group produced 11.616 and
MolsonCoors 6.617. By itself, AB InBev SA/NV could fill almost 14,000 long course Olympic
swimming pools18 with beer. Additionally, AB InBev SA/NV produced other 6.6 billion liters
14 Dog of the Snow (2017) 15 Statista (2016) 16 Carlsberg Full Annual Report (2016) 17 MolsonCoors Quarterly Reports (2016) 18 Olympic long course swimming pool’s dimensions: 50m x 25m x 2.5m

21
of non-beer volume, including for instance Guaraná Antartica, a worldwide famous Brazilian
soft drink.
The brewery possesses over 50019 brands, including sub-brands, local brands, multi-
country brands and global brands. For means of comparison, Unilever, that produces food,
beverages, home care and personal care items, owns around 40020 brands. According to
BrandZ21, out of the ten most valuable beer brands in the world, seven are in possession of AB
InBev SA/NV. The worldwide most valuable leader, Budweiser, is one of the three global
brands the company owns, together with Stella Artois and Corona.
Figure 5 - Company´s Key Facts
Source: Author, based on company´s information
1.2.4 Culture and Building a Better World
The company follows 10 guiding principles that describe the group’s dream, people and
culture. The dream, which is to become the Best Beer Company Bringing People Together for
a Better World, energizes everyone to work in the same result-oriented direction. The
recruitment and the career development are thought to retain employees, who are motivated to
never be completely satisfied and always consider cost efficiency. The consumer is the boss
and collaborators, who are the firm’s main asset, must have an “owner thinking”: results,
leadership, quality and hard work should always be kept in mind.
19 BrandZ (2016) 20 The Guardian (2010) 21 BrandZ (2016)
22
Besides the aggressiveness in relation to financial results, AB InBev SA/NV has a strong
social and environmental bias and thus conducts projects in many fields, especially in
developing countries. These are some examples from Building a Better World Program:
Investments in small retailers
Enhancement in growers’ productivity and livelihood
Boost of communities through use of local ingredients
Enhancement of access to clean water and watershed restoration
Use of renewable energies and recycled materials
Increase in awareness about harmful drinking
Improvement of road safety
1.2.5 Corporate Governance
AB InBev SA/NV’s adheres to the principles and provisions of the Belgian Corporate
Governance Code, once it is incorporated under Belgium law and listed on Euronext Brussels.
The corporate governance ensures responsible management and proper control of the company,
through framework of best practices, way of thinking and modus operandi.
As the brewery has the listing of ADSs (American Depositary Shares) representing
ordinary shares on the New York Stock Exchange (NYSE), the NYSE Corporate Governance
Rules for Foreign Private Issuers are applicable to the company. Moreover, the firm has
registered with the SEC (Securities and Exchange Commission) and as a result, it is subject to
Sarbanes-Oxley Act of 2002 and the SEC rules about corporate governance.
Since the company has operations spread all over the globe, it faces a broad range of
business practices and cultures. As a result, it is key that the code of conduct is clear, strict and
consistent. AB InBev SA/NV’s Code of Business Conduct provides information about the
principles, compliance, human rights and ethical conduct to be followed by the employees.
Besides the code, the brewery developed an Anti-Corruption Policy to alert the collaborators
about corruption when dealing not only with commercial partners, but also with public officials.
As mentioned before, AB InBev SA/NV’s CEO is the Brazilian Carlos de Alves Brito, who
first joined the company in 1989, when it was still Brahma. To perform his duties of daily
management, Brito is assisted by the Executive Board of Management (EBM). The EBM is
composed by the 21 members:
Chief Executive Officer (the chairman of the EBM)
23
Chief Financial and Technology Officer
Chief Marketing Officer
Chief Supply Officer
Chief People Officer
Chief Legal and Corporate Affairs Officer
Chief Procurement Officer
Chief Sales Officer
Chief Integration Officer
Chief Supply Integration Officer
Chief Disruptive Growth
Chief Strategist & External Affairs Officer
Asia-Pacific South Zone President
Asia-Pacific North Zone President
Middle Americas Zone President
Europe Zone President
North America Zone President
Latin America North Zone President
Latin America South Zone President
Latin America COPEC Zone President
Africa Zone President
The Board of Directors is composed of three independent directors, three members
appointed by the restricted shareholders and nine members appointed by the Stichting
Anheuser-Busch InBev, a foundation that represents interests of the Brazilian and Belgium
founding families. The influence of the three founders of the investment bank Garantia is still
very clear: Marcel Herrmann Telles, Carlos Alberto Sicupira and Paulo Alberto Lemann (Jorge
Paulo’s son) are three of the nine members appointed by the foundation. Four committees assist
the Board of Directors: Audit, Finance, Nomination and Remuneration committees.
The group issues the Corporate Governance Charter, whose aim is to provide transparent
disclosure of the company’s corporate governance in detail. The information of this section was
removed from the 2016´s Corporate Governance Charter. The document also presents rules and
agreements related to: shareholders, capital, shares, voting rights, meetings, dividends,
communication, the board, committees, executive management and code of conduct.

24
1.2.6 Revenues and Geographic Segmentation
In Figure 6, there are the revenues accompanied by its CAGR and the earnings before
interest, tax, depreciation and amortization (EBITDA) accompanied by the EBITDA margin of
past 5 years. All the information was extracted from the firm’s official annual reports.
Figure 6 - Company´s Revenues and EBITDA from 2012 to 2016
Source: Author, based on company´s information
As a whole, revenue has been growing in past years, except from 2014 to 2015, when it
fell almost US$3.5 billion. The growth from 2012 to 2016 was 14.5% and the CAGR equal to
3.4%. Annual average revenue in this period was US$43.8 billion.
EBITDA and EBITDA margin has been falling slightly in the past 3 years. In 2013,
however, they were much higher and the margin reached almost 55%. The abrupt increase on
both values from 2012 to 2013 catches attention: EBITDA raised more than 50% and EBITDA
margin almost 40%. From 2012 to 2016, average EBITDA was US$18.2 billion and EBITDA
average margin was 41.5%.
0
5
10
15
20
25
30
35
40
45
50
Billions US$
Revenues and EBITDA in Previous 5 Years
revenue EBITDA
2012 2013 2014 2015 2016
CAGR of
39.0%
54.2%
39.2% 39.1% 35.9%
25
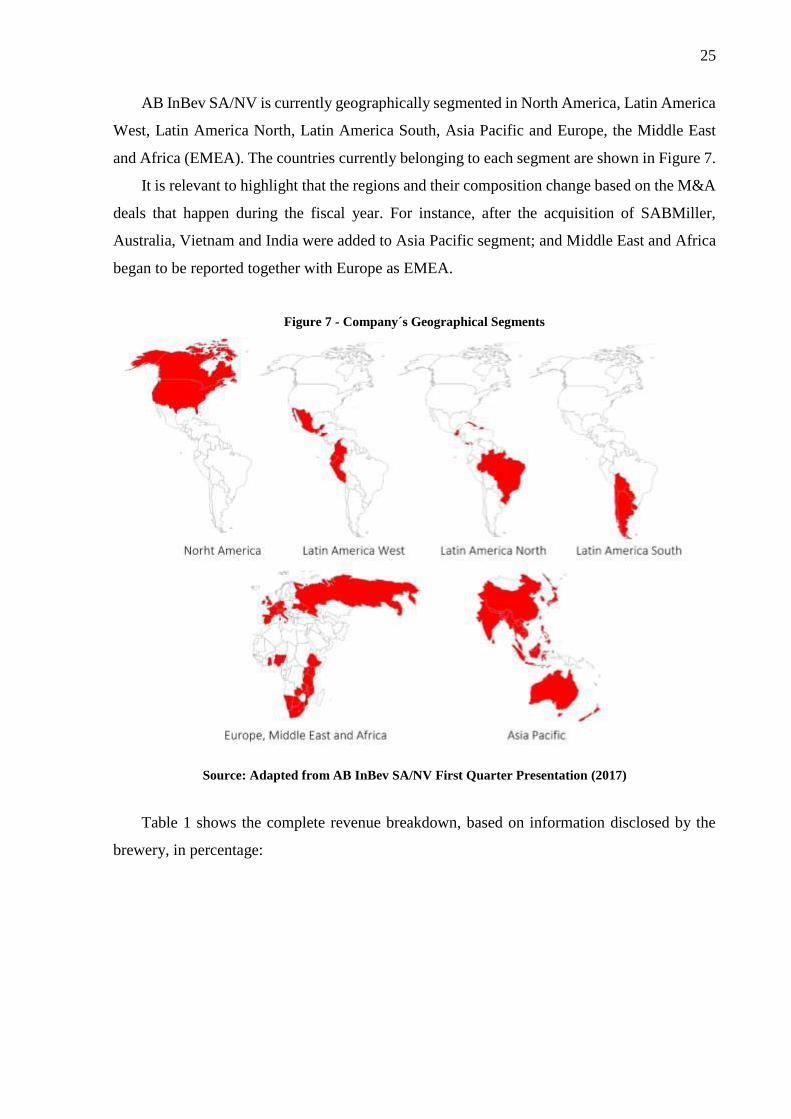
AB InBev SA/NV is currently geographically segmented in North America, Latin America
West, Latin America North, Latin America South, Asia Pacific and Europe, the Middle East
and Africa (EMEA). The countries currently belonging to each segment are shown in Figure 7.
It is relevant to highlight that the regions and their composition change based on the M&A
deals that happen during the fiscal year. For instance, after the acquisition of SABMiller,
Australia, Vietnam and India were added to Asia Pacific segment; and Middle East and Africa
began to be reported together with Europe as EMEA.
Figure 7 - Company´s Geographical Segments
Source: Adapted from AB InBev SA/NV First Quarter Presentation (2017)
Table 1 shows the complete revenue breakdown, based on information disclosed by the
brewery, in percentage:

26
Table 1 - Company´s Revenue Breakdown by Region
Source: Author, based on company´s information
Analyzing the data, one will notice that North America’s participation in total revenues has
been falling. The same is happening happens to Latin America North, where the main
consuming country is Brazil. Together, the participation of those two regions has fallen more
than 23% in the past 5 years. The European market has also demonstrated a slight decrease in
participation, possibly due to the fierce competition, seeing as The Heineken Company and
Carlsberg Group own strong brands in the area.
On the other hand, the growth on Asia Pacific Market is remarkable: the increase in
participation from 2012 to 2016 is almost 100% and the CAGR is 18.5%. Latin America West
has also seen a major raise in percentage of total revenues, mainly due to the acquisitions of
Grupo Modelo and SABMiller, owners of brands in this region. The SABMiller acquisition
was also key for Africa, from where AB InBev did not have revenue flowing. As a matter of
fact, the complete geographic footprint of the group in relation to the combination with the UK-
based brewery is represented in Figure 8:
North
America
Latin
America
West
Latin
America
North
Latin
America
South
Western
Europe
Central and
Eastern
Europe
Middle East
and AfricaAsia Pacific
Global
Export and
Holding
Companies
2012 40.3% 0.0% 28.8% 7.6% 9.1% 4.2% 0.0% 6.8% 3.2%
2013 37.1% 6.4% 25.2% 7.6% 8.4% 3.3% 0.0% 7.8% 4.3%
2014 34.2% 9.8% 23.9% 6.3% 0.0% 10.7% 4.7%
2015 35.8% 9.1% 20.9% 7.9% 0.0% 12.7% 4.4%
2016 34.5% 11.4% 18.6% 6.3% 13.3% 2.7%
10.3%
9.2%
13.2%
EMEA

27
Figure 8 - Geographic Footprint of the Combination with SABMiller
Source: AB InBev SA/NV Analyst Call Presentation (2016)
The Global Export and Holding Companies include the company’s global headquarters,
the export businesses that have not been allocated to the regions, and the interim supply
agreement with Constellation Brands, a beer import company.
1.2.7 Shareholding and Voting Rights
The following information is also based on data from the Corporate Governance Charter
as at October 11, 2016.
There are mainly two types of shares: ordinary and restricted. The restricted shares are
unlisted and are subject to rules laid out by the issuing company and agreed upon by the owner
of the shares. There are also treasury shares (included in the ordinary shares), which are held
by AB InBev SA/NV and some of its subsidiaries. All the stocks of the company have the same
rights (each share entitles its owner to one vote).
Table 2 represents the number of each type of share:
Table 2 - Company´s Quantities of Each Type of Share
Source: Author, based on company´s information
Share Quantity
outstanding shares 2,019,241,973
outstanding ordinary shares 1,693,242,156
-ordinary shares of major shareholders 847,648,483
-ordinary treasury shares 85,540,392
-ordinary shares not of major shareholders and not treasury (public free float) 760,053,281
outstanding restricted shares 325,999,817
-restricted shares of major shareholders 281,978,135
-restricted shares not of major shareholders 44,021,682

28
The holding percentages (percentage of voting rights) are calculated excluding treasury
shares, which means the base for the calculation is the number of outstanding shares net of the
number of ordinary treasury shares: 1,933,701,581.
Table 3 - Company´s Holding Percentage of Each Type of Shareholder
Source: Author, based on company´s information
As seen in Table 3, less than half of the company’s equity value is traded on Stock
Exchanges. The free float is composed of 760,053,281 ordinary shares or 39.31%. This
represents approximately US$84 billion, based on the US$213.99 billion market cap reported
in 2016.
The AB InBev SA/NV has a complex shareholding structure including ownership by many
entities under laws of different countries. Once again, it is strong the presence of Marcel
Herrmann Telles (MH Telles), Carlos Alberto Sicupira (CA Sicupira) and Jorge Paulo Lemann
(JP Lemann) as owners of great majority of BRC Luxembourg, which possesses 50% of
Stichting Anheuser-Busch InBev (Stichting AK Netherlands). Besides, BRC Luxembourg
directly owns another 1.94% of the brewery.
Stichting Anheuser-Busch InBev possesses 34.29% of the group, and it is by far the major
shareholder. Therefore, based on market cap disclosed on 2016’s full financial report, the three
Brazilian founders are owners of almost US$35 billion22 of company’s equity, only through
BRC Luxembourg. Telles, for instance, is the only owner of MHT Benefiting Holding, which
has 0.19% of the brewery (around US$407 million). The list of major shareholders is on
Appendix A and in Figure 9, there is the company’s full ownership structure:
22 US$34.68 billion=213,993*0,3429*0,5*0,8322 + 213,993* 0,0194
Holding Percentage Percentage
ordinary shares (excluding the treasury shares) 83.14%
-major shareholders of ordinary shares 43.84%
-public free float 39.31%
restricted shares 16.86%
-major shareholders of restricted shares 14.58%
-not major shareholders of restricted shares 2.28%

29
Figure 9 - Company´s Shareholder Structure
Source: AB InBev SA/NV Website (2017)
1.2.8 Listings on Stock Exchanges
AB InBev SA/NV is traded on the Brussels Stock Exchange (Euronext: ABI), with
secondary listings on the Mexican Stock Exchange (BMV: ANB) and on the Johannesburg
Stock Exchange (JSE: ANH).

30
Moreover, the group has American Depositary Shares (ADSs) on the New York Stock
Exchange (NYSE: BUD). They are represented by American Depositary Receipts (ADRs) and
each ADR is equivalent to one share.
The company’s ordinary shares are included in 56 indexes all over the world, including
Euronext, DJ (Dow Jones), FTSE (Financial Times Stock Exchange), MSCI (Morgan Stanley
Capital International), S&P (Standard & Poor’s) and TRIB (Temple Records Index Bureau)
indexes.
1.2.9 Bonds
The conglomerate has 70 bonds outstanding as of May 16, 2017. The offers vary in terms
of size, currency, type of coupon, value of coupon, maturity and market of trade. The company
has offers from US$726 thousand up to US$11 billion and periods of duration from 3 years up
to 40 years. Among the 70 outstanding bonds, only five have floating coupons.
Appendix B shows the list of outstanding bonds.
1.2.10 Income Statement and Balance Sheet
According to 2016’s full report, AB InBev SA/NV disclosed the subsequent key facts:
Revenue: US$45.517 billion
EBITDA: US$16.360 billion
Normalized EBITDA: U$S16.753 billion
Profit attributable to equity holders: US$1.241billion
Normalized profit attributable to equity holders: US$4.853 billion
Weighted average number of ordinary and restricted shares: 1.717 billion
Normalized earnings per share (EPS): US$2.83
Earnings per share (EPS): US$0.72
Dividends per share: U$S3.85 (US$1.71 interim dividend + US$2.14 dividend)
Payout ratio: 136%
Net financial debt: US$107.953 billion
Non-current assets: US$215.320 billion
Current assets: US$43.061 billion
Non-current liabilities: US$136.841 billion

31
Current liabilities: US$40.116 billion
Equity: US$81.425 billion
The normalized values are the ones adjusted for non-recurring items, defined by the
company as “those that in management’s judgment need to be disclosed by virtue of their size
or incidence”.
It is interesting to highlight that goodwill corresponds to 63.4% of non-current assets and
52.8% of total assets. Another point that catches attention is that US$10.086 billion of equity
are non-controlling interests related to AB InBev SA/NV’s 62% ownership of AmBev S/A, the
Brazilian subsidiary mentioned previously.
A curiosity is that the par value of shares is only €0.6134, which multiplied by the number
of outstanding shares (2.019 billion), results in an issued capital of €1.239 billion (or US$1.736
billion)
The Consolidated Income Statement is on Appendix C and the Consolidated Balance Sheet
or Consolidated Statement of Financial Position in on Appendix D. In addition, the detailed
calculation of weighted average number of ordinary and restricted shares and earnings per share
is described on Appendix E.
Besides the key facts of 2016, in Table 4, there is relevant information provided in the
previous full year reports, from 2012 to 2016:
Table 4 - Company´s Relevant Information from Reports from 2012 to 2016
Source: Author, based on company´s information * net financial debt defined as non-current and current interest-bearing loans and borrowings and bank overdrafts minus
debt securities and cash and cash equivalents
According to the information provided, it is possible to calculate some important indicators:
(data in
millions
US$)
revenue EBITDA
EBIT
(operating
profit)
profit
attributable
to equity
holders of
AB InBev
net financial
debt*market cap total assets
equity
attributable
to equity
holders of
AB InBev
total equitytotal
liabilities
2012 39,758 15,493 12,733 7,160 30,114 138,716 122,621 41,142 45,441 77,180
2013 43,195 23,428 20,443 14,394 38,800 171,142 141,666 50,365 55,308 86,358
2014 47,063 18,465 15,111 9,216 42,135 183,167 142,550 49,972 54,257 88,293
2015 43,604 17,057 13,904 8,273 42,185 200,302 134,635 42,137 45,719 88,916
2016 45,517 16,360 12,882 1,241 107,953 213,993 258,381 71,339 81,425 176,957
32
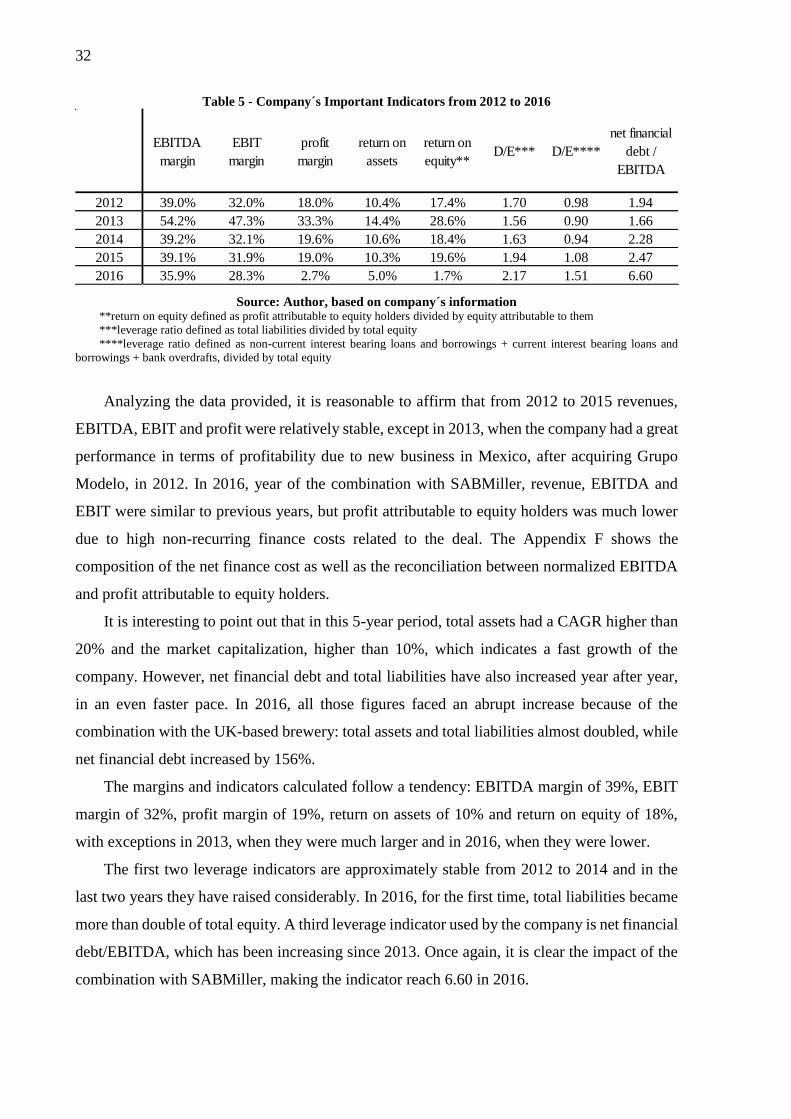
Table 5 - Company´s Important Indicators from 2012 to 2016
Source: Author, based on company´s information **return on equity defined as profit attributable to equity holders divided by equity attributable to them
***leverage ratio defined as total liabilities divided by total equity
****leverage ratio defined as non-current interest bearing loans and borrowings + current interest bearing loans and
borrowings + bank overdrafts, divided by total equity
Analyzing the data provided, it is reasonable to affirm that from 2012 to 2015 revenues,
EBITDA, EBIT and profit were relatively stable, except in 2013, when the company had a great
performance in terms of profitability due to new business in Mexico, after acquiring Grupo
Modelo, in 2012. In 2016, year of the combination with SABMiller, revenue, EBITDA and
EBIT were similar to previous years, but profit attributable to equity holders was much lower
due to high non-recurring finance costs related to the deal. The Appendix F shows the
composition of the net finance cost as well as the reconciliation between normalized EBITDA
and profit attributable to equity holders.
It is interesting to point out that in this 5-year period, total assets had a CAGR higher than
20% and the market capitalization, higher than 10%, which indicates a fast growth of the
company. However, net financial debt and total liabilities have also increased year after year,
in an even faster pace. In 2016, all those figures faced an abrupt increase because of the
combination with the UK-based brewery: total assets and total liabilities almost doubled, while
net financial debt increased by 156%.
The margins and indicators calculated follow a tendency: EBITDA margin of 39%, EBIT
margin of 32%, profit margin of 19%, return on assets of 10% and return on equity of 18%,
with exceptions in 2013, when they were much larger and in 2016, when they were lower.
The first two leverage indicators are approximately stable from 2012 to 2014 and in the
last two years they have raised considerably. In 2016, for the first time, total liabilities became
more than double of total equity. A third leverage indicator used by the company is net financial
debt/EBITDA, which has been increasing since 2013. Once again, it is clear the impact of the
combination with SABMiller, making the indicator reach 6.60 in 2016.
EBITDA
margin
EBIT
margin
profit
margin
return on
assets
return on
equity**D/E*** D/E****
net financial
debt /
EBITDA
2012 39.0% 32.0% 18.0% 10.4% 17.4% 1.70 0.98 1.94
2013 54.2% 47.3% 33.3% 14.4% 28.6% 1.56 0.90 1.66
2014 39.2% 32.1% 19.6% 10.6% 18.4% 1.63 0.94 2.28
2015 39.1% 31.9% 19.0% 10.3% 19.6% 1.94 1.08 2.47
2016 35.9% 28.3% 2.7% 5.0% 1.7% 2.17 1.51 6.60

33
1.3 Definition of Open Issues for Discussion
As mentioned before, in 2015, AB InBev SA/NV developed an incentive plan for its
managers with the intention of motivating them to reach US$100 billion revenue between 2020
and 2022. The plan is called 2020 Dream Incentive Plan and is properly registered in the
Securities and Exchange Commission of the United States. According to it, the company will
award a maximum of 6,000,000 stock options to eligible employees and each option will give
the right to purchase one ordinary share of the company in Belgium (Euronext: ABI).
The eligible employees are 65 senior managers, excluding members from the Executive
Board of Management (EBM), to help them work towards the internal stretch target and future
growth. Each employee has received an offer letter from the group indicating the number of
call options offered and their exercise price.
The Terms and Conditions of the agreement state that the options can only be exercised if
the performance test is met. The performance test in this case is net revenue reported equals, at
least, to US$100 billion.
Based on the information provided in the introduction and the description of the 2020
Dream Incentive Plan, some questions can be raised:
i) In which geographic segments would it make more sense to focus investments?
ii) Which is the best way for the company to expand its business? Should AB InBev
SA/NV choose organic or inorganic growth? If organic, how? If inorganic, which
would be interesting companies to acquire?
iii) Which would be the best financing strategies for the investments?
iv) Would a listing in another Stock Exchange make sense? If yes, in which one?
In order to address the issues presented, it is relevant to mention that AB InBev SA/NV
considers its optimal capital structure as a net financial debt/EBITDA ratio of approximately
2x. The brewery also disclosed its capital allocation objectives in the first quarter 2017 results
presentation, and they are, in order of priority:
1. Organic growth: investing in the organic growth our business.
2. Deleveraging: deleveraging to around the 2x level remains our commitment.

34
3. Selective M&A: non-organic, external growth is a core competency and we will continue
to consider suitable opportunities when and if they arise, subject to our strict financial
discipline and deleveraging commitment.
4. Return of cash to shareholders: our goal is for dividends to be a growing flow over time in
line with the non-cyclical nature of our business. Given the importance of deleveraging,
dividend growth is expected to be modest.
1.4 Motivation
AB InBev SA/NV and the topics approached in this case study were chosen by the author
due to a series of reasons.
The firm has an admirable success history, which certainly has attracted the author´s
attention, but more importantly, the conglomerate has a Brazilian origin and had its expansion
orchestrated by Brazilian entrepreneurs and executives, who are still in control of the company.
At present, the thousands of brands the brewery manages are known all over the world and the
aggressive business strategy is an example for many.
Furthermore, the issues approached in this study are strictly related to subjects the author
has coursed at Escola Poltécnica da USP and Politecnico di Milano, particularly the ones
regarding to strategy, accounting, corporate finance, financial markets and entrepreneurship.
Moreover, the author has developed an internship in one of the largest consumer goods
companies in the world and is currently working at a consultancy firm. Combined, these two
experiences have instigated the will to assess large corporations, its markets and draw
suggestions to improve performance.
1.5 Document Structure
This document is divided in six chapters, plus appendices.
This first chapter, Introduction, contains the objective of this study, information about the
company, the definition of the open issues that will be discussed on chapter 4 and the author´s
motivation.
The second chapter, Literature Review, includes theories and concepts that belong to the
areas of strategy and finance that will be mentioned in the development of the discussion.

35
The third chapter, Methodology, consists on the explanation of the case study methodology
employed in this work.
The forth chapter, Discussion, presents the analysis and drawing of suggestions for each of
the open issues proposed.
The fifth chapter, Conclusion, covers the results of the work and proposals for future
studies.
The sixth chapter, References, enumerates the bibliographic references used in this work
Lastly, the appendices used are exhibited.

36

37
2 LITERATURE REVIEW
The literature review presented in this chapter provides theoretical foundation for this
work. This chapter is divided in four parts: Accounting and Annual Report, Corporate
Governance, Financing and Leverage and Growth Strategies
2.1 Accounting and Annual Report
Mott (2005) affirms that annual accounts are essentially composed by two documents, the
Income Statement and the Balance Sheet. Additionally, there is a third document, which is the
Cash Flow Statement.
According to Damodaran (2012), the Income Statement shows the results of a company
during certain period and is composed mainly by revenues and expenses, as shown on Figure
10.
Figure 10 - Income Statement
Source: Damodaran (2012)
It is a structured way of demonstrating the results of the firm, starting from the revenue
obtained through sales, discounting all kinds of expenses and adding other revenue streams. On
the bottom line, it is possible to reach the net income, which can be positive (profit) or negative
(loss).

38
A well-known acronym used in financial markets is EBITDA, which stands for earnings
before interest, tax, depreciation and amortization. Rosembaum and Pearl (2009) state that
EBITDA is the sum of EBIT (earnings before interest and tax) and depreciation and
amortization. EBITDA is not an accounting measure and therefore, if disclosed in financial
reports, is presented separately from the Income Statement. Is important to mention that
EBITDA is useful for understanding the potential of cash flow generation of a company, as
well as for comparing the profitability of different businesses, once it considers only operating
results.
The Balance Sheet shows the financial position of the company in terms of its goods,
receivables and payables. Differently from the Income Statement, which shows the results of
the firm during certain period, the first refers to a specific moment. A Balance Sheet is a
snapshot picture at a moment in time. On the one-hand it shows the value of assets (possessions)
owned by the business and, on the other, it shows who provided the funds with which to finance
those assets and to whom the business is ultimately liable (MOTT, 2005).
Therefore, the document is composed by two parts, assets and liabilities and shareholder´s
equity, as shown on Figure 11. Both parts are divided into accounting lines, which represent
rights or obligations of the company concerned. It is important to emphasize that the sum of the
assets of the company must always be equal to the sum of the liabilities and shareholders' equity.
Figure 11 - Balance Sheet
Source: Author, based on Mott (2005) and Marion (2015)
ASSETSLIABILITIES AND
SHAREHOLDER´S QUITY
Current Liabilities
Current Assets Accounts payable
Cash and Cash Equivalents Accrued wages
Investments, within twelve months Accrued compensation
Inventories Income taxes payable
Accounts receivable Debt, within twelve months
Pre-paid expenses Others
Others Non-current Liabilities
Non-Current Assets Defered tax payable
Property, plant and equipment Debt, over twelve months
Leasehold improvements Others
Investments, over twelve months Shareholder s Equity
Intangible assets Investment capital
Others Accumulated retained earnings
Reserves
Total Assets Total Liabilities and Shareholder s Equity

39
Marion (2015) states that in order to be considered an asset, the following characteristics
are required: be a good, right or property, be measurable in cash and generate present or future
benefit. It should be mentioned that some durable assets lose their potential to generate value
gradually, and this loss is discounted from the asset value as time goes by. The discount is
called depreciation.
The liabilities represent debt and obligations the organization owes to other parties, while
shareholder´s equity refers to the net value of the company (total assets net of total liabilities),
as is composed by invested capital, accumulated profit or loss and reserves.
Assets and liabilities are divided between current and non-current, according to the time
horizon considered. Current represents a horizon of 12 months or less and non-current for over
12 months. Current assets and liabilities suffer frequent variations in value, since they are
moving constantly.
From the Income Statement and the Balance Sheet, some useful well-known indicators can
be calculated: return on assets (ROA) and return on equity (ROE). ROA is defined as the ratio
between operating profit (EBIT) and total assets, while ROE as the ratio between profit and
equity attributable to equity holders. Margins such as EBITDA margin, EBIT margin and profit
margin are the ratio between the figure considered and revenue. Another relevant figure is
earnings per share (EPS), defined as the ratio between net profit and the quantity of outstanding
shares of the firm.
Accounting information is included and communicated periodically by listed companies
through an official document called an Annual Report which summarizes the monetary value
of assets the company holds at a given moment (usually, the end of the year), and the economic
and financial transactions the company undertook in a given period (usually, a fiscal year).
Reports are one of the most crucial ways a firm communicates with investors and the market
as a whole, and due to its relevance, the documents, the figures and all the calculation undergo
an auditing process by third parties according to the applicable standards and regulations.
2.2 Corporate Governance
Listed firms suffer from incentive problems, which are a consequence of different
objectives of managers, shareholders and stakeholders. Therefore, a system of checks and
balances is required, in order to maintain the company in the path to maximize its value and
create benefits to all stakeholders.

40
Corporate governance is about how public companies are structured and directed. Every
strategy, every innovation in product, operations, and marketing, every acquisition and
divestiture, every decision about asset allocation, finance, joint ventures, financial reports,
systems, compensation, and community relations – every decision and every one of the
thousands of decisions within each one – is determined by some part of the system of corporate
governance (MONKS e MINOW, 2011).
Hence, corporate governance is a set of systems, principles and processes through which a
firm is governed in the direction of its objectives. Its main players are the executives, the board
of directors and the shareholders of a company. However, it is relevant to stress that corporate
governance considers not only internal stakeholders, but also external ones, as shown on Figure
12.
Figure 12 - Corporate Governance
Source: Author, based on Monks and Minow (2011)
The main principles of corporate governance are related to rights and treatment of
shareholders, interest of stakeholders, responsibilities of the board, integrity, ethical behavior,
disclosure and transparency. The principles are crucial for the maintenance of a prosperous
business and a good relation with investors.
In essence, according to Monks and Minow (2011), corporate governance is a structure
intended to guarantee that the right questions are being asked, and to provide checks and
balances that secure that the answers reflect the intention of creating long-term, sustainable and
renewable value.

41
2.3 Financing and Leverage
Brealey, Myers and Marcus (2001) classify the financing strategies as internal and
external. The first refers to the situation where company´s own retained earnings, coming from
its net profit, are ploughed back to the firm, increasing shareholder´s investments. The second
covers all the solutions of debt and equity financing.
Generally, debt financing is related to scenarios where the lender borrows money and
agrees to repay it in the future, with the addition of interest. The most usual forms of debt are
bank loans and bonds. A peculiarity of this strategy is the limited liability of corporations, which
means that the repayment commitment is not always met. If a firm has financial problems, it
has the right to default and hand over its assets to the lenders.
Equity financing, on the other hand, is associated to the raise of capital through the issue
of shares. This happens considering a restricted group of investors or the general public, in
private placements or public issues, respectively.
There are many differences between debt and equity solutions: when the firm borrows, it
promises to repay the debt with interest. If it doesn’t keep its promise, the debtholders may force the
firm into bankruptcy. However, no such commitments are made to the equity holders. They are entitled
to whatever is left over after the debtholders have been paid off. For this reason, equity is called a
residual claim on the firm (BREALEY, MYERS e MARCUS, 2001).
Different possibilities of debt and equity financing will be exposed in detail on the Discussion
chapter of this work, as well as the Pecking Order Theory by Myers and Majluf (1984). This theory
states that, as a consequence of the increasing cost of financing, firms will resort firstly to
internal funds, then to debt solutions and lastly to equity financing.
A relevant observation by Brealey, Myers and Marcus (2001) is the existence of innovative
and unusual products, such as indexed bonds, asset-backed bonds, reverse floaters and even
convertible securities. The latter are hybrid products that can be converted from debt to equity
and vice versa, based on the interest of the party that holds the right to exercise the conversion.
Another key concept related to this issue is the financial leverage. Financial leverage
refers to the extent to which a firm relies on debt. The more debt financing a firm uses in its
capital structure, the more financial leverage it employs (BREALEY, MYERS e MARCUS,
2001). In order to explain the leverage more in detail, it is fruitful to introduce the weighted
average cost of capital (WACC) and the optimal capital structure.

42
WACC represents the firm´s overall cost of capital, based on the ratio between debt and
equity, the cost of debt and the cost of equity. According to Brealey, Myers and Marcus (2001),
in order to maximize stock value, the company will seek the lowest possible WACC, once it
enables the maximization of the firm´s cash flows, and consequently, the maximization of the
value of the organization. A particular debt-to-equity ratio represents the optimal capital
structure when it results in the lowest possible WACC.
In financial markets, there are several indicators used to assess the leverage degree of a
company and the most common one is the debt-to-equity ratio (defined as total liabilities
divided by total equity or the sum of non-current interest bearing loans and borrowings, current
interest bearing loans and borrowings and bank overdrafts, divided by total equity). Other
indicators may be used, such as the ratio between net financial debt (defined as non-current and
current interest-bearing loans and borrowings and bank overdrafts minus debt securities and
cash and cash equivalents) and EBITDA, as used AB InBev SA/NV.
Companies use the financial leverage in order to make investments funded by debt and to
disclose more attractive indicators to investors, especially ROE and EPS. However, it is crucial
to stress that the higher the debt-to-equity ratio, the higher is ROE´s variance and the amount
of interest to be repaid to lenders, resulting in a riskier perception of the firm by the market.
2.4 Growth Strategies
According to Lockett, Wiklund, et al. (2009), managers of a company face mainly two
strategic options regarding to growth: organic growth and acquisitive growth (referred to as
inorganic growth in this work). Both strategies incur adjustment costs, which consist of time,
effort and resources required to expand the firm in terms of integration of new managers and
the operations.
Organic growth refers to internal generation of resources such as new competences, new
staff, new business lines, new products, new markets and new operations. An adequate
indicator to measure organic growth is company´s revenue.
Many resources are complex, integrated, firm specific and involve tacit knowledge,
which means they are extremely difficult to trade individually. Furthermore, the construction
of a solid foundation that can sustain growth takes a long period of time.
Those barriers lead to the second type of growth: acquisitive or inorganic growth. This
strategy arises when one firm buys controlling interest in another firm and the acquired
business is integrated within current operations or becomes a subsidiary of the acquirer´s

43
portfolio (LOCKETT, WIKLUND, et al., 2009). It enables the managers to acquire complete
sets of resources, being an attractive alternative to organic growth, especially considering the
time span.
Penrose (2009) affirms inorganic growth allows firms to break new paths of development
and access new opportunities, being best suited for companies that lack ability to expand
organically. She also mentions that adjustment costs in a merger or acquisition arise because
manager´s time and capabilities will have to be dedicated to the integration of resources of the
acquired firm, rather than to internal activities.
The recommendations about expansion in the selected geographical segments will be
drawn based on the concepts and considerations presented in this chapter, AB InBev SA/NV´s
capital allocation objectives and its current situation.

44

45
3 METHODOLOGY
In this chapter, an explanation about the case study methodology will be introduced.
3.1 Selection and Dimensions of a Case Study
Yin (2009) states that case study is only one among many several ways of developing
science research. In general, case studies are preferred method when (a) “how” and “why”
questions are being posed, (b) the investigator has little control over events, and (c) the focus
is on a contemporary phenomenon within a real-life context (YIN, 2009). Therefore, it is
reasonable to justify the selection of such methodology to develop the present work about AB
InBev SA/NV: “how” and “why” open issues are raised from actual context where the author
has no interference.
According to Yin (2009), case studies are used in many situations and fields of knowledge,
from psychology and sociology to political sciences and business. However, in all these
scenarios the need for such method arises out of the desire to understand complex phenomena.
The present work is an application of the case study methodology to the beer business.
A peculiarity of case studies is that there will be many more variables of interest than data
points. In response, an essential tactic is to use multiple sources of evidence, with data needing
to converge in a triangulating fashion. This challenge is only one aspect that makes case study
research “hard”, although it has classically been considered a “soft” form of research. (YIN,
2009).
Scholz and Tietje (2002) point seven dimensions of case studies: design, motivation,
epistemological status, purpose, data, format and synthesis. Each dimension presents two or
more classifications as shown on Figure 13.

46
Figure 13 - Case Studies Dimensions and Classifications
Source: Scholz and Tietje (2002)
The adequate classification is an important step to introduce the discussion and to align
expectation with the readers of this work.
Regarding to design, this case study is considered as embedded, once it involves more than
one unit or object of analysis and is not limited to qualitative analysis alone (SCHOLZ e
TIETJE, 2002). It is a multiple case, once the units or objects of analysis are approached under
different sets of information. Figure 14 illustrates the possible designs of case studies.
Figure 14 - Case Study Designs
Source: Yin (2009)

47
This work is intrinsically motivated, once it was a result of the will of the author to
investigate the case of AB InBev SA/NV for nonscientific reasons, which means that the
objective of the present analysis is not related to the development of new theories or application
of scientific methods. It is considered an exploratory case study, once it helps to gain insight
into the structure of a phenomenon in order to develop hypotheses, models or theories and it is
not based on a reference theory or model (SCHOLZ e TIETJE, 2002).
The purpose of the present work is mainly related to teaching intentions. Clearly, the goal
of teaching by case studies is to improve one's ability to solve problems. Case studies are good
for problems where truth is relative, reality is realistic, and a structural relationship is
contingent. Hence, case teaching focuses primarily on the development of understanding,
judgment, and intuition (SCHOLZ e TIETJE, 2002). The “learning by doing” principle applies
and the problem becomes the student´s own. This way, readers shall develop the capacity to
ask appropriate questions, to listen carefully and respond constructively, to deal with
uncertainty, to reward and to punish, and to create learning environments of openness and trust
(BARNES, CHRISTENSEN e HANSEN, 1994). Thus, teaching by means of case studies
should be conceived of as open learning approaches that encourage community involvement-
an active, democratic approach (SCHOLZ e TIETJE, 2002).
In terms of data, this a typical mixed case study. Both types of data are crucial to the
discussion of the open issues proposed. For this reason, in each topic, both qualitative and
quantitative data are provided.
The format of the present work is an unstructured case due to three reasons: it has no best
solution, some theory is explained during the resolution and contextual information is necessary
to propose solutions.
As the case study report is similar to a narrative, its synthesis process is considered to be
informal, emphatic or intuitive, once the author guides the audience through data and several
assessments, pointing out possible recommendations.

48
3.2 Case Study Process
Yin (2009) divides the case study research in six stages, resulting in a linear but iterative
process, as show on Figure 15.
Figure 15 - Case Study Process
Source: Yin (2009)
The first stage, “Plan”, consists on the selection of the case study method as the proper
method to assess the issue and also on the understanding of the scope, strengths and limitations
of such a method. The case study is selected to analyze financial and strategic aspects of AB
InBev SA/NV once, as mentioned in the beginning of this chapter, “how” and “why” open
issues are raised from actual context where the author has no interference.
Subsequently, in the “Design” stage, the units of analysis that will be studied are defined
and the dimensions are set. To fit the characteristics expected by the author, the present work
was developed as an embedded, multiple, unstructured, exploratory, intrinsically motivated
case study, with mainly teaching purpose, qualitative and quantitative data and an informal,
emphatic or intuitive synthesis. A research design is the logic that links the data to be collected
(and the conclusions to be drawn) to the initial questions of the study (YIN, 2009).
In “Prepare”, the investigator of the case study (i.e. the author of this work) shall hone their
skills in order to develop an enriching assessment. The preparation of the investigator is
considered one of the most important steps in the whole process, especially because of the high
degree of difficulty imposed by such method. In fact, case study research is among the hardest
types of research to do because of the absence of routine procedures. Case study investigators

49
therefore need to feel comfortable in addressing procedural uncertainties during the course of a
study (YIN, 2009). Besides coursing subjects related to strategy, accounting, corporate finance,
financial markets and entrepreneurship at Escola Polténica da USP, in São Paulo and
Politecnico di Milano, in Milan, the author of this case study has attended mentoring meetings
with professors from both Universities for guidance and counseling referring to the structure
and content of the present work.
Afterwards, in “Collect”, multiple sources of information are used, a case study database
is established and a chain of evidence is drawn. According to Yin (2009), these three paramount
principles are crucial to any data collection effort in doing case studies. In the present work,
reports and presentations disclosed by breweries around the world, academic articles, books
and websites represent the main origin of data, and from them, the database is set.
In the fourth stage, “Analyze”, theoretical propositions and strategies are applied and
discussed. Analyzing case study evidence is especially difficult because the techniques have
not been well defined. To overcome this circumstance, every case study analysis should follow
a general analytic strategy (YIN, 2009). In the present work, depending on the open issue
approached, a different strategy to guide the assessments was selected by the author, in order
to reach possible recommendations.
The final stage, “Share”, represents the concerns about textual and visual aspects of the
material and the display of evidence for the reader to reach his/her own conclusion. Reporting
a case study means bringing its results and findings in a clear and data-supported manner, and
more importantly, leaving the discussion open to other viewpoints and judgements. In the
present work, the conclusion synthetizes the suggestions drawn by the author and introduces
correlated issues that can be approached in future studies.

50
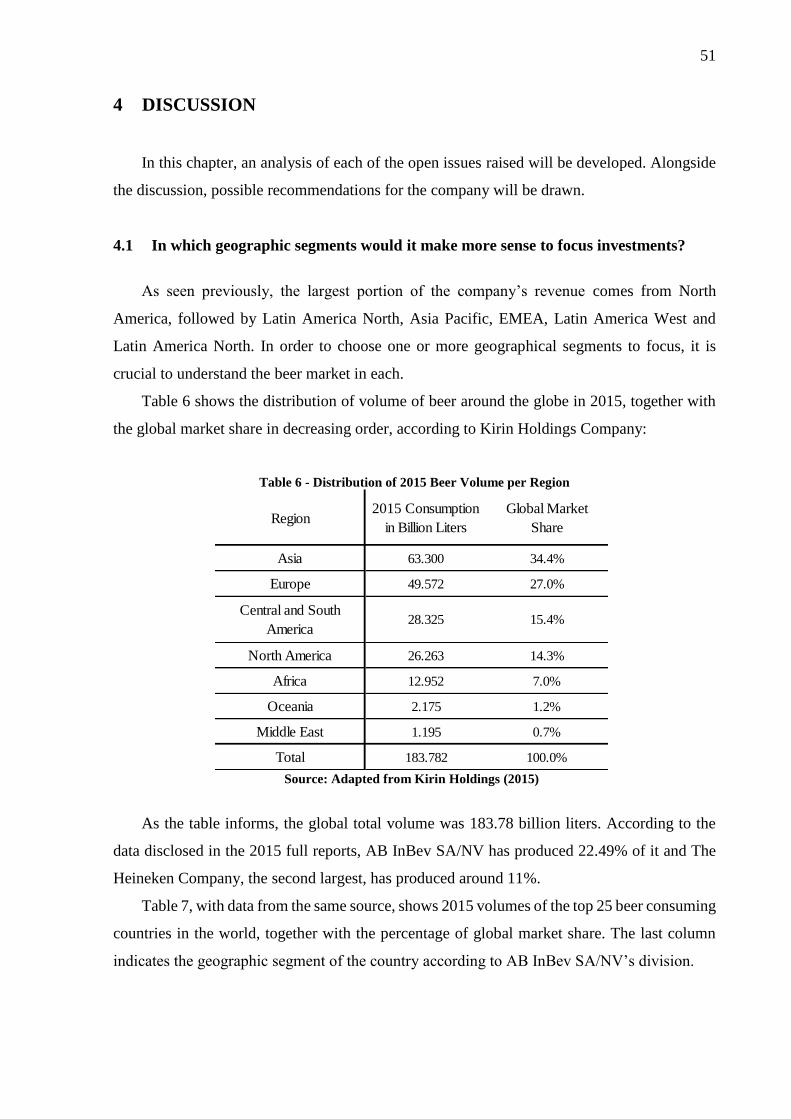
51
4 DISCUSSION
In this chapter, an analysis of each of the open issues raised will be developed. Alongside
the discussion, possible recommendations for the company will be drawn.
4.1 In which geographic segments would it make more sense to focus investments?
As seen previously, the largest portion of the company’s revenue comes from North
America, followed by Latin America North, Asia Pacific, EMEA, Latin America West and
Latin America North. In order to choose one or more geographical segments to focus, it is
crucial to understand the beer market in each.
Table 6 shows the distribution of volume of beer around the globe in 2015, together with
the global market share in decreasing order, according to Kirin Holdings Company:
Table 6 - Distribution of 2015 Beer Volume per Region
Source: Adapted from Kirin Holdings (2015)
As the table informs, the global total volume was 183.78 billion liters. According to the
data disclosed in the 2015 full reports, AB InBev SA/NV has produced 22.49% of it and The
Heineken Company, the second largest, has produced around 11%.
Table 7, with data from the same source, shows 2015 volumes of the top 25 beer consuming
countries in the world, together with the percentage of global market share. The last column
indicates the geographic segment of the country according to AB InBev SA/NV’s division.
Region2015 Consumption
in Billion Liters
Global Market
Share
Asia 63.300 34.4%
Europe 49.572 27.0%
Central and South
America28.325 15.4%
North America 26.263 14.3%
Africa 12.952 7.0%
Oceania 2.175 1.2%
Middle East 1.195 0.7%
Total 183.782 100.0%
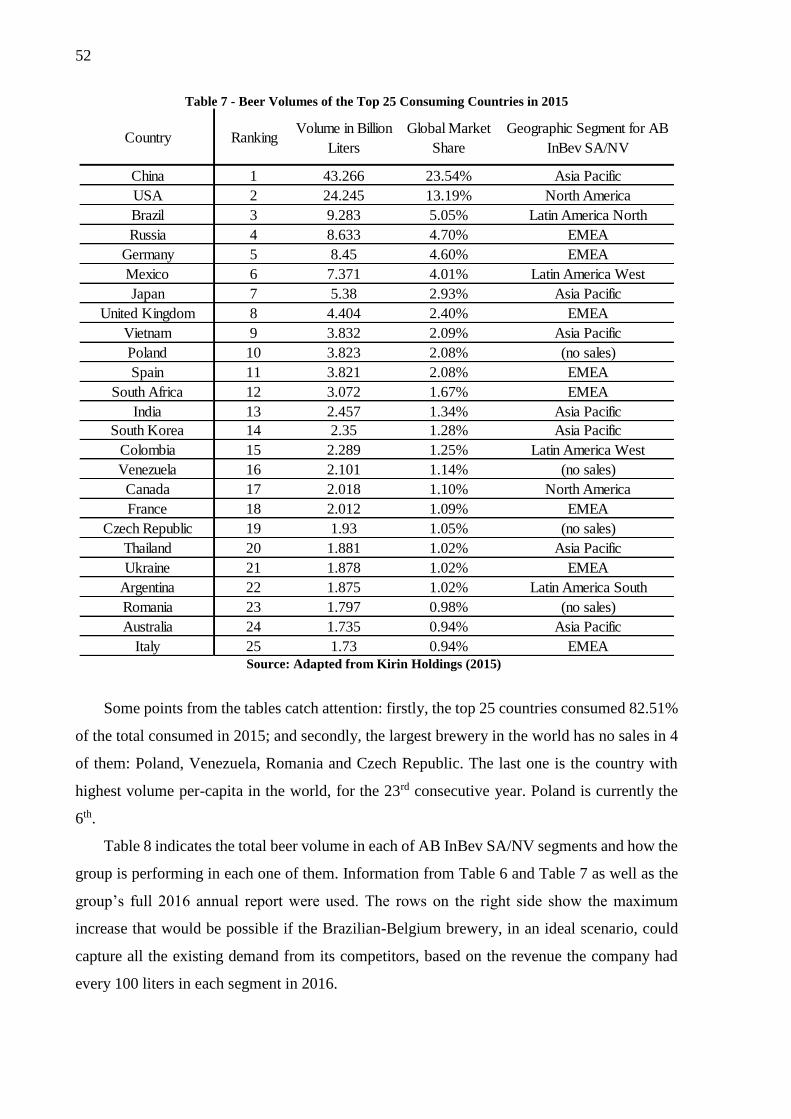
52
Table 7 - Beer Volumes of the Top 25 Consuming Countries in 2015
Source: Adapted from Kirin Holdings (2015)
Some points from the tables catch attention: firstly, the top 25 countries consumed 82.51%
of the total consumed in 2015; and secondly, the largest brewery in the world has no sales in 4
of them: Poland, Venezuela, Romania and Czech Republic. The last one is the country with
highest volume per-capita in the world, for the 23rd consecutive year. Poland is currently the
6th.
Table 8 indicates the total beer volume in each of AB InBev SA/NV segments and how the
group is performing in each one of them. Information from Table 6 and Table 7 as well as the
group’s full 2016 annual report were used. The rows on the right side show the maximum
increase that would be possible if the Brazilian-Belgium brewery, in an ideal scenario, could
capture all the existing demand from its competitors, based on the revenue the company had
every 100 liters in each segment in 2016.
Country RankingVolume in Billion
Liters
Global Market
Share
Geographic Segment for AB
InBev SA/NV
China 1 43.266 23.54% Asia Pacific
USA 2 24.245 13.19% North America
Brazil 3 9.283 5.05% Latin America North
Russia 4 8.633 4.70% EMEA
Germany 5 8.45 4.60% EMEA
Mexico 6 7.371 4.01% Latin America West
Japan 7 5.38 2.93% Asia Pacific
United Kingdom 8 4.404 2.40% EMEA
Vietnam 9 3.832 2.09% Asia Pacific
Poland 10 3.823 2.08% (no sales)
Spain 11 3.821 2.08% EMEA
South Africa 12 3.072 1.67% EMEA
India 13 2.457 1.34% Asia Pacific
South Korea 14 2.35 1.28% Asia Pacific
Colombia 15 2.289 1.25% Latin America West
Venezuela 16 2.101 1.14% (no sales)
Canada 17 2.018 1.10% North America
France 18 2.012 1.09% EMEA
Czech Republic 19 1.93 1.05% (no sales)
Thailand 20 1.881 1.02% Asia Pacific
Ukraine 21 1.878 1.02% EMEA
Argentina 22 1.875 1.02% Latin America South
Romania 23 1.797 0.98% (no sales)
Australia 24 1.735 0.94% Asia Pacific
Italy 25 1.73 0.94% EMEA
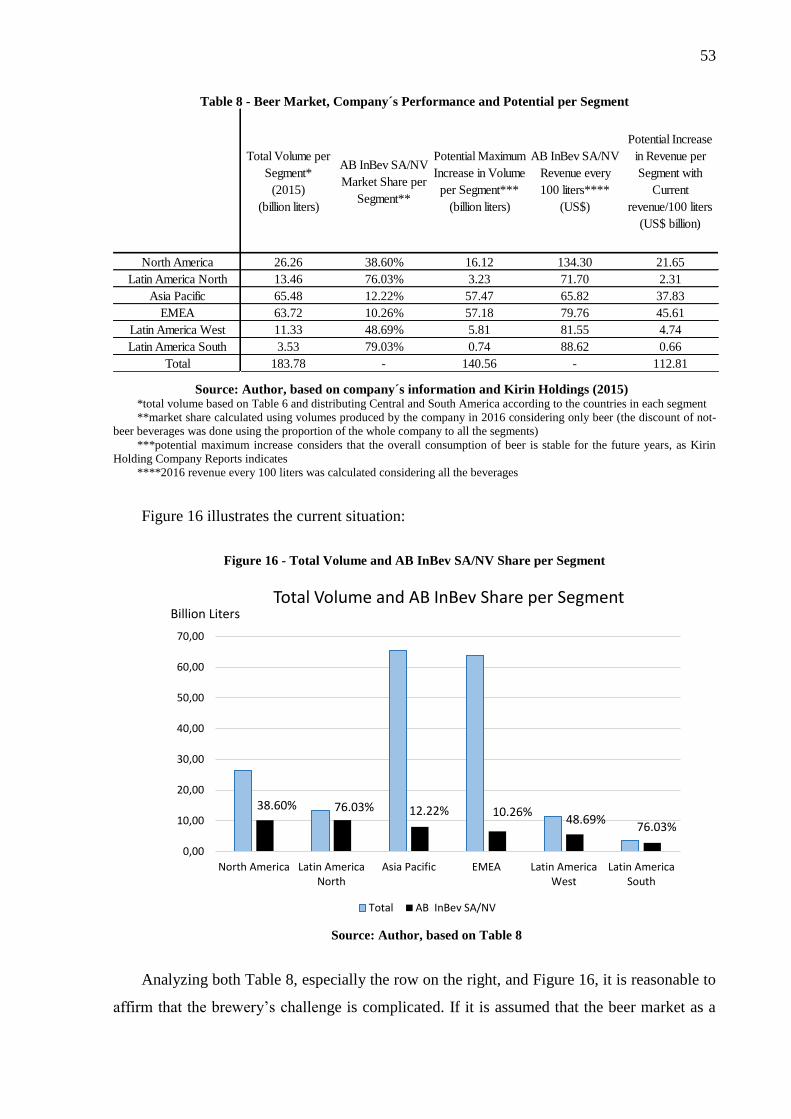
53
Table 8 - Beer Market, Company´s Performance and Potential per Segment
Source: Author, based on company´s information and Kirin Holdings (2015) *total volume based on Table 6 and distributing Central and South America according to the countries in each segment
**market share calculated using volumes produced by the company in 2016 considering only beer (the discount of not-
beer beverages was done using the proportion of the whole company to all the segments)
***potential maximum increase considers that the overall consumption of beer is stable for the future years, as Kirin
Holding Company Reports indicates
****2016 revenue every 100 liters was calculated considering all the beverages
Figure 16 illustrates the current situation:
Figure 16 - Total Volume and AB InBev SA/NV Share per Segment
Source: Author, based on Table 8
Analyzing both Table 8, especially the row on the right, and Figure 16, it is reasonable to
affirm that the brewery’s challenge is complicated. If it is assumed that the beer market as a
Total Volume per
Segment*
(2015)
(billion liters)
AB InBev SA/NV
Market Share per
Segment**
Potential Maximum
Increase in Volume
per Segment***
(billion liters)
AB InBev SA/NV
Revenue every
100 liters****
(US$)
Potential Increase
in Revenue per
Segment with
Current
revenue/100 liters
(US$ billion)
North America 26.26 38.60% 16.12 134.30 21.65
Latin America North 13.46 76.03% 3.23 71.70 2.31
Asia Pacific 65.48 12.22% 57.47 65.82 37.83
EMEA 63.72 10.26% 57.18 79.76 45.61
Latin America West 11.33 48.69% 5.81 81.55 4.74
Latin America South 3.53 79.03% 0.74 88.62 0.66
Total 183.78 - 140.56 - 112.81
0,00
10,00
20,00
30,00
40,00
50,00
60,00
70,00
North America Latin AmericaNorth
Asia Pacific EMEA Latin AmericaWest
Latin AmericaSouth
Total Volume and AB InBev Share per Segment
Total AB InBev SA/NV
Billion Liters
38.60% 76.03% 12.22% 10.26%48.69%
76.03%

54
whole is not growing, the maximum potential increase in revenue the company may have is
US$112.81 billion. This means that, based on the combined expected revenue for 2017,
US$55.5 billion, the company still has to capture US$44.5 billion from its competitors,
increasing its income by 80%. Considering the most feasible case, in which the company
reaches the goal by 2022, it would mean a CAGR of 12.50%.
The three Latin American segments do not present good perspectives, once in the best-
case scenario the group would be able to raise its revenue only by US$7.71 billion. Considering
also the market shares on those segments one can assess that it would be really difficult to
increase participation in Latin America South (currently 79.03%) and Latin America North
(currently 76.03%). The market share the group possess is already high and trying to increase
it further could generate a series of reactions from market authorities. Another point that would
make improvement in these segments hard is the fact that competing breweries, who control
the rest of the market, probably have loyal customers and its owners may not want to sell their
businesses. Thinking about Latin America West, where the market share is 48.69%, the
possibilities are better. The segment has two top 25 consuming countries (Mexico and
Colombia) where AB InBev already operates. Furthermore, the brewery has no sales in
Venezuela, the 16th largest beer consumer, probably due to the country’s risk caused by general
crisis of past years. However, even if AB InBev could capture the whole demand of the region,
the increase in sales would be US$4.74 billion.
Concluding, it would not make sense to focus on any of the three Latin American segments
for now. Maybe, in the longer-term, especially if Venezuela recovers, the company could try to
raise its participation in Latin America West.
Going in deep in the North America segment, where AB InBev SA/NV has a market
share of 38.60%, it is possible to estimate that in the US, the Brazilian-Belgium conglomerate
has a market share of around 42%, (followed by MolsonCoors with approximately 25%23) and
in Canada, a market share close to 31% (followed closely by MolsonCoors with approximately
27%24). Once again, even though the market size is large (with almost US$22 billion to
capture), the difficulty to beat competitors and market regulations might be a huge challenge
for AB InBev SA/NV. Remembering the issues the company faced in the SABMiller
acquisition by the end of 2016 having to sell Miller to MolsonCoors, it is clear that depending
on the market regulators the perspectives for an acquisition and a large improvement are not
good. The only option in North America would therefore be organic growth: competing with
23 Statista (2017) 24 Statista (2017)

55
the other breweries could generate some new income. However, even raising market share by
10%, which for sure would be a tremendous challenge, the extra revenue would be only
US$3.52 billion.
For those reasons, it seems that investing in growth in the North America segment is not
an attractive idea. As a whole, the American continent does not show good perspectives, except
for Latin America West, in the long-run.
Both EMEA and Asia Pacific are segments where the presence of AB InBev SA/NV is
not strong, in fact, they are by far the lowest market shares the company has, with respectively
10.26% and 12.22%. Another appealing fact is that those are the two largest markets by-far,
together representing more the 70% of the world’s demand. The participation of the Brazilian-
Belgium brewery is more recent in Asia, Oceania and Africa and not as consolidated as it is in
Latin America, North America and Europe, from where the first three breweries that merged
come from: AmBev from Brazil, Anheuser-Busch from US and Interbrew from Belgium. This
means that problems with authorities regarding the free competition would be theoretically less
severe if the company opts for inorganic growth. On the other hand, cultural, post-merger,
corporate governance and legal mismatches are more likely to arise due to large amount of
differences between those markets and the ones where the brewery is more used to sell its
products.
In terms of the operational challenge, it is believed that AB InBev SA/NV is capable of
being economically competitive even in markets where it does not have tradition, as it has
proven many times throughout its expansionary background. For those reasons, it looks like
both organic and inorganic growth are viable in EMEA and Asia Pacific.
Asia Pacific has seven representatives in the top 25 consuming countries, consuming
35.63% of the global volume, while EMEA has eight and consumes 34.67%. Furthermore,
China is the global leader (with almost the double of the volume consumed by US) and among
the 25 countries in the ranking, there are three where AB InBev SA/NV does not operate that
could be added to the EMEA segment: Poland, Czech Republic and Romania.
It is true that the competition in both segments is tough, The Heineken Company and
Carlsberg Group have strong presence in Europe but the combination with SABMiller can be a
game-changer in the EMEA region in favor of the world leader, especially due to Africa. The
Asia Pacific market also has large companies, and the major players are: Asahi Group, Beijing
Yanjing Brewery, Carlsberg Group, United Breweries Group, SABMiller (already a part of AB
InBev SA/NV group), Tsingtao Group, China Resource Snow Breweries and Kirin Holdings.
56
Even though the world consumption as a whole is expected to be stable, the perspectives
for Asia Pacific are attractive: the market size is expected to grow with a CAGR of 7.3%
between 2014 and 2020, reaching US$202 billion25 annually by the end of the period. For this
reason, the major players in the global brewing industry have their sights firmly set on the area.
They are motivated by the ease of gaining market share when the market is growing, once there
is no need to capture a customer that already has an established relationship with another brand.
It is important to highlight that even a small percentage increase in large markets like
EMEA and Asia Pacific can represent a large amount in terms of revenue. For instance,
capturing 20% of the Potential Maximum Increase in both markets would create almost US$17
billion in sales.
Other information from Table 8 that seems promising is the fact that Asia Pacific and
EMEA are the last and the 4th in terms of revenue generated every 100 liters of beer sold.
Following the premiumnization26 trend that happens worldwide, it might be profitable to make
marketing efforts with the aim of raising prices. Another initiative could be a change in brand
mix which would increase sales of more expensive beers.
Finally, it is possible to conclude that AB InBev SA/NV should focus its investments in
Asia Pacific and EMEA for a series of reasons: these are the two largest markets and where the
company has the lowest market share; both organic and inorganic growth are possible; the
group has proven to be able to deal with new different landscapes; SABMiller combination can
be a game-changer in these segments; Asia Pacific market is growing in a fast pace; small
percentage volume increase means large increase in income; it seems feasible to raise prices.
4.2 Which is the best way for the company to expand its business? Should AB InBev
SA/NV choose organic or inorganic growth? If organic, how? If inorganic, which
would be interesting companies to acquire?
According to the analysis developed in the previous section, it was possible to conclude
that EMEA and Asia Pacific are the most appealing market segments to focus investments, but
which is the best way to expand in each one?
The EMEA segment is composed by Europe, Middle East and Africa.
The European beer market is very competitive and AB InBev SA/NV has a good presence
in Western and Central Europe, Russia and Ukraine, but not in the Eastern or Nordic countries.
25 The Drinks Business (2015) 26 Forbes (2016)

57
Actually, in order to fulfill antitrust requirements, AB InBev SA/NV sold SABMiller’s brands
that are well recognized in the east (such as Pilsner Urquell, Kozel and Tyskie) and even some
important brands in the west (such as Peroni and Grolsch) to the Japanese Asahi Group. The
Belgium-Brazilian group has no presence in crucial countries in the east market such as Czech
Republic, Poland, Hungary, Slovakia, Croatia and Romania. However, the presence is
satisfactory in Russia and Ukraine and as show on Table 7, they are the 4th and 21st largest
markets in the world.
According to Appendix G, it is clear that Carlsberg Group and The Heineken Company
focus much more effort on the east and in the Nordics, making it difficult for the world leader
to penetrate without an acquisition. However, as has already happened, market authorities do
not seem to let AB InBev SA/NV inorganically expand its business in this area. The same
restrictions in terms of takeovers apply to the west, once the brewery had to sell brands in the
region to close the SABMiller deal. Hence, in the European market as a whole, it looks that the
best option is organic growth in Western and Central Europe, Russia and Ukraine. Fortunately,
expanding existing sales is the priority of the group according to the capital allocation
objectives disclosed.
AB InBev SA/NV does not own national brands in many countries in the west and center
of the continent, which means that in those countries the revenue flows from the sales of brands
imported from countries in the European Union. Belgium, Germany, UK and Spain are the
places where the conglomerate owns well-recognized brands. On the other hand, Italy, France,
Switzerland, Austria, Netherlands and Portugal are countries with no important national brands,
as seen in Table 9, with the relevant brands in terms of volume:

58
Table 9 - Relevant Local Brands in Western and Center Europe
Source: Author, based on Euromonitor (2017)
The imported beers in those countries are always more expensive, making competition with
local brands a challenge. Once EU has generally no taxes between member states, lowering
profit margins in order to compete in price with national brands may be feasible and interesting,
especially because the imported beers from Germany and Belgium (countries with tremendous
tradition and quality in beer production and where AB InBev SA/NV owns a series of
worldwide known brands) are usually already seen as premium. As the goal was developed in
terms of revenue and not necessarily profit, reducing the margin for some years should make
sense to boost organic growth and create more brand recognition. Of course, for longer-term,
after volume expansion and brand building, the company could raise margins again.
In Russia, AB InBev SA/NV has a market share of around 17%27, in the second position
after Carlsberg (39%) and right ahead of Heineken (15%). The Belgium-based group has its
revenues flowing from national brands and from imported global brands such as Stella Artois
and Budweiser. The Ukrainian market is led by AB InBev SA/NV, with 35%28 volume market
share. The company own three brands including the market leader, Chernigivske. The most
relevant competitor is the Carlsberg Group, with 29%.
With the intention of growing revenues, the company could focus on the more expensive
imported brands in Russia, once the difficult economic environment and pressure from smaller
local breweries create a scenario in which is not rational to compete in price. Moreover, the
27 Global Agricultural Information Network of the United States (2016) 28 Euromonitor (2017)
Key Local Brand Owner
Moretti The Heineken Company
Peroni/Nastro Azzuro Asahi Group
Poretti Carlsberg Group
France Kronenburg/1664 Carlsberg Group
Switzerland Feldschlösschen Getränke Carlsberg Group
Brau-Union Österreich The Heineken Company
Stiegl Stieglbrauerei zu Salzburg
Heineken/Amstel The Heineken Company
Groslch Asahi Group
Bavaria Bavaria Brewery
Super Bock Unicer
Sagres The Heineken Company
Italy
Austria
Netherlands
Portugal

59
beer market is expected to decline with a CAGR of -2%29 until 2020 due to economic recession.
In situations like this, usually the volume of high-end beer is the one that varies the least, with
high-income citizens being the less impacted ones.
In Ukraine, there will be the halt of the importation of Russian beer, meaningful in terms
of volume, because of the introduction of a trade embargo. This means that local brands will
have a chance to fill this demand. AB InBev SA/NV, as the market leader, is in the best position
to seize this opportunity: focusing strategy in marketing efforts and low prices could improve
sales and raise market share.
The representation in Middle East is given by Anadolu Efes, a Turkish associate company
responsible for production and commercialization of Efes Pilsen, the market leader in the
country with 63%30 market share. The company is 24% owned by AB InBev SA/NV.
Nevertheless, an expansion in the Middle East seems unlikely due to market restrictions and
Islamism, the predominant ideology in the area that considers alcohol consumption unlawful.
Additionally, the minority stake the Belgium-based firm owns in Anadolu Efes does not grant
a commanding position, which means the decision-making is mostly done by other
shareholders.
As mentioned before, the acquisition of the SABMiller group has created great
opportunities for the world leader to penetrate the African market. Currently, AB InBev
SA/NV has participations in breweries in nine countries in Africa: Botswana, Ghana,
Mozambique, Nigeria, South Africa, Tanzania, Uganda, Zambia and Zimbabwe. The national
market share position and the participation of Brazilian-Belgium group are shown in Table 10:
Table 10 - Participation and Market Share Ranking of African Breweries
Source: Author, based on company´s information, Worldometers (2017) and Euromonitor (2017)
29 Euromonitor (2017) 30 Euromonitor (2017)
CountryPopulation
(million)
% of African
PopulationCompany
National
Market Share
Ranking
AB InBev
SA/NV
Partcipation
Intafact Beverages second 37.5%
International Breweries third 36.0%
South Africa 55 4.8% South African Breweries first 100.0%
Tanzania 51 4.2% Tanzania Breweries first 36.0%
Uganda 37 3.1% Nile Breweries first 61.8%
Mozambique 28 2.2% Cervejas de Moçambique first 49.1%
Ghana 27 2.2% Accra Brewery second 59.84%
Zambia 15 1.3% Zambiam Breweries first 54.0%
Zimbabwe 14 1.2% Delta Corporation first 25.0%
Botswana 2 0.2% Kgalagadi Breweries first 31.0%
Nigeria 182 16.0%

60
Africa is the most promising of the emerging markets, as it is projected that by 2025, one-
fifth of the world’s population will be living in the continent31. Furthermore, over half of the
expected growth worldwide between 2017 and 2050 is likely to occur in Africa. Nigeria, for
instance, is expected to become the world’s third largest population by 2050 according to the
United Nations32. Considering also the highest urbanization and GDP growth rates, the scenario
of this region seems quite attractive.
An interesting African trend is the related to the craft beer market: as the middle class
grows, the microbrew market is also predicted to flourish. Craft beer is expected by specialists
to appear in large urban centers, particularly the ones with intense business and tourism
activities33.
The list of the top 15 African countries by population is also a relevant data in order to
appraise what are the most interesting moves for the world leader in the African continent:
Table 11 - Top 15 African Countries by Population
Source: Author, based on company´s information and Worldometers (2017)
Based on the information provided, is possible to draw some suggestions regarding the
African market.
31 Borgen Maganize (2016) 32 CNN (2017) 33 Beverage Daily (2016)
Country RankingPopulation
(million)
% of African
Population
AB InBev
SA/NV Presence
Nigeria 1 182 16.0% yes
Ethiopia 2 99 7.8% no
Egypt 3 89 7.7% no
D. R. Congo 4 77 6.7% no
South Africa 5 55 4.8% yes
Tanzania 6 51 4.2% yes
Kenya 7 46 3.8% no
Sudan 8 40 3.3% no
Algeria 9 40 3.3% no
Uganda 10 37 3.1% yes
Morocco 11 34 3.0% no
Mozambique 12 28 2.2% yes
Ghana 13 27 2.2% yes
Angola 14 25 2.1% no
Ivory Coast 15 23 2.0% no

61
On the countries where AB InBev SA/NV is already present, organic growth focusing on
marketing efforts to expand consumer base or to create new products is recommended,
particularly in Nigeria, South Africa, Tanzania, Uganda, Mozambique and Ghana, due to the
high population (and consequently higher potential of growth in terms of volume) and the solid
presence of the group. It is important to stress that one of the two countries where the Belgium-
based company does not own participation of the market share leader is Nigeria, the largest
market. The Heineken Company owns more than one third of the absolute leader, Nigerian
Breweries, with about 65% of volume share34. Therefore, the perspectives in Nigeria are not
the best.
Out of the top 15 most populated African countries, AB InBev is present only in 6, which
means there is a lot of room for growth within the continent. It would make more sense for the
company to avoid large acquisitions at the moment as their first priority in the capital allocation
is their organic growth. Egypt, Sudan, Algeria and Morocco are countries where Islam is the
dominant religion, being practiced by more than 90% of the population in each country. As
mentioned previously, alcohol consumption is considered unlawful by this ideology, which
means that AB InBev SA/NV should not focus on such countries, which summed up, represent
roughly 19% of the African population.
Ethiopia, Democratic Republic of Congo, Kenya and Angola represent more than 20% of
the population and do not have Islam as their main religion. Once the potential market is
meaningful, putting effort in trying to expand the brands present in other African countries
sounds attractive. All four of these markets are relatively close to Uganda, Tanzania, Zambia,
Zimbabwe, Mozambique, South Africa and Botswana, countries where the brewery already
possesses a good presence. The same expansion logic applies to the Ivory Coast, but with brands
being imported from other countries: Ghana and Nigeria. As organic growth in Nigeria is
unlikely due to Heineken clear dominance, maybe an expansion to other country can bring
positive results in terms of sales.
A final suggestion to Africa would be to analyze small craft breweries and acquire them if
it they are a suitable opportunity, in order to seize the tendency of this kind of product. This
applies particularly to countries with large business centers such as South Africa, Kenya and
Nigeria.
Regarding the Asia Pacific segment, it is key to restate that this market has an expected
growth with a CAGR of 7.3% between 2014 and 2020 and that, out of the six segments used
34 Euromonitor (2016)

62
by AB InBev SA/NV, it is already the largest. Another key fact is that the segment has the
lowest revenue/liter ratio.
In the Table 12, there are the top 15 Asian countries by population:
Table 12 - Top 15 Asian Countries by Population
Source: Author, based on Worldometers (2017) *ranking and % of Asian Population without considering Russia and Middle East countries
Besides the Asian countries listed above, another relevant market in the Asia Pacific
segment is Australia, with a population of 24 million people.
Before going in deep into the analysis of the Asia Pacific market, it is reasonable to discard
expansion in the subsequent countries due the elevated percentage of adherents of Islam:
Indonesia, Pakistan, Bangladesh, Uzbekistan, Malaysia and Afghanistan.
Hinduism (predominant in India and Nepal) and Buddhism (predominant in Thailand and
Myanmar) are ideologies that are not clear about alcohol consumption (differing from the
practices of Islam, which explicitly prohibits it), resulting in a taboo related to this issue.
Consequently, depending on the geographic area, the sect, the degree of religiousness and even
the event, the consumption of alcoholic beverages is accepted or not. Furthermore, in India and
Thailand, there are leading local breweries that control close to 50%35 of the national volume
(United Breweries Group and Roon Rawd Breweries, respectively), besides possessing the
35 Euromonitor (2017)
Country Ranking* Population
(million)% of Asian Population*
China 1 1,387 34.8%
India 2 1,299 32.9%
Indonesia 3 255 6.4%
Pakistan 4 192 4.9%
Bangladesh 5 159 4.0%
Japan 6 127 3.1%
Philippines 7 101 2.4%
Vietnam 8 92 2.2%
Thailand 9 68 1.7%
Myanmar 10 52 1.3%
South Korea 11 51 1.2%
Uzbekistan 12 31 0.8%
Malaysia 13 31 0.8%
Nepal 14 28 0.7%
Afghanistan 15 27 0.7%
63
know-how on dealing with the religious taboo. Thus, it seems logical to avoid dedicating effort
to delicate markets where the Hinduism or the Buddhism are so predominant.
Of the remaining relevant countries in the Asia Pacific segment, AB InBev SA/NV sustains
leading positions in Australia (with 34% volume market share36) and South Korea. In the
Oceanian country, the world leader owns 100% of Carlton & United Breweries (CUB). CUB
possesses five out of the top ten most sold brands in the country. Lion, a company that belongs
to Kirin Holdings, owns four of the top ten most sold37 and it is AB InBev’s main competitor.
In South Korea, the Brazilian-Belgium organization fully owns of the Oriental Brewery (OB),
number one company in terms of volume38 closely followed by Hite-Jinro. OB owns top
national brands and manages 18 imported brands.
Since AB InBev SA/NV already is the leader in Australia and South Korea with at least
one big competitor in both markets, it seems like that organic growth is the only feasible option.
Acquisitions, besides not being company’s priority, seem unlikely to happen due to eventual
restriction by regulators. Hence, in addition to focusing on the increase of number of liters sold,
CUB and OB could consider the possibility of raising prices to boost the revenue/liter ratio and
make the company achieve higher global revenues.
The remaining countries in the top 15 list are China, Japan, the Philippines and Vietnam.
The Chinese annual beer volume is approximately 4 times the volume of the other three
together, and on this country, AB InBev SA/NV holds the rights of eight brands, including the
fourth most sold beer: Harbin39. In 2015, the Brazilian-Belgium brewery was third with 15.7%
market share, after China Resource Snow Breweries (24.6%) and Tsingtao Group (17.9%) and
ahead of Beijing Yanjing (10.5%) and Carlsberg (5.0%). Since 2010, the presence of the world
leader in China has been growing roughly 1% per year and since 2016, it has been pushing
strongly the sales of the US-produced craft-beer Goose Island, as a strategy of promoting pricier
beer. 40
In Japan, however, the conglomerate is not present. Asahi Group leads the market in the
land of the rising sun with 35.5% share, followed by Kirin Holdings (30.3%), Suntory Holdings
(15.3%) and Saporro Holdings (10.2%)41.
AB InBev SA/NV is also not present in the Philippines, where San Miguel Brewery
controls the market with 93%42 volume share (the company is 48.6% owned by Kirin Holdings)
36 Euromonitor (2017) 37 Beer and Brewer (2015) 38 Euromonitor (2017) 39 Ceoworld Megazine (2014) 40 Fortune (2017) 41 Wall Street Journal (2016) 42 Euromonitor (2017)

64
and in Vietnam, where Sabeco (51.4%) leads market, followed by Vietnam Brewery Limited
(29.7%) and Habeco (13.9%)43. The Vietnamese Government holds 89% of the leader and 82%
of Habeco, but is has been planning to divest completely in the short-term44. Heineken has a
60% stake in the second largest player and Carlsberg has a 10% stake in Habeco45.
To raise revenues in the Asia Pacific segment, the Brazilian-Belgium conglomerate could
therefore seize the leading position in Australia and South Korea as well as try to increase sales
of Harbin, Goose Island and the other seven brands it owns in China. However, as the AB InBev
SA/NV sales goal of the 2020 Dream Incentive Plan represents an 80% increase by 2022,
growing organically in these markets may not be enough. The intense cultural difference
between Western and Eastern Hemispheres is another barrier for a fast organic expansion.
Hence, the possibility of M&A deals will be analyzed.
It is essential to clarify that, even though deleveraging is second in the capital allocation
objectives and that selective M&A is only third, it seems that making a big move in Asia is
promising. Solidifying the presence in the continent is not only key to achieve the revenue goal
set by the plan, but also to keep the company growing in the longer-run. Additionally, in the
EMEA segment, the recommendation is to grow organically in almost the entire segment
(accordingly with the number one objective), with exception of acquisitions of minor craft-beer
makers in Africa.
As a big move in the Asia Pacific region is what makes sense, the selection of potential
targets includes only large Asian companies, that is, the ones based in China and Japan. First,
an assessment of the qualitative characteristics of each company will be made, with the
objective of understanding if an acquisition is feasible in terms of restrictions and if it is
strategically attractive. Afterwards, a quantitative analysis based on the information provided
in 2016 annual reports will be developed, in order to appraise the main figures and indicators.
43 Industry Sourcing (2015) 44 Forbes (2016) 45 Forbes (2016)

65
Table 13 - Qualitative Aspects of Target Companies
Target
Company
Company
Presence Main Possessions
Shareholding
Structure Relevant Facts Listing
China
Resources
Beer (CR
Beer)
[CHINA]
First in
China
Market
Share
Snow: the leading
brand by volume
in China and in
the world
98 breweries in
China
51.91%
owned by
China
Resources
National
Corporation
(a state-
owned firm
that has
many
different
businesses)
0.09%
owned by
other entities
48.00% free
float
CR Snow was a joint venture
between CR Beer and
SABMiller, but in order to
complete the combination
with AB InBev, the UK-
based firm was forced to sell
its 49% stake in CR Snow to
China Resources Beer
The company is state-
controlled and it is unlikely
that the Chinese Government
would allow a takeover by
AB InBev SA/NV
Hong
Kong
Stock
Exchang
e
OTC
Markets
Group
(US)
Tsingtao
Brewery
[CHINA]
Second in
China
Market
Share
Tsingtao
brand is
present in
94
countries
in the
world
Tsingtao: second
brand by volume
in China and
spread all over the
world
62 breweries and
2 joint-investment
breweries in
China
30.83%
owned by
Tsingtao
Brewery
Group (a
state-owned
firm)
19.99%
owned by
Asahi Group
6.12%
owned by
other entities
43.05% free
float
Anheuser-Busch used to own
27% of the Tsingtao Group
and it sold 20% to Asahi
Group in 2009, one year after
the merger with InBev. The
other 7% were sold to a
Chinese tycoon. In the
beginning of 2017, Asahi
Group announced that it
wants to sell its 20% stake in
the Chinese company
because it did not meet
Tokyo-based firm's
expectations
Even though the free float
share is larger than the state-
owned part, the Chinese
Government may impose
barriers to an eventual deal
Hong
Kong
Stock
Exchang
e
Shangha
i Stock
Exchang
e
OTC
Markets
Group
(US)

66
Beijing
Yanjing
Brewery
[CHINA]
Fourth in
China
Market
Share
Yanjing
brand is
present in
15
countries
in the
world
Yanjing: third
brand by volume
in China and
spread in Asia
43 breweries and
8 affiliated
breweries in
China
57.40%
owned by
Beijing
Yanjing Beer
Investment
(a state-
owned firm)
7.71%
owned by
other entities
34.89% free
float
The company is state-
controlled and it is unlikely
that the Chinese Government
would allow a takeover by
AB InBev SA/NV
From all the target
companies selected, this is
the only with no financial
reports or website in English.
The cultural difference in this
case seems to be the most
severe
Shenzhe
n Stock
Exchang
e
Asahi
Group
[JAPAN]
First in
Japan
Share
Asahi is
present in
countries
in Asia,
Oceania,
North
America
and
Europe
Second in
Italy
Share
Tenth in
Market
Share +
Craft Beer
in the UK
Second in
Netherlan
ds Market
Share
First in
Czech
Republic,
Poland,
Hungary,
Romania
and
second in
Slovakia
Market
Share
Asahi: leading
brand by volume
in Japan and
spread all over the
world
9 breweries in 8
counties
19.99% of
Tsingtao Group:
second in China
Market Share
(Asahi announced
in 2017 that
wishes to sell this
stake)
Peroni: second
brand by volume
in Italy
Peroni Nastro
Azzuro: tenth
brand by volume
+ Meantime:
pioneer craft beer
in the UK
Grolsch: second
brand by volume
in the Netherlands
Key brands in
eastern Europe
including: Pilsner
Urquell, Tyskie,
Lech, Dreher and
Ursus
5.26%
owned by the
company
itself
28.62%
owned by
other entities
66.12% free
float
Focused also on other
alcoholic beverages (besides
beer), soft drinks and food.
However, alcoholic
beverages represented
roughly 60% of 2016's
revenue
Asahi Holdings acquired
Peroni, Grolsch and
Meantime from AB InBev
and Eastern Europe brands
from SABMiller in 2016, as
the world leader was
pressured by authorities in
order to close the deal with
SABMiller
Tokyo
Stock
Exchang
e
OTC
Markets
Group
(US)
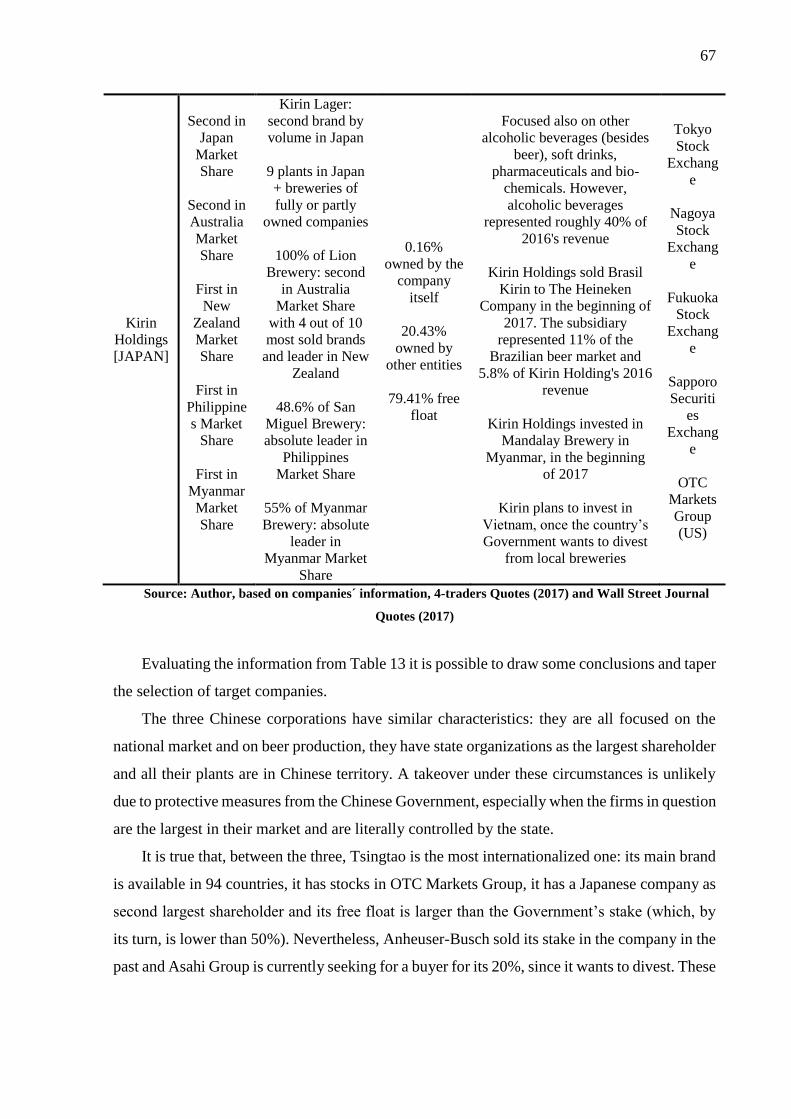
67
Kirin
Holdings
[JAPAN]
Second in
Japan
Market
Share
Second in
Australia
Market
Share
First in
New
Zealand
Market
Share
First in
Philippine
s Market
Share
First in
Myanmar
Market
Share
Kirin Lager:
second brand by
volume in Japan
9 plants in Japan
+ breweries of
fully or partly
owned companies
100% of Lion
Brewery: second
in Australia
Market Share
with 4 out of 10
most sold brands
and leader in New
Zealand
48.6% of San
Miguel Brewery:
absolute leader in
Philippines
Market Share
55% of Myanmar
Brewery: absolute
leader in
Myanmar Market
Share
0.16%
owned by the
company
itself
20.43%
owned by
other entities
79.41% free
float
Focused also on other
alcoholic beverages (besides
beer), soft drinks,
pharmaceuticals and bio-
chemicals. However,
alcoholic beverages
represented roughly 40% of
2016's revenue
Kirin Holdings sold Brasil
Kirin to The Heineken
Company in the beginning of
2017. The subsidiary
represented 11% of the
Brazilian beer market and
5.8% of Kirin Holding's 2016
revenue
Kirin Holdings invested in
Mandalay Brewery in
Myanmar, in the beginning
of 2017
Kirin plans to invest in
Vietnam, once the country’s
Government wants to divest
from local breweries
Tokyo
Stock
Exchang
e
Nagoya
Stock
Exchang
e
Fukuoka
Stock
Exchang
e
Sapporo
Securiti
es
Exchang
e
OTC
Markets
Group
(US)
Source: Author, based on companies´ information, 4-traders Quotes (2017) and Wall Street Journal
Quotes (2017)
Evaluating the information from Table 13 it is possible to draw some conclusions and taper
the selection of target companies.
The three Chinese corporations have similar characteristics: they are all focused on the
national market and on beer production, they have state organizations as the largest shareholder
and all their plants are in Chinese territory. A takeover under these circumstances is unlikely
due to protective measures from the Chinese Government, especially when the firms in question
are the largest in their market and are literally controlled by the state.
It is true that, between the three, Tsingtao is the most internationalized one: its main brand
is available in 94 countries, it has stocks in OTC Markets Group, it has a Japanese company as
second largest shareholder and its free float is larger than the Government’s stake (which, by
its turn, is lower than 50%). Nevertheless, Anheuser-Busch sold its stake in the company in the
past and Asahi Group is currently seeking for a buyer for its 20%, since it wants to divest. These
68
are indications that holding a participation in a massive Chinese beer maker may create more
concerns than business opportunities.
Besides, AB InBev SA/NV already holds a satisfactory third position in the largest beer
market in the world, and more importantly, it has been raising its market share organically 1%
per annum since 2010. Therefore, it appears reasonable to concentrate attention in the two
Japanese companies for now. It is also valid to remember that AB InBev SA/NV is not present
in Japan as of now.
Asahi Group and Kirin Holdings also share some features: they have meaningful presence
in other markets rather than Japan, they have no equity participation of Governmental bodies,
they have large free floats and they produce other items in addition to beer. Regarding to
qualitative aspects, their main difference is given by the presence in foreign countries: while
Asahi has sales in high-volume countries in Europe such as Poland, Czech Republic and Italy,
Kirin is effective in the Southeastern Asia and Oceania.
The two firms operate other lines of non-beer drinks, which might be strategically attractive
to AB InBev, once, as mentioned before, almost 15% of the 50 billion liters of beverage
produced in 2016 is not beer. Both firms also sell products that are completely unrelated to the
Brazilian-Belgium brewery business: Asahi produces food and Kirin produces pharmaceuticals
and bio-chemicals.
An eventual acquisition of one of the companies would generate, for sure, a debate
regarding the competitive landscape in some country. As shown on the table, Asahi Group has
recently purchased brands from AB InBev and from SABMiller in order to create the necessary
market conditions for the closing of the combination. This means that, if the world leader
acquires Asahi, the same restrictions faced previously would regain momentum. Conversely,
in case of a takeover of Kirin Holdings, the most likely difficulty to emerge could be regarding
the Oceanian market. CUB (already owned by AB InBev SA/NV) and Lion (owned by Kirin),
together, would control close to 70% of market share and own nine out of the ten most sold
brands in Australia. Kirin has just sold Brasil Kirin to Heineken, which means that an eventual
pressure from Brazilian authorities is now unlikely to happen.
For both strategy and volume reasons, an acquisition of the two companies seems
interesting for the main brewery in the world. However, with the aim of analyzing the situation
more in depth the situation, Table 14 and Table 15 can be built using quantitative data from
the 2016 annual reports officially disclosed.
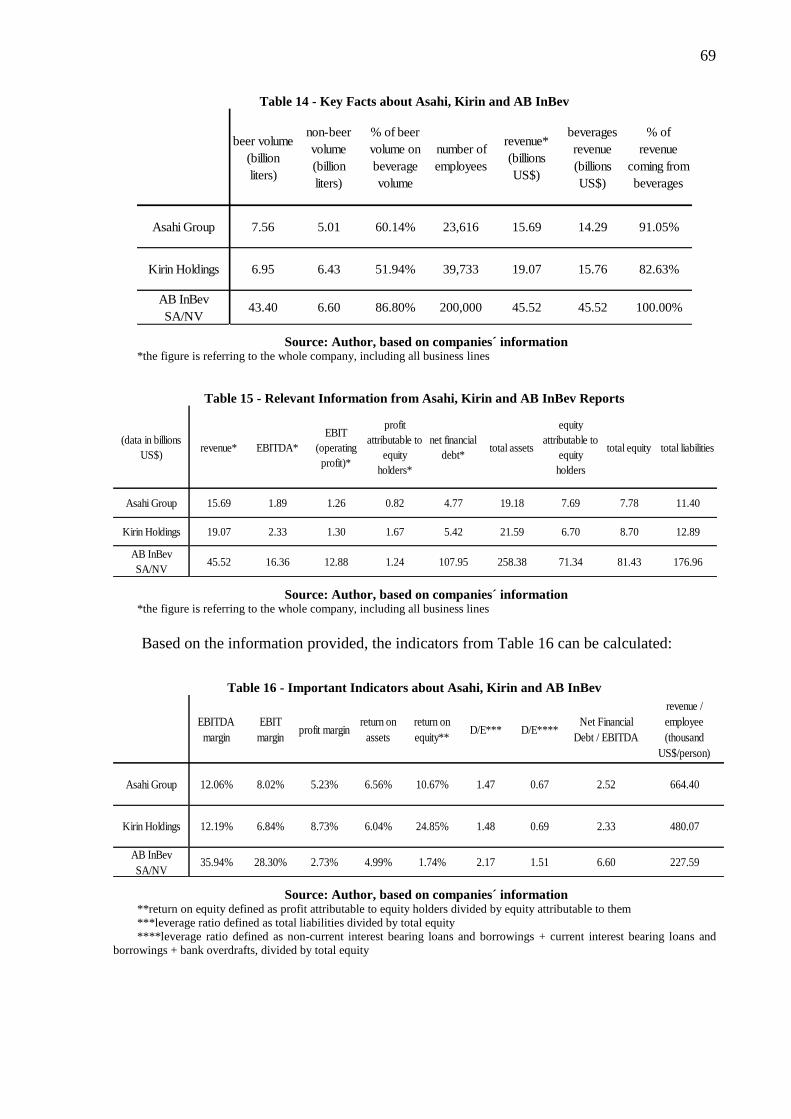
69
Table 14 - Key Facts about Asahi, Kirin and AB InBev
Source: Author, based on companies´ information *the figure is referring to the whole company, including all business lines
Table 15 - Relevant Information from Asahi, Kirin and AB InBev Reports
Source: Author, based on companies´ information *the figure is referring to the whole company, including all business lines
Based on the information provided, the indicators from Table 16 can be calculated:
Table 16 - Important Indicators about Asahi, Kirin and AB InBev
Source: Author, based on companies´ information **return on equity defined as profit attributable to equity holders divided by equity attributable to them
***leverage ratio defined as total liabilities divided by total equity
****leverage ratio defined as non-current interest bearing loans and borrowings + current interest bearing loans and
borrowings + bank overdrafts, divided by total equity
beer volume
(billion
liters)
non-beer
volume
(billion
liters)
% of beer
volume on
beverage
volume
number of
employees
revenue*
(billions
US$)
beverages
revenue
(billions
US$)
% of
revenue
coming from
beverages
Asahi Group 7.56 5.01 60.14% 23,616 15.69 14.29 91.05%
Kirin Holdings 6.95 6.43 51.94% 39,733 19.07 15.76 82.63%
AB InBev
SA/NV43.40 6.60 86.80% 200,000 45.52 45.52 100.00%
(data in billions
US$)revenue* EBITDA*
EBIT
(operating
profit)*
profit
attributable to
equity
holders*
net financial
debt*total assets
equity
attributable to
equity
holders
total equity total liabilities
Asahi Group 15.69 1.89 1.26 0.82 4.77 19.18 7.69 7.78 11.40
Kirin Holdings 19.07 2.33 1.30 1.67 5.42 21.59 6.70 8.70 12.89
AB InBev
SA/NV45.52 16.36 12.88 1.24 107.95 258.38 71.34 81.43 176.96
EBITDA
margin
EBIT
marginprofit margin
return on
assets
return on
equity**D/E*** D/E****
Net Financial
Debt / EBITDA
revenue /
employee
(thousand
US$/person)
Asahi Group 12.06% 8.02% 5.23% 6.56% 10.67% 1.47 0.67 2.52 664.40
Kirin Holdings 12.19% 6.84% 8.73% 6.04% 24.85% 1.48 0.69 2.33 480.07
AB InBev
SA/NV35.94% 28.30% 2.73% 4.99% 1.74% 2.17 1.51 6.60 227.59

70
Analyzing data from Table 14, it is possible to point out that:
The Japanese companies have a lot in common and they are both much smaller than AB
InBev SA/NV. In general, Kirin is a little larger than Asahi.
They dedicate much more effort to non-beer beverages (alcoholic or not) than the
Brazilian-Belgium group. Between them, Asahi has a higher proportion of beer in the overall
drinks volume when compared to Kirin.
Asahi generated only ⅓ of AB InBev’s revenue and Kirin, ⅖.
They have important participation of businesses unrelated to beverages in their revenue.
Kirin Holdings depends more on other businesses than Asahi.
From Table 16, the following statements can be made:
The Belgium-based company had a much stronger EBITDA and EBIT margin but a
lower profit margin when compared to the Japanese, who presented a similar performance.
Both ROA (return on assets) and ROE (return on equity) of Asahi and Kirin were
considerably higher. The low profit margin and return on equity presented by AB InBev can be
explained by the combination with SABMiller. Kirin’s high ROE catches attention.
Considering all three leverage ratios, it is clear that the Japanese firms use lighter
leverage and show close indicators to each other.
In terms of revenue/employee, the world leader stands far behind the Japanese, and
Asahi demonstrated a better performance than Kirin.
Asahi and Kirin share many great characteristics that make them interesting investment
options. Both show strong performance in the Japanese market (where AB InBev is not
present) and in other foreign markets, they do not have Government bodies as stockholders,
they have more than 65% of free float, they are listed on a global Stock Exchange (Tokyo),
more than 80% of their revenue comes from beverages, they presented satisfactory financial
indicators in 2016, they have a high revenue/employee ratio and a low leverage if compared
to AB InBev. All these common features are attractive, but in order to choose one firm,
Table 17 points out pros and cons comparing the two:

71
Table 17 - Pros and Cons about Asahi Group and Kirin Holdings
Asahi Group Kirin Holdings
Pros
Stronger in Japan
Good presence in Europe, especially on the
eastern countries
Higher proportion of beer in overall
beverage volume
Higher proportion of beverages revenue in
overall sales
Higher revenue/employee ratio
Good presence in Southeastern Asia, where
AB InBev is not present
Higher free float
Recently sold Brasil Kirin to Heineken,
which reduces authority pressure
Plans to invest in Vietnam, where AB InBev
is not present
Higher overall revenue and higher absolute
beverages revenue
Better financial performance (especially
regarding to ROE)
Cons
Recently acquired European brands from
AB InBev SA/NV and SABMiller in order
to make the deal between them feasible and
this increases the probability of facing
difficulties to close deal due to European
market authorities.
High probability of facing difficulties to
close deal due to Australian market
authorities.
Source: Author, based on companies´ information
According to the date presented and the overall context, it seems that Kirin Holdings would
be a better acquisition for AB InBev SA/NV because its pros are stronger and its cons are less
severe.
Asahi market share in Japan is only 5.2% higher and the markets where Kirin is present
can aggregate much more value to the Belgium-based group, once they are mainly Japan and
Southeastern Asia, where AB InBev is not present. Moreover, Asia Pacific is the part of the
world with the highest expected of growth for beer consumption for the future years.
The countries where Asahi has key brands are not that interesting for AB InBev, once as
mentioned earlier, the pressure from market authorities would be greater because many of these
brands used to be owned by AB InBev or SABMiller.
It is true that beer represents a higher proportion of Asahi’s beverage volume and that
Kirin’s revenue depends more on other business, however, in absolute numbers, the revenue
flowing to Kirin Holdings from beverages is larger than the ones flowing to Asahi. The fact
that Kirin has other crucial business lines rather than beverages can actually be converted into

72
an advantage, once the if AB InBev purchases the whole group, it could think about the
possibility of selling non-beverage lines and avoid raising the leverage ratios too much.
Other points that favor Kirin are the higher free float, the plans to invest in Vietnam (where
the Brazilian-Belgium conglomerate is also not present), better-performing financial indicators
and the recent divesture in Brazil, where AB InBev would probably have to struggle with the
authorities due to its controlling positon in the country.
Regarding to the cons, suffering pressure from the Australian market authority is of less
concern since the Australian market is much smaller than the European and because in the
worst-case scenario, AB InBev could negotiate Lion (Kirin’s subsidiary in Australia) with
another conglomerate.
Of course, a deeper analysis would have to be developed to eventually close the deal with
Kirin Holdings, especially in terms of the valuation of the company. Refreshing some concepts
is interesting at this point. The market cap or equity value (E) is given by the product between
the number of outstanding shares and the share price. The enterprise value (EV), on the other
hand, reflects the market value of the entire business, including its net financial position
(synthetically, enterprise value equals the sum of equity value and net financial position, where
net financial position equals debt minus cash). EV can be considered the takeover price of a
business, since the eventual purchaser would take on the company’s debts and pocket its cash,
gaining the right to all future earnings of the firm.
For a matter of notion of size, Table 18 shows EV and E of the three companies under
discussion. The values used were extracted from YCharts and the 2016’s average EV an E were
calculated based on monthly figures of the last year. It is crucial to mention that the market cap
disclosed by AB InBev SA/NV on its annual report (and used earlier on this document) differ
from the one show in Table 18.
Table 18 - Equity and Enterprise Values of Asahi, Kirin and AB InBev
Source: Author, based on YCharts (2017)
(data in
billions US$)
2016 EV
average
2016 E
average
EV as at June
29, 2017
E as at June
29, 2017
Asahi Group 18.41 15.21 30.51 17.60
Kirin Holdings 23.10 14.44 26.78 19.04
AB InBev
SA/NV241.88 192.97 301.21 182.86

73
Both companies enterprise value as of June 29, 2017, are close to only 10% of AB InBev
SA/NV, which would represent a small acquisition when compared to SABMiller’s, acquired
by more than US$100 billion. Therefore, it looks that the acquisition is in fact feasible, even
though a more complete M&A assessment is indispensable before any move.
Finally, it is possible to draw some conclusions on how the AB InBev SA/NV could act in
EMEA and Asia Pacific segments in order to reach the 2020 Dream Incentive Plan goal.
In Europe, the company should push the sales of premium German and Belgium brands in
countries like Italy, France Switzerland, Austria and the Netherlands, where the brewery does
not own national relevant beers. In Russia, where the group is currently second in market share,
the focus could be on high-end beer as the country’s beer consumption is expected to decrease
as consequence of economic recession. AB InBev is the market leader in Ukraine and therefore
it could seize the trade embargo, which will stop Russian beer from entering the country, to
improve its market share by filling the demand previously attended by the importations from
the neighbor country.
In the Middle East, where the Turkish leader Anadolu Efes represents the brewery, the
suggestion would be to hold the position. The recommendation is sustained by the fact that AB
InBev is only a minor shareholder of Anadolu and that the Islamism is predominant in the
region. According to the ideology, alcoholic consumption is unlawful.
Regarding to the African market, it would make sense for the brewery to try to grow
organically in high population countries where it is already present: Nigeria, South Africa,
Tanzania, Uganda, Mozambique and Ghana. From those markets, AB InBev SA/NV could also
export beer to other five countries in the continent. Moreover, the acquisition of minor craft
breweries in large business centers may be interesting.
In the Asia Pacific segment, where the expected growth is the largest in the globe, the
moves could be: seize market leadership in Australia and South Korea to push revenue by
raising the revenue/liter ratio and the absolute volume and, in Japan, acquire Kirin Holdings.
The group demonstrates many great features such as good presence in Japan (where it is only
5.2% after the leader) and in Southeastern Asia, large revenue coming from the sales of
beverages, interesting expansion plan and a lower leverage when compared to AB InBev.
Furthermore, the difficulties regarding to market regulators and other non-beverage businesses
could be overcome. Nevertheless, a deeper M&A analysis should be developed before
negotiations.

74
4.3 Which would be the best financing strategies for the investments?
With the aim of developing a more complete analysis, first, two theories related to
financing will be introduced: the Pecking Order Theory and the Market for Lemons.
The Pecking Order Theory by Myers and Majluf (1984) postulates that the cost of financing
increases as the level of asymmetric information raises. As a consequence of this statement, in
order to avoid high costs, Myers and Majluf (1984) affirms that companies will fund its projects
using firstly internal financing, then debt financing and lastly equity financing.
The internal financing happens when firms use their own earnings to fund projects.
Alternatively, debt financing occurs when the company raises money by selling bonds, asking
for credit or any kind of borrowing that is repaid with the addition of interest. Equity financing
appears when capital is raised through the sale of shares of the company, as happens in public
offerings, private placements and rights issue.
The increasing cost of capital from internal to equity financing is explained through adverse
selection, a phenomenon caused by asymmetric information. Using retained earnings has no
adverse selection problem, thus, there is no cost. Oppositely, equity is subject to severe adverse
selection problem, while debt also faces the issue, but in a lesser manner. The stronger is the
adverse selection question, the riskier is for the outside investor and therefore, the higher is the
risk premium charged. The risk premium makes the financing strategies more or less costly.
But how does asymmetric information create adverse selection? This can be explained
based on the Market for Lemons by Akerlof (1970). The study is originally about the market
for used cars, but it can also be applied to companies raising capital.
The used car buyers cannot tell the difference between good cars (plums) and bad cars
(lemons), since there is information asymmetry and only the owners know which kind of car
they possess. As the information coming from the sellers is not credible because they have an
incentive to say they own a plum, the buyers are willing to pay only an average expected value
for any car (average of the values of good and bad cars).
At this amount, only the lemons will be sold, since the offered quantity is larger than the
value of the car. In contrast, plums will not be sold and its owners tend to leave the market.
According to Akerlof (1970), the sale of bad cars instead of the good ones represents the adverse
selection.
Following the same logic, it is possible to think about the external financing market. Well-
run firms tend to avoid market and use internal financing as much as they can, once due to the
presence of information asymmetries, lenders and investors usually attribute an average value
75
for items which harms good firms and favors the bad ones. This means that, when it comes to
financing, the well-managed companies offset the poor performance of the others.
Between many occasions in which this effect can be noticed, these are three examples:
Good firms will have to accept a higher interest than they should in order to borrow
money (debt financing).
Well-managed firms will have to sell bonds at lowers price and thus, they have reasons
not to issue bonds or try a private placement (debt financing).
Stocks of good companies will be undervalued and thus, there is an incentive for owners
not to list or delist them (equity financing).
The adverse selection problem influences the economy as a whole, once good companies
will eventually pass up promising projects because they were not able to raise capital properly.
The most obvious way to deal with this question is through the reduction of information
asymmetries. In this sense, solutions include the disclosure of information by companies
(borrower) and private collection of data followed by screening by financial institutions
(lender). Nevertheless, other actions might be taken to weaken the adverse selection
complication, such as requiring firms to invest resources of their own or pledging of collateral
to insure lenders against borrower’s default.
Firms who wish to raise funds might incur costs to signal their creditworthiness with the
intention of arranging inexpensive capital in the market. An example of signaling cost would
be fees charged by independent rating agencies to assess debtor's ability to pay back debt and
the likelihood of default. Normally, the more renowned is the rating agency, the more effective
the signaling and the higher the fees they charge. That is the reason why the big-three rating
agencies (Standard & Poor’s, Fitch and Moody’s) are frequently the priciest to hire.
Considering the two theories presented, it is reasonable to assume that firms will prefer to
use their retained earnings to invest, because this option does not suffer from information
asymmetries and therefore, is the least costly. However, it is true that companies need to trade-
off retained earnings and dividends, once the first is the aggregate of every year’s difference
between net profit of the firm and dividends paid to shareholders. If the firm wishes to keep all
its net profit of the year for future business investments, it means that it will not pay dividends,
which may displease stockholders. On the contrary, if the enterprise distributes generous
dividends, the lower will be the amount saved as retained earnings.
At this point is important to refresh the distinction between retained earnings and reserves.
Both belong to the equity of a company, but the first is the part of the net profit kept for

76
reinvestments or debt repayment, while the second is designated to cover future unforeseen
losses. In this appraisal, AB InBev SA/NV’s reserves will not be considered as a source of
funds.
Table 19 shows data related to retained earnings and the dividends of the brewery
according to the annual reports from 2012 to 2016:
Table 19 - Retained Earnings and Dividend Information from 2012 to 2016
Source: Author, based on company´s information
Analyzing the table, it is acceptable to state that AB InBev SA/NV does not follow a
tendency regarding to these indicators. The variation from year to year of profit attributable to
equity holders and the payout ratio, caused among others by M&A deals and shareholders wills
on each specific year, can explain the instability in the other figures. For instance, in 2016,
although the company had a thin 2.7% profit margin (the average from 2012 to 2015 was
22.5%) due the SABMiller acquisition, the payout ratio was 535%, resulting in a generous
US$3.85 dividend per-share. A payout ratio higher than 100% means the enterprise distributed
more than its net profit in the fiscal year, and thus, retained earnings were discounted.
Even though the preferable financing option is retained earnings, it seems that AB InBev
cannot rely only on it because the amount suffers variations depending on the events and the
decision-making of the fiscal year. Moreover, a firm should not spend all its retained earnings,
once it has to consider, among other questions, longer-term expenditures, buffer for dividends
and debt repayment.
Furthermore, the investments the firm would have to make to put in practice some of the
suggestions given in this case study would probably overcome 2016’s retained earnings. For
instance, only to acquire Kirin Holdings, the brewery would have to spend something around
US$30 billion, which by itself is larger than the all firm’s current amount of US$28.2 billion.
Therefore, besides partially using its retained earnings, AB InBev SA/NV should examine other
(data in millions
US$ or US$ for
per-share)
aggregate
retained
earnings
aggregate
retained
earnings / total
equity
basic
earnings per-
share (basic
EPS)*
dividend
per-share
payout
ratio
ploughed-
back ratio
2012 21,677 48% 4.53 2.24 49% 51%
2013 31,004 56% 8.90 2.83 32% 68%
2014 35,174 65% 5.64 3.52 62% 38%
2015 35,949 79% 5.05 3.95 78% 22%
2016 28,214 35% 0.72 3.85 535% -435%
77
substantial sources of funds related to debt financing and equity financing. Next, the main
aspects related to these two areas of capital raising will be presented.
Debt financing for public large companies, in general, is associated with the subsequent
characteristics, as stated by Brealey, Myers and Marcus (2001):
The lender is entitled to repay the principal plus interest at certain dates, as agreed
beforehand through a contract.
Independently of company’s performance, debtholder must receive the amount agreed
earlier. In case of firm’s success, it has no right to claim its profits. In case of default, it is
normally protected by a borrower’s pledged asset (collateral), which can be liquidated.
Part of the cash flow of the firm will be dedicated to repay debt and interest.
Cost of debt is lower than cost of equity.
The more urgent is the need to raise debt, the higher will be the interest rates.
Interest paid on debt is tax deductible.
No dilution of shareholders’ ownership.
The company that raises debt has full control and make all the decisions.
Frequently, the more indebted is the firm, the pricier it becomes to raise more funds.
Among other aspects, company’s background, rating, assets and future perspectives
influence on the firm’s creditworthiness, and consequently on the cost of debt.
The process is less complicated and faster than equity financing. However, bond issues
require a prospectus.
Debtholders have priority over equity holders in recovering funds from a bankrupt firm.
Debt has direct impact on the debt-to-equity ratio [D/E]: the more debt the company has
in relation to its equity, the higher is the ratio and the more leveraged is the firm. A leveraged
firm can be perceived as riskier by market, once its profit or loss will be intensified (and its
return on equity variance, amplified).
On the other hand, equity financing for large listed firms, is usually linked with the
following aspects raised by Brealey, Myers and Marcus (2001):
The investor becomes owner of part of the company or enlarges its pre-issue stake.
There is no contract regarding to the repayment of the invested amount or interest.
The remuneration will depend on company’s performance. In case of success, investors
will appreciate profits through dividends or selling their shares in the market. In case of loss
and/or depreciation of stock value, investors may lose their money.
No cash flow dedicated to repay investors.

78
Cost of equity is higher than cost of debt.
Previous shareholders will be diluted and therefore, they may impose barriers for the
approval of the equity issue.
New stockholders will probably have voting rights, thus they may take part in the
decision-making. Normally, the larger is the capital invested, the higher is the number of shares
owned and the broader is the control.
New investors may offer valuable business assistance to the firm, but they might also
damage company’s performance.
The capital raising will depend on market reaction to the equity issue, which, by its turn,
is based on company’s background and mainly on expectations about the future.
The process is more complex, risky and time consuming. Public issues require a
prospectus.
New shares have to be issued at discount, otherwise no investor would subscribe. This
discount provokes the dilution of pre-issue stockholders.
Equity holders have no priority in recovering funds in case of bankruptcy.
It has direct impact on the debt-to-equity ratio [D/E]: the larger is the equity of the
company, the lower is the ratio and the less leveraged is the firm.
Both debt financing and equity financing solutions present advantages and drawbacks.
Briefly, raising debt is cheaper, control and shareholding are kept, the process is faster and
preferred according to the Pecking Order Theory, but, it increases the leverage, business risk
and cash outflows. Alternatively, raising capital through equity creates dilution and loss of
control, but there is no direct repayment and it reduces the debt-to-equity ratio.
The best financing option for a firm will depend on its characteristics, its current situation
and its objectives. Furthermore, firms could opt for a hybrid solution, mixing both debt and
equity.
As mentioned previously, the AB InBev SA/NV uses net financial debt/EBITDA as a
leverage indicator. The values from 2012 to 2016 are shown in Table 20:

79
Table 20 - Net Financial Debt/EBITDA from 2012 to 2016
Source: Author, based on company´s information
According to information disclosed and mentioned earlier, the conglomerate considers its
optimal capital structure as a net financial debt/EBITDA ratio of 2x and besides, deleveraging
is the firm’s second capital allocation objective, only after organic growth.
Since 2014, the brewery has been using a ratio larger than 2x and furthermore, the indicator
grew considerably in the period. Therefore, it seems that raising capital via debt financing does
not match the company’s optimal financing mix neither its objectives, especially taking into
account that from 2015 to 2016, net financial debt more than doubled.
The expectation for this specific indicator is better for the next year, as AB InBev SA/NV
successfully completed the acquisition of SABMiller recently, the forecasted revenue for 2017
is US$55.5 billion, representing a 21.9% leap from 2016’s top line. Assuming that EBITDA
will also grow and that net financial debt is likely to decrease, the tendency is to enter a
deleveraging path.
It is important to assess also the other leverage indicators used by the market. Two of them
are total liabilities/total equity and (current and non-current interest bearing loans and
borrowings + bank overdrafts)/total equity. Both indicators have equity as denominator, which
means that an equity increase accompanied or not by a debt decrease will generate a reduction
on the ratio.
Hence, the fact that the brewery is already overleveraged in relation to its optimal capital
structure and that raising equity will impact market ratios in the desired way towards the
deleveraging objective, gives the impression that equity financing is a suitable strategy for AB
InBev SA/NV.
There are six forms of equity financing that might be interesting for the group and will be
discussed in this appraisal. All six involve issuance of discounted shares, capital raising by the
firm and dilution of pre-issue shareholders. The solutions are seasoned public offering, private
(data in
millions
US$)
EBITDA
net
financial
debt
net
financial
debt /
EBITDA
2012 15,493 30,114 1.94
2013 23,428 38,800 1.66
2014 18,465 42,135 2.28
2015 17,057 42,185 2.47
2016 16,360 107,953 6.60

80
placement, rights issue, warrants issue, leveraged employee share ownership plan and
contingent equity line.
Seasoned public offering (SPO): it is an offer of new shares of a listed firm to all retail
investors in the market. The process needs the authorization of the market authority and requires
a detailed prospectus. It can be considered as a costly, time-consuming and even risky method,
once its success depends on the market appreciation. An underwriter usually guarantees the
issue by purchasing unsubscribed shares.
Private placement: it is an offer of new shares to specific entities. Investors may be
financial institutions, companies, institutional investors and others. However, in a private issue,
potential investors have large bargaining power in terms of the price of the new stocks. The
process is faster, requires lighter bureaucracy and is generally linked to smaller capital raising
when compared to a public offering.
Rights issue: all existing shareholders of the company are granted a number of rights
equal to the number of shares they own. The rights give the stockholders the right, but not the
obligation, to buy an amount of the new shares at discount on a stated future date. The quantity
of discounted shares depends on the subscription ratio, which represents the number of new
stocks per right. Therefore, the rights have a value and can be traded independently in the
market. If all shareholders exercise their rights, the ownership structure is maintained. An
underwriter usually guarantees the issue by purchasing unsubscribed shares.
Warrants issue: warrants are usually issued in correspondence to public or private
capital increases or bonds, and they allow issuing company to raise capital in the future.
Warrants give the holders the right, but not the obligation, to buy an amount of the new shares
at pre-set price at certain day or during a certain period. Hence, they are similar to call options,
but a warrant is issued by the firm and implies the subscription of new shares. The quantity of
shares depends on the subscription ratio, which represents the number of new stocks per
warrant. Likewise rights, they have a value and can be traded independently in the market.
Leveraged employee share ownership plan (LESOP): it is a share ownership and
investment plan addressed to workers of a company. According to it, the company may grant
free shares to its employees and allow them to acquire discounted shares (together, these stocks
are the “invested shares”). Besides the invested shares, employees may acquire extra discounted
shares (the “leveraged shares”) issued by the firm, with funds provided by an investment bank.
At maturity, the employees deliver all their shares (invested and leveraged) to the investment
bank, and receive the initial market value (without the discount) regarding to the invested

81
shares, which represents a protected capital independent of downside in stock price.
Furthermore, workers get a percentage of an eventual appreciation of the stock price, computed
on all shares (invested and leveraged).
Continent equity line (CEL): it is an agreement between a company and an investment
bank where the latter commits to subscribe new shares that the firm may issue in case of need
for additional capital. The new shares are issued following a request by the company or a trigger
event, and at a lower discount when compared to market prices. This process provides
flexibility to the firm and a faster capital raising when compared to other solutions.
The most appropriate solutions depends on factors that AB InBev SA/NV has to ponder
accordingly to its intentions. Among other the relevant aspects to address, some topics that
affect the selection of the equity raising approach are:
Size of the issue: the amount of capital to be raised according to the investment needs,
equal to the product between the number of new shares and the discounted price.
Discount of the new shares: the percentage of discount in relation to market value of the
share has impact on the subscription of the issue and on the dilution intensity.
Required effort: complexity of the process, bureaucracy, costs and regulation related to
the issue.
Time frame: time required to complete the process and raise capital, combined with
timing required by the investments.
Approval of the issue by the meeting of shareholders: equity issues normally have to be
approved by the meeting of shareholders, where the dilution and the objectives of the issue may
create controversy among owners of the firm.
Target of the issue: from whom the capital will be raised. New equity may come from
retail investors, specific large entities, existing shareholders and employees.
Risk: the likelihood of success of the issue. Methods present different risks, and this has
to be considered by the firm when choosing the most appropriate solution.
From the information presented, it is possible to conclude that AB InBev SA/NV should,
at first, resort to its own retained earnings, as recommended by the Pecking Order Theory. This
solution should not suffer from information asymmetries and is the most inexpensive, hence, it
sustains a better potential of generating larger returns to the brewery. However, in order to make
big moves, the retained earnings would probably be insufficient, especially considering that the
brewery would not exhaust all the US$28.2 billion of accumulated retained earnings disclosed
in the 2016 annual report.

82
The other two broad sources of funds the firm could refer to are debt financing and equity
financing. Both options present pros and cons, and the selection of one instead of the other will
depend on company’s characteristics, situation and objectives, among other aspects. AB InBev
SA/NV’s current situation in terms of leverage, its optimal capital structure and its capital
allocation objectives create the sense that debt financing is not adequate. Therefore, equity
financing sounds more attractive to the group in that moment, particularly considering the fact
that leverage ratios used by the market (with total equity as denominator) will decrease with
the expansion of equity.
With the intention of presenting alternatives to raise equity capital, six solutions were
introduced: seasoned public offering, private placement, rights issue, warrants issue, leveraged
employee share ownership plan and contingent equity line. However, the selection of a specific
method that best fits AB InBev SA/NV depends on factors that the company would have to
balance based on its plans for the future. Some of these features are the amount of capital that
has to be raised, the discount of the new shares, the effort demanded, the timing, the permission
of shareholders, the targets and the risk.
4.4 Would a listing in another Stock Exchange make sense? If yes, in which one?
As mentioned previously, AB InBev SA/NV is traded on the Brussels Stock Exchange
(Euronext) with secondary listings on the Mexican Stock Exchange (BMV) and on the
Johannesburg Stock Exchange (JSE). The group also has American Depositary Shares on the
New York Stock Exchange (NYSE).
The shares are currently commercialized where major breweries in the company’s M&A
history were listed: Anheuser-Busch is originally from the US, Interbrew from Belgium, SAB
from South Africa and Grupo Modelo from Mexico. Nevertheless, the stocks are not traded in
the UK (home of Miller) and in Brazil (home of AmBev). The company is probably not listed
in the London Stock Exchange because it is already listed in Euronext, second largest Exchange
in Europe. The absence in Brazil is possibly due to the effects it could create in the trading of
the shares of AmBev, subsidiary of AB InBev SA/NV and largest market cap in São Paulo
Stock Exchange.
In order to discuss the question properly, first, it is important to understand the current
scenario of the Stock Exchanges where AB InBev is traded, as well as the global landscape.
In Table 21, there is key information about NYSE, Euronext, JSE and BMV:

83
Table 21 Relevant Information about Stock Exchanges where AB InBev is Listed
Source: Author, based on NYSE (2017), Eurnoext (2017), JSE (2017) and (BMV 2017) *Brussels Stock Exchange is part of the Euronext Exchange, composed also by Exchanges in Amsterdam, Lisbon, London
and Paris. Euronext merged with NYSE in 2007, creating the NYSE Euronext Inc.
**calculation considering 2015 market cap officially disclosed in the annual report: US$200.3 billion
From Table 21, it is possible to confirm what is usually expected. The larger is the Stock
Exchange in terms of total market cap and quantity of listed companies, the larger is the overall
volume traded monthly and the turnover, and the lower is the relevance of AB InBev SA/NV.
The company is listed in two global Exchanges (NYSE and Euronext) and in other two houses
that are much more irrelevant: together, JSE and BMV represent 7.1% of NYSE’s market cap
and 2.6% of its monthly volume. Furthermore, JSE and BMV have a much narrower reach in
terms of potential investors than the Exchanges located in North America and Europe.
Figure 17 shows other set of interesting information regarding the top 20 Stock Exchanges
globally, in terms of market cap:
Rank by Market
Cap
2015 Overall
Market Cap
(US$ billions)
Number of
Companies
Listed
2015 AB InBev
Market Cap /
Overall Market
Cap**
2015 Overall
Volume Traded
Monthly
(US$ billions)
Turnover
[Volume Traded
Monthly /
Overall Market
Cap]
New York Stock Exchange
[NYSE] (via ADRs)1 19,223 2,406 1.04% 1,520.0 7.91%
Brussels Stock Exchange
[Euronext]*7 3,321 1,299 6.03% 184.0 5.54%
Johannesburg Stock Exchange
[JSE]17 951 374 21.06% 27.6 2.90%
Mexican Stock Exchange [BVM] over 20 418 146 47.92% 11.2 2.69%

84
Figure 17 - Top 20 Stock Exchanges in the World in Terms of Market Cap
Source: Author, based on The Money Project (2016)
A point that catches attention in the ranking is the presence of nine Asia Pacific Exchanges.
As mentioned before, the Brazilian-Belgium group is represented in North America, Europe,
Africa, Central America and South America (through its subsidiary AmBev), but not in the
Asian market.
There are facts seen earlier that make a listing in this part of the world attractive:
Asia Pacific is the largest market in terms of beer volume.
It is the market with the best growth expectation.
In 2016, 13.3% of AB InBev SA/NV revenue flowed from the segment.
Organic and inorganic expansion in this region are suggested to reach the 2020 Dream
Inventive Plan goal.
Additionally, according to BCG 2016 Global Wealth Report, on Appendix H:
In 2015, 29.9% of global financial private wealth was concentrated in Asia Pacific.
0 4000 8000 12000 16000 20000
São Paulo Stock Exchange - Brazil
Taiwan Stock Exchange - Taiwan
BME Spanish Exchanges - Spain
Johannesburg Stock Exchange - South Africa
OMX Nordic Exchange - Nothern Europe
Korea Exchange - Korea
Australian Securities Exchange - Australia
SIX Swiss Exchange - Switzerland
National Stock Exchange of India - India
Bombay Stock Exchange - India
Deutsche Börse - Germany
Toronto Stock Exchange - Canada
Shenzhen Stock Exchange - China
Euronext - EU
Hong Kong Stock Exchange - Hong Kong
Shanghai Stock Exchange - China
Tokyo Stock Exchange - Japan
London Stock Exchange Group - UK
NASDAQ - USA
New York Stock Exchange - USA
Top 20 Stock Exchanges in the World in Terms of 2016 Overall Market Cap
Billions U$

85
In 2020, this percentage is expected to grow up to 33.5%.
China, Japan and Taiwan were 2nd, 3rd and 10th countries with most millionaire
households in 2016.
China, India and Hong Kong were 2nd, 4th and 12th countries with most UHNW (upper-
high net worth) households in 2014. UHNW individuals are the ones who own more than
US$100 million in private financial wealth.
The beer market in the continent is large and important to AB InBev, especially due to its
potential for future expansion. Furthermore, Asia Pacific holds a meaningful share of financial
private wealth, which is expected to grow even more, and has representatives in the rankings
of millionaire and UHNW households. Therefore, it seems that a listing in an Asian market
makes sense.
However, before making a recommendation, it is crucial to acknowledge the advantages
and disadvantages of cross-listing. There is a wide academic literature about motivations,
costs and impact in firm’s value related to cross-listing. Most of the studies are related to US-
based firms that are considering a listing outside the country or foreign companies analyzing a
listing in the US, which means they cannot be perfectly applied to AB InBev SA/NV, once it is
a Belgium-based enterprise listed in US (via ADRs), Belgium, South Africa and Mexico.
Nevertheless, some ideas and notions regarding this topic will be used on the subsequent
assessment. The most common pros and cons associated to cross-listing are listed in Table 22:
Table 22 - Advantages and Disadvantages of Cross-listing
Advantages Disadvantages
Benefit from a lower cost of capital due to
increased accessibility to shares, contact with
other financial markets and stronger contractual
power towards credit entities
Increase shareholders base by lowering the
perceived risk. By raising the level of investor
protection ("bonding") it is possible to attract
investors that were previously reluctant to invest.
Increase liquidity of the stocks and enlarge the
period when shares are traded in the worldwide
market
Enhance information management and disclosure
Incur costs such as listing expenses and fees
charged by legal and financial advisors
Have to dedicate time and effort to the listing
Be subject to eventual expenses to comply with
the requirements of the Stock Exchange, such
costs related to auditing, accounting standard,
the board, investors relations office and others
Deal with pressure from foreign market and
authorities
Be exposed to foreign market turmoil
Increase the chances of information spill-over to
competitors in the foreign market

86
Strengthen company's image, media attention,
visibility and in a foreign market, which is
important to boost sales
Intensify analyst coverage
Create an environment more prone to M&A deals
in a foreign market
Have the possibility to offer share and option
plans to foreign employees
Facilitate foreign business operations
Increase firm value may or may not happen
Be subject to reduction in the control of the
company in case of acquisition of large stakes
by foreign investors
Cause a decrease in the traded volume in other
Stock Exchanges where the firm is already
listed
Source: Author, based on Roosenboom and van Dijk (2009), Doobs and Goedhart (2008), Sarkissian
and Schill (2009)
With the intention of making a precise suggestion, checking if the advantages overcome
the disadvantages is an interesting path to follow.
Some of the positive aspects presented would probably create no impact to AB InBev
SA/NV, since the firm is a global mega cap already listed in four Exchanges, including the
largest in the world. For instance the better information management and disclosure or the
enlargement of trading hours. From the advantages, the ones with the most promising results in
the Asian continent are lower cost of capital, larger shareholder base, stronger image and
visibility, easiness for business operations and a more tendentious environment for M&A
negotiations. It is essential to point out that the advantages in Asia depend on the plans of the
company for this continent.
Regarding to the value creation of cross-listings, the appraisals developed in the past years
point to different outcomes. Roosenboom and van Dijk (2009) analyzed 526 cross-listings of
companies from 44 countries on 8 major Stock Exchanges, and the result indicates that this
move can generate a positive price reaction: the average return of cross-listing in US Exchanges
was 1.3%, 1.1% in the London Stock Exchange, 0.6% in continental European Exchanges and
0.5% on the Tokyo Stock Exchange. Contrariwise, Doobs and Goedhart (2008) explain why
cross-listing shares does not create value, stating that the expected advantages do not actually
arise. Additionally, according to Sarkissian and Schill (2009), any valuation gain created by a
cross-listing is not permanent. Hence, it is not possible to claim that cross-listings increase the
firm value, neither that an eventual increment will be long-lasting.
The benefits of a cross-listing seem to be only partly applicable to the situation of AB
InBev SA/NV, but all the drawbacks presented can negatively impact the brewery. The listing

87
and advisory fees will incur for sure and other compliance expenses will vary depending on the
Stock Exchange chosen. Additionally, another listing will expose the firm to risks associated to
market turmoil, spill-over, loss of control and reduction in volume traded elsewhere. Last but
not least, the time and effort required by a new listing could be dedicated to more rewarding
activities inside the enterprise.
Based on the pros and cons description and also on AB InBev SA/NV current situation, it
is possible to conclude that a fifth listing is not suitable, once the disadvantages are more certain
to happen and impact the firm than the eventual benefits. However, supposing a scenario in
which the Brazilian-Belgian conglomerate wishes to acquire the Japanese Kirin Holdings, as
recommended previously, the suggestion may differ.
If AB InBev thinks that proceeding with the deal is an auspicious move, listing in a
Japanese Stock Exchange can be considered. In 2016, before the closure of the deal with
SABMiller in October, the company debuted in Johannesburg Stock Exchange (where
SABMiller was listed) in January. According to financial publishers46, this action removed
hurdles regarding to market authorities and investors, besides the demonstration of commitment
to plans for the continent. Therefore, following the same logic, it seems reasonable to consider
a listing in Japan as an important move towards a successful negotiation with Kirin.
In the top 20 largest Stock Exchanges shown on Figure 17, there is only one Japanese
representative, the Tokyo Stock Exchange. Kirin Holdings is listed in Tokyo and in the
Exchanges of Nagoya, Fukuoka and Sapporo. However, the Exchange house of the capital of
the country is much more relevant than the others in terms of size and internationalization. The
Tokyo Exchange trades shares of 3560 companies, while the largest of the other three, Nagoya
Stock Exchange, has only 293 listed firms47. Hence, if AB InBev would like to cross-list in
Japan and then acquire Kirin, the only adequate Stock Exchange to its size and worldwide
exposure is the Tokyo Stock Exchange.
A listing in Tokyo would provide AB InBev certain benefits that could make a takeover
much more propitious:
AB InBev SA/NV would be able to raise money at lower cost and in the same currency
used by Kirin, which is indispensable for an acquisition.
The company would show commitment to the development of the Japanese economy,
which could reduce difficulties related to regulations or market authorities in the future.
46 Financial Times (2016); Business Report (2016); Wall Street Journal (2016) 47 Tokyo Stock Exchange (2017); Nagoya Stock Exchange (2017)

88
Image and visibility in Japan would be enhanced and that is especially important once
the firm is currently not present in the country.
The brewery would be able to develop relationships with local banks, funds, M&A
boutiques and other entities that could support the acquisition.
The negotiation with the major shareholders of the firm could become less complicated
with a listing in Japan, particularly in case they become stockholders of the combined firm. The
four largest holders are Japanese entities that own approximately 16% of Kirin Holdings.
Therefore, a listing in Tokyo Stock Exchange is recommended if the plans include the
acquisition of Kirin Holdings. This way, AB InBev SA/NV would be traded in global
Exchanges in North America, Europe and Asia, and it would also become more accessible to
investors based in all Asian countries.
Concluding, all ideas and analysis developed give the impression that another listing
would only make sense if the Brazilian-Belgium brewery wishes to acquire Kirin Holdings. In
the no-acquisition scenario, the disadvantages are more certain and therefore they overcome
any eventual benefits the firm could appreciate. Oppositely, in case of desire to negotiate with
Kirin Holdings, AB InBev SA/NV could consider a listing in the Tokyo Stock Exchange, in
order to create an atmosphere favorable to the deal in terms of cost of capital, image, visibility,
regulations, market authority and relationship with shareholders and financial institutions.
89
5 CONCLUSION
5.1 Synthesis about the Company
Anheuser-Busch InBev SA/NV is a global brewery with approximately 500 brands and is
the largest beer producer in the world. The firm has an intense M&A background, with deals
involving four mega caps: AmBev, Interbrew, Anheuser-Busch and SABMiller. Its main
competitors in most of the countries are The Heineken Company and the Carlsberg Group.
The growth of the world leader is related to the history of Jorge Paulo Lemann, Marcel
Herrmann Telles and Carlos Alberto Sicupira, three Brazilian businessmen that are still very
influential in the company. AB InBev SA/NV’s CEO is another Brazilian, Carlos de Alves
Brito, who joined the brewery almost 30 years ago.
Currently, the company counts with roughly 200,000 collaborators and has a market cap
of more than US$200 billion. From 2004 to 2016, the equity value increased more than 10 times
and the CAGR was over 20%.
The revenue in 2016 was US$45.5 billion and the expectation is to reach a US$55.5 billion
top line in 2017, as consequence of the merger with SABMiller completed in October, 2016.
The CAGR of the revenue from 2012 to 2016 was a modest 3.44%.
In terms of geographic segmentation, the company currently divides its operations in North
America, Latin America West, Latin America North, Latin America South, EMEA (Europe,
Middle East and Africa) and Asia Pacific. In 2016, almost 35% of the group’s revenue came
from North America (due to US) and almost 20% from Latin America North (due to Brazil).
However, the participation of these two segments have been decreasing year after year. On the
other hand, the Asia Pacific segment participation had an 18.5% CAGR from 2012 to 2016.
AB InBev SA/NV is mainly listed in Euronext Brussels, with secondary listings in Mexico
and South Africa. The shares are also traded in the New York Stock Exchange via ADRs. The
shareholding structure of the conglomerate is complex and its public free float represents
around 40% of its stocks. Furthermore, as of May 2017, the company had 70 bonds outstanding
in different markets.
Regarding to the financial indicators, from 2012 to 2016, the group presented satisfying
averages of 39% EBITDA margin, 32% EBIT margin, 19% profit margin, 10% ROA and 18%
ROE, with variations depending on major events during the fiscal years, such as the acquisition
of the Mexican Grupo Modelo or the UK-based SABMiller.

90
The open issues proposed in this case study are related to the goal set by an incentive plan
designed by AB InBev SA/NV, called the 2020 Dream Incentive Plan. The scheme motivates
65 senior managers, awarding them with stock options, to reach US$100 billion revenue
between 2020 and 2022. In order to address the questions proposed, the current capital
allocation objectives disclosed by the company were also introduced.
5.2 Recommendations Drawn
Based on the analyses and discussion developed, these are the suggestions drawn in this
study for each one of the four open issues:
i) In which geographic segments would make more sense to focus investments?
AB InBev SA/NV could focus investments in EMEA (Europe, Middle East and Africa)
and Asia Pacific, once these are the largest markets and where the firm holds its lowest market
shares. Furthermore, other characteristics make these segments attractive, such Asia Pacific´s
7.3% expected CAGR in terms of beer volume until 2020 and the possibility of raising prices
in the region.
ii) Which is the best way for the company to expand its business? Should AB
InBev SA/NV choose organic or inorganic growth? If organic, how? If
inorganic, which would be interesting companies to acquire?
In Europe, AB InBev should push sales of premium from Germany and Belgium to Italy,
France, Switzerland, Austria and the Netherlands. In Russia, the group could focus on high-
end beer and in Ukraine, it could seize opportunity to fill the demand previously attended by
Russian importations.
In the Middle East, the suggestion is to hold the position by keeping the stake the firm has
in the Turkish market leader, Anadolu Efes.
In Africa, it would make sense to try to grow organically in Nigeria, South Africa,
Tanzania, Uganda, Mozambique and Ghana. Nevertheless, it is true that the perspectives for
Nigeria, the most populated country in Africa, are not the best. The company could also export
beer from these countries to Ethiopia, Democratic Republic of Congo, Kenya, Angola and the
Ivory Coast. Furthermore, acquiring minor craft breweries might be interesting in relevant
business centers.

91
In the Asia Pacific segment, the firm could seize the leadership position in Australia and
South Korea by increasing revenue/liter ratio and absolute volume. Moreover, it should
consider a next big move through the acquisition of Kirin Holdings, in Japan.
iii) Which would be the best financing strategies for the investments?
Firstly, AB InBev SA/NV should resort to its own retained earnings. Then, the firm could
select one or more equity financing solutions, based on their features and on the company’s
intentions for the future.
The recommendation does not follow the Pecking Order theory completely, once it affirms
debt financing should be the second source of funds, only after internal financing. However,
raising debt does match the brewery´s deleveraging objective and its current capital structure
situation.
iv) Would a listing in another Stock Exchange make sense? If yes, in which one?
It seems that another listing would only make sense if AB InBev SA/NV wishes to acquire
Kirin Holdings. In this case, the firm could consider a cross-listing in the Tokyo Stock
Exchange.
In the scenario without the acquisition, the drawbacks of another listing are more likely to
happen, and therefore, they overcome eventual advantages. On the other hand, it the
conglomerate wishes to proceed with a deal with the Japanese group, the benefits of a listing in
Tokyo become more intense than the downside.
5.3 Proposals for Future Studies
Any other assessment and opinion based on the information provided in the preset work is
encouraged by the author, once an intrinsic characteristic of a case study is the collectiveness,
the debate and the sharing of ideas. The awakening of curiosity in the readers is desirable and
might result future discussions.
In addition to the financial and strategic aspects discussed, the present work has raised
topics that certainly can be approached in more detail. Suggestions of topics correlated to the
open issues presented in this case study are:
92
Complete M&A analysis including a valuation of Kirin Holdings, funding and the steps
of a deal
Net present value (NPV) and payback calculation of investments funded by the
recommended financing strategies
Listing process in a foreign Stock Exchange such as the Tokyo Stock Exchange
Assessment of the options distributed in the 2020 Dream Incentive Plan (proper strike
price, payoff and value)
Assessment of company´s fair share price (and market capitalization) according to its
growth towards the goal set by the incentive plan
Assessment of the payout ratio (and ploughed-back ratio) that the company could
practice in order to reach its goal, as well as dividend payout strategies
Furthermore, a company with the characteristics of AB InBev SA/NV is likely to face
challenges and require improvements frequently. Therefore, analyses in many areas may be
developed. Innovative incentive plans, market entry options, portfolio analysis, marketing
efforts, cost efficiency, operations management and logistics management are only some of the
topics that can be studied.

93
6 REFERENCES
AKERLOF, G. A. The Market for “Lemons”: Quality Uncertainty and the Market
Mechanism. Quarterly Journal of Economics, v. 84, n. 3, 1970. p. 488-500.
BARNES, L. B.; CHRISTENSEN, R. C.; HANSEN, A. J. Teaching and the Case Method:
Text, Cases and Readings. 3ª. ed. Boston: Harvard Business School Press, 1994. 352 p.
BREALEY, R. A.; MYERS, S. C.; MARCUS, A. J. Fundamentals of Corporate Finance.
3ª. ed. New York: McGraw-Hill Education, 2001. 633 p.
CORREA, C. Sonho Grande. 1ª. ed. Rio de Janeiro: Primeira Pessoa, 2013. 177 p.
DAMODARAN, A. Investment Valuation: Tools and Techniques for Determining teh
Value of Any Asset. 3ª. ed. New Jersey: Wiley Finance, 2012. 992 p.
DOBBS, R.; GOEDHART, M. Why cross-listing shares doesn´t create value. McKinsey &
Company Insights, 2008.
LOCKETT, A. et al. Organic and Acquisitive Gowth: Re-examining, Testing and Extending
Penrose´s Growth Theory. Journal of Management Studies, v. 48, 2009. p. 48-74.
MARION, J. C. Contabilidade Empresarial. 17ª. ed. São Paulo: Atlas, 2015. 536 p.
MONKS, R. A. G.; MINOW, N. Corporate Governance. 5ª. ed. New Jersey: Wiley Finance,
2011. 542 p.
MOTT, G. Accounting for Non-accountants: A Manual for Managers and Students. 6ª. ed.
London: Kogan Page, 2005. 344 p.
MYERS, S. C.; MAJLUF, N. S. Corporate Financing and Investment Decisions When Firms
Have Information That Investors Do Not Have. Journal of Financial Economics, v. 13, n. 2,
1984. p. 187-221.
PENROSE, E. The Growth of the Firm. 4ª. ed. Oxford: Oxford University Press, 2009. 304
p.
ROOSENBOOM, P.; VAN DIJK, M. A. The Market Reaction to Cross-listings: Does
Destination Matter? Journal of Banking & Finance, v. 33, n. 10, 2009. p. 1898-1908.
ROSENBAUM, J.; PEARL, J. Investment Banking: Valuations, Leveraged Buyouts and
Mergers & Acquisitions. 1ª. ed. New Jearsey: Wiley Finance, 2009. 304 p.
SARKISSIAN, S.; SCHILL, M. J. Are There Permanent Valuation Gains to Overseas
Listing? The Review of Financial Studies, v. 22, n. 1, 2009. p. 271-412.
SCHOLZ, R. W.; TIETJE, O. Embedded Case Study Methods: Integrating Quantitative and
Qualitative Knowledge. 1ª. ed. Thousend Oaks: Sage Publications, 2002. 389 p.

94
YIN, R. K. Case Study Reasearch: Design and Methods. 4ª. ed. Thousand Oaks: Sage
Pubications, 2009. 217 p.
ANHEUSER-BUSCH INBEV SA/NV. Retrieved from <http://www.ab-inbev.com/about-
us.html>. Retrieved from <http://www.ab-inbev.com/investors/reports-and-filings.html>.
Retrieved from < http://www.ab-inbev.com/investors/corporate-governance.html>. Retrieved
from <http://www.ab-inbev.com/investors/presentations.html>. Retrieved from
<http://www.ab-inbev.com/investors/fixed-income-information.html>. Accessed from May to
September, 2017.
ASAHI GROUP. Retrieved from <http://www.asahigroup-
holdings.com/en/ir/library/kessan.html>. Accessed on July 30, 2017.
BEER AND BREWER. Retrieved from <http://www.beerandbrewer.com/top-10-biggest-
beer-brands/>. Accessed on July 14, 2017.
BEIJING YANJING BREWERY. Retrieved from
<http://www.yanjing.com.cn/index.php?ctl=index&goto=index>. Accessed on August 03,
2017
BEVERAGE DAILY. Retrieved from <http://www.beveragedaily.com/Markets/Africa-The-
fastest-growing-beer-market)>. Accessed on July 10, 2017.
BLOOMBERG. Retrieved from <https://www.bloomberg.com/news/articles/2013-08-
29/jorge-lemann-he-is-dot-the-worlds-most-interesting-billionaire>. Accessed on May 29,
2017.
BM&FBOVSEPA. Retrieved from <http://www2.bmfbovespa.com.br/capitalizacao-
bursatil/BuscarBursatilGeral.aspx?idioma=en-us>. Accessed on the May 10, 2017.
BORGEN MEGAZINE. Retrieved from <http://www.borgenmagazine.com/african-beer-
market/>. Accessed on July 05, 2017.
BOSTON CONSULTING GROUP. Retrieved from
<https://www.bcgperspectives.com/content/articles/financial-institutions-consumer-insight-
global-wealth-2016/>. Accessed on July 29, 2017.
BRANDZ. Retrieved from < http://brandz.com/article/beer--merger-of-global-leaders-forms-
500-brand-portfolio-1792>. Accessed on May 28, 2017. Retrieved from
<http://brandz.com/admin/uploads/files/BZ_Global_2016_Report.pdf)>. Accessed on June
03, 2017.
BUSSINESS INSIDER. Retrieved from <http://www.businessinsider.com/biggest-beer-
companies-in-the-world-2016-1?IR=T>. Accessed on May 19, 2017.
CARLSBERG GROUP. Retrieved from < https://carlsberggroup.com/investor-
relations/investor-home/>. Accessed on May 24, 2017.
CEOWORLD. Retrieved from <http://ceoworld.biz/2014/07/28/5-biggest-beer-brands-china-
volume/>. Accessed on July 17, 2017.
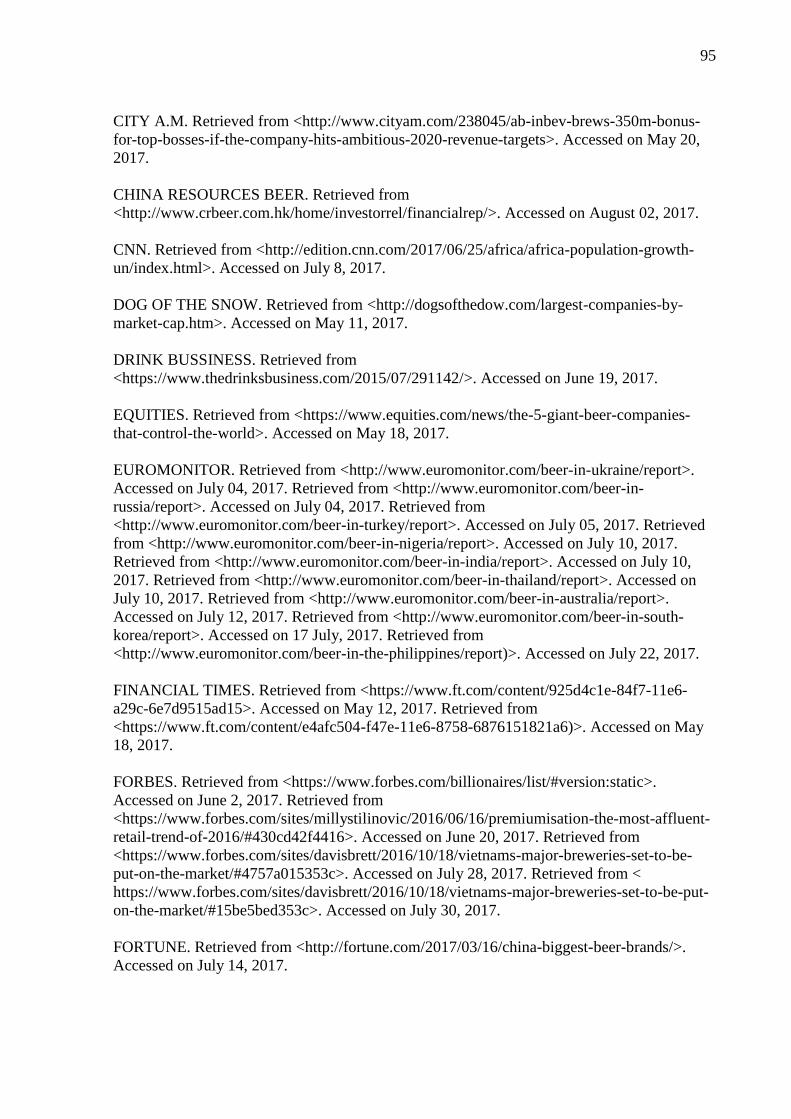
95
CITY A.M. Retrieved from <http://www.cityam.com/238045/ab-inbev-brews-350m-bonus-
for-top-bosses-if-the-company-hits-ambitious-2020-revenue-targets>. Accessed on May 20,
2017.
CHINA RESOURCES BEER. Retrieved from
<http://www.crbeer.com.hk/home/investorrel/financialrep/>. Accessed on August 02, 2017.
CNN. Retrieved from <http://edition.cnn.com/2017/06/25/africa/africa-population-growth-
un/index.html>. Accessed on July 8, 2017.
DOG OF THE SNOW. Retrieved from <http://dogsofthedow.com/largest-companies-by-
market-cap.htm>. Accessed on May 11, 2017.
DRINK BUSSINESS. Retrieved from
<https://www.thedrinksbusiness.com/2015/07/291142/>. Accessed on June 19, 2017.
EQUITIES. Retrieved from <https://www.equities.com/news/the-5-giant-beer-companies-
that-control-the-world>. Accessed on May 18, 2017.
EUROMONITOR. Retrieved from <http://www.euromonitor.com/beer-in-ukraine/report>.
Accessed on July 04, 2017. Retrieved from <http://www.euromonitor.com/beer-in-
russia/report>. Accessed on July 04, 2017. Retrieved from
<http://www.euromonitor.com/beer-in-turkey/report>. Accessed on July 05, 2017. Retrieved
from <http://www.euromonitor.com/beer-in-nigeria/report>. Accessed on July 10, 2017.
Retrieved from <http://www.euromonitor.com/beer-in-india/report>. Accessed on July 10,
2017. Retrieved from <http://www.euromonitor.com/beer-in-thailand/report>. Accessed on
July 10, 2017. Retrieved from <http://www.euromonitor.com/beer-in-australia/report>.
Accessed on July 12, 2017. Retrieved from <http://www.euromonitor.com/beer-in-south-
korea/report>. Accessed on 17 July, 2017. Retrieved from
<http://www.euromonitor.com/beer-in-the-philippines/report)>. Accessed on July 22, 2017.
FINANCIAL TIMES. Retrieved from <https://www.ft.com/content/925d4c1e-84f7-11e6-
a29c-6e7d9515ad15>. Accessed on May 12, 2017. Retrieved from
<https://www.ft.com/content/e4afc504-f47e-11e6-8758-6876151821a6)>. Accessed on May
18, 2017.
FORBES. Retrieved from <https://www.forbes.com/billionaires/list/#version:static>.
Accessed on June 2, 2017. Retrieved from
<https://www.forbes.com/sites/millystilinovic/2016/06/16/premiumisation-the-most-affluent-
retail-trend-of-2016/#430cd42f4416>. Accessed on June 20, 2017. Retrieved from
<https://www.forbes.com/sites/davisbrett/2016/10/18/vietnams-major-breweries-set-to-be-
put-on-the-market/#4757a015353c>. Accessed on July 28, 2017. Retrieved from <
https://www.forbes.com/sites/davisbrett/2016/10/18/vietnams-major-breweries-set-to-be-put-
on-the-market/#15be5bed353c>. Accessed on July 30, 2017.
FORTUNE. Retrieved from <http://fortune.com/2017/03/16/china-biggest-beer-brands/>.
Accessed on July 14, 2017.

96
HARVARD BUSSINESS SCHOOL. Retrieved from < https://rctom.hbs.org/submission/ab-
inbev-getting-high-on-growth/>. Accessed on June 26, 2017.
HEINEKEN COMPANY. Retrieved from <http://www.theheinekencompany.com/investors>.
Accessed on May 22, 2017.
INDUSTRY SOURCING. Retrieved from
<http://www.industrysourcing.com/article/asia%E2%80%99s-brews-emerging-force-reckon>.
Accessed on July 19, 2017.
INSEAD BUSINESS SCHOOL. Retrieved from <https://knowledge.insead.edu/blog/insead-
blog/ab-inbevs-acquisition-formula-4457>. Accessed on June 09, 2017.
JEFFERIES. Retrieved from
<https://www.jefferies.com/CMSFiles/Jefferies.com/files/Insights/ABInbev.pdf>. Accessed
on June 09, 2017.
KIRIN HOLDINGS. Retrieved from
<http://www.kirinholdings.co.jp/english/news/2016/1221_01.html>. Accessed on June 14,
2017. Retrieved from <http://www.kirinholdings.co.jp/english/ir/>. Accessed on July 30,
2017.
MOLSON COORS. Retrieved from <http://ir.molsoncoors.com/financials/financial-
summary/default.aspx>. Accessed on May 26, 2017.
NESTLÉ. Retrieved from <http://www.nestle.com/investors>. Accessed on May 22, 2017.
PWC. Retrieved from <https://www.pwc.com/gx/en/services/audit-
assurance/publications/global-top-100-companies-2016.html>. Accessed on May 23, 2017.
STATISTA. Retrieved from <https://www.statista.com/statistics/269117/number-of-
beverage-plants-of-anheuser-busch-inbev-by-region/>. Accessed on May 21, 2017. Retrieved
from <https://www.statista.com/statistics/188723/top-domestic-beer-brands-in-the-united-
states/>. Accessed on June 20, 2017. Retrieved from
<https://www.statista.com/statistics/339828/market-share-of-the-canadian-brewing-
industry/>. Accessed on June 20, 2017.
THE GUARDIAN. Retrieved from
<https://www.theguardian.com/business/1999/sep/22/unilever>. Accessed on June 01, 2017.
TSINGTAO BREWERY. Retrieved from
<http://stock.tsingtao.com.cn/en/gonggao/directors.jsp?_pagecount=2>. Accessed on August
03, 2017.
U.S. GLOBAL AGRICULTURAL INFORMATION NETWROK. Retrieved from
<https://gain.fas.usda.gov/Recent%20GAIN%20Publications/Russian%20Beer%20Market%2
0Update_Moscow%20ATO_Russian%20Federation_2-19-2016.pdf>. Accessed on July 02,
2017.

97
U.S. SESUCRITES AND EXCHANGE COMMISSION. Retrieved from
<https://www.sec.gov/Archives/edgar/data/1140467/000119312515407864/d40141dex46.htm
>. Accessed on June 12, 2017.
WALL STREET JOURNAL. Retrieved from <https://www.wsj.com/articles/sabmiller-ab-
inbev-shareholders-approve-100-billion-plus-merger-1475059015>. Accessed on May 15,
2017. Retrieved from <https://blogs.wsj.com/briefly/2016/08/31/japans-beer-industry-the-
numbers/>. Accessed on July 30, 2017. Retrieved from <http://quotes.wsj.com/company-
list>. Accessed on August 04, 2017.
WORLDOMETERS. Retrieved from <http://www.worldometers.info/>. Accessed on July 17,
2017.
Y-CHARTS. Retrieved from < https://ycharts.com/companies/>. Accessed on June 29, 2017.
4-TRADERS. Retrieved from < http://www.4-traders.com/stock-exchange/shares/>. Accessed
on August 02, 2017.

98
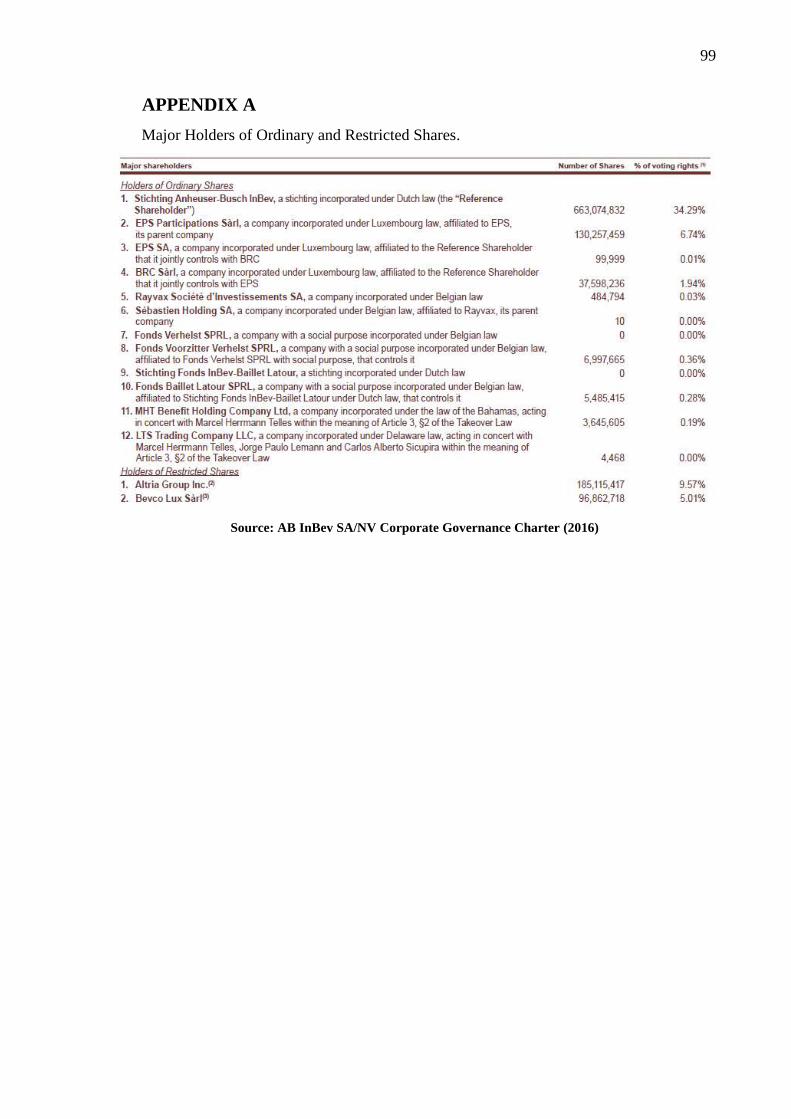
99
APPENDIX A
Major Holders of Ordinary and Restricted Shares.
Source: AB InBev SA/NV Corporate Governance Charter (2016)

100
APPENDIX B
Outstanding Bonds as at 16,May,2017.
Source: AB InBev SA/NV Fixed Income (2017)
BONDCHAIN DESCRIPTION ISSUER AMT OUTSTD CRNCY AMT OUTSTD (USD) CPN TYP COUPON ISSUE_DT MATURITY ID_ISIN ID_CUSIP
EH866372 ABIBB 6.500 06/23/17 ANHEUSER-BUSCH INBEV SA 750.000.000 GBP $1.078.125.000 FIXED 6,500% 23-Jun-09 23-Jun-17 BE6000183549 EH8663724
EJ280560 ABIBB 1.375 07/15/17 ANHEUSER-BUSCH INBEV WOR 2.000.000.000 USD $2.000.000.000 FIXED 1,375% 16-Jul-12 15-Jul-17 US03523TBN72 03523TBN7
EH090972 ABIBB 5.500 01/15/18 ANHEUSER-BUSCH COS LLC 500.000.000 USD $500.000.000 FIXED 5,500% 30-Nov-07 15-Jan-18 US035229DD29 035229DD2
EJ514752 ABIBB 1.250 01/17/18 ANHEUSER-BUSCH INBEV FIN 1.000.000.000 USD $1.000.000.000 FIXED 1,250% 17-Jan-13 17-Jan-18 US035242AC00 035242AC0
EJ522220 ABIBB 2.375 01/25/18 ANHEUSER-BUSCH INBEV FIN 600.000.000 CAD $459.171.960 FIXED 2,375% 25-Jan-13 25-Jan-18 CA03524BAA40 03524BAA4
EK148516 ABIBB FRN 03/29/18 ANHEUSER-BUSCH INBEV NV 850.000.000 EUR $957.100.000 FLOATING 0,695% 31-Mar-14 29-Mar-18 BE6265140077 EK1485169
EC891878 ABIBB 4.500 04/01/18 ANHEUSER-BUSCH COS LLC 200.000.000 USD $200.000.000 FIXED 4,500% 11-Mar-03 1-Apr-18 US035229CS07 035229CS0
EI223956 ABIBB 4.000 04/26/18 ANHEUSER-BUSCH INBEV SA 750.000.000 EUR $844.500.000 FIXED 4,000% 26-Apr-10 26-Apr-18 BE6000782712 EI2239560
EK855842 ABIBB FRN 10/19/18 ANHEUSER-BUSCH INBEV NV 750.000.000 EUR $844.500.000 FLOATING 0,261% 20-Apr-15 19-Oct-18 BE6276038419 EK8558422
EH677744 ABIBB 7.750 01/15/19 ANHEUSER-BUSCH INBEV WOR 3.143.000 USD $3.143.000 FIXED 7,750% 12-Jan-09 15-Jan-19 USU03597AB45 EH6795858
EI571530 ABIBB 7.750 01/15/19 ANHEUSER-BUSCH INBEV WOR 2.496.857.000 USD $2.496.857.000 FIXED 7,750% 14-Mar-11 15-Jan-19 US03523TBE73 03523TBE7
EK041667 ABIBB FRN 02/01/19 ANHEUSER-BUSCH INBEV FIN 250.000.000 USD $250.000.000 FLOATING 0,642% 27-Jan-14 1-Feb-19 US035242AF31 035242AF3
EK041679 ABIBB 2.150 02/01/19 ANHEUSER-BUSCH INBEV FIN 1.250.000.000 USD $1.250.000.000 FIXED 2,150% 27-Jan-14 1-Feb-19 US035242AE65 035242AE6
JV6417622 ABIBB 1.900 02/01/19 ANHEUSER-BUSCH INBEV FIN 4.000.000.000 USD 4.000.000.000 FIXED 1,900% 25-Jan-16 1-Feb-19 US035242AG14 035242AG1
ED352144 ABIBB 5.000 03/01/19 ANHEUSER-BUSCH COS LLC 300.000.000 USD $300.000.000 FIXED 5,000% 1-Mar-04 1-Mar-19 US035229CW19 035229CW1
EH824641 ABIBB 6.875 11/15/19 ANHEUSER-BUSCH INBEV WOR 2.370.000 USD $2.370.000 FIXED 6,875% 14-May-09 15-Nov-19 US03523TAE82 03523TAE8
EI571578 ABIBB 6.875 11/15/19 ANHEUSER-BUSCH INBEV WOR 997.630.000 USD $997.630.000 FIXED 6,875% 14-Mar-11 15-Nov-19 US03523TBH05 03523TBH0
EJ370009 ABIBB 2.000 12/16/19 ANHEUSER-BUSCH INBEV NV 750.000.000 EUR $844.500.000 FIXED 2,000% 25-Sep-12 16-Dec-19 BE6243180666 EJ3700097
EI009833 ABIBB 5.375 01/15/20 ANHEUSER-BUSCH INBEV WOR 750.000 USD $750.000 FIXED 5,375% 16-Oct-09 15-Jan-20 USU03597AJ70 EI0108692
EI101720 ABIBB 5.375 01/15/20 ANHEUSER-BUSCH INBEV WOR 2.249.250.000 USD $2.249.250.000 FIXED 5,375% 5-Feb-10 15-Jan-20 US03523TAN81 03523TAN8
JK482254 ABIBB FRN 03/17/20 ANHEUSER-BUSCH INBEV NV 1.250.000.000 EUR $1.407.500.000 FLOATING 3M EURIBOR + 7529-Mar-16 17-Mar-20 BE6285450449 JK4822546
JK482520 ABIBB 0.625 03/17/20 ANHEUSER-BUSCH INBEV NV 1.750.000.000 EUR $1.970.500.000 FIXED 0,625% 29-Mar-16 17-Mar-20 BE6285451454 JK4825200
EI199969 ABIBB 5.000 04/15/20 ANHEUSER-BUSCH INBEV WOR 4.162.000 USD $4.162.000 FIXED 5,000% 29-Mar-10 15-Apr-20 US03523TAU25 03523TAU2
EI349110 ABIBB 5.000 04/15/20 ANHEUSER-BUSCH INBEV WOR 995.838.000 USD $995.838.000 FIXED 5,000% 2-Sep-10 15-Apr-20 US03523TAV08 03523TAV0
EJ841776 ABIBB 2.250 09/24/20 ANHEUSER-BUSCH INBEV NV 750.000.000 EUR $844.500.000 FIXED 2,250% 24-Sep-13 24-Sep-20 BE6258027729 EJ8417762
JV6456216 ABIBB 2.650 02/01/21 ANHEUSER-BUSCH INBEV FIN 7.500.000.000 USD 7.500.000.000 FIXED 2,650% 25-Jan-16 1-Feb-21 US035242AJ52 035242AJ5
JV6457792 ABIBB FRN 02/01/19 ANHEUSER-BUSCH INBEV FIN 500.000.000 USD 500.000.000 FLOATING US0003M +126.025-Jan-16 1-Feb-21 US035242AK26 035242AK2
EI550508 ABIBB 4.375 02/15/21 ANHEUSER-BUSCH INBEV WOR 500.000.000 USD $500.000.000 FIXED 4,375% 27-Jan-11 15-Feb-21 US03523TBB35 03523TBB3
EI691989 ABIBB 4.000 06/02/21 ANHEUSER-BUSCH INBEV SA 750.000.000 EUR $844.500.000 FIXED 4,000% 2-Jun-11 2-Jun-21 BE6221503202 EI6919894
EK148546 ABIBB 1.950 09/30/21 ANHEUSER-BUSCH INBEV NV 650.000.000 EUR $731.900.000 FIXED 1,950% 31-Mar-14 30-Sep-21 BE6265141083 EK1485466
JK482619 ABIBB 0.875 03/17/22 ANHEUSER-BUSCH INBEV NV 2.000.000.000 EUR $2.252.000.000 FIXED 0,875% 29-Mar-16 17-Mar-22 BE6285452460 JK4826190
EJ280565 ABIBB 2.500 07/15/22 ANHEUSER-BUSCH INBEV WOR 3.000.000.000 USD $3.000.000.000 FIXED 2,500% 16-Jul-12 15-Jul-22 US03523TBP21 03523TBP2
EJ514757 ABIBB 2.625 01/17/23 ANHEUSER-BUSCH INBEV FIN 1.250.000.000 USD $1.250.000.000 FIXED 2,625% 17-Jan-13 17-Jan-23 US035242AA44 035242AA4
EJ522225 ABIBB 3.375 01/25/23 ANHEUSER-BUSCH INBEV FIN 600.000.000 CAD $459.171.960 FIXED 3,375% 25-Jan-13 25-Jan-23 CA03524BAB23 03524BAB2
JV6459715 ABIBB 3.300 02/01/23 ANHEUSER-BUSCH INBEV FIN 6.000.000.000 USD 6.000.000.000 FIXED 3,300% 25-Jan-16 1-Feb-23 US035242AL09 035242AL0
EK855908 ABIBB 0.800 04/20/23 ANHEUSER-BUSCH INBEV NV 1.000.000.000 EUR $1.126.000.000 FIXED 0,800% 20-Apr-15 20-Apr-23 BE6276039425 EK8559081
EK041703 ABIBB 3.700 02/01/24 ANHEUSER-BUSCH INBEV FIN 1.400.000.000 USD $1.400.000.000 FIXED 3,700% 27-Jan-14 1-Feb-24 US03524BAE65 03524BAE6
EH698690 ABIBB 9.750 07/30/24 ANHEUSER-BUSCH INBEV SA 550.000.000 GBP $790.625.000 FIXED 9,750% 30-Jan-09 30-Jul-24 BE0934986036 EH6986903
EJ370004 ABIBB 2.875 09/25/24 ANHEUSER-BUSCH INBEV NV 750.000.000 EUR $844.500.000 FIXED 2,875% 25-Sep-12 25-Sep-24 BE6243179650 EJ3700048
JK482715 ABIBB 1.500 03/17/25 ANHEUSER-BUSCH INBEV NV 2.500.000.000 EUR $2.815.000.000 FIXED 1,500% 29-Mar-16 17-Mar-25 BE6285454482 JK4827156
EJ841794 ABIBB 4.000 09/24/25 ANHEUSER-BUSCH INBEV NV 500.000.000 GBP $718.750.000 FIXED 4,000% 24-Sep-13 24-Sep-25 BE6258029741 EJ8417945
JV6466116 ABIBB 3.650 02/01/26 ANHEUSER-BUSCH INBEV FIN 11.000.000.000 USD 11.000.000.000 FIXED 3,650% 25-Jan-16 1-Feb-26 US035242AP13 035242AP1
EK148564 ABIBB 2.700 03/31/26 ANHEUSER-BUSCH INBEV NV 1.000.000.000 EUR $1.126.000.000 FIXED 2,700% 31-Mar-14 31-Mar-26 BE6265142099 EK1485649
DD114713 ABIBB 6.750 12/15/27 ANHEUSER-BUSCH COS LLC 100.000.000 USD $100.000.000 FIXED 6,750% 16-Dec-97 15-Dec-27 US035229BP76 035229BP7
DD115183 ABIBB 6.500 01/01/28 ANHEUSER-BUSCH COS LLC 100.000.000 USD $100.000.000 FIXED 6,500% 12-Jan-98 1-Jan-28 US035229BQ59 035229BQ5
JK482752 ABIBB 2.000 03/17/28 ANHEUSER-BUSCH INBEV NV 3.000.000.000 EUR $3.378.000.000 FIXED 2,000% 29-Mar-16 17-Mar-28 BE6285455497 JK4827529
EK855926 ABIBB 1.500 04/18/30 ANHEUSER-BUSCH INBEV NV 1.250.000.000 EUR $1.407.500.000 FIXED 1,500% 20-Apr-15 18-Apr-30 BE6276040431 EK8559263
EC298296 ABIBB 7.550 10/01/30 ANHEUSER-BUSCH COS LLC 200.000.000 USD $200.000.000 FIXED 7,550% 5-Oct-00 1-Oct-30 US035229CF85 035229CF8
EC320131 ABIBB 6.800 01/15/31 ANHEUSER-BUSCH COS LLC 200.000.000 USD $200.000.000 FIXED 6,800% 19-Dec-00 15-Jan-31 US035229CG68 035229CG6
EC408122 ABIBB 6.800 08/20/32 ANHEUSER-BUSCH COS LLC 300.000.000 USD $300.000.000 FIXED 6,800% 22-Jun-01 20-Aug-32 US035229CJ08 035229CJ0
EC741543 ABIBB 5.950 01/15/33 ANHEUSER-BUSCH COS LLC 300.000.000 USD $300.000.000 FIXED 5,950% 31-Oct-02 15-Jan-33 US035229CQ41 035229CQ4
EJ523596 ABIBB 3.250 01/24/33 ANHEUSER-BUSCH INBEV NV 500.000.000 EUR $563.000.000 FIXED 3,250% 23-Jan-13 24-Jan-33 BE6248644013 EJ5235969
JV6468336 ABIBB 4.700 02/01/36 ANHEUSER-BUSCH INBEV FIN 6.000.000.000 USD 6.000.000.000 FIXED 4,700% 25-Jan-16 1-Feb-36 US035242AM81 035242AM8
JK482849 ABIBB 2.750 03/17/36 ANHEUSER-BUSCH INBEV NV 2.750.000.000 EUR $3.096.500.000 FIXED 2,750% 29-Mar-16 17-Mar-36 BE6285457519 JK4828493
EF316890 ABIBB 5.750 04/01/36 ANHEUSER-BUSCH COS LLC 300.000.000 USD $300.000.000 FIXED 5,750% 10-Mar-06 1-Apr-36 US035229DA89 035229DA8
682753AS7 ABC 4.950% 07/01/36 ANHEUSER-BUSCH COS LLC 2.200.000 USD $2.200.000 FIXED 4,950% 21-Jul-06 1-Jul-36 US682753AS77 682753AS7
EG758701 ABIBB 6.450 09/01/37 ANHEUSER-BUSCH COS LLC 500.000.000 USD $500.000.000 FIXED 6,450% 24-Aug-07 1-Sep-37 US035229DC46 035229DC4
EH677752 ABIBB 8.200 01/15/39 ANHEUSER-BUSCH INBEV WOR 726.000 USD $726.000 FIXED 8,200% 12-Jan-09 15-Jan-39 USU03597AC28 EH6795338
EI571554 ABIBB 8.200 01/15/39 ANHEUSER-BUSCH INBEV WOR 1.249.274.000 USD $1.249.274.000 FIXED 8,200% 14-Mar-11 15-Jan-39 US03523TBF49 03523TBF4
EI571574 ABIBB 8.000 11/15/39 ANHEUSER-BUSCH INBEV WOR 450.000.000 USD $450.000.000 FIXED 8,000% 14-Mar-11 15-Nov-39 US03523TBJ60 03523TBJ6
EI101732 ABIBB 6.375 01/15/40 ANHEUSER-BUSCH INBEV WOR 500.000.000 USD $500.000.000 FIXED 6,375% 5-Feb-10 15-Jan-40 US03523TAP30 03523TAP3
EC474849 ABIBB 6.000 11/01/41 ANHEUSER-BUSCH COS LLC 250.000.000 USD $250.000.000 FIXED 6,000% 6-Nov-01 1-Nov-41 US035229CL53 035229CL5
EC561532 ABIBB 6.500 05/01/42 ANHEUSER-BUSCH COS LLC 250.000.000 USD $250.000.000 FIXED 6,500% 2-May-02 1-May-42 US035229CM37 035229CM3
EJ280570 ABIBB 3.750 07/15/42 ANHEUSER-BUSCH INBEV WOR 1.000.000.000 USD $1.000.000.000 FIXED 3,750% 16-Jul-12 15-Jul-42 US03523TBQ04 03523TBQ0
EJ514762 ABIBB 4.000 01/17/43 ANHEUSER-BUSCH INBEV FIN 750.000.000 USD $750.000.000 FIXED 4,000% 17-Jan-13 17-Jan-43 US035242AB27 035242AB2
EC601408 ABIBB 6.500 02/01/43 ANHEUSER-BUSCH COS LLC 300.000.000 USD $300.000.000 FIXED 6,500% 27-Jun-02 1-Feb-43 US035229CN10 035229CN1
EK041721 ABIBB 4.625 02/01/44 ANHEUSER-BUSCH INBEV FIN 850.000.000 USD $850.000.000 FIXED 4,625% 27-Jan-14 1-Feb-44 US03524BAF31 03524BAF3
AF236170 ABIBB 4.600 07/23/45 ANHEUSER-BUSCH INBEV FIN 565.000.000 USD $565.000.000 FIXED 4,600% 23-Jul-15 23-Jul-45 XS1261286147 AF2361703
JV7662598 ABIBB 4.915 01/29/46 ANHEUSER-BUSCH INBEV FIN 1.470.000.000 USD 1.470.000.000 FIXED 4,915% 29-Jan-16 29-Jan-46 XS1351803355BBG00BZ25JK3
JV6469441 ABIBB 4.900 02/01/46 ANHEUSER-BUSCH INBEV FIN 11.000.000.000 USD 11.000.000.000 FIXED 4,900% 25-Jan-16 1-Feb-46 US035242AN64 035242AN6

101
APPENDIX C
2016 Consolidated Income Statement.
Source: AB InBev SA/NV Full Annual Report (2016)

102
APPENDIX D
2016 Consolidated Statement of Financial Position.
Source: AB InBev SA/NV Full Annual Report (2016)

103
APPENDIX E
2016 Weighted Average Number of Shares and EPS Calculation.
Source: AB InBev SA/NV Full Annual Report (2016)
104
APPENDIX F
2016 Reconciliation and Net Finance Cost.
Source: AB InBev SA/NV Full Annual Report (2016)
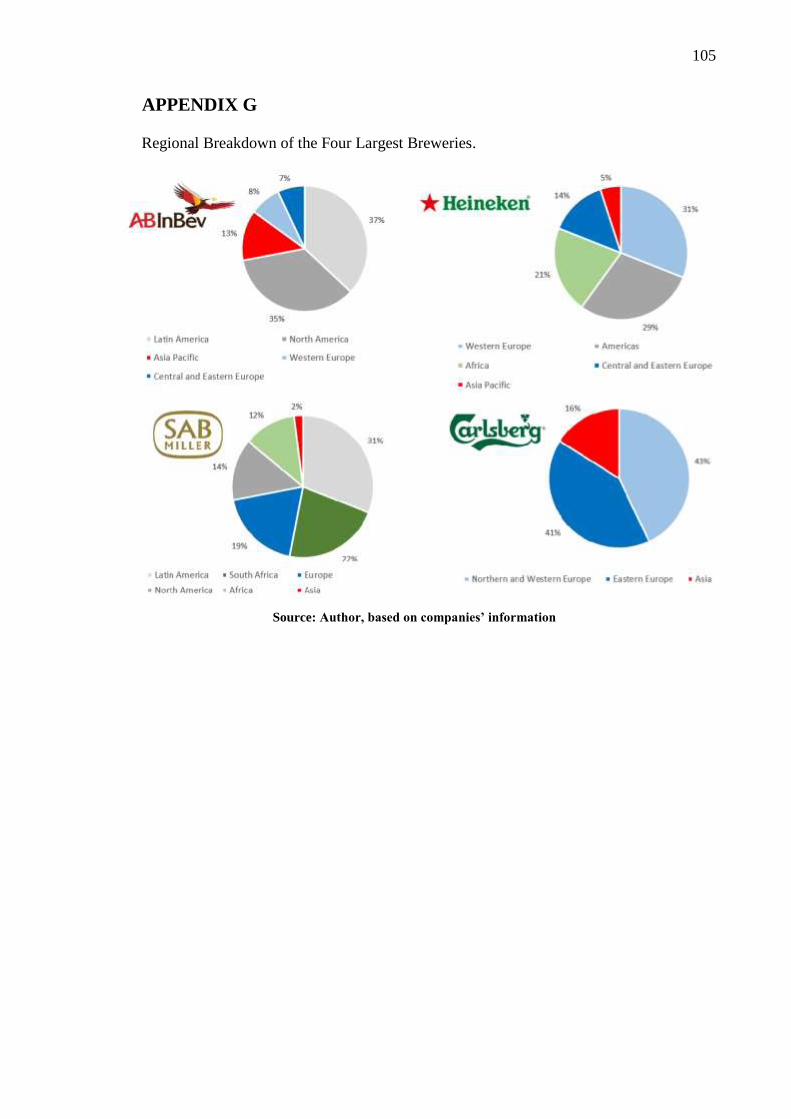
105
APPENDIX G
Regional Breakdown of the Four Largest Breweries.
Source: Author, based on companies’ information

106
APPENDIX H
Global Wealth Report Information.
Source: BCG Global Wealth Report (2016)