K Management of Selected Tropical Crops · K Management of Selected Tropical Crops Zhuhai City -...
45
K Management of Selected Tropical Crops Zhuhai City - Guangdong Province - China November 14, 2006 Prof. Godofredo Cesar Vitti Agronomist, MSc, PhD, Titular Professor ESALQ/USP Piracicaba, São Paulo Brazil [email protected] Prof. Pedro Henrique Cerqueira Luz Agronomist, MSc, PhD, FZEA/USP Pirassununga, São Paulo Brazil [email protected]
Transcript of K Management of Selected Tropical Crops · K Management of Selected Tropical Crops Zhuhai City -...
K Management of Selected Tropical Crops
Zhuhai City - Guangdong Province - ChinaNovember 14, 2006
Prof. Godofredo Cesar VittiAgronomist, MSc, PhD, Titular Professor ESALQ/USP Piracicaba, São Paulo Brazil
[email protected]. Pedro Henrique Cerqueira Luz
Agronomist, MSc, PhD, FZEA/USP Pirassununga, São Paulo Brazil
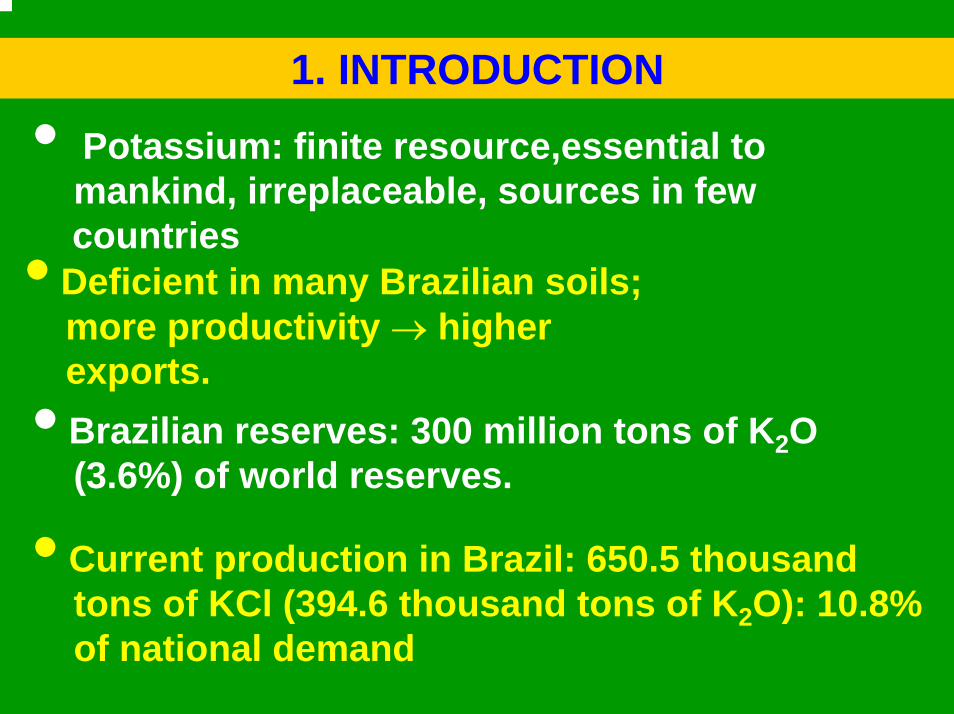
1. INTRODUCTION
• Potassium: finite resource,essential to mankind, irreplaceable, sources in few countries• Deficient in many Brazilian soils; more productivity → higher exports.
• Brazilian reserves: 300 million tons of K2O (3.6%) of world reserves.
• Current production in Brazil: 650.5 thousand tons of KCl (394.6 thousand tons of K2O): 10.8% of national demand
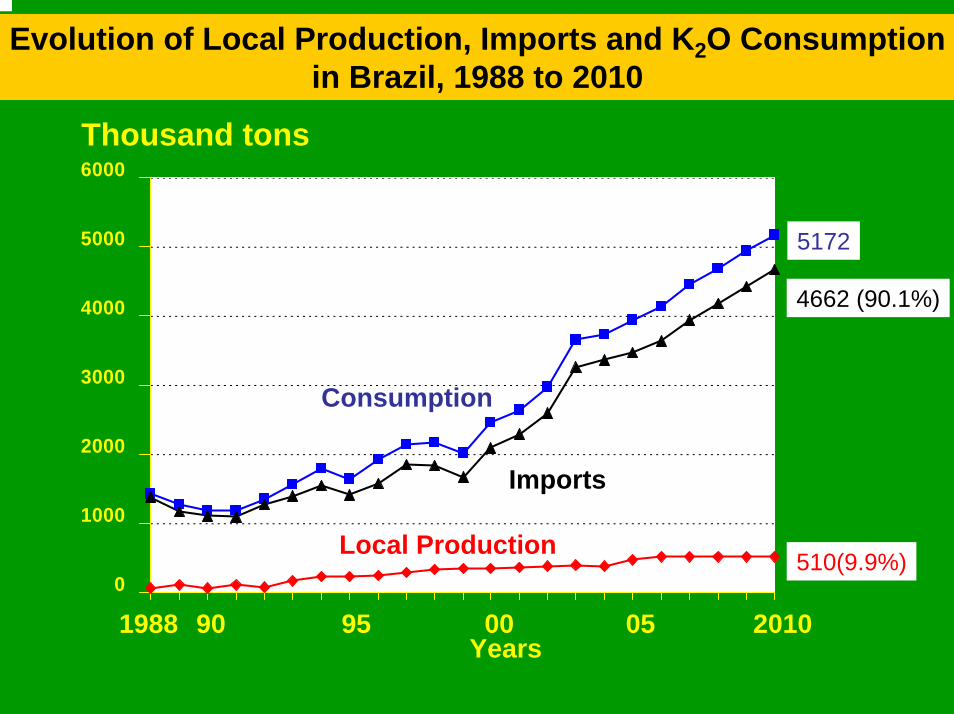
Evolution of Local Production, Imports and K2O Consumption in Brazil, 1988 to 2010
0
1000
2000
3000
4000
5000
6000
Local Production
Consumption
Imports
Thousand tons
1988 90 95 00 05
510(9.9%)
2010
5172
4662 (90.1%)
Years

FERTILIZERS: IMPORT NEEDSFERTILIZERS: IMPORT NEEDS
90%
10%
45%60%
55%40%
Nitrogen Phosphorus Potassium
Brazilian Consumption - 2004 (m tons of nutrients)
2003
EVOLUTION OF IMPORTS IN FERTILIZER CONSUMPTION
Year
2004
20001990
Import Percentage
68%64%63%36%
Source: ANDA and SIACESP.
ImportLocal Production

Fertilizers: World ConsumptionFertilizers: World Consumption (1000 tons of nutrients)(1000 tons of nutrients)
Countries N-P2O5-K2O K2O N-P2O5-K2O K2O N-P2O5-K2O K2OCHINA 44.600 5.700 49.350 7.700 28.71 24.58UNITED STATES 19.265 4.463 21.104 4.953 12.28 15.81INDIA 18.739 2.125 23.418 2.943 13.62 9.39BRAZIL 8.475 3.404 9.900 4.106 5.76 13.11PAKISTAN 3.789 34 4.377 50 2.55 0.16FRANCE 3.773 846 3.731 796 2.17 2.54OTHERS 54.529 9.748 60.004 10.780 34.91 34.41WORLD 153.170 26.320 171.884 31.328 100 100
2005 2010 2010 % Share
Source:IFA/ANDA 2006
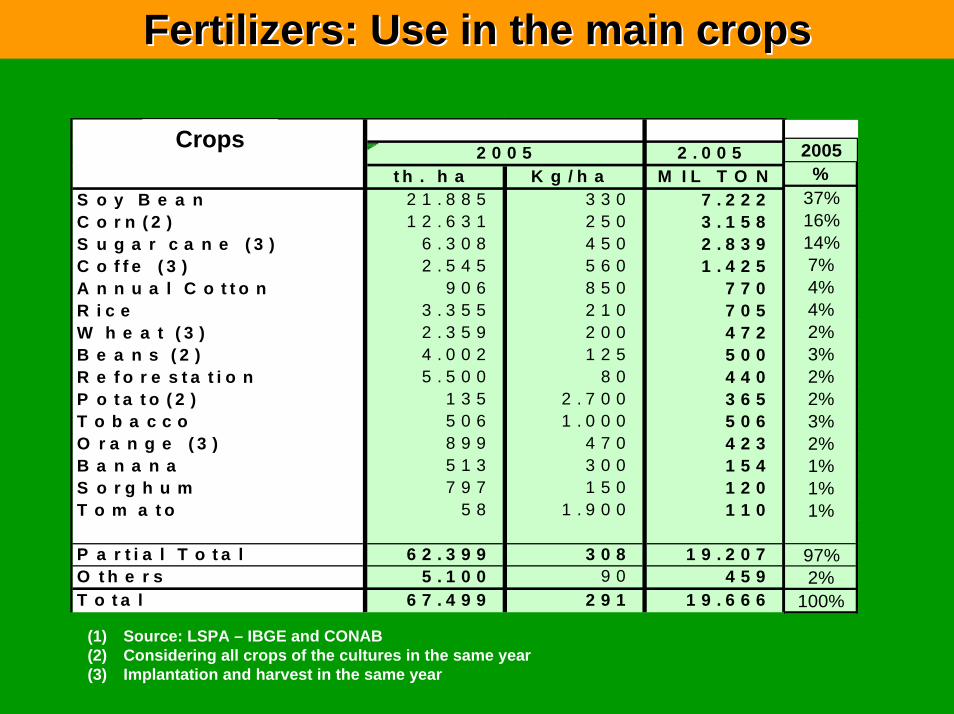
Fertilizers: Use in theFertilizers: Use in the mainmain cropscrops
C u l t u r e s2 0 0 5 2 . 0 0 5
t h . h a K g / h a M I L T O NS o y B e a n 2 1 . 8 8 5 3 3 0 7 . 2 2 2C o r n ( 2 ) 1 2 . 6 3 1 2 5 0 3 . 1 5 8S u g a r c a n e ( 3 ) 6 . 3 0 8 4 5 0 2 . 8 3 9C o f f e ( 3 ) 2 . 5 4 5 5 6 0 1 . 4 2 5A n n u a l C o t t o n 9 0 6 8 5 0 7 7 0R i c e 3 . 3 5 5 2 1 0 7 0 5W h e a t ( 3 ) 2 . 3 5 9 2 0 0 4 7 2B e a n s ( 2 ) 4 . 0 0 2 1 2 5 5 0 0R e f o r e s t a t i o n 5 . 5 0 0 8 0 4 4 0P o t a t o ( 2 ) 1 3 5 2 . 7 0 0 3 6 5T o b a c c o 5 0 6 1 . 0 0 0 5 0 6O r a n g e ( 3 ) 8 9 9 4 7 0 4 2 3B a n a n a 5 1 3 3 0 0 1 5 4S o r g h u m 7 9 7 1 5 0 1 2 0T o m a t o 5 8 1 . 9 0 0 1 1 0
P a r t i a l T o t a l 6 2 . 3 9 9 3 0 8 1 9 . 2 0 7O t h e r s 5 . 1 0 0 9 0 4 5 9T o t a l 6 7 . 4 9 9 2 9 1 1 9 . 6 6 6
(1) Source: LSPA – IBGE and CONAB(2) Considering all crops of the cultures in the same year(3) Implantation and harvest in the same year
2005%
37%16%14%7%4%4%2%3%2%2%3%2%1%1%1%
97%2%
100%
Crops

Ratio of nutrientes consumption in Brazil (Total and Without soybean - 2003) and
Countries with Technified Agriculture - 2002
N P2O5 K2O N P2O5 K2O N P2O5 K2O
With soybean
No soybean
Countries with technifiedagriculture
Source: ANDA, 2004.
0
0.5
1
1.5
2
2.5
3
0.65
1.12 1.191.00
2.82
1.00 1.001.001.23
Relation
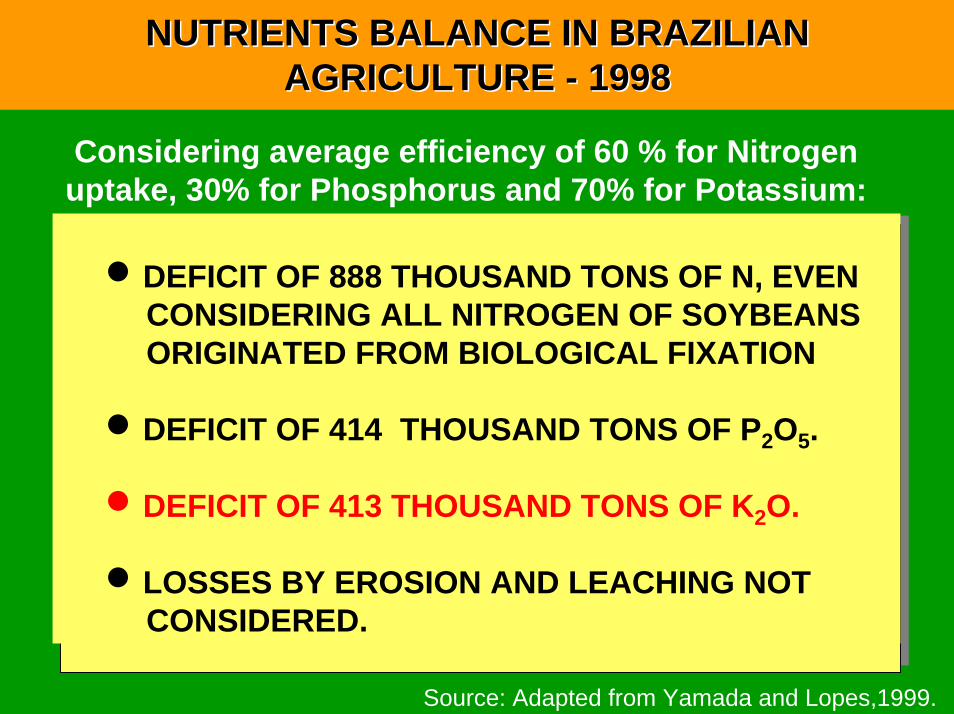
NUTRIENTS BALANCE IN BRAZILIAN NUTRIENTS BALANCE IN BRAZILIAN AGRICULTURE AGRICULTURE -- 19981998
Considering average efficiency of 60 % for Nitrogen uptake, 30% for Phosphorus and 70% for Potassium:
n DEFICIT OF 888 THOUSAND TONS OF N, EVEN CONSIDERING ALL NITROGEN OF SOYBEANS ORIGINATED FROM BIOLOGICAL FIXATION
n DEFICIT OF 414 THOUSAND TONS OF P2O5.
n DEFICIT OF 413 THOUSAND TONS OF K2O.
n LOSSES BY EROSION AND LEACHING NOT CONSIDERED.
Source: Adapted from Yamada and Lopes,1999.
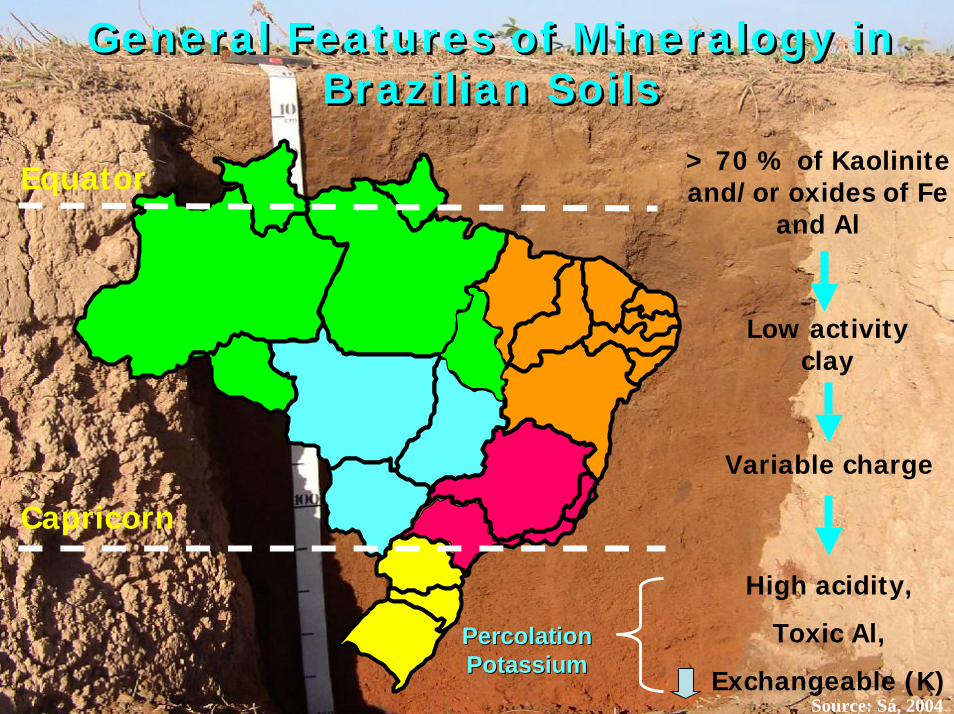
High acidity,
Toxic Al,
Exchangeable (K)
Low activity clay
Variable charge
> 70 % of Kaolinite and/or oxides of Fe
and Al
General Features of Mineralogy in Brazilian Soils
General Features of Mineralogy in Brazilian Soils
Equator
Capricorn
Source: Sá, 2004
PercolationPercolationPotassiumPotassium

THE “CERRADOS”* REGION IN BRAZIL
Source: IBGE, 2000.
2.04 million square km20% of the country
*Flatlands

The typical of “Cerrado”, sparse vegetation, with low and twisted trees, very low fertility.
With the use of managementadjusted as :
• No tillage;• Corrective Practices;• Fertilization.
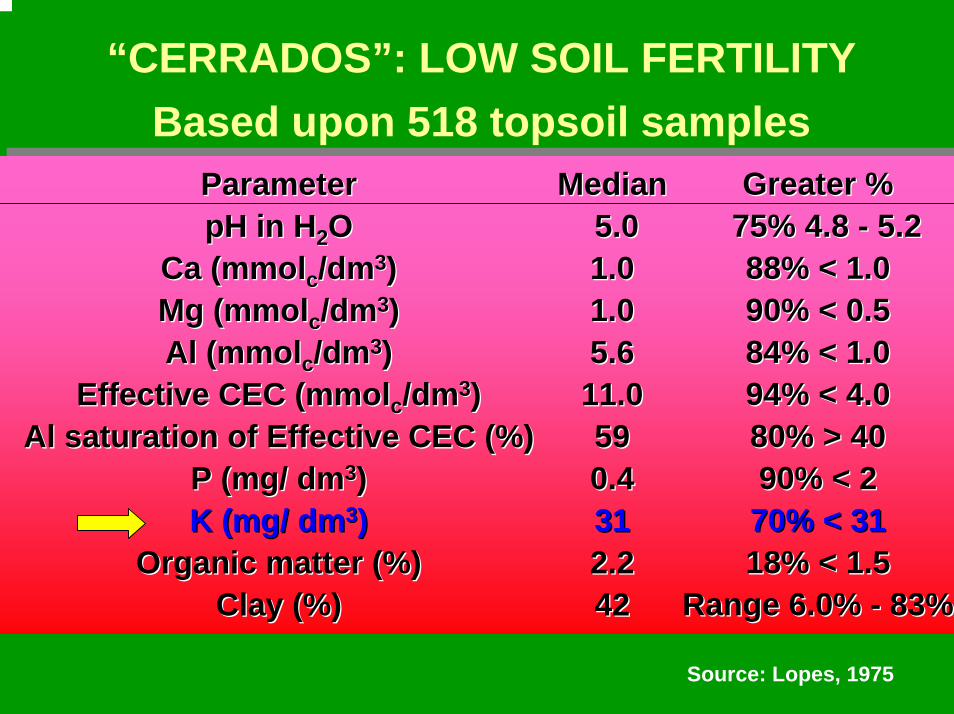
“CERRADOS”: LOW SOIL FERTILITYBased upon 518 topsoil samples
Source: Lopes, 1975
Parameter Parameter pH in HpH in H22O O
Ca (Ca (mmolmmolcc/dm/dm33) ) Mg (Mg (mmolmmolcc/dm/dm33) ) Al (Al (mmolmmolcc/dm/dm33) )
Effective CEC (Effective CEC (mmolmmolcc/dm/dm33) ) Al saturation of Effective CEC (%)Al saturation of Effective CEC (%)
P (mg/ dmP (mg/ dm33) ) K (mg/ dmK (mg/ dm33) )
Organic matter (%)Organic matter (%)Clay (%)Clay (%)
Median Median 5.0 5.0 1.0 1.0 1.0 1.0 5.6 5.6
11.011.059590.4 0.4 31 31 2.22.242 42
Greater % Greater % 75% 4.8 75% 4.8 -- 5.25.288% < 1.0 88% < 1.0 90% < 0.5 90% < 0.5 84% < 1.0 84% < 1.0 94% < 4.094% < 4.080% > 4080% > 4090% < 2 90% < 2 70% < 3170% < 3118% < 1.518% < 1.5
Range 6.0% Range 6.0% -- 83% 83%

AVERAGE YIELD 2002AVERAGE YIELD 2002GOOD FARMERS GOOD FARMERS –– BRAZIL BRAZIL –– MOSTLY IN THE MOSTLY IN THE
“CERRADOS”“CERRADOS”
Rice : 6 t/ha (upland)Rice : 6 t/ha (upland)Rice: 9 Rice: 9 -- 10 t/ha (irrigated)10 t/ha (irrigated)
Common beans : 3.5 t/ha (irrigated)Common beans : 3.5 t/ha (irrigated)Corn: 10 Corn: 10 -- 12 t/ha12 t/haSoybeans: 4 t/haSoybeans: 4 t/ha
Corn: 6 Corn: 6 -- 7 t/ha (after soybeans in the same year)7 t/ha (after soybeans in the same year)Cotton: 5.3 t/haCotton: 5.3 t/ha
Coffee: 1.8 and 3.0 t/ha without and with irrigationCoffee: 1.8 and 3.0 t/ha without and with irrigation

EQUILIBRIUM BETWEEN SOURCES OF K IN SOIL
K - available
K-exchangeable capacity K-solutionquantity intensity
Q IKBC(*) = Q
I(*)KBC = PotassiumBuffer Capacity

K-exchangeable ⇔ K-solution
Q IKBC = Q
I
Soil Liming Q I KBC
S. Angelo no - - 13with - - 37
Vacaria no - - 15with - - 40
Colonia - 0,094 0,46x10⁻² 17Nazaré - 0,095 0,14x10⁻² 24Itabuna - 0,186 0,24x10⁻² 76Cepec - 0,530 0,60x10⁻² 72
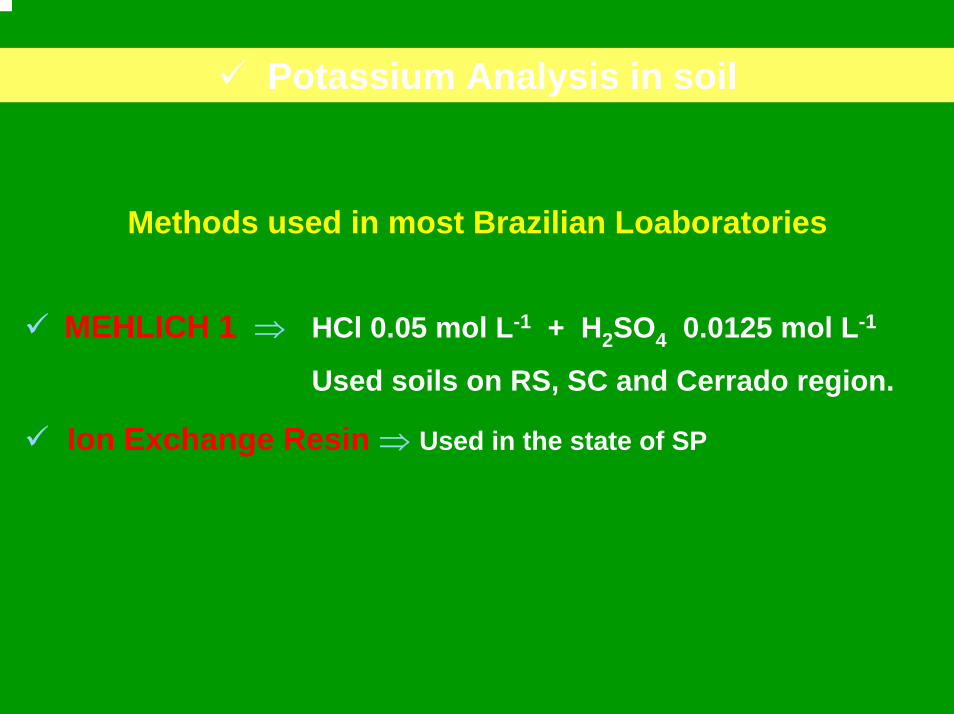
MEHLICH 1 ⇒ HCl 0.05 mol L-1 + H2SO4 0.0125 mol L-1
Used soils on RS, SC and Cerrado region.
Ion Exchange Resin ⇒ Used in the state of SP
Methods used in most Brazilian Loaboratories
Potassium Analysis in soil
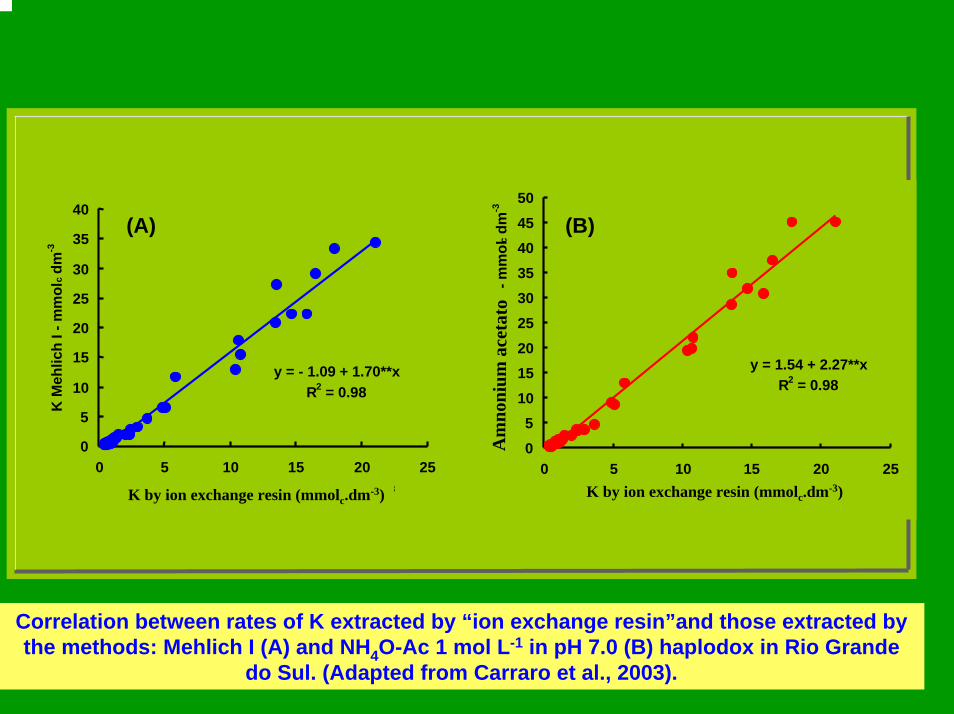
Correlation between rates of K extracted by “ion exchange resin”and those extracted bythe methods: Mehlich I (A) and NH4O-Ac 1 mol L-1 in pH 7.0 (B) haplodox in Rio Grande
do Sul. (Adapted from Carraro et al., 2003).
y = 1.54 + 2.27**x R2 = 0.98
05
101520253035404550
0 5 10 15 20 25
K Resina de Troca Iônica - mmolc dm-3K
Ace
tato
de
Am
ônio
-m
mol
c dm
-3
y = - 1.09 + 1.70**x R2 = 0.98
0
5
10
15
20
25
30
35
40
0 5 10 15 20 25
K Resina de Troca Iônica - mmolc dm-3
K M
ehlic
h I -
mm
olc
dm-3
(A) (B)
K by ion exchange resin (mmolc.dm-3) K by ion exchange resin (mmolc.dm-3)A
mno
nium
ace
tato

Correlation between the production of three crops with soil potassium (Raij, 1991).
0
20
40
60
80
100
120
140
0,0 1,0 2,0 3,0 4,0 5,0 6,0
Potássio Trocável - mmolc.dm-3
Prod
ução
Rel
ativ
a - %
y = 111,8 - 3,21 1/xr = - 0,762*
Exchangeable potassium – mmolc.dm-3
Rel
ativ
eyi
e ld

Interpretation of available potassium availability in Brazilian soil
A) Available potassium:
PlacePlace Adequate rate of KAdequate rate of K SourceSource
Cerrado regionCerrado region 1.3 to 2.0 mmol1.3 to 2.0 mmolcc dmdm--33 Embrapa (1996)Embrapa (1996)
SSãão Pauloo Paulo 1.6 to 3.0 mmol1.6 to 3.0 mmolcc dmdm--33 Raij et al. (1996)Raij et al. (1996)
Rio Grande do Sul Rio Grande do Sul and Santa Catarinaand Santa Catarina
2.1 to 3.1 mmol2.1 to 3.1 mmolcc dmdm--33 ComissComissãão de Fertilidade o de Fertilidade
do Solo do Solo –– RS/SC (1995) RS/SC (1995)

YieldYield vs. K rates in soilvs. K rates in soilo Mauá da Serra, PR. LV, 74 % of clay
0
500
1000
1500
2000
2500
3000
3500
0.00 0.10 0.20 0.30 0.40 0.50 0.60
K content in soil, cmolc/dm3
Gra
inyi
eld
, k
g/ha
Crop 2000/2001Crop 2000/2001
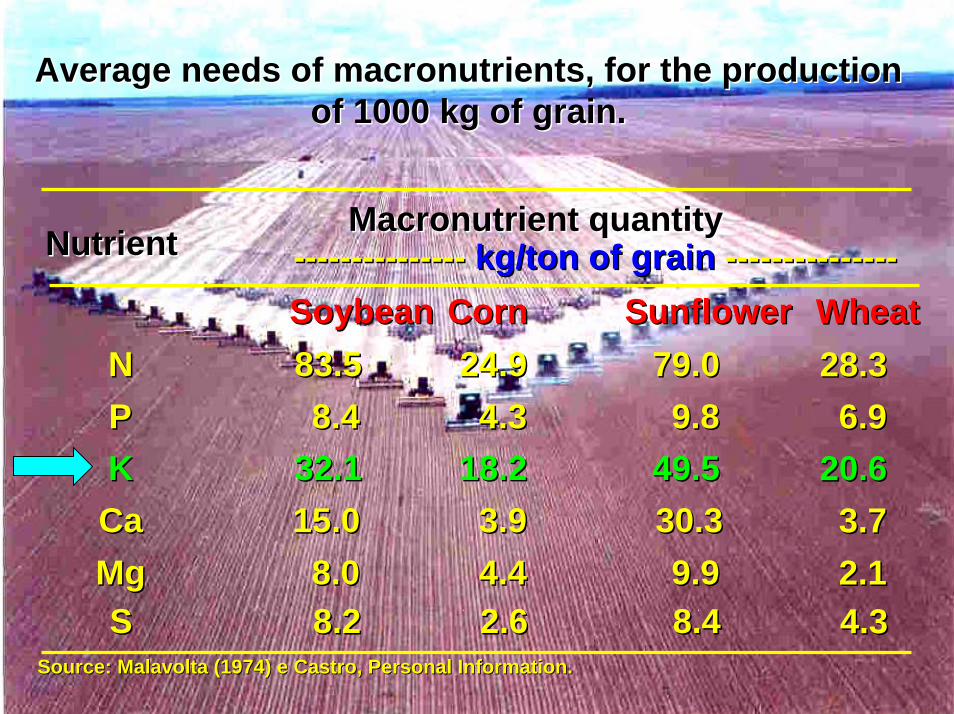
AverageAverage needs of macronutrients, for theneeds of macronutrients, for the production production of 1000 kg of grain.of 1000 kg of grain.
MacronutrientMacronutrient quantityquantity------------------------------ kg/ton of grainkg/ton of grain ------------------------------NutrientNutrient
SoybeanSoybean CornCorn SunflowerSunflowerNN 83.583.5 24.924.9 79.079.0PP 8.48.4 4.34.3 9.89.8KK 32.132.1 18.218.2 49.549.5
CaCa 15.015.0 3.93.9 30.330.3MgMg 8.08.0 4.44.4 9.99.9
Source: Malavolta (1974) e Castro, PersonalSource: Malavolta (1974) e Castro, Personal Information.Information.
WheatWheat28.328.36.96.9
20.620.63.73.72.12.1
SS 8.28.2 2.62.6 8.48.4 4.34.3

Table. Interpretation of potassium rates in soil andfertilization recommendation (kg/ha) of K2O in relation to thedesired productivity.
(1) The quantities recommended are equal to removal reposition to theseproductivities (21 Kg/ha of K2O to each 1000 kg/ha of soybean) and canbe reduced when conditions of price are unfavourable.Source: Boletim de pesquisa de soja 2006.1 BAG = 60kg grain
kg/ha K2ORates
K in soil
(mmolc.dm-3) 55 a 60 bags/ha
Good > 1.5 ≤ 72(1)
Medium 1.0 to 1.5 80 to 100
Low 0.5 to 1.0 100 to 120
Very low < 0.5 120 to 140
SOYBEAN

Potassium fertilizationPotassium fertilization recommendationrecommendation
•• Principal features in thePrincipal features in the soilsoil analysis;analysis;
• The limits between the rates in the table are similar in the whole country
Source: Coelho (1995)
CORN
K – in soil
mmolc/dm3 Corn - Fodder
Very Low < 0.7 150 to 180
Low 0.8 to 1.5 120 to 150
Medium 1.6 to 3.0 60 to 120
High > 3.0 6030
Rates in soil
90 to 120
60 to 90
30 to 60
Recommended K 2O dosages
Corn – grain
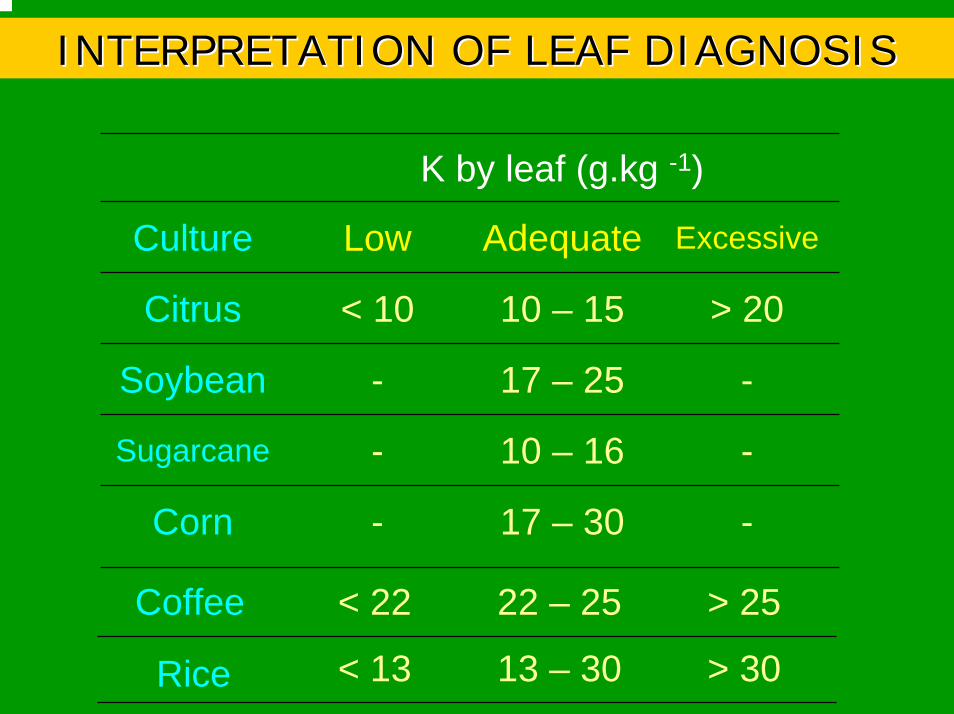
-17 – 30-Corn
-10 – 16 -Sugarcane
-17 – 25 -Soybean
> 2010 – 15 < 10Citrus
ExcessiveAdequateLowCulture
K by leaf (g.kg -1)
INTERPRETATION OF LEAF DIAGNOSISINTERPRETATION OF LEAF DIAGNOSIS
> 2522 – 25< 22Coffee
> 3013 – 30< 13Rice

A) Annual Crops (soybean, corn, rice)
a) Before planting (whole area)
Potassium fertilization
When?When?
K soil < 1.3 mmolc. dm-3
Clay soils, CEC > 60 mmolc.dm-3
Clay content ≥ 20%
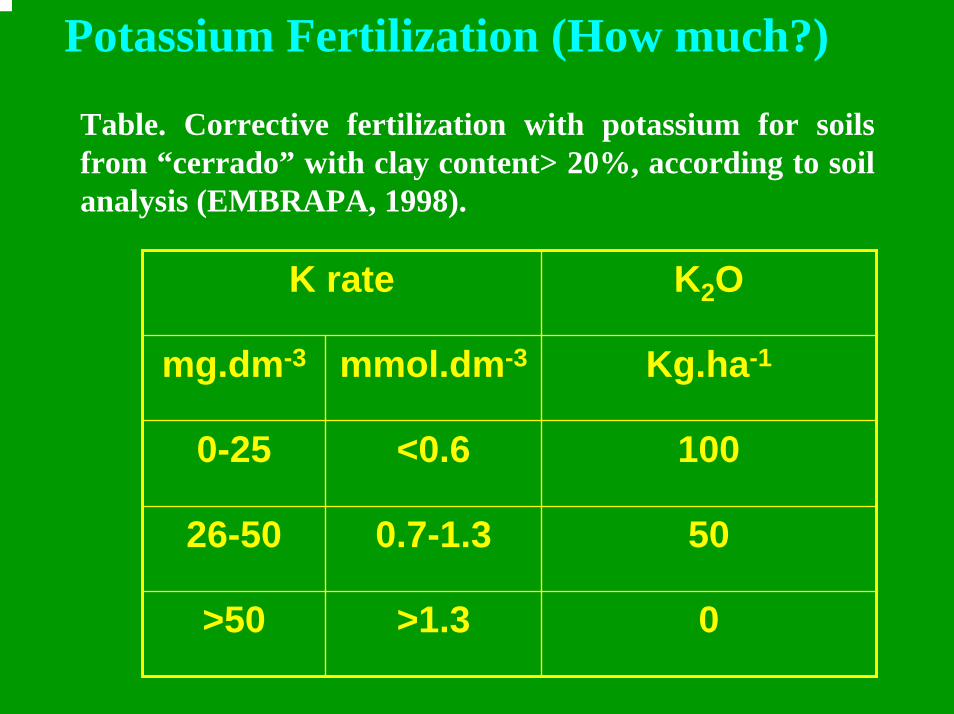
Table. Corrective fertilization with potassium for soilsfrom “cerrado” with clay content> 20%, according to soilanalysis (EMBRAPA, 1998).
Potassium Fertilization (How much?)
K rate K2O
mg.dm-3 mmol.dm-3 Kg.ha-1
0-25 <0.6 100
26-50 0.7-1.3 50
>50 >1.3 0
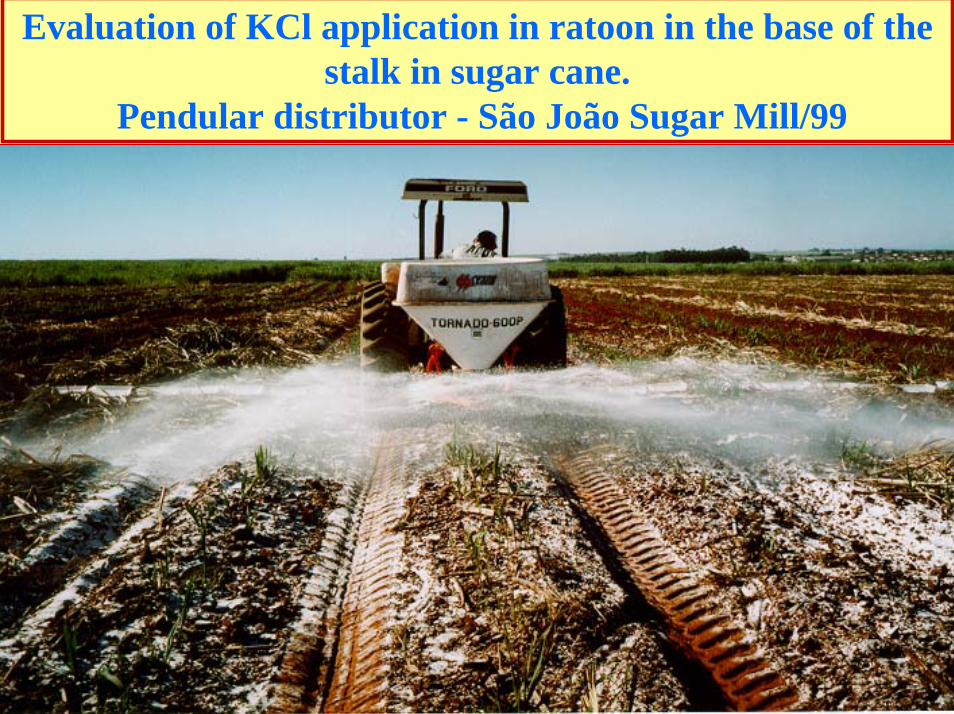
Evaluation of KCl application in ratoon in the base of thestalk in sugar cane.
Pendular distributor - São João Sugar Mill/99
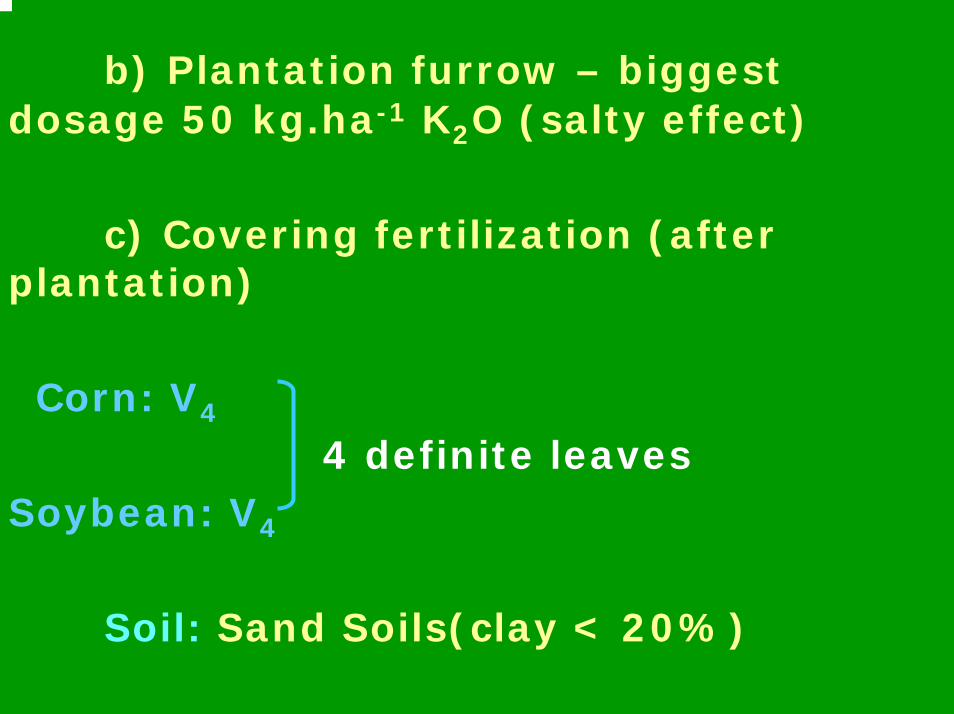
b) Plantation furrow – biggestdosage 50 kg.ha-1 K2O (salty effect)
c) Covering fertilization (afterplantation)
Corn: V4
4 definite leavesSoybean: V4
Soil: Sand Soils(clay < 20%)

Surce: Boletim 100 IAC, 1996
K+ exchangeable (mmolc/dm-3)Productivityexpectation 0-0.7 0.8-1.5 1.6-3.0 >3.0---tons/ha--- --------------------------K2O (kg/ha)---------------------
2-4 60 40 20 04-6 80 50 30 06-8 100 70 40 20
Furrow:
Potassium Fertilization in Lowland Rice

B) Perennial Crops (coffee, citrus)
a) Plantation furrow
Maximum dosage: 30g/m of ridge K2O
b) Formation fertilization
Age Fertilization
c) Production fertilization (by modules)
- Expected production- Soil analysis- Leaf tissue analysis

Technology of Application Technology of Application

Quantity of Macronutrients in 40.8 kg of fruitsQuantity of Macronutrients in 40.8 kg of fruits
1.91.93.23.22.72.7SS6.46.412.312.37.67.6MgMg
26.526.515.815.810.710.7CaCa73.273.295.195.162.262.2KK4.94.95.85.85.65.6PP
45.445.458.1258.1255.755.7NN
LemonLemonPonkanPonkanOrangeOrangeNutrientNutrient g/box(40,8kg)g/box(40,8kg)

Relative production of Pineappleorange
0102030405060708090
100C
ompl
eta
- 1/2
N - P - K - Ca
- Mg
- S
- Zn
%
Com
plet
e

0100140180> 50
09012016040 a 50
07010012031 a 40
050709021a 300405070< 20
> 3.01.6 to 3.00.7 to 1.5< 0.7tons/ha-1
dm3mmolcsoloK no Production
Potassium
Split K in 4, at most
K in soil mmolc.dm3
----------------------- kg /ha-1 of K2O ----------------------
* When K rate in the leaf is bigger than 20g/kg, supress the last K fertilization;

KK++ exchangeableexchangeable (mmol(mmolcc/dm/dm--33))ExpectedExpectedProductionProduction 00--0.70.7 0.80.8--1.51.5 1.61.6--3.03.0 >3.0>3.0------Kg/haKg/ha------ --------------------------------------------------KK22O (kg/ha)O (kg/ha)------------------------------------------
<600<600 150150 100100 5050 2020600600--12001200 180180 120120 7070 303012001200--18001800 210210 140140 9090 404018001800--24002400 240240 160160 110110 505024002400--36003600 300300 200200 140140 808036003600--48004800 360360 250250 170170 100100
>4800>4800 450450 300300 200200 120120Source: Boletim 100 IAC, 1996Source: Boletim 100 IAC, 1996
Potassium Fertilizer in Coffee
From third year on:
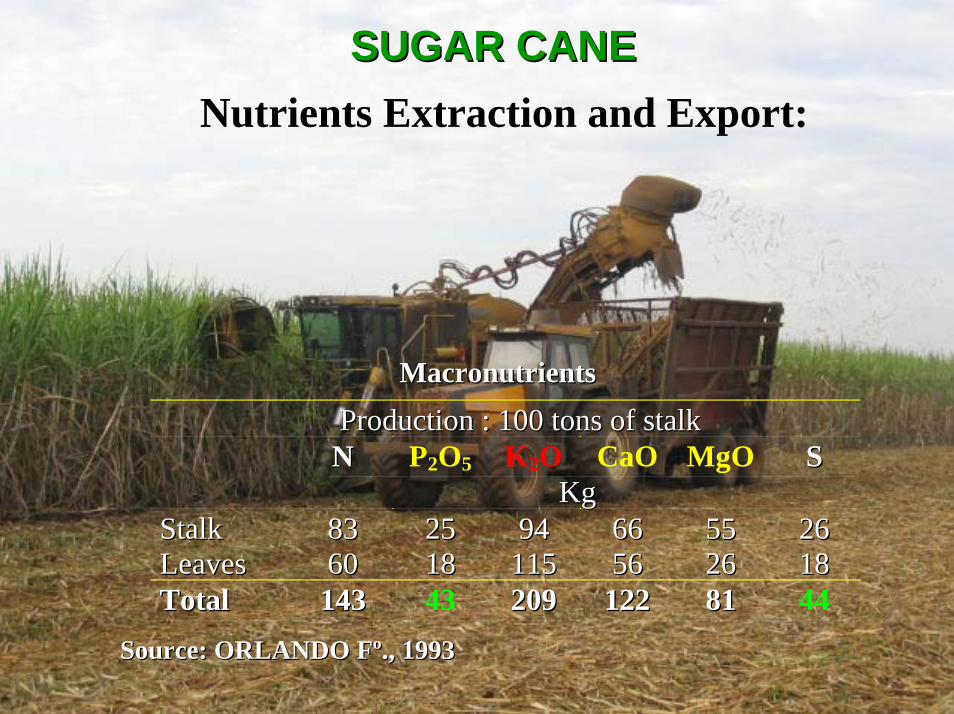
Nutrients Extraction and Export:
Production : 100 tons of stalkProduction : 100 tons of stalkNN P2O5 K2O CaO MgO SS
KgKgStalkStalk 8383 2525 9494 6666 5555 2626LeavesLeaves 6060 1818 115115 5656 2626 1818TotalTotal 143143 43 209209 122122 8181 44
MacronutrientsMacronutrients
Source: ORLANDO FSource: ORLANDO Fºº., 1993., 1993
SUGAR CANESUGAR CANE
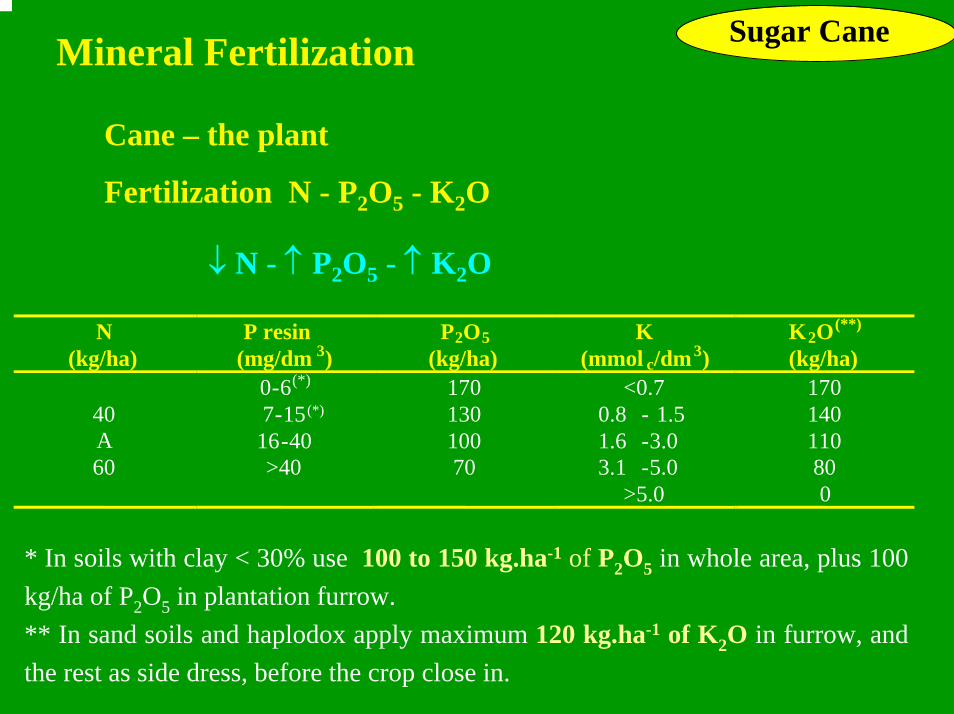
Cane – the plant
Fertilization N - P2O5 - K2O
N(kg/ha)
P resin(mg/dm 3)
P2O5(kg/ha)
K(mmol c/dm3)
K2O(**)
(kg/ha)0-6(*) 170 <0.7 1707-15(*) 130 0.8 - 1.5 140
16-40 100 1.6 -3.0 110>40 70 3.1 -5.0 80
40A60
>5.0 0
↓ N - ↑ P2O5 - ↑ K2O
Mineral Fertilization Sugar Cane
* In soils with clay < 30% use 100 to 150 kg.ha-1 of P2O5 in whole area, plus 100 kg/ha of P2O5 in plantation furrow.** In sand soils and haplodox apply maximum 120 kg.ha-1 of K2O in furrow, andthe rest as side dress, before the crop close in.

Fertilization N - P2O5 - K2O - Ratoon↑ N - ↓ P2O5 - ↑ K2O
Expected Productivity ton/ha N K2O ---------------------------------kg/ha-----------------------------
65-80 80 100 81-100 100 130 >100 120 160
Ratio N:K2O = 1.3 a 1.5
1.0 a 1.2 kg N = 1ton stalk
K (mmolc.dm-3) K2O (kg.ha-1)<1.5 150 a 180
1.6 a 3.0 110 a 140
>3.0 80Source: Vitti, et. al. 2005
Recommendation of potassium fertilization for ratoon, based on soil analysis


PRODUCT PRODUCT -- FERTILIZERFERTILIZER•• B) GranulationB) Granulation characteristicscharacteristics
– B.1) SIZE• Segregation ⇒ features:
– QUANTITY ⇒ Uniformity in “Dosages”– QUALITY ⇒ “Chemical” Uniformity
• Classification–– A) POWDEREDA) POWDERED–– B) BRANEDB) BRANED–– C) GRANEDC) GRANED
– B.2) FORM• Fluidity x Gravelling x Higroscopicity
– < Contact surface and exposition ⇒ “Spherical”

GRANULATION CHARACTERISTICS X SEGREGATIONGRANULATION CHARACTERISTICS X SEGREGATION
• A) Packed:Transport and Management– Bag 50 kg and Big Bag (500 to 800 kg)
• B) On Application– Mechanical Throw: Distance f ( size and density )
Distance
Distance
BiggerBigger diameterdiameter andanddensitydensity
SmallerSmaller diameterdiameter andanddensitydensity
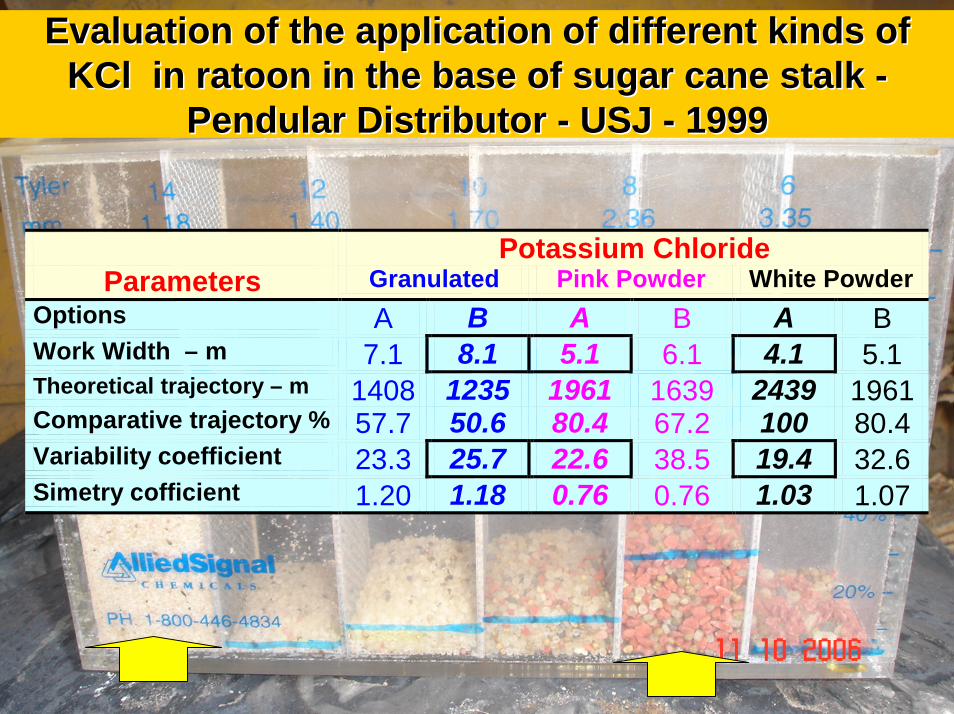
Evaluation of theEvaluation of the application of differentapplication of different kinds of kinds of KCl in ratoon in the base of sugar caneKCl in ratoon in the base of sugar cane stalk stalk --
Pendular Distributor Pendular Distributor -- USJ USJ -- 19991999
Potassium Chloride Parameters Granulated Pink Powder White Powder
Options A B A B A B Work Width – m 7.1 8.1 5.1 6.1 4.1 5.1 Theoretical trajectory – m 1408 1235 1961 1639 2439 1961 Comparative trajectory % 57.7 50.6 80.4 67.2 100 80.4 Variability coefficient 23.3 25.7 22.6 38.5 19.4 32.6 Simetry cofficient 1.20 1.18 0.76 0.76 1.03 1.07
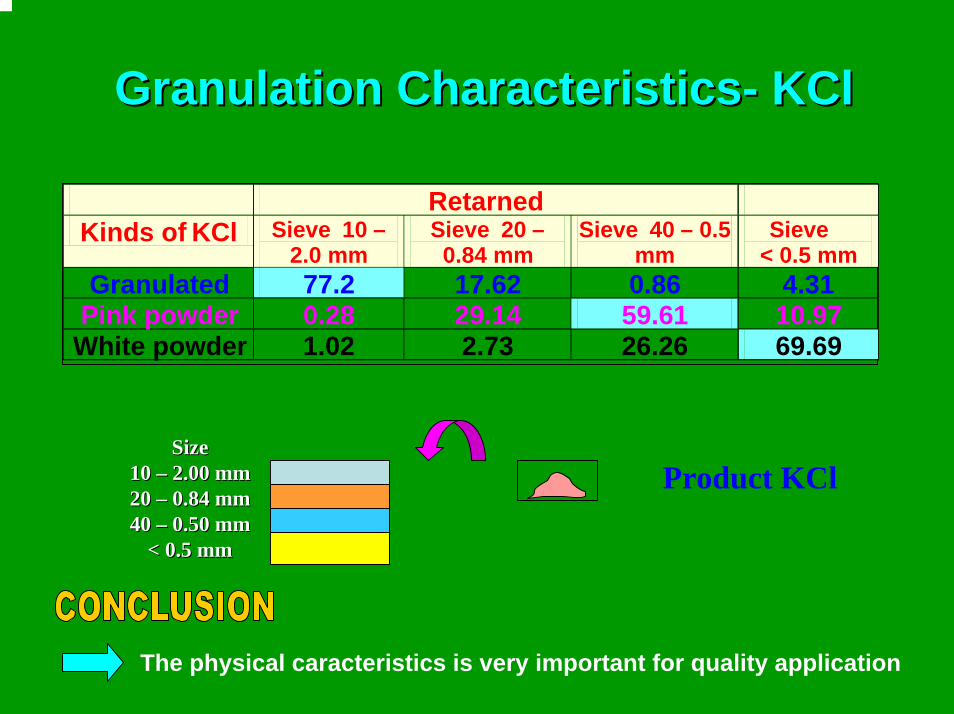
GranulationGranulation CharacteristicsCharacteristics-- KClKCl
SizeSize10 10 –– 2.00 mm2.00 mm20 20 –– 0.84 mm0.84 mm40 40 –– 0.50 mm0.50 mm
< 0.5 mm< 0.5 mm
Product KCl
RetarnedKinds of KCl Sieve 10 –
2.0 mmSieve 20 –0.84 mm
Sieve 40 – 0.5 mm
Sieve< 0.5 mm
Granulated 77.2 17.62 0.86 4.31Pink powder 0.28 29.14 59.61 10.97
White powder 1.02 2.73 26.26 69.69
The physical caracteristics is very important for quality application

Prof. PhD. Godofredo Cesar Vitti Prof. PhD. Pedro Henrique Cerqueira [email protected] [email protected] [email protected]