Modeling the logistics design of a multi-commodity industry · nova fábrica exigiu a readequação...
13
Gest. Prod., São Carlos, v. 24, n. 1, p. 148-160, 2017 http://dx.doi.org/10.1590/0104-530X842-16 Resumo: Neste trabalho apresentamos duas diferentes formulações matemáticas para o Projeto de Rede da Cadeia de Suprimentos de uma empresa responsável por produção e distribuição multicommodity. O investimento em uma nova fábrica exigiu a readequação do projeto logístico da empresa, implicando na reestruturação dos fluxos de matérias-primas e produtos acabados, assim como a abertura de novos CDs. A cadeia de suprimentos foi modelada utilizando-se uma formulação em programação inteira linear mista na qual as facilidades são representadas pelos nós e os links, pelos arcos. As implementações computacionais foram realizadas em OPL e os resultados obtidos utilizando-se o solver CPLEX © . Para validar os modelos implementados, uma série de experimentos computacionais foi realizada. Para viabilizar a aplicação dos modelos ao problema da empresa, estudos para identificar as demandas de mercado (market shares) e os custos de transporte foram incorporados ao trabalho. A aplicação dos modelos apoiou várias decisões referentes ao projeto inicial da empresa, realizadas pela equipe de projeto. Palavras-chave: Projeto logístico; Multicommodity; Projeto de rede da cadeia de suprimentos; Single-source; Pesquisa operacional. Abstract: This paper presents two different mathematical formulations for the Supply Chain Network Design of a company responsible for producing and distributing multi-commodity products. Investments in a new manufacturing plant required the readjustment of the company’s logistics project, with a necessary re-structuring of the raw materials and finished product flows and the possibility of opening new distribution centers (DCs). The supply chain was modeled using a formulation in mixed linear integer programming, in which the facilities are represented by nodes and the links by the arcs. The computer implementations were performed using OPL and results obtained by CPLEX © solver. The implemented models was validated by a series of computational experiments. We incorporated studies to identify the market demands (market shares) and transportation costs in order to enable the application of models to the company’s problem. The application of the models allowed several decisions concerning the initial project of the company to be performed by the project team. Keywords: Logistics project; Multicommodity; Supply chain network design; Single-source; Operational research. Modeling the logistics design of a multi-commodity industry Modelando o projeto logístico de uma indústria multicommodity Everton da Silveira Farias 1,2 Denis Borenstein 2 1 Departamento Interdisciplinar em Ciência e Tecnologia, Universidade Federal do Rio Grande do Sul – UFRGS, Rodovia RS 030, 11.700 Km 92, CEP 95590-000, Tramandaí, RS, Brazil, e-mail: [email protected] 2 Programa de Pós-graduação em Administração, Universidade Federal do Rio Grande do Sul – UFRGS, Rua Washington Luiz, 855, Centro Histórico, CEP 90010-460, Porto Alegre, RS, Brazil, e-mail: [email protected] Received Oct. 4, 2015 - Accepted Feb. 10, 2016 Financial support: CAPES and CNPq Projeto nº 301453/2013-6. 1 Introduction The supply chain represents a number of organizations responsible for the different processes and activities that produce value in the form of products and services placed at the disposal of the end consumer. The management of the supply chain deals with the flows external to the company and is aimed at coordinating and controlling materials, information and finances which range from the supplier to the consumer, passing by the manufacturers, wholesalers and a retailers (Ballou, 2006). By planning, organization and effective control of corporate activities, logistics aims at providing a better level of service, reducing operational costs and contributing to the prosperity of the business (Bowersox et al., 2006). The definition of a Supply Chain Network Design (SCND) is one of the most extensive problems regarding the supply chain, since it involves decisions at operational, tactical and strategic levels (Shen, 2005). According to Jang et al. (2002), defining the network structure of a chain means to determine the number, location, capacity and types of plants
Transcript of Modeling the logistics design of a multi-commodity industry · nova fábrica exigiu a readequação...
Gest. Prod., São Carlos, v. 24, n. 1, p. 148-160, 2017http://dx.doi.org/10.1590/0104-530X842-16
Resumo: Neste trabalho apresentamos duas diferentes formulações matemáticas para o Projeto de Rede da Cadeia de Suprimentos de uma empresa responsável por produção e distribuição multicommodity. O investimento em uma nova fábrica exigiu a readequação do projeto logístico da empresa, implicando na reestruturação dos fluxos de matérias-primas e produtos acabados, assim como a abertura de novos CDs. A cadeia de suprimentos foi modelada utilizando-se uma formulação em programação inteira linear mista na qual as facilidades são representadas pelos nós e os links, pelos arcos. As implementações computacionais foram realizadas em OPL e os resultados obtidos utilizando-se o solver CPLEX©. Para validar os modelos implementados, uma série de experimentos computacionais foi realizada. Para viabilizar a aplicação dos modelos ao problema da empresa, estudos para identificar as demandas de mercado (market shares) e os custos de transporte foram incorporados ao trabalho. A aplicação dos modelos apoiou várias decisões referentes ao projeto inicial da empresa, realizadas pela equipe de projeto.Palavras-chave: Projeto logístico; Multicommodity; Projeto de rede da cadeia de suprimentos; Single-source; Pesquisa operacional.
Abstract: This paper presents two different mathematical formulations for the Supply Chain Network Design of a company responsible for producing and distributing multi-commodity products. Investments in a new manufacturing plant required the readjustment of the company’s logistics project, with a necessary re-structuring of the raw materials and finished product flows and the possibility of opening new distribution centers (DCs). The supply chain was modeled using a formulation in mixed linear integer programming, in which the facilities are represented by nodes and the links by the arcs. The computer implementations were performed using OPL and results obtained by CPLEX© solver. The implemented models was validated by a series of computational experiments. We incorporated studies to identify the market demands (market shares) and transportation costs in order to enable the application of models to the company’s problem. The application of the models allowed several decisions concerning the initial project of the company to be performed by the project team.Keywords: Logistics project; Multicommodity; Supply chain network design; Single-source; Operational research.
Modeling the logistics design of a multi-commodity industry
Modelando o projeto logístico de uma indústria multicommodity
Everton da Silveira Farias1,2
Denis Borenstein2
1 Departamento Interdisciplinar em Ciência e Tecnologia, Universidade Federal do Rio Grande do Sul – UFRGS, Rodovia RS 030, 11.700 Km 92, CEP 95590-000, Tramandaí, RS, Brazil, e-mail: [email protected]
2 Programa de Pós-graduação em Administração, Universidade Federal do Rio Grande do Sul – UFRGS, Rua Washington Luiz, 855, Centro Histórico, CEP 90010-460, Porto Alegre, RS, Brazil, e-mail: [email protected]
Received Oct. 4, 2015 - Accepted Feb. 10, 2016Financial support: CAPES and CNPq Projeto nº 301453/2013-6.
1 IntroductionThe supply chain represents a number of
organizations responsible for the different processes and activities that produce value in the form of products and services placed at the disposal of the end consumer. The management of the supply chain deals with the flows external to the company and is aimed at coordinating and controlling materials, information and finances which range from the supplier to the consumer, passing by the manufacturers, wholesalers and a retailers (Ballou, 2006). By planning, organization and effective control
of corporate activities, logistics aims at providing a better level of service, reducing operational costs and contributing to the prosperity of the business (Bowersox et al., 2006).
The definition of a Supply Chain Network Design (SCND) is one of the most extensive problems regarding the supply chain, since it involves decisions at operational, tactical and strategic levels (Shen, 2005). According to Jang et al. (2002), defining the network structure of a chain means to determine the number, location, capacity and types of plants
Modeling the logistics design... 149
and distribution centers (DC) that will be used. The network design also establishes the distribution channels and quantities of materials and items to consume, produce and send to the suppliers at each level of consumption in the chain. The number of stages is determined based on the complexity of the fragmented problems of the network (Pirkul & Jayaraman, 1998).
Operational Research techniques are increasingly used to define the network of supply chains in order to provide a solution that is not only feasible but in many cases optimal to this complex problem. The mathematical modeling of distribution chains generally seeks to optimize the costs of moving materials over the network, without significantly compromising the levels of service offered to the customers. The literature presents several mathematical models, mainly in linear programming, to design of supply chains that incorporate several aspects of the operational, tactical and strategic sphere.
This article presents the development and application of mathematical models based on Mixed Integer Linear Programming for the initial design of the supply chain of a company in the rubber-based products industry (commodity). The company is expanding its area of action installing a new plant in Brazil. Due to this new geographic location, it is necessary to restructure their distribution system. The company has an extensive list of products, with a great diversity of sizes, technical characteristics and specific applications. Therefore, the operational flows to meet the demands of the facilities via efficient raw materials and finished product flows require the development of models that will include multi-commodity production and distribution. In order to make the application of the models to the company problems more feasible, studies to identify the demands and costs of transportation were also performed, as well as the construction of different scenarios, incorporating different strategic and operational elements.
This study is organized as follows: section 2 presents the review of literature used to develop the models to be presented and discussed in section 3, which deals with the stages of the research methodology used. In section 4, the application of the model to the initial design of the company supply chain is presented and discussed in detail. Finally, section 5 presents the conclusions and aspects which motivate future work.
2 Review of literatureThe review of literature in this paper comprises
studies about applying modeling to multi-commodity supply chain network design. Geoffrion & Graves (1974) performed the pioneering study which deals
with the design of the distribution system incorporating multi-commodity. This work is characterized by discussing the capacity of plants and DCs, flow of products and meeting the demands of consumers in a multi-commodity environment. In this study the Benders Decompositions method was used for the solution. The model was applied to a foodstuff industry that manufactured about one hundred products at 14 locations, with national distribution using a dozen DCs. Geoffrion & Powers (1995) reviewed this initial model, adding restrictions of facility capacity and the limitation of the product flow along the supply chain to the initial modeling. The authors say that it is very difficult to solve the problem of finding the optimal composition for an integrated supply chain.
Based on the seminal work on multi-commodity distribution network design by Geoffrion & Graves (1974), several models were developed to solve supply chain problems, discussing issues involving transport and warehousing. Pirkul & Jayaraman (1996) discuss the integration of production, transportation and multi-commodity distribution planning, presenting a mixed integer programming model for the location of plants and DCs in order to minimize costs. This model allows each customer zone to be supplied by only one distribution center, called a single-source strategy. Lagrangian and heuristic relaxation techniques were applied for the mathematical solution of the model. This work was expanded in Jayaraman & Pirkul (2001) by incorporating suppliers of raw material to the model, resulting in a more complex computation problem. In this expanded model, the condition of supplying demand is maintained by a distribution center. The authors discuss the problem of multiple products grouping products for transportation. This drastically reduces the number of variables and makes it easier to solve the model, but diminishes the representativeness of the model in relation to the real problem.
Since then, different approaches to modeling and solution have been described in the literature. Cole (1995) developed a Mixed Integer Programming model of multiple products for the optimization of the integrated system of the supply chain and minimization of the strategic and operational costs. In this case, the opening and closing of the facilities were considered strategic costs; production, inventory and transportation costs were incorporated to the operational costs. According to Vidal & Goetschalckx (1997), the model presented by Cole (1995) is the most appropriate for supply chain network design with internal integration.
Papageorgiou et al. (2001) demonstrated and applied an integrated supply chain model for pharmaceutical
Farias, E. S. et al.150 Gest. Prod., São Carlos, v. 24, n. 1, p. 148-160, 2017
companies. The results obtained showed the applicability of the mixed integer programming for large scale problems to find the ideal solution in a supply chain. Alonso-Ayuso et al. (2003) presented a two-stage model for strategic planning of the supply chain based on binary integer programming and stochastic methods. The algorithm proposed for the solution is based on the branch and fix algorithmic coordination. Shen (2005) presents the first model of multi-commodity supply chain design which includes economy of scale in the supply chain regarding costs. An algorithm is proposed for the solution, and the results presented are more efficient compared to already existing algorithm solutions. Ma & Suo (2006) developed a model to conceive logistics networks with several products in three stages. A mixed integer linear programming model was used to configure the network, and then an inventory planning model and a vehicle routing method were developed to identify the shortest route between wholesalers and retailers. Li et al. (2009) approached multi-commodity flow through the classical Capacitated Plant Location Problem. The method for the solution was developed from the combination of Lagrangian Relaxation and Tabu Search. Computer implementation used CPLEX© and randomly generated instances.
Although these models present mathematical formulas that can incorporate a number of real life aspects, few studies show results applied with experiments in realistic situations. This research study focuses on applying the models developed in a case study, presenting the challenges faced when complex models are applied to real world problems, specifically to the design of multi commodity supply chain networks.
3 Model development3.1 Defining the problem
The company is responsible for producing a set of rubber-based products. These products are of different sizes, with different properties and specifications from each other, but are constituted basically of the same raw materials. The manufacturing plants receive raw material from several suppliers. The set of distribution centers receives various types of products from the manufacturing plants. In their turn, the distribution centers (DCs) are responsible for sending to the customer zones the amounts of each product according to demand. In this way, the supply chain network of this industry is formed by the raw material suppliers, manufacturing plants, DCs and product customer zones.
The company is currently implementing the construction of a new plant in Brazil. This plant will be responsible for supplying the already existing DCs, and also for supplying new DCs that may be constructed according to the new geographic position of the plant. The investment in the new manufacturing plant does not rule out using the already existing plants, but they will have to undergo capacity adjustments. If it is a distribution chain of physical products, there is the need for transportation between the players of this network. Thus it is necessary to consider the costs of transporting raw materials and products at each stage of the chain. Due to the amount of products involved in supply network flows it is necessary to consider the issues of production capacity of each plant and also the processing capacity of each distribution center. Consequently, the fixed and variable costs of the facilities (especially the DCs) must be considered.
Hence the problem consists of determining the set of DCs needed to supply the demand for products in the customer zones with a lower operational cost. For this it is necessary to consider the quantities of each of the raw materials that must be acquired from each supplier, and also the amount of product that will be produced at each plant. However, since it is a design project, the company has not defined the distribution strategy involved in supplying the customer zones. Thus, in the problem at hand, it has not been defined whether a customer zone can be supplied by more than one DC, or whether this supply will be single-source. Therefore, in this study, the problem is approached presenting two mathematical models for the logistics design of the supply chain. The approach, called “Single-source” presupposes that each customer zone received products from only one DC. On the other hand, in the second approach, here called “Arc-based”, the structure of cost of transportation between plants, DCs and customers is represented by arcs that connect each of these players, and there is no exclusive attention to a customer by a single DC.
3.2 Formulations and mathematical modeling
The mathematical models developed were based on the formulation presented by Jayaraman & Pirkul (2001). The continuous variables are defined from the quantity of raw materials from suppliers to plants and the quantity of products sent from the factories to the customer zones through the DCs. Next is presented the notation common to both formulations elaborated.
Modeling the logistics design... 151
Sets:
C: set of customer zones (customers) indexed by c;
W: set of DCs (warehouses), indexed by w;
F: set of manufacturing plants (plants), indexed by f:
R: set of raw materials, indexed by r;
V: set of suppliers, indexed by v;
S: set of products indexed by s;
P: set of paths (routes) indexed by p.
Parameters:
scd : demand for products s ∈ S from the customer zone c ∈ C;
fU : maximum number of plants that can be opened;
wU : maximum number of DCs that can be opened;
rsu : rate of raw material use r ∈ R for the goods s ∈ S;
su : rate of capacity use by goods s ∈ S;
WCAP : DC transfer capacity;
vrCAP : capacity to supply raw material r ∈ R by supplier v ∈ V;
fCAP : production capacity of plant f ∈ F;
ofCT : annual fixed cost for plant operation f ∈ F;
owCT : annual fixed cost for distribution center
operation w ∈ W;
gwCT : unit cost of transfer of the distribution
center operation w ∈ W;
pfsCT : unit cost of production for product s ∈ S
in the plant f ∈ F;
tfvrCT : unit cost of transportation of raw material
r ∈ R from supplier v ∈ V to the plant f ∈ F;
tpsCT : unit cost of transportation of product
s ∈ S using pathway p ∈ P;
tfwsCT : unit cost of transportation of product
s ∈ S using plant f ∈ F to the DC w ∈ W;
twcsCT : unit cost of transportation of the product
s ∈ S using the DC w ∈ W to the customer zone c ∈ C;
minu : minimum demand for opening of DC w ∈ W.
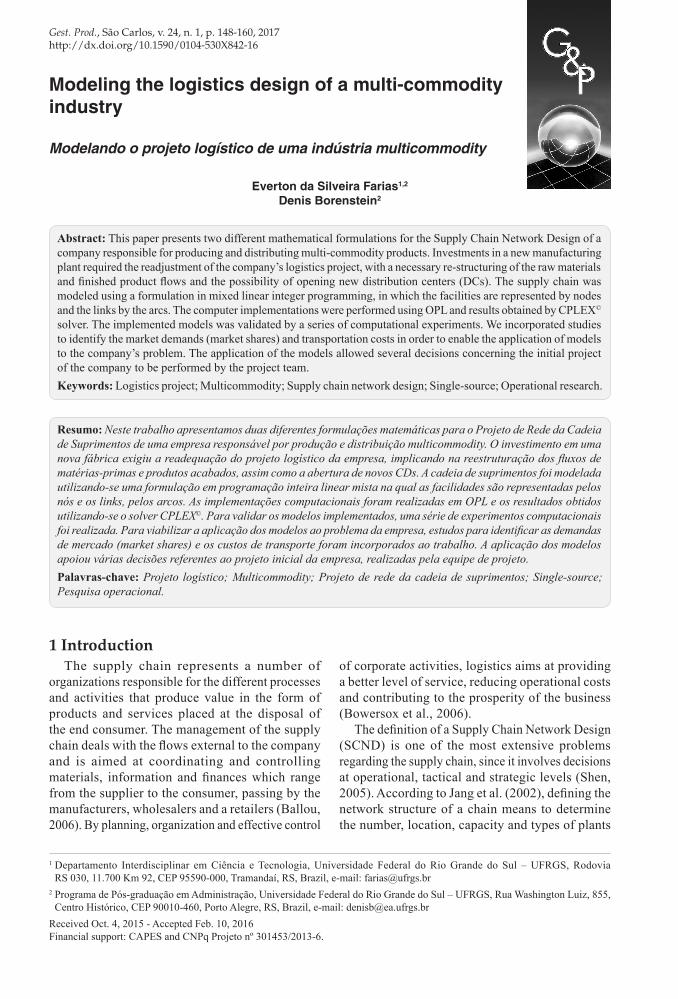
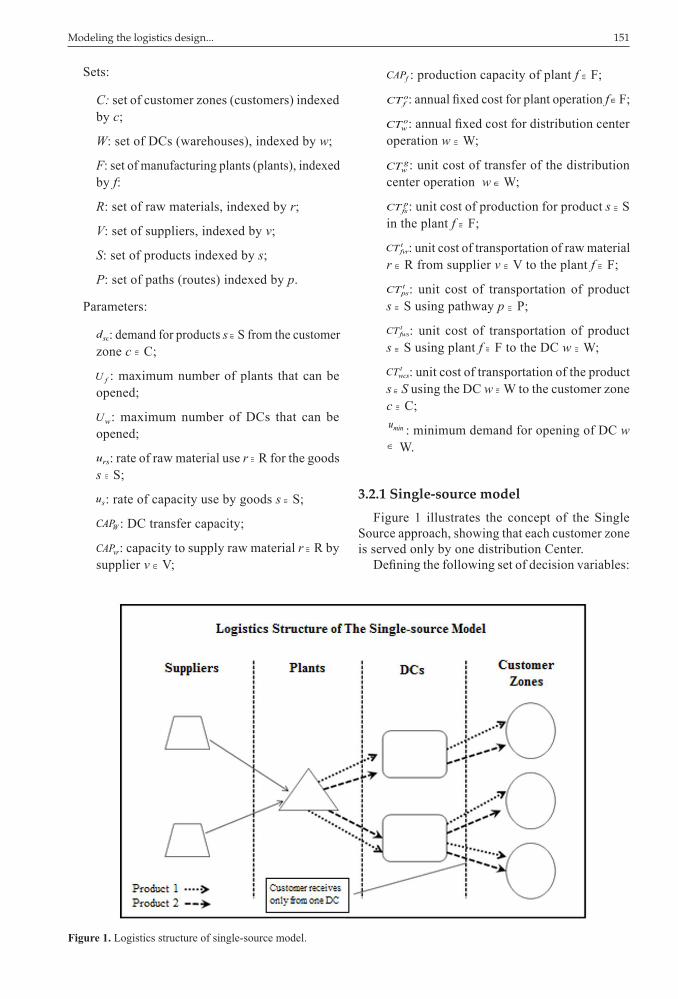
3.2.1 Single-source modelFigure 1 illustrates the concept of the Single
Source approach, showing that each customer zone is served only by one distribution Center.
Defining the following set of decision variables:
Figure 1. Logistics structure of single-source model.
Farias, E. S. et al.152 Gest. Prod., São Carlos, v. 24, n. 1, p. 148-160, 2017
fwsx : quantity of product s ∈ S sent from the plant f ∈ F to the DC w ∈ W;
vfry : quantity of raw materials r ∈ R sent from supplier v ∈ V to plant f ∈ F;
wa : binary variable that assumes value 1 if the DC w ∈ W is selected, and if otherwise;
wcg : binary variable that indicates if distribution center w ∈ W meets the demand of the customer zone c ∈ C.
The problem considering the decision variables defined and a single source approach can be formulated as a mixed integer programming model as follows:
• Single-source model:
min
o g pw w w sc wc fs fws
w W w W c C s S f F w W s S
t t tfvr vfr fws fws wcs sc wc
v V f F r R f F w W s S w W c C s S
CT a CT d g CT x
CT y CT x CT d g
∈ ∈ ∈ ∈ ∈ ∈ ∈
∈ ∈ ∈ ∈ ∈ ∈ ∈ ∈ ∈
+ + +
+ +
∑ ∑∑∑ ∑∑∑
∑∑∑ ∑∑∑ ∑∑∑ (1a)
St:
1 wcw W
g c C∈
= ∀ ∈∑ (1b)
sc wc w wc C s S
d g CAP z w W∈ ∈
≤ ∀ ∈∑∑ (1c)
w ww W
a U∈
≤∑ (1d)
, sc wc fwsc C f F
d g x w W c C∈ ∈
≤ ∀ ∈ ∀ ∈∑ ∑ (1e)
, vfr vrf F
y CAP r R v V∈
≤ ∀ ∈ ∀ ∈∑ (1f)
, rs fws vfrw W s S v V
u x y r R f F∈ ∈ ∈
≤ ∀ ∈ ∀ ∈∑ ∑ ∑ (1g)
s fws fw W s S
u x CAP f F∈ ∈
≤ ∀ ∈∑ ∑ (1h)
fws minf F s S
x u w W∈ ∈
≥ ∀ ∈∑∑ (1i)
{ } 0,1 wa w W= ∀ ∈ (1j)
{ } 0,1 , wcg w W c C= ∀ ∈ ∀ ∈ (1k)
The objective function (1a) minimizes the sum of the annual cost of DCs, the cost of processing of the DCs, the costs of plant production, the costs of transporting raw material to the plants and the costs of transportation from the plants to the customer zones through the DCs. Restriction (1b) ensures that each customer zone is assigned to a single distribution center, respecting the “single-source” approach. Restriction (1c) guarantees that the capacity of each distribution center is not violated. Restriction (1d) limits the number of DCs to be opened. Restriction (1e) ensures that the DCs have sufficient capacity to
serve the customer zones. Restriction (1f) ensures that the supplier’s capacity to supply the plant with raw materials in respected. Restriction (1g) shows that the relation between raw material and products must be satisfied. Restriction (1h) guarantees that the plants’ capacities are obeyed. Restriction (1i) imposes the minimum quantity of products to open a distribution center. Restrictions (1j) and (1k) are conditions of integrality of the binary variables.
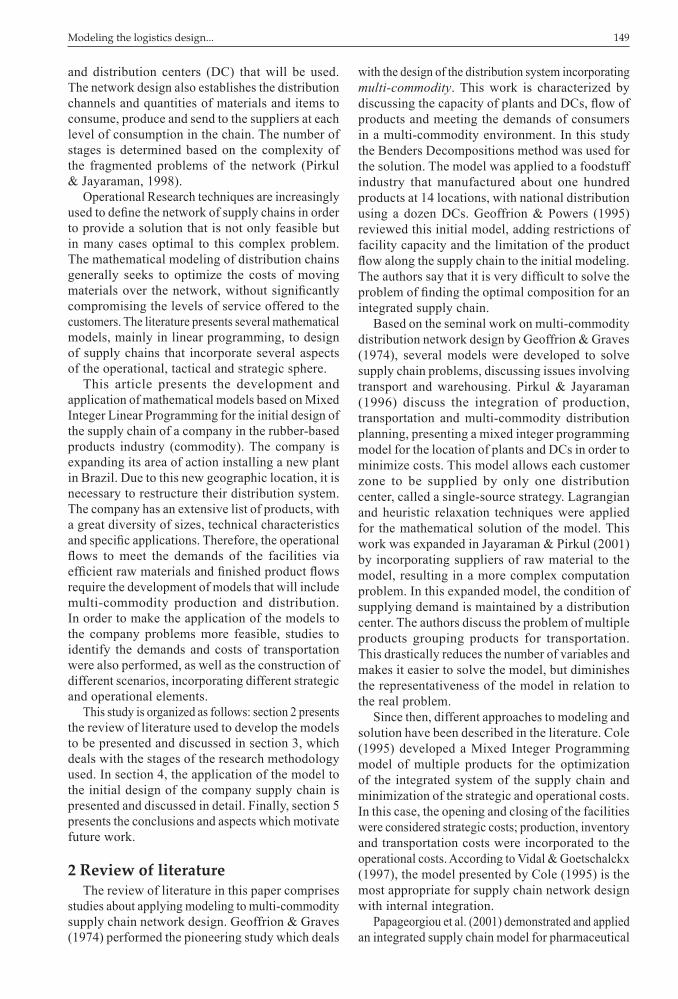
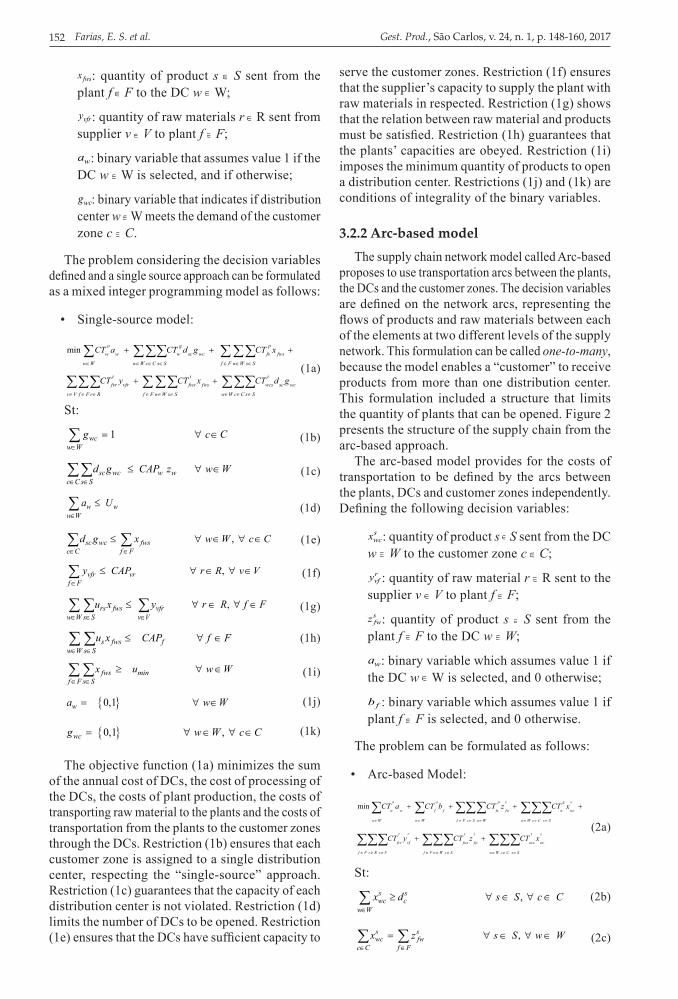
3.2.2 Arc-based modelThe supply chain network model called Arc-based
proposes to use transportation arcs between the plants, the DCs and the customer zones. The decision variables are defined on the network arcs, representing the flows of products and raw materials between each of the elements at two different levels of the supply network. This formulation can be called one-to-many, because the model enables a “customer” to receive products from more than one distribution center. This formulation included a structure that limits the quantity of plants that can be opened. Figure 2 presents the structure of the supply chain from the arc-based approach.
The arc-based model provides for the costs of transportation to be defined by the arcs between the plants, DCs and customer zones independently. Defining the following decision variables:
swcx : quantity of product s ∈ S sent from the DC
w ∈ W to the customer zone c ∈ C;
rvfy : quantity of raw material r ∈ R sent to the
supplier v ∈ V to plant f ∈ F;
sfwz : quantity of product s ∈ S sent from the
plant f ∈ F to the DC w ∈ W;
wa : binary variable which assumes value 1 if the DC w ∈ W is selected, and 0 otherwise;
fb : binary variable which assumes value 1 if plant f ∈ F is selected, and 0 otherwise.
The problem can be formulated as follows:
• Arc-based Model:
min
o o p s g s
w w f f fs fw w wc
w W w W f F s S w W w W c C s S
t r t s t s
fvr vf fws fw wcs wc
f F r R v V f F w W s S w W c C s S
CT a CT b CT z CT x
CT y CT z CT x
∈ ∈ ∈ ∈ ∈ ∈ ∈ ∈
∈ ∈ ∈ ∈ ∈ ∈ ∈ ∈ ∈
+ + + +
+ +
∑ ∑ ∑∑∑ ∑∑∑
∑∑∑ ∑∑∑ ∑∑∑ (2a)
St:
, s swc c
w Wx d s S c C
∈
≥ ∀ ∈ ∀ ∈∑ (2b)
, s swc fw
c C f Fx z s S w W
∈ ∈
= ∀ ∈ ∀ ∈∑ ∑ (2c)
Modeling the logistics design... 153
swc w w
c C s Sx CAP a w W
∈ ∈
≤ ∀ ∈∑∑ (2d)
, rvf vr
f Fy CAP r R v V
∈
≤ ∀ ∈ ∀ ∈∑ (2e)
, s rrs fw vf
w W s S v Vu z y r R f F
∈ ∈ ∈
≤ ∀ ∈ ∀ ∈∑ ∑ ∑ (2f)
ss fw f f
w W s Su z CAP b f F
∈ ∈
≤ ∀ ∈∑ ∑ (2g)
w ww W
a U∈
≤∑ (2h)
f ff F
b U∈
≤∑ (2i)
{ } 0,1 wa w W= ∀ ∈ (2j)
{ } 0,1 fb f F= ∀ ∈ (2k)
The objective function (2a) minimizes the sum of the annual cost of DCs, processing costs of DCs, fixed costs and plant production, costs of raw material transported to the plants, and costs of product transportation from the plants do the DCs. Restriction (2b) ensures that the demands of the customers (customer zones) are met. Restriction (2c) ensures that the quantity of product transported from the plants to each DC is equal to the quantity sent by the DC to the customer zones. Restriction (2d)
ensures that the capacity of each distribution center is not violated. Restriction (2e) ensures the suppliers’ capacity to provide raw materials. Restriction (2f) ensures the relation between the quantity of raw material and the quantity of product. Restriction (2g) ensures that the capacity of the plants is met. Restrictions (2h) and (2i) limit the number of DCs and plants that can be opened, respectively. Restrictions (2j) and (2k) are the integrality conditions of the binary variables.
3.3 Computational validation
The models were implemented using environment ILOG OPL Studio©, version 6.3, solved by solver IBM ILOG CPLEX© version 12.2 in its default configuration, ie., without tolerance for the optimality gap. All the computational procedures were performed on a PC with a Core™ 2 Duo processor of 2,4 Ghz and RAM of 4Gb.
Tests and experiments performed enabled verifying and validating the functionality of the models implemented. The purpose of these experiments was to define the capacity of CPLEX© to solve different instances, especially regarding their size. The different instances generated emphasized applying the models in situations of different quantities of
Figure 2. Logistics Structure of the Arc-based model.
Farias, E. S. et al.154 Gest. Prod., São Carlos, v. 24, n. 1, p. 148-160, 2017
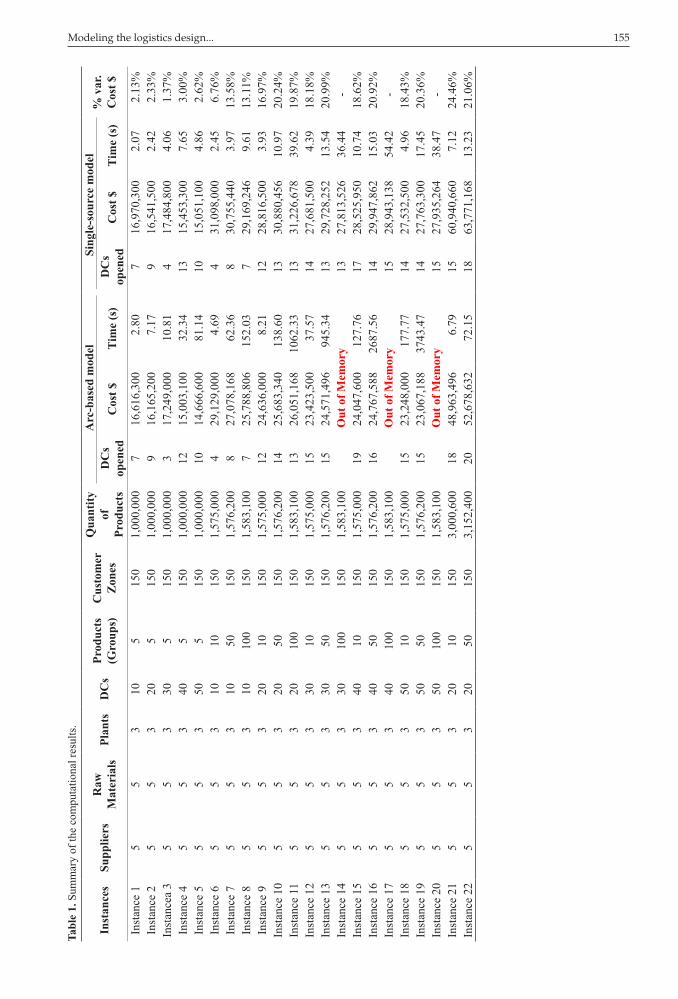
DCs, products and customer zones, similarly to the implementations presented in the works by Park (2005), Li et al. (2009), Golmohammadi et al. (2010) and Lee & Kwon (2010). Thus, the implementations become close regarding the quantity of restrictions and variables to the instances demonstrated in the articles by Jayaraman & Pirkul (2001) and Vidal & Goetschalckx (2001). The quantity of suppliers, types of raw materials and plants were kept fixed in all instances. The processing capacity and the fixed costs of the DCs were established in such a way as to present a realistic character for the problem approached. Table 1 presents a summary of the instances executed.
Analyzing Table 1 it is observed that the implementations were gradually exposed to problems that were more complex regarding the quantity of variables and restrictions. The main decision variable that strongly influenced the objective function is the quantity of DCs opened. According to the results presented, it is perceived that the number of DCs opened varies in relation to the Arc-based and Single-source approaches. Although in some instances the number of DCs is the same in both approaches, the total cost is higher in the results of the Single source approach, since restriction (1b) which determines that each Customer (customer zone) must be supplied from a single DC, restricts the space of solutions compared to the Arc-based approach, with a consequent penalty to the objective function. In this sense, the last column of Table 1 presents the percentage variation of the total costs (of the solutions found) between the Arc-based and Single-source model for each instance executed.
As to the computational time, the instances submitted to the Single-source approach presented better results (shorter time) compared to the Arc-based approach. Although that implementation presents a greater number of integer variables, considering variable wcg , the Arc-based formulation is penalized because of the excessive number of s
wcx variables needed to define the flow of each product that leaves each DC to meet the demands of each customer zone. Larger instances involving more than 30M of integer and non-integer variables (750,000 variables being due to s
wcx ) were not solved by CPLEX©.
Considering the magnitude of the problem to be solved for the company that is the focus of the case study, the results presented in both approaches were very satisfactory and validated the application of the Arc-based and Single-source models for the initial design of the supply chain of the company to be described in the next section.
4 Applying the models to logistics designIn this section we present the application of
the mathematical models implemented to solve the problem of the initial supply chain design of the commodities-producing industry studied here. In order to apply the models, a preliminary study was performed to define the demand of the main markets serviced by the company. Given the large quantity of products, three families of products were defined for market research. After defining the main customer poles (261 customer zones), it was necessary to map the distance from all customer zones to the places where the DCs could be located. Once the distances were defined, it was possible to determine the cost of transportation to each place based on the mean cost of transportation of each group of products. Different scenarios (market shares) were elaborated to best represent the real operation situations. Applying the models in the case study is presented in the following stages: collecting and structuring the data, applying the models and analyzing the results.
4.1 Collecting and structuring the dataThe company portfolio presents approximately
160 different commodities. In order to implement the models satisfactorily, it is necessary to define the demand of each commodity for each possible customer zone. Unfortunately, in the design phase in which this study was performed, the company only knew the aggregate demand of each commodity for each type of market, ie., the company did not know the demand for possible customer zones. The absence of this information prevented a more detailed application of the models developed. In this way, the models were applied for what was called an initial design, whose purpose it was to mark out all decisions of the company until more detailed information was obtained regarding the demand for the commodities, to be defined jointly with a company specialized in market analysis. The products for this initial design were divided into 3 large categories, according to the market they were to be sent, and called Commodity 1, Commodity 2 and Commodity 3.
The models require that one know the “customers” who will be served, and therefore the national market was divided into two categories: (i) Original Market: comprising the demands of the companies that manufacture goods using these commodities to assemble their products; and (ii) Retail-market comprising retail stores that sell the commodities to replace products that are excessively worn by use. Possible exports at this stage of the design
Modeling the logistics design... 155
Tabl
e 1.
Sum
mar
y of
the
com
puta
tiona
l res
ults
.
Inst
ance
sSu
pplie
rsR
aw
Mat
eria
lsPl
ants
DC
sPr
oduc
ts
(Gro
ups)
Cus
tom
er
Zon
es
Qua
ntity
of
Pr
oduc
ts
Arc
-bas
ed m
odel
Sing
le-s
ourc
e m
odel
% v
ar.
Cos
t $D
Cs
open
edC
ost $
Tim
e (s
)D
Cs
open
edC
ost $
Tim
e (s
)
Inst
ance
15
53
105
150
1,00
0,00
07
16,6
16,3
002.
807
16,9
70,3
002.
072.
13%
Inst
ance
25
53
205
150
1,00
0,00
09
16,1
65,2
007.
179
16,5
41,5
002.
422.
33%
Inst
ance
a 3
55
330
515
01,
000,
000
317
,249
,000
10.8
14
17,4
84,8
004.
061.
37%
Inst
ance
45
53
405
150
1,00
0,00
012
15,0
03,1
0032
.34
1315
,453
,300
7.65
3.00
%In
stan
ce 5
55
350
515
01,
000,
000
1014
,666
,600
81.1
410
15,0
51,1
004.
862.
62%
Inst
ance
65
53
1010
150
1,57
5,00
04
29,1
29,0
004.
694
31,0
98,0
002.
456.
76%
Inst
ance
75
53
1050
150
1,57
6,20
08
27,0
78,1
6862
.36
830
,755
,440
3.97
13.5
8%In
stan
ce 8
55
310
100
150
1,58
3,10
07
25,7
88,8
0615
2.03
729
,169
,246
9.61
13.1
1%In
stan
ce 9
55
320
1015
01,
575,
000
1224
,636
,000
8.21
1228
,816
,500
3.93
16.9
7%In
stan
ce 1
05
53
2050
150
1,57
6,20
014
25,6
83,3
4013
8.60
1330
,880
,456
10.9
720
.24%
Inst
ance
11
55
320
100
150
1,58
3,10
013
26,0
51,1
6810
62.3
313
31,2
26,6
7839
.62
19.8
7%In
stan
ce 1
25
53
3010
150
1,57
5,00
015
23,4
23,5
0037
.57
1427
,681
,500
4.39
18.1
8%In
stan
ce 1
35
53
3050
150
1,57
6,20
015
24,5
71,4
9694
5.34
1329
,728
,252
13.5
420
.99%
Inst
ance
14
55
330
100
150
1,58
3,10
0O
ut o
f Mem
ory
1327
,813
,526
36.4
4-
Inst
ance
15
55
340
1015
01,
575,
000
1924
,047
,600
127.
7617
28,5
25,9
5010
.74
18.6
2%In
stan
ce 1
65
53
4050
150
1,57
6,20
016
24,7
67,5
8826
87.5
614
29,9
47,8
6215
.03
20.9
2%In
stan
ce 1
75
53
4010
015
01,
583,
100
Out
of M
emor
y15
28,9
43,1
3854
.42
-In
stan
ce 1
85
53
5010
150
1,57
5,00
015
23,2
48,0
0017
7.77
1427
,532
,500
4.96
18.4
3%In
stan
ce 1
95
53
5050
150
1,57
6,20
015
23,0
67,1
8837
43.4
714
27,7
63,3
0017
.45
20.3
6%In
stan
ce 2
05
53
5010
015
01,
583,
100
Out
of M
emor
y15
27,9
35,2
6438
.47
-In
stan
ce 2
15
53
2010
150
3,00
0,60
018
48,9
63,4
966.
7915
60,9
40,6
607.
1224
.46%
Inst
ance
22
55
320
5015
03,
152,
400
2052
,678
,632
72.1
518
63,7
71,1
6813
.23
21.0
6%
Farias, E. S. et al.156 Gest. Prod., São Carlos, v. 24, n. 1, p. 148-160, 2017
were not considered. The annual demand for the commodities is basically defined by information about the production of goods that require the commodities, by data on the sales of the commodities at retailers and wholesalers, and by the intended market share within each of these markets. The demands of the original market looked at the information on the production of goods by the plants that use the commodities as components of their end products. During this stage, the main players with plants in Brazil were considered. For the Retail-market demand, the number of goods that use the existing commodities in each municipality or region of the country was considered. Besides, information was collected by means of research done at the sites (internet) of the national associations responsible for the sales and regulation of the commodities discussed in this study.
The customer zones were defined based on demand poles. These poles were created establishing a circle around cities with a high demand for the respective commodities, incorporating the demand for smaller neighboring cities/regions. For instance, the city of Ribeirão Preto, in the state of São Paulo, includes the cities of Taquaritinga, Matão, Pirassununga, Mococa, Porto Ferreira, Monte Alto, São José do Rio Pardo, Jaboticabal, Itápoli, Batatais and Sertãozinho. Thus, the demand of the Ribeirão Preto pole is determined by the sum of the estimated demands of each of these cities. Specifically for Commodity 1 the territorial division based on information from the IBGE (Brazilian Institute of Geography and Statistics) was used, due to the high consumption of this commodity compared to the others, and the socioeconomic characteristics are most appropriate to define the city clusters. According to the data surveyed, the circles have the following diameter sizes, considering the total demands for the commodities.
• Commodity 1: defined by the IBGE, territorial division of the CENSO 2006;
• Commodity 2: 100 km;
• Commodity 3: 100 km.
Based on these definitions, about 250 poles were identified for Commodity 1, 100 poles for Commodity 2 and 100 poles for Commodity 3. Possible zones not considered due to the lack of tangency of the circles
were incorporated into the neighboring pole where there was a higher demand. In order to implement the models, the Retail-market and original markets were considered for the three groups of commodities and the possibility of different market shares in each group and in each market. In order to prioritize the poles that are economically more viable, a “cutoff” line was established for the demands of Commodity 1, considering the market share intended by the company. Thus it was defined that only cities with a demand greater than 500 units/year would be served. Consequently, the number of poles for Commodity 1 was reduced to 181 poles. In order to define the total number of customer zones, it was necessary to cross-match the poles for the 3 commodities, since some presented specific demands for a single type of commodity. For the original market 32 plants were defined that produced goods that had to be supplied by some kind of commodity. Based on this information, the number of customer zones defined for the execution of the models is 261 customer zones, according to Table 2.
After the customer zones were defined, 5 potential cities were selected to install the new DCs. Based on the definition of the location of DCs, it is necessary to consider the distance from each of these DCs to one of the customer zones to define the transportation costs. The data referring to the distances were collected by the pathfinding service made available on internet by Google© Maps. Using this tool, it was possible to research the shortest road distances of approximately 1,300 different routes.
For the cost of transportation between the DCs and the customer zone, the use of a single type of model is considered: by road. Thus, we consider that a full capacity trailer type truck transports, on average, exclusively: 80 units of Commodity 1; 1,500 units of Commodity 2; and 240 units of commodity 3. In this way, the mean unit cost of each category, in simplified terms, was defined proportionally, where Commodity 1 corresponds to 20 units of Commodity 2 and about 5 units of Commodity 3. Based on this proportionality, we define the unit mean cost of transportation per kilometer, for each of the commodities: $0.040, $0.002 and $0.008, for Commodity 1, 2 and 3, respectively.
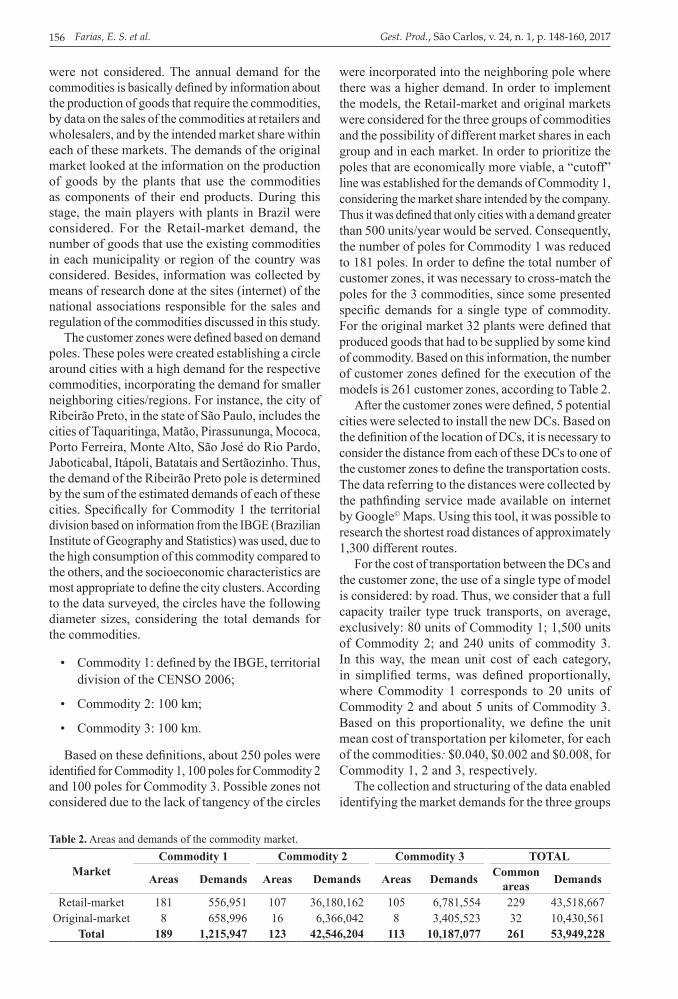
The collection and structuring of the data enabled identifying the market demands for the three groups
Table 2. Areas and demands of the commodity market.
MarketCommodity 1 Commodity 2 Commodity 3 TOTAL
Areas Demands Areas Demands Areas Demands Common areas Demands
Retail-market 181 556,951 107 36,180,162 105 6,781,554 229 43,518,667Original-market 8 658,996 16 6,366,042 8 3,405,523 32 10,430,561
Total 189 1,215,947 123 42,546,204 113 10,187,077 261 53,949,228
Modeling the logistics design... 157
of commodities. However, the company discussed in this study can only meet part of these demands, ie., for each type of commodity, the market share that the company wishes to meet must be defined. From discussions with the company executives, various scenarios of the future operation were defined, considering different market shares based on strategies that can be adopted by the company. Table 2 presents the annual demands calculated for each market and that provide a base for the definition of market shares.
The demands of each customer zone, to execute the models, were computed based on the definition of the market shares of each commodity and for each market considered. The Table 1 presents the scenarios considered for the study based on the definition of the percentage of market demand that the company wishes to meet. These scenarios try to represent different strategies for the national market, and
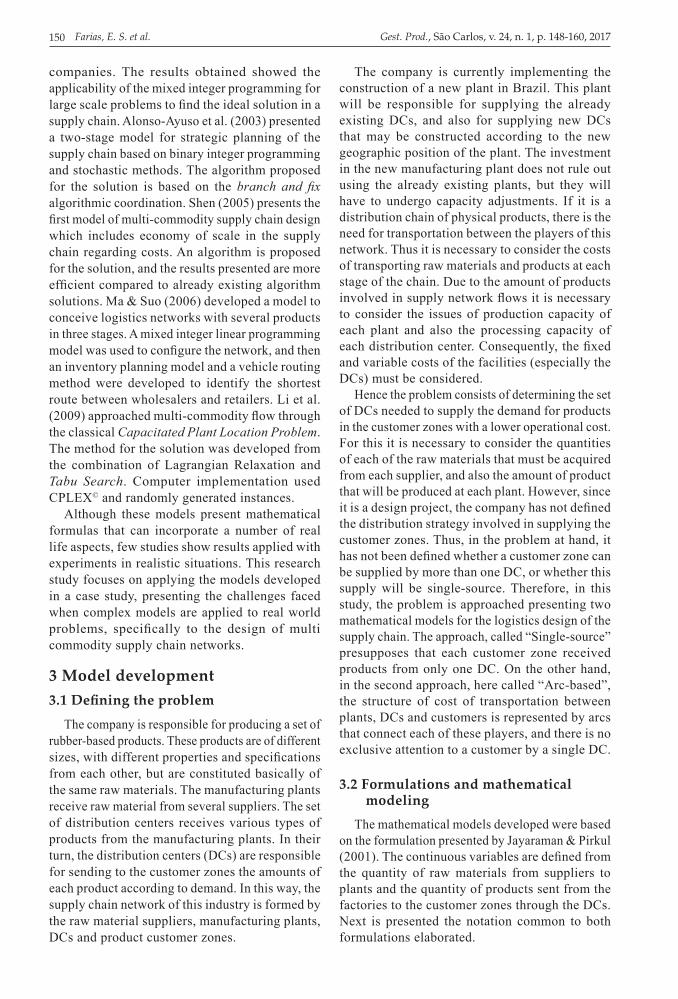
there is a special concern with meeting the regional demand of the state where the manufacturing base of this industry is located, for reasons of tax breaks, and shown in Chart 1 on the line “original state”.
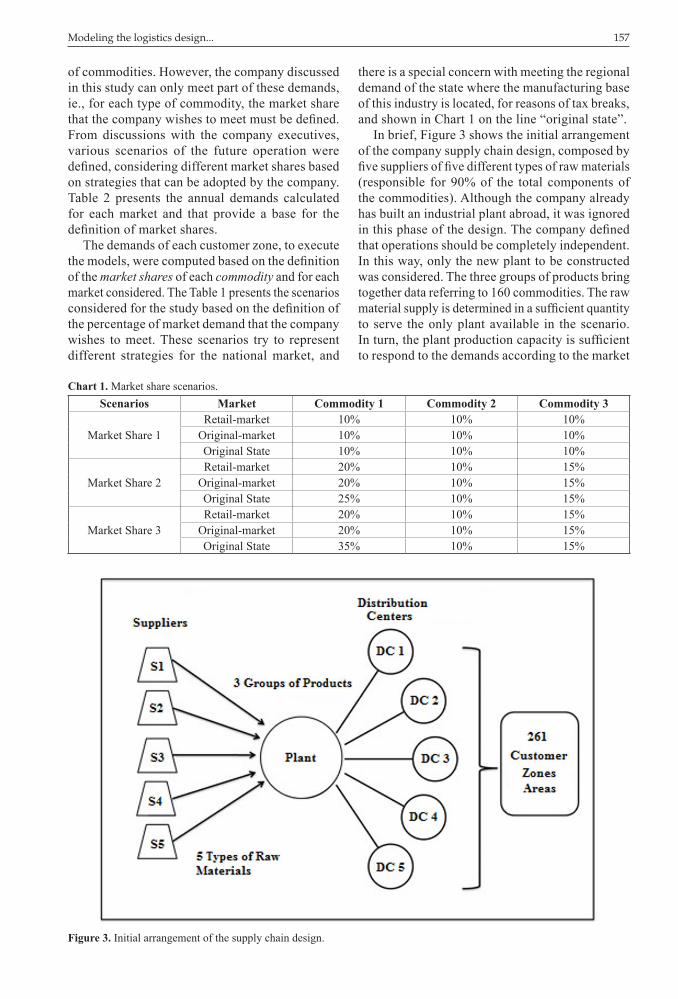
In brief, Figure 3 shows the initial arrangement of the company supply chain design, composed by five suppliers of five different types of raw materials (responsible for 90% of the total components of the commodities). Although the company already has built an industrial plant abroad, it was ignored in this phase of the design. The company defined that operations should be completely independent. In this way, only the new plant to be constructed was considered. The three groups of products bring together data referring to 160 commodities. The raw material supply is determined in a sufficient quantity to serve the only plant available in the scenario. In turn, the plant production capacity is sufficient to respond to the demands according to the market
Figure 3. Initial arrangement of the supply chain design.
Chart 1. Market share scenarios.Scenarios Market Commodity 1 Commodity 2 Commodity 3
Market Share 1Retail-market 10% 10% 10%
Original-market 10% 10% 10%Original State 10% 10% 10%
Market Share 2Retail-market 20% 10% 15%
Original-market 20% 10% 15%Original State 25% 10% 15%
Market Share 3Retail-market 20% 10% 15%
Original-market 20% 10% 15%Original State 35% 10% 15%
Farias, E. S. et al.158 Gest. Prod., São Carlos, v. 24, n. 1, p. 148-160, 2017
requested, in order to analyze the decision of the logistics design
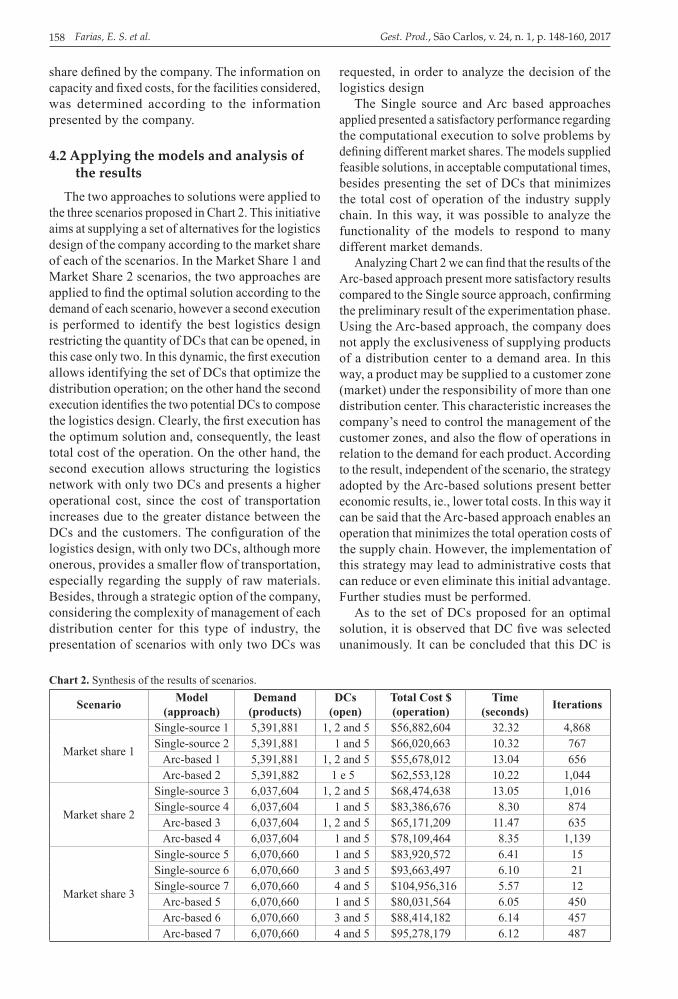
The Single source and Arc based approaches applied presented a satisfactory performance regarding the computational execution to solve problems by defining different market shares. The models supplied feasible solutions, in acceptable computational times, besides presenting the set of DCs that minimizes the total cost of operation of the industry supply chain. In this way, it was possible to analyze the functionality of the models to respond to many different market demands.
Analyzing Chart 2 we can find that the results of the Arc-based approach present more satisfactory results compared to the Single source approach, confirming the preliminary result of the experimentation phase. Using the Arc-based approach, the company does not apply the exclusiveness of supplying products of a distribution center to a demand area. In this way, a product may be supplied to a customer zone (market) under the responsibility of more than one distribution center. This characteristic increases the company’s need to control the management of the customer zones, and also the flow of operations in relation to the demand for each product. According to the result, independent of the scenario, the strategy adopted by the Arc-based solutions present better economic results, ie., lower total costs. In this way it can be said that the Arc-based approach enables an operation that minimizes the total operation costs of the supply chain. However, the implementation of this strategy may lead to administrative costs that can reduce or even eliminate this initial advantage. Further studies must be performed.
As to the set of DCs proposed for an optimal solution, it is observed that DC five was selected unanimously. It can be concluded that this DC is
share defined by the company. The information on capacity and fixed costs, for the facilities considered, was determined according to the information presented by the company.
4.2 Applying the models and analysis of the results
The two approaches to solutions were applied to the three scenarios proposed in Chart 2. This initiative aims at supplying a set of alternatives for the logistics design of the company according to the market share of each of the scenarios. In the Market Share 1 and Market Share 2 scenarios, the two approaches are applied to find the optimal solution according to the demand of each scenario, however a second execution is performed to identify the best logistics design restricting the quantity of DCs that can be opened, in this case only two. In this dynamic, the first execution allows identifying the set of DCs that optimize the distribution operation; on the other hand the second execution identifies the two potential DCs to compose the logistics design. Clearly, the first execution has the optimum solution and, consequently, the least total cost of the operation. On the other hand, the second execution allows structuring the logistics network with only two DCs and presents a higher operational cost, since the cost of transportation increases due to the greater distance between the DCs and the customers. The configuration of the logistics design, with only two DCs, although more onerous, provides a smaller flow of transportation, especially regarding the supply of raw materials. Besides, through a strategic option of the company, considering the complexity of management of each distribution center for this type of industry, the presentation of scenarios with only two DCs was
Chart 2. Synthesis of the results of scenarios.
Scenario Model(approach)
Demand (products)
DCs (open)
Total Cost $(operation)
Time (seconds) Iterations
Market share 1
Single-source 1 5,391,881 1, 2 and 5 $56,882,604 32.32 4,868Single-source 2 5,391,881 1 and 5 $66,020,663 10.32 767
Arc-based 1 5,391,881 1, 2 and 5 $55,678,012 13.04 656Arc-based 2 5,391,882 1 e 5 $62,553,128 10.22 1,044
Market share 2
Single-source 3 6,037,604 1, 2 and 5 $68,474,638 13.05 1,016Single-source 4 6,037,604 1 and 5 $83,386,676 8.30 874
Arc-based 3 6,037,604 1, 2 and 5 $65,171,209 11.47 635Arc-based 4 6,037,604 1 and 5 $78,109,464 8.35 1,139
Market share 3
Single-source 5 6,070,660 1 and 5 $83,920,572 6.41 15Single-source 6 6,070,660 3 and 5 $93,663,497 6.10 21Single-source 7 6,070,660 4 and 5 $104,956,316 5.57 12
Arc-based 5 6,070,660 1 and 5 $80,031,564 6.05 450Arc-based 6 6,070,660 3 and 5 $88,414,182 6.14 457Arc-based 7 6,070,660 4 and 5 $95,278,179 6.12 487
Modeling the logistics design... 159
models determine the amount of raw materials that must be supplied, as well as which suppliers are to supply each of the plants, based on the demands for each product for each customer zone. Independently from the scenario, the Single source and Arc-based models present solutions for the logistics design of the supply chain that fully cover the demands, as well as the supply of raw materials in a quantity and at costs in accordance with the proposal for the minimization of operational cost.
The final result of this study may be described as the development of mathematical models that enable identifying the better composition of the logistics network analyzing different scenarios. The models constructed support major decisions regarding the logistics design of the supply chain of the industry that is discussed in this study. In this sense it is possible to adapt these mathematical models to solutions in different segments of the industry.
For the design of future studies, it is suggested that different types of transportation (train, ship, truck) be incorporated to the mathematical modeling of the supply chain. Besides, heuristics can be developed to solve instances that involve a greater number of products. For this, it is necessary to perform a preliminary study that will determine the demands of each product for each consumption area. It is also proposed that the logistics problem of the supply chain be broadened to introduce a time-related variable. In this way the solutions for planning the supply chain would include not only cost issues, but also tactical aspects such as delivery dates, levels of production, warehousing and transportation.
AcknowledgementsThe authors thank Capes and CNPq for the
financial support.
ReferencesAlonso-Ayuso, A., Escudero, L. F., Garin, A., Ortuño, M.
T., & Pérez, G. (2003). An approach for strategic supply chain planning under uncertainty based of stochastic 0-1 programming. Journal of Global Optimization, 26(1), 97-124. http://dx.doi.org/10.1023/A:1023071216923.
Ballou, R. (2006). Gerenciamento da cadeia de suprimentos (5. ed.). Porto Alegre: Bookman.
Bowersox, D. J., Closs, D. J., & Cooper, M. B. (2006). Gestão logística de cadeias de suprimentos. Porto Alegre: Bookman.
Cole, M. H. (1995). Service considerations and the design of strategic distribution systems (Tese de doutorado). Georgia Institute of Technology, Atlanta.
Geoffrion, A. M., & Graves, G. W. (1974). Multicommodity distribution system design by benders decomposition.
essential to optimize the company’s distribution operation, probably due to the geographic location in relation to the production plant. Besides, DC five can be considered extremely important strategically, because of its proximity to the customer zones with great market potential, both for Retail-market and for the original market.
For the Market Share 3 scenario, six different executions were performed that enabled analyzing different options for the logistics network. These instances enabled identifying the best alternatives to meet the demands of markets with lower costs according to the set of DCs available. Of these executions, the Arc-based instance presented the lowest operations cost involving the distribution of 6,070,600 products to the 261 consumers. Thus, Arc-based 5 modeling supplies the best configuration of the supply chain network for multi-commodity distribution
Analyzing the computational time to find a variable solution for the scenarios proposed, there is no significant difference between the Single-source and Arc-based approach. It can therefore be said that both approaches present similar computational results, and at tolerable levels of execution according to the literature presented in this article.
5 Final considerationsThe Single-source and Arc-based models
represent different distribution strategies and the mathematical modeling of both strategies presented important results for the initial logistics design of the company surveyed in this study. The decision to adopt the single source approach strategy, which requires that a customer receive all types of products from a single Distribution Center, may provide benefits compared to operational management through gains in productivity and in quality of services, since the customer will deal directly with one distribution center. On the other hand, the arc-based approach enables structuring the supply chain network optimizing the total costs of production and transportation operations.
It should be highlighted that the Operational Research methodology used in this study enabled the development of formulations and implementations which presented important results to enable the logistics design of the company. This was possible because of the resolution of instances that present practical real life situations. It was therefore possible to verify the compliance of the models implemented and validate their functionality
Although the focus of this study is to determine which DCs should be opened to form the logistics chain of the industry, the models developed cover the entire network of the supply chain. In this way, the
Farias, E. S. et al.160 Gest. Prod., São Carlos, v. 24, n. 1, p. 148-160, 2017
Papageorgiou, G. E., Rotstein, G. E., & Shah, N. (2001). Strategic supply chain optimization for the pharmaceutical industries. Industrial & Engineering Chemistry Research, 40(1), 275-286. http://dx.doi.org/10.1021/ie990870t.
Park, Y. B. (2005). An integrated approach for production and distribution planning in supply chain management. International Journal of Production Research, 43(6), 1205-1224. http://dx.doi.org/10.1080/00207540412331327718.
Pirkul, H., & Jayaraman, V. (1996). Distribution planning in a multi-commodity tri-echelon system. Transportation Science, 30(4), 291-302. http://dx.doi.org/10.1287/trsc.30.4.291.
Pirkul, H., & Jayaraman, V. (1998). A multi-commodity, multi-plant, capacitated facility location problem: formulation and efficient heuristic solution. Computers & Operations Research, 25(10), 869-878. http://dx.doi.org/10.1016/S0305-0548(97)00096-8.
Shen, Z. J. (2005). A multi-commodity supply chain design problem. Institute of Industrial Engineers Transactions, 37, 753-762.
Vidal, C. J., & Goetschalckx, M. (1997). Strategic production-distribution models: a critical review with emphasis on global supply chain models. European Journal of Operational Research, 98(1), 1-18. http://dx.doi.org/10.1016/S0377-2217(97)80080-X.
Vidal, C. J., & Goetschalckx, M. (2001). A global supply chain model with transfer pricing and transportation cost allocation. European Journal of Operational Research, 129(1), 134-158. http://dx.doi.org/10.1016/S0377-2217(99)00431-2.
Management Science, 20(5), 822-844. http://dx.doi.org/10.1287/mnsc.20.5.822.
Geoffrion, A. M., & Powers, R. F. (1995). Twenty years of strategic distribution system design: an evolutionary perspective. Interfaces, 25(5), 105-128. http://dx.doi.org/10.1287/inte.25.5.105.
Golmohammadi, V., Afshari, H., Hasanzadeh, A., & Rahimi, M. (2010). A heuristic approach for designing a distribution network in a supply chain system. African Journal of Business Management, 4(3), 308-311.
Jang, Y. J., Jang, S. Y., Chang, B. M., & Park, J. (2002). A combined model of network design and production/distribution planning for a supply network. Computers & Industrial Engineering, 43(1-2), 269-281. http://dx.doi.org/10.1016/S0360-8352(02)00074-8.
Jayaraman, V., & Pirkul, H. (2001). Planning and coordination of production and distribution facilities for multiple commodity. European Journal of Operational Research, 133(2), 394-408. http://dx.doi.org/10.1016/S0377-2217(00)00033-3.
Lee, Y. H., & Kwon, S. G. (2010). The hybrid planning algorithm for the distribution center operation using tabu search and decomposed optimization. Expert Systems with Applications, 37(4), 3093-3103. http://dx.doi.org/10.1016/j.eswa.2009.09.020.
Li, J., Chu, F., & Prins, C. (2009). Lower and upper bounds for a capacitated plan location problem with multicommodity flow. Computers & Operations Research, 36(11), 3019-3030. http://dx.doi.org/10.1016/j.cor.2009.01.012.
Ma, H., & Suo, C. (2006). A model for designing multiple products logistics networks. International Journal of Physical Distribution & Logistics Management, 36(2), 127-135. http://dx.doi.org/10.1108/09600030610656440.