
Nós somos daqui. E o nosso Banco também. We are from here ... · E o nosso Banco também. We are...
180
RELATÓRIO E CONTAS ANNUAL REPORT Nós somos daqui. E o nosso Banco também. We are from here. Our Bank also.
Transcript of Nós somos daqui. E o nosso Banco também. We are from here ... · E o nosso Banco também. We are...
RELATÓRIO E CONTASANNUAL REPORT
Nós somos daqui.E o nosso Banco também.We are from here.Our Bank also.
Mensagem do Presidenteda Comissão Executiva 006
O nosso Banco, o seu Banco1. Principais Indicadores de Gestão 0142. Sumário Executivo 0163. Apresentação do BCI 020Órgãos sociais 022Dimensão do BCI 023Rede de distribuição 024Recursos humanos 026Formação profissional 031Responsabilidade social 033
Contexto actual4. Enquadramento Macroeconómico 036Economia internacional 036Economia moçambicana 040Inflação 042Taxas de juro 044Evolução cambial 046Sistema financeiro moçambicano 0485. Estratégia e Negócio 051Visão estratégica 2008-2012 051Comunicação 052Tecnologia 0536. Canais Electrónicos e Meios de Pagamento 056Introdução 056Canais electrónicos 056Meios de Pagamento 058
Análise Financeira7. Análise Financeira 062Resultados e rentabilidade 062Rendimentos Operacionais 063Evolução do balanço 065Créditos e recursos 067Carteira de títulos e participações financeiras 069Passivos subordinados 070Fundos próprios 0708. Proposta de Aplicação de Resultados 071
Demonstrações Financeiras9. Demonstrações Financeiras
em Base Individual 07610. Notas às Demonstrações Financeiras 08211. Demonstrações Financeiras
em Base Consolidada 166
Relatórios Anexos12. Relatório dos Auditores Independentes 17413. Relatório e Parecer do Conselho Fiscal 176
ÍndiceIndex
BCI
Message from the chairman of the executive board 006
Our Bank, your Bank1. Principal management indicators 0142. Executive summary 0163. BCI overview 020Statutory bodies 022Bci’s dimension 023Branch office network 024Human resources 026Training 031Social responsibility 033
Current Context4. Macroeconomic background 036World economy 036Mozambique’s economy 040Inflation 042Interest rates 044Exchange rates 046Mozambique’s financial system 0485. Strategy and business 051Strategic vision 2008-2012 051Communication 052Technology 0536. Electronic channels and means of payment 056Introduction 056Electronic channels 056Means of payment 058
Financial Analysis7. Financial analysis 062Income and profitability 062Operating income 063Balance sheet 065Credit and resources 067Securities and financial investments portfolio 069Subordinated liabilities 070Own funds 0708. Proposal for the appropriation
of net income 071
Financial Statements9. Financial statements on a separate basis 07610. Notes to the financial statements 08211. Financial statements
on a consolidated basis 166
Attached Reports12. External auditors’ report 17413. Report and opinion of audit board 176
006
BCI | RELATÓRIO E CONTAS 2010 | ANNUAL REPORT 2010BCI
Mensagem do Presidente da Comissão ExecutivaMessage from the Chairman of the Executive Board
2010 was a year full of intense activity, performed with the aim of implementing BCI’s mission of making an active contribution to Mozambique’s economic and social development and that of its citizens, creating value and generating satisfaction for our customers, shareholders, workers, partners and the community in general, in a socially responsible and sustainable manner.
It is our unshakable belief in the importance of this mission that has led and continues to lead us to do our very best every day to make this mission a reality.
We also share a common vision: to be the bank of preference of most Mozambicans and a benchmark financial system operator in terms of best practice, competitiveness and innovation. And because we have a clear vision, shared by all of our workers, we have the timespan to achieve it and a framework for our strategy and corresponding practice and attitudes.
I refer to the strategy we adopted in September 2008, centred on a Strategic 10 year development plan for the bank, implemented via the “Leader Project” which was designed as a framework for the activity of all structural organs and workers, as a means of achieving our goal of being one of the biggest and best banks, on the basis of a universal bank model, embracing all segments.
O Ano de 2010 foi um ano pleno de intensa actividade, visando implementar a Missão do BCI, que é de Con-tribuir activamente para o desenvolvimento económico e social de Moçambique e dos moçambicanos, criando valor e gerando satisfação para os nossos Clientes, Accionistas, Colaboradores, Parceiros e Comunidade em geral, de modo socialmente responsável e susten-tável.
É a crença inabalável na importância desta Missão que nos levou e leva a dar o melhor de nós próprios todos os dias para que ela seja uma realidade. Mas temos também uma Visão comum: Ser o Banco preferido pela maioria dos moçambicanos e uma refe-rência para o sistema financeiro, ao nível da aplicação das melhores práticas, da competitividade e da inova-ção. E, porque temos uma Visão clara e partilhada por todos os Colaboradores, temos um horizonte para onde nos queremos dirigir, podendo assim orientar a nossa estratégia e as nossas práticas e atitudes nesse sentido.
Refiro-me a uma estratégia que abraçámos em Setembro de 2008, em torno de um Plano Estratégico de Desenvolvimento para o Banco, a 10 anos, imple-mentado através do Projecto Líder, e que teve em vista orientar a actividade de todos os órgãos de estrutura e Colaboradores para sermos um dos maiores e melho-res bancos, através de um modelo de Banca Universal servindo todos os segmentos.

Ibraímo IbraímoPresidente da Comissão Executiva do BCIChairman of BCI’s Executive Board
BCI | RELATÓRIO E CONTAS 2010 | ANNUAL REPORT 2010
008
O balanço geral da execução do Projecto Líder em 2010, à semelhança do aconteceu em 2009, é posi-tivo, tendo o nível dos resultados alcançados atingido já grande parte dos macro objectivos definidos para a 1ª Fase do Plano Estratégico (2008 – 2012), no que respeita aos indicadores principais do Plano (Volume de Negócios, Produto Bancário, Quota de Mercado, Número de Clientes e Agências).
O ano de 2010, tal como o de 2009, foi fundamental-mente um ano de consolidação do nosso crescimento e de aprofundamento qualitativo do conceito de Banco Universal. Aprofundámos o processo de segmentação e de construção de Propostas de Valor para os prin-cipais Segmentos, ao nível da Oferta de Produtos e Serviços, em muitos aspectos de forma inovadora e diferenciadora. Demos um novo impulso à aplicação dos Modelos de Atenção específicos para cada um destes Segmentos, que são actualmente:
• OespaçoBCIPrivate,emMaputo;
• OsCentrosBCICorporate
• O desenvolvimento do conceito dos Centros BCIExclusivo, que em breve permitirá oferecer aos Clientes Affluent condições de atendimento ao nível das suas expectativas.
• Os espaços BCI Negócios, dirigidos a PequenasEmpresas e a Empresários em Nome Individual, com Gestores de Cliente próprios, que se espera possam também evoluir à medida do crescimento das cartei-rasdeClientes;
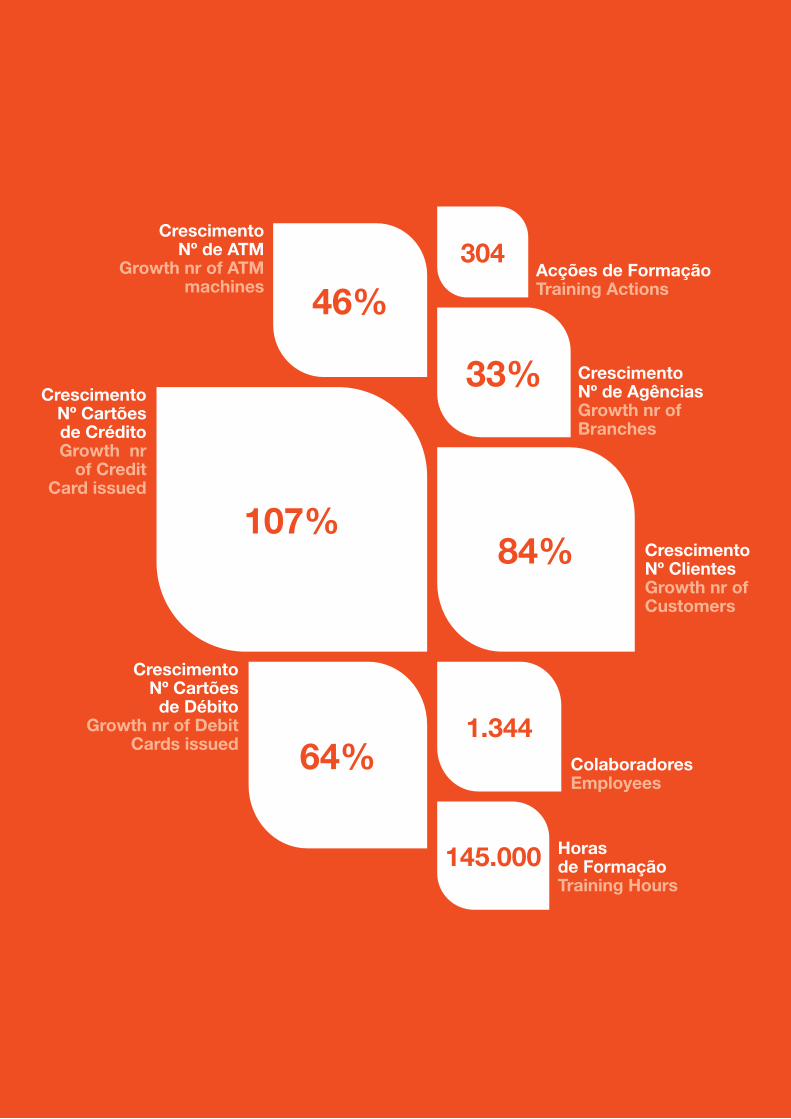
Relativamente ao plano de expansão da Rede Comercial, concretizámos 24 novas Agências e Centros BCI Corporate, um crescimento de 33% de forma equi-librada, entre zonas urbanas e zonas rurais onde a Banca estava ausente ou era manifestamente insufi-ciente, opção que significa um contributo efectivo para o desenvolvimento económico e social do nosso País. Em número de Clientes, alcançámos em 2010 mais de 261.000, mais 84% da base de Clientes com que terminámos 2009 (142.000).
The overall results of the “Leader Project” in 2010, as in 2009, were positive and have already achieved a large part of the macro objectives defined from the first stage of the strategic plan (2008 – 2012), as regards the plan’s main indicators (turnover, net operat-ing income, market share, number of customers and branch offices).
2010, as in 2009, was fundamentally a year of consoli-dation of our growth and the qualitative consolidation of the universal bank concept. We strengthened the segmentation process and creation of value proposals in terms of our products and services for our main seg-ments, often through the adoption of an innovative and differentiated approach. We provided a fresh impulse to the application of specific service models for each of the segments, which currently comprise:
• BCI’sprivatearea,inMaputo;
• BCI’scorporatecentres; • ThedevelopmentoftheBCI“exclusivecentres”con-
cept, which will shortly enable us to provide our more affluent customers with a level of service commensu-ratewiththeirexpectations;
• BCIbusinessspacesforsmallcompaniesandself-employed businesspeople, with their own account managers, which we hope will also evolve in line with the growth of customer portfolios.
In terms of the expansion plan for our branch offices, we opened 24 new branches and BCI corporate centres, comprising a growth rate of 33%, balanced between urban and rural zones in which banking services were ether non-existent or clearly insufficient and consider that this option makes an effective contri-bution to Mozambique’s economic and social develop-ment. We had more than 260,000 customers, in 2010, up 84% in comparison to our customer base of 142,000 at the end of 2009.
We ended the year with a total number of 218 ATMs, up 46% over the 2009 to a total of 150, comprising a growth of market share in ATMs from 24.4% to 29.74%%.
009
MENSAgEM dO PRESIdENTE dA COMISSãO ExECuTIvA MENSAgEM dO PRESIdENTE dA COMISSãO ExECuTIvA
107%84%
1.344
145.000
64%
304
33%
46%Acções de FormaçãoTraining Actions
Crescimento Nº de ATM
Growth nr of ATM machines
Crescimento Nº de AgênciasGrowth nr of Branches
Crescimento Nº ClientesGrowth nr of Customers
Crescimento Nº Cartõesde CréditoGrowth nr
of Credit Card issued
Crescimento Nº Cartõesde Débito
Growth nr of Debit Cards issued
ColaboradoresEmployees
Horas de FormaçãoTraining Hours
BCI | RELATÓRIO E CONTAS 2010 | ANNUAL REPORT 2010
010
Em número de ATM, terminámos o ano com 218, o que representa um aumento de 46% relativamente a 2009 (150), o que representa um crescimento na quota de mercado de ATM de 24,4% para 29,74%%.Crescemos em número de cartões de débito emitidos, que são agora cerca 225.000, um crescimento anual de 64% (eram 137.000 em 2009), e em número de cartões de crédito emitidos, que atingiu cerca de 30.000 final do ano, correspondendo a um cresci-mento de 107% relativamente ao ano de 2009 (14.500).
Atingimos uma quota de mercado, no final do ano, de 30% em Volume de Negócios, quando em Dezembro do ano passado era de 28,9%, e uma quota de mer-cado próxima dos 27,3% nos Recursos, quando no final de 2009 era de 25,3%.
Para apoiar a dinamização comercial dos nossos pro-dutos e serviços, reforçámos a comunicação da nossa marca e dos nossos produtos com um posicionamento forte e eficaz, dirigido a todos os moçambicanos, incorporando as nossas cores e os nossos valores. Foram várias as campanhas publicitárias executadas em 2010 que atingiram elevada recordação e noto-riedade.
Por outro lado, mantivemo-nos atentos às Comuni-dades onde estamos inseridos, evidenciando uma atitude de permanente responsabilidade social, con-cretizada através do apoio a muitas dezenas de acções e iniciativas de Associações Cívicas e Profissionais, Editoras, Clubes, ONG, Escolas e Universidades, Autarquias e Ministérios, e que com esse apoio ajudá-mos a viabilizar, nas áreas do Desporto, das Artes e da Cultura, da Educação e Cidadania, da Saúde, em benefício de crianças, jovens, idosos, portadores de deficiências, doentes, pessoas carenciadas, etc., contribuindo para minorar o seu sofrimento, para oferecer maior conforto e qualidade de vida, melhores condições para aprendizagem ou valorização profissio-nal, para a prática de desporto, para aceder à cultura ou à saúde. Refiro ainda, a título de exemplo e pelo seu particular significado, uma acção de doação de san-gue pelos Colaboradores, a participação activa na luta contra o HIV-SIDA e a oferta de brinquedos e cestas básicas em todas as Pediatrias dos Hospitais Centrais Provinciais, acções que distinguem o BCI de outras organizações e que comprovam o nosso sentido muito particular de responsabilidade social. Aumentámos ainda a actividade das nossas Mediatecas de Maputo e da Beira, oferecendo a milhares de estudantes o acesso à leitura e à Internet.
We also achieved an annual growth of 64% in the number of debit cards issued, which currently total around 225,000 against 137,000 cards in 2009, in addition to the number of credit cards issued to 30,000 at the end of the year, up 107% over the 2009 total of 14,500 cards.
We achieved an end of year market share of 30% in turnover in comparison to 28.9% in December of the preceding year and a market share of close to 27.3% in terms of resources against 25.3% at the end of 2009.
To support the commercial promotion of our products and services, we reinforced communicational aspects related with our brand and products with a strong, effective presence incorporating our colours and our values, targeted at all Mozambicans. Several advertis-ing campaigns, achieving high levels in terms of brand recognition factor and recall indices were launched in 2010.
We also remained attentive to the communities in which we operate, displaying an attitude of permanent social responsibility, in our support for the many dozens of actions and initiatives of civic and professional asso-ciations, publishing houses, clubs, NGOs, schools and universities, municipalities and ministries, which took advantage of our support in their organisation of sport-ing, artistic, cultural, educational, citizenship initiatives and health, support for children, young people, the eld-erly and the handicapped, the infirm, needy etc, con-tributing towards alleviating their suffering and provid-ing greater comfort and quality of life, better learning facilities or professional advancement prospects in terms of sport, access to culture or healthcare. I also wish to make reference to the special significance of our workers’ blood donor activities and their active partici-pation in the fight against HIV-AIDS together and gifts of toys and shopping baskets of staple foods in all pae-diatrics departments of provisional central hospitals. These actions distinguish BCI from other organisations and certify our highly developed sense of social respon-sibility. We also expanded the activity of our media-theques in Maputo and Beira, providing thousands of students with access to reading facilities and the internet.
011
MENSAgEM dO PRESIdENTE dA COMISSãO ExECuTIvA MESSAgE fROM ThE ChAIRMAN Of ThE ExECuTIvE BOARd
Como corolário desta intensa actividade, foi com bastante satisfação e orgulho que encarámos a con-quista do “Diamond Arrow 2010 – PMR África”, o mais pres tigiado prémio atribuído pelos Empresários, Adminis tra dores e Directores das Grandes e Médias Empresas moçambicanas, pelo reconhecimento do extraordi nário contributo dado em 2009 para estimular o crescimento e o desenvolvimento económico em Moçambique. O BCI entrou pela primeira vez na tabela dos 100 maiores Bancos de África e foi a primeira das maiores marcas bancárias nacionais a ostentar as insígnias “Made in Mozambique - Orgulho Moçam-bicano”, sublinhando o conceito de “O meu Banco é daqui” subjacente à comunicação institucional e comercial do BCI. Decor ridos os dois primeiros anos da implementação do Plano Estratégico, efectuámos um exercício de reajus tamento, que envolveu todos os Órgãos de Estrutura do Banco e que mereceu a apro-vação do Conselho de Administração, apontando no sentido da manutenção e reforço dos nossos objec-tivos e no investimento em sistemas de informação, visando melhorar a qualidade de serviço prestado ao Cliente e garantir o adequado suporte ao crescimento do Banco.
O Plano Estratégico, a 10 anos, cuja implementação nos próximos três anos se fará através do Projecto Líder+, é um Plano que assenta numa absoluta con-vergência de esforços, o envolvimento e o compromis-so de todos os Colaboradores do BCI. Em 2010 a Família BCI também cresceu.
O número de Colaboradores do BCI passou de 1023 para 1.344, com a entrada de 321 novos colegas que se juntaram a nós e à nossa Missão. A integração destes novos colaboradores confere-nos a respon-sabilidade de os acolher e integrar na nossa cultura e na nossa empresa. Neste ano, realizámos 304 acções de formação, e registámos 2.749 participações, tra duzindo-se num total de mais de 145.000 horas de formação que permitiram desenvolver, promover e capacitar as pes soas com os conhecimentos téc-nicos, as práticas comportamentais e as atitudes necessárias a uma maior qualidade no atendimento e na resposta às necessi dades dos Clientes.
As a corollary to such an intense level of activity, it was with satisfaction and pride that we received the “Diamond Arrow 2010 – PMR Africa” prize. This is the most coveted award from Mozambican businesspeo-ple, directors and managers of large and medium sized enterprises, in due recognition of the extraordinary contribution made, in 2009, to Mozambique’s growth and economic development. BCI was listed for the first time as one the 100 largest banks in Africa and was the leading national banking brand to display the “Made in Mozambique - Pride of Mozambique” insignias, stressing the concept of O meu Banco é daqui (This is where my bank is from) underpinning BCI’s institu-tional and commercial communication. Two years after the implementation of our strategic plan we implemented a readjustment exercise which merited the approval of the board of directors and which involved all of the bank’s structural organs. It is geared to the mainte-nance and reinforcement of our objectives and invest-ment in IT systems and improving our quality of customer service, providing the bank’s growth with adequate support.
The 10 years strategic plan, to be implemented over the next three years under the “Leader Project+” is based on the absolute convergence of efforts, involvement and commitment of all BCI workers. The BCI family also grew in 2010.
The number of BCI workers increased from 1,023 to 1,344, with an additional 321 colleagues joining us in our mission. The integration of these new workers gives us the responsibility of welcoming them and assimilating them into our culture and company. This year we organised 304 training events attended by 2,749 participants, translating into a total number of more than 145,000 training hours. This enabled us to develop, promote and provide our people with techni-cal expertise, behavioural standards and the necessary attitude to achieve a better quality of service and prompt response to our customers’ needs.
BCI | RELATÓRIO E CONTAS 2010 | ANNUAL REPORT 2010
012
Em 2011, com o Projecto Líder+, iremos procurar manter elevada a trajectória de aproximação à lide-rança do sistema bancário moçambicano e consolidar um posicionamento competitivo de maior agressivi-dade e ambição. Teremos que corresponder com competência, entrega e dedicação às expectativas criadas junto de cada um dos nossos clientes e do mer-cado. Tenho, no entanto, plena confiança na equipa do BCI que estamos permanentemente a alargar, certo de que saberemos dar continuidade à nossa caminhada com o objectivo de fazer do BCI o maior e o melhor Banco em Moçambique, concretizando a Missão e a Visão deste Banco.
Ibraímo IbraímoPresidente da Comissão Executiva do BCI
In 2011, with our “Leader Project+”, we shall endeavour to maintain a trajectory of approximation to the leader-ship of Mozambique’s banking system, consolidating a competitive, more aggressive and ambitious approach. We shall correspond with competence, commitment and dedication to the expectations that have been created with each of our customers and the market. I have every confidence in the BCI team which we are permanently expanding, certain that we shall provide continuity to our objective of making BCI the biggest and best bank in Mozambique, fulfilling our mission and the bank’s vision.
Ibraímo IbraímoChairman of BCI’s executive board

O nosso Banco,
o seu Banco
Our Bank,your Bank

014
BCI | RELATÓRIO E CONTAS 2010 | ANNUAL REPORT 2010BCI
01. Principais Indicadores de gestão Principal Management Indicators
015
01. PRINCIPAIS INdICAdORES dE gESTãO PRINCIPAL MANAgEMENT INdICATORS
PRINCIPAIS INDICADORES DE GESTÃO | PRINCIPAl MANAGEMENT INDICATORS
2008 2009 2010 VAR. | ChAnge (%)2008-2009
VAR. | ChAnge (%)2009-2010
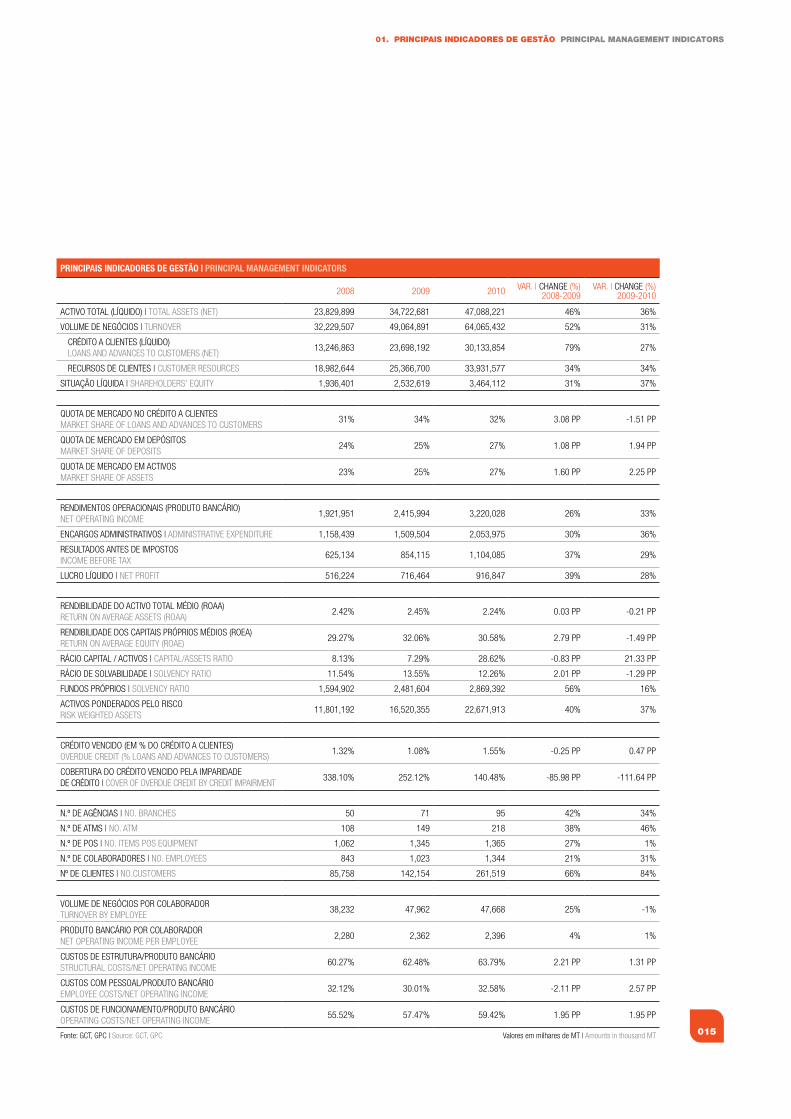
ACTIVO TOTAL (LÍQUIDO) | TOTAL AsseTs (neT) 23,829,899 34,722,681 47,088,221 46% 36%
VOLUMe De negÓCIOs | TURnOVeR 32,229,507 49,064,891 64,065,432 52% 31%
CRÉDITO A CLIenTes (LÍQUIDO)LOAns AnD ADVAnCes TO CUsTOMeRs (neT)
13,246,863 23,698,192 30,133,854 79% 27%
ReCURsOs De CLIenTes | CUsTOMeR ResOURCes 18,982,644 25,366,700 33,931,577 34% 34%
sITUAÇÃO LÍQUIDA | shARehOLDeRs’ eQUITy 1,936,401 2,532,619 3,464,112 31% 37%
QUOTA De MeRCADO nO CRÉDITO A CLIenTesMARkeT shARe Of LOAns AnD ADVAnCes TO CUsTOMeRs
31% 34% 32% 3.08 PP -1.51 PP
QUOTA De MeRCADO eM DePÓsITOsMARkeT shARe Of DePOsITs
24% 25% 27% 1.08 PP 1.94 PP
QUOTA De MeRCADO eM ACTIVOsMARkeT shARe Of AsseTs
23% 25% 27% 1.60 PP 2.25 PP
RenDIMenTOs OPeRACIOnAIs (PRODUTO BAnCÁRIO)neT OPeRATIng InCOMe
1,921,951 2,415,994 3,220,028 26% 33%
enCARgOs ADMInIsTRATIVOs | ADMInIsTRATIVe exPenDITURe 1,158,439 1,509,504 2,053,975 30% 36%
ResULTADOs AnTes De IMPOsTOsInCOMe BefORe TAx
625,134 854,115 1,104,085 37% 29%
LUCRO LÍQUIDO | neT PROfIT 516,224 716,464 916,847 39% 28%
RenDIBILIDADe DO ACTIVO TOTAL MÉDIO (ROAA)ReTURn On AVeRAge AsseTs (ROAA)
2.42% 2.45% 2.24% 0.03 PP -0.21 PP
RenDIBILIDADe DOs CAPITAIs PRÓPRIOs MÉDIOs (ROeA)ReTURn On AVeRAge eQUITy (ROAe)
29.27% 32.06% 30.58% 2.79 PP -1.49 PP
RÁCIO CAPITAL / ACTIVOs | CAPITAL/AsseTs RATIO 8.13% 7.29% 28.62% -0.83 PP 21.33 PP
RÁCIO De sOLVABILIDADe | sOLVenCy RATIO 11.54% 13.55% 12.26% 2.01 PP -1.29 PP
fUnDOs PRÓPRIOs | sOLVenCy RATIO 1,594,902 2,481,604 2,869,392 56% 16%
ACTIVOs POnDeRADOs PeLO RIsCORIsk weIghTeD AsseTs
11,801,192 16,520,355 22,671,913 40% 37%
CRÉDITO VenCIDO (eM % DO CRÉDITO A CLIenTes)OVeRDUe CReDIT (% LOAns AnD ADVAnCes TO CUsTOMeRs)
1.32% 1.08% 1.55% -0.25 PP 0.47 PP
COBeRTURA DO CRÉDITO VenCIDO PeLA IMPARIDADe De CRÉDITO | COVeR Of OVeRDUe CReDIT By CReDIT IMPAIRMenT
338.10% 252.12% 140.48% -85.98 PP -111.64 PP
n.º De AgÊnCIAs | nO. BRAnChes 50 71 95 42% 34%
n.º De ATMs | nO. ATM 108 149 218 38% 46%
n.º De POs | nO. ITeMs POs eQUIPMenT 1,062 1,345 1,365 27% 1%
n.º De COLABORADORes | nO. eMPLOyees 843 1,023 1,344 21% 31%
nº De CLIenTes | nO.CUsTOMeRs 85,758 142,154 261,519 66% 84%
VOLUMe De negÓCIOs POR COLABORADORTURnOVeR By eMPLOyee
38,232 47,962 47,668 25% -1%
PRODUTO BAnCÁRIO POR COLABORADORneT OPeRATIng InCOMe PeR eMPLOyee
2,280 2,362 2,396 4% 1%
CUsTOs De esTRUTURA/PRODUTO BAnCÁRIOsTRUCTURAL COsTs/neT OPeRATIng InCOMe
60.27% 62.48% 63.79% 2.21 PP 1.31 PP
CUsTOs COM PessOAL/PRODUTO BAnCÁRIOeMPLOyee COsTs/neT OPeRATIng InCOMe
32.12% 30.01% 32.58% -2.11 PP 2.57 PP
CUsTOs De fUnCIOnAMenTO/PRODUTO BAnCÁRIOOPeRATIng COsTs/neT OPeRATIng InCOMe
55.52% 57.47% 59.42% 1.95 PP 1.95 PP
fonte: gCT, gPC | source: gCT, gPC Valores em milhares de MT | Amounts in thousand MT
016
BCI | RELATÓRIO E CONTAS 2010 | ANNUAL REPORT 2010BCI
02. Sumário Executivo Executive Summary
Em 2010 o BCI reforçou o seu posicionamento como um Banco universal, orientado para a satis-fação das necessidades dos seus clientes e para a criação de valor aos seus diversos parceiros. Este reforço foi concretizado através do aumento e diversificação da oferta de produtos e serviços, da continuação da estratégia de expansão da sua rede nacional de distribuição e da preocupação permanente de melhoria da qualidade global no serviço ao cliente.
BCI reinforced its status as a universal bank, in 2010, geared to meeting its customers’ expec-tations and creating value for its various partners. This has been achieved by expanding and diversi-fying our products and services and continuing to implement our strategy of expanding the national branch office network in conjunction with our permanent concern to improve the over-all quality of our customer service.
017
02. SuMÁRIO ExECuTIvO ExECuTIvE SuMMARY
Neste contexto, o BCI prosseguiu com a implementa-ção do seu plano estratégico, merecendo particular destaque: a expansão da rede de distribuição (mais 24 agências e Centros Corporate), o crescimento da base de clientes em 84% e o reforço da quota de mercado. Este posicionamento teve como corolário a entrada do BCI, pela primeira vez, no ranking dos 100 maiores ban-cos de África, e foi fundamental para a atribuição do direito à utilização das insígnias “Made in Mozambique”.
Este conjunto de acções e acontecimentos veio concre-tizar o conceito de “O Meu Banco é Daqui”, amplamente divulgado através de diversas campanhas de comuni-cação institucionais.
Os Resultados Líquidos do BCI em 2010 totalizaram MT 916,85 milhões, tendo aumentado 28% face ao ano transacto, apesar da actividade do Banco ter sido condi-cionada por diversos factores, dos quais são de realçar:
1. O estreitamento das margens de intermediação por via do incremento do custo do funding, motivado pelo aumento da concorrência na captação de fundos, equepressionouaevoluçãodamargemfinanceira;
2. O forte investimento na expansão da Rede de dis-tribuição que resultou num impacto significativo na estruturadecustos;
3. A acentuada depreciação do MZN face ao USD, com o respectivo impacto no custo dos serviços de ter-ceiros facturados em moeda externa (em especial serviços importados).
A Margem Financeira elevou-se a MT 1,99 mil milhões (+36%), quando comparado com o período homólogo). O incremento dos juros resultante do aumento da carteira de crédito permitiu compensar o impacto resultante da subida do custo do funding, bem como da redução da carteira de títulos.
Os Resultados em Operações Financeiras apresen-taram um valor positivo de MT 628,25 milhões, o que representa um crescimento de 22% face ao ano anterior.
O significativo incremento da actividade do Banco jus-tifica a variação de 40,40% verificada na rubrica Comissões Líquidas (MT + 131,22 milhões).
BCI has, accordingly, continued to implement its stra-tegic plan, particularly concentrating on the expansion of its branch office network (with an additional 24 branch-es and corporate centres), having achieved growth of 84% in its customer base and reinforcement of its market share. The corollary to these achievements were BCI’s entry, for the first time, in the ranking of Africa’s 100 largest banks as a fundamental factor in its entitlement to use the “Made in Mozambique” insignia.
Such actions and events fulfilled the O Meu Banco é Daqui (My Bank is from here) concept which has been widely publicised in diverse institutional communication campaigns.
BCI’s net income, in 2010, was up 28% over the pre-ceding year to MT 916.85 million, notwithstanding several constraining factors, such as:
1. Narrowing intermediation margins owing to higher funding costs, deriving from increased competition in securing funds, putting pressure on the evolution ofnetinterestincome;
2. Major investment in terms of branch office expansion, havingasignificantimpactonthecostsstructure;
3. The MZN’s marked depreciation against the USD and respective impact on the costs of external services invoiced in foreign currency (particularly imported services).
Net interest income was up 36% to MT 1.99 billion over the preceding year. The increase in interest deriving from the increase in the credit portfolio made it possible to offset the impact of higher funding costs in addition to the reduction of the securities portfolio.
Income from financial operations was up 22% over the preceding year to MT 628.25 million.
The significant increase in the bank’s activity explains the 40.40% change in the net commissions account heading (up MT 131.22 million).
Owing to the above, net operating income from bank-ing activity was up 33% over 2009 to MT 3.22 billion.
BCI | RELATÓRIO E CONTAS 2010 | ANNUAL REPORT 2010
018
Em resultado da evolução descrita, o Produto da Activi-dade Bancária totalizou MT 3,22 mil milhões, registando um aumento de 33%, quando comparado com 2009.
Em termos de Custos Operativos, a sua evolução reflecte o impacto esperado da forte expansão da rede e do inves timento nos colaboradores, tendo registado um crescimento de MT 544 milhões face ao período homó-logo (+36,07%). Esta evolução incorpora igualmente o impacto da depreciação do metical, resultante de parte significativa dos serviços a serem importados.
Em consequência da evolução do produto bancário e dos custos operativos acima referidos, o rácio de efi-ciência do BCI – cost-to-income – aumentou de 62,48% no exercício anterior para 63,79%.
Tendo em consideração os valores alcançados pelo produto bancário e os custos operativos, o Resultado Bruto de exploração foi de MT 1,1 mil milhões, valor signi ficativamente superior ao do ano anterior (+ MT 249,9 milhões, +29%).
A Dotação para Provisões e a Imparidade de outros activos ascenderam, no seu conjunto, a MT 168,68 milhões, incluindo-se neste último agregado cerca de MT 143,51 milhões relativos à Imparidade do crédito, líquida de reversões.
A Rendibilidade Líquida dos Capitais Próprios Médios (ROAE) situou-se em 30,58% (36,82% antes de impos-tos) e a rendibilidade líquida do Activo Médio (ROAA) em 2,24% (2,70% antes de impostos).
O Activo líquido do BCI totalizou MT 47,09 mil milhões no final de 2010, o que corresponde a um aumento de MT 12,36 mil milhões (+36%) face a igual data do ano anterior, assente, em grande parte, na evolução das aplicações em IC’s (+ 5,2 mil milhões, + 258%) e da carteira de Crédito a Clientes (+ 6,4 mil milhões, +27%).
Em consequência do aumento da carteira de crédito ter sido inferior ao crescimento da carteira de depósitos veri-ficou-se uma redução do rácio de conversão dos depósi-tos em crédito (ascendeu em Dezembro de 2010 a 91,0% contra 96,3% em 2009). O valor do rácio está afectado pelo facto da carteira de crédito de médio e longo prazo incluir MT 4,68 mil milhões de créditos concedidos com recurso a funding, obtido especificamente para tal, junto de instituições financeiras internacionais, nomeadamente a Caixa Geral de Depósitos, o IFC e a PROPARCO. Expurgando o efeito destes créditos, o rácio de conver-são dos depósitos em crédito seria de 77,2%.
The evolution of operating costs reflects the expected impact of the major expansion of the branch office net-work and investment in employees, which was up 36.07% in year-on-year terms by MT 544 million. This evolution also incorporates the impact of the metical’s depreciation, resulting from imports of a significant proportion of services.
As a consequence of the above referred to evolution of net operating income and operating costs BCI’s cost-to-income ratio was up from 62.48% last year to 63.79%.
Taking net operating income and operating costs into account, gross operating income was significantly up by 20% or MT 249.9 million over the preceding year to MT 1.1 billion.
The appropriation for provisions and impairment on other assets totalled MT 168.68 million, which latter aggregate included an amount of around MT 143.51 million for credit impairment, net of reversals.
ROAE (return on average equity) was 30.58% (36.82% before tax) and ROAA (return on average assets) 2.24% (2.70% before tax).
BCI’s net assets were up 36% by MT 12.36 billion to MT 47.09 billion at the end of 2010 in comparison to the preceding year. This was largely based on the 258% increase of MT 5.2 billion in investments in credit institutions and 27% increase of MT 6.4 billion in the customers’ credit portfolio.
The fact that the increase in the credit portfolio was less than the growth of the deposits portfolio reduced the deposits-to-loans rate to 91.0% in December 2010 in comparison to 96.3% in 2009. The ratio has been affected by the fact that the medium and long term credit portfolio includes MT 4.68 billion in funded cred-its, specifically secured from international financial insti-tutions, namely Caixa Geral de Depósitos, IFC and PROPARCO. The elimination of the effect of these credits would have resulted in a deposits-to-loans ratio of 77.2%.
Asset quality, measured by the non-performing credit ratio, was 1.55% with the credit overdue for more than 90 days ratio remaining at 1.00%. The level of overdue credit cover was 167.42% against the preceding year’s 252.12%.
019
02. SuMÁRIO ExECuTIvO ExECuTIvE SuMMARY
A qualidade dos activos medida pelo rácio de crédito com incumprimento fixou-se em 1,55%, enquanto o rácio de crédito vencido com mais de 90 dias manteve-se em 1,00%. O grau de cobertura de crédito vencido cifrou-se em 167,42%, contra 252,12% registado um ano antes.
As Aplicações em Títulos, ascenderam a MT 2,06 mil milhões, valor inferior em 25% ao registado no ano ante-rior. Esta variação deveu-se à não renovação de parte da carteira de Bilhetes de Tesouro, para fazer face à subida das Reservas Obrigatórias resultante do incre-mento da carteira de depósitos e do aumento do coe-ficiente de Reservas Obrigatórias de 8% para 8,75%.
Em termos de funding, os recursos totais captados pelo BCI (excluindo o mercado monetário interbancário e os recursos subordinados) totalizaram MT 33,91 mil milhões, +29,9% que um ano antes. Em termos de depósitos de Clientes, o crescimento foi de 34,00%. Esta evolução, conjugada com a variação da carteira de crédito, explica o incremento do volume de negócios em 31% face ao ano anterior.
Os Capitais Próprios ascenderam a MT 3,46 mil milhões, montante superior ao registado no ano anterior em MT 0,93 mil milhões (+37,0%). De referir que, de modo a adequar o Capital Social à actual dimensão do banco e aos desafios futuros, no decurso de 2010 a Assembleia Geral aprovou, por unanimidade, a proposta do Conselho de Administração de aumento do Capital Social de MT 321.428.570,00 para MT 1.900.000.000,00. Em Dezembro de 2010, o Rácio de Solvabilidade, deter-minado no quadro regulamentar do Banco de Moçam-bique, fixou-se em 12,26%.
Securities investments were down 25% over the pre-ceding year to MT 2.06 billion. This change was due to the non-renewal of a part of the treasury bills portfo-lio to provide for the increase in mandatory reserves resulting from the increase in the deposits portfolio and increase in the mandatory reserves rate from 8% to 8.75%.
In funding terms, total resources taken by BCI (exclud-ing the interbank money market and subordinated resources) were up 29.9% over the preceding year to MT 33.91 billion. Growth of customer deposits, was 34.00%. This evolution, in conjunction with the change in the credit portfolio, explains the 31% increase in turnover in comparison to the preceding year.
Shareholders’ equity was up 37.0% by MT 0.93 billion over the preceding year to MT 3.46 billion. To adjust share capital to the bank’s current dimension and future challenges the general meeting of shareholders, in 2010, unanimously approved a board of directors’ proposal to increase the bank’s share capital from MT 321,428,570,00 to MT 1,900,000,000.00. In December 2010, the solvency ratio, assessed in line with the Bank of Mozambique’s regulatory framework was 12.26%.
020
BCI | RELATÓRIO E CONTAS 2010 | ANNUAL REPORT 2010BCI
03. Estrutura Societária BCI Overview
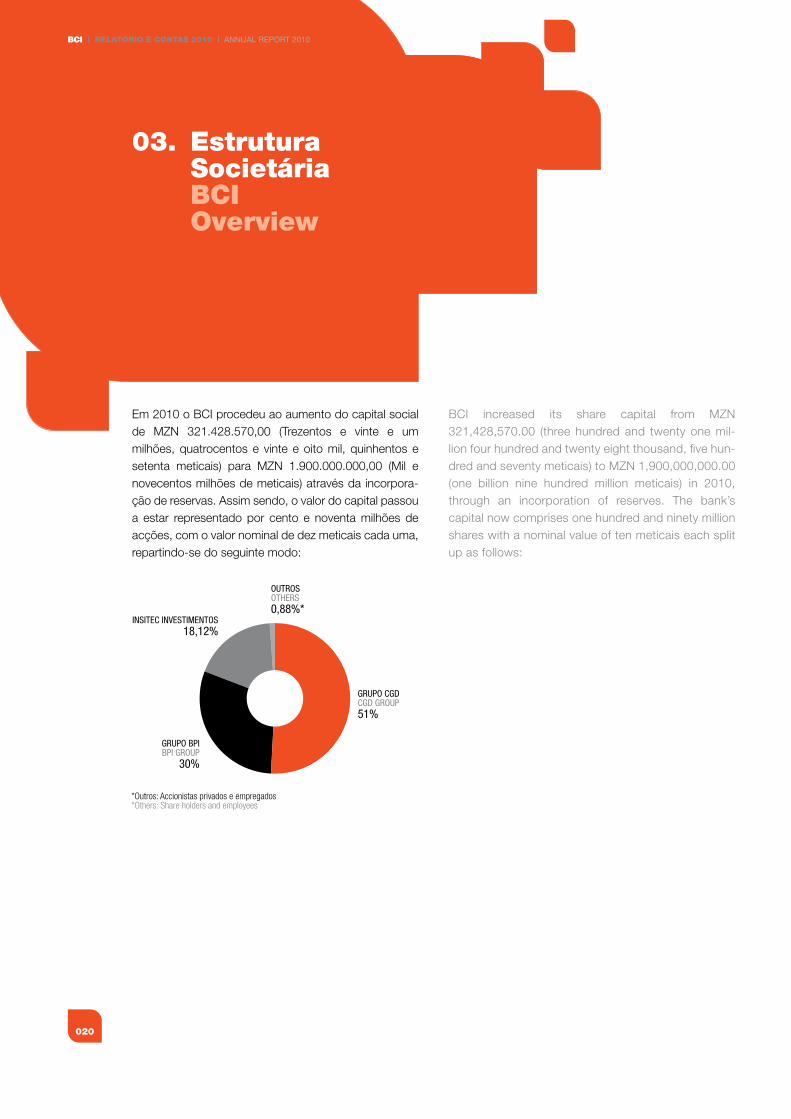
Em 2010 o BCI procedeu ao aumento do capital social de MZN 321.428.570,00 (Trezentos e vinte e um milhões, quatrocentos e vinte e oito mil, quinhentos e setenta meticais) para MZN 1.900.000.000,00 (Mil e novecentos milhões de meticais) através da incorpora-ção de reservas. Assim sendo, o valor do capital passou a estar representado por cento e noventa milhões de acções, com o valor nominal de dez meticais cada uma, repartindo-se do seguinte modo:
BCI increased its share capital from MZN 321,428,570.00 (three hundred and twenty one mil-lion four hundred and twenty eight thousand, five hun-dred and seventy meticais) to MZN 1,900,000,000.00 (one billion nine hundred million meticais) in 2010, through an incorporation of reserves. The bank’s capital now comprises one hundred and ninety million shares with a nominal value of ten meticais each split up as follows:
OUTROSOTHERS0,88%*
GRUPO CGDCGD GROUP51%
GRUPO BPIBPI GROUP
30%
INSITEC INVESTIMENTOS18,12%
*Outros: Accionistas privados e empregados*Others: Share holders and employees
021
03. ESTRuTuRA SOCIETÁRIA BCI OvERvIEW
A PARBANCA SGPS, SA é participada do grupo Caixa Geral de Depósitos, o maior grupo bancário e segurador português. Este grupo encontra-se presente em 23 paí-ses e desenvolve a sua actividade numa óptica de ban-ca universal. O Grupo Caixa Geral de Depósitos (CGD) está presente de forma integrada em todos os quadran-tes do negócio bancário, nomeadamente: Banca de Investimento, Corretagem e Capital de Risco, Mercado Imobiliário, Seguros, Gestão de Activos, Crédito Especializado, Comércio Electrónico e Actividades Culturais.
Em Setembro de 2009, foi assinado um protocolo entre a CGD e a Direcção Nacional do Tesouro de Moçambique com o objectivo de criar um banco de investimento nes-te país. O banco terá um capital de 500 milhões de dóla-res, o qual será detido em 50% por capitais moçambi-canos e os restantes 50% pela CGD.
O Grupo BPI é o terceiro maior grupo bancário privado português. Este grupo desenvolve igualmente a sua actividade numa óptica de banca universal, através de uma rede de distribuição multicanal totalmente integra-da e abrangendo todos os quadrantes do negócio ban-cário. A nível internacional o BPI possui actividade, entre outros países, em Angola através do Banco de Fomento, no qual detém 50,1% do capital. De relembrar que em 2007, o BPI desempenhou um importante papel no pro-cesso de reversão da empresa Hidroeléctrica de Cahora Bassa ao Estado Moçambicano. Para além deste pro-jecto de capital importância para Moçambique, o Banco BPI continua activamente envolvido no estudo de um conjunto de projectos estruturantes em Moçambique, ligados a diversos sectores. A Insitec Investimentos é uma empresa moçambicana, resultante da fusão das empresas SCI – Sociedade de Controlo e Gestão de Participações Financeiras, Energia Capital e Insitec Holding, detida na sua maioria pelo Grupo Insitec. Este grupo de elevada referência em Moçam-bique congrega na sua estrutura três sub-holdings: a Insitec Imobiliária, a Insitec Investimentos e a Insitec Constrói. A Insitec Imobiliária é especializada na gestão deprojectosdedesenvolvimentoimobiliáriodequalidade;a Insitec Investimentos dá harmonia e dirige todos os investimentos nos sectores estratégicos em que o grupo participa, tais como a Banca, a Energia, as Infra-estru-turas e a Logística. A Insitec Constrói congrega as parti-cipadas dos sectores de construção e cimentos.
PARBANCA SGPS, SA is a subsidiary of Caixa Geral de Depósitos, which is Portugal’s largest banking and insurance group. The group operates as a universal bank in 23 countries. Caixa Geral de Depósitos Group has an integrated presence in all banking business seg-ments, notably: investment banking, brokerage and venture capital, property, insurance, asset manage-ment, specialised credit, e-commerce and cultural activities.
A protocol between CGD and the Direcção Nacional do Tesouro de Moçambique [Mozambique’s National Treasury] was entered into in September 2009 with the aim of setting up an investment bank in Mozambique. The bank will have a capital of 500 million dollars, of which 50% will be owned by Mozambican capital and the remaining 50% by CGD.
BPI Group is Portugal’s third largest financial group. It also operates as a universal bank with a fully inte-grated multi-channel branch office network encom-passing all banking business segments. BPI is active internationally in Angola in addition to other countries via Banco de Fomento, in which it has an equity invest-ment of 50.1%. In 2007, BPI played an important role in the reversion of the Cahora Bassa hydroelectric power station/dam to the state of Mozambique. In addition to this project which is of capital importance to Mozambique, Banco BPI remains actively engaged on the study of a collection of structuring projects in Mozambique, associated with several sectors. Insitec Investimentos is a Mozambican company result-ing from the merger between the companies SCI – Sociedade de Controlo e Gestão de Participações Financeiras, Energia Capital and Insitec Holding, with Insitec Group as its majority shareholder. This major Mozambican group comprises three sub-holding com-panies: Insitec Imobiliária, Insitec Investimentos and Insitec Constrói. Insitec Imobiliária specialises in the management of high quality property development projects;InsitecInvestimentosoverseesanddirectsallof the investments in the strategic sectors in which the group is involved such as banking, energy, infrastruc-tures and logistics. Insitec Constrói operates as an umbrella organisation for the main construction and cement sector subsidiaries.

BCI | RELATÓRIO E CONTAS 2010 | ANNUAL REPORT 2010
022
Órgãos Sociais
Em 31 de Dezembro de 2010 os Órgãos Sociais do BCIapresentavam a seguinte estrutura:
Statutory Bodies
Information on the structure of BCI’s statutory bodies, at 31 December 2010, is set out below:
Mesa da Assembleia-GeralGeneral Meeting of Shareholders
Presidente | ChairmanAntónio Manuel de
Carvalho Ferreira Vitorino
Secretário | SecretaryHernâni Loureiro
ComissãoExecutivaExecutiveBoard
Presidente | ChairmanIbraimo Abdul Carimo
Issufo Ibraimo
Administrador Director
Duarte Janlet César da Fonseca
AdministradorDirectorJoão Luis
Fernandes Jorge
Administrador Director
José Maria Ribeiro Rodrigues
ConselhoFiscalAuditBoard
Presidente | ChairmanVictor Manuel Santos de Abreu Côrte-Real
Vogal | Board memberJoaquim Paulo
Taveira de Sousa
Vogal | Board memberYasmeen
Mohamadrashid Sulemane
Conselhode AdministraçãoBoard of Directors
Presidente | ChairmanCelso Ismael Correia
Vice-PresidenteDeputy chairman
Ibraimo Abdul Carimo Issufo Ibraimo
Vice-PresidenteDeputy chairmanFrancisco Manuel Marques Bandeira
Vice-PresidenteDeputy chairmanAntónio Domingues
Vogal | Board memberEugénio Manuel
dos Santos Ramos
Vogal | Board memberMaria Celeste Ferreira
Lopes Cardona
Vogal | Board memberJorge Humberto
Correia Tomé
Vogal | Board memberJoão Luis
Fernandes Jorge
Vogal | Board memberDuarte Janlet César
da Fonseca
Vogal | Board memberJosé Maria Ribeiro
Rodrigues
Vogal | Board memberEduardo Teodorico França
Magaia
023
03. ESTRuTuRA SOCIETÁRIA BCI OvERvIEW
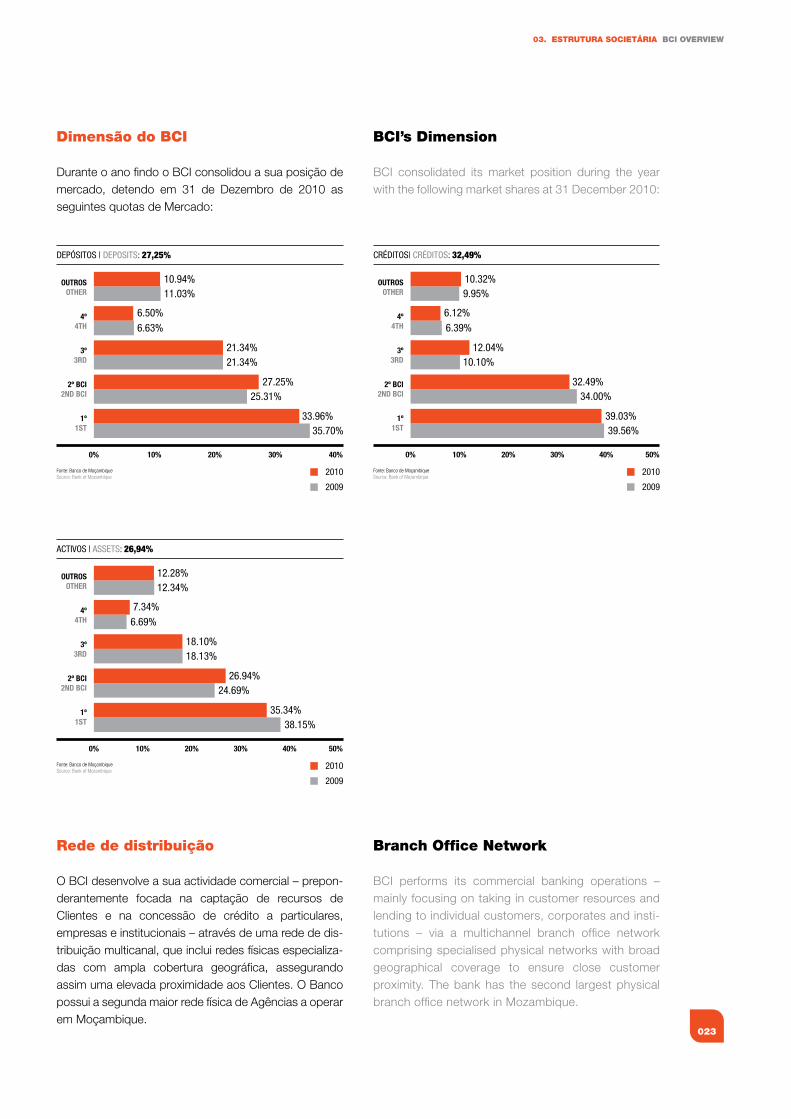
dimensão do BCI
Durante o ano findo o BCI consolidou a sua posição de mercado, detendo em 31 de Dezembro de 2010 as seguintes quotas de Mercado:
Rede de distribuição
O BCI desenvolve a sua actividade comercial – prepon-derantemente focada na captação de recursos de Clientes e na concessão de crédito a particulares, empresas e institucionais – através de uma rede de dis-tribuição multicanal, que inclui redes físicas especializa-das com ampla cobertura geográfica, assegurando assim uma elevada proximidade aos Clientes. O Banco possui a segunda maior rede física de Agências a operar em Moçambique.
DEPÓSITOS | DEPOSITS: 27,25%
OUTROSOTHER
10.94%11.03%
6.50%6.63%
21.34%21.34%
27.25%25.31%
33.96%35.70%
2010
2009
Fonte: Banco de MoçambiqueSource: Bank of Mozambique
4º4TH
3º3RD
2º BCI2ND BCI
1º1ST
0% 10% 20% 30% 40%
CRÉDITOS| CRÉDITOS: 32,49%
OUTROSOTHER
10.32%9.95%
6.12%6.39%
12.04%10.10%
32.49%34.00%
39.03%39.56%
2010
2009
Fonte: Banco de MoçambiqueSource: Bank of Mozambique
4º4TH
3º3RD
2º BCI2ND BCI
1º1ST
0% 10% 20% 30% 40% 50%
ACTIVOS | ASSETS: 26,94%
OUTROSOTHER
12.28%12.34%
7.34%6.69%
18.10%18.13%
26.94%24.69%
35.34%38.15%
2010
2009
Fonte: Banco de MoçambiqueSource: Bank of Mozambique
4º4TH
3º3RD
2º BCI2ND BCI
1º1ST
0% 10% 20% 30% 40% 50%
BCI’s dimension
BCI consolidated its market position during the year with the following market shares at 31 December 2010:
Branch Office Network
BCI performs its commercial banking operations – mainly focusing on taking in customer resources and lending to individual customers, corporates and insti-tutions – via a multichannel branch office network comprising specialised physical networks with broad geographical coverage to ensure close customer proximity. The bank has the second largest physical branch office network in Mozambique.
BCI | RELATÓRIO E CONTAS 2010 | ANNUAL REPORT 2010
024
Em termos de rede física, para além das agências tradi-cionais, o BCI possui Centros Corporate, que se consti-tuem como espaços de atendimento dirigidos a Clientes empresariais, disponibilizando equipas especializadas na resposta às necessidades das empresas.
No decurso de 2010 prosseguiu-se com a política de reforço da rede de distribuição, nomeadamente da rede de Centros Corporate, reforçando a proximidade e a capacidade de resposta aos seus Clientes empresariais.
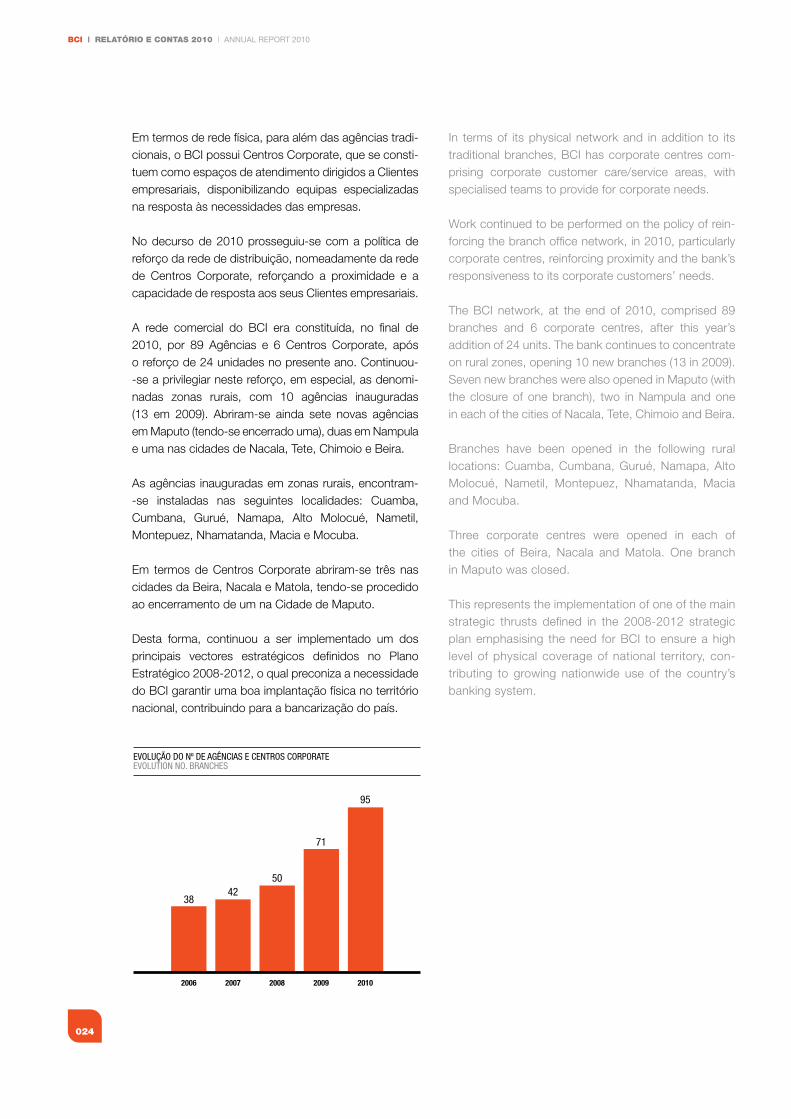
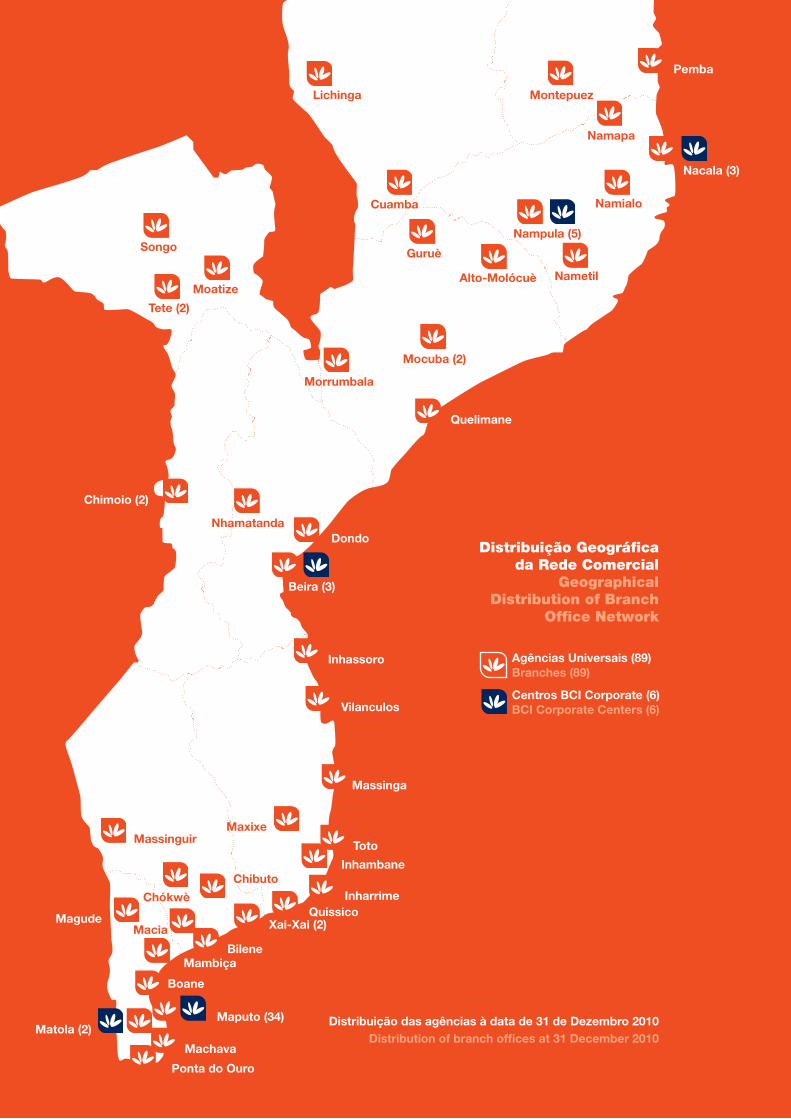
A rede comercial do BCI era constituída, no final de 2010, por 89 Agências e 6 Centros Corporate, após o reforço de 24 unidades no presente ano. Continuou--se a privilegiar neste reforço, em especial, as denomi-nadas zonas rurais, com 10 agências inauguradas (13 em 2009). Abriram-se ainda sete novas agências em Maputo (tendo-se encerrado uma), duas em Nampula e uma nas cidades de Nacala, Tete, Chimoio e Beira.
As agências inauguradas em zonas rurais, encontram--se instaladas nas seguintes localidades: Cuamba, Cumbana, Gurué, Namapa, Alto Molocué, Nametil, Montepuez, Nhamatanda, Macia e Mocuba.
Em termos de Centros Corporate abriram-se três nas cidades da Beira, Nacala e Matola, tendo-se procedido ao encerramento de um na Cidade de Maputo.
Desta forma, continuou a ser implementado um dos principais vectores estratégicos definidos no Plano Estratégico 2008-2012, o qual preconiza a necessidade do BCI garantir uma boa implantação física no território nacional, contribuindo para a bancarização do país.
EVOLUÇÃO DO Nº DE AGÊNCIAS E CENTROS CORPORATEEVOLUTION NO. BRANCHES
2006
3842
50
71
95
2007 2008 2009 2010
In terms of its physical network and in addition to its traditional branches, BCI has corporate centres com-prising corporate customer care/service areas, with specialised teams to provide for corporate needs.
Work continued to be performed on the policy of rein-forcing the branch office network, in 2010, particularly corporate centres, reinforcing proximity and the bank’s responsiveness to its corporate customers’ needs.
The BCI network, at the end of 2010, comprised 89 branches and 6 corporate centres, after this year’s addition of 24 units. The bank continues to concentrate on rural zones, opening 10 new branches (13 in 2009). Seven new branches were also opened in Maputo (with the closure of one branch), two in Nampula and one in each of the cities of Nacala, Tete, Chimoio and Beira.
Branches have been opened in the following rural locations: Cuamba, Cumbana, Gurué, Namapa, Alto Molocué, Nametil, Montepuez, Nhamatanda, Macia and Mocuba.
Three corporate centres were opened in each of the cities of Beira, Nacala and Matola. One branch in Maputo was closed.
This represents the implementation of one of the main strategic thrusts defined in the 2008-2012 strategic plan emphasising the need for BCI to ensure a high level of physical coverage of national territory, con-tributing to growing nationwide use of the country’s banking system.
025
03. ESTRuTuRA SOCIETÁRIA ESTRuTuRA SOCIETÁRIA
Pemba
Montepuez
Cuamba
Guruè
Alto-Molócuè
Mocuba (2)
Morrumbala
Nhamatanda
MassinguirMaxixe
Macia
Chibuto
Chókwè
Songo
Tete (2)
Moatize
Lichinga
Namapa
Namialo
Nampula (5)
Nametil
Nacala (3)
Quelimane
Inhassoro
Vilanculos
Massinga
Toto
Inhambane
InharrimeQuissico
Xai-Xai (2)
BileneMambiça
Maputo (34)Matola (2)
Magude
Machava
Ponta do Ouro
Dondo
Beira (3)
Chimoio (2)
Agências Universais (89)Branches (89)
Centros BCI Corporate (6)BCI Corporate Centers (6)
distribuição geográfica da Rede Comercial
geographical distribution of Branch
Office Network
Distribuição das agências à data de 31 de Dezembro 2010Distribution of branch offices at 31 December 2010
Boane
BCI | RELATÓRIO E CONTAS 2010 | ANNUAL REPORT 2010
026
Recursos humanos
A Administração mantém a convicção de que o valor do Capital Humano do BCI é um factor decisivo para a prossecução dos objectivos e, em particular, para o sucesso do plano estratégico em curso. A assumpção da importância das pessoas permitiu durante o exercício de 2010 e no âmbito do plano estra-tégico, a consolidação de algumas das práticas de recursos humanos já iniciadas em 2009 - Avaliação do Potencial Interno, Recrutamento Externo, Estágios, Qualificação Funcional, Sistemas de Compensação e Formação Profissional - e em 2010 introduzir-se um novo Sistema de Avaliação de Resultados e Desempenho, visando dotar a instituição de um sistema mais objectivo, bem como iniciar o desenho de um novo Sistema de Carreiras, no sentido de perspectivar uma evolução profissional aos seus colaboradores.
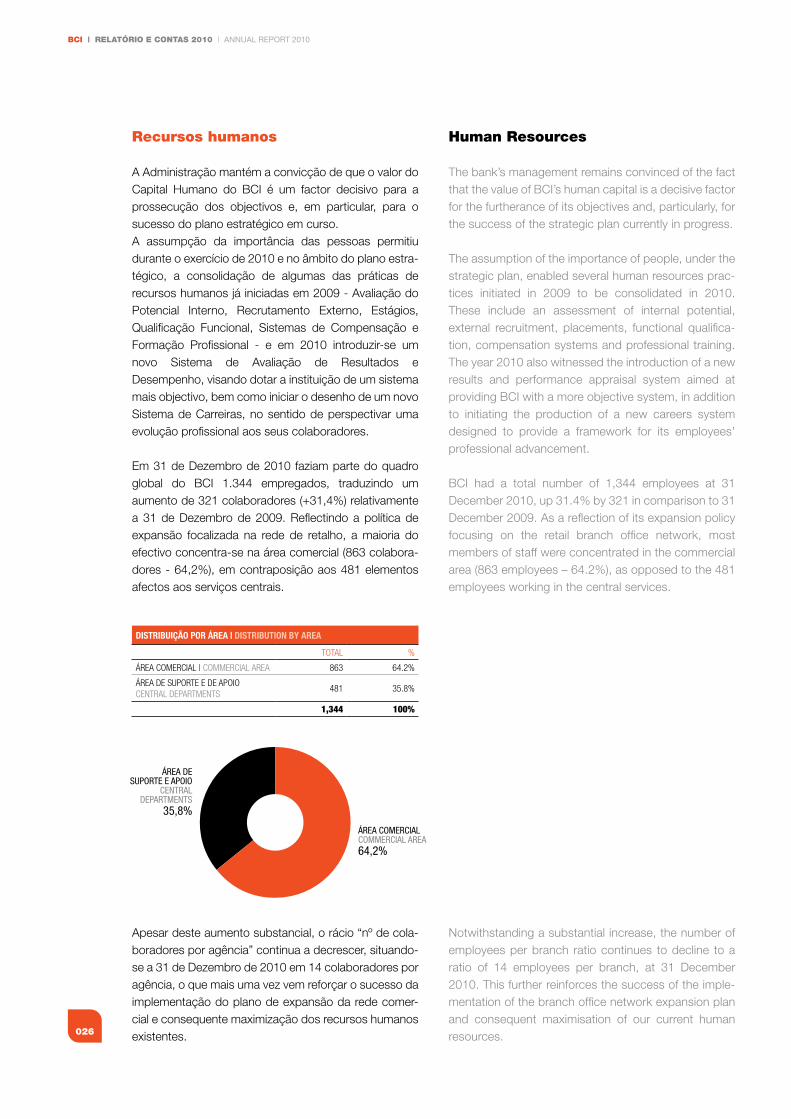
Em 31 de Dezembro de 2010 faziam parte do quadro global do BCI 1.344 empregados, traduzindo um aumento de 321 colaboradores (+31,4%) relativamente a 31 de Dezembro de 2009. Reflectindo a política de expansão focalizada na rede de retalho, a maioria do efectivo concentra-se na área comercial (863 colabora-dores - 64,2%), em contraposição aos 481 elementos afectos aos serviços centrais.
Apesar deste aumento substancial, o rácio “nº de cola-boradores por agência” continua a decrescer, situando-se a 31 de Dezembro de 2010 em 14 colaboradores por agência, o que mais uma vez vem reforçar o sucesso da implementação do plano de expansão da rede comer-cial e consequente maximização dos recursos humanos existentes.
DISTRIbuIçÃO POR ÁREA | DISTRIbuTION by AREA
TOTAL %
ÁReA COMeRCIAL | COMMeRCIAL AReA 863 64.2%
ÁReA De sUPORTe e De APOIOCenTRAL DePARTMenTs
481 35.8%
1,344 100%
ÁREA COMERCIALCOMMERCIAL AREA64,2%
ÁREA DESUPORTE E APOIO
CENTRALDEPARTMENTS
35,8%
human Resources
The bank’s management remains convinced of the fact that the value of BCI’s human capital is a decisive factor for the furtherance of its objectives and, particularly, for the success of the strategic plan currently in progress.
The assumption of the importance of people, under the strategic plan, enabled several human resources prac-tices initiated in 2009 to be consolidated in 2010. These include an assessment of internal potential, external recruitment, placements, functional qualifica-tion, compensation systems and professional training. The year 2010 also witnessed the introduction of a new results and performance appraisal system aimed at providing BCI with a more objective system, in addition to initiating the production of a new careers system designed to provide a framework for its employees’ professional advancement.
BCI had a total number of 1,344 employees at 31 December 2010, up 31.4% by 321 in comparison to 31 December 2009. As a reflection of its expansion policy focusing on the retail branch office network, most members of staff were concentrated in the commercial area (863 employees – 64.2%), as opposed to the 481 employees working in the central services.
Notwithstanding a substantial increase, the number of employees per branch ratio continues to decline to a ratio of 14 employees per branch, at 31 December 2010. This further reinforces the success of the imple-mentation of the branch office network expansion plan and consequent maximisation of our current human resources.
027
03. ESTRuTuRA SOCIETÁRIA BCI OvERvIEW
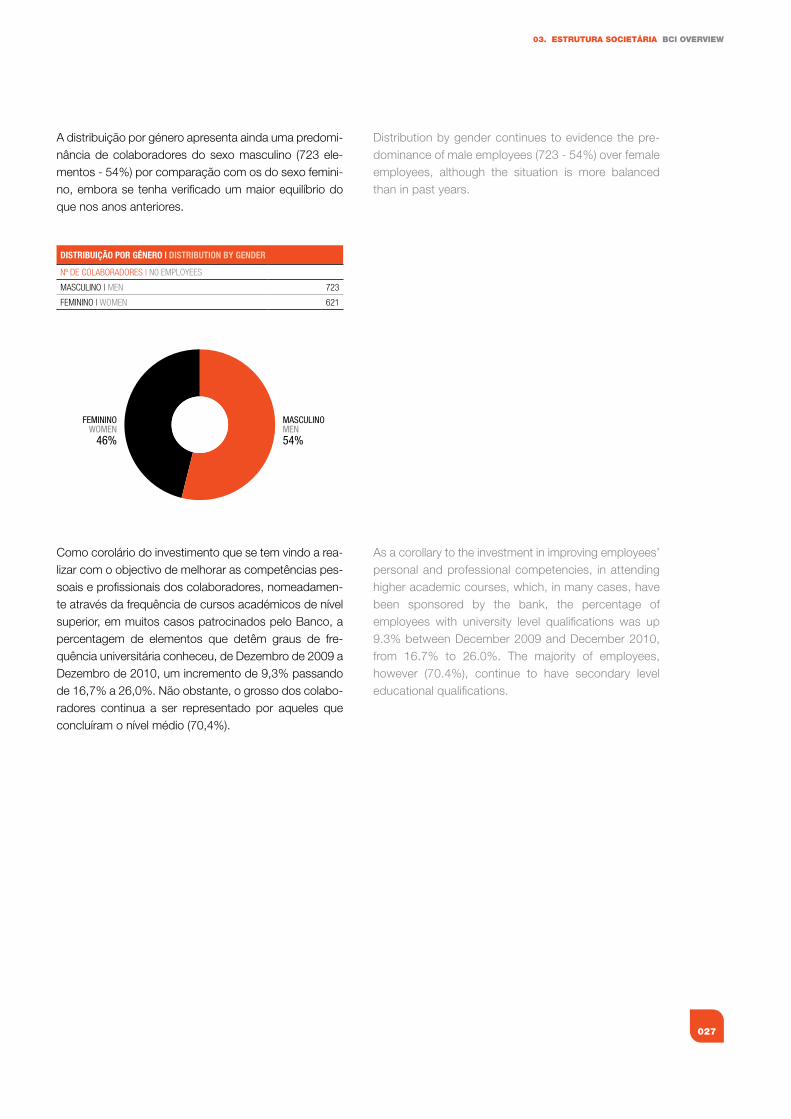
A distribuição por género apresenta ainda uma predomi-nância de colaboradores do sexo masculino (723 ele-mentos - 54%) por comparação com os do sexo femini-no, embora se tenha verificado um maior equilíbrio do que nos anos anteriores.
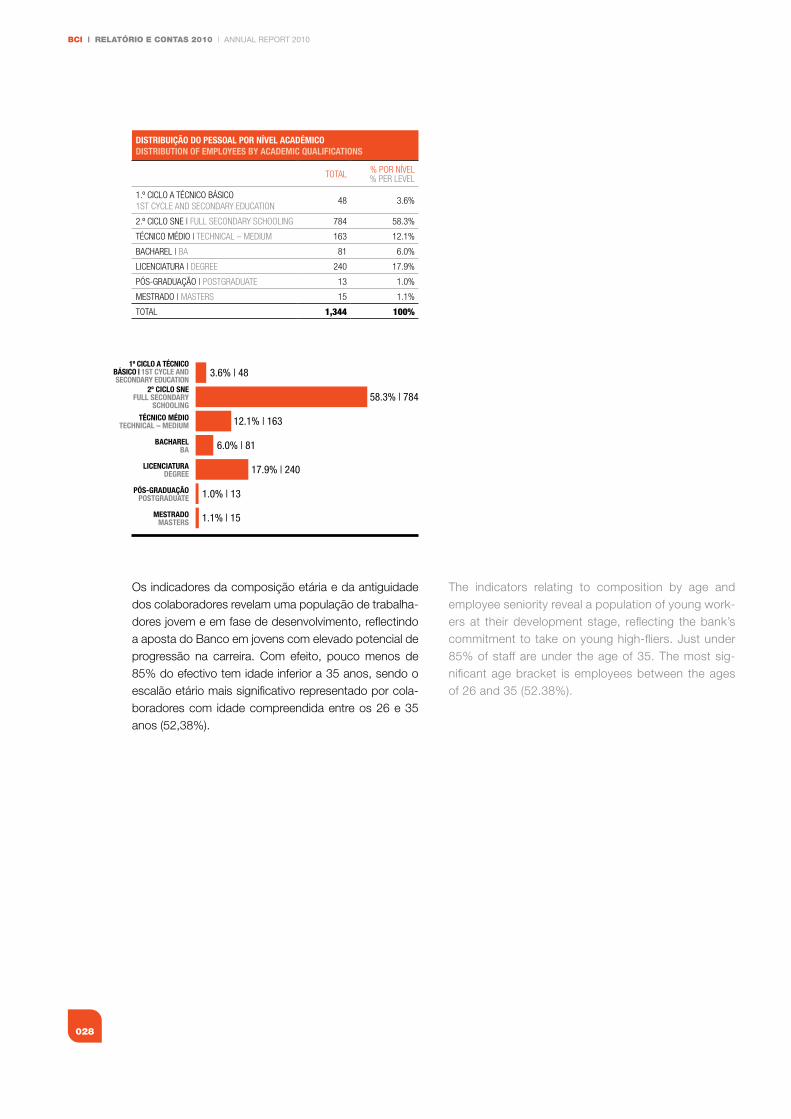
Como corolário do investimento que se tem vindo a rea-lizar com o objectivo de melhorar as competências pes-soais e profissionais dos colaboradores, nomeadamen-te através da frequência de cursos académicos de nível superior, em muitos casos patrocinados pelo Banco, a percentagem de elementos que detêm graus de fre-quência universitária conheceu, de Dezembro de 2009 a Dezembro de 2010, um incremento de 9,3% passando de 16,7% a 26,0%. Não obstante, o grosso dos colabo-radores continua a ser representado por aqueles que concluíram o nível médio (70,4%).
MASCULINOMEN54%
FEMININOWOMEN
46%
DISTRIbuIçÃO POR GéNERO | DISTRIbuTION by GENDER
nº De COLABORADORes | n0 eMPLOyees
MAsCULInO | Men 723
feMInInO | wOMen 621
Distribution by gender continues to evidence the pre-dominance of male employees (723 - 54%) over female employees, although the situation is more balanced than in past years.
As a corollary to the investment in improving employees’ personal and professional competencies, in attending higher academic courses, which, in many cases, have been sponsored by the bank, the percentage of employees with university level qualifications was up 9.3% between December 2009 and December 2010, from 16.7% to 26.0%. The majority of employees, however (70.4%), continue to have secondary level educational qualifications.
BCI | RELATÓRIO E CONTAS 2010 | ANNUAL REPORT 2010
028
Os indicadores da composição etária e da antiguidade dos colaboradores revelam uma população de trabalha-dores jovem e em fase de desenvolvimento, reflectindo a aposta do Banco em jovens com elevado potencial de progressão na carreira. Com efeito, pouco menos de 85% do efectivo tem idade inferior a 35 anos, sendo o escalão etário mais significativo representado por cola-boradores com idade compreendida entre os 26 e 35 anos (52,38%).
DISTRIbuIçÃO DO PESSOAl POR NívEl ACADéMICODISTRIbuTION Of EMPlOyEES by ACADEMIC quAlIfICATIONS
TOTAL % POR nÍVeL% PeR LeVeL
1.º CICLO A TÉCnICO BÁsICO1sT CyCLe AnD seCOnDARy eDUCATIOn
48 3.6%
2.º CICLO sne | fULL seCOnDARy sChOOLIng 784 58.3%
TÉCnICO MÉDIO | TeChnICAL – MeDIUM 163 12.1%
BAChAReL | BA 81 6.0%
LICenCIATURA | DegRee 240 17.9%
PÓs-gRADUAÇÃO | POsTgRADUATe 13 1.0%
MesTRADO | MAsTeRs 15 1.1%
TOTAL 1,344 100%
58.3% | 784
3.6% | 48
12.1% | 163
6.0% | 81
17.9% | 240
1.0% | 13
1.1% | 15MESTRADOMASTERS
PÓS-GRADUAÇÃOPOSTGRADUATE
LICENCIATURADEGREE
BACHARELBA
TÉCNICO MÉDIOTECHNICAL – MEDIUM
2º CICLO SNEFULL SECONDARY
SCHOOLING
1º CICLO A TÉCNICOBÁSICO | 1ST CYCLE ANDSECONDARY EDUCATION
The indicators relating to composition by age and employee seniority reveal a population of young work-ers at their development stage, reflecting the bank’s commitment to take on young high-fliers. Just under 85% of staff are under the age of 35. The most sig-nificant age bracket is employees between the ages of 26 and 35 (52.38%).
029
03. ESTRuTuRA SOCIETÁRIA BCI OvERvIEW
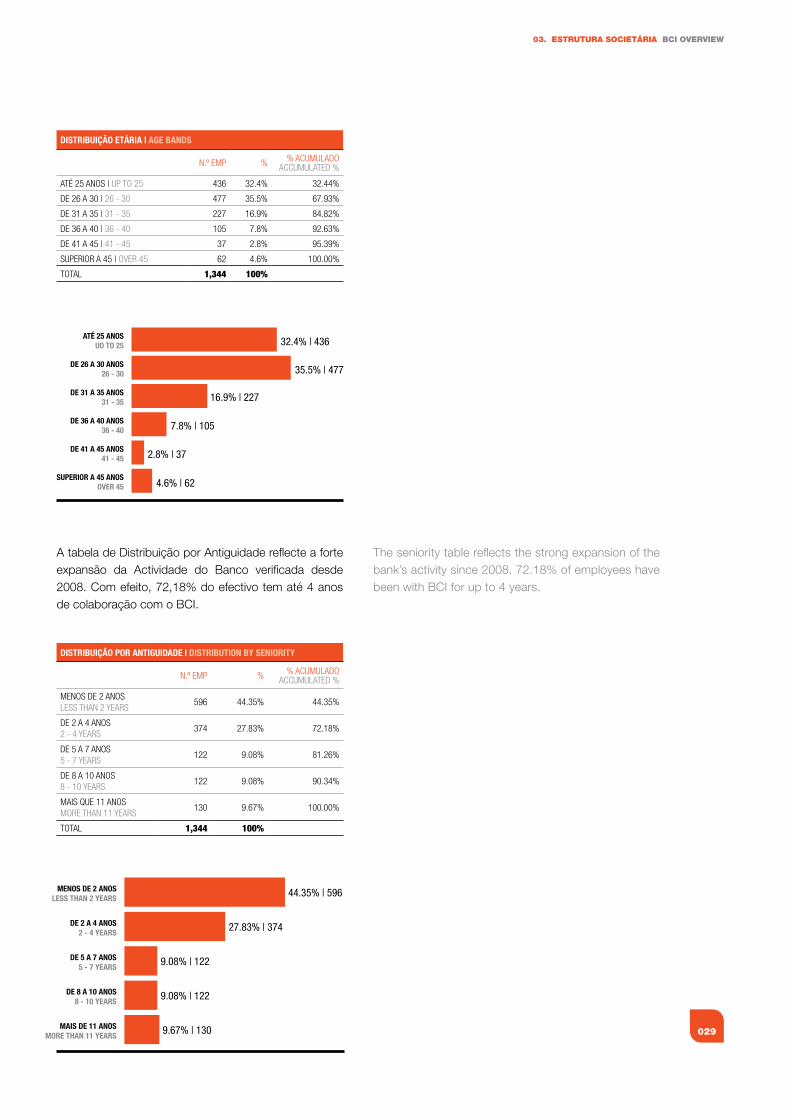
A tabela de Distribuição por Antiguidade reflecte a forte expansão da Actividade do Banco verificada desde 2008. Com efeito, 72,18% do efectivo tem até 4 anos de colaboração com o BCI.
35.5% | 477
32.4% | 436
16.9% | 227
7.8% | 105
2.8% | 37
4.6% | 62SUPERIOR A 45 ANOS
OVER 45
DE 41 A 45 ANOS41 - 45
DE 36 A 40 ANOS36 - 40
DE 31 A 35 ANOS31 - 35
DE 26 A 30 ANOS26 - 30
ATÉ 25 ANOSUO TO 25
DISTRIbuIçÃO ETÁRIA | AGE bANDS
n.º eMP % % ACUMULADOACCUMULATeD %
ATÉ 25 AnOs | UP TO 25 436 32.4% 32.44%
De 26 A 30 | 26 - 30 477 35.5% 67.93%
De 31 A 35 | 31 - 35 227 16.9% 84.82%
De 36 A 40 | 36 - 40 105 7.8% 92.63%
De 41 A 45 | 41 - 45 37 2.8% 95.39%
sUPeRIOR A 45 | OVeR 45 62 4.6% 100.00%
TOTAL 1,344 100%
DISTRIbuIçÃO POR ANTIGuIDADE | DISTRIbuTION by SENIORITy
n.º eMP % % ACUMULADOACCUMULATeD %
MenOs De 2 AnOsLess ThAn 2 yeARs
596 44.35% 44.35%
De 2 A 4 AnOs2 - 4 yeARs
374 27.83% 72.18%
De 5 A 7 AnOs5 - 7 yeARs
122 9.08% 81.26%
De 8 A 10 AnOs8 - 10 yeARs
122 9.08% 90.34%
MAIs QUe 11 AnOsMORe ThAn 11 yeARs
130 9.67% 100.00%
TOTAL 1,344 100%
27.83% | 374
44.35% | 596
9.08% | 122
9.08% | 122
9.67% | 130MAIS DE 11 ANOSMORE THAN 11 YEARS
DE 8 A 10 ANOS8 - 10 YEARS
DE 5 A 7 ANOS5 - 7 YEARS
DE 2 A 4 ANOS2 - 4 YEARS
MENOS DE 2 ANOSLESS THAN 2 YEARS
The seniority table reflects the strong expansion of the bank’s activity since 2008. 72.18% of employees have been with BCI for up to 4 years.
BCI | RELATÓRIO E CONTAS 2010 | ANNUAL REPORT 2010
030
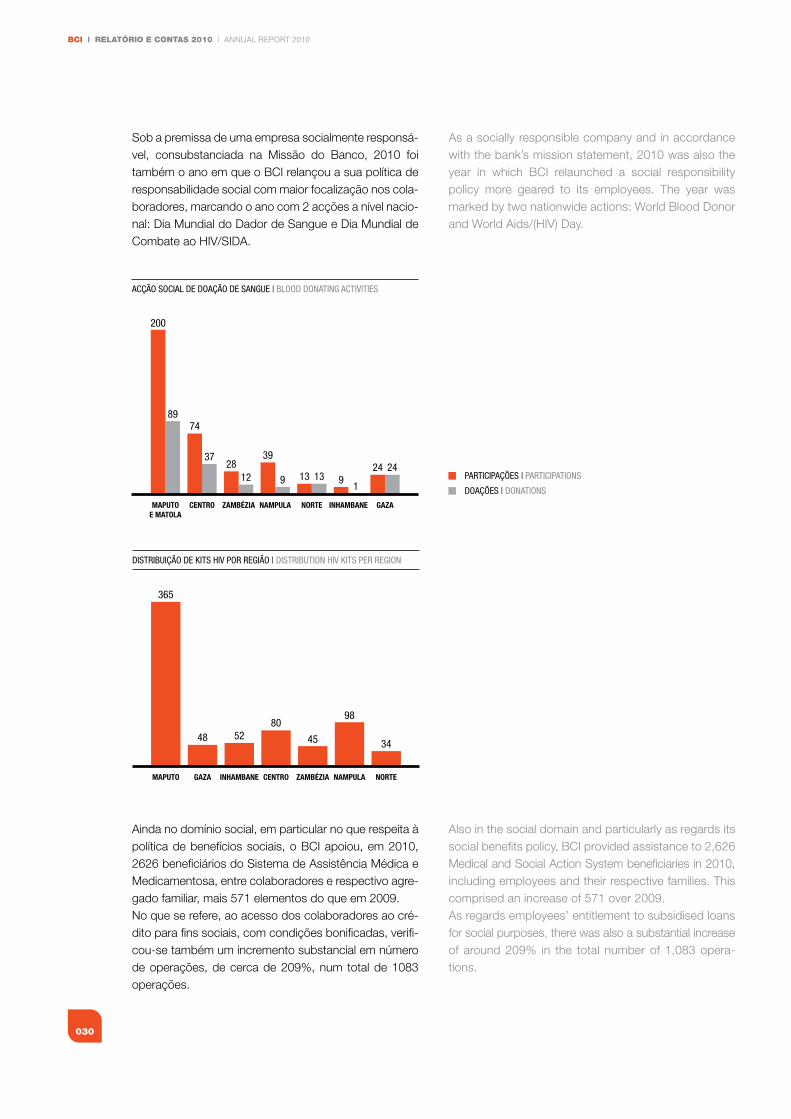
Sob a premissa de uma empresa socialmente responsá-vel, consubstanciada na Missão do Banco, 2010 foi também o ano em que o BCI relançou a sua política de responsabilidade social com maior focalização nos cola-boradores, marcando o ano com 2 acções a nível nacio-nal: Dia Mundial do Dador de Sangue e Dia Mundial de Combate ao HIV/SIDA.
Ainda no domínio social, em particular no que respeita à política de benefícios sociais, o BCI apoiou, em 2010, 2626 beneficiários do Sistema de Assistência Médica e Medicamentosa, entre colaboradores e respectivo agre-gado familiar, mais 571 elementos do que em 2009.No que se refere, ao acesso dos colaboradores ao cré-dito para fins sociais, com condições bonificadas, verifi-cou-se também um incremento substancial em número de operações, de cerca de 209%, num total de 1083 operações.
ACÇÃO SOCIAL DE DOAÇÃO DE SANGUE | BLOOD DONATING ACTIVITIES
GAZAINHAMBANENORTENAMPULAZAMBÉZIACENTROMAPUTOE MATOLA
200
8974
3728
12
39
9 13 13 91
24 24PARTICIPAÇÕES | PARTICIPATIONS
DOAÇÕES | DONATIONS
DISTRIBUIÇÃO DE KITS HIV POR REGIÃO | DISTRIBUTION HIV KITS PER REGION
NORTENAMPULAZAMBÉZIACENTROINHAMBANEGAZAMAPUTO
365
48 52
98
34
80
45
As a socially responsible company and in accordance with the bank’s mission statement, 2010 was also the year in which BCI relaunched a social responsibility policy more geared to its employees. The year was marked by two nationwide actions: World Blood Donor and World Aids/(HIV) Day.
Also in the social domain and particularly as regards its social benefits policy, BCI provided assistance to 2,626 Medical and Social Action System beneficiaries in 2010, including employees and their respective families. This comprised an increase of 571 over 2009.As regards employees’ entitlement to subsidised loans for social purposes, there was also a substantial increase of around 209% in the total number of 1,083 opera-tions.
031
03. ESTRuTuRA SOCIETÁRIA BCI OvERvIEW
formação profissional
A actividade formativa desenvolvida em 2010 reflectiu a orientação estratégica adoptada no sentido de dar res-posta aos seguintes desafios:
• Garantirrecursoshumanospreparadosparaoprojectodeexpansãodaredecomercialàescalanacional;
• Promoverumaconsciênciaeatitudesprofissionaisorien-tadas para a prestação de um serviço de excelên cia assente numa permanente cultura de mudança e na orientação ao cliente, à qualidade e aos resultados.
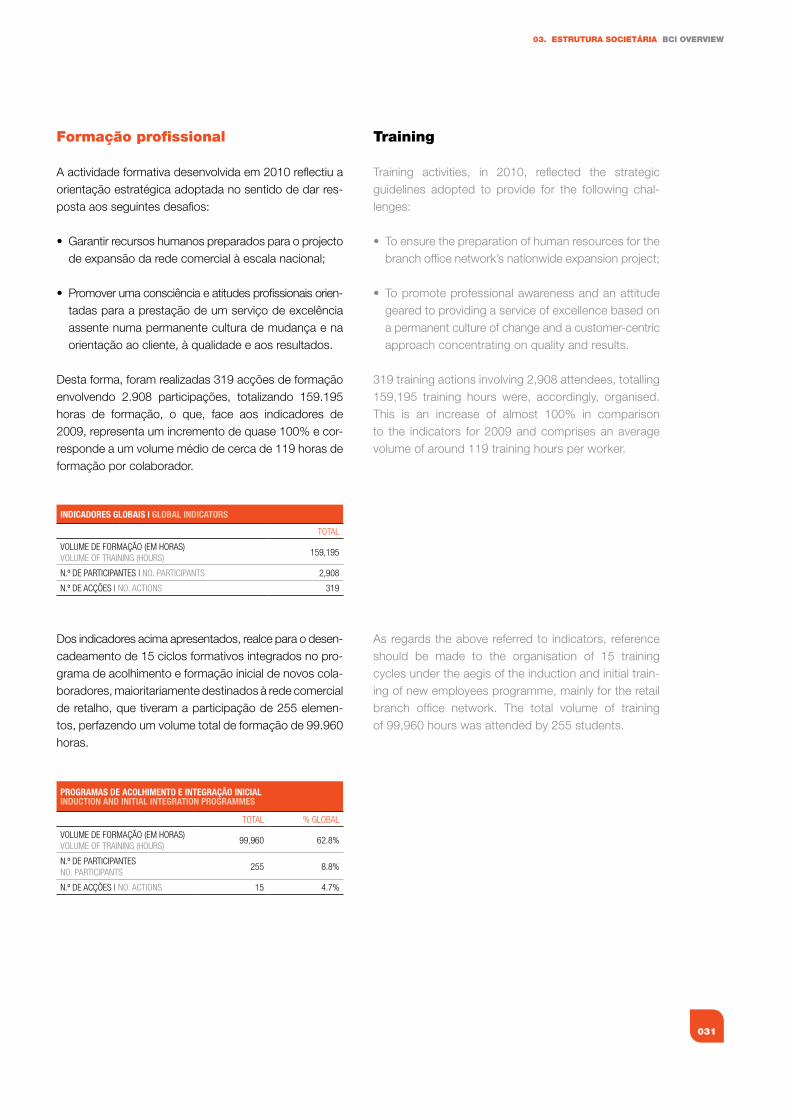
Desta forma, foram realizadas 319 acções de formação envolvendo 2.908 participações, totalizando 159.195 horas de formação, o que, face aos indicadores de 2009, representa um incremento de quase 100% e cor-responde a um volume médio de cerca de 119 horas de formação por colaborador.
Dos indicadores acima apresentados, realce para o desen-cadeamento de 15 ciclos formativos integrados no pro-grama de acolhimento e formação inicial de novos cola-boradores, maioritariamente destinados à rede comercial de retalho, que tiveram a participação de 255 elemen-tos, perfazendo um volume total de formação de 99.960 horas.
INDICADORES GlObAIS | GlObAl INDICATORS
TOTAL
VOLUMe De fORMAÇÃO (eM hORAs)VOLUMe Of TRAInIng (hOURs)
159,195
n.º De PARTICIPAnTes | nO. PARTICIPAnTs 2,908
n.º De ACÇões | nO. ACTIOns 319
PROGRAMAS DE ACOlhIMENTO E INTEGRAçÃO INICIAlINDuCTION AND INITIAl INTEGRATION PROGRAMMES
TOTAL % gLOBAL
VOLUMe De fORMAÇÃO (eM hORAs)VOLUMe Of TRAInIng (hOURs)
99,960 62.8%
n.º De PARTICIPAnTesnO. PARTICIPAnTs
255 8.8%
n.º De ACÇões | nO. ACTIOns 15 4.7%
Training
Training activities, in 2010, reflected the strategic guidelines adopted to provide for the following chal-lenges:
• Toensurethepreparationofhumanresourcesforthebranchofficenetwork’snationwideexpansionproject;
• Topromoteprofessionalawarenessandanattitudegeared to providing a service of excellence based on a permanent culture of change and a customer-centric approach concentrating on quality and results.
319 training actions involving 2,908 attendees, totalling 159,195 training hours were, accordingly, organised. This is an increase of almost 100% in comparison to the indicators for 2009 and comprises an average volume of around 119 training hours per worker.
As regards the above referred to indicators, reference should be made to the organisation of 15 training cycles under the aegis of the induction and initial train-ing of new employees programme, mainly for the retail branch office network. The total volume of training of 99,960 hours was attended by 255 students.
BCI | RELATÓRIO E CONTAS 2010 | ANNUAL REPORT 2010
032
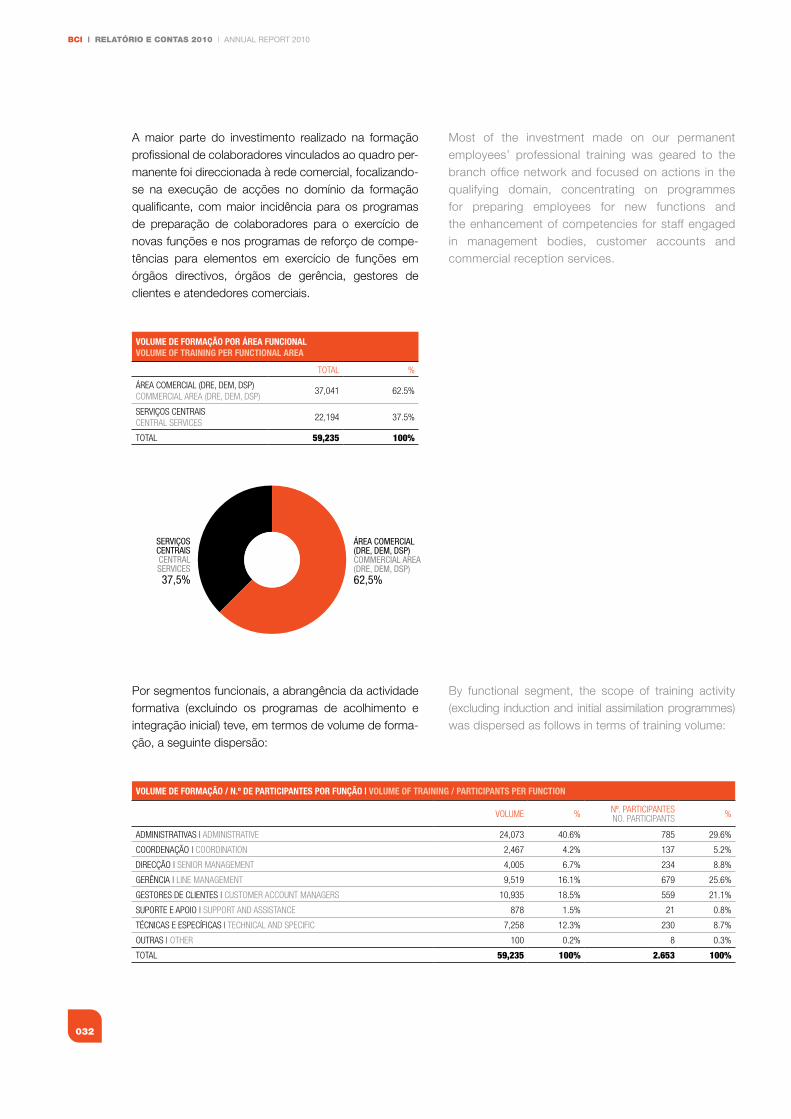
A maior parte do investimento realizado na formação profissional de colaboradores vinculados ao quadro per-manente foi direccionada à rede comercial, focalizando-se na execução de acções no domínio da formação qualificante, com maior incidência para os programas de preparação de colaboradores para o exercício de novas funções e nos programas de reforço de compe-tências para elementos em exercício de funções em órgãos directivos, órgãos de gerência, gestores de clientes e atendedores comerciais.
Por segmentos funcionais, a abrangência da actividade formativa (excluindo os programas de acolhimento e integração inicial) teve, em termos de volume de forma-ção, a seguinte dispersão:
vOluME DE fORMAçÃO POR ÁREA fuNCIONAlvOluME Of TRAINING PER fuNCTIONAl AREA
TOTAL %
ÁReA COMeRCIAL (DRe, DeM, DsP)COMMeRCIAL AReA (DRe, DeM, DsP)
37,041 62.5%
seRVIÇOs CenTRAIsCenTRAL seRVICes
22,194 37.5%
TOTAL 59,235 100%
ÁREA COMERCIAL(DRE, DEM, DSP)COMMERCIAL AREA(DRE, DEM, DSP)62,5%
SERVIÇOSCENTRAISCENTRALSERVICES37,5%
vOluME DE fORMAçÃO / N.º DE PARTICIPANTES POR fuNçÃO | vOluME Of TRAINING / PARTICIPANTS PER fuNCTION
VOLUMe % nº. PARTICIPAnTesnO. PARTICIPAnTs %
ADMInIsTRATIVAs | ADMInIsTRATIVe 24,073 40.6% 785 29.6%
COORDenAÇÃO | COORDInATIOn 2,467 4.2% 137 5.2%
DIReCÇÃO | senIOR MAnAgeMenT 4,005 6.7% 234 8.8%
geRÊnCIA | LIne MAnAgeMenT 9,519 16.1% 679 25.6%
gesTORes De CLIenTes | CUsTOMeR ACCOUnT MAnAgeRs 10,935 18.5% 559 21.1%
sUPORTe e APOIO | sUPPORT AnD AssIsTAnCe 878 1.5% 21 0.8%
TÉCnICAs e esPeCÍfICAs | TeChnICAL AnD sPeCIfIC 7,258 12.3% 230 8.7%
OUTRAs | OTheR 100 0.2% 8 0.3%
TOTAL 59,235 100% 2.653 100%
Most of the investment made on our permanent employees’ professional training was geared to the branch office network and focused on actions in the qualifying domain, concentrating on programmes for preparing employees for new functions and the enhancement of competencies for staff engaged in management bodies, customer accounts and commercial reception services.
By functional segment, the scope of training activity (excluding induction and initial assimilation programmes) was dispersed as follows in terms of training volume:
033
03. ESTRuTuRA SOCIETÁRIA BCI OvERvIEW
Responsabilidade social
A Responsabilidade Social é uma componente indisso-ciável da actividade corrente do BCI, na qual está sem-pre presente a preocupação com o desenvolvimento económico e social das Comunidades em que estamos inseridos. Neste âmbito, em 2010 o BCI levou a cabo várias iniciativas orientadas para as áreas da educação, saúde, cultura e desporto, cuja face mais visível foram as acções solidárias do BCI e o apoio às iniciativas leva-das a cabo por diversas entidades sem fins lucrativos, das quais se mencionam as seguintes:
• DoaçãodepublicaçõesdoArquivoHistóricodaUni-ver sidade Eduardo Mondlane a diversas escolas de país;
• OfertadeBolsasdeEstudoseumaSaladeInformáticaaosEstudantesdaUniversidadeEduardoMondlane;
• ApoioàFeiradeEnfermagem,organizadapelaAsso-ciaçãoNacionaldeEnfermeirasdeMoçambique;
• ApoioàiniciativaLocomotivadeesperançadoClubeFerroviário de Maputo, destinado à formação despor-tiva das camadas jovens dos bairros desfavorecidos daCidadedeMaputo;
• Apoios à Casa do Gaiato, Hospital Central deQuelimane, Hospital Central de Nampula, Serviços Sociais da PRM, Associação de Assistência Social, Associação dos Surdos de Moçambique e outras ins-tituiçõesdesolidariedadesocial;
• Oferta de cabazes solidários emdiversaspediatriasnas capitais províncias do país, em substituição das ofertas de brindes de fim de ano aos seus Clientes, e
• Apoio aoNatal doDoente naCidade de Tete e noDistrito de Muecate, em Nampula.
Social Responsibility
Social responsibility is an indispensable component part of BCI’s current activity and the bank’s concern over the economic and social development of the com-munities in which it operates is ever present. BCI, was, accordingly, responsible for several initiatives geared to educational, health, cultural and sporting activities, in 2010, whose most visible face were BCI’s social actions in support of initiatives performed by several not-for-profit entities, including:
• ThedonationofpublicationsfromEduardoMondlaneUniversity’s historical archives to various schools, nationwide;
• TheprovisionofgrantsandanITroomforEduardoMondlaneUniversitystudents;
• Support for the nursing symposium organised byMozambique’sNationalAssociationofNurses;
• Support for Maputo Railway Club’s “Locomotiveof hope” initiative for sports training facilities for youngerpeoplefromthepoorerquarterofMaputo;
• Support for the Casa do Gaiato, Quelimane and Nampula central hospitals, Presidency of the Republic of Mozambique’s Social Services, Social Welfare Association, Association for the Deaf of Mozambique andothersocialwelfareinstitutions;
• Shopping baskets for diverse paediatric units inMozambique’s provincial capitals, instead of our gifts to customers at the end of the year, and
• Supportforthe“ChristmasforPatients”inTeteandin Nampula’s Muecate district.
BCI | RELATÓRIO E CONTAS 2010 | ANNUAL REPORT 2010
034
Mediateca
No contexto da responsabilidade social corporativa do BCI, durante o ano de 2010 foram realizadas na Mediateca do BCI localizada em Maputo diversas expo-sições e outros eventos de carácter cultural e académi-co, sendo de destacar os seguintes:
• Exposiçãocolectivadepintura,esculturaecerâmicados artistas Malangatana, Mankeu, Naftal Langa, Idasse,Reinata,Simões,DitoeSitoe;
• ExposiçãodopintorSebastiãoMatsinhe,dosalunosda Escola Nacional de Artes Visuais e do Laboratório Gemológico da Universidade Eduardo Mondlane.
A Mediateca, criada em 1997, é uma biblioteca informa-tizada e multimédia integrada na estrutura orgânica do BCI tendo como população – alvo estudantes, profes-sores, quadros e técnicos de empresas e da administra-ção pública e funcionários do sector financeiro.
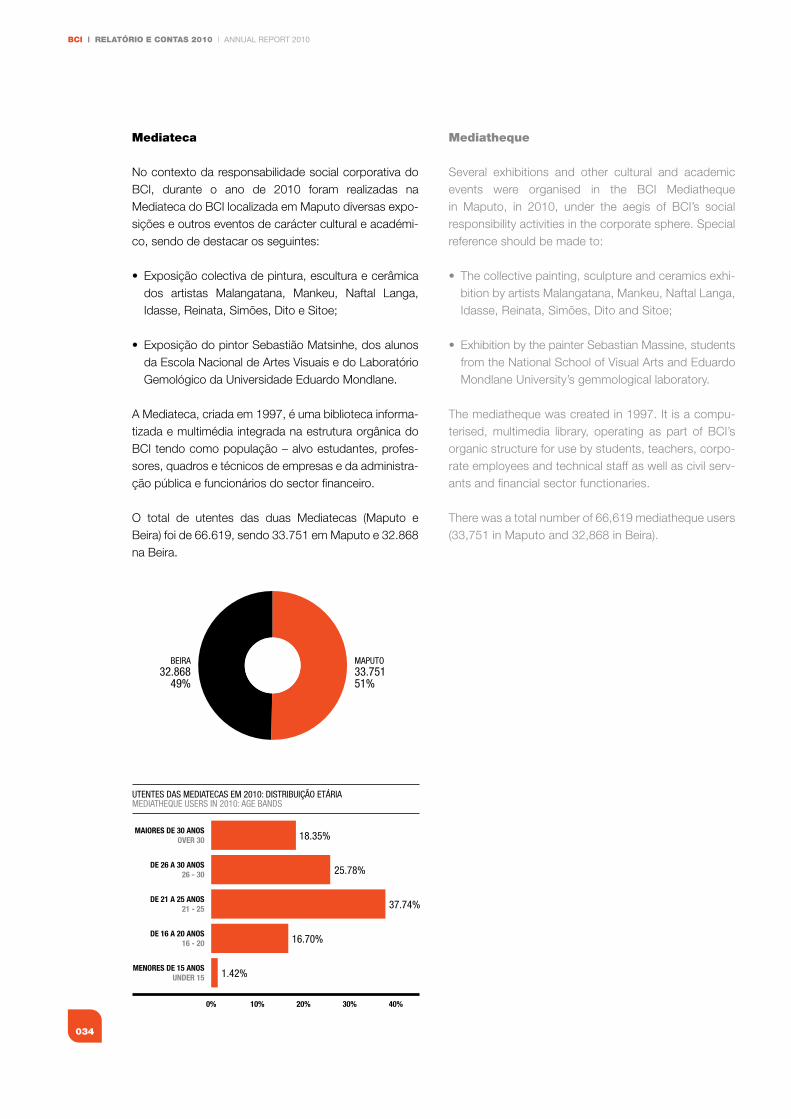
O total de utentes das duas Mediatecas (Maputo e Beira) foi de 66.619, sendo 33.751 em Maputo e 32.868 na Beira.
MAPUTO33.75151%
BEIRA32.868
49%
25.78%
18.35%
37.74%
16.70%
1.42%
0% 10% 20% 30% 40%
MENORES DE 15 ANOSUNDER 15
DE 16 A 20 ANOS16 - 20
DE 21 A 25 ANOS21 - 25
DE 26 A 30 ANOS26 - 30
MAIORES DE 30 ANOSOVER 30
UTENTES DAS MEDIATECAS EM 2010: DISTRIBUIÇÃO ETÁRIAMEDIATHEQUE USERS IN 2010: AGE BANDS
Mediatheque
Several exhibitions and other cultural and academic events were organised in the BCI Mediatheque in Maputo, in 2010, under the aegis of BCI’s social responsibility activities in the corporate sphere. Special reference should be made to:
• Thecollectivepainting,sculptureandceramicsexhi-bition by artists Malangatana, Mankeu, Naftal Langa, Idasse,Reinata,Simões,DitoandSitoe;
• ExhibitionbythepainterSebastianMassine,studentsfrom the National School of Visual Arts and Eduardo Mondlane University’s gemmological laboratory.
The mediatheque was created in 1997. It is a compu-terised, multimedia library, operating as part of BCI’s organic structure for use by students, teachers, corpo-rate employees and technical staff as well as civil serv-ants and financial sector functionaries.
There was a total number of 66,619 mediatheque users (33,751 in Maputo and 32,868 in Beira).

Contextoactual
CurrentContext
036
BCI | RELATÓRIO E CONTAS 2010 | ANNUAL REPORT 2010BCI
04. Enquadramento Macroeconómico Macroeconomic background
Economia internacional
No decurso de 2010, a estabilidade financeira mundial sofreu um grande revés com a crise nos mercados de dívida iniciada no segundo trimestre de 2010. A Ásia teve uma extensão de recuperação notável, sendo de destacar a China, que se tornou na segunda maior potência mun-dial, deixando para trás o Japão. Os Estados Unidos e o Japão experimentaram uma notável desaceleração no segundo trimestre de 2010, enquanto o crescimento acelerado na Europa permaneceu forte nas economias emergentes e economias em desenvolvimento, sendo de destacar o Reino Unido que após permanecer em crise durante vários trimestres consecutivos, experimen-tou um crescimento positivo no período em apreço. A produção industrial global cresceu a taxas de aproxi-madamente 15% e o comércio mundial recuperou a taxas superiores a 40% durante o mesmo período.
Não obstante a tendência de recuperação da actividade económica, o nível geral de preços evoluiu no sentido de desaceleração, tanto ao nível das economias avançadas como das de mercados emergentes, a reflectir, em parte, a evolução favorável dos preços internacionais das princi-pais mercadorias, em particular os cereais, apesar da ten-dência de agravamento do preço do petróleo. Entretanto, no mercado de trabalho a taxa de desemprego continua a espelhar sinais mistos, com uma tendência clara de redução nos E.U.A. para níveis de um dígito, em linha com a recuperação da economia, contra uma clara persistên-cia em níveis considerados elevados na Área do Euro.
Do ponto de vista de medidas de políticas, o 1º trimestre de 2010 foi marcado, de entre várias acções, pela con-tínua injecção de pacotes de estímulo fiscal pelo gover-no do Japão, visando estimular o nível geral de preços queaindapermaneceempatamaresnegativos;criação
World economy
During the course of 2010, the stability of the world economy suffered a major setback with the crisis in the debt markets starting in second quarter 2010. Asia achieved a notable level of recovery in respect of which special reference should be made to China, which, in outpacing Japan, became the second largest world power. The United States and Japan went through a sharp period of deceleration in the second quarter of 2010, whereas the acceleration of growth in Europe remained strong in the emerging and developing econ-omies, in which special mention should be made of the United Kingdom which, after having been mired in crisis for several consecutive quarters, enjoyed positive growth in the period in question. Industrial output grew at rates of around 15% and world trade recovered with rates of more than 40% in the same period.
Notwithstanding the trend towards economic recovery, the general trend in terms of price levels was one of deceleration, both on a level of the advanced as in the emerging economies, partly reflecting the favourable evolution of international commodity prices, particularly cereals, notwithstanding the trend towards hikes in oil prices. In terms of the labour market, the unemploy-ment rate continued to give off mixed signals, with a clear downwards trend in the USA to a one digit level in line with economic recovery as against the clear con-tinuation of levels considered to be high in the euro area.
From a viewpoint of policy measures, first quarter 2010 was, inter alia, characterised by the continuous injec-tion of fiscal stimulus measures by the Japanese gov-ernment, to stimulate the general level of prices which remainnegative;thecreationofaEuropeanmegafund
037
04. ENquAdRAMENTO MACROECONÓMICO MACROECONOMIC BACkgROuNd
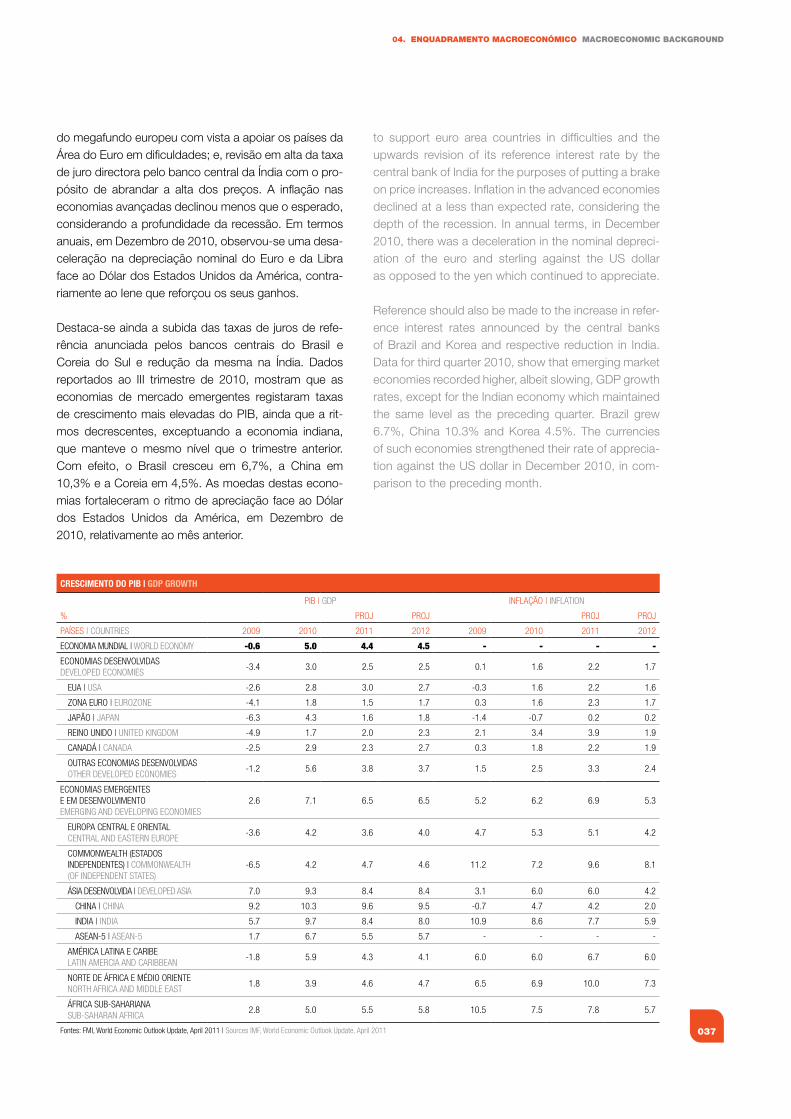
do megafundo europeu com vista a apoiar os países da ÁreadoEuroemdificuldades;e,revisãoemaltadataxade juro directora pelo banco central da Índia com o pro-pósito de abrandar a alta dos preços. A inflação nas economias avançadas declinou menos que o esperado, considerando a profundidade da recessão. Em termos anuais, em Dezembro de 2010, observou-se uma desa-celeração na depreciação nominal do Euro e da Libra face ao Dólar dos Estados Unidos da América, contra-riamente ao Iene que reforçou os seus ganhos. Destaca-se ainda a subida das taxas de juros de refe-rência anunciada pelos bancos centrais do Brasil e Coreia do Sul e redução da mesma na Índia. Dados reportados ao III trimestre de 2010, mostram que as economias de mercado emergentes registaram taxas de crescimento mais elevadas do PIB, ainda que a rit-mos decrescentes, exceptuando a economia indiana, que manteve o mesmo nível que o trimestre anterior. Com efeito, o Brasil cresceu em 6,7%, a China em 10,3% e a Coreia em 4,5%. As moedas destas econo-mias fortaleceram o ritmo de apreciação face ao Dólar dos Estados Unidos da América, em Dezembro de 2010, relativamente ao mês anterior.
CRESCIMENTO DO PIb | GDP GROwTh
PIB | gDP InfLAÇÃO | InfLATIOn
% PROJ PROJ PROJ PROJ
PAÍses | COUnTRIes 2009 2010 2011 2012 2009 2010 2011 2012
eCOnOMIA MUnDIAL | wORLD eCOnOMy -0.6 5.0 4.4 4.5 - - - -
eCOnOMIAs DesenVOLVIDAsDeVeLOPeD eCOnOMIes
-3.4 3.0 2.5 2.5 0.1 1.6 2.2 1.7
eUA | UsA -2.6 2.8 3.0 2.7 -0.3 1.6 2.2 1.6
ZOnA eURO | eUROZOne -4.1 1.8 1.5 1.7 0.3 1.6 2.3 1.7
JAPÃO | JAPAn -6.3 4.3 1.6 1.8 -1.4 -0.7 0.2 0.2
ReInO UnIDO | UnITeD kIngDOM -4.9 1.7 2.0 2.3 2.1 3.4 3.9 1.9
CAnADÁ | CAnADA -2.5 2.9 2.3 2.7 0.3 1.8 2.2 1.9
OUTRAs eCOnOMIAs DesenVOLVIDAsOTheR DeVeLOPeD eCOnOMIes
-1.2 5.6 3.8 3.7 1.5 2.5 3.3 2.4
eCOnOMIAs eMeRgenTes e eM DesenVOLVIMenTO eMeRgIng AnD DeVeLOPIng eCOnOMIes
2.6 7.1 6.5 6.5 5.2 6.2 6.9 5.3
eUROPA CenTRAL e ORIenTALCenTRAL AnD eAsTeRn eUROPe
-3.6 4.2 3.6 4.0 4.7 5.3 5.1 4.2
COMMOnweALTh (esTADOs InDePenDenTes) | COMMOnweALTh (Of InDePenDenT sTATes)
-6.5 4.2 4.7 4.6 11.2 7.2 9.6 8.1
ÁsIA DesenVOLVIDA | DeVeLOPeD AsIA 7.0 9.3 8.4 8.4 3.1 6.0 6.0 4.2
ChInA | ChInA 9.2 10.3 9.6 9.5 -0.7 4.7 4.2 2.0
InDIA | InDIA 5.7 9.7 8.4 8.0 10.9 8.6 7.7 5.9
AseAn-5 | AseAn-5 1.7 6.7 5.5 5.7 - - - -
AMÉRICA LATInA e CARIBeLATIn AMeRCIA AnD CARIBBeAn
-1.8 5.9 4.3 4.1 6.0 6.0 6.7 6.0
nORTe De ÁfRICA e MÉDIO ORIenTenORTh AfRICA AnD MIDDLe eAsT
1.8 3.9 4.6 4.7 6.5 6.9 10.0 7.3
ÁfRICA sUB-sAhARIAnAsUB-sAhARAn AfRICA
2.8 5.0 5.5 5.8 10.5 7.5 7.8 5.7
fontes: fMI, world economic Outlook Update, April 2011 | sources IMf, world economic Outlook Update, April 2011
to support euro area countries in difficulties and the upwards revision of its reference interest rate by the central bank of India for the purposes of putting a brake on price increases. Inflation in the advanced economies declined at a less than expected rate, considering the depth of the recession. In annual terms, in December 2010, there was a deceleration in the nominal depreci-ation of the euro and sterling against the US dollar as opposed to the yen which continued to appreciate. Reference should also be made to the increase in refer-ence interest rates announced by the central banks of Brazil and Korea and respective reduction in India. Data for third quarter 2010, show that emerging market economies recorded higher, albeit slowing, GDP growth rates, except for the Indian economy which maintained the same level as the preceding quarter. Brazil grew 6.7%, China 10.3% and Korea 4.5%. The currencies of such economies strengthened their rate of apprecia-tion against the US dollar in December 2010, in com-parison to the preceding month.
BCI | RELATÓRIO E CONTAS 2010 | ANNUAL REPORT 2010
038
EUA – Dados publicados pelo Bureau of Economic Analysis indicam que o PIB norte-americano cresceu cerca de 3.2% no IV trimestre de 2010, depois de uma expansão de 2.6% no terceiro trimestre. Em relação ao período homólogo de 2009, o PIB expandiu em torno de 2.8%, após uma contracção de 2.6% registada em 2009. O aumento do PIB é explicado pelo desempenho do consumo privado, que cresceu 4.4%, e das exporta-ções, com um incremento de 7.1%.Informações citadas pela mesma fonte indicam que a inflação anual situou-se em 1.5% em Dezembro, após 1.1% observado em Novembro.
Zona Euro – A taxa de inflação anual ultrapassou, em Dezembro, o limite de 2% pela primeira vez em mais de dois anos, tendo, de acordo com dados divulgados pela Eurostat atingido a cifra de 2.2% em Dezembro, após 1.9% em Novembro. O índice de actividade no sector industrial subiu em Dezembro em dois pontos em rela-ção a Novembro, o que aconteceu pelo quarto mês consecutivo a reflectir o aumento das encomendas à indústria, graças a factores como a melhoria do merca-do de emprego.
Japão – O incentivo fiscal, a retoma do comércio mun-dial e a forte dinâmica da demanda em outras regiões da Ásia têm impulsionado o crescimento do Produto Interno Bruto desde o quarto trimestre de 2009, mas a actividade diminuiu consideravelmente no segundo tri-mestre de 2010. Segundo dados tornados públicos pelo Cabinet Office, o PIB nipónico contraiu 1.1% no último trimestre de 2010, depois de no terceiro trimestre ter crescido 3.3%. Para todo o ano de 2010, a econo-mia do Japão recuperou, com o seu crescimento a atin-gir os 3.9%, após uma contracção de 5.0% em 2009. Com a divulgação dos dados anuais, ficou confirmado que o PIB japonês foi ultrapassado pelo PIB da China, que se tornou, nesta óptica, na segunda economia do Mundo, depois dos EUA, lugar até então ocupado pelo Japão desde 1968. A mesma fonte indica que, o IPC apresentou uma variação nula em Dezembro de 2010, após 0.1% no mês anterior.
Economias Emergentes – Na Ásia emergente o cres-cimento ascendeu em cerca de 9 ½%, enquanto a forte dinâmica da procura interna é transmitida pela China, Índia e Indonésia para outras economias da Ásia. O Gabinete Nacional de Estatísticas da China anunciou, um crescimento 10.3% do PIB em 2010, após 9.2% em 2009. Este crescimento ultrapassou as previsões de 8% feitas pelo Governo, sendo o mesmo justificado pelo incremento da produção industrial e das vendas a reta-lho. Com este desempenho, a China, que era no século
USA – Data published by the Bureau of Economic Analysis indicate that US GDP grew by around 3.2% in the fourth quarter of 2010, after expanding 2.6% in the third quarter. GDP expanded by around 2.8% in comparison to the same period 2009, in which it con-tracted 2.6%. The increase of GDP is explained by the 4.4% increase in private consumption and 7.1% increase in exports, Information quoted by the same source indicates that annual inflation was 1.5% in December, against 1.1% in November.
Euro Zone – The annual inflation rate, in December, was higher than the 2% limit for the first time in more than two years, having, in accordance with Eurostat data risen to 2.2% in December, against the November rate of 1.9%. There was a two point increase in the industrial sector activity indicator in December over November. This was for the fourth consecutive month and reflected the increase of orders from industry owing to factors such as improvements in the labour market.
Japan – Fiscal incentives, world economic upturn and the strong dynamics of demand in other regions of Asia have been fuelling GDP growth since fourth quarter 2009, although activity was considerably down in the second quarter of 2010. According to data published by its Cabinet Office, Japan’s GDP contracted by 1.1% in the last quarter of 2010, following growth of 3.3% in the third quarter. The Japanese economy grew by 3.9% over 2010 as a whole, after contracting 5.0% in 2009. The disclosure of annual data confirmed that Japan’s GDP had been overtaken by that of China which has accordingly become the world’s second largest econo-my, coming after the USA, which position had been occupied by Japan since 1968. According to the same source there was no change in the CPI in December 2010, following the preceding month’s 0.1%.
Emerging economies – Growth in emerging Asia was up by around 9.5% with the major dynamics relating to domestic demand being transmitted by China, India and Indonesia to other Asian economies. China’s National Statistics Office announced 10.3% GDP growth in 2010, in comparison to 9.2% in 2009. This growth outpaced the government’s forecasts of 8% and was justified by the increase in industrial output and retail sales. With this performance, China, which in the 20th century was the seventh largest economy now comes second in the world ranking. The same institu-tion announced that inflation had decelerated to 4.6% in December, following a two year high of 5.1% in the preceding month.

039
04. ENquAdRAMENTO MACROECONÓMICO MACROECONOMIC BACkgROuNd
XXI a sétima economia, passou a ocupar a segunda posição no ranking mundial. A mesma instituição anun-ciou que a inflação desacelerou para os 4.6% em Dezembro, depois de ter atingido o recorde de dois anos de 5.1% no mês anterior.
África, Economias da SADC – As últimas projecções do FMI, através de World Economic Outlook, avançam que a África Sub-Sahariana poderá crescer a uma taxa anual de 5,0% em 2010, o que representa 2,8pp face aos 2,2% do crescimento observado em 2009, sendo que para 2011 a projecção aponta para um crescimento de 5,5%. Adicionalmente prevê-se que as exportações aumentem em face do crescimento do mercado na Ásia. Contudo, as incertezas quanto à recuperação dos países desenvolvidos poderão comprometer o fluxo do financiamento para África devido às políticas de aperto fiscal na maior parte dos mesmos. Na região da SADC, ocorreu uma recuperação da maior economia da região a “África do Sul” ao registar uma aceleração da taxa de crescimento económico de 1,6% no I Trimestre para 3,0% no II Trimestre de 2010, e uma previsão de 3,5% para 2011. Segundo o SARB, a balança comercial do país registou um superavit de USD 1.45 mil milhões em Dezembro de 2010, após um excedente de USD 1.18 mil milhões no mês anterior, impulsionado pelo aumento das exportações minérios de ferro e metais preciosos. Dados divulgados pelo Statistics South Africa indicam que a inflação homóloga desacelerou em 10 pb, tendo se situado em 3.5% em Dezembro de 2010, após 3.6% observado no mês anterior, posicionando-se, deste modo, dentro da banda estabelecida pelo SARB. A inflação média anual situou-se em 4.3%, contra 7.1% registados no mês anterior.
De um modo geral, em relação a inflação, registou-se um comportamento misto, ao verificar-se aceleração em países como Angola, Moçambique (mantêm-se como os únicos países que registam dois dígitos na sua inflação), Botswana, Maurícias e desaceleração na África de Sul, Malawi, Tanzânia e Zâmbia.
De referir que relativamente à taxa de câmbio, as moe-das dos países da SADC registaram uma relativa estabi-lidade na sua depreciação, exceptuando a África do Sul e Maurícias que registaram uma apreciação face ao dólar dos EUA, de Julho a Setembro de 2010, compa-rativamente ao final do trimestre anterior e em termos anuais. Destaque vai para a moeda sul-africana, a mais forte da região, que observou uma aceleração na sua apreciação, em 10.7% face ao dólar americano, em Dezembro, após 4.4 % no mês anterior.
Africa, SADC Economies – The latest IMF projec-tions, published in the World Economic Outlook, indi-cate that Sub-Saharan Africa may grow at an annual rate of 5.0% in 2010. This is up 2.8pp over the 2.2% growth noted in 2009, with projections for 2011 pointing to growth of 5.5%. Exports are also forecast to increase owing to the growing market in Asia. However, uncer-tainty over the recovery of the developed countries may compromise the flow of funding to Africa owing to the fiscal adjustment policies in most of them. The SADC region has witnessed a recovery of the region’s largest economy in South Africa which posted an acceleration of economic growth of 1.6% in the first quarter to 3.0% in the second quarter of 2010 and a forecast of 3.5% for 2011. According to the SARB, the country had a trade surplus of USD 1.45 billion in December 2010, following a surplus of USD 1.18 billion in the preceding month, fuelled by higher exports of iron ore and precious metals. According to data published by Statistics South Africa, year-on-year inflation decelerated 10 bp, to 3.5% in December 2010, in comparison to the preceding month’s 3.6%, thus positioning itself within the band established by the SARB. Average annual inflation was 4.3%, against the 7.1% recorded in the preceding month.
Inflation figures were generally mixed, with an accelera-tion in countries such as Angola, Mozambique (which are the only two countries in the region with double digit inflation), Botswana, Mauritius and deceleration in South Africa, Malawi, Tanzania and Zambia.
It should be noted that in terms of exchange rates, the SADC currencies recorded relative stability in terms of depreciation, except for South Africa and Mauritius which appreciated against the US dollar from July to September 2010, in comparison to the end of the last quarter of the year in annual terms. Reference should be made to the South African currency which is the strongest in the region and appreciated 10.7% against the US dollar, in December, in comparison to the preceding month’s 4.4 %.
The increase in the nominal value of the rand against the dollar, reflected the increase in the international market price of gold and higher inflow of capital from the international markets to South Africa, owing to the favourable differences in interest rates in the latter country.
BCI | RELATÓRIO E CONTAS 2010 | ANNUAL REPORT 2010
040
O aumento do valor nominal do Rand face ao Dólar, reflectiu a valorização do ouro no mercado internacional e um maior fluxo de capitais dos mercados internacio-nais para a África do Sul, em face do diferencial da taxa de juro favorável a este último país.
Registou-se, igualmente, uma evolução diferenciada na evolução das principais taxas directoras dos bancos centrais da região: o banco central das Maurícias reviu em baixa a taxa directora em 100 pb fixando-se em 4,75%;obancocentralsul-africanodecidiureduzir,emSetembro de 2010, a sua taxa de juro de política em 50 pb, para 6,0%, face às perspectivas da inflação em situ-ar-se, no médio prazo, entre 3%-6%, definida pelas autoridades monetárias, até 2012; comportamentooposto verificado em Moçambique, onde o banco cen-tralagravouataxadejuropara15,5%;e,finalmente,noBotswana, o banco central decidiu-se pela manutenção da taxa em 10%.
Economia moçambicana
De acordo com o Country Report, publicado pelo FMI em Dezembro de 2010, o desempenho económico de Moçambique permaneceu forte, apesar do ambiente externo continuar menos favorável que o previsto. Moçambique mostrou robustez em termos de cresci-mento, através do aligeiramento das políticas macroe-conómicas de combate aos efeitos da crise económica, projectando-se que o crescimento do PIB real acelere para 7,25% no final de 2010, acima das taxas de cres-cimento dos países congéneres, determinado pela recu-peração da procura externa.
A recuperação dos preços dos produtos de base que impulsionou as exportações derivadas dos mega pro-jectos, o aumento de entradas de capitais privados e o forte e continuado apoio dos doadores devem contribuir para melhorar as contas externas de Moçambique e assegurar níveis confortáveis de reservas internacionais. Ainda assim, as políticas monetárias e fiscais acomoda-tícias adoptadas na esteira da crise internacional, asso-ciadas a pressões sobre a balança de pagamentos, contribuíram para a depreciação da taxa de câmbio e para um aumento da inflação, o que colocou um fardo considerável nos segmentos mais vulneráveis da popu-lação.
Com o crescimento económico numa base sólida, o FMI apoia a intenção das autoridades de conter a emergên-cia de expectativas inflacionárias através de um ajuste das suas políticas macroeconómicas. Isto deverá
Differentiation was also recorded in the evolution between the main reference rates of the region’s cen-tral banks: the central bank of Mauritius revised its rate downwards by 100 bp to 4.75%; the SouthAfrican central bank decided to reduce its policy inter-est rate by 50 bp to 6.0% in September 2010, in light of inflationary prospects of between 3%-6%, over the medium term, defined by the monetary authorities, up to2012;with anopposite reactionbyMozambique,whose central bank increased the interest rate to15.5%;and,lastly,inBotswana,wherethecentralbank opted to keep the rate at 10%.
Mozambique’s economy
According to the Country Report, published by the IMF, in December 2010, Mozambique’s economic perform-ance remained strong, notwithstanding the continua-tion of a less favourable than forecast external environ-ment. Mozambique posted robust growth, by alleviating its macroeconomic policies designed to counteract the effects of the economic crisis, with real GDP growth projected to accelerate to 7.25% at the end of 2010, higher than the growth rates of its similar countries determined by the recovery of external demand.
Recovery in prices of basic products which fuelled exports deriving from mega projects, increase in pri-vate capital inflows and strong and continued donor support should contribute towards an improvement of Mozambique’s external accounts and ensure comfort-able levels of international reserves. The accommoda-tive monetary and fiscal policies adopted in the sphere of the international crisis, associated with pressures on the balance of payments, contributed, however, towards the depreciation of the exchange rate and higher inflation, placing a considerable burden on the more vulnerable segments of the population.
With economic growth on a solid basis, the IMF is sup-portive of the authorities’ intention to contain the emer-gence of inflationary expectations on the basis of an adjustment to its macroeconomic policies. This should continue to contribute towards a return to single digit inflation in the coming year. In order to support the eco-nomic stimulus measures adopted in 2010, the govern-ment intends to reinforce its collection procedures and define expenditure priorities in an endeavour to reduce the primary domestic fiscal deficit in 2011.
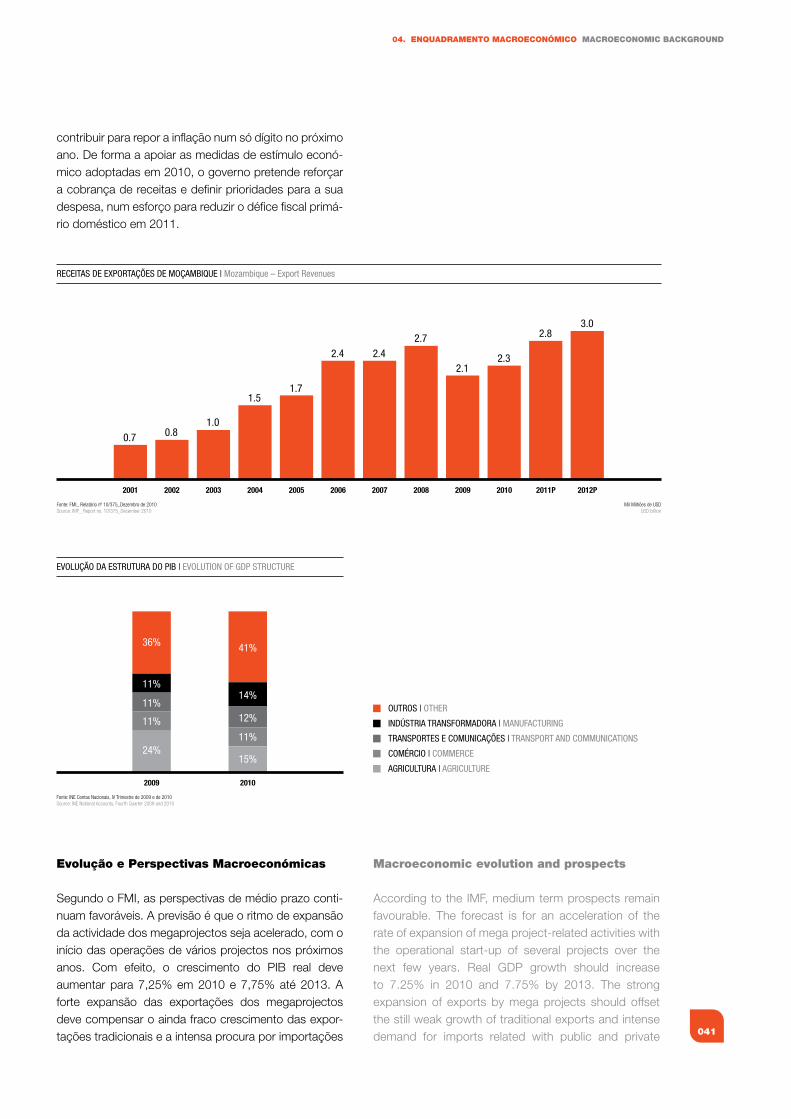
041
04. ENquAdRAMENTO MACROECONÓMICO MACROECONOMIC BACkgROuNd
contribuir para repor a inflação num só dígito no próximo ano. De forma a apoiar as medidas de estímulo econó-mico adoptadas em 2010, o governo pretende reforçar a cobrança de receitas e definir prioridades para a sua despesa, num esforço para reduzir o défice fiscal primá-rio doméstico em 2011.
Evolução e Perspectivas Macroeconómicas
Segundo o FMI, as perspectivas de médio prazo conti-nuam favoráveis. A previsão é que o ritmo de expansão da actividade dos megaprojectos seja acelerado, com o início das operações de vários projectos nos próximos anos. Com efeito, o crescimento do PIB real deve aumentar para 7,25% em 2010 e 7,75% até 2013. A forte expansão das exportações dos megaprojectos deve compensar o ainda fraco crescimento das expor-tações tradicionais e a intensa procura por importações
RECEITAS DE EXPORTAÇÕES DE MOÇAMBIQUE | Mozambique – Export Revenues
0.7 0.81.0
1.51.7
2.4 2.42.7
2.12.3
2.83.0
2001 2002 2003 2004 2005 2006 2007 2008 2009 2010 2012P2011P
Fonte: FMI_ Relatório nº 10/375_Dezembro de 2010Source: IMF_ Report no. 10/375_December 2010
Mil Milhões de USDUSD billion
EVOLUÇÃO DA ESTRUTURA DO PIB | EVOLUTION OF GDP STRUCTURE
36%
11%
11%
11%
24%
41%
14%
12%
11%
15%
2009 2010
Fonte: INE Contas Nacionais, IV Trimestre de 2009 e de 2010Source: INE National Accounts, Fourth Quarter 2009 and 2010
OUTROS | OTHER
INDÚSTRIA TRANSFORMADORA | MANUFACTURING
TRANSPORTES E COMUNICAÇÕES | TRANSPORT AND COMMUNICATIONS
COMÉRCIO | COMMERCE
AGRICULTURA | AGRICULTURE
Macroeconomic evolution and prospects
According to the IMF, medium term prospects remain favourable. The forecast is for an acceleration of the rate of expansion of mega project-related activities with the operational start-up of several projects over the next few years. Real GDP growth should increase to 7.25% in 2010 and 7.75% by 2013. The strong expansion of exports by mega projects should offset the still weak growth of traditional exports and intense demand for imports related with public and private
BCI | RELATÓRIO E CONTAS 2010 | ANNUAL REPORT 2010
042
relacionadas com o investimento público e privado, estabilizando, dessa forma, a conta corrente externa (após donativos) em cerca de 12 % do PIB e mantendo a cobertura das importações pelas reservas em cerca de 5 meses no médio prazo. No ano 2010, as autoridades iniciaram o aperto das polí-ticas macroeconómicas, revertendo a orientação expan-sionista adoptada durante a crise económica mundial. Com o crescimento económico bem alicerçado, reco-nhece-se a necessidade de acelerar o aperto das políti-cas monetárias e fiscais em 2011 para combater as expectativas inflacionistas. As autoridades continuam focalizadas, a médio prazo, em promover o desenvolvi-mento económico inserido num ambiente de estabili-dade macroeconómica. Um dos principais enfoques da estratégia é o aumento do investimento público em sec-tores promotores de crescimento (transporte e energia), financiado em parte por empréstimos externos não con-cessionais. A expectativa é que isto ajude a atrair o investimento privado e estimule a criação de empregos. A planeada aceleração do investimento público fará par-te de um conjunto de políticas prudentes para manter a estabilidade macroeconómica e a sustentabilidade da dívida. A intenção das autoridades é limitar o défice pri-mário interno ao nível anteriormente previsto, de cerca de 4 % PIB a partir de 2012, conjugando-o com o aper-to da política monetária de forma a alcançar os seus objectivos de inflação, aliviar as pressões sobre a procu-ra e apoiar o desenvolvimento do sector financeiro. Inflação
Após atingir um mínimo histórico em 2009 (4,2%), a taxa de inflação situou-se em 16,62% no fecho do ano 2010, correspondente a uma subida de 12 p.p em relação ao período homólogo.
As principais razões para esta evolução foram: a depre-ciação do metical face ao dólar americano, rand sul--africanoeeuro,encarecendoosprodutosimportados;o aumento nos mercados internacionais dos produtos energéticosealimentares;e,aretiradadesubsídiosaospreços de combustíveis, entre outros bens de primeira necessidade.
De Fevereiro a Dezembro de 2010, a inflação evoluiu de forma atípica no sentido ascendente, tendo este com-portamento sido determinado, essencialmente, pelo agravamento acumulado dos preços da classe de pro-dutos alimentares e bebidas não alcoólicas com uma contribuição de 8,27 pp contra 0,12 pp no período homólogo de 2009.
investment, thus stabilising the external current account, (after donations) by around 12% of GDP and maintaining import cover by reserves of around 5 months over the medium term. In 2010, the authorities put a squeeze on macroeco-nomic policies, reversing the expansionary guidelines adopted during the current world economic crisis. With economic growth on a sound footing, the need has been recognised to accelerate the squeeze on mone-tary and fiscal policies in 2011, to combat inflationary expectations. The authorities have remained focused over the medium term on the promotion of economic development in an environment of macroeconomic stability. One of the main strategy focuses is to increase public investment in growth promotion sectors (trans-port and energy), part funded by external non-conces-sionary loans. This is expected to help to attract private investment and stimulate job creation. The planned acceleration of public investment is part of a set of prudent policies designed to maintain macroeconomic stability and debt sustainability. The authorities intend to limit the domestic primary deficit on the formerly planned level of 4% of GDP starting 2012, combining it with a squeeze on monetary policy to achieve its inflation objectives, alleviating pressure on demand and supporting financial sector develop-ment. Inflation
After reaching a historically low level of 4.2% in 2009, the inflation rate, at the end of 2010, was up 12 pp in comparison to the same period last year at 16.62%.
The main reasons for this evolution were: the metical’s depreciation against the US dollar, South African rand andtheeuro,makingimportedgoodsmoreexpensive;price increases in the international energy and foodstuff commodities markets and elimination of subsidies on fuel and other staple goods.
The evolution of inflation over the February-December 2010 period was atypical in its upwards movement, essentially on account of the accumulated increases in prices of foodstuffs and non-alcoholic beverages with a contribution of 8.27 pp in comparison to 0.12 pp over the same period 2009.
In light of high inflation levels, the Bank of Mozambique (BM) tightened its restrictive approach to monetary policy starting in the middle of the year. In June and September the cumulative increase in its main reference
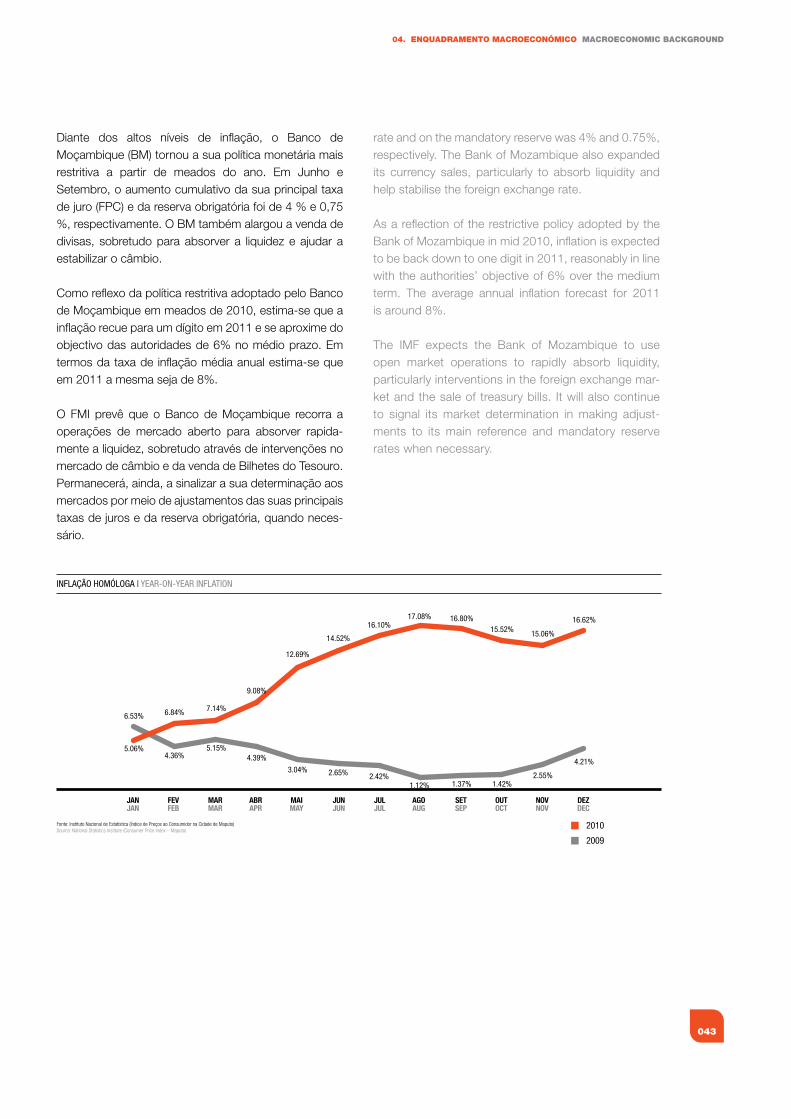
043
04. ENquAdRAMENTO MACROECONÓMICO MACROECONOMIC BACkgROuNd
Diante dos altos níveis de inflação, o Banco de Moçambique (BM) tornou a sua política monetária mais restritiva a partir de meados do ano. Em Junho e Setembro, o aumento cumulativo da sua principal taxa de juro (FPC) e da reserva obrigatória foi de 4 % e 0,75 %, respectivamente. O BM também alargou a venda de divisas, sobretudo para absorver a liquidez e ajudar a estabilizar o câmbio.
Como reflexo da política restritiva adoptado pelo Banco de Moçambique em meados de 2010, estima-se que a inflação recue para um dígito em 2011 e se aproxime do objectivo das autoridades de 6% no médio prazo. Em termos da taxa de inflação média anual estima-se que em 2011 a mesma seja de 8%.
O FMI prevê que o Banco de Moçambique recorra a operações de mercado aberto para absorver rapida-mente a liquidez, sobretudo através de intervenções no mercado de câmbio e da venda de Bilhetes do Tesouro. Permanecerá, ainda, a sinalizar a sua determinação aos mercados por meio de ajustamentos das suas principais taxas de juros e da reserva obrigatória, quando neces-sário.
INFLAÇÃO HOMÓLOGA | YEAR-ON-YEAR INFLATION
Fonte: Instituto Nacional de Estatística (Índice de Preços ao Consumidor na Cidade de Maputo)Source: National Statistics Institute (Consumer Price Index – Maputo)
12.69%
5.06%
6.84% 7.14%
9.08%
14.52%
16.10%17.08% 16.80%
15.52% 15.06%
16.62%
3.04%
6.53%
4.36%5.15%
4.39%
2.65% 2.42%1.12% 1.37% 1.42%
2.55%
4.21%
2010
2009
DEZDEC
JANJAN
FEVFEB
MARMAR
ABRAPR
MAIMAY
JUNJUN
JULJUL
AGOAUG
OUTOCT
SETSEP
NOVNOV
rate and on the mandatory reserve was 4% and 0.75%, respectively. The Bank of Mozambique also expanded its currency sales, particularly to absorb liquidity and help stabilise the foreign exchange rate.
As a reflection of the restrictive policy adopted by the Bank of Mozambique in mid 2010, inflation is expected to be back down to one digit in 2011, reasonably in line with the authorities’ objective of 6% over the medium term. The average annual inflation forecast for 2011 is around 8%. The IMF expects the Bank of Mozambique to use open market operations to rapidly absorb liquidity, particularly interventions in the foreign exchange mar-ket and the sale of treasury bills. It will also continue to signal its market determination in making adjust-ments to its main reference and mandatory reserve rates when necessary.
BCI | RELATÓRIO E CONTAS 2010 | ANNUAL REPORT 2010
044
Taxas de juro
O crescimento dinâmico que a economia moçambicana tem registado obriga o Banco Central a redobrar os esforços no controlo dos excessos de liquidez, de modo a assegurar a estabilidade de preços. Para controlar a evolução deste agregado, o Banco de Moçambique intervém no Mercado Monetário Interbancário (MMI) através da venda e compra de Bilhetes de Tesouro, no Mercado Cambial Interbancário (MCI) através da com-pra e venda de divisas, e utiliza ainda para o efeito uma Facilidade Permanente de Cedência (FPC) e uma Facilidade Permanente de Depósitos (FPD).
No decurso de 2010 a taxa da FPC sofreu três altera-ções, em Abril, Junho e Setembro, tendo a FPD tido um único ajustamento em Junho de 2010. O Banco de Moçambique decidiu, com efeitos a partir de 13 de Abril de 2010, rever em alta a taxa da Facilidade Permanente de Cedência (FPC) em 1,00 pp, de 11,50% para 12,50%. O 2º incremento da FPC registou-se em Junho de 2010 e consistiu no aumento de 2,00 pp, de 12,50% para 14,50%. No mesmo período, a taxa da Facilidade Permanente de Depósito (FPD) aumentou em 1,0 pp, para 4,00%. Em Setembro de 2010, o Banco de Moçambique, tomando em consideração o comporta-mento recente da taxa de câmbio, as previsões de infla-ção a curto e médios prazos e as medidas de conten-ção de preços e austeridade orçamental anunciadas pelo governo, deliberou incrementar a taxa de juro da Facilidade Permanente de Cedência em 100 pontos base, de 14,50% para 15,50%.
Com estas medidas, as autoridades pretendem modifi-car o comportamento recente da inflação e as respecti-vas previsões de curto e médio prazos, as medidas em curso de correcção dos preços, bem como a evolução da taxa de câmbio. Com o aumento das taxas de refe-rência da FPC e FPD, verificou-se em 2010 um aumento substancial das taxas de juro das permutas de liquidez entre os bancos comerciais, as quais passaram do nível médio de 6,65% em finais de 2009 para 13,09% no fecho de 2010.
Outra medida utilizada pelo BdM para restringir a liqui-dez na economia foi o aumento do coeficiente de reser-vas obrigatórias para 8,75%, o que obriga os bancos a aumentar as suas reservas, limitando a concessão de crédito.
Interest rates
The Mozambican economy’s dynamic growth levels have forced the central bank to redouble its efforts to control surplus liquidity in order to guarantee price stability. To control the evolution of this aggregate, the Bank of Mozambique intervenes in the interbank mon-ey market via sales and purchases of treasury bills in the interbank foreign exchange market, through its purchase and sale of currencies and also makes use of a standing lending facility and a standing deposit facility.
During the course of 2010 three changes were made to the interest rate on the standing lending facility in April, June and September, with a single adjustment having been made to the standing deposit facility in June 2010. The Bank of Mozambique decided, effective 13 April 2010, to increase the interest rate on the standard lending facility by 1.00 pp, from 11.50% to 12.50%. The second increase in the standing lend-ing facility was made in June 2010 and consisted of an increase of 2.00 pp from 12.50% to 14.50%. During the same period, the rate on the standing deposit facility was increased by 1.0 pp to 4.00%. In September 2010, the Bank of Mozambique, taking into consideration the recent reaction of the exchange rate, short and medium term inflation forecasts, price containment measures and fiscal austerity announced by the government, decided to increase the interest rate on its standing lending facility by 100 basis points from 14.50% to 15.50%.
The authorities, with these measures, aim to modify recent inflationary trends and respective short and medium term forecasts, measures in progress and price adjustments, in addition to the evolution of the exchange rate. The increase in the reference rates of the standing lending and deposit facilities was accom-panied by a substantial increase in interest rates on liquidity swaps between commercial banks, in 2010, from an average level of 6.65% at the end of 2009 to 13.09% at the end of 2010.
Another measure used by the Bank of Mozambique to restrict liquidity in the economy was to increase the mandatory reserves rate to 8.75%. This forces banks to increase their reserves and limit their lending operations.
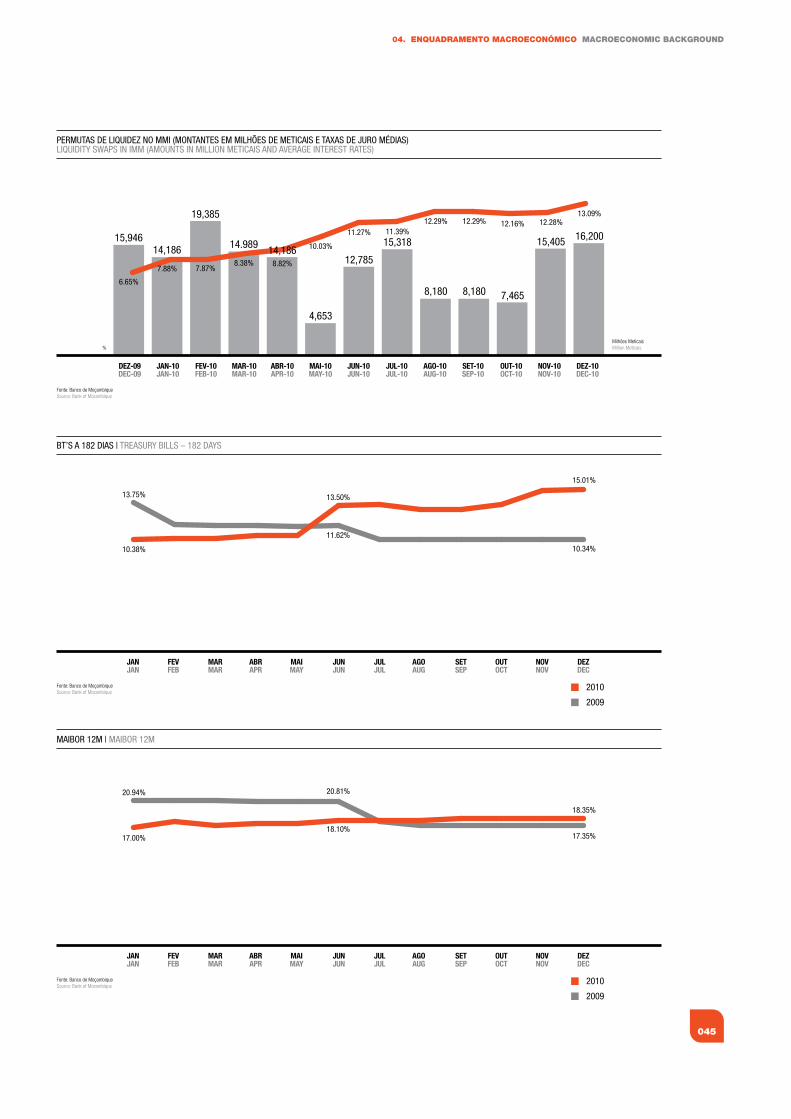
045
04. ENquAdRAMENTO MACROECONÓMICO MACROECONOMIC BACkgROuNd
PERMUTAS DE LIQUIDEZ NO MMI (MONTANTES EM MILHÕES DE METICAIS E TAXAS DE JURO MÉDIAS) LIQUIDITY SWAPS IN IMM (AMOUNTS IN MILLION METICAIS AND AVERAGE INTEREST RATES)
15,94614,186
19,385
14.989
4,653
12,785
15,318
8,180 8,180 7,465
15,405 16,200
DEZ-10DEC-10
DEZ-09DEC-09
JAN-10JAN-10
FEV-10FEB-10
MAR-10MAR-10
ABR-10APR-10
MAI-10MAY-10
JUN-10JUN-10
JUL-10JUL-10
AGO-10AUG-10
OUT-10OCT-10
SET-10SEP-10
NOV-10NOV-10
Fonte: Banco de MoçambiqueSource: Bank of Mozambique
Milhões MeticaisMillion Meticais%
14,1868.82%
6.65%
7.88% 7.87%8.38%
10.03%
11.27% 11.39%12.29% 12.29% 12.16% 12.28%
13.09%
BT’S A 182 DIAS | TREASURY BILLS – 182 DAYS
Fonte: Banco de MoçambiqueSource: Bank of Mozambique
10.38%
13.50%
15.01%
13.75%
11.62%
10.34%
2010
2009
DEZDEC
JANJAN
FEVFEB
MARMAR
ABRAPR
MAIMAY
JUNJUN
JULJUL
AGOAUG
OUTOCT
SETSEP
NOVNOV
MAIBOR 12M | MAIBOR 12M
DEZDEC
JANJAN
FEVFEB
MARMAR
ABRAPR
MAIMAY
JUNJUN
JULJUL
AGOAUG
OUTOCT
SETSEP
NOVNOV
Fonte: Banco de MoçambiqueSource: Bank of Mozambique
17.00%
20.81%
18.35%
20.94%
18.10%17.35%
2010
2009
BCI | RELATÓRIO E CONTAS 2010 | ANNUAL REPORT 2010
046
Evolução cambial
Até Setembro de 2010, o Metical observou uma acele-rada depreciação em relação às principais moedas estrangeiras transaccionadas em Moçambique. Com efeito, face ao Dólar Americano, o Metical registou uma tendência de desvalorização ao longo do ano de 2010, não obstante ter observado uma apreciação no último trimestre do ano, resultante da intervenção do BdM no mercado cambial interbancário e de uma melhoria no saldo das trocas com o exterior devido a um aumento das exportações e à entrada de donativos.
Comparativamente ao Rand, a moeda nacional registou uma tendência de aceleração do nível de depreciação, no mesmo período. A aceleração da depreciação do Metical relativamente ao Rand Sul-Africano, está asso-ciada ao fortalecimento da moeda Sul-Africana face às principais divisas internacionais, em resultado da apre-ciação do ouro e de outros metais no mercado interna-cional, bem como do maior influxo de capitais para a economia Sul-Africana, movido pela atractividade da taxa de juro comparativamente a outras economias mais desenvolvidas.
O Euro apreciou-se cerca de 36% face ao Metical entre Julho e Novembro de 2010. Devido à maior prioridade dada pelo BdM à estabilidade do metical face ao Dólar, a flutuação do metical face ao Euro espelha a evolução desta moeda face ao dólar.
A tendência de estabilidade da taxa de câmbio do Metical face ao Dólar deve-se, essencialmente, às medi-das tomadas pelo BdM, nomeadamente: aumento das intervenções habituais no MCI no sentido de prover divi-sas suficientes no mercado para atender à procura, incluindo a derivada ao pagamento das facturas de combustíveis que passou a ser coberta em 100% con-traosanteriores40%;e,medidasdepolíticamonetáriamais restritivas, como o aumento da taxa de juro de referência do Banco de Moçambique (FPC) e da taxa de reservas obrigatórias, para conter a expansão dos agre-gados monetários.
Segundo o BdM, através da sua publicação Preços e Conjuntura Financeira de Junho de 2010, as principais causas da forte depreciação do Metical face à divisa Norte-Americana, podem estar relacionadas com os seguintes factores:
• Quedadovalordasexportaçõescomorescaldodoimpacto da crise financeira internacional, concorrendo para a compressão do fundo cambial num ambiente
Exchange rates
There was an acceleration in the metical’s depreciation against the major foreign currencies traded in Mozambique up to September 2010. The metical’s trend vis-à-vis the US dollar was downwards, during the course of 2010, notwithstanding its appreciation in the last quarter of the year, owing to the Bank of Mozambique’s intervention in the interbank foreign exchange market and an improvement in the overseas trade balance owing to an increase in exports and inflow of donations.
In comparison to the rand, Mozambique’s currency recorded an accelerating depreciation trend over the same period. The acceleration in the metical’s depre-ciation against the South African rand is associated with the strengthening of the South African currency vis-à-vis the main international currencies owing to higher prices of gold and other metals in the interna-tional marketplace, in addition to the higher inflow of capital to the South African economy deriving from attractive interest rates in comparison to other more developed economies.
The euro appreciated by around 36% against the metical between July and November 2010. Owing to the greater priority afforded by the Bank of Mozambique to the stability of the metical against the dollar, the metical’s fluctuation against the euro mirrors the said evolution against the dollar.
The trend towards the stability of the metical to dollar exchange rate essentially derives from the measures taken by the Bank of Mozambique, notably: the increase in its customary interventions in the interbank foreign exchange market for the purpose of providing sufficient currency in the market to cater for demand, including payments of fuel which were 100% covered in comparison to the former 40% and more restrictive monetary policy measures such as the increase in the Bank of Mozambique’s reference rate (standing lending facility) and mandatory reserves, to contain the expan-sion of monetary aggregates.
According to the Bank of Mozambique in its Prices and Financial Environment publication of June 2010, the main reasons for the metical’s marked depreciation against the US currency may be related with the following factors:
• Afallinthevalueofexportsresultingfromtheimpactof the international financial crisis, as a contributory factor in the compression of the foreign exchange
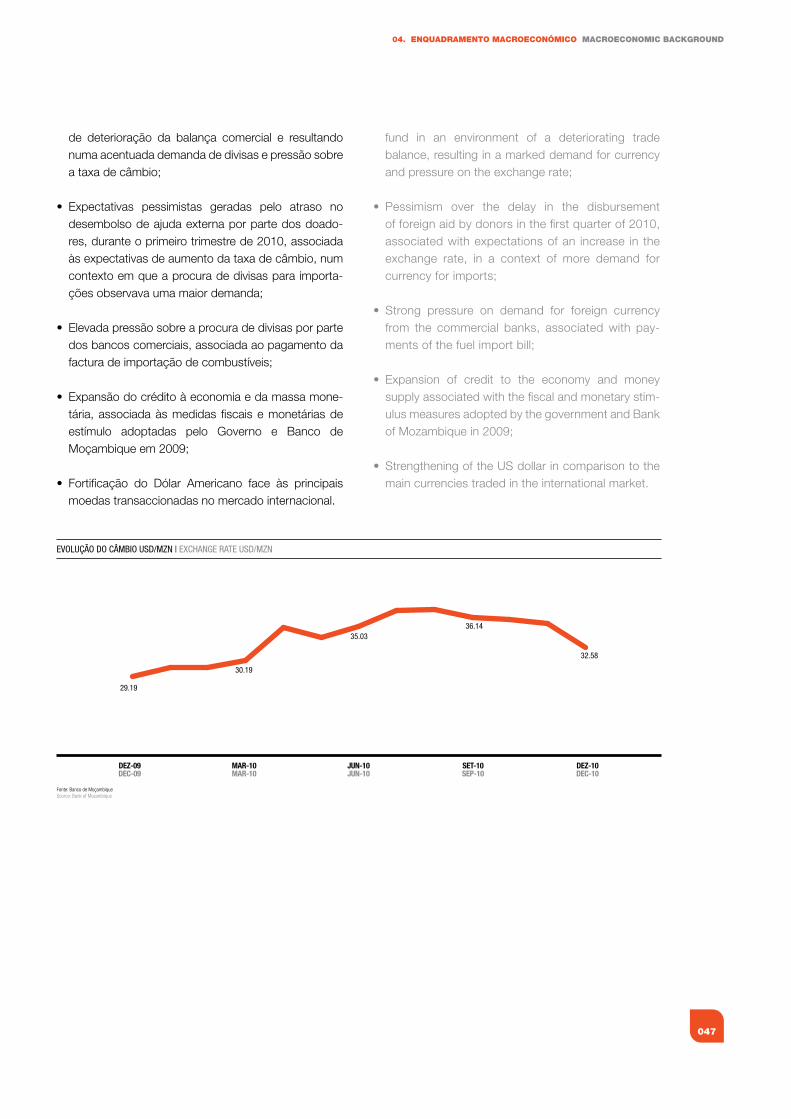
047
04. ENquAdRAMENTO MACROECONÓMICO MACROECONOMIC BACkgROuNd
de deterioração da balança comercial e resultando numa acentuada demanda de divisas e pressão sobre ataxadecâmbio;
• Expectativas pessimistas geradas pelo atraso nodesem bolso de ajuda externa por parte dos doado-res, durante o primeiro trimestre de 2010, associada às expectativas de aumento da taxa de câmbio, num contexto em que a procura de divisas para importa-çõesobservavaumamaiordemanda;
• Elevadapressãosobreaprocuradedivisasporpartedos bancos comerciais, associada ao pagamento da facturadeimportaçãodecombustíveis;
• Expansãodocréditoàeconomiaedamassamone-tária, associada às medidas fiscais e monetárias de estímulo adoptadas pelo Governo e Banco de Moçambiqueem2009;
• Fortificação do Dólar Americano face às principaismoedas transaccionadas no mercado internacional.
EVOLUÇÃO DO CÂMBIO USD/MZN | EXCHANGE RATE USD/MZN
DEZ-10DEC-10
DEZ-09DEC-09
MAR-10MAR-10
JUN-10JUN-10
SET-10SEP-10
Fonte: Banco de MoçambiqueSource: Bank of Mozambique
29.19
30.19
35.0336.14
32.58
fund in an environment of a deteriorating trade balance, resulting in a marked demand for currency andpressureontheexchangerate;
• Pessimism over the delay in the disbursementof foreign aid by donors in the first quarter of 2010, associated with expectations of an increase in the exchange rate, in a context of more demand for currencyforimports;
• Strong pressure on demand for foreign currencyfrom the commercial banks, associated with pay-mentsofthefuelimportbill;
• Expansion of credit to the economy and money supply associated with the fiscal and monetary stim-ulus measures adopted by the government and Bank ofMozambiquein2009;
• StrengtheningoftheUSdollarincomparisontothemain currencies traded in the international market.
BCI | RELATÓRIO E CONTAS 2010 | ANNUAL REPORT 2010
048
Sistema financeiro moçambicano
O sistema financeiro nacional demonstra uma contínua evolução positiva, a qual é assente:1)Nocrescimentodonúmerodebalcões;2)Nadiversificaçãodeprodutosfinanceiros;3) No uso de tecnologias de informação em ordem ao
alargamento dos serviços financeiros, através da adopção de mecanismos alternativos à banca tradi-cional;
4) Na entrada de novos bancos e no aumento da com-petitividadedosoperadoresfinanceiros;
5) Na expansão da rede comercial, principalmente para aszonasrurais;
Dos 471 balcões autorizados até Dezembro de 2010, 416 encontram-se em pleno funcionamento, cobrindo um total de 53 distritos, o que equivale a uma taxa de cobertura territorial de 45,3%. Mais ainda, excluindo as capitais provinciais e considerando os 128 distritos do País, o número de balcões autorizados para operar nos distritos até Dezembro situou-se nos 108, para um total de 58 distritos, sendo que, 88 balcões já se encontram efectivamente operacionais nos 53 distritos já referidos.O Banco de Moçambique continua optimista em relação à criação da Sociedade Interbancária de Serviços. Esta sociedade tem como objectivo a partilha de infra – estru-turas tecnológicas pelos bancos comerciais no país, como forma de reduzir os custos de transacção e pro-movendo a massificação de instrumentos alternativos ao numerário nos pagamentos.
Segundo o banco central, espera-se que em 2011 as ATM’s e os POS’s do sistema financeiro passem a estar conectados à mesma rede.
Até ao II trimestre de 2010, o desempenho do Sistema Financeiro Moçambicano apresentou um crescimento significativo, consubstanciado nos seguintes factores:
• Bomníveldecapitalização,preservandoporissoumbom potencial para a expansão da carteira de crédito. O rácio de solvabilidade situa-se em 14,8%, muito acima do nível mínimo (8%) estabelecido pelas nor-masdoBancodeMoçambique;
• Osresultadosdosistemabancáriotêmregistadoumaumento, reflectindo o ambiente macroeconómico favorável que se verificou no período em análise e a importância que este desempenha para a actividade bancária.
Mozambique’s financial system
The national financial system has evidenced continuous positive evolution based on:1)Growthinthenumberofbranchoffices;2)Diversificationoffinancialproducts;3) Use of information technologies to expand the range
of financial services, through the adoption of alterna-tivetraditionalbankingmechanisms;
4) Entry of new banks and increased competitiveness offinancialoperators;
5) Expansion of the branch office network, mainly in rural zones.
416 of the 471 branches authorised up to December 2010, were fully operational, covering a total number of 53 districts and equivalent to a nationwide cover rate of 45.3%. In addition, excluding the provincial capitals and considering the country’s 128 districts, there was a total number of 108 branch offices authorised to operate in the districts up to December, in 58 dis-tricts with 88 branches already effectively operational in the 53 referred to districts.
The Bank of Mozambique remains optimistic over the creation of the Sociedade Interbancária de Serviços. The objective of this company is the sharing of techno-logical infrastructures by the country’s commercial banks as a form of reducing transaction costs and encouraging the general population’s use of alternative instruments to payments in cash.
According to the central bank, financial system ATMs and items of POS equipment are expected to be con-nected to the same network in 2011.
Up to the second quarter of 2010, there was consider-able growth in the performance of Mozambique’s finan-cial system, comprising the following:
• A high level of capitalisation, therefore continuingto have good potential for the expansion of the credit portfolio. The solvency ratio, at 14.8%, is much higher than the minimum level of 8% established by Bank ofMozambiquestandards;
• Banking system results have been improving asa reflection of the favourable macroeconomic envi-ronment in the period under analysis and its impor-tance in terms of banking activity.
049
04. ENquAdRAMENTO MACROECONÓMICO MACROECONOMIC BACkgROuNd
• A Margem Financeira representa 48% do produtobancário, sendo a principal componente deste indica-dor. Por sua vez, os Resultados em Operações Finan-ceiras mantiveram-se como a segunda componente do produto bancário, com um peso de 38%, superando assim as comissões líquidas.
• OCréditocorrespondea51%do totaldosactivos,representando um incremento de 8pp em relação ao trimestre anterior, seguindo-se os activos financeiros e as aplicações em Instituições de crédito, com peso de 13% e 12% sobre o total dos activos, respectiva-mente.
Segundo o FMI, apesar da tendência de expansão do número e da dimensão das instituições financeiras, o grau de intermediação bancária não é elevado, isto é, o acesso a serviços financeiros pela população permanece redu-zido e fragmentado, destacando-se os seguintes factos: • Grande parcela das Pequenas e Médias Empresas
e dos Particulares não têm acesso a crédito, dado o elevado grau de informalidade da economia moçam-bicana;eaporçãodeempresasqueutilizalinhasdecréditoébaixa;
• Menosde6%dapopulaçãoadultatemcréditonumainstituição financeira registada e pouco mais de 10% temcontadepoupança;
• Apopulação rural continua compouco acesso aosserviços financeiros.
Preocupados com a solidez do sistema financeiro, o governo e o Banco de Moçambique têm estado a dar célere seguimento às recomendações da actualização do Programa de Avaliação do Sector Financeiro (FSAP) de 2009:
• Criaçãodemedidastendentesaampliaroacessoaofinanciamento e a promover o desenvolvimento dos mercados financeiros, a reforçar o cumprimento dos Princípios Básicos de Supervisão Bancária de Basileia pelo quadro de supervisão e a concluir a moderniza-ção do sistema de pagamentos.
• Melhoraragestãoderiscos:emissãoderegulamen-tação (Aviso) sobre gestão de riscos e seguro de depósitos.
• Aprimorarasupervisãodosistemabancário.Depoisdo rápido crescimento do crédito nos últimos dois anos, o BM supervisionará de perto as actividades no sistema bancário. Será dada especial atenção à ava-liação das condições de liquidez e à qualidade das carteiras de crédito.
• Netinterestincomerepresents48%ofnetoperatingincome and is its main component part. In turn, income from financial operations continued to be the second largest component of net operating income accounting for a proportion of 38% and outperform-ing net commissions.
• Credit,up8ppovertheprecedingquarter,comprises51% of total assets, followed by financial assets and investments in credit institutions, accounting for 13% and 12% of total assets, respectively.
According to the IMF, notwithstanding the expansion-ary trend in terms of the number and dimension of financial institutions, the level of banking intermedia-tion is not high. i.e. the population’s access to financial services remains reduced and fragmented. Reference should be made to the following facts: • A large proportion of small and medium sized
companies and individual customers do not have access to credit, given the highly “informal” level of Mozambique’s economy with a low proportion ofcompaniesusinglinesofcredit;
• Lessthan6%oftheadultpopulationhasaloanwitha registered financial institution with just over 10% havingasavingsaccount;
• Theruralpopulationcontinuestohavelimitedaccessto financial services.
In its concern over the stability of the financial system, the government and the Bank of Mozambique have been promptly following up the recommendations of the updating of the Financial Sector Assessment Programme (FSAP) of 2009:
• Creation ofmeasures leading to greater access tofinancing and promoting the development of financial markets, to reinforce compliance with the basic Basel banking supervision principles by the supervi-sory authorities and completion of the payments modernisation system.
• To improve risk management: issue of regulations(official notices) on risk management and deposit insurance.
• To perfect the supervision of the banking system.Following the rapid growth of credit over the last few years, the Bank of Mozambique will be closely monitoring banking sector activities. Special care will be taken to assess liquidity conditions and credit portfolio quality.
BCI | RELATÓRIO E CONTAS 2010 | ANNUAL REPORT 2010
050
Crédito e depósitos
O saldo do endividamento do sector privado junto do sistema bancário nacional reduziu em Dezembro em 1,911.9 milhões de MT (-2.1%) comparativamente ao mês anterior, tendo fixando-se no final de Dezembro em 91,067 milhões de MT, montante correspondente a um incremento anual de 19,627.1 milhões de MT (+27.5%), variação que representa uma desaceleração face à expansão de 39.0% e 58.6% verificada até Novembro e em Dezembro de 2009, respectivamente.
A redução deste agregado resultou da queda do Crédito em ME em 1,449 milhões de MT (-5.1%) e da compo-nente em MN numa menor proporção, em 462.9 milhões de MT (-0.7%). Retirando o impacto da aprecia-ção do Metical no mês sobre o crédito concedido em ME, o crédito à economia expande em 0.5%, enquanto em termos anuais a variação reduz para 23.5%, devido a depreciação anual de cerca de 19%.
Com relação aos depósitos, dados provisórios das con-tas monetárias reportadas ao mês de Dezembro de 2010, indicam um saldo 131,465 milhões de MT, valor que representa um acréscimo mensal e acumulado de 2,636 milhões de MT (2.0%) e 24,392 milhões de MT (22.8%), respectivamente, equivalentes a uma desace-leração quando comparadas com 2009, onde as varia-ções mensal e acumulada foram de 6.3% e 26.0%, res-pectivamente.
No que respeita a decomposição dos Depósitos por moedas, e em termos acumulados, constata-se que tanto os depósitos denominados em MN como em ME registaram um acréscimo, de 8,397 milhões de MT (14.1%) e 11,651 milhões de MT (33.7%), respectiva-mente, sendo que, em relação à parte em ME, 4,806 milhões de MT, reflecte o impacto da depreciação anual do Metical em relação ao USD.
Credit and deposits
There was a 2.1% reduction of MT 1,911.9 million in private sector debt to the national banking system in comparison to the preceding month to MT 91,067 at the end of December, which change comprises a 27.5% annual increase of MT 19,627.1 million, which, in turn, comprises a deceleration in comparison to the expansion of 39.0% and 58.6% verified up to November and December 2009, respectively.
The reduction of this aggregate derived from the 5.1% drop of MT 1,449 million in foreign currency credit and the domestic currency component to a lesser extent (by MT 462.9 million, down 0.7%). Eliminating the impact of the metical’s appreciation during the month on loans made in foreign currency, general lending was up 0.5%, although, in annual terms the change was down 23.5%, owing to the annual depreciation of around 19%.
Provisional data supplied by the monetary accounts for December 2010, indicate a deposits balance of MT 131.465 million comprising a monthly, accumulated amount of MT 2.636 million (up 2.0%) and MT 24.392 million (up 22.8%), respectively, equivalent to a decel-eration in comparison to 2009, in which the monthly and accumulated changes were 6.3% and 26.0%, respectively.
As regards the breakdown of deposits by currency and in accumulated terms, both foreign and domestic currency loans were up MT 8.397 million (14.1%) and MT 11.651 million (33.7%), respectively, with MT 4.806 million of the foreign currency component reflecting the impact of the metical’s annual depreciation against the USD.
051
05. Estratégia e Negócio Strategy and Business
visão Estratégica 2008-2012
Em conformidade com o verificado nos exercícios ante-riores, a actividade do BCI em 2010 teve como principal elemento orientador a Visão Estratégica definida pelo Conselho de Administração e aprovada pelos Accio-nistas, para o quinquénio 2008-2012.
De acordo com essa Visão, o BCI deve procurar conso-lidar-se como um Banco estruturante do sistema finan-ceiro moçambicano.
Na continuidade da implementação do Plano Estra té-gico, durante o ano de 2010, foram realizadas um con-junto de acções, com particular destaque para:• A reengenharia de alguns dos principais processoscríticosdonegócio;
• ContinuidadedaimplementaçãodosProtocoloscele-brados em 2009, e extensão desta política a outras instituições públicas e privadas não abrangidas nos acordoscelebradosem2009;
• Adefiniçãodemodelosdeatençãodiferenciadosdeatendimento para os Clientes da Rede e do Corporate;
• Continuidadedapolíticade forte expansãoda redeComercial, com a abertura de novas Agências e Centros Corporateeexpansãogeográficadamesma;
• Oredesenhodaofertadeprodutoseserviços;• Amelhoriadaeficiênciaecustosatravésdarevisãoe
renegociação dos contratos de fornecimento de bens e serviços, da definição de políticas e da introdução demedidasepráticasparaareduçãodecustos;e
• Olevantamentoderequisitoseoiníciododesenvolvi-mentodeumSistemadeInformaçãodeGestão;
Strategic vision 2008-2012
In conformity with past years the principal framework governing BCI’s activity in 2010 was its strategic vision as defined by its board of directors and approved by shareholders for the five year period 2008-2012.
In accordance with the said vision, BCI will consolidate its activities as a structuring bank for Mozambique’s financial system.
A series of actions were taken to continue the imple-mentation of the strategic plan, in 2010, particularly:• Thereengineeringofseveralofthemaincriticalbusi-nessprocesses;
• Continuedimplementationofprotocolsenteredintoin 2009 and extension of this policy to other public and private institutions not covered by the agreements enteredintoin2009;
• Thedefinitionofdifferentiatedservicemodelsforbranchnetworkandcorporatecustomers;
• Continuation of the policy of major branch office network expansion, with the opening of new branches and corporate centres and their geographical expan-sion;
• Redesignedoffersofproductsandservices;• Improved efficiency and lower costs through the
revision and renegotiation of goods and services contracts, definition of policies and introduction ofcostreductionmeasuresandpractices;and
• Asurveyofrequirementsandstart-upofthedevel-opment of a management information system.
BCI | RELATÓRIO E CONTAS 2010 | ANNUAL REPORT 2010
052
Comunicação
Comunicação Institucional
Em 2010 o BCI reforçou o seu posicionamento como um Banco universal, orientado para a satisfação das necessidades dos seus clientes. Este posicionamento foi concretizado através de campanhas institucionais e pela presença de elementos unificadores em todas as campanhas de comunicação, que permitiram o seu ali-nhamento com o conceito “O meu banco é daqui”.
Seguindo uma estratégia iniciada no ano anterior, para além dos suportes convencionais as campanhas do BCI, em 2010, foram veiculadas através de canais de comunicação alternativos, tais como a personalização de autocarros dos Transportes Públicos de Maputo (TPM) com a imagem do Banco, ecrãs de ATM’s e painéis electrónicos (LED).
Das acções de comunicação institucional realizadas em 2010, destacam-se as seguintes:
• Campanha “O meu Banco é daqui”, lançada emMarço, que marcou o início da estratégia de reforço do posicionamento do BCI como um Banco nacional, em que foram evidenciados os valores culturais que identificam o BCI como uma marca moçambicana. Esta campanha recebeu o Grande Prémio dos Utili za-dores Sapo Moçambique, resultante da votação dos internautas que visitaram este portal na Internet em 2010.
• DivulgaçãodalinhainformativaBCIDirecto,cominíciono mês de Junho, através da criação de uma logo-marca própria e a sua colocação em todos os novos folhetos de produtos e serviços do Banco, nos meios de pagamento electrónico e outros suportes.
• Campanha alusiva à recepção em Setembro dasinsígnias Made in Mozambique pelo BCI, tornando-se a primeira das grandes marcas bancárias a receber esta distinção, destinada às empresas de direito moçam-bicano que cumprem os requisitos de elegibilidade definidos pelo Ministério da Indústria e Comércio.
A comunicação institucional do BCI foi também vei cu-lada através dos diversos apoios institucionais e patro-cínios concedidos pelo Banco, que asseguraram a pre-sença da marca BCI em vários eventos sociais, espectáculos de música e teatro, edições culturais e desportivas, entre outros, de onde se destacam os seguintes:
Communication
Institutional communication
BCI reinforced its status as a universal bank, in 2010, geared towards meeting its customers’ needs. Its position was achieved on the basis of institutional campaigns and the presence of unifying elements in all communication campaigns, in line with the O meu banco é daqui concept.
Continuing to employ a strategy first implemented in the preceding year, in addition to conventional adver-tising media, BCI’s campaigns, in 2010, made use of alternative communication channels such as deco-rating buses on Maputo’s public transport network with the bank’s image, ATM displays and LED panels.
Special reference should be made to the following insti-tutional communication actions in 2010:
• TheO meu Banco é daqui, campaign which was launched in March. This signalled the implementation of a strategy designed to reinforce BCI’s status as a national bank, displaying the cultural values identi-fying BCI as a Mozambican brand. This campaign won the Grande Prémio dos Utilizadores Sapo Moçambique prize, based on votes cast by visitors to this internet portal in 2010.
053
05. ESTRATÉgIA E NEgÓCIO STRATEgY ANd BuSINESS
• PatrocínioàSelecçãoNacionaldeFutebol,osMambas;• FestivalinternacionaldemúsicaorganizadopelaAsso-ciaçãoKulungwana;
• EdiçãodoLivro“Moçambique:Identidades,Colonia-lismoeLibertação”deJoséLuisCabaço;
• Parceria comaAssociação dos EscritoresMoçam-bicanos (AEMO) na criação do Prémio anual BCI de Literatura.
Comunicação Comercial
No ano 2010 o BCI realizou várias campanhas de comu-nicação orientadas para a divulgação dos seus produ-tos e serviços, nomeadamente produtos de poupança, crédito, meios de pagamento e canais de acesso ao Banco. Estas campanhas estiveram sempre alinhadas com o posicionamento do BCI como um Banco univer-sal que procura as melhores soluções para os seus Clientes. Destacam-se:
• AcampanhadepromoçãodosPOSdoBCIalusivaao Mundial FIFA 2010, com o objectivo de incentivar a utilização dos POS do Banco no pagamento de compras. Esta campanha incluía um concurso em que foram sorteados ingressos e viagens para assistir aosjogosdoMundialdefutebolnaÁfricadoSul;
• IníciodadinamizaçãodoCartãoBCIUniversitário,umcartão de débito destinado exclusivamente aos estu-dantes das instituições de ensino superior, que, para além da vertente bancária, serve também como cartão de identificação do estudante. A divulgação deste produto teve lugar nos campus das universi-dades aderentes.
• EmparceriacomaFundaçãoUniversitáriadaUniver-sidade Eduardo Mondlane e outras três empresas moçambicanas, foi lançada em Março a Cam panha e-Moçambique, uma iniciativa inovadora que colocou no mercado um novo crédito pessoal destinado essencialmente aos estudantes universitários, para o financiamento de computadores portáteis com liga-ção à Internet 3G.
• LançamentodoCartãoBCINegócios,umcartãodecrédito destinado exclusivamente aos Empresários em Nome Individual (ENI) e às Pequenas e Médias Empresas, com o objectivo de responder às suas neces sidades de tesouraria de curto prazo.
• Comvistaaestimularedesenvolverohábitodepou-par junto da camada jovem e da população em geral, teve lugar, em Julho, o lançamento da Conta Futuro BCI, uma conta de poupança destinada aos menores de idade. A campanha publicitária Conta Futuro BCI, esteve presente nos principais meios de comuni cação, incluindo a Internet e ecrãs de ATM, promovendo os
• PublicisingoftheBCI Directo hotline, starting June, through the creation of a customised logobrand and its display in all of the bank’s new products and serv-ices leaflets, electronic means of payment and other support media.
• Campaign referring to theSeptemberawardof theMade in Mozambique by BCI, insignias in which BCI was the first major banking brand to receive this dis-tinction. The award recognises Mozambican compa-nies which comply with the eligibility criteria defined by the Ministry of Industry and Commerce.
BCI’s institutional communication was also promoted in the form of various institutional support media and sponsorships by the bank, comprising the presence of the BCI brand at several social events, including, inter alia, music and theatre festivals and cultural and sporting publications of which special reference should be made to: • Sponsorshipofthenationalfootballteam–Mambas;• InternationalmusicfestivalorganisedbytheKulungwanaassociation;
• PublicationofbookMoçambique: Identidades, Colo-nia lismo e LibertaçãobyJoséLuisCabaço;
• Partnership with the Association of MozambicanAuthors (AEMO) for the creation of BCI’s annual literature prize.
Commercial communication
BCI organised various communication campaigns to provide information on its products and services, in 2010, notably savings products, loans, means of payment and bank access channels. These campaigns were always aligned with BCI’s status as a universal bank and its endeavours to find the best solutions for its customers. Reference should be made to:
• BCI’sFIFAWorldCup2010POSpromotion, incen-tivising the use of the bank’s POS system for pur-chases. The campaign included a competition and drawforticketstotheworldcupinSouthAfrica;
• StartofspecialBCIuniversitystudentscardpromo-tion. This is a debit card for the exclusive use of stu-dents in higher education, which, in addition to bank-ing aspects can also be used as a student ID card. This card was promoted on the campuses of sub-scribing universities.
• The e-Moçambique campaign, in partnership with the Eduardo Mondlane University Foundation and three other Mozambican companies, was launched
BCI | RELATÓRIO E CONTAS 2010 | ANNUAL REPORT 2010
054
benefícios da poupança para a educação dos menores através da mensagem “Uma solução daqui, para o futuro dos seus filhos”, reforçada com a oferta de um mealheiro aos Clientes no acto de adesão ao produto.
• No âmbito de uma parceria com o InternationalFinance Corporation (IFC), um membro do Grupo Banco Mundial, que visa criar facilidades de acesso da Mulher Empreendedora aos serviços do BCI, foi lançada, no mês de Julho, uma campanha de divul-gação das soluções disponíveis no BCI para este segmento do mercado. O lançamento da Campanha BCI Negócios Mulher Empreendedora, que incluía a divulgação do Cartão de Crédito BCI Negócios Mulher Empreendedora, teve lugar num evento público, na cidade de Maputo, que contou com a presença de empresárias nacionais e representantes das associa-ções de empresárias. A Campanha teve uma forte presença nos meios de comunicação, Internet e ecrãs de ATM e incluiu a distribuição de brindes alusivos à logomarca BCI Negócios Mulher Empreendedora.
• EmparceriacomasLinhasAéreasdeMoçambique(LAM), foi lançado, em Agosto, o Cartão Crediviagem LAM, um cartão de Crédito Private Label destinado à compra de viagens e outros serviços oferecidos pela LAM e seus parceiros. A Campanha Crediviagem LAM, com a mensagem “Viage agora e pague depois” esteve presente nos principais meios de comunica-ção, Internet, ecrãs de ATM’s e nos pontos de venda do BCI e da LAM.
Comunicação de segmentos
Em alinhamento com os modelos de atenção definidos para os diferentes segmentos de Clientes do BCI, foram realizadas diversas iniciativas de dinamização e reforço do relacionamento comercial com os Clientes do Banco, das quais se destacam as seguintes:
• Comunicação e dinamização comercial das ofertasde produtos e serviços por segmento, nomeadamen-te as Soluções BCI Negócios, Soluções BCI Negócios Mulher Empreendedora, Soluções BCI Exclusivo, Soluções Private e oferta BCI para menores de idade.
• Dinamização dos Protocolos comerciais assinadoscom diversas instituições públicas e privadas, cujo objectivo é a oferta de condições preferenciais de acesso aos serviços bancários aos colaboradores destas instituições.
in March. This is an innovative initiative marketing a new personal credit card, essentially for university students, to finance the purchase of portable, inter-net 3G enabled computers.
• LaunchofBCI Negócios card. This is a credit card for the exclusive use of self-employed businesspeo-ple and small and medium sized enterprises with the aim of meeting their short term cash needs.
• BCI’sConta Futuro was launched in July as a young people’s savings solution to encourage and develop the savings habits of young people and the general population. BCI’s Conta Futuro advertising campaign was present in the main communication media, including the internet and ATM displays, to promote the benefits of saving for young people’s education through the message Today’s solution for your chil-dren’s future, reinforced with the offer of a piggy bank to customers subscribing for the product.
• UnderthetermsofapartnershipwiththeInternationalFinance Corporation (IFC), a member of the World Bank Group designed to create women entrepreneurs’ access to BCI’s services, an informational campaign on BCI’s solutions for this market segment was launched in July. The launch of BCI’s Entrepreneurial Woman’s campaign which included the promotion of BCI’s Entrepreneurial Businesswoman’s credit card took place at a public event in Maputo, attend-ed by national businesswomen and representatives from business associations. Information on the cam-paign was broadly publicised in the media, internet and ATM displays and included the distribution of gifts with the BCI Entrepreneurial Woman logobrand.
• TheCrediviagem LAM card was launched in August, in partnership with Linhas Aéreas de Moçambique (LAM). This is a private label credit card for the purchase of journeys and other service provided by LAM and its partners. The “Travel now, pay later” Crediviagem LAM campaign was present in the main media outlets, internet, ATM displays and BCI and LAM sales outlets.
Segment communication
In alignment with the service models defined for BCI’s different customer segments, various initiatives designed to promote and reinforce the commercial relationship with the bank’s customers were realised and particularly included:
055
05. ESTRATÉgIA E NEgÓCIO STRATEgY ANd BuSINESS
• Celebraçãoedinamizaçãodeparceriascomdiversosfornecedores de produtos e de serviços, que ofere-cem vantagens e benefícios aos titulares dos cartões de crédito e de débito do BCI no pagamento das suas compras.
• Dinamizaçãodassoluçõesdefinanciamentoparaosempreendimentos “Xiluva” e “Casa Jovem” na Cidade de Maputo.
• Celebração de um acordo de parceria com aUniversidade Eduardo Mondlane, tendo em vista apoiar o desenvolvimento de um portal na Internet destinado a Pequenas e Médias Empresas nacionais, o SMEToolkit Moçambique.
Tecnologia
No seguimento do plano estratégico de sistemas de informação definido em 2009, foi lançada em 2010 a primeira versão do novo Front-End aplicacional do BCI para as agências. Esta nova plataforma operacional, desenvolvida internamente, visa reforçar o alinhamento entre os sistemas de informação e as necessidades do negócio evitando a alteração das plataformas centrais, criando capacidade de sistematizar processos de negó-cio (workflow), introduzindo conceitos de gestão docu-mental (papel electrónico) e alargando o espectro e a qualidade de informação disponível aos operadores no momento da realização das operações.
Este novo conceito operacional foi desenhado de forma a permitir replicar as suas vantagens para os canais não presenciais (banca telefónica e internet), criando desta forma uma uniformização de canais, o que permite reduzir significativamente o esforço interno de imple-mentação de novos produtos e serviços.
Do ponto de vista das infra-estruturas tecnológicas, o foco foi dirigido para o redesenho da arquitectura de comunicações nacionais, criando novos mecanismos de redundância quer para os circuitos locais quer para as ligações interurbanas, concentração das comunica-ções e criação de pólos regionais de tecnologia. Este projecto, iniciado em 2010, terá a sua conclusão em 2011.
• Communicationandcommercialpromotionofprod-ucts and services by segment notably: BCI Negócios, Soluções BCI Negócios Mulher Empreendedora, Soluções BCI Exclusivo, Soluções Private and BCI solutions for minors.
• Promotion of commercial protocols entered intowith various public and private institutions aimed at providing preferred access terms to banking services for the said institutions’ employees.
• Entering into and promotion of partnerships withvarious suppliers of products and services, to pro-vide advantages and benefits to holders of BCI cred-it and debit cards when paying for their purchases.
• Promotion of financing solutions for theXiluva and Casa Jovem projects in Maputo.
• Partnershipagreementwith theEduardoMondlaneUniversity, in support of the development of an inter-net portal for small and medium sized national enter-prises, in the form of the SMEToolkit Moçambique.
Technology
The first release of BCI’s new front end application for branch offices was launched in 2010, following the strategic information systems plan defined in 2009. This new, internally developed operating platform has been designed to reinforce the alignment between information systems and business needs, avoiding changes to central platforms, creating the capacity to systemise workflows through the introduction of paperless offices and broadening the spectrum and the quality of information available to operators performing the operations.
This new operating concept was designed to make it possible to replicate advantages on distance chan-nels (telephone and internet), harmonising channels and enabling significant reductions to be made to inter-nal endeavours to implement new products and serv-ices.
In terms of technological infrastructures the focus was geared to redesigning the national communications architecture, creating new redundancy mechanisms on both local and interurban circuits, communications concentration and the establishing of regional techno-logical hubs. This project, first implemented in 2010, is scheduled for completion in 2011.
056
BCI | RELATÓRIO E CONTAS 2010 | ANNUAL REPORT 2010BCI
06. Canais Electrónicos e Meios de Pagamento Electronic Channels and Means of Payment
Introdução
Em consonância com o objectivo de estreitar o relacio-namento com todos os moçambicanos, estando ao dis-por dos seus clientes todos os dias e a qualquer hora, em 2010 manteve-se a estratégia de crescimento e ino-vação na área dos canais não presenciais.
Os clientes do BCI, que já dispunham de um leque diversificado de canais de acesso a serviços financeiros, como os ATMs, POS, Internet banking, e SMS, passa-ram a ter acesso a um novo canal para poderem intera-gir, via telefone, de forma segura e profissional, com o seu banco: o Contact Center.
Estes canais foram responsáveis por mais de 12 milhões de operações correspondendo a um aumento de 70% face ao ano de 2009, representando um claro voto de confiança dos clientes no leque de canais do BCI, fazen-do uso dos mesmos de forma diversificada, em função da necessidade específica, localização e momento.
Canais Eletrónicos
ATM
O canal ATM continua a ser uma aposta do BCI, quer no que se refere ao crescimento da rede de máquinas, quer na incorporação de novas funcionalidades, de forma a não só estar mais próximo do cliente, mas também ofe-recer mais e melhor serviço ao cliente. O crescimento do parque de ATMs em 2010 alicerçou-se em dois vectores: 1) acompanhamento da expansão da rede de agências doBanco; 2) alargamento da rede deATMs em locais não servidos por agências (ATMs Remotas).
Introduction
BCI maintained its growth and innovation strategy in the distance channels area, in 2010, in accordance with the objective of improving relationships with all Mozambicans, making itself available to customers any day, any time.
BCI customers who already enjoyed a diversified range of access channels to financial services such as ATMs, POS equipment, internet banking and SMS, now have access to a new channel enabling them to interact with their bank by telephone in a safe and professional man-ner via its contact centre.
These channels were responsible for more than 12 mil-lion operations comprising an increase of 70% over 2009, representing our customers’ unmistakable vote of confidence in BCI’s range of channels, in their diver-sified use thereof based on specific needs, location and opportunity.
Electronic channels
ATMs
BCI remains committed to its ATM network both in terms of the growth of its branch office network as in the incorporation of new functionalities in order not only to enjoy closer relationships with customers but also to provide them with more and better services. The growth in the total number of ATM installations, in 2010, was based on a twofold approach: 1) accom-panying the expansion of the bank’s branch office network; 2) expanding the ATM network in locationsnot served by branches (remote ATMs). The overall
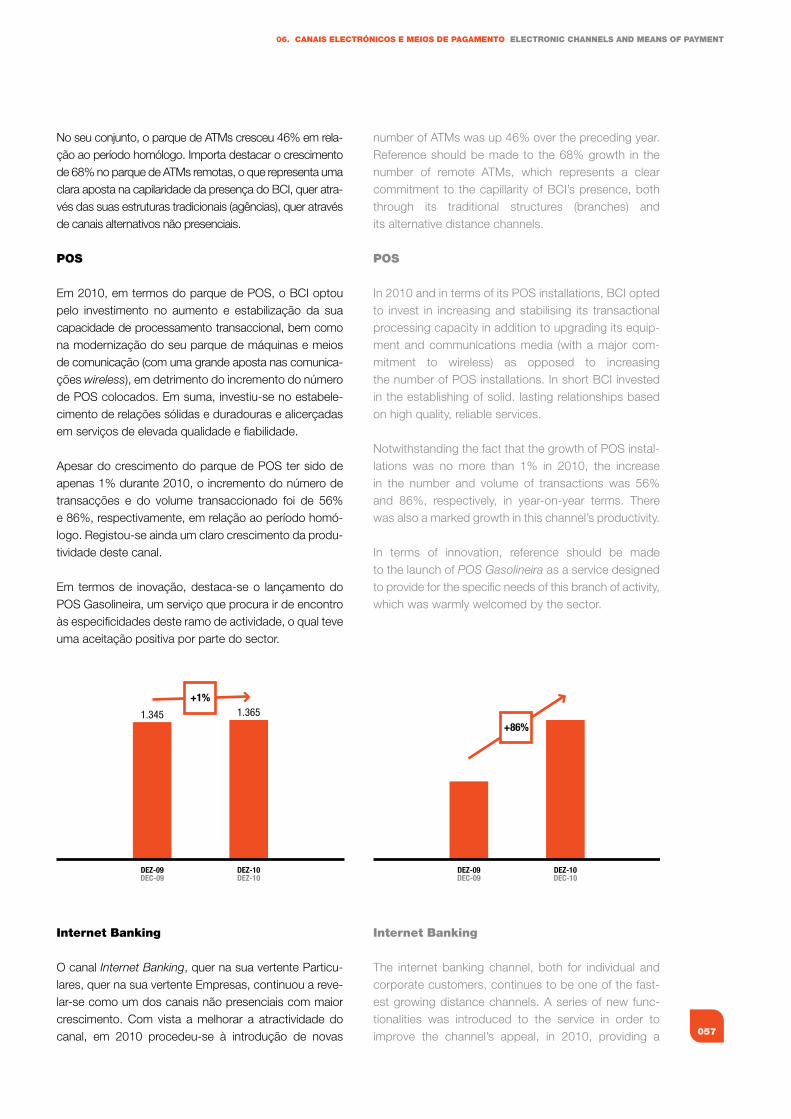
057
06. CANAIS ELECTRÓNICOS E MEIOS dE PAgAMENTO ELECTRONIC ChANNELS ANd MEANS Of PAYMENT
No seu conjunto, o parque de ATMs cresceu 46% em rela-ção ao período homólogo. Importa destacar o crescimento de 68% no parque de ATMs remotas, o que representa uma clara aposta na capilaridade da presença do BCI, quer atra-vés das suas estruturas tradicionais (agências), quer através de canais alternativos não presenciais.
POS
Em 2010, em termos do parque de POS, o BCI optou pelo investimento no aumento e estabilização da sua capacidade de processamento transaccional, bem como na modernização do seu parque de máquinas e meios de comunicação (com uma grande aposta nas comunica-ções wireless), em detrimento do incremento do número de POS colocados. Em suma, investiu-se no estabele-cimento de relações sólidas e duradouras e alicerçadas em serviços de elevada qualidade e fiabilidade.
Apesar do crescimento do parque de POS ter sido de apenas 1% durante 2010, o incremento do número de transacções e do volume transaccionado foi de 56% e 86%, respectivamente, em relação ao período homó-logo. Registou-se ainda um claro crescimento da produ-tividade deste canal.
Em termos de inovação, destaca-se o lançamento do POS Gasolineira, um serviço que procura ir de encontro às especificidades deste ramo de actividade, o qual teve uma aceitação positiva por parte do sector.
Internet Banking
O canal Internet Banking, quer na sua vertente Parti cu-lares, quer na sua vertente Empresas, continuou a reve-lar -se como um dos canais não presenciais com maior crescimento. Com vista a melhorar a atractividade do canal, em 2010 procedeu-se à introdução de novas
1.345 1.365
DEZ-09DEC-09
DEZ-10DEZ-10
+1%
DEZ-09DEC-09
DEZ-10DEC-10
+86%
number of ATMs was up 46% over the preceding year. Reference should be made to the 68% growth in the number of remote ATMs, which represents a clear commitment to the capillarity of BCI’s presence, both through its traditional structures (branches) and its alternative distance channels.
POS
In 2010 and in terms of its POS installations, BCI opted to invest in increasing and stabilising its transactional processing capacity in addition to upgrading its equip-ment and communications media (with a major com-mitment to wireless) as opposed to increasing the number of POS installations. In short BCI invested in the establishing of solid. lasting relationships based on high quality, reliable services.
Notwithstanding the fact that the growth of POS instal-lations was no more than 1% in 2010, the increase in the number and volume of transactions was 56% and 86%, respectively, in year-on-year terms. There was also a marked growth in this channel’s productivity.
In terms of innovation, reference should be made to the launch of POS Gasolineira as a service designed to provide for the specific needs of this branch of activity, which was warmly welcomed by the sector.
Internet Banking
The internet banking channel, both for individual and corporate customers, continues to be one of the fast-est growing distance channels. A series of new func-tionalities was introduced to the service in order to improve the channel’s appeal, in 2010, providing a
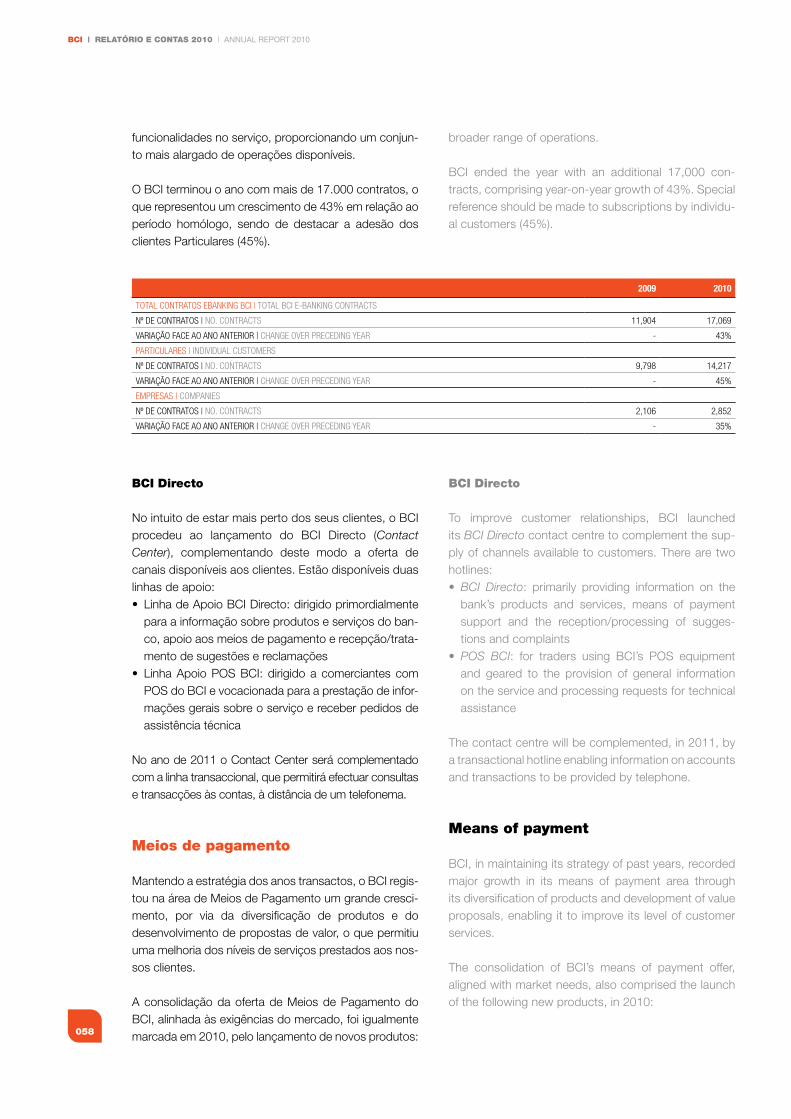
BCI | RELATÓRIO E CONTAS 2010 | ANNUAL REPORT 2010
058
funcionalidades no serviço, proporcionando um conjun-to mais alargado de operações disponíveis.
O BCI terminou o ano com mais de 17.000 contratos, o que representou um crescimento de 43% em relação ao período homólogo, sendo de destacar a adesão dos clientes Particulares (45%).
BCI directo
No intuito de estar mais perto dos seus clientes, o BCI pro cedeu ao lançamento do BCI Directo (Contact Center), complementando deste modo a oferta de canais dis poníveis aos clientes. Estão disponíveis duas linhas de apoio:• LinhadeApoioBCIDirecto:dirigidoprimordialmente
para a informação sobre produtos e serviços do ban-co, apoio aos meios de pagamento e recepção/trata-mento de sugestões e reclamações
• LinhaApoioPOSBCI: dirigido a comerciantes comPOS do BCI e vocacionada para a prestação de infor-mações gerais sobre o serviço e receber pedidos de assistência técnica
No ano de 2011 o Contact Center será complementado com a linha transaccional, que permitirá efectuar consultas e transacções às contas, à distância de um telefonema.
Meios de pagamento
Mantendo a estratégia dos anos transactos, o BCI regis-tou na área de Meios de Pagamento um grande cresci-mento, por via da diversificação de produtos e do desenvolvimento de propostas de valor, o que permitiu uma melhoria dos níveis de serviços prestados aos nos-sos clientes.
A consolidação da oferta de Meios de Pagamento do BCI, alinhada às exigências do mercado, foi igualmente marcada em 2010, pelo lançamento de novos produtos:
2009 2010
TOTAL COnTRATOs eBAnkIng BCI | TOTAL BCI e-BAnkIng COnTRACTs
nº De COnTRATOs | nO. COnTRACTs 11,904 17,069
VARIAÇÃO fACe AO AnO AnTeRIOR | ChAnge OVeR PReCeDIng yeAR - 43%
PARTICULARes | InDIVIDUAL CUsTOMeRs
nº De COnTRATOs | nO. COnTRACTs 9,798 14,217
VARIAÇÃO fACe AO AnO AnTeRIOR | ChAnge OVeR PReCeDIng yeAR - 45%
eMPResAs | COMPAnIes
nº De COnTRATOs | nO. COnTRACTs 2,106 2,852
VARIAÇÃO fACe AO AnO AnTeRIOR | ChAnge OVeR PReCeDIng yeAR - 35%
broader range of operations.
BCI ended the year with an additional 17,000 con-tracts, comprising year-on-year growth of 43%. Special reference should be made to subscriptions by individu-al customers (45%).
BCI directo
To improve customer relationships, BCI launched its BCI Directo contact centre to complement the sup-ply of channels available to customers. There are two hotlines:• BCI Directo: primarily providing information on the
bank’s products and services, means of payment support and the reception/processing of sugges-tions and complaints
• POS BCI: for traders using BCI’s POS equipment and geared to the provision of general information on the service and processing requests for technical assistance
The contact centre will be complemented, in 2011, by a transactional hotline enabling information on accounts and transactions to be provided by telephone.
Means of payment
BCI, in maintaining its strategy of past years, recorded major growth in its means of payment area through its diversification of products and development of value proposals, enabling it to improve its level of customer services.
The consolidation of BCI’s means of payment offer, aligned with market needs, also comprised the launch of the following new products, in 2010:
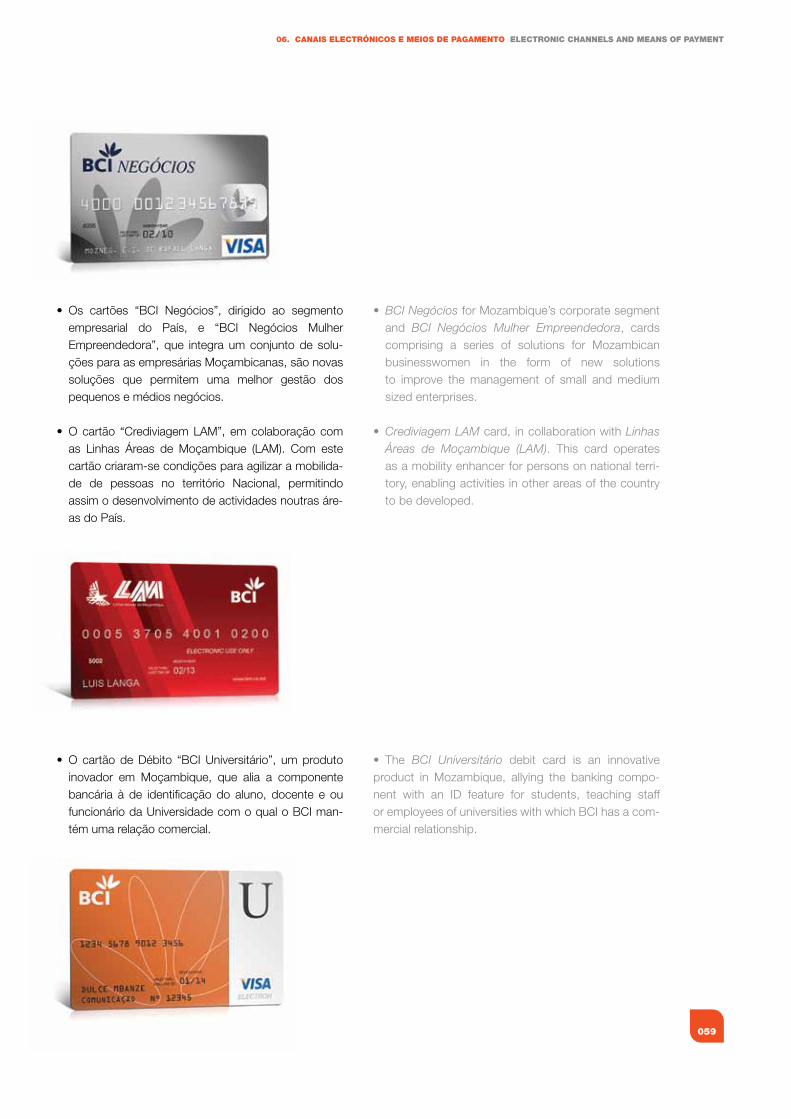
059
06. CANAIS ELECTRÓNICOS E MEIOS dE PAgAMENTO ELECTRONIC ChANNELS ANd MEANS Of PAYMENT
• Os cartões “BCI Negócios”, dirigido ao segmentoempresarial do País, e “BCI Negócios Mulher Empreendedora”, que integra um conjunto de solu-ções para as empresárias Moçambicanas, são novas soluções que permitem uma melhor gestão dos pequenos e médios negócios.
• O cartão “CrediviagemLAM”, emcolaboração comas Linhas Áreas de Moçambique (LAM). Com este cartão criaram-se condições para agilizar a mobilida-de de pessoas no território Nacional, permitindo assim o desenvolvimento de actividades noutras áre-as do País.
• O cartãodeDébito “BCIUniversitário”, umprodutoinovador em Moçambique, que alia a componente bancária à de identificação do aluno, docente e ou funcionário da Universidade com o qual o BCI man-tém uma relação comercial.
• BCI Negócios for Mozambique’s corporate segment and BCI Negócios Mulher Empreendedora, cards comprising a series of solutions for Mozambican businesswomen in the form of new solutions to improve the management of small and medium sized enterprises.
• Crediviagem LAM card, in collaboration with Linhas Áreas de Moçambique (LAM). This card operates as a mobility enhancer for persons on national terri-tory, enabling activities in other areas of the country to be developed.
• The BCI Universitário debit card is an innovative product in Mozambique, allying the banking compo-nent with an ID feature for students, teaching staff or employees of universities with which BCI has a com-mercial relationship.
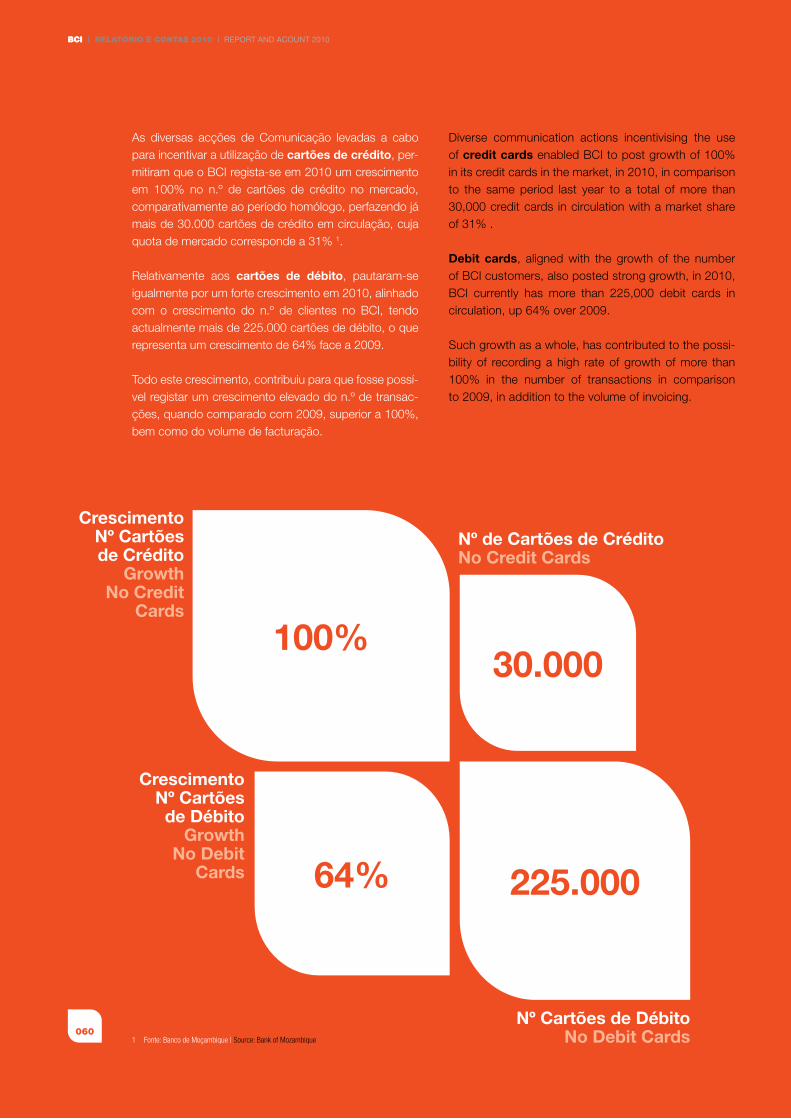
100%30.000
225.00064%
Nº de Cartões de CréditoNo Credit Cards
Crescimento Nº Cartõesde Crédito
Growth No Credit
Cards
Crescimento Nº Cartõesde Débito
Growth No Debit
Cards
Nº Cartões de DébitoNo Debit Cards
As diversas acções de Comunicação levadas a cabo para incentivar a utilização de cartões de crédito, per-mitiram que o BCI regista-se em 2010 um crescimento em 100% no n.º de cartões de crédito no mercado, comparativamente ao período homólogo, perfazendo já mais de 30.000 cartões de crédito em circulação, cuja quota de mercado corresponde a 31% 1.
Relativamente aos cartões de débito, pautaram-se igualmente por um forte crescimento em 2010, alinhado com o crescimento do n.º de clientes no BCI, tendo actualmente mais de 225.000 cartões de débito, o que representa um crescimento de 64% face a 2009.
Todo este crescimento, contribuiu para que fosse possí-vel registar um crescimento elevado do n.º de transac-ções, quando comparado com 2009, superior a 100%, bem como do volume de facturação.
1 fonte: Banco de Moçambique | source: Bank of Mozambique060
BCI | RELATÓRIO E CONTAS 2010 | REPORT AND ACOUNT 2010BCI
Diverse communication actions incentivising the use of credit cards enabled BCI to post growth of 100% in its credit cards in the market, in 2010, in comparison to the same period last year to a total of more than 30,000 credit cards in circulation with a market share of 31% .
Debit cards, aligned with the growth of the number of BCI customers, also posted strong growth, in 2010, BCI currently has more than 225,000 debit cards in circulation, up 64% over 2009.
Such growth as a whole, has contributed to the possi-bility of recording a high rate of growth of more than 100% in the number of transactions in comparison to 2009, in addition to the volume of invoicing.
Análisefinanceira
financialAnalysis
062
BCI | RELATÓRIO E CONTAS 2010 | ANNUAL REPORT 2010BCI
07. Análise financeira financial Analysis
Resultados e rentabilidade
Os Resultados Líquidos do BCI ascenderam, em 2010, a MT 916,85 milhões, o que representou um aumento de 28% face ao ano anterior (MT 716, 46 milhões). Ao longo do exercício, a actividade do Banco viu-se condicionada por diversos factores:
1. O estreitamento das margens de intermediação por via do incremento do custo do funding, motivado pelo aumento da concorrência na captação de fundos, pressionou a evolução da margem financeira. Este factor foi agravado pela dificuldade de implementação de um reposicionamento de preços e custos ajustado àsnovasemaisonerosascondiçõesdefinanciamento;
2. Conforme esperado, o forte investimento na expan-são da Rede de distribuição resultou num impacto significativonaestruturadecustos;
3. Acentuada depreciação do MZN face ao USD, com o respectivo impacto no custo dos serviços de ter-ceiros facturados em moeda externa (em especial serviços importados).
O crescimento do Volume de Negócios, mais 31% do que em 2009, permitiu compensar, em parte, os impactos acima referidos.
Income and Profitability
BCI’s net income, in 2010, was up 28% to MT 916.85 million, in comparison to last year’s MT 716.46 million. The bank’s activity was conditioned by several factors, over the course of the year:
1. Narrowing intermediation margins owing to higher funding costs deriving from greater competition in securing funds brought pressure to bear on the evolution of net interest income. This factor was heightened by difficulties in implementing the adjust-ment of repricing and cost terms in line with the more difficultfundingsituation;
2. As expected, major investment in branch office net-work expansion had a significant impact on the costs structure;
3. Sharp depreciation of the MZN to the USD, with its respective impact on the costs of externally sourced services invoiced in foreign currency (particularly imported services).
The more than 31% growth in turnover, in 2009, enabled a part of the above referred to impacts to be offset.
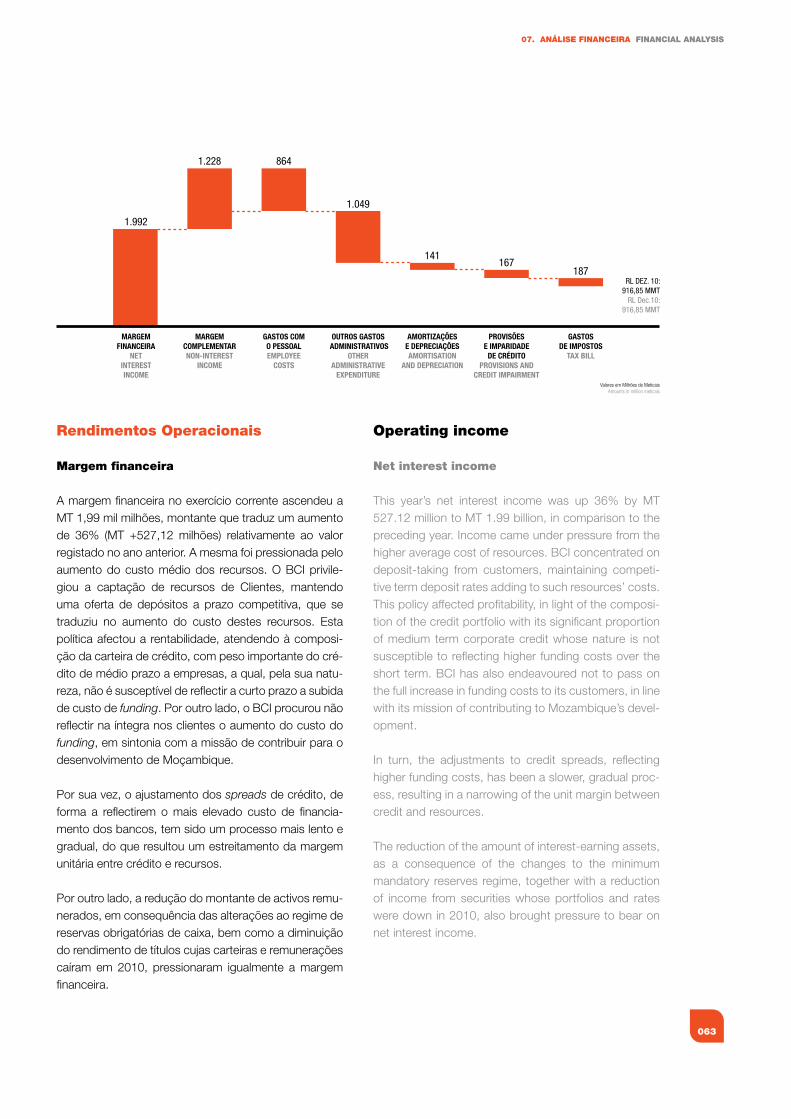
063
07. ANÁLISE fINANCEIRA fINANCIAL ANALYSIS
Rendimentos Operacionais
Margem financeira
A margem financeira no exercício corrente ascendeu a MT 1,99 mil milhões, montante que traduz um aumento de 36% (MT +527,12 milhões) relativamente ao valor registado no ano anterior. A mesma foi pressionada pelo aumento do custo médio dos recursos. O BCI privile-giou a captação de recursos de Clientes, mantendo uma oferta de depósitos a prazo competitiva, que se traduziu no aumento do custo destes recursos. Esta política afectou a rentabilidade, atendendo à composi-ção da carteira de crédito, com peso importante do cré-dito de médio prazo a empresas, a qual, pela sua natu-reza, não é susceptível de reflectir a curto prazo a subida de custo de funding. Por outro lado, o BCI procurou não reflectir na íntegra nos clientes o aumento do custo do funding, em sintonia com a missão de contribuir para o desenvolvimento de Moçambique.
Por sua vez, o ajustamento dos spreads de crédito, de forma a reflectirem o mais elevado custo de financia-mento dos bancos, tem sido um processo mais lento e gradual, do que resultou um estreitamento da margem unitária entre crédito e recursos.
Por outro lado, a redução do montante de activos remu-nerados, em consequência das alterações ao regime de reservas obrigatórias de caixa, bem como a diminuição do rendimento de títulos cujas carteiras e remunerações caíram em 2010, pressionaram igualmente a margem financeira.
MARGEM FINANCEIRA
NET INTEREST INCOME
MARGEM COMPLEMENTARNON-INTEREST
INCOME
GASTOS COM O PESSOALEMPLOYEE
COSTS
OUTROS GASTOS ADMINISTRATIVOS
OTHERADMINISTRATIVE
EXPENDITURE
AMORTIZAÇÕESE DEPRECIAÇÕESAMORTISATION
AND DEPRECIATION
PROVISÕESE IMPARIDADE
DE CRÉDITOPROVISIONS AND
CREDIT IMPAIRMENT
GASTOSDE IMPOSTOS
TAX BILL
1.992
1.228 864
1.049
141167
187RL DEZ. 10:
916,85 MMTRL Dec.10:
916,85 MMT
Valores em Milhões de MeticaisAmounts in million meticais
Operating income
Net interest income
This year’s net interest income was up 36% by MT 527.12 million to MT 1.99 billion, in comparison to the preceding year. Income came under pressure from the higher average cost of resources. BCI concentrated on deposit-taking from customers, maintaining competi-tive term deposit rates adding to such resources’ costs. This policy affected profitability, in light of the composi-tion of the credit portfolio with its significant proportion of medium term corporate credit whose nature is not susceptible to reflecting higher funding costs over the short term. BCI has also endeavoured not to pass on the full increase in funding costs to its customers, in line with its mission of contributing to Mozambique’s devel-opment.
In turn, the adjustments to credit spreads, reflecting higher funding costs, has been a slower, gradual proc-ess, resulting in a narrowing of the unit margin between credit and resources.
The reduction of the amount of interest-earning assets, as a consequence of the changes to the minimum mandatory reserves regime, together with a reduction of income from securities whose portfolios and rates were down in 2010, also brought pressure to bear on net interest income.
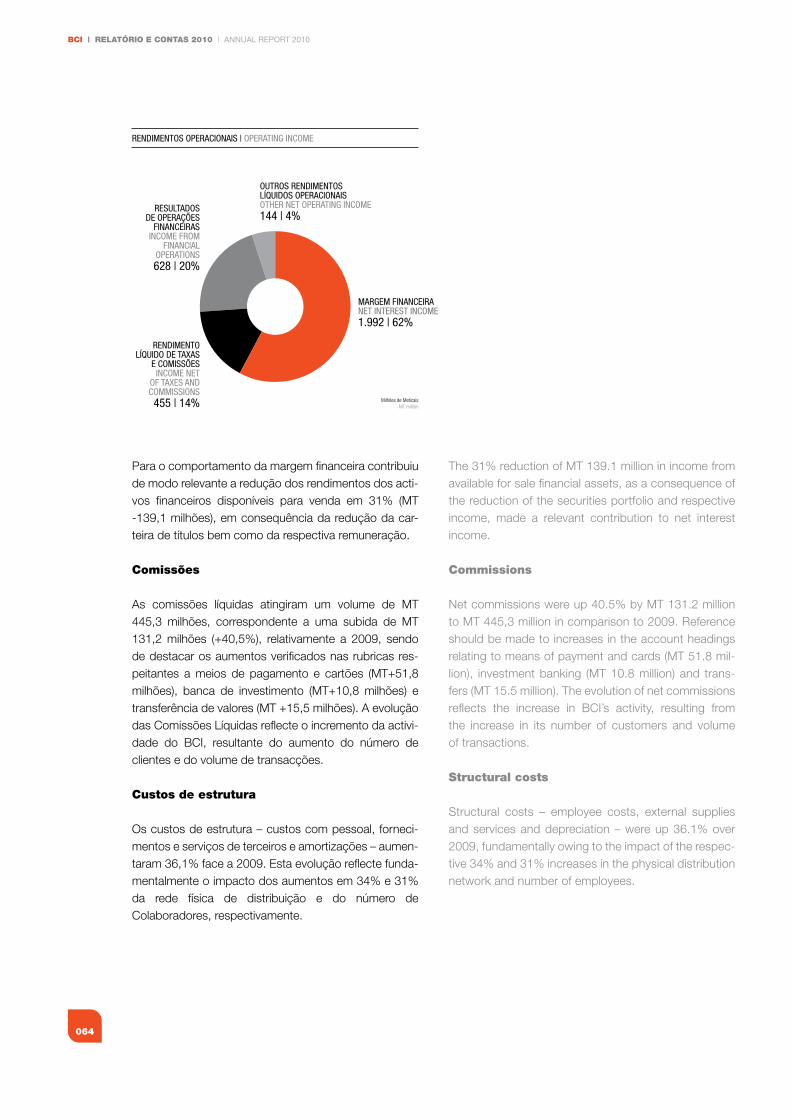
BCI | RELATÓRIO E CONTAS 2010 | ANNUAL REPORT 2010
064
Para o comportamento da margem financeira contribuiu de modo relevante a redução dos rendimentos dos acti-vos financeiros disponíveis para venda em 31% (MT -139,1 milhões), em consequência da redução da car-teira de títulos bem como da respectiva remuneração.
Comissões
As comissões líquidas atingiram um volume de MT 445,3 milhões, correspondente a uma subida de MT 131,2 milhões (+40,5%), relativamente a 2009, sendo de destacar os aumentos verificados nas rubricas res-peitantes a meios de pagamento e cartões (MT+51,8 milhões), banca de investimento (MT+10,8 milhões) e transferência de valores (MT +15,5 milhões). A evolução das Comissões Líquidas reflecte o incremento da activi-dade do BCI, resultante do aumento do número de clientes e do volume de transacções.
Custos de estrutura
Os custos de estrutura – custos com pessoal, forneci-mentos e serviços de terceiros e amortizações – aumen-taram 36,1% face a 2009. Esta evolução reflecte funda-mentalmente o impacto dos aumentos em 34% e 31% da rede física de distribuição e do número de Colaboradores, respectivamente.
MARGEM FINANCEIRANET INTEREST INCOME1.992 | 62%
RESULTADOSDE OPERAÇÕES
FINANCEIRASINCOME FROM
FINANCIALOPERATIONS628 | 20%
OUTROS RENDIMENTOSLÍQUIDOS OPERACIONAISOTHER NET OPERATING INCOME144 | 4%
RENDIMENTOLÍQUIDO DE TAXAS
E COMISSÕESINCOME NET
OF TAXES ANDCOMMISSIONS455 | 14%
RENDIMENTOS OPERACIONAIS | OPERATING INCOME
Milhões de MeticaisMT million
The 31% reduction of MT 139.1 million in income from available for sale financial assets, as a consequence of the reduction of the securities portfolio and respective income, made a relevant contribution to net interest income.
Commissions
Net commissions were up 40.5% by MT 131.2 million to MT 445,3 million in comparison to 2009. Reference should be made to increases in the account headings relating to means of payment and cards (MT 51.8 mil-lion), investment banking (MT 10.8 million) and trans-fers (MT 15.5 million). The evolution of net commissions reflects the increase in BCI’s activity, resulting from the increase in its number of customers and volume of transactions.
Structural costs
Structural costs – employee costs, external supplies and services and depreciation – were up 36.1% over 2009, fundamentally owing to the impact of the respec-tive 34% and 31% increases in the physical distribution network and number of employees.
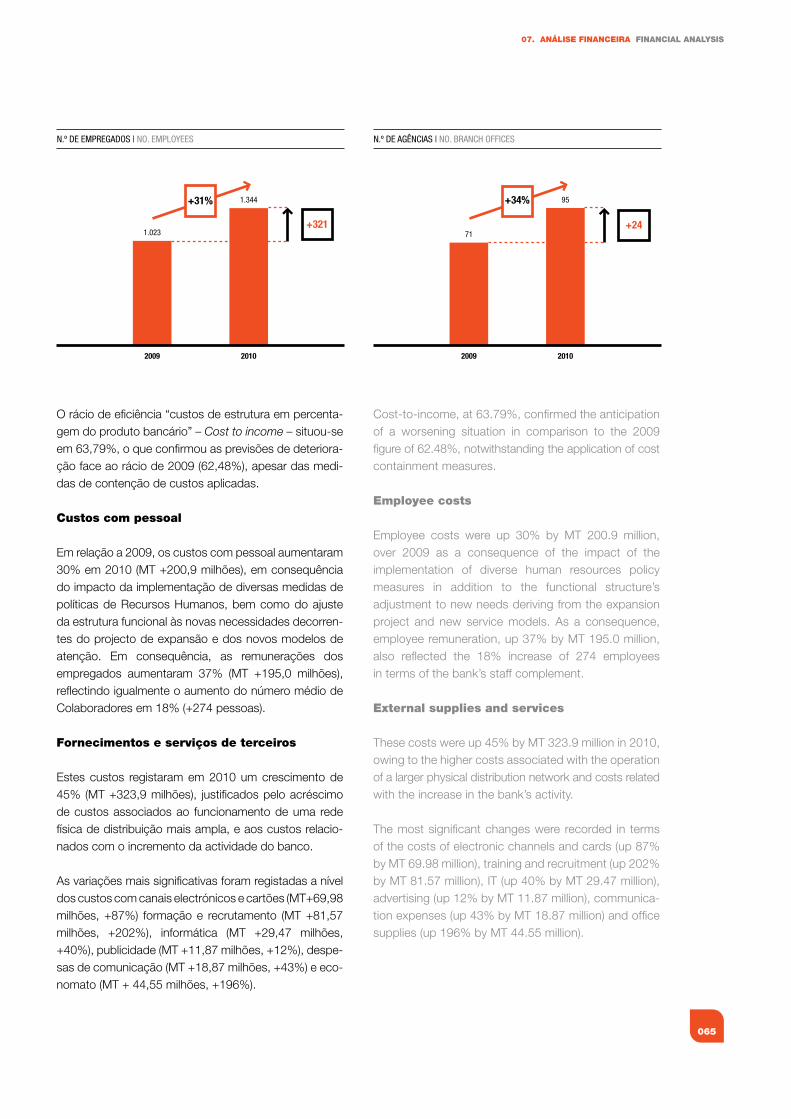
065
07. ANÁLISE fINANCEIRA fINANCIAL ANALYSIS
O rácio de eficiência “custos de estrutura em percenta-gem do produto bancário” – Cost to income – situou-se em 63,79%, o que confirmou as previsões de deteriora-ção face ao rácio de 2009 (62,48%), apesar das medi-das de contenção de custos aplicadas.
Custos com pessoal
Em relação a 2009, os custos com pessoal aumentaram 30% em 2010 (MT +200,9 milhões), em consequência do impacto da implementação de diversas medidas de políticas de Recursos Humanos, bem como do ajuste da estrutura funcional às novas necessidades decorren-tes do projecto de expansão e dos novos modelos de atenção. Em consequência, as remunerações dos empregados aumentaram 37% (MT +195,0 milhões), reflectindo igualmente o aumento do número médio de Colaboradores em 18% (+274 pessoas).
fornecimentos e serviços de terceiros
Estes custos registaram em 2010 um crescimento de 45% (MT +323,9 milhões), justificados pelo acréscimo de custos associados ao funcionamento de uma rede física de distribuição mais ampla, e aos custos relacio-nados com o incremento da actividade do banco.
As variações mais significativas foram registadas a nível dos custos com canais electrónicos e cartões (MT+69,98 milhões, +87%) formação e recrutamento (MT +81,57 milhões, +202%), informática (MT +29,47 milhões, +40%), publicidade (MT +11,87 milhões, +12%), despe-sas de comunicação (MT +18,87 milhões, +43%) e eco-nomato (MT + 44,55 milhões, +196%).
1.023
1.344
2009 2010
N.º DE EMPREGADOS | NO. EMPLOYEES
+321
+31% +34%
71
95
+24
2009 2010
N.º DE AGÊNCIAS | NO. BRANCH OFFICES
Cost-to-income, at 63.79%, confirmed the anticipation of a worsening situation in comparison to the 2009 figure of 62.48%, notwithstanding the application of cost containment measures.
Employee costs
Employee costs were up 30% by MT 200.9 million, over 2009 as a consequence of the impact of the implementation of diverse human resources policy measures in addition to the functional structure’s adjustment to new needs deriving from the expansion project and new service models. As a consequence, employee remuneration, up 37% by MT 195.0 million, also reflected the 18% increase of 274 employees in terms of the bank’s staff complement.
External supplies and services
These costs were up 45% by MT 323.9 million in 2010, owing to the higher costs associated with the operation of a larger physical distribution network and costs related with the increase in the bank’s activity.
The most significant changes were recorded in terms of the costs of electronic channels and cards (up 87% by MT 69.98 million), training and recruitment (up 202% by MT 81.57 million), IT (up 40% by MT 29.47 million), advertising (up 12% by MT 11.87 million), communica-tion expenses (up 43% by MT 18.87 million) and office supplies (up 196% by MT 44.55 million).
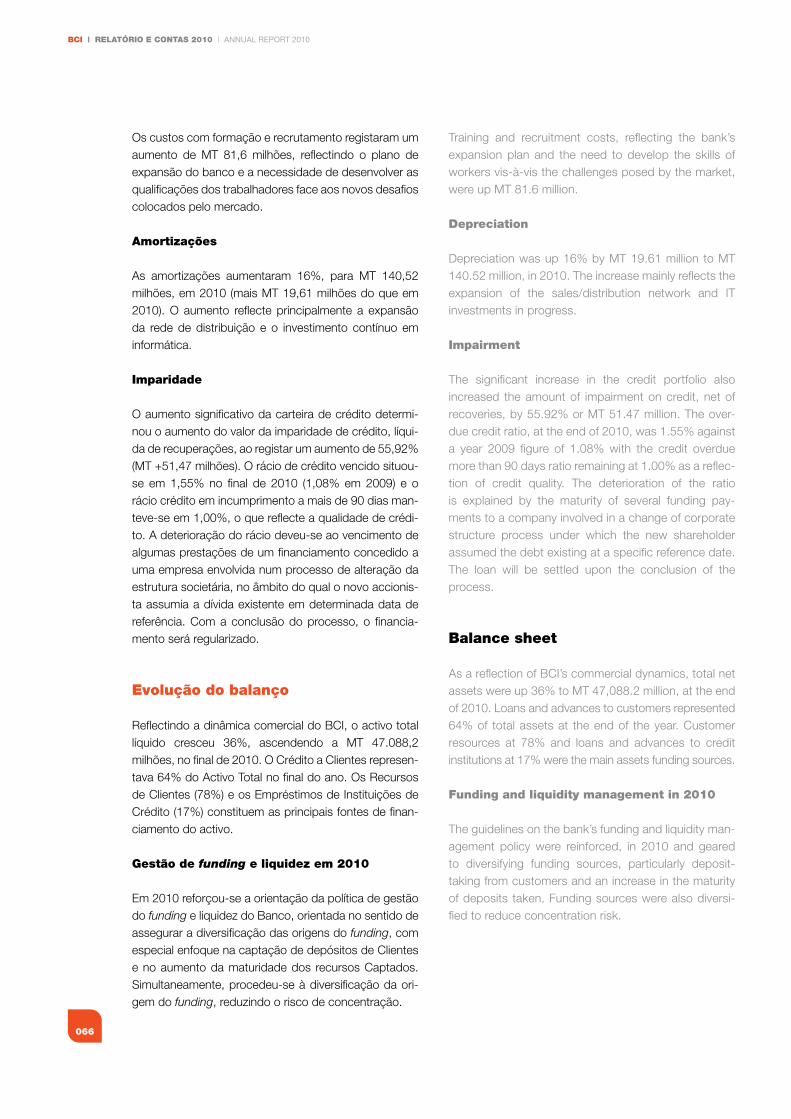
BCI | RELATÓRIO E CONTAS 2010 | ANNUAL REPORT 2010
066
Os custos com formação e recrutamento registaram um aumento de MT 81,6 milhões, reflectindo o plano de expansão do banco e a necessidade de desenvolver as qualificações dos trabalhadores face aos novos desafios colocados pelo mercado.
Amortizações
As amortizações aumentaram 16%, para MT 140,52 milhões, em 2010 (mais MT 19,61 milhões do que em 2010). O aumento reflecte principalmente a expansão da rede de distribuição e o investimento contínuo em informática.
Imparidade
O aumento significativo da carteira de crédito determi-nou o aumento do valor da imparidade de crédito, líqui-da de recuperações, ao registar um aumento de 55,92% (MT +51,47 milhões). O rácio de crédito vencido situou-se em 1,55% no final de 2010 (1,08% em 2009) e o rácio crédito em incumprimento a mais de 90 dias man-teve-se em 1,00%, o que reflecte a qualidade de crédi-to. A deterioração do rácio deveu-se ao vencimento de algumas prestações de um financiamento concedido a uma empresa envolvida num processo de alteração da estrutura societária, no âmbito do qual o novo accionis-ta assumia a dívida existente em determinada data de referência. Com a conclusão do processo, o financia-mento será regularizado.
Evolução do balanço
Reflectindo a dinâmica comercial do BCI, o activo total líquido cresceu 36%, ascendendo a MT 47.088,2 milhões, no final de 2010. O Crédito a Clientes represen-tava 64% do Activo Total no final do ano. Os Recursos de Clientes (78%) e os Empréstimos de Instituições de Crédito (17%) constituem as principais fontes de finan-ciamento do activo.
gestão de funding e liquidez em 2010
Em 2010 reforçou-se a orientação da política de gestão do funding e liquidez do Banco, orientada no sentido de assegurar a diversificação das origens do funding, com especial enfoque na captação de depósitos de Clientes e no aumento da maturidade dos recursos Captados. Simultaneamente, procedeu-se à diversificação da ori-gem do funding, reduzindo o risco de concentração.
Training and recruitment costs, reflecting the bank’s expansion plan and the need to develop the skills of workers vis-à-vis the challenges posed by the market, were up MT 81.6 million.
depreciation
Depreciation was up 16% by MT 19.61 million to MT 140.52 million, in 2010. The increase mainly reflects the expansion of the sales/distribution network and IT investments in progress.
Impairment
The significant increase in the credit portfolio also increased the amount of impairment on credit, net of recoveries, by 55.92% or MT 51.47 million. The over-due credit ratio, at the end of 2010, was 1.55% against a year 2009 figure of 1.08% with the credit overdue more than 90 days ratio remaining at 1.00% as a reflec-tion of credit quality. The deterioration of the ratio is explained by the maturity of several funding pay-ments to a company involved in a change of corporate structure process under which the new shareholder assumed the debt existing at a specific reference date. The loan will be settled upon the conclusion of the process.
Balance sheet
As a reflection of BCI’s commercial dynamics, total net assets were up 36% to MT 47,088.2 million, at the end of 2010. Loans and advances to customers represented 64% of total assets at the end of the year. Customer resources at 78% and loans and advances to credit institutions at 17% were the main assets funding sources.
funding and liquidity management in 2010
The guidelines on the bank’s funding and liquidity man-agement policy were reinforced, in 2010 and geared to diversifying funding sources, particularly deposit-taking from customers and an increase in the maturity of deposits taken. Funding sources were also diversi-fied to reduce concentration risk.
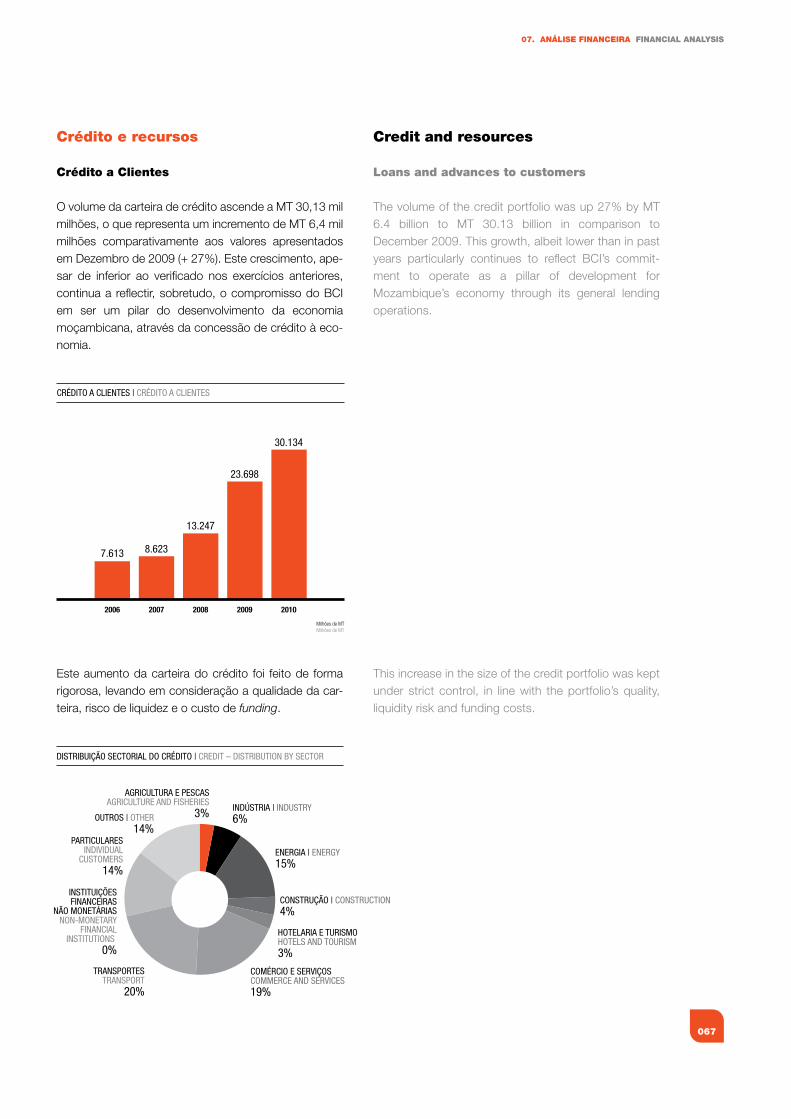
067
07. ANÁLISE fINANCEIRA fINANCIAL ANALYSIS
Crédito e recursos
Crédito a Clientes
O volume da carteira de crédito ascende a MT 30,13 mil milhões, o que representa um incremento de MT 6,4 mil milhões comparativamente aos valores apresentados em Dezembro de 2009 (+ 27%). Este crescimento, ape-sar de inferior ao verificado nos exercícios anteriores, continua a reflectir, sobretudo, o compromisso do BCI em ser um pilar do desenvolvimento da economia moçambicana, através da concessão de crédito à eco-nomia.
Este aumento da carteira do crédito foi feito de forma rigorosa, levando em consideração a qualidade da car-teira, risco de liquidez e o custo de funding.
CRÉDITO A CLIENTES | CRÉDITO A CLIENTES
2006
7.613 8.623
13.247
23.698
30.134
2007 2008 2009 2010
Milhões de MTMilhões de MT
INDÚSTRIA | INDUSTRY6%
ENERGIA | ENERGY15%
CONSTRUÇÃO | CONSTRUCTION4%
HOTELARIA E TURISMOHOTELS AND TOURISM3%
COMÉRCIO E SERVIÇOSCOMMERCE AND SERVICES19%
INSTITUIÇÕESFINANCEIRAS
NÃO MONETÁRIASNON-MONETARY
FINANCIALINSTITUTIONS
0%
PARTICULARESINDIVIDUAL
CUSTOMERS14%
OUTROS | OTHER14%
AGRICULTURA E PESCASAGRICULTURE AND FISHERIES
3%
TRANSPORTESTRANSPORT
20%
DISTRIBUIÇÃO SECTORIAL DO CRÉDITO | CREDIT – DISTRIBUTION BY SECTOR
Credit and resources
Loans and advances to customers
The volume of the credit portfolio was up 27% by MT 6.4 billion to MT 30.13 billion in comparison to December 2009. This growth, albeit lower than in past years particularly continues to reflect BCI’s commit-ment to operate as a pillar of development for Mozambique’s economy through its general lending operations.
This increase in the size of the credit portfolio was kept under strict control, in line with the portfolio’s quality, liquidity risk and funding costs.
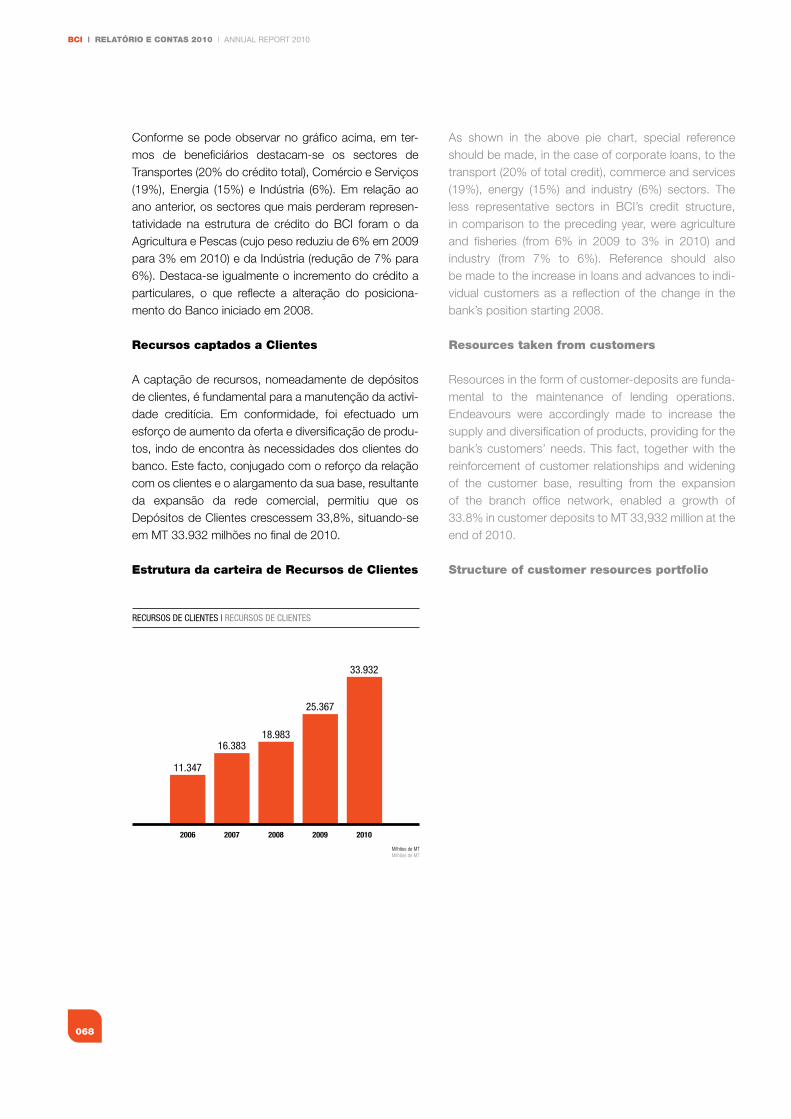
BCI | RELATÓRIO E CONTAS 2010 | ANNUAL REPORT 2010
068
Conforme se pode observar no gráfico acima, em ter-mos de beneficiários destacam-se os sectores de Transportes (20% do crédito total), Comércio e Serviços (19%), Energia (15%) e Indústria (6%). Em relação ao ano anterior, os sectores que mais perderam represen-tatividade na estrutura de crédito do BCI foram o da Agricultura e Pescas (cujo peso reduziu de 6% em 2009 para 3% em 2010) e da Indústria (redução de 7% para 6%). Destaca-se igualmente o incremento do crédito a particulares, o que reflecte a alteração do posiciona-mento do Banco iniciado em 2008.
Recursos captados a Clientes
A captação de recursos, nomeadamente de depósitos de clientes, é fundamental para a manutenção da activi-dade creditícia. Em conformidade, foi efectuado um esforço de aumento da oferta e diversificação de produ-tos, indo de encontra às necessidades dos clientes do banco. Este facto, conjugado com o reforço da relação com os clientes e o alargamento da sua base, resultante da expansão da rede comercial, permitiu que os Depósitos de Clientes crescessem 33,8%, situando-se em MT 33.932 milhões no final de 2010.
Estrutura da carteira de Recursos de Clientes
RECURSOS DE CLIENTES | RECURSOS DE CLIENTES
2006
11.347
16.38318.983
25.367
33.932
2007 2008 2009 2010
Milhões de MTMilhões de MT
As shown in the above pie chart, special reference should be made, in the case of corporate loans, to the transport (20% of total credit), commerce and services (19%), energy (15%) and industry (6%) sectors. The less representative sectors in BCI’s credit structure, in comparison to the preceding year, were agriculture and fisheries (from 6% in 2009 to 3% in 2010) and industry (from 7% to 6%). Reference should also be made to the increase in loans and advances to indi-vidual customers as a reflection of the change in the bank’s position starting 2008.
Resources taken from customers
Resources in the form of customer-deposits are funda-mental to the maintenance of lending operations. Endeavours were accordingly made to increase the supply and diversification of products, providing for the bank’s customers’ needs. This fact, together with the reinforcement of customer relationships and widening of the customer base, resulting from the expansion of the branch office network, enabled a growth of 33.8% in customer deposits to MT 33,932 million at the end of 2010.
Structure of customer resources portfolio

069
07. ANÁLISE fINANCEIRA fINANCIAL ANALYSIS
Em termos da denominação por moeda, verificou-se em 2010 um reforço do peso dos Depósitos constituídos em Meticais, reflectindo a tendência que se verifica de reforço da moeda nacional como referência nas tran-sacções económicas.
No que respeita à decomposição da carteira por tipo de produto, verificou-se um reforço dos Depósitos a Prazo, em consonância com a política de gestão de liquidez do BCI, que privilegia a estabilidade do funding.
Recursos de Instituições de Crédito
No âmbito da preocupação em melhorar a gestão de liquidez da Instituição, reduzindo os gaps de maturidade existentes entre as operações activas e passivas, obti-veram-se apoios financeiros internacionais de Médio e Longo prazo no montante de USD 54,4 milhões (a acrescentar aos USD 128,4 milhões contratados em 2009). Estes apoios possibilitaram a concretização de diversas operações de crédito de médio e longo prazo concedidas a clientes exportadores.
DEPÓSITOS POR MOEDA | DEPOSITS BY CURRENCY
42.9%
57.1%
41.3%
58.7%
2009 2010
MOEDA ESTRANGEIRA | FOREIGN CURRENCY
MOEDA NACIONAL | DOMESTIC CURRENCY
DEPÓSITOS POR PRODUTO | DEPOSITS BY PRODUCT
42.7%
57.3%
46.2%
53.8%
2009 2010
A PRAZO | TERM
À ORDEM | SIGHT
In terms of currency, 2010 witnessed a reinforcement of the proportion of deposits in meticais, reflecting the trend towards the national currency’s greater role as the standard for economic transactions.
Term deposits were reinforced in line with BCI’s liquidity management policy of favouring funding stability as regards the breakdown of the portfolio by type of product.
Credit institutions’ resources
In the bank’s concerns to improve liquidity manage-ment and reduce existing maturity gaps between its lending and borrowing operations, international finan-cial support, comprising medium and long term funding of USD 54.4 million was obtained (plus the USD 128.4 million contracted for in 2009). This funding enabled the bank to proceed with several medium and long term credit operations with its export customers.
BCI | RELATÓRIO E CONTAS 2010 | ANNUAL REPORT 2010
070
Carteira de títulos e participações financeiras
Em 31 de Dezembro de 2010, o total das carteiras de activos disponíveis para venda e investimentos em associadas ascendia a MT 2,06 mil milhões, o que cor-respondia a 4% do activo total do BCI.
Cerca de 94% da carteira de activos disponíveis para venda corresponde a dívida pública (Bilhetes e Obrigações do Tesouro).
Passivos subordinados
Em 31 de Dezembro de 2010, os passivos e obrigações subordinadas totalizavam MT 811,0 milhões, decom-postos conforme segue:• EmpréstimoSubordinadoconcedidopelosAccionistas:USD10Milhões;
• Empréstimo subordinado contratado junto do IFC:USD8,5Milhões;
• Empréstimoobrigacionista subordinado:MT205,96milhões.
A contratação destes empréstimos permitiu ao Banco reforçar a sua capacidade de intervenção no mercado, cumprindo os objectivos dos seus Accionistas de contri-buir para a modernização da economia moçambicana.
fundos próprios
No final de 2010, os fundos próprios de base totaliza-vam MT 3,46 mil milhões, o que corresponde a um aumento de MT 931,49 milhões (+37%) relativamente a Dezembro de 2009. De realçar a alteração da estrutura dos Fundos Próprios, resultante do aumento do capital social de MT 321.428.570 para MT 1.900.000.000.
Securities and financial investments portfolio
The total amount of available for sale assets and invest-ments in associated companies portfolios totalled MT 2.06 billion at 31 December 2010, comprising 4% of BCI’s total assets.
Around 94% of the available for sale assets portfolio comprises public debt (treasury bills and bonds).
Subordinated liabilities
Subordinated liabilities and bonds, at 31 December 2010, totalled MT 811.0 million, as follows:• Subordinatedloanfromshareholders:USD10million;• SubordinatedloanfromIFC:USD8.5million;• Subordinatedbondloan:MT205.96million.
These loans enabled the bank to reinforce its market intervention capacity, complying with its shareholders’ objectives in contributing to the modernisation of Mozambique’s economy.
Own funds
BCI’s basis own funds, at the end of 2010, were up 37% by MT 931.49 million to MT 3.46 billion over December 2009. Reference should be made to the change of the structure of own funds resulting from the increase in share capital from MT 321,428,570 to MT 1,900,000,000.
071
08. Proposta de Aplicação de Resultados Proposal for the Appropriation of Net Income
Considerando a necessidade de sustentar a política de crescimento orgânico encetada no quadro da imple-mentação do Plano Estratégico 2008-2012, bem como de reduzir a deterioração dos Fundos Próprios resultante da apreciação do USD face ao Metical, propõe-se o reforço dos fundos próprios e equiparados do BCI, através da retenção de 75% do Resultado Líquido do exercício de 2010, correspondente a 687.635.090,95 meticais. Deste modo, a aplicação dos resultados líqui-dos dever-se á apresentar do seguinte modo: • Reservas Legais (15%):MT 135.527.018,19 (Cento
e Trinta e Cinco Milhões, Quinhentos e Vinte e Sete Mil, Dezoito Meticais, e Dezanove Centavos)
• ReservasLivres(60%):MT550.108.072,76(Quinhentose Cinquenta Milhões, Cento e Oito Mil, Setenta e Dois Meticais e Setenta e Seis Centavos)
• DistribuiçãodeDividendosaosAccionistas(25%):MT229.211.696,98 (Duzentos e Vinte e Nove Milhões, Duzentos e Onze Mil, Seiscentos e Noventa e Seis Meticais e Noventa e Oito Centavos)
Referências
Ao concluir a apresentação da actividade do Banco no exercício de 2010, o Conselho de Administração do BCI deseja expressar o seu reconhecimento a todos os que contribuíram para a consolidação deste projecto, em especial: • Aosnossosclientes;• Aosnossosfornecedores;• Àsautoridadesmonetáriasefinanceiras,pela forma
como acompanharam e cooperaram no desenvolvi-mentodaactividadedoBCI;
Considering the need to sustain the organic growth policy initiated under the framework of the 2008-2012 strategic plan, in addition to reducing the deterioration of own funds resulting from the appreciation of the USD against the metical, it is proposed that BCI’s own funds should be reinforced by retaining 75% of the net profit for 2010, for the amount of 687,635,090.95 meticais. Information on the appropriation of net income is there-fore as set out below: • Legalreserve(15%):MT135,527,018.19(onehun-dred and thirty five million, five hundred and twenty seven thousand, eighteen meticais and nineteen cents)
• Free reserves (60%):MT550,108,072.76 (fivehun-dred and fifty million, one hundred and eight thousand, seventy two meticais and seventy six cents)
• Dividendstoshareholders(25%):MT229,211,696,98(two hundred and twenty nine million, two hundred and eleven thousand, six hundred and ninety six meticais and eight cents)
Acknowledgments
BCI’s board of directors, in concluding its presentation of the bank’s operations for 2010, particularly wishes to acknowledge the endeavours of all who have contributed to the consolidation of this project and par-ticularly: • Ourcustomers;• Oursuppliers;• ThemonetaryandfinancialauthoritiesformonitoringandcooperatinginthedevelopmentofBCI’sactivities;
• Thegeneralmeetingandauditboard, for theircol-laborationoverthecourseoftheyear;
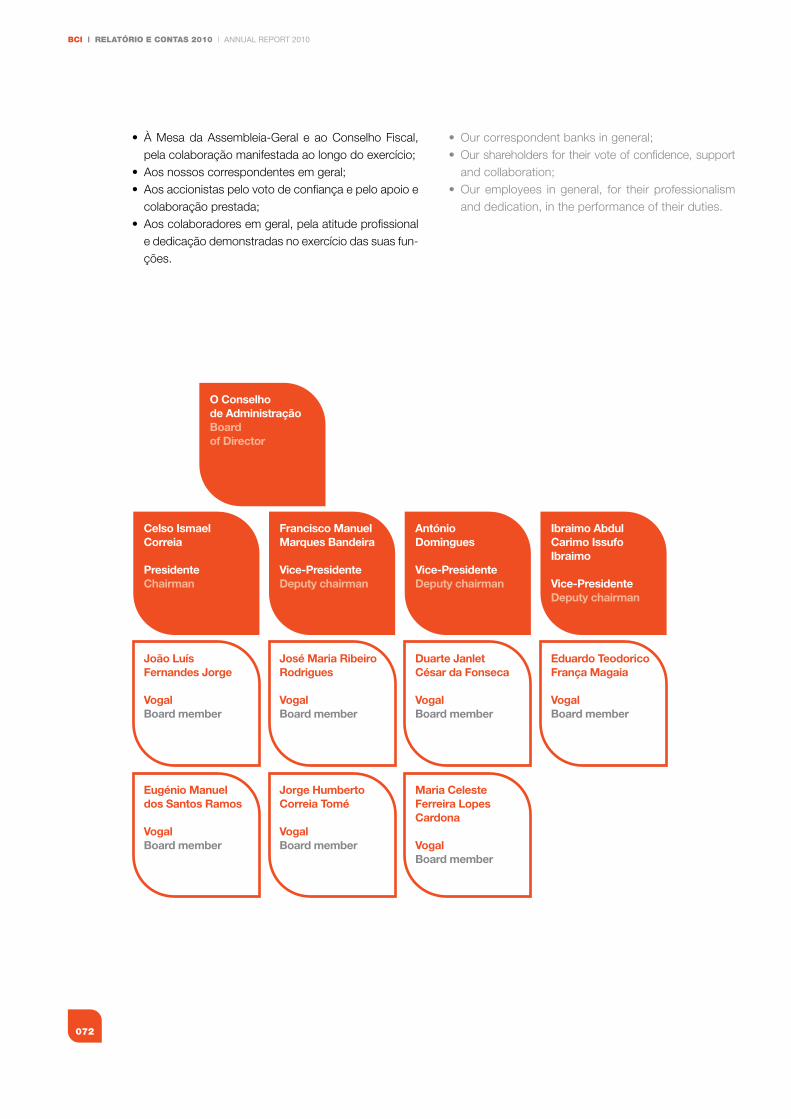
BCI | RELATÓRIO E CONTAS 2010 | ANNUAL REPORT 2010
072
• ÀMesadaAssembleia-Geral e aoConselhoFiscal,pelacolaboraçãomanifestadaaolongodoexercício;
• Aosnossoscorrespondentesemgeral;• Aosaccionistaspelovotodeconfiançaepeloapoioecolaboraçãoprestada;
• Aoscolaboradoresemgeral,pelaatitudeprofissionale dedicação demonstradas no exercício das suas fun-ções.
Celso Ismael Correia
PresidenteChairman
Jorge Humberto Correia Tomé
VogalBoard member
João Luís Fernandes Jorge
VogalBoard member
Francisco Manuel Marques Bandeira
Vice-PresidenteDeputy chairman
Eugénio Manuel dos Santos Ramos
VogalBoard member
Eduardo Teodorico França Magaia
VogalBoard member
António Domingues
Vice-PresidenteDeputy chairman
Maria Celeste Ferreira Lopes Cardona
VogalBoard member
José Maria Ribeiro Rodrigues
VogalBoard member
Ibraimo Abdul Carimo Issufo Ibraimo
Vice-PresidenteDeputy chairman
Duarte Janlet César da Fonseca
VogalBoard member
O Conselho de AdministraçãoBoardof Director
• Ourcorrespondentbanksingeneral;• Ourshareholdersfortheirvoteofconfidence,supportandcollaboration;
• Our employees ingeneral, for their professionalismand dedication, in the performance of their duties.
demonstrações financeiras
financialStatements
BCI | RELATÓRIO E CONTAS 2010 | ANNUAL REPORT 2010
074
declaração de Responsabilidade dos Administradores
Os Administradores do Banco são responsáveis pela pre-paração e apresentação adequada das demonstrações financeiras anuais do Banco Comercial e de Investi mentos, SA, que compreendem a Demonstração da Posição Finan-ceira, em 31 de Dezembro de 2010, a Demonstração compreensiva de resultados, a Demonstração do movi-mento em fundos próprios, a Demonstração de receitas compreensivas e o mapa dos fluxos de caixa do exercício findo naquela data, assim como as notas às demonstra-ções financeiras que incluem um sumário das principais políticas contabilísticas e outras notas explicativas, assim como o relatório do Conselho de Administração, de acordo com as Normas Internacionais de Relato Financeiro.
Esta responsabilidade inclui: a concepção, implementa-ção e manutenção de um sistema de controlo interno relevante para a preparação e apresentação apropriada de demonstrações financeiras que estejam isentas de distorçõesmateriais,devidasquerafraude,queraerro;a selecção e aplicação de políticas contabilísticas apro-priadas e o apuramento de estimativas contabilísticas que sejam razoáveis nas circunstâncias.
Os Administradores são ainda responsáveis pela manu-tenção de registos contabilísticos adequados e de um sistema de gestão de risco eficiente e eficaz.
Os Administradores procederam a uma avaliação para determinar se o Banco tem capacidade para continuar a operar com a devida observância do princípio da continui-dade, e não têm motivos para duvidar que o Banco con-tinuará a operar segundo esse princípio no próximo ano.
Aprovação das demonstrações financeiras Anuais
As demonstrações financeiras anuais do Banco Comer-cial e de Investimentos, SA, conforme identificado no primeiro parágrafo, foram aprovadas pelo Conselho de Administração em 18 de Fevereiro de 2011 e vão assi-nadas em seu nome, por:
directors’ Term of Liability
The bank’s directors are responsible for the preparation and adequate presentation of the annual financial state-ments of Banco Comercial e de Investimentos, SA, which include the statement of its financial position, at 31 December 2010, the statement of comprehensive results, statement of own funds movements and statement of comprehensive revenues and the table of cash flows for the year then ended, in addition to the notes to the finan-cial statements which include a summary of the principal accounting policies and other explanatory notes as well as the board of directors’ report in accordance with the International Financial Reporting Standards.
This responsibility includes: the conception, implementa-tion and maintenance of an internal control system rele-vant to the preparation and appropriate presentation of the financial statements, free from material distortions, eitherduetooffraudorerror;theselectionandapplica-tion of appropriate accounting policies and accounting estimates which are reasonable to the circumstances.
The directors are also responsible for keeping adequate accounting records and maintaining an efficient and effec-tive risk management system.
The directors assessed whether the bank has the capac-ity to continue to operate in due compliance with the going-concern principle and has no reason to doubt that the bank will continue to operate in accordance with this principle during the course of the coming year.
Approval of the Annual financial Statements
The annual financial statements of Banco Comercial e de Investimentos, SA, identified in the first paragraph, were approved by the board of directors on 18 February 2011 and shall be signed off on its behalf by:
Celso Correia Ibraimo IbraimoPresidente do Conselho de Administração Vice Presidente do Conselho de AdministraçãoChairman of the board of directors Deputy chairman of the board of directors

075
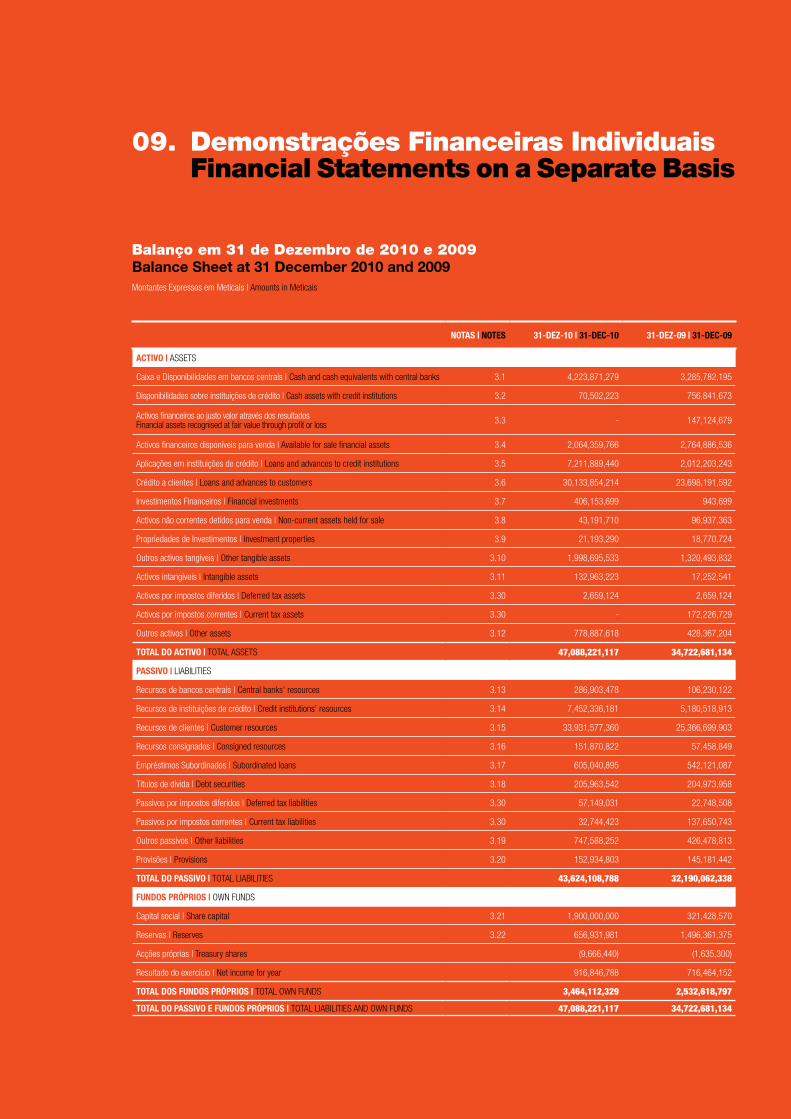
076
BCI | RELATÓRIO E CONTAS 2010 | ANNUAL REPORT 2010BCI
09. demonstrações financeiras Individuais financial Statements on a Separate Basis
Balanço em 31 de dezembro de 2010 e 2009Balance Sheet at 31 December 2010 and 2009Montantes expressos em Meticais | Amounts in Meticais
NOTAS | NOTES 31-DEZ-10 | 31-DEC-10 31-DEZ-09 | 31-DEC-09
ACTIvO | AsseTs
Caixa e Disponibilidades em bancos centrais | Cash and cash equivalents with central banks 3.1 4,223,871,279 3,285,782,195
Disponibilidades sobre instituições de crédito | Cash assets with credit institutions 3.2 70,502,223 756,841,673
Activos financeiros ao justo valor através dos resultadosfinancial assets recognised at fair value through profit or loss 3.3 - 147,124,679
Activos financeiros disponíveis para venda | Available for sale financial assets 3.4 2,064,359,766 2,764,886,536
Aplicações em instituições de crédito | Loans and advances to credit institutions 3.5 7,211,889,440 2,012,203,243
Crédito a clientes | Loans and advances to customers 3.6 30,133,854,214 23,698,191,592
Investimentos financeiros | financial investments 3.7 406,153,699 943,699
Activos não correntes detidos para venda | non-current assets held for sale 3.8 43,191,710 96,937,363
Propriedades de Investimentos | Investment properties 3.9 21,193,290 18,770,724
Outros activos tangíveis | Other tangible assets 3.10 1,998,695,533 1,320,493,832
Activos intangíveis | Intangible assets 3.11 132,963,223 17,252,541
Activos por impostos diferidos | Deferred tax assets 3.30 2,659,124 2,659,124
Activos por impostos correntes | Current tax assets 3.30 - 172,226,729
Outros activos | Other assets 3.12 778,887,618 428,367,204
TOTAl DO ACTIvO | TOTAL AsseTs 47,088,221,117 34,722,681,134
PASSIvO | LIABILITIes
Recursos de bancos centrais | Central banks’ resources 3.13 286,903,478 106,230,122
Recursos de instituições de crédito | Credit institutions’ resources 3.14 7,452,336,181 5,180,518,913
Recursos de clientes | Customer resources 3.15 33,931,577,360 25,366,699,903
Recursos consignados | Consigned resources 3.16 151,870,822 57,458,849
empréstimos subordinados | subordinated loans 3.17 605,040,895 542,121,087
Títulos de dívida | Debt securities 3.18 205,963,542 204,973,958
Passivos por impostos diferidos | Deferred tax liabilities 3.30 57,149,031 22,748,508
Passivos por impostos correntes | Current tax liabilities 3.30 32,744,423 137,650,743
Outros passivos | Other liabilities 3.19 747,588,252 426,478,813
Provisões | Provisions 3.20 152,934,803 145,181,442
TOTAl DO PASSIvO | TOTAL LIABILITIes 43,624,108,788 32,190,062,338
fuNDOS PRÓPRIOS | Own fUnDs
Capital social | share capital 3.21 1,900,000,000 321,428,570
Reservas | Reserves 3.22 656,931,981 1,496,361,375
Acções próprias | Treasury shares (9,666,440) (1,635,300)
Resultado do exercício | net income for year 916,846,788 716,464,152
TOTAl DOS fuNDOS PRÓPRIOS | TOTAL Own fUnDs 3,464,112,329 2,532,618,797
TOTAl DO PASSIvO E fuNDOS PRÓPRIOS | TOTAL LIABILITIes AnD Own fUnDs 47,088,221,117 34,722,681,134
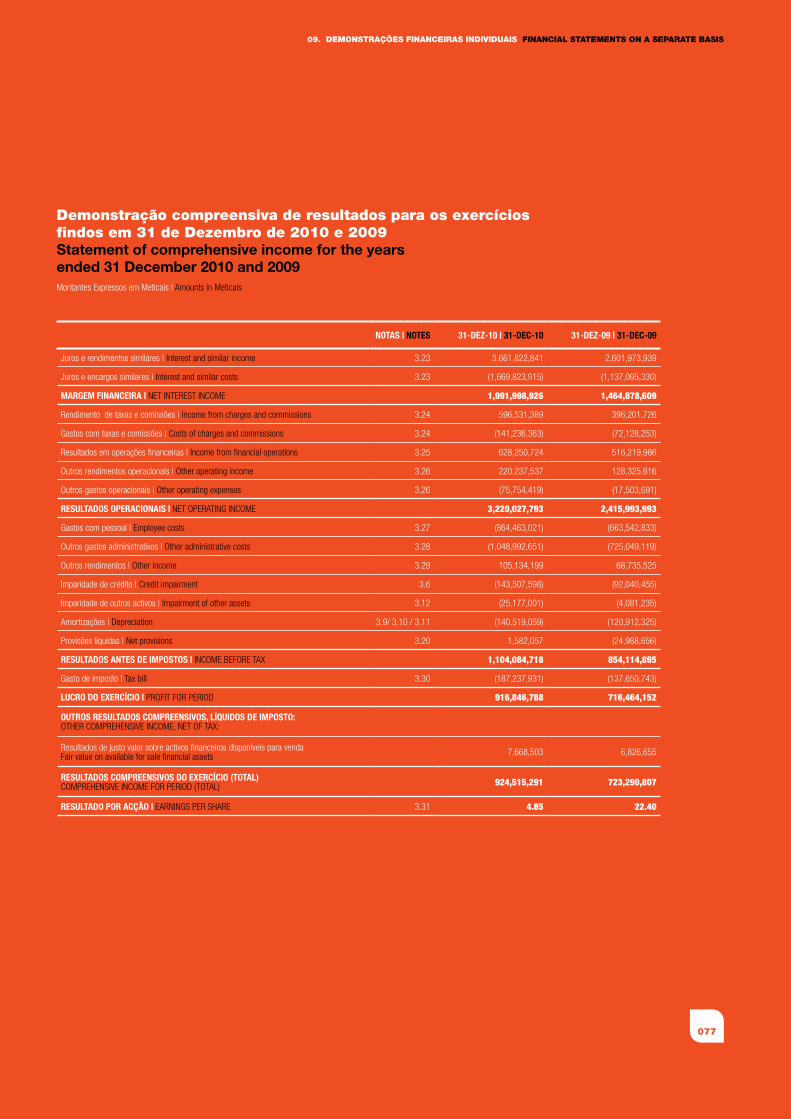
077
09. dEMONSTRAÇÕES fINANCEIRAS INdIvIduAIS fINANCIAL STATEMENTS ON A SEPARATE BASIS
demonstração compreensiva de resultados para os exercícios findos em 31 de dezembro de 2010 e 2009Statement of comprehensive income for the years ended 31 December 2010 and 2009Montantes expressos em Meticais | Amounts in Meticais
NOTAS | NOTES 31-DEZ-10 | 31-DEC-10 31-DEZ-09 | 31-DEC-09
Juros e rendimentos similares | Interest and similar income 3.23 3,661,822,841 2,601,973,939
Juros e encargos similares | Interest and similar costs 3.23 (1,669,823,915) (1,137,095,330)
MARGEM fINANCEIRA | neT InTeResT InCOMe 1,991,998,926 1,464,878,609
Rendimento de taxas e comissões | Income from charges and commissions 3.24 596,531,389 396,201,726
gastos com taxas e comissões | Costs of charges and commissions 3.24 (141,236,363) (72,128,253)
Resultados em operações financeiras | Income from financial operations 3.25 628,250,724 516,219,986
Outros rendimentos operacionais | Other operating income 3.26 220,237,537 128,325,616
Outros gastos operacionais | Other operating expenses 3.26 (75,754,419) (17,503,691)
RESulTADOS OPERACIONAIS | neT OPeRATIng InCOMe 3,220,027,793 2,415,993,993
gastos com pessoal | employee costs 3.27 (864,463,021) (663,542,833)
Outros gastos administrativos | Other administrative costs 3.28 (1,048,992,651) (725,049,119)
Outros rendimentos | Other income 3.29 105,134,199 68,735,525
Imparidade de crédito | Credit impairment 3.6 (143,507,598) (92,040,455)
Imparidade de outros activos | Impairment of other assets 3.12 (25,177,001) (4,081,235)
Amortizações | Depreciation 3.9/ 3.10 / 3.11 (140,519,059) (120,912,325)
Provisões líquidas | net provisions 3.20 1,582,057 (24,988,656)
RESulTADOS ANTES DE IMPOSTOS | InCOMe BefORe TAx 1,104,084,718 854,114,895
gasto de imposto | Tax bill 3.30 (187,237,931) (137,650,743)
luCRO DO ExERCíCIO | PROfIT fOR PeRIOD 916,846,788 716,464,152
OuTROS RESulTADOS COMPREENSIvOS, líquIDOS DE IMPOSTO:OTheR COMPRehensIVe InCOMe, neT Of TAx:
Resultados de justo valor sobre activos financeiros disponíveis para vendafair value on available for sale financial assets 7,668,503 6,826,655
RESulTADOS COMPREENSIvOS DO ExERCíCIO (TOTAl)COMPRehensIVe InCOMe fOR PeRIOD (TOTAL) 924,515,291 723,290,807
RESulTADO POR ACçÃO | eARnIngs PeR shARe 3.31 4.85 22.40
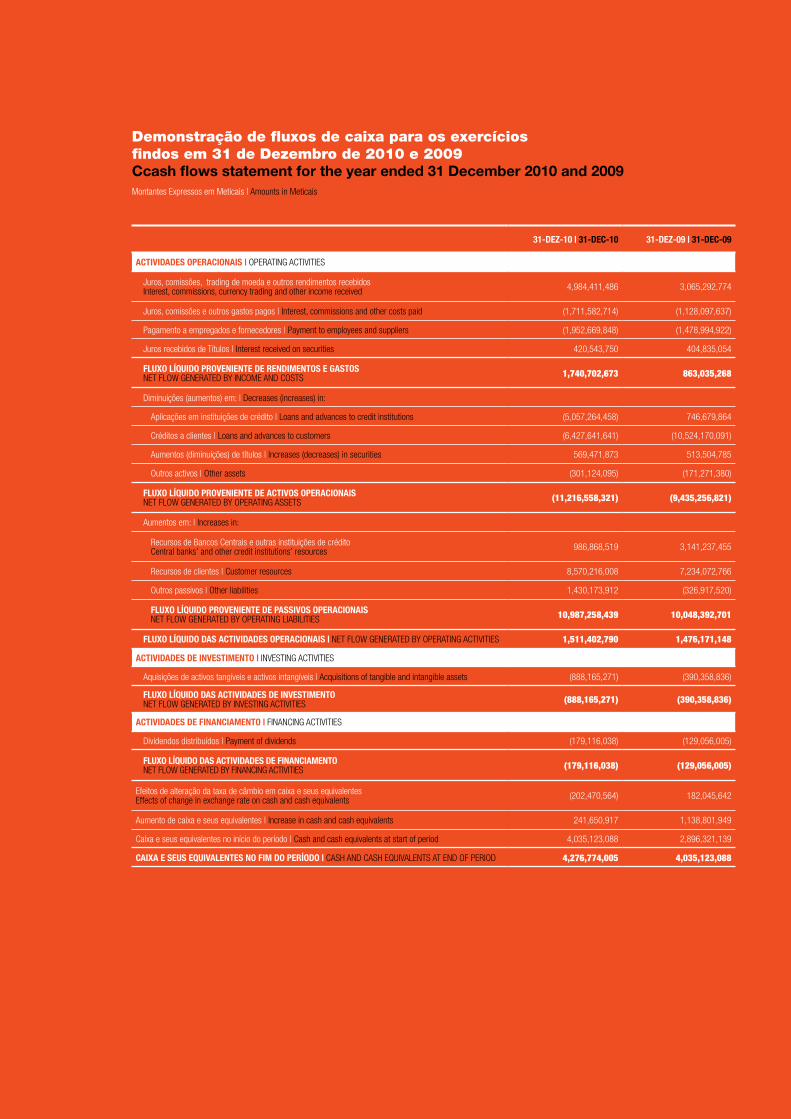
078
BCI | RELATÓRIO E CONTAS 2010 | ANNUAL REPORT 2010BCI
demonstração de fluxos de caixa para os exercícios findos em 31 de dezembro de 2010 e 2009Ccash flows statement for the year ended 31 December 2010 and 2009Montantes expressos em Meticais | Amounts in Meticais
31-DEZ-10 | 31-DEC-10 31-DEZ-09 | 31-DEC-09
ACTIvIDADES OPERACIONAIS | OPeRATIng ACTIVITIes
Juros, comissões, trading de moeda e outros rendimentos recebidosInterest, commissions, currency trading and other income received 4,984,411,486 3,065,292,774
Juros, comissões e outros gastos pagos | Interest, commissions and other costs paid (1,711,582,714) (1,128,097,637)
Pagamento a empregados e fornecedores | Payment to employees and suppliers (1,952,669,848) (1,478,994,922)
Juros recebidos de Títulos | Interest received on securities 420,543,750 404,835,054
fluxO líquIDO PROvENIENTE DE RENDIMENTOS E GASTOSneT fLOw geneRATeD By InCOMe AnD COsTs 1,740,702,673 863,035,268
Diminuições (aumentos) em: | Decreases (increases) in:
Aplicações em instituições de crédito | Loans and advances to credit institutions (5,057,264,458) 746,679,864
Créditos a clientes | Loans and advances to customers (6,427,641,641) (10,524,170,091)
Aumentos (diminuições) de títulos | Increases (decreases) in securities 569,471,873 513,504,785
Outros activos | Other assets (301,124,095) (171,271,380)
fluxO líquIDO PROvENIENTE DE ACTIvOS OPERACIONAISneT fLOw geneRATeD By OPeRATIng AsseTs (11,216,558,321) (9,435,256,821)
Aumentos em: | Increases in:
Recursos de Bancos Centrais e outras instituições de créditoCentral banks’ and other credit institutions’ resources 986,868,519 3,141,237,455
Recursos de clientes | Customer resources 8,570,216,008 7,234,072,766
Outros passivos | Other liabilities 1,430,173,912 (326,917,520)
fluxO líquIDO PROvENIENTE DE PASSIvOS OPERACIONAISneT fLOw geneRATeD By OPeRATIng LIABILITIes 10,987,258,439 10,048,392,701
fluxO líquIDO DAS ACTIvIDADES OPERACIONAIS | neT fLOw geneRATeD By OPeRATIng ACTIVITIes 1,511,402,790 1,476,171,148
ACTIvIDADES DE INvESTIMENTO | InVesTIng ACTIVITIes
Aquisições de activos tangíveis e activos intangíveis | Acquisitions of tangible and intangible assets (888,165,271) (390,358,836)
fluxO líquIDO DAS ACTIvIDADES DE INvESTIMENTOneT fLOw geneRATeD By InVesTIng ACTIVITIes (888,165,271) (390,358,836)
ACTIvIDADES DE fINANCIAMENTO | fInAnCIng ACTIVITIes
Dividendos distribuídos | Payment of dividends (179,116,038) (129,056,005)
fluxO líquIDO DAS ACTIvIDADES DE fINANCIAMENTOneT fLOw geneRATeD By fInAnCIng ACTIVITIes (179,116,038) (129,056,005)
efeitos de alteração da taxa de câmbio em caixa e seus equivalenteseffects of change in exchange rate on cash and cash equivalents (202,470,564) 182,045,642
Aumento de caixa e seus equivalentes | Increase in cash and cash equivalents 241,650,917 1,138,801,949
Caixa e seus equivalentes no início do período | Cash and cash equivalents at start of period 4,035,123,088 2,896,321,139
CAIxA E SEuS EquIvAlENTES NO fIM DO PERíODO | CAsh AnD CAsh eQUIVALenTs AT enD Of PeRIOD 4,276,774,005 4,035,123,088

079
09. dEMONSTRAÇÕES fINANCEIRAS INdIvIduAIS fINANCIAL STATEMENTS ON A SEPARATE BASIS
Conciliação com os saldos constantes do balanço:Reconciliation with balances set out in the balance sheet:
NOTAS | NOTES 31-DEZ-10 | 31-DEC-10 31-DEZ-09 | 31-DEC-09
CAIxA E EquIvAlENTES | CAsh AnD CAsh eQUIVALenTs 4,276,774,005 4,035,123,088
(-) Cheques a cobrar sobre Instituições de Crédito no estrangeiro(-) Cheques pending settlement on credit institutions abroad 3.2 14,044,768 7,177,177
(-) Cheques a cobrar sobre Instituições de Crédito no país(-) Cheques pending settlement on credit institutions in Mozambique 3.2 3,554,728 323,603
TOTAl 4,294,373,502 4,042,623,868
Caixa e Disponibilidades em Bancos Centrais | Cash and cash equivalents with central banks 3.1 4,223,871,279 3,285,782,195
Disponibilidades sobre instituições de crédito | Cash assets with credit institutions 3.2 70,502,223 756,841,673
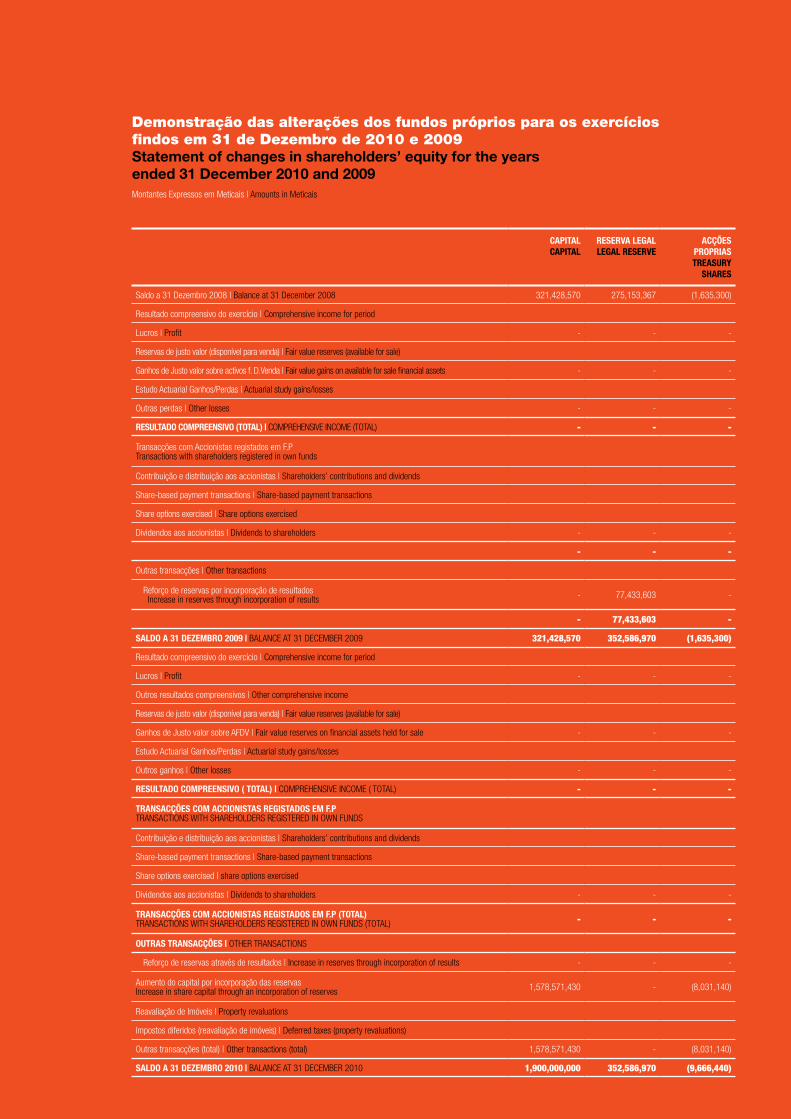
080
BCI | RELATÓRIO E CONTAS 2010 | ANNUAL REPORT 2010BCI
CAPITAlCAPITAl
RESERvA lEGAllEGAl RESERvE
ACçõES PROPRIAS TREASuRy
ShARES
saldo a 31 Dezembro 2008 | Balance at 31 December 2008 321,428,570 275,153,367 (1,635,300)
Resultado compreensivo do exercício | Comprehensive income for period
Lucros | Profit - - -
Reservas de justo valor (disponível para venda) | fair value reserves (available for sale)
ganhos de Justo valor sobre activos f. D.Venda | fair value gains on available for sale financial assets - - -
estudo Actuarial ganhos/Perdas | Actuarial study gains/losses
Outras perdas | Other losses - - -
RESulTADO COMPREENSIvO (TOTAl) | COMPRehensIVe InCOMe (TOTAL) - - -
Transacções com Accionistas registados em f.PTransactions with shareholders registered in own funds
Contribuição e distribuição aos accionistas | shareholders’ contributions and dividends
share-based payment transactions | share-based payment transactions
share options exercised | share options exercised
Dividendos aos accionistas | Dividends to shareholders - - -
- - -
Outras transacções | Other transactions
Reforço de reservas por incorporação de resultados Increase in reserves through incorporation of results - 77,433,603 -
- 77,433,603 -
SAlDO A 31 DEZEMbRO 2009 | BALAnCe AT 31 DeCeMBeR 2009 321,428,570 352,586,970 (1,635,300)
Resultado compreensivo do exercício | Comprehensive income for period
Lucros | Profit - - -
Outros resultados compreensivos | Other comprehensive income
Reservas de justo valor (disponível para venda) | fair value reserves (available for sale)
ganhos de Justo valor sobre AfDV | fair value reserves on financial assets held for sale - - -
estudo Actuarial ganhos/Perdas | Actuarial study gains/losses
Outros ganhos | Other losses - - -
RESulTADO COMPREENSIvO ( TOTAl) | COMPRehensIVe InCOMe ( TOTAL) - - -
TRANSACçõES COM ACCIONISTAS REGISTADOS EM f.PTRAnsACTIOns wITh shARehOLDeRs RegIsTeReD In Own fUnDs
Contribuição e distribuição aos accionistas | shareholders’ contributions and dividends
share-based payment transactions | share-based payment transactions
share options exercised | share options exercised
Dividendos aos accionistas | Dividends to shareholders - - -
TRANSACçõES COM ACCIONISTAS REGISTADOS EM f.P (TOTAl)TRAnsACTIOns wITh shARehOLDeRs RegIsTeReD In Own fUnDs (TOTAL) - - -
OuTRAS TRANSACçõES | OTheR TRAnsACTIOns
Reforço de reservas através de resultados | Increase in reserves through incorporation of results - - -
Aumento do capital por incorporação das reservasIncrease in share capital through an incorporation of reserves 1,578,571,430 - (8,031,140)
Reavaliação de Imóveis | Property revaluations
Impostos diferidos (reavaliação de imóveis) | Deferred taxes (property revaluations)
Outras transacções (total) | Other transactions (total) 1,578,571,430 - (8,031,140)
SAlDO A 31 DEZEMbRO 2010 | BALAnCe AT 31 DeCeMBeR 2010 1,900,000,000 352,586,970 (9,666,440)
demonstração das alterações dos fundos próprios para os exercícios findos em 31 de dezembro de 2010 e 2009Statement of changes in shareholders’ equity for the years ended 31 December 2010 and 2009Montantes expressos em Meticais | Amounts in Meticais
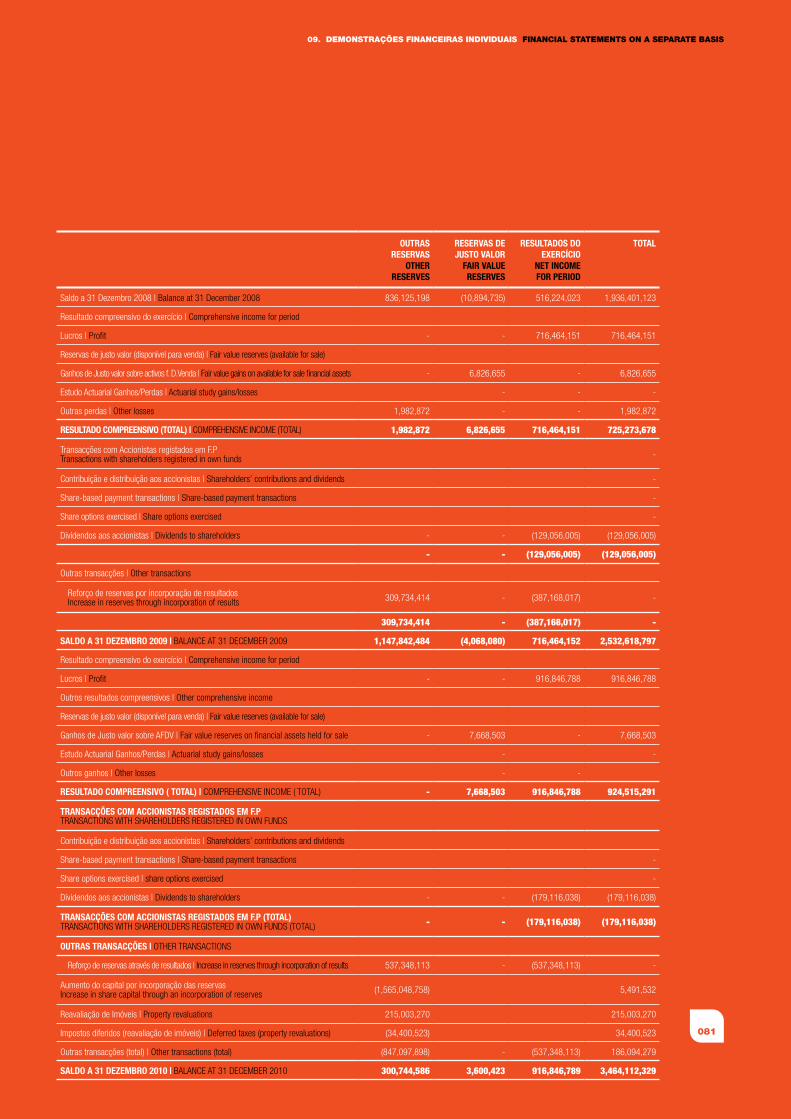
081
09. dEMONSTRAÇÕES fINANCEIRAS INdIvIduAIS fINANCIAL STATEMENTS ON A SEPARATE BASIS
OuTRAS RESERvAS
OThERRESERvES
RESERvAS DE JuSTO vAlOR
fAIR vAluE RESERvES
RESulTADOS DO ExERCíCIO
NET INCOMEfOR PERIOD
TOTAl
saldo a 31 Dezembro 2008 | Balance at 31 December 2008 836,125,198 (10,894,735) 516,224,023 1,936,401,123
Resultado compreensivo do exercício | Comprehensive income for period
Lucros | Profit - - 716,464,151 716,464,151
Reservas de justo valor (disponível para venda) | fair value reserves (available for sale)
ganhos de Justo valor sobre activos f. D.Venda | fair value gains on available for sale financial assets - 6,826,655 - 6,826,655
estudo Actuarial ganhos/Perdas | Actuarial study gains/losses - - -
Outras perdas | Other losses 1,982,872 - - 1,982,872
RESulTADO COMPREENSIvO (TOTAl) | COMPRehensIVe InCOMe (TOTAL) 1,982,872 6,826,655 716,464,151 725,273,678
Transacções com Accionistas registados em f.PTransactions with shareholders registered in own funds -
Contribuição e distribuição aos accionistas | shareholders’ contributions and dividends -
share-based payment transactions | share-based payment transactions -
share options exercised | share options exercised -
Dividendos aos accionistas | Dividends to shareholders - - (129,056,005) (129,056,005)
- - (129,056,005) (129,056,005)
Outras transacções | Other transactions
Reforço de reservas por incorporação de resultadosIncrease in reserves through incorporation of results 309,734,414 - (387,168,017) -
309,734,414 - (387,168,017) -
SAlDO A 31 DEZEMbRO 2009 | BALAnCe AT 31 DeCeMBeR 2009 1,147,842,484 (4,068,080) 716,464,152 2,532,618,797
Resultado compreensivo do exercício | Comprehensive income for period
Lucros | Profit - - 916,846,788 916,846,788
Outros resultados compreensivos | Other comprehensive income
Reservas de justo valor (disponível para venda) | fair value reserves (available for sale)
ganhos de Justo valor sobre AfDV | fair value reserves on financial assets held for sale - 7,668,503 - 7,668,503
estudo Actuarial ganhos/Perdas | Actuarial study gains/losses - -
Outros ganhos | Other losses - -
RESulTADO COMPREENSIvO ( TOTAl) | COMPRehensIVe InCOMe ( TOTAL) - 7,668,503 916,846,788 924,515,291
TRANSACçõES COM ACCIONISTAS REGISTADOS EM f.PTRAnsACTIOns wITh shARehOLDeRs RegIsTeReD In Own fUnDs
Contribuição e distribuição aos accionistas | shareholders’ contributions and dividends
share-based payment transactions | share-based payment transactions -
share options exercised | share options exercised -
Dividendos aos accionistas | Dividends to shareholders - - (179,116,038) (179,116,038)
TRANSACçõES COM ACCIONISTAS REGISTADOS EM f.P (TOTAl)TRAnsACTIOns wITh shARehOLDeRs RegIsTeReD In Own fUnDs (TOTAL) - - (179,116,038) (179,116,038)
OuTRAS TRANSACçõES | OTheR TRAnsACTIOns
Reforço de reservas através de resultados | Increase in reserves through incorporation of results 537,348,113 - (537,348,113) -
Aumento do capital por incorporação das reservasIncrease in share capital through an incorporation of reserves (1,565,048,758) 5,491,532
Reavaliação de Imóveis | Property revaluations 215,003,270 215,003,270
Impostos diferidos (reavaliação de imóveis) | Deferred taxes (property revaluations) (34,400,523) 34,400,523
Outras transacções (total) | Other transactions (total) (847,097,898) - (537,348,113) 186,094,279
SAlDO A 31 DEZEMbRO 2010 | BALAnCe AT 31 DeCeMBeR 2010 300,744,586 3,600,423 916,846,789 3,464,112,329
BCI | RELATÓRIO E CONTAS 2010 | ANNUAL REPORT 2010
082
10. Notas às demonstrações financeiras Notes to the financial Statements
1. Nota introdutória
O BCI é uma sociedade anónima de responsabilidade limitada, constituída em 17 de Janeiro de 1996 por tempo indeterminado. A actividade operacional iniciou-se a 19 de Abril de 1997. Nessa altura, a CGD detinha uma parti cipação de 60% no capital repartindo-se os restantes 40% pela SCI – Sociedade de Controlo e Gestão de Participações (38,63%) e por pequenos accionistas (1,37%). Em Dezembro de 2003 o BCI fun-diu-se com o Banco de Fomento (BF) através da inte-gração de todos os activos do BF no BCI e da extinção do BF. Esta opera ção tornou possível a entrada de um novo grande accionista, o Grupo BPI, com 30% das acções. Em Novembro de 2007 registou-se a saída do Grupo SCI e a entrada do Grupo INSITEC com 18,12% das acções. A participação da CGD passou para 51%, a do Grupo BPI passou para 30% das acções. Os res-tantes 0,88% encontram-se dispersos por diversos pequenos accionistas. O BCI tem a sua Sede em Maputo e rege-se pelos seus estatutos e demais legis-lação aplicável ao sector.
As demonstrações financeiras do exercício findo em 31 de Dezembro de 2010 foram aprovadas pelo Conselho de Administração em 18 de Fevereiro de 2011.
2. Políticas contabilísticas
2.1. Bases de apresentação
declaração de cumprimento
As demonstrações financeiras foram preparadas de acordo com as Normas Internacionais de Relato Financeiro (IFRS), emitidas pelo Comité Internacional de Normas de Contabilidade.
No seguimento do disposto no Aviso N.º 4/GBM/2007, de 30 de Março de 2007, do Banco de Moçambique, as demonstrações financeiras do exercício findo em 31 de Dezembro de 2010 foram preparadas de acordo com
1. Introductory note
BCI is a public limited liability company, formed on 17 January 1996 for an indeterminate period of time, hav-ing initiated its commercial operations on 19 April 1997. CGD, at the time, had an equity investment of 60% with the remaining 40% being held by SCI – Sociedade de Controlo e Gestão de Participações with 38.63% and small shareholders with 1.37%. BCI merged with Banco de Fomento (BF) in December 2003 with all BF assets having been assimilated by BCI and BF having been extinguished. This operation permitted the entry of a new major shareholder - BPI Group - with an equi-ty investment of 30%. The SCI Group disposed of its equity investment in November 2007 when the INSITEC group acquired 18.12% of the shares. CGD’s invest-ment was adjusted to 51% with 30% of the shares being held by BPI Group. The remaining 0.88% is owned by diverse small shareholders. BCI is head-quartered in Maputo and is governed by its articles of association and other legislation applicable to the sector.
The financial statements for the year ended 31 December 2010 were approved by the board of direc-tors on 18 February 2011.
2. Accounting policies
2.1. Presentation bases
Statement of compliance
The financial statements have been prepared in con-formity with the International Financial Reporting Standards (IFRS), issued by the International Accounting Standards Committee.
In compliance with the dispositions of the Bank of Mozambique’s official notice 4/GBM/2007 of 30 March 2007, the financial statements for the year ended 31 December 2010 have been prepared in accordance
083
10. NOTAS àS dEMONSTRAÇÕES fINANCEIRAS NOTES TO ThE fINANCIAL STATEMENTS
as Normas Internacionais de Relato Financeiro (“IFRS”). As IFRS incluem as normas emitidas pelo International Accounting Standards Board (“IASB”) bem como as interpretações emitidas pelo International Financial Reporting Interpretations Committee (“IFRIC”) e pelos respectivos órgãos antecessores.
As demonstrações financeiras foram preparadas com base no princípio do custo histórico, modificada pela aplicação do justo valor para os activos e passivos financeiros disponíveis para venda, excepto aqueles para os quais o justo valor não está disponível. Na pre-paração das suas demonstrações financeiras referentes a 31 de Dezembro de 2010, o BCI adopta a IFRS 7 – Instrumentos Financeiros: Divulgações, bem como a IAS 1 – Apresentação das Demonstrações Financeiras – Requisitos de divulgação de capital regulamentar.
A preparação das demonstrações financeiras em con-formidade com as IFRS exige a formulação de julga-mentos, estimativas e pressupostos de aplicação das políticas contabilísticas, estando as principais estimati-vas e incertezas associadas à aplicação das políticas contabilísticas descritas na nota 2.2 (t).
As demonstrações financeiras anexas estão expressas em Meticais e são idênticas às que foram preparadas pelo Banco a partir dos seus registos contabilísticos e que irão ser submetidas à aprovação da Assembleia Geral de accionistas.
2.2. Principais Políticas Contabilísticas
As políticas contabilísticas que se seguem são aplicá-veis às demonstrações financeiras individuais do Banco BCI.
(a) Operações em moeda estrangeira (IAS 21)
As demonstrações financeiras estão apresentadas em Meticais que constitui a moeda funcional e de apresen-tação utilizada pelo BCI nas suas operações e demons-trações financeiras.
As operações em moeda estrangeira são inicialmente convertidas para a moeda funcional à taxa de câmbio emvigoràdatada transacção.Àdatadobalançoosactivos e passivos monetários denominados em moeda estrangeira são convertidos para Meticais à taxa média
with the International Financial Reporting Standards (IFRS). These include the standards published by the International Accounting Standards Board (IASB) and the interpretations issued by the International Financial Reporting Interpretations Committee (IFRIC) and their respective predecessors.
The financial statements have been prepared on the basis of the historical costs principle, modified by the application of fair value on available for sale assets and liabilities, excluding those on which information on fair value is not available. In the preparation of its financial statements at 31 December 2010, BCI adopted IFRS 7 – Financial Instruments: Disclosures and IAS 1 – Presentation of Financial Statements – Regulatory Capital Requirements.
The preparation of the financial statements in conform-ity with the IFRS requires the formulation of judgments, estimates and presuppositions on the application of the accounting policies, whose principal estimates and uncertainties associated with the application of such accounting policies are described in note 2.2 (t). The attached financial statements are expressed in meticais and are identical to the financial statements prepared by the bank from its accounting records, for submission for the approval of the general meeting of shareholders.
2.2. Principal accounting policies
The following accounting policies are applicable to Banco BCI’s separate financial statements.
(a) foreign exchange operations (IAS 21)
The financial statements are set out in meticais which is the operating and presentation currency used by BCI in its operations and financial statements.
Foreign exchange operations are initially translated into the operating currency at the exchange rate in force at the transaction date. At the date of the balance sheet, monetary assets and liabilities denominated in foreign currency are translated into meticais at the average exchange rate published by the Bank of Mozambique. Unrealised foreign exchange rate differences are recog-nised in the income statement for the period to which
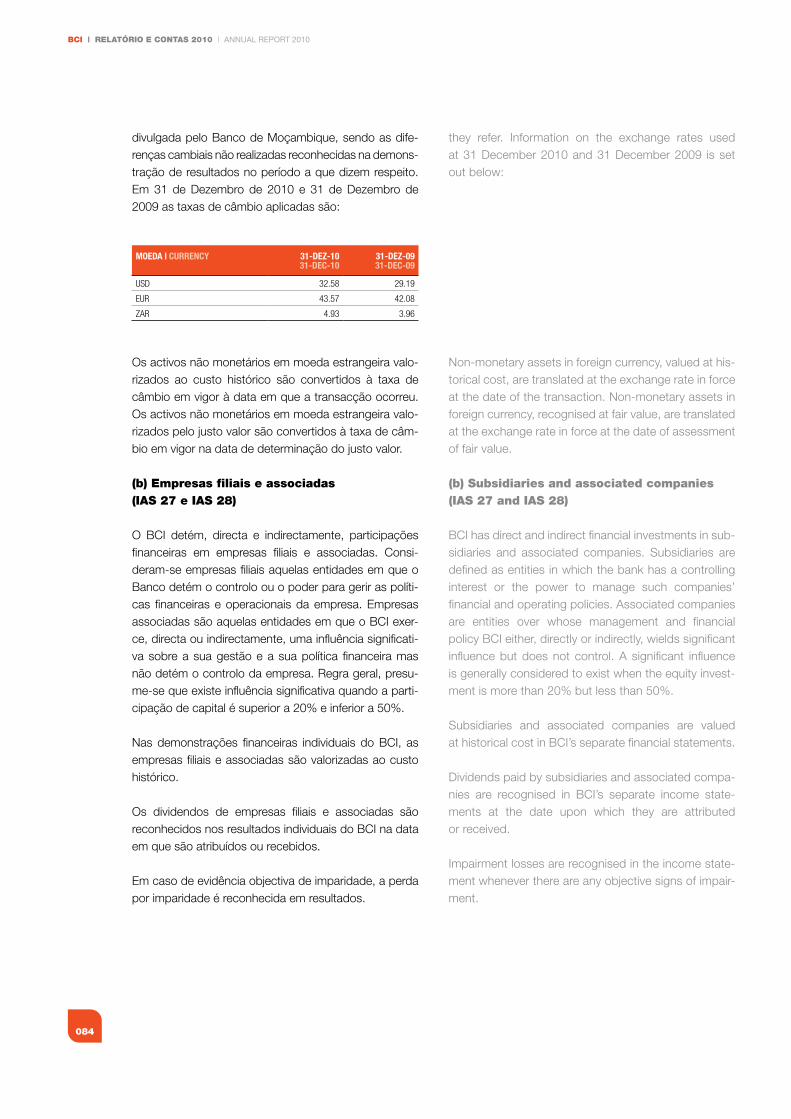
BCI | RELATÓRIO E CONTAS 2010 | ANNUAL REPORT 2010
084
divulgada pelo Banco de Moçambique, sendo as dife-renças cambiais não realizadas reconhecidas na demons-tração de resultados no período a que dizem respeito. Em 31 de Dezembro de 2010 e 31 de Dezembro de 2009 as taxas de câmbio aplicadas são:
Os activos não monetários em moeda estrangeira valo-rizados ao custo histórico são convertidos à taxa de câmbio em vigor à data em que a transacção ocorreu. Os activos não monetários em moeda estrangeira valo-rizados pelo justo valor são convertidos à taxa de câm-bio em vigor na data de determinação do justo valor.
(b) Empresas filiais e associadas (IAS 27 e IAS 28)
O BCI detém, directa e indirectamente, participações financeiras em empresas filiais e associadas. Consi-deram-se empresas filiais aquelas entidades em que o Banco detém o controlo ou o poder para gerir as políti-cas financeiras e operacionais da empresa. Empresas associadas são aquelas entidades em que o BCI exer-ce, directa ou indirectamente, uma influência significati-va sobre a sua gestão e a sua política financeira mas não detém o controlo da empresa. Regra geral, presu-me-se que existe influência significativa quando a parti-cipação de capital é superior a 20% e inferior a 50%.
Nas demonstrações financeiras individuais do BCI, as empresas filiais e associadas são valorizadas ao custo histórico.
Os dividendos de empresas filiais e associadas são reconhecidos nos resultados individuais do BCI na data em que são atribuídos ou recebidos.
Em caso de evidência objectiva de imparidade, a perda por imparidade é reconhecida em resultados.
MOEDA | CuRRENCy 31-DEZ-1031-DEC-10
31-DEZ-0931-DEC-09
UsD 32.58 29.19
eUR 43.57 42.08
ZAR 4.93 3.96
they refer. Information on the exchange rates used at 31 December 2010 and 31 December 2009 is set out below:
Non-monetary assets in foreign currency, valued at his-torical cost, are translated at the exchange rate in force at the date of the transaction. Non-monetary assets in foreign currency, recognised at fair value, are translated at the exchange rate in force at the date of assessment of fair value.
(b) Subsidiaries and associated companies (IAS 27 and IAS 28)
BCI has direct and indirect financial investments in sub-sidiaries and associated companies. Subsidiaries are defined as entities in which the bank has a controlling interest or the power to manage such companies’ financial and operating policies. Associated companies are entities over whose management and financial policy BCI either, directly or indirectly, wields significant influence but does not control. A significant influence is generally considered to exist when the equity invest-ment is more than 20% but less than 50%.
Subsidiaries and associated companies are valued at historical cost in BCI’s separate financial statements.
Dividends paid by subsidiaries and associated compa-nies are recognised in BCI’s separate income state-ments at the date upon which they are attributed or received.
Impairment losses are recognised in the income state-ment whenever there are any objective signs of impair-ment.
085
10. NOTAS àS dEMONSTRAÇÕES fINANCEIRAS NOTES TO ThE fINANCIAL STATEMENTS
(c) Transacções eliminadas na consolidação
Os lucros não realizados que resultem de transacções com as associadas são eliminados na medida dos inte-resses do Banco nessa entidade. Os lucros não realiza-dos são eliminados por contrapartida dos Investimentos nas associadas. As perdas não realizadas são elimina-das da mesma forma mas apenas na medida em que não haja evidência de qualquer redução do respectivo valor recuperável.
(d) Activos e passivos financeiros (IAS 32 e IAS 39)
A classificação de instrumentos financeiros no reconheci-mento inicial depende do objectivo para o qual o instru-mento foi adquirido bem como das suas características.
Os activos e passivos financeiros são reconhecidos no balanço do BCI na data de contratação pelo respectivo justo valor acrescido de custos de transacção directa-mente atribuíveis, excepto para activos e passivos ao justo valor através dos resultados em que os custos de transac-ção são imediatamente reconhecidos em resultados.
Entende-se por justo valor o montante pelo qual um activo ou passivo pode ser transferido ou liquidado, entre partes independentes, informadas e interessadas na concretização da transacção em condições normais de mercado. O justo valor de um instrumento financeiro no reconhecimento inicial é geralmente o preço da tran-sacção.
O justo valor é determinado com base em preços de um mercado activo ou em métodos de avaliação no caso de inexistência de tal mercado activo. Um mercado é considerado activo se ocorrerem transacções de forma regular.
O BCI avalia, à data de cada balanço, se existe evidên-cia objectiva de que um activo financeiro ou grupo de activos financeiros está em imparidade. Considera-se que um activo financeiro está em imparidade se, e ape-nas se, existir evidência objectiva de perda de valor em resultado de um ou mais acontecimentos que tenham ocorrido após o reconhecimento inicial do activo e des-de que tais acontecimentos tenham um impacto sobre os fluxos de caixa futuros estimados dos activos finan-ceiros. A evidência de imparidade pode incluir indicações
(c) Transactions eliminated from the consolidation
Unrealised profit resulting from transactions with asso-ciated companies have been eliminated in line with the bank’s interests in the entity. Unrealised profit is elimi-nated as a charge to investments in associated companies. Unrealised losses are similarly eliminated but only to the extent that there is no evidence of any reduction to their recoverable value.
(d) financial assets and liabilities (IAS 32 and IAS 39)
The classification of financial instruments, at the time of initial recognition, depends upon the objective behind the instrument’s acquisition and its characteristics.
Financial assets and liabilities are recognised in BCI’s balance sheet at their respective fair value at the agree-ment date, plus costs directly attributable to the trans-action, except for assets and liabilities recognised at fair value through profit or loss whose transaction costs are immediately recognised in the income statement.
Fair value is understood to be the amount for which an asset or liability can be transferred or liquidated between independent, informed parties, interested in realising the transaction under normal market condi-tions. The fair value of a financial instrument, at the time of initial recognition, is generally its transaction price.
Fair value is determined on the basis of prices in an active market or valuation methods if no such active market exists. A market is considered active if transac-tions are performed regularly.
At each balance sheet date, BCI assesses if there is any objective evidence on whether a financial asset or group of financial assets is/are impaired. A financial asset is considered to be impaired if, and only if, there is objective evidence of loss of value, deriving from the occurrence of one or more events after the asset’s date of initial recognition and provided that such events have an impact on the estimated future cash flows of the financial assets. Evidence of impairment may include signs that a debtor, or group of debtors, is/are in finan-cial difficulty, in default or in arrears on settlements of capital or interest, the probability of bankruptcy or
BCI | RELATÓRIO E CONTAS 2010 | ANNUAL REPORT 2010
086
de que o devedor ou um grupo de devedores está em dificuldades financeiras, incumprimento ou mora na liquidação de capital ou juros, a probabilidade de entra-rem em falência ou em reorganização financeira e sem-pre que esteja disponível informação que indica um decréscimo de valor dos fluxos de caixa futuros.
i. Activos financeiros pelo justo valor através dos resultados
Esta categoria inclui activos financeiros classificados de forma irrevogável no seu reconhecimento inicial como sendo activos financeiros ao justo valor através de resul-tados.
Os activos financeiros classificados nesta categoria são registados no balanço pelo justo valor, sendo os ganhos e perdas gerados pela valorização subsequente reflecti-dos em resultados do exercício.
A 31 de Dezembro de 2010, esta rubrica apresentava saldo nulo.
ii. Investimentos detidos até à maturidade
Nesta categoria são classificados títulos de rendimento fixo de risco reduzido que o Banco tem intenção e capa-cidade de deter até ao seu vencimento.
Estes activos financeiros encontram-se registados pelo custo amortizado. De acordo com este método, o valor do instrumento financeiro em cada data de balanço cor-responde ao seu custo inicial, tomando em considera-ção qualquer desconto ou prémio de aquisição e comis-sões que são uma parte integrante da taxa de juro efectiva, deduzido de reembolsos de capital efectuados e perdas por imparidade e ajustado pela amortização, com base no método da taxa efectiva.
Os juros são reconhecidos com base no método da taxa efectiva, o qual permite calcular o custo amortizado e repartir os juros ao longo do período da operação financeira. A taxa efectiva é aquela que, sendo utilizada para descontar os fluxos de caixa futuros estimados associados ao instrumento financeiro, permite igualar o seu valor actual ao valor do instrumento financeiro na data do reconhecimento inicial.
the implementation of financial restructuring operations and whenever any information indicates a decrease in value of future cash flows.
i. financial assets at fair value through profit or loss
This category includes financial assets irrevocably clas-sified at the time of their initial recognition as financial assets at fair value through profit or loss.
Financial assets classified in this category are recog-nised in the balance sheet at fair value. The gains and losses generated by their subsequent valuation are rec-ognised as income for the year.
There was a nil balance on this account at 31 December 2010.
ii. Investments held to maturity
Low risk fixed-income securities the bank intends and has capacity to hold to maturity are included in this category.
These financial assets are recognised at amortised cost. In accordance with this method, the value of the financial instrument at each balance sheet date corre-sponds to its initial cost, taking into account any dis-count or acquisition premium and commissions which are an integral part of the effective interest rate, less capital repayments and impairment losses, adjusted for amortisation using the effective rate method.
Interest is recognised on the basis of the effective inter-est rate method, enabling the amortised cost to be calculated and interest split up over the period of the financial operation. The effective rate is the rate that, being used to discount the estimated future cash flows associated with the financial instrument, enables its present value to be matched with the value of the finan-cial instrument at the date of initial recognition.
087
10. NOTAS àS dEMONSTRAÇÕES fINANCEIRAS NOTES TO ThE fINANCIAL STATEMENTS
O BCI avalia, individualmente, se existe evidência de imparidade para os activos financeiros detidos até à maturidade. Caso exista evidência objectiva de que foi incorrida uma perda por imparidade, o montante da per-da é determinado pela diferença entre a quantia escritu-rada do activo e o valor presente dos fluxos de caixa futuros do activo. A quantia escriturada do activo é reduzida e a perda é reconhecida na demonstração de resultados.
Se, em períodos subsequentes, o montante da perda por imparidade reduzir em virtude de um evento após o reconhecimento da perda, quaisquer montantes ante-riormente registados devem ser ajustados.
Em 31 de Dezembro de 2010 e 2009, esta rubrica apre-senta saldo nulo.
iii. Empréstimos e contas a receber
Os empréstimos e contas a receber são activos finan-ceiros com pagamentos fixos ou determináveis, e matu-ridade fixa, não cotados em mercados activos.
Os empréstimos e contas a receber abrangem os cré-ditos concedidos pelo Banco a clientes e a instituições de crédito que não sejam transaccionados num mer-cado activo e para os quais não haja intenção de venda.
No reconhecimento inicial os empréstimos e contas a receber são registados pelo seu justo valor, deduzido de eventuais comissões incluídas na taxa efectiva, e acres-cido de todos os custos incrementais directamente atri-buíveis à transacção. Subsequentemente, estes activos são valorizados ao custo amortizado, com base no método da taxa de juro efectiva e sujeitos a testes de imparidade. Os juros são reconhecidos com base no método da taxa efectiva.
Garantias prestadas e compromissos irrevogáveis
As responsabilidades por garantias prestadas e com-promissos irrevogáveis são registadas em contas extra-patrimoniais pelo valor em risco, sendo os fluxos de juros, comissões ou outros proveitos registados em contas de resultados ao longo da vida das operações. Estas operações são sujeitas a testes de imparidade.
BCI performs a separate assessment on whether there is any evidence of impairment on financial assets held to maturity. If there is any objective evidence of the occurrence of an impairment loss, the amount of the loss is assessed on the basis of the difference between the asset’s book value and the present value of the asset’s future cash flows. The asset’s book value is reduced and the loss is recognised in the income statement.
If, in subsequent periods, the amount of the impairment loss is reduced by the occurrence of an event after the recognition of the loss, any previously registered amounts are adjusted.
There was a nil balance on this account at 31 December 2010 and 2009.
iii. Loans and accounts receivable
Loans and accounts receivable are financial assets with fixed or determinable payments and an agreed maturity date, not listed on active markets.
Loans and accounts receivable include loans made by the bank to customers and credit institutions which are not traded on an active market and which it has no intention of selling.
At their time of initial recognition, loans and accounts receivable are recognised at their fair value, less any commissions included in the effective rate, plus all incremental costs directly attributable to the transac-tion. These assets are subsequently valued at amor-tised cost, based on the effective interest rate method and subject to impairment tests. Interest is recognised on the basis of the effective rate method.
guarantees issued and irrevocable commitments
Liabilities for guarantees issued and irrevocable com-mitments are recognised in off-balance sheet accounts for the amount at risk, whose interest flows, commis-sions or other income are recognised in income accounts over the course of the operations’ lives. These operations are subject to impairment tests.
BCI | RELATÓRIO E CONTAS 2010 | ANNUAL REPORT 2010
088
Imparidade
O BCI efectua regularmente análises de imparidade dos créditos e valores a receber. A identificação de indícios de imparidade é efectuada numa base individual, para os créditos em que o montante de exposição é significa-tivo, e numa base colectiva, quanto aos activos homo-géneos cujos saldos não sejam individualmente signifi-cativos.
De acordo com a IAS 39, um activo financeiro encontra-se em situação de imparidade quando existe evidência de que tenham ocorrido um ou mais eventos de perda após o reconhecimento inicial do activo, e esses even-tos tenham impacto na estimativa do valor recuperável dos fluxos de caixa futuros do activo financeiro conside-rado.
Segundo o estabelecido na IAS 39, os seguintes even-tos são considerados como constituindo indícios de imparidade em activos financeiros:• Incumprimentodecláusulascontratuais,comoatra-sosnopagamentodosjurosoucapital;
• Registo de situações de incumprimento no sistemafinanceiro;
• Existênciadeoperaçõesemvigorresultantesderees-truturações de créditos ou de negociações em curso parareestruturaçõesdecrédito;
• Dificuldadesaoníveldacapacidadedossóciosedagestão, nomeadamente no que se refere à saída de sócios de referência ou dos principais quadros e divergênciasentreossócios;
• Dificuldades financeirassignificativasdodevedoroudoemissordadívida;
• Existênciadeumaelevadaprobabilidadededeclara-çãodefalênciadodevedoroudoemissordadívida;
• Diminuiçãodaposiçãocompetitivadodevedor;• Comportamentohistóricodascobrançasquepermita
deduzir que o valor nominal não será recuperado na totalidade.
Impairment
BCI regularly performs impairment tests on its loans and accounts receivable. Signs of impairment are iden-tified on a separate basis on credit in which there is a significant level of exposure and on a collective basis on like-for-like assets, whose balances are not individu-ally significant.
Under IAS 39, a financial asset is impaired when there is evidence of the occurrence of one or more event losses after the asset’s initial recognition and when such events have an impact on the estimated recover-able value of the said asset’s future cash flows.
Under the terms of IAS 39, the following events are considered to be signs of impairment on financial assets:• Failure to complywith contractual clauses suchasarrearsofinterestorcapital;
• Incidentsofdefaultsinthefinancialsystem;• Existenceofexistingoperationsderivingfromcredit
restructuring operations or from credit restructuring negotiationsinprogress;
• Difficulties in termsof thecapacityofpartners andmanagement, i.e. when leading partners or principal senior staff leave the company and in the event ofdisagreementsbetweenpartners;
• Debtor or debt issuing entities’ significant financialdifficulties;
• Existence of a strong probability of a declarationofbankruptcybythedebtorordebtissuingentity;
• Adecreaseinthedebtor’scompetiveness;• Historical recordsofcollectionssuggestingthatthe
nominal value will never be fully recovered.
089
10. NOTAS àS dEMONSTRAÇÕES fINANCEIRAS NOTES TO ThE fINANCIAL STATEMENTS
Análise individual
Para os activos relativamente aos quais existe evidência objectiva de imparidade numa base individual, o cálculo da imparidade é efectuado mutuário a mutuário, tendo como referência a informação que consta da análise de risco de crédito do Banco os quais consideram, entre outros, os seguintes factores:• ExposiçãoglobaldoClienteenaturezadasresponsa-bilidades contraídas junto do Banco: operações finan-ceiras ou não-financeiras (nomeadamente, responsabili-dades de natureza comercial ou garantias de boa execução);• Análise de risco doCliente determinada através doacompanhamento regular do Banco a qual incorpora, entre outras, as seguintes características:• Situaçãoeconómico-financeiradoCliente;• Riscodosectordeactividadeemqueopera;• QualidadedegestãodoCliente,medidapelaexperi-
ência no relacionamento com o BCI e pela existência deincidentes;
• Qualidadedainformaçãocontabilísticaapresentada;• Natureza e montante das garantias associadas àsresponsabilidadescontraídasjuntodoBanco;
• Créditoemsituaçãodeincumprimento.
Sempre que sejam identificados indícios de imparidade em activos analisados individualmente, a eventual perda por imparidade corresponde à diferença entre o valor actual dos fluxos de caixa futuros que se espera receber (valor recuperável), descontado com base na taxa de juro efectiva original do activo, e o valor inscrito no balanço no momento da análise.
De salientar que o valor expectável de recuperação do crédito reflecte os fluxos de caixa que poderão resultar da execução das garantias ou colaterais associados ao crédito concedido, deduzido dos custos inerentes ao respectivo processo de recuperação.
Os activos avaliados individualmente e para os quais não foram identificados indícios objectivos de imparida-de, são igualmente objecto de avaliação colectiva de imparidade. Os activos avaliados individualmente e para os quais foi reconhecida uma perda por imparidade são excluídos das análises colectivas.
Separate analysis
For assets in which there is objective evidence of impairment, on a separate basis, impairment is calcu-lated on a borrower-by-borrower basis, using informa-tion contained in the bank’s credit risk analysis which considers, inter alia, the following factors:• Acustomer’sglobal exposureand typeof liabilities
to the bank: financial or non-financial operations (i.e. commercial liabilities or good performance guarantees);
• An analysis of customer risk, regularly monitoredby the bank, incorporating, inter alia, the following characteristics:
• Acustomer’seconomic-financialsituation;• Riskattachedtothesectorofactivityinwhichacus-tomeroperates;
• Customer’squalitymanagement,measuredbyexpe-rience of the relationship with BCI and the existence ofanyincidents;
• Qualityofpresentationofaccountinginformation;• Typeandamountofguaranteesassociatedwiththeliabilitiestothebank;
• Anynon-performingcredit.
Whenever signs of impairment on separately analysed assets are identified, the eventual impairment loss comprises the difference between the present book value of expected future cash flows receivable (recov-erable value), discounted on the basis of the asset’s effective original interest rate and its book value at the time of the analysis.
The expectable amount of credit recovery reflects the cash flows which may result from the executing of guarantees or collateral associated with the credit, less the costs of the respective recovery process.
Collective impairment analyses are also performed on separately valued assets upon which no objective signs of impairment have been noted. Assets valued separately and on which an impairment loss has been recognised are excluded from the collective analyses.
BCI | RELATÓRIO E CONTAS 2010 | ANNUAL REPORT 2010
090
Análise colectiva
Para os activos sujeitos a análise colectiva o cálculo da imparidade é feito com recurso a um modelo definido para o efeito, no qual os activos são agrupados em gru-pos homogéneos de risco para se apurar as probabili-dades destes apresentarem indícios de default, assim como a percentagem de perda caso o mesmo se verifi-que.
Os grupos homogéneos de risco são constituídos com base no:• Segmentodoclienteouproduto;• Tipodegarantiasassociadasàoperaçãodecrédito;• Comportamentoactualdaoperaçãodecrédito;• Comportamentohistóricodaoperaçãodecrédito;e• Duração dos diferentes comportamentos da opera-
ção de crédito.
Os fluxos de caixa futuros dos créditos sujeitos a análise colectiva de imparidade são estimados com base nos dados históricos disponíveis acerca das perdas para activos com características de risco de crédito seme-lhante e o montante de imparidade apurado é reconhe-cido nos resultados.
iv. Activos financeiros disponíveis para venda
Esta categoria inclui nomeadamente:• Títulosderendimentovariávelnãoclassificadoscomoactivosaojustovaloratravésderesultados;
• Obrigaçõeseoutrosinstrumentosdedívidaaquiclas-sificados no reconhecimento inicial.
Os activos financeiros disponíveis para venda são ava-liados ao justo valor, com excepção de instrumentos de capital não cotados num mercado activo e cujo justo valor não possa ser estimado com fiabilidade, os quais permanecem registados ao custo. Os ganhos ou perdas resultantes da alteração no justo valor são reconhecidos directamente nos fundos próprios. No momento da alie-nação, ou caso seja determinada imparidade, as varia-ções acumuladas no justo valor são transferidas para resultados do período.
Os juros relativos a instrumentos de dívida classificados nesta categoria são determinados com base no método da taxa efectiva.
Os dividendos de instrumentos de capital classificados nesta categoria são registados como rendimentos aquando do seu recebimento.
Collective analysis
For assets subject to a collective analysis, impairment is calculated using a model defined for the purpose, in which assets are grouped into like-for-like risk groups to ascertain the probabilities of signs of default as well as the percentage loss in the case of effective default.
Like-for-like risk groups comprise:• Customerorproductsegment;• Typeofguaranteesassociatedwiththecreditopera-tion;
• Currentstatusofcreditoperation;• Trackrecordofcreditoperation;and• Durationofthedifferentcreditoperationbehaviours.
The future cash flows of credit subject to a collective impairment analysis are estimated on the basis of the historical date available on losses relating to assets with similar credit risk characteristics with the amount of impairment assessed being recognised in the income statement.
iv. Available for sale financial assets
This category includes:• Variable-income securities not classified as assetsrecognisedatfairvaluethroughprofitorloss;
• Bondsandotherdebt instrumentshereinclassifiedat the time of initial recognition.
Available for sale financial assets are assessed at their fair value, except for equity instruments not listed on an active market whose fair value cannot be reliably esti-mated, which continue to be recognised at cost. Gains or losses resulting from fair value changes are recog-nised directly in own funds. At the time of disposal or if any impairment is assessed, the accumulated changes in fair value are transferred to the income statement for the period.
Interest on debt instruments classified in this category is assessed by the effective rate method.
The dividends from equity instruments classified in this category are recognised as income, upon receipt.
091
10. NOTAS àS dEMONSTRAÇÕES fINANCEIRAS NOTES TO ThE fINANCIAL STATEMENTS
v. Depósitos e outros recursos
Após o reconhecimento inicial os depósitos e outros recursos financeiros de clientes e instituições de crédito são valorizados ao custo amortizado, com base no método da taxa de juro efectiva.
O BCI deixa de reconhecer activos financeiros quando:• Osdireitoscontratuaisaosfluxosdecaixaassociadosaoactivotenhamexpirado;• OBancotenhatransferidoosdireitoscontratuaisaosfluxos de caixa decorrentes do activo bem como tenha transferido substancialmente todos os riscos e vanta-gens do activo, ou o controlo do activo não tendo, no entanto, transferido todos os riscos e vantagens asso-ciados ao activo.
Um passivo financeiro deixa de ser reconhecido quando a respectiva obrigação for satisfeita, cancelada ou expi-rar. Quando o passivo é substituído por outro do mesmo mutuário em condições substancialmente distintas, ou as condições de um passivo existente são substancial-mente modificadas, tal modificação ou troca é tratada como o reconhecimento de um novo passivo, e conse-quente não reconhecimento do passivo original, sendo a diferença entre os respectivos montantes reconhecida nos resultados do período.
Os títulos comprados com acordo de revenda não são registados na carteira de títulos. Os fundos entregues são registados, na data de liquidação, como um crédito, sendo periodificado o valor de juros.
Os títulos vendidos com acordo de recompra são man-tidos na carteira onde estavam originalmente regista-dos. Os fundos recebidos são registados, na data de liquidação, em conta própria do passivo, sendo periodi-ficado o valor de juros.
Os activos e passivos financeiros apenas são compen-sados, e o seu valor líquido apresentado no balanço, quando o BCI tem o direito de proceder à sua compen-sação e pretende liquidar numa base líquida ou realizar o activo e liquidar simultaneamente o passivo.
(e) Activos não correntes detidos para venda (IfRS 5)
Os activos não correntes, ou grupos de activos e passi-vos a alienar são classificados como detidos para venda sempre que seja expectável que o seu valor de balanço seja essencialmente recuperado através da venda, e
v. deposits and other resources
After initial recognition, customers’ and credit institu-tions’ deposits and other financial resources are valued at amortised cost, using the effective interest rate method.
BCI ceases to recognise financial assets when:• Thecontractualrightstoanasset’sassociatedcashflowshaveexpired;
• Thebankhastransferredthecontractualrightstothecash flows deriving from the asset, in addition to hav-ing substantially transferred all of the risks and ben-efits attached to the asset, or control of the asset, not having, however, transferred all of the risks and benefits associated with the asset.
A financial liability is no longer recognised when the respective liability has been satisfied, cancelled or expires. When the liability is replaced by another liability from the same borrower under substantially different conditions or the conditions attached to a present liability are substantially modified, such a modification, or exchange is processed as the recognition of a new liability and consequent derecognition of the original liability with the difference between the respective amounts being recognised in the income statement for the period.
The purchase of securities under repos agreements is not recognised in the securities portfolio. The funds delivered are recognised as a credit, on the settlement date and the amount of the interest is periodised.
Securities sold under repos agreements are maintained in the portfolio in which they were originally recognised. Funds received are recognised, at the settlement date, in a specific liabilities account and the amount of inter-est is periodised.
Financial assets and liabilities are only offset and their net value recognised in the balance sheet, when BCI is entitled to do so and intends to make settlement, in cash, or realise the asset while simultaneously liqui-dating the liability.
(e) Non-current assets held for sale (IfRS 5)
Non-current assets or groups of assets and liabilities, for sale, are classified as being held for sale whenever their balance sheet value is expected to be essentially recovered on the basis of their sale and not their continued use. For an asset (or group of assets and
BCI | RELATÓRIO E CONTAS 2010 | ANNUAL REPORT 2010
092
não de uso continuado. Para que um activo (ou grupo de activos e passivos) seja classificado nesta rubrica é necessário o cumprimento dos seguintes requisitos:• Aprobabilidadedeocorrênciadavendasejaelevada;• Oactivoestejadisponívelparavendaimediatanoseuestadoactual;• Deveráexistiraexpectativadequeavendasevenhaa concretizar até um ano após a classificação do activo nesta rubrica.
Os activos registados nesta rubrica não são amortiza-dos, sendo valorizados ao menor valor entre o custo de aquisição e o seu justo valor, deduzido dos custos a incorrer na venda. O justo valor destes activos é deter-minado com base em avaliações efectuadas pelas enti-dades especializadas.
Caso o valor registado em balanço seja inferior ao justo valor, deduzido dos custos de venda, são registadas perdas por imparidade na rubrica adequada.
Os imóveis e outros bens arrematados obtidos por recu-peração de créditos vencidos são registados pelo valor de arrematação, sendo o passivo regularizado quando os respectivos processos judiciais se encontram con-cluídos, por contrapartida dos créditos vencidos.
(f) Propriedades de investimento (IAS 40)
As propriedades de investimento correspondem a imó-veis detidos pelo BCI com o objectivo de obtenção de rendimentos através do arrendamento ou da sua valori-zação.
Após o reconhecimento inicial, as propriedades de inves timento são mensuradas pelo modelo do custo deduzido de amortizações acumuladas e perdas por imparidade acumuladas.
(g) Outros activos tangíveis (IAS 16)
Os activos tangíveis utilizados pelo BCI no decurso da sua actividade são registados ao custo de aquisição, deduzido de amortizações e perdas por imparidade acumuladas. Os custos subsequentes são reconheci-dos como um activo separado apenas se for provável que deles resultarão benefícios económicos futuros para o BCI. As despesas de manutenção e reparação e outras despesas associadas ao seu uso são reconheci-das nos resultados do período em que foram incorridas.
liabilities) to be classified in this account heading, the following requirements must be met:• Thereshouldbeastrongprobabilityofsale;• The asset should be available for immediate saleinitspresentstate;
• Thesaleisexpectedtooccurwithinayearfromtheasset’s classification in the said heading.
Assets recognised in this account heading are not depreciated and are valued at cost, or fair value, which-ever the lesser, less the costs incurred on the sale. The fair value of such assets is assessed on the basis of valuations carried out by specialised entities.
Impairment losses are recognised in the adequate account heading if the balance sheet amount is less than the fair value, less the costs of the sale.
Property and other auctioned assets received on the recovery of overdue credit are recognised at the bid price, with the liability being regularised when the respective judicial procedures have been completed, as a charge to overdue credit.
(f) Investment properties (IAS 40)
Investment properties are properties held by BCI with the objective of obtaining income from their rental or appreciation in value. After initial recognition, investment properties are measured using the cost less accumulated amortisa-tion model and accumulated impairment losses.
(g) Other tangible assets (IAS 16)
Tangible assets used by BCI during the course of its operations are recognised at cost, less depreciation and accumulated impairment losses. The subsequent costs are only recognised as a separate asset if they are likely to produce future economic benefits for BCI. Maintenance and repair and other expenses incurred on use are recognised in the income statement for the period in which they are incurred.
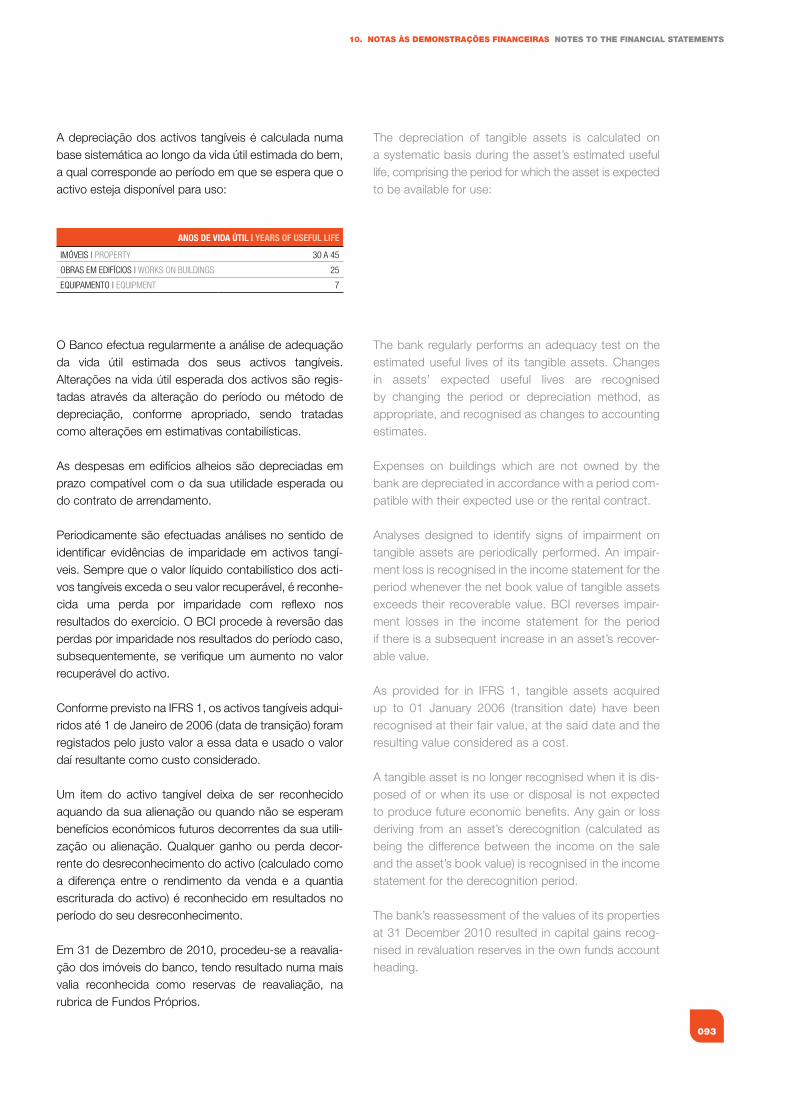
093
10. NOTAS àS dEMONSTRAÇÕES fINANCEIRAS NOTES TO ThE fINANCIAL STATEMENTS
A depreciação dos activos tangíveis é calculada numa base sistemática ao longo da vida útil estimada do bem, a qual corresponde ao período em que se espera que o activo esteja disponível para uso:
O Banco efectua regularmente a análise de adequação da vida útil estimada dos seus activos tangíveis. Alterações na vida útil esperada dos activos são regis-tadas através da alteração do período ou método de depreciação, conforme apropriado, sendo tratadas como alterações em estimativas contabilísticas.
As despesas em edifícios alheios são depreciadas em prazo compatível com o da sua utilidade esperada ou do contrato de arrendamento.
Periodicamente são efectuadas análises no sentido de identificar evidências de imparidade em activos tangí-veis. Sempre que o valor líquido contabilístico dos acti-vos tangíveis exceda o seu valor recuperável, é reconhe-cida uma perda por imparidade com reflexo nos resultados do exercício. O BCI procede à reversão das perdas por imparidade nos resultados do período caso, subsequentemente, se verifique um aumento no valor recuperável do activo.
Conforme previsto na IFRS 1, os activos tangíveis adqui-ridos até 1 de Janeiro de 2006 (data de transição) foram registados pelo justo valor a essa data e usado o valor daí resultante como custo considerado.
Um item do activo tangível deixa de ser reconhecido aquando da sua alienação ou quando não se esperam benefícios económicos futuros decorrentes da sua utili-zação ou alienação. Qualquer ganho ou perda decor-rente do desreconhecimento do activo (calculado como a diferença entre o rendimento da venda e a quantia escriturada do activo) é reconhecido em resultados no período do seu desreconhecimento.
Em 31 de Dezembro de 2010, procedeu-se a reavalia-ção dos imóveis do banco, tendo resultado numa mais valia reconhecida como reservas de reavaliação, na rubrica de Fundos Próprios.
ANOS DE vIDA úTIl | yEARS Of uSEful lIfE
IMÓVeIs | PROPeRTy 30 A 45
OBRAs eM eDIfÍCIOs | wORks On BUILDIngs 25
eQUIPAMenTO | eQUIPMenT 7
The depreciation of tangible assets is calculated on a systematic basis during the asset’s estimated useful life, comprising the period for which the asset is expected to be available for use:
The bank regularly performs an adequacy test on the estimated useful lives of its tangible assets. Changes in assets’ expected useful lives are recognised by changing the period or depreciation method, as appropriate, and recognised as changes to accounting estimates.
Expenses on buildings which are not owned by the bank are depreciated in accordance with a period com-patible with their expected use or the rental contract.
Analyses designed to identify signs of impairment on tangible assets are periodically performed. An impair-ment loss is recognised in the income statement for the period whenever the net book value of tangible assets exceeds their recoverable value. BCI reverses impair-ment losses in the income statement for the period if there is a subsequent increase in an asset’s recover-able value.
As provided for in IFRS 1, tangible assets acquired up to 01 January 2006 (transition date) have been recognised at their fair value, at the said date and the resulting value considered as a cost.
A tangible asset is no longer recognised when it is dis-posed of or when its use or disposal is not expected to produce future economic benefits. Any gain or loss deriving from an asset’s derecognition (calculated as being the difference between the income on the sale and the asset’s book value) is recognised in the income statement for the derecognition period.
The bank’s reassessment of the values of its properties at 31 December 2010 resulted in capital gains recog-nised in revaluation reserves in the own funds account heading.
BCI | RELATÓRIO E CONTAS 2010 | ANNUAL REPORT 2010
094
(h) Locações (IAS 17)
A determinação se um acordo contém uma locação é baseada na substância do acordo e requer uma ava-liação sobre se o seu cumprimento está dependente da utilização de um bem específico e se o acordo dá o direito de uso desse bem.
BCI como locatário
A locação financeira, a qual transfere substancialmente para o Banco todos os riscos e vantagens inerentes à propriedade de um activo, é capitalizada no momento inicial do contrato ao mais baixo entre o justo valor do activo e o valor actual dos pagamentos mínimos de locação, e incluído em activos tangíveis, registando a correspondente responsabilidade para com o locador em outros passivos.
Os activos tangíveis adquiridos através de operações de locação financeira são depreciados durante o prazo da locação ou da sua vida útil, o que for mais curto. As rendas relativas a contratos de locação financeira são desdobradas de acordo com o respectivo plano finan-ceiro, reduzindo-se o passivo pela parte correspondente à amortização do capital. Os juros suportados são reco-nhecidos no resultado do período.
Os pagamentos associados a locações operacionais não são reconhecidos no balanço. Os pagamentos de uma locação operacional são reconhecidos como um gasto numa base de linha recta durante o prazo da loca-ção e registados em gastos operacionais.
BCI como locador
As locações em que o Banco não transfere substan-cialmente todos os riscos e vantagens da propriedade do bem locado são classificadas como locações ope-racionais. O BCI possui nestas condições as suas pro-priedades de investimento as quais geram rendimento de rendas.
Os activos em regime de locação financeira encontram--se registados no balanço como “Crédito a clientes”, sendo este reembolsado através das amortizações de capital constantes do plano financeiro dos contratos. Os juros incluídos nas rendas são reconhecidos no resulta-do do período.
(h) Leases (IAS 17)
An assessment of whether an agreement contains a lease is based on the substance of the agreement and requires an assessment on whether compliance is dependent on the use of a specific asset and whether the agreement entitles such an asset to be used.
BCI as lessee
Leases which substantially transfer all of the risks and benefits attached to an asset’s ownership to the bank are capitalised at the initial date of the agreement at the asset’s fair value or the present value of the minimum lease payments, whichever the lesser and included in tangible assets, with the corresponding liability to the lessor being recognised in other liabilities.
Tangible assets acquired under leases are depreciated during the period of the lease or their useful life, which-ever the shorter period. The instalments relating to lease agreements are split up in accordance with the respective financial schedule, whose liabilities are reduced by the part corresponding to the payment of the capital. The payment of interest is recognised in the income statement for the period.
Payments associated with operating leases are not recognised in the balance sheet. Operating lease pay-ments are recognised as straight line expenditure for the period of the lease and in the operating expenses account heading.
BCI as lessor
Lease operations in which the bank does not substan-tially transfer all of the risks and benefits attached to the leased asset’s ownership are classified as operating leases. BCI’s investment properties, which generate rental income, are classified as such.
Leased assets are recognised in the balance sheet as “loans and advances to customers”, which are repaid by the payments of the capital set out in the agree-ment’s financial schedules. The interest included in the instalments is recognised as income for the period.
095
10. NOTAS àS dEMONSTRAÇÕES fINANCEIRAS NOTES TO ThE fINANCIAL STATEMENTS
(i) Activos intangíveis (IAS 38)
O BCI regista como activos intangíveis as despesas com a aquisição, desenvolvimento ou preparação para uso próprio de aplicações informáticas (“software”). Nos casos em que sejam cumpridos os requisitos definidos na IAS 38, os custos internos directos incorridos no desenvolvimento de aplicações informáticas são capita-lizados como activos intangíveis.
Os activos intangíveis são registados ao custo de aqui-sição, deduzido de depreciações e perdas por impari-dade acumuladas.
As depreciações são registadas numa base sistemática, ao longo da vida útil estimada dos activos, a qual usual-mente situa-se nos 3 anos. O período de depreciação e o método de depreciação dos activos intangíveis com vida útil definida são revistos no final de cada período. Alterações na vida útil esperada são registadas como alterações de estimativa.
As despesas com manutenção de aplicações informáti-cas são contabilizadas como gasto no exercício em que são incorridas.
(j) Imparidade de activos não financeiros (IAS 36)
O Banco avalia, a cada data de relato, ou com maior frequência caso tenha ocorrido alterações que indiquem que um determinado activo possa estar em imparidade, se existem indicações de que um activo não financeiro se possa encontrar em imparidade. Se tal indicação existir, o Banco estima a respectiva quantia recuperável e, caso esta se apresente inferior à quantia escriturada, o activo encontra-se em imparidade e é reduzido para a sua quantia recuperável.
A cada data de balanço, o Banco reavalia se existe qualquer indicação de que uma perda por imparidade anteriormente reconhecida possa já não existir ou possa ter reduzido. Caso exista tal indicação, o Banco estima a quantia recuperável do activo e reverte perdas por imparidade previamente reconhecidas apenas se tive-rem ocorrido alterações nas estimativas usadas para estimar a quantia recuperável desde o reconhecimento da perda.
(i) Intangible assets (IAS 38)
BCI recognises expenses on the acquisition, develop-ment or preparation of software for its own use as intangible assets. In cases in which the requirements defined in IAS 38 are met, direct internal costs incurred on the development of software are capitalised as intangible assets.
Intangible assets are recognised at cost, less deprecia-tion and accumulated impairment losses
Depreciation is recognised on a systematic basis, over the course of assets’ estimated useful lives which is normally 3 years. The depreciation period and depre-ciation method used for intangible assets with a defined useful life are reviewed at the end of each period. Changes to expected useful lives are recognised as changes to estimates.
Expenses on software maintenance are recognised for the year in which they are incurred.
(j) Impairment of non-financial assets (IAS 36)
The bank, at each report date, or more frequently in the event of the occurrence of any changes indicating that a specific asset may be impaired, assesses whether there are any signs that a non-financial asset may be impaired. If this appears to be the case, the bank estimates the respective recoverable amount and, if this is less than the book value, the asset is impaired and its value reduced to its recoverable amount.
At each balance sheet date, the bank reassesses if there is any indication of whether a previously recog-nised impairment loss may no longer exist or may have been reduced. If such an indication exists, the bank estimates the asset’s recoverable value and reverses previously recognised impairment losses only in the event of the occurrence of changes to the estimates used to assess the recoverable amount since the loss’s recognition.
BCI | RELATÓRIO E CONTAS 2010 | ANNUAL REPORT 2010
096
(k) Reconhecimento de rendimentos e gastos (IAS 18)
Os réditos são reconhecidos desde que seja provável que irão fluir benefícios económicos para o Banco e desde que o rendimento possa ser mensurado com fiabilidade. O reconhecimento de rendimentos obedece, ainda, aos seguintes critérios:
Juros, rendimentos e gastos equiparados
Para todos os instrumentos financeiros valorizados ao custo amortizado e juros relacionados com instrumentos financeiros classificados como disponíveis para venda, os gastos e rendimentos de juros são registados à taxa de juro efectiva a qual representa a taxa que desconta os futu-ros pagamentos estimados durante a vida esperada do instrumento financeiro ou período mais curto, se apropria-do, para a quantia escriturada do activo ou passivo finan-ceiro. O cálculo toma em consideração todos os termos contratuais dos instrumentos financeiros e inclui comissões ou custos adicionais directamente relacionados com o instrumento e que se consideram uma parte integrante da taxa de juro efectiva, não considerando perdas futuras.
Uma vez que o activo financeiro ou grupo de activos financeiros tenha sido reduzido como resultado de uma perda por imparidade, o rendimento do juro é daí em diante reconhecido usando a taxa de juro utilizada para descontar os fluxos de caixa futuros para efeitos de quantificação da perda por imparidade.
Rendimentos de taxas e comissões
O BCI obtém taxas e comissões de diversos serviços financeiros prestados aos seus clientes. Tais rendimen-tos podem ser divididos nas seguintes categorias:
Receitas obtidas por serviços prestados durante um determinado período de tempo
Os rendimentos obtidos por serviços prestados durante um determinado período de tempo, onde se incluem comissões, são especializados e reconhecidos no perí-odo correspondente. As comissões relacionadas com créditos são diferidas e reconhecidas como um ajusta-mento à taxa de juro efectiva do empréstimo.
Receitas obtidas por serviços de intermediação
As comissões resultantes da negociação ou participação na negociação de uma transacção com um terceiro são reconhecidas aquando da finalização da transacção.
(k) Recognition of revenue and expenses (IAS 18)
Credit is recognised provided that it is likely to provide the bank with economic benefits and provided that such revenues can be reliably measured. Income rec-ognition also complies with the following criteria:
Interest, income and similar expenses
For all financial instruments valued at amortised cost and interest related with available for sale financial instruments, interest expenses and income are recog-nised at the effective interest rate which discounts the estimated future payments during the expected life of the financial instrument or a shorter period, if appro-priate, vis-à-vis the asset’s or financial liability’s book value. The calculation takes into consideration all of the contractual terms attached to the financial instruments and includes commissions or additional costs directly related with the instrument, considered to be an inte-gral part of the effective interest rate, not considering future losses.
If the value of a financial asset or group of financial assets has been reduced as the result of an impairment loss, the interest income is thereinafter recognised using the interest rate used to discount the future cash flows for the purposes of quantifying the impairment loss.
Income from charges and commissions
BCI makes charges for and receives commissions on diverse financial services provided to its customers. Such income can be divided up into the following categories:
Revenues obtained from services provided over a specific period of time
Income obtained for services provided over a specific period of time, including commissions, is split up and recognised in the corresponding period. Commissions relating to credit are deferred and recognised as an adjustment to the loan’s effective interest rate.
Revenues obtained from intermediation services
Commissions deriving from trading or investment in a business transaction with third parties is recognised when the transaction is finalised.
097
10. NOTAS àS dEMONSTRAÇÕES fINANCEIRAS NOTES TO ThE fINANCIAL STATEMENTS
Rendimentos de rendas
Os rendimentos de rendas de propriedades de investi-mento são reconhecidos numa base de linha recta durante o prazo do contrato sendo reconhecidos na demonstra-ção de resultados em outros rendimentos operacionais.
(l) Caixa e equivalentes de caixa
Caixa e equivalentes de caixa, conforme apresentados da demonstração de fluxos de caixa, englobam os valo-res apresentados no balanço em caixa, contas corren-tes com bancos centrais e investimentos altamente líquidos.
(m) Impostos sobre os lucros (IAS 12)
O Banco, ao abrigo dos incentivos aduaneiros e fiscais previstos no Código dos Benefícios Fiscais em Moçambique (CBFM), aprovado pelo Decreto n.º 12/93, de 21 de Julho, beneficia até 31 de Dezembro de 2013 dos seguintes benefícios:•ReduçãodataxadoImpostosobreRendimentodasPessoasColectivasemcinquentaporcento(50%);
•Apossibilidadedededução,nocálculodoIRPC,dasdespesas realizadas em programas de formação de trabalhadores moçambicanos até ao limite máximo de cincoporcento(5%)damatériacolectável;e
•Isenção de impostos sobre os fundos próprios ouempréstimos e respectivos juros, aplicados em inves-timentos realizados no âmbito do Projecto.
O total dos impostos sobre lucros registados em resul-tados engloba os impostos correntes e os impostos diferidos.
Imposto corrente
O imposto corrente, activo ou passivo, é estimado com base no valor esperado a recuperar ou a pagar às auto-ridades fiscais. A taxa legal de imposto usada para cal-cular o montante é a que se encontra em vigor à data de balanço.
O imposto corrente é calculado com base no lucro tribu-tável do exercício, o qual difere do resultado contabilísti-co devido a ajustamentos à matéria colectável resultan-tes de gastos ou rendimentos não relevantes para efeitos fiscais, ou que apenas serão considerados nou-tros períodos contabilísticos.
Rental income
Rental income from investment properties is recog-nised on a straight line basis during the period of the agreement in other operating income in the income statement.
(l) Cash and cash equivalents
Cash and cash equivalents, as set out in the statement of cash flows, include the amounts set out in the bal-ance sheet in the cash, current accounts with central banks and highly liquid investments account headings. (m) Income tax (IAS 12)
The bank, in accordance with the customs and fiscal incentives provided for in the Code of Fiscal Benefits in Mozambique (CBFM), approved under Decree 12/93 of 21 July, enjoys the following benefits up to 31 December 2013:•50%(fiftypercent)reductionintherateoftaxonthe
“Income of Collective Persons” (corporate tax)•The possibility of deducting the expenses incurred
on training programmes for Mozambican workers from the IRPC calculation, up to a maximum of 5% (fivepercent)oftaxableincome;and
•Exemption from tax on own funds or loans andrespective interest, when invested under the scope of the project.
Total income tax recognised in the income statement includes current and deferred taxes.
Current tax
Current tax assets or liabilities are estimated on the basis of the amount expected to be recovered from or paid to the fiscal authorities. The rate of tax in force used to calculate the amount is the rate in force at the date of the balance sheet.
Current tax is calculated on the basis of taxable profit for the year, which is different from accounting income owing to adjustments to taxable income resulting from expenses or income which are not relevant for fiscal purposes or only considered in other accounting periods.
BCI | RELATÓRIO E CONTAS 2010 | ANNUAL REPORT 2010
098
Imposto diferido
Os impostos diferidos activos e passivos correspondem ao valor do imposto a recuperar e a pagar em períodos futuros resultante de diferenças temporárias entre o valor de um activo ou passivo no balanço e a sua base de tributação. Os prejuízos fiscais reportáveis assim como os benefícios fiscais dão também origem a impos-tos diferidos activos.
Os impostos diferidos activos são reconhecidos até ao montante em que seja provável a existência de lucros tributáveis futuros contra os quais possam ser deduzi-dos os impostos diferidos activos.
Os impostos diferidos foram calculados com base nas taxas fiscais decretadas para o período em que se prevê que seja realizado o respectivo activo ou passivo.
Os impostos sobre o rendimento (correntes ou diferidos) são reflectidos nos resultados do exercício, excepto nos casos em que as transacções que os originaram tenham sido reflectidas noutras rubricas de fundos próprios. Nestas situações, o correspondente imposto é igual-mente reflectido por contrapartida de fundos próprios, não afectando o resultado do exercício.
(n) Provisões e passivos contingentes (IAS 37)
O BCI constitui provisões quando tem uma obrigação presente (legal ou construtiva) resultante de eventos passados relativamente à qual seja provável o futuro dis-pêndio de recursos financeiros, e este possa ser deter-minado com fiabilidade. O montante da provisão corres-ponde à melhor estimativa do valor a desembolsar para liquidar a responsabilidade na data do balanço.
(o) garantias (IAS 37)
No decorrer da sua actividade o BCI concede garantias, cartas de crédito e avais. Tais garantias são registadas em contas fora do balanço e divulgadas como passivos contingentes.
(p) Benefícios dos empregados (IAS 19)
A responsabilidade com pensões de reforma relativa aos colaboradores do Ex-BF foi incorporada no passivo do BCI ao abrigo da escritura de fusão datada 4 de Dezembro de 2003.
O Ex-BF subscreveu o Acordo Colectivo de Trabalho (ACT) de 30 de Dezembro de 1997, que vigora para o
Deferred tax
Deferred tax assets and liabilities comprise the amount of tax to be recovered and paid in future periods result-ing from temporary differences between the balance sheet value of an asset or liability and its taxable base. The carry-back of tax losses to previous years and fiscal benefits also give rise to deferred tax assets.
Deferred tax assets are recognised up to the amount by which the existence of future taxable profit, permit-ting the use of the corresponding deferred tax assets is probable.
Deferred taxes were calculated on the basis of the fis-cal rates decreed for the period in which the respective asset or liability is expected to be realised.
Income tax (current or deferred) is recognised in the income statement for the period, except for cases in which the originating transactions have been recog-nised in other own funds accounts. In these situations, the corresponding tax is also recognised as a charge to own funds and does not affect income for the year.
(n) Provisions and contingent liabilities (IAS 37)
BCI sets up provisions whenever it has a present (legal or constructive) obligation resulting from past events involving the probable future expenditure of financial resources and when this may be reliably determined. The amount of the provision comprises the best esti-mate of the amount to be paid to liquidate the liability at the date of the balance sheet. (o) guarantees (IAS 37)
During the course of its activity, BCI issues guarantees, letters of credit and sureties. These guarantees are recog-nised in off-balance sheet accounts and disclosed as contingent liabilities.
(p) Employee benefits (IAS 19)
Liabilities for the retirement pensions of former BF workers have been incorporated into BCI’s liabilities under the terms of the merger dated 04 December 2003.
The former BF was a signatory to the Collective Wage Bargaining Agreement (ACT) of 30 December 1997, in force for the banking sector. Its locally engaged
099
10. NOTAS àS dEMONSTRAÇÕES fINANCEIRAS NOTES TO ThE fINANCIAL STATEMENTS
sector bancário, pelo que os seus empregados con-tratados localmente ou as suas famílias têm direito a prestações pecuniárias a título de reforma por velhice, invalidez e sobrevivência.
Estas prestações são em função do tempo de serviço dos trabalhadores e da respectiva retribuição à data da reforma, sendo actualizadas com base nas tabelas sala-riais anexas ao ACT, as quais são revistas anualmente.
No entanto, uma vez que os trabalhadores estão inscritos no Sistema de Segurança Social, as responsabilidades do BCI consistem no pagamento de complementos.
O valor das responsabilidades por serviços passados é determinado anualmente, por actuários especializados, utilizando o método “Projected Unit Credit” e pressupos tos actuariais considerados adequados (Vide Nota 4.20).
Os ganhos e perdas decorrentes de diferenças entre os pressupostos actuariais e financeiros utilizados e os valo-res efectivamente verificados, bem como os resultantes de alterações de pressupostos actuariais, são reconhe-cidos como rendimento ou gasto quando os ganhos e perdas actuariais não reconhecidos acumulados ao final do ano anterior excedam 10% do valor actual das res-ponsabilidades por serviços passados ou do valor do fundo de pensões, dos dois o maior, reportados à mes-ma data. Os ganhos ou perdas actuariais que excedam o “corredor” são reconhecidos em resultados pelo perío do de tempo médio até à idade esperada de refor-ma dos colaboradores abrangidos pelo plano.
Na data da transição, o BCI adoptou a excepção previs-ta na IFRS 1 de não recalcular os ganhos e perdas actu-ariais diferidos desde o início dos planos.
(q) Acções Próprias (IAS 32)
As acções próprias do Banco são deduzidas nos fun-dos próprios não sendo reconhecidos nas demonstra-ções financeiras quaisquer ganhos ou perdas realizados aquando da sua venda. As retribuições recebidas estão a ser directamente reconhecidas no capital próprio.
(r) dividendos de acções ordinárias (IAS 10)
Os dividendos de acções ordinárias são reconhecidos como um passivo e deduzidos aos fundos próprios quando são declarados e já não se encontram à discri-ção do Banco. Os dividendos do exercício aprovados após a data de balanço são divulgados como um even-to após a data de balanço.
employees or their families are, therefore, entitled to cash payments in the form of old age, disability and survivors’ pensions.
Such payments are based on workers’ length of employment and their respective remuneration at the date of retirement which is updated in line with the wage scales annexed to the ACT, which are revised annually.
However, as workers are enrolled with the National Social Security System, BCI’s liabilities consist of the payment of retirement subsidies.
The amount of liabilities for past services is assessed annually, by specialised actuaries, using the projected unit credit method and adequate actuarial presupposi-tions (see Note 4.20).
Gains and losses on the differences between the actu-arial and financial presuppositions used and the amounts effectively verified, in addition to amounts resulting from changes to the actuarial presupposi-tions, are recognised as income or expenses when the accumulated unrealised actuarial gains and losses at the end of the preceding year exceed 10% of the present value of liabilities for past services or the value of the pension fund relating to the same date, which-ever the higher of the two. Actuarial gains or losses which exceed the “corridor” are recognised in the income statement for the average period of time up to the expected retirement age of workers included in the plan.
At the transition date, BCI adopted the exception of not recalculating deferred actuarial gains and losses since the inception of the plans, provided for in IFRS 1.
(q) Treasury shares (IAS 32)
The bank’s treasury shares are deducted from own funds. Any gains or losses realised on their sale are not recognised in the financial statements. Income received is directly recognised in shareholders equity.
(r) dividends from ordinary shares (IAS 10)
Dividends from ordinary shares are recognised as a liability and deducted from own funds when they are declared and are no longer at the bank’s discretion. Dividends for the year approved after the date of the balance sheet are disclosed as an event occurring after the date of the balance sheet.
BCI | RELATÓRIO E CONTAS 2010 | ANNUAL REPORT 2010
100
(s) Resultado por acção
Os resultados por acção básicos são calculados dividindo o resultado atribuível a accionistas do BCI pelo número médio ponderado de acções ordinárias emitidas, excluindo o número médio de acções ordinárias com-pradas pelo Banco e detidas como acções próprias.
(t) IfRS 8 – Segmentos operacionais
De acordo com os requisitos da norma, o reporte externo por segmentos deverá estar baseado no reporting interno apreciado pela Comissão Executiva. A aplicação da nor-ma não tem qualquer impacto material sobre as contas do Banco.
Um segmento de negócio é um componente identifi-cável do Grupo, que se destina a fornecer um produto ou serviço individual ou um conjunto de produtos ou serviços relacionados, e que esteja sujeito a riscos e benefícios que sejam diferenciáveis dos restantes seg-mentos de negócio.
A adopção da alteração obriga a divulgações adicionais mas não tem impacto na posição financeira nem nos resultados do Banco.
Conforme apresentado na nota 3.32, o BCI controla a sua actividade através dos seguintes segmentos prin-cipais:•Bancaderetalho;•Bancaempresas;
(u) Principais estimativas e incertezas associadas à aplicação das políticas contabilísticas
As IFRS estabelecem um conjunto de políticas contabi-lísticas que requerem que o Conselho de Administração efectue julgamentos e realize estimativas. As estimativas e pressupostos associados são baseados na experiên-cia histórica e noutros factores considerados razoáveis, de acordo com as circunstâncias e como uma base para os julgamentos sobre os valores dos activos e pas-sivos cuja valorização não é evidente através de outras fontes. As principais estimativas contabilísticas utiliza-das pelo BCI são analisadas como segue:
Imparidade de empréstimos e contas a receber
O BCI reavalia periodicamente a evidência de impari-dade de forma a aferir da necessidade de reconhecer perdas por imparidade adicionais, nomeadamente, para
(s) Earnings per share
Basic earnings per share are calculated by dividing the income attributable to BCI shareholders by the average weighted number of ordinary shares issued, excluding the average number of ordinary shares purchased by the bank and held as treasury shares.
(t) IfRS 8 – Operating segments
In accordance with the standard’s requirements, exter-nal segment reporting should be based on internal reporting considered by the executive board. The appli-cation of this standard does not have any material impact on the bank’s accounts.
A business segment is one of the group’s identifiable components, in terms of the supply of a product or separate service or collection of related products or services and which is subject to risks and benefits which can be differentiated from other business seg-ments.
The adopting of the amendment requires additional disclosures but does not have an impact on the Bank’s financial position or income.
As set out in note 3.32, BCI controls its activity on the following principal segments:•Retailbanking;•Corporatebanking;
(u) Principal estimates and uncertainties associated with the application of the accounting policies
The IFRS establish a series of accounting policies requiring the board of directors to make judgements and estimates. The associated estimates and presup-positions are based on the bank’s past experience and other factors considered to be reasonable in accord-ance with the circumstances and as a basis for judg-ments on the values of assets and liabilities, when not evident from other sources. The principal accounting estimates used by BCI are set out below:
Impairment on loans and accounts receivable
BCI periodically reassesses evidence of impairment, to gauge the need for the recognition of additional impairment losses. Estimates provided by the bank’s management for calculating the amounts related with future cash flows are used to assess potential loss
101
10. NOTAS àS dEMONSTRAÇÕES fINANCEIRAS NOTES TO ThE fINANCIAL STATEMENTS
a determinação do nível de perda potencial, são usadas estimativas da Administração nos cálculos dos montan-tes relacionados com os fluxos de caixa futuros. Tais estimativas são baseadas em pressupostos de diversos factores, podendo os resultados efectivos alterar no futuro, resultando em alterações dos montantes constituídos para fazer face a perdas efectivas.
Adicionalmente à análise de imparidade individual, o Banco efectua uma análise de imparidade colectiva da carteira de crédito para fazer face a situações de perda de valor que, embora não especificamente identifi cáveis, incorporam um grande risco de incumprimento face à situa-ção inicial, no momento em que foram reconhecidos.
O BCI considera que a imparidade determinada com base na metodologia apresentada permite reflectir de forma adequada o risco associado à sua carteira de crédito.
Justo valor de instrumentos financeiros
Quando o justo valor dos activos e passivos financeiros reconhecidos no balanço não pode ser determinado com base na respectiva cotação num mercado activo, estes são determinados através da utilização de técni-cas de avaliação que incluem a utilização de modelos matemáticos. Os “inputs” utilizados nos referidos mode-los são baseados em informações disponíveis no mer-cado. Contudo, sempre que tal não seja praticável, são efectuados julgamentos na determinação dos justos valores dos instrumentos financeiros.
O banco mede o justo valor usando a seguinte hierar-quia de justo valor, que reflecte a importância dos “inputs” utilizados na mensuração:
• Nível 1: Preço de mercado cotado (não ajustado) nummercadoactivoparauminstrumentoidêntico;
• Nível 2: Técnicas de valorização baseadas em dados observáveis, quer directamente (ou seja, como os preços) ou indirectamente (ou seja, derivada de pre-ços). Esta categoria inclui instrumentos valorizados com utilização de: preços de mercado cotados em mercadosactivosparainstrumentossimilares;preçoscotados para instrumentos idênticos ou similares em mercados considerados menos activos, ou outras técnicas de avaliação em que todos os insumos sejam directa ou indirectamente observáveis a partir dedadosdomercado;
levels. These estimates are based on presuppositions involving diverse factors, whose effective income may be subject to future change, resulting in changes to the amounts set up to cover effective losses.
In addition to the separate impairment analysis, the bank performs a collective impairment analysis on its credit portfolio to provide for situations involving loss of value which, although not specifically identifiable, incor-porate a major risk of default vis-à-vis the initial situa-tion at the time of recognition.
BCI considers that the assessment of impairment based on the methodology presented enables the risk associated with its credit portfolio to be adequately recognised.
Fair value of financial instruments
When the fair value of financial assets and liabilities rec-ognised in the balance sheet cannot be assessed on the basis of their respective prices in an active market, they are assessed by the use of valuation techniques, including the use of mathematical models. The input for the referred to models is based on available market information. Whenever, however, this is not practicable, judgments on the assessment of the fair values of finan-cial instruments are made.
The bank measures fair value through the use of the following fair value ranking, which reflects the impor-tance of the input used in the measurement:
• Level 1: Listed market price (unadjusted) in an active marketforanidenticalinstrument;
• Level 2: Valuation techniques based on observable data, either directly (i.e. such as prices) or indirectly (i.e. deriving from prices). This category includes instruments valued by the use of: listed market pric-es in active markets for similar instruments; listedprices for identical or similar instruments in markets considered less active or other valuation techniques in which all input factors are either directly or indi-rectlyobservablefrommarketdata;
• Level 3: Valuation techniques using significant, non-observable input factors. This category includes all instruments in which the valuation technique uses any input which is not based on observable data and when non-observable input has a significant effect
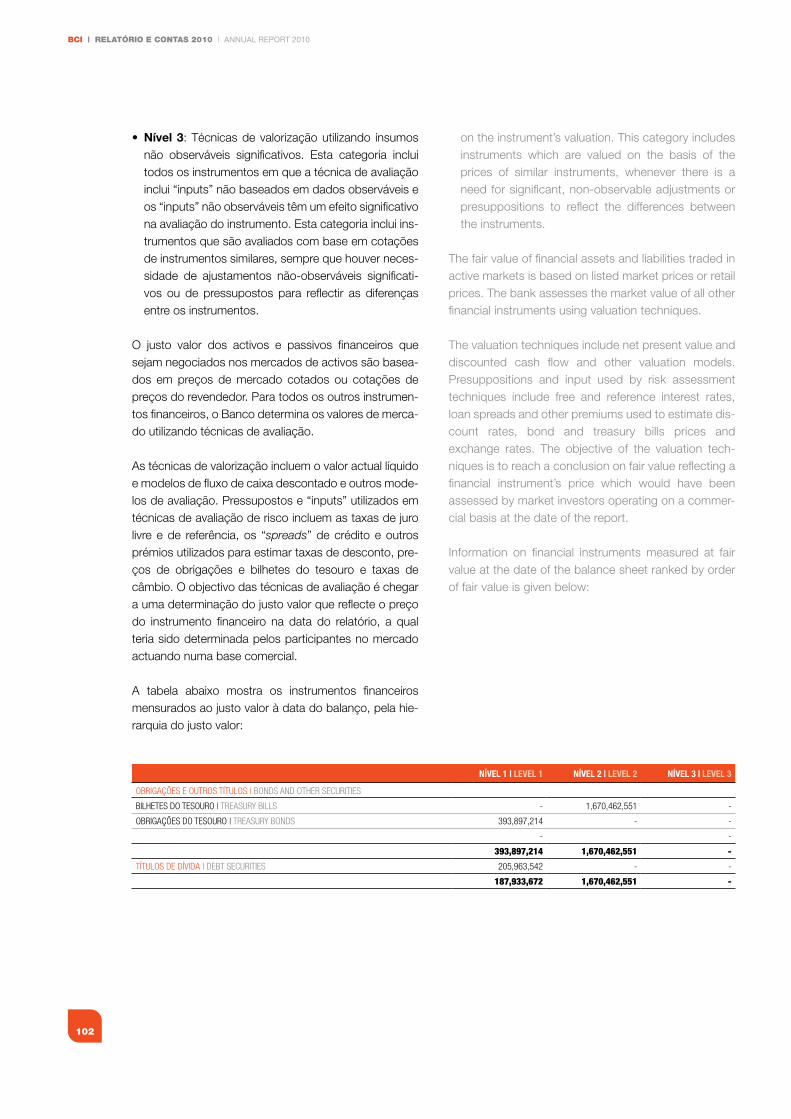
BCI | RELATÓRIO E CONTAS 2010 | ANNUAL REPORT 2010
102
• Nível 3: Técnicas de valorização utilizando insumos não observáveis significativos. Esta categoria inclui todos os instrumentos em que a técnica de avaliação inclui “inputs” não baseados em dados observáveis e os “inputs” não observáveis têm um efeito significativo na avaliação do instrumento. Esta categoria inclui ins-trumentos que são avaliados com base em cotações de instrumentos similares, sempre que houver neces-sidade de ajustamentos não-observáveis significati-vos ou de pressupostos para reflectir as diferenças entre os instrumentos.
O justo valor dos activos e passivos financeiros que sejam negociados nos mercados de activos são basea-dos em preços de mercado cotados ou cotações de preços do revendedor. Para todos os outros instrumen-tos financeiros, o Banco determina os valores de merca-do utilizando técnicas de avaliação.
As técnicas de valorização incluem o valor actual líquido e modelos de fluxo de caixa descontado e outros mode-los de avaliação. Pressupostos e “inputs” utilizados em técnicas de avaliação de risco incluem as taxas de juro livre e de referência, os “spreads” de crédito e outros prémios utilizados para estimar taxas de desconto, pre-ços de obrigações e bilhetes do tesouro e taxas de câmbio. O objectivo das técnicas de avaliação é chegar a uma determinação do justo valor que reflecte o preço do instrumento financeiro na data do relatório, a qual teria sido determinada pelos participantes no mercado actuando numa base comercial.
A tabela abaixo mostra os instrumentos financeiros mensurados ao justo valor à data do balanço, pela hie-rarquia do justo valor:
NívEl 1 | lEvEl 1 NívEl 2 | lEvEl 2 NívEl 3 | lEvEl 3
OBRIgAÇões e OUTROs TÍTULOs | BOnDs AnD OTheR seCURITIes
BILheTes DO TesOURO | TReAsURy BILLs - 1,670,462,551 -
OBRIgAÇões DO TesOURO | TReAsURy BOnDs 393,897,214 - -
- -
393,897,214 1,670,462,551 -
TÍTULOs De DÍVIDA | DeBT seCURITIes 205,963,542 - -
187,933,672 1,670,462,551 -
on the instrument’s valuation. This category includes instruments which are valued on the basis of the prices of similar instruments, whenever there is a need for significant, non-observable adjustments or presuppositions to reflect the differences between the instruments.
The fair value of financial assets and liabilities traded in active markets is based on listed market prices or retail prices. The bank assesses the market value of all other financial instruments using valuation techniques.
The valuation techniques include net present value and discounted cash flow and other valuation models. Presuppositions and input used by risk assessment techniques include free and reference interest rates, loan spreads and other premiums used to estimate dis-count rates, bond and treasury bills prices and exchange rates. The objective of the valuation tech-niques is to reach a conclusion on fair value reflecting a financial instrument’s price which would have been assessed by market investors operating on a commer-cial basis at the date of the report.
Information on financial instruments measured at fair value at the date of the balance sheet ranked by order of fair value is given below:
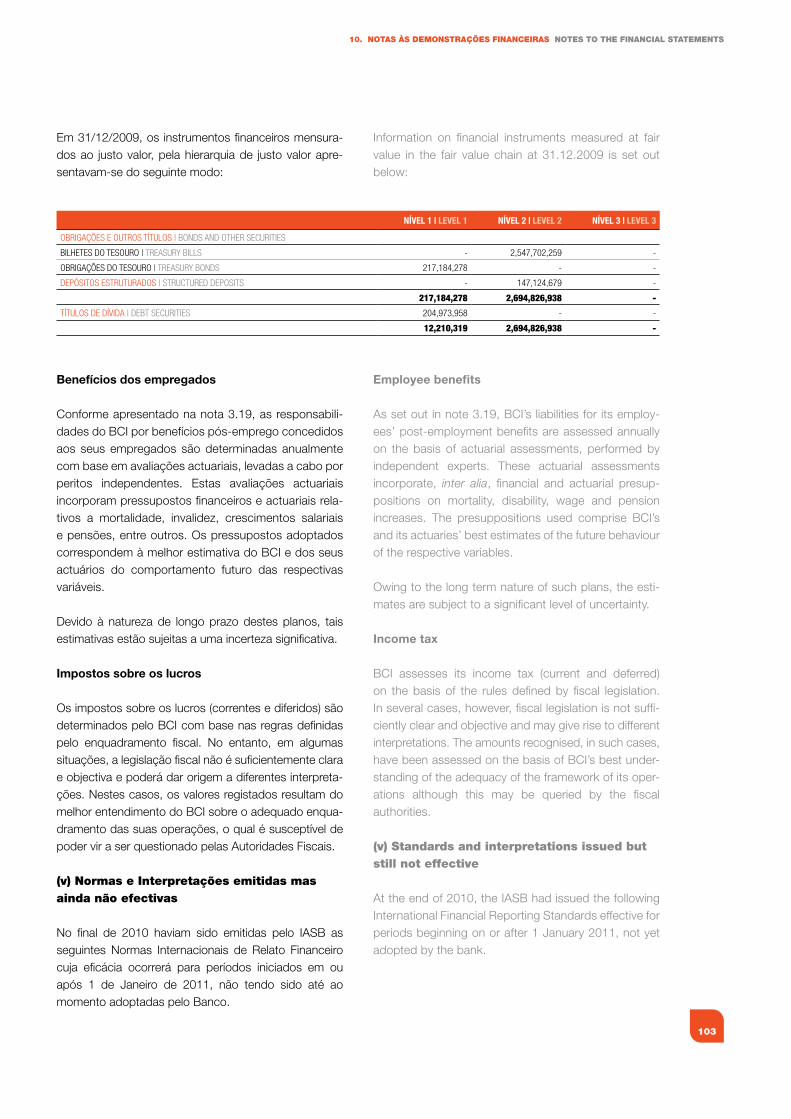
103
10. NOTAS àS dEMONSTRAÇÕES fINANCEIRAS NOTES TO ThE fINANCIAL STATEMENTS
Em 31/12/2009, os instrumentos financeiros mensura-dos ao justo valor, pela hierarquia de justo valor apre-sentavam-se do seguinte modo:
Benefícios dos empregados
Conforme apresentado na nota 3.19, as responsabili-dades do BCI por benefícios pós-emprego concedidos aos seus empregados são determinadas anualmente com base em avaliações actuariais, levadas a cabo por peritos independentes. Estas avaliações actuariais incorporam pressupostos financeiros e actuariais rela-tivos a mortalidade, invalidez, crescimentos salariais e pensões, entre outros. Os pressupostos adoptados correspondem à melhor estimativa do BCI e dos seus actuários do comportamento futuro das respectivas variáveis.
Devido à natureza de longo prazo destes planos, tais estimativas estão sujeitas a uma incerteza significativa.
Impostos sobre os lucros
Os impostos sobre os lucros (correntes e diferidos) são determinados pelo BCI com base nas regras definidas pelo enquadramento fiscal. No entanto, em algumas situações, a legislação fiscal não é suficientemente clara e objectiva e poderá dar origem a diferentes interpreta-ções. Nestes casos, os valores registados resultam do melhor entendimento do BCI sobre o adequado enqua-dramento das suas operações, o qual é susceptível de poder vir a ser questionado pelas Autoridades Fiscais.
(v) Normas e Interpretações emitidas mas ainda não efectivas
No final de 2010 haviam sido emitidas pelo IASB as seguintes Normas Internacionais de Relato Financeiro cuja eficácia ocorrerá para períodos iniciados em ou após 1 de Janeiro de 2011, não tendo sido até ao momento adoptadas pelo Banco.
NívEl 1 | lEvEl 1 NívEl 2 | lEvEl 2 NívEl 3 | lEvEl 3
OBRIgAÇões e OUTROs TÍTULOs | BOnDs AnD OTheR seCURITIes
BILheTes DO TesOURO | TReAsURy BILLs - 2,547,702,259 -
OBRIgAÇões DO TesOURO | TReAsURy BOnDs 217,184,278 - -
DePÓsITOs esTRUTURADOs | sTRUCTUReD DePOsITs - 147,124,679 -
217,184,278 2,694,826,938 -
TÍTULOs De DÍVIDA | DeBT seCURITIes 204,973,958 - -
12,210,319 2,694,826,938 -
Information on financial instruments measured at fair value in the fair value chain at 31.12.2009 is set out below:
Employee benefits
As set out in note 3.19, BCI’s liabilities for its employ-ees’ post-employment benefits are assessed annually on the basis of actuarial assessments, performed by independent experts. These actuarial assessments incorporate, inter alia, financial and actuarial presup-positions on mortality, disability, wage and pension increases. The presuppositions used comprise BCI’s and its actuaries’ best estimates of the future behaviour of the respective variables.
Owing to the long term nature of such plans, the esti-mates are subject to a significant level of uncertainty.
Income tax
BCI assesses its income tax (current and deferred) on the basis of the rules defined by fiscal legislation. In several cases, however, fiscal legislation is not suffi-ciently clear and objective and may give rise to different interpretations. The amounts recognised, in such cases, have been assessed on the basis of BCI’s best under-standing of the adequacy of the framework of its oper-ations although this may be queried by the fiscal authorities.
(v) Standards and interpretations issued but still not effective
At the end of 2010, the IASB had issued the following International Financial Reporting Standards effective for periods beginning on or after 1 January 2011, not yet adopted by the bank.
BCI | RELATÓRIO E CONTAS 2010 | ANNUAL REPORT 2010
104
IAS 1 – Apresentação das Demonstrações financeiras
Esta norma teve uma emenda cuja adopção será obri-gatória a partir de 1 de Janeiro de 2011. A mesma esclarece que a desagregação das variações em cada componente do capital próprio resultante de transac-ções reconhecidas em outros rendimentos globais tam-bém devem ser apresentados, mas a mesma pode ser feita na demonstração das variações de capitais pró-prios ou nas notas.
IFRS 9 – Instrumentos Financeiros, parte 1: Classificação e Valorimetria
A IFRS 9, substitui partes da IAS 39 relacionadas com classificações e valorimetria de activos financeiros e a sua adopção será obrigatória a partir de 1 de Janeiro de 2013. Alguns elementos chave incluem:
• Aobrigatoriedadedeclassificaçãodosactivosfinan-ceiros em 2 grandes grupos de custeio: justo valor e custo amortizado. A decisão deverá ser tomada no reconhecimento inicial do activo, sendo a mesma dependente, por um lado, do modelo de negócio da entidade na gestão de instrumentos financeiros e, por outro, nas características do activo no concernente à libertação de cash flow.
• Avalorizaçãodoactivofinanceiroaocustoamortiza-do somente se for um instrumento de dívida e se os objectivos do modelo de negócio da entidade forem a manutenção do activo para a obtenção de cash flows (contratados), representando estes apenas pagamen-tos de capital e de juros. Todos os restantes instru-mentos de dívida devem ser valorizados ao justo valor através de lucros ou perdas.
• Acontabilizaçãodeinstrumentosdecapitalaojustovalor e de instrumentos de capital mantidos para negociação ao justo valor através de resultados. Para todos os restantes instrumentos deve ser efectuada uma escolha irreversível no reconhecimento inicial por forma a reconhecer ganhos ou perdas de justo valor realizados ou não realizados através de outros resul-tados que não sejam os lucros ou perdas. A escolha poderá ser efectuada caso a caso e os dividendos devem ser apresentados em lucros ou perdas desde que representem retorno sobre o investimento.
IAS 1 – Presentation of financial statements
An amendment was made to this standard, whose adoption is mandatory starting 1 January 2011. The amendment clarifies that although the splitting up of the changes in each shareholders’ equity component resulting from transactions recognised in other global income should also be presented, this can be done in the statement of changes in shareholder’s equity or in the notes.
IFRS 9 – Financial instruments, part 1: classifica-tion and measurement
IFRS 9, replaces the parts of IAS 39 related with the classifications and measurement of financial assets and their adoption is mandatory starting 1 January 2013. Several key elements include:
• Theobligationtoclassifyfinancialassetsintwomajorcost groups: fair value and amortised cost. The deci-sion should be taken at the time of the asset’s initial recognition and is, on the one hand, dependent on the entity’s business model in its management of financial instruments and, on the other, the charac-teristics of the assets in terms of releasing cash flow.
• Themeasurementofthefinancialassetatamortisedcost, only if it is a debt instrument and if the objec-tives of the entity’s business model are to hold the asset to obtain cash flows (contracted) on them, representing only the payment of capital and interest. All of the other debt instruments should be measured at fair value through profit or loss.
• The accounting of equity instruments at fair valueand equity instruments held for trading at fair value through profit or loss. In the case of all other instru-ments an irreversible choice should be made at the time of initial recognition for the purpose of the rec-ognition of fair value gains or losses whether or not realised through income other than profit or losses. The choice may be made on a case by case basis and the dividends should be recognised as profit or loss provided that they comprise a return on the investment.
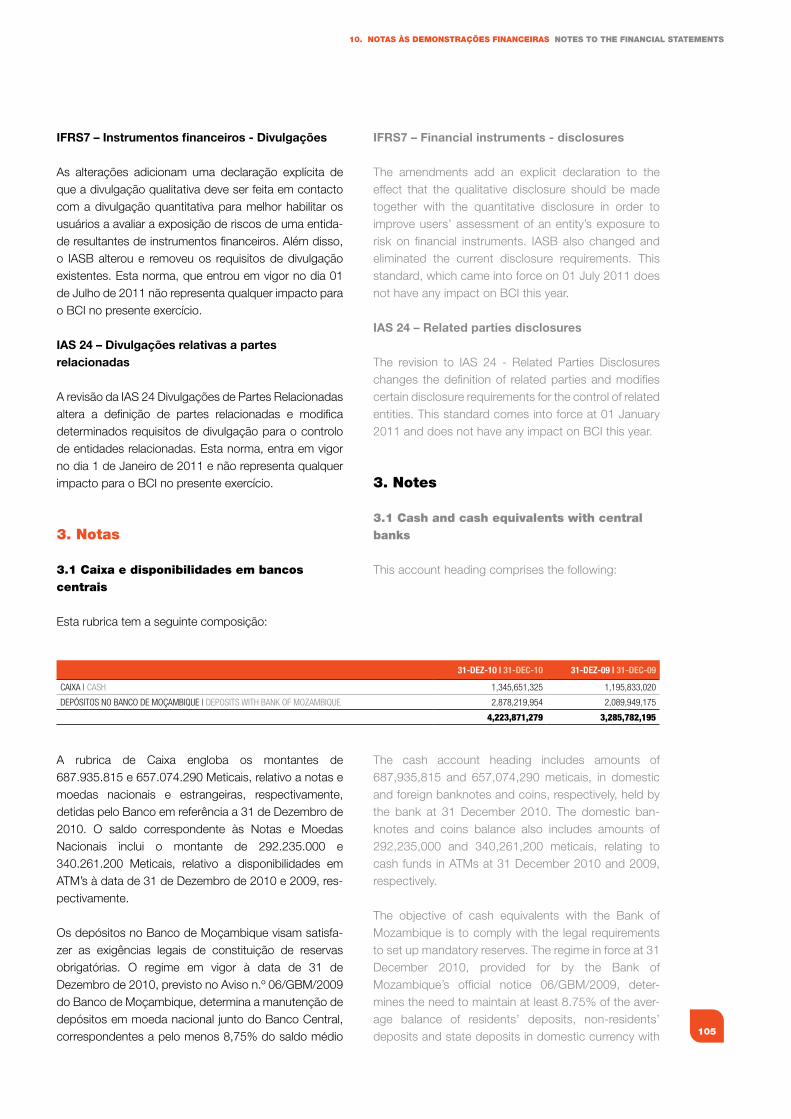
105
10. NOTAS àS dEMONSTRAÇÕES fINANCEIRAS NOTES TO ThE fINANCIAL STATEMENTS
IFRS7 – Instrumentos financeiros - Divulgações
As alterações adicionam uma declaração explícita de que a divulgação qualitativa deve ser feita em contacto com a divulgação quantitativa para melhor habilitar os usuários a avaliar a exposição de riscos de uma entida-de resultantes de instrumentos financeiros. Além disso, o IASB alterou e removeu os requisitos de divulgação existentes. Esta norma, que entrou em vigor no dia 01 de Julho de 2011 não representa qualquer impacto para o BCI no presente exercício.
IAS 24 – Divulgações relativas a partes relacionadas
A revisão da IAS 24 Divulgações de Partes Relacionadas altera a definição de partes relacionadas e modifica determinados requisitos de divulgação para o controlo de entidades relacionadas. Esta norma, entra em vigor no dia 1 de Janeiro de 2011 e não representa qualquer impacto para o BCI no presente exercício.
3. Notas
3.1 Caixa e disponibilidades em bancos centrais
Esta rubrica tem a seguinte composição:
A rubrica de Caixa engloba os montantes de 687.935.815 e 657.074.290 Meticais, relativo a notas e moedas nacionais e estrangeiras, respectivamente, detidas pelo Banco em referência a 31 de Dezembro de 2010. O saldo correspondente às Notas e Moedas Nacionais inclui o montante de 292.235.000 e 340.261.200 Meticais, relativo a disponibilidades em ATM’s à data de 31 de Dezembro de 2010 e 2009, res-pectivamente.
Os depósitos no Banco de Moçambique visam satisfa-zer as exigências legais de constituição de reservas obrigatórias. O regime em vigor à data de 31 de Dezembro de 2010, previsto no Aviso n.º 06/GBM/2009 do Banco de Moçambique, determina a manutenção de depósitos em moeda nacional junto do Banco Central, correspondentes a pelo menos 8,75% do saldo médio
31-DEZ-10 | 31-DEC-10 31-DEZ-09 | 31-DEC-09
CAIxA | CAsh 1,345,651,325 1,195,833,020
DePÓsITOs nO BAnCO De MOÇAMBIQUe | DePOsITs wITh BAnk Of MOZAMBIQUe 2,878,219,954 2,089,949,175
4,223,871,279 3,285,782,195
IFRS7 – Financial instruments - disclosures
The amendments add an explicit declaration to the effect that the qualitative disclosure should be made together with the quantitative disclosure in order to improve users’ assessment of an entity’s exposure to risk on financial instruments. IASB also changed and eliminated the current disclosure requirements. This standard, which came into force on 01 July 2011 does not have any impact on BCI this year.
IAS 24 – Related parties disclosures
The revision to IAS 24 - Related Parties Disclosures changes the definition of related parties and modifies certain disclosure requirements for the control of related entities. This standard comes into force at 01 January 2011 and does not have any impact on BCI this year.
3. Notes
3.1 Cash and cash equivalents with central banks
This account heading comprises the following:
The cash account heading includes amounts of 687,935,815 and 657,074,290 meticais, in domestic and foreign banknotes and coins, respectively, held by the bank at 31 December 2010. The domestic ban-knotes and coins balance also includes amounts of 292,235,000 and 340,261,200 meticais, relating to cash funds in ATMs at 31 December 2010 and 2009, respectively.
The objective of cash equivalents with the Bank of Mozambique is to comply with the legal requirements to set up mandatory reserves. The regime in force at 31 December 2010, provided for by the Bank of Mozambique’s official notice 06/GBM/2009, deter-mines the need to maintain at least 8.75% of the aver-age balance of residents’ deposits, non-residents’ deposits and state deposits in domestic currency with
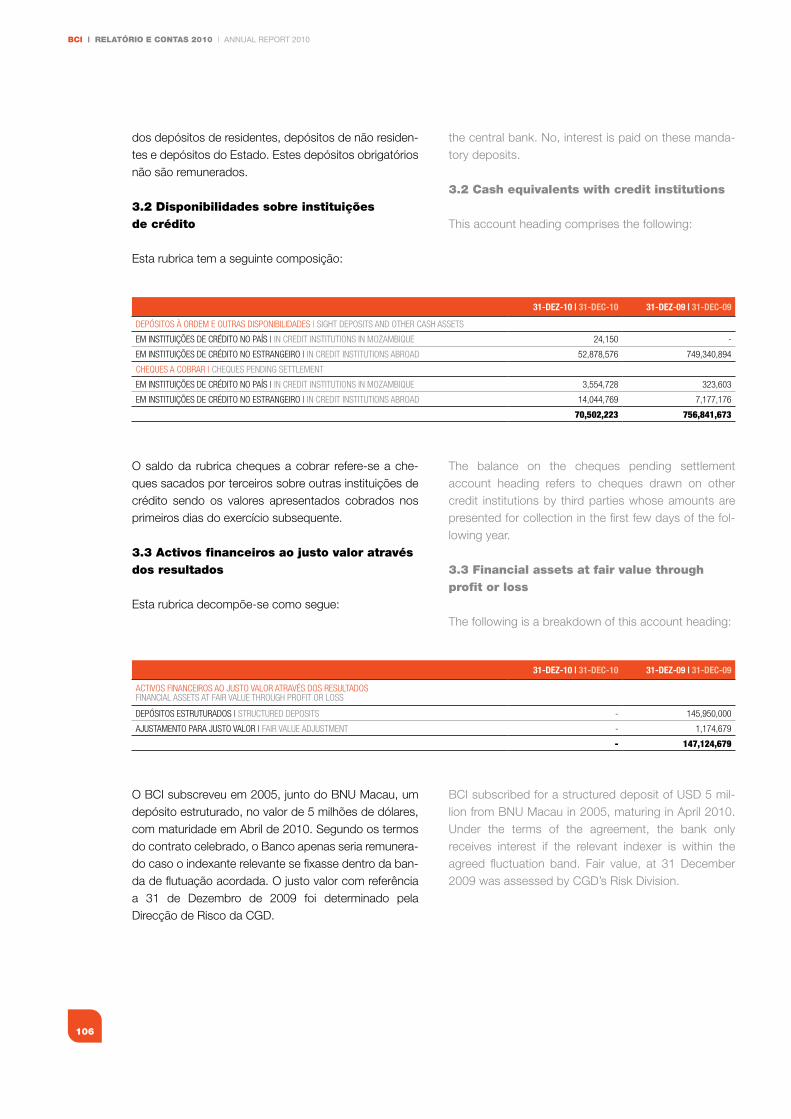
BCI | RELATÓRIO E CONTAS 2010 | ANNUAL REPORT 2010
106
dos depósitos de residentes, depósitos de não residen-tes e depósitos do Estado. Estes depósitos obrigatórios não são remunerados.
3.2 disponibilidades sobre instituições de crédito
Esta rubrica tem a seguinte composição:
O saldo da rubrica cheques a cobrar refere-se a che-ques sacados por terceiros sobre outras instituições de crédito sendo os valores apresentados cobrados nos primeiros dias do exercício subsequente.
3.3 Activos financeiros ao justo valor através dos resultados
Esta rubrica decompõe-se como segue:
O BCI subscreveu em 2005, junto do BNU Macau, um depósito estruturado, no valor de 5 milhões de dólares, com maturidade em Abril de 2010. Segundo os termos do contrato celebrado, o Banco apenas seria remunera-do caso o indexante relevante se fixasse dentro da ban-da de flutuação acordada. O justo valor com referência a 31 de Dezembro de 2009 foi determinado pela Direcção de Risco da CGD.
31-DEZ-10 | 31-DEC-10 31-DEZ-09 | 31-DEC-09
DePÓsITOs à ORDeM e OUTRAs DIsPOnIBILIDADes | sIghT DePOsITs AnD OTheR CAsh AsseTs
eM InsTITUIÇões De CRÉDITO nO PAÍs | In CReDIT InsTITUTIOns In MOZAMBIQUe 24,150 -
eM InsTITUIÇões De CRÉDITO nO esTRAngeIRO | In CReDIT InsTITUTIOns ABROAD 52,878,576 749,340,894
CheQUes A COBRAR | CheQUes PenDIng seTTLeMenT
eM InsTITUIÇões De CRÉDITO nO PAÍs | In CReDIT InsTITUTIOns In MOZAMBIQUe 3,554,728 323,603
eM InsTITUIÇões De CRÉDITO nO esTRAngeIRO | In CReDIT InsTITUTIOns ABROAD 14,044,769 7,177,176
70,502,223 756,841,673
31-DEZ-10 | 31-DEC-10 31-DEZ-09 | 31-DEC-09
ACTIVOs fInAnCeIROs AO JUsTO VALOR ATRAVÉs DOs ResULTADOsfInAnCIAL AsseTs AT fAIR VALUe ThROUgh PROfIT OR LOss
DePÓsITOs esTRUTURADOs | sTRUCTUReD DePOsITs - 145,950,000
AJUsTAMenTO PARA JUsTO VALOR | fAIR VALUe ADJUsTMenT - 1,174,679
- 147,124,679
the central bank. No, interest is paid on these manda-tory deposits.
3.2 Cash equivalents with credit institutions
This account heading comprises the following:
The balance on the cheques pending settlement account heading refers to cheques drawn on other credit institutions by third parties whose amounts are presented for collection in the first few days of the fol-lowing year.
3.3 financial assets at fair value through profit or loss
The following is a breakdown of this account heading:
BCI subscribed for a structured deposit of USD 5 mil-lion from BNU Macau in 2005, maturing in April 2010. Under the terms of the agreement, the bank only receives interest if the relevant indexer is within the agreed fluctuation band. Fair value, at 31 December 2009 was assessed by CGD’s Risk Division.
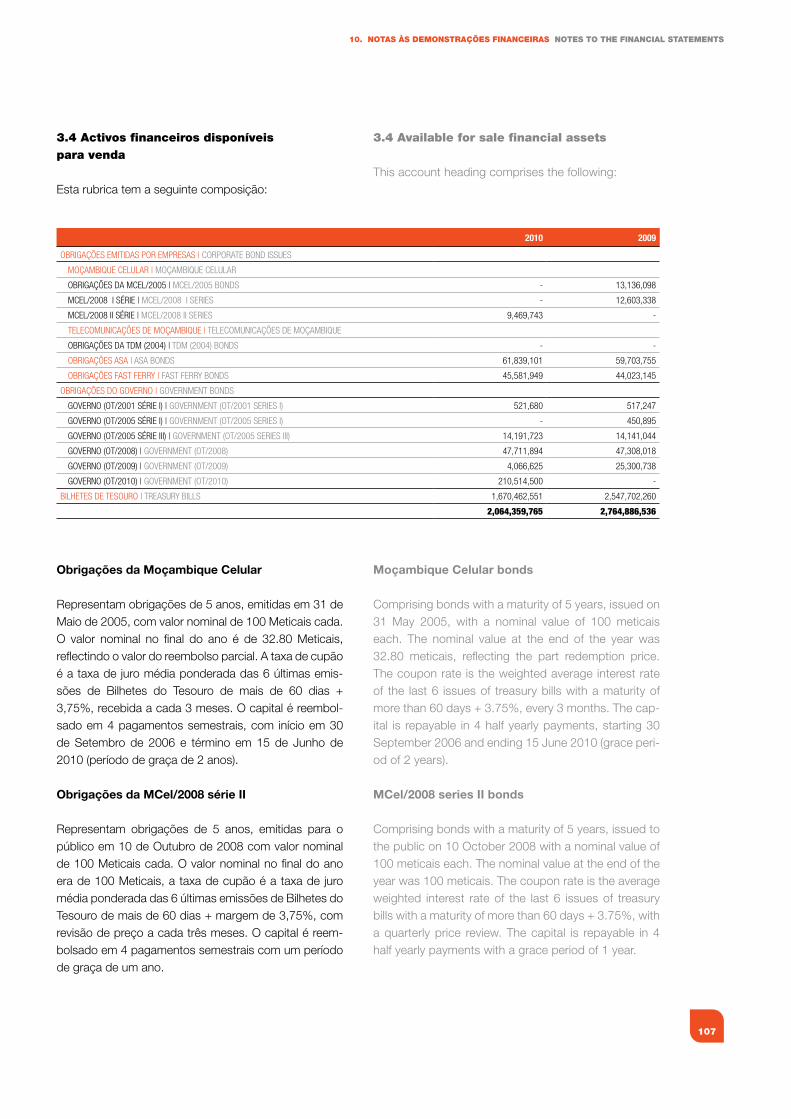
107
10. NOTAS àS dEMONSTRAÇÕES fINANCEIRAS NOTES TO ThE fINANCIAL STATEMENTS
3.4 Activos financeiros disponíveis para venda
Esta rubrica tem a seguinte composição:
Obrigações da Moçambique Celular
Representam obrigações de 5 anos, emitidas em 31 de Maio de 2005, com valor nominal de 100 Meticais cada. O valor nominal no final do ano é de 32.80 Meticais, reflectindo o valor do reembolso parcial. A taxa de cupão é a taxa de juro média ponderada das 6 últimas emis-sões de Bilhetes do Tesouro de mais de 60 dias + 3,75%, recebida a cada 3 meses. O capital é reembol-sado em 4 pagamentos semestrais, com início em 30 de Setembro de 2006 e término em 15 de Junho de 2010 (período de graça de 2 anos).
Obrigações da MCel/2008 série II
Representam obrigações de 5 anos, emitidas para o público em 10 de Outubro de 2008 com valor nominal de 100 Meticais cada. O valor nominal no final do ano era de 100 Meticais, a taxa de cupão é a taxa de juro média ponderada das 6 últimas emissões de Bilhetes do Tesouro de mais de 60 dias + margem de 3,75%, com revisão de preço a cada três meses. O capital é reem-bolsado em 4 pagamentos semestrais com um período de graça de um ano.
2010 2009
OBRIgAÇões eMITIDAs POR eMPResAs | CORPORATe BOnD IssUes
MOÇAMBIQUe CeLULAR | MOÇAMBIQUe CeLULAR
OBRIgAÇões DA MCeL/2005 | MCeL/2005 BOnDs - 13,136,098
MCeL/2008 I sÉRIe | MCeL/2008 I seRIes - 12,603,338
MCeL/2008 II sÉRIe | MCeL/2008 II seRIes 9,469,743 -
TeLeCOMUnICAÇões De MOÇAMBIQUe | TeLeCOMUnICAÇões De MOÇAMBIQUe
OBRIgAÇões DA TDM (2004) | TDM (2004) BOnDs - -
OBRIgAÇões AsA | AsA BOnDs 61,839,101 59,703,755
OBRIgAÇões fAsT feRRy | fAsT feRRy BOnDs 45,581,949 44,023,145
OBRIgAÇões DO gOVeRnO | gOVeRnMenT BOnDs
gOVeRnO (OT/2001 sÉRIe I) | gOVeRnMenT (OT/2001 seRIes I) 521,680 517,247
gOVeRnO (OT/2005 sÉRIe I) | gOVeRnMenT (OT/2005 seRIes I) - 450,895
gOVeRnO (OT/2005 sÉRIe III) | gOVeRnMenT (OT/2005 seRIes III) 14,191,723 14,141,044
gOVeRnO (OT/2008) | gOVeRnMenT (OT/2008) 47,711,894 47,308,018
gOVeRnO (OT/2009) | gOVeRnMenT (OT/2009) 4,066,625 25,300,738
gOVeRnO (OT/2010) | gOVeRnMenT (OT/2010) 210,514,500 -
BILheTes De TesOURO | TReAsURy BILLs 1,670,462,551 2,547,702,260
2,064,359,765 2,764,886,536
3.4 Available for sale financial assets
This account heading comprises the following:
Moçambique Celular bonds
Comprising bonds with a maturity of 5 years, issued on 31 May 2005, with a nominal value of 100 meticais each. The nominal value at the end of the year was 32.80 meticais, reflecting the part redemption price. The coupon rate is the weighted average interest rate of the last 6 issues of treasury bills with a maturity of more than 60 days + 3.75%, every 3 months. The cap-ital is repayable in 4 half yearly payments, starting 30 September 2006 and ending 15 June 2010 (grace peri-od of 2 years).
MCel/2008 series II bonds
Comprising bonds with a maturity of 5 years, issued to the public on 10 October 2008 with a nominal value of 100 meticais each. The nominal value at the end of the year was 100 meticais. The coupon rate is the average weighted interest rate of the last 6 issues of treasury bills with a maturity of more than 60 days + 3.75%, with a quarterly price review. The capital is repayable in 4 half yearly payments with a grace period of 1 year.
BCI | RELATÓRIO E CONTAS 2010 | ANNUAL REPORT 2010
108
Telecomunicações de Moçambique - Obrigações da TDM/2004
Representam as Obrigações de 6 anos, emitidas em 24 de Março de 2004 com valor nominal de 100 Meticais cada. O valor nominal no fim do ano era de 25 Meticais cada, reflectindo o reembolso parcialmente efectuado até à data. A taxa de cupão é a taxa de juro média pon-derada das 6 últimas emissões de Bilhetes de Tesouro de mais de 60 dias ou Títulos da Autoridade Monetária (TAM’s) + 4%, recebida a cada 3 meses. O reembolso de capital é efectuado em 20 pagamentos trimestrais iguais de 5 Meticais por obrigação, com início em 24 de Março de 2005 e término em 24 de Março de 2010 (período de graça de 1 ano).
Obrigações do Governo (OT/2004)
Obrigações de 5 anos emitidas em 8 de Junho de 2004 com um valor nominal de 100 Meticais cada. Em 31 de Dezembro de 2008 o valor nominal era de 82.60 Meticais. A taxa de cupão era a taxa de juro média pon-derada das 6 últimas emissões de Bilhetes do Tesouro com maturidades entre 60 e 182 dias + 1%, recebido a cada 6 meses. O reembolso do capital será efectuado no final do período, em 9 de Junho de 2009.
Obrigações do Governo (OT/2005 série III)
Representam as Obrigações do Tesouro de 10 anos emitidas em 22 de Novembro de 2005 com maturidade em 22 de Novembro de 2015. As Obrigações têm um valor nominal de 100 Meticais cada. Em 31 de Dezembro de 2009 o valor nominal era de 67,01 Meticais. A taxa de cupão é a taxa de juro média das 6 últimas emissões de Bilhetes de Tesouro (ou TAM’s na ausência de OT’s) ponderada pela maturidade + 1%, recebido a cada 6 meses. O capital será reembolsado na data de venci-mento das obrigações, em 22 de Novembro de 2015.
Obrigações do Governo (OT/2005 série I )
Representam as Obrigações do Tesouro de 5 anos subscritas em 21 de Junho de 2005 com maturidade em 10 de Junho de 2010. As Obrigações têm um valor nominal de 100 Meticais cada. Em 31 de Dezembro de 2009, o valor nominal era 89,94 Meticais. A taxa de cupão é a taxa de juro média ponderada das 6 últimas emissões dos Bilhetes do Tesouro de 60 e 91 dias + 1%, recebido a cada 3 meses. O capital será reembol-sado na data de maturidade das obrigações, em 10 de Junho de 2010.
Telecomunicações de Moçambique - TDM/2004 bonds
Comprising bonds with a maturity of 6 years, issued on 24 March 2004 with a nominal value of 100 meticais each. Their nominal value at the end of the year was 25 meticais each, reflecting the part redemption made to date. The coupon rate is the weighted average interest rate of the last 6 issues of treasury bonds with a matu-rity of more than 60 days or monetary authority bills + 4%, payable every 3 months. The capital is redeemable in 20 equal quarterly payments of 5 meticais per bond, starting 24 March 2005 and ending 24 March 2010 (grace period of 1 year).
Government bonds (OT/2004)
Comprising bonds with a maturity of 5 years issued on 8 June 2004 with a nominal value of 100 meticais each. At 31 December 2008 their nominal value was 82.60 meticais. The coupon rate was the weighted average interest rate of the last 6 issues of treasury bills with maturities of between 60 and 182 days + 1%, payable every 6 months. The capital is redeemable at the end of the period, on 09 June 2009.
Government bonds (OT/2005 series III)
Comprising treasury bonds with a maturity of 10 years issued on 22 November 2005 and maturing on 22 November 2015. The bonds have a nominal value of 100 meticais each. At 31 December 2009 their nominal value was 67.01 meticais. The coupon rate is the aver-age interest rate of the last 6 issues of treasury bonds (or monetary authority bills in the absence thereof) weighted by maturity + 1%, payable every 6 months. The capital is redeemable on the bonds’ maturity date of 22 November 2015.
Government bonds (OT/2005 series I )
Comprising treasury bonds with a maturity of 5 years subscribed for on 21 June 2005 and maturing on 10 June 2010. The bonds have a nominal value of 100 meticais each. Their nominal value at 31 December 2009 was 89.94 meticais. The coupon rate is the weighted average interest rate of the last 6 treasury bill issues with a maturity of between 60 and 91 days + 1%, payable every 3 months. The capital is redeemable on the bonds’ maturity date of 10 June 2010.
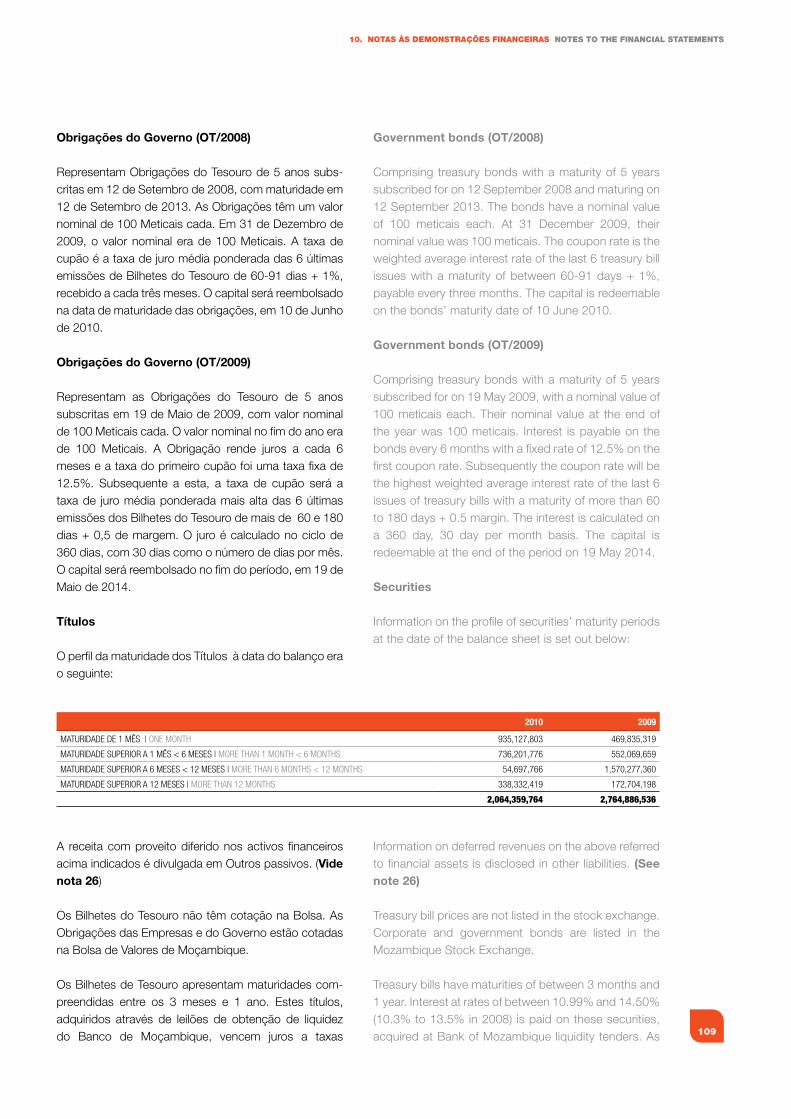
109
10. NOTAS àS dEMONSTRAÇÕES fINANCEIRAS NOTES TO ThE fINANCIAL STATEMENTS
Obrigações do Governo (OT/2008)
Representam Obrigações do Tesouro de 5 anos subs-critas em 12 de Setembro de 2008, com maturidade em 12 de Setembro de 2013. As Obrigações têm um valor nominal de 100 Meticais cada. Em 31 de Dezembro de 2009, o valor nominal era de 100 Meticais. A taxa de cupão é a taxa de juro média ponderada das 6 últimas emissões de Bilhetes do Tesouro de 60-91 dias + 1%, recebido a cada três meses. O capital será reembolsado na data de maturidade das obrigações, em 10 de Junho de 2010.
Obrigações do Governo (OT/2009)
Representam as Obrigações do Tesouro de 5 anos subscritas em 19 de Maio de 2009, com valor nominal de 100 Meticais cada. O valor nominal no fim do ano era de 100 Meticais. A Obrigação rende juros a cada 6 meses e a taxa do primeiro cupão foi uma taxa fixa de 12.5%. Subsequente a esta, a taxa de cupão será a taxa de juro média ponderada mais alta das 6 últimas emissões dos Bilhetes do Tesouro de mais de 60 e 180 dias + 0,5 de margem. O juro é calculado no ciclo de 360 dias, com 30 dias como o número de dias por mês. O capital será reembolsado no fim do período, em 19 de Maio de 2014.
Títulos
O perfil da maturidade dos Títulos à data do balanço era o seguinte:
A receita com proveito diferido nos activos financeiros acima indicados é divulgada em Outros passivos. (Vide nota 26)
Os Bilhetes do Tesouro não têm cotação na Bolsa. As Obrigações das Empresas e do Governo estão cotadas na Bolsa de Valores de Moçambique.
Os Bilhetes de Tesouro apresentam maturidades com-preen didas entre os 3 meses e 1 ano. Estes títulos, adquiridos através de leilões de obtenção de liquidez do Banco de Moçambique, vencem juros a taxas
2010 2009
MATURIDADe De 1 MÊs | One MOnTh 935,127,803 469,835,319
MATURIDADe sUPeRIOR A 1 MÊs < 6 Meses | MORe ThAn 1 MOnTh < 6 MOnThs 736,201,776 552,069,659
MATURIDADe sUPeRIOR A 6 Meses < 12 Meses | MORe ThAn 6 MOnThs < 12 MOnThs 54,697,766 1,570,277,360
MATURIDADe sUPeRIOR A 12 Meses | MORe ThAn 12 MOnThs 338,332,419 172,704,198
2,064,359,764 2,764,886,536
Government bonds (OT/2008)
Comprising treasury bonds with a maturity of 5 years subscribed for on 12 September 2008 and maturing on 12 September 2013. The bonds have a nominal value of 100 meticais each. At 31 December 2009, their nominal value was 100 meticais. The coupon rate is the weighted average interest rate of the last 6 treasury bill issues with a maturity of between 60-91 days + 1%, payable every three months. The capital is redeemable on the bonds’ maturity date of 10 June 2010.
Government bonds (OT/2009)
Comprising treasury bonds with a maturity of 5 years subscribed for on 19 May 2009, with a nominal value of 100 meticais each. Their nominal value at the end of the year was 100 meticais. Interest is payable on the bonds every 6 months with a fixed rate of 12.5% on the first coupon rate. Subsequently the coupon rate will be the highest weighted average interest rate of the last 6 issues of treasury bills with a maturity of more than 60 to 180 days + 0.5 margin. The interest is calculated on a 360 day, 30 day per month basis. The capital is redeemable at the end of the period on 19 May 2014.
Securities
Information on the profile of securities’ maturity periods at the date of the balance sheet is set out below:
Information on deferred revenues on the above referred to financial assets is disclosed in other liabilities. (See note 26)
Treasury bill prices are not listed in the stock exchange. Corporate and government bonds are listed in the Mozambique Stock Exchange.
Treasury bills have maturities of between 3 months and 1 year. Interest at rates of between 10.99% and 14.50% (10.3% to 13.5% in 2008) is paid on these securities, acquired at Bank of Mozambique liquidity tenders. As
BCI | RELATÓRIO E CONTAS 2010 | ANNUAL REPORT 2010
110
compreendidas entre 10,99% e 14,50% (2008: 10,3% a 13,95%). Dado não existir um mercado activo para activos financeiros com características semelhantes, nomeadamente no que se refere à maturidade dos títu-los em carteira, o justo valor dos Bilhetes do Tesouro foi calculado por recurso a um método de valorização baseado na informação disponível no mercado a cada data relevante. O gasto resultante da valorização da carteira de Bilhetes do Tesouro pelo justo valor foi reco-nhecido directamente em fundos próprios de acordo com a IAS 39.
A rubrica de Obrigações emitidas por outros emissores é composta por:
Obrigações ASA – Aeroportos e Segurança Aérea, SA
O valor de 60,456,265 Meticais corresponde a 153,000 obrigações emitidas pela empresa ASA – Aeroportos e Segurança Aérea, SA em Agosto de 2007, com um valor nominal de 9.06 Euros, sendo o reembolso em Agosto de 2012. A remuneração variável de cada cupão semestral é indexada à maior da TBA (Taxa Base Anual) ou Euribor a 6 meses, acrescida de um spread de 2,25% e o reembolso será efectuado pelo Valor Nominal.
Obrigações Fast Ferry
Em carteira existem 111,000 obrigações, com um valor nominal de 9.06 Euros cada e com data de reembolso em 24 de Julho de 2015, sendo o contravalor em meti-cais igual a 43,860,427. A taxa de juro nominal aplicável a cada um dos períodos de juros é fixa e igual a 9% anual.
3.5 Aplicações em instituições de crédito
Esta rubrica tem a seguinte composição:
31-DEZ-10 | 31-DEC-10 31-DEZ-09 | 31-DEC-09
APLICAÇões eM InsTITUIÇões De CRÉDITO nO PAÍs | LOAns AnD ADVAnCes TO CReDIT InsTITUTIOns In MOZAMBIQUe 12,921,974 10,588,181
MeRCADO MOneTÁRIO InTeRBAnCÁRIO | InTeRBAnk MOney MARkeT - -
eMPRÉsTIMO - CURTO PRAZO | LOAn - shORT TeRM 6,439,300 740,052
eMPRÉsTIMO - MÉDIO e LOngO PRAZO | LOAn - MeDIUM AnD LOng TeRM 6,485,190 9,856,571
ReCeITAs COM RenDIMenTO DIfeRIDO De OPeRAÇões ACTIVAsDefeRReD InCOMe fROM LenDIng OPeRATIOns
(2,516) (8,442)
APLICAÇões eM InsTITUIÇões De CRÉDITO nO esTRAngeIROLOAns AnD ADVAnCes TO CReDIT InsTITUTIOns ABROAD 7,198,967,466 2,001,615,062
APLICAÇões A MUITO CURTO PRAZO | VeRy shORT TeRM LOAns AnD ADVAnCes 1,709,245,660 486,181,189
DePÓsITOs | DePOsITs 5,489,721,806 1,515,433,872
7,211,889,440 2,012,203,243
there is no active market for financial assets with similar characteristics, i.e. as regards the maturity of the port-folio securities, fair value was calculated using a valua-tion method based on the market information available at each relevant date. The expenditure resulting from the valuation of the treasury bills portfolio at fair value was recognised directly in own funds in accordance with IAS 39.
The bonds issued by other entities account heading comprises:
ASA – Aeroportos e Segurança Aérea, SA bonds
The amount of 60,456,265 meticais comprises 153,000 bonds issued by ASA – Aeroportos e Segurança Aérea, SA in August 2007, with a nominal value of EUR 9.06, redeemable in August 2012. The variable rate on each six months coupon is indexed to the base annual rate or 6 months Euribor rate, whichever the higher, plus a spread of 2.25%, redeemable at their nominal value.
Fast Ferry bonds
The portfolio comprised 111,000 bonds with a nominal value of EUR 9.06 each redeemable on 24 July 2015, with a counter value of 43,860,427 meticais. The nom-inal interest rate applicable to each of the interest peri-ods is fixed at 9% p.a.
3.5 Loans and advances to credit institutions
This account heading comprises the following:
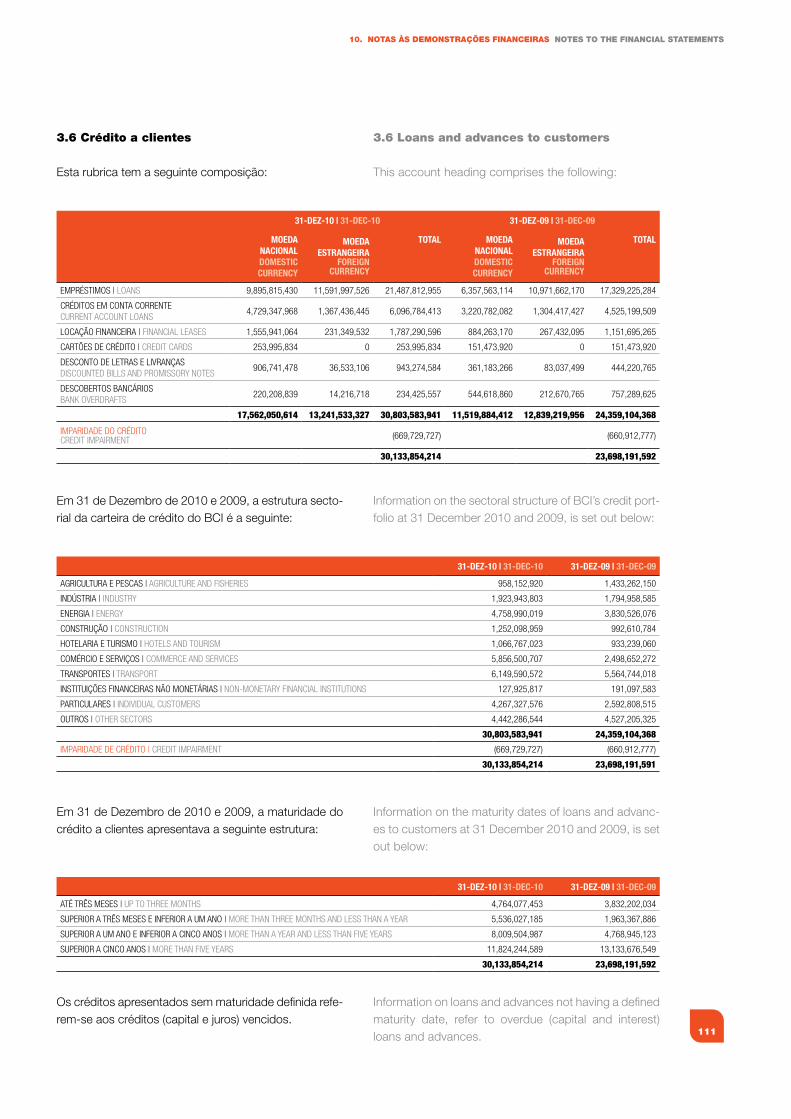
111
10. NOTAS àS dEMONSTRAÇÕES fINANCEIRAS NOTES TO ThE fINANCIAL STATEMENTS
3.6 Crédito a clientes
Esta rubrica tem a seguinte composição:
Em 31 de Dezembro de 2010 e 2009, a estrutura secto-rial da carteira de crédito do BCI é a seguinte:
Em 31 de Dezembro de 2010 e 2009, a maturidade do crédito a clientes apresentava a seguinte estrutura:
Os créditos apresentados sem maturidade definida refe-rem-se aos créditos (capital e juros) vencidos.
31-DEZ-10 | 31-DEC-10 31-DEZ-09 | 31-DEC-09
MOEDANACIONAl DOMESTIC CuRRENCy
MOEDA ESTRANGEIRA
fOREIGN CuRRENCy
TOTAl MOEDANACIONAl DOMESTIC CuRRENCy
MOEDA ESTRANGEIRA
fOREIGN CuRRENCy
TOTAl
eMPRÉsTIMOs | LOAns 9,895,815,430 11,591,997,526 21,487,812,955 6,357,563,114 10,971,662,170 17,329,225,284
CRÉDITOs eM COnTA CORRenTeCURRenT ACCOUnT LOAns
4,729,347,968 1,367,436,445 6,096,784,413 3,220,782,082 1,304,417,427 4,525,199,509
LOCAÇÃO fInAnCeIRA | fInAnCIAL LeAses 1,555,941,064 231,349,532 1,787,290,596 884,263,170 267,432,095 1,151,695,265
CARTões De CRÉDITO | CReDIT CARDs 253,995,834 0 253,995,834 151,473,920 0 151,473,920
DesCOnTO De LeTRAs e LIVRAnÇAsDIsCOUnTeD BILLs AnD PROMIssORy nOTes
906,741,478 36,533,106 943,274,584 361,183,266 83,037,499 444,220,765
DesCOBeRTOs BAnCÁRIOsBAnk OVeRDRAfTs
220,208,839 14,216,718 234,425,557 544,618,860 212,670,765 757,289,625
17,562,050,614 13,241,533,327 30,803,583,941 11,519,884,412 12,839,219,956 24,359,104,368
IMPARIDADe DO CRÉDITOCReDIT IMPAIRMenT (669,729,727) (660,912,777)
30,133,854,214 23,698,191,592
31-DEZ-10 | 31-DEC-10 31-DEZ-09 | 31-DEC-09
AgRICULTURA e PesCAs | AgRICULTURe AnD fIsheRIes 958,152,920 1,433,262,150
InDúsTRIA | InDUsTRy 1,923,943,803 1,794,958,585
eneRgIA | eneRgy 4,758,990,019 3,830,526,076
COnsTRUÇÃO | COnsTRUCTIOn 1,252,098,959 992,610,784
hOTeLARIA e TURIsMO | hOTeLs AnD TOURIsM 1,066,767,023 933,239,060
COMÉRCIO e seRVIÇOs | COMMeRCe AnD seRVICes 5,856,500,707 2,498,652,272
TRAnsPORTes | TRAnsPORT 6,149,590,572 5,564,744,018
InsTITUIÇões fInAnCeIRAs nÃO MOneTÁRIAs | nOn-MOneTARy fInAnCIAL InsTITUTIOns 127,925,817 191,097,583
PARTICULARes | InDIVIDUAL CUsTOMeRs 4,267,327,576 2,592,808,515
OUTROs | OTheR seCTORs 4,442,286,544 4,527,205,325
30,803,583,941 24,359,104,368
IMPARIDADe De CRÉDITO | CReDIT IMPAIRMenT (669,729,727) (660,912,777)
30,133,854,214 23,698,191,591
31-DEZ-10 | 31-DEC-10 31-DEZ-09 | 31-DEC-09
ATÉ TRÊs Meses | UP TO ThRee MOnThs 4,764,077,453 3,832,202,034
sUPeRIOR A TRÊs Meses e InfeRIOR A UM AnO | MORe ThAn ThRee MOnThs AnD Less ThAn A yeAR 5,536,027,185 1,963,367,886
sUPeRIOR A UM AnO e InfeRIOR A CInCO AnOs | MORe ThAn A yeAR AnD Less ThAn fIVe yeARs 8,009,504,987 4,768,945,123
sUPeRIOR A CInCO AnOs | MORe ThAn fIVe yeARs 11,824,244,589 13,133,676,549
30,133,854,214 23,698,191,592
3.6 Loans and advances to customers
This account heading comprises the following:
Information on the sectoral structure of BCI’s credit port-folio at 31 December 2010 and 2009, is set out below:
Information on the maturity dates of loans and advanc-es to customers at 31 December 2010 and 2009, is set out below:
Information on loans and advances not having a defined maturity date, refer to overdue (capital and interest) loans and advances.
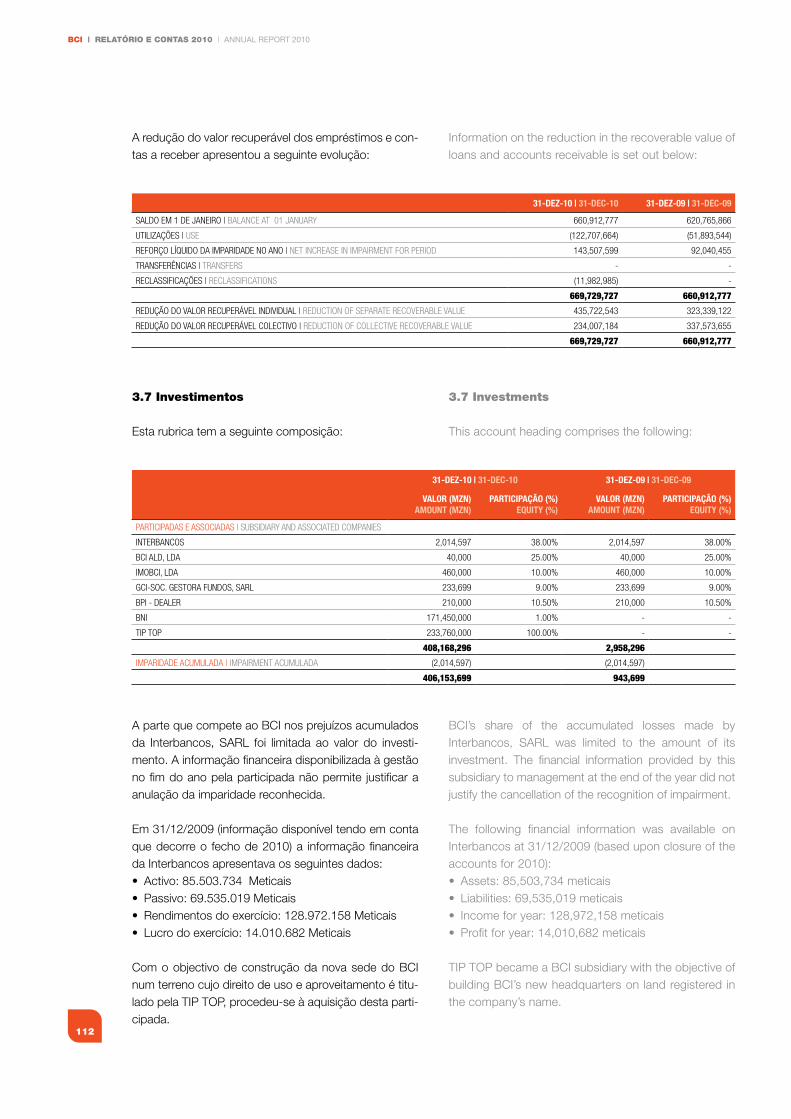
BCI | RELATÓRIO E CONTAS 2010 | ANNUAL REPORT 2010
112
A redução do valor recuperável dos empréstimos e con-tas a receber apresentou a seguinte evolução:
3.7 Investimentos
Esta rubrica tem a seguinte composição:
A parte que compete ao BCI nos prejuízos acumulados da Interbancos, SARL foi limitada ao valor do investi-mento. A informação financeira disponibilizada à gestão no fim do ano pela participada não permite justificar a anulação da imparidade reconhecida.
Em 31/12/2009 (informação disponível tendo em conta que decorre o fecho de 2010) a informação financeira da Interbancos apresentava os seguintes dados:• Activo:85.503.734Meticais• Passivo:69.535.019Meticais• Rendimentosdoexercício:128.972.158Meticais• Lucrodoexercício:14.010.682Meticais
Com o objectivo de construção da nova sede do BCI num terreno cujo direito de uso e aproveitamento é titu-lado pela TIP TOP, procedeu-se à aquisição desta parti-cipada.
31-DEZ-10 | 31-DEC-10 31-DEZ-09 | 31-DEC-09
sALDO eM 1 De JAneIRO | BALAnCe AT 01 JAnUARy 660,912,777 620,765,866
UTILIZAÇões | Use (122,707,664) (51,893,544)
RefORÇO LÍQUIDO DA IMPARIDADe nO AnO | neT InCReAse In IMPAIRMenT fOR PeRIOD 143,507,599 92,040,455
TRAnsfeRÊnCIAs | TRAnsfeRs - -
ReCLAssIfICAÇões | ReCLAssIfICATIOns (11,982,985) -
669,729,727 660,912,777
ReDUÇÃO DO VALOR ReCUPeRÁVeL InDIVIDUAL | ReDUCTIOn Of sePARATe ReCOVeRABLe VALUe 435,722,543 323,339,122
ReDUÇÃO DO VALOR ReCUPeRÁVeL COLeCTIVO | ReDUCTIOn Of COLLeCTIVe ReCOVeRABLe VALUe 234,007,184 337,573,655
669,729,727 660,912,777
31-DEZ-10 | 31-DEC-10 31-DEZ-09 | 31-DEC-09
vAlOR (MZN)AMOuNT (MZN)
PARTICIPAçÃO (%)EquITy (%)
vAlOR (MZN)AMOuNT (MZN)
PARTICIPAçÃO (%)EquITy (%)
PARTICIPADAs e AssOCIADAs | sUBsIDIARy AnD AssOCIATeD COMPAnIes
InTeRBAnCOs 2,014,597 38.00% 2,014,597 38.00%
BCI ALD, LDA 40,000 25.00% 40,000 25.00%
IMOBCI, LDA 460,000 10.00% 460,000 10.00%
gCI-sOC. gesTORA fUnDOs, sARL 233,699 9.00% 233,699 9.00%
BPI - DeALeR 210,000 10.50% 210,000 10.50%
BnI 171,450,000 1.00% - -
TIP TOP 233,760,000 100.00% - -
408,168,296 2,958,296
IMPARIDADe ACUMULADA | IMPAIRMenT ACUMULADA (2,014,597) (2,014,597)
406,153,699 943,699
Information on the reduction in the recoverable value of loans and accounts receivable is set out below:
3.7 Investments
This account heading comprises the following:
BCI’s share of the accumulated losses made by Interbancos, SARL was limited to the amount of its investment. The financial information provided by this subsidiary to management at the end of the year did not justify the cancellation of the recognition of impairment.
The following financial information was available on Interbancos at 31/12/2009 (based upon closure of the accounts for 2010):• Assets:85,503,734meticais• Liabilities:69,535,019meticais• Incomeforyear:128,972,158meticais• Profitforyear:14,010,682meticais
TIP TOP became a BCI subsidiary with the objective of building BCI’s new headquarters on land registered in the company’s name.
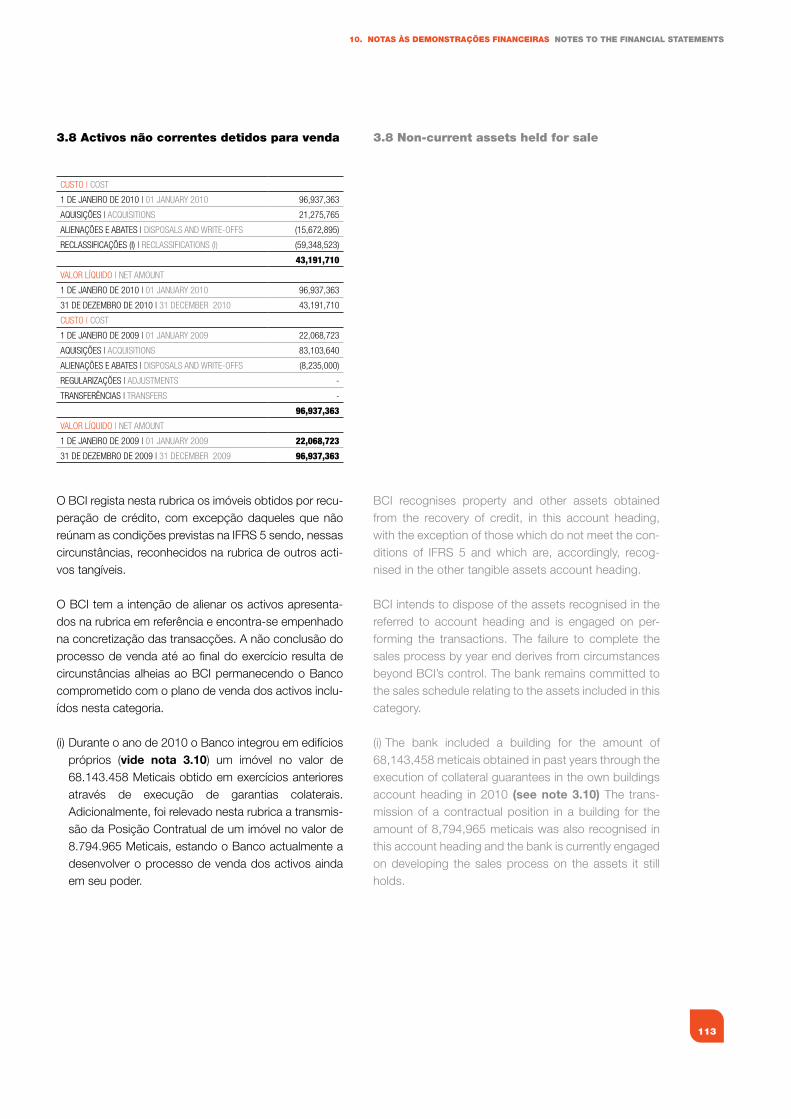
113
10. NOTAS àS dEMONSTRAÇÕES fINANCEIRAS NOTES TO ThE fINANCIAL STATEMENTS
3.8 Activos não correntes detidos para venda
O BCI regista nesta rubrica os imóveis obtidos por recu-peração de crédito, com excepção daqueles que não reúnam as condições previstas na IFRS 5 sendo, nessas circunstâncias, reconhecidos na rubrica de outros acti-vos tangíveis.
O BCI tem a intenção de alienar os activos apresenta-dos na rubrica em referência e encontra-se empenhado na concretização das transacções. A não conclusão do processo de venda até ao final do exercício resulta de circunstâncias alheias ao BCI permanecendo o Banco comprometido com o plano de venda dos activos inclu-ídos nesta categoria.
(i) Durante o ano de 2010 o Banco integrou em edifícios próprios (vide nota 3.10) um imóvel no valor de 68.143.458 Meticais obtido em exercícios anteriores através de execução de garantias colaterais. Adicionalmente, foi relevado nesta rubrica a transmis-são da Posição Contratual de um imóvel no valor de 8.794.965 Meticais, estando o Banco actualmente a desenvolver o processo de venda dos activos ainda em seu poder.
CUsTO | COsT
1 De JAneIRO De 2010 | 01 JAnUARy 2010 96,937,363
AQUIsIÇões | ACQUIsITIOns 21,275,765
ALIenAÇões e ABATes | DIsPOsALs AnD wRITe-Offs (15,672,895)
ReCLAssIfICAÇões (I) | ReCLAssIfICATIOns (I) (59,348,523)
43,191,710
VALOR LÍQUIDO | neT AMOUnT
1 De JAneIRO De 2010 | 01 JAnUARy 2010 96,937,363
31 De DeZeMBRO De 2010 | 31 DeCeMBeR 2010 43,191,710
CUsTO | COsT
1 De JAneIRO De 2009 | 01 JAnUARy 2009 22,068,723
AQUIsIÇões | ACQUIsITIOns 83,103,640
ALIenAÇões e ABATes | DIsPOsALs AnD wRITe-Offs (8,235,000)
RegULARIZAÇões | ADJUsTMenTs -
TRAnsfeRÊnCIAs | TRAnsfeRs -
96,937,363
VALOR LÍQUIDO | neT AMOUnT
1 De JAneIRO De 2009 | 01 JAnUARy 2009 22,068,723
31 De DeZeMBRO De 2009 | 31 DeCeMBeR 2009 96,937,363
3.8 Non-current assets held for sale
BCI recognises property and other assets obtained from the recovery of credit, in this account heading, with the exception of those which do not meet the con-ditions of IFRS 5 and which are, accordingly, recog-nised in the other tangible assets account heading.
BCI intends to dispose of the assets recognised in the referred to account heading and is engaged on per-forming the transactions. The failure to complete the sales process by year end derives from circumstances beyond BCI’s control. The bank remains committed to the sales schedule relating to the assets included in this category.
(i) The bank included a building for the amount of 68,143,458 meticais obtained in past years through the execution of collateral guarantees in the own buildings account heading in 2010 (see note 3.10) The trans-mission of a contractual position in a building for the amount of 8,794,965 meticais was also recognised in this account heading and the bank is currently engaged on developing the sales process on the assets it still holds.
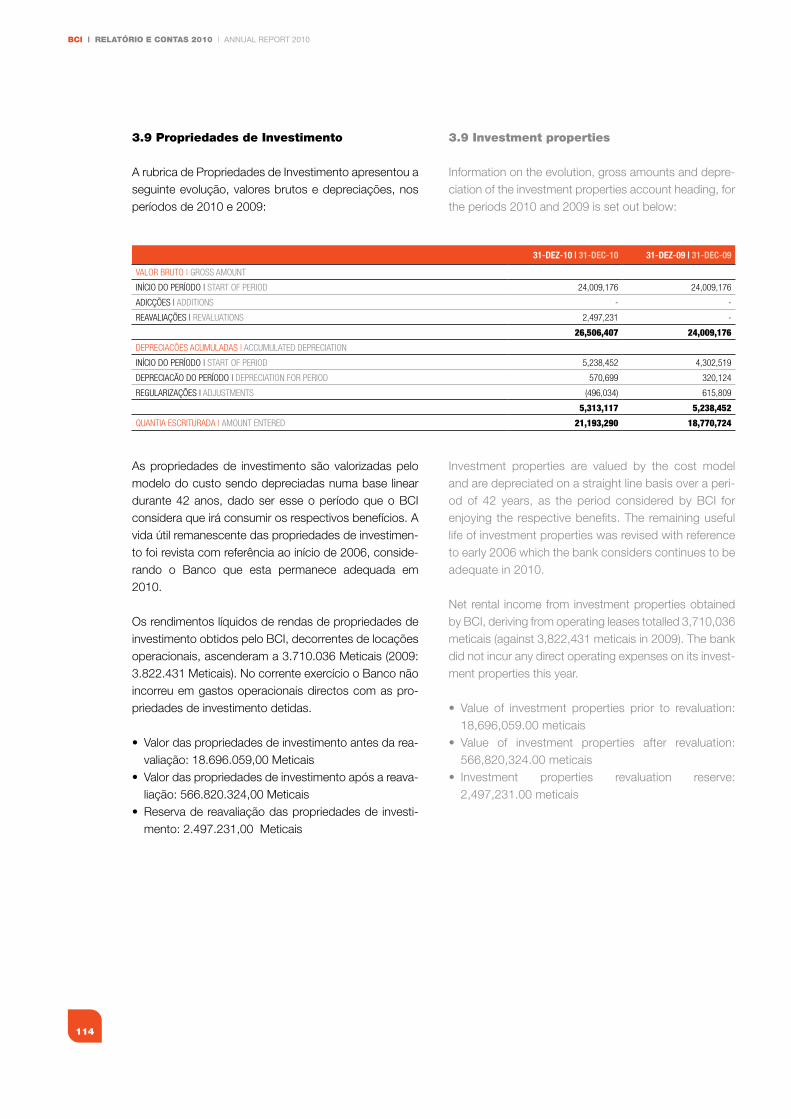
BCI | RELATÓRIO E CONTAS 2010 | ANNUAL REPORT 2010
114
3.9 Propriedades de Investimento
A rubrica de Propriedades de Investimento apresentou a seguinte evolução, valores brutos e depreciações, nos períodos de 2010 e 2009:
As propriedades de investimento são valorizadas pelo modelo do custo sendo depreciadas numa base linear durante 42 anos, dado ser esse o período que o BCI considera que irá consumir os respectivos benefícios. A vida útil remanescente das propriedades de investimen-to foi revista com referência ao início de 2006, conside-rando o Banco que esta permanece adequada em 2010.
Os rendimentos líquidos de rendas de propriedades de investimento obtidos pelo BCI, decorrentes de locações operacionais, ascenderam a 3.710.036 Meticais (2009: 3.822.431 Meticais). No corrente exercício o Banco não incorreu em gastos operacionais directos com as pro-priedades de investimento detidas.
• Valordaspropriedadesdeinvestimentoantesdarea-valiação: 18.696.059,00 Meticais
• Valordaspropriedadesdeinvestimentoapósareava-liação: 566.820.324,00 Meticais
• Reservadereavaliaçãodaspropriedadesdeinvesti-mento: 2.497.231,00 Meticais
31-DEZ-10 | 31-DEC-10 31-DEZ-09 | 31-DEC-09
VALOR BRUTO | gROss AMOUnT
InÍCIO DO PeRÍODO | sTART Of PeRIOD 24,009,176 24,009,176
ADICÇões | ADDITIOns - -
ReAVALIAÇões | ReVALUATIOns 2,497,231 -
26,506,407 24,009,176
DePReCIACões ACUMULADAs | ACCUMULATeD DePReCIATIOn
InÍCIO DO PeRÍODO | sTART Of PeRIOD 5,238,452 4,302,519
DePReCIACÃO DO PeRÍODO | DePReCIATIOn fOR PeRIOD 570,699 320,124
RegULARIZAÇões | ADJUsTMenTs (496,034) 615,809
5,313,117 5,238,452
QUAnTIA esCRITURADA | AMOUnT enTeReD 21,193,290 18,770,724
3.9 Investment properties
Information on the evolution, gross amounts and depre-ciation of the investment properties account heading, for the periods 2010 and 2009 is set out below:
Investment properties are valued by the cost model and are depreciated on a straight line basis over a peri-od of 42 years, as the period considered by BCI for enjoying the respective benefits. The remaining useful life of investment properties was revised with reference to early 2006 which the bank considers continues to be adequate in 2010.
Net rental income from investment properties obtained by BCI, deriving from operating leases totalled 3,710,036 meticais (against 3,822,431 meticais in 2009). The bank did not incur any direct operating expenses on its invest-ment properties this year.
• Value of investment properties prior to revaluation:18,696,059.00 meticais
• Value of investment properties after revaluation:566,820,324.00 meticais
• Investment properties revaluation reserve:2,497,231.00 meticais
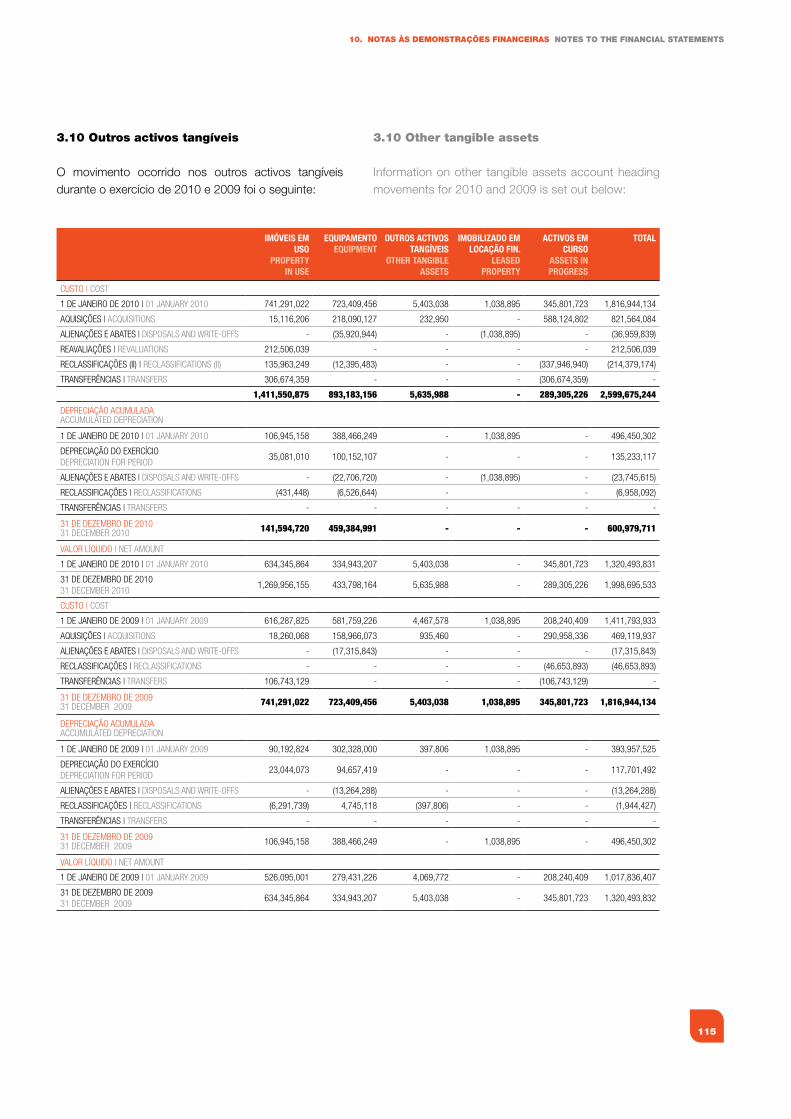
115
10. NOTAS àS dEMONSTRAÇÕES fINANCEIRAS NOTES TO ThE fINANCIAL STATEMENTS
3.10 Outros activos tangíveis
O movimento ocorrido nos outros activos tangíveis durante o exercício de 2010 e 2009 foi o seguinte:
IMÓvEIS EM uSO
PROPERTy IN uSE
EquIPAMENTOEquIPMENT
OuTROS ACTIvOS TANGívEIS
OThER TANGIblE ASSETS
IMObIlIZADO EM lOCAçÃO fIN.
lEASED PROPERTy
ACTIvOS EM CuRSO
ASSETS IN PROGRESS
TOTAl
CUsTO | COsT
1 De JAneIRO De 2010 | 01 JAnUARy 2010 741,291,022 723,409,456 5,403,038 1,038,895 345,801,723 1,816,944,134
AQUIsIÇões | ACQUIsITIOns 15,116,206 218,090,127 232,950 - 588,124,802 821,564,084
ALIenAÇões e ABATes | DIsPOsALs AnD wRITe-Offs - (35,920,944) - (1,038,895) - (36,959,839)
ReAVALIAÇões | ReVALUATIOns 212,506,039 - - - - 212,506,039
ReCLAssIfICAÇões (II) | ReCLAssIfICATIOns (II) 135,963,249 (12,395,483) - - (337,946,940) (214,379,174)
TRAnsfeRÊnCIAs | TRAnsfeRs 306,674,359 - - - (306,674,359) -
1,411,550,875 893,183,156 5,635,988 - 289,305,226 2,599,675,244
DePReCIAÇÃO ACUMULADAACCUMULATeD DePReCIATIOn
1 De JAneIRO De 2010 | 01 JAnUARy 2010 106,945,158 388,466,249 - 1,038,895 - 496,450,302
DePReCIAÇÃO DO exeRCÍCIODePReCIATIOn fOR PeRIOD
35,081,010 100,152,107 - - - 135,233,117
ALIenAÇões e ABATes | DIsPOsALs AnD wRITe-Offs - (22,706,720) - (1,038,895) - (23,745,615)
ReCLAssIfICAÇões | ReCLAssIfICATIOns (431,448) (6,526,644) - - (6,958,092)
TRAnsfeRÊnCIAs | TRAnsfeRs - - - - - -
31 De DeZeMBRO De 201031 DeCeMBeR 2010 141,594,720 459,384,991 - - - 600,979,711
VALOR LÍQUIDO | neT AMOUnT
1 De JAneIRO De 2010 | 01 JAnUARy 2010 634,345,864 334,943,207 5,403,038 - 345,801,723 1,320,493,831
31 De DeZeMBRO De 201031 DeCeMBeR 2010
1,269,956,155 433,798,164 5,635,988 - 289,305,226 1,998,695,533
CUsTO | COsT
1 De JAneIRO De 2009 | 01 JAnUARy 2009 616,287,825 581,759,226 4,467,578 1,038,895 208,240,409 1,411,793,933
AQUIsIÇões | ACQUIsITIOns 18,260,068 158,966,073 935,460 - 290,958,336 469,119,937
ALIenAÇões e ABATes | DIsPOsALs AnD wRITe-Offs - (17,315,843) - - - (17,315,843)
ReCLAssIfICAÇões | ReCLAssIfICATIOns - - - - (46,653,893) (46,653,893)
TRAnsfeRÊnCIAs | TRAnsfeRs 106,743,129 - - - (106,743,129) -
31 De DeZeMBRO De 200931 DeCeMBeR 2009 741,291,022 723,409,456 5,403,038 1,038,895 345,801,723 1,816,944,134
DePReCIAÇÃO ACUMULADAACCUMULATeD DePReCIATIOn
1 De JAneIRO De 2009 | 01 JAnUARy 2009 90,192,824 302,328,000 397,806 1,038,895 - 393,957,525
DePReCIAÇÃO DO exeRCÍCIODePReCIATIOn fOR PeRIOD
23,044,073 94,657,419 - - - 117,701,492
ALIenAÇões e ABATes | DIsPOsALs AnD wRITe-Offs - (13,264,288) - - - (13,264,288)
ReCLAssIfICAÇões | ReCLAssIfICATIOns (6,291,739) 4,745,118 (397,806) - - (1,944,427)
TRAnsfeRÊnCIAs | TRAnsfeRs - - - - - -
31 De DeZeMBRO De 200931 DeCeMBeR 2009 106,945,158 388,466,249 - 1,038,895 - 496,450,302
VALOR LÍQUIDO | neT AMOUnT
1 De JAneIRO De 2009 | 01 JAnUARy 2009 526,095,001 279,431,226 4,069,772 - 208,240,409 1,017,836,407
31 De DeZeMBRO De 200931 DeCeMBeR 2009
634,345,864 334,943,207 5,403,038 - 345,801,723 1,320,493,832
3.10 Other tangible assets
Information on other tangible assets account heading movements for 2010 and 2009 is set out below:
BCI | RELATÓRIO E CONTAS 2010 | ANNUAL REPORT 2010
116
(ii) Reclassificações:
a. Durante o ano de 2010 o Banco integrou em edifícios próprios (vide nota 3.8) um imóvel no valor de 68.143.458 Meticais obtido em exercícios anteriores atravésdeexecuçãodegarantiascolaterais;
b. Devido ao cancelamento do contrato de empreitada de construção da futura sede do Banco, foi anulado na rubrica de activos tangíveis em curso o montante de149.055.000,00Meticais;
c. Foi reclassificado para activos intangíveis (vide nota 3.11) a parte correspondente ao montante de softwa-re reconhecido inicialmente em activos tangíveis em curso no montante de 53.635.360,00 Meticais.
Os imóveis acima apresentados encontram-se localiza-dos em terra arrendada pelo Governo de Moçambique. De acordo com a legislação moçambicana toda a terra é propriedade do Estado.
O BCI optou por adoptar a isenção prevista na IFRS 1 - Adopção pela primeira vez das normas internacionais de relato financeiro e reavaliou alguns imóveis com refe-rência a 1 de Janeiro de 2006, tendo usado o valor resultante da avaliação, conduzida por peritos indepen-dentes, como custo considerado.
No corrente exercício foi efectuada uma reavaliação dos imóveis, tendo a mesma sido registada pelo método de Avaliação de Custo de Substituição, o qual consiste em determinar o valor pelo custo de substituição do imóvel em condições idênticas.
• Valor dos activos tangíveis antes da reavaliação:354.314.285,00 Meticais
• Valor dos activos tangíveis após a reavaliação:566.820.324,00 Meticais
• Reserva de reavaliação dos activos tangíveis:212.506.039,00 Meticais
(ii) Reclassifications:
a. The bank included a building obtained in past years through the execution of collateral guarantees for the amount of 68,143,458 meticais, in its own buildings account heading in 2010 (see note 3.8);
b. Owing to the cancellation of the construction project for the bank’s future new headquarters office, an amount of 149,055,000.00 was eliminated from the tangiblefixedassetsinprogressaccount;
c. The part corresponding to the software initially rec-ognised in tangible assets in progress for the amount of 53,635,360.00 meticais was reclassified to intan-gible assets (see note 3.11).
The above referred to properties are located on land which is rented by the government of Mozambique. Under Mozambican legislation, all land is state-owned.
BCI chose to adopt the exemption provided for in IFRS 1 - “First time Adoption of International Financial Reporting Standards” and revalued several properties with reference to 01 January 2006, having used the amount resulting from the valuation, performed by independent experts, as a deemed cost.
A property revaluation exercise was performed this year and recognised using the replacement cost assessment method in which the value was assessed by the cost of replacing the property with identical property.
• Value of tangible assets prior to revaluation:354,314,285.00 meticais
• Value of tangible assets after revaluation:566,820,324.00 meticais
• Tangibleassetsrevaluationreserve:212,506,039.00meticais
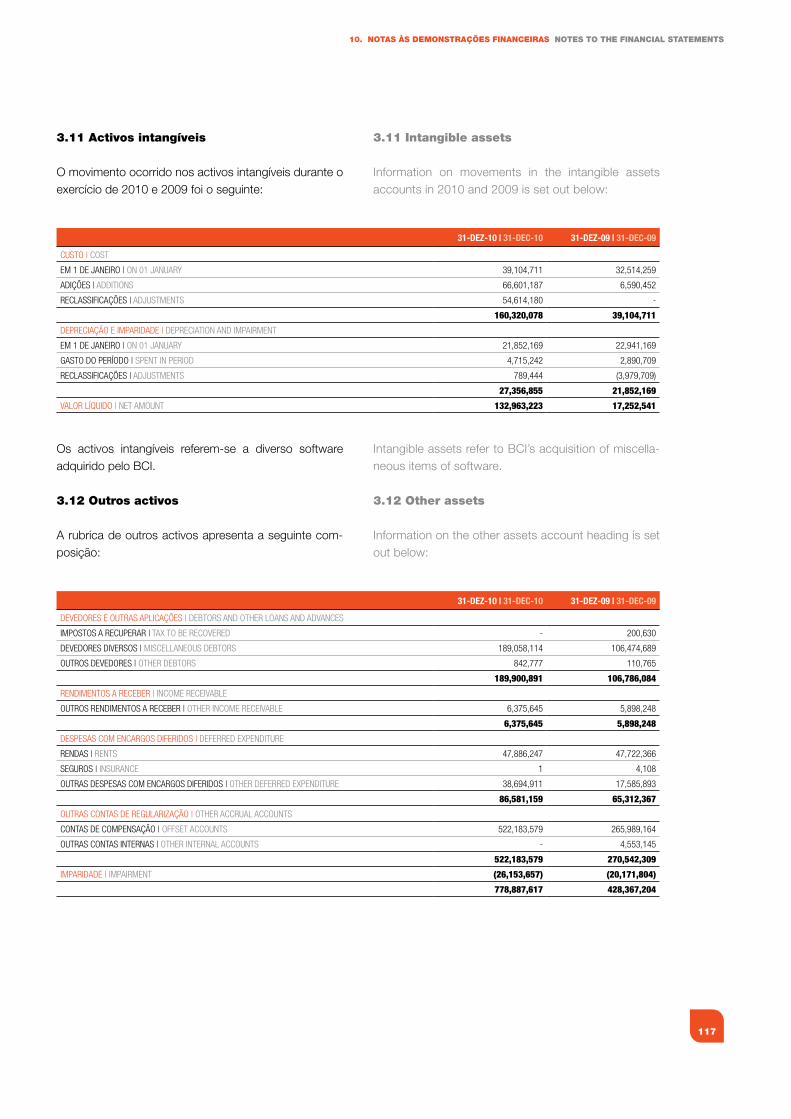
117
10. NOTAS àS dEMONSTRAÇÕES fINANCEIRAS NOTES TO ThE fINANCIAL STATEMENTS
3.11 Activos intangíveis
O movimento ocorrido nos activos intangíveis durante o exercício de 2010 e 2009 foi o seguinte:
Os activos intangíveis referem-se a diverso software adquirido pelo BCI.
3.12 Outros activos
A rubrica de outros activos apresenta a seguinte com-posição:
31-DEZ-10 | 31-DEC-10 31-DEZ-09 | 31-DEC-09
CUsTO | COsT
eM 1 De JAneIRO | On 01 JAnUARy 39,104,711 32,514,259
ADIÇões | ADDITIOns 66,601,187 6,590,452
ReCLAssIfICAÇões | ADJUsTMenTs 54,614,180 -
160,320,078 39,104,711
DePReCIAÇÃO e IMPARIDADe | DePReCIATIOn AnD IMPAIRMenT
eM 1 De JAneIRO | On 01 JAnUARy 21,852,169 22,941,169
gAsTO DO PeRÍODO | sPenT In PeRIOD 4,715,242 2,890,709
ReCLAssIfICAÇões | ADJUsTMenTs 789,444 (3,979,709)
27,356,855 21,852,169
VALOR LÍQUIDO | neT AMOUnT 132,963,223 17,252,541
31-DEZ-10 | 31-DEC-10 31-DEZ-09 | 31-DEC-09
DeVeDORes e OUTRAs APLICAÇões | DeBTORs AnD OTheR LOAns AnD ADVAnCes
IMPOsTOs A ReCUPeRAR | TAx TO Be ReCOVeReD - 200,630
DeVeDORes DIVeRsOs | MIsCeLLAneOUs DeBTORs 189,058,114 106,474,689
OUTROs DeVeDORes | OTheR DeBTORs 842,777 110,765
189,900,891 106,786,084
RenDIMenTOs A ReCeBeR | InCOMe ReCeIVABLe
OUTROs RenDIMenTOs A ReCeBeR | OTheR InCOMe ReCeIVABLe 6,375,645 5,898,248
6,375,645 5,898,248
DesPesAs COM enCARgOs DIfeRIDOs | DefeRReD exPenDITURe
RenDAs | RenTs 47,886,247 47,722,366
segUROs | InsURAnCe 1 4,108
OUTRAs DesPesAs COM enCARgOs DIfeRIDOs | OTheR DefeRReD exPenDITURe 38,694,911 17,585,893
86,581,159 65,312,367
OUTRAs COnTAs De RegULARIZAÇÃO | OTheR ACCRUAL ACCOUnTs
COnTAs De COMPensAÇÃO | OffseT ACCOUnTs 522,183,579 265,989,164
OUTRAs COnTAs InTeRnAs | OTheR InTeRnAL ACCOUnTs - 4,553,145
522,183,579 270,542,309
IMPARIDADe | IMPAIRMenT (26,153,657) (20,171,804)
778,887,617 428,367,204
3.11 Intangible assets
Information on movements in the intangible assets accounts in 2010 and 2009 is set out below:
Intangible assets refer to BCI’s acquisition of miscella-neous items of software.
3.12 Other assets
Information on the other assets account heading is set out below:
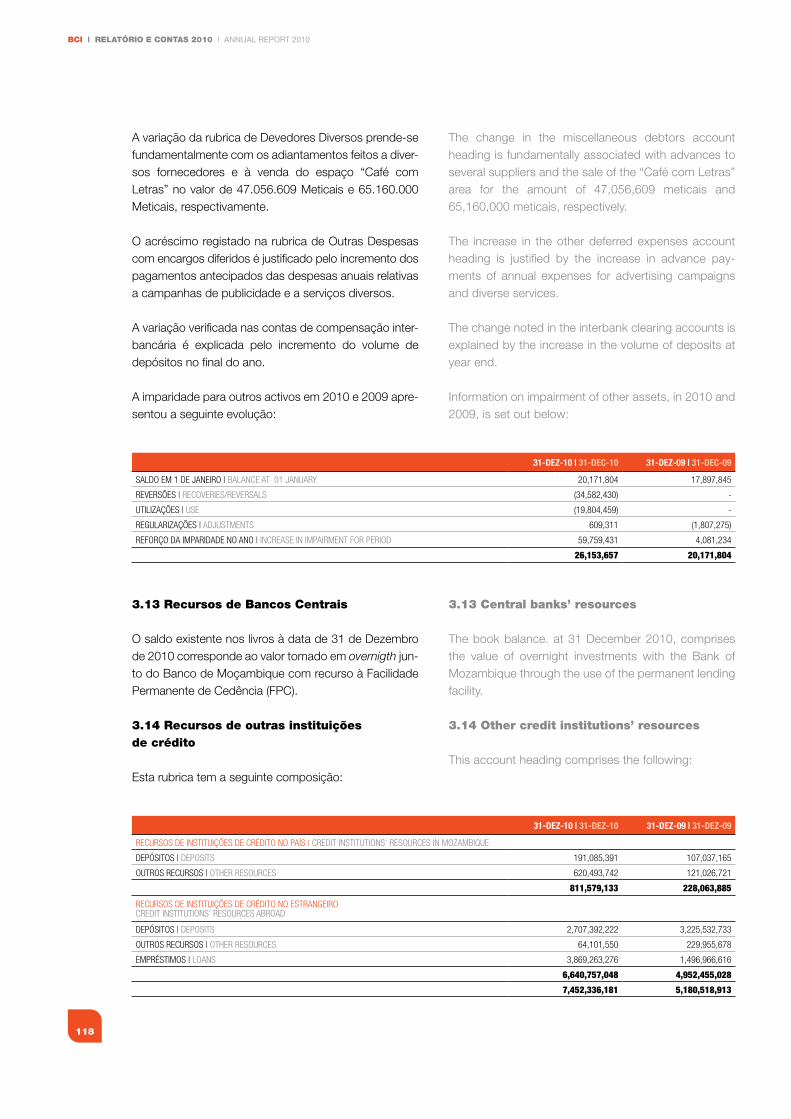
BCI | RELATÓRIO E CONTAS 2010 | ANNUAL REPORT 2010
118
A variação da rubrica de Devedores Diversos prende-se fundamentalmente com os adiantamentos feitos a diver-sos fornecedores e à venda do espaço “Café com Letras” no valor de 47.056.609 Meticais e 65.160.000 Meticais, respectivamente.
O acréscimo registado na rubrica de Outras Despesas com encargos diferidos é justificado pelo incremento dos pagamentos antecipados das despesas anuais relativas a campanhas de publicidade e a serviços diversos.
A variação verificada nas contas de compensação inter-bancária é explicada pelo incremento do volume de depósitos no final do ano.
A imparidade para outros activos em 2010 e 2009 apre-sentou a seguinte evolução:
3.13 Recursos de Bancos Centrais
O saldo existente nos livros à data de 31 de Dezembro de 2010 corresponde ao valor tomado em overnigth jun-to do Banco de Moçambique com recurso à Facilidade Permanente de Cedência (FPC).
3.14 Recursos de outras instituições de crédito
Esta rubrica tem a seguinte composição:
31-DEZ-10 | 31-DEC-10 31-DEZ-09 | 31-DEC-09
sALDO eM 1 De JAneIRO | BALAnCe AT 01 JAnUARy 20,171,804 17,897,845
ReVeRsões | ReCOVeRIes/ReVeRsALs (34,582,430) -
UTILIZAÇões | Use (19,804,459) -
RegULARIZAÇões | ADJUsTMenTs 609,311 (1,807,275)
RefORÇO DA IMPARIDADe nO AnO | InCReAse In IMPAIRMenT fOR PeRIOD 59,759,431 4,081,234
26,153,657 20,171,804
31-DEZ-10 | 31-DEZ-10 31-DEZ-09 | 31-DEZ-09
ReCURsOs De InsTITUIÇões De CRÉDITO nO PAÍs | CReDIT InsTITUTIOns’ ResOURCes In MOZAMBIQUe
DePÓsITOs | DePOsITs 191,085,391 107,037,165
OUTROs ReCURsOs | OTheR ResOURCes 620,493,742 121,026,721
811,579,133 228,063,885
ReCURsOs De InsTITUIÇões De CRÉDITO nO esTRAngeIROCReDIT InsTITUTIOns’ ResOURCes ABROAD
DePÓsITOs | DePOsITs 2,707,392,222 3,225,532,733
OUTROs ReCURsOs | OTheR ResOURCes 64,101,550 229,955,678
eMPRÉsTIMOs | LOAns 3,869,263,276 1,496,966,616
6,640,757,048 4,952,455,028
7,452,336,181 5,180,518,913
The change in the miscellaneous debtors account heading is fundamentally associated with advances to several suppliers and the sale of the “Café com Letras” area for the amount of 47,056,609 meticais and 65,160,000 meticais, respectively.
The increase in the other deferred expenses account heading is justified by the increase in advance pay-ments of annual expenses for advertising campaigns and diverse services.
The change noted in the interbank clearing accounts is explained by the increase in the volume of deposits at year end.
Information on impairment of other assets, in 2010 and 2009, is set out below:
3.13 Central banks’ resources
The book balance. at 31 December 2010, comprises the value of overnight investments with the Bank of Mozambique through the use of the permanent lending facility.
3.14 Other credit institutions’ resources
This account heading comprises the following:
119
10. NOTAS àS dEMONSTRAÇÕES fINANCEIRAS NOTES TO ThE fINANCIAL STATEMENTS
No intuito de melhorar a gestão da liquidez, nomeada-mente em termos de gaps de maturidade das opera-ções, o BCI contratou junto do BNU, IFC e PROPARCO empréstimos de médio e longo prazo, garantindo deste modo o funding para operações activas de prazo seme-lhante.
Empréstimo BNU
Empréstimo do Banco Nacional Ultramarino (BNU), no valor de USD 79.000.000,00 (2.573.820.000,00 Meticais), destina-se a apoiar no Funding do Finan-ciamento. O prazo de validade é de um ano renovável, com remuneração semestral, a taxa de juro aplicável é a LIBOR 6 meses acrescida de um spread de 2,75%.
Empréstimo da PROPARCO
O valor do empréstimo contraído com a PROPARCO para o desenvolvimento das actividade do Banco é de USD 20.000.000,00 (651.600.000,00 Meticais), sendo o reembolso em Setembro de 2015. A remuneração é semestral e a taxa de juros aplicável é a Libor 6 meses, carecido de um spread de 3,2%.
Empréstimo do IFC
O BCI contraiu um empréstimo com o IFC para financia-mento a pequenas e médias empresas, assim como Banca de retalho e Corporate no valor de USD 19.000.000,00 (619.020.000,00 Meticais), sendo o reembolso em Junho de 2015. A remuneração é tri-mestral e a taxa de juros aplicável é a Libor 3 meses, carecido de um spread de 3,4%.
To improve liquidity management, notably as regards maturity mismatches, BCI took out several medium and long term loans with BNU, IFC and PROPARCO to guarantee funding for its lending operations with similar maturities.
BNU loan
The Banco Nacional Ultramarino (BNU) loan of USD 79,000,000.00 (2,573,820,000.00 meticais), was for use as a funding support tool. It has a renewable, one year maturity, upon which six monthly interest at the 6 months LIBOR rate plus a spread of 2.75% is charged. PROPARCO loan
A loan of USD 20,000,000.00 (651,600,000.00 metic-ais), repayable in September 2015, was taken out with PROPARCO for the development of the bank’s activity. Interest is paid half yearly at the Libor 6 months rate plus a spread of 3.2%.
IFC loan
BCI took out a loan of USD 19,000,000.00 (619,020,000.00 meticais), from IFC for small and medium size companies, in addition to retail and cor-porate banks funding applications, repayable in June 2015. Interest is paid quarterly at the Libor 3 months rate plus a spread of 3.4%.
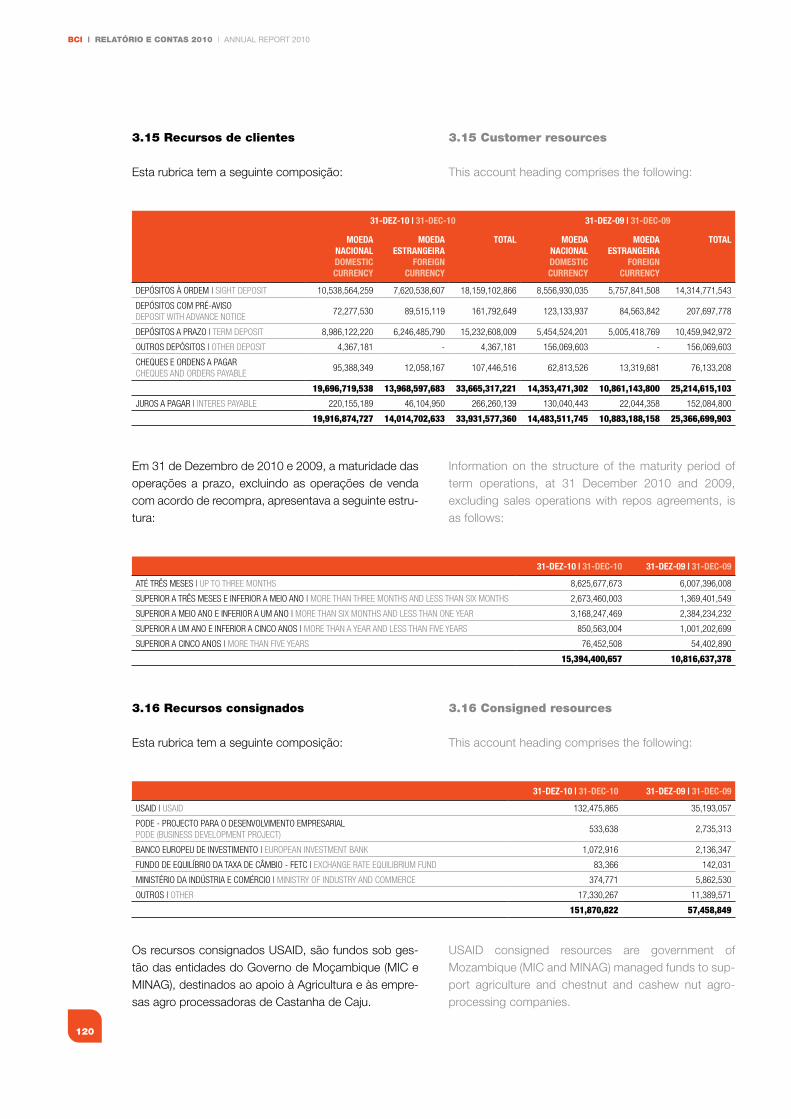
BCI | RELATÓRIO E CONTAS 2010 | ANNUAL REPORT 2010
120
3.15 Recursos de clientes
Esta rubrica tem a seguinte composição:
Em 31 de Dezembro de 2010 e 2009, a maturidade das operações a prazo, excluindo as operações de venda com acordo de recompra, apresentava a seguinte estru-tura:
3.16 Recursos consignados
Esta rubrica tem a seguinte composição:
Os recursos consignados USAID, são fundos sob ges-tão das entidades do Governo de Moçambique (MIC e MINAG), destinados ao apoio à Agricultura e às empre-sas agro processadoras de Castanha de Caju.
31-DEZ-10 | 31-DEC-10 31-DEZ-09 | 31-DEC-09
MOEDANACIONAl DOMESTIC CuRRENCy
MOEDA ESTRANGEIRA
fOREIGN CuRRENCy
TOTAl MOEDANACIONAl DOMESTIC CuRRENCy
MOEDA ESTRANGEIRA
fOREIGN CuRRENCy
TOTAl
DePÓsITOs à ORDeM | sIghT DePOsIT 10,538,564,259 7,620,538,607 18,159,102,866 8,556,930,035 5,757,841,508 14,314,771,543
DePÓsITOs COM PRÉ-AVIsODePOsIT wITh ADVAnCe nOTICe
72,277,530 89,515,119 161,792,649 123,133,937 84,563,842 207,697,778
DePÓsITOs A PRAZO | TeRM DePOsIT 8,986,122,220 6,246,485,790 15,232,608,009 5,454,524,201 5,005,418,769 10,459,942,972
OUTROs DePÓsITOs | OTheR DePOsIT 4,367,181 - 4,367,181 156,069,603 - 156,069,603
CheQUes e ORDens A PAgARCheQUes AnD ORDeRs PAyABLe
95,388,349 12,058,167 107,446,516 62,813,526 13,319,681 76,133,208
19,696,719,538 13,968,597,683 33,665,317,221 14,353,471,302 10,861,143,800 25,214,615,103
JUROs A PAgAR | InTeRes PAyABLe 220,155,189 46,104,950 266,260,139 130,040,443 22,044,358 152,084,800
19,916,874,727 14,014,702,633 33,931,577,360 14,483,511,745 10,883,188,158 25,366,699,903
31-DEZ-10 | 31-DEC-10 31-DEZ-09 | 31-DEC-09
ATÉ TRÊs Meses | UP TO ThRee MOnThs 8,625,677,673 6,007,396,008
sUPeRIOR A TRÊs Meses e InfeRIOR A MeIO AnO | MORe ThAn ThRee MOnThs AnD Less ThAn sIx MOnThs 2,673,460,003 1,369,401,549
sUPeRIOR A MeIO AnO e InfeRIOR A UM AnO | MORe ThAn sIx MOnThs AnD Less ThAn One yeAR 3,168,247,469 2,384,234,232
sUPeRIOR A UM AnO e InfeRIOR A CInCO AnOs | MORe ThAn A yeAR AnD Less ThAn fIVe yeARs 850,563,004 1,001,202,699
sUPeRIOR A CInCO AnOs | MORe ThAn fIVe yeARs 76,452,508 54,402,890
15,394,400,657 10,816,637,378
31-DEZ-10 | 31-DEC-10 31-DEZ-09 | 31-DEC-09
UsAID | UsAID 132,475,865 35,193,057
PODe - PROJeCTO PARA O DesenVOLVIMenTO eMPResARIALPODe (BUsIness DeVeLOPMenT PROJeCT)
533,638 2,735,313
BAnCO eUROPeU De InVesTIMenTO | eUROPeAn InVesTMenT BAnk 1,072,916 2,136,347
fUnDO De eQUILÍBRIO DA TAxA De CâMBIO - feTC | exChAnge RATe eQUILIBRIUM fUnD 83,366 142,031
MInIsTÉRIO DA InDúsTRIA e COMÉRCIO | MInIsTRy Of InDUsTRy AnD COMMeRCe 374,771 5,862,530
OUTROs | OTheR 17,330,267 11,389,571
151,870,822 57,458,849
3.15 Customer resources
This account heading comprises the following:
Information on the structure of the maturity period of term operations, at 31 December 2010 and 2009, excluding sales operations with repos agreements, is as follows:
3.16 Consigned resources
This account heading comprises the following:
USAID consigned resources are government of Mozambique (MIC and MINAG) managed funds to sup-port agriculture and chestnut and cashew nut agro-processing companies.
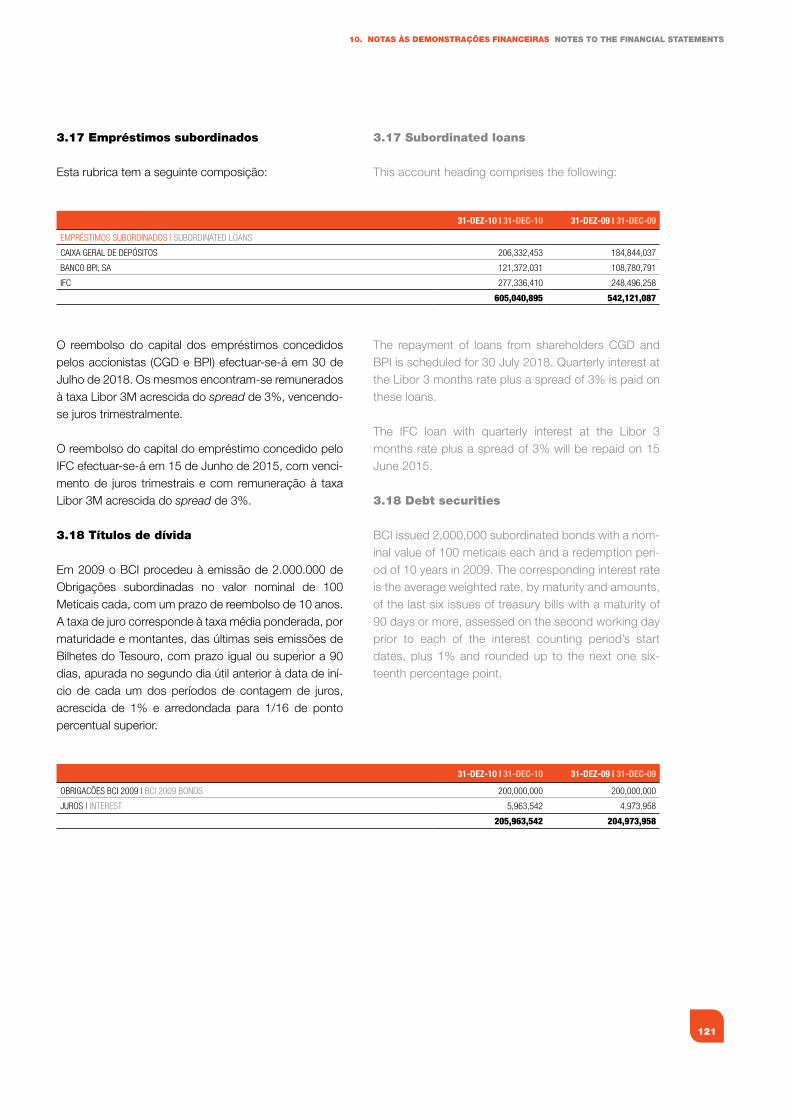
121
10. NOTAS àS dEMONSTRAÇÕES fINANCEIRAS NOTES TO ThE fINANCIAL STATEMENTS
3.17 Empréstimos subordinados
Esta rubrica tem a seguinte composição:
O reembolso do capital dos empréstimos concedidos pelos accionistas (CGD e BPI) efectuar-se-á em 30 de Julho de 2018. Os mesmos encontram-se remunerados à taxa Libor 3M acrescida do spread de 3%, vencendo-se juros trimestralmente.
O reembolso do capital do empréstimo concedido pelo IFC efectuar-se-á em 15 de Junho de 2015, com venci-mento de juros trimestrais e com remuneração à taxa Libor 3M acrescida do spread de 3%.
3.18 Títulos de dívida
Em 2009 o BCI procedeu à emissão de 2.000.000 de Obrigações subordinadas no valor nominal de 100 Meticais cada, com um prazo de reembolso de 10 anos. A taxa de juro corresponde à taxa média ponderada, por maturidade e montantes, das últimas seis emissões de Bilhetes do Tesouro, com prazo igual ou superior a 90 dias, apurada no segundo dia útil anterior à data de iní-cio de cada um dos períodos de contagem de juros, acrescida de 1% e arredondada para 1/16 de ponto percentual superior.
31-DEZ-10 | 31-DEC-10 31-DEZ-09 | 31-DEC-09
eMPRÉsTIMOs sUBORDInADOs | sUBORDInATeD LOAns
CAIxA geRAL De DePÓsITOs 206,332,453 184,844,037
BAnCO BPI, sA 121,372,031 108,780,791
IfC 277,336,410 248,496,258
605,040,895 542,121,087
31-DEZ-10 | 31-DEC-10 31-DEZ-09 | 31-DEC-09
OBRIgACões BCI 2009 | BCI 2009 BOnDs 200,000,000 200,000,000
JUROs | InTeResT 5,963,542 4,973,958
205,963,542 204,973,958
3.17 Subordinated loans
This account heading comprises the following:
The repayment of loans from shareholders CGD and BPI is scheduled for 30 July 2018. Quarterly interest at the Libor 3 months rate plus a spread of 3% is paid on these loans.
The IFC loan with quarterly interest at the Libor 3 months rate plus a spread of 3% will be repaid on 15 June 2015.
3.18 debt securities
BCI issued 2,000,000 subordinated bonds with a nom-inal value of 100 meticais each and a redemption peri-od of 10 years in 2009. The corresponding interest rate is the average weighted rate, by maturity and amounts, of the last six issues of treasury bills with a maturity of 90 days or more, assessed on the second working day prior to each of the interest counting period’s start dates, plus 1% and rounded up to the next one six-teenth percentage point.
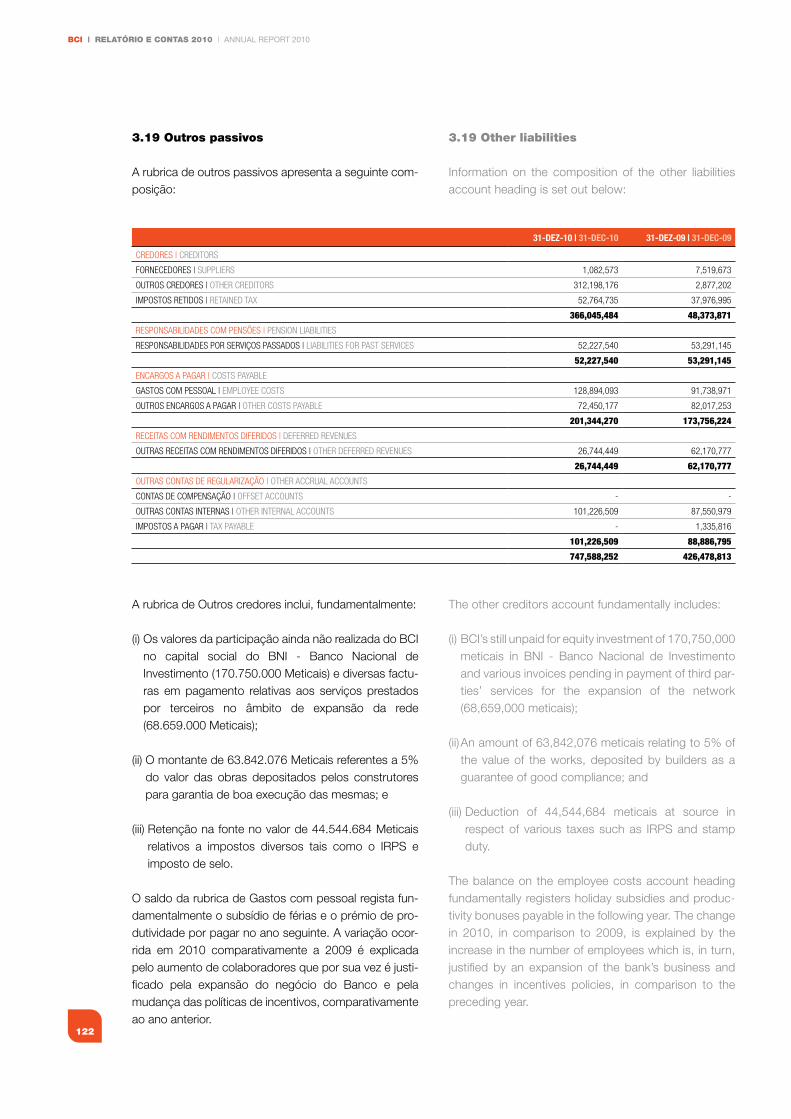
BCI | RELATÓRIO E CONTAS 2010 | ANNUAL REPORT 2010
122
3.19 Outros passivos
A rubrica de outros passivos apresenta a seguinte com-posição:
A rubrica de Outros credores inclui, fundamentalmente:
(i) Os valores da participação ainda não realizada do BCI no capital social do BNI - Banco Nacional de Investimento (170.750.000 Meticais) e diversas factu-ras em pagamento relativas aos serviços prestados por terceiros no âmbito de expansão da rede (68.659.000Meticais);
(ii) O montante de 63.842.076 Meticais referentes a 5% do valor das obras depositados pelos construtores paragarantiadeboaexecuçãodasmesmas;e
(iii) Retenção na fonte no valor de 44.544.684 Meticais relativos a impostos diversos tais como o IRPS e imposto de selo.
O saldo da rubrica de Gastos com pessoal regista fun-damentalmente o subsídio de férias e o prémio de pro-dutividade por pagar no ano seguinte. A variação ocor-rida em 2010 comparativamente a 2009 é explicada pelo aumento de colaboradores que por sua vez é justi-ficado pela expansão do negócio do Banco e pela mudança das políticas de incentivos, comparativamente ao ano anterior.
31-DEZ-10 | 31-DEC-10 31-DEZ-09 | 31-DEC-09
CReDORes | CReDITORs
fORneCeDORes | sUPPLIeRs 1,082,573 7,519,673
OUTROs CReDORes | OTheR CReDITORs 312,198,176 2,877,202
IMPOsTOs ReTIDOs | ReTAIneD TAx 52,764,735 37,976,995
366,045,484 48,373,871
ResPOnsABILIDADes COM Pensões | PensIOn LIABILITIes
ResPOnsABILIDADes POR seRVIÇOs PAssADOs | LIABILITIes fOR PAsT seRVICes 52,227,540 53,291,145
52,227,540 53,291,145
enCARgOs A PAgAR | COsTs PAyABLe
gAsTOs COM PessOAL | eMPLOyee COsTs 128,894,093 91,738,971
OUTROs enCARgOs A PAgAR | OTheR COsTs PAyABLe 72,450,177 82,017,253
201,344,270 173,756,224
ReCeITAs COM RenDIMenTOs DIfeRIDOs | DefeRReD ReVenUes
OUTRAs ReCeITAs COM RenDIMenTOs DIfeRIDOs | OTheR DefeRReD ReVenUes 26,744,449 62,170,777
26,744,449 62,170,777
OUTRAs COnTAs De RegULARIZAÇÃO | OTheR ACCRUAL ACCOUnTs
COnTAs De COMPensAÇÃO | OffseT ACCOUnTs - -
OUTRAs COnTAs InTeRnAs | OTheR InTeRnAL ACCOUnTs 101,226,509 87,550,979
IMPOsTOs A PAgAR | TAx PAyABLe - 1,335,816
101,226,509 88,886,795
747,588,252 426,478,813
3.19 Other liabilities
Information on the composition of the other liabilities account heading is set out below:
The other creditors account fundamentally includes:
(i) BCI’s still unpaid for equity investment of 170,750,000 meticais in BNI - Banco Nacional de Investimento and various invoices pending in payment of third par-ties’ services for the expansion of the network (68,659,000meticais);
(ii) An amount of 63,842,076 meticais relating to 5% of the value of the works, deposited by builders as a guaranteeofgoodcompliance;and
(iii) Deduction of 44,544,684 meticais at source in respect of various taxes such as IRPS and stamp duty.
The balance on the employee costs account heading fundamentally registers holiday subsidies and produc-tivity bonuses payable in the following year. The change in 2010, in comparison to 2009, is explained by the increase in the number of employees which is, in turn, justified by an expansion of the bank’s business and changes in incentives policies, in comparison to the preceding year.
123
10. NOTAS àS dEMONSTRAÇÕES fINANCEIRAS NOTES TO ThE fINANCIAL STATEMENTS
A rubrica de Outras contas internas registou um incre-mento motivado pelas transferências recebidas no final do ano que aguardavam a regularização nos primeiros dias do ano seguinte.
As responsabilidades com pensões do BCI referem-se aos colaboradores do Ex-BF e foram incorporadas no passivo do Banco no decurso da escritura de fusão datada de 4 de Dezembro de 2003.
Ao abrigo do Acordo Colectivo de Trabalho (ACT) em vigor no sector bancário subscrito pelo Ex-BF, os cola-boradores contratados localmente ou as suas famílias têm o direito a prestações pecuniárias a título de refor-ma por velhice, invalidez e sobrevivência.
Aos trabalhadores do BCI abrangidos pelo plano de pensões ser-lhes-á atribuído um complemento de pen-são, calculado com base na aplicação do esquema de benefícios do ACT do Sector Bancário, deduzido das prestações que venham a receber do Instituto Nacional da Segurança Social.
As responsabilidades por serviços passados são calcu-ladas em conformidade com o estabelecido na IAS 19.
Um plano de benefícios definidos é um plano de pen-sões que define uma quantia do benefício de pensões que um empregado terá direito a receber aquando da data da sua reforma, dependendo de um ou mais facto-res como a idade, anos de serviço e salário.
As avaliações actuariais necessárias ao cálculo das res-ponsabilidades por pensões de reforma e sobrevivência foram conduzidas pela BPI Pensões.
O passivo associado à responsabilidade é determinado numa base actuarial através da utilização do método Projected Unit Credit ajustado pelos ganhos e perdas actuariais não reconhecidos. A responsabilidade é des-contada utilizando uma taxa com referência aos rendi-mentos do mercado à data do balanço em obrigações de alta qualidade de sociedades. Os ganhos e perdas actuariais não são reconhecidos a não ser que os ganhos e perdas líquidos acumulados no final do perío-do anterior excedam 10% do valor actual das responsa-bilidades por serviços passados. Nestas circunstâncias, é reconhecido nos resultados do período o excesso daí resultante durante o tempo médio de trabalho remanes-cente dos empregados participantes no plano.
The other internal account headings register an increase deriving from transfers received at the end of the year, pending settlement in the first few days of the following year.
BCI’s pensions liabilities refer to former BF workers and were incorporated with the bank’s liabilities at the time of signing the title deed relating to the merger, dated 04 December 2003.
Under the terms of the collective labour agreement in force in the banking sector to which the former BF is a signatory, local employees or their families are entitled to cash payments in the form of old age, disability and survivors’ pensions.
BCI workers enrolled in the pension plan are paid a pension subsidy, calculated on the basis of the applica-tion of the benefits scheme attached to the collective labour agreement for the banking sector, less pay-ments they receive from the National Social Security Institute.
Liabilities for past services are calculated in conformity with the dispositions of IAS 19.
A defined benefit plan is a pension plan which defines the amount of a pension benefit an employee is entitled to receive upon retirement, depending on one or more factors such as age, number of years’ service and salary.
BPI Pensões was responsible for the actuarial assess-ments necessary for the calculation of retirement and survivors’ pensions liabilities.
Liabilities associated with the responsibility are assessed actuarially using the projected unit credit method adjusted for unrecognised actuarial gains and losses. The liability is discounted on the basis of a refer-ence rate on market income from high quality corpo-rate bonds at the date of the balance sheet. Actuarial gains and losses are only recognised when the accu-mulated gains and losses at the end of the preceding period exceed 10% of the present value of liabilities for past services. In such circumstances, the resulting excess for the average length of the remaining working lives of employees enrolled in the plan is recognised in the income statement for the period.
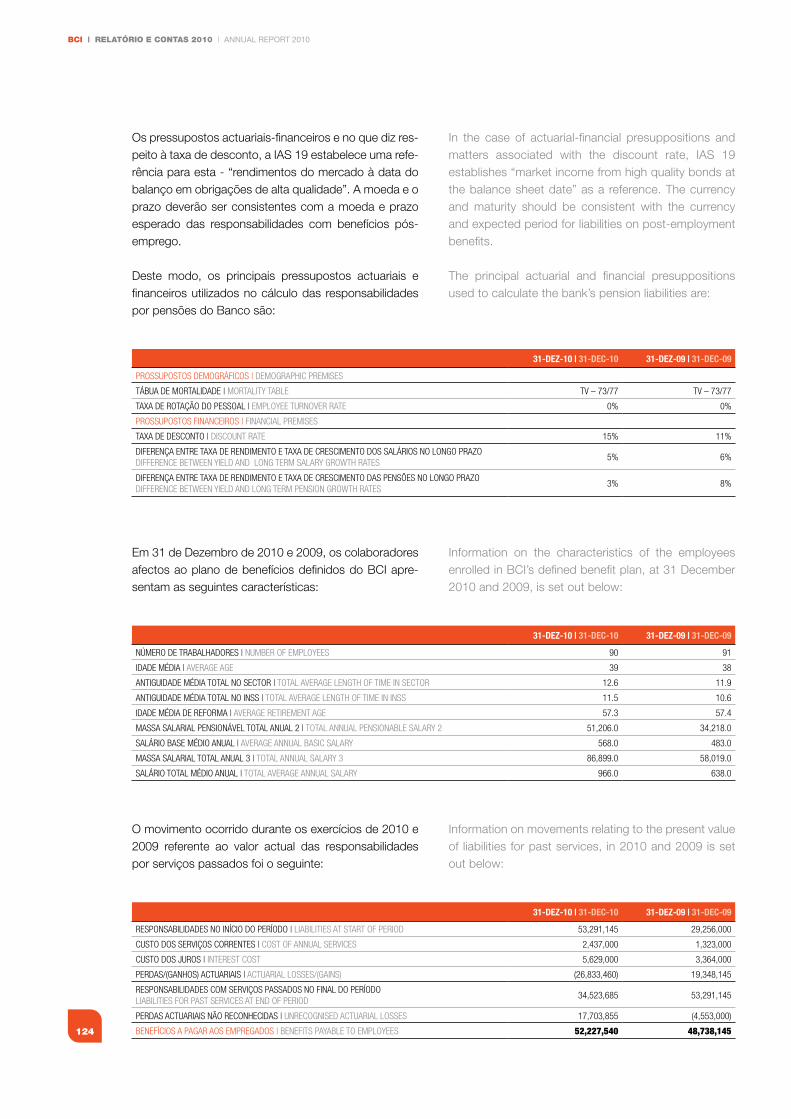
BCI | RELATÓRIO E CONTAS 2010 | ANNUAL REPORT 2010
124
Os pressupostos actuariais-financeiros e no que diz res-peito à taxa de desconto, a IAS 19 estabelece uma refe-rência para esta - “rendimentos do mercado à data do balanço em obrigações de alta qualidade”. A moeda e o prazo deverão ser consistentes com a moeda e prazo esperado das responsabilidades com benefícios pós-emprego.
Deste modo, os principais pressupostos actuariais e financeiros utilizados no cálculo das responsabilidades por pensões do Banco são:
Em 31 de Dezembro de 2010 e 2009, os colaboradores afectos ao plano de benefícios definidos do BCI apre-sentam as seguintes características:
O movimento ocorrido durante os exercícios de 2010 e 2009 referente ao valor actual das responsabilidades por serviços passados foi o seguinte:
31-DEZ-10 | 31-DEC-10 31-DEZ-09 | 31-DEC-09
PROssUPOsTOs DeMOgRÁfICOs | DeMOgRAPhIC PReMIses
TÁBUA De MORTALIDADe | MORTALITy TABLe TV – 73/77 TV – 73/77
TAxA De ROTAÇÃO DO PessOAL | eMPLOyee TURnOVeR RATe 0% 0%
PROssUPOsTOs fInAnCeIROs | fInAnCIAL PReMIses
TAxA De DesCOnTO | DIsCOUnT RATe 15% 11%
DIfeRenÇA enTRe TAxA De RenDIMenTO e TAxA De CResCIMenTO DOs sALÁRIOs nO LOngO PRAZODIffeRenCe BeTween yIeLD AnD LOng TeRM sALARy gROwTh RATes
5% 6%
DIfeRenÇA enTRe TAxA De RenDIMenTO e TAxA De CResCIMenTO DAs Pensões nO LOngO PRAZODIffeRenCe BeTween yIeLD AnD LOng TeRM PensIOn gROwTh RATes
3% 8%
31-DEZ-10 | 31-DEC-10 31-DEZ-09 | 31-DEC-09
núMeRO De TRABALhADORes | nUMBeR Of eMPLOyees 90 91
IDADe MÉDIA | AVeRAge Age 39 38
AnTIgUIDADe MÉDIA TOTAL nO seCTOR | TOTAL AVeRAge LengTh Of TIMe In seCTOR 12.6 11.9
AnTIgUIDADe MÉDIA TOTAL nO Inss | TOTAL AVeRAge LengTh Of TIMe In Inss 11.5 10.6
IDADe MÉDIA De RefORMA | AVeRAge ReTIReMenT Age 57.3 57.4
MAssA sALARIAL PensIOnÁVeL TOTAL AnUAL 2 | TOTAL AnnUAL PensIOnABLe sALARy 2 51,206.0 34,218.0
sALÁRIO BAse MÉDIO AnUAL | AVeRAge AnnUAL BAsIC sALARy 568.0 483.0
MAssA sALARIAL TOTAL AnUAL 3 | TOTAL AnnUAL sALARy 3 86,899.0 58,019.0
sALÁRIO TOTAL MÉDIO AnUAL | TOTAL AVeRAge AnnUAL sALARy 966.0 638.0
31-DEZ-10 | 31-DEC-10 31-DEZ-09 | 31-DEC-09
ResPOnsABILIDADes nO InÍCIO DO PeRÍODO | LIABILITIes AT sTART Of PeRIOD 53,291,145 29,256,000
CUsTO DOs seRVIÇOs CORRenTes | COsT Of AnnUAL seRVICes 2,437,000 1,323,000
CUsTO DOs JUROs | InTeResT COsT 5,629,000 3,364,000
PeRDAs/(gAnhOs) ACTUARIAIs | ACTUARIAL LOsses/(gAIns) (26,833,460) 19,348,145
ResPOnsABILIDADes COM seRVIÇOs PAssADOs nO fInAL DO PeRÍODOLIABILITIes fOR PAsT seRVICes AT enD Of PeRIOD
34,523,685 53,291,145
PeRDAs ACTUARIAIs nÃO ReCOnheCIDAs | UnReCOgnIseD ACTUARIAL LOsses 17,703,855 (4,553,000)
BenefÍCIOs A PAgAR AOs eMPRegADOs | BenefITs PAyABLe TO eMPLOyees 52,227,540 48,738,145
In the case of actuarial-financial presuppositions and matters associated with the discount rate, IAS 19 establishes “market income from high quality bonds at the balance sheet date” as a reference. The currency and maturity should be consistent with the currency and expected period for liabilities on post-employment benefits.
The principal actuarial and financial presuppositions used to calculate the bank’s pension liabilities are:
Information on the characteristics of the employees enrolled in BCI’s defined benefit plan, at 31 December 2010 and 2009, is set out below:
Information on movements relating to the present value of liabilities for past services, in 2010 and 2009 is set out below:
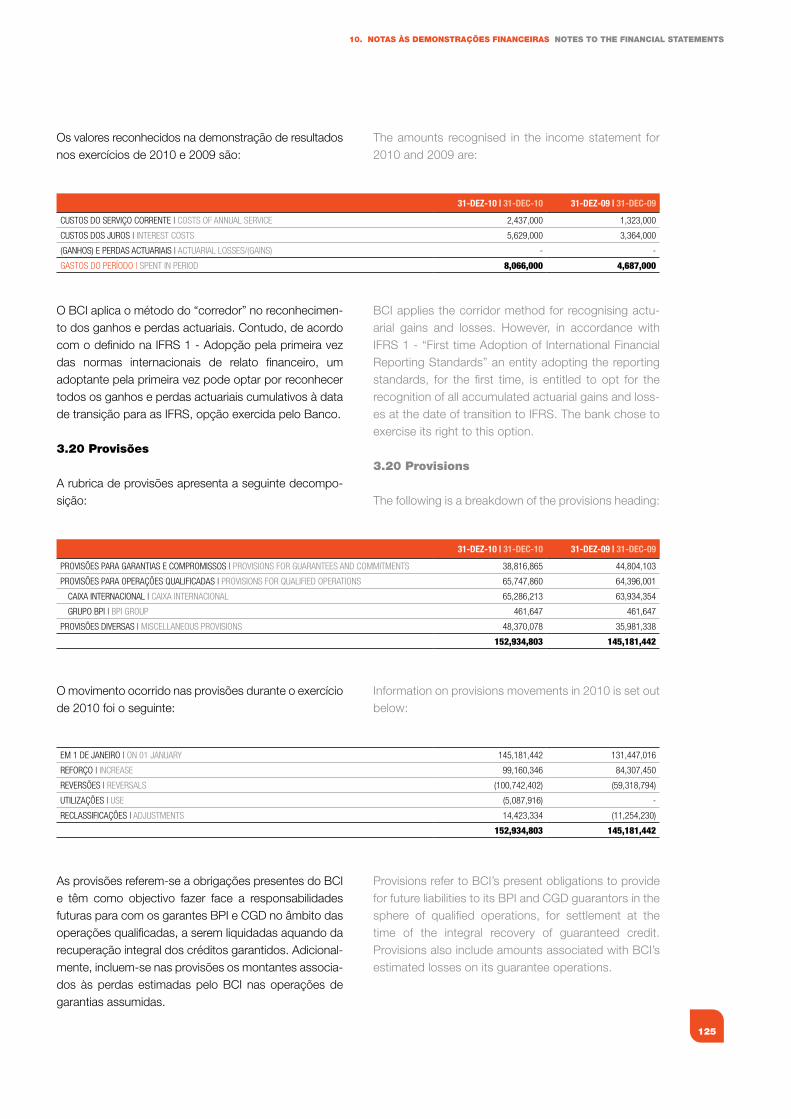
125
10. NOTAS àS dEMONSTRAÇÕES fINANCEIRAS NOTES TO ThE fINANCIAL STATEMENTS
Os valores reconhecidos na demonstração de resultados nos exercícios de 2010 e 2009 são:
O BCI aplica o método do “corredor” no reconhecimen-to dos ganhos e perdas actuariais. Contudo, de acordo com o definido na IFRS 1 - Adopção pela primeira vez das normas internacionais de relato financeiro, um adoptante pela primeira vez pode optar por reconhecer todos os ganhos e perdas actuariais cumulativos à data de transição para as IFRS, opção exercida pelo Banco.
3.20 Provisões
A rubrica de provisões apresenta a seguinte decompo-sição:
O movimento ocorrido nas provisões durante o exercício de 2010 foi o seguinte:
As provisões referem-se a obrigações presentes do BCI e têm como objectivo fazer face a responsabilidades futuras para com os garantes BPI e CGD no âmbito das operações qualificadas, a serem liquidadas aquando da recuperação integral dos créditos garantidos. Adicional-mente, incluem-se nas provisões os montantes associa-dos às perdas estimadas pelo BCI nas operações de garantias assumidas.
31-DEZ-10 | 31-DEC-10 31-DEZ-09 | 31-DEC-09
CUsTOs DO seRVIÇO CORRenTe | COsTs Of AnnUAL seRVICe 2,437,000 1,323,000
CUsTOs DOs JUROs | InTeResT COsTs 5,629,000 3,364,000
(gAnhOs) e PeRDAs ACTUARIAIs | ACTUARIAL LOsses/(gAIns) - -
gAsTOs DO PeRÍODO | sPenT In PeRIOD 8,066,000 4,687,000
31-DEZ-10 | 31-DEC-10 31-DEZ-09 | 31-DEC-09
PROVIsões PARA gARAnTIAs e COMPROMIssOs | PROVIsIOns fOR gUARAnTees AnD COMMITMenTs 38,816,865 44,804,103
PROVIsões PARA OPeRAÇões QUALIfICADAs | PROVIsIOns fOR QUALIfIeD OPeRATIOns 65,747,860 64,396,001
CAIxA InTeRnACIOnAL | CAIxA InTeRnACIOnAL 65,286,213 63,934,354
gRUPO BPI | BPI gROUP 461,647 461,647
PROVIsões DIVeRsAs | MIsCeLLAneOUs PROVIsIOns 48,370,078 35,981,338
152,934,803 145,181,442
eM 1 De JAneIRO | On 01 JAnUARy 145,181,442 131,447,016
RefORÇO | InCReAse 99,160,346 84,307,450
ReVeRsões | ReVeRsALs (100,742,402) (59,318,794)
UTILIZAÇões | Use (5,087,916) -
ReCLAssIfICAÇões | ADJUsTMenTs 14,423,334 (11,254,230)
152,934,803 145,181,442
The amounts recognised in the income statement for 2010 and 2009 are:
BCI applies the corridor method for recognising actu-arial gains and losses. However, in accordance with IFRS 1 - “First time Adoption of International Financial Reporting Standards” an entity adopting the reporting standards, for the first time, is entitled to opt for the recognition of all accumulated actuarial gains and loss-es at the date of transition to IFRS. The bank chose to exercise its right to this option.
3.20 Provisions
The following is a breakdown of the provisions heading:
Information on provisions movements in 2010 is set out below:
Provisions refer to BCI’s present obligations to provide for future liabilities to its BPI and CGD guarantors in the sphere of qualified operations, for settlement at the time of the integral recovery of guaranteed credit. Provisions also include amounts associated with BCI’s estimated losses on its guarantee operations.
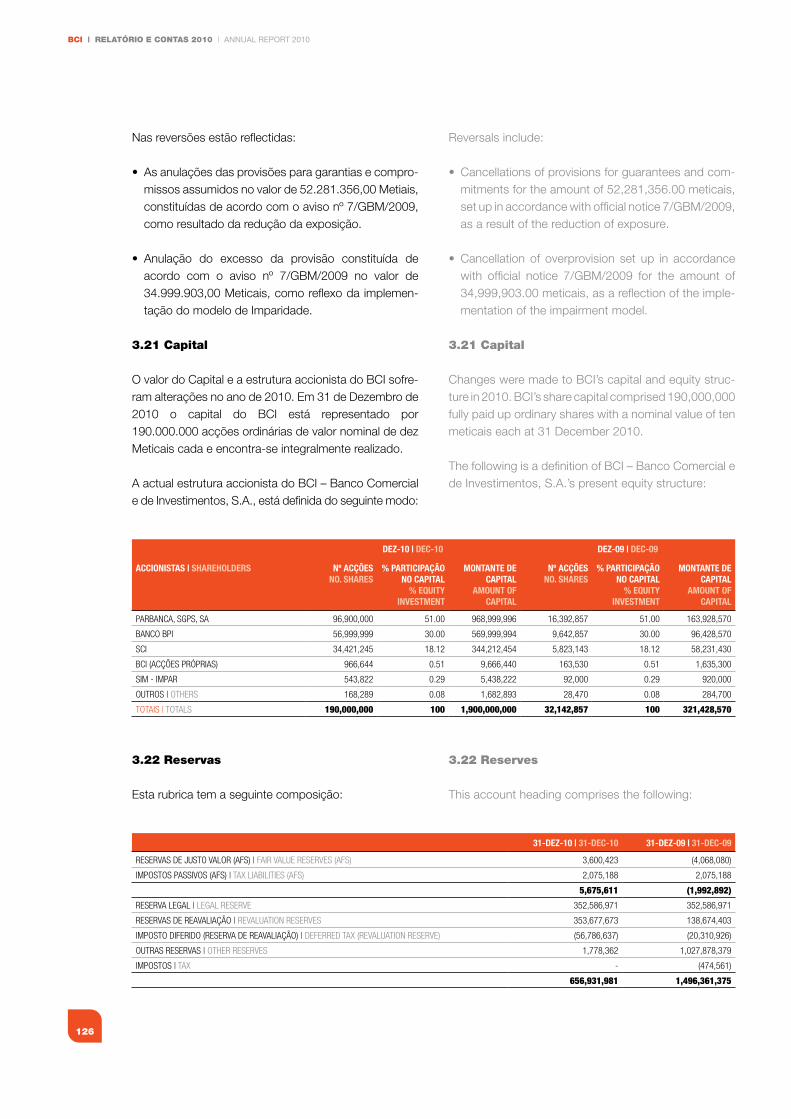
BCI | RELATÓRIO E CONTAS 2010 | ANNUAL REPORT 2010
126
Nas reversões estão reflectidas:
• Asanulaçõesdasprovisõesparagarantiasecompro-missos assumidos no valor de 52.281.356,00 Metiais, constituídas de acordo com o aviso nº 7/GBM/2009, como resultado da redução da exposição.
• Anulação do excesso da provisão constituída deacordo com o aviso nº 7/GBM/2009 no valor de 34.999.903,00 Meticais, como reflexo da implemen-tação do modelo de Imparidade.
3.21 Capital
O valor do Capital e a estrutura accionista do BCI sofre-ram alterações no ano de 2010. Em 31 de Dezembro de 2010 o capital do BCI está representado por 190.000.000 acções ordinárias de valor nominal de dez Meticais cada e encontra-se integralmente realizado.
A actual estrutura accionista do BCI – Banco Comercial e de Investimentos, S.A., está definida do seguinte modo:
3.22 Reservas
Esta rubrica tem a seguinte composição:
DEZ-10 | DEC-10 DEZ-09 | DEC-09
ACCIONISTAS | ShAREhOlDERS Nº ACçõESNO. ShARES
% PARTICIPAçÃO NO CAPITAl
% EquITy INvESTMENT
MONTANTE DE CAPITAl
AMOuNT Of CAPITAl
Nº ACçõESNO. ShARES
% PARTICIPAçÃO NO CAPITAl
% EquITy INvESTMENT
MONTANTE DE CAPITAl
AMOuNT Of CAPITAl
PARBAnCA, sgPs, sA 96,900,000 51.00 968,999,996 16,392,857 51.00 163,928,570
BAnCO BPI 56,999,999 30.00 569,999,994 9,642,857 30.00 96,428,570
sCI 34,421,245 18.12 344,212,454 5,823,143 18.12 58,231,430
BCI (ACÇões PRÓPRIAs) 966,644 0.51 9,666,440 163,530 0.51 1,635,300
sIM - IMPAR 543,822 0.29 5,438,222 92,000 0.29 920,000
OUTROs | OTheRs 168,289 0.08 1,682,893 28,470 0.08 284,700
TOTAIs | TOTALs 190,000,000 100 1,900,000,000 32,142,857 100 321,428,570
31-DEZ-10 | 31-DEC-10 31-DEZ-09 | 31-DEC-09
ReseRVAs De JUsTO VALOR (Afs) | fAIR VALUe ReseRVes (Afs) 3,600,423 (4,068,080)
IMPOsTOs PAssIVOs (Afs) | TAx LIABILITIes (Afs) 2,075,188 2,075,188
5,675,611 (1,992,892)
ReseRVA LegAL | LegAL ReseRVe 352,586,971 352,586,971
ReseRVAs De ReAVALIAÇÃO | ReVALUATIOn ReseRVes 353,677,673 138,674,403
IMPOsTO DIfeRIDO (ReseRVA De ReAVALIAÇÃO) | DefeRReD TAx (ReVALUATIOn ReseRVe) (56,786,637) (20,310,926)
OUTRAs ReseRVAs | OTheR ReseRVes 1,778,362 1,027,878,379
IMPOsTOs | TAx - (474,561)
656,931,981 1,496,361,375
Reversals include:
• Cancellationsofprovisionsforguaranteesandcom-mitments for the amount of 52,281,356.00 meticais, set up in accordance with official notice 7/GBM/2009, as a result of the reduction of exposure.
• Cancellation of overprovision set up in accordancewith official notice 7/GBM/2009 for the amount of 34,999,903.00 meticais, as a reflection of the imple-mentation of the impairment model.
3.21 Capital
Changes were made to BCI’s capital and equity struc-ture in 2010. BCI’s share capital comprised 190,000,000 fully paid up ordinary shares with a nominal value of ten meticais each at 31 December 2010.
The following is a definition of BCI – Banco Comercial e de Investimentos, S.A.’s present equity structure:
3.22 Reserves
This account heading comprises the following:
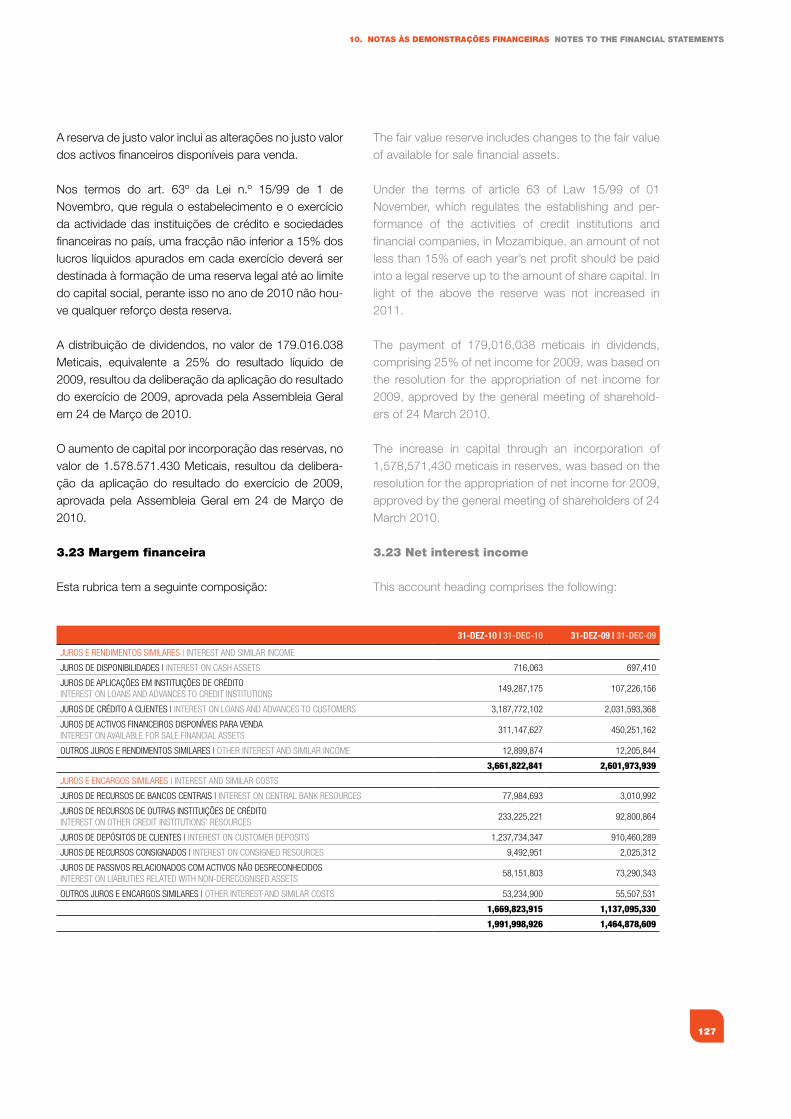
127
10. NOTAS àS dEMONSTRAÇÕES fINANCEIRAS NOTES TO ThE fINANCIAL STATEMENTS
A reserva de justo valor inclui as alterações no justo valor dos activos financeiros disponíveis para venda.
Nos termos do art. 63º da Lei n.º 15/99 de 1 de Novembro, que regula o estabelecimento e o exercício da actividade das instituições de crédito e sociedades financeiras no país, uma fracção não inferior a 15% dos lucros líquidos apurados em cada exercício deverá ser destinada à formação de uma reserva legal até ao limite do capital social, perante isso no ano de 2010 não hou-ve qualquer reforço desta reserva.
A distribuição de dividendos, no valor de 179.016.038 Meticais, equivalente a 25% do resultado líquido de 2009, resultou da deliberação da aplicação do resultado do exercício de 2009, aprovada pela Assembleia Geral em 24 de Março de 2010.
O aumento de capital por incorporação das reservas, no valor de 1.578.571.430 Meticais, resultou da delibera-ção da aplicação do resultado do exercício de 2009, aprovada pela Assembleia Geral em 24 de Março de 2010.
3.23 Margem financeira
Esta rubrica tem a seguinte composição:
31-DEZ-10 | 31-DEC-10 31-DEZ-09 | 31-DEC-09
JUROs e RenDIMenTOs sIMILARes | InTeResT AnD sIMILAR InCOMe
JUROs De DIsPOnIBILIDADes | InTeResT On CAsh AsseTs 716,063 697,410
JUROs De APLICAÇões eM InsTITUIÇões De CRÉDITOInTeResT On LOAns AnD ADVAnCes TO CReDIT InsTITUTIOns
149,287,175 107,226,156
JUROs De CRÉDITO A CLIenTes | InTeResT On LOAns AnD ADVAnCes TO CUsTOMeRs 3,187,772,102 2,031,593,368
JUROs De ACTIVOs fInAnCeIROs DIsPOnÍVeIs PARA VenDAInTeResT On AVAILABLe fOR sALe fInAnCIAL AsseTs
311,147,627 450,251,162
OUTROs JUROs e RenDIMenTOs sIMILARes | OTheR InTeResT AnD sIMILAR InCOMe 12,899,874 12,205,844
3,661,822,841 2,601,973,939
JUROs e enCARgOs sIMILARes | InTeResT AnD sIMILAR COsTs
JUROs De ReCURsOs De BAnCOs CenTRAIs | InTeResT On CenTRAL BAnk ResOURCes 77,984,693 3,010,992
JUROs De ReCURsOs De OUTRAs InsTITUIÇões De CRÉDITOInTeResT On OTheR CReDIT InsTITUTIOns’ ResOURCes
233,225,221 92,800,864
JUROs De DePÓsITOs De CLIenTes | InTeResT On CUsTOMeR DePOsITs 1,237,734,347 910,460,289
JUROs De ReCURsOs COnsIgnADOs | InTeResT On COnsIgneD ResOURCes 9,492,951 2,025,312
JUROs De PAssIVOs ReLACIOnADOs COM ACTIVOs nÃO DesReCOnheCIDOsInTeResT On LIABILITIes ReLATeD wITh nOn-DeReCOgnIseD AsseTs
58,151,803 73,290,343
OUTROs JUROs e enCARgOs sIMILARes | OTheR InTeResT AnD sIMILAR COsTs 53,234,900 55,507,531
1,669,823,915 1,137,095,330
1,991,998,926 1,464,878,609
The fair value reserve includes changes to the fair value of available for sale financial assets.
Under the terms of article 63 of Law 15/99 of 01 November, which regulates the establishing and per-formance of the activities of credit institutions and financial companies, in Mozambique, an amount of not less than 15% of each year’s net profit should be paid into a legal reserve up to the amount of share capital. In light of the above the reserve was not increased in 2011.
The payment of 179,016,038 meticais in dividends, comprising 25% of net income for 2009, was based on the resolution for the appropriation of net income for 2009, approved by the general meeting of sharehold-ers of 24 March 2010.
The increase in capital through an incorporation of 1,578,571,430 meticais in reserves, was based on the resolution for the appropriation of net income for 2009, approved by the general meeting of shareholders of 24 March 2010.
3.23 Net interest income
This account heading comprises the following:
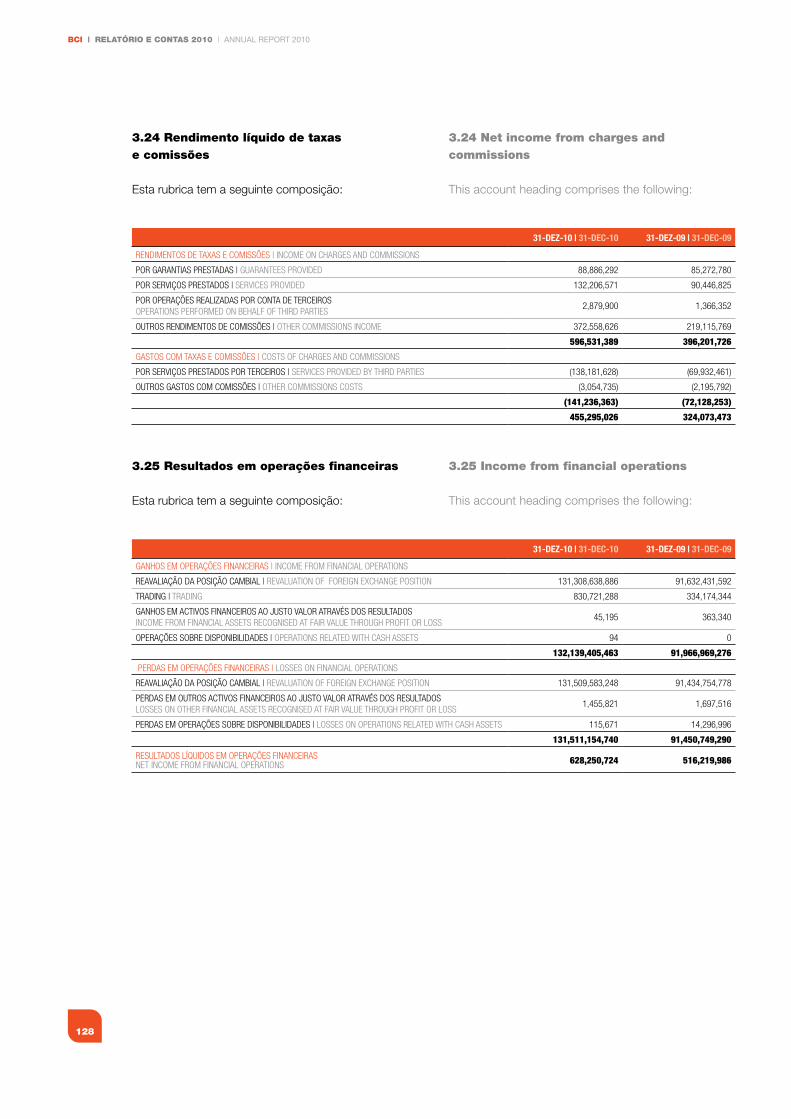
BCI | RELATÓRIO E CONTAS 2010 | ANNUAL REPORT 2010
128
3.24 Rendimento líquido de taxas e comissões
Esta rubrica tem a seguinte composição:
3.25 Resultados em operações financeiras
Esta rubrica tem a seguinte composição:
31-DEZ-10 | 31-DEC-10 31-DEZ-09 | 31-DEC-09
RenDIMenTOs De TAxAs e COMIssões | InCOMe On ChARges AnD COMMIssIOns
POR gARAnTIAs PResTADAs | gUARAnTees PROVIDeD 88,886,292 85,272,780
POR seRVIÇOs PResTADOs | seRVICes PROVIDeD 132,206,571 90,446,825
POR OPeRAÇões ReALIZADAs POR COnTA De TeRCeIROsOPeRATIOns PeRfORMeD On BehALf Of ThIRD PARTIes
2,879,900 1,366,352
OUTROs RenDIMenTOs De COMIssões | OTheR COMMIssIOns InCOMe 372,558,626 219,115,769
596,531,389 396,201,726
gAsTOs COM TAxAs e COMIssões | COsTs Of ChARges AnD COMMIssIOns
POR seRVIÇOs PResTADOs POR TeRCeIROs | seRVICes PROVIDeD By ThIRD PARTIes (138,181,628) (69,932,461)
OUTROs gAsTOs COM COMIssões | OTheR COMMIssIOns COsTs (3,054,735) (2,195,792)
(141,236,363) (72,128,253)
455,295,026 324,073,473
31-DEZ-10 | 31-DEC-10 31-DEZ-09 | 31-DEC-09
gAnhOs eM OPeRAÇões fInAnCeIRAs | InCOMe fROM fInAnCIAL OPeRATIOns
ReAVALIAÇÃO DA POsIÇÃO CAMBIAL | ReVALUATIOn Of fOReIgn exChAnge POsITIOn 131,308,638,886 91,632,431,592
TRADIng | TRADIng 830,721,288 334,174,344
gAnhOs eM ACTIVOs fInAnCeIROs AO JUsTO VALOR ATRAVÉs DOs ResULTADOsInCOMe fROM fInAnCIAL AsseTs ReCOgnIseD AT fAIR VALUe ThROUgh PROfIT OR LOss
45,195 363,340
OPeRAÇões sOBRe DIsPOnIBILIDADes | OPeRATIOns ReLATeD wITh CAsh AsseTs 94 0
132,139,405,463 91,966,969,276
PeRDAs eM OPeRAÇões fInAnCeIRAs | LOsses On fInAnCIAL OPeRATIOns
ReAVALIAÇÃO DA POsIÇÃO CAMBIAL | ReVALUATIOn Of fOReIgn exChAnge POsITIOn 131,509,583,248 91,434,754,778
PeRDAs eM OUTROs ACTIVOs fInAnCeIROs AO JUsTO VALOR ATRAVÉs DOs ResULTADOsLOsses On OTheR fInAnCIAL AsseTs ReCOgnIseD AT fAIR VALUe ThROUgh PROfIT OR LOss
1,455,821 1,697,516
PeRDAs eM OPeRAÇões sOBRe DIsPOnIBILIDADes | LOsses On OPeRATIOns ReLATeD wITh CAsh AsseTs 115,671 14,296,996
131,511,154,740 91,450,749,290
ResULTADOs LÍQUIDOs eM OPeRAÇões fInAnCeIRAsneT InCOMe fROM fInAnCIAL OPeRATIOns 628,250,724 516,219,986
3.24 Net income from charges and commissions
This account heading comprises the following:
3.25 Income from financial operations
This account heading comprises the following:
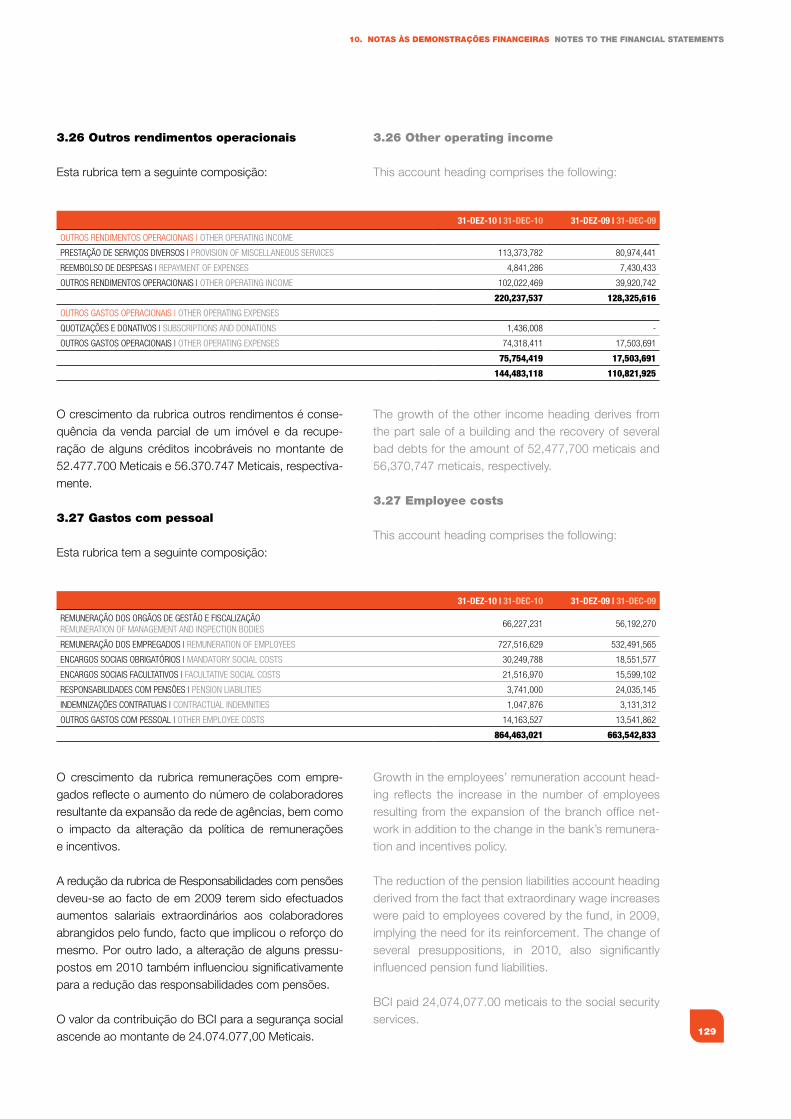
129
10. NOTAS àS dEMONSTRAÇÕES fINANCEIRAS NOTES TO ThE fINANCIAL STATEMENTS
3.26 Outros rendimentos operacionais
Esta rubrica tem a seguinte composição:
O crescimento da rubrica outros rendimentos é conse-quência da venda parcial de um imóvel e da recupe-ração de alguns créditos incobráveis no montante de 52.477.700 Meticais e 56.370.747 Meticais, respectiva-mente.
3.27 gastos com pessoal
Esta rubrica tem a seguinte composição:
O crescimento da rubrica remunerações com empre-gados reflecte o aumento do número de colaboradores resultante da expansão da rede de agências, bem como o impacto da alteração da política de remunerações e incentivos.
A redução da rubrica de Responsabilidades com pensões deveu-se ao facto de em 2009 terem sido efectuados aumentos salariais extraordinários aos colaboradores abrangidos pelo fundo, facto que implicou o reforço do mesmo. Por outro lado, a alteração de alguns pressu-postos em 2010 também influenciou significativamente para a redução das responsabilidades com pensões.
O valor da contribuição do BCI para a segurança social ascende ao montante de 24.074.077,00 Meticais.
31-DEZ-10 | 31-DEC-10 31-DEZ-09 | 31-DEC-09
OUTROs RenDIMenTOs OPeRACIOnAIs | OTheR OPeRATIng InCOMe
PResTAÇÃO De seRVIÇOs DIVeRsOs | PROVIsIOn Of MIsCeLLAneOUs seRVICes 113,373,782 80,974,441
ReeMBOLsO De DesPesAs | RePAyMenT Of exPenses 4,841,286 7,430,433
OUTROs RenDIMenTOs OPeRACIOnAIs | OTheR OPeRATIng InCOMe 102,022,469 39,920,742
220,237,537 128,325,616
OUTROs gAsTOs OPeRACIOnAIs | OTheR OPeRATIng exPenses
QUOTIZAÇões e DOnATIVOs | sUBsCRIPTIOns AnD DOnATIOns 1,436,008 -
OUTROs gAsTOs OPeRACIOnAIs | OTheR OPeRATIng exPenses 74,318,411 17,503,691
75,754,419 17,503,691
144,483,118 110,821,925
31-DEZ-10 | 31-DEC-10 31-DEZ-09 | 31-DEC-09
ReMUneRAÇÃO DOs ORgÃOs De gesTÃO e fIsCALIZAÇÃOReMUneRATIOn Of MAnAgeMenT AnD InsPeCTIOn BODIes
66,227,231 56,192,270
ReMUneRAÇÃO DOs eMPRegADOs | ReMUneRATIOn Of eMPLOyees 727,516,629 532,491,565
enCARgOs sOCIAIs OBRIgATÓRIOs | MAnDATORy sOCIAL COsTs 30,249,788 18,551,577
enCARgOs sOCIAIs fACULTATIVOs | fACULTATIVe sOCIAL COsTs 21,516,970 15,599,102
ResPOnsABILIDADes COM Pensões | PensIOn LIABILITIes 3,741,000 24,035,145
InDeMnIZAÇões COnTRATUAIs | COnTRACTUAL InDeMnITIes 1,047,876 3,131,312
OUTROs gAsTOs COM PessOAL | OTheR eMPLOyee COsTs 14,163,527 13,541,862
864,463,021 663,542,833
3.26 Other operating income
This account heading comprises the following:
The growth of the other income heading derives from the part sale of a building and the recovery of several bad debts for the amount of 52,477,700 meticais and 56,370,747 meticais, respectively.
3.27 Employee costs
This account heading comprises the following:
Growth in the employees’ remuneration account head-ing reflects the increase in the number of employees resulting from the expansion of the branch office net-work in addition to the change in the bank’s remunera-tion and incentives policy.
The reduction of the pension liabilities account heading derived from the fact that extraordinary wage increases were paid to employees covered by the fund, in 2009, implying the need for its reinforcement. The change of several presuppositions, in 2010, also significantly influenced pension fund liabilities.
BCI paid 24,074,077.00 meticais to the social security services.
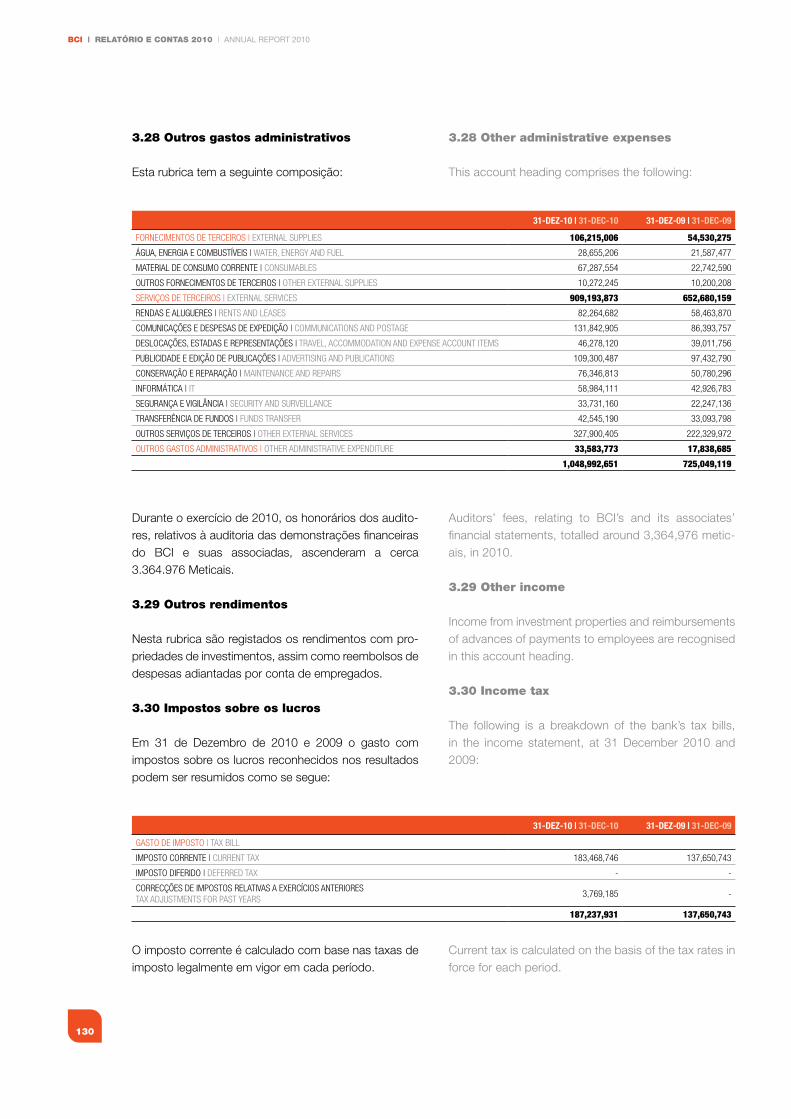
BCI | RELATÓRIO E CONTAS 2010 | ANNUAL REPORT 2010
130
3.28 Outros gastos administrativos
Esta rubrica tem a seguinte composição:
Durante o exercício de 2010, os honorários dos audito-res, relativos à auditoria das demonstrações financeiras do BCI e suas associadas, ascenderam a cerca 3.364.976 Meticais.
3.29 Outros rendimentos
Nesta rubrica são registados os rendimentos com pro-priedades de investimentos, assim como reembolsos de despesas adiantadas por conta de empregados.
3.30 Impostos sobre os lucros
Em 31 de Dezembro de 2010 e 2009 o gasto com impostos sobre os lucros reconhecidos nos resultados podem ser resumidos como se segue:
O imposto corrente é calculado com base nas taxas de imposto legalmente em vigor em cada período.
31-DEZ-10 | 31-DEC-10 31-DEZ-09 | 31-DEC-09
fORneCIMenTOs De TeRCeIROs | exTeRnAL sUPPLIes 106,215,006 54,530,275
ÁgUA, eneRgIA e COMBUsTÍVeIs | wATeR, eneRgy AnD fUeL 28,655,206 21,587,477
MATeRIAL De COnsUMO CORRenTe | COnsUMABLes 67,287,554 22,742,590
OUTROs fORneCIMenTOs De TeRCeIROs | OTheR exTeRnAL sUPPLIes 10,272,245 10,200,208
seRVIÇOs De TeRCeIROs | exTeRnAL seRVICes 909,193,873 652,680,159
RenDAs e ALUgUeRes | RenTs AnD LeAses 82,264,682 58,463,870
COMUnICAÇões e DesPesAs De exPeDIÇÃO | COMMUnICATIOns AnD POsTAge 131,842,905 86,393,757
DesLOCAÇões, esTADAs e RePResenTAÇões | TRAVeL, ACCOMMODATIOn AnD exPense ACCOUnT ITeMs 46,278,120 39,011,756
PUBLICIDADe e eDIÇÃO De PUBLICAÇões | ADVeRTIsIng AnD PUBLICATIOns 109,300,487 97,432,790
COnseRVAÇÃO e RePARAÇÃO | MAInTenAnCe AnD RePAIRs 76,346,813 50,780,296
InfORMÁTICA | IT 58,984,111 42,926,783
segURAnÇA e VIgILânCIA | seCURITy AnD sURVeILLAnCe 33,731,160 22,247,136
TRAnsfeRÊnCIA De fUnDOs | fUnDs TRAnsfeR 42,545,190 33,093,798
OUTROs seRVIÇOs De TeRCeIROs | OTheR exTeRnAL seRVICes 327,900,405 222,329,972
OUTROs gAsTOs ADMInIsTRATIVOs | OTheR ADMInIsTRATIVe exPenDITURe 33,583,773 17,838,685
1,048,992,651 725,049,119
31-DEZ-10 | 31-DEC-10 31-DEZ-09 | 31-DEC-09
gAsTO De IMPOsTO | TAx BILL
IMPOsTO CORRenTe | CURRenT TAx 183,468,746 137,650,743
IMPOsTO DIfeRIDO | DefeRReD TAx - -
CORReCÇões De IMPOsTOs ReLATIVAs A exeRCÍCIOs AnTeRIOResTAx ADJUsTMenTs fOR PAsT yeARs
3,769,185 -
187,237,931 137,650,743
3.28 Other administrative expenses
This account heading comprises the following:
Auditors’ fees, relating to BCI’s and its associates’ financial statements, totalled around 3,364,976 metic-ais, in 2010.
3.29 Other income
Income from investment properties and reimbursements of advances of payments to employees are recognised in this account heading.
3.30 Income tax
The following is a breakdown of the bank’s tax bills, in the income statement, at 31 December 2010 and 2009:
Current tax is calculated on the basis of the tax rates in force for each period.
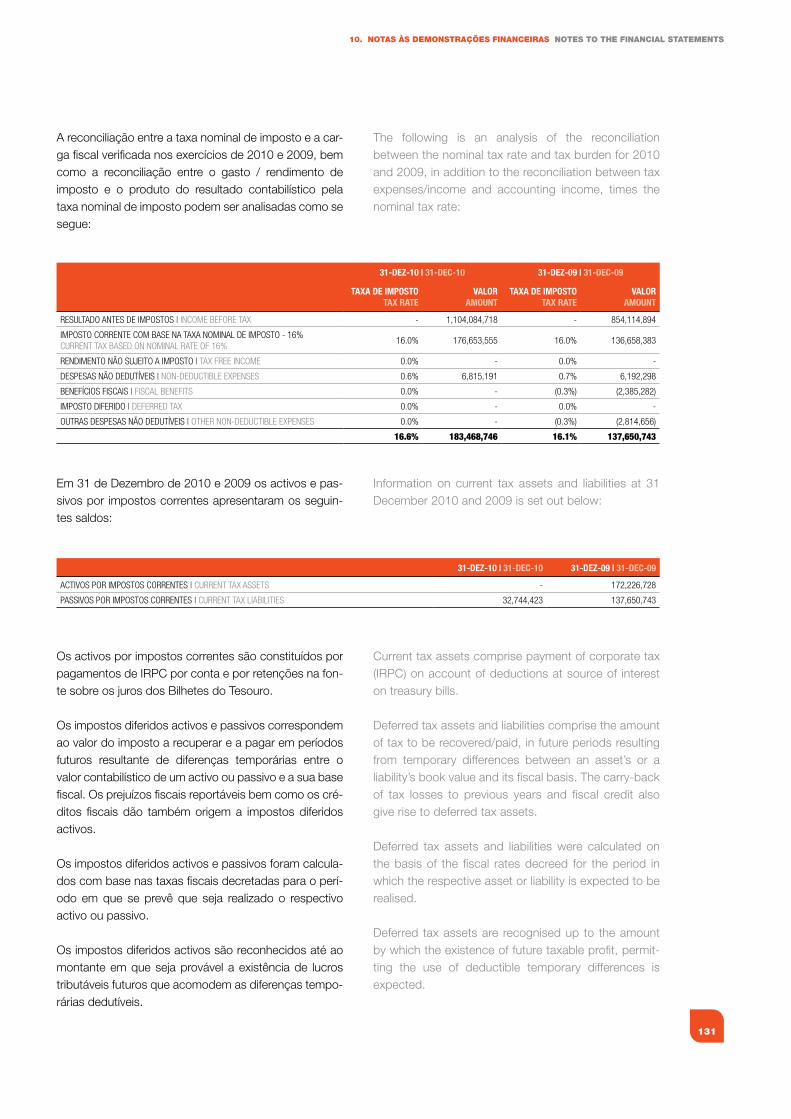
131
10. NOTAS àS dEMONSTRAÇÕES fINANCEIRAS NOTES TO ThE fINANCIAL STATEMENTS
A reconciliação entre a taxa nominal de imposto e a car-ga fiscal verificada nos exercícios de 2010 e 2009, bem como a reconciliação entre o gasto / rendimento de imposto e o produto do resultado contabilístico pela taxa nominal de imposto podem ser analisadas como se segue:
Em 31 de Dezembro de 2010 e 2009 os activos e pas-sivos por impostos correntes apresentaram os seguin-tes saldos:
Os activos por impostos correntes são constituídos por pagamentos de IRPC por conta e por retenções na fon-te sobre os juros dos Bilhetes do Tesouro.
Os impostos diferidos activos e passivos correspondem ao valor do imposto a recuperar e a pagar em períodos futuros resultante de diferenças temporárias entre o valor contabilístico de um activo ou passivo e a sua base fiscal. Os prejuízos fiscais reportáveis bem como os cré-ditos fiscais dão também origem a impostos diferidos activos.
Os impostos diferidos activos e passivos foram calcula-dos com base nas taxas fiscais decretadas para o perí-odo em que se prevê que seja realizado o respectivo activo ou passivo.
Os impostos diferidos activos são reconhecidos até ao montante em que seja provável a existência de lucros tributáveis futuros que acomodem as diferenças tempo-rárias dedutíveis.
31-DEZ-10 | 31-DEC-10 31-DEZ-09 | 31-DEC-09
TAxA DE IMPOSTOTAx RATE
vAlORAMOuNT
TAxA DE IMPOSTOTAx RATE
vAlORAMOuNT
ResULTADO AnTes De IMPOsTOs | InCOMe BefORe TAx - 1,104,084,718 - 854,114,894
IMPOsTO CORRenTe COM BAse nA TAxA nOMInAL De IMPOsTO - 16%CURRenT TAx BAseD On nOMInAL RATe Of 16%
16.0% 176,653,555 16.0% 136,658,383
RenDIMenTO nÃO sUJeITO A IMPOsTO | TAx fRee InCOMe 0.0% - 0.0% -
DesPesAs nÃO DeDUTÍVeIs | nOn-DeDUCTIBLe exPenses 0.6% 6,815,191 0.7% 6,192,298
BenefÍCIOs fIsCAIs | fIsCAL BenefITs 0.0% - (0.3%) (2,385,282)
IMPOsTO DIfeRIDO | DefeRReD TAx 0.0% - 0.0% -
OUTRAs DesPesAs nÃO DeDUTÍVeIs | OTheR nOn-DeDUCTIBLe exPenses 0.0% - (0.3%) (2,814,656)
16.6% 183,468,746 16.1% 137,650,743
31-DEZ-10 | 31-DEC-10 31-DEZ-09 | 31-DEC-09
ACTIVOs POR IMPOsTOs CORRenTes | CURRenT TAx AsseTs - 172,226,728
PAssIVOs POR IMPOsTOs CORRenTes | CURRenT TAx LIABILITIes 32,744,423 137,650,743
The following is an analysis of the reconciliation between the nominal tax rate and tax burden for 2010 and 2009, in addition to the reconciliation between tax expenses/income and accounting income, times the nominal tax rate:
Information on current tax assets and liabilities at 31 December 2010 and 2009 is set out below:
Current tax assets comprise payment of corporate tax (IRPC) on account of deductions at source of interest on treasury bills.
Deferred tax assets and liabilities comprise the amount of tax to be recovered/paid, in future periods resulting from temporary differences between an asset’s or a liability’s book value and its fiscal basis. The carry-back of tax losses to previous years and fiscal credit also give rise to deferred tax assets.
Deferred tax assets and liabilities were calculated on the basis of the fiscal rates decreed for the period in which the respective asset or liability is expected to be realised.
Deferred tax assets are recognised up to the amount by which the existence of future taxable profit, permit-ting the use of deductible temporary differences is expected.
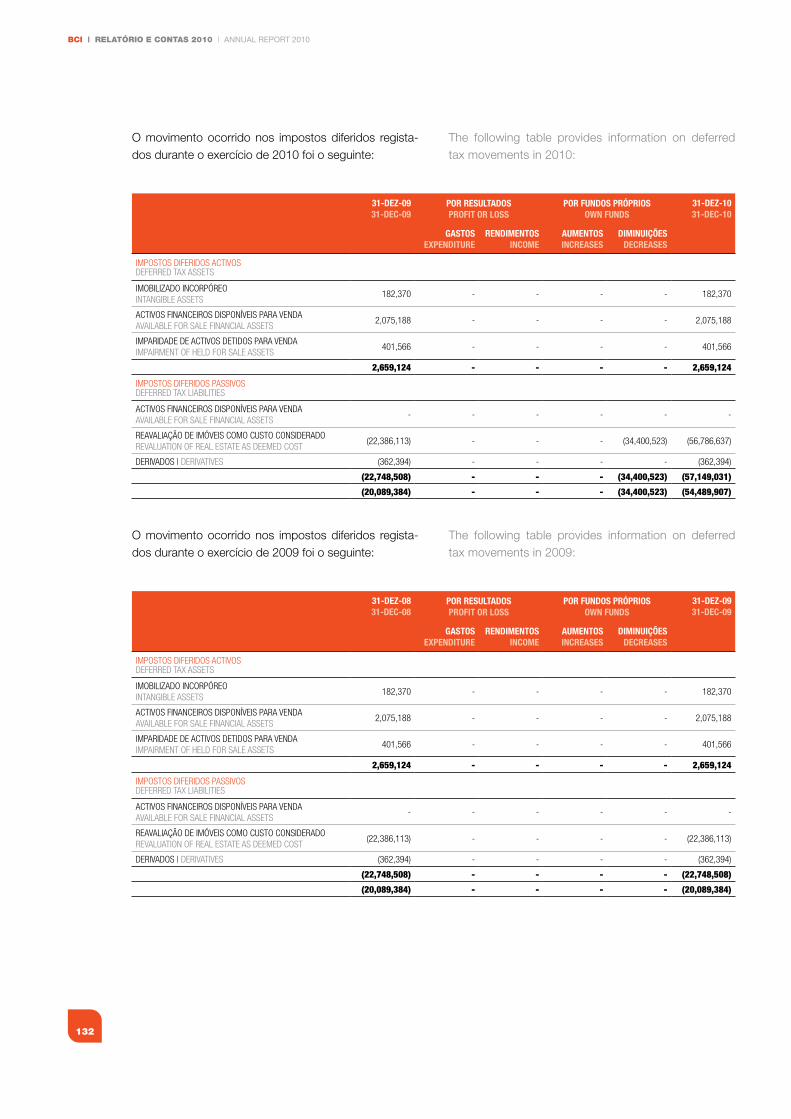
BCI | RELATÓRIO E CONTAS 2010 | ANNUAL REPORT 2010
132
O movimento ocorrido nos impostos diferidos regista-dos durante o exercício de 2010 foi o seguinte:
O movimento ocorrido nos impostos diferidos regista-dos durante o exercício de 2009 foi o seguinte:
31-DEZ-0931-DEC-09
POR RESulTADOSPROfIT OR lOSS
POR fuNDOS PRÓPRIOSOwN fuNDS
31-DEZ-1031-DEC-10
GASTOSExPENDITuRE
RENDIMENTOSINCOME
AuMENTOSINCREASES
DIMINuIçõESDECREASES
IMPOsTOs DIfeRIDOs ACTIVOsDefeRReD TAx AsseTs
IMOBILIZADO InCORPÓReOInTAngIBLe AsseTs
182,370 - - - - 182,370
ACTIVOs fInAnCeIROs DIsPOnÍVeIs PARA VenDAAVAILABLe fOR sALe fInAnCIAL AsseTs
2,075,188 - - - - 2,075,188
IMPARIDADe De ACTIVOs DeTIDOs PARA VenDAIMPAIRMenT Of heLD fOR sALe AsseTs
401,566 - - - - 401,566
2,659,124 - - - - 2,659,124
IMPOsTOs DIfeRIDOs PAssIVOsDefeRReD TAx LIABILITIes
ACTIVOs fInAnCeIROs DIsPOnÍVeIs PARA VenDAAVAILABLe fOR sALe fInAnCIAL AsseTs
- - - - - -
ReAVALIAÇÃO De IMÓVeIs COMO CUsTO COnsIDeRADOReVALUATIOn Of ReAL esTATe As DeeMeD COsT
(22,386,113) - - - (34,400,523) (56,786,637)
DeRIVADOs | DeRIVATIVes (362,394) - - - - (362,394)
(22,748,508) - - - (34,400,523) (57,149,031)
(20,089,384) - - - (34,400,523) (54,489,907)
31-DEZ-0831-DEC-08
POR RESulTADOSPROfIT OR lOSS
POR fuNDOS PRÓPRIOSOwN fuNDS
31-DEZ-0931-DEC-09
GASTOSExPENDITuRE
RENDIMENTOSINCOME
AuMENTOSINCREASES
DIMINuIçõESDECREASES
IMPOsTOs DIfeRIDOs ACTIVOsDefeRReD TAx AsseTs
IMOBILIZADO InCORPÓReOInTAngIBLe AsseTs
182,370 - - - - 182,370
ACTIVOs fInAnCeIROs DIsPOnÍVeIs PARA VenDAAVAILABLe fOR sALe fInAnCIAL AsseTs
2,075,188 - - - - 2,075,188
IMPARIDADe De ACTIVOs DeTIDOs PARA VenDAIMPAIRMenT Of heLD fOR sALe AsseTs
401,566 - - - - 401,566
2,659,124 - - - - 2,659,124
IMPOsTOs DIfeRIDOs PAssIVOsDefeRReD TAx LIABILITIes
ACTIVOs fInAnCeIROs DIsPOnÍVeIs PARA VenDAAVAILABLe fOR sALe fInAnCIAL AsseTs
- - - - - -
ReAVALIAÇÃO De IMÓVeIs COMO CUsTO COnsIDeRADOReVALUATIOn Of ReAL esTATe As DeeMeD COsT
(22,386,113) - - - - (22,386,113)
DeRIVADOs | DeRIVATIVes (362,394) - - - - (362,394)
(22,748,508) - - - - (22,748,508)
(20,089,384) - - - - (20,089,384)
The following table provides information on deferred tax movements in 2010:
The following table provides information on deferred tax movements in 2009:
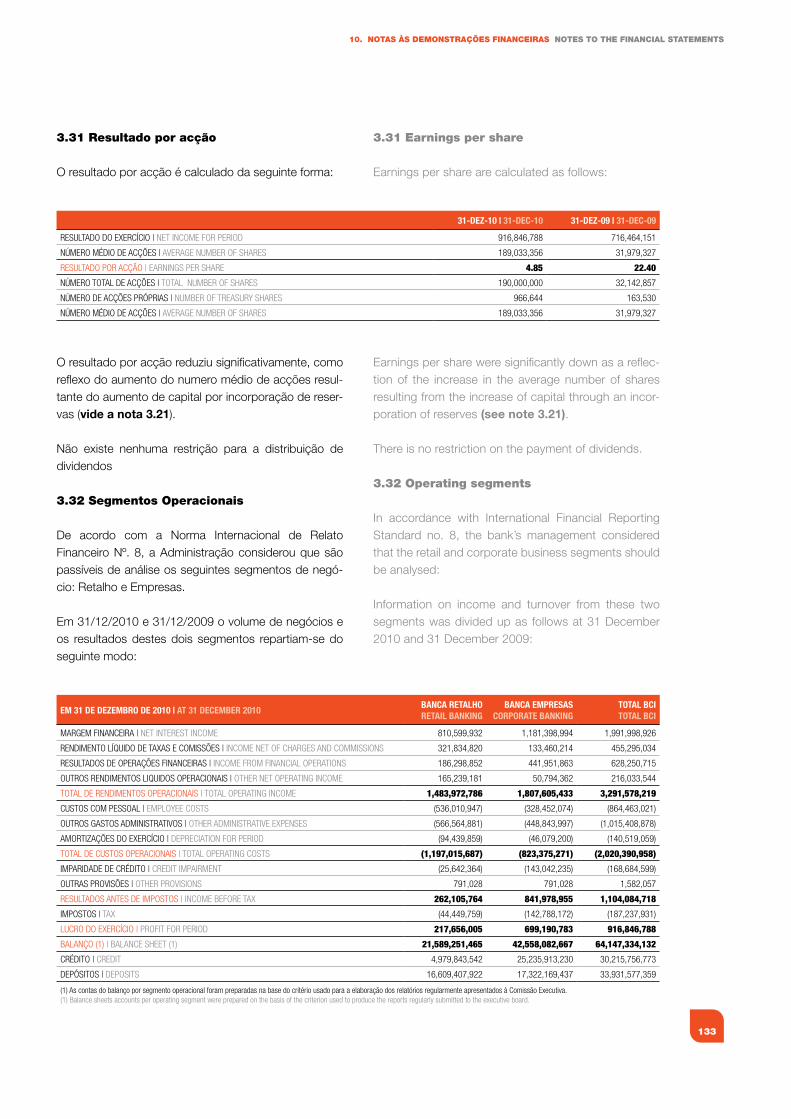
133
10. NOTAS àS dEMONSTRAÇÕES fINANCEIRAS NOTES TO ThE fINANCIAL STATEMENTS
3.31 Resultado por acção
O resultado por acção é calculado da seguinte forma:
O resultado por acção reduziu significativamente, como reflexo do aumento do numero médio de acções resul-tante do aumento de capital por incorporação de reser-vas (vide a nota 3.21).
Não existe nenhuma restrição para a distribuição de dividendos
3.32 Segmentos Operacionais
De acordo com a Norma Internacional de Relato Financeiro Nº. 8, a Administração considerou que são passíveis de análise os seguintes segmentos de negó-cio: Retalho e Empresas.
Em 31/12/2010 e 31/12/2009 o volume de negócios e os resultados destes dois segmentos repartiam-se do seguinte modo:
31-DEZ-10 | 31-DEC-10 31-DEZ-09 | 31-DEC-09
ResULTADO DO exeRCÍCIO | neT InCOMe fOR PeRIOD 916,846,788 716,464,151
núMeRO MÉDIO De ACÇões | AVeRAge nUMBeR Of shARes 189,033,356 31,979,327
ResULTADO POR ACÇÃO | eARnIngs PeR shARe 4.85 22.40
núMeRO TOTAL De ACÇões | TOTAL nUMBeR Of shARes 190,000,000 32,142,857
núMeRO De ACÇões PRÓPRIAs | nUMBeR Of TReAsURy shARes 966,644 163,530
núMeRO MÉDIO De ACÇões | AVeRAge nUMBeR Of shARes 189,033,356 31,979,327
EM 31 DE DEZEMbRO DE 2010 | AT 31 DECEMbER 2010bANCA RETAlhORETAIl bANkING
bANCA EMPRESASCORPORATE bANkING
TOTAl bCITOTAl bCI
MARgeM fInAnCeIRA | neT InTeResT InCOMe 810,599,932 1,181,398,994 1,991,998,926
RenDIMenTO LÍQUIDO De TAxAs e COMIssões | InCOMe neT Of ChARges AnD COMMIssIOns 321,834,820 133,460,214 455,295,034
ResULTADOs De OPeRAÇões fInAnCeIRAs | InCOMe fROM fInAnCIAL OPeRATIOns 186,298,852 441,951,863 628,250,715
OUTROs RenDIMenTOs LIQUIDOs OPeRACIOnAIs | OTheR neT OPeRATIng InCOMe 165,239,181 50,794,362 216,033,544
TOTAL De RenDIMenTOs OPeRACIOnAIs | TOTAL OPeRATIng InCOMe 1,483,972,786 1,807,605,433 3,291,578,219
CUsTOs COM PessOAL | eMPLOyee COsTs (536,010,947) (328,452,074) (864,463,021)
OUTROs gAsTOs ADMInIsTRATIVOs | OTheR ADMInIsTRATIVe exPenses (566,564,881) (448,843,997) (1,015,408,878)
AMORTIZAÇões DO exeRCÍCIO | DePReCIATIOn fOR PeRIOD (94,439,859) (46,079,200) (140,519,059)
TOTAL De CUsTOs OPeRACIOnAIs | TOTAL OPeRATIng COsTs (1,197,015,687) (823,375,271) (2,020,390,958)
IMPARIDADe De CRÉDITO | CReDIT IMPAIRMenT (25,642,364) (143,042,235) (168,684,599)
OUTRAs PROVIsões | OTheR PROVIsIOns 791,028 791,028 1,582,057
ResULTADOs AnTes De IMPOsTOs | InCOMe BefORe TAx 262,105,764 841,978,955 1,104,084,718
IMPOsTOs | TAx (44,449,759) (142,788,172) (187,237,931)
LUCRO DO exeRCÍCIO | PROfIT fOR PeRIOD 217,656,005 699,190,783 916,846,788
BALAnÇO (1) | BALAnCe sheeT (1) 21,589,251,465 42,558,082,667 64,147,334,132
CRÉDITO | CReDIT 4,979,843,542 25,235,913,230 30,215,756,773
DePÓsITOs | DePOsITs 16,609,407,922 17,322,169,437 33,931,577,359
(1) As contas do balanço por segmento operacional foram preparadas na base do critério usado para a elaboração dos relatórios regularmente apresentados à Comissão executiva.(1) Balance sheets accounts per operating segment were prepared on the basis of the criterion used to produce the reports regularly submitted to the executive board.
3.31 Earnings per share
Earnings per share are calculated as follows:
Earnings per share were significantly down as a reflec-tion of the increase in the average number of shares resulting from the increase of capital through an incor-poration of reserves (see note 3.21).
There is no restriction on the payment of dividends.
3.32 Operating segments
In accordance with International Financial Reporting Standard no. 8, the bank’s management considered that the retail and corporate business segments should be analysed:
Information on income and turnover from these two segments was divided up as follows at 31 December 2010 and 31 December 2009:
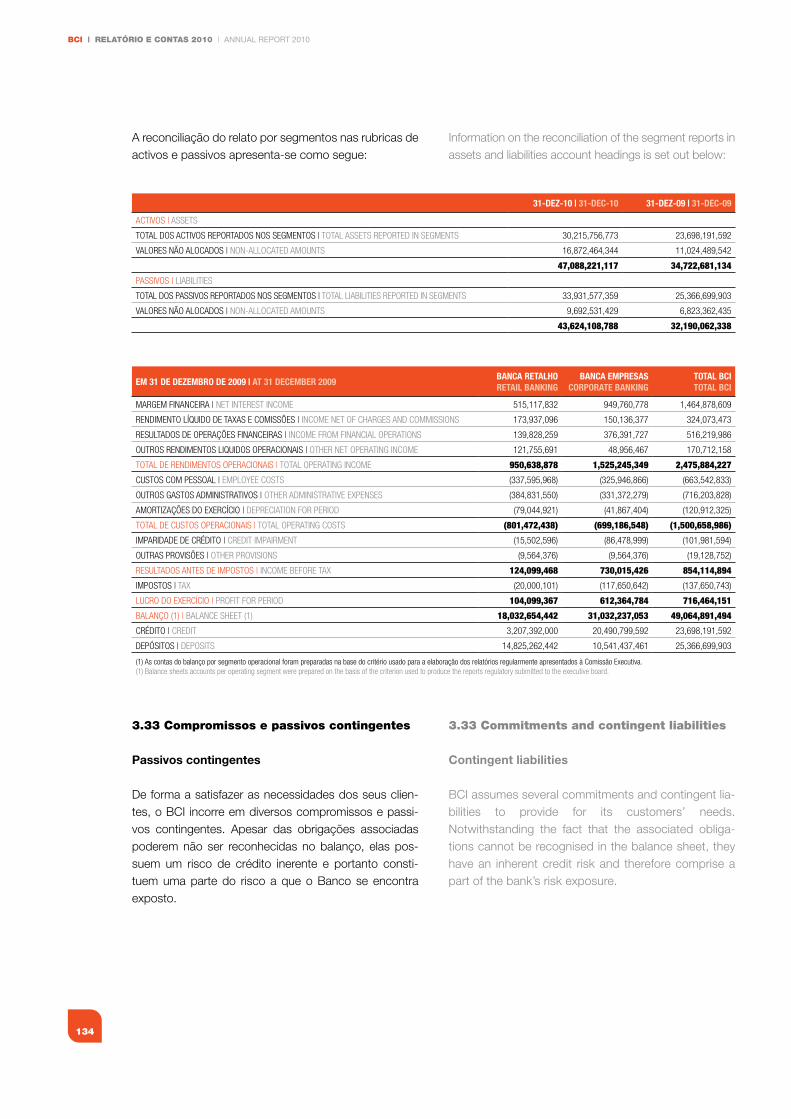
BCI | RELATÓRIO E CONTAS 2010 | ANNUAL REPORT 2010
134
A reconciliação do relato por segmentos nas rubricas de activos e passivos apresenta-se como segue:
3.33 Compromissos e passivos contingentes
Passivos contingentes
De forma a satisfazer as necessidades dos seus clien-tes, o BCI incorre em diversos compromissos e passi-vos contingentes. Apesar das obrigações associadas poderem não ser reconhecidas no balanço, elas pos-suem um risco de crédito inerente e portanto consti-tuem uma parte do risco a que o Banco se encontra exposto.
31-DEZ-10 | 31-DEC-10 31-DEZ-09 | 31-DEC-09
ACTIVOs | AsseTs
TOTAL DOs ACTIVOs RePORTADOs nOs segMenTOs | TOTAL AsseTs RePORTeD In segMenTs 30,215,756,773 23,698,191,592
VALORes nÃO ALOCADOs | nOn-ALLOCATeD AMOUnTs 16,872,464,344 11,024,489,542
47,088,221,117 34,722,681,134
PAssIVOs | LIABILITIes
TOTAL DOs PAssIVOs RePORTADOs nOs segMenTOs | TOTAL LIABILITIes RePORTeD In segMenTs 33,931,577,359 25,366,699,903
VALORes nÃO ALOCADOs | nOn-ALLOCATeD AMOUnTs 9,692,531,429 6,823,362,435
43,624,108,788 32,190,062,338
EM 31 DE DEZEMbRO DE 2009 | AT 31 DECEMbER 2009bANCA RETAlhORETAIl bANkING
bANCA EMPRESASCORPORATE bANkING
TOTAl bCITOTAl bCI
MARgeM fInAnCeIRA | neT InTeResT InCOMe 515,117,832 949,760,778 1,464,878,609
RenDIMenTO LÍQUIDO De TAxAs e COMIssões | InCOMe neT Of ChARges AnD COMMIssIOns 173,937,096 150,136,377 324,073,473
ResULTADOs De OPeRAÇões fInAnCeIRAs | InCOMe fROM fInAnCIAL OPeRATIOns 139,828,259 376,391,727 516,219,986
OUTROs RenDIMenTOs LIQUIDOs OPeRACIOnAIs | OTheR neT OPeRATIng InCOMe 121,755,691 48,956,467 170,712,158
TOTAL De RenDIMenTOs OPeRACIOnAIs | TOTAL OPeRATIng InCOMe 950,638,878 1,525,245,349 2,475,884,227
CUsTOs COM PessOAL | eMPLOyee COsTs (337,595,968) (325,946,866) (663,542,833)
OUTROs gAsTOs ADMInIsTRATIVOs | OTheR ADMInIsTRATIVe exPenses (384,831,550) (331,372,279) (716,203,828)
AMORTIZAÇões DO exeRCÍCIO | DePReCIATIOn fOR PeRIOD (79,044,921) (41,867,404) (120,912,325)
TOTAL De CUsTOs OPeRACIOnAIs | TOTAL OPeRATIng COsTs (801,472,438) (699,186,548) (1,500,658,986)
IMPARIDADe De CRÉDITO | CReDIT IMPAIRMenT (15,502,596) (86,478,999) (101,981,594)
OUTRAs PROVIsões | OTheR PROVIsIOns (9,564,376) (9,564,376) (19,128,752)
ResULTADOs AnTes De IMPOsTOs | InCOMe BefORe TAx 124,099,468 730,015,426 854,114,894
IMPOsTOs | TAx (20,000,101) (117,650,642) (137,650,743)
LUCRO DO exeRCÍCIO | PROfIT fOR PeRIOD 104,099,367 612,364,784 716,464,151
BALAnÇO (1) | BALAnCe sheeT (1) 18,032,654,442 31,032,237,053 49,064,891,494
CRÉDITO | CReDIT 3,207,392,000 20,490,799,592 23,698,191,592
DePÓsITOs | DePOsITs 14,825,262,442 10,541,437,461 25,366,699,903
(1) As contas do balanço por segmento operacional foram preparadas na base do critério usado para a elaboração dos relatórios regularmente apresentados à Comissão executiva.(1) Balance sheets accounts per operating segment were prepared on the basis of the criterion used to produce the reports regulatory submitted to the executive board.
Information on the reconciliation of the segment reports in assets and liabilities account headings is set out below:
3.33 Commitments and contingent liabilities
Contingent liabilities
BCI assumes several commitments and contingent lia-bilities to provide for its customers’ needs. Notwithstanding the fact that the associated obliga-tions cannot be recognised in the balance sheet, they have an inherent credit risk and therefore comprise a part of the bank’s risk exposure.
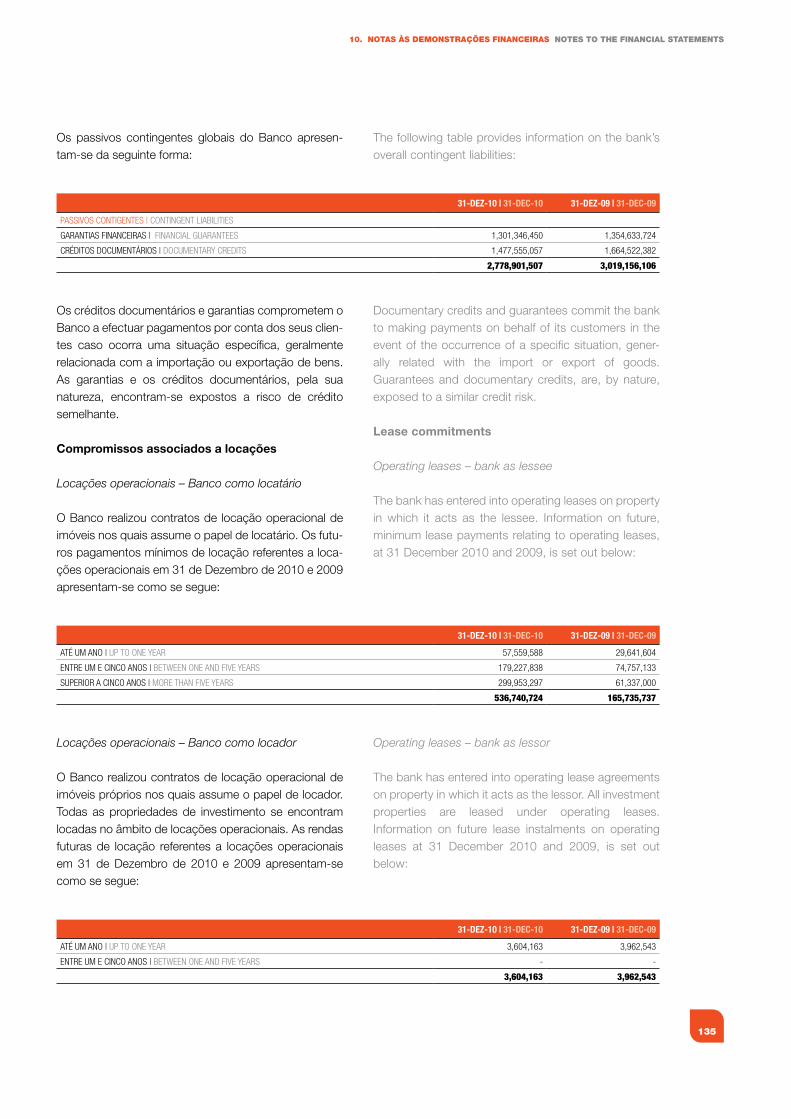
135
10. NOTAS àS dEMONSTRAÇÕES fINANCEIRAS NOTES TO ThE fINANCIAL STATEMENTS
Os passivos contingentes globais do Banco apresen-tam-se da seguinte forma:
Os créditos documentários e garantias comprometem o Banco a efectuar pagamentos por conta dos seus clien-tes caso ocorra uma situação específica, geralmente relacionada com a importação ou exportação de bens. As garantias e os créditos documentários, pela sua natureza, encontram-se expostos a risco de crédito semelhante.
Compromissos associados a locações
Locações operacionais – Banco como locatário
O Banco realizou contratos de locação operacional de imóveis nos quais assume o papel de locatário. Os futu-ros pagamentos mínimos de locação referentes a loca-ções operacionais em 31 de Dezembro de 2010 e 2009 apresentam-se como se segue:
Locações operacionais – Banco como locador
O Banco realizou contratos de locação operacional de imóveis próprios nos quais assume o papel de locador. Todas as propriedades de investimento se encontram locadas no âmbito de locações operacionais. As rendas futuras de locação referentes a locações operacionais em 31 de Dezembro de 2010 e 2009 apresentam-se como se segue:
31-DEZ-10 | 31-DEC-10 31-DEZ-09 | 31-DEC-09
PAssIVOs COnTIgenTes | COnTIngenT LIABILITIes
gARAnTIAs fInAnCeIRAs | fInAnCIAL gUARAnTees 1,301,346,450 1,354,633,724
CRÉDITOs DOCUMenTÁRIOs | DOCUMenTARy CReDITs 1,477,555,057 1,664,522,382
2,778,901,507 3,019,156,106
31-DEZ-10 | 31-DEC-10 31-DEZ-09 | 31-DEC-09
ATÉ UM AnO | UP TO One yeAR 57,559,588 29,641,604
enTRe UM e CInCO AnOs | BeTween One AnD fIVe yeARs 179,227,838 74,757,133
sUPeRIOR A CInCO AnOs | MORe ThAn fIVe yeARs 299,953,297 61,337,000
536,740,724 165,735,737
31-DEZ-10 | 31-DEC-10 31-DEZ-09 | 31-DEC-09
ATÉ UM AnO | UP TO One yeAR 3,604,163 3,962,543
enTRe UM e CInCO AnOs | BeTween One AnD fIVe yeARs - -
3,604,163 3,962,543
The following table provides information on the bank’s overall contingent liabilities:
Documentary credits and guarantees commit the bank to making payments on behalf of its customers in the event of the occurrence of a specific situation, gener-ally related with the import or export of goods. Guarantees and documentary credits, are, by nature, exposed to a similar credit risk.
Lease commitments
Operating leases – bank as lessee
The bank has entered into operating leases on property in which it acts as the lessee. Information on future, minimum lease payments relating to operating leases, at 31 December 2010 and 2009, is set out below:
Operating leases – bank as lessor
The bank has entered into operating lease agreements on property in which it acts as the lessor. All investment properties are leased under operating leases. Information on future lease instalments on operating leases at 31 December 2010 and 2009, is set out below:
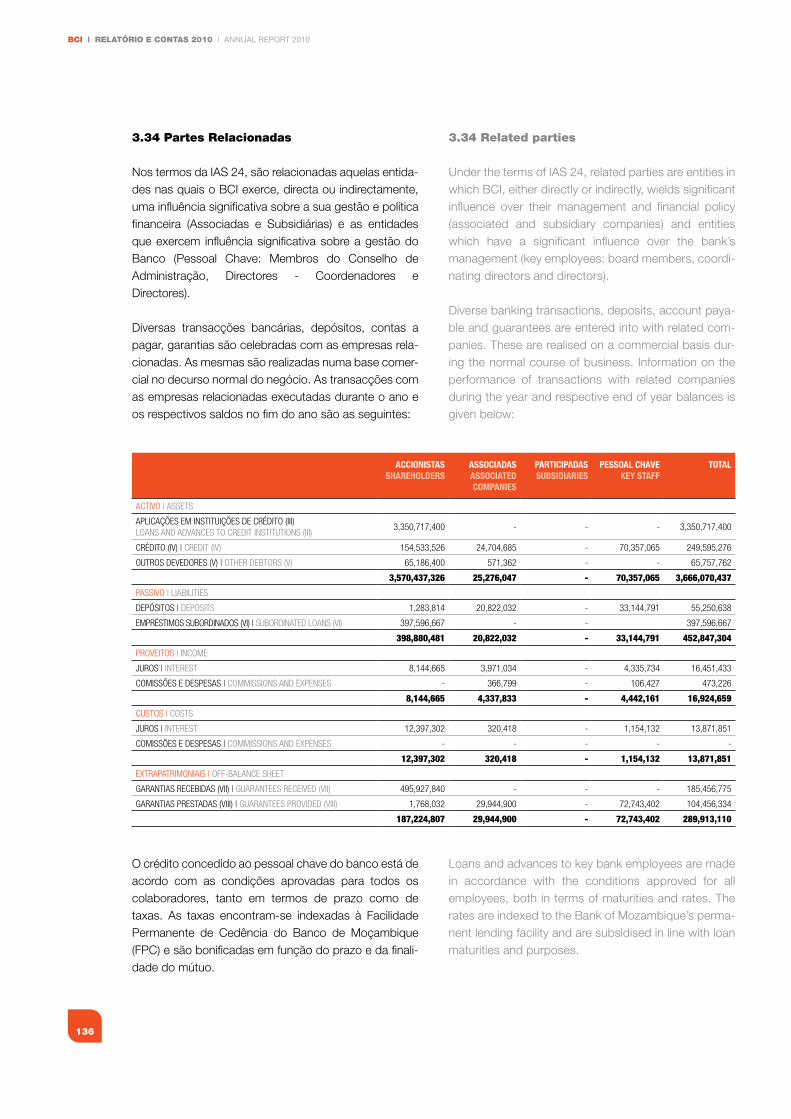
BCI | RELATÓRIO E CONTAS 2010 | ANNUAL REPORT 2010
136
3.34 Partes Relacionadas
Nos termos da IAS 24, são relacionadas aquelas entida-des nas quais o BCI exerce, directa ou indirectamente, uma influência significativa sobre a sua gestão e política financeira (Associadas e Subsidiárias) e as entidades que exercem influência significativa sobre a gestão do Banco (Pessoal Chave: Membros do Conselho de Administração, Directores - Coordenadores e Directores).
Diversas transacções bancárias, depósitos, contas a pagar, garantias são celebradas com as empresas rela-cionadas. As mesmas são realizadas numa base comer-cial no decurso normal do negócio. As transacções com as empresas relacionadas executadas durante o ano e os respectivos saldos no fim do ano são as seguintes:
O crédito concedido ao pessoal chave do banco está de acordo com as condições aprovadas para todos os colaboradores, tanto em termos de prazo como de taxas. As taxas encontram-se indexadas à Facilidade Permanente de Cedência do Banco de Moçambique (FPC) e são bonificadas em função do prazo e da finali-dade do mútuo.
ACCIONISTASShAREhOlDERS
ASSOCIADASASSOCIATED COMPANIES
PARTICIPADASSubSIDIARIES
PESSOAl ChAvEkEy STAff
TOTAl
ACTIVO | AsseTs
APLICAÇões eM InsTITUIÇões De CRÉDITO (III)LOAns AnD ADVAnCes TO CReDIT InsTITUTIOns (III)
3,350,717,400 - - - 3,350,717,400
CRÉDITO (IV) | CReDIT (IV) 154,533,526 24,704,685 - 70,357,065 249,595,276
OUTROs DeVeDORes (V) | OTheR DeBTORs (V) 65,186,400 571,362 - - 65,757,762
3,570,437,326 25,276,047 - 70,357,065 3,666,070,437
PAssIVO | LIABILITIes
DePÓsITOs | DePOsITs 1,283,814 20,822,032 - 33,144,791 55,250,638
eMPRÉsTIMOs sUBORDInADOs (VI) | sUBORDInATeD LOAns (VI) 397,596,667 - - 397,596,667
398,880,481 20,822,032 - 33,144,791 452,847,304
PROVeITOs | InCOMe
JUROs | InTeResT 8,144,665 3,971,034 - 4,335,734 16,451,433
COMIssões e DesPesAs | COMMIssIOns AnD exPenses - 366,799 - 106,427 473,226
8,144,665 4,337,833 - 4,442,161 16,924,659
CUsTOs | COsTs
JUROs | InTeResT 12,397,302 320,418 - 1,154,132 13,871,851
COMIssões e DesPesAs | COMMIssIOns AnD exPenses - - - - -
12,397,302 320,418 - 1,154,132 13,871,851
exTRAPATRIMOnIAIs | Off-BALAnCe sheeT
gARAnTIAs ReCeBIDAs (VII) | gUARAnTees ReCeIVeD (VII) 495,927,840 - - - 185,456,775
gARAnTIAs PResTADAs (VIII) | gUARAnTees PROVIDeD (VIII) 1,768,032 29,944,900 - 72,743,402 104,456,334
187,224,807 29,944,900 - 72,743,402 289,913,110
3.34 Related parties
Under the terms of IAS 24, related parties are entities in which BCI, either directly or indirectly, wields significant influence over their management and financial policy (associated and subsidiary companies) and entities which have a significant influence over the bank’s management (key employees: board members, coordi-nating directors and directors).
Diverse banking transactions, deposits, account paya-ble and guarantees are entered into with related com-panies. These are realised on a commercial basis dur-ing the normal course of business. Information on the performance of transactions with related companies during the year and respective end of year balances is given below:
Loans and advances to key bank employees are made in accordance with the conditions approved for all employees, both in terms of maturities and rates. The rates are indexed to the Bank of Mozambique’s perma-nent lending facility and are subsidised in line with loan maturities and purposes.
137
10. NOTAS àS dEMONSTRAÇÕES fINANCEIRAS NOTES TO ThE fINANCIAL STATEMENTS
(iii) O BCI cedeu à Caixa Geral de Depósitos fundos a curto prazo ao nível do Mercado Monetário Inter-bancário (MMI), que ascendem a 2.631.812.400,00 Meticais (equivalentes a U$80.780.000,00), a uma taxamédiade0,52%;O BCI cedeu à Caixa Geral de Depósitos fundos a curto prazo ao nível do Mercado Monetário Inter ban-cário (MMI), que ascendem a 588.195.000,00 meti-cais (equivalentes a €13.500.000,00) a uma taxa de 1,050%.
(iv) O montante corresponde a dois financiamentos con-cedidos a Insitec, um em forma de conta corrente no valor de 117.033.525,00 Meticais, taxa de 22.5% e o outro em forma um empréstimo a longo prazo no valor de 37.500.000,00 Meticais, à taxa de juro de 19%, com vencimento em 2016.
(v) O montante corresponde à divida da Insitec relativa à venda de um imóvel no valor de 65.186.000,00 Meticais.
(vi) Vide nota 3.17
(vii) O montante corresponde às seguintes operações:
a Garantia bancária recebida da Caixa Geral de Depósitos no valor de 250.866.000,00 Meticais (equivalentes a U$7.700.000,00), prazo de venci-mento2014;
b. Garantia bancária recebida da Caixa Geral de Depósitos no valor de 173.060.040,00 meticais (equivalentes a €3.972.000,00), prazo maturida-de2011;
c. Garantia bancária recebida do BPI no valor de 72.001.800,00 Meticais (equivalentes a U$2.210.000,00), prazo de vencimento 2011.
(iii) BCI loaned short term funds of 2,631,812,400.00 meticais (equivalent to U$80,780,000.00), at an average rate of 0.52% to Caixa Geral de Depósitos funds on an interbank monetary level, BCI loaned short term funds of 588,195,000.00 meticais (equivalent to €13,500,000.00) at a rate of 1.050% to Caixa Geral de Depósitos on an inter-bank monetary level,
(iv) The amount comprising two loans to Insitec, one in the form of a current account loan of 117,033,525.00 meticais at a rate of 22.5% and another in the form of a long term loan of 37,500,000.00 meticais, at an interest rate of 19%, maturing in 2016.
(v) The amount corresponds to Insitec’s debt on the sale of a building for 65,186,000.00 meticais.
(vi) See note 3.17
(vii) The amount comprised the following operations:
a. A bank guarantee of 250,66,000.00 meticais (equivalent to U$7,700,000.00) received from CaixaGeraldeDepósitosandmaturingin2014;
b. A bank guarantee of 173,060,040.00 meticais (equivalent to €3,972,000.00) received from CaixaGeraldeDepósitosandmaturingin2011;
c. A bank guarantee of 72,001,800.00 meticais (equivalent to U$2,210,000.00) received from BPI and maturing in 2011.
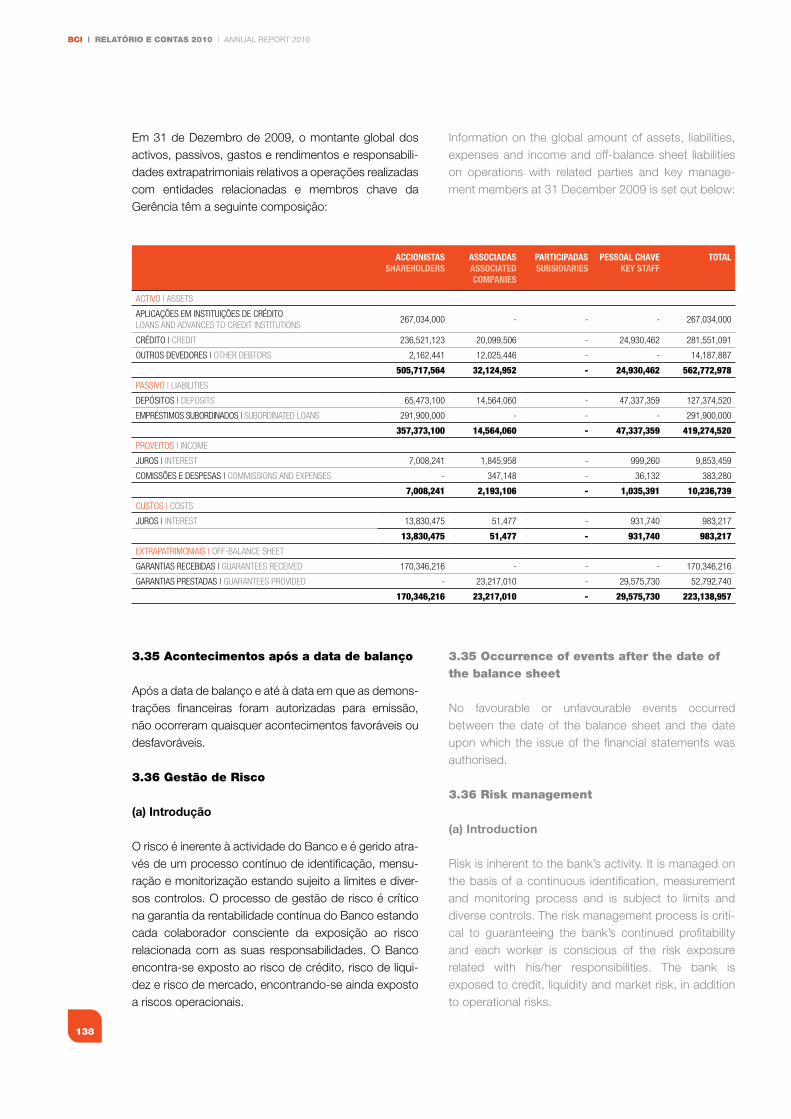
BCI | RELATÓRIO E CONTAS 2010 | ANNUAL REPORT 2010
138
Em 31 de Dezembro de 2009, o montante global dos activos, passivos, gastos e rendimentos e responsabili-dades extrapatrimoniais relativos a operações realizadas com entidades relacionadas e membros chave da Gerência têm a seguinte composição:
3.35 Acontecimentos após a data de balanço
Após a data de balanço e até à data em que as demons-trações financeiras foram autorizadas para emissão, não ocorreram quaisquer acontecimentos favoráveis ou desfavoráveis.
3.36 gestão de Risco
(a) Introdução
O risco é inerente à actividade do Banco e é gerido atra-vés de um processo contínuo de identificação, mensu-ração e monitorização estando sujeito a limites e diver-sos controlos. O processo de gestão de risco é crítico na garantia da rentabilidade contínua do Banco estando cada colaborador consciente da exposição ao risco relacionada com as suas responsabilidades. O Banco encontra-se exposto ao risco de crédito, risco de liqui-dez e risco de mercado, encontrando-se ainda exposto a riscos operacionais.
ACCIONISTASShAREhOlDERS
ASSOCIADASASSOCIATED COMPANIES
PARTICIPADASSubSIDIARIES
PESSOAl ChAvEkEy STAff
TOTAl
ACTIVO | AsseTs
APLICAÇões eM InsTITUIÇões De CRÉDITOLOAns AnD ADVAnCes TO CReDIT InsTITUTIOns
267,034,000 - - - 267,034,000
CRÉDITO | CReDIT 236,521,123 20,099,506 - 24,930,462 281,551,091
OUTROs DeVeDORes | OTheR DeBTORs 2,162,441 12,025,446 - - 14,187,887
505,717,564 32,124,952 - 24,930,462 562,772,978
PAssIVO | LIABILITIes
DePÓsITOs | DePOsITs 65,473,100 14,564,060 - 47,337,359 127,374,520
eMPRÉsTIMOs sUBORDInADOs | sUBORDInATeD LOAns 291,900,000 - - - 291,900,000
357,373,100 14,564,060 - 47,337,359 419,274,520
PROVeITOs | InCOMe
JUROs | InTeResT 7,008,241 1,845,958 - 999,260 9,853,459
COMIssões e DesPesAs | COMMIssIOns AnD exPenses - 347,148 - 36,132 383,280
7,008,241 2,193,106 - 1,035,391 10,236,739
CUsTOs | COsTs
JUROs | InTeResT 13,830,475 51,477 - 931,740 983,217
13,830,475 51,477 - 931,740 983,217
exTRAPATRIMOnIAIs | Off-BALAnCe sheeT
gARAnTIAs ReCeBIDAs | gUARAnTees ReCeIVeD 170,346,216 - - - 170,346,216
gARAnTIAs PResTADAs | gUARAnTees PROVIDeD - 23,217,010 - 29,575,730 52,792,740
170,346,216 23,217,010 - 29,575,730 223,138,957
Information on the global amount of assets, liabilities, expenses and income and off-balance sheet liabilities on operations with related parties and key manage-ment members at 31 December 2009 is set out below:
3.35 Occurrence of events after the date of the balance sheet
No favourable or unfavourable events occurred between the date of the balance sheet and the date upon which the issue of the financial statements was authorised.
3.36 Risk management
(a) Introduction
Risk is inherent to the bank’s activity. It is managed on the basis of a continuous identification, measurement and monitoring process and is subject to limits and diverse controls. The risk management process is criti-cal to guaranteeing the bank’s continued profitability and each worker is conscious of the risk exposure related with his/her responsibilities. The bank is exposed to credit, liquidity and market risk, in addition to operational risks.
139
10. NOTAS àS dEMONSTRAÇÕES fINANCEIRAS NOTES TO ThE fINANCIAL STATEMENTS
O processo de controlo de risco não inclui riscos de negócio como seja a exposição a alterações do ambien-te económico, tecnológicas ou industriais.
A gestão e controlo de riscos é realizada no BCI de for-ma centralizada e incide principalmente sobre a avalia-ção, gestão e controlo dos riscos de crédito, de merca-do, taxa de juro, liquidez e operacional incorridos pela Instituição, consagrando o princípio da segregação de funções entre as áreas comerciais, de risco e financeira.
No âmbito do processo de gestão de activos e passivos (Asset-Liability Management, ALM), o BCI prosseguiu o objectivo de assegurar uma gestão prudente da situa-ção de liquidez, de consumo de capital e de controlo dos riscos financeiros associados, debruçando-se em particular sobre os riscos de liquidez, de taxa de juro e de mercado.
(b) Risco de crédito
O risco de crédito é o risco do Banco incorrer numa perda pelo facto das contrapartes não cumprirem com as suas obrigações de crédito para com o Banco. O BCI gere e controla o risco de crédito fixando limites aos montantes de risco que está disposto a aceitar para contrapartes individuais e monitorizando a exposição em relação a esses limites.
O risco de crédito, dada a natureza e especificidade da actividade bancária, reveste-se de particular importân-cia, face à sua materialidade, não obstante a sua interli-gação com os restantes riscos.
O BCI tem mantido um processo contínuo de avaliação, qualitativa e quantitativa, da sua carteira de crédito com a finalidade de identificar a existência, ou não, de evi-dências claras e objectivas de imparidade da mesma.
Um crédito estará, em princípio, em imparidade sempre que se verificarem um ou mais eventos de perda com impacto na recuperação integral do mesmo.
O modelo actual de Imparidade do banco assenta, fun-damentalmente, numa metodologia de cálculo baseada na análise individual e colectiva da carteira de crédito.
The risk control process does not include business risk such as exposure to changes in economic, technologi-cal or industrial circumstances.
BCI centralises its risk management and control which mainly encompasses the assessment, management and control of its credit, market, interest rate, liquidity and operational risks, firmly establishing the principle of separation between commercial, risk and financial functions.
Pursuant to its ALM (asset-liability management) pro-cedures, BCI furthered its objective of ensuring the pru-dent management of its liquidity situation, capital expenditure and control of associated financial risks, particularly concentrating on liquidity, interest rate and market risks. (b) Credit risk
Credit risk is the risk incurred by the bank on any coun-terparty default. BCI manages and controls credit risk by fixing limits on the amounts of risk it is willing to accept on individual counterparties, monitoring the exposure on such limits.
Given the specific nature of banking activity, credit risk is particularly important, owing to its material nature, notwithstanding its interconnection with the remaining risks.
BCI has maintained a continuous qualitative and quan-titative assessment of its credit portfolio, to identify the possible existence of clear and objective evidence of impairment thereon.
A loan is, in principle, impaired in the event of the occurrence of one or more loss events having an impact on its full recovery.
The bank’s current impairment model is fundamentally based on a calculation methodology comprising an individual and collective analysis of the credit portfolio.
BCI | RELATÓRIO E CONTAS 2010 | ANNUAL REPORT 2010
140
A análise individual incide sobre os créditos com exposi-ção significativa e/ou em situação irregular há mais de 179 dias, para uma avaliação pormenorizada e objectiva da capacidade dos respectivos mutuários em cumprir com o serviço de dívida, através da: • Avaliaçãodasituaçãoeconómico-financeira;• Verificaçãodaexistência,ounão,deoperaçõescom
crédito e juros vencidos, no Grupo BCI e/ou no siste-mabancárionacional;
• Adequaçãodovaloredotipodegarantiasexistentesaosaldodevedor;e
• Análisedatendênciadeevoluçãohistóricadepaga-mento dos clientes.
Para os créditos com exposição significativa e/ou em situação irregular há mais de 179 dias, para os quais não tenham sido identificadas situações objectivas de imparidade individual, efectua-se o cálculo da sua impa-ridade colectiva, de acordo com os factores de risco para créditos com características semelhantes (classes homogéneas de risco).
Os créditos que não são sujeitos à análise individual, são agrupados em classes homogéneas de risco (v.g. segmento de crédito, tipo de colateral, histórico de comportamento de pagamento, etc.), para o apuramen-to da sua imparidade colectiva.
Em 2010, a procura pela melhoria contínua dos proces-sos e procedimentos internos, e das melhores ferra-mentas para a identificação, avaliação, gestão e contro-lo do Risco de Crédito, manteve-se como objectivo último de elevar a qualidade da carteira de crédito do banco e consequentemente reduzir as probabilidades de perda por incumprimento.
Neste contexto, foi efectuada uma revisão profunda do Regulamento Geral de Crédito e um ajustamento da Delegação de Competências de Crédito para as diferen-tes instâncias delegadas distribuídas pela estrutura comercial. Paralelamente, houve um reforço da vigilân-cia sobre as operações individuais de crédito de elevado valor e sobre os clientes com exposição significativa através de uma análise mais cuidada e objectiva, pelos analistas de crédito das áreas comerciais e do risco, para aferir, com maior precisão, o risco potencial de cré-dito implícito. Estas análises passaram a ser efectuadas não só na concessão inicial dos créditos, como também nas renovações das facilidades em curso.
A separate analysis is performed in the case of signifi-cant exposures to loans in default for more than 179 days, with the realisation of a detailed, objective assessment of the respective borrowers’ capacity to meet their debt servicing requirements, through:• Anassessmentoftheireconomic-financialsituation;• Verificationoftheexistenceofanyoperationsinvolving
overdue credit and interest, within BCI Group and/or thenationalfinancialsystem;
• Adequacyoftheamountandtypeofguaranteestooutstandingbalances;and
• Ananalysisofthehistoricaltrendoftheevolutionofcustomers’ payments.
Collective impairment is calculated on loans with a sig-nificant exposure and/or overdue for more than 179 days, on which no objective situations of separate impairment have been identified, in accordance with risk factors for loans with similar characteristics (like-for-like categories).
Loans which are not separately analysed are grouped into like-for-like risk categories (e.g. credit segment, type of collateral, payment history, etc.), for the assess-ment of collective impairment. In 2010, the bank continued to endeavour to perfect its internal processes and procedures and secure the best tools for the identification, assessment, management and control of credit risk, with the ultimate objective of improving the quality of its credit portfolio and conse-quently reducing the probabilities of losses on defaults. A major overhaul of the General Credit Regulation was effected together with adjustments to the delegations of credit competencies to the different parties in the bank’s commercial structure. This was accompanied by improved surveillance on separate credit operations involving large amounts and on customers with signifi-cant exposure in the form of a more careful and objec-tive analysis performed by commercial and risk area credit analysts, to provide a more detailed picture of the potential implicit credit risk. These analyses are now performed not only when the loans are first issued but whenever credit facilities are renewed.
141
10. NOTAS àS dEMONSTRAÇÕES fINANCEIRAS NOTES TO ThE fINANCIAL STATEMENTS
Adicionalmente, no âmbito da Gestão e Controlo do Risco de Crédito e do Cumprimento dos Rácios Prudenciais Regulamentares, é efectuado um acompa-nhamento contínuo da evolução da carteira, com parti-cular enfoque na análise da Concentração do Crédito (cliente/grupo, produto, maturidade, prazo residual, sector de actividade e região), Crédito Correlacionado (accionistas, empresas participadas e de grupo e cola-boradores) e Crédito em Grandes Riscos (créditos a clientes/grupos com exposição igual ou superior a 10% do valor dos Fundos Próprios do banco).
No que se refere à Imparidade/Provisões, são monitora-dos os níveis de cobertura do crédito por imparidade/provisões, os clientes com maior nível de incumprimen-to e as taxas de incumprimento por produto, segmento, sector, moeda e região, para a tomada de medidas cor-rectivas e/ou preventivas para mitigar e/ou eliminar os riscos de perdas potenciais futuras.
Riscos relacionados com crédito
O BCI coloca à disposição dos seus clientes garantias que poderão exigir que o Banco efectue pagamentos por sua conta. Tais pagamentos são recebidos dos clientes conforme definido nos termos das cartas de crédito. Os produtos em referência expõem o Banco a riscos semelhantes aos riscos dos empréstimos conce-didos sendo estes mitigados através de processos semelhantes.
Exposição máxima ao risco de crédito sem tomar em consideração quaisquer garantias
O quadro abaixo apresenta a exposição máxima ao ris-co de crédito por produto e por sector de actividade. A exposição máxima é apresentada em valores brutos não tomando em consideração os possíveis efeitos de quaisquer garantias colaterais.
In addition, within the management and control of credit risk and compliance with regulatory prudential ratios spheres, portfolio evolution is continuously moni-tored and particularly focuses on credit concentration levels (customer/group, product, maturity, period to maturity, operating sector and region), correlated cred-it (shareholders, subsidiary and group companies and employees) and major credit risk (loans to customers/groups in which the exposure is equal to or more than 10% of the bank’s own funds).
As regards impairment/provisions, impairment/provi-sions on credit relating to customers with the highest default levels and default rates per product, segment, sector, currency and region, for remedial and/or pre-ventative action to mitigate and/or eliminate the risks of potential future losses are taken.
Credit-related risks
BCI provides its customers with guarantees which could entail a requirement for the bank to make pay-ments on their behalf. Such payments are received from customers as defined in the terms of letters of credit. The respective products expose the bank to risks which are similar to the risks on lending and are mitigated by similar processes. Maximum exposure to credit risk without consid-ering any guarantees
The following table provides information on maximum exposure to credit risk by product and sector of activity. The amounts of maximum exposure are gross and do not take into consideration the possible effects of any collateral guarantees.
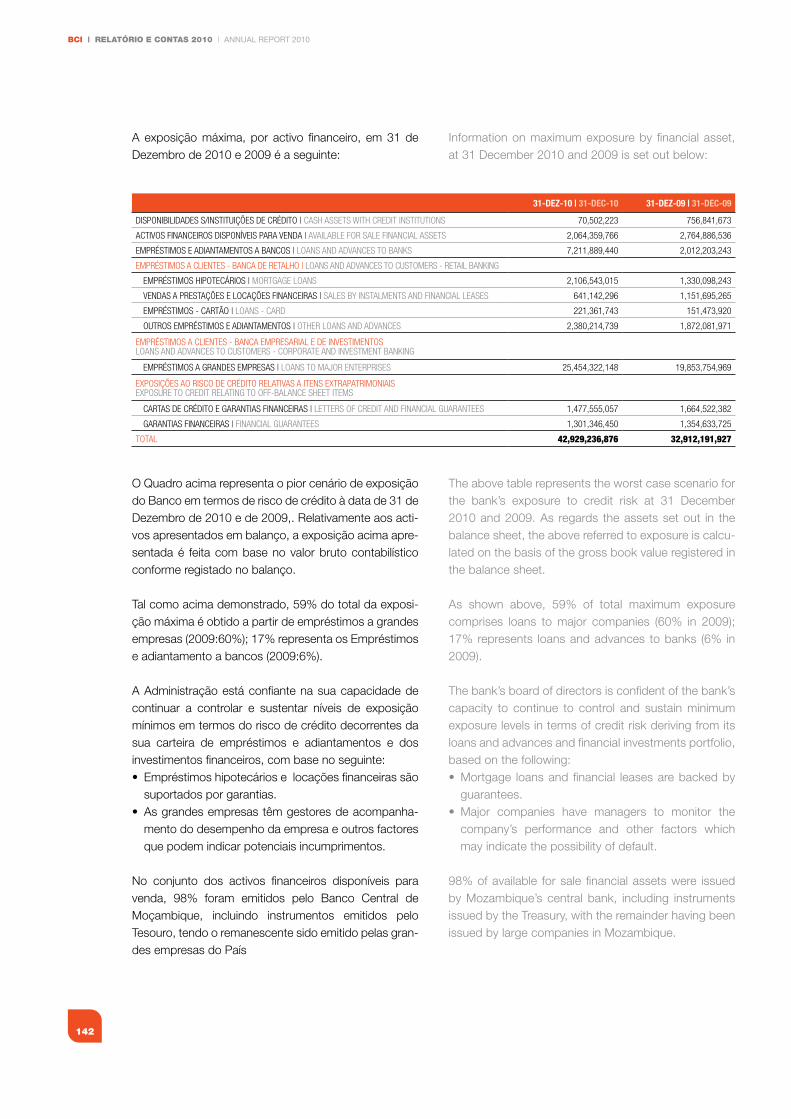
BCI | RELATÓRIO E CONTAS 2010 | ANNUAL REPORT 2010
142
A exposição máxima, por activo financeiro, em 31 de Dezembro de 2010 e 2009 é a seguinte:
O Quadro acima representa o pior cenário de exposição do Banco em termos de risco de crédito à data de 31 de Dezembro de 2010 e de 2009,. Relativamente aos acti-vos apresentados em balanço, a exposição acima apre-sentada é feita com base no valor bruto contabilístico conforme registado no balanço.
Tal como acima demonstrado, 59% do total da exposi-ção máxima é obtido a partir de empréstimos a grandes empresas(2009:60%);17%representaosEmpréstimose adiantamento a bancos (2009:6%).
A Administração está confiante na sua capacidade de continuar a controlar e sustentar níveis de exposição mínimos em termos do risco de crédito decorrentes da sua carteira de empréstimos e adiantamentos e dos investimentos financeiros, com base no seguinte:• Empréstimoshipotecárioselocaçõesfinanceirassão
suportados por garantias.• Asgrandesempresastêmgestoresdeacompanha-
mento do desempenho da empresa e outros factores que podem indicar potenciais incumprimentos.
No conjunto dos activos financeiros disponíveis para venda, 98% foram emitidos pelo Banco Central de Moçambique, incluindo instrumentos emitidos pelo Tesouro, tendo o remanescente sido emitido pelas gran-des empresas do País
31-DEZ-10 | 31-DEC-10 31-DEZ-09 | 31-DEC-09
DIsPOnIBILIDADes s/InsTITUIÇões De CRÉDITO | CAsh AsseTs wITh CReDIT InsTITUTIOns 70,502,223 756,841,673
ACTIVOs fInAnCeIROs DIsPOnÍVeIs PARA VenDA | AVAILABLe fOR sALe fInAnCIAL AsseTs 2,064,359,766 2,764,886,536
eMPRÉsTIMOs e ADIAnTAMenTOs A BAnCOs | LOAns AnD ADVAnCes TO BAnks 7,211,889,440 2,012,203,243
eMPRÉsTIMOs A CLIenTes - BAnCA De ReTALhO | LOAns AnD ADVAnCes TO CUsTOMeRs - ReTAIL BAnkIng
eMPRÉsTIMOs hIPOTeCÁRIOs | MORTgAge LOAns 2,106,543,015 1,330,098,243
VenDAs A PResTAÇões e LOCAÇões fInAnCeIRAs | sALes By InsTALMenTs AnD fInAnCIAL LeAses 641,142,296 1,151,695,265
eMPRÉsTIMOs - CARTÃO | LOAns - CARD 221,361,743 151,473,920
OUTROs eMPRÉsTIMOs e ADIAnTAMenTOs | OTheR LOAns AnD ADVAnCes 2,380,214,739 1,872,081,971
eMPRÉsTIMOs A CLIenTes - BAnCA eMPResARIAL e De InVesTIMenTOsLOAns AnD ADVAnCes TO CUsTOMeRs - CORPORATe AnD InVesTMenT BAnkIng
eMPRÉsTIMOs A gRAnDes eMPResAs | LOAns TO MAJOR enTeRPRIses 25,454,322,148 19,853,754,969
exPOsIÇões AO RIsCO De CRÉDITO ReLATIVAs A ITens exTRAPATRIMOnIAIsexPOsURe TO CReDIT ReLATIng TO Off-BALAnCe sheeT ITeMs
CARTAs De CRÉDITO e gARAnTIAs fInAnCeIRAs | LeTTeRs Of CReDIT AnD fInAnCIAL gUARAnTees 1,477,555,057 1,664,522,382
gARAnTIAs fInAnCeIRAs | fInAnCIAL gUARAnTees 1,301,346,450 1,354,633,725
TOTAL 42,929,236,876 32,912,191,927
Information on maximum exposure by financial asset, at 31 December 2010 and 2009 is set out below:
The above table represents the worst case scenario for the bank’s exposure to credit risk at 31 December 2010 and 2009. As regards the assets set out in the balance sheet, the above referred to exposure is calcu-lated on the basis of the gross book value registered in the balance sheet.
As shown above, 59% of total maximum exposure comprises loans tomajor companies (60% in 2009);17% represents loans and advances to banks (6% in 2009).
The bank’s board of directors is confident of the bank’s capacity to continue to control and sustain minimum exposure levels in terms of credit risk deriving from its loans and advances and financial investments portfolio, based on the following:• Mortgage loansandfinancial leasesarebackedby
guarantees.• Major companies have managers to monitor the
company’s performance and other factors which may indicate the possibility of default.
98% of available for sale financial assets were issued by Mozambique’s central bank, including instruments issued by the Treasury, with the remainder having been issued by large companies in Mozambique.
143
10. NOTAS àS dEMONSTRAÇÕES fINANCEIRAS NOTES TO ThE fINANCIAL STATEMENTS
Garantias colaterais
O tipo e valor das garantias colaterais exigidas depen-dem da avaliação do risco de crédito da contraparte. O Banco implementou critérios relativos à aceitação dos diversos tipos de garantias e parâmetros de avaliação.
Os principais tipos de garantias obtidas são:• Depósitos-cauçãoedepósitosaprazo,• Hipotecassobrebensmóveiseimóveis(habitaçãoe
instalações comerciais e/ou industriais)• Garantiasbancáriasdeoutrasinstituiçõesfinanceiras
O Banco pode obter ainda garantias de empresas-mãe relativamente a créditos a conceder às suas subsidiárias.
É política do Banco alienar os bens recebidos em dação em cumprimento de forma a reduzir o montante do cré-dito em dívida. De uma forma geral, o BCI não ocupa os imóveis recebidos para utilização no decurso da sua actividade.
Durante o exercício de 2010 o Banco executou garan-tias, na sua maioria hipotecárias (imóveis) e penhores de depósitos a prazo, para cobertura de créditos vencidos, tendo resgatado o valor total de 48,3 milhões de Meticais.
Collateral guarantees
The type and value of collateral guarantees required are contingent upon an assessment of counterparty credit risk. The bank has implemented criteria on the acceptance of diverse types of guarantees and assess-ment parameters.
The principal types of guarantees obtained are:• Secureddepositsandtermdeposits,• Pledges/mortgages on movable and immovable
assets (homes and commercial and/or industrial premises)
• Bank guarantees issued by other financial institu-tions.
The bank may also obtain guarantees from parent companies on loans to their subsidiaries.
It is bank policy to dispose of the assets received as payment in kind with the aim of reducing the outstand-ing credit balance. It is not BCI’s standard practice to use repossessed property for the performance of its activity.
The bank called in a total amount of 48.3 million meticais in guarantees, in 2010, most of which on property and pledges on term deposits to cover overdue credit.
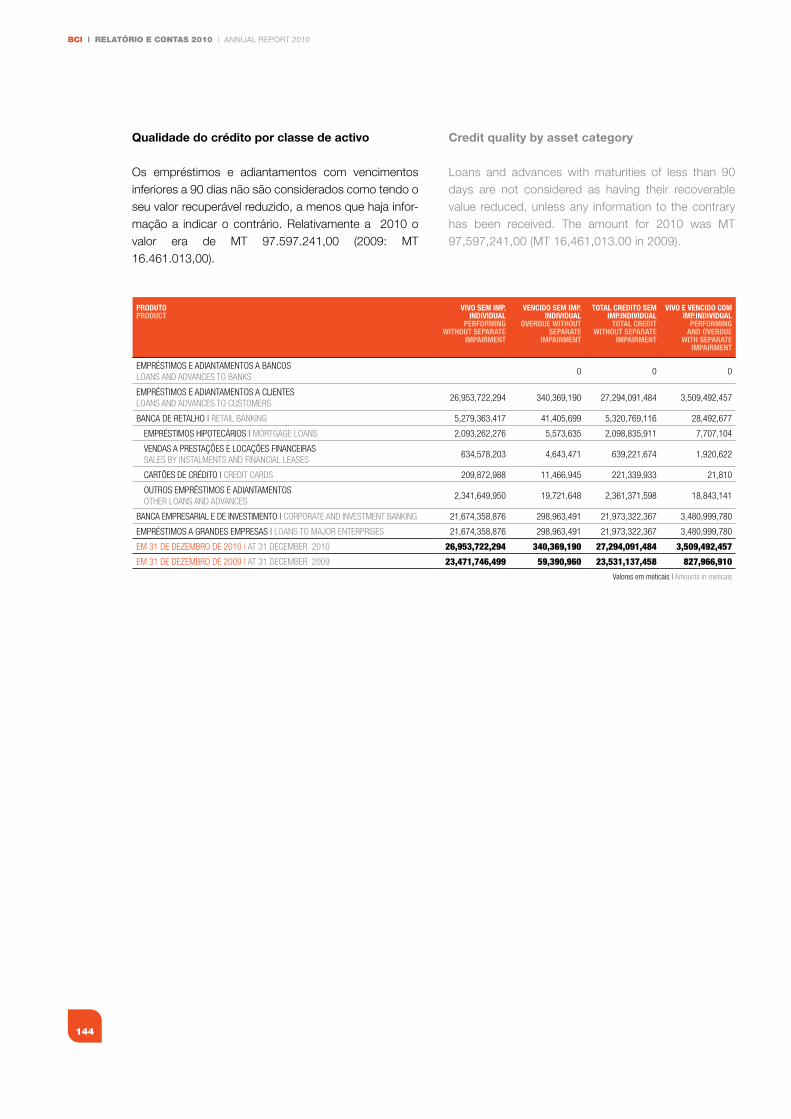
BCI | RELATÓRIO E CONTAS 2010 | ANNUAL REPORT 2010
144
Qualidade do crédito por classe de activo
Os empréstimos e adiantamentos com vencimentos inferiores a 90 dias não são considerados como tendo o seu valor recuperável reduzido, a menos que haja infor-mação a indicar o contrário. Relativamente a 2010 o valor era de MT 97.597.241,00 (2009: MT 16.461.013,00).
PRODuTOPRODuCT
vIvO SEM IMP.INDIvIDuAl
PERfORMING wIThOuT SEPARATE
IMPAIRMENT
vENCIDO SEM IMP.INDIvIDuAl
OvERDuE wIThOuT SEPARATE
IMPAIRMENT
TOTAl CREDITO SEM IMP.INDIvIDuAl
TOTAl CREDIT wIThOuT SEPARATE
IMPAIRMENT
vIvO E vENCIDO COM IMP.INDIvIDuAl
PERfORMING AND OvERDuE
wITh SEPARATE IMPAIRMENT
eMPRÉsTIMOs e ADIAnTAMenTOs A BAnCOsLOAns AnD ADVAnCes TO BAnks
0 0 0
eMPRÉsTIMOs e ADIAnTAMenTOs A CLIenTesLOAns AnD ADVAnCes TO CUsTOMeRs
26,953,722,294 340,369,190 27,294,091,484 3,509,492,457
BAnCA De ReTALhO | ReTAIL BAnkIng 5,279,363,417 41,405,699 5,320,769,116 28,492,677
eMPRÉsTIMOs hIPOTeCÁRIOs | MORTgAge LOAns 2,093,262,276 5,573,635 2,098,835,911 7,707,104
VenDAs A PResTAÇões e LOCAÇões fInAnCeIRAssALes By InsTALMenTs AnD fInAnCIAL LeAses
634,578,203 4,643,471 639,221,674 1,920,622
CARTões De CRÉDITO | CReDIT CARDs 209,872,988 11,466,945 221,339,933 21,810
OUTROs eMPRÉsTIMOs e ADIAnTAMenTOsOTheR LOAns AnD ADVAnCes
2,341,649,950 19,721,648 2,361,371,598 18,843,141
BAnCA eMPResARIAL e De InVesTIMenTO | CORPORATe AnD InVesTMenT BAnkIng 21,674,358,876 298,963,491 21,973,322,367 3,480,999,780
eMPRÉsTIMOs A gRAnDes eMPResAs | LOAns TO MAJOR enTeRPRIses 21,674,358,876 298,963,491 21,973,322,367 3,480,999,780
eM 31 De DeZeMBRO De 2010 | AT 31 DeCeMBeR 2010 26,953,722,294 340,369,190 27,294,091,484 3,509,492,457
eM 31 De DeZeMBRO De 2009 | AT 31 DeCeMBeR 2009 23,471,746,499 59,390,960 23,531,137,458 827,966,910
Valores em meticais | Amounts in meticais
Credit quality by asset category
Loans and advances with maturities of less than 90 days are not considered as having their recoverable value reduced, unless any information to the contrary has been received. The amount for 2010 was MT 97,597,241,00 (MT 16,461,013.00 in 2009).
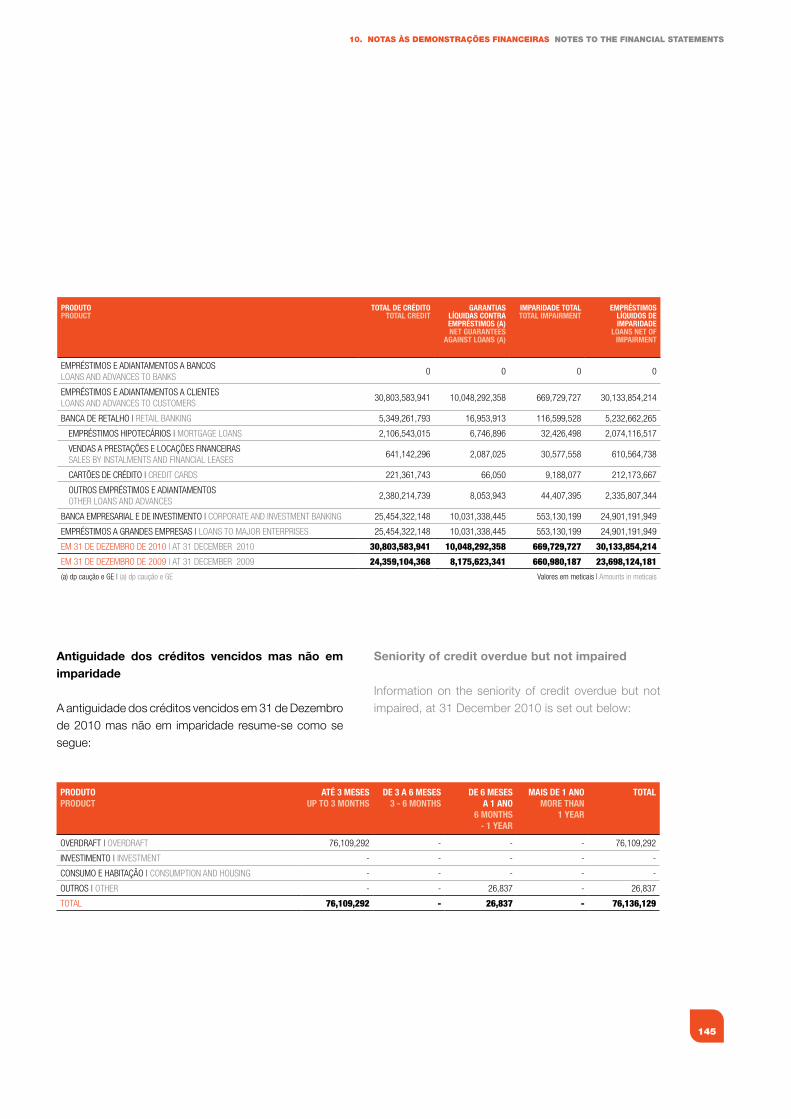
145
10. NOTAS àS dEMONSTRAÇÕES fINANCEIRAS NOTES TO ThE fINANCIAL STATEMENTS
PRODuTOPRODuCT
TOTAl DE CRéDITOTOTAl CREDIT
GARANTIAS líquIDAS CONTRA EMPRéSTIMOS (A)NET GuARANTEES
AGAINST lOANS (A)
IMPARIDADE TOTAlTOTAl IMPAIRMENT
EMPRéSTIMOS líquIDOS DE IMPARIDADE
lOANS NET Of IMPAIRMENT
eMPRÉsTIMOs e ADIAnTAMenTOs A BAnCOsLOAns AnD ADVAnCes TO BAnks
0 0 0 0
eMPRÉsTIMOs e ADIAnTAMenTOs A CLIenTesLOAns AnD ADVAnCes TO CUsTOMeRs
30,803,583,941 10,048,292,358 669,729,727 30,133,854,214
BAnCA De ReTALhO | ReTAIL BAnkIng 5,349,261,793 16,953,913 116,599,528 5,232,662,265
eMPRÉsTIMOs hIPOTeCÁRIOs | MORTgAge LOAns 2,106,543,015 6,746,896 32,426,498 2,074,116,517
VenDAs A PResTAÇões e LOCAÇões fInAnCeIRAssALes By InsTALMenTs AnD fInAnCIAL LeAses
641,142,296 2,087,025 30,577,558 610,564,738
CARTões De CRÉDITO | CReDIT CARDs 221,361,743 66,050 9,188,077 212,173,667
OUTROs eMPRÉsTIMOs e ADIAnTAMenTOsOTheR LOAns AnD ADVAnCes
2,380,214,739 8,053,943 44,407,395 2,335,807,344
BAnCA eMPResARIAL e De InVesTIMenTO | CORPORATe AnD InVesTMenT BAnkIng 25,454,322,148 10,031,338,445 553,130,199 24,901,191,949
eMPRÉsTIMOs A gRAnDes eMPResAs | LOAns TO MAJOR enTeRPRIses 25,454,322,148 10,031,338,445 553,130,199 24,901,191,949
eM 31 De DeZeMBRO De 2010 | AT 31 DeCeMBeR 2010 30,803,583,941 10,048,292,358 669,729,727 30,133,854,214
eM 31 De DeZeMBRO De 2009 | AT 31 DeCeMBeR 2009 24,359,104,368 8,175,623,341 660,980,187 23,698,124,181
(a) dp caução e ge | (a) dp caução e ge Valores em meticais | Amounts in meticais
PRODuTOPRODuCT
ATé 3 MESESuP TO 3 MONThS
DE 3 A 6 MESES3 - 6 MONThS
DE 6 MESES A 1 ANO
6 MONThS- 1 yEAR
MAIS DE 1 ANO MORE ThAN
1 yEAR
TOTAl
OVeRDRAfT | OVeRDRAfT 76,109,292 - - - 76,109,292
InVesTIMenTO | InVesTMenT - - - - -
COnsUMO e hABITAÇÃO | COnsUMPTIOn AnD hOUsIng - - - - -
OUTROs | OTheR - - 26,837 - 26,837
TOTAL 76,109,292 - 26,837 - 76,136,129
Antiguidade dos créditos vencidos mas não em imparidade
A antiguidade dos créditos vencidos em 31 de Dezembro de 2010 mas não em imparidade resume-se como se segue:
Seniority of credit overdue but not impaired
Information on the seniority of credit overdue but not impaired, at 31 December 2010 is set out below:
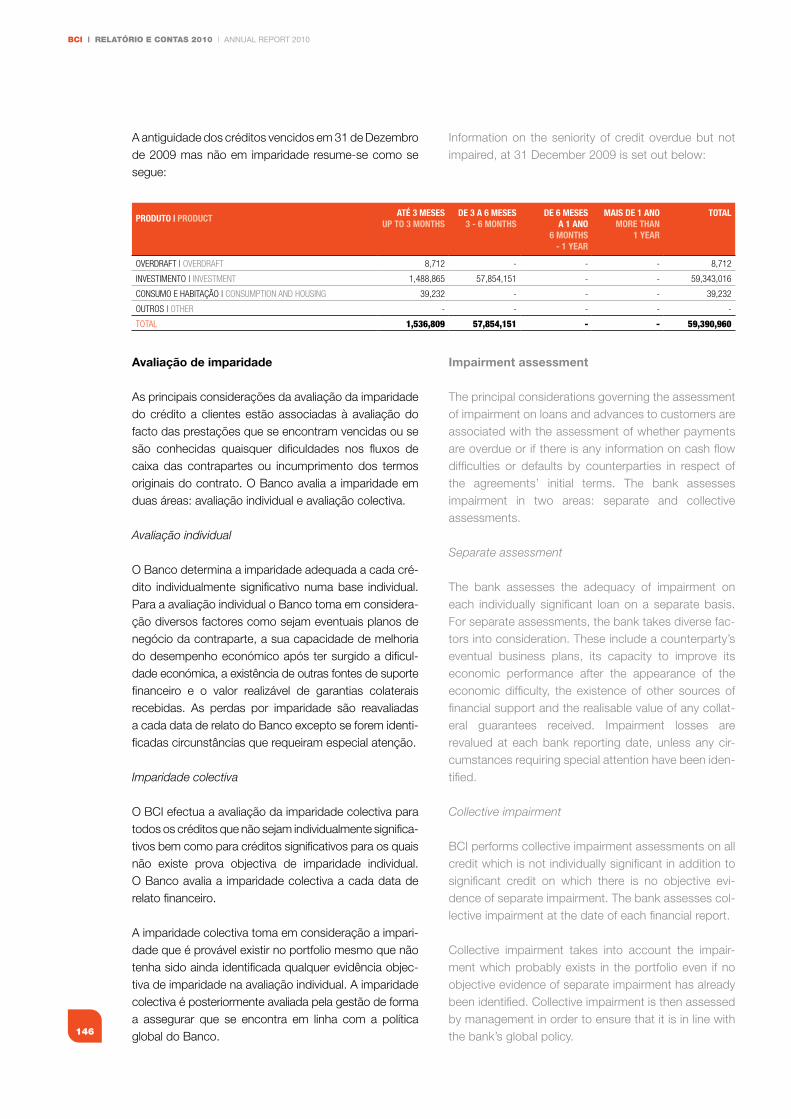
BCI | RELATÓRIO E CONTAS 2010 | ANNUAL REPORT 2010
146
A antiguidade dos créditos vencidos em 31 de Dezembro de 2009 mas não em imparidade resume-se como se segue:
Avaliação de imparidade
As principais considerações da avaliação da imparidade do crédito a clientes estão associadas à avaliação do facto das prestações que se encontram vencidas ou se são conhecidas quaisquer dificuldades nos fluxos de caixa das contrapartes ou incumprimento dos termos originais do contrato. O Banco avalia a imparidade em duas áreas: avaliação individual e avaliação colectiva.
Avaliação individual
O Banco determina a imparidade adequada a cada cré-dito individualmente significativo numa base individual. Para a avaliação individual o Banco toma em considera-ção diversos factores como sejam eventuais planos de negócio da contraparte, a sua capacidade de melhoria do desempenho económico após ter surgido a dificul-dade económica, a existência de outras fontes de suporte financeiro e o valor realizável de garantias colaterais recebidas. As perdas por imparidade são reavaliadas a cada data de relato do Banco excepto se forem identi-ficadas circunstâncias que requeiram especial atenção.
Imparidade colectiva
O BCI efectua a avaliação da imparidade colectiva para todos os créditos que não sejam individualmente significa-tivos bem como para créditos significativos para os quais não existe prova objectiva de imparidade individual. O Banco avalia a imparidade colectiva a cada data de relato financeiro.
A imparidade colectiva toma em consideração a impari-dade que é provável existir no portfolio mesmo que não tenha sido ainda identificada qualquer evidência objec-tiva de imparidade na avaliação individual. A imparidade colectiva é posteriormente avaliada pela gestão de forma a assegurar que se encontra em linha com a política global do Banco.
PRODuTO | PRODuCTATé 3 MESES
uP TO 3 MONThSDE 3 A 6 MESES
3 - 6 MONThSDE 6 MESES
A 1 ANO6 MONThS
- 1 yEAR
MAIS DE 1 ANO MORE ThAN
1 yEAR
TOTAl
OVeRDRAfT | OVeRDRAfT 8,712 - - - 8,712
InVesTIMenTO | InVesTMenT 1,488,865 57,854,151 - - 59,343,016
COnsUMO e hABITAÇÃO | COnsUMPTIOn AnD hOUsIng 39,232 - - - 39,232
OUTROs | OTheR - - - - -
TOTAL 1,536,809 57,854,151 - - 59,390,960
Information on the seniority of credit overdue but not impaired, at 31 December 2009 is set out below:
Impairment assessment
The principal considerations governing the assessment of impairment on loans and advances to customers are associated with the assessment of whether payments are overdue or if there is any information on cash flow difficulties or defaults by counterparties in respect of the agreements’ initial terms. The bank assesses impairment in two areas: separate and collective assessments.
Separate assessment
The bank assesses the adequacy of impairment on each individually significant loan on a separate basis. For separate assessments, the bank takes diverse fac-tors into consideration. These include a counterparty’s eventual business plans, its capacity to improve its economic performance after the appearance of the economic difficulty, the existence of other sources of financial support and the realisable value of any collat-eral guarantees received. Impairment losses are revalued at each bank reporting date, unless any cir-cumstances requiring special attention have been iden-tified.
Collective impairment
BCI performs collective impairment assessments on all credit which is not individually significant in addition to significant credit on which there is no objective evi-dence of separate impairment. The bank assesses col-lective impairment at the date of each financial report.
Collective impairment takes into account the impair-ment which probably exists in the portfolio even if no objective evidence of separate impairment has already been identified. Collective impairment is then assessed by management in order to ensure that it is in line with the bank’s global policy.
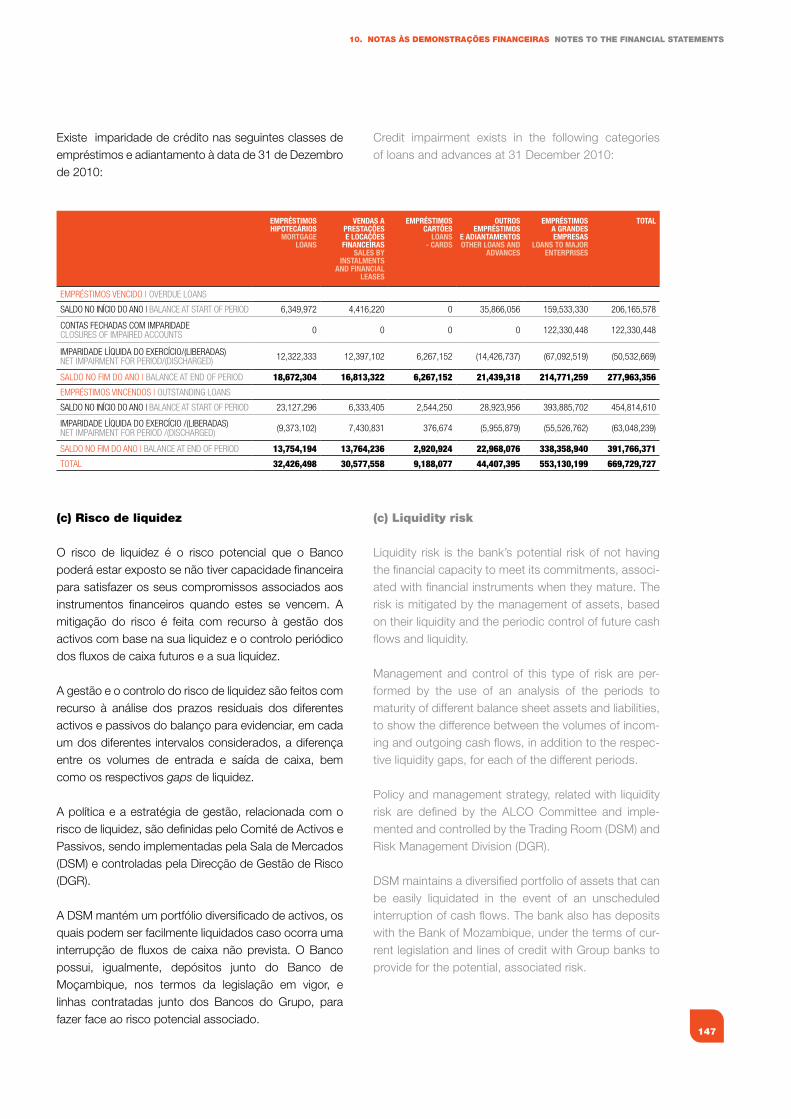
147
10. NOTAS àS dEMONSTRAÇÕES fINANCEIRAS NOTES TO ThE fINANCIAL STATEMENTS
Existe imparidade de crédito nas seguintes classes de empréstimos e adiantamento à data de 31 de Dezembro de 2010:
(c) Risco de liquidez
O risco de liquidez é o risco potencial que o Banco poderá estar exposto se não tiver capacidade financeira para satisfazer os seus compromissos associados aos instrumentos financeiros quando estes se vencem. A mitigação do risco é feita com recurso à gestão dos activos com base na sua liquidez e o controlo periódico dos fluxos de caixa futuros e a sua liquidez.
A gestão e o controlo do risco de liquidez são feitos com recurso à análise dos prazos residuais dos diferentes activos e passivos do balanço para evidenciar, em cada um dos diferentes intervalos considerados, a diferença entre os volumes de entrada e saída de caixa, bem como os respectivos gaps de liquidez.
A política e a estratégia de gestão, relacionada com o risco de liquidez, são definidas pelo Comité de Activos e Passivos, sendo implementadas pela Sala de Mercados (DSM) e controladas pela Direcção de Gestão de Risco (DGR).
A DSM mantém um portfólio diversificado de activos, os quais podem ser facilmente liquidados caso ocorra uma interrupção de fluxos de caixa não prevista. O Banco possui, igualmente, depósitos junto do Banco de Moçambique, nos termos da legislação em vigor, e linhas contratadas junto dos Bancos do Grupo, para fazer face ao risco potencial associado.
EMPRéSTIMOS hIPOTECÁRIOS
MORTGAGE lOANS
vENDAS A PRESTAçõES E lOCAçõES
fINANCEIRASSAlES by
INSTAlMENTS AND fINANCIAl
lEASES
EMPRéSTIMOS CARTõES
lOANS- CARDS
OuTROS EMPRéSTIMOS
E ADIANTAMENTOSOThER lOANS AND
ADvANCES
EMPRéSTIMOS A GRANDES EMPRESAS
lOANS TO MAJOR ENTERPRISES
TOTAl
eMPRÉsTIMOs VenCIDO | OVeRDUe LOAns
sALDO nO InÍCIO DO AnO | BALAnCe AT sTART Of PeRIOD 6,349,972 4,416,220 0 35,866,056 159,533,330 206,165,578
COnTAs feChADAs COM IMPARIDADeCLOsURes Of IMPAIReD ACCOUnTs 0 0 0 0 122,330,448 122,330,448
IMPARIDADe LÍQUIDA DO exeRCÍCIO/(LIBeRADAs)neT IMPAIRMenT fOR PeRIOD/(DIsChARgeD) 12,322,333 12,397,102 6,267,152 (14,426,737) (67,092,519) (50,532,669)
sALDO nO fIM DO AnO | BALAnCe AT enD Of PeRIOD 18,672,304 16,813,322 6,267,152 21,439,318 214,771,259 277,963,356
eMPRÉsTIMOs VInCenDOs | OUTsTAnDIng LOAns
sALDO nO InÍCIO DO AnO | BALAnCe AT sTART Of PeRIOD 23,127,296 6,333,405 2,544,250 28,923,956 393,885,702 454,814,610
IMPARIDADe LÍQUIDA DO exeRCÍCIO /(LIBeRADAs)neT IMPAIRMenT fOR PeRIOD /(DIsChARgeD) (9,373,102) 7,430,831 376,674 (5,955,879) (55,526,762) (63,048,239)
sALDO nO fIM DO AnO | BALAnCe AT enD Of PeRIOD 13,754,194 13,764,236 2,920,924 22,968,076 338,358,940 391,766,371
TOTAL 32,426,498 30,577,558 9,188,077 44,407,395 553,130,199 669,729,727
Credit impairment exists in the following categories of loans and advances at 31 December 2010:
(c) Liquidity risk
Liquidity risk is the bank’s potential risk of not having the financial capacity to meet its commitments, associ-ated with financial instruments when they mature. The risk is mitigated by the management of assets, based on their liquidity and the periodic control of future cash flows and liquidity.
Management and control of this type of risk are per-formed by the use of an analysis of the periods to maturity of different balance sheet assets and liabilities, to show the difference between the volumes of incom-ing and outgoing cash flows, in addition to the respec-tive liquidity gaps, for each of the different periods.
Policy and management strategy, related with liquidity risk are defined by the ALCO Committee and imple-mented and controlled by the Trading Room (DSM) and Risk Management Division (DGR).
DSM maintains a diversified portfolio of assets that can be easily liquidated in the event of an unscheduled interruption of cash flows. The bank also has deposits with the Bank of Mozambique, under the terms of cur-rent legislation and lines of credit with Group banks to provide for the potential, associated risk.
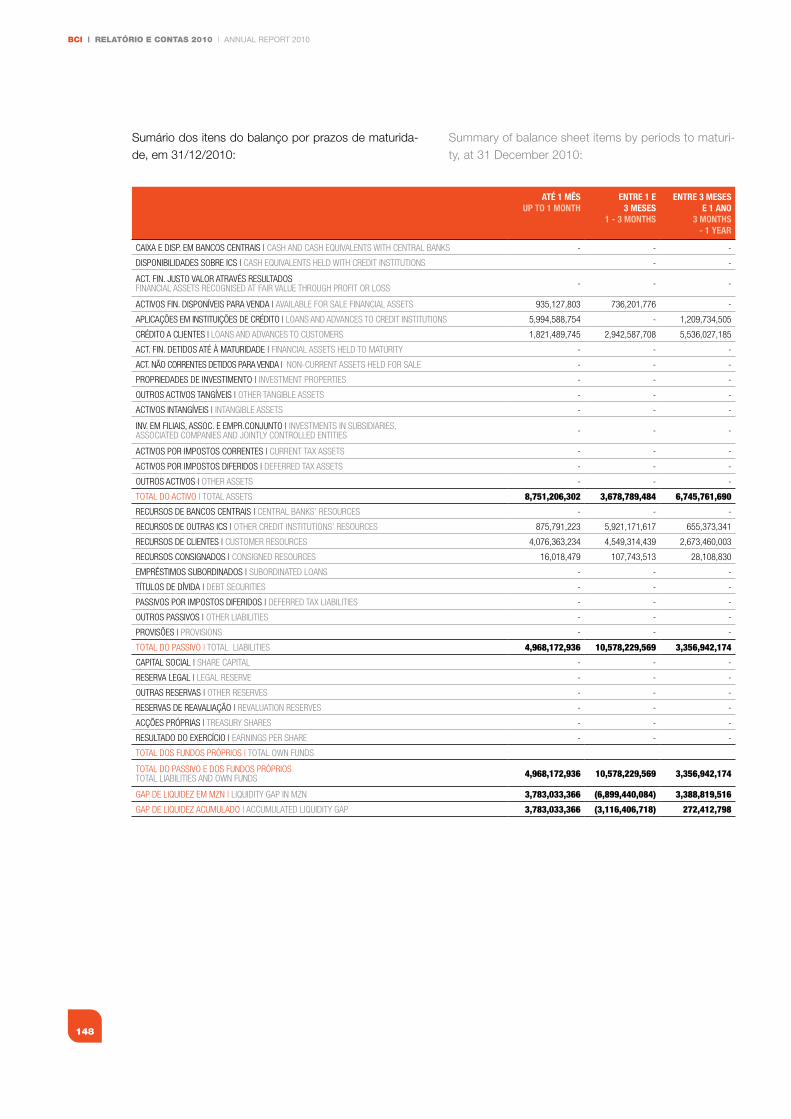
BCI | RELATÓRIO E CONTAS 2010 | ANNUAL REPORT 2010
148
Sumário dos itens do balanço por prazos de maturida-de, em 31/12/2010:
ATé 1 MêSuP TO 1 MONTh
ENTRE 1 E3 MESES
1 - 3 MONThS
ENTRE 3 MESESE 1 ANO
3 MONThS- 1 yEAR
CAIxA e DIsP. eM BAnCOs CenTRAIs | CAsh AnD CAsh eQUIVALenTs wITh CenTRAL BAnks - - -
DIsPOnIBILIDADes sOBRe ICs | CAsh eQUIVALenTs heLD wITh CReDIT InsTITUTIOns - -
ACT. fIn. JUsTO VALOR ATRAVÉs ResULTADOsfInAnCIAL AsseTs ReCOgnIseD AT fAIR VALUe ThROUgh PROfIT OR LOss - - -
ACTIVOs fIn. DIsPOnÍVeIs PARA VenDA | AVAILABLe fOR sALe fInAnCIAL AsseTs 935,127,803 736,201,776 -
APLICAÇões eM InsTITUIÇões De CRÉDITO | LOAns AnD ADVAnCes TO CReDIT InsTITUTIOns 5,994,588,754 - 1,209,734,505
CRÉDITO A CLIenTes | LOAns AnD ADVAnCes TO CUsTOMeRs 1,821,489,745 2,942,587,708 5,536,027,185
ACT. fIn. DeTIDOs ATÉ à MATURIDADe | fInAnCIAL AsseTs heLD TO MATURITy - - -
ACT. nÃO CORRenTes DeTIDOs PARA VenDA | nOn-CURRenT AsseTs heLD fOR sALe - - -
PROPRIeDADes De InVesTIMenTO | InVesTMenT PROPeRTIes - - -
OUTROs ACTIVOs TAngÍVeIs | OTheR TAngIBLe AsseTs - - -
ACTIVOs InTAngÍVeIs | InTAngIBLe AsseTs - - -
InV. eM fILIAIs, AssOC. e eMPR.COnJUnTO | InVesTMenTs In sUBsIDIARIes,AssOCIATeD COMPAnIes AnD JOInTLy COnTROLLeD enTITIes - - -
ACTIVOs POR IMPOsTOs CORRenTes | CURRenT TAx AsseTs - - -
ACTIVOs POR IMPOsTOs DIfeRIDOs | DefeRReD TAx AsseTs - - -
OUTROs ACTIVOs | OTheR AsseTs - - -
TOTAL DO ACTIVO | TOTAL AsseTs 8,751,206,302 3,678,789,484 6,745,761,690
ReCURsOs De BAnCOs CenTRAIs | CenTRAL BAnks’ ResOURCes - - -
ReCURsOs De OUTRAs ICs | OTheR CReDIT InsTITUTIOns’ ResOURCes 875,791,223 5,921,171,617 655,373,341
ReCURsOs De CLIenTes | CUsTOMeR ResOURCes 4,076,363,234 4,549,314,439 2,673,460,003
ReCURsOs COnsIgnADOs | COnsIgneD ResOURCes 16,018,479 107,743,513 28,108,830
eMPRÉsTIMOs sUBORDInADOs | sUBORDInATeD LOAns - - -
TÍTULOs De DÍVIDA | DeBT seCURITIes - - -
PAssIVOs POR IMPOsTOs DIfeRIDOs | DefeRReD TAx LIABILITIes - - -
OUTROs PAssIVOs | OTheR LIABILITIes - - -
PROVIsões | PROVIsIOns - - -
TOTAL DO PAssIVO | TOTAL LIABILITIes 4,968,172,936 10,578,229,569 3,356,942,174
CAPITAL sOCIAL | shARe CAPITAL - - -
ReseRVA LegAL | LegAL ReseRVe - - -
OUTRAs ReseRVAs | OTheR ReseRVes - - -
ReseRVAs De ReAVALIAÇÃO | ReVALUATIOn ReseRVes - - -
ACÇões PRÓPRIAs | TReAsURy shARes - - -
ResULTADO DO exeRCÍCIO | eARnIngs PeR shARe - - -
TOTAL DOs fUnDOs PRÓPRIOs | TOTAL Own fUnDs
TOTAL DO PAssIVO e DOs fUnDOs PRÓPRIOsTOTAL LIABILITIes AnD Own fUnDs 4,968,172,936 10,578,229,569 3,356,942,174
gAP De LIQUIDeZ eM MZn | LIQUIDITy gAP In MZn 3,783,033,366 (6,899,440,084) 3,388,819,516
gAP De LIQUIDeZ ACUMULADO | ACCUMULATeD LIQUIDITy gAP 3,783,033,366 (3,116,406,718) 272,412,798
Summary of balance sheet items by periods to maturi-ty, at 31 December 2010:
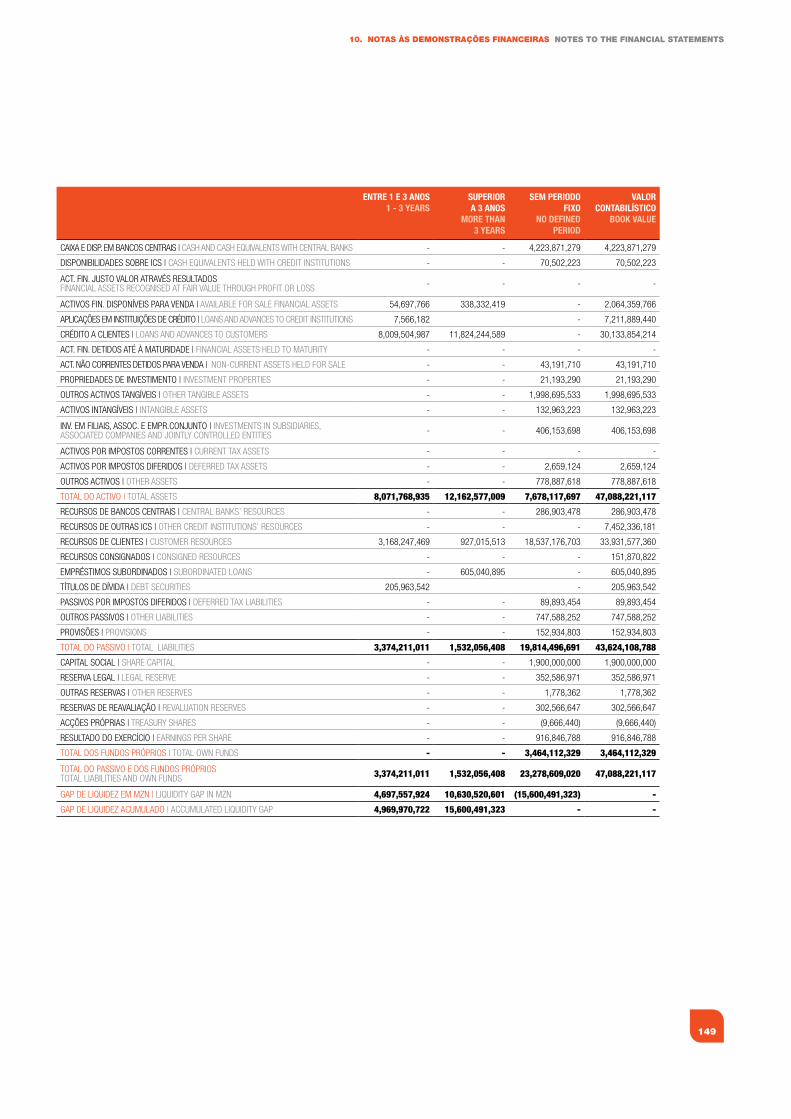
149
10. NOTAS àS dEMONSTRAÇÕES fINANCEIRAS NOTES TO ThE fINANCIAL STATEMENTS
ENTRE 1 E 3 ANOS 1 - 3 yEARS
SuPERIORA 3 ANOS
MORE ThAN3 yEARS
SEM PERIODO fIxO
NO DEfINED PERIOD
vAlOR CONTAbIlíSTICO
bOOk vAluE
CAIxA e DIsP. eM BAnCOs CenTRAIs | CAsh AnD CAsh eQUIVALenTs wITh CenTRAL BAnks - - 4,223,871,279 4,223,871,279
DIsPOnIBILIDADes sOBRe ICs | CAsh eQUIVALenTs heLD wITh CReDIT InsTITUTIOns - - 70,502,223 70,502,223
ACT. fIn. JUsTO VALOR ATRAVÉs ResULTADOsfInAnCIAL AsseTs ReCOgnIseD AT fAIR VALUe ThROUgh PROfIT OR LOss - - - -
ACTIVOs fIn. DIsPOnÍVeIs PARA VenDA | AVAILABLe fOR sALe fInAnCIAL AsseTs 54,697,766 338,332,419 - 2,064,359,766
APLICAÇões eM InsTITUIÇões De CRÉDITO | LOAns AnD ADVAnCes TO CReDIT InsTITUTIOns 7,566,182 - 7,211,889,440
CRÉDITO A CLIenTes | LOAns AnD ADVAnCes TO CUsTOMeRs 8,009,504,987 11,824,244,589 - 30,133,854,214
ACT. fIn. DeTIDOs ATÉ à MATURIDADe | fInAnCIAL AsseTs heLD TO MATURITy - - - -
ACT. nÃO CORRenTes DeTIDOs PARA VenDA | nOn-CURRenT AsseTs heLD fOR sALe - - 43,191,710 43,191,710
PROPRIeDADes De InVesTIMenTO | InVesTMenT PROPeRTIes - - 21,193,290 21,193,290
OUTROs ACTIVOs TAngÍVeIs | OTheR TAngIBLe AsseTs - - 1,998,695,533 1,998,695,533
ACTIVOs InTAngÍVeIs | InTAngIBLe AsseTs - - 132,963,223 132,963,223
InV. eM fILIAIs, AssOC. e eMPR.COnJUnTO | InVesTMenTs In sUBsIDIARIes, AssOCIATeD COMPAnIes AnD JOInTLy COnTROLLeD enTITIes - - 406,153,698 406,153,698
ACTIVOs POR IMPOsTOs CORRenTes | CURRenT TAx AsseTs - - - -
ACTIVOs POR IMPOsTOs DIfeRIDOs | DefeRReD TAx AsseTs - - 2,659,124 2,659,124
OUTROs ACTIVOs | OTheR AsseTs - - 778,887,618 778,887,618
TOTAL DO ACTIVO | TOTAL AsseTs 8,071,768,935 12,162,577,009 7,678,117,697 47,088,221,117
ReCURsOs De BAnCOs CenTRAIs | CenTRAL BAnks’ ResOURCes - - 286,903,478 286,903,478
ReCURsOs De OUTRAs ICs | OTheR CReDIT InsTITUTIOns’ ResOURCes - - - 7,452,336,181
ReCURsOs De CLIenTes | CUsTOMeR ResOURCes 3,168,247,469 927,015,513 18,537,176,703 33,931,577,360
ReCURsOs COnsIgnADOs | COnsIgneD ResOURCes - - - 151,870,822
eMPRÉsTIMOs sUBORDInADOs | sUBORDInATeD LOAns - 605,040,895 - 605,040,895
TÍTULOs De DÍVIDA | DeBT seCURITIes 205,963,542 - 205,963,542
PAssIVOs POR IMPOsTOs DIfeRIDOs | DefeRReD TAx LIABILITIes - - 89,893,454 89,893,454
OUTROs PAssIVOs | OTheR LIABILITIes - - 747,588,252 747,588,252
PROVIsões | PROVIsIOns - - 152,934,803 152,934,803
TOTAL DO PAssIVO | TOTAL LIABILITIes 3,374,211,011 1,532,056,408 19,814,496,691 43,624,108,788
CAPITAL sOCIAL | shARe CAPITAL - - 1,900,000,000 1,900,000,000
ReseRVA LegAL | LegAL ReseRVe - - 352,586,971 352,586,971
OUTRAs ReseRVAs | OTheR ReseRVes - - 1,778,362 1,778,362
ReseRVAs De ReAVALIAÇÃO | ReVALUATIOn ReseRVes - - 302,566,647 302,566,647
ACÇões PRÓPRIAs | TReAsURy shARes - - (9,666,440) (9,666,440)
ResULTADO DO exeRCÍCIO | eARnIngs PeR shARe - - 916,846,788 916,846,788
TOTAL DOs fUnDOs PRÓPRIOs | TOTAL Own fUnDs - - 3,464,112,329 3,464,112,329
TOTAL DO PAssIVO e DOs fUnDOs PRÓPRIOsTOTAL LIABILITIes AnD Own fUnDs 3,374,211,011 1,532,056,408 23,278,609,020 47,088,221,117
gAP De LIQUIDeZ eM MZn | LIQUIDITy gAP In MZn 4,697,557,924 10,630,520,601 (15,600,491,323) -
gAP De LIQUIDeZ ACUMULADO | ACCUMULATeD LIQUIDITy gAP 4,969,970,722 15,600,491,323 - -

BCI | RELATÓRIO E CONTAS 2010 | ANNUAL REPORT 2010
150
Sumário dos itens do balanço por prazos de maturidade, em 31/12/2009:
ATé 1 MêSuP TO 1 MONTh
ENTRE 1 E3 MESES
1 - 3 MONThS
ENTRE 3 MESESE 1 ANO
3 MONThS- 1 yEAR
CAIxA e DIsP. eM BAnCOs CenTRAIs | CAsh AnD CAsh eQUIVALenTs wITh CenTRAL BAnks - - -
DIsPOnIBILIDADes sOBRe ICs | CAsh eQUIVALenTs heLD wITh CReDIT InsTITUTIOns - - -
ACT. fIn. JUsTO VALOR ATRAVÉs ResULTADOsfInAnCIAL AsseTs ReCOgnIseD AT fAIR VALUe ThROUgh PROfIT OR LOss - - 147,124,679
ACTIVOs fIn. DIsPOnÍVeIs PARA VenDA | AVAILABLe fOR sALe fInAnCIAL AsseTs 469,835,319 705,147,545 1,417,199,475
APLICAÇões eM InsTITUIÇões De CRÉDITO | LOAns AnD ADVAnCes TO CReDIT InsTITUTIOns 612,856,785 1,392,430,698
CRÉDITO A CLIenTes | LOAns AnD ADVAnCes TO CUsTOMeRs 1,488,692,483 2,082,083,974 1,963,367,886
ACT. fIn. DeTIDOs ATÉ à MATURIDADe | fInAnCIAL AsseTs heLD TO MATURITy - - -
ACT. nÃO CORRenTes DeTIDOs PARA VenDA | nOn-CURRenT AsseTs heLD fOR sALe - - -
PROPRIeDADes De InVesTIMenTO | InVesTMenT PROPeRTIes - - -
OUTROs ACTIVOs TAngÍVeIs | OTheR TAngIBLe AsseTs - - -
ACTIVOs InTAngÍVeIs | InTAngIBLe AsseTs - - -
InV. eM fILIAIs, AssOC. e eMPR.COnJUnTO | InVesTMenTs In sUBsIDIARIes,AssOCIATeD COMPAnIes AnD JOInTLy COnTROLLeD enTITIes - - -
ACTIVOs POR IMPOsTOs CORRenTes | CURRenT TAx AsseTs - - -
ACTIVOs POR IMPOsTOs DIfeRIDOs | DefeRReD TAx AsseTs - - -
OUTROs ACTIVOs | OTheR AsseTs - - -
TOTAL DO ACTIVO | TOTAL AsseTs 2,571,384,587 2,787,231,519 4,920,122,738
ReCURsOs De BAnCOs CenTRAIs | CenTRAL BAnks’ ResOURCes - - -
ReCURsOs De OUTRAs ICs | OTheR CReDIT InsTITUTIOns’ ResOURCes 1,218,112,517 210,278,141 4,531,242
ReCURsOs De CLIenTes | CUsTOMeR ResOURCes 3,162,318,398 2,845,077,610 3,753,635,781
ReCURsOs COnsIgnADOs | COnsIgneD ResOURCes 22,677,658 - -
eMPRÉsTIMOs sUBORDInADOs | sUBORDInATeD LOAns - - -
TÍTULOs De DÍVIDA | DeBT seCURITIes - - -
PAssIVOs POR IMPOsTOs DIfeRIDOs | DefeRReD TAx LIABILITIes - - -
OUTROs PAssIVOs | OTheR LIABILITIes - - -
PROVIsões | PROVIsIOns - - -
TOTAL DO PAssIVO | TOTAL LIABILITIes 4,403,108,573 3,055,355,751 3,758,167,022
CAPITAL sOCIAL | shARe CAPITAL - - -
ReseRVA LegAL | LegAL ReseRVe - - -
OUTRAs ReseRVAs | OTheR ReseRVes - - -
ReseRVAs De ReAVALIAÇÃO | ReVALUATIOn ReseRVes - - -
ACÇões PRÓPRIAs | TReAsURy shARes - - -
ResULTADO DO exeRCÍCIO | eARnIngs PeR shARe - - -
TOTAL DOs fUnDOs PRÓPRIOs | TOTAL Own fUnDs - - -
TOTAL DO PAssIVO e DOs fUnDOs PRÓPRIOsTOTAL LIABILITIes AnD Own fUnDs 4,403,108,573 3,055,355,751 3,758,167,022
gAP De LIQUIDeZ eM MZn | LIQUIDITy gAP In MZn (1,831,723,986) (268,124,232) 1,161,955,715
gAP De LIQUIDeZ ACUMULADO | ACCUMULATeD LIQUIDITy gAP (1,831,723,986) (2,099,848,218) (937,892,503)
Summary of balance sheet items by periods to maturi-ty, at 31.12.2009:
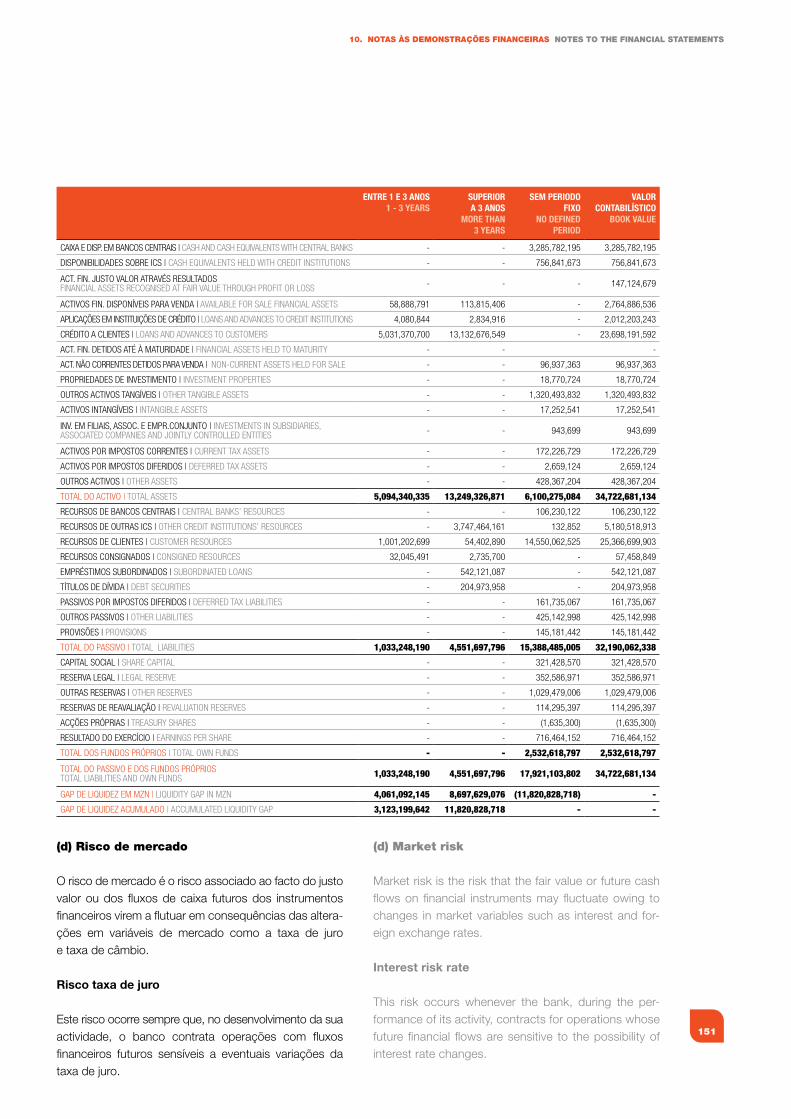
151
10. NOTAS àS dEMONSTRAÇÕES fINANCEIRAS NOTES TO ThE fINANCIAL STATEMENTS
ENTRE 1 E 3 ANOS 1 - 3 yEARS
SuPERIORA 3 ANOS
MORE ThAN3 yEARS
SEM PERIODO fIxO
NO DEfINED PERIOD
vAlOR CONTAbIlíSTICO
bOOk vAluE
CAIxA e DIsP. eM BAnCOs CenTRAIs | CAsh AnD CAsh eQUIVALenTs wITh CenTRAL BAnks - - 3,285,782,195 3,285,782,195
DIsPOnIBILIDADes sOBRe ICs | CAsh eQUIVALenTs heLD wITh CReDIT InsTITUTIOns - - 756,841,673 756,841,673
ACT. fIn. JUsTO VALOR ATRAVÉs ResULTADOsfInAnCIAL AsseTs ReCOgnIseD AT fAIR VALUe ThROUgh PROfIT OR LOss - - - 147,124,679
ACTIVOs fIn. DIsPOnÍVeIs PARA VenDA | AVAILABLe fOR sALe fInAnCIAL AsseTs 58,888,791 113,815,406 - 2,764,886,536
APLICAÇões eM InsTITUIÇões De CRÉDITO | LOAns AnD ADVAnCes TO CReDIT InsTITUTIOns 4,080,844 2,834,916 - 2,012,203,243
CRÉDITO A CLIenTes | LOAns AnD ADVAnCes TO CUsTOMeRs 5,031,370,700 13,132,676,549 - 23,698,191,592
ACT. fIn. DeTIDOs ATÉ à MATURIDADe | fInAnCIAL AsseTs heLD TO MATURITy - - -
ACT. nÃO CORRenTes DeTIDOs PARA VenDA | nOn-CURRenT AsseTs heLD fOR sALe - - 96,937,363 96,937,363
PROPRIeDADes De InVesTIMenTO | InVesTMenT PROPeRTIes - - 18,770,724 18,770,724
OUTROs ACTIVOs TAngÍVeIs | OTheR TAngIBLe AsseTs - - 1,320,493,832 1,320,493,832
ACTIVOs InTAngÍVeIs | InTAngIBLe AsseTs - - 17,252,541 17,252,541
InV. eM fILIAIs, AssOC. e eMPR.COnJUnTO | InVesTMenTs In sUBsIDIARIes,AssOCIATeD COMPAnIes AnD JOInTLy COnTROLLeD enTITIes - - 943,699 943,699
ACTIVOs POR IMPOsTOs CORRenTes | CURRenT TAx AsseTs - - 172,226,729 172,226,729
ACTIVOs POR IMPOsTOs DIfeRIDOs | DefeRReD TAx AsseTs - - 2,659,124 2,659,124
OUTROs ACTIVOs | OTheR AsseTs - - 428,367,204 428,367,204
TOTAL DO ACTIVO | TOTAL AsseTs 5,094,340,335 13,249,326,871 6,100,275,084 34,722,681,134
ReCURsOs De BAnCOs CenTRAIs | CenTRAL BAnks’ ResOURCes - - 106,230,122 106,230,122
ReCURsOs De OUTRAs ICs | OTheR CReDIT InsTITUTIOns’ ResOURCes - 3,747,464,161 132,852 5,180,518,913
ReCURsOs De CLIenTes | CUsTOMeR ResOURCes 1,001,202,699 54,402,890 14,550,062,525 25,366,699,903
ReCURsOs COnsIgnADOs | COnsIgneD ResOURCes 32,045,491 2,735,700 - 57,458,849
eMPRÉsTIMOs sUBORDInADOs | sUBORDInATeD LOAns - 542,121,087 - 542,121,087
TÍTULOs De DÍVIDA | DeBT seCURITIes - 204,973,958 - 204,973,958
PAssIVOs POR IMPOsTOs DIfeRIDOs | DefeRReD TAx LIABILITIes - - 161,735,067 161,735,067
OUTROs PAssIVOs | OTheR LIABILITIes - - 425,142,998 425,142,998
PROVIsões | PROVIsIOns - - 145,181,442 145,181,442
TOTAL DO PAssIVO | TOTAL LIABILITIes 1,033,248,190 4,551,697,796 15,388,485,005 32,190,062,338
CAPITAL sOCIAL | shARe CAPITAL - - 321,428,570 321,428,570
ReseRVA LegAL | LegAL ReseRVe - - 352,586,971 352,586,971
OUTRAs ReseRVAs | OTheR ReseRVes - - 1,029,479,006 1,029,479,006
ReseRVAs De ReAVALIAÇÃO | ReVALUATIOn ReseRVes - - 114,295,397 114,295,397
ACÇões PRÓPRIAs | TReAsURy shARes - - (1,635,300) (1,635,300)
ResULTADO DO exeRCÍCIO | eARnIngs PeR shARe - - 716,464,152 716,464,152
TOTAL DOs fUnDOs PRÓPRIOs | TOTAL Own fUnDs - - 2,532,618,797 2,532,618,797
TOTAL DO PAssIVO e DOs fUnDOs PRÓPRIOsTOTAL LIABILITIes AnD Own fUnDs 1,033,248,190 4,551,697,796 17,921,103,802 34,722,681,134
gAP De LIQUIDeZ eM MZn | LIQUIDITy gAP In MZn 4,061,092,145 8,697,629,076 (11,820,828,718) -
gAP De LIQUIDeZ ACUMULADO | ACCUMULATeD LIQUIDITy gAP 3,123,199,642 11,820,828,718 - -
(d) Risco de mercado
O risco de mercado é o risco associado ao facto do justo valor ou dos fluxos de caixa futuros dos instrumentos financeiros virem a flutuar em consequências das altera-ções em variáveis de mercado como a taxa de juro e taxa de câmbio.
Risco taxa de juro
Este risco ocorre sempre que, no desenvolvimento da sua actividade, o banco contrata operações com fluxos financeiros futuros sensíveis a eventuais variações da taxa de juro.
(d) Market risk
Market risk is the risk that the fair value or future cash flows on financial instruments may fluctuate owing to changes in market variables such as interest and for-eign exchange rates.
Interest risk rate
This risk occurs whenever the bank, during the per-formance of its activity, contracts for operations whose future financial flows are sensitive to the possibility of interest rate changes.
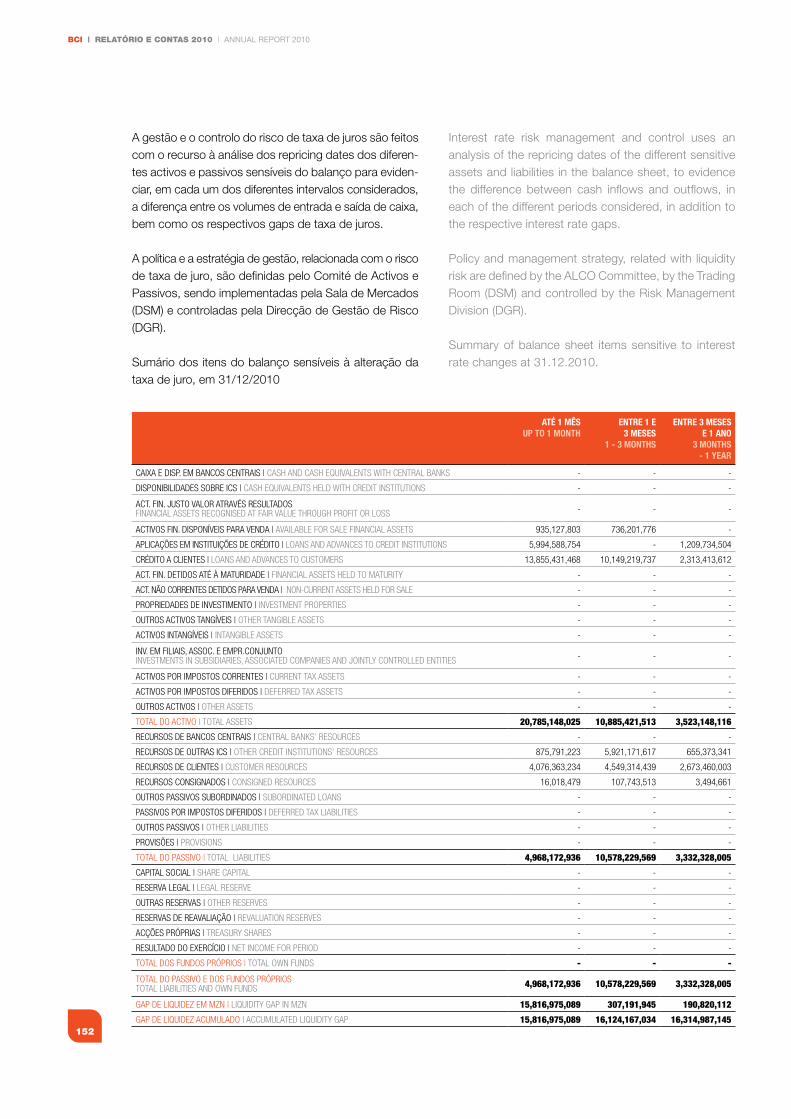
BCI | RELATÓRIO E CONTAS 2010 | ANNUAL REPORT 2010
152
A gestão e o controlo do risco de taxa de juros são feitos com o recurso à análise dos repricing dates dos diferen-tes activos e passivos sensíveis do balanço para eviden-ciar, em cada um dos diferentes intervalos considerados, a diferença entre os volumes de entrada e saída de caixa, bem como os respectivos gaps de taxa de juros.
A política e a estratégia de gestão, relacionada com o risco de taxa de juro, são definidas pelo Comité de Activos e Passivos, sendo implementadas pela Sala de Mercados (DSM) e controladas pela Direcção de Gestão de Risco (DGR).
Sumário dos itens do balanço sensíveis à alteração da taxa de juro, em 31/12/2010
ATé 1 MêSuP TO 1 MONTh
ENTRE 1 E3 MESES
1 - 3 MONThS
ENTRE 3 MESESE 1 ANO
3 MONThS- 1 yEAR
CAIxA e DIsP. eM BAnCOs CenTRAIs | CAsh AnD CAsh eQUIVALenTs wITh CenTRAL BAnks - - -
DIsPOnIBILIDADes sOBRe ICs | CAsh eQUIVALenTs heLD wITh CReDIT InsTITUTIOns - - -
ACT. fIn. JUsTO VALOR ATRAVÉs ResULTADOsfInAnCIAL AsseTs ReCOgnIseD AT fAIR VALUe ThROUgh PROfIT OR LOss - - -
ACTIVOs fIn. DIsPOnÍVeIs PARA VenDA | AVAILABLe fOR sALe fInAnCIAL AsseTs 935,127,803 736,201,776 -
APLICAÇões eM InsTITUIÇões De CRÉDITO | LOAns AnD ADVAnCes TO CReDIT InsTITUTIOns 5,994,588,754 - 1,209,734,504
CRÉDITO A CLIenTes | LOAns AnD ADVAnCes TO CUsTOMeRs 13,855,431,468 10,149,219,737 2,313,413,612
ACT. fIn. DeTIDOs ATÉ à MATURIDADe | fInAnCIAL AsseTs heLD TO MATURITy - - -
ACT. nÃO CORRenTes DeTIDOs PARA VenDA | nOn-CURRenT AsseTs heLD fOR sALe - - -
PROPRIeDADes De InVesTIMenTO | InVesTMenT PROPeRTIes - - -
OUTROs ACTIVOs TAngÍVeIs | OTheR TAngIBLe AsseTs - - -
ACTIVOs InTAngÍVeIs | InTAngIBLe AsseTs - - -
InV. eM fILIAIs, AssOC. e eMPR.COnJUnTOInVesTMenTs In sUBsIDIARIes, AssOCIATeD COMPAnIes AnD JOInTLy COnTROLLeD enTITIes - - -
ACTIVOs POR IMPOsTOs CORRenTes | CURRenT TAx AsseTs - - -
ACTIVOs POR IMPOsTOs DIfeRIDOs | DefeRReD TAx AsseTs - - -
OUTROs ACTIVOs | OTheR AsseTs - - -
TOTAL DO ACTIVO | TOTAL AsseTs 20,785,148,025 10,885,421,513 3,523,148,116
ReCURsOs De BAnCOs CenTRAIs | CenTRAL BAnks’ ResOURCes - - -
ReCURsOs De OUTRAs ICs | OTheR CReDIT InsTITUTIOns’ ResOURCes 875,791,223 5,921,171,617 655,373,341
ReCURsOs De CLIenTes | CUsTOMeR ResOURCes 4,076,363,234 4,549,314,439 2,673,460,003
ReCURsOs COnsIgnADOs | COnsIgneD ResOURCes 16,018,479 107,743,513 3,494,661
OUTROs PAssIVOs sUBORDInADOs | sUBORDInATeD LOAns - - -
PAssIVOs POR IMPOsTOs DIfeRIDOs | DefeRReD TAx LIABILITIes - - -
OUTROs PAssIVOs | OTheR LIABILITIes - - -
PROVIsões | PROVIsIOns - - -
TOTAL DO PAssIVO | TOTAL LIABILITIes 4,968,172,936 10,578,229,569 3,332,328,005
CAPITAL sOCIAL | shARe CAPITAL - - -
ReseRVA LegAL | LegAL ReseRVe - - -
OUTRAs ReseRVAs | OTheR ReseRVes - - -
ReseRVAs De ReAVALIAÇÃO | ReVALUATIOn ReseRVes - - -
ACÇões PRÓPRIAs | TReAsURy shARes - - -
ResULTADO DO exeRCÍCIO | neT InCOMe fOR PeRIOD - - -
TOTAL DOs fUnDOs PRÓPRIOs | TOTAL Own fUnDs - - -
TOTAL DO PAssIVO e DOs fUnDOs PRÓPRIOsTOTAL LIABILITIes AnD Own fUnDs 4,968,172,936 10,578,229,569 3,332,328,005
gAP De LIQUIDeZ eM MZn | LIQUIDITy gAP In MZn 15,816,975,089 307,191,945 190,820,112
gAP De LIQUIDeZ ACUMULADO | ACCUMULATeD LIQUIDITy gAP 15,816,975,089 16,124,167,034 16,314,987,145
Interest rate risk management and control uses an analysis of the repricing dates of the different sensitive assets and liabilities in the balance sheet, to evidence the difference between cash inflows and outflows, in each of the different periods considered, in addition to the respective interest rate gaps.
Policy and management strategy, related with liquidity risk are defined by the ALCO Committee, by the Trading Room (DSM) and controlled by the Risk Management Division (DGR).
Summary of balance sheet items sensitive to interest rate changes at 31.12.2010.
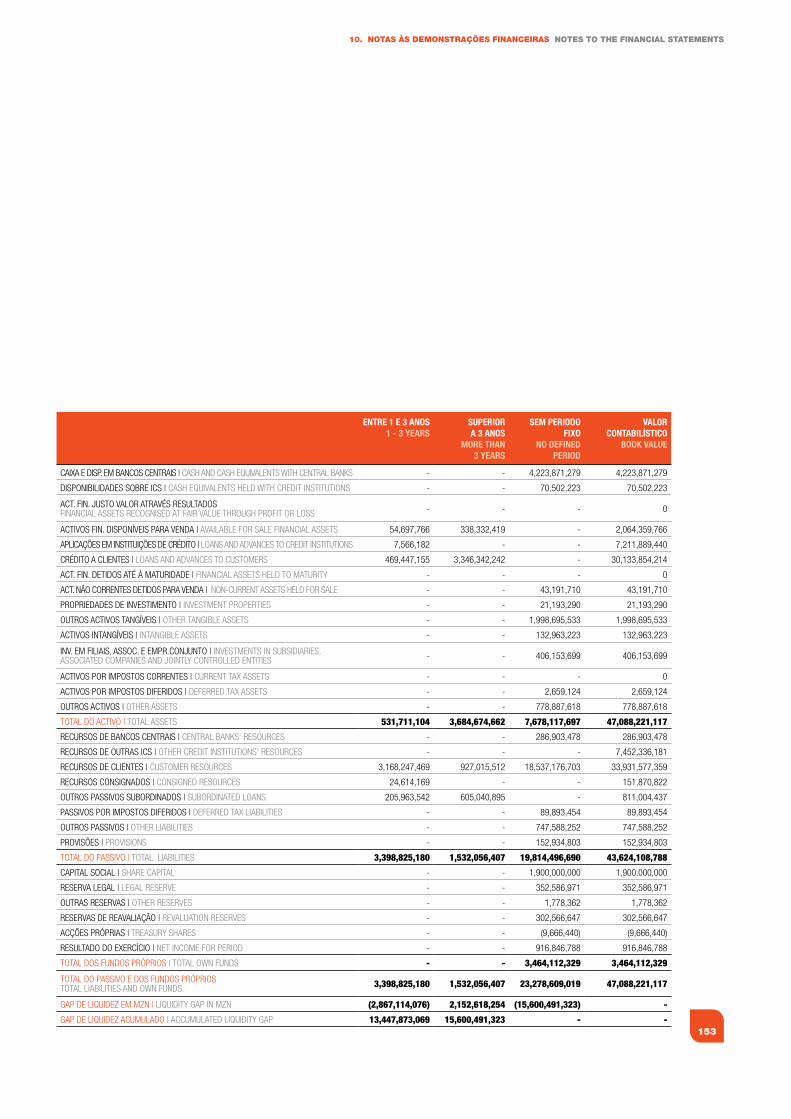
153
10. NOTAS àS dEMONSTRAÇÕES fINANCEIRAS NOTES TO ThE fINANCIAL STATEMENTS
ENTRE 1 E 3 ANOS 1 - 3 yEARS
SuPERIORA 3 ANOS
MORE ThAN3 yEARS
SEM PERIODO fIxO
NO DEfINED PERIOD
vAlOR CONTAbIlíSTICO
bOOk vAluE
CAIxA e DIsP. eM BAnCOs CenTRAIs | CAsh AnD CAsh eQUIVALenTs wITh CenTRAL BAnks - - 4,223,871,279 4,223,871,279
DIsPOnIBILIDADes sOBRe ICs | CAsh eQUIVALenTs heLD wITh CReDIT InsTITUTIOns - - 70,502,223 70,502,223
ACT. fIn. JUsTO VALOR ATRAVÉs ResULTADOsfInAnCIAL AsseTs ReCOgnIseD AT fAIR VALUe ThROUgh PROfIT OR LOss - - - 0
ACTIVOs fIn. DIsPOnÍVeIs PARA VenDA | AVAILABLe fOR sALe fInAnCIAL AsseTs 54,697,766 338,332,419 - 2,064,359,766
APLICAÇões eM InsTITUIÇões De CRÉDITO | LOAns AnD ADVAnCes TO CReDIT InsTITUTIOns 7,566,182 - - 7,211,889,440
CRÉDITO A CLIenTes | LOAns AnD ADVAnCes TO CUsTOMeRs 469,447,155 3,346,342,242 - 30,133,854,214
ACT. fIn. DeTIDOs ATÉ à MATURIDADe | fInAnCIAL AsseTs heLD TO MATURITy - - - 0
ACT. nÃO CORRenTes DeTIDOs PARA VenDA | nOn-CURRenT AsseTs heLD fOR sALe - - 43,191,710 43,191,710
PROPRIeDADes De InVesTIMenTO | InVesTMenT PROPeRTIes - - 21,193,290 21,193,290
OUTROs ACTIVOs TAngÍVeIs | OTheR TAngIBLe AsseTs - - 1,998,695,533 1,998,695,533
ACTIVOs InTAngÍVeIs | InTAngIBLe AsseTs - - 132,963,223 132,963,223
InV. eM fILIAIs, AssOC. e eMPR.COnJUnTO | InVesTMenTs In sUBsIDIARIes, AssOCIATeD COMPAnIes AnD JOInTLy COnTROLLeD enTITIes - - 406,153,699 406,153,699
ACTIVOs POR IMPOsTOs CORRenTes | CURRenT TAx AsseTs - - - 0
ACTIVOs POR IMPOsTOs DIfeRIDOs | DefeRReD TAx AsseTs - - 2,659,124 2,659,124
OUTROs ACTIVOs | OTheR AsseTs - - 778,887,618 778,887,618
TOTAL DO ACTIVO | TOTAL AsseTs 531,711,104 3,684,674,662 7,678,117,697 47,088,221,117
ReCURsOs De BAnCOs CenTRAIs | CenTRAL BAnks’ ResOURCes - - 286,903,478 286,903,478
ReCURsOs De OUTRAs ICs | OTheR CReDIT InsTITUTIOns’ ResOURCes - - - 7,452,336,181
ReCURsOs De CLIenTes | CUsTOMeR ResOURCes 3,168,247,469 927,015,512 18,537,176,703 33,931,577,359
ReCURsOs COnsIgnADOs | COnsIgneD ResOURCes 24,614,169 - - 151,870,822
OUTROs PAssIVOs sUBORDInADOs | sUBORDInATeD LOAns 205,963,542 605,040,895 - 811,004,437
PAssIVOs POR IMPOsTOs DIfeRIDOs | DefeRReD TAx LIABILITIes - - 89,893,454 89,893,454
OUTROs PAssIVOs | OTheR LIABILITIes - - 747,588,252 747,588,252
PROVIsões | PROVIsIOns - - 152,934,803 152,934,803
TOTAL DO PAssIVO | TOTAL LIABILITIes 3,398,825,180 1,532,056,407 19,814,496,690 43,624,108,788
CAPITAL sOCIAL | shARe CAPITAL - - 1,900,000,000 1,900,000,000
ReseRVA LegAL | LegAL ReseRVe - - 352,586,971 352,586,971
OUTRAs ReseRVAs | OTheR ReseRVes - - 1,778,362 1,778,362
ReseRVAs De ReAVALIAÇÃO | ReVALUATIOn ReseRVes - - 302,566,647 302,566,647
ACÇões PRÓPRIAs | TReAsURy shARes - - (9,666,440) (9,666,440)
ResULTADO DO exeRCÍCIO | neT InCOMe fOR PeRIOD - - 916,846,788 916,846,788
TOTAL DOs fUnDOs PRÓPRIOs | TOTAL Own fUnDs - - 3,464,112,329 3,464,112,329
TOTAL DO PAssIVO e DOs fUnDOs PRÓPRIOsTOTAL LIABILITIes AnD Own fUnDs 3,398,825,180 1,532,056,407 23,278,609,019 47,088,221,117
gAP De LIQUIDeZ eM MZn | LIQUIDITy gAP In MZn (2,867,114,076) 2,152,618,254 (15,600,491,323) -
gAP De LIQUIDeZ ACUMULADO | ACCUMULATeD LIQUIDITy gAP 13,447,873,069 15,600,491,323 - -
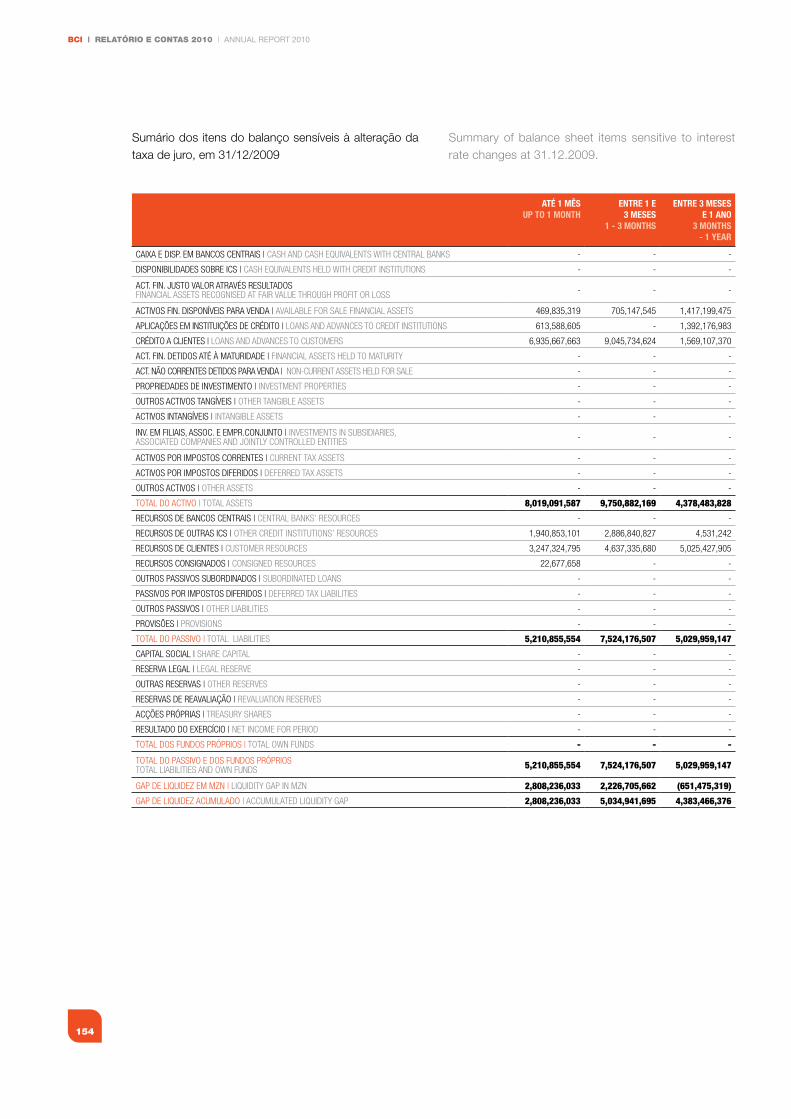
BCI | RELATÓRIO E CONTAS 2010 | ANNUAL REPORT 2010
154
Sumário dos itens do balanço sensíveis à alteração da taxa de juro, em 31/12/2009
ATé 1 MêSuP TO 1 MONTh
ENTRE 1 E3 MESES
1 - 3 MONThS
ENTRE 3 MESESE 1 ANO
3 MONThS- 1 yEAR
CAIxA e DIsP. eM BAnCOs CenTRAIs | CAsh AnD CAsh eQUIVALenTs wITh CenTRAL BAnks - - -
DIsPOnIBILIDADes sOBRe ICs | CAsh eQUIVALenTs heLD wITh CReDIT InsTITUTIOns - - -
ACT. fIn. JUsTO VALOR ATRAVÉs ResULTADOsfInAnCIAL AsseTs ReCOgnIseD AT fAIR VALUe ThROUgh PROfIT OR LOss - - -
ACTIVOs fIn. DIsPOnÍVeIs PARA VenDA | AVAILABLe fOR sALe fInAnCIAL AsseTs 469,835,319 705,147,545 1,417,199,475
APLICAÇões eM InsTITUIÇões De CRÉDITO | LOAns AnD ADVAnCes TO CReDIT InsTITUTIOns 613,588,605 - 1,392,176,983
CRÉDITO A CLIenTes | LOAns AnD ADVAnCes TO CUsTOMeRs 6,935,667,663 9,045,734,624 1,569,107,370
ACT. fIn. DeTIDOs ATÉ à MATURIDADe | fInAnCIAL AsseTs heLD TO MATURITy - - -
ACT. nÃO CORRenTes DeTIDOs PARA VenDA | nOn-CURRenT AsseTs heLD fOR sALe - - -
PROPRIeDADes De InVesTIMenTO | InVesTMenT PROPeRTIes - - -
OUTROs ACTIVOs TAngÍVeIs | OTheR TAngIBLe AsseTs - - -
ACTIVOs InTAngÍVeIs | InTAngIBLe AsseTs - - -
InV. eM fILIAIs, AssOC. e eMPR.COnJUnTO | InVesTMenTs In sUBsIDIARIes,AssOCIATeD COMPAnIes AnD JOInTLy COnTROLLeD enTITIes - - -
ACTIVOs POR IMPOsTOs CORRenTes | CURRenT TAx AsseTs - - -
ACTIVOs POR IMPOsTOs DIfeRIDOs | DefeRReD TAx AsseTs - - -
OUTROs ACTIVOs | OTheR AsseTs - - -
TOTAL DO ACTIVO | TOTAL AsseTs 8,019,091,587 9,750,882,169 4,378,483,828
ReCURsOs De BAnCOs CenTRAIs | CenTRAL BAnks’ ResOURCes - - -
ReCURsOs De OUTRAs ICs | OTheR CReDIT InsTITUTIOns’ ResOURCes 1,940,853,101 2,886,840,827 4,531,242
ReCURsOs De CLIenTes | CUsTOMeR ResOURCes 3,247,324,795 4,637,335,680 5,025,427,905
ReCURsOs COnsIgnADOs | COnsIgneD ResOURCes 22,677,658 - -
OUTROs PAssIVOs sUBORDInADOs | sUBORDInATeD LOAns - - -
PAssIVOs POR IMPOsTOs DIfeRIDOs | DefeRReD TAx LIABILITIes - - -
OUTROs PAssIVOs | OTheR LIABILITIes - - -
PROVIsões | PROVIsIOns - - -
TOTAL DO PAssIVO | TOTAL LIABILITIes 5,210,855,554 7,524,176,507 5,029,959,147
CAPITAL sOCIAL | shARe CAPITAL - - -
ReseRVA LegAL | LegAL ReseRVe - - -
OUTRAs ReseRVAs | OTheR ReseRVes - - -
ReseRVAs De ReAVALIAÇÃO | ReVALUATIOn ReseRVes - - -
ACÇões PRÓPRIAs | TReAsURy shARes - - -
ResULTADO DO exeRCÍCIO | neT InCOMe fOR PeRIOD - - -
TOTAL DOs fUnDOs PRÓPRIOs | TOTAL Own fUnDs - - -
TOTAL DO PAssIVO e DOs fUnDOs PRÓPRIOsTOTAL LIABILITIes AnD Own fUnDs 5,210,855,554 7,524,176,507 5,029,959,147
gAP De LIQUIDeZ eM MZn | LIQUIDITy gAP In MZn 2,808,236,033 2,226,705,662 (651,475,319)
gAP De LIQUIDeZ ACUMULADO | ACCUMULATeD LIQUIDITy gAP 2,808,236,033 5,034,941,695 4,383,466,376
Summary of balance sheet items sensitive to interest rate changes at 31.12.2009.
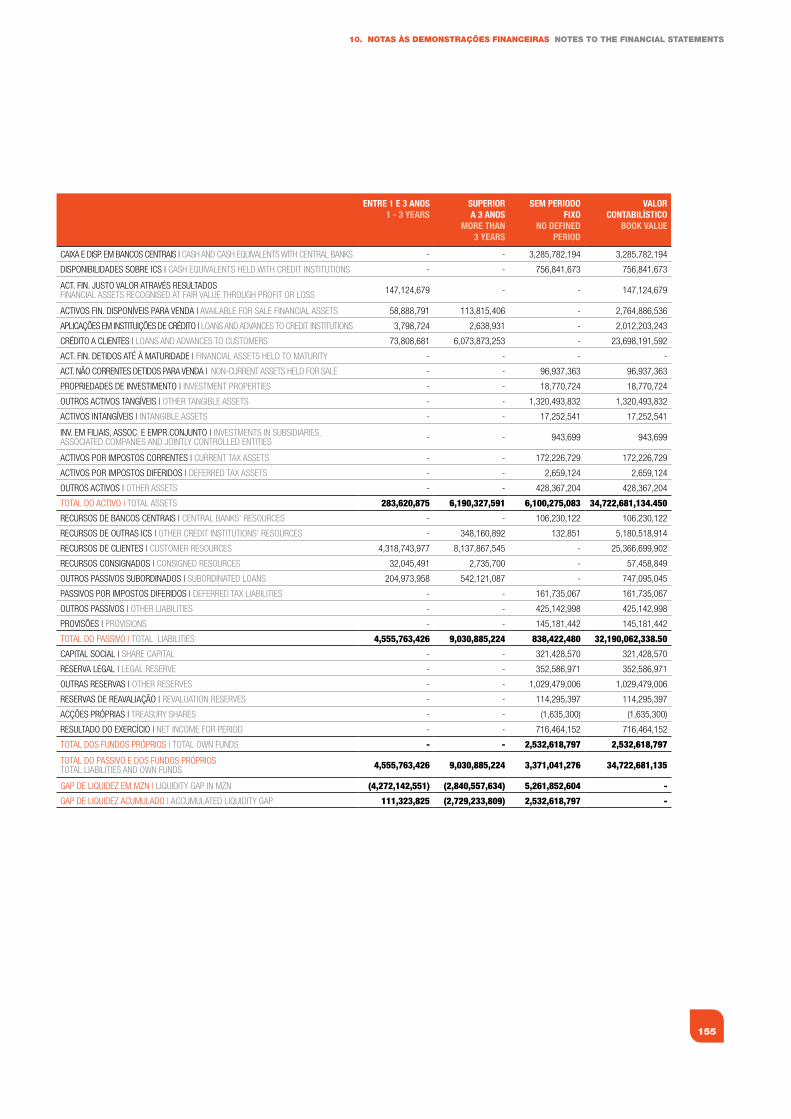
155
10. NOTAS àS dEMONSTRAÇÕES fINANCEIRAS NOTES TO ThE fINANCIAL STATEMENTS
ENTRE 1 E 3 ANOS 1 - 3 yEARS
SuPERIORA 3 ANOS
MORE ThAN3 yEARS
SEM PERIODO fIxO
NO DEfINED PERIOD
vAlOR CONTAbIlíSTICO
bOOk vAluE
CAIxA e DIsP. eM BAnCOs CenTRAIs | CAsh AnD CAsh eQUIVALenTs wITh CenTRAL BAnks - - 3,285,782,194 3,285,782,194
DIsPOnIBILIDADes sOBRe ICs | CAsh eQUIVALenTs heLD wITh CReDIT InsTITUTIOns - - 756,841,673 756,841,673
ACT. fIn. JUsTO VALOR ATRAVÉs ResULTADOsfInAnCIAL AsseTs ReCOgnIseD AT fAIR VALUe ThROUgh PROfIT OR LOss 147,124,679 - - 147,124,679
ACTIVOs fIn. DIsPOnÍVeIs PARA VenDA | AVAILABLe fOR sALe fInAnCIAL AsseTs 58,888,791 113,815,406 - 2,764,886,536
APLICAÇões eM InsTITUIÇões De CRÉDITO | LOAns AnD ADVAnCes TO CReDIT InsTITUTIOns 3,798,724 2,638,931 - 2,012,203,243
CRÉDITO A CLIenTes | LOAns AnD ADVAnCes TO CUsTOMeRs 73,808,681 6,073,873,253 - 23,698,191,592
ACT. fIn. DeTIDOs ATÉ à MATURIDADe | fInAnCIAL AsseTs heLD TO MATURITy - - - -
ACT. nÃO CORRenTes DeTIDOs PARA VenDA | nOn-CURRenT AsseTs heLD fOR sALe - - 96,937,363 96,937,363
PROPRIeDADes De InVesTIMenTO | InVesTMenT PROPeRTIes - - 18,770,724 18,770,724
OUTROs ACTIVOs TAngÍVeIs | OTheR TAngIBLe AsseTs - - 1,320,493,832 1,320,493,832
ACTIVOs InTAngÍVeIs | InTAngIBLe AsseTs - - 17,252,541 17,252,541
InV. eM fILIAIs, AssOC. e eMPR.COnJUnTO | InVesTMenTs In sUBsIDIARIes, AssOCIATeD COMPAnIes AnD JOInTLy COnTROLLeD enTITIes - - 943,699 943,699
ACTIVOs POR IMPOsTOs CORRenTes | CURRenT TAx AsseTs - - 172,226,729 172,226,729
ACTIVOs POR IMPOsTOs DIfeRIDOs | DefeRReD TAx AsseTs - - 2,659,124 2,659,124
OUTROs ACTIVOs | OTheR AsseTs - - 428,367,204 428,367,204
TOTAL DO ACTIVO | TOTAL AsseTs 283,620,875 6,190,327,591 6,100,275,083 34,722,681,134.450
ReCURsOs De BAnCOs CenTRAIs | CenTRAL BAnks’ ResOURCes - - 106,230,122 106,230,122
ReCURsOs De OUTRAs ICs | OTheR CReDIT InsTITUTIOns’ ResOURCes - 348,160,892 132,851 5,180,518,914
ReCURsOs De CLIenTes | CUsTOMeR ResOURCes 4,318,743,977 8,137,867,545 - 25,366,699,902
ReCURsOs COnsIgnADOs | COnsIgneD ResOURCes 32,045,491 2,735,700 - 57,458,849
OUTROs PAssIVOs sUBORDInADOs | sUBORDInATeD LOAns 204,973,958 542,121,087 - 747,095,045
PAssIVOs POR IMPOsTOs DIfeRIDOs | DefeRReD TAx LIABILITIes - - 161,735,067 161,735,067
OUTROs PAssIVOs | OTheR LIABILITIes - - 425,142,998 425,142,998
PROVIsões | PROVIsIOns - - 145,181,442 145,181,442
TOTAL DO PAssIVO | TOTAL LIABILITIes 4,555,763,426 9,030,885,224 838,422,480 32,190,062,338.50
CAPITAL sOCIAL | shARe CAPITAL - - 321,428,570 321,428,570
ReseRVA LegAL | LegAL ReseRVe - - 352,586,971 352,586,971
OUTRAs ReseRVAs | OTheR ReseRVes - - 1,029,479,006 1,029,479,006
ReseRVAs De ReAVALIAÇÃO | ReVALUATIOn ReseRVes - - 114,295,397 114,295,397
ACÇões PRÓPRIAs | TReAsURy shARes - - (1,635,300) (1,635,300)
ResULTADO DO exeRCÍCIO | neT InCOMe fOR PeRIOD - - 716,464,152 716,464,152
TOTAL DOs fUnDOs PRÓPRIOs | TOTAL Own fUnDs - - 2,532,618,797 2,532,618,797
TOTAL DO PAssIVO e DOs fUnDOs PRÓPRIOsTOTAL LIABILITIes AnD Own fUnDs 4,555,763,426 9,030,885,224 3,371,041,276 34,722,681,135
gAP De LIQUIDeZ eM MZn | LIQUIDITy gAP In MZn (4,272,142,551) (2,840,557,634) 5,261,852,604 -
gAP De LIQUIDeZ ACUMULADO | ACCUMULATeD LIQUIDITy gAP 111,323,825 (2,729,233,809) 2,532,618,797 -
BCI | RELATÓRIO E CONTAS 2010 | ANNUAL REPORT 2010
156
Risco cambial
O risco cambial decorre da existência de gaps entre o valor dos activos e passivos detidos em determinada moeda.
A política e a estratégia de gestão, relacionada com o risco cambial, são definidas pela Comissão Executiva, a curto prazo, quinzenalmente no Comité de Activos e Passivos, são implementadas pela Direcção da Sala de Mercados e controladas pela Direcção de Gestão de Risco.
As posições cambiais são controladas, diariamente, com base nos limites definidos pelo Comité de Activos e Passivos e de acordo com os rácios e Limites Prudenciais fixados pelo Banco de Moçambique.
A Sala de Mercados procede diariamente ao fecho das posições cambiais denominadas em EUR e ZAR, man-tendo posições abertas apenas em USD, de acordo com o limite autorizado. Estas posições são diariamente controladas, tanto pela direcção do risco do BCI como pela direcção do risco da CGD. Esta última calcula dia-riamente o VaR e VM, de acordo com a seguinte meto-dologia:
VaR (Value-at-Risk): estimativa de máxima perda, para um determinado período de detenção e dado um nível de confiança, assumindo comportamentos normais do mercado. A metodologia utilizada é a da Simulação Histórica (os eventos futuros são totalmente explicados pelos eventos passados). Os parâmetros do modelo são: - período de detenção: n dias (n=10); - nível deconfiança:99%(n=10);
Foreign exchange risk
Foreign exchange risk derives from the existence of gaps between the value of assets and liabilities held in a specific currency.
Management policy and strategy, related with exchange risk, are defined, over the short term, by the executive board and fortnightly by the ALCO committee. They are implemented by Trading Room Management and controlled by the Risk Management Division.
Foreign exchange positions are controlled daily, on the basis of the limits defined by the ALCO Committee and the ratios and prudential limits fixed by the Bank of Mozambique.
The Trading Room closes EUR and ZAR foreign exchange positions on a daily basis, keeping open positions only in USD, in accordance with the author-ised limit. These positions are controlled daily, both by BCI’s and CGD’s risk divisions. The latter calculates VaR and VM, daily in accordance with the following methodology:
VaR (Value-at-Risk): estimate of the maximum loss, for a specific period of holding an asset and a given confidence level under normal market conditions. The method used is the historic simulation method (future events are fully explained by past events). The model’s parameters: - period for holding the asset: n days (n=10);-confidencelevel:99%(n=10);
157
10. NOTAS àS dEMONSTRAÇÕES fINANCEIRAS NOTES TO ThE fINANCIAL STATEMENTS
Risco de taxa de juro e câmbio:
O BCI, no respeitante aos riscos de taxa de juro e de câmbio, utiliza modelos internos para o acompanha-mento e monitorização destes riscos, nomeadamente:
(i) Análise de gaps (diferencial de taxa de juro), sendo os gaps constituídos por prazos residuais de repricing doscontratosvivos;
(ii) Análise de sensibilidade ao Risco de taxa de Juro na carteira bancária. A avaliação do risco de taxa de juro por operações de carteira é efectuada através da análise de sensibilidade, por prazos residuais de repri-cing, à alteração das curvas de taxa de juro.
(iii) Risco Cambial:a. Posição Cambial Líquida por divisa – recolhida dia-
riamente ao nível do sistema informático pela Direcção de Contabilidade e validada pela DirecçãodeRiscoeSaladeMercados;
b. Indicador de Sensibilidade – calculado através da simulação do potencial impacto nos Resultados do Banco, de hipotéticas variações nas taxas de câmbio de valorimetria (calcula-se para variações de1%,3%e5%);
c. Conforme referido acima, a Direcção de risco da CGD calcula diariamente o VaR ( Value at Risk).
Interest rate risk:
BCI uses internal models to accompany and monitor interest rate and foreign exchange risks:
(i) Gap analysis (interest rate spread), in which the gaps comprise periods to maturity for the repricing of live contracts;
(ii) Sensitivity analysis to interest rate risk in the banking portfolio. The assessment of interest rate risk by portfolio operation is performed on the basis of a sensitivity analysis, by residual repricing periods, to changes in interest rate curves.
(iii) Foreign exchange risks:a. Net foreign exchange position by currency – cal-
culated on a daily basis by the Accounting Division’s IT system and validated by the Risk and TradingRoomDivision;
b. Sensitivity indicator – calculated by the simulation of the potential impact of hypothetical changes in the exchange rates measurement criteria (with the calculation of changes of 1%, 3% and 5%) in the bank’s results,
c. As referred to above CGD’s Risk Division calcu-lates VaR ( Value at Risk) daily.
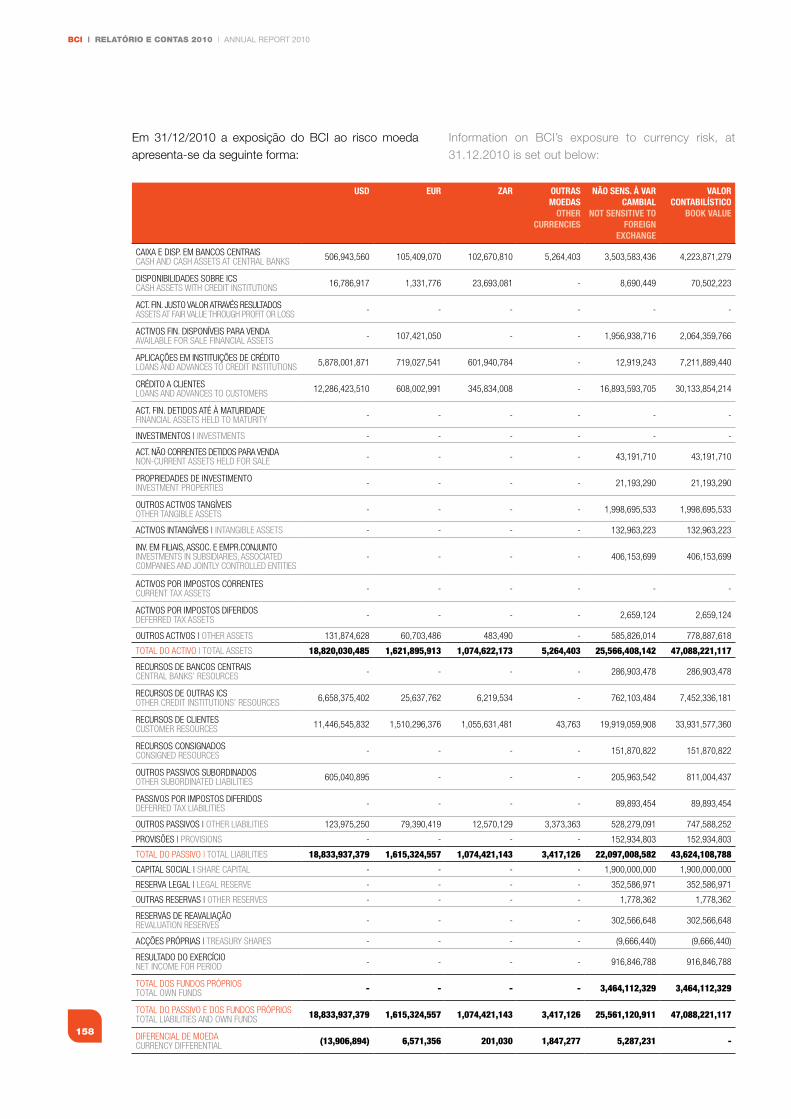
BCI | RELATÓRIO E CONTAS 2010 | ANNUAL REPORT 2010
158
Em 31/12/2010 a exposição do BCI ao risco moeda apresenta-se da seguinte forma:
uSD EuR ZAR OuTRASMOEDAS
OThERCuRRENCIES
NÃO SENS. à vAR CAMbIAl
NOT SENSITIvE TOfOREIGN
ExChANGE
vAlOR CONTAbIlíSTICO
bOOk vAluE
CAIxA e DIsP. eM BAnCOs CenTRAIsCAsh AnD CAsh AsseTs AT CenTRAL BAnks 506,943,560 105,409,070 102,670,810 5,264,403 3,503,583,436 4,223,871,279
DIsPOnIBILIDADes sOBRe ICsCAsh AsseTs wITh CReDIT InsTITUTIOns 16,786,917 1,331,776 23,693,081 - 8,690,449 70,502,223
ACT. fIn. JUsTO VALOR ATRAVÉs ResULTADOsAsseTs AT fAIR VALUe ThROUgh PROfIT OR LOss - - - - - -
ACTIVOs fIn. DIsPOnÍVeIs PARA VenDAAVAILABLe fOR sALe fInAnCIAL AsseTs - 107,421,050 - - 1,956,938,716 2,064,359,766
APLICAÇões eM InsTITUIÇões De CRÉDITOLOAns AnD ADVAnCes TO CReDIT InsTITUTIOns 5,878,001,871 719,027,541 601,940,784 - 12,919,243 7,211,889,440
CRÉDITO A CLIenTesLOAns AnD ADVAnCes TO CUsTOMeRs 12,286,423,510 608,002,991 345,834,008 - 16,893,593,705 30,133,854,214
ACT. fIn. DeTIDOs ATÉ à MATURIDADefInAnCIAL AsseTs heLD TO MATURITy - - - - - -
InVesTIMenTOs | InVesTMenTs - - - - - -
ACT. nÃO CORRenTes DeTIDOs PARA VenDAnOn-CURRenT AsseTs heLD fOR sALe - - - - 43,191,710 43,191,710
PROPRIeDADes De InVesTIMenTOInVesTMenT PROPeRTIes - - - - 21,193,290 21,193,290
OUTROs ACTIVOs TAngÍVeIsOTheR TAngIBLe AsseTs - - - - 1,998,695,533 1,998,695,533
ACTIVOs InTAngÍVeIs | InTAngIBLe AsseTs - - - - 132,963,223 132,963,223
InV. eM fILIAIs, AssOC. e eMPR.COnJUnTOInVesTMenTs In sUBsIDIARIes, AssOCIATeD COMPAnIes AnD JOInTLy COnTROLLeD enTITIes
- - - - 406,153,699 406,153,699
ACTIVOs POR IMPOsTOs CORRenTesCURRenT TAx AsseTs - - - - - -
ACTIVOs POR IMPOsTOs DIfeRIDOsDefeRReD TAx AsseTs - - - - 2,659,124 2,659,124
OUTROs ACTIVOs | OTheR AsseTs 131,874,628 60,703,486 483,490 - 585,826,014 778,887,618
TOTAL DO ACTIVO | TOTAL AsseTs 18,820,030,485 1,621,895,913 1,074,622,173 5,264,403 25,566,408,142 47,088,221,117
ReCURsOs De BAnCOs CenTRAIsCenTRAL BAnks’ ResOURCes - - - - 286,903,478 286,903,478
ReCURsOs De OUTRAs ICsOTheR CReDIT InsTITUTIOns’ ResOURCes 6,658,375,402 25,637,762 6,219,534 - 762,103,484 7,452,336,181
ReCURsOs De CLIenTesCUsTOMeR ResOURCes 11,446,545,832 1,510,296,376 1,055,631,481 43,763 19,919,059,908 33,931,577,360
ReCURsOs COnsIgnADOsCOnsIgneD ResOURCes - - - - 151,870,822 151,870,822
OUTROs PAssIVOs sUBORDInADOsOTheR sUBORDInATeD LIABILITIes 605,040,895 - - - 205,963,542 811,004,437
PAssIVOs POR IMPOsTOs DIfeRIDOsDefeRReD TAx LIABILITIes - - - - 89,893,454 89,893,454
OUTROs PAssIVOs | OTheR LIABILITIes 123,975,250 79,390,419 12,570,129 3,373,363 528,279,091 747,588,252
PROVIsões | PROVIsIOns - - - - 152,934,803 152,934,803
TOTAL DO PAssIVO | TOTAL LIABILITIes 18,833,937,379 1,615,324,557 1,074,421,143 3,417,126 22,097,008,582 43,624,108,788
CAPITAL sOCIAL | shARe CAPITAL - - - - 1,900,000,000 1,900,000,000
ReseRVA LegAL | LegAL ReseRVe - - - - 352,586,971 352,586,971
OUTRAs ReseRVAs | OTheR ReseRVes - - - - 1,778,362 1,778,362
ReseRVAs De ReAVALIAÇÃOReVALUATIOn ReseRVes - - - - 302,566,648 302,566,648
ACÇões PRÓPRIAs | TReAsURy shARes - - - - (9,666,440) (9,666,440)
ResULTADO DO exeRCÍCIOneT InCOMe fOR PeRIOD - - - - 916,846,788 916,846,788
TOTAL DOs fUnDOs PRÓPRIOs TOTAL Own fUnDs - - - - 3,464,112,329 3,464,112,329
TOTAL DO PAssIVO e DOs fUnDOs PRÓPRIOsTOTAL LIABILITIes AnD Own fUnDs 18,833,937,379 1,615,324,557 1,074,421,143 3,417,126 25,561,120,911 47,088,221,117
DIfeRenCIAL De MOeDACURRenCy DIffeRenTIAL (13,906,894) 6,571,356 201,030 1,847,277 5,287,231 -
Information on BCI’s exposure to currency risk, at 31.12.2010 is set out below:
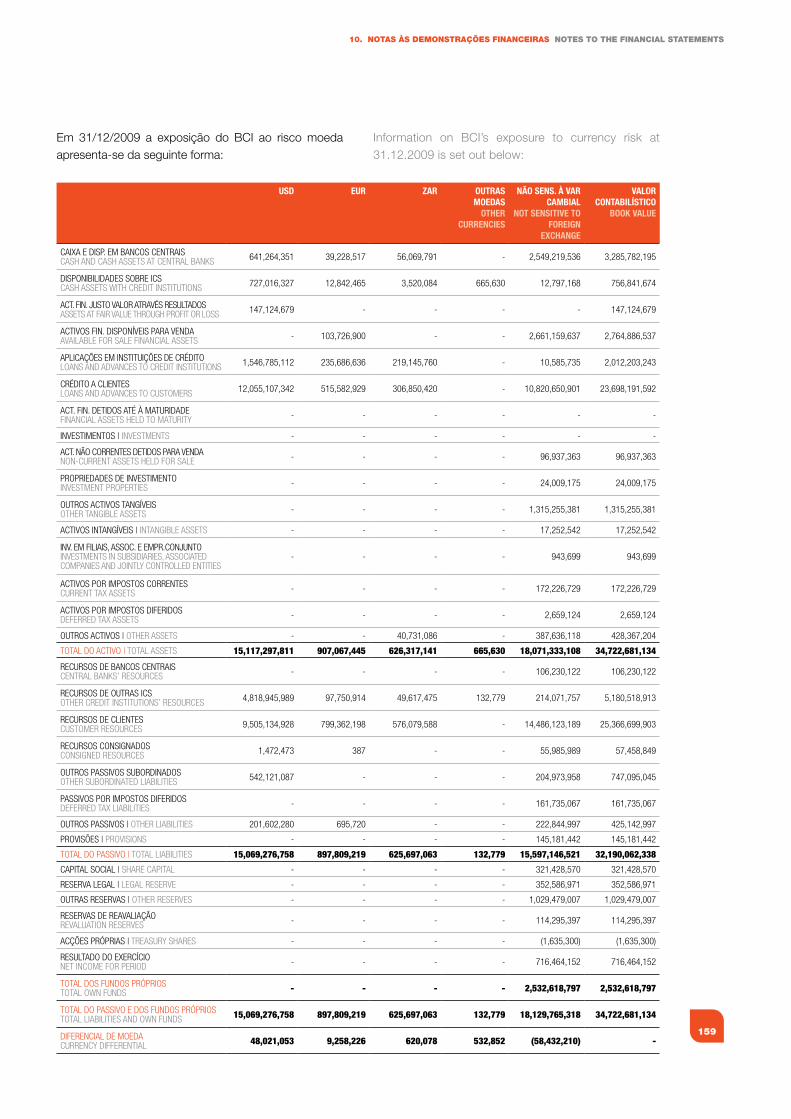
159
10. NOTAS àS dEMONSTRAÇÕES fINANCEIRAS NOTES TO ThE fINANCIAL STATEMENTS
Em 31/12/2009 a exposição do BCI ao risco moeda apresenta-se da seguinte forma:
uSD EuR ZAR OuTRASMOEDAS
OThERCuRRENCIES
NÃO SENS. à vAR CAMbIAl
NOT SENSITIvE TOfOREIGN
ExChANGE
vAlOR CONTAbIlíSTICO
bOOk vAluE
CAIxA e DIsP. eM BAnCOs CenTRAIsCAsh AnD CAsh AsseTs AT CenTRAL BAnks 641,264,351 39,228,517 56,069,791 - 2,549,219,536 3,285,782,195
DIsPOnIBILIDADes sOBRe ICsCAsh AsseTs wITh CReDIT InsTITUTIOns 727,016,327 12,842,465 3,520,084 665,630 12,797,168 756,841,674
ACT. fIn. JUsTO VALOR ATRAVÉs ResULTADOsAsseTs AT fAIR VALUe ThROUgh PROfIT OR LOss 147,124,679 - - - - 147,124,679
ACTIVOs fIn. DIsPOnÍVeIs PARA VenDAAVAILABLe fOR sALe fInAnCIAL AsseTs - 103,726,900 - - 2,661,159,637 2,764,886,537
APLICAÇões eM InsTITUIÇões De CRÉDITOLOAns AnD ADVAnCes TO CReDIT InsTITUTIOns 1,546,785,112 235,686,636 219,145,760 - 10,585,735 2,012,203,243
CRÉDITO A CLIenTesLOAns AnD ADVAnCes TO CUsTOMeRs 12,055,107,342 515,582,929 306,850,420 - 10,820,650,901 23,698,191,592
ACT. fIn. DeTIDOs ATÉ à MATURIDADefInAnCIAL AsseTs heLD TO MATURITy - - - - - -
InVesTIMenTOs | InVesTMenTs - - - - - -
ACT. nÃO CORRenTes DeTIDOs PARA VenDAnOn-CURRenT AsseTs heLD fOR sALe - - - - 96,937,363 96,937,363
PROPRIeDADes De InVesTIMenTOInVesTMenT PROPeRTIes - - - - 24,009,175 24,009,175
OUTROs ACTIVOs TAngÍVeIsOTheR TAngIBLe AsseTs - - - - 1,315,255,381 1,315,255,381
ACTIVOs InTAngÍVeIs | InTAngIBLe AsseTs - - - - 17,252,542 17,252,542
InV. eM fILIAIs, AssOC. e eMPR.COnJUnTOInVesTMenTs In sUBsIDIARIes, AssOCIATeD COMPAnIes AnD JOInTLy COnTROLLeD enTITIes
- - - - 943,699 943,699
ACTIVOs POR IMPOsTOs CORRenTesCURRenT TAx AsseTs - - - - 172,226,729 172,226,729
ACTIVOs POR IMPOsTOs DIfeRIDOsDefeRReD TAx AsseTs - - - - 2,659,124 2,659,124
OUTROs ACTIVOs | OTheR AsseTs - - 40,731,086 - 387,636,118 428,367,204
TOTAL DO ACTIVO | TOTAL AsseTs 15,117,297,811 907,067,445 626,317,141 665,630 18,071,333,108 34,722,681,134
ReCURsOs De BAnCOs CenTRAIsCenTRAL BAnks’ ResOURCes - - - - 106,230,122 106,230,122
ReCURsOs De OUTRAs ICsOTheR CReDIT InsTITUTIOns’ ResOURCes 4,818,945,989 97,750,914 49,617,475 132,779 214,071,757 5,180,518,913
ReCURsOs De CLIenTesCUsTOMeR ResOURCes 9,505,134,928 799,362,198 576,079,588 - 14,486,123,189 25,366,699,903
ReCURsOs COnsIgnADOsCOnsIgneD ResOURCes 1,472,473 387 - - 55,985,989 57,458,849
OUTROs PAssIVOs sUBORDInADOsOTheR sUBORDInATeD LIABILITIes 542,121,087 - - - 204,973,958 747,095,045
PAssIVOs POR IMPOsTOs DIfeRIDOsDefeRReD TAx LIABILITIes - - - - 161,735,067 161,735,067
OUTROs PAssIVOs | OTheR LIABILITIes 201,602,280 695,720 - - 222,844,997 425,142,997
PROVIsões | PROVIsIOns - - - - 145,181,442 145,181,442
TOTAL DO PAssIVO | TOTAL LIABILITIes 15,069,276,758 897,809,219 625,697,063 132,779 15,597,146,521 32,190,062,338
CAPITAL sOCIAL | shARe CAPITAL - - - - 321,428,570 321,428,570
ReseRVA LegAL | LegAL ReseRVe - - - - 352,586,971 352,586,971
OUTRAs ReseRVAs | OTheR ReseRVes - - - - 1,029,479,007 1,029,479,007
ReseRVAs De ReAVALIAÇÃOReVALUATIOn ReseRVes - - - - 114,295,397 114,295,397
ACÇões PRÓPRIAs | TReAsURy shARes - - - - (1,635,300) (1,635,300)
ResULTADO DO exeRCÍCIOneT InCOMe fOR PeRIOD - - - - 716,464,152 716,464,152
TOTAL DOs fUnDOs PRÓPRIOs TOTAL Own fUnDs - - - - 2,532,618,797 2,532,618,797
TOTAL DO PAssIVO e DOs fUnDOs PRÓPRIOsTOTAL LIABILITIes AnD Own fUnDs 15,069,276,758 897,809,219 625,697,063 132,779 18,129,765,318 34,722,681,134
DIfeRenCIAL De MOeDACURRenCy DIffeRenTIAL 48,021,053 9,258,226 620,078 532,852 (58,432,210) -
Information on BCI’s exposure to currency risk at 31.12.2009 is set out below:
BCI | RELATÓRIO E CONTAS 2010 | ANNUAL REPORT 2010
160
(e) Risco operacional
O risco operacional é o risco de perdas decorrentes de falhas de sistemas, erro humano, fraude ou aconteci-mentos externos. Quando ocorre uma falha nos contro-los, os riscos operacionais podem causar danos na reputação do Banco, ter implicações legais ou regula-mentares ou dar origem a perdas financeiras. O Banco considera que um adequado ambiente de controlo, monitorizando e respondendo a riscos potenciais, é possível mitigar alguns dos riscos operacionais com que se depara frequentemente. Os controlos incluem uma segregação de funções adequada, procedimentos de autorização e reconciliação, processos de formação e avaliação dos colaboradores, incluindo a existência de um departamento de auditoria interna.
No BCI, para além do cumprimento das obrigações regulamentares, a necessidade de desenvolvimento de um processo de gestão de risco operacional resulta do entendimento sobre a sua relevância e das vantagens de seguir as boas práticas de gestão do mesmo.
Assim, durante o ano de 2010, com o apoio da CGD, o BCI iniciou a implementação do Projecto ROCI – Risco Operacional e Controlo Interno. A primeira fase do ROCI, ainda em curso, consiste no levantamento e documentação de todos os processos e a identificação dos riscos operacionais potenciais associados a cada tarefa para registo numa ferramenta informática que suporta a documentação de processos., Concluída a primeira fase, far-se-á a exportação da informação para uma outra ferramenta informática que suporta, de uma forma integrada, as principais funcionalidades de gestão de risco operacional, nomeadamente:• Registodeeventosderiscooperacional,respectivasperdasefectivaserecuperações;
• Lançamento, recolha e tratamento de questionáriosdeauto-avaliaçãodoriscooperacional;
• Recolhaegestãodeindicadoresderisco(KRI–KeyRiskIndicators);
• Gestãodeocorrênciaseplanosdeacçãoparamiti-gaçãoderiscooperacional;e
• Relatóriosdegestão.
Prevê-se que o início do processo de gestão integrada do risco operacional e recolha de eventos de risco ope-racional se materialize ainda no decurso do primeiro semestre de 2011.
(e) Operational risk
Operational risk is the risk of losses deriving from sys-tem faults, human error, fraud or external events. If there is a control failure, operational risks can damage the bank’s reputation, have legal or regulatory implica-tions or give rise to financial losses. The bank considers that an adequate control environment, monitoring and providing for potential risks, enables several of the operational risks which frequently occur, to be mitigated. Controls include adequate separation between func-tions, authorisation and reconciliation procedures and employee training and assessment processes, including the existence of an internal audit department.
In addition to BCI’s compliance with regulatory obliga-tions, the need to develop an operational risk manage-ment process derives from an understanding of its relevance and the advantages of complying with good management practice in respect thereof.
Accordingly, in 2010, with the support of CGD, BCI ini-tiated the development of the “ROCI” (operational risk and internal control) project. ROCI’s first stage, which is still in progress, consists of a survey and documenta-tion on all processes and the identification of potential operational risks associated with each task for registra-tion to be entered into a computer application supporting documentary processes, After the completion of the first stage, the information will be exported to another computer application providing integrated support to the main operational risk management functionalities, namely:• Registration of operational risk events, effectiverespectivelossesandrecoveries;
• Issue,collectionandprocessingofself-assessmentquestionnairesonoperationalrisk;
• Collection and management of KRI – Key RiskIndicators;
• Management of occurrences and action plans tomitigateoperationalrisk;and
• Managementreports.
The start of the operational risk integrated manage-ment process and collection of information on opera-tional risk events is scheduled for first half 2011.
161
10. NOTAS àS dEMONSTRAÇÕES fINANCEIRAS NOTES TO ThE fINANCIAL STATEMENTS
Com a implementação da gestão integrada do risco operacional o Banco espera:• Reduzirasperdasfuturasdecorrentesderiscoopera-
cional através do desenvolvimento de iniciativas para amitigaçãooutransferênciaderisco;
• Reduzir o consumode capitais próprios através dapossibilidade de adopção de abordagens mais sofis-ticadas no cálculo de requisitos de fundos próprios a afectarariscooperacional;e
• Responderaaspectosderegulaçãoecompliance.
3.37 Capital
O BCI mantém uma gestão activa de capital que lhe permite cobrir os riscos inerentes à sua actividade. A gestão do capital do Banco é feita em conformidade e através das regras e rácios prudenciais estabelecidos pelo Banco de Moçambique, cumprindo integralmente com os requisitos de capital impostos.
Gestão de capital
O principal objectivo da gestão de capital é assegurar o cumprimento dos requisitos e a manutenção dos rácios de capital saudáveis para garantir a continuidade do negócio e maximizar o valor dos accionistas.
Mediante alterações das condições económicas e características de risco da actividade do Banco, a estru-tura de capitais pode sofrer ajustamentos para melhor se adequar à nova situação. Nos últimos anos, e face a estabilidade das condições do mercado nacional, os objectivos, as políticas e os processos, referentes à ges-tão de capital do Banco, não sofreram alterações signi-ficativas dignas de realce.
Os capitais próprios ascenderam, no final de 2010, a 3,3 mil milhões de Meticais, tendo sido reforçados em 745,4 milhões de Meticais (+29,4%) durante o ano.
The bank, with the implementation of operational risk integrated management, expects to:• Reduce potential losses deriving from operational
risk through the development of initiatives designed tomitigateortransfertherisk;
• Reduce itsuseof shareholders’ equity through thepossibility of the adoption of more sophisticated approaches to the calculation of own funds require-mentsaffectingoperationalrisk;and
• Respond to regulation and compliance-relatedaspects.
3.37 Capital
Capital management in BCI maintains an active manage-ment approach enabling it to cover risks inherent to its activity. Capital management within the bank is per-formed in conformity with and on the basis of the rules and prudential ratios defined by the Bank of Mozambique and is complied with in full.
Capital management
The principal capital management objective is to ensure that the bank complies with requirements and main-tains healthy capital ratios to guarantee business conti-nuity to maximise shareholder value.
On the basis of changes to economic conditions and the risk characteristics of the bank’s operations, the capital structure may be changed to bring it more into line with the new situation. Over the last few years and in light of the stability of conditions in the domestic marketplace, there have been no changes of note to the objectives, policies and processes related with cap-ital management.
There was a 29.4% increase of 745.4 million meticais in shareholders’ equity during the year to 3.3 billion met-icais at the end of 2010.
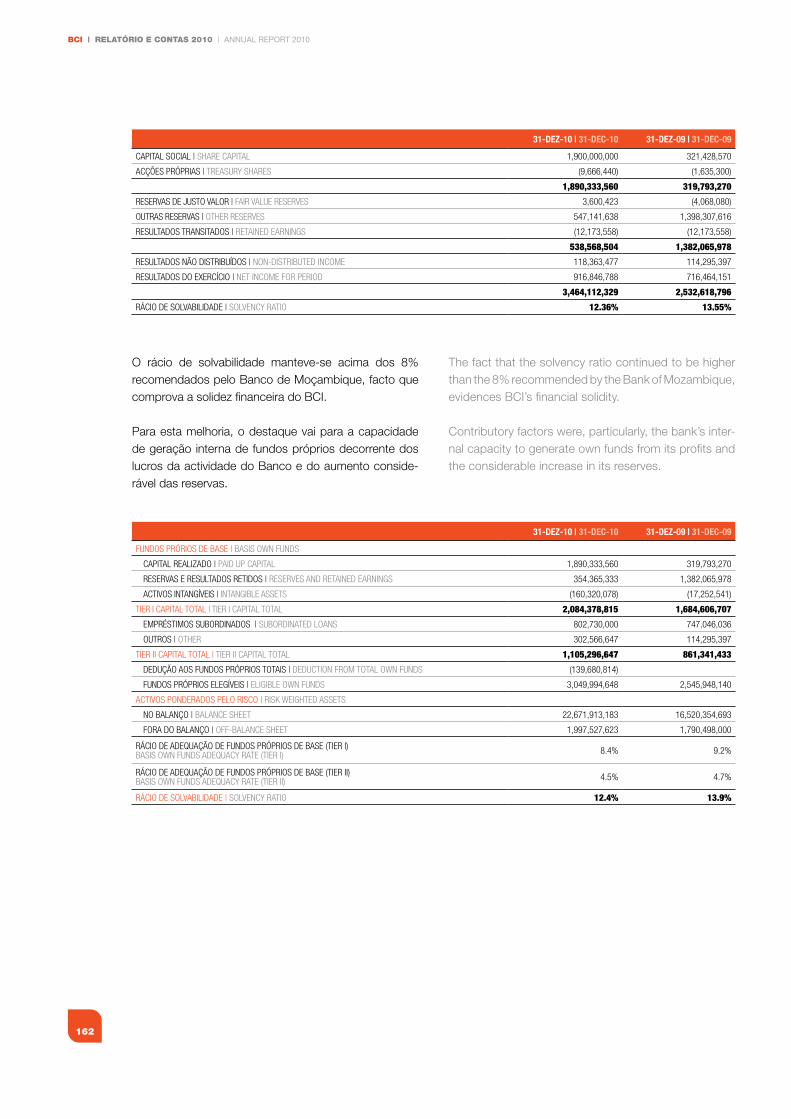
BCI | RELATÓRIO E CONTAS 2010 | ANNUAL REPORT 2010
162
O rácio de solvabilidade manteve-se acima dos 8% recomendados pelo Banco de Moçambique, facto que comprova a solidez financeira do BCI.
Para esta melhoria, o destaque vai para a capacidade de geração interna de fundos próprios decorrente dos lucros da actividade do Banco e do aumento conside-rável das reservas.
31-DEZ-10 | 31-DEC-10 31-DEZ-09 | 31-DEC-09
CAPITAL sOCIAL | shARe CAPITAL 1,900,000,000 321,428,570
ACÇões PRÓPRIAs | TReAsURy shARes (9,666,440) (1,635,300)
1,890,333,560 319,793,270
ReseRVAs De JUsTO VALOR | fAIR VALUe ReseRVes 3,600,423 (4,068,080)
OUTRAs ReseRVAs | OTheR ReseRVes 547,141,638 1,398,307,616
ResULTADOs TRAnsITADOs | ReTAIneD eARnIngs (12,173,558) (12,173,558)
538,568,504 1,382,065,978
ResULTADOs nÃO DIsTRIBUÍDOs | nOn-DIsTRIBUTeD InCOMe 118,363,477 114,295,397
ResULTADOs DO exeRCÍCIO | neT InCOMe fOR PeRIOD 916,846,788 716,464,151
3,464,112,329 2,532,618,796
RÁCIO De sOLVABILIDADe | sOLVenCy RATIO 12.36% 13.55%
31-DEZ-10 | 31-DEC-10 31-DEZ-09 | 31-DEC-09
fUnDOs PRÓRIOs De BAse | BAsIs Own fUnDs
CAPITAL ReALIZADO | PAID UP CAPITAL 1,890,333,560 319,793,270
ReseRVAs e ResULTADOs ReTIDOs | ReseRVes AnD ReTAIneD eARnIngs 354,365,333 1,382,065,978
ACTIVOs InTAngÍVeIs | InTAngIBLe AsseTs (160,320,078) (17,252,541)
TIeR I CAPITAL TOTAL | TIeR I CAPITAL TOTAL 2,084,378,815 1,684,606,707
eMPRÉsTIMOs sUBORDInADOs | sUBORDInATeD LOAns 802,730,000 747,046,036
OUTROs | OTheR 302,566,647 114,295,397
TIeR II CAPITAL TOTAL | TIeR II CAPITAL TOTAL 1,105,296,647 861,341,433
DeDUÇÃO AOs fUnDOs PRÓPRIOs TOTAIs | DeDUCTIOn fROM TOTAL Own fUnDs (139,680,814)
fUnDOs PRÓPRIOs eLegÍVeIs | eLIgIBLe Own fUnDs 3,049,994,648 2,545,948,140
ACTIVOs POnDeRADOs PeLO RIsCO | RIsk weIghTeD AsseTs
nO BALAnÇO | BALAnCe sheeT 22,671,913,183 16,520,354,693
fORA DO BALAnÇO | Off-BALAnCe sheeT 1,997,527,623 1,790,498,000
RÁCIO De ADeQUAÇÃO De fUnDOs PRÓPRIOs De BAse (TIeR I)BAsIs Own fUnDs ADeQUACy RATe (TIeR I) 8.4% 9.2%
RÁCIO De ADeQUAÇÃO De fUnDOs PRÓPRIOs De BAse (TIeR II)BAsIs Own fUnDs ADeQUACy RATe (TIeR II) 4.5% 4.7%
RÁCIO De sOLVABILIDADe | sOLVenCy RATIO 12.4% 13.9%
The fact that the solvency ratio continued to be higher than the 8% recommended by the Bank of Mozambique, evidences BCI’s financial solidity. Contributory factors were, particularly, the bank’s inter-nal capacity to generate own funds from its profits and the considerable increase in its reserves.
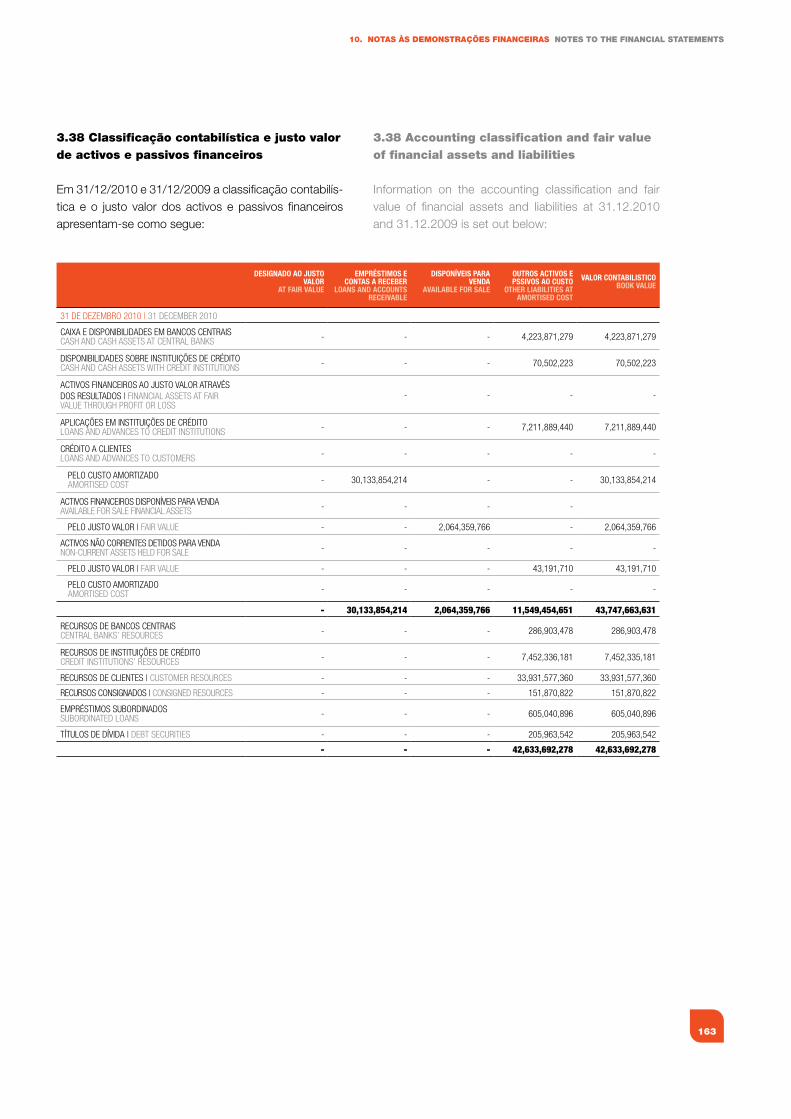
163
10. NOTAS àS dEMONSTRAÇÕES fINANCEIRAS NOTES TO ThE fINANCIAL STATEMENTS
3.38 Classificação contabilística e justo valor de activos e passivos financeiros
Em 31/12/2010 e 31/12/2009 a classificação contabilís-tica e o justo valor dos activos e passivos financeiros apresentam-se como segue:
DESIGNADO AO JuSTO vAlOR
AT fAIR vAluE
EMPRéSTIMOS E CONTAS A RECEbER
lOANS AND ACCOuNTS RECEIvAblE
DISPONívEIS PARA vENDA
AvAIlAblE fOR SAlE
OuTROS ACTIvOS E PSSIvOS AO CuSTO
OThER lIAbIlITIES AT AMORTISED COST
vAlOR CONTAbIlISTICObOOk vAluE
31 De DeZeMBRO 2010 | 31 DeCeMBeR 2010
CAIxA e DIsPOnIBILIDADes eM BAnCOs CenTRAIs CAsh AnD CAsh AsseTs AT CenTRAL BAnks - - - 4,223,871,279 4,223,871,279
DIsPOnIBILIDADes sOBRe InsTITUIÇões De CRÉDITO CAsh AnD CAsh AsseTs wITh CReDIT InsTITUTIOns - - - 70,502,223 70,502,223
ACTIVOs fInAnCeIROs AO JUsTO VALOR ATRAVÉs DOs ResULTADOs | fInAnCIAL AsseTs AT fAIR VALUe ThROUgh PROfIT OR LOss
- - - -
APLICAÇões eM InsTITUIÇões De CRÉDITOLOAns AnD ADVAnCes TO CReDIT InsTITUTIOns - - - 7,211,889,440 7,211,889,440
CRÉDITO A CLIenTesLOAns AnD ADVAnCes TO CUsTOMeRs - - - - -
PeLO CUsTO AMORTIZADOAMORTIseD COsT - 30,133,854,214 - - 30,133,854,214
ACTIVOs fInAnCeIROs DIsPOnÍVeIs PARA VenDAAVAILABLe fOR sALe fInAnCIAL AsseTs - - - -
PeLO JUsTO VALOR | fAIR VALUe - - 2,064,359,766 - 2,064,359,766
ACTIVOs nÃO CORRenTes DeTIDOs PARA VenDAnOn-CURRenT AsseTs heLD fOR sALe - - - - -
PeLO JUsTO VALOR | fAIR VALUe - - - 43,191,710 43,191,710
PeLO CUsTO AMORTIZADOAMORTIseD COsT - - - - -
- 30,133,854,214 2,064,359,766 11,549,454,651 43,747,663,631
ReCURsOs De BAnCOs CenTRAIsCenTRAL BAnks’ ResOURCes - - - 286,903,478 286,903,478
ReCURsOs De InsTITUIÇões De CRÉDITOCReDIT InsTITUTIOns’ ResOURCes - - - 7,452,336,181 7,452,335,181
ReCURsOs De CLIenTes | CUsTOMeR ResOURCes - - - 33,931,577,360 33,931,577,360
ReCURsOs COnsIgnADOs | COnsIgneD ResOURCes - - - 151,870,822 151,870,822
eMPRÉsTIMOs sUBORDInADOssUBORDInATeD LOAns - - - 605,040,896 605,040,896
TÍTULOs De DÍVIDA | DeBT seCURITIes - - - 205,963,542 205,963,542
- - - 42,633,692,278 42,633,692,278
3.38 Accounting classification and fair value of financial assets and liabilities
Information on the accounting classification and fair value of financial assets and liabilities at 31.12.2010 and 31.12.2009 is set out below:
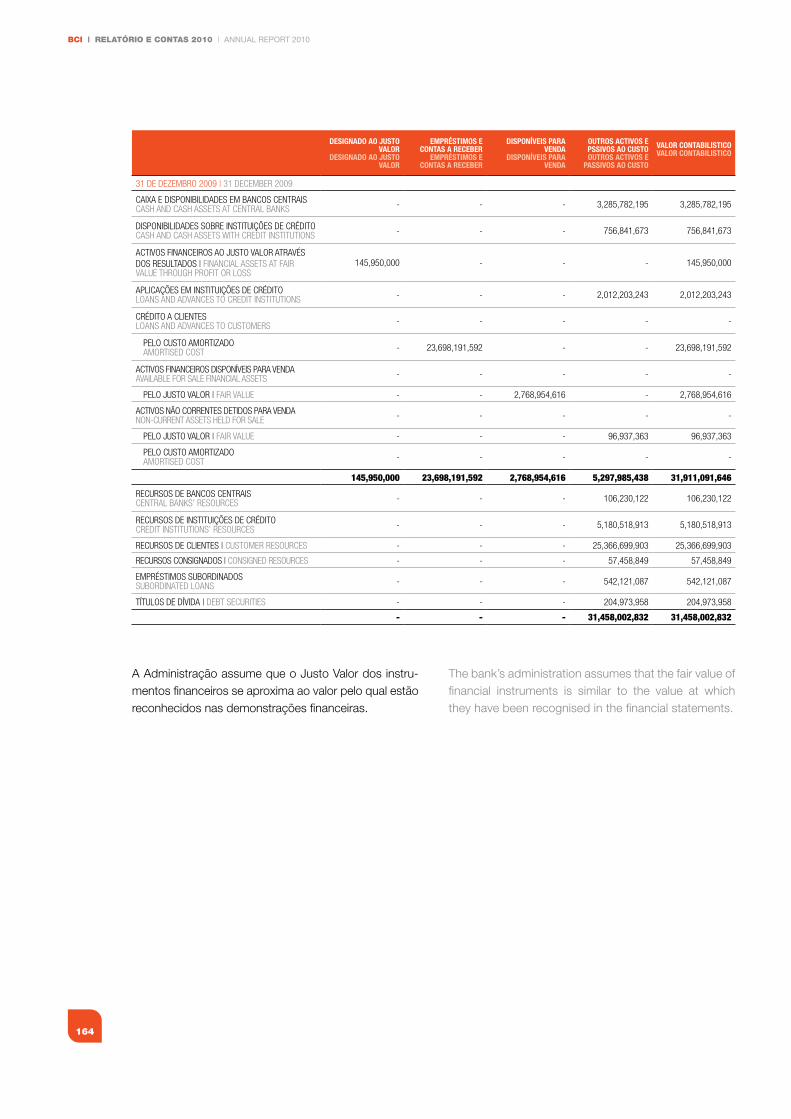
BCI | RELATÓRIO E CONTAS 2010 | ANNUAL REPORT 2010
164
DESIGNADO AO JuSTO vAlOR
DESIGNADO AO JuSTO vAlOR
EMPRéSTIMOS E CONTAS A RECEbER
EMPRéSTIMOS E CONTAS A RECEbER
DISPONívEIS PARA vENDA
DISPONívEIS PARA vENDA
OuTROS ACTIvOS E PSSIvOS AO CuSTOOuTROS ACTIvOS E
PASSIvOS AO CuSTO
vAlOR CONTAbIlISTICOvAlOR CONTAbIlISTICO
31 De DeZeMBRO 2009 | 31 DeCeMBeR 2009
CAIxA e DIsPOnIBILIDADes eM BAnCOs CenTRAIs CAsh AnD CAsh AsseTs AT CenTRAL BAnks - - - 3,285,782,195 3,285,782,195
DIsPOnIBILIDADes sOBRe InsTITUIÇões De CRÉDITO CAsh AnD CAsh AsseTs wITh CReDIT InsTITUTIOns - - - 756,841,673 756,841,673
ACTIVOs fInAnCeIROs AO JUsTO VALOR ATRAVÉs DOs ResULTADOs | fInAnCIAL AsseTs AT fAIR VALUe ThROUgh PROfIT OR LOss
145,950,000 - - - 145,950,000
APLICAÇões eM InsTITUIÇões De CRÉDITOLOAns AnD ADVAnCes TO CReDIT InsTITUTIOns - - - 2,012,203,243 2,012,203,243
CRÉDITO A CLIenTesLOAns AnD ADVAnCes TO CUsTOMeRs - - - - -
PeLO CUsTO AMORTIZADOAMORTIseD COsT - 23,698,191,592 - - 23,698,191,592
ACTIVOs fInAnCeIROs DIsPOnÍVeIs PARA VenDAAVAILABLe fOR sALe fInAnCIAL AsseTs - - - - -
PeLO JUsTO VALOR | fAIR VALUe - - 2,768,954,616 - 2,768,954,616
ACTIVOs nÃO CORRenTes DeTIDOs PARA VenDAnOn-CURRenT AsseTs heLD fOR sALe - - - - -
PeLO JUsTO VALOR | fAIR VALUe - - - 96,937,363 96,937,363
PeLO CUsTO AMORTIZADOAMORTIseD COsT - - - - -
145,950,000 23,698,191,592 2,768,954,616 5,297,985,438 31,911,091,646
ReCURsOs De BAnCOs CenTRAIsCenTRAL BAnks’ ResOURCes - - - 106,230,122 106,230,122
ReCURsOs De InsTITUIÇões De CRÉDITOCReDIT InsTITUTIOns’ ResOURCes - - - 5,180,518,913 5,180,518,913
ReCURsOs De CLIenTes | CUsTOMeR ResOURCes - - - 25,366,699,903 25,366,699,903
ReCURsOs COnsIgnADOs | COnsIgneD ResOURCes - - - 57,458,849 57,458,849
eMPRÉsTIMOs sUBORDInADOssUBORDInATeD LOAns - - - 542,121,087 542,121,087
TÍTULOs De DÍVIDA | DeBT seCURITIes - - - 204,973,958 204,973,958
- - - 31,458,002,832 31,458,002,832
A Administração assume que o Justo Valor dos instru-mentos financeiros se aproxima ao valor pelo qual estão reconhecidos nas demonstrações financeiras.
The bank’s administration assumes that the fair value of financial instruments is similar to the value at which they have been recognised in the financial statements.

165
10. NOTAS àS dEMONSTRAÇÕES fINANCEIRAS NOTES TO ThE fINANCIAL STATEMENTS
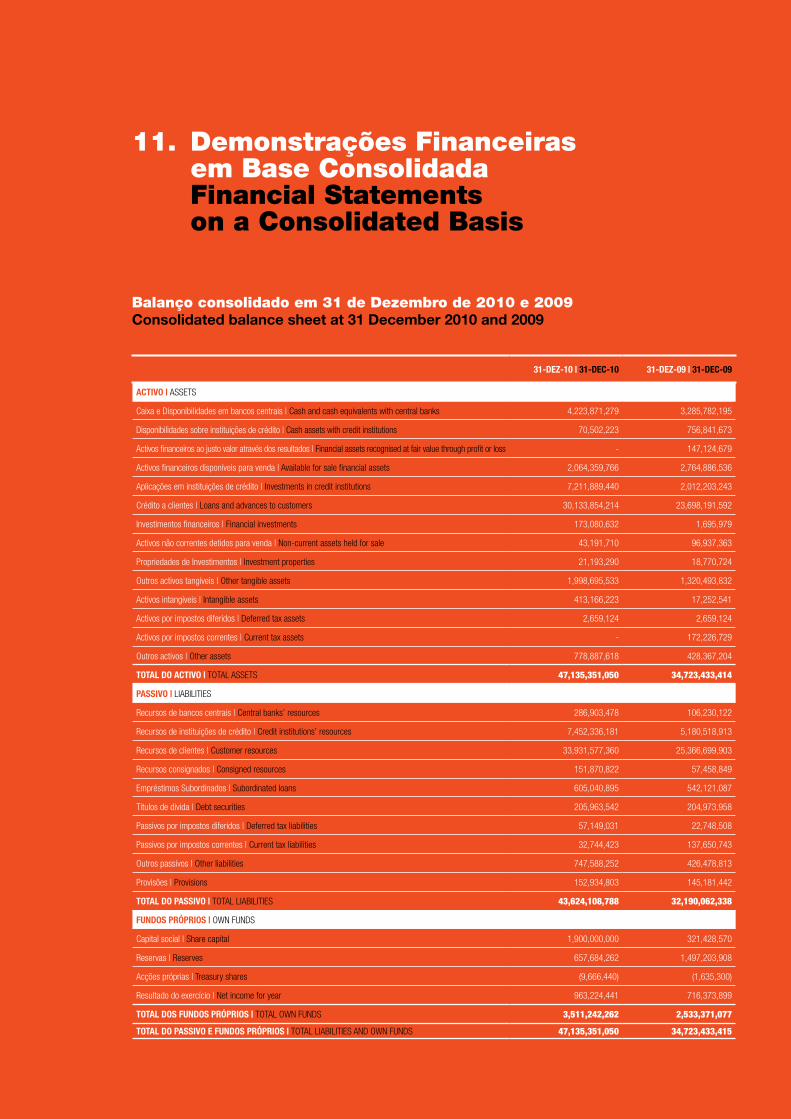
166
BCI | RELATÓRIO E CONTAS 2010 | ANNUAL REPORT 2010BCI
11. demonstrações financeiras em Base Consolidada
financial Statementson a Consolidated Basis
Balanço consolidado em 31 de dezembro de 2010 e 2009Consolidated balance sheet at 31 December 2010 and 2009
31-DEZ-10 | 31-DEC-10 31-DEZ-09 | 31-DEC-09
ACTIvO | AsseTs
Caixa e Disponibilidades em bancos centrais | Cash and cash equivalents with central banks 4,223,871,279 3,285,782,195
Disponibilidades sobre instituições de crédito | Cash assets with credit institutions 70,502,223 756,841,673
Activos financeiros ao justo valor através dos resultados | financial assets recognised at fair value through profit or loss - 147,124,679
Activos financeiros disponíveis para venda | Available for sale financial assets 2,064,359,766 2,764,886,536
Aplicações em instituições de crédito | Investments in credit institutions 7,211,889,440 2,012,203,243
Crédito a clientes | Loans and advances to customers 30,133,854,214 23,698,191,592
Investimentos financeiros | financial investments 173,080,632 1,695,979
Activos não correntes detidos para venda | non-current assets held for sale 43,191,710 96,937,363
Propriedades de Investimentos | Investment properties 21,193,290 18,770,724
Outros activos tangíveis | Other tangible assets 1,998,695,533 1,320,493,832
Activos intangíveis | Intangible assets 413,166,223 17,252,541
Activos por impostos diferidos | Deferred tax assets 2,659,124 2,659,124
Activos por impostos correntes | Current tax assets - 172,226,729
Outros activos | Other assets 778,887,618 428,367,204
TOTAl DO ACTIvO | TOTAL AsseTs 47,135,351,050 34,723,433,414
PASSIvO | LIABILITIes
Recursos de bancos centrais | Central banks’ resources 286,903,478 106,230,122
Recursos de instituições de crédito | Credit institutions’ resources 7,452,336,181 5,180,518,913
Recursos de clientes | Customer resources 33,931,577,360 25,366,699,903
Recursos consignados | Consigned resources 151,870,822 57,458,849
empréstimos subordinados | subordinated loans 605,040,895 542,121,087
Títulos de dívida | Debt securities 205,963,542 204,973,958
Passivos por impostos diferidos | Deferred tax liabilities 57,149,031 22,748,508
Passivos por impostos correntes | Current tax liabilities 32,744,423 137,650,743
Outros passivos | Other liabilities 747,588,252 426,478,813
Provisões | Provisions 152,934,803 145,181,442
TOTAl DO PASSIvO | TOTAL LIABILITIes 43,624,108,788 32,190,062,338
fuNDOS PRÓPRIOS | Own fUnDs
Capital social | share capital 1,900,000,000 321,428,570
Reservas | Reserves 657,684,262 1,497,203,908
Acções próprias | Treasury shares (9,666,440) (1,635,300)
Resultado do exercício | net income for year 963,224,441 716,373,899
TOTAl DOS fuNDOS PRÓPRIOS | TOTAL Own fUnDs 3,511,242,262 2,533,371,077
TOTAl DO PASSIvO E fuNDOS PRÓPRIOS | TOTAL LIABILITIes AnD Own fUnDs 47,135,351,050 34,723,433,415
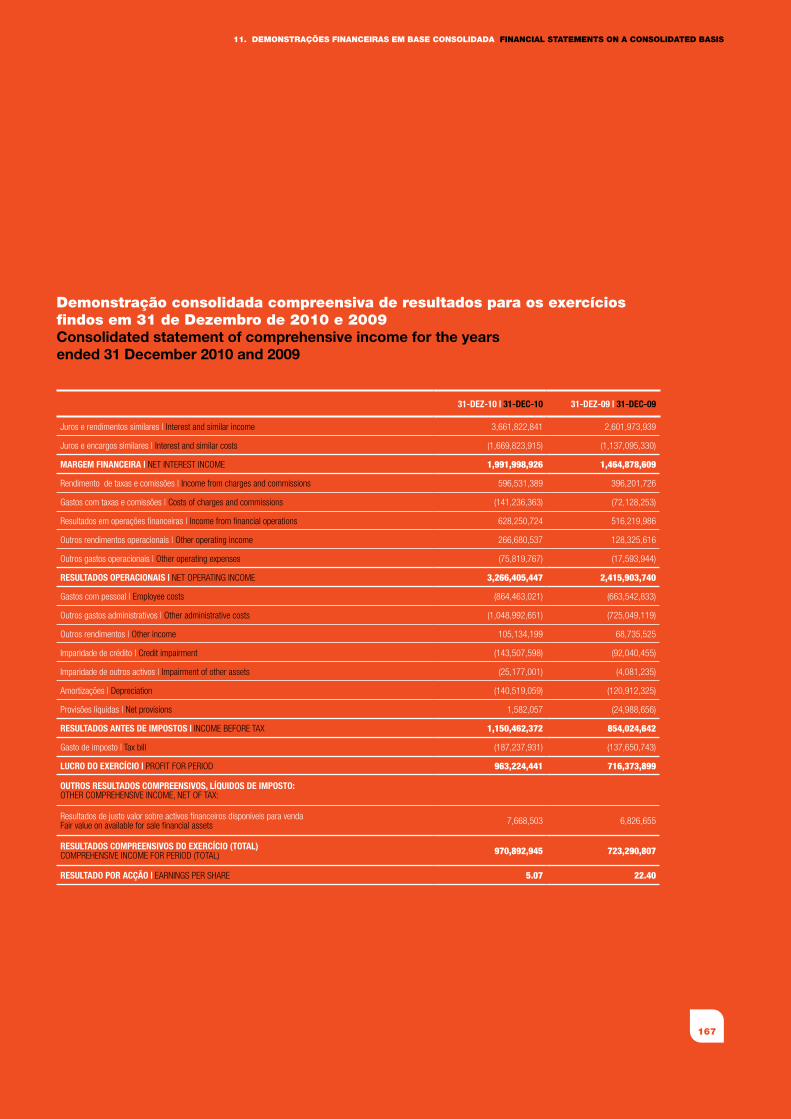
167
11. dEMONSTRAÇÕES fINANCEIRAS EM BASE CONSOLIdAdA fINANCIAL STATEMENTS ON A CONSOLIdATEd BASIS
demonstração consolidada compreensiva de resultados para os exercícios findos em 31 de dezembro de 2010 e 2009Consolidated statement of comprehensive income for the years ended 31 December 2010 and 2009
31-DEZ-10 | 31-DEC-10 31-DEZ-09 | 31-DEC-09
Juros e rendimentos similares | Interest and similar income 3,661,822,841 2,601,973,939
Juros e encargos similares | Interest and similar costs (1,669,823,915) (1,137,095,330)
MARGEM fINANCEIRA | neT InTeResT InCOMe 1,991,998,926 1,464,878,609
Rendimento de taxas e comissões | Income from charges and commissions 596,531,389 396,201,726
gastos com taxas e comissões | Costs of charges and commissions (141,236,363) (72,128,253)
Resultados em operações financeiras | Income from financial operations 628,250,724 516,219,986
Outros rendimentos operacionais | Other operating income 266,680,537 128,325,616
Outros gastos operacionais | Other operating expenses (75,819,767) (17,593,944)
RESulTADOS OPERACIONAIS | neT OPeRATIng InCOMe 3,266,405,447 2,415,903,740
gastos com pessoal | employee costs (864,463,021) (663,542,833)
Outros gastos administrativos | Other administrative costs (1,048,992,651) (725,049,119)
Outros rendimentos | Other income 105,134,199 68,735,525
Imparidade de crédito | Credit impairment (143,507,598) (92,040,455)
Imparidade de outros activos | Impairment of other assets (25,177,001) (4,081,235)
Amortizações | Depreciation (140,519,059) (120,912,325)
Provisões líquidas | net provisions 1,582,057 (24,988,656)
RESulTADOS ANTES DE IMPOSTOS | InCOMe BefORe TAx 1,150,462,372 854,024,642
gasto de imposto | Tax bill (187,237,931) (137,650,743)
luCRO DO ExERCíCIO | PROfIT fOR PeRIOD 963,224,441 716,373,899
OuTROS RESulTADOS COMPREENSIvOS, líquIDOS DE IMPOSTO:OTheR COMPRehensIVe InCOMe, neT Of TAx:
Resultados de justo valor sobre activos financeiros disponíveis para vendafair value on available for sale financial assets 7,668,503 6,826,655
RESulTADOS COMPREENSIvOS DO ExERCíCIO (TOTAl)COMPRehensIVe InCOMe fOR PeRIOD (TOTAL) 970,892,945 723,290,807
RESulTADO POR ACçÃO | eARnIngs PeR shARe 5.07 22.40
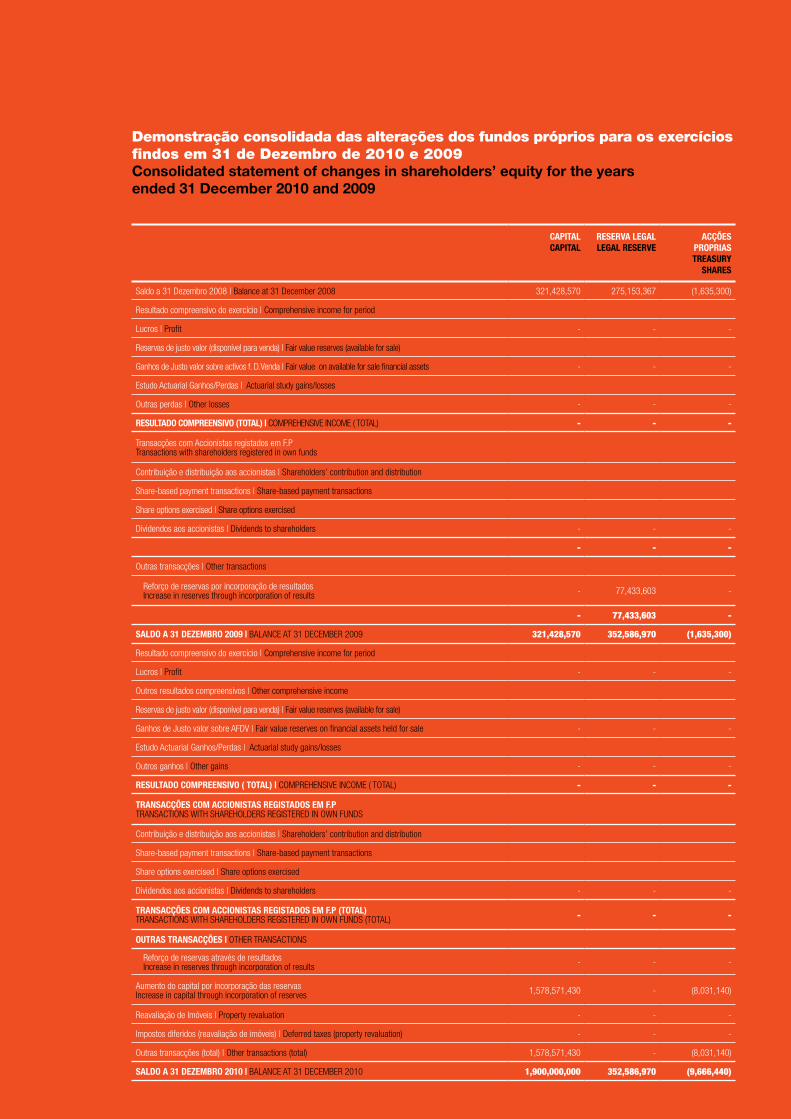
168
BCI | RELATÓRIO E CONTAS 2010 | ANNUAL REPORT 2010BCI
demonstração consolidada das alterações dos fundos próprios para os exercícios findos em 31 de dezembro de 2010 e 2009Consolidated statement of changes in shareholders’ equity for the years ended 31 December 2010 and 2009
CAPITAlCAPITAl
RESERvA lEGAllEGAl RESERvE
ACçõES PROPRIAS TREASuRy
ShARES
saldo a 31 Dezembro 2008 | Balance at 31 December 2008 321,428,570 275,153,367 (1,635,300)
Resultado compreensivo do exercício | Comprehensive income for period
Lucros | Profit - - -
Reservas de justo valor (disponível para venda) | fair value reserves (available for sale)
ganhos de Justo valor sobre activos f. D.Venda | fair value on available for sale financial assets - - -
estudo Actuarial ganhos/Perdas | Actuarial study gains/losses
Outras perdas | Other losses - - -
RESulTADO COMPREENSIvO (TOTAl) | COMPRehensIVe InCOMe ( TOTAL) - - -
Transacções com Accionistas registados em f.PTransactions with shareholders registered in own funds
Contribuição e distribuição aos accionistas | shareholders’ contribution and distribution
share-based payment transactions | share-based payment transactions
share options exercised | share options exercised
Dividendos aos accionistas | Dividends to shareholders - - -
- - -
Outras transacções | Other transactions
Reforço de reservas por incorporação de resultadosIncrease in reserves through incorporation of results - 77,433,603 -
- 77,433,603 -
SAlDO A 31 DEZEMbRO 2009 | BALAnCe AT 31 DeCeMBeR 2009 321,428,570 352,586,970 (1,635,300)
Resultado compreensivo do exercício | Comprehensive income for period
Lucros | Profit - - -
Outros resultados compreensivos | Other comprehensive income
Reservas de justo valor (disponível para venda) | fair value reserves (available for sale)
ganhos de Justo valor sobre AfDV | fair value reserves on financial assets held for sale - - -
estudo Actuarial ganhos/Perdas | Actuarial study gains/losses
Outros ganhos | Other gains - - -
RESulTADO COMPREENSIvO ( TOTAl) | COMPRehensIVe InCOMe ( TOTAL) - - -
TRANSACçõES COM ACCIONISTAS REGISTADOS EM f.PTRAnsACTIOns wITh shARehOLDeRs RegIsTeReD In Own fUnDs
Contribuição e distribuição aos accionistas | shareholders’ contribution and distribution
share-based payment transactions | share-based payment transactions
share options exercised | share options exercised
Dividendos aos accionistas | Dividends to shareholders - - -
TRANSACçõES COM ACCIONISTAS REGISTADOS EM f.P (TOTAl)TRAnsACTIOns wITh shARehOLDeRs RegIsTeReD In Own fUnDs (TOTAL) - - -
OuTRAS TRANSACçõES | OTheR TRAnsACTIOns
Reforço de reservas através de resultadosIncrease in reserves through incorporation of results - - -
Aumento do capital por incorporação das reservasIncrease in capital through incorporation of reserves 1,578,571,430 - (8,031,140)
Reavaliação de Imóveis | Property revaluation - - -
Impostos diferidos (reavaliação de imóveis) | Deferred taxes (property revaluation) - - -
Outras transacções (total) | Other transactions (total) 1,578,571,430 - (8,031,140)
SAlDO A 31 DEZEMbRO 2010 | BALAnCe AT 31 DeCeMBeR 2010 1,900,000,000 352,586,970 (9,666,440)
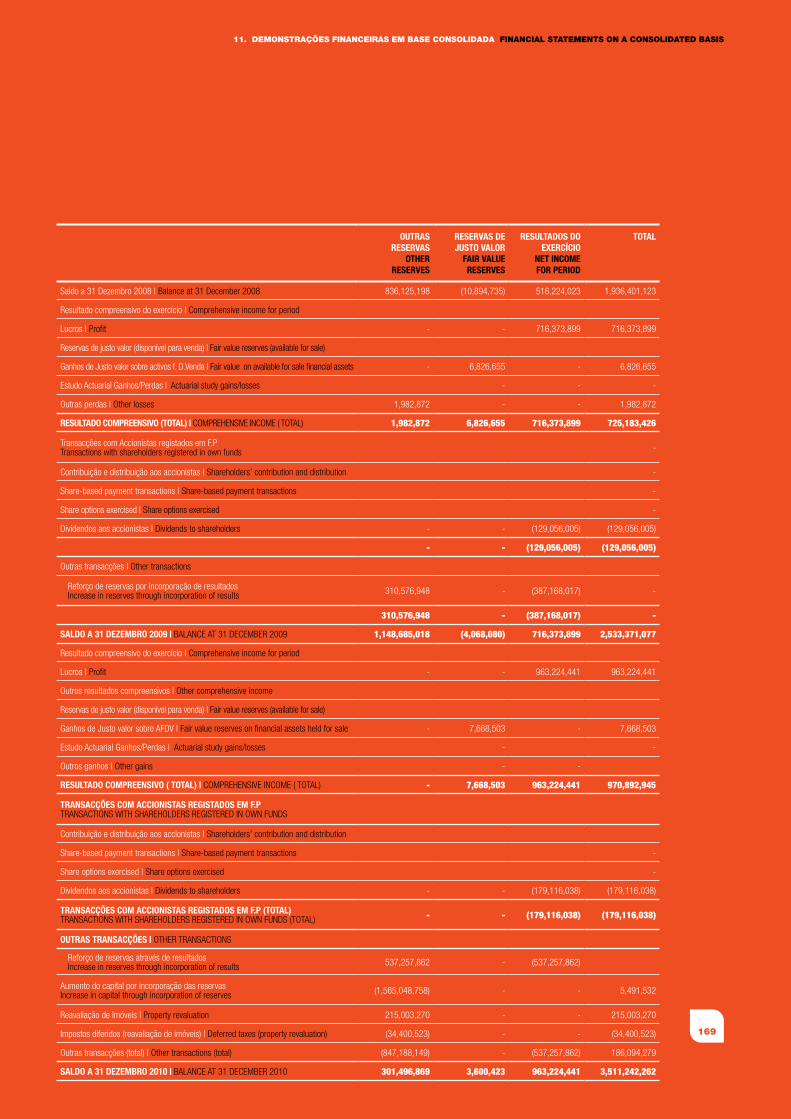
169
11. dEMONSTRAÇÕES fINANCEIRAS EM BASE CONSOLIdAdA fINANCIAL STATEMENTS ON A CONSOLIdATEd BASIS
OuTRAS RESERvAS
OThERRESERvES
RESERvAS DE JuSTO vAlOR
fAIR vAluE RESERvES
RESulTADOS DO ExERCíCIO
NET INCOMEfOR PERIOD
TOTAl
saldo a 31 Dezembro 2008 | Balance at 31 December 2008 836,125,198 (10,894,735) 516,224,023 1,936,401,123
Resultado compreensivo do exercício | Comprehensive income for period
Lucros | Profit - - 716,373,899 716,373,899
Reservas de justo valor (disponível para venda) | fair value reserves (available for sale)
ganhos de Justo valor sobre activos f. D.Venda | fair value on available for sale financial assets - 6,826,655 - 6,826,655
estudo Actuarial ganhos/Perdas | Actuarial study gains/losses - - -
Outras perdas | Other losses 1,982,872 - - 1,982,872
RESulTADO COMPREENSIvO (TOTAl) | COMPRehensIVe InCOMe ( TOTAL) 1,982,872 6,826,655 716,373,899 725,183,426
Transacções com Accionistas registados em f.PTransactions with shareholders registered in own funds -
Contribuição e distribuição aos accionistas | shareholders’ contribution and distribution -
share-based payment transactions | share-based payment transactions -
share options exercised | share options exercised -
Dividendos aos accionistas | Dividends to shareholders - - (129,056,005) (129,056,005)
- - (129,056,005) (129,056,005)
Outras transacções | Other transactions
Reforço de reservas por incorporação de resultadosIncrease in reserves through incorporation of results 310,576,948 - (387,168,017) -
310,576,948 - (387,168,017) -
SAlDO A 31 DEZEMbRO 2009 | BALAnCe AT 31 DeCeMBeR 2009 1,148,685,018 (4,068,080) 716,373,899 2,533,371,077
Resultado compreensivo do exercício | Comprehensive income for period
Lucros | Profit - - 963,224,441 963,224,441
Outros resultados compreensivos | Other comprehensive income
Reservas de justo valor (disponível para venda) | fair value reserves (available for sale)
ganhos de Justo valor sobre AfDV | fair value reserves on financial assets held for sale - 7,668,503 - 7,668,503
estudo Actuarial ganhos/Perdas | Actuarial study gains/losses - -
Outros ganhos | Other gains - -
RESulTADO COMPREENSIvO ( TOTAl) | COMPRehensIVe InCOMe ( TOTAL) - 7,668,503 963,224,441 970,892,945
TRANSACçõES COM ACCIONISTAS REGISTADOS EM f.PTRAnsACTIOns wITh shARehOLDeRs RegIsTeReD In Own fUnDs
Contribuição e distribuição aos accionistas | shareholders’ contribution and distribution
share-based payment transactions | share-based payment transactions -
share options exercised | share options exercised -
Dividendos aos accionistas | Dividends to shareholders - - (179,116,038) (179,116,038)
TRANSACçõES COM ACCIONISTAS REGISTADOS EM f.P (TOTAl)TRAnsACTIOns wITh shARehOLDeRs RegIsTeReD In Own fUnDs (TOTAL) - - (179,116,038) (179,116,038)
OuTRAS TRANSACçõES | OTheR TRAnsACTIOns
Reforço de reservas através de resultadosIncrease in reserves through incorporation of results 537,257,862 - (537,257,862)
Aumento do capital por incorporação das reservasIncrease in capital through incorporation of reserves (1,565,048,758) - - 5,491,532
Reavaliação de Imóveis | Property revaluation 215,003,270 - - 215,003,270
Impostos diferidos (reavaliação de imóveis) | Deferred taxes (property revaluation) (34,400,523) - - (34,400,523)
Outras transacções (total) | Other transactions (total) (847,188,149) - (537,257,862) 186,094,279
SAlDO A 31 DEZEMbRO 2010 | BALAnCe AT 31 DeCeMBeR 2010 301,496,869 3,600,423 963,224,441 3,511,242,262
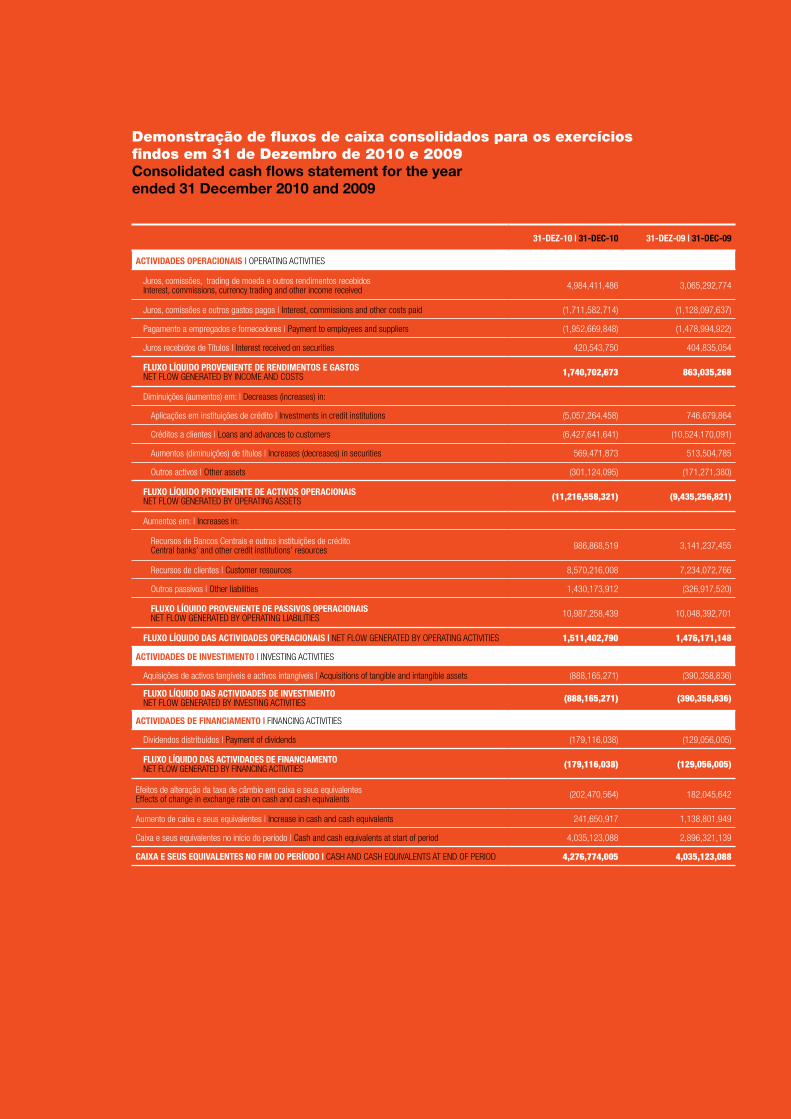
170
BCI | RELATÓRIO E CONTAS 2010 | ANNUAL REPORT 2010BCI
demonstração de fluxos de caixa consolidados para os exercícios findos em 31 de dezembro de 2010 e 2009Consolidated cash flows statement for the year ended 31 December 2010 and 2009
31-DEZ-10 | 31-DEC-10 31-DEZ-09 | 31-DEC-09
ACTIvIDADES OPERACIONAIS | OPeRATIng ACTIVITIes
Juros, comissões, trading de moeda e outros rendimentos recebidosInterest, commissions, currency trading and other income received 4,984,411,486 3,065,292,774
Juros, comissões e outros gastos pagos | Interest, commissions and other costs paid (1,711,582,714) (1,128,097,637)
Pagamento a empregados e fornecedores | Payment to employees and suppliers (1,952,669,848) (1,478,994,922)
Juros recebidos de Títulos | Interest received on securities 420,543,750 404,835,054
fluxO líquIDO PROvENIENTE DE RENDIMENTOS E GASTOSneT fLOw geneRATeD By InCOMe AnD COsTs 1,740,702,673 863,035,268
Diminuições (aumentos) em: | Decreases (increases) in:
Aplicações em instituições de crédito | Investments in credit institutions (5,057,264,458) 746,679,864
Créditos a clientes | Loans and advances to customers (6,427,641,641) (10,524,170,091)
Aumentos (diminuições) de títulos | Increases (decreases) in securities 569,471,873 513,504,785
Outros activos | Other assets (301,124,095) (171,271,380)
fluxO líquIDO PROvENIENTE DE ACTIvOS OPERACIONAISneT fLOw geneRATeD By OPeRATIng AsseTs (11,216,558,321) (9,435,256,821)
Aumentos em: | Increases in:
Recursos de Bancos Centrais e outras instituições de créditoCentral banks’ and other credit institutions’ resources 986,868,519 3,141,237,455
Recursos de clientes | Customer resources 8,570,216,008 7,234,072,766
Outros passivos | Other liabilities 1,430,173,912 (326,917,520)
fluxO líquIDO PROvENIENTE DE PASSIvOS OPERACIONAISneT fLOw geneRATeD By OPeRATIng LIABILITIes 10,987,258,439 10,048,392,701
fluxO líquIDO DAS ACTIvIDADES OPERACIONAIS | neT fLOw geneRATeD By OPeRATIng ACTIVITIes 1,511,402,790 1,476,171,148
ACTIvIDADES DE INvESTIMENTO | InVesTIng ACTIVITIes
Aquisições de activos tangíveis e activos intangíveis | Acquisitions of tangible and intangible assets (888,165,271) (390,358,836)
fluxO líquIDO DAS ACTIvIDADES DE INvESTIMENTOneT fLOw geneRATeD By InVesTIng ACTIVITIes (888,165,271) (390,358,836)
ACTIvIDADES DE fINANCIAMENTO | fInAnCIng ACTIVITIes
Dividendos distribuídos | Payment of dividends (179,116,038) (129,056,005)
fluxO líquIDO DAS ACTIvIDADES DE fINANCIAMENTOneT fLOw geneRATeD By fInAnCIng ACTIVITIes (179,116,038) (129,056,005)
efeitos de alteração da taxa de câmbio em caixa e seus equivalenteseffects of change in exchange rate on cash and cash equivalents (202,470,564) 182,045,642
Aumento de caixa e seus equivalentes | Increase in cash and cash equivalents 241,650,917 1,138,801,949
Caixa e seus equivalentes no início do período | Cash and cash equivalents at start of period 4,035,123,088 2,896,321,139
CAIxA E SEuS EquIvAlENTES NO fIM DO PERíODO | CAsh AnD CAsh eQUIVALenTs AT enD Of PeRIOD 4,276,774,005 4,035,123,088
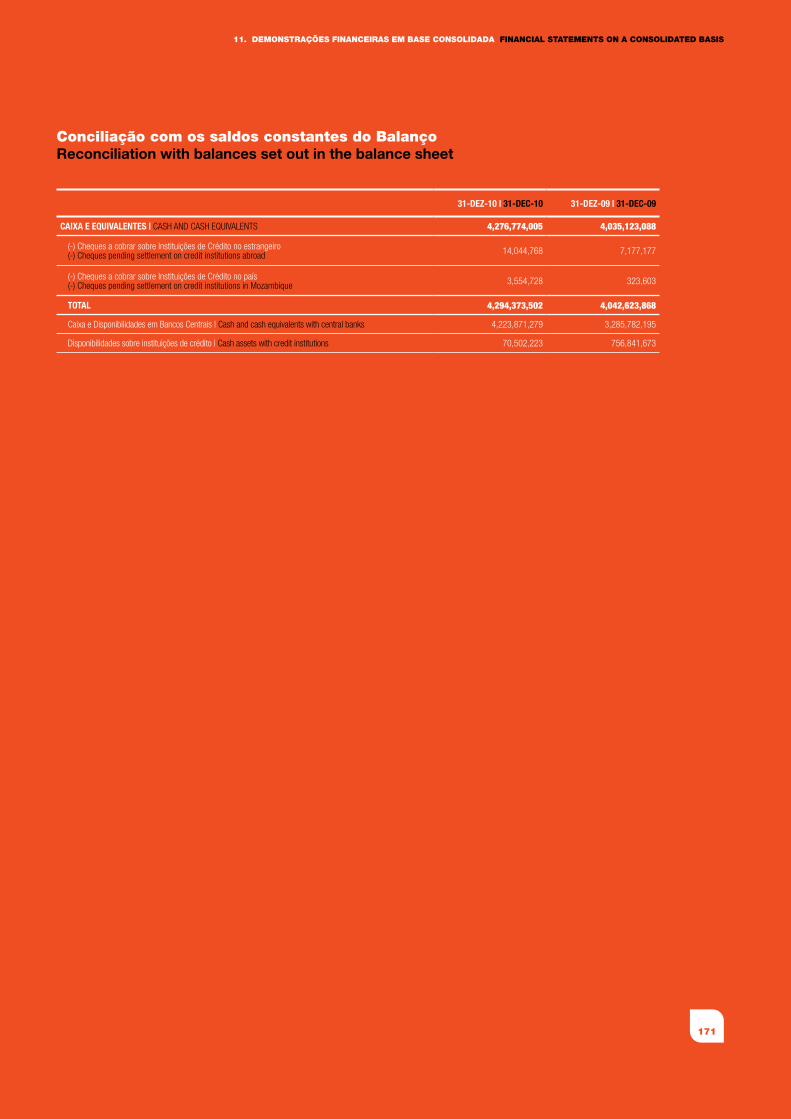
171
11. dEMONSTRAÇÕES fINANCEIRAS EM BASE CONSOLIdAdA fINANCIAL STATEMENTS ON A CONSOLIdATEd BASIS
Conciliação com os saldos constantes do BalançoReconciliation with balances set out in the balance sheet
31-DEZ-10 | 31-DEC-10 31-DEZ-09 | 31-DEC-09
CAIxA E EquIvAlENTES | CAsh AnD CAsh eQUIVALenTs 4,276,774,005 4,035,123,088
(-) Cheques a cobrar sobre Instituições de Crédito no estrangeiro(-) Cheques pending settlement on credit institutions abroad 14,044,768 7,177,177
(-) Cheques a cobrar sobre Instituições de Crédito no país(-) Cheques pending settlement on credit institutions in Mozambique 3,554,728 323,603
TOTAl 4,294,373,502 4,042,623,868
Caixa e Disponibilidades em Bancos Centrais | Cash and cash equivalents with central banks 4,223,871,279 3,285,782,195
Disponibilidades sobre instituições de crédito | Cash assets with credit institutions 70,502,223 756,841,673

Relatóriosanexos
Attachedreports
BCI | RELATÓRIO E CONTAS 2010 | ANNUAL REPORT 2010
174
12. Relatório dos Auditores Independentes Independent Auditors’ Report
Aos Accionistas do BCI – Banco Comercial e de Investimentos, S.A.
Procedemos à auditoria das demonstrações financeiras do BCI - Banco Comercial e de Investimentos, S.A, que comportam o balanço à data de 31 de Dezembro de 2010, a demonstração de resultados, a demonstração com-preensiva de resultados, a demonstração de fluxos de caixa e a demonstração das alterações dos fundos pró-prios do ano findo na mesma data, assim como as notas às demonstrações financeiras que incluem um resumo das políticas contabilísticas mais significativas e outras notas explicativas, constantes das páginas 4 a 76.
Responsabilidade da Administração em relação às demonstrações financeiras
A Administração do Banco é responsável pela prepara-ção e apresentação adequada destas demonstrações financeiras, de acordo com as Normas Internacionais de Relato Financeiro. Esta responsabilidade inclui: a con-cepção, implementação e manutenção de um sistema de controlo interno relevante para a preparação e apre-sentação adequada das demonstrações financeiras, que estejam livres de distorções, devidas a fraude ou erros; selecçãoeaplicaçãodepolíticascontabilísticasadequadas;eelaboraçãodeestimativascontabilísticasque sejam apropriadas, nas circunstâncias.
Responsabilidade do Auditor
A nossa responsabilidade é expressar uma opinião sobre estas demonstrações financeiras com base na nossa auditoria. Executámos a nossa auditoria de acor-do com as Normas Internacionais de Auditoria. Tais nor-mas exigem, da nossa parte, o cumprimento de requisi-tos éticos pertinentes, bem como o planeamento e a
To the shareholders of BCI – Banco Comercial e de Investimentos, S.A.
We have audited the financial statements of BCI - Banco Comercial e de Investimentos, S.A, comprising its balance sheet at 31 December 2010, income state-ment, statement of comprehensive income, statement of cash flows and statement to changes in sharehold-ers’ equity for the year then ended, in addition to the notes to the financial statements which include a sum-mary of the most significant accounting policies and other explanatory notes as set out on pages 04 - 76.
Board of directors’ responsibility for the financial statements
The board of directors is responsible for the prepara-tion and adequate presentation of these financial state-ments in accordance with the International Financial Reporting Standards. This responsibility includes the design, implementation and maintenance of a relevant internal control system for the preparation and ade-quate presentation of the financial statements, ensur-ing that they are free from distortions, deriving from fraud or errors, the selection and application of ade-quate accounting policies and the preparation of appropriate accounting estimates vis-à-vis the circum-stances.
Auditors’ responsibility
It is our responsibility to express an opinion on these financial statements based on our audit. Our audit was performed in accordance with international audit stand-ards. These standards require, on our part, compliance with pertinent ethical requirements, in addition to the planning and performance of the audit, with the aim of
175
12. RELATÓRIO dOS AudITORES INdEPENdENTES INdEPENdENT AudITORS’ REPORT
execução da auditoria de forma a obter uma certeza razoável de que as demonstrações financeiras estão livres de quaisquer distorções materialmente relevantes.Uma auditoria inclui a aplicação de procedimentos que nos permitiram obter evidência de auditoria a respeito dos valores e divulgações apresentadas nas demons-trações financeiras. Os procedimentos seleccionados dependem do nosso julgamento, incluindo a avaliação dos riscos de distorções materiais das demonstrações financeiras, quer devidas a fraude ou erro. Ao proceder-mos à avaliação desses riscos, consideramos os con-trolos internos relevantes para a preparação e apresen-tação adequada das demonstrações financeiras pela entidade, de modo a permitir o desenho de procedi-mentos de auditoria que sejam, nas circunstâncias, apropriados, mas não com a finalidade de expressar-mos uma opinião sobre a eficiência dos sistemas de controle interno da entidade. Uma auditoria também inclui a avaliação da adequação dos princípios contabi-lísticos adoptados e a razoabilidade das estimativas contabilísticas feitas pela Administração, assim como uma avaliação da apresentação global das demonstra-ções financeiras.Acreditamos que a evidência de auditoria obtida é sufi-ciente e adequada para fornecer uma base razoável para a emissão do nosso parecer.
Opinião
Na nossa opinião, as demonstrações financeiras apre-sentam de forma adequada, em todos os aspectos materiais, a situação financeira do BCI – Banco Comercial e de Investimentos, S.A, à data de 31 de Dezembro de 2010, e o seu desempenho financeiro, flu-xos de caixa e alterações dos fundos próprios do ano findo na mesma data, em conformidade com as Normas Internacionais de Relatório Financeiro.
KPMG 18 de Fevereiro de 2011Maputo
obtaining a reasonable degree of assurance as to whether the financial statements are free from any materially relevant distortions.An audit includes the application of procedures designed to enable us to obtain sufficient audit evi-dence on the amounts and disclosures set out in the financial statements. The selected procedures depend on our judgement and include an assessment of the risks of material distortions in the financial statements, either owing to fraud or error. In assessing such risks we consider the relevant internal controls on the entity’s preparation and adequate presentation of the financial statements, with the objective of enabling us to draw up the audit procedures appropriate to the circum-stances, but not with the objective of expressing an opinion on the efficacy of the entity’s internal control systems. An audit also includes an assessment of the adequacy of the accounting policies adopted and the reasonableness of the accounting estimates made by the board of directors, in addition to an assessment of the presentation of the financial statements as a whole.We believe that the audit evidence obtained is sufficient and adequate to provide us with a reasonable basis for us to issue our opinion.
Opinion
In our opinion, the financial statements give an ade-quate presentation, in all material aspects, of the finan-cial situation of BCI – Banco Comercial e de Investimentos, S.A, at 31 December 2010 and its finan-cial performance, cash flows and changes to its own funds for the year then ended in conformity with the International Financial Reporting Standards.
KPMG 18 February 2011Maputo
BCI | RELATÓRIO E CONTAS 2010 | ANNUAL REPORT 2010
176
13. Relatório e Parecer do Conselho fiscal Report and Opinion of Audit Board
Aos Accionistas do BCI – Banco Comercial e de Investimentos, S.A.
Nos termos da lei e do mandato que nos conferiram, apresentamos o relatório sobre a acção fiscalizadora desenvolvida pelo Conselho Fiscal e damos parecer sobre o Relatório de Gestão, Demonstrações Financeiras e proposta de aplicação de resultados do exercício de 2010, apresentados pelo Conselho de Administração do BCI - Banco Comercial e de Investimentos, S.A.
Relatório
Desde 20 de Abril de 2010, data da eleição dos seus membros, o Conselho Fiscal acompanhou, com a perio-dicidade e a extensão que considerou adequadas, as demonstrações financeiras mensais, a evolução da acti-vidade, o controlo de diversos riscos da actividade e a regularidade dos registos contabilísticos do Banco, bem como o cumprimento das normas legais e regulamenta-res aplicáveis, com base na informação mensal contabi-lística, financeira, de gestão de riscos e de compliance, tendo obtido do Conselho de Administração e dos ser-viços do Banco as informações e os esclarecimentos solicitados, e tenso emitido as recomendações que constam das Actas das reuniões do Conselho Fiscal.
O Conselho Fiscal verificou a eficácia e adequação do Sistema de Controlo Interno do Banco, integrando o sis-tema de gestão de riscos, de compliance e de auditoria interna, de que resultaram as recomendações incluídas no parecer de 14 de Junho de 2010.
O Conselho Fiscal examinou o Relatório de Gestão, incluindo proposta de aplicação de resultados, as Demonstrações Financeiras do exercício de 2010 e as Notas às mesmas Demonstrações Financeiras, apre-sentados pelo Conselho de Administração, bem como o
To the shareholders of BCI – Banco Comercial e de Investimentos, S.A.
As required by law and our instructions we hereby present our report on the audit board’s inspection and issue an opinion on the board of directors’ report, financial statements and proposal for the appropriation of net income for 2010, as presented by BCI - Banco Comercial e de Investimentos, S.A.’s board of directors
Report
Since the election of its members on 20 April 2010, the audit board has, with the periodicity and to the extent considered necessary, monitored the monthly financial statements, evolution of activity, control of various activity-related risks and the regularity of the bank’s accounting statements, in addition to its compliance with the applicable legal and regulatory standards, based on the monthly accounting, financial, risk man-agement and compliance information, having obtained from the board of directors and the bank’s various serv-ices the information and clarifications requested and also having issued the recommendations set out in the minutes of the audit board.
The audit board examined the effectiveness and ade-quacy of the bank’s internal control system, integrating the risk management, compliance and internal audit systems resulting in the recommendations included in the opinion of 14 June 2010.
The audit board examined the management report, including the proposal for the appropriation of net income, the financial statements for 2010 and notes to the said financial statements submitted by the board of directors, in addition to the report of the external audi-tors KPMG – Auditores e Consultores S.A on the
177
13. RELATÓRIO E PARECER dO CONSELhO fISCAL REPORT ANd OPINION Of AudIT BOARd
Relatório dos Auditores Independentes KPMG – Audi-tores e Consultores S.A sobre as Demonstrações Finan-ceiras referentes a 31 de Dezembro de 2010, tendo verificado que:
a) o Balanço, a Demonstração de Resultados, a Demons-tração das Alterações nos Fundos Próprios e a Demonstração dos Fluxos de Caixa, bem como as correspondentes Notas explicativas, traduzem de forma verdadeira, em todos os aspectos materiais, asituaçãopatrimonialeresultadosdoexercício;
b) as políticas e critérios contabilísticos adoptados con-duzem a uma correcta avaliação da situação patrimo-nial e dos resultados, e estão de acordo com as disposições legais, regulamentares e estatutárias aplicáveis;
c) o Relatório de Gestão é suficientemente esclarecedor da evolução da actividade do Banco, evidenciando os aspectosmaissignificativos;
d) e a proposta de aplicação de resultados não contraria as disposições legais, regulamentares ou estatutárias aplicáveis.
Parecer
Nestes termos, o Conselho Fiscal emite parecer favo-rável a que a Assembleia Geral aprove o Relatório, Demonstrações Financeiras e proposta de aplicação de resultados do exercício de 2010, apresentados pelo Conselho de Administração.
Por último, o Conselho Fiscal agradece ao Conselho de Administração e aos Colaboradores do Banco com que contactou a boa colaboração que lhe foi prestada no exercício da sua acção fiscalizadora.
Lisboa, 25 de Fevereiro de 2011O Conselho Fiscal
financial statements relative to 31 December 2010, having verified that:
a) the balance sheet, income statement, statement of changes to shareholders’ equity and statement of cash flows, in addition to their corresponding explanatory notes, accurately reflect the company’s net worth and income for the year in all material aspects;
b) the policies and accounting criteria adopted provide an accurate assessment of the company’s net worth and income and are in accordance with the applica-blelegal,regulatoryandstatutorydispositions;
c) the management report is sufficiently clear as regards the evolution of the bank’s activity and situation, evidencingthemostsignificantaspects;
d) the proposal for the appropriation of net income does not contravene the applicable legal, regulatory and statutory dispositions.
Opinion
The audit board, accordingly, issues a favourable opinion that the general meeting of shareholders should approve the report, financial statements and proposal for the appropriation of net income for 2010, as submitted by the board of directors. The audit board, lastly, wishes to thank the board of directors and the bank’s employees for their excellent collaboration during the course of its inspection duties.
Lisbon, 25 February 2011Audit Board

imagem capaOcuaOcua
O orgulho de ser daqui
Moçambique é um país único, em beleza e cultura. O BCI faz parte dele e do seu crescimento. Ao longo deste Relatório e Contas, mostramos-lhe como os nossos mais de 1400 colaboradores dão a cara pelo seu país e pelo BCI, formando, com os seus rostos, uma parte da identidade moçambicana.Agora apresentamos-lhe as imagens originais para que desfrute em pleno da beleza e cultura que fazem parte de todos nós, de si e do BCI.
The proud of being from here
Mozambique is a country unique in beauty and culture. And BCI is part of it and its growth. Throughout this Annual Report, we show you how our more than 1400 employees give a face for their country and for BCI, forming, with their faces, a part of Mozambican identity.Now we introduce you to the original images for you to fully enjoy the beauty and culture that are part of all of us, you and the BCI.

Imagens/ Images: Paulo Alexandre
imagem página 035Monte Binga a 2436 metrosMonte Binga at 2436 meters
imagem página 013RelanzapoRelanzapo
imagem página 061InhambaneInhambane
imagem página 073Ilha de Moz – FortalezaMozambique Island – Fortress

imagem página 173ChipandeChipande


![Molecular analysis of the endobronchial stent microbial ... · These methods have recently been applied to oral [9–11] and endotracheal tube biofilms[12– 16]. Here we present](https://static.fdocumentos.com/doc/165x107/5ed1fabb5abf7913ed2539e9/molecular-analysis-of-the-endobronchial-stent-microbial-these-methods-have-recently.jpg)