O DESAFIO DA INOVAÇÃO EM ONCOLOGIA EM PORTUGAL … da... · O DESAFIO DA INOVAÇÃO EM ONCOLOGIA...
47
O DESAFIO DA INOVAÇÃO EM ONCOLOGIA EM PORTUGAL The Challenges of innovative oncology care in Portugal Gabriela Sousa Oncologia Médica IPO Coimbra
Transcript of O DESAFIO DA INOVAÇÃO EM ONCOLOGIA EM PORTUGAL … da... · O DESAFIO DA INOVAÇÃO EM ONCOLOGIA...
O DESAFIO DA INOVAÇÃO EM ONCOLOGIA EM PORTUGAL
The Challenges of innovative oncology care in Portugal
Gabriela SousaOncologia Médica
IPO Coimbra
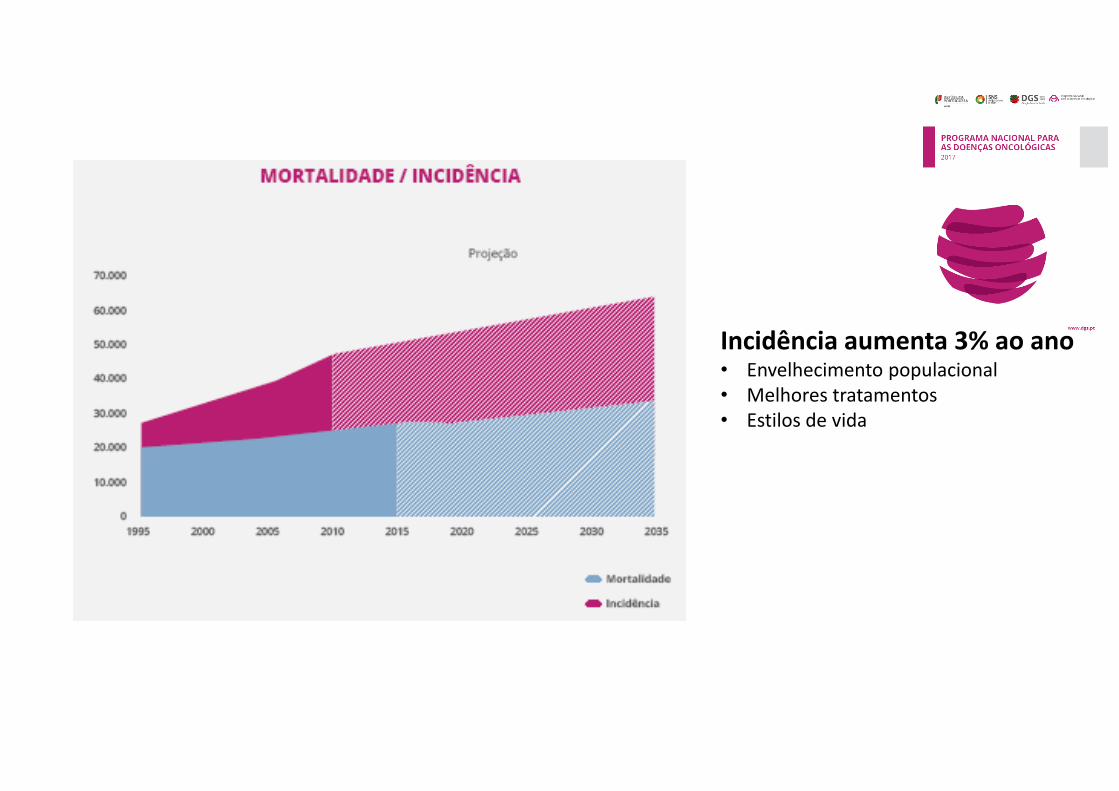
Incidência aumenta 3% ao ano• Envelhecimento populacional• Melhores tratamentos• Estilos de vida
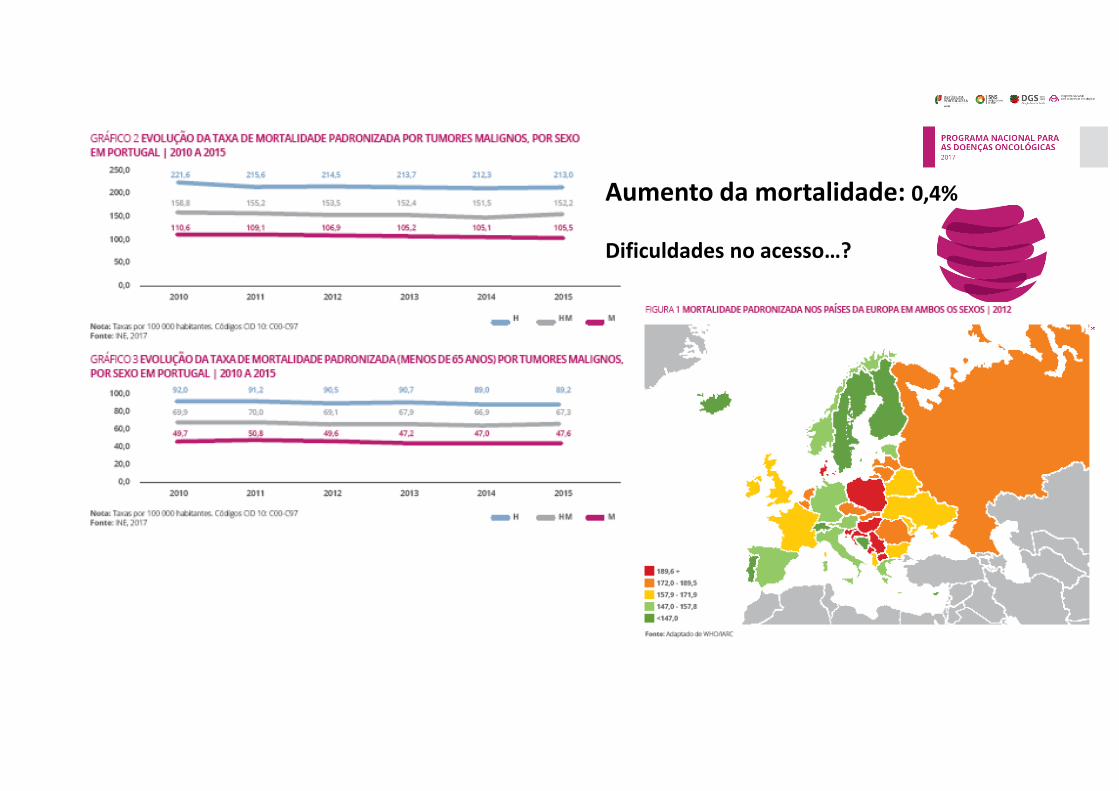
Aumento da mortalidade: 0,4%
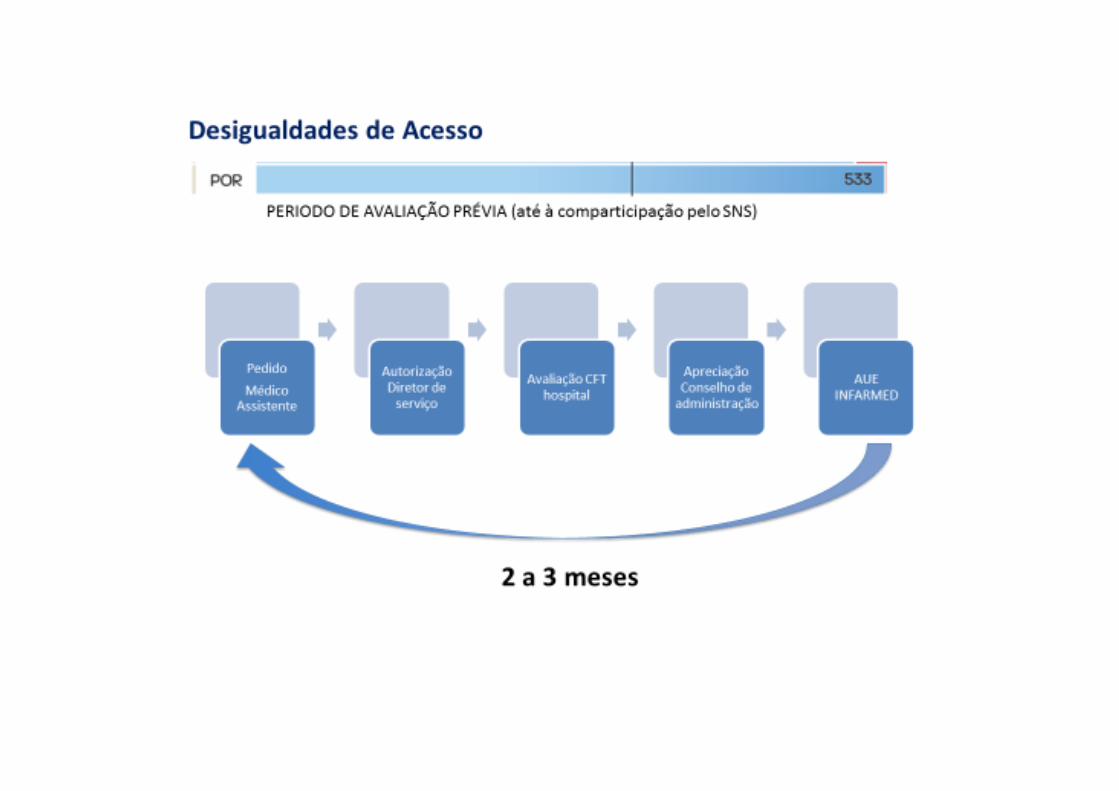
Dificuldades no acesso…?
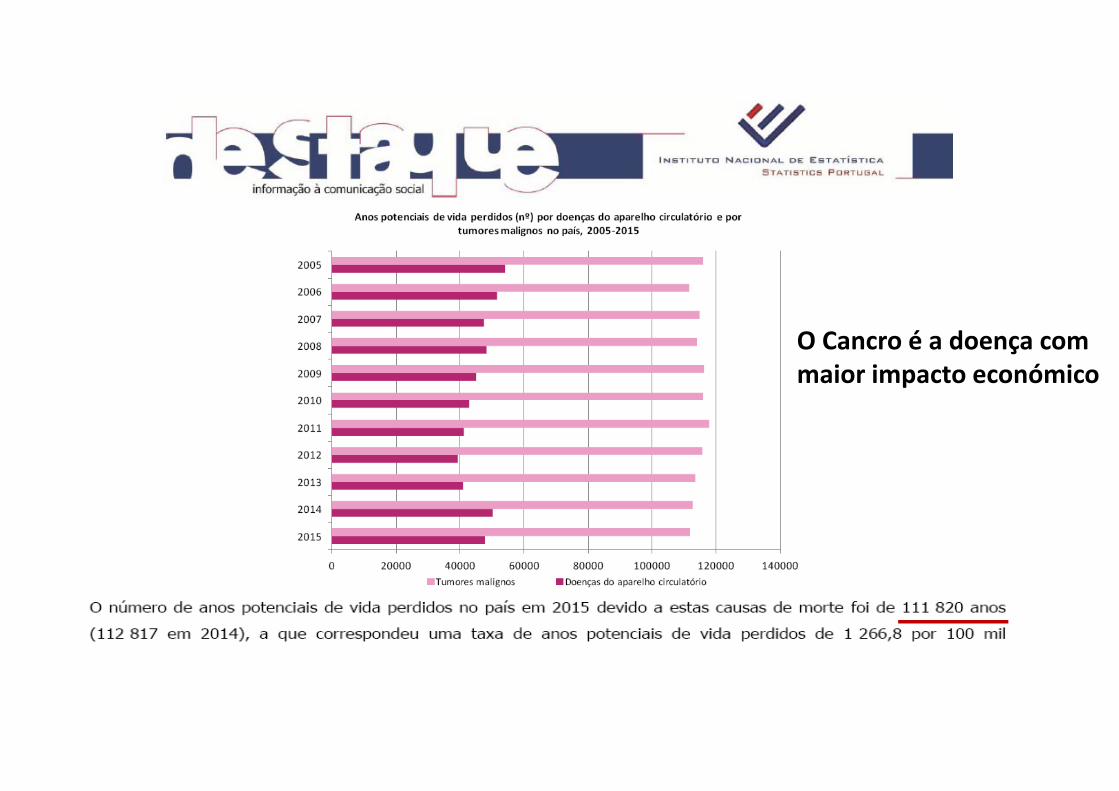
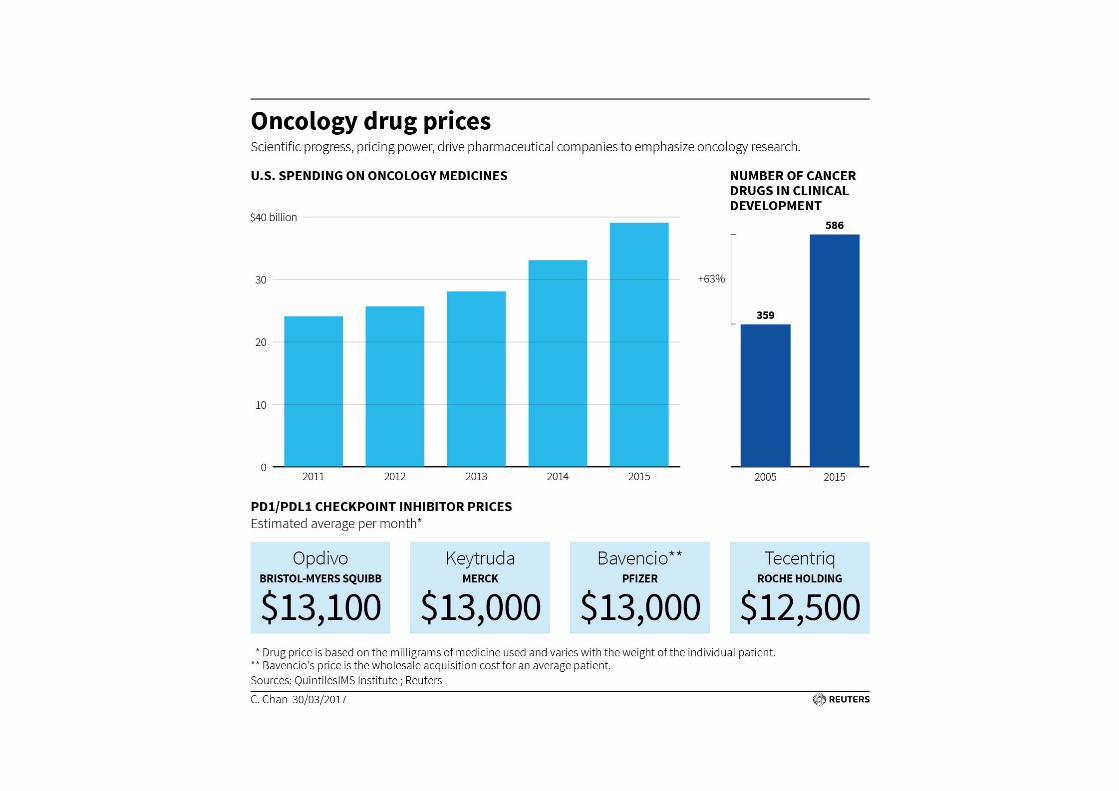
O Cancro é a doença com maior impacto económico
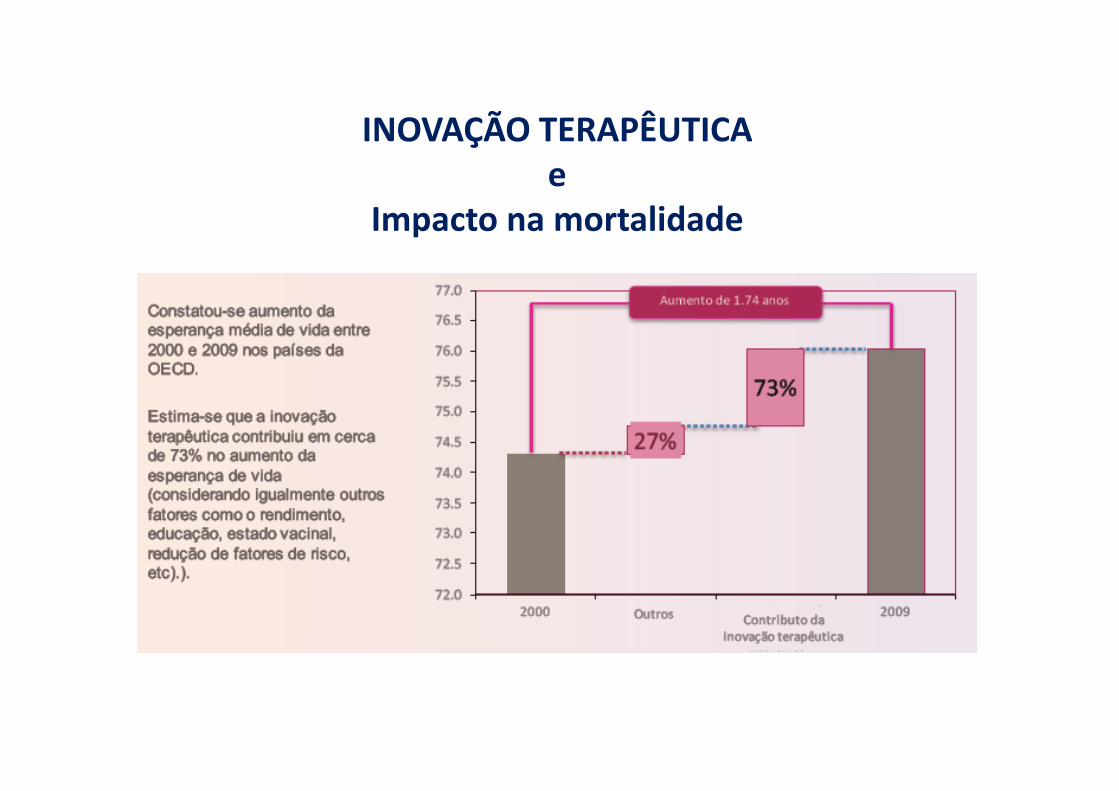
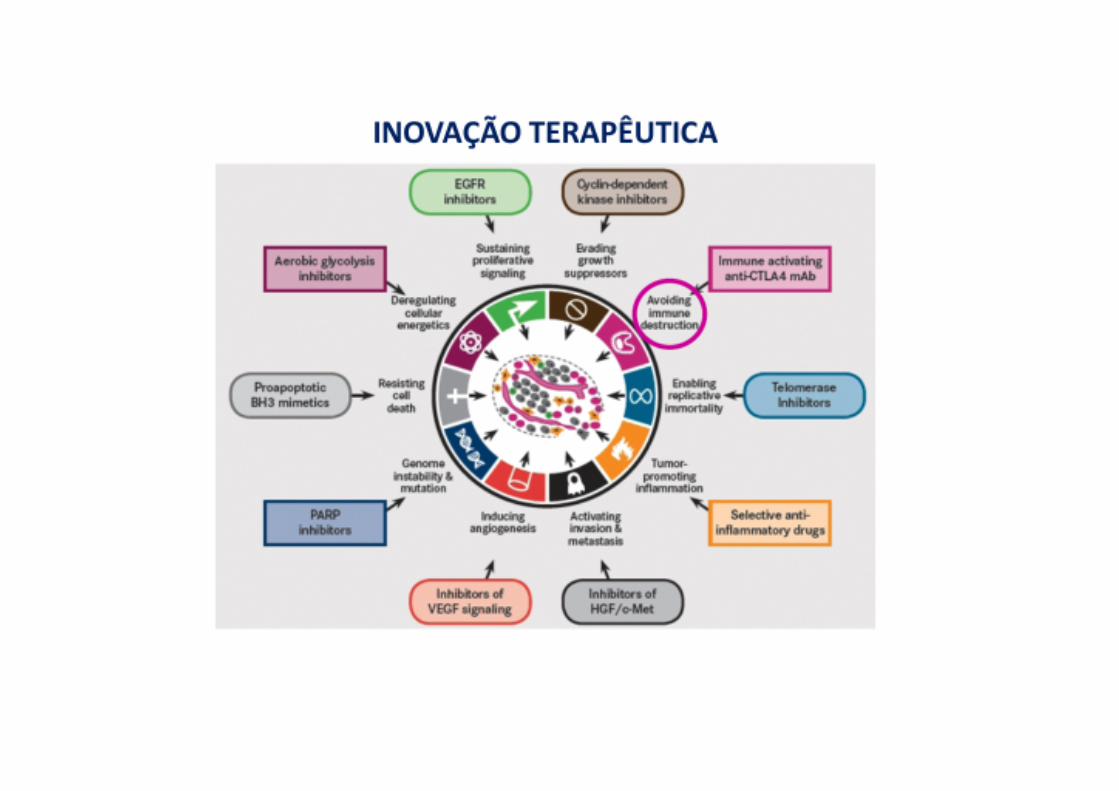
INOVAÇÃO TERAPÊUTICA e
Impacto na mortalidade
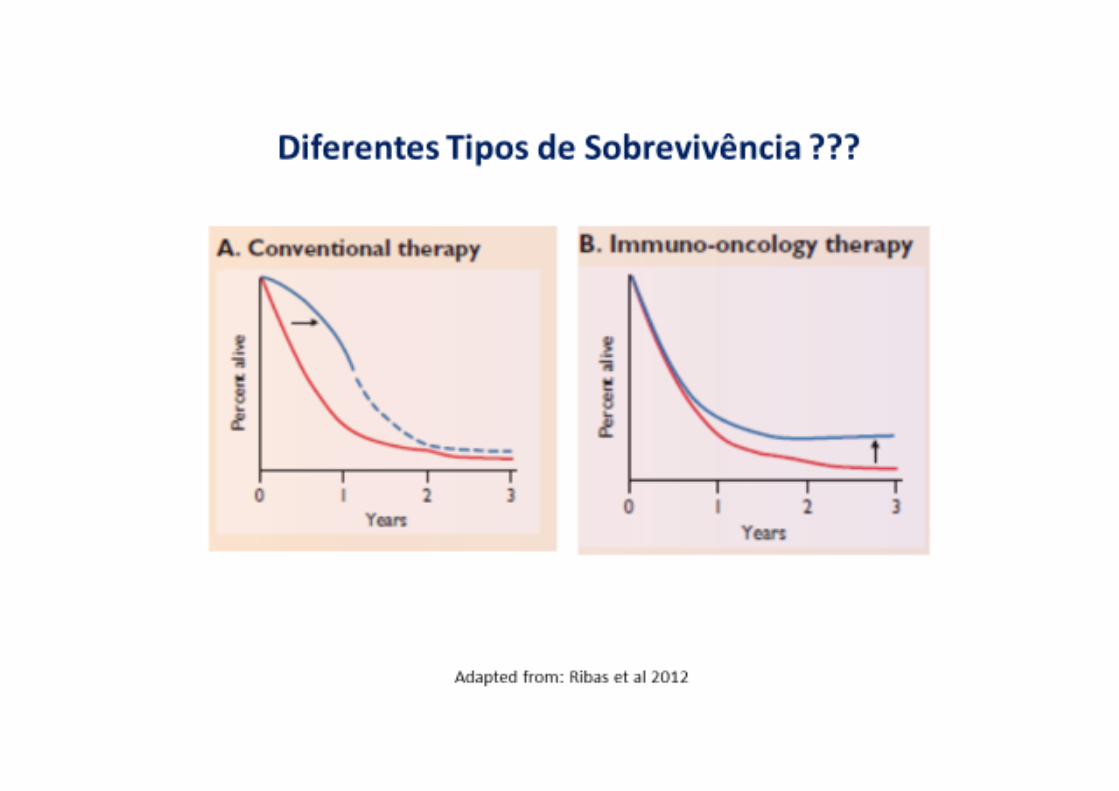
Era revolucionária no tratamento do cancro
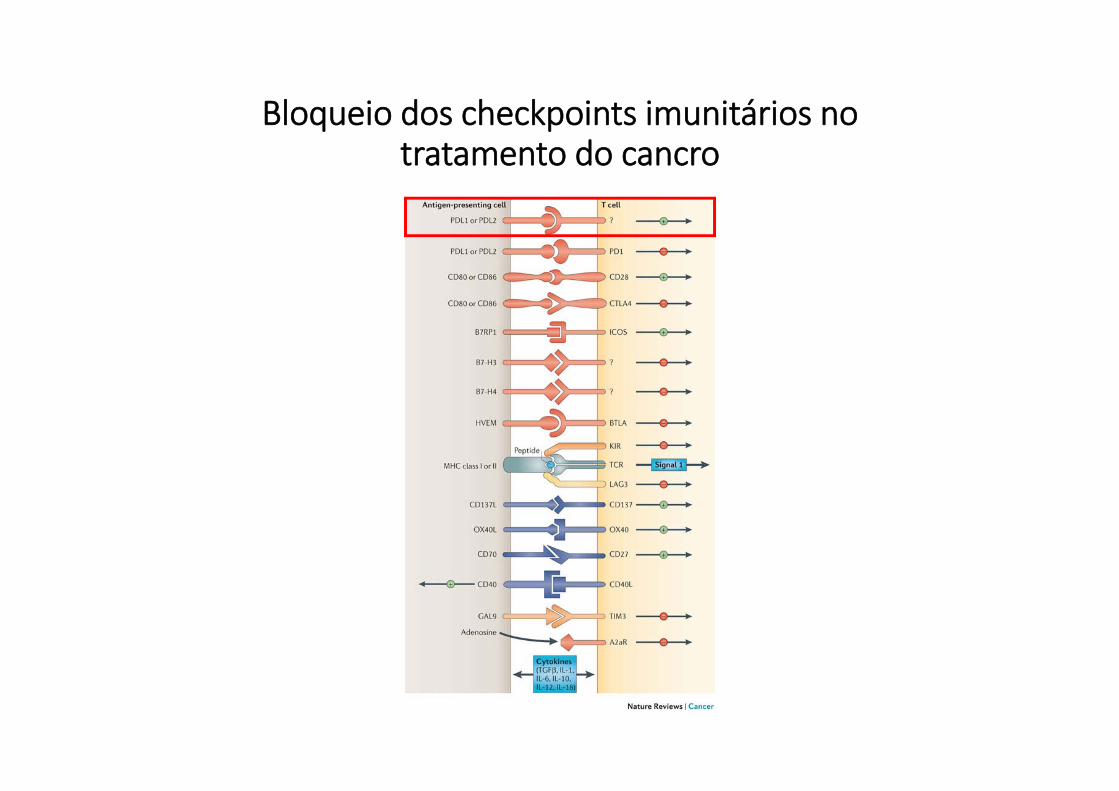
Bloqueio dos checkpoints imunitários no tratamento do cancro
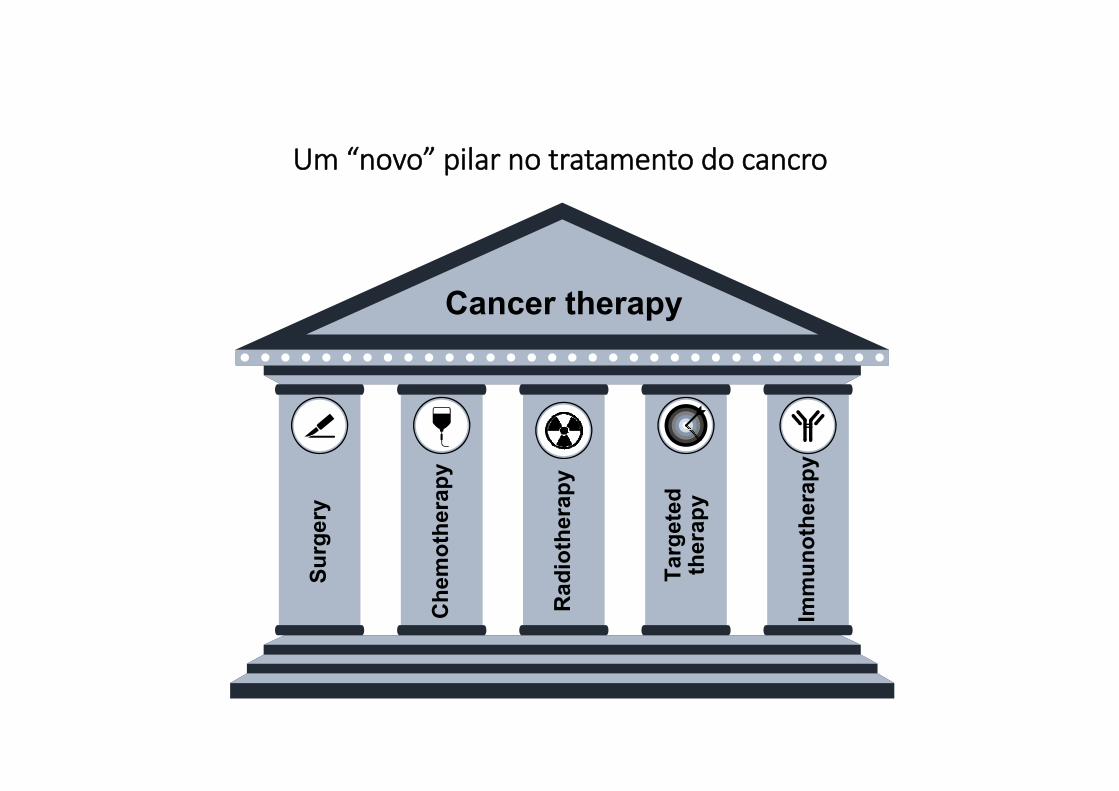
Um “novo” pilar no tratamento do cancro
Cancer therapySu
rger
y
Che
mot
hera
py
Rad
ioth
erap
y
Targ
eted
th
erap
y
Imm
unot
hera
py
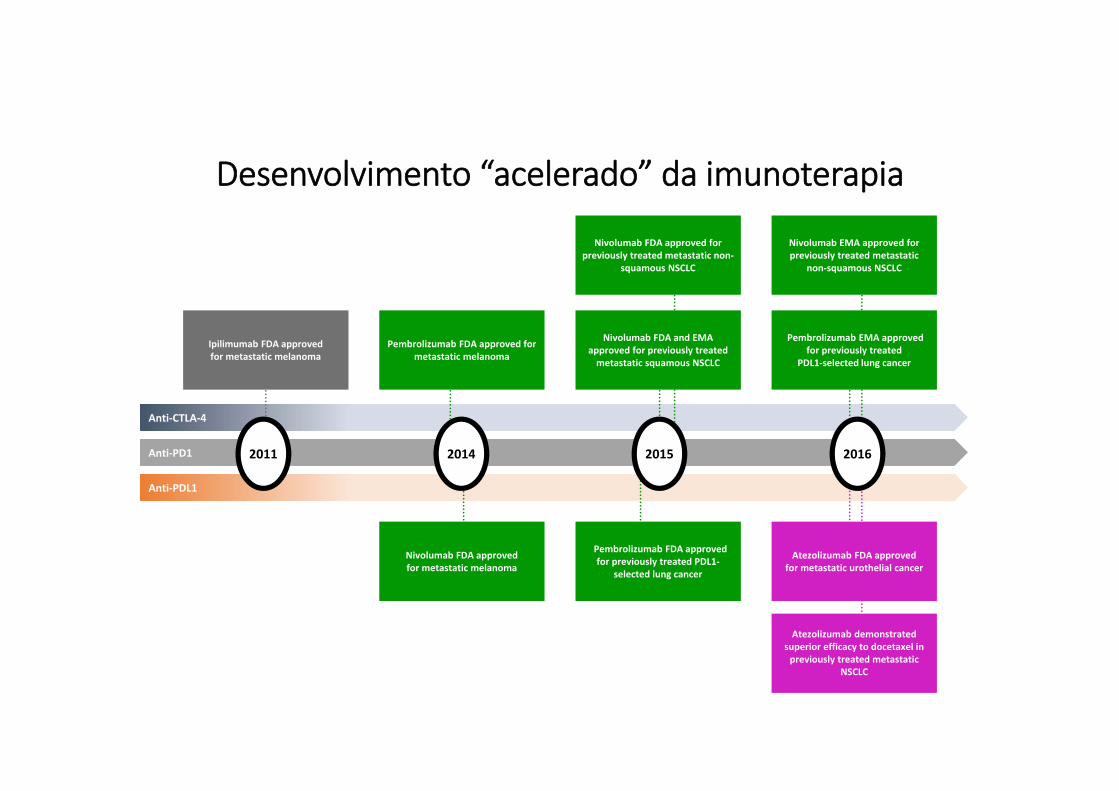
Desenvolvimento “acelerado” da imunoterapia
Anti‐CTLA‐4
Anti‐PD1
Anti‐PDL1
Nivolumab FDA approvedfor metastatic melanoma
Pembrolizumab FDA approved for previously treated PDL1‐
selected lung cancer
Nivolumab EMA approved for previously treated metastatic
non‐squamous NSCLC
Pembrolizumab EMA approved for previously treated
PDL1‐selected lung cancer
Ipilimumab FDA approvedfor metastatic melanoma
Pembrolizumab FDA approved for metastatic melanoma
Nivolumab FDA approved for previously treated metastatic non‐
squamous NSCLC
Nivolumab FDA and EMA approved for previously treated metastatic squamous NSCLC
Atezolizumab demonstrated superior efficacy to docetaxel in previously treated metastatic
NSCLC
2011 2014 2015 2016
Atezolizumab FDA approved for metastatic urothelial cancer
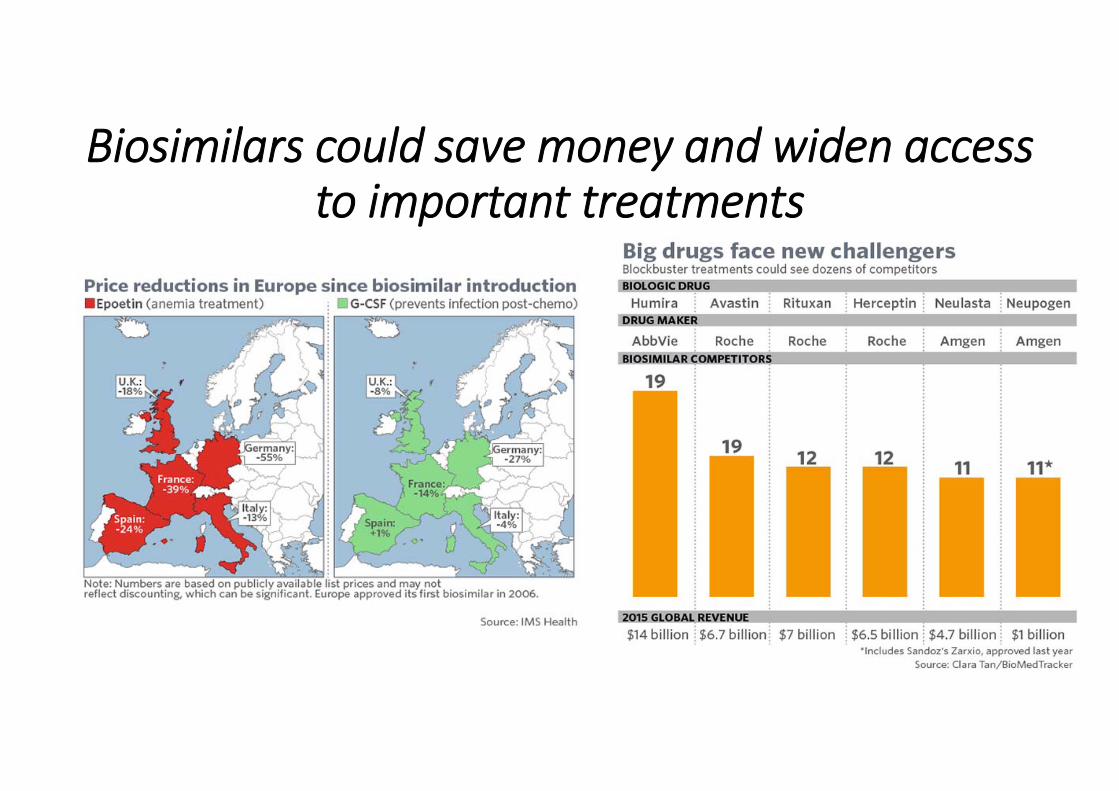
Biosimilars could save money and widen access to important treatments
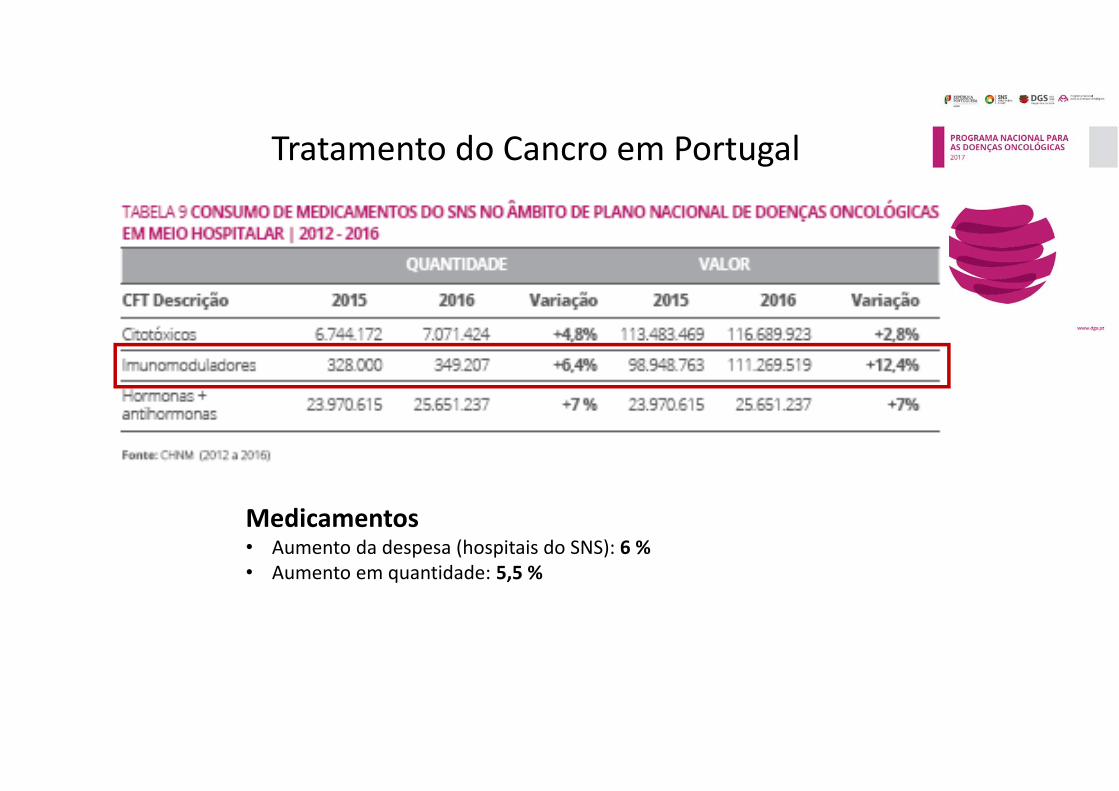
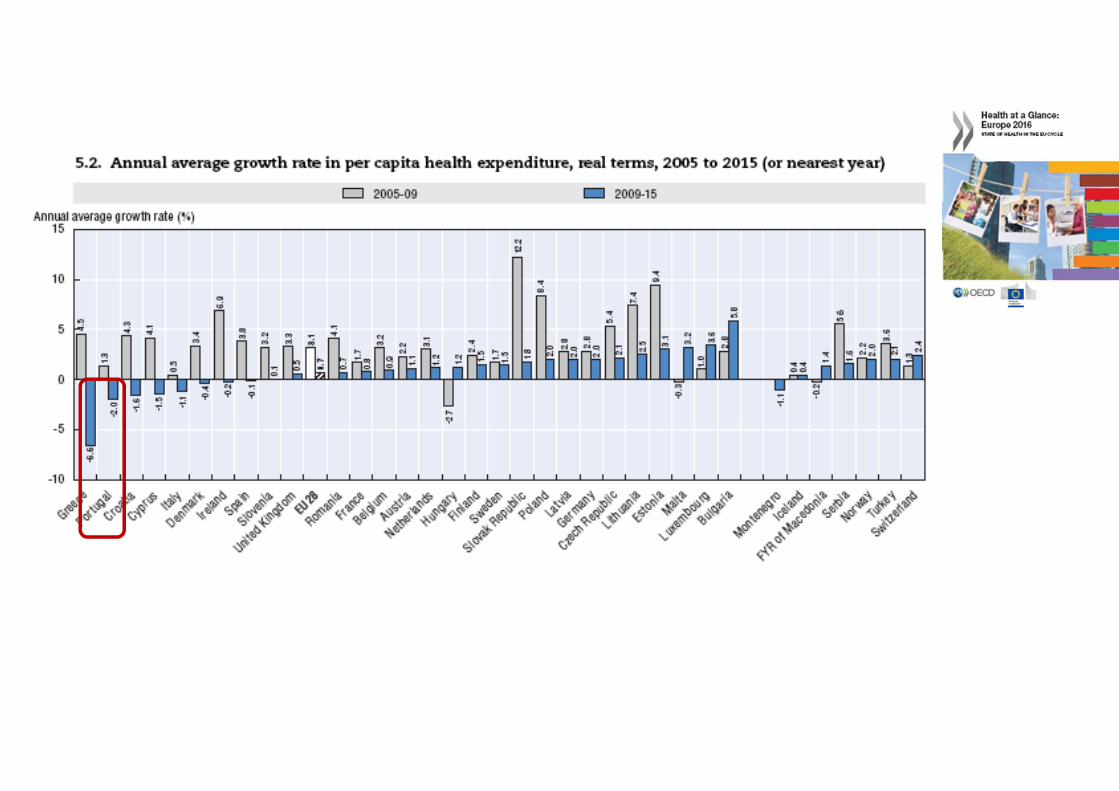
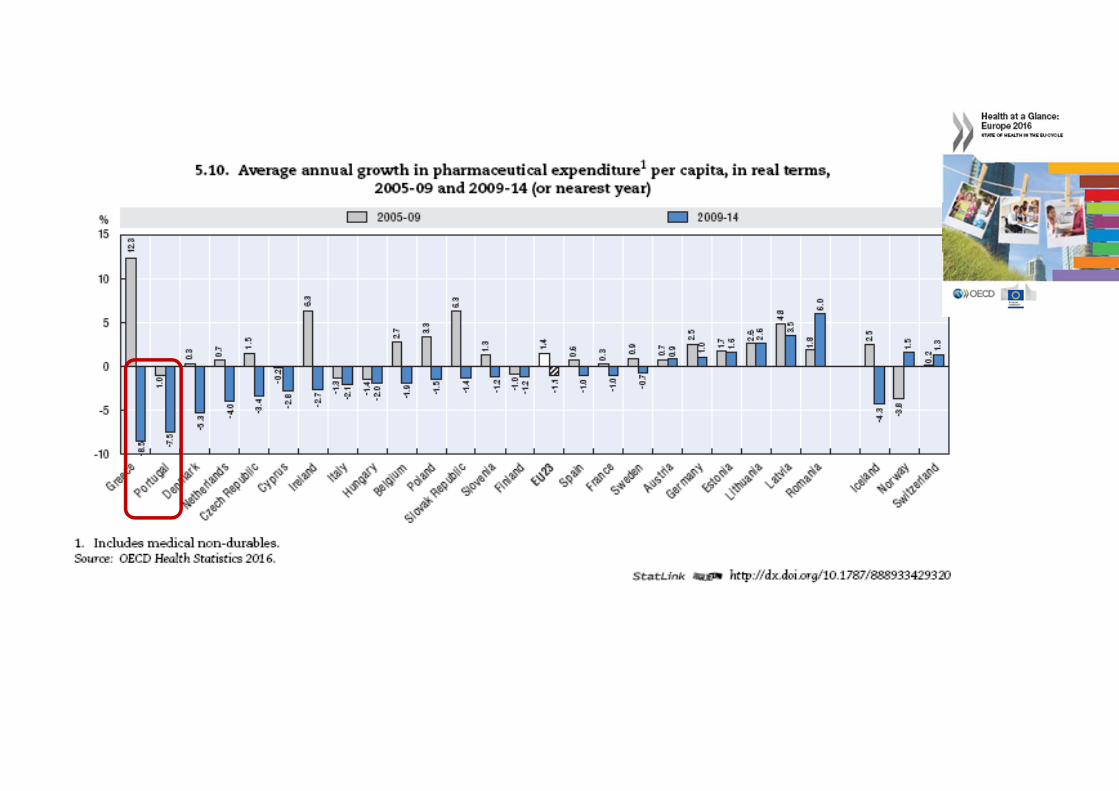
Tratamento do Cancro em Portugal
Medicamentos • Aumento da despesa (hospitais do SNS): 6 % • Aumento em quantidade: 5,5 %
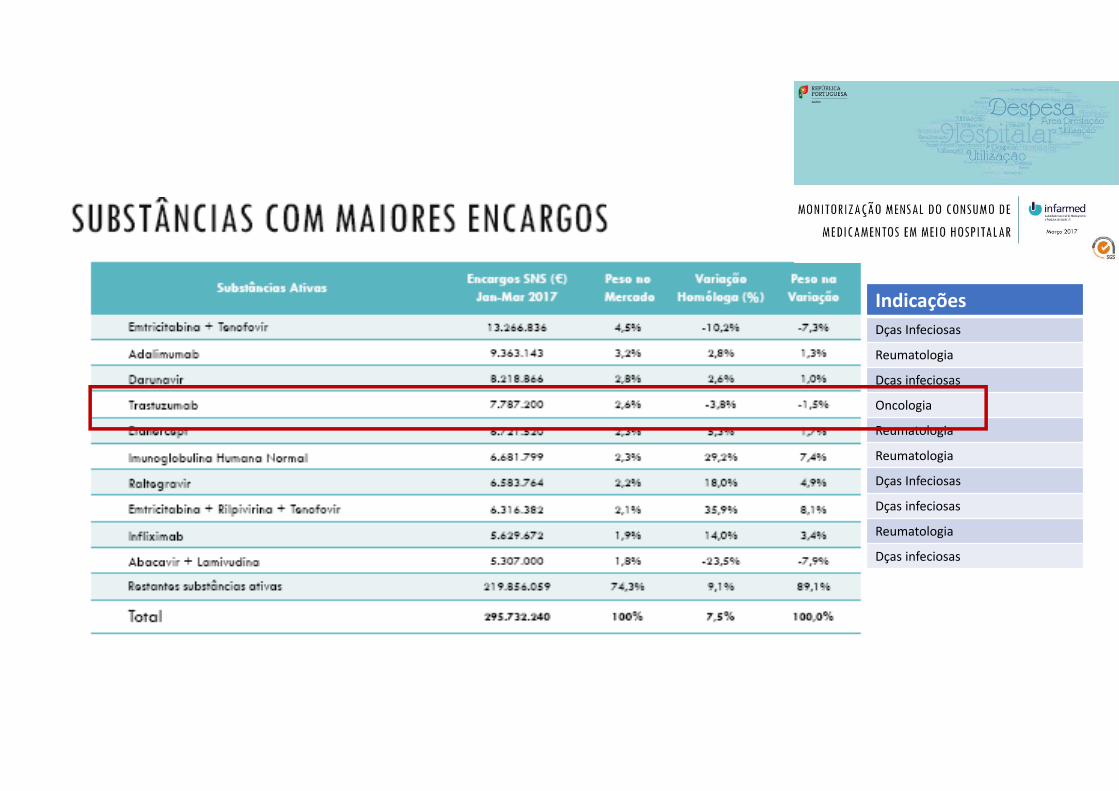
IndicaçõesDças Infeciosas
Reumatologia
Dças infeciosas
Oncologia
Reumatologia
Reumatologia
Dças Infeciosas
Dças infeciosas
Reumatologia
Dças infeciosas
Desafios da Imuno‐Oncologia
• Equidade no tratamento• Seleção dos doentes (fatores preditores de resposta)• Biologia (tumor vs hospedeiro)
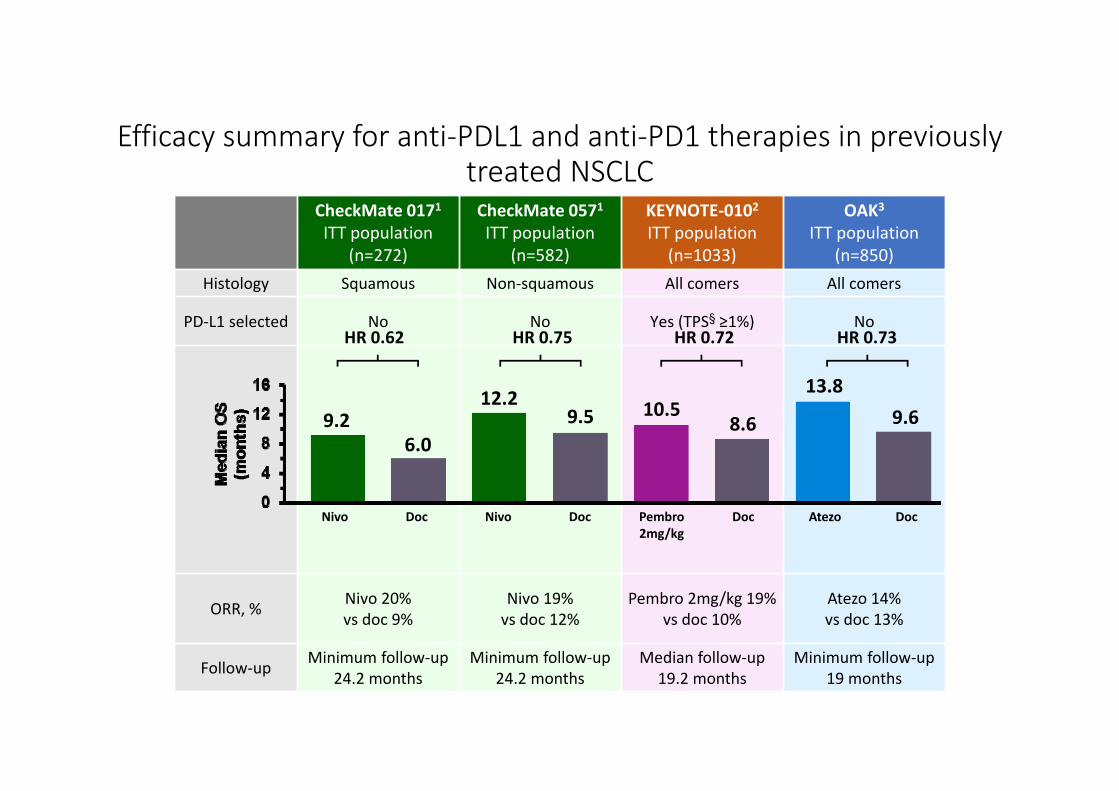
Efficacy summary for anti‐PDL1 and anti‐PD1 therapies in previously treated NSCLC
*Phase III dose: 2mg/kg q3w and 10mg/kg q3w; §Tumour proportion score (TPS) is the proportion of viable tumour cells showing partial or complete membrane PD-L1 expression
Barlesi, et al. ESMO 2016 (Abs. 1215PD)Herbst, et al. ESMO 2016 (Abs. LBA48)Barlesi, et al. ESMO 2016 (Abs. LBA44)
CheckMate 0171ITT population
(n=272)
CheckMate 0571ITT population
(n=582)
KEYNOTE‐0102ITT population
(n=1033)
OAK3
ITT population(n=850)
Histology Squamous Non‐squamous All comers All comers
PD‐L1 selected No No Yes (TPS§ ≥1%) No
ORR, % Nivo 20% vs doc 9%
Nivo 19% vs doc 12%
Pembro 2mg/kg 19%vs doc 10%
Atezo 14% vs doc 13%
Follow‐up Minimum follow‐up 24.2 months
Minimum follow‐up 24.2 months
Median follow‐up19.2 months
Minimum follow‐up 19 months
HR 0.62 HR 0.75 HR 0.73
Nivo Doc Nivo Doc Atezo Doc
HR 0.72
Pembro2mg/kg
Doc
13.89.69.2
6.09.5
12.2 10.58.6
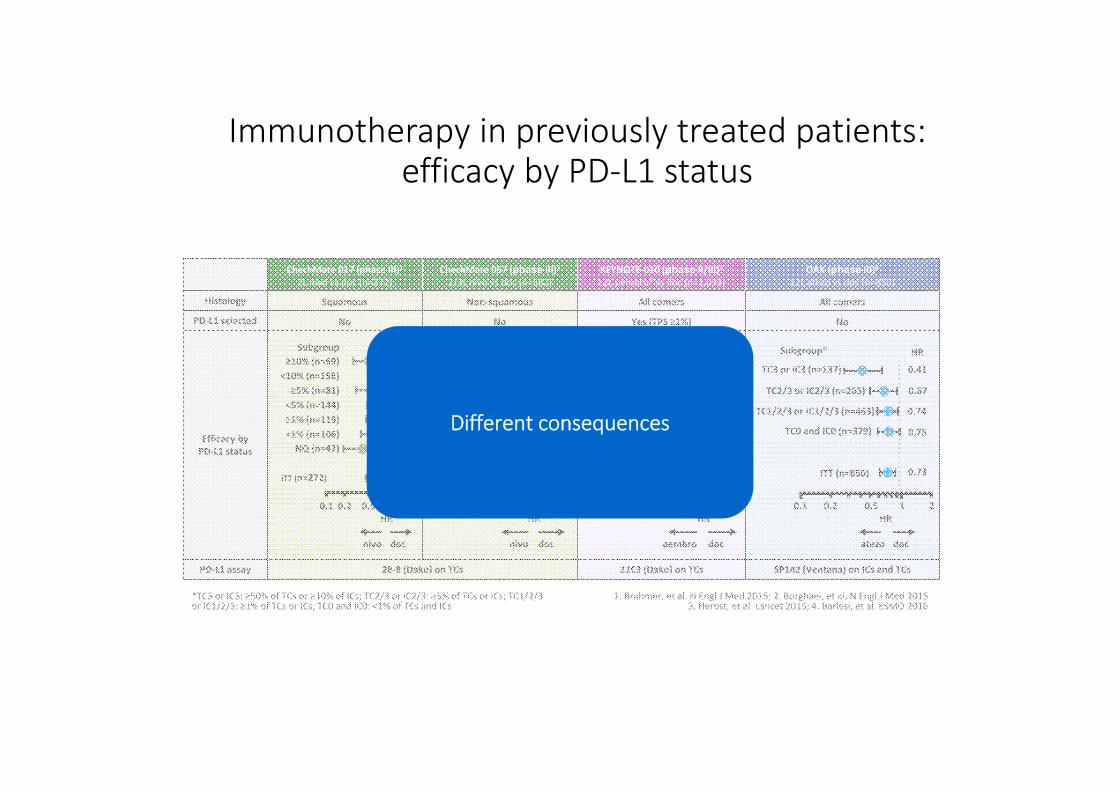
Immunotherapy in previously treated patients: efficacy by PD‐L1 status
*TC3 or IC3: ≥50% of TCs or ≥10% of ICs; TC2/3 or IC2/3: ≥5% of TCs or ICs; TC1/2/3 or IC1/2/3: ≥1% of TCs or ICs; TC0 and IC0: <1% of TCs and ICs
1. Brahmer, et al. N Engl J Med 2015; 2. Borghaei, et al. N Engl J Med 2015 3. Herbst, et al. Lancet 2015; 4. Barlesi, et al. ESMO 2016
CheckMate 017 (phase III)12L nivo vs doc (n=272)
CheckMate 057 (phase III)22/3L nivo vs doc (n=582)
KEYNOTE‐010 (phase II/III)3≥2L pembro¶ vs doc (n=1,033)
OAK (phase III)4≥2L atezo vs doc (n=850)
Histology Squamous Non‐squamous All comers All comers
PD‐L1 selected No No Yes (TPS ≥1%) No
Efficacy by PD‐L1 status
PD‐L1 assay 28‐8 (Dako) on TCs 22C3 (Dako) on TCs SP142 (Ventana) on ICs and TCs
0.53
0.76
HR
1–49% (n=591)
≥50% (n=442)
Subgroup (pooled doses)
doc
HR
pembro
0.1 1 20.50.2
0.67ITT (n=1,033)
≥5% (n=81)<5% (n=144)
≥10% (n=69)<10% (n=156)
≥1% (n=119)<1% (n=106)
ITT (n=272)
0.690.58
0.530.70
0.500.70
0.39
0.59
HRSubgroup
doc
HR
nivo
0.1 1 20.50.2
NQ (n=47)
≥5% (n=181)<5% (n=274)
≥10% (n=165)<10% (n=290)
≥1% (n=246)<1% (n=209)
ITT (n=582)
0.580.87
0.430.96
0.400.96
0.72
HRSubgroup
doc
HR
nivo
0.1 1 20.50.2
docatezo
HR
TC1/2/3 or IC1/2/3 (n=463)
TC0 and IC0 (n=379)
TC3 or IC3 (n=137)
TC2/3 or IC2/3 (n=265)
ITT (n=850) 0.73
0.41
0.67
0.74
0.75
HRSubgroup*
<1% not available study design
210.1 0.2 0.5
Different consequences
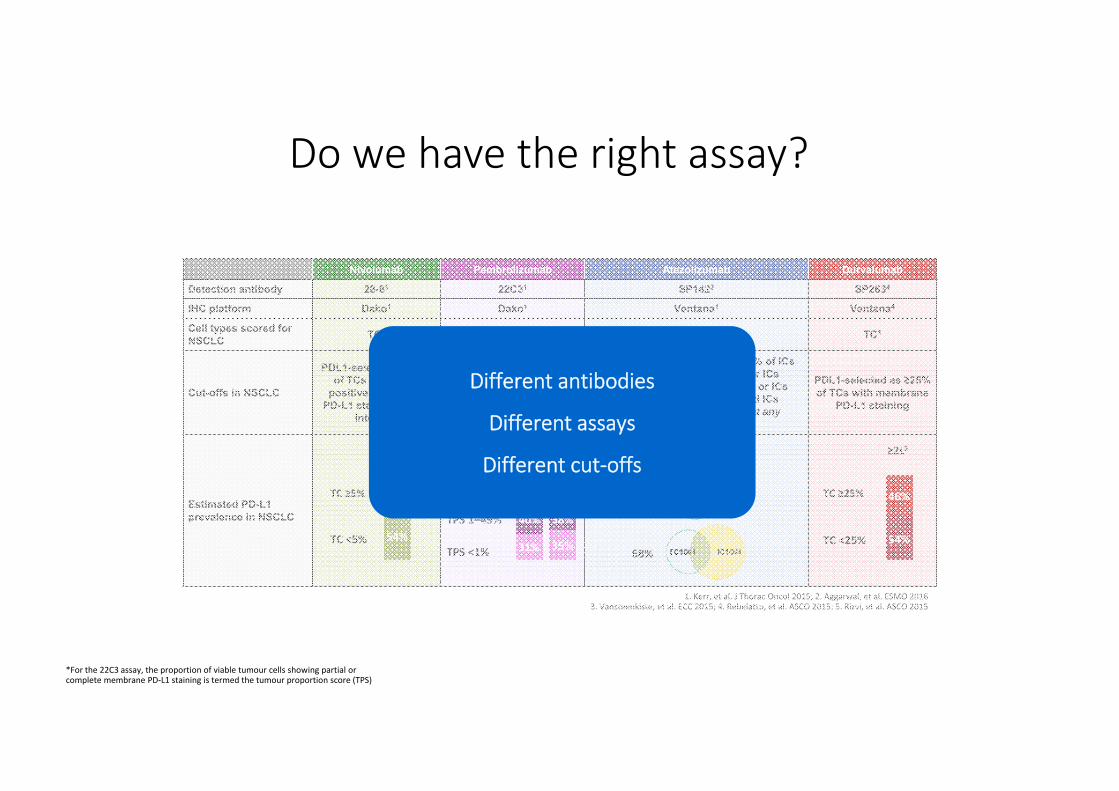
Nivolumab Pembrolizumab Atezolizumab Durvalumab
Detection antibody 28-81 22C31 SP1423 SP2634
IHC platform Dako1 Dako1 Ventana1 Ventana4
Cell types scored for NSCLC TC1 TC1 IC and TC1,3 TC1
Cut-offs in NSCLC
PDL1-selected as ≥5% of TCs exhibiting
positive membrane PD-L1 staining at any
intensity
PDL1-selected as ≥50% (treatment-naïve) or ≥1%
(previously treated) of viable TCs showing partial
or complete membrane PD-L1 expression*
TC3 or IC3: ≥50% of TCs or ≥10% of ICsTC2/3 or IC2/3: ≥5% of TCs or ICs
TC1/2/3 or IC1/2/3: ≥1% of TCs or ICsTC0 and IC0: <1% of TCs and ICs(proportion of cells stained at any
intensity)
PDL1-selected as ≥25% of TCs with membrane
PD-L1 staining
Estimated PD-L1 prevalence in NSCLC
Do we have the right assay?
*For the 22C3 assay, the proportion of viable tumour cells showing partial or complete membrane PD‐L1 staining is termed the tumour proportion score (TPS)
1. Kerr, et al. J Thorac Oncol 2015; 2. Aggarwal, et al. ESMO 2016 3. Vansteenkiste, et al. ECC 2015; 4. Rebelatto, et al. ASCO 2015; 5. Rizvi, et al. ASCO 2015
37%
68%
16%
TC <5%
TC ≥5%
≥2L1
54%
46%
TC <25%
TC ≥25%
≥2L5
54%
46%
TPS <1%
TPS 1–49%
TPS ≥50%
1L2 ≥2L2
31% 35%
40% 38%
30% 27%
Different antibodies
Different assays
Different cut‐offs
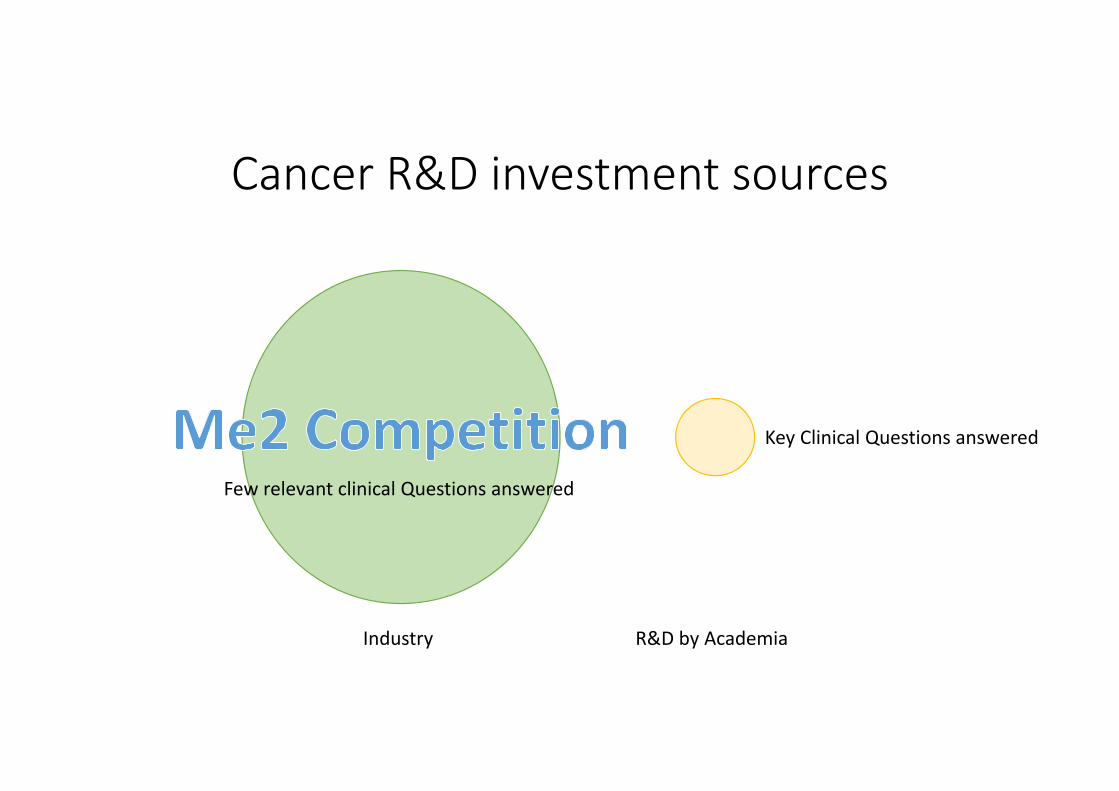
Cancer R&D investment sources
Industry R&D by Academia
Few relevant clinical Questions answered
Key Clinical Questions answered
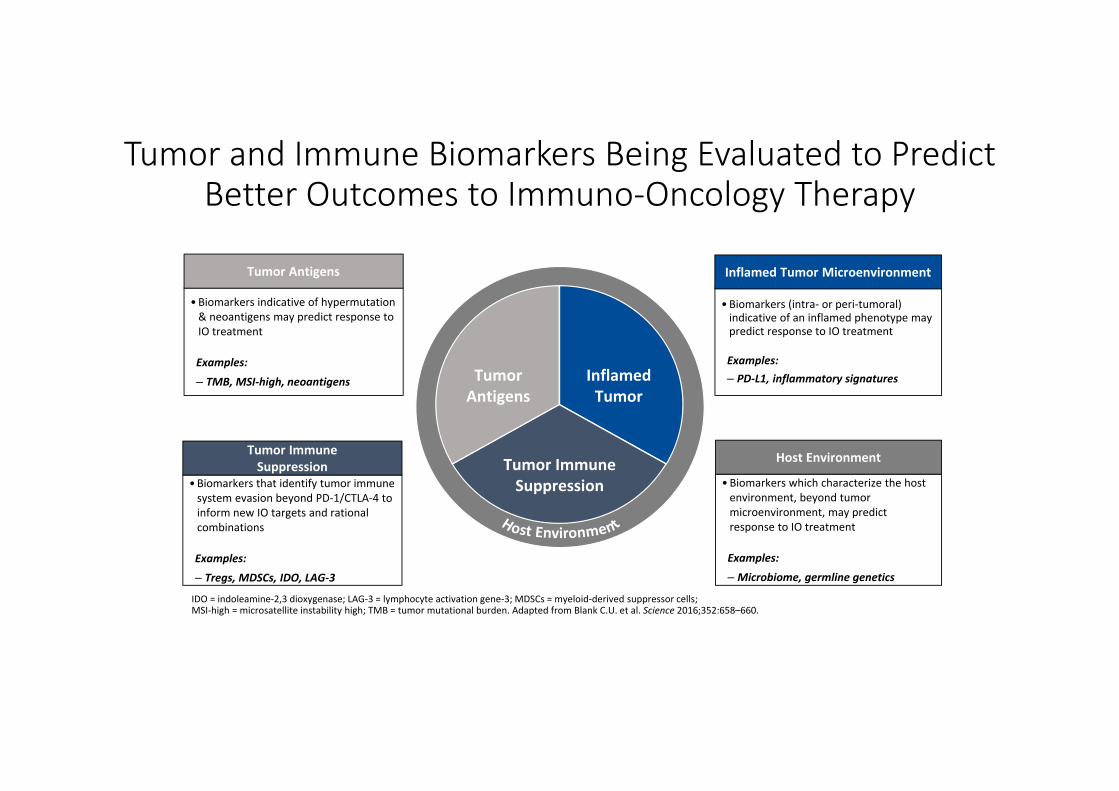
•Biomarkers indicative of hypermutation & neoantigens may predict response to IO treatment
Examples:
‒ TMB, MSI‐high, neoantigens
Tumor Antigens
•Biomarkers that identify tumor immune system evasion beyond PD‐1/CTLA‐4 to inform new IO targets and rational combinations
Examples:
‒ Tregs, MDSCs, IDO, LAG‐3
Tumor Immune Suppression
•Biomarkers (intra‐ or peri‐tumoral) indicative of an inflamed phenotype may predict response to IO treatment
Examples: ‒ PD‐L1, inflammatory signatures
Inflamed Tumor Microenvironment
•Biomarkers which characterize the host environment, beyond tumor microenvironment, may predict response to IO treatment
Examples:
‒ Microbiome, germline genetics
Host Environment
Tumor Antigens
Tumor Immune Suppression
Inflamed Tumor
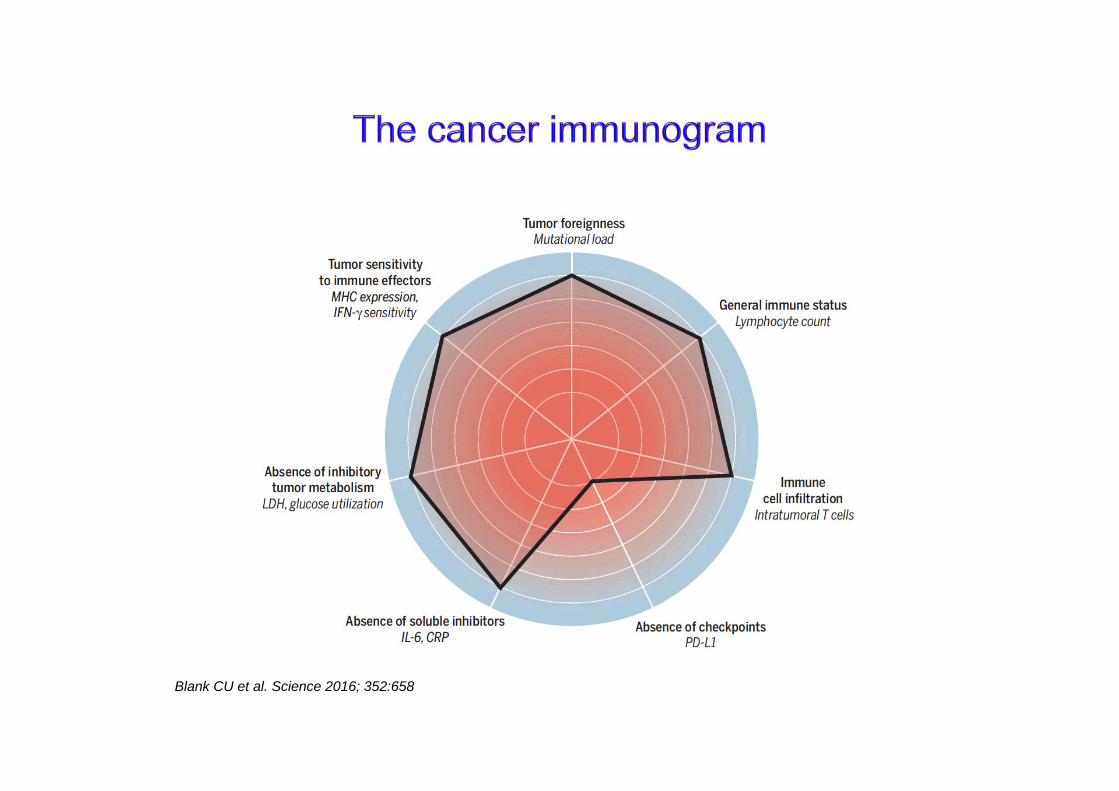
IDO = indoleamine‐2,3 dioxygenase; LAG‐3 = lymphocyte activation gene‐3; MDSCs = myeloid‐derived suppressor cells; MSI‐high = microsatellite instability high; TMB = tumor mutational burden. Adapted from Blank C.U. et al. Science 2016;352:658–660.
Tumor and Immune Biomarkers Being Evaluated to Predict Better Outcomes to Immuno‐Oncology Therapy
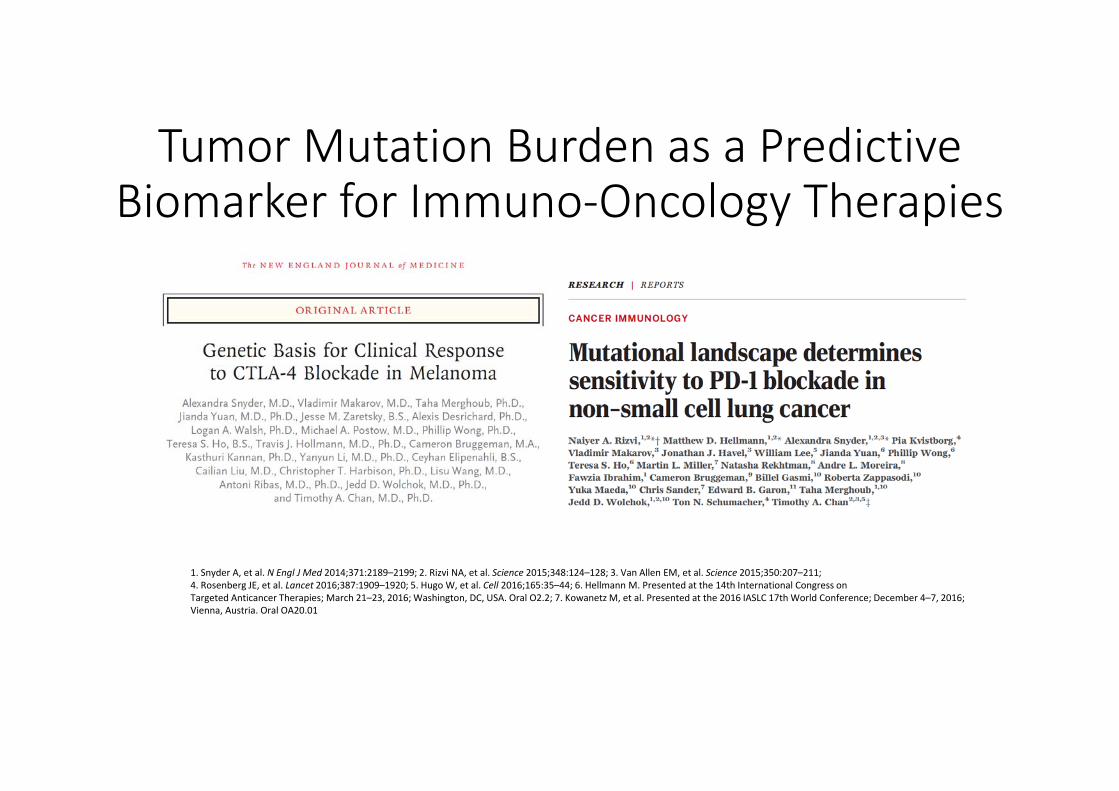
Tumor Mutation Burden as a PredictiveBiomarker for Immuno‐Oncology Therapies
1. Snyder A, et al. N Engl J Med 2014;371:2189–2199; 2. Rizvi NA, et al. Science 2015;348:124–128; 3. Van Allen EM, et al. Science 2015;350:207–211; 4. Rosenberg JE, et al. Lancet 2016;387:1909–1920; 5. Hugo W, et al. Cell 2016;165:35–44; 6. Hellmann M. Presented at the 14th International Congress on Targeted Anticancer Therapies; March 21–23, 2016; Washington, DC, USA. Oral O2.2; 7. Kowanetz M, et al. Presented at the 2016 IASLC 17th World Conference; December 4–7, 2016; Vienna, Austria. Oral OA20.01
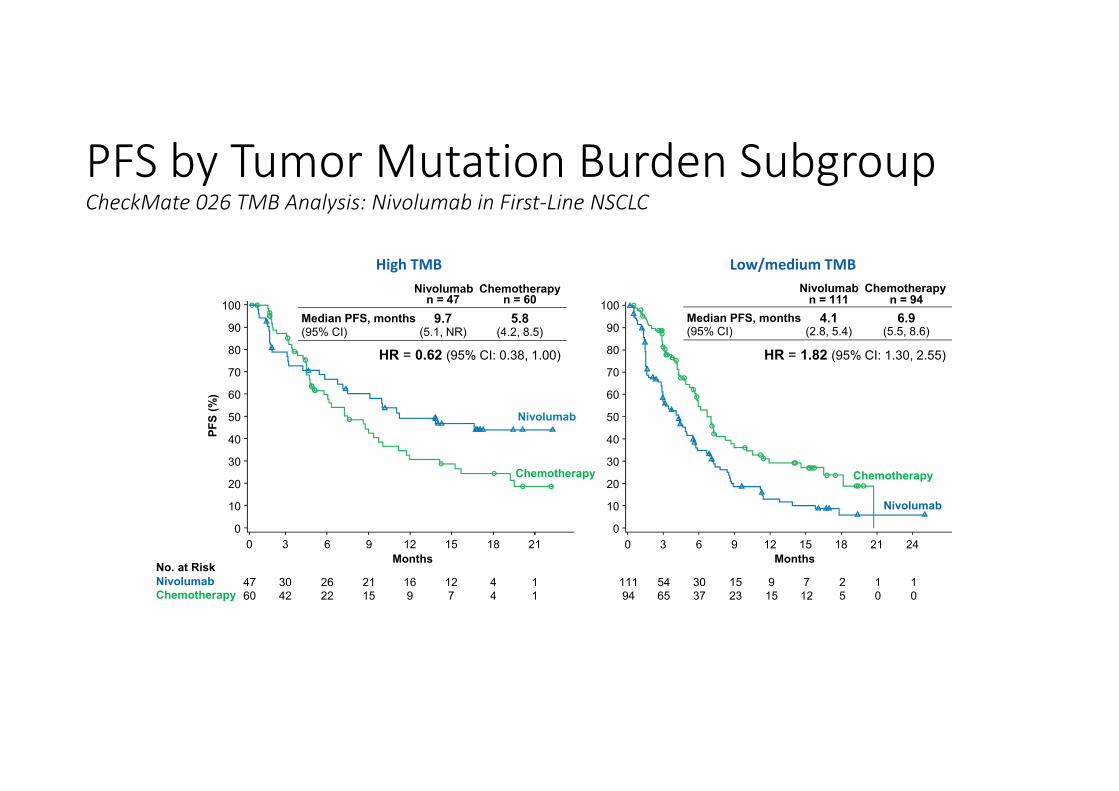
PFS by Tumor Mutation Burden SubgroupCheckMate 026 TMB Analysis: Nivolumab in First‐Line NSCLC
NivolumabChemotherapy
47 30 26 21 16 12 4 160 42 22 15 9 7 4 1
111 54 30 15 9 7 2 1 194 65 37 23 15 12 5 0 0
Nivolumabn = 47 n = 60
9.7(5.1, NR)
5.8(4.2, 8.5)
Chemotherapy
Median PFS, months(95% CI)
High TMB
PFS
(%)
3 6 9 12 15 18 21
No. at RiskMonths
100
90
80
70
60
50
40
30
20
10
00
Nivolumab
Chemotherapy
0 3 6 9 12Months
15 18 21 24
Nivolumab
Chemotherapy
100
90
80
70
60
50
40
30
20
10
0
n = 111 n = 944.1
(2.8, 5.4)6.9
(5.5, 8.6)
HR = 1.82 (95% CI: 1.30, 2.55)
Nivolumab Chemotherapy
(95% CI)Median PFS, months
Low/medium TMB
HR = 0.62 (95% CI: 0.38, 1.00)
Blank CU et al. Science 2016; 352:658
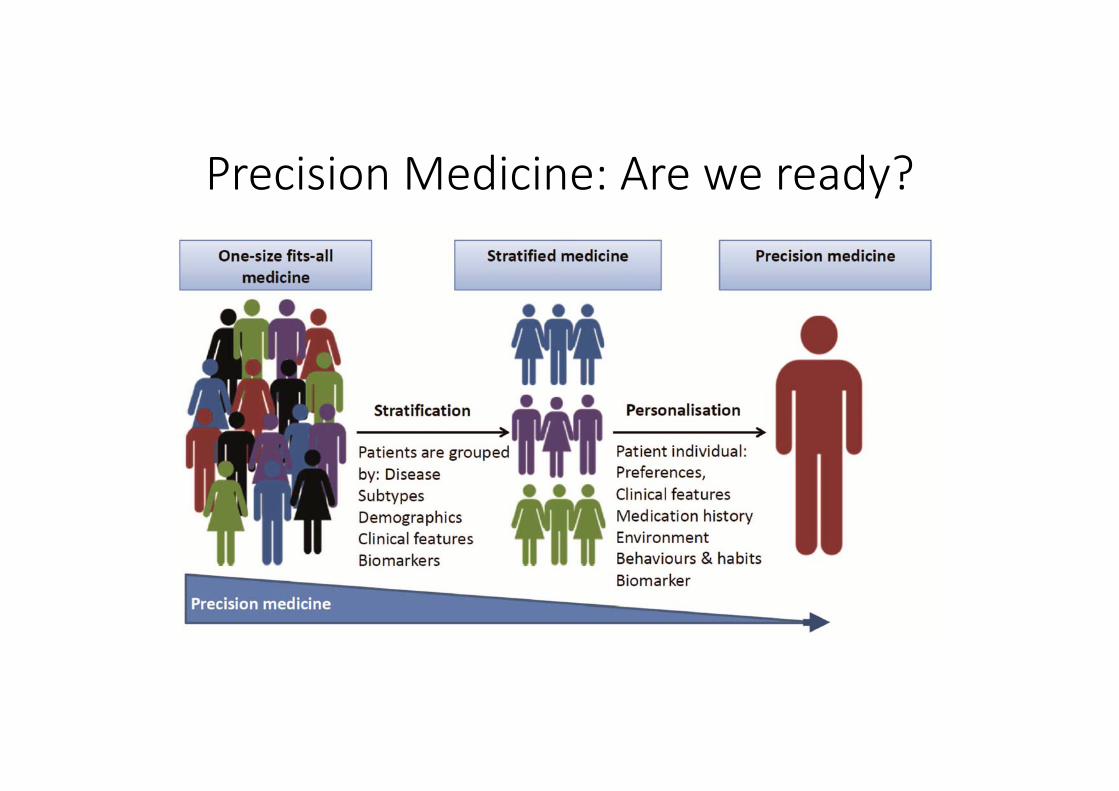
Precision Medicine: Are we ready?
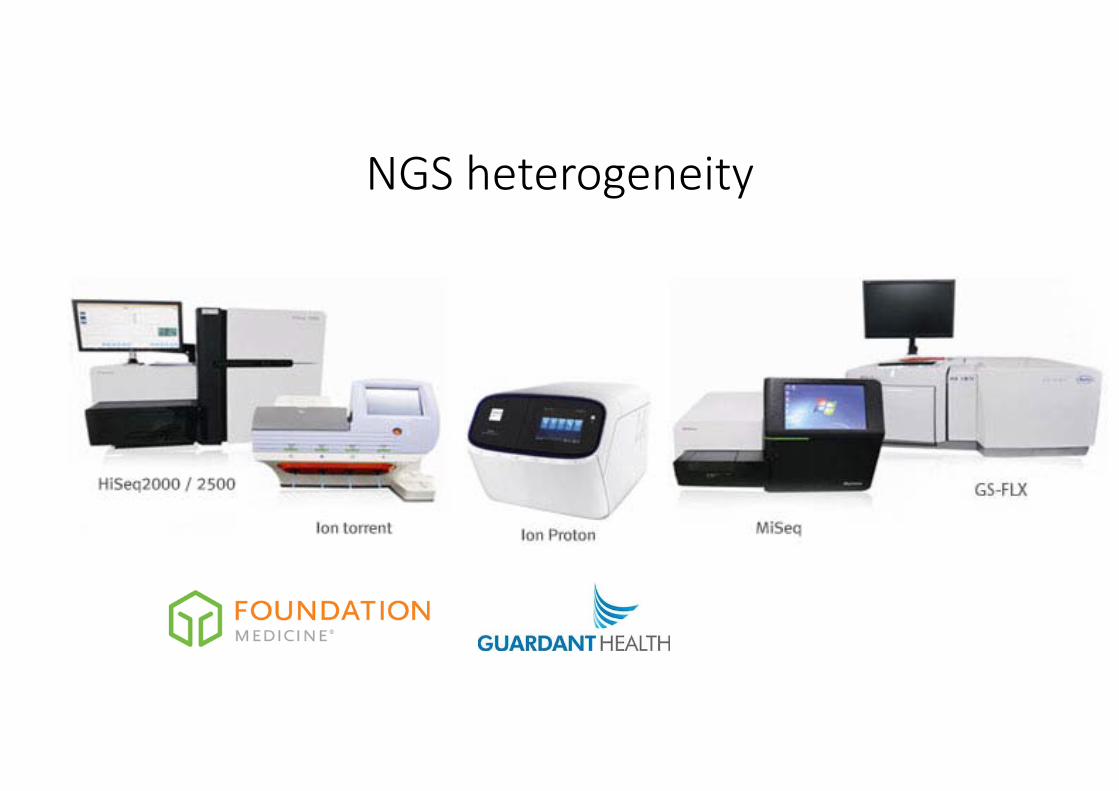
NGS heterogeneity

The French project
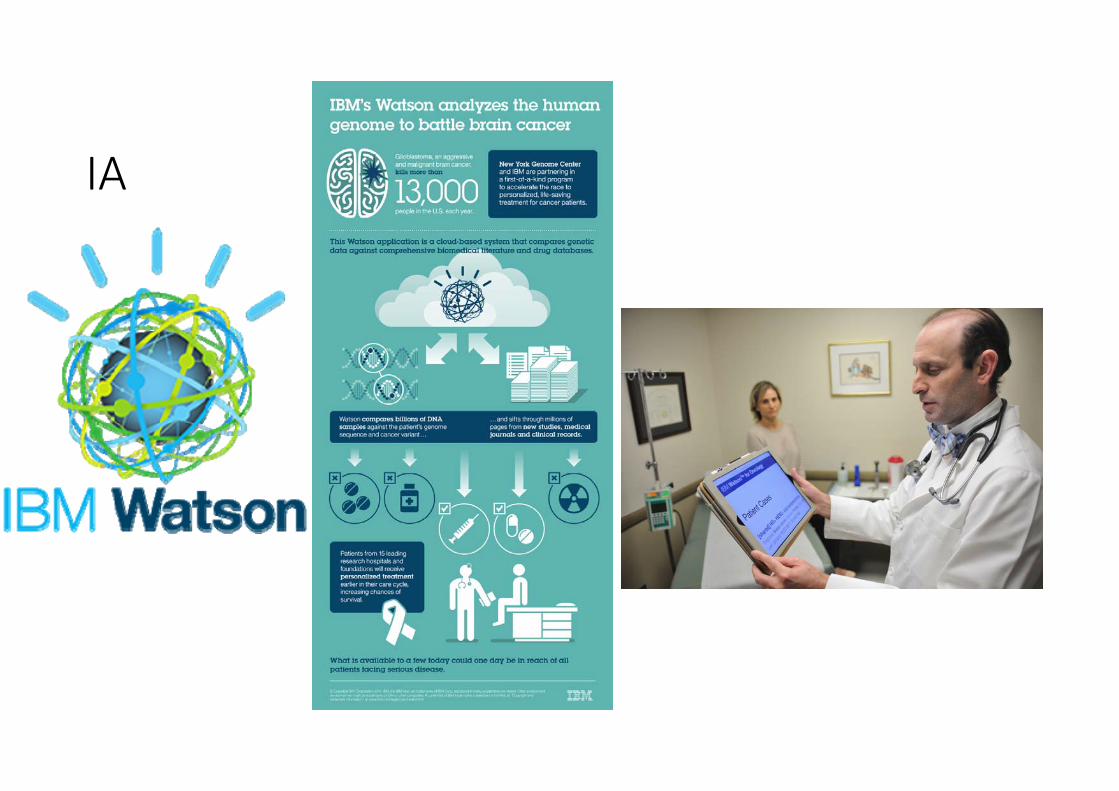
IA
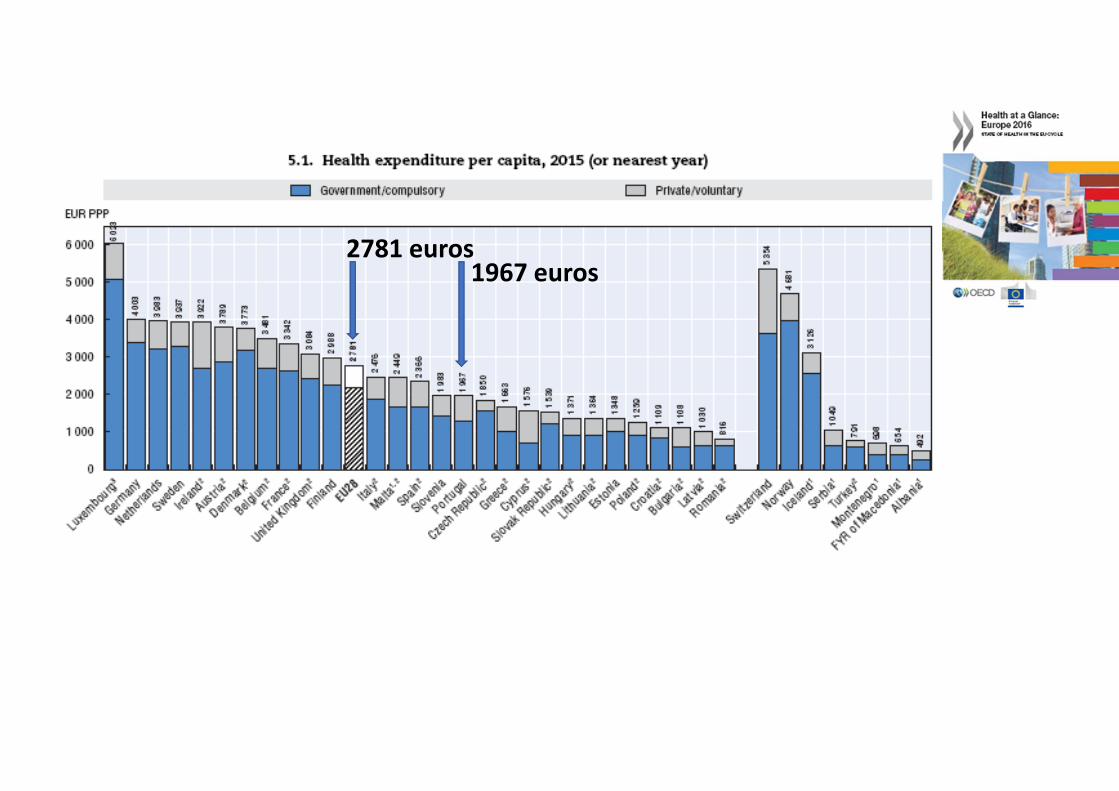
1967 euros 2781 euros