
Potential for ORC Application in the Portuguese ...Mariana Walter de Freitas Pereira Marques...
133
Mariana Walter de Freitas Pereira Marques Licenciada em Ciências de Engenharia do Ambiente Potential for ORC Application in the Portuguese Manufacturing Industry Dissertação para obtenção do Grau de Mestre em Engenharia do Ambiente, perfil Gestão e Sistemas Ambientais Orientador: João Joanaz de Melo, Professor Auxiliar com Agregação, Faculdade de Ciências e Tecnologia, Universidade Nova de Lisboa. Júri: Presidente: Prof. Doutora Maria Júlia Fonseca de Seixas Arguente: Prof. Doutor Henrique Aníbal Santos de Matos Abril de 2014
Transcript of Potential for ORC Application in the Portuguese ...Mariana Walter de Freitas Pereira Marques...

Mariana Walter de Freitas Pereira Marques
Licenciada em Ciências de Engenharia do Ambiente
Potential for ORC Application in the Portuguese Manufacturing Industry
Dissertação para obtenção do Grau de Mestre em Engenharia do Ambiente, perfil Gestão e Sistemas Ambientais
Orientador: João Joanaz de Melo, Professor Auxiliar com Agregação, Faculdade de Ciências e Tecnologia,
Universidade Nova de Lisboa.
Júri:
Presidente: Prof. Doutora Maria Júlia Fonseca de Seixas
Arguente: Prof. Doutor Henrique Aníbal Santos de Matos
Abril de 2014

ii
Mariana Walter de Freitas Pereira Marques
Licenciada em Ciências de Engenharia do Ambiente
Potential for ORC application in the Portuguese Manufacturing Industry
Dissertação para obtenção do Grau de Mestre em Engenharia do Ambiente, perfil Gestão e Sistemas Ambientais
Orientador: João Joanaz de Melo, Professor Auxiliar com Agregação, Faculdade de Ciências e Tecnologia,
Universidade Nova de Lisboa.
Júri:
Presidente: Prof. Doutora Maria Júlia Fonseca de Seixas Arguente: Prof. Doutor Henrique Aníbal Santos de Matos
Abril de 2014

ii

iii
POTENTIAL FOR ORC APPLICATION IN THE PORTUGUESE MANUFACTURING INDUSTRY
Copyright © Mariana Walter de Freitas Pereira Marques, Faculdade de Ciências e Tecnologia, Universidade Nova de Lisboa
A Faculdade de Ciências e Tecnologia e a Universidade Nova de Lisboa têm o direito, perpétuo e sem limites geográficos, de arquivar e publicar esta dissertação através de exemplares impressos reproduzidos em papel ou de forma digital, ou por qualquer outro meio conhecido ou que venha a ser inventado, e de a divulgar através de repositórios científicos e de admitir a sua cópia e distribuição com objectivos educacionais ou de investigação, não comerciais, desde que seja dado crédito ao autor e editor.
The Faculty of Science and Technology and the New University of Lisbon have the right, perpetual and without geographical boundaries, to archive and publish this dissertation through printed copies reproduced on paper or digital form, or by any other means known or which may be invented, and its promotion through scientific repositories and admit its copy and distribution for educational or research purposes, non-commercial, as long as credit is given to the author and publisher.

iv

v
ACKNOWLEDGEMENTS
First of all, I would like to give a special thanks to all those that directly contributed for the success of my work, kindly helped me and provided all the information and orientation I needed.
To my orientation teacher, Professor João Joanaz de Melo, for the willingness to discuss and advice throughout all this time, and to all those that make my faculty, FCT-UNL, a source of motivated and powerful students.
To the Directorate General for Energy and Geology, in the person of João Bernardo, for providing the data in which this Thesis was based.
To Mr. Francesco Campana, in representation of Turboden s.r.l., for the willingness to constantly answer to my questions, provide information and documents that were key for the present work, and later to receive me in person at Turboden.
To Mr. Manuel Silva, in representation of Suldouro, for the willingness to always clarify my doubts and provide information on the case study of Sermonde.
To Mr. Frederico Monteiro and Professor Daniel Vaz for the willingness to meet in person and discuss technical issues. To Mr. Pedro Costa, in representation of ERSE, for the willingness to answer to my specific questions.
Secondly, I would like to dedicate my Thesis to my mother as a reward for everything she ever invested in my education and my success, my life and my happiness. I know I already make you proud but this is a recognition of your recognition, thank you for everything!
A special thanks to all my family: my grandparents for being an eternal role model for the young people; to my older brother for all the constant inception about the importance of educating yourself and for the complicity of being the tutors of one another in our special way; to my aunts and uncles for all the orientation and advices, all that intermediate maturity and coaching that I will still be looking for in much more years to come!
To all my friends for always supporting me and making my life an adventure. Special thanks to: my fellow students and friends, Ana Barradinhas, Vanessa Tavares, Ana Cristina Rodrigues, Catarina Oliveira, Sandra Gonçalves and Marta Alves; to all my great friends for life, Marta Osório, Catarina Freitas, Catarina Pimentel, Catarina Girão, Catarina Marques, Joana Costa Pereira, Marta Candeias, Bárbara Rodrigues, Bruno Lopes, Francisco Lopes e Pedro Sá; to Sofia Vistas and Ricardo Bangueses, my dear friends and rescuers of software-panic situations; to Apostolhs Pantazis for all the support and lovely story together; to all my foreign and missed friends, Muito obrigada!, Grazie mille!, ¡Gracias!, Σαρ εςσαπιστούμε!, Paldies!, Dziękujemy!, Danke!
To my second family and magical ark of inspiration and challenges, ESN Lisboa, that taught me ―Sharing is caring‖ and all a parallel world of voluntary, addictive, constructive and lovely entrepreneurism and friendship. You and all the people we met together made my infinite time of work an infinite time of pleasure and adventure.
“It’s only impossible until it’s done.”
“What you think, you become.”
Mariana

vi
vii
RESUMO
A Directiva Europeia para a Eficiência Energética (Directiva 2012/27/EU) entrou em vigor em 2012 para tornar a meta de Eficiência Energética do Horizonte "20-20-20" da UE em legislação vinculativa. Cada Estado-Membro foi obrigado a definir uma meta nacional indicativa de eficiência energética de forma a alcançar uma determinada poupança de energia final em 2016. O segundo Plano Nacional de Acção para a Eficiência Energética (PNAEE 2016) Português define uma meta de 8.2% para a poupança no consumo de energia final em 2016. Cerca de 24% das poupanças estabelecidas pela meta estão concentradas na Indústria, mas menos de metade dessas poupanças foram executadas pelo PNAEE anterior (PNAEE 2008-2015) até 2010.
Grandes oportunidades de poupança existem ainda, tais como a possibilidade de recuperação das grandes quantidades de calor desperdiçado pelos processos industriais. Algumas tecnologias têm sido propostas para produzir eletricidade a partir de fontes de calor de baixa hentalpia, entre as quais o Ciclo Orgânico de Rankine (COR).
O presente trabalho tem como objectivo quantificar o calor desperdiçado em alguns sectores da indústria de manufactura Portuguesa e o potencial de aplicação de sistemas COR. A metodologia desenvolvida baseou-se na análise de 116 instalações industriais através de auditorias energéticas e outros documentos. As 50 instalações que revelaram potencial para a aplicação de COR constituíram a base das estimativas e representam 16% do consumo total energético da indústria de manufactura em 2010.
Os regimes a operar no país de apoio à produção de eletricidade a partir de fontes renováveis e cogeração não contemplam especificamente a produção através da recuperação de calor. O país carece assim de um enquadramento adequado. O presente estudo fornece uma avaliação preliminar dos benefícios alcançáveis através da geração de eletricidade a partir de fontes de calor desperdiçado, e procura motivar o Governo a concentrar esforços futuros na inclusão dos sistemas COR nas estratégias nacionais como uma medida de eficiência energética na indústria .
Um total de 8 setores industriais foram analisados, mas apenas 4 estão incluídos no universo final: Cerâmica, Cimento , Metais de base (Siderurgia e Metalurgia) e Madeira & Cortiça. Para estes, unidades COR de potência instalada de 48 kWe a 3.3 MWe são viáveis, demostrando períodos de retorno normalmente entre 2 e 6 anos.
Para um investimento estimado em 104 M€ em sistemas COR instalado nos sectores da Cerâmica, Cimento , Metais de base e Madeira & Cortiça, uma potência elétrica instalada total de 37 MWe pode significar a execução de 5.2 a 6.6% da meta Portuguesa de Eficiência Energética (2016) para a Indústria, com emissões evitadas associadas de 132 kt CO2e/ano.
TERMOS-CHAVE: COR, recuperação de calor, Indústria de Manufactura, Meta de eficiência energética

viii
ix
ABSTRACT
The European Directive on Energy Efficiency (Directive 2012/27/EU) entered into force in 2012 to translate the EU ―20-20-20‖ Efficiency Target into binding legislation. Each Member State was obligated to set an indicative national energy efficiency target and to achieve a certain amount of final energy savings by 2016. The second Portuguese National Action Plan for Energy Efficiency (PNAEE 2016) defines a target of 8.2% for savings on final energy consumption by 2016. Savings in Industry account for 24% of the target, but less than half of it was executed through the former Plan (PNAEE 2008-2015), by the end of 2010.
Worthwhile energy saving opportunities remains such as the recovery of the great amounts of wasted heat in industrial processes. Some technologies have been proposed to generate electricity from low temperature heat sources, among which the Organic Rankine Cycle (ORC).
The present work assesses the wasted heat in some sectors of the Portuguese manufacture industry and the potential to implement ORC systems. The methodology developed was based on the analysis of 116 industrial plants through energy audits and other documents. The 50 plants that revealed potential for ORC implementation were the base for estimations and represent 16% of the manufacture industry total energy consumption in 2010.
The national support schemes for power generation from renewable resources and cogeneration do not contemplate specifically the electricity production through waste heat recovery. Therefore, the country lacks on an appropriate framework. This study provides a preliminary assessment of the benefits reachable through waste heat-to-power generation and intends to help focus future efforts by the government on the inclusion of ORC in national strategies as an energy efficiency measure in Industry.
A total of 8 sectors were analysed but only 4 are included in the final universe: Ceramic, Cement, Basic metals and Wood & Cork. For these, ORC units of 48 kWe to 3.3 MWe installed power are feasible, showing payback times typically between 2 and 6 years.
For an estimated total investment of 104 M€ in ORC systems in the Ceramic, Cement, Basic metals and Wood & Cork industries, about 37 MWe installable power could mean executing 5.2 to 6.6% of the Portuguese 2016 Target of savings on Final Energy consumption in Industry, with associated avoided emissions of 132 kt CO2e/year.
KEY-WORDS: ORC, Waste heat recovery, Manufacture Industry, Energy Efficiency target.

x
xi
INDEX OF FIGURES ................................................................................................................................ xiii
INDEX OF TABLES ................................................................................................................................... xv
ACRONYMS AND ABBREVIATIONS ........................................................................................................ xvii
1 INTRODUCTION .................................................................................................................................. 1
1.1 Framework ..................................................................................................................................... 1
1.2 Objectives ...................................................................................................................................... 2
1.3 Organization of the work ................................................................................................................ 2
2 WASTE HEAT RECOVERY FOR POWER GENERATION IN THE MANUFACTURING INDUSTRY ................................................................................................................................................................ 5
2.1 Framework ..................................................................................................................................... 5
2.2 Factors affecting Waste Heat Recovery feasibility ........................................................................ 6
2.3 Sources of Low-grade Waste Heat and Potential for Power Generation ...................................... 9
2.3.1 Cross-cutting sources in Industry ........................................................................................... 9
2.3.2 Sources by Industrial sector and Heat Recovery practices .................................................. 10
2.4 WHRPG in Industry in a Political and Economic framework ....................................................... 20
2.4.1 Project feasibility ................................................................................................................... 21
2.5 Energy and Energy Efficiency in Portuguese Industry ................................................................ 22
2.5.1 Framework and late developments....................................................................................... 22
2.5.2 Funds for Energy Efficiency and Remuneration Regimes for the Production of Electricity .. 25
2.5.3 Conclusion ............................................................................................................................ 26
2.5.4 Case studies in Portugal ....................................................................................................... 27
3 LOW-GRADE WASTE HEAT RECOVERY TECHNOLOGIES FOR POWER GENERATION ........ 29
3.1 Power cycles ................................................................................................................................ 29
3.2 Working Fluids ............................................................................................................................. 31
3.3 Organic Rankine Cycle (ORC) ..................................................................................................... 34
3.3.1 History and Applications ....................................................................................................... 34
3.3.2 The market ............................................................................................................................ 35
3.3.3 Comparison to Steam Rankine cycle.................................................................................... 40
3.3.4 System working conditions and configuration ...................................................................... 41
3.3.5 Working Fluids ...................................................................................................................... 43
3.3.6 Mechanical components and optimization ............................................................................ 45
3.3.7 ORC applied to the manufacture Industry – Case Studies ................................................... 47
4 METHODOLOGY ............................................................................................................................... 51
4.1 Sequence of tasks ....................................................................................................................... 51
4.2 Characterization of the Industrial Sectors .................................................................................... 52
4.3 Conclusion on political and economic framework for ORC ......................................................... 52
4.4 Analysis of Industrial Installations ................................................................................................ 52
4.4.1 Estimation of the representativeness of samples ................................................................. 52
4.4.2 Identification and characterization of waste heat sources by installation ............................. 53
4.4.3 Quantification of low-grade waste heat by sector ................................................................. 54
4.4.4 Estimation of power generation through ORC by installation ............................................... 54
4.5 Calculation of ORC total installable power .................................................................................. 59
xii
4.6 Conclusion on benefits of ORC application for national target on Energy Efficiency .................. 59
4.7 Conclusion on benefits of ORC application on CO2 emissions ................................................... 60
4.8 Economic Evaluation ................................................................................................................... 60
4.8.1 Estimation of total investment ............................................................................................... 60
4.8.2 Estimation of payback times ................................................................................................. 61
5 RESULTS........................................................................................................................................... 63
5.1 Characterization of the Industrial Sectors .................................................................................... 63
5.2 Conclusion on political and economic framework for ORC ......................................................... 64
5.2.1 Integration in national strategies and remuneration regimes ............................................... 64
5.2.2 Integration in funds for energy efficiency .............................................................................. 65
5.3 Analysis of the Industrial installations .......................................................................................... 66
5.3.1 Estimation of the representativeness of samples ................................................................. 66
5.3.2 Identification and characterization of waste heat sources by installation ............................. 68
5.3.3 Quantification of low-grade waste heat by sector ................................................................. 73
5.3.4 Estimation of power generation through ORC by installation ............................................... 73
5.4 Calculation of ORC total installable power .................................................................................. 78
5.5 Conclusion on benefits of ORC application for national target on Energy Efficiency .................. 79
5.6 Conclusion on benefits of ORC application on CO2e emissions ................................................. 79
5.7 Economic Evaluation ................................................................................................................... 80
6 CONCLUSION ................................................................................................................................... 83
6.1 Synthesis of the developed work ................................................................................................. 83
6.2 Synthesis of the main results ....................................................................................................... 83
6.3 Limitations of the work ................................................................................................................. 84
6.4 Future developments ................................................................................................................... 85
REFERENCES ...................................................................................................................................... 87
ANNEX I ................................................................................................................................................ 97
ANNEX II ............................................................................................................................................. 100
xiii
INDEX OF FIGURES
Figure 2.1 - The influence of temperature differential between heat source and sink on the heat exchange surface area varying with heat transfer coefficient (U). ..................................................................................... 8
Figure 2.2 - Heat recovery curve for natural gas-fired boiler (adapted from BCS Incorporated, 2008). .................. 8
Figure 2.3 - Energy losses by source and process unit in a 200 000 bbl/d refinery plant (adapted from Meacher, 1981). .................................................................................................................................................................... 12
Figure 2.4 - Generic wet sulfuric acid process and opportunities for HR. .............................................................. 12
Figure 2.5 - Schematic diagram of a generic tunnel kiln (a) and an example of a combined heat recycling system (b) (adapted from EC, 2007). ................................................................................................................................ 14
Figure 2.6 - Generic cross-fired regenerative furnace (a) with heat recovery opportunities from flue gases (b), before (1) and after (2) the cleaning system (adapted from EC, 2013; Hnat et al., 1981). .................................... 15
Figure 2.7 – Possible layout of waste heat recovery systems on a cement plant using ORC (adapted from Exergy S.p.A., 2013). ........................................................................................................................................................ 17
Figure 2.8 - Gas and solids temperature profiles in a cyclone preheater kiln system (EC, 2013c). ...................... 17
Figure 2.9 - Conceivable layout for waste heat recovery from EAF using ORC (adapted from Campana, 2012). 19
Figure 2.10 - Hot rolling mill schematic (adapted from IETD, 2014). ..................................................................... 19
Figure 2.11 - Electricity prices for industrial consumers with average consumption (Eurostat Ic band price) in EU-27 with focus to Italy, Portugal and Norway (Eurostat, 2013). ............................................................................... 22
Figure 2.12 - Evolution of registrations in SGCIE (ADENE, 2014). ...................................................................... 24
Figure 2.13 - GHG emissions in Portugal by sector in 2011 (APA, 2013). ............................................................ 24
Figure 2.14 - Annual average cost of the Production in Special Regime - PRE (ERSE, 2014). ............................ 26
Figure 3.1 - Thermodynamic cycles and their temperature range (Paanu et al., 2012). ........................................ 29
Figure 3.2 - ORC efficiencies vs. Hot source Temperature: (a) total heat recovery efficiency and (b) cycle efficiency; ηP is the polyotropic efficiency (adapted from Bianchi & De Pascale, 2011). ....................................... 31
Figure 3.3 – T-s charts of isentropic, wet and dry working fluids (adapted from Quoilin et al., 2013) ................... 32
Figure 3.4 - T-s diagram of a dry and a wet fluid used in supercritical Rankine cycles (adapted from Chen, 2010) .............................................................................................................................................................................. 33
Figure 3.5 - Distribution of 35 working fluids in Tc- ξ chart with detail to common WF for ORC (adapted from Chen, 2010). ......................................................................................................................................................... 34
Figure 3.6 – ORC market evolution (Enertime, 2009). .......................................................................................... 36
Figure 3.7 - Number of references to ORC systems by country (Enertime, 2009). ............................................... 36
Figure 3.8 - Number of references to ORC system according to the heat source (Rettig et al., 2011).................. 36
Figure 3.9 - Number of ORC systems per power and temperature range (Enertime, 2009). ................................ 36
Figure 3.10 - The three main ORC manufacturers in terms of installed units and installed power (Source: Quoilin et al., 2013). .......................................................................................................................................................... 37
Figure 3.11 - Examples of ORC modules available on the market: Tri-o-Gen 165kWe (a) and Turboden 5MWe (b) power units. ........................................................................................................................................................... 37
Figure 3.12 - Comparison of a 100 kWe ORC-plant realized with (A) conventional technology and with (B) high-speed technology (same scale); 1 turbine, 2 generator, 3 reduction gear, 4 oil pump, 5 feed pump, 6 vacuum pump, 7 shaft seal (Larjola, 1995). ...................................................................................................... 38
Figure 3.13 – Triogen high-speed turbo generator (Triogen). ............................................................................... 38
Figure 3.14 - Module (empty dots) and total (plain dots) cost of ORC systems depending on the target application and on the net electrical power (adapted from Quoilin et al., 2013). .......................................... 39
Figure 3.15 - Specific cost function of ORC systems (Rettig et al., 2011). ............................................................ 39
Figure 3.16 - Cycle efficiency as function of turbine inlet temperature (Quoilin et al., 2013). ...................... 41
xiv
Figure 3.17 - T–s diagram of water and organic fluids (Vankeirsbilck et al., 2011). .............................................. 41
Figure 3.18 - Schematic view of an ORC with (a) and without (b) recuperator, with detail to ORC T-s diagram (adapted from Quoilin et al., 2013). ....................................................................................................................... 42
Figure 3.19 - WF used in ORC modules available on the market depending on the temperature of the hot source (adapted from David et al., 2011). ......................................................................................................................... 43
Figure 3.20 - Net Power Output from the ORC system at various ambient temperatures (Datla & Brasz, 2012). . 44
Figure 3.21 - ORC fluid families (Branchini et al., 2012). ...................................................................................... 44
Figure 3.22 - Allowed power range for each type of expansion machine (Quoilinet al., 2012)..................... 46
Figure 3.23 - VER values of existing ORC turbines of different technology and with specified fluids (Branchini et al., 2012). .............................................................................................................................................................. 46
Figure 3.24 - Schematic view of the Turboden turbine–recuperator–condenser assembly (Quoilin et al., 2013). . 47
Figure 3.25 - Simplified scheme of a heat recovery plant on a ceramic kiln with (A) feedpump, (B) preheater, (C) vaporizer, (D) turbine, (E) condenser, (H) stack, (M) by-pass valve and (N) cooling tower (adpated from EC, 1981). .................................................................................................................................................................... 48
Figure 3.26 - Proposed layout of a MDF plant in Metso, Turboden (COGEN, 2011). ........................................... 50
Figure 3.27 - Schematic diagram of a CHP biomass plant for sawmills with drying chambers and an ORC unit (Peretti, 2008). ...................................................................................................................................................... 50
Figure 4.1 - Illustration of a generic heat source considered for ORC systems (adapted from David et al., 2011). .............................................................................................................................................................................. 53
Figure 5.1 - Share on final energy consumption (%) in Portugal by sector of economic activity (a) and industrial sector (b) (DGEG, 2012). ...................................................................................................................................... 63
Figure 5.2 - Fluctuations of energy consumption by sector between 2008 and 2012, evidencing larger variations (DGEG, 2012). ...................................................................................................................................................... 63
Figure 5.3 - Representativeness of the main sectors of the Ceramic industry in 2010 (CTCV, 2012). .................. 64
Figure 5.4 – Observed frequency of temperatures (ºC) of the waste heat sources in FDM, Meat production & Tobacco sector...................................................................................................................................................... 69
Figure 5.5 – Observed average energy profile of Ceramic kilns and frequency of exhaust air temperatures by Ceramic subsector. ............................................................................................................................................... 70
Figure 5.6 - Distribution of the total installable power (kWe) in the Ceramic sector. .............................................. 75
Figure 5.7 - Installed power ratio (rA) of 21 analyzed cement plants (Campana, 2012). ....................................... 76
Figure 5.8 – ORC total installable power and maximum ORC unit size by sector in the Portuguese Manufacturing Industry. ................................................................................................................................................................ 79
Figure 5.9 - Avoided CO2e emissions through the application of the proposed ORC systems in the Portuguese Manufacture Industry. ........................................................................................................................................... 79
Figure 5.10 – Specific Cost of the application of ORC systems on the manufacturing industry. ........................... 80
Figure 5.11 – Allocation of the investment (M€) in the ranges of ORC installable power. ..................................... 81
xv
INDEX OF TABLES
Table 2.1 - Examples of hot sources for recovery, ranges of temperature and applicable technologies. ................ 5
Table 2.2 - Potential for heat recovery on manufacture industrial sectors (adapted from Rossetti, 2010). ........... 10
Table 2.3 - Sources of low-grade heat in food processing industry (Law et al., 2011). ......................................... 11
Table 2.4 - Typical temperatures of waste streams in integrated steelworks and limits to HR feasibility (BCS Incorporated, 2008; IETD, 2014) ........................................................................................................................... 18
Table 2.5 - Typical temperatures of waste streams in non-ferrous plants (BCS, Incorporated, 2008; EC, 2001a; Vankeirsbilck et al., 2011). .................................................................................................................................... 20
Table 2.6 - Values of the reference tariff (Tref) in PRE regime, published in Order Nº1/2014, applicable on the first trimester of 2014 (DGEG, 2014; ERSEa, 2014). ................................................................................................... 26
Table 2.7 - Average Annual Cost by Technology – mainland Portugal (ERSEa, 2014a). ..................................... 26
Table 3.1 - Capital cost of different technologies for waste heat recovery for power generation (BCS, Incorporated, 2008). .............................................................................................................................................. 40
Table 4.1 - General methodology and sequence of works of the present study. ................................................... 51
Table 4.2 - Adopted WF for considered ranges of the hot source temperature and stated ORC efficiencies. ...... 56
Table 4.3 - Process Capacity Parameters (PCP) and rP values (Campana, 2012). .............................................. 57
Table 4.4 - Estimated impact of ORC application in the Portuguese target for 2016 on Savings of Final Energy in Industry. ................................................................................................................................................................ 59
Table 4.5 - Costs of ORC systems as an approximated function of installed power. ............................................ 60
Table 5.1 – Categories evaluated eligible for the integration of ORC systems as an energy efficiency measure in the SGCIE for Industry. ......................................................................................................................................... 65
Table 5.2 – Available Energy Audits in the different CAE for Industry................................................................... 67
Table 5.3 - Representativeness of the sample of installations on Total Energy consumption by Sector. .............. 67
Table 5.4 - Representativeness of the installations analysed for ORC application on Total Energy consumption by Sector. ................................................................................................................................................................... 67
Table 5.5 - Sources of heat analyzed for ORC application by sector. ................................................................... 68
Table 5.6 - Observed temperatures of the waste heat sources in FDM, Meat production & Tobacco sector. ....... 68
Table 5.7 - Observed waste heat sources - Chemicals & Plastics sector. ........................................................... 69
Table 5.8 - Observed waste heat sources - Ceramics sector. ............................................................................... 70
Table 5.9 - Estimated waste heat sources - Ceramics sector. .............................................................................. 71
Table 5.10 – Heat recovery strategies in analysed Cement plants. ...................................................................... 71
Table 5.11 - Observed waste heat sources – Basic metals sector. ....................................................................... 72
Table 5.12 - Observed temperatures of boilers in Wood & Cork sector. ............................................................... 73
Table 5.13 - Estimated wasted energy by sector referring to 2012 consumptions. ............................................... 73
Table 5.14 – Installable ORC units in the Ceramic subsectors – 1st Method. ........................................................ 74
Table 5.15 – Installable total ORC electric power in the Ceramic sector – 1st Method. ......................................... 75
Table 5.16 - Validation of the extrapolated results through the 1st Method for the Ceramic sector. ...................... 75
Table 5.17 - Installable total ORC electric power in the Ceramic sector – 2nd
Method. ......................................... 75
Table 5.18 - Installable total ORC electric power in the Cement sector. ............................................................... 77
Table 5.19 - Installable total ORC electric power in the Basic metals sector. ....................................................... 77
Table 5.20 – Comparison between waste heat recovery and cogeneration ORC systems in the Wood & Cork sector. ................................................................................................................................................................... 78
Table 5.21 - Installable total ORC electric power by sector in the Portuguese manufacturing industry................. 78
xvi
Table 5.22 - Estimated impact of ORC application as an energy efficiency measure in the Portuguese targets of savings on final energy consumption in Industry. .................................................................................................. 79
Table 5.23 – Payback periods, total investment and specific cost of the ORC systems in the final considered sectors of the Manufacturing Industry. .................................................................................................................. 80
Table AI 1 - Operating data of continuous kilns for each sub-sector of Ceramic Industry (EC, 2007a). ................ 97
Table AI 2 - ORC manufacturers and data on respective products. ...................................................................... 98
Table AII 1 - Waste heat sources, wasted heat and ORC instalable electric power in FDM, Meat production and Tobacco plants. ................................................................................................................................................... 100
Table AII 2 - Waste heat sources, wasted heat and ORC instalable electric power in Paper process plants. .... 103
Table AII 3 - Waste heat sources, wasted heat and ORC instalable electric power in Chemical & Plastic plants. ............................................................................................................................................................................ 104
Table AII 4 - Considered values on the calculation of wasted heat and power generation for the Unknown kilns of the Ceramic Industry. Reference values from CTCV (2012) and BREF on Ceramics (2007). ............................ 105
Table AII 5 - Waste heat sources, wasted heat and ORC instalable electric power in Ceramic plants. .............. 106
Table AII 6 - Waste heat sources, wasted heat and ORC instalable electric power in Cement plants. ............... 109
Table AII 7 - Waste heat sources, wasted heat and ORC instalable electric power in Basic metals processing plants. ................................................................................................................................................................. 109
Table AII 8 - Boilers, wasted heat, biomass availability and ORC best-case instalable electric power in Wood & Cork plants. ......................................................................................................................................................... 110
xvii
ACRONYMS AND ABBREVIATIONS
e.g. - Latin exempli gratia (for example)
f.i. – for instance
i.e. – that is
rec. – recovered
w/ – with
w/o – without
CAPEX – Capital expenditure
CC – Clinker cooler
CEN – Comité Européen de Normalisation (European Committee for Standardization)
CHP – Combined Heat and Power
CTCV – Centro Tecnológico da Cerâmica e do Vidro (Ceramics and Glass Technological Centre)
DGEG – Direcção Geral de Energia e Geologia (Directorate General for Energy and Geology)
EAF – Electric arc furnace
EC – European Comission
EE – Energy Efficiency
EEP – Energy Efficiency Plan
ESP – Electrostatic precipitators
ETS – Emission Trading System
EU – European Union
FDM – Food, drink and milk
GHG – Greenhouse gases
GWP – Greenhouse Warming Potential
HR – Heat recovery
HX – Heat exchanger
xviii
IBC – Inverted Brayton Cycle
ICE – Internal Combustion Engine
IIP – Institute for Industrial Productivity
KCT - Kalina Cycle Technology®
LE – Large Enterprise
MRC – micro Rankine cycles
MS – Member-State of the European Union
NEAAP – National Energy Efficiency Action Plan
ODP – Ozone Depleting Potential
OMTS – Octamethyltrisiloxane
PBT – Payback time
PH – Preheater
PNALE – Plano Nacional de Atribuição de Licenças de Emissão (National Allocation Plan)
PRE – Produção em Regime Especial (Special Regime of Production)
PREn – Plano de Racionalização dos Consumos de Energia (Energy Consumption Rationalizations Plan)
QREN – Quadro de Referência Estratégica Nacional (National Strategic Reference Framework)
R&D – Research and Development
ROI – Return on Investment
ScRC – Supercritical Rankine Cycle
SGCIE – Sistema de Gestão dos Consumo Intensivos de Energia (Intensive Energy Consumption Management System)
SILC – Sustainable Industry Low Carbon
SME – Small and Medium Enterprise
SMI – Small and Medium-size Industrie
SRC – Steam Rankine cycle
TFC – Trilateral Flash Cycle
toe – Tonne of oil equivalent
TXIFOF – Texas Industries of the Future

xix
We – Electric power
WF – Working Fluid
WHR – Waste heat recovery
WHRPG – Waste heat recovery for power generation
Wth – Thermal power

xx
1 INTRODUCTION
1.1 Framework
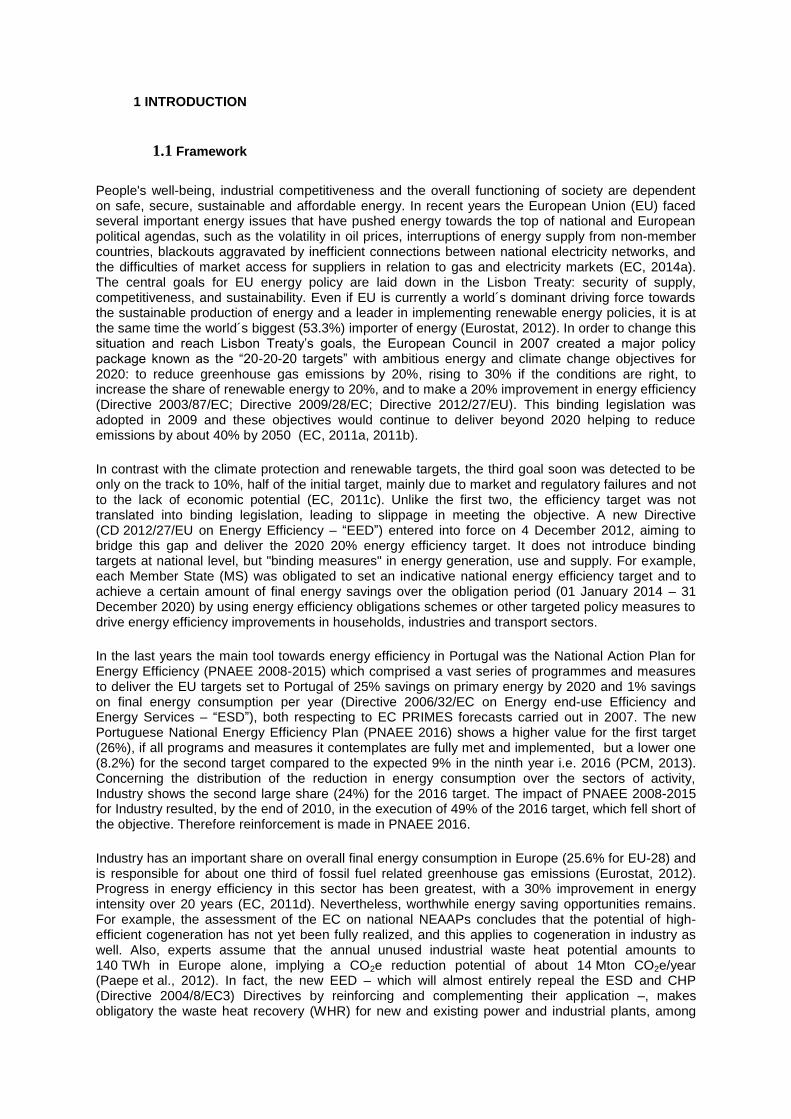
People's well-being, industrial competitiveness and the overall functioning of society are dependent on safe, secure, sustainable and affordable energy. In recent years the European Union (EU) faced several important energy issues that have pushed energy towards the top of national and European political agendas, such as the volatility in oil prices, interruptions of energy supply from non-member countries, blackouts aggravated by inefficient connections between national electricity networks, and the difficulties of market access for suppliers in relation to gas and electricity markets (EC, 2014a). The central goals for EU energy policy are laid down in the Lisbon Treaty: security of supply, competitiveness, and sustainability. Even if EU is currently a world´s dominant driving force towards the sustainable production of energy and a leader in implementing renewable energy policies, it is at the same time the world´s biggest (53.3%) importer of energy (Eurostat, 2012). In order to change this situation and reach Lisbon Treaty‘s goals, the European Council in 2007 created a major policy package known as the ―20-20-20 targets‖ with ambitious energy and climate change objectives for 2020: to reduce greenhouse gas emissions by 20%, rising to 30% if the conditions are right, to increase the share of renewable energy to 20%, and to make a 20% improvement in energy efficiency (Directive 2003/87/EC; Directive 2009/28/EC; Directive 2012/27/EU). This binding legislation was adopted in 2009 and these objectives would continue to deliver beyond 2020 helping to reduce emissions by about 40% by 2050 (EC, 2011a, 2011b).
In contrast with the climate protection and renewable targets, the third goal soon was detected to be only on the track to 10%, half of the initial target, mainly due to market and regulatory failures and not to the lack of economic potential (EC, 2011c). Unlike the first two, the efficiency target was not translated into binding legislation, leading to slippage in meeting the objective. A new Directive (CD 2012/27/EU on Energy Efficiency – ―EED‖) entered into force on 4 December 2012, aiming to bridge this gap and deliver the 2020 20% energy efficiency target. It does not introduce binding targets at national level, but "binding measures" in energy generation, use and supply. For example, each Member State (MS) was obligated to set an indicative national energy efficiency target and to achieve a certain amount of final energy savings over the obligation period (01 January 2014 – 31 December 2020) by using energy efficiency obligations schemes or other targeted policy measures to drive energy efficiency improvements in households, industries and transport sectors.
In the last years the main tool towards energy efficiency in Portugal was the National Action Plan for Energy Efficiency (PNAEE 2008-2015) which comprised a vast series of programmes and measures to deliver the EU targets set to Portugal of 25% savings on primary energy by 2020 and 1% savings on final energy consumption per year (Directive 2006/32/EC on Energy end-use Efficiency and Energy Services – ―ESD‖), both respecting to EC PRIMES forecasts carried out in 2007. The new Portuguese National Energy Efficiency Plan (PNAEE 2016) shows a higher value for the first target (26%), if all programs and measures it contemplates are fully met and implemented, but a lower one (8.2%) for the second target compared to the expected 9% in the ninth year i.e. 2016 (PCM, 2013). Concerning the distribution of the reduction in energy consumption over the sectors of activity, Industry shows the second large share (24%) for the 2016 target. The impact of PNAEE 2008-2015 for Industry resulted, by the end of 2010, in the execution of 49% of the 2016 target, which fell short of the objective. Therefore reinforcement is made in PNAEE 2016.
Industry has an important share on overall final energy consumption in Europe (25.6% for EU-28) and is responsible for about one third of fossil fuel related greenhouse gas emissions (Eurostat, 2012). Progress in energy efficiency in this sector has been greatest, with a 30% improvement in energy intensity over 20 years (EC, 2011d). Nevertheless, worthwhile energy saving opportunities remains. For example, the assessment of the EC on national NEAAPs concludes that the potential of high-efficient cogeneration has not yet been fully realized, and this applies to cogeneration in industry as well. Also, experts assume that the annual unused industrial waste heat potential amounts to 140 TWh in Europe alone, implying a CO2e reduction potential of about 14 Mton CO2e/year (Paepe et al., 2012). In fact, the new EED – which will almost entirely repeal the ESD and CHP (Directive 2004/8/EC3) Directives by reinforcing and complementing their application –, makes obligatory the waste heat recovery (WHR) for new and existing power and industrial plants, among
2
other initiatives (EC, 2012b). The recovery of industrial waste heat plays already an important role in EE. However, it is observed that more than 50% of industrial waste heat is of low-grade and an important opportunity reside in power generation through a number of new solutions that have been proposed to generate electricity from low temperature heat sources. Among other, the works on Organic Rankine Cycle (ORC) were intensified and it is being progressively adopted as a premier technology to convert low-grade heat resources into power (Navarro-Esbri et al., 2013).
In Portugal, Manufacturing Industry is responsible for 29% of final energy consumption, of which 27% electricity (INE, 2012). The sector presents improvements in EE in the last years, but at the very modest rate of 1% between 2000 and 2009 (ADENE, 2012). The recovery of the untapped low-grade industrial waste heat for power generation could help Portugal reaching its EE target, while rising energy efficiency in industry and decreasing the CO2e emissions. Analogous study appears to be developed for France concluding over 50MWe could be implemented in steel factories and more than 15MWe in cement factories (David et al., 2011). Lukawski (2009) investigated the possibility of introducing standardized ORC power plants to the European energy market.
1.2 Objectives
This work focuses on the ORC as a Waste Heat Recovery for Power Generation (WHRPG) technology capable of exploiting low-grade waste heat in the Manufacturing Industry, applied to the case of Portugal. The results support the ORC as a proposed measure for energy efficiency in the Manufacture Industry.
The main objectives are as follows:
1) Review the practises of Heat Recovery in the different industrial sectors and the opportunities for WHRPG;
2) Review the WHRPG technologies with detail to ORC; 3) Identify waste heat sources in Industrial sectors eligible for ORC; 4) Conclude the market, economic and political framework of ORC; 5) Assess the technical and economic potential for ORC application in the Portuguese
manufacturing Industry, based on Energy Audits to installations provided by DGEG and other documents;
6) Estimate the impact of the application of the proposed ORC systems in the execution of the national target on Energy Efficiency.
1.3 Organization of the work
The present dissertation is divided into 6 Chapters.
Chapter 2. The situation of energy consumption and energy efficiency in Industry is summarized connected to the EU strategy for Energy and Carbon emissions. Reference is made to undergoing studies on WHR in Industry. A review on the opportunities for WHR is performed, referring to the estimated dimension of available waste heat in the Manufacturing Industry, present state of exploitation, characteristics of the waste heat sources and techniques in use or applicable by industrial sector. Other common and/or specific sources of heat eligible for ORC are presented. The review allowed assessing later the untapped waste heat in the Portuguese Manufacturing Industry. The political and economic framework of WHRPG practises is summarized, addressing the main constraints for their feasibility, with detail to the Portuguese case. The main tools to promote energy efficiency and the clean generation of electricity in Portugal are addressed. National case studies are presented.
Chapter 3. A review and comparison of power cycles is made, with detailed information on the best performing conditions for each and conclusion on the best option for low-grade waste heat recovery. A characterization of the working fluids available for the power cycles is given. The ORC is developed individually and the history of the technology, applications, the market, players, products, costs, the system working conditions and configuration variants, the working fluids, mechanical components and

3
performance constraints are summarized. Finally, it is presented a group of case studies in the different industrial sectors where the ORC was applied.
Chapter 4. The methodology of the work is presented by a serial of tasks referring to the literature review stages and data treatment. The practical part of the work is discriminated with reference to assumptions, calculation methods and consulted documents. The work general approach is presented, as well as the complementary specific approaches used to each industrial sector.
Chapter 5. The development of the tasks summarized in Chapter 4 is performed and results are presented and discussed. The industrial sectors in Portugal are characterized, and it is concluded the political and economic framework for ORC implementation in the Portuguese manufacturing industry. The ORC total installable power is calculated and a brief economic analysis performed. It concludes the benefits of ORC application on CO2e emissions and on the execution of national EE target set by EU requirements.
Chapter 6. The final Chapter presents a summary of the work, develops the limitations of the methodology and results, and makes considerations on information defaults and recommendations for future works.

4
5
2 WASTE HEAT RECOVERY FOR POWER GENERATION IN THE MANUFACTURING INDUSTRY
2.1 Framework
The industrial sector in EU-28 accounts for approximately 26.1% of final end-use of energy, consuming approximately 289 Mtoe annually and emitting about 5 671 kt of CO2e associated with industrial processes (Eurostat, 2011a, 2001b). The EU Low-carbon Roadmap shows the path for reducing EU‘s CO2e emissions by 80% by 2050, and to the industry sectors that would mean aggregate reductions of 34-40% by 2030, and of 83-87% by 2050, considering assumptions of technology and fossil fuel price. Sectors subject to the Emission Trading System (ETS) are, on aggregate, bound to reduce by 2020 their carbon emissions by 21% from the level in 2005, compared with 10% for the non-ETS sectors (EC, 2013).
The EU Energy Efficiency Action Plan of 2006 recognized manufacturing industry as one of the most promising sectors to reduce primary energy consumption, with an estimated overall potential of 25%. The EU Impact Assessment of the Commission staff on the EEP 2011 recognized that the energy intensive industries (EII) make already use of energy efficiency improvements to decrease costs but that it is still some remaining potential, and that this is particularly true for small and medium-size industries (SMI). With the right technology and support, SMI could make energy savings of 20%, and by changing certain production processes, savings of 30% up to 65%.
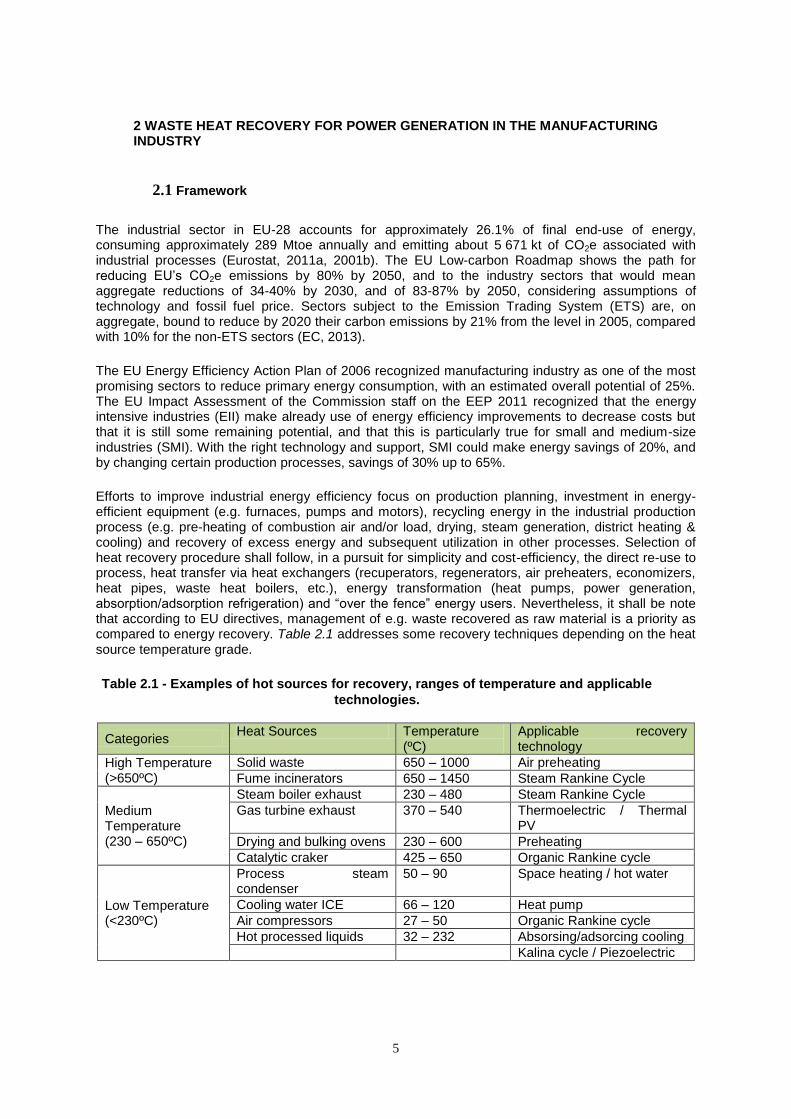
Efforts to improve industrial energy efficiency focus on production planning, investment in energy-efficient equipment (e.g. furnaces, pumps and motors), recycling energy in the industrial production process (e.g. pre-heating of combustion air and/or load, drying, steam generation, district heating & cooling) and recovery of excess energy and subsequent utilization in other processes. Selection of heat recovery procedure shall follow, in a pursuit for simplicity and cost-efficiency, the direct re-use to process, heat transfer via heat exchangers (recuperators, regenerators, air preheaters, economizers, heat pipes, waste heat boilers, etc.), energy transformation (heat pumps, power generation, absorption/adsorption refrigeration) and ―over the fence‖ energy users. Nevertheless, it shall be note that according to EU directives, management of e.g. waste recovered as raw material is a priority as compared to energy recovery. Table 2.1 addresses some recovery techniques depending on the heat source temperature grade.
Table 2.1 - Examples of hot sources for recovery, ranges of temperature and applicable
technologies.
Categories Heat Sources Temperature
(ºC) Applicable recovery technology
High Temperature (>650ºC)
Solid waste 650 – 1000 Air preheating
Fume incinerators 650 – 1450 Steam Rankine Cycle
Medium Temperature (230 – 650ºC)
Steam boiler exhaust 230 – 480 Steam Rankine Cycle
Gas turbine exhaust 370 – 540 Thermoelectric / Thermal PV
Drying and bulking ovens 230 – 600 Preheating
Catalytic craker 425 – 650 Organic Rankine cycle
Low Temperature (<230ºC)
Process steam condenser
50 – 90 Space heating / hot water
Cooling water ICE 66 – 120 Heat pump
Air compressors 27 – 50 Organic Rankine cycle
Hot processed liquids 32 – 232 Absorsing/adsorcing cooling
Kalina cycle / Piezoelectric
6
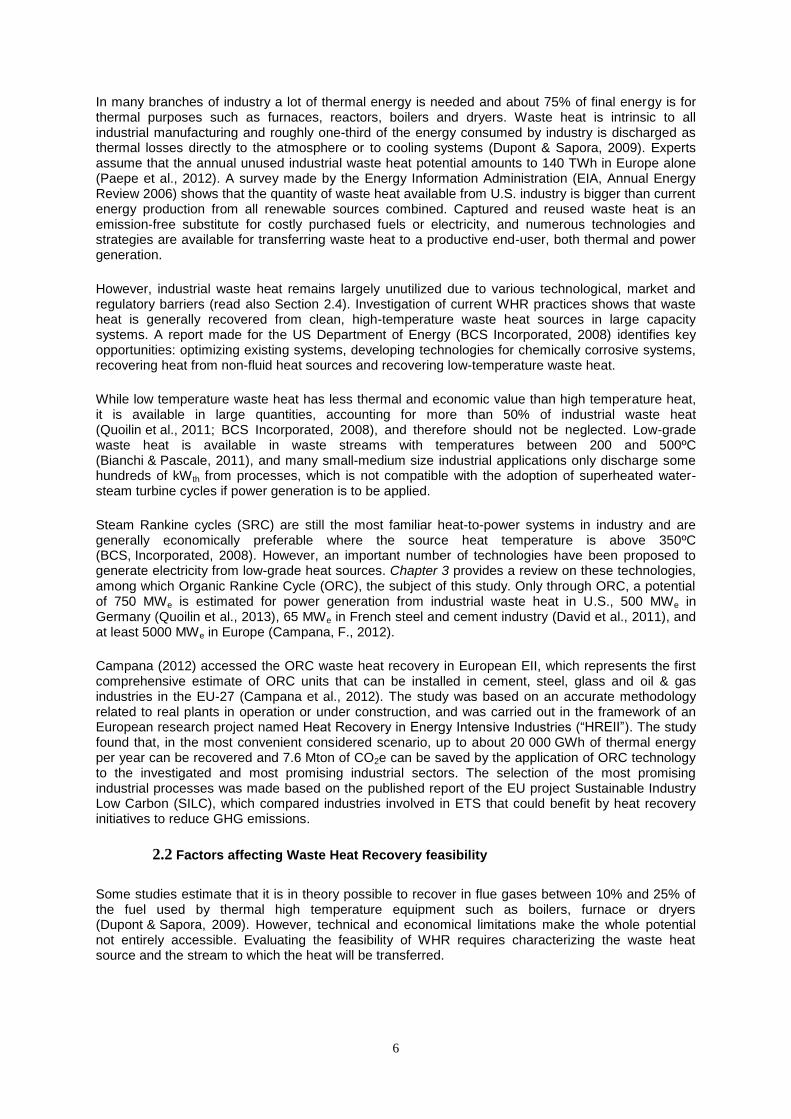
In many branches of industry a lot of thermal energy is needed and about 75% of final energy is for thermal purposes such as furnaces, reactors, boilers and dryers. Waste heat is intrinsic to all industrial manufacturing and roughly one-third of the energy consumed by industry is discharged as thermal losses directly to the atmosphere or to cooling systems (Dupont & Sapora, 2009). Experts assume that the annual unused industrial waste heat potential amounts to 140 TWh in Europe alone (Paepe et al., 2012). A survey made by the Energy Information Administration (EIA, Annual Energy Review 2006) shows that the quantity of waste heat available from U.S. industry is bigger than current energy production from all renewable sources combined. Captured and reused waste heat is an emission-free substitute for costly purchased fuels or electricity, and numerous technologies and strategies are available for transferring waste heat to a productive end-user, both thermal and power generation.
However, industrial waste heat remains largely unutilized due to various technological, market and regulatory barriers (read also Section 2.4). Investigation of current WHR practices shows that waste heat is generally recovered from clean, high-temperature waste heat sources in large capacity systems. A report made for the US Department of Energy (BCS Incorporated, 2008) identifies key opportunities: optimizing existing systems, developing technologies for chemically corrosive systems, recovering heat from non-fluid heat sources and recovering low-temperature waste heat.
While low temperature waste heat has less thermal and economic value than high temperature heat, it is available in large quantities, accounting for more than 50% of industrial waste heat (Quoilin et al., 2011; BCS Incorporated, 2008), and therefore should not be neglected. Low-grade waste heat is available in waste streams with temperatures between 200 and 500ºC (Bianchi & Pascale, 2011), and many small-medium size industrial applications only discharge some hundreds of kWth from processes, which is not compatible with the adoption of superheated water-steam turbine cycles if power generation is to be applied.
Steam Rankine cycles (SRC) are still the most familiar heat-to-power systems in industry and are generally economically preferable where the source heat temperature is above 350ºC (BCS, Incorporated, 2008). However, an important number of technologies have been proposed to generate electricity from low-grade heat sources. Chapter 3 provides a review on these technologies, among which Organic Rankine Cycle (ORC), the subject of this study. Only through ORC, a potential of 750 MWe is estimated for power generation from industrial waste heat in U.S., 500 MWe in Germany (Quoilin et al., 2013), 65 MWe in French steel and cement industry (David et al., 2011), and at least 5000 MWe in Europe (Campana, F., 2012).
Campana (2012) accessed the ORC waste heat recovery in European EII, which represents the first comprehensive estimate of ORC units that can be installed in cement, steel, glass and oil & gas industries in the EU-27 (Campana et al., 2012). The study was based on an accurate methodology related to real plants in operation or under construction, and was carried out in the framework of an European research project named Heat Recovery in Energy Intensive Industries (―HREII‖). The study found that, in the most convenient considered scenario, up to about 20 000 GWh of thermal energy per year can be recovered and 7.6 Mton of CO2e can be saved by the application of ORC technology to the investigated and most promising industrial sectors. The selection of the most promising industrial processes was made based on the published report of the EU project Sustainable Industry Low Carbon (SILC), which compared industries involved in ETS that could benefit by heat recovery initiatives to reduce GHG emissions.
2.2 Factors affecting Waste Heat Recovery feasibility
Some studies estimate that it is in theory possible to recover in flue gases between 10% and 25% of the fuel used by thermal high temperature equipment such as boilers, furnace or dryers (Dupont & Sapora, 2009). However, technical and economical limitations make the whole potential not entirely accessible. Evaluating the feasibility of WHR requires characterizing the waste heat source and the stream to which the heat will be transferred.
7
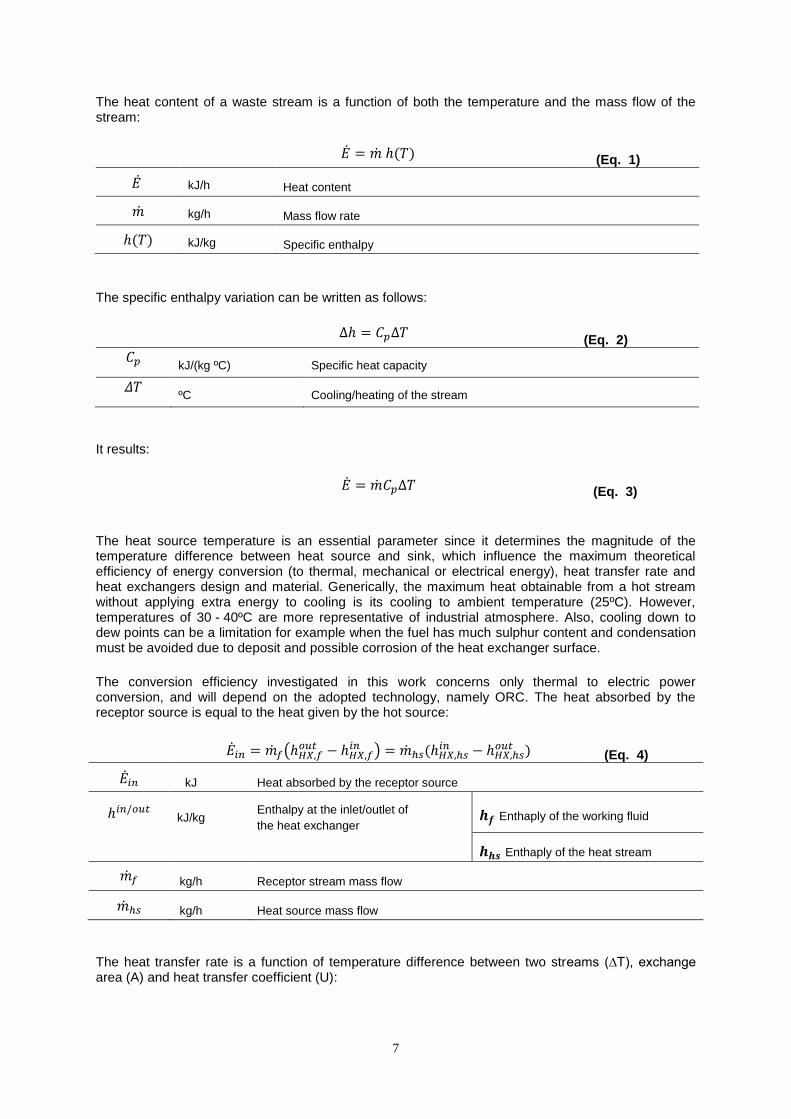
The heat content of a waste stream is a function of both the temperature and the mass flow of the stream:
(Eq. 1)
kJ/h Heat content
kg/h Mass flow rate
kJ/kg Specific enthalpy
The specific enthalpy variation can be written as follows:
(Eq. 2)
kJ/(kg ºC) Specific heat capacity
ºC Cooling/heating of the stream
It results:
(Eq. 3)
The heat source temperature is an essential parameter since it determines the magnitude of the temperature difference between heat source and sink, which influence the maximum theoretical efficiency of energy conversion (to thermal, mechanical or electrical energy), heat transfer rate and heat exchangers design and material. Generically, the maximum heat obtainable from a hot stream without applying extra energy to cooling is its cooling to ambient temperature (25ºC). However, temperatures of 30 - 40ºC are more representative of industrial atmosphere. Also, cooling down to dew points can be a limitation for example when the fuel has much sulphur content and condensation must be avoided due to deposit and possible corrosion of the heat exchanger surface.
The conversion efficiency investigated in this work concerns only thermal to electric power conversion, and will depend on the adopted technology, namely ORC. The heat absorbed by the receptor source is equal to the heat given by the hot source:
(
)
(Eq. 4)
kJ Heat absorbed by the receptor source
kJ/kg Enthalpy at the inlet/outlet of
the heat exchanger Enthaply of the working fluid
Enthaply of the heat stream
kg/h Receptor stream mass flow
kg/h Heat source mass flow
The heat transfer rate is a function of temperature difference between two streams (∆T), exchange area (A) and heat transfer coefficient (U):
8
(Eq. 5)
W Heat transfer rate
W/(
m2
ºC)
Heat transfer coefficient
A m2
Exchange area
ºC Temperature difference between two streams
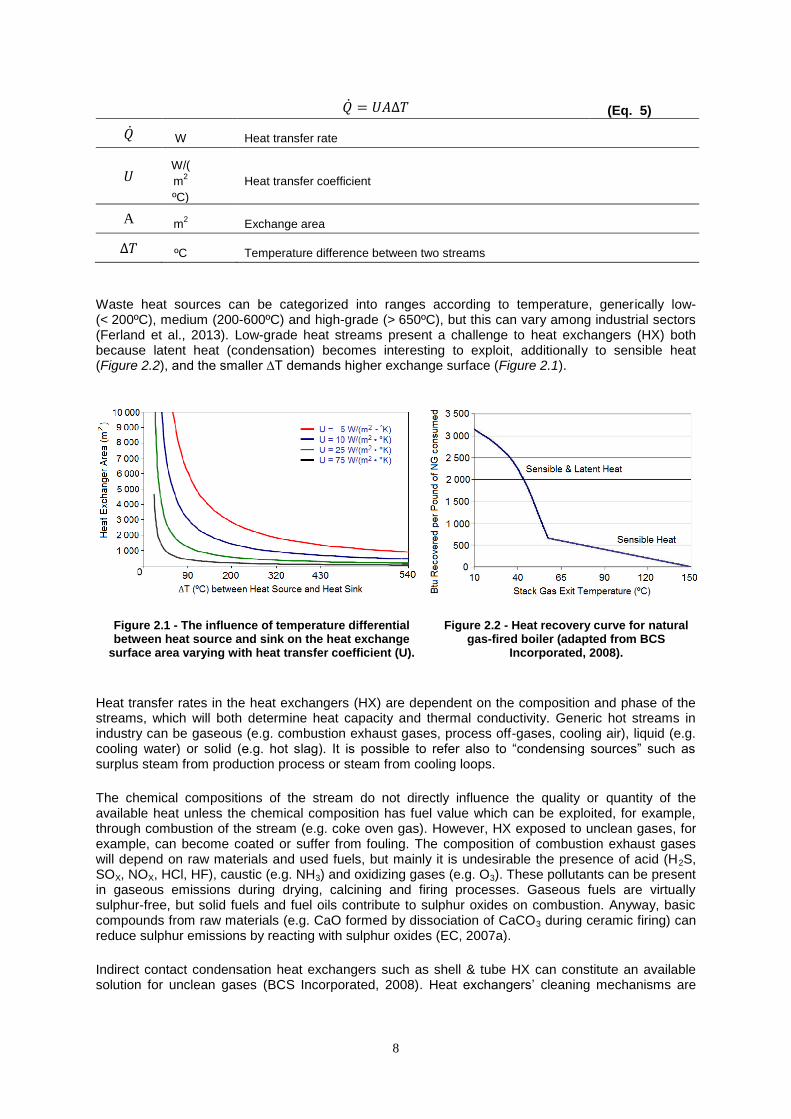
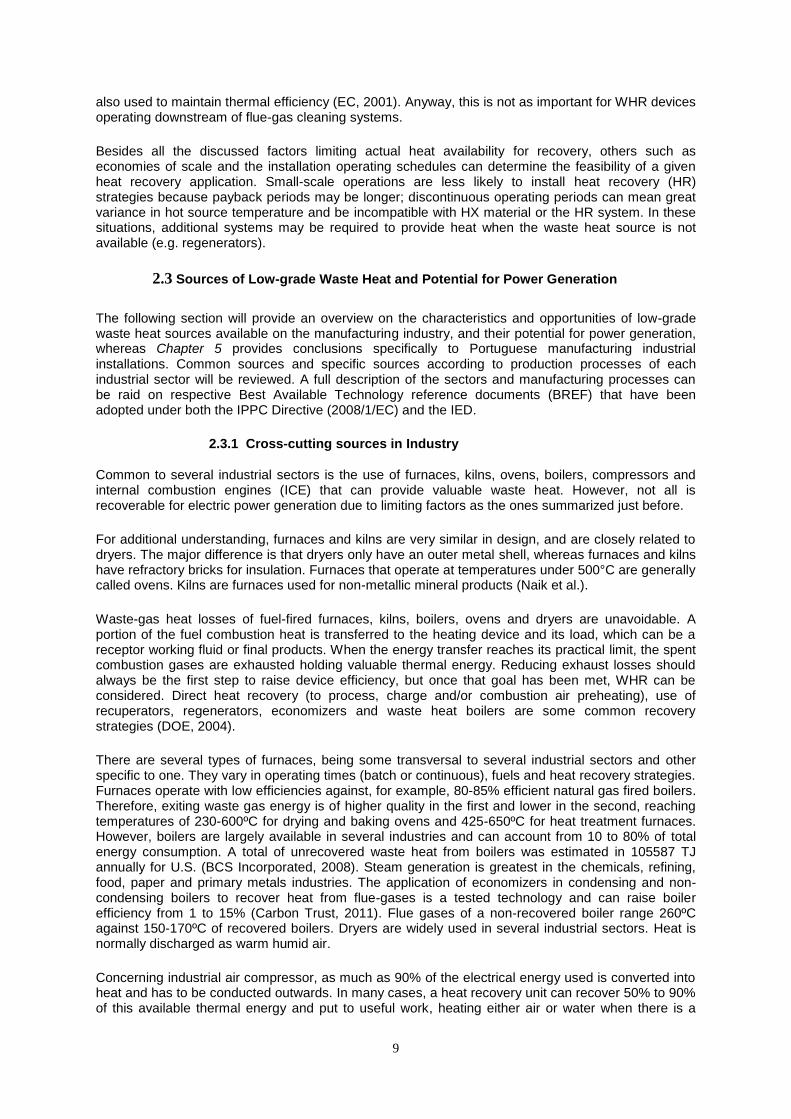
Waste heat sources can be categorized into ranges according to temperature, generically low- (< 200ºC), medium (200-600ºC) and high-grade (> 650ºC), but this can vary among industrial sectors (Ferland et al., 2013). Low-grade heat streams present a challenge to heat exchangers (HX) both because latent heat (condensation) becomes interesting to exploit, additionally to sensible heat (Figure 2.2), and the smaller ∆T demands higher exchange surface (Figure 2.1).
Figure 2.1 - The influence of temperature differential between heat source and sink on the heat exchange
surface area varying with heat transfer coefficient (U).
Figure 2.2 - Heat recovery curve for natural gas-fired boiler (adapted from BCS
Incorporated, 2008).
Heat transfer rates in the heat exchangers (HX) are dependent on the composition and phase of the streams, which will both determine heat capacity and thermal conductivity. Generic hot streams in industry can be gaseous (e.g. combustion exhaust gases, process off-gases, cooling air), liquid (e.g. cooling water) or solid (e.g. hot slag). It is possible to refer also to ―condensing sources‖ such as surplus steam from production process or steam from cooling loops.
The chemical compositions of the stream do not directly influence the quality or quantity of the available heat unless the chemical composition has fuel value which can be exploited, for example, through combustion of the stream (e.g. coke oven gas). However, HX exposed to unclean gases, for example, can become coated or suffer from fouling. The composition of combustion exhaust gases will depend on raw materials and used fuels, but mainly it is undesirable the presence of acid (H2S, SOX, NOX, HCl, HF), caustic (e.g. NH3) and oxidizing gases (e.g. O3). These pollutants can be present in gaseous emissions during drying, calcining and firing processes. Gaseous fuels are virtually sulphur-free, but solid fuels and fuel oils contribute to sulphur oxides on combustion. Anyway, basic compounds from raw materials (e.g. CaO formed by dissociation of CaCO3 during ceramic firing) can reduce sulphur emissions by reacting with sulphur oxides (EC, 2007a).
Indirect contact condensation heat exchangers such as shell & tube HX can constitute an available solution for unclean gases (BCS Incorporated, 2008). Heat exchangers‘ cleaning mechanisms are
9
also used to maintain thermal efficiency (EC, 2001). Anyway, this is not as important for WHR devices operating downstream of flue-gas cleaning systems.
Besides all the discussed factors limiting actual heat availability for recovery, others such as economies of scale and the installation operating schedules can determine the feasibility of a given heat recovery application. Small-scale operations are less likely to install heat recovery (HR) strategies because payback periods may be longer; discontinuous operating periods can mean great variance in hot source temperature and be incompatible with HX material or the HR system. In these situations, additional systems may be required to provide heat when the waste heat source is not available (e.g. regenerators).
2.3 Sources of Low-grade Waste Heat and Potential for Power Generation
The following section will provide an overview on the characteristics and opportunities of low-grade waste heat sources available on the manufacturing industry, and their potential for power generation, whereas Chapter 5 provides conclusions specifically to Portuguese manufacturing industrial installations. Common sources and specific sources according to production processes of each industrial sector will be reviewed. A full description of the sectors and manufacturing processes can be raid on respective Best Available Technology reference documents (BREF) that have been adopted under both the IPPC Directive (2008/1/EC) and the IED.
2.3.1 Cross-cutting sources in Industry
Common to several industrial sectors is the use of furnaces, kilns, ovens, boilers, compressors and internal combustion engines (ICE) that can provide valuable waste heat. However, not all is recoverable for electric power generation due to limiting factors as the ones summarized just before.
For additional understanding, furnaces and kilns are very similar in design, and are closely related to dryers. The major difference is that dryers only have an outer metal shell, whereas furnaces and kilns have refractory bricks for insulation. Furnaces that operate at temperatures under 500°C are generally called ovens. Kilns are furnaces used for non-metallic mineral products (Naik et al.).
Waste-gas heat losses of fuel-fired furnaces, kilns, boilers, ovens and dryers are unavoidable. A portion of the fuel combustion heat is transferred to the heating device and its load, which can be a receptor working fluid or final products. When the energy transfer reaches its practical limit, the spent combustion gases are exhausted holding valuable thermal energy. Reducing exhaust losses should always be the first step to raise device efficiency, but once that goal has been met, WHR can be considered. Direct heat recovery (to process, charge and/or combustion air preheating), use of recuperators, regenerators, economizers and waste heat boilers are some common recovery strategies (DOE, 2004).
There are several types of furnaces, being some transversal to several industrial sectors and other specific to one. They vary in operating times (batch or continuous), fuels and heat recovery strategies. Furnaces operate with low efficiencies against, for example, 80-85% efficient natural gas fired boilers. Therefore, exiting waste gas energy is of higher quality in the first and lower in the second, reaching temperatures of 230-600ºC for drying and baking ovens and 425-650ºC for heat treatment furnaces. However, boilers are largely available in several industries and can account from 10 to 80% of total energy consumption. A total of unrecovered waste heat from boilers was estimated in 105587 TJ annually for U.S. (BCS Incorporated, 2008). Steam generation is greatest in the chemicals, refining, food, paper and primary metals industries. The application of economizers in condensing and non-condensing boilers to recover heat from flue-gases is a tested technology and can raise boiler efficiency from 1 to 15% (Carbon Trust, 2011). Flue gases of a non-recovered boiler range 260ºC against 150-170ºC of recovered boilers. Dryers are widely used in several industrial sectors. Heat is normally discharged as warm humid air.
Concerning industrial air compressor, as much as 90% of the electrical energy used is converted into heat and has to be conducted outwards. In many cases, a heat recovery unit can recover 50% to 90% of this available thermal energy and put to useful work, heating either air or water when there is a
10
demand (Worrel et al., 2008). Recovery of ―high‖ grade heat comes from ―de-superheating‖ the refrigerant between the compressor and condenser, on common temperatures between 60-90ºC and up to 110ºC. Recovery of ―low‖ grade heat comes from the refrigerant being condensed between 20 to 40ºC (Carbon Trust, 2011). It has been estimated that approximately 14.6 kWh of recoverable heat is available for each 1.7 m
3/h of compressor capacity. However, recoverable heat from a compressed air
system is normally insufficient to be used to produce steam directly or drive a power cycle (EC, 2009).
Internal combustion engines (ICE) can only convert about one third of the fuel energy into mechanical power (Saidur et al., 2012). Gas turbines are known for their relatively low efficiency, especially under partial load, with flue gases typically between 370-540ºC. Cogeneration is usually desired, but a bottoming power cycle can also be considered. A universal design of binary units should be procured for greater cost-effectiveness (Lukawski, 2009). Basically, there are four engine waste heat streams that can be recovered by a bottoming cycle: exhaust gas, charge air, jacket water, and lubricating oil (Paanu et al., 2012).
Other less common sources for heat valorisation are the hot streams before abatement systems, which need usually cooling. If a waste heat recovery for power generation (WHRPG) system is to be applied, the electricity consumption of the waste treatment can be covered (HREII, 2013a).
Different industries have a different threshold for what they characterize as low temperature and thus low-grade waste heat sources. For example, in the glass and metal industries, low temperature is anything below 315°C; in facilities that produce food and beverages, is below 80°C. Others, such as the petroleum refining and chemicals sectors, have a similar range (170-200°C). Nevertheless, criteria applied to heat streams such as state, flow rate, heat content, source and temperature can be used to identify potential candidates of waste heat recovery technologies (Ferland et al., 2013).
2.3.2 Sources by Industrial sector and Heat Recovery practices
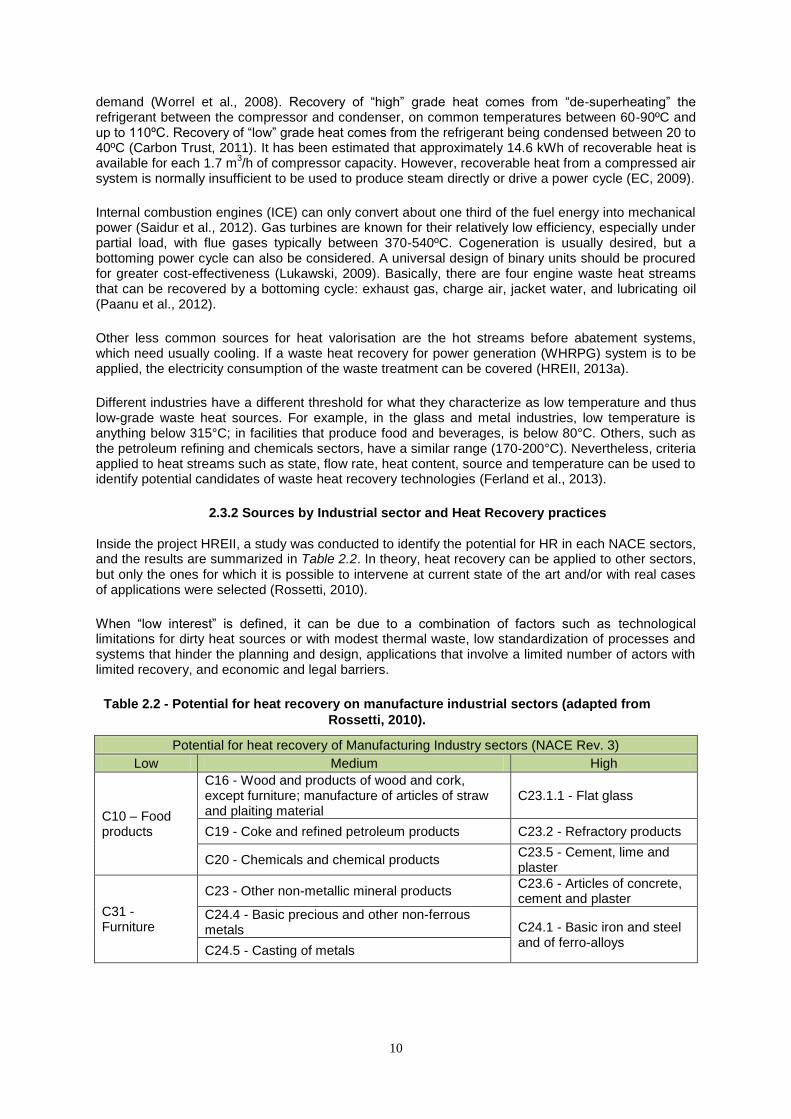
Inside the project HREII, a study was conducted to identify the potential for HR in each NACE sectors, and the results are summarized in Table 2.2. In theory, heat recovery can be applied to other sectors, but only the ones for which it is possible to intervene at current state of the art and/or with real cases of applications were selected (Rossetti, 2010).
When ―low interest‖ is defined, it can be due to a combination of factors such as technological limitations for dirty heat sources or with modest thermal waste, low standardization of processes and systems that hinder the planning and design, applications that involve a limited number of actors with limited recovery, and economic and legal barriers.
Table 2.2 - Potential for heat recovery on manufacture industrial sectors (adapted from
Rossetti, 2010).
Potential for heat recovery of Manufacturing Industry sectors (NACE Rev. 3)
Low Medium High
C10 – Food products
C16 - Wood and products of wood and cork, except furniture; manufacture of articles of straw and plaiting material
C23.1.1 - Flat glass
C19 - Coke and refined petroleum products C23.2 - Refractory products
C20 - Chemicals and chemical products C23.5 - Cement, lime and plaster
C31 - Furniture
C23 - Other non-metallic mineral products C23.6 - Articles of concrete, cement and plaster
C24.4 - Basic precious and other non-ferrous metals C24.1 - Basic iron and steel
and of ferro-alloys C24.5 - Casting of metals
11
FDM, Meat production & Tobacco
Food, drink and milk industries (FDM) require electrical and thermal energy for virtually every step of the process, thus cogeneration is a valuable alternative for the sector. Whereas the process heating is the main consumer in FDM installations (29% of the total energy used in the sector), followed by process cooling and refrigeration (about 16%), for example at slaughterhouses the refrigeration plant is the biggest consumer of electricity (45-90%) (EC, 2006).
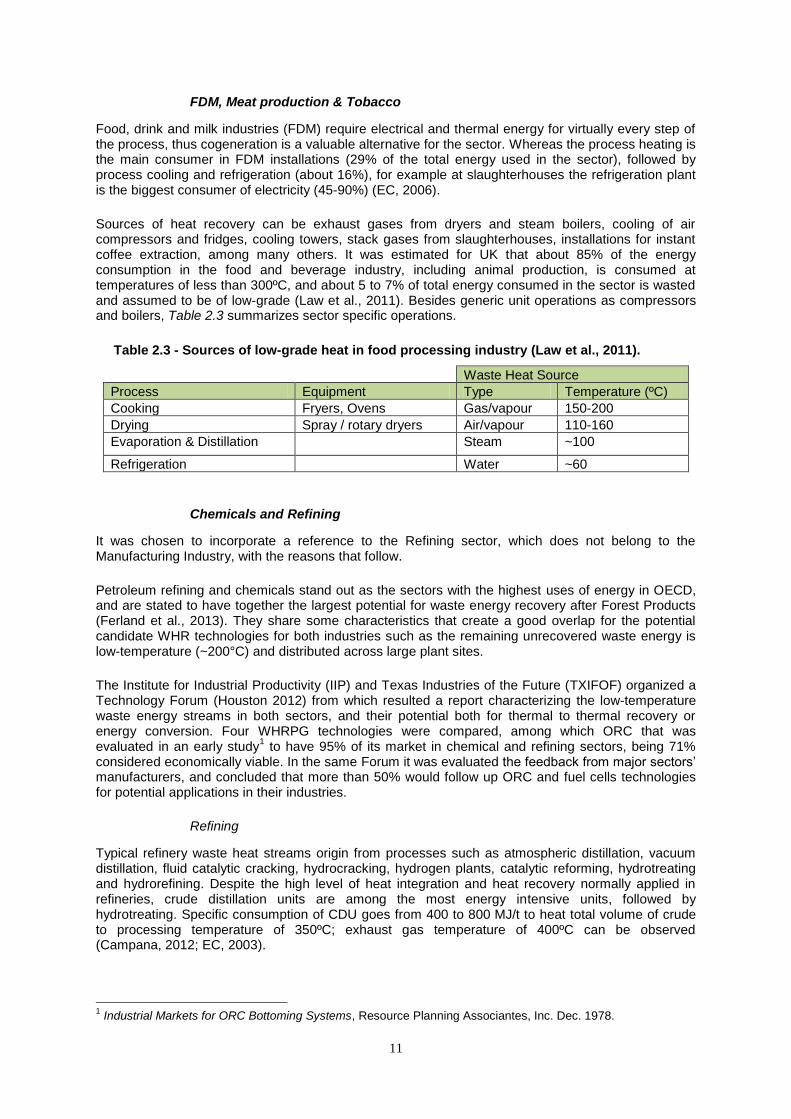
Sources of heat recovery can be exhaust gases from dryers and steam boilers, cooling of air compressors and fridges, cooling towers, stack gases from slaughterhouses, installations for instant coffee extraction, among many others. It was estimated for UK that about 85% of the energy consumption in the food and beverage industry, including animal production, is consumed at temperatures of less than 300ºC, and about 5 to 7% of total energy consumed in the sector is wasted and assumed to be of low-grade (Law et al., 2011). Besides generic unit operations as compressors and boilers, Table 2.3 summarizes sector specific operations.
Table 2.3 - Sources of low-grade heat in food processing industry (Law et al., 2011).
Waste Heat Source
Process Equipment Type Temperature (ºC)
Cooking Fryers, Ovens Gas/vapour 150-200
Drying Spray / rotary dryers Air/vapour 110-160
Evaporation & Distillation Steam ~100
Refrigeration Water ~60
Chemicals and Refining
It was chosen to incorporate a reference to the Refining sector, which does not belong to the Manufacturing Industry, with the reasons that follow.
Petroleum refining and chemicals stand out as the sectors with the highest uses of energy in OECD, and are stated to have together the largest potential for waste energy recovery after Forest Products (Ferland et al., 2013). They share some characteristics that create a good overlap for the potential candidate WHR technologies for both industries such as the remaining unrecovered waste energy is low-temperature (~200°C) and distributed across large plant sites.
The Institute for Industrial Productivity (IIP) and Texas Industries of the Future (TXIFOF) organized a Technology Forum (Houston 2012) from which resulted a report characterizing the low-temperature waste energy streams in both sectors, and their potential both for thermal to thermal recovery or energy conversion. Four WHRPG technologies were compared, among which ORC that was evaluated in an early study
1 to have 95% of its market in chemical and refining sectors, being 71%
considered economically viable. In the same Forum it was evaluated the feedback from major sectors‘ manufacturers, and concluded that more than 50% would follow up ORC and fuel cells technologies for potential applications in their industries.
Refining
Typical refinery waste heat streams origin from processes such as atmospheric distillation, vacuum distillation, fluid catalytic cracking, hydrocracking, hydrogen plants, catalytic reforming, hydrotreating and hydrorefining. Despite the high level of heat integration and heat recovery normally applied in refineries, crude distillation units are among the most energy intensive units, followed by hydrotreating. Specific consumption of CDU goes from 400 to 800 MJ/t to heat total volume of crude to processing temperature of 350ºC; exhaust gas temperature of 400ºC can be observed (Campana, 2012; EC, 2003).
1 Industrial Markets for ORC Bottoming Systems, Resource Planning Associantes, Inc. Dec. 1978.
12
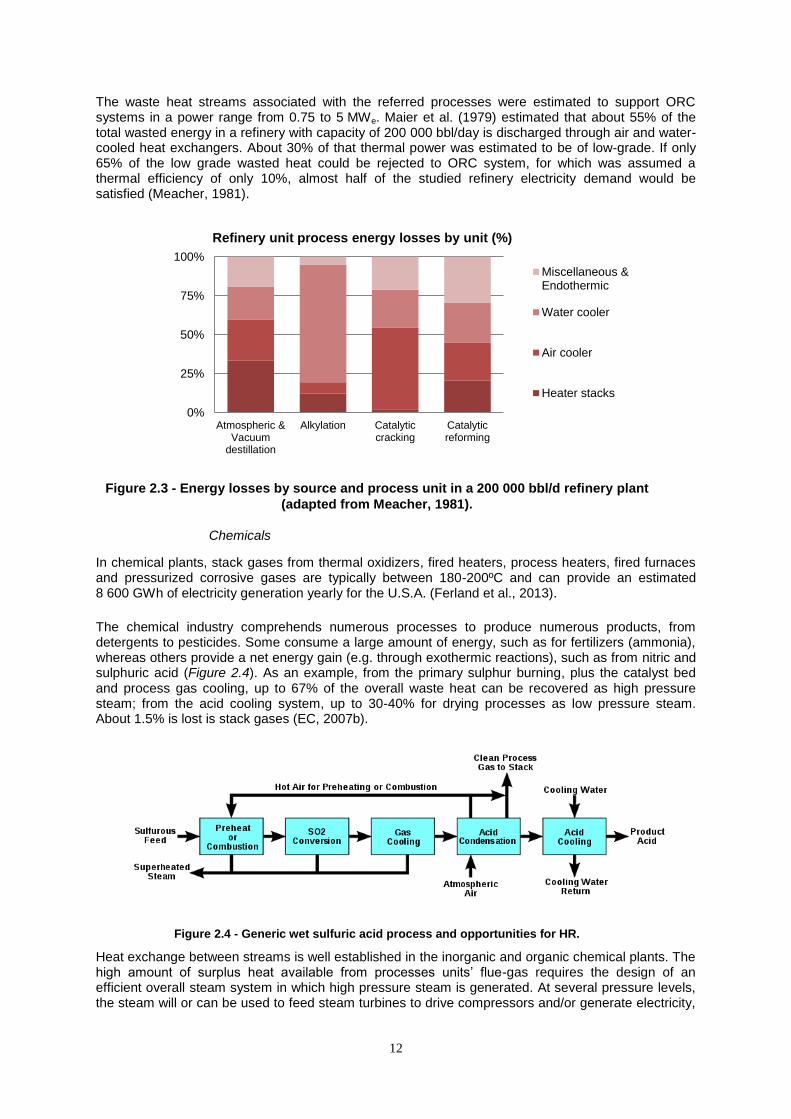
The waste heat streams associated with the referred processes were estimated to support ORC systems in a power range from 0.75 to 5 MWe. Maier et al. (1979) estimated that about 55% of the total wasted energy in a refinery with capacity of 200 000 bbl/day is discharged through air and water-cooled heat exchangers. About 30% of that thermal power was estimated to be of low-grade. If only 65% of the low grade wasted heat could be rejected to ORC system, for which was assumed a thermal efficiency of only 10%, almost half of the studied refinery electricity demand would be satisfied (Meacher, 1981).
Figure 2.3 - Energy losses by source and process unit in a 200 000 bbl/d refinery plant
(adapted from Meacher, 1981).
Chemicals
In chemical plants, stack gases from thermal oxidizers, fired heaters, process heaters, fired furnaces and pressurized corrosive gases are typically between 180-200ºC and can provide an estimated 8 600 GWh of electricity generation yearly for the U.S.A. (Ferland et al., 2013).
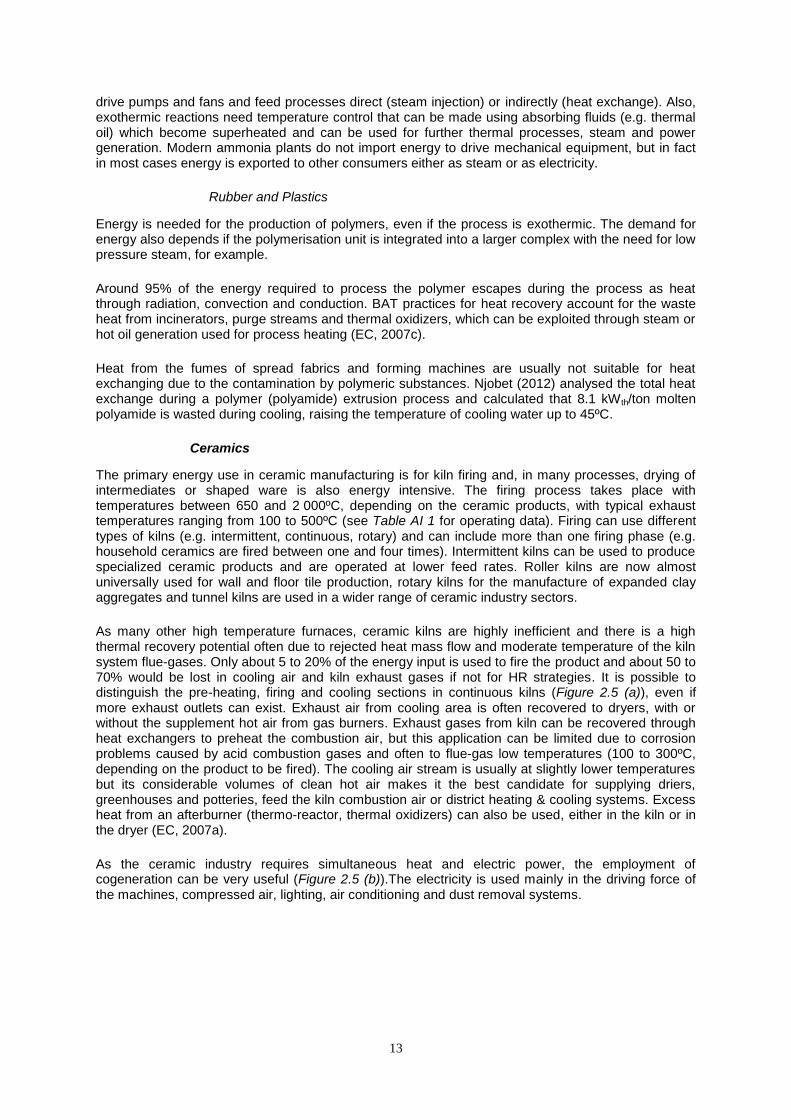
The chemical industry comprehends numerous processes to produce numerous products, from detergents to pesticides. Some consume a large amount of energy, such as for fertilizers (ammonia), whereas others provide a net energy gain (e.g. through exothermic reactions), such as from nitric and sulphuric acid (Figure 2.4). As an example, from the primary sulphur burning, plus the catalyst bed and process gas cooling, up to 67% of the overall waste heat can be recovered as high pressure steam; from the acid cooling system, up to 30-40% for drying processes as low pressure steam. About 1.5% is lost is stack gases (EC, 2007b).
Figure 2.4 - Generic wet sulfuric acid process and opportunities for HR.
Heat exchange between streams is well established in the inorganic and organic chemical plants. The high amount of surplus heat available from processes units‘ flue-gas requires the design of an efficient overall steam system in which high pressure steam is generated. At several pressure levels, the steam will or can be used to feed steam turbines to drive compressors and/or generate electricity,
0%
25%
50%
75%
100%
Atmospheric &Vacuum
destillation
Alkylation Catalyticcracking
Catalyticreforming
Refinery unit process energy losses by unit (%)
Miscellaneous &Endothermic
Water cooler
Air cooler
Heater stacks
13
drive pumps and fans and feed processes direct (steam injection) or indirectly (heat exchange). Also, exothermic reactions need temperature control that can be made using absorbing fluids (e.g. thermal oil) which become superheated and can be used for further thermal processes, steam and power generation. Modern ammonia plants do not import energy to drive mechanical equipment, but in fact in most cases energy is exported to other consumers either as steam or as electricity.
Rubber and Plastics
Energy is needed for the production of polymers, even if the process is exothermic. The demand for energy also depends if the polymerisation unit is integrated into a larger complex with the need for low pressure steam, for example.
Around 95% of the energy required to process the polymer escapes during the process as heat through radiation, convection and conduction. BAT practices for heat recovery account for the waste heat from incinerators, purge streams and thermal oxidizers, which can be exploited through steam or hot oil generation used for process heating (EC, 2007c).
Heat from the fumes of spread fabrics and forming machines are usually not suitable for heat exchanging due to the contamination by polymeric substances. Njobet (2012) analysed the total heat exchange during a polymer (polyamide) extrusion process and calculated that 8.1 kWth/ton molten polyamide is wasted during cooling, raising the temperature of cooling water up to 45ºC.
Ceramics
The primary energy use in ceramic manufacturing is for kiln firing and, in many processes, drying of intermediates or shaped ware is also energy intensive. The firing process takes place with temperatures between 650 and 2 000ºC, depending on the ceramic products, with typical exhaust temperatures ranging from 100 to 500ºC (see Table AI 1 for operating data). Firing can use different types of kilns (e.g. intermittent, continuous, rotary) and can include more than one firing phase (e.g. household ceramics are fired between one and four times). Intermittent kilns can be used to produce specialized ceramic products and are operated at lower feed rates. Roller kilns are now almost universally used for wall and floor tile production, rotary kilns for the manufacture of expanded clay aggregates and tunnel kilns are used in a wider range of ceramic industry sectors.
As many other high temperature furnaces, ceramic kilns are highly inefficient and there is a high thermal recovery potential often due to rejected heat mass flow and moderate temperature of the kiln system flue-gases. Only about 5 to 20% of the energy input is used to fire the product and about 50 to 70% would be lost in cooling air and kiln exhaust gases if not for HR strategies. It is possible to distinguish the pre-heating, firing and cooling sections in continuous kilns (Figure 2.5 (a)), even if more exhaust outlets can exist. Exhaust air from cooling area is often recovered to dryers, with or without the supplement hot air from gas burners. Exhaust gases from kiln can be recovered through heat exchangers to preheat the combustion air, but this application can be limited due to corrosion problems caused by acid combustion gases and often to flue-gas low temperatures (100 to 300ºC, depending on the product to be fired). The cooling air stream is usually at slightly lower temperatures but its considerable volumes of clean hot air makes it the best candidate for supplying driers, greenhouses and potteries, feed the kiln combustion air or district heating & cooling systems. Excess heat from an afterburner (thermo-reactor, thermal oxidizers) can also be used, either in the kiln or in the dryer (EC, 2007a).
As the ceramic industry requires simultaneous heat and electric power, the employment of cogeneration can be very useful (Figure 2.5 (b)).The electricity is used mainly in the driving force of the machines, compressed air, lighting, air conditioning and dust removal systems.
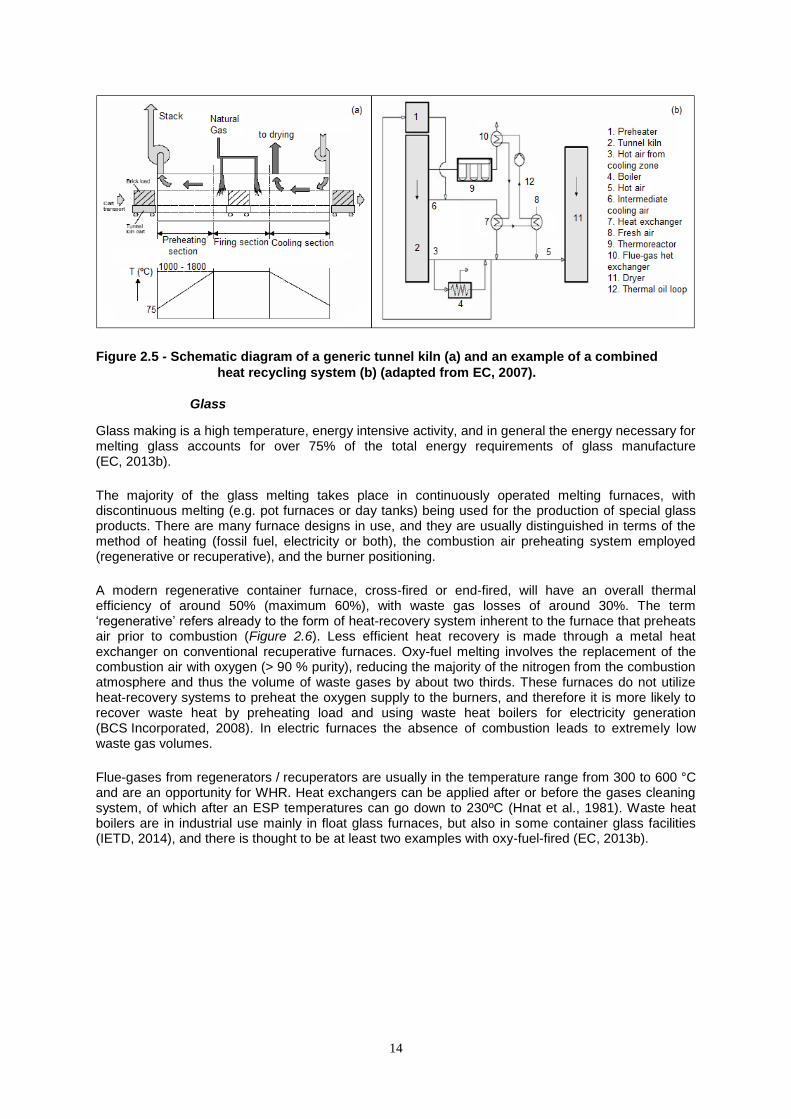
14
Figure 2.5 - Schematic diagram of a generic tunnel kiln (a) and an example of a combined
heat recycling system (b) (adapted from EC, 2007).
Glass
Glass making is a high temperature, energy intensive activity, and in general the energy necessary for melting glass accounts for over 75% of the total energy requirements of glass manufacture (EC, 2013b).
The majority of the glass melting takes place in continuously operated melting furnaces, with discontinuous melting (e.g. pot furnaces or day tanks) being used for the production of special glass products. There are many furnace designs in use, and they are usually distinguished in terms of the method of heating (fossil fuel, electricity or both), the combustion air preheating system employed (regenerative or recuperative), and the burner positioning.
A modern regenerative container furnace, cross-fired or end-fired, will have an overall thermal efficiency of around 50% (maximum 60%), with waste gas losses of around 30%. The term ‗regenerative‘ refers already to the form of heat-recovery system inherent to the furnace that preheats air prior to combustion (Figure 2.6). Less efficient heat recovery is made through a metal heat exchanger on conventional recuperative furnaces. Oxy-fuel melting involves the replacement of the combustion air with oxygen (> 90 % purity), reducing the majority of the nitrogen from the combustion atmosphere and thus the volume of waste gases by about two thirds. These furnaces do not utilize heat-recovery systems to preheat the oxygen supply to the burners, and therefore it is more likely to recover waste heat by preheating load and using waste heat boilers for electricity generation (BCS Incorporated, 2008). In electric furnaces the absence of combustion leads to extremely low waste gas volumes.
Flue-gases from regenerators / recuperators are usually in the temperature range from 300 to 600 °C and are an opportunity for WHR. Heat exchangers can be applied after or before the gases cleaning system, of which after an ESP temperatures can go down to 230ºC (Hnat et al., 1981). Waste heat boilers are in industrial use mainly in float glass furnaces, but also in some container glass facilities (IETD, 2014), and there is thought to be at least two examples with oxy-fuel-fired (EC, 2013b).
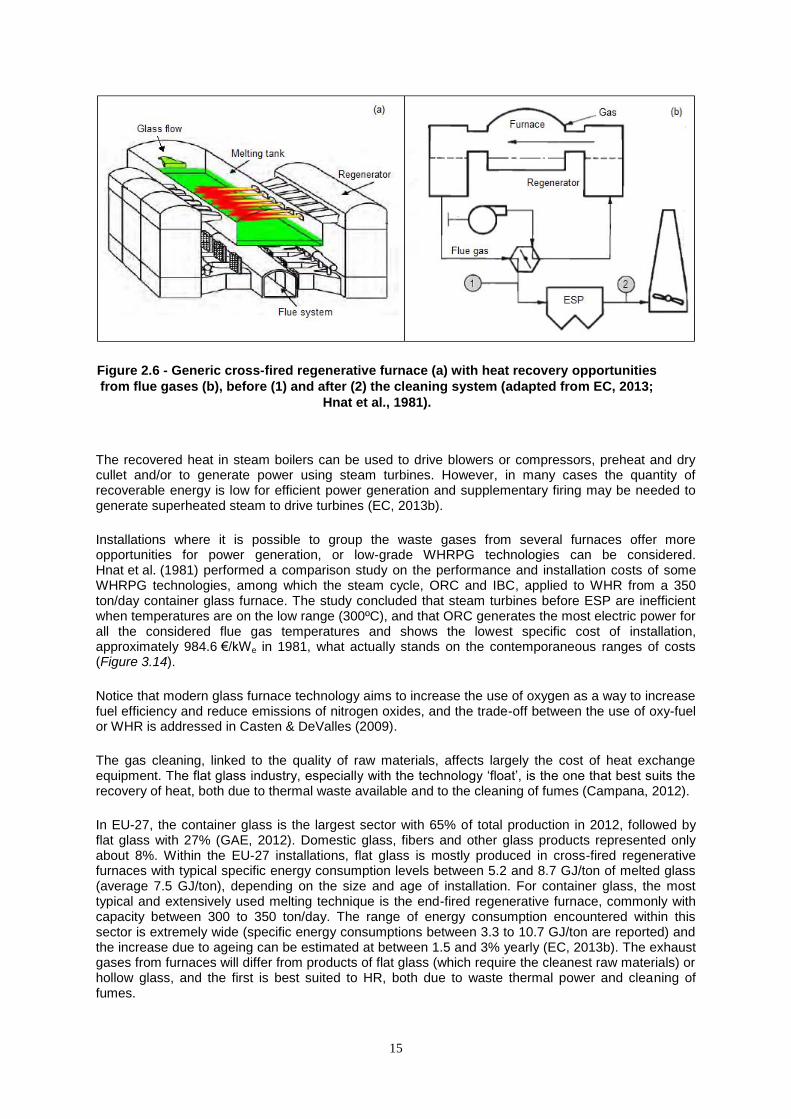
15
Figure 2.6 - Generic cross-fired regenerative furnace (a) with heat recovery opportunities
from flue gases (b), before (1) and after (2) the cleaning system (adapted from EC, 2013;
Hnat et al., 1981).
The recovered heat in steam boilers can be used to drive blowers or compressors, preheat and dry cullet and/or to generate power using steam turbines. However, in many cases the quantity of recoverable energy is low for efficient power generation and supplementary firing may be needed to generate superheated steam to drive turbines (EC, 2013b).
Installations where it is possible to group the waste gases from several furnaces offer more opportunities for power generation, or low-grade WHRPG technologies can be considered. Hnat et al. (1981) performed a comparison study on the performance and installation costs of some WHRPG technologies, among which the steam cycle, ORC and IBC, applied to WHR from a 350 ton/day container glass furnace. The study concluded that steam turbines before ESP are inefficient when temperatures are on the low range (300ºC), and that ORC generates the most electric power for all the considered flue gas temperatures and shows the lowest specific cost of installation, approximately 984.6 €/kWe in 1981, what actually stands on the contemporaneous ranges of costs (Figure 3.14).
Notice that modern glass furnace technology aims to increase the use of oxygen as a way to increase fuel efficiency and reduce emissions of nitrogen oxides, and the trade-off between the use of oxy-fuel or WHR is addressed in Casten & DeValles (2009).
The gas cleaning, linked to the quality of raw materials, affects largely the cost of heat exchange equipment. The flat glass industry, especially with the technology ‗float‘, is the one that best suits the recovery of heat, both due to thermal waste available and to the cleaning of fumes (Campana, 2012).
In EU-27, the container glass is the largest sector with 65% of total production in 2012, followed by flat glass with 27% (GAE, 2012). Domestic glass, fibers and other glass products represented only about 8%. Within the EU-27 installations, flat glass is mostly produced in cross-fired regenerative furnaces with typical specific energy consumption levels between 5.2 and 8.7 GJ/ton of melted glass (average 7.5 GJ/ton), depending on the size and age of installation. For container glass, the most typical and extensively used melting technique is the end-fired regenerative furnace, commonly with capacity between 300 to 350 ton/day. The range of energy consumption encountered within this sector is extremely wide (specific energy consumptions between 3.3 to 10.7 GJ/ton are reported) and the increase due to ageing can be estimated at between 1.5 and 3% yearly (EC, 2013b). The exhaust gases from furnaces will differ from products of flat glass (which require the cleanest raw materials) or hollow glass, and the first is best suited to HR, both due to waste thermal power and cleaning of fumes.
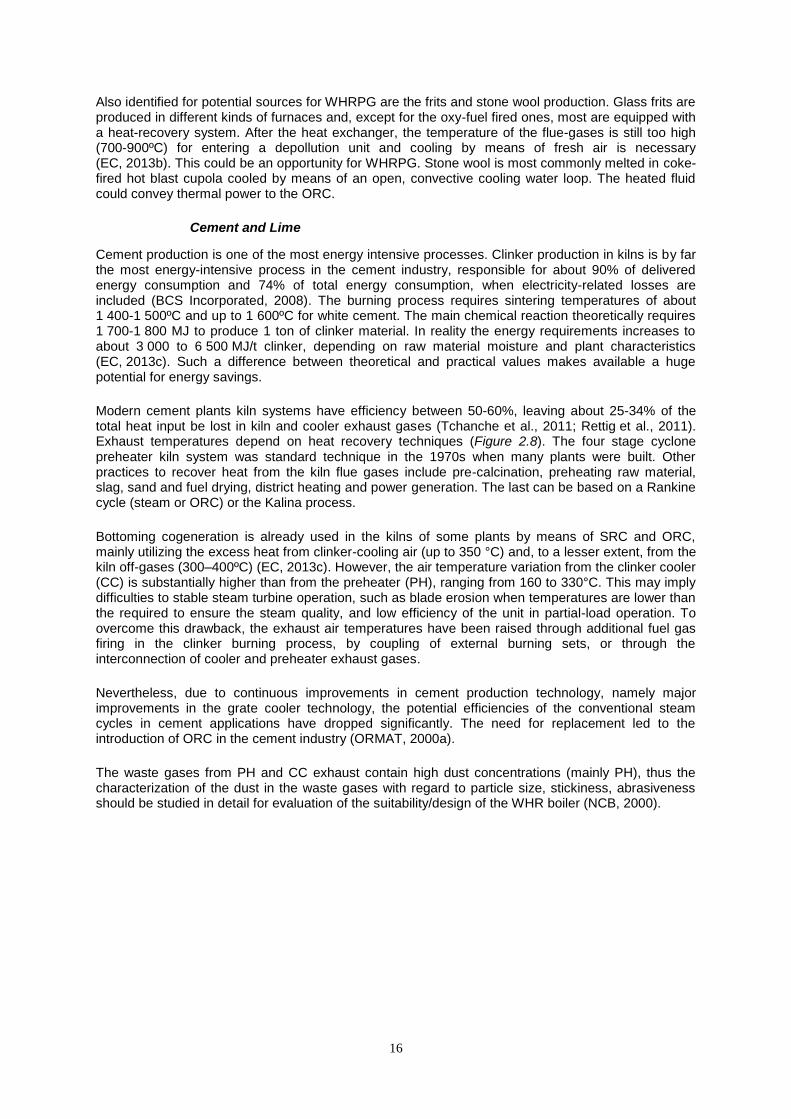
16
Also identified for potential sources for WHRPG are the frits and stone wool production. Glass frits are produced in different kinds of furnaces and, except for the oxy-fuel fired ones, most are equipped with a heat-recovery system. After the heat exchanger, the temperature of the flue-gases is still too high (700-900ºC) for entering a depollution unit and cooling by means of fresh air is necessary (EC, 2013b). This could be an opportunity for WHRPG. Stone wool is most commonly melted in coke-fired hot blast cupola cooled by means of an open, convective cooling water loop. The heated fluid could convey thermal power to the ORC.
Cement and Lime
Cement production is one of the most energy intensive processes. Clinker production in kilns is by far the most energy-intensive process in the cement industry, responsible for about 90% of delivered energy consumption and 74% of total energy consumption, when electricity-related losses are included (BCS Incorporated, 2008). The burning process requires sintering temperatures of about 1 400-1 500ºC and up to 1 600ºC for white cement. The main chemical reaction theoretically requires 1 700-1 800 MJ to produce 1 ton of clinker material. In reality the energy requirements increases to about 3 000 to 6 500 MJ/t clinker, depending on raw material moisture and plant characteristics (EC, 2013c). Such a difference between theoretical and practical values makes available a huge potential for energy savings.
Modern cement plants kiln systems have efficiency between 50-60%, leaving about 25-34% of the total heat input be lost in kiln and cooler exhaust gases (Tchanche et al., 2011; Rettig et al., 2011). Exhaust temperatures depend on heat recovery techniques (Figure 2.8). The four stage cyclone preheater kiln system was standard technique in the 1970s when many plants were built. Other practices to recover heat from the kiln flue gases include pre-calcination, preheating raw material, slag, sand and fuel drying, district heating and power generation. The last can be based on a Rankine cycle (steam or ORC) or the Kalina process.
Bottoming cogeneration is already used in the kilns of some plants by means of SRC and ORC, mainly utilizing the excess heat from clinker-cooling air (up to 350 °C) and, to a lesser extent, from the kiln off-gases (300–400ºC) (EC, 2013c). However, the air temperature variation from the clinker cooler (CC) is substantially higher than from the preheater (PH), ranging from 160 to 330°C. This may imply difficulties to stable steam turbine operation, such as blade erosion when temperatures are lower than the required to ensure the steam quality, and low efficiency of the unit in partial-load operation. To overcome this drawback, the exhaust air temperatures have been raised through additional fuel gas firing in the clinker burning process, by coupling of external burning sets, or through the interconnection of cooler and preheater exhaust gases.
Nevertheless, due to continuous improvements in cement production technology, namely major improvements in the grate cooler technology, the potential efficiencies of the conventional steam cycles in cement applications have dropped significantly. The need for replacement led to the introduction of ORC in the cement industry (ORMAT, 2000a).
The waste gases from PH and CC exhaust contain high dust concentrations (mainly PH), thus the characterization of the dust in the waste gases with regard to particle size, stickiness, abrasiveness should be studied in detail for evaluation of the suitability/design of the WHR boiler (NCB, 2000).
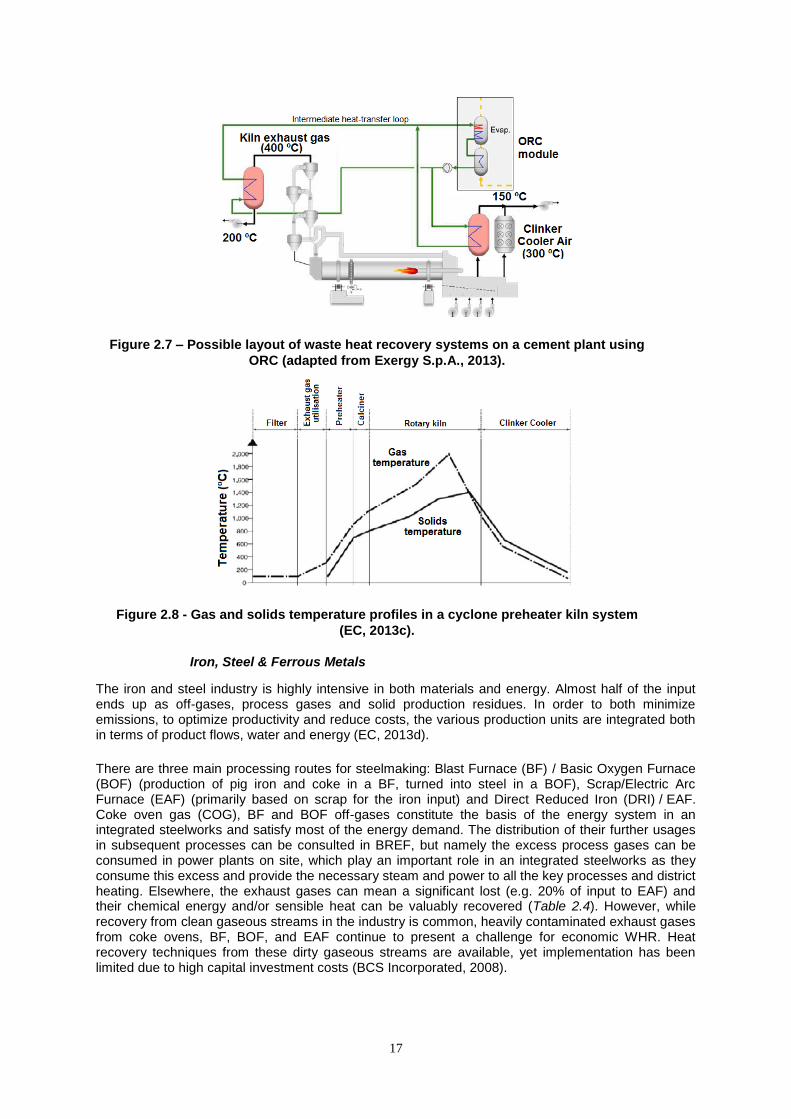
17
Figure 2.7 – Possible layout of waste heat recovery systems on a cement plant using
ORC (adapted from Exergy S.p.A., 2013).
Figure 2.8 - Gas and solids temperature profiles in a cyclone preheater kiln system
(EC, 2013c).
Iron, Steel & Ferrous Metals
The iron and steel industry is highly intensive in both materials and energy. Almost half of the input ends up as off-gases, process gases and solid production residues. In order to both minimize emissions, to optimize productivity and reduce costs, the various production units are integrated both in terms of product flows, water and energy (EC, 2013d).
There are three main processing routes for steelmaking: Blast Furnace (BF) / Basic Oxygen Furnace (BOF) (production of pig iron and coke in a BF, turned into steel in a BOF), Scrap/Electric Arc Furnace (EAF) (primarily based on scrap for the iron input) and Direct Reduced Iron (DRI) / EAF. Coke oven gas (COG), BF and BOF off-gases constitute the basis of the energy system in an integrated steelworks and satisfy most of the energy demand. The distribution of their further usages in subsequent processes can be consulted in BREF, but namely the excess process gases can be consumed in power plants on site, which play an important role in an integrated steelworks as they consume this excess and provide the necessary steam and power to all the key processes and district heating. Elsewhere, the exhaust gases can mean a significant lost (e.g. 20% of input to EAF) and their chemical energy and/or sensible heat can be valuably recovered (Table 2.4). However, while recovery from clean gaseous streams in the industry is common, heavily contaminated exhaust gases from coke ovens, BF, BOF, and EAF continue to present a challenge for economic WHR. Heat recovery techniques from these dirty gaseous streams are available, yet implementation has been limited due to high capital investment costs (BCS Incorporated, 2008).
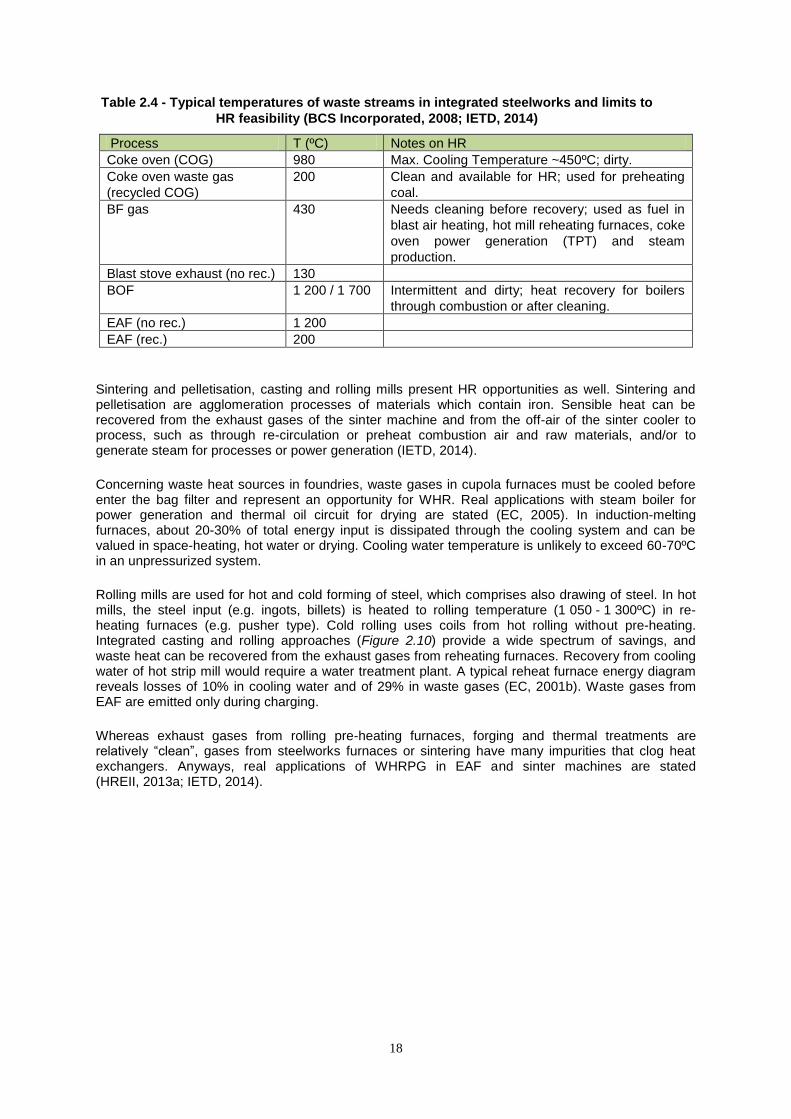
18
Table 2.4 - Typical temperatures of waste streams in integrated steelworks and limits to
HR feasibility (BCS Incorporated, 2008; IETD, 2014)
Process T (ºC) Notes on HR
Coke oven (COG) 980 Max. Cooling Temperature ~450ºC; dirty.
Coke oven waste gas
(recycled COG)
200 Clean and available for HR; used for preheating
coal.
BF gas 430 Needs cleaning before recovery; used as fuel in
blast air heating, hot mill reheating furnaces, coke
oven power generation (TPT) and steam
production.
Blast stove exhaust (no rec.) 130
BOF 1 200 / 1 700 Intermittent and dirty; heat recovery for boilers
through combustion or after cleaning.
EAF (no rec.) 1 200
EAF (rec.) 200
Sintering and pelletisation, casting and rolling mills present HR opportunities as well. Sintering and pelletisation are agglomeration processes of materials which contain iron. Sensible heat can be recovered from the exhaust gases of the sinter machine and from the off-air of the sinter cooler to process, such as through re-circulation or preheat combustion air and raw materials, and/or to generate steam for processes or power generation (IETD, 2014).
Concerning waste heat sources in foundries, waste gases in cupola furnaces must be cooled before enter the bag filter and represent an opportunity for WHR. Real applications with steam boiler for power generation and thermal oil circuit for drying are stated (EC, 2005). In induction-melting furnaces, about 20-30% of total energy input is dissipated through the cooling system and can be valued in space-heating, hot water or drying. Cooling water temperature is unlikely to exceed 60-70ºC in an unpressurized system.
Rolling mills are used for hot and cold forming of steel, which comprises also drawing of steel. In hot mills, the steel input (e.g. ingots, billets) is heated to rolling temperature (1 050 - 1 300ºC) in re-heating furnaces (e.g. pusher type). Cold rolling uses coils from hot rolling without pre-heating. Integrated casting and rolling approaches (Figure 2.10) provide a wide spectrum of savings, and waste heat can be recovered from the exhaust gases from reheating furnaces. Recovery from cooling water of hot strip mill would require a water treatment plant. A typical reheat furnace energy diagram reveals losses of 10% in cooling water and of 29% in waste gases (EC, 2001b). Waste gases from EAF are emitted only during charging.
Whereas exhaust gases from rolling pre-heating furnaces, forging and thermal treatments are relatively ―clean‖, gases from steelworks furnaces or sintering have many impurities that clog heat exchangers. Anyways, real applications of WHRPG in EAF and sinter machines are stated (HREII, 2013a; IETD, 2014).
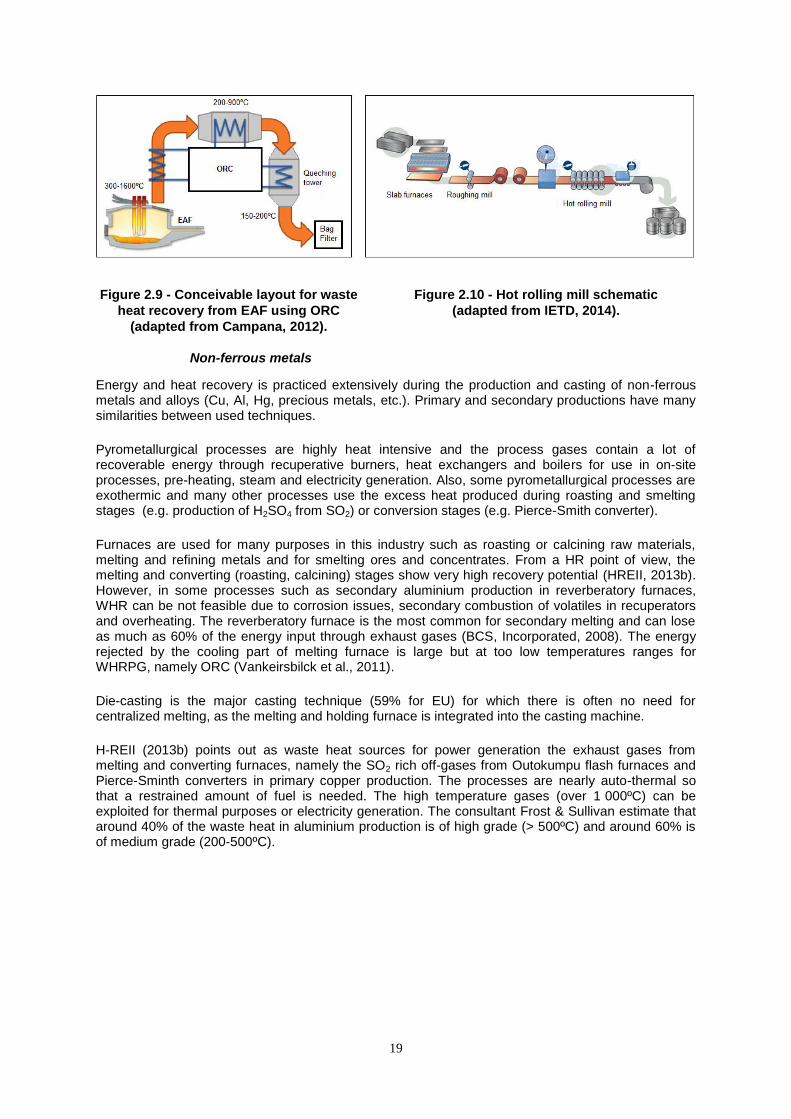
19
Figure 2.9 - Conceivable layout for waste
heat recovery from EAF using ORC
(adapted from Campana, 2012).
Figure 2.10 - Hot rolling mill schematic
(adapted from IETD, 2014).
Non-ferrous metals
Energy and heat recovery is practiced extensively during the production and casting of non-ferrous metals and alloys (Cu, Al, Hg, precious metals, etc.). Primary and secondary productions have many similarities between used techniques.
Pyrometallurgical processes are highly heat intensive and the process gases contain a lot of recoverable energy through recuperative burners, heat exchangers and boilers for use in on-site processes, pre-heating, steam and electricity generation. Also, some pyrometallurgical processes are exothermic and many other processes use the excess heat produced during roasting and smelting stages (e.g. production of H2SO4 from SO2) or conversion stages (e.g. Pierce-Smith converter).
Furnaces are used for many purposes in this industry such as roasting or calcining raw materials, melting and refining metals and for smelting ores and concentrates. From a HR point of view, the melting and converting (roasting, calcining) stages show very high recovery potential (HREII, 2013b). However, in some processes such as secondary aluminium production in reverberatory furnaces, WHR can be not feasible due to corrosion issues, secondary combustion of volatiles in recuperators and overheating. The reverberatory furnace is the most common for secondary melting and can lose as much as 60% of the energy input through exhaust gases (BCS, Incorporated, 2008). The energy rejected by the cooling part of melting furnace is large but at too low temperatures ranges for WHRPG, namely ORC (Vankeirsbilck et al., 2011).
Die-casting is the major casting technique (59% for EU) for which there is often no need for centralized melting, as the melting and holding furnace is integrated into the casting machine.
H-REII (2013b) points out as waste heat sources for power generation the exhaust gases from melting and converting furnaces, namely the SO2 rich off-gases from Outokumpu flash furnaces and Pierce-Sminth converters in primary copper production. The processes are nearly auto-thermal so that a restrained amount of fuel is needed. The high temperature gases (over 1 000ºC) can be exploited for thermal purposes or electricity generation. The consultant Frost & Sullivan estimate that around 40% of the waste heat in aluminium production is of high grade (> 500ºC) and around 60% is of medium grade (200-500ºC).
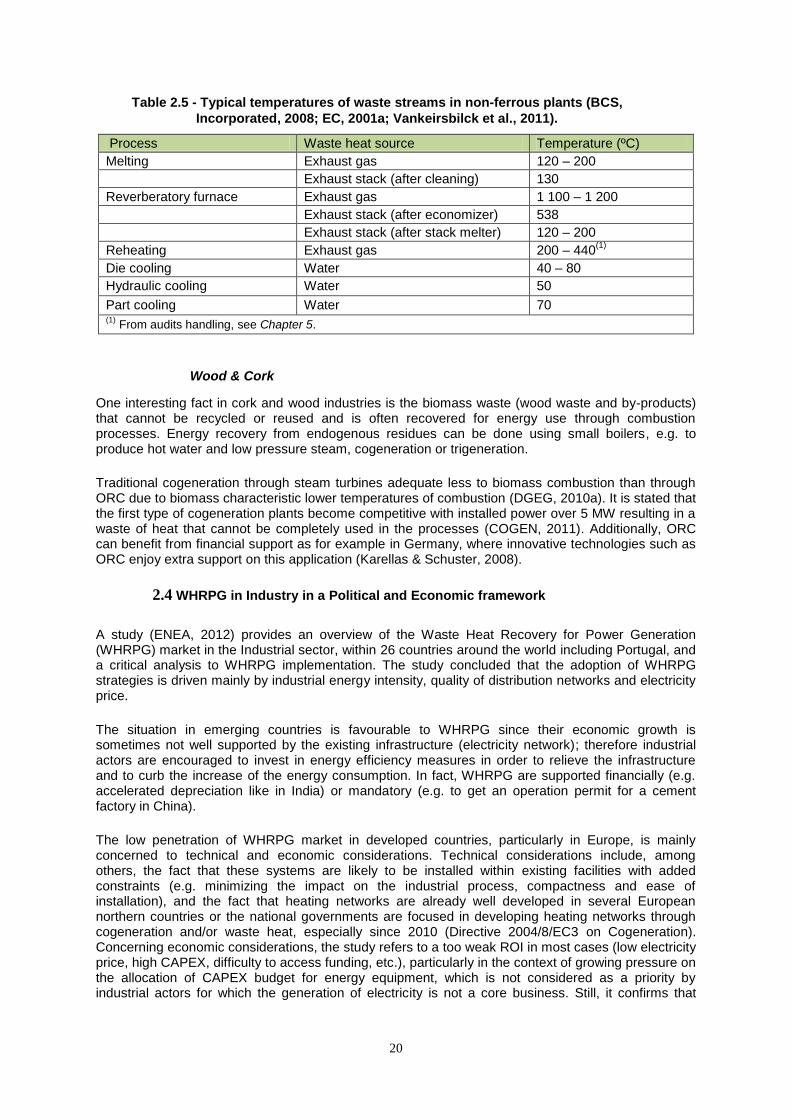
20
Table 2.5 - Typical temperatures of waste streams in non-ferrous plants (BCS,
Incorporated, 2008; EC, 2001a; Vankeirsbilck et al., 2011).
Process Waste heat source Temperature (ºC)
Melting Exhaust gas 120 – 200
Exhaust stack (after cleaning) 130
Reverberatory furnace Exhaust gas 1 100 – 1 200
Exhaust stack (after economizer) 538
Exhaust stack (after stack melter) 120 – 200
Reheating Exhaust gas 200 – 440(1)
Die cooling Water 40 – 80
Hydraulic cooling Water 50
Part cooling Water 70 (1)
From audits handling, see Chapter 5.
Wood & Cork
One interesting fact in cork and wood industries is the biomass waste (wood waste and by-products) that cannot be recycled or reused and is often recovered for energy use through combustion processes. Energy recovery from endogenous residues can be done using small boilers, e.g. to produce hot water and low pressure steam, cogeneration or trigeneration.
Traditional cogeneration through steam turbines adequate less to biomass combustion than through ORC due to biomass characteristic lower temperatures of combustion (DGEG, 2010a). It is stated that the first type of cogeneration plants become competitive with installed power over 5 MW resulting in a waste of heat that cannot be completely used in the processes (COGEN, 2011). Additionally, ORC can benefit from financial support as for example in Germany, where innovative technologies such as ORC enjoy extra support on this application (Karellas & Schuster, 2008).
2.4 WHRPG in Industry in a Political and Economic framework
A study (ENEA, 2012) provides an overview of the Waste Heat Recovery for Power Generation (WHRPG) market in the Industrial sector, within 26 countries around the world including Portugal, and a critical analysis to WHRPG implementation. The study concluded that the adoption of WHRPG strategies is driven mainly by industrial energy intensity, quality of distribution networks and electricity price.
The situation in emerging countries is favourable to WHRPG since their economic growth is sometimes not well supported by the existing infrastructure (electricity network); therefore industrial actors are encouraged to invest in energy efficiency measures in order to relieve the infrastructure and to curb the increase of the energy consumption. In fact, WHRPG are supported financially (e.g. accelerated depreciation like in India) or mandatory (e.g. to get an operation permit for a cement factory in China).
The low penetration of WHRPG market in developed countries, particularly in Europe, is mainly concerned to technical and economic considerations. Technical considerations include, among others, the fact that these systems are likely to be installed within existing facilities with added constraints (e.g. minimizing the impact on the industrial process, compactness and ease of installation), and the fact that heating networks are already well developed in several European northern countries or the national governments are focused in developing heating networks through cogeneration and/or waste heat, especially since 2010 (Directive 2004/8/EC3 on Cogeneration). Concerning economic considerations, the study refers to a too weak ROI in most cases (low electricity price, high CAPEX, difficulty to access funding, etc.), particularly in the context of growing pressure on the allocation of CAPEX budget for energy equipment, which is not considered as a priority by industrial actors for which the generation of electricity is not a core business. Still, it confirms that
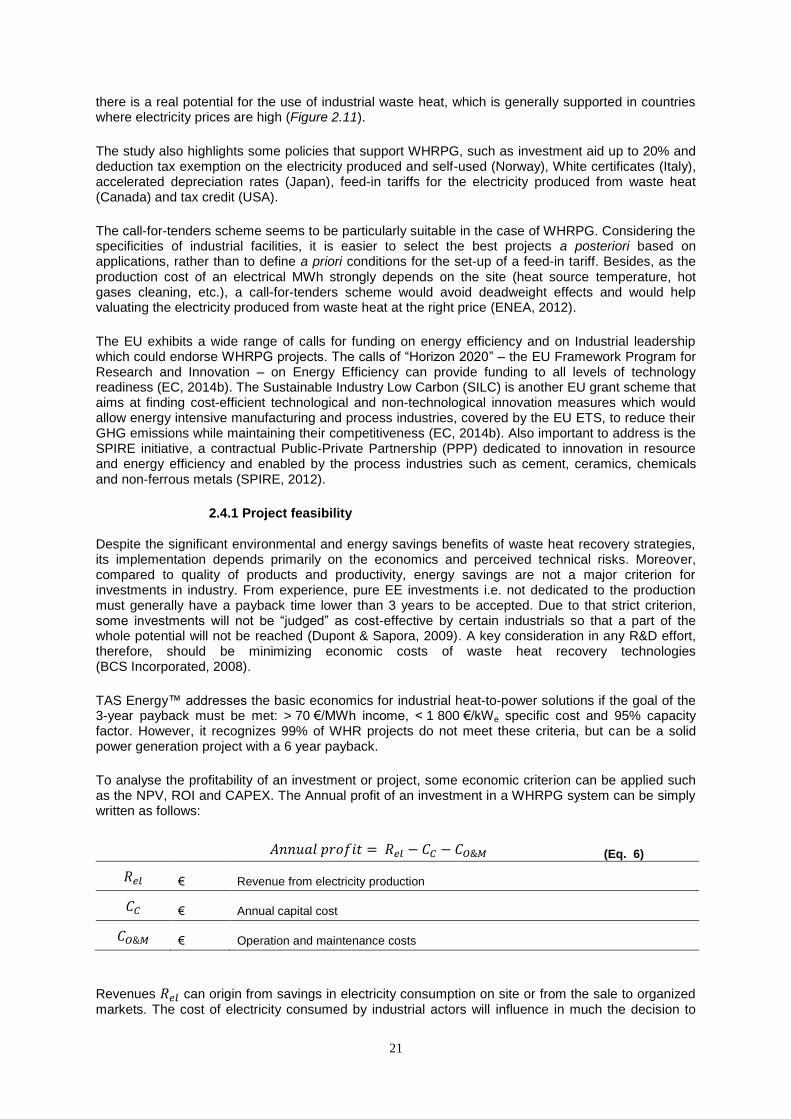
21
there is a real potential for the use of industrial waste heat, which is generally supported in countries where electricity prices are high (Figure 2.11).
The study also highlights some policies that support WHRPG, such as investment aid up to 20% and deduction tax exemption on the electricity produced and self-used (Norway), White certificates (Italy), accelerated depreciation rates (Japan), feed-in tariffs for the electricity produced from waste heat (Canada) and tax credit (USA).
The call-for-tenders scheme seems to be particularly suitable in the case of WHRPG. Considering the specificities of industrial facilities, it is easier to select the best projects a posteriori based on applications, rather than to define a priori conditions for the set-up of a feed-in tariff. Besides, as the production cost of an electrical MWh strongly depends on the site (heat source temperature, hot gases cleaning, etc.), a call-for-tenders scheme would avoid deadweight effects and would help valuating the electricity produced from waste heat at the right price (ENEA, 2012).
The EU exhibits a wide range of calls for funding on energy efficiency and on Industrial leadership which could endorse WHRPG projects. The calls of ―Horizon 2020‖ – the EU Framework Program for Research and Innovation – on Energy Efficiency can provide funding to all levels of technology readiness (EC, 2014b). The Sustainable Industry Low Carbon (SILC) is another EU grant scheme that aims at finding cost-efficient technological and non-technological innovation measures which would allow energy intensive manufacturing and process industries, covered by the EU ETS, to reduce their GHG emissions while maintaining their competitiveness (EC, 2014b). Also important to address is the SPIRE initiative, a contractual Public-Private Partnership (PPP) dedicated to innovation in resource and energy efficiency and enabled by the process industries such as cement, ceramics, chemicals and non‑ferrous metals (SPIRE, 2012).
2.4.1 Project feasibility
Despite the significant environmental and energy savings benefits of waste heat recovery strategies, its implementation depends primarily on the economics and perceived technical risks. Moreover, compared to quality of products and productivity, energy savings are not a major criterion for investments in industry. From experience, pure EE investments i.e. not dedicated to the production must generally have a payback time lower than 3 years to be accepted. Due to that strict criterion, some investments will not be ―judged‖ as cost-effective by certain industrials so that a part of the whole potential will not be reached (Dupont & Sapora, 2009). A key consideration in any R&D effort, therefore, should be minimizing economic costs of waste heat recovery technologies (BCS Incorporated, 2008).
TAS Energy™ addresses the basic economics for industrial heat-to-power solutions if the goal of the 3-year payback must be met: > 70 €/MWh income, < 1 800 €/kWe specific cost and 95% capacity factor. However, it recognizes 99% of WHR projects do not meet these criteria, but can be a solid power generation project with a 6 year payback.
To analyse the profitability of an investment or project, some economic criterion can be applied such as the NPV, ROI and CAPEX. The Annual profit of an investment in a WHRPG system can be simply written as follows:
(Eq. 6)
€ Revenue from electricity production
€ Annual capital cost
€ Operation and maintenance costs
Revenues can origin from savings in electricity consumption on site or from the sale to organized markets. The cost of electricity consumed by industrial actors will influence in much the decision to
22
invest in WHRPG. When the electricity purchased from the grid is expensive and represent a significant part of the production cost of the finished goods, manufacturers are likely to take into consideration such an investment, even if no public financial support is provided. Payback time (PBT) or ROI estimates improve when the cost of the purchased electricity increase. For example, Italy has an electricity price for industrial consumers above the average EU-27 (Figure 2.11). Plus, the implemented support scheme (White certificates) subsidizes the injection of low-carbon electricity in the network at a low cost: the selling price above which a project is profitable will be reached with a lower subsidy compared to a country where the electricity is cheaper and where the subsidy will thus need to be higher. One White certificate was worth 60 €/MWhe in 2011 (ENEA, 2012). On the other hand, in France the average price of electricity for industrial companies is very low - between 50 and 75 €/MWh – due to the predominance of nuclear in the energy mix (David et al., 2011). This price level does not allow the financing of high PBT projects, namely WHRPG. However, despite of its quite cheap electricity, Norway has also put in place such a supportive scheme showing that the price of electricity is not the only driving factor taken into consideration by public policies.
Figure 2.11 - Electricity prices for industrial consumers with average consumption
(Eurostat Ic band price) in EU-27 with focus to Italy, Portugal and Norway
(Eurostat, 2013).
2.5 Energy and Energy Efficiency in Portuguese Industry
2.5.1 Framework and late developments
Over the period 2000-2010, the overall energy efficiency increased around 4% in Portugal, which was supported mainly by the significant improvement on energy efficiency (EE) in residential sector. On the other hand the overall EE of industry has increased only 1%, measured in terms of energy used per production index (ADENE, 2012). About 37% of the total final energy consumed by the Portuguese Manufacture Industry is fossil fuels (DGEG, 2012).
The 2008-2015 National Energy Efficiency Action Plan (PNAEE 2008-2015) and 2010 National Renewable Energy Action Plan (PNAER 2010) are energy planning tools which establish ways of achieving the targets and international commitments assumed by Portugal with regard to energy efficiency and the use of energy from renewable resources. The analysis of their implementation made possible to conclude that whereas Portugal has an energy intensity of primary energy in line with the EU, the energy intensity of the productive economy is 27% higher than EU average, resulting in the need for direct actions regarding final energy (PCM, 2013). It must be said that the transport and services sectors were the ones contributing the most for this result. Both plans were revised on a joint approach facilitating specially the decision making processes involving choices between investing in energy efficiency and promoting the use of renewable energy.
23
The PNAEE 2008-2015 was, in the last years, the main tool to EE. It comprised a vast series of EE programs and measures, with a 2015 timeline, for the transport, residential, State and industrial sectors, as well as transversal programs dealing with behaviour, green taxation and funding for EE. The PNAEE 2016, approved by RCM No 20/2013, followed the PNAEE 2008-2015 and aims to project new actions and targets for 2016. It was decided to continue the majority of the measures envisaged in the PNAEE 2008, although some of them were changed in terms of respective goals or the inclusion/exclusion of some of their actions (PCM, 2013).
Concerning industry, the previous PNAEE 2008 covered the Energy Efficiency System for Industry, which included the program for competitive energy in industry and the Intensive Energy Consumption Management System (SGCIE), regulated by DL 71/2008, which took over the prior Regulation on Management of Energy Consumption (RGCE). The first facilitates the SGCIE through partial repayment of energy audits and investments on EE, revision of tariffs and licensing applied to installations converting to natural gas or biomass, tendering for funding, among others. The SGCIE obligates installations with energy consumptions above 500 toe/year
2 to report and reduce energy
consumption through EE measures, aiming established energy intensity, carbon intensity and energy specific consumption targets. Measures identified in obligatory energy audits must be implemented according to PB time and energy consumption of the installation, subjected to penalties.
The progress made through SGCIE resulted in the delivery of almost 400 Energy Consumption Rationalizations Plans (PREn) which comprise specific measures applied to each installation after prior energy audit, and which become Agreements for Rationalization of Energy Consumption (ARCE) after approval of regulatory entity (DGEG). The impact of the measures, and thus of the PNAEE 2008 referring to Industry, was calculated based on the impact of the measures framed within each PREn, by the end of 2010, and on the impact of measures to promote energy savings still being implemented (RGCE). A total reduction on final energy consumption of 178 ktoe was recorded, corresponding to the execution of 49% of the new target set to 2016 for Industry (365 ktoe). However, the results fell short of the objective resulting in the review of the SGCIE and its enhancement in NEAAP 2016. It will be revised in order to, among others:
Expand its scope of application;
Improve the level of monitoring of implementation of EE measures using verification protocols;
Improve the conditions of incentives to encourage companies to join voluntarily the SGCIE;
Converge the EE obligations of DL No34/2011 on ―Miniproduction‖ systems, so they can be framed within SGCIE regulations.
The ARCE provides facility operators with excise duty exemptions (ISP) on oil and energy products, as well as possibility to apply for incentives on energy audit costs and on investments in energy management and monitoring equipment (ADENE, 2012).
It should be addressed that not all industrial installations are regulated by SGCIE, and that industries under European Trading Scheme (ETS), implemented through National Allocation Plan for Emission Allowances (PNALE II), are not obligated to report or reduce their energy consumptions since it was assumed that the obligations of CO2,eq emissions reduction were directly linked to their energy performance. However, it was recognized that this may not mean energy efficiency on processes such as the ones consuming electricity. It is therefore unknown the impact of ETS in effective EE improvements (ODYSSEE MURE, 2009).
Small and Medium Enterprises (SME) are not included in CELE or SGCIE and are not regulated or followed with respect to improvements in energy performance or energy efficiency. This sensitive situation is pointed out in the Impact Assessment of the Commission staff on the EEP 2011 (EC, 2011c) and studied by Brazão (2012) to the specific case of Portugal given that SME represent, for the Portuguese manufacturing industry, 99.2% of registered companies and 60.4% of GVA.
Facilities under the PNALE are not covered by SGCIE, but they may participate on a voluntarily basis, as can facilities with annual energy consumptions lower than 500 toe. Figure 2.11 summarizes the
2 With exception with cogeneration units legally independent from respective energy consumers.
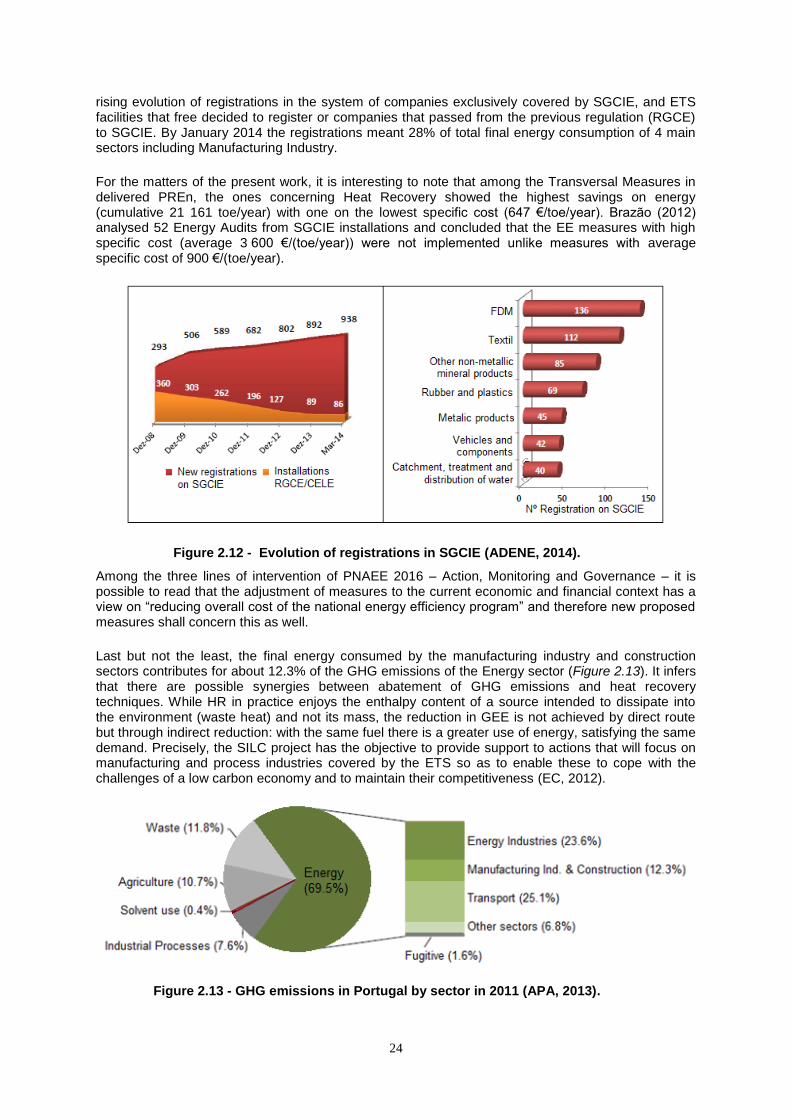
24
rising evolution of registrations in the system of companies exclusively covered by SGCIE, and ETS facilities that free decided to register or companies that passed from the previous regulation (RGCE) to SGCIE. By January 2014 the registrations meant 28% of total final energy consumption of 4 main sectors including Manufacturing Industry.
For the matters of the present work, it is interesting to note that among the Transversal Measures in delivered PREn, the ones concerning Heat Recovery showed the highest savings on energy (cumulative 21 161 toe/year) with one on the lowest specific cost (647 €/toe/year). Brazão (2012) analysed 52 Energy Audits from SGCIE installations and concluded that the EE measures with high specific cost (average 3 600 €/(toe/year)) were not implemented unlike measures with average specific cost of 900 €/(toe/year).
Figure 2.12 - Evolution of registrations in SGCIE (ADENE, 2014).
Among the three lines of intervention of PNAEE 2016 – Action, Monitoring and Governance – it is possible to read that the adjustment of measures to the current economic and financial context has a view on ―reducing overall cost of the national energy efficiency program‖ and therefore new proposed measures shall concern this as well.
Last but not the least, the final energy consumed by the manufacturing industry and construction sectors contributes for about 12.3% of the GHG emissions of the Energy sector (Figure 2.13). It infers that there are possible synergies between abatement of GHG emissions and heat recovery techniques. While HR in practice enjoys the enthalpy content of a source intended to dissipate into the environment (waste heat) and not its mass, the reduction in GEE is not achieved by direct route but through indirect reduction: with the same fuel there is a greater use of energy, satisfying the same demand. Precisely, the SILC project has the objective to provide support to actions that will focus on manufacturing and process industries covered by the ETS so as to enable these to cope with the challenges of a low carbon economy and to maintain their competitiveness (EC, 2012).
Figure 2.13 - GHG emissions in Portugal by sector in 2011 (APA, 2013).
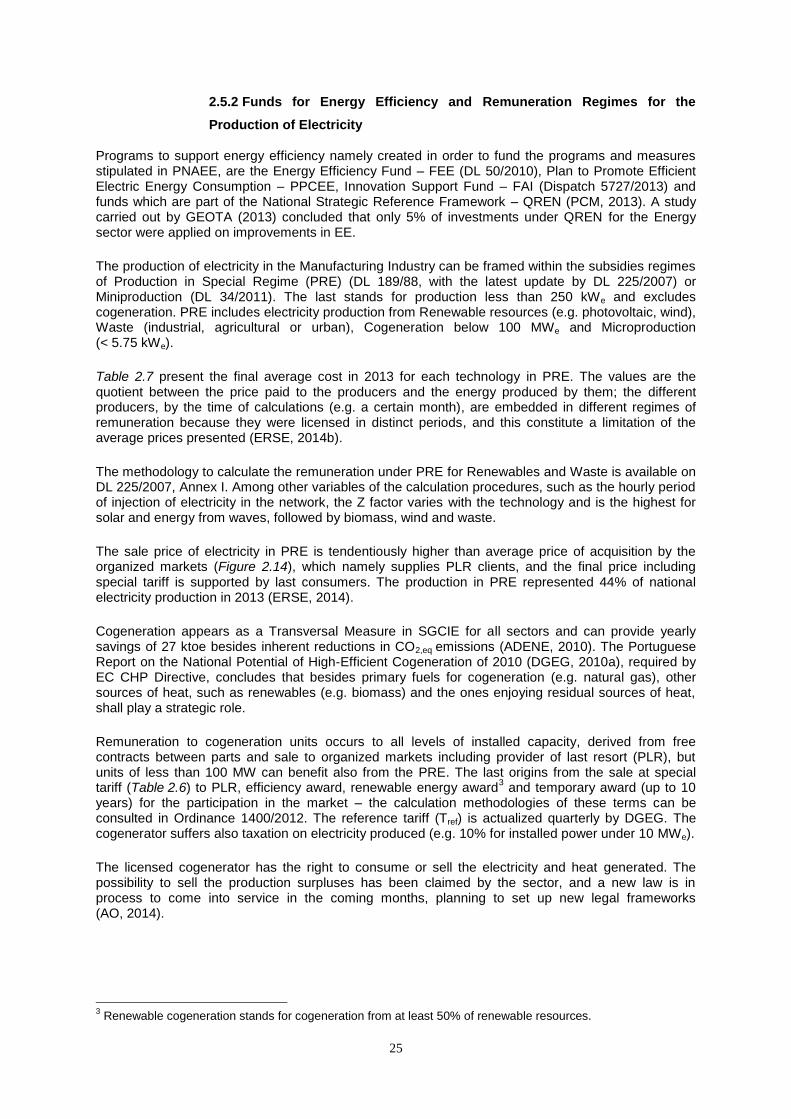
25
2.5.2 Funds for Energy Efficiency and Remuneration Regimes for the
Production of Electricity
Programs to support energy efficiency namely created in order to fund the programs and measures stipulated in PNAEE, are the Energy Efficiency Fund – FEE (DL 50/2010), Plan to Promote Efficient Electric Energy Consumption – PPCEE, Innovation Support Fund – FAI (Dispatch 5727/2013) and funds which are part of the National Strategic Reference Framework – QREN (PCM, 2013). A study carried out by GEOTA (2013) concluded that only 5% of investments under QREN for the Energy sector were applied on improvements in EE.
The production of electricity in the Manufacturing Industry can be framed within the subsidies regimes of Production in Special Regime (PRE) (DL 189/88, with the latest update by DL 225/2007) or Miniproduction (DL 34/2011). The last stands for production less than 250 kWe and excludes cogeneration. PRE includes electricity production from Renewable resources (e.g. photovoltaic, wind), Waste (industrial, agricultural or urban), Cogeneration below 100 MWe and Microproduction (< 5.75 kWe).
Table 2.7 present the final average cost in 2013 for each technology in PRE. The values are the quotient between the price paid to the producers and the energy produced by them; the different producers, by the time of calculations (e.g. a certain month), are embedded in different regimes of remuneration because they were licensed in distinct periods, and this constitute a limitation of the average prices presented (ERSE, 2014b).
The methodology to calculate the remuneration under PRE for Renewables and Waste is available on DL 225/2007, Annex I. Among other variables of the calculation procedures, such as the hourly period of injection of electricity in the network, the Z factor varies with the technology and is the highest for solar and energy from waves, followed by biomass, wind and waste.
The sale price of electricity in PRE is tendentiously higher than average price of acquisition by the organized markets (Figure 2.14), which namely supplies PLR clients, and the final price including special tariff is supported by last consumers. The production in PRE represented 44% of national electricity production in 2013 (ERSE, 2014).
Cogeneration appears as a Transversal Measure in SGCIE for all sectors and can provide yearly savings of 27 ktoe besides inherent reductions in CO2,eq emissions (ADENE, 2010). The Portuguese Report on the National Potential of High-Efficient Cogeneration of 2010 (DGEG, 2010a), required by EC CHP Directive, concludes that besides primary fuels for cogeneration (e.g. natural gas), other sources of heat, such as renewables (e.g. biomass) and the ones enjoying residual sources of heat, shall play a strategic role.
Remuneration to cogeneration units occurs to all levels of installed capacity, derived from free contracts between parts and sale to organized markets including provider of last resort (PLR), but units of less than 100 MW can benefit also from the PRE. The last origins from the sale at special tariff (Table 2.6) to PLR, efficiency award, renewable energy award
3 and temporary award (up to 10
years) for the participation in the market – the calculation methodologies of these terms can be consulted in Ordinance 1400/2012. The reference tariff (Tref) is actualized quarterly by DGEG. The cogenerator suffers also taxation on electricity produced (e.g. 10% for installed power under 10 MWe).
The licensed cogenerator has the right to consume or sell the electricity and heat generated. The possibility to sell the production surpluses has been claimed by the sector, and a new law is in process to come into service in the coming months, planning to set up new legal frameworks (AO, 2014).
3 Renewable cogeneration stands for cogeneration from at least 50% of renewable resources.
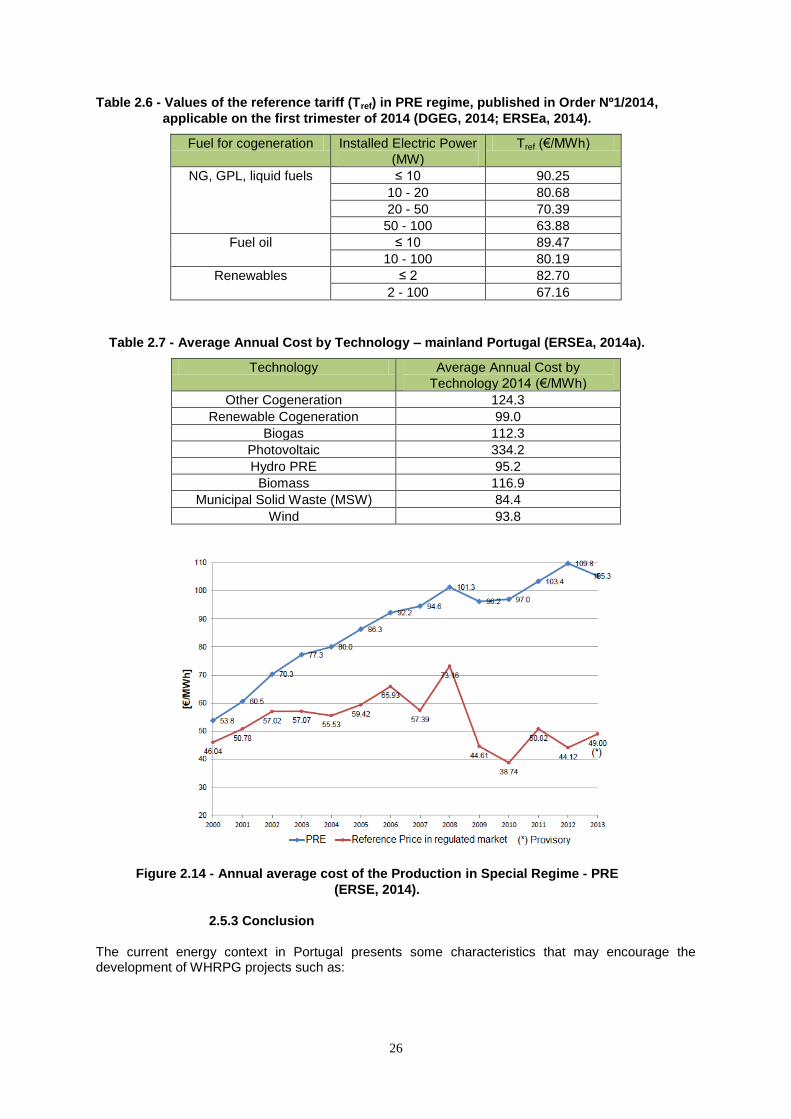
26
Table 2.6 - Values of the reference tariff (Tref) in PRE regime, published in Order Nº1/2014,
applicable on the first trimester of 2014 (DGEG, 2014; ERSEa, 2014).
Fuel for cogeneration Installed Electric Power
(MW)
Tref (€/MWh)
NG, GPL, liquid fuels ≤ 10 90.25
10 - 20 80.68
20 - 50 70.39
50 - 100 63.88
Fuel oil ≤ 10 89.47
10 - 100 80.19
Renewables ≤ 2 82.70
2 - 100 67.16
Table 2.7 - Average Annual Cost by Technology – mainland Portugal (ERSEa, 2014a).
Technology Average Annual Cost by
Technology 2014 (€/MWh)
Other Cogeneration 124.3
Renewable Cogeneration 99.0
Biogas 112.3
Photovoltaic 334.2
Hydro PRE 95.2
Biomass 116.9
Municipal Solid Waste (MSW) 84.4
Wind 93.8
Figure 2.14 - Annual average cost of the Production in Special Regime - PRE
(ERSE, 2014).
2.5.3 Conclusion
The current energy context in Portugal presents some characteristics that may encourage the development of WHRPG projects such as:
27
Expectations of fossil fuel price increase globally, and thus also the cost of fuel based electricity (DECC, 2013);
Interesting feed-in tariffs for electricity production in special regimes;
Good opportunities for funding;
Urgency on the execution of national targets on EE.
However, some other can be discouraging such as the lack of dedicated policies to support industrial actors willing to invest in WHRPG and the restrictive investment criteria in terms of expected profitability (the goal of the 3-year payback). For EE measure with high specific costs and PBT, Brazão (2012) proposes an energy tax that would allow reforming the FEE and reimbursing the industries through a deduction system on investments in new EE measures, lowering the PBT.
2.5.4 Case studies in Portugal
From a short research, it appears that no study exists on WHRPG in Industry for Portugal. The project COMFORTABLE (COGEN, 2006), supported by QREN, studied the potential to convert fuel oil engines into engines using more environmental friendly fuels, namely NG (Diesel to Otto). A total of 30 engines were studied in different sectors including examples of the manufacturing industry. At the same time, the potential to apply ORC as bottoming cycle to raise combined cycle efficiency was assessed, and it can be seen as a primary study on the technology feasible implementation.
There are three cases of ORC application in Portugal and even if none in the manufacturing industry, it was seen as relevant to state the figures of such installations.
The first two were implemented in 1994/98 in Azores island of S. Miguel (Ribeira Grande and Pico Vermelho), showing together 23 MW of installed power in geothermal wells with turbo-machines from the manufacturer ORMAT. In 2007, both power plants produced 41% of the island total electricity demand (COGEN, 2006).
The third was implemented in 2012 in Sermonde, north of Portugal, exploiting the exhaust gas from biogas engines from landfill (majority) and anaerobic digestion. Four biogas engines supply two ORC modules producing about 300 kWe with Tri-O-Gen equipment. A by-pass valve regulates the heat flow to the ORC modules; the heat flow is commonly in excess resulting in the modules‘ operation commonly at full load. The production of electricity of the combined cycles enjoys the feed-in-tariffs under PRE for electricity produced from landfill gas. The exploitation of the thermal energy (to heat the digesters) is not high enough to be considered cogeneration, thus the ORCs are contemplated as an extension of the biogas engines installed power and the electricity is sold at the final price that applies from DL 225/2007. In 2013, the average final price was 123 €/MWh, close to the cost of electricity for the installation (120 €/MWh).

28
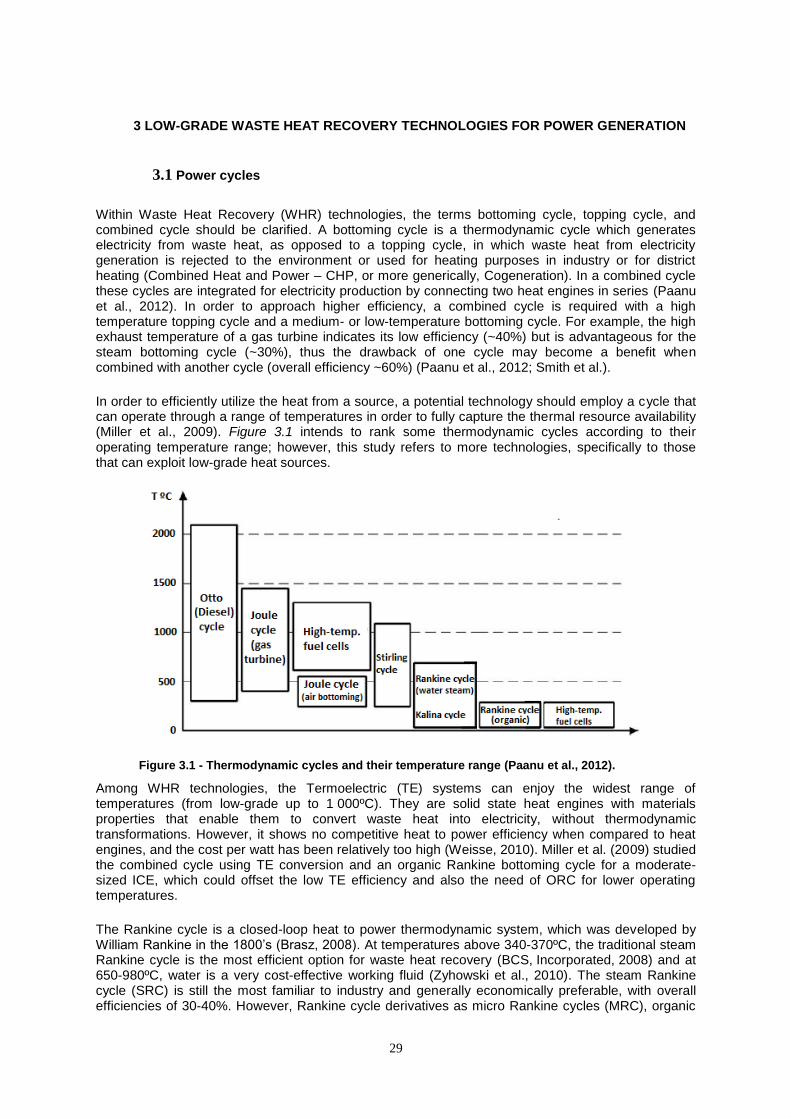
29
3 LOW-GRADE WASTE HEAT RECOVERY TECHNOLOGIES FOR POWER GENERATION
3.1 Power cycles
Within Waste Heat Recovery (WHR) technologies, the terms bottoming cycle, topping cycle, and combined cycle should be clarified. A bottoming cycle is a thermodynamic cycle which generates electricity from waste heat, as opposed to a topping cycle, in which waste heat from electricity generation is rejected to the environment or used for heating purposes in industry or for district heating (Combined Heat and Power – CHP, or more generically, Cogeneration). In a combined cycle these cycles are integrated for electricity production by connecting two heat engines in series (Paanu et al., 2012). In order to approach higher efficiency, a combined cycle is required with a high temperature topping cycle and a medium- or low-temperature bottoming cycle. For example, the high exhaust temperature of a gas turbine indicates its low efficiency (~40%) but is advantageous for the steam bottoming cycle (~30%), thus the drawback of one cycle may become a benefit when combined with another cycle (overall efficiency ~60%) (Paanu et al., 2012; Smith et al.).
In order to efficiently utilize the heat from a source, a potential technology should employ a cycle that can operate through a range of temperatures in order to fully capture the thermal resource availability (Miller et al., 2009). Figure 3.1 intends to rank some thermodynamic cycles according to their operating temperature range; however, this study refers to more technologies, specifically to those that can exploit low-grade heat sources.
Figure 3.1 - Thermodynamic cycles and their temperature range (Paanu et al., 2012).
Among WHR technologies, the Termoelectric (TE) systems can enjoy the widest range of temperatures (from low-grade up to 1 000ºC). They are solid state heat engines with materials properties that enable them to convert waste heat into electricity, without thermodynamic transformations. However, it shows no competitive heat to power efficiency when compared to heat engines, and the cost per watt has been relatively too high (Weisse, 2010). Miller et al. (2009) studied the combined cycle using TE conversion and an organic Rankine bottoming cycle for a moderate-sized ICE, which could offset the low TE efficiency and also the need of ORC for lower operating temperatures.
The Rankine cycle is a closed-loop heat to power thermodynamic system, which was developed by William Rankine in the 1800‘s (Brasz, 2008). At temperatures above 340-370ºC, the traditional steam Rankine cycle is the most efficient option for waste heat recovery (BCS, Incorporated, 2008) and at 650-980ºC, water is a very cost-effective working fluid (Zyhowski et al., 2010). The steam Rankine cycle (SRC) is still the most familiar to industry and generally economically preferable, with overall efficiencies of 30-40%. However, Rankine cycle derivatives as micro Rankine cycles (MRC), organic
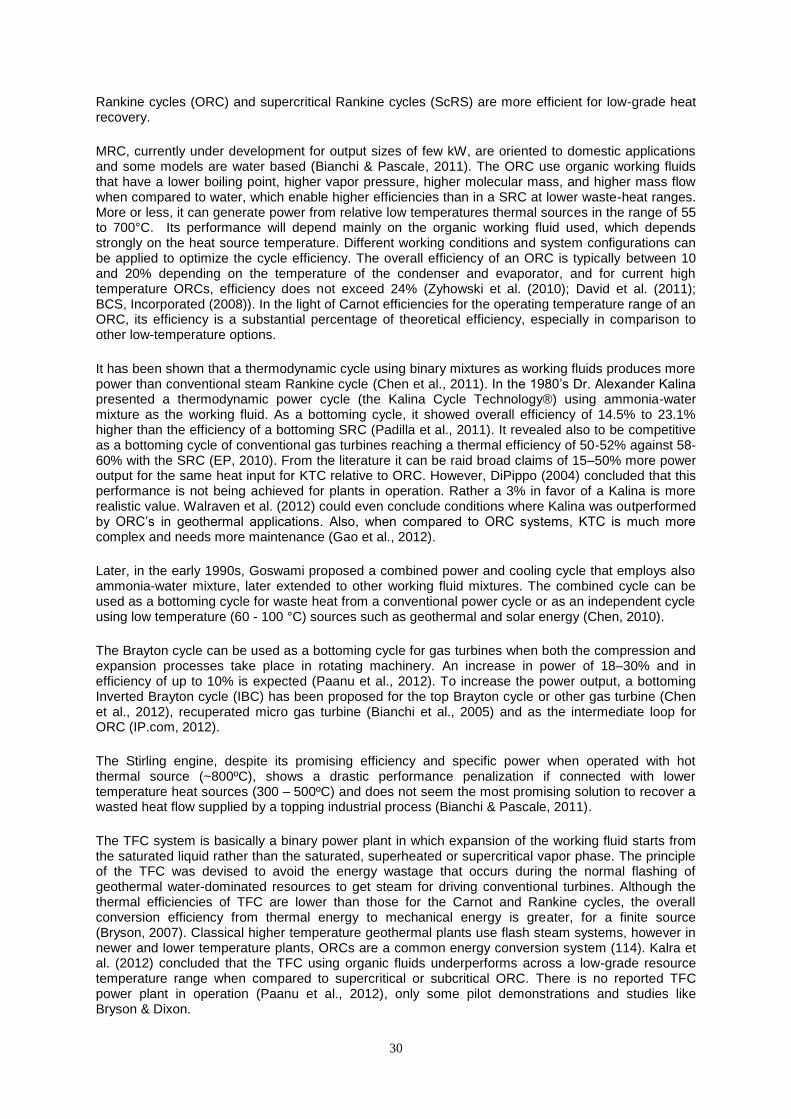
30
Rankine cycles (ORC) and supercritical Rankine cycles (ScRS) are more efficient for low-grade heat recovery.
MRC, currently under development for output sizes of few kW, are oriented to domestic applications and some models are water based (Bianchi & Pascale, 2011). The ORC use organic working fluids that have a lower boiling point, higher vapor pressure, higher molecular mass, and higher mass flow when compared to water, which enable higher efficiencies than in a SRC at lower waste-heat ranges. More or less, it can generate power from relative low temperatures thermal sources in the range of 55 to 700°C. Its performance will depend mainly on the organic working fluid used, which depends strongly on the heat source temperature. Different working conditions and system configurations can be applied to optimize the cycle efficiency. The overall efficiency of an ORC is typically between 10 and 20% depending on the temperature of the condenser and evaporator, and for current high temperature ORCs, efficiency does not exceed 24% (Zyhowski et al. (2010); David et al. (2011); BCS, Incorporated (2008)). In the light of Carnot efficiencies for the operating temperature range of an ORC, its efficiency is a substantial percentage of theoretical efficiency, especially in comparison to other low-temperature options.
It has been shown that a thermodynamic cycle using binary mixtures as working fluids produces more power than conventional steam Rankine cycle (Chen et al., 2011). In the 1980‘s Dr. Alexander Kalina presented a thermodynamic power cycle (the Kalina Cycle Technology®) using ammonia-water mixture as the working fluid. As a bottoming cycle, it showed overall efficiency of 14.5% to 23.1% higher than the efficiency of a bottoming SRC (Padilla et al., 2011). It revealed also to be competitive as a bottoming cycle of conventional gas turbines reaching a thermal efficiency of 50-52% against 58-60% with the SRC (EP, 2010). From the literature it can be raid broad claims of 15–50% more power output for the same heat input for KTC relative to ORC. However, DiPippo (2004) concluded that this performance is not being achieved for plants in operation. Rather a 3% in favor of a Kalina is more realistic value. Walraven et al. (2012) could even conclude conditions where Kalina was outperformed by ORC‘s in geothermal applications. Also, when compared to ORC systems, KTC is much more complex and needs more maintenance (Gao et al., 2012).
Later, in the early 1990s, Goswami proposed a combined power and cooling cycle that employs also ammonia-water mixture, later extended to other working fluid mixtures. The combined cycle can be used as a bottoming cycle for waste heat from a conventional power cycle or as an independent cycle using low temperature (60 - 100 °C) sources such as geothermal and solar energy (Chen, 2010).
The Brayton cycle can be used as a bottoming cycle for gas turbines when both the compression and expansion processes take place in rotating machinery. An increase in power of 18–30% and in efficiency of up to 10% is expected (Paanu et al., 2012). To increase the power output, a bottoming Inverted Brayton cycle (IBC) has been proposed for the top Brayton cycle or other gas turbine (Chen et al., 2012), recuperated micro gas turbine (Bianchi et al., 2005) and as the intermediate loop for ORC (IP.com, 2012).
The Stirling engine, despite its promising efficiency and specific power when operated with hot thermal source (~800ºC), shows a drastic performance penalization if connected with lower temperature heat sources (300 – 500ºC) and does not seem the most promising solution to recover a wasted heat flow supplied by a topping industrial process (Bianchi & Pascale, 2011).
The TFC system is basically a binary power plant in which expansion of the working fluid starts from the saturated liquid rather than the saturated, superheated or supercritical vapor phase. The principle of the TFC was devised to avoid the energy wastage that occurs during the normal flashing of geothermal water-dominated resources to get steam for driving conventional turbines. Although the thermal efficiencies of TFC are lower than those for the Carnot and Rankine cycles, the overall conversion efficiency from thermal energy to mechanical energy is greater, for a finite source (Bryson, 2007). Classical higher temperature geothermal plants use flash steam systems, however in newer and lower temperature plants, ORCs are a common energy conversion system (114). Kalra et al. (2012) concluded that the TFC using organic fluids underperforms across a low-grade resource temperature range when compared to supercritical or subcritical ORC. There is no reported TFC power plant in operation (Paanu et al., 2012), only some pilot demonstrations and studies like Bryson & Dixon.
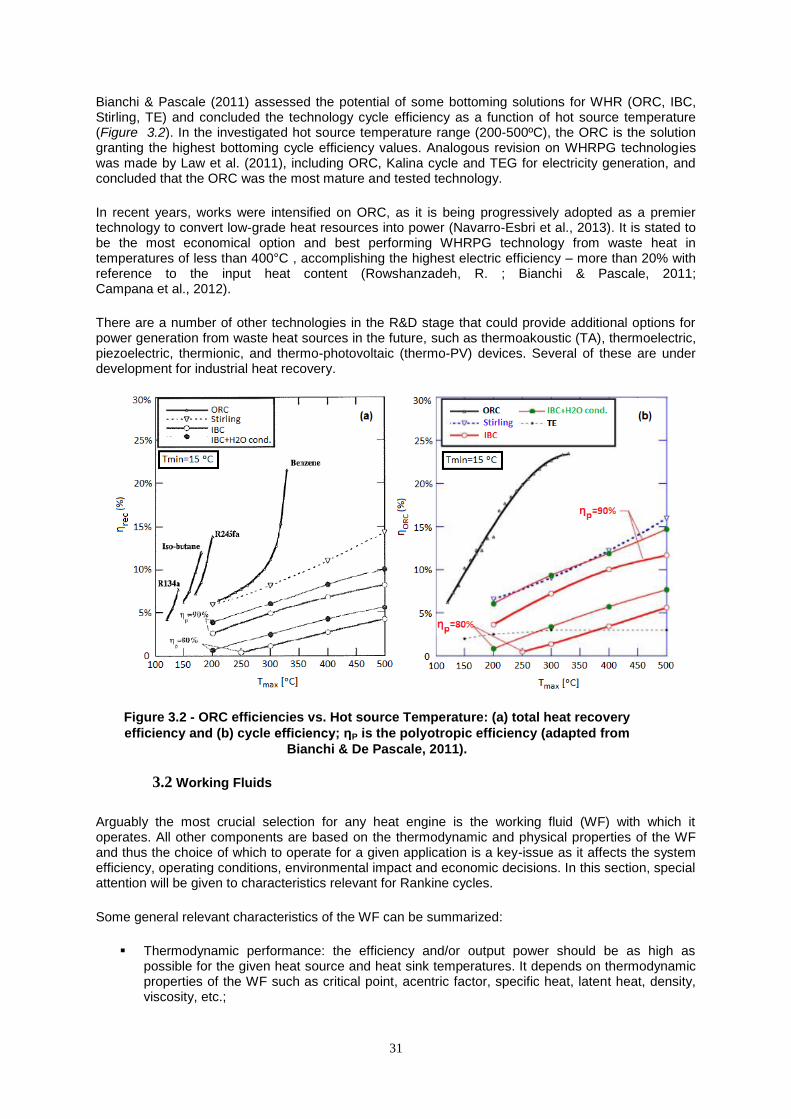
31
Bianchi & Pascale (2011) assessed the potential of some bottoming solutions for WHR (ORC, IBC, Stirling, TE) and concluded the technology cycle efficiency as a function of hot source temperature (Figure 3.2). In the investigated hot source temperature range (200-500ºC), the ORC is the solution granting the highest bottoming cycle efficiency values. Analogous revision on WHRPG technologies was made by Law et al. (2011), including ORC, Kalina cycle and TEG for electricity generation, and concluded that the ORC was the most mature and tested technology.
In recent years, works were intensified on ORC, as it is being progressively adopted as a premier technology to convert low-grade heat resources into power (Navarro-Esbri et al., 2013). It is stated to be the most economical option and best performing WHRPG technology from waste heat in temperatures of less than 400°C , accomplishing the highest electric efficiency – more than 20% with reference to the input heat content (Rowshanzadeh, R. ; Bianchi & Pascale, 2011; Campana et al., 2012).
There are a number of other technologies in the R&D stage that could provide additional options for power generation from waste heat sources in the future, such as thermoakoustic (TA), thermoelectric, piezoelectric, thermionic, and thermo-photovoltaic (thermo-PV) devices. Several of these are under development for industrial heat recovery.
Figure 3.2 - ORC efficiencies vs. Hot source Temperature: (a) total heat recovery
efficiency and (b) cycle efficiency; ηP is the polyotropic efficiency (adapted from
Bianchi & De Pascale, 2011).
3.2 Working Fluids
Arguably the most crucial selection for any heat engine is the working fluid (WF) with which it operates. All other components are based on the thermodynamic and physical properties of the WF and thus the choice of which to operate for a given application is a key-issue as it affects the system efficiency, operating conditions, environmental impact and economic decisions. In this section, special attention will be given to characteristics relevant for Rankine cycles.
Some general relevant characteristics of the WF can be summarized:
Thermodynamic performance: the efficiency and/or output power should be as high as possible for the given heat source and heat sink temperatures. It depends on thermodynamic properties of the WF such as critical point, acentric factor, specific heat, latent heat, density, viscosity, etc.;
32
Saturation vapour curve: the slope of this curve will dictate the configuration of the system and working conditions for better performance;
Vapour density: it will dictate mainly the dimension of the expander, heat exchangers and piping. A low density leads to higher volume flow rate and larger equipment;
Viscosity: low viscosity in both liquid and vapour phase results in high heat transfer coefficients in the heat exchangers;
Working pressures: high pressures usually lead to higher investment costs and increasing complexity;
Positive condensing gauge: the low pressure should be higher than the atmospheric pressure to avoid air infiltration into the cycle;
Melting point: should be lower than the lowest ambient temperature through the year to avoid freezing of the WF;
Chemical stability temperature: will limit the maximum heat source temperature to avoid chemical deteriorations and decomposition of the working fluid;
Environmental impact and safety level: the main parameters to take into account are the Ozone Depleting Potential (ODP), the Greenhouse Warming Potential (GWP), the toxicity and the flammability;
Good availability and low cost.
Working fluids can be ―dry‖, ―wet‖ or isentropic, depending on their behaviour on a T-s diagram (Figure 3.3). Dry fluids are characterized by a positive slope of the saturated vapour curve and generally have a large molecular weight. Wet fluids, by definition water, have a negative slope and low molecular weight. Isentropic fluids have almost vertical intervals in the curve of saturated vapour, approaching isentropic expansion.
Figure 3.3 – T-s charts of isentropic, wet and dry working fluids (adapted from
Quoilin et al., 2013)
When applied to Rankine cycles, the vapour quality at the end of the expansion must be such to do not erode the expansion device, which means, should not be a wet expansion. If superheating is not applied to wet fluids, the expansion process will end on the two-phase region and lead to droplets in the later stages of the expander. For isentropic and dry fluids this is not a requisite since after expansion the WF remains in the superheated vapour region.
Isentropic and dry fluids are suggested for ORC, but if the fluid is ―too dry‖ the expanded vapour will leave the turbine with substantial superheat which will be wasted and added to the cooling load in the condenser. As explained in Section 3.3.7, the use of a recuperator can be applied to raise the cycle efficiency. Wet fluids, on the other hand, will need a higher turbine inlet temperature but there is less concern about de-superheating ―losses‖ after expansion.
If the expansion process is allowed to pass through the two phase region, the dry fluid can leave the turbine still in a superheated state, whereas wet fluids cannot (Figure 3.4). The two-phase expansion of the dry fluid does not actually degrade the expander device (Chen, 2010) neither its performance, being stated potential gains in the net fluid effectiveness in the order of 8% (Demuth & Kochan, 1981). In this way, dry fluids may be more suitable for supercritical Rankine cycles if the turbine expansion involves a two-phase region.
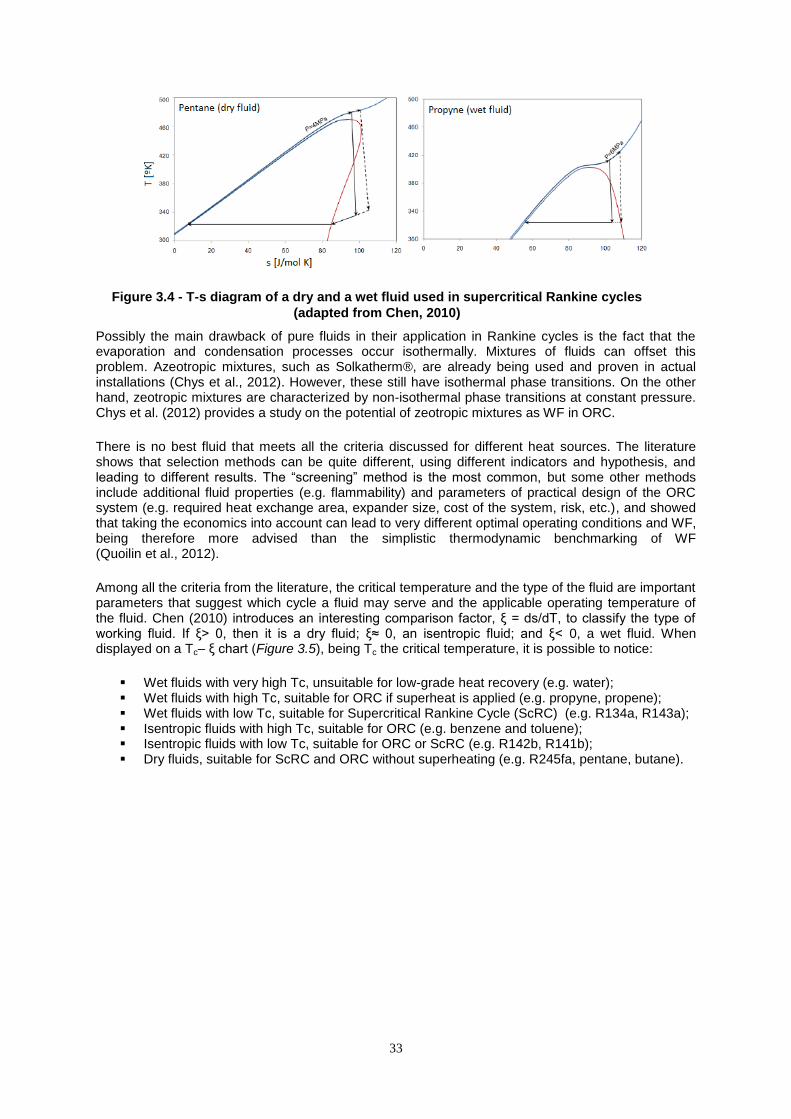
33
Figure 3.4 - T-s diagram of a dry and a wet fluid used in supercritical Rankine cycles
(adapted from Chen, 2010)
Possibly the main drawback of pure fluids in their application in Rankine cycles is the fact that the evaporation and condensation processes occur isothermally. Mixtures of fluids can offset this problem. Azeotropic mixtures, such as Solkatherm®, are already being used and proven in actual installations (Chys et al., 2012). However, these still have isothermal phase transitions. On the other hand, zeotropic mixtures are characterized by non-isothermal phase transitions at constant pressure. Chys et al. (2012) provides a study on the potential of zeotropic mixtures as WF in ORC.
There is no best fluid that meets all the criteria discussed for different heat sources. The literature shows that selection methods can be quite different, using different indicators and hypothesis, and leading to different results. The ―screening‖ method is the most common, but some other methods include additional fluid properties (e.g. flammability) and parameters of practical design of the ORC system (e.g. required heat exchange area, expander size, cost of the system, risk, etc.), and showed that taking the economics into account can lead to very different optimal operating conditions and WF, being therefore more advised than the simplistic thermodynamic benchmarking of WF (Quoilin et al., 2012).
Among all the criteria from the literature, the critical temperature and the type of the fluid are important parameters that suggest which cycle a fluid may serve and the applicable operating temperature of the fluid. Chen (2010) introduces an interesting comparison factor, ξ = ds/dT, to classify the type of working fluid. If ξ> 0, then it is a dry fluid; ξ≈ 0, an isentropic fluid; and ξ< 0, a wet fluid. When displayed on a Tc– ξ chart (Figure 3.5), being Tc the critical temperature, it is possible to notice:
Wet fluids with very high Tc, unsuitable for low-grade heat recovery (e.g. water); Wet fluids with high Tc, suitable for ORC if superheat is applied (e.g. propyne, propene); Wet fluids with low Tc, suitable for Supercritical Rankine Cycle (ScRC) (e.g. R134a, R143a); Isentropic fluids with high Tc, suitable for ORC (e.g. benzene and toluene); Isentropic fluids with low Tc, suitable for ORC or ScRC (e.g. R142b, R141b); Dry fluids, suitable for ScRC and ORC without superheating (e.g. R245fa, pentane, butane).
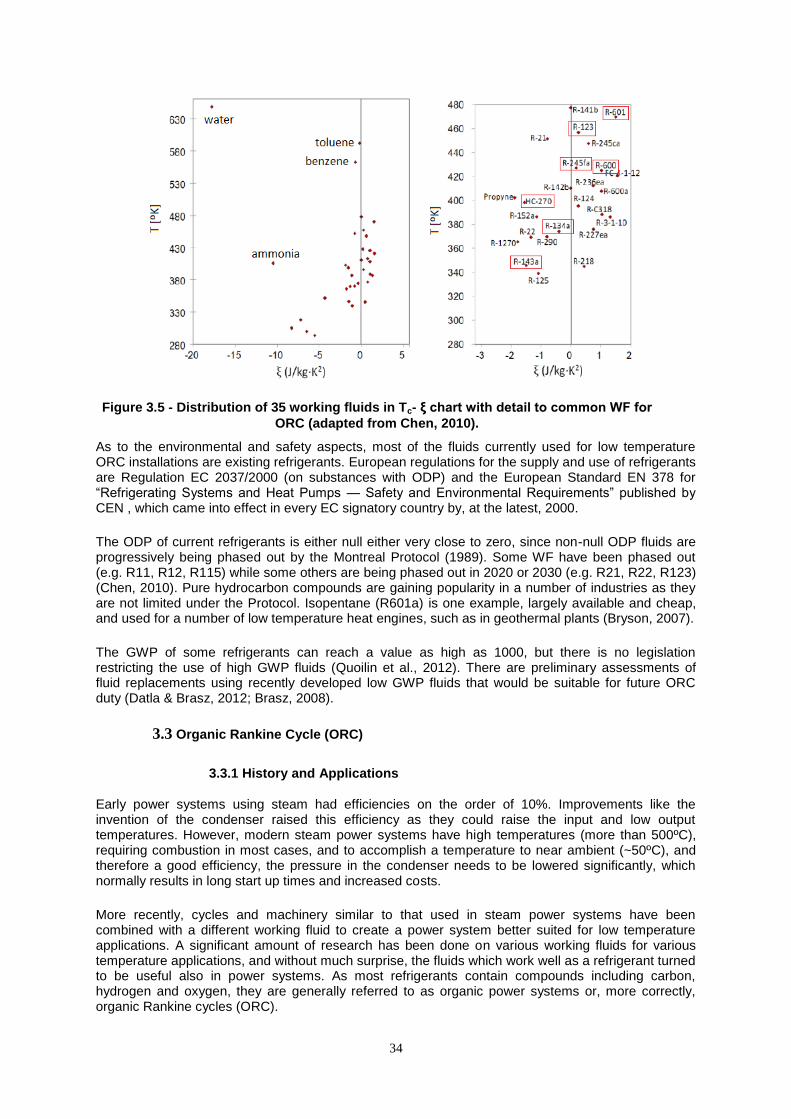
34
Figure 3.5 - Distribution of 35 working fluids in Tc- ξ chart with detail to common WF for
ORC (adapted from Chen, 2010).
As to the environmental and safety aspects, most of the fluids currently used for low temperature ORC installations are existing refrigerants. European regulations for the supply and use of refrigerants are Regulation EC 2037/2000 (on substances with ODP) and the European Standard EN 378 for ―Refrigerating Systems and Heat Pumps — Safety and Environmental Requirements‖ published by CEN , which came into effect in every EC signatory country by, at the latest, 2000.
The ODP of current refrigerants is either null either very close to zero, since non-null ODP fluids are progressively being phased out by the Montreal Protocol (1989). Some WF have been phased out (e.g. R11, R12, R115) while some others are being phased out in 2020 or 2030 (e.g. R21, R22, R123) (Chen, 2010). Pure hydrocarbon compounds are gaining popularity in a number of industries as they are not limited under the Protocol. Isopentane (R601a) is one example, largely available and cheap, and used for a number of low temperature heat engines, such as in geothermal plants (Bryson, 2007).
The GWP of some refrigerants can reach a value as high as 1000, but there is no legislation restricting the use of high GWP fluids (Quoilin et al., 2012). There are preliminary assessments of fluid replacements using recently developed low GWP fluids that would be suitable for future ORC duty (Datla & Brasz, 2012; Brasz, 2008).
3.3 Organic Rankine Cycle (ORC)
3.3.1 History and Applications
Early power systems using steam had efficiencies on the order of 10%. Improvements like the invention of the condenser raised this efficiency as they could raise the input and low output temperatures. However, modern steam power systems have high temperatures (more than 500ºC), requiring combustion in most cases, and to accomplish a temperature to near ambient (~50ºC), and therefore a good efficiency, the pressure in the condenser needs to be lowered significantly, which normally results in long start up times and increased costs.
More recently, cycles and machinery similar to that used in steam power systems have been combined with a different working fluid to create a power system better suited for low temperature applications. A significant amount of research has been done on various working fluids for various temperature applications, and without much surprise, the fluids which work well as a refrigerant turned to be useful also in power systems. As most refrigerants contain compounds including carbon, hydrogen and oxygen, they are generally referred to as organic power systems or, more correctly, organic Rankine cycles (ORC).
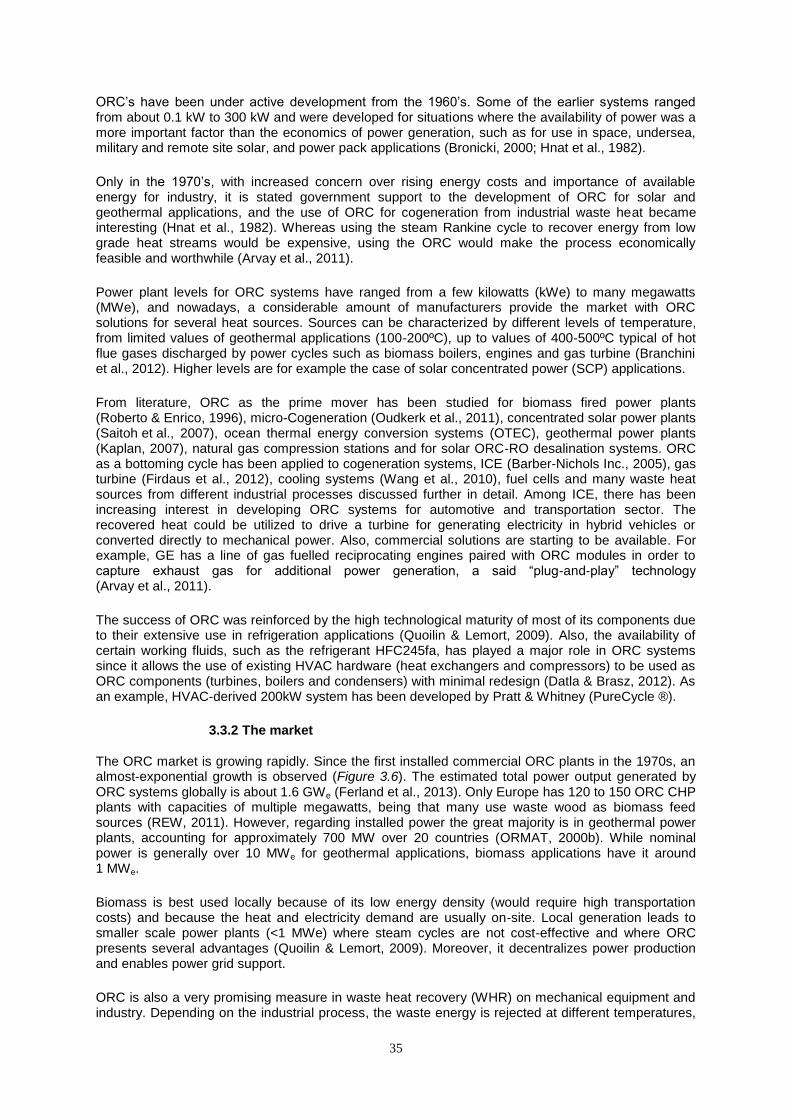
35
ORC‘s have been under active development from the 1960‘s. Some of the earlier systems ranged from about 0.1 kW to 300 kW and were developed for situations where the availability of power was a more important factor than the economics of power generation, such as for use in space, undersea, military and remote site solar, and power pack applications (Bronicki, 2000; Hnat et al., 1982).
Only in the 1970‘s, with increased concern over rising energy costs and importance of available energy for industry, it is stated government support to the development of ORC for solar and geothermal applications, and the use of ORC for cogeneration from industrial waste heat became interesting (Hnat et al., 1982). Whereas using the steam Rankine cycle to recover energy from low grade heat streams would be expensive, using the ORC would make the process economically feasible and worthwhile (Arvay et al., 2011).
Power plant levels for ORC systems have ranged from a few kilowatts (kWe) to many megawatts (MWe), and nowadays, a considerable amount of manufacturers provide the market with ORC solutions for several heat sources. Sources can be characterized by different levels of temperature, from limited values of geothermal applications (100-200ºC), up to values of 400-500ºC typical of hot flue gases discharged by power cycles such as biomass boilers, engines and gas turbine (Branchini et al., 2012). Higher levels are for example the case of solar concentrated power (SCP) applications.
From literature, ORC as the prime mover has been studied for biomass fired power plants (Roberto & Enrico, 1996), micro-Cogeneration (Oudkerk et al., 2011), concentrated solar power plants (Saitoh et al., 2007), ocean thermal energy conversion systems (OTEC), geothermal power plants (Kaplan, 2007), natural gas compression stations and for solar ORC-RO desalination systems. ORC as a bottoming cycle has been applied to cogeneration systems, ICE (Barber-Nichols Inc., 2005), gas turbine (Firdaus et al., 2012), cooling systems (Wang et al., 2010), fuel cells and many waste heat sources from different industrial processes discussed further in detail. Among ICE, there has been increasing interest in developing ORC systems for automotive and transportation sector. The recovered heat could be utilized to drive a turbine for generating electricity in hybrid vehicles or converted directly to mechanical power. Also, commercial solutions are starting to be available. For example, GE has a line of gas fuelled reciprocating engines paired with ORC modules in order to capture exhaust gas for additional power generation, a said ―plug-and-play‖ technology (Arvay et al., 2011).
The success of ORC was reinforced by the high technological maturity of most of its components due to their extensive use in refrigeration applications (Quoilin & Lemort, 2009). Also, the availability of certain working fluids, such as the refrigerant HFC245fa, has played a major role in ORC systems since it allows the use of existing HVAC hardware (heat exchangers and compressors) to be used as ORC components (turbines, boilers and condensers) with minimal redesign (Datla & Brasz, 2012). As an example, HVAC-derived 200kW system has been developed by Pratt & Whitney (PureCycle ®).
3.3.2 The market
The ORC market is growing rapidly. Since the first installed commercial ORC plants in the 1970s, an almost-exponential growth is observed (Figure 3.6). The estimated total power output generated by ORC systems globally is about 1.6 GWe (Ferland et al., 2013). Only Europe has 120 to 150 ORC CHP plants with capacities of multiple megawatts, being that many use waste wood as biomass feed sources (REW, 2011). However, regarding installed power the great majority is in geothermal power plants, accounting for approximately 700 MW over 20 countries (ORMAT, 2000b). While nominal power is generally over 10 MWe for geothermal applications, biomass applications have it around 1 MWe.
Biomass is best used locally because of its low energy density (would require high transportation costs) and because the heat and electricity demand are usually on-site. Local generation leads to smaller scale power plants (<1 MWe) where steam cycles are not cost-effective and where ORC presents several advantages (Quoilin & Lemort, 2009). Moreover, it decentralizes power production and enables power grid support.
ORC is also a very promising measure in waste heat recovery (WHR) on mechanical equipment and industry. Depending on the industrial process, the waste energy is rejected at different temperatures,
36
which makes very important the choice of the working fluid and cycle design to achieve maximum cycle efficiency. For economic and technical reasons, traditional steam cycle would not be able to recover heat in the low range of temperatures characteristic of waste heat industrial streams, thus a huge potential market is available for ORC technology in this field.
Figure 3.9 clusters all the ORC plants (2009) by temperature and power ranges. It is possible to notice that ORC is a mature technology for WHR, biomass CHP and geothermal power; solar applications are being developed and ORC systems below 100 kWe are already available.
Figure 3.6 – ORC market
evolution (Enertime, 2009).
Figure 3.7 - Number of references to ORC
systems by country (Enertime, 2009).
Figure 3.8 - Number of references
to ORC system according to the
heat source (Rettig et al., 2011).
Figure 3.9 - Number of ORC systems
per power and temperature range
(Enertime, 2009).
Players
ORC manufacturers have been present on the market since the beginning of the 1980s. Nowadays, at least 26 manufacturers provide ORC solutions in a broad range of power levels, as shown in Table AII 4. The three main manufacturers in terms of installed units and installed power are displayed in Figure 3.10. The large share of ORMAT in the cumulated power is explained by its focus on large-scale low temperature geothermal binary plants, while it presents few references in the field of heat recovery (Paepe et al., 2012).
In the middle power range the number and strength of the players is less pronounced, and the market seems to be still quite fragmented. Some big companies such as GE, UTC and BEP-Europe developed ORC products, while some other new companies are entering the market dedicated to ORC technology, such as Enertime, Enogia, Tri-o-gen and Rank.
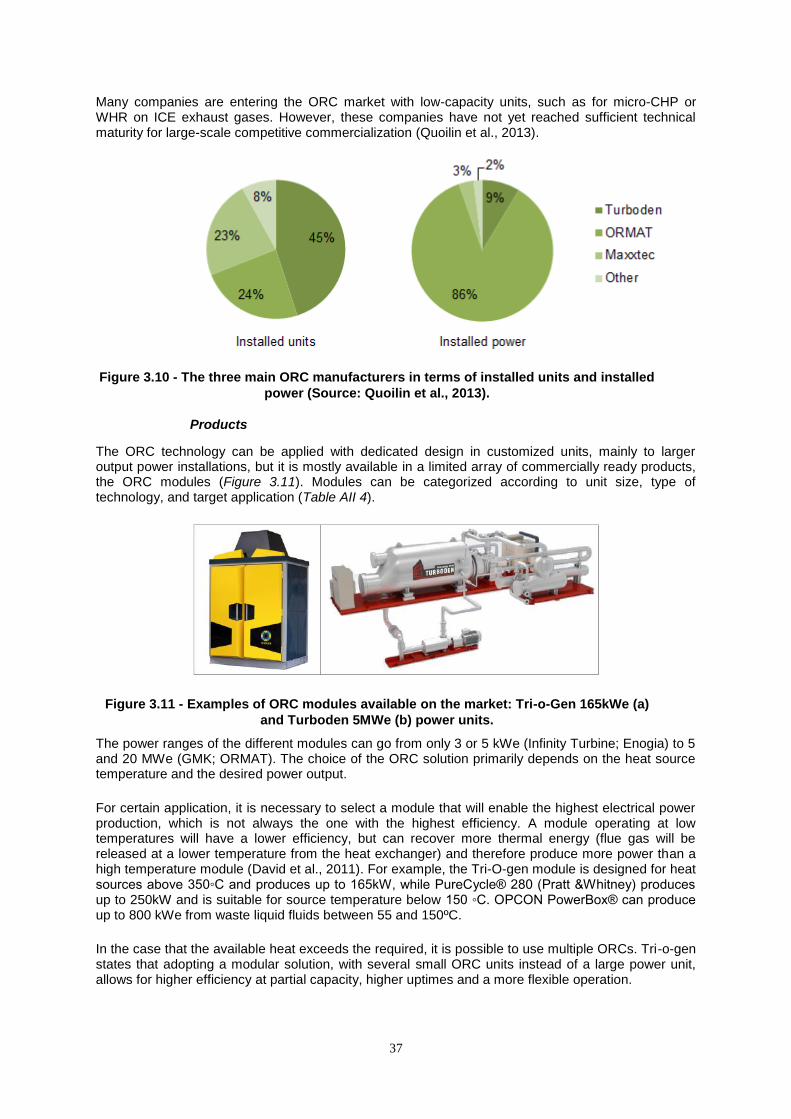
37
Many companies are entering the ORC market with low-capacity units, such as for micro-CHP or WHR on ICE exhaust gases. However, these companies have not yet reached sufficient technical maturity for large-scale competitive commercialization (Quoilin et al., 2013).
Figure 3.10 - The three main ORC manufacturers in terms of installed units and installed
power (Source: Quoilin et al., 2013).
Products
The ORC technology can be applied with dedicated design in customized units, mainly to larger output power installations, but it is mostly available in a limited array of commercially ready products, the ORC modules (Figure 3.11). Modules can be categorized according to unit size, type of technology, and target application (Table AII 4).
Figure 3.11 - Examples of ORC modules available on the market: Tri-o-Gen 165kWe (a)
and Turboden 5MWe (b) power units.
The power ranges of the different modules can go from only 3 or 5 kWe (Infinity Turbine; Enogia) to 5 and 20 MWe (GMK; ORMAT). The choice of the ORC solution primarily depends on the heat source temperature and the desired power output.
For certain application, it is necessary to select a module that will enable the highest electrical power production, which is not always the one with the highest efficiency. A module operating at low temperatures will have a lower efficiency, but can recover more thermal energy (flue gas will be released at a lower temperature from the heat exchanger) and therefore produce more power than a high temperature module (David et al., 2011). For example, the Tri-O-gen module is designed for heat sources above 350◦C and produces up to 165kW, while PureCycle® 280 (Pratt &Whitney) produces up to 250kW and is suitable for source temperature below 150 ◦C. OPCON PowerBox® can produce up to 800 kWe from waste liquid fluids between 55 and 150ºC.
In the case that the available heat exceeds the required, it is possible to use multiple ORCs. Tri-o-gen states that adopting a modular solution, with several small ORC units instead of a large power unit, allows for higher efficiency at partial capacity, higher uptimes and a more flexible operation.
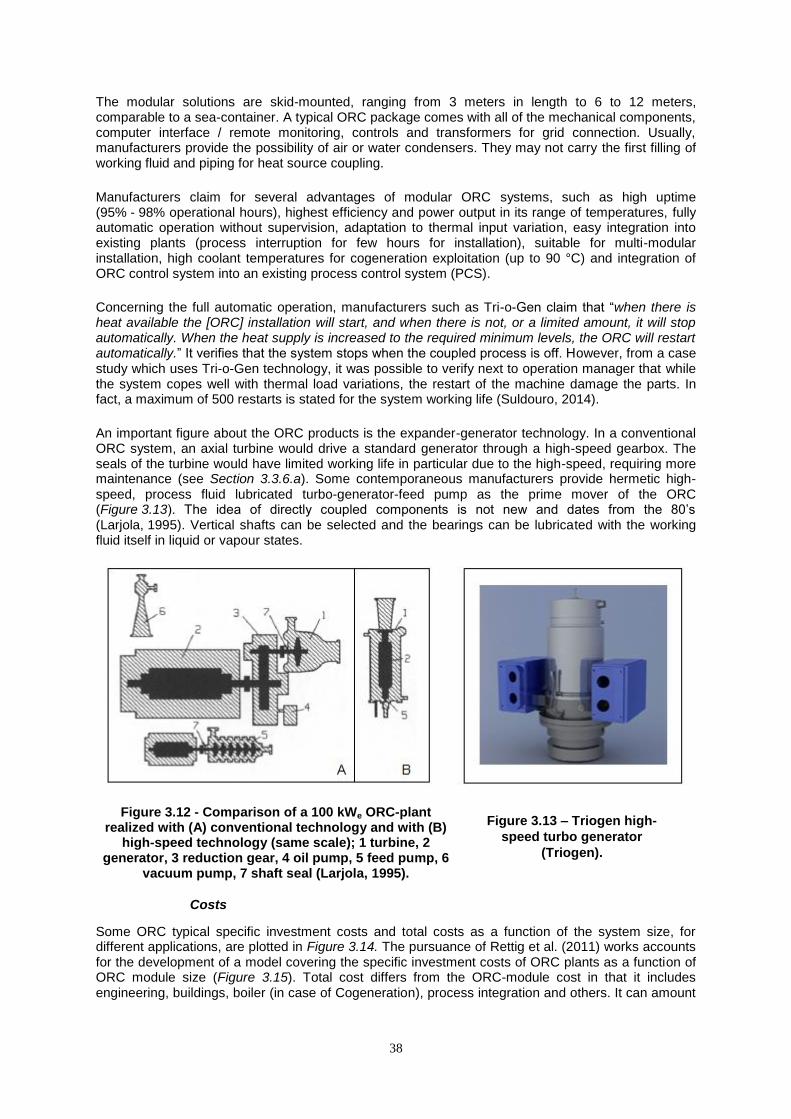
38
The modular solutions are skid-mounted, ranging from 3 meters in length to 6 to 12 meters, comparable to a sea-container. A typical ORC package comes with all of the mechanical components, computer interface / remote monitoring, controls and transformers for grid connection. Usually, manufacturers provide the possibility of air or water condensers. They may not carry the first filling of working fluid and piping for heat source coupling.
Manufacturers claim for several advantages of modular ORC systems, such as high uptime (95% - 98% operational hours), highest efficiency and power output in its range of temperatures, fully automatic operation without supervision, adaptation to thermal input variation, easy integration into existing plants (process interruption for few hours for installation), suitable for multi-modular installation, high coolant temperatures for cogeneration exploitation (up to 90 °C) and integration of ORC control system into an existing process control system (PCS).
Concerning the full automatic operation, manufacturers such as Tri-o-Gen claim that ―when there is heat available the [ORC] installation will start, and when there is not, or a limited amount, it will stop automatically. When the heat supply is increased to the required minimum levels, the ORC will restart automatically.‖ It verifies that the system stops when the coupled process is off. However, from a case study which uses Tri-o-Gen technology, it was possible to verify next to operation manager that while the system copes well with thermal load variations, the restart of the machine damage the parts. In fact, a maximum of 500 restarts is stated for the system working life (Suldouro, 2014).
An important figure about the ORC products is the expander-generator technology. In a conventional ORC system, an axial turbine would drive a standard generator through a high-speed gearbox. The seals of the turbine would have limited working life in particular due to the high-speed, requiring more maintenance (see Section 3.3.6.a). Some contemporaneous manufacturers provide hermetic high-speed, process fluid lubricated turbo-generator-feed pump as the prime mover of the ORC (Figure 3.13). The idea of directly coupled components is not new and dates from the 80‘s (Larjola, 1995). Vertical shafts can be selected and the bearings can be lubricated with the working fluid itself in liquid or vapour states.
Figure 3.12 - Comparison of a 100 kWe ORC-plant realized with (A) conventional technology and with (B)
high-speed technology (same scale); 1 turbine, 2 generator, 3 reduction gear, 4 oil pump, 5 feed pump, 6
vacuum pump, 7 shaft seal (Larjola, 1995).
Figure 3.13 – Triogen high-
speed turbo generator
(Triogen).
Costs
Some ORC typical specific investment costs and total costs as a function of the system size, for different applications, are plotted in Figure 3.14. The pursuance of Rettig et al. (2011) works accounts for the development of a model covering the specific investment costs of ORC plants as a function of ORC module size (Figure 3.15). Total cost differs from the ORC-module cost in that it includes engineering, buildings, boiler (in case of Cogeneration), process integration and others. It can amount
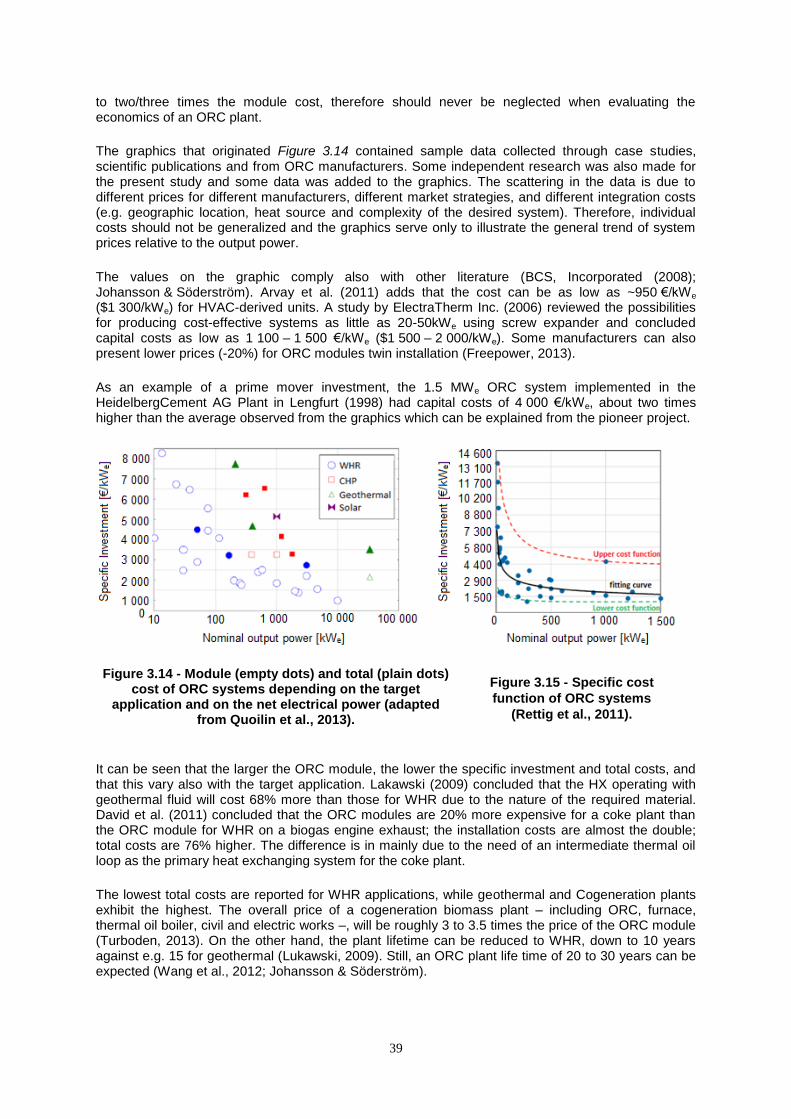
39
to two/three times the module cost, therefore should never be neglected when evaluating the economics of an ORC plant.
The graphics that originated Figure 3.14 contained sample data collected through case studies, scientific publications and from ORC manufacturers. Some independent research was also made for the present study and some data was added to the graphics. The scattering in the data is due to different prices for different manufacturers, different market strategies, and different integration costs (e.g. geographic location, heat source and complexity of the desired system). Therefore, individual costs should not be generalized and the graphics serve only to illustrate the general trend of system prices relative to the output power.
The values on the graphic comply also with other literature (BCS, Incorporated (2008); Johansson & Söderström). Arvay et al. (2011) adds that the cost can be as low as ~950 €/kWe ($1 300/kWe) for HVAC-derived units. A study by ElectraTherm Inc. (2006) reviewed the possibilities for producing cost-effective systems as little as 20-50kWe using screw expander and concluded capital costs as low as 1 100 – 1 500 €/kWe ($1 500 – 2 000/kWe). Some manufacturers can also present lower prices (-20%) for ORC modules twin installation (Freepower, 2013).
As an example of a prime mover investment, the 1.5 MWe ORC system implemented in the HeidelbergCement AG Plant in Lengfurt (1998) had capital costs of 4 000 €/kWe, about two times higher than the average observed from the graphics which can be explained from the pioneer project.
Figure 3.14 - Module (empty dots) and total (plain dots) cost of ORC systems depending on the target
application and on the net electrical power (adapted from Quoilin et al., 2013).
Figure 3.15 - Specific cost
function of ORC systems
(Rettig et al., 2011).
It can be seen that the larger the ORC module, the lower the specific investment and total costs, and that this vary also with the target application. Lakawski (2009) concluded that the HX operating with geothermal fluid will cost 68% more than those for WHR due to the nature of the required material. David et al. (2011) concluded that the ORC modules are 20% more expensive for a coke plant than the ORC module for WHR on a biogas engine exhaust; the installation costs are almost the double; total costs are 76% higher. The difference is in mainly due to the need of an intermediate thermal oil loop as the primary heat exchanging system for the coke plant.
The lowest total costs are reported for WHR applications, while geothermal and Cogeneration plants exhibit the highest. The overall price of a cogeneration biomass plant – including ORC, furnace, thermal oil boiler, civil and electric works –, will be roughly 3 to 3.5 times the price of the ORC module (Turboden, 2013). On the other hand, the plant lifetime can be reduced to WHR, down to 10 years against e.g. 15 for geothermal (Lukawski, 2009). Still, an ORC plant life time of 20 to 30 years can be expected (Wang et al., 2012; Johansson & Söderström).
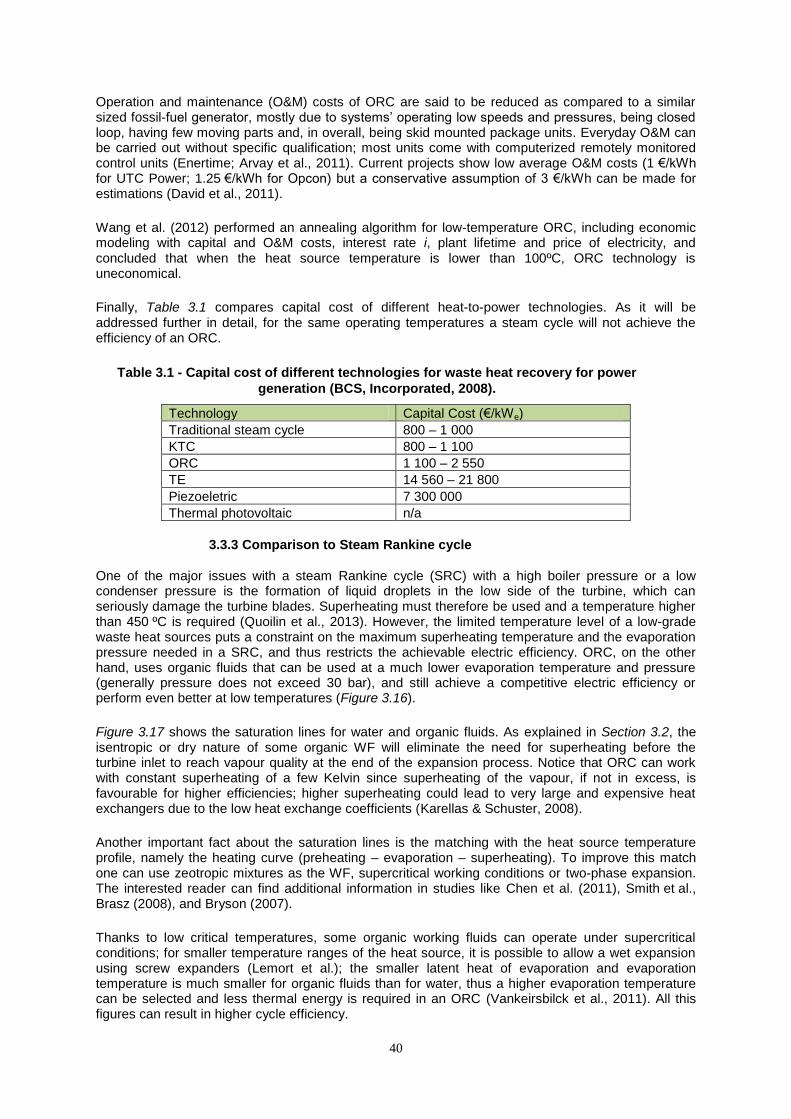
40
Operation and maintenance (O&M) costs of ORC are said to be reduced as compared to a similar sized fossil-fuel generator, mostly due to systems‘ operating low speeds and pressures, being closed loop, having few moving parts and, in overall, being skid mounted package units. Everyday O&M can be carried out without specific qualification; most units come with computerized remotely monitored control units (Enertime; Arvay et al., 2011). Current projects show low average O&M costs (1 €/kWh for UTC Power; 1.25 €/kWh for Opcon) but a conservative assumption of 3 €/kWh can be made for estimations (David et al., 2011).
Wang et al. (2012) performed an annealing algorithm for low-temperature ORC, including economic modeling with capital and O&M costs, interest rate i, plant lifetime and price of electricity, and concluded that when the heat source temperature is lower than 100ºC, ORC technology is uneconomical.
Finally, Table 3.1 compares capital cost of different heat-to-power technologies. As it will be addressed further in detail, for the same operating temperatures a steam cycle will not achieve the efficiency of an ORC.
Table 3.1 - Capital cost of different technologies for waste heat recovery for power
generation (BCS, Incorporated, 2008).
Technology Capital Cost (€/kWe)
Traditional steam cycle 800 – 1 000
KTC 800 – 1 100
ORC 1 100 – 2 550
TE 14 560 – 21 800
Piezoeletric 7 300 000
Thermal photovoltaic n/a
3.3.3 Comparison to Steam Rankine cycle
One of the major issues with a steam Rankine cycle (SRC) with a high boiler pressure or a low condenser pressure is the formation of liquid droplets in the low side of the turbine, which can seriously damage the turbine blades. Superheating must therefore be used and a temperature higher than 450 ºC is required (Quoilin et al., 2013). However, the limited temperature level of a low-grade waste heat sources puts a constraint on the maximum superheating temperature and the evaporation pressure needed in a SRC, and thus restricts the achievable electric efficiency. ORC, on the other hand, uses organic fluids that can be used at a much lower evaporation temperature and pressure (generally pressure does not exceed 30 bar), and still achieve a competitive electric efficiency or perform even better at low temperatures (Figure 3.16).
Figure 3.17 shows the saturation lines for water and organic fluids. As explained in Section 3.2, the isentropic or dry nature of some organic WF will eliminate the need for superheating before the turbine inlet to reach vapour quality at the end of the expansion process. Notice that ORC can work with constant superheating of a few Kelvin since superheating of the vapour, if not in excess, is favourable for higher efficiencies; higher superheating could lead to very large and expensive heat exchangers due to the low heat exchange coefficients (Karellas & Schuster, 2008).
Another important fact about the saturation lines is the matching with the heat source temperature profile, namely the heating curve (preheating – evaporation – superheating). To improve this match one can use zeotropic mixtures as the WF, supercritical working conditions or two-phase expansion. The interested reader can find additional information in studies like Chen et al. (2011), Smith et al., Brasz (2008), and Bryson (2007).
Thanks to low critical temperatures, some organic working fluids can operate under supercritical conditions; for smaller temperature ranges of the heat source, it is possible to allow a wet expansion using screw expanders (Lemort et al.); the smaller latent heat of evaporation and evaporation temperature is much smaller for organic fluids than for water, thus a higher evaporation temperature can be selected and less thermal energy is required in an ORC (Vankeirsbilck et al., 2011). All this figures can result in higher cycle efficiency.
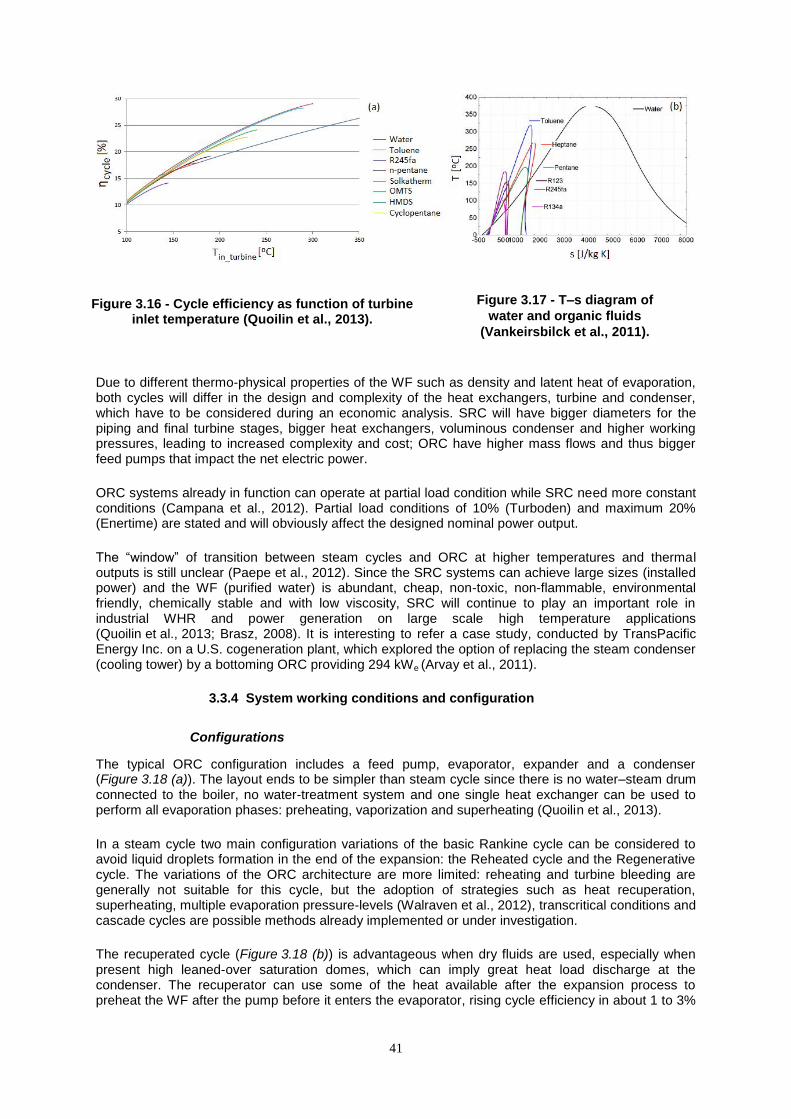
41
Figure 3.16 - Cycle efficiency as function of turbine inlet temperature (Quoilin et al., 2013).
Figure 3.17 - T–s diagram of
water and organic fluids
(Vankeirsbilck et al., 2011).
Due to different thermo-physical properties of the WF such as density and latent heat of evaporation, both cycles will differ in the design and complexity of the heat exchangers, turbine and condenser, which have to be considered during an economic analysis. SRC will have bigger diameters for the piping and final turbine stages, bigger heat exchangers, voluminous condenser and higher working pressures, leading to increased complexity and cost; ORC have higher mass flows and thus bigger feed pumps that impact the net electric power.
ORC systems already in function can operate at partial load condition while SRC need more constant conditions (Campana et al., 2012). Partial load conditions of 10% (Turboden) and maximum 20% (Enertime) are stated and will obviously affect the designed nominal power output.
The ―window‖ of transition between steam cycles and ORC at higher temperatures and thermal outputs is still unclear (Paepe et al., 2012). Since the SRC systems can achieve large sizes (installed power) and the WF (purified water) is abundant, cheap, non-toxic, non-flammable, environmental friendly, chemically stable and with low viscosity, SRC will continue to play an important role in industrial WHR and power generation on large scale high temperature applications (Quoilin et al., 2013; Brasz, 2008). It is interesting to refer a case study, conducted by TransPacific Energy Inc. on a U.S. cogeneration plant, which explored the option of replacing the steam condenser (cooling tower) by a bottoming ORC providing 294 kWe (Arvay et al., 2011).
3.3.4 System working conditions and configuration
Configurations
The typical ORC configuration includes a feed pump, evaporator, expander and a condenser (Figure 3.18 (a)). The layout ends to be simpler than steam cycle since there is no water–steam drum connected to the boiler, no water-treatment system and one single heat exchanger can be used to perform all evaporation phases: preheating, vaporization and superheating (Quoilin et al., 2013).
In a steam cycle two main configuration variations of the basic Rankine cycle can be considered to avoid liquid droplets formation in the end of the expansion: the Reheated cycle and the Regenerative cycle. The variations of the ORC architecture are more limited: reheating and turbine bleeding are generally not suitable for this cycle, but the adoption of strategies such as heat recuperation, superheating, multiple evaporation pressure-levels (Walraven et al., 2012), transcritical conditions and cascade cycles are possible methods already implemented or under investigation.
The recuperated cycle (Figure 3.18 (b)) is advantageous when dry fluids are used, especially when present high leaned-over saturation domes, which can imply great heat load discharge at the condenser. The recuperator can use some of the heat available after the expansion process to preheat the WF after the pump before it enters the evaporator, rising cycle efficiency in about 1 to 3%
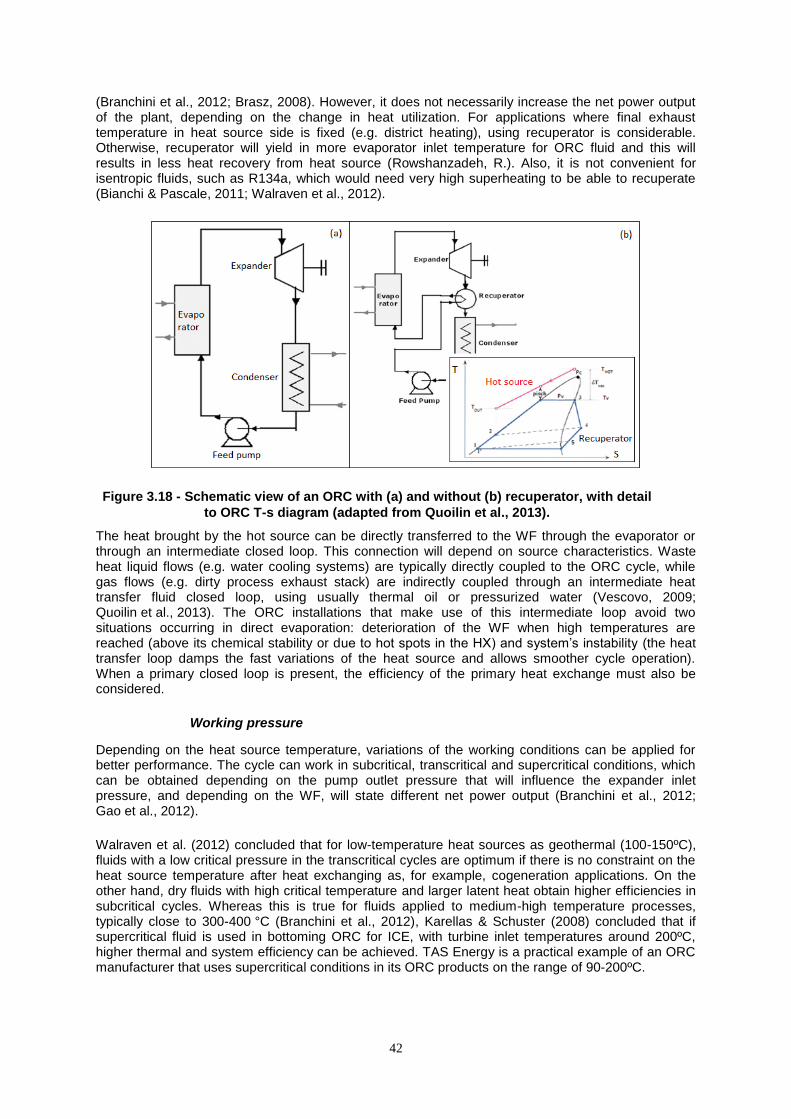
42
(Branchini et al., 2012; Brasz, 2008). However, it does not necessarily increase the net power output of the plant, depending on the change in heat utilization. For applications where final exhaust temperature in heat source side is fixed (e.g. district heating), using recuperator is considerable. Otherwise, recuperator will yield in more evaporator inlet temperature for ORC fluid and this will results in less heat recovery from heat source (Rowshanzadeh, R.). Also, it is not convenient for isentropic fluids, such as R134a, which would need very high superheating to be able to recuperate (Bianchi & Pascale, 2011; Walraven et al., 2012).
Figure 3.18 - Schematic view of an ORC with (a) and without (b) recuperator, with detail
to ORC T-s diagram (adapted from Quoilin et al., 2013).
The heat brought by the hot source can be directly transferred to the WF through the evaporator or through an intermediate closed loop. This connection will depend on source characteristics. Waste heat liquid flows (e.g. water cooling systems) are typically directly coupled to the ORC cycle, while gas flows (e.g. dirty process exhaust stack) are indirectly coupled through an intermediate heat transfer fluid closed loop, using usually thermal oil or pressurized water (Vescovo, 2009; Quoilin et al., 2013). The ORC installations that make use of this intermediate loop avoid two situations occurring in direct evaporation: deterioration of the WF when high temperatures are reached (above its chemical stability or due to hot spots in the HX) and system‘s instability (the heat transfer loop damps the fast variations of the heat source and allows smoother cycle operation). When a primary closed loop is present, the efficiency of the primary heat exchange must also be considered.
Working pressure
Depending on the heat source temperature, variations of the working conditions can be applied for better performance. The cycle can work in subcritical, transcritical and supercritical conditions, which can be obtained depending on the pump outlet pressure that will influence the expander inlet pressure, and depending on the WF, will state different net power output (Branchini et al., 2012; Gao et al., 2012).
Walraven et al. (2012) concluded that for low-temperature heat sources as geothermal (100-150ºC), fluids with a low critical pressure in the transcritical cycles are optimum if there is no constraint on the heat source temperature after heat exchanging as, for example, cogeneration applications. On the other hand, dry fluids with high critical temperature and larger latent heat obtain higher efficiencies in subcritical cycles. Whereas this is true for fluids applied to medium-high temperature processes, typically close to 300-400 °C (Branchini et al., 2012), Karellas & Schuster (2008) concluded that if supercritical fluid is used in bottoming ORC for ICE, with turbine inlet temperatures around 200ºC, higher thermal and system efficiency can be achieved. TAS Energy is a practical example of an ORC manufacturer that uses supercritical conditions in its ORC products on the range of 90-200ºC.
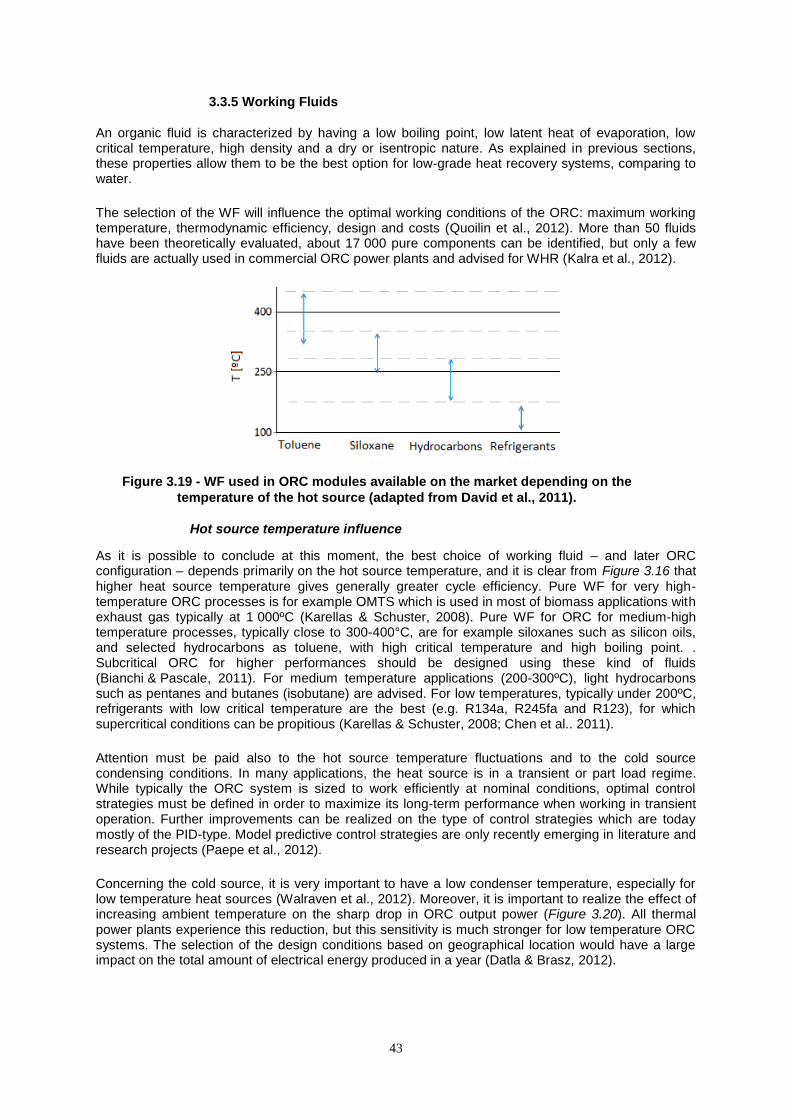
43
3.3.5 Working Fluids
An organic fluid is characterized by having a low boiling point, low latent heat of evaporation, low critical temperature, high density and a dry or isentropic nature. As explained in previous sections, these properties allow them to be the best option for low-grade heat recovery systems, comparing to water.
The selection of the WF will influence the optimal working conditions of the ORC: maximum working temperature, thermodynamic efficiency, design and costs (Quoilin et al., 2012). More than 50 fluids have been theoretically evaluated, about 17 000 pure components can be identified, but only a few fluids are actually used in commercial ORC power plants and advised for WHR (Kalra et al., 2012).
Figure 3.19 - WF used in ORC modules available on the market depending on the
temperature of the hot source (adapted from David et al., 2011).
Hot source temperature influence
As it is possible to conclude at this moment, the best choice of working fluid – and later ORC configuration – depends primarily on the hot source temperature, and it is clear from Figure 3.16 that higher heat source temperature gives generally greater cycle efficiency. Pure WF for very high-temperature ORC processes is for example OMTS which is used in most of biomass applications with exhaust gas typically at 1 000ºC (Karellas & Schuster, 2008). Pure WF for ORC for medium-high temperature processes, typically close to 300-400°C, are for example siloxanes such as silicon oils, and selected hydrocarbons as toluene, with high critical temperature and high boiling point. . Subcritical ORC for higher performances should be designed using these kind of fluids (Bianchi & Pascale, 2011). For medium temperature applications (200-300ºC), light hydrocarbons such as pentanes and butanes (isobutane) are advised. For low temperatures, typically under 200ºC, refrigerants with low critical temperature are the best (e.g. R134a, R245fa and R123), for which supercritical conditions can be propitious (Karellas & Schuster, 2008; Chen et al.. 2011).
Attention must be paid also to the hot source temperature fluctuations and to the cold source condensing conditions. In many applications, the heat source is in a transient or part load regime. While typically the ORC system is sized to work efficiently at nominal conditions, optimal control strategies must be defined in order to maximize its long-term performance when working in transient operation. Further improvements can be realized on the type of control strategies which are today mostly of the PID-type. Model predictive control strategies are only recently emerging in literature and research projects (Paepe et al., 2012).
Concerning the cold source, it is very important to have a low condenser temperature, especially for low temperature heat sources (Walraven et al., 2012). Moreover, it is important to realize the effect of increasing ambient temperature on the sharp drop in ORC output power (Figure 3.20). All thermal power plants experience this reduction, but this sensitivity is much stronger for low temperature ORC systems. The selection of the design conditions based on geographical location would have a large impact on the total amount of electrical energy produced in a year (Datla & Brasz, 2012).
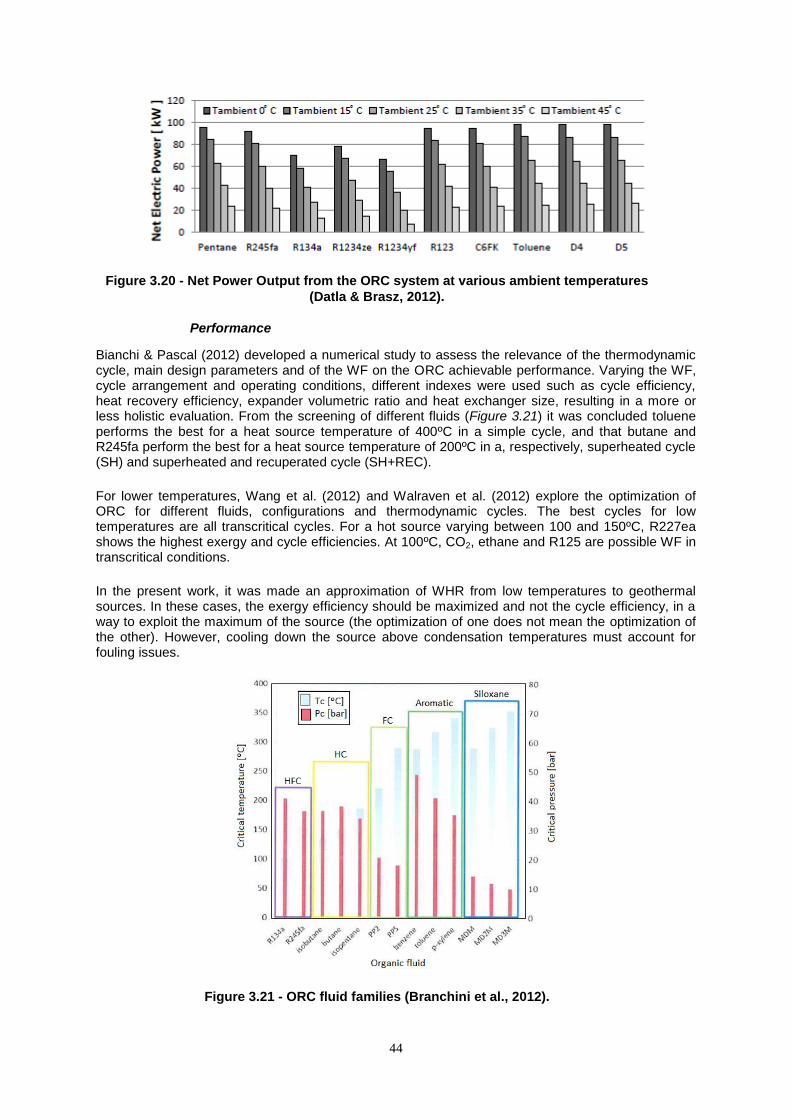
44
Figure 3.20 - Net Power Output from the ORC system at various ambient temperatures
(Datla & Brasz, 2012).
Performance
Bianchi & Pascal (2012) developed a numerical study to assess the relevance of the thermodynamic cycle, main design parameters and of the WF on the ORC achievable performance. Varying the WF, cycle arrangement and operating conditions, different indexes were used such as cycle efficiency, heat recovery efficiency, expander volumetric ratio and heat exchanger size, resulting in a more or less holistic evaluation. From the screening of different fluids (Figure 3.21) it was concluded toluene performs the best for a heat source temperature of 400ºC in a simple cycle, and that butane and R245fa perform the best for a heat source temperature of 200ºC in a, respectively, superheated cycle (SH) and superheated and recuperated cycle (SH+REC).
For lower temperatures, Wang et al. (2012) and Walraven et al. (2012) explore the optimization of ORC for different fluids, configurations and thermodynamic cycles. The best cycles for low temperatures are all transcritical cycles. For a hot source varying between 100 and 150ºC, R227ea shows the highest exergy and cycle efficiencies. At 100ºC, CO2, ethane and R125 are possible WF in transcritical conditions.
In the present work, it was made an approximation of WHR from low temperatures to geothermal sources. In these cases, the exergy efficiency should be maximized and not the cycle efficiency, in a way to exploit the maximum of the source (the optimization of one does not mean the optimization of the other). However, cooling down the source above condensation temperatures must account for fouling issues.
Figure 3.21 - ORC fluid families (Branchini et al., 2012).
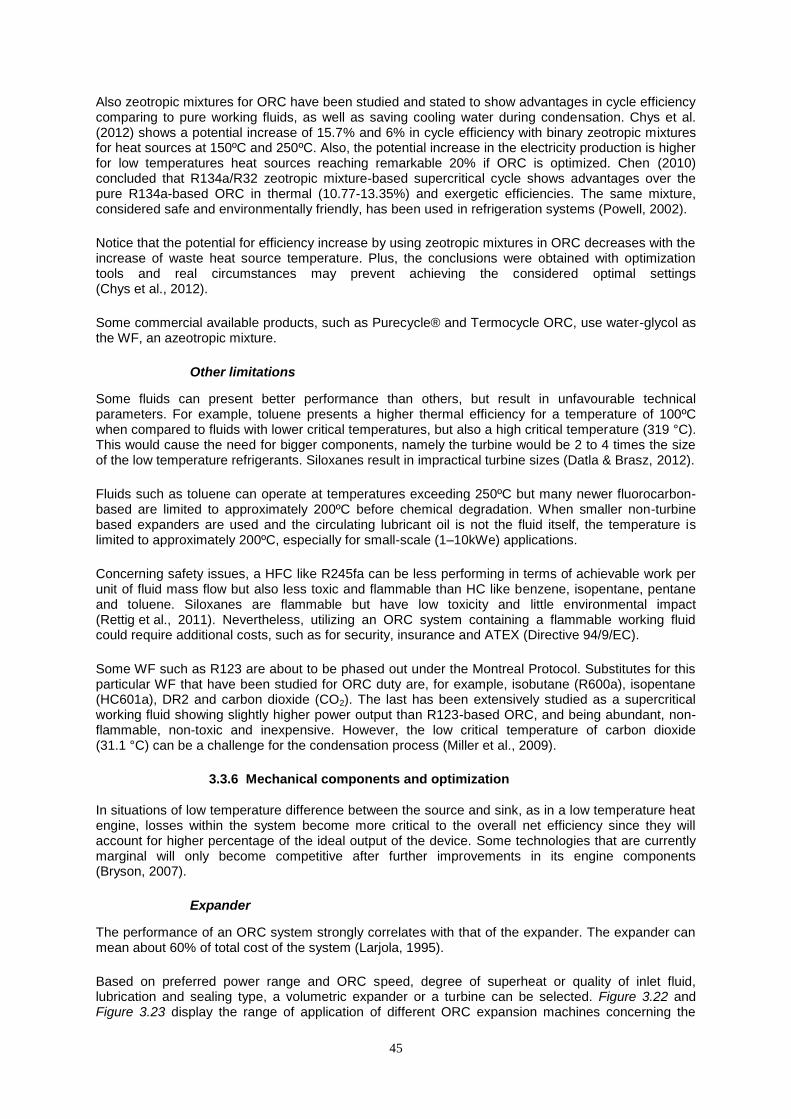
45
Also zeotropic mixtures for ORC have been studied and stated to show advantages in cycle efficiency comparing to pure working fluids, as well as saving cooling water during condensation. Chys et al. (2012) shows a potential increase of 15.7% and 6% in cycle efficiency with binary zeotropic mixtures for heat sources at 150ºC and 250ºC. Also, the potential increase in the electricity production is higher for low temperatures heat sources reaching remarkable 20% if ORC is optimized. Chen (2010) concluded that R134a/R32 zeotropic mixture-based supercritical cycle shows advantages over the pure R134a-based ORC in thermal (10.77-13.35%) and exergetic efficiencies. The same mixture, considered safe and environmentally friendly, has been used in refrigeration systems (Powell, 2002).
Notice that the potential for efficiency increase by using zeotropic mixtures in ORC decreases with the increase of waste heat source temperature. Plus, the conclusions were obtained with optimization tools and real circumstances may prevent achieving the considered optimal settings (Chys et al., 2012).
Some commercial available products, such as Purecycle® and Termocycle ORC, use water-glycol as the WF, an azeotropic mixture.
Other limitations
Some fluids can present better performance than others, but result in unfavourable technical parameters. For example, toluene presents a higher thermal efficiency for a temperature of 100ºC when compared to fluids with lower critical temperatures, but also a high critical temperature (319 °C). This would cause the need for bigger components, namely the turbine would be 2 to 4 times the size of the low temperature refrigerants. Siloxanes result in impractical turbine sizes (Datla & Brasz, 2012).
Fluids such as toluene can operate at temperatures exceeding 250ºC but many newer fluorocarbon-based are limited to approximately 200ºC before chemical degradation. When smaller non-turbine based expanders are used and the circulating lubricant oil is not the fluid itself, the temperature is limited to approximately 200ºC, especially for small-scale (1–10kWe) applications.
Concerning safety issues, a HFC like R245fa can be less performing in terms of achievable work per unit of fluid mass flow but also less toxic and flammable than HC like benzene, isopentane, pentane and toluene. Siloxanes are flammable but have low toxicity and little environmental impact (Rettig et al., 2011). Nevertheless, utilizing an ORC system containing a flammable working fluid could require additional costs, such as for security, insurance and ATEX (Directive 94/9/EC).
Some WF such as R123 are about to be phased out under the Montreal Protocol. Substitutes for this particular WF that have been studied for ORC duty are, for example, isobutane (R600a), isopentane (HC601a), DR2 and carbon dioxide (CO2). The last has been extensively studied as a supercritical working fluid showing slightly higher power output than R123-based ORC, and being abundant, non-flammable, non-toxic and inexpensive. However, the low critical temperature of carbon dioxide (31.1 °C) can be a challenge for the condensation process (Miller et al., 2009).
3.3.6 Mechanical components and optimization
In situations of low temperature difference between the source and sink, as in a low temperature heat engine, losses within the system become more critical to the overall net efficiency since they will account for higher percentage of the ideal output of the device. Some technologies that are currently marginal will only become competitive after further improvements in its engine components (Bryson, 2007).
Expander
The performance of an ORC system strongly correlates with that of the expander. The expander can mean about 60% of total cost of the system (Larjola, 1995).
Based on preferred power range and ORC speed, degree of superheat or quality of inlet fluid, lubrication and sealing type, a volumetric expander or a turbine can be selected. Figure 3.22 and Figure 3.23 display the range of application of different ORC expansion machines concerning the
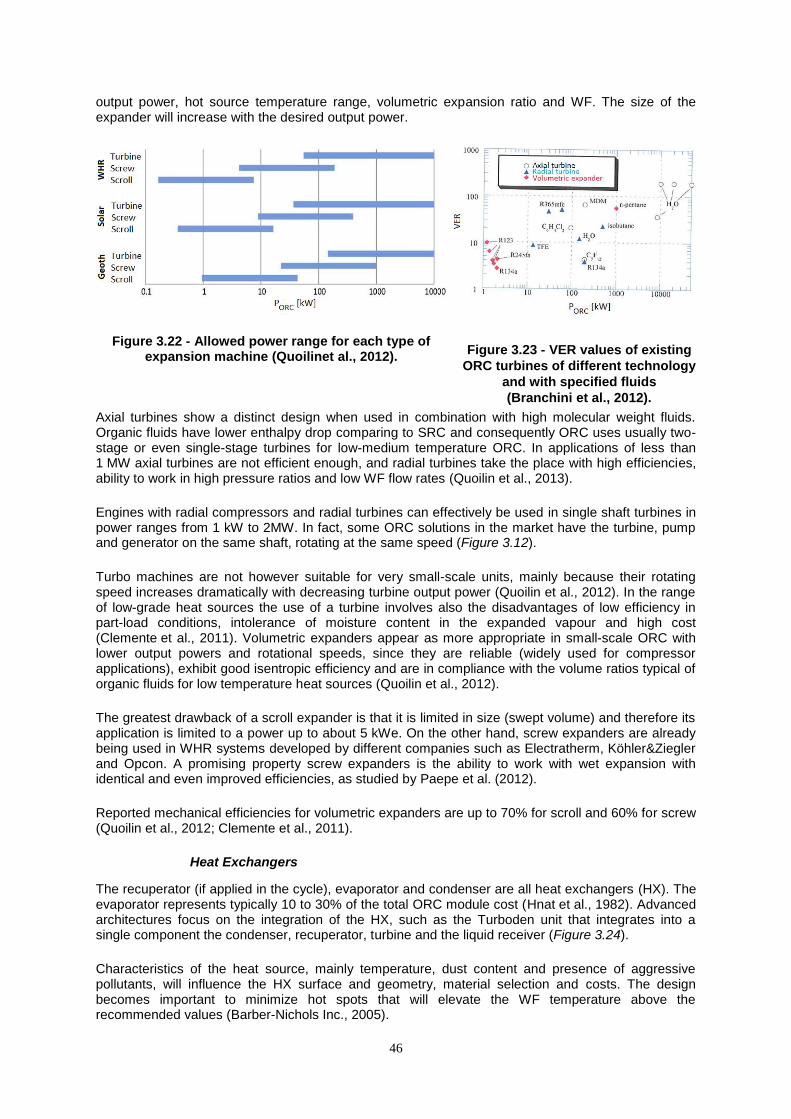
46
output power, hot source temperature range, volumetric expansion ratio and WF. The size of the expander will increase with the desired output power.
Figure 3.22 - Allowed power range for each type of expansion machine (Quoilinet al., 2012).
Figure 3.23 - VER values of existing
ORC turbines of different technology
and with specified fluids
(Branchini et al., 2012).
Axial turbines show a distinct design when used in combination with high molecular weight fluids. Organic fluids have lower enthalpy drop comparing to SRC and consequently ORC uses usually two-stage or even single-stage turbines for low-medium temperature ORC. In applications of less than 1 MW axial turbines are not efficient enough, and radial turbines take the place with high efficiencies, ability to work in high pressure ratios and low WF flow rates (Quoilin et al., 2013).
Engines with radial compressors and radial turbines can effectively be used in single shaft turbines in power ranges from 1 kW to 2MW. In fact, some ORC solutions in the market have the turbine, pump and generator on the same shaft, rotating at the same speed (Figure 3.12).
Turbo machines are not however suitable for very small-scale units, mainly because their rotating speed increases dramatically with decreasing turbine output power (Quoilin et al., 2012). In the range of low-grade heat sources the use of a turbine involves also the disadvantages of low efficiency in part-load conditions, intolerance of moisture content in the expanded vapour and high cost (Clemente et al., 2011). Volumetric expanders appear as more appropriate in small-scale ORC with lower output powers and rotational speeds, since they are reliable (widely used for compressor applications), exhibit good isentropic efficiency and are in compliance with the volume ratios typical of organic fluids for low temperature heat sources (Quoilin et al., 2012).
The greatest drawback of a scroll expander is that it is limited in size (swept volume) and therefore its application is limited to a power up to about 5 kWe. On the other hand, screw expanders are already being used in WHR systems developed by different companies such as Electratherm, Köhler&Ziegler and Opcon. A promising property screw expanders is the ability to work with wet expansion with identical and even improved efficiencies, as studied by Paepe et al. (2012).
Reported mechanical efficiencies for volumetric expanders are up to 70% for scroll and 60% for screw (Quoilin et al., 2012; Clemente et al., 2011).
Heat Exchangers
The recuperator (if applied in the cycle), evaporator and condenser are all heat exchangers (HX). The evaporator represents typically 10 to 30% of the total ORC module cost (Hnat et al., 1982). Advanced architectures focus on the integration of the HX, such as the Turboden unit that integrates into a single component the condenser, recuperator, turbine and the liquid receiver (Figure 3.24).
Characteristics of the heat source, mainly temperature, dust content and presence of aggressive pollutants, will influence the HX surface and geometry, material selection and costs. The design becomes important to minimize hot spots that will elevate the WF temperature above the recommended values (Barber-Nichols Inc., 2005).
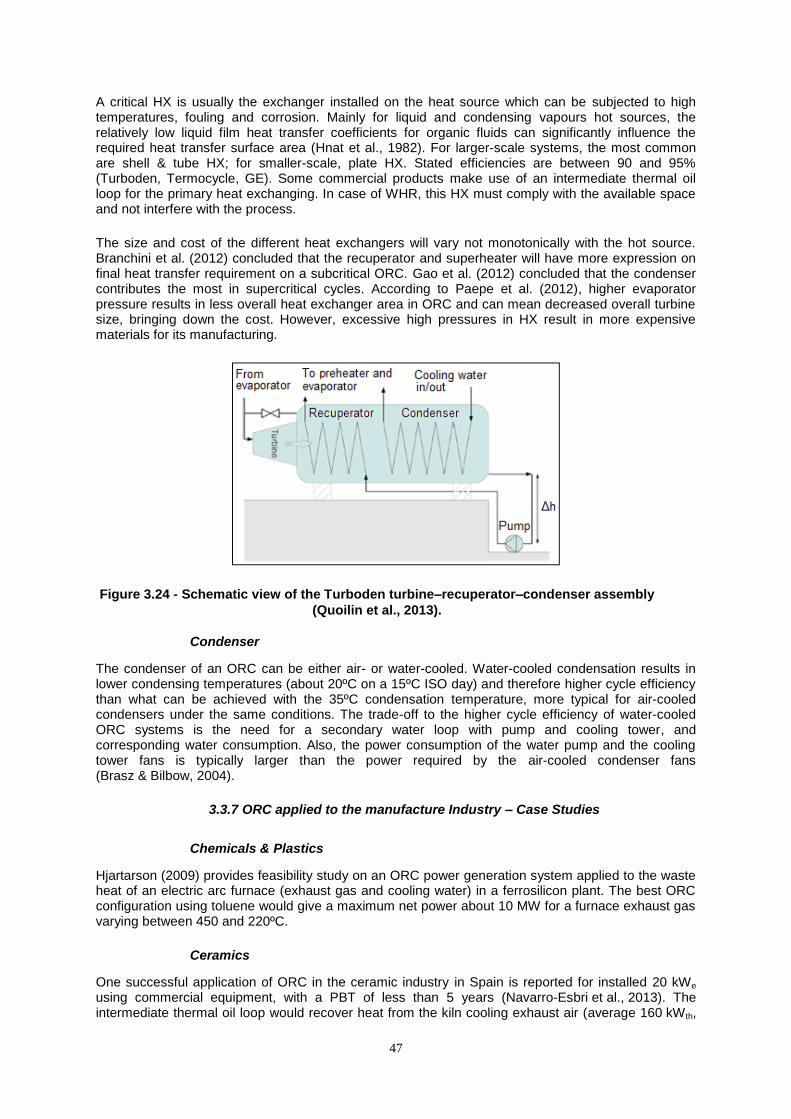
47
A critical HX is usually the exchanger installed on the heat source which can be subjected to high temperatures, fouling and corrosion. Mainly for liquid and condensing vapours hot sources, the relatively low liquid film heat transfer coefficients for organic fluids can significantly influence the required heat transfer surface area (Hnat et al., 1982). For larger-scale systems, the most common are shell & tube HX; for smaller-scale, plate HX. Stated efficiencies are between 90 and 95% (Turboden, Termocycle, GE). Some commercial products make use of an intermediate thermal oil loop for the primary heat exchanging. In case of WHR, this HX must comply with the available space and not interfere with the process.
The size and cost of the different heat exchangers will vary not monotonically with the hot source. Branchini et al. (2012) concluded that the recuperator and superheater will have more expression on final heat transfer requirement on a subcritical ORC. Gao et al. (2012) concluded that the condenser contributes the most in supercritical cycles. According to Paepe et al. (2012), higher evaporator pressure results in less overall heat exchanger area in ORC and can mean decreased overall turbine size, bringing down the cost. However, excessive high pressures in HX result in more expensive materials for its manufacturing.
Figure 3.24 - Schematic view of the Turboden turbine–recuperator–condenser assembly
(Quoilin et al., 2013).
Condenser
The condenser of an ORC can be either air- or water-cooled. Water-cooled condensation results in lower condensing temperatures (about 20ºC on a 15ºC ISO day) and therefore higher cycle efficiency than what can be achieved with the 35ºC condensation temperature, more typical for air-cooled condensers under the same conditions. The trade-off to the higher cycle efficiency of water-cooled ORC systems is the need for a secondary water loop with pump and cooling tower, and corresponding water consumption. Also, the power consumption of the water pump and the cooling tower fans is typically larger than the power required by the air-cooled condenser fans (Brasz & Bilbow, 2004).
3.3.7 ORC applied to the manufacture Industry – Case Studies
Chemicals & Plastics
Hjartarson (2009) provides feasibility study on an ORC power generation system applied to the waste heat of an electric arc furnace (exhaust gas and cooling water) in a ferrosilicon plant. The best ORC configuration using toluene would give a maximum net power about 10 MW for a furnace exhaust gas varying between 450 and 220ºC.
Ceramics
One successful application of ORC in the ceramic industry in Spain is reported for installed 20 kWe using commercial equipment, with a PBT of less than 5 years (Navarro-Esbri et al., 2013). The intermediate thermal oil loop would recover heat from the kiln cooling exhaust air (average 160 kWth,
48
flow of about 4 000 Nm3/h), and transfer it to the ORC unit. The system activation temperature was
120ºC; experimental data showed a temperature variation of 220-270ºC. The presence of material voids in ceramic kilns was demonstrated to reduce the waste heat and the thermal oil temperature up to 30ºC. The ORC was able to absorb these variations and produce power from 10 to 23 kWe.
Another practical study demonstrated that the coupling of the exhaust gases of two ceramic kilns at 220ºC can allow an ORC electric efficiency of 11.5% (EC, 1981). The hot source would be cooled to about 150ºC providing 350 kW th to the ORC system. The working fluid was C2Cl4 (tetrachloroethylene) on a supercritical cycle with a single-stage turbine. The HX was placed on a secondary exhaust duct and the condenser was water cooled. It was identified that high thermal losses in non-insulated duct will put evaporator inlet temperature down to 160-180ºC, and that exhaust contaminants can affect the heat exchangers.
Figure 3.25 - Simplified scheme of a heat recovery plant on a ceramic kiln with (A)
feedpump, (B) preheater, (C) vaporizer, (D) turbine, (E) condenser, (H) stack, (M) by-pass
valve and (N) cooling tower (adpated from EC, 1981).
Glass
Italy currently hosts the only two examples of ORC in the international glass sector thanks to certain boundary conditions, such as the high electricity price and an effective incentive mechanism for the first five years of operation (see Section 2.4.1), which allowed a discounted payback period of less than 4 years (GW, 2013). Both plants produce flat glass and are equipped with recuperative furnaces with a rated production approximately of 600 t/d. One, the AGC plant in Cuneo, recovers the thermal power from flue gases before gas treatment and produces about 1.3 MWe since 2012. The other, Sangalli plant in Manfredonia, has two heat exchangers, one before and one after gas treatment, and a 2 MWe ORC module since 2011.
Cement
The first ORC system applied in the cement industry was the 1.5 MWe (1.3MWe net) system at the HeidelbergCement AG Plant in Lengfurt, implemented in 1998. After years of experience, ORC can be regarded as a technically feasible alternative to steam power plants and economic for the owner. At Lengfurt, 8.4 MWth waste heat is provided by the clinker cooler vent air to the ORC during 97% of the operation time of the cement kiln (EC, 2013c). The tube heat exchanger was installed after the precipitator (ESP), transferring the heat through thermal oil (Mobiltherm 594) low-pressure closed loop until the ORC working fluid (pentane). The ORC enables the degree of flexibility for the continuously changing heat source conditions in flows and temperatures (180-340ºC), which makes the thermal oil fluctuate between 120 to 230ºC, and power generation between 400 to 1 500 kW (equivalent to about 12% of the plant's electricity demand). A low speed turbine (3 000 rpm) direct connected to an asynchronous induction generator was used. Anchieved O&M costs are 0.00146 €/kWh (ORMAT, 2002).
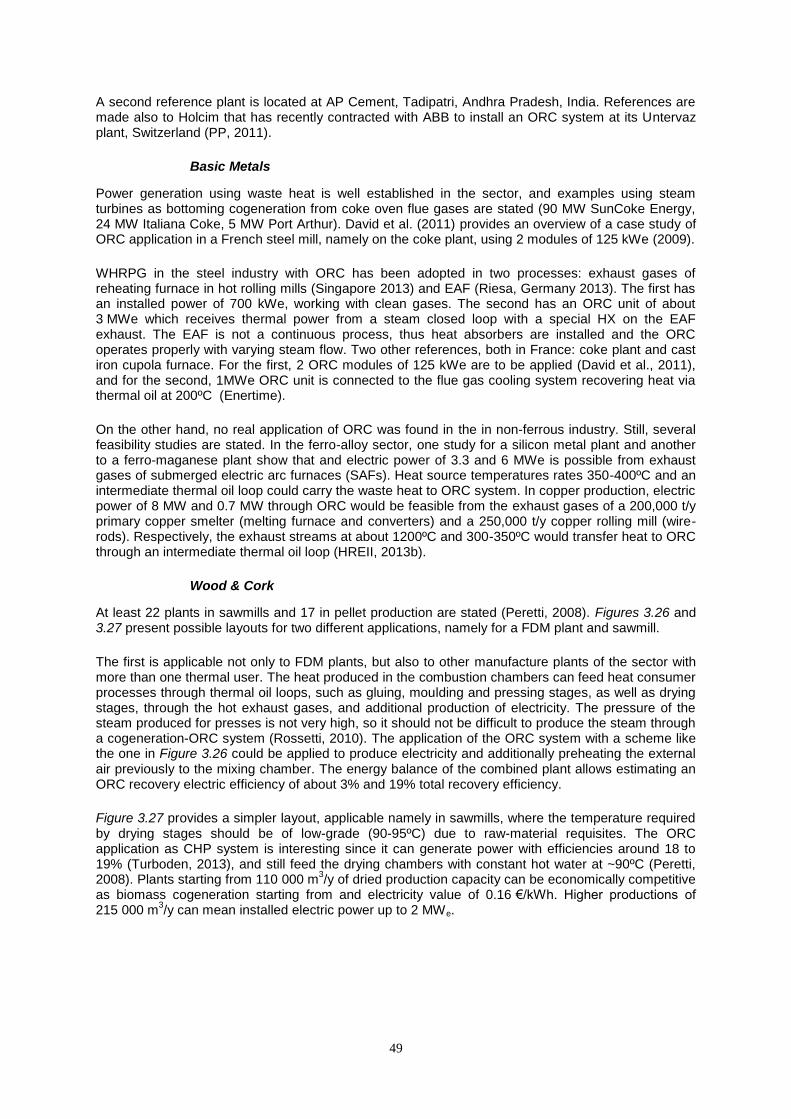
49
A second reference plant is located at AP Cement, Tadipatri, Andhra Pradesh, India. References are made also to Holcim that has recently contracted with ABB to install an ORC system at its Untervaz plant, Switzerland (PP, 2011).
Basic Metals
Power generation using waste heat is well established in the sector, and examples using steam turbines as bottoming cogeneration from coke oven flue gases are stated (90 MW SunCoke Energy, 24 MW Italiana Coke, 5 MW Port Arthur). David et al. (2011) provides an overview of a case study of ORC application in a French steel mill, namely on the coke plant, using 2 modules of 125 kWe (2009).
WHRPG in the steel industry with ORC has been adopted in two processes: exhaust gases of reheating furnace in hot rolling mills (Singapore 2013) and EAF (Riesa, Germany 2013). The first has an installed power of 700 kWe, working with clean gases. The second has an ORC unit of about 3 MWe which receives thermal power from a steam closed loop with a special HX on the EAF exhaust. The EAF is not a continuous process, thus heat absorbers are installed and the ORC operates properly with varying steam flow. Two other references, both in France: coke plant and cast iron cupola furnace. For the first, 2 ORC modules of 125 kWe are to be applied (David et al., 2011), and for the second, 1MWe ORC unit is connected to the flue gas cooling system recovering heat via thermal oil at 200ºC (Enertime).
On the other hand, no real application of ORC was found in the in non-ferrous industry. Still, several feasibility studies are stated. In the ferro-alloy sector, one study for a silicon metal plant and another to a ferro-maganese plant show that and electric power of 3.3 and 6 MWe is possible from exhaust gases of submerged electric arc furnaces (SAFs). Heat source temperatures rates 350-400ºC and an intermediate thermal oil loop could carry the waste heat to ORC system. In copper production, electric power of 8 MW and 0.7 MW through ORC would be feasible from the exhaust gases of a 200,000 t/y primary copper smelter (melting furnace and converters) and a 250,000 t/y copper rolling mill (wire-rods). Respectively, the exhaust streams at about 1200ºC and 300-350ºC would transfer heat to ORC through an intermediate thermal oil loop (HREII, 2013b).
Wood & Cork
At least 22 plants in sawmills and 17 in pellet production are stated (Peretti, 2008). Figures 3.26 and 3.27 present possible layouts for two different applications, namely for a FDM plant and sawmill.
The first is applicable not only to FDM plants, but also to other manufacture plants of the sector with more than one thermal user. The heat produced in the combustion chambers can feed heat consumer processes through thermal oil loops, such as gluing, moulding and pressing stages, as well as drying stages, through the hot exhaust gases, and additional production of electricity. The pressure of the steam produced for presses is not very high, so it should not be difficult to produce the steam through a cogeneration-ORC system (Rossetti, 2010). The application of the ORC system with a scheme like the one in Figure 3.26 could be applied to produce electricity and additionally preheating the external air previously to the mixing chamber. The energy balance of the combined plant allows estimating an ORC recovery electric efficiency of about 3% and 19% total recovery efficiency.
Figure 3.27 provides a simpler layout, applicable namely in sawmills, where the temperature required by drying stages should be of low-grade (90-95ºC) due to raw-material requisites. The ORC application as CHP system is interesting since it can generate power with efficiencies around 18 to 19% (Turboden, 2013), and still feed the drying chambers with constant hot water at ~90ºC (Peretti, 2008). Plants starting from 110 000 m
3/y of dried production capacity can be economically competitive
as biomass cogeneration starting from and electricity value of 0.16 €/kWh. Higher productions of 215 000 m
3/y can mean installed electric power up to 2 MWe.
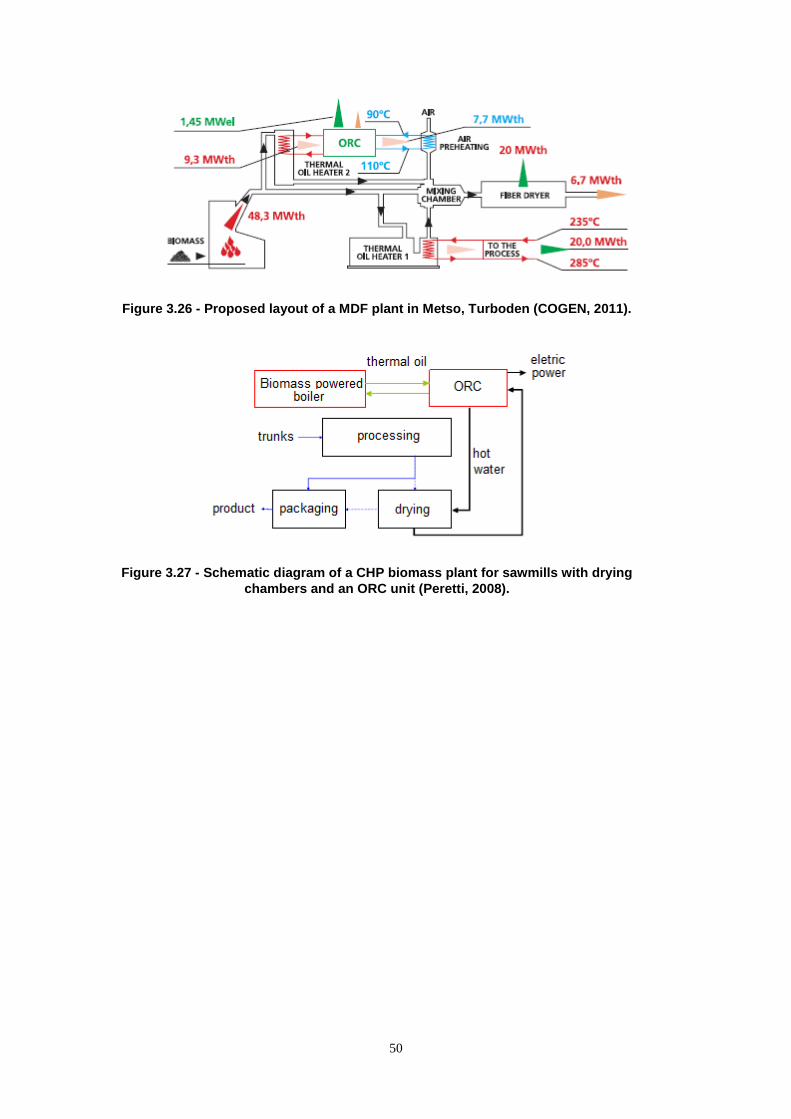
50
Figure 3.26 - Proposed layout of a MDF plant in Metso, Turboden (COGEN, 2011).
Figure 3.27 - Schematic diagram of a CHP biomass plant for sawmills with drying
chambers and an ORC unit (Peretti, 2008).
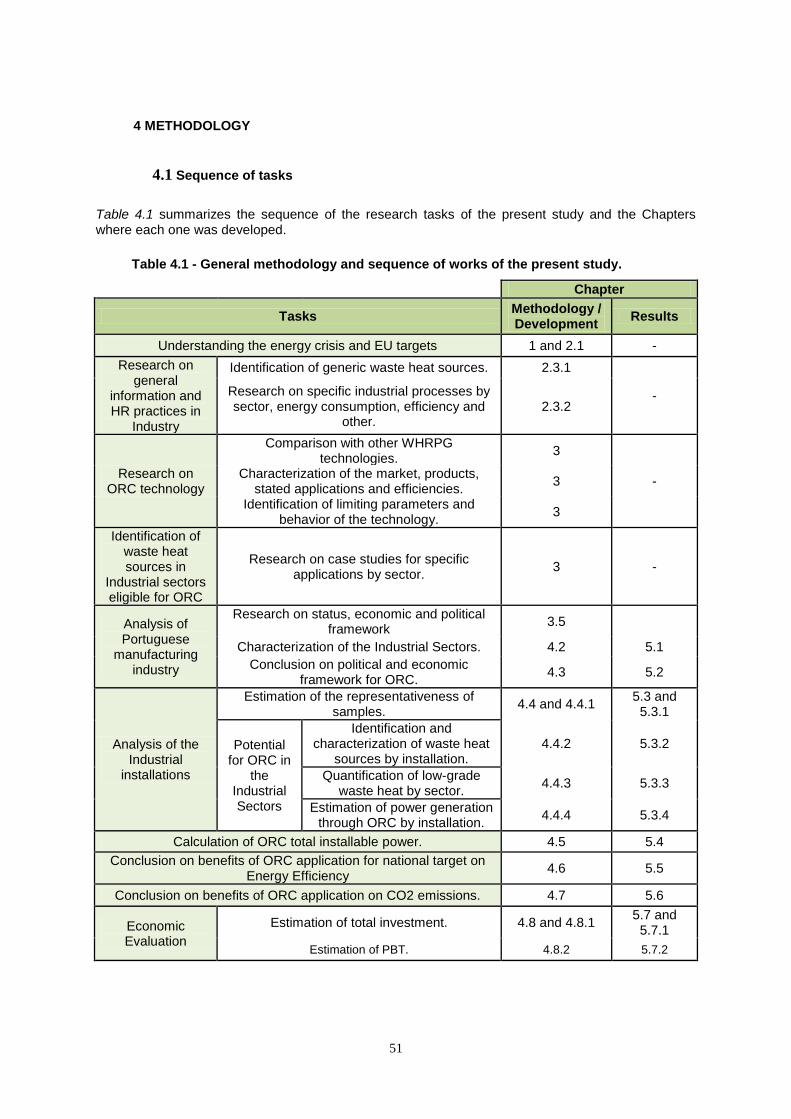
51
4 METHODOLOGY
4.1 Sequence of tasks
Table 4.1 summarizes the sequence of the research tasks of the present study and the Chapters where each one was developed.
Table 4.1 - General methodology and sequence of works of the present study.
Chapter
Tasks Methodology / Development
Results
Understanding the energy crisis and EU targets 1 and 2.1 -
Research on general
information and HR practices in
Industry
Identification of generic waste heat sources. 2.3.1
- Research on specific industrial processes by sector, energy consumption, efficiency and
other. 2.3.2
Research on ORC technology
Comparison with other WHRPG technologies.
3
- Characterization of the market, products,
stated applications and efficiencies. 3
Identification of limiting parameters and behavior of the technology.
3
Identification of waste heat sources in
Industrial sectors eligible for ORC
Research on case studies for specific applications by sector.
3 -
Analysis of Portuguese
manufacturing industry
Research on status, economic and political framework
3.5
Characterization of the Industrial Sectors. 4.2 5.1
Conclusion on political and economic framework for ORC.
4.3 5.2
Analysis of the Industrial
installations
Estimation of the representativeness of samples.
4.4 and 4.4.1 5.3 and 5.3.1
Potential for ORC in
the Industrial Sectors
Identification and characterization of waste heat
sources by installation. 4.4.2 5.3.2
Quantification of low-grade waste heat by sector.
4.4.3 5.3.3
Estimation of power generation through ORC by installation.
4.4.4 5.3.4
Calculation of ORC total installable power. 4.5 5.4
Conclusion on benefits of ORC application for national target on Energy Efficiency
4.6 5.5
Conclusion on benefits of ORC application on CO2 emissions. 4.7 5.6
Economic Evaluation
Estimation of total investment. 4.8 and 4.8.1 5.7 and 5.7.1
Estimation of PBT. 4.8.2 5.7.2
52
4.2 Characterization of the Industrial Sectors
The sectors excluded from Table 2.2 were not developed.
The interesting variables to characterized the Industrial sectors are: final energy consumption by sector (with detail to electricity consumption); variations in energy consumption, production, sales and in energy efficiency indicators such as Specific Consumption. The yearly variation of total energy consumption per sector can be explained, on a basic perspective, by the break on production or increase in energy efficiency (decrease of specific consumption of the productive process). The electricity share on total energy consumption by sector can constitute an indicator of the most suitable sectors for ORC application, together with quantified wasted heat by sector, which is unfortunately not assessed for the country and constitutes a key research area.
4.3 Conclusion on political and economic framework for ORC
An exploratory research was done to assess which regulations, policies and supportive schemes affect and/or apply to ORC as an electricity production technology, cogeneration technology and/or energy efficiency measure in the Portuguese manufacturing industry.
4.4 Analysis of Industrial Installations
In the present work, a total of 101 Energy Audits (EA) were handled, provided by DGEG for research purposes and with confidential nature. The EA preceded or accompanied RPEC of single installations within SGCIE, and date from different years (2008-2012). The reference year was chosen to be 2010 because the only definitive Energy Balance for the country available dates from 2010 (DGEG, 2010b); it was considered the middle year of observed reference years of the audits and RPEC.
For all installations only one EA was available, but for some cases, more than one RPEC was available. For those, when possible, the collection of SGCIE indicators (e.g. specific consumption), energy consumption and production levels was done from the documents dated more closely to 2010, which in some cases did not correspond to the most updated documents. The data concerning industrial processes and waste heat (e.g. exhaust temperatures, device efficiency) was collected from audits and assumed to be conservative until 2010.
The analysed EA respected to single installations within SGCIE, therefore provided data only on EII installations (> 500 toe/year), meaning SME were excluded. Other installations, such as cement and steel works plants, were studied through respective Environmental Reports and other published documents.
Notice that the analysis of the Ceramic industry was held in a different and more detailed way due to the availability of data, and can stand as a role model for further analysis of other sectors in the occasion of access to analogous amount of data.
4.4.1 Estimation of the representativeness of samples
To quantify the representativeness of analysed samples referring to respective industrial sector, the
indicator ―Share on sector’s total energy consumption 2010 (%)‖ ( ) was used (Eq. 8). A sample can be:
- the group of available Energy Audits of single installations with NACE Code belonging to the same industrial sector (Portuguese Economic Activity Classification – CAE-Rev.3);
- the group of installations studied through other documentation for the same industrial sector; - the group of installations assumed for the same industrial sector;
making a total of 116 installations analysed. When the indicator showed a modest value to a certain sample, extrapolations for the sector were not developed.
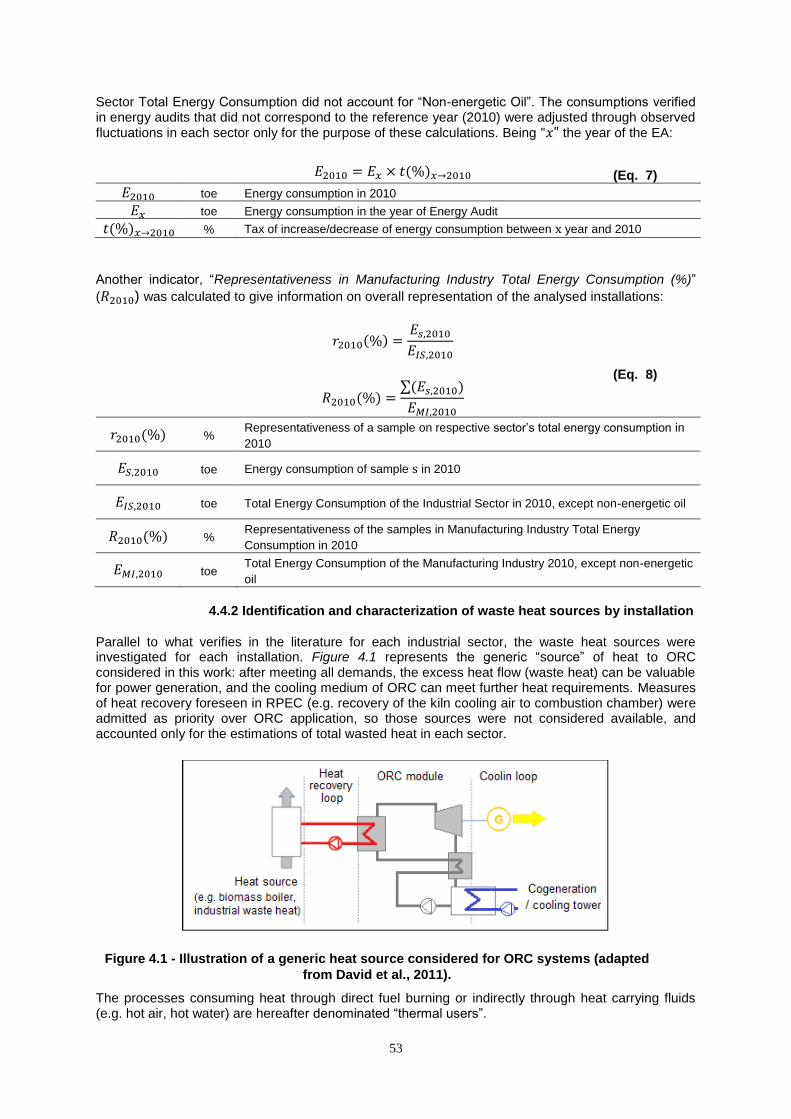
53
Sector Total Energy Consumption did not account for ―Non-energetic Oil‖. The consumptions verified in energy audits that did not correspond to the reference year (2010) were adjusted through observed fluctuations in each sector only for the purpose of these calculations. Being the year of the EA:
(Eq. 7)
toe Energy consumption in 2010
toe Energy consumption in the year of Energy Audit
% Tax of increase/decrease of energy consumption between year and 2010
Another indicator, ―Representativeness in Manufacturing Industry Total Energy Consumption (%)‖
( ) was calculated to give information on overall representation of the analysed installations:
∑
(Eq. 8)
% Representativeness of a sample on respective sector‘s total energy consumption in
2010
toe Energy consumption of sample in 2010
toe Total Energy Consumption of the Industrial Sector in 2010, except non-energetic oil
% Representativeness of the samples in Manufacturing Industry Total Energy
Consumption in 2010
toe Total Energy Consumption of the Manufacturing Industry 2010, except non-energetic
oil
4.4.2 Identification and characterization of waste heat sources by installation
Parallel to what verifies in the literature for each industrial sector, the waste heat sources were investigated for each installation. Figure 4.1 represents the generic ―source‖ of heat to ORC considered in this work: after meeting all demands, the excess heat flow (waste heat) can be valuable for power generation, and the cooling medium of ORC can meet further heat requirements. Measures of heat recovery foreseen in RPEC (e.g. recovery of the kiln cooling air to combustion chamber) were admitted as priority over ORC application, so those sources were not considered available, and accounted only for the estimations of total wasted heat in each sector.
Figure 4.1 - Illustration of a generic heat source considered for ORC systems (adapted
from David et al., 2011).
The processes consuming heat through direct fuel burning or indirectly through heat carrying fluids (e.g. hot air, hot water) are hereafter denominated ―thermal users‖.
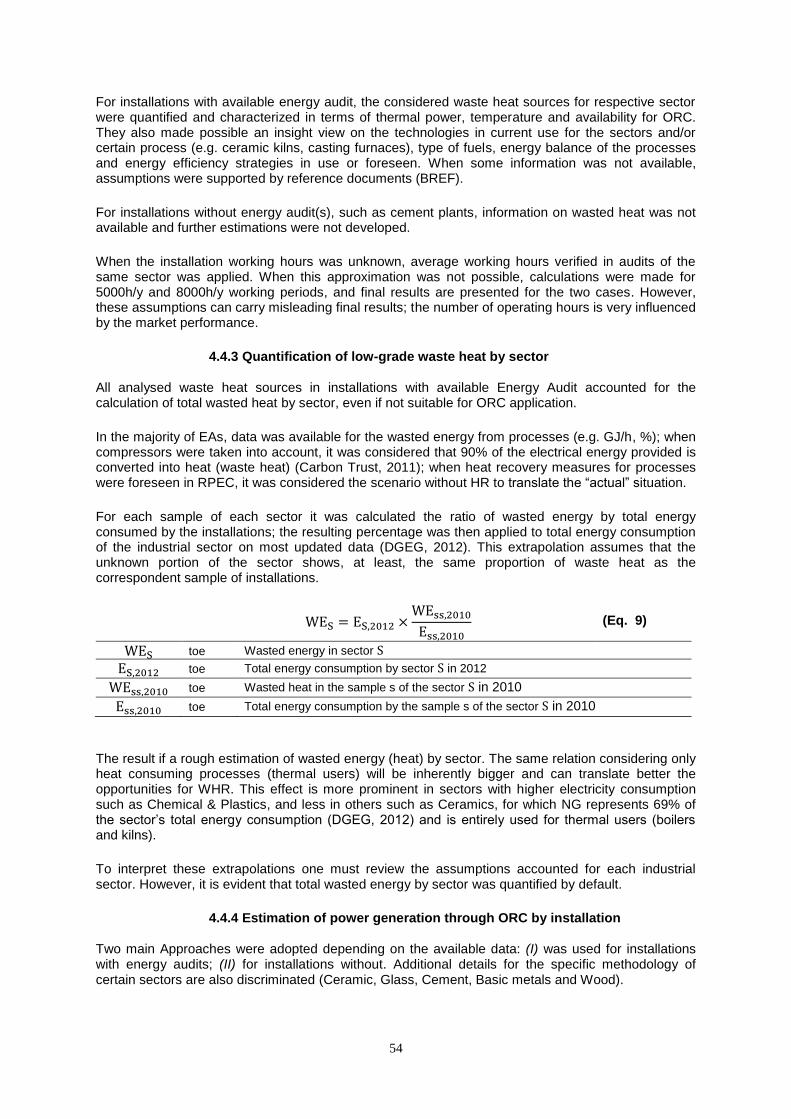
54
For installations with available energy audit, the considered waste heat sources for respective sector were quantified and characterized in terms of thermal power, temperature and availability for ORC. They also made possible an insight view on the technologies in current use for the sectors and/or certain process (e.g. ceramic kilns, casting furnaces), type of fuels, energy balance of the processes and energy efficiency strategies in use or foreseen. When some information was not available, assumptions were supported by reference documents (BREF).
For installations without energy audit(s), such as cement plants, information on wasted heat was not available and further estimations were not developed.
When the installation working hours was unknown, average working hours verified in audits of the same sector was applied. When this approximation was not possible, calculations were made for 5000h/y and 8000h/y working periods, and final results are presented for the two cases. However, these assumptions can carry misleading final results; the number of operating hours is very influenced by the market performance.
4.4.3 Quantification of low-grade waste heat by sector
All analysed waste heat sources in installations with available Energy Audit accounted for the calculation of total wasted heat by sector, even if not suitable for ORC application.
In the majority of EAs, data was available for the wasted energy from processes (e.g. GJ/h, %); when compressors were taken into account, it was considered that 90% of the electrical energy provided is converted into heat (waste heat) (Carbon Trust, 2011); when heat recovery measures for processes were foreseen in RPEC, it was considered the scenario without HR to translate the ―actual‖ situation.
For each sample of each sector it was calculated the ratio of wasted energy by total energy consumed by the installations; the resulting percentage was then applied to total energy consumption of the industrial sector on most updated data (DGEG, 2012). This extrapolation assumes that the unknown portion of the sector shows, at least, the same proportion of waste heat as the correspondent sample of installations.
(Eq. 9)
toe Wasted energy in sector
toe Total energy consumption by sector in 2012
toe Wasted heat in the sample s of the sector in 2010
toe Total energy consumption by the sample s of the sector in 2010
The result if a rough estimation of wasted energy (heat) by sector. The same relation considering only heat consuming processes (thermal users) will be inherently bigger and can translate better the opportunities for WHR. This effect is more prominent in sectors with higher electricity consumption such as Chemical & Plastics, and less in others such as Ceramics, for which NG represents 69% of the sector‘s total energy consumption (DGEG, 2012) and is entirely used for thermal users (boilers and kilns).
To interpret these extrapolations one must review the assumptions accounted for each industrial sector. However, it is evident that total wasted energy by sector was quantified by default.
4.4.4 Estimation of power generation through ORC by installation
Two main Approaches were adopted depending on the available data: (I) was used for installations with energy audits; (II) for installations without. Additional details for the specific methodology of certain sectors are also discriminated (Ceramic, Glass, Cement, Basic metals and Wood).
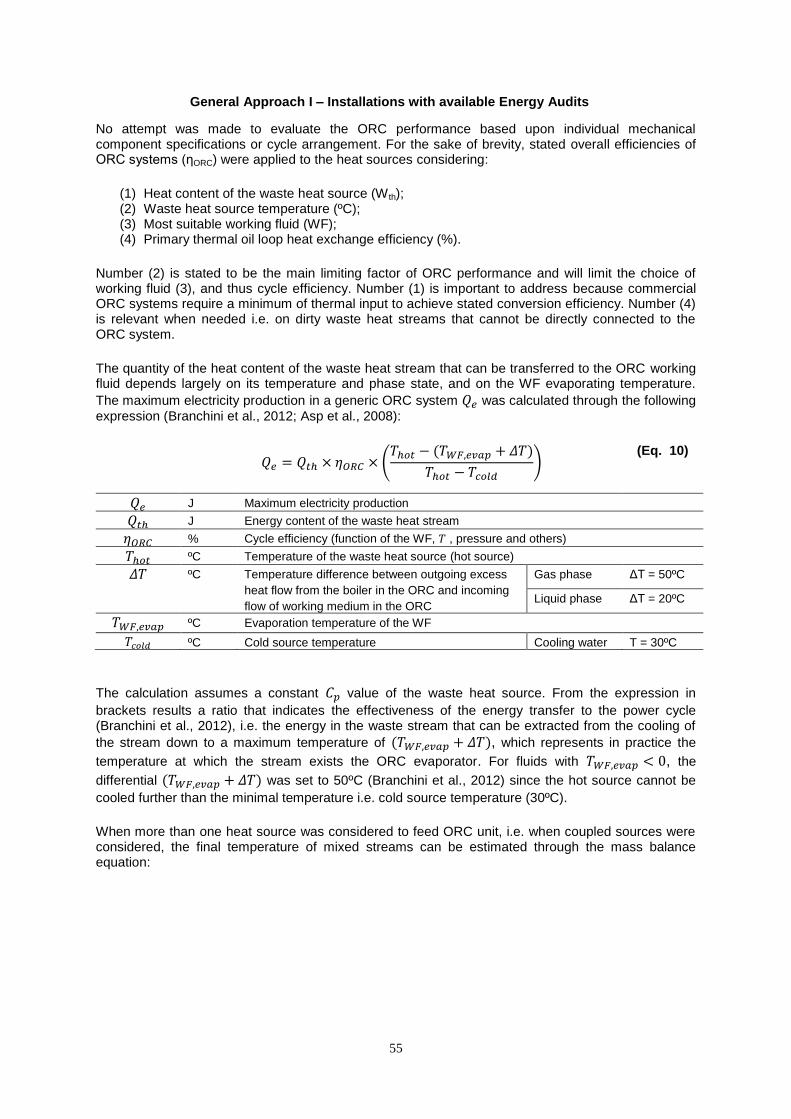
55
General Approach I – Installations with available Energy Audits
No attempt was made to evaluate the ORC performance based upon individual mechanical component specifications or cycle arrangement. For the sake of brevity, stated overall efficiencies of ORC systems (ηORC) were applied to the heat sources considering:
(1) Heat content of the waste heat source (W th); (2) Waste heat source temperature (ºC); (3) Most suitable working fluid (WF); (4) Primary thermal oil loop heat exchange efficiency (%).
Number (2) is stated to be the main limiting factor of ORC performance and will limit the choice of working fluid (3), and thus cycle efficiency. Number (1) is important to address because commercial ORC systems require a minimum of thermal input to achieve stated conversion efficiency. Number (4) is relevant when needed i.e. on dirty waste heat streams that cannot be directly connected to the ORC system.
The quantity of the heat content of the waste heat stream that can be transferred to the ORC working fluid depends largely on its temperature and phase state, and on the WF evaporating temperature.
The maximum electricity production in a generic ORC system was calculated through the following
expression (Branchini et al., 2012; Asp et al., 2008):
(
)
(Eq. 10)
J Maximum electricity production
J Energy content of the waste heat stream
% Cycle efficiency (function of the WF, , pressure and others)
ºC Temperature of the waste heat source (hot source)
ºC Temperature difference between outgoing excess
heat flow from the boiler in the ORC and incoming
flow of working medium in the ORC
Gas phase ΔT = 50ºC
Liquid phase ΔT = 20ºC
ºC Evaporation temperature of the WF
ºC Cold source temperature Cooling water T = 30ºC
The calculation assumes a constant value of the waste heat source. From the expression in
brackets results a ratio that indicates the effectiveness of the energy transfer to the power cycle (Branchini et al., 2012), i.e. the energy in the waste stream that can be extracted from the cooling of
the stream down to a maximum temperature of , which represents in practice the
temperature at which the stream exists the ORC evaporator. For fluids with , the
differential was set to 50ºC (Branchini et al., 2012) since the hot source cannot be
cooled further than the minimal temperature i.e. cold source temperature (30ºC).
When more than one heat source was considered to feed ORC unit, i.e. when coupled sources were considered, the final temperature of mixed streams can be estimated through the mass balance equation:
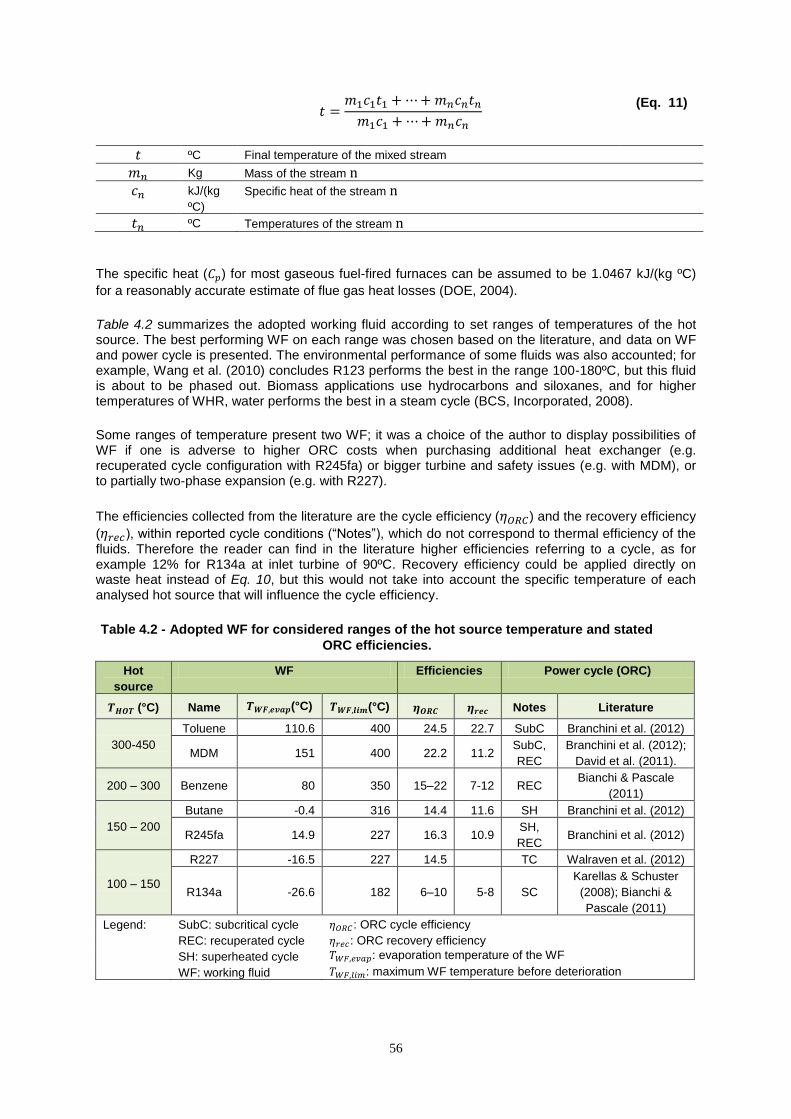
56
(Eq. 11)
ºC Final temperature of the mixed stream
Kg Mass of the stream
kJ/(kg
ºC)
Specific heat of the stream
ºC Temperatures of the stream
The specific heat ( ) for most gaseous fuel-fired furnaces can be assumed to be 1.0467 kJ/(kg ºC)
for a reasonably accurate estimate of flue gas heat losses (DOE, 2004).
Table 4.2 summarizes the adopted working fluid according to set ranges of temperatures of the hot source. The best performing WF on each range was chosen based on the literature, and data on WF and power cycle is presented. The environmental performance of some fluids was also accounted; for example, Wang et al. (2010) concludes R123 performs the best in the range 100-180ºC, but this fluid is about to be phased out. Biomass applications use hydrocarbons and siloxanes, and for higher temperatures of WHR, water performs the best in a steam cycle (BCS, Incorporated, 2008).
Some ranges of temperature present two WF; it was a choice of the author to display possibilities of WF if one is adverse to higher ORC costs when purchasing additional heat exchanger (e.g. recuperated cycle configuration with R245fa) or bigger turbine and safety issues (e.g. with MDM), or to partially two-phase expansion (e.g. with R227).
The efficiencies collected from the literature are the cycle efficiency ( ) and the recovery efficiency
( ), within reported cycle conditions (―Notes‖), which do not correspond to thermal efficiency of the fluids. Therefore the reader can find in the literature higher efficiencies referring to a cycle, as for example 12% for R134a at inlet turbine of 90ºC. Recovery efficiency could be applied directly on waste heat instead of Eq. 10, but this would not take into account the specific temperature of each analysed hot source that will influence the cycle efficiency.
Table 4.2 - Adopted WF for considered ranges of the hot source temperature and stated
ORC efficiencies.
Hot
source
WF Efficiencies Power cycle (ORC)
(°C) Name (°C) (°C) Notes Literature
300-450
Toluene 110.6 400 24.5 22.7 SubC Branchini et al. (2012)
MDM 151 400 22.2 11.2 SubC,
REC
Branchini et al. (2012);
David et al. (2011).
200 – 300 Benzene 80 350 15–22 7-12 REC Bianchi & Pascale
(2011)
150 – 200
Butane -0.4 316 14.4 11.6 SH Branchini et al. (2012)
R245fa 14.9 227 16.3 10.9 SH,
REC Branchini et al. (2012)
100 – 150
R227 -16.5 227 14.5 TC Walraven et al. (2012)
R134a -26.6 182 6–10 5-8 SC
Karellas & Schuster
(2008); Bianchi &
Pascale (2011)
Legend: SubC: subcritical cycle : ORC cycle efficiency
REC: recuperated cycle : ORC recovery efficiency
SH: superheated cycle : evaporation temperature of the WF
WF: working fluid : maximum WF temperature before deterioration
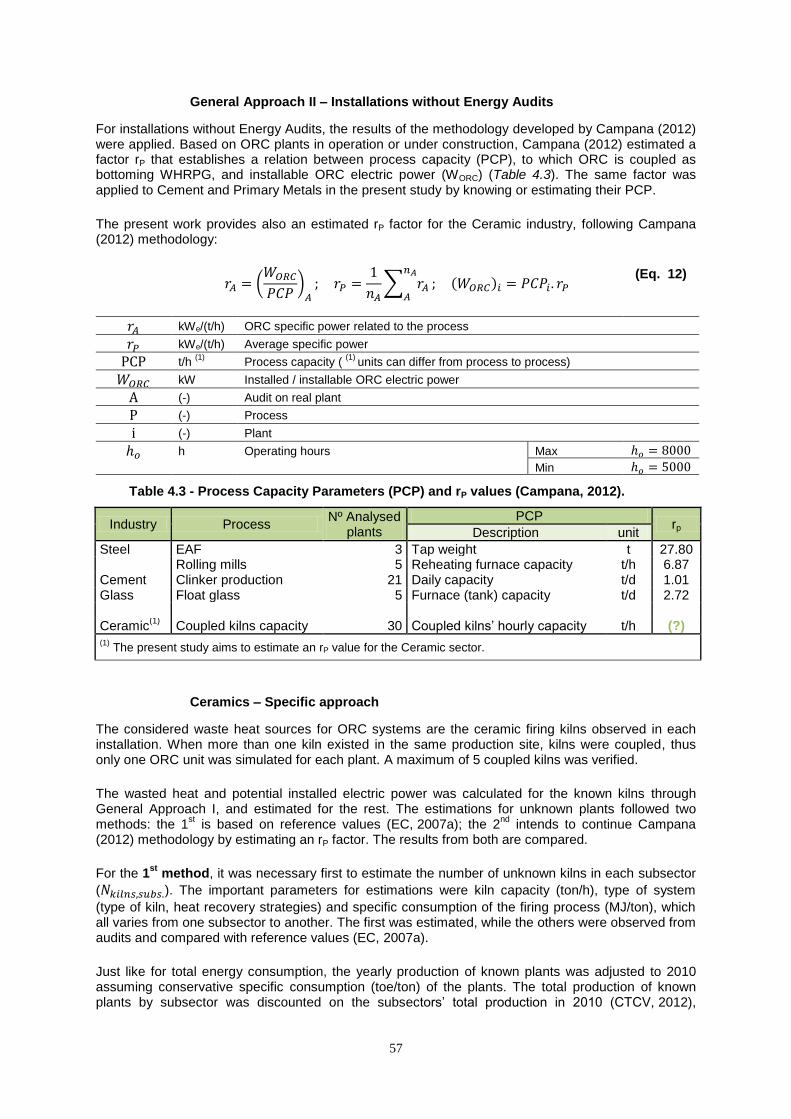
57
General Approach II – Installations without Energy Audits
For installations without Energy Audits, the results of the methodology developed by Campana (2012) were applied. Based on ORC plants in operation or under construction, Campana (2012) estimated a factor rP that establishes a relation between process capacity (PCP), to which ORC is coupled as bottoming WHRPG, and installable ORC electric power (WORC) (Table 4.3). The same factor was applied to Cement and Primary Metals in the present study by knowing or estimating their PCP.
The present work provides also an estimated rP factor for the Ceramic industry, following Campana (2012) methodology:
(
)
∑
(Eq. 12)
kWe/(t/h) ORC specific power related to the process
kWe/(t/h) Average specific power
t/h (1)
Process capacity ( (1)
units can differ from process to process)
kW Installed / installable ORC electric power
(-) Audit on real plant
(-) Process
(-) Plant
h Operating hours Max
Min
Table 4.3 - Process Capacity Parameters (PCP) and rP values (Campana, 2012).
Industry Process Nº Analysed
plants
PCP rp
Description unit
Steel EAF 3 Tap weight t 27.80
Rolling mills 5 Reheating furnace capacity t/h 6.87
Cement Clinker production 21 Daily capacity t/d 1.01 Glass Float glass 5 Furnace (tank) capacity t/d 2.72 Ceramic
(1) Coupled kilns capacity 30 Coupled kilns‘ hourly capacity t/h (?)
(1) The present study aims to estimate an rP value for the Ceramic sector.
Ceramics – Specific approach
The considered waste heat sources for ORC systems are the ceramic firing kilns observed in each installation. When more than one kiln existed in the same production site, kilns were coupled, thus only one ORC unit was simulated for each plant. A maximum of 5 coupled kilns was verified.
The wasted heat and potential installed electric power was calculated for the known kilns through General Approach I, and estimated for the rest. The estimations for unknown plants followed two methods: the 1
st is based on reference values (EC, 2007a); the 2
nd intends to continue Campana
(2012) methodology by estimating an rP factor. The results from both are compared.
For the 1st
method, it was necessary first to estimate the number of unknown kilns in each subsector
( ). The important parameters for estimations were kiln capacity (ton/h), type of system
(type of kiln, heat recovery strategies) and specific consumption of the firing process (MJ/ton), which all varies from one subsector to another. The first was estimated, while the others were observed from audits and compared with reference values (EC, 2007a).
Just like for total energy consumption, the yearly production of known plants was adjusted to 2010 assuming conservative specific consumption (toe/ton) of the plants. The total production of known plants by subsector was discounted on the subsectors‘ total production in 2010 (CTCV, 2012),
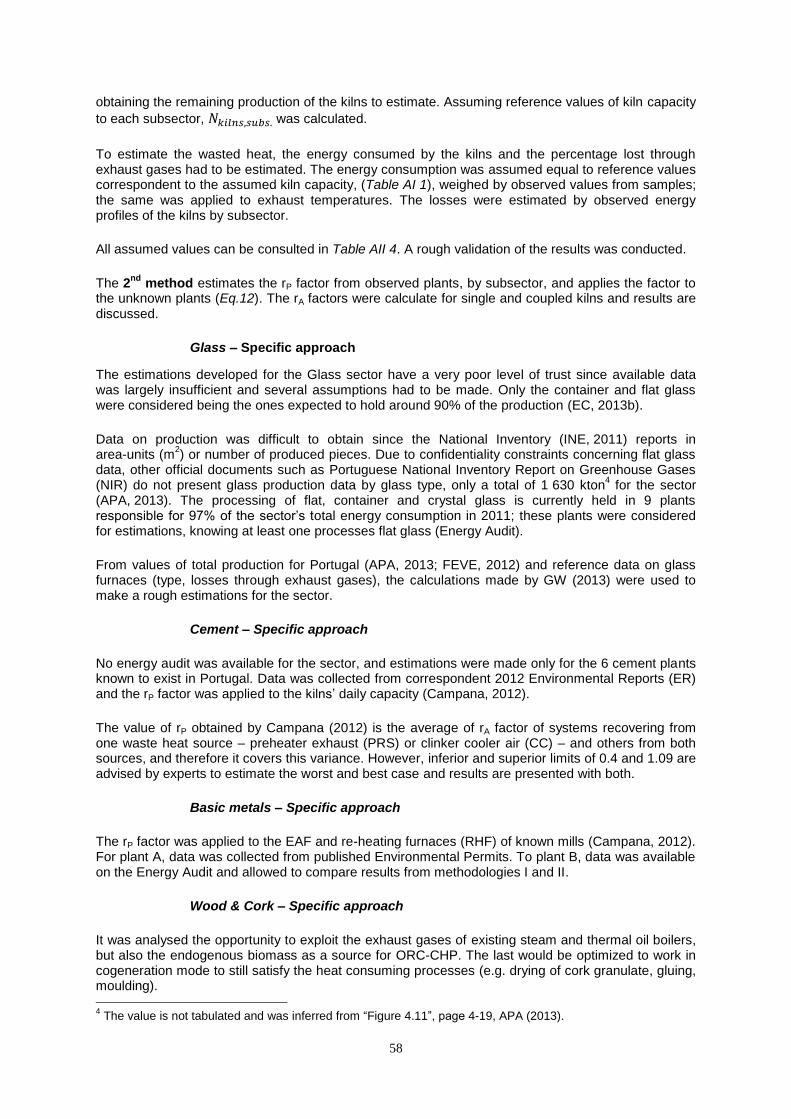
58
obtaining the remaining production of the kilns to estimate. Assuming reference values of kiln capacity
to each subsector, was calculated.
To estimate the wasted heat, the energy consumed by the kilns and the percentage lost through exhaust gases had to be estimated. The energy consumption was assumed equal to reference values correspondent to the assumed kiln capacity, (Table AI 1), weighed by observed values from samples; the same was applied to exhaust temperatures. The losses were estimated by observed energy profiles of the kilns by subsector.
All assumed values can be consulted in Table AII 4. A rough validation of the results was conducted.
The 2nd
method estimates the rP factor from observed plants, by subsector, and applies the factor to the unknown plants (Eq.12). The rA factors were calculate for single and coupled kilns and results are discussed.
Glass – Specific approach
The estimations developed for the Glass sector have a very poor level of trust since available data was largely insufficient and several assumptions had to be made. Only the container and flat glass were considered being the ones expected to hold around 90% of the production (EC, 2013b).
Data on production was difficult to obtain since the National Inventory (INE, 2011) reports in area-units (m
2) or number of produced pieces. Due to confidentiality constraints concerning flat glass
data, other official documents such as Portuguese National Inventory Report on Greenhouse Gases (NIR) do not present glass production data by glass type, only a total of 1 630 kton
4 for the sector
(APA, 2013). The processing of flat, container and crystal glass is currently held in 9 plants responsible for 97% of the sector‘s total energy consumption in 2011; these plants were considered for estimations, knowing at least one processes flat glass (Energy Audit).
From values of total production for Portugal (APA, 2013; FEVE, 2012) and reference data on glass furnaces (type, losses through exhaust gases), the calculations made by GW (2013) were used to make a rough estimations for the sector.
Cement – Specific approach
No energy audit was available for the sector, and estimations were made only for the 6 cement plants known to exist in Portugal. Data was collected from correspondent 2012 Environmental Reports (ER) and the rP factor was applied to the kilns‘ daily capacity (Campana, 2012).
The value of rP obtained by Campana (2012) is the average of rA factor of systems recovering from one waste heat source – preheater exhaust (PRS) or clinker cooler air (CC) – and others from both sources, and therefore it covers this variance. However, inferior and superior limits of 0.4 and 1.09 are advised by experts to estimate the worst and best case and results are presented with both.
Basic metals – Specific approach
The rP factor was applied to the EAF and re-heating furnaces (RHF) of known mills (Campana, 2012). For plant A, data was collected from published Environmental Permits. To plant B, data was available on the Energy Audit and allowed to compare results from methodologies I and II.
Wood & Cork – Specific approach
It was analysed the opportunity to exploit the exhaust gases of existing steam and thermal oil boilers, but also the endogenous biomass as a source for ORC-CHP. The last would be optimized to work in cogeneration mode to still satisfy the heat consuming processes (e.g. drying of cork granulate, gluing, moulding). 4 The value is not tabulated and was inferred from ―Figure 4.11‖, page 4-19, APA (2013).
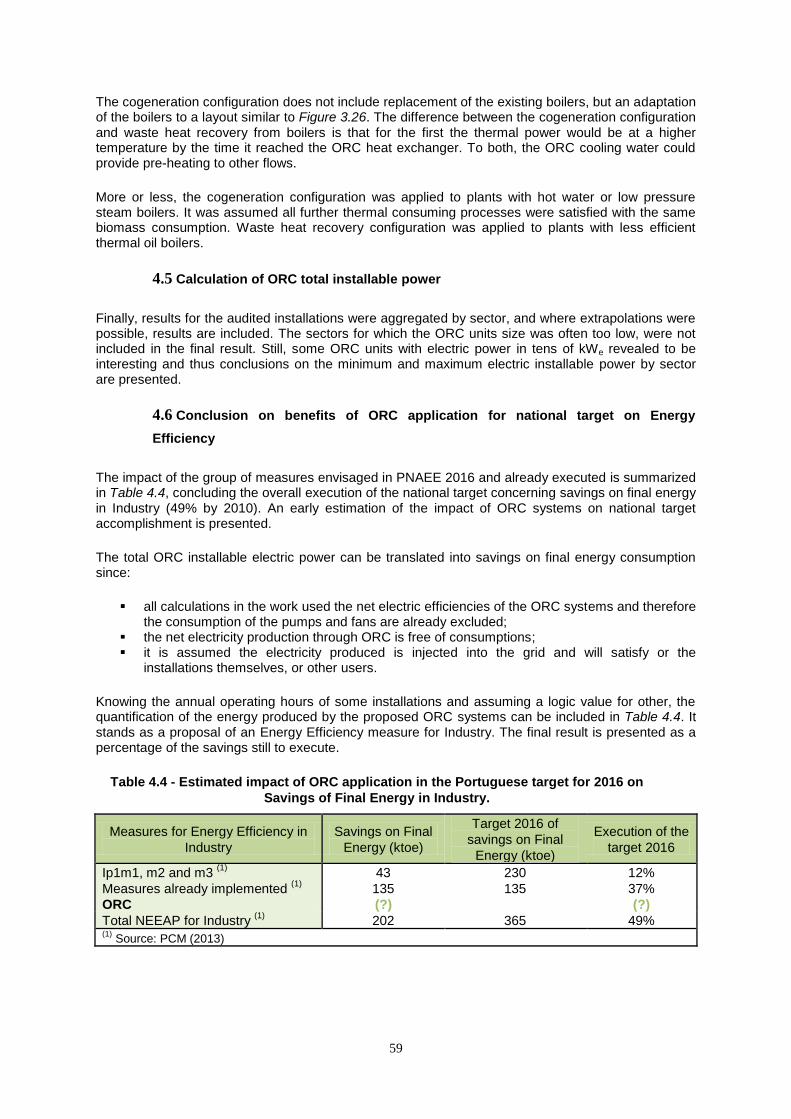
59
The cogeneration configuration does not include replacement of the existing boilers, but an adaptation of the boilers to a layout similar to Figure 3.26. The difference between the cogeneration configuration and waste heat recovery from boilers is that for the first the thermal power would be at a higher temperature by the time it reached the ORC heat exchanger. To both, the ORC cooling water could provide pre-heating to other flows.
More or less, the cogeneration configuration was applied to plants with hot water or low pressure steam boilers. It was assumed all further thermal consuming processes were satisfied with the same biomass consumption. Waste heat recovery configuration was applied to plants with less efficient thermal oil boilers.
4.5 Calculation of ORC total installable power
Finally, results for the audited installations were aggregated by sector, and where extrapolations were possible, results are included. The sectors for which the ORC units size was often too low, were not included in the final result. Still, some ORC units with electric power in tens of kWe revealed to be interesting and thus conclusions on the minimum and maximum electric installable power by sector are presented.
4.6 Conclusion on benefits of ORC application for national target on Energy
Efficiency
The impact of the group of measures envisaged in PNAEE 2016 and already executed is summarized in Table 4.4, concluding the overall execution of the national target concerning savings on final energy in Industry (49% by 2010). An early estimation of the impact of ORC systems on national target accomplishment is presented.
The total ORC installable electric power can be translated into savings on final energy consumption since:
all calculations in the work used the net electric efficiencies of the ORC systems and therefore the consumption of the pumps and fans are already excluded;
the net electricity production through ORC is free of consumptions; it is assumed the electricity produced is injected into the grid and will satisfy or the
installations themselves, or other users.
Knowing the annual operating hours of some installations and assuming a logic value for other, the quantification of the energy produced by the proposed ORC systems can be included in Table 4.4. It stands as a proposal of an Energy Efficiency measure for Industry. The final result is presented as a percentage of the savings still to execute.
Table 4.4 - Estimated impact of ORC application in the Portuguese target for 2016 on
Savings of Final Energy in Industry.
Measures for Energy Efficiency in
Industry
Savings on Final
Energy (ktoe)
Target 2016 of
savings on Final
Energy (ktoe)
Execution of the
target 2016
Ip1m1, m2 and m3 (1)
43 230 12%
Measures already implemented (1)
135 135 37%
ORC (?)
(?)
Total NEEAP for Industry (1)
202 365 49% (1)
Source: PCM (2013)
60
4.7 Conclusion on benefits of ORC application on CO2 emissions
For the purpose of accounting for carbon intensity by emission of GHG, it is considered that the emission factor associated with the consumption of electricity is equal to 0.47 kg CO2e/kWh in accordance with the provisions of Ordinance No. 63/2008 of 21 January, 1
st series (MEID, 2008).
4.8 Economic Evaluation
The economic evaluation was performed by estimating the investment by installation and the revenues through savings on electricity acquisition. The profitability of the investment was measured through the payback times (Eq. 13).
The average Specific Cost of investment (Eq. 14) was used as a benchmark indicator for the ORC as proposed energy efficiency (EE) measure for Industry. Two reference values were used, namely the ones calculated by Brazão (2012): one represents the average specific cost of EE measures verified to be adopted by EII (900 €/(toe/year)) and the other represents the average specific cost of EE measures verified to not be adopted by EII (3 600 €/(toe/year)).
(Eq. 13)
(Eq. 14)
years Payback time
€ Total investment in the ORC implementation
€/year Periodic cash flow equal to total savings on electricity purchase per year
€/(toe/year) Specific Cost of the investment
toe/year Energy savings per year
4.8.1 Estimation of total investment
The investment costs as a function of the ORC system size (installed power) were collected from literature and direct contact with vendors (Table 4.5). For ―plug and play‖ units, such as the Tri-o-Gen 165 kWe unit, the cost presented can be seen as estimated total costs (Suldouro, 2014). For the biomass-CHP applications, more accurate data was given by a vendor (Turboden, 2013); for the Cement and Steel industries, a factor of 2.5 and 1.8 times the unit price was applied (Vescovo, 2009).
Table 4.5 - Costs of ORC systems as an approximated function of installed power.
ORC size (kWe) Capital costs (€/kWe) Source
<20 1650 Infinity; Arvay et al. (2011)
[20 – 65[ 1850 Electratherm
[65 – 165] 3500 Tri-o-gen
]165 – 200[ 3000 Turboden
[200 – 300[ 2100 PureCycle®; Arvay et al. (2011)
[300 – 700[ 2000
[700 – 1 000[ 1600 Opcon Powerbox
[1 000 – 1 500[ 1300
[1 500 – 10 000[ 1000
10 000 500 Turboden
Biomass Capital costs (€/kWe) Source
200 3500 Turboden
<=500 3000
>500 2000

61
4.8.2 Estimation of payback times
The revenues considered only the savings in electricity consumption, equal to retail price to industrial consumers of 0.1015 €/kWh (Eurostat, 2013).
The final value of the feed-in-tariffs for cogeneration and for the production of electricity under PRE is tendentiously higher than average price of acquisition by the organized markets (MEID, 2007). However, as there is not a legal framework for electricity production from waste heat, it was considered that the revenues for industrials investing in ORC systems are, at least, equal to the price of electricity acquisition in the market. Moreover, it was observed in analysed plants that the plants‘ electricity demand is always higher than the power generated through simulated ORC systems, and therefore there would be always a justifiable electricity demand without excess.

62
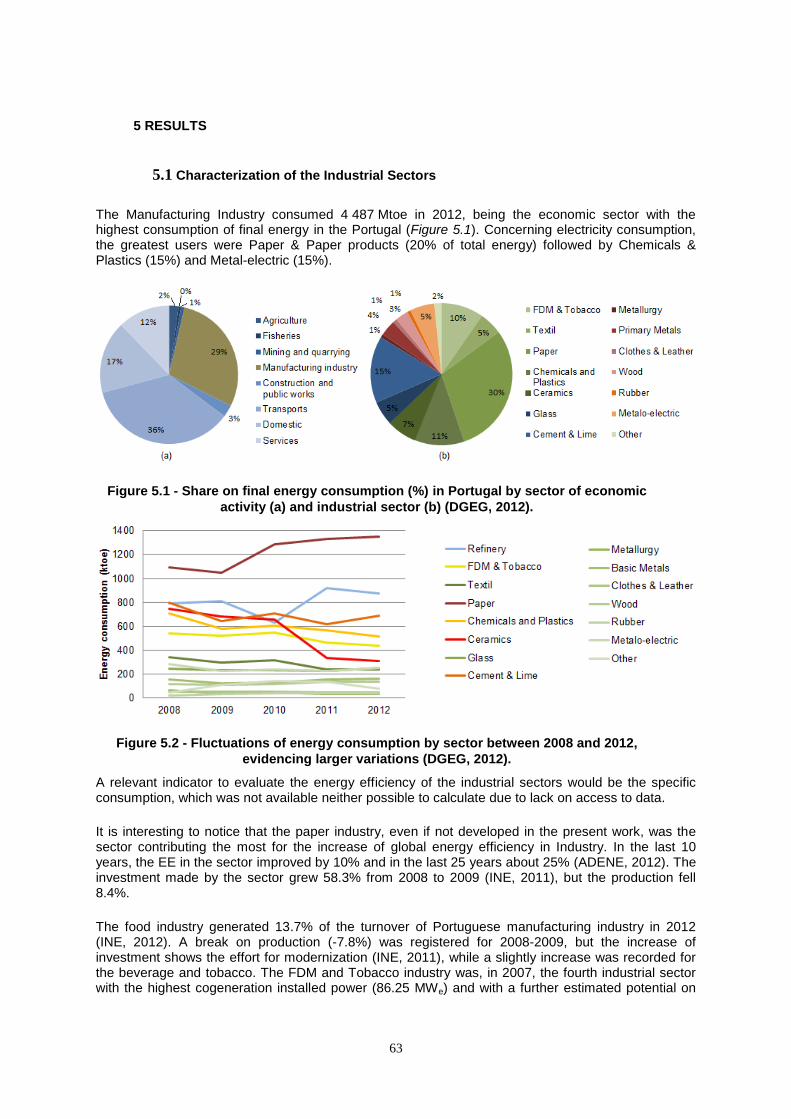
63
5 RESULTS
5.1 Characterization of the Industrial Sectors
The Manufacturing Industry consumed 4 487 Mtoe in 2012, being the economic sector with the highest consumption of final energy in the Portugal (Figure 5.1). Concerning electricity consumption, the greatest users were Paper & Paper products (20% of total energy) followed by Chemicals & Plastics (15%) and Metal-electric (15%).
Figure 5.1 - Share on final energy consumption (%) in Portugal by sector of economic
activity (a) and industrial sector (b) (DGEG, 2012).
Figure 5.2 - Fluctuations of energy consumption by sector between 2008 and 2012,
evidencing larger variations (DGEG, 2012).
A relevant indicator to evaluate the energy efficiency of the industrial sectors would be the specific consumption, which was not available neither possible to calculate due to lack on access to data.
It is interesting to notice that the paper industry, even if not developed in the present work, was the sector contributing the most for the increase of global energy efficiency in Industry. In the last 10 years, the EE in the sector improved by 10% and in the last 25 years about 25% (ADENE, 2012). The investment made by the sector grew 58.3% from 2008 to 2009 (INE, 2011), but the production fell 8.4%.
The food industry generated 13.7% of the turnover of Portuguese manufacturing industry in 2012 (INE, 2012). A break on production (-7.8%) was registered for 2008-2009, but the increase of investment shows the effort for modernization (INE, 2011), while a slightly increase was recorded for the beverage and tobacco. The FDM and Tobacco industry was, in 2007, the fourth industrial sector with the highest cogeneration installed power (86.25 MWe) and with a further estimated potential on
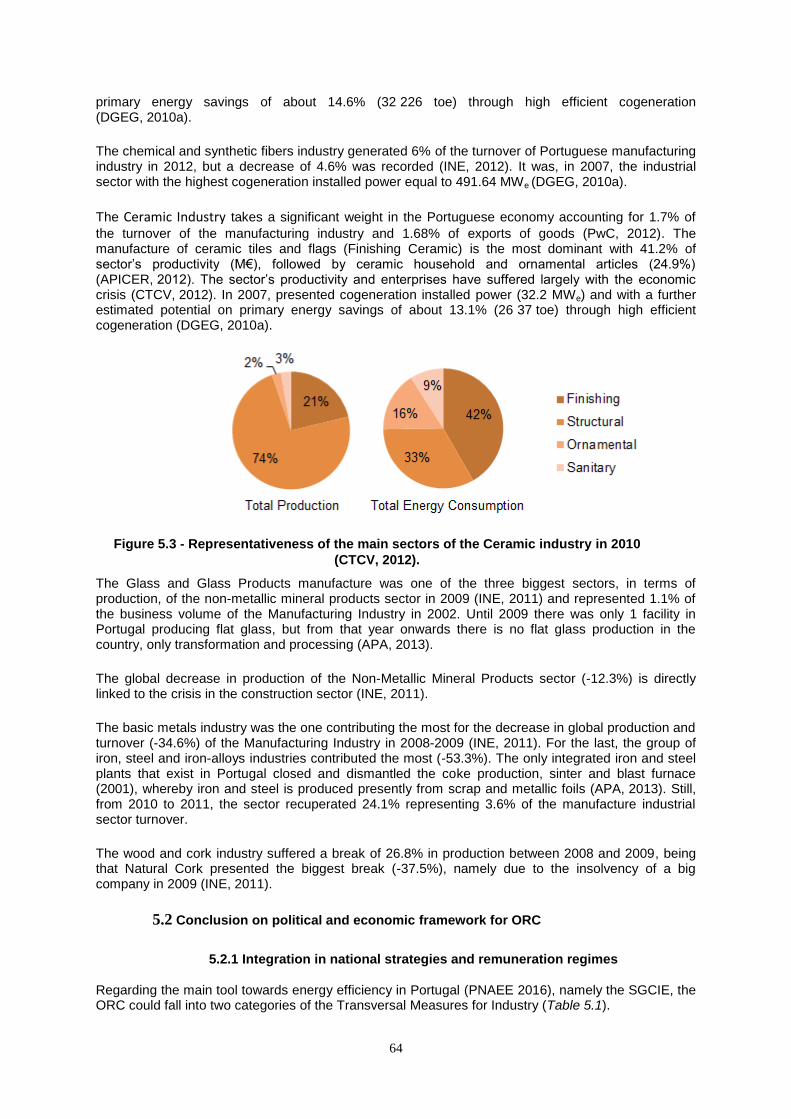
64
primary energy savings of about 14.6% (32 226 toe) through high efficient cogeneration (DGEG, 2010a).
The chemical and synthetic fibers industry generated 6% of the turnover of Portuguese manufacturing industry in 2012, but a decrease of 4.6% was recorded (INE, 2012). It was, in 2007, the industrial sector with the highest cogeneration installed power equal to 491.64 MWe (DGEG, 2010a).
The Ceramic Industry takes a significant weight in the Portuguese economy accounting for 1.7% of
the turnover of the manufacturing industry and 1.68% of exports of goods (PwC, 2012). The manufacture of ceramic tiles and flags (Finishing Ceramic) is the most dominant with 41.2% of sector‘s productivity (M€), followed by ceramic household and ornamental articles (24.9%) (APICER, 2012). The sector‘s productivity and enterprises have suffered largely with the economic crisis (CTCV, 2012). In 2007, presented cogeneration installed power (32.2 MWe) and with a further estimated potential on primary energy savings of about 13.1% (26 37 toe) through high efficient cogeneration (DGEG, 2010a).
Figure 5.3 - Representativeness of the main sectors of the Ceramic industry in 2010
(CTCV, 2012).
The Glass and Glass Products manufacture was one of the three biggest sectors, in terms of production, of the non-metallic mineral products sector in 2009 (INE, 2011) and represented 1.1% of the business volume of the Manufacturing Industry in 2002. Until 2009 there was only 1 facility in Portugal producing flat glass, but from that year onwards there is no flat glass production in the country, only transformation and processing (APA, 2013).
The global decrease in production of the Non-Metallic Mineral Products sector (-12.3%) is directly linked to the crisis in the construction sector (INE, 2011).
The basic metals industry was the one contributing the most for the decrease in global production and turnover (-34.6%) of the Manufacturing Industry in 2008-2009 (INE, 2011). For the last, the group of iron, steel and iron-alloys industries contributed the most (-53.3%). The only integrated iron and steel plants that exist in Portugal closed and dismantled the coke production, sinter and blast furnace (2001), whereby iron and steel is produced presently from scrap and metallic foils (APA, 2013). Still, from 2010 to 2011, the sector recuperated 24.1% representing 3.6% of the manufacture industrial sector turnover.
The wood and cork industry suffered a break of 26.8% in production between 2008 and 2009, being that Natural Cork presented the biggest break (-37.5%), namely due to the insolvency of a big company in 2009 (INE, 2011).
5.2 Conclusion on political and economic framework for ORC
5.2.1 Integration in national strategies and remuneration regimes
Regarding the main tool towards energy efficiency in Portugal (PNAEE 2016), namely the SGCIE, the ORC could fall into two categories of the Transversal Measures for Industry (Table 5.1).
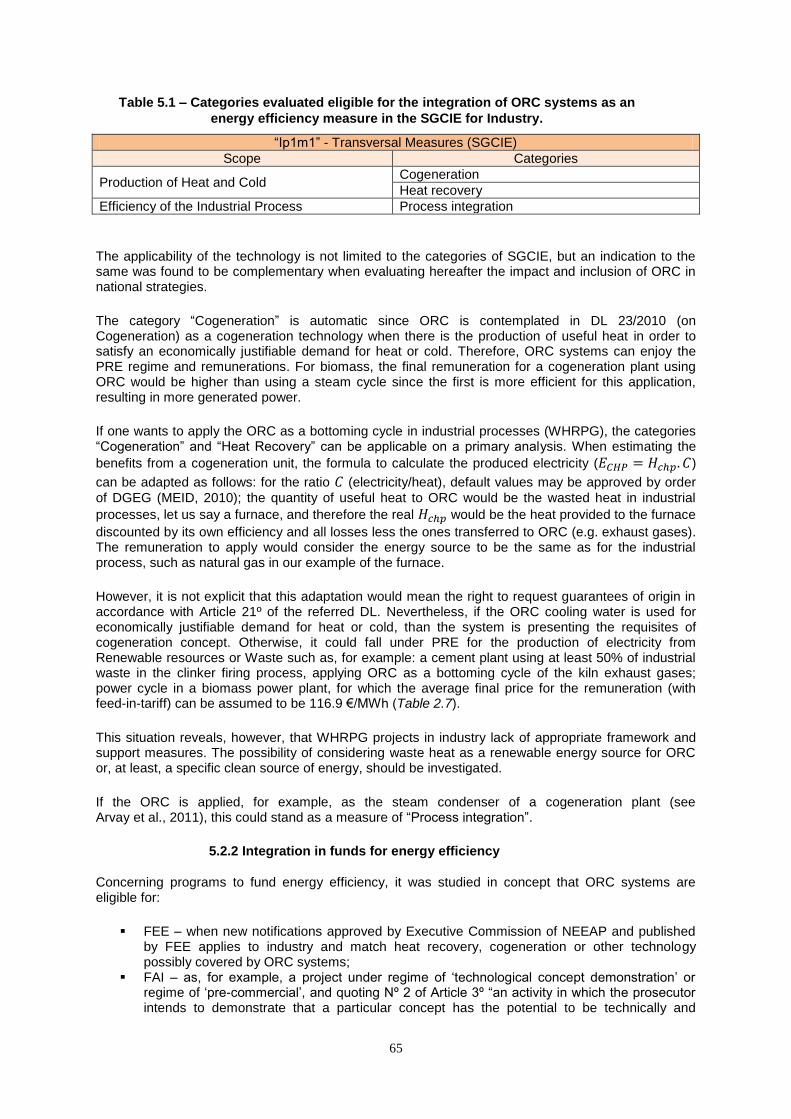
65
Table 5.1 – Categories evaluated eligible for the integration of ORC systems as an
energy efficiency measure in the SGCIE for Industry.
―Ip1m1‖ - Transversal Measures (SGCIE)
Scope Categories
Production of Heat and Cold Cogeneration
Heat recovery
Efficiency of the Industrial Process Process integration
The applicability of the technology is not limited to the categories of SGCIE, but an indication to the same was found to be complementary when evaluating hereafter the impact and inclusion of ORC in national strategies.
The category ―Cogeneration‖ is automatic since ORC is contemplated in DL 23/2010 (on Cogeneration) as a cogeneration technology when there is the production of useful heat in order to satisfy an economically justifiable demand for heat or cold. Therefore, ORC systems can enjoy the PRE regime and remunerations. For biomass, the final remuneration for a cogeneration plant using ORC would be higher than using a steam cycle since the first is more efficient for this application, resulting in more generated power.
If one wants to apply the ORC as a bottoming cycle in industrial processes (WHRPG), the categories ―Cogeneration‖ and ―Heat Recovery‖ can be applicable on a primary analysis. When estimating the
benefits from a cogeneration unit, the formula to calculate the produced electricity ( )
can be adapted as follows: for the ratio (electricity/heat), default values may be approved by order
of DGEG (MEID, 2010); the quantity of useful heat to ORC would be the wasted heat in industrial
processes, let us say a furnace, and therefore the real would be the heat provided to the furnace
discounted by its own efficiency and all losses less the ones transferred to ORC (e.g. exhaust gases). The remuneration to apply would consider the energy source to be the same as for the industrial process, such as natural gas in our example of the furnace.
However, it is not explicit that this adaptation would mean the right to request guarantees of origin in accordance with Article 21º of the referred DL. Nevertheless, if the ORC cooling water is used for economically justifiable demand for heat or cold, than the system is presenting the requisites of cogeneration concept. Otherwise, it could fall under PRE for the production of electricity from Renewable resources or Waste such as, for example: a cement plant using at least 50% of industrial waste in the clinker firing process, applying ORC as a bottoming cycle of the kiln exhaust gases; power cycle in a biomass power plant, for which the average final price for the remuneration (with feed-in-tariff) can be assumed to be 116.9 €/MWh (Table 2.7).
This situation reveals, however, that WHRPG projects in industry lack of appropriate framework and support measures. The possibility of considering waste heat as a renewable energy source for ORC or, at least, a specific clean source of energy, should be investigated.
If the ORC is applied, for example, as the steam condenser of a cogeneration plant (see Arvay et al., 2011), this could stand as a measure of ―Process integration‖.
5.2.2 Integration in funds for energy efficiency
Concerning programs to fund energy efficiency, it was studied in concept that ORC systems are eligible for:
FEE – when new notifications approved by Executive Commission of NEEAP and published by FEE applies to industry and match heat recovery, cogeneration or other technology possibly covered by ORC systems;
FAI – as, for example, a project under regime of ‗technological concept demonstration‘ or regime of ‗pre-commercial‘, and quoting Nº 2 of Article 3º ―an activity in which the prosecutor intends to demonstrate that a particular concept has the potential to be technically and
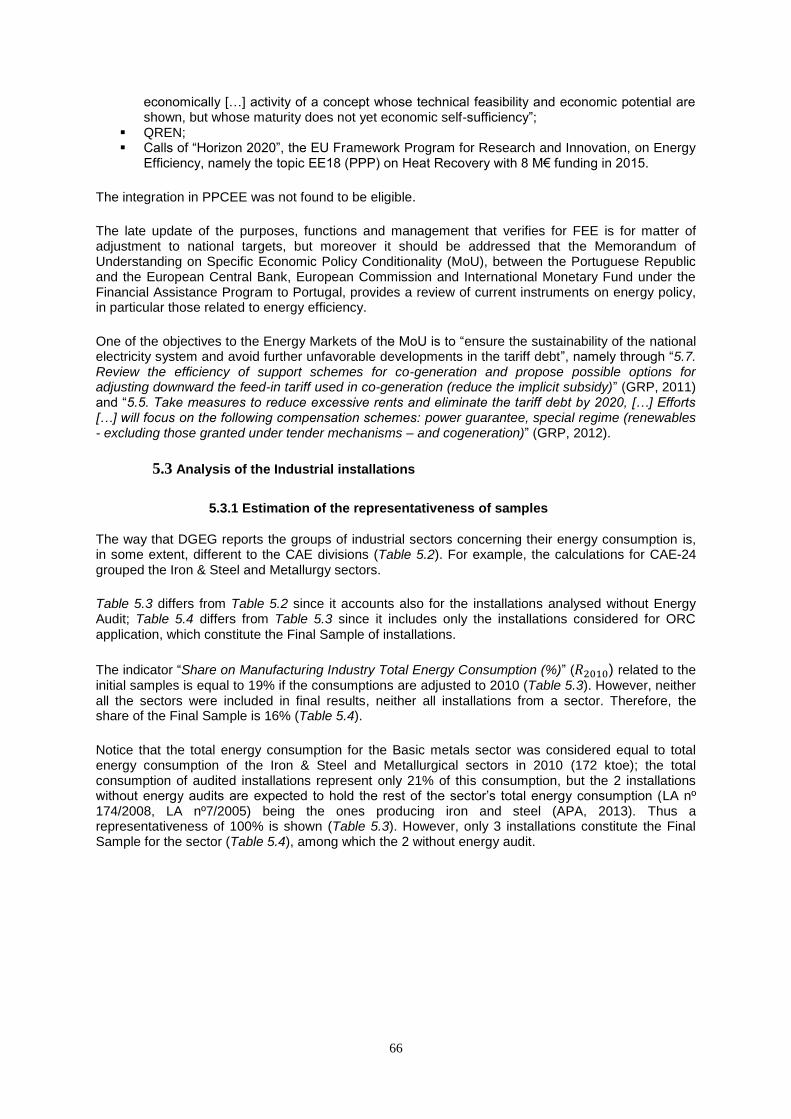
66
economically […] activity of a concept whose technical feasibility and economic potential are shown, but whose maturity does not yet economic self-sufficiency‖;
QREN; Calls of ―Horizon 2020‖, the EU Framework Program for Research and Innovation, on Energy
Efficiency, namely the topic EE18 (PPP) on Heat Recovery with 8 M€ funding in 2015.
The integration in PPCEE was not found to be eligible.
The late update of the purposes, functions and management that verifies for FEE is for matter of adjustment to national targets, but moreover it should be addressed that the Memorandum of Understanding on Specific Economic Policy Conditionality (MoU), between the Portuguese Republic and the European Central Bank, European Commission and International Monetary Fund under the Financial Assistance Program to Portugal, provides a review of current instruments on energy policy, in particular those related to energy efficiency.
One of the objectives to the Energy Markets of the MoU is to ―ensure the sustainability of the national electricity system and avoid further unfavorable developments in the tariff debt‖, namely through ―5.7. Review the efficiency of support schemes for co-generation and propose possible options for adjusting downward the feed-in tariff used in co-generation (reduce the implicit subsidy)‖ (GRP, 2011) and ―5.5. Take measures to reduce excessive rents and eliminate the tariff debt by 2020, […] Efforts […] will focus on the following compensation schemes: power guarantee, special regime (renewables - excluding those granted under tender mechanisms – and cogeneration)‖ (GRP, 2012).
5.3 Analysis of the Industrial installations
5.3.1 Estimation of the representativeness of samples
The way that DGEG reports the groups of industrial sectors concerning their energy consumption is, in some extent, different to the CAE divisions (Table 5.2). For example, the calculations for CAE-24 grouped the Iron & Steel and Metallurgy sectors.
Table 5.3 differs from Table 5.2 since it accounts also for the installations analysed without Energy Audit; Table 5.4 differs from Table 5.3 since it includes only the installations considered for ORC application, which constitute the Final Sample of installations.
The indicator ―Share on Manufacturing Industry Total Energy Consumption (%)‖ ( ) related to the initial samples is equal to 19% if the consumptions are adjusted to 2010 (Table 5.3). However, neither all the sectors were included in final results, neither all installations from a sector. Therefore, the share of the Final Sample is 16% (Table 5.4).
Notice that the total energy consumption for the Basic metals sector was considered equal to total energy consumption of the Iron & Steel and Metallurgical sectors in 2010 (172 ktoe); the total consumption of audited installations represent only 21% of this consumption, but the 2 installations without energy audits are expected to hold the rest of the sector‘s total energy consumption (LA nº 174/2008, LA nº7/2005) being the ones producing iron and steel (APA, 2013). Thus a representativeness of 100% is shown (Table 5.3). However, only 3 installations constitute the Final Sample for the sector (Table 5.4), among which the 2 without energy audit.
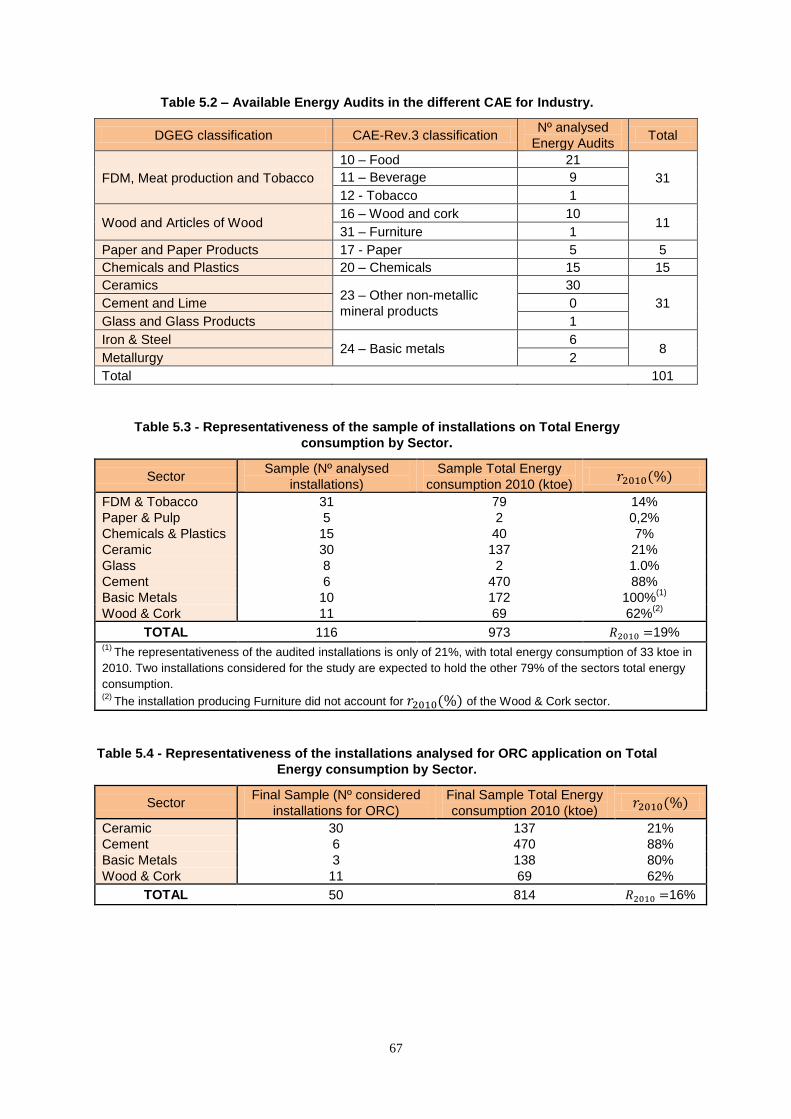
67
Table 5.2 – Available Energy Audits in the different CAE for Industry.
DGEG classification CAE-Rev.3 classification Nº analysed
Energy Audits Total
FDM, Meat production and Tobacco
10 – Food 21
31 11 – Beverage 9
12 - Tobacco 1
Wood and Articles of Wood 16 – Wood and cork 10
11 31 – Furniture 1
Paper and Paper Products 17 - Paper 5 5
Chemicals and Plastics 20 – Chemicals 15 15
Ceramics 23 – Other non-metallic
mineral products
30
31 Cement and Lime 0
Glass and Glass Products 1
Iron & Steel 24 – Basic metals
6 8
Metallurgy 2
Total 101
Table 5.3 - Representativeness of the sample of installations on Total Energy
consumption by Sector.
Sector Sample (Nº analysed
installations)
Sample Total Energy
consumption 2010 (ktoe)
FDM & Tobacco 31 79 14%
Paper & Pulp 5 2 0,2%
Chemicals & Plastics 15 40 7%
Ceramic 30 137 21%
Glass 8 2 1.0%
Cement 6 470 88%
Basic Metals
10 172 100%(1)
Wood & Cork 11 69 62%(2)
TOTAL 116 973 19% (1)
The representativeness of the audited installations is only of 21%, with total energy consumption of 33 ktoe in
2010. Two installations considered for the study are expected to hold the other 79% of the sectors total energy
consumption. (2)
The installation producing Furniture did not account for of the Wood & Cork sector.
Table 5.4 - Representativeness of the installations analysed for ORC application on Total
Energy consumption by Sector.
Sector Final Sample (Nº considered
installations for ORC)
Final Sample Total Energy
consumption 2010 (ktoe)
Ceramic 30 137 21%
Cement 6 470 88%
Basic Metals 3 138 80%
Wood & Cork 11 69 62%
TOTAL 50 814 16%
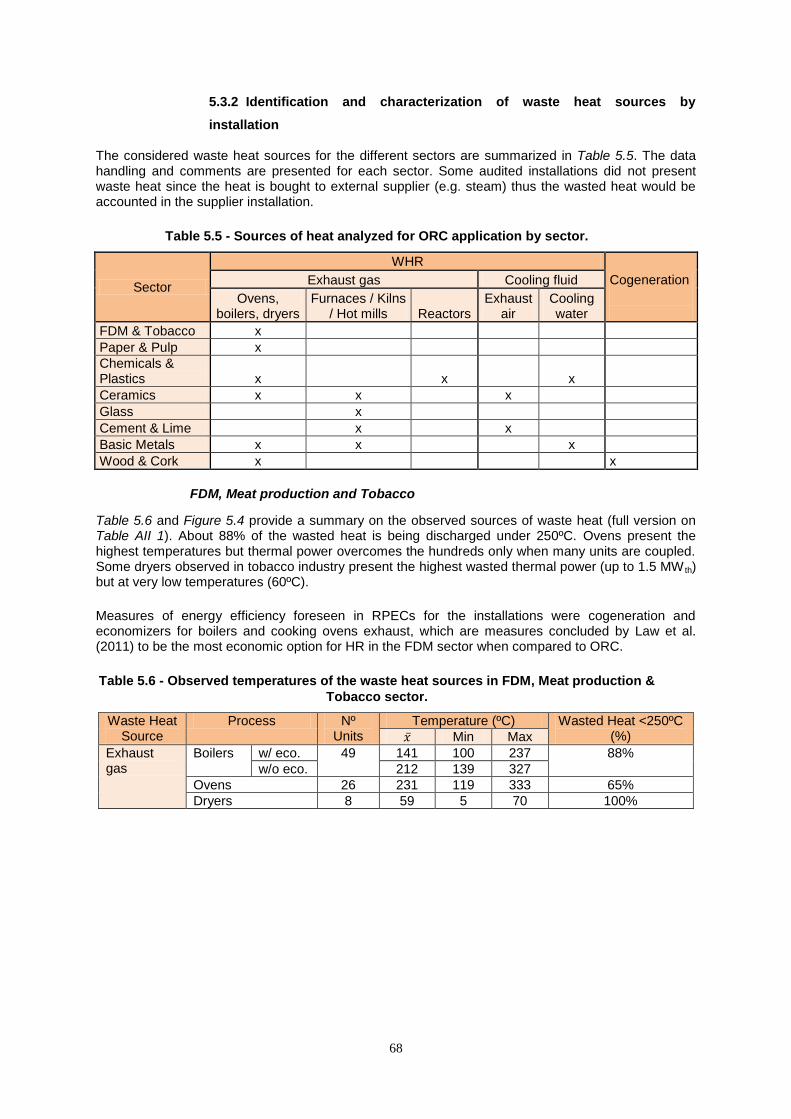
68
5.3.2 Identification and characterization of waste heat sources by
installation
The considered waste heat sources for the different sectors are summarized in Table 5.5. The data handling and comments are presented for each sector. Some audited installations did not present waste heat since the heat is bought to external supplier (e.g. steam) thus the wasted heat would be accounted in the supplier installation.
Table 5.5 - Sources of heat analyzed for ORC application by sector.
Sector
WHR
Cogeneration
Exhaust gas Cooling fluid
Ovens, boilers, dryers
Furnaces / Kilns / Hot mills Reactors
Exhaust air
Cooling water
FDM & Tobacco x
Paper & Pulp x
Chemicals & Plastics x
x
x
Ceramics x x
x
Glass
x
Cement & Lime
x
x
Basic Metals x x
x
Wood & Cork x
x
FDM, Meat production and Tobacco
Table 5.6 and Figure 5.4 provide a summary on the observed sources of waste heat (full version on Table AII 1). About 88% of the wasted heat is being discharged under 250ºC. Ovens present the highest temperatures but thermal power overcomes the hundreds only when many units are coupled. Some dryers observed in tobacco industry present the highest wasted thermal power (up to 1.5 MW th) but at very low temperatures (60ºC).
Measures of energy efficiency foreseen in RPECs for the installations were cogeneration and economizers for boilers and cooking ovens exhaust, which are measures concluded by Law et al. (2011) to be the most economic option for HR in the FDM sector when compared to ORC.
Table 5.6 - Observed temperatures of the waste heat sources in FDM, Meat production &
Tobacco sector.
Waste Heat Source
Process Nº Units
Temperature (ºC) Wasted Heat <250ºC (%) Min Max
Exhaust gas
Boilers w/ eco. 49 141 100 237 88%
w/o eco. 212 139 327
Ovens 26 231 119 333 65%
Dryers 8 59 5 70 100%
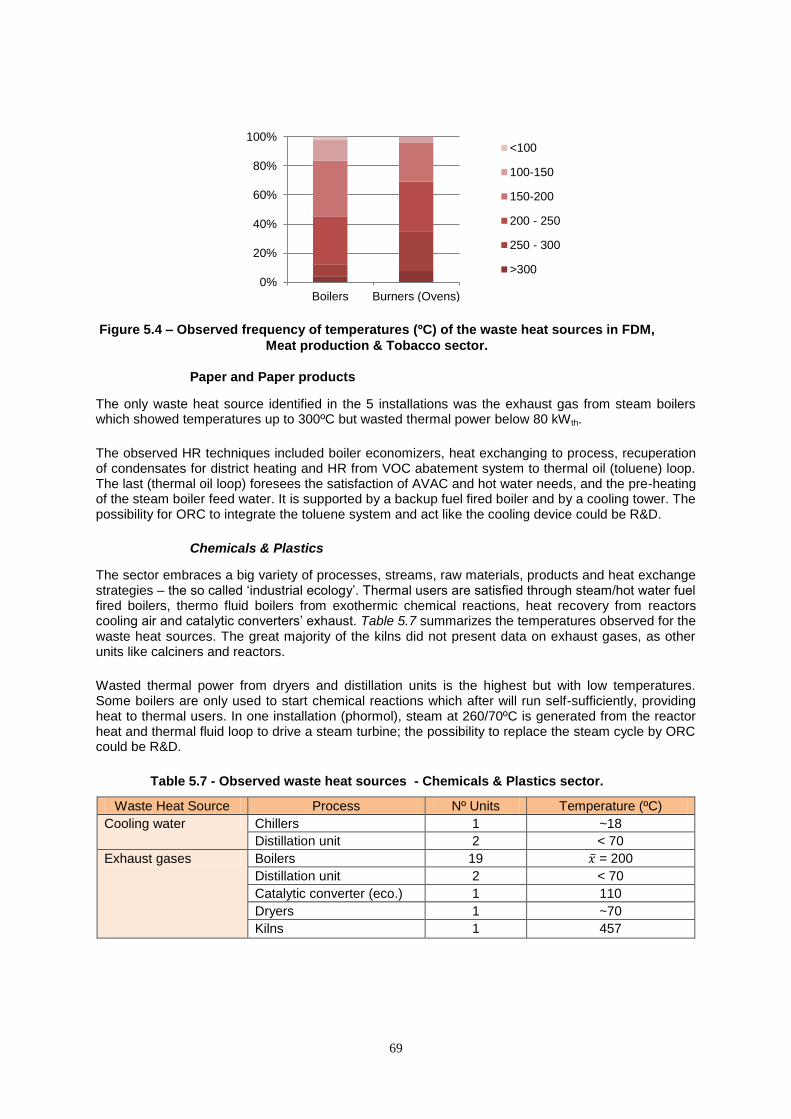
69
Figure 5.4 – Observed frequency of temperatures (ºC) of the waste heat sources in FDM,
Meat production & Tobacco sector.
Paper and Paper products
The only waste heat source identified in the 5 installations was the exhaust gas from steam boilers which showed temperatures up to 300ºC but wasted thermal power below 80 kWth.
The observed HR techniques included boiler economizers, heat exchanging to process, recuperation of condensates for district heating and HR from VOC abatement system to thermal oil (toluene) loop. The last (thermal oil loop) foresees the satisfaction of AVAC and hot water needs, and the pre-heating of the steam boiler feed water. It is supported by a backup fuel fired boiler and by a cooling tower. The possibility for ORC to integrate the toluene system and act like the cooling device could be R&D.
Chemicals & Plastics
The sector embraces a big variety of processes, streams, raw materials, products and heat exchange strategies – the so called ‗industrial ecology‘. Thermal users are satisfied through steam/hot water fuel fired boilers, thermo fluid boilers from exothermic chemical reactions, heat recovery from reactors cooling air and catalytic converters‘ exhaust. Table 5.7 summarizes the temperatures observed for the waste heat sources. The great majority of the kilns did not present data on exhaust gases, as other units like calciners and reactors.
Wasted thermal power from dryers and distillation units is the highest but with low temperatures. Some boilers are only used to start chemical reactions which after will run self-sufficiently, providing heat to thermal users. In one installation (phormol), steam at 260/70ºC is generated from the reactor heat and thermal fluid loop to drive a steam turbine; the possibility to replace the steam cycle by ORC could be R&D.
Table 5.7 - Observed waste heat sources - Chemicals & Plastics sector.
Waste Heat Source Process Nº Units Temperature (ºC)
Cooling water Chillers 1 ~18
Distillation unit 2 < 70
Exhaust gases Boilers 19 = 200
Distillation unit 2 < 70
Catalytic converter (eco.) 1 110
Dryers 1 ~70
Kilns 1 457
0%
20%
40%
60%
80%
100%
Boilers Burners (Ovens)
<100
100-150
150-200
200 - 250
250 - 300
>300
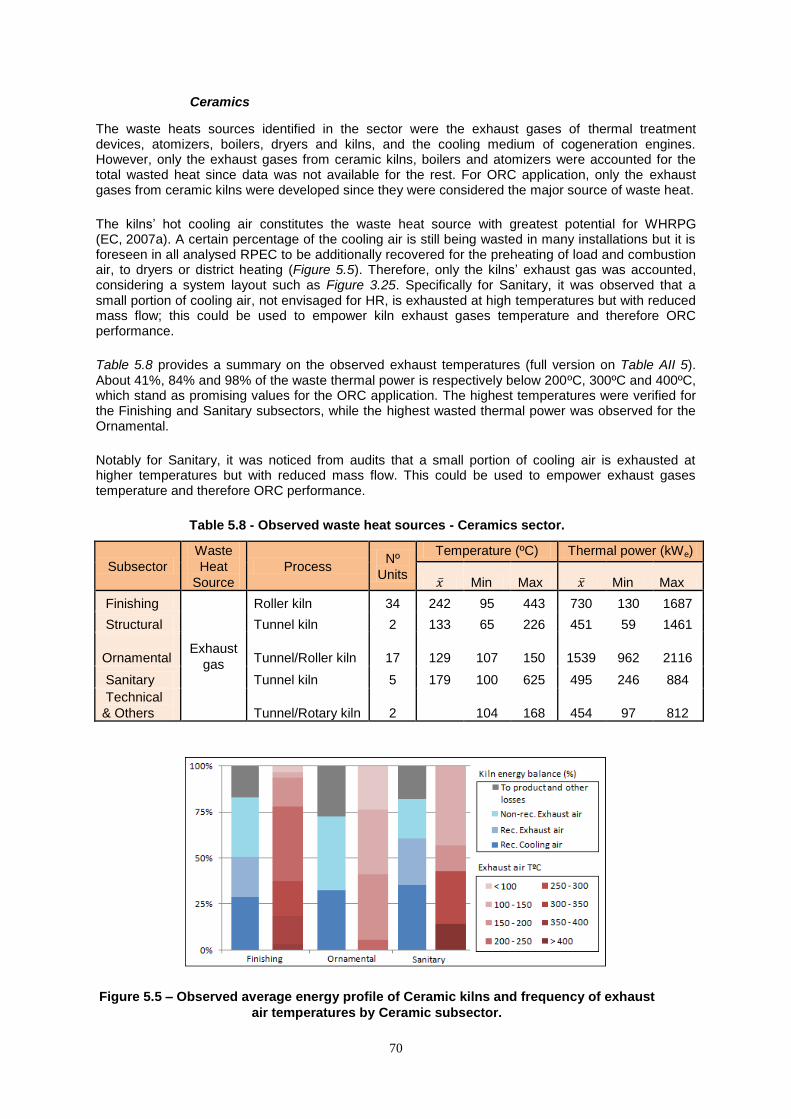
70
Ceramics
The waste heats sources identified in the sector were the exhaust gases of thermal treatment devices, atomizers, boilers, dryers and kilns, and the cooling medium of cogeneration engines. However, only the exhaust gases from ceramic kilns, boilers and atomizers were accounted for the total wasted heat since data was not available for the rest. For ORC application, only the exhaust gases from ceramic kilns were developed since they were considered the major source of waste heat.
The kilns‘ hot cooling air constitutes the waste heat source with greatest potential for WHRPG (EC, 2007a). A certain percentage of the cooling air is still being wasted in many installations but it is foreseen in all analysed RPEC to be additionally recovered for the preheating of load and combustion air, to dryers or district heating (Figure 5.5). Therefore, only the kilns‘ exhaust gas was accounted, considering a system layout such as Figure 3.25. Specifically for Sanitary, it was observed that a small portion of cooling air, not envisaged for HR, is exhausted at high temperatures but with reduced mass flow; this could be used to empower kiln exhaust gases temperature and therefore ORC performance.
Table 5.8 provides a summary on the observed exhaust temperatures (full version on Table AII 5). About 41%, 84% and 98% of the waste thermal power is respectively below 200ºC, 300ºC and 400ºC, which stand as promising values for the ORC application. The highest temperatures were verified for the Finishing and Sanitary subsectors, while the highest wasted thermal power was observed for the Ornamental.
Notably for Sanitary, it was noticed from audits that a small portion of cooling air is exhausted at higher temperatures but with reduced mass flow. This could be used to empower exhaust gases temperature and therefore ORC performance.
Table 5.8 - Observed waste heat sources - Ceramics sector.
Subsector
Waste
Heat
Source
Process Nº
Units
Temperature (ºC) Thermal power (kWe)
Min Max Min Max
Finishing
Exhaust
gas
Roller kiln 34 242 95 443 730 130 1687
Structural Tunnel kiln 2 133 65 226 451 59 1461
Ornamental Tunnel/Roller kiln 17 129 107 150 1539 962 2116
Sanitary Tunnel kiln 5 179 100 625 495 246 884
Technical
& Others Tunnel/Rotary kiln 2
104 168 454 97 812
Figure 5.5 – Observed average energy profile of Ceramic kilns and frequency of exhaust
air temperatures by Ceramic subsector.
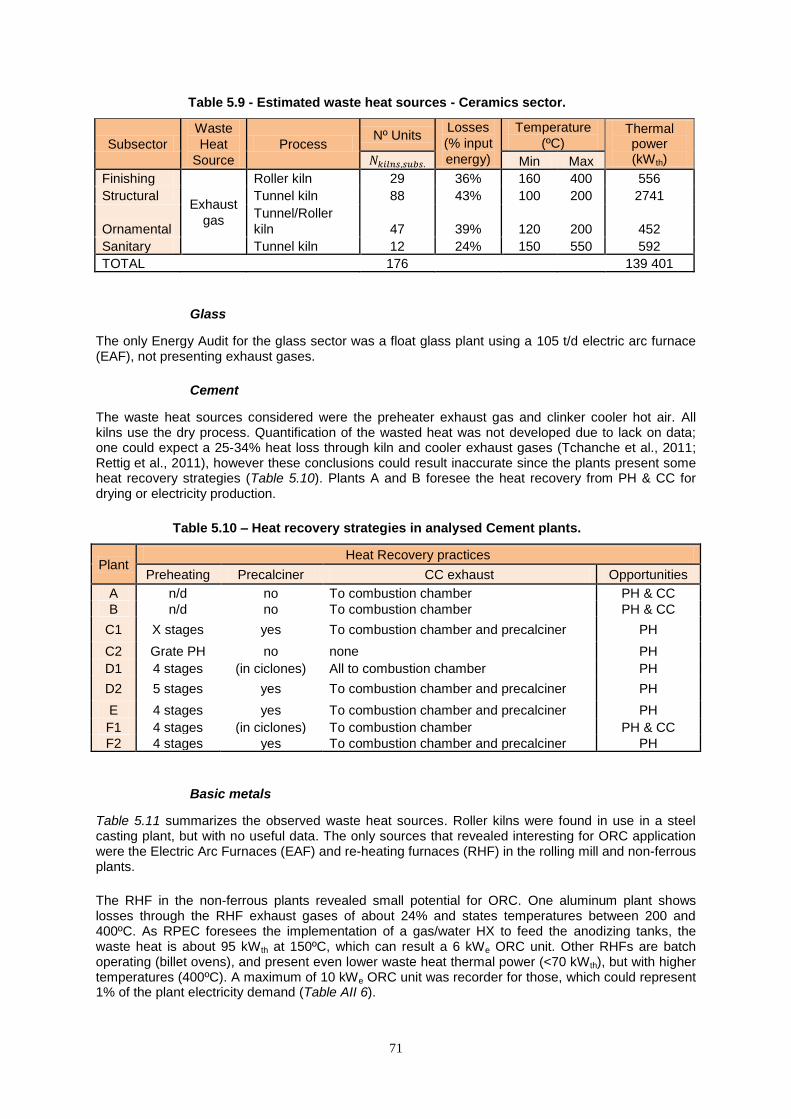
71
Table 5.9 - Estimated waste heat sources - Ceramics sector.
Subsector
Waste
Heat
Source
Process Nº Units
Losses
(% input
energy)
Temperature
(ºC) Thermal power (kWth) Min Max
Finishing
Exhaust
gas
Roller kiln 29 36% 160 400 556
Structural Tunnel kiln 88 43% 100 200 2741
Ornamental
Tunnel/Roller
kiln 47 39% 120 200 452
Sanitary Tunnel kiln 12 24% 150 550 592
TOTAL 176 139 401
Glass
The only Energy Audit for the glass sector was a float glass plant using a 105 t/d electric arc furnace (EAF), not presenting exhaust gases.
Cement
The waste heat sources considered were the preheater exhaust gas and clinker cooler hot air. All kilns use the dry process. Quantification of the wasted heat was not developed due to lack on data; one could expect a 25-34% heat loss through kiln and cooler exhaust gases (Tchanche et al., 2011; Rettig et al., 2011), however these conclusions could result inaccurate since the plants present some heat recovery strategies (Table 5.10). Plants A and B foresee the heat recovery from PH & CC for drying or electricity production.
Table 5.10 – Heat recovery strategies in analysed Cement plants.
Plant Heat Recovery practices
Preheating Precalciner CC exhaust Opportunities
A n/d no To combustion chamber
PH & CC
B n/d no To combustion chamber
PH & CC
C1 X stages yes To combustion chamber and precalciner PH
C2 Grate PH no none PH
D1 4 stages (in ciclones) All to combustion chamber PH
D2 5 stages yes To combustion chamber and precalciner PH
E 4 stages yes To combustion chamber and precalciner PH
F1 4 stages (in ciclones) To combustion chamber PH & CC
F2 4 stages yes To combustion chamber and precalciner PH
Basic metals
Table 5.11 summarizes the observed waste heat sources. Roller kilns were found in use in a steel casting plant, but with no useful data. The only sources that revealed interesting for ORC application were the Electric Arc Furnaces (EAF) and re-heating furnaces (RHF) in the rolling mill and non-ferrous plants.
The RHF in the non-ferrous plants revealed small potential for ORC. One aluminum plant shows losses through the RHF exhaust gases of about 24% and states temperatures between 200 and 400ºC. As RPEC foresees the implementation of a gas/water HX to feed the anodizing tanks, the waste heat is about 95 kWth at 150ºC, which can result a 6 kWe ORC unit. Other RHFs are batch operating (billet ovens), and present even lower waste heat thermal power (<70 kWth), but with higher temperatures (400ºC). A maximum of 10 kWe ORC unit was recorder for those, which could represent 1% of the plant electricity demand (Table AII 6).
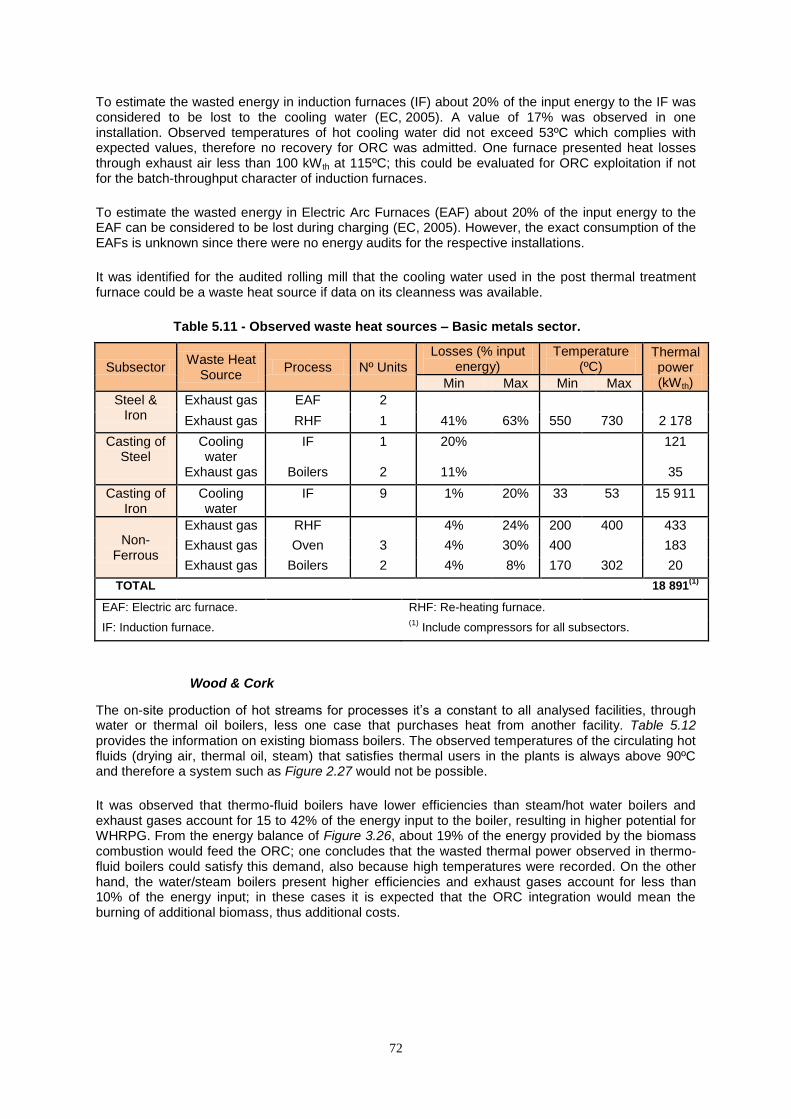
72
To estimate the wasted energy in induction furnaces (IF) about 20% of the input energy to the IF was considered to be lost to the cooling water (EC, 2005). A value of 17% was observed in one installation. Observed temperatures of hot cooling water did not exceed 53ºC which complies with expected values, therefore no recovery for ORC was admitted. One furnace presented heat losses through exhaust air less than 100 kWth at 115ºC; this could be evaluated for ORC exploitation if not for the batch-throughput character of induction furnaces.
To estimate the wasted energy in Electric Arc Furnaces (EAF) about 20% of the input energy to the EAF can be considered to be lost during charging (EC, 2005). However, the exact consumption of the EAFs is unknown since there were no energy audits for the respective installations.
It was identified for the audited rolling mill that the cooling water used in the post thermal treatment furnace could be a waste heat source if data on its cleanness was available.
Table 5.11 - Observed waste heat sources – Basic metals sector.
Subsector Waste Heat
Source Process Nº Units
Losses (% input energy)
Temperature (ºC)
Thermal power (kWth) Min Max Min Max
Steel & Iron
Exhaust gas EAF 2
Exhaust gas RHF 1 41% 63% 550 730 2 178
Casting of Steel
Cooling water
IF 1 20% 121
Exhaust gas Boilers 2 11% 35
Casting of Iron
Cooling water
IF 9 1% 20% 33 53 15 911
Non-Ferrous
Exhaust gas RHF 4% 24% 200 400 433
Exhaust gas Oven 3 4% 30% 400 183
Exhaust gas Boilers 2 4% 8% 170 302 20
TOTAL 18 891(1)
EAF: Electric arc furnace. RHF: Re-heating furnace.
IF: Induction furnace. (1)
Include compressors for all subsectors.
Wood & Cork
The on-site production of hot streams for processes it‘s a constant to all analysed facilities, through water or thermal oil boilers, less one case that purchases heat from another facility. Table 5.12 provides the information on existing biomass boilers. The observed temperatures of the circulating hot fluids (drying air, thermal oil, steam) that satisfies thermal users in the plants is always above 90ºC and therefore a system such as Figure 2.27 would not be possible.
It was observed that thermo-fluid boilers have lower efficiencies than steam/hot water boilers and exhaust gases account for 15 to 42% of the energy input to the boiler, resulting in higher potential for WHRPG. From the energy balance of Figure 3.26, about 19% of the energy provided by the biomass combustion would feed the ORC; one concludes that the wasted thermal power observed in thermo-fluid boilers could satisfy this demand, also because high temperatures were recorded. On the other hand, the water/steam boilers present higher efficiencies and exhaust gases account for less than 10% of the energy input; in these cases it is expected that the ORC integration would mean the burning of additional biomass, thus additional costs.
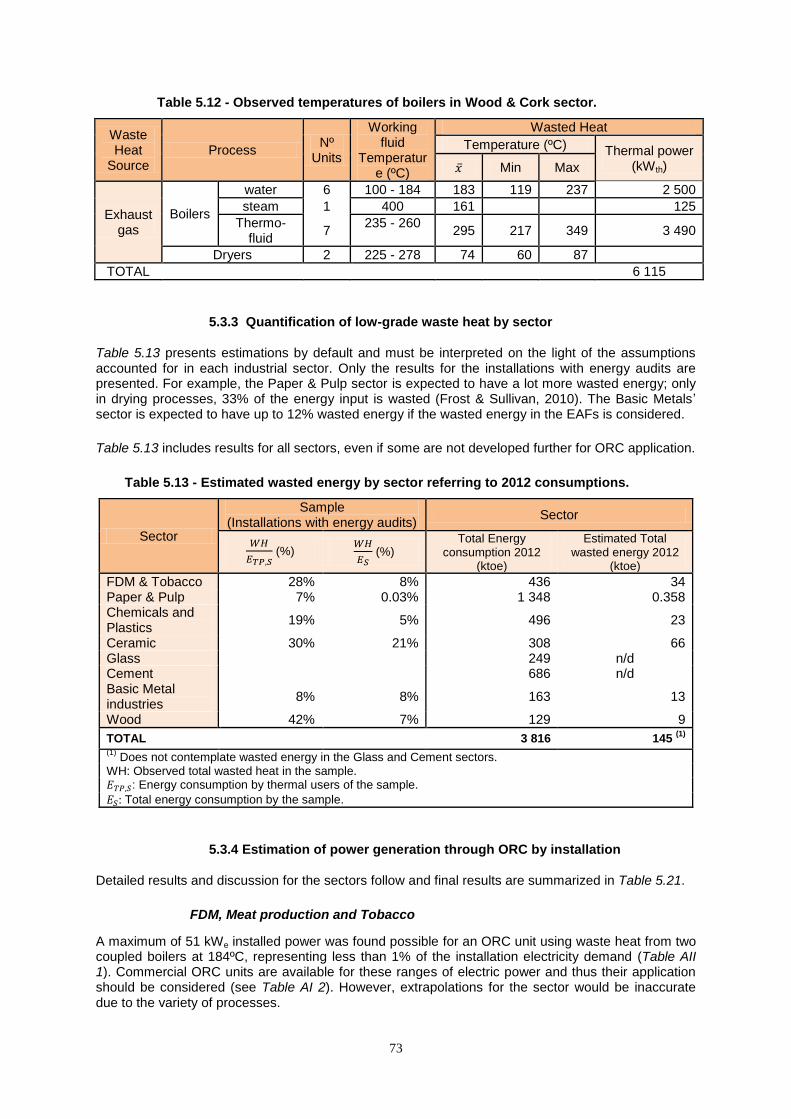
73
Table 5.12 - Observed temperatures of boilers in Wood & Cork sector.
Waste Heat
Source Process
Nº Units
Working fluid
Temperature (ºC)
Wasted Heat
Temperature (ºC) Thermal power (kWth) Min Max
Exhaust gas
Boilers
water 6 100 - 184 183 119 237 2 500
steam 1 400 161 125
Thermo-fluid
7 235 - 260
295 217 349 3 490
Dryers 2 225 - 278 74 60 87
TOTAL 6 115
5.3.3 Quantification of low-grade waste heat by sector
Table 5.13 presents estimations by default and must be interpreted on the light of the assumptions accounted for in each industrial sector. Only the results for the installations with energy audits are presented. For example, the Paper & Pulp sector is expected to have a lot more wasted energy; only in drying processes, 33% of the energy input is wasted (Frost & Sullivan, 2010). The Basic Metals‘ sector is expected to have up to 12% wasted energy if the wasted energy in the EAFs is considered.
Table 5.13 includes results for all sectors, even if some are not developed further for ORC application.
Table 5.13 - Estimated wasted energy by sector referring to 2012 consumptions.
Sector
Sample (Installations with energy audits)
Sector
(%)
(%)
Total Energy consumption 2012
(ktoe)
Estimated Total wasted energy 2012
(ktoe)
FDM & Tobacco 28% 8% 436 34 Paper & Pulp 7% 0.03% 1 348 0.358 Chemicals and Plastics
19% 5% 496 23
Ceramic 30% 21% 308 66 Glass
249 n/d
Cement
686 n/d Basic Metal industries
8% 8% 163 13
Wood 42% 7% 129 9
TOTAL 3 816 145 (1)
(1) Does not contemplate wasted energy in the Glass and Cement sectors.
WH: Observed total wasted heat in the sample. : Energy consumption by thermal users of the sample.
: Total energy consumption by the sample.
5.3.4 Estimation of power generation through ORC by installation
Detailed results and discussion for the sectors follow and final results are summarized in Table 5.21.
FDM, Meat production and Tobacco
A maximum of 51 kWe installed power was found possible for an ORC unit using waste heat from two coupled boilers at 184ºC, representing less than 1% of the installation electricity demand (Table AII 1). Commercial ORC units are available for these ranges of electric power and thus their application should be considered (see Table AI 2). However, extrapolations for the sector would be inaccurate due to the variety of processes.
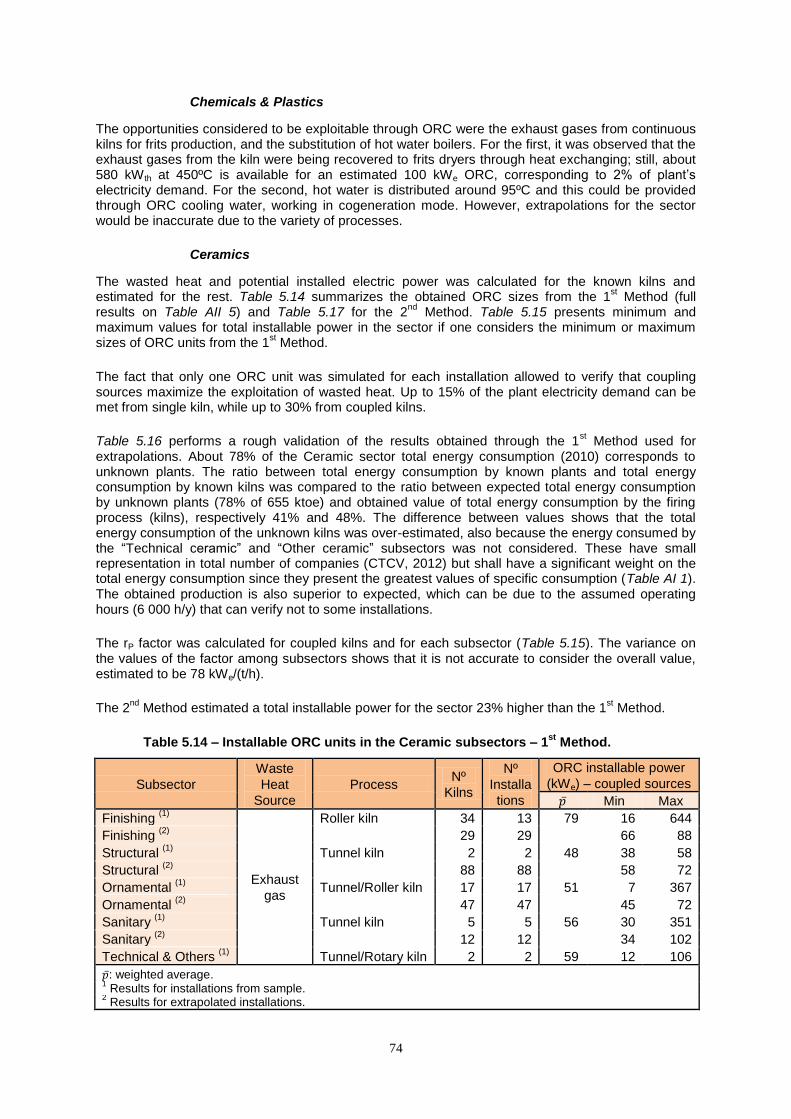
74
Chemicals & Plastics
The opportunities considered to be exploitable through ORC were the exhaust gases from continuous kilns for frits production, and the substitution of hot water boilers. For the first, it was observed that the exhaust gases from the kiln were being recovered to frits dryers through heat exchanging; still, about 580 kWth at 450ºC is available for an estimated 100 kWe ORC, corresponding to 2% of plant‘s electricity demand. For the second, hot water is distributed around 95ºC and this could be provided through ORC cooling water, working in cogeneration mode. However, extrapolations for the sector would be inaccurate due to the variety of processes.
Ceramics
The wasted heat and potential installed electric power was calculated for the known kilns and estimated for the rest. Table 5.14 summarizes the obtained ORC sizes from the 1
st Method (full
results on Table AII 5) and Table 5.17 for the 2nd
Method. Table 5.15 presents minimum and maximum values for total installable power in the sector if one considers the minimum or maximum sizes of ORC units from the 1
st Method.
The fact that only one ORC unit was simulated for each installation allowed to verify that coupling sources maximize the exploitation of wasted heat. Up to 15% of the plant electricity demand can be met from single kiln, while up to 30% from coupled kilns.
Table 5.16 performs a rough validation of the results obtained through the 1st Method used for
extrapolations. About 78% of the Ceramic sector total energy consumption (2010) corresponds to unknown plants. The ratio between total energy consumption by known plants and total energy consumption by known kilns was compared to the ratio between expected total energy consumption by unknown plants (78% of 655 ktoe) and obtained value of total energy consumption by the firing process (kilns), respectively 41% and 48%. The difference between values shows that the total energy consumption of the unknown kilns was over-estimated, also because the energy consumed by the ―Technical ceramic‖ and ―Other ceramic‖ subsectors was not considered. These have small representation in total number of companies (CTCV, 2012) but shall have a significant weight on the total energy consumption since they present the greatest values of specific consumption (Table AI 1). The obtained production is also superior to expected, which can be due to the assumed operating hours (6 000 h/y) that can verify not to some installations.
The rP factor was calculated for coupled kilns and for each subsector (Table 5.15). The variance on the values of the factor among subsectors shows that it is not accurate to consider the overall value, estimated to be 78 kWe/(t/h).
The 2nd
Method estimated a total installable power for the sector 23% higher than the 1st Method.
Table 5.14 – Installable ORC units in the Ceramic subsectors – 1st
Method.
Subsector
Waste
Heat
Source
Process Nº
Kilns
Nº
Installa
tions
ORC installable power
(kWe) – coupled sources
Min Max
Finishing (1)
Exhaust
gas
Roller kiln 34 13 79 16 644
Finishing (2)
29 29 66 88
Structural (1)
Tunnel kiln 2 2 48 38 58
Structural (2)
88 88 58 72
Ornamental (1)
Tunnel/Roller kiln 17 17 51 7 367
Ornamental (2)
47 47 45 72
Sanitary (1)
Tunnel kiln 5 5 56 30 351
Sanitary (2)
12 12 34 102
Technical & Others (1)
Tunnel/Rotary kiln 2 2 59 12 106
: weighted average. 1 Results for installations from sample.
2 Results for extrapolated installations.
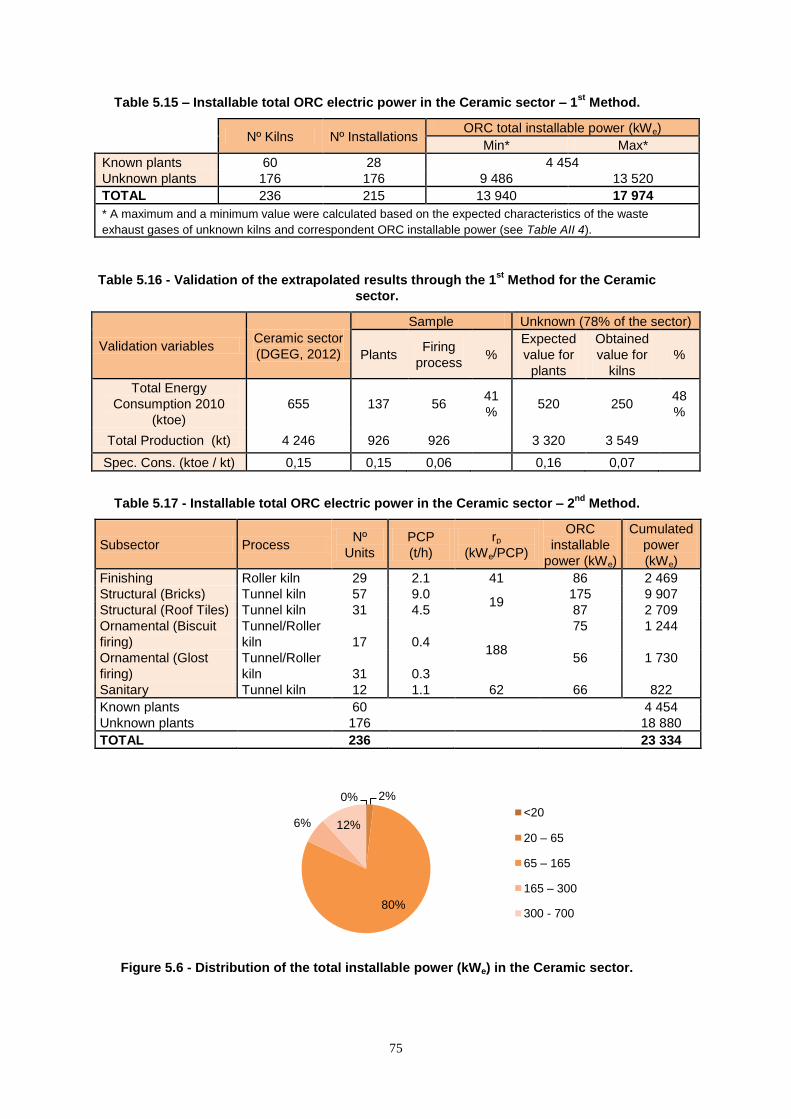
75
Table 5.15 – Installable total ORC electric power in the Ceramic sector – 1st
Method.
Nº Kilns Nº Installations ORC total installable power (kWe)
Min* Max*
Known plants 60 28 4 454
Unknown plants 176 176 9 486 13 520
TOTAL 236 215 13 940 17 974
* A maximum and a minimum value were calculated based on the expected characteristics of the waste
exhaust gases of unknown kilns and correspondent ORC installable power (see Table AII 4).
Table 5.16 - Validation of the extrapolated results through the 1st
Method for the Ceramic
sector.
Validation variables Ceramic sector
(DGEG, 2012)
Sample Unknown (78% of the sector)
Plants Firing
process %
Expected
value for
plants
Obtained
value for
kilns
%
Total Energy
Consumption 2010
(ktoe)
655 137 56 41
% 520 250
48
%
Total Production (kt) 4 246 926 926
3 320 3 549
Spec. Cons. (ktoe / kt) 0,15 0,15 0,06
0,16 0,07
Table 5.17 - Installable total ORC electric power in the Ceramic sector – 2nd
Method.
Subsector Process Nº
Units
PCP
(t/h)
rp
(kWe/PCP)
ORC
installable
power (kWe)
Cumulated
power
(kWe)
Finishing Roller kiln 29 2.1 41 86 2 469
Structural (Bricks) Tunnel kiln 57 9.0 19
175 9 907
Structural (Roof Tiles) Tunnel kiln 31 4.5 87 2 709
Ornamental (Biscuit
firing)
Tunnel/Roller
kiln 17 0.4 188
75 1 244
Ornamental (Glost
firing)
Tunnel/Roller
kiln 31 0.3
56 1 730
Sanitary Tunnel kiln 12 1.1 62 66 822
Known plants 60 4 454
Unknown plants 176 18 880
TOTAL 236 23 334
Figure 5.6 - Distribution of the total installable power (kWe) in the Ceramic sector.
0% 2%
80%
6% 12% <20
20 – 65
65 – 165
165 – 300
300 - 700
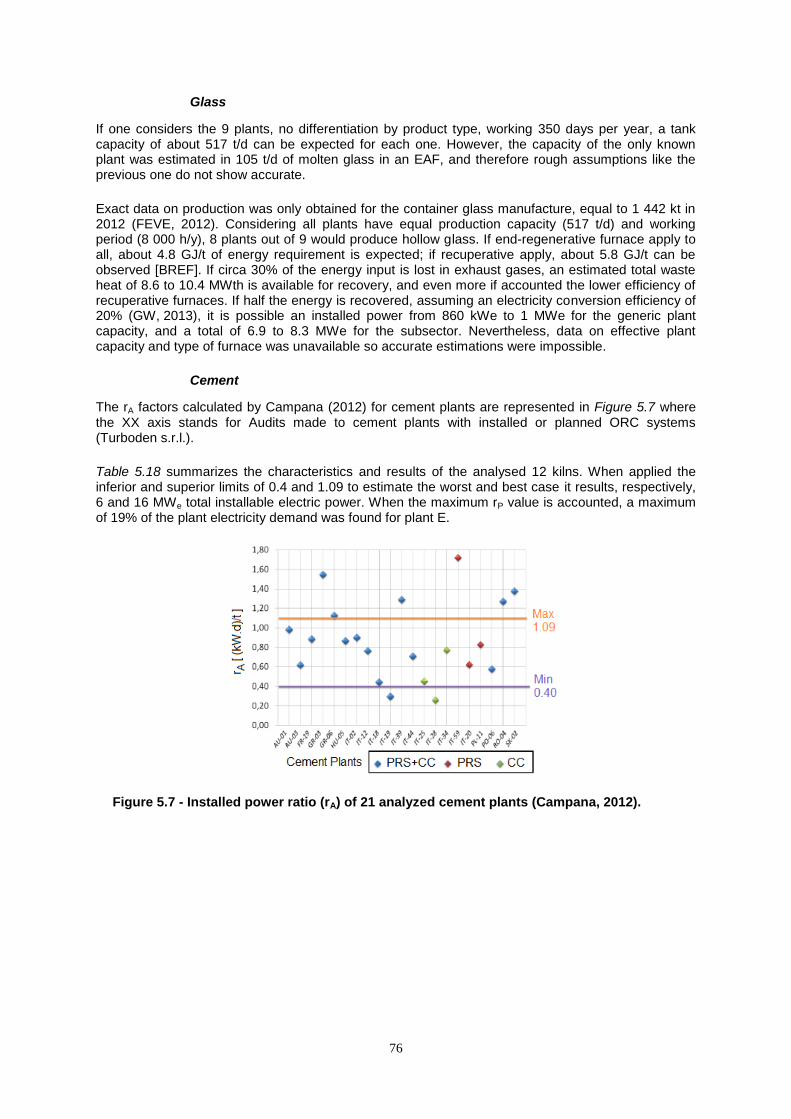
76
Glass
If one considers the 9 plants, no differentiation by product type, working 350 days per year, a tank capacity of about 517 t/d can be expected for each one. However, the capacity of the only known plant was estimated in 105 t/d of molten glass in an EAF, and therefore rough assumptions like the previous one do not show accurate.
Exact data on production was only obtained for the container glass manufacture, equal to 1 442 kt in 2012 (FEVE, 2012). Considering all plants have equal production capacity (517 t/d) and working period (8 000 h/y), 8 plants out of 9 would produce hollow glass. If end-regenerative furnace apply to all, about 4.8 GJ/t of energy requirement is expected; if recuperative apply, about 5.8 GJ/t can be observed [BREF]. If circa 30% of the energy input is lost in exhaust gases, an estimated total waste heat of 8.6 to 10.4 MWth is available for recovery, and even more if accounted the lower efficiency of recuperative furnaces. If half the energy is recovered, assuming an electricity conversion efficiency of 20% (GW, 2013), it is possible an installed power from 860 kWe to 1 MWe for the generic plant capacity, and a total of 6.9 to 8.3 MWe for the subsector. Nevertheless, data on effective plant capacity and type of furnace was unavailable so accurate estimations were impossible.
Cement
The rA factors calculated by Campana (2012) for cement plants are represented in Figure 5.7 where the XX axis stands for Audits made to cement plants with installed or planned ORC systems (Turboden s.r.l.).
Table 5.18 summarizes the characteristics and results of the analysed 12 kilns. When applied the inferior and superior limits of 0.4 and 1.09 to estimate the worst and best case it results, respectively, 6 and 16 MWe total installable electric power. When the maximum rP value is accounted, a maximum of 19% of the plant electricity demand was found for plant E.
Figure 5.7 - Installed power ratio (rA) of 21 analyzed cement plants (Campana, 2012).
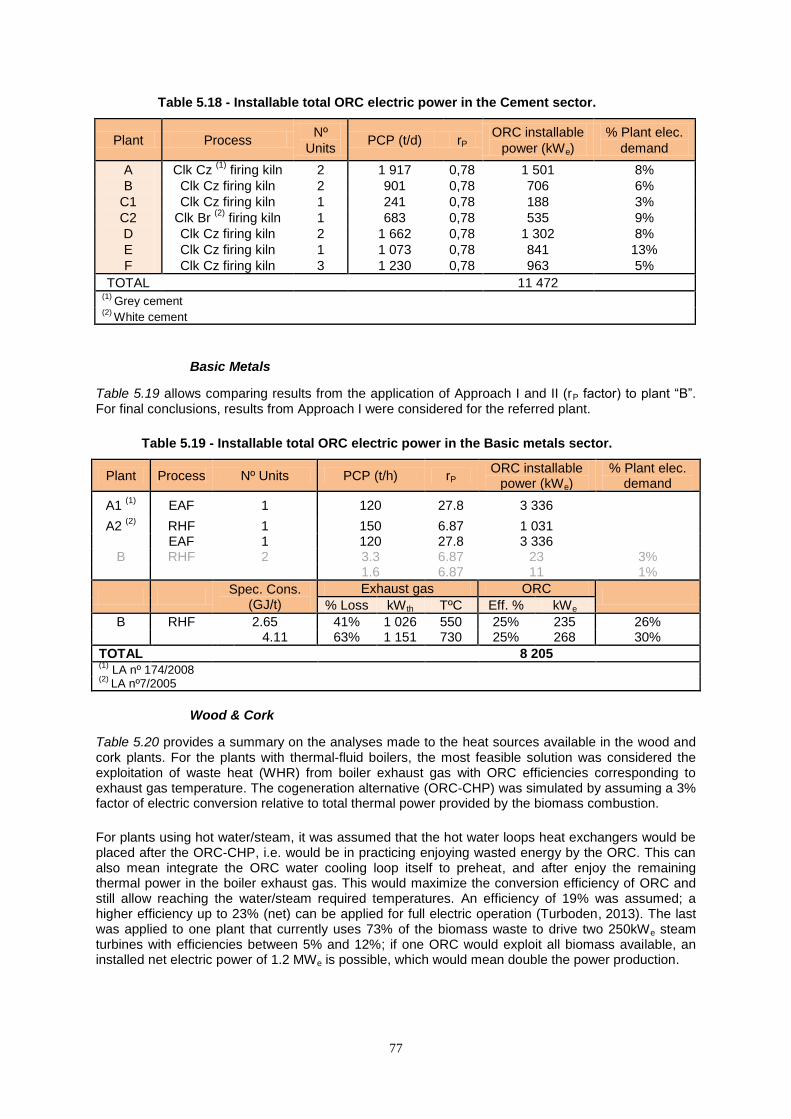
77
Table 5.18 - Installable total ORC electric power in the Cement sector.
Plant Process Nº
Units PCP (t/d) rP
ORC installable
power (kWe)
% Plant elec.
demand
A Clk Cz (1)
firing kiln 2 1 917 0,78 1 501 8%
B Clk Cz firing kiln 2 901 0,78 706 6%
C1 Clk Cz firing kiln 1 241 0,78 188 3%
C2 Clk Br (2)
firing kiln 1 683 0,78 535 9%
D Clk Cz firing kiln 2 1 662 0,78 1 302 8%
E Clk Cz firing kiln 1 1 073 0,78 841 13%
F Clk Cz firing kiln 3 1 230 0,78 963 5%
TOTAL 11 472 (1)
Grey cement (2)
White cement
Basic Metals
Table 5.19 allows comparing results from the application of Approach I and II (rP factor) to plant ―B‖. For final conclusions, results from Approach I were considered for the referred plant.
Table 5.19 - Installable total ORC electric power in the Basic metals sector.
Plant Process Nº Units PCP (t/h) rP ORC installable
power (kWe) % Plant elec.
demand
A1 (1)
EAF 1 120 27.8 3 336
A2 (2)
RHF 1 150 6.87 1 031
EAF 1 120 27.8 3 336 B RHF 2 3.3 6.87 23 3%
1.6 6.87 11 1%
Spec. Cons.
(GJ/t)
Exhaust gas ORC
% Loss kWth TºC Eff. % kWe
B RHF 2.65 41% 1 026 550 25% 235 26% 4.11 63% 1 151 730 25% 268 30%
TOTAL 8 205 (1)
LA nº 174/2008 (2)
LA nº7/2005
Wood & Cork
Table 5.20 provides a summary on the analyses made to the heat sources available in the wood and cork plants. For the plants with thermal-fluid boilers, the most feasible solution was considered the exploitation of waste heat (WHR) from boiler exhaust gas with ORC efficiencies corresponding to exhaust gas temperature. The cogeneration alternative (ORC-CHP) was simulated by assuming a 3% factor of electric conversion relative to total thermal power provided by the biomass combustion.
For plants using hot water/steam, it was assumed that the hot water loops heat exchangers would be placed after the ORC-CHP, i.e. would be in practicing enjoying wasted energy by the ORC. This can also mean integrate the ORC water cooling loop itself to preheat, and after enjoy the remaining thermal power in the boiler exhaust gas. This would maximize the conversion efficiency of ORC and still allow reaching the water/steam required temperatures. An efficiency of 19% was assumed; a higher efficiency up to 23% (net) can be applied for full electric operation (Turboden, 2013). The last was applied to one plant that currently uses 73% of the biomass waste to drive two 250kWe steam turbines with efficiencies between 5% and 12%; if one ORC would exploit all biomass available, an installed net electric power of 1.2 MWe is possible, which would mean double the power production.
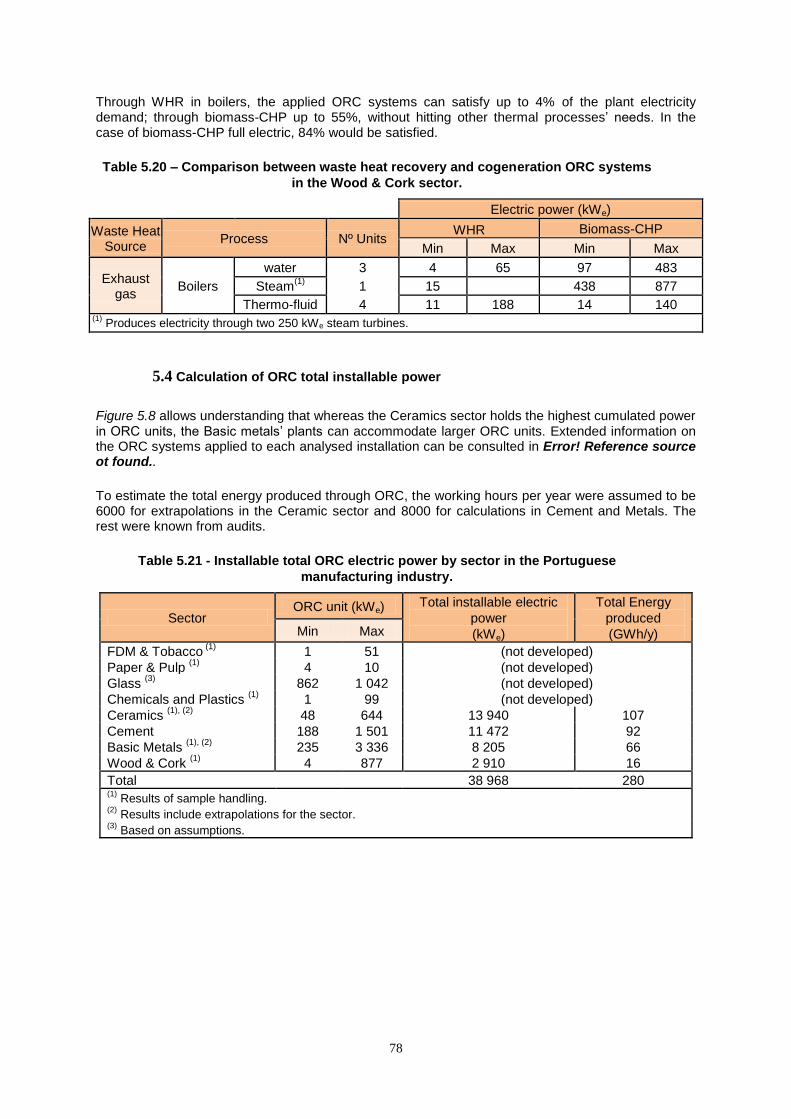
78
Through WHR in boilers, the applied ORC systems can satisfy up to 4% of the plant electricity demand; through biomass-CHP up to 55%, without hitting other thermal processes‘ needs. In the case of biomass-CHP full electric, 84% would be satisfied.
Table 5.20 – Comparison between waste heat recovery and cogeneration ORC systems
in the Wood & Cork sector.
Electric power (kWe)
Waste Heat Source
Process Nº Units WHR Biomass-CHP
Min Max Min Max
Exhaust gas
Boilers
water 3 4 65 97 483
Steam(1)
1 15
438 877
Thermo-fluid 4 11 188 14 140 (1)
Produces electricity through two 250 kWe steam turbines.
5.4 Calculation of ORC total installable power
Figure 5.8 allows understanding that whereas the Ceramics sector holds the highest cumulated power in ORC units, the Basic metals‘ plants can accommodate larger ORC units. Extended information on the ORC systems applied to each analysed installation can be consulted in Error! Reference source ot found..
To estimate the total energy produced through ORC, the working hours per year were assumed to be 6000 for extrapolations in the Ceramic sector and 8000 for calculations in Cement and Metals. The rest were known from audits.
Table 5.21 - Installable total ORC electric power by sector in the Portuguese
manufacturing industry.
Sector ORC unit (kWe)
Total installable electric
power
(kWe)
Total Energy
produced
(GWh/y) Min Max
FDM & Tobacco (1)
1 51 (not developed)
Paper & Pulp (1)
4 10 (not developed)
Glass (3)
862 1 042 (not developed)
Chemicals and Plastics (1)
1 99 (not developed)
Ceramics (1), (2)
48 644 13 940 107
Cement 188 1 501 11 472 92
Basic Metals (1), (2)
235 3 336 8 205 66
Wood & Cork (1)
4 877 2 910 16
Total
38 968 280 (1)
Results of sample handling. (2)
Results include extrapolations for the sector. (3)
Based on assumptions.
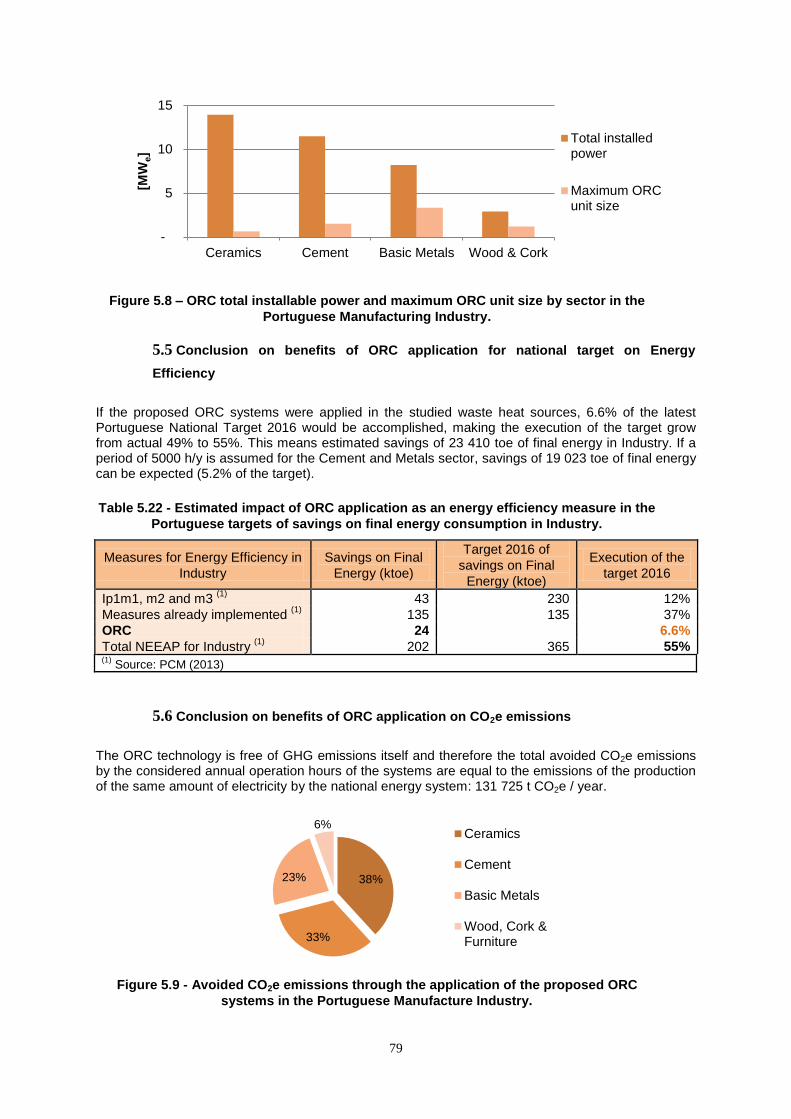
79
Figure 5.8 – ORC total installable power and maximum ORC unit size by sector in the
Portuguese Manufacturing Industry.
5.5 Conclusion on benefits of ORC application for national target on Energy
Efficiency
If the proposed ORC systems were applied in the studied waste heat sources, 6.6% of the latest Portuguese National Target 2016 would be accomplished, making the execution of the target grow from actual 49% to 55%. This means estimated savings of 23 410 toe of final energy in Industry. If a period of 5000 h/y is assumed for the Cement and Metals sector, savings of 19 023 toe of final energy can be expected (5.2% of the target).
Table 5.22 - Estimated impact of ORC application as an energy efficiency measure in the
Portuguese targets of savings on final energy consumption in Industry.
Measures for Energy Efficiency in
Industry
Savings on Final
Energy (ktoe)
Target 2016 of
savings on Final
Energy (ktoe)
Execution of the
target 2016
Ip1m1, m2 and m3 (1)
43 230 12%
Measures already implemented (1)
135 135 37%
ORC 24
6.6%
Total NEEAP for Industry (1)
202 365 55% (1)
Source: PCM (2013)
5.6 Conclusion on benefits of ORC application on CO2e emissions
The ORC technology is free of GHG emissions itself and therefore the total avoided CO2e emissions by the considered annual operation hours of the systems are equal to the emissions of the production of the same amount of electricity by the national energy system: 131 725 t CO2e / year.
Figure 5.9 - Avoided CO2e emissions through the application of the proposed ORC
systems in the Portuguese Manufacture Industry.
-
5
10
15
Ceramics Cement Basic Metals Wood & Cork
[MW
e]
Total installedpower
Maximum ORCunit size
38%
33%
23%
6% Ceramics
Cement
Basic Metals
Wood, Cork &Furniture
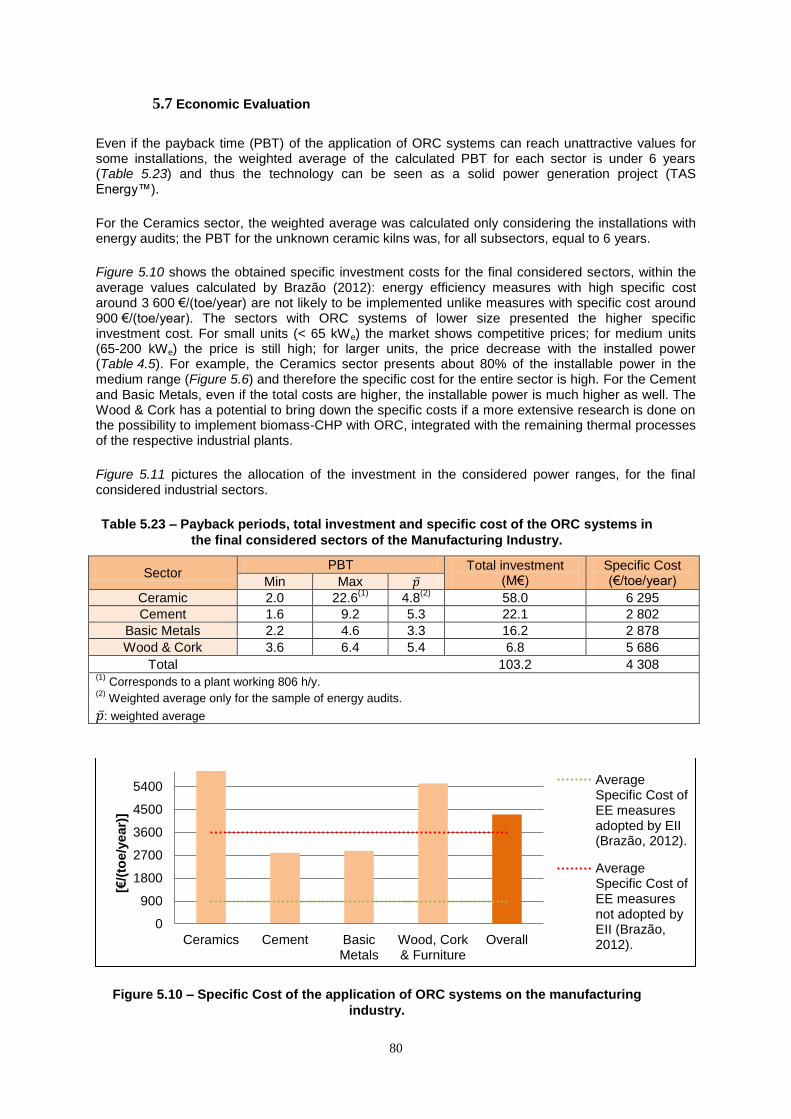
80
5.7 Economic Evaluation
Even if the payback time (PBT) of the application of ORC systems can reach unattractive values for some installations, the weighted average of the calculated PBT for each sector is under 6 years (Table 5.23) and thus the technology can be seen as a solid power generation project (TAS Energy™).
For the Ceramics sector, the weighted average was calculated only considering the installations with energy audits; the PBT for the unknown ceramic kilns was, for all subsectors, equal to 6 years.
Figure 5.10 shows the obtained specific investment costs for the final considered sectors, within the average values calculated by Brazão (2012): energy efficiency measures with high specific cost around 3 600 €/(toe/year) are not likely to be implemented unlike measures with specific cost around 900 €/(toe/year). The sectors with ORC systems of lower size presented the higher specific investment cost. For small units (< 65 kWe) the market shows competitive prices; for medium units (65-200 kWe) the price is still high; for larger units, the price decrease with the installed power (Table 4.5). For example, the Ceramics sector presents about 80% of the installable power in the medium range (Figure 5.6) and therefore the specific cost for the entire sector is high. For the Cement and Basic Metals, even if the total costs are higher, the installable power is much higher as well. The Wood & Cork has a potential to bring down the specific costs if a more extensive research is done on the possibility to implement biomass-CHP with ORC, integrated with the remaining thermal processes of the respective industrial plants.
Figure 5.11 pictures the allocation of the investment in the considered power ranges, for the final considered industrial sectors.
Table 5.23 – Payback periods, total investment and specific cost of the ORC systems in
the final considered sectors of the Manufacturing Industry.
Sector PBT Total investment
(M€) Specific Cost (€/toe/year) Min Max
Ceramic 2.0 22.6(1)
4.8(2)
58.0 6 295
Cement 1.6 9.2 5.3 22.1 2 802
Basic Metals 2.2 4.6 3.3 16.2 2 878
Wood & Cork 3.6 6.4 5.4 6.8 5 686
Total 103.2 4 308 (1)
Corresponds to a plant working 806 h/y. (2)
Weighted average only for the sample of energy audits.
: weighted average
Figure 5.10 – Specific Cost of the application of ORC systems on the manufacturing
industry.
0
900
1800
2700
3600
4500
5400
Ceramics Cement BasicMetals
Wood, Cork& Furniture
Overall
[€/(
toe/y
ear)
]
AverageSpecific Cost ofEE measuresadopted by EII(Brazão, 2012).
AverageSpecific Cost ofEE measuresnot adopted byEII (Brazão,2012).
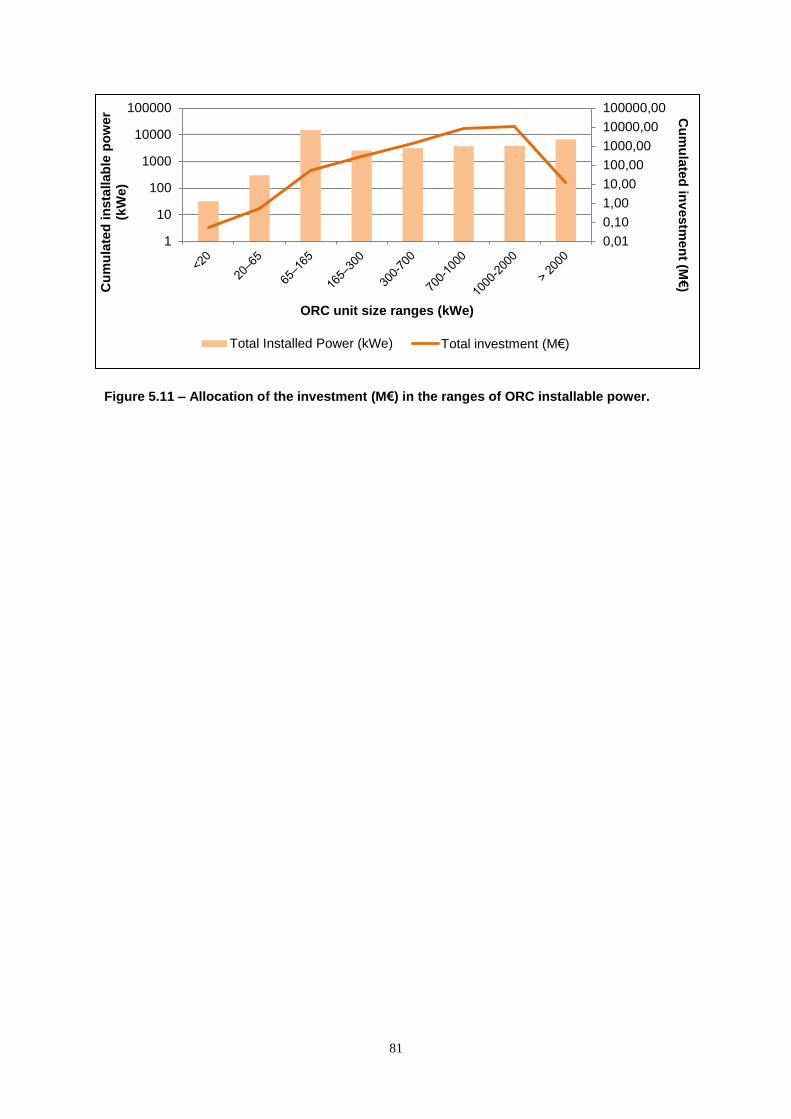
81
Figure 5.11 – Allocation of the investment (M€) in the ranges of ORC installable power.
0,01
0,10
1,00
10,00
100,00
1000,00
10000,00
100000,00
1
10
100
1000
10000
100000 Cu
mu
late
d in
vestm
en
t (M€) C
um
ula
ted
in
sta
llab
le p
ow
er
(kW
e)
ORC unit size ranges (kWe)
Total Installed Power (kWe) Total investment (M€)

82
83
6 CONCLUSION
6.1 Synthesis of the developed work
Within the global energy panorama and European energy targets, the importance of Energy Efficiency (EE) is addressed. The magnitude of wasted heat in Industry makes it a huge opportunity for savings, and the application of waste heat recovery for power generation (WHRPG) technologies, such as the Organic Rankine Cycle (ORC), can be a feasible and profitable EE measure.
Through a group of Energy Audits of Portuguese energy intensive industrial installations enrolled in the SGCIE and RGCE (ADENE, DGEG), it was possible to analyse the wasted heat by installation and study the potential for power generation and/or cogeneration through ORC systems. Some other installations without energy audit were also analysed, and data was collected from published technical documents. From a total of 116 analysed plants, 50 constituted the final universe to which ORC systems were applied, being representative of about 16% of the total energy consumption in the manufacture industry of 2010.
A research was made on the ORC technology to understand the constraints for its application, limitations, configurations, performance and market status. The direct contact with vendors and the analysis of case studies, namely one in Portugal, was very helpful to conclude the current technological, economic and political framework of the technology.
The estimated total installable electric power in ORC units is in fact savings on final energy consumption since the net electricity production through ORC is free of consumptions. The final value is analysed within the Portuguese target of savings on Final Energy by 2016 for Industry. The ORC is therefore proposed as an EE measure for the manufacturing industry, and the impact of the measure is presented as a percentage (%) of execution of the national target, considering the accomplishments made so far in the sector.
The investment, energy savings and avoided CO2e emissions are calculated for each industrial installation. The final results for each sector are assessed through the payback times and specific cost of the investment. Discussion on the results is developed within the context of each sector and national current situation.
This work does not yet provide a robust cost-benefit analysis. Instead, it provides a preliminary assessment to help focus future efforts by the government on the investigation of the opportunities offered by new clean waste heat to power generation technologies, namely the ORC, as well as to initiate or extend policies to support the uptake of these technologies and increase their profitability for industrial actors.
Even if it was not possible to assess or estimate the wasted heat in all sectors of the Manufacture Industry, namely big installations under the ETS, a literature synthesis was made on the low-grade waste heat sources by sector and can be useful on further analogous studies.
6.2 Synthesis of the main results
The urgency for competitiveness of the Portuguese industries constitutes an opportunity to invest on the promotion of energy self-sufficiency and energy efficiency. Sectors as the FDM and Chemical industries revealed low potential for waste heat recovery for power generation (WHRPG) and topping cogeneration cycle appears as a more promising measure. Sectors as the non-metallic mineral products, basic metals and the ones with biomass waste showed interesting opportunities for WHRPG.
84
Among 116 analysed plants, 50 revealed potential for ORC application, and additional 176 were simulated for the Ceramic sector. A total of 226 proposed ORC systems applied to the Ceramic, Cement, Basic metals and Wood & Cork industries would represent about 37 MWe installable power. This would mean executing 5.2 to 6.6% of the Portuguese 2016 target of savings on Final Energy consumption in Industry, with associated avoided emissions of 132 kt CO2e/year.
The electric power produced by the proposed ORC systems would mean that about 2% of the total energy consumption by the plants is converted into useful energy (electricity). This value can be higher if the efficiency of ORC working in cogeneration is considered, i.e. the energy wasted by the ORC cooling system is also exploited.
The sector that has shown the highest potential for ORC in terms of cumulated installable power was the Ceramic sector with 14 MWe. However, it is expected that the Wood & Cork sector hold more installable power than the one obtained in this study if a more accurate analysis is made to the biomass available for cogeneration, using the ORC as the topping power cycle for all installations. On the other hand, the sector that has shown the highest potential for ORC in terms of installed power for single unit was the Basic metals industry with a unit of 3.3 MWe.
Following Campana (2012) methodology, the specific power related to the process (―rP‖ factor) was calculated for the different subsectors of the Ceramics sector. This factor can be used to estimate the ORC installable power in ceramic plants with several ceramic kilns. However, it was evaluated that the rP factor for the Basic metals‘ sector, calculated by Campana (2012), and for the Ceramic subsectors can be used as a primary assessment of the installable ORC power in a certain process, but there can be a considerable gap between these results and the ones applicable to each case.
When the ORC systems are applied to recover waste heat from industrial processes, it was observed that the electric power produced can represent from 1% of the plant electricity demand (small applications) to typically 10% and up to 30% in medium applications. When the ORC is applied as a cogeneration technology to biomass waste, the power production is more efficient than steam turbines and can mean up to 84% of the plant electricity demand.
The estimated total installable power equates for an estimated total investment of 104 M€ in ORC systems, with an overall specific cost of 4 307 € per tonne of oil equivalent (toe) saved per year. This value stands above the average value of what industrials are willing to invest in EE measures, and gets even higher for medium ORC units. This situation could be offset by favouring the credit to investment on equipment by means of lower interest rates. On the other hand, the Cement and Basic Metals present specific investment costs under the reference value, showing higher potential to adopt ORC systems.
The payback times are typically between 3 and 6 years, which can be considered promising but not highly attractive. This situation could be offset by increasing the revenues through the application of feed-in tariffs or other supports specifically to the production of clean energy from waste heat. The feed-in tariffs already existing for the clean production of electricity and/or for cogeneration should be extended for the specific case of WHR.
The integration of the ORC and other WHRPG technologies in the national support schemes and strategies for energy is of major importance. It was evaluated that the ORC can integrate the categories ―Cogeneration‖, ―Heat Recovery‖ and ―Process integration‖ of the Transversal Measures of the SGCIE, which constitutes the main tool for EE in energy intensive industries in Portugal.
6.3 Limitations of the work
Three important groups of assumptions were made in this work that can influence the results: the performance of the ORC systems, the total costs of installing the systems and the regular operating hours of the processes / plant operating schedules.
The simulation of the application of ORC systems to all analysed heat sources would be more accurate with the use of thermodynamic simulation programs such as Aspen Properties®, and
85
working fluid databases such as FluidProp. Instead, a quite simple analysis was made based on reported cycle efficiencies provided by parametric studies that can be consulted if one wants to know the key-factors assumed. More or less, it can be addressed that the efficiencies calculated by the studies, and therefore used in this work, considered the optimal power cycle variants for each case, meaning e.g. type of expander or cycle arrangement. Also, the ORC net electric efficiency was applied instead of the gross electric efficiency, and therefore the actual final values of total installable power are expected to be around 8-10% higher.
Total costs were collected from literature and direct contact with vendors, but when dealing with site-specific constraints, such as the need for longer pipes when the ORC needs to distance physically from the process, the final price can differ largely.
While the clinker production is a continuous process, the boilers, kilns and rolling mill can suffer periodic stops that were not taken into account when estimating final energy produced by the ORC. This will also influence the conclusions of the economic evaluation and avoided emissions.
The work would also benefit if some analysis were complemented. For the Wood & Cork sector, the energy balance of all processes in the plants, namely heat consuming processes, would have allowed the accurate simulation of the integration of an ORC unit in the plants, concluding more precisely the best configuration – ORC waste heat recovery from boilers or ORC as the prime mover of a cogeneration system.
On the other hand, the estimations performed would have benefit if some data was available for research, both in quantity and quality. First, data on industrial production is reported in different units and aggregated, which difficult the data processing for statistical purposes, namely extrapolations. The common reported unit is often monetary (M€) and is not suitable to estimations concerning energy spent on industrial processes since the income does not follow a constant relation to production. Second, the access to energy audits of all considered installations would be extremely valuable mainly to estimate wasted energy.
6.4 Future developments
Besides the waste heat recovery, the application of the ORC to biomass-CHP looks promising for Portugal, namely for the forest biomass. There is a legal framework for the forest biomass exploitation for power production in the country, and the ORC constitutes a more efficient power cycle than the conventional steam cycle when working at the temperatures typical of biomass combustion. In 2006, the forecast was for annual consumption of around 1 million tonnes of waste from forest management and production activities (ADENE, 2012). A call for tender was open under DL 33-A/2005 to deliver 100 MW of electricity to the public electrical grid from 15 thermoelectric power plants using forest biomass. The DL 225/2007, which implements a set of measures related to renewable energy, extended the targets to 150 MW towards the creation of a network of biomass plants.
The threshold of cost-effectiveness of installing an ORC system with certain installed power and the associated fixed costs of projecting and constructing was not developed in the present work, neither found in the literature, and would be extremely helpful.
Also, it would be interesting to quantify or record the wasted heat in the Portuguese industrial plants This could stand as an indicator for the sectors more conducive to heat recovery or WHRPG strategies. As explained before, waste heat represents and enormous opportunity for energy savings.

86
87
REFERENCES
ADENE – Agência para a Energia (2010). Medidas de Eficiência Energética Aplicáveis à Indústria Portuguesa: Um Enquadramento Tecnológico Sucinto, ISBN 978-972-8646-18-9, Portugal.
ADENE – Agência para a Energia (2012). Energy Efficiency Policies and Measures in Portugal, ODYSSEE- MURE 2010, Lisboa, Portugal.
ADENE (2014). SGCIE – Relatório Síntese, Portugal.
AO – Ambiente Online (2014). Decreto-Lei sobre auto-consumo em “fase avançada” – Projectos de autoconsumo em paralelo com a rede já são possíveis. Nova legislação passou despercebida, http://www.ambienteonline.pt/canal/detalhe/decreto-lei-sobre-auto-consumo-em-, 16 January 2014.
APA – Agência Portuguesa do Ambiente, I.P. (2013). Portuguese National Inventory Report on Greenhouse Gases, 1990-2011, Departamento de Alterações Climáticas (DCLIMA), Amadora, Portugal.
APICER – Associação Portuguesa da Indústria de Cerâmica (2012). Guia de Boas Práticas de Gestão Estratégica na Indústria Cerâmica Europeia, Portugal.
Arvay, P., Muller, M., Ramdeen, V. (2011). Economic Implementation of the Organic Rankine Cycle in Industry, 2011 ACEEE Summer Study on Energy Efficiency in Industry.
Asp, B., Wiklund, M., Dahl, J. (2008). Användning av stålindustrins restenergier för elproduktion – Ett effektivt resursutnyttjande för elproduktion (―Use of the steel industry's residual energy for electricity generation – An efficient resource utilization for electricity generation‖), ISSN 0280-249X, Jernkontoret research, Sweden.
Barber-Nichols Inc. (2005). Conversion of Low Temperature Waste Heat Utilizing Hermetic Organic Rankine Cycle, Arvada, USA, DE2006-838860.
BCS, Incorporated (2008). Waste Heat Recovery: Technology and Opportunities in U.S. Industry, U.S. Department of Energy, USA. (BCS Incorporated, 2008)
Bianchi, M., De Pascale, A., Montenegro, G. (2005). Micro Gas Turbine Repowering With Inverted Brayton Cycle, ASME Turbo Expo 2005: Power for Land, Sea, and Air, ISBN: 0-7918-4727-6.
Bianchi, M. & Pascale, A. (2011). Bottoming cycles for electric energy generation: Parametric investigation of available and innovative solutions for the exploitation of low and medium temperature heat source, Applied Energy 88 (2011) 1500-1509.
Branchini, L., De Pascale, A., Peretto, A. (2012). Thermodynamic Analysis and Comparison of Different Organic Rankine Cycle Configurations, International Conference on Applied Energy, ICAE 2012, Jul 5-8, 2012, Suzhou, China.
Brasz, J. (2008). Assessment of C6F as Working Fluid for Organic Rankine Cycle Applications, International Refrigeration and Air Conditioning Conference, Paper 941.
Brasz, L. J. & Bilbow, W. M. (2004). Ranking of Working Fluids for Organic Rankine Cycle Applications, Refrigeration and Air Conditioning Conference. Paper 722.
88
Brazão, A. (2012). Políticas para a Promoção da Eficiência Energética na Indústria Portuguesa, Master on Environmental Engineering, Faculdade de Ciências e Tecnologia, Universidade Nova de Lisboa, Lisboa, Portugal.
Bryson, M. & Dixon, C.. Applying the Trilateral Flash Cycle to the Portland Geothermal Resource to Produce Power, RMIT University, Australia.
Bryson, M. (2007). The Conversion of Low-Grade Heat into Electricity Using the Thermosyphon Rankine Engine and Trilateral Flash Cycle, RMIT University, país??.
Campana, F., Bianchi, M., Branchini, L., De Pascale, A., Peretto, A., Baresi, M., Fermi, A., Rossetti, N., Vescovo, R. (2012). ORC waste heat recovery in European energy intensive industries: Energy and GHG savings, Energy Conversion and Management 76 (2013) 244–252.
Campana, F. (2012). Studio delle potenzialità di recupero di calore dalle industrie Europee per la produzione di energia elettrica tramite sistemi ORC, Università di Bologna, Industrial Engineering Department, Bologna, Italy.
Carbon Trust (2011). Heat recovery – A guide to key systems and applications, UK.
Casten, S. & DeValles, M. (2009). Waste not, Want Not: Generating Power from Glass Plants, Presentation to Energy Efficiency Workshop, Glass Manufacturing Industry Council, Recycled Energy Development, LLC.
Chen, H., Goswami, D., Stefanakos, E. (2010). A review of thermodynamic cycles and working fluids for the conversion of low-grade heat, Clean Energy Research Center, College of Engineering, University of South Florida, USA, Renewable and Sustainable Energy Reviews 14 (2010) 3059–3067.
Chen, H., Goswami, D., Rahman, M., Stefanakos, E. (2011). Optimizing energy conversion using organic Rankine cycles and supercritical Rankine cycles, Proceedings of the ASME 2011 5th International Conference on Energy Sustainability, August 7-10, 2011, Washington, DC, USA.
Chen, L., Zhang, Z., Sun, F. (2012). Thermodynamic Modeling for Open Combined Regenerative Brayton and Inverse Brayton Cycles with Regeneration before the Inverse Cycle, Entropy 2012, 14, 58-73, ISSN 1099-4300, China.
Chen, H. (2010). The Conversion of Low-Grade Heat into Power Using Supercritical Rankine Cycles, University of South Florida, USA.
Chys, M., van den Broek, M., Vanslambrouck, B., De Paepe, M. (2012). Potential of zeotropic mixtures as working fluids in organic Rankine cycles, Energy 44 (2012) 623 – 632.
Clemente, S., Micheli, D., Reini, M., Taccani, R. (2011). Performance Analysis and Modeling of Different Volumetric Expanders for Small-Scale Organic Rankine Cycles, Proceedings of the ASME 2011 5th International Conference on Energy Sustainability ES2011 August 7-10, 2011, Washington, DC, USA.
COGEN – COGEN Portugal (2006). Projecto COMFORTABLE, http://www.cogenportugal.com/content/projectos.aspx?mt=2&ml=10&mls=42&type=3, consulted last time 25th April 2014.
COGEN – COGEN Portugal (2011). Ciclos Orgânicos de Rankine, Porto, Portugal.
CTCV – Centro Tecnológico da Cerâmica e do Vidro (2012). Plano sectorial de melhoria da eficiência energética em PME – Sector da Cerâmica e do Vidro, EFINERG, ISBN: 978-989-8644-01-5.
89
CTCV – Centro Tecnológico da Cerâmica e do Vidro (2012). Plano sectorial de melhoria da eficiência energética em PME - Sector da cerâmica e do vidro, ISBN: 978-989-8644-01-5.
Datla, B. & Brasz, J. (2012). Organic Rankine Cycle System Analysis for Low GWP Working Fluids, International Refrigeration and Air Conditioning Conference at Purdue, July 16-19, 2012.
David, G., Michel, F., Sanchez, L. (2011). Waste heat recovery projects using Organic Rankine Cycle technology – Examples of biogas engines and steel mills applications, World Engineers‘ Convention 2011, Geneva.
DECC – Department of Energy and Climate Change (2013). DECC Fossil Fuel Price Projections, London, UK.
Demuth, O. & Kochan, R. (1981). Analysis of Mixed-Hydrocarbon Binary Thermodynamic Cycles for Moderate-Temperature Geothermal Resources Using Regeneration Techniques, U.S. Department of Energy, Idaho.
DGEG (2010a). Estudo do Potencial de Cogeração de Elevada Eficiência em Portugal, Portugal.
DGEG (2010b). Balanço Energético 2010, Direção de Serviços de Planeamento e Estatística, Balanços e Indicadores Energéticos, downloadable at http://www.dgeg.pt/.
DGEG (2012). Balanço Energético 2012 (provisório), Direção de Serviços de Planeamento e Estatística, Balanços e Indicadores Energéticos, downloadable at http://www.dgeg.pt/.
DGEG (2014). Despacho Nº1/2014, MAOT, Portugal.
DiPippo, R. (2004). Second Law assessment of binary plants generating power from low-temperature geothermal fluids, University of Massachusetts Dartmouth, USA, Geothermics 33 (2004) 565–586.
DOE - U.S. Department of Energy (2004). Waste Heat Reduction and Recovery for Improving Furnace Efficiency, Productivity and Emissions Performance, Industrial Technologies Program, USA. (U.S. Department of Energy, 2004)
Dupont, M. & Sapora, E. (2009). The heat recovery potential in the French industry: which opportunities for heat pump systems?, ECEEE 2009 Summer Study, France.
EC – European Commission (1981). Heat Recovery by Organic Rankine Cycle in Ceramics Firing Ovens, Contract No 198 EEI, Final Report, Luxembourg.
EC – European Commission (2001a). Reference Document on Best Available Techniques in the Non Ferrous Metals Industries, Sevilla, Spain.
EC – European Commission (2001b). Reference Document on Best Available Techniques in the Ferrous Metals Processing Industry, Sevilla, Spain.
EC – European Commission (2003). Reference Document on Best Available Techniques for Mineral Oil and Gas Refineries, Sevilla, Spain.
EC – European Commission (2005). Reference Document on Best Available Techniques in the Smitheries and Foundries Industry, Sevilla, Spain.
EC – European Commission (2006). Reference Document on Best Available Techniques in the Food, Drink and Milk Industries, Sevilla, Spain.
90
EC – European Commission (2007a). Reference Document on Best Available Techniques in the Ceramic Manufacturing Industry, Sevilla, Spain.
EC – European Commission (2007b). Reference Document on Best Available Techniques for the Manufacture of Large Volume Inorganic Chemicals – Ammonia, Acids and Fertilizers, Sevilla, Spain.
EC – European Commission (2007c). Reference Document on Best Available Techniques in the Production of Polymers, Sevilla, Spain.
EC – European Commission (2011a), Energy Roadmap 2050, COM 2011/885, Brussels.
EC – European Commission (2011b). Energy 2020 – A strategy for competitive, sustainable and secure energy, Directorate-General for Energy, Belgium.
EC – European Commission (2011c). Impact Assessment – Energy Efficiency Plan 2011, SEC 2011/277, Brussels, Belgium.
EC – European Commission (2011d). Energy Efficiency Plan 2011, COM 2011/109, Brussels, Belgium.
EC – European Commission (2012a). Sustainable Industry Low Carbon scheme (SILC) I, http://ec.europa.eu/enterprise/newsroom/cf/itemdetail.cfm?item_id=5811&lang=en, consulted the last time on 20 April 2014.
EC – European Commission (2012b). Directive 2012/27/EU of the European Parliament and of the Council of 25 October 2012 on energy efficiency, Official Journal of the European Union, L 315/1.
EC – European Commission (2013a). High-level Round Table on the future of the European Steel Industry Recommendations, Brussels, Belgium.
EC – European Commission (2013b). Best Available Techniques (BAT) Reference Document for the Manufacture of Glass, ISBN 978-92-79-28284-3, Luxembourg.
EC – European Commission (2013c). Best Available Techniques (BAT) Reference Document for the Production of Cement, Lime and Magnesium Oxide, Sevilla, Spain.
EC – European Commission (2013d). Best Available Techniques (BAT) Reference Document for Iron and Steel Production, ISBN 978-92-79-26475-7, Luxembourg.
EC – European Commission (2014a). Progress report on the application of Directive2006/32/EC on energy end-use efficiency and energy services and on the application of Directive 2004/8/EC on the promotion of cogeneration based on a useful heat demand in the internal energy market, COM(2013) 938, Brussels, Belgium.
EC – European Commission (2014b), Funding under the Energy-efficiency Call of Horizon 2020, http://ec.europa.eu/easme/energy_en.htm, consulted the last time on 20 April 2014.
ElectraTherm Inc. (2006). Cost Effective Small Scale ORC Systems for Power Recovery from Low Grade Heat Sources, Proceedings of IMECE2006, ASME International Mechanical Engineering Congress and Exposition November 5-10, 2006, Chicago, Illinois, USA.
ENEA Consulting (2012). Waste Heat Recovery for Power Generation – Panorama of public policies supporting power generation from industrial waste heat, Paris, France.
91
Enertime (2009). Markets and actors, http://www.cycle-organique-rankine.com/market-markers.php, consulted last time 24th April 2014.
Enertime, ORCHID© - 1MWE – 200°C, http://www.enertime.com/en/organic-rankine-cycle-machines/products/orchid, consulted last time 24th April 2014.
EP – European Parliament (2010). Assessment of Potential and Promotion of New Generation of Renewable Technologies, Directorate-General for Internal Policies, Brussels.
ERSE – Entidade Reguladora dos Serviços Energéticos (2014a). Informação sobre Produção em Regime Especial (PRE), Portugal.
ERSE – Entidade Reguladora dos Serviços Energéticos (2014b). Questões sobre a PRE e outros Regimes - Tese de MIEA, 20 April 2014, 4:50 p.m.
European Commission (2009). Reference Document on Best Available Techniques for Energy Efficiency, Sevilla, Spain.
Eurostat (2011a), Energy Statistics, http://epp.eurostat.ec.europa.eu/portal/page/portal/environment/data/main_tables, consulted the last time on 18th April 2014.
Eurostat (2011b), Environment Statistics, Main tables, http://epp.eurostat.ec.europa.eu/portal/page/portal/energy/data/main_tables, last consulted in 18 April 2014.
Eurostat (2013). Electricity prices for industrial consumers, http://epp.eurostat.ec.europa.eu/tgm/graph.do?tab=graph&plugin=1&language=en&pcode=ten00114&toolbox=type, consulted the last time on 20th April 2014.
Exergy S.p.A. (2013). Heat recovery from cement plants with the radial outflow turbine, Italy.
Ferland, K., Papar, R., Kumar, S., Quinn, J. (2013). Technologies to Recover Low-temperature Waste Energy in Chemical Plants and Refineries, ESL-IE-13-05-05, Proceedings of the Thrity-Fifth Industrial Energy Technology Conference New Orleans, LA May 21-24, LA.
FEVE – The European Container Glass Federation (2012). Production Year 2012 – 5 Year History, Statistics, downloadable at http://www.feve.org/.
Firdaus, E., Saaed, K., Bryant, D., Jones, M., Biggs, S., Bahawodin, B. (2012). Assessment and modelling of the waste heat availability from gas turbine based CHP systems for ORC systems, International Conference on Renewable Energies and Power Quality (ICREPQ‘12), Santiago de Compostela (Spain), 28th to 30th March, 2012.
Freepower (2013). REQUEST for information - MASTER THESIS regarding the ORC technology - Portugal, 22 July 2013, 8:41 p.m.
Frost & Sullivan (2010). Waste Heat Recovery Opportunities in Selected US Industries, Executive Summary.
GAE – Glass Alliance Europe (2012). Statistical Data, http://www.glassallianceeurope.eu/en/statistical-data, consulted the last time on 19 April 2014.
Gao, H., Lin, C., He, C., Xu, X., Wu, S., Li, Y. (2012). Performance Analysis and Working Fluid Selection of a Supercritical Organic Rankine Cycle for Low Grade Waste Heat Recovery, Energies 2012, 5, 3233-3247, ISSN 1996-1073.
92
GEOTA – Grupo de Estudos de Ordenamento de Território e Ambiente (2013). Reforma Fiscal Ambiental: fiscalidade e incentivos no sector energético – versão preliminar para discussão pública, Lisboa, Portugal.
GRP – Governo da República Portuguesa (2011). Attachment I. Portugal – Memorandum of Understanding on Specific Economic Policy Conditionality, Second Update—December 9, 2011, Lisboa, Portugal.
GRP – Governo da República Portuguesa (2012). Portugal – Memorandum of Understanding on Specific Economic Policy Conditionality, Third Update – 15 March 2012, Lisboa, Portugal.
GW – Glass Worldwide (2013). Waste heat recovery expertise, Focus on Italy, issue forty eight 2013, UK.
Hjartarson, H. (2009). Waste Heat Utilization at Elkem Ferrosilicon Plant in Iceland, University of Iceland, Reykjavik, Iceland.
Hnat, J., Patten, J., Sheth, P. (1981). Rankine and Brayton Cycle Cogeneration for Glass Melting, ESL-IE-81-04-119, Proceedings from the Third Industrial Energy Technology Conference Houston, TX, April 26-29, 1981.
Hnat, J., Patten, J., Bartone, L., Cutting, J. (1982). Industrial Heat Recovery with Organic Rankine Cycles, Proceedings from the Fourth Industrial Energy Technology Conference, Houston, TX, April 4-7, 1982.
HREII – HREII DEMO Observatory (2013a). ORC Waste Heat Recovery for a more Competitive and Sustainable Steel Industry, LIFE10 ENV/IT/000397.
HREII – HREII DEMO Observatory (2013b). Waste heat recovery to power in non-ferrous metal industries, LIFE10 ENV/IT/000397.
IETD – Industrial Efficiency Technology Database (2014). Sectors, http://ietd.iipnetwork.org/sectors, consulted the last time on 19 April 2014.
INE – Instituto Nacional de Estatística, I.P. (2011). Indústria e Energia em Portugal 2008-2009, Edição 2011, ISBN 978-989-25-0146-8.
INE – Instituto Nacional de Estatística, I.P. (2012). Estatísticas da Produção Industrial 2012, ISBN 978-989-25-0201-4.
IP.com (2012). Power Producing Organic Rankine Cycle Intermediate Loop Using Iverted Brayton Cycle, IPCOM000222146D, USA.
Johansson, M. T. & Söderström, M. Electricity generation from low temperature industrial excess heat – an opportunity for the steel industry, Linköping University, University of Gävle, Sweden.
Kalra, C., Becquin, G., Jackson, J., Laursen, A., Chen, H., Myers, K., Hardy, A., Klockow, H., Zia, J. (2012). High-Potential Working Fluids and Cycle Concepts for Next-Generation Binary Organic Rankine Cycle for Enhanced Geothermal Systems, Proceedings Thirty-Seventh Workshop on Geothermal Reservoir Engineering Stanford University, Stanford, California, January 30 - February 1, 2012.
Karellas, S. & Schuster, A. (2008). Supercritical Fluid Parameters in Organic Rankine Cycle Applications, ISSN 1301-9724, Int. J. of Thermodynamics 11-3 (2008) 101-108.
93
Larjola, J. (1995). Electricity from industrial waste heat using high-speed organic Rankine cycle (ORC), Lappeenranta University of Technology, Int. J. Production Economics 41 (1995) 227-235, Finland.
Law, R., Harvey, A., Reay, D. (2011). Opportunities for Low-Grade Heat Recovery in the UK Food Processing Industry, Applied Thermal Engineering 53 (2013) 188–196, UK.
Lemort, V., Guillaume, L., Legros, A., Declaye, S., Quoilin, S., A Comparison of Piston, Screw and Scroll Expanders for Small-Scale Rankine Cycle Systems, Thermodynamics Laboratory, University of Liège, Belgium.
Lukawski, M. (2009). Design and Optimization of Standardized Organic Rankine Cycle Power Plant for European Conditions, School for Renewable Energy Science, University of Iceland & University of Akureyri, Akureyri.
Maier, R., Olivent, W., Brandt, D., Golden, T. (1979). Refinery Energy Profile – Final Report, Alliance Refinery, Gulf Research & Development Company, U.S. Department of Energy, USA. Ebook available on: https://play.google.com/books/reader?id=Ex5PAAAAMAAJ&printsec=frontcover&output=reader&authuser=0&hl=en&pg=GBS.PP5
Meacher, J. (1981). Organic Rankine Cycles Systems for Waste Heat Recovery in Refineries and Chemical Process Plants, Proceedings from the Third Industrial Energy Technology Conference Houston, TX, April 26-29, 1981, Mechanical Technology Incorporated, Latham, New York.
MEID – Ministério da Economia, da Inovação e do Desenvolvimento (2007), Decreto-Lei n.º 225/2007, Diário da República, 1.a série—N.º 105—31 de Maio de 2007.
MEID – Ministério da Economia, da Inovação e do Desenvolvimento (2008), Despacho n.º 17313/2008, Diário da República, 2.ª série — N.º 122 — 26 de Junho de 2008.
MEID – Ministério da Economia, da Inovação e do Desenvolvimento (2010), Decreto-Lei nº 23/2010, Diário da República, 1.ª série — N.º 59 — 25 de Março de 2010.
Miller, E., Hendricks, T., Wang, H., Peterson, R. (2009). Integrated dual-cycle energy recovery using thermoelectric conversion and an organic Rankine bottoming cycle, DOI: 10.1177/2041296710394238, Proceedings of the Institution of Mechanical Engineers, Part A: Journal of Power and Energy, DOI: 10.1177/2041296710394238.
Naik, S., Messacar, J., Mauter, E., Kaplan, K., Minbiole, K., Chen, H., Encyclopedia of Chemical Engineering Equipment – Furnaces & Kilns, http://encyclopedia.che.engin.umich.edu/Pages/HeatTransfer/Furnaces&Kilns/Furnaces&Kilns.html#top, consulted the last time on 19 April 2014.
Navarro-Esbri, J. Peris, B., Collado, R., Molés, F. (2013). Micro-generation and micro combined heat and power generation using “free” low temperature heat sources through Organic Rankine Cycles, International Conference on Renewable Energies and Power Quality (ICREPQ‘13), Bilbao, Spain.
NCB – National Council for Cement and Building Materials (2000). Cogeneration of Power Utilising Waste Heat in Cement Manufacture: Technological Perspectives, Proceedings from the Seventh NCB International Seminar on Cement and Building Materials, New Delhi, 21-24 November, 2000.
Njobet, N. (2012). Energy Analysis in the Extrusion of Plastics.
94
ORMAT – ORMAT Industries Ltd. (2002). Recovery of Industrial Heat in the Cement Industry by Means of the ORC Process, ida\papers\IEEE 2002\4066-1.
ORMAT – ORMAT International Inc. (2000a). Proven Power from Cement Plant Waste Heat, CII – CMA Seminar Power Generation from Cement Plant Waste Heat, Hyderabad, July 21, 2000.
ORMAT – ORMAT International Inc. (2000b). Organic Rankine Cycle Power Plant for Waste Heat Recovery, CEPSI 2000.
ORMAT Technologies, Inc. (2007). Organic Rankine Cycle Configurations, Proceedings European Geothermal Congress 2007, Unterhaching, Germany, 30 May-1 June 2007.
Oudkerk, JF., Quoilin, S., Lemort, V. (2011). Evaluation of an ORC-based micro-CHP System involving a Hermetic Scroll Expander, Université de Liège, ORC 2011 – First International Seminar on ORC Power Systems, Delft.
Paanu, T., Niemi, S., Rantanen, P. (2012). Waste Heat Recovery – Bottoming Cycle Alternatives, Proceedings of the University of Vaasa, Reports 175, ISBN 978–952–476–389–9, Vaasa.
Padilla, R., Archibold, A., Demirkaya, G., Besarati, S., Goswami, D., Rahman, M., Stefanakos, E. (2011). Performance Analysis of a Rankine-Goswami Combined Cycle, Proceedings of the ASME 2011 5th International Conference on Energy Sustainability, August 7-10, 2011, Washington, DC, USA.
Paepe, M., T‘Joen, C., Vierendeels, J., Degroote, J., Verbruggen, A., Lemort, Quoilin, S., Vanslambrouck, B., Stockman, K., Eetvelde, G., De Maeyer, J., Vanneste, S., Goethals, A., De Keyzer, R., Ionescu, C. (2012). The next generation Organic Rankine Cycles, IWT Vlaanderen, SBO call 2010-2011.
PCM – Presidência do Conselho de Ministros (2013), Council of Ministers Resolution No 20/2013, Diário da República, 1.ª série, 70 (2013) 2022-2091, Portugal. (PCM, 2013)
Peretti, I. (2008). Application of ORC Units in Sawmills. Technical-Economic Considerations, Turboden s.r.l., Brescia, Italy.
Powell, R. (2002). CFC phase-out: have we met the challenge?, Journal of Fluorine Chemistry 114 (2002) 237–250, Manchester, UK.
PP – Palladian Publications Ltd. (2011). Waste Heat Recovery Systems, worldcement.com.
PwC – PricewaterhouseCoopers (2012). APICER - Associação Portuguesa da Industria Cerâmica, Promoção do empreendedorismo e da criação de empresas com maior valor acrescentado, Portugal.
Quoilin, S., Declaye, S., Tchanche, B., Lemort, V. (2011). Thermo-Economic optimization of waste heat recovery Organic Rankine Cycles, Applied Thermal Engineering (2011), doi:10.1016/j.applthermaleng.2011.05.014.
Quoilin, S., Declaye, S., Legros, A., Guillaume, L., Lemort, V. (2012). Working fluid selection and operating maps for Organic Rankine Cycle expansion machines, International Compressor Engineering Conference at Purdue, July 16-19, 2012.
Quoilin, S., Van Den Broek, M., Declaye, S., Dewallef, P., Lemort, V. (2013). Techno-economic survey of Organic Rankine Cycle (ORC) systems, Renewable and Sustainable Energy Reviews 22 (2013) 168–186.
95
Quoilin, S. & Lemort, V. (2009). Technological and Economical Survey of Organic Rankine Cycle Systems, 5th European Conference Economics and Management of Energy in Industry, 14-17 April 2009, Vilamoura, Portugal.
Rettig, A., Lagler, M., Lamare, T., Li, S., Mahadea, V., McCallion, S., Chernushevich, J. (2011). Application of Organic Rankine Cycles (ORC), World Engineers‘ Convention, Geneva, 4-9 September, 2011.
REW – Renewable Energy World.com (2011). Capturing Waste Heat with Organic Rankine Cycle Systems, Texas, USA, http://www.renewableenergyworld.com/rea/news/article/2011/01/capturing-waste-heat-with-organic-rankine-cycle-systems, consulted last time 24th April 2014.
Roberto, B. & Enrico, M. (1996). Organic Rankine Cycle Turbogenerators for Combined Heat and Power Production from Biomass, 3rd Munich Discussion Meeting ―Energy Conversion from Biomass Fuels Current Trends and Future Systems‖, 22-23 October 1996, Munich, Germany.
Rossetti, N. (2010). Energy Intensive Industry list per sector, H-REII Annex 1, LIFE08 ENV/IT/000422.
Rowshanzadeh, R. Performance and cost evaluation of Organic Rankine Cycle at different technologies, Department Of Energy Technology, KTH, Sweden.
Saidur, R., Rezaei, M., Muzammil, W., Hassan, M., Hasanuzzaman, M. (2012). Technologies to recover exhaust heat from internal combustion engines, Renewable and Sustainable Energy Reviews 16 (2012) 5649–5659.
Saitoh, T., Yamada, N., Wakashima, S. (2007). Solar Rankine Cycle System Using Scroll Expander, DOI: 10.1299/jee.2.708, Japan.
Smith, I., Stosic, N., Aldis, C., Trilateral Flash Cycle System, a High Efficiency Power Plant for Liquid Resources, City University, London, ECIV OHB, UK.
SPIRE (2012). What is SPIRE, http://www.spire2030.eu/spire-vision/what-is-spire, consulted the last time on 20th April 2014.
Suldouro – Suldouro S.A. (2014). Pedido de informações - ORC caso de Sermonde - TESE de Mestrado, 23 April 201a, 10:00 a.m.
Tchanche, B., Lambrinos, Gr., Frangoudakis, A., Papadakis, G. (2011). Low-grade heat conversion into power using organic Rankine cycles – A review of various applications, Renewable and Sustainable Energy Reviews 15 (2011) 3963–3979.
The Engineering ToolBox, http://www.engineeringtoolbox.com/, consulted last time 19th December 2013.
Turboden – Turboden s.r.l. (2013). Form from general contacts page on turboden.com website - english version, 22 July 2013, 9:54 a.m.
Vankeirsbilck, I., Vanslambrouck, B., De Paepe, M. (2011). Organic Rankine Cycle as Efficient Alternative to Steam Cycle for Small Scale Power Generation, HEFAT2011, 8th International Conference on Heat Transfer, Fluid Mechanics and Thermodynamics 11 – 13 July 2011, Pointe Aux Piments, Mauritius.
Vescovo, R. (2009). ORC recovering industrial heat – power generation from waste energy streams, Turboden s.r.l., Brescia, Italy.
96
Walraven, D., Laene, B., D'haeseleer, W. (2012). Comparison of Thermodynamic Cycles for Power Production from Low-Temperature Geothermal Heat Sources, http://dx.doi.org/10.1016/j.enconman.2012.10.003.
Wang, H., Peterson, R., Harada, K., Miller, E., Ingram-Goble, R., Fisher, L., Yih, J., Ward, C. (2010). Performance of a Combined Organic Rankine Cycle and Vapor Compression Cycle for Heat Activated Cooling, Oregon State University, USA.
Wang, Z.Q., Zhou, N.J., Guo, J., Wang, X.Y. (2012). Fluid selection and parametric optimization of organic Rankine cycle using low temperature waste heat, Energy 40 (2012) 107-115, China.
Weisse, J. (2010). Thermoelectric Generators, Stanford University, http://large.stanford.edu/courses/2010/ph240/weisse1/, consulted last time 23rd April 2014.
Worrel, E., Galitsky, C., Masanet, E., Graus, W. (2008). Energy Efficiency Improvement and Cost Saving Opportunities for the Glass Industry, LBNL-57335-Revision, University of California, Berkeley.
Zyhowski, G., Brown, A., Achaichia, A. (2010). HFC-245fa Working Fluid in Organic Rankine Cycle - A Safe and Economic Way to Generate Electricity from Waste Heat, 23rd International Conference on Efficiency, Cost, Optimization, Simulation and Environmental Impact of Energy, 14-17th june 2010, Lausanne, Switzerland.
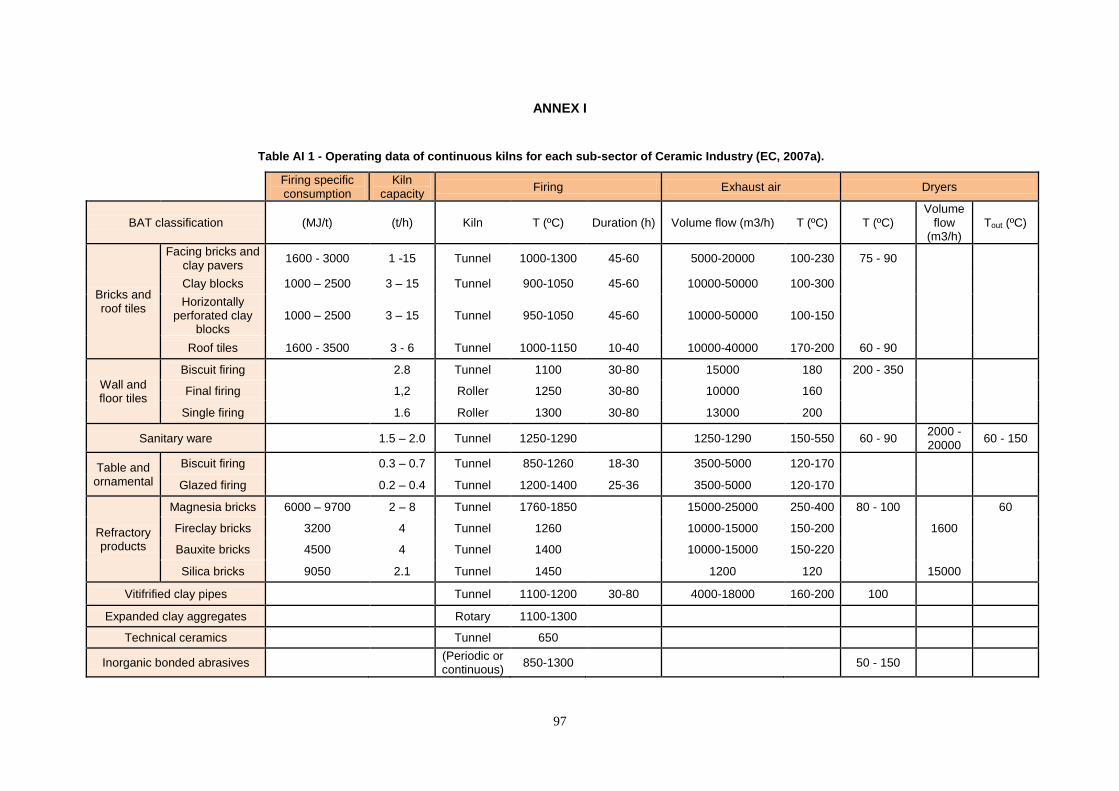
97
ANNEX I
Table AI 1 - Operating data of continuous kilns for each sub-sector of Ceramic Industry (EC, 2007a).
Firing specific consumption
Kiln capacity
Firing Exhaust air Dryers
BAT classification (MJ/t) (t/h) Kiln T (ºC) Duration (h) Volume flow (m3/h) T (ºC) T (ºC) Volume
flow (m3/h)
Tout (ºC)
Bricks and roof tiles
Facing bricks and clay pavers
1600 - 3000 1 -15 Tunnel 1000-1300 45-60 5000-20000 100-230 75 - 90
Clay blocks 1000 – 2500 3 – 15 Tunnel 900-1050 45-60 10000-50000 100-300
Horizontally perforated clay
blocks 1000 – 2500 3 – 15 Tunnel 950-1050 45-60 10000-50000 100-150
Roof tiles 1600 - 3500 3 - 6 Tunnel 1000-1150 10-40 10000-40000 170-200 60 - 90
Wall and floor tiles
Biscuit firing 2.8 Tunnel 1100 30-80 15000 180 200 - 350
Final firing 1,2 Roller 1250 30-80 10000 160
Single firing 1.6 Roller 1300 30-80 13000 200
Sanitary ware 1.5 – 2.0 Tunnel 1250-1290
1250-1290 150-550 60 - 90 2000 - 20000
60 - 150
Table and ornamental
Biscuit firing 0.3 – 0.7 Tunnel 850-1260 18-30 3500-5000 120-170
Glazed firing 0.2 – 0.4 Tunnel 1200-1400 25-36 3500-5000 120-170
Refractory products
Magnesia bricks 6000 – 9700 2 – 8 Tunnel 1760-1850
15000-25000 250-400 80 - 100 60
Fireclay bricks 3200 4 Tunnel 1260
10000-15000 150-200 1600
Bauxite bricks 4500 4 Tunnel 1400
10000-15000 150-220
Silica bricks 9050 2.1 Tunnel 1450
1200 120 15000
Vitifrified clay pipes Tunnel 1100-1200 30-80 4000-18000 160-200 100
Expanded clay aggregates Rotary 1100-1300
Technical ceramics Tunnel 650
Inorganic bonded abrasives (Periodic or continuous)
850-1300
50 - 150
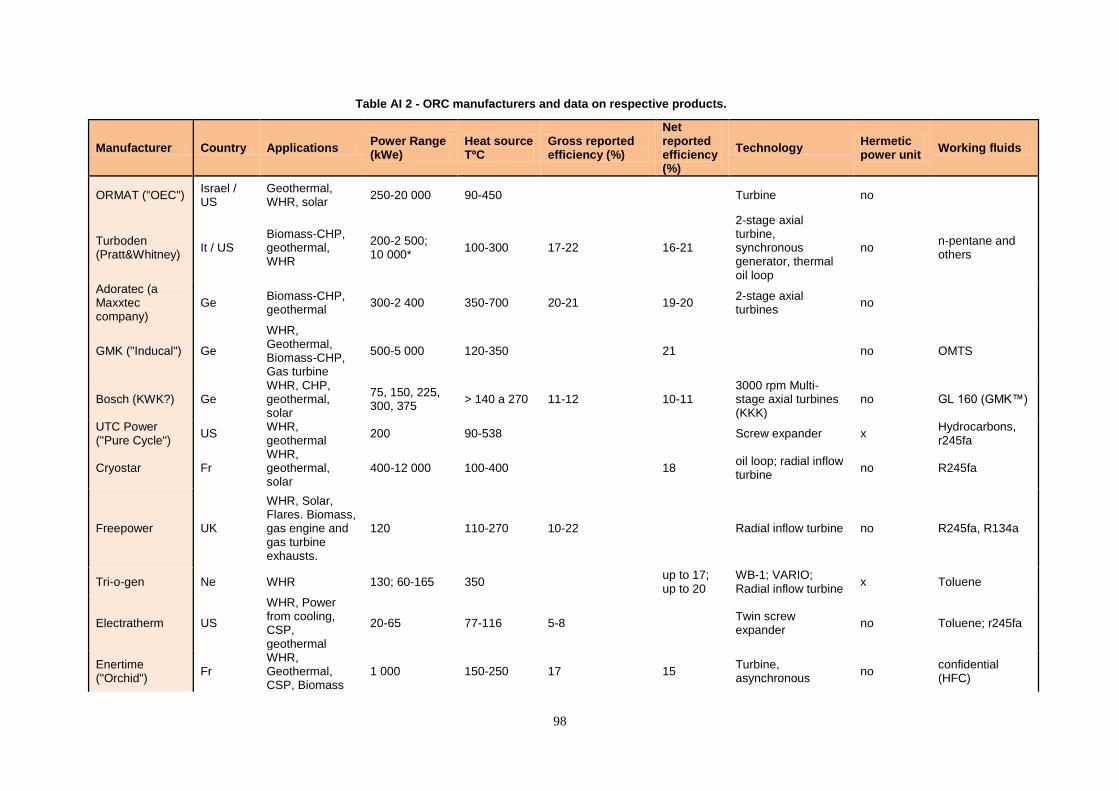
98
Table AI 2 - ORC manufacturers and data on respective products.
Manufacturer Country Applications Power Range (kWe)
Heat source TºC
Gross reported efficiency (%)
Net reported efficiency (%)
Technology Hermetic power unit
Working fluids
ORMAT ("OEC") Israel / US
Geothermal, WHR, solar
250-20 000 90-450
Turbine no
Turboden (Pratt&Whitney)
It / US Biomass-CHP, geothermal, WHR
200-2 500; 10 000*
100-300 17-22 16-21
2-stage axial turbine, synchronous generator, thermal oil loop
no n-pentane and others
Adoratec (a Maxxtec company)
Ge Biomass-CHP, geothermal
300-2 400 350-700 20-21 19-20 2-stage axial turbines
no
GMK ("Inducal") Ge
WHR, Geothermal, Biomass-CHP, Gas turbine
500-5 000 120-350 21
no OMTS
Bosch (KWK?) Ge WHR, CHP, geothermal, solar
75, 150, 225, 300, 375
> 140 a 270 11-12 10-11 3000 rpm Multi-stage axial turbines (KKK)
no GL 160 (GMK™)
UTC Power ("Pure Cycle")
US WHR, geothermal
200 90-538
Screw expander x Hydrocarbons, r245fa
Cryostar Fr WHR, geothermal, solar
400-12 000 100-400 18 oil loop; radial inflow turbine
no R245fa
Freepower UK
WHR, Solar, Flares. Biomass, gas engine and gas turbine exhausts.
120 110-270 10-22
Radial inflow turbine no R245fa, R134a
Tri-o-gen Ne WHR 130; 60-165 350
up to 17; up to 20
WB-1; VARIO; Radial inflow turbine
x Toluene
Electratherm US
WHR, Power from cooling, CSP, geothermal
20-65 77-116 5-8
Twin screw expander
no Toluene; r245fa
Enertime ("Orchid")
Fr WHR, Geothermal, CSP, Biomass
1 000 150-250 17 15 Turbine, asynchronous
no confidential (HFC)
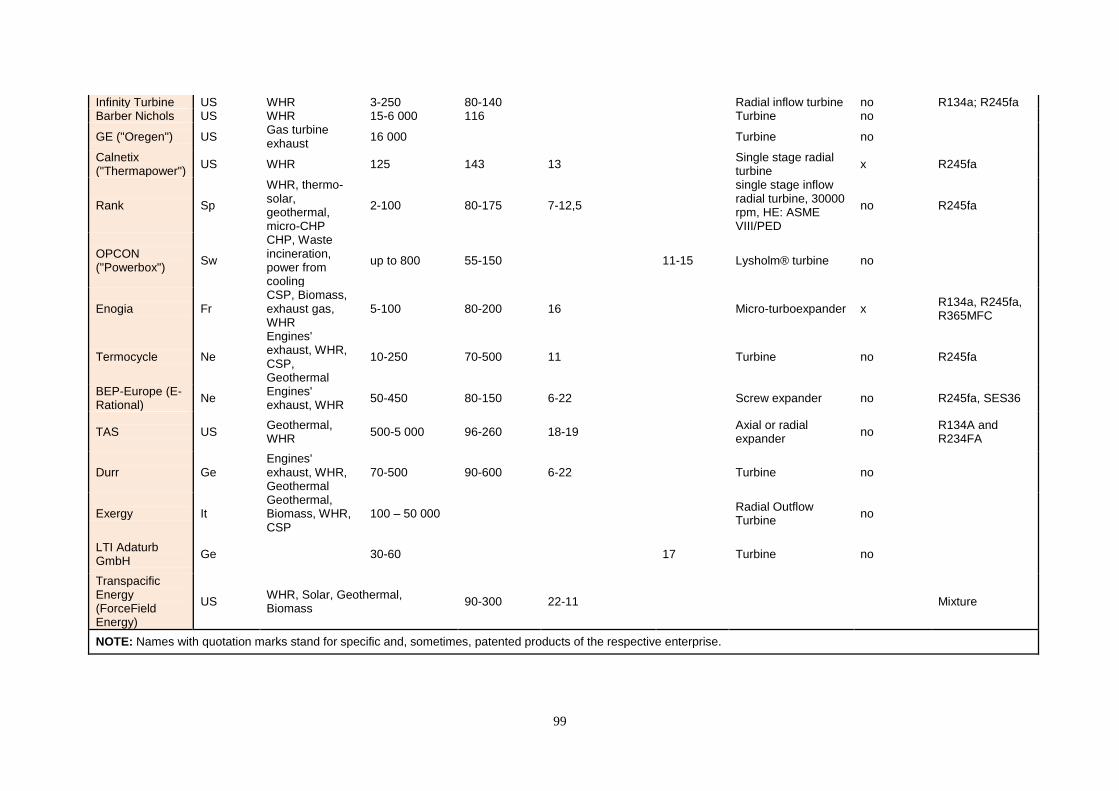
99
Infinity Turbine US WHR 3-250 80-140
Radial inflow turbine no R134a; R245fa Barber Nichols US WHR 15-6 000 116
Turbine no
GE ("Oregen") US
Gas turbine exhaust
16 000
Turbine no
Calnetix ("Thermapower")
US WHR 125 143 13
Single stage radial turbine
x R245fa
Rank Sp
WHR, thermo-solar, geothermal, micro-CHP
2-100 80-175 7-12,5
single stage inflow radial turbine, 30000 rpm, HE: ASME VIII/PED
no R245fa
OPCON ("Powerbox")
Sw
CHP, Waste incineration, power from cooling
up to 800 55-150
11-15 Lysholm® turbine no
Enogia Fr CSP, Biomass, exhaust gas, WHR
5-100 80-200 16
Micro-turboexpander x R134a, R245fa, R365MFC
Termocycle Ne
Engines' exhaust, WHR, CSP, Geothermal
10-250 70-500 11
Turbine no R245fa
BEP-Europe (E-Rational)
Ne Engines' exhaust, WHR
50-450 80-150 6-22
Screw expander no R245fa, SES36
TAS US Geothermal, WHR
500-5 000 96-260 18-19
Axial or radial expander
no R134A and R234FA
Durr Ge Engines' exhaust, WHR, Geothermal
70-500 90-600 6-22
Turbine no
Exergy It Geothermal, Biomass, WHR, CSP
100 – 50 000 Radial Outflow Turbine
no
LTI Adaturb GmbH
Ge
30-60
17 Turbine no
Transpacific Energy (ForceField Energy)
US WHR, Solar, Geothermal, Biomass
90-300 22-11
Mixture
NOTE: Names with quotation marks stand for specific and, sometimes, patented products of the respective enterprise.
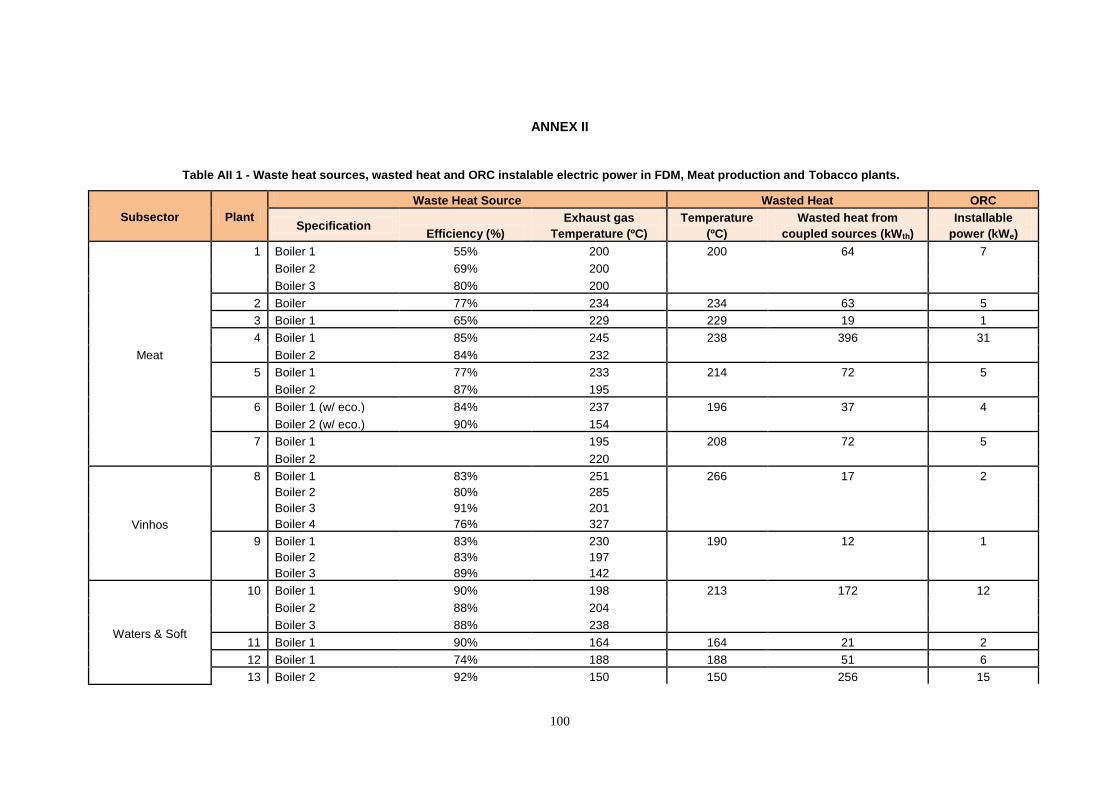
100
ANNEX II
Table AII 1 - Waste heat sources, wasted heat and ORC instalable electric power in FDM, Meat production and Tobacco plants.
Subsector Plant
Waste Heat Source Wasted Heat ORC
Specification Efficiency (%)
Exhaust gas
Temperature (ºC)
Temperature
(ºC)
Wasted heat from
coupled sources (kWth)
Installable
power (kWe)
Meat
1 Boiler 1 55% 200 200 64 7
Boiler 2 69% 200
Boiler 3 80% 200
2 Boiler 77% 234 234 63 5
3 Boiler 1 65% 229 229 19 1
4 Boiler 1 85% 245 238 396 31
Boiler 2 84% 232
5 Boiler 1 77% 233 214 72 5
Boiler 2 87% 195
6 Boiler 1 (w/ eco.) 84% 237 196 37 4
Boiler 2 (w/ eco.) 90% 154
7 Boiler 1
195 208 72 5
Boiler 2
220
Vinhos
8 Boiler 1 83% 251 266 17 2
Boiler 2 80% 285
Boiler 3 91% 201
Boiler 4 76% 327
9 Boiler 1 83% 230 190 12 1
Boiler 2 83% 197
Boiler 3 89% 142
Waters & Soft
10 Boiler 1 90% 198 213 172 12
Boiler 2 88% 204
Boiler 3 88% 238
11 Boiler 1 90% 164 164 21 2
12 Boiler 1 74% 188 188 51 6
13 Boiler 2 92% 150 150 256 15
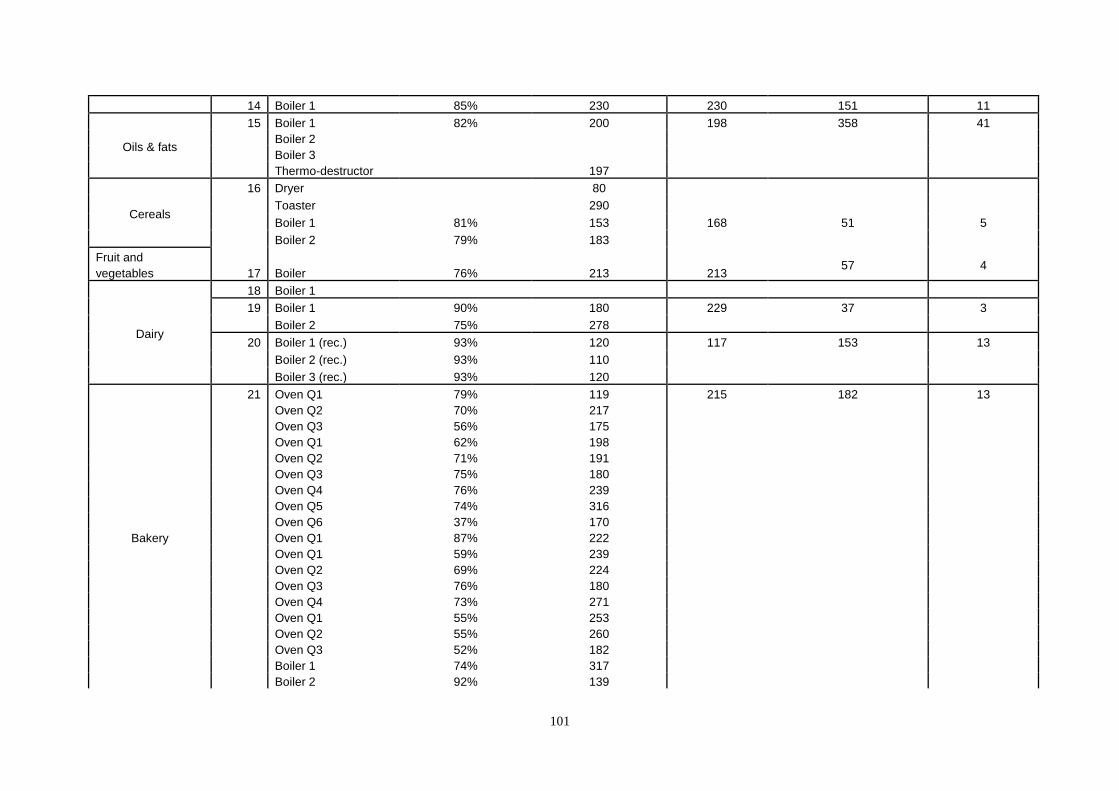
101
14 Boiler 1 85% 230 230 151 11
Oils & fats
15 Boiler 1 82% 200 198 358 41
Boiler 2
Boiler 3
Thermo-destructor 197
Cereals
16 Dryer
80
Toaster
290
Boiler 1 81% 153 168 51 5
Boiler 2 79% 183
Fruit and
vegetables 17 Boiler 76% 213 213 57 4
Dairy
18 Boiler 1
19 Boiler 1 90% 180 229 37 3
Boiler 2 75% 278
20 Boiler 1 (rec.) 93% 120 117 153 13
Boiler 2 (rec.) 93% 110
Boiler 3 (rec.) 93% 120
Bakery
21 Oven Q1 79% 119 215 182 13
Oven Q2 70% 217
Oven Q3 56% 175
Oven Q1 62% 198
Oven Q2 71% 191
Oven Q3 75% 180
Oven Q4 76% 239
Oven Q5 74% 316
Oven Q6 37% 170
Oven Q1 87% 222
Oven Q1 59% 239
Oven Q2 69% 224
Oven Q3 76% 180
Oven Q4 73% 271
Oven Q1 55% 253
Oven Q2 55% 260
Oven Q3 52% 182
Boiler 1 74% 317
Boiler 2 92% 139
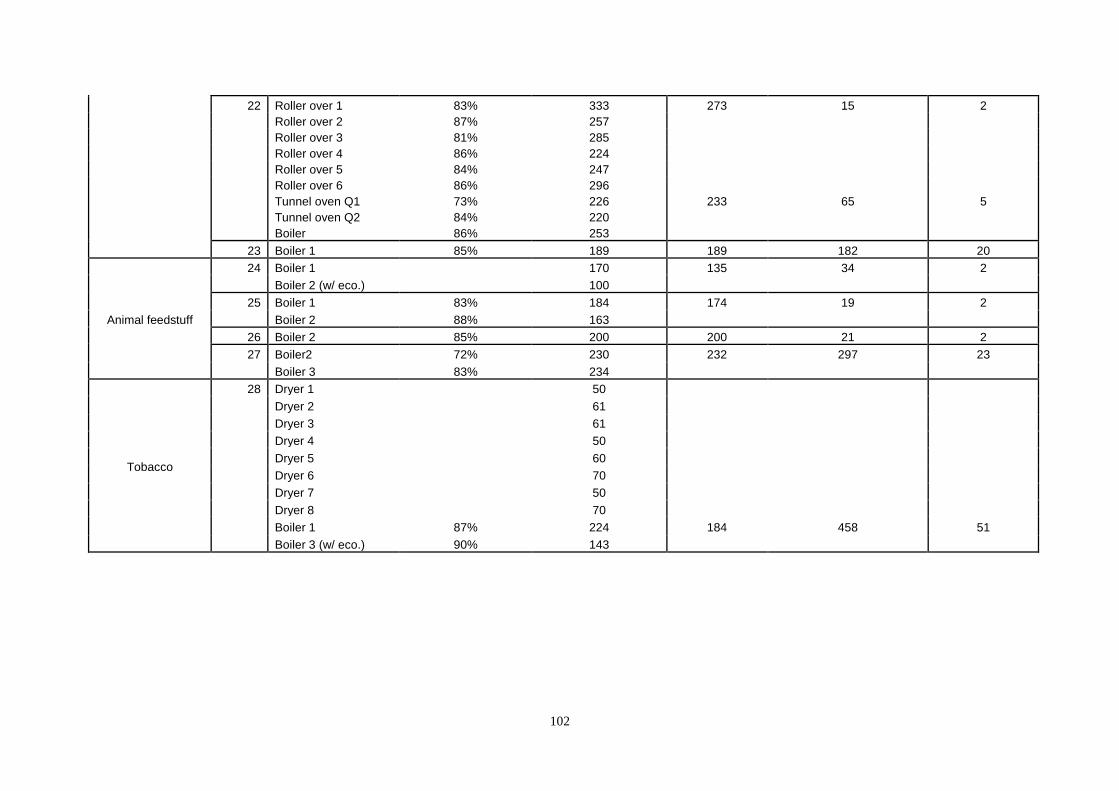
102
22 Roller over 1 83% 333 273 15 2
Roller over 2 87% 257
Roller over 3 81% 285
Roller over 4 86% 224
Roller over 5 84% 247
Roller over 6 86% 296
Tunnel oven Q1 73% 226 233 65 5
Tunnel oven Q2 84% 220
Boiler 86% 253
23 Boiler 1 85% 189 189 182 20
Animal feedstuff
24 Boiler 1
170 135 34 2
Boiler 2 (w/ eco.) 100
25 Boiler 1 83% 184 174 19 2
Boiler 2 88% 163
26 Boiler 2 85% 200 200 21 2
27 Boiler2 72% 230 232 297 23
Boiler 3 83% 234
Tobacco
28 Dryer 1
50
Dryer 2
61
Dryer 3
61
Dryer 4
50
Dryer 5
60
Dryer 6
70
Dryer 7
50
Dryer 8
70
Boiler 1 87% 224 184 458 51
Boiler 3 (w/ eco.) 90% 143
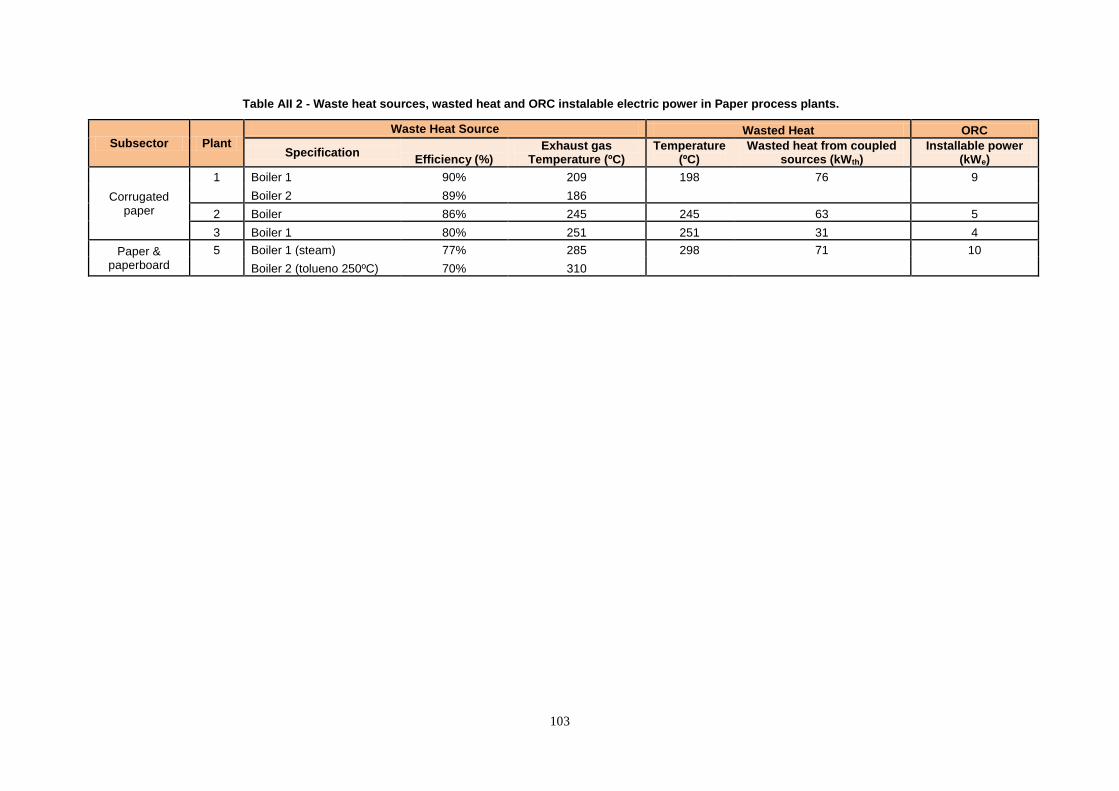
103
Table AII 2 - Waste heat sources, wasted heat and ORC instalable electric power in Paper process plants.
Subsector Plant
Waste Heat Source Wasted Heat ORC
Specification Efficiency (%)
Exhaust gas Temperature (ºC)
Temperature (ºC)
Wasted heat from coupled sources (kWth)
Installable power (kWe)
Corrugated paper
1 Boiler 1 90% 209 198 76 9
Boiler 2 89% 186
2 Boiler 86% 245 245 63 5
3 Boiler 1 80% 251 251 31 4
Paper & paperboard
5 Boiler 1 (steam) 77% 285 298 71 10
Boiler 2 (tolueno 250ºC) 70% 310
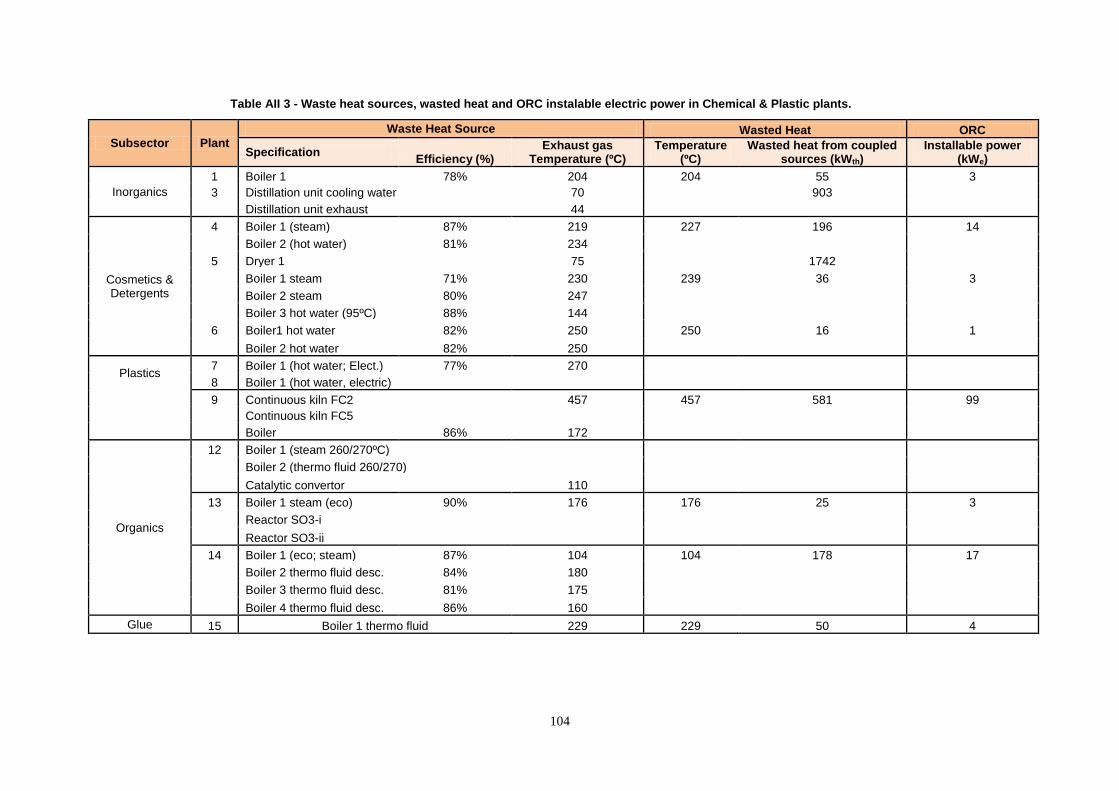
104
Table AII 3 - Waste heat sources, wasted heat and ORC instalable electric power in Chemical & Plastic plants.
Subsector Plant
Waste Heat Source Wasted Heat ORC
Specification Efficiency (%)
Exhaust gas Temperature (ºC)
Temperature (ºC)
Wasted heat from coupled sources (kWth)
Installable power (kWe)
Inorganics
1 Boiler 1 78% 204 204 55 3
3 Distillation unit cooling water 70
903
Distillation unit exhaust 44
Cosmetics & Detergents
4 Boiler 1 (steam) 87% 219 227 196 14
Boiler 2 (hot water) 81% 234
5 Dryer 1
75
1742
Boiler 1 steam 71% 230 239 36 3
Boiler 2 steam 80% 247
Boiler 3 hot water (95ºC) 88% 144
6 Boiler1 hot water 82% 250 250 16 1
Boiler 2 hot water 82% 250
Plastics
7 Boiler 1 (hot water; Elect.) 77% 270 8 Boiler 1 (hot water, electric)
9 Continuous kiln FC2 457 457 581 99
Continuous kiln FC5
Boiler 86% 172
Organics
12 Boiler 1 (steam 260/270ºC)
Boiler 2 (thermo fluid 260/270)
Catalytic convertor 110
13 Boiler 1 steam (eco) 90% 176 176 25 3
Reactor SO3-i
Reactor SO3-ii
14 Boiler 1 (eco; steam) 87% 104 104 178 17
Boiler 2 thermo fluid desc. 84% 180
Boiler 3 thermo fluid desc. 81% 175
Boiler 4 thermo fluid desc. 86% 160
Glue 15 Boiler 1 thermo fluid 229 229 50 4
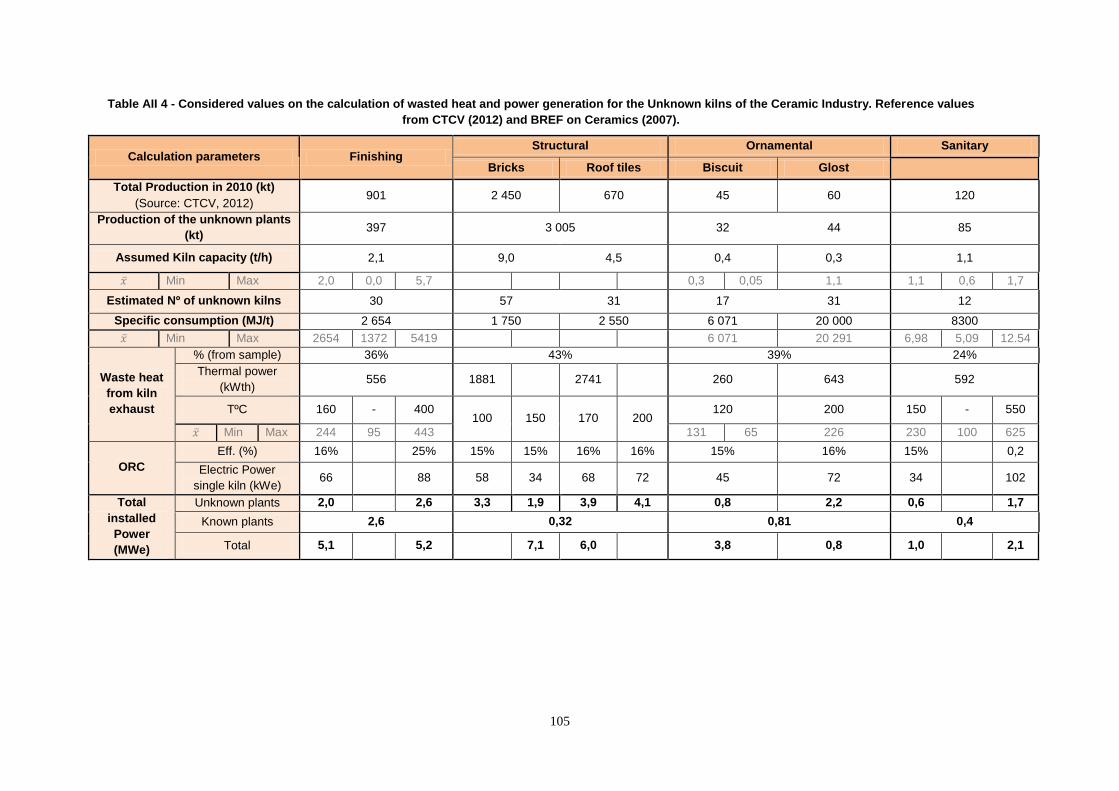
105
Table AII 4 - Considered values on the calculation of wasted heat and power generation for the Unknown kilns of the Ceramic Industry. Reference values
from CTCV (2012) and BREF on Ceramics (2007).
Calculation parameters Finishing Structural Ornamental Sanitary
Bricks Roof tiles Biscuit Glost
Total Production in 2010 (kt)
(Source: CTCV, 2012) 901 2 450 670 45 60 120
Production of the unknown plants
(kt) 397 3 005 32 44 85
Assumed Kiln capacity (t/h) 2,1 9,0 4,5 0,4 0,3 1,1
Min Max 2,0 0,0 5,7
0,3 0,05 1,1 1,1 0,6 1,7
Estimated Nº of unknown kilns 30 57 31 17 31 12
Specific consumption (MJ/t) 2 654 1 750 2 550 6 071 20 000 8300
Min Max 2654 1372 5419
6 071 20 291 6,98 5,09 12.54
Waste heat
from kiln
exhaust
% (from sample) 36% 43% 39% 24%
Thermal power
(kWth) 556 1881
2741
260 643 592
TºC 160 - 400 100 150 170 200
120 200 150 - 550
Min Max 244 95 443 131 65 226 230 100 625
ORC
Eff. (%) 16%
25% 15% 15% 16% 16% 15% 16% 15%
0,2
Electric Power
single kiln (kWe) 66
88 58 34 68 72 45 72 34
102
Total
installed
Power
(MWe)
Unknown plants 2,0
2,6 3,3 1,9 3,9 4,1 0,8 2,2 0,6
1,7
Known plants 2,6 0,32 0,81 0,4
Total 5,1
5,2
7,1 6,0
3,8 0,8 1,0
2,1
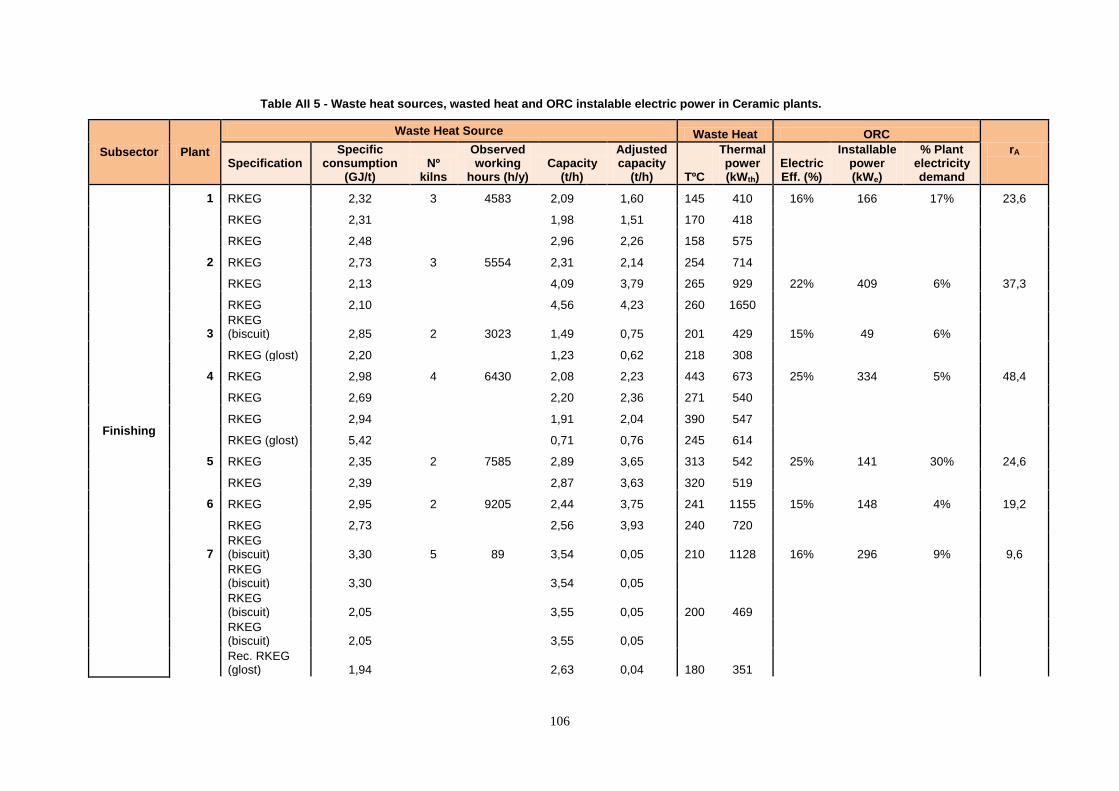
106
Table AII 5 - Waste heat sources, wasted heat and ORC instalable electric power in Ceramic plants.
Subsector Plant
Waste Heat Source Waste Heat ORC
rA
Specification Specific
consumption (GJ/t)
Nº kilns
Observed working
hours (h/y) Capacity
(t/h)
Adjusted capacity
(t/h) TºC
Thermal power (kWth)
Electric Eff. (%)
Installable power (kWe)
% Plant electricity demand
Finishing
1 RKEG 2,32 3 4583 2,09 1,60 145 410 16% 166 17% 23,6
RKEG 2,31
1,98 1,51 170 418
RKEG 2,48
2,96 2,26 158 575
2 RKEG 2,73 3 5554 2,31 2,14 254 714
RKEG 2,13
4,09 3,79 265 929 22% 409 6% 37,3
RKEG 2,10
4,56 4,23 260 1650
3 RKEG (biscuit) 2,85 2 3023 1,49 0,75 201 429 15% 49 6%
RKEG (glost) 2,20
1,23 0,62 218 308
4 RKEG 2,98 4 6430 2,08 2,23 443 673 25% 334 5% 48,4
RKEG 2,69
2,20 2,36 271 540
RKEG 2,94
1,91 2,04 390 547
RKEG (glost) 5,42
0,71 0,76 245 614
5 RKEG 2,35 2 7585 2,89 3,65 313 542 25% 141 30% 24,6
RKEG 2,39
2,87 3,63 320 519
6 RKEG 2,95 2 9205 2,44 3,75 241 1155 15% 148 4% 19,2
RKEG 2,73
2,56 3,93 240 720
7 RKEG (biscuit) 3,30 5 89 3,54 0,05 210 1128 16% 296 9% 9,6
RKEG (biscuit) 3,30
3,54 0,05
RKEG (biscuit) 2,05
3,55 0,05 200 469
RKEG (biscuit) 2,05
3,55 0,05
Rec. RKEG (glost) 1,94
2,63 0,04 180 351
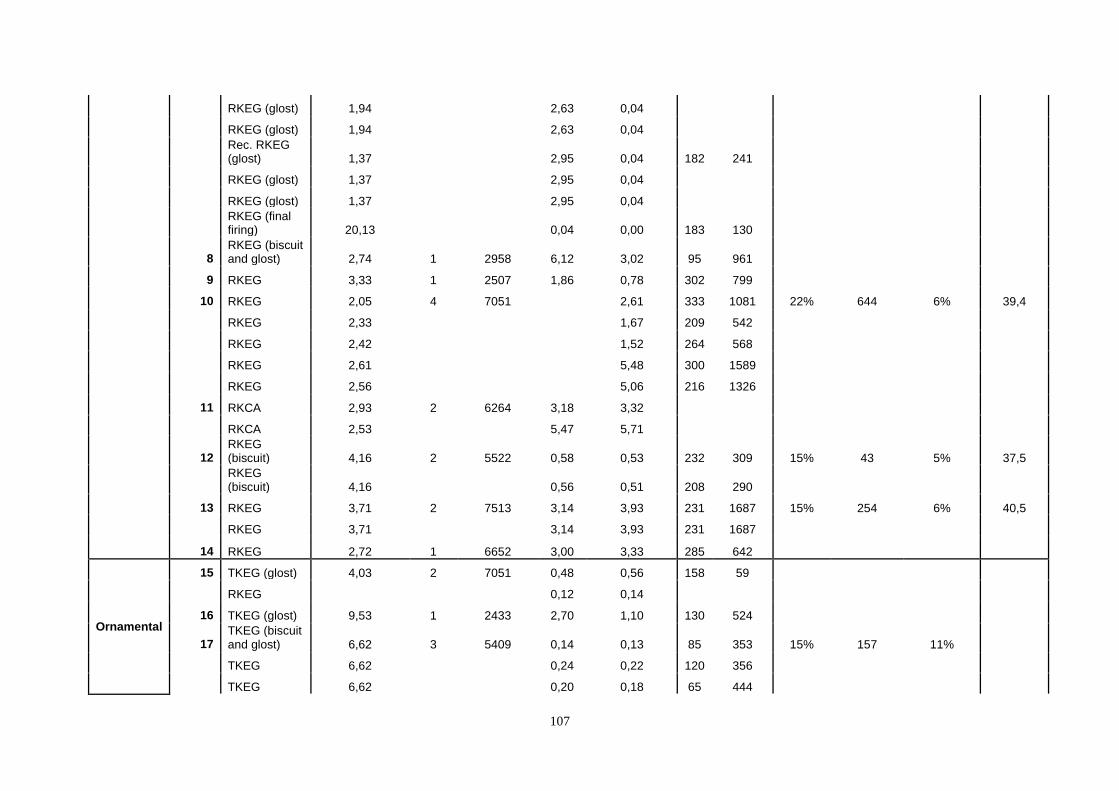
107
RKEG (glost) 1,94
2,63 0,04
RKEG (glost) 1,94
2,63 0,04
Rec. RKEG (glost) 1,37
2,95 0,04 182 241
RKEG (glost) 1,37
2,95 0,04
RKEG (glost) 1,37
2,95 0,04
RKEG (final firing) 20,13
0,04 0,00 183 130
8 RKEG (biscuit and glost) 2,74 1 2958 6,12 3,02 95 961
9 RKEG 3,33 1 2507 1,86 0,78 302 799
10 RKEG 2,05 4 7051
2,61 333 1081 22% 644 6% 39,4
RKEG 2,33
1,67 209 542
RKEG 2,42
1,52 264 568
RKEG 2,61
5,48 300 1589
RKEG 2,56
5,06 216 1326
11 RKCA 2,93 2 6264 3,18 3,32
RKCA 2,53
5,47 5,71
12 RKEG (biscuit) 4,16 2 5522 0,58 0,53 232 309 15% 43 5% 37,5
RKEG (biscuit) 4,16
0,56 0,51 208 290
13 RKEG 3,71 2 7513 3,14 3,93 231 1687 15% 254 6% 40,5
RKEG 3,71
3,14 3,93 231 1687
14 RKEG 2,72 1 6652 3,00 3,33 285 642
Ornamental
15 TKEG (glost) 4,03 2 7051 0,48 0,56 158 59
RKEG
0,12 0,14
16 TKEG (glost) 9,53 1 2433 2,70 1,10 130 524
17 TKEG (biscuit and glost) 6,62 3 5409 0,14 0,13 85 353 15% 157 11%
TKEG 6,62
0,24 0,22 120 356
TKEG 6,62
0,20 0,18 65 444
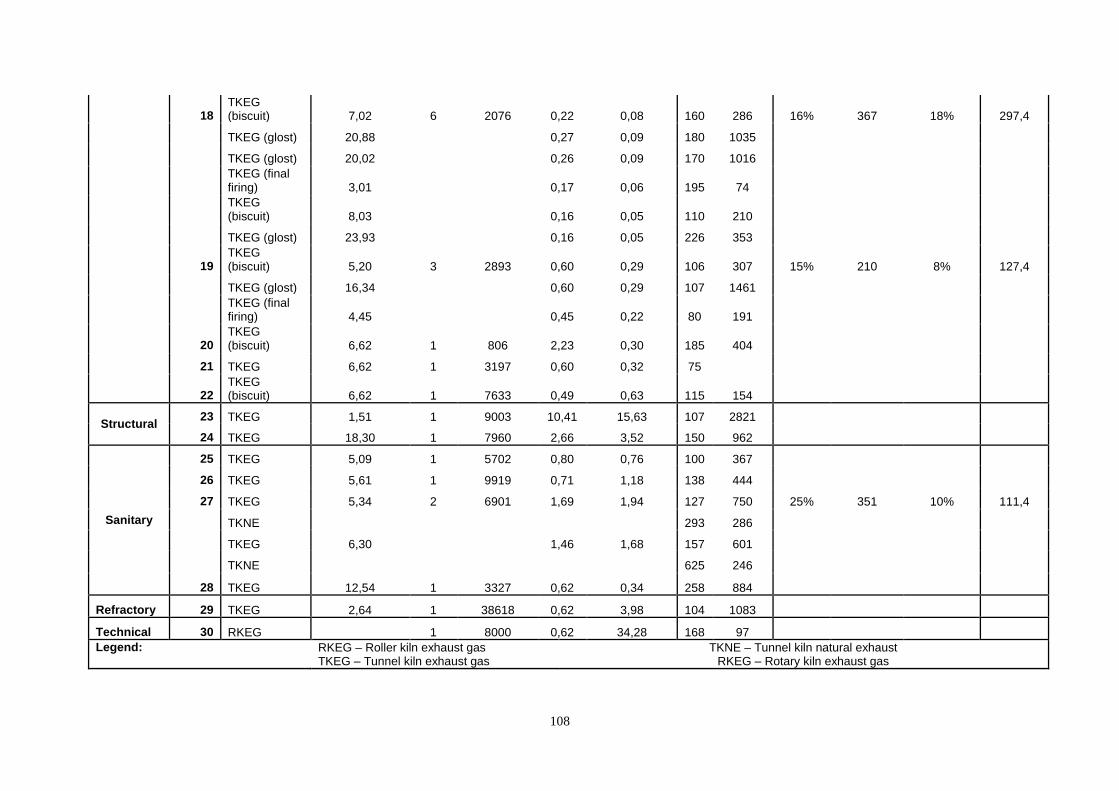
108
18 TKEG (biscuit) 7,02 6 2076 0,22 0,08 160 286 16% 367 18% 297,4
TKEG (glost) 20,88
0,27 0,09 180 1035
TKEG (glost) 20,02
0,26 0,09 170 1016
TKEG (final firing) 3,01
0,17 0,06 195 74
TKEG (biscuit) 8,03
0,16 0,05 110 210
TKEG (glost) 23,93
0,16 0,05 226 353
19 TKEG (biscuit) 5,20 3 2893 0,60 0,29 106 307 15% 210 8% 127,4
TKEG (glost) 16,34
0,60 0,29 107 1461
TKEG (final firing) 4,45
0,45 0,22 80 191
20 TKEG (biscuit) 6,62 1 806 2,23 0,30 185 404
21 TKEG 6,62 1 3197 0,60 0,32 75
22 TKEG (biscuit) 6,62 1 7633 0,49 0,63 115 154
Structural 23 TKEG 1,51 1 9003 10,41 15,63 107 2821
24 TKEG 18,30 1 7960 2,66 3,52 150 962
Sanitary
25 TKEG 5,09 1 5702 0,80 0,76 100 367
26 TKEG 5,61 1 9919 0,71 1,18 138 444
27 TKEG 5,34 2 6901 1,69 1,94 127 750 25% 351 10% 111,4
TKNE
293 286
TKEG 6,30
1,46 1,68 157 601
TKNE
625 246
28 TKEG 12,54 1 3327 0,62 0,34 258 884
Refractory 29 TKEG 2,64 1 38618 0,62 3,98 104 1083
Technical 30 RKEG
1 8000 0,62 34,28 168 97 Legend:
RKEG – Roller kiln exhaust gas TKEG – Tunnel kiln exhaust gas
TKNE – Tunnel kiln natural exhaust RKEG – Rotary kiln exhaust gas
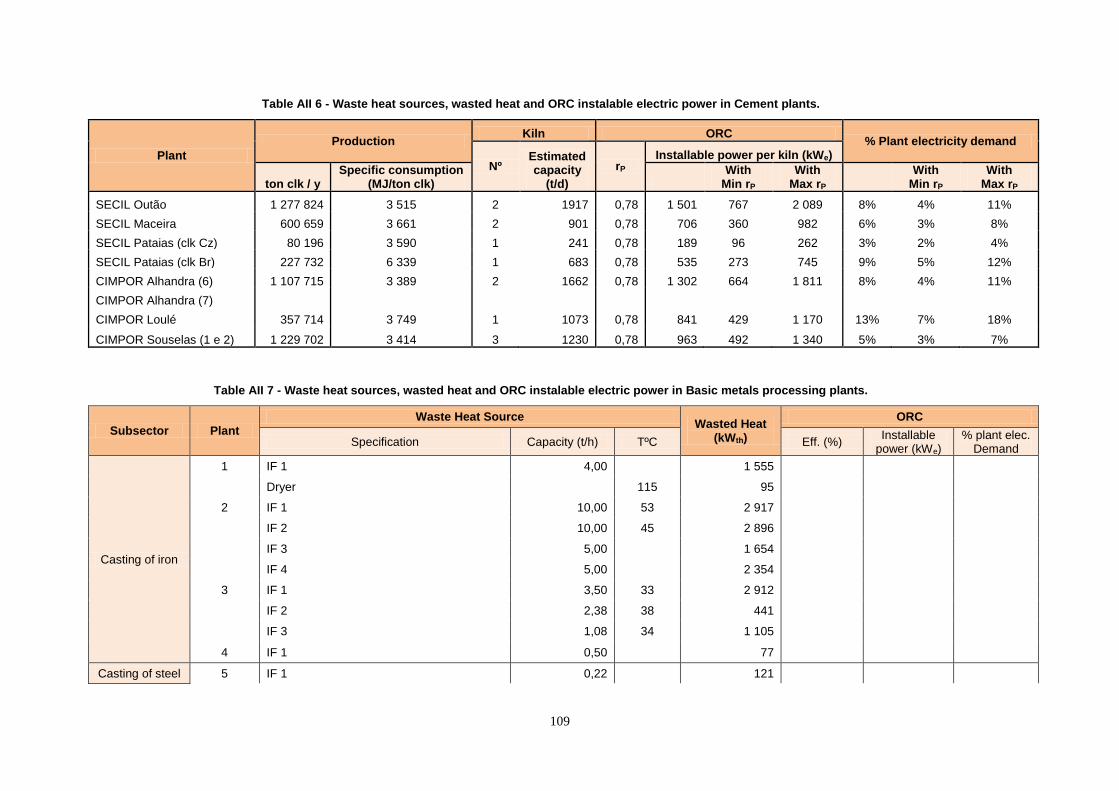
109
Table AII 6 - Waste heat sources, wasted heat and ORC instalable electric power in Cement plants.
Plant
Production Kiln ORC
% Plant electricity demand
Nº Estimated capacity
(t/d)
rP Installable power per kiln (kWe)
ton clk / y Specific consumption
(MJ/ton clk) With
Min rP With
Max rP
With Min rP
With Max rP
SECIL Outão 1 277 824 3 515 2 1917 0,78 1 501 767 2 089 8% 4% 11%
SECIL Maceira 600 659 3 661 2 901 0,78 706 360 982 6% 3% 8%
SECIL Pataias (clk Cz) 80 196 3 590 1 241 0,78 189 96 262 3% 2% 4%
SECIL Pataias (clk Br) 227 732 6 339 1 683 0,78 535 273 745 9% 5% 12%
CIMPOR Alhandra (6) 1 107 715 3 389 2 1662 0,78 1 302 664 1 811 8% 4% 11%
CIMPOR Alhandra (7)
CIMPOR Loulé 357 714 3 749 1 1073 0,78 841 429 1 170 13% 7% 18%
CIMPOR Souselas (1 e 2) 1 229 702 3 414 3 1230 0,78 963 492 1 340 5% 3% 7%
Table AII 7 - Waste heat sources, wasted heat and ORC instalable electric power in Basic metals processing plants.
Subsector Plant
Waste Heat Source Wasted Heat
(kWth)
ORC
Specification Capacity (t/h) TºC Eff. (%) Installable
power (kWe) % plant elec.
Demand
Casting of iron
1 IF 1 4,00
1 555
Dryer 115 95
2 IF 1 10,00 53 2 917
IF 2 10,00 45 2 896
IF 3 5,00
1 654
IF 4 5,00
2 354
3 IF 1 3,50 33 2 912
IF 2 2,38 38 441
IF 3 1,08 34 1 105
4 IF 1 0,50
77
Casting of steel 5 IF 1 0,22
121
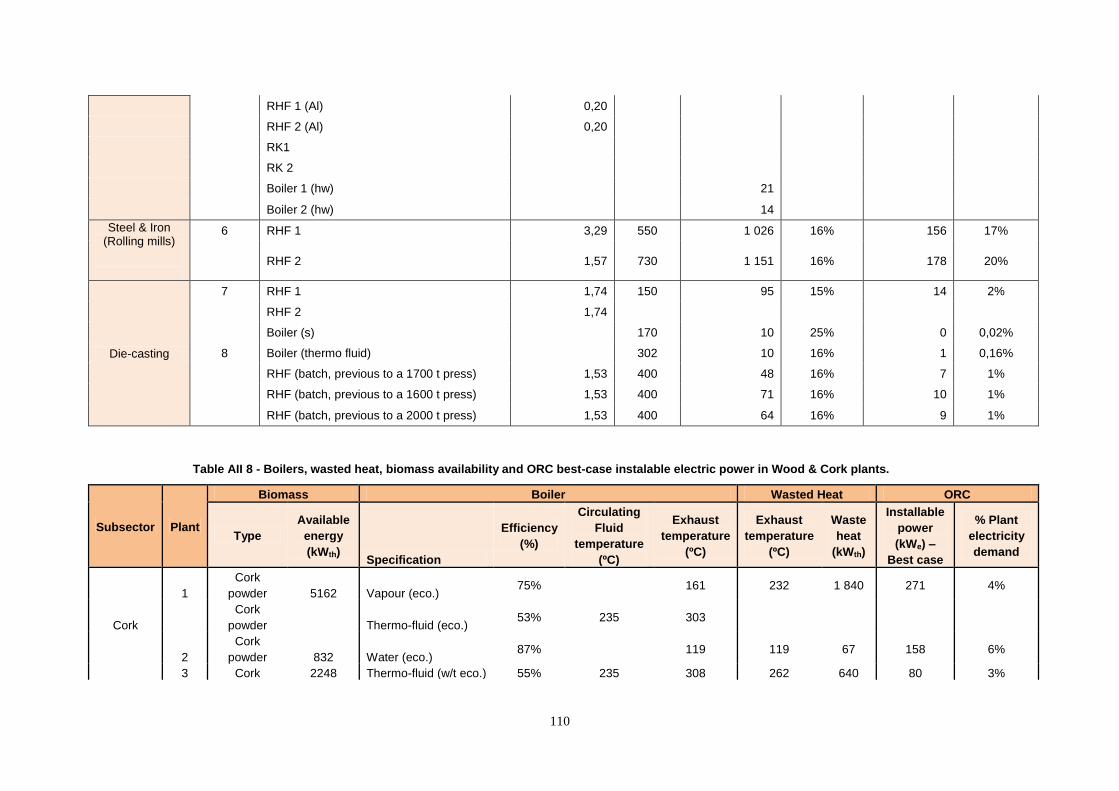
110
RHF 1 (Al) 0,20
RHF 2 (Al) 0,20
RK1
RK 2
Boiler 1 (hw)
21
Boiler 2 (hw)
14
Steel & Iron
(Rolling mills)
6 RHF 1 3,29 550 1 026 16% 156 17%
RHF 2 1,57 730 1 151 16% 178 20%
Die-casting
7 RHF 1 1,74 150 95 15% 14 2%
RHF 2 1,74
Boiler (s) 170 10 25% 0 0,02%
8 Boiler (thermo fluid) 302 10 16% 1 0,16%
RHF (batch, previous to a 1700 t press) 1,53 400 48 16% 7 1%
RHF (batch, previous to a 1600 t press) 1,53 400 71 16% 10 1%
RHF (batch, previous to a 2000 t press) 1,53 400 64 16% 9 1%
Table AII 8 - Boilers, wasted heat, biomass availability and ORC best-case instalable electric power in Wood & Cork plants.
Subsector Plant
Biomass Boiler Wasted Heat ORC
Type
Available
energy
(kWth) Specification
Efficiency
(%)
Circulating
Fluid
temperature
(ºC)
Exhaust
temperature
(ºC)
Exhaust
temperature
(ºC)
Waste
heat
(kWth)
Installable
power
(kWe) –
Best case
% Plant
electricity
demand
Cork
1
Cork
powder 5162 Vapour (eco.) 75%
161 232 1 840 271 4%
Cork
powder
Thermo-fluid (eco.) 53% 235 303
2
Cork
powder 832 Water (eco.) 87%
119 119 67 158 6%
3 Cork 2248 Thermo-fluid (w/t eco.) 55% 235 308 262 640 80 3%
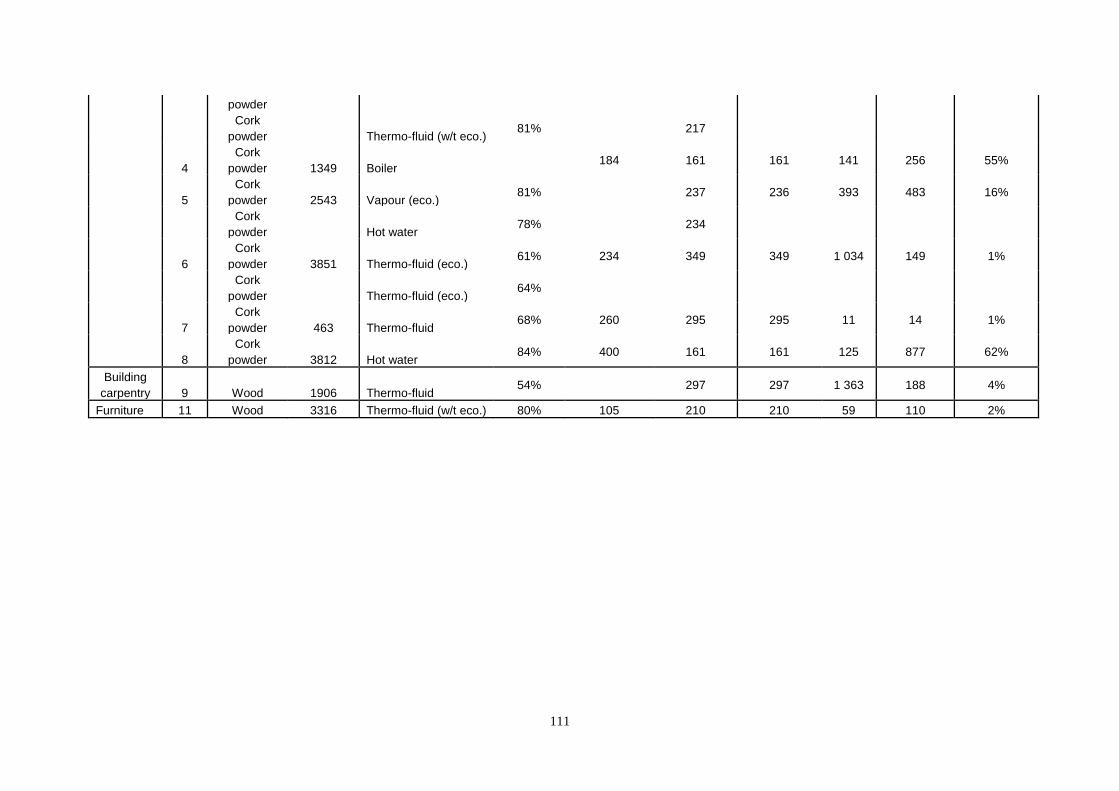
111
powder
Cork
powder
Thermo-fluid (w/t eco.) 81%
217
4
Cork
powder 1349 Boiler 184 161 161 141 256 55%
5
Cork
powder 2543 Vapour (eco.) 81%
237 236 393 483 16%
Cork
powder
Hot water 78%
234
6
Cork
powder 3851 Thermo-fluid (eco.) 61% 234 349 349 1 034 149 1%
Cork
powder
Thermo-fluid (eco.) 64%
7
Cork
powder 463 Thermo-fluid 68% 260 295 295 11 14 1%
8
Cork
powder 3812 Hot water 84% 400 161 161 125 877 62%
Building
carpentry 9 Wood 1906 Thermo-fluid 54%
297 297 1 363 188 4%
Furniture 11 Wood 3316 Thermo-fluid (w/t eco.) 80% 105 210 210 59 110 2%