Quality control and comparative dissolution profile of Ibuprofen … · 2016-12-25 · Quality...
16
ARTIGO ORIGINAL / RESEARCH Quality control and comparative dissolution profile of Ibuprofen oral suspension Controle de qualidade e perfil de dissolução comparativo de ibuprofeno em suspensão oral Jaqueline Bandeira Rubenick 1 *, Alexandre Machado Rubim 1,2 , Marcos Roberto dos Santos 1 , Tatieli Sampaio dos Santos 1 & Luciane Varini Laporta 1,2 . 1 Laboratory of Control of Drug Quality, Franciscan University Center, Santa Maria, Brazil. 2 Department of Pharmacy, Federal University of Santa Maria, Santa Maria, Brazil. *Contact: Jaqueline Bandeira Rubenick, Laboratory of Control of Drug Quality, Franciscan University Center, Street Andradas, 1614, building 4, room S011, Santa Maria - RS, Cep: 97010-032, Phone: (55) 3220 1226, e- mail: [email protected]
-
Upload
trinhthien -
Category
Documents
-
view
221 -
download
0
Transcript of Quality control and comparative dissolution profile of Ibuprofen … · 2016-12-25 · Quality...
ARTIGO ORIGINAL / RESEARCH
Quality control and comparative dissolution profile of Ibuprofen oral
suspension
Controle de qualidade e perfil de dissolução comparativo de ibuprofeno em suspensão oral
Jaqueline Bandeira Rubenick1*, Alexandre Machado Rubim1,2, Marcos Roberto dos Santos1,
Tatieli Sampaio dos Santos1 & Luciane Varini Laporta1,2.
1 Laboratory of Control of Drug Quality, Franciscan University Center, Santa Maria, Brazil.
2 Department of Pharmacy, Federal University of Santa Maria, Santa Maria, Brazil.
*Contact: Jaqueline Bandeira Rubenick, Laboratory of Control of Drug Quality, Franciscan University Center,
Street Andradas, 1614, building 4, room S011, Santa Maria - RS, Cep: 97010-032, Phone: (55) 3220 1226, e-
mail: [email protected]
ARTIGO ORIGINAL / RESEARCH
925 Rubenick, J. B. et al Rev.Bras. Farm.95 (3), 924 – 939, 2014.
ABSTRACT
Due to large number of generic and similar medications containing ibuprofen oral suspension
available in the Brazilian market and the need to ensure the quality of these medications, tests
to verify the quality and dissolution profile in vitro were performed with samples called R
(reference), G1, G2 (generic), S1 and S2 (similar), purchased locally. All the products were
approved in drug identification, pH, dissolution and quantification assays. In the volume
control test, products R and G1 were approved, while products G2, S1 and S2 showed an
average volume lower than claimed. Products R, G2 and S1 met the drip test criteria, but
products G1 and S2 showed an average content of ibuprofen drop of 71.19% and 66.16%
respectively. After evaluation the comparative dissolution profile between products differs as
to speed and amount of dissolved drug, and may thus compromise future in vivo-in vitro
correlations for these formulations.
KEYWORDS: Anti-inflammatory, Generic drugs, Similar drugs, Pharmaceutical
equivalence.
ARTIGO ORIGINAL / RESEARCH
926 Rubenick, J. B. et al Rev.Bras. Farm.95 (3), 924 – 939, 2014.
RESUMO
Devido ao grande número de medicamentos genéricos e similares contendo ibuprofeno
suspensão oral disponíveis no mercado brasileiro e a necessidade de assegurar a qualidade
desses medicamentos, testes para o controle de qualidade e o perfil de dissolução in vitro
foram realizados com amostras denominadas R (referência), G1 e G2 (genéricos), S1 e S2
(similares), adquiridas no comércio local. Todos os produtos analisados foram aprovados nos
testes de identificação, pH, dissolução e teor do fármaco. No teste de controle de volume, os
produtos R e G1 foram aprovados e os produtos G2, S1 e S2 apresentaram volume médio
inferior ao declarado. Os produtos R, G2 e S1 cumpriram os critérios do teste de gotejamento,
porém os produtos G1 e S2 apresentaram teor médio de ibuprofeno por gota de 71,19% e
66,16% respectivamente. Após a avaliação do perfil de dissolução comparativo entre os
produtos, estes apresentaram diferenças na velocidade e quantidade de fármaco dissolvido,
podendo assim comprometer futuras correlações in vivo – in vitro para estas formulações.
PALAVRAS-CHAVE: Anti-inflamatório, Medicamentos genéricos, Medicamentos
Similares, Equivalência farmacêutica.
ARTIGO ORIGINAL / RESEARCH
927 Rubenick, J. B. et al Rev.Bras. Farm.95 (3), 924 – 939, 2014.
INTRODUCTION
Inflammation is characterized as an organism response to cell lesion, and it is a complex,
dynamic phenomenon promoted by different harmful agents, such as the physical (radiation,
Burns, trauma), biological (microorganism, immune reactions) or chemical (caustic
substance) type (Silva, 2010; Zaldivar et al. 2006).
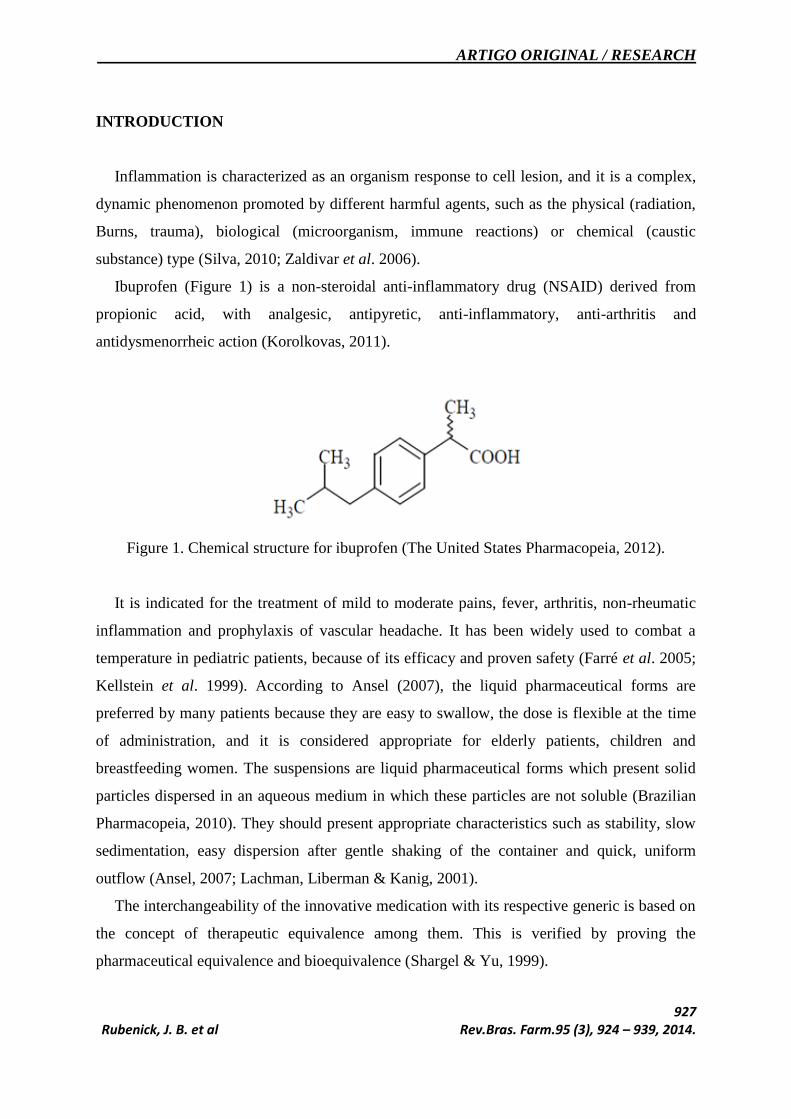
Ibuprofen (Figure 1) is a non-steroidal anti-inflammatory drug (NSAID) derived from
propionic acid, with analgesic, antipyretic, anti-inflammatory, anti-arthritis and
antidysmenorrheic action (Korolkovas, 2011).
Figure 1. Chemical structure for ibuprofen (The United States Pharmacopeia, 2012).
It is indicated for the treatment of mild to moderate pains, fever, arthritis, non-rheumatic
inflammation and prophylaxis of vascular headache. It has been widely used to combat a
temperature in pediatric patients, because of its efficacy and proven safety (Farré et al. 2005;
Kellstein et al. 1999). According to Ansel (2007), the liquid pharmaceutical forms are
preferred by many patients because they are easy to swallow, the dose is flexible at the time
of administration, and it is considered appropriate for elderly patients, children and
breastfeeding women. The suspensions are liquid pharmaceutical forms which present solid
particles dispersed in an aqueous medium in which these particles are not soluble (Brazilian
Pharmacopeia, 2010). They should present appropriate characteristics such as stability, slow
sedimentation, easy dispersion after gentle shaking of the container and quick, uniform
outflow (Ansel, 2007; Lachman, Liberman & Kanig, 2001).
The interchangeability of the innovative medication with its respective generic is based on
the concept of therapeutic equivalence among them. This is verified by proving the
pharmaceutical equivalence and bioequivalence (Shargel & Yu, 1999).
ARTIGO ORIGINAL / RESEARCH
928 Rubenick, J. B. et al Rev.Bras. Farm.95 (3), 924 – 939, 2014.
The study of dissolution is the most appropriate method for an in vitro evaluation of the
kinetics of the release of a drug contained in a solid pharmaceutical form and/or in a
dispersed/suspended pharmaceutical form, where the cumulative amount of drug which
passes into the solution is quantified based on time, and is thus considered an important tool
to evaluate the factors that influence bioavailability (Aulton, 2005).
For class II drugs such as ibuprofen with high permeability and low solubility, the
dissolution rate is one of the main limiting factors of oral absorption. Thus is it considered
essential to establish a strong correlation between the results observed in the in vitro
dissolution assay and the in vivo absorption rate (Dressman et al., 1998; Dressman &
Fleisher, 1986).
Due to the large number of generic and similar medications containing an oral suspension
of ibuprofen available in the Brazilian market and the need to ensure the quality of these
medications, the purpose of this study was to evaluate quality control and in vitro dissolution
profile of the reference medication, two generic medications and two similar ones.
MATERIAL AND METHODS
Samples, Chemical Reference Substance (CRS) and reagents
Ibuprofen Chemical Reference Substance (CRS) - Lote K0J008 - The United States
Pharmacopeia. Oral suspensions of ibuprofen 50 mg/ml purchased in local businesses were
used. They were classified as similar (S1 and S2), generic (G1 and G2) and reference
medication (R). The other reagents were all analytic grade.
Equipment
The development and validation of the assay was performed on a Shimadzu® LC system
(Kyoto, Japan), with an LC-10AD pump, detector with variable wave length UV/Vis model
SPD-10Avp, controller SLC-10Dvp, automatic integrator with Class VP, automatic injector
SIL-10-Avp and column oven CTO-10Asvp. Phenomenex® Luna C8 Column , 150 x 4,6
mm, the size of particle 5 µm. Dissolutor, PTWS Pharmatest®, Viscosimeter, Brookfield®,
and Ultrabasic Potentiometer, Denver®.
ARTIGO ORIGINAL / RESEARCH
929 Rubenick, J. B. et al Rev.Bras. Farm.95 (3), 924 – 939, 2014.
EVALUATION OF QUALITY CONTROL
Identification
The samples were identified by thin layer chromatography (TLC) (The United States
Pharmacopeia, 2012).
Determination of the pH
The pH was determined directly in the samples, with the help of a previously calibrated
potentiometer (The United States Pharmacopeia, 2012).
Viscosity
Apparent viscosity was determined directly in the samples, at a temperature of 25 ºC,
taking 1 minute to adjust the velocity factor (Brasil, 2010a). For samples R, G2 and S1
spindle 3 was used, and for G1 and S2 spindle 2, all at a velocity of 100 rpm.
Determination of volume
Ten flasks chosen randomly were weighed individually, washed first with water and then
ethanol, dried at room temperature and weighed again. The difference between the two
weighings was the weight of the content (Brasil, 2010a).
Drip test
The drip test was evaluated using 10 units of each product at a controlled temperature of
20 °C, where the mass relative to the number of drops corresponding to 1 mL was
determined, as declared by the manufacturer, and the amount of drug per drop for each unit
tested (Brasil, 2010a).
ARTIGO ORIGINAL / RESEARCH
930 Rubenick, J. B. et al Rev.Bras. Farm.95 (3), 924 – 939, 2014.
Determination of density
The density was determined using a pycnometer previously calibrated with ultra-purified
water and samples at a temperature of 20 ºC (Brasil, 2010a).
Dosing
The ibuprofen content in the suspensions was determined using the following
chromatographic conditions: column C8 (4.6 mm x 15 cm, 5 µm), mobile phase phosphoric
acid 0.01 M and acetonitrile (63:37, v/v), flow of 2 mL/minute, the injection volume was 5
µl, PDA detection at 220 nm (The United States Pharmacopeia, 2012).
Preparation of the standard curve for dosing
About 160 mg of internal standard benzophenone were weighed for a 50 mL balloon in
order to obtain a solution at 3.2 mg/mL. Then precisely 50 mg of ibuprofen CRS were
weighed for a 50 mL volumetric balloon; 30 mL of diluent solution were added, composed of
acetonitrile and water (1:1). This was taken to the ultrasound for 15 minutes and the volume
was completed with the same diluent (1000 µg/mL). The standard curve was prepared from
this solution with concentrations ranging from 400 µg/mL to 600 µg/mL. The procedure was
performed in triplicate, and the solutions obtained were submitted to analysis by HPLC using
the previously described chromatographic conditions.
Preparation of the samples for dosing
A pool was prepared with 10 flasks of each product. Using this pool the mass equivalent to
60 mg of ibuprofen was measured; 30 mL of diluent were added for a 50 mL volumetric
balloon volumetric balloon. It was placed for 15 minutes in ultrasound and the volume was
completed with diluent. A 20 mL aliquot was removed and transferred to a 50 mL volumetric
balloon, 1 mL of the internal standard benzophenone solution was added and the volume was
ARTIGO ORIGINAL / RESEARCH
931 Rubenick, J. B. et al Rev.Bras. Farm.95 (3), 924 – 939, 2014.
completed with acetonitrile, homogenized and filtered into vials. The samples were prepared
in triplicate and submitted to analysis by HPLC using the previously described
chromatographic conditions.
Dissolution and dissolution profile
The parameters described in Table 1 were used to perform dissolution, and the collection
was performed within a 60 minute period (The United States Pharmacopeia, 2012). The same
conditions of the dissolution test were used to analyze the dissolution profile, with collections
of 10 mL used at 5, 10, 15, 20 and 40 minutes. The volume removed was replaced with the
same dissolution medium.
Table 1. Parameters utilized for realization of dissolution test.
Parameter Condition
Dissolution medium and
temperature Buffer solution pH 7.2/37.0 ± 0.5 ºC
Volume of dissolution médium 900 mL
Apparatus/speed of rotation Paddle/50 rpm
Volume of sample utilized 10 mL (equivalent of 500 mg of
ibuprofen)
Concentration of sample 555,55 µg/mL
Preparation of the standard curve for dissolution and dissolution profile
Precisely about 50 mg of ibuprofen CRS were weighed for a 50 mL volumetric balloon,
30 mL of diluent solution composed of acetonitrile and water (1:1) were added. The solution
was taken to the ultrasound for 15 minutes and the volume was completed with the same
solvent (1000 µg/mL). Based on this stock solution, a standard curve was prepared with
concentrations from 110 µg/mL to 650 µg/mL. The procedure was performed in triplicate and
the solutions obtained were analyzed using the same parameters for analysis described for
dosing.
ARTIGO ORIGINAL / RESEARCH
932 Rubenick, J. B. et al Rev.Bras. Farm.95 (3), 924 – 939, 2014.
Preparation of the samples for dissolution and dissolution profile
A pool of 10 flasks of each product was prepared. Syringes were filled with a quantity
equivalent to 500 mg of ibuprofen (approximately 10 mL) while maintaining constant
shaking. The samples were released slowly and constantly into the vessels while the
apparatus was moving. The syringes were weighed before and after the addition of the
samples and the difference in weight was related to density in order to calculate the real
quantity added to each vessel. The amount of dissolved ibuprofen was determined by a
chromatographic method using the same conditions as for the dosing assay.
RESULTS AND DISCUSSION
Identification
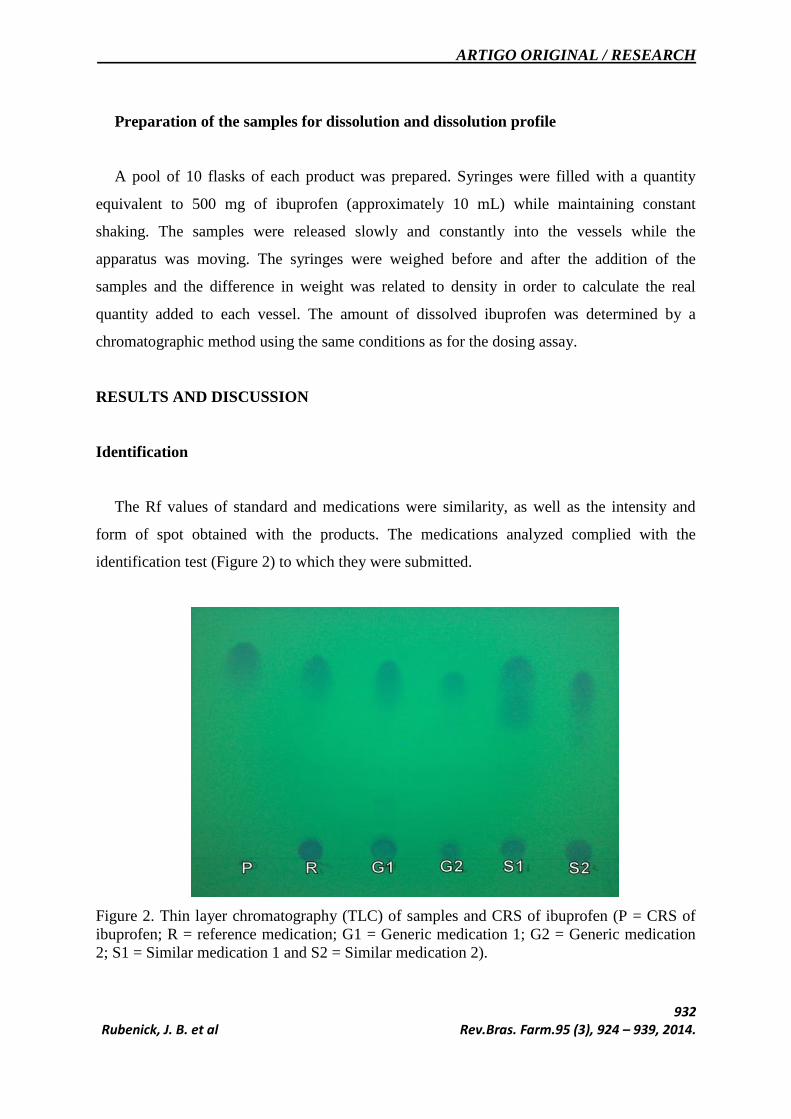
The Rf values of standard and medications were similarity, as well as the intensity and
form of spot obtained with the products. The medications analyzed complied with the
identification test (Figure 2) to which they were submitted.
Figure 2. Thin layer chromatography (TLC) of samples and CRS of ibuprofen (P = CRS of
ibuprofen; R = reference medication; G1 = Generic medication 1; G2 = Generic medication
2; S1 = Similar medication 1 and S2 = Similar medication 2).
ARTIGO ORIGINAL / RESEARCH
933 Rubenick, J. B. et al Rev.Bras. Farm.95 (3), 924 – 939, 2014.
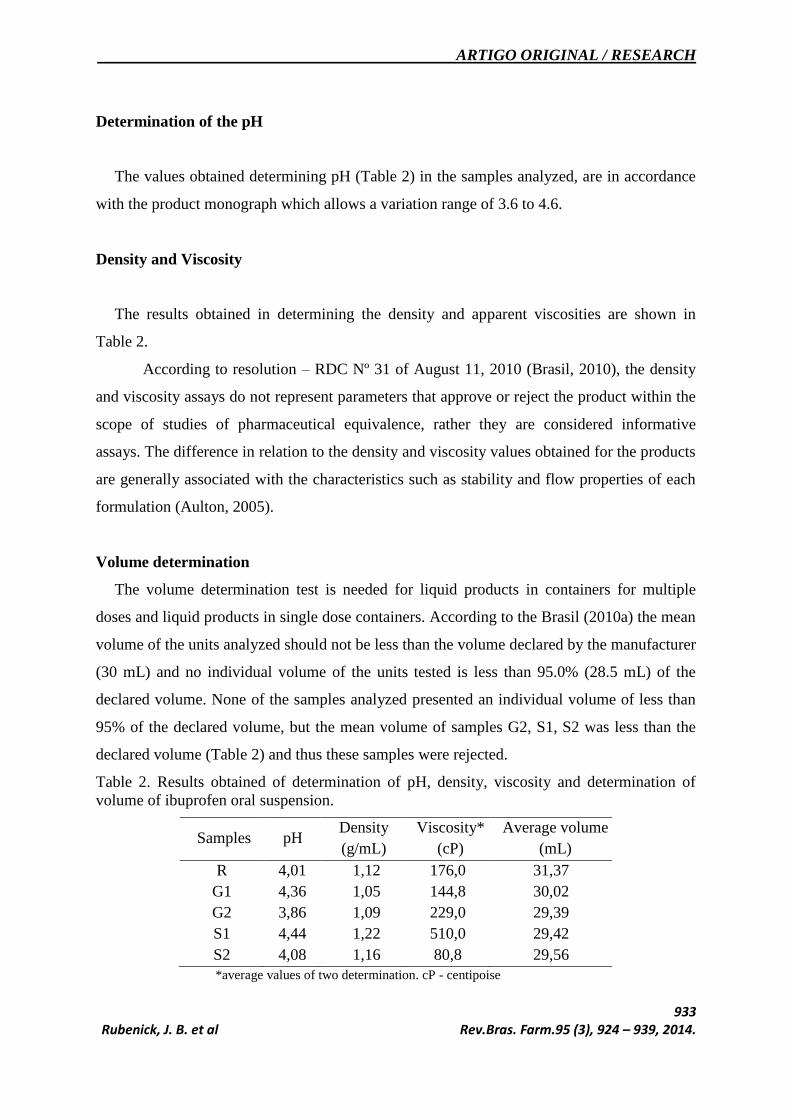
Determination of the pH
The values obtained determining pH (Table 2) in the samples analyzed, are in accordance
with the product monograph which allows a variation range of 3.6 to 4.6.
Density and Viscosity
The results obtained in determining the density and apparent viscosities are shown in
Table 2.
According to resolution – RDC Nº 31 of August 11, 2010 (Brasil, 2010), the density
and viscosity assays do not represent parameters that approve or reject the product within the
scope of studies of pharmaceutical equivalence, rather they are considered informative
assays. The difference in relation to the density and viscosity values obtained for the products
are generally associated with the characteristics such as stability and flow properties of each
formulation (Aulton, 2005).
Volume determination
The volume determination test is needed for liquid products in containers for multiple
doses and liquid products in single dose containers. According to the Brasil (2010a) the mean
volume of the units analyzed should not be less than the volume declared by the manufacturer
(30 mL) and no individual volume of the units tested is less than 95.0% (28.5 mL) of the
declared volume. None of the samples analyzed presented an individual volume of less than
95% of the declared volume, but the mean volume of samples G2, S1, S2 was less than the
declared volume (Table 2) and thus these samples were rejected.
Table 2. Results obtained of determination of pH, density, viscosity and determination of
volume of ibuprofen oral suspension.
Samples pH Density
(g/mL)
Viscosity*
(cP)
Average volume
(mL)
R 4,01 1,12 176,0 31,37
G1 4,36 1,05 144,8 30,02
G2 3,86 1,09 229,0 29,39
S1 4,44 1,22 510,0 29,42
S2 4,08 1,16 80,8 29,56
*average values of two determination. cP - centipoise
ARTIGO ORIGINAL / RESEARCH
934 Rubenick, J. B. et al Rev.Bras. Farm.95 (3), 924 – 939, 2014.
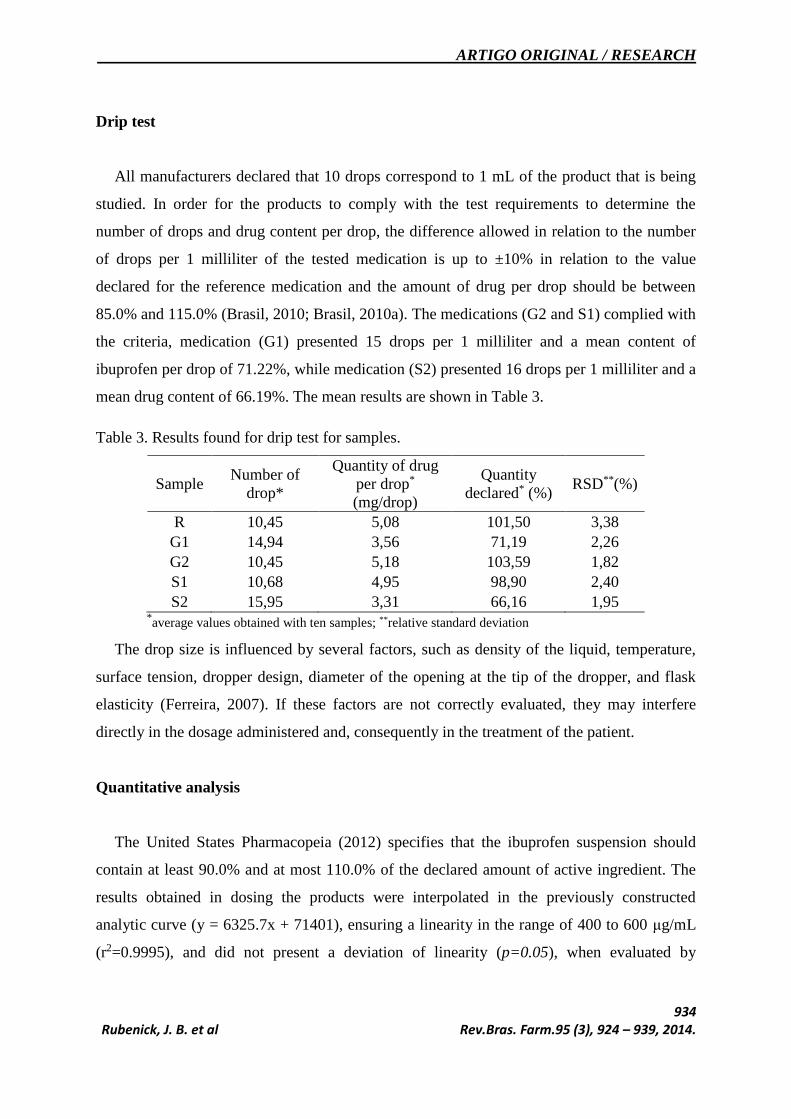
Drip test
All manufacturers declared that 10 drops correspond to 1 mL of the product that is being
studied. In order for the products to comply with the test requirements to determine the
number of drops and drug content per drop, the difference allowed in relation to the number
of drops per 1 milliliter of the tested medication is up to ±10% in relation to the value
declared for the reference medication and the amount of drug per drop should be between
85.0% and 115.0% (Brasil, 2010; Brasil, 2010a). The medications (G2 and S1) complied with
the criteria, medication (G1) presented 15 drops per 1 milliliter and a mean content of
ibuprofen per drop of 71.22%, while medication (S2) presented 16 drops per 1 milliliter and a
mean drug content of 66.19%. The mean results are shown in Table 3.
Table 3. Results found for drip test for samples.
Sample Number of
drop*
Quantity of drug
per drop*
(mg/drop)
Quantity
declared* (%) RSD**(%)
R 10,45 5,08 101,50 3,38
G1 14,94 3,56 71,19 2,26
G2 10,45 5,18 103,59 1,82
S1 10,68 4,95 98,90 2,40
S2 15,95 3,31 66,16 1,95 *
average values obtained with ten samples; **relative standard deviation
The drop size is influenced by several factors, such as density of the liquid, temperature,
surface tension, dropper design, diameter of the opening at the tip of the dropper, and flask
elasticity (Ferreira, 2007). If these factors are not correctly evaluated, they may interfere
directly in the dosage administered and, consequently in the treatment of the patient.
Quantitative analysis
The United States Pharmacopeia (2012) specifies that the ibuprofen suspension should
contain at least 90.0% and at most 110.0% of the declared amount of active ingredient. The
results obtained in dosing the products were interpolated in the previously constructed
analytic curve (y = 6325.7x + 71401), ensuring a linearity in the range of 400 to 600 μg/mL
(r2=0.9995), and did not present a deviation of linearity (p=0.05), when evaluated by
ARTIGO ORIGINAL / RESEARCH
935 Rubenick, J. B. et al Rev.Bras. Farm.95 (3), 924 – 939, 2014.
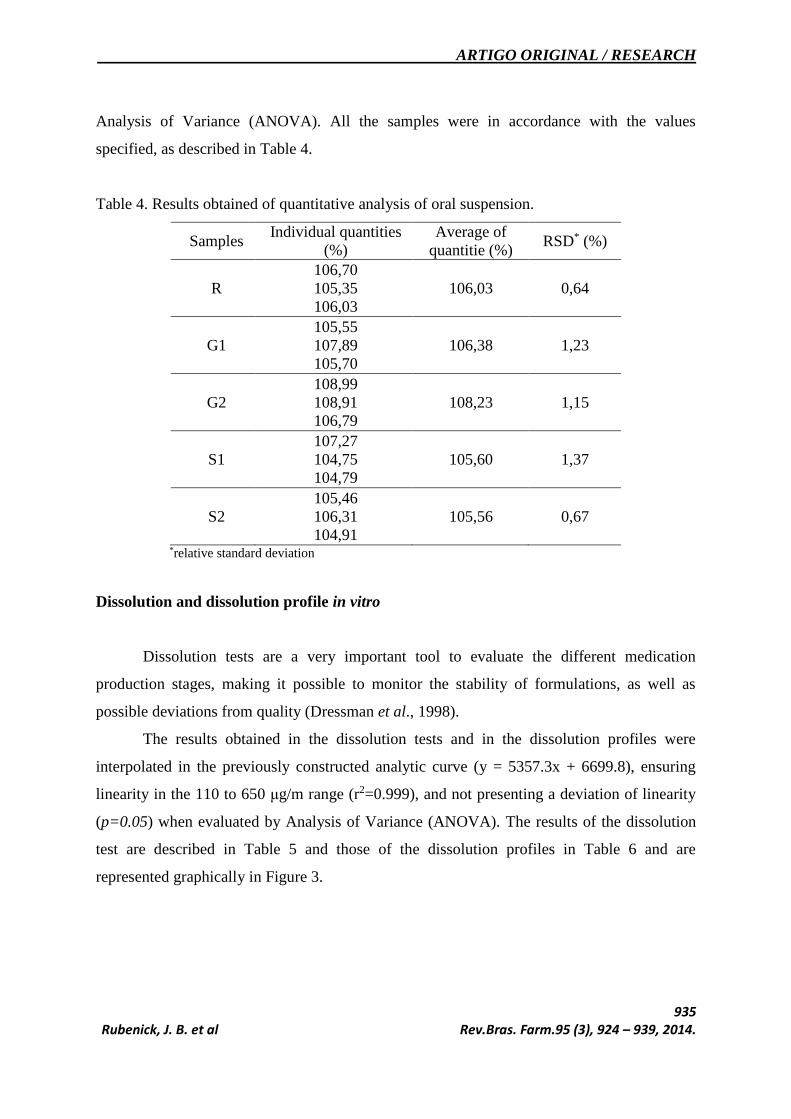
Analysis of Variance (ANOVA). All the samples were in accordance with the values
specified, as described in Table 4.
Table 4. Results obtained of quantitative analysis of oral suspension.
Samples Individual quantities
(%)
Average of
quantitie (%) RSD* (%)
R
106,70
105,35
106,03
106,03 0,64
G1
105,55
107,89
105,70
106,38 1,23
G2
108,99
108,91
106,79
108,23 1,15
S1
107,27
104,75
104,79
105,60 1,37
S2
105,46
106,31
104,91
105,56 0,67
*relative standard deviation
Dissolution and dissolution profile in vitro
Dissolution tests are a very important tool to evaluate the different medication
production stages, making it possible to monitor the stability of formulations, as well as
possible deviations from quality (Dressman et al., 1998).
The results obtained in the dissolution tests and in the dissolution profiles were
interpolated in the previously constructed analytic curve (y = 5357.3x + 6699.8), ensuring
linearity in the 110 to 650 μg/m range (r2=0.999), and not presenting a deviation of linearity
(p=0.05) when evaluated by Analysis of Variance (ANOVA). The results of the dissolution
test are described in Table 5 and those of the dissolution profiles in Table 6 and are
represented graphically in Figure 3.
ARTIGO ORIGINAL / RESEARCH
936 Rubenick, J. B. et al Rev.Bras. Farm.95 (3), 924 – 939, 2014.
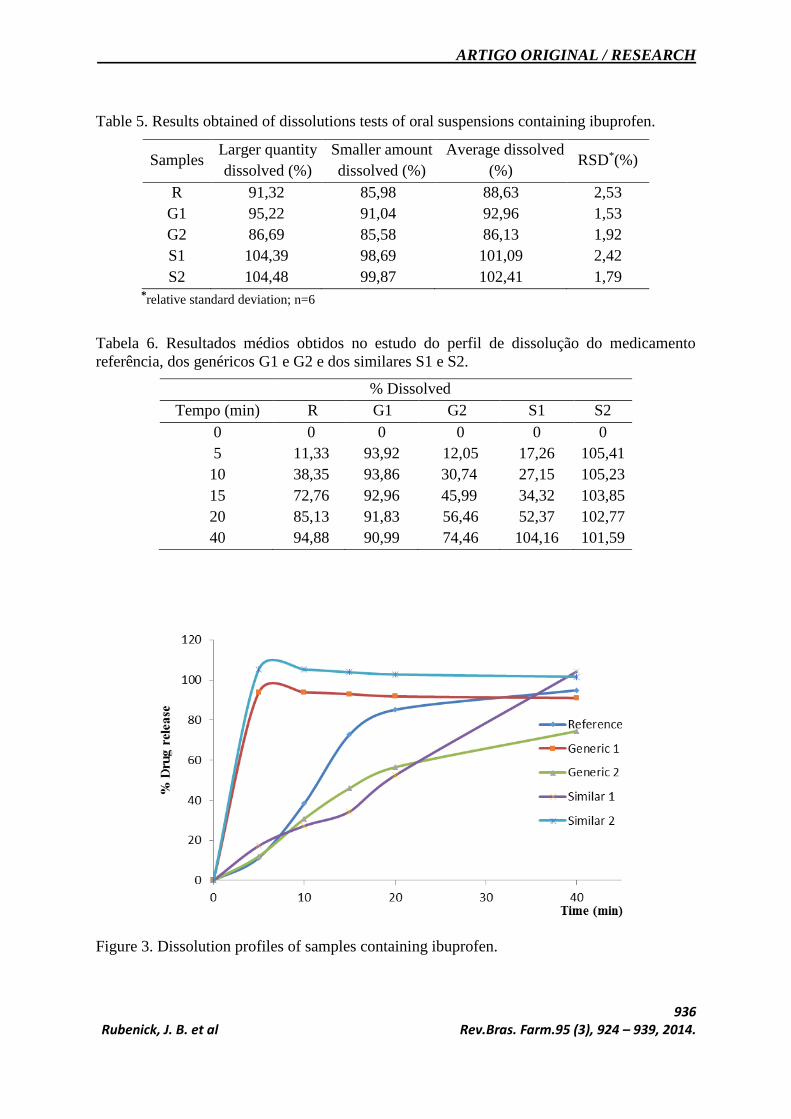
Table 5. Results obtained of dissolutions tests of oral suspensions containing ibuprofen.
Samples Larger quantity
dissolved (%)
Smaller amount
dissolved (%)
Average dissolved
(%) RSD*(%)
R 91,32 85,98 88,63 2,53
G1 95,22 91,04 92,96 1,53
G2 86,69 85,58 86,13 1,92
S1 104,39 98,69 101,09 2,42
S2 104,48 99,87 102,41 1,79 *relative standard deviation; n=6
Tabela 6. Resultados médios obtidos no estudo do perfil de dissolução do medicamento
referência, dos genéricos G1 e G2 e dos similares S1 e S2.
% Dissolved
Tempo (min) R G1 G2 S1 S2
0 0 0 0 0 0
5 11,33 93,92 12,05 17,26 105,41
10 38,35 93,86 30,74 27,15 105,23
15 72,76 92,96 45,99 34,32 103,85
20 85,13 91,83 56,46 52,37 102,77
40 94,88 90,99 74,46 104,16 101,59
Figure 3. Dissolution profiles of samples containing ibuprofen.
ARTIGO ORIGINAL / RESEARCH
937 Rubenick, J. B. et al Rev.Bras. Farm.95 (3), 924 – 939, 2014.
The products evaluated complied with the approval criteria for the dissolution test and this
was that no less than 80.0% (Q) of the declared quantity of ibuprofen dissolved in 60
minutes.
The dissolution profiles of medications presented were different from each other,
especially as regards velocity and percentage of the drug released. Medications G1 and S2
released more than 85.0% of the drug already during the first 5 minutes of the test, and were
classified as very quick release (Brasil, 2010). The reference medications and S1 released
94.88% and 104.16% in 40 minutes, but during this same time formulation G2 released
74.46%.
In order to compare the dissolution profiles the difference (f1) and similarity (f2) factors
were calculated between reference product R and similar product S1, since product S1
presented a type of dissolution corresponding to product R. The profiles studied are
considered similar when the comparison between them results in values of f1 between 0 and
15 and f2 between 50 and 100 (Brasil, 2010). After the test the results obtained for (f1) and
(f2) were 32.27 and 31.29 respectively, showing non similarity between the profiles.
The formulations evaluated showed a great difference when compared to the reference
product. The comparison (reference x G2) could not be performed because product G2 and
reference do not release simultaneously 85.0% of the drug at least at one point of collection,
since this is one of the criteria for the use of the factors f1 and f2 as parameters for
comparison. All profiles presented a RSD of less than 20% in the first 15 minutes and less
than 10% at the other times, complying with the determinations of RDC 31 (Brasil, 2010).
CONCLUSION
The results obtained after the quality control of the products evaluated showed that all
products complied with the identification tests and pH, showing viscosity and density values
appropriate to the characteristics of each formulation. In the volume control test products G2,
S1, S2, did not comply with the test. After the evaluation of the drip test, products R, G2 and
S1 complied with the test criteria. All the products complied with the dosing and dissolution
test but presented a great difference in relation to velocity and quantity of drug released,
compared to the reference product, and thus may compromise future tests on the comparative
dissolution profile between formulations.
ARTIGO ORIGINAL / RESEARCH
938 Rubenick, J. B. et al Rev.Bras. Farm.95 (3), 924 – 939, 2014.
REFERÊNCIAS
Ansel CH, Allen LV, Popovich NG. Formas Farmacêuticas e Sistemas de Liberação de
Farmacos. 8. ed. Porto Alegre: Artmed, 2007. 776 p.
Aulton ME. Delineamento de formas farmacêuticas. 2. ed. Porto Alegre: Artmed, 2005. 677
p.
Brasil. Ministério da Saúde. Agência Nacional de Vigilância Sanitária. Resolução RE nº 31,
de 11 de agosto de 2010. Dispõe sobre a realização dos Estudos de Equivalência
Farmacêutica e de Perfil de Dissolução Comparativo. Publicada no D.O.U. de 12 de agosto
de 2010.
Dressman JB, Amidon GL, Reppas C, Shah VP. Dissolution testing as a prognostic tool for
oral drug absorption: immediate release dosage forms. Pharm. Res. 15(1): 11-22, 1998.
Dressman JB, Fleisher D. Mixing tank model for predicting dissolution rate control of oral
absorption. J. Pharm. Sci. 75(2): 109-116, 1986.
Farré M, Rosset PN, Pascual JA, Abanades S, Menoyo E, Álvaréz Y, Baena A. Estudio de
biodisponibilidad en magnitud y velocidad de comprimidos de ibuprofeno. Reumatol. Clin.
1(3): 155-60, 2005.
Farmacopeia Brasileira. Agência Nacional de Vigilância Sanitária. 5.ed. Brasília: Anvisa,
2010a. V. 2, p. 61-90.
Kellstein DE, Waksman JA, Furey SA, Binstock G, Cooper SA. The safety profile of
nonprescription ibuprofen in multiple-dose use: a meta-analysis. J. Clin. Pharmacol. 39(5):
520-532, 1999.
Korolkovas, A. Dicionário Terapêutico Guanabara. 18. ed. Rio de Janeiro: Guanabara
Koogan S.A, 2011. 700 p.
Lachman L, Lieberman HA, Kanig JL. Teoria e prática na indústria farmacêutica. 2. ed.
Lisboa: 2001. 500 p.
Martin W, Koselowske G, Toberich H, Kerkmann T, Mangold B, Augustin J.
Pharmacokinetics and absolute bioavailability of ibuprofen after oral administration of
ibuprofen lysine in man, Biopharm. & Drug Dispos. 11(3): 265-278, 1990.
Shargel L & Yu ABC. Applied biopharmaceutics and pharmacokinetics. 4 ed. Stamford:
Appleton & Lange, 1999. 768 p.
Penildon S. Farmacologia. Rio de Janeiro: Guanabara Koogan, 2010. 1325 p.
ARTIGO ORIGINAL / RESEARCH
939 Rubenick, J. B. et al Rev.Bras. Farm.95 (3), 924 – 939, 2014.
Souza J, Freitas ZMF, Storpirtis S. Modelos in vitro para determinação da absorção de
fármacos e relação da previsão dissolução/absorção. Rev. Bras. Ci. Farm. 43(4): 1–13, 2007.
THE UNITED STATES PHARMACOPEIA. Rockville: Twinbrook Parkway, 2012. 3241 p.
Zaldivar F, Rodrigues JW, Nemet D, Schwindt C, Galassetti P, Mills PJ, Wilson LD, Cooper
DM. Constitutive pro-and anti-inflammatory cytokine and growth factor response to exercise
in leukocytes. J. Appl. Physiol. 100(4): 1124-1133, 2006.