
RADIOBIOLOGY WITH PROTON CYCLOTRON …
72
Imagem Micaela dos Santos Cunha RADIOBIOLOGY WITH PROTON RADIOBIOLOGY WITH PROTON RADIOBIOLOGY WITH PROTON RADIOBIOLOGY WITH PROTON CYCLOTRON BEAMS: CYCLOTRON BEAMS: CYCLOTRON BEAMS: CYCLOTRON BEAMS: A VIABILITY STUDY VIABILITY STUDY VIABILITY STUDY VIABILITY STUDY Dissertação de Mestrado na área científica de Engenharia Biomédica, especialidade Imagem e Radiação, orientada pelo Professor Doutor Rui Ferreira Marques, Professor Doutor Francisco Alves e Professor Doutor Paulo Crespo e apresentada ao Departamento de Física da Faculdade de Ciências e Tecnologia da Universidade de Coimbra. Setembro de 2010
Transcript of RADIOBIOLOGY WITH PROTON CYCLOTRON …

Imagem
Micaela dos Santos Cunha
RADIOBIOLOGY WITH PROTONRADIOBIOLOGY WITH PROTONRADIOBIOLOGY WITH PROTONRADIOBIOLOGY WITH PROTON CYCLOTRON BEAMS:CYCLOTRON BEAMS:CYCLOTRON BEAMS:CYCLOTRON BEAMS: AAAA VIABILITY STUDYVIABILITY STUDYVIABILITY STUDYVIABILITY STUDY
Dissertação de Mestrado na área científica de Engenharia Biomédica, especialidade Imagem e Radiação, orientada pelo Professor Doutor Rui Ferreira Marques, Professor Doutor Francisco Alves e Professor Doutor Paulo Crespo e apresentada ao Departamento de Física da Faculdade de Ciências e Tecnologia da Universidade de Coimbra.
Setembro de 2010
Radiobiology With Proton Cyclotron Beams:A Viability Study
Faculty of Sciences and Technology
University of Coimbra
To obtain the degree
of Master of Science in Biomedical Engineering
M.Sc. dissertation Micaela dos Santos Cunha
from Santo Tirso, Portugal
Coimbra 2010

Supervisor: Prof. Dr. Rui Ferreira MarquesCo-supervisor: Prof. Dr. Paulo CrespoCo-supervisor: Prof. Dr. Francisco Alves
Submission date: 06.09.2010Public examination date: 14.09.2010

Para os que sempre me apoiaram.


Index
List of Figures iii
List of Tables v
List of Acronyms and Abbreviations vii
Sumário ixMotivação . . . . . . . . . . . . . . . . . . . . . . . . . . . . . . . . . . . . . . . . . . ix
Summary xiMotivation . . . . . . . . . . . . . . . . . . . . . . . . . . . . . . . . . . . . . . . . . xi
1 Radiotherapy With Protons 11.1 Motivation . . . . . . . . . . . . . . . . . . . . . . . . . . . . . . . . . . . . . . 11.2 Brief history . . . . . . . . . . . . . . . . . . . . . . . . . . . . . . . . . . . . . 31.3 Rationale . . . . . . . . . . . . . . . . . . . . . . . . . . . . . . . . . . . . . . . 4
1.3.1 Physical rationale . . . . . . . . . . . . . . . . . . . . . . . . . . . . . . 41.3.2 Radiobiological rationale . . . . . . . . . . . . . . . . . . . . . . . . . . 8
1.4 Comparison with photons . . . . . . . . . . . . . . . . . . . . . . . . . . . . . . 91.5 Comparison with other charged particles . . . . . . . . . . . . . . . . . . . . . 101.6 Equipment and facilities . . . . . . . . . . . . . . . . . . . . . . . . . . . . . . . 11
1.6.1 Accelerators . . . . . . . . . . . . . . . . . . . . . . . . . . . . . . . . . 111.6.2 Treatment delivery systems . . . . . . . . . . . . . . . . . . . . . . . . . 13
2 Simulation Tools for the Development of a Proton Radiobiological Setup 172.1 Geant4 and SRIM/TRIM . . . . . . . . . . . . . . . . . . . . . . . . . . . . . . 172.2 Validation of Geant4 . . . . . . . . . . . . . . . . . . . . . . . . . . . . . . . . . 17
2.2.1 Proton range . . . . . . . . . . . . . . . . . . . . . . . . . . . . . . . . . 172.2.2 Proton beam lateral scattering . . . . . . . . . . . . . . . . . . . . . . . 20
3 Concept for a Proton Cyclotron-Based Radiobiology Facility 233.1 ICNAS cyclotron . . . . . . . . . . . . . . . . . . . . . . . . . . . . . . . . . . . 243.2 Design proposal . . . . . . . . . . . . . . . . . . . . . . . . . . . . . . . . . . . 253.3 Influence of beam divergence on dose delivery . . . . . . . . . . . . . . . . . . . 25
3.3.1 Pencil beam . . . . . . . . . . . . . . . . . . . . . . . . . . . . . . . . . 253.3.2 Beam with dispersion . . . . . . . . . . . . . . . . . . . . . . . . . . . . 26
4 Conclusions 374.1 Work results . . . . . . . . . . . . . . . . . . . . . . . . . . . . . . . . . . . . . . 374.2 Future work . . . . . . . . . . . . . . . . . . . . . . . . . . . . . . . . . . . . . . 39
i

ii Index
Appendices 41
A Software and hardware used 43A.1 Hardware . . . . . . . . . . . . . . . . . . . . . . . . . . . . . . . . . . . . . . . 43A.2 Geant4 simulation toolkit . . . . . . . . . . . . . . . . . . . . . . . . . . . . . . 43A.3 Other software . . . . . . . . . . . . . . . . . . . . . . . . . . . . . . . . . . . . 44
B Havar® 47
Bibliography 48
Acknowledgments 55

List of Figures
1.1 Cancer incidence and mortality rates worlwide per 100 000 population . . . . . 11.2 Prediction of the number of cases of cancer in 2030 . . . . . . . . . . . . . . . . 21.3 Depth-dose profiles for photons, carbon ions and protons . . . . . . . . . . . . . 31.4 Spread-out Bragg peak produced from several pristine Bragg peaks . . . . . . . 41.5 Energy loss in water for several particles . . . . . . . . . . . . . . . . . . . . . . 61.6 Lateral broadening of a photon, carbon and proton beam . . . . . . . . . . . . 71.7 Characteristic cell survival pattern for X-rays and charged particles or neutrons 81.8 Definition of the relative biological effectiveness, with cell survival curves . . . . 91.9 Comparison of the irradiation of a medulloblastoma with X-rays and with protons 101.10 The relative biological effectiveness for heavy ions . . . . . . . . . . . . . . . . . 111.11 Floor plan of the proton therapy centers in Loma Linda and Heidelberg . . . . 121.12 Scheme of the nozzle at the Francis H. Burr Proton Therapy Center . . . . . . 131.13 Comparison between intensity modulated therapy with photons and protons . . 14
2.1 Representation of the simulation setup for proton range validation . . . . . . . 182.2 Range in water for 18-MeV protons, obtained using TRIM . . . . . . . . . . . . 182.3 Range of 18-MeV protons in a 5-mm long water target. . . . . . . . . . . . . . . 192.4 Schematic illustration of the simulation setup for proton beam width validation 202.5 Angular distribution of protons after traversing 1.5 mm of water . . . . . . . . 22
3.1 Dose-response curve for tumor control and normal tissue damage probability . . 233.2 Concept of the experimental setup being planned . . . . . . . . . . . . . . . . . 253.3 Depth-dose profile in water for 18-MeV protons . . . . . . . . . . . . . . . . . . 263.4 Influence of density variation on depth-dose profile in water for 18- and 17.5-MeV
protons . . . . . . . . . . . . . . . . . . . . . . . . . . . . . . . . . . . . . . . . 273.5 Influence of proton beam energy on depth-dose profile in water . . . . . . . . . 283.6 Representation of the simulation setup for irradiating water with 200-MeV protons 283.7 Influence of water density on depth-dose profile in water for 200-MeV protons . 293.8 Representation of the simulation setup for first simulations of a beam with dis-
persion . . . . . . . . . . . . . . . . . . . . . . . . . . . . . . . . . . . . . . . . . 303.9 Depth-dose profiles in water at different radius for 17- and 17.5-MeV protons . 313.10 Representation of the simulation setup for calculating the dose 3D distribution 323.11 Depth-dose profile and 2D distribution of 17-MeV protons in water . . . . . . . 333.12 Representation of the simulation setup for studying the influence of Havar® on
dose 3D distribution . . . . . . . . . . . . . . . . . . . . . . . . . . . . . . . . . 343.13 Influence of Havar® on depth-dose profile and 2D distribution of 17-MeV protons
in water . . . . . . . . . . . . . . . . . . . . . . . . . . . . . . . . . . . . . . . . 35
4.1 Schematic representation of a setup configuration to allow for the delivery of lowdoses . . . . . . . . . . . . . . . . . . . . . . . . . . . . . . . . . . . . . . . . . . 39
iii

iv List of Figures

List of Tables
1.1 List of all currently operating proton therapy facilities . . . . . . . . . . . . . . 51.2 Quantities relevant for the Bethe-Bloch equation and some of their values . . . 6
2.1 Some of the values used for calculating beam lateral scattering . . . . . . . . . 212.2 Parameters used to fit the simulated data to a pseudo-Voigt function . . . . . . 21
4.1 Relevant positron-emitter production reactions . . . . . . . . . . . . . . . . . . 40
A.1 Machines used to perform the simulations . . . . . . . . . . . . . . . . . . . . . 43
B.1 Nominal composition of Havar® . . . . . . . . . . . . . . . . . . . . . . . . . . 47B.2 Physical properties of Havar® . . . . . . . . . . . . . . . . . . . . . . . . . . . . 47
v

vi List of Tables

List of Acronyms and Abbreviations
2D / 3D 2 Dimension(al) / 3 Dimension(al)
ASR Age-Standardized Rate
CATANA Centro di AdroTerapia e Applicazioni Nucleari Avanzate, Catania, Italy
DNA Deoxyribonucleic Acid
EBRT External Beam Radiation Therapy
FTPI Florida Proton Therapy Institute, Jacksonville, FL, USAFWHM Full Width at Half Maximum
GSI Gesellschaft für Schwerionenforschung, Darmstadt, Germany
HIBMC Hyogo Ion Beam Medical Center, Hyogo, JapanHIT Heavy Ion Therapy, Heidelberg, GermanyHMI Hahn-Meitner-Institut Berlin, Berlin, GermanyHZB Helmholtz Zentrum Berlin für Materialien und Energie, Berlin, Germany
IBA Ion Beam Applications, S.A., Louvain-la-Neuve, BelgiumICNAS Instituto de Ciências Nucleares Aplicadas à Saúde, Coimbra, PortugalIMRT Intensity Modulated Radiation TherapyIMPT Intensity Modulated Proton TherapyINFN-LNS Istituto Nazionale di Fisica Nucleare - Laboratori Nazionali del Sud,
Catania, ItalyITEP Institute for Theoretical and Experimental Physics, Moscow, Russia
LBNL Lawrence Berkeley National Laboratory, Berkeley, CA, USALET Linear Energy TransferLINAC Linear AcceleratorLIP Laboratório de Instrumentação e Física Experimental de Partículas,
Coimbra, Portugal
MCS Multiple Coulomb ScatteringMGH Massachusetts General Hospital, Boston, MA, USAMPRI Midwest Proton Radiotherapy Institute, Bloomington, IN, USA
NCC National Cancer Center, Kashiwa, JapanNCC National Cancer Center, Ilsan, South KoreaNPTC Northeast Proton Treatment Center, Boston, MA, USA
vii

viii List of Acronyms and Abbreviations
OAR Organ at Risk
PET Positron Emission TomographyPMRC Proton Medical Research Center, Tsukuba, JapanPTV Planning Treatment VolumePSI Paul Scherrer Institute, Villigen, Switzerland
RBE Relative Biological EffectivenessRPC Resistive Plate ChamberRPTC Rinecker Proton Therapy Center, Munich, Germany
SOBP Spread-Out Bragg PeakSRIM The Stopping and Range of Ions in Matter
TRIM The Transport of Ions in MatterTRIUMF TRI-University Meson Facility, Vancouver, Canada
UCSF University of California, San Francisco, CA, USA
WERC The Wakasa Wan Energy Research Center, Tsuruga, JapanWPTC Wanjie Proton Therapy Center, Zibo, China

Sumário
MotivaçãoO número de centros de radioterapia com protões está a aumentar em todo o mundo, com trintacentros actualmente em operação e mais de vinte em fase de planeamento ou já em construção.Os resultados da radioterapia com protões estão a despertar o interesse de cada vez maiscentros médicos, num número crescente de países, em disponibilizá-la aos seus doentes. Aomesmo tempo, ciclotrões capazes de acelerar protões até cerca de 20 MeV têm sido instaladospor todo o mundo. Embora o seu propósito seja principalmente a produção de radioisótopospara tomografia por emissão de positrões, eles estão equipados com várias linhas de feixe quepodem ser utilizadas para investigação científica. Cada linha de feixe pode dar tipicamentecorrentes de 150 µA (1x10¹⁵ partículas/s). Fazer estudos radiobiológicos usando estas linhasde feixe pode contribuir para o melhoramento dos resultados da radioterapia com protões,nomeadamente por dar novos dados para a resposta a algumas questões ainda por esclarecer:
• o impacto do fraccionamento da radioterapia com partículas na eficácia da dose, incluindoos diferentes efeitos nas regiões irradiadas no pico de Bragg versus no patamar;
• a influência das respostas dos tecidos vivos, como o edema, o encolhimento do tumor,o dano vascular com consequente permeabilidade aumentada, e processos inflamatórioscom consequentes alterações na densidade dos tecidos;
• o efeito adjuvante e/ou tóxico do uso de compostos farmacêuticos em concomitância coma radioterapia;
• as causas da hipersensibilidade a baixas doses de radiação [Ste07b, Sch10];
• os mecanismos por detrás do efeito bystander ou efeito bystander induzido por radiação,e das chamadas respostas adaptativas [Mot04, Wid09]; e
• a evolução espacial e temporal do dano provocado pela radiação, a qual pode ser avaliadaatravés da evolução espacial e temporal das quebras da cadeia dupla de ADN [Sch10].
Novos dados para responder a estas e outras questões podem contribuir para a melhoria dosresultados da radioterapia e consequentemente para a redução das taxas de mortalidade emdoentes com cancro.
Neste trabalho estudamos a viabilidade da implementação de um sistema experimental numadas linhas de feixe do ciclotrão de 18 MeV recentemente instalado no Instituto de CiênciasNucleares Aplicadas à Saúde, Universidade de Coimbra. Esse sistema deve permitir a realizaçãode estudos radiobiológicos, incluindo os efeitos da irradiação com protões em culturas celularese animais de pequeno porte.
Várias simulações baseadas em Monte Carlo foram desenvolvidas no Geant4 para optimizar osistema em estudo. Estas foram inicialmente validadas contra outro software como o SRIM/TRIM
ix

x Sumário
e também contra resultados teóricos publicados. Os cálculos de dose foram feitos usando difer-entes configurações para avaliar perfis de dose-profundidade e distribuições 2D.

Summary
MotivationThe number of proton radiotherapy facilities is increasing througout the world, with thirtycenters currently operational and more than twenty in a planning stage or already under con-struction. Proton therapy outcomes are triggering the interest of more and more medicalfacilities, of a crescent number of countries, in making it available for their patients. At thesame time, cyclotrons capable of accelerating protons up to about 20 MeV have been world-wide installed. Although their purpose is mainly positron emission tomography radioisotopeproduction, they are equipped with several beam lines that may be used for scientific research.Each beam line may typically deliver proton currents up to 150 µA (1x10¹⁵ particles/s). Radio-biological studies using of these beam lines may contribute to further improve proton therapyresults, namely by giving input to some unclear questions, namely:
• the impact of fractionation of particle radiotherapy on dose effectiveness including differ-ent effects in regions irradiated in the Bragg peak versus the plateau;
• the influence of living tissue responses such as edema, tumor shrinkage, vascular damagewith consequent increased permeability, and inflammatory processes with consequentchanges in tissue density;
• the adjuvant and/or toxic effects of using pharmaceutical compounds in concomitancewith radiotherapy;
• the causes of hypersensitivity to low doses of radiation, a phenomenon called low-dosehyper-radiosensitivity [Ste07b, Sch10];
• the mechanisms underlying the bystander effect or radiation-induced bystander effect andthe so-called adaptative responses [Mot04, Wid09]; and
• the spatial and temporal evolution of radiation damage, which can be evaluated throughthe spatial and temporal evolution of DNA double-strand breaks [Sch10].
Input to these and other issues could contribute to the further improvement of radiotherapyoutcomes and consequently to the decrease of mortality rates in cancer patients.
In this work we study the viability of implementing an experimental setup at one of the beamlines of the 18-MeV proton cyclotron recently installed at Instituto de Ciências NuclearesAplicadas à Saúde, University of Coimbra, Portugal. Such setup should allow radiobiologicalstudies to be performed, including the effects of proton irradiation on cell cultures and smallanimals.
Several Monte Carlo simulations based on Geant4 were deployed to optimize the setup understudy. These were initially validated with against packages such as SRIM/TRIM and also
xi

xii Summary
against theoretical published results. Dose calculations were performed using different config-urations to evaluate depth-dose profiles and dose 2D distributions.

Chapter 1
Radiotherapy With Protons
1.1 Motivation
Cancer is a major concern in today’s society, as more than one in three people will havecancer during their lifetime [CRU10b]. Only in 2008 almost 13 million new cases of cancerwere registered and almost 8 million people died all over the world due to this disease [Fer10].Furthermore, about three-quarters of all cases of cancer are developed by people with 60 yearsand over who represent 10% of the total world population nowadays and are expected torepresent 22% in 2050. This fact combined with the prospective of increase of life expectancyfrom the current 65 years to 76 years in 2050, means that the number of occurrences of cancerwill be higher in the future, admitting that the current rates of incidence (age-standardized
Figure 1.1: Cancer incidence and mortality rates per 100 000 population of both sexes andall ages in several regions of the world; after [Fer10]. Data for all types of cancer excludingnon-melanoma skin cancer in age-standardized rates (ASR).
1

2 Chapter 1. Radiotherapy With Protons
Figure 1.2: Prediction of the number of cases of cancer in 2030 for men and women of all agesworldwide. The prediction is performed by adding the expected demographic effect for the year2030 to the number of cases of cancer registered in 2008; after [Fer10].
rates (ASR1) in Fig. 1.1) remain the same [CRU10a]. Fig. 1.2 shows a prediction of the numberof cases of cancer in 2030 for men and women of all ages based on the numbers of 2008 andadding the expected demographic effect.
Looking at these statistics, specially at those concerning cancer mortality, one can realize howimportant it is to create and improve the existing conditions for people with cancer to havethe highest probabilities of being cured or, at least, get palliative treatment. Radiotherapyplays a major role when it comes to cancer treatment, either curative or palliative. It canbe administered alone or in a multimodality plan, usually in conjunction with surgery and/orchemotherapy. For example, in the United Kingdom 40% of the patients cured from cancerwere treated with radiotherapeutical means [Boa03] and worldwide more than 50% of all cancerpatients need to receive radiation therapy during their treatment [Boy08, Fow06, Sch06].
Radiotherapy has greatly improved since its early days, by the time of the discovery of theX-rays by Roentgen in 1895, and it is still in progress nowadays [Fow06]. All issues involvedin treatment planning like patient positioning, dose calculation, tumor volume definition andlocalization, and the treatment technique are under constant research, so that the goal ofradiotherapy can be fulfilled, i.e., to kill the tumor with the lowest possible damage to the sur-rounding healthy tissue [Sch06]. Furthermore, therapy with radiation is not limited to externalbeam radiation therapy (EBRT) and definitely not limited to photons and electrons. Thereare other options to consider such as brachytherapy, charged particle therapy, and neutrontherapy, just to name a few. In particular, proton and carbon ion therapy are two topics ofgreat interest nowadays. These particle techniques are characterized by a property not sharedby photons and electrons, the Bragg peak, which allows for a higher deposition of energy in thetarget volume while lowering the dose to the vicinity. This characteristic may allow improvingcancer treatment results, thereby contributing to the reduction of the mortality rates due tocancer.
1 An age-standardized rate is a summary measure of the rate that a population would have if it had a standardage structure [Fer10]. The ASR is a weighted mean of the age-specific rates; the weights are taken frompopulation distribution of the standard population. The most frequently used standard population is theWorld Standard Population. The calculated incidence or mortality rate is then called age-standardizedincidence or mortality rate (world). It is also expressed per 100 000.

1.2. Brief history 3
Figure 1.3: Depth-dose profiles for photons, carbon ions and protons; from [Lag07].
1.2 Brief history
Protons and heavier ions1 were suggested as a possibility for radiation treatment for the firsttime in 1946, by Robert Wilson [Wil46], who thought that the depth-dose distribution presentedby these particles would be adequate to treat tumors in humans. Unlike photons and electrons,these particles show a low and nearly flat energy deposition which increases with the penetrationdepth until it reaches a maximum called the Bragg peak, and then falls steeply to approximatelyzero (Fig. 1.3). This means protons and heavier charged particles will cause, towards the endof their range, higher ionization than photons or electrons of comparable energy, enablingthe delivery of a higher dose to a deep-seated tumor, while sparing the surrounding healthytissues. Protons, because distal to the tumor the energy deposition falls to zero, delivers nodose beyond the tumor [Kra00, Smi06]. Carbon and other heavy charged particles show anincreased relative biological effectiveness (RBE) that potentiates their action mainly in theBragg peak, in addition to a smaller lateral scattering and range straggling [Kra00].
Wilson also proposed a technique widely used today to encase all the volume of large tumors,using a range modulation wheel to produce a spread-out Bragg peak (SOBP). In Fig.1.4 wecan see a SOBP built up from several pristine2 Bragg peaks.
As soon as 1954, radiotherapy with protons started to be an option available to cancer patientsat the Lawrence Berkeley National Laboratory (LBNL) [Tob58]. After some previous animalexperiments [Tob52, Tob42] Tobias and his colleagues irradiated the first patient for a pitu-itary treatment with proton beams from the ’184- inch Synchrocyclotron’ built by Lawrenceand Edlefsen in 1930 [Law30]. By 1957 radiotherapy with protons commenced in Europe atthe University of Uppsala in Sweden, where a broad spectrum of cancers were treated, suchas glioblastoma multiforme, carcinomas of the cervix, nasopharynx, head and neck, amongothers [Fal62]. Larsson and his team were the first to implement Wilson’s idea of modulatingthe proton beam and producing a SOBP by designing the adequate ridge filters and they alsowere the first to use beam scanning to produce large treatment fields in the lateral dimen-sion [Lar61]. Other proton therapy facilities were implemented in several countries like Russia(Dubna, 1967), Japan (Chiba, 1979), and Switzerland (Villigen, 1984) [Sui07, Smi06] in thefollowing 30 years after the irradiation of the first patient at LBNL. Proton therapy has grown
1 Ions heavier than protons are called heavy in radiobiology, as opposed to nuclear physics terminology, dueto their increased biological effectiveness [Kra00].
2 A pristine Bragg peak is the one measured for a single energy beam [She08].

4 Chapter 1. Radiotherapy With Protons
Figure 1.4: Spread-out Bragg peak (SOBP) produced from several pristine Bragg peaks throughrange and intensity modulation. SOBPs can be achieved using a physical device (ridge filter ormodulation wheel) or selecting the energy from the accelerator and weighting each individualBragg peak; from [Smi06].
significantly with about 67 000 patients treated to date worldwide [Jer10]. Table 1.2 lists allcenters in operation in 2010.
1.3 Rationale
When we refer to the rationale for using protons in radiotherapy we are evoking both thephysical rationale and the radiobiological rationale. The former has to do with the physicalprocesses that occur when the proton interacts with matter in general, and the latter pertainsto the reactions (and its consequences) at a cellular level.
1.3.1 Physical rationale
As previously mentioned in section 1.2, protons were considered an option to radiotherapy dueto their depth-dose profile [Wil46]. This profile, the Bragg curve, shows a narrow peak nearthe end of the particles track, which makes protons suitable for the treatment of deep-seated,inoperable, radioresistant, and/or close to organs at risk (OAR) tumors. This characteristicprofile is explained by protons interaction with matter, which at this energy level are knownto be mainly Coulomb interactions with bound atomic electrons. This electronic energy lossis described by the Bethe-Bloch equation (equation 1.1), which gives the mean rate of energyloss (or stopping power) [Nah07a, Kra00, Nak10]:
− dE
dx= Kz2eff
Z
A
1
β2
[1
2ln
2mec2β2γ2Tmax
I2− β2 − δ
2
](1.1)
where Tmax is the maximum kinetic energy that can be imparted to a free electron in a singlecollision. The other quantities are defined in Table 1.2.

1.3. Rationale 5
Table 1.1: List of all currently operating proton therapy facilities; adapted from [pFa10].
Max. StartClinical Beam of Total
Who, Where Country Energy, Direction Treat- PatientsMeV ment Treated
ITEP, Moscow Russia 250 horiz. 1969 4162St.Petersburg Russia 1000 horiz. 1975 1353PSI, Villigen Switzerland 72 1 horiz. 1984 5300Dubna Russia 200**** horiz. 1999 595Uppsala Sweden 200 1 horiz. 1989 929Clatterbridge England 62 1 horiz. 1989 1923Loma Linda CA.,USA 250 3 gantry, 1 horiz. 1990 14000Nice France 65 1 horiz. 1991 3935Orsay France 200 2 horiz. 1991 4811iThemba Labs South Africa 200 1 horiz. 1993 511MPRI(2) IN.,USA 200 2 gantry, 1 horiz. 2004 890UCSF CA.,USA 60 1 horiz. 1994 1200TRIUMF, Vancouver Canada 72 1 horiz. 1995 145PSI, Villigen** Switzerland 250* 1 gantry 1996 542HZB (HMI), Berlin Germany 72 1 horiz. 1998 1437NCC, Kashiwa Japan 235 2 gantry 1998 680HIBMC, Hyogo Japan 230 gantry 2001 2382PMRC(2), Tsukuba Japan 250 gantry 2001 1586NPTC, MGH Boston USA 235 2 gantry, 1 horiz. 2001 4270INFN-LNS, Catania Italy 60 1 horiz. 2002 174Shizuoka Japan 235 gantry, horiz. 2003 852WERC, Tsuruga Japan 200 1 horiz.,vertical 2002 56WPTC, Zibo China 230 2 gantry, 1 horiz. 2004 977MD Anderson CancerCenter, Houston*** USA 250 3 gantry, 1 horiz. 2006 1700FPTI, Jacksonville USA 230 3 gantry, 1 horiz. 2006 1847NCC, IIsan South Korea 230 2 gantry, 1 horiz. 2007 519RPTC, Munich** Germany 250 4 gantry, 1 horiz. 2009 78ProCure Proton TherapyCenter, Oklahoma City USA 230 gantry, horiz. 2009 21HIT, Heidelberg** Germany 250 1 gantry, 2 horiz. 2009 N.A.UPenn, Philadelphia USA 230 4 gantry, 1 horiz. 2010 N.A.
* degraded beam for 1996 to 2006; dedicated 250 MeV proton beam from 2007 on** with beam scanning
*** with spread beam and beam scanning (MD Anderson, since 2008)**** degraded beamN.A. not applicable (treatment started)

6 Chapter 1. Radiotherapy With Protons
Table 1.2: Quantities relevant for the Bethe-Bloch equation and some of their values accordingto [Nak10].
Symbol Definition Units or valuedEdx energy loss MeVg−1 cm2
A atomic mass of medium gmol−1
NA Avogadro’s number 6.022 136 7(36)× 1023 mol−1
KA 4πNAr
2emec
2/A 0.307 075 MeVg−1 cm2
for A = 1 g mol−1
zeff effective charge of incident particleZ atomic number of mediummec2 electron rest energy 0.510 999 06(15) MeVI mean excitation energy eVδ density effect correction
Most important in this equation is the dependence on1
β2and zeff . These two are key factors
to understand the appearance of protons Bragg peak near the end of their range, as emphasized
in an energy loss versus depth plot. The1
β2≃ 1
Efactor yields an increasing energy loss with
decreasing particle energy, related to the time a given through-going particle is disturbing theatomic cloud; at low energies, in turn, not only the available energy is small, but electronsfrom the target are collected by the passing particle, thus rapidly decreasing its zeff . The twocontributions cause the distinct maximum of energy loss. Also, the low energy loss at higherenergies explains the quasi constant plateau of energy deposition in the entrance [Kra00]. Thesecharacteristics can be seen in Figure 1.5 for several ions, with the stopping power displayedwith units of linear energy transfer (LET), a measure of the energy deposited in the target byall electrons ejected by the passing particle.
Figure 1.5: Energy loss in water for several particles; after [Sch91, Cre05]. The curves werecalculated with the computer code ATIMA (atomic interactions with matter).

1.3. Rationale 7
Figure 1.6: Lateral broadening of a photon, carbon and proton beam; after [Web96, Kra00].
Another relevant process is multiple Coulomb scattering (MCS). Protons suffer small anglesdeflections when traversing a medium due to both strong interactions and, mainly, Coulombinteractions with target nuclei. Coulomb scattering distribution is approximately Gaussian forsmall deflection angles, showing larger tails for larger angles [Nak10]. For small angles θ it isenough to use a Gaussian approximation with an angular width given by [Hig75, Kra00].
σθ =14.1MeV
βpcz
√x
X0
(1 +
1
9log10
x
X0
), (1.2)
where p is the momentum, βc the velocity, and z the charge of the projectile.x
X0is the
thickness of the scattering medium expressed in radiation length1.
MCS has consequences both on the lateral width (Fig. 1.6) and range straggling of protonbeams (Fig. 1.3). In Fig. 1.3 the comparison between photon, carbon and proton beams showsthat carbon has the lowest beam width and that for protons the lateral scattering exceeds theone of the photons for penetration depths larger than 7 cm. In Fig. 1.3 the smaller rangestraggling of carbons in comparison to protons can be observed.
Beam lateral scattering is very important from the clinical point of view, even more than thelongitudinal scattering. That is because the treatment planning avoids the stopping of thebeam in front of the OAR due to range uncertainties and, consequently, tumor volumes closeto critical structures can only be irradiated with the beam passing by. The distance at whichthe beam will pass by is determined by its lateral scattering [Kra00].
There are several published proton multiple Coulomb scattering measurements, ranging from1 MeV to 200 GeV of incident energy [Got93].
1 Mean distance over which a high-energy electron loses all but1
eof its energy by bremsstrahlung [Nak10].

8 Chapter 1. Radiotherapy With Protons
Figure 1.7: Characteristic cell survival pattern for low-LET X-rays and high-LET charged par-ticles or neutrons; from [Ger07]. Higher LET radiations increase the slope of cell survival curve,resulting in a larger relative biological effectiveness per unit dose.
1.3.2 Radiobiological rationale
Radiation can cause damage in the tissues either by direct or indirect action. In direct actionthe radiation interacts directly with the critical target in the cell (mostly DNA), ionizing andexciting the atoms of the target through Coulomb interactions. This triggers a chain of physicaland chemical events that may, or may not, lead to the biological damage [Sun05]. Indirectaction occurs when the radiation interacts with other molecules and atoms within or in thesurroundings of the cell, producing free radicals that diffuse until reach the critical target.In the case of indirect action, the radiation interacts mainly with water, in a process calledradiolysis, from which results short lived but extremely reactive free radicals like OH· (hydroxylradical) [Sun05, For02].
Following the radiolysis of water other products are formed from subsequent reactions. Forexample, two OH· can react forming H2O2 (hydrogen peroxide). This is quite relevant becauseOH·, along with H2O2, is responsible for approximately two-thirds of all radiation damagefollowing the radiolysis of water [For02]. A known important factor that can enhance theradiation damage is the amount of oxygen in the tissues [Hal06].
Indirect action is very important when it comes to protons, because about two-thirds of thedamage they induce is through this mechanism. This is true not only for protons but for allsparsely ionizing radiation or low-LET radiation [Sun05]. Photons, electrons, protons, and he-lium can be included in this category. Although protons are low-LET radiation and consideredbiologically radiation equivalent to photons [DK07], the resulting biological effects substan-tially differ, as shown in Fig. 1.7. The differences are due to the discrepancies in the relativebiological effectiveness (RBE). The RBE is defined in reference to sparsely ionizing radiation,mostly 220 keV X-rays [ICR86, Kra00] and is the ratio of X-ray dose to particle dose thatproduces the same effect (Fig. 1.8). The effect may be cell killing, mutation, transformation,i.e., carcinogenesis, tissue damage, among other endpoints [Ger07].

1.4. Comparison with photons 9
Figure 1.8: Definition of RBE, the relative biological effectiveness, illustrated with cell survivalcurves; from [Kra00].
For protons, there is evidence that the RBE increases slightly throughout the SOBP, speciallyin the distal one-third [Ger99, Raj95]. Carbon beams also present variations in the RBE alongtheir track, but at a higher scale (section 1.4). RBE > > 1 provides larger tumor-to-healthytissue equivalent dosage, which potentiates useful clinical applications (section 1.5). So, thischaracteristic of protons can be seen as a drawback or as an advantage, depending on thetherapeutical application in view. Although protons have a smaller biological effectiveness,this enhances simplicity of models for proton radiotherapy [Ger07].
1.4 Comparison with photons
The main advantage of protons, when compared with photons, is its inverted depth-dose profile,as depicted in Fig. 1.3. Unlike protons and heavier charged particles, photons depth-doseprofile shows the highest energy deposition shortly after their entrance in the tissue, which thendecreases exponentially as the penetration depth increases. Fig. 1.9 compares the irradiation ofa young patient with medulloblastoma with conventional X-rays and protons. The differencesare clearly visible, with the protons avoiding the irradiation of the OAR in the vicinity of thevertebral bodies.
Another important advantage of protons is that the beam can be driven by magnetic deflection,which permits directing and shaping the beam without any passive components (section 1.6).
The lateral scattering of protons can also be considered an advantage in comparison to photons,but only if the penetration depth does not exceed 7 cm (Fig. 1.6). Above that value, lateralscattering of protons increases very steeply.
The major hindrance to the further development of proton therapy is its relatively higher cost.It is estimated that the ratio of the costs of proton versus X-ray therapy per treatment fractionis about 2.4 [Pag06, Goi03].

10 Chapter 1. Radiotherapy With Protons
Figure 1.9: Treatment of a young patient with medulloblastoma; from [Sui03]. The image on theright side shows the irradiation with the conventional posterior 4 MV X-ray beam and resultantintermediate high dose to the anterior tissues/organs. The image on the left shows the treatmentby a posterior proton beam which delivers nearly zero dose to all tissues anterior to the anteriorsurface of the vertebral bodies.
1.5 Comparison with other charged particles
Although protons share some features with heavy charged particles, such as the Bragg peak,some differences are also present. Even the Bragg peak shows dissimilarities between them,being narrower for heavy particles because they do not suffer as much Coulomb scatteringfrom target nuclei as protons. However, heavy particles undergo a process called nuclearfragmentation [Nör80] that causes an increase in the dose beyond the Bragg peak, deliveringunwanted dose distal to the tumor [Jäk06].
Heavy ions show an increasing RBE with increasing charge (Fig. 1.10). Carbon and neon ions,in particular, show a significant difference between the RBE at the entrance and at the Braggpeak, which allows for an enhanced dose essentially in the tumor, sparing the surroundinghealthy tissues (Fig. 1.10 for carbon). In the particular case of carbon, the most studiedheavy particle for therapy, with five currently operational centers in Japan, Germany, andUSA [pFa10] and other five already proposed or under construction [pro10], the RBE valuesare between three and five at the Bragg peak for most radioresistant tumors [Cre05].
Because they are high-LET or densely ionizing radiation, heavy ions damage cells mainlythrough direct action. This is an enormous advantage because it eliminates the dependence onthe presence of oxygen within the cell. Since the particles interact directly with the atoms ofthe cell, they cause unrepairable damage in the DNA whether there is oxygen or not [Cre05].
Another significant advantage of heavy ions is that they may interact with the target througha nuclear reaction , causing auto and/or target activation, and decay by β+ decay [Cre05].Fortunately, the positrons emitted allow monitoring the dose delivered to the patient withPET.

1.6. Equipment and facilities 11
Figure 1.10: The RBE for a fractionated irradiation of jejunal crypt cells of mice after irradi-ation with different ions in different positions of a SOBP; from [Jäk06]. The modulation depthof the SOBP was 8-10 cm and the initial energy was 160, 225, 400, 557, and 570 MeV/u forprotons, helium, carbon, neon, and argon ions, respectively. Proton data from [Tep77] and iondata from [Gol81] (left). Comparison between the physical and the biological dose for carbon ions;from [Kan99, Pag09] (right).
1.6 Equipment and facilities
The currently operating proton therapy centers are listed in Table 1.2. Some of them arehospital-based facilities (e,g., Loma Linda, USA), others are associated physically with a na-tional laboratory (e.g., GSI, Germany), and others are stand-alone facilities not physicallylinked to any hospital (e.g., Orsay, France) [Tso07]. Nevertheless, all of them need an accel-erator to produce the proton beams and adequate systems to perform the treatment deliveryto the patient. These topics will be discussed in this section, along with the techniques morecommonly used in proton therapy.
1.6.1 Accelerators
The accelerator used in a proton facility can be either a cyclotron or a synchrotron. A cyclotronis a circular chamber with two ’dees’ acting like accelerating electrodes, while a magnetic fieldkeeps particles in a circular trajectory with crescent radius. Beam particles are injected inthe center of the cyclotron and then accelerated each time they pass through the electric field.When the beam reaches its maximum energy it is extracted from the cyclotron and directed tothe treatment room. A synchrotron is a narrow vacuum ring tube that receives and acceleratesa beam, generally pre-accelerated by a LINAC. The main difference to the cyclotron is thatthe synchrotron gradually increases the magnetic field to keep the beam within the tube asits energy also increases. The beam is extracted when the desired energy is reached, i.e., thesynchrotron allows for energy variation [Fla07, Pag06].
Within a facility, an accelerator is generally used to serve more than one treatment room(Fig. 1.11). Clinical parameters such as dose rate, range, distal fall-off, and lateral penumbraare directly affected by the beam current, beam energy, the beam energy spread, and thebeam size, respectively. Therefore it is important to assure that the accelerator is optimizedfor production of the intended clinical beams and delivery modalities. For example, if passivebeam shaping (section 1.6.2) is used, the clinical parameters are also influenced by the materials

12 Chapter 1. Radiotherapy With Protons
used to modulate the beam, so adjustments to the accelerator beam parameters will eventuallybe needed.
With the growing interest in proton therapy, there is the need of developing smaller cyclotronsthat can be affordable to more medical centers. Since there is an evolution from therapy centersphysically associated with a laboratory for physical research to hospital-based facilities, it isalso needed that accelerators are designed according to this new reality. This should comprise,besides building more compact accelerators, designing equipment that allows for maintenanceto keep a high reliability, investing in new methods of acceleration and improving treatmentsegments to allow more on-treatment adjustments to dose delivery, among other things.
Figure 1.11: Floor plan of the Loma Linda University Medical Center’s Proton TreatmentCenter, Loma Linda, CA, USA, with three gantry rooms and another with horizontal beams;from [Ama10]. The 7 m diameter synchrotron built by Fermilab accelerates the protons up to 250MeV (top). Floor plan of the Heavy-Ion Therapy (HIT), Heidelberg, Germany, with one gantryroom and two others with horizontal beams; from [Lag07] (bottom).

1.6. Equipment and facilities 13
Figure 1.12: The nozzle at Francis H. Burr Proton Therapy Center, Boston, MA, USA;from [Pag04]. Beam monitoring devices are ionization chambers and a range verifier (multi-layerFaraday cup). Beam-shaping devices are scattering systems, range modulators, and wobblingmagnets. Variable collimators (’jaws’) and the snout determine the field size.
1.6.2 Treatment delivery systems
After the beam is extracted from the accelerator, it must be directed to the treatment roomsand to the patient. This is made through magnets for bending, steering and focusing. Thetreatment room can have either a fixed horizontal beam line or a full rotating gantry. Theformer allows only the irradiation of the patient in seated or near-seated positions, whereasthe latter allows delivering the beam from any angle, which is of great importance when itcomes to conformal radiation therapy. Gantries are quite large, typically with up to 10 mof diameter, for two reasons. First, protons at therapeutical energies require large radii tobe bent, and second, they have to accommodate in their nozzle all the components for beamshaping and beam monitoring. Beam shaping devices include scatterers, absorbers, and otherpatient specific hardware [Fla07, Pag06]. Fig. 1.12 depicts the components of a nozzle in theFrancis H. Burr Proton Therapy Center, formerly Northeast Proton Therapy Center (NPTC).
Passive beam shaping
Passive beam shaping and pencil beam scanning (or raster scanning) can be used to modulatethe beam so it covers all the planning treatment volume (PTV). Passive shaping currentlydominates clinical use because it is simpler to use than active systems (section 1.6.2), whichuse magnetic deflection to control the beam. In passive beam shaping the beam is spreaded outwith scatterers to cover the field cross section. The SOBP is produced modulating the energy ofthe beam with range modulators like ridge filters, range-modulator wheels, and range shifters.

14 Chapter 1. Radiotherapy With Protons
Additional modulation of the beam can be achieved using apertures and range compensatorsspecific for each patient. Different combinations of these components are made in order toaccomplish the desired dose distribution. However, care must be taken with the position (i.e.,upstream or downstream) and the number of devices used, because there is the risk that dosesharpness is degraded and lateral penumbra augmented [Got07, Ped00, Pag06].
Another form of modulation can still be used with passive shaping, beam gating and currentmodulation. It consists, essentially in turning off the beam during part of the revolution, andvarying the beam current during the modulator cycle, respectively, thereby reducing the highnumber of range modulators, apertures, and range compensators required to satisfy the needsof all patients [Got07].
Active beam shaping
Although it is still restricted to a few centers, the trend is towards the increase in the use ofpencil beam scanning. Currently, only the PSI, the MD Anderson Cancer Center, the FrancisH. Burr Proton Therapy Center, the RPTC, and the HIT have this technique available, butthere are others already considering it [Nau10].
In pencil beam scanning, a narrow beam of protons is made to enter the patient at differentlocations by deflecting the beam under magnetic control. Although it is more complex, thisavoids the considerably high number of devices utilized to modulate the beam with passivebeam shaping, because it is usually applied without field- or patient-specific hardware, andunder computer control. This brings other advantages like the reduction of the infrastructurefor manufacturing and storing passive components, and the simplification of patient positioning,thereby diminishing the required treatment time. Also, the absence, or reduced number, offield-specific devices lowers the activation of the material near the patient [Ped00, Ped07].
Figure 1.13: Example of intensity modulated therapy with photons (left) and spot scanning withprotons (right); after [Ped00]. The yellow contours represent the targets (the visible tumor, thetreatment volume with involved limph nodes). The red lines represent OARs to spare (salivaryglands, brain stem). The dose distribution for photons (shown with color shading in percentage ofthe dose) is obtained through the superposition of 9 convergent photon fields. The dose distributionfor protons is obtained this time with only 4 fields. The advantage compared to photons is thereduction of the dose outside the target volume.

1.6. Equipment and facilities 15
Beam scanning manages to achieve a true 3D conformal dose distribution, conforming to the lat-eral, distal, and, in contrast to passive shaping, to proximal dimension of the PTV, preventingthe delivery of unwanted dose to healthy tissues. The major disadvantage of pencil beam scan-ning in comparison with passive shaping is its higher sensitivity to organ motion [Ped00, Ped07].
Beam scanning is a subset of and intrinsically promotes the delivery of intensity-modulatedproton therapy (IMPT) fields, which is analogous to intensity-modulated radiation therapy(IMRT) for photons. In IMPT, a single field delivers an inhomogeneous dose and the finalhomogeneous target dose is achieved only with multiple fields. IMPT allows designing anddelivering dose to PTVs with complex shapes, even with convexities and holes. [Ped07]. Thedifference for IMRT is that it is possible to vary the energy of each pencil beam in addition toits intensity [Pag06]. Fig. 1.13 shows the distinct dose distributions obtained with IMRT andIMPT.
A specific modality of pencil beam scanning is spot scanning, which consists in delivering doseonly in specific static positions, i.e., the beam moves without delivering dose until it reachesa particular position where the dose is delivered [Ped07]. It is simpler to use than rasterscanning but, in turn, irradiation with this technique requires a higher amount of time and itis error-prone due to difficulties in achieving a highly uniform dose.

16 Chapter 1. Radiotherapy With Protons

Chapter 2
Simulation Tools for the Developmentof a Proton Radiobiological Setup
2.1 Geant4 and SRIM/TRIM
The code for this work was implemented using Geant4 (Appendix A) [Ago03, All06]. Geant4is an acronym for geometry and tracking and is based on Monte Carlo. First validations of thecode were made against SRIM/TRIM (Appendix A) [Zie08]. SRIM stands for stopping andrange of ions in matter and it is a group of programs which calculate the stopping and rangeof ions [SRI10]. TRIM is an acronym for transport of ions in matter and a computer programalso based on Monte Carlo that calculates the interactions of energetic ions with amorphoustargets [Zie08].
2.2 Validation of Geant4
The code used in this work is based on a hadrontherapy example from Geant4 and it wasdeveloped by G.A.P. Cirrone, F. Di Rosa, S. Guatelli, and G. Russo from Laboratori Nazionalidel Sud of the National Institute for Nuclear Physics, Catania, Italy, and National Institutefor Nuclear Physics Section of Genova, Genova, Italy. It was created in May 2005.
We used several setups for validating our code. We wanted to make sure we would obtaintrustable results with it. As that, we did one validation for proton range, and another forbeam lateral scattering.
2.2.1 Proton range
The setup depicted in Fig. 2.1 was used for validation of proton range in water. The watertarget thickness was chosen based on a first calculation with SRIM, from which resulted aprojected range of 3.45 mm. So we proceeded to the simulation of a 18-MeV proton beamhitting a 5-mm long water target. We used an ideal source and put both the target and thesource within a spheric perfect detector so that particles eventually leaving the target couldbe detected. It is important to notice that the detector is in vacuum and not in air. Thisconsideration was made for simplification reasons, as we are interested solely, in this case,in determining the proton range in water. Furthermore, SRIM/TRIM calculations are also
17

18 Chapter 2. Simulation Tools for the Development of a Proton Radiobiological Setup
Figure 2.1: Schematic representation of the simulation setup used for proton range validation.A water target with dimensions 1x1x5 mm is in the center of a 300-mm radius spheric perfectdetector in vacuum. The distance between the point source and the water target center is 160 mm.The beam travels along the Z positive direction.
Figure 2.2: Range in water for 18-MeV protons, obtained using TRIM software. The simulationconsisted in 99 999 pencil-beam shaped 18-MeV protons hitting a 5-mm long liquid water targetwith an angle of incidence of 0°.
2.2. Validation of Geant4 19
idealized, considering that protons enter directly in the water target. So, vacuum is the mostadequate ’medium’ to compare simulation data of both SRIM/TRIM and Geant4.
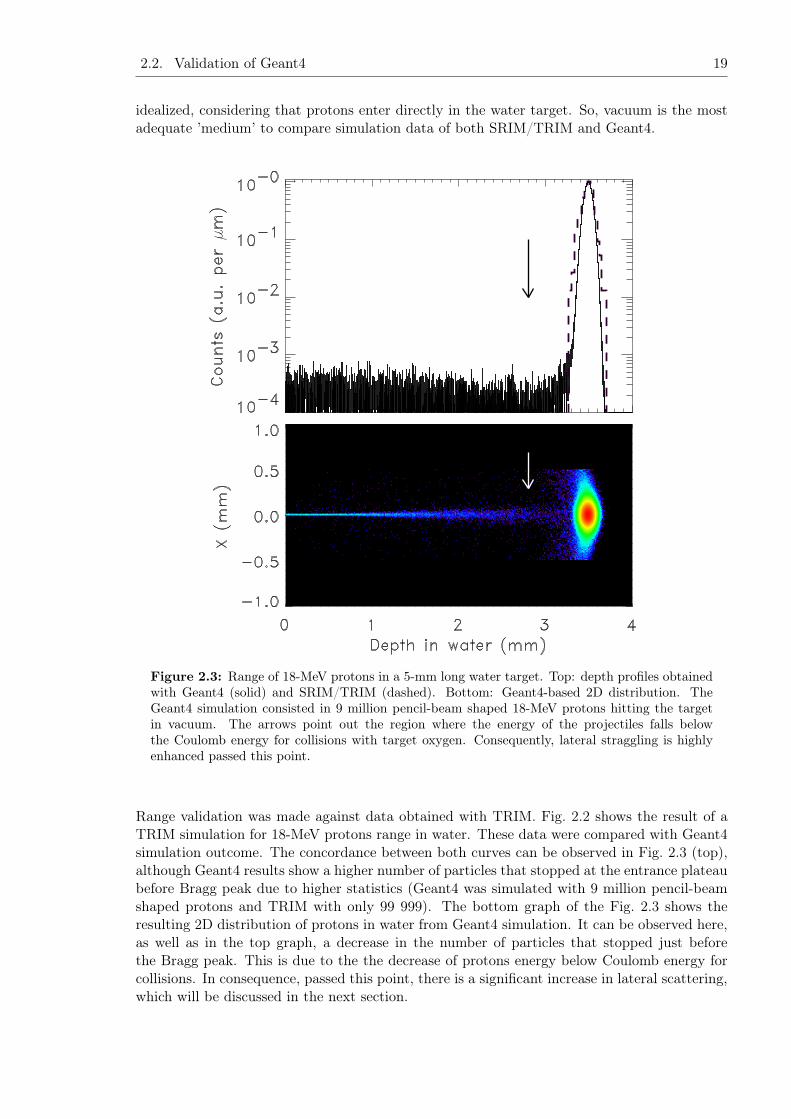
Figure 2.3: Range of 18-MeV protons in a 5-mm long water target. Top: depth profiles obtainedwith Geant4 (solid) and SRIM/TRIM (dashed). Bottom: Geant4-based 2D distribution. TheGeant4 simulation consisted in 9 million pencil-beam shaped 18-MeV protons hitting the targetin vacuum. The arrows point out the region where the energy of the projectiles falls belowthe Coulomb energy for collisions with target oxygen. Consequently, lateral straggling is highlyenhanced passed this point.
Range validation was made against data obtained with TRIM. Fig. 2.2 shows the result of aTRIM simulation for 18-MeV protons range in water. These data were compared with Geant4simulation outcome. The concordance between both curves can be observed in Fig. 2.3 (top),although Geant4 results show a higher number of particles that stopped at the entrance plateaubefore Bragg peak due to higher statistics (Geant4 was simulated with 9 million pencil-beamshaped protons and TRIM with only 99 999). The bottom graph of the Fig. 2.3 shows theresulting 2D distribution of protons in water from Geant4 simulation. It can be observed here,as well as in the top graph, a decrease in the number of particles that stopped just beforethe Bragg peak. This is due to the the decrease of protons energy below Coulomb energy forcollisions. In consequence, passed this point, there is a significant increase in lateral scattering,which will be discussed in the next section.

20 Chapter 2. Simulation Tools for the Development of a Proton Radiobiological Setup
2.2.2 Proton beam lateral scattering
The setup used for validation of beam lateral scattering is depicted in Fig. 2.4. The differencefor the setup in Fig 2.1 is target thickness, which is 1.5 mm in this case. This thickness waschosen to allow protons to interact with the target long enough to suffer Coulomb scattering,and then leave the target, being detected in the spheric perfect detector. Once again, thesource is a point source and the detector is in vacuum for simplicity reasons.
Figure 2.4: Schematic illustration of the simulation setup used for proton beam width validation.The water target with dimensions 1x1x1.5 mm is in the center of a 300-mm radius spheric perfectdetector in vacuum. The distance between the point source and the water target center is 160 mm.The beam travels along the Z positive direction.
Validation is done against Equation 1.2. Values used for calculating σθ are listed in Table 2.1.1
X0for water is obtained summing the contributions from
1
X0for oxygen and hydrogen (equa-
tion 2.1), yielding an equivalent value to tabulated X0 for water, 36.08 g/cm2.
18
X0(H2O)=
2
X0(H)+
16
X0(O), (2.1)
The theoretical value obtained for σθ was an angle of 1.2293.

2.2. Validation of Geant4 21
Table 2.1: Some of the values used for calculating beam lateral scattering.Quantity Value Units
β 0.196815p 184.667485 MeV/cc 299792458a) m/sz 1x 0.15 g/cm2
X0(H) 63.0470b) g/cm2
X0(O) 34.2381b) g/cm2
a) According to [Nak10].c) According to [Tsa74].
Data was fit with a pseudo-Voigt1 function and the result corresponds to the blue curve inFig. 2.5. The parameters used in the fit are listed in Table 2.2.2. The fit yielded a σθ valueof 1.3678± 0.0045 (338 iterations), which represents a difference of about 11.3% in respect tothe theoretical value calculated.
Table 2.2: Parameters used to fit the simulated data to a pseudo-Voigt function.
Name ValueConstantG 80000Mean 0Sigma 1.35Pedestal 0Slope 0ConstantL -1500Width -2Peak 4
This result may seem somewhat high, since dosimetry requires accurate outcomes. However, ifwe compare the theoretical value already calculated with the one obtained with another well-established expression, like equation 2.2 [Hig75, Hig79, Cre05], which yields a σθ of 1.0945,a similar discrepancy can be observed. This value corresponds to a difference of nearly 10.9%in respect to the one calculated with equation 1.2. The reason for these uncertainties in σθvalues obtained with both expressions can be explained by the fact that such expressions areobtained by adjustments made to beams with no negligible width.
σθ =13.6MeV
βpcz
√x
X0
[1 + 0.038 ln
(x
X0
)], (2.2)
1 A Voigt function is the convolution of a Gaussian function and a Lorentzian function. As it requires arelatively involved computational procedure, it is often replaced by a pseudo-Voigt function, which consistsin the weighted sum of a Gaussian function and a Lorentzian function [Ver06].

22 Chapter 2. Simulation Tools for the Development of a Proton Radiobiological Setup
Angle (deg)0 1 2 3 4 5 6 7 8 9 10
/ sr)
°/ 0
.13
10×C
ount
s (
0
10
20
30
40
50
60
70
Simulated data
Pseudo-Voigt fit
Figure 2.5: Proton beam lateral scattering. Angular distribution of 18-MeV protons after travers-ing 1.5-mm long water target. The simulation consisted in 25 million pencil-beam shaped protonshitting the target in vacuum.

Chapter 3
Concept for a Proton Cyclotron-BasedRadiobiology Facility
Although it may be suitable for other cyclotron-based facilities, the setup described and studiedin this work is planned to be implemented at one of the beam lines of the cyclotron recentlyinstalled at Instituto de Ciências Nucleares Aplicadas à Saúde (ICNAS), University of Coimbra.As that, it is important to know some of its features, which will be described briefly. Thechronology of such information is also relevant in order to understand the sequence of thiswork.
After the first code validations, described in the previous chapter, what we will be doing hereis a systematic approach with Geant4. We simulate the dose delivered by the cyclotron beamand study how dispersion influences it.
Figure 3.1: Dose-response curve for tumor control probability and normal tissue damage prob-ability; from [Hal06]. The dose-response relationship is sigmoid in shape for both tumor controland normal tissue damage. That for normal tissue damage may be steeper than for tumor control.The therapeutic ratio (or index) is the percent of tumor control that can be achieved for a givenlevel of normal tissue damage. In this hypothetical example, about 30% tumor control can beachieved for a 5% incidence of normal tissue damage.
23

24 Chapter 3. Concept for a Proton Cyclotron-Based Radiobiology Facility
The dose calculated in this work is the absorbed dose. Independently of the number of protonssimulated, the depth-dose curves obtained correspond to the dose delivered by one million pro-tons hitting the target. In radiotherapy, the accurate determination of this quantity is crucialdue to the relatively steep sigmoidal dose-response curve for both tumor control and normaltissue damage (Fig. 3.1) [Nah07b]. Absorbed dose is a non-stochastic quantity applicable toboth indirectly and directly ionizing radiations and is related to the stochastic quantity energyimparted. The absorbed dose is defined as the mean energy ε imparted by ionizing radiationto matter of mass m in a finite volume V by [Seu05, Nah07b, ICR80, ICR98]:
D =dε
dm(3.1)
The energy imparted ε is the sum of all the energy entering the volume of interest minus all theenergy leaving the volume, taking into account any mass-energy conversion within the volume.The unit of absorbed dose is joule per kilogram (J/kg). The name for the unit of absorbeddose is the gray (Gy).
3.1 ICNAS cyclotron
The cyclotron installed at ICNAS is manufactured by IBA (Ion Beam Applications, S.A.,Belgium) and is a Cyclone® 18/9 HC, a fixed-energy cyclotron that accelerates protons anddeuterons. Initial informations about beam energy were gathered in IBA’s website, whichindicates that protons are accelerated up to 18 MeV and deuterons up to 9 MeV [IBA10]. Later,in a private communication, we became aware of details about the beam port design, namelythat it is composed of several materials, through which the beam has to pass before leaving thethe cyclotron. The first one is a thin foil (approximately 50 µm) of Havar® (Appendix B) tokeep the necessary low operating pressure inside the cyclotron; then, there is a chamber withgaseous helium that acts as a cooling system; in the other end of the chamber another materialis placed, usually a thin foil (approximately 12 µm) of aluminum or titanium, to make theseparation between the helium and the exterior of the cyclotron, to support the target and toact as a thermal interface between the helium and the target. In the context of the same privatecommunication, a first approximation was made to what would be the beam dispersion, and theconclusions were that the beam would have a nearly Gaussian distribution with a FWHM (fullwidth at half maximum) of 10 mm after 30 cm. Also, an estimed value was given for the beamenergy after traversing these materials, which would be around 17 MeV for protons [Alv10a].
Through a contact with IBA Molecular, more precise specifications were obtained: the cyclotronis capable of accelerating protons up to 18.5 MeV and deuterons up to 9.2 MeV with beamcurrents equal to 150 µA and 40 µA, respectively; both beams present an approximatelyGaussian distribution, with 80% of protons and 70% of deuterons within 10 mm and a dispersionof 3σ and 4σ, respectively; and the energy of the beam after leaving the port is 17.5 ± 0.2 MeVfor protons and 8.2 ± 0.1 MeV for deuterons [Alv10b].

3.2. Design proposal 25
Figure 3.2: Concept of the experimental setup being planned at one of the beam lines of thecyclotron of the University of Coimbra. A moving range modulator allows for a controlled decreasein beam energy below 18 MeV. A shutter-equipped collimator with adjustable hole size follows. Itregulates both beam lateral size and time exposure which, consequently, allows for the control ofthe area and dose delivered to the target. The target may consist of cell cultures, small animals,or dosimetric devices enabling the characterization and control of beam parameters.
3.2 Design proposal
Fig. 3.2 depicts the first draft of the experimental setup being planned, which will allow per-forming radiobiological studies either with cell cultures or small animals. It is composed ofseveral devices, namely a moving range modulator, a shutter-equipped collimator, and a sup-port system for the target. The range modulator permits decreasing the beam energy below18 MeV; the collimator has an adjustable hole size, which permits controlling the area beingirradiated; and the shutter associated with the collimator regulates time exposure and, thus,the dose delivered to the target.
3.3 Influence of beam divergence on dose delivery
3.3.1 Pencil beam
In a first phase of this study we did simulations with 18-MeV pencil-beam shaped protonshitting a water target, using the setup depicted in Fig. 2.1. The depth-dose profile in Fig. 3.3is the one resulting from such simulation. It can be observed that the peak in this curvematches the simulated Bragg peak in Fig. 2.3, since it is verified at 3.449 mm. The dose at thepeak is 2.9605 Gy.
Following this simulation, the next step was to introduce a small variation in water targetdensity in order to study the influence of target density variation in depth-dose curves. Thisway we would be able to verify if and how such variation would affect the location of the peakinto the target. Using the same setup (Fig. 2.1), but changing the water density from 1.00 g/cm3

26 Chapter 3. Concept for a Proton Cyclotron-Based Radiobiology Facility
Figure 3.3: Depth-dose profile in water for 18-MeV protons. The curve peak is 2.9605 Gy for adepth in water of 3.449 mm. The simulation consisted in 9 million pencil-beam shaped 18-MeVprotons hitting the target in vacuum.
to 1.05 g/cm3, which means a difference of 5%, we obtained the depth-dose profile representedwith a dashed blue line in Fig. 3.4(a). It can be observed that the curve peak is shifted tothe left. It has now a value of 2.9619 Gy at 3.286 mm, which corresponds to a difference of163 µm in respect to the solid black curve peak. When we were informed about the actualproton beam energy after leaving the beam port, 17.5 MeV, we used the same setup (Fig. 2.1)to make an identical simulation and determine the depth-dose profiles for protons with thisenergy. The resulting curves are shown in Fig. 3.4(b). In this case, the peaks are situated at3.281 mm and 3.124 mm for the solid black line and the dashed blue one, respectively. Thecorrespondent values of dose are 3.0189 Gy and 3.0234 Gy.
Fig. 3.5 compares the depth-dose profiles in water of regular density for 18-MeV and 17.5-MeVprotons. It can be noticed that protons with less energy (dashed red line) have a smaller rangein the same target.
In face of these results, we wanted to check if and with which proportions this phenomenonwould occur for higher energies. So we made a simulation using the setup depicted in Fig. 3.6.The resulting dose profiles are shown in Fig. 3.6. Also in this case, it can observed that thepeak of the depth-dose profile corresponding to the water target with 1.05 g/cm3 is shifted tothe left. The difference in this case is of 12.038 mm.
3.3.2 Beam with dispersion
After the private communication in which we were given a first approximation of what wouldbe the beam dispersion [Alv10a], we started making simulations taking this variable in account.We calculated an angle of dispersion of 0.95484 for a FWHM of 10 mm at 30 cm. Also, wechanged the beam energy to 17 MeV and considered a circular source with a radius of 1 mm.

3.3. Influence of beam divergence on dose delivery 27
(a) 18-MeV protons.
(b) 17.5-MeV protons.
Figure 3.4: Influence of density variation on depth-dose profile in water for 18-MeV and 17.5-MeVprotons. The solid black curve is the depth-dose profile in water with a density of 1.00 g/cm3 andthe dashed blue one is the depth-dose profile in water with a density of 1.05 g/cm3. The simulationsto obtain these curves consisted in pencil beam shaped protons hitting the correspondent watertargets with 5% difference in density. The total number of protons was 9 million for (a) and 8million for (b). (a) The peak for the solid black curve is 2.9605 Gy at 3.449 mm and, for thedashed blue curve, it is 2.9619 Gy at 3.286 mm, which corresponds to a difference of 163 µmbetween both peaks. (b) The peak for the solid black curve is 3.0189 Gy at 3.281 mm and, for thedashed blue curve, it is 3.0234 Gy at 3.124 mm, corresponding to a difference of 157 µm betweenboth peaks.

28 Chapter 3. Concept for a Proton Cyclotron-Based Radiobiology Facility
Figure 3.5: Influence of proton beam energy on depth-dose profile in water. The solid black curverepresents the depth-dose profile in water for 18-MeV protons and the dashed red line correspondsto the same profile for 17.5-MeV protons. These curves are the same represented by the solid blackline in Fig. 3.4(a) and (b), respectively.
Figure 3.6: Schematic representation of the simulation setup used for irradiating water with200-MeV protons. A water target with dimensions 5x5x300 mm is in the center of a 300-mmradius spheric perfect detector in vacuum. The distance between the point source and the watertarget center is 300 mm. The beam travels along the Z positive direction.

3.3. Influence of beam divergence on dose delivery 29
Figure 3.7: Influence of density variation on depth-dose profile in water for 200-MeV protons.The black curve is the depth-dose profile in water with a density of 1.00 g/cm3 and the blue oneis the depth-dose profile in water with a density of 1.05 g/cm3. The peak for the black curveis 7.1170 mGy at 254.958 mm and, for the blue curve, the dose in the peak is 7.4487 mGy at242.920 mm. This corresponds to a difference of 12.038 mm between both peaks. In both cases,the simulation consisted in 400 thousand pencil-beam shaped protons hitting a water target. Thedifference was the water density, which was 5% higher for the dashed blue curve.
Several setups were used for the simulations in this phase. We first simulated the effect of beamdispersion in a cylindric water target. The correspondent setup is represented in Fig. 3.8. Theresult is shown in Fig. 3.9(a). Looking at these curves one can see that the dose is higher withina radius equal to 1 mm and decreases as the radius increases, meaning that the dose is deliveredmainly in the center of the target, even in the case of a beam with dispersion. Fig. 3.9(b)represents the same depth-dose profiles in the same target but for 17.5-MeV protons. Thissimulation was made after we were told the beam energy after traversing the material in thebeam port is 17.5 MeV.
The following step was to study dose 3D distribution. We used the setup depicted in Fig. 3.10,in which there is a parallelepiped of dimensions 50x50x15 mm that is hit by protons. The dosein this target is registered in each 100 µm cube. The resulting 2D distribution from simulationswith this setup, and the correspondent profile, is shown in Fig. 3.13.
Havar® target
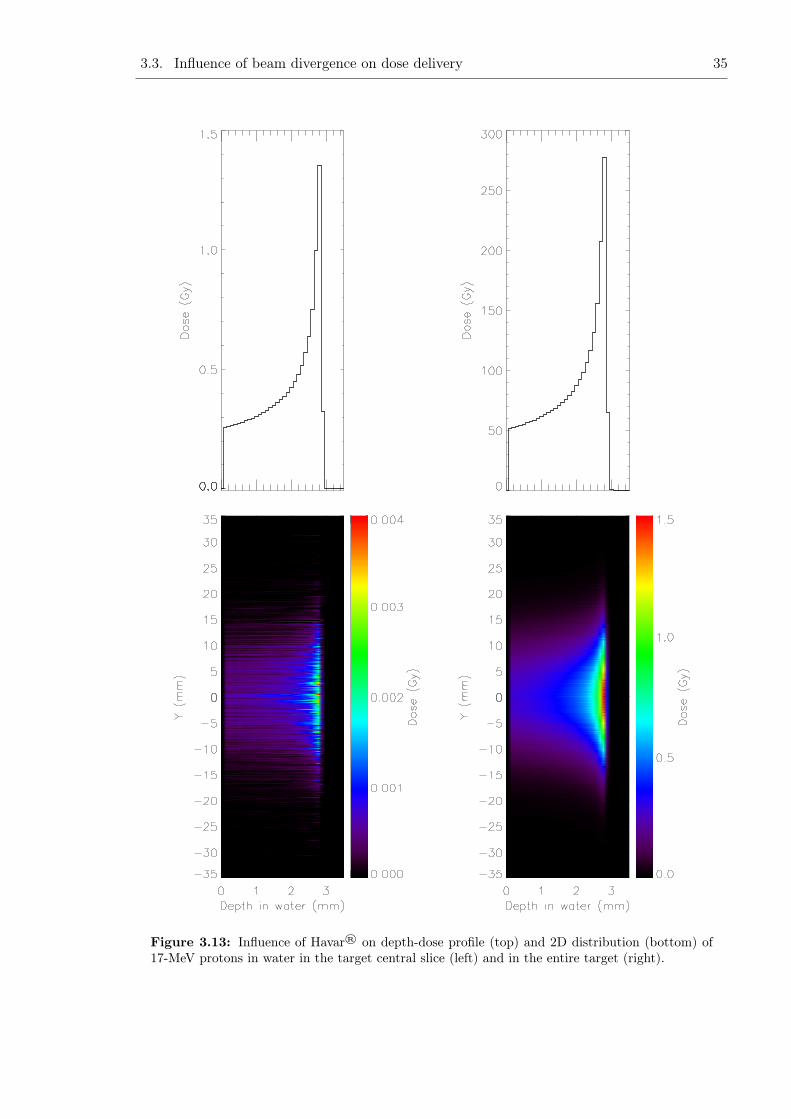
At the time we got the information that the beam energy after leaving the beam port is17.5 MeV, we were also informed that Havar® is the main responsible for beam disper-sion [Alv10b]. As that, we used the setup depicted in Fig. 3.12 to study the influence ofHavar® on dose. This setup uses the same source and beam dispersion considered in the pre-vious case, but between the source and the target, at a distance of 300 mm from the source

30 Chapter 3. Concept for a Proton Cyclotron-Based Radiobiology Facility
and 150 mm from the water target, there is a 50-µm-long Havar® foil.
Figure 3.8: Schematic representation of the simulation setup used for first simulations of a beamwith dispersion. A 25-mm radius and 10-mm long cylindric water target is in the center of a300-mm radius spheric perfect detector in vacuum. The distance between the circular source andthe water target center is 300 mm. The beam travels along the Z positive direction with 0.95484dispersion.

3.3. Influence of beam divergence on dose delivery 31
(a) 17-MeV protons.
(b) 17.5-MeV protons.
Figure 3.9: Depth-dose profiles in water at four different radius for 17- and 17.5-MeV protons.The dotted dashed black line is the depth-dose curve for a 1-mm radius cylindric water target,the dotted blue line is the one for a 5-mm radius, the dashed purple line for a 10-mm radius andthe solid red line for a 25-mm radius. The simulations consisted in 1 million pencil-beam shaped17-MeV (a) and 17.5-MeV (b) protons with dispersion from a 1-mm radius circular source hitting25-mm radius cylindric water target in vacuum.

32 Chapter 3. Concept for a Proton Cyclotron-Based Radiobiology Facility
Figure 3.10: Schematic illustration of the simulation setup for calculating the dose 3D distribu-tion. A water target with dimensions of 50x50x15 mm is in the center of a 300-mm radius sphericperfect detector in vacuum. The distance between the circular source and the water target centeris 307.5 mm. The beam travels along the Z positive direction with 0.95484 dispersion.

3.3. Influence of beam divergence on dose delivery 33
Figure 3.11: Depth-dose profile (top) and 2D distribution (bottom) of 17-MeV protons in waterin the target central slice (left) and in the entire target (right).

34 Chapter 3. Concept for a Proton Cyclotron-Based Radiobiology Facility
Figure 3.12: Schematic illustration of the simulation setup for studying the influence ofHavar® on dose 3D distribution. A water target with dimensions of 70x70x15 mm is in thecenter of a 450-mm radius spheric perfect detector in vacuum. Between the source and the targetthere is a 50-µm-long Havar® foil. The distance between the circular source and the Havar® foilcenter is 300-mm. and the distance between the water target center and Havar® is 150 mm. Thebeam travels along the Z positive direction with 0.95484 dispersion.
3.3. Influence of beam divergence on dose delivery 35
Figure 3.13: Influence of Havar® on depth-dose profile (top) and 2D distribution (bottom) of17-MeV protons in water in the target central slice (left) and in the entire target (right).

36 Chapter 3. Concept for a Proton Cyclotron-Based Radiobiology Facility

Chapter 4
Conclusions
4.1 Work results
This work is focused on cyclotron proton beams for radiobiology. The scientific basis of aviability study for the implementation of a cyclotron-based radiobiology facility, consideringan 18-MeV proton cyclotron, and particularly the one installed at ICNAS. We started from analready structured Geant4-based code and validated it against well-established Monte-Carlobased codes, as SRIM/TRIM, and theoretical expressions, as equation 1.2. Then, we continuedmanipulating the code to yield dose profiles and 2D distributions.
We can therefore divide this work in two main phases, the validation phase and the doseestimation phase. All work following validation was strongly influenced by the sequence of theinformations about the cyclotron beam characteristics.
During the first phase, simulations were performed to validate the code for either proton rangeand proton beam lateral scattering. The former was validated against data from SRIM/TRIMand the latter against the theoretical σθ of proton angular distribution, predicted by equa-tion 1.2. Proton range was clearly validated, as seen in Fig. 2.3. The curve correspondentto simulated data remarkably matches the curve correspondent to data obtained with TRIM.Also, either in Bragg curve and in 2D dose distribution of Fig. 2.3 it is possibly to observea depression right before the Bragg peak, which corresponds to the decrease of protons en-ergy below Coulomb energy for collisions with target oxygen. Passed this point, protons arescattered mainly by interactions with target nuclei. Beam lateral scattering was also validatedconsidering the theoretical expected values.
The second phase itself can be subdivided in several parts, not necessarily subsequent to eachother. Right after code validation we began to run simulations to build dose profiles obtainedwith pencil beam protons from ideal point sources. This would give us a reference for compar-ison when calculating doses delivered by beams with dispersion from non-ideal sources. Usingbeams and sources with these properties, we also did simulations to study the effect of targetdensity variation on depth-dose profiles. Fig. 3.4 and Fig. 3.7 show such effect for differentbeam energies. One can observe that density variation influences depth-dose curves peak loca-tion and that such influence is higher for higher energies, i.e., the difference in peak location isequal to some micrometer in case of proton energies of about 18 MeV, whereas it correspondsto more than a centimeter if the beam energy is 200 MeV.
37

38 Chapter 4. Conclusions
This a very important result because variations in human tissue density can also occur duringa radiotherapy treatment with several sessions (fractionated radiotherapy). If such variationsare not taken into account between sessions, then one can be irradiating healthy tissue with-out being aware and creating cold spots in the tumor. This difference is crucial because aninsuffiecient irradiation in the tumor contributes to its relapse and dose in the healthy tissueinduces undesirable side effects, including potential late cancer.
The simulations using beams with dispersion from non-ideal sources were an approximation tothe cyclotron beam characteristics. They were based on the first estimation of beam dispersionand energy after leaving the target [Alv10a]. There were several simulations made using theseconsiderations. The first meant to study the depth-dose profiles in four distinct radius of acilindric water target for a beam with dispersion (Fig. 3.9). From it we can conclude that thedose is far more concentrated in small radii, being around 10 times higher in a 1-mm radiusthan in a 25-mm radius. The results are similar for 17- and 17.5-MeV proton beams, the peakbeing slightly shifted to the left for 17-MeV protons.
Another set of simulations took place for calculating dose deposition in 3D. The dose wasregistered voxel by voxel, these being 100-µm3 cubes (Fig 3.13). A comparative study wasmade to analyze the dispersion caused by Havar®. Further corrections were not made, likesimulating beam dispersion after passing through set of materials in the beam port (section 3.1)due to lack of time and computational resources. Nevertheless, such simulations allow us tohave a first glance on dose values delivered by cyclotron beams to a water target.
The overall conclusion of this simulation work is that the cyclotron beam dose is too high forusing in radiobiology. With a current of 150 µA, the flux is around 1×10¹⁵ protons per second.All doses calculated in this work are for 106 protons hitting the target. So, in order to estimatewhich dose will be delivered by 1 × 10¹⁵ proton, we must multiply the doses by 109. Thismeans the result would be, in most cases, doses of GGy in only one second (for the case of anunrealizable, perfectly shaped pencil-beam).
The particular case of the calculus of 3D dose is the one with more interest because we can getthe maximum dose in a 100 µm voxel of the target and it is that value we will use from thispoint on for our calculus. Our reference is the standard value for fractionated radiotherapy,which is 2 Gy per fraction [Ste07a]. In case Havar® is not present, the maximum dose for 106
protons is 0.0278234 Gy. Multiplying this by 109, we obtain 27.8234×10⁶ Gy. This is a veryhigh value of dose to be delivered in only one second. In case Havar® is present, the maximumdose for 106 protons is 0.00383697 Gy. Multiplying by 109, we get 3.83697×10⁶ Gy. It is nearly10 times smaller than the previous value, but it is still too high.
One way to overcome this excessive dose is to reduce cyclotron beam current. If we consider acurrent of 15 µA instead of 150 µA, the dose will also decrease 10 times. So, we get 2.78234 MGywithout Havar® and 0.383697 MGy with it. Another solution to reduce even further thesevalues may be to deviate the target from the beam center and make use of beam fringes,since we have already concluded that it is in the center that more dose is delivered (Fig. 3.9).Fig. 4.1 represents a way to make it possible. When leaving the cyclotron, the beam is, asalready mentioned, approximately Gaussian with 80% of protons within 10 mm. Admittingthat 10% of particles are beyond 5 mm on each side of the beam axis, we can make use ofsuch particles to irradiate the target. The distance from cyclotron to the slit center was set as2.4 m.

4.2. Future work 39
Figure 4.1: Schematic representation of a setup configuration to allow for the delivery of lowdoses. The target is situated under the rotating disk, which is, in turn, deviated from the beamaxis. The rotating disk, with 350-mm radius, has a slit of 1-mm width and R = 300 mm. Thedistance from cyclotron exit and the slit center is 2.4 m.
4.2 Future work
This study had as goal to study the viability of implementing a setup at ICNAS. Further workshall be performed to confirm and re-evaluate the conclusions presented here, there are somethings that can be done.
The code used is based on a hadrontherapy example from Geant4 from 2005. When runningthe simulations in Geant4 9.3, in the verbosity there were messages alerting for the fact thatsome classes are already obsolete and that they will be removed with the next major releaseof Geant4. So, our code must be updated and we may try to run the same simulations we didhere using other physics and compare the outcomes.
One of the possibilities that may arise from the implementation of this setup is the chanceto determine the accuracy of proton range using post-treatment PET [Kno10]. This can bedone because positron-emitter and gamma production reactions occur when protons hit atarget [Bee03]. Table 4.1 lists some of the most relevant of those reactions.
Positrons resulting from these reactions can be detected with the RPC-PET (resistive platechamber1-PET) that is being developed at Laboratório de Instrumentação e Física Experimen-tal de Partículas (LIP) [Bla06]. Its submillimetric spatial resolution and high sensitivity makesit a potential dedicated animal PET.
The results achieved with the simulation code showed that this project is now at the stagewhere a next-step, full-setup implementation can be fullfilled.
1 The resistive plate chamber is a gaseous particle detector developed for high energy physics.

40 Chapter 4. Conclusions
Table 4.1: Relevant positron-emitter production reactions; from [Bee03].
Nuclear Threshold energy Half-life Positron Max.
reactions (MeV) time Energy (MeV)16O(p,pn)15O 16.79 2.037 1.7216O(p,2p2n)13Na) 5.66c) 9.965 1.1914N(p,pn)13N 11.44 9.965 1.1912C(p,pn)11C 20.61 20.39 0.9614N(p,2p2n)11Ca) 3.22c) 20.39 0.9616O(p,3p3n)11Cb) 27.50c) 20.39 0.96
a) (p,2p2n) is inclusive of (p,α)b) (p,3p3n) is inclusive of (p, α pn)c) Listed thresholds refer to (p, α) and (p, α pn)

Appendices
41

42 Appendices

Appendix A
Software and hardware used
A.1 Hardware
Machines used for performing the simulations necessary to this work are listed in Table A.1).
Table A.1: Machines used to perfom the simulationsNumber RAM
CPU of cores memory
Machine 1 Intel® Pentium® Dual-Core T4200 2.0GHz 2 4 GBMachine 2 Intel® 2140 1.60GHz 2 4 GBMachine 3 Intel® Core™ 2 Quad Q6600 2.40GHz 4 4 GB
A.2 Geant4 simulation toolkit
Geant4 is a Monte-Carlo based software toolkit that simulates the passage of particles throughmatter [Ago03, All06]. It is a very flexible solution with innumerous models of physics pro-cesses in a wide range of energies [Ago03]. It can cover hadronic, electromagnetic and op-tical interactions and has libraries to a large set of materials, elements and long-lived parti-cles [Ago03, All06]. It is designed to be used as object-oriented language and is implementedin C++ [Ago03].
The hadronic interactions with Geant4 are divided in three major groups: (1) cascade state,(2) pre-equilibrium state, and (3) equilibrium state. Each state has its own models, but forsome cases it is not necessary to have a model for each state. For example, interactions atlow energy (< 100 MeV) can be modelized without the cascade phase [Wri10, Ago03]. Thecascade state describes the intra-nuclear projectile-nucleon and nucleon-nucleon interactionsafter the projectile enters the nucleus. The two main models for this phase are the Bertinicascade and binary cascade. The main code for modelization of pre-equilibrium state is theprecompound model that takes a nucleus from a highly-excited set of particle-hole states downto equilibrium energy by emitting protons, neutrons, deuterons, tritium nuclei, helium-3 nuclei,and alphas [Wri10]. The final phase, the equilibrium state, is known also as nuclear evaporationor nucleus de-excitation phase. After the pre-equilibrium phase, the nucleus is supposed to beleft in an equilibrium state, in which the excitation energy is shared by a large number of
43

44 Appendix A. Software and hardware used
nucleons. If the excitation energy is higher than the separation energy1, it can still ejectnucleons and light particles (deuterons, tritium nuclei, helium-3 nuclei, and alphas) [Gea09].The generalized evaporation model (GEM) is an example of an evaporation model.
A.3 Other software
Other software used is listed below:
• Operating system: openSuse 11.2 64-bit version (Linux kernel 2.6.31.12)2
• Library for high energy physics: CLHEP version 2.0.4.5.
• C++ compiler: GCC version 4.4.1
• Geant4 visualization system: HepRApp version 3.15.0
• Data analysis: ROOT framework version 5.26/00 and IDL version 7.0.6
1 Separation energy is the energy needed to remove a nucleon or other particle from a nucleus2 Other versions of openSuse were also used, but almost all simulations were done with openSuse 11.2 64-bit
version

A.3. Other software 45
used

46 Appendix A. Software and hardware used

Appendix B
Havar®
Havar® was originally developed in the late 1940’s by the Hamilton Watch Company as an ’un-breakable’ mainspring material [Rob03]. As watches moved from spring to battery power, thinHavar® strip found a second life in high strength, non-magnetic, corrosion resistant pressuresensing diaphragms for process control equipment [Rob03].
According to the technical sheet of Havar® [HPM], this material is a heat treatable cobaltbase alloy that provides very high strength. The alloy has excellent corrosion resistance and isnon-magnetic. Applications have included pressure diaphragms, power springs, gap spacers inmagnetic heads, and target foils in nuclear physics [HPM].
Table B.1: Nominal composition of Havar®. After [HPM].
Element Elemental percentage
Cobalt 42.0%Chromium 19.5%Nickel 12.7%Tungsten 2.7%Molybdenum 2.2%Manganese 1.6%Carbon 0.2%Iron Balance
Table B.2: Physical properties of Havar®. After [HPM].
Property Value
Density 8.304 g cm−3
Melting point 1480Electrical resistivity @ R. T. 92.0 µΩ cmThermal expansion coefficient (0 to 50) 12.5 × 10⁻⁶ −1
Thermal conductivity 13.0 W m−1 KMagnetic attraction none
47

48 Appendix B. Havar®
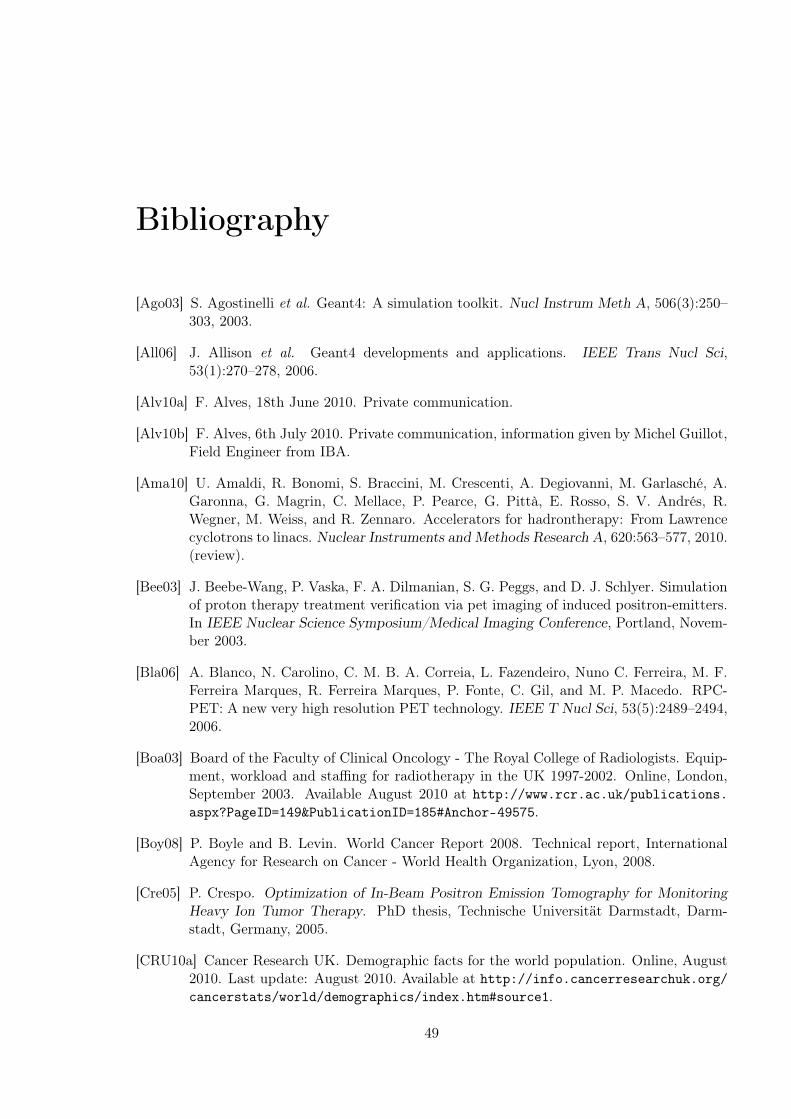
Bibliography
[Ago03] S. Agostinelli et al. Geant4: A simulation toolkit. Nucl Instrum Meth A, 506(3):250–303, 2003.
[All06] J. Allison et al. Geant4 developments and applications. IEEE Trans Nucl Sci,53(1):270–278, 2006.
[Alv10a] F. Alves, 18th June 2010. Private communication.
[Alv10b] F. Alves, 6th July 2010. Private communication, information given by Michel Guillot,Field Engineer from IBA.
[Ama10] U. Amaldi, R. Bonomi, S. Braccini, M. Crescenti, A. Degiovanni, M. Garlasché, A.Garonna, G. Magrin, C. Mellace, P. Pearce, G. Pittà, E. Rosso, S. V. Andrés, R.Wegner, M. Weiss, and R. Zennaro. Accelerators for hadrontherapy: From Lawrencecyclotrons to linacs. Nuclear Instruments and Methods Research A, 620:563–577, 2010.(review).
[Bee03] J. Beebe-Wang, P. Vaska, F. A. Dilmanian, S. G. Peggs, and D. J. Schlyer. Simulationof proton therapy treatment verification via pet imaging of induced positron-emitters.In IEEE Nuclear Science Symposium/Medical Imaging Conference, Portland, Novem-ber 2003.
[Bla06] A. Blanco, N. Carolino, C. M. B. A. Correia, L. Fazendeiro, Nuno C. Ferreira, M. F.Ferreira Marques, R. Ferreira Marques, P. Fonte, C. Gil, and M. P. Macedo. RPC-PET: A new very high resolution PET technology. IEEE T Nucl Sci, 53(5):2489–2494,2006.
[Boa03] Board of the Faculty of Clinical Oncology - The Royal College of Radiologists. Equip-ment, workload and staffing for radiotherapy in the UK 1997-2002. Online, London,September 2003. Available August 2010 at http://www.rcr.ac.uk/publications.
aspx?PageID=149&PublicationID=185#Anchor-49575.
[Boy08] P. Boyle and B. Levin. World Cancer Report 2008. Technical report, InternationalAgency for Research on Cancer - World Health Organization, Lyon, 2008.
[Cre05] P. Crespo. Optimization of In-Beam Positron Emission Tomography for MonitoringHeavy Ion Tumor Therapy. PhD thesis, Technische Universität Darmstadt, Darm-stadt, Germany, 2005.
[CRU10a] Cancer Research UK. Demographic facts for the world population. Online, August2010. Last update: August 2010. Available at http://info.cancerresearchuk.org/cancerstats/world/demographics/index.htm#source1.
49

50 Bibliography
[CRU10b] Cancer Research UK. Key facts for all cancers combined. Online, August2010. Last update: August 2010. Available at http://info.cancerresearchuk.org/cancerstats/keyfacts/Allcancerscombined/018212#All.
[DK07] T. F. Delaney and H. M. Kooy, editors. Proton and Charged Particle Radiotherapy,pages ix–x. Lippincott Williams & Wilkins, 1st edition, 2007. Preface.
[Fal62] S. Falkmer, B. Fors, and B. Larsson. Pilot study on proton irradiation of humancarcinoma. Acta Radiol, 58:33–51, 1962.
[Fer10] J. Ferlay, H. R. Shin, F. Bray, D. Forman, C. Mathers, and D. M. Parkin. GLOBOCAN2008, Cancer Incidence and Mortality Worldwide: IARC CancerBase No. 10. Internet,2010. Lyon, France: International Agency for Research on Cancer. Available from:http://globocan.iarc.fr.
[Fla07] J. Flanz. Particle accelerators. In T. F. Delaney and H. M. Kooy, editors, Protonand Charged Particle Radiotherapy, chapter 4, pages 27–32. Lippincott Williams &Wilkins, 1st edition, 2007.
[For02] S. Forshier. Essentials of Radiation Biology and Protection. Delmar, New York, 1stedition, 2002.
[Fow06] J. F. Fowler. Development of radiobiology for oncology - a personal view. Phys. Med.Biol., 51:R263–R286, 2006. (review).
[Gea09] Geant4 team. Physics Reference Manual, December 2009. Version: Geant4 9.3.
[Ger99] L. Gerweck and S. V. Kozin. Relative biological effectiveness of proton beams in clinicaltherapy. Radiotherapy and Oncology, 50:135–142, 1999.
[Ger07] L. Gerweck and H. Paganetti. Radiobiology of charged particles. In T. F. Delaneyand H. M. Kooy, editors, Proton and Charged Particle Radiotherapy, chapter 2, pages8–18. Lippincott Williams & Wilkins, 1st edition, 2007.
[Goi03] M. Goitein and M. Jermann. The relative costs of proton and X-ray radiation therapy.Clin Oncol, 15:S37–S50, 2003.
[Gol81] L. S. Goldstein, T. L. Phillips, and G. Y. Ross. Biological effects of accelerated heavyions. II. Fractionated irradiation of intestinal crypt cells. Radiat Res, 86:542–558,1981.
[Got93] B. Gottschalk, A.M. Koehler, R.J. Schneider, J.M. Sisterson, and M.S. Wagner. Mul-tiple Coulomb scattering of 160 MeV protons. Nucl Instrum Meth B, 74(4):467–490,1993.
[Got07] B. Gottschalk. Treatment delivery systems - passive beam scattering. In T. F. Delaneyand H. M. Kooy, editors, Proton and Charged Particle Radiotherapy, chapter 5A, pages33–40. Lippincott Williams & Wilkins, 1st edition, 2007.
[Hal06] E. J. Hall and A. J. Giaccia. Radiobiology for the Radiologist. Lippincott Williams &Wilkins, 6th edition, 2006.
[Hig75] V.L. Highland. Some practical remarks on multiple scattering. Nucl. Instrum. Meth.,129:497, 1975.

Bibliography 51
[Hig79] V.L. Highland. Some practical remarks on multiple scattering. Nucl. Instrum. Meth.,161:171, 1979.
[HPM] HPM®: Hamilton Precision Metals. Havar®. Available at http://www.hpmetals.
com/pdfs/Havar.pdf.
[IBA10] Cyclone®18/9 - Moving ahead, delivering more. Online, August 2010. Available athttp://www.iba-cyclotron-solutions.com.
[ICR80] Radiation Quantities and Units. ICRU Report No. 33, Bethesda, MD, 1980.
[ICR86] The Quality Factor in Radiation Protection. ICRU Report No. 40, Washington, 1986.
[ICR98] Fundamental Quantities and Units for Ionising Radiation. ICRU Report No. 60,Bethesda, MD, 1998.
[Jäk06] O. Jäkel. Heavy ion radiotherapy. In W. Schlegel, T. Bortfeld, and A.-L. Grosu, editors,New Technologies in Radiation Oncology, Medical Radiology - Diagnostic Imaging andRadiation Oncology, chapter 28, pages 365–377. Springer-Verlag, Heidelberg, 2006.
[Jer10] M. Jermann. Hadron therapy patient statistics. Online, August 2010. Last update:25th March 2010. Available at http://ptcog.web.psi.ch/patient_statistics.
html.
[Kan99] T. Kanai, M. Endo, S. Minohara, N. Miyahara, H. Koyama-ito, H. Tomura, N. Matsu-fuji, Y. Futami, A. Fukumura, T. Hiraoka, Y. Furusawa, K. Ando, M. Suzuki, F. Soga,and K. Kawachi. Biophysical characteristics of HIMAC clinical irradiation system forheavy-ion radiation therapy. Int J Radiat Oncol Biol Phys, 44(1):201–210, 1999.
[Kno10] A.-C. Knopf, K. Parodi, H. Paganetti, T. Bortfeld, J. Daartz, M. Engelsman, N.Liebsch, and H. Shih. Accuracy of proton beam range verification using post-treatmentpositron emission tomography/computed tomography as function of treatment site. IntJ Radiation Oncology Biol Phys, In Press, Corrected Proof:1–8, 2010.
[Kra00] G. Kraft. Tumor therapy with heavy charged particles. Prog. Part. Nucl. Phys.,45:S473–S544, 2000.
[Lag07] J.-M. Lagniel. Hadrontherapy in Europe. In 2007 Particle Accelerator Conference,Albuquerque, USA, June 2007.
[Lar61] B. Larsson. Pre-therapeutic physical experiments with high energy protons. Br JRadiol Suppl, 34:143–151, 1961.
[Law30] E. Lawrence and N. Edlefsen. On the production of high speed hydrogen ions withoutthe use of high voltage. Science, 72:376, 1930.
[Mot04] C. Mothersill and C. Seymour. Radiation-induced bystander effects and adaptiveresponses - the Yin and Yang of low dose radiobiology? Mutation Research, 568:121–128, 2004. (review).
[Nah07a] A. Nahum. Interactions of charged particles with matter. In P. Mayles, A. Nahum,and J. C. Rosenwald, editors, Handbook of Radiotherapy Physics: Theory and Prac-tice, chapter A3, pages 35–55. Taylor & Francis, New York, 1st edition, 2007.

52 Bibliography
[Nah07b] A. Nahum. Principles and basic concepts in radiation dosimetry. In P. Mayles,A. Nahum, and J. C. Rosenwald, editors, Handbook of Radiotherapy Physics: Theoryand Practice, chapter A6, pages 89–121. Taylor & Francis, New York, 1st edition,2007.
[Nak10] K. Nakamura et al. Review of Particle Physics. Phys. Rev. G, 37, 2010. Online,August 2010. Available at http://pdg.lbl.gov.
[Nau10] J. Naumann. Pencil-beam scanning systems in particle therapy - an overview. InPTCOG 49, Educational School, Chiba, Japan, May 2010.
[Nör80] W. Nörenberg. Basic concepts in the description of collisions between heavy nuclei. InR. Bock, editor, Heavy Ion Collisions, pages 1–43. North-Holland, 1980.
[Pag04] H. Paganetti, H. Jiang, S.-Y. Lee, and H. Kooy. Accurate Monte Carlo for nozzledesign, commissioning, and quality assurance in proton therapy. Med Phys, 31:2107–2118, 2004.
[Pag06] H. Paganetti and T. Bortfeld. Proton therapy. In W. Schlegel, T. Bortfeld, andA.-L. Grosu, editors, New Technologies in Radiation Oncology, Medical Radiology- Diagnostic Imaging and Radiation Oncology, chapter 27, pages 345–363. Springer-Verlag, Heidelberg, 2006.
[Pag09] H. Paganetti. Biological uncertainties in proton (ion) therapy. In A Symposium onthe Promises and Perils of Proton Radiotherapy, Baltimore, USA, May 2009.
[Ped00] E. Pedroni. Latest developments in proton therapy. In Proceedings of EPAC 2000,pages 240–244, Vienna, Austria, 2000.
[Ped07] E. Pedroni. Treatment delivery systems - pencil beam scanning. In T. F. Delaney andH. M. Kooy, editors, Proton and Charged Particle Radiotherapy, chapter 5B, pages40–49. Lippincott Williams & Wilkins, 1st edition, 2007.
[pFa10] Particle therapy facilities in operation (incl. patient statistics). Online, August 2010.Last update: 31st July 2010. Available at http://ptcog.web.psi.ch/ptcentres.
html.
[pro10] Particle therapy facilities in a planning stage or under construction. Online, Au-gust 2010. Last update: 31st July 2010. Available at http://ptcog.web.psi.ch/
newptcentres.html.
[Raj95] M. R. Raju. Proton radiobiology, radiosurgery and radiotherapy. Int J Radiat Biol,67(3):237–259, 1995. (review).
[Rob03] Mark Robinson. Havar® a New, Old Co-Cr Biocompatible Alloy for Implants. InSanjay Shrivastava, editor, Medical Device Materials: Proceedings of the Materials &Processes for Medical Devices Conference, pages 324–328, Anaheim, California, USA,September 2003. ASM International.
[Sch91] T. Schwab. Transport von Schwerionen durch Materie innerhalb ionenoptischer Sys-teme. PhD thesis, University of Gießen, Gießen, 1991. GSI report 91-10.
[Sch06] W. Schlegel. New technologies in 3D conformal radiation therapy: Introduction andoverview. In W. Schlegel, T. Bortfeld, and A.-L. Grosu, editors, New Technologies inRadiation Oncology, Medical Radiology - Diagnostic Imaging and Radiation Oncology,chapter 1, pages 1–6. Springer-Verlag, Heidelberg, 2006.

Bibliography 53
[Sch10] G. Schettino, M. Folkard, B. Vojnovic, A. Michette, and K. M. Prise. X-ray mi-crobeams for radiobiological studies: Current status and future challenges. In PIERS2010 Xi’an - Progress In Electromagnetics Research Symposium Proceedings, pages56–60, Xi’an, China, March 2010. The Electromagnetics Academy.
[Seu05] J. P. Seuntjens, W. Strydom, and K. R. Shortt. Dosimetric principles, quantitiesand units. In E. B. Podgoršak, editor, Radiation Oncology Physics: A Handbook forTeachers and Students, chapter 2, pages 45–70. International Atomic Energy Agency,Vienna, 1st edition, 2005. Available August 2010 at http://www-naweb.iaea.org/
nahu/dmrp/syllabus.shtm.
[She08] D. M. Shepard, C. Yu, M. Murphy, M. R. Bussière, and F. J. Bova. Treatment planningfor stereotactic radiosurgery. In L. S. Chin and William F. Regine, editors, Principlesand Practice of Stereotactic Radiosurgery, chapter 7, pages 69–90. Springer, New York,2008.
[Smi06] A. R. Smith. Proton therapy. Phys. Med. Biol., 51:R491–R504, 2006. (review).
[SRI10] SRIM - The Stopping and Range of Ions in Matter. Online, August 2010. Last update:14th September 2006. Available at http://www.srim.org/SRIM/SRIMINTRO.htm.
[Ste07a] G. Steel. Dose fractionation in radiotherapy. In P. Mayles, A. Nahum, and J. C.Rosenwald, editors, Handbook of Radiotherapy Physics: Theory and Practice, chap-ter B9, pages 163–177. Taylor & Francis, New York, 1st edition, 2007.
[Ste07b] G. Steel. Radiobiology of tumours. In P. Mayles, A. Nahum, and J. C. Rosenwald,editors, Handbook of Radiotherapy Physics: Theory and Practice, chapter B7, pages127–148. Taylor & Francis, New York, 1st edition, 2007.
[Sui03] H. Suit, S. Goldberg, A. Niemierko, A. Trofimov, J. Adams, H. Paganetti, G. T. Y.Chen, T. Bortfeld, S. Rosenthal, J. Loeffler, and T. Delaney. Proton beams to replacephoton beams in radical dose treatments. Acta Oncologica, 42(8):800–808, 2003.
[Sui07] H. Suit and W. Chu. History of charged particle radiotherapy. In T. F. Delaney andH. M. Kooy, editors, Proton and Charged Particle Radiotherapy, chapter 1, pages 1–7.Lippincott Williams & Wilkins, 1st edition, 2007.
[Sun05] N. Suntharalingam, E. B. Podgoršak and J. H. Hendry. Basic radiobiology. In E. B.Podgoršak, editor, Radiation Oncology Physics: A Handbook for Teachers and Stu-dents, chapter 14, pages 485–504. International Atomic Energy Agency, Vienna, 1stedition, 2005. Available August 2010 at http://www-naweb.iaea.org/nahu/dmrp/
syllabus.shtm.
[Tep77] J. Tepper, L. Verhey, and M. Goitein et al. In vivo determinations of RBE in a highenergy modulated proton beam using normal tissue reactions and fractionated doseschedules. Int J Radiat Oncol Biol Phys, 2:1115–1122, 1977.
[Tob42] C. A. Tobias, D. C. Van Dyke, and M. E. Simpson. Irradiation of the pituitary of therat with high energy deuterons. Am J Roentgenol Radium Ther Nucl Med, 72:1–21,1942.
[Tob52] C. A. Tobias, H. O. Anger, and J. H. Lawrence. Radiological use of high energydeuterons and alpha particles. Am J Roentgenol Radium Ther Nucl Med, 67:1–27,1952.
54 Bibliography
[Tob58] C. A. Tobias, J. H. Lawrence, J. L. Born, R. McCombs, J. E. Roberts, H. O. Anger,B. V. A. Low-Beer, and C. Huggins. Pituitary irradiation with high energy protonbeams: A preliminary report. Cancer Res, 18:121–139, 1958.
[Tsa74] Y.-S. Tsai. Pair production and bremsstrahlung of charged leptons. Rev Mod Phys,46(4):815–851, 1974.
[Tso07] E. T. M. Tsoi and J. Flanz. Facility design. In T. F. Delaney and H. M. Kooy,editors, Proton and Charged Particle Radiotherapy, chapter 4, pages 19–26. LippincottWilliams & Wilkins, 1st edition, 2007.
[Ver06] L. Vergara, J. Olivares, E. Iborra, M. Clement, A. Sanz-Hervás, and J. Sangrador.Effect of rapid thermal annealing on the crystal quality and the piezoelectric responseof polycrystalline AlN films. Thin Solid Films, 515:1814–1818, 2006.
[Web96] U. Weber. Volumenkonforme Bestrahlung mit Kohlenstoffionen zur Vorbereitungeiner Strahlentherapie. PhD thesis, University of Kassel, Kassel, 1996.
[Wid09] M. Wideł, W. Przybyszewski, and J. Rzeszowska-Wolny. Radiation-induced bystandereffect: The important part of ionizing radiation response. Potential clinical implica-tions. Hig Med Dosw, 63:377–388, 2009. (review).
[Wil46] R. R. Wilson. Radiological use of fast protons. Radiology, 47:487–491, 1946.
[Wri10] D. Wright. Hadronic Physics I. Online, August 2010. SLAC Geant4 Tutorial.
[Zie08] J. F. Ziegler, J. P. Biersack, and U. Littmark. The Stopping and Range of Ions inSolids. Pergamon Press, New York, 2008.

Acknowledgments
This work would not have been possible without the dedication and endeavour of all peo-ple who were involved in it, and the collaboration between institutions was determinant foraccomplishing the initial goals.
My supervisor, Prof. Dr. Rui Ferreira Marques, and my co-supervisors, Prof. Dr. FranciscoAlves and Prof. Dr. Paulo Crespo supported me throughout this quest, sharing their knowledgeand providing all the help I needed. Also, their enthusiasm and dedication were remarkableand an actual example to me. Thank you.
I thank Prof. Luís Metello for establishing the institutional contacts that made this project areality.
Many thanks to Prof. Dr. Gerhard Kraft, Eng. Wolfgang Becher and Dr. Michael Scholz fromGSI, Darmstadt, for the informations shared and for the availability shown for collaboratingwith this work.
I also would like to thank Prof. Dr. Filomena Botelho for all the support and the disposal tocollaborate with this project.
LIP contribution was unvaluable, welcoming us and providing the computational resources formeeting the goals of this work. For this and for all the support, many thanks. I also expressmy gratitude to ISEC for the availability shown for giving their support.
Finally, but no less important I would like thank to my family. Aos meus pais, em especial, porprovidenciarem as condições para o meu sucesso enquanto estudante do curso de EngenhariaBiomédica em Coimbra. Aos meus irmãos e aos meus avós pelo apoio e pelo carinho nestalonga jornada. A todos vós, muito obrigada. A ti, Marco, por toda a paciência, encorajamentoe apoio em particular neste último ano. Sem ti a meu lado, nunca teria chegado tão longe.
55