REMOTE SENSING FROM UNMANNED AERIAL VEHICLES FOR 3D …
11
1118 REMOTE SENSING FROM UNMANNED AERIAL VEHICLES FOR 3D URBAN MODELLING: CASE STUDY OF LOULÉ, PORTUGAL José António Tenedório Professor at Faculdade de Ciências Sociais e Humanas, Universidade NOVA de Lisboa | Centro Interdisciplinar de Ciências Sociais CICS.NOVA - Faculdade de Ciências Sociais e Humanas - Universidade NOVA de Lisboa (CICS.NOVA.FCSH/UNL), Portugal Avenida de Berna, 26 C, Lisboa, 1069-061, Portugal [email protected] +351 966110536 Rossana Estanqueiro Professor at Faculdade de Ciências Sociais e Humanas, Universidade NOVA de Lisboa | Centro Interdisciplinar de Ciências Sociais CICS.NOVA - Faculdade de Ciências Sociais e Humanas - Universidade NOVA de Lisboa (CICS.NOVA.FCSH/UNL), Portugal Avenida de Berna, 26 C, Lisboa, 1069-061, Portugal [email protected] +351 967090695 Ana Matos Lima GIS Coordinator at Planning, Geographical Information and Cadastre Division Municipal Council of Loulé Praça da República, 8104-001 Loulé [email protected] +351 966850623 João Marques Geodrone Postal Adress: Rua Palmira Bastos, n7, Almada, 2810-268, Portugal [email protected] +351 912616502 Key words: UAV data, 3D Urban models, Urban planning, city centre of Loulé Abstract Data acquisition using Unmanned Aerial Vehicles (UAVs) is currently a fast and low-cost Remote Sensing approach. UAVs have become standard platforms for applications in photogrammetric data capture. This capture is still only feasible for small areas, around dozens of hectares. In view of our description, we can say that the data obtained using UAVs are useful for 3D urban modelling, i.e., buildings and urban areas, with a view to support large scale urbanism and urban planning studies. The data were gathered from RGB UAV imagery at a height of 100 meters covering the city centre of Loulé, Portugal. To conduct the UAV survey the following steps were followed from data acquisition through processing 3D urban models: a) establishing flight plan parameters (height, overlapping, time, focal distance, camera data, spatial resolution) and collecting data survey (regarding preparation
Transcript of REMOTE SENSING FROM UNMANNED AERIAL VEHICLES FOR 3D …
1118
REMOTE SENSING FROM UNMANNED AERIAL VEHICLES FOR 3D URBAN
MODELLING: CASE STUDY OF LOULÉ, PORTUGAL
José António Tenedório
Professor at Faculdade de Ciências Sociais e Humanas, Universidade NOVA de Lisboa | Centro
Interdisciplinar de Ciências Sociais CICS.NOVA - Faculdade de Ciências Sociais e Humanas -
Universidade NOVA de Lisboa (CICS.NOVA.FCSH/UNL), Portugal
Avenida de Berna, 26 C, Lisboa, 1069-061, Portugal
+351 966110536
Rossana Estanqueiro
Professor at Faculdade de Ciências Sociais e Humanas, Universidade NOVA de Lisboa | Centro
Interdisciplinar de Ciências Sociais CICS.NOVA - Faculdade de Ciências Sociais e Humanas -
Universidade NOVA de Lisboa (CICS.NOVA.FCSH/UNL), Portugal
Avenida de Berna, 26 C, Lisboa, 1069-061, Portugal
+351 967090695
Ana Matos Lima
GIS Coordinator at Planning, Geographical Information and Cadastre Division
Municipal Council of Loulé
Praça da República, 8104-001 Loulé
+351 966850623
João Marques
Geodrone
Postal Adress: Rua Palmira Bastos, n7, Almada, 2810-268, Portugal
+351 912616502
Key words: UAV data, 3D Urban models, Urban planning, city centre of Loulé
Abstract
Data acquisition using Unmanned Aerial Vehicles (UAVs) is currently a fast and low-cost Remote
Sensing approach. UAVs have become standard platforms for applications in photogrammetric data
capture. This capture is still only feasible for small areas, around dozens of hectares. In view of our
description, we can say that the data obtained using UAVs are useful for 3D urban modelling, i.e.,
buildings and urban areas, with a view to support large scale urbanism and urban planning studies.
The data were gathered from RGB UAV imagery at a height of 100 meters covering the city centre of
Loulé, Portugal. To conduct the UAV survey the following steps were followed from data acquisition
through processing 3D urban models: a) establishing flight plan parameters (height, overlapping, time,
focal distance, camera data, spatial resolution) and collecting data survey (regarding preparation

1119
aspects such as safety, interferences, and calibration); b) loading photos; inspecting loaded images
and removing unnecessary images; c) aligning photos; d) building dense point clouds; e) building a
mesh; building a 3D polygonal model; f) texturing the 3D model; g) calculating DEM and DTM; h)
creating an orthoimage; and i) exporting results. After processing the data, we arrived at two highly
accurate 3D urban models. Taking these results into consideration, we have integrated them into
urban plans in order to show their usability in the planning process of a city.
Introduction
The history of cities follows cycles. Sometimes these cycles imply progress, and sometimes they imply
decline, considering only the extremes. Each cycle reflects in different scales and dimensions, and
at different rhythms the importance of local political decisions when it comes to city planning.
Planning a city is an established practice that should result in the desired evolution models. As a
general rule, those models correspond to urban plans that are created mostly based on qualitative
assumptions. Those models embody the dominant ideas that result from the interpretation of the spirit
of the Law, the debate around technical solutions, and public participation.
However, in light of the recent theories on urban dynamics, we can employ quantitative models that
disclose the self-organization of systems, cities, and territories. These models make extensive use of
spatial modelling in a Geographic Information Systems environment and rely on the simulation of
future urban growth based on the historical information provided by the observed geographical
changes. When, for example, any changes in land use are quantified and subsequently confronted
with the changes that had been foreseen in the plans, quantitative modelling conditions are created,
thus promoting the dialectic between those models. Therefore, it is not a matter of confronting
qualitative and quantitative models to eliminate the relevance and/or the excessive weight of one type
over the other. On the contrary, what is at stake here is assessing the potential of each type of model
and use the outcome of that assessment for improved technical efficiency at the time territorial
management tools are created, monitored, and evaluated.
Taking into consideration what was just said, we would like to highlight the following aspects that are
important for this analysis and for city planning purposes: i) these plans are designed based on
geographic information; ii) this geographic information supports the 2D and 3D representations of
cities; and iii) these 2D and 3D representations require fast and low-cost information acquisition
methods (Tenedório et al., 2014) taking into consideration the speed at which the city’s functions and
morphology change. Theoretically, an urban plan is a formal tool whose aim is the efficiency of a city.
Bearing this in mind, two questions might be asked: What is a smart city plan? Is a smart city plan
technology-based? The answers to these questions are complex. A smart city corresponds to a vision
of urban development that implies the usage of very different technologies. These technologies should
promote urban quality of life, i.e., they should aid in the analysis and management of the efficiency of
a city’s performance through local departments information systems, e.g., in the fields of energy,
transport, water, green spaces, heritage, urban revitalization, urban services in general (education,
health, culture, public participation in the discussion of city plans, entertainment and leisure, etc.). In
no way can technology be seen as a means of dematerializing urban services; there can be no virtual
cities without technology (Tenedório et al., 2014).
According to Batty (2014: p.1) «(…) the smart city is the automated city where the goal is to improve
the efficiency of how the city functions. These new technologies tend to improve the performance of
cities in the short term with respect to how cities function over minutes, hours or days rather than over
years or decades». Batty’s statement encompasses the notion of speed that currently explains much
of the functioning of a city. The short period of time in which events develop is presently one of the
main factors that explain urban change. Computation is part of the smart city concept (Batty, 2013).
For that reason, we can say that the smart city is the aim and technology is a tool employed to achieve
that aim. The role played by computation is of such importance that we cannot talk about the
1120
dematerialization of urban plans or about virtual urban plans without accepting the processes of
virtually representing urban metabolism. Let us look at the case of energy performance and the use of
solar energy. Mapping photovoltaic potential in urban areas uses the solar model to identify building
tops for the installation of solar panels (Brito et al., 2012). We cannot think about applying the solar
model without considering the 3D representation of urban buildings made with the information
obtained by LiDAR or without considering computation to simulate the photovoltaic potential. This
case clearly illustrates the role that data acquisition technology and computation play for the benefit of
the smart city.
Technologies used to acquire urban geographical information are an irreplaceable tool for the creation
of information on the city. They also feed the computation of urban data as well as the 2D and 3D
representations that are necessary to create urban plans. UAVs (Unmanned Aerial Vehicles) are
currently a very fast and low-cost information acquisition technology. UAV technology draws from the
knowledge provided by previous technologies, such as photogrammetry and information acquisition by
LiDAR (Light Detection And Ranging) (Colomina & Molina, 2014). UAV technology allows for a good
cost-time relationship, since it combines low cost and fast information acquisition. The little time
needed for the survey, as well as the frequency with which we can obtain data are two of the most
important capabilities of this technology (Colomina & Molina, 2014; Haala, Cramer, & Rothermel,
2013).
UAV technology is the ultimate technology for urban data acquisition by remote sensing. Data
modelling for 3D urban representation is achieved based on photogrammetry principles. That type of
data modelling is particularly important for the generation of consistent geographic information, namely
for the analysis of urban revitalization areas. Urban revitalization can have many positive effects,
namely: reduced urban sprawl, improved quality housing, improved cultural and social amenities, etc..
In Portugal, urban revitalization has been present in the city’s policies over the last few years, mostly
due to the economic and financial crisis and the consolidation of this new ‘paradigm’ for the
construction of the city. That built heritage is usually associated with the centre of Portuguese cities,
and therefore with their urban origin, regardless of their size and relative historical value. This paper
summarizes the process of data acquisition using UAV and 3D modelling in an extensive
computational environment.
Study area
The case study on which we worked in 2016 corresponds to part of the historical centre of Loulé
(Study Area, ARU) in the District of Faro, Southern Portugal (Figure 1). This part of the historical
centre is located in the urban revitalization area of Loulé.
The concept of ‘Urban Revitalization Area’ (ARU) was born in Portugal with Decree-Law no. 307/2009
of 23rd
October, which defined the Legal Framework for Urban Rehabilitation (RJRU). Thus, paragraph
2(b) of article 2 states that ARU is ‘the territorially delimited area that, due to the insufficiency,
disrepair, or obsolescence of the buildings, infrastructures, collective equipment, and collective urban
and green spaces, namely regarding their conditions of use, solidity, safety, aesthetics, or salubrity,
justify an integrated intervention, which may be delimited in its own instrument or correspond to the
area of intervention of a detailed plan for urban rehabilitation.’ ARU should then be understood as a
parcel of land that belongs to the city and is in need of recovery or revitalization. We would like to
highlight that ARUs are areas with great potential in terms of urban dynamics, where intervention is
urgent. In order to intervene in those areas, the usage of Geographic Information Technologies (GIT)
is significant because it not only facilitates the access of interested citizens to information, but also
aids in the promotion of those areas, which are usually uncharacterised and lifeless.

1121
Figure 1. Location of the study area in Loulé, Portugal
Source: Authors. 2016
The intervention area (Figure 2) of the urban revitalization of Loulé (named ‘Urban Revitalization
Area’, or Área de Reabilitação Urbana ARU in Portuguese) corresponds to the historical centre
of the city and is located in the parish of São Clemente, which is the seat of the municipality with that
same name. It encompasses a total of 10 hectares, with 27 blocks, around 438 buildings, and a
resident population of 440 thousand inhabitants, composed of 229 families, according to the
Population Census of 2011. This area includes the whole perimeter inside the city walls, the Mouraria
(old Moorish quarter), and the surrounding public space that includes Praça da República, Largo Gago
Coutinho, Avenida Marçal Pacheco, Praça D. Afonso III, Rua da Barbacã, and Largo Dr. Bernardo
Lopes.
In terms of historical heritage, this area also includes a number of buildings classified as National
Monuments, such as, for example, Igreja Matriz (the main church of the parish), the castle, and the
portal and stone cross of Igreja da Misericórdia (another church). The Ermida Nossa Sr.ª da
Conceição (a chapel) is a Public Interest Building. And the Café Calcinha (a café) is a Municipal
Interest Building. Besides these classified buildings, other places have a historical and heritage value,
such as the Mercado Municipal (the municipal market), the Jardim dos Amuados (a park), the
Convento Espírito Santo (a convent) and the Cerca do Convento (the fence of the convent), the
Alcaidaria (the old city governor’s house), the Ermida da Nossa Sr.ª do Pilar (a chapel), the Paços do
Concelho (Council buildings), the Bicas Velhas (old water pipes), and the Banhos Islâmicos (old
Muslim baths).

1122
Figure 2. Location of the study area in Loulé, Portugal
Source: Authors. 2016
ARU integrates part of the Special Area of Protection and has an urban morphology where the line of
the walls, distinguishable from some remaining parts, defines the limit of the expansion of the old town
to the North, West, and South. We can see that only to the East did the construction of the market (in
beginning of the 20th century) trigger the renovation of the Medieval urban fabric and the subsequent
development of that area.
Data acquisition by UAV remote sensing
The UAV flight (Table 1) was planned to survey ARU’s data. A quadcopter micro drone equipped with
a Sony A5100 camera, an RGB sensor, and a 16 mm focal length camera were used.
Table 1 Summary of the UAV flight characteristics
Source: Authors. 2016
Flight characteristics
Data 15/10/2015
Number of photos 252
Altitude 138 m
Spatial resolution 3.42 cm
Longitudinal overlapping 90%
Transversal overlapping 40%

1123
The flight resulted in 252 photos with 90% longitudinal overlapping and 40% transversal overlapping.
Spatial resolution was 3.41 cm, which was therefore adequate to model urban data for the creation of
3D models for the extraction of detailed information (Tenedório et al., 2014; Haala, Cramer, &
Rothermel, 2013). From the total of 252 aerial photos obtained, 51 were used to model a sample area
(Figure 3) focused on the castle of the city of Loulé (a very important urban landmark for the
configuration of the original urban morphology).
3D data modelling
The smart city urban plan requires high-quality information based on computational processing. This
may originate two types of products: 2D ortho-images and 3D urban models. Using those products we
can then measure and extract urban parameters, such as building façade height, building volume,
solar exposure, public spaces, green areas, urban sustainability indicators, among other pieces of
quantitative information that are useful for the plan. Besides the extraction of the abovementioned
parameters, 3D visualization is fundamental for the promotion of the plan at different stages of the
planning process, for example, at the time of public participation in the debate on urban revitalization
proposals. In this section, we show that it is possible to model UAV-obtained data assessing their
quality.
The complete sequence of the processing and modelling procedure consists in the following stages: 1)
loading photos; inspecting loaded images and removing unnecessary images; 2) aligning photos; 3)
building dense point clouds; 4) building a mesh; building a 3D polygonal model; 5) texturing the 3D
model; 6) calculating the Digital Surface Model (DSM) and the Digital Terrain Model (DTM); and 7)
creating an ortho-image. The software Agisoft PhotoScan was used for computational processing.
The essential stages of the creation of this model are:
Aligning photos: at this stage, matching points between photos are searched, creating the first
scattered point cloud, which enables the calculation of pitch angles and the relative position of the
photos. After this stage, Ground Control Points are associated by identifying them in the photos.
Building point clouds: this is made after photo calibration and the creation of a point cloud in the
previous stage; the software creates a point cloud that may vary in terms of density according to
the selected parameters and that enables the subsequent construction of a polygonal mesh that is
representative of the covered area.
Creating the DSM: this is made from the polygonal mesh of the point cloud, and may become a
DTM in case the points of the point cloud that correspond to a building or vegetation are filtered.
Creating an ortho-image based on the DSM or on the polygonal mesh.
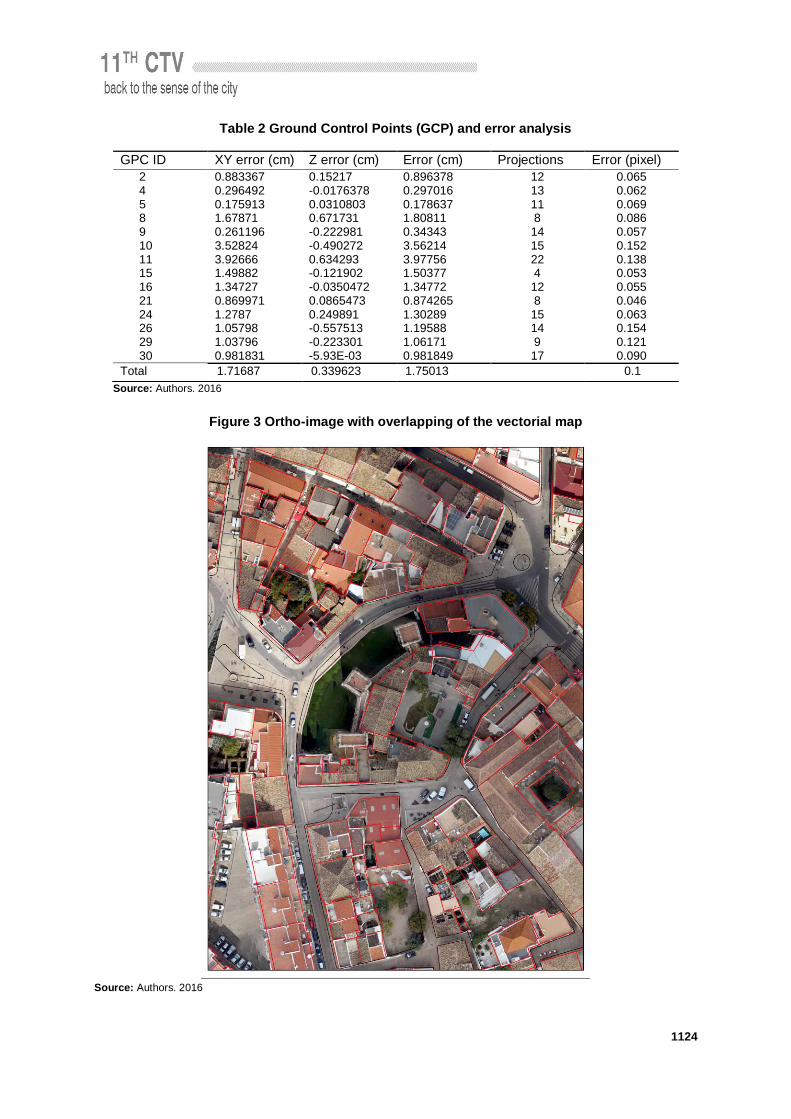
All these stages were subject to quantitative assessment based on the technical report produced by
the software. For the error analysis (Table 2), 14 Ground Control Points (GCP) of the whole area were
used, covered by 252 photos. The results of the error analysis are in compliance with the reference
values for the production of very high resolution ortho-images. A visual comparison between the
geometry of the ortho-image and a vectorial map (Figure 3) was also carried out. This vectorial map
was produced according to standards issued by the body that regulates national cartography
(General-Directorate of the Treasury) to integrate the national cartographic series on a 1:2000 scale
(SCN2k). The aerial coverage that originated that vectorial map was performed in 2008, in the
Hayford-Gauss Datum 73 Reference System, replaced by the PT-TM06-ETRS89 System. The
conversion between the Hayford-Gauss Datum 73 Reference system and the ETRS89-TM06 System
was carried out through a polynomial transformation.
1124
Table 2 Ground Control Points (GCP) and error analysis
Source: Authors. 2016
Figure 3 Ortho-image with overlapping of the vectorial map
Source: Authors. 2016
GPC ID XY error (cm) Z error (cm) Error (cm) Projections Error (pixel)
2 0.883367 0.15217 0.896378 12 0.065 4 0.296492 -0.0176378 0.297016 13 0.062 5 0.175913 0.0310803 0.178637 11 0.069 8 1.67871 0.671731 1.80811 8 0.086 9 0.261196 -0.222981 0.34343 14 0.057 10 3.52824 -0.490272 3.56214 15 0.152 11 3.92666 0.634293 3.97756 22 0.138 15 1.49882 -0.121902 1.50377 4 0.053 16 1.34727 -0.0350472 1.34772 12 0.055 21 0.869971 0.0865473 0.874265 8 0.046 24 1.2787 0.249891 1.30289 15 0.063 26 1.05798 -0.557513 1.19588 14 0.154 29 1.03796 -0.223301 1.06171 9 0.121 30 0.981831 -5.93E-03 0.981849 17 0.090
Total 1.71687 0.339623 1.75013 0.1

1125
A visual observation shows a very high correlation between the vectorial map and the urban objects
represented by the ortho-image. In fact, this observation confirms what had been determined by the
error analysis (Table 2). Taking this assessment into consideration, this product can be used in an
urban setting, namely for morphological analysis.
Building on the DTM we can explore information that might be interesting for urban analysis, such as
the extraction of polylines (Figure 4) and consequently the calculation of profiles (Figures 5 e 6).
Figure 4 Ortho-image with polylines extracted from the DTM
Source: Authors. 2016
Figure 5 North-South profile obtained from polylines extracted from the DTM
Figure 6 East-West profile obtained from polylines extracted from the DTM
Source: Authors. 2016
1126
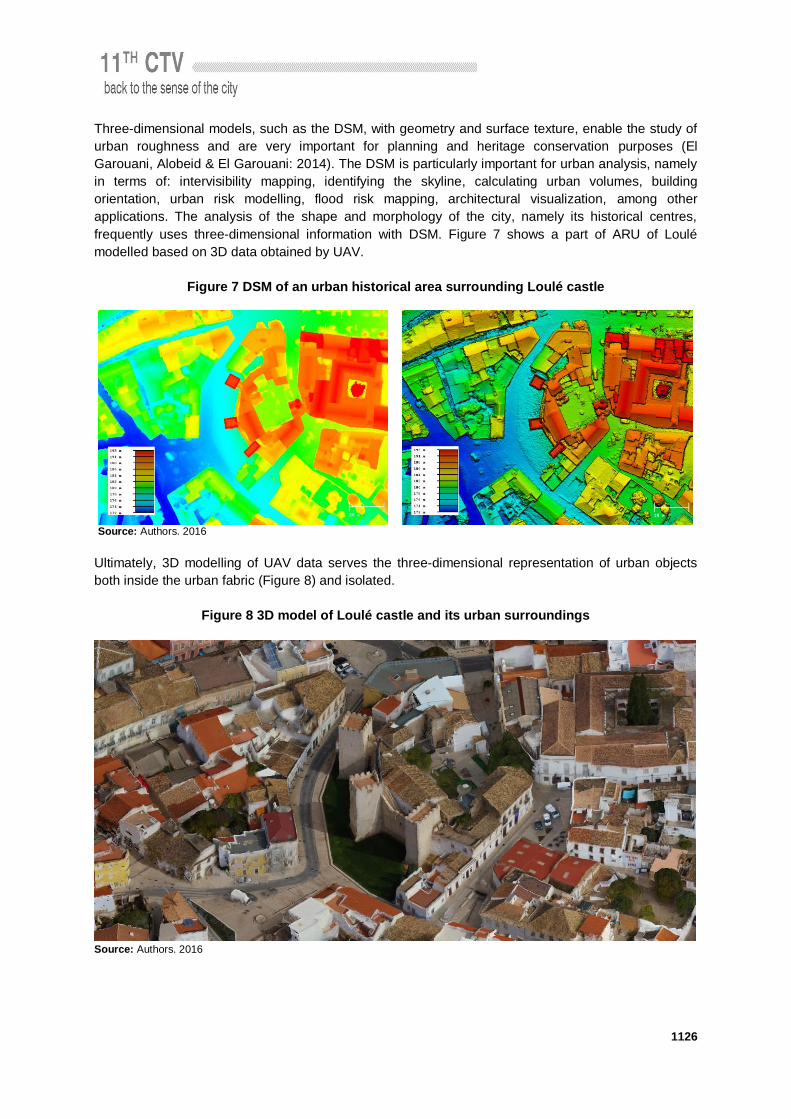
Three-dimensional models, such as the DSM, with geometry and surface texture, enable the study of
urban roughness and are very important for planning and heritage conservation purposes (El
Garouani, Alobeid & El Garouani: 2014). The DSM is particularly important for urban analysis, namely
in terms of: intervisibility mapping, identifying the skyline, calculating urban volumes, building
orientation, urban risk modelling, flood risk mapping, architectural visualization, among other
applications. The analysis of the shape and morphology of the city, namely its historical centres,
frequently uses three-dimensional information with DSM. Figure 7 shows a part of ARU of Loulé
modelled based on 3D data obtained by UAV.
Figure 7 DSM of an urban historical area surrounding Loulé castle
Source: Authors. 2016
Ultimately, 3D modelling of UAV data serves the three-dimensional representation of urban objects
both inside the urban fabric (Figure 8) and isolated.
Figure 8 3D model of Loulé castle and its urban surroundings
Source: Authors. 2016

1127
The creation of a 3D model of Loulé castle and its urban surroundings (Figure 8) made use of 51
aerial photos as mentioned before. From those aerial photos with 90% longitudinal overlapping and
40% transversal overlapping, a cloud with 23116106 points, 2311901 vertices, and 4616659 faces
was created.
Conclusions: modelling UAV data for analysis and urban planning
The importance of 3D data obtained by UAV for urban analysis, and consequently for the design of
urban plans, was made evident in the previous sections although it has some limitations. On the one
hand, data obtained by UAV may support urban databases with low-cost 3D information albeit
confined to small geographic areas. Computation is still limited when it comes to dealing with large
volumes of data, which would be required for wider areas. On the other hand, UAV technology that is
affordable to local administrations has also very specific limitations: low UAV autonomy to cover vast
areas, and heavy computational processing.
In spite of the limitations we have identified, we would like to stress the advantages of modelling UAV
data for urban analysis and for the creation of city plans: i) low cost; ii) undemanding in terms of
human resources; iii) possibility of creating 3D urban models to make measurements and extract
interesting parameters; iv) permanently updateable; v) monitoring extreme weather events with urban
impact (floods); vi) creating and maintaining digital archives of urban evolution.
Data acquisition and modelling technology promotes the implementation of the idea of smart cities. In
fact, UAV for surveying and mapping may contribute to generate data and information that will serve
the dimensions of city smartness.
References Batty, M. (2013). The New Science of Cities (pp. 1-518). Cambridge MA: The MIT Press.
Batty, M. (2014). Deconstructing Smart Cities. In N. Pinto, J. Tenedório, A. Antunes, & J. Cladera
(Eds.) Technologies for Urban and Spatial Planning: Virtual Cities and Territories (pp. 1-13). Hershey,
PA: Information Science Reference.
Brito C., Gomes N., Santos T., Tenedório J. A. (2012). Photovoltaic Potential in a Lisbon Suburb
Using LiDAR Data. Solar Energy, 86, 283-288.
Colomina, I., Molina, P. (2014). Unmanned Aerial Systems for Photogrammetry and Remote
Sensing: A Review. ISPRS Journal of Photogrammetry and Remote Sensing, 92, 79–97.
El Garouani, A., Alobeid, A., El Garouani, S. (2014). Digital Surface Model Based on Aerial Image
Stereo Pairs for 3D Building. International Journal of Sustainable Built Environment, 3: 119–126
Haala, N., Cramer, M., Rothermel, M. (2013). Quality of 3D Point Clouds From Highly Overlapping
UAV Imagery. International Archives of the Photogrammetry, Remote Sensing and Spatial Information
Sciences, XL (September), 4–6.
Pinto, N. N., Tenedório, J. A., Antunes, A. P., & Cladera, J. R. (2014). Technologies for Urban and
Spatial Planning: Virtual Cities and Territories (pp. 1-349). Hershey, PA: IGI Global.
Tenedório, J. A., Rebelo, C., Estanqueiro, R., Henriques, C. D., Marques, L., & Gonçalves, J. A.
(2014). New Developments in Geographical Information Technology for Urban and Spatial Planning.
In N. Pinto, J. Tenedório, A. Antunes, & J. Cladera (Eds.) Technologies for Urban and Spatial
Planning: Virtual Cities and Territories (pp. 196-227). Hershey, PA: Information Science Reference.

1128