Sara Vanessa Afonso Reis Teixeira - Universidade do...
82
Dezembro de 2011 Universidade do Minho Escola de Engenharia Sara Vanessa Afonso Reis Teixeira Development of a sensoring device for environmental estrogens in wastewater UMinho|2011 Sara Vanessa Afonso Reis Teixeira Development of a sensoring device for environmental estrogens in wastewater
Transcript of Sara Vanessa Afonso Reis Teixeira - Universidade do...

Dezembro de 2011
Universidade do MinhoEscola de Engenharia
Sara Vanessa Afonso Reis Teixeira
Development of a sensoring device for environmental estrogens in wastewater
UM
inho
|201
1Sa
ra V
anes
sa A
fons
o Re
is T
eixe
iraD
eve
lop
me
nt
of
a s
en
sori
ng
dev
ice
fo
r e
nvi
ron
me
nta
l est
rog
en
s in
wa
stew
ate
r

Dissertação de Mestrado em Micro e Nano Tecnologias
Trabalho realizado sob a orientação daDoutora Graça Minase doDoutor Klaus Kühn
Dezembro de 2011
Universidade do MinhoEscola de Engenharia
Sara Vanessa Afonso Reis Teixeira
Development of a sensoring device for environmental estrogens in wastewater

É AUTORIZADA A REPRODUÇÃO PARCIAL DESTA DISSERTAÇÃO APENAS PARA EFEITOSDE INVESTIGAÇÃO, MEDIANTE DECLARAÇÃO ESCRITA DO INTERESSADO, QUE A TAL SECOMPROMETE;
Universidade do Minho, ___/___/______
Assinatura: ________________________________________________

iii
ACKNOWLEDGEMENTS
This project would not have been possible unless for Prof. Gianaurelio Cuniberti having
given me the opportunity to take part in his scientific group as a guest and Prof.
Wolfgang Pompe giving the ingenious idea about the project's theme.
The exchange program at Technische Universität Dresden was a truly good experience
and I am very thankful to Erasmus.
I am greatly thankful to my supervisors Graça Minas, Klaus Kühn and Bettina Soltmann
whose encouragement, guidance and support from the initial to the conclusion of this
project enabled me to develop an understanding of the subject as also to Martin
Mkandawire.
I am very grateful to Prof. Gerhard Rödel, from the Institute of Genetics, TUD, for
allowing me to use their equipment and the opportunity to improve my knowledge in
genetics. I would also like to thank all the people at the Institute for strongly providing
me the insight needed to conduct part of my experiments, in particular to Kai
Ostermann, Astrid Schuller, Msau Mkandawire, Nuriye Korkmaz and Katja Zoschke
that strongly provided me the insight need to conduct some of my experiments.
I owe my deepest gratitude to Prof. Jungbauer/Dr. Svjetlana Medjakovic (University of
Natural Resources and Life Sciences, Vienna) who kindly provided the recombinant
Saccharomyces cerevisiae.
I am indescribably indebted to my parents for providing me with the opportunity to be
where I am. Without them none of this would even be possible.
I offer my best regards to many of my colleagues for supporting me, mainly Liliana
Melro and Marisa Rio.
I wish to thank my many student colleagues and other researchers at the Institut für
Werkstoffwissenschaft for providing a stimulating and fun environment in which to
learn and grow. I am especially grateful to Mahipal Ganji, Laila Ladhani, "Nacho"
Gonzalez, Gerhard Lackner, Stanislav Advoshenko, Li Wu and Thomas Brumme.
Lastly, I offer my regards to all of those who supported me in any respect during the
completion of this thesis.

iv

v
Development of a sensoring device for environmental estrogens in wastewater
ABSTRACT
There is an increasing public concern about the possible adverse consequences at both
human health and wildlife, arising from the release of estrogens into the environment.
These endocrine disrupting chemicals include a variety of chemical classes, such as
natural and synthetic hormones, plant constituents (phytoestrogens), pesticides,
compounds used in the plastics industry, among other industrial by-products and
pollutants. They are frequently widely dispersed in the environment. Some can be
persistent and can be transported through long distances. Others are rapidly degraded.
For these reasons it is necessary to proceed to the environment monitoring of these
compounds.
Green Fluorescent Protein has been employed as a reporter protein in whole-cell sensing
systems based on stress induction. This is a new developed method of reporting systems
since it can substitute the assay that frequently has been used, the β-galactosidase as a
reporter gene, which is a time-consuming procedure and since it requires cells
disruption it increases the errors.
Thus, this work aimed to construct a biosensor based on a genetically modified yeast
cells expressing the Green Fluorescent Protein (GFP) upon exposition to estrogenic
compounds on wastewater. In order to test the operation of the sensor it was measured
the transmittance and fluorescence of slides with alginate and FluoSpheres plotted in
three immobilization layouts: 'separated dots', 'dots together' and dip coated. The
transmittance and the fluorescence signals were detected by a CMOS optical sensor.
FluoSpheres beads were used instead of the yeast cells due to legal issues, it was not
possible to bring the genetically modified yeast cells to Portugal
The results showed that the transmittance is affected by the thickness of the alginate
layer, which scatters the light, therefore the dip coated slides present lower
transmittance values. The 'dots together' layout is the most effective in fluorescence
detection. High concentrations of FluoSpheres beads presented lower values of
fluorescence.

vi

vii
Desenvolvimento de um sensor para detecção de compostos estrogénicos em
águas residuais
RESUMO
A preocupação pública tem vindo a aumentar relativamente às consequências adversas
na sua saúde e nos habitats devido à libertação de compostos estrogénicos no ambiente.
Estes disrutores endócrinos incluem uma diversidade de classes químicas como as
hormonas naturais e sintéticas, fitoestrogénios (estrogénios presentes nas plantas),
pesticidas, químicos usados na indústria dos plásticos, entre outros subprodutos
industriais e poluentes. São facilmente dispersos no ambiente e enquanto uns podem ser
persistentes e transportados até longas distâncias, outros são rapidamente degradados.
Desta forma, é necessário proceder à monitorização ambiental destes compostos.
A Proteína Verde Fluorescente (GFP) tem vindo a ser usada como uma proteína
repórter em biosistemas através da indução de stresse. Este é um novo método
desenvolvido para sistemas repórter uma vez que pode substituir o teste que tem sido
usado frequentemente, o de β-galactosidase como gene repórter, que é um procedimento
moroso e requerer a desintegração celular.
Assim, este trabalho visa a construção de um biossensor baseado em células de
leveduras geneticamente modificadas que expressam GFP aquando da exposição a
compostos estrogénicos em água. De forma a testar o funcionamento do sensor foi
medida a transmitância e a fluorescência usando-se lâminas com alginato e FluoSpheres
imobilizados em três layouts diferentes: "separated dots", "dots together" e dip coated.
Os sinais de transmitância e fluorescência foram detectados com um sensor óptico
CMOS. Usaram-se as FluoSpheres em alternativa às células das leveduras devido a
questões legais, uma vez que não era possível trazer as leveduras geneticamente
modificadas para Portugal.
Os resultados obtidos demonstraram que a transmitância é afectada pela espessura da
camada de alginato que dispersa a luz. Por conseguinte as lâminas dip coated
apresentaram menores valores. O layout "dots together" foi o mais efetivo na deteção de
fluorescência. Elevadas concentrações de FluoSpheres apresentaram menores valores de
fluorescência.

viii

ix
TABLE OF CONTENTS Acknowledgements ................................................................................................................. iii
Abstract .................................................................................................................................... v
Table of acronyms ...................................................................................................................xi
Table of figures ..................................................................................................................... xiii
1. Introduction .......................................................................................................................... 1
1.1 Context ...................................................................................................................... 1
1.1.1 Endocrine system ............................................................................................... 3
1.2 Objective ................................................................................................................... 6
1.3 Motivation ................................................................................................................. 6
1.4 Work description ....................................................................................................... 7
1.5 Thesis organization .................................................................................................... 8
2. Biosensor .............................................................................................................................. 9
2.1 Whole-cell biosensors .............................................................................................. 10
2.2 Immobilization techniques ....................................................................................... 15
2.3 Electronic device ..................................................................................................... 16
2.3.1 Photodiode ....................................................................................................... 18
2.3.2 Home-made spectrophotometer and its components ......................................... 21
2.3.3 Beer-Lambert's law .......................................................................................... 22
2.4 Pollutants................................................................................................................. 24
2.4.1 Bisphenol A ..................................................................................................... 25
2.4.2 4-Nonylphenol ................................................................................................. 26
2.4.3 17β-Estradiol ................................................................................................... 27
3. Materials and Methods ........................................................................................................ 29
3.1 Chemicals ................................................................................................................ 29
3.1.1 Testing the modified yeast cells........................................................................ 29
3.1.2 Using FluoSpheres beads for testing the electronic device ................................ 29
3.2 Detection of expressed GFP from the genetically modified Saccharomyces cerevisiae 30
3.3 Immobilization ........................................................................................................ 30
3.3.1 Dip coating ...................................................................................................... 31
3.3.2 Nanoplotting .................................................................................................... 32
3.4 Activation process of the yeast cells ......................................................................... 33
3.5 Experimental conditions while testing the FluoSpheres beads with the sensor .......... 34
4. Results and Discussion ........................................................................................................ 41
4.1 Yeast cells induction ................................................................................................ 41

x
4.1.1 Induction with Estradiol ................................................................................... 41
4.1.2 Induction with Bisphenol ................................................................................. 42
4.1.3 Induction with 4-Nonylphenol .......................................................................... 44
4.2 Microplate test ......................................................................................................... 45
4.3 FluoSpheres Beads .................................................................................................. 49
4.3.1 Macro Sensor readings of the FluoSpheres beads ............................................. 50
5. Conclusions and further work .............................................................................................. 57
Bibliography ........................................................................................................................... 61
xi
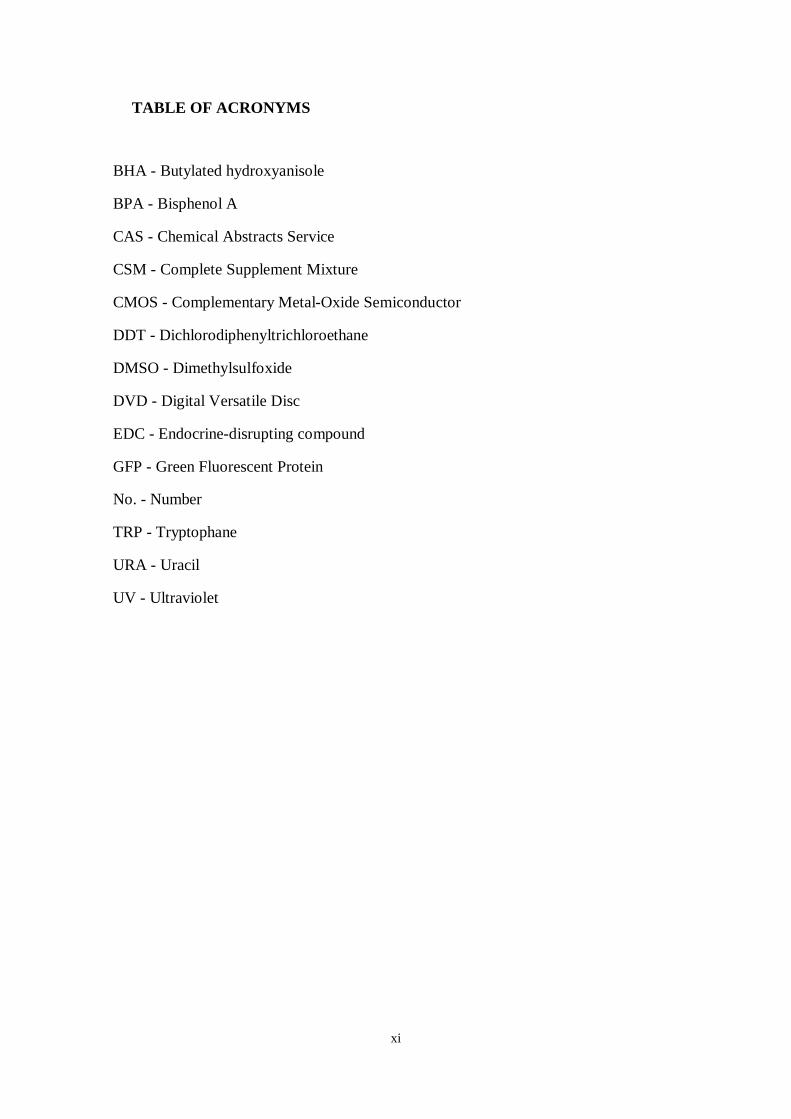
TABLE OF ACRONYMS
BHA - Butylated hydroxyanisole
BPA - Bisphenol A
CAS - Chemical Abstracts Service
CSM - Complete Supplement Mixture
CMOS - Complementary Metal-Oxide Semiconductor
DDT - Dichlorodiphenyltrichloroethane
DMSO - Dimethylsulfoxide
DVD - Digital Versatile Disc
EDC - Endocrine-disrupting compound
GFP - Green Fluorescent Protein
No. - Number
TRP - Tryptophane
URA - Uracil
UV - Ultraviolet

xii

xiii
TABLE OF FIGURES
Figure 1 - Routes of exposure to endocrine disruptors. Adapted from (World Health
Organization 2002) ................................................................................................................... 2
Figure 2 - Endocrine System (American Medical Association n.d.) ........................................... 4
Figure 3 - Basic principle of whole-cell-based sensor using recombinant DNA technology.
Microorganisms receive extracellular signs through the receptor, and the signal-mediated
activation of the response element (RE) induces the transcription of the reporter gene. The
reporter protein exhibits a detectable signal as fluorescence. Adapted from (Yagi 2006) .......... 10
Figure 4 - Jablonski Energy Diagram (Fluorescence). Red line represents the absorption of light
and the blue one represents the fluorescence light. Adapted from (Lakowicz 2006) ................. 12
Figure 5 - X-ray crystal structure of green fluorescent protein (GFP) pictured from the side(left)
and the top (right) (Daunert, et al. 2000) .................................................................................. 12
Figure 6 - The excitation and emission spectrum of GFP (Institute of Structural and Molecular
Biology n.d.) ........................................................................................................................... 13
Figure 7 - Reporter gene scheme. Green Fluorescent Protein is given as an example (Berthold
Technologies 2008) ................................................................................................................. 14
Figure 8 - GFP Spectra on the left (University of London - Institute of Structural and Molecular
Biology 1996). Green line corresponds to the emission spectrum of green light (peak at 509 and
a small shoulder at 540 nm) and the blue line corresponds to the absorption of blue light (peak
at 395 nm and a minor peak at 475 nm). On the right, FluoSpheres spectra in water (Invitrogen
2011) . The blue line corresponds to the absorption (peak at 505 nm) and emission is
represented by the red light (peak at 515 nm) .......................................................................... 17
Figure 9 - FluoSpheres' Stoke's shift is 10 nm. Adapted from (Invitrogen 2011) ...................... 18
Figure 10 - Loss of energy during molecular vibration. Adapted from (Lakowicz 2006) .......... 18
Figure 11 - Symbol of a photodiode (McComb and Boysen 2005) ........................................... 19
Figure 12 - Scheme of a P-N junction ...................................................................................... 19
Figure 13 - Depletion region scheme ....................................................................................... 20
Figure 14 - P-N junction in reverse bias .................................................................................. 20
Figure 15 - P-N junction n+/p-epi (Coura, Salles e Monteiro 2011) ......................................... 21
Figure 16 -Components of the spectrophotometer. Adapted from (Thomas 1996) .................... 22
Figure 17 - Beer-Lambert absorption diagram of a light traveling through a sample of width l.
Adapted from (The Hebrew University of Jerusalem - Faculty of Agriculture, Food and
Environment 2009) ................................................................................................................. 23
Figure 18 - Molecular structure of Bisphenol A (Staples, et al. 1998) ...................................... 25
Figure 19- Molecular structure of 4-Nonylphenol (Sigma Aldrich n.d.) ................................... 26

xiv
Figure 20 - Molecular structure of 17β-Estradiol (Gabet, et al. 2007) ....................................... 27
Figure 21 - Dip coating scheme to dip coat with yeast and FluoSpheres ................................... 32
Figure 22 - Different layouts of nanoplotting 5 x 5 in a 26 x 76 mm slide. Each spot on the left
slide (separated spots) has 17 nL of the solution and the spots on the right slide (dots together)
have 85 nL of solution ............................................................................................................ 32
Figure 23 - Nano Plotter 2.1. Image on the right is a sub-microliter piezoelectric pipette (GeSiM
n.d.) ........................................................................................................................................ 33
Figure 24 - Example of a Test Point setup. Fluorescence measurements testing in a range of 400
nm to 700 nm in an interval wavelength of 1 nm ..................................................................... 35
Figure 25 - Home-made spectrophotometer ............................................................................. 36
Figure 26 - Optical fiber cable and sensor in a front-surface geometry to procedure to
fluorescence in a macrodevice testing (the blue box is the sensor) ........................................... 37
Figure 27 - Fluorescence measurements using a 550 nm filter (the round object), macrodevice 37
Figure 28 - Transmittance measurements using a 550 nm filter, microdevice (Ferreira, et al.
2011) ...................................................................................................................................... 38
Figure 29 - Measurements using a filter of 550 nm .................................................................. 38
Figure 30 - Photodiode L-Edit image. a) A zoom in showing the contacts part of the b) all
photodiode image.................................................................................................................... 39
Figure 31 - S. cerevisiae nanoplotted (strain 188 R1), induced with Estradiol (10-5 M).
Visualization of 4 spots in a) bright field, b) fluorescence and c) overlap the bright field and
fluorescence, zoom 40x ........................................................................................................... 41
Figure 32 - S. cerevisiae nanoplotted (strain 188 R1) induced with Estradiol (10-5 M).
Visualization of a single spot in a) bright field, b) fluorescence and c) overlap the bright field
and fluorescence, zoom 200x .................................................................................................. 42
Figure 33 - S. cerevisiae (strain 188 R1), with Estradiol (10-5 M). Visualization of the 'dots
together' layout in a) bright field, b) fluorescence and c) overlap the bright field and
fluorescence, zoom 40x ........................................................................................................... 42
Figure 34 - S. cerevisiae nanoplotted, induced with Bisphenol (10-5 M). Visualization of 4 spots
in a) bright field, b) fluorescence and c) overlap the bright field and fluorescence, zoom 40x... 43
Figure 35 - S. cerevisiae nanoplotted, induced with Bisphenol (10-5 M). Visualization of a single
spot in a) bright field, b) fluorescence, zoom 200x .................................................................. 43
Figure 36 - S. cerevisiae nanoplotted in a different layout, 'dots together', induced with
Bisphenol................................................................................................................................ 44
Figure 37 - S. cerevisiae nanoplotted, in a 'separated spots' layout, induced with 4-Nonylphenol
(10-6 M). Visualization in a) bright field, b) fluorescence and c) overlap the bright field and
fluorescence, zoom 40x ........................................................................................................... 44

xv
Figure 38 - S. cerevisiae nanoplotted, induced with 4-Nonylphenol (10-6 M). Visualization of a
single spot in fluorescence field, zoom 200x ........................................................................... 45
Figure 39 - Microplate test scheme .......................................................................................... 46
Figure 40 - Induction of the cells with Estradiol. On the left side the cells are suspended in
medium, on the right side the cells are entrapped in alginate .................................................... 47
Figure 41 - Induction of the cells with 4-Nonylphenol. On the left side the cells are suspended in
medium, on the right side the cells are entrapped in alginate .................................................... 48
Figure 42 - Induction of the cells with Bisphenol A. On the left side the cells are suspended in
medium, on the right side the cells are entrapped in alginate .................................................... 48
Figure 43 - Dip coated FluoSpheres beads, zoom 200x. The scalebar corresponds to 30 µm .... 49
Figure 44 - FluoSpheres beads in suspension solution, 200x .................................................... 49
Figure 45 - Nanoplotted FluoSpheres beads. Bright field (upper) and fluorescence (lower).
Images on the left represent the layout 'dots together' (zoom 40x), the image on the right
represents one single spot (zoom 200x). In the left lower image the FluoSpheres are the little
dots, big dots might be some waste or noise. ........................................................................... 50
Figure 46 - Transmittance comparison of a new unused slide to the blank ............................... 51
Figure 47 - FluoSpheres beads' transmittance assay ................................................................. 51
Figure 48 - Fluorescence assay by non-using the 550 nm longpass filter. Normalized values in
relation to 'dots together' ......................................................................................................... 52
Figure 49 - Fluorescence assay by using the 550 nm longpass filter. Normalized values in
relation to 'dots together' from figure 48 .................................................................................. 53
Figure 50 - Fluorescence raw data using a longpass 550 nm filter ............................................ 54

xvi

Development of a sensoring device for environmental estrogens in wastewater
1
1. INTRODUCTION
Nowadays, there is considerable concern related to the soil and groundwater
contamination by pollutants. The increasing levels of environmental pollutants gain
importance due to its possible adverse effects on environmental and human health. One
of these effects is related to the reproductive capabilities of humans and animals,
impairing fertility in a wide range of wildlife species (Stahlschmidt-Allner, et al. 1997),
(Daunert, et al. 2000), (Kostrzynska, et al. 2002).
Therefore, specific measures are required to determine the presence of these pollutants.
Faster, portable and cost-effective environmental screening and monitoring methods are
needed regarding pollutants determination (Rogers 1995).
1.1 Context
According to the National Institute of Environmental Health Science endocrine
disruptors are chemicals that interfere with the endocrine system by mimicking
hormones and lead to negative effects on reproduction and development, as well as with
the nervous and immune systems in humans and fauna once they disrupt the
physiological functions of hormones.
Various substances, both natural and those produced by man, are considered to cause
endocrine disruption, such as estrogen (National Institute of Environmental Health
Sciences n.d.).
Estrogen is a steroid hormone with effect in the estrous cycle and hence it is the one of
the hormones that controls the reproduction in vertebrates. Natural estrogens might be
found in high amounts in soy plants and others. However, one observes to the
increasing number of man-made compounds mimicking the effects of this hormone
(Harries, et al. 1996), (Gabet, et al. 2007), (Ahmed 2000).
Xenoestrogens or environmental estrogens may be man-made or natural compounds
that mimic the action of estrogen hormones by binding to the estrogen receptor in the
organism and inducing negative effects (Corrieri, et al. 2007), (Vethaak, et al. 2005).
These xenoestrogens include pharmaceuticals (e.g., birth control pills and hormone
replacement therapy), pesticides, plasticizers such as Bisphenol A, BPA, a known
estrogenic chemical used in plastic (e.g. bottles), butylated hydroxyanisole, BHA, a
common food preservative, parabens, used as preservatives in cosmetics (e.g. the well

Development of a sensoring device for environmental estrogens in wastewater
2
known para-hydroxybenzoic acid), among others. It has been speculated that these
compounds may be responsible for the increasing incidence of reproductive disorders
associated with male infertility and increasing incidence of breast cancer. It is known
that exposure to endocrine disruptors during prenatal and early postnatal development
may pose the greatest risk since it is by that time that organs and neural systems are
formed (National Institute of Environmental Health Sciences n.d.), (O’Connor 2003),
(Harries, et al. 1996), (Stahlschmidt-Allner, et al. 1997), (Li 1998).
Many of the xenoestrogens are released into rivers via sewage systems, once they are
excreted by human bodies and other point-discharge and diffuse sources. However,
domestic wastewaters are believed to be the main source of estrogenic contamination.
The consequences of the presence of endocrine disruptors in the aquatic environment
are still not well-known, but some negative impacts have been reported such as
toxicological effects on wildlife and feminization of fish. In fact, some studies have
demonstrated that sewage effluents are estrogenic to trout (Harries, et al. 1996), (Gabet,
et al. 2007), (Stahlschmidt-Allner, et al. 1997), (Oishi 2010).
There are various sources and pathways of xenoestrogen uptake: inhalation (i.e., from
indoor air), dermal contact (i.e., from personal care products or occupational exposition),
and ingestion of food (i.e., chemicals that migrate from packaging material into edibles),
see figure 1 (World Health Organization 2002).
Figure 1 - Routes of exposure to endocrine disruptors. Adapted from (World Health Organization
2002)

Development of a sensoring device for environmental estrogens in wastewater
3
In order to prevent public and occupational exposure to chemicals, they have to be
detected in the environment. Therefore sensing systems have been developed. These
sensing systems based on the cell metabolism in response to factors, such as toxicity,
growth, and other cellular events, are being widely explored. It can be achieved by
measuring cellular pH, oxygen consumption, carbon dioxide production, lactate
production, or redox potential (Bousse 1996), (Daunert, et al. 2000).
This way, a biosensor is a measurement gadget or system in which a biological element
is used as the recognition element. This element recognizes a chemical or physical
change, coupled to a transducing element that produces a measurable signal in response
to environmental changes. There are various biological components: macromolecules,
lipid bilayers and liposomes, whole-cells, intact organs or tissue. In the past few years,
whole-cells have been used as that recognition element (Bousse 1996), (Daunert, et al.
2000).
These whole-cell biosensors are a long-desired system once it enables to interface living
cell responses on a microfabricated device. Progresses were made by incorporation of
microfabrication technology and gene-modified engineering into cell-based assay
systems (Bartlett 2008).
Through progress in genetic engineering, cell-based systems can be designed to afford
high specificity and selectivity for the substance to analyze and are stable in various
environmental conditions (Daunert, et al. 2000).
Biosensors have a multiplicity of applications in environmental monitoring, clinical
diagnosis, food technology, industrial and military, among others (Gupta and
Chaudhury 2007), (Su, et al. 2010). When used for environmental applications, a further
potential advantage is their capability of continuous monitoring, and it can be made
small enough to use in the field rather than in the laboratory. The main potential
disadvantage is the handling and lifetime of the living component (Bousse 1996).
1.1.1 Endocrine system
The endocrine system is a system of glands, also called the hormone system, and it is
present in all mammals, birds, reptiles and fish. The name derives from the Greek words
"endo" that signifies inside and "krin" that means secrete.

Development of a sensoring device for environmental estrogens in wastewater
4
It is constituted by (U.S. Environmental Protection Agency 2010):
Glands, see figure 2;
Hormones that are produced by the glands and released into the bloodstream or
the fluid surrounding cells;
Receptors, that recognize and respond to the hormones, present in some organs
and tissues.
Figure 2 - Endocrine System (American Medical Association n.d.)
Hormones are released by glands to the bloodstream so they can reach the diverse
organs and be attached to target tissues that contain cells with matching receptors-
proteins. Despite hormones reaching all parts of the body, only target cells with
compatible receptors are equipped to respond, this way, hormones need to find
compatible receptors to bind properly (K. Beck 2001), (U.S. Environmental Protection
Agency 2010).
The endocrine system regulates all biological processes including mood, growth and
development, metabolism and blood sugar levels (U.S. Environmental Protection
Agency 2010).

Development of a sensoring device for environmental estrogens in wastewater
5
Estrogens are a group of compounds that act as the primary female sex hormone. They
are mostly produced by the ovaries and in small amounts by the adrenal glands (U.S.
Environmental Protection Agency 2010).
Some environmental chemicals have the potential to alter the normal functioning of the
endocrine system of humans and wildlife. These chemicals are called endocrine
disruptors. They are known to mimic natural hormones, leading the body to:
over-respond to the stimulus;
respond at inappropriate times (e.g., producing insulin when it is not needed);
block the effects of a hormone from its receptor;
inhibit the endocrine system directly, leading to overproduction or
underproduction of hormones;
accumulate in fatty tissues therefore they may persist in the body providing a
chronic reservoir of estrogenic chemicals (Liehr, Somasunderam and Roy 1998),
(Ahmed 2000).
Birth control pills are used to intentionally cause some of these effects (U.S.
Environmental Protection Agency 2010), (World Health Organization n.d.). In 2001
according to a survey carried out by the Dutch Central Bureau of Statistics 43 % of
Dutch females were using birth control pills and it was estimated that the total human
excretion of estrogen from oral contraceptives via urine was approximately 1 % in The
Netherlands. Therefore, it is suggested that estrogen-like chemicals enter into the
environment from other sources, cited in (Wise, O'Brien and Woodruff 2011).
The environmental exposure to some pollutants might lead to diseases of the endocrine
system. A variety of chemicals have been found to disrupt the endocrine systems.
Studies with laboratory animals associates chemical exposure to xenoestrogens and
abnormal development and reproductive effects (U.S. Environmental Protection Agency
2010).
One example of the consequences of the exposure to endocrine disruptors dates back to
the early 1970's, when doctors in order to prevent spontaneous miscarriage and promote
fetal development prescribed diethylstilbestrol, a synthetic estrogen, to pregnant women.
Later it was discovered, when children faced puberty, that this compound affected the
reproductive system development and could have been a cause of vaginal cancer (U.S.
Environmental Protection Agency 2010).

Development of a sensoring device for environmental estrogens in wastewater
6
1.2 Objective
This work aimed to construct a biosensor based on genetically modified yeast cells
expressing the Green Fluorescent Protein (GFP) upon exposition to estrogenic
compounds on wastewater. Induction with Bisphenol A, β-Estradiol and 4-Nonylphenol
(estrogenic compounds) at different concentrations led to the expression of the reporter
molecule, the GFP.
The fluorescence is detected by an optical sensor, which is basically a P-N junction
photodiode, projected using the L-Edit software program and fabricated in a CMOS
foundry. Various immobilization layouts were tested for transmittance and fluorescence.
1.3 Motivation
Concern about soil and groundwater contamination by pollutants has increased
nowadays due to the negative effects on environmental and human health.
Endocinre-disrupting compounds are chemicals that may disturb the functions of the
endocrine system and cause reproductive disorders.
Estrogens and estrogen-like chemicals belong to this class of chemicals. Bisphenol A,
4-Nonylphenol and Estradiol are three estrogen-like compounds that mimic the action
of the estrogen hormones produced by the organism.
These chemicals might be found in plastic bottles, detergents, lubricants, pesticides,
among other daily products. It is also believed that animal agriculture can be the main
source of Estradiol. It is of great concert since this chemical is believed to be
widespread into the soil and therefore contaminate vegetables, plants, fruits that we all
eat a posteriori.
One of these adverse effects associated to estrogen-like chemicals is related to the
reproductive capabilities of humans and animals, impairing fertility in a wide range of
wildlife species. Furthermore, the incidence of cancer has increased in the last years and
since these pollutants acts at the endocrine system they might improve the probability of
cancer development.
Environmental monitoring includes steps such as sampling, sample handling, and
sample transportation to specialized laboratories. The call for environmental monitoring

Development of a sensoring device for environmental estrogens in wastewater
7
in loco requires new devices featuring precision, sensitivity, specificity, rapidity, and
ease of handling to detect concentrations of pollutants.
For these reasons it is of great importance to monitor the presence of these contaminants
in order to diminish the exposition to these chemicals. And the production of a device
that allows an in loco monitoring system would be also of great importance since one
would spend less time consuming and it would decrease the price of the samples testing.
1.4 Work description
For the previous reasons, the present work focus on the development of a sensoring
device capable to detect the presence of endocrine-disruptors chemicals in water by
using genetically modified yeast cells that will fluoresce in presence of these
contaminants.
An assay has been developed in a whole-cell sensor where an expression plasmid
YEpE12 expressing estrogen receptor alpha (ER α) and a reporter plasmid YRpE2-GFP
were introduced into yeast cells (Saccharomyces cerevisiae, strain 188 R1) responding
to estrogen-like acting compounds.
In order to test the influence of these compounds at the yeast cells, one tested two
different immobilization schemes: dip coated the slides with alginate and sol-gel and
nanoplotted the yeast cells in two different layouts.
After incubation, yeast induction with β-Estradiol, a natural estrogen, Bisphenol A and
4-Nonylphenol both xenoestrogens, at different concentrations led to the expression of
the reporter Green Fluorescent Protein (GFP), visualized by fluorescence microscopy.
Also, a microplate test was performed to test the yeast cells entrapped in alginate and
suspended in medium. This assay was performed in order to compare the induction of
the cells in these two different matrices to the testing compounds.
These experiments were conducted at the Institute of Genetics and at the Institut für
Werkstoffwissenschaft (both at Technische Universität Dresden).
The sensor was projected by using the L-Edit software program. It was projected a
n+/p-epilayer P-N junction photodiode.
For testing the sensor one used FluoSpheres beads (polystyrene microspheres filled up
with a yellow-green fluorescent dye, Fluorescein) due to legal issues, it was not possible
to bring the genetically modified yeast cells to Portugal. These FluoSpheres beads have

Development of a sensoring device for environmental estrogens in wastewater
8
similar excitation and emission spectrum as GFP and they are easier to manipulate than
the yeast cells.
One immobilized and nanoplotted the FluoSpheres beads' slides as done for the yeast
cells. The immobilization layouts were tested for transmittance and fluorescence.
These experiments were conducted at the Institut für Werkstoffwissenschaft
(Technische Universität Dresden) and at University of Minho.
1.5 Thesis organization
Chapter 1 presents the context of this thesis, its objectives, what motivated the writing
of this thesis, a brief description of the work that has been done, a description of the
endocrine system and the impact of the exposition to endocrine disruptors and the
organization of the thesis.
In chapter 2 a general description about the biosensor and immobilization techniques of
the biological element is exposed. The photodiode used in the experiments and a
description of the related elements necessary to perform these experiments is also
described. Also, the chemicals that have been used to induce the yeast cells are
described in this chapter.
Chapter 3 describes the materials and methods, e.g., the immobilization techniques, the
experimental conditions, among others.
Along the chapter 4 the results of the yeast cells induction, the microplate tests and the
detection tests using the sensor are shown and discussed.
Chapter 5 provides a general overview about the results and discussion of the all
experiments and outlines direction for further work.

Development of a sensoring device for environmental estrogens in wastewater
9
2. BIOSENSOR
Ecosystems and human health protection is a priority issue these days and requires rapid
and precise sensors capable of detecting pollutants. However, identifying chemical
substances that may cause negative effects under wildlife conditions is difficult and
demands specific instrumentation since the substances usually occur at low
concentrations (Stahlschmidt-Allner, et al. 1997).
Improvements in technology have led to more accurate, more rapid, less costly and
more sensitive sensors. Nowadays, due to these improvements, one may detect
pollutants in situ and they can be used for real-time continuous monitoring (Theodore
2005).
One may consider a biosensor as an analytical device where a biological recognition
element coupled to a physical transducer integrates a microelectronic system in order to
enable rapid, accurate, low-level detection of a substance (Kissinger 2005), (Su, et al.
2010), (Belkin 2003).
The biological sensing element answers to specific compounds and the transducer
converts the biological response into a detectable signal that can be measured
electronically, and then correlated to its concentration (Su, et al. 2010).
Biological elements are extremely specific. This represents an advantage regarding their
use as recognition elements (Belkin 2003). The worst problem in developing this
biosensor is the incorporation of sensing molecules in a suitable matrix and
monitoring/quantifying the interactions between the analyzed substance and these
molecules (Gupta and Chaudhury 2007).
Diverse biological recognition elements, such as enzymes, antibodies, microorganisms,
and tissues, have been used in biosensor production. Enzymes, due to their unique
specificity and sensitivity are widely used as recognition elements. However, their
purification is costly, time-consuming and, due to in vitro operating environment, the
enzyme activity is decreased. Therefore, bacteria, yeast and algae offer an alternative in
the fabrication of biosensors since they are easy to produce, and they can be more easily
manipulated and have better viability and stability in vitro when compared to other cells
from higher organisms such as plants and animals. For these reasons yeast, bacterial and
algae cells can greatly simplify the fabrication process and enhance the performance of
biosensors (Bousse 1996).
Development of a sensoring device for environmental estrogens in wastewater
10
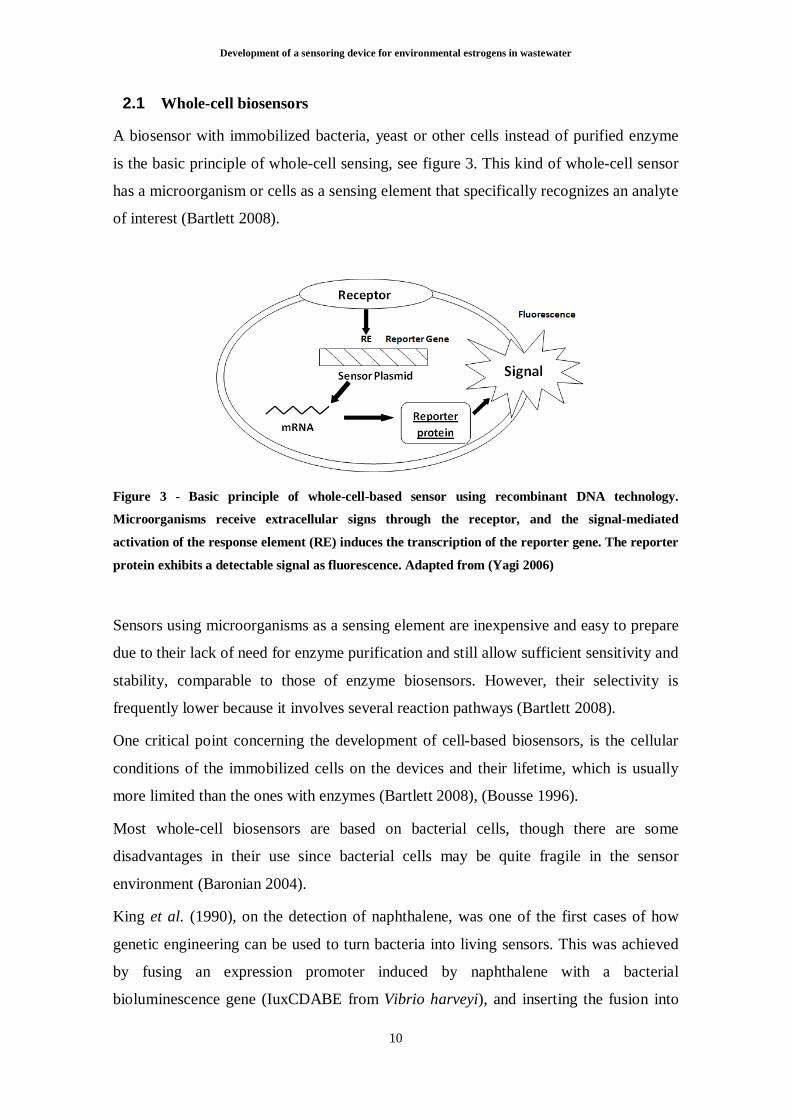
2.1 Whole-cell biosensors
A biosensor with immobilized bacteria, yeast or other cells instead of purified enzyme
is the basic principle of whole-cell sensing, see figure 3. This kind of whole-cell sensor
has a microorganism or cells as a sensing element that specifically recognizes an analyte
of interest (Bartlett 2008).
Figure 3 - Basic principle of whole-cell-based sensor using recombinant DNA technology.
Microorganisms receive extracellular signs through the receptor, and the signal-mediated
activation of the response element (RE) induces the transcription of the reporter gene. The reporter
protein exhibits a detectable signal as fluorescence. Adapted from (Yagi 2006)
Sensors using microorganisms as a sensing element are inexpensive and easy to prepare
due to their lack of need for enzyme purification and still allow sufficient sensitivity and
stability, comparable to those of enzyme biosensors. However, their selectivity is
frequently lower because it involves several reaction pathways (Bartlett 2008).
One critical point concerning the development of cell-based biosensors, is the cellular
conditions of the immobilized cells on the devices and their lifetime, which is usually
more limited than the ones with enzymes (Bartlett 2008), (Bousse 1996).
Most whole-cell biosensors are based on bacterial cells, though there are some
disadvantages in their use since bacterial cells may be quite fragile in the sensor
environment (Baronian 2004).
King et al. (1990), on the detection of naphthalene, was one of the first cases of how
genetic engineering can be used to turn bacteria into living sensors. This was achieved
by fusing an expression promoter induced by naphthalene with a bacterial
bioluminescence gene (IuxCDABE from Vibrio harveyi), and inserting the fusion into

Development of a sensoring device for environmental estrogens in wastewater
11
Pseudomonas fluorescens. This work has led to a fiber optic biosensor for naphthalene
and salicylate using immobilized bacteria, cited in (Bousse 1996).
Since yeasts are eukaryotes they can provide relevant information to other eukaryotes
that prokaryotic cells cannot. Hence, the use of eukaryotic cells as a detection element is
preferable since their response to pollutants more precisely predicts the response in
plant and animal cells than the prokaryote. Further reasons to use yeast rather than
bacteria in sensing applications are that yeasts have more physical robustness and
superior pH, temperature and osmolarity/ionic strength tolerances in comparison to
bacteria, they are easier to manipulate, they have rapid growth, and they grow on a
broad range of substrates, once yeast and filamentous fungi occupy a wide range of
environmental niches, one may expect they will collectively respond to a wide range of
substrates. There are some yeasts capable of metabolizing several substrates, e.g. Arxula
adeninivorans is even capable of catabolizing aromatic compounds (Baronian 2004).
Recently, the employment of genetically modified yeast as the sensing element in
biosensors is being reported with increasing frequency. Many of the current yeast
sensors are used for genotoxicity and they are based on modified Saccharomyces
cerevisiae (Baronian 2004). This yeast is the most intensively studied eukaryotic model
organism due to its characteristics.
In order to detect specific classes of pollutants, bioluminescence has served as reporter,
with a few examples of β-galactosidase activity and, more recently, Green Fluorescent
Protein (GFP). Conjugating the previous characteristics, some genetically modified
microorganisms have been used as indicators of environmental toxicity once they
exhibit luminescence (Belkin 2003), (Su, et al. 2010).
Autofluorescence is the primary advantage of GFP as a reporter protein, and therefore,
its use does not require the addition of cofactors or exogenous substrates to light
emission (Chalfie and Kain 2006), (Daunert, et al. 2000). Furthermore, GFP has as an
advantage the possibility of in-situ measuring and it is a noninvansive marker to living
cells.
Fluorescence is the reaction that certain molecules exhibit when upon absorbing light of
a certain wavelength, they become therefore excited to a higher state of energy.
However, this excited state cannot be sustained for long which results in a decrease of
the energy and consequent emission of light at a longer wavelength than the original
light absorbed, see figure 4 (Nill 2002), (Lakowicz 2006).

Development of a sensoring device for environmental estrogens in wastewater
12
Figure 4 - Jablonski Energy Diagram (Fluorescence). Red line represents the absorption of light
and the blue one represents the fluorescence light. Adapted from (Lakowicz 2006)
The Jablonski-Energy diagram illustrates the process that occurs between the absorption
and emission of light. When a fluorophore (fluorescent substance) absorbs light it is
usually excited to a higher energy and vibrational level, S1. There are multiple excited
states that the fluorophore can reach, depending on the energy and wavelength of the
absorbed light. However, this excited state is unstable and therefore the molecules
rapidly relax to the lowest vibrational level which is the lowest-energy excited state but
still semi-stable and generally completed prior to emission. When the electron returns to
the ground state (S0) a photon is emitted. The average time between the excitation and
the return to the ground state is the lifetime of a fluorophore that is typically near 10 ns
(Lakowicz 2006).
Green Fluorescent Protein (GFP) is a common natural fluorescent protein isolated from
the jellyfish Aequorea victoria, see figure 5. Variants of GFP have also been cloned
from the sea pansy, Renilla reniformis (Daunert, et al. 2000). Using recombinant DNA
techniques the GFP gene can be introduced into living cultured cells. These cells will
express GFP and thus emit a green fluorescence when irradiated (Lodish, et al. 2000),
(Kostrzynska, et al. 2002).
Figure 5 - X-ray crystal structure of green fluorescent protein (GFP) pictured from the side(left)
and the top (right) (Daunert, et al. 2000)

Development of a sensoring device for environmental estrogens in wastewater
13
The excitation spectrum of GFP wild type (from A. victoria) absorbs blue light (it has
two excitation maxima; one at 395 nm and a minor peak at 475 nm) and emits green
light (the fluorescent emission maxima occurs at 509 nm with a small shoulder at 540
nm), see figure 6 (Daunert, et al. 2000), (Lam, et al. 2009), (Kostrzynska, et al. 2002).
Figure 6 - The excitation and emission spectrum of GFP (Institute of Structural and Molecular
Biology n.d.)
GFP is an ideal reporter protein due to its characteristics. It has high stability and the
ability to alter its stability and spectral properties through structural modifications of the
native protein is a particularly useful aspect of GFP as a reporter (Daunert, et al. 2000).
Moreover, normally, GFP is non-toxic and can be expressed with low effects on
physiology in different organisms (The Royal Swedish Academy of Sciences 2008).
Additional advantages of GFP include assay simplicity and high pH stability (Daunert,
et al. 2000).
In a study, the green fluorescent protein reporter gene was incorporated into a plasmid,
yeast-Enhanced Green Fluorescent Protein, to optimize its expression in S. cerevisiae
(Baronian 2004). A reporter gene is a particular gene inserted into the DNA of a cell so
when a signal transduction occurs in that cell, it will “report” it (Nill 2002). A gene is
made of two parts: one is a specific DNA-sequence that regulates the transcription of
the gene (promoter) and the other part is a DNA-sequence that possess the information
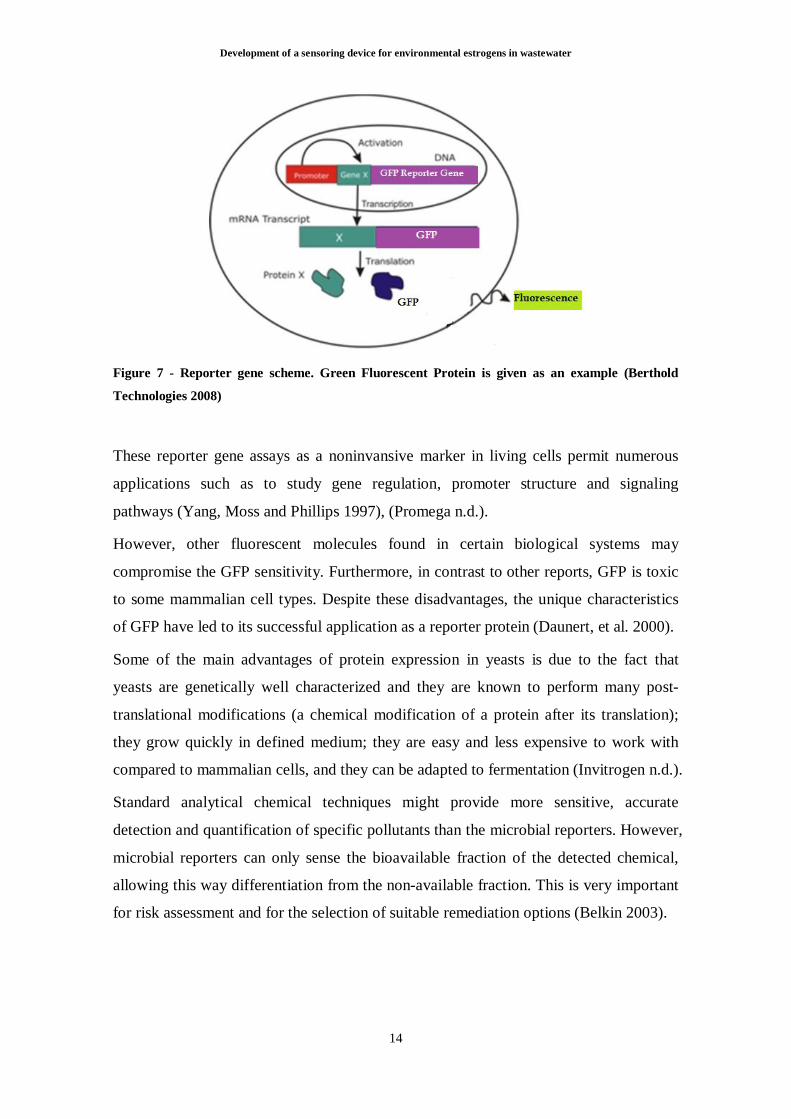
about the protein that is produced (in this case GFP), see figure 7 (Berthold
Technologies 2008). Therefore, the cell receives a signal through a receptor which
induces the transcription of the reporter gene. The reporter protein (GFP) possesses a
specific fluorescence as the detectable signal (Yagi 2006).
Development of a sensoring device for environmental estrogens in wastewater
14
Figure 7 - Reporter gene scheme. Green Fluorescent Protein is given as an example (Berthold
Technologies 2008)
These reporter gene assays as a noninvansive marker in living cells permit numerous
applications such as to study gene regulation, promoter structure and signaling
pathways (Yang, Moss and Phillips 1997), (Promega n.d.).
However, other fluorescent molecules found in certain biological systems may
compromise the GFP sensitivity. Furthermore, in contrast to other reports, GFP is toxic
to some mammalian cell types. Despite these disadvantages, the unique characteristics
of GFP have led to its successful application as a reporter protein (Daunert, et al. 2000).
Some of the main advantages of protein expression in yeasts is due to the fact that
yeasts are genetically well characterized and they are known to perform many post-
translational modifications (a chemical modification of a protein after its translation);
they grow quickly in defined medium; they are easy and less expensive to work with
compared to mammalian cells, and they can be adapted to fermentation (Invitrogen n.d.).
Standard analytical chemical techniques might provide more sensitive, accurate
detection and quantification of specific pollutants than the microbial reporters. However,
microbial reporters can only sense the bioavailable fraction of the detected chemical,
allowing this way differentiation from the non-available fraction. This is very important
for risk assessment and for the selection of suitable remediation options (Belkin 2003).

Development of a sensoring device for environmental estrogens in wastewater
15
2.2 Immobilization techniques
An efficient immobilization of the cells into the sensor is one important parameter in the
development of whole-cell biosensors. The immobilization technique should maintain
the cells’ viability by immobilizing the cells on matrixes that represent nontoxicity and
allow nutrients access. Additionally, the matrixes need to be permeable to the target
analyte being sensed and they should be homogeneous (Daunert, et al. 2000).
Immobilization techniques require adjustments that mainly concern the material used
for the confinement. It ideally should possess mechanical stability, but allowing long-
term/continuous process leakage in order for the diffusion of molecules to and from the
immobilized cells, biocompatibility and non-toxicity to happen (Baronian 2004),
(Callone, et al. 2008).
One of the most significant advantages of solid sensing elements compared to
suspended cell cultures is their compatibility with continuous monitoring schemes
(Premkumar, et al. 2001).
There are various immobilization techniques used in yeast biosensors (Gupta and
Chaudhury 2007), (Baronian 2004). Adsorption, encapsulation, entrapment, covalent
binding and cross-linking are some traditional methods for microorganism
immobilization (Su, et al. 2010). One may utilize adsorption on membranes, entrapment
in agar/agarose, in alginate, in polyacrylamide and in sol-gels, physical entrapment
behind dialysis membranes and immobilization using porous glass beads (Daunert, et al.
2000).
Adsorption techniques are easy to perform, in general, but the bonding is often weak
causing leaching and biocatalyst lack the degree of stabilization, which is possible by
covalent attachment and entrapment. The covalent techniques often require several
chemical steps (Gupta and Chaudhury 2007).
A better way of immobilization is to use sol-gel glass, immobilizing the molecules
within its porous optically transparent matrix and it has demonstrated functional activity
of encapsulated biomolecules (Gupta and Chaudhury 2007).
Polymers have been used to entrap yeast cells. Although biopolymers such as calcium
alginate are permeable and non-toxic to cells, they appear to have poor mechanical
stability, once they are very sensitive to abrasion and may be degraded by some
organisms, under nonsterile conditions (Baronian 2004).
Development of a sensoring device for environmental estrogens in wastewater
16
Sol-gel derived glasses can be a potential host matrix for chemical sensing and
biosensing (Gupta and Chaudhury 2007). Their products may present suitable porosity
avoiding mass transport restrictions, good stiffness in order to hold the designed
geometry, minimal interference with bioactivity, viability of immobilized biomasses
and easy processing for engineering of the method (Boninsegna, Toso and Monte 2003).
Due to the porous nature of the sol-gel network, entrapped species remain accessible
and can interact with analytes.
However sol-gel based sensors may suffer from some disadvantages once the
entrapment may change chemical and biological properties of the entrapped species
(Gupta and Chaudhury 2007).
Yeast and filamentous fungi are often used in suspension as sensor components. Yeast,
however, has been demonstrated to be possible to be immobilized on membranes, in
hydrogel and in pastes (Baronian 2004).
Immobilized micro-organisms have several advantages over free-living micro-
organisms. These advantages include protection from environmental conditions, such as
temperature, chemicals, pH, among others. Moreover the immobilization allows its re-
use (Pereira and Millar 2005). Although immobilization prevents leaching, it frequently
can present problems associated with loss of activity and stability due to the interference
of molecules within the cell and nutrients in the media (Gupta and Chaudhury 2007),
(Daunert, et al. 2000).
2.3 Electronic device
Environmental monitoring is vital to protect the environment and the public health from
various contaminants released into the water, air and soil. Therefore, there is a need to
create accurate, portable, inexpensive, operated in situ sensors able to procedure long-
term monitoring of environmental contaminants (Ho, et al. 2005).
In the biosensor, the interaction between the microorganisms and the target compounds
can be detected by a number of techniques. Among these techniques, electrochemical
and optical are most widely used in the development of biosensors (Su, et al. 2010). The
biological recognition element responds to the target compounds and the transducer
converts the biological response into a detectable signal, which can be electronically
measured and then correlated with the analyte concentration (Su, et al. 2010).
Development of a sensoring device for environmental estrogens in wastewater
17
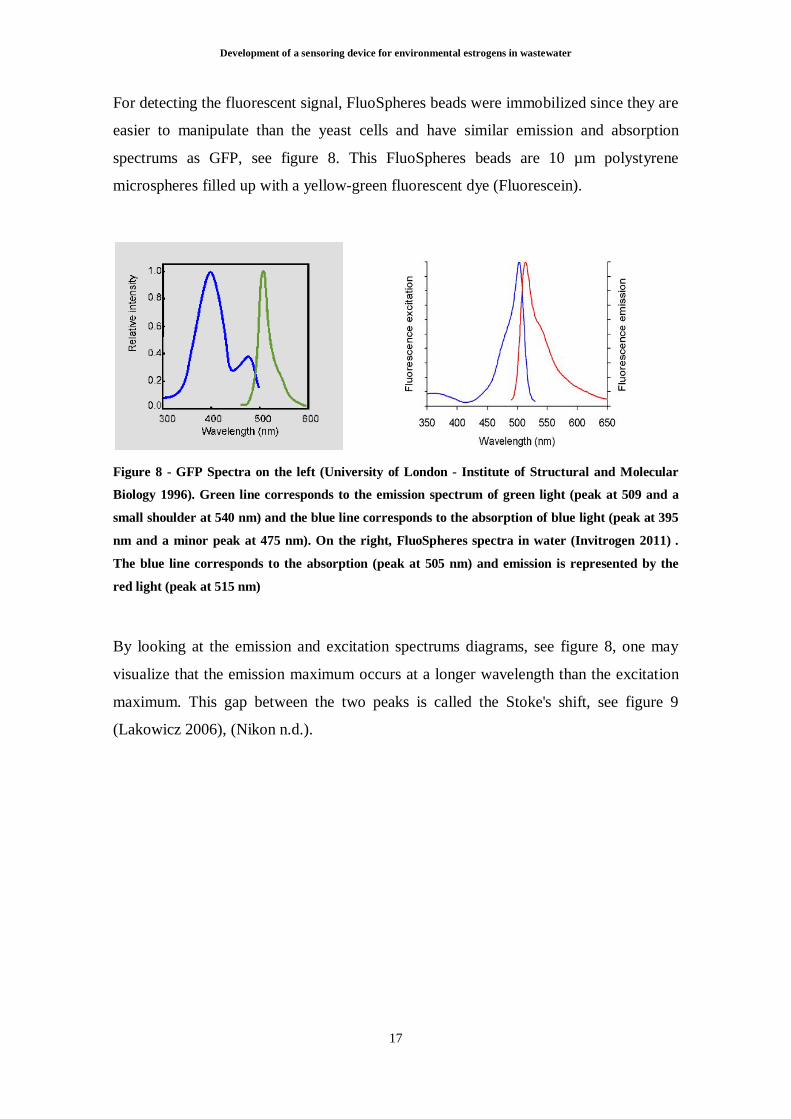
For detecting the fluorescent signal, FluoSpheres beads were immobilized since they are
easier to manipulate than the yeast cells and have similar emission and absorption
spectrums as GFP, see figure 8. This FluoSpheres beads are 10 µm polystyrene
microspheres filled up with a yellow-green fluorescent dye (Fluorescein).
Figure 8 - GFP Spectra on the left (University of London - Institute of Structural and Molecular
Biology 1996). Green line corresponds to the emission spectrum of green light (peak at 509 and a
small shoulder at 540 nm) and the blue line corresponds to the absorption of blue light (peak at 395
nm and a minor peak at 475 nm). On the right, FluoSpheres spectra in water (Invitrogen 2011) .
The blue line corresponds to the absorption (peak at 505 nm) and emission is represented by the
red light (peak at 515 nm)
By looking at the emission and excitation spectrums diagrams, see figure 8, one may
visualize that the emission maximum occurs at a longer wavelength than the excitation
maximum. This gap between the two peaks is called the Stoke's shift, see figure 9
(Lakowicz 2006), (Nikon n.d.).

Development of a sensoring device for environmental estrogens in wastewater
18
Figure 9 - FluoSpheres' Stoke's shift is 10 nm. Adapted from (Invitrogen 2011)
This Stoke's shift occurs due to the loss of energy of the excited fluorophore through
molecular vibration. This energy is dissipated as heat to the immediate environment, see
figure 10 (Lakowicz 2006), (Nikon n.d.).
Figure 10 - Loss of energy during molecular vibration. Adapted from (Lakowicz 2006)
2.3.1 Photodiode
Photodiodes are semiconductor light sensors used to detect light, see figure 11. They
consist of a reverse biased active P-N junction operated under the photoelectric effect.
By absorption of photons or charged particles, a current which is proportional to the
intensity of light is generated (Georgia State University - Department of Physics and
Astronomy n.d.), (OSI Optoelectronics n.d.).
The photoelectric effect is a result of the absorption of energy from electromagnetic
radiation, as visible or ultraviolet light, whereby a photon with higher energy than the

Development of a sensoring device for environmental estrogens in wastewater
19
bandgap energy hits a surface of the material and ejects a single electron out of it,
creating a hole (Stanford University 2009).
Figure 11 - Symbol of a photodiode (McComb and Boysen 2005)
Photodiodes can be classified by their function (detection of the intensity, position,
color and presence of light) and structure (Hamamatsu 2008), (Hamamatsu n.d.):
P-N photodiode;
PIN photodiode;
Schottky type photodiode;
APD (Avalanche photodiode).
Due to photoelectric effect, an electron from the valence band is excited to the
conduction band leaving a hole behind. Generally the electrons from the conduction
band recombine themselves with the holes on the valence band, therefore it is necessary
to remove the electrons from this conduction band in order to prevent this association,
forming a reverse biased P-N junction (International Union of Pure and Applied
Chemistry 1997), (OSI Optoelectronics n.d.), (Minas 2004).
This P-N junction is the limit of two different semi conductive materials: N-type (excess
of electrons) and P-type (excess of holes), see figure 12.
Figure 12 - Scheme of a P-N junction
Development of a sensoring device for environmental estrogens in wastewater
20
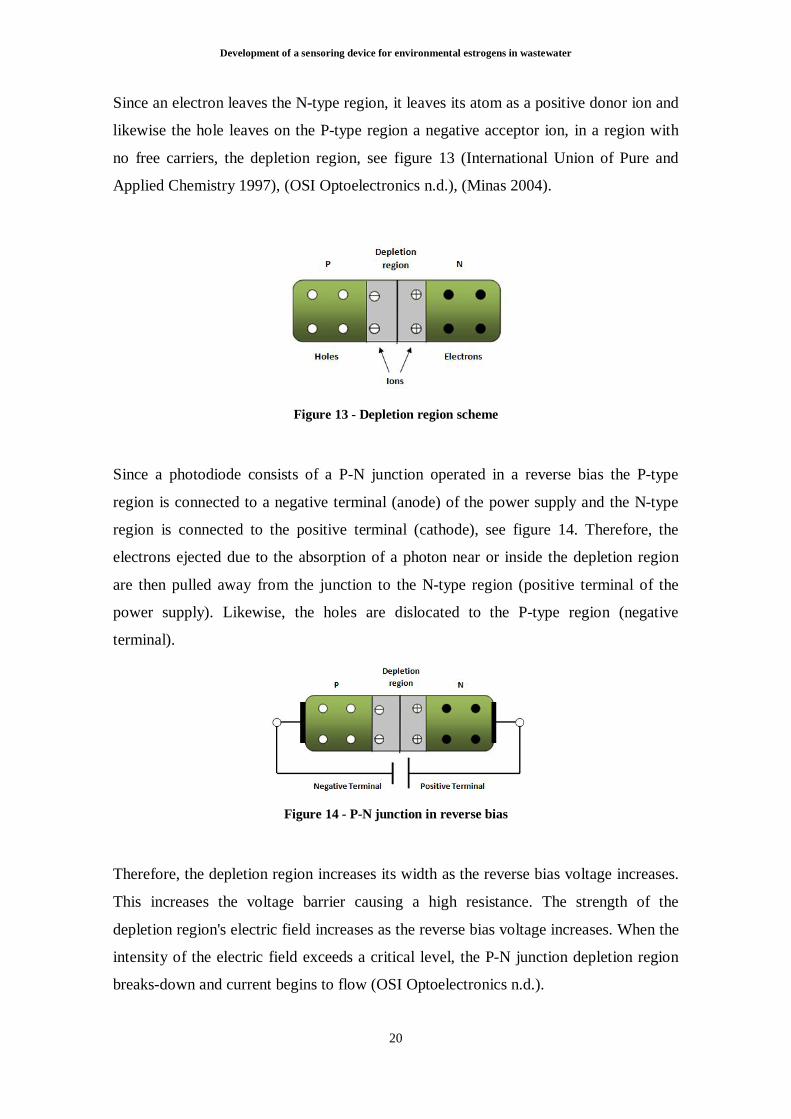
Since an electron leaves the N-type region, it leaves its atom as a positive donor ion and
likewise the hole leaves on the P-type region a negative acceptor ion, in a region with
no free carriers, the depletion region, see figure 13 (International Union of Pure and
Applied Chemistry 1997), (OSI Optoelectronics n.d.), (Minas 2004).
Figure 13 - Depletion region scheme
Since a photodiode consists of a P-N junction operated in a reverse bias the P-type
region is connected to a negative terminal (anode) of the power supply and the N-type
region is connected to the positive terminal (cathode), see figure 14. Therefore, the
electrons ejected due to the absorption of a photon near or inside the depletion region
are then pulled away from the junction to the N-type region (positive terminal of the
power supply). Likewise, the holes are dislocated to the P-type region (negative
terminal).
Figure 14 - P-N junction in reverse bias
Therefore, the depletion region increases its width as the reverse bias voltage increases.
This increases the voltage barrier causing a high resistance. The strength of the
depletion region's electric field increases as the reverse bias voltage increases. When the
intensity of the electric field exceeds a critical level, the P-N junction depletion region
breaks-down and current begins to flow (OSI Optoelectronics n.d.).

Development of a sensoring device for environmental estrogens in wastewater
21
This mechanism originates an electric current proportional to the intensity of the
incident light (International Union of Pure and Applied Chemistry 1997), (OSI
Optoelectronics n.d.), (Minas 2004).
Among the vertical P-N junction photodiodes available in Complementary Metal-
Oxide-Semiconductor (CMOS) technology, it was chosen the n+/p-epilayer type, see
figure 15. This photodiode was chosen since literature states that it shows higher
quantum efficiency for the studied wavelengths (450 - 650 nm) (Minas 2004).
Figure 15 - P-N junction n+/p-epi (Coura, Salles e Monteiro 2011)
Nowadays more than 95 % of integrated circuits are fabricated in CMOS due to its
characteristics (Baker 2010):
CMOS devices have high noise immunity;
They have low power consumption while operating in high speeds
(consequently CMOS devices do not produce as much waste heat as other forms
of logic);
They can be made in small areas, recommended for portable devices;
They can be fabricated with few defects and it is a low cost technology.
2.3.2 Home-made spectrophotometer and its components
The instruments used to measure several optical properties of a material, e.g., the
absorption, transmission or fluorescence, as a function of wavelength is a
spectrophotometer.
This home-made spectrophotometer has components that are the same as the
commercial spectrophotometers, see figure 16.
Development of a sensoring device for environmental estrogens in wastewater
22
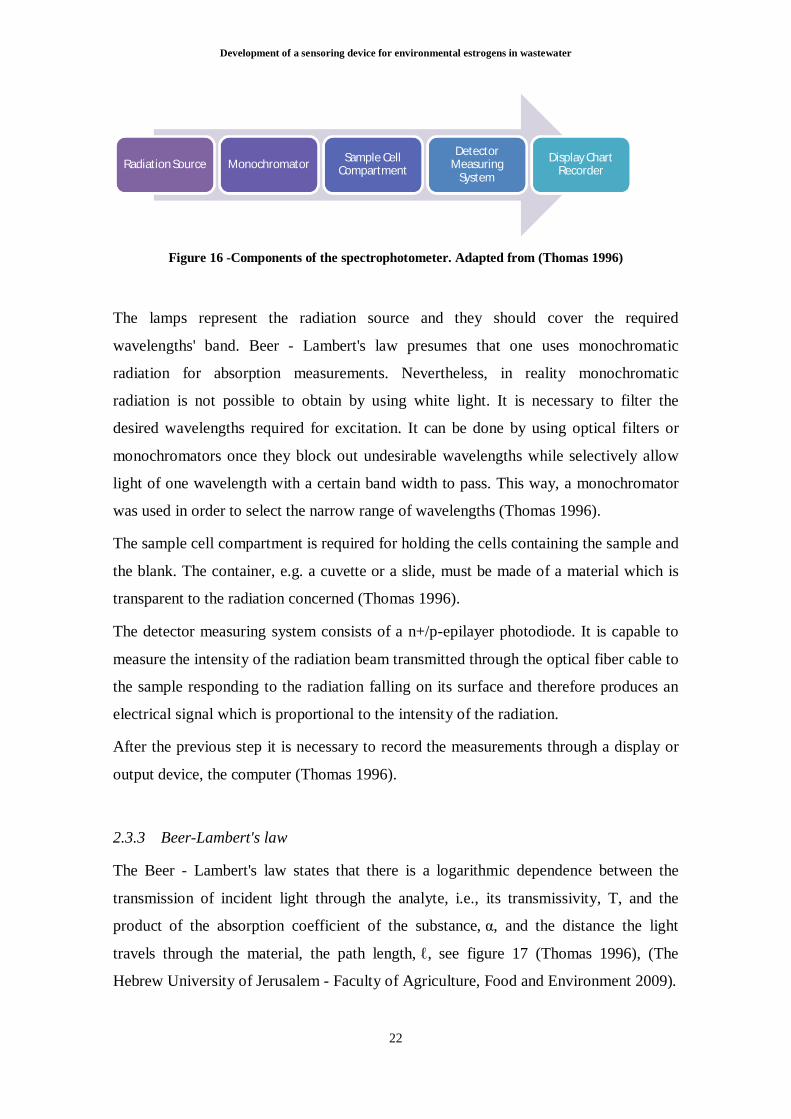
Figure 16 -Components of the spectrophotometer. Adapted from (Thomas 1996)
The lamps represent the radiation source and they should cover the required
wavelengths' band. Beer - Lambert's law presumes that one uses monochromatic
radiation for absorption measurements. Nevertheless, in reality monochromatic
radiation is not possible to obtain by using white light. It is necessary to filter the
desired wavelengths required for excitation. It can be done by using optical filters or
monochromators once they block out undesirable wavelengths while selectively allow
light of one wavelength with a certain band width to pass. This way, a monochromator
was used in order to select the narrow range of wavelengths (Thomas 1996).
The sample cell compartment is required for holding the cells containing the sample and
the blank. The container, e.g. a cuvette or a slide, must be made of a material which is
transparent to the radiation concerned (Thomas 1996).
The detector measuring system consists of a n+/p-epilayer photodiode. It is capable to
measure the intensity of the radiation beam transmitted through the optical fiber cable to
the sample responding to the radiation falling on its surface and therefore produces an
electrical signal which is proportional to the intensity of the radiation.
After the previous step it is necessary to record the measurements through a display or
output device, the computer (Thomas 1996).
2.3.3 Beer-Lambert's law
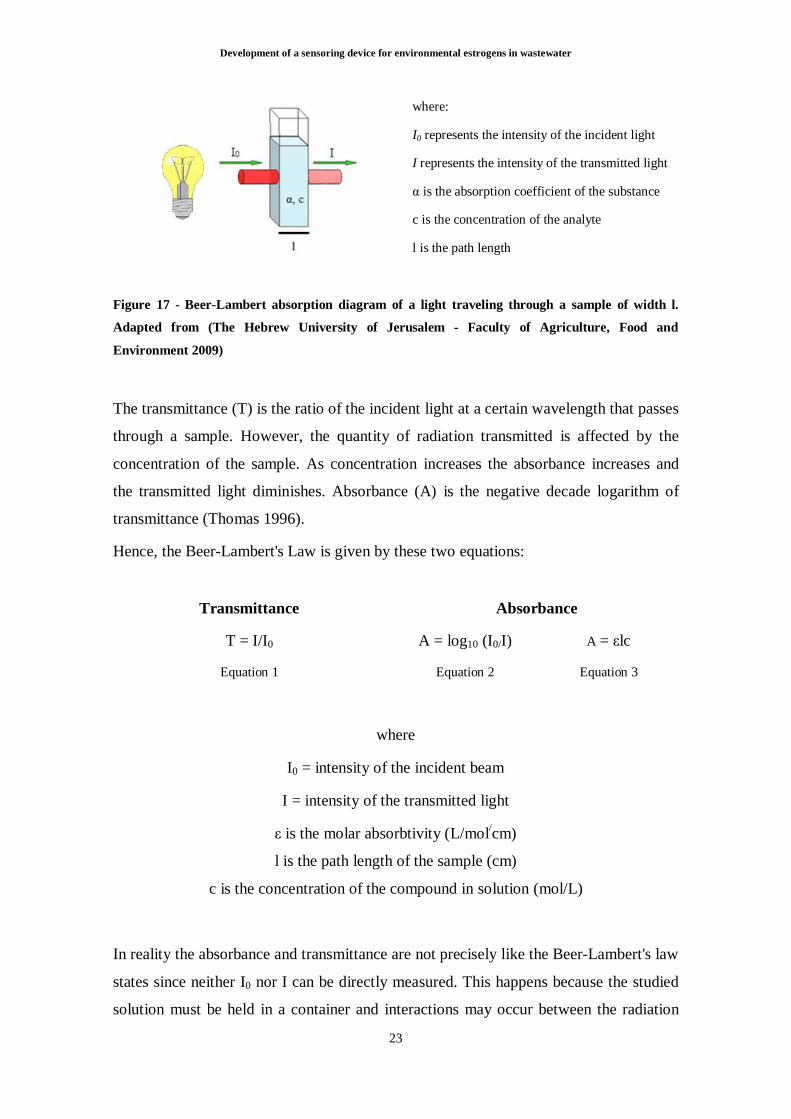
The Beer - Lambert's law states that there is a logarithmic dependence between the
transmission of incident light through the analyte, i.e., its transmissivity, T, and the
product of the absorption coefficient of the substance, α, and the distance the light
travels through the material, the path length, ℓ, see figure 17 (Thomas 1996), (The
Hebrew University of Jerusalem - Faculty of Agriculture, Food and Environment 2009).
Radiation Source Monochromator Sample Cell Compartment
Detector Measuring
System
Display Chart Recorder
Development of a sensoring device for environmental estrogens in wastewater
23
where:
I0 represents the intensity of the incident light
I represents the intensity of the transmitted light
α is the absorption coefficient of the substance
c is the concentration of the analyte
l is the path length
Figure 17 - Beer-Lambert absorption diagram of a light traveling through a sample of width l.
Adapted from (The Hebrew University of Jerusalem - Faculty of Agriculture, Food and
Environment 2009)
The transmittance (T) is the ratio of the incident light at a certain wavelength that passes
through a sample. However, the quantity of radiation transmitted is affected by the
concentration of the sample. As concentration increases the absorbance increases and
the transmitted light diminishes. Absorbance (A) is the negative decade logarithm of
transmittance (Thomas 1996).
Hence, the Beer-Lambert's Law is given by these two equations:
Transmittance Absorbance
T = I/I0
Equation 1
A = log10 (I0/I)
Equation 2
A = εlc
Equation 3
where
I0 = intensity of the incident beam
I = intensity of the transmitted light
ε is the molar absorbtivity (L/mol/cm)
l is the path length of the sample (cm)
c is the concentration of the compound in solution (mol/L)
In reality the absorbance and transmittance are not precisely like the Beer-Lambert's law
states since neither I0 nor I can be directly measured. This happens because the studied
solution must be held in a container and interactions may occur between the radiation

Development of a sensoring device for environmental estrogens in wastewater
24
and the wall of the container, resulting in a loss of intensity due to reflection or
absorption (Thomas 1996).
2.4 Pollutants
When related to environmental sensing, micro and nano sensors are able to operate as a
monitoring system since they are miniaturized, rapid and portable. Sensor systems may
measure particulate matter, inorganic aerosol constituents, and tracers, and they are able
to determine spatial and temporal distribution of the pollutants (Jokerst and Jones n.d.).
The use of genetically engineered cells in sensors to express a reporter protein in the
presence of an analyte has a lot of advantages as a sensing system. In these systems,
different strains are engineered to contain the desired genes. Toxics-sensitive
nonspecific biosensing systems employ a promoterless reporter protein (e.g., GFP,
luciferase, β-galactosidase) fused downstream of the gene corresponding to the stress
promoter of interest. These sensing systems can be compared to an environmental
switch which is turned on when critical amounts of the toxics are present. Although they
do not provide any information on the type of present toxicant they are used to detect
any compound that is toxic to the cells (Daunert, et al. 2000).
The use of cells for environmental applications has the advantage to allow the
measurement of the total bioavailability of a given analyte (Bousse 1996), i.e., it permits
to obtain relevant data relative to the response of the cells to an analyte and to measure
the bioavailability of the analyte (Daunert, et al. 2000).
It has been shown that the normal hormonal levels of aquatic species exposed to
estrogenic compounds have been altered. The presence of multiple compounds in water
can potentiate the additive or synergistic toxic effects, even with compounds of different
modes of action (Kolpin, et al. 2002).
Bisphenol A, 4-Nonylphenol and 17β-Estradiol are known to be estrogen receptor
agonists. Estrogen agonists are chemicals that bind to an estrogen receptor of a cell and
trigger a response, mimicking the action of estrogen C18H24O2 (World Health
Organization n.d.).
Nevertheless, there is a limitation to draw conclusions about endocrine disruptor
chemicals, since there are not sufficient epidemiological or wildlife studies to measure
the exposure. Therefore this issue is especially relevant for those endocrine disrupting

Development of a sensoring device for environmental estrogens in wastewater
25
chemicals that are rapidly degraded, like Bisphenol A. This implies that the exposure
that might have caused an adverse outcome is not detectable at the same time as clinical
manifestations. Hence, most of the chemicals that are used to describe cause-and-effect
relationships are those that are biologically and ecologically persistent, e.g., DDT,
dioxins (World Health Organization 2002).
2.4.1 Bisphenol A
Bisphenol A (CAS No. 80-05-7), figure 18, is an industrial chemical used to make
epoxy resins, polycarbonate plastic and flame retardants.
Figure 18 - Molecular structure of Bisphenol A (Staples, et al. 1998)
It is used in DVDs, thermal and carbonless paper coatings, optical lenses, toys, and
others (U.S. Environmental Protection Agency 2010), (Centers for Disease Control and
Prevention n.d.). It is also a component of resin used in dentistry (Ahmed 2000). It is
known to have estrogenic properties capable to bind to estrogen receptors (Okada, et al.
2008).
It has low volatility at room temperature and is rapidly degraded by sunlight: however,
low levels might be released to the environment (American Chemistry Council n.d.),
(U.S. Environmental Protection Agency 2010).
There are some routes of Bisphenol A to entry into the environment. Low levels of
Bisphenol A are directly released to surface waters and to the atmosphere at
manufacturing and during its use and while processing and handling it despite its
control by good practicing at workplaces (Staples, et al. 1998).
The U.S. National Toxicology Program of the Department of Health and Human
Services conducted a carcinogenesis bioassay in rats and mice exposed to Bisphenol A.
Under the conditions of this bioassay, the authors considered that "there was not
convincing evidence that Bisphenol A was carcinogenic for rats or mice of either sex".

Development of a sensoring device for environmental estrogens in wastewater
26
Although it may not be considered carcinogenic another study demonstrated that 2 and
20 μg/kg/d of Bisphenol A increased prostate weight in mice (World Health
Organization 2002).
It has been knowledge that Bisphenol A, even at low doses, acts as an endocrine
disruptor. Nevertheless, its bindings to estrogen receptor is particularly weak, and thus
these low-dose effects are rather intangible (Okada, et al. 2008).
The U.S. Environmental Protection Agency (EPA) estimates that annually more than
453 tons of Bisphenol A are released to the environment.
The U.S. Geological Survey held an assay in water resources detecting the presence of
pharmaceuticals, hormones, and other organic water contaminants, like Bisphenol A, β-
Estradiol, and 4-Nonylphenol. In this survey it was chosen as sampling sites, areas
considered susceptible to contamination from human, industrial, and agricultural
wastewater. It was tested 139 samples during the years of 1999 and 2000. In this survey
the median concentration of Bisphenol A was 0,1 µg/L (Kolpin, et al. 2002). In 2006,
the European Food Safety Authority set a Tolerable Daily Intake of Bisphenol A of 50
µg/kg of body weight.
2.4.2 4-Nonylphenol
Nonylphenol (CAS No. 104-40-5), figure 19, is an industrial chemical with endocrine
effects. It is an organic compound used to produce anionic detergents, lubricants,
antistatic agents, antioxidants for rubber manufacture, high performance textile scouring
agents, emulsifiers for agrichemicals, among others (U.S. Environmental Protection
Agency 2004).
Figure 19- Molecular structure of 4-Nonylphenol (Sigma Aldrich n.d.)
It binds to the estrogen receptors and initiates the expression of estrogen controlled
genes. However, its affinity to the receptor is lower than Estradiol, the natural ligand.
Nonylphenol is accumulated in aquatic organisms, resulting in high body concentrations

Development of a sensoring device for environmental estrogens in wastewater
27
so that effects on the estrogen receptors can be expected with environmentally relevant
concentrations (0,3 - 15 µg/L) (Stahlschmidt-Allner, et al. 1997).
In the U.S. Geological Survey, mentioned previously in Bisphenol A section, 139 water
samples were tested during the years of 1999 and 2000 and the median concentration of
this compound found in water was 0,8 µg/L (Kolpin, et al. 2002). As said before, the
median concentration of Bisphenol A was 0,1 µg/L which means that Nonylphenol is
quite persistent in the environment and less degraded when compared to Bisphenol A.
Concentrations of 0,8 mg/kg/d resulted in a reduction of rat testis, epididymis, seminal
vesicle and prostate weight and at 8 mg/kg/d one noticed a reduced anogenital distance,
poor differentiation of seminiferous tubules, sperm count, motility and reduced fertility
(World Health Organization 2002), (O’Connor 2003). In female rats, a dietary exposure
of 200, 650 and 2000 ppm to Nonylphenol led to an acceleration of puberty, alterations
in the estrous cycle, lowered fertility and lowered ovary weight (O’Connor 2003).
2.4.3 17β-Estradiol
17β-Estradiol (CAS No. 50-28-2), figure 20, represents the major estrogen in humans
and it is a reproductive hormone. It is the predominant sex hormone present in females
and it represents the major estrogen in humans. This hormone is very important either
for the reproductive and sexual function but also to some other organs, including bones.
Figure 20 - Molecular structure of 17β-Estradiol (Gabet, et al. 2007)
The presence of this compound has been detected in the environment and it is believed
that animal agriculture may be the main source. It is also believed that 17β-Estradiol is
widespread into the soil (Schuh, et al. 2010).
A study with male rats showed that at a concentration of 10 and 50 mg/kg/d, 17β-
Estradiol caused a reduction of testis and epididymides weight, testis and epididymides
atrophy, seminiferous tubule degeneration, reduced sperm numbers and motility (World
Health Organization 2002).

Development of a sensoring device for environmental estrogens in wastewater
28
According to the U.S. Geological Survey it was estimated a median concentration of
0,16 µg/L for this compound during the years 1999 and 2000 (Kolpin, et al. 2002).
17β-Estradiol is not expected to show long-term persistence in the aquatic environment.
It is predicted a half life of 5 days for this compound (Bowman, Readman and Zhou
2003).

Development of a sensoring device for environmental estrogens in wastewater
29
3. MATERIALS AND METHODS
Along this chapter it is possible to read about the materials used to carry out the
experiments and the methods performed.
3.1 Chemicals
3.1.1 Testing the modified yeast cells
Dimethylsulfoxide (DMSO) was purchased from Merck (Darmstadt, Germany). For
yeast media preparation, yeast nitrogen base without amino acids was obtained from
Difco (Franklin Lakes, NJ), CSM-TRP-URA was purchased from MoBiTec (Göttingen,
Germany) and the glucose was obtained from Sigma Aldrich (St. Louis, MO).
The FluoSpheres polystyrene yellow-green microspheres, 10 µm, were purchased from
Invitrogen (Darmstadt, Germany). Alginic acid sodium salt (medium viscosity A2033),
17β-Estradiol, 4-Nonylphenol and Bisphenol A were obtained from Sigma Aldrich (St.
Louis, MO).
Stock solutions of Bisphenol A (4,51 x 10⁻¹ M), 17β-Estradiol (4,51 x 10⁻⁴ M) and 4-
Nonylphenol (4,51 x 10⁻¹ M) were prepared in DMSO before each experiment and were
filtered through a 0,20 µm filter (Sartorius stedim, Aubagne, France). For testing, serial
dilutions of the substances were made with sterile water.
Copper sulfate (CuSO4) was added in every well with a final concentration of 10 µM in
order to induce the expression of estrogen receptor α.
3.1.2 Using FluoSpheres beads for testing the electronic device
As said previously one used the FluoSpheres for testing the electronic device since it
was not possible to bring the modified yeast cells from Germany due to legal issues.
Sol-gel M149B, for the immobilization, was kindly provided by GMBU e.V. (Dresden,
Germany) and the slides pretreated with Fixacol, provided by Mandy Koitsch (GMBU
e.V., Dresden, Germany).
The sodium chloride was purchased from José Vaz Pereira, S.A (Benavente, Portugal).
The sodium hydroxide was obtained from Vencilab (Sermonde, Portugal) and the
calcium chloride came from Panreac (Barcelona, Spain).
Development of a sensoring device for environmental estrogens in wastewater
30
3.2 Detection of expressed GFP from the genetically modified Saccharomyces
cerevisiae
Recombinant Saccharomyces cerevisiae was kindly provided by Prof. Jungbauer/Dr.
Svjetlana Medjakovic (University of Natural Resources and Life Sciences, Vienna).
Herein an expression plasmid YEpE12 expressing the estrogen receptor α and a reporter
plasmid YRpE2-GFP were introduced into yeast cells (Saccharomyces cerevisiae, strain
188 R1) responding to estrogen-like acting molecules (Beck, Pfitscher and Jungbauer
2005).
The yeast was stored on selective agar plates at 4 °C. The agar plates were prepared by
mixing agar-agar 10 g/L, Yeast Nitrogen Base without amino acids 6,7 g/L, CSM - TRP
- URA 0,72 g/L and glucose 20 g/L.
Saccharomyces cerevisiae was grown at 30 ºC overnight with constant shaking in Yeast
Extract Nitrogen Base without amino acids 6,7 g/L, Complete Supplement Mixture
(CSM) without tryptophane and uracil 0,72 g/L and glucose 20 g/L. Before each
microplate test a new overnight yeast culture was used. Optical Density (OD) was
measured at 600 nm with a Cary 100Bio UV-Visible, Varian and the OD600 of the
culture was adjusted to 0,4 by diluting the yeast samples.
For the coating experiment, the yeast was washed: 1 mL of an overnight culture with an
OD600 = 3,2 was transferred to a microcentrifuge tube and centrifuged for 5 minutes at 5
000 rpm. The supernatant was discarded and the cells were resuspended in 1 mL of
0,9 % NaCl to be added to the coating solutions.
For the microplate test 200 µL of yeast suspension (OD600 = 0,4), 5 µl of the test
chemicals and 20,5 µL of CuSO4 solution were pipetted in each well of a sterile 96-well
black microplate with transparent bottom (BRANDplates, Wertheim, Germany) in four
replicates. With a FLUOstar Optima scanner (BMG Labtech, Offenburg, Germany)
fluorescent samples were measured at 485 nm excitation wavelength and at 520 nm for
emission wavelength at the same analysis. The optical density was determined at 595
nm.
3.3 Immobilization
An efficient immobilization of the cells in a sensor device is one important parameter in
the development of whole-cell biosensors. The immobilization technique should

Development of a sensoring device for environmental estrogens in wastewater
31
maintain the cells’ viability by immobilize the cells on matrices that show nontoxicity
and allow access of nutrients and analytes (Daunert, et al. 2000).
There are various immobilization techniques used in yeast biosensors (see
'Immobilization techniques' on section 3.2). The used one was the entrapment in
alginate gel covered with silica using the sol-gel process.
Biopolymers such as alginate are permeable and non-toxic however they have poor
mechanical stability and therefore one uses the silica sol-gel entrapment. Due to the
porous nature of the sol-gel network, entrapped species remain accessible and can
interact with analytes.
Two forms of immobilization of the yeast cells and the FluoSpheres beads were used:
dip coating and immobilization using the laboratory robotics Nano Plotter (GeSiM mbH,
Grosserkmannsdorf, Germany).
3.3.1 Dip coating
This kind of immobilization was used to entrap yeast and FluoSpheres beads. 26 x 76
mm Slides were pretreated with Fixacol, kindly provided by Mandy Koitsch (GMBU
e.V., Dresden, Germany).
For the FluoSpheres beads, two solutions were prepared in order to test different
concentrations:
0,5 mL of FluoSpheres beads (3,6 x 10⁶ beads/mL) in 15 mL 2 % (w/v) alginate,
with a final concentration of 1,2 x 10⁵ beads/mL;
4 mL of FluoSpheres beads (3,6 x 10⁶ beads/mL) in 30 mL 2 % (w/v) alginate,
with a final concentration of 4,8 x 10⁵ beads/mL.
The yeast cells' dip coating slides and 1,2 x 10⁵ beads/mL FluoSpheres' dip coating
slides were done by using a device of constant drawing velocity ('Dipomat' provided by
Rocco Liebschner). The 4,8 x 10⁵ beads/mL FluoSpheres' dip coating slides were done
manually, by using tweezers and dip the slide into a recipient with the solution.
Then the slides were treated in a Petri dish for 20 minutes with CaCl2 0,2 M and 5 % of
the polycation DP62779 (DuPont), except for the 4,8 x 10⁵ beads/mL FluoSpheres' dip
coating slides which one did not add the polycation DP62779. This step was performed
in order to harden the alginate (crosslinking). After the 20 minutes the slides were
rinsed with distilled water. Finally one dip coated all the slides with a sol-gel M149B,

Development of a sensoring device for environmental estrogens in wastewater
32
kindly provided by GMBU e.V. (Dresden, Germany), assuring that the pH was near 6
(adjusting it with 0,1 mol/L NaOH). After drying for 5 minutes the slides were stored in
a Petri dish filled with 0,9 % NaCl solution (+ 0,05 mol/L CaCl2) at 4 ºC, see the dip
coating scheme on figure 21.
Figure 21 - Dip coating scheme to dip coat with yeast and FluoSpheres
3.3.2 Nanoplotting
A concentrated yeast suspension was added in different concentrations to 15 mL of
alginate solution 2 % (w/v). For the FluoSpheres beads, 15 mL of 2 % (w/v) alginate
was mixed with 0,5 mL of FluoSpheres beads (3 x 10⁶ beads/mL), in a final
concentration of 1,2 x 10⁵ beads/mL.
Two different layouts were nanoplotted, see figure 22.
Figure 22 - Different layouts of nanoplotting 5 x 5 in a 26 x 76 mm slide. Each spot on the left slide
(separated spots) has 17 nL of the solution and the spots on the right slide (dots together) have 85
nL of solution
The previous mixtures, the yeast cells or the FluoSpheres beads were nanoplotted with
the device 'Delo Dot', see figure 23. This equipment is a microdispensing valve driven
by two parallel piezo actuators (DELO 2010).

Development of a sensoring device for environmental estrogens in wastewater
33
To prevent the biological samples from drying, the humidity inside the Nanoplotter was
adjusted to 95 %. Immediately after plotting a sterile mixture of CaCl2 and 5 % of the
Polycation DP62779 was overlayed in order to harden the spots for 20 minutes. Then it
was rinsed with distilled water and dip coated in a M149B sol-gel in a pH of 6. The
slides were dried in contact with air and stored in a solution of 0,9 % NaCl with 0,05
mol/L CaCl2 at 4 ºC.
Figure 23 - Nano Plotter 2.1. Image on the right is a sub-microliter piezoelectric pipette (GeSiM
n.d.)
3.4 Activation process of the yeast cells
These experiments were conducted in the Institute of Genetics, TUD (Director: Prof.
Gerhard Rödel).
One chose to test 17β-Estradiol, a natural estrogen, and Bisphenol A and 4-Nonylphenol,
both xenoestrogens.
In order to test the influence of these compounds on the dip coated and nanoplotted
yeast cells, the medium in which the cells were stored, a mixture of NaCl and CaCl2
was changed against growing medium Dropout Base. After incubation during four
hours at 30 ºC Bisphenol A 10-5 M, 17β-Estradiol 10-5 M and 4-Nonylphenol 10-6 M
were added to the different dip coated slides. The inspection on microscope was done
by the All-in-One Fluorescence Microscope (BZ 8100) Keyene, kindly provided by the
Institute of Genetics, TUD.
As a negative control one inspected the slides without the addition of the compounds.

Development of a sensoring device for environmental estrogens in wastewater
34
3.5 Experimental conditions while testing the FluoSpheres beads with the
sensor
Since contaminants may interfere with the fluorescence measurements it is very
important to control the experiment when preparing the studied samples (Wehry 1997).
Sterile needles were used to withdraw samples avoiding potential bacterial
contamination which have same autofluorescence and may disturb the results. Besides,
the beads were preserved in the flask by addition of thimerosal to prevent bacterial
contamination.
Also, care must be taken with convection currents because dust, fibers and suspended
particulates may float in and out the sampling area and cause false signals due to light
scattering (University of Washington 1999). For this reason it is important to keep the
doors and windows closed during the readings.
Additionally, the oils secreted by the skin are fluorescent, for this reason one used
gloves when handling the samples in order to diminish the contamination (University of
Washington 1999).
The FluoSpheres beads are microspheres filled up with yellow-green fluorescent dyes
(Fluorescein) that are very stable. Only less than 1 % of the fluorescent signal is lost in
six months. If the recommended storage conditions are maintained the FluoSpheres
beads are stable at least one year (University of Washington 1999). The ones one used
were bought 7 months before these experiments.
Sunlight exposure has been proven to degrade the dye in less than one week (University
of Washington 1999), (Lichtman and Conchello 2005). For this reason the flask and the
slides containing the fluorescent FluoSpheres beads were stored in the dark when not in
use in order to avoid sample's photobleaching.
Temperature is another issue since high temperatures may cause softening of the beads
and lead to the fluorescence degradation (University of Washington 1999). This way,
one kept the FluoSpheres beads and the slides in the refrigerator at 4ºC.
Measure of the control is important since it allows to monitor methodological noise.
Moreover, a change in its intensities may be a signal that the light source is starting to
fail or the settings are not properly set (University of Washington 1999). Therefore one
prepared a blank slide as the other testing slides, according to figure 22 ('Dip coating
scheme to dip coating with yeast and FluoSpheres' section 3.5.1 Dip coating). The dip
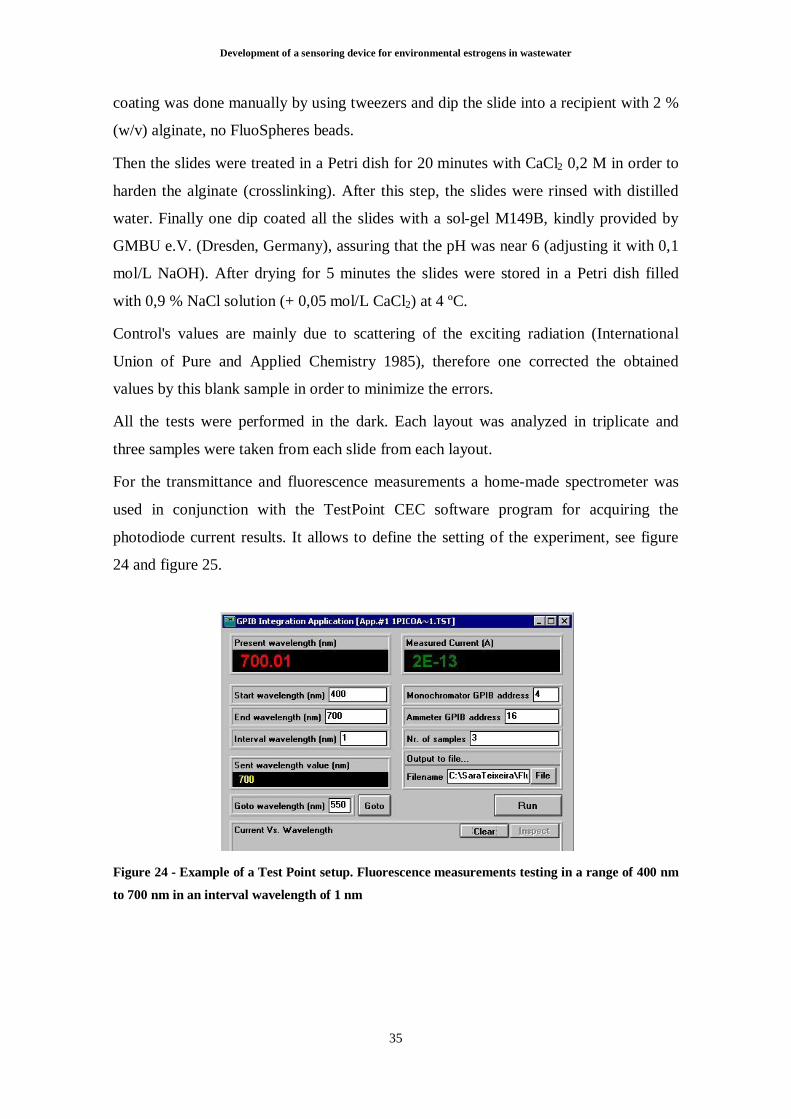
Development of a sensoring device for environmental estrogens in wastewater
35
coating was done manually by using tweezers and dip the slide into a recipient with 2 %
(w/v) alginate, no FluoSpheres beads.
Then the slides were treated in a Petri dish for 20 minutes with CaCl2 0,2 M in order to
harden the alginate (crosslinking). After this step, the slides were rinsed with distilled
water. Finally one dip coated all the slides with a sol-gel M149B, kindly provided by
GMBU e.V. (Dresden, Germany), assuring that the pH was near 6 (adjusting it with 0,1
mol/L NaOH). After drying for 5 minutes the slides were stored in a Petri dish filled
with 0,9 % NaCl solution (+ 0,05 mol/L CaCl2) at 4 ºC.
Control's values are mainly due to scattering of the exciting radiation (International
Union of Pure and Applied Chemistry 1985), therefore one corrected the obtained
values by this blank sample in order to minimize the errors.
All the tests were performed in the dark. Each layout was analyzed in triplicate and
three samples were taken from each slide from each layout.
For the transmittance and fluorescence measurements a home-made spectrometer was
used in conjunction with the TestPoint CEC software program for acquiring the
photodiode current results. It allows to define the setting of the experiment, see figure
24 and figure 25.
Figure 24 - Example of a Test Point setup. Fluorescence measurements testing in a range of 400 nm
to 700 nm in an interval wavelength of 1 nm

Development of a sensoring device for environmental estrogens in wastewater
36
Figure 25 - Home-made spectrophotometer
Firstly one wanted to study the transmittance so one defined the software to do the
measurements in a range of 400 - 700 nm, in a 1 nm interval wavelength and 3 samples
of each measurement, so one could see if there were differences between the different
layouts: dip coated slides, 'separated spots' slides or 'dots together' slides.
Secondly, one illuminated the samples at 400 - 700 nm in order to visualize the
fluorescent behaviour of the FluoSpheres beads, in a 1 nm interval wavelength and 3
samples of each measurement. Literature says that 505 nm is the wavelength at which
the proportion of excited molecules is maximal. This means, that 505 nm is the
wavelength that excites more fluorophores than any other wavelength of light. Light
with a wavelength near the excitation maximum also cause excitation, however it does
less efficiently.
For samples adsorbed on solid surfaces it is recommended to proceed to the
fluorescence measurements on a front-surface geometry, this way the fluorescence is
measured from the face of the sample on which the exciting beam impinge (Wehry
1997). This geometry issue is important since the fluorescence is affected by the
directions of the exciting and emitting radiation comparatively to the sample. Thus the
incident angle of the exciting beam should be inferior to 90º while the direction of the
incident angle of the exciting beam and observation direction should be inferior to 180º,
see figure 26 (International Union of Pure and Applied Chemistry 1985).

Development of a sensoring device for environmental estrogens in wastewater
37
Figure 26 - Optical fiber cable and sensor in a front-surface geometry to procedure to fluorescence
in a macrodevice testing (the blue box is the sensor)
Optical filters are sometimes desirable to use in addition to monochromators in order to
compensate the less-than-desirable performance of monochromators, or even for
replacing monochromators towards an integrated solution (Lakowicz 2006).
In this experiment one used the FEL0550 filter from Thorlab (Newton, N.J., USA),
which is a 550 nm cut-on longpass filter, see figure 27.
Figure 27 - Fluorescence measurements using a 550 nm filter (the round object), macrodevice
One tested experimentally the slides containing the FluoSpheres beads in a macrodevice,
see figures 26 and 27, however in a integrated process (in a microdevice) the optical
filter would be deposited by sputtering on top of the photodiode, see figure 28.

Development of a sensoring device for environmental estrogens in wastewater
38
Figure 28 - Transmittance measurements using a 550 nm filter, microdevice (Ferreira, et al. 2011)
This filter blocks out the emission light lower than 550 nm in order to reduce
background noise, transmitting everything else, see figure 29.
Figure 29 - Measurements using a filter of 550 nm
FluoSpheres beads absorb a range of wavelengths, see figure 29 (blue line), and emit a
range of wavelength (red line).
Like the excitation, fluorescence emission behaves in a similar way. It is more likely to
occur at a particular wavelength. This wavelength is the emission maximum for the
fluorophore, in the case of FluoSpheres beads it is at 515 nm. At wavelengths near the
emission maximum, the excited fluorophore can also emit light although the light will
be less intense.

Development of a sensoring device for environmental estrogens in wastewater
39
At wavelengths longer than 550 nm (the emission peak), fluorophore's molecules still
fluoresce but in smaller proportions.
The Stoke's shift is a parameter to be considered when choosing which filters to be used.
Since the Stoke's shift is the difference between the excitation's peak wavelength and
the emission's peak wavelength, a small Stoke's shift will limit the use of a filter.
FluoSpheres beads show a small Stoke's shift as a result it is difficult to find a filter
without causing overlap between the excitation and emission curves. Neither the entire
excitation spectrum can be used to excite the FluoSpheres nor can all the emitted light
be collected.
One used the L-Edit (Tanner EDA Software) program version 8.22 to project the n+/p-
epilayer photodiode, see figure 30.
Figure 30 - Photodiode L-Edit image. a) A zoom in showing the contacts part of the b) all
photodiode image
a)
b)

Development of a sensoring device for environmental estrogens in wastewater
40
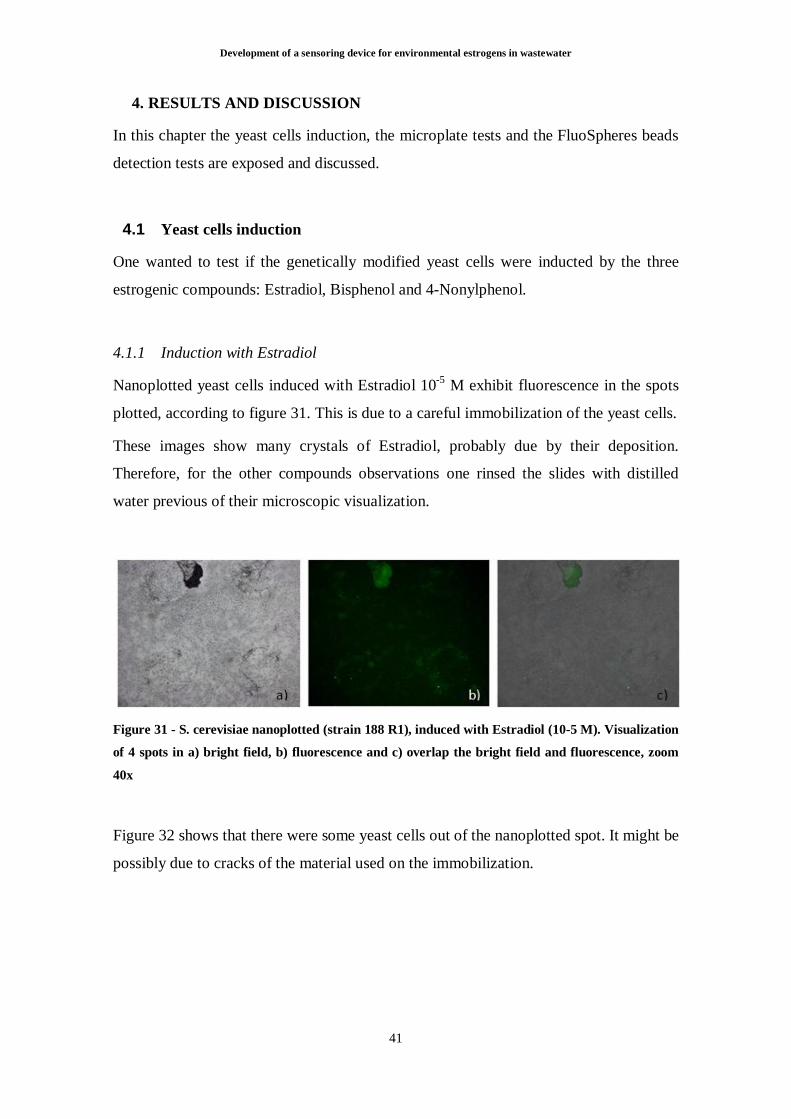
Development of a sensoring device for environmental estrogens in wastewater
41
4. RESULTS AND DISCUSSION
In this chapter the yeast cells induction, the microplate tests and the FluoSpheres beads
detection tests are exposed and discussed.
4.1 Yeast cells induction
One wanted to test if the genetically modified yeast cells were inducted by the three
estrogenic compounds: Estradiol, Bisphenol and 4-Nonylphenol.
4.1.1 Induction with Estradiol
Nanoplotted yeast cells induced with Estradiol 10-5 M exhibit fluorescence in the spots
plotted, according to figure 31. This is due to a careful immobilization of the yeast cells.
These images show many crystals of Estradiol, probably due by their deposition.
Therefore, for the other compounds observations one rinsed the slides with distilled
water previous of their microscopic visualization.
Figure 31 - S. cerevisiae nanoplotted (strain 188 R1), induced with Estradiol (10-5 M). Visualization
of 4 spots in a) bright field, b) fluorescence and c) overlap the bright field and fluorescence, zoom
40x
Figure 32 shows that there were some yeast cells out of the nanoplotted spot. It might be
possibly due to cracks of the material used on the immobilization.
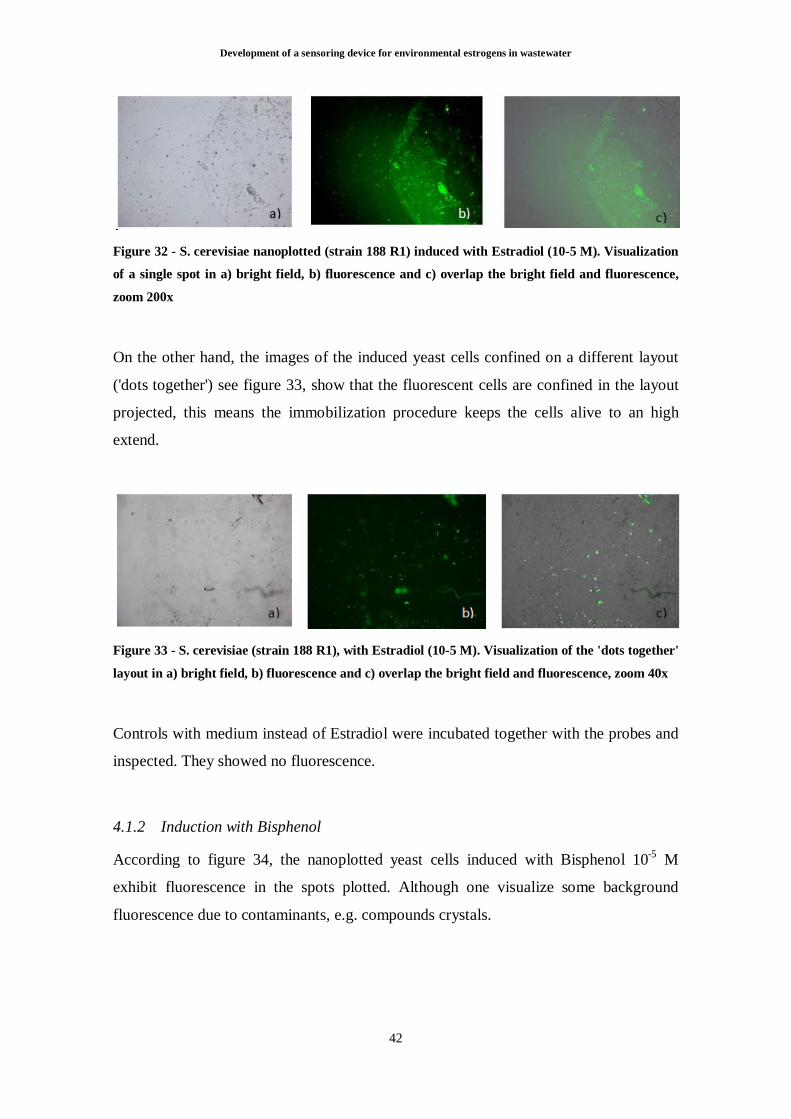
Development of a sensoring device for environmental estrogens in wastewater
42
Figure 32 - S. cerevisiae nanoplotted (strain 188 R1) induced with Estradiol (10-5 M). Visualization
of a single spot in a) bright field, b) fluorescence and c) overlap the bright field and fluorescence,
zoom 200x
On the other hand, the images of the induced yeast cells confined on a different layout
('dots together') see figure 33, show that the fluorescent cells are confined in the layout
projected, this means the immobilization procedure keeps the cells alive to an high
extend.
Figure 33 - S. cerevisiae (strain 188 R1), with Estradiol (10-5 M). Visualization of the 'dots together'
layout in a) bright field, b) fluorescence and c) overlap the bright field and fluorescence, zoom 40x
Controls with medium instead of Estradiol were incubated together with the probes and
inspected. They showed no fluorescence.
4.1.2 Induction with Bisphenol
According to figure 34, the nanoplotted yeast cells induced with Bisphenol 10-5 M
exhibit fluorescence in the spots plotted. Although one visualize some background
fluorescence due to contaminants, e.g. compounds crystals.

Development of a sensoring device for environmental estrogens in wastewater
43
Figure 34 - S. cerevisiae nanoplotted, induced with Bisphenol (10-5 M). Visualization of 4 spots in a)
bright field, b) fluorescence and c) overlap the bright field and fluorescence, zoom 40x
Figure 35 represents a visualization of a single spot and one can observe that the yeast
cells are confined at the plotted spot. The images of the induced yeast cells with
Bisphenol 10-5 M show that the fluorescent cells are immobilized although there are
some fluorescence between the spots, however this might be due to some residual noise
or same yeast washed out, however, if the yeast cells were washed out, it means the
covering sol-gel has broader cracks than intended.
It might be said that the washing of the slides with distilled water washed the crystals of
Bisphenol A away.
Figure 35 - S. cerevisiae nanoplotted, induced with Bisphenol (10-5 M). Visualization of a single spot
in a) bright field, b) fluorescence, zoom 200x
On figure 36, the induced yeast cells are confined on the projected layout therefore the
immobilization in this layout was successful.

Development of a sensoring device for environmental estrogens in wastewater
44
Figure 36 - S. cerevisiae nanoplotted in a different layout, 'dots together', induced with Bisphenol
(10-5 M). Visualization in a) bright field, b) fluorescence, zoom 40x
Controls with medium instead of Bisphenol were incubated together with the probes
and inspected. They showed no fluorescence.
4.1.3 Induction with 4-Nonylphenol
After visualization on microscope, one might see the 4-Nonylphenol crystals deposited
on the slide were washed out providing a better visualization of the nanoplotted dots,
since it reduces the background fluorescence and the fluorescent cells are confined at
the nanoplotted spots, this indicates that there was a good immobilization and that 4-
Nonylphenol induces fluorescence on the yeast cells, see figures 37 and 38.
Figure 37 - S. cerevisiae nanoplotted, in a 'separated spots' layout, induced with 4-Nonylphenol (10-6
M). Visualization in a) bright field, b) fluorescence and c) overlap the bright field and fluorescence,
zoom 40x

Development of a sensoring device for environmental estrogens in wastewater
45
Figure 38 - S. cerevisiae nanoplotted, induced with 4-Nonylphenol (10-6 M). Visualization of a single
spot in fluorescence field, zoom 200x
Controls with medium instead of 4-Nonylphenol were incubated together with the
probes and inspected. No fluorescence was observed.
The immobilization in a 'dots together' layout was not possible to visualize on
microscope because the slides were compromised, i.e., they had cracks, therefore the
spots vanished.
Of all compounds, 4-Nonylphenol is the one with lowest induction to the yeast cells.
However, according to this experiment, the three compounds have estrogenic activity
and therefore induced the estrogenic receptor of the yeast cells, expressing it by
fluorescence.
4.2 Microplate test
In this experiment, a microplate test was performed, testing the yeast cells entrapped in
alginate and suspended in medium.
This test was performed in order to compare the induction of the cells in different
matrices to the three testing compounds. One tested the induction of the cells entrapped
in alginate beads and dispersive in medium, see scheme in figure 39.
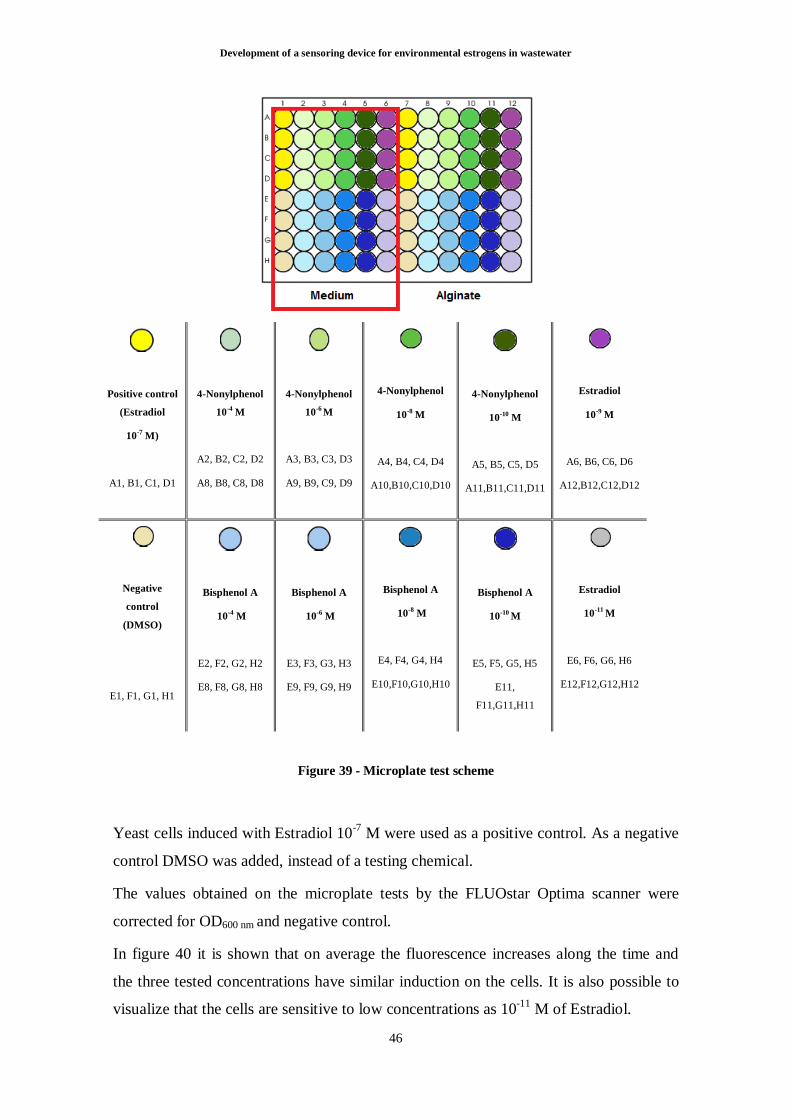
Development of a sensoring device for environmental estrogens in wastewater
46
Positive control
(Estradiol
10-7 M)
A1, B1, C1, D1
4-Nonylphenol
10-4 M
A2, B2, C2, D2
A8, B8, C8, D8
4-Nonylphenol
10-6 M
A3, B3, C3, D3
A9, B9, C9, D9
4-Nonylphenol
10-8 M
A4, B4, C4, D4
A10,B10,C10,D10
4-Nonylphenol
10-10 M
A5, B5, C5, D5
A11,B11,C11,D11
Estradiol
10-9 M
A6, B6, C6, D6
A12,B12,C12,D12
Negative
control
(DMSO)
E1, F1, G1, H1
Bisphenol A
10-4 M
E2, F2, G2, H2
E8, F8, G8, H8
Bisphenol A
10-6 M
E3, F3, G3, H3
E9, F9, G9, H9
Bisphenol A
10-8 M
E4, F4, G4, H4
E10,F10,G10,H10
Bisphenol A
10-10 M
E5, F5, G5, H5
E11,
F11,G11,H11
Estradiol
10-11 M
E6, F6, G6, H6
E12,F12,G12,H12
Figure 39 - Microplate test scheme
Yeast cells induced with Estradiol 10-7 M were used as a positive control. As a negative
control DMSO was added, instead of a testing chemical.
The values obtained on the microplate tests by the FLUOstar Optima scanner were
corrected for OD600 nm and negative control.
In figure 40 it is shown that on average the fluorescence increases along the time and
the three tested concentrations have similar induction on the cells. It is also possible to
visualize that the cells are sensitive to low concentrations as 10-11 M of Estradiol.

Development of a sensoring device for environmental estrogens in wastewater
47
In alginate, the cells exposed to Estradiol 10-9 M presents higher fluorescent values,
despite what was expected. It was expected that the higher concentration (10-7 M, the
positive control) had the highest curve. Since for the next testing chemicals, the positive
control curve in alginate is the same as in this graph one might say that either it was an
error with the Estradiol 10-9 M experiment or that the cells are slightly more active in
the presence of this concentration.
Figure 40 - Induction of the cells with Estradiol. On the left side the cells are suspended in medium,
on the right side the cells are entrapped in alginate
For both medium and alginate the fluorescence values are quite similar, around 1 arb.
unit., when yeast cells are exposed to 4-Nonylphenol, see figure 41.
On average the induction is reasonably lower than the induction with Estradiol and it
remains constant with time.
These lower fluorescence values were expected since the microscope visualization of
the nanoplotted cells has demonstrated that the cells exposed to this compound showed
lower induction as well.
In alginate it is shown that Nonylphenol 10-4 M has a slightly higher curve compared to
the other concentrations which suggests the cells are more sensitive to this
concentration than to lower ones.
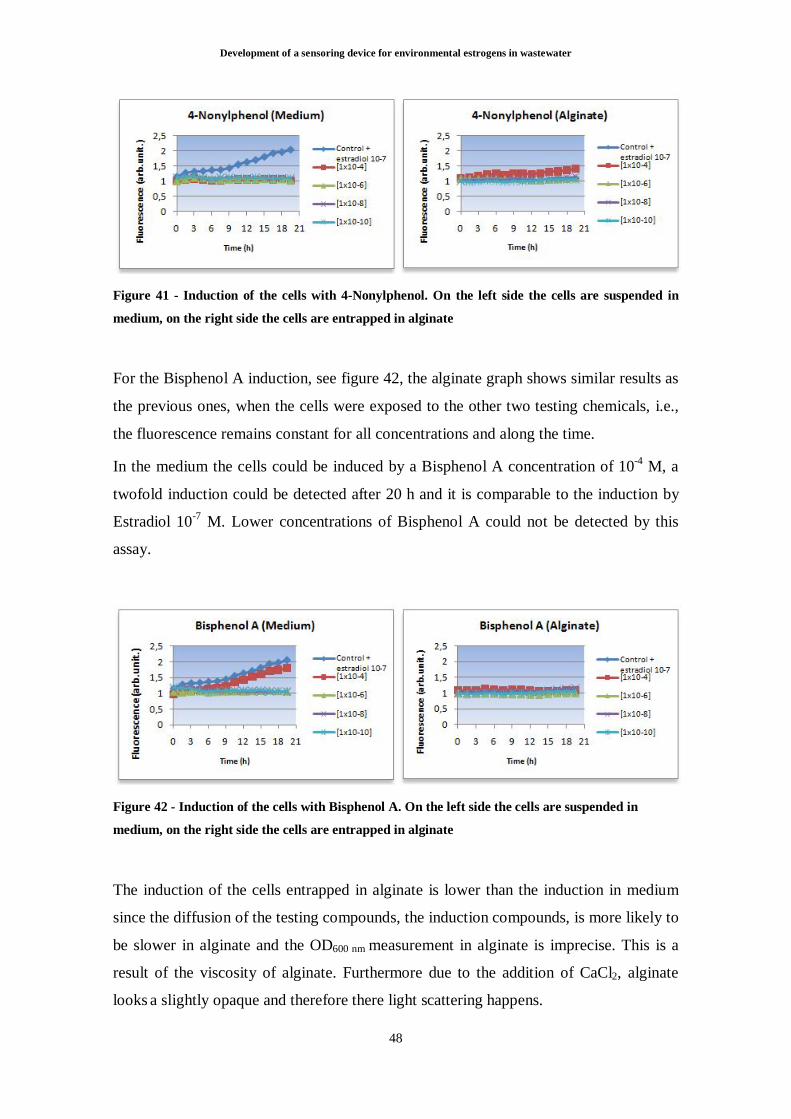
Development of a sensoring device for environmental estrogens in wastewater
48
Figure 41 - Induction of the cells with 4-Nonylphenol. On the left side the cells are suspended in
medium, on the right side the cells are entrapped in alginate
For the Bisphenol A induction, see figure 42, the alginate graph shows similar results as
the previous ones, when the cells were exposed to the other two testing chemicals, i.e.,
the fluorescence remains constant for all concentrations and along the time.
In the medium the cells could be induced by a Bisphenol A concentration of 10-4 M, a
twofold induction could be detected after 20 h and it is comparable to the induction by
Estradiol 10-7 M. Lower concentrations of Bisphenol A could not be detected by this
assay.
Figure 42 - Induction of the cells with Bisphenol A. On the left side the cells are suspended in
medium, on the right side the cells are entrapped in alginate
The induction of the cells entrapped in alginate is lower than the induction in medium
since the diffusion of the testing compounds, the induction compounds, is more likely to
be slower in alginate and the OD600 nm measurement in alginate is imprecise. This is a
result of the viscosity of alginate. Furthermore due to the addition of CaCl2, alginate
looks a slightly opaque and therefore there light scattering happens.

Development of a sensoring device for environmental estrogens in wastewater
49
4.3 FluoSpheres Beads
The aim of the second part of this thesis consists on the development of a
microelectronic device to measure the GFP fluorescence signal, therefore, for testing the
microelectronic device, FluoroSpheres beads were immobilized once they are easier to
manipulate than the yeast cells.
The distribution of the FluoSpheres beads in alginate, see figure 43, is homogeneous as
it is in suspension solution, see figure 44. According to the figure 43 a homogenous
immobilization is visible which is of great importance to build a sensor for green
fluorescence.
Figure 43 - Dip coated FluoSpheres beads, zoom 200x. The scalebar corresponds to 30 µm
Figure 44 - FluoSpheres beads in suspension solution, 200x
Figure 45 represents 'dots together' layout nanoplotted with FluoSpheres beads. And on
the right a visualization of a single spot is given. One may say that on the two left
images the FluoSheperes beads are confined in the projected layout.

Development of a sensoring device for environmental estrogens in wastewater
50
Figure 45 - Nanoplotted FluoSpheres beads. Bright field (upper) and fluorescence (lower). Images
on the left represent the layout 'dots together' (zoom 40x), the image on the right represents one
single spot (zoom 200x). In the left lower image the FluoSpheres are the little dots, big dots might be
some waste or noise.
4.3.1 Macro Sensor readings of the FluoSpheres beads
For testing the electronic device, FluoSpheres beads were immobilized in slides and
tested by using a macrodevice, see figures 26 and 27 ('Optical fiber cable and sensor in
a front-surface geometry to procedure the fluorescence in a macrodevice testing (the
blue box is the sensor)' and 'Fluorescence measurements using a 550 nm filter,
macrodevice' from section 5.5 Experimental conditions while testing the FluoSpheres
beads with the sensor).
One performed a test with a new unused slide and compared it to the blank, see figure
46. The transmittance values of the new unused slide are higher than the values obtained
by the blank which was expected since the blank has the crosslinked alginate layer that
scatters the light.
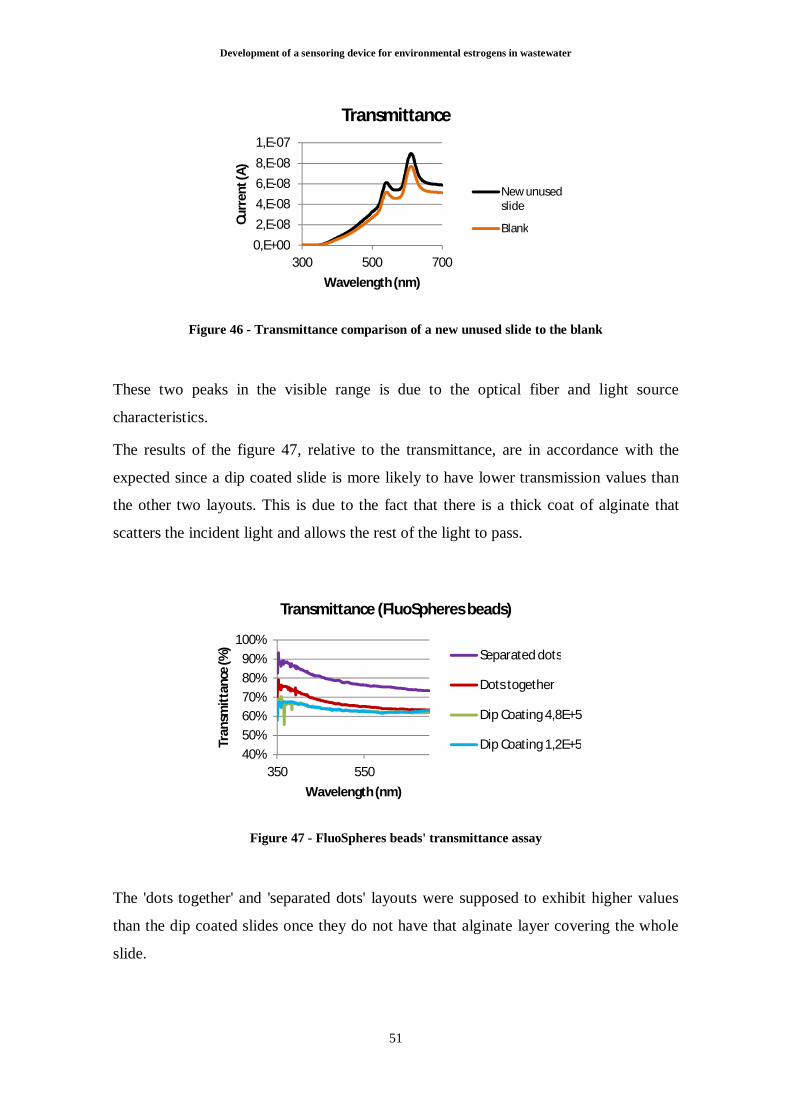
Development of a sensoring device for environmental estrogens in wastewater
51
Figure 46 - Transmittance comparison of a new unused slide to the blank
These two peaks in the visible range is due to the optical fiber and light source
characteristics.
The results of the figure 47, relative to the transmittance, are in accordance with the
expected since a dip coated slide is more likely to have lower transmission values than
the other two layouts. This is due to the fact that there is a thick coat of alginate that
scatters the incident light and allows the rest of the light to pass.
Figure 47 - FluoSpheres beads' transmittance assay
The 'dots together' and 'separated dots' layouts were supposed to exhibit higher values
than the dip coated slides once they do not have that alginate layer covering the whole
slide.
0,E+002,E-084,E-086,E-088,E-081,E-07
300 500 700
Curr
ent (
A)
Wavelength (nm)
Transmittance
New unused slide
Blank
40%50%60%70%80%90%
100%
350 550
Tran
smitt
ance
(%)
Wavelength (nm)
Transmittance (FluoSpheres beads)
Separated dots
Dots together
Dip Coating 4,8E+5
Dip Coating 1,2E+5

Development of a sensoring device for environmental estrogens in wastewater
52
The 'separated dots' layout exhibits larger spaces between the dots in comparison to the
'dots together' layout, which means that the light passes through the dots and for that
reason presents higher transmittance values.
The 'dots together' layout shows transmittance's values near the dip coating slides
because its spaces between the dots are small which means that nearly the whole area of
these layout is covered with alginate and FluoSpheres, decreasing the transmitted light.
The dip coated slides with different concentrations show similar values since which
differs is the FluoSpheres' concentration.
The values from the previous two graphs, see figure 48 and figure 49, are normalized
values in relation to 'dots together' measurements from the figure 48.
Figure 48 - Fluorescence assay by non-using the 550 nm longpass filter. Normalized values in
relation to 'dots together'
0,6
0,7
0,8
0,9
1
1,1
400 500 600 700
Fluo
resc
ence
(Nor
mal
ized
Val
ues)
Wavelength (nm)
Fluorescence without 550 nm Filter
Dots together
Dip coating 1,2E+5
Separated dots
Dip Coating 4,8E+5

Development of a sensoring device for environmental estrogens in wastewater
53
Figure 49 - Fluorescence assay by using the 550 nm longpass filter. Normalized values in relation to
'dots together' from figure 48
As one may observe by looking at the previous figures, see figure 48 and figure 49, the
fluorescence values are lower in the experiment by using the 550 nm filter.
This 550 nm longpass filter was used to measure the fluorescence since this filter lets
pass light that is longer than a wavelength of 550 nm and rejects all shorter wavelength.
For this reason, only values higher than 550 nm were considered, see figure 29
('Measurements using a filter of 550 nm' from section 4.5 Experimental conditions
while testing the FluoSpheres beads with the sensor).
This 550 nm filter was used as most organic molecules, e.g. contaminants, absorb and
fluoresce in the UV or visible range, from 200 nm to 550 nm, this way the measuring
error caused by contaminants is decreased by procedure to fluorescence measurements
at longer wavelengths, reducing the background fluorescence (Wehry 1997).
This previous paragraph might explain the difference in the fluorescence's values by
using a filter, figure 49, and by non-using the 550 nm filter, see figure 48. This means
that the samples might have impurities and therefore these contaminants might increase
the fluorescence's values, which explains the higher values in figure 48. By using the
550 nm filter one reduces the errors.
According to figure 29 ('Measurements using a longpass filter of 550 nm' from section
4.5 Experimental conditions while testing the FluoSpheres beads with the sensor) the
fluorescence decreases beyond 515 nm, therefore, in the fluorescence measurements
using a 550 nm longpass filter one should see a reducing on the values. By looking at
the figure 49 one may observe a slight decrease on these values, which is in accordance
to the literature.
0,4
0,5
0,6
0,7
0,8
550 600 650 700
Fluo
resc
ence
(Nor
mal
ized
Val
ues)
Wavelength (nm)
Fluorescence (Filter 550 nm)
Dots together
Separated dots
Dip coating 1,2E+5
Dip Coating 4,8E+5

Development of a sensoring device for environmental estrogens in wastewater
54
In both graphs the 'dots together' layout presents high fluorescence values and the dip
coating 4,8 x 10⁵ beads/mL present the lowest values. One possible explanation for the
slides with the highest FluoSphere's concentration present lower fluorescence is that a
high sample's concentration may lead to quenching and background noise increases
faster than the signal (Lichtman and Conchello 2005), (University of Washington 1999).
On graph 48 the intensity signal fluctuations can be due to environmental dust that
scatters the incident light or fluoresce (Lakowicz 2006).
On Figure 50, one may observe the blank signal (no FluoSpheres beads) in comparison
to the different slides with the FluoSpheres. This is the raw data obtained by the
picoammeter with no blank correction. The values used are the arithmetic means. One
may visualize that the filter blocks the signal beneath 550 nm.
Figure 50 - Fluorescence raw data using a longpass 550 nm filter
The dip coated 4,8 x 10⁵ slides show the lowest values of fluorescence even lower than
the blank. This means that something went wrong with these slides. One probable
explanation is related to the fact that a sample's high concentration may lead to
quenching and background noise increases faster than the signal (Lichtman and
Conchello 2005), (University of Washington 1999). Other explanation could be that the
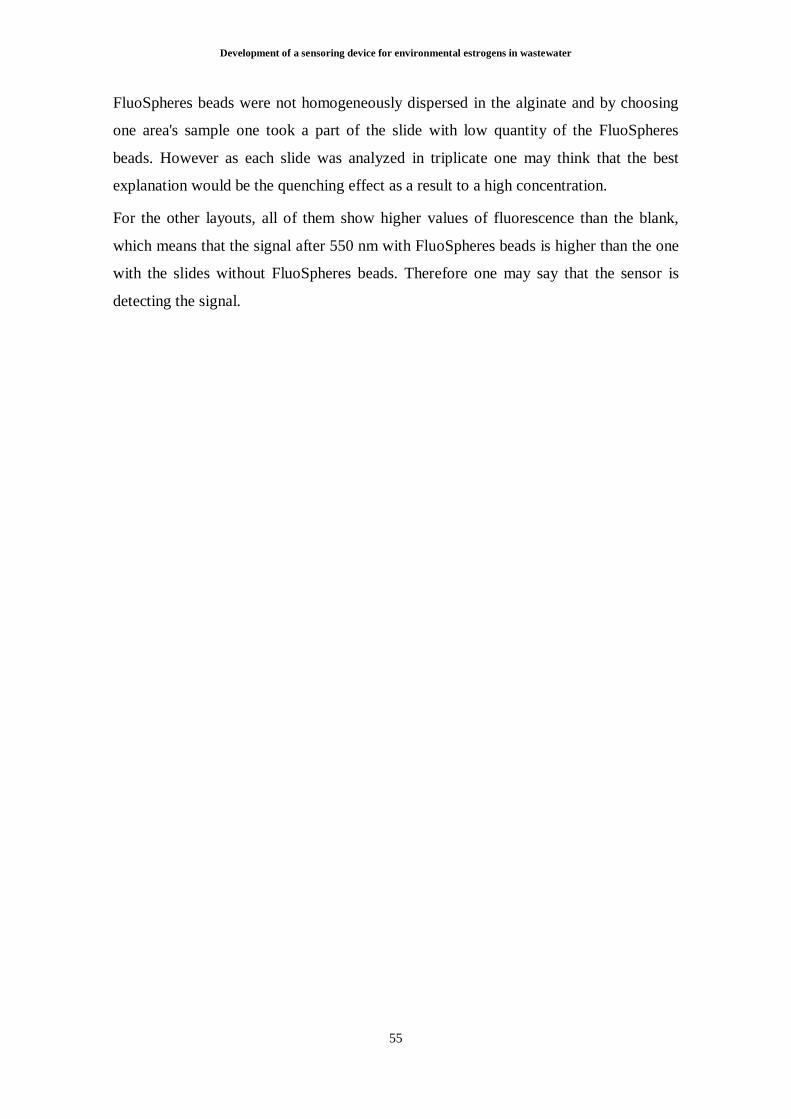
Development of a sensoring device for environmental estrogens in wastewater
55
FluoSpheres beads were not homogeneously dispersed in the alginate and by choosing
one area's sample one took a part of the slide with low quantity of the FluoSpheres
beads. However as each slide was analyzed in triplicate one may think that the best
explanation would be the quenching effect as a result to a high concentration.
For the other layouts, all of them show higher values of fluorescence than the blank,
which means that the signal after 550 nm with FluoSpheres beads is higher than the one
with the slides without FluoSpheres beads. Therefore one may say that the sensor is
detecting the signal.

Development of a sensoring device for environmental estrogens in wastewater
56

Development of a sensoring device for environmental estrogens in wastewater
57
5. CONCLUSIONS AND FURTHER WORK
There is nowadays great concern for the contamination of the environment with
endocrine-disrupting compounds (EDCs), e.g. xenoestrogens, chemicals that may alter
the functions of the endocrine system and cause reproductive disorders. A class of these
endocrine-disrupting chemicals are xenoestrogens since they mimic the actions of the
naturally estrogen hormones produced by the organism.
Environmental monitoring normally involves steps such as sampling, sample handling,
and sample transportation to specialized laboratories. The need of environmental
monitoring in situ requires new devices featuring precision, sensitivity, specificity,
rapidity, and ease of handling to detect concentrations of an array of pollutants (Badihi-
Mossberg, Buchner and Rishpon 2007).
One challenging aspect of biosensor development is their miniaturization and portability.
This technology is valuable for applications such as point-of-care diagnostics,
environmental monitoring in situ, and home testing systems. Since it uses small sample
sizes, sensitivity might represent a limitation for these devices. Nevertheless the higher
sensitivity of cell-based reporter gene systems as compared to more traditional sensing
techniques coupled with the additional information (e.g., bioavailability) and the
selectivity provided by these systems has already indicated their potential for
miniaturization (Daunert, et al. 2000).
Therefore the use of genetically engineered whole-cells containing reporter genes
coupled to biological recognition components allows for the design of rapid, highly
specific, and sensitive biosensing systems (Daunert, et al. 2000).
Sensors based on whole-cells are able to provide information that biological molecules
are unable to (about toxicity and genotoxicity). If the cells are mutated or genetically
modified, whole-cells are able to respond to a range of substrates, and provide broad-
spectrum, yet specific, responses (Baronian 2004).
It is likely that yeasts will prove to be an extensive biosensor resource given the total
number of yeast and the variety of environments they are known to inhabit (Baronian
2004).
Yeast biosensors used to detect a range of specific molecules are reported in the
literature. Most detect common catabolic substrates or discriminate between such
Development of a sensoring device for environmental estrogens in wastewater
58
molecules in a mixture of these substrates, for example ethanol and glucose.
Interference from other substrates can be a problem for whole-cell sensors (Baronian
2004).
Traditional methods for the immobilization of microorganisms include adsorption,
encapsulation, entrapment, covalent binding and cross-linking (Su, et al. 2010).
Recently, some potential immobilization solutions were found, including alginate
attachment onto optic fiber tips, agar immobilization at the bottom of a microtiter plate
wells and encapsulation in sol-gel matrices (Belkin 2003).
One of the most important advantages of solid sensing elements compared to suspended
microorganisms is their compatibility with continuous monitoring schemes (Premkumar,
et al. 2001).
With this experiment one recognizes that Bisphenol A, 4-Nonylphenol and β-Estradiol
are three active estrogenic compounds. Although the three compounds have estrogenic
activity and therefore induced the estrogenic receptor of the yeast cells, expressing it by
fluorescence, 4-Nonylphenol is the one with lowest induction to the yeast cells. One
may also observe that the immobilization of the yeast cells was successful with both
layouts.
According to the microplate experiment, on average, the cells presented higher
fluorescent values when exposed to Estradiol, as it was expected. Cells entrapped in
alginate show lower fluorescent values for Estradiol and Bisphenol A 10-4 M than the
same exposure of the yeast cells in medium.
Again, as expected, 4-Nonylphenol showed the lowest fluorescence values. It was
expected to happen since the microscope visualization of the nanoplotted cells has
demonstrated that the cells exposed to this compound showed lower induction, as well.
The microplate test revealed that the three compounds have estrogenic activity and
therefore induced the estrogenic receptor of the yeast cells, expressing it by
fluorescence.
Endocrine disruptors have been shown to contribute to the incidence of common
diseases of multifactorial etiology (e.g., infertility, cancer, neurobehavioral deficits) and
its mechanism of action is not limited to those agents that interact directly with hormone
receptors. Some have the capability to inhibit hormone synthesis, transport, or
Development of a sensoring device for environmental estrogens in wastewater
59
metabolism and activation of receptor through processors (World Health Organization
2002) and therefore one has to prevent the water consumption with these pollutants.
The neglect of simple actions while preparing the samples to prevent the introduction of
fluorescent contaminants into the sample, e.g., by non-using gloves, by non-cleaning the
glassware, among others, the quantity and type of these interfering species, the
complexity of the sample, the loss of the analyte, e.g., by non storing in the dark are
factors that can lead to cause errors and decrease the accuracy and precision of
fluorescent analyses (Wehry 1997).
Additionally, the interference of the scattering light, the stray light and the presence of
impurities in the sample represent the main sources of errors in optical measurements.
Therefore, these errors can be diminished by controlling the experiments in order to
diminish the impurities in the sample, by the use of optical filters in addition to
monochromators and by appropriate selection of the emission filter (Lakowicz 2006).
In the experiments it was possible to observe that the lowest transmittance was
associated to the dip coated slides due to the thickness of alginate layer in its surface. It
means that it scatters more light than the other layouts.
Since the presence of contaminants in the samples might increase the obtained values,
one may think that the studied samples were slightly contaminated because the
fluorescence values by non-using the 550 nm longpass filter were somewhat higher than
the fluorescence values by using this filter.
Relatively to the fluorescence graphs the 'dots together' layout slides present higher
fluorescence values than the other two layouts. Therefore, this layout should be the most
appropriated layout to use in immobilization.
The dip coating 4,8 x 10⁵ slides present the lowest fluorescence values. One probable
explanation is associated to the fact that a high sample's concentration may lead to
quenching and background noise increases faster than the signal.
One visualizes that the sensor detects the FluoSpheres beads fluorescence. Future work
might include doing measurements by using the genetically modified yeast cells and the
use of the integrated microsensor. Calibration is an important issue if quantitative
analyses are intended. For this reason different known concentrations of the chemicals
tested might be done and procedure to signal measurements. These values are going to
be used for further comparisons with signal obtained from the testing wastewater.

Development of a sensoring device for environmental estrogens in wastewater
60

Development of a sensoring device for environmental estrogens in wastewater
61
BIBLIOGRAPHY
Ahmed, S. "The immune system as a potential target for environmental estrogens (endocrine disrupters): a new emerging field." Toxicology 150 (2000): 191–206.
American Chemistry Council. http://www.bisphenol-a.org/contact/index.html (accessed February 22, 2011).
American Medical Association. http://www.ama-assn.org/ama/pub/physician-resources/patient-education-materials/atlas-of-human-body/endocrine-system.shtml (accessed February 25, 2011).
Badihi-Mossberg, M., V. Buchner, and J. Rishpon. “Electrochemical Biosensors for Pollutants in the Environment.” Electroanalysis 19-20 (2007): 2015 – 2028.
Baker, R. Jacob. CMOS Circuit Design Layout and Simulation. Third Edition. Wiley, 2010.
Baronian, K. "The use of yeast and moulds as sensing elements in biosensors." Biosensors & Electronics 19 (2004): 953-962.
Bartlett, P. Bioelectrochemistry: fundamentals, experimental techniques and applications. Wiley, 2008.
Beck, K. Principles and practice of endocrinology and metabolism. Lippincott Williams & Wilkins, 2001.
Beck, V., A. Pfitscher, and A. Jungbauer. “GFP-reporter for a high throughput assay to monitor estrogenic compounds.” Journal of Biochemical and Biophysical Methods 64 (2005): 19-37.
Belkin, Shimshon. "Microbial whole-cell sensing systems of environmental pollutants." (Current Opinion in Microbiology) 6 (2003): 206-212.
Berthold Technologies. Reporter Gene Assay. 2008. http://www.berthold.com/ww/en/pub/bioanalytik/applikation/reporter_gene.cfm (accessed June 2, 2011).
Boninsegna, S., R. Toso, and R., Carturan, G. Monte. "Alginate Microspheres Loaded with Animal Cells and Coated by a Siliceous Layer." Journal of Sol-Gel Science and Technology 26 (2003): 1151-1157.
Bousse, L. "Whole cell biosensors." Sensors and Actuators (Elsevier) 34 (1996): 270-275.
Bowman, J., J. Readman, and J. Zhou. "Sorption of the natural endocrine disruptors, oestrone and 17β-estradiol in the aquatic environment." Environmental Geochemistry and Health 25 (2003): 63–67.
Callone, E., R. Campostrini, G. Carturan, A. Cavazza, and R. Guzzen. “Immobilization of yeast and bacteria cells in alginate microbeads coated with silica membranes: procedures, physico-chemical features and bioactivity.” Journal of Materials Chemistry, 2008: 4839-4848.
Centers for Disease Control and Prevention . National Report on Human Exposure to Environmental Chemicals. http://www.cdc.gov/exposurereport/data_tables/BisphenolA_ChemicalInformation.html (accessed February 21, 2011).
Chalfie, M., and S. Kain. Green fluorescent protein: properties, applications, and protocols. 2nd Edition. Wiley-Interscience, 2006.

Development of a sensoring device for environmental estrogens in wastewater
62
Corrieri, L., D. Seta, V. Canoine, and L. Fusani. "Developmental exposure to xenoestrogen enhances spatial learning in male rats." Hormones and Behavior 51 (May 2007): 620-625.
Coura, T., L. Salles, e D. Lima Monteiro. “Quantum-efficiency enhancement of CMOS photodiodes by deliberate violation of design rules.” Sensors and Actuators A: Physical, March 2011: 1-12.
Daunert, S., G. Barrett, J. Feliciano, and R. Shetty. "Genetically Engineered Whole-Cell Sensing Systems: Coupling Biological Recognition with Reporter Genes." Chemical Reviews 100 (2000): 2705-2738.
DELO. 2010. http://www.venso.se/pdf/delo/delodot.pdf (accessed June 4, 2011).
Ferreira, Débora, Jelena Mirkovic, Reinoud Wolffenbuttel, José Correia, Michael Feld, and Graça Minas. “Narrow-band pass filter array for integrated opto-electronic spectroscopy detectors to assess esophageal tissue.” Biomedical Optics Express 2 (June 2011): 1703-1716.
Gabet, V., C. Miège, P. Bados, and M. Coquery. "Analysis of estrogens in environmental matrices." Trends in Analytical Chemistry 26 (2007): 1113-1131.
Georgia State University - Department of Physics and Astronomy. Photodiodes. http://hyperphysics.phy-astr.gsu.edu/hbase/electronic/photdet.html#c2 (accessed August 15, 2011).
GeSiM. http://www.gesim.de/front_content.php?idcat=75&lang=2 (accessed April 10, 2011).
Gupta, R., and N. Chaudhury. "Entrapment of biomolecules in sol-gel matrix for applications in biosensors: Problems and future prospects." Biosensors & Electronics (Elsevier) 22 (2007): 2387-2399.
Hamamatsu. Photodiode Technical Guide. http://sales.hamamatsu.com/assets/html/ssd/si-photodiode/ (accessed August 5, 2011).
—. Photodiode Technical Information. September 4, 2008. http://sales.hamamatsu.com/assets/applications/SSD/photodiode_technical_information.pdf (accessed July 20, 2011).
Harries, J., et al. "A survey of estrogenic activity in United Kingdom inland waters." Environmental Toxicology and Chemistry 15 (1996): 1993-2002.
Ho, C. K., A. Robinson, D. R. Miller, e J. Davis. “Overview of Sensors and Needs for Environmental Monitoring.” Sensors 5 (2005): 4-37.
Institute of Structural and Molecular Biology. Department of Biological Sciences. http://www.cryst.bbk.ac.uk/PPS2/projects/jonda/chromoph.htm (accessed February 23, 2011).
International Union of Pure and Applied Chemistry. "PART VI : Molecular Luminescence Spectroscopy." 1985. http://old.iupac.org/reports/V/spectro/partVI.pdf (accessed October 12, 2011).
—. Photodiode. 1997. http://old.iupac.org/goldbook/P04598.pdf (accessed August 2, 2011).
Invitrogen. http://www.invitrogen.com/site/us/en/home/Products-and-Services/Applications/Protein-Expression-and-Analysis/Protein-Expression/Yeast-Expression.html (accessed January 16, 2011).

Development of a sensoring device for environmental estrogens in wastewater
63
—. Product Spectra - FluoSpheres yellow-green fluorescent microspheres/H2O. 2011. http://www.invitrogen.com/site/us/en/home/support/Product-Technical-Resources/Product-Spectra.8811h2o.html (accessed May 17, 2011).
Jokerst, N., and J. Jones. "Integrated Nano and Micro Sensor Systems." Department of Electrical and Computer Engineering, Duke University.
Kissinger, P. "Biosensors - a perspective." Biosensors & Electronics (Elsevier) 20 (2005): 2512-2516.
Kolpin, D., et al. "Pharmaceuticals, Hormones, and other organic wastewater contaminants in US streams 1999-2000: a national reconnaissance." Environmental Science & Technology 36 (2002): 1202-1211.
Kostrzynska, M., K. Leung, H. Lee, and J. Trevors. "Green fluorescent protein-based biosensor for detecting SOS-inducing activity of genotoxic compounds." Journal of Microbiological Methods 48 (2002): 43–51.
Lakowicz, J. Principles of Fluorescence Spectroscopy. 3rd Edition. Springer, 2006.
Lam, H., et al. Optical Sensor Systemas in Biotechnology. Springer, 2009.
Li, J. and Li, S. “Natural and anthropogenic environmental oestrogens: the scientific basis for risk assessment - Breast cancer evidence for xeno-oestrogen involvement in altering its incidence and risk.” Pure & Applied Chemistry 70 (1998): 1713-1723.
Lichtman, J., and José-Angel Conchello. "Fluorescence microscopy." Nature 2 (December 2005): 910-919.
Liehr, J., A. Somasunderam, and D. Roy. "Natural and anthropogenic environmental oestrogens: the scientific basis for risk assessment - Metabolism and fate of xeno-oestrogens in man." Pure & Applied Chemistry 70 (1998): 1747-1758.
Lodish, H., S. Berk, S. Zipursky, P. Matsudaira, D. Baltimore, and J. Darnell. Molecular Cell Biology. New York: W. H. Freeman, 2000.
McComb, Gordon, and Earl Boysen. Electronics for Dummies. Wiley, 2005.
Minas, Graça Maria Henriques. "Microssistema Laboratorial para Análise de Fluídos Biológicos." Doctorial Thesis, Industrial Electronics, 2004.
National Institute of Environmental Health Sciences, NIEHS. National Institutes of Health. http://www.niehs.nih.gov/health/topics/agents/endocrine/index.cfm (accessed February 14, 2011).
Nikon. "Microscopy - The source for microscopy education." Introduction to Fluorescence Microscopy. http://www.microscopyu.com/articles/fluorescence/fluorescenceintro.html (accessed October 17, 2011).
Nill, Kimball. Glossary of Biotechnology Terms. 3rd ed. CRC Press, 2002.
O’Connor, J. and Chapin, R. "Critical evaluation of observed adverse effects of endocrine active substances on reproduction and development, the immune system, and the nervous system." Pure and Applied Chemistry 75 (2003): 2099–2123.

Development of a sensoring device for environmental estrogens in wastewater
64
Oishi, K. and Moriuchi, A. "Removal of dissolved estrogen in sewage effluents by β-cyclodextrin polymer." Science of the Total Environment 409 (2010): 112–115.
Okada, H., Tokunaga, T., X. Liu, S. Takayanagi, A. Matsushima, and Y. Shimohigashi. "Direct Evidence Revealing Structural Elements Essential for the High Binding Ability of Bisphenol A to Human Estrogen-Related Receptor-γ." Environmental Health Perspectives 116 (January 2008): 32-38.
OSI Optoelectronics. Photodiode Characteristics. http://www.optics.arizona.edu/palmer/OPTI400/SuppDocs/pd_char.pdf (accessed July 14, 2011).
Pereira, T., and T. and Chuck, J. Millar. "Viability analysis of alginate encapsulated micro-organisms using fluorescent stains." Journal of Microencapsulation 22 (2005): 787–792.
Premkumar, J., O. Lev, R. Marks, B. Polyak, R. Rosen, and S. Belkin. “Antibody-based immobilization of bioluminescent bacterial sensor cells.” Talanta 55 (2001): 1029–1038.
Promega. Introduction to Reporter Gene Assays. http://www.promega.com/resources/multimedia/reporter-assays-and-transfection/introduction-to-reporter-gene-assays/ (accessed June 2, 2011).
Rogers, K. "Biosensors for environmental applications." Biosensors & Bioelectronics 10 (1995): 533-541.
Schuh, M., et al. "An on-farm survey of spatial and temporal stratifications of 17β-Estradiol concentrations." Chemosphere 82 (March 2010): 1683-9.
Sigma Aldrich. 4-Nonylphenol. http://www.sigmaaldrich.com/catalog/ProductDetail.do?lang=en&N4=46405|FLUKA&N5=SEARCH_CONCAT_PNO|BRAND_KEY&F=SPEC (accessed March 10, 2011).
Stahlschmidt-Allner, P., B. Allner, Römbke, and J. "Endocrine Disrupters in the Aquatic Environment." Environmental Science & Pollutants 4 (1997): 155 - 162.
Stanford University. The Photoelectric Effect. 15 June 2009. http://www2.slac.stanford.edu/vvc/theory/photoelectric.html (accessed August 24, 2011).
Staples, C., P. Dorn, G. Klecka, S. O’Blook, and L. Harris. “A review of the environmental fate, effects, and exposures of Bisphenol A.” Chemosphere 36 (1998): 2149-2173.
Su, Liang, Wenzhao Jia, Changjun Hou, and Yu Lei. "Microbial biosensors: A review." Biosensors and Bioelectronics, 2010.
The Hebrew University of Jerusalem - Faculty of Agriculture, Food and Environment. UV-VIS Spectrophotometer. 2009. (accessed October 10, 2011).
The Royal Swedish Academy of Sciences. “The green fluorescent protein: discovery, expression and development.” Stockholm, Sweden, 2008.
Theodore, L. and Kunz, R. Nanotechnology: Environmental Implications. Wiley - Interscience, 2005.
Thomas, Michael. Ultraviolet and Visible Spectroscopy. Second Edition. John Wiley & Sons, 1996.

Development of a sensoring device for environmental estrogens in wastewater
65
U.S. Environmental Protection Agency. 2010. http://www.epa.gov/endo/pubs/edspoverview/whatare.htm (accessed February 24, 2011).
—. 2010. http://www.epa.gov/opptintr/existingchemicals/pubs/actionplans/bpa_action_plan.pdf (accessed February 22, 2011).
U.S. Environmental Protection Agency. "Ambient Aquatic Life Water Quality Criteria for Nonylphenol - Draft." 2004.
University of London - Institute of Structural and Molecular Biology. The Chromophore of GFP. October 11, 1996. http://www.cryst.bbk.ac.uk/PPS2/projects/jonda/chromoph.htm (accessed May 15, 2011).
University of Washington. "Fluorescent Microsphere Physical Characteristics." Fluorescent Microsphere Resource Center. 1999. http://fmrc.pulmcc.washington.edu/DOCUMENTS/FMRC499.pdf (accessed October 19, 2011).
—. “Standard curves, Fluorescent controls, Background fluorescence & Sources of error.” Tutorial in Fluorescence and Fluorescent Instrumentation. 1999. http://fmrc.pulmcc.washington.edu/DOCUMENTS/FMRC399.pdf (accessed October 19, 2011).
—. “Tutorial in Fluorescence and Fluorescent Instrumentation.” Fluorescent Microsphere Resource Center. 1999. http://fmrc.pulmcc.washington.edu/DOCUMENTS/FMRC299.pdf (accessed October 19, 2011).
Vethaak, A., et al. "An integrated assessment of estrogenic contaminationand biological effects in the aquatic environment of the Netherlands." Chemosphere 59 (2005): 511–524.
Wehry, Earl. "Molecular Fluorescence and Phosphorescence Spectrometry." In Handbook of Instrumental Techniques for Analytical Chemistry, by Frank Settle, 507-539. Prentice-Hall, 1997.
Wise, Amber, Kacie O'Brien, and Tracey Woodruff. "Are Oral Contraceptives a Significant Contributor to the Estrogenicity of Drinking Water?" Environmental Science & Technology 45 (2011): 51-60.
World Health Organization. http://www.who.int/ceh/risks/cehemerging2/en/ (accessed February 24, 2011).
—. The International Programme of Chemical Safety. 2002. http://www.who.int/ipcs/publications/new_issues/endocrine_disruptors/en/ (accessed February 24, 2011).
—. The International Programme of Chemical Safety. http://www.who.int/ipcs/publications/new_issues/endocrine_disruptors/en/ (accessed February 24, 2011).
Yagi, K. "Applications of whole-cell bacterial sensors in biotechnology and environmental science." Applied Microbiology Biotechnology 73 (2006): 1251-1258.
Yang, F., L. Moss, and G. Phillips. "The Molecular Structure of Green Fluorescent Protein." Department of Biochemistry and Cell Biology, Rice University, 1997.
.