SASMITA MUDANÇAS ESTRATÉGICA NO SECTOR …§ão.pdfSASMITA MOHANTY MUDANÇAS ESTRATÉGICA NO...
83
SASMITA MOHANTY MUDANÇAS ESTRATÉGICA NO SECTOR DAS TELECOMUNICAÇÕES: EUROPA VS. ÍNDIA STRATEGIC CHANGES IN THE TELECOMMUNICATIONS SECTOR: EUROPE VS. INDIA Universidade de Aveiro 2012 Departamento de Economia,Gestão e Engenharia Industrial
Transcript of SASMITA MUDANÇAS ESTRATÉGICA NO SECTOR …§ão.pdfSASMITA MOHANTY MUDANÇAS ESTRATÉGICA NO...
SASMITA MOHANTY
MUDANÇAS ESTRATÉGICA NO SECTOR DAS TELECOMUNICAÇÕES: EUROPA VS. ÍNDIA
STRATEGIC CHANGES IN THE TELECOMMUNICATIONS SECTOR: EUROPE VS. INDIA
Universidade de Aveiro
2012 Departamento de Economia,Gestão e Engenharia
Industrial
SASMITA MOHANTY
MUDANÇAS ESTRATÉGICA NO SECTOR DAS TELECOMUNICAÇÕES: EUROPA VS. ÍNDIA
STRATEGIC CHANGES IN THE TELECOMMUNICATIONS SECTOR: EUROPE VS. INDIA
Dissertação apresentada à Universidade de Aveiro para cumprimento dos requisitos necessários à obtenção do grau de Mestre em Gestão, realizada sob a orientação científica do Doutor António Carrizo Moreira, Professor Auxiliar do Departamento de Economia,Gestão e Engenharia Industrial da Universidade de Aveiro
Universidade de Aveiro
2012 Departamento de Economia,Gestão e Engenharia
Industrial

Este trabalho é dedicado à minha família e sogros.
o júri
presidente Profa. Doutora Maria Madalena Gomes Vilas Boas
Professora Auxiliar Convidada, Departamento de Economia,Gestão e Engenharia Industrial, Universidade de Aveiro
Prof. Doutor Daniel Ferreira Polonia Professor Auxiliar Convidado, Departamento de Economia,Gestão e Engenharia Industrial, Universidade de Aveiro
Prof. Doutor António Carrizo Moreira
Professor Auxiliar, Departamento de Economia,Gestão e Engenharia Industrial,
Universidade de Aveiro
agradecimentos
Este trabalho foi feito com ajuda valiosa e sugestões de vários amigos,
colegas e professores. Um agradecimento especial a minha tese de
conselheiro António Carrizo Moreira Prof por sua orientação e valiosas
sugestões.
Agradeço também a meus familiares pelo seu amor e apoio. Especialmente,
ao meu marido que me ajudou em vários aspectos.
palavras-chave Gestão de Telecomunicações, a estratégia de estratégia, em
telecomunicações, mudanças estratégicas em telecom, telecomunicações na
Europa, as mudanças estratégicas no setor de telecomunicações na Europa,
indiano de telecomunicações, as mudanças estratégicas no setor de
telecomunicações indiano.
resumo Neste trabalho, as mudanças estratégicas no setor de telecomunicações da
Europa são estudados. Dez maiores empresas da Europa são selecionados
para esta análise. Suas mudanças estratégicas sobre a década 2001 - 2011
são estudadas e analisadas. Essas mudanças estratégicas do mercado
Telecom Europeia são posteriormente comparados com o seu homólogo
indiano. Estes dois mercados são, então, analisada a partir dos pontos de
vista de mudanças estratégicas. Finalmente, as semelhanças e diferenças
entre os dois mercados são analisados e comparados.
keywords Telecommunication management, strategy, strategy in telecom, strategic
changes in telecom, telecom in Europe, strategic changes in telecom
sector in Europe, Indian telecom, strategic changes in Indian telecom
sector
abstract In this work, the strategic changes in the telecom sector of Europe are
studied. Ten largest companies of Europe are selected for this analysis.
Their strategic changes over the 2001 – 2011 decade are studied and
analyzed. These strategic changes of European Telecom market are
subsequently compared with its Indian counterpart. These two markets
are then analyzed from the view points of strategic changes. Finally, the
similarities and differences between the two markets are analyzed and
compared.
i
Contents
List of abbreviations ……………………………………………………………………………………… iv
List of figures ……………………………………………………………………………………………... vi
List of tables ………………………………………………………………………………………………. vii
Chapter Title Page
Introduction ……………………………………………………………………………. 1
Objectives ………………………………………………………………………………………… 2
Methodology ……………………………………………………………………………………... 2
Previous Works …………………………………………………………………………………... 2
1 Overview of Telecom Market (Literature Review) …………………………………. 5
1.1 A Brief History of Telecommunication Industry ………………………………………………… 5
1.2 Basic Telecom Statistics ………………………………………………………………………….. 6
1.3 Key Indicators of Europe and the Rest of the World …………………………………………….. 10
1.4 Telecommunication Market Shares ………………………………………………………………. 11
1.5 Bandwidth Demand per User in the Internet ……………………………………………………... 13
1.6 Top Broadband Economies of the World ………………………………………………………… 14
1.7 The Reasons behind the Strategic Shifts …………………………………………………………. 16
1.7.1 Market Penetration and Growth Rate …………………………………………………………….. 16
1.7.2. Mobile Cellular Market …………………………………………………………………………….. 16
1.7.3 Fixed Broadband Market …………………………………………………………………………… 17
1.7.4 Mobile Broadband Market …………………………………………………………………………. 17
1.7.5 Internet Users Market ……………………………………………………………………………….. 18
2 Factors and Indicators of Strategic Changes of Big Companies of Europe ………... 19
2.1 Analysis of Big Companies of Europe …………………………………………………………… 19
2.2 Fluctuation of Revenues ………………………………………………………………………….. 21
2.3 Technological Factors ……………………………………………………………………………. 23
2.4 Competition and Globalization Factors …………………………………………………………... 23
2.5 Market Dynamics ………………………………………………………………………………… 24
2.6 Social Factors …………………………………………………………………………………….. 24
3 Changes in Internal and External Strategies of European Telecom Companies ….. 25
3.1 External Strategic Changes in the main European companies …………………………………… 25
3.1.1 Strategic Changes due to Demographic Segment ………………………………………………. 26
3.1.2 Strategic Changes due to the Economic Segment ……………………………………………….. 26
3.1.3 Strategic Changes due to the Political Segment …………………………………………………. 26
3.1.4 Strategic Changes due to the Sociocultural Segment …………………………………………… 26
3.1.5 Strategic Changes due to the Technological Segment ………………………………………….. 27
3.2 Strategic Focus of the Companies towards Competitors …………………………………………. 27
3.2.1 Strategic Changes due to threat of new Entrant …………………………………………………. 27
3.2.2 Strategic Changes due to Bargaining power of Suppliers ……………………………………… 27
3.2.3 Strategic Changes due to Bargaining Power of Buyers ………………………………………… 28
ii
3.2.4 Strategic Changes due to Threat of Substitute of Products …………………………………….. 28
3.2.5 Strategic Changes due to Intensity of Rivalry among the Competitors ………………………. 28
3.3 Internal Strategic Changes in the main European companies ……………………………………. 28
3.4 Managing Changes ……………………………………………………………………………….. 30
3.4.1 Change in Focus due to Competition: Wireless companies looking towards landline ……... 30
3.4.2 Outsourcing of Services to cheaper destinations ………………………………………………… 31
4 Changes in the Business Level Strategies and Strategic Actions …………………… 33
4.1 Changes in Business Level Strategies ……………………………………………………………. 33
4.2 Competitor in one country and Alliance Partners in another country ……………………………. 33
4.2.1 Rivalry through Alliance ……………………………………………………………………………. 34
I. Case of Orange and T-mobile alliance in the UK ……………………………………... 34
II. Case of Vodafone and Airtel in India …………………………………………………… 35
4.3 Internationalization of European Companies …………………………………………………….. 35
4.4 Other cases of Mergers, Acquisitions and Takeovers ……………………………………………. 36
4.5 New Trends due to advanced technologies ………………………………………………………. 37
4.6 Reversal of Strategies …………………………………………………………………………….. 38
4.7 Strategic Changes in Leadership …………………………………………………………………. 39
4.8 Strategic Changes in Entrepreneurship …………………………………………………………... 39
4.9 Changes in Marketing Strategies …………………………………………………………………. 40
4.10 Cultural Diversities and other Management Strategies ………………………………………....... 40
5 Company-wise Strategic Changes of European Players in the Last Decade ………. 43
5.1 Strategic Changes of Vodafone …………………………………………………………………... 43
5.2 Strategic Changes of Deutsche Telecom …………………………………………………………. 43
5.3 Strategic Changes of France Telecom ……………………………………………………………. 44
5.4 Strategic Changes of Telefónica…………………………………………………………………... 45
5.5 Strategic Changes of TIM………………………………………………………………………… 46
5.6 Strategic Changes of BT ………………………………………………………………………….. 46
5.7 Strategic Changes of Telia Sonera………………………………………………………………... 47
5.8 Strategic Changes of Telenor …………………………………………………………………….. 47
5.9 Strategic Changes of MTS ……………………………………………………………………….. 48
5.10 Strategic Changes of PT ………………………………………………………………………….. 48
6 Telecom Scenario of India in the 2001 to 2011 Period ………………………………. 51
6.1 Overview of Indian Telecom Market …………………………………………………………….. 51
6.2 Top 10 telecom players of India ………………………………………………………………….. 54
6.3 Changes in Strategic Moves ……………………………………………………………………… 56
6.3.1 Arrival of International Companies ……………………………………………………………… 56
6.3.2 Alliances between Companies …………………………………………………………………….. 56
6.3.3 Mergings and mega-mergings ……………………………………………………………………... 56
6.3.4 Joint Ventures with Telecom Vendors …………………………………………………………….. 56
6.3.5 Changes in Advertising and Branding ……………………………………………………………. 57
6.3.6 Looking for Fixed Network and Infrastructure Business ……………………………………….. 57
6.3.7 Introduction of VAS and new Services ……………………………………………………………. 57
iii
6.3.8 Expanding Services in other Related and Unrelated Sectors …………………………………. 57
6.3.9 New Services Adaptable with VoIP ………………………………………………………………. 57
6.3.10 New Ventures with Companies like Google ……………………………………………………. 58
7 Comparison between the European and Indian Industries …………………………. 59
7.1 The Figures ……………………………………………………………………………………….. 59
7.2 Similarities ……………………………………………………………………………………….. 59
7.3 Differences ……………………………………………………………………………………….. 59
7.4 Strategic Differences between the two Markets ………………………………………………….. 61
Conclusions …………………………………………………………………………….. 63
References ……………………………………………………………………………… 65
iv
List of Abbreviations
3 : 3G and other advanced service provider of Hutchinson Whampoa
2G : 2nd
Generation of Mobile Communications
2.5G : The Intermediate Generation between 2G and 3G
3G : 3rd
Generation of Mobile Communications
4G : 4th
Generation of Mobile Communications
ADSL : Asymmetric Digital Subscriber Line
AT & T : American Telephone and Telegraph
BLS : Bureau of Labor Statistics (of USA)
BSNL : Bharat Sanchar Nigam Limited (An Indian Company)
BT : British Telecom
CATV : Cable Television
CDG : CDMA Development Group
CEO : Chief Executive Officer
CERN : European Organization for Nuclear Research
CIS : Commonwealth of Independent States
CTIA : Cellular Telecommunications & Internet Association
CWW : Cable and Wireless Worldwide
DoT : Department of Telecommunications (India)
DSL : Digital Subscriber Line
DTH : Direct To Home
EBITDA : Earnings Before Interest, Taxes, Depreciation, and Amortization
EU : European Union
FCC : Federal Communications Commission (of USA)
FDI : Foreign Direct Investment
FTSE : Financial Times Stock Exchange (Indicator of LSE)
GBP : Great Britain Pound
Gbps : Giga Bits per second
GDP : Gross Domestic Product
GPRS : General Packet Radio Service
GPS : Global Positioning System
GSM : Global System for Mobile (Communication)
HSDPA : High-Speed Downlink Packet Access
ICT : Information and Communication Technologies
INR : Indian Rupees
IPTV : Internet Protocol Television
IT : Information Technology
ITA : International Trade Administration (Dept. of Commerce)
ITU : International Telecommunication Union
ITW : InternetWorldStats
Kbps : Kilo Bits per second
LTE : Long Term Evolution
Mbps : Mega Bits per second
MTNL : Mahanagar Telephone Nigam Limited
MTS : Mobile Tele-System
NSN : Nokia Siemens Networks
NTT : Nippon Telegraph and Telephone
OCED : Organization for Economic Co-operation and Development
PC : Personal Computer
PON : Passive Optical Network
PRE : Plunkett Research Estimate
PT : Portugal Telecom
v
R&D : Research and Development
SIM : Subscriber´s Identity Module
SMS : Short Message Service
STD : Subscriber´s Trunk Dialing
Tbps : Tera Bits per second
TIA : Telecommunications Industry Association
TIM : Telecom Italia Mobile
TRAI : Telecommunications Regulatory Authority of India
TV : Television
UK : United Kingdom
UMTS : Universal Mobile Telecommunication System
UN : United Nations
USA : United States of America
USD : United States Dollar
VAS : Value Added Services
VNI : Visual Networking Index
VoD : Video on Demand
VoIP : Voice over Internet Protocol
WiFi : Wireless Fidelity
WiMAX : Worldwide interoperability Microwave Access
vi
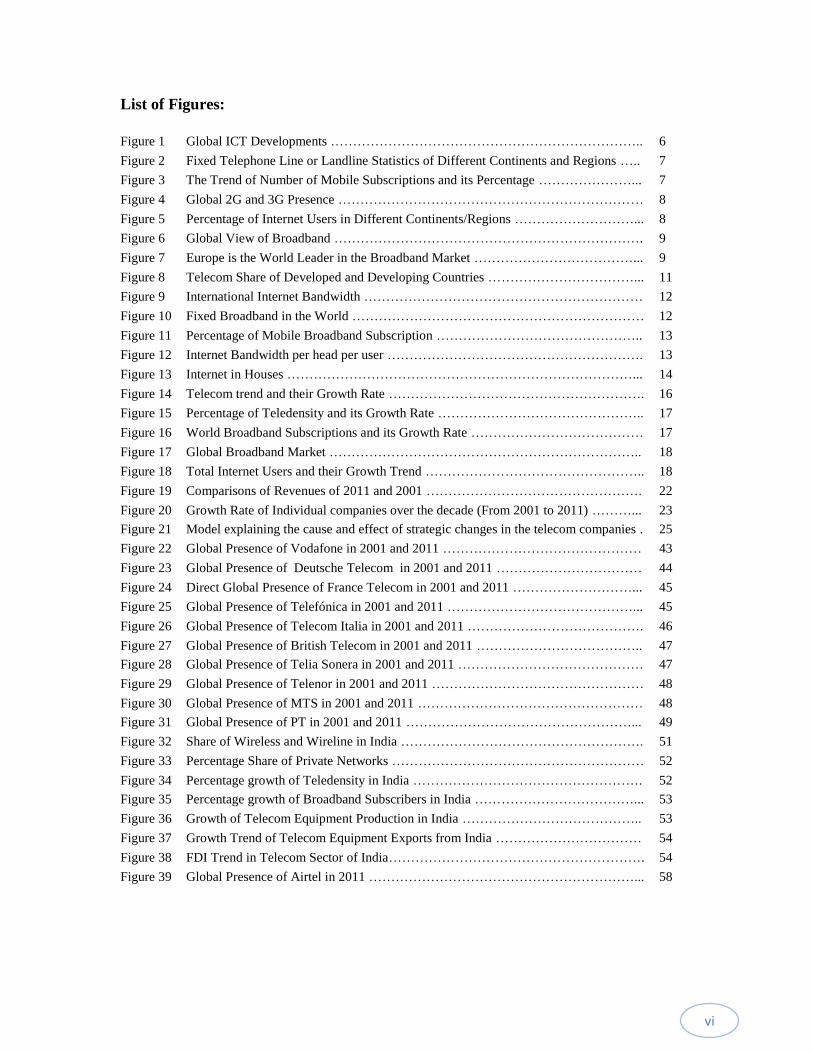
List of Figures:
Figure 1 Global ICT Developments …………………………………………………………….. 6
Figure 2 Fixed Telephone Line or Landline Statistics of Different Continents and Regions ….. 7
Figure 3 The Trend of Number of Mobile Subscriptions and its Percentage …………………... 7
Figure 4 Global 2G and 3G Presence …………………………………………………………… 8
Figure 5 Percentage of Internet Users in Different Continents/Regions ………………………... 8
Figure 6 Global View of Broadband ……………………………………………………………. 9
Figure 7 Europe is the World Leader in the Broadband Market ………………………………... 9
Figure 8 Telecom Share of Developed and Developing Countries ……………………………... 11
Figure 9 International Internet Bandwidth ……………………………………………………… 12
Figure 10 Fixed Broadband in the World ………………………………………………………… 12
Figure 11 Percentage of Mobile Broadband Subscription ……………………………………….. 13
Figure 12 Internet Bandwidth per head per user …………………………………………………. 13
Figure 13 Internet in Houses ……………………………………………………………………... 14
Figure 14 Telecom trend and their Growth Rate …………………………………………………. 16
Figure 15 Percentage of Teledensity and its Growth Rate ……………………………………….. 17
Figure 16 World Broadband Subscriptions and its Growth Rate ………………………………… 17
Figure 17 Global Broadband Market …………………………………………………………….. 18
Figure 18 Total Internet Users and their Growth Trend ………………………………………….. 18
Figure 19 Comparisons of Revenues of 2011 and 2001 …………………………………………. 22
Figure 20 Growth Rate of Individual companies over the decade (From 2001 to 2011) ………... 23
Figure 21 Model explaining the cause and effect of strategic changes in the telecom companies . 25
Figure 22 Global Presence of Vodafone in 2001 and 2011 ……………………………………… 43
Figure 23 Global Presence of Deutsche Telecom in 2001 and 2011 …………………………… 44
Figure 24 Direct Global Presence of France Telecom in 2001 and 2011 ………………………... 45
Figure 25 Global Presence of Telefónica in 2001 and 2011 ……………………………………... 45
Figure 26 Global Presence of Telecom Italia in 2001 and 2011 …………………………………. 46
Figure 27 Global Presence of British Telecom in 2001 and 2011 ……………………………….. 47
Figure 28 Global Presence of Telia Sonera in 2001 and 2011 …………………………………… 47
Figure 29 Global Presence of Telenor in 2001 and 2011 ………………………………………… 48
Figure 30 Global Presence of MTS in 2001 and 2011 …………………………………………… 48
Figure 31 Global Presence of PT in 2001 and 2011 ……………………………………………... 49
Figure 32 Share of Wireless and Wireline in India ………………………………………………. 51
Figure 33 Percentage Share of Private Networks ………………………………………………… 52
Figure 34 Percentage growth of Teledensity in India ……………………………………………. 52
Figure 35 Percentage growth of Broadband Subscribers in India ………………………………... 53
Figure 36 Growth of Telecom Equipment Production in India ………………………………….. 53
Figure 37 Growth Trend of Telecom Equipment Exports from India …………………………… 54
Figure 38 FDI Trend in Telecom Sector of India…………………………………………………. 54
Figure 39 Global Presence of Airtel in 2011 ……………………………………………………... 58
vii
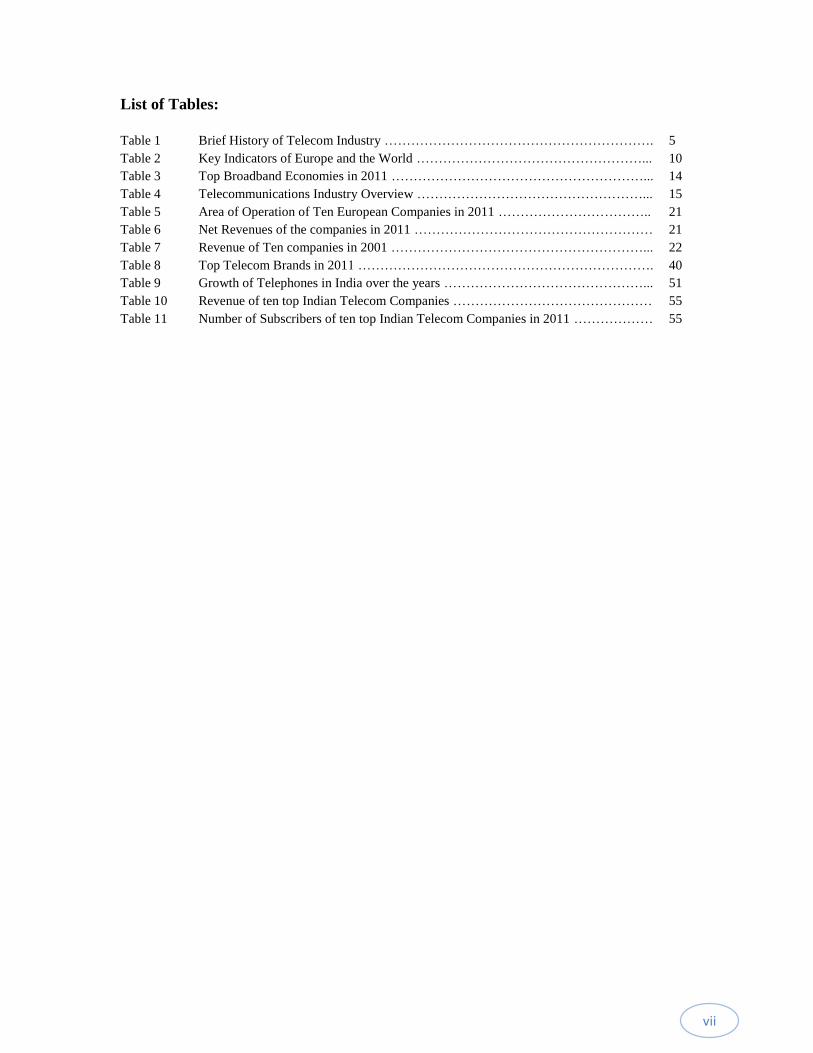
List of Tables:
Table 1 Brief History of Telecom Industry ……………………………………………………. 5
Table 2 Key Indicators of Europe and the World ……………………………………………... 10
Table 3 Top Broadband Economies in 2011 …………………………………………………... 14
Table 4 Telecommunications Industry Overview ……………………………………………... 15
Table 5 Area of Operation of Ten European Companies in 2011 …………………………….. 21
Table 6 Net Revenues of the companies in 2011 ……………………………………………… 21
Table 7 Revenue of Ten companies in 2001 …………………………………………………... 22
Table 8 Top Telecom Brands in 2011 …………………………………………………………. 40
Table 9 Growth of Telephones in India over the years ………………………………………... 51
Table 10 Revenue of ten top Indian Telecom Companies ……………………………………… 55
Table 11 Number of Subscribers of ten top Indian Telecom Companies in 2011 ……………… 55
1
Introduction
Telecommunications has changed the life style of people around the world. It has changed the
way people do business, the way people interact remotely and almost everything to some extent
in the modern world. Along with these changes, the telecom sector itself has changed a lot from
its business, organization and management points of views. The early days of
telecommunications had a few service providers and thus monopoly used to be observed in
several countries. As it was one of the basic services, in most of the countries they were owned
by the government or the public sector companies. But in the recent years, mainly after the
nineties the competition has become fierce. Each year the number of service providers is
increasing in every country. Globalization and liberalization have made these issues even
smoother for competition and expansion. The business world has become really flat. The
business and commercial issues of telecommunications have become very important. It is not
only because telecommunication services are one of the basic requirements; but also due to the
huge market size of this sector. All these issues make telecommunications an interesting area of
business analysis.
Europe is one of the prime contributors of telecommunication science and engineering. Since the
1850s it has contributed to the telecommunications sector (IEEE, 2005). In the 21st century, its
role has become pivotal in the development of new technologies. Along with that, it has played
significant roles in telecom business as well. Both in and out of Europe its telecom companies
have a lot of businesses. That is why the European telecom market becomes quite important in
the global telecommunication marketplace. It is the main motivation for choosing the European
telecom sector for this thesis work.
India is one of the largest emerging markets of telecommunications in the world. In the last
couple of decades, its telecom industry has been revolutionized. With the globalization and
privatization of its markets; its telecom sector is able to attract large amount of FDI (DoT, 2011).
As of Dec 2011, India is the second largest national market in the world after China with more
than 900 million mobile subscribers (TRAI, 2011). These huge changes of Indian telecom
market are compared with its European counterpart to analyze the strategic focus of the
companies of both the markets.
Along with the changes in the market and the growing number of subscribers and competition,
the strategic moves are changing in every part of the world. However, Europe has more number
of service providers and thus the competition gets fiercer. Europe is also one of the hot spots as
far as the telecommunication related innovations and researches are concerned. There are several
changes in the telecom strategies of the operators in the last decade. In this thesis, the telecom
market of Europe is analyzed from the operators’ strategic points of views. Strategic shifts of
main companies of Europe are taken into consideration. The reasons behind the strategic shifts
are analyzed. These changes of the European markets are compared with its Indian counter parts
2
in a similar way. There are several objectives to be achieved in this project. The main objectives
of this thesis are provided here.
Objectives
The main objectives of this thesis are listed below.
1. To analyze the telecommunication market scenario of Europe over the 2001-2011 decade.
2. To identify the major changes of strategic moves of the ten main companies of Europe.
3. To compare strategic scenarios of European Telecom sector around 2001 with that of
around 2011.
4. To analyze the reasons and motivations behind the strategic changes.
5. To analyze the Indian telecom sector in the similar way as that of Europe.
6. To compare the strategic shifts of the two markets
Methodology
In order to achieve the above objectives, certain methods are used in this thesis work. Ten large
and important companies are chosen for this analysis. Main European companies are analyzed
from their data and market positions are analyzed. Their strategic positions and market values are
compared over the last one decade. Some changes are very much clear and others need careful
data analysis. In fact, the total European market dynamics of the telecom industry is taken into
account in this analysis.
Various steps of the methodology adopted in this work are:
1. To select ten main telecom companies of Europe. The criteria for selection are annual
revenue, market capture, international influence and customer base.
2. To study the strategic moves through their policies in different markets, pricing,
internationalization, expansion or contraction of coverage areas, addition or deletion of
services, technological adoption, merging, acquisition and takeovers etc.
3. To compare the changes over the decadal performances and strategic shifts.
4. To select ten largest telecom operators of India keeping the same criteria as for the
European company selections.
5. To analyze their strategic shifts.
6. To compare the two scenarios from the strategic changes points of views.
Previous Works
Strategy is a basic necessity of every business and it shows the way forward to the corporates.
Porter (1979), provides the shapes of competitive forces from the strategic points of views.
Porter (1980), gives the principal features of competitive strategy. Porter (1985), provides major
advantages of competitive strategies for successful ventures. Porter (1986), Minzberg (1994) &
Minzberg (1999) provide main requirements of strategies in the modern business. Porter (1998),
3
gives specific strategic initiative of critical competition in a versatile marketplace. There are
several works on the telecom industries of different countries and continents. Rosenbush (1997)
and Shaw (2000) provided several strategic management principles for telecommunications
industry. Strouse (2001) describes the general strategies of telecommunication marketplace.
Pehrsson (2001) presents the strategic scenarios in the emerging telecommunication markets.
Porter (2001), provides the strategic advantages and risk factors of online businesses. Beardsley
(1998), proposed several scenarios of the telecommunication sector competition of the 1990s and
2000s in Europe.
Zhang & Prybutok (2005), analyzed the telecom markets of China, US and Europe and compare
their strategies. Sung (2011), analyzed the cable TV industry of South Korea. Steinbock (2001),
analyzed the telecom innovation and development clusters of Finland. Langlade (1997), analyzes
the early broadband market strategies in Asia. Krafft (2003) presents the vertical orientation of
the strategic framework of telecommunication industry. Agar (2003), provides a systematic
history of mobile telecommunications market. Ahonen (2002), provides the developmental issues
of mobile technologies in the advanced applications such an m-commerce. Bekkers et. al. (2002),
provides the strategic developments of intellectual property issues in telecommunications.
Geroski (2003), provided the competitive scenarios of technology markets including
telecommunications. Bhargava et. al. (2000), described the pricing issues of electronic markets
and their implications.
Furuskar et. al. (1999), provides the market potential of GSM and its advanced versions. Pouillot
(2002), gives UMTS oriented strategic moves of the companies during the beginning of 3G
services. Kevin & Brien (2005), present the new technology initiatives in mobile communication
markets. Liu & Jayakar (2012), compare the telecommunications policies of Indian and China
with several strategic changes in both the markets. Albrecht (2011), provides the technological
and legal issues of smart technologies in USA. Binmore & Klemperer (2002), gave a clear
picture of 3G spectrum auction in the UK and its impact on the telecom industry. Bjorkdahl &
Bohlin (2002), analyzed the finalcial and strategic issues of Swedish telecom market. Fan (2004),
illustrates the clear picture of telecom innovation related strategies of Chinese companies. Geser
(2004), analyzed the social impacts of mobile communications. Gruber & Verboven (2001),
provides the evolution of telecommunications market.
Telecommunications regulations play significant role in the growth and proliferation of the
industry and customers. There are several works on the telecom regulations. Whalley & Curwen
(2003), presents the regulations and the strategic policies of the European companies for license
acquisition. Lehr & Kiessling (1999), provides the centralized authority of telecom regulations in
USA and Europe. Coen (2005), provides a comparative analysis of 3G regulations of UK and
Germany. European Commission (2002), is the detailed report of European telecom regutaions
for mobile communications. It provides all the major issues of telecom regulations and their
implementation issues.
4
The rest part of this thesis is arranged in the following chapters. In Chapter 1 the overview of the
global telecommunication market is analyzed with the available data. Mainly the information
available from the ITU has been presented with their implications. The European
telecommunication markets along with its global counterparts are analyzed in detail and the
effects of indicators of strategic changes are identified.
In Chapter 2 ten largest companies of Europe are chosen for the analysis of strategic changes.
Basic strategies of the ten chosen companies are analyzed for the last decade. Using the data
available from the annual reports and other sources the global positions of these companies are
analyzed and their growth rates are estimated. All the major factors and indicators are identified.
In Chapter 3 the internal and external strategies of the chosen companies are analyzed for the
whole decade of 2001-2011. The changes of the strategies of 2001 and that of 2011 are noted
down and compared.
In Chapter 4 details of the business and corporate level actions of these companies are analyzed
and their business dynamics are observed. The major changes in their business level focus are
documented in this chapter.
In Chapter 5 company-wise decadal strategic changes are analyzed and their implications in the
company´s overall performance are noted. Then these strategic changes are summarized, their
overall effects are listed and used for the comparison with the Indian telecom market.
In Chapter 6 the telecommunication market of India is analyzed from the available data from
their regulatory authority, TRAI and individual company reports of the last decade. The main
strategic points of India´s telecom market dynamics are carefully studied and presented in this
chapter.
In chapter 7 the telecom sectors of India and Europe are compared with each other. Main
strategic differences are studied and analyzed. Then the outcomes are presented as similarities
and differences.
Finally, the whole work is summarized in the conclusion with few remarks on the probable
changes in the future.
5
Chapter 1
An Overview of the Telecommunication Market
There are large numbers of publications available on the telecommunications statistics and its
changing scenario in Europe. There are regular articles on these companies and telecom sectors
in the magazines and newspapers. However, the total analysis of the whole decadal figure is not
found in any publication with respect to the individual companies from the strategic prospective.
So it is a motivating factor to analyze these collective data and to summarize the effective
strategic changes. In this chapter, these data and literatures are summarized to present the
telecom scenario of Europe in the last decade.
1.1 A Brief History of Telecom Industry
The electronic telecommunication started with the Morse code in 1831 (IEEE, 2005). Morse
started the telegraph in the USA and then it was introduced in Europe after few years. In 1876,
Alexander Graham-Bell introduced the voice communication or the telephone. Ericson started
making telephone handsets in Europe in 1880s. Marconi designed and proliferated the uses of
wireless radio broadcasting (IEEE, 2005 & Agar, 2003). Since that time many new players have
come to telecommunications scenario and changed it. That is why so many wonders in
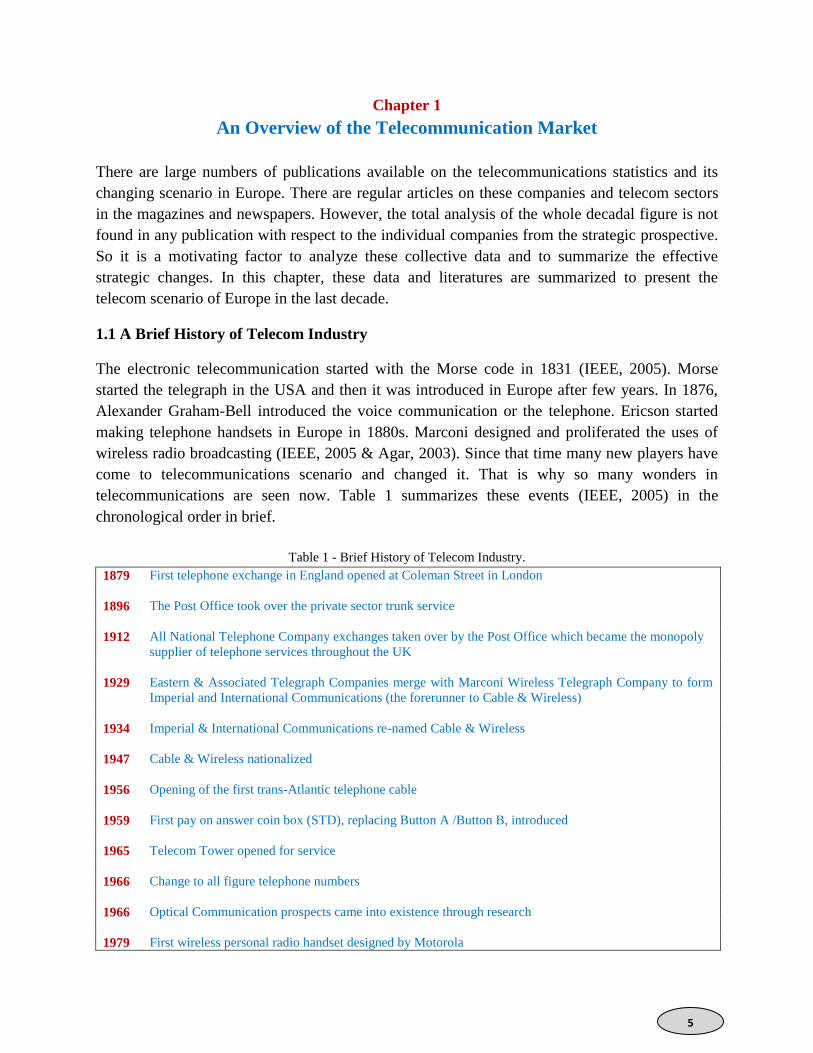
telecommunications are seen now. Table 1 summarizes these events (IEEE, 2005) in the
chronological order in brief.
Table 1 - Brief History of Telecom Industry.
1879 First telephone exchange in England opened at Coleman Street in London
1896 The Post Office took over the private sector trunk service
1912 All National Telephone Company exchanges taken over by the Post Office which became the monopoly
supplier of telephone services throughout the UK
1929 Eastern & Associated Telegraph Companies merge with Marconi Wireless Telegraph Company to form
Imperial and International Communications (the forerunner to Cable & Wireless)
1934 Imperial & International Communications re-named Cable & Wireless
1947 Cable & Wireless nationalized
1956 Opening of the first trans-Atlantic telephone cable
1959 First pay on answer coin box (STD), replacing Button A /Button B, introduced
1965 Telecom Tower opened for service
1966 Change to all figure telephone numbers
1966 Optical Communication prospects came into existence through research
1979 First wireless personal radio handset designed by Motorola
6
1984 AT&T demerged into 19 small companies
1985 Vodafone started the cellular communication services in England
1988 First Trans-Atlantic Fiber cable started operation
1989 Internet was invented at CERN, Geneva
1996 New Telecom regulations were brought in USA and other counties followed it
1.2 Basic Telecom Statistics
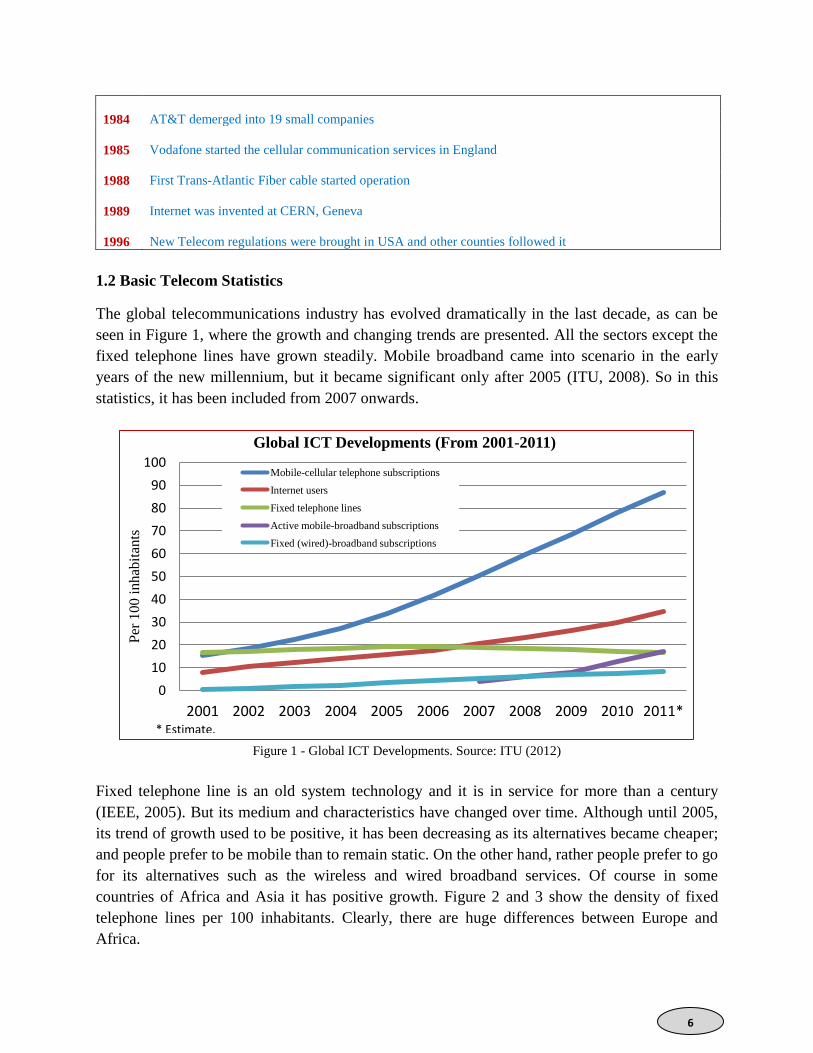
The global telecommunications industry has evolved dramatically in the last decade, as can be
seen in Figure 1, where the growth and changing trends are presented. All the sectors except the
fixed telephone lines have grown steadily. Mobile broadband came into scenario in the early
years of the new millennium, but it became significant only after 2005 (ITU, 2008). So in this
statistics, it has been included from 2007 onwards.
Figure 1 - Global ICT Developments. Source: ITU (2012)
Fixed telephone line is an old system technology and it is in service for more than a century
(IEEE, 2005). But its medium and characteristics have changed over time. Although until 2005,
its trend of growth used to be positive, it has been decreasing as its alternatives became cheaper;
and people prefer to be mobile than to remain static. On the other hand, rather people prefer to go
for its alternatives such as the wireless and wired broadband services. Of course in some
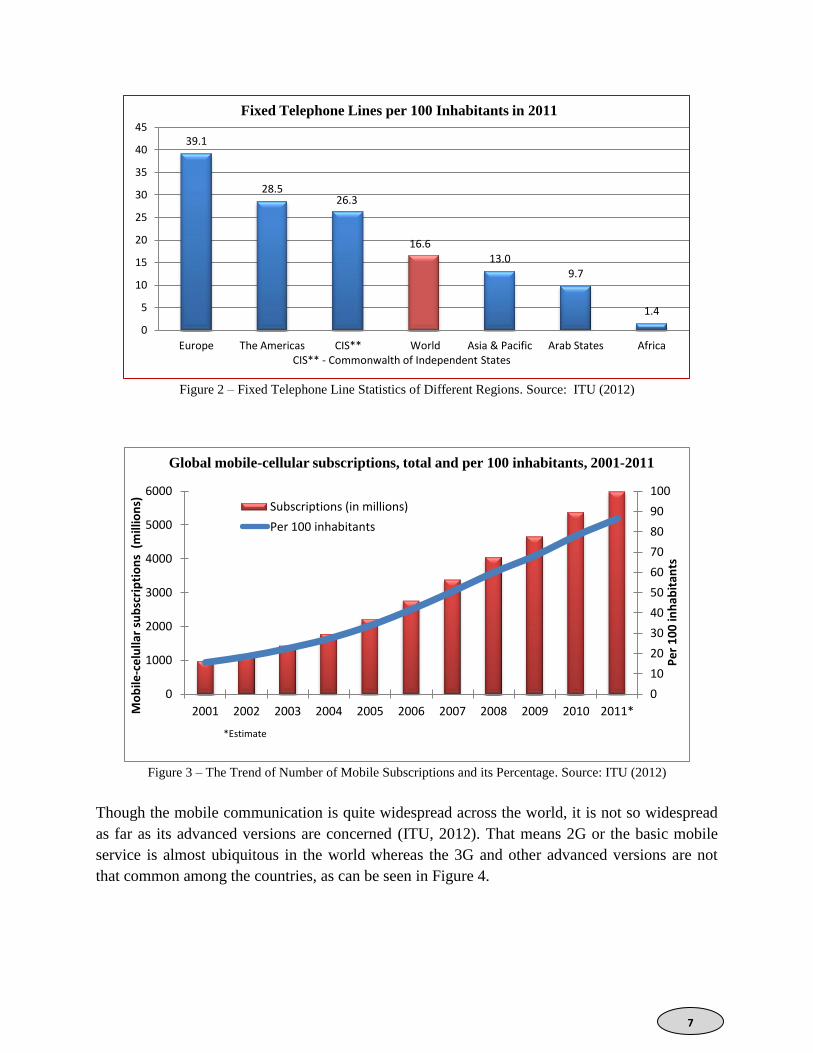
countries of Africa and Asia it has positive growth. Figure 2 and 3 show the density of fixed
telephone lines per 100 inhabitants. Clearly, there are huge differences between Europe and
Africa.
0
10
20
30
40
50
60
70
80
90
100
2001 2002 2003 2004 2005 2006 2007 2008 2009 2010 2011*
Per
100 i
nhab
itan
ts
Global ICT Developments (From 2001-2011)
Mobile-cellular telephone subscriptions
Internet users
Fixed telephone lines
Active mobile-broadband subscriptions
Fixed (wired)-broadband subscriptions
* Estimate.
7
Figure 2 – Fixed Telephone Line Statistics of Different Regions. Source: ITU (2012)
Figure 3 – The Trend of Number of Mobile Subscriptions and its Percentage. Source: ITU (2012)
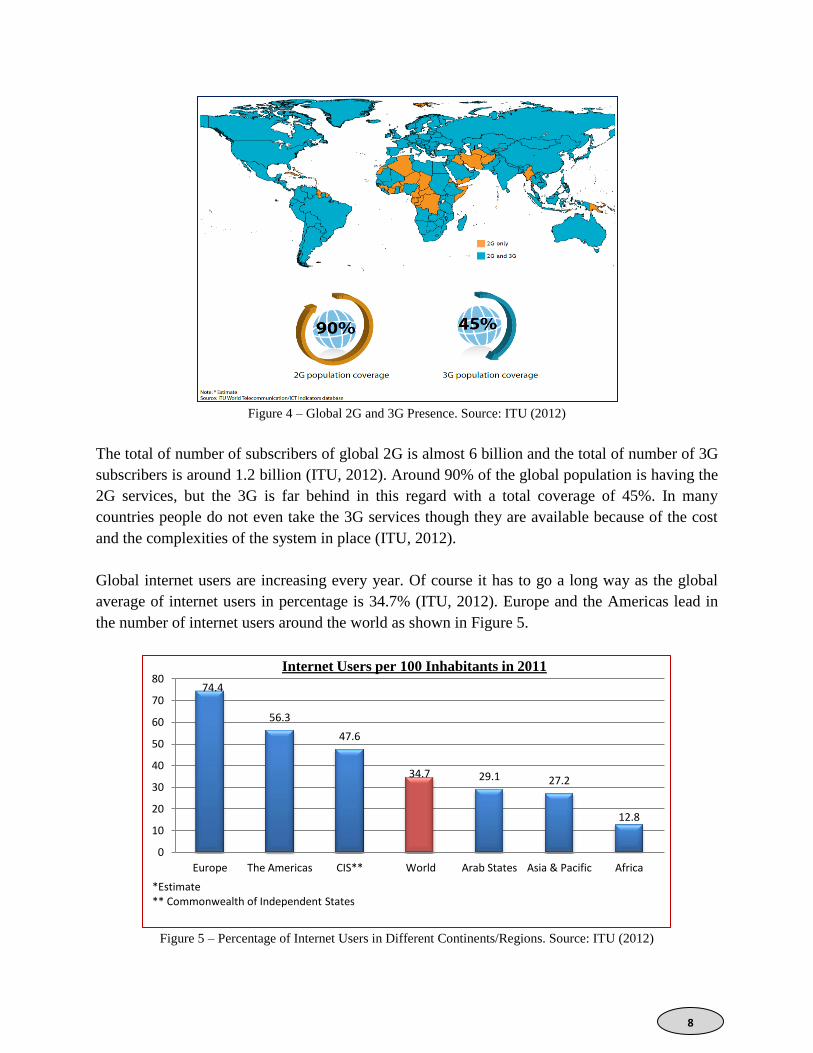
Though the mobile communication is quite widespread across the world, it is not so widespread
as far as its advanced versions are concerned (ITU, 2012). That means 2G or the basic mobile
service is almost ubiquitous in the world whereas the 3G and other advanced versions are not
that common among the countries, as can be seen in Figure 4.
39.1
28.5 26.3
16.6 13.0
9.7
1.4
0
5
10
15
20
25
30
35
40
45
Europe The Americas CIS** World Asia & Pacific Arab States Africa
Fixed Telephone Lines per 100 Inhabitants in 2011
CIS** - Commonwalth of Independent States
0
10
20
30
40
50
60
70
80
90
100
0
1000
2000
3000
4000
5000
6000
2001 2002 2003 2004 2005 2006 2007 2008 2009 2010 2011*
Pe
r 1
00
inh
abit
ants
Mo
bile
-ce
lulla
r su
bsc
rip
tio
ns
(m
illio
ns)
Subscriptions (in millions)
Per 100 inhabitants
Global mobile-cellular subscriptions, total and per 100 inhabitants, 2001-2011
*Estimate
8
Figure 4 – Global 2G and 3G Presence. Source: ITU (2012)
The total of number of subscribers of global 2G is almost 6 billion and the total of number of 3G
subscribers is around 1.2 billion (ITU, 2012). Around 90% of the global population is having the
2G services, but the 3G is far behind in this regard with a total coverage of 45%. In many
countries people do not even take the 3G services though they are available because of the cost
and the complexities of the system in place (ITU, 2012).
Global internet users are increasing every year. Of course it has to go a long way as the global
average of internet users in percentage is 34.7% (ITU, 2012). Europe and the Americas lead in
the number of internet users around the world as shown in Figure 5.
Figure 5 – Percentage of Internet Users in Different Continents/Regions. Source: ITU (2012)
74.4
56.3
47.6
34.7 29.1 27.2
12.8
0
10
20
30
40
50
60
70
80
Europe The Americas CIS** World Arab States Asia & Pacific Africa
Internet Users per 100 Inhabitants in 2011
*Estimate ** Commonwealth of Independent States
9
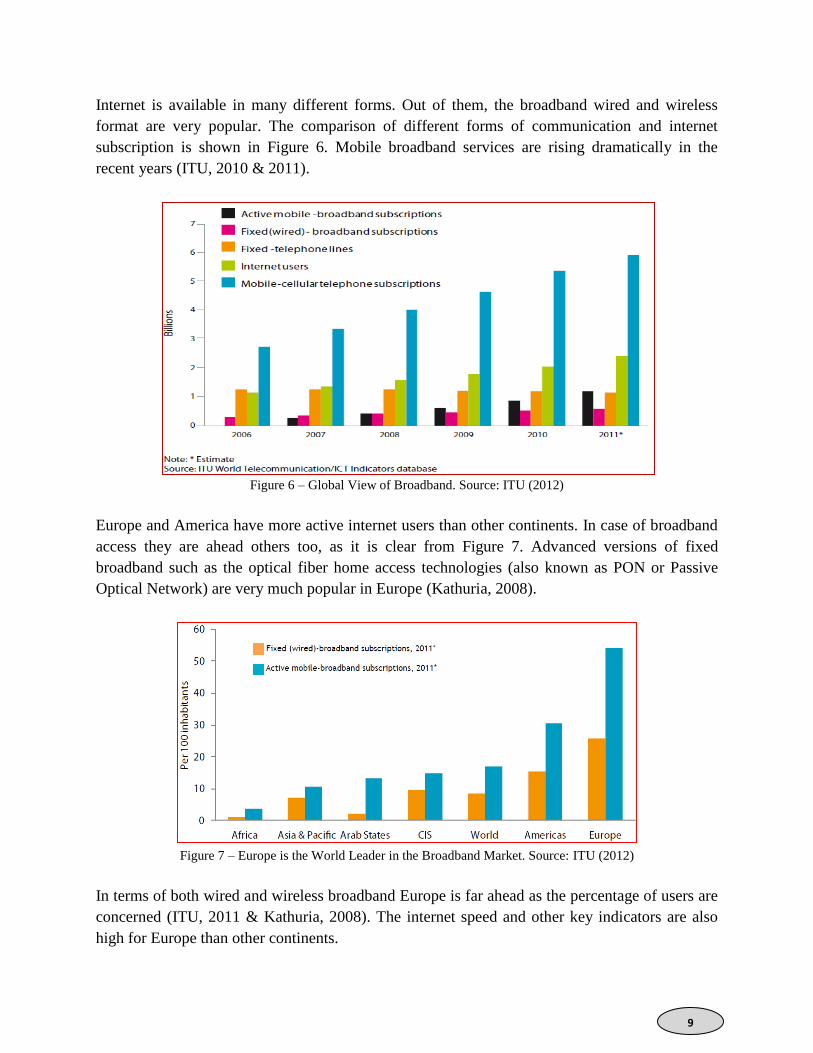
Internet is available in many different forms. Out of them, the broadband wired and wireless
format are very popular. The comparison of different forms of communication and internet
subscription is shown in Figure 6. Mobile broadband services are rising dramatically in the
recent years (ITU, 2010 & 2011).
Figure 6 – Global View of Broadband. Source: ITU (2012)
Europe and America have more active internet users than other continents. In case of broadband
access they are ahead others too, as it is clear from Figure 7. Advanced versions of fixed
broadband such as the optical fiber home access technologies (also known as PON or Passive
Optical Network) are very much popular in Europe (Kathuria, 2008).
Figure 7 – Europe is the World Leader in the Broadband Market. Source: ITU (2012)
In terms of both wired and wireless broadband Europe is far ahead as the percentage of users are
concerned (ITU, 2011 & Kathuria, 2008). The internet speed and other key indicators are also
high for Europe than other continents.
10
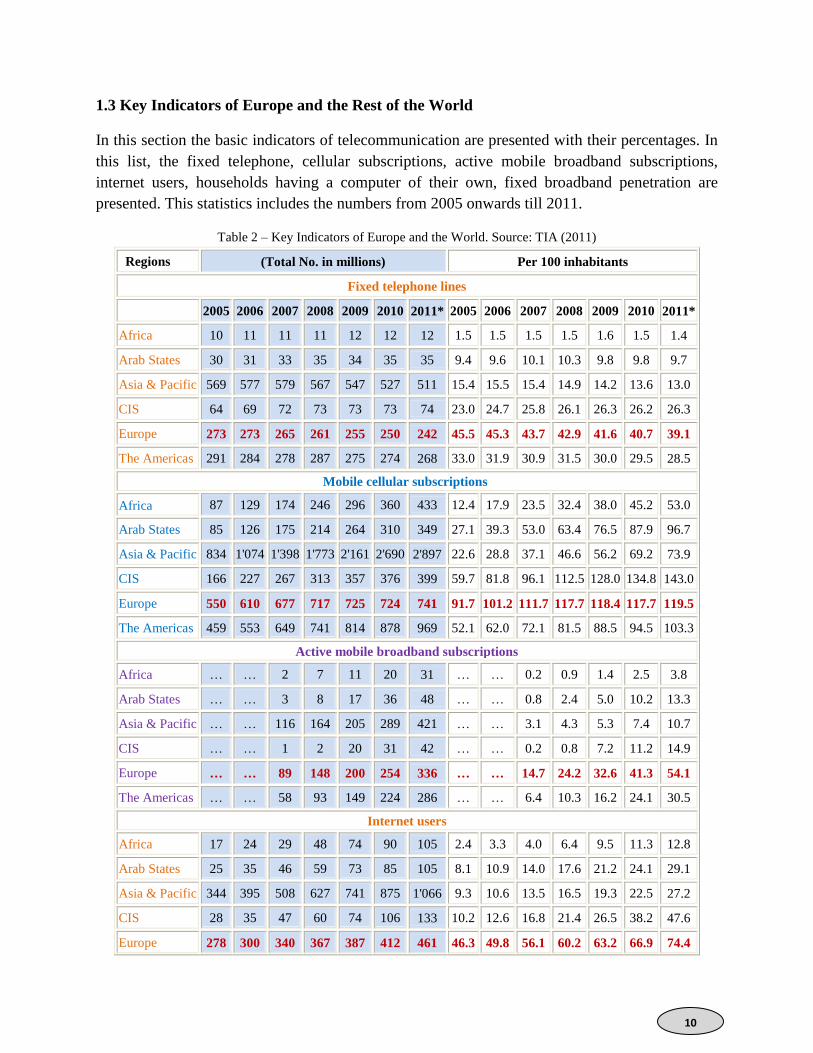
1.3 Key Indicators of Europe and the Rest of the World
In this section the basic indicators of telecommunication are presented with their percentages. In
this list, the fixed telephone, cellular subscriptions, active mobile broadband subscriptions,
internet users, households having a computer of their own, fixed broadband penetration are
presented. This statistics includes the numbers from 2005 onwards till 2011.
Table 2 – Key Indicators of Europe and the World. Source: TIA (2011)
Regions (Total No. in millions) Per 100 inhabitants
Fixed telephone lines
2005 2006 2007 2008 2009 2010 2011* 2005 2006 2007 2008 2009 2010 2011*
Africa 10 11 11 11 12 12 12 1.5 1.5 1.5 1.5 1.6 1.5 1.4
Arab States 30 31 33 35 34 35 35 9.4 9.6 10.1 10.3 9.8 9.8 9.7
Asia & Pacific 569 577 579 567 547 527 511 15.4 15.5 15.4 14.9 14.2 13.6 13.0
CIS 64 69 72 73 73 73 74 23.0 24.7 25.8 26.1 26.3 26.2 26.3
Europe 273 273 265 261 255 250 242 45.5 45.3 43.7 42.9 41.6 40.7 39.1
The Americas 291 284 278 287 275 274 268 33.0 31.9 30.9 31.5 30.0 29.5 28.5
Mobile cellular subscriptions
Africa 87 129 174 246 296 360 433 12.4 17.9 23.5 32.4 38.0 45.2 53.0
Arab States 85 126 175 214 264 310 349 27.1 39.3 53.0 63.4 76.5 87.9 96.7
Asia & Pacific 834 1'074 1'398 1'773 2'161 2'690 2'897 22.6 28.8 37.1 46.6 56.2 69.2 73.9
CIS 166 227 267 313 357 376 399 59.7 81.8 96.1 112.5 128.0 134.8 143.0
Europe 550 610 677 717 725 724 741 91.7 101.2 111.7 117.7 118.4 117.7 119.5
The Americas 459 553 649 741 814 878 969 52.1 62.0 72.1 81.5 88.5 94.5 103.3
Active mobile broadband subscriptions
Africa … … 2 7 11 20 31 … … 0.2 0.9 1.4 2.5 3.8
Arab States … … 3 8 17 36 48 … … 0.8 2.4 5.0 10.2 13.3
Asia & Pacific … … 116 164 205 289 421 … … 3.1 4.3 5.3 7.4 10.7
CIS … … 1 2 20 31 42 … … 0.2 0.8 7.2 11.2 14.9
Europe … … 89 148 200 254 336 … … 14.7 24.2 32.6 41.3 54.1
The Americas … … 58 93 149 224 286 … … 6.4 10.3 16.2 24.1 30.5
Internet users
Africa 17 24 29 48 74 90 105 2.4 3.3 4.0 6.4 9.5 11.3 12.8
Arab States 25 35 46 59 73 85 105 8.1 10.9 14.0 17.6 21.2 24.1 29.1
Asia & Pacific 344 395 508 627 741 875 1'066 9.3 10.6 13.5 16.5 19.3 22.5 27.2
CIS 28 35 47 60 74 106 133 10.2 12.6 16.8 21.4 26.5 38.2 47.6
Europe 278 300 340 367 387 412 461 46.3 49.8 56.1 60.2 63.2 66.9 74.4
11
The Americas 316 346 385 402 424 462 529 35.9 38.8 42.7 44.2 46.1 49.7 56.3
Fixed (wired) broadband subscriptions
Africa - - 1 1 1 1 1 - 0.1 0.1 0.1 0.1 0.2 0.2
Arab States 1 2 3 4 6 7 8 0.3 0.5 0.9 1.3 1.7 1.9 2.2
Asia & Pacific 80 103 126 151 181 212 243 2.2 2.8 3.3 4.0 4.7 5.5 6.2
CIS 2 4 6 12 17 23 27 0.6 1.3 2.3 4.5 6.1 8.3 9.6
Europe 66 89 112 126 137 146 160 10.9 14.8 18.4 20.7 22.4 23.8 25.8
The Americas 66 81 99 113 124 131 145 7.5 9.1 11.0 12.4 13.5 14.1 15.5
Households with a computer
Africa N/A N/A N/A N/A N/A N/A N/A 3.0 3.3 3.8 5.6 6.3 7.1 7.9
Arab States N/A N/A N/A N/A N/A N/A N/A 14.9 17.4 19.7 22.7 25.8 28.0 30.7
Asia & Pacific N/A N/A N/A N/A N/A N/A N/A 20.1 21.3 22.6 24.4 26.2 26.9 28.5
CIS N/A N/A N/A N/A N/A N/A N/A 10.8 12.2 24.6 31.8 36.8 39.2 43.8
Europe N/A N/A N/A N/A N/A N/A N/A 52.8 56.3 61.2 65.1 68.5 71.9 75.5
The Americas N/A N/A N/A N/A N/A N/A N/A 40.9 42.8 45.5 48.1 49.3 51.5 53.6
Households with Internet access at home
Africa N/A N/A N/A N/A N/A N/A N/A 1.0 1.3 1.7 2.6 3.4 4.3 5.7
Arab States N/A N/A N/A N/A N/A N/A N/A 9.3 10.9 12.9 14.7 18.2 21.7 26.1
Asia & Pacific N/A N/A N/A N/A N/A N/A N/A 11.8 13.5 15.8 17.0 18.5 20.5 24.9
CIS N/A N/A N/A N/A N/A N/A N/A 5.3 6.7 16.8 20.7 27.0 32.3 38.5
Europe N/A N/A N/A N/A N/A N/A N/A 42.0 46.4 51.7 57.7 62.4 67.8 72.2
The Americas N/A N/A N/A N/A N/A N/A N/A 32.7 34.5 36.8 38.9 42.0 45.0 49.7
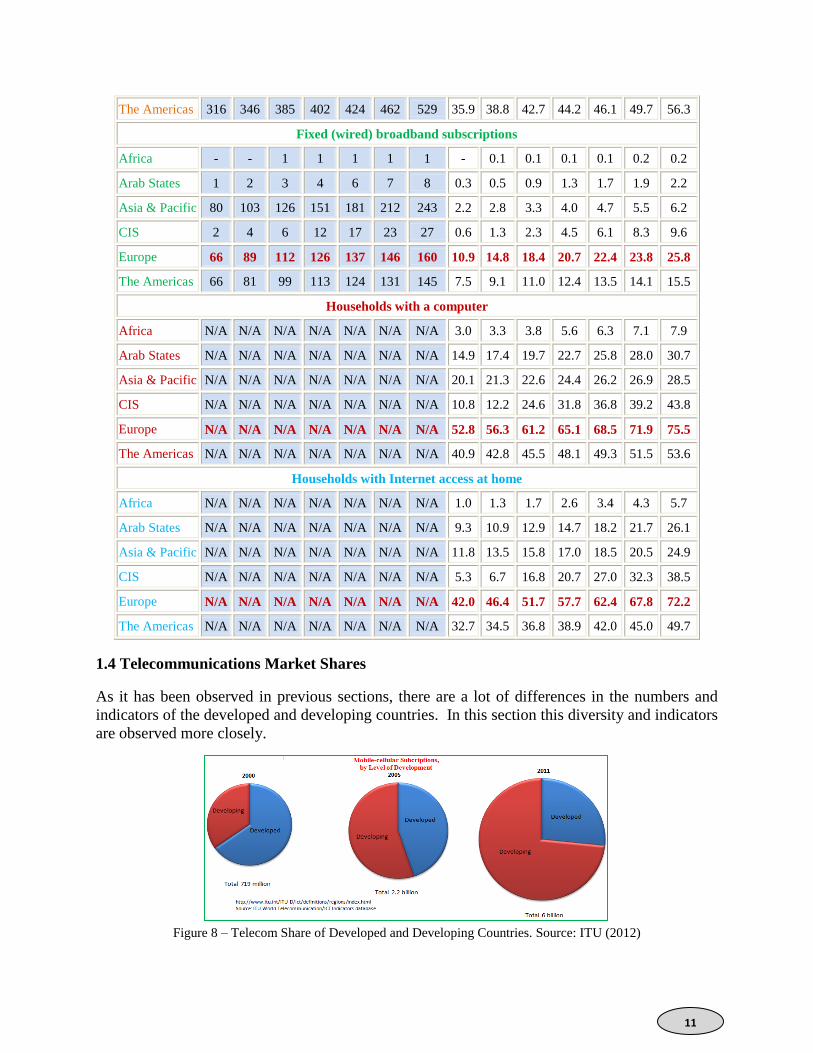
1.4 Telecommunications Market Shares
As it has been observed in previous sections, there are a lot of differences in the numbers and
indicators of the developed and developing countries. In this section this diversity and indicators
are observed more closely.
Figure 8 – Telecom Share of Developed and Developing Countries. Source: ITU (2012)
12
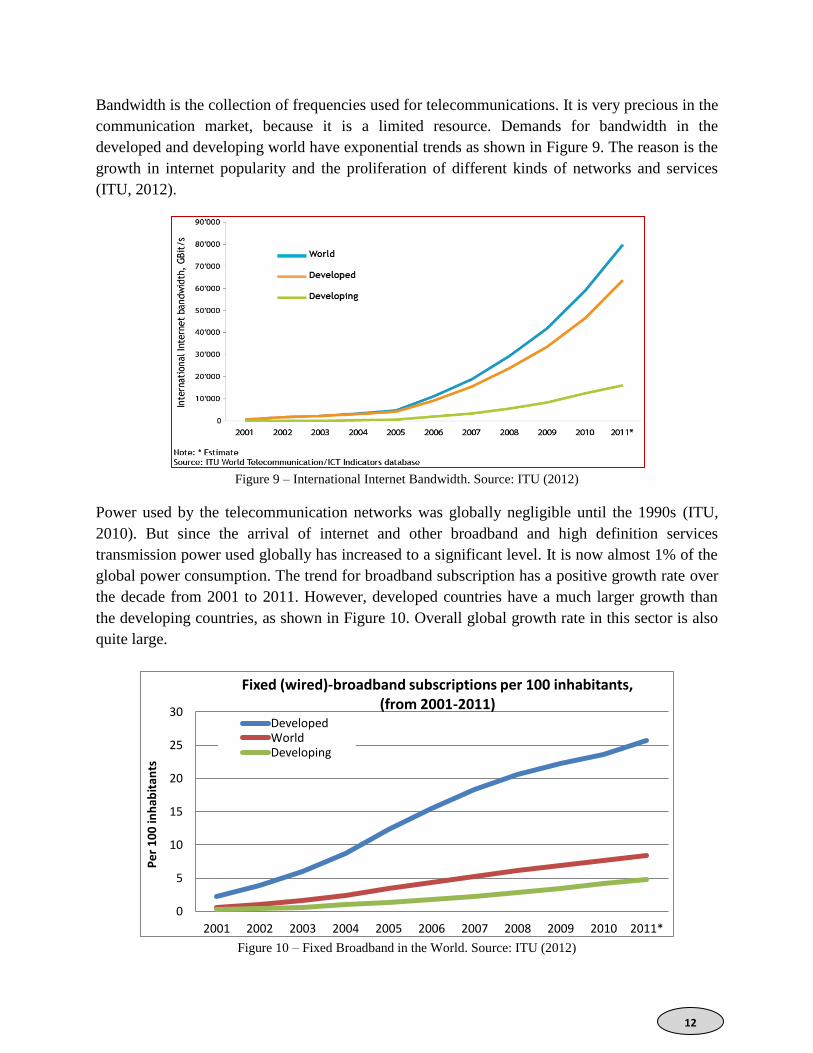
Bandwidth is the collection of frequencies used for telecommunications. It is very precious in the
communication market, because it is a limited resource. Demands for bandwidth in the
developed and developing world have exponential trends as shown in Figure 9. The reason is the
growth in internet popularity and the proliferation of different kinds of networks and services
(ITU, 2012).
Figure 9 – International Internet Bandwidth. Source: ITU (2012)
Power used by the telecommunication networks was globally negligible until the 1990s (ITU,
2010). But since the arrival of internet and other broadband and high definition services
transmission power used globally has increased to a significant level. It is now almost 1% of the
global power consumption. The trend for broadband subscription has a positive growth rate over
the decade from 2001 to 2011. However, developed countries have a much larger growth than
the developing countries, as shown in Figure 10. Overall global growth rate in this sector is also
quite large.
Figure 10 – Fixed Broadband in the World. Source: ITU (2012)
0
5
10
15
20
25
30
2001 2002 2003 2004 2005 2006 2007 2008 2009 2010 2011*
Pe
r 1
00
inh
abit
ants
Fixed (wired)-broadband subscriptions per 100 inhabitants, (from 2001-2011)
Developed World Developing
13
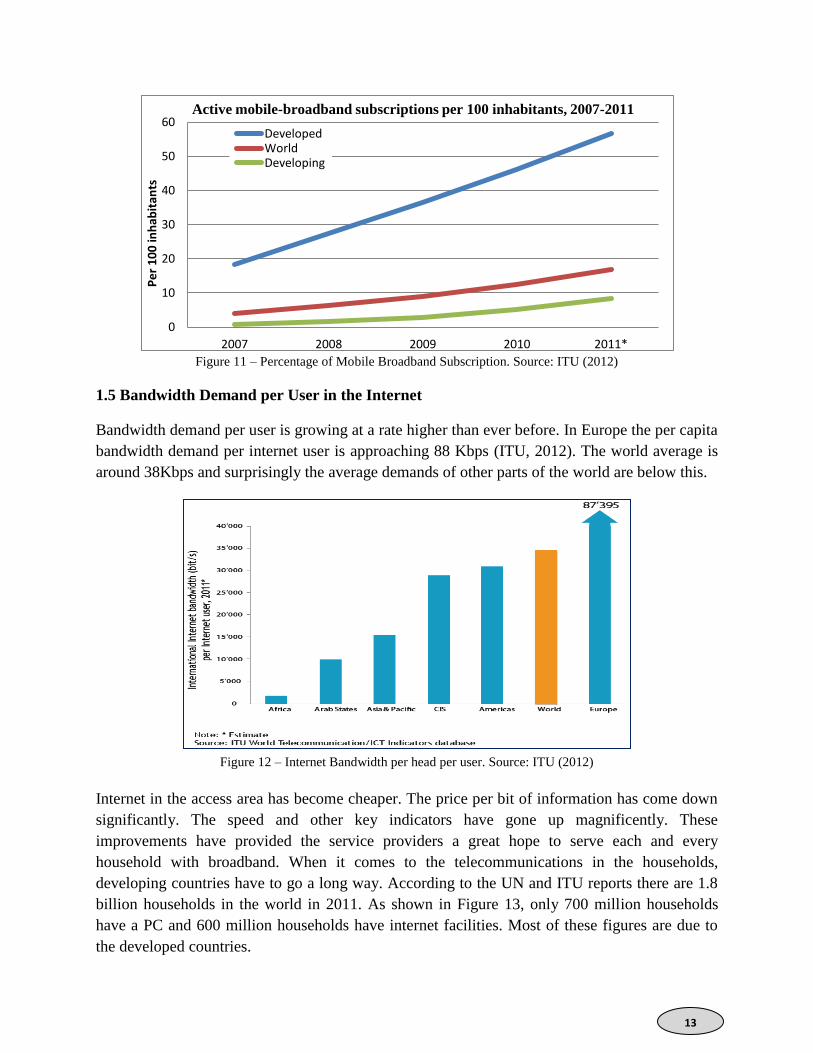
Figure 11 – Percentage of Mobile Broadband Subscription. Source: ITU (2012)
1.5 Bandwidth Demand per User in the Internet
Bandwidth demand per user is growing at a rate higher than ever before. In Europe the per capita
bandwidth demand per internet user is approaching 88 Kbps (ITU, 2012). The world average is
around 38Kbps and surprisingly the average demands of other parts of the world are below this.
Figure 12 – Internet Bandwidth per head per user. Source: ITU (2012)
Internet in the access area has become cheaper. The price per bit of information has come down
significantly. The speed and other key indicators have gone up magnificently. These
improvements have provided the service providers a great hope to serve each and every
household with broadband. When it comes to the telecommunications in the households,
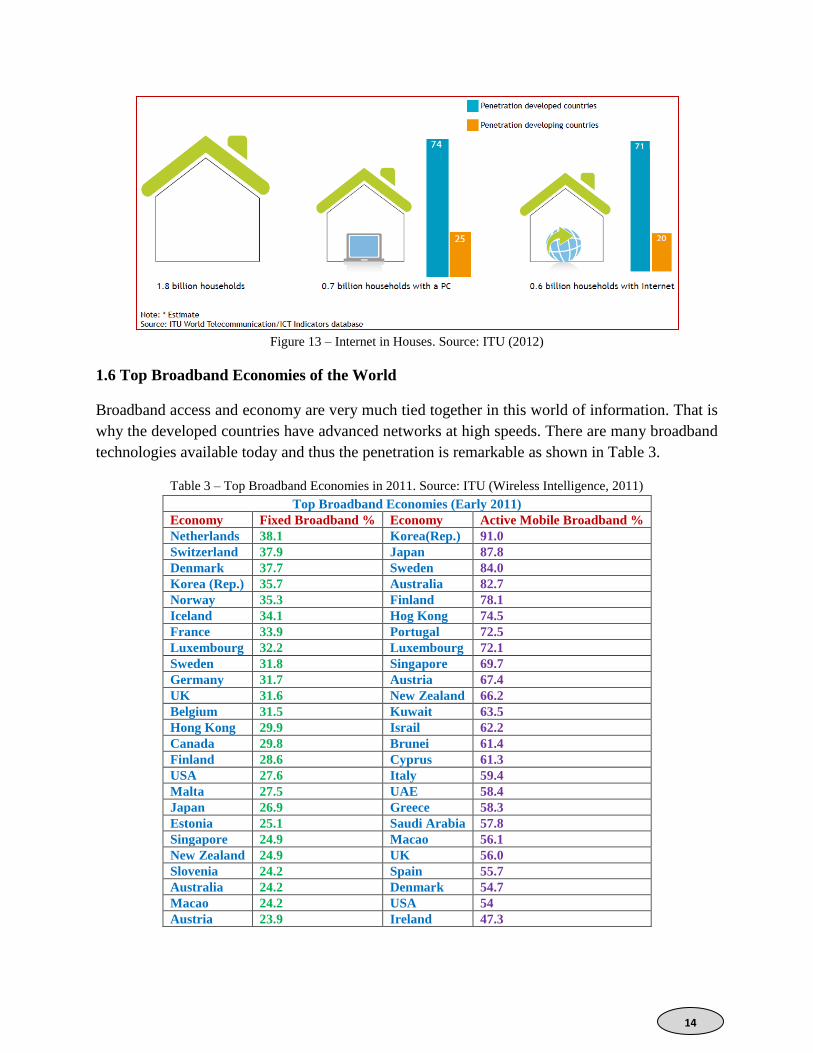
developing countries have to go a long way. According to the UN and ITU reports there are 1.8
billion households in the world in 2011. As shown in Figure 13, only 700 million households
have a PC and 600 million households have internet facilities. Most of these figures are due to
the developed countries.
0
10
20
30
40
50
60
2007 2008 2009 2010 2011*
Pe
r 1
00
inh
abit
ants
Developed World Developing
Active mobile-broadband subscriptions per 100 inhabitants, 2007-2011
14
Figure 13 – Internet in Houses. Source: ITU (2012)
1.6 Top Broadband Economies of the World
Broadband access and economy are very much tied together in this world of information. That is
why the developed countries have advanced networks at high speeds. There are many broadband
technologies available today and thus the penetration is remarkable as shown in Table 3.
Table 3 – Top Broadband Economies in 2011. Source: ITU (Wireless Intelligence, 2011)
Top Broadband Economies (Early 2011)
Economy Fixed Broadband % Economy Active Mobile Broadband %
Netherlands 38.1 Korea(Rep.) 91.0
Switzerland 37.9 Japan 87.8
Denmark 37.7 Sweden 84.0
Korea (Rep.) 35.7 Australia 82.7
Norway 35.3 Finland 78.1
Iceland 34.1 Hog Kong 74.5
France 33.9 Portugal 72.5
Luxembourg 32.2 Luxembourg 72.1
Sweden 31.8 Singapore 69.7
Germany 31.7 Austria 67.4
UK 31.6 New Zealand 66.2
Belgium 31.5 Kuwait 63.5
Hong Kong 29.9 Israil 62.2
Canada 29.8 Brunei 61.4
Finland 28.6 Cyprus 61.3
USA 27.6 Italy 59.4
Malta 27.5 UAE 58.4
Japan 26.9 Greece 58.3
Estonia 25.1 Saudi Arabia 57.8
Singapore 24.9 Macao 56.1
New Zealand 24.9 UK 56.0
Slovenia 24.2 Spain 55.7
Australia 24.2 Denmark 54.7
Macao 24.2 USA 54
Austria 23.9 Ireland 47.3
15
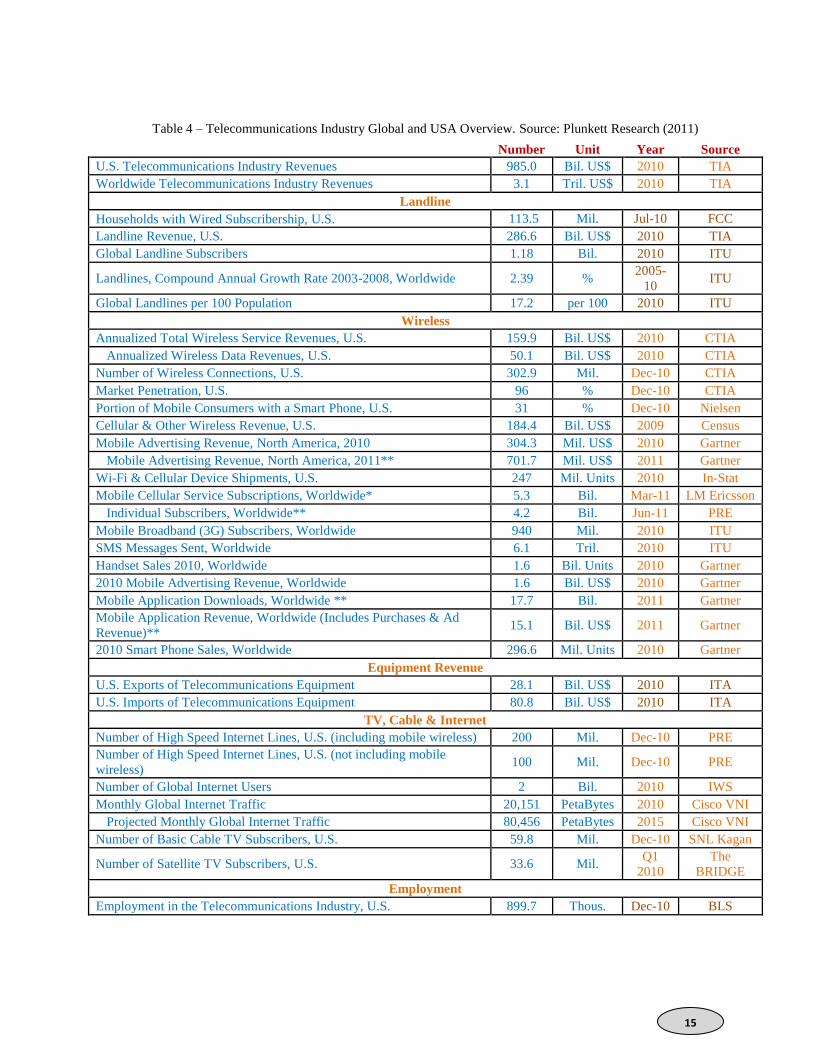
Table 4 – Telecommunications Industry Global and USA Overview. Source: Plunkett Research (2011)
Number Unit Year Source
U.S. Telecommunications Industry Revenues 985.0 Bil. US$ 2010 TIA
Worldwide Telecommunications Industry Revenues 3.1 Tril. US$ 2010 TIA
Landline
Households with Wired Subscribership, U.S. 113.5 Mil. Jul-10 FCC
Landline Revenue, U.S. 286.6 Bil. US$ 2010 TIA
Global Landline Subscribers 1.18 Bil. 2010 ITU
Landlines, Compound Annual Growth Rate 2003-2008, Worldwide 2.39 % 2005-
10 ITU
Global Landlines per 100 Population 17.2 per 100 2010 ITU
Wireless
Annualized Total Wireless Service Revenues, U.S. 159.9 Bil. US$ 2010 CTIA
Annualized Wireless Data Revenues, U.S. 50.1 Bil. US$ 2010 CTIA
Number of Wireless Connections, U.S. 302.9 Mil. Dec-10 CTIA
Market Penetration, U.S. 96 % Dec-10 CTIA
Portion of Mobile Consumers with a Smart Phone, U.S. 31 % Dec-10 Nielsen
Cellular & Other Wireless Revenue, U.S. 184.4 Bil. US$ 2009 Census
Mobile Advertising Revenue, North America, 2010 304.3 Mil. US$ 2010 Gartner
Mobile Advertising Revenue, North America, 2011** 701.7 Mil. US$ 2011 Gartner
Wi-Fi & Cellular Device Shipments, U.S. 247 Mil. Units 2010 In-Stat
Mobile Cellular Service Subscriptions, Worldwide* 5.3 Bil. Mar-11 LM Ericsson
Individual Subscribers, Worldwide** 4.2 Bil. Jun-11 PRE
Mobile Broadband (3G) Subscribers, Worldwide 940 Mil. 2010 ITU
SMS Messages Sent, Worldwide 6.1 Tril. 2010 ITU
Handset Sales 2010, Worldwide 1.6 Bil. Units 2010 Gartner
2010 Mobile Advertising Revenue, Worldwide 1.6 Bil. US$ 2010 Gartner
Mobile Application Downloads, Worldwide ** 17.7 Bil. 2011 Gartner
Mobile Application Revenue, Worldwide (Includes Purchases & Ad
Revenue)** 15.1 Bil. US$ 2011 Gartner
2010 Smart Phone Sales, Worldwide 296.6 Mil. Units 2010 Gartner
Equipment Revenue
U.S. Exports of Telecommunications Equipment 28.1 Bil. US$ 2010 ITA
U.S. Imports of Telecommunications Equipment 80.8 Bil. US$ 2010 ITA
TV, Cable & Internet
Number of High Speed Internet Lines, U.S. (including mobile wireless) 200 Mil. Dec-10 PRE
Number of High Speed Internet Lines, U.S. (not including mobile
wireless) 100 Mil. Dec-10 PRE
Number of Global Internet Users 2 Bil. 2010 IWS
Monthly Global Internet Traffic 20,151 PetaBytes 2010 Cisco VNI
Projected Monthly Global Internet Traffic 80,456 PetaBytes 2015 Cisco VNI
Number of Basic Cable TV Subscribers, U.S. 59.8 Mil. Dec-10 SNL Kagan
Number of Satellite TV Subscribers, U.S. 33.6 Mil. Q1
2010
The
BRIDGE
Employment
Employment in the Telecommunications Industry, U.S. 899.7 Thous. Dec-10 BLS
16
1.7 The Reasons behind the Strategic Shifts
Though we have gone through varieties of statistics of the world´s telecom industry the exact
reasons behind the strategic changes in the telecom industry are not very clear. Of course some
of the presented statistics indicate a few points in this regard. In this section all the key
motivating factors and their intentions are described with the supporting statistics collected from
different reliable sources. More points with detailed reasons are given in Chapter 2.
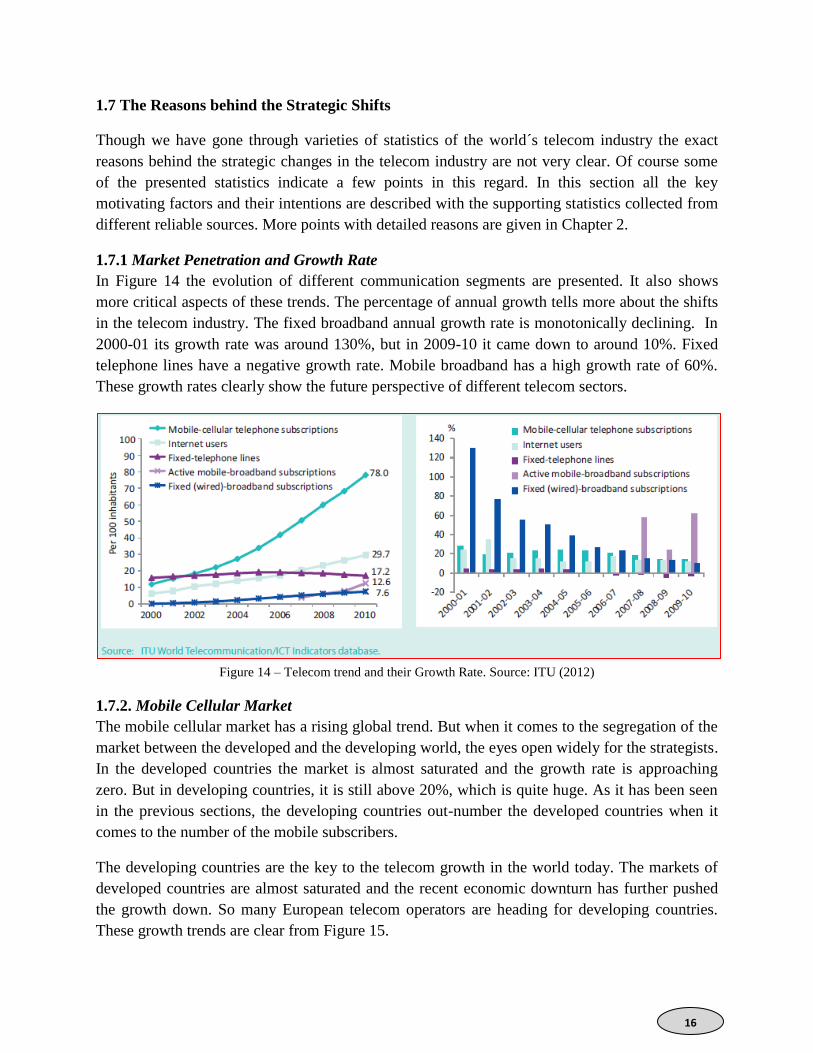
1.7.1 Market Penetration and Growth Rate
In Figure 14 the evolution of different communication segments are presented. It also shows
more critical aspects of these trends. The percentage of annual growth tells more about the shifts
in the telecom industry. The fixed broadband annual growth rate is monotonically declining. In
2000-01 its growth rate was around 130%, but in 2009-10 it came down to around 10%. Fixed
telephone lines have a negative growth rate. Mobile broadband has a high growth rate of 60%.
These growth rates clearly show the future perspective of different telecom sectors.
Figure 14 – Telecom trend and their Growth Rate. Source: ITU (2012)
1.7.2. Mobile Cellular Market
The mobile cellular market has a rising global trend. But when it comes to the segregation of the
market between the developed and the developing world, the eyes open widely for the strategists.
In the developed countries the market is almost saturated and the growth rate is approaching
zero. But in developing countries, it is still above 20%, which is quite huge. As it has been seen
in the previous sections, the developing countries out-number the developed countries when it
comes to the number of the mobile subscribers.
The developing countries are the key to the telecom growth in the world today. The markets of
developed countries are almost saturated and the recent economic downturn has further pushed
the growth down. So many European telecom operators are heading for developing countries.
These growth trends are clear from Figure 15.
17
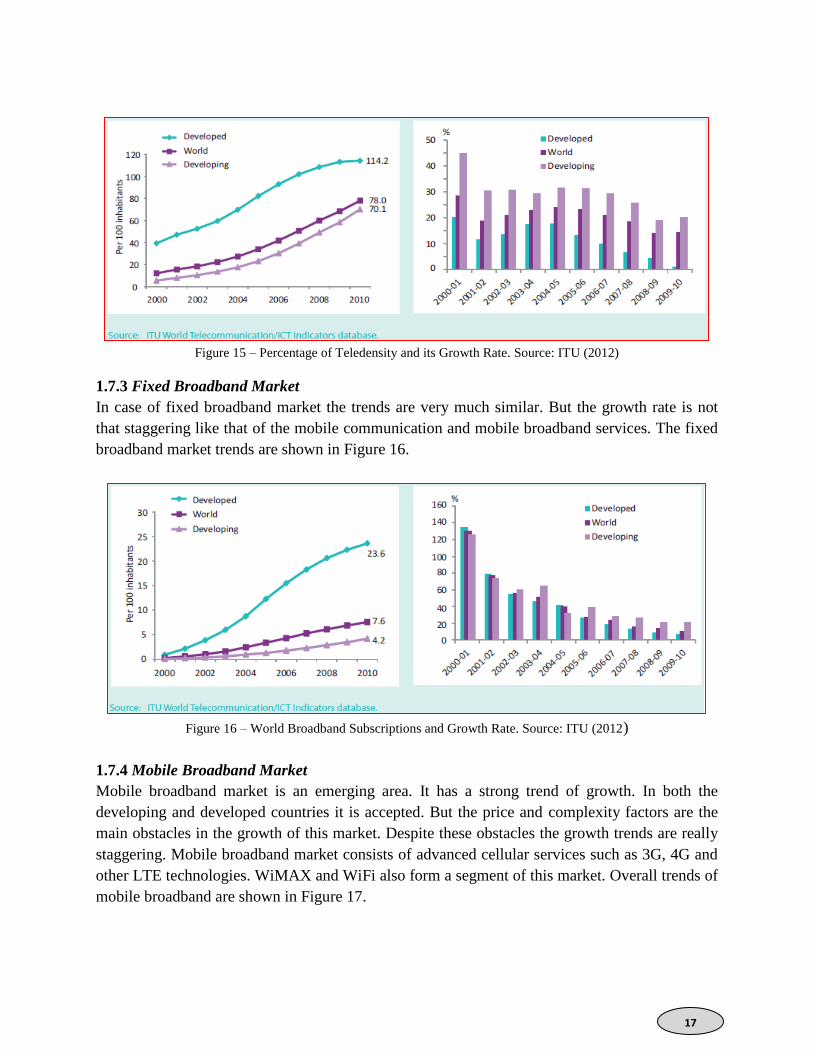
Figure 15 – Percentage of Teledensity and its Growth Rate. Source: ITU (2012)
1.7.3 Fixed Broadband Market
In case of fixed broadband market the trends are very much similar. But the growth rate is not
that staggering like that of the mobile communication and mobile broadband services. The fixed
broadband market trends are shown in Figure 16.
Figure 16 – World Broadband Subscriptions and Growth Rate. Source: ITU (2012)
1.7.4 Mobile Broadband Market
Mobile broadband market is an emerging area. It has a strong trend of growth. In both the
developing and developed countries it is accepted. But the price and complexity factors are the
main obstacles in the growth of this market. Despite these obstacles the growth trends are really
staggering. Mobile broadband market consists of advanced cellular services such as 3G, 4G and
other LTE technologies. WiMAX and WiFi also form a segment of this market. Overall trends of
mobile broadband are shown in Figure 17.
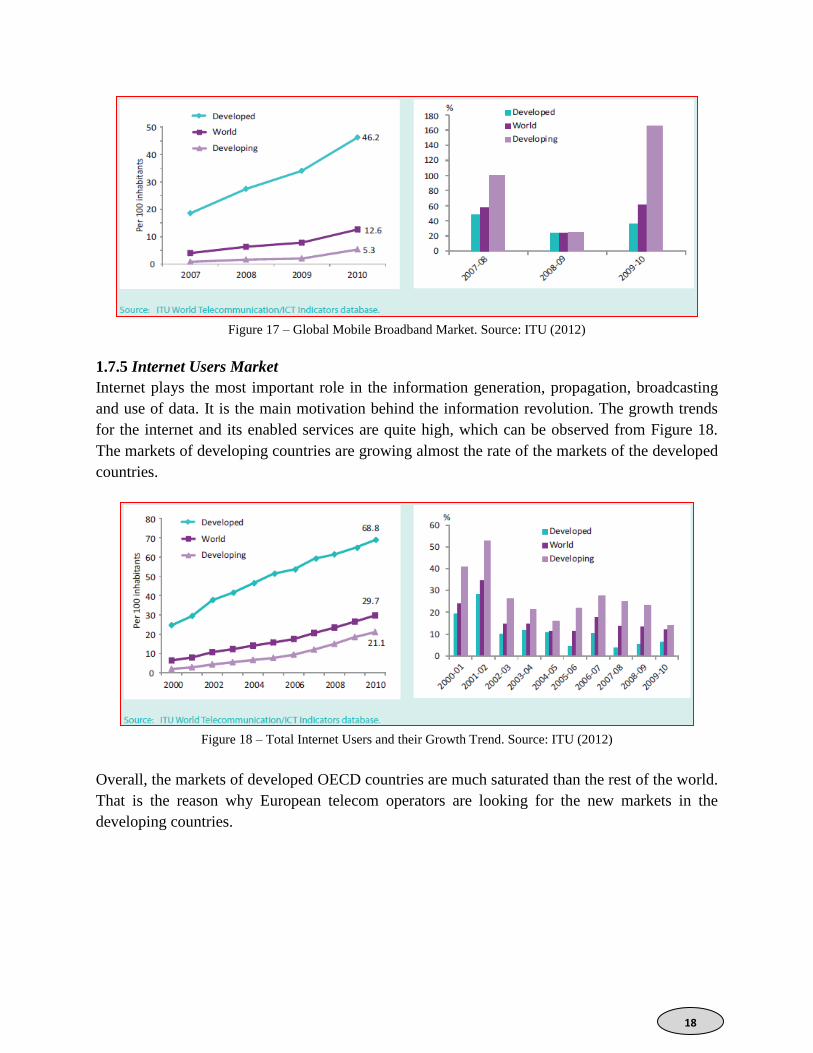
18
Figure 17 – Global Mobile Broadband Market. Source: ITU (2012)
1.7.5 Internet Users Market
Internet plays the most important role in the information generation, propagation, broadcasting
and use of data. It is the main motivation behind the information revolution. The growth trends
for the internet and its enabled services are quite high, which can be observed from Figure 18.
The markets of developing countries are growing almost the rate of the markets of the developed
countries.
Figure 18 – Total Internet Users and their Growth Trend. Source: ITU (2012)
Overall, the markets of developed OECD countries are much saturated than the rest of the world.
That is the reason why European telecom operators are looking for the new markets in the
developing countries.
19
Chapter 2
Factors and Indicators of Strategic Changes of Big Companies of Europe
In this chapter, main factors and indicators of strategic changes of European Operators are
studied. For this purpose ten largest telecom companies of Europe have been analyzed. In this
analysis main companies of Western Europe and Russia are taken into account. These companies
are among the market leaders in their home country and some are also big players in Europe and
the world. Some of these companies are public sector companies with the government as the
main stakeholder and others are completely private companies. Some of these companies are
specialists of wireless communication and others have both wireless and wired networks. Some
are even the mainstream service providers of several countries. All these aspects are considered
to study the markets and their effects over the telecom economy and overall business sectors.
2.1 Analysis of Big Companies of Europe
Ten big telecom companies of Europe are studied from the strategic shifts point of views. These
companies are among the biggest telecom players in the world and their combined revenue is
more than 30% of the global telecom revenue of the telecom operator’s market according to the
2010 reports of ITU and Eurostat. These companies have played important roles in the global
telecom changes since their establishments. These companies are:
1. Vodafone
2. Telefónica
3. France Telecom
4. Deutsche Telecom
5. British Telecom
6. Telecom Italia
7. Telenor
8. TeliaSonera
9. MTS (Sistema)
10. Portugal Telecom
Vodafone is the largest mobile telecom company in the world by revenue and second largest by
number of subscribers. It was founded in 1984 and switched on in 1985 and then acquired
several companies to enlarge its operation (Vodafone.co.uk, 2010). Now it operates in 30
countries and in further 40 countries it has partnerships with other companies (Vodafone, 2011).
Telefónica is the largest as well as the incumbent Spanish Telecom Company. It is the third
largest wireless service provider in Europe (Telefónica, 2011). It was founded in the year 1924;
it was formerly a public owned company. But Spanish government privatized it in 1994 in the
interest of the company. It is having a dominant share in the market in the telecom area.
20
France Telecom is one of the largest in the world and third largest telecom Sector Company in
Europe, having located in Paris, France. It was started in 1988. It provides broadband services,
fixed wireline and wireless services in France and several other countries in Europe and outside
Europe (France Telecom, 2011).
Deutsche Telekom is the largest telecom company of Europe. It was formerly a state owned
company situated in Bonn in Germany; it became privatized and incorporated in 1996. Their
total revenue was 62.42 billion euro in 2010 (Deutsche Telecom, 2011). It has operations in
Europe and North America.
British Telecom shortly known as BT is one of the largest as well as oldest telecommunication
companies in the world. Having headquartered in London, it has several services and operations
in UK, Europe, North America and some other countries. It also supplies services and
infrastructures to Government sectors and British Armed forces (British Telecom, 2011).
Telecom Italia is one the leading and forefront companies in the post-privatized Europe. It was
started in 1994.It is popular for its network management expertise and its geographically
diversified portfolio of telecom assets. It had network operations mainly in Europe and Latin
America.TIM is a subsidiary of it (Telecom Italia, 2011).
Telenor is the largest telecom service provider in Norway. It has its operation mainly in Nordic
countries and Eastern Europe. But since last five years it has taken markets in Asia and growing
quite fast. It is providing both cellular and broadband services to its customers. It has 203 million
subscribers in total (Telenor, 2011).
TeliaSonera is a telephone company in Sweden and Finland. The company has operations in
other countries in Northern and Eastern Europe, Central Asia and Spain. It has in total more than
150 million mobile customers (Telia Sonera, 2010). It is headquartered in Stockholm and its
stocks are traded on the Stockholm and Helsinki stock exchanges. It is also a fast growing
company.
MTS Systema is a Russian conglomerate with a large market capitalization in Russia and other
USSR countries. It is also present in 24 other countries (MTS, 2011). It is the largest telecom
company of Russia and also one of the fast growing companies of the world.
Portugal Telecom or PT was incorporated in 1994 and became a major European telecom
operator. It is the largest telecomm company in Portugal, but it operates Brazil and other
Portuguese speaking countries like Angola and Guinea-Bissau (Portugal Telecom, 2011). It has a
de facto monopoly in fixed and broadband communications in Portugal.
Similarly, for the Indian market, 10 largest operators have been chosen. They are also huge
companies with millions of customers and revenues. Some of them are also global players like
the European companies presented above. Those companies and their analysis are in chapter 6.
21
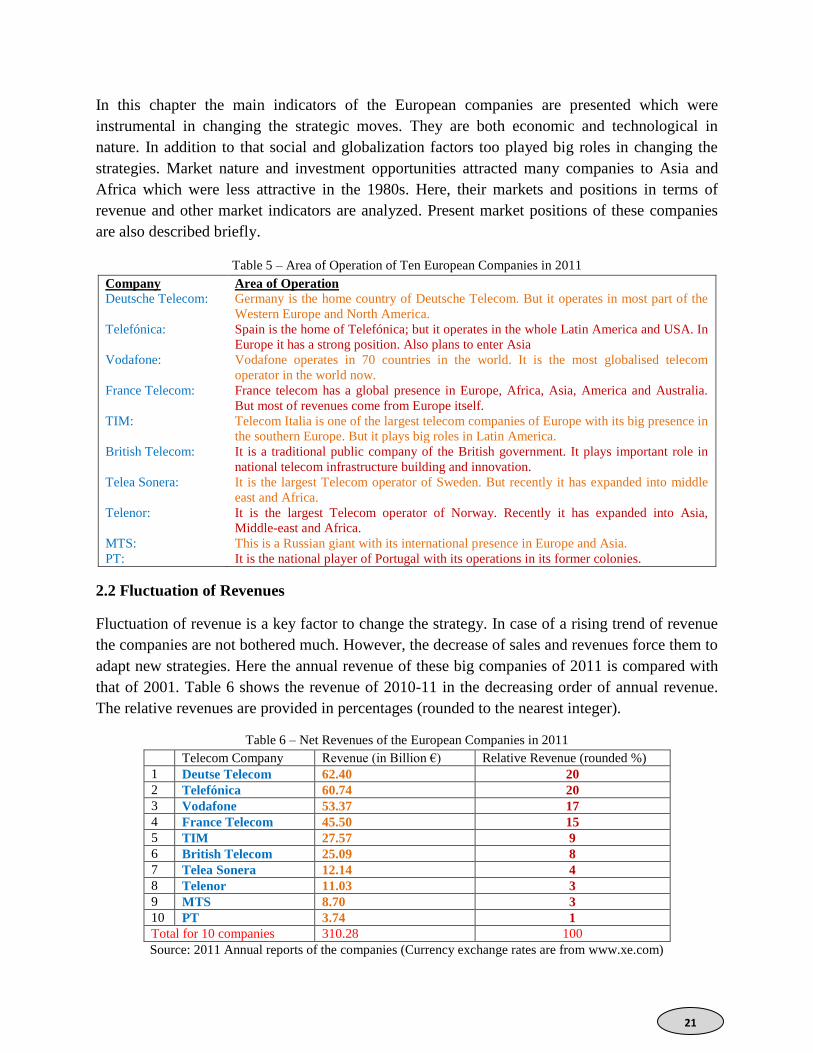
In this chapter the main indicators of the European companies are presented which were
instrumental in changing the strategic moves. They are both economic and technological in
nature. In addition to that social and globalization factors too played big roles in changing the
strategies. Market nature and investment opportunities attracted many companies to Asia and
Africa which were less attractive in the 1980s. Here, their markets and positions in terms of
revenue and other market indicators are analyzed. Present market positions of these companies
are also described briefly.
Table 5 – Area of Operation of Ten European Companies in 2011
Company Area of Operation
Deutsche Telecom: Germany is the home country of Deutsche Telecom. But it operates in most part of the
Western Europe and North America.
Telefónica: Spain is the home of Telefónica; but it operates in the whole Latin America and USA. In
Europe it has a strong position. Also plans to enter Asia
Vodafone: Vodafone operates in 70 countries in the world. It is the most globalised telecom
operator in the world now.
France Telecom: France telecom has a global presence in Europe, Africa, Asia, America and Australia.
But most of revenues come from Europe itself.
TIM: Telecom Italia is one of the largest telecom companies of Europe with its big presence in
the southern Europe. But it plays big roles in Latin America.
British Telecom: It is a traditional public company of the British government. It plays important role in
national telecom infrastructure building and innovation.
Telea Sonera: It is the largest Telecom operator of Sweden. But recently it has expanded into middle
east and Africa.
Telenor: It is the largest Telecom operator of Norway. Recently it has expanded into Asia,
Middle-east and Africa.
MTS: This is a Russian giant with its international presence in Europe and Asia.
PT: It is the national player of Portugal with its operations in its former colonies.
2.2 Fluctuation of Revenues
Fluctuation of revenue is a key factor to change the strategy. In case of a rising trend of revenue
the companies are not bothered much. However, the decrease of sales and revenues force them to
adapt new strategies. Here the annual revenue of these big companies of 2011 is compared with
that of 2001. Table 6 shows the revenue of 2010-11 in the decreasing order of annual revenue.
The relative revenues are provided in percentages (rounded to the nearest integer).
Table 6 – Net Revenues of the European Companies in 2011
Telecom Company Revenue (in Billion €) Relative Revenue (rounded %)
1 Deutse Telecom 62.40 20
2 Telefónica 60.74 20
3 Vodafone 53.37 17
4 France Telecom 45.50 15
5 TIM 27.57 9
6 British Telecom 25.09 8
7 Telea Sonera 12.14 4
8 Telenor 11.03 3
9 MTS 8.70 3
10 PT 3.74 1
Total for 10 companies 310.28 100
Source: 2011 Annual reports of the companies (Currency exchange rates are from www.xe.com)
22
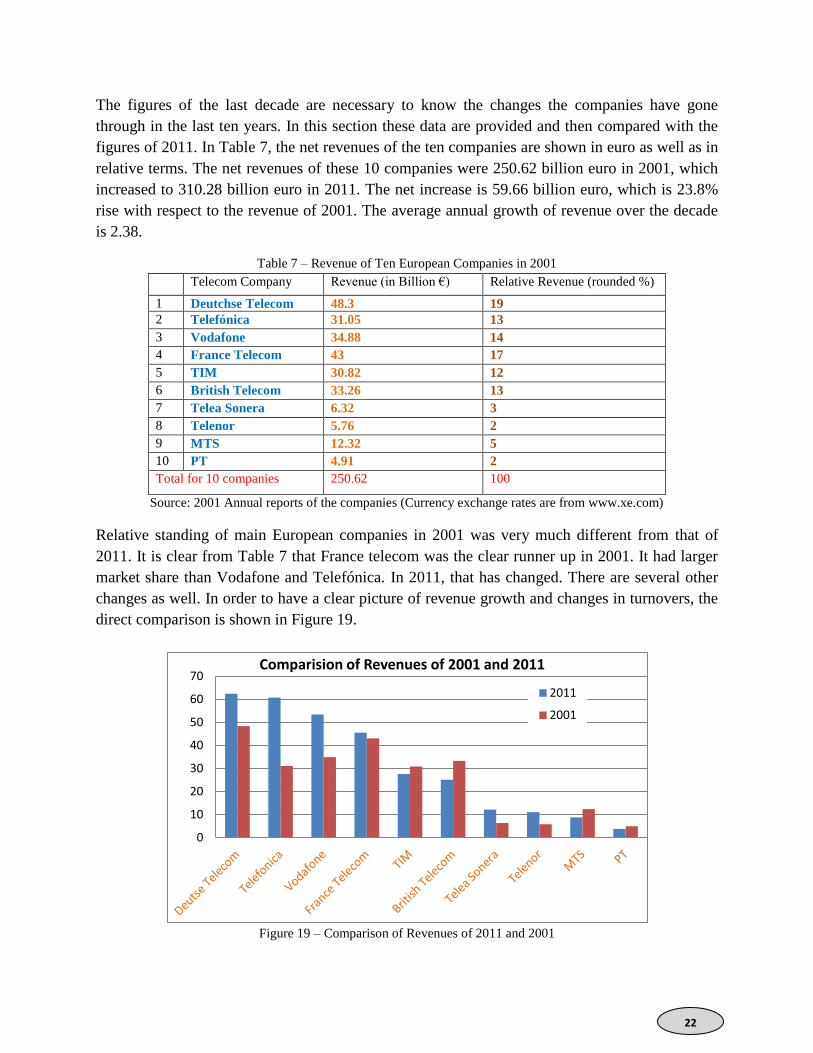
The figures of the last decade are necessary to know the changes the companies have gone
through in the last ten years. In this section these data are provided and then compared with the
figures of 2011. In Table 7, the net revenues of the ten companies are shown in euro as well as in
relative terms. The net revenues of these 10 companies were 250.62 billion euro in 2001, which
increased to 310.28 billion euro in 2011. The net increase is 59.66 billion euro, which is 23.8%
rise with respect to the revenue of 2001. The average annual growth of revenue over the decade
is 2.38.
Table 7 – Revenue of Ten European Companies in 2001
Telecom Company Revenue (in Billion €) Relative Revenue (rounded %)
1 Deutchse Telecom 48.3 19
2 Telefónica 31.05 13
3 Vodafone 34.88 14
4 France Telecom 43 17
5 TIM 30.82 12
6 British Telecom 33.26 13
7 Telea Sonera 6.32 3
8 Telenor 5.76 2
9 MTS 12.32 5
10 PT 4.91 2
Total for 10 companies 250.62 100
Source: 2001 Annual reports of the companies (Currency exchange rates are from www.xe.com)
Relative standing of main European companies in 2001 was very much different from that of
2011. It is clear from Table 7 that France telecom was the clear runner up in 2001. It had larger
market share than Vodafone and Telefónica. In 2011, that has changed. There are several other
changes as well. In order to have a clear picture of revenue growth and changes in turnovers, the
direct comparison is shown in Figure 19.
Figure 19 – Comparison of Revenues of 2011 and 2001
0
10
20
30
40
50
60
70 Comparision of Revenues of 2001 and 2011
2011
2001
23
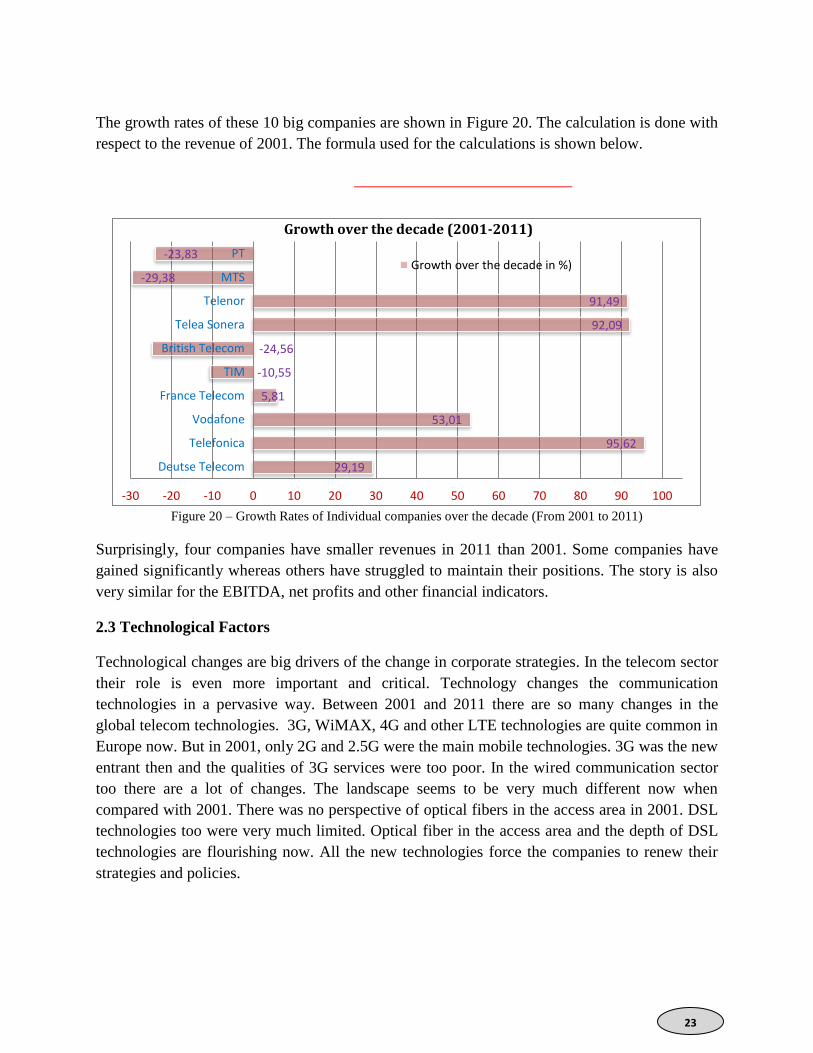
The growth rates of these 10 big companies are shown in Figure 20. The calculation is done with
respect to the revenue of 2001. The formula used for the calculations is shown below.
Figure 20 – Growth Rates of Individual companies over the decade (From 2001 to 2011)
Surprisingly, four companies have smaller revenues in 2011 than 2001. Some companies have
gained significantly whereas others have struggled to maintain their positions. The story is also
very similar for the EBITDA, net profits and other financial indicators.
2.3 Technological Factors
Technological changes are big drivers of the change in corporate strategies. In the telecom sector
their role is even more important and critical. Technology changes the communication
technologies in a pervasive way. Between 2001 and 2011 there are so many changes in the
global telecom technologies. 3G, WiMAX, 4G and other LTE technologies are quite common in
Europe now. But in 2001, only 2G and 2.5G were the main mobile technologies. 3G was the new
entrant then and the qualities of 3G services were too poor. In the wired communication sector
too there are a lot of changes. The landscape seems to be very much different now when
compared with 2001. There was no perspective of optical fibers in the access area in 2001. DSL
technologies too were very much limited. Optical fiber in the access area and the depth of DSL
technologies are flourishing now. All the new technologies force the companies to renew their
strategies and policies.
29,19
95,62
53,01
5,81
-10,55
-24,56
92,09
91,49
-29,38
-23,83
-30 -20 -10 0 10 20 30 40 50 60 70 80 90 100
Deutse Telecom
Telefonica
Vodafone
France Telecom
TIM
British Telecom
Telea Sonera
Telenor
MTS
PT
Growth over the decade (2001-2011)
Growth over the decade in %)
24
2.4 Competition and Globalization Factors
Competition is fierce in European telecom market. There are several players in every country to
take the market in their favor. The true globalization started in Europe and thus Europe is far
ahead of others in this aspect. Globalization provides a ground for tough competition. All the big
players of European telecom are having some roles of globalization and internationalization.
Accordingly, there are several strategic changes in the European market. Several companies have
gone for joint operation or co-operation, Many have gone for merging, some have acquired the
small companies for strategic advantages. These details are provided in the subsequent chanters.
2.5 Market Dynamics
Market dynamics plays important roles in changing the course and trends of a company. Every
market has its own dynamics and the companies have to cope with that. For example European
market has a completely different dynamics than the Indian market. So, when an European
company enter the Indian market is has to changes its strategies to cope with the markets and
vice versa. The effect of recession also changes the dynamics and the companies change their
strategies as well to cope with the difficulties.
2.6 Social Factors
Social factors are there in the changes of strategies. Social factors affect the marketing and
advertising of each and every company. In the international landscape it is very important to take
the social factors into the strategic framework. All the international companies are doing that
very carefully.
Besides these main factors there are other individual issues of the companies and markets which
force for strategic changes. Some of these issues are addressed in the following chapters.
25
Chapter 3
Changes in Internal and External Strategies of European Telecom Companies
It has been observed in the chapter 2 that the telecom scenario is very much different in 2011
than in the early years of 2000s. With the changing numbers and statistics, the strategies need to
be different as well. In fact they have been changed to a large extent. Some of the companies
have gone beyond their perimeter to a really global landscape. Some of them have done the
reverse by selling their shares to others and leaving the operations in some specific countries.
Some of them have gone for merging and joint operations in some countries. Some have
acquired the small and weak companies for strategic advantages and larger market. In this
chapter the external and internal issues of strategic moves of the ten chosen companies are
analyzed. All the issues related to external and internal factors are presented in this chapter. The
summary of the changes are provided briefly in chapter 5. The different reasons and segments of
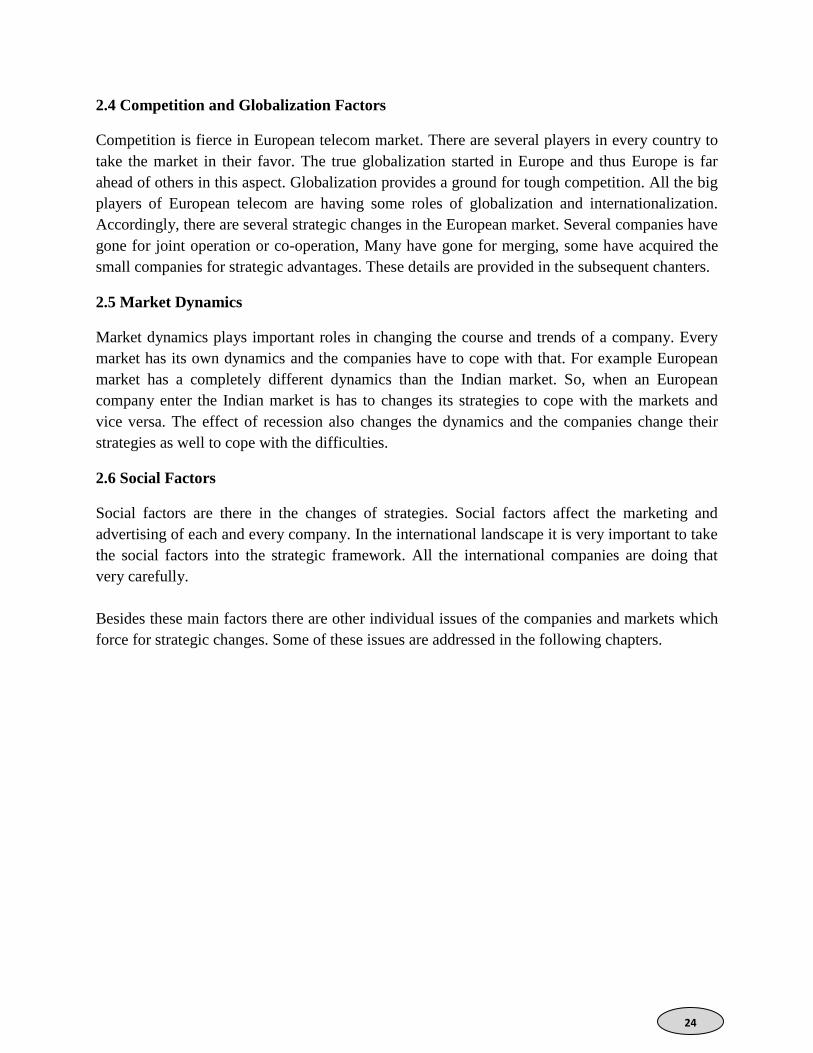
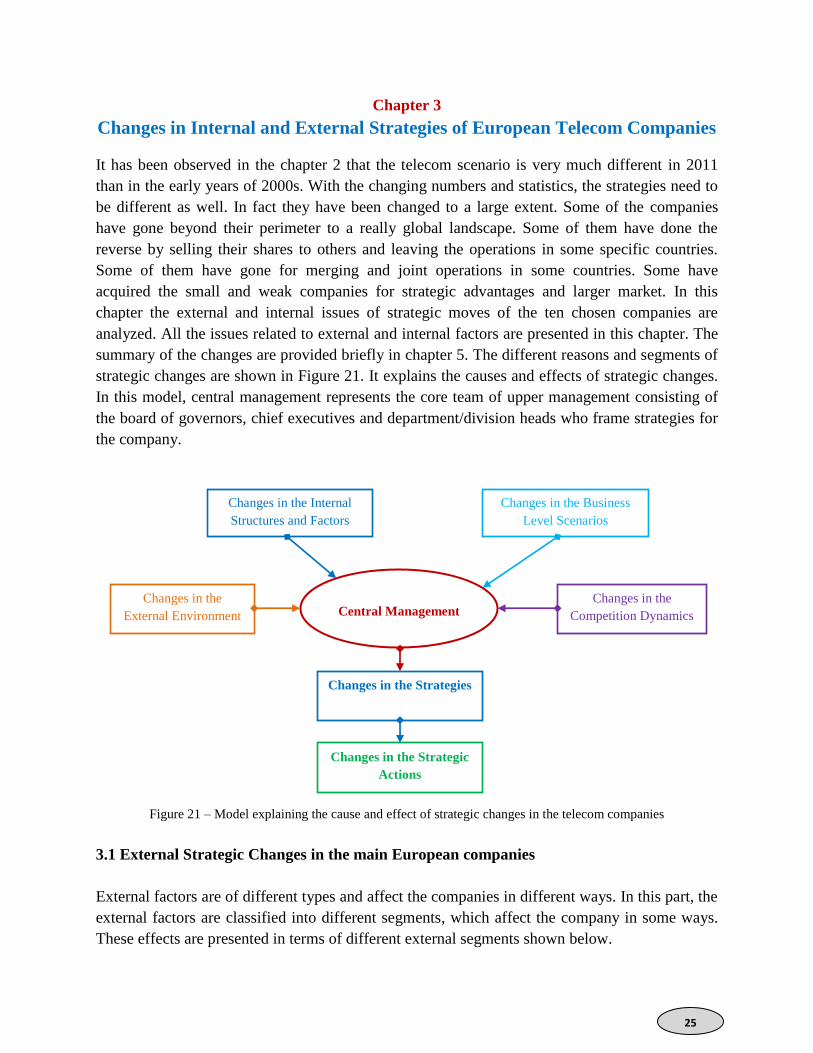
strategic changes are shown in Figure 21. It explains the causes and effects of strategic changes.
In this model, central management represents the core team of upper management consisting of
the board of governors, chief executives and department/division heads who frame strategies for
the company.
Figure 21 – Model explaining the cause and effect of strategic changes in the telecom companies
3.1 External Strategic Changes in the main European companies
External factors are of different types and affect the companies in different ways. In this part, the
external factors are classified into different segments, which affect the company in some ways.
These effects are presented in terms of different external segments shown below.
Changes in the Business
Level Scenarios
Changes in the Internal
Structures and Factors
Central Management Changes in the
Competition Dynamics
Changes in the
External Environment
Changes in the Strategies
Changes in the Strategic
Actions
26
3.1.1 Strategic Changes due to Demographic Reasons
Demographic reasons for a company include the demographic factors of its customers and
market size. In this case of telecom operators, the demographics include the population size of a
country or market, the age of the population, the geographic distribution of customers, tele-
density, penetration percentage, distribution of age groups, ethnic background and income
distribution etc. These factors are handled by telecom operators through strategic changes.
All the telecom operators try to optimize their customer base. That is done through market
specific strategies. For example, the price of voice, video and text all have come down since the
1990s. This change is found in all the companies (Gerrard, 1998). It is also true that all of them
did not get the proportionate returns for these changes, which are clear from the numbers
presented in the comparison figures of the companies.
3.1.2 Strategic Changes due to the Economic Reasons
This segment is the direct reflection of the competition the company faces in a certain
environment. Companies plan for their growth. For this they prefer stable and safe markets. This
segment is very much important for the telecom companies. That is why; most of the companies
try to stay out of failed nations. They also pull out of the unstable and unpredictable markets
instead of making looses. Companies under difficult situations try to be merged with the market
leaders to save the further decline (Hitt, 2009). This factor is also a part of the policies for
foreign investment. The growing markets of Asia and South America attract a lot of European
telecom companies to invest there.
Under this segment there are several examples. Portugal Telecom, under the leadership of Zeinal
Bava pulled out of its operations in Brazil in Vivo. Similarly, Cable and Wireless was acquired
by Vodafone in 2012.
3.1.3 Strategic Changes due to the Political Reasons
Policy issues affect the business regulations of a country or market. There is not much difference
in the policies of the countries in the European Union except for a few. The regulations of
telecommunication of different countries of Europe are also very much similar. However when
the companies operate outside Europe these issues become obstacles.
For example, there are legal cases against Vodafone in USA for which it cannot use its Vodafone
brand in its joint venture with Verizon wireless (Vodafone, 2010). Thus Vodafone is changing its
strategies for its USA operations. Similarly there are various political and legal issues with the
companies working internationally.
3.1.4 Strategic Changes due to the Sociocultural Reasons
Sociocultural issues are fundamental to the businesses which deal with the customers at the
ground level. Telecom sector is one such area where companies deal with customers directly.
The home companies get the benefits of home culture in which they are a part and can easily
27
understand the issues of customer emotions and values. However, for the foreign companies it is
quite difficult.
In telecom sector it happens with many companies when they enter a foreign market. That is why
many companies prefer to have a local partner in foreign countries. It reduces the risk of
misunderstanding and cultural differences. Many companies prefer to employ the local
workforce to minimize such issues. Almost all the successful companies are having such
strategies in foreign markets.
3.1.5 Strategic Changes due to the Technological Segment
This issue has been addressed in the previous chapter as one of the major forces for strategy
formation in the telecom industry. Technology in telecommunication is the main driver and thus
the companies must try to changes their technological strategies at the appropriate juncture of
time (Anwar, 2003).
All the successful companies are using these strategic changes when they have the right
technology. Innovation is the fundamental need to drive this strategy. T-mobile, Telefónica, BT,
Portugal telecom all are having innovation as a major strategy these days.
3.2 Strategic Focus of the Companies towards Competitors
In modern business, the role of management is not only to look after its own business and
products, but also to have a proper vision and analysis of the competitors’ positions and moves.
Lack of ability to handle competitors in the market can be fatal and the price paid for this
negligence is huge (Porter, 1998). In telecom sector, these factors are even more serious if the
operators do not take care of their competitors at the right time in the right markets. So the
companies are very often forced to change their strategies due to the potential harm from the
rival companies and their actions.
3.2.1 Strategic Changes due to threat of new Entrants
In telecommunication sector a new entrant always creates a threat to the existing operators. The
new entrant has a potential to take a share of the market from the existing players in many
different grounds (Porter, 1979). If the new entrants are smart and more capable then the existing
players are very much vulnerable.
In the UK, in 2003 the main players of mobile communication were Vodafone, Orange, T-
mobile, O2 and Virgin mobile. But 3 (3G and other advanced service provider of Hutchinson
Whampoa) entered to the market and changed the equations very soon after that. The 99% of the
competition was limited to the above five companies. But 3 took the market shares from each
and every company and Vodafone lost its pole position. This is how the market shares are being
changed by the new entrants.
28
3.2.2 Strategic Changes due to Bargaining power of Suppliers
It is very common in businesses to change the strategies when the suppliers change or the
existing suppliers start new bargains to change their own positions (Porter, 1979). In case of
telecom companies the suppliers are the telecom vendors or the infrastructure and component
builders. There are many telecom vendors in Europe. Even the non-European vendors are having
successful business in Europe. So there are always a bargaining among the vendors and the
operators. It changes the strategies of the companies in several ways such as initiatives for cost
savings. Of course some of the operators themselves are vendors such as British Telecom,
Portugal Telecom and France Telecom. But still they are affected by the new technologies and
innovations.
3.2.3 Strategic Changes due to Bargaining Power of Buyers
Buyers or the customers are the key forces of any business. In telecom too they hold the key
position of the whole business processes. In case of telecom the general public is the buyer and it
has a great bargaining power. The bargaining may be oriented around the price of the service or
the quality of the service or the reliability and trustworthiness of the services (Porter, 1979).
Customers also want security in their online activities. All the telecom companies try to handle
the bargaining power of the buyers appropriately. Especially when they enter the foreign markets
the pricing and billing methods are not very much the same as their domestic markets. So, they
cope with the new environments and challenges with suitable strategies.
3.2.4 Strategic Changes due to Threat of Substitute of Products
This threat is always there in the telecom market. It is also completely valid in every country and
every market scenario. Any new or existing entrant can take the market and customers away
from any vulnerable operators (Porter, 1987). Telecom sector is very much vulnerable from the
substitute of products. All the good and sensible operators have very much similar kind of
services in place except for a few. It can happen by the domestic companies or the foreign
companies entering with good services and attractive pricing policies. It has happened in several
cases in telecommunications market.
3.2.5 Strategic Changes due to Intensity of Rivalry among the Competitors
Intensity of rivalry is always a concern for the companies in today’s market. It is always good to
keep a vigil on the rivals (Porter, 1986 & Minzberg, 1994). Companies change their strategies
when their rivals come forward with some attractive offers of policies to take the market share
away from them. It happens in all the markets. In the UK the mobile operators used to offer the
services only, without any scheme for handsets. But some operators offered handsets and other
customer oriented schemes and took a huge market share. Now almost all the big players offer
handsets and service bonuses to compete with each other.
29
3.3 Internal Strategic Changes in the main European Companies
In this section the main resources, capabilities, competitive advantages and core competencies
are analyzed. Telecom companies have different types of resources as telecom infrastructure,
skilled manpower, innovative capabilities etc. Of course the capabilities, core competencies and
resources are common for some factors. In the following subsections these issues are addressed.
Capabilities are inherent to the individual companies depending on their resources, skills and
manpower (Porter, 1986 & Minzberg, 1994). However with the changes in the external
environment such as the customer base, markets and other core issues force the companies to
transform their capabilities. For example, the 2G and other 2.5G services were the main focus of
the telecomm companies in the UK, though they had the capabilities of 3G. But when 3 entered
the market it changed the market dynamics and all the operators had to focus on the advanced
services such as the 3G to cope with the threats of 3.
Core competencies are key to produce effective and attractive products and services. It also
includes the magical management power of the companies to handle the good and bad times
skillfully. In telecom business core competencies have big roles to play. Core competencies such
as the innovation help a lot to capture the market and to make money from the innovations. For
example European companies collaborated to develop GSM technology and thus most of the
European companies do not pay any royalty for using GSM. But the non-European companies
pay a royalty for using GSM. The case is similar for CDMA. QUALCOMM makes money from
the CDMA technologies. Now many operators are having their own labs and research centers for
the future technologies such as the LTE and beyond 4G.
Companies cannot hold the values they have forever. Values of the products and services keep
on changing with time and markets. The companies understand that and they changes the values
accordingly. In case of telecom markets there are aspects related to the values of the products
and services. Value for the customer is the good services (good quality of service, good
coverage, good experience without bad side effects etc.) at good (i.e., low) prices. In the 1990s
and before that the call quality was the sole value needed in the mobile operations. In the early
2000s, call, SMS and connection capabilities were the new requirements. Now it has many
dimensions such as the audio, video, text, picture, mobility and location based services all
demand many basic needs. These requirements have to be fulfilled by the operators. Otherwise
they lose the customer and market.
Sustainability is not a luxury to follow rather a basic requirement for companies. In a broad sense
sustainability means efficient and judicious planning and implementation of various actions. It
may be the efficient ways of harnessing energy or minimization of environmental degradations
or the use of green technologies etc. There are several reasons why each and every company
wants to be a sustainable one. Without sustainability, the company faces a lot of difficulties.
Obviously the companies bend their strategies for long term sustainability.
30
Green technologies are related to the efficiency in the consumption of energy. Now the telecom
networks are huge and consume a large amount of energy. Green technologies are quite popular
in the new researches of the telecommunication sector. It saves energy and also facilitates the use
of non-conventional energy in telecom operations. Many big companies are heading for green
areas. It is a strategic change and all the companies would follow this trend in the near future. It
not only reduces the energy bill but also gives hope for the energy solutions in the remote
corners of the world where energy sources are not available. Deutsche Telecom is a front runner
in this area. Other European companies are also investing in this research. This is an internal
strategic change driven by the new technologies.
3.4 Managing Changes
As the changes are numerous in both the internal and external environments, the companies
change their strategies to manage those changes. In this section, some major moves are listed
with examples of the companies to manage the changes.
3.4.1 Change in Focus due to Competition: Wireless companies looking towards fiber and
landline sectors
In 2001, wireless and wired services were not that much connected with each other from the
commercial points of views. Wireless companies did not have much interest for the wired
services such as the internet service provisioning through copper wires, twisted pairs, coax,
ADSL and optical fibers. Of course optical fiber technology was not advanced enough to be used
by the end user directly at that time.
However those things have changed a lot. Wireless companies are trying hard to have a
share in the wired services. Wired services are paying large returns these days. With the increase
of triple play (Voice, video and data over a common channel) applications the values of wired
services have increased tremendously. It is very much lucrative in the general public service
domain as every household wants to have broadband connections.
It is clear from many initiatives taken by the mobile companies like Vodafone. Vodafone
acquired Cable and Wireless Worldwide for 1.29 billion € (1.04 billion pound) in March 2012.
Not only the landline services, the Telecom companies are also looking for all kind of telecom
markets such as IPTV(Internet Protocol Television), CATV (Cable Television), DSL (Digital
Subscriber Line), DTH Services (Direct To Home Television Services), Optical fiber backbone
networking services etc (ITU, 2010). Even the VoIP services are part of their long term strategy.
Some companies also provide VoIP services at low prices for long distance calls.
Mobile communication started as a voice enabled service. Then new service got added to the
mobile platforms. First it was the text message services or SMS through the 2.5G and its similar
protocols. Then in 3G both picture and low content videos could be sent. In HSDPA+, 4G and
other LTE services these things have changed tremendously. These are the internal changes
31
which did not play any roles in 2001. More about these changes are presented in the next
chapter.
Europe is the home of GSM technology, which was invented by an European research
collaboration. So they do not pay the royalty for using this technology rather collect it from those
who use it outside Europe. However CDMA is American technology invented by Qualcomm and
it European companies have to pay royalties for using it. That is why CDMA was almost absent
in Europe. But due to the competition and public demand for high bandwidth services, some
companies have started using CDMA. Of course they use it only for the data or internet service
provisioning.
The size of the telecom companies grow due to the size of the market and internationalization.
Traditional methods are not enough to manage such complex industries. It needs new methods
and technologies to handle these challenges. The management and data analytic softwares are the
solution provider in these cases. Vodafone, Telefónica, France Telecom and other companies
have acquired such companies to manage their operations smoothly.
3.4.2 Outsourcing of Services to cheaper destinations
Most of the companies in the UK, USA, Canada and other English speaking countries outsource
their services to India. All the customer service related operations are transferred to India. Other
countries also outsource some of their back office works to low cost destinations. That is how
they save a lot of money and create markets for themselves in the low cost destination countries.

32
33
Chapter – 4
Changes in the Business Level Strategies and Strategic Actions
There are numerous changes in the business level strategies and actions by the telecom operators
around the world in the last decade. Many new scenarios emerged due to the business level
strategic changes. Many merging and mega-mergings have taken place. Many partnerships have
been formed and broken. Cooperative strategies are also rising in number. These strategies are
always the big moves by the companies and take the pole positions of the business news in
various media very often.
4.1 Changes in Business Level Strategies
Business level strategies are those steps, which are essential to differentiate the position of a
company from its rivals. Each and every telecom company has its own business level strategy in
each and every market to cope with their rivals and competitors. Every year the companies
evaluate their business level strategies and take appropriate actions to remain active and
profitable in business.
However the twenty first century business level strategies are very much different from the
previous ones. In the recent times the competitions are so fierce that rival companies alliance
with each other to face the common competitor/s. There are several such examples. In this
chapter some of those cases are presented briefly. Mainly merging is done for each other’s
benefits. In few cases even they compete through alliances. Here is a small list of such cases of
last decade. The detailed analysis follows in the subsequent sections.
- Case of Orange and T-mobile in UK forming Everything Everywhere
- Case of merging and separation of PT and Telefónica in Brazil
- Case of Vodafone and Hutchinson
- Case of International ventures outside Europe
- Heading for fixed network services
- Vodafone taking over CWW
- Telefónica operating in China through partners
- Deutsche telecom renewing its abilities to innovate through T-labs
- France telecom entering emerging markets in Asia
- PT sold its shares in Vivo to concentrate in European markets
- PT looking for innovations to do well as a telecom vendor
4.2 Competitor in one Country and Alliance Partners in another Country
However when we look back down a decade, the scenario was very much different. The revenue
was not that big, the region of operation was not that wide, the competition was way far low and
34
thus the strategy making was also simpler. In the second decade of the 21st century the story is
very much changed.
4.2.1 Rivalry through Alliance
Rivalry is turning into alliances. Or in other words the rivalry is handled through alliances. This
is the new strategy of the telecom operators. There are several cases of Rivalry through alliance.
I. Case of Orange and T-mobile alliance in the UK
Rivalries in the modern times have become too fierce. However the surprising part is the rivals
coming together as alliance partners. Here the wonderful case of Everything Everywhere is
presented briefly. Everything Everywhere was formed on officially 1July 2010 by the merging of
the UK operations of Orange and T-mobile, two main players of British telecom market. The
plan for the alliance started in early 2010 and the network performances were measured in May
and June of 2010. Then the better versions of the available services were lunched as the part of
the alliance.
Orange in UK
It was launched from its Bristol headquarters in 1994. It was the fourth company to enter the UK
mobile marketplace. By the end of 1996 its coverage reached 90% of the population of UK . It
entered the stock market as Orange Plc and became the youngest company ever to enter the
FTSE-100, valued at 3.27 billion euro (estimated value from 2.4 billion GBP) and with one
million customers.
Orange for the first time launched a tv-on-the-mobile service in 2005. It also launched the iPhone
in 2009 and took a large market in the UK. Now it has over 15 million customers in the UK, and
is one of the most recognizable brands on the high street.
T-mobile in UK
T-mobile in the UK started its operation as a partner of One2One. The brand was acquired by
Deutsche Telekom in 1999. One2One launched Virgin Mobile, as a 50:50 joint venture partner
with Richard Branson’s Virgin group in the same year. In 2002 One2One rebranded to become
T-Mobile, and in the same year became the first network in the Europe to offer picture
messaging. So the brand T-Mobile became a new attraction throughout the UK. In 2010 it sold
over 4.5 million handsets and around 10 million SIM cards.
Everything Everywhere
Everything Everywhere was formed with the 50:50 ownership of Orange and T-mobile. This
partnership is only valid in the UK with its headquarters in London. Outside the UK, Orange and
T-mobile are two separate competitors as they used to be. There were a lot of changes in the UK
mobile operator’s market after the formation of Everything Everywhere.
Impact of Everything Everywhere
Everything Everywhere changed the basic landscape of telecom business of the UK. After its
formation it became the largest telecom operator in the UK surpassing both Telefónica (as O2)
35
and Vodafone. It has a market share of 27.2% in the UK as of March 2012. Both Orange and T-
mobile agreed to maintain their partnerships that existed prior to the alliance. Thus Virgin mobile
and 3 broadband services are active partners of Everything Everywhere. The costs of operation
have been cut significantly after the alliance. The High Street customer services have been
strengthened after the merging. A lot of improvements have been provided to the network with
the joint expertise of Orange and T-mobile.
II. Case of Vodafone and Airtel in India
Both Vodafone and Airtel are big players in the Indian mobile telecom industry. Airtel is the
number one player since the early 2000s. Vodafone entered the Indian market in 2007 as a
partner of Essar and expanded its operations. But the network infrastructure building was a
challenge for Vodafone. India is a big country and the number of subscribers is huge. Vodafone,
instead of spending a huge sum on the infrastructure, used the Airtel infrastructure and paid the
rent for it. Airtel in return took similar helps from Vodafone in African markets where both the
companies coexist. In 2010, Vodafone bought all the shares of Essar to be the sole owner of
Vodafone-Essar. Airtel too maintains its pole position in both revenue and number of subscribers
in the Indian telecom market.
4.3 Internationalization of European Companies
European telecom companies were among the front runners of the global mobile communication.
They innovated GSM, UMTS and its legacy systems. Even some of the CDMA technologies, the
WiMAX and LTE were the brain children of these companies. So these companies had the
abilities and skills to internationalize their businesses and they did it. The basic requirement of
internationalization was to increase the revenue and profits. But the secondary needs were there
as well. The costs of operation of specific sectors were expensive in Europe. So they shifted
those operations to the low cost destinations of Asia and Eastern Europe. Entering Asia, South
America, Australia and Africa were very much beneficial. So the traditional markets of Europe
and North America were not enough for these companies.
More and more European companies are looking towards the markets outside Europe and
Americas. The reality is the size of the markets of Asia and Africa. World’s largest telecom
markets are not in Europe and Americas in terms of number of subscribers. In order to play a
truly global role they have to enter other markets. The environments of investment in the
developing markets have changed by a large margin. These markets are very much friendly and
want the participation of the western companies.
- Case of Vodafone moving to India
Vodafone used to be a successful company in Europe and America. But it was not so effective in
its Asian operations until 2006. But in 2007 under the leadership of Arun Sarin it successfully
entered Indian market and made a good impact with rapid growth. At the end of 2011, it was
number two in revenue and number three in customer base in Indian telecom market. Due to its
36
Indian market, Vodafone became the second largest mobile telecom operator (in terms of
customer base) in the world after China Mobile.
- Case of Telefónica and TIM in Latin America
Latin America is always a good market for the Spanish and Italian companies. The language and
cultural similarities help them a lot to capture the markets. Both Telefónica and Telecom Italia
(TIM) are successful in Latin American markets. Since 2009, their positions are consolidated by
the high growth rates and increasing customer bases. Telefónica took over the total shares from
Portugal Telecom from Brazilian company Vivo. After that Vivo became a big brand of
Telefónica. Similarly TIM has strengthened its position in Brazil and Argentina.
- Cases of Other companies out of Europe operations
All the European companies are looking for markets outside their traditional strongholds. Orange
has strengthened its African Operations. Portugal Telecom is also doing the same. It also
consolidates in its Asian markets in Macau and East Timor. MTS has entered Indian market
successfully. Telenor has expanded its Asian presence. In 2008 it entered the Indian market from
its Singapore branch. Telia Sonera too has expanded its operations in Asia. It has become a
significant player in Uzbekistan, Russia and some gulf countries.
In the last decade there are a few companies who have pulled out of the foreign markets. Of
course they do it with respect to the market positions and dynamics. It is interesting that they sell
out their shares in one company and buy new shares of another company in the same market.
This issue has been addressed in the later part of this chapter.
4.4 Other Cases of Mergers, Acquisitions and Takeovers
Mergers, acquisitions and takeovers are quite common in telecom business. In telecom sectors of
Europe, companies are not that rigid in taking the decisions which are beneficial but
compromising in a few aspects.
- Case of complete takeover of O2 and Vivo by Telefónica
BT Cellnet sold half of its to Telefónica in 2002. The name of the joint operation became known
as O2. After a successful run for next four years BT wanted to pull out its shares and to invest
more on the national infrastructure and international collaborations. In 2006, O2 became a brand
of Telefónica with 100% ownership. Similar takeover took place in Brazil. Both Telefónica and
Portugal Telecom nurtured the Brazilian company Vivo. But Portugal Telecom sold its shares to
Telefónica and left out of Vivo. Now Vivo is a pure Telefónica brand.
- Vodafone taking over Hutch and CWW
Vodafone was looking forward to have a dominant position in Asia in 2006. But building the
infrastructure and to start a business from scratch was too tough for it. At that time Hutch (or the
Hutchinson Whampoa) had a good share of market in Honk Kong. After successful negotiation,
Vodafone took over Hutch in 2007. It also helped Vodafone to partner its operations in China
37
and Taiwan. Then it bought the Indian operations of Hutchinson-Essar for 10.7 billion USD.
Vodafone got a commanding position in Asian Telecom sector. Vodafone had a plan to have
fixed network shares. The changed scenario shows that the fixed markets are also as profitable as
the mobile market. Vodafone took over Cable and Wireless Worldwide recently to strengthen its
fixed network business in the UK.
4.5 New Trends due to Advanced Technologies
There are numerous advanced technologies available in the market now. Every year some new
additions take place. Based on the technologies there are a lot of new trends in place. Some of
them are directly related to the telecom services and others are not.
These services are the additional services which are available on the mobile platforms. It helps
the companies in topping up their income from the wireless services. However in Europe these
services are growing rapidly and the revenue shares too are in the range of 10% of the net
income of the companies. So they cannot neglect it.
- Mobile computing services
Mobile computing is related to the computing aspects available on the smart mobile platforms. In
3G and other advanced mobile platforms the computing facilities are enormous. It can do a lot of
tasks other than the telecom services. It can provide online business and commercial facilities,
online gaming, financial services, location and choice based services, emergency helping, health
care facilities etc.
- Place based services
Place based services are the advanced mobile computing applications which are identified by the
smart platforms and the user gets these services when it is in the surroundings. This is in fact a
sensor area network service which recognizes the places and facilities by some smart means such
as the GPS or other place identification techniques.
- Location based services
This service is similar to the place based service but it is only related to a specific location. These
services are becoming very popular in the areas of tourism and travels. Almost all the cab drivers
are using these technologies based on the GPS and other methods. Police and emergency service
departments also use these services to improve their performances.
- mCommerce services on the mobile platform
mCommerce or the mobile commerce applications are available on the mobile platforms. But the
security aspects were not that good. So it was not very popular until last couple of years. Now
the security aspects have been improved significantly and thus the mobile commerce applications
also increase. It allows the users to transact anywhere anytime.
- mPesa (mMoney) and money transfer solutions
38
mPesa is the online money transfer system enabled through the mobile platforms. It is very easy
and simple application and can be done by the common users without many hassles. In countries
where the bank accounts are not that easy to open or banks are not available, mPesa is a good
solution.
- mHealth Solutions
These are the online healthcare related services that can be provided through the mobiles. It helps
the patient a lot to get advice and pre-clinical preparations. Remotely monitored surgeries are
carried out through these technologies. These solutions are very popular these days and also
growing every year.
- 4G and LTE services
4G is the fourth generation of mobile communication and it has higher data rates, higher
bandwidths, better qualities and lower latencies than the 3G. 4G services have been launched in
different countries of Europe recently. It is also present in many parts of Asia, America and
Australia. In fact, 4G is an LTE (Long Term Evolution) technology, which has the aim to keep
the mobile evolution growing forever so that new services and products will keep on coming to
the market.
4.6 Reversal of Strategies
There are several cases of reversal of previous business level strategies. In fact the changing
landscapes of the international business force the companies to take these steps in the current
scenario.
- T-mobile entered US in 2001 and now wants to leave it back
T-mobile entered the US market with ambitious goals. It was successful in expanding its
operations in the USA. However, it has different plans. The USA market is very much
competitive and needs effective management all the time. Instead, T-mobile wants to increase its
European presence and has plans to lead the innovation in telecommunications. So, it wants to
pull out of the USA. There were negotiations between AT&T and T-mobile for the takeover
which was valued at 50 billion USD. But the talks have failed as per the news sources. There was
also news that AT&T itself wants to get rid of the wireless business.
- Vodafone entered into a joint venture with Verizon
Vodafone entered the American market with a lot of positive ambitions. It got its returns from
the partnership with Verizon. It has 45% share in Verizon Wireless. However it is an
uncontrolled business sector for Vodafone as most of the decisions are controlled by Verizon.
Vodafone also cannot use its brand name in that joint venture. Having all these restrictions,
Vodafone wants to stop the partnership with Verizon Wireless. But it does not want to leave the
big US market. So its plan as published in the telecom magazines is to sell its shares to Verizon
and to acquire another company in the USA like AT&T.
39
- PT leaving Vivo and entering Oi
Portugal Telecom had almost half of the shares in Vivo of Brazil. The other half was with
Telefónica. But under the leadership of Zeinal Bava, PT pulled out its shares from Vivo for 7.7
billion euro. But after a few months of that pull out, it bought 25% shares of Oi in the same
market. That is of course paying the returns as PT is back into the growing forms.
4.7 Strategic Changes in Leadership
Leadership is a key aspect of every company. All leaders are not alike and thus every company
does not follow the same path. Leadership takes the role of showing the path to the company and
employees. In case of Vodafone it had chosen Arun Sarin to lead its globalization processes. He
led Vodafone in the right direction for five years. After him came Vittorio Colao, who followed
the growing path provided by Arun Sarin (Vodafone, 2011). Like Vodafone other companies too
have changed their CEOs as a part of their strategic leadership. Sometimes it is difficult to get
charismatic leaders in the same sector and thus the companies hire the great leaders from other
sectors. Portugal Telecom brought Zeinal Bava from the banking sector (wireless.com, 2012).
There are also instances of sacking the leaders for wrong policies. In T-mobile, the CEO was
sacked after the eavesdropping scandal came to public in 2008. René Obermann was appointed
as the new CEO and he handled the post-scandal issues and led the company for renewed
growth, which was badly affected due to the controversy.
4.8 Strategic Changes in Entrepreneurship
Strategic changes in entrepreneurship are required to kick start the new trends of business. It
incorporates the changes in innovation processes, innovation at the corporate level governances,
innovative structural changes and above all new motivation for growth and innovation.
Deutsche Telecom is the largest telecom company of Europe. Its mobile wing, T-mobile is also a
big brand in Europe and America. But the 2008 controversies hit it very hard. The new
management cooperated with the public prosecutors and wanted to come out of it. In addition to
these soothing steps Deutsche Telecom wanted to change its face value through new innovations.
The outcome was T-Labs (Deutsche Telecom, 2011). T-Labs are advanced research facilities for
all major current issues of telecommunications.
Following the paths of Deutsche Telecom, now other companies also follow the same route.
British Telecom has increased its role in innovation and university partnerships. It is reducing its
presence from the telecom operations and increasing the R&D expenditures. Portugal Telecom
too looking for its growth powered by the innovations. It is clear from the increase of funding in
PT Inovação projects and university collaborations (Portugal Telecom, 2011). Telenor, Teleia
Sonera and MTS too have similar initiatives in their own countries.
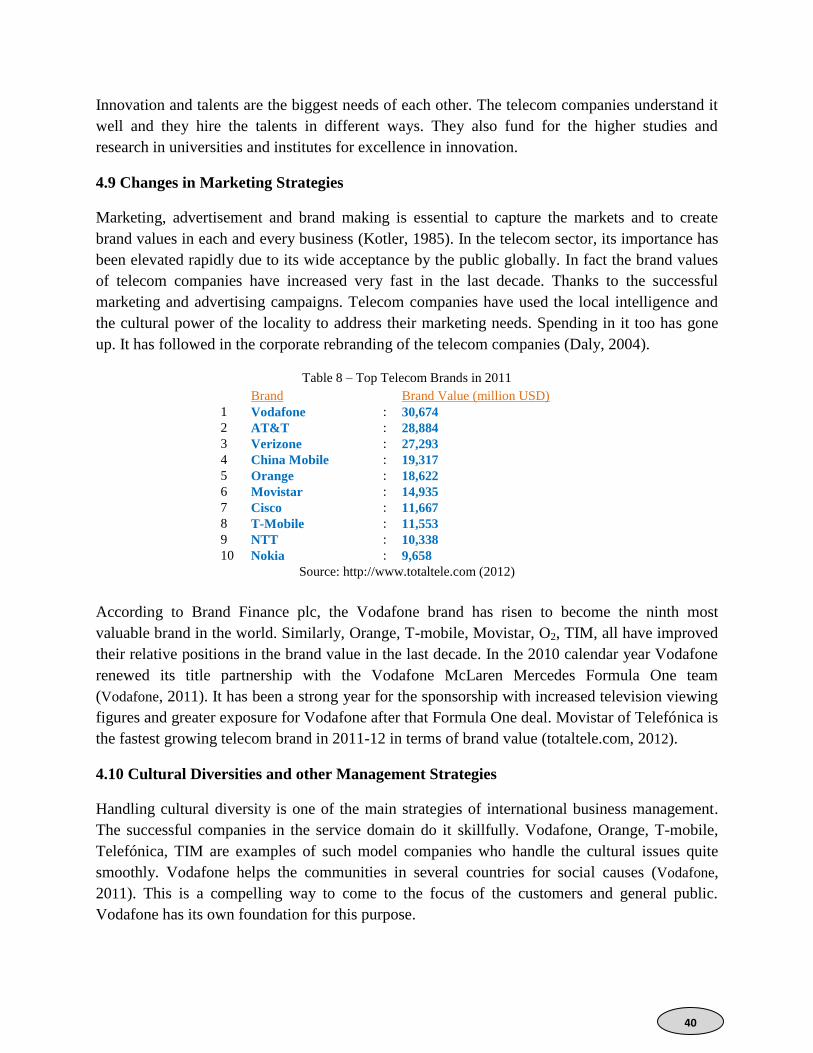
40
Innovation and talents are the biggest needs of each other. The telecom companies understand it
well and they hire the talents in different ways. They also fund for the higher studies and
research in universities and institutes for excellence in innovation.
4.9 Changes in Marketing Strategies
Marketing, advertisement and brand making is essential to capture the markets and to create
brand values in each and every business (Kotler, 1985). In the telecom sector, its importance has
been elevated rapidly due to its wide acceptance by the public globally. In fact the brand values
of telecom companies have increased very fast in the last decade. Thanks to the successful
marketing and advertising campaigns. Telecom companies have used the local intelligence and
the cultural power of the locality to address their marketing needs. Spending in it too has gone
up. It has followed in the corporate rebranding of the telecom companies (Daly, 2004).
Table 8 – Top Telecom Brands in 2011
Brand Brand Value (million USD)
1 Vodafone : 30,674
2 AT&T : 28,884
3 Verizone : 27,293
4 China Mobile : 19,317
5 Orange : 18,622
6 Movistar : 14,935
7 Cisco : 11,667
8 T-Mobile : 11,553
9 NTT : 10,338
10 Nokia : 9,658
Source: http://www.totaltele.com (2012)
According to Brand Finance plc, the Vodafone brand has risen to become the ninth most
valuable brand in the world. Similarly, Orange, T-mobile, Movistar, O2, TIM, all have improved
their relative positions in the brand value in the last decade. In the 2010 calendar year Vodafone
renewed its title partnership with the Vodafone McLaren Mercedes Formula One team
(Vodafone, 2011). It has been a strong year for the sponsorship with increased television viewing
figures and greater exposure for Vodafone after that Formula One deal. Movistar of Telefónica is
the fastest growing telecom brand in 2011-12 in terms of brand value (totaltele.com, 2012).
4.10 Cultural Diversities and other Management Strategies
Handling cultural diversity is one of the main strategies of international business management.
The successful companies in the service domain do it skillfully. Vodafone, Orange, T-mobile,
Telefónica, TIM are examples of such model companies who handle the cultural issues quite
smoothly. Vodafone helps the communities in several countries for social causes (Vodafone,
2011). This is a compelling way to come to the focus of the customers and general public.
Vodafone has its own foundation for this purpose.
41
Vodafone Group has continued to fund the good work of the Vodafone Foundation (Vodafone,
2011). Through the Vodafone Foundation and their network of national affiliate foundations they
support communities and societies in the countries in which they operate. In the financial year
2011 they invested a total of £50 million in foundation programmes and social causes. Their
World of Difference programme is now in 20 countries and has so far enabled 1,500 people to
take paid time to work for a charitable purpose of their choice in their own community or in a
developing country. Their Mobiles for Good programme, combining our technology with their
giving, saw the launch of Instant Network, a partnership with Telecoms Sans Frontiers which
enables a network to be deployed from three suitcases, covering 10 km2 for usage of up to
12,000 people. Field trials are currently underway.
Like Vodafone foundation other companies too have their own foundations, which provide some
philanthropic services to the general public and gives a humanitarian face to the companies.
Telenor in Bangladesh has formed a cooperative phone network for the poor people with the help
of Nobel Laureate M. Yunus. These initiatives help strength the public relations ships of the
companies and improves the brand value.

42
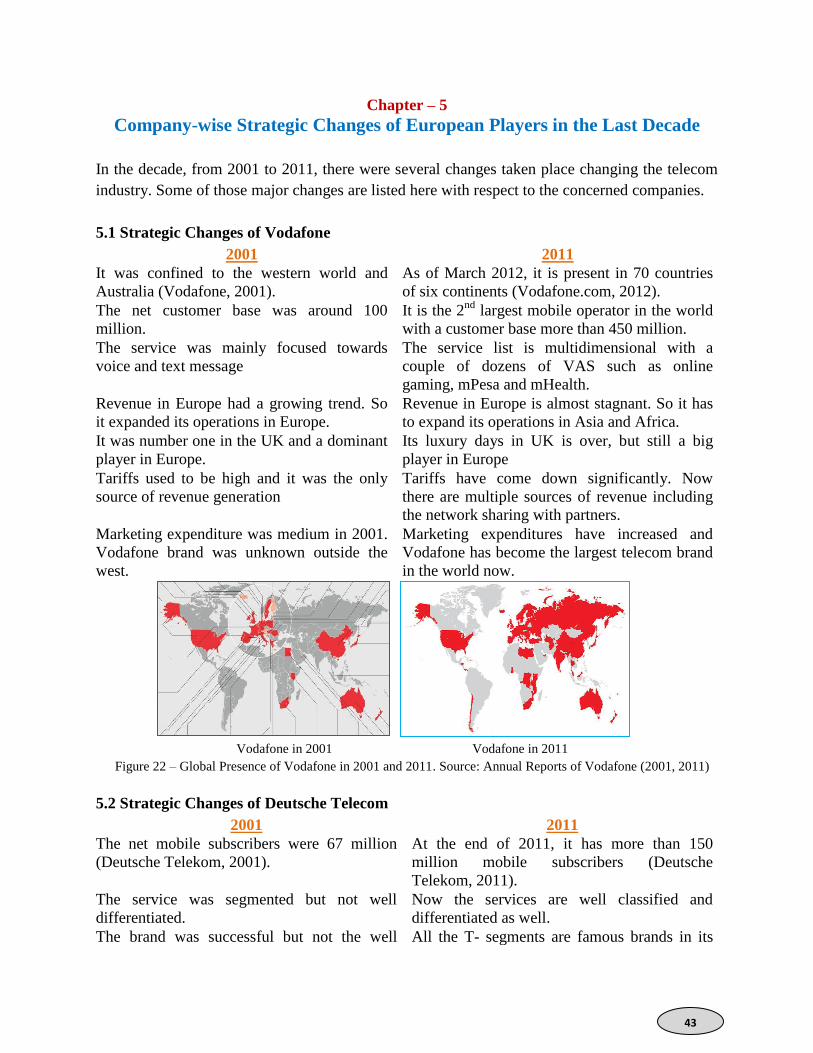
43
Chapter – 5
Company-wise Strategic Changes of European Players in the Last Decade
In the decade, from 2001 to 2011, there were several changes taken place changing the telecom
industry. Some of those major changes are listed here with respect to the concerned companies.
5.1 Strategic Changes of Vodafone
2001 2011
It was confined to the western world and
Australia (Vodafone, 2001).
As of March 2012, it is present in 70 countries
of six continents (Vodafone.com, 2012).
The net customer base was around 100
million.
It is the 2nd
largest mobile operator in the world
with a customer base more than 450 million.
The service was mainly focused towards
voice and text message
The service list is multidimensional with a
couple of dozens of VAS such as online
gaming, mPesa and mHealth.
Revenue in Europe had a growing trend. So
it expanded its operations in Europe.
Revenue in Europe is almost stagnant. So it has
to expand its operations in Asia and Africa.
It was number one in the UK and a dominant
player in Europe.
Its luxury days in UK is over, but still a big
player in Europe
Tariffs used to be high and it was the only
source of revenue generation
Tariffs have come down significantly. Now
there are multiple sources of revenue including
the network sharing with partners.
Marketing expenditure was medium in 2001.
Vodafone brand was unknown outside the
west.
Marketing expenditures have increased and
Vodafone has become the largest telecom brand
in the world now.
Vodafone in 2001 Vodafone in 2011
Figure 22 – Global Presence of Vodafone in 2001 and 2011. Source: Annual Reports of Vodafone (2001, 2011)
5.2 Strategic Changes of Deutsche Telecom
2001 2011
The net mobile subscribers were 67 million
(Deutsche Telekom, 2001).
At the end of 2011, it has more than 150
million mobile subscribers (Deutsche
Telekom, 2011).
The service was segmented but not well
differentiated.
Now the services are well classified and
differentiated as well.
The brand was successful but not the well All the T- segments are famous brands in its
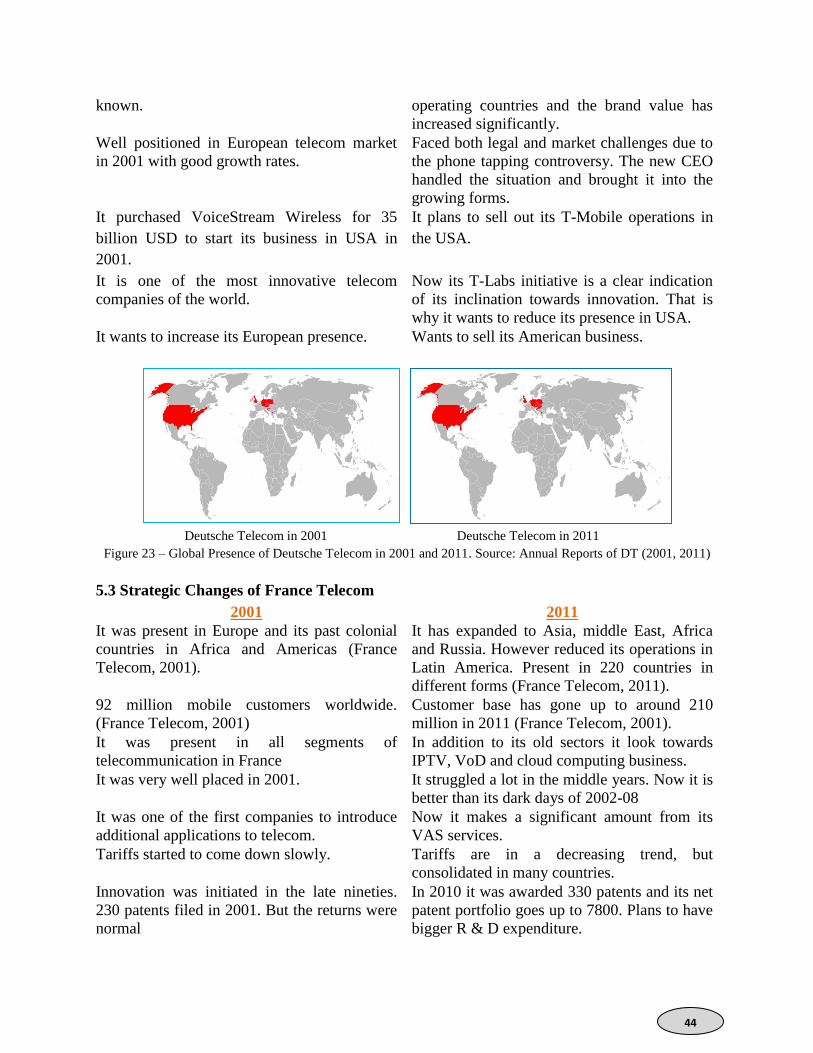
44
known. operating countries and the brand value has
increased significantly.
Well positioned in European telecom market
in 2001 with good growth rates.
Faced both legal and market challenges due to
the phone tapping controversy. The new CEO
handled the situation and brought it into the
growing forms.
It purchased VoiceStream Wireless for 35
billion USD to start its business in USA in
2001.
It plans to sell out its T-Mobile operations in
the USA.
It is one of the most innovative telecom
companies of the world.
Now its T-Labs initiative is a clear indication
of its inclination towards innovation. That is
why it wants to reduce its presence in USA.
It wants to increase its European presence. Wants to sell its American business.
Deutsche Telecom in 2001 Deutsche Telecom in 2011
Figure 23 – Global Presence of Deutsche Telecom in 2001 and 2011. Source: Annual Reports of DT (2001, 2011)
5.3 Strategic Changes of France Telecom
2001 2011
It was present in Europe and its past colonial
countries in Africa and Americas (France
Telecom, 2001).
It has expanded to Asia, middle East, Africa
and Russia. However reduced its operations in
Latin America. Present in 220 countries in
different forms (France Telecom, 2011).
92 million mobile customers worldwide.
(France Telecom, 2001)
Customer base has gone up to around 210
million in 2011 (France Telecom, 2001).
It was present in all segments of
telecommunication in France
In addition to its old sectors it look towards
IPTV, VoD and cloud computing business.
It was very well placed in 2001. It struggled a lot in the middle years. Now it is
better than its dark days of 2002-08
It was one of the first companies to introduce
additional applications to telecom.
Now it makes a significant amount from its
VAS services.
Tariffs started to come down slowly. Tariffs are in a decreasing trend, but
consolidated in many countries.
Innovation was initiated in the late nineties.
230 patents filed in 2001. But the returns were
normal
In 2010 it was awarded 330 patents and its net
patent portfolio goes up to 7800. Plans to have
bigger R & D expenditure.
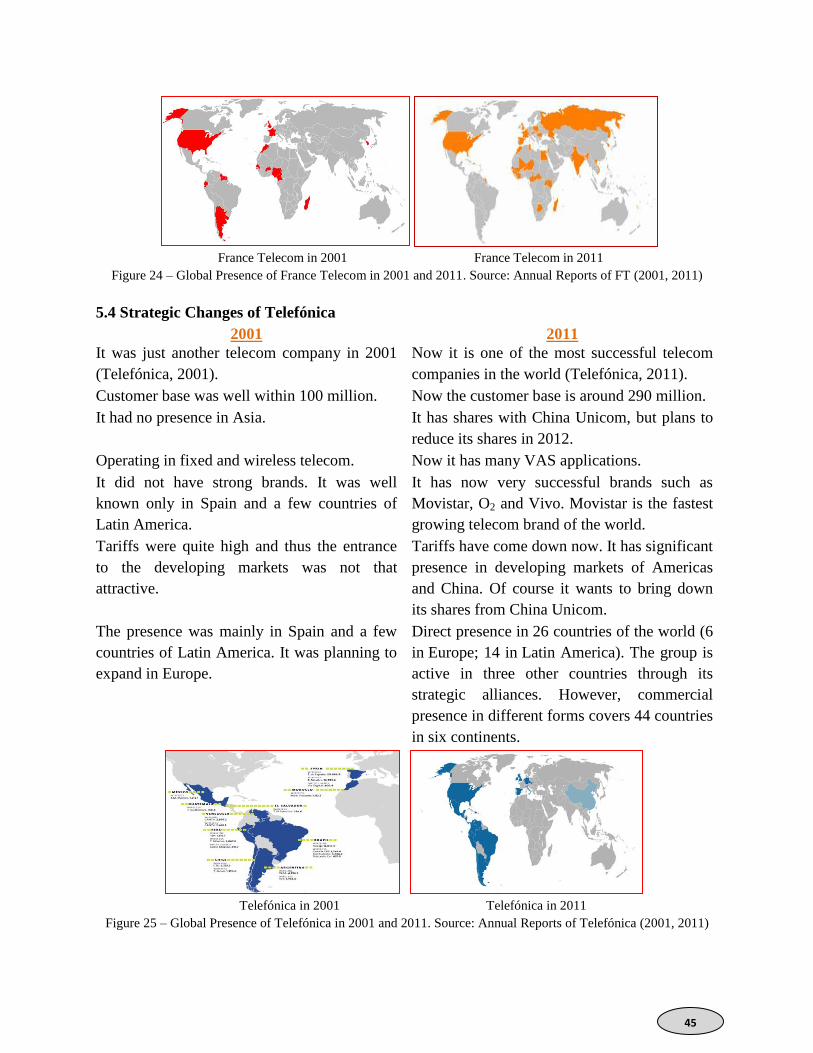
45
France Telecom in 2001 France Telecom in 2011
Figure 24 – Global Presence of France Telecom in 2001 and 2011. Source: Annual Reports of FT (2001, 2011)
5.4 Strategic Changes of Telefónica
2001 2011
It was just another telecom company in 2001
(Telefónica, 2001).
Now it is one of the most successful telecom
companies in the world (Telefónica, 2011).
Customer base was well within 100 million. Now the customer base is around 290 million.
It had no presence in Asia. It has shares with China Unicom, but plans to
reduce its shares in 2012.
Operating in fixed and wireless telecom. Now it has many VAS applications.
It did not have strong brands. It was well
known only in Spain and a few countries of
Latin America.
It has now very successful brands such as
Movistar, O2 and Vivo. Movistar is the fastest
growing telecom brand of the world.
Tariffs were quite high and thus the entrance
to the developing markets was not that
attractive.
Tariffs have come down now. It has significant
presence in developing markets of Americas
and China. Of course it wants to bring down
its shares from China Unicom.
The presence was mainly in Spain and a few
countries of Latin America. It was planning to
expand in Europe.
Direct presence in 26 countries of the world (6
in Europe; 14 in Latin America). The group is
active in three other countries through its
strategic alliances. However, commercial
presence in different forms covers 44 countries
in six continents.
Telefónica in 2001 Telefónica in 2011
Figure 25 – Global Presence of Telefónica in 2001 and 2011. Source: Annual Reports of Telefónica (2001, 2011)
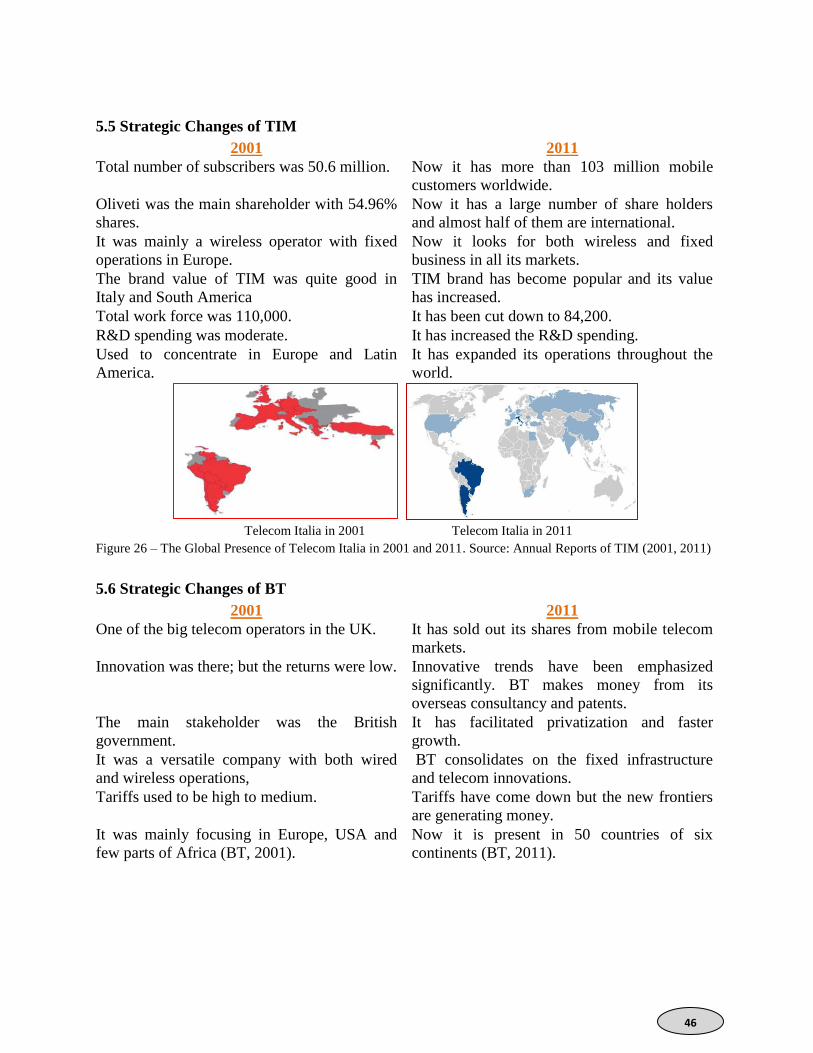
46
5.5 Strategic Changes of TIM
2001 2011
Total number of subscribers was 50.6 million. Now it has more than 103 million mobile
customers worldwide.
Oliveti was the main shareholder with 54.96%
shares.
Now it has a large number of share holders
and almost half of them are international.
It was mainly a wireless operator with fixed
operations in Europe.
Now it looks for both wireless and fixed
business in all its markets.
The brand value of TIM was quite good in
Italy and South America
TIM brand has become popular and its value
has increased.
Total work force was 110,000. It has been cut down to 84,200.
R&D spending was moderate. It has increased the R&D spending.
Used to concentrate in Europe and Latin
America.
It has expanded its operations throughout the
world.
Telecom Italia in 2001 Telecom Italia in 2011
Figure 26 – The Global Presence of Telecom Italia in 2001 and 2011. Source: Annual Reports of TIM (2001, 2011)
5.6 Strategic Changes of BT
2001 2011
One of the big telecom operators in the UK. It has sold out its shares from mobile telecom
markets.
Innovation was there; but the returns were low. Innovative trends have been emphasized
significantly. BT makes money from its
overseas consultancy and patents.
The main stakeholder was the British
government.
It has facilitated privatization and faster
growth.
It was a versatile company with both wired
and wireless operations,
BT consolidates on the fixed infrastructure
and telecom innovations.
Tariffs used to be high to medium. Tariffs have come down but the new frontiers
are generating money.
It was mainly focusing in Europe, USA and
few parts of Africa (BT, 2001).
Now it is present in 50 countries of six
continents (BT, 2011).
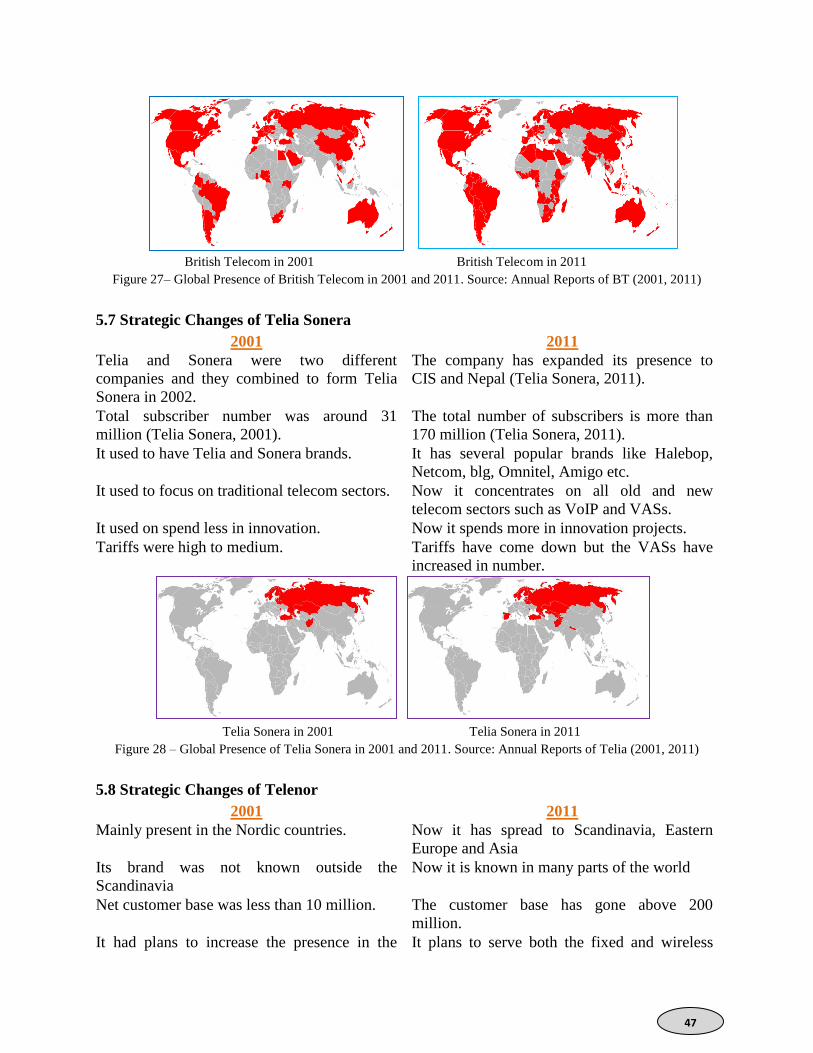
47
British Telecom in 2001 British Telecom in 2011
Figure 27– Global Presence of British Telecom in 2001 and 2011. Source: Annual Reports of BT (2001, 2011)
5.7 Strategic Changes of Telia Sonera
2001 2011
Telia and Sonera were two different
companies and they combined to form Telia
Sonera in 2002.
The company has expanded its presence to
CIS and Nepal (Telia Sonera, 2011).
Total subscriber number was around 31
million (Telia Sonera, 2001).
The total number of subscribers is more than
170 million (Telia Sonera, 2011).
It used to have Telia and Sonera brands. It has several popular brands like Halebop,
Netcom, blg, Omnitel, Amigo etc.
It used to focus on traditional telecom sectors. Now it concentrates on all old and new
telecom sectors such as VoIP and VASs.
It used on spend less in innovation. Now it spends more in innovation projects.
Tariffs were high to medium. Tariffs have come down but the VASs have
increased in number.
Telia Sonera in 2001 Telia Sonera in 2011
Figure 28 – Global Presence of Telia Sonera in 2001 and 2011. Source: Annual Reports of Telia (2001, 2011)
5.8 Strategic Changes of Telenor
2001 2011
Mainly present in the Nordic countries. Now it has spread to Scandinavia, Eastern
Europe and Asia
Its brand was not known outside the
Scandinavia
Now it is known in many parts of the world
Net customer base was less than 10 million. The customer base has gone above 200
million.
It had plans to increase the presence in the It plans to serve both the fixed and wireless
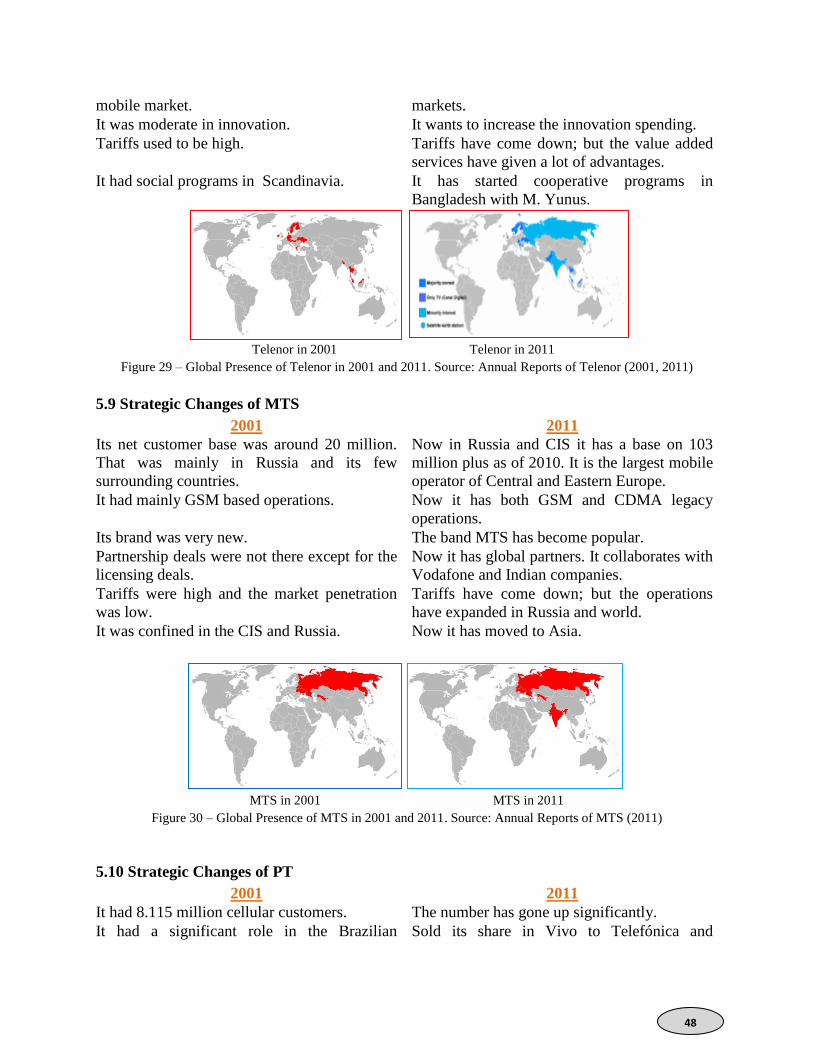
48
mobile market. markets.
It was moderate in innovation. It wants to increase the innovation spending.
Tariffs used to be high. Tariffs have come down; but the value added
services have given a lot of advantages.
It had social programs in Scandinavia. It has started cooperative programs in
Bangladesh with M. Yunus.
Telenor in 2001 Telenor in 2011
Figure 29 – Global Presence of Telenor in 2001 and 2011. Source: Annual Reports of Telenor (2001, 2011)
5.9 Strategic Changes of MTS
2001 2011
Its net customer base was around 20 million.
That was mainly in Russia and its few
surrounding countries.
Now in Russia and CIS it has a base on 103
million plus as of 2010. It is the largest mobile
operator of Central and Eastern Europe.
It had mainly GSM based operations. Now it has both GSM and CDMA legacy
operations.
Its brand was very new. The band MTS has become popular.
Partnership deals were not there except for the
licensing deals.
Now it has global partners. It collaborates with
Vodafone and Indian companies.
Tariffs were high and the market penetration
was low.
Tariffs have come down; but the operations
have expanded in Russia and world.
It was confined in the CIS and Russia. Now it has moved to Asia.
MTS in 2001 MTS in 2011
Figure 30 – Global Presence of MTS in 2001 and 2011. Source: Annual Reports of MTS (2011)
5.10 Strategic Changes of PT
2001 2011
It had 8.115 million cellular customers. The number has gone up significantly.
It had a significant role in the Brazilian Sold its share in Vivo to Telefónica and
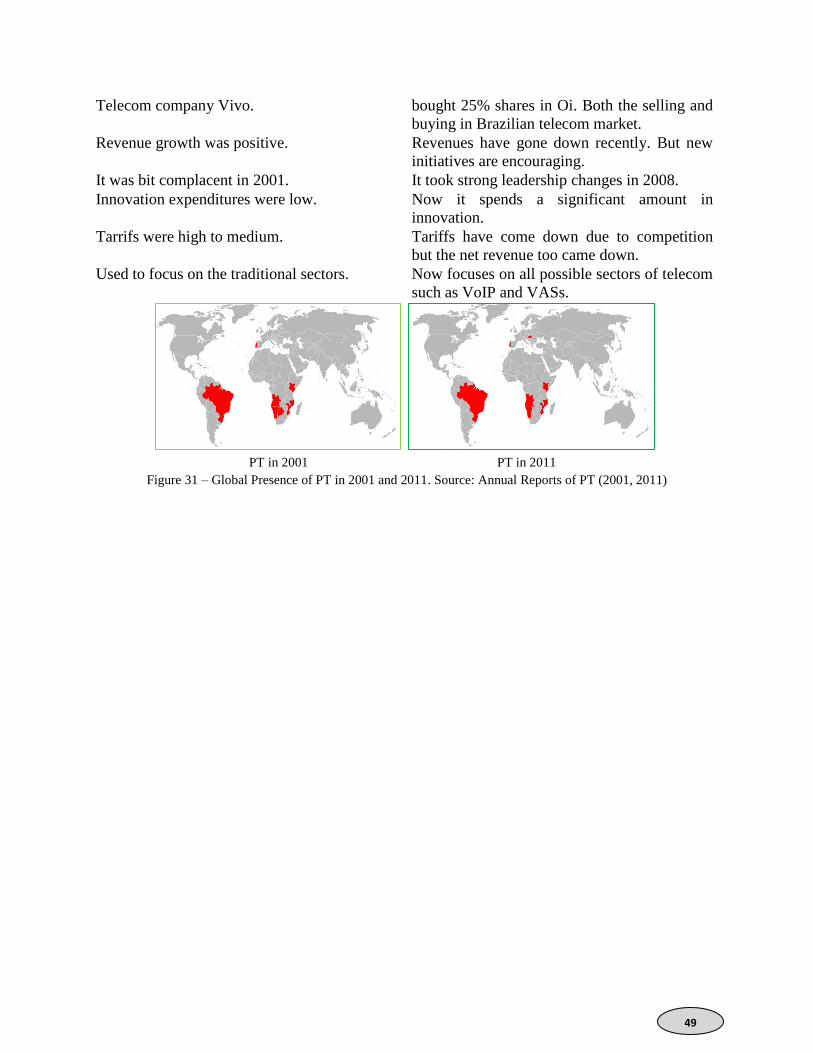
49
Telecom company Vivo. bought 25% shares in Oi. Both the selling and
buying in Brazilian telecom market.
Revenue growth was positive. Revenues have gone down recently. But new
initiatives are encouraging.
It was bit complacent in 2001. It took strong leadership changes in 2008.
Innovation expenditures were low. Now it spends a significant amount in
innovation.
Tarrifs were high to medium. Tariffs have come down due to competition
but the net revenue too came down.
Used to focus on the traditional sectors. Now focuses on all possible sectors of telecom
such as VoIP and VASs.
PT in 2001 PT in 2011
Figure 31 – Global Presence of PT in 2001 and 2011. Source: Annual Reports of PT (2001, 2011)

50
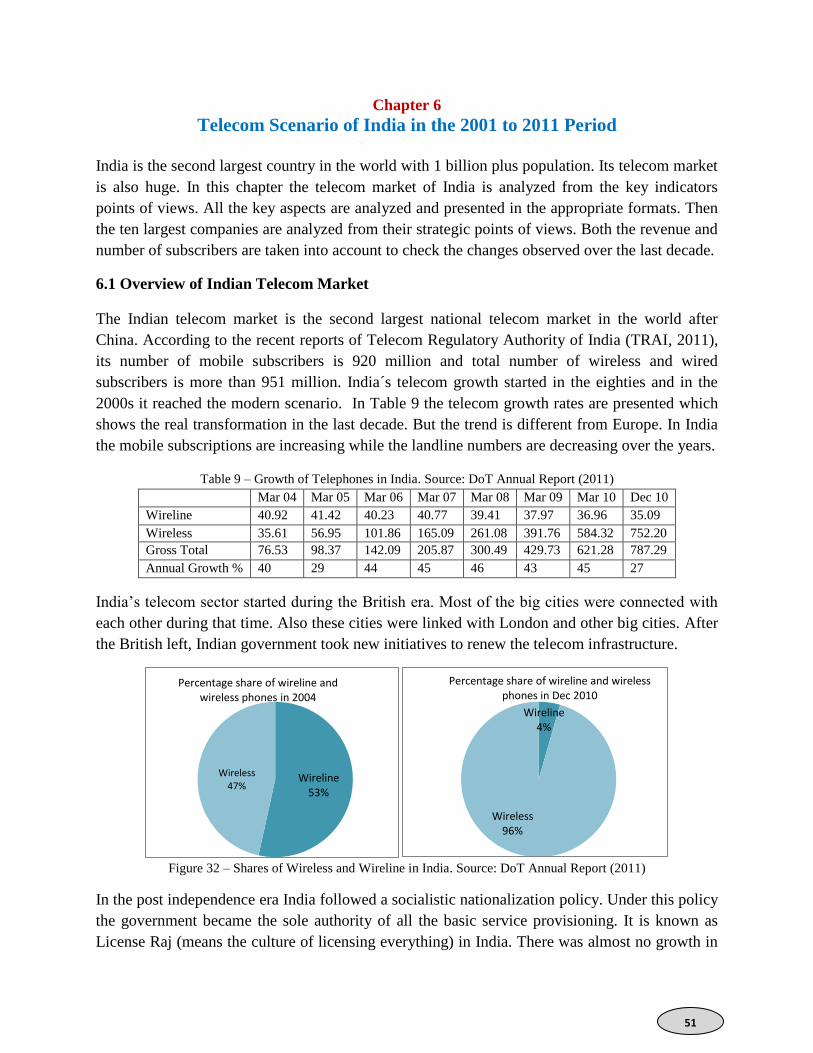
51
Chapter 6
Telecom Scenario of India in the 2001 to 2011 Period
India is the second largest country in the world with 1 billion plus population. Its telecom market
is also huge. In this chapter the telecom market of India is analyzed from the key indicators
points of views. All the key aspects are analyzed and presented in the appropriate formats. Then
the ten largest companies are analyzed from their strategic points of views. Both the revenue and
number of subscribers are taken into account to check the changes observed over the last decade.
6.1 Overview of Indian Telecom Market
The Indian telecom market is the second largest national telecom market in the world after
China. According to the recent reports of Telecom Regulatory Authority of India (TRAI, 2011),
its number of mobile subscribers is 920 million and total number of wireless and wired
subscribers is more than 951 million. India´s telecom growth started in the eighties and in the
2000s it reached the modern scenario. In Table 9 the telecom growth rates are presented which
shows the real transformation in the last decade. But the trend is different from Europe. In India
the mobile subscriptions are increasing while the landline numbers are decreasing over the years.
Table 9 – Growth of Telephones in India. Source: DoT Annual Report (2011)
Mar 04 Mar 05 Mar 06 Mar 07 Mar 08 Mar 09 Mar 10 Dec 10
Wireline 40.92 41.42 40.23 40.77 39.41 37.97 36.96 35.09
Wireless 35.61 56.95 101.86 165.09 261.08 391.76 584.32 752.20
Gross Total 76.53 98.37 142.09 205.87 300.49 429.73 621.28 787.29
Annual Growth % 40 29 44 45 46 43 45 27
India’s telecom sector started during the British era. Most of the big cities were connected with
each other during that time. Also these cities were linked with London and other big cities. After
the British left, Indian government took new initiatives to renew the telecom infrastructure.
Figure 32 – Shares of Wireless and Wireline in India. Source: DoT Annual Report (2011)
In the post independence era India followed a socialistic nationalization policy. Under this policy
the government became the sole authority of all the basic service provisioning. It is known as
License Raj (means the culture of licensing everything) in India. There was almost no growth in
Wireline 53%
Wireless 47%
Percentage share of wireline and wireless phones in 2004
Wireline 4%
Wireless 96%
Percentage share of wireline and wireless phones in Dec 2010
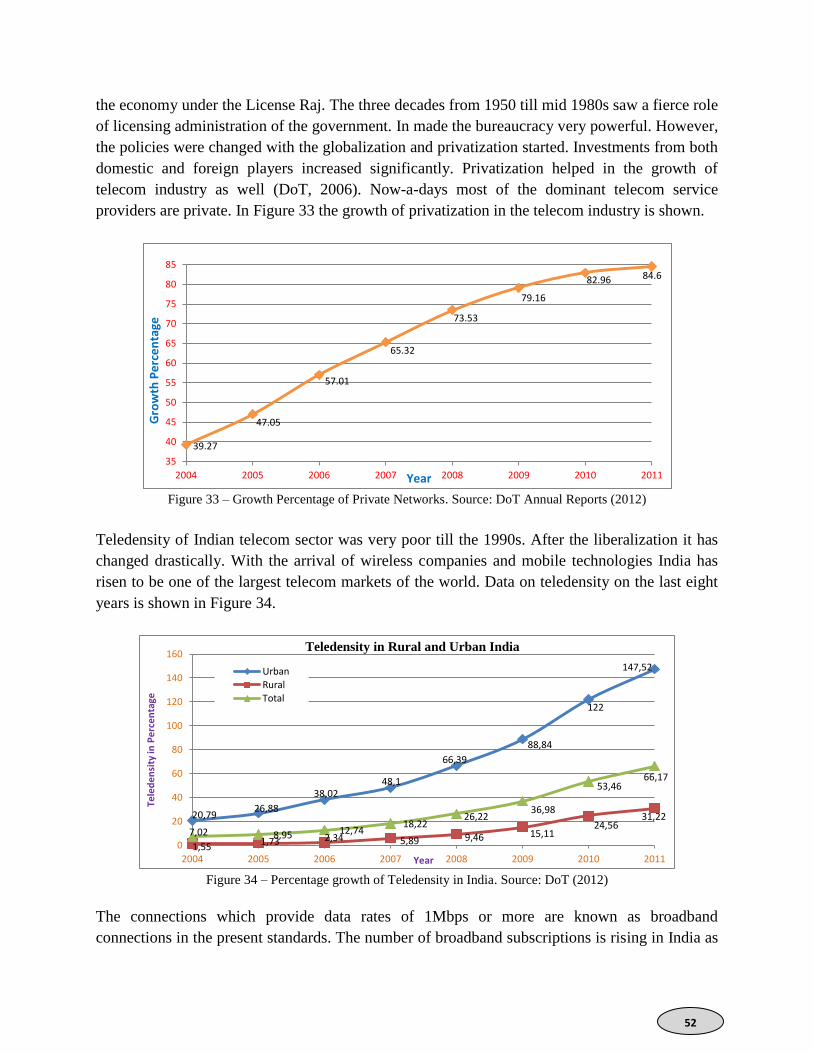
52
the economy under the License Raj. The three decades from 1950 till mid 1980s saw a fierce role
of licensing administration of the government. In made the bureaucracy very powerful. However,
the policies were changed with the globalization and privatization started. Investments from both
domestic and foreign players increased significantly. Privatization helped in the growth of
telecom industry as well (DoT, 2006). Now-a-days most of the dominant telecom service
providers are private. In Figure 33 the growth of privatization in the telecom industry is shown.
Figure 33 – Growth Percentage of Private Networks. Source: DoT Annual Reports (2012)
Teledensity of Indian telecom sector was very poor till the 1990s. After the liberalization it has
changed drastically. With the arrival of wireless companies and mobile technologies India has
risen to be one of the largest telecom markets of the world. Data on teledensity on the last eight
years is shown in Figure 34.
Figure 34 – Percentage growth of Teledensity in India. Source: DoT (2012)
The connections which provide data rates of 1Mbps or more are known as broadband
connections in the present standards. The number of broadband subscriptions is rising in India as
39.27
47.05
57.01
65.32
73.53
79.16
82.96 84.6
35
40
45
50
55
60
65
70
75
80
85
2004 2005 2006 2007 2008 2009 2010 2011
Gro
wth
Pe
rce
nta
ge
Year
20,79 26,88
38,02 48,1
66,39
88,84
122
147,52
1,55 1,73 2,34 5,89 9,46 15,11
24,56 31,22
7,02 8,95 12,74 18,22
26,22 36,98
53,46 66,17
0
20
40
60
80
100
120
140
160
2004 2005 2006 2007 2008 2009 2010 2011
Tele
de
nsi
ty in
Pe
rce
nta
ge
Year
Teledensity in Rural and Urban India
Urban
Rural
Total
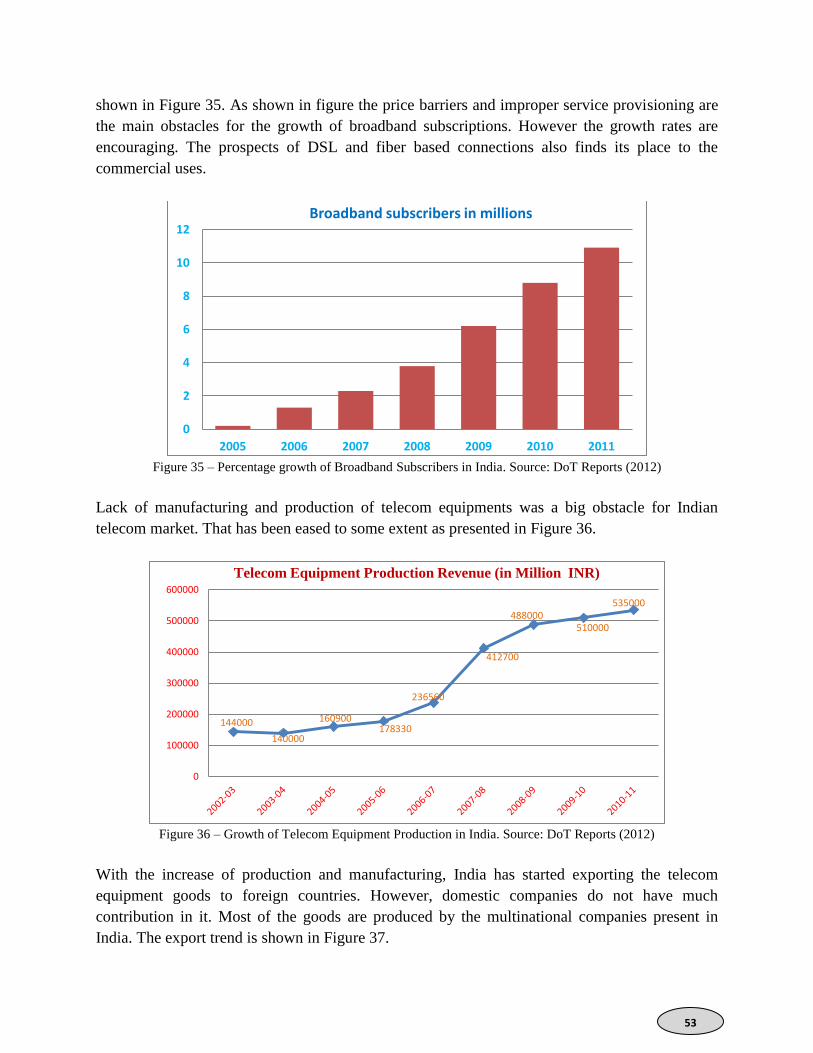
53
shown in Figure 35. As shown in figure the price barriers and improper service provisioning are
the main obstacles for the growth of broadband subscriptions. However the growth rates are
encouraging. The prospects of DSL and fiber based connections also finds its place to the
commercial uses.
Figure 35 – Percentage growth of Broadband Subscribers in India. Source: DoT Reports (2012)
Lack of manufacturing and production of telecom equipments was a big obstacle for Indian
telecom market. That has been eased to some extent as presented in Figure 36.
Figure 36 – Growth of Telecom Equipment Production in India. Source: DoT Reports (2012)
With the increase of production and manufacturing, India has started exporting the telecom
equipment goods to foreign countries. However, domestic companies do not have much
contribution in it. Most of the goods are produced by the multinational companies present in
India. The export trend is shown in Figure 37.
0
2
4
6
8
10
12
2005 2006 2007 2008 2009 2010 2011
Broadband subscribers in millions
144000
140000
160900 178330
236560
412700
488000 510000
535000
0
100000
200000
300000
400000
500000
600000
Telecom Equipment Production Revenue (in Million INR)
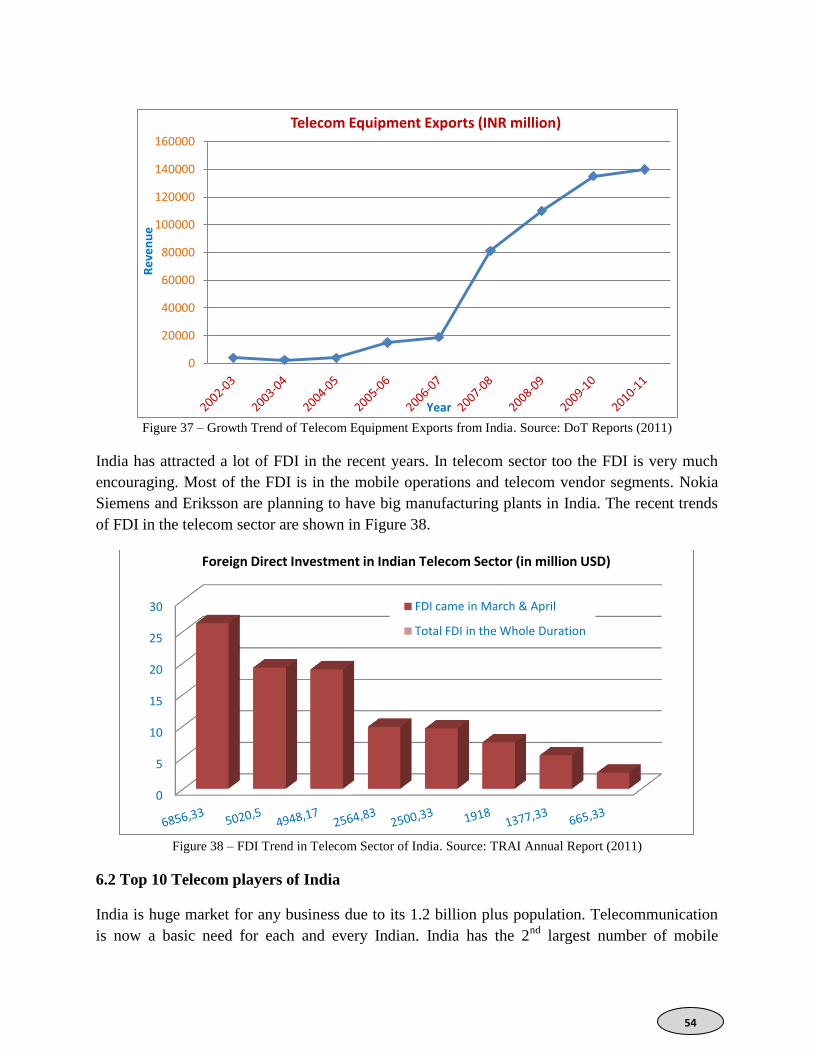
54
Figure 37 – Growth Trend of Telecom Equipment Exports from India. Source: DoT Reports (2011)
India has attracted a lot of FDI in the recent years. In telecom sector too the FDI is very much
encouraging. Most of the FDI is in the mobile operations and telecom vendor segments. Nokia
Siemens and Eriksson are planning to have big manufacturing plants in India. The recent trends
of FDI in the telecom sector are shown in Figure 38.
Figure 38 – FDI Trend in Telecom Sector of India. Source: TRAI Annual Report (2011)
6.2 Top 10 Telecom players of India
India is huge market for any business due to its 1.2 billion plus population. Telecommunication
is now a basic need for each and every Indian. India has the 2nd
largest number of mobile
0
20000
40000
60000
80000
100000
120000
140000
160000 R
eve
nu
e
Year
Telecom Equipment Exports (INR million)
0
5
10
15
20
25
30
Foreign Direct Investment in Indian Telecom Sector (in million USD)
FDI came in March & April
Total FDI in the Whole Duration
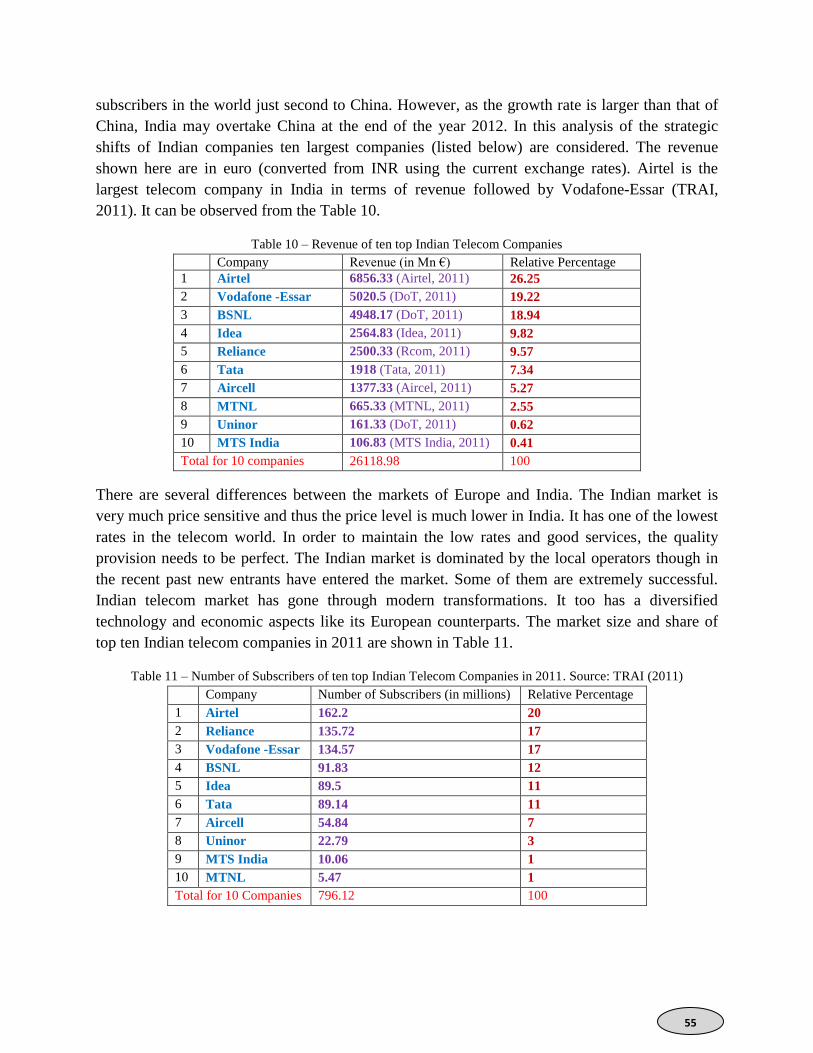
55
subscribers in the world just second to China. However, as the growth rate is larger than that of
China, India may overtake China at the end of the year 2012. In this analysis of the strategic
shifts of Indian companies ten largest companies (listed below) are considered. The revenue
shown here are in euro (converted from INR using the current exchange rates). Airtel is the
largest telecom company in India in terms of revenue followed by Vodafone-Essar (TRAI,
2011). It can be observed from the Table 10.
Table 10 – Revenue of ten top Indian Telecom Companies
Company Revenue (in Mn €) Relative Percentage
1 Airtel 6856.33 (Airtel, 2011) 26.25
2 Vodafone -Essar 5020.5 (DoT, 2011) 19.22
3 BSNL 4948.17 (DoT, 2011) 18.94
4 Idea 2564.83 (Idea, 2011) 9.82
5 Reliance 2500.33 (Rcom, 2011) 9.57
6 Tata 1918 (Tata, 2011) 7.34
7 Aircell 1377.33 (Aircel, 2011) 5.27
8 MTNL 665.33 (MTNL, 2011) 2.55
9 Uninor 161.33 (DoT, 2011) 0.62
10 MTS India 106.83 (MTS India, 2011) 0.41
Total for 10 companies 26118.98 100
There are several differences between the markets of Europe and India. The Indian market is
very much price sensitive and thus the price level is much lower in India. It has one of the lowest
rates in the telecom world. In order to maintain the low rates and good services, the quality
provision needs to be perfect. The Indian market is dominated by the local operators though in
the recent past new entrants have entered the market. Some of them are extremely successful.
Indian telecom market has gone through modern transformations. It too has a diversified
technology and economic aspects like its European counterparts. The market size and share of
top ten Indian telecom companies in 2011 are shown in Table 11.
Table 11 – Number of Subscribers of ten top Indian Telecom Companies in 2011. Source: TRAI (2011)
Company Number of Subscribers (in millions) Relative Percentage
1 Airtel 162.2 20
2 Reliance 135.72 17
3 Vodafone -Essar 134.57 17
4 BSNL 91.83 12
5 Idea 89.5 11
6 Tata 89.14 11
7 Aircell 54.84 7
8 Uninor 22.79 3
9 MTS India 10.06 1
10 MTNL 5.47 1
Total for 10 Companies 796.12 100
56
The comparative standings of the companies are clear from Table 11, which shows the
percentage shares of individual companies. Airtel is leading with 20% of the market. As the
growth rate of Vodafone is much higher than Reliance, it is expected that Vodafone will be in
second position in 2012 fiscal year.
6.3 Main Strategic Changes
There are several changes in different segments of strategies of the telecom companies. In the
following sections the main changes in the strategies are described in brief.
6.3.1 Arrival of International Companies
The Indian telecom market was very much dominated by the national players until 2004. The
foreign operations were limited to the vendors and infrastructure builders. However, the
liberalizations in the economic policies and the investor friendly markets have been attracting the
foreign companies since 2004. In all sectors of telecom (i.e., wireless and wired operations,
vendors, VoIP, internet service provisioning) foreign companies started their business
operations. Firstly, Hutch entered from its Hong Kong base. Then Vodafone entered in 2007,
followed by Telenor, MTS and others. 2007 onwards, Indian telecom sector is very much
international in nature from the operators’ points of views. The national players had to protect
their markets through appropriate strategies. Mainly the dominating players faced a lot of
challenges to maintain their market share.
6.3.2 Alliances between Companies
Foreign companies normally do not enter the Indian market directly. That is due the difference of
Indian business processes than the foreigners. They prefer partners in India to ease their initial
challenges. Vodafone and Hutch both partnered with Essar of India. Similarly, Telenor took the
help of Unitech to form a joint venture called Uninor. This strategic partnership helped both the
companies in forming a strong business environment for mutual growth. Some of the companies
extend their partnerships beyond India.
6.3.3 Mergings and mega-mergings
Merging and acquisitions of telecom companies have a big impact on the telecom sector.
Vodafone first acquired 67% stake of Hutchinson-Essar India. Then it took over other small
operations of its Indian partners. In 2010, Vodafone completely bought the shares of Hutch and
Essar to have the sole ownership of its operations. Tata tele-services and DoCoMo of Japan
agree to merge their Indian operations. Later, DoCoMo paid 2.2 billion USD to Tata to have the
deal. The merger between Hutch and Vodafone is a mega deal in Indian telecom business.
6.3.4 Joint Ventures with Telecom Vendors
Joint ventures between telecom companies are not uncommon. But in India there are joint
ventures between the telecom operators and vendors. There are many such big joint ventures
between the big players. Some of the large ones are presented here.
57
Airtel-Erricson: Ericsson and Airtel are old friends since Airtel started its mobile operations in
the mid 1990s. The network maintainace and optimization of Airtel are done by Ericsson. After
Airtel took over Zain, they have agreed to extend these collaboration to the African operations of
Airtel (Airtel, 2010).
Vodafone-NSN: Vodafone and NSN have also similar understandings to manage and optimize
the networks of Vodafone. NSN has similar deals with other telecom operators as well
(rcrwireless.com, 2011).
Huwei-Aircel: Chinese vendor Huwei and Aircel of India have entered a 120 million USD deal
to test and deploy LTE networks. This deal is going to be a long term joint venture between the
two (telecompaper.com, 2012).
6.3.5 Changes in Advertising and Branding
Advertisement and branding in India used to be trivial matters before the 1990s. However when
the markets were liberalized and competition sky rocketed, the old tradition changed a lot. Now,
companies like Vodafone spend a lot to capture the market. The brand building too has been very
important. Some companies even use social scientists and gaze experts to judge the effects of
their advertising and branding. Airtel, Reliance and Idea are in the top 100 telecom brands of the
world.
6.3.6 Looking for Fixed Network and Infrastructure Business
Like their western counterparts, Indian telecom companies are also looking forward to have fixed
telephone markets. Some of them like Airtel and Reliance are also deploying optical fibers. They
have ambitious plans for the future. Reliance Infocom bought Flag Telecom of UK in 2002 and it
deploys undersea long distance optical fiber cables in the Indian Ocean regions.
6.3.7 Introduction of VAS and new Services like ´Airtel Money´
This is a value added service or VAS on the mobile platform. It does not need many hassles and
quite easy to use. In India the population is huge and the numbers of banks in the rural areas are
very few. So, people prefer these services like Airtel money to transact. Not only the money
transfer there are several VAS very popular over the mobile platforms in India.
6.3.8 Expanding Services in other Related and Unrelated Sectors
Mobile platforms are no more limited to the voice services. First the short message services
came. Then arrived the picture and video related services. Now there are so many VASs being
operated on the mobile platform.
6.3.9 New Services Adaptable with VoIP
All the main telecom operators of India are looking towards the VoIP service for the long
distance voice communications. They provide international calling cards which generates money
for the international calls. Using these calling cards the customers can save substantially.
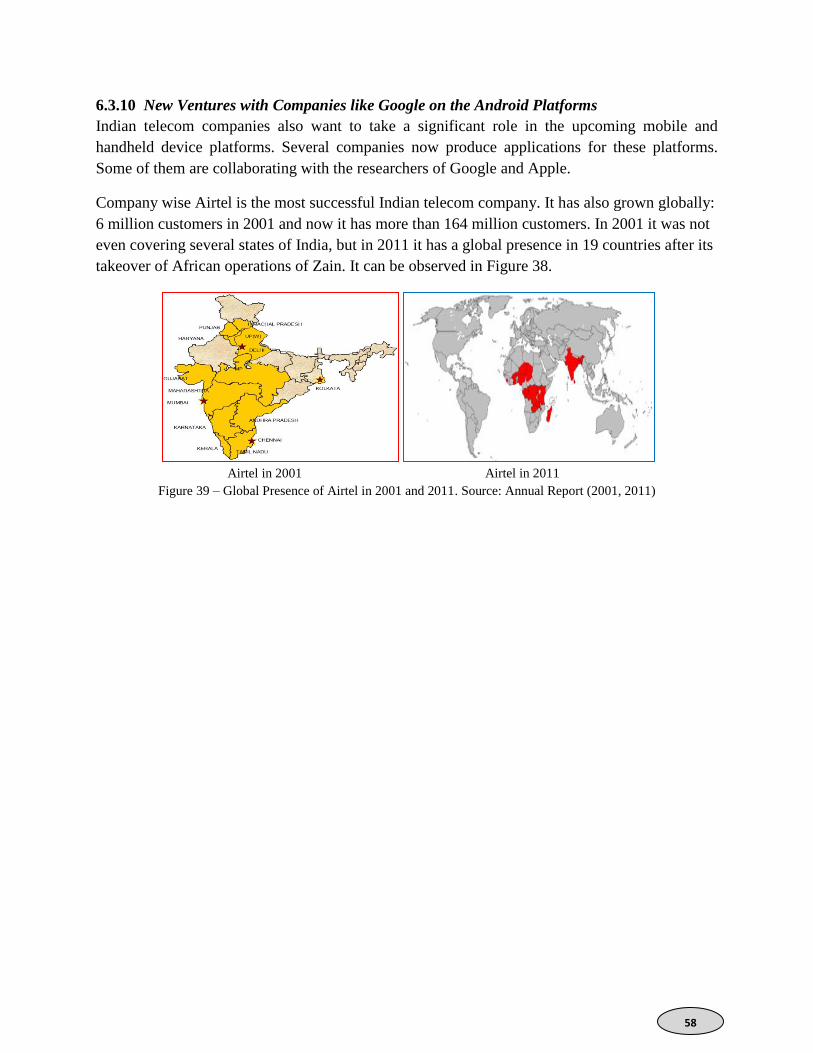
58
6.3.10 New Ventures with Companies like Google on the Android Platforms
Indian telecom companies also want to take a significant role in the upcoming mobile and
handheld device platforms. Several companies now produce applications for these platforms.
Some of them are collaborating with the researchers of Google and Apple.
Company wise Airtel is the most successful Indian telecom company. It has also grown globally:
6 million customers in 2001 and now it has more than 164 million customers. In 2001 it was not
even covering several states of India, but in 2011 it has a global presence in 19 countries after its
takeover of African operations of Zain. It can be observed in Figure 38.
Airtel in 2001 Airtel in 2011
Figure 39 – Global Presence of Airtel in 2001 and 2011. Source: Annual Report (2001, 2011)
59
Chapter 7
Comparison between the European and Indian Industries
At this juncture, it is very much clear that the European and Indian telecom markets are very
much different in several aspects. It is also true that the market nature and their dynamics are
also very dissimilar. In the following sections the similarities and differences between the two
markets are presented.
7.1 The Figures
The markets of both Europe and India are huge in their own right. European Market has a huge
revenue, perhaps continent wise the largest telecom market. But Indian market is the 2nd
largest
national market in terms of number of subscribers. The total number of subscribers of India is
more than that of Europe. But the revenue of Indian telecom sector is less than that of Europe. It
is due to the differences in the economy. The Indian market is a developing market with low
labor costs, whereas the European market is highly developed with high labor costs.
7.2 Similarities
At the end, the similarities between the European telecom sector and its Indian counterpart are
warped up here in this section. Both the markets are huge in size. In last ten years both markets
have grown significantly. The competition has become fierce in both the cases. Both the markets
have gone for internationalization to increase their sizes and profits. GSM and its legacy technologies are the main drivers of telecom growth in both Europe and
India. Though India allows CDMA operators, GSM has the lion’s share in its market. Europe is
the GSM-land. It has almost no presence of CDMA in the voice communication sector.
Fierce competition is common to both the Indian and European markets. It is not easy to manage
for the complacent in either market.
7.3 Differences
Despite the above similarities, there are several differences between the two markets. The
European market is saturated in terms of tele-density. However, the Indian market is still
growing and it would take another ten years or so to be saturated. The European market is thus
looking for alternative ways to expand its horizon such as the broadband services like 3G, 4G
and WiMAX. In India, this segment is growing but not as fast as the 2G segment. The European
market is looking towards the additional components like mobile computing and location based
services to bring extra revenue. These sectors are growing slowly in India. Alliances between the
rivals are quite common in Europe, but in India it is not that common though there are few such
cases at the small scale.
60
In India both CDMA and GSM technologies are used for all kind of mobile communication and
its related services. Though GSM has a larger share, India is still one of the largest markets of
CDMA in the world. Of course there is a strategic partnership between Qualcomm (parent
company of CDMA) and the Indian mobile operators in this regard. According to that,
Qualcomm takes less royalty from the Indian operators for using CDMA technologies. The
royalties paid for CDMA is less than the royalties paid for GSM.
In Europe GSM is everywhere for voice and CDMA is used only for data and that too only in a
few countries. That is quite obvious because most of the European operators do not pay any
royalty for GSM as it is their own technology. However, for CDMA they have to pay some
royalty.
Landline density per 100 people is far larger in Europe than in India. It is due to the early
developments of Europe. Also their infrastructure is very much uniform across the countries. In
India the rural areas do not have advanced infrastructure. So the land line density is low. The
price factor also plays a role in the decrease of landlines. Over the years India’s landline density
is shrinking.
The broadband subscriber density of Europe is also highest among the continents. Along with
that the varieties of broadband technologies have also changed. Wireless broadband is the fastest
growing sector among all broadband access technologies.
Overall teledensity of Europe is highest among the continents. In India the cities have the
comparable rate of teledensity as Europe. But the rural teledensity is far lower than the national
average. But in Europe it is not the case. Though the rural teledensity is lower than the cities in
Europe but they are very much near the 100% mark.
European telecom companies do cutting edge research in telecommunications. They file a large
number of patents every year. They make money from patents and save money from royalties.
Innovations make them the trend setters in the world.
However, Indian telecom companies are far away from their European counterparts in this
respect. All the Indian companies pay a huge amount for the royalties of the technologies they
use. Slow innovation processes are among the main reason behind the slow growth of telecom
companies of India.
The European market is very much saturated. There is almost no place for external companies to
start business in telecom sector. It is a tough place for new entrants. Even the existing players
find it tough to survive in some countries.

61
However, the Indian telecom market is still investor friendly. There are a lot of opportunities for
new entrants and several different operations. The VAS attraction in Indian market is quite
remarkable. Services such as mMoney and mPesa are very popular and binding the rural India
with the modern markets, which are absent in Europe.
7.4 Strategic Differences between the two Markets
Some strategic differences between the two markets are there. European market is already
saturated and looks for alternative services for revenue. Entering new markets within Europe
does not provide much return rather the business processes become too difficult to handle due to
the tough competitions. New services as described in the previous sections such as the mobile
computing, location based services are quite encouraging in the growth. Almost all the European
companies remain static in their service coverage within Europe. Alternatively, they look for
opportunities outside Europe. North and South Americas are used to be a growth area for them.
But as of 2011, the growth rates of these markets have come down and the revenues from the
operations in these markets are almost stagnant. The case of Australia is also similar. Only
Africa and some countries of Asia provide high growth trends. African telecom markets are still
virgin in some countries. The teledensity is also quite low. But the case of Asia is different. It has
all kind of diversities and a rising marketplace for investment for European telecom operators.
Indian market is not as saturated as the European market. Its subscriber base is huge and
increasing. Especially in the rural India, the teledensity is growing very fast. This is very much
attractive for the existing and new telecom operators. In the last few years, Indian market has got
large FDIs in this sector. There are also new opportunities for the additional service over the
mobile platforms.

62
63
Conclusion
European telecom market was analyzed with the major events of the last decade. European
telecom market has evolved very differently from other world markets as described in Chapter 2,
3 and 4. Now it is almost saturated and the growth rate is very small. The only growths are
happing in the value added services sectors such as the mobile computing applications. Of course
new technologies such as 4G and LTE opened the doors for new markets. Otherwise the
European market is very much saturated and stagnant as far as the numbers of subscribers are
concerned. Thus the competition is quite fierce and there is almost no place for the new entrants
with the traditional services.
In contrast to that, Indian market is very much young and the growth rates are in the double
digits. India is also a versatile market with a lot of variety of service providers, operators and
customers. Rural India has a significant void of teledensity. It is an area of concentration for both
the domestic and international operators. In addition to that Indian market is a big attraction due
to its huge size in terms of number of subscribers and revenue growing potentials.
Strategically, there are a lot of changes in the European market. Some of the companies have
grown very rapidly and leading the global communication. Some of them have struggled to keep
their positions intact. Most of them have increased their coverage area of services. But a few
have done the reverse. All these moves are strategy driven to keep their operations in track and
healthy. Marketing and cultural issues are of main focus for the big players. They have handled
these issues successfully to a large extent. The branding and advertisement have changed over
the decade. In 2011, the telecom operators of Europe are among the biggest brands of the world.
The brand values have increased significantly as well.
Indian companies too have looked forward in different aspects. Some of them have crossed the
border and have multinational operations now. They have strategic collaborations with
international operators which help both in the business and technology transfers. Indian
companies have grown very fast in the last decade in terms of their revenue. Some of the
operators have been placed in the top ten in various aspects.
Overall, the big companies with the right strategy are doing well. Strategic changes are always
there for them. The right changes are the right time and right places pay the maximum returns.
Most of the changes with positive intention have given encouraging results. However, immature
and stupid changes in strategies have backfired.
However, the focus of strategic management is changing from the traditional courses. In the
modern days it is more value oriented than short term market capture. This will hopefully remain
the trend for telecom companies for the coming decades.

64
65
Bibliography
Agar, J. (2003). Constant Touch: A Global History of the Mobile Phone. Duxford, Cambridge, UK: Icon Books.
Ahonen, T. (2002). m-Profits: Making Money from 3G Services. NY: John Wiley.
Albrecht, K. (2011). Supermarket Cards: The Tip of the Retail Surveillance Iceberg. Denver University Law Review,
Volume 79, Issue 4, pp. 534-539 and 558-565.
Anwar, S. T. (2003). Cases of Vodafone and the wireless industry: a case in market expansion and global strategy.
Journal of Business & Industrial Marketing, Vol. 18 Issue: 3, pp. 270 – 288.
ARCEP. (2006, February). Public Consultation on the wholesale market for SMS call termination on public
mobile telephone networks. Available from: http://www.art-telecom.fr/fileadmin/uploads/tx_ gspub
lication/consult-tasms-241005-eng.pdf.
Beardsley, S. (1998, May). Full Telecom competition in Europe is years away. The Mckinsey Quarterly.
Bekkers, R., Duysters, G. & Verspagen, B. (2002). Intellectual property rights, strategic technology agreements
and market structure: The case of GSM. Research Policy, Vol. 31 , pp. 1141–1161.
Bhargava, H., Choudhary, V. & Krishnan, R. (2000). Pricing and product design: intermediary strategies in an
electronic market. International Journal of Electronic Commerce, 5 (1/Fall) pp. 37–56.
Binmore, K. & Klemperer, P. (2002). The Biggest Auction Ever : The Sale of the British 3G Telecom Licenses. The
Economic Journal, Vol. 112, no. 478, March, pp. C74-C96.
Bjorkdahl, J. & Bohlin, E. (2002). Financial Analysis of the Swedish 3G Licensees: Where are the Profits. info, vol.
4, no. 4, pp. 10-16.
Choi, S. K., Lee, M. & Chung, G. H. (2001). Competition in Korean mobile telecommunications market: business
strategy and regulatory environment. Telecommunication policy, vol. 25, pp. 125-138.
Coen, D. (2005). Managing the political life cycle of regulation in the UK and German telecommunication sectors.
Annals of Public and Cooperative Economics, 76 (1), pp. 59–84.
Daly, A. & Moloney, D. (2004). Managing Corporate Rebranding. Irish Management Review, November, vol. 17,
no 1, 2.
Dobbs, A. (2002). The Assessment of Market Power and Market Boundaries Using the Hypothetical Monopoly
Test. Department of Accounting and Finance, and Newcastle School of Management, University of
Newcastle upon Tyne, NE1 7RU, UK.
European Commission (2002, July). Comparative Assessment of the Licensing Regimes for 3G Mobile
Communications in the European Union and their Impact on the Mobile Communications Sector.
McKinsey & Co.
European Commission. (2002). Eighth Report on the Implementation of the Telecommunications Regulatory
Package. COM,695.
Fan, P. (2004). Catching up through developing innovation capability: evidence from china’s telecom-equipment
industry. Technovation, vol. 26, pp. 359-368.
Furuskar, A., Mazur, S. F., & Olofsson, H. (1999). EDGE: enhanced data rates for GSM and TDMA/136 evolution,
IEEE Personal Communications, 6 (3) , pp. 55–66.
Garrard, G. (1998). Cellular Communications: Worldwide Market Development. Boston, MA: Artech House
Publishers.
Geroski, P. (2003). Competition in markets and competition for markets. Journal of Industry, Competition and
Trade, vol. 3, pp. 151–166.
Geser, H. (2004). Towards a Sociological Theory of the Mobile Phone, University of Zurich http://socio.ch/
mobile/t_geser1.htm
Gruber, H. & Verboven, F. (2001). The Evolution of Markets Entry and Standards Regulation: The Case of
Global Mobile Telecommunications. Katholieke Universiteit Leuven.
Hitt, M. A., Ireland, R. D. & Hoskisson, R. E. (2009). Concepts of Strategic Management: Competitiveness &
Globalization, 9th
ed., Mason, OH: South-Western Cengage Learning.
66
IEEE. (2005). A Brief History of Communication, IEEE Communications Publication.
Jamison, M. A. & Chan-Olmsted, S. (2002), Rivalry Through Alliances: Competitive Strategy in Global Telecoms
Market. European Management Journal, vol. 20, no1, pp. 95-97.
Kallio, J., Markku, T. & Tseng, A. (2006). An international comparison of operator-driven business models.
Business Process Management Journal, vol. 12, Issue: 3, pp. 281 – 298.
Kathuria, R. (2008). Prospects for the telecommunications sector under the Indo-Europe trade and investment
agreement. Report of ICRIER
Kevin, J. & Brien, O. (2005, June 29). Cell phone customers put new technologies on hold. International Herald
Tribune.
Kotler, P. & Turner, R. (1985). Marketing Management: Analysis, Planning, and Control, Canada: Prentice-Hall.
Krafft, J. (2003). Vertical structure of the industry and completion: an analysis of the evolution of the info-
communications industry, Telecommunication policy, vol. 27, pp. 625-649.
Langlade, J. (1997). International competitive in Asia Broadband telecommunications and interactive multimedia.
Telecommunication policy. vol. 21, pp 235 -249.
Lehr, W. & Kiessling, T. (1999). Telecommunication Regulation in the United States and Europe: The case for
centralized authority, MIT Dspace.
Liu. C. & Jayakar, K. (2012). The evolution of telecommunication policy making; comparative analysis of China
and India. Telecommunication policy, vol. 36, pp. 13-28.
Maitland, C. F., Bauer, J. M. & Westerveld, R. (2002). The European market for mobile data: evolving value chains
and industry structures. Telecommunication Policy, vol. 26, pp. 485-504.
Mansell, R. & Jenkins, M. (1994). Telecommunication strategies:, incremental change in Europe. Elsevier science
publisher, The Ned, 9th
Int Conf on Global telecommunications strategies and technological changes, pp.
81 – 96.
Marleba, F. & Nelson R. R. (2012). Innovation and Learning for Economic Development: The Evolution of Sectoral
Telecommunication, Edward Elgar Publishing
Meyer-Krahmer, F. & Reger, G. (2000). New perspectives on the innovation strategies of multinational enterprises:
lessons for technology policy in Europe. Science Direct, Available online from 11 January 2000.
Minzberg, H. (1999). Reflecting on the strategic process. Sloan Management Review, Spring Issue.
Minzberg, H. (1994). The Rise and Fall of Strategic Planning. NY: The Free Press.
Pehrsson, A. (2001). Strategy in Emerging Markets: Telecommunications Establishments in Europe, London, UK:
Rutledge.
Porter, M. E. (1980). Competitive Strategy, New York: The Free Press.
Porter, M. E. (1985). Competitive Advantage, New York: The Free Press.
Porter, M. E. (1986). Competition in Global Industries, Boston, MA: Harvard Business School Press
Porter, M. E. (1987). From Competitive Advantage to Corporate Strategy, Harvard Business Review, May/June
1987, pp. 43-59.
Porter, M.E. (1979, March/April). How Competitive Forces Shape Strategy, Harvard Business Review, pp. 91-102.
Porter, M. E. (1998). On Competition, Boston, MA: Harvard Business School Press.
Porter, M.E. ( 2001, March). Strategy and the Internet. Harvard Business Review, pp. 62-78.
Porter, M.E. (2006). Strategy and Society: The Link Between Competitive Advantage and Corporate Social
Responsibility. Harvard Business Review, December, pp. 78-92.
Porter, M.E. (2008). The Five Competitive Forces That Shape Strategy, Harvard Business Review, January 2008,
pp. 79-93.
Porter, M.E. (1996, Nov/Dec). What is Strategy?. Harvard Business Review, pp. 58-72.
Pouillot, D. (2002). Key Profitability Factors for Future UMTS Operators. Communications & Strategies, vol. 46,
2nd
quarter.
Shaw, J. K. (2000). Strategic Management in Telecommunications, Norwood, MA: Artech House.
67
Rosenbush, S. (1997). Telecom Business Opportunities: The Entrepreneur's Guide to Making Money in the
Telecommunications Revolution, London, UK: Aegis Publishing Group.
Steinbock, D. (2001). Assessing Finland’s wireless valley: can the pioneering continue?. Telecommunication Policy,
vol. 25, pp. 71-100.
Strouse, Karen, G. (2001). Strategies for Success for the new Telecommunication Marketplace, Norwood, MA:
Artech House.
Sung, N. (2011). Competitive rivalry,inter-modal competition and market performance in the Korean cable
television markets: an empirical analysis, Telecommunication Policy, vol 35, pp. 483-493.
Whalley, J. & Curwen, P. (2003). License acquisition strategy in the European mobile communications industry,
Telecommunication Info, Vol. 5 Iss: 6, pp.45 – 57.
Zhang, X. & Prybutok, V. R. (2005). How the mobile communication markets differ in China, the U.S., and
Europe, Communications of the ACM, Volume 48 Issue 3, March 2005 , Pages 111 – 114.
Aircel. (2011). 2011 Annual Report of Aircel.
Airtel. (2010). 2010 Annual Report of Airtel
Airtel. (2011). 2011 Annual Report of Airtel
Airtel. (2001). 2001 Annual Report of Airtel
British Telecom. (2011)2011. Annual Financial Report of British Telecom.
British Telecom. (2011). 2011 Annual Report of British Telecom.
British Telecom. (2001). 2001 Annual Financial Report of BT
British Telecom. (2001). 2001 Annual Report of BT.
British Telecom. (2001). 2001 Annual Financial Report of British Telecom.
Deutsche Telekom. (2001). 2001 Annual Report of Deutsche Telekom.
Deutsche Telekom. (2010). 2010 Annual Report of Deutsche Telekom.
Deutshe Telecom. (2011), 2011 Annual Report of Deutsche Telekom.
DoT. (2001). 2001 Annual Report of DoT, India.
DoT. (2002). 2002 Annual Report of DoT, India.
DoT. (2003). 2003 Annual Report of DoT, India.
DoT. (2004). 2004 Annual Report of DoT, India.
DoT. (2005). 2005 Annual Report of DoT, India.
DoT. (2006). 2006 Annual Report of DoT, India.
DoT. (2007). 2007 Annual Report of DoT, India.
DoT. (2008). 2008 Annual Report of DoT, India.
DoT. (2009). 2009 Annual Report of DoT, India.
DoT. (2010). 2010 Annual Report of DoT, India.
DoT. (2011). 2011 Annual Report of DoT, India.
DoT. (2006). 2006 Annual Financial Report of DoT, India.
DoT. (2007). 2007 Annual Financial Report of DoT, India.
DoT. (2008). 2008 Annual Financial Report of DoT, India.
DoT. (2009). 2009 Annual Financial Report of DoT, India.
DoT. (2010). 2010 Annual Financial Report of DoT, India.
France Telecom. (2001). 2001 Annual Report of France Telecom.
France Telecom. (2010). 2010 Annual Report of France Telecom.
France Telecom. (2011). 2011 Annual Report of France Telecom.
Idea Cellular. (2010). 2010 Annual Report of Idea Cellular.
Idea Cellular. (2011). 2011 Annual Report of Idea Cellular.
ITU. (2001). 2001 Annual Telecommunication Report of ITU.
ITU. (2009). 2009 Annual Telecommunication Report of ITU.
ITU. (2010). 2010 Annual Telecommunication Report of ITU.
ITU. (2011). 2011 Annual Telecommunication Report of ITU.
68
ITU. (2012). 2012 Annual Telecommunication Report of ITU.
MTNL. (2011). 2011 Annual Report of MTNL.
MTS. (2001). 2001 Annual Report of MTS.
MTS. (2010). 2010 Annual Report of MTS.
MTS. (2011). 2011 Annual Report of MTS.
MTS India. (2011). 2011 Annual Report of MTS India.
Portugal Telecom. (2001). 2001 Annual Report of Portugal Telecom.
Portugal Telecom. (2010), 2010 Annual Report of Portugal Telecom.
Portugal Telecom. (2011). 2011 Annual Report of Portugal Telecom.
Reliance Infocom. (2010). 2010 Annual Report of Reliance Infocom
Reliance Infocom. (2011). 2011 Annual Report of Reliance Infocom
Reliance Infocom. (2001). 2001 Annual Report of Reliance Infocom
Tata Teleservices. (2011). 2011 Annual Report of Tata Teleservices.
Telecom Italia. (2011). 2011 Annual Report of Telecom Italia.
Telecom Italia. (2010). Annual Report of Telecom Italia.
Telecom Italia. (2001). 2001 Annual Report of Telecom Italia.
Telefónica. (2001). 2001 Annual Report of Telefónica.
Telefónica. (2010). 2010 Annual Report of Telefónica.
Telefonica. (2011). 2011 Annual Report of Telefónica.
Telenor. (2001). 2001 Annual Report of Telenor.
Telenor. (2010). 2010 Annual Report of Telenor.
Telenor. (2011). 2011 Annual Report of Telenor.
TeliaSonera. (2001). 2001 Annual Report of TeliaSonera.
Teliasonera. (2011). 2011 Annual Report of TeliaSonera.
TeliaSonera. (2010). 2010 Annual Report of TeliaSonera.
TRAI. (2010). 2010 Annual Report of TRAI, India.
TRAI. (2011). 2011 Annual Report of TRAI, India.
Vodafone. (2001). 2001 Annual Report of Vodafone.
Vodafone.(2010). 2010 Annual Report of Vodafone.
Vodafone. (2011). 2011 Annual Report of Vodafone.
Webography
http://www.vodafone.com
http://www.bt.com
http://www.telecom.pt
http://www.telenor.no
http://www.teliasonera.com
http://www.mtsgsm.com
http://www.cnnmoney.com
http://www.wikipedia.com
http://www.tech.fortune.cnn.com
http://everythingeverywhere.com/
http://www.orange.co.uk/
http://www.t-mobile.com/
http://www.mts.ru/
http://www.telecomitalia.com/tit/en/about-us/profile/latin-america.html
http://www.plunkettresearch.com/telecommunications-market-research/industry-and-business-ata/statistics
69
http://www.airtel.in/
http://www.rcom.co.in/Rcom/personal/home/index.html
http://www.ideacellular.com/
http://www.bsnl.co.in/
http://www.mtnl.net.in/
http://mtnldelhi.in/
http://www.uninor.in/Pages/home.aspx
http://www.vodafone.in/pages/index.aspx
http://www.mtsindia.in/
www.dotindia.com
www.reservebankofindia.com
http://www.brandrepublic.com/news/1059821/
http://everythingeverywhere.com/2011/04/28/everything-everywhere-evolution-on-track-with-commercial-stability-
despite-slowing-market/
http://everythingeverywhere.com/brands/
http://everythingeverywhere.com/2012/05/02/everything-everywhere-results-for-the-first-quarter-to-31-march-2012/
http://everythingeverywhere.com/2012/05/02/everything-everywhere-launches-first-live-4g-customer-trial-in-the -
north-of-england/
http://everythingeverywhere.com/network-guide/
http://everythingeverywhere.com/vision/
http://www.marketingweek.co.uk/everything-everywhere-readies-orange-and-t-mobile-brand-campaigns/ 3033664
.article
http://www.multinationalsolutions.Telefónica.com/en/Telefónica/about-us/commercial-presence.aspx
http://online.wsj.com/article/SB10001424052970203413304577088180993556996.html
http://charts.medianama.com/indian-telecom-subscriber-and-revenue-report-%E2%80%93-operator-data/
http://www.diplointernetgovernance.org/group/CoE/forum/topics/tier-1-operators
http://www.cdg.org/worldwide/cdma_world_subscriber.asp
http://www.rcrwireless.com/
http://www.networkworld.com/
http://www.telecompaper.com/
http://www.fiercetelecom.com/