Síntese da Execução Orçamental de março de 2018 - Informação … · XLS file · Web...
32
March 2018 Complementary Statistics Information Budget Outturn
Transcript of Síntese da Execução Orçamental de março de 2018 - Informação … · XLS file · Web...

March 2018
Complementary Statistics InformationBudget Outturn

março 2018
Informação EstatísticaComplementarSíntese Execução Orçamental

Index Last updated on Next update Last available figures
1 - Budget Execution Evolution - General Government 26-April-18 25-May-18 March 2018
2 - State subsector revenue - Economic Classification 26-April-18 25-May-18 March 2018
3 - State subsector expenditure - Functional Classification 26-April-18 25-May-18 March 2018
4 - State subsector expenditure - Economic/Organic Classification 26-April-18 25-May-18 March 2018
5 - Autonomous Services and Funds expenditure - Functional Classification 26-April-18 25-May-18 March 2018
6 - Autonomous Services and Funds expenditure - Economic/Organic Classification 26-April-18 25-May-18 March 2018
7 - Metadata 26-April-18 25-May-18 March 2018
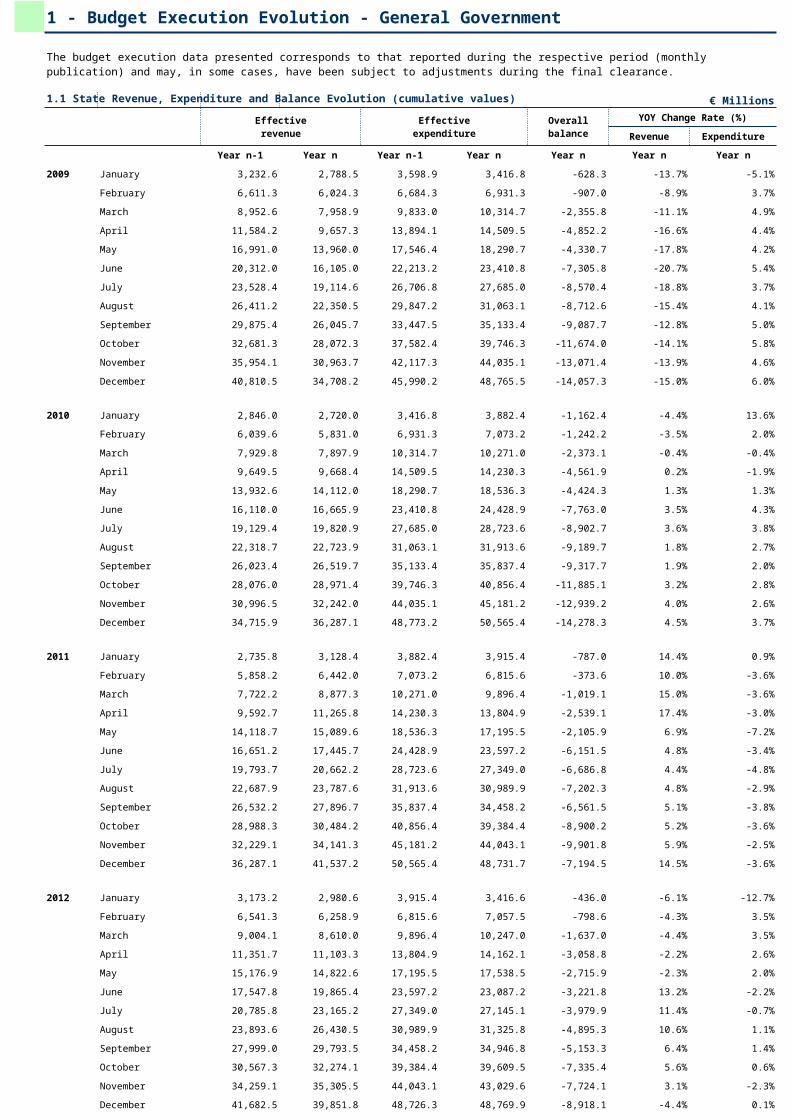
1 - Budget Execution Evolution - General Government
1.1 State Revenue, Expenditure and Balance Evolution (cumulative values) € MillionsYOY Change Rate (%)
Revenue Expenditure
Year n-1 Year n Year n-1 Year n Year n Year n Year n
2009 January 3,232.6 2,788.5 3,598.9 3,416.8 -628.3 -13.7% -5.1%
February 6,611.3 6,024.3 6,684.3 6,931.3 -907.0 -8.9% 3.7%
March 8,952.6 7,958.9 9,833.0 10,314.7 -2,355.8 -11.1% 4.9%
April 11,584.2 9,657.3 13,894.1 14,509.5 -4,852.2 -16.6% 4.4%
May 16,991.0 13,960.0 17,546.4 18,290.7 -4,330.7 -17.8% 4.2%
June 20,312.0 16,105.0 22,213.2 23,410.8 -7,305.8 -20.7% 5.4%
July 23,528.4 19,114.6 26,706.8 27,685.0 -8,570.4 -18.8% 3.7%
August 26,411.2 22,350.5 29,847.2 31,063.1 -8,712.6 -15.4% 4.1%
September 29,875.4 26,045.7 33,447.5 35,133.4 -9,087.7 -12.8% 5.0%
October 32,681.3 28,072.3 37,582.4 39,746.3 -11,674.0 -14.1% 5.8%
November 35,954.1 30,963.7 42,117.3 44,035.1 -13,071.4 -13.9% 4.6%
December 40,810.5 34,708.2 45,990.2 48,765.5 -14,057.3 -15.0% 6.0%
2010 January 2,846.0 2,720.0 3,416.8 3,882.4 -1,162.4 -4.4% 13.6%
February 6,039.6 5,831.0 6,931.3 7,073.2 -1,242.2 -3.5% 2.0%
March 7,929.8 7,897.9 10,314.7 10,271.0 -2,373.1 -0.4% -0.4%
April 9,649.5 9,668.4 14,509.5 14,230.3 -4,561.9 0.2% -1.9%
May 13,932.6 14,112.0 18,290.7 18,536.3 -4,424.3 1.3% 1.3%
June 16,110.0 16,665.9 23,410.8 24,428.9 -7,763.0 3.5% 4.3%
July 19,129.4 19,820.9 27,685.0 28,723.6 -8,902.7 3.6% 3.8%
August 22,318.7 22,723.9 31,063.1 31,913.6 -9,189.7 1.8% 2.7%
September 26,023.4 26,519.7 35,133.4 35,837.4 -9,317.7 1.9% 2.0%
October 28,076.0 28,971.4 39,746.3 40,856.4 -11,885.1 3.2% 2.8%
November 30,996.5 32,242.0 44,035.1 45,181.2 -12,939.2 4.0% 2.6%
December 34,715.9 36,287.1 48,773.2 50,565.4 -14,278.3 4.5% 3.7%
2011 January 2,735.8 3,128.4 3,882.4 3,915.4 -787.0 14.4% 0.9%
February 5,858.2 6,442.0 7,073.2 6,815.6 -373.6 10.0% -3.6%
March 7,722.2 8,877.3 10,271.0 9,896.4 -1,019.1 15.0% -3.6%
April 9,592.7 11,265.8 14,230.3 13,804.9 -2,539.1 17.4% -3.0%
May 14,118.7 15,089.6 18,536.3 17,195.5 -2,105.9 6.9% -7.2%
June 16,651.2 17,445.7 24,428.9 23,597.2 -6,151.5 4.8% -3.4%
July 19,793.7 20,662.2 28,723.6 27,349.0 -6,686.8 4.4% -4.8%
August 22,687.9 23,787.6 31,913.6 30,989.9 -7,202.3 4.8% -2.9%
September 26,532.2 27,896.7 35,837.4 34,458.2 -6,561.5 5.1% -3.8%
October 28,988.3 30,484.2 40,856.4 39,384.4 -8,900.2 5.2% -3.6%
November 32,229.1 34,141.3 45,181.2 44,043.1 -9,901.8 5.9% -2.5%
December 36,287.1 41,537.2 50,565.4 48,731.7 -7,194.5 14.5% -3.6%
2012 January 3,173.2 2,980.6 3,915.4 3,416.6 -436.0 -6.1% -12.7%
February 6,541.3 6,258.9 6,815.6 7,057.5 -798.6 -4.3% 3.5%
March 9,004.1 8,610.0 9,896.4 10,247.0 -1,637.0 -4.4% 3.5%
April 11,351.7 11,103.3 13,804.9 14,162.1 -3,058.8 -2.2% 2.6%
May 15,176.9 14,822.6 17,195.5 17,538.5 -2,715.9 -2.3% 2.0%
June 17,547.8 19,865.4 23,597.2 23,087.2 -3,221.8 13.2% -2.2%
July 20,785.8 23,165.2 27,349.0 27,145.1 -3,979.9 11.4% -0.7%
August 23,893.6 26,430.5 30,989.9 31,325.8 -4,895.3 10.6% 1.1%
September 27,999.0 29,793.5 34,458.2 34,946.8 -5,153.3 6.4% 1.4%
October 30,567.3 32,274.1 39,384.4 39,609.5 -7,335.4 5.6% 0.6%
November 34,259.1 35,305.5 44,043.1 43,029.6 -7,724.1 3.1% -2.3%
December 41,682.5 39,851.8 48,726.3 48,769.9 -8,918.1 -4.4% 0.1%
The budget execution data presented corresponds to that reported during the respective period (monthly publication) and may, in some cases, have been subject to adjustments during the final clearance.
Effectiverevenue
Effectiveexpenditure
Overallbalance

2013 January 2,998.9 3,068.6 3,416.6 3,805.2 -736.6 2.3% 11.4%
February 6,305.7 6,433.1 7,057.4 7,304.3 -871.1 2.0% 3.5%
March 8,658.4 8,936.6 10,246.9 10,788.6 -1,852.0 3.2% 5.3%
April 11,133.5 11,612.1 14,162.0 14,589.7 -2,977.6 4.3% 3.0%
May 14,826.1 15,966.0 17,538.4 18,646.5 -2,680.5 7.7% 6.3%
June 19,867.2 18,650.8 23,087.1 23,501.9 -4,851.2 -6.1% 1.8%
July 23,168.7 21,989.6 27,141.3 27,686.1 -5,696.6 -5.1% 2.0%
August 26,436.0 25,209.1 31,322.0 31,236.4 -6,027.3 -4.6% -0.3%
September 29,805.8 29,495.0 34,943.0 34,938.2 -5,443.1 -1.0% 0.0%
October 32,280.7 32,448.8 39,603.4 40,166.4 -7,717.6 0.5% 1.4%
November 35,327.5 35,923.9 43,021.2 44,599.4 -8,675.6 1.7% 3.7%
December 39,859.5 41,189.0 48,755.5 48,876.5 -7,687.5 3.3% 0.2%
2014 January 3,073.6 3,341.5 3,805.2 3,522.9 -181.4 8.7% -7.4%
February 6,436.1 6,870.3 7,304.3 7,449.4 -579.1 6.7% 2.0%
March 8,947.7 9,334.9 10,788.6 10,824.3 -1,489.4 4.3% 0.3%
April 11,620.7 12,135.6 14,589.7 14,876.2 -2,740.6 4.4% 2.0%
May 15,976.5 16,178.1 18,646.5 18,564.6 -2,386.4 1.3% -0.4%
June 18,667.5 19,007.5 23,501.9 24,313.5 -5,306.0 1.8% 3.5%
July 22,010.0 22,381.8 27,686.1 29,024.0 -6,642.2 1.7% 4.8%
August 25,224.5 26,585.7 31,236.4 32,262.2 -5,676.5 5.4% 3.3%
September 29,507.1 30,609.4 34,938.2 35,799.9 -5,190.5 3.7% 2.5%
October 32,469.6 33,606.1 40,166.4 40,696.6 -7,090.5 3.5% 1.3%
November 35,949.2 37,198.6 44,542.0 44,633.8 -7,435.2 3.5% 0.2%
December 41,216.1 41,311.4 48,880.6 48,403.9 -7,092.5 0.2% -1.0%
2015 January 3,347.6 3,129.7 3,522.9 3,547.7 -418.0 -6.5% 0.7%
February 6,872.3 6,941.2 7,449.4 7,911.4 -970.2 1.0% 6.2%
March 9,346.5 9,881.8 10,824.3 11,431.3 -1,549.5 5.7% 5.6%
April 12,144.8 12,881.8 14,874.1 15,728.6 -2,846.8 6.1% 5.7%
May 16,193.9 16,973.6 18,562.5 19,558.4 -2,584.8 4.8% 5.4%
June 19,022.0 19,935.1 24,313.5 25,063.3 -5,128.2 4.8% 3.1%
July 22,395.0 23,222.1 29,024.0 29,714.3 -6,492.2 3.7% 2.4%
August 26,597.3 27,869.7 32,262.2 33,103.0 -5,233.3 4.8% 2.6%
September 30,622.3 32,112.4 35,799.9 36,367.8 -4,255.4 4.9% 1.6%
October 33,625.7 35,224.4 40,696.6 41,337.4 -6,113.0 4.8% 1.6%
November 37,218.3 38,890.4 44,633.8 45,005.9 -6,115.5 4.5% 0.8%
December 41,329.4 42,887.1 48,457.3 48,493.5 -5,606.4 3.8% 0.1%
2016 January 3,139.3 3,347.0 3,547.7 3,585.2 -238.2 6.6% 1.1%
February 6,948.6 7,104.7 7,911.4 8,310.7 -1,205.9 2.2% 5.0%
March 9,889.5 9,843.9 11,431.3 11,805.1 -1,961.2 -0.5% 3.3%
April 12,896.4 13,116.6 15,728.5 16,018.3 -2,901.7 1.7% 1.8%
May 16,987.5 17,539.2 19,558.4 19,844.3 -2,305.1 3.2% 1.5%
June 19,896.9 20,479.8 25,063.3 25,295.6 -4,815.9 2.9% 0.9%
July 23,225.9 23,783.7 29,700.4 30,267.1 -6,483.4 2.4% 1.9%
August 27,887.4 27,855.3 33,103.0 33,844.9 -5,989.6 -0.1% 2.2%
September 32,131.0 32,310.8 36,367.8 37,277.7 -4,966.9 0.6% 2.5%
October 35,250.2 35,562.7 41,337.4 42,220.5 -6,657.8 0.9% 2.1%
November 38,904.9 39,347.2 45,005.9 45,887.3 -6,540.1 1.1% 2.0%
December 42,887.1 44,229.2 48,493.5 50,361.4 -6,132.2 3.1% 3.9%
2017 January 3,500.2 3,080.8 3,585.2 3,575.4 -494.7 -12.0% -0.3%
February 7,256.5 6,927.9 8,310.6 8,062.4 -1,134.5 -4.5% -3.0%
March 10,006.4 9,900.1 11,805.1 11,599.8 -1,699.7 -1.1% -1.7%
April 13,130.7 12,664.1 16,018.3 15,944.3 -3,280.2 -3.6% -0.5%
May 17,581.9 16,909.9 19,844.3 19,687.5 -2,777.6 -3.8% -0.8%
June 20,501.1 20,085.2 25,295.5 25,135.3 -5,050.0 -2.0% -0.6%

July 23,814.8 24,482.7 30,266.7 29,552.0 -5,069.3 2.8% -2.4%
August 27,870.9 28,965.9 33,843.9 33,119.1 -4,153.2 3.9% -2.1%
September 32,331.4 33,652.1 37,277.7 36,590.1 -2,938.1 4.1% -1.8%
October 35,582.5 36,940.6 42,220.5 41,458.0 -4,517.3 3.8% -1.8%
November 39,366.6 40,750.0 45,887.1 45,471.5 -4,721.5 3.5% -0.9%
December 44,229.2 45,584.9 50,361.4 50,406.9 -4,822.0 3.1% 0.1%
2018 January 3,088.9 3,290.0 3,575.5 3,526.5 -236.5 6.5% -1.4%
February 6,936.3 7,368.7 8,062.4 8,090.8 -722.1 6.2% 0.4%
March 9,915.6 10,336.6 11,599.7 11,606.7 -1,270.1 4.2% 0.1%
April
May
June
July
August
September
October
November
December
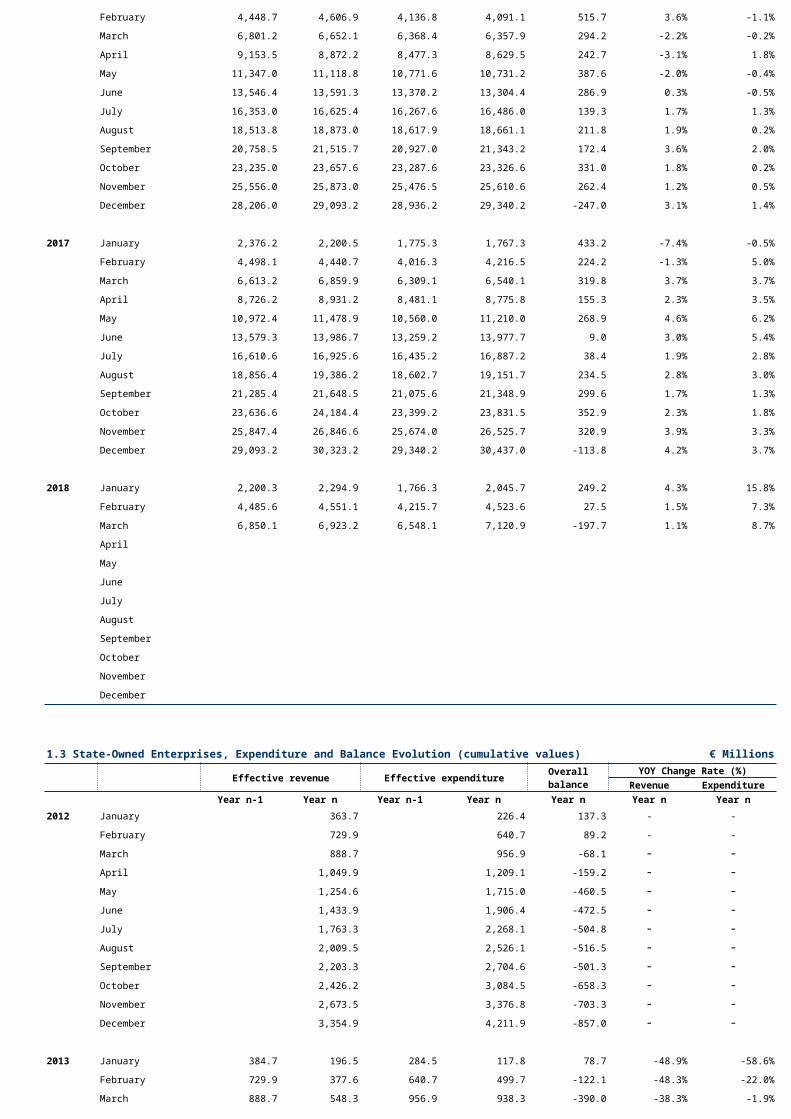
1.2 Autonomous Services and Funds Revenue, Expenditure and Balance Evolution (cumulative values) € Millions
Effective revenue Effective expenditureYOY Change Rate (%)
Revenue Expenditure
Year n-1 Year n Year n-1 Year n Year n Year n Year n
2009 January 1,688.8 1,835.4 1,287.4 1,407.3 428.2 8.7% 9.3%
February 3,527.6 3,813.0 2,876.0 3,096.4 716.6 8.1% 7.7%
March 5,397.1 5,677.9 4,684.5 4,866.3 811.6 5.2% 3.9%
April 7,356.0 7,513.0 6,433.2 6,710.6 802.4 2.1% 4.3%
May 9,286.3 9,432.2 8,152.9 8,522.3 909.8 1.6% 4.5%
June 10,958.0 11,600.6 10,331.3 10,876.0 724.6 5.9% 5.3%
July 13,360.3 14,081.9 12,662.1 13,120.9 961.0 5.4% 3.6%
August 15,035.3 15,849.2 14,328.4 15,027.5 821.7 5.4% 4.9%
September 16,740.1 17,719.1 16,063.8 16,910.5 808.6 5.8% 5.3%
October 18,754.4 19,937.4 18,038.0 19,038.4 899.0 6.3% 5.5%
November 21,150.2 22,221.2 20,576.4 21,736.6 484.6 5.1% 5.6%
December 24,239.2 25,645.0 23,857.6 25,017.0 628.0 5.8% 4.9%
2010 January 1,835.4 1,844.5 1,407.3 1,377.9 466.6 0.5% -2.1%
February 3,813.2 3,594.8 3,086.4 2,992.4 602.3 -5.7% -3.0%
March 5,678.1 5,381.0 4,856.2 4,645.9 735.1 -5.2% -4.3%
April 7,513.0 7,107.3 6,710.6 6,297.7 809.6 -5.4% -6.2%
May 9,433.4 8,956.3 8,522.4 7,920.8 1,035.5 -5.1% -7.1%
June 11,602.7 11,011.7 10,876.0 10,169.0 842.8 -5.1% -6.5%
July 14,190.9 13,871.4 13,228.6 12,608.5 1,262.9 -2.3% -4.7%
August 16,000.5 15,618.2 15,174.9 14,468.6 1,149.6 -2.4% -4.7%
September 17,893.0 17,486.6 17,078.4 16,469.7 1,016.9 -2.3% -3.6%
October 19,940.3 19,268.2 19,038.4 18,333.4 934.8 -3.4% -3.7%
November 22,226.8 21,717.4 21,736.7 21,250.7 466.7 -2.3% -2.2%
December 25,645.0 26,526.2 25,017.0 24,431.5 2,094.7 3.4% -2.3%
2011 January 1,844.5 1,972.0 1,377.9 1,466.7 505.3 6.9% 6.4%
February 3,594.8 3,835.6 2,992.4 3,102.8 732.8 6.7% 3.7%
March 5,381.1 5,699.7 4,645.9 4,828.7 871.0 5.9% 3.9%
April 7,107.4 7,495.9 6,297.7 6,505.0 991.0 5.5% 3.3%
May 8,956.3 9,525.5 7,920.8 8,447.5 1,078.0 6.4% 6.6%
June 11,011.7 11,567.7 10,169.0 10,461.2 1,106.4 5.0% 2.9%
July 13,871.4 13,788.5 12,608.5 12,804.1 984.3 -0.6% 1.6%
Overallbalance

August 15,618.2 15,859.1 14,468.6 14,665.2 1,193.9 1.5% 1.4%
September 17,486.6 17,587.2 16,469.7 16,429.7 1,157.5 0.6% -0.2%
October 19,268.2 19,633.8 18,333.4 18,321.2 1,312.7 1.9% -0.1%
November 21,717.4 21,972.9 21,250.7 20,931.8 1,041.2 1.2% -1.5%
December 26,526.2 24,429.8 24,431.5 23,527.3 902.5 -7.9% -3.7%
2012 January 1,978.6 2,164.9 1,473.4 1,630.4 534.4 9.4% 10.7%
February 3,835.9 4,576.3 3,092.3 3,652.1 924.2 19.3% 18.1%
March 5,699.7 6,487.2 4,828.7 5,611.1 876.1 13.8% 16.2%
April 7,529.0 8,409.5 6,534.3 7,525.7 883.8 11.7% 15.2%
May 9,532.0 10,497.6 8,450.9 9,794.9 702.6 10.1% 15.9%
June 11,584.0 13,040.1 10,475.6 11,801.9 1,238.3 12.6% 12.7%
July 13,807.8 15,101.9 12,820.7 14,553.4 548.5 9.4% 13.5%
August 15,865.2 18,008.1 14,674.0 17,398.9 609.2 13.5% 18.6%
September 17,594.1 19,842.5 16,439.6 19,347.7 494.7 12.8% 17.7%
October 19,641.3 21,938.9 18,332.1 21,546.5 392.4 11.7% 17.5%
November 21,980.1 23,990.3 20,937.7 23,581.6 408.7 9.1% 12.6%
December 24,552.1 28,088.8 24,006.3 26,989.5 1,099.3 14.4% 12.4%
2013 January 2,186.5 2,117.2 1,689.5 1,553.0 564.2 -3.2% -8.1%
February 4,576.3 4,177.6 3,652.0 3,617.8 559.7 -8.7% -0.9%
March 6,487.2 6,132.4 5,611.1 5,749.8 382.5 -5.5% 2.5%
April 8,414.4 8,047.9 7,529.5 7,597.3 450.6 -4.4% 0.9%
May 10,471.2 10,268.5 9,794.9 9,832.7 435.9 -1.9% 0.4%
June 13,040.1 12,319.9 11,801.9 11,903.6 416.2 -5.5% 0.9%
July 15,101.9 14,178.5 14,553.4 14,001.9 176.6 -6.1% -3.8%
August 18,027.9 16,803.0 17,413.5 16,247.0 556.0 -6.8% -6.7%
September 19,859.6 18,688.9 19,368.5 18,263.4 425.5 -5.9% -5.7%
October 21,988.2 21,139.3 21,591.5 20,910.9 228.4 -3.9% -3.2%
November 24,022.5 23,692.1 23,612.8 23,770.1 -77.9 -1.4% 0.7%
December 28,194.4 26,432.1 27,347.1 27,086.8 -654.7 -6.3% -1.0%
2014 January 2,117.2 2,292.3 1,553.0 1,711.5 580.9 8.3% 10.2%
February 4,184.2 4,336.9 3,624.6 3,907.4 429.5 3.7% 7.8%
March 6,145.2 6,496.9 5,760.7 5,877.3 619.5 5.7% 2.0%
April 8,062.3 8,469.9 7,609.2 7,940.1 529.9 5.1% 4.3%
May 10,268.5 10,731.1 9,832.7 9,956.0 775.1 4.5% 1.3%
June 12,319.9 12,940.4 11,903.6 12,259.4 681.0 5.0% 3.0%
July 14,628.5 15,802.2 14,266.3 15,139.4 662.8 8.0% 6.1%
August 16,810.0 17,804.2 16,257.9 17,303.2 501.0 5.9% 6.4%
September 18,848.2 20,031.2 18,424.9 19,400.8 630.4 6.3% 5.3%
October 21,179.4 22,355.3 20,960.5 21,807.2 548.1 5.6% 4.0%
November 23,750.8 24,520.7 23,840.3 23,950.5 570.2 3.2% 0.5%
December 26,521.3 27,214.2 27,282.2 27,588.4 -374.1 2.6% 1.1%
2015 January 2,302.4 2,417.0 1,712.7 1,828.8 588.1 5.0% 6.8%
February 4,342.2 4,429.1 3,906.6 4,125.8 303.3 2.0% 5.6%
March 6,495.8 6,771.1 5,878.0 6,339.5 431.6 4.2% 7.9%
April 8,465.1 9,157.8 7,942.6 8,438.8 718.9 8.2% 6.2%
May 10,719.9 11,350.3 9,955.1 10,777.6 572.7 5.9% 8.3%
June 12,940.4 13,557.3 12,259.0 13,376.7 180.5 4.8% 9.1%
July 15,773.0 16,557.3 15,147.0 16,298.9 258.4 5.0% 7.6%
August 17,798.9 18,746.1 17,301.6 18,709.2 36.9 5.3% 8.1%
September 20,031.1 20,811.5 19,400.8 20,986.4 -175.0 3.9% 8.2%
October 22,355.4 23,315.0 21,808.5 23,372.2 -57.1 4.3% 7.2%
November 24,512.3 25,661.3 23,952.7 25,620.5 40.9 4.7% 7.0%
December 27,258.6 28,206.0 27,684.3 28,936.2 -730.2 3.5% 4.5%
2016 January 2,348.6 2,433.6 1,748.9 1,817.3 616.3 3.6% 3.9%
February 4,448.7 4,606.9 4,136.8 4,091.1 515.7 3.6% -1.1%
March 6,801.2 6,652.1 6,368.4 6,357.9 294.2 -2.2% -0.2%
April 9,153.5 8,872.2 8,477.3 8,629.5 242.7 -3.1% 1.8%
May 11,347.0 11,118.8 10,771.6 10,731.2 387.6 -2.0% -0.4%
June 13,546.4 13,591.3 13,370.2 13,304.4 286.9 0.3% -0.5%
July 16,353.0 16,625.4 16,267.6 16,486.0 139.3 1.7% 1.3%
August 18,513.8 18,873.0 18,617.9 18,661.1 211.8 1.9% 0.2%
September 20,758.5 21,515.7 20,927.0 21,343.2 172.4 3.6% 2.0%
October 23,235.0 23,657.6 23,287.6 23,326.6 331.0 1.8% 0.2%
November 25,556.0 25,873.0 25,476.5 25,610.6 262.4 1.2% 0.5%
December 28,206.0 29,093.2 28,936.2 29,340.2 -247.0 3.1% 1.4%
2017 January 2,376.2 2,200.5 1,775.3 1,767.3 433.2 -7.4% -0.5%
February 4,498.1 4,440.7 4,016.3 4,216.5 224.2 -1.3% 5.0%
March 6,613.2 6,859.9 6,309.1 6,540.1 319.8 3.7% 3.7%
April 8,726.2 8,931.2 8,481.1 8,775.8 155.3 2.3% 3.5%
May 10,972.4 11,478.9 10,560.0 11,210.0 268.9 4.6% 6.2%
June 13,579.3 13,986.7 13,259.2 13,977.7 9.0 3.0% 5.4%
July 16,610.6 16,925.6 16,435.2 16,887.2 38.4 1.9% 2.8%
August 18,856.4 19,386.2 18,602.7 19,151.7 234.5 2.8% 3.0%
September 21,285.4 21,648.5 21,075.6 21,348.9 299.6 1.7% 1.3%
October 23,636.6 24,184.4 23,399.2 23,831.5 352.9 2.3% 1.8%
November 25,847.4 26,846.6 25,674.0 26,525.7 320.9 3.9% 3.3%
December 29,093.2 30,323.2 29,340.2 30,437.0 -113.8 4.2% 3.7%
2018 January 2,200.3 2,294.9 1,766.3 2,045.7 249.2 4.3% 15.8%
February 4,485.6 4,551.1 4,215.7 4,523.6 27.5 1.5% 7.3%
March 6,850.1 6,923.2 6,548.1 7,120.9 -197.7 1.1% 8.7%
April
May
June
July
August
September
October
November
December
1.3 State-Owned Enterprises, Expenditure and Balance Evolution (cumulative values) € Millions
Effective revenue Effective expenditureYOY Change Rate (%)
Revenue ExpenditureYear n-1 Year n Year n-1 Year n Year n Year n Year n
2012 January 363.7 226.4 137.3 - -
February 729.9 640.7 89.2 - -
March 888.7 956.9 -68.1 - -April 1,049.9 1,209.1 -159.2 - -May 1,254.6 1,715.0 -460.5 - -June 1,433.9 1,906.4 -472.5 - -July 1,763.3 2,268.1 -504.8 - -August 2,009.5 2,526.1 -516.5 - -September 2,203.3 2,704.6 -501.3 - -October 2,426.2 3,084.5 -658.3 - -November 2,673.5 3,376.8 -703.3 - -December 3,354.9 4,211.9 -857.0 - -
2013 January 384.7 196.5 284.5 117.8 78.7 -48.9% -58.6%
February 729.9 377.6 640.7 499.7 -122.1 -48.3% -22.0%
March 888.7 548.3 956.9 938.3 -390.0 -38.3% -1.9%
Overallbalance

April 1,054.8 748.1 1,212.9 1,069.8 -321.6 -29.1% -11.8%
May 1,254.6 976.0 1,715.0 1,495.3 -519.2 -22.2% -12.8%
June 1,433.9 1,158.8 1,906.4 1,757.2 -598.4 -19.2% -7.8%
July 1,763.3 1,378.3 2,268.1 1,992.5 -614.2 -21.8% -12.2%
August 2,009.7 1,585.3 2,526.1 2,141.8 -556.5 -21.1% -15.2%
September 2,208.7 1,666.7 2,713.4 2,260.2 -593.4 -24.5% -16.7%
October 2,458.4 2,041.0 3,115.7 2,680.3 -639.3 -17.0% -14.0%
November 2,705.7 2,227.4 3,408.0 2,932.7 -705.4 -17.7% -13.9%
December 3,424.6 2,528.5 4,259.4 3,501.3 -972.9 -26.2% -17.8%
2014 January 196.5 285.6 117.8 137.0 148.6 45.3% 16.2%
February 384.2 444.1 506.5 599.6 -155.5 15.6% 18.4%
March 548.3 628.7 938.3 790.6 -161.9 14.7% -15.7%
April 748.7 816.2 1,069.8 1,099.4 -283.2 9.0% 2.8%
May 976.1 1,042.7 1,495.4 1,291.1 -248.4 6.8% -13.7%
June 1,158.9 1,244.2 1,757.3 1,649.6 -405.4 7.4% -6.1%
July 1,378.4 1,492.8 1,992.5 1,899.1 -406.2 8.3% -4.7%
August 1,585.4 1,667.4 2,141.9 2,176.9 -509.5 5.2% 1.6%
September 1,822.8 1,957.8 2,421.9 2,419.2 -461.3 7.4% -0.1%
October 2,081.2 2,200.5 2,730.2 2,764.2 -563.6 5.7% 1.2%
November 2,289.0 2,462.8 3,005.9 2,969.2 -506.4 7.6% -1.2%
December 2,623.4 2,870.8 3,602.4 3,940.2 -1,069.5 9.4% 9.4%
2015 January 292.1 645.8 137.9 493.1 152.7 121.1% 257.5%
February 448.3 1,193.5 599.5 1,406.5 -213.0 166.2% 134.6%
March 628.1 1,985.6 791.2 2,182.0 -196.4 216.1% 175.8%
April 811.4 2,941.8 1,101.9 2,909.4 32.4 262.6% 164.0%
May 1,031.3 3,496.2 1,290.1 3,750.9 -254.8 239.0% 190.7%
June 1,244.2 4,018.9 1,649.2 4,657.0 -638.1 223.0% 182.4%
July 1,492.8 4,883.3 1,898.7 5,434.4 -551.1 227.1% 186.2%
August 1,701.9 5,659.6 2,175.2 6,356.8 -697.2 232.6% 192.2%
September 1,957.8 6,337.8 2,419.2 7,135.8 -797.9 223.7% 195.0%
October 2,200.6 7,130.9 2,765.5 8,069.1 -938.3 224.0% 191.8%
November 2,452.3 7,862.0 2,969.2 8,850.8 -988.8 220.6% 198.1%
December 2,866.6 8,968.9 3,974.9 10,159.1 -1,190.2 212.9% 155.6%
2016 January 648.4 650.4 484.1 467.9 182.6 0.3% -3.4%
February 1,210.3 1,310.0 1,414.7 1,374.1 -64.1 8.2% -2.9%
March 2,016.2 1,935.4 2,213.9 2,188.9 -253.5 -4.0% -1.1%
April 2,938.8 2,671.7 2,951.7 3,079.4 -407.7 -9.1% 4.3%
May 3,494.3 3,341.4 3,749.5 3,676.4 -335.0 -4.4% -2.0%
June 4,009.9 4,117.5 4,655.5 4,598.8 -481.2 2.7% -1.2%
July 4,679.5 4,901.0 5,407.2 5,600.7 -699.8 4.7% 3.6%
August 5,428.2 5,564.6 6,270.0 6,314.1 -749.5 2.5% 0.7%
September 6,282.7 6,506.7 7,078.0 7,275.7 -769.0 3.6% 2.8%
October 7,048.0 7,091.5 7,985.6 7,911.0 -819.5 0.6% -0.9%
November 7,756.1 7,918.3 8,710.5 8,634.5 -716.2 2.1% -0.9%
December 8,968.9 9,179.7 10,159.1 10,179.6 -999.9 2.4% 0.2%
2017 January 593.1 597.6 429.0 470.4 127.1 0.7% 9.7%
February 1,200.0 1,192.3 1,298.2 1,440.7 -248.4 -0.6% 11.0%
March 1,893.5 1,969.0 2,137.7 2,223.0 -254.0 4.0% 4.0%
April 2,527.8 2,624.5 2,932.5 2,992.4 -367.9 3.8% 2.0%
May 3,180.5 3,453.0 3,506.3 3,898.2 -445.2 8.6% 11.2%
June 4,106.1 4,293.2 4,554.0 5,034.8 -741.6 4.6% 10.6%
July 4,886.8 4,979.9 5,550.5 5,750.6 -770.7 1.9% 3.6%
August 5,549.7 5,726.9 6,258.0 6,479.4 -752.5 3.2% 3.5%
September 6,488.0 6,360.4 7,220.6 7,187.9 -827.4 -2.0% -0.5%
October 7,072.5 7,066.3 7,985.2 7,946.9 -880.6 -0.1% -0.5%
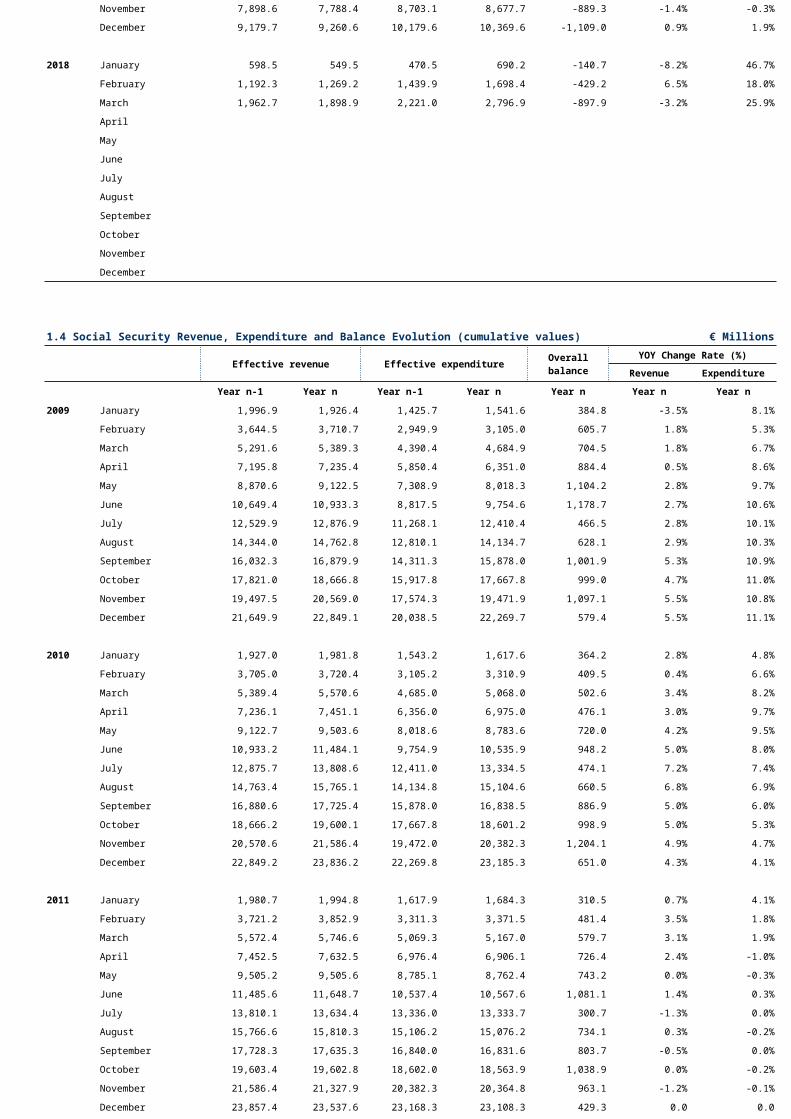
November 7,898.6 7,788.4 8,703.1 8,677.7 -889.3 -1.4% -0.3%
December 9,179.7 9,260.6 10,179.6 10,369.6 -1,109.0 0.9% 1.9%
2018 January 598.5 549.5 470.5 690.2 -140.7 -8.2% 46.7%
February 1,192.3 1,269.2 1,439.9 1,698.4 -429.2 6.5% 18.0%
March 1,962.7 1,898.9 2,221.0 2,796.9 -897.9 -3.2% 25.9%
April
May
June
July
August
September
October
November
December
1.4 Social Security Revenue, Expenditure and Balance Evolution (cumulative values) € Millions
Effective revenue Effective expenditureYOY Change Rate (%)
Revenue Expenditure
Year n-1 Year n Year n-1 Year n Year n Year n Year n
2009 January 1,996.9 1,926.4 1,425.7 1,541.6 384.8 -3.5% 8.1%
February 3,644.5 3,710.7 2,949.9 3,105.0 605.7 1.8% 5.3%
March 5,291.6 5,389.3 4,390.4 4,684.9 704.5 1.8% 6.7%
April 7,195.8 7,235.4 5,850.4 6,351.0 884.4 0.5% 8.6%
May 8,870.6 9,122.5 7,308.9 8,018.3 1,104.2 2.8% 9.7%
June 10,649.4 10,933.3 8,817.5 9,754.6 1,178.7 2.7% 10.6%
July 12,529.9 12,876.9 11,268.1 12,410.4 466.5 2.8% 10.1%
August 14,344.0 14,762.8 12,810.1 14,134.7 628.1 2.9% 10.3%
September 16,032.3 16,879.9 14,311.3 15,878.0 1,001.9 5.3% 10.9%
October 17,821.0 18,666.8 15,917.8 17,667.8 999.0 4.7% 11.0%
November 19,497.5 20,569.0 17,574.3 19,471.9 1,097.1 5.5% 10.8%
December 21,649.9 22,849.1 20,038.5 22,269.7 579.4 5.5% 11.1%
2010 January 1,927.0 1,981.8 1,543.2 1,617.6 364.2 2.8% 4.8%
February 3,705.0 3,720.4 3,105.2 3,310.9 409.5 0.4% 6.6%
March 5,389.4 5,570.6 4,685.0 5,068.0 502.6 3.4% 8.2%
April 7,236.1 7,451.1 6,356.0 6,975.0 476.1 3.0% 9.7%
May 9,122.7 9,503.6 8,018.6 8,783.6 720.0 4.2% 9.5%
June 10,933.2 11,484.1 9,754.9 10,535.9 948.2 5.0% 8.0%
July 12,875.7 13,808.6 12,411.0 13,334.5 474.1 7.2% 7.4%
August 14,763.4 15,765.1 14,134.8 15,104.6 660.5 6.8% 6.9%
September 16,880.6 17,725.4 15,878.0 16,838.5 886.9 5.0% 6.0%
October 18,666.2 19,600.1 17,667.8 18,601.2 998.9 5.0% 5.3%
November 20,570.6 21,586.4 19,472.0 20,382.3 1,204.1 4.9% 4.7%
December 22,849.2 23,836.2 22,269.8 23,185.3 651.0 4.3% 4.1%
2011 January 1,980.7 1,994.8 1,617.9 1,684.3 310.5 0.7% 4.1%
February 3,721.2 3,852.9 3,311.3 3,371.5 481.4 3.5% 1.8%
March 5,572.4 5,746.6 5,069.3 5,167.0 579.7 3.1% 1.9%
April 7,452.5 7,632.5 6,976.4 6,906.1 726.4 2.4% -1.0%
May 9,505.2 9,505.6 8,785.1 8,762.4 743.2 0.0% -0.3%
June 11,485.6 11,648.7 10,537.4 10,567.6 1,081.1 1.4% 0.3%
July 13,810.1 13,634.4 13,336.0 13,333.7 300.7 -1.3% 0.0%
August 15,766.6 15,810.3 15,106.2 15,076.2 734.1 0.3% -0.2%
September 17,728.3 17,635.3 16,840.0 16,831.6 803.7 -0.5% 0.0%
October 19,603.4 19,602.8 18,602.0 18,563.9 1,038.9 0.0% -0.2%
November 21,586.4 21,327.9 20,382.3 20,364.8 963.1 -1.2% -0.1%
December 23,857.4 23,537.6 23,168.3 23,108.3 429.3 0.0 0.0
Overallbalance

2012 January 1,993.8 2,016.9 1,683.5 1,788.0 228.9 1.2% 6.2%
February 3,850.9 4,056.7 3,369.7 3,643.3 413.4 5.3% 8.1%
March 5,743.7 5,806.4 5,164.0 5,528.2 278.2 1.1% 7.1%
April 7,628.6 7,697.4 6,902.2 7,422.1 275.3 0.9% 7.5%
May 9,500.8 9,598.7 8,757.5 9,283.4 315.3 1.0% 6.0%
June 11,642.8 11,429.8 10,561.7 11,156.0 273.8 -1.8% 5.6%
July 13,628.3 13,874.5 13,325.9 13,734.8 139.6 1.8% 3.1%
August 15,795.2 15,911.1 15,067.5 15,642.3 268.8 0.7% 3.8%
September 17,625.8 17,678.5 16,822.2 17,434.3 244.2 0.3% 3.6%
October 19,592.2 19,492.9 18,553.2 19,256.2 236.7 -0.5% 3.8%
November 21,316.2 21,236.8 20,353.2 21,121.6 115.2 -0.4% 3.8%
December 23,542.6 24,180.3 23,103.2 23,767.3 413.0 2.7% 2.9%
2013 January 2,016.9 2,068.1 1,788.1 1,927.1 141.0 2.5% 7.8%
February 4,056.7 3,986.9 3,643.3 3,922.4 64.5 -1.7% 7.7%
March 5,806.4 6,134.0 5,528.2 5,999.3 134.7 5.6% 8.5%
April 7,697.4 8,121.5 7,422.1 8,063.1 58.4 5.5% 8.6%
May 9,598.7 10,328.5 9,283.4 9,997.0 331.5 7.6% 7.7%
June 11,429.8 12,382.6 11,156.0 11,964.5 418.1 8.3% 7.2%
July 13,874.5 14,907.6 13,734.8 14,735.4 172.3 7.4% 7.3%
August 15,911.1 17,161.4 15,642.3 16,670.0 491.4 7.9% 6.6%
September 17,678.5 19,008.0 17,434.3 18,580.5 427.5 7.5% 6.6%
October 19,492.9 21,093.2 19,256.2 20,542.7 550.5 8.2% 6.7%
November 21,236.8 22,943.5 21,121.6 22,507.5 436.0 8.0% 6.6%
December 24,192.2 25,336.5 23,760.8 24,857.9 478.6 4.7% 4.6%
2014 January 2,068.1 2,083.5 1,927.1 1,948.0 135.5 0.7% 1.1%
February 3,986.9 3,976.1 3,922.4 3,881.6 94.5 -0.3% -1.0%
March 6,134.0 5,998.5 5,999.3 5,924.3 74.2 -2.2% -1.3%
April 8,121.5 7,945.3 8,063.1 7,895.1 50.2 -2.2% -2.1%
May 10,328.5 10,158.0 9,997.0 9,819.7 338.4 -1.7% -1.8%
June 12,382.6 12,198.9 11,964.5 11,729.0 470.0 -1.5% -2.0%
July 14,907.6 14,984.8 14,735.4 14,718.7 266.2 0.5% -0.1%
August 17,161.4 17,035.9 16,670.0 16,625.6 410.3 -0.7% -0.3%
September 19,008.0 18,989.7 18,580.5 18,491.0 498.8 -0.1% -0.5%
October 21,093.2 20,894.2 20,542.7 20,381.7 512.5 -0.9% -0.8%
November 22,943.5 22,683.5 22,507.5 22,292.2 391.3 -1.1% -1.0%
December 25,383.4 24,669.5 24,894.3 24,250.2 419.3 -2.8% -2.6%
2015 January 2,083.5 2,183.0 1,948.3 1,930.1 252.9 4.8% -0.9%
February 3,976.1 4,183.5 3,881.6 3,801.5 382.0 5.2% -2.1%
March 5,998.5 6,035.9 5,924.3 5,625.0 410.9 0.6% -5.1%
April 7,945.3 8,022.2 7,895.1 7,455.4 566.9 1.0% -5.6%
May 10,158.0 9,914.8 9,819.7 9,242.1 672.7 -2.4% -5.9%
June 12,198.9 11,999.4 11,729.0 11,084.5 914.9 -1.6% -5.5%
July 14,984.8 14,678.8 14,718.7 14,048.0 630.7 -2.0% -4.6%
August 17,035.9 16,688.1 16,625.6 15,881.8 806.2 -2.0% -4.5%
September 18,989.7 18,590.8 18,491.0 17,769.2 821.6 -2.1% -3.9%
October 20,894.2 20,525.6 20,381.7 19,658.9 866.7 -1.8% -3.5%
November 22,683.5 22,429.7 22,292.2 21,597.3 832.4 -1.1% -3.1%
December 24,681.0 24,591.0 24,251.6 23,562.9 1,028.1 -0.4% -2.8%
2016 January 2,183.0 2,183.4 1,930.1 1,858.1 325.3 0.0% -3.7%
February 4,183.5 4,280.2 3,801.5 3,697.8 582.4 2.3% -2.7%
March 6,035.9 6,308.4 5,625.0 5,570.1 738.3 4.5% -1.0%
April 8,022.2 8,315.4 7,455.4 7,481.2 834.2 3.7% 0.3%
May 9,914.8 10,259.4 9,242.1 9,344.8 914.6 3.5% 1.1%
June 11,999.4 12,509.6 11,084.5 11,280.9 1,228.8 4.3% 1.8%

July 14,678.8 15,242.4 14,048.0 14,350.6 891.8 3.8% 2.2%
August 16,688.1 17,310.2 15,881.8 16,281.6 1,028.6 3.7% 2.5%
September 18,590.8 19,359.5 17,769.2 18,206.6 1,152.9 4.1% 2.5%
October 20,525.6 21,310.7 19,658.9 20,102.4 1,208.3 3.8% 2.3%
November 22,429.7 23,373.4 21,597.3 22,071.2 1,302.2 4.2% 2.2%
December 24,602.0 25,711.7 23,565.1 24,147.6 1,564.1 4.5% 2.5%
2017 January 2,183.4 2,313.4 1,858.1 1,917.2 396.1 6.0% 3.2%
February 4,280.2 4,431.8 3,697.8 3,753.0 678.8 3.5% 1.5%
March 6,308.4 6,470.6 5,570.1 5,592.6 878.0 2.6% 0.4%
April 8,315.4 8,548.2 7,481.2 7,473.5 1,074.8 2.8% -0.1%
May 10,259.4 10,601.4 9,344.8 9,315.5 1,286.0 3.3% -0.3%
June 12,509.6 12,825.1 11,280.9 11,177.4 1,647.7 2.5% -0.9%
July 15,242.4 15,241.8 14,350.6 14,204.7 1,037.1 0.0% -1.0%
August 17,310.2 17,460.4 16,281.7 16,026.6 1,433.8 0.9% -1.6%
September 19,359.5 19,540.1 18,206.6 17,877.0 1,663.1 0.9% -1.8%
October 21,310.7 21,649.1 20,102.4 19,758.4 1,890.7 1.6% -1.7%
November 23,373.4 23,799.3 22,071.2 21,766.5 2,032.8 1.8% -1.4%
December 25,711.7 26,684.7 24,147.6 24,606.7 2,078.0 3.8% 1.9%
2018 January 2,313.4 2,447.3 1,917.2 1,943.9 503.4 5.8% 1.4%
February 4,431.8 4,608.0 3,753.0 3,828.7 779.2 4.0% 2.0%
March 6,470.6 6,667.9 5,592.6 5,688.9 979.0 3.0% 1.7%
April
May
June
July
August
September
October
November
December
1.5 Local Government Revenue, Expenditure and Balance Evolution (cumulative values) € Millions
Effective revenue Effective expenditureYOY Change Rate (%)
Revenue ExpenditureYear n-1 Year n Year n-1 Year n Year n Year n Year n
2009 Q1 1,257.0 1,484.6 1,184.0 1,462.3 22.4 18.1% 23.5%
Q2 2,908.8 3,518.6 2,794.0 3,503.0 15.6 21.0% 25.4%Q3 4,349.5 5,207.3 4,250.2 5,538.2 -330.9 19.7% 30.3%
Q4 6,183.9 7,201.0 6,438.0 7,851.7 -650.7 16.4% 22.0%
2010 Q1 1,484.6 1,394.4 1,462.3 1,401.1 -6.7 -6.1% -4.2%
Q2 3,518.6 3,438.5 3,503.0 3,277.8 160.7 -2.3% -6.4%Q3 5,207.3 5,137.3 5,538.2 4,991.7 145.6 -1.3% -9.9%
Q4 7,201.0 7,246.2 7,851.7 7,181.6 64.6 0.6% -8.5%
2011 Q1 1,394.4 1,457.5 1,401.1 1,433.4 24.1 4.5% 2.3%Q2 3,438.5 3,525.0 3,277.8 3,307.8 217.2 2.5% 0.9%
Q3 5,137.3 5,137.0 4,991.7 4,941.6 195.4 0.0% -1.0%
Q4 7,246.2 7,281.7 7,181.6 7,072.3 209.4 0.5% -1.5%
2012 January 456.1 406.2 49.9 - -February 902.0 857.5 44.5 - -
March 1,457.5 1,377.9 1,433.4 1,352.8 25.1 -5.5% -5.6%April 1,863.0 1,820.2 42.8 - -
May 2,917.0 2,513.0 404.0 - -June 3,525.0 3,407.8 3,307.8 3,118.6 289.2 -3.3% -5.7%
July 3,943.3 3,675.6 267.7 - -August 4,474.1 4,172.1 302.0
September 5,137.0 5,068.1 4,941.6 4,674.3 393.8 -1.3% -5.4%
October 6,022.5 5,298.6 723.9 - -November 6,537.5 5,883.1 654.4 - -
Overallbalance

December 7,281.7 7,444.9 7,072.3 6,696.2 748.7 2.2% -5.3%
2013 January 456.1 429.1 406.2 376.5 52.6 -5.9% -7.3%February 902.0 844.3 857.5 890.7 -46.4 -6.4% 3.9%March 1,377.9 1,281.1 1,352.8 1,385.1 -104.1 -7.0% 2.4%April 1,863.0 1,786.4 1,820.2 1,943.7 -157.3 -4.1% 6.8%May 2,917.0 2,799.7 2,513.0 2,660.1 139.6 -4.0% 5.9%June 3,407.8 3,275.5 3,118.6 3,325.4 -49.9 -3.9% 6.6%July 3,943.3 3,851.6 3,675.6 3,993.1 -141.4 -2.3% 8.6%August 4,474.1 4,594.9 4,172.1 4,606.2 -11.3 2.7% 10.4%September 5,068.1 5,129.0 4,674.3 5,237.2 -108.2 1.2% 12.0%October 6,022.5 5,618.2 5,298.6 5,778.0 -159.8 -6.7% 9.0%November 6,537.5 6,100.5 5,883.1 6,280.0 -179.5 -6.7% 6.7%December 7,444.9 7,011.0 6,696.2 7,074.4 -63.4 -5.8% 5.6%
2014 January 429.1 523.2 376.5 420.2 103.0 21.9% 11.6%February 844.3 938.0 890.7 840.1 97.9 11.1% -5.7%March 1,281.1 1,392.0 1,385.1 1,316.6 75.4 8.7% -4.9%April 1,786.4 1,814.6 1,943.7 1,792.2 22.4 1.6% -7.8%
May 2,799.7 2,842.2 2,660.1 2,418.4 423.8 1.5% -9.1%
June 3,275.5 3,341.9 3,325.4 3,085.0 256.9 2.0% -7.2%July 3,851.6 3,820.1 3,993.1 3,626.1 194.1 -0.8% -9.2%
August 4,594.9 4,541.4 4,606.2 4,106.4 435.1 -1.2% -10.9%September 5,129.0 5,045.9 5,237.2 4,631.4 414.5 -1.6% -11.6%October 5,618.2 5,506.5 5,778.0 5,140.0 366.4 -2.0% -11.0%November 6,100.5 5,946.0 6,280.0 5,600.1 345.8 -2.5% -10.8%December 7,011.0 6,937.9 7,074.4 6,520.8 417.1 -1.0% -7.8%
2015 January 429.1 466.0 376.5 370.5 95.5 8.6% -1.6%February 844.3 888.8 890.7 805.7 83.1 5.3% -9.5%March 1,281.1 1,361.2 1,385.1 1,308.7 52.5 6.3% -5.5%April 1,786.4 1,853.2 1,943.7 1,798.6 54.6 3.7% -7.5%May 2,799.7 2,946.6 2,660.1 2,391.7 555.0 5.2% -10.1%
June 3,275.5 3,446.0 3,325.4 3,076.9 369.1 5.2% -7.5%July 3,851.6 3,988.8 3,993.1 3,649.2 339.6 3.6% -8.6%
August 4,594.9 4,754.2 4,606.2 4,132.9 621.4 3.5% -10.3%
September 5,129.0 5,200.0 5,237.2 4,645.3 554.7 1.4% -11.3%October 5,618.2 5,761.5 5,778.0 5,142.0 619.5 2.6% -11.0%
November 6,100.5 6,158.2 6,280.0 5,567.1 591.2 0.9% -11.4%December 7,011.0 7,245.5 7,074.4 6,504.2 741.3 3.3% -8.1%
2016 January 466.0 489.4 370.5 347.5 141.9 5.0% -6.2%February 888.8 898.6 805.7 762.9 135.7 1.1% -5.3%March 1,361.2 1,383.2 1,308.7 1,253.2 130.0 1.6% -4.2%April 1,853.2 1,873.5 1,798.6 1,712.2 161.3 1.1% -4.8%
May 2,946.6 2,928.6 2,391.7 2,304.2 624.4 -0.6% -3.7%June 3,446.0 3,451.2 3,076.9 2,979.4 471.8 0.1% -3.2%
July 3,989.2 4,000.6 3,649.2 3,526.7 473.8 0.3% -3.4%August 4,754.2 4,798.5 4,132.9 4,069.3 729.3 0.9% -1.5%
September 5,200.0 5,311.9 4,645.3 4,618.0 693.8 2.2% -0.6%October 5,770.4 5,801.8 5,149.5 5,160.6 641.3 0.5% 0.2%
November 6,248.9 6,300.4 5,648.3 5,695.6 604.8 0.8% 0.8%December 6,938.4 7,322.6 6,521.3 6,662.2 660.4 5.5% 2.2%
2017 janeiro 503.3 580.3 349.4 360.3 220.0 18.6% 3.7%
February 899.7 1,038.8 765.3 815.3 223.5 15.6% 6.9%
March 1,374.3 1,580.8 1,241.7 1,382.8 198.0 14.3% 10.3%
April 1,871.6 2,018.7 1,709.9 1,855.6 163.1 7.8% 8.4%
May 2,912.8 3,108.2 2,299.6 2,505.0 603.2 6.7% 8.9%
June 3,446.5 3,685.7 2,973.1 3,244.0 441.7 6.9% 9.1%
July 3,999.4 4,213.8 3,528.3 3,866.0 347.8 5.4% 9.6%
August 4,795.2 5,091.9 4,069.0 4,489.7 602.2 6.2% 10.3%
September 5,315.7 5,674.8 4,615.9 5,123.6 551.2 6.8% 11.0%
October 5,802.5 6,185.5 5,159.7 5,662.4 523.1 6.6% 9.7%
November 6,301.3 6,702.4 5,700.3 6,297.8 404.6 6.4% 10.5%
December 7,318.2 7,734.9 6,660.1 7,269.2 465.7 5.7% 9.1%
2018 January 569.1 542.1 360.9 373.2 168.9 -4.7% 3.4%
February 1,028.5 969.8 813.6 858.5 111.3 -5.7% 5.5%
March 1,548.9 1,505.7 1,381.6 1,410.2 95.5 -2.8% 2.1%
April

May
June
July
August
September
October
November
December
1.6 Regional Government Revenue, Expenditure and Balance Evolution (cumulative values) € Millions
Effective revenue Effective expenditureYOY Change Rate (%)
Revenue ExpenditureYear n-1 Year n Year n-1 Year n Year n Year n Year n
2008 Q1 425.1 404.4 373.7 375.3 29.1 -4.9% 0.4%
Q2 992.8 937.0 902.1 919.1 17.9 -5.6% 1.9%Q3 1,443.4 1,417.7 1,381.8 1,636.5 -218.8 -1.8% 18.4%
Q4 2,162.9 2,115.8 2,167.5 2,287.2 -171.4 -2.2% 5.5%
2009 Q1 404.4 397.5 375.3 386.9 10.6 -1.7% 3.1%Q2 937.0 865.5 919.1 960.6 -95.2 -7.6% 4.5%
Q3 1,417.7 1,342.5 1,636.5 1,461.1 -118.6 -5.3% -10.7%
Q4 2,115.8 2,001.8 2,287.2 2,148.8 -147.0 -5.4% -6.1%
2010 Q1 397.5 406.3 386.9 430.7 -24.4 2.2% 11.3%Q2 865.5 869.8 960.6 950.9 -81.1 0.5% -1.0%
Q3 1,342.5 1,404.4 1,461.1 1,451.0 -46.7 4.6% -0.7%Q4 2,001.8 2,144.8 2,148.8 2,276.2 -131.4 7.1% 5.9%
2011 January 210.8 121.2 89.6 - -
February 322.9 253.2 69.7 - -March 406.3 436.1 430.7 424.5 11.6 7.3% -1.4%
April 702.7 569.6 133.1 - -
May 819.0 779.1 39.9 - -June 869.9 937.9 951.0 977.8 -39.9 7.8% 2.8%
July 1,202.9 1,174.8 28.1 - -August 1,349.3 1,345.6 3.7 - -
September 1,404.4 1,511.7 1,451.0 1,530.2 -18.5 7.6% 5.5%October 1,727.9 1,688.1 39.8 - -
November 1,887.3 1,893.7 -6.5 - -December 2,144.8 2,114.3 2,276.2 2,126.6 -12.3 -1.4% -6.6%
2012 January 210.8 170.6 121.2 109.3 61.3 -19.0% -9.8%
February 322.9 283.8 253.2 246.3 37.5 -12.1% -2.7%
March 436.1 424.3 424.5 405.6 18.7 -2.7% -4.4%April 702.7 624.5 569.6 547.1 77.4 -11.1% -4.0%
May 819.0 787.3 779.1 790.0 -2.7 -3.9% 1.4%June 937.9 896.1 977.8 984.2 -88.1 -4.5% 0.6%
July 1,202.9 1,104.0 1,174.8 1,166.9 -62.9 -8.2% -0.7%August 1,349.3 1,258.4 1,345.6 1,340.2 -81.9 -6.7% -0.4%
September 1,511.7 1,402.4 1,530.2 1,473.6 -71.2 -7.2% -3.7%October 1,727.9 1,612.5 1,688.1 1,669.7 -57.2 -6.7% -1.1%
November 1,887.3 1,735.7 1,893.7 1,809.6 -73.9 -8.0% -4.4%December 2,114.3 2,015.1 2,126.6 2,281.2 -266.1 -4.7% 7.3%
2013 January 210.8 214.2 121.2 114.4 99.8 1.6% -5.6%February 322.9 331.2 253.2 310.2 20.9 2.6% 22.5%
March 436.1 467.3 424.5 463.6 3.7 7.2% 9.2%April 702.7 713.5 569.6 643.2 70.3 1.5% 12.9%
May 819.0 845.0 779.1 862.7 -17.7 3.2% 10.7%June 937.9 1,039.2 977.8 1,031.8 7.4 10.8% 5.5%
July 1,202.9 1,323.8 1,174.8 1,475.4 -151.5 10.1% 25.6%August 1,349.3 1,495.6 1,345.6 1,970.5 -474.9 10.8% 46.4%
September 1,511.7 1,741.7 1,530.2 2,464.2 -722.5 15.2% 61.0%
October 1,727.9 2,020.1 1,688.1 2,733.6 -713.5 16.9% 61.9%November 1,887.3 2,165.4 1,893.7 2,925.3 -759.9 14.7% 54.5%
December 2,114.3 2,443.9 2,126.6 3,275.2 -831.3 15.6% 54.0%
2014 January 170.6 190.6 109.3 177.5 13.1 11.7% 62.3%February 283.8 324.1 246.3 402.0 -77.9 14.2% 63.2%
Overallbalance

March 424.3 473.5 405.6 598.0 -124.5 11.6% 47.4%
April 624.5 699.8 547.1 810.2 -110.4 12.1% 48.1%May 787.3 867.2 790.0 1,015.7 -148.4 10.1% 28.6%
June 896.1 1,058.0 984.2 1,349.9 -291.9 18.1% 37.2%
July 1,104.0 1,301.5 1,166.9 1,602.7 -301.2 17.9% 37.3%August 1,258.4 1,462.8 1,340.2 1,800.2 -337.5 16.2% 34.3%
September 1,402.4 1,641.9 1,473.6 1,977.7 -335.8 17.1% 34.2%October 1,612.5 1,914.6 1,669.7 2,214.1 -299.5 18.7% 32.6%
November 1,735.7 2,062.2 1,809.6 2,360.4 -298.2 18.8% 30.4%December 2,015.1 2,319.5 2,281.2 2,739.0 -419.5 15.1% 20.1%
2015 January 190.6 201.7 177.5 169.0 32.7 5.8% -4.8%
February 324.1 333.4 402.0 376.8 -43.4 2.9% -6.3%March 473.5 477.3 598.0 547.6 -70.3 0.8% -8.4%
April 699.8 711.9 810.2 754.9 -43.0 1.7% -6.8%
May 845.0 842.8 862.7 922.7 -79.9 -0.3% 6.9%June 1,039.2 1,025.3 1,031.8 1,157.5 -132.1 -1.3% 12.2%
July 1,301.5 1,301.5 1,602.7 1,406.4 -104.9 0.0% -12.2%August 1,462.8 1,501.6 1,800.2 1,679.9 -178.3 2.7% -6.7%
September 1,741.7 1,662.7 2,464.2 1,849.3 -186.6 -4.5% -25.0%October 2,020.1 1,986.5 2,733.6 2,121.5 -135.0 -1.7% -22.4%
November 2,062.2 2,152.8 2,360.4 2,294.0 -141.2 4.4% -2.8%December 2,319.5 2,456.0 2,739.0 2,649.5 -193.5 5.9% -3.3%
2016 January 201.7 174.4 169.0 147.8 26.6 -13.5% -12.5%February 333.4 345.0 376.8 357.8 -12.7 3.5% -5.0%
March 477.3 486.3 547.6 511.5 -25.2 1.9% -6.6%April 711.9 780.4 754.9 750.4 29.9 9.6% -0.6%
May 842.8 928.9 922.7 945.2 -16.3 10.2% 2.4%June 1,025.3 1,149.6 1,157.5 1,188.3 -38.7 12.1% 2.7%
July 1,301.5 1,420.1 1,406.4 1,422.3 -2.2 9.1% 1.1%August 1,501.6 1,651.2 1,679.9 1,620.8 30.3 10.0% -3.5%
September 1,662.7 1,827.3 1,849.3 1,803.4 23.8 9.9% -2.5%October 1,986.5 2,108.1 2,121.5 2,061.3 46.8 6.1% -2.8%
November 2,152.8 2,274.0 2,294.0 2,239.2 46.8 5.6% -2.4%
December 2,456.5 2,567.0 2,649.4 2,597.7 -30.6 4.5% -2.0%

2 - State subsector revenue - Economic Classification
€ MillionsTax revenue Income tax Non-tax revenue and non Income tax
Direct taxes Indirect taxes Total Total Property incom Transfers Other revenue Total TOTAL
2010 13,569.2 18,720.6 32,289.7 234.0 590.3 473.5 1,103.1 416.3 169.4 1,010.7 3,763.4 36,287.12011 15,046.9 19,312.3 34,359.2 464.8 698.6 288.2 4,532.4 433.7 17.4 888.2 6,858.5 41,682.52012 13,633.6 18,407.0 32,040.6 433.1 736.4 526.9 3,705.5 449.7 2.2 1,979.1 7,399.8 39,873.52013 17,415.1 18,857.9 36,272.9 494.1 752.3 1,129.5 959.1 399.8 65.7 1,164.4 4,470.7 41,237.72014 17,539.4 19,581.0 37,120.4 685.8 788.6 692.5 775.6 452.7 44.7 847.0 3,601.1 41,407.32015 18,245.8 20,603.7 38,849.6 611.6 908.0 632.3 804.7 476.9 55.3 686.2 3,563.4 43,024.62016 17,747.7 22,495.5 40,243.2 633.3 852.8 497.5 1,339.9 493.3 51.5 816.9 4,051.9 44,928.42017
January 1,116.3 1,565.2 2,681.5 5.0 75.5 25.5 49.2 37.9 12.7 203.0 403.7 3,090.2February 2,212.8 4,036.7 6,249.5 9.6 155.1 58.4 112.1 81.7 13.0 262.4 682.7 6,941.8March 3,386.7 5,592.1 8,978.8 15.5 226.9 66.8 199.9 122.9 15.7 316.0 948.2 9,942.4April 4,312.5 7,233.4 11,545.9 20.3 291.6 76.9 245.3 161.4 16.7 341.7 1,133.6 12,699.8May 5,671.6 9,574.4 15,246.0 24.8 358.2 363.2 359.3 212.1 24.2 381.3 1,698.3 16,969.1June 6,889.4 11,281.7 18,171.1 31.9 438.7 396.6 415.7 253.6 24.3 421.7 1,950.6 20,153.6July 9,201.5 13,142.8 22,344.3 36.8 518.9 397.5 492.0 290.3 24.5 456.4 2,179.7 24,560.8August 11,022.1 15,583.2 26,605.3 42.9 601.4 424.2 544.3 328.4 24.5 487.0 2,409.8 29,057.9September 13,427.9 17,650.1 31,078.0 47.4 671.1 432.0 640.2 357.7 24.5 519.8 2,645.4 33,770.7October 14,642.4 19,537.7 34,180.1 52.0 746.4 431.8 678.9 394.0 24.6 556.4 2,832.0 37,064.0November 15,748.5 22,017.8 37,766.3 57.8 818.0 440.0 785.7 433.9 24.7 590.1 3,092.4 40,916.5December 18,331.6 23,848.8 42,180.4 60.2 887.5 558.4 905.9 498.1 26.5 678.2 3,554.6 45,795.3
2018January 1,253.7 1,660.5 2,914.2 6.1 76.3 24.8 48.6 32.3 0.0 192.2 374.2 3,294.4February 2,364.6 4,390.1 6,754.7 12.1 148.5 27.7 127.7 67.0 0.6 247.3 618.8 7,385.6March 3,474.5 6,041.5 9,516.0 16.7 215.8 30.6 198.8 104.9 -2.7 285.7 833.2 10,365.8AprilMayJuneJulyAugustSeptemberOctoberNovemberDecember
Taxes, fines and other penalties
Sale of current goods and
servicesSale of
investment goods

3 - State subsector expenditure - Functional Classification
€ MillionsSovereign General Functions Social Functions Economic Functions Other Functions
National Defense Education Health TOTAL
2010 1,945.9 3,079.8 3,242.6 8,559.2 9,776.5 11,809.8 315.8 381.9 468.0 72.8 573.6 0.0 473.2 4,970.0 4,896.3 0.0 50,565.42011 1,752.3 1,943.6 3,526.7 7,878.5 9,171.7 11,233.2 260.0 318.6 473.6 0.2 1,268.8 0.0 195.3 6,037.8 4,666.1 0.0 48,726.32012 1,814.7 1,729.6 2,737.7 6,622.4 10,403.5 12,370.8 186.1 593.8 436.0 0.0 381.5 0.0 171.0 6,848.7 4,473.5 0.2 48,769.62013 1,858.1 1,800.0 3,087.6 7,108.4 8,588.8 13,795.5 125.6 197.1 378.0 167.3 296.0 0.0 158.4 6,841.6 4,499.9 0.0 48,902.32014 2,066.8 1,809.1 3,159.1 6,945.0 8,332.1 13,318.6 134.7 121.7 466.4 5.2 282.8 20.8 147.2 7,379.3 4,676.1 0.5 48,865.42015 1,674.7 1,868.9 3,181.6 6,755.8 8,518.4 13,625.7 108.4 115.9 384.8 10.9 181.5 16.6 314.5 7,091.8 4,776.1 0.7 48,626.62016 1,737.1 1,812.2 3,175.1 7,177.1 8,811.5 13,632.2 142.4 131.2 418.1 110.2 697.1 16.4 380.9 7,379.2 4,896.8 0.3 50,518.02017
January 127.6 90.2 211.2 557.8 667.8 1,146.3 3.0 6.4 23.5 0.5 3.5 0.9 6.3 179.2 552.9 0.0 3,576.8February 236.3 194.0 436.9 1,109.2 1,367.9 2,243.4 8.8 13.4 47.0 1.2 60.7 3.2 16.0 1,408.1 922.0 0.0 8,067.9March 354.8 357.9 668.5 1,736.6 2,050.9 3,263.4 12.4 31.2 70.2 1.8 104.7 4.1 24.5 1,704.2 1,241.3 0.0 11,626.5April 485.6 501.6 898.3 2,294.3 2,718.3 4,352.5 18.0 51.1 91.4 2.5 110.6 5.5 32.0 2,659.4 1,758.8 0.0 15,979.9May 632.9 635.9 1,139.6 2,844.1 3,456.5 5,463.8 20.9 76.7 115.6 3.4 234.3 6.8 41.2 2,969.7 2,105.3 0.0 19,746.7June 798.2 804.2 1,527.9 3,778.5 4,170.6 6,499.3 29.8 100.6 146.4 4.5 265.3 8.2 58.3 4,559.5 2,452.3 0.0 25,203.5July 947.5 967.3 1,783.9 4,357.6 4,911.3 8,137.4 37.4 123.5 167.0 5.1 274.6 9.3 67.5 4,875.0 2,965.5 0.0 29,630.0August 1,065.4 1,088.2 2,034.0 4,859.9 5,605.6 9,222.3 40.1 158.3 193.1 5.8 458.6 10.9 78.4 5,136.2 3,254.2 0.0 33,211.1September 1,224.3 1,194.3 2,304.7 5,379.6 6,356.7 10,239.6 58.0 187.5 223.1 7.0 465.3 12.3 93.3 5,374.7 3,588.3 0.0 36,708.7October 1,382.4 1,367.3 2,526.5 5,911.3 7,034.4 11,259.4 63.8 215.9 274.6 8.1 547.6 13.7 101.5 6,779.6 4,095.2 0.0 41,581.3November 1,533.6 1,531.7 2,898.6 6,654.4 7,685.1 12,522.0 72.2 240.7 347.2 9.0 588.4 15.0 117.4 6,993.2 4,429.4 0.0 45,637.9December 1,848.1 1,820.6 3,214.2 7,289.2 8,757.7 13,669.6 90.9 290.3 446.6 14.3 899.6 16.4 365.3 7,123.2 4,771.2 0.0 50,617.2
2018
General Public Services
Public Order and Safety
Safety and Social Services
Housing and Collective Services
Cultural, Recreational e
Religious Services
Agriculture and Livestock,
Forestry, Fishing and Hunting
Industry and Energy
Transport and Communication
Trade and Tourism
Other Economic Functions
Public Debt Operations
Transfers within the General Government
Not Elsewhere Classified

4 - State Expenditure - Economic/Organic Classification
(Period: January to February)2018
Finanças Defesa Nacional Justiça Cultura Educação Saúde Economia Ambiente
Current Expenditure 775.2 23.9 50.1 2,409.3 296.0 393.5 229.1 62.7 339.9 1,353.4 3,215.5 2,098.6 25.5 18.6 9.2 67.8Employees 8.7 10.0 28.6 92.7 241.6 345.3 200.3 6.2 1.1 1,036.1 10.3 3.4 0.6 9.0 4.7 20.5
Certain and permanent wages 7.2 8.2 15.3 71.5 143.4 229.5 152.6 5.0 0.8 780.7 8.2 2.8 0.5 7.0 3.7 16.1Variable or contingent bonuses 0.2 0.1 9.8 3.8 15.9 21.4 14.5 0.1 0.0 1.4 0.2 0.1 0.0 0.2 0.1 0.5Social security 1.3 1.7 3.4 17.4 82.3 94.4 33.3 1.1 0.3 254.0 1.9 0.6 0.1 1.8 0.9 3.9
Purchase of current goods and services 0.4 1.4 6.1 19.9 46.5 30.2 19.3 1.1 0.3 14.9 1.2 1.0 0.1 2.4 0.5 3.8Purchase of goods 0.0 0.1 0.1 1.2 10.4 4.8 3.6 0.1 0.0 10.4 0.1 0.2 0.0 0.2 0.0 0.4Purchase of services 0.4 1.3 6.0 18.7 36.1 25.4 15.7 1.0 0.3 4.5 1.2 0.7 0.1 2.1 0.5 3.5
Interests and other charges 0.0 0.0 0.0 1,650.1 0.0 0.0 0.0 0.0 0.0 0.0 0.0 0.0 0.0 0.0 0.0 0.0Current transfers 766.0 12.5 12.5 627.8 7.0 17.7 9.1 54.4 338.4 189.2 3,203.9 2,094.2 24.8 7.1 4.0 42.9
General Government 765.9 11.3 11.0 13.3 4.2 16.5 8.7 53.8 277.8 132.8 3,203.4 2,093.8 24.8 7.1 3.9 42.7Central Government 59.4 11.3 10.9 12.6 4.2 16.5 8.7 53.6 277.8 64.2 1,188.7 2,093.8 24.8 7.1 3.9 42.7Regional Government 90.6 0.0 0.0 0.0 0.0 0.0 0.0 0.0 0.0 0.0 0.0 0.0 0.0 0.0 0.0 0.0Local Government 615.8 0.0 0.0 0.0 0.0 0.1 0.0 0.2 0.0 64.0 0.4 0.0 0.0 0.0 0.0 0.0Social Security 0.0 0.0 0.1 0.7 0.0 0.0 0.0 0.0 0.0 4.6 2,014.4 0.0 0.0 0.0 0.0 0.0
Other current transfers 0.1 1.2 1.6 614.5 2.8 1.2 0.3 0.6 60.7 56.3 0.5 0.3 0.0 0.0 0.1 0.2Subsidies 0.0 0.0 0.0 11.2 0.0 0.0 0.0 0.9 0.0 0.0 0.0 0.0 0.0 0.0 0.0 0.0Other current expenditure 0.0 0.1 2.9 7.7 0.9 0.2 0.4 0.0 0.0 113.3 0.0 0.0 0.0 0.0 0.0 0.6
Capital expenditure 86.6 0.4 0.0 35.3 19.4 1.5 2.0 0.2 51.8 1.8 0.1 0.1 45.5 0.2 1.8 13.7Investment 0.0 0.1 0.0 0.8 19.1 0.4 0.5 0.2 0.0 0.8 0.1 0.0 0.0 0.1 0.0 1.6Capital transfers 86.6 0.2 0.0 34.5 0.2 1.0 1.5 0.0 51.8 0.0 0.0 0.1 45.5 0.1 1.8 12.1
General Government 86.6 0.2 0.0 0.0 0.2 1.0 1.5 0.0 51.8 0.0 0.0 0.1 45.5 0.1 1.8 12.1Central Government 1.3 0.2 0.0 0.0 0.2 1.0 1.5 0.0 51.8 0.0 0.0 0.1 45.5 0.1 1.8 12.1Regional Government 36.3 0.0 0.0 0.0 0.0 0.0 0.0 0.0 0.0 0.0 0.0 0.0 0.0 0.0 0.0 0.0Local Government 49.0 0.0 0.0 0.0 0.0 0.0 0.0 0.0 0.0 0.0 0.0 0.0 0.0 0.0 0.0 0.0Social Security 0.0 0.0 0.0 0.0 0.0 0.0 0.0 0.0 0.0 0.0 0.0 0.0 0.0 0.0 0.0 0.0
Other capital transfers 0.0 0.0 0.0 34.5 0.0 0.0 0.0 0.0 0.0 0.0 0.0 0.0 0.0 0.0 0.0 0.0Other capital expenditure 0.0 0.0 0.0 0.0 0.0 0.0 0.0 0.0 0.0 1.0 0.0 0.0 0.0 0.0 0.0 0.0
Effective Expenditure 861.9 24.3 50.2 2,444.7 315.3 394.9 231.1 63.0 391.7 1,355.3 3,215.6 2,098.7 71.1 18.7 11.1 81.5 Memo item:
Financial assets 0.0 0.0 0.0 899.2 0.0 0.0 0.0 0.0 0.0 0.0 0.0 0.0 0.0 0.0 0.0 0.0Financial liabilities 0.0 0.0 0.0 15,414.0 0.0 0.0 0.0 0.0 0.0 0.0 0.0 0.0 0.0 0.0 0.0 0.0
Public Debt Settlement Fund transfers 0.0 0.0 0.0 0.0 0.0 0.0 0.0 0.0 0.0 0.0 0.0 0.0
Encargos Gerais do Estado
Presidência do conselho
deMinistrosNegócios
estrangeirosAdministração
InternaCiência,
Tecnologia e Ensino Superior
Trabalho, Solidariedade e
Segurança SocialPlaneamento e Infraestruturas
Agricultura, Florestas e
Desenvolvimento Rural

4 - State Expenditure - Economic/Organic Classification
(Period: January to February)
Current ExpenditureEmployees
Certain and permanent wagesVariable or contingent bonusesSocial security
Purchase of current goods and servicesPurchase of goodsPurchase of services
Interests and other chargesCurrent transfers
General GovernmentCentral GovernmentRegional GovernmentLocal GovernmentSocial Security
Other current transfersSubsidiesOther current expenditure
Capital expenditureInvestmentCapital transfers
General GovernmentCentral GovernmentRegional GovernmentLocal GovernmentSocial Security
Other capital transfersOther capital expenditure
Effective Expenditure Memo item:
Financial assetsFinancial liabilities
Public Debt Settlement Fund transfers
4 - State Expenditure - Economic/Organic Classification
€ Million2018
Mar TOTAL
7.1 11,375.42.8 2,022.02.2 1,454.70.1 68.20.6 499.10.6 149.70.0 31.80.6 118.00.0 1,650.13.7 7,415.33.7 6,674.83.7 3,883.90.0 90.60.0 680.50.0 2,019.80.0 740.50.0 12.10.0 126.2
0.00.0 260.50.0 23.90.0 235.60.0 201.10.0 115.80.0 36.30.0 49.00.0 0.00.0 34.60.0 1.0
7.1 11,636.0
0.0 899.20.0 15,414.0
0.0 0.0

4 - State Expenditure - Economic/Organic Classification
(Period: January to February)
Current ExpenditureEmployees
Certain and permanent wagesVariable or contingent bonusesSocial security
Purchase of current goods and servicesPurchase of goodsPurchase of services
Interests and other chargesCurrent transfers
General GovernmentCentral GovernmentRegional GovernmentLocal GovernmentSocial Security
Other current transfersSubsidiesOther current expenditure
Capital expenditureInvestmentCapital transfers
General GovernmentCentral GovernmentRegional GovernmentLocal GovernmentSocial Security
Other capital transfersOther capital expenditure
Effective Expenditure Memo item:
Financial assetsFinancial liabilities
Public Debt Settlement Fund transfers
4 - State Expenditure - Economic/Organic Classification
2017
Finanças Defesa Nacional Justiça Cultura Educação Saúde Economia Ambiente
762.2 22.9 52.2 2,314.7 322.2 408.9 232.3 27.0 341.1 1,397.4 3,266.7 2,034.7 46.7 17.9 6.7 57.69.1 10.0 29.4 95.0 263.1 367.5 203.1 6.2 1.2 1,050.6 10.5 3.7 0.6 9.0 4.5 20.77.5 8.3 16.0 73.4 150.0 240.0 155.2 5.0 0.8 807.6 8.4 3.0 0.5 7.1 3.6 16.40.2 0.1 9.9 3.6 20.9 22.3 13.4 0.1 0.0 1.5 0.1 0.0 0.0 0.2 0.1 0.31.4 1.6 3.6 17.9 92.2 105.2 34.6 1.1 0.4 241.5 2.0 0.7 0.1 1.8 0.8 4.00.4 1.5 7.1 23.0 38.0 32.0 21.8 1.0 0.3 9.6 1.1 2.2 0.1 1.7 0.6 2.40.0 0.1 0.1 1.2 10.7 5.2 5.8 0.1 0.0 6.4 0.1 0.1 0.0 0.2 0.1 0.30.4 1.3 7.1 21.8 27.2 26.8 16.0 0.9 0.2 3.2 1.0 2.1 0.0 1.4 0.6 2.10.0 0.0 0.0 1,704.2 0.0 0.0 0.0 0.0 0.0 0.0 0.0 0.0 0.0 0.0 0.0 0.0
752.7 11.4 12.2 483.4 16.7 9.3 7.0 19.8 339.6 193.7 3,255.0 2,028.8 46.0 7.1 1.5 34.4752.5 10.5 10.5 9.1 13.7 7.3 6.2 17.4 281.4 128.5 3,254.7 2,027.8 46.0 7.1 1.5 34.2
58.8 10.5 10.5 8.0 13.7 7.1 6.2 17.2 281.4 57.4 1,111.3 2,027.8 46.0 7.1 1.5 34.287.9 0.0 0.0 0.0 0.0 0.0 0.0 0.0 0.0 0.0 0.0 0.0 0.0 0.0 0.0 0.0
605.8 0.0 0.0 0.0 0.0 0.2 0.0 0.2 0.0 68.6 0.0 0.0 0.0 0.0 0.0 0.00.0 0.0 0.0 1.1 0.0 0.0 0.0 0.0 0.0 2.5 2,143.4 0.0 0.0 0.0 0.0 0.00.1 0.9 1.8 474.3 2.9 2.0 0.8 2.4 58.2 65.2 0.2 1.0 0.0 0.0 0.0 0.20.0 0.0 0.0 5.0 0.0 0.0 0.0 0.0 0.0 0.0 0.0 0.0 0.0 0.0 0.0 0.00.0 0.0 3.4 4.1 4.5 0.2 0.4 0.0 0.0 143.5 0.1 0.0 0.0 0.0 0.0 0.1
85.8 0.2 0.7 35.6 38.8 1.1 1.2 0.9 54.7 26.5 0.0 0.0 52.5 1.3 0.2 8.20.0 0.0 0.5 1.4 38.8 0.9 1.2 0.2 0.0 1.0 0.0 0.0 0.0 0.0 0.0 0.3
85.7 0.2 0.2 34.1 0.0 0.2 0.0 0.7 54.6 0.5 0.0 0.0 52.5 1.2 0.2 8.085.7 0.2 0.2 0.0 0.0 0.2 0.0 0.1 54.6 0.5 0.0 0.0 52.5 1.1 0.2 8.0
1.3 0.2 0.2 0.0 0.0 0.1 0.0 0.1 54.6 0.5 0.0 0.0 52.5 1.1 0.2 8.035.2 0.0 0.0 0.0 0.0 0.0 0.0 0.0 0.0 0.0 0.0 0.0 0.0 0.0 0.0 0.049.2 0.0 0.0 0.0 0.0 0.2 0.0 0.0 0.0 0.0 0.0 0.0 0.0 0.0 0.0 0.0
0.0 0.0 0.0 0.0 0.0 0.0 0.0 0.0 0.0 0.0 0.0 0.0 0.0 0.0 0.0 0.00 0 0 34 0 0 0 1 0 0 0 0 0 0 0 0
0.0 0.0 0.0 0.0 0.0 0.0 0.0 0.0 0.0 25.0 0.0 0.0 0.0 0.0 0.0 0.0
847.9 23.1 52.9 2,350.3 361.0 410.1 233.5 27.9 395.8 1,423.9 3,266.7 2,034.8 99.2 19.1 6.9 65.8
0.0 0.0 0.0 3,183.0 0.0 0.0 0.0 0.0 0.0 0.0 0.0 0.0 0.0 0.0 0.0 0.00.0 0.0 0.0 12,757.4 0.0 0.0 0.0 0.0 0.0 0.0 0.0 0.0 0.0 0.0 0.0 0.0
0.0 0.0 0.0 0.0 0.0 0.0 0.0 0.0 0.0 0.0 0.0 0.0
Encargos Gerais do Estado
Presidência do conselho
deMinistrosNegócios
estrangeirosAdministração
InternaCiência,
Tecnologia e Ensino Superior
Trabalho, Solidariedade e
Segurança SocialPlaneamento e Infraestruturas
Agricultura, Florestas e
Desenvolvimento Rural

4 - State Expenditure - Economic/Organic Classification
(Period: January to February)
Current ExpenditureEmployees
Certain and permanent wagesVariable or contingent bonusesSocial security
Purchase of current goods and servicesPurchase of goodsPurchase of services
Interests and other chargesCurrent transfers
General GovernmentCentral GovernmentRegional GovernmentLocal GovernmentSocial Security
Other current transfersSubsidiesOther current expenditure
Capital expenditureInvestmentCapital transfers
General GovernmentCentral GovernmentRegional GovernmentLocal GovernmentSocial Security
Other capital transfersOther capital expenditure
Effective Expenditure Memo item:
Financial assetsFinancial liabilities
Public Debt Settlement Fund transfers
4 - State Expenditure - Economic/Organic Classification
€ Million2017
Mar TOTAL
6.9 11,318.22.7 2,087.12.1 1,504.80.1 72.70.6 509.60.9 143.40.0 30.50.9 113.00.0 1,704.33.2 7,221.83.1 6,611.53.1 3,701.70.0 87.90.0 674.80.0 2,147.00.1 610.30.0 5.00.0 156.5
0.00.7 308.40.7 45.10.0 238.30.0 203.40.0 118.80.0 35.20.0 49.40.0 0.0
0 34.90.0 25.0
7.6 11,626.5
0.0 3,183.00.0 12,757.4
0.0 0.0

4 - State Expenditure - Economic/Organic Classification
(Period: January to February)
Current ExpenditureEmployees
Certain and permanent wagesVariable or contingent bonusesSocial security
Purchase of current goods and servicesPurchase of goodsPurchase of services
Interests and other chargesCurrent transfers
General GovernmentCentral GovernmentRegional GovernmentLocal GovernmentSocial Security
Other current transfersSubsidiesOther current expenditure
Capital expenditureInvestmentCapital transfers
General GovernmentCentral GovernmentRegional GovernmentLocal GovernmentSocial Security
Other capital transfersOther capital expenditure
Effective Expenditure Memo item:
Financial assetsFinancial liabilities
Public Debt Settlement Fund transfers
4 - State Expenditure - Economic/Organic Classification
YOY Change Rate (%)
Finanças Defesa Nacional Justiça Cultura Educação Saúde Economia Ambiente
1.7 4.3 -4.1 4.1 -8.1 -3.8 -1.4 132.1 -0.4 -3.2 -1.6 3.1 -45.3 3.7 38.7 17.8-3.7 -0.4 -2.7 -2.4 -8.2 -6.0 -1.4 -0.2 -8.3 -1.4 -2.4 -7.9 0.4 -0.2 3.4 -0.9-4.0 -0.8 -4.2 -2.6 -4.4 -4.4 -1.7 -0.2 -0.5 -3.3 -2.6 -7.0 -0.9 -0.6 3.5 -1.95.6 10.1 -0.2 3.5 -24.2 -3.8 8.0 4.8 -26.6 -7.1 17.9 18.9 134.1 28.6 17.6 79.6
-3.2 1.3 -2.9 -2.8 -10.7 -10.3 -3.8 -0.5 -21.0 5.2 -2.7 -13.8 -1.0 -1.3 1.7 -2.54.6 -5.6 -15.2 -13.5 22.5 -5.4 -11.6 19.0 4.7 55.4 14.4 -55.0 79.2 39.6 -15.3 60.1
13.3 2.8 0.6 3.2 -3.0 -7.4 -38.6 28.4 34.4 63.4 -15.0 130.2 -11.2 -11.6 -14.6 11.43.6 -6.4 -15.3 -14.3 32.6 -5.1 -1.8 17.8 2.1 39.8 17.3 -64.7 128.6 48.4 -15.4 67.9
-100.0 -100.0 - -3.2 - -41.1 -96.1 114.8 -100.0 -100.0 130.4 - - - 161.0 50.01.8 9.3 2.6 29.9 -58.2 90.2 30.3 174.8 -0.3 -2.4 -1.6 3.2 -46.1 0.3 169.9 24.61.8 7.1 5.0 45.9 -69.4 127.4 41.1 - -1.3 3.4 -1.6 3.3 -46.1 0.6 164.0 24.81.1 7.1 4.0 57.9 -69.4 132.2 41.1 - -1.3 11.9 7.0 3.3 -46.1 0.6 164.0 24.83.1 - - - - - - - - - - - - - - -1.7 - - - - -63.3 - -0.9 - -6.7 - - - - - -
- - - -39.1 40.1 -100.0 - -100.0 - 86.7 -6.0 - - -100.0 - -0.5 35.3 -11.6 29.6 -6.2 -43.0 -56.0 -74.7 4.3 -13.6 108.9 -66.2 - -52.1 - -7.6
- - - 121.4 121.8 - - - - - - - - - - --100.0 97.4 -16.1 86.0 -79.5 25.1 2.2 -58.1 34.9 -21.1 -48.8 110.4 - -23.5 -18.6 -
1.0 93.4 -93.9 -0.7 -50.1 29.7 70.0 -75.2 -5.2 -93.1 - 158.5 -13.3 -85.5 - 65.7-33.8 - -92.0 -43.1 -50.6 -53.4 -58.8 27.5 -88.8 -23.3 - - - 154.1 -87.7 -
1.0 30.0 -97.3 1.1 - - - -98.4 -5.2 -94.3 - 111.4 -13.3 -89.7 - 51.51.0 30.0 -97.3 -100.0 - - - -87.1 -5.2 -96.6 - 111.4 -13.3 -88.4 - 51.51.0 30.0 -97.3 -100.0 - - - -100.0 -5.2 -98.5 - 111.4 -13.3 -88.4 - 51.53.1 - - - - - - - - - - - - - - -
-0.5 - - - - -100.0 - - - - - - - - - -- - - - - - - - - - - - - - - -
-100.0 - - 1.1 - - - -100.0 - - - - - -100.0 - -- - - - - - - - - -95.9 - - - - - -
1.6 5.0 -5.2 4.0 -12.7 -3.7 -1.0 125.6 -1.0 -4.8 -1.6 3.1 -28.4 -2.1 60.6 23.8
Encargos Gerais do Estado
Presidência do conselho
deMinistrosNegócios
estrangeirosAdministração
InternaCiência,
Tecnologia e Ensino Superior
Trabalho, Solidariedade e
Segurança SocialPlaneamento e Infraestruturas
Agricultura, Florestas e
Desenvolvimento Rural

4 - State Expenditure - Economic/Organic Classification
(Period: January to February)
Current ExpenditureEmployees
Certain and permanent wagesVariable or contingent bonusesSocial security
Purchase of current goods and servicesPurchase of goodsPurchase of services
Interests and other chargesCurrent transfers
General GovernmentCentral GovernmentRegional GovernmentLocal GovernmentSocial Security
Other current transfersSubsidiesOther current expenditure
Capital expenditureInvestmentCapital transfers
General GovernmentCentral GovernmentRegional GovernmentLocal GovernmentSocial Security
Other capital transfersOther capital expenditure
Effective Expenditure Memo item:
Financial assetsFinancial liabilities
Public Debt Settlement Fund transfers
4 - State Expenditure - Economic/Organic Classification
YOY Change Rate (%)
Mar TOTAL
4.0 0.53.0 -3.13.0 -3.3
17.6 -6.21.4 -2.1
-33.2 4.4-47.6 4.2-32.6 4.4
- -3.214.7 2.718.9 1.018.9 4.9
- 3.1- 0.8- -5.9
-94.1 21.3- 140.0- -19.4
-99.8 -15.5-99.8 -47.0
-100.0 -1.1-100.0 -1.1-100.0 -2.6
- 3.1- -0.7- -
-100.0 -1.1- -95.9
-5.8 0.1

5 - Autonomous Services and Funds expenditure - Functional Classification
€ MillionsSovereign General Functions Social Functions Economic Functions Other Functions
Education Health TOTAL
2010 963.7 95.2 757.0 1,857.9 13,874.4 8,566.6 161.1 136.7 1,015.9 10.1 220.9 199.3 1,105.3 0.0 0.0 0.0 28,964.22011 824.3 76.8 932.6 1,661.5 12,827.7 9,028.0 175.5 134.3 1,068.0 8.8 210.4 210.3 1,001.6 0.1 0.0 0.0 28,159.82012 770.7 71.1 662.3 2,146.3 10,121.8 8,303.6 123.6 406.6 1,103.4 24.5 2,575.2 159.2 1,263.4 60.0 0.0 0.0 27,791.72013 851.5 75.2 590.6 1,924.2 9,007.0 9,576.6 202.9 436.5 1,119.7 27.9 2,324.8 157.8 1,385.1 21.0 0.0 0.0 27,700.92014 811.9 101.2 559.9 1,916.5 8,670.2 9,837.5 212.9 419.4 1,143.5 21.2 2,664.7 160.0 1,528.9 19.3 0.0 0.0 28,067.12015 792.5 73.2 548.9 2,078.5 13,662.4 10,042.4 286.4 426.0 908.6 47.6 3,102.6 172.7 1,712.6 196.6 0.0 3.5 34,054.32016 847.0 68.1 512.2 2,059.8 15,282.2 10,049.7 212.0 446.5 996.8 48.9 3,260.3 171.7 1,757.5 719.0 0.0 19.9 36,451.72017
General Public Services
National Defense
Public Order and Safety
Safety and Social Services
Housing and Collective Services
Cultural, Recreational e
Religious Services
Agriculture and Livestock,
Forestry, Fishing and Hunting
Industry and Energy
Transport and Communication
Trade and Tourism
Other Economic Functions
Public Debt Operations
Transfers within the General Government
Not Elsewhere Classified

6 - Autonomous Services and Funds - Economic/Organic Classification
(Period: January to February)2018
Finanças Defesa Nacional Justiça Cultura Educação Saúde Economia Ambiente
Current Expenditure 71.3 15.5 21.4 58.7 22.5 24.5 68.4 87.7 366.8 51.0 2,360.5 4,370.4 258.9 54.6 468.6Employees 46.9 7.0 12.6 17.5 14.1 2.7 4.8 27.9 269.8 8.0 62.8 864.0 76.3 14.8 29.3
Certain and permanent wages 32.1 5.6 9.2 12.8 2.8 2.3 4.2 25.4 221.5 6.3 48.6 600.1 53.2 11.7 20.5Variable or contingent bonuses 7.5 0.1 0.5 0.4 0.1 0.1 0.1 0.5 3.7 0.6 1.7 114.5 7.5 0.2 1.8Social security 7.3 1.3 2.9 4.2 11.2 0.4 0.5 2.1 44.6 1.1 12.5 149.4 15.6 2.9 7.0
Purchase of current goods and services 5.4 1.7 2.4 14.4 6.1 3.5 17.6 54.6 40.8 5.0 46.3 2,728.8 78.1 14.9 27.1Purchase of goods 0.5 0.1 0.0 0.8 1.4 0.4 0.2 37.3 6.7 0.3 5.8 896.2 12.9 0.4 2.1Purchase of services 5.0 1.6 2.4 13.7 4.6 3.0 17.4 17.3 34.1 4.8 40.6 1,832.6 65.2 14.5 25.0
Interests and other charges 0.0 0.0 0.0 4.2 0.0 0.2 0.0 1.1 0.0 0.0 0.3 0.2 49.3 0.0 383.8Current transfers 2.8 6.2 6.3 18.9 0.2 18.1 46.0 0.9 53.9 32.4 2,174.4 774.0 54.4 21.5 27.4
General Government 2.8 1.5 1.9 5.4 0.0 0.3 45.8 0.6 1.7 21.5 61.6 753.8 41.7 7.4 9.9Central Government 2.8 1.5 1.9 5.4 0.0 0.0 45.8 0.6 1.6 0.0 24.7 753.4 41.7 7.0 9.9Regional Government 0.0 0.0 0.0 0.0 0.0 0.0 0.0 0.0 0.0 0.0 0.0 0.0 0.0 0.0 0.0Local Government 0.0 0.0 0.0 0.0 0.0 0.3 0.0 0.0 0.0 0.0 0.0 0.2 0.0 0.2 0.0Social Security 0.0 0.0 0.0 0.0 0.0 0.0 0.0 0.0 0.0 21.5 36.9 0.2 0.0 0.2 0.0
Other current transfers 0.0 4.7 4.4 13.5 0.2 17.9 0.2 0.3 52.2 10.9 2,112.8 20.2 12.7 14.1 17.5Subsidies 15.9 0.0 0.0 0.0 0.0 0.0 0.0 2.1 0.0 0.0 73.7 0.0 0.0 0.1 0.0Other current expenditure 0.2 0.6 0.1 3.7 2.2 0.0 0.1 1.2 2.3 5.5 3.0 3.4 0.7 3.3 1.1
Capital expenditure 0.6 0.1 1.3 1.1 0.2 0.2 3.1 3.1 58.6 0.6 11.8 27.1 468.1 6.7 9.7Investment 0.5 0.1 0.4 0.4 0.2 0.1 1.4 3.1 9.6 0.6 8.6 27.1 468.1 1.1 9.7Capital transfers 0.1 0.0 0.9 0.7 0.0 0.1 1.7 0.0 49.0 0.0 3.2 0.1 0.0 5.6 0.0
General Government 0.1 0.0 0.9 0.0 0.0 0.0 1.7 0.0 13.9 0.0 1.0 0.0 0.0 1.5 0.0Central Government 0.1 0.0 0.9 0.0 0.0 0.0 1.7 0.0 13.9 0.0 1.0 0.0 0.0 0.1 0.0Regional Government 0.0 0.0 0.0 0.0 0.0 0.0 0.0 0.0 0.0 0.0 0.0 0.0 0.0 0.0 0.0Local Government 0.0 0.0 0.0 0.0 0.0 0.0 0.0 0.0 0.0 0.0 0.0 0.0 0.0 1.3 0.0Social Security 0.0 0.0 0.0 0.0 0.0 0.0 0.0 0.0 0.0 0.0 0.0 0.0 0.0 0.0 0.0
Other capital transfers 0.0 0.0 0.0 0.7 0.0 0.1 0.0 0.0 35.1 0.0 2.3 0.0 0.0 4.2 0.0Other capital expenditure 0.0 0.0 0.0 0.0 0.0 0.0 0.0 0.0 0.0 0.0 0.0 0.0 0.0 0.0 0.0
Effective Expenditure 71.9 15.5 22.7 59.8 22.8 24.7 71.5 90.8 425.4 51.5 2,372.3 4,397.5 727.0 61.4 478.2 Memo item:
Financial assets 0.0 0.1 0.0 656.6 0.0 10.6 0.0 0.0 0.0 0.0 50.1 0.2 4.7 109.1 0.2dos quais:
Public Debt Settlement Fund transfers 0.0 0.0
Financial liabilities 0.0 0.0 0.0 12.3 0.0 0.0 0.0 0.0 0.2 0.0 0.0 2.4 22.5 2.0 39.0dos quais:
Public Debt Settlement Fund transfers 0.0 0.0
Encargos Gerais do Estado
Presidência do conselho
deMinistrosNegócios
estrangeirosAdministração
InternaCiência,
Tecnologia e Ensino Superior
Trabalho, Solidariedade e
Segurança SocialPlaneamento e Infraestruturas

6 - Autonomous Services and Funds - Economic/Organic Classification
(Period: January to February)
Current ExpenditureEmployees
Certain and permanent wagesVariable or contingent bonusesSocial security
Purchase of current goods and servicesPurchase of goodsPurchase of services
Interests and other chargesCurrent transfers
General GovernmentCentral GovernmentRegional GovernmentLocal GovernmentSocial Security
Other current transfersSubsidiesOther current expenditure
Capital expenditureInvestmentCapital transfers
General GovernmentCentral GovernmentRegional GovernmentLocal GovernmentSocial Security
Other capital transfersOther capital expenditure
Effective Expenditure Memo item:
Financial assetsdos quais:
Public Debt Settlement Fund transfers
Financial liabilitiesdos quais:
Public Debt Settlement Fund transfers
€ Million2018
Mar TOTAL
114.3 5.1 8,420.217.3 3.0 1,478.913.7 2.2 1,072.2
0.3 0.2 139.73.4 0.6 267.09.4 0.6 3,056.60.5 0.1 965.68.9 0.5 2,091.14.9 0.0 444.1
78.4 1.5 3,317.23.3 0.0 959.21.6 0.0 898.00.0 0.0 0.01.7 0.0 2.40.0 0.0 58.8
75.1 1.4 2,358.03.9 0.0 95.70.3 0.0 27.5
58.4 0.3 651.11.4 0.3 532.7
56.9 0.0 118.40.6 0.0 19.70.2 0.0 17.90.0 0.0 0.00.4 0.0 1.80.0 0.0 0.0
56.3 0.0 98.70.0 0.0 0.0
0.0172.7 5.4 9,071.3
0.0 0.0 831.6
0.0
3.2 0.0 81.8
0.0
Agricultura, Florestas e
Desenvolvimento Rural

6 - Autonomous Services and Funds - Economic/Organic Classification
(Period: January to February)
Current ExpenditureEmployees
Certain and permanent wagesVariable or contingent bonusesSocial security
Purchase of current goods and servicesPurchase of goodsPurchase of services
Interests and other chargesCurrent transfers
General GovernmentCentral GovernmentRegional GovernmentLocal GovernmentSocial Security
Other current transfersSubsidiesOther current expenditure
Capital expenditureInvestmentCapital transfers
General GovernmentCentral GovernmentRegional GovernmentLocal GovernmentSocial Security
Other capital transfersOther capital expenditure
Effective Expenditure Memo item:
Financial assetsdos quais:
Public Debt Settlement Fund transfers
Financial liabilitiesdos quais:
Public Debt Settlement Fund transfers
2017
Finanças Defesa Nacional Justiça Cultura Educação Saúde Economia Ambiente
60.7 12.9 22.0 136.5 22.9 17.2 71.5 77.9 381.1 55.2 2,407.4 3,893.3 233.0 36.6 96.147.3 7.0 13.0 22.0 13.3 2.9 5.9 28.5 282.9 7.4 65.2 892.4 75.1 14.2 28.633.3 5.6 9.6 14.2 5.7 2.3 5.0 26.2 233.6 5.8 50.2 606.1 52.8 11.7 19.9
6.4 0.1 0.6 2.8 0.4 0.0 0.1 0.4 4.4 0.5 1.6 126.0 7.2 0.2 1.87.5 1.3 2.8 5.0 7.1 0.5 0.8 1.9 44.9 1.1 13.3 160.2 15.1 2.2 6.95.7 2.0 2.0 17.7 6.6 2.7 20.1 43.2 41.9 2.7 48.5 2,421.3 75.2 11.5 26.30.6 0.1 0.0 1.0 2.1 0.5 0.1 27.4 8.3 0.2 7.2 595.8 6.8 0.8 1.95.2 1.9 1.9 16.6 4.6 2.2 20.0 15.8 33.5 2.5 41.3 1,825.5 68.4 10.7 24.40.0 0.0 0.0 69.8 0.0 0.0 0.0 1.0 0.0 0.0 0.2 1.1 48.7 0.1 33.92.6 3.4 7.0 18.9 0.2 11.7 45.4 1.1 53.6 41.4 2,215.3 573.9 32.7 7.9 4.92.6 0.0 2.3 4.3 0.0 0.1 45.3 0.0 2.5 32.3 56.4 556.5 29.6 6.0 2.42.6 0.0 2.3 4.3 0.0 0.1 45.3 0.0 2.5 0.0 23.0 556.1 29.6 5.2 2.40.0 0.0 0.0 0.0 0.0 0.0 0.0 0.0 0.0 0.0 0.0 0.0 0.0 0.0 0.00.0 0.0 0.0 0.0 0.0 0.0 0.0 0.0 0.0 0.0 0.0 0.3 0.0 0.1 0.00.0 0.0 0.0 0.0 0.0 0.0 0.0 0.0 0.1 32.3 33.4 0.1 0.0 0.8 0.00.0 3.4 4.7 14.6 0.2 11.6 0.1 1.1 51.1 9.1 2,158.9 17.4 3.1 1.9 2.55.1 0.0 0.0 0.0 0.0 0.0 0.0 3.1 0.0 0.0 76.1 0.1 0.0 0.1 0.40.1 0.6 0.1 8.0 2.8 0.0 0.1 1.0 2.7 3.7 2.1 4.6 1.3 2.8 2.1
0.7 0.2 0.2 0.4 0.1 0.0 3.1 5.1 67.2 3.3 9.7 17.9 480.7 7.9 12.10.7 0.2 0.2 0.4 0.1 0.0 1.3 5.1 9.3 3.2 8.7 17.8 480.7 0.6 7.00.1 0.0 0.0 0.0 0.0 0.0 1.8 0.0 57.9 0.0 0.9 0.1 0.0 7.3 5.20.1 0.0 0.0 0.0 0.0 0.0 1.8 0.0 31.2 0.0 0.9 0.0 0.0 3.6 0.20.1 0.0 0.0 0.0 0.0 0.0 1.8 0.0 31.2 0.0 0.9 0.0 0.0 0.1 0.00.0 0.0 0.0 0.0 0.0 0.0 0.0 0.0 0.0 0.0 0.0 0.0 0.0 0.4 0.00.0 0.0 0.0 0.0 0.0 0.0 0.0 0.0 0.0 0.0 0.0 0.0 0.0 3.1 0.20.0 0.0 0.0 0.0 0.0 0.0 0.0 0.0 0.0 0.0 0.0 0.0 0.0 0.0 0.00.0 0.0 0.0 0.0 0.0 0.0 0.0 0.0 26.7 0.0 0.0 0.1 0.0 3.7 5.00.0 0.0 0.0 0.0 0.0 0.0 0.0 0.0 0.0 0.1 0.0 0.0 0.0 0.0 0.0
61.5 13.1 22.2 136.9 22.9 17.3 74.6 83.0 448.4 58.5 2,417.0 3,911.2 713.8 44.5 108.2
0.0 1.6 0.0 511.1 0.0 50.1 0.0 1.5 0.0 0.0 46.4 0.2 13.2 192.6 0.10.0
0.0
0.0 0.0 0.0 19.7 0.0 0.0 0.0 0.0 0.2 0.0 0.1 4.4 22.5 1.4 93.5
0.0 0.0
Encargos Gerais do Estado
Presidência do conselho
deMinistrosNegócios
estrangeirosAdministração
InternaCiência,
Tecnologia e Ensino Superior
Trabalho, Solidariedade e
Segurança SocialPlaneamento e Infraestruturas

6 - Autonomous Services and Funds - Economic/Organic Classification
(Period: January to February)
Current ExpenditureEmployees
Certain and permanent wagesVariable or contingent bonusesSocial security
Purchase of current goods and servicesPurchase of goodsPurchase of services
Interests and other chargesCurrent transfers
General GovernmentCentral GovernmentRegional GovernmentLocal GovernmentSocial Security
Other current transfersSubsidiesOther current expenditure
Capital expenditureInvestmentCapital transfers
General GovernmentCentral GovernmentRegional GovernmentLocal GovernmentSocial Security
Other capital transfersOther capital expenditure
Effective Expenditure Memo item:
Financial assetsdos quais:
Public Debt Settlement Fund transfers
Financial liabilitiesdos quais:
Public Debt Settlement Fund transfers
€ Million2017
Mar TOTAL
74.3 4.5 7,603.218.0 3.1 1,526.814.2 2.3 1,098.7
0.2 0.2 153.03.6 0.6 275.18.8 0.4 2,736.50.3 0.1 653.18.5 0.4 2,083.52.1 0.0 156.9
42.9 0.9 3,063.81.3 0.0 741.50.8 0.0 674.10.0 0.0 0.00.5 0.0 1.00.0 0.0 66.5
41.6 0.9 2,322.31.8 0.0 86.70.7 0.0 32.5
79.1 0.0 687.814.7 0.0 550.064.4 0.0 137.7
0.1 0.0 37.90.0 0.0 34.10.0 0.0 0.40.1 0.0 3.30.0 0.0 0.0
64.3 0.0 99.80.0 0.0 0.1
0.0153.4 4.5 8,291.0
0.0 0.0 816.60.0
0.0
6.6 0.0 148.4
0.0
Agricultura, Florestas e
Desenvolvimento Rural

6 - Autonomous Services and Funds - Economic/Organic Classification
(Period: January to February)
Current ExpenditureEmployees
Certain and permanent wagesVariable or contingent bonusesSocial security
Purchase of current goods and servicesPurchase of goodsPurchase of services
Interests and other chargesCurrent transfers
General GovernmentCentral GovernmentRegional GovernmentLocal GovernmentSocial Security
Other current transfersSubsidiesOther current expenditure
Capital expenditureInvestmentCapital transfers
General GovernmentCentral GovernmentRegional GovernmentLocal GovernmentSocial Security
Other capital transfersOther capital expenditure
Effective Expenditure Memo item:
Financial assetsdos quais:
Public Debt Settlement Fund transfers
Financial liabilitiesdos quais:
Public Debt Settlement Fund transfers
YOY Change Rate (%)
Finanças Defesa Nacional Justiça Cultura Educação Saúde Economia Ambiente
17.4 19.9 -2.7 -57.0 -1.4 42.3 -4.3 12.5 -3.8 -7.7 -1.9 12.3 11.1 49.3 --0.7 -0.9 -3.1 -20.7 6.5 -5.6 -19.4 -2.2 -4.6 8.2 -3.7 -3.2 1.6 4.7 2.6-3.5 -0.9 -4.4 -9.8 -51.7 -2.8 -16.2 -3.1 -5.2 8.3 -3.1 -1.0 0.8 0.0 3.317.3 4.4 -11.1 -84.7 -66.0 55.0 -9.9 5.2 -16.0 33.5 1.0 -9.2 4.0 -13.7 0.4-3.3 -1.3 3.2 -16.1 57.5 -23.0 -39.1 8.7 -0.6 -2.5 -6.3 -6.8 3.4 31.0 1.1-4.9 -12.0 21.6 -18.3 -8.8 29.9 -12.7 26.2 -2.5 84.5 -4.4 12.7 3.8 28.8 3.0
-19.2 8.4 -15.1 -26.3 -31.3 -8.4 41.4 36.1 -19.3 23.4 -19.4 50.4 89.4 -52.9 11.9-3.4 -12.9 22.4 -17.8 1.6 38.5 -13.0 9.2 1.7 90.3 -1.8 0.4 -4.7 34.9 2.3
- - - -94.0 - - 93.7 7.6 7.1 95.4 72.0 -79.1 1.2 -35.8 -7.1 85.3 -9.3 -0.3 1.9 55.6 1.4 -16.3 0.5 -21.7 -1.8 34.9 66.5 171.2 -7.4 - -15.8 26.1 - 150.4 1.3 - -34.5 -33.3 9.2 35.5 41.2 22.8 -7.4 - -15.8 26.1 - -100.0 1.3 - -34.8 - 7.2 35.5 41.2 34.8 -
- - - - - - - - - - - - - - -- - - - - - - - - - - -35.3 - 98.6 -- - - - - - - -100.0 -100.0 -33.3 10.5 112.7 -100.0 -70.5 89.4
-37.5 39.3 -6.1 -8.0 1.8 54.7 35.9 -68.6 2.2 19.2 -2.1 16.1 - - -- - - - - - - -33.1 - - -3.2 -100.0 161.9 13.9 -100.0- 0.6 31.7 -53.3 -21.6 -21.9 -16.1 16.1 -15.2 49.4 39.8 -25.5 -44.9 18.4 -49.4
-11.8 -57.2 - 142.3 162.7 - -0.5 -38.3 -12.8 -82.0 22.5 51.5 -2.6 -14.8 -20.1-21.3 -57.2 145.1 -20.1 162.7 - 8.6 -38.3 3.1 -81.9 -1.4 51.8 -2.6 79.7 38.671.0 - - - - - -7.2 - -15.4 - - -15.7 110.9 -22.8 -99.571.0 - - - - - -7.2 - -55.4 - 4.7 - 110.9 -59.4 -100.071.0 - - - - - -7.2 - -55.4 - 4.7 - 110.9 21.5 -
- - - - - - - - - - - - - -100.0 -- - - - - - - - - - - - - -56.1 -100.0- - - - - - - - - - - - - - -- - - - - - - - 31.4 - - -54.9 - 12.9 -99.5- - - - - - - - - -84.8 - - - - -
17.0 18.9 2.3 -56.3 -0.7 43.4 -4.1 9.4 -5.1 -11.9 -1.8 12.4 1.9 37.9 -
Encargos Gerais do Estado
Presidência do conselho
deMinistrosNegócios
estrangeirosAdministração
InternaCiência,
Tecnologia e Ensino Superior
Trabalho, Solidariedade e
Segurança SocialPlaneamento e Infraestruturas

6 - Autonomous Services and Funds - Economic/Organic Classification
(Period: January to February)
Current ExpenditureEmployees
Certain and permanent wagesVariable or contingent bonusesSocial security
Purchase of current goods and servicesPurchase of goodsPurchase of services
Interests and other chargesCurrent transfers
General GovernmentCentral GovernmentRegional GovernmentLocal GovernmentSocial Security
Other current transfersSubsidiesOther current expenditure
Capital expenditureInvestmentCapital transfers
General GovernmentCentral GovernmentRegional GovernmentLocal GovernmentSocial Security
Other capital transfersOther capital expenditure
Effective Expenditure Memo item:
Financial assetsdos quais:
Public Debt Settlement Fund transfers
Financial liabilitiesdos quais:
Public Debt Settlement Fund transfers
YOY Change Rate (%)
Mar TOTAL
53.8 12.8 10.7-3.7 -3.1 -3.1-3.6 -4.8 -2.412.2 14.9 -8.7-5.2 -1.3 -2.97.0 36.6 11.7
88.4 122.5 47.94.6 21.8 0.4
139.2 -95.6 183.182.5 54.0 8.3
148.9 20.7 29.499.7 20.7 33.2
132.9 - 132.9- - 154.5
-100.0 - -11.680.4 54.2 1.5
118.1 - 10.5-54.3 - -15.3
-26.2 - -5.3-90.2 - -3.1-11.7 - -14.0
- - -48.0- - -47.5- - -100.0- - -46.8- - -
-12.5 - -1.1- - -65.4
12.5 19.2 9.4
Agricultura, Florestas e
Desenvolvimento Rural

Quadro 1.1 - Metainformação Table 1.1 - Metadata
Subsetor das Administrações Públicas Estado State Subsector of General Government
Periodicidade Mensal Monthly Frequency
Fonte MF/DGO, execução orçamental mensal MF/DGO, monthly budgetary reporting Source
Ótica da contabilidade Contabilidade pública Cash-basis Accounting basis
Período de reporte [2010 : 2018-03] [2010 : 2018-03] Reporting period
Unidade Milhões de Euros Millions of Euro Unit
Cobertura do universo Total All units within this sub-sector Sector coverage
Dados estimados Não No Estimations
Dados revistos mar-17 Mar-17 Revisions
Data da última atualização 4/26/2018 4/26/2018 Last update date
Data da próxima atualização 5/25/2018 5/25/2018 Next update date
Notas: Notes:
- Os valores constantes do presente quadro são agregados (não são consolidados); - Data of the present chart are aggregated (not consolidated).
Quadro 1.2 - Metainformação Table 1.2 - Metadata
Subsetor das Administrações Públicas Serviços e Fundos Autónomos Autonomous Services and Funds Subsector of General Government
Periodicidade Mensal Monthly Frequency
Fonte MF/DGO, execução orçamental mensal MF/DGO, monthly budgetary reporting Source
Ótica da contabilidade Contabilidade pública Cash-basis Accounting basis
Período de reporte [2010 : 2018-03] [2010 : 2018-03] Reporting period
Unidade Milhões de Euros Millions of Euro Unit
Cobertura do universo Total All units within this sub-sector Sector coverage
Dados estimados Estimations
Dados revistos mar-17 Mar-17 Revisions
Data da última atualização 4/26/2018 4/26/2018 Last update date
Data da próxima atualização 5/25/2018 5/25/2018 Next update date
Notas: Notes:
Nota - Alteração face a publicações anteriores: Revisão da série de 2012 a 2014, pela incorporação das EPR.
- Entidades em incumprimento no reporte de execução orçamental no mês em análise: - Non reporting entities, are identified, below:
2017 2017
2018 2018
Quadro 1.3 - Metainformação Table 1.3 - Metadata
Subsetor das Administrações Públicas Entidades Públicas Reclassificadas Reclassified Public Entities Subsector of General Government
Periodicidade Mensal Monthly Frequency
Fonte MF/DGO, execução orçamental mensal MF/DGO, monthly budgetary reporting Source
Ótica da contabilidade Contabilidade pública Cash-basis Accounting basis
Período de reporte [2010 : 2018-03] [2010 : 2018-03] Reporting period
Unidade Milhões de Euros Millions of Euro Unit
Cobertura do universo Total All units within this sub-sector Sector coverage
Dados estimados Estimations
Dados revistos mar-17 Mar-17 Revisions
Data da última atualização 4/26/2018 4/26/2018 Last update date
Data da próxima atualização 5/25/2018 5/25/2018 Next update date
Notas: Notes:
- As EPR são simultaneamente SFA, produzindo nesta série o respetivo impacto;
- Entidades em incumprimento no reporte de execução orçamental no mês em análise: - Non reporting entities, are identified, below:
2017 2017
2018 2018
Quadro 1.4 - Metainformação Table 1.4 - Metadata
Subsetor das Administrações Públicas Fundos da Segurança Social Social Security Funds Subsector of General Government
Periodicidade Mensal Monthly Frequency
Fonte MF/DGO, execução orçamental mensal MF/DGO, monthly budgetary reporting Source
Ótica da contabilidade Contabilidade pública Cash-basis Accounting basis
Período de reporte [2010 : 2018-03] [2010 : 2018-03] Reporting period
Unidade Milhões de Euros Millions of Euro Unit
Cobertura do universo Total All units within this sub-sector Sector coverage
Dados estimados Não No Estimations
Dados revistos mar-17 Mar-17 Revisions
Data da última atualização 4/26/2018 4/26/2018 Last update date
Data da próxima atualização 5/25/2018 5/25/2018 Next update date
Notas: Notes:
Quadro 1.5 - Metainformação Table 1.5 - MetadataSubsetor das Administrações Públicas Administração Local Local Government Subsector of General Government
Periodicidade Mensal Monthly Frequency
Fonte MF/DGO, execução orçamental mensal MF/DGO, monthly budgetary reporting Source
Ótica da contabilidade Contabilidade pública Cash-basis Accounting basis
Período de reporte [2009-03 : 2018-03] [2009-03 : 2018-03] Reporting period
Unidade Milhões de Euros Millions of Euro Unit
Cobertura do universo Municípios Municipalities Sector coverage
Dados estimados Estimations
Dados revistos Mar-17 Mar-17 Revisions
Data da última atualização 4/20/2018 4/20/2018 Last update date
Data da próxima atualização 5/21/2018 5/21/2018 Next update date
Notas: Notes:
2017 2017
março: 308 Mun. mar: 308 Mun.Nenhum None
2018 2018
mar: 289 Mun.; Em falta: 19 mar: 289 Mun.; Missing report:19
Quadro 1.6 - Metainformação Table 1.6 - MetadataSubsetor das Administrações Públicas Administração Regional Regional Government Subsector of General Government
Periodicidade Mensal Monthly Frequency
Fonte MF/DGO, execução orçamental mensal MF/DGO, monthly budgetary reporting Source
Ótica da contabilidade Contabilidade pública Cash-basis Accounting basis
Período de reporte [2008-03 : 2018-03] [2008-03 : 2018-03] Reporting period
Ministério das Finanças / Ministry of Finance
- A receita é apresentada por classificador económico, sendo que o agregado “Transferências” engloba as transferências correntes e as de capital e o agregado “Outras receitas” inclui as outras receitas correntes, as outras receitas de capital, os recursos próprios comunitários, as reposições não abatidas nos pagamentos e, entre 2010 e 2015, os saldos da gerência anterior (nesses anos, este capítulo de receita era considerado receita efetiva);
- Revenue is presented by economic classifier, with the "Transfers" aggregate comprising current transfers and capital transfers and the "Other revenue" aggregate includes other current revenue, other capital revenue, community own resources, refunds not deducted from payments and, between 2010 and 2015, balances of the previous management (in those years, this item was considered effective revenue);
- Valores registados no Sistema Central de Receitas (SCR). Estes valores são provisórios até ao encerramento da Conta Geral do Estado.
- Amounts accounted for on the Central Revenue System (SCR). These figures are provisional until General Public Accounts are closed.
- Os valores mensais de 2017 e 2018 representam os divulgados no respetivo período e os valores de 2010 a 2016 correspondem aos valores da respetiva Conta Geral do Estado.
- The monthly amounts for 2017 and 2018 represent those disclosed in the respective period, and the values for 2010 to 2016 correspond to the values of the respective General State Account.
mar-17: - Nº de entidades estimadas: 6mar-18: - Nº de entidades estimadas: 17
Mar-17: - Nº of estimated entities: 6Mar-18: - Nº of estimated entities: 17
- Diferenças de consolidação resultam da consolidação do subsetor. As transferências, aquisição de bens e serviços da Saúde e os juros intra-setoriais são excluídos do quadro e, na parte que não é comum com a da despesa, são imputadas a diferenças de conciliação.
- Consolidation differences result of subsector consolidation (that is, the elimination of the corresponding values and the allocation of the expenditure's parcel which is not common with revenue to this residuary item) .These operations apply to "transfers", "interest paid/income received" and "acquisition of current goods and services" (the lattest only for Health Sector).
- Os valores da receita e da despesa correspondem aos divulgados no respetivo período tendo, em alguns casos, sido objeto de ajustamento posterior à sua divulgação.
- The revenue and expenditure data presented correspond to that reported during the respective period and may, in some cases, have been subject to adjustments after publication.
- Em janeiro de 2018, o perímetro de entidades a incluir no Orçamento de Estado foi atualizado. Nos termos da Lei do Enquadramento Orçamental (n.º 4 do artigo 2.º da Lei de Enquadramento Orçamental, aprovada pela Lei n.º 151/2015, de 11 de setembro) consideram-se integradas no setor público administrativo as entidades incluídas nas últimas contas setoriais publicadas pelo Instituto Nacional de Estatística, referentes ao ano anterior ao da apresentação do orçamento;
-In January 2018, the perimeter of entities to be included in the state budget has been updated. According to the Budget Framework Law (paragraph 4 of Article 2 of Law No. 151/2015, of September 11) are considered integrated into the general government sector entities included in the last sector accounts published by the National Statistical Institute, for the year preceding the presentation of the budget;
- Para as entidades abrangidas pelo Regime Simplificado (Circular Série A N.º 1387, da DGO, de 3 de agosto de 2017 - circular de preparação do Orçamento do Estado para 2018) considera-se na execução orçamental uma estimativa de execução para o mês, a qual corresponde ao último reporte de execução trimestral no presente ano, acrescido de uma estimativa de execução para o mês em análise.
- For entities under Simplified Accounting Scheme (as foreseen at Budget General Directorate Circular 1387 of August 3th 2017 - 2018 Budget Preparation) it is being used an estimate, which corresponds to last quarterly execution report added by an execution estimate for the current nonth;
- Os valores mensais de 2017 e 2018 representam os divulgados no respetivo período e os valores de 2010 a 2016 correspondem aos valores da respetiva Conta Geral do Estado.
- The monthly amounts for 2017 and 2018 represent those disclosed in the respective period, and the values for 2010 to 2016 correspond to the values of the respective General State Account.
Note - Change compared to previous publications: Series Revision from 2012 to 2014, by the incorporation of the EPR.
Es Tech Ventures, SGPS, S.A.; FRME - Fundo para a Revitalização e Modernização do Tecido Empresarial, SGPS, S.A.; Fundação Carlos Lloyd Braga; Praça do Marquês - Serviços Auxiliares,S.A.; Quinta dos Cónegos - Sociedade Imobiliária,S.A.; Righthour, S.A..
Agência Nacional para a Gestão do Programa Erasmus + Educação e Formação; Associação Escola Portuguesa da Guiné-Bissau; AVEIROPOLIS - Sociedade para o Desenvolvimento do Programa Polis em Aveiro, S.A.; Centro Hospitalar de Leiria, E.P.E; ECODETRA - Sociedade de Tratamento e Deposição de Resíduos, S.A.; Es Tech Ventures, SGPS, S.A.; Fundação Carlos Lloyd Braga; Fundação da Faculdade de Ciências e Tecnologia da Universidade Nova de Lisboa; Fundação das Universidades Portuguesas; Fundação Escola Portuguesa de Macau; Fundação Juventude; GNB Concessões, SGPS, S.A.; Mobi.E, S.A.; Praça do Marquês - Serviços Auxiliares,S.A.; Quinta dos Cónegos - Sociedade Imobiliária,S.A.; Righthour, S.A.; SERQ - Centro de Inovação e Competências da Floresta - Associação.
Agência Nacional para a Gestão do Programa Erasmus + Educação e Formação; Associação Escola Portuguesa da Guiné-Bissau; AVEIROPOLIS - Sociedade para o Desenvolvimento do Programa Polis em Aveiro, S.A.; Centro Hospitalar de Leiria, E.P.E; ECODETRA - Sociedade de Tratamento e Deposição de Resíduos, S.A.; Es Tech Ventures, SGPS, S.A.; Fundação Carlos Lloyd Braga; Fundação da Faculdade de Ciências e Tecnologia da Universidade Nova de Lisboa; Fundação das Universidades Portuguesas; Fundação Escola Portuguesa de Macau; Fundação Juventude; GNB Concessões, SGPS, S.A.; Mobi.E, S.A.; Praça do Marquês - Serviços Auxiliares,S.A.; Quinta dos Cónegos - Sociedade Imobiliária,S.A.; Righthour, S.A.; SERQ - Centro de Inovação e Competências da Floresta - Associação.
mar-17: - Nº de entidades estimadas: 6mar-18: - Nº de entidades estimadas: 16
Mar-17: - Nº of estimated entities: 6Mar-18: - Nº of estimated entities: 16
- Diferenças de consolidação resultam da consolidação do subsetor. As transferências, aquisição de bens e serviços da Saúde e os juros intra-setoriais são excluídos do quadro e, na parte que não é comum com a da despesa, são imputadas a diferenças de conciliação.
- Consolidation differences result of subsector consolidation (that is, the elimination of the corresponding values and the allocation of the expenditure's parcel which is not common with revenue to this residuary item) .These operations apply to "transfers", "interest paid/income received" and "acquisition of current goods and services" (the lattest only for Health Sector).
- Os valores da receita e da despesa correspondem aos divulgados no respetivo período tendo, em alguns casos, sido objeto de ajustamento posterior à sua divulgação.
- The revenue and expenditure data presented correspond to that reported during the respective period and may, in some cases, have been subject to adjustments after publication.
- Em janeiro de 2018, o perímetro de entidades a incluir no Orçamento de Estado foi atualizado. Nos termos da Lei do Enquadramento Orçamental (n.º 4 do artigo 2.º da Lei de Enquadramento Orçamental, aprovada pela Lei n.º 151/2015, de 11 de setembro) consideram-se integradas no setor público administrativo as entidades incluídas nas últimas contas setoriais publicadas pelo Instituto Nacional de Estatística, referentes ao ano anterior ao da apresentação do orçamento;
-In January 2018, the perimeter of entities to be included in the state budget has been updated. According to the Budget Framework Law (paragraph 4 of Article 2 of Law No. 151/2015, of September 11) are considered integrated into the general government sector entities included in the last sector accounts published by the National Statistical Institute, for the year preceding the presentation of the budget;
- Para as entidades abrangidas pelo Regime Simplificado (Circular Série A N.º 1387, da DGO, de 3 de agosto de 2017 - circular de preparação do Orçamento do Estado para 2018) considera-se na execução orçamental uma estimativa de execução para o mês, a qual corresponde ao último reporte de execução trimestral no presente ano, acrescido de uma estimativa de execução para o mês em análise.
- For entities under Simplified Accounting Scheme (as foreseen at Budget General Directorate Circular 1387 of August 3th 2017 - 2018 Budget Preparation) it is being used an estimate, which corresponds to last quarterly execution report added by an execution estimate for the current nonth;
- Reclassified Public Entities are simultaneously entities of the Autonomous Services and Funds subsector, having therefore the corresponding impact on this series.
- Os valores mensais de 2017 e 2018 representam os divulgados no respetivo período e os valores de 2010 a 2016 correspondem aos valores da respetiva Conta Geral do Estado.
- The monthly amounts for 2017 and 2018 represent those disclosed in the respective period, and the values for 2010 to 2016 correspond to the values of the respective General State Account.
Es Tech Ventures, SGPS, S.A.; FRME - Fundo para a Revitalização e Modernização do Tecido Empresarial, SGPS, S.A.; Fundação Carlos Lloyd Braga; Praça do Marquês - Serviços Auxiliares,S.A.; Quinta dos Cónegos - Sociedade Imobiliária,S.A.; Righthour, S.A..
Es Tech Ventures, SGPS, S.A.; FRME - Fundo para a Revitalização e Modernização do Tecido Empresarial, SGPS, S.A.; Fundação Carlos Lloyd Braga; Praça do Marquês - Serviços Auxiliares,S.A.; Quinta dos Cónegos - Sociedade Imobiliária,S.A.; Righthour, S.A..
Associação Escola Portuguesa da Guiné-Bissau; AVEIROPOLIS - Sociedade para o Desenvolvimento do Programa Polis em Aveiro, S.A.; Centro Hospitalar de Leiria, E.P.E; ECODETRA - Sociedade de Tratamento e Deposição de Resíduos, S.A.; Es Tech Ventures, SGPS, S.A.; Fundação Carlos Lloyd Braga; Fundação da Faculdade de Ciências e Tecnologia da Universidade Nova de Lisboa; Fundação das Universidades Portuguesas; Fundação Escola Portuguesa de Macau; Fundação Juventude; GNB Concessões, SGPS, S.A.; Mobi.E, S.A.; Praça do Marquês - Serviços Auxiliares,S.A.; Quinta dos Cónegos - Sociedade Imobiliária,S.A.; Righthour, S.A.; SERQ - Centro de Inovação e Competências da Floresta - Associação.
Associação Escola Portuguesa da Guiné-Bissau; AVEIROPOLIS - Sociedade para o Desenvolvimento do Programa Polis em Aveiro, S.A.; Centro Hospitalar de Leiria, E.P.E; ECODETRA - Sociedade de Tratamento e Deposição de Resíduos, S.A.; Es Tech Ventures, SGPS, S.A.; Fundação Carlos Lloyd Braga; Fundação da Faculdade de Ciências e Tecnologia da Universidade Nova de Lisboa; Fundação das Universidades Portuguesas; Fundação Escola Portuguesa de Macau; Fundação Juventude; GNB Concessões, SGPS, S.A.; Mobi.E, S.A.; Praça do Marquês - Serviços Auxiliares,S.A.; Quinta dos Cónegos - Sociedade Imobiliária,S.A.; Righthour, S.A.; SERQ - Centro de Inovação e Competências da Floresta - Associação.
- Diferenças de consolidação resultam da consolidação do subsetor. As transferências, aquisição de bens e serviços da Saúde e os juros intra-setoriais são excluídos do quadro e, na parte que não é comum com a da despesa, são imputadas a diferenças de conciliação.
- Consolidation differences result of subsector consolidation (that is, the elimination of the corresponding values and the allocation of the expenditure's parcel which is not common with revenue to this residuary item) .These operations apply to "transfers", "interest paid/income received" and "acquisition of current goods and services" (the lattest only for Health Sector).
- Os valores mensais de 2017 e 2018 representam os divulgados no respetivo período e os valores de 2010 a 2016 correspondem aos valores da respetiva Conta Geral do Estado.
- The monthly amounts for 2017 and 2018 represent those disclosed in the respective period, and the values for 2010 to 2016 correspond to the values of the respective General State Account.
março-2017: - Nº de municípios com dados estimados: 0março-2018: - Nº de municípios com dados estimados: 19
mar-17: - Nr. of municipalities with estimated data: 0mar-18: - Nr. of municipalities with estimated data: 19
Quebra de série: a partir de janeiro de 2016 (inclusivé) a série abrange o universo real e o universo estimado, conforme com o mês de reporte (o período anterior contempla apenas o universo real).
Series break: from January 2016 (inclusive) the series covers the real universe and the estimated universe, according to the reporting month (the previous period only includes the real universe).
Arruda dos Vinhos, Bombarral, Caldas da Rainha, Cartaxo, Cascais, Castanheira de Pêra, Moimenta da Beira, Montemor-o-Novo, Mortágua, Oeiras, Paços de Ferreira, Pampilhosa da Serra, Pedrógão Grande, Ponte da Barca, Porto Santo, Serpa, Trancoso, Vila Flor, Vila Verde.
Arruda dos Vinhos, Bombarral, Caldas da Rainha, Cartaxo, Cascais, Castanheira de Pêra, Moimenta da Beira, Montemor-o-Novo, Mortágua, Oeiras, Paços de Ferreira, Pampilhosa da Serra, Pedrógão Grande, Ponte da Barca, Porto Santo, Serpa, Trancoso, Vila Flor, Vila Verde.

Ministério das Finanças / Ministry of Finance
Unidade Milhões de Euros Millions of Euro Unit
Cobertura do universo Total All units within this sub-sector Sector coverage
Dados estimados Não No Estimations
Dados revistos Não No Revisions
Data da última atualização 4/19/2018 4/19/2018 Last update date
Data da próxima atualização 5/21/2018 5/21/2018 Next update date
Notas: Notes:
Quadro 2 - Metainformação Table 2 - MetadataSubsetor das Administrações Públicas Estado State Subsector of General Government
Periodicidade Mensal Monthly Frequency
Fonte MF/DGO, execução orçamental mensal MF/DGO, monthly budgetary reporting Source
Ótica da contabilidade Contabilidade pública Cash-basis Accounting basis
Período de reporte [2010 : 2018-03] [2010 : 2018-03] Reporting period
Unidade Milhões de Euros Millions of Euro Unit
Cobertura do universo Total All units within this sub-sector Sector coverage
Dados estimados Não No Estimations
Dados revistos mar-17 Mar-17 Revisions
Data da última atualização 4/26/2018 4/26/2018 Last update date
Data da próxima atualização 5/25/2018 5/25/2018 Next update date
Notas: Notes:
- Os valores constantes do presente quadro são agregados (não são consolidados); - Data of the present chart are aggregated (not consolidated).
Quadro 3 - Metainformação Table 3 - MetadataSubsetor das Administrações Públicas Estado State Subsector of General Government
Periodicidade Frequency
Fonte MF/DGO, execução orçamental mensal MF/DGO, monthly budgetary reporting Source
Ótica da contabilidade Contabilidade pública Cash-basis Accounting basis
Período de reporte [2010 : 2018-03] [2010 : 2018-03] Reporting period
Unidade Milhões de Euros Millions of Euro Unit
Cobertura do universo Total All units within this sub-sector Sector coverage
Dados estimados Não No Estimations
Dados revistos mar-17 Mar-17 Revisions
Data da última atualização 4/26/2018 4/26/2018 Last update date
Data da próxima atualização 5/25/2018 5/25/2018 Next update date
Notas: Notes:
- A despesa é apresentada por classificador funcional; - Expenditure is displayed by function;
- Os valores constantes do presente quadro não são consolidados. - Data of the present chart are not consolidated.
Quadro 4 - Metainformação Table 4 - MetadataSubsetor das Administrações Públicas Estado State Subsector of General Government
Periodicidade Mensal Monthly Frequency
Fonte MF/DGO, execução orçamental mensal MF/DGO, monthly budgetary reporting Source
Ótica da contabilidade Contabilidade pública Cash-basis Accounting basis
Período de reporte mar-17 e mar-18 Mar-17 and Mar-18 Reporting period
Unidade Milhões de Euros Millions of Euro Unit
Cobertura do universo Total All units within this sub-sector Sector coverage
Dados estimados Não No Estimations
Dados revistos Não No Revisions
Data da última atualização 4/26/2018 4/26/2018 Last update date
Data da próxima atualização 5/25/2018 5/25/2018 Next update date
Notas: Notes:
- A despesa é apresentada por ministério e classificador economico; - Expenditure is displayed by ministry and economic categories;
- Os valores constantes do presente quadro não são consolidados. - Data of the present chart are not consolidated.
Quadro 5 - Metainformação Table 5 - MetadataSubsetor das Administrações Públicas Serviços e Fundos Autónomos Autonomous Services and Funds Subsector of General Government
Periodicidade Frequency
Fonte MF/DGO, execução orçamental mensal MF/DGO, monthly budgetary reporting Source
Ótica da contabilidade Contabilidade pública Cash-basis Accounting basis
Período de reporte [2010 : 2018-03] [2010 : 2018-03] Reporting period
Unidade Milhões de Euros Millions of Euro Unit
Cobertura do universo Total All units within this sub-sector Sector coverage
Dados estimados Estimations
Dados revistos mar-17 Mar-17 Revisions
Data da última atualização 4/26/2018 4/26/2018 Last update date
Data da próxima atualização 5/25/2018 5/25/2018 Next update date
Notas: Notes:
- A despesa é apresentada por classificador funcional; - Expenditure is displayed by function;
- Os valores constantes do presente quadro não são consolidados. - Data of the present chart are not consolidated.
- Entidades em incumprimento no reporte de execução orçamental no mês em análise: - Non reporting entities, are identified, below:
2017 2017
2018 2018
Quadro 6 - Metainformação Table 6 - MetadataSubsetor das Administrações Públicas Serviços e Fundos Autónomos Autonomous Services and Funds Subsector of General Government
Periodicidade Mensal Monthly Frequency
Fonte MF/DGO, execução orçamental mensal MF/DGO, monthly budgetary reporting Source
Ótica da contabilidade Contabilidade pública Cash-basis Accounting basis
Período de reporte mar-17 e mar-18 Mar-17 and Mar-18 Reporting period
Unidade Milhões de Euros Millions of Euro Unit
Cobertura do universo Total All units within this sub-sector Sector coverage
Dados estimados Estimations
Dados revistos Não No Revisions
Data da última atualização 4/26/2018 4/26/2018 Last update date
Data da próxima atualização 5/25/2018 5/25/2018 Next update date
Notas: Notes:- A despesa é apresentada por ministério e classificador economico; - Expenditure is displayed by ministry and economic categories;
- Os valores constantes do presente quadro não são consolidados. - Data of the present chart are not consolidated.
- As EPR são simultaneamente SFA, produzindo nesta série o respetivo impacto;
- Entidades em incumprimento no reporte de execução orçamental no mês em análise: - Non reporting entities, are identified, below:
2017 2017
2018 2018
- A receita é apresentada por classificador económico, sendo que o agregado “Transferências” engloba as transferências correntes e as de capital e o agregado “Outras receitas” inclui as outras receitas correntes, as outras receitas de capital, os recursos próprios comunitários, as reposições não abatidas nos pagamentos e, entre 2010 e 2015, os saldos da gerência anterior (nesses anos, este capítulo de receita era considerado receita efetiva);
- Revenue is presented by economic classifier, with the "Transfers" aggregate comprising current transfers and capital transfers and the "Other revenue" aggregate includes other current revenue, other capital revenue, community own resources, refunds not deducted from payments and, between 2010 and 2015, balances of the previous management (in those years, this item was considered effective revenue);
- Os valores mensais de receita de 2016 e 2017 representam os divulgados no respetivo período e os valores de 2010 a 2015 e os de dezembro de 2016 correspondem aos valores da respetiva Conta Geral do Estado.
- The monthly revenue amounts for 2016 and 2017 represent those disclosed in the respective period, and the values for 2010 to 2015 and those for December 2016 correspond to the values of the respective General State Account.
[2010 : 2012] - Anual[2013 : presente] - Mensal
[2010 : 2012] - Annually[2013 : onwards] - Monthly
- Os valores de despesa correspondem aos divulgados no respetivo período tendo, em alguns casos, sido objeto de ajustamento posterior à sua divulgação.
-Expenditure data presented correspond to that reported during the respective period and may, in some cases, have been subject to adjustments after publication.
- Os valores mensais de 2017 e 2018 representam os divulgados no respetivo período e os valores de 2010 a 2016 correspondem aos valores da respetiva Conta Geral do Estado.
- The monthly amounts for 2017 and 2018 represent those disclosed in the respective period, and the values for 2010 to 2016 correspond to the values of the respective General State Account.
- Mensalmente os valores apresentados são acumulados e sobrepostos aos do mês anterior, eliminando-se assim o registo histórico;
- Monthly presented values are accumulated and overlaid on the previous month, thus eliminating the historical record;
[2010 : 2012] - Anual[2013 : presente] - Mensal
[2010 : 2012] - Annually[2013 : onwards] - Monthly
mar-17: - Nº de entidades estimadas: 6mar-18: - Nº de entidades estimadas: 17
Mar-17: - Nº of estimated entities: 6Mar-18: - Nº of estimated entities: 17
- Os valores de despesa correspondem aos divulgados no respetivo período tendo, em alguns casos, sido objeto de ajustamento posterior à sua divulgação.
-Expenditure data presented correspond to that reported during the respective period and may, in some cases, have been subject to adjustments after publication.
- Em janeiro de 2018, o perímetro de entidades a incluir no Orçamento de Estado foi atualizado. Nos termos da Lei do Enquadramento Orçamental (n.º 4 do artigo 2.º da Lei de Enquadramento Orçamental, aprovada pela Lei n.º 151/2015, de 11 de setembro) consideram-se integradas no setor público administrativo as entidades incluídas nas últimas contas setoriais publicadas pelo Instituto Nacional de Estatística, referentes ao ano anterior ao da apresentação do orçamento;
-In January 2018, the perimeter of entities to be included in the state budget has been updated. According to the Budget Framework Law (paragraph 4 of Article 2 of Law No. 151/2015, of September 11) are considered integrated into the general government sector entities included in the last sector accounts published by the National Statistical Institute, for the year preceding the presentation of the budget;
- Para as entidades abrangidas pelo Regime Simplificado (Circular Série A N.º 1387, da DGO, de 3 de agosto de 2017 - circular de preparação do Orçamento do Estado para 2018) considera-se na execução orçamental uma estimativa de execução para o mês, a qual corresponde ao último reporte de execução trimestral no presente ano, acrescido de uma estimativa de execução para o mês em análise.
- For entities under Simplified Accounting Scheme (as foreseen at Budget General Directorate Circular 1387 of August 3th 2017 - 2018 Budget Preparation) it is being used an estimate, which corresponds to last quarterly execution report added by an execution estimate for the current nonth;
- Os valores mensais de 2017 e 2018 representam os divulgados no respetivo período e os valores de 2010 a 2016 correspondem aos valores da respetiva Conta Geral do Estado.
- The monthly amounts for 2017 and 2018 represent those disclosed in the respective period, and the values for 2010 to 2016 correspond to the values of the respective General State Account.
Es Tech Ventures, SGPS, S.A.; FRME - Fundo para a Revitalização e Modernização do Tecido Empresarial, SGPS, S.A.; Fundação Carlos Lloyd Braga; Praça do Marquês - Serviços Auxiliares,S.A.; Quinta dos Cónegos - Sociedade Imobiliária,S.A.; Righthour, S.A..
Es Tech Ventures, SGPS, S.A.; FRME - Fundo para a Revitalização e Modernização do Tecido Empresarial, SGPS, S.A.; Fundação Carlos Lloyd Braga; Praça do Marquês - Serviços Auxiliares,S.A.; Quinta dos Cónegos - Sociedade Imobiliária,S.A.; Righthour, S.A..
Agência Nacional para a Gestão do Programa Erasmus + Educação e Formação; Associação Escola Portuguesa da Guiné-Bissau; AVEIROPOLIS - Sociedade para o Desenvolvimento do Programa Polis em Aveiro, S.A.; Centro Hospitalar de Leiria, E.P.E; ECODETRA - Sociedade de Tratamento e Deposição de Resíduos, S.A.; Es Tech Ventures, SGPS, S.A.; Fundação Carlos Lloyd Braga; Fundação da Faculdade de Ciências e Tecnologia da Universidade Nova de Lisboa; Fundação das Universidades Portuguesas; Fundação Escola Portuguesa de Macau; Fundação Juventude; GNB Concessões, SGPS, S.A.; Mobi.E, S.A.; Praça do Marquês - Serviços Auxiliares,S.A.; Quinta dos Cónegos - Sociedade Imobiliária,S.A.; Righthour, S.A.; SERQ - Centro de Inovação e Competências da Floresta - Associação.
Agência Nacional para a Gestão do Programa Erasmus + Educação e Formação; Associação Escola Portuguesa da Guiné-Bissau; AVEIROPOLIS - Sociedade para o Desenvolvimento do Programa Polis em Aveiro, S.A.; Centro Hospitalar de Leiria, E.P.E; ECODETRA - Sociedade de Tratamento e Deposição de Resíduos, S.A.; Es Tech Ventures, SGPS, S.A.; Fundação Carlos Lloyd Braga; Fundação da Faculdade de Ciências e Tecnologia da Universidade Nova de Lisboa; Fundação das Universidades Portuguesas; Fundação Escola Portuguesa de Macau; Fundação Juventude; GNB Concessões, SGPS, S.A.; Mobi.E, S.A.; Praça do Marquês - Serviços Auxiliares,S.A.; Quinta dos Cónegos - Sociedade Imobiliária,S.A.; Righthour, S.A.; SERQ - Centro de Inovação e Competências da Floresta - Associação.
mar-17: - Nº de entidades estimadas: 6mar-18: - Nº de entidades estimadas: 17
Mar-17: - Nº of estimated entities: 6Mar-18: - Nº of estimated entities: 17
- Mensalmente os valores apresentados são acumulados e sobrepostos aos do mês anterior, eliminando-se assim o registo histórico;
- Monthly presented values are accumulated and overlaid on the previous month, thus eliminating the historical record;
- Em janeiro de 2018, o perímetro de entidades a incluir no Orçamento de Estado foi atualizado. Nos termos da Lei do Enquadramento Orçamental (n.º 4 do artigo 2.º da Lei de Enquadramento Orçamental, aprovada pela Lei n.º 151/2015, de 11 de setembro) consideram-se integradas no setor público administrativo as entidades incluídas nas últimas contas setoriais publicadas pelo Instituto Nacional de Estatística, referentes ao ano anterior ao da apresentação do orçamento;
-In January 2018, the perimeter of entities to be included in the state budget has been updated. According to the Budget Framework Law (paragraph 4 of Article 2 of Law No. 151/2015, of September 11) are considered integrated into the general government sector entities included in the last sector accounts published by the National Statistical Institute, for the year preceding the presentation of the budget;
- Reclassified Public Entities are simultaneously entities of the Autonomous Services and Funds subsector, having therefore the corresponding impact on this series.
- Para as entidades abrangidas pelo Regime Simplificado (Circular Série A N.º 1387, da DGO, de 3 de agosto de 2017 - circular de preparação do Orçamento do Estado para 2018) considera-se na execução orçamental uma estimativa de execução para o mês, a qual corresponde ao último reporte de execução trimestral no presente ano, acrescido de uma estimativa de execução para o mês em análise.
- For entities under Simplified Accounting Scheme (as foreseen at Budget General Directorate Circular 1387 of August 3th 2017 - 2018 Budget Preparation) it is being used an estimate, which corresponds to last quarterly execution report added by an execution estimate for the current nonth;
Es Tech Ventures, SGPS, S.A.; FRME - Fundo para a Revitalização e Modernização do Tecido Empresarial, SGPS, S.A.; Fundação Carlos Lloyd Braga; Praça do Marquês - Serviços Auxiliares,S.A.; Quinta dos Cónegos - Sociedade Imobiliária,S.A.; Righthour, S.A..
Es Tech Ventures, SGPS, S.A.; FRME - Fundo para a Revitalização e Modernização do Tecido Empresarial, SGPS, S.A.; Fundação Carlos Lloyd Braga; Praça do Marquês - Serviços Auxiliares,S.A.; Quinta dos Cónegos - Sociedade Imobiliária,S.A.; Righthour, S.A..