SUGAR CANE’S ENERGY · 2018-05-21 · III. Sustainability of the agricultural production base 172...
230
Transcript of SUGAR CANE’S ENERGY · 2018-05-21 · III. Sustainability of the agricultural production base 172...


SUGAR CANE’SENERGY
Twelve studies on Brazilian sugar caneagribusiness and its sustainability
Dados internacionais de Catalogação na Publicação (CIP)(Câmara Brasileira do Livro, SP, Brasil)
Sugar Cane’s Energy – Twelve studies on Brasilian sugar caneagribusiness and its sustainability / Isaias de Carvalho Macedoorganizer ; translation Walter Heinrich Rudolph Frank and MarcioMendonça ; revision Flávio Devienne Ferreira and Cory Willis ;foreword Eduardo Pereira de Carvalho. -- São Paulo : Berlendis &Vertecchia : UNICA – União da Agroindústria Canavieira do Estadode São Paulo, 2005.
Vários autores.Título original: A Energia da Cana-de-Açúcar – Doze estudos sobre
a agroindústria da cana-de-açúcar no Brasil e sua sustentabilidade.
1. Agribusiness - Brasil 2. Agricultura sustentável 3. Cana-de-açúcar- Indústria e comércio - Brasil 4. Impacto ambiental - Estudos 5. Meio ambiente 6. Recursos naturaisI. Macedo, Isaias de Carvalho. II. Carvalho,Eduardo Pereira de.
05-6254 CDD-338.173610981
Índices para catálogo sistemático:1. Agroindústria : Cana-de-açúcar : Sustentabilidade :
Brasil : Economia 338.1736109812. Brasil : Agroindústria da cana-de-açúcar :
Sustentabilidade : Economia 338.1736109813. Cana-de-açúcar : Agroindústria : Sustentabilidade :
Brasil : Economia 338.173610981
2005, 2007 © UNICA – São Paulo Sugar Cane Agroindustry Union – All Rights Reserved.
Editorial supervision:Mario Alberto de Almeida
Administrative support:Denise Rodrigues Azevedo
Art direction:Bruno Berlendis de Carvalho
Cover:Bia Villela
Publishing:Berlendis Editores Ltda.
UNICAAv. Brigadeiro Faria Lima, 2179 9ºandar São Paulo, SP 01452-000 Brazil
(+55.11) 3812.2100 fax (+55.11) 3812.1416 [email protected]
Berlendis Editores Ltda.Rua Moacyr Piza, 63 São Paulo, SP 01421-030 Brazil
(+55.11) 3085.9583 fax: (+55.11) 3085.2344 [email protected]
2nd edition: May, 2007
Isaias de Carvalho Macedo
(Organizer)
SUGAR CANE’SENERGY
Twelve studies on Brazilian sugar caneagribusiness and its sustainability
Table of Contents
Foreword 9Acknowledgements 17Authors 18Preface 25Synthesis 27Introduction 39
I. Impacts on the use of material resources 48Chapter 1:Share in the use of fossil energy 51Chapter 2: Impacts on the use of materials 65
II. Impacts on the Environment 72Chapter 3:Impacts on air quality: cities and rural areas 77Chapter 4:Impacts on global climate: greenhouse gas emissions 87Chapter 5:Impacts on the water supply 101Chapter 6:Soil occupation: new production areas and biodiversity 115Chapter 7:Preservation of agricultural soils 135Chapter 8:Use of agrochemicals 143Chapter 9:Use of fertilizers 159
III. Sustainability of the agricultural production base 172Chapter 10:Varieties and protection from diseases and pests 175
IV. Impacts of production on commercial actions 182Chapter 11:Competitiveness of Brazil’s sugar cane agribusiness 185
V. Socioeconomic impacts of the sugar cane agribusiness 194Chapter 12:Jobs and income 197
AppendixesAbbreviations and units 226Subject index 228Index of names 235

9
Foreword:Between oil and hydrogen, ethanol is much more
than just a transition in this 21st century
Eduardo Pereira de CarvalhoUNICA – São Paulo Sugar Cane Agroindustry Union
For a very short period of twenty months, commencing when the firstedition of this compilation came out, the global energy base started to gothrough an intense transformation phase. This is taking place for a simple butstrong reason: at last the leaderships in the world’s major nations have bowedto the evidences and now acknowledge the decisive impact of carbonemissions from human activities as a primary cause of the global warming.This triumph of the science has finally opened the door to a new era in whichthe oil civilization will give ground to renewable energy sources, therebyreversing a trend that has ruled unrivalled since the mid 19th century. Boundup for many generations by the consistent, vigorous predominance ofprospecting for oil and consuming it, powerful societies, which have forcenturies been used to dictate solutions to all others, now suddenly findthemselves compelled by internal pressures to recognize concepts andprovisions negotiated in a multilateral context. The climate change worrieseveryone, and the answer to the related fears lies not in the set of palliativemeasures that had been proposed since the early 1990’s. Mankind feelscompelled to go deeper in order to solve the problem that it created in thecourse of its undoubtedly successful history.
For Brazil, that represents an opportunity of a kind that hasn’t been seenfor a long time: it is now time for renewable energy, and, with it, mankindfinds that its future is linked with the properties of fuels recovered fromnewly harvested plant mass. The list of complements that are nowindispensable to oil is extensive; standing out from that list due to both itscompetitiveness and unmatched environmental performance is an oldacquaintance of our social lives: the wholesome sugar-cane.
This turn of events in the energy paradigm is taking place so fast becausethe disturbance caused by the global warming is becoming palpable. Highlyelaborated counter-arguments have ruined before the eyes of billions ofpeople with common sense. In the face of the overwhelming evidence ofmore and more predictable climate disturbances, the benefit of the doubt
Sugar cane’s energy
10
turns into irresponsibility. There is time to correct the path of unbridledgreenhouse gas emissions, which are a decisive, primary cause of theacceleration of the global warming phenomenon. But action must be taken ina realistic, decisive way to bring on new components for the fuel blend thatmoves the day-to-day lives of people who depend on oil to eat, dress, workand have fun.
In addition to the traditionally rich part of the planet, there are severalbillions of new consumers, a vast majority of whom consisting of citizens inemerging countries, who can now for the first time own goods that maketheir lives less tiresome thanks to the work of engines. In view of this massivepressure on the demand, the human society now bows, in a turn-around thatvery few people of goodwill would assume to be plausible in such a shortperiod, to the evidence that fossil fuel reserves are finite and even ratherlimited.
The change in the energy supply scenario in light vehicle transportationis now a definitive fact not only in people’s minds, but also on the politicalplane. This is just why it is opportune to rephrase the title and most of theintroductory note to the first edition of this paper that was prepared byBrazilian scientists and researchers invited by UNICA and published in thesecond half of 2005. The original Twelve Studies, compiled herein fromsources that are respectable but not immune nonetheless to the formidableignorance of sugar cane growing and the manufacturing of ethanol thatprevails in the Northern Hemisphere, address challenging issues facingBrazilians who deal with this tropical grass.
The data that have been collected over decades in Brazil on both theenvironmental impact of the activity and the cost of the fuel that comes froma renewable source and is used without any kind of subsidy by a significantportion of the national fleet of light vehicles are undisputable. Nevertheless,the colonizing wisdom has kept monotonously casting doubts. Hence thecareful, substantive tone used at all stages of the paper – using special care inthe preparation of the texts. The result, based on experiments, plenty ofstatistic information and, whenever possible, original research, was intendedto speak to people of science, who may be coming from an antagonisticposition, but do not hesitate when they acknowledge strengths in thearguments opposing their own. As a matter of fact, this approach wasthoroughly maintained in this edition, which gathers together the latestinformation on the industries under analysis.
It also happens that in the second half of 2005 major multilateralorganizations, particularly the World Bank and the International EnergyAgency, circulated the conclusions of independent papers on energy from
Foreword
11
renewable sources. Those papers showed that the primary sources used bydeveloped countries have acknowledged for the first time that sugar-caneethanol is competitive with oil at very comfortable prices – while recognizingthat the Brazilian ethanol program is free of subsidies and that theenvironmental balance of sugar-cane growing and processing is broadlybeneficial to the planet, especially as regards carbon emissions.
Now reviewed and updated in depth, the papers prepared by Brazilianresearchers are therefore validated to a rather unusual extent in competitivesituations in these globalization times. Brazil no is longer required to claim tohigh heavens the great quality of a fuel that for three decades has played arole on the streets of its large cities, as well as every corner of the continent-sized country. That doesn’t mean that multiplying the supply of that productwill be just a cruise over the next few years. There are substantial problemsto be examined and solved. However, before considering them, it is worthpointing out the success that has been achieved over time. There is aneffective answer to the world’s question as to what the complement would beto the overly pollutant oil, and it is now acknowledged that such answer isgiven by an emerging nation: ours! Therefore, it’s time to add ethanol to thelist of fuels that transform life in the human society: between oil andhydrogen, which are a revolution of the past and a revolution envisaged forthe future, respectively, lies a contemporary revolution in which Brazil playsa major role.
As a matter of fact, the tropical origin of the best-proposed fuel availablefrom a renewable source is quite understandable: it is in low-latitude zonesthat the sunlight provides the best results for crops that capture solar energythrough photosynthesis. However, there is yet another reason for emergingcountries to mobilize in search of answers to face the energy challenge. Since1973, on occasion of the first oil shock, the share of those nations, which areknown as developing countries in the world demand for energy, has grownby ten percentage points. The International Energy Agency itself projects thatemerging countries will account for 56 percent of the demand by 2030.Therefore, in just two generations’ time, the core of the issue will be radicallydisplaced, as the OECD (Organization for Economic Cooperation andDevelopment) nations, which were responsible for 62 percent of theconsumption in the early 1970’s, will account for just 44 percent of it in2030.
Now, when one looks towards the future, energy security means adifferent thing: emerging markets feel compelled to ensure their own supply,irrespective of effectiveness, and seem less prone to make strategic decisions,leaving the environmental emissions theme to the developed world’s agenda,
where it’s in an important position already. In the course of the 21st century,these two realities will certainly converge. The conditions for suchconvergence now seem well-accepted by most of the analysts and interveningparties: the severity of the problems involved in the prospective depletion ofoil reserves; the dangerous geographic concentration of that raw material; thealarming global warming problem; the imperative need to improve the livingconditions – and, therefore, the economic development – of most of theworld’s population; and the very wide range of interests of the oil industry.Due to all of these factors, the issue should not and cannot be left exclusivelyat the whim of market forces.
The pace of this transition, which began in a hesitating way, now speedsup. Back in the early 1970’s, when the fossil fuel-powered locomotionparadigm seemed unshakable, professor Nicholas Georgescu-Roegen waspractically banned from the academic community when he published his Theentropy law and the economic process, which warned about the physicaldifficulties that he was then the only one to see in the horizon of humanevolution, and that would break out soon afterwards with the first oil shock,on November 1973. Disregarded at that time, his conclusions have becomemore and more of a reference source for the study of economic prospects forthe next few decades. It is based on views that sounded notably pessimisticthat the knowledge and even the relations between peoples and continentsgained dimensions and even a language radically new.
It is in this scenario that Brazil assumes a privileged position to argueabout the sustainability of the energy model currently in place, which isunderpinned by liquid fossil fuels. Of course, the starting point of suchexperience was necessity: a country fascinated by the automobile, but whichdepended on imports and had no access to hard currency. In 1974, the oilbill represented 40 percent of the country’s export revenues. No othersociety would suffer more than Brazil’s with the OPEC’s gesture, as thelimitation on access to fuel stations by rotation, which was considered andeven tried at many places, became a stressful situation in the Brazilian’s day-to-day lives.
That gave rise to a growing, intensive addition of ethanol to gasoline, asa state program – followed in the early 1980’s by the experience with carsrunning exclusively on ethanol and, starting in 2003, with flex-fuel engines.The successful evolution of this model, along with a tradition of intensive useof hydroelectric power, have placed Brazil in a unique position amongnations with an industry base: the share of energy from renewable sources inthe country’s entire energy base, which was around 41 percent earlier thisdecade, exceeds by far the world average of around 14 percent.
Sugar cane’s energy
12
With these credentials, sugar and ethanol producers based in São Paulo,the world’s leading sugar-cane growing and processing center, offer to startshowing through UNICA, by means of this paper prepared by expertsrenowned in their respective fields of expertise, the reasons for the success ofa value chain that has tripled in size over the past thirty years and is nowgoing through an investment phase that is expected to add 50 percent to theregion’s installed capacity by the 2010/11 crop.
This may become a historic moment for the sugar and ethanol industryin view of the convergence between Brazil’s and the United States’ interests inthis renewable energy issue. Together, the two ethanol producers account forthree quarters of the world production. If they continue to be truly willing tocombine their respective competitive advantages for a common effort towardsresearching into and encouraging the activity along with other potentialproducing countries, then the development of biofuels may become adecisive factor for overcoming the climate deadlock. That applies today, butit is also a great opportunity for the future.
There are many possible sources of biomass, just as well as thetechnological evolution can and should find successors to generate hydrogenat some point in this first half of the 21st century. However, the fact remainsthat Brazil has a strong scientific base to genetically work with sugar-canevarieties, makes massive investments of private funds to consistently expandthe production, is watching a dramatically fast-growing demand for lightvehicles equipped with flex-fuel engines, is capable of and has actuallysucceeded in delivering increasing amounts of ethanol at the world’s mostdistant ports, sustains a subsidy-free agricultural policy that has beenrecognized as such by the World Trade Organization, seeks to maximize theutilization of sugar-cane waste for energy purposes, and has a strict policy toimprove labor relationships and social conditions in the industry.
When major countries like the United States, to begin with, adhere tobiomass as a strategic ingredient to reduce emissions without affecting theeconomic balance of their energy base, they add momentum for the samedecision to be made in other centers where the activity is dynamic, such asthe European Union and Japan. There is a constellation of other examples inall continents to name: China, India, Sweden, Thailand, Australia, Colombia,Guatemala, Canada, etc. Such diversity attests that the decisive move towardschanging energy options has already been made.
Before that this globalized movement took shape and gained strength,the constellation of major light vehicle producers did what they could tomove directly from gasoline to hydrogen. In other words, from the fuel thatdominates the first century of automobile history to the answer that all
Foreword
13
scientists consider to be unbeatable in order to insure the primacy ofindividual transportation for the next one hundred years. However, betweenthe two events, i.e. the fall of oil and the rise of hydrogen, these majorindustries have been unable to tackle the still insurmountable energy yieldchallenge, so that it can be stated that there exists a permanent solution forthe automotive fuel problem.
It is right now that the ethanol produced from sugar-cane in Brazil canhave a huge, positive impact on the energy base of advanced societies thatconsume energy intensively and are therefore responsible for a greater portionof the cleaning operation that takes shape at the same pace as natural disastersshock public opinion and force governments and business entities to invest inshort-term solutions. As can be demonstrated by the data gathered together inthis paper, producing ethanol from sugar-cane saves energy while preventingpollution thanks to the intensive use of a fuel that results from the veryprocess, from the harvesting to the fermenting and distillation process, themain energy source of which being combined heat and power generation fromthe sugar-cane bagasse and straw that are left at the crushing facilities. Inaddition, sugar-cane ethanol ensures more energy for end use per energy unitthat is spend to produce it than any other currently known renewable source.
The pace at which the energy base has been transforming has neverstopped surprising since the human society became aware that oil was indeeda finite resource. However, no answer has been more dynamic than that givenby Brazil. For example, the introduction of light vehicles equipped with flex-fuel engines sounded like an obscure chimera as recently as 2002. Reliableestimates prepared just two years ago indicated that two thirds of all carsproduced would be flex-fuel vehicles in 2007. Reality shows that the actualrate has turned out to be around 90 percent, as consumers realized that theygain great bargaining power by having equipment that can function just aseffectively whatever the proportion of the gasoline-ethanol blend.
Reason always prevails in economic decisions of major impact. Theevents arising out of the heavy pollutant load that the intensive use of fossilfuels has imposed on the world in the last two centuries give place to theefforts to find a competitive and sounder alternative. It is one of thosesituations that could even trigger spectacular changes in the hierarchy ofnations. It is something as big as what our forefathers were able to witnesswhen the United States went ahead and placed all of their economic andstrategic chips on the potential of oil. Ironically, Henry Ford, who was thentaking the first steps of his lonely adventure that would endow eachAmerican home with an unfailing black Ford Model T, originally intended tomotorize his cars with ethanol driven engines.
Sugar cane’s energy
14
Foreword
15
The room available for biomass-derived fuels tends to grow, creatingprospects for all countries – particularly those located in the tropical belt or,in other words, the least developed ones. Diversified sources are welcome.Ethanol can be produced not only from sugar-cane, but also from grains andlignocellulosic materials, the latter being a source that is still being tested inlaboratories, but with promising results that suggest they will be, within a fewdecades, in a prominent position among world’s most used energy rawmaterials. It is on societies in need of real opportunities that the effortstowards growing plants that are more suitable for energy purposes should befocused. With intelligent trade rules that actually move forward to free accessto currently super-protected markets, humanity will take its most significantstep towards achieving the necessary security in energy supply, whilecontributing to a greater income generation in the least favored parts of theworld – thereby creating a both effective and peaceful method to defeatterrorism by redeeming those who are hopeless today.


17
Acknowledgements
The idea of preparing this report arose from the realization by the Boardand Advisors of UNICA of the need for a more solid knowledge of the sugarcane industry’s position in the Center-South of Brazil regarding its sustain-ability in the context of the expansion of its activities. The definitions of scopeand coverage must be credited to many people from these groups, particu-larly Eduardo Carvalho.
The administrative and financial support for some of the studies wasprovided by UNICA, and it was essential to get the quality work we wanted.
The technical support provided by many advisors of UNICA was consis-tent and went beyond the preparation of reports in their fields of expertise;we highlight the work performed by Maria Luiza Barbosa in interaction withthe mills.
Finally, the power of this study is based on the contributions providedby twenty-three professionals who were selected for their renowned compe-tence. These individuals agreed to go out of their way in order to produce thetexts and adapt them to the context, and work with the coordinators on manyoccasions to improve the whole of the report.
Our thanks to you all.
Isaias de Carvalho Macedo
Coordinator
Authors
Twenty-three professionals from several fields have directly contributedtexts either on the national or international context or, specifically, on aspectsof the sugar cane agribusiness in Brazil.
Adhair Ricci Junior is an agricultural engineer specializing in chemicalcontrol of weeds and induced sugar cane maturation through maturingchemicals. An expert in agricultural technology at CTC (Sugar CaneTechnology Center, São Paulo, Brazil), he has worked since 1981 on sugarcane experimentation, consulting and agricultural projects for mills. Heworked for the Agriculture Department of São Paulo State (CATI and IAC)providing technical advice and conducting research.
Alfred Szwarc is a mechanical engineer (1975), has a MSc. degree inenvironmental pollution control from Leeds University, UK (1977), and wasa visiting researcher at the University of Southern California, USA (1985). Heis director of ADS Tecnologia e Desenvolvimento Sustentável and technicalconsultant at UNICA. His work has been mainly in the fields of energy use,particularly renewable fuels, and environmental pollution prevention andcontrol. He served as director of environmental engineering at CETESB, withprominent activities in the setting of motor vehicle air and noise emissioncontrol standards for both Brazil and the Mercosur. He has been working asconsultant for several national and international organizations and is amember of the Brazilian Association of Automotive Engineers and SAE Brazil.
André Elia Neto, civil engineer from EESC-USP, specializes in ecology andenvironmental engineering. He worked for CETESB-SP from 1977 until 1982 incontrol and analysis of liquid waste projects. He has worked at CTC (SugarCane Technology Center) in advice and environmental projects for the sugarand ethanol industry since 1982.
Carlos Afonso Nobre is an electrical engineer from ITA, and Ph.D. fromthe Massachusetts Institute of Technology. Researcher at INPE – NationalInstitute of Space Research, he has been the general coordinator of the Centerfor Weather Forecast and Climatic Studies since 1991. He serves as scientificcoordinator of the Large-Scale Amazon Biosphere-Atmosphere Experiment(LBA), and participates in the assessments conducted by theIntergovernmental Panel on Climate Changes. Research on weather
18
forecasting, climate modeling, biosphere-atmosphere interaction and theAmazon have been his main areas of activity.
Elimara Aparecida Assad Sallum is a consultant for UNICA – São PauloSugar Cane Agroindustry Union and is responsible for the ConsultingDepartment of the Sugar Industry’s Union in São Paulo State and the EthanolManufacturers’ Union in São Paulo State. She is a law graduate from UNIMEP
– Universidade Metodista de Piracicaba (Methodist University of Piracicaba),has worked for more than 20 years in labor courts, regional and superiorcourts, in individual and collective actions.
Enrico De Beni Arrigoni is an agricultural engineer from ESALQ-USP,with Master’s and Doctor’s degrees in entomology from the same university.He has worked for CTC since 1983, developing research, sugar cane anddomisanitary pest control technology transfer projects. He has been thecoordinator of human and material resources for CTC since 2002.
Eugênio César Ulian is manager of technology at CTC (Sugar CaneTechnology Center). He is an agricultural engineer (UNESP), with Master’s andDoctor’s degrees in plant physiology from Texas A&M University, CollegeStation, Texas. He has worked as a researcher at CTC, where he was head ofthe Molecular Biology Section, which led the International Sugar CaneBiotechnology Consortium for several years and created the Sugar CaneGenome Project.
Gabriela Alves Macedo is an assistant professor of food biochemistry atFEA-UNICAMP. She is a food engineer from FEA-UNICAMP, has Master’s andDoctor’s degrees in food science from the same university. She worked inresearch on food materials and ingredients in the private sector (Degussa andRhodia Food do Brasil) for a few years. Her main research subjects areenzyme production and ingredients for fermentation processes.
Isaias de Carvalho Macedo is a mechanical engineer and master ofsciences from ITA, and a Ph.D. in mechanical engineering (thermal sciences)from the University of Michigan (1971). He was a researcher at INPE, andprofessor at ITA and UNICAMP in the energy field until 1981. His main researchactivities were related to alternative energy. For twenty years (1981-2001) heplanned and conducted R&D and technology transfer programs at CTC –Sugar Cane Technology Center, initially in the industrial field, and then asmanager at CTC, starting in 1994. He has served as consultant in energy (forthe federal government and private companies) since 2001. At UNICAMP, he
Authors
19
was an advisor for the dean’s office and now coordinates biomass energyresearch programs.
Jayme Buarque de Hollanda is an engineer (PUC-RJ) and statistician(ENCE, 1967), with post graduation in automation at ENSA, France. He iscurrently the general director at INEE – National Institute of Energy Efficiency.He is a member of the Management Board of the World Alliance forDecentralized Energy (WADE, UK). He served as assistant to the president anddirectors of Energy and Coordination at Eletrobrás, and head of the SpecialBody of Advisors (strategic planning) of Eletrobrás. He was economic-financial director at Embratel. He coordinated technology developmentprojects such as SIGAME/WBP, in biomass gasification, funded by GEF/UN. Hewas a member of the Management Board of Cirpress (Brazil’s leading printedcircuit manufacturer at the time).
Jorge Luis Donzelli is a manager of R&D Programs at the Sugar CaneTechnology Center, where he coordinates Agribusiness Planning and Control,and Soil Preparation, Planting and Production Technology. He is anagricultural engineer from UNESP, having served at IAC – Agronomic Instituteof Campinas in wetland soil genesis and morphology research, as well assurvey and mapping of sugar cane areas. He coordinated works at CTC in soilmapping, potential agricultural production, geoprocessing (SIG/OrbitalImages), soil conservation and preparation, sugar cane mineral nutrition,herbicides and maturing agents.
Luiz Antonio Dias Paes is an agricultural engineering graduate, with aMaster’s degree from the Federal University of Viçosa, State of Minas Gerais.He majored in remote sensing at UNESP in 1985, where he was a professor. Heworked as engineer for companies like Ruralminas, Codevasf and Fahma. AtCTC, where he is now manager of technology transfer, he headed thedepartments of Agricultural Hydraulics and Variety Management, havingworked on industrial waste utilization, agricultural planning, geoprocessingand environmental projects.
Luiz Carlos de Almeida is an agricultural engineer, having started hiscareer with nuclear energy applications in agriculture in the early seventies:CNEN (1974-76) and CNPq-PLANFAP (CENA–ESALQ, 1976-79). He was thecoordinator of courses in Sugar and Ethanol production at the UNIMEP
(Piracicaba Methodist University, S. Paulo) from 1978 to 1981, and from
Sugar cane’s energy
20
1981 to 1987 he was a researcher in Enthomology at Planalsucar (IAA). Since1987 he is with CTC – Centro de Tecnologia Canavieira in the Enthomologyarea, participating in the most important projects in the sector and leadingthe technology transfer to a large number of associates sugar mills.
Luiz Gylvan Meira Filho, electrical engineer (ITA) and Ph.D. inastrogeophysics (Colorado University), is currently a visiting professor at IEA-USP – Advanced Studies Institute of the University of São Paulo. We was asenior scientific advisor for the UN Framework Convention on ClimateChange Secretary’s Office, in Bonn, Germany, 2003; secretary of science andtechnology policies for the Ministry of Science and Technology, 2001-2002;and president of the Brazilian Space Agency, 1994-2001. He was co-chairmanof the UN Intergovernmental Panel on Climate Change’s Scientific WorkGroup, 1990-1995, and deputy chairman of the Panel, 1995-2001.
Márcia Azanha Ferraz Dias de Moraes is a mechanical engineer(UNICAMP) with Master’s and Doctor’s degrees in applied economics fromESALQ-USP. Having worked in production for a few years, she has been aprofessor of the Economics, Administration and Sociology Department ofESALQ-USP since 2000. She has been working on the analysis of the Braziliansugar cane industry’s supply chain, having published two books(deregulation of the industry; evolution and challenges) over the past fewyears. She has recently concluded an analysis of the Brazilian labor market inthe sugar cane industry for the World Bank.
Marcos Guimarães de Andrade Landell is an agricultural engineerfrom UNESP, with Master’s and Doctor’s degrees in plant production fromUNESP as well. He joined the Campinas Agronomical Institute in 1982. Since1993, he has coordinated the IAC Genetic Improvement Program and thePhytotechnical Sugar Cane Group. He is chairman of the TechnicalCommission on Sugar Cane of São Paulo State (Department of Agricultureand Supply). He has served as director of the IAC Sugar Cane Center, havingparticipated as one of the coordinators in the development of the Sugar CaneGuideline with UPOV – International Union for the Protection of New Varietiesof Plants.
Marcos José Marques is an economist from FCE-UFMG, with extensivegraduate studies in Brazil and overseas (in administration, technologicalmanagement and energy). He has been the president of the National Instituteof Energy Efficiency since 1992. He has held dozens of positions in entities
Authors
21
related to energy, such as chairman and member of management boards (UTE
Norte-Fluminense, FINEP/MCT, Eletronuclear, Chesf, Escelsa, Furnas CentraisElétricas, Suframa, Light, Eletronorte, Cesp, Furnas) and managementcommittees (Energy Efficiency, MME; South African Fund; Sectoral Fund forEnergy, MCT), having served as director of Eletrobrás and Cepel. He alsoserved as secretary general for the Ministry of Industry and Trade, where hechaired CENAL (1979-1984), and deputy secretary of finance (Minas Gerais)for the period from 1975 until 1979.
Maria Luiza Barbosa is responsible for the center for socialresponsibility of UNICA – São Paulo Sugar Cane Agroindustry Union. Shegraduated in pedagogy and the physically challenged in audiocommunication (PUC-SP), having majored in special education (MaconUniversity, USA), the third sector (FGV-SP), and community education (SESC-SP), and taken several other courses in the United States. In the 1998-2001period, she created the Social Responsibility Center at HSBC (Brazil; social andcultural projects and management of donations and sponsorship). She heldexecutive positions at travel companies (Brazil and US) specializing incultural and continued education programming. She is a director at the GaiaRevida Institute, São Francisco Xavier, SP.
Marinez Ferreira de Siqueira, biologist, master of ecology at UNICAMP,is taking a doctor’s program in environmental engineering sciences at USP-SãoCarlos. She has worked for 10 years with information systems and internet-based databases on Brazilian biodiversity. Her main research lines are treespecies of cerrado, environmental niche modeling and geographicdistribution. She is a member researcher of CRIA – Environmental InformationReference Center, in Campinas, SP.
Rodolfo Hoffmann is a professor at the Institute of Economics atUNICAMP. From 1966 until 1996, he was a professor and full-time researcherat ESALQ-USP. He is the author of books on agricultural business management,regression analysis, statistics for economists, and income distribution:inequality and poverty measurements. His most constant research theme hasbeen the analysis of income distribution in Brazil.
Sérgio Antônio Veronez de Sousa is an agricultural engineer from theFederal University of Viçosa, where he got his Master’s degree in agriculturalengineering (irrigation and drainage), and has a Doctor’s degree from ESALQ-USP in the same field. He currently serves as agricultural technology expert at
Sugar cane’s energy
22
CTC – Sugar Cane Technology Center, where he works in agriculturalhydraulics, hydrology, irrigation, agrometeorology and environment. He hasrecently participated in the development of studies aimed at setting thetechnical standard (CETESB) on criteria and procedures for vinasse applicationto agricultural soils.
Vanderlei Perez Canhos, food engineer, master in food sciences fromUNICAMP, and Ph.D. in food science from the Oregon State University. As aretired professor at UNICAMP, he now serves as chief executive officer at CRIA –Environmental Information Reference Center, where he performs researchand management activities relative to the development of biodiversityinformation systems.
William Lee Burnquist is an agricultural engineer with a Doctor’sdegree in genetic improvement from ESALQ-USP, and a Ph.D. in the same fieldfrom Cornell University. He has participated in the CTC Sugar Cane GeneticImprovement Program since 1980, having coordinated the geneticimprovement, phytosanitary and biotechnology programs in 1994. Theseprograms account for the development of the SP sugar cane varieties, whichcover approximately 50 percent of Brazil’s sugar cane crops. He is chairmanof the CTC Internal Biosafety Commission. At ISSCT – International Society ofSugar Cane Technologists, he chaired the genetic improvement committee(1999-2001) and was a member of the committees on genetic improvementand molecular biology for many years since 1992.
Unassigned essays and texts have been written by the Organizer.
Authors
23

Preface
The purpose of this report is to present a unified view of the various aspects ofthe sugar cane agribusiness’ sustainability in the Center-South of Brazil.
The evolution of such industry over the past twenty years and its growthprospects for the next few years demand a much different position from thetraditional sugar producer, who should include the role of energy producerand do a lot more business in the world markets. The last twenty years alsosaw an extraordinary improvement in our knowledge of the consequences ofhuman interaction with the environment, as well as the social consequencesof political and economic action in a much more interrelated (globalized)world.
This is the context in which we gathered 23 experts for preparing thisreport, which also relied on the informal participation of a number of otherprofessionals. The scope of the themes, the complexity and, in some cases,the insufficiency of knowledge indicate that said purpose can only be fulfilledin a limited way, and that the concepts, analyzing methods and, as result,conclusions and recommendations contained herein need permanentreviews.
A very appropriate remark by Dernbach1 in the much more generalcontext of today’s society is that our present actions lead us “stumblingtoward sustainability.” In the face of Brazil’s sugar cane industry, both thecurrent situation reflected in this study and the great opportunities forgrowth and sustainable development make up very appealing scenarios,thereby allowing researchers, businessmen and governmental players to hopefor successful work. We hope this study can help determine the paths for thisfuture.
Isaias de Carvalho Macedo
Coordinator
25
1 DERNBACH, J.C. (Ed.):Stumbling toward sustain-ability, Washington DC,Environmental LawInstitute, 2002

Synthesis
The interaction of the industry’s activities with the environment, societyand economy is complex; instead of treating it according to activity type(agriculture, industrial process, marketing, end use), we chose to group thetopics by type of impact. Accordingly, we considered the Impacts on the use ofmaterial resources (especially energy and materials); the Impacts on theenvironment (air quality, global climate, water supply, soil occupation,biodiversity, soil preservation, use of pesticides and fertilizers); theSustainability of the agricultural production base, including resistance to pestsand diseases; the Impacts on commercial actions, covering competitiveness andsubsidies; and, in conclusion, some Socioeconomic impacts, with greatemphasis on the creation of jobs and income. These topics are covered in thefollowing twelve chapters.
I. Impacts on the use of material resources
Even though it is known that there is a need, as well as possibilities, toreduce specific consumption of energy and materials in developed countrieswithout compromising the quality of life, that has not been accomplished.The analysis of Impacts on the use of material resources of the sugar caneindustry’s activities point to a very positive situation (and possibilities): theindustry is an energy supplier, replacing fossil energy, and may become asupplier of (renewable) materials, such as plastics and chemicals.
The world supply of energy is based on fossil fuels (75%); the scale onwhich fossil fuels are used quickly leads to depletion of resources, leaving aheavy burden for future generations. Additionally, the use of fossil fuels isresponsible for a large amount of local pollution and most of the greenhousegas emissions. The use of energy should grow as a result of advances in manyof the world’s developing regions. The current challenge is to seek renewableenergy sources and to increase efficiencies in energy generation and use on anunprecedented scale.
Brazil has an intermediate consumption level (1.1 toe / inhab.year), witha deep focus on renewable energy sources (43.8%, compared to 13.8% in theworld). Brazil can significantly increase the use of biomass and otherresources to improve generation and use efficiencies. In this respect, amongother initiatives, Brazil should implement the distributed generation of
27
electrical power (based on combined heat and power), which could reach 10-20 percent of the total within 10-15 years, and establish a fuel policy for thetransportation sector.
The sugar cane industry already provides a major contribution (responsivesustainability) to the substitution of fossil fuels, going much further than energy self-sufficiency (electrical and thermal power).
! It generates 11.3 TWh of electrical and mechanical power(3% of the electrical power generated in the country)
! It uses bagasse as a fuel: 20.2 Mtoe (equivalent to the sumof all of the natural gas and fuel oil used in the country)
! It produced nearly 50% of all the gasolineused in the country in 2004
The sugar cane industry’s improved energy performance (use of sugarcane trash, and the implementation of efficient co-generation) can lead to anadditional 30 TWh of electrical power. Alternatively, the implementation ofprocesses for bagasse and trash conversion to ethanol in the future canincrease ethanol production by 40 percent for the same sugar caneproduction level.
If the expected sugar cane production increases for the next yearsmaterialize, for every additional 100 Mt of sugar cane, the industry wouldsupply 3.8 percent of the current electrical power consumption and 4.9 Mm3
more ethanol (assuming that 58% of the sugar cane are used in ethanolproduction). The alternative ethanol production from bagasse and trash,when technically possible, would lead to an additional 3.4 Mm3 of ethanol.
The per capita consumption of materials and resources worldwide hascontinued growing over the past ten years, and so have the resultingenvironmental impacts. As in the case of energy, governmental policies havenot been sufficient to reverse the trends that are aggravated by the advancesof large developing areas.
Agriculture (having solar energy as an input) is a field that can lead to asustainable production of materials in some cases. This perception promotesbiological products as “environmentally sound”. Ethanol based products(Brazil, 1980’s and 1990’s) have brought several examples, as have recentadvances in sucrose chemistry.
Brazil’s sugar cane production corresponded (2006) to a production of60 Mt of sucrose and 120 Mt (DM) of lignocellulose residue. Sucrose iscurrently used in sugar and ethanol production, but other importantactivities are beginning in new products development. Of the residue, 50percent are used at low efficiency rates in energy generation, and more than25 percent (trash) are recoverable at costs compatible with energy uses.
Sugar cane’s energy
28
The production costs in Brazil and the availability of bagasse energymake sucrose very attractive to dozens of other products. In Brazil, there iscommercial production of amino acids, organic acids, sorbitol, and yeastextracts, as well as developments concerning products for large amounts(plastics). Over the next few years, it will be possible to use 1.5 Mt ofsucrose in these processes.
In the 1980’s and 1990’s, more than 30 products were produced fromethanol in Brazil, several of which relied on installed capacities in excess of100,000 tons / year (via ethylene, acetaldehyde or direct transformations).They became unfeasible in the 1990’s because of the national policy for oilderived chemicals and the relative cost of ethanol. The new oil-ethanol costratio now leads those processes to be reconsidered.
The large-scale production of renewable materials from sugar cane inBrazil is a possibility, but is still at an early implementation stage. It is growingsomewhat rapidly in the use of sucrose, and may grow in alcohol chemistryagain, while having a great unrealized potential in terms of residueutilization. It would certainly contribute a lot to the sugar cane agribusiness’“responsive sustainability” position.
II. Impacts on the environment
The Impacts on the environment consider the sugar cane culture, industrialprocessing and end use. They include effects on local air pollution and theglobal climate, on the use of soil and biodiversity, on soil conservation, onwater resources, and the use of agrochemicals and fertilizers. Those impactsmay be either positive or negative; in some cases, the sugar cane industry hasvery important results, such as the decrease in GHG (Greenhouse Gas)emissions and the recovery of agricultural soils. The environmentallegislation (including restrictions on soil use) is advanced in Brazil, andefficiently applies to sugar cane crops.
The deterioration of air quality in urban centers is one of the world’smost serious environmental problems. For the most part, it is caused by theuse of fossil fuels, which also contribute to cross-border pollution, such asacid rain, for example. Mitigating efforts include an increasingly restrictivelegislation on fuels and utilization systems.
The sugar cane agribusiness has two very distinct points of connectionwith the impacts on air quality: ethanol use has been leading to considerableair quality improvements in urban centers; and the sugar cane burning in the
Synthesis
29
field, on a very different scale, causes problems by dispersing particulatematter and because of the risks associated with the smoke.
The main effects of ethanol use (whether straight or as an additive togasoline) on urban centers were as follows: elimination of lead compoundsfrom gasoline; reduction of carbon monoxide emissions; elimination ofsulphur and particulate matter; and less toxic and photochemically reactiveemissions of organic compounds.
The burning of sugar cane trash (used in most producing countries tomake harvesting easier) was the subject of many papers in the 1980’s and 90’s(in Brazil and other countries); they were unable to conclude that theemissions are harmful to human health. Such undesirable effects as the risks(electrical systems, railways, forest reserves) and dust (particulate matter)remained. In São Paulo State, legislation was passed which graduallyprohibits the burning, with a schedule that considers the technologiesavailable and the expected unemployment, including immediate prohibitionin risk areas. That solution is in force, and is an important example given thesize of the São Paulo production.
The 30-percent increase in the concentration of greenhouse gases in theatmosphere since pre-industrial times corresponds to an average increase of0.6 ºC in the surface temperature of the planet. In the 21st century, the meantemperature may increase by more than 3 ºC if the current trend is notchanged. The Kyoto Protocol represents one step towards (increasinglyconsensual) preventing an increase of up to 2 ºC by 2050.
The global climate models, still evolving, always point to temperaturerises in Brazil, but the uncertainties about the rainfall are large. Themodels indicate temperature increases of 1-4 ºC (low emission scenario)or 2-6 ºC (high emission scenario). There is no agreement on the rainfallresults, but climate extremes (droughts, severe storms) are expected tooccur more often. In the models that indicate a greater amount of rainfall(GFDL, US) the savannah would expand to the Northeast. In the otherscenarios (for example, the HADCM3, England), the savannah wouldexpand to parts of the Amazon, and the caatinga in the Northeast wouldbecome a desert.
A vulnerability assessment of the agricultural sector should consider thesimultaneous effects of the temperature (and rains) and the “fertilization” bythe increased concentration of CO2. There are only a few studies for Brazil,and they are focused on coffee and wheat in specific regions.
The evaluation of GHG emissions from Brazil for the 1990-94 periodindicates “Change in the use of land and forests” as the factor accounting for themost emissions (75%), followed by “Energy”, with 23 percent.
Sugar cane’s energy
30
In the sugar cane industry, the “renewable energy produced to fossilenergy used” ratio is 8.9 for ethanol production. The consequence of this is anextraordinary performance of the industry, which avoids GHG emissionsequivalent to 13 percent of the emissions from Brazil’s entire energy sector(reference 1994).
For every additional 100 Mt of sugar cane, emissions of 12.6 Mt CO2equivalent could be avoided over the next few years using ethanol, sugar canebagasse and the added excess electrical power.
Even though Brazil has the greatest water availability in the world, with14 percent of the surface waters and the equivalent of annual flow inunderground aquifers, the use of crop irrigation is very small (~3.3 Mha,compared to 227 Mha in the world).
Sugar cane crops are virtually non-irrigated in Brazil, except for somesmall areas (supplementary irrigation). Efficient methods (subsurfacedripping and others) are being evaluated.
The levels of water withdraw and release for industrial use havesubstantially decreased over the past few years, from around 5 m3 / sugar canet collected in 1990 and 1997 to 1.83 m3 / sugar cane t in 2004 (sampling inSão Paulo). The water reuse level is high (the total use was 21 m3 / sugar canet in 1997), and the release treatment efficiency was in excess of 98 percent.
It seems possible to reach rates near 1 m3 / sugar cane t (collection) andzero (release) by optimizing both the reuse and use of wastewater in ferti-irrigation.
For the most part, environmental problems relating to water quality,which result from irrigation (water run-off, with nutrients and pesticides,erosion) and industrial use, are not found in São Paulo. In this respect,EMBRAPA rates sugar cane as Level 1 (no impact on water quality).
The Permanent Protection Areas (APP, in Portuguese) relating toriverside woods have reached 8.1 percent of the sugar cane crop area in SãoPaulo, 3.4 percent of which having natural woods, and 0.8 percent havingbeen reforested. The implementation of riverside wood restoration programs,in addition to the protection of water sources and streams, can promote therestoration of plant biodiversity on the long term scale.
With 850 Mha, Brazil has a large portion of its territory with conditionsto economically support agricultural production, while preserving vast forest
Emissions avoided in 2003:
With ethanol substituting for gasoline: 27.5 Mt CO2 equivalent
Bagasse in sugar production: 5.7 Mt CO2 equivalent
Synthesis
31
areas with different biomes. Today, agriculture uses only 7 percent of thisterritory (half of which being taken up by soybean and corn crops), pasturesuse around 35 percent, and forests 55 percent. The expansion of agricultureover the past 40 years took place mostly in degraded pasture areas and“campos sujos” (grassland with some shrubs), rather than forest areas. The areacurrently occupied by sugar cane crops represents only 0.6 percent of theterritory, and the area currently able to support the expansion of this kind ofcrop represents at least 12 percent.
The cerrado (24% of the territory) has been extensively utilized foragriculture and cattle-breeding over the past 40 years. The expansion of sugarcane crops in areas covered by the cerrado vegetation has been very small sofar, and has replaced other covers that had previously replaced the cerrado(usually pastures).
The expansion of sugar cane crops has taken place essentially in Brazil’sCenter-South region over the past 25 years, in areas that are very far from thecurrent biomes of the Amazon Rain Forest, the Atlantic Forest and thePantanal. From 1992 until 2003, almost all of the expansion (94%) in theCenter-South region occurred in already existing sugar fields; newagricultural borders were involved very slightly. In São Paulo, the growth hasoccurred through substitution of pastures and other crops.
For the next few years, there should be growth in the Center-Southregion, with an emphasis on western São Paulo, the borders with MatoGrosso, and in some areas within the state of Goiás.
Brazil concentrates the world’s largest biological diversity (including theAmazon Rain Forest, the Atlantic Forest, and the cerrado), and a flora estimatedat 50,000 to 60,000 angiosperm species. The biodiversity preservationpriorities were set mainly between 1995 and 2000, with the contribution ofhundreds of experts; protected areas were established for the six major biomesin the National Preservation Units System. This important initiative shouldundergo some reviews, so as to incorporate methodology advances and toconsider the expansion of agriculture and the vulnerability to climate changes.
Since the discovery of Brazil, the Atlantic Forest was the first biome to bepartially replaced with the exploitation of wood, agriculture and cattle-breeding along Brazil’s entire coast. Among many others, the sugar caneculture (Center-South and Northeast) is now in areas originally covered bythat biome. The process by far preceded any concern for preservation, andthat preservation requires restoration of protected areas (riverside woods,hillsides).
The agricultural occupation of the cerrado is very recent, and includesareas occupied by cattle-breeding, as well as firewood and coal exploitation.
Sugar cane’s energy
32
Its growth should be planned, taking into consideration the preservation ofbiodiversity and water resources, especially in sensitive areas (sources ofrivers that flow to the Pantanal, and recharge areas of the Guarani Aquifer).
Harmonizing socioeconomic development with environmental preservationrequires up-to-date information and appropriate tools for analyzing impact andvulnerability; programs like that of the IVB (São Paulo) and advances in thesurvey of geo-referenced data (in progress) are highly important in this context.
Sugar cane crops have been expanding in areas having poorer soils(especially “highly anthropized cerrados,” mostly extensive pastures). Theycontribute to the recovery of those soils by adding organic matter andchemical-organic fertilizers, which also contribute to improving thephysicochemical conditions of the soil, thereby incorporating them intoBrazil’s agricultural area.
Today, the sugar cane culture in Brazil is renowned for its relatively smallsoil erosion loss (compared to soybean and corn, for example). This situationkeeps improving as harvesting without burning expands and reducedpreparation techniques are introduced, thereby reducing losses to very lowrates that are comparable to those for direct planting in annual cultures.
The concern about the impact of pesticides is present in many sections ofAgenda 21, which provides specific control actions. The use of new technologiesbased on genetically modified plants is promising (reduction of pesticideutilization), but requires additional caution. Ideally, biological controls and, tothe extent possible, “organic” agriculture techniques should be used.
The Brazilian legislation, including rules and regulations fromproduction to use and disposal of materials, covers all important aspects.
Pesticide consumption in sugar cane crops is lower than in citric, corn,coffee and soybean crops; the use of insecticides is low, and that of fungicidesis virtually null.
Among the main sugar cane pests, the sugar cane beetle (the mostimportant pest) and the cigarrinha are biologically controlled. The sugar canebeetle is the subject of the country’s largest biological control program. Ants,beetles and termites are chemically controlled. It has been possible tosubstantially reduce the use of pesticides through selective application.
Sugar cane diseases are fought against through the selection of disease-resistant varieties in major genetic improvement programs. This procedurehas been sufficient to address the occurrences in large proportions, such asthe mosaic virus (1920), the sugar cane smut and rust (1980’s), and theSCYLV (1990’s), through replacement of varieties.
Genetic modifications (at field test stage) have produced plants resistantto herbicides, smut, the mosaic virus, the SCYLV and the sugar cane beetle.
Synthesis
33

Weed control methods have been frequently changed because oftechnological advances (cultural and mechanical or chemical). In Brazil,sugar cane crops still use more herbicides than coffee and corn crops, lessherbicides than citric crops, and the same amounts as soybean crops.
There is a strong trend towards an increase in “green” sugar caneharvesting, with the trash remaining on the soil. Today it seems impossible tototally eliminate herbicides as expected, especially because of the rise ofunusual pests.
The use of fertilizers in Brazilian agriculture is relatively small, althoughit has increased over the past thirty years, thereby substantially reducing theneed for new areas.
Among Brazil’s large crops (area larger than 1 Mha), sugar cane usessmaller amounts of fertilizers than cotton, coffee and orange, and isequivalent to soybean crops in this respect. The amount of fertilizers used isalso small compared to sugar cane crops in other countries (48% more isused in Australia).
The most important factor is the nutrient recycling through applicationof industrial waste (vinasse and filtercake), considering the limitingtopographic, soil and environmental control conditions. Substantial rises inthe potassium content of the soil and productivity have been observed.Nutrient recycling is being optimized, and the trash utilization is yet to beimplemented. It will be very important in expansion areas.
A number of studies in respect to leaching and possibilities ofunderground water contamination with vinasse indicate that there are generallyno damaging impacts for applications of less than 300 m3 / ha. A technicalstandard by the Office of the Secretary of Environment (São Paulo) regulates allrelevant aspects: risk areas (prohibition); permitted doses; and technologies.
III. Sustainability of the agricultural production base
The Sustainability of Brazil’s sugar cane production base requires the abilityto respond to pests and diseases and to periodical climate changes, withoutseriously impairing it.
The production conditions in Brazil, with its diversity of regions andmicroclimates, have been responding appropriately to periodical climatechanges.
Protection from pests and diseases is considered a strength of Brazil’sproduction: it is based much more on a continued supply of disease andpest-resistant sugar cane varieties than on phytosanitary barriers, allowinggrowers to operate with a great diversification.
Sugar cane’s energy
34
There are four operational sugar cane genetic improvement programs inBrazil (the two leading programs are private); they use one quarantine andtwo hybridization facilities, with germplasm banks. They work withapproximately 1.5 million seedlings per year.
More than 500 varieties are grown today (51 have been released over thepast ten years). The twenty most important varieties occupy 80 percent ofthe crop area, but the most widely used occupies just 12.6 percent. Thesubstantial rise in diversification over the past twenty years has providedgreat safety concerning resistance to exogenous diseases and pests.
Brazil stands out from other producing countries for its sugar canebiotechnology, having had (non-commercial) transgenic varieties since the1990’s. In 2003 the identification of 40,000 sugar cane genes was completedin Brazilian laboratories. There are dozens of groups working on thefunctional genome, and they are already using the genes in geneticimprovement programs (experimental stages). Commercial results may ariseover the next five years.
More funds are recommended in order to properly integrate thegermplasm banks for all programs and to support specific developments foreach expansion area.
The efforts on the legislative front should be carried on in order tofacilitate the development of biotechnological research at its final stages.
IV. Impacts of production on commercial actions
The sugar cane ethanol and sugar production in Brazil’s Center-South regiontoday have no adverse economic impacts on the external environment; there isno externalization of costs to be paid by other sectors of society. The sugar caneproducts do not have any price support mechanism under governmentalpolicies, and there are no subsidies to sugar production or trade today.
Ethanol production cost (without taxes) in the Center-South mills, wasestimated at R$ 647/m3, which is highly competitive with internationalgasoline prices. Ethanol production costs in Brazil are also significantly lowerthan the costs for corn ethanol in the US or wheat and beet ethanol in Europe.
The ethanol cost reductions in Brazil since the program was introducedhave occurred due to advances in technology and management andinvestments in infrastructure. A broader implementation of existing(commercial) technologies may further reduce costs in the Center-South, butthe best prospects relate to new technologies being developed. These includeprecision agriculture, new sugar cane and trash transportation systems, andgenetic modifications of sugar cane.
Synthesis
35
In addition, the production diversification will contribute to the rise incompetitiveness, as it did upon introduction of ethanol. Such diversificationincludes the increase (in progress) in the use of sucrose and some ethanol-based routes, and the production of excess energy from sugar cane biomassin several ways (also in progress).
The sugar from the Center-South has had the world’s lowest productioncost for many years now, amounting to R$ 410 / t. The world production costis currently evaluated at US$ 120 / t, for up to 20 Mt (the production ofBrazil’s Center-South region); for 20 Mt to 65 Mt, the cost goes up to US$200-250 / t; and for 65 Mt to 100 Mt, it rises to US$ 400 / t. The total sugarproduction and export cost in the Center-South represents 65 percent of themean cost of other exporters.
The high availability of appropriate land for expansion and the lack ofgovernmental policy-supported prices in Brazil would make the country evenmore competitive in a trade liberalization scenario (as expected). Analyses ofthe ethanol and sugar markets point to a demand of 560 Mt of sugar cane /year in Brazil for 2010.
V. Socioeconomic impacts of the sugar cane agribusiness
Brazil has had an unemployment rate of 9 to 10 percent over the past fewyears. Job quality and income distribution are serious problems; the Ginicoefficient was 0.607 (1998) and 0.554 (2003). Notwithstanding the increasein income, social inequalities have not been significantly reduced over thepast 20 years. Workers who do not contribute to the social security systemare estimated at 55 percent. The rates of child labor (2.4%, 10-14-year-olds)and functional illiteracy (23.9%, less than 3 years at school) have beensignificantly lowered, but are still high. The per capita income in 2002 wasUS$ (PPP) 7,600.00.
In the consideration of Socioeconomic impacts of the agribusiness, the mostimportance its attached to job and income creation for a very wide range ofworkforce capacity building programs, with the flexibility to support localcharacteristics using different technologies. It should also be rememberedthat the industry fosters substantial foreign currency savings by avoiding oilimports, and the business and technological development of a majorequipment industry.
The replacement of gasoline with ethanol between 1976 and 2004represented savings of US$ 60.7 billion (exchange rate of December 2004),or US$ 121.3 billion, considering the interest rates.
Sugar cane’s energy
36
The Brazilian industry supplying equipment for cane, sugar and ethanolproduction developed into a leading position; the largest manufacturer,alone, produces 726 distilleries (distillation units), 106 full plants, 112combined cogeneration plants, and 1,200 boilers (including exported units).
Brazil’s labor legislation is renowned for being advanced in workerprotection; the union organization is developed and plays a key role inemployment relationships. For sugar cane, the specific aspects ofemployment relations in agriculture (specific unions) and industrialoperations (unions of the food and chemical industries) are well-defined,including the conclusion of collective agreements, which advanced duringthe last decade. Compared to the Brazilian 45-percent mean rate of formaljobs, the sugar cane industry’s agricultural activities now have a rate of 72.9percent (from the 53.6% of 1992). In the Center-South, the rate of formaljobs in sugar cane production is 85.8%, reaching 93.8 percent in São Paulo(2005).
The differences in regional development are reflected in the industry’soccupational indicators; poorer regions are characterized by lower salariesand a much larger use of labor, consistent with their technological levels(automation, mechanization).
In the early 1990’s, there were 800,000 direct jobs; for every 1 Mt ofsugar cane produced and processed, there were 2,200 direct jobs (73% inagriculture); in the North-Northeast, three times as much as in the Center-South. In São Paulo, non-specialized workers (sugar cane cutters) were paidUS$ 140 / month (US$ at that time), which was higher than the amount paidto 86 percent of agricultural workers in general, and 46 percent of industrialworkers. The mean family income of those workers was higher than that of50 percent of all Brazilian families.
The seasonal index for jobs was 2.2 in São Paulo in the early 1980’s, 1.8in the late 1980’s, and 1.3 in the mid 1990’s. This decrease was motivatedmainly by the mechanical harvesting of sugar cane, which also enabled moretraining and career planning.
In the late 1990’s, with 650,000 direct jobs and 940,000 indirect jobs(plus around 1,800,000 induced jobs), the number of jobs per product unitin the Center-South region was still 3.5 times higher than in the North-Northeast; there is a correlation between the difference in the mean jobquality (according to years of education) and salary levels.
The formal, direct jobs in the industry are now increasing in number andreached 982,000 in 2005. Of those formally employed, 90.8 percent are aged18 to 48 (0.2% under the age of 17). Industrial jobs increase more than jobsin agriculture. People having studied for less than 4 years represent 35.2
Synthesis
37
percent of the workers, 11.3 percent being illiterate (4% in the Center-South).
Considering both formal and informal jobs (2005 PNAD sample), theincome of working people in Brazil was as follows: all industries, R$ 801 /month; agriculture, R$ 462 / month; industrial operations, R$ 770 / month;services, R$ 821 / month; sugar cane agricultural jobs: Brazil, 495; N-NE,316; C-S, 697; São Paulo, 810; Sugar industry: Brazil, 742; N-NE, 600; C-S,839; São Paulo, 837.
The amounts for ethanol are a higher than those for sugar, reaching 960for Brazil and 1196 for São Paulo.
In agriculture, the mean education level in the North-Northeast isequivalent to half the level (years at school) of the Center-South.
In the Center-South, the income of people working in sugar cane cropsis higher than in coffee and corn crops, equivalent to citrus but lower than insoybean crops (highly mechanized, with more specialized jobs). In theNorth-Northeast, the income in sugar cane crops is higher than in coffee,rice, banana, manioc and corn crops, equivalent to the income in citruscrops, and lower than in soybean crops.
The income in formal jobs does not include the 13th salary or anybenefits. Mills maintain more than 600 schools, 200 daycare units and 300ambulatory care units. In a sample of 47 São Paulo-based units, more than90 percent provide health and dental care, transportation and collective lifeinsurance, and over 80 percent provide meals and pharmaceutical care. Morethan 84 percent have profit-sharing programs, accommodations and daycareunits. Social Balance Sheet Indicators for 73 companies (UNICA, SP, 2003)show that funds equivalent to 24.5 percent of the payroll are used for suchpurposes as profit-sharing programs (6.72%), food (6.54%), healthcare(5.9%), occupational health and safety (5.3%), and education, capacitybuilding and professional development (1.9%).
Sugar cane’s energy
38
Introduction
The purpose of this report is to present a unified view of the various aspectsof the sugar cane agribusiness’ sustainability in the Center-South of Brazil. Inthis introduction we list some basic sustainable development concepts andthe main issues relating to agriculture. Brazil’s sugar cane agribusiness ischaracterized by some production indicators and data. Also a briefdescription of the production processes is provided for an identification ofthe interactions of the production system with the environment andsociety.
Sustainable development
With the end of the Second World War and, particularly, the explosionof atomic bombs in the Japanese cities of Hiroshima and Nagasaki,humanity found itself in the face of a real possibility of undermining its lifeand survival on the planet through its actions. Over the following years, theexuberant industrial expansion and exponential increase in environmentalcontamination problems added to that perception.
As a result of those concerns, the First World Environment Conferencewas held in Stockholm by the United Nations in 1972. In addition tomatters pertaining to pollution and problems caused by the ever-moreintensive use of natural resources, it became evident thereafter that there isan unbreakable link between the need to fight misery and humanexploitation and the need for development and quality of life (and,therefore, the quality of the environment we occupy).
However, outside expert circles, peace and security, economic dev-elopment and social development, the latter translating as respect for humanrights, were understood as basic conditions for “human development” untila little more than ten years ago. In 1992, at the UN Conference onEnvironment and Development (Rio de Janeiro), the nations around theworld agreed to implement an ambitious project to promote a “sustainabledevelopment.” The principles established in the Rio Declaration, and theresulting actions and responsibilities that were detailed in Agenda 21 in1992 added environmental protection to the list of basic conditions forhuman development, as it is considered essential to prevent futuregenerations from being unable to accomplish their development.
39
Accordingly, the main goals of mankind (freedom, equality, and quality oflife) became valid not only in the present, but also for future generations: adevelopment that, by meeting present requirements, would not underminethe future generations’ ability to meet their own needs. Rather thandevelopment with harm to the environment, or environmental protectionwith harm to development, a sustainable development would seek both the“traditional” development and environmental protection (or restoration).
Agenda 21, as an action plan, defines the current challenge asovercoming “a perpetuation of disparities between and within nations, aworsening of poverty, hunger, ill health and illiteracy, and the continuingdeterioration of the ecosystems on which we depend for our well-being”.1
Misery and environmental degradation are destabilizing factors. The centralidea of Agenda 21 is that each country is responsible for seeking sustainabledevelopment, either by itself or in cooperation with other countries.
The implementation of these actions has been considerably delayed forreasons that include some governments’ disagreement with essential topics.However, it is undeniable that there has been great progress in many fields onthe part of governments, and that the decentralizing nature of Agenda 21 hasvery effectively led to many actions “from the bottom to the top” throughmunicipal and state decisions, NGOs and private sectors of the economies.Such movements are growing in number and influence, and should beexpected to eventually determine governmental actions even in more hesitatingcountries. In fact, the experience over the past few years has shown that eventhough the environmental legislation plays a key role in the evolution ofsustainability, it takes more than just laws and policies: the involvement ofmany other sectors of society.
The following are some of the basic principles of Agenda 21: • integrated decision-making process (development and environmentalprotection)• the “polluter-payer” principle (not transferring the costs to others)• seeking sustainable population and consumption levels• the precautionary principle: in cases of serious risks, the lack of scien-tific certainty should not delay environmental protection measures• inter-generation equity•participation of the population• common but differentiated responsibilities (among developed anddeveloping countries)
Sugar cane’s energy
40
1 U. N. Conference onEnvironment and Dev-elopment, Agenda 21, U.N. Doc. A/CONF. 151.26,1992
The topics addressed in Agenda 21, which have been detailed since itsintroduction, cover a wide range of aspects of our civilization, includingregional differences. As the main examples, we can point out: populationand consumption (demographic policies, consumption of materials andenergy); international trade, development financing and support;preservation and management of natural resources (potable water, oceansand estuaries, seashore waters, and sea pollution; air pollution; climatechanges; biodiversity; land use, agriculture, forestry); toxic waste andchemical control (agrochemicals, radioactive and non-radioactive waste);education; institutions and infrastructure (transportation, health).
The recent ratification of the Kyoto Protocol is yet another statement ofhow important sustainable development has become over the past few years.
Agriculture and sustainable development
Agriculture is enormously relevant to human development. Clearly,today’s food supply is insufficient for the six billion inhabitants on the planet,and in spite of the efforts set forth in Agenda 21 with respect to rationaldemographic policies, the world population should reach nine billion withina few decades. Agriculture is a business that will grow together with theglobal demand. The question that has been asked more and more often is asfollows: can agriculture be performed without harm to the ecosystem?
As a matter of fact, according to the concepts of the “green revolution,”including the intensive use of materials and water, the sustainability ofagriculture is an open question in the best-case scenario; many of thepractices are clearly unsustainable. However, we should acknowledge thatthey have been essential in diminishing hunger around the world over thepast few decades. Considering that human development and environmentalprotection should not be exclusive of each other, what is the properbreakeven point, and how can we evolve into sustainability?
Part of the answer to that question lays in the appropriate use of theproduction factors: technologies and investment. The stronger emphasis onsustainability is a very recent thing; many of the “modern agriculture”paradigms of twenty years ago are now contested from the emergingstandpoint. On the other hand, it is clear that the definitions contained inAgenda 21 are very general, which demand additional efforts towardsapplication to such a diverse sector as agriculture. Agriculture – as well asurban concentrations and most human activities –, in practice, breaks naturalecological functions; there will always be some kind of conflict between itand the “environmental” part of sustainability.
Introduction
41
Examples that are replicated in many countries are evidence of the distancebetween the systems in use and the sustainability ideals. A recent analysis2 ofagriculture in the United States shows the origin of the system that somewhatprevails today: strong federal intervention, starting in 1930, combining priceand income (subsidies) with a subsidized “conservationist” agriculture. Here,“conservation” is different than “environmental protection”: it is aboutmaintaining potential resources, preventing waste and maximizing productivity,focusing on utilization for the population. The following are two importantexamples:
• Irrigation projects in the western United States (such as that of YakimaValley), initiated in 1902. There are 46 million acres of irrigated soil in theWest (water depth of 0.9 m) with infrastructure paid by the federal gov-ernment; the water is still strongly subsidized today. The sustainability ofthat is questioned (water availability limitation, competition for land forother purposes, soil contamination, dragging of fertilizers and pesticides).In the western states, irrigated crops are responsible for 89 percent of thecontaminated river sections and more than 40 percent of the pollution incontaminated lakes.• Drainage projects in grain and cotton-growing areas; drainage wasintensively used since 1930, with federal resources, to increase produc-tion areas. States like Iowa, Illinois and Minnesota were converted fromsystems that were rich in water into large dry, arable areas (according to“conservationist” concepts). Such “dry land agriculture” has been veryimportant to the US and the world. But the price to pay is the large vol-ume of polluted waters which the drainage system discharges without soilfiltration to rivers and lakes.
This is how Agenda 21 (properly) defines the tough problem ofagriculture for the next few years: “By the year 2025, 83 percent of the expectedglobal population of 8.5 billion will be living in developing countries. Yet thecapacity of available resources and technologies to satisfy the demands of thisgrowing population for food and other agricultural commodities remains uncertain.Agriculture has to meet this challenge, mainly by increasing production on landalready in use and by avoiding further encroachment on land that is onlymarginally suitable for cultivation”.
Any intervention in nature and living organisms (even when the purposeis to cure diseases and degenerative processes) implies the choice of optionsthat are selected according to predetermined goals and considering theuncertainties inherent in these choices. The same applies to sustainabledevelopment proposals.
Sugar cane’s energy
42
2 DAVIDSON, J.H.: “Agri-culture”, in: DERNBACH,J.C. (Ed.): Stumblingtoward sustainability,Washington DC, Environ-mental Law Institute,2002
In the search for effective alternatives for achieving sustainability inagriculture, and considering the pressures that this activity intrinsically puts onthe environment, a suggestion made for the American agriculture2 seemsappropriate: agriculture should be both internally and externally sustainable,while serving as an available resource with which to assist other sectors of theeconomy and society.
• Internal sustainability includes the ability to preserve its resources bypreventing soil and water degradation, and to respond to pests and dis-eases of the relevant plants, to climate changes, and to market changes.This should occur without any dependence on direct financial supportfrom the government.• External sustainability means not imposing costly externalities on the“non-agricultural” society or the local environment.• Responsive sustainability is the ability to assist other sectors (for exam-ple, generating “clean” energy from biomass, restoring degraded soilsand riverside woods, producing excess to satisfy the needs arising out ofany falls in other locations, and creating jobs and income).
These practical guidelines can be very helpful in planning and assessingsustainability in agricultural sectors. The will be used in the course of thisstudy in respect of Brazil’s sugar cane production. Despite not seekingabsolute parameters in many cases, these guidelines help by putting thecurrent situations and trends in perspective. The guidance resulting fromthese observations will contribute to have the steps appropriately orientedtowards the industry’s sustainability.
The sugar cane agribusiness in Brazil
Sugar cane growing in Brazil covers an area of nearly six million hectaresin all geographic regions, reaching a production of approximately 420 milliontons in 2006/07, which represents a quarter of the world production. Around50 percent of that was used in sugar production (30.6 Mt), and 50 percent inethanol production (17.4 Mm3), in 320 industrial units. There are around 77new units in construction or in advanced project stage today, and they areexpected to start up within the next six years.
Sugar cane production increased from around 120 to 240 million tonsfrom 1975 until 1985, especially as a result of PNA, and remained stable onthat level between 1985 and 1995. Another growth cycle started in 1995,basically motivated by sugar exports. In 1990, sugar exports amounted to 1.2Mt, and then increased to 19.6 Mt in 2006, demonstrating the Brazilianproduct’s extraordinary increase in competitiveness.
2 see p.42
Introduction
43
Meeting the domestic and international demand for ethanol and sugar(estimations: see 11.3 and 11.5) would require a production of around 680 Mt ofsugar cane per year by 2012-2013 (an increase of 60% the current production).
The production system comprises mills having very different capacities(from 0.6 to 6.0 Mt of processed sugar cane / year); on average, the millsproduce sugar cane on their own land, or on leased land or agriculturalpartnerships (around 70%), and the remaining 30 percent are supplied byindependent growers, which amount to around 45,000, most of whom useless than two agricultural modules. The two producing regions are theNortheast (15%) and the Center-South (85%).
Governmental controls (production and export quotas, prices, and subsidygrants for production and transportation of both sugar and ethanol) have beeneliminated by a transition system implemented in the early 1990’s and concludedin 1998. Today, the government is present in the regulation of hydrous andanhydrous ethanol specifications and in the determination of the ethanol contentof gasoline. The prices are free at all levels of the supply chain, and ethanol is soldin nearly 29,000 fuel stations all over the Brazilian territory.
The pertinent themes of a sustainability analysis of any important sectorof human activity entail a number of fields of knowledge if appropriatelyaddressed in the entire life cycle. The interdependence among these fields maycause any such analysis to be “incomplete,” allowing for an increase in scopeand depth, and the consideration of new points of view. In this study, we tryto be critical in a constructive way, relying on many experts and differentviews. The intention is to apply the formalized sustainability concepts to thesugar cane industry as it is today in the Center-South region of Brazil withgreater clarity and depth, and seeking opportunities to strengthen it.
A number of “uncertainties” are facing world agriculture today (includingthe sugar cane agribusiness), and they affect each country in a slightly differentway. For example: uncertainties about the future of transgenic plants and theirimplications; uncertainty about the magnitude and timing of global climatechanges (heating and rainfall); and uncertainty about the world markets,which is deepened by protectionist practices (or elimination thereof).
One of the most important facts demonstrated in this study is that underthe present conditions of Brazil’s sugar cane agribusiness, there is a veryrelevant set of responsive sustainability activities in the industry (a part ofwhich being already in progress, and another part appearing as potential)which can make it a promising example in the international context.
Sugar cane’s energy
44
Production processes in Brazil
A simplified description of the production processes helps one understandthe relations between the sugar cane agribusiness and the environment. Thereare sugar cane crops in more than 80 countries around the world, withvariations concerning growing periods and techniques, depending on localconditions. It is characterized as a very highly photosynthesis-efficient culture(thereby featuring great biomass production per unit area).
In Brazil, sugar cane is grown mainly in large areas in the Northeast andCenter-South regions. Five or six harvesting cycles are completed before thesugar cane crop is reformed, and the harvesting period extends for six toseven months. The entire production process is labor-intensive, especially theharvesting, while the expansion of mechanical harvesting has been reducingthe number of jobs (per production unit) and also the seasonal index. Sugarcane crops use fertilizers and agrochemicals moderately, and recycle allindustrial waste from ethanol and sugar production as crop fertilizers. Theuse of sugar cane burning before harvesting (removing the leaves to facilitateharvesting) is gradually decreasing by virtue of environmental and safetyrestrictions in some areas, but still prevails.
Sugar cane transportation to the industry (in fact, the integratedharvesting, loading and transportation operation) has evolved very much toavoid agricultural soil compactation and reduce costs using high-capacitysystems within the legal limits of the highways.
The sugar cane crop is used to produce ethanol and sugar; a part of thecane is washed for removing mineral impurities (manually harvested sugarcane only). An extraction system (in Brazil, almost exclusively milling: thesugar cane is chopped, shredded, and goes through a series of millingequipment) separates the juice, which contains sucrose, from the fiber(bagasse). For sugar production, the juice is cleaned (settling and filter-press,whereby the filtercake is removed), concentrated and crystallized. A part ofnon-crystallized sugars and impurities (molasses) is separated. In Brazil, it isusually much richer in sugar, avoiding the final crystallization stage, and it isused as a fermentation material added to the juice.
Such mixture is taken to the appropriate concentration and fermentedwith yeasts; most systems are fed-batch type with yeast recycling, but there arecontinuous processes. The resulting wine is distilled, whereby ethanol isproduced (hydrous or anhydrous) and vinasse is left as waste (the sugar canewater and the water added in the milling process, the organic matter andimportant minerals, such as potassium, which came along with the sugar cane).
Introduction
45
The entire energy consumed by the process (electrical power;mechanical energy, for activating some pumps, fans and milling equipment;and thermal energy, for the juice concentration and distillation processes) issupplied by combined heat and power systems that use only the bagasse asthe energy source; the mill is self-sufficient and usually has excess energy.
The waste of the industrial processes consists of vinasse, filtercake, andbagasse boiler ashes. There are totally recycled to the crops: vinasse in liquidform, for ferti-irrigation; the filtercake is transported on trucks as a fertilizer.The industrial processes use water (collected from rivers and wells) in severaloperations; there is intense recycling to reduce both withdraw and the levelof treated waste disposal.
Sugar cane’s energy
46

IIImpacts on the use
of material resources
49
One of the important contributions provided by the socioeconomic analy-ses that began to include such parameters as consumption of energy and mate-rials in the 1960’s and increasingly in the 1970’s was the reaffirmation thatbeyond certain levels (which are relatively low), human well-being (“quality oflife”) is independent of the increase in consumption of such items.
However, what has been noted until the present day is an importantincrease in specific consumptions by the planet’s populations, with a greateremphasis on developed countries, especially those which were major con-sumers already.
In 1997 that situation was well quantified in the argument1 that it wouldbe possible to double the humanity’s well-being while reducing the use ofenergy and resources by half; the factor 4 could be proposed as a target pro-ductivity increase for the use of resources. There are those who propose uti-lization of a factor 10 for the flow of materials in the OECD countries.
Energy and raw materials are usually the topics considered in such stud-ies, and fresh water is a theme that increasingly arouses great concern. In thecase focused on herein (sugar cane production and processing), these threeitems will be considered separately, with energy and raw materials inChapters 2 and 3, and water in Chapter 5. The use of other agricultural andindustrial materials (pesticides, fertilizers, lubricants) is relatively small, andwill be approached in the following sections.
In the considerations on energy and raw materials, one of the mostimportant characteristics of this agribusiness is noted: it is essentially anindustry that uses the extraordinary efficiency in sugar cane photosynthesisto produce basic materials (lignocellulosic materials and sucrose) from solarenergy. Therefore, its role in the impacts on energy and material resourcesboth potentially and actually is not that of a user, but rather a supplier. In thisrespect, it is a classic case of “responsive sustainability,” as it helps otherindustries; today this is very important in terms of energy, and is now start-ing to be explored for other material resources.
1 WEIZSACKER, E.; LOVINS,A.; LOVINS, H.: “Factorfour: doubling wealth,halving resource use”,1997

Chapter 1:Share in the use of fossil energy
1.1 Introduction; the global context
Isaias de Carvalho MacedoNIPE / UNICAMP
Energy is essential to mankind in its search for a healthy and productive life; itis necessary for the production of foods, clothing and other basic goods; for build-ings, homes, trade, hospitals and healthcare, education; and the transportation ofcargo and people. On the other hand, the production of energy based on fossil fuels(more than ¥ of the world’s current total production) has resulted in environmen-tal pollution associated with extraction, local air pollution, regional pollution byacid rain, and global pollution by greenhouse gas emissions. Its utilization on a largescale is clearly leading to the depletion of resources, leaving a heavy burden forfuture generations.
For the energy sector, sustainable development should consider a more efficientuse of fuels based on non-renewable sources, new technologies to significantlyreduce the local and global pollution resulting from fossil fuels, and an increaseddevelopment and implementation of the use of renewable energy sources.
The use of oil over the past fifty years is probably the most spectacular exampleof depletion of non-renewable resources caused by mankind. As early as 1989 it waspossible to foresee, even considering all the possible ways to extend the oil supply(natural gas conversion, non-conventional oil, shale oil, bituminous sands), that thesupply peak would take place around 2020 (conventional oil: before 2010). Thelarge-scale use of coal (if at all possible with its environmental limitations) couldpostpone by ten years that supply peak.1 More recent evaluations are no longer opti-mistic, quite the opposite: the Global Hubbert Peak (time when the world supply ofconventional or non-conventional oil and liquid natural gas ceases growing, startingto decline year after year) is expected to occur before 2020,2 and some estimationspoint to some time before 2010 (for the most part, because of the present instabilitythat may prevent the increase in oil supply from the Middle East).
51
2 OLSON, R.L.: “The endof the oil age: How soon?How real? How critical?”,Institute for AlternativeFutures, 2004
1 BOOKOUT, J.F.: “Twocenturies of fossil fuelenergy”, Episodes, vol.12, 1989, pp. 257-262
The production of ethanol from sugar cane in Brazilleads to important savings in fossil energy; for instance,ethanol from corn in the United States needs a ratiobetween renewable energy production and fuel fossil uti-lization that is under a fourth of the Brazilian equivalent.This relation can still be improved in Brazil with better useof the bagasse and cane trash for electricity or other energyutilization.
The world use of energy by resource in 2000 was 77% from fossil sources(half of which of oil, and the rest consisting of natural gas and coal); 15% fromhydraulic energy and traditional biomass, 6% nuclear, and 2% from “new”renewable sources.3 “New” renewable sources include biomass as commercialenergy, such as ethanol, whereas “traditional” biomass is essentially firewood andresidue, of which the production is neither organized nor sustainable.
Most important (and preoccupying) is the consideration that ten years afterthe oil supply peak, a substitute will be needed for around a half of the oil thatwe use today, i.e. a substitute for 10 to 15 billion barrels a year.
A strong restriction that will be imposed on the solutions being sought derivesfrom today’s acknowledgement that fossil fuels are responsible for the most anthro-pogenic GHG (Greenhouse Gas) emissions, and that the increased concentrationsof atmospheric CO2 are responsible for global climate changes. From the pre-indus-trial concentration level (~250 ppm), we have now reached around 380 ppm; annu-al emissions increased from 1.9 Gt C per year (1954) to 7.0 Gt C per year in 2003.If the emissions are maintained on that level (7.0 Gt C / year), we may reach overthe next decades an equilibrium concentration of ~500 ppm.4
The magnitude of the problem and the very scarce time to implement solu-tions (or, in fact, to develop them) have been somewhat “ignored” by a large por-tion of those responsible, partly based on vague considerations about the coalreserves and new, “cleaner” technologies for its use, and even the return of nuclearenergy on large scale. Those who are already convinced of the need for environ-mental sustainability view renewable energies (sunlight, biomass, wind, water)and all possibilities of energy conservation (including a rationing of the end use)as the natural answer.
Challenges are posed to the implementation of any source as an alternativeto oil. For non-renewable sources (natural gas, coal, shale oil), the cost, the needfor carbon sequestering, other environmental impacts, and availability (naturalgas) are the main challenges. Energy conservation is very important, but itwould not be enough. Among renewable sources, hydraulic, biomass and windare important, but not enough either. Wave, geothermal and solar energy (PV)still feature very high costs. Nuclear (fission) entails radioactive waste treatmentand security problems.
The global energy consumption has a strong motivation to grow (ratherthan stabilize or especially decrease) because of the enormous regional uneven-ness of its use. Around one third of the world’s population today (two billionpeople) have no commercially available energy to so much as cook food. In1992, a single country that has 5% of the world’s population (the United States)used 24% of all the energy on the planet; ten years later, in 2002, that samecountry had increased its energy use by 21%. The high growth rates seen inChina and India, for example (and their environmental consequences), areindicative of the changes that are already taking place.
Sugar cane’s energy
52
3 SAWIN, J.L.: “Renewablepower: on the brink of anenergy revolution”,Worldwatch Institute,2004
4 SOKOLOW, R.; PACALA,S.; GREENBLATT, J.:“Wedges: early mitigationwith familiar techno-logy”, 7th Int. Conferenceon Greenhouse GasControl Technologies,Vancouver, 2004
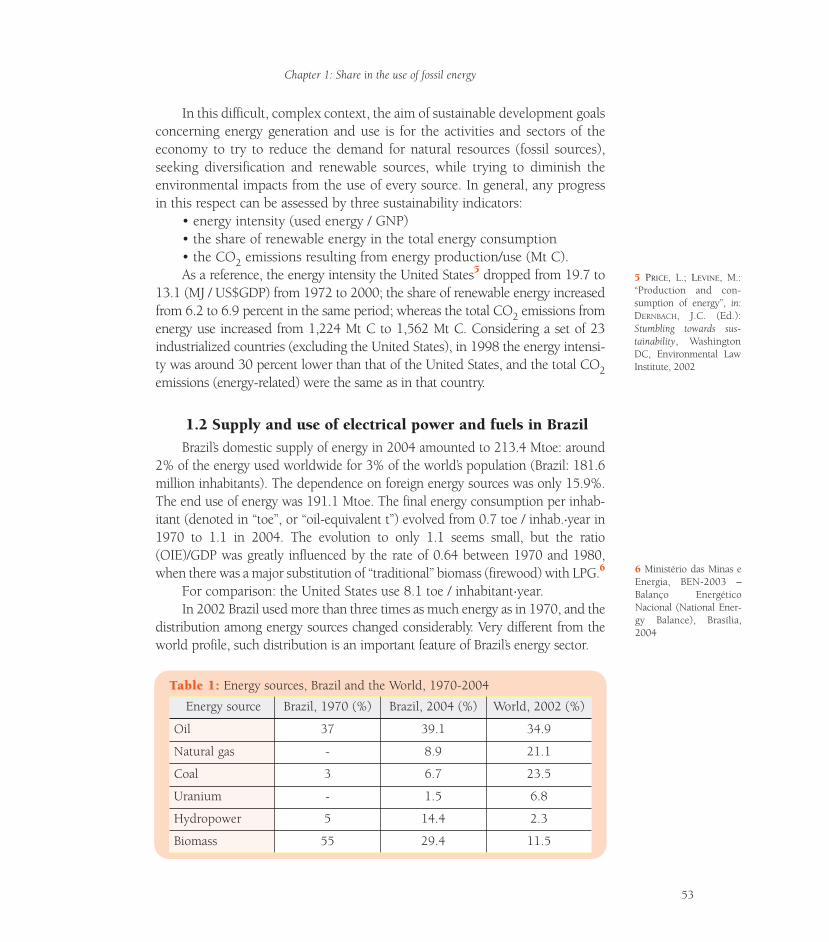
In this difficult, complex context, the aim of sustainable development goalsconcerning energy generation and use is for the activities and sectors of theeconomy to try to reduce the demand for natural resources (fossil sources),seeking diversification and renewable sources, while trying to diminish theenvironmental impacts from the use of every source. In general, any progressin this respect can be assessed by three sustainability indicators:
• energy intensity (used energy / GNP)• the share of renewable energy in the total energy consumption• the CO2 emissions resulting from energy production/use (Mt C).As a reference, the energy intensity the United States5 dropped from 19.7 to
13.1 (MJ / US$GDP) from 1972 to 2000; the share of renewable energy increasedfrom 6.2 to 6.9 percent in the same period; whereas the total CO2 emissions fromenergy use increased from 1,224 Mt C to 1,562 Mt C. Considering a set of 23industrialized countries (excluding the United States), in 1998 the energy intensi-ty was around 30 percent lower than that of the United States, and the total CO2emissions (energy-related) were the same as in that country.
1.2 Supply and use of electrical power and fuels in BrazilBrazil’s domestic supply of energy in 2004 amounted to 213.4 Mtoe: around
2% of the energy used worldwide for 3% of the world’s population (Brazil: 181.6million inhabitants). The dependence on foreign energy sources was only 15.9%.The end use of energy was 191.1 Mtoe. The final energy consumption per inhab-itant (denoted in “toe”, or “oil-equivalent t”) evolved from 0.7 toe / inhab..year in1970 to 1.1 in 2004. The evolution to only 1.1 seems small, but the ratio(OIE)/GDP was greatly influenced by the rate of 0.64 between 1970 and 1980,when there was a major substitution of “traditional” biomass (firewood) with LPG.6
For comparison: the United States use 8.1 toe / inhabitant.year.In 2002 Brazil used more than three times as much energy as in 1970, and the
distribution among energy sources changed considerably. Very different from theworld profile, such distribution is an important feature of Brazil’s energy sector.
Chapter 1: Share in the use of fossil energy
53
5 PRICE, L.; LEVINE, M.:“Production and con-sumption of energy”, in:DERNBACH, J.C. (Ed.):Stumbling towards sus-tainability, WashingtonDC, Environmental LawInstitute, 2002
TTable 1:able 1: Energy sources, Brazil and the World, 1970-2004
Energy source Brazil, 1970 (%) Brazil, 2004 (%) World, 2002 (%)
Oil 37 39.1 34.9
Natural gas - 8.9 21.1
Coal 3 6.7 23.5
Uranium - 1.5 6.8
Hydropower 5 14.4 2.3
Biomass 55 29.4 11.5
6 Ministério das Minas eEnergia, BEN-2003 –Balanço EnergéticoNacional (National Ener-gy Balance), Brasília,2004
The two energy sources at the bottom are renewable.Electrical power (14.4% of the total energy supply) reached 424 TWh
(8.8% being imported, and only 8.9% from self-producers), around 75% beingproduced by hydroelectric power plants. There was an installed power of 90.7GW, 8% from self-producers.
Oils and derivatives (including LNG), accounting from 39.1% of the sup-ply, corresponded to a production of 1.54 M barrels / day and a net depend-ence on imports of 10%, especially concerning diesel, LPG and naphtha.
Natural gas corresponded to 18.9% of the supply, with 32% to imports.The supply of firewood (13.2% of the total supply) was used in the
domestic and industrial sectors, as well as for charcoal production.The sugar cane industry accounted for 13.5% of the total supply, pro-
ducing 0.23 M barrels / day of ethanol and 6.97 TWh of electricity, 14% ofwhich were sold (surplus production). Bagasse production (102 M t) was usedin co-generation for eletricity and heat in the sugar mills
On the other hand, the final consumption of 191.1 Mtoe occurred main-ly in the transportation (26.9%) and industrial sectors (37.8%), as well as inthe residential sector (11.2%).
Between 1970 and 2004, our share of “renewable energy” dropped from58.4 to 43.9%. Such reduction corresponded to the coming of LPG and fuel oilas substitutes for firewood, with much more efficiency (for home and industrialuse), and also the substitution of charcoal with metallurgical coke in steel works.In the early 1970’s, most of the firewood production was not renewed, partlypredatory, with energy production as the main use. In the 1980’s Brazil’s energyproduction drifted away from the model that still widely predominates in devel-oping countries: extensive use of “traditional” biomass coming essentially fromdeforestation firewood. A remarkable example is that the commercial availabilityof energy (LPG in this case) for cooking in Brazil reaches 98% of all homes today,whereas one third of the world’s population have no access to it.
The current trend is again towards an increase in biomass energy, but on asustainable basis; charcoal from planted forests is an example. During this peri-od, there were major increases: in hydropower (5.1 to 14.4%) and sugar caneproducts (5.4 to 13.5%); the total renewable energy (43.9%) is substantiallylarger than in the rest of the world (14%). The relative share of natural gas, ura-nium and charcoal in Brazil is around one third of the world’s share (%).
One of the consequences is that Brazil appears in a privileged position,with emissions of 1.62 t CO2 eq. / toe, against a world average of 2.32. It isvery possible that the sugar cane industry may substantially increase ethanolproduction because that product currently competes with gasoline, and theinternational demand has been growing. That will have effects on electricalpower production as well (combined heat and power in sugar mills).
Sugar cane’s energy
54
We can say that the supply of energy for Brazil’s growth arouses no con-cerns as to a lack of options; the country has abundant renewable resources(biomass and hydropower); even on the fossil fuel front, oil and natural gascan meet the foreseeable requirements in the short term. There is room toincrease the utilization efficiencies and reduce energy waste.6
On the other hand, there is, to some extent, a deficiency in a solid, sus-tained, integrated planning on the energy sector. The following are two criti-cal cases where policies are deficient: in the electrical energy sector, for com-plementary thermal generation and, generally, for distributed generation; andin the field of transportation fuels (a sector that uses 27% of all the country’senergy), where fast variations in the options (fleet “dieselization”; ethanol;NGV, flex-fuel vehicles, etc.) have been causing high losses.
Those two cases are pertinent to the analysis of the sugar cane producers’role in the substitution of fossil energy in Brazil (in the present situation andthe prospects for the next few years).
1.3 Distributed generation (and combined heat and power)in Brazil: the need and opportunity in the next twentyyears
Jayme Buarque de HollandaINEE – National Institute of Energy Efficiency
Marcos José MarquesINEE – National Institute of Energy Efficiency
The electrical power policies have long given priority to meeting the pop-ulation’s requirements through central generation (CG) systems based on largegenerators of which the locations are usually far from consumer centers. Theidea is that only through large-scale production is it possible to assure moder-ate costs, despite the inconveniences associated with complex transmissionsystems where 10-15 percent of the energy production are lost, thereby requir-ing additional 20-30 percent power at the location of use.
That concept consolidated worldwide over the past century, when elec-trical power systems were shaped around large monopolies, several of whichintegrating the generation, transmission and distribution on a vertical basis.After successive oil crises, the search of new alternatives and a real technolog-ical revolution increasingly enabled what is called distributed generation(DG): electrical power generation near or next to the load.
Development took place mostly in countries where the supply of distrib-uted natural gas increased, thereby facilitating the use of combined heat and
Chapter 1: Share in the use of fossil energy
55
6 see p. 53
Sugar cane’s energy
56
power: a thermoelectric power plant where the heat that would be lost in theCG is used in the processes (production, heating or cooling). Such more effi-cient solution is typical of DG because the thermal power cannot be transport-ed for long distances; the rejected heat used in DG contains more than half theenergy of the fuel used, and that saving compensates for the costs associatedwith small-scale production. But DG is not limited to this technology, or size orspecific source limitations. It can use solar cell panels, energy available fromproduction processes in the form of gases and wastes. Like in the sugar caneindustry and in many other sectors.
In Brazil, DG still has a minimal share in the electrical power supply, inspite of its great potential. To name one item, the sugar cane biomass that wasprocessed for the 2004/05 crop had an energy content of 46 million toe7; it isbeing used at low efficiency rates in the sugar and ethanol industry because ofthe difficulty in exporting electrical power to the power industry. In compari-son, the hydropower used in the same year was around 30 million toe, and thecountry’s oil production was 77 million t.
Even though DG has not been formally prevented, it has been made difficultbecause it breaks a hundred-year tradition and changes the economic basis of thetraditional service. For example, the full use of sugar cane energy recommendedat the end of the second stage of the Proálcool program was left aside for notadapting to the electrical power industry’s traditional culture. The lack of a well-structured policy for natural gas has led to the prioritization of its use in central-ized generation, which is an unsuccessful option that contrasts the situation inPortugal, for example. Here NG (natural gas) was preceded by efforts to developcombined heat and power together with consumers, which went as far as to cre-ate a secondary market and increase operational flexibility. The development ofDG also requires that the inert position of new players be overcome and that theopportunities be noticed. Such process can be accelerated if some of the culturalresistance is removed, provided that there is political will.
By acknowledging DG and removing some of the barriers to distributors,and in spite of some lack of definition concerning operational aspects, the newmodel of the electrical power sector (Law no. 10,848/04) and its regulation cre-ate the conditions for the full realization of that potential. The expansion of DGin Brazil should rely on two complementary facts. On one hand, the tradition-al electrical power sector has failed to prove itself capable of meeting the grow-ing demand; on the other hand, the country has at least two very importantvocations for DG which are going through a maturing process. It is worthdetailing these points.
The successive crises in the electrical power sector have been taking place sincethe late 1990’s, and have not been more acute only because the country had an
7 Estimation based onthe National EnergyBalance – BEN 2005,adjusted to include thestraw currently burned inthe field, ethanol final usewas 6.8 M toe.
installed overcapacity and the increase in demand over those years was mediocre.The model that would organize the sector on new bases, incorporating a broad pri-vatization process, gave rise to a situation in which investments in new CG unitswere not made, which led the government to make an intervention, back in 1999,through a thermoelectric power plant (PPT) construction incentive program, whichhas proved completely wrong. The lack of energy wound up causing the 2001 cri-sis, which was solved mostly by shrinkage of the market and decisive actions in theconservation context. That was followed by a period of immobility, and the actionsfor construction of new CG units extended for nearly three years.
The crisis showed how convenient DG was, but in stead of developing thecountry’s potential together with customers having a potential for DG, the coun-try opted for a centralizing and “transitory” solution with the Brazilian EmergencyEnergy Seller (CBEE). The only successful aspect of the reform was the construc-tion of transmission lines that were considered natural monopolies. Inasmuch thecosts of that service were “packed” with other costs, especially those of the gen-eration having already been amortized, they were not felt in their true dimension.However, upon adoption of a more realistic cost policy, transmission prices raisedstrongly and point to an increase in margins, which is a factor that further valuesthe strengthening of DG.
Today a scenario based exclusively on CG to meet the new demand withprivate investment is not so likely to occur. On the other hand, the attractivepoints of DG began to grow again following the announcement in 2003 thatimportant natural gas reserves were found near Brazil’s main urban and indus-trial centers. Considering the problems of its destination to CG in the past,Petrobras has declared its intent to distribute that gas.
Ethanol, whose use as a fuel had been decreasing until the end of lastdecade, when at some government levels people were already working underthe assumption that its use in transportation would substantially decrease, hasalso gained ground. The current demand for ethanol is going through a boomin both the international market (it is the only “clean” gasoline oxygenizer andhas been adopted in several countries as a substitute for MTBE) and thedomestic market, where sales of ethanol-powered and bi-fuel vehicles aregrowing on the back of an attractive price.
The sugar cane industry has been expanding its installed DG capacityeven with the crisis, after which the construction of CG units was paralyzed.The incorporation of this new business with no linkage with others can reducerisks, thereby leading to a virtuous cycle of cost reduction for all products. Asimilar synergy took place upon implementation of the Proálcool program,when the industry used the sugar production modernization and intensivelybenefited from the new stimulus, improving agricultural and industrial pro-ductivity while lowering its costs, which are now the lowest in the world. The
Chapter 1: Share in the use of fossil energy
57
existence of reliable energy and raw material (sucrose) brings prospects fornew products, as in the case of corn processing. This form of DG has severalother interesting aspects. These include the greater reliability and quality ofthe energy, and the broader utilization of labor per energy unit generated. Forthe mills, it brings an opportunity to recover and modernize energy systems,making them more efficient and producing surplus power.
The energy is competitive, as demonstrated by the existing operationswith distributors, and even the recent tender of more than 300 MW for R$ 93per MWh within the scope of PROINFA (Alternative Electric Power SourceIncentive Program), when the projected costs for new hydroelectric and ther-moelectric power plants are R$ 105 and R$ 120 per MWh, respectively.
Therefore, a scenario that increasingly emphasizes DG seems to be themost effective way to meet the new demand for electric power, while beingattractive to the private enterprise. With the introduction of a large number ofnew players, the demand would be met more consistently with its growth andwith fewer idle investments. DG is the most advisable way of meeting therequirements of some specific consumers, but it indirectly benefits all con-sumers who are interconnected with the electrical power system. Since onlysome specific sectors can perform DG competitively, most electrical power con-sumers will continue to depend on the interconnected system that takes theenergy to them regardless of the source, whether CG or GD. Even when theyare inactive, DG units increase the power reserves together with the loads,thereby reducing risks of blackouts and dismissing improvised solutions likeCBEE. Accordingly, DG does not compete, but it complements and improvesboth existing and future CG systems.
There is a lot of room for DG development to take place in harmony with,and as a complement to, the existing CG system, as well as that which is yetto be built; little by little, authorities and regulating agencies will consider thisa natural scenario, perfecting the rules and guidelines that implicitly presup-pose DG, as has occurred in several countries.
Recently the National Energy Plan for 2030 acknowledges the importanceof DG, especially the generation derived from the so called alternative sources,forecasting an increase of more than 15,000 MW by 2030. For the sugar caneindustry a conservative projection is made for 4,000 MW (till 2030), with1,100 million t sugar cane being processed annually. Accordingly, the BNDES
(National Social and Economic Development Bank) is including in its financ-ing projects specific incentives for the use (by the sugar cane industry) of moreefficient technologies for energy production in the sugar mills.
It is difficult to provide a quantitative overview of the role to be played byDG in Brazil. Studies conducted by INEE – National Institute of Energy Efficiency
Sugar cane’s energy
58
show that it is perfectly possible to account for 10 to 20% of Brazil’s require-ments within the next ten to fifteen years. Although it seems a small share, sincethe DG base is currently inexpressive (lower than 5%), an increase could repre-sent a dramatic share of the new potential in an activity that will be turning overa few billion reals a year within the next few years.
1.4 Energy production by the sugar cane industry:fossil fuel substitution
Isaias de Carvalho MacedoNIPE / UNICAMP
Brazil’s sugar cane production has an important characteristic, among others:the production system has been designed and developed (varieties, agriculturalpractices) to be independent of irrigation. High levels of photosynthetic conver-sion (mainly sucrose/hectare) were sought using selected varieties and recyclingof all by-products (including crop residue water in ferti-irrigation) for the field.The basic oritentation has never been towards a maximum biomass production.Much higher biomass values could be achieved by using irrigation and/or choos-ing specific varieties, which, however, would reduce (considering currentoptions) the sucrose/ha values or, ultimately, increase the sucrose cost (in R$ /ton). This option is not being considered (at the moment).
1.4.1 Current energy supply from the industry
For the year 2002, based on a sample of mills located mainly in theCenter-South region, the production characteristics were as follows8:
• Sugar cane harvest: the estimation for Brazil is 65% manual harvesting, and35% mechanical harvesting (34% in 2005); 80% of the sugar cane is burnt.• Sugar and fiber content of the crop residue: the mean values for theperiod between 1998 and 2002 were 14.53 sucrose % of sugar cane (14.2in 2005), and 13.46 fiber % of sugar cane (Center-South).9
• Agricultural productivity: the mean value for several areas within theCenter-South region from 1998 until 2002 was 82.4 t of sugar cane /ha.year (82 in 2005; on the harvest area); the mean age of reform was5.33 harvests (2001-2002).9 Considering 5 harvesting periods, the pro-ductivity (total area) is 68.7 t of sugar cane / ha.year.• Brazil’s sugar cane production evolved from 80 Mt / year (1970) to 149Mt / year (1980), 222 Mt / year (1990), 256 Mt / year (2000), and 425 Mt/ year (2006). In 2005/06, around 50 percent of the sugar cane was usedin ethanol production, and the other half in sugar production. These fig-ures refer to the weight of crop residue ready for industrial processing,excluding the vegetable matter on sugar cane tips and leaves.
8 SEABRA, J.E.; LEAL.M.R.L.V.; MACEDO, I.C.:The energy balance andGHG avoided emissionsin the production / use ofethanol from sugar canein Brazil: the situationtoday and the expectedevolution in the nextdecade; XVI Interna-tional Symposium onAlcohol Fuels, Rio deJaneiro, Nov 2006
9 CTC – Centro deTecnologia Canavieira,Controles MútuosAgrícolas Anuais – Safras1998/1999 a 2002/2006
Chapter 1: Share in the use of fossil energy
59
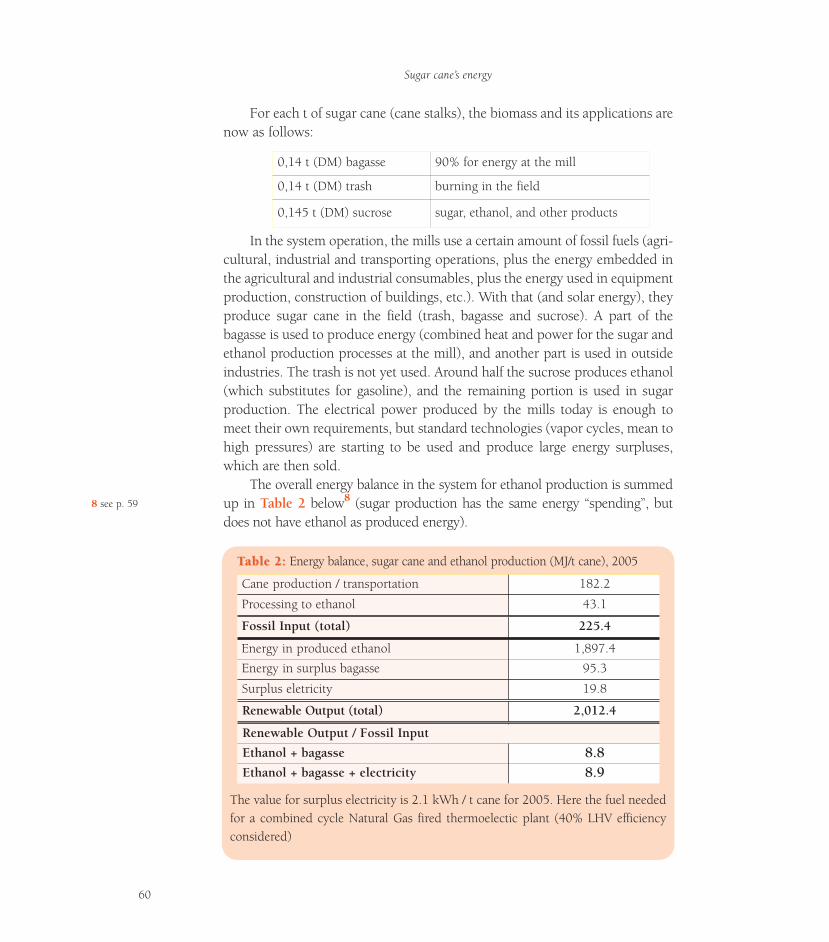
For each t of sugar cane (cane stalks), the biomass and its applications arenow as follows:
In the system operation, the mills use a certain amount of fossil fuels (agri-cultural, industrial and transporting operations, plus the energy embedded inthe agricultural and industrial consumables, plus the energy used in equipmentproduction, construction of buildings, etc.). With that (and solar energy), theyproduce sugar cane in the field (trash, bagasse and sucrose). A part of thebagasse is used to produce energy (combined heat and power for the sugar andethanol production processes at the mill), and another part is used in outsideindustries. The trash is not yet used. Around half the sucrose produces ethanol(which substitutes for gasoline), and the remaining portion is used in sugarproduction. The electrical power produced by the mills today is enough tomeet their own requirements, but standard technologies (vapor cycles, mean tohigh pressures) are starting to be used and produce large energy surpluses,which are then sold.
The overall energy balance in the system for ethanol production is summedup in Table 2 below8 (sugar production has the same energy “spending”, butdoes not have ethanol as produced energy).
0,14 t (DM) bagasse 90% for energy at the mill
0,14 t (DM) trash burning in the field
0,145 t (DM) sucrose sugar, ethanol, and other products
Sugar cane’s energy
60
8 see p. 59
TTable 2:able 2: Energy balance, sugar cane and ethanol production (MJ/t cane), 2005
The value for surplus electricity is 2.1 kWh / t cane for 2005. Here the fuel neededfor a combined cycle Natural Gas fired thermoelectic plant (40% LHV efficiencyconsidered)
Cane production / transportation 182.2
Processing to ethanol 43.1
Fossil Input (total) 225.4
Energy in produced ethanol 1,897.4
Energy in surplus bagasse 95.3
Surplus eletricity 19.8
Renewable Output (total) 2,012.4
Renewable Output / Fossil Input
Ethanol + bagasse 8.8Ethanol + bagasse + electricity 8.9
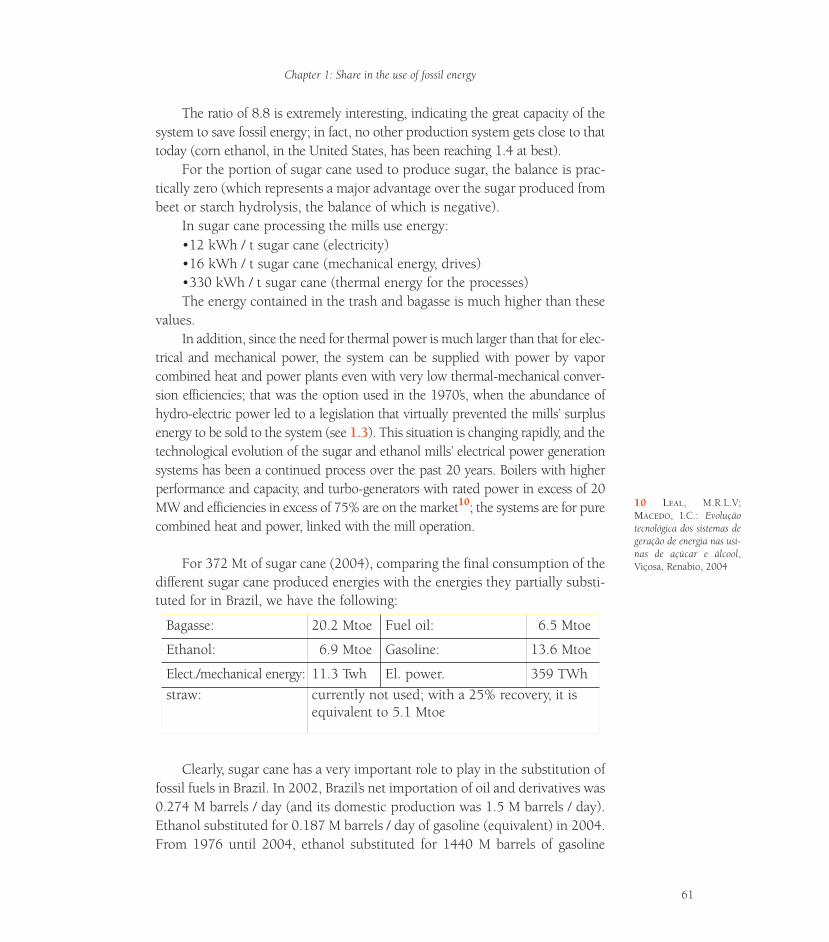
The ratio of 8.8 is extremely interesting, indicating the great capacity of thesystem to save fossil energy; in fact, no other production system gets close to thattoday (corn ethanol, in the United States, has been reaching 1.4 at best).
For the portion of sugar cane used to produce sugar, the balance is prac-tically zero (which represents a major advantage over the sugar produced frombeet or starch hydrolysis, the balance of which is negative).
In sugar cane processing the mills use energy: •12 kWh / t sugar cane (electricity) •16 kWh / t sugar cane (mechanical energy, drives) •330 kWh / t sugar cane (thermal energy for the processes)The energy contained in the trash and bagasse is much higher than these
values.In addition, since the need for thermal power is much larger than that for elec-
trical and mechanical power, the system can be supplied with power by vaporcombined heat and power plants even with very low thermal-mechanical conver-sion efficiencies; that was the option used in the 1970’s, when the abundance ofhydro-electric power led to a legislation that virtually prevented the mills’ surplusenergy to be sold to the system (see 1.3). This situation is changing rapidly, and thetechnological evolution of the sugar and ethanol mills’ electrical power generationsystems has been a continued process over the past 20 years. Boilers with higherperformance and capacity, and turbo-generators with rated power in excess of 20MW and efficiencies in excess of 75% are on the market10; the systems are for purecombined heat and power, linked with the mill operation.
For 372 Mt of sugar cane (2004), comparing the final consumption of thedifferent sugar cane produced energies with the energies they partially substi-tuted for in Brazil, we have the following:
Clearly, sugar cane has a very important role to play in the substitution offossil fuels in Brazil. In 2002, Brazil’s net importation of oil and derivatives was0.274 M barrels / day (and its domestic production was 1.5 M barrels / day).Ethanol substituted for 0.187 M barrels / day of gasoline (equivalent) in 2004.From 1976 until 2004, ethanol substituted for 1440 M barrels of gasoline
Bagasse: 20.2 Mtoe Fuel oil: 6.5 Mtoe
Ethanol: 6.9 Mtoe Gasoline: 13.6 Mtoe
Elect./mechanical energy: 11.3 Twh El. power. 359 TWhstraw: currently not used; with a 25% recovery, it is
equivalent to 5.1 Mtoe
10 LEAL, M.R.L.V;MACEDO, I.C.: Evoluçãotecnológica dos sistemas degeração de energia nas usi-nas de açúcar e álcool,Viçosa, Renabio, 2004
Chapter 1: Share in the use of fossil energy
61
(around 11.0% of the proven and condensable oil reserves in Brazil). The finalconsumption of bagasse as a fuel for industrial use was equal to the sum of allfinal uses of natural gas and fuel oil in the country in 2004, and the electricaland mechanical energy generated (for internal use) corresponded to 3 percentof the electrical energy generated in the country.
1.4.2 Potential increase in supply with the current sugar caneproduction
The industry’s goals generally include an increase in the bagasse use effi-ciency, and the development of trash recovery and use, as well as new sucroseproducts (high volume).
Two main alternatives are considered in order to increase the industry’senergy production. The most immediate of which (under way) is to increaseelectrical power generation. The second one, which is dependent on ongoingtechnological developments, would be the production of ethanol fromresidues (excess bagasse and recovered trash).
The expected increase in combined heat and power efficiency, the reductionof internal energy consumption, and the recovery of trash for energy purposeshave been extensively analyzed and are beginning to be implemented. Trashrecovery is related to programs for reducing and controlling trash burning in thefield, which are motivated by the need to control local air pollution (see item3.3); the amount of sugar cane that is not burned already represents 24% of theproduction in São Paulo, and should increase over the next few years.
Estimations of increases in surplus electrical power have been prepared forvarious technology levels, whether standard or developing ones. The operationwith standard high-pressure steam cycles with 40-percent recovered trash, ifimplemented in 80% of the systems, could lead to around 30 TWh of excessenergy (9% of the current electrical power consumption in Brazil) at the presentsugar cane production level.
The most promising technology to enable a considerable increase in themills’ generation of excess electrical power for the future (besides the implemen-tation of trash recovery) is biomass gasification integrated with gas turbine com-bined cycles (BIG/GT). The processes are not yet commercial.
Alternatively, one of the processes that is much sought after is the hydrolysisof lignocellulosic materials (excess bagasse and trash) for ethanol production.These processes arouse great interest because the abundance of raw materialsavailable in practically all regions of the world could turn ethanol into a com-modity with a large number of producers. Of the countless developing process-es,11 the highlights are those which seek cellulose and hemicellulose conversion
11 U.S. Department ofEnergy: www.bioproducts-bioenergy.gov/pdfs /HistoryofOBPandCellulosicEthanol.pdf
Sugar cane’s energy
62
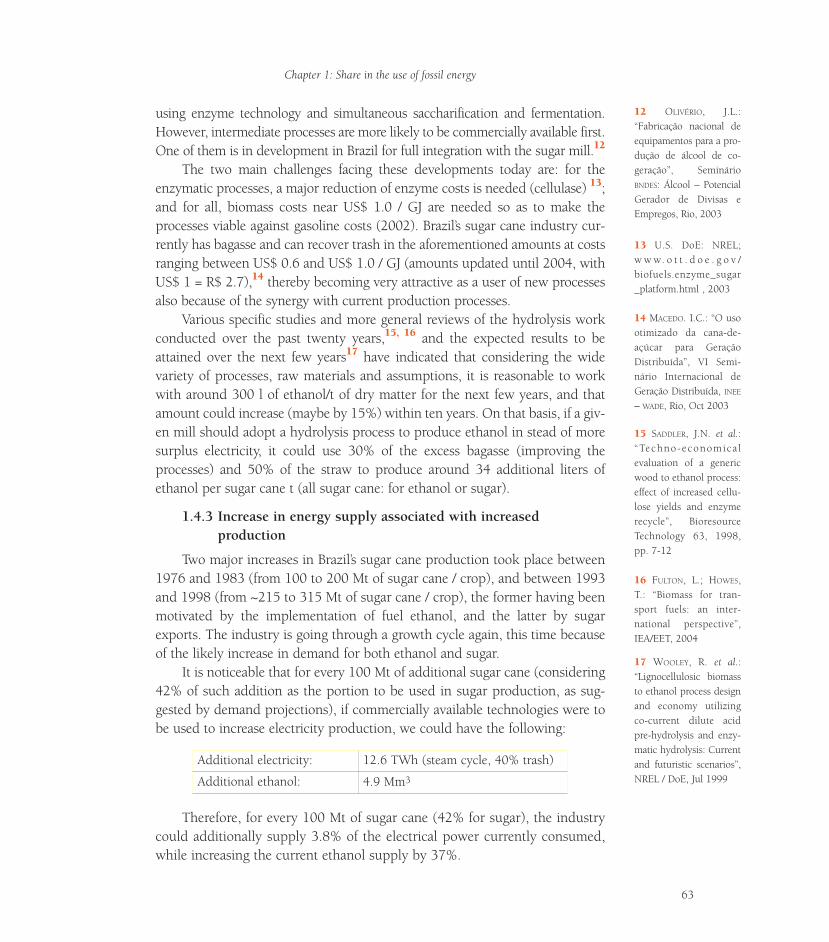
using enzyme technology and simultaneous saccharification and fermentation.However, intermediate processes are more likely to be commercially available first.One of them is in development in Brazil for full integration with the sugar mill.12
The two main challenges facing these developments today are: for theenzymatic processes, a major reduction of enzyme costs is needed (cellulase) 13;and for all, biomass costs near US$ 1.0 / GJ are needed so as to make theprocesses viable against gasoline costs (2002). Brazil’s sugar cane industry cur-rently has bagasse and can recover trash in the aforementioned amounts at costsranging between US$ 0.6 and US$ 1.0 / GJ (amounts updated until 2004, withUS$ 1 = R$ 2.7),14 thereby becoming very attractive as a user of new processesalso because of the synergy with current production processes.
Various specific studies and more general reviews of the hydrolysis workconducted over the past twenty years,15, 16 and the expected results to beattained over the next few years17 have indicated that considering the widevariety of processes, raw materials and assumptions, it is reasonable to workwith around 300 l of ethanol/t of dry matter for the next few years, and thatamount could increase (maybe by 15%) within ten years. On that basis, if a giv-en mill should adopt a hydrolysis process to produce ethanol in stead of moresurplus electricity, it could use 30% of the excess bagasse (improving theprocesses) and 50% of the straw to produce around 34 additional liters ofethanol per sugar cane t (all sugar cane: for ethanol or sugar).
1.4.3 Increase in energy supply associated with increasedproduction
Two major increases in Brazil’s sugar cane production took place between1976 and 1983 (from 100 to 200 Mt of sugar cane / crop), and between 1993and 1998 (from ~215 to 315 Mt of sugar cane / crop), the former having beenmotivated by the implementation of fuel ethanol, and the latter by sugarexports. The industry is going through a growth cycle again, this time becauseof the likely increase in demand for both ethanol and sugar.
It is noticeable that for every 100 Mt of additional sugar cane (considering42% of such addition as the portion to be used in sugar production, as sug-gested by demand projections), if commercially available technologies were tobe used to increase electricity production, we could have the following:
Therefore, for every 100 Mt of sugar cane (42% for sugar), the industrycould additionally supply 3.8% of the electrical power currently consumed,while increasing the current ethanol supply by 37%.
Additional electricity: 12.6 TWh (steam cycle, 40% trash)
Additional ethanol: 4.9 Mm3
Chapter 1: Share in the use of fossil energy
63
13 U.S. DoE: NREL;w w w. o t t . d o e . g o v /biofuels.enzyme_sugar_platform.html , 2003
16 FULTON, L.; HOWES,T.: “Biomass for tran-sport fuels: an inter-national perspective”,IEA/EET, 2004
15 SADDLER, J.N. et al.:“Techno-economica levaluation of a genericwood to ethanol process:effect of increased cellu-lose yields and enzymerecycle”, BioresourceTechnology 63, 1998,pp. 7-12
14 MACEDO. I.C.: “O usootimizado da cana-de-açúcar para GeraçãoDistribuída”, VI Semi-nário Internacional deGeração Distribuída, INEE
– WADE, Rio, Oct 2003
17 WOOLEY, R. et al.:“Lignocellulosic biomassto ethanol process designand economy utilizingco-current dilute acidpre-hydrolysis and enzy-matic hydrolysis: Currentand futuristic scenarios”,NREL / DoE, Jul 1999
12 OLIVÉRIO, J.L.:“Fabricação nacional deequipamentos para a pro-dução de álcool de co-geração”, SeminárioBNDES: Álcool – PotencialGerador de Divisas eEmpregos, Rio, 2003
Alternatively to electricity production, and depending on the time whenthe hydrolysis technologies will be commercially available, it would be pos-sible to have an additional supply of 3.4 Mm3 of ethanol, totaling 8.3 Mm3.
1.5 Summary and conclusions
• Context: the world supply of energy is based on fossil fuels (75%); theutilization scale quickly leads to depletion of resources, thereby leaving aheavy additional load to the future generations. Additionally, the use offossil fuels is responsible for a large load of local pollution and most of thegreenhouse gas emissions. The use of energy should grow as a result ofthe advance of many of the world’s developing regions. The current chal-lenge is to seek renewable energy sources and to increase efficiencies inenergy generation and use on an unprecedented scale.
• Brazil has an intermediate consumption level (1.1 toe / inhab.year),with a deep focus on renewable energy sources (43.8%, compared to13.8% in the world). Brazil can significantly increase the use of biomassand other sources, and improve generation and use efficiencies. In thisrespect, among other initiatives, Brazil should implement the distributedgeneration of electrical power (based on combined heat and power),which could reach 10-20 percent of the total within 10-15 years, and setup a policy for the transportation fuel industry.
• The sugar cane industry already provides a major contribution (respon-sive sustainability) to the substitution of fossil fuels, going much furtherthan energy self-sufficiency (electrical and thermal power).
! It generates 11.3 TWh of electrical and mechanical energy(3% of the electrical energy generated in the country)
! It uses bagasse as a fuel: 20.2 Mtoe (equivalent to the sumof all of the NG and fuel oil used in the country)
! It produced nearly 50% of all the gasoline used in the country in 2004
• The sugar cane industry’s improved energy performance (use of trash,DG implementation) can lead to an additional 30 TWh of electrical pow-er. Alternatively, the implementation of processes for bagasse and trashconversion to ethanol in the future can increase ethanol production by40% for the same sugar cane production level.
• If the expected sugar cane production increases for the next years mate-rialize, for every additional 100 Mton of sugar cane, the industry wouldsupply 3.8% of the current electrical power consumption, and 4.9 Mm3
more of ethanol (assuming that 58% of the sugar cane are used in ethanol
Sugar cane’s energy
64
production). The alternative ethanol production from bagasse and trash,when technically possible, would lead to an additional 3.4 Mm3 ofethanol.
Chapter 1: Share in the use of fossil energy
65
Chapter 2: Impacts on the use of materials
2.1 Introduction
Sustainability in the use of materials and resources should be evaluat-ed as to the level of those resources (what the resource utilization rate is rel-atively to the stocks) and the level of waste released to the environment.Both levels have grown significantly in some regions, and in an “unsustain-able” way in many cases. In 1992, each person in the United States wasresponsible for the extraction and use of 50 kg of materials a day; thatamount increased by 10 percent up to 2002.1 On the other hand, the envi-ronmental impacts of the consumption of resources have grown around 15percent in that period. The figures differ in other regions of the world, butit is clear that the governmental policies have not been appropriate toreverse the trends. It has been proposed that taxes should gradually movefrom labor and income to materials and energy (as in Norway and Sweden),and that any subsidies which contribute aggravating environmental prob-lems should be eliminated. The actions (and implications) are very differ-ent from one country to another, and even regionally within the same coun-try, which hinders a fast implementation; but the necessary direction isclear.
Agriculture has a very interesting characteristic in terms of sustainabil-ity: a major input is sunlight energy (renewable). If the use of water andconsumables (pesticides, fertilizers, fuels) can be limited, then agricultureis a source of “renewable” materials. This has been attained by some but notall production systems. In adequate systems, the use of materials (fertiliz-ers, pesticides, fuels) may be relatively small when the energy production(which already occurs) or the potential production of a wide range of mate-rials (such as sugar cane) is taken into consideration.
67
1 DERNBACH, J.C. (Ed.):Stumbling toward sustain-ability; Washington DC,Environmental Law Ins-titute, 2002
Agriculture takes sunlight as its basic input and maylead to sustainable production of materials. The low productioncosts in the cane culture in Brazil and the availability of bagasseas an energy source make sucrose very attractive to dozens ofother products; some amino acids, organic acids, sorbitol andyeast extracts are already being produced. Developments inplastics and other large scale products (including ethanol deriv-atives) are being considered.
Over the past fifteen years, environmental concerns have led to the useof biological products as substitutes for petrochemicals to be considered“environmentally sound and desirable”. Several mechanisms have been usedto foster new energy technologies. Practically all of them originally soughtfeasibility through direct subsidies. That occurred with PURPA – PublicUtilities Regulatory Policy Act for decentralized generation of electrical pow-er from biomass in the United States, the sugar cane ethanol in Brazil, thecorn ethanol in the United States as well, biodiesel programs in the US andEurope, etc. Generally, the main concern was energy production indeed (dueto the need of oil substitution), but the possibilities to produce renewablematerials began to be explored.
Under an exceptionally successful program, it was possible to removethe initial subsidies to sugar cane ethanol, in Brazil, on the back of the indus-try’s technological and managerial evolution. That program brought along avery interesting non-energy component in the field of products of biologicalorigin, replacing petrochemicals: alcohol chemistry, in the 1980’s in Brazil.
A fast-growing bio-products program is based on corn starch glucose inthe US. Supported by interesting technological breakthroughs, several prod-ucts have been introduced in different markets over the past ten years. Geneticengineering technologies should bring more results over the next few years.2
Sugar cane sucrose is a natural candidate to become a main raw materialin many processes. This is beginning to happen in Brazil.
2.2 Sugar cane fiber and sucrose
Between 1998 and 2002, the mean sugar and fiber contents of sugar caneresidue (Center-South) were 14.53 sucrose % of sugar cane and 13.46 fiber %of sugar cane. Around 80 percent of the sugar cane were burned (Brazil)before the harvest, thereby eliminating the trash. The total productionamounted to 380 Mt of sugar cane (2004), which refers to the sugar cane stalkmass (without the trash).
For each ton of sugar cane stalk (sugar cane ton), the biomass generatedis (see item 1.4.1) 0.28 t (DM) of bagasse and trash, and 0.145 t (DM) ofsucrose. Therefore, the amount of materials produced is very big even whencompared to the petrochemical context, for example; about 55 Mt of sucrose,and 100 Mt (MS) of lignocellulosic residue.
Works conducted in Brazil seeking to develop trash collection/transporta-tion technology, including an assessment of its actual availability, have con-
Sugar cane’s energy
68
2 NREL, USA, “Fosteringthe bioeconomic revolu-tion in biobased pro-ducts and biotechnolo-gy”, Biomass Researchand Development Board,Interagency StrategicPlanning; January 2001
cluded that 50 percent of the trash can be recovered at costs of US$ 0.6-1.0 /GJ, depending on the process.3 The legislation that gradually restricts the pre-harvest burning should play a positive role in causing the residue to be incor-porated into the energy generation system over the next few years. On the oth-er hand, commercially available technologies may (probably) lead to consump-tion decreases in mill processes, resulting in excess bagasse of up to 45%.
This surplus amount of bagasse and straw are important in the energycontext. Their use in energy production (with competition between electricalpower and ethanol production by hydrolysis) can be expected to be imple-mented on large scale over the next few years. The costs of those residues arelower in Brazil (today and in the foreseeable future) than overall energy bio-mass costs in many other countries.
The possibilities offered by new sucrose products are much greater thanthose currently implemented.
2.3 Sucrose as a raw material for other products
Gabriela Alves MacedoFood Engineering College, UNICAMP
Sucrose is a very versatile raw material, being a very reactive moleculefrom the chemical and enzymatic standpoints. With its eight hydroxylgroups, it may act as a base for several “blocks” to build molecules of inter-est. Additionally, it is produced in more than 80 countries around the worldabundantly (nearly 200 million tons a year) and at a high purity degree. Itsproduction cost is relatively low, especially in Brazil (see Chapter 11). Thereare additional advantages: sucrose products may have lower environmentalimpacts than petrochemicals (as in the biodegradability of some plastics, andthe renewability of the energy used in the processes, particularly in the use ofsugar cane sucrose).
In the early 1990’s around 60 products obtained from direct sugar fer-mentation could already be listed, some with several natural producingmicroorganisms. In many cases, secondary products were developed fromthose primary products by fermentation or enzyme catalysis. Of all thoseproducts, a much smaller number are now commercially important, but sev-eral have been added to the list over the past ten years,4 and research in thisfield is intensive.
Such growing diversification of sucrose applications to produce interme-diate and end products (besides ethanol and sugar) is mainly motivated by
3 Reports of the project“Biomass power genera-tion: sugar cane bagasseand trash”, UNDP-GEF /Copersucar, Centro deTecnologia Canavieira,2003
Chapter 2: Impacts on the use of materials
69
4 GODSHALL, M.A.:“Future directions forthe sugar industry”, SPRI,Int. Sugar Journal, vol.103, no. 1233, 2001
the low sugar production costs that Brazil has attained. We can consider theproduction cost of raw crystal sugar from Brazil’s Center-South region in2002 at US$ 0.13 / kg (with sucrose in the juice corresponding to US$ 0.08/ kg, and in the HTM to US$ 0.11 / kg; US$ 1 = R$ 2.7, 2002). In compari-son, the corn glucose costs would be US$ 0.13 / kg, beet sucrose or wheathydrolysate (Germany) at ~0.19 and 0.17 in the juice.5 There have been costincreases due to higher land costs (with the large expansion since 2005), andlabor costs; and for export considerations, the strong appreciation of the Realagainst the US$ is also important. The production of sugar cane sucrosederivatives can also be totally supplied with energy independently (throughthe bagasse), as is ethanol today.
Prospecting works with respect to commercially available products orproducts at a relatively advanced development stage are under way in sever-al product categories. Sucrose has some exclusive applications, and can sub-stitute for glucose in almost all fermentation cases of interest. The main cat-egories are: sweeteners, polyols, solvents, biodegradable plastics, amino acidsand vitamins, polysaccharides, organic acids, enzymes, yeasts, and esters.Some may include products that would use large amounts of sugar (plastics,solvents, some organic acids), while others would correspond high value-added products for smaller amounts.
The “average” mill in Brazil could add (as an annexed production plant)up to ~ 40,000 tons per year of a new product using Å of the sugar cane itprocesses; some products that are already commercially available reach thescale of 1 Mt / year worldwide. There would be waste water treatment syner-gies in the annexed plants, and energy independence is possible in all of them.By using the bagasse and standard (commercially available) generation systemsalready in use, around 2.4 kWh / kg of sucrose (thermal energy) and 0.6 kWh/ kg of sucrose (electricity) can be made available for processing.
In Brazil there is today commercial production of citric acid, amino acidslike lysine and MSG, yeast extracts and derivatives, and sorbitol. Some plas-tics (commercial polylactic, abroad; poly-hydroxybutyrate, pre-commercialstage, in Brazil) are being considered for local production here. In addition,some of the ethanol derived products from the 1980’s (especially ethylene andderivatives) are being considered again. The world’s current (growing) marketsin amino acids, some organic acids and polyols already use a few million tonsof sugars on a yearly basis; the plastic markets may increase that demand con-siderably.
Sugar cane’s energy
70
5 Based on HENNIGES, O.;ZEDDIES, J.: “Fuel ethanolproduction in the USAand Germany – a costcomparison”, F. O. Licht’sWorld Ethanol andBiofuels Report, vol. 1,no. 11. Feb 11 2003
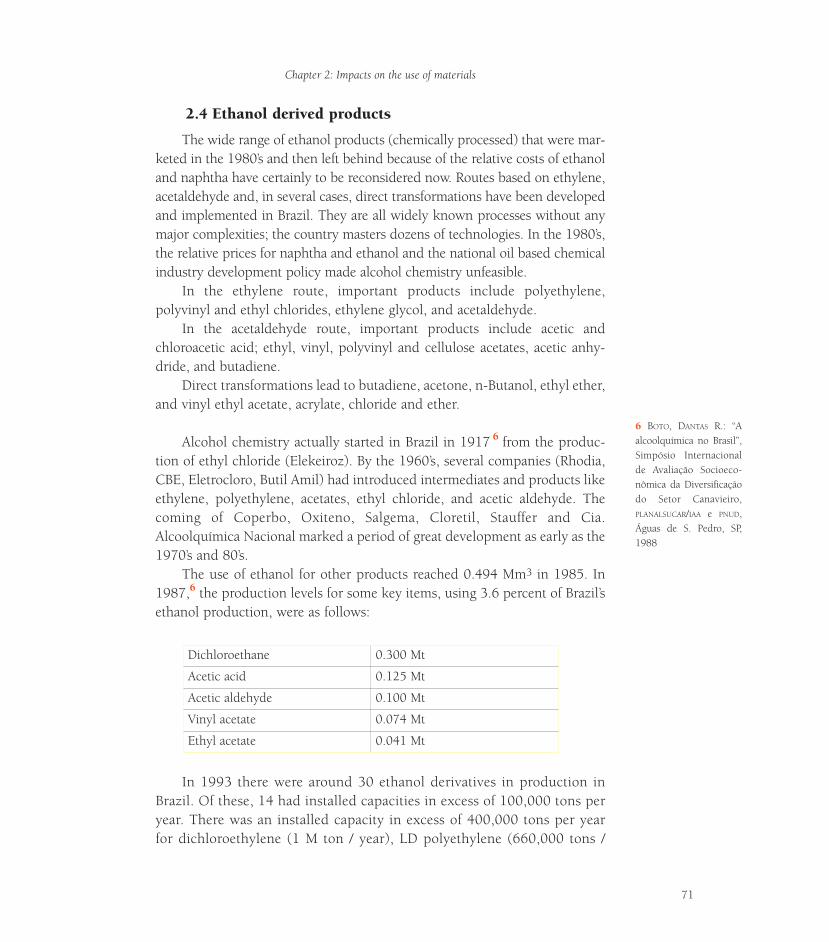
2.4 Ethanol derived products
The wide range of ethanol products (chemically processed) that were mar-keted in the 1980’s and then left behind because of the relative costs of ethanoland naphtha have certainly to be reconsidered now. Routes based on ethylene,acetaldehyde and, in several cases, direct transformations have been developedand implemented in Brazil. They are all widely known processes without anymajor complexities; the country masters dozens of technologies. In the 1980’s,the relative prices for naphtha and ethanol and the national oil based chemicalindustry development policy made alcohol chemistry unfeasible.
In the ethylene route, important products include polyethylene,polyvinyl and ethyl chlorides, ethylene glycol, and acetaldehyde.
In the acetaldehyde route, important products include acetic andchloroacetic acid; ethyl, vinyl, polyvinyl and cellulose acetates, acetic anhy-dride, and butadiene.
Direct transformations lead to butadiene, acetone, n-Butanol, ethyl ether,and vinyl ethyl acetate, acrylate, chloride and ether.
Alcohol chemistry actually started in Brazil in 1917 6 from the produc-tion of ethyl chloride (Elekeiroz). By the 1960’s, several companies (Rhodia,CBE, Eletrocloro, Butil Amil) had introduced intermediates and products likeethylene, polyethylene, acetates, ethyl chloride, and acetic aldehyde. Thecoming of Coperbo, Oxiteno, Salgema, Cloretil, Stauffer and Cia.Alcoolquímica Nacional marked a period of great development as early as the1970’s and 80’s.
The use of ethanol for other products reached 0.494 Mm3 in 1985. In1987,6 the production levels for some key items, using 3.6 percent of Brazil’sethanol production, were as follows:
In 1993 there were around 30 ethanol derivatives in production inBrazil. Of these, 14 had installed capacities in excess of 100,000 tons peryear. There was an installed capacity in excess of 400,000 tons per yearfor dichloroethylene (1 M ton / year), LD polyethylene (660,000 tons /
Dichloroethane 0.300 Mt
Acetic acid 0.125 Mt
Acetic aldehyde 0.100 Mt
Vinyl acetate 0.074 Mt
Ethyl acetate 0.041 Mt
Chapter 2: Impacts on the use of materials
71
6 BOTO, DANTAS R.: “Aalcoolquímica no Brasil”,Simpósio Internacionalde Avaliação Socioeco-nômica da Diversificaçãodo Setor Canavieiro,PLANALSUCAR/IAA e PNUD,Águas de S. Pedro, SP,1988
year), ethyl-benzene (500,000 tons / year), vinyl chloride and HD poly-ethylene.
In the current assessments, the ability to work on much smaller scalesthan those of oil based factories, the decentralized production and theability to get synergies with the mills’ traditional production continue tobe important.
2.5 Summary and conclusions
• The per capita consumption of materials and resources worldwide haskept growing over the past ten years, and so have the resulting environ-mental impacts. As in the case of energy, governmental policies have notbeen enough to reverse the trends that are aggravated by the advances oflarge developing areas in the world.• Agriculture (having solar energy as an input) is a field that can lead tosustainable production of materials in some cases. This perception pro-motes biological products as “environmentally sound”; alcohol chemistry(Brazil, 1980’s and 1990’s) has brought several examples, as have recentadvances in sugar chemistry.• Brazil’s sugar cane production corresponded (2004) to 55 Mt ofsucrose and 100 Mt (DM) of lignocellulosic residue. Sucrose is current-ly used in sugar and ethanol production, but other important productsare being considered. Fifty percent of the residues are used with low effi-ciencies in energy generation, and more than 25 percent (trash) arerecoverable at costs compatible with energy uses.• The production costs in Brazil and the availability of bagasse energy makesucrose very attractive to dozens of other products. In Brazil, there is a com-mercial production of amino acids, organic acids, sorbitol, and yeastextracts, as well as developments concerning products for large amounts(plastics). Over the next few years, it will be possible to use 1.5 Mt ofsucrose in these processes.• In the 1980’s and 1990’s, more than 30 products were derived fromethanol in Brazil, several with installed capacities in excess of 100,000tons / year (via ethylene, acetaldehyde or direct transformations). Theybecame unfeasible in the 1990’s because of the national policy for oilchemistry and the relative costs of ethanol. The oil-ethanol cost rationow leads those processes to be reconsidered.• The large-scale production of renewable materials from sugar cane inBrazil is a possibility, but is still at an early implementation stage; it is
Sugar cane’s energy
72
Chapter 2: Impacts on the use of materials
73
growing somewhat rapidly in the use of sucrose, and may grow in alco-hol chemistry again, while having a great unrealized potential in termsof residues. It would certainly contribute considerably to the sugar caneagribusiness’ “responsive sustainability” position.
IIIIImpacts on the environment
The impacts on the environment considered in general agricultural pro-duction should be viewed in respect of the sugar cane culture, as shouldthose pertaining to industrial production and end use. They include local airpollution by sugar cane burning and the use of ethanol as a fuel, greenhousegas emissions throughout the life cycle, and the impacts of the use of newareas, including the biodiversity, as well as the impacts on soil conservation,erosion, the use of water resources, the quality of water, and the use of pesti-cides and fertilizers.
In assessing the environmental effects of the growth of sugar cane pro-duction, it is important to consider that such assessment is always relative,and always refers to alternative uses of land. The impacts (erosion, produc-tion base production, biodiversity, use of chemicals, etc.) are much differentif sugar cane should substitute (as it has occurred in most cases) for extensivepastures or orange crops, or if it should directly occupy savannah areas ofeven forests. These considerations are usually made at the time of substitu-tion of soil uses in order to check whether there is any potential degradationor the new use will foster environmental recovery.
The sugar cane production in Brazil today has interesting aspects, envi-ronmentally speaking. It uses small amounts of pesticides, it relies on thelargest biological pest control implemented in the country, it features the low-est soil erosion rate in Brazilian agriculture, it recycles all of its waste, it doesnot compromise the quality of water resources, and it actively participates ininnovations by having, for example, the country’s largest organic productionarea (as a separate culture).1
The legal restrictions on soil use aimed at protecting the environment arethe subject of extensive legislation in Brazil. An overview of the scope of suchlegislation is provided below.
75
1 ROSSETTO, R.: “A culturada cana, da degradação àconservação”, VisãoAgrícola, ESALQ-USP, Ano1, jan 2004
Sugar cane’s energy
76
Aspects of the environmental legislationfor the sugar cane industry
André Elia NetoCentro de Tecnologia Canavieira (Sugar Cane Technology Center)
The considerations about environmental pollution have evolved over thepast few decades from case-specific analyses of the most apparent environmen-tal degradation (water and air pollution, deforestation) into a more compre-hensive view, including socioeconomic and cultural affairs, and biodiversity, forexample. In Brazil, this change appears in the environmental legislation withCONAMA (National Environment Council) resolution no. 01/1986, whichrequires the conduct of Environmental Impact Studies (EIA) and preparation ofthe corresponding Environmental Impact Reports (RIMA) before any licensecan be obtained for activities that may significantly alter the environment. Thislegislation applies to all undertaking projects in the sugar and ethanol industry,2, 3 and their main aspects are discussed below.
Environmental Impact Study (EIA)
CONAMA resolution no. 01/86, of January 23, 1986 (article 10), defines“impact” as “any change in the physical, chemical and biological properties of theenvironment (…) resulting from human activities which may directly or indirectlyaffect: the population’s health, security and well-being; social and economic activi-ties; the biota; the sanitary and aesthetic conditions of the environment; and thequality of environmental resources.” Article 20 lists the activities that depend onEIA/RIMA to get a permit; these include highways, bridges, industrial andagribusiness units (including ethanol distilleries), and several other activitiesthe dimension and/or location or the environment-altering potential of which“shall have their impacts identified, and interpreted as to their magnitude or rele-vance, reversibility degree, cumulative and synergic properties, and distribution ofsocial costs and benefits.”
Figure 1 shows a diagram of the structure for analyzing the environ-mental impacts when conducting/preparing EIA/RIMA for the sugar andethanol industry. The impacts result from the crossing of each of theagribusiness activities considered with possibly affected environments: thephysical environment (atmosphere, land and water), the biotic environment(flora and fauna), and the anthropic environment (jobs, economy and socio-cultural aspects). Many of the mitigating measures taken in the sugar andethanol industry have been in use for many years, and are usually incorpo-rated into the agribusiness process.
CONAMA Resolution no. 237, of 1997, provided new criteria for grantingenvironmental permits, including sugar production and refining as an activ-
2 ELIA NETO, A.;NAKAHODO, T.: “Aspectosda análise ambiental nosetor industrial sucroal-cooleiro - Relatório par-cial” - Relatório Técnicon.º 1077-00/01, CTC –Centro de TecnologiaCanavieira, Piracicaba, SP,2001
3 SALLES, L. da S.:Elementos para o plane-jamento ambiental do com-plexo agroindustrial sucro-alcooleiro no Estado de SãoPaulo: Conceitos, aspectos emétodos – Dissertação deMestrado Escola de Enge-nharia de São Carlos-USP,São Carlos, SP, p. 113,1993
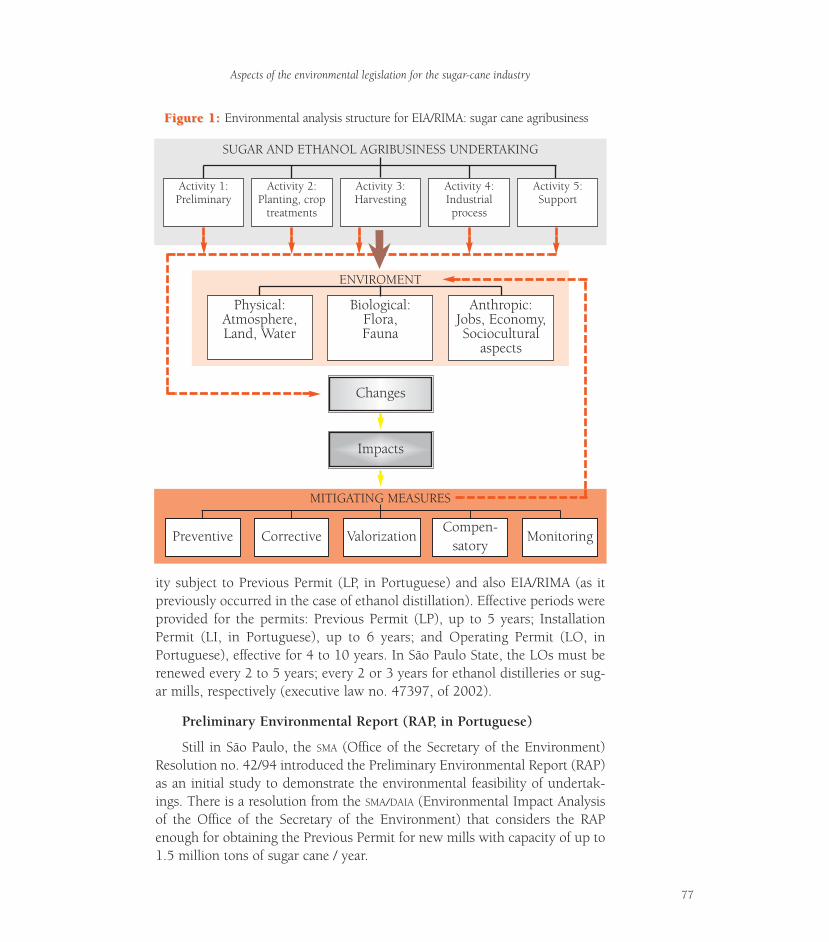
Aspects of the environmental legislation for the sugar-cane industry
77
ity subject to Previous Permit (LP, in Portuguese) and also EIA/RIMA (as itpreviously occurred in the case of ethanol distillation). Effective periods wereprovided for the permits: Previous Permit (LP), up to 5 years; InstallationPermit (LI, in Portuguese), up to 6 years; and Operating Permit (LO, inPortuguese), effective for 4 to 10 years. In São Paulo State, the LOs must berenewed every 2 to 5 years; every 2 or 3 years for ethanol distilleries or sug-ar mills, respectively (executive law no. 47397, of 2002).
Preliminary Environmental Report (RAP, in Portuguese)
Still in São Paulo, the SMA (Office of the Secretary of the Environment)Resolution no. 42/94 introduced the Preliminary Environmental Report (RAP)as an initial study to demonstrate the environmental feasibility of undertak-ings. There is a resolution from the SMA/DAIA (Environmental Impact Analysisof the Office of the Secretary of the Environment) that considers the RAPenough for obtaining the Previous Permit for new mills with capacity of up to1.5 million tons of sugar cane / year.
FigurFigure 1: e 1: Environmental analysis structure for EIA/RIMA: sugar cane agribusiness
MITIGATING MEASURES
SUGAR AND ETHANOL AGRIBUSINESS UNDERTAKING
ENVIROMENT
Biological:Flora,Fauna
Physical:Atmosphere,Land, Water
Anthropic:Jobs, Economy,Sociocultural
aspects
Changes
Impacts
Activity 3:Harvesting
Activity 4:Industrialprocess
Activity 5:Support
Activity 2:Planting, crop
treatments
Activity 1:Preliminary
Preventive Corrective ValorizationCompen-
satoryMonitoring
Sensitive Areas
There are more sensitive areas from the environmental viewpoint whichhave received special treatment in respect to the establishment of agribusi-ness activities: they are the Environmental Protection Areas (APA, inPortuguese),4 and the Aquifer Recharge Areas5 (such as the Guarani Aquifer).
The APAs are extensive areas with regionally important ecosystems andwhose land arrangement is oriented towards a sustainable use of naturalresources, as set forth in a specific law. In practice, environmental preserva-tion and recovery are sought to be placed in harmony with human needs. Theenvironmental permit for undertakings in APAs follows usual procedures thathave been set up by the São Paulo State SMA, but the legislation in such areaseither is or will be more restrictive using specific agreements to prevent orforbid activities which could lead to environmental degradation.
The Guarani aquifer, covering a total area of approximately 1.2 millionkm2 – 839,800 km2 in the Center-West and South regions of Brazil –, storesaround 46,000 km3 of water. The sustainable extraction considers thedemand from 360 million people, with a per capita consumption of 300 l /inhab.day. The conserved volume could supply water to Brazil’s populationfor 3,500 years. One of the large recharge areas of that aquifer is located inthe north of São Paulo, including an important sugar cane producing center;this leads to further restrictions on these areas and the fertigation rates used.
Trends
The sugar and ethanol industry in Brazil is known today for the envi-ronmental benefits of using ethanol in substitution of a fossil fuel, of pro-ducing sugar using a renewable fuel exclusively, and of starting to use thepotential excess electrical power production.6, 7 On the other hand, its rela-tionship with the environment, which improves the position of ethanol as a“clean product with clean production,” can go further than meeting legalrequirements, seeking a continued environmental improvement of the pro-duction process. This will be an imposition, especially because of Brazil’sposition as the most internationally competitive producer.
The normal trend in the environmental legislation is to become increas-ingly restrictive; important areas where the producers’ evolution is alreadysensitive include control over effluents and rationing of water use, such issuesbeing addressed in specific items below. Brazil’s legislation has a strongdynamics, and the Operating Permits must be renewed periodically (everytwo to three years, in the case of mills or distilleries).
Sugar cane’s energy
78
5 SMA – Secretaria DeEstado do Meio Am-biente, Gestão Ambientaldo Aqüífero Guarani, sitewww.ambiente.sp.gov.br/a q u i f e ro / p r i n c i p a l _aquifero.htm , acessadoem 22/02/2005, GT-Guarani, São Paulo, SP,2005
4 SMA – Secretaria deEstado do Meio Ambien-te, Áreas de ProteçãoAmbiental do Estado deSão Paulo, sitehttp://www.ambiente.sp.gov.br/apas/apa.htm ,(22/02/2005)
7 OMETTO, J.G.S: O álcoolcombustível e o desenvolvi-mento sustentado, SãoPaulo, PIC Editorial,1998
6 ELIA NETO, A.: “Análisedos impactos ambientaisda colheita de cana crua edo aproveitamento ener-gético da palha”, Relatórion.º RLT-073, MCT/PNUDContrato de Serviço n.º137/97, CTC – Centro deTeconologia Canavieira,Piracicaba, 1999
Chapter 3:Impacts on air quality: cities and rural area
3.1 Introduction
The impacts on air quality from ethanol use in urban centers and sugar-cane burning prior to the harvesting in rural areas are highlighted in thischapter.
Air pollution is a major challenge facing sustainable development world-wide. It causes damage to human health and ecosystems in several ways.Carbon monoxide (CO), particulate matter (PM), sulfur oxides (SOx), nitro-gen oxides (NOx), volatile organic compounds (VOC), tropospheric ozone(formed from atmosphere reactions involving mainly VOC and NOx) andlead have all been causing serious problems in many urban centers aroundthe world. Particulate matter (in association with NOx and SOx) have beenrelated with dozens of thousands of premature deaths in the United States1
and elsewhere; CO is associated with several cardio-respiratory and neuro-logical problems and is a greenhouse gas (GHG); tropospheric ozone, also aGHG, attacks materials, harms agriculture in addition of being an irritant ofthe respiratory system; NOx and SOx also affect health and contribute theformation of acid rain, which has various undesirable effects such as reduc-tion of agriculture productivity. Last but not least problematic, lead is highlytoxic and accumulates in living organisms. Agenda 21 sets the goal of elimi-nating “unacceptable or unreasonable” risks of air pollution “to the extenteconomically possible.” Agenda 21 also provides for air pollution controlactions across the geographic borders. Acid rain, tropospheric ozone, fine PMand GHG certainly deserve undivided attention in this context.
Despite of important advances observed in many countries over the lastdecades to mitigate air pollution, the challenge for air quality improvement,particularly in developing countries, is enormous. Transport, energy produc-tion and industrial processes are the leading sectors that contribute to air pol-
79
Ethanol utilization (straight, or blended with gaso-line) has led to important improvements in air quality inurban areas, through the elimination of lead compoundsin gasoline and sulphur, and the reduction of CO emis-sions and the reactivity and toxicity of organic compoundemissions. Controlling the undesirable effects of caneburning practices (risks to forests, traffic in roads, trans-mission lines and dirtiness) is being efficiently implantedwith the current legislation in São Paulo.
1 DRIESEN, D. M.; “Airpollution”, in DERN-BACH, J.C. (Ed.):Stumbling toward sus-tainability; WashingtonDC, Environmental LawInstitute, 2002
lution worldwide and the vast majority of air pollutants result from the inten-sive use of fossil fuels. The efforts to prevent and control air pollution havebeen intensified, with market-derived strategies being associated to increas-ingly stricter regulations on fuels and utilization systems. Even though suchextremely serious cases as the use of lead-based additives in gasoline havebeen almost entirely eliminated, it is apparent that there is still a lot to do.With this perspective the use of renewable fuels such as ethanol and bagasse,in substitution of fossil fuels, is a step towards an energy matrix in line withsustainable development goals.
3.2 Impacts of the use of ethanol on vehicle emissions inurban areas
Alfred SzwarcADS Tecnologia e Desenvolvimento Sustentável
Brazil has been the largest laboratory in the world with regard to the useof ethanol as an automotive fuel. Since 1977, in compliance with the NationalAlcohol Program requirements, blending of ethanol into gasoline gainednationwide scale and strategic importance. Presently the renewable fuelmakes up 20% to 25% of the blend (named gasoline C). Exception made toaviation gasoline, all gasoline sold in the country contains ethanol.Furthermore, since 1979 ethanol has been widely used as a straight fuel(E100); as a result over 5 million dedicated ethanol vehicles have been pro-duced. Flex-fuel vehicles (able to run on gasoline C or E100 or any blend ofboth) were introduced in the Brazilian market in 2003 and have gained con-sumers preference very quickly. In December 2006 the market share of newflex-fuel vehicles reached 78.1% with sales totaling 2.7 million units since2003.2
Although the National Alcohol Program was not specifically designed toreduce motor vehicle emissions, blending of ethanol to gasoline and use ofE100 in dedicated alcohol vehicles resulted in significant emission reduc-tions, contributing therefore to important environmental benefits. Thedecrease in emissions can be seen in Table 1, which shows the progress of themain pollutants until 1994. Emission levels are compared for straight gaso-line, certification grade gasoline C (78% gasoline and 22% anhydrousethanol) and E100 hydrous ethanol.
Sugar cane’s energy
80
2 ANFAVEA, 2007
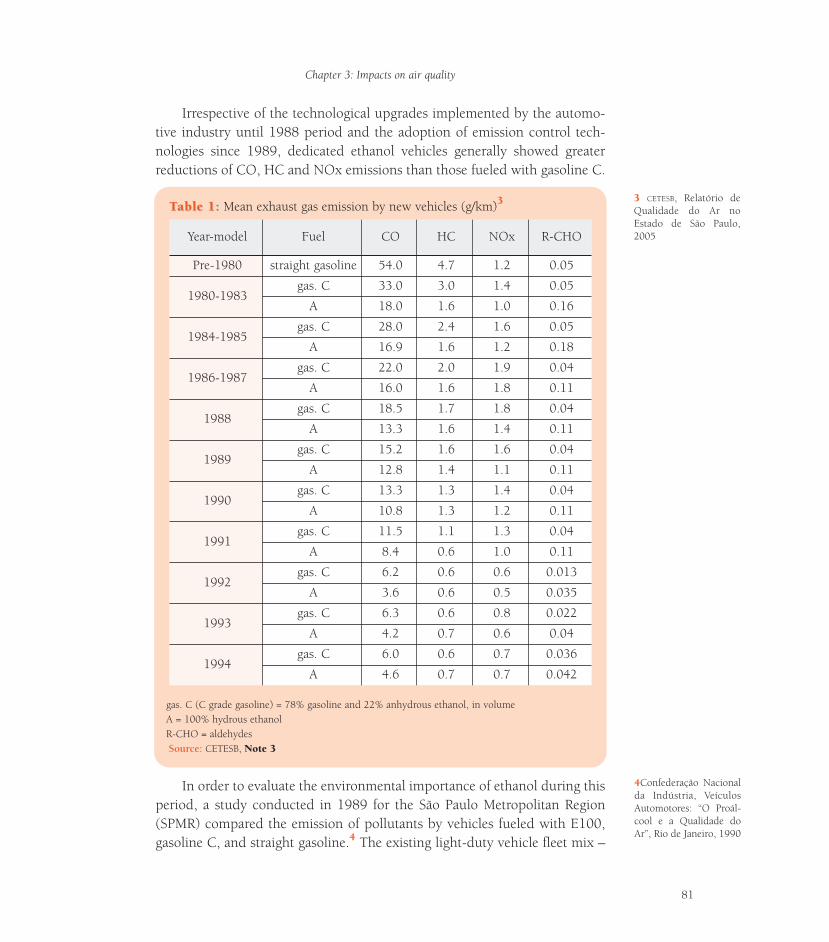
Irrespective of the technological upgrades implemented by the automo-tive industry until 1988 period and the adoption of emission control tech-nologies since 1989, dedicated ethanol vehicles generally showed greaterreductions of CO, HC and NOx emissions than those fueled with gasoline C.
Chapter 3: Impacts on air quality
81
TTable 1:able 1: Mean exhaust gas emission by new vehicles (g/km)3
gas. C (C grade gasoline) = 78% gasoline and 22% anhydrous ethanol, in volumeA = 100% hydrous ethanolR-CHO = aldehydesSource: CETESB, Note 3
Year-model Fuel CO HC NOx R-CHO
Pre-1980 straight gasoline 54.0 4.7 1.2 0.05
1980-1983gas. C 33.0 3.0 1.4 0.05
A 18.0 1.6 1.0 0.16
1984-1985gas. C 28.0 2.4 1.6 0.05
A 16.9 1.6 1.2 0.18
1986-1987gas. C 22.0 2.0 1.9 0.04
A 16.0 1.6 1.8 0.11
1988gas. C 18.5 1.7 1.8 0.04
A 13.3 1.6 1.4 0.11
1989gas. C 15.2 1.6 1.6 0.04
A 12.8 1.4 1.1 0.11
1990gas. C 13.3 1.3 1.4 0.04
A 10.8 1.3 1.2 0.11
1991gas. C 11.5 1.1 1.3 0.04
A 8.4 0.6 1.0 0.11
1992gas. C 6.2 0.6 0.6 0.013
A 3.6 0.6 0.5 0.035
1993gas. C 6.3 0.6 0.8 0.022
A 4.2 0.7 0.6 0.04
1994gas. C 6.0 0.6 0.7 0.036
A 4.6 0.7 0.7 0.042
In order to evaluate the environmental importance of ethanol during thisperiod, a study conducted in 1989 for the São Paulo Metropolitan Region(SPMR) compared the emission of pollutants by vehicles fueled with E100,gasoline C, and straight gasoline.4 The existing light-duty vehicle fleet mix –
3 CETESB, Relatório deQualidade do Ar noEstado de São Paulo,2005
4Confederação Nacionalda Indústria, VeículosAutomotores: “O Proál-cool e a Qualidade doAr”, Rio de Janeiro, 1990
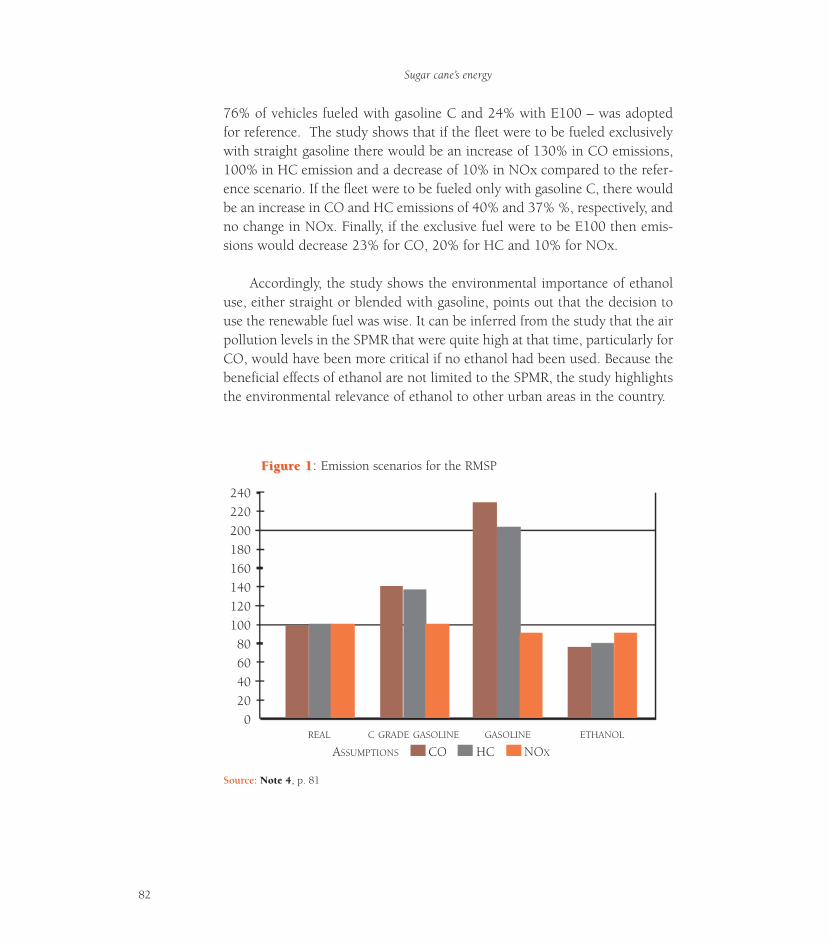
76% of vehicles fueled with gasoline C and 24% with E100 – was adoptedfor reference. The study shows that if the fleet were to be fueled exclusivelywith straight gasoline there would be an increase of 130% in CO emissions,100% in HC emission and a decrease of 10% in NOx compared to the refer-ence scenario. If the fleet were to be fueled only with gasoline C, there wouldbe an increase in CO and HC emissions of 40% and 37% %, respectively, andno change in NOx. Finally, if the exclusive fuel were to be E100 then emis-sions would decrease 23% for CO, 20% for HC and 10% for NOx.
Accordingly, the study shows the environmental importance of ethanoluse, either straight or blended with gasoline, points out that the decision touse the renewable fuel was wise. It can be inferred from the study that the airpollution levels in the SPMR that were quite high at that time, particularly forCO, would have been more critical if no ethanol had been used. Because thebeneficial effects of ethanol are not limited to the SPMR, the study highlightsthe environmental relevance of ethanol to other urban areas in the country.
Sugar cane’s energy
82
FigurFigure 1e 1: Emission scenarios for the RMSP
REAL C GRADE GASOLINE GASOLINE ETHANOL
240220200180160140120100
80604020
0
ASSUMPTIONS CO HC NOX
Source: Note 4, p. 81
The enforcement of stricter vehicle emission limits in the mid ninetiesresulted in substantial emission reduction, particularly for gasoline C vehi-cles. At that time, due to a number of reasons but mainly because of the rel-ative low prices of oil the motor industry reduced its interest (and conse-quently investments) in the technological development of dedicated ethanolvehicles therefore restraining the evolution of its environmental performance.As a result levels of controlled exhaust emissions became equivalent on aquantitative basis, with some advantage for gasoline C vehicles. However thefundamental conditions that made E100 to be known as “clean” fuel are stillin place. When E100 is used in flex-fuel vehicles average CO emission is stilllower, VOC have lower toxicity and photochemical reactivity and emission ofboth PM and SOx is practically nil; not to mention the enormous advantagewith regard to carbon dioxide (CO2) emission, the main GHG.
Aldehyde (R-CHO) emissions need to be analyzed separately becausethis matter always comes up when environmental impacts of ethanol are dis-cussed.
Although it is true that combustion of ethanol generates aldehydes thisis also true to other automotive fuels like gasoline, diesel oil and natural gas,although less recognized. A first fact that needs to be acknowledged in thisdiscussion is that fossil fuels generate a variety of aldehyde species with hightoxicity and photochemical reactivity, such as formaldehyde and acrolein,while ethanol combustion generates primarily acetaldehyde, which has low-er toxicity and smaller environmental impact. Another relevant fact is thatemission of aldehydes from both gasoline C and E100 have been consider-ably reduced over the years due to advances in emission control technology(Table 1). For ethanol vehicles, the average observed with 1992 model-yearcars (0.035 g/km) is lower than the level reported for the end of the 1970’sfor straight gasoline vehicles (0.05 g/km); 2003 model-year ethanol and gaso-line C vehicles showed, respectively, a mean emission of 0.020 g/km and0.004 g/km. With flex-fuels the average emission for 2005 model-year vehi-cles was further reduced reaching 0.014 g/km with E100 and 0.003 withgasoline C3. These values are substantially lower that the present emissionlimit for aldehydes (sum of acetaldehyde and formaldehyde must be lowerthan 0.03 g/km).
For comparison, it is worth mentioning a survey conducted by theCETESB (the São Paulo State environmental protection agency) in 2003 withdiesel-powered light commercial vehicles5 that likewise elsewhere are notsubject to aldehyde emission control. The survey showed that depending on
Chapter 3: Impacts on air quality
83
5 ABRANTES, R., “A emis-são de aldeídos e hidro-carbonetos policíclicosaromáticos de veículoscomerciais a diesel”,SIMEA, São Paulo, 2003
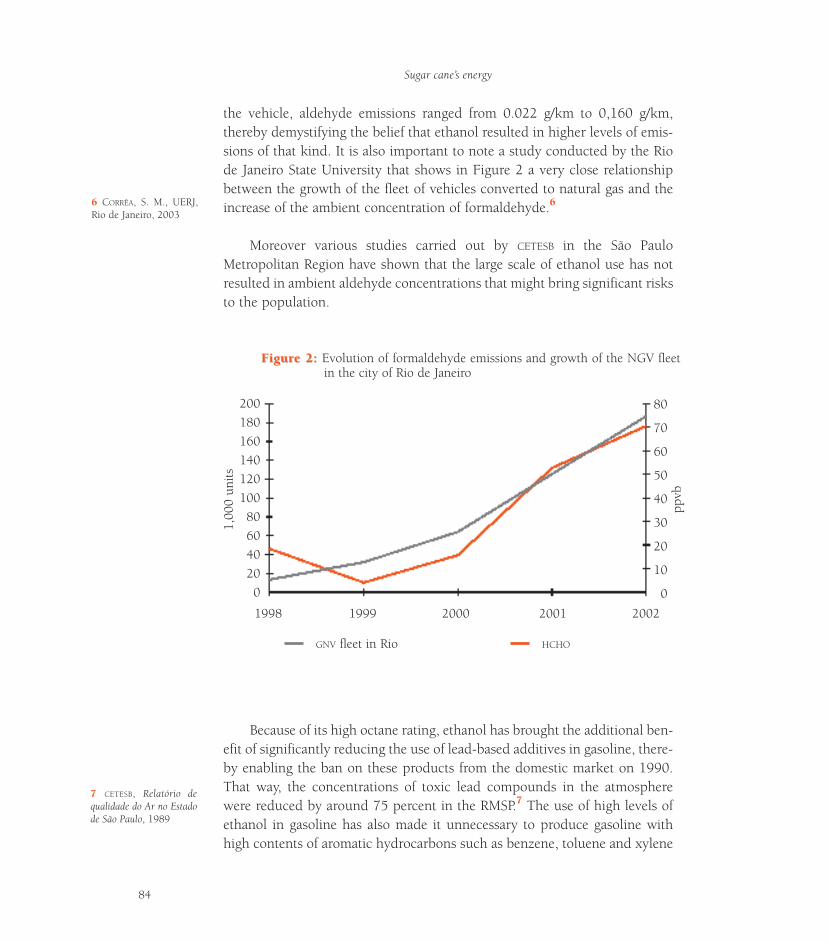
the vehicle, aldehyde emissions ranged from 0.022 g/km to 0,160 g/km,thereby demystifying the belief that ethanol resulted in higher levels of emis-sions of that kind. It is also important to note a study conducted by the Riode Janeiro State University that shows in Figure 2 a very close relationshipbetween the growth of the fleet of vehicles converted to natural gas and theincrease of the ambient concentration of formaldehyde.6
Moreover various studies carried out by CETESB in the São PauloMetropolitan Region have shown that the large scale of ethanol use has notresulted in ambient aldehyde concentrations that might bring significant risksto the population.
Sugar cane’s energy
84
GNV fleet in Rio HCHO
200180160140120100
80604020
0
80
70
60
50
40
30
20
10
0
ppvb
1,00
0 un
its
1998 1999 2000 2001 2002
FigurFigure 2:e 2: Evolution of formaldehyde emissions and growth of the NGV fleetin the city of Rio de Janeiro
Because of its high octane rating, ethanol has brought the additional ben-efit of significantly reducing the use of lead-based additives in gasoline, there-by enabling the ban on these products from the domestic market on 1990.That way, the concentrations of toxic lead compounds in the atmospherewere reduced by around 75 percent in the RMSP.7 The use of high levels ofethanol in gasoline has also made it unnecessary to produce gasoline withhigh contents of aromatic hydrocarbons such as benzene, toluene and xylene
7 CETESB, Relatório dequalidade do Ar no Estadode São Paulo, 1989
6 CORRÊA, S. M., UERJ,Rio de Janeiro, 2003
to substitute lead-based additives. Because these substances are known to betoxic and have high photochemical reactivity its content is being reduced ingasoline used in the most developed countries.
A point of paramount importance to this discussion is the impact ofvehicle emissions on public health. Numerous research studies have demon-strated that there is a connection between air pollution, respiratory and car-diovascular diseases and premature deaths. An example is the relationshipbetween asthma and air pollution in the vicinity of busy roadways. The liter-ature on this subject is abundant and identifies SOx, PM and troposphericozone, pollutants strongly associated with fossil fuels combustion, as themain trigger of asthma attacks.8 Data gathered by the Canadian organizationVictoria Transport Policy Institute, shows that the average environmental costdue to the use of gasoline and diesel oil in automobiles is within US$ 0.6 – 5cents/km.9 A study conducted in Europe by the World Health Organization10
shows that the social costs (diseases and premature deaths) related to fine PMpollution can be up to 190 billion Euro/year. The study emphasizes the con-tribution of diesel vehicles to the problem, which respond for about one thirdof the fine PM in the region.
Taking into consideration the earlier comments as well as the confirma-tion by the University of São Paulo’s Experimental Air Pollution Laboratorythat vapor and gases resulting from ethanol combustion are less toxic thanthose resulting from gasoline combustion, which was reported in severalpublished works, it can be said that ethanol is a clean fuel and as such shouldbe increasingly used.
3.3 Emissions by sugar cane burning; control
Luiz Antonio Dias PaesSugar Cane Technology Center
The burning of sugar cane straw is a usual practice in almost all of the 97countries where sugar cane is produced. That burning aims to improve theworkers’ safety and the harvesting yield by eliminating the straw and dry leaves.
3.3.1 Human health
In the 1980’s and 1990’s, several works were conducted in Brazil andother countries in order the clarify whether the emissions from sugar cane
Chapter 3: Impacts on air quality
85
8 . E N V I R O N M E N T A L
D E F E N S E , w w w .environmentaldefense.org/ d o c u m e n t s / 2 6 5 5 _MotorAirPollutionAsthma.pdf
9 VICTORIA TRANSPORT
POLICY INSTITUE, Trans-portation Costs andBenefit Analysis – AirPollution Costs, Canadá,2006
10 WORLD HEALTH
O R G A N I Z A T I O N ,w w w. e u ro . w h o . i n t /mediacentre/PR/2005/20050414_1
burning were harmful to health. Papers prepared by the Ribeirão PretoMedical School associate sugar cane burning with the increase in respiratorydiseases, but fail to analyze other regions where there is no sugar cane burn-ing at the same season (winter) to use it as a reference.
The local effect was considered in the paper for a research11 jointly con-ducted by EMBRAPA (Brazilian Crops and Livestock Company), USP (Universityof São Paulo), UNICAMP (University of Campinas) and Ecoforça in order toassess the occurrence of chronic respiratory diseases in some regions of SãoPaulo State (Atibaia, Ribeirão Preto, São José dos Campos and Campinas).Taking Atibaia as a reference, it concludes that the risk increases by around40 percent in São José dos Campos, gets close to 80 percent in Campinas,and is unchanged in Ribeirão Preto. The conclusion, therefore, is thatRibeirão Preto, Brazil’s leading sugar and ethanol production park, has thesame disease occurrence risk as a Atibaia, a municipality considered a cli-matic zone where there is no sugar cane production.
In Hawaii, during the 1988-89 period, NIOSH – US National Institute forOccupational Safety and Health conducted an investigation into the chroniceffects of exposure to sugar cane burning soot (which contains biogenic silicafibers – BSF) on the health of workers in the sugar cane agribusiness. The occur-rence of respiratory diseases and mesothelioma (lung cancer) were not associatedwith BSF exposure.12
Although several papers show no direct relationship between burning anddamage to health, it should undoubtedly be noted that any kind of burning hassome sort of effect on the environment, especially when performed incompletely,which is the case of sugar cane burning. In addition, sugar cane burning brings thediscomfort caused by the emission of particulate matter (known as “carvãozinho”)and some risk to areas having electrical networks and highways.
3.3.2 Technologies and evolution
The introduction of mechanical harvesting of sugar cane in Brazil actu-ally took place in the 1980’s and has been growing over the years. Theincrease in the mechanical harvesting area is due to the need for mills to meettheir schedules at times when the workforce became extremely scarce(Cruzado Plan, etc.), to cost reductions, and to the environmental pressure forharvesting sugar cane without burning it. Figure 3 shows the evolution ofmechanical harvesting in the leading producing state (São Paulo) and theCenter-South region of Brazil, which accounts for more than 80 percent ofthe country’s sugar cane production. Approximately 10 percent of the cropareas in the Northeast region have mechanical harvesting.
Sugar cane’s energy
86
11 MIRANDA, E.E.; DORA-DO, A.J.; ASSUNÇÃO, J.V:Doenças respiratóriascrônicas em quatromunicípios paulistas,USP/UNICAMP/Ecoforça,1994
12 SINKS, T.H.; HARTLE,R.W.; BOENIGER, M.F.;MANNINO, D.M.: “Healthhazard evaluation:Report”, Hawaiian Com-mercial & Sugar Com-pany/Hamakua SugarPlantation (Health HazardEvaluation HETA Report88-119-2345), ago 1993,p. 44
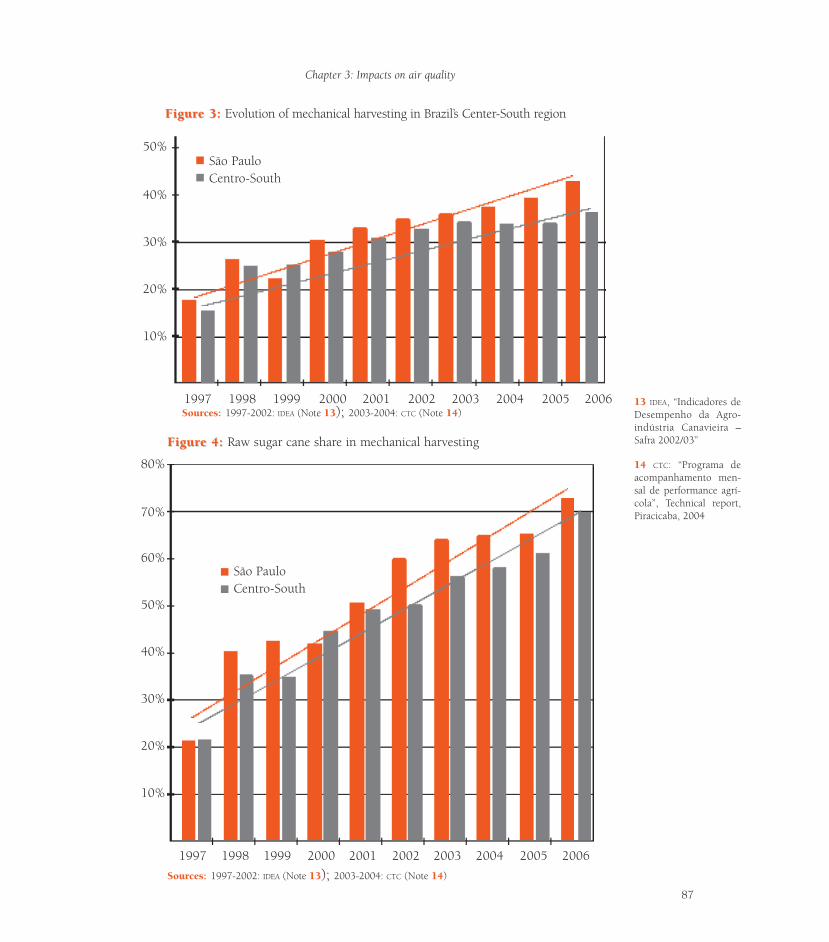
1997 1998 1999 2000 2001 2002 2003 2004 2005 2006
São PauloCentro-South
50%
40%
30%
20%
10%
Chapter 3: Impacts on air quality
87
FigurFigure 3:e 3: Evolution of mechanical harvesting in Brazil’s Center-South region
Sources: 1997-2002: IDEA (Note 13); 2003-2004: CTC (Note 14)
14 CTC: “Programa deacompanhamento men-sal de performance agrí-cola”, Technical report,Piracicaba, 2004
13 IDEA, “Indicadores deDesempenho da Agro-indústria Canavieira –Safra 2002/03”FigurFigure 4:e 4: Raw sugar cane share in mechanical harvesting
1997 1998 1999 2000 2001 2002 2003 2004 2005 2006
40%
30%
20%
80%
70%
60%
50%
10%
São PauloCentro-South
Sources: 1997-2002: IDEA (Note 13); 2003-2004: CTC (Note 14)
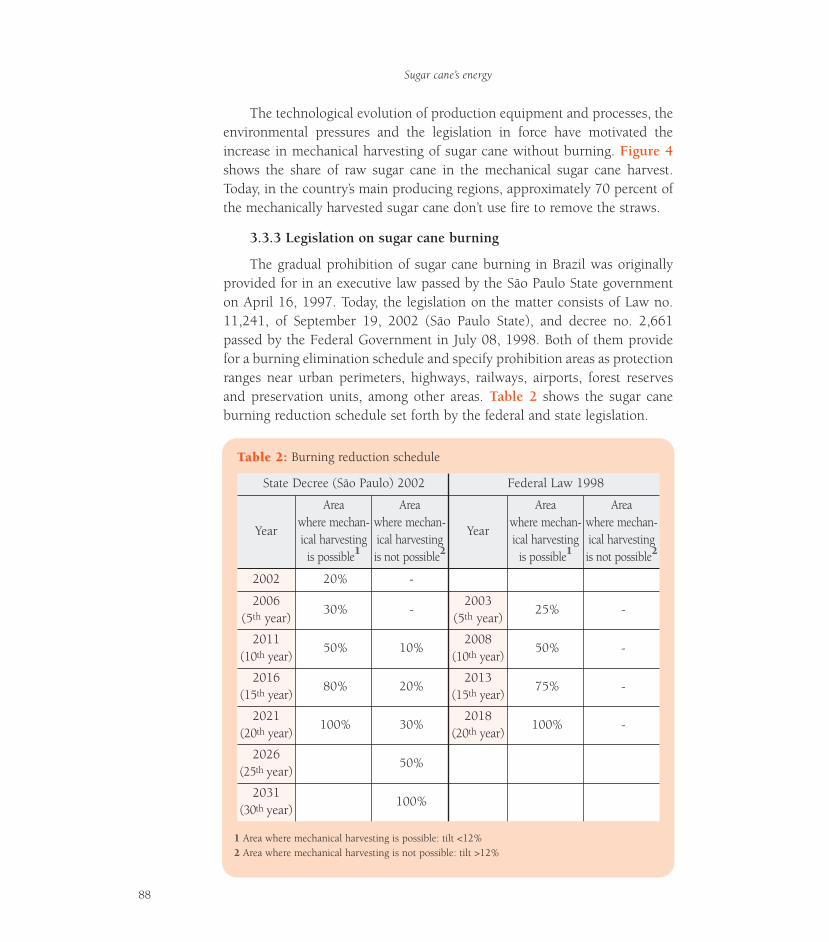
Sugar cane’s energy
88
TTable 2:able 2: Burning reduction schedule
1 Area where mechanical harvesting is possible: tilt <12%2 Area where mechanical harvesting is not possible: tilt >12%
State Decree (São Paulo) 2002 Federal Law 1998
Year
Areawhere mechan-ical harvesting
is possible1
Areawhere mechan-ical harvestingis not possible2
Year
Areawhere mechan-ical harvesting
is possible1
Areawhere mechan-ical harvestingis not possible2
2002 20% -
2006(5th year)
30% -2003
(5th year)25% -
2011(10th year)
50% 10%2008
(10th year)50% -
2016(15th year)
80% 20%2013
(15th year)75% -
2021(20th year)
100% 30%2018
(20th year)100% -
2026(25th year)
50%
2031(30th year)
100%
The technological evolution of production equipment and processes, theenvironmental pressures and the legislation in force have motivated theincrease in mechanical harvesting of sugar cane without burning. Figure 4shows the share of raw sugar cane in the mechanical sugar cane harvest.Today, in the country’s main producing regions, approximately 70 percent ofthe mechanically harvested sugar cane don’t use fire to remove the straws.
3.3.3 Legislation on sugar cane burning
The gradual prohibition of sugar cane burning in Brazil was originallyprovided for in an executive law passed by the São Paulo State governmenton April 16, 1997. Today, the legislation on the matter consists of Law no.11,241, of September 19, 2002 (São Paulo State), and decree no. 2,661passed by the Federal Government in July 08, 1998. Both of them providefor a burning elimination schedule and specify prohibition areas as protectionranges near urban perimeters, highways, railways, airports, forest reservesand preservation units, among other areas. Table 2 shows the sugar caneburning reduction schedule set forth by the federal and state legislation.
In order to comply with the legislation, the introduction of mechanicalharvesting shall extend to 100 percent of the crop areas where the soil tilt iscompatible with such practice within the next 13 years (2018).
For crop areas where the soils are on sharper tilt, the federal decree doesnot prohibit burning, while the state decree provides that the burning shouldterminate within 30 years, i.e. in 2031. Since those areas do not allowmechanical harvesting and the cost of manual harvesting of sugar cane with-out burning would reduce their competitiveness, the producing areas can bereasonably expected to migrate to regions featuring better topographic char-acteristics. Attempts to increase production in areas where mechanical har-vesting is possible by incorporating new technologies into the productionprocess are also likely to occur.
3.3.4 Burning reduction and impacts on employment levels
Brazil’s sugar cane agribusiness plays an important role in job creation,an the number of people it directly employs is estimated at around one mil-lion (see Chapter 12), approximately 80 percent in the agricultural area.Sugar cane is one of the leading job-creating cultures per crop area unit. InSão Paulo State, it employs around 35 percent of the agricultural workforce,totaling 250,000 workers.15 The demand for labor in sugar cane productionshould be reduced by the increased introduction of mechanical harvestingand planting (reduction), and that reduction will be only partly compensat-ed for by the likely introduction in the field of the straw collection processfor energy generation, as discussed in Chapter 12.
3.4 Summary and conclusions
• The deterioration of air quality in urban centers is one of the world’smost serious environmental problems. For the most part, it is caused bythe use fossil fuels, which also contribute to cross-border pollution, suchas acid rain, for example. Mitigating efforts include an increasinglyrestrictive legislation on fuels and utilization systems.• The sugar cane agribusiness has two very distinct points of connectionwith the impacts on air quality: the use of ethanol has been leading to con-siderable air quality improvements in urban centers; and the sugar caneburning in the field, on a very different scale, cause problems by dispers-ing particulate matter and because of the risks associated with the smoke.
Chapter 3: Impacts on air quality
89
15 Anuário Estatístico doEstado de São Paulo -2002
• The main effects of ethanol use (whether straight or as an additive togasoline) on urban centers were as follows: elimination of lead com-pounds from gasoline; reduction of CO emissions; elimination of S andparticulate matter; and less toxic and photochemically reactive emissionsof organic compounds.• The burning of sugar cane straw (used in most producing countries tomake harvesting easier) was the subject of many papers in the 1980’s and1990’s (in Brazil and other countries) that were unable to conclude thatthe emissions are harmful to human health. Such undesirable effects asthe risks (electrical systems, railways, forest reserves) and dust (particu-late matter) remained. In São Paulo State, legislation was passed whichgradually prohibits the burning, with a schedule that considers the tech-nologies available and the expected unemployment, including immedi-ate prohibition in risk areas. That solution is in force, and is an impor-tant example given the size of the São Paulo production.
Sugar cane’s energy
90
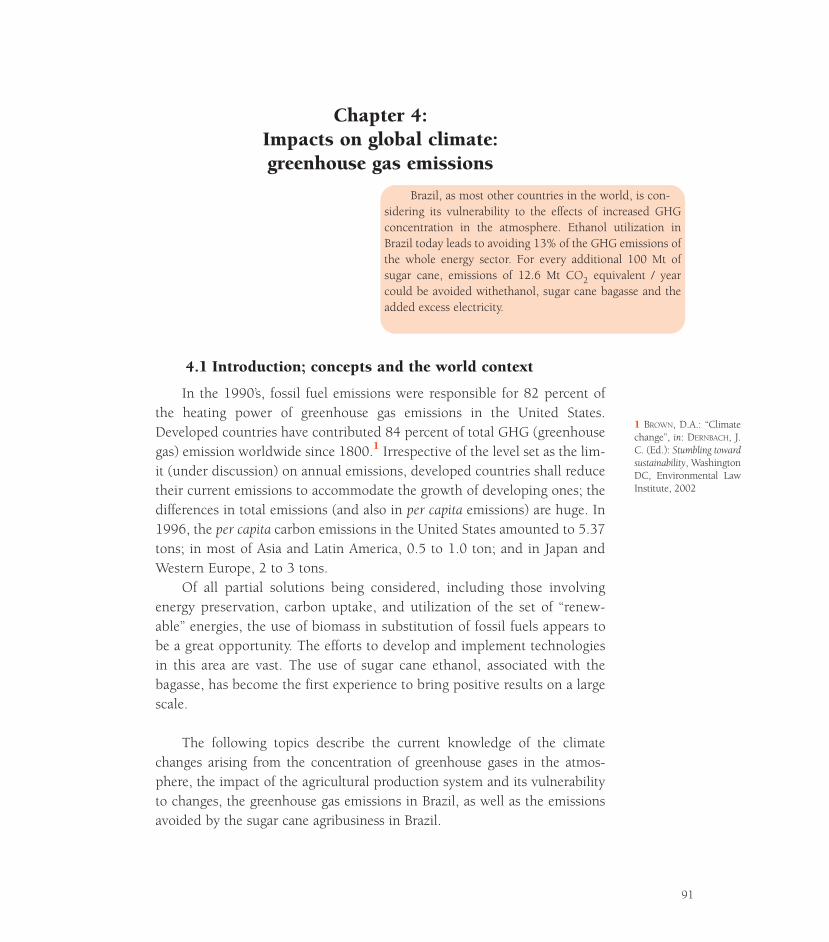
1 BROWN, D.A.: “Climatechange”, in: DERNBACH, J.C. (Ed.): Stumbling towardsustainability, WashingtonDC, Environmental LawInstitute, 2002
91
Chapter 4:Impacts on global climate:greenhouse gas emissions
4.1 Introduction; concepts and the world context
In the 1990’s, fossil fuel emissions were responsible for 82 percent ofthe heating power of greenhouse gas emissions in the United States.Developed countries have contributed 84 percent of total GHG (greenhousegas) emission worldwide since 1800.1 Irrespective of the level set as the lim-it (under discussion) on annual emissions, developed countries shall reducetheir current emissions to accommodate the growth of developing ones; thedifferences in total emissions (and also in per capita emissions) are huge. In1996, the per capita carbon emissions in the United States amounted to 5.37tons; in most of Asia and Latin America, 0.5 to 1.0 ton; and in Japan andWestern Europe, 2 to 3 tons.
Of all partial solutions being considered, including those involvingenergy preservation, carbon uptake, and utilization of the set of “renew-able” energies, the use of biomass in substitution of fossil fuels appears tobe a great opportunity. The efforts to develop and implement technologiesin this area are vast. The use of sugar cane ethanol, associated with thebagasse, has become the first experience to bring positive results on a largescale.
The following topics describe the current knowledge of the climatechanges arising from the concentration of greenhouse gases in the atmos-phere, the impact of the agricultural production system and its vulnerabilityto changes, the greenhouse gas emissions in Brazil, as well as the emissionsavoided by the sugar cane agribusiness in Brazil.
Brazil, as most other countries in the world, is con-sidering its vulnerability to the effects of increased GHGconcentration in the atmosphere. Ethanol utilization inBrazil today leads to avoiding 13% of the GHG emissions ofthe whole energy sector. For every additional 100 Mt ofsugar cane, emissions of 12.6 Mt CO2 equivalent / yearcould be avoided withethanol, sugar cane bagasse and theadded excess electricity.
The conditions for sugar cane and ethanol production in Brazil have ledto extremely positive results in terms of decreasing emissions, and have putethanol in the spotlight as a fuel for the world.
4.2 Global climate changes: current knowledge
Luiz Gylvan Meira FilhoIEA-USP (Institute of Advanced Studies, University of São Paulo)
The climate change addressed by the United Nations FrameworkConvention on Climate Change and its Kyoto Protocol focuses on globalchange caused by the man-induced gradual increase in the amount or con-centration of carbon dioxide and other gases.
The concentration of carbon dioxide in the atmosphere 200 years agohas increased from 280 ppmv (parts per million in volume) to 370 ppmv, andcontinues to grow.
Even though the amount is very small compared to those of nitrogen andoxygen, which jointly correspond to around 99 percent of our atmosphere,carbon dioxide and other gases known as greenhouse gases are responsiblefor preventing the surface from naturally cooling down due to infrared radi-ation. Those who live in cold areas know that cloudless winter nights are verycold exactly because of such radiation cooling. By preventing natural cooling,the greenhouse effect causes an increase in the surface temperature, in addi-tion to other climate changes in general.
The greenhouse effect is a natural phenomenon. Without it, the meantemperature on the surface of the planet would be more than 30 degreesCelsius lower than it is today. What happens is that as the concentration ofcarbon dioxide in the atmosphere increases, the greenhouse of our planetbecomes more efficient. Since the pre-industrial period, the mean global sur-face temperature has increased by around 0.6 ºC. According to the forecastsof the United Nations Intergovernmental Panel on Climate Change(www.ipcc.ch), the temperature will have increased by around 3 degreesCelsius by the year 2010, if we fail to take action in order to mitigate theincrease of greenhouse gas concentration in the atmosphere.
In addition to carbon dioxide, methane and nitrous oxide resulting fromhuman activities, as well as other greenhouse gases having a lesser effect, areincreasing in the atmosphere and contributing to the climate change.
Sugar cane’s energy
92
In the face of this problem, there are only three possible options:i. inactivity, which means accepting the climate change and the dam-
age that will be caused as it reaches its peak many years after the emission ofgases to the atmosphere (around 20 years of delay, for methane, 40 years, forcarbon dioxide, and 50 years, for nitrous oxide).
ii. mitigation of the climate change by reducing greenhouse gas emis-sions or, in the case of carbon dioxide, removing it from the atmospherethrough the process called “carbon uptake”. The removal of carbon dioxidefrom the atmosphere can be temporary, through its fixation to the biosphereby planting trees, for example. It can also be a longer-term action, in the caseof what is known as geological sequestration, through carbon dioxide injec-tion into oil wells, etc.
iii. adapting to the climate change through measures designed to miti-gate the damage resulting from that change. In a very schematic way, raisingthe level of ocean restraining dams to diminish the damage resulting from arise in sea levels, and more generally, actions designed to build-up resistanceto climate changes that will tend to increase in extent and frequency as theclimate changes, are adaptation measures. In many cases, however, adapta-tion is simply not possible. The best examples of this are the melting of theArctic ice cap and, in Brazil, the “savannization” trend on the edges of theAmazon Forest as result of changes in the wet weather flow as part of the cli-mate change.
In 1990, the United Nations General Assembly passed a resolutionrequiring global action for protecting the climate from changes. Theydecided to negotiate a convention in order to address this theme. The taskwas performed in two years, and in 1992, the United Nations Frame-work Convention on Climate Change was opened in Rio de Janeiro. TheConvention was subscribed to and ratified by essentially all of the coun-tries.
According to the Convention, countries must undertake a stabilizationof the concentration of greenhouse gases in the atmosphere at such levelsas capable of allowing the dangerous human interference with the climatesystem (atmosphere, oceans and biosphere) to be prevented. No exclusiveanswer exists to the question as to what greenhouse gas concentration levelin the atmosphere should be considered dangerous and should not beexceeded. This is due to the fact that the harmful effects of the climatechange are distinct in different regions and in different fields of human activ-ity.
Chapter 4: Impacts on global climate – greenhouse gas emissions
93
It is also plausible to admit that, initially, a small increase in temperaturemay even have beneficial effects by improving climatic conditions for agri-culture in regions where the weather is very cold. For the most part, howev-er, there is a growing consensus that we should not let the mean global tem-perature increase by any more than around 2 degrees Celsius by the year2050. Such is the opinion of European countries, in particular. This themewas the subject of a scientific debate at a recent international science confer-ence held in Great Britain.2
As a first step towards fulfilling the goal of the Convention, 1997 saw theadoption of the Convention’s Kyoto Protocol. It took effect in February 2005with the remarkable absence of the United States and Australia, who indicat-ed that they intended to pursue the said goal by other means. The KyotoProtocol has the noteworthy characteristic of providing for mechanisms tocompensate for the reduction of emissions among projects and countries. Thereason for this, is to reduce the global cost of decreasing emissions. With thisin mind, the compensation mechanisms release market forces that tend tomake the decreases take place only in those sectors where the costs are lower.
In the Brazilian case, experience has shown that there are favorable con-ditions, especially concerning the use of biomass as an energy source. In par-ticular, the substitution of gasoline with ethanol in the transportation sector,and steel works coke with charcoal in the production of pig iron (and steeldirectly, in some cases).
It is interesting to note that the irreversible world trend towards limitinggreenhouse gas emissions, especially those of carbon dioxide, have the imme-diate effect of valuing the use of renewable fuels. As a result, the considera-tion of such a factor shall value either those fuels or, in the case of charcoalsteel works, the product itself. This, whether due to market requirements orthe use of the Clean Development Mechanism to provide an economic mar-gin that is essential to making the activities viable in some cases.
As the Kyoto Protocol takes effect, international attentions turn to thedefinition of the international system on climate change that shall be adopt-ed following 2012. The participation of the sectors concerned is essential toensuring that Brazil’s competitive edge will be taken into account in future.
Sugar cane’s energy
94
2 www.stabilisation.com
4.3 Vulnerability, impacts, and adaptation to the climatechange; the present knowledge
Carlos A. NobreCPTEC/INPE (National Institute of Space Research)
4.3.1. Introduction
In 2004, the CGEE – Center for Management and Strategic Studies con-ducted a study (Prospective Activity in Climate Change)3 in order to assess thevulnerability conditions, and the impacts of climate changes arising fromincreased GHG concentrations in the atmosphere on Brazil and the country’sadaptation thereto. The study also focused on the international negotiationsconcerning the mitigation of such changes. The study had a broad coverage,considering the vulnerability of and impacts on forests, livestock, soils andbiodiversity, regional aspects like coastal and subarid areas, social vulnerabili-ty aspects, and water resources. As it happens in a large portion of developingcountries, there still is little information on these issues. This summary bringssome of the results that are interesting to Brazil’s agricultural activities.
The discussions about climate change, vulnerability, impacts and adap-tation have particular connotations. Here, vulnerability refers to a certain sys-tem’s level of reaction to a specific climate change. Impacts (climatic) refer tothe consequences of the climate change to natural and human systems.Adaptation describes adjustments in ecological or socioeconomic systems inresponse to current or projected climate changes resulting from structuralpractices, processes, measures or changes.
The assessments conducted by the IPCC indicate that developing coun-tries are among the most vulnerable to climate changes. In Brazil, for exam-ple, adverse impacts of natural climate changes are droughts, overflows andfloods, and hillside landslips.
Adaptation and/or mitigation strategies depend on the existence of cred-ible climate change scenarios on a regional time scale of decades. Presentknowledge does not yet allow such scenarios to be established with greatconfidence. Notwithstanding that all projections point to a temperatureincrease, it is essential for a tropical country like Brazil to advance in order toget reliable scenarios of likely changes in the water cycle, as many of theimpacts are primarily associated with water. Even though some centers inBrazil are building up capacity to set up regional scenarios by downscalingscenarios from global models, the uncertainty inherent in global climate
3 “Atividade prospectivaem mudança do clima”,Brasília, CGEE – Centro deGestão e Estudos Estra-tégicos, Agosto 2004
Chapter 4: Impacts on global climate – greenhouse gas emissions
95
models remains. The main difficulty in analyzing potential sectoral impacts isprecisely that which results from the uncertainty about the future behavior ofthe rainfall intensity and distribution. These impacts still require a wide rangeof possible scenarios to be considered.
The mean overall temperature on the surface of the planet has increasedby 0.6 ºC over the past 100 years, and that increase has been sharper sincethe 1960-70’s. The three hottest years in the past 1,000 years of the recentgeological history have all occurred in the past decade. Today, by analyzingthe systematic analyses conducted by the IPCC, a reasonable consensus can bereached that the global heating over the past 100 years is probably explainedmainly by the man-induced emissions of greenhouse gases (GHG), ratherthan any natural climate variability.4 Until the beginning of the IndustrialRevolution in the late 18th century, the concentrations of carbon dioxide(CO2) in the atmosphere had ranged from 180 parts per million in volume(ppmv) to 200 ppmv of the total atmospheric mass (which characterized it asa minority gas) for at least 700,000 years, but possibly for more than 5 mil-lion years. Over the past few years the concentration of that gas has exceed-ed 375 ppmv and keeps on growing, as 8 to 9 million tons of carbon (in theform of CO2) are released every year by the burning of fossil fuels and man-induced changes in land use, especially deforestation in rain forests. The con-centration of other important greenhouse gases (CH4, N2O) in the atmos-phere has been increasing at rates that are even higher than those of CO2.
4.3.2 Climate change scenarios for South Americain the 2090-2100 decade
In order to project probable climate change scenarios for the future, math-ematical models of the global climate system are used which take into consid-eration the behavior of climate components (atmosphere, oceans, cryosphere,soil-vegetation, etc.) and their interactions. These models allow climate evolu-tion scenarios to be simulated for several GHG emission scenarios. Given theuncertainties about future GHG emissions, as well as uncertainties arisingfrom imperfections of the very models, several models and scenarios are used.
Figures 1 and 2 show climate scenarios for South America in the 2091-2100 decade for five different global climate models and two GHG emissionscenarios from the Intergovernmental Panel on Climate Change.5 A2 is a sce-nario consisting of a high level of GHG emissions, i.e. maintaining the GHGemission standards observed for the past few decades. The level shown hereindicates that by 2100 we would have CO2 concentrations in the atmosphereof 850 ppmv. B2 is a lower emission scenario considering a stabilization ofGHG emissions and a concentration of 550 ppmv at the end of this century.
4 HOUGHTON, R.A. et al.:Climate change 2001: Thescientific basis, Cambridge,Cambridge UniversityPress, 2001
5 NAKICENOVIC, N.;SWART, R. (Eds.):Emissions scenarios 2000:Special report of theIntergovernmental Panelon Climate Change,Cambrigde, CambridgeUniversity, 2000
Sugar cane’s energy
96
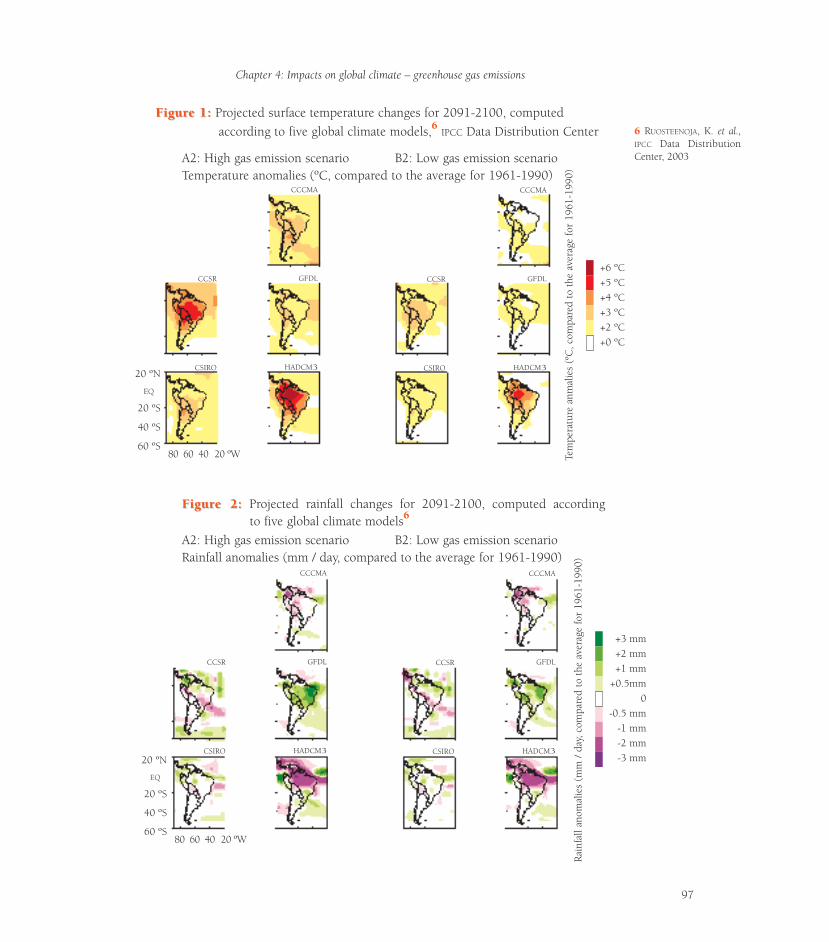
FigurFigure 1:e 1: Projected surface temperature changes for 2091-2100, computedaccording to five global climate models,6 IPCC Data Distribution Center
A2: High gas emission scenario B2: Low gas emission scenarioTemperature anomalies (ºC, compared to the average for 1961-1990)
FigurFigure 2:e 2: Projected rainfall changes for 2091-2100, computed accordingto five global climate models6
A2: High gas emission scenario B2: Low gas emission scenarioRainfall anomalies (mm / day, compared to the average for 1961-1990)
6 RUOSTEENOJA, K. et al.,IPCC Data DistributionCenter, 2003
Chapter 4: Impacts on global climate – greenhouse gas emissions
97
Rain
fall
anom
alie
s (m
m /
day,
com
pare
d to
the
ave
rage
for
1961
-199
0)
20 ºS
40 ºS
60 ºS
EQ
20 ºN
80 60 40 20 ºW
CCCMA
GFDL
HADCM3
CCSR
CSIRO
CCCMA
GFDL
HADCM3
CCSR
CSIRO
+3 mm+2 mm+1 mm
+0.5mm0
-0.5 mm-1 mm-2 mm-3 mm
20 ºN
20 ºS
EQ
40 ºS
60 ºS80 60 40 20 ºW
CCCMA
GFDL
HADCM3
CCSR
CSIRO
CCCMA
GFDL
HADCM3
CCSR
CSIRO
+6 ºC+5 ºC+4 ºC+3 ºC+2 ºC+0 ºC
Tem
pera
ture
anm
alie
s (º
C, c
ompa
red
to t
he a
vera
ge fo
r 19
61-1
990)
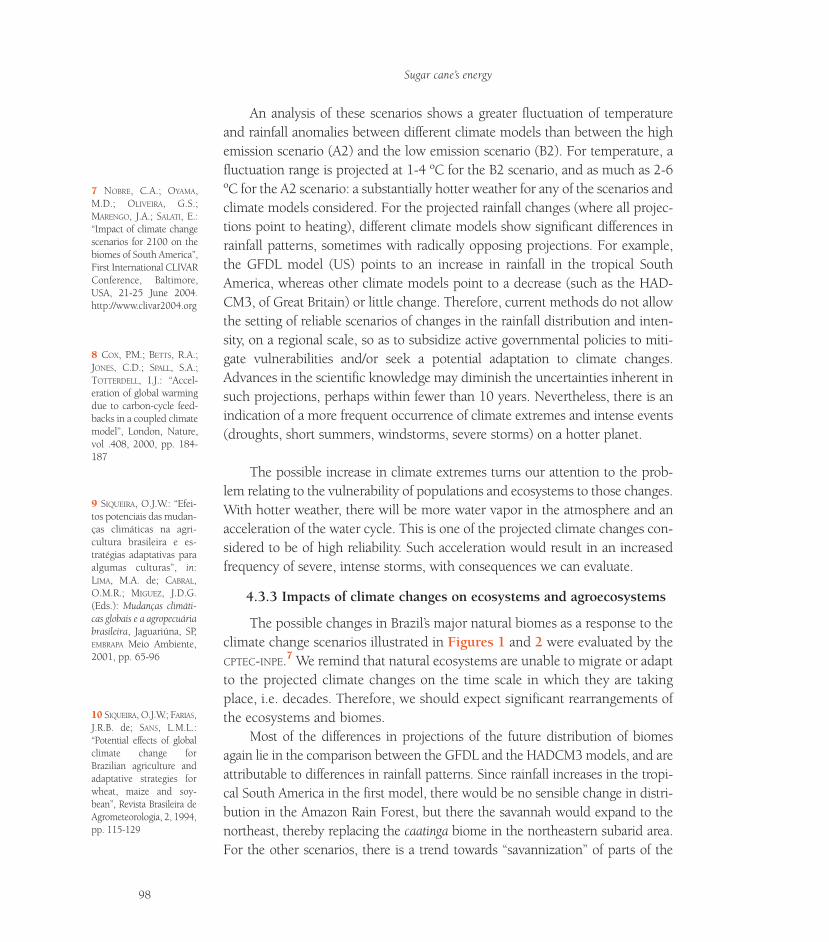
An analysis of these scenarios shows a greater fluctuation of temperatureand rainfall anomalies between different climate models than between the highemission scenario (A2) and the low emission scenario (B2). For temperature, afluctuation range is projected at 1-4 ºC for the B2 scenario, and as much as 2-6ºC for the A2 scenario: a substantially hotter weather for any of the scenarios andclimate models considered. For the projected rainfall changes (where all projec-tions point to heating), different climate models show significant differences inrainfall patterns, sometimes with radically opposing projections. For example,the GFDL model (US) points to an increase in rainfall in the tropical SouthAmerica, whereas other climate models point to a decrease (such as the HAD-CM3, of Great Britain) or little change. Therefore, current methods do not allowthe setting of reliable scenarios of changes in the rainfall distribution and inten-sity, on a regional scale, so as to subsidize active governmental policies to miti-gate vulnerabilities and/or seek a potential adaptation to climate changes.Advances in the scientific knowledge may diminish the uncertainties inherent insuch projections, perhaps within fewer than 10 years. Nevertheless, there is anindication of a more frequent occurrence of climate extremes and intense events(droughts, short summers, windstorms, severe storms) on a hotter planet.
The possible increase in climate extremes turns our attention to the prob-lem relating to the vulnerability of populations and ecosystems to those changes.With hotter weather, there will be more water vapor in the atmosphere and anacceleration of the water cycle. This is one of the projected climate changes con-sidered to be of high reliability. Such acceleration would result in an increasedfrequency of severe, intense storms, with consequences we can evaluate.
4.3.3 Impacts of climate changes on ecosystems and agroecosystems
The possible changes in Brazil’s major natural biomes as a response to theclimate change scenarios illustrated in Figures 1 and 2 were evaluated by theCPTEC-INPE.7 We remind that natural ecosystems are unable to migrate or adaptto the projected climate changes on the time scale in which they are takingplace, i.e. decades. Therefore, we should expect significant rearrangements ofthe ecosystems and biomes.
Most of the differences in projections of the future distribution of biomesagain lie in the comparison between the GFDL and the HADCM3 models, and areattributable to differences in rainfall patterns. Since rainfall increases in the tropi-cal South America in the first model, there would be no sensible change in distri-bution in the Amazon Rain Forest, but there the savannah would expand to thenortheast, thereby replacing the caatinga biome in the northeastern subarid area.For the other scenarios, there is a trend towards “savannization” of parts of the
7 NOBRE, C.A.; OYAMA,M.D.; OLIVEIRA, G.S.;MARENGO, J.A.; SALATI, E.:“Impact of climate changescenarios for 2100 on thebiomes of South America”,First International CLIVARConference, Baltimore,USA, 21-25 June 2004.http://www.clivar2004.org
8 COX, P.M.; BETTS, R.A.;JONES, C.D.; SPALL, S.A.;TOTTERDELL, I.J.: “Accel-eration of global warmingdue to carbon-cycle feed-backs in a coupled climatemodel”, London, Nature,vol .408, 2000, pp. 184-187
10 SIQUEIRA, O.J.W.; FARIAS,J.R.B. de; SANS, L.M.L.:“Potential effects of globalclimate change forBrazilian agriculture andadaptative strategies forwheat, maize and soy-bean”, Revista Brasileira deAgrometeorologia, 2, 1994,pp. 115-129
9 SIQUEIRA, O.J.W.: “Efei-tos potenciais das mudan-ças climáticas na agri-cultura brasileira e es-tratégias adaptativas paraalgumas culturas”, in:LIMA, M.A. de; CABRAL,O.M.R.; MIGUEZ, J.D.G.(Eds.): Mudanças climáti-cas globais e a agropecuáriabrasileira, Jaguariúna, SP,EMBRAPA Meio Ambiente,2001, pp. 65-96
Sugar cane’s energy
98
Amazon (i.e. expansion of the cerrado, or savannah to the north) and even towardsthe caatinga of part of the subarid area becoming a semi-desert. Generally, there isa projected expansion of savannah areas in the tropical South America and adecrease in the caatinga area. Four of the five scenarios point to a decrease in thearea covered by the Amazon Rain Forest. In particular, the HADCM3 model is theone providing the most extreme scenario for the Amazon, going as far as to spec-ulate about a possible complete disappearance of the Amazon Rain Forest.8
An analogous reasoning could be used in respect to the impact of suchprojected climate changes on the agroecosystems. For the most part, except forthe GFDL, there is a trend towards decreased availability of water in parts of theAmazon, the Northeast and the Center-West, which could adversely affect agri-culture, especially in the Northeast and the Center-West. In the South andSoutheast, those projections point to much smaller changes in the water sys-tem. However, in order to project the impacts on agriculture and, as a result,evaluate the vulnerability, the effects of the temperature and the concentrationof carbon dioxide (CO2 “fertilization”), should be considered. A sharp increasein the mean temperature is usually harmful to the crops if outside the optimumrange, but in the other way around, an increase in CO2 concentration usuallyresults in higher productivity for the crops.
There are only a few studies dealing with the impacts of climate changeson the Brazilian agriculture. Some of the studies used future climate changescenarios based on global climate models. These studies sought to calculatethe negative and positive effects on the productivity of wheat, corn and soy-bean crops9, 10, 11 or the impact of climate changes in the occurrence of pestsin wheat crops in the south of Brazil.12 Other studies analyzed the agrocli-matic risk to coffee crops at climate extremes.13, 14 In São Paulo State, forexample, it was calculated that with an increase of 3 ºC in the mean temper-ature and 15% in rainfall, only 15% of the state’s area would be favorable tothe Arabic coffee culture (compared to today’s 40%), even considering thatthere would be no risk of frosts in these scenarios.
For the most part, the studies of the impacts on the agricultural produc-tivity of corn, wheat and soybean crops do not allow the conclusion to besafely reached that the effect of temperature rises contributes to productivitydecreases, even including the possibility of the greater occurrence of pests. Tosome extent, this can be compensated for by the increased concentration ofcarbon dioxide. Effects on soil (new physicochemical and biological balances,influencing fertility) also need evaluation. It is noted that all studies haveused mathematical models to estimate the impacts on agriculture, but theirresults lack further validation by field experiments.
13 MARENGO, J.A.: “Impac-tos das condições climá-ticas e da variabilidade emudanças do clima sobrea produção e os preçosagrícolas: ondas de frio eseu impacto sobre a cafei-cultura nas regiões Sul eSudeste do Brasil”, in:LIMA, M.A.; CABRAL,O.M.R.; MIGUEZ, J.D.G.(Eds.): Mudanças climáti-cas globais e a agropecuáriabrasileira, Jaguariúna, SP,EMBRAPA Meio Ambiente,2001, pp. 97-123
Chapter 4: Impacts on global climate – greenhouse gas emissions
99
14 PINTO H.S.; ASSAD, E.D.;ZULLO JR.; BRUNINI, O.:“O aquecimento global e aagricultura”, Revista Eletrô-nica do Jornalismo Cien-tífico, COMCIENCIA - SBPC,vol. 35, 2002, pp. 1-6
12 FERNANDES, J.M. et al.:“Expected impacts of cli-mate change on the inci-dence of crop disease inthe Pampas region ofArgentina, Brazil andUruguay: Modeling fus-arium head blight inwheat under climatechange using linkedprocess-based model”(AIACC Project No. LA27),Second AIACC RegionalWorkshop for Latin Amer-ica and the Caribbean
11 TRAVASSO, M. et al.:“Expected impacts of cli-mate change on crop yieldsin the Pampas region ofArgentina, Brazil andUruguay” (AIACC ProjectNo. LA27), Second AIACCRegional Workshop forLatin America and theCaribbean, Buenos Aires,Argentina, 24-27 August2004
9 see p. 98
10 see p. 98
8 see p. 98
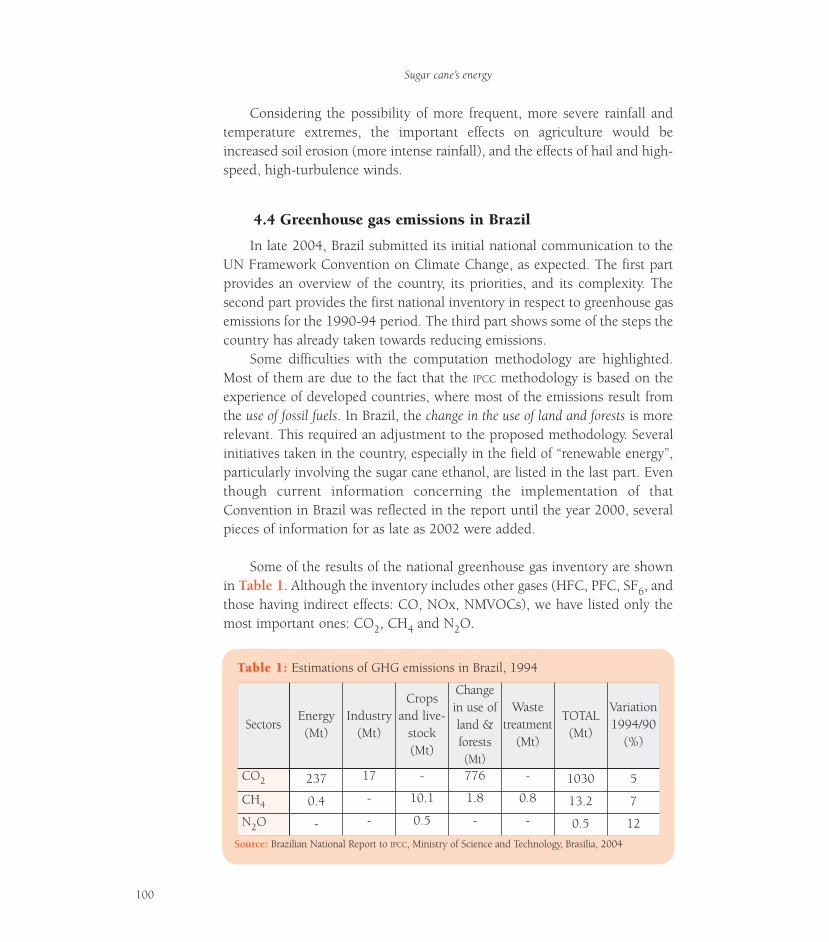
Considering the possibility of more frequent, more severe rainfall andtemperature extremes, the important effects on agriculture would beincreased soil erosion (more intense rainfall), and the effects of hail and high-speed, high-turbulence winds.
4.4 Greenhouse gas emissions in Brazil
In late 2004, Brazil submitted its initial national communication to theUN Framework Convention on Climate Change, as expected. The first partprovides an overview of the country, its priorities, and its complexity. Thesecond part provides the first national inventory in respect to greenhouse gasemissions for the 1990-94 period. The third part shows some of the steps thecountry has already taken towards reducing emissions.
Some difficulties with the computation methodology are highlighted.Most of them are due to the fact that the IPCC methodology is based on theexperience of developed countries, where most of the emissions result fromthe use of fossil fuels. In Brazil, the change in the use of land and forests is morerelevant. This required an adjustment to the proposed methodology. Severalinitiatives taken in the country, especially in the field of “renewable energy”,particularly involving the sugar cane ethanol, are listed in the last part. Eventhough current information concerning the implementation of thatConvention in Brazil was reflected in the report until the year 2000, severalpieces of information for as late as 2002 were added.
Some of the results of the national greenhouse gas inventory are shownin Table 1. Although the inventory includes other gases (HFC, PFC, SF6, andthose having indirect effects: CO, NOx, NMVOCs), we have listed only themost important ones: CO2, CH4 and N2O.
Sugar cane’s energy
100
TTable 1:able 1: Estimations of GHG emissions in Brazil, 1994
Source: Brazilian National Report to IPCC, Ministry of Science and Technology, Brasília, 2004
SectorsEnergy(Mt)
Industry(Mt)
Cropsand live-
stock(Mt)
Changein use ofland &forests(Mt)
Wastetreatment
(Mt)
TOTAL(Mt)
Variation1994/90
(%)
CO2 237 17 - 776 - 1030 5
CH4 0.4 - 10.1 1.8 0.8 13.2 7
N2O - - 0.5 - - 0.5 12
As demonstrated in Table 1, CO2 emissions in 1994 were caused bychanges in the use of land and forests (75%), followed by energy (23%). Methaneemissions originated mainly from crops and livestock (77%, most of whichfrom enteric fermentation by ruminants), which also accounted for 92 per-cent of the N2O emissions. We point out that the “global warming power” ofmethane is 29 times as large as that of CO2, while that of N2O is 296 timesas large as that of CO2.
The figures above serve as a reference for comparison with GHG emis-sions from sugar cane production and processing, and with the emissionsprevented by using ethanol and bagasse as fuels, as quantified in item 4.5.
4.5 GHG emissions by the sugar and ethanol industry inBrazil: current and expected values
Isaias de Carvalho MacedoNIPE / UNICAMP
The energy products of sugar cane, i.e. ethanol and bagasse, have large-ly contributed to the reduction of the emissions of greenhouse gases (GHG)in Brazil, by substituting for fossil fuels, i.e. gasoline and fuel oil, respective-ly. Not only does the bagasse supply energy (thermal and electrical) forethanol production, it is also used in sugar production (substituting for thefossil fuel that would be used in the alternative production from sugar beets,or starch) and other industrial sectors (such as orange processing).
Fossil fuels are consumed in sugar cane planting, harvesting, transporta-tion and processing and emit GHG. Also, there are processes that have noconnection with fuels, but generate emissions that are not compensated forby photosynthetic re-absorption as the sugar cane grows (non CO2 gases intrash burning, fertilizer decomposition, etc.). A complete balance sheet ofenergy and emissions (in the life cycle) for evaluating the net results inethanol production from sugar cane and its utilization as a fuel in trans-portation sector has been prepared and recently updated in Brazil.15 In 2006a new update included also some forecasts for the evolution (based on tech-nical improvements) for the next years.16
The energy analysis is summed up in item 1.4.1, resulting in a meanratio between the production of renewable energy and consumption of fossilenergy of 8.9. For comparison, the energy ratio in the case of ethanol andcorn in the United States was evaluated at 1.34 in 2002.
15 MACEDO, I.C.; LEAL,M.R.L.V.; SILVA, J.E.A.:”Emissões de gases deefeito estufa (GEE) naprodução e uso deetanol no Brasil: situa-ção atual (2002)”, SMA– Secretaria do MeioAmbiente de SãoPaulo, São Paulo, 2004
16 SEABRA, J.E.; LEAL.M.R.L.V.; MACEDO, I.C.:The energy balance andGHG avoided emis-sions in the production/ use of ethanol fromsugar cane in Brazil:the situation today andthe expected evolutionin the next decade; XVII n t e r n a t i o n a lSymposium on AlcoholFuels, Rio de Janeiro,Nov 2006
Chapter 4: Impacts on global climate – greenhouse gas emissions
101
For greenhouse gases, emissions from the use of fossil energy were eval-uated at 0.20 kgCO2 eq./m3 ethanol anhydrous (on average), and emissionsfrom other sources (non CO2 gases from trash burning, fertilizer decomposi-tion, etc.) 0.18 kgCO2 eq./m3 ethanol anhydrous. As a net result, the emis-sions avoided by the substitution of ethanol for gasoline, and of surplusbagasse for fuel oil, minus the foregoing values amount to 2.86 t CO2eq. / m3
of anhydrous ethanol and 2.16 t CO2eq. / m3 of hydrous ethanol, for themean values. For the mills featuring the best performance, the values can bearound 4 percent higher. These values consider anhydrous ethanol as anadditive (added up to 24%) and hydrous ethanol for E100 cars.
These are very relevant results. Under these conditions, which reflect thecurrent situation in Brazil, ethanol production from sugar cane is much supe-rior compared to any other technology to produce biomass fuels worldwide.This is because of the “renewable energy obtained/fossil energy used” ratioand the very high rate of decrease in the emissions of GHG. For the Brazilianconsumption of ethanol in 2003, i.e. 11.6 million m3 per year (6.1 Mm3 ofwhich consisting of hydrous ethanol), ethanol was responsible for a reduc-tion of around 27.5 million t CO2 equivalent.
The emission of GHG from beet sugar production (energy based on coalor natural gas) is much larger than that from cane-sugar production.Although that difference cannot be used in CDM projects due to baseline def-initions, it should nonetheless be pointed out. At the moment, beet process-ing takes less energy (on average) than sugar cane processing (the availabili-ty of bagasse has made sugar mills less energy-efficient). Modern beet sugarmills operate today with around 1.1 Gcal / sugar t (on average); using natu-ral gas, the CO2 emissions would amount to 0.26 ton CO2 / sugar t. This isa conservative result. Compared to the emissions from beet-based sugarmills, the Brazilian mills have avoided emissions of 5.7 million tons CO2equivalent in 2003.
An analysis of the expected situation concerning emissions for the nextfew years17 considers:
• Increased mechanical harvesting of sugar cane (increasing the con-sumption of fossil fuels), and reduced sugar cane burning (reducingsome methane and nitrous oxide emissions• Equivalences between ethanol and gasoline, for the various applica-tions, being changed to include new compositions with the use of flex-fuel engines
Sugar cane’s energy
102
17 MACEDO, I.C.:“Estimativa da reduçãoadicional de emissões degases de efeito estufa(GEE) com o aumento daprodução de cana ederivados no Brasil;2010”, Internal report,UNICA, São Paulo, 2004
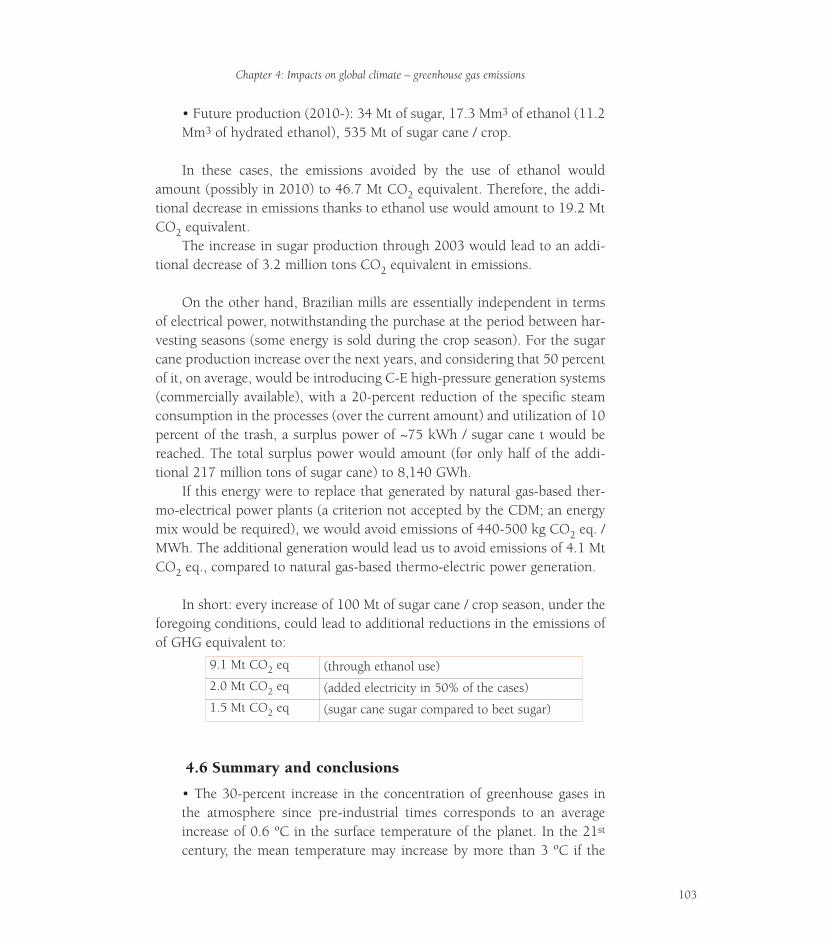
• Future production (2010-): 34 Mt of sugar, 17.3 Mm3 of ethanol (11.2Mm3 of hydrated ethanol), 535 Mt of sugar cane / crop.
In these cases, the emissions avoided by the use of ethanol wouldamount (possibly in 2010) to 46.7 Mt CO2 equivalent. Therefore, the addi-tional decrease in emissions thanks to ethanol use would amount to 19.2 MtCO2 equivalent.
The increase in sugar production through 2003 would lead to an addi-tional decrease of 3.2 million tons CO2 equivalent in emissions.
On the other hand, Brazilian mills are essentially independent in termsof electrical power, notwithstanding the purchase at the period between har-vesting seasons (some energy is sold during the crop season). For the sugarcane production increase over the next years, and considering that 50 percentof it, on average, would be introducing C-E high-pressure generation systems(commercially available), with a 20-percent reduction of the specific steamconsumption in the processes (over the current amount) and utilization of 10percent of the trash, a surplus power of ~75 kWh / sugar cane t would bereached. The total surplus power would amount (for only half of the addi-tional 217 million tons of sugar cane) to 8,140 GWh.
If this energy were to replace that generated by natural gas-based ther-mo-electrical power plants (a criterion not accepted by the CDM; an energymix would be required), we would avoid emissions of 440-500 kg CO2 eq. /MWh. The additional generation would lead us to avoid emissions of 4.1 MtCO2 eq., compared to natural gas-based thermo-electric power generation.
In short: every increase of 100 Mt of sugar cane / crop season, under theforegoing conditions, could lead to additional reductions in the emissions ofof GHG equivalent to:
4.6 Summary and conclusions
• The 30-percent increase in the concentration of greenhouse gases inthe atmosphere since pre-industrial times corresponds to an averageincrease of 0.6 ºC in the surface temperature of the planet. In the 21st
century, the mean temperature may increase by more than 3 ºC if the
9.1 Mt CO2 eq (through ethanol use)
2.0 Mt CO2 eq (added electricity in 50% of the cases)
1.5 Mt CO2 eq (sugar cane sugar compared to beet sugar)
Chapter 4: Impacts on global climate – greenhouse gas emissions
103
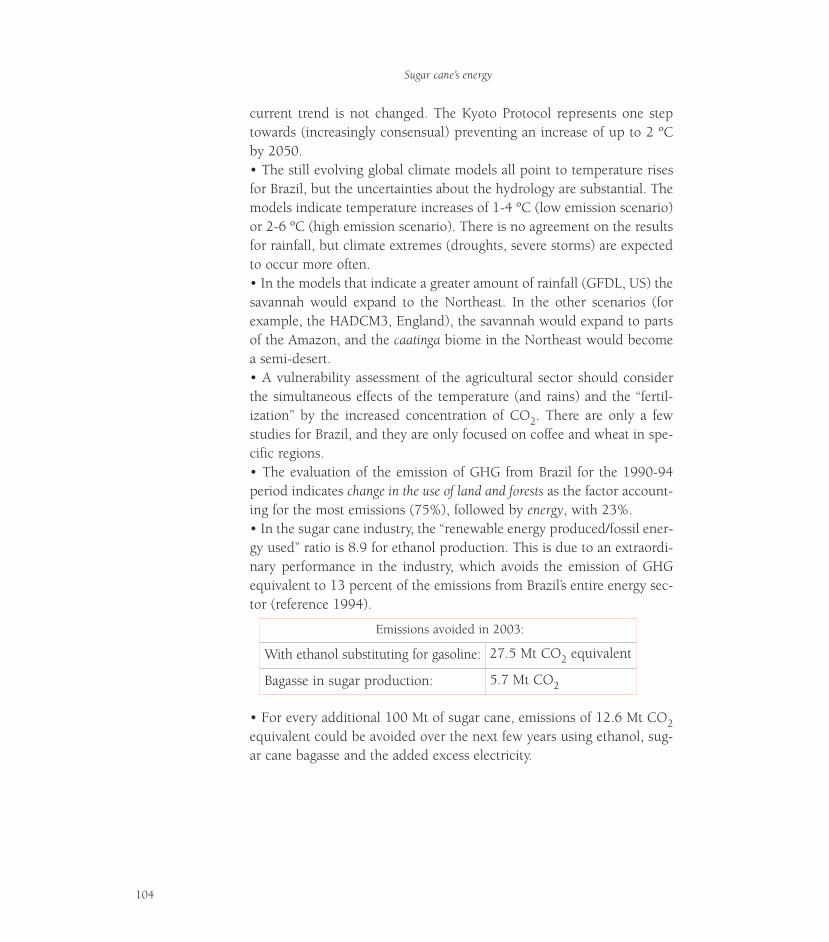
current trend is not changed. The Kyoto Protocol represents one steptowards (increasingly consensual) preventing an increase of up to 2 ºCby 2050.• The still evolving global climate models all point to temperature risesfor Brazil, but the uncertainties about the hydrology are substantial. Themodels indicate temperature increases of 1-4 ºC (low emission scenario)or 2-6 ºC (high emission scenario). There is no agreement on the resultsfor rainfall, but climate extremes (droughts, severe storms) are expectedto occur more often.• In the models that indicate a greater amount of rainfall (GFDL, US) thesavannah would expand to the Northeast. In the other scenarios (forexample, the HADCM3, England), the savannah would expand to partsof the Amazon, and the caatinga biome in the Northeast would becomea semi-desert.• A vulnerability assessment of the agricultural sector should considerthe simultaneous effects of the temperature (and rains) and the “fertil-ization” by the increased concentration of CO2. There are only a fewstudies for Brazil, and they are only focused on coffee and wheat in spe-cific regions.• The evaluation of the emission of GHG from Brazil for the 1990-94period indicates change in the use of land and forests as the factor account-ing for the most emissions (75%), followed by energy, with 23%.• In the sugar cane industry, the “renewable energy produced/fossil ener-gy used” ratio is 8.9 for ethanol production. This is due to an extraordi-nary performance in the industry, which avoids the emission of GHGequivalent to 13 percent of the emissions from Brazil’s entire energy sec-tor (reference 1994).
• For every additional 100 Mt of sugar cane, emissions of 12.6 Mt CO2equivalent could be avoided over the next few years using ethanol, sug-ar cane bagasse and the added excess electricity.
Emissions avoided in 2003:
With ethanol substituting for gasoline: 27.5 Mt CO2 equivalent
Bagasse in sugar production: 5.7 Mt CO2
Sugar cane’s energy
104
105
1 Estimations (2005) for
2003, CHRISTOFIDIS, D.;
complementing Min.
Integração Nacional /SIH/
DDH (1999); also
CHRISTOFIDIS, D.:
“Irrigação, a fronteira
hídrica na produção de
alimentos”, Item, vol. 2.,
no. 54, 2002, pp. 46-55
Chapter 5:Impacts on the water supply
5.1 Introduction
The use of water for irrigation is considered an essential factor toagriculture worldwide. For a harvested crop surface (2000)1 of 1,500 Mha,around 275 Mha are irrigated. There are around 190 Mha that allowagricultural use by agricultural drainage systems. The crop surface under dryfarming, covering around 1,225 Mha (approximately 82% of the total),accounts for 58 percent of the production, which clearly demonstrates theimportance of irrigation. The water used in agricultural productionworldwide (2,595 km3 in 2000) corresponded to an average of 9,436 m3 /ha.year. It is estimated that this average can be reduced to 8,100 m3 / ha.yearby 2025.
The conflicts surrounding the uses of water have become more and moreimportant around the world, with crop irrigation as one of its major issues.Likewise, the water sources and streams must be protected in order toprevent aggradations.
The impacts of the sugar cane culture on the water supply today(volumes and quality) are small under the conditions found in São Paulo. Themain reasons for this are non-utilization of irrigation; an important reductionof water withdraw for industrial purposes that has been attained over the pastfew years thanks to internal reuse in the processes; and the practice ofreturning the water to the crops in the ferti-irrigation systems.
On the other hand, the forest protection legislation and its specificapplication to environmental protection areas (APP, in Portuguese) consistingof riverside woods have been releasing those areas from planting. This maylead to a major advance, creating corridors for biodiversity restoration, asproposed by the Office of the Secretary of Environment (São Paulo).
Brazil has the greatest availability of water in theworld, and the use of crop irrigation is relatively small. Sugarcane crops are virtually not irrigated. The levels of waterwithdraw and release for industrial use have substantiallydecreased in the last years, with larger water reuse. Watertreatment before discharge in São Paulo is adequate. Theprotection of areas around waterways and lagoons hasadvanced and may constitute an important factor also forthe protection of biodiversity.
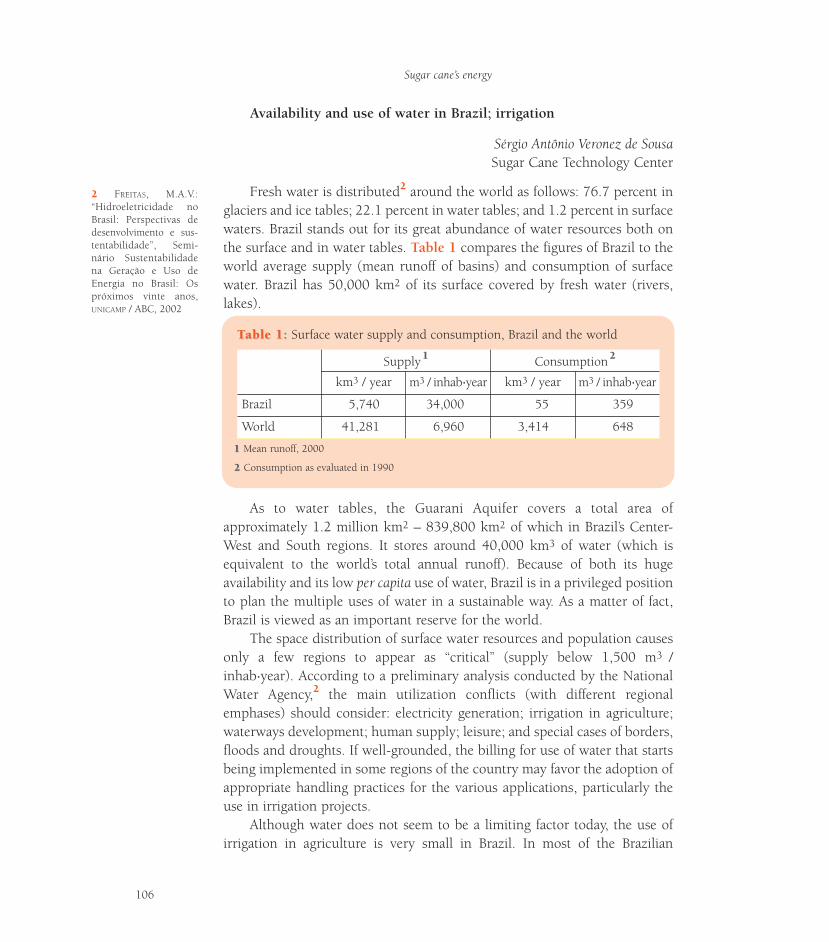
Availability and use of water in Brazil; irrigation
Sérgio Antônio Veronez de SousaSugar Cane Technology Center
Fresh water is distributed2 around the world as follows: 76.7 percent inglaciers and ice tables; 22.1 percent in water tables; and 1.2 percent in surfacewaters. Brazil stands out for its great abundance of water resources both onthe surface and in water tables. Table 1 compares the figures of Brazil to theworld average supply (mean runoff of basins) and consumption of surfacewater. Brazil has 50,000 km2 of its surface covered by fresh water (rivers,lakes).
As to water tables, the Guarani Aquifer covers a total area ofapproximately 1.2 million km2 – 839,800 km2 of which in Brazil’s Center-West and South regions. It stores around 40,000 km3 of water (which isequivalent to the world’s total annual runoff). Because of both its hugeavailability and its low per capita use of water, Brazil is in a privileged positionto plan the multiple uses of water in a sustainable way. As a matter of fact,Brazil is viewed as an important reserve for the world.
The space distribution of surface water resources and population causesonly a few regions to appear as “critical” (supply below 1,500 m3 /inhab.year). According to a preliminary analysis conducted by the NationalWater Agency,2 the main utilization conflicts (with different regionalemphases) should consider: electricity generation; irrigation in agriculture;waterways development; human supply; leisure; and special cases of borders,floods and droughts. If well-grounded, the billing for use of water that startsbeing implemented in some regions of the country may favor the adoption ofappropriate handling practices for the various applications, particularly theuse in irrigation projects.
Although water does not seem to be a limiting factor today, the use ofirrigation in agriculture is very small in Brazil. In most of the Brazilian
2 FREITAS, M.A.V.:“Hidroeletricidade noBrasil: Perspectivas dedesenvolvimento e sus-tentabilidade”, Semi-nário Sustentabilidadena Geração e Uso deEnergia no Brasil: Ospróximos vinte anos,UNICAMP / ABC, 2002
Sugar cane’s energy
106
TTable 1:able 1: Surface water supply and consumption, Brazil and the world
11 Mean runoff, 2000
22 Consumption as evaluated in 1990
Supply 1 Consumption 2
km3 / year m3 / inhab.year km3 / year m3 / inhab.year
Brazil 5,740 34,000 55 359
World 41,281 6,960 3,414 648
territory, the agriculture used is dry farming: crops are grown dependingexclusively on natural rainfall. In some regions, especially the cerrados, orsavannahs, the total rainfall in the rainy season is enough for thedevelopment of agriculture. This is in spite of the frequent occurrence ofsuccessive dry days during the rainy season, which affects the developmentof crops and the final productivity.
Irrigation in Brazil’s crop areas took up only 2.9 Mha in 2002.3 Morerecent estimations point to 3.3 M ha, including all systems (drainage controlon the surface, or using standard sprinkling, central swivel systems orlocalized irrigation). This corresponds to only 1.2 percent of the world’sirrigated areas (277 Mha). Some studies3 indicate that additional areasconsidered to be fit for a “sustainable irrigation” (fit soils with assured water)worldwide have reached 195 Mha. Around 15 percent of those areas are inBrazil (30 Mha), two thirds of which being located in the North and Center-West regions.
Even though the use of water for irrigation is very little in Brazil, itshould be pointed out that the use efficiency (relation between the watercoming to the crops and the water withdrawn from sources) is low: 61percent on average. This results from the use of surface irrigation for 50percent of the total water in Brazil. The future should consider the re-conversion of those systems: with equipment easier to control, adequatehandling of surface irrigation systems, more uniform water applicationsystems (by sprinkling), and spot irrigation (dripping and microsprinkling).
The use of irrigation is being investigated in Brazil for sugar cane, on avery small scale. The uses being tested correspond to very conservativetechnologies with a minimum use of water. Taking full advantage of thenatural climatic conditions while implementing irrigation systems – for full,supplementary or salvage irrigation – may lead to interesting cost-benefitratios in some cases.
Irrigation in sugar cane production is more widespread in theNortheast.4 It also displays gradual growth in the Center-West and someareas in the Southeast, especially in Rio de Janeiro, Espírito Santo and westof São Paulo. “Salvage irrigation” is used after the planting of sugar cane inorder to ensure sprouting in long periods without rain. “Supplementaryirrigation” with different blades at the most critical of development stages isused in order to mitigate any shortages of water; and irrigation is usedthroughout the cycle, in relatively small areas.
3 FAO, Data Base: Faostat,2004
4 ANSELMI, R.: “Irrigar épreciso”, JornalCana, ed.124, Apr. 2004, pp. 36-40
Chapter 5: Impacts on the water supply
107
Practically all of the sugar cane produced in São Paulo State is grownwithout irrigation,5 based on economic analyses that were conductedconsidering full irrigation and productivity gains. However, experimentsconducted by the Sugar Cane Technology Center have demonstrated theeconomic feasibility of subsurface sprinkling in the Ribeirão Preto region.The sugar cane harvesting season and the increase in longevity of the sugarcane crop, among other factors, have an influence of the feasibility ofirrigation.
Although it is usual to associate sugar cane productivity with wateravailability (a 8.0-12.0 mm ratio of water evapotranspired for each t of sugarcane produced is widely used), that ratio varies according to many factors.6
However, it is important to keep a suitable humidity level throughout thegrowing process in order to get high yields. Depending on the weather, thewater required by sugar cane crops amounts to 1,500 to 2,500 mm,uniformly distributed across the cycle. The growing demand for theincorporation of new sugar cane areas in the Center-South region of Brazilhas lead to the exploitation of regions having higher water deficits. In thesecases, irrigation can be economically feasible, especially using more efficientmethods.
For the most part, it can be said that some of the environmentalproblems arising from irrigation, and found in many sugar cane and beetcrops around the world, do not exist in Brazil. An evaluation provided byEMBRAPA
7 now rates the impacts of sugar cane crops on water quality as level1 (no impact).
5.3 Water withdraw and use in sugar cane processing
André Elia Neto Sugar Cane Technology Center
The sugar cane culture in Brazil has traditionally not used irrigation. Thisis highly important in the reduction of environmental impacts (not onlybecause of the little use of water, but also to avoid the dragging of nutrientsand agrochemical residues, loss of soil, etc.). The water goes into the millswith the sugar cane (around 70% of the crop stalks weight) and it is alsowithdrawn from sources to be used in the industry. The collected water isused in several processes, at different reuse levels. Part of it is returned to thewater streams after the necessary treatments, and another part is used in ferti-irrigation together with the vinasse. The difference between withdrawn and
5 MATIOLI, C.S.: Irrigaçãosuplementar de cana-de-açúcar: modelo de análisede decisão para o Estadode São Paulo, Piracicaba,SP, Doctor’s thesis –Escola Superior deAgricultura “Luiz deQueiroz”, Universidadede São Paulo, 1998
6 DOORENBOS, J.; KASSAM,A.H.: Yield response towater (Irrigation andDrainage Paper, 33),Rome, FAO, 1979
Sugar cane’s energy
108
7 ROSSETTO, R.: “A cul-tura da cana, dadegradação à conser-vação”, Visão Agrícola,ESALQ-USP, Ano 1, Jan2004
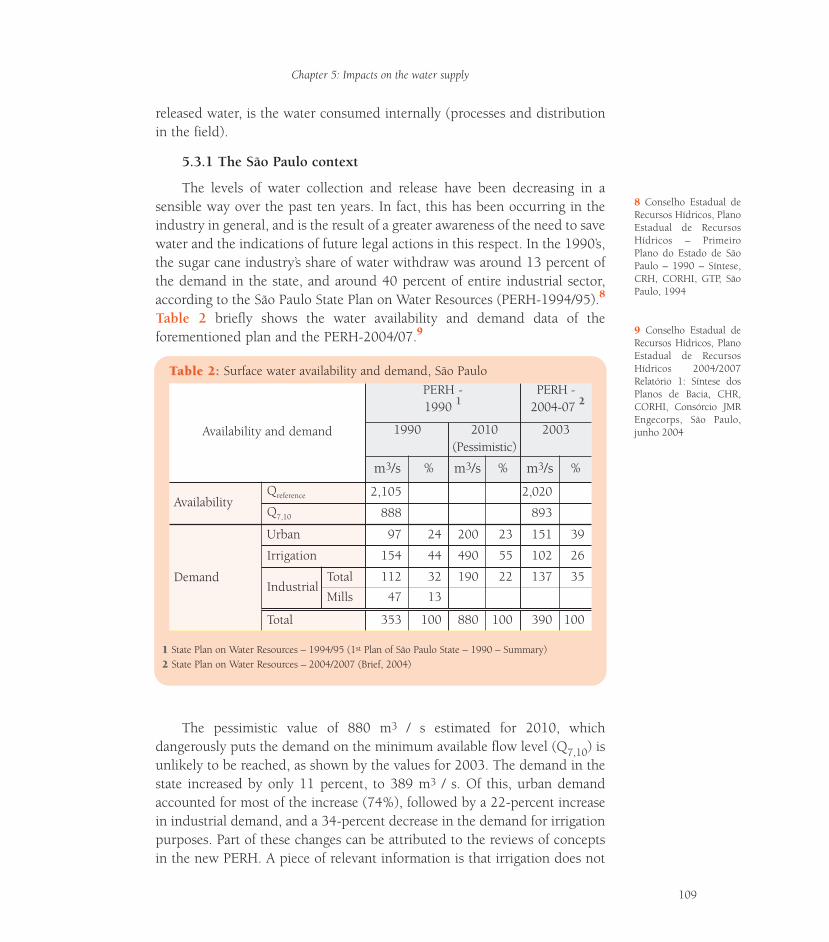
released water, is the water consumed internally (processes and distributionin the field).
5.3.1 The São Paulo context
The levels of water collection and release have been decreasing in asensible way over the past ten years. In fact, this has been occurring in theindustry in general, and is the result of a greater awareness of the need to savewater and the indications of future legal actions in this respect. In the 1990’s,the sugar cane industry’s share of water withdraw was around 13 percent ofthe demand in the state, and around 40 percent of entire industrial sector,according to the São Paulo State Plan on Water Resources (PERH-1994/95).8
Table 2 briefly shows the water availability and demand data of theforementioned plan and the PERH-2004/07.9
The pessimistic value of 880 m3 / s estimated for 2010, whichdangerously puts the demand on the minimum available flow level (Q7,10) isunlikely to be reached, as shown by the values for 2003. The demand in thestate increased by only 11 percent, to 389 m3 / s. Of this, urban demandaccounted for most of the increase (74%), followed by a 22-percent increasein industrial demand, and a 34-percent decrease in the demand for irrigationpurposes. Part of these changes can be attributed to the reviews of conceptsin the new PERH. A piece of relevant information is that irrigation does not
8 Conselho Estadual deRecursos Hídricos, PlanoEstadual de RecursosHídricos – PrimeiroPlano do Estado de SãoPaulo – 1990 – Síntese,CRH, CORHI, GTP, SãoPaulo, 1994
9 Conselho Estadual deRecursos Hídricos, PlanoEstadual de RecursosHídricos 2004/2007Relatório 1: Síntese dosPlanos de Bacia, CHR,CORHI, Consórcio JMREngecorps, São Paulo,junho 2004
Chapter 5: Impacts on the water supply
109
TTable 2:able 2: Surface water availability and demand, São Paulo
11 State Plan on Water Resources – 1994/95 (1st Plan of São Paulo State – 1990 – Summary)22 State Plan on Water Resources – 2004/2007 (Brief, 2004)
Availability and demand
PERH -1990 1
PERH -2004-07 2
1990 2010(Pessimistic)
2003
m3/s % m3/s % m3/s %
AvailabilityQreference 2,105 2,020
Q7,10 888 893
Demand
Urban 97 24 200 23 151 39
Irrigation 154 44 490 55 102 26
IndustrialTotal 112 32 190 22 137 35
Mills 47 13
Total 353 100 880 100 390 100
have the weight that was previously attributed to it; the leading user of wateris the urban sector, with around 39 percent of the state’s surface water.
In the industrial sector (including the sugar cane agribusiness), thedemand for water increased by only 22 percent in that period. This is partlybecause of the rationalization of water use that has been encouraged by theimplementation of the new legislation, which provides for billing for the useof water (yet to be regulated).
Some partial estimations and measurements have been concluded for thesugar cane industry regarding water withdraw, use and release. Previously, thewater release figures and the polluting load were always more important tothe sector than the collection. Based on the estimated demand for 6 croppingmonths, and the total milling of sugar cane in 1990 in São Paulo State,10 thewater collection rate at the time was estimated at 5.6 m3 / t of sugar cane. Thespecific release flow rate (32.3 m3 / s, according to the PERH-1990) wasestimated at 3.8 m3/t of sugar cane, leading to consumption of 1.8 m3 / t ofsugar cane.
For the 2004/05 crop, 207.8 Mt of sugar cane milled in São Paulo,11
represent a growth of 58.5 percent since 1990, which has outpaced theincrease in demand for water without a doubt.
5.3.2 Legislation on the use of water resources
The billing for use of water is based upon the “user-payer” and“pollutant-payer” principles: based on the amount and quality of the watercollected and released by the user. All uses that require consent are subject tobilling, such as collection, derivation, disposal dilution, energy production,navigation and others.
The costs affecting the industrial sector correspond to water withdraw,consumption and disposal. Billing for the use of water in São Paulo has beenimplemented for two geographic basins, the PCJ (Piracicaba, Jundiaí eCapivari) and the Paraiba do Sul. Both have established federal and statecommittees, and the water in rivers crossing state borders are already beingbilled for urban, industrial and rural utilization. For the state rivers (within asingle state) and for underground water billing will be effective in 2007(Decrees 51449 and 51450, from 2006, for the PCJ and Paraiba do Sul). Themajority of the remaining 18 basin committees (in São Paulo) will start thebilling in 2008; in São Paulo the billing of water for irrigation was postponedtill 2010. The main legal mechanisms to bill for use of water at the federaland state levels for São Paulo State are as follows:
10 FERNANDES, A.C.:“Desempenho da agro-indústria da cana-de-açúcar no Brasil (1970 a1995)”, Piracicaba, SP,CTC – Centro deTecnologia Canavieira,July 1996
11 UNICA, “Resumo daprodução da regiãoCentro-Sul”, sitewww.portalunica.com.br/referencia/estatisticas.jspaccessed in Feb 03 2005
Sugar cane’s energy
110
• The São Paulo Constitution, 1988: it provides that the use of waterresources shall be billed, and the proceeds shall be used to maintain thequality and quantity of water.• State Law (SP) no. 7,663, 1991: it introduces the State Policy for WaterResources and the Integrated Water Resources Management System; pro-vided for the Water Resources Management Hydrographic Units(UGRHI), the basis for billing water collection and use; the apportion-ment of multi-use works costs, and the granting of rights to use by thestate. It also sets the priorities for uses, to be effective for as long as theplan for a certain basin is not established.• Federal Law no. 9,433, 1997: it provides for the National Policy forWater Resources and creates the National Water Resources ManagementSystem, which is based on principles of decentralized management, mul-tiple uses of water, and priorities.• CEIVAP Decision no. 08, 2001: whereby the Committee for Integrationof the Paraíba do Sul River Basin (CEIVAP) provides for the implementa-tion of billing for the use of water resources from the basin, effective asof 2002. The billing considers the collection, consumption, the treatedeffluents-total effluents ration, and the BOD (Biochemical OxygenDemand) reduction level of the treated effluent.• CEIVAP Resolution 65/2006, establishing new mechanisms to consoli-date the billing of water in the Paraiba do Sul with the State regulations• CNRH Resolution 52 (2005) approving the methodology and valuesfor the billing in the PCJ (federal) rivers for 2006• Law 2183 (2005) establishes the methodology, limits and values for thebilling in State rivers • State Decree 50667 (2006), including the procedures for determina-tion of the final prices• CRH (State Water Resources Council), in Dec 2006, approved thepropositions for the billing in State areas • State Decrees (S Paulo) 51449 and 51450 (Dec 29, 2006) determinethe billing in the PCJ and Paraiba do Sul basins.
5.3.3 Water withdraw for industrial use in the sugar caneagribusiness
Table 3 sums up the specific water use ranges and averages for industrialprocessing of sugar cane. It considers that the sugar cane is used in theproduction of sugar and ethanol on a 50/50 basis.12
The estimated mean end use of 21 m3 / sugar cane t corresponds tomuch lower levels of water collection, consumption and release due to waterreuse. Note that about 87 percent of the uses take place in four processes:
Chapter 5: Impacts on the water supply
111
12 ELIA NETO, A.:“Workshop sobre co-brança pelo uso da água”– Convênio AIAA Comitêda Bacia Hidrográfica dosRios Piracicabas, Capivarie Jundiaí (CBH-PCJ),Piracicaba, 1996
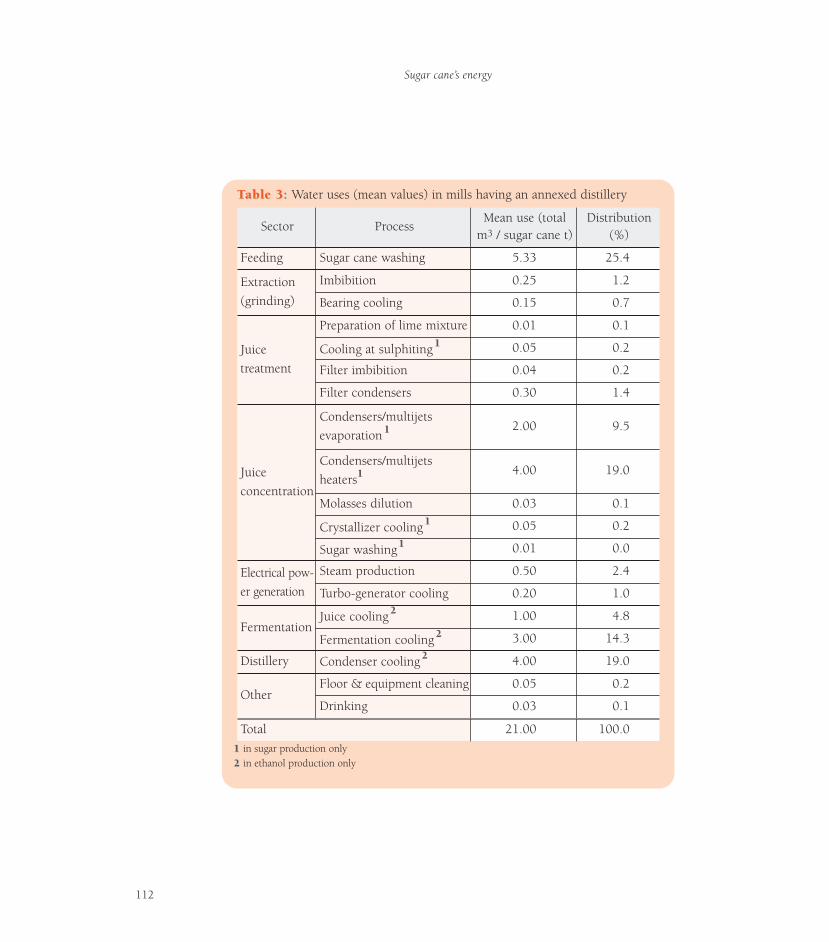
Sugar cane’s energy
112
TTable 3:able 3: Water uses (mean values) in mills having an annexed distillery
11 in sugar production only22 in ethanol production only
Sector ProcessMean use (total
m3 / sugar cane t)Distribution
(%)
Feeding Sugar cane washing 5.33 25.4
Extraction(grinding)
Imbibition 0.25 1.2
Bearing cooling 0.15 0.7
Juicetreatment
Preparation of lime mixture 0.01 0.1
Cooling at sulphiting 1 0.05 0.2
Filter imbibition 0.04 0.2
Filter condensers 0.30 1.4
Juiceconcentration
Condensers/multijetsevaporation 1 2.00 9.5
Condensers/multijetsheaters1 4.00 19.0
Molasses dilution 0.03 0.1
Crystallizer cooling 1 0.05 0.2
Sugar washing1 0.01 0.0
Electrical pow-er generation
Steam production 0.50 2.4
Turbo-generator cooling 0.20 1.0
FermentationJuice cooling 2 1.00 4.8
Fermentation cooling 2 3.00 14.3
Distillery Condenser cooling 2 4.00 19.0
OtherFloor & equipment cleaning 0.05 0.2
Drinking 0.03 0.1
Total 21.00 100.0
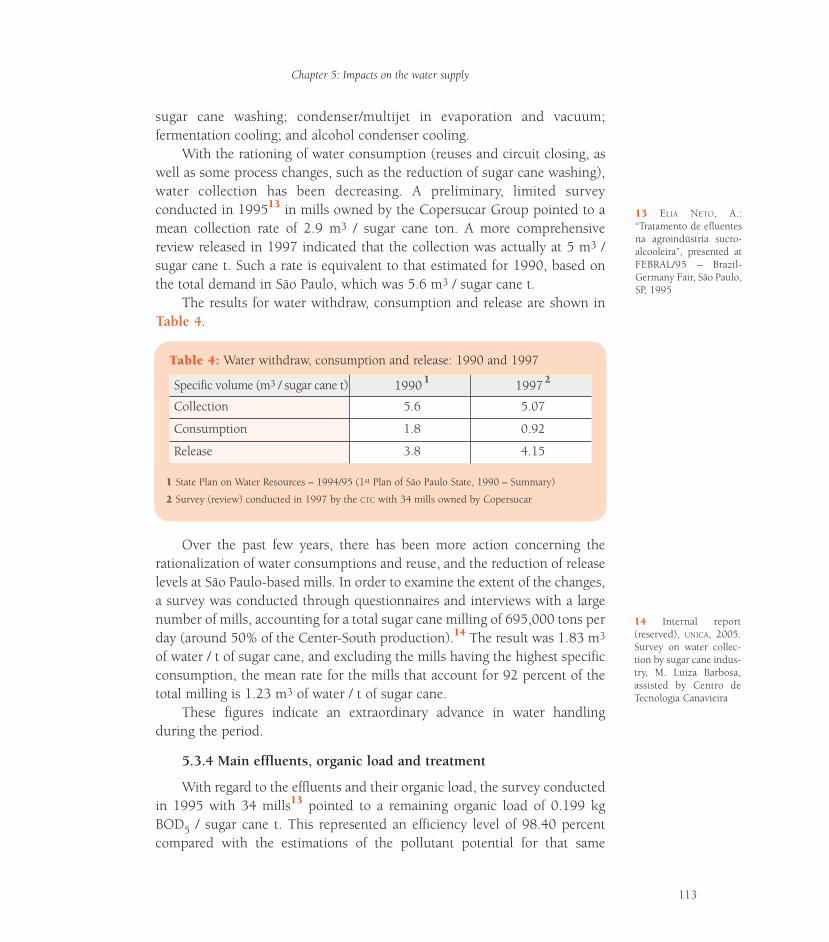
sugar cane washing; condenser/multijet in evaporation and vacuum;fermentation cooling; and alcohol condenser cooling.
With the rationing of water consumption (reuses and circuit closing, aswell as some process changes, such as the reduction of sugar cane washing),water collection has been decreasing. A preliminary, limited surveyconducted in 199513 in mills owned by the Copersucar Group pointed to amean collection rate of 2.9 m3 / sugar cane ton. A more comprehensivereview released in 1997 indicated that the collection was actually at 5 m3 /sugar cane t. Such a rate is equivalent to that estimated for 1990, based onthe total demand in São Paulo, which was 5.6 m3 / sugar cane t.
The results for water withdraw, consumption and release are shown inTable 4.
Over the past few years, there has been more action concerning therationalization of water consumptions and reuse, and the reduction of releaselevels at São Paulo-based mills. In order to examine the extent of the changes,a survey was conducted through questionnaires and interviews with a largenumber of mills, accounting for a total sugar cane milling of 695,000 tons perday (around 50% of the Center-South production).14 The result was 1.83 m3
of water / t of sugar cane, and excluding the mills having the highest specificconsumption, the mean rate for the mills that account for 92 percent of thetotal milling is 1.23 m3 of water / t of sugar cane.
These figures indicate an extraordinary advance in water handlingduring the period.
5.3.4 Main effluents, organic load and treatment
With regard to the effluents and their organic load, the survey conductedin 1995 with 34 mills13 pointed to a remaining organic load of 0.199 kgBOD5 / sugar cane t. This represented an efficiency level of 98.40 percentcompared with the estimations of the pollutant potential for that same
14 Internal report(reserved), UNICA, 2005.Survey on water collec-tion by sugar cane indus-try, M. Luiza Barbosa,assisted by Centro deTecnologia Canavieira
Chapter 5: Impacts on the water supply
113
TTable 4:able 4: Water withdraw, consumption and release: 1990 and 1997
11 State Plan on Water Resources – 1994/95 (1st Plan of São Paulo State, 1990 – Summary)
22 Survey (review) conducted in 1997 by the CTC with 34 mills owned by Copersucar
Specific volume (m3 / sugar cane t) 1990 1 1997 2
Collection 5.6 5.07
Consumption 1.8 0.92
Release 3.8 4.15
13 ELIA NETO, A.:“Tratamento de efluentesna agroindústria sucro-alcooleira”, presented atFEBRAL/95 – Brazil-Germany Fair, São Paulo,SP, 1995
period. Note that ferti-irrigation of sugar cane crops is the major disposalchannel for that organic matter, with environmental and economic benefits.
The main effluents and their treatment systems are as follows: • Sugar cane washing water: 180-500mg / l of BOD5 and highconcentration of solids. Treated with settling and stabilization ponds forthe case of release to water bodies. For reuse, the treatment consists ofsettling and pH correction of 9-10.• Multijet and barometric condenser waters: low pollutant potential (10-40 mg / BOD5) and high temperature (~50ºC). Treatment with sprinklertanks or cooling towers, with recirculation or release.• Fermentation vats and ethanol condenser cooling waters: hightemperature (~50ºC). Treatment with cooling towers or sprinkler tanksfor return or release.• Vinasse and wastewaters: large volume and organic load (10.85 / l ofethanol, with around 175 g BOD5 / l of alcohol).15 Vinasse is used insugar cane crops together with wastewaters (floor washing, closed-circuitpurging, condensate remainders), promoting ferti-irrigation using thenutrients.
5.3.5 Prospects for the industry
Since 1995, the industry (especially the Sugar Cane Technology Center)has been assessing techniques for a rational use of water and reuse of waste.The possibility of reaching a water collection rate of 1 m3 / sugar cane t andan effluent release rate of zero in the mid term has been considered. Theorganic load would be treated by using waste in crop ferti-irrigation togetherwith the vinasse. Water consumption (difference between the amount ofcollected water and released water) would be near the collection value, i.e. 1m3 / sugar cane t. We noted that sugar cane itself carries 70 percent of water,which does not represent utilization of water resources.
These basic guidelines imply a management of water, including adecrease in collection and a maximum reuse of effluents. This has alreadyoccurred partially, and may be accelerated by the incorporation of newtechnologies, including dry cleaning of sugar cane (eliminating sugar canewashing). Treatments like biodigestion of vinasse might reduce the organicload, thereby allowing recirculation upon tertiary treatment.
The results of the latest assessment indicate that there has been anevolution to these goals over the past few years. Even when the particularitiesof mills are taken into account, which will certainly imply different results,the withdraw averages may continue to decrease. An optimization of reuseshall be the subject of studies over the next few years, aiming at reducing thecosts of disposal.
Sugar cane’s energy
114
15 ELIA NETO, A.;NAKAHODO, T.: “Carac-terização físico-químicada vinhaça”, Project no.9500278, CTC – Centrode Tecnologia Canavieira,Piracicaba, SP, 1995
5.4 Protection of water sources and streams
Adhair Ricci JuniorSugar Cane Technology Center
The preservation and recovery of riverside woods, combined withappropriate soil preservation and handling, are essential to ensuring one ofthe main natural resources, water. Riverside woods are essential plant systemsfor environmental equilibrium. Their functions include controlling erosionon banks of water streams, thereby avoiding fountainhead aggradations,minimizing the effects of floods, maintaining the amount and quality of thewaters, filtering any possible waste resulting from the chemicals used aspesticides and fertilizers, and helping to preserve biodiversity and the geneticinheritance of the flora and fauna.
5.4.1 Legal aspects; forest legislation
The main legal aspects of riverside woods and their preservation andrestoration are distributed among several rules at the state and federallevels.16 The subject is addressed by several pieces of the environmentallegislation, such as the Forest Code, the Environmental Crime Law, rules onpermits and licenses and recovery projects, as well as the tax legislation onrural properties. In addition to the specific legislation on the subject, thelegislation on Preservation Units is also relevant.
Brazil’s main legislation on forests17 is the Forest Code (Law no.4,771/65, as amended by Law no. 7,803/89 and Provisional Measure no.2,166-67), which contain the following items applicable to riverside woods:
Article 2nd - For the purposes of this law, forests and other forms of naturalvegetation are considered permanent preservation units when located as follows:
a) along rivers or any water streams, from their highest level, in a marginalwidth range of at least:
1) 30 m, for less than 10 m wide water streams;2) 50 m, for 10-50 m wide water streams;3) 100 m, for 50-200 m wide water streams;4) 200 m, for 200-500 m wide water streams;5) 500 m, for more than 600 m wide water streams;
b) around lagoons, lakes, or natural or artificial water reservoirs;c) at springs, yet intermittent, and at “water holes”, whatever the topographic
situation, within a radius of at least 50 m.
Chapter 5: Impacts on the water supply
115
17 VENTURA, V.J.;RAMBELL, A.M.: Legislaçãofederal sobre o meio ambi-ente, Vana Editora, 3rd
ed., 1999
16 Estado de São Paulo,Secretaria de Estado doMeio Ambiente: “Projetode recuperação de matasciliares no Estado de SãoPaulo: proposta o GEF”,Documento de avaliaçãoambiental, São Paulo,2003, site www.ambiente.sp.gov.braccessed in Feb. 1 2005
These principles and limits extend to urban areas.Riverside woods are the main example of Permanent Preservation Areas
(APP, in Portuguese), as defined in the Forest Code (Law no. 4,771/65) andits regulation (particularly CONAMA Resolution 303/02). In addition, the SãoPaulo State Constitution, article 197, defines springs, fountainheads andriverside woods as permanent protection areas.
Under the federal legislation, riverside woods are protected from cutting.However, their restoration, if no environmental infringement is characterized,is not mandatory, except for springs (Law no. 7,754, of 04/14/1989). Theriverside strips, if duly covered by woods or other natural vegetation, areexcluded from the taxable area of the property, as set forth in the specificlegislation on the Rural Property Tax (ITR, Law no. 9,393/96).
Formally, there is no explicit determination in the federal legislation thatriverside woods should be recovered if previously degraded. There is no cleardefinition of acceptable uses in the law either, and such uses as public utilityand/or social interest are often mentioned for suppression of vegetation(articles 2nd and 3rd of the Forest Code). In São Paulo State, Law no. 9,989,of May 22, 1998 requires riverside woods to be recovered by owners of ruralproperty. This, however, was not regulated within the expected period.
It is an environmental crime to damage a forest or cut trees in APPs. Thepunishments and fines are set forth in the Environmental Crime Law (Lawno. 9,605/97). There are also punishments for “preventing or hindering thenatural regeneration of forests and other forms of vegetation” (Forest Code, Lawno. 4,771/65).
5.4.2 Provision of seeds and seedlings
Obtaining seeds and seedlings of native species in an adequate manner,considering such factors as quality and intra- and inter-specific diversity, is acritical aspect of forest recovery actions. In this case, Preservation Units (UCs,in Portuguese) and State Parks may represent an important, if not the onlysource of such genetic material. In São Paulo State, those units, under Lawno. 9,985, of July 18, 2000, and Decree no. 25,341, of June 04, 1986(Regulation of São Paulo State Parks), have restrictions on the collection ofplant specimens and seeds. For the sake of recovering degraded areas, suchrestrictions should be reviewed.
Law no. 10,711, of 2003, on the National Seed and Seedling System(SNSM, in Portuguese), regulates the production of and trade in seeds offorest, native or exotic species. Decree no. 5,153, of 2004, provides for theforest species seed and seedling production and certification process.
Sugar cane’s energy
116
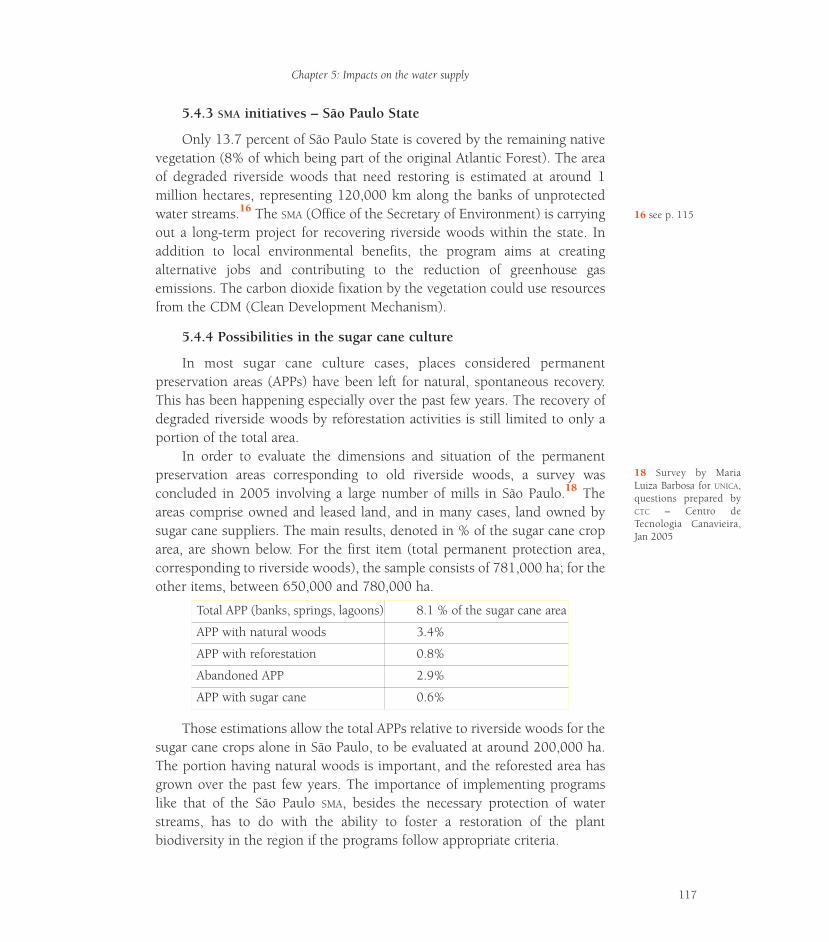
5.4.3 SMA initiatives – São Paulo State
Only 13.7 percent of São Paulo State is covered by the remaining nativevegetation (8% of which being part of the original Atlantic Forest). The areaof degraded riverside woods that need restoring is estimated at around 1million hectares, representing 120,000 km along the banks of unprotectedwater streams.16 The SMA (Office of the Secretary of Environment) is carryingout a long-term project for recovering riverside woods within the state. Inaddition to local environmental benefits, the program aims at creatingalternative jobs and contributing to the reduction of greenhouse gasemissions. The carbon dioxide fixation by the vegetation could use resourcesfrom the CDM (Clean Development Mechanism).
5.4.4 Possibilities in the sugar cane culture
In most sugar cane culture cases, places considered permanentpreservation areas (APPs) have been left for natural, spontaneous recovery.This has been happening especially over the past few years. The recovery ofdegraded riverside woods by reforestation activities is still limited to only aportion of the total area.
In order to evaluate the dimensions and situation of the permanentpreservation areas corresponding to old riverside woods, a survey wasconcluded in 2005 involving a large number of mills in São Paulo.18 Theareas comprise owned and leased land, and in many cases, land owned bysugar cane suppliers. The main results, denoted in % of the sugar cane croparea, are shown below. For the first item (total permanent protection area,corresponding to riverside woods), the sample consists of 781,000 ha; for theother items, between 650,000 and 780,000 ha.
Those estimations allow the total APPs relative to riverside woods for thesugar cane crops alone in São Paulo, to be evaluated at around 200,000 ha.The portion having natural woods is important, and the reforested area hasgrown over the past few years. The importance of implementing programslike that of the São Paulo SMA, besides the necessary protection of waterstreams, has to do with the ability to foster a restoration of the plantbiodiversity in the region if the programs follow appropriate criteria.
Total APP (banks, springs, lagoons) 8.1 % of the sugar cane area
APP with natural woods 3.4%
APP with reforestation 0.8%
Abandoned APP 2.9%
APP with sugar cane 0.6%
16 see p. 115
18 Survey by MariaLuiza Barbosa for UNICA,questions prepared byCTC – Centro deTecnologia Canavieira,Jan 2005
Chapter 5: Impacts on the water supply
117
5.5 Summary and conclusions
• Even though Brazil has the greatest availability of water in the world,with 14 percent of the surface waters and the equivalent to the annualflow in underground aquifers, the use of crop irrigation is very small(~3.3 Mha, compared to 227 Mha in the world).• Sugar cane crops are virtually not irrigated in Brazil, except for somesmall areas (supplementary irrigation). Efficient methods (subsurfacedripping and others) are being evaluated.• The levels of water withdraw and release for industrial use have sub-stantially decreased over the past few years, from around 5 m3 / sugarcane t collected in 1990 and 1997 to 1.83 m3 / sugar cane t in 2004(sampling in São Paulo). The water reuse level is high (the total use was21 m3 / sugar cane t in 1997), and the efficiency of the treatment forrelease was in excess of 98 percent.• It seems possible to reach rates near 1 m3 / sugar cane ton (collection)and zero (release) by optimizing both the reuse and use of wastewater inferti-irrigation.• For the most part, environmental problems relating to water quality,which result from irrigation (dragging of nutrients and pesticides, ero-sion) and industrial use, are not found in São Paulo. In this respect,EMBRAPA rates sugar cane as Level 1 (no impact on water quality).• The APPs relating to riverside woods have reached 8.1 percent of thesugar cane crop area in São Paulo, 3.4 percent of which having naturalwoods, and 0.8 percent having been reforested. The implementation ofriverside wood restoration programs, in addition to the protection ofwater springs and streams, can promote the restoration of plant biodi-versity in the long term.
Sugar cane’s energy
118
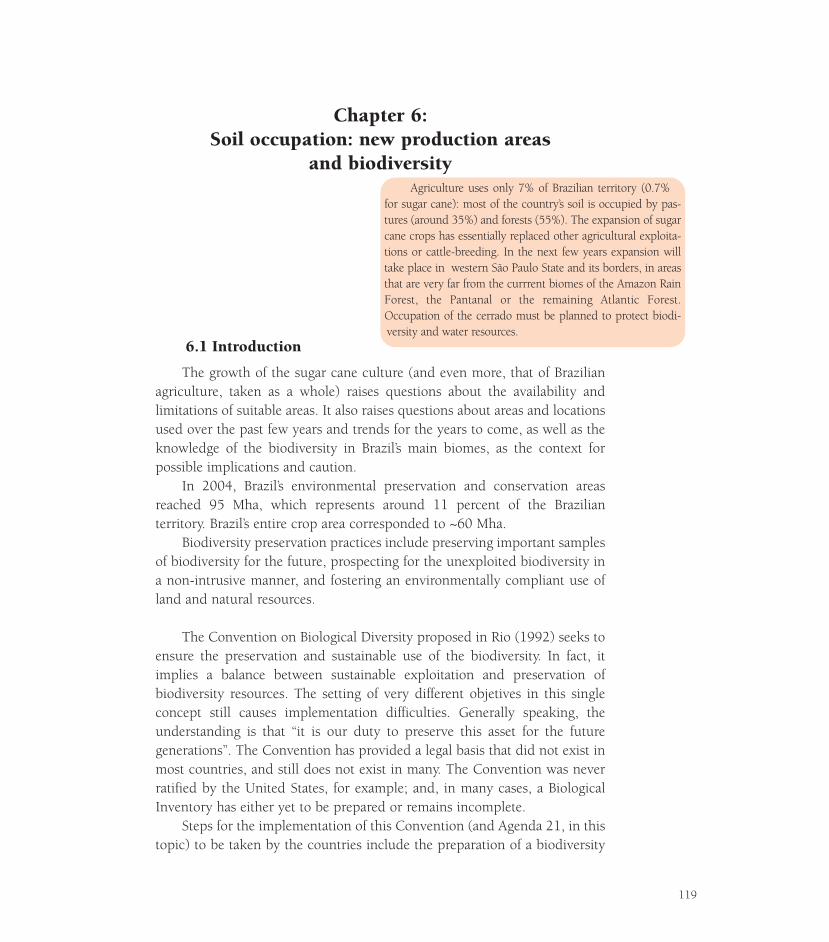
119
Chapter 6:Soil occupation: new production areas
and biodiversity
6.1 Introduction
The growth of the sugar cane culture (and even more, that of Brazilianagriculture, taken as a whole) raises questions about the availability andlimitations of suitable areas. It also raises questions about areas and locationsused over the past few years and trends for the years to come, as well as theknowledge of the biodiversity in Brazil’s main biomes, as the context forpossible implications and caution.
In 2004, Brazil’s environmental preservation and conservation areasreached 95 Mha, which represents around 11 percent of the Brazilianterritory. Brazil’s entire crop area corresponded to ~60 Mha.
Biodiversity preservation practices include preserving important samplesof biodiversity for the future, prospecting for the unexploited biodiversity ina non-intrusive manner, and fostering an environmentally compliant use ofland and natural resources.
The Convention on Biological Diversity proposed in Rio (1992) seeks toensure the preservation and sustainable use of the biodiversity. In fact, itimplies a balance between sustainable exploitation and preservation ofbiodiversity resources. The setting of very different objetives in this singleconcept still causes implementation difficulties. Generally speaking, theunderstanding is that “it is our duty to preserve this asset for the futuregenerations”. The Convention has provided a legal basis that did not exist inmost countries, and still does not exist in many. The Convention was neverratified by the United States, for example; and, in many cases, a BiologicalInventory has either yet to be prepared or remains incomplete.
Steps for the implementation of this Convention (and Agenda 21, in thistopic) to be taken by the countries include the preparation of a biodiversity
Agriculture uses only 7% of Brazilian territory (0.7%for sugar cane): most of the country’s soil is occupied by pas-tures (around 35%) and forests (55%). The expansion of sugarcane crops has essentially replaced other agricultural exploita-tions or cattle-breeding. In the next few years expansion willtake place in western São Paulo State and its borders, in areasthat are very far from the currrent biomes of the Amazon RainForest, the Pantanal or the remaining Atlantic Forest.Occupation of the cerrado must be planned to protect biodi-versity and water resources.
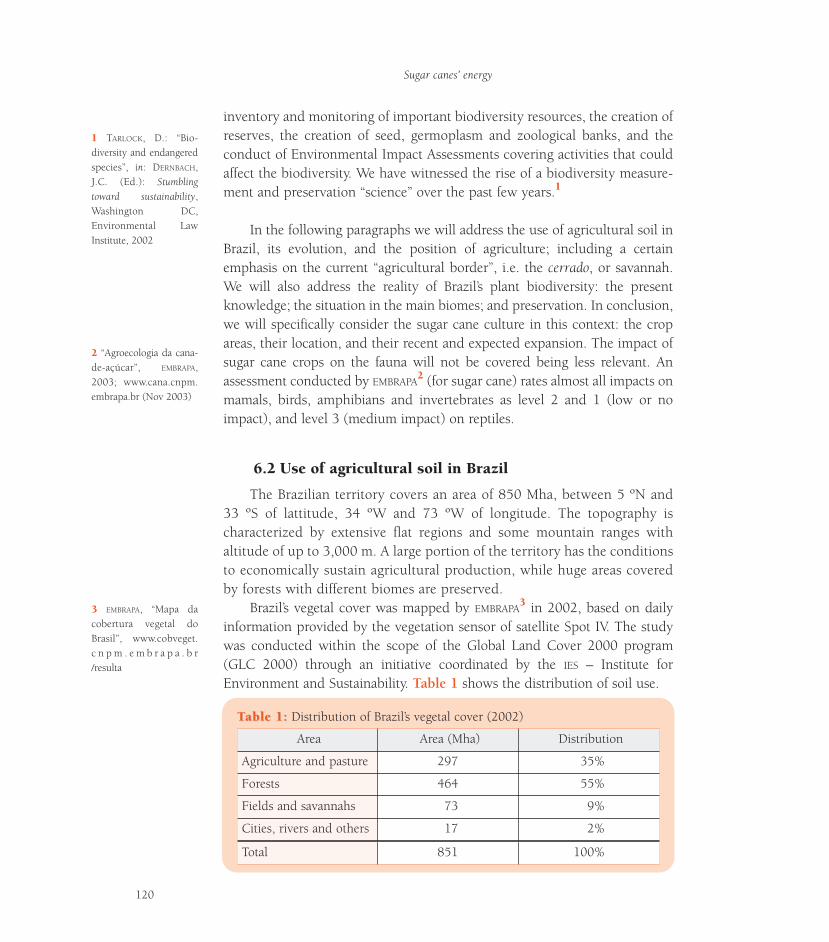
inventory and monitoring of important biodiversity resources, the creation ofreserves, the creation of seed, germoplasm and zoological banks, and theconduct of Environmental Impact Assessments covering activities that couldaffect the biodiversity. We have witnessed the rise of a biodiversity measure-ment and preservation “science” over the past few years.1
In the following paragraphs we will address the use of agricultural soil inBrazil, its evolution, and the position of agriculture; including a certainemphasis on the current “agricultural border”, i.e. the cerrado, or savannah.We will also address the reality of Brazil’s plant biodiversity: the presentknowledge; the situation in the main biomes; and preservation. In conclusion,we will specifically consider the sugar cane culture in this context: the cropareas, their location, and their recent and expected expansion. The impact ofsugar cane crops on the fauna will not be covered being less relevant. Anassessment conducted by EMBRAPA
2 (for sugar cane) rates almost all impacts onmamals, birds, amphibians and invertebrates as level 2 and 1 (low or noimpact), and level 3 (medium impact) on reptiles.
6.2 Use of agricultural soil in Brazil
The Brazilian territory covers an area of 850 Mha, between 5 ºN and33 ºS of lattitude, 34 ºW and 73 ºW of longitude. The topography ischaracterized by extensive flat regions and some mountain ranges withaltitude of up to 3,000 m. A large portion of the territory has the conditionsto economically sustain agricultural production, while huge areas coveredby forests with different biomes are preserved.
Brazil’s vegetal cover was mapped by EMBRAPA3 in 2002, based on daily
information provided by the vegetation sensor of satellite Spot IV. The studywas conducted within the scope of the Global Land Cover 2000 program(GLC 2000) through an initiative coordinated by the IES – Institute forEnvironment and Sustainability. Table 1 shows the distribution of soil use.
2 “Agroecologia da cana-de-açúcar”, EMBRAPA,2003; www.cana.cnpm.embrapa.br (Nov 2003)
3 EMBRAPA, “Mapa dacobertura vegetal doBrasil”, www.cobveget.c n p m . e m b r a p a . b r/resulta
Sugar canes’ energy
120
1 TARLOCK, D.: “Bio-diversity and endangeredspecies”, in: DERNBACH,J.C. (Ed.): Stumblingtoward sustainability,Washington DC,Environmental LawInstitute, 2002
TTable 1:able 1: Distribution of Brazil’s vegetal cover (2002)
Area Area (Mha) Distribution
Agriculture and pasture 297 35%
Forests 464 55%
Fields and savannahs 73 9%
Cities, rivers and others 17 2%
Total 851 100%
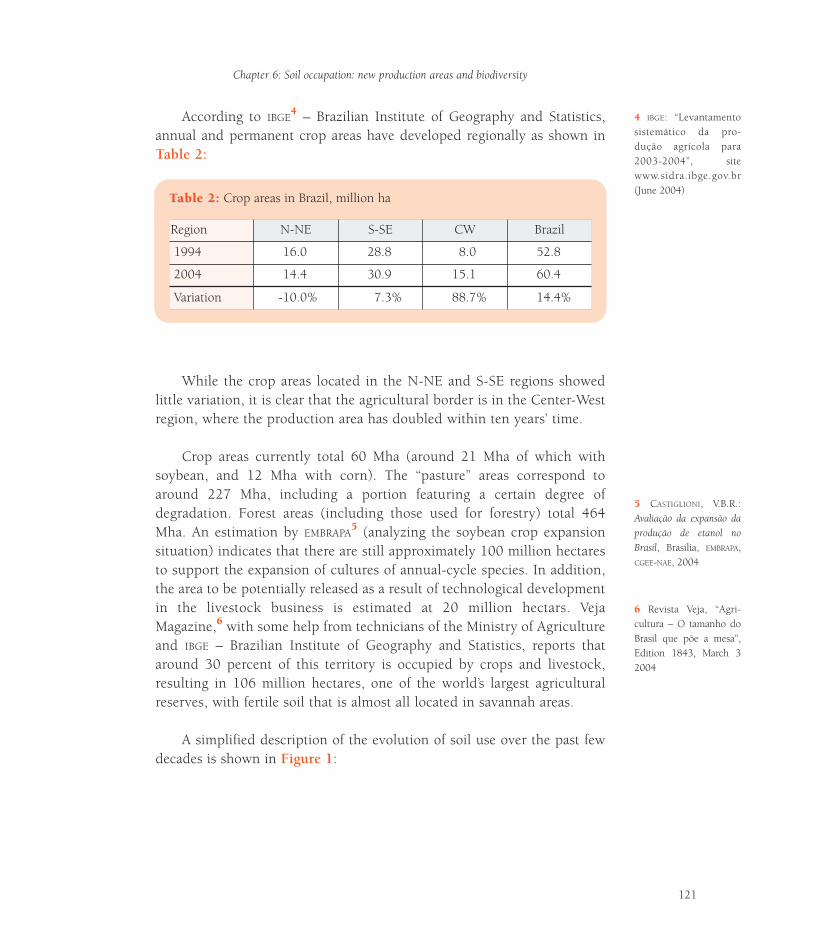
According to IBGE4 – Brazilian Institute of Geography and Statistics,
annual and permanent crop areas have developed regionally as shown inTable 2:
While the crop areas located in the N-NE and S-SE regions showedlittle variation, it is clear that the agricultural border is in the Center-Westregion, where the production area has doubled within ten years’ time.
Crop areas currently total 60 Mha (around 21 Mha of which withsoybean, and 12 Mha with corn). The “pasture” areas correspond toaround 227 Mha, including a portion featuring a certain degree ofdegradation. Forest areas (including those used for forestry) total 464Mha. An estimation by EMBRAPA
5 (analyzing the soybean crop expansionsituation) indicates that there are still approximately 100 million hectaresto support the expansion of cultures of annual-cycle species. In addition,the area to be potentially released as a result of technological developmentin the livestock business is estimated at 20 million hectars. VejaMagazine,6 with some help from technicians of the Ministry of Agricultureand IBGE – Brazilian Institute of Geography and Statistics, reports thataround 30 percent of this territory is occupied by crops and livestock,resulting in 106 million hectares, one of the world’s largest agriculturalreserves, with fertile soil that is almost all located in savannah areas.
A simplified description of the evolution of soil use over the past fewdecades is shown in Figure 1:
4 IBGE: “Levantamentosistemático da pro-dução agrícola para2003-2004”, sitewww.sidra.ibge.gov.br(June 2004)
5 CASTIGLIONI, V.B.R.:Avaliação da expansão daprodução de etanol noBrasil, Brasilia, EMBRAPA,CGEE-NAE, 2004
6 Revista Veja, “Agri-cultura – O tamanho doBrasil que põe a mesa”,Edition 1843, March 32004
Chapter 6: Soil occupation: new production areas and biodiversity
121
TTable 2:able 2: Crop areas in Brazil, million ha
Region N-NE S-SE CW Brazil
1994 16.0 28.8 8.0 52.8
2004 14.4 30.9 15.1 60.4
Variation -10.0% 7.3% 88.7% 14.4%
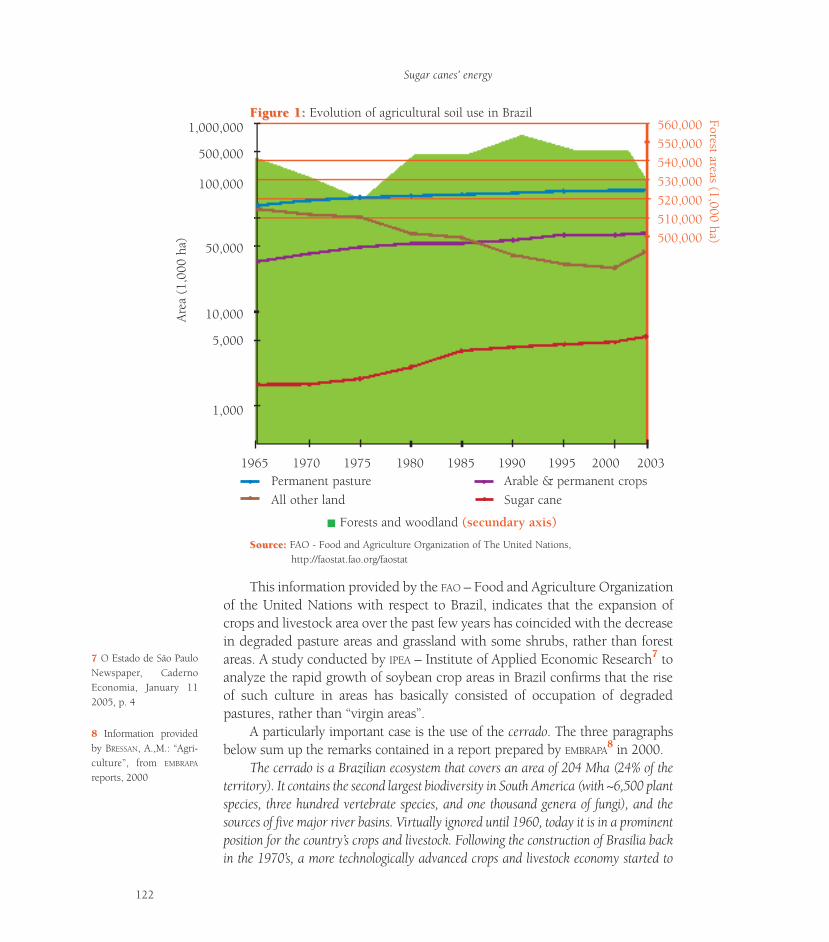
SourSource:ce: FAO - Food and Agriculture Organization of The United Nations,http://faostat.fao.org/faostat
This information provided by the FAO – Food and Agriculture Organizationof the United Nations with respect to Brazil, indicates that the expansion ofcrops and livestock area over the past few years has coincided with the decreasein degraded pasture areas and grassland with some shrubs, rather than forestareas. A study conducted by IPEA – Institute of Applied Economic Research7 toanalyze the rapid growth of soybean crop areas in Brazil confirms that the riseof such culture in areas has basically consisted of occupation of degradedpastures, rather than “virgin areas”.
A particularly important case is the use of the cerrado. The three paragraphsbelow sum up the remarks contained in a report prepared by EMBRAPA
8 in 2000.The cerrado is a Brazilian ecosystem that covers an area of 204 Mha (24% of the
territory). It contains the second largest biodiversity in South America (with ~6,500 plantspecies, three hundred vertebrate species, and one thousand genera of fungi), and thesources of five major river basins. Virtually ignored until 1960, today it is in a prominentposition for the country’s crops and livestock. Following the construction of Brasília backin the 1970’s, a more technologically advanced crops and livestock economy started to
8 Information providedby BRESSAN, A.,M.: “Agri-culture”, from EMBRAPA
reports, 2000
7 O Estado de São PauloNewspaper, CadernoEconomia, January 112005, p. 4
Sugar canes’ energy
122
1965 1970 1975 1980 1985 1990 1995 2000 2003Permanent pastureAll other land
Arable & permanent cropsSugar cane
Forests and woodland (secundary axis)
1,000,000
500,000
500,000510,000520,000530,000540,000550,000560,000
100,000
50,000
10,000
5,000
1,000
Are
a (1
,000
ha)
Forest areas (1,000 ha)FigurFigure 1:e 1: Evolution of agricultural soil use in Brazil
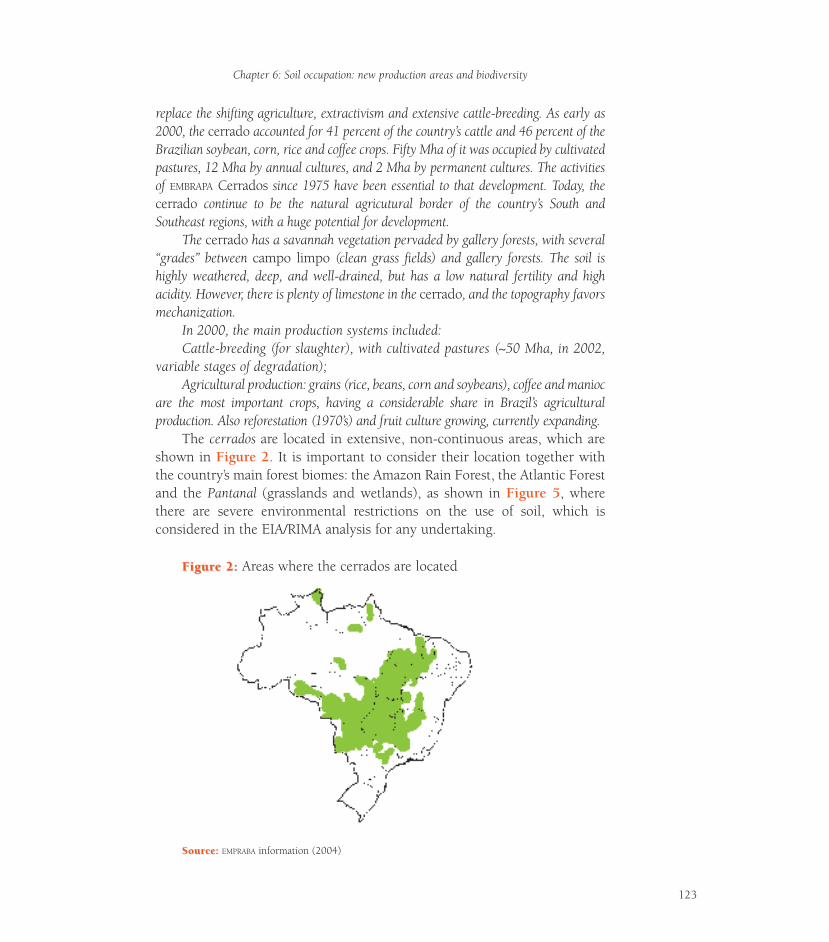
replace the shifting agriculture, extractivism and extensive cattle-breeding. As early as2000, the cerrado accounted for 41 percent of the country’s cattle and 46 percent of theBrazilian soybean, corn, rice and coffee crops. Fifty Mha of it was occupied by cultivatedpastures, 12 Mha by annual cultures, and 2 Mha by permanent cultures. The activitiesof EMBRAPA Cerrados since 1975 have been essential to that development. Today, thecerrado continue to be the natural agricutural border of the country’s South andSoutheast regions, with a huge potential for development.
The cerrado has a savannah vegetation pervaded by gallery forests, with several“grades” between campo limpo (clean grass fields) and gallery forests. The soil ishighly weathered, deep, and well-drained, but has a low natural fertility and highacidity. However, there is plenty of limestone in the cerrado, and the topography favorsmechanization.
In 2000, the main production systems included:Cattle-breeding (for slaughter), with cultivated pastures (~50 Mha, in 2002,
variable stages of degradation);Agricultural production: grains (rice, beans, corn and soybeans), coffee and manioc
are the most important crops, having a considerable share in Brazil’s agriculturalproduction. Also reforestation (1970’s) and fruit culture growing, currently expanding.
The cerrados are located in extensive, non-continuous areas, which areshown in Figure 2. It is important to consider their location together withthe country’s main forest biomes: the Amazon Rain Forest, the Atlantic Forestand the Pantanal (grasslands and wetlands), as shown in Figure 5, wherethere are severe environmental restrictions on the use of soil, which isconsidered in the EIA/RIMA analysis for any undertaking.
FigurFigure 2:e 2: Areas where the cerrados are located
SourSource:ce: EMPRABA information (2004)
Chapter 6: Soil occupation: new production areas and biodiversity
123
The expansion of sugar cane crops in areas that were originally taken upby cerrados has been relatively small. In most cases, it seems to have takenplace by replacing other covers that had already subsituted for the cerrado(usually pastures). The current trends seem to be towards the continuationof such a situation: expansion of sugar cane crops in the west of São Paulo,replacing pasture areas. Table 2 shows that the total sugar cane crop areathat was added between 1993 and 2003 in all states where there wereextensive cerrado regions (Goiás, Mato Grosso, Mato Grosso do Sul, MinasGerais) reached only around 300,000 ha (the expansion of the sugar canecrop area in the Center-South region represented 1.4 Mha in the sameperiod, and the expansion of the entire crop area in the region between 1994and 2004 amounted to 7 Mha). However, because sugar cane may play a roleof increasing importance in the agribusiness development within theseregions, it will be necessary to consider specific sustainability aspects ofsugar cane growing in these region. This obviously applies to all other cropsconsidered (some of which, such as soybean, being already used on a largescale) for the cerrados as well. Also, it must be noted that the occupation ofcerrado areas or, alternatively, areas orginally covered by the cerrados butcurrently used as pastures, for example, may have very differentconsequences (sometimes opposing consequences) to such factors as soilquality, erosion and others.
Analyses are now being conducted on this early occupation stage of thecerrados, including the perspective of environmental preservation and thesearch for profitable and socially fair production systems. A lot moreattention shall be given to the combination of irrigated systems with the useof pesticides and fertilizers, improper soil preparation and conservationpractices, inefficient use of water, and the effects of the great and rapidurbanization, with deficient waste treatment systems.
6.3 Plant biodiversity in Brazil: knowledge, situation inthe main Biomas; preservation
Vanderlei Perez CanhosCRIA – Centro de Referência em Informação Ambiental
(Environmental Information Reference Center), Campinas, SP
Marinez Ferreira de SiqueiraCRIA – Centro de Referência em Informação Ambiental
(Environmental Information Reference Center), Campinas, SP
Sugar canes’ energy
124
Brazil, a mega-diverse country
Brazil is regarded as the country that has the world’s largest biologicaldiversity for having a large portion of the Amazon Rain Forest, the largestgreen area on the planet, the Atlantic Forest and the Cerrado. These areecosystems considered to be hotspots because of the threat to, and the widediversity of, related endemic species.9 Brazil has one of the world’s richestfloras, estimated at 50,000 to 60,000 angiosperm species (plants withflowers).
In Brazil, the main effort to set biodiversity preservation priorities(hotspots and wilderness areas) was developed within the scope of the“Priority Actions for Preservation of the Biodiversity of Brazilian Biomes”project.10 This project, coordinated by the Ministry of the Environment,was carried out in conjunction with Conservation International, Funatura,and the Biodiversitas Foundation. In the period between 1995 and 2000,workshops were held in order to discuss and set the preservation prioritiesfor the Cerrado and the Pantanal, the Coastal and Marine Zone, theAmazon Rain Forest, the Atlantic Forest, the Southern Fields, and theCaatinga. Over a thousand experts (in ecology, botanics, zoology andrelated disciplines) contributed to setting the preservation priorities forBrazil’s main biomes. Base maps were drafted for the inclusion ofinformation on natural areas, existing preservation areas, physical andpolitical subdivisions, demographic and economic statistics, and faunaand flora gathered by experts. The setting of priorities was based on theknowledge and opinions of the experts who were consulted. Because theinitiative did not take into consideration any future scenarios, includingthe impact of agricultural expansion and vulnerability to climate changes,it is important to review the preservation priorities by incorporatingadvances in methodology, aiming at building new impact and vulnerabilityscenarios.11
Present situation of, and threats to, Brazilian biomes
Of the areas originally taken up by the different biomes in Brazil (Table3), variable and not always known portions remain, given the imprecisionof existing estimations. The areas protected as preservation units are alsovariable from biome to biome, showing disproportionate efforts in search ofrepresentativeness in the National Preservation Units System.
9 MITTERMEYER, R.A.;MYERS, N.; MITTERMEYER,C.G: “Hotspots Earth’sbiologically richest andmost endangered terres-trial ecoregions”, NewYork, CEMEX, Conser-vation International,1999
10 www.mma.gov.br/biodiversidade/probio/sub.html
11 CANHOS, V.P.C; SI-QUEIRA, M.F.: “D.A.L.2004 – Mudanças climá-ticas globais: conseqüên-cias para a biodiversi-dade”, Nota Técnica elab-orada para o Núcleo deAssuntos Estratégicos daPresidência da República,Centro de Gestão e Estu-dos Estratégicos, Contra-to no. 083/2004
Chapter 6: Soil occupation: new production areas and biodiversity
125
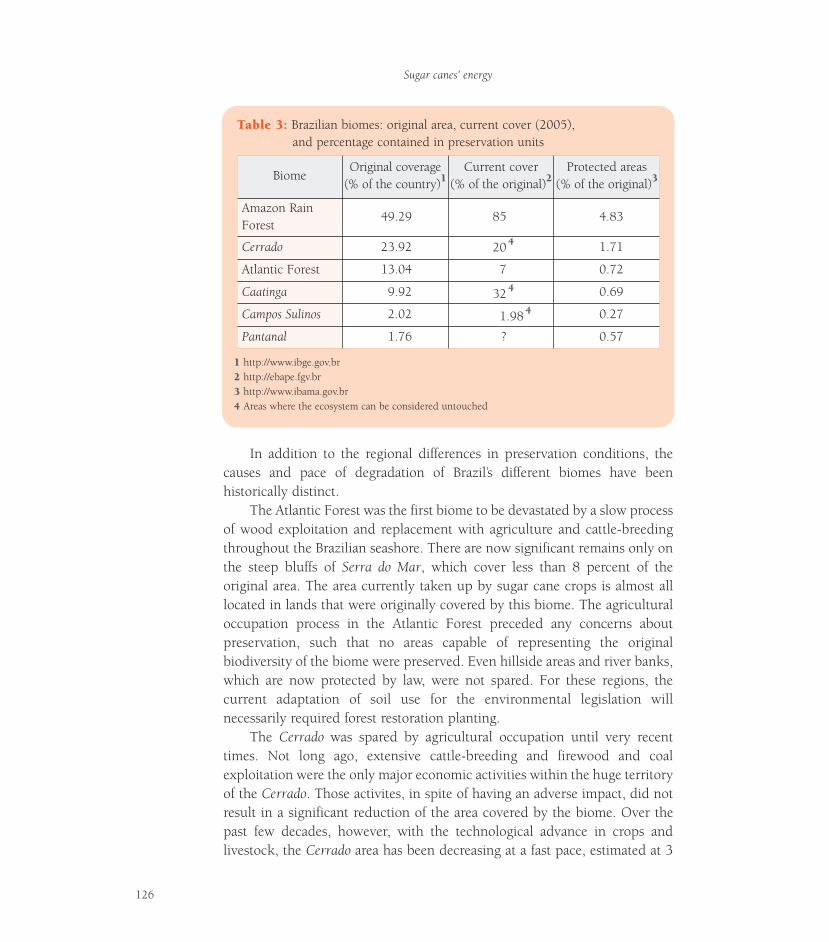
In addition to the regional differences in preservation conditions, thecauses and pace of degradation of Brazil’s different biomes have beenhistorically distinct.
The Atlantic Forest was the first biome to be devastated by a slow processof wood exploitation and replacement with agriculture and cattle-breedingthroughout the Brazilian seashore. There are now significant remains only onthe steep bluffs of Serra do Mar, which cover less than 8 percent of theoriginal area. The area currently taken up by sugar cane crops is almost alllocated in lands that were originally covered by this biome. The agriculturaloccupation process in the Atlantic Forest preceded any concerns aboutpreservation, such that no areas capable of representing the originalbiodiversity of the biome were preserved. Even hillside areas and river banks,which are now protected by law, were not spared. For these regions, thecurrent adaptation of soil use for the environmental legislation willnecessarily required forest restoration planting.
The Cerrado was spared by agricultural occupation until very recenttimes. Not long ago, extensive cattle-breeding and firewood and coalexploitation were the only major economic activities within the huge territoryof the Cerrado. Those activites, in spite of having an adverse impact, did notresult in a significant reduction of the area covered by the biome. Over thepast few decades, however, with the technological advance in crops andlivestock, the Cerrado area has been decreasing at a fast pace, estimated at 3
Sugar canes’ energy
126
TTable 3:able 3: Brazilian biomes: original area, current cover (2005),and percentage contained in preservation units
11 http://www.ibge.gov.br22 http://ebape.fgv.br33 http://www.ibama.gov.br44 Areas where the ecosystem can be considered untouched
BiomeOriginal coverage
(% of the country)1Current cover
(% of the original)2Protected areas
(% of the original)3
Amazon RainForest
49.29 85 4.83
Cerrado 23.92 20 4 1.71
Atlantic Forest 13.04 7 0.72
Caatinga 9.92 32 4 0.69
Campos Sulinos 2.02 1.98 4 0.27
Pantanal 1.76 ? 0.57
percent a year. At least 50 percent of the original Cerrado has been totallydestroyed.12 Extensive areas have been highly modified by the invadingAfrican grass varieties and very frequent fires, and only 20 percent of theoriginal area is untouched.13 The recent agricultural expansion on theCerrado has been taking place without so much as complying with theenvironmental legislation in force. Since 1965, when the Forest Code tookeffect, the Cerrado vegetation should have been preserved in at least 20percent of the area of each property (50% in the Amazon), not to mention thepermanent preservation areas (hilltops, hillsides, and water body banks).Even in São Paulo State, where the Cerrado vegetation currently covers lessthan 1 percent of the territory, cases of deforestation for the expansion ofagriculture and cattle-breeding have been reported, and the area covered bythe biome in that state has decreased by 26 percent since 1990 (data providedby Instituto Florestal).
Unlike the Atlantic Forest, however, for a large portion of the regioncovered by the Cerrado it is still possible to plan the occupation in asustainable manner, harmonizing the exploitation of crops and livestock withpreservation of biodiversity and water resources. Special attention is requiredin some areas in Goiás (GO), Mato Grosso do Sul (MS) and Mato Grosso(MT) where lie the springs of the rivers that flow to the Pantanal. If poorlyplanned, the agricultural occupation of these areas undermine the stability ofthe entire Pantanal ecosystem. Likewise, the charging areas of the Guaraniaquifer, in the Southeast region, which are usually covered by the Cerradovegetation, need to be preserved.
Building impact and vulnerability scenarios
Harmonizing socioeconomic development with environmental preser-vation is no easy task. The development and implementation of appropriatesustainable development strategies will be increasingly based on knowledgemanagement, and the incorporation of recent developments in informationtechnologies and communications. There is a growing demand for quickanswers with a view to solving the problems relating to the occurrence anddistribution of biological species, such as impact studies linked with therelease of transgenic organisms in the environment and the implementationof invading species and crop pest restraining and controlling measures.Systemic approaches to support an educated decision-making process willdepend more and more on access to and integration of information availablefrom information distributing sources. They will also depend on the use ofadvanced computer-based data analysis and space viewing tools, as well asthe building of impact and vulnerability scenarios.
12 FELFILI, J.M.; HARIDA-SAN, M.; MENDONÇA, R.C.;FILGUEIRAS, T.S.; SILVA JU-NIOR, M.C.: “Projeto Bio-geografia do bioma cerra-do: vegetação e solos“,Cadernos de Geociências,12, Rio de Janeiro, 1994,pp. 75-165
13 www.ibama.gov.br/
Chapter 6: Soil occupation: new production areas and biodiversity
127
The Instituto Virtual da Biodiversidade, (Virtual Institute of Biodiversity),related to the FAPESP Biota Program,14 incorporates the latest breakthroughsin information technology for biodiversity. That initiative integrates theinformation from more than 50 research projects (fauna, flora andmicrobiota) through interoperated information systems, including SinBiota15
and speciesLink.16 These systems have been designed in line withinternationally accepted standards and protocols, as well as free software withopen protocols. SinBiota supports the integration, summarization and spaceviewing of data from field observations. SinBiota is a centralized system thatdynamically integrates data from projects related to the program with thosefrom external information sources (national and international) via theInternet. The use of the standard data sheet and the geo-coding (lattitude andlongitude) for the collection site are compulsory for projects related to theprogram. The digital map base of São Paulo State, with associatedenvironmental layers, including river basins, vegetal cover, highways, citylimits and preservation areas, make up the Atlas Biota. The speciesLinknetwork integrates primaty data on specimens from distributed biologicalcollection in real time, and uses computer-based tools for correcting andviewing more than one million records of collections related to system (dataobtained in Nov 10, 2006).
Geo-referenced information is of paramount importance to the setting ofbiodiversity preservation and sustainable use strategies. However, there arestill significant gaps in the knowledge of species distribution in the mainBrazilian biomes. Computer-based tools to model the distribution of specieshelp the direction field research and the identification of biologically richerareas, as well as the delimitation of potentialy rich in threatened or endemicspecies. It also helps identifying species that could be used in environmentalrecovery efforts, assessing potential threats posed by invading species andevaluating the possible impact of climate changes on biodiversity. The mostcommonly used predictive modeling system for species are based on thespecies ecological niche concept. These methods use a sub-set of conditionsfor the ecological niche, combining species occurrence data with theenvironmental characteristics of the occurrence spot, seeking to define placeshaving similar environmental characteristics through algorithms. The nichemodeling sets the enviromental limitations on the dimensions where themodel is developed, thereby allowing the distribution of a given species to beprojected in a geographic space with a view to anticipating where the speciescan or cannot keep viable populations.17 In order to assess the impact ofclimate changes on 162 tree species of the Brazilian Cerrado, Siqueira &
14 www.biota.org.br
15 http://sinbiota.cria.org.br/atlas
16 http://splink.cria.org.br
Sugar canes’ energy
128
17 PETERSON, A.T.:“Predicting species’ geo-graphic distributionsbased on ecological nichemodeling”, Condor 103,2001, pp.599-605
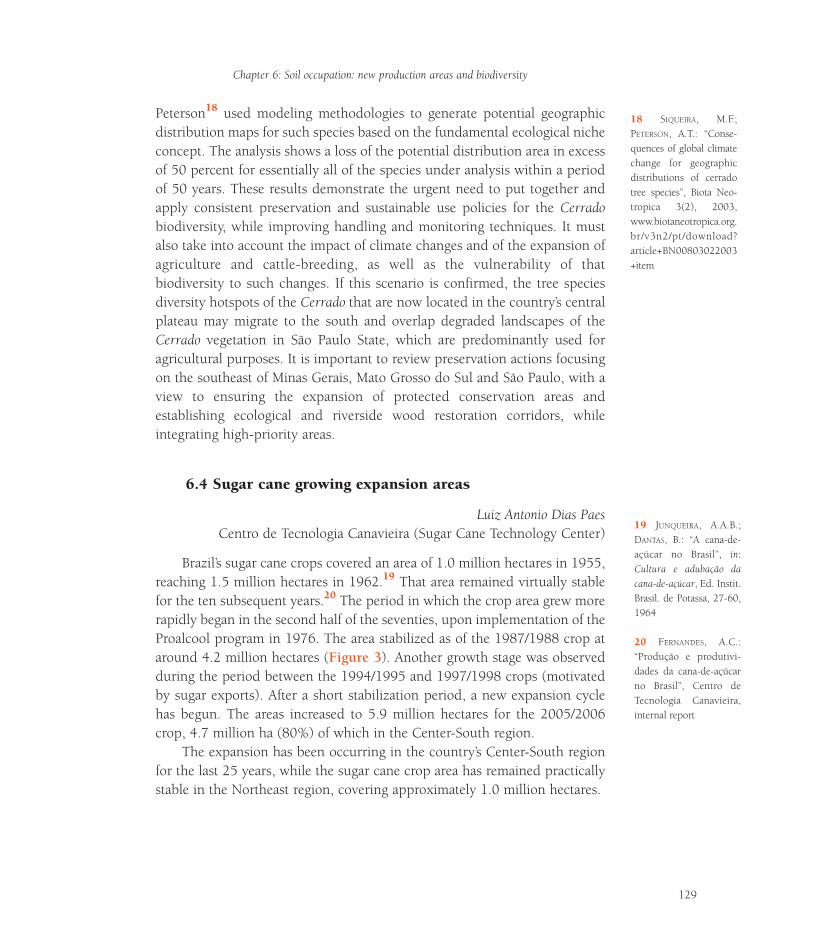
Peterson18 used modeling methodologies to generate potential geographicdistribution maps for such species based on the fundamental ecological nicheconcept. The analysis shows a loss of the potential distribution area in excessof 50 percent for essentially all of the species under analysis within a periodof 50 years. These results demonstrate the urgent need to put together andapply consistent preservation and sustainable use policies for the Cerradobiodiversity, while improving handling and monitoring techniques. It mustalso take into account the impact of climate changes and of the expansion ofagriculture and cattle-breeding, as well as the vulnerability of thatbiodiversity to such changes. If this scenario is confirmed, the tree speciesdiversity hotspots of the Cerrado that are now located in the country’s centralplateau may migrate to the south and overlap degraded landscapes of theCerrado vegetation in São Paulo State, which are predominantly used foragricultural purposes. It is important to review preservation actions focusingon the southeast of Minas Gerais, Mato Grosso do Sul and São Paulo, with aview to ensuring the expansion of protected conservation areas andestablishing ecological and riverside wood restoration corridors, whileintegrating high-priority areas.
6.4 Sugar cane growing expansion areas
Luiz Antonio Dias PaesCentro de Tecnologia Canavieira (Sugar Cane Technology Center)
Brazil’s sugar cane crops covered an area of 1.0 million hectares in 1955,reaching 1.5 million hectares in 1962.19 That area remained virtually stablefor the ten subsequent years.20 The period in which the crop area grew morerapidly began in the second half of the seventies, upon implementation of theProalcool program in 1976. The area stabilized as of the 1987/1988 crop ataround 4.2 million hectares (Figure 3). Another growth stage was observedduring the period between the 1994/1995 and 1997/1998 crops (motivatedby sugar exports). After a short stabilization period, a new expansion cyclehas begun. The areas increased to 5.9 million hectares for the 2005/2006crop, 4.7 million ha (80%) of which in the Center-South region.
The expansion has been occurring in the country’s Center-South regionfor the last 25 years, while the sugar cane crop area has remained practicallystable in the Northeast region, covering approximately 1.0 million hectares.
20 FERNANDES, A.C.:“Produção e produtivi-dades da cana-de-açúcarno Brasil”, Centro deTecnologia Canavieira,internal report
19 JUNQUEIRA, A.A.B.;DANTAS, B.: “A cana-de-açúcar no Brasil”, in:Cultura e adubação dacana-de-açúcar, Ed. Instit.Brasil. de Potassa, 27-60,1964
Chapter 6: Soil occupation: new production areas and biodiversity
129
18 SIQUEIRA, M.F.;PETERSON, A.T.: “Conse-quences of global climatechange for geographicdistributions of cerradotree species”, Biota Neo-tropica 3(2), 2003,www.biotaneotropica.org.br/v3n2/pt/download?article+BN00803022003+item
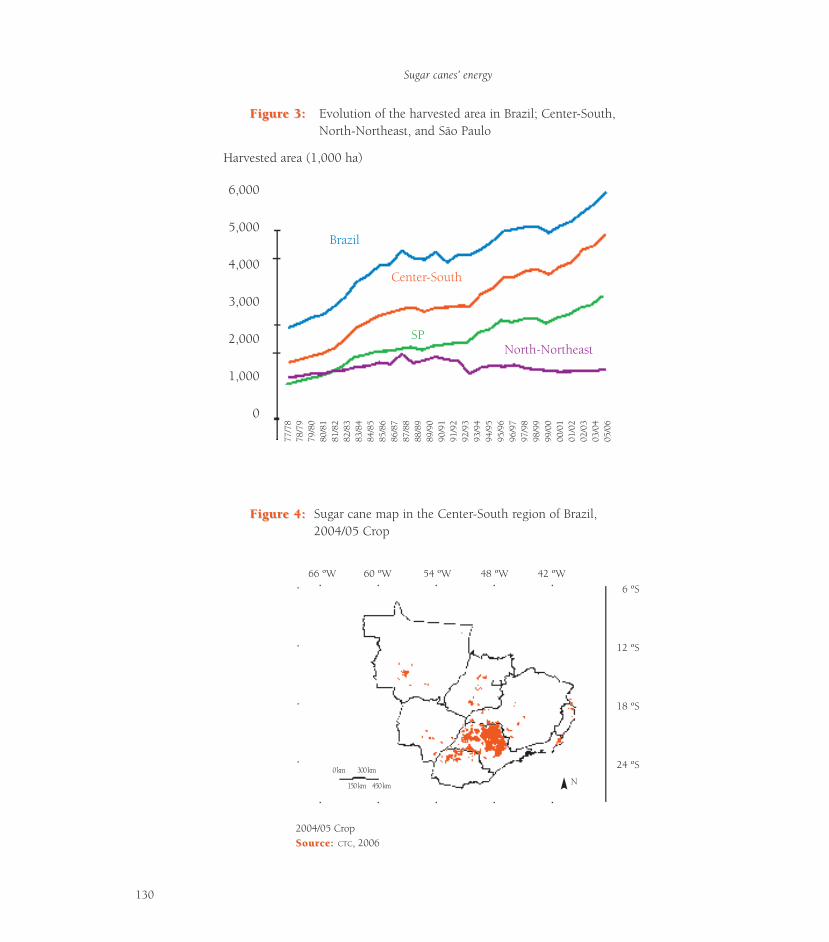
FigurFigure 3:e 3: Evolution of the harvested area in Brazil; Center-South,North-Northeast, and São Paulo
FigurFigure 4:e 4: Sugar cane map in the Center-South region of Brazil,2004/05 Crop
Sugar canes’ energy
130
66 ºW 60 ºW 54 ºW 48 ºW 42 ºW
6 ºS
12 ºS
18 ºS
24 ºS
2004/05 CropSourSource: ce: CTC, 2006
N0 km 300 km
150 km 450 km
Brazil
Center-South
SPNorth-Northeast
6,000
5,000
4,000
3,000
2,000
1,000
0
77/7
878
/79
79/8
080
/81
81/8
282
/83
83/8
484
/85
85/8
686
/87
87/8
888
/89
89/9
090
/91
91/9
292
/93
93/9
494
/95
95/9
696
/97
97/9
898
/99
99/0
000
/01
01/0
202
/03
03/0
405
/06
Harvested area (1,000 ha)
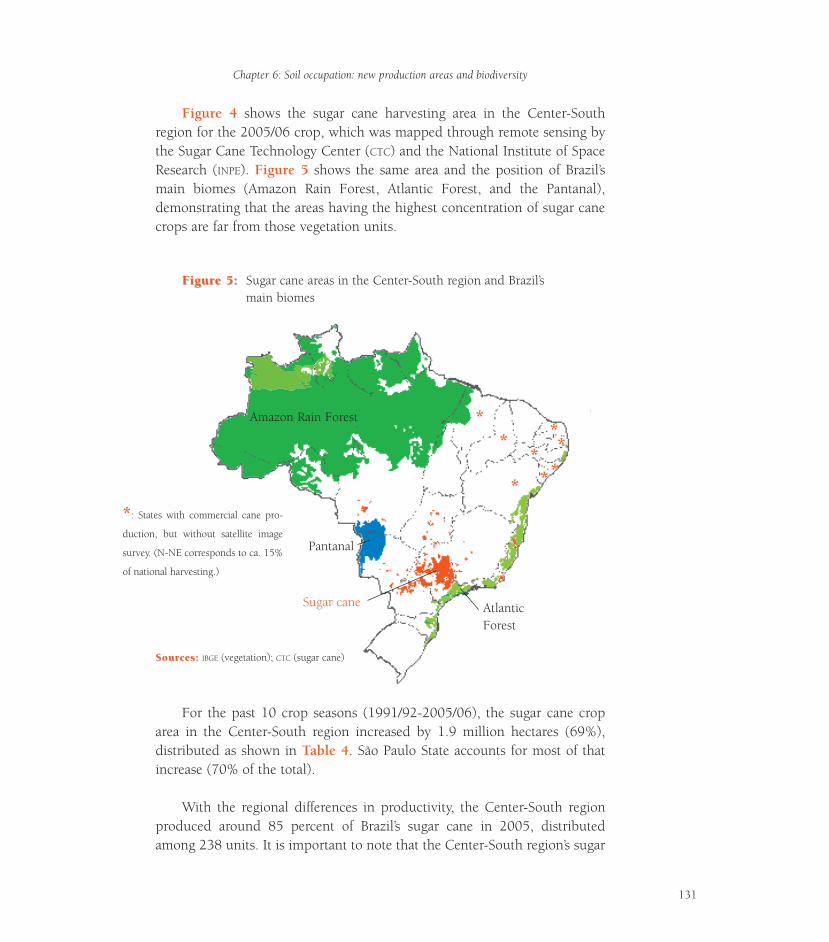
Figure 4 shows the sugar cane harvesting area in the Center-Southregion for the 2005/06 crop, which was mapped through remote sensing bythe Sugar Cane Technology Center (CTC) and the National Institute of SpaceResearch (INPE). Figure 5 shows the same area and the position of Brazil’smain biomes (Amazon Rain Forest, Atlantic Forest, and the Pantanal),demonstrating that the areas having the highest concentration of sugar canecrops are far from those vegetation units.
FigurFigure 5:e 5: Sugar cane areas in the Center-South region and Brazil’smain biomes
For the past 10 crop seasons (1991/92-2005/06), the sugar cane croparea in the Center-South region increased by 1.9 million hectares (69%),distributed as shown in Table 4. São Paulo State accounts for most of thatincrease (70% of the total).
With the regional differences in productivity, the Center-South regionproduced around 85 percent of Brazil’s sugar cane in 2005, distributedamong 238 units. It is important to note that the Center-South region’s sugar
Chapter 6: Soil occupation: new production areas and biodiversity
131
Amazon Rain Forest
Pantanal
AtlanticForest
Sugar cane
SourSources:ces: IBGE (vegetation); CTC (sugar cane)
*
**
**
***
*: States with commercial cane pro-
duction, but without satellite image
survey. (N-NE corresponds to ca. 15%
of national harvesting.)
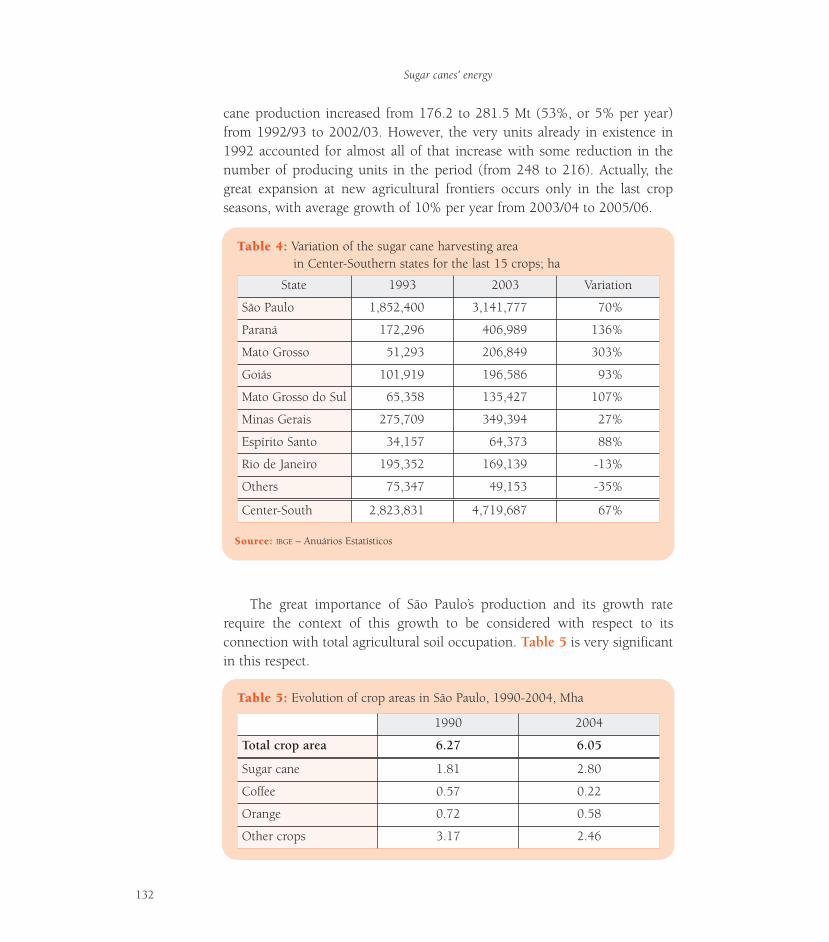
cane production increased from 176.2 to 281.5 Mt (53%, or 5% per year)from 1992/93 to 2002/03. However, the very units already in existence in1992 accounted for almost all of that increase with some reduction in thenumber of producing units in the period (from 248 to 216). Actually, thegreat expansion at new agricultural frontiers occurs only in the last cropseasons, with average growth of 10% per year from 2003/04 to 2005/06.
The great importance of São Paulo’s production and its growth raterequire the context of this growth to be considered with respect to itsconnection with total agricultural soil occupation. Table 5 is very significantin this respect.
Sugar canes’ energy
132
TTable 4:able 4: Variation of the sugar cane harvesting areain Center-Southern states for the last 15 crops; ha
SourSource:ce: IBGE – Anuários Estatísticos
State 1993 2003 Variation
São Paulo 1,852,400 3,141,777 70%
Paraná 172,296 406,989 136%
Mato Grosso 51,293 206,849 303%
Goiás 101,919 196,586 93%
Mato Grosso do Sul 65,358 135,427 107%
Minas Gerais 275,709 349,394 27%
Espírito Santo 34,157 64,373 88%
Rio de Janeiro 195,352 169,139 -13%
Others 75,347 49,153 -35%
Center-South 2,823,831 4,719,687 67%
TTable 5:able 5: Evolution of crop areas in São Paulo, 1990-2004, Mha
1990 2004
Total crop area 6.27 6.05
Sugar cane 1.81 2.80
Coffee 0.57 0.22
Orange 0.72 0.58
Other crops 3.17 2.46
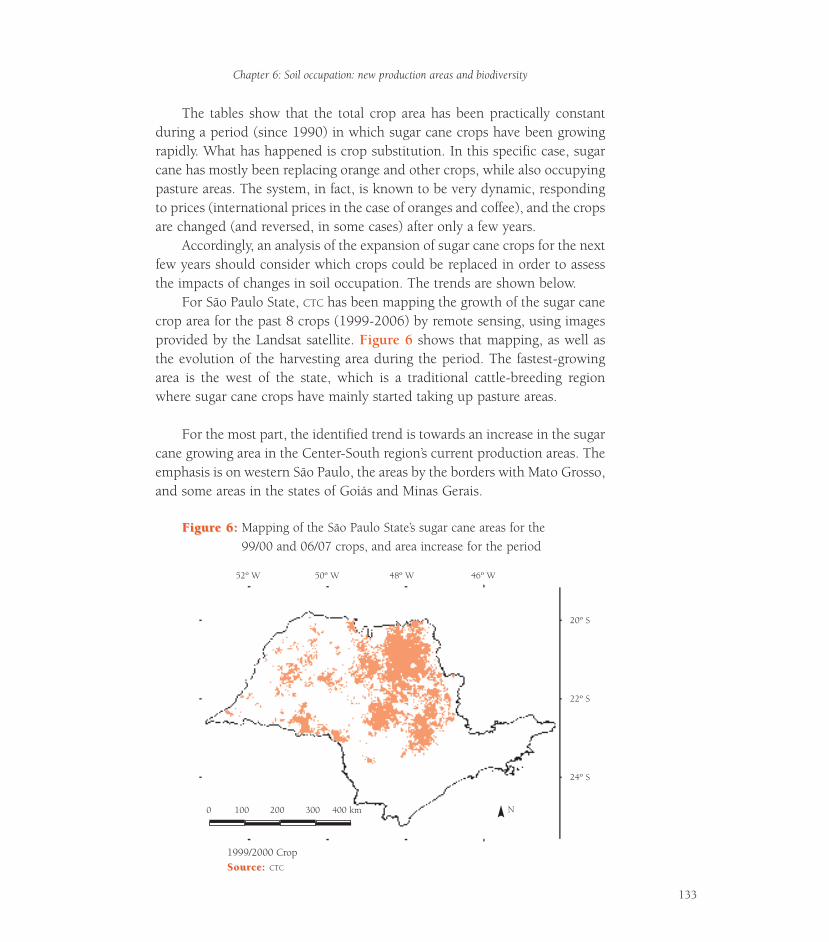
Chapter 6: Soil occupation: new production areas and biodiversity
133
0 100 200 300 400 km
52º W 50º W 48º W 46º W
20º S
22º S
24º S
N
1999/2000 CropSourSource: ce: CTC
The tables show that the total crop area has been practically constantduring a period (since 1990) in which sugar cane crops have been growingrapidly. What has happened is crop substitution. In this specific case, sugarcane has mostly been replacing orange and other crops, while also occupyingpasture areas. The system, in fact, is known to be very dynamic, respondingto prices (international prices in the case of oranges and coffee), and the cropsare changed (and reversed, in some cases) after only a few years.
Accordingly, an analysis of the expansion of sugar cane crops for the nextfew years should consider which crops could be replaced in order to assessthe impacts of changes in soil occupation. The trends are shown below.
For São Paulo State, CTC has been mapping the growth of the sugar canecrop area for the past 8 crops (1999-2006) by remote sensing, using imagesprovided by the Landsat satellite. Figure 6 shows that mapping, as well asthe evolution of the harvesting area during the period. The fastest-growingarea is the west of the state, which is a traditional cattle-breeding regionwhere sugar cane crops have mainly started taking up pasture areas.
For the most part, the identified trend is towards an increase in the sugarcane growing area in the Center-South region’s current production areas. Theemphasis is on western São Paulo, the areas by the borders with Mato Grosso,and some areas in the states of Goiás and Minas Gerais.
FigurFigure 6:e 6: Mapping of the São Paulo State’s sugar cane areas for the99/00 and 06/07 crops, and area increase for the period
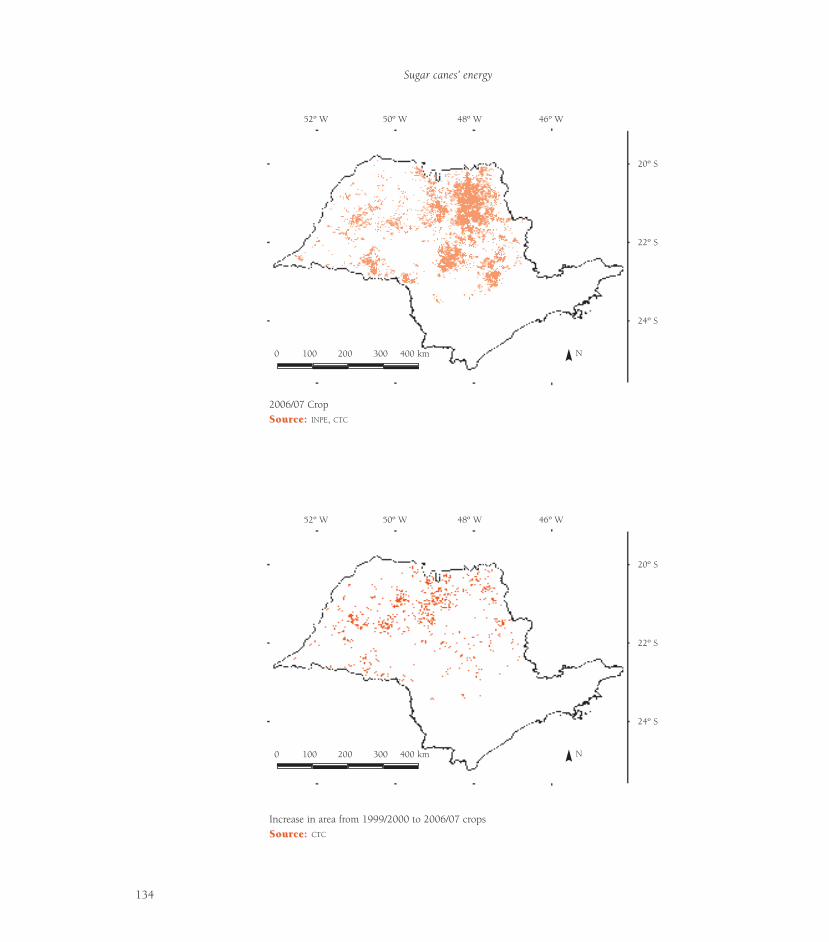
Sugar canes’ energy
134
0 100 200 300 400 km
52º W 50º W 48º W 46º W
20º S
22º S
24º S
N
2006/07 CropSourSource: ce: INPE, CTC
Increase in area from 1999/2000 to 2006/07 cropsSourSource: ce: CTC
0 100 200 300 400 km
52º W 50º W 48º W 46º W
20º S
22º S
24º S
N
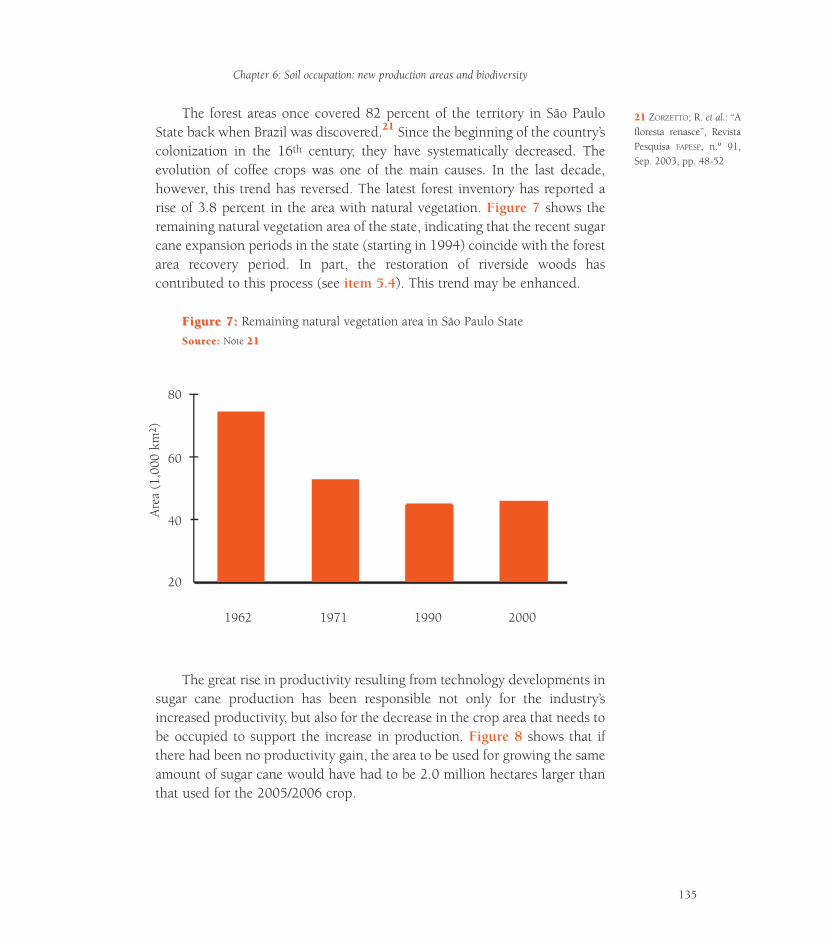
The forest areas once covered 82 percent of the territory in São PauloState back when Brazil was discovered.21 Since the beginning of the country’scolonization in the 16th century, they have systematically decreased. Theevolution of coffee crops was one of the main causes. In the last decade,however, this trend has reversed. The latest forest inventory has reported arise of 3.8 percent in the area with natural vegetation. Figure 7 shows theremaining natural vegetation area of the state, indicating that the recent sugarcane expansion periods in the state (starting in 1994) coincide with the forestarea recovery period. In part, the restoration of riverside woods hascontributed to this process (see item 5.4). This trend may be enhanced.
FigurFigure 7:e 7: Remaining natural vegetation area in São Paulo State
SourSource:ce: Note 2121
The great rise in productivity resulting from technology developments insugar cane production has been responsible not only for the industry’sincreased productivity, but also for the decrease in the crop area that needs tobe occupied to support the increase in production. Figure 8 shows that ifthere had been no productivity gain, the area to be used for growing the sameamount of sugar cane would have had to be 2.0 million hectares larger thanthat used for the 2005/2006 crop.
21 ZORZETTO; R. et al.: “Afloresta renasce”, RevistaPesquisa FAPESP, n.º 91,Sep. 2003, pp. 48-52
Chapter 6: Soil occupation: new production areas and biodiversity
135
1962 1971 1990 2000
80
60
40
20
Are
a (1
,000
km
2 )
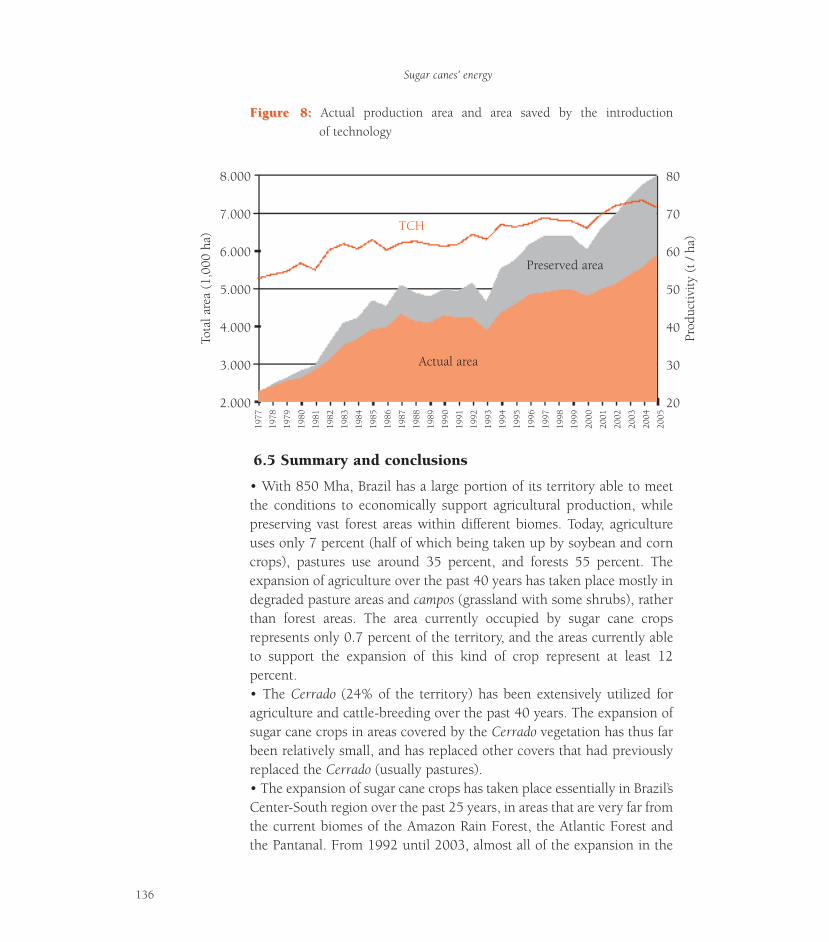
FigurFigure 8:e 8: Actual production area and area saved by the introductionof technology
6.5 Summary and conclusions
• With 850 Mha, Brazil has a large portion of its territory able to meetthe conditions to economically support agricultural production, whilepreserving vast forest areas within different biomes. Today, agricultureuses only 7 percent (half of which being taken up by soybean and corncrops), pastures use around 35 percent, and forests 55 percent. Theexpansion of agriculture over the past 40 years has taken place mostly indegraded pasture areas and campos (grassland with some shrubs), ratherthan forest areas. The area currently occupied by sugar cane cropsrepresents only 0.7 percent of the territory, and the areas currently ableto support the expansion of this kind of crop represent at least 12percent.• The Cerrado (24% of the territory) has been extensively utilized foragriculture and cattle-breeding over the past 40 years. The expansion ofsugar cane crops in areas covered by the Cerrado vegetation has thus farbeen relatively small, and has replaced other covers that had previouslyreplaced the Cerrado (usually pastures).• The expansion of sugar cane crops has taken place essentially in Brazil’sCenter-South region over the past 25 years, in areas that are very far fromthe current biomes of the Amazon Rain Forest, the Atlantic Forest andthe Pantanal. From 1992 until 2003, almost all of the expansion in the
Sugar canes’ energy
136
1977
1978
1979
1980
1981
1982
1983
1984
1985
1986
1987
1988
1989
1990
1991
1992
1993
1994
1995
1996
1997
1998
1999
2000
2001
2002
2003
2004
2005
8.000
7.000
6.000
5.000
4.000
3.000
2.000
80
70
60
50
40
30
20
Tota
l are
a (1
,000
ha)
Prod
uctiv
ity (
t / h
a)
TCH
Actual area
Preserved area
Center-South region occurred in existing units; new agricultural borderswere involved very slightly. In São Paulo, the growth has occurredthrough the substitution of pastures and other crops.• For the next few years, there shall be growth in the Center-Southregion, with an emphasis on the west of São Paulo, regions by theborders with Mato Grosso, and in some areas within the states of Goiásand Minas Gerais.• Brazil concentrates the world’s largest biological diversity (includingthe Amazon Rain Forest, the Atlantic Forest, and the Cerrado), and aflora estimated at 50,000 to 60,000 angiosperm species. The biodiversitypreservation priorities were set mainly between 1995 and 2000, with thecontribution of hundreds of experts. Protected areas were established forthe six major biomes in the National Preservation Units System. Thisimportant initiative shall be undergoing some reviews, so as toincorporate methodology advances and to consider the expansion ofagriculture and the vulnerability to climate changes. • Since the discovery of Brazil, the Atlantic Forest has been the firstbiome to be partially replaced through the exploitation of wood,agriculture and cattle-breeding along Brazil’s entire coast. Among manyothers, the sugar cane culture (Center-South and Northeast) is now inareas originally covered by that biome. This process by far preceded anyconcern for preservation, and consequently, preservation requires therestoration of areas protected by law (riverside woods, hillsides).• The occupation of the Cerrado by agriculture is very recent, andincludes areas occupied by cattle-breeding, as well as firewood and coalexploitation. Its growth should be planned taking into consideration thepreservation of biodiversity and water resources, especially in sensitiveareas (sources of rivers that flow to the Pantanal, and recharge areas ofthe Guarani aquifer).• Harmonizing socioeconomic development with environmental preser-vation requires up-to-date information and appropriate tools for analyz-ing impact and vulnerability. Programs like that of the IVB (São Paulo)and advances in the survey of geo-referenced data (in progress) are there-fore highly important in this context.
Chapter 6: Soil occupation: new production areas and biodiversity
137
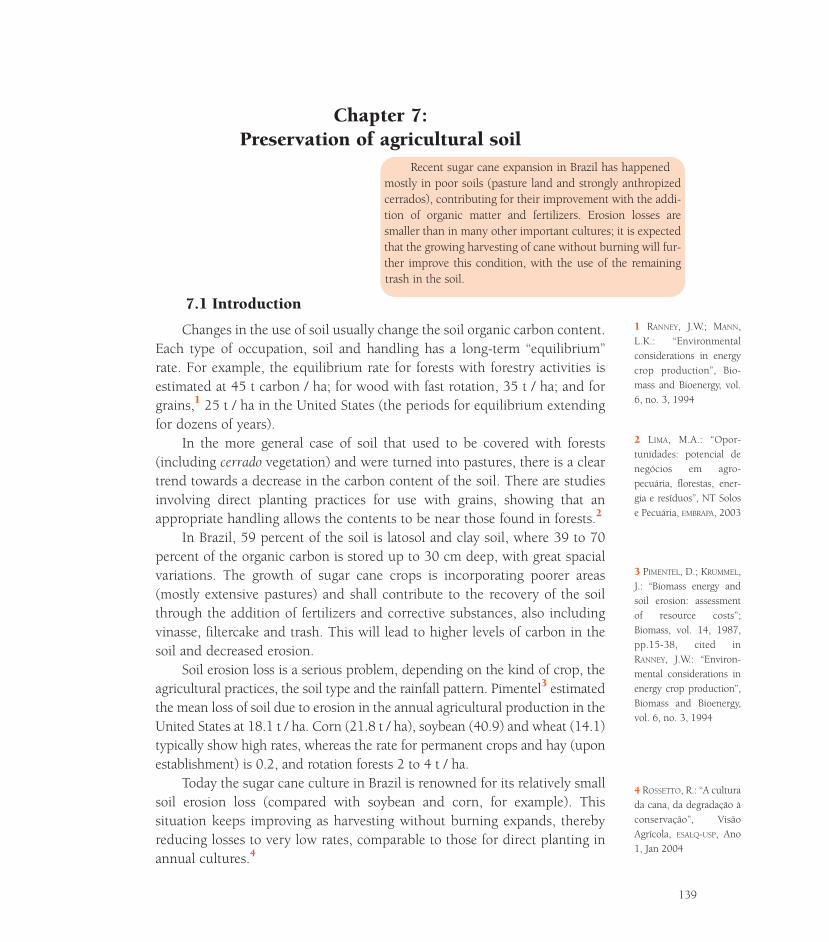
3 PIMENTEL, D.; KRUMMEL,J.: “Biomass energy andsoil erosion: assessmentof resource costs”;Biomass, vol. 14, 1987,pp.15-38, cited inRANNEY, J.W.: “Environ-mental considerations inenergy crop production”,Biomass and Bioenergy,vol. 6, no. 3, 1994
2 LIMA, M.A.: “Opor-tunidades: potencial denegócios em agro-pecuária, florestas, ener-gia e resíduos”, NT Solose Pecuária, EMBRAPA, 2003
4 ROSSETTO, R.: “A culturada cana, da degradação àconservação”, VisãoAgrícola, ESALQ-USP, Ano1, Jan 2004
139
1 RANNEY, J.W.; MANN,L.K.: “Environmentalconsiderations in energycrop production”, Bio-mass and Bioenergy, vol.6, no. 3, 1994
Chapter 7:Preservation of agricultural soil
7.1 Introduction
Changes in the use of soil usually change the soil organic carbon content.Each type of occupation, soil and handling has a long-term “equilibrium”rate. For example, the equilibrium rate for forests with forestry activities isestimated at 45 t carbon / ha; for wood with fast rotation, 35 t / ha; and forgrains,1 25 t / ha in the United States (the periods for equilibrium extendingfor dozens of years).
In the more general case of soil that used to be covered with forests(including cerrado vegetation) and were turned into pastures, there is a cleartrend towards a decrease in the carbon content of the soil. There are studiesinvolving direct planting practices for use with grains, showing that anappropriate handling allows the contents to be near those found in forests.2
In Brazil, 59 percent of the soil is latosol and clay soil, where 39 to 70percent of the organic carbon is stored up to 30 cm deep, with great spacialvariations. The growth of sugar cane crops is incorporating poorer areas(mostly extensive pastures) and shall contribute to the recovery of the soilthrough the addition of fertilizers and corrective substances, also includingvinasse, filtercake and trash. This will lead to higher levels of carbon in thesoil and decreased erosion.
Soil erosion loss is a serious problem, depending on the kind of crop, theagricultural practices, the soil type and the rainfall pattern. Pimentel3 estimatedthe mean loss of soil due to erosion in the annual agricultural production in theUnited States at 18.1 t / ha. Corn (21.8 t / ha), soybean (40.9) and wheat (14.1)typically show high rates, whereas the rate for permanent crops and hay (uponestablishment) is 0.2, and rotation forests 2 to 4 t / ha.
Today the sugar cane culture in Brazil is renowned for its relatively smallsoil erosion loss (compared with soybean and corn, for example). Thissituation keeps improving as harvesting without burning expands, therebyreducing losses to very low rates, comparable to those for direct planting inannual cultures.4
Recent sugar cane expansion in Brazil has happenedmostly in poor soils (pasture land and strongly anthropizedcerrados), contributing for their improvement with the addi-tion of organic matter and fertilizers. Erosion losses aresmaller than in many other important cultures; it is expectedthat the growing harvesting of cane without burning will fur-ther improve this condition, with the use of the remainingtrash in the soil.
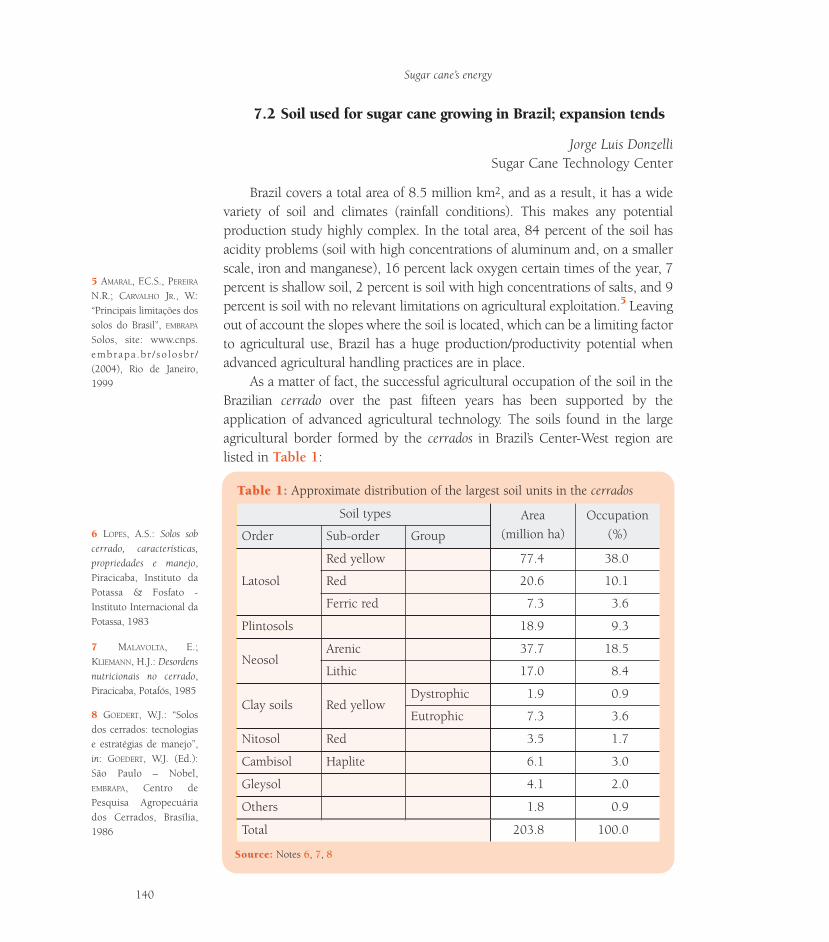
7.2 Soil used for sugar cane growing in Brazil; expansion tends
Jorge Luis DonzelliSugar Cane Technology Center
Brazil covers a total area of 8.5 million km2, and as a result, it has a widevariety of soil and climates (rainfall conditions). This makes any potentialproduction study highly complex. In the total area, 84 percent of the soil hasacidity problems (soil with high concentrations of aluminum and, on a smallerscale, iron and manganese), 16 percent lack oxygen certain times of the year, 7percent is shallow soil, 2 percent is soil with high concentrations of salts, and 9percent is soil with no relevant limitations on agricultural exploitation.5 Leavingout of account the slopes where the soil is located, which can be a limiting factorto agricultural use, Brazil has a huge production/productivity potential whenadvanced agricultural handling practices are in place.
As a matter of fact, the successful agricultural occupation of the soil in theBrazilian cerrado over the past fifteen years has been supported by theapplication of advanced agricultural technology. The soils found in the largeagricultural border formed by the cerrados in Brazil’s Center-West region arelisted in Table 1:
5 AMARAL, F.C.S., PEREIRA
N.R.; CARVALHO JR., W.:“Principais limitações dossolos do Brasil”, EMBRAPA
Solos, site: www.cnps.embrapa .br / so losbr /(2004), Rio de Janeiro,1999
6 LOPES, A.S.: Solos sobcerrado, características,propriedades e manejo,Piracicaba, Instituto daPotassa & Fosfato -Instituto Internacional daPotassa, 1983
8 GOEDERT, W.J.: “Solosdos cerrados: tecnologiase estratégias de manejo”,in: GOEDERT, W.J. (Ed.):São Paulo – Nobel,EMBRAPA, Centro dePesquisa Agropecuáriados Cerrados, Brasília,1986
7 MALAVOLTA, E.;KLIEMANN, H.J.: Desordensnutricionais no cerrado,Piracicaba, Potafós, 1985
Sugar cane’s energy
140
TTable 1:able 1: Approximate distribution of the largest soil units in the cerrados
SourSource:ce: Notes 6, 7, 8
Soil types Area(million ha)
Occupation(%)Order Sub-order Group
Latosol
Red yellow 77.4 38.0
Red 20.6 10.1
Ferric red 7.3 3.6
Plintosols 18.9 9.3
NeosolArenic 37.7 18.5
Lithic 17.0 8.4
Clay soils Red yellowDystrophic 1.9 0.9
Eutrophic 7.3 3.6
Nitosol Red 3.5 1.7
Cambisol Haplite 6.1 3.0
Gleysol 4.1 2.0
Others 1.8 0.9
Total 203.8 100.0
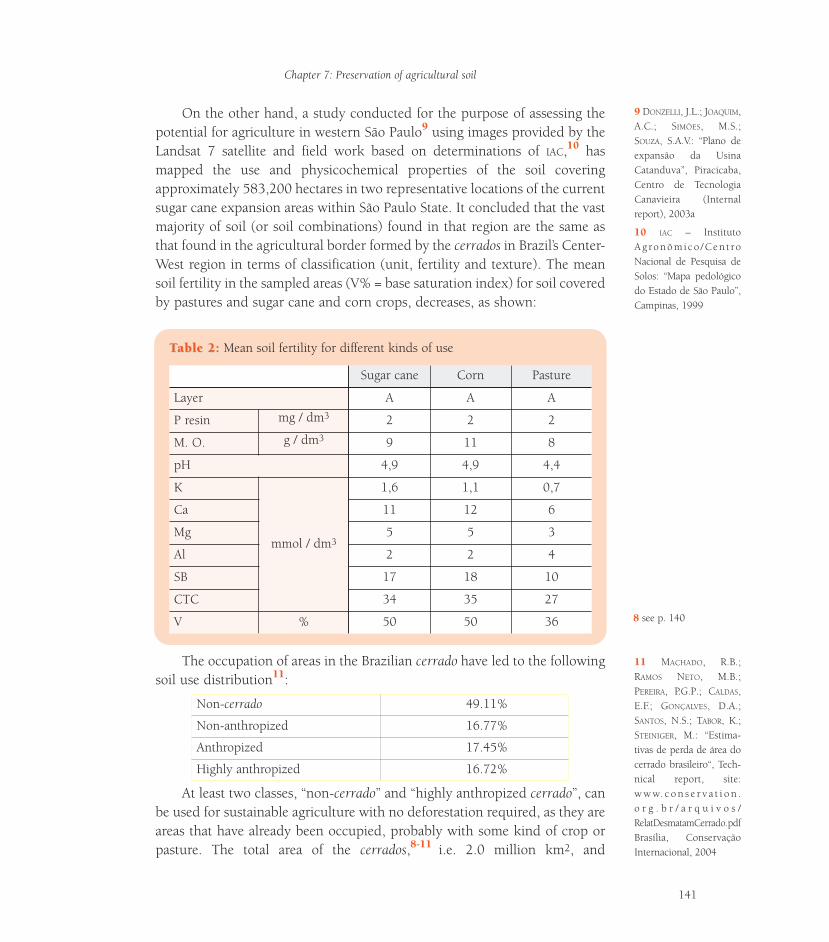
On the other hand, a study conducted for the purpose of assessing thepotential for agriculture in western São Paulo9 using images provided by theLandsat 7 satellite and field work based on determinations of IAC,10 hasmapped the use and physicochemical properties of the soil coveringapproximately 583,200 hectares in two representative locations of the currentsugar cane expansion areas within São Paulo State. It concluded that the vastmajority of soil (or soil combinations) found in that region are the same asthat found in the agricultural border formed by the cerrados in Brazil’s Center-West region in terms of classification (unit, fertility and texture). The meansoil fertility in the sampled areas (V% = base saturation index) for soil coveredby pastures and sugar cane and corn crops, decreases, as shown:
The occupation of areas in the Brazilian cerrado have led to the followingsoil use distribution11:
At least two classes, “non-cerrado” and “highly anthropized cerrado”, canbe used for sustainable agriculture with no deforestation required, as they areareas that have already been occupied, probably with some kind of crop orpasture. The total area of the cerrados,8-11 i.e. 2.0 million km2, and
Non-cerrado 49.11%
Non-anthropized 16.77%
Anthropized 17.45%
Highly anthropized 16.72%
9 DONZELLI, J.L.; JOAQUIM,A.C.; SIMÕES, M.S.;SOUZA, S.A.V.: “Plano deexpansão da UsinaCatanduva”, Piracicaba,Centro de TecnologiaCanavieira (Internalreport), 2003a
10 IAC – InstitutoA g ro n ô m i c o / C e n t roNacional de Pesquisa deSolos: “Mapa pedológicodo Estado de São Paulo”,Campinas, 1999
11 MACHADO, R.B.;RAMOS NETO, M.B.;PEREIRA, P.G.P.; CALDAS,E.F.; GONÇALVES, D.A.;SANTOS, N.S.; TABOR, K.;STEINIGER, M.: “Estima-tivas de perda de área docerrado brasileiro“, Tech-nical report, site:w w w. c o n s e r v a t i o n .o r g . b r / a r q u i v o s /RelatDesmatamCerrado.pdfBrasília, ConservaçãoInternacional, 2004
Chapter 7: Preservation of agricultural soil
141
TTable 2:able 2: Mean soil fertility for different kinds of use
Sugar cane Corn Pasture
Layer A A A
P resin mg / dm3 2 2 2
M. O. g / dm3 9 11 8
pH 4,9 4,9 4,4
K
mmol / dm3
1,6 1,1 0,7
Ca 11 12 6
Mg 5 5 3
Al 2 2 4
SB 17 18 10
CTC 34 35 27
V % 50 50 36 8 see p. 140
considering that a vast majority of the pastures probably fall into the “highlyanthropized” class, reach 17 percent, or 34 million ha. If their soil has a basesaturation index similar to that found in the studies of western São Paulo(around 36%), soil fertility can be expected to increase at a mean rate of 39percent just by adjusting the base saturation index to V% = 50%, through theaddition of corrective substances and fertilizers. This would be possible withthe introduction of advanced, sustainable agricultural handling practices inthese soils, which could then be effectively incorporated into Brazil’sagricultural area.
Chemical correction (limestone and gypsum) and fertilizers are required,but the sustainability of the production entails the addition of organic matter(OM) to the soil. The use of this soils for growing crops that add OM and/orchemical-organic fertilization, as in the case of sugar cane, will contribute toimproving their physicochemical conditions.
There is an increase in the OM contents of soil used for growing sugarcane and corn compared to those of pastures (Table 2). Studies12 of theaccumulation of OM in a soil where sugar cane is grown (eutroferric redlatosol), conducted in the Ribeirão Preto region, found an addition of 13.5 t(MS) / ha. This data is consistent with other results obtained in São Paulo,and lower than those achieved for Brazil’s Northeast region.12 Experiments13
have shown the great potential for sugar cane growing without trash burningof increasing the concentration of organic matter in the soil, especially arenic(AQ), which is known to have very low carbon content.
Evaluations of these results, and of studies conducted with the use ofvinasse (Chapter 9) point to the potential for improvement of the soilthrough sugar cane planting in both physical (due to the addition of organicmatter by the trash and roots), and nutritional aspects (through addition ofwastes from the sugar and ethanol production processes, vinasse andfiltercake).
7.3 Erosion in sugar cane crops: situation and prospects
Jorge Luis DonzelliCentro de Tecnologia Canavieira - Sugar Cane Technology Center
The erosion process is the leading cause of agricultural soil degradation.The application of soil conservation techniques aim at mitigating soil loss.Any project for the use of land in agriculture should consider the soil type(texture, diagnostic horizon types, water infiltration rate), slope, rainfall
12 LUCA, E.F. et. al: “Efeitosda colheita sem queima dacana-de-açúcar sobre amatéria orgânica e a bio-massa microbiana de umlatossolo roxo”, presentedin: XXVII Congresso Bra-sileiro de Ciência do Solo,Brasília, June 1999
13 FELLER, C.L.: “Efeitosda colheita sem queima dacana-de-açúcar sob adinâmica de carbono epropriedades do solo”,Report by FAPESP/USP/CENA (98/12648-3),Piracicaba, Universidadede São Paulo, Centro deEnergia Nuclear naAgricultura, 2001
Sugar cane’s energy
142
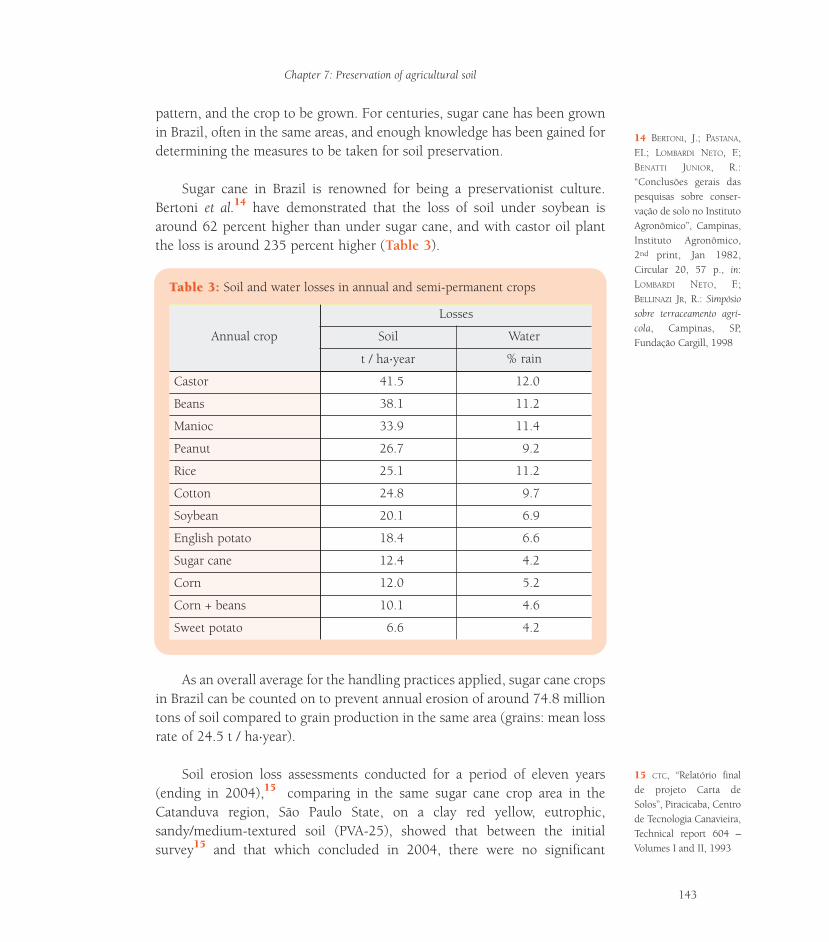
pattern, and the crop to be grown. For centuries, sugar cane has been grownin Brazil, often in the same areas, and enough knowledge has been gained fordetermining the measures to be taken for soil preservation.
Sugar cane in Brazil is renowned for being a preservationist culture.Bertoni et al.14 have demonstrated that the loss of soil under soybean isaround 62 percent higher than under sugar cane, and with castor oil plantthe loss is around 235 percent higher (Table 3).
As an overall average for the handling practices applied, sugar cane cropsin Brazil can be counted on to prevent annual erosion of around 74.8 milliontons of soil compared to grain production in the same area (grains: mean lossrate of 24.5 t / ha.year).
Soil erosion loss assessments conducted for a period of eleven years(ending in 2004),15 comparing in the same sugar cane crop area in theCatanduva region, São Paulo State, on a clay red yellow, eutrophic,sandy/medium-textured soil (PVA-25), showed that between the initialsurvey15 and that which concluded in 2004, there were no significant
Chapter 7: Preservation of agricultural soil
143
TTable 3:able 3: Soil and water losses in annual and semi-permanent crops
Annual crop
Losses
Soil Water
t / ha.year % rain
Castor 41.5 12.0
Beans 38.1 11.2
Manioc 33.9 11.4
Peanut 26.7 9.2
Rice 25.1 11.2
Cotton 24.8 9.7
Soybean 20.1 6.9
English potato 18.4 6.6
Sugar cane 12.4 4.2
Corn 12.0 5.2
Corn + beans 10.1 4.6
Sweet potato 6.6 4.2
14 BERTONI, J.; PASTANA,F.I.; LOMBARDI NETO, F.;BENATTI JUNIOR, R.:“Conclusões gerais daspesquisas sobre conser-vação de solo no InstitutoAgronômico”, Campinas,Instituto Agronômico,2nd print, Jan 1982,Circular 20, 57 p., in:LOMBARDI NETO, F.;BELLINAZI JR, R.: Simpósiosobre terraceamento agrí-cola, Campinas, SP,Fundação Cargill, 1998
15 CTC, “Relatório finalde projeto Carta deSolos”, Piracicaba, Centrode Tecnologia Canavieira,Technical report 604 –Volumes I and II, 1993
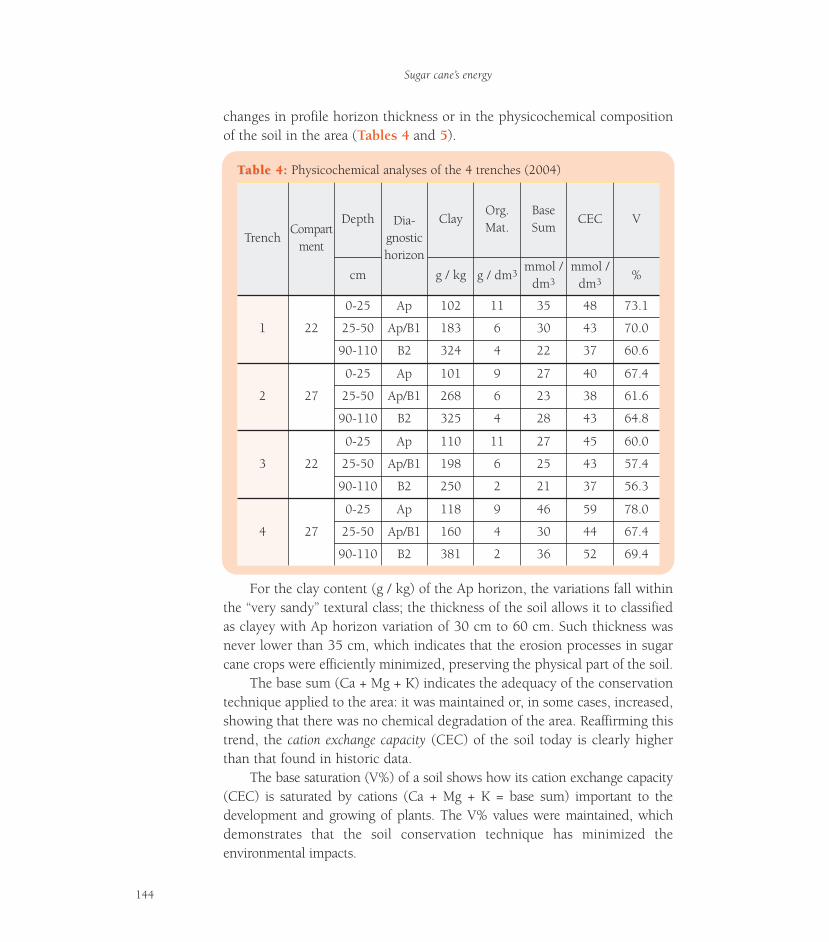
changes in profile horizon thickness or in the physicochemical compositionof the soil in the area (Tables 4 and 5).
For the clay content (g / kg) of the Ap horizon, the variations fall withinthe “very sandy” textural class; the thickness of the soil allows it to classifiedas clayey with Ap horizon variation of 30 cm to 60 cm. Such thickness wasnever lower than 35 cm, which indicates that the erosion processes in sugarcane crops were efficiently minimized, preserving the physical part of the soil.
The base sum (Ca + Mg + K) indicates the adequacy of the conservationtechnique applied to the area: it was maintained or, in some cases, increased,showing that there was no chemical degradation of the area. Reaffirming thistrend, the cation exchange capacity (CEC) of the soil today is clearly higherthan that found in historic data.
The base saturation (V%) of a soil shows how its cation exchange capacity(CEC) is saturated by cations (Ca + Mg + K = base sum) important to thedevelopment and growing of plants. The V% values were maintained, whichdemonstrates that the soil conservation technique has minimized theenvironmental impacts.
Sugar cane’s energy
144
TTable 4:able 4: Physicochemical analyses of the 4 trenches (2004)
TrenchCompart
ment
Depth Dia-gnostichorizon
ClayOrg.Mat.
BaseSum
CEC V
cm g / kg g / dm3mmol /
dm3
mmol /dm3
%
1 22
0-25 Ap 102 11 35 48 73.1
25-50 Ap/B1 183 6 30 43 70.0
90-110 B2 324 4 22 37 60.6
2 27
0-25 Ap 101 9 27 40 67.4
25-50 Ap/B1 268 6 23 38 61.6
90-110 B2 325 4 28 43 64.8
3 22
0-25 Ap 110 11 27 45 60.0
25-50 Ap/B1 198 6 25 43 57.4
90-110 B2 250 2 21 37 56.3
4 27
0-25 Ap 118 9 46 59 78.0
25-50 Ap/B1 160 4 30 44 67.4
90-110 B2 381 2 36 52 69.4
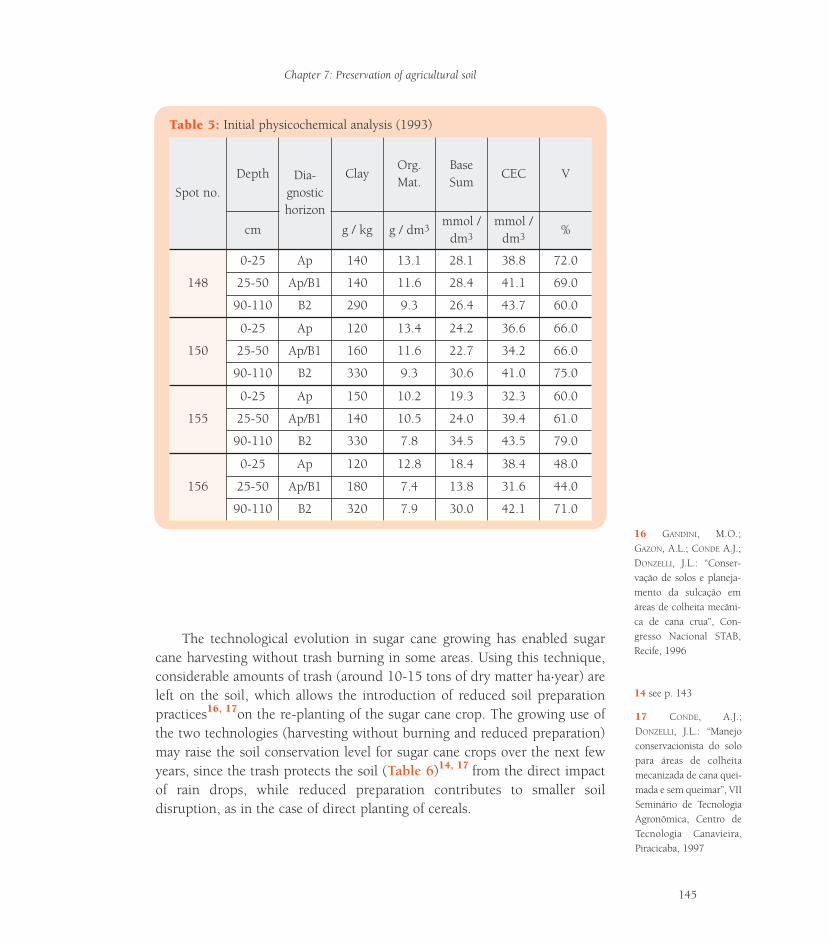
Chapter 7: Preservation of agricultural soil
145
TTable 5:able 5: Initial physicochemical analysis (1993)
Spot no.Depth Dia-
gnostichorizon
ClayOrg.Mat.
BaseSum
CEC V
cm g / kg g / dm3mmol /
dm3
mmol /dm3
%
148
0-25 Ap 140 13.1 28.1 38.8 72.0
25-50 Ap/B1 140 11.6 28.4 41.1 69.0
90-110 B2 290 9.3 26.4 43.7 60.0
150
0-25 Ap 120 13.4 24.2 36.6 66.0
25-50 Ap/B1 160 11.6 22.7 34.2 66.0
90-110 B2 330 9.3 30.6 41.0 75.0
155
0-25 Ap 150 10.2 19.3 32.3 60.0
25-50 Ap/B1 140 10.5 24.0 39.4 61.0
90-110 B2 330 7.8 34.5 43.5 79.0
156
0-25 Ap 120 12.8 18.4 38.4 48.0
25-50 Ap/B1 180 7.4 13.8 31.6 44.0
90-110 B2 320 7.9 30.0 42.1 71.0
The technological evolution in sugar cane growing has enabled sugarcane harvesting without trash burning in some areas. Using this technique,considerable amounts of trash (around 10-15 tons of dry matter ha.year) areleft on the soil, which allows the introduction of reduced soil preparationpractices16, 17on the re-planting of the sugar cane crop. The growing use ofthe two technologies (harvesting without burning and reduced preparation)may raise the soil conservation level for sugar cane crops over the next fewyears, since the trash protects the soil (Table 6)14, 17 from the direct impactof rain drops, while reduced preparation contributes to smaller soildisruption, as in the case of direct planting of cereals.
17 CONDE, A.J.;DONZELLI, J.L.: “Manejoconservacionista do solopara áreas de colheitamecanizada de cana quei-mada e sem queimar”, VIISeminário de TecnologiaAgronômica, Centro deTecnologia Canavieira,Piracicaba, 1997
16 GANDINI, M.O.;GAZON, A.L.; CONDE A.J.;DONZELLI, J.L.: “Conser-vação de solos e planeja-mento da sulcação emáreas de colheita mecâni-ca de cana crua”, Con-gresso Nacional STAB,Recife, 1996
14 see p. 143
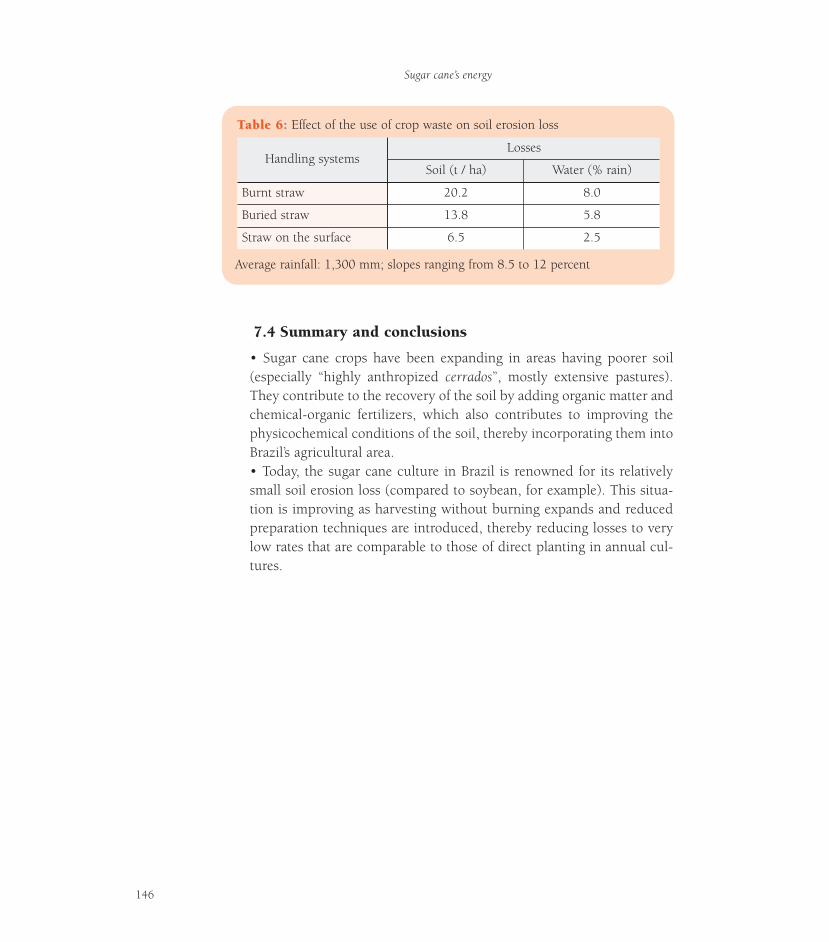
Sugar cane’s energy
146
TTable 6:able 6: Effect of the use of crop waste on soil erosion loss
Average rainfall: 1,300 mm; slopes ranging from 8.5 to 12 percent
Handling systemsLosses
Soil (t / ha) Water (% rain)
Burnt straw 20.2 8.0
Buried straw 13.8 5.8
Straw on the surface 6.5 2.5
7.4 Summary and conclusions
• Sugar cane crops have been expanding in areas having poorer soil(especially “highly anthropized cerrados”, mostly extensive pastures).They contribute to the recovery of the soil by adding organic matter andchemical-organic fertilizers, which also contributes to improving thephysicochemical conditions of the soil, thereby incorporating them intoBrazil’s agricultural area.• Today, the sugar cane culture in Brazil is renowned for its relativelysmall soil erosion loss (compared to soybean, for example). This situa-tion is improving as harvesting without burning expands and reducedpreparation techniques are introduced, thereby reducing losses to verylow rates that are comparable to those of direct planting in annual cul-tures.
Chapter 8:Use of agrochemicals
8.1 Introduction
Several principles of the Rio Declaration and, more specifically, Chapters14 and 19 of Agenda 21, refer to the cautions to be taken in using chemicals(including pesticides). The principle concerned with precaution requirescontrol measures for cases in which there still isn’t a fully establishedscientific certainty about environmental degradation. The precautionprinciple would have us avoid some of the major problems facing us todayworldwide, such as water contamination with pesticides, and very expensivecleaning actions. The inter-generation equity principle needs to be followedin order to prevent the repetition of problems for future generations, such ascontaminated agricultural and aquatic ecosystems through the use of DDT,PCBs and dioxins. Another principle refers to the restriction on commercialmovement of hazardous products and the people’s access to information ontheir use and movement.
In Agenda 21, Chapter 14 includes “Integrated pest control andmanagement in agriculture”, which recommends, among other things,promoting the “use of biological control agents and organic pesticides”.Chapter 19 establishes a program for control over toxic chemicals. Theconcerns are justified by the problems that were established during therelatively short period of intensified “modern” agriculture. For example, theuse of pesticides (insecticides, herbicides and fungicides) doubled in theUnited States (from 400 to 800 million lb / year) between 1965 and 1985,1
while the use of non-agricultural pesticides dropped 33 percent between1970 and 1990.
In several situations, there is now a growing interest in newtechnologies (PIPs) based on genetic modifications of plants designed to add
1 GOLDMAN, L.R.: “Toxicchemicals and pesti-cides”, in: DERNBACH, J.C.(Ed.): Stumbling towardsustainability, Washing-ton DC, EnvironmentalLaw Institute, 2002
147
Among the main sugar cane pests, the sugar canebeetle and spittlebug are currently biologically con-trolled. Plant diseases are fought with the selection of dis-ease-resistant varieties in genetic improvement programs.No transgenic variety is used today, but the developmentsin course may help reducing the use of chemicals in thefuture. In Brazil, sugar cane crops still use more herbi-cides than coffee and corn crops, less herbicides than cit-ric crops and the same amount as soybeans.
resistance to pests or pesticide characteristics. Agenda 21 highlights some ofthe promises of these technologies (more specific, and cleaner inproduction), but also mentions the potential problems, such as thescattering of genes, adverse impacts on non-targeted organisms, potentialfood contamination, etc. In the United States, the EPA approved nine PIPsbetween 1992 and 2002 (most of which with genes for Bt toxin production)and rejected two.
There are differences between countries in legislations on PIPs. Forexample, in the United States there are no specific labeling procedures forGMO foods, but there are in the European Union. Brazil is gradually definingits position, especially in regard to soybean. The sugar cane industry has notyet started to make efforts to get authorizations to commercial planting oftransgenic varieties, but it may do so shortly (see item 10.3).
Other ways to reduce the use of pesticides include the application ofbiological control. Brazil’s major programs in this field are already in use insugar cane crops. This has been done in a more (commercially) limited butvery important way, given the results and orientation for the future, “organic”production.
Organic production is much more than reducing the use of pesticides.Organic production of brown sugar and spirits2 has been used in relativelysmall areas for ten years now. Large-scale production was developed in Brazilby the São Francisco mill, based in São Paulo, where 13,500 ha of sugar caneplantations have been certified for organic production since 1997. Othermills are certified; there are a few certifying agencies for the production ofsugar and spirits. The requirements vary, but they usually include theutilization of areas having not used pesticides and trash burning for a fewyears, and the preservation of ecosystems (forest corridors, diversity islands).The conservation of soil and water resources is checked, and the use ofpesticides under predetermined amounts and other conditions may beallowed in some cases. Biological controls (pests and diseases) and soilcoverage with straw (in substitution of herbicides) are given priority. Oneother resource is manual harrowing. Vinasse and filtercake recycling is anessential part of fertilization, for which low-solubility organic or mineralfertilizers can be used. The cautions extend to industrial production. On suchan important scale, and having its production certified for seven years now,the S. Francisco mill reports rises of 10 percent in productivity and 50 to 60percent in costs.2
2 ROSSETTO, R.: “O sis-tema de cultivo orgâni-co”, Visão Agrícola,ESALQ-USP, Ano 1, Jan2004
Sugar cane’s energy
148
That work is considered very important for testing the limits of theprocess of reducing impacts for sugar cane crops, and should be watchedvery closely over the coming years.
8.2 Agrochemicals (pesticides and others)
Enrico De Beni ArrigoniLuiz Carlos de Almeida
Centro de Tecnologia Canavieira (Sugar Cane Technology Center)
8.2.1 Legislation and controls in Brazil
The Brazilian legislation on pesticides was updated by Law no. 7,802, inJuly 11, 1989, as regulated by Decree no. 98,816 of January 11, 1990.Agrochemicals include herbicides, insecticides, fungicides, maturators, adhesivespreading agents, and defoliants, among others. “Related” products include allbiological and microbial products, vegetable extracts and pheromones that areused to control pests and diseases, yet have no toxicological characteristics andrisks. The legislation is complemented by Ordinances by the Crops andLivestock Protection Department, IBAMA – Brazilian Institute of the Environmentand ANVISA – Brazilian Sanitary Authority.
The recommendation to use pesticides and related products is made byprofessionals in the agricultural, cattle-breeding and forestry industries byway of specific Agronomical Prescriptions for each place and problem, amonglisted products. It is incumbent upon the State Departments of Agricultureand the CREAs (Regional Councils of Engineering, Architecture andAgronomy) to inspect and notify. Pesticides are listed upon evaluation byagronomical efficiency, residue tests, and toxicological and environmentalstudies. The Ministries of Agriculture, Environment and Health areresponsible for these evaluations.
8.2.2 Use of pesticides (insecticides, fungicides and others)in sugar cane crops
The level of consumption of insecticides, fungicides, acaricides and otherpesticides in Brazil’s sugar cane crops is lower than in citric, corn, coffee andsoybean crops. Herbicides, which are the group most widely used ascommercially available products or active ingredients, are addressed in item8.3. The fungicide consumption is virtually nil, while insecticideconsumption is relatively low (Tables 1 and 2).
Chapter 8: Use of agrochemicals
149
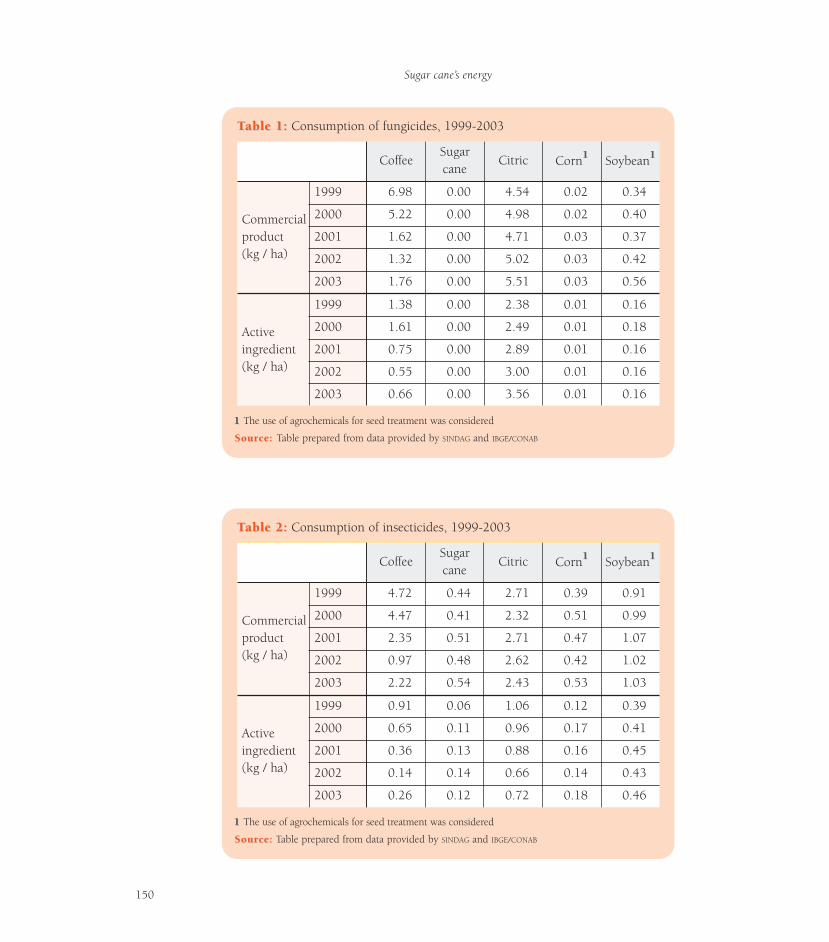
Sugar cane’s energy
150
TTable 2:able 2: Consumption of insecticides, 1999-2003
11 The use of agrochemicals for seed treatment was considered
SourSource:ce: Table prepared from data provided by SINDAG and IBGE/CONAB
CoffeeSugarcane
Citric Corn1 Soybean1
Commercialproduct (kg / ha)
1999 4.72 0.44 2.71 0.39 0.91
2000 4.47 0.41 2.32 0.51 0.99
2001 2.35 0.51 2.71 0.47 1.07
2002 0.97 0.48 2.62 0.42 1.02
2003 2.22 0.54 2.43 0.53 1.03
Activeingredient(kg / ha)
1999 0.91 0.06 1.06 0.12 0.39
2000 0.65 0.11 0.96 0.17 0.41
2001 0.36 0.13 0.88 0.16 0.45
2002 0.14 0.14 0.66 0.14 0.43
2003 0.26 0.12 0.72 0.18 0.46
TTable 1:able 1: Consumption of fungicides, 1999-2003
11 The use of agrochemicals for seed treatment was considered
SourSource: ce: Table prepared from data provided by SINDAG and IBGE/CONAB
CoffeeSugarcane
Citric Corn1 Soybean1
Commercialproduct (kg / ha)
1999 6.98 0.00 4.54 0.02 0.34
2000 5.22 0.00 4.98 0.02 0.40
2001 1.62 0.00 4.71 0.03 0.37
2002 1.32 0.00 5.02 0.03 0.42
2003 1.76 0.00 5.51 0.03 0.56
Activeingredient (kg / ha)
1999 1.38 0.00 2.38 0.01 0.16
2000 1.61 0.00 2.49 0.01 0.18
2001 0.75 0.00 2.89 0.01 0.16
2002 0.55 0.00 3.00 0.01 0.16
2003 0.66 0.00 3.56 0.01 0.16
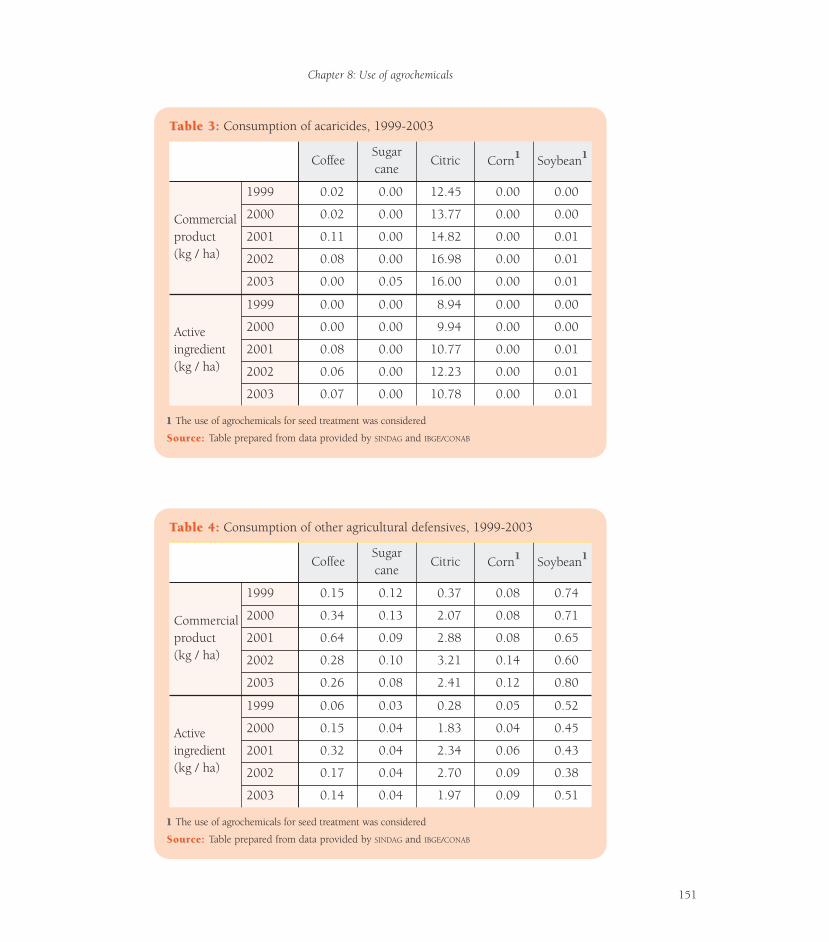
Chapter 8: Use of agrochemicals
151
TTable 3:able 3: Consumption of acaricides, 1999-2003
11 The use of agrochemicals for seed treatment was considered
SourSource: ce: Table prepared from data provided by SINDAG and IBGE/CONAB
CoffeeSugarcane
Citric Corn1 Soybean1
Commercialproduct(kg / ha)
1999 0.02 0.00 12.45 0.00 0.00
2000 0.02 0.00 13.77 0.00 0.00
2001 0.11 0.00 14.82 0.00 0.01
2002 0.08 0.00 16.98 0.00 0.01
2003 0.00 0.05 16.00 0.00 0.01
Activeingredient(kg / ha)
1999 0.00 0.00 8.94 0.00 0.00
2000 0.00 0.00 9.94 0.00 0.00
2001 0.08 0.00 10.77 0.00 0.01
2002 0.06 0.00 12.23 0.00 0.01
2003 0.07 0.00 10.78 0.00 0.01
TTable 4:able 4: Consumption of other agricultural defensives, 1999-2003
11 The use of agrochemicals for seed treatment was considered
SourSource: ce: Table prepared from data provided by SINDAG and IBGE/CONAB
CoffeeSugarcane
Citric Corn1 Soybean1
Commercialproduct(kg / ha)
1999 0.15 0.12 0.37 0.08 0.74
2000 0.34 0.13 2.07 0.08 0.71
2001 0.64 0.09 2.88 0.08 0.65
2002 0.28 0.10 3.21 0.14 0.60
2003 0.26 0.08 2.41 0.12 0.80
Activeingredient(kg / ha)
1999 0.06 0.03 0.28 0.05 0.52
2000 0.15 0.04 1.83 0.04 0.45
2001 0.32 0.04 2.34 0.06 0.43
2002 0.17 0.04 2.70 0.09 0.38
2003 0.14 0.04 1.97 0.09 0.51
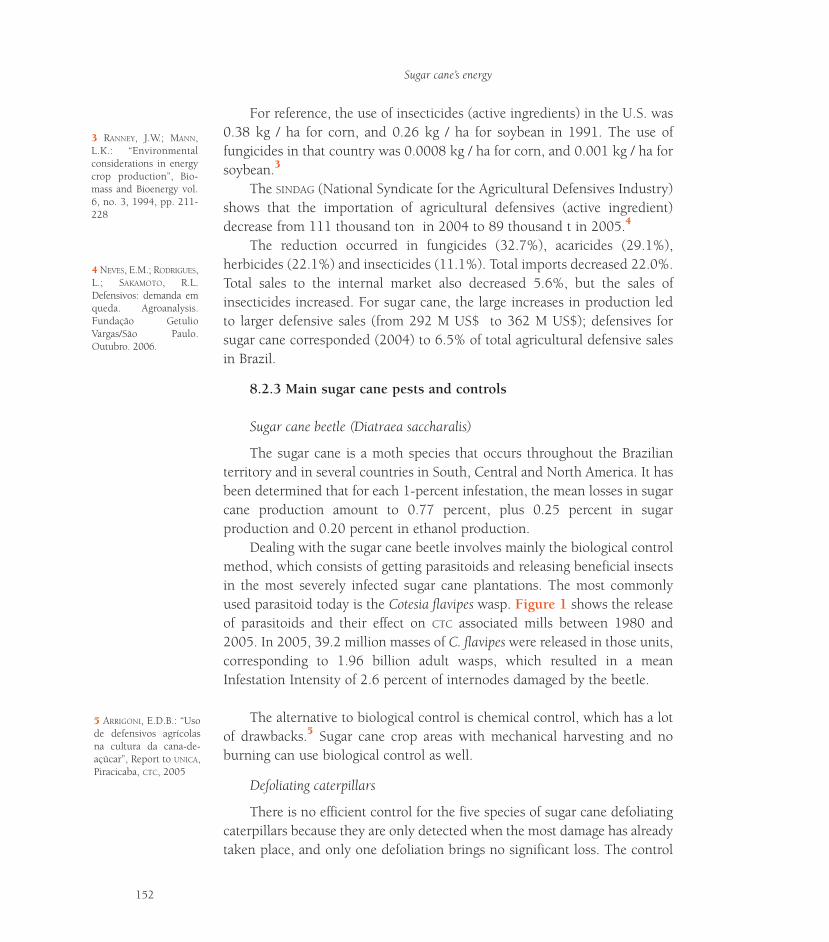
For reference, the use of insecticides (active ingredients) in the U.S. was0.38 kg / ha for corn, and 0.26 kg / ha for soybean in 1991. The use offungicides in that country was 0.0008 kg / ha for corn, and 0.001 kg / ha forsoybean.3
The SINDAG (National Syndicate for the Agricultural Defensives Industry)shows that the importation of agricultural defensives (active ingredient)decrease from 111 thousand ton in 2004 to 89 thousand t in 2005.4
The reduction occurred in fungicides (32.7%), acaricides (29.1%),herbicides (22.1%) and insecticides (11.1%). Total imports decreased 22.0%.Total sales to the internal market also decreased 5.6%, but the sales ofinsecticides increased. For sugar cane, the large increases in production ledto larger defensive sales (from 292 M US$ to 362 M US$); defensives forsugar cane corresponded (2004) to 6.5% of total agricultural defensive salesin Brazil.
8.2.3 Main sugar cane pests and controls
Sugar cane beetle (Diatraea saccharalis)
The sugar cane is a moth species that occurs throughout the Brazilianterritory and in several countries in South, Central and North America. It hasbeen determined that for each 1-percent infestation, the mean losses in sugarcane production amount to 0.77 percent, plus 0.25 percent in sugarproduction and 0.20 percent in ethanol production.
Dealing with the sugar cane beetle involves mainly the biological controlmethod, which consists of getting parasitoids and releasing beneficial insectsin the most severely infected sugar cane plantations. The most commonlyused parasitoid today is the Cotesia flavipes wasp. Figure 1 shows the releaseof parasitoids and their effect on CTC associated mills between 1980 and2005. In 2005, 39.2 million masses of C. flavipes were released in those units,corresponding to 1.96 billion adult wasps, which resulted in a meanInfestation Intensity of 2.6 percent of internodes damaged by the beetle.
The alternative to biological control is chemical control, which has a lotof drawbacks.5 Sugar cane crop areas with mechanical harvesting and noburning can use biological control as well.
Defoliating caterpillars
There is no efficient control for the five species of sugar cane defoliatingcaterpillars because they are only detected when the most damage has alreadytaken place, and only one defoliation brings no significant loss. The control
3 RANNEY, J.W.; MANN,L.K.: “Environmentalconsiderations in energycrop production”, Bio-mass and Bioenergy vol.6, no. 3, 1994, pp. 211-228
4 NEVES, E.M.; RODRIGUES,L.; SAKAMOTO, R.L.Defensivos: demanda emqueda. Agroanalysis.Fundação GetulioVargas/São Paulo.Outubro. 2006.
Sugar cane’s energy
152
5 ARRIGONI, E.D.B.: “Usode defensivos agrícolasna cultura da cana-de-açúcar”, Report to UNICA,Piracicaba, CTC, 2005
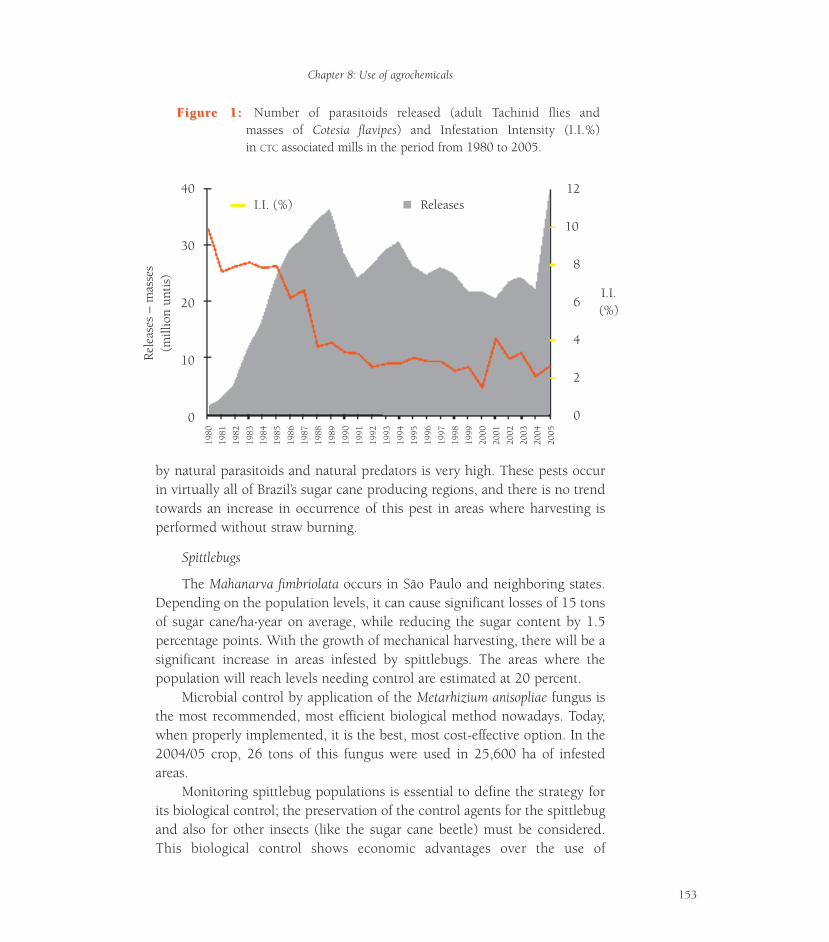
by natural parasitoids and natural predators is very high. These pests occurin virtually all of Brazil’s sugar cane producing regions, and there is no trendtowards an increase in occurrence of this pest in areas where harvesting isperformed without straw burning.
Spittlebugs
The Mahanarva fimbriolata occurs in São Paulo and neighboring states.Depending on the population levels, it can cause significant losses of 15 tonsof sugar cane/ha.year on average, while reducing the sugar content by 1.5percentage points. With the growth of mechanical harvesting, there will be asignificant increase in areas infested by spittlebugs. The areas where thepopulation will reach levels needing control are estimated at 20 percent.
Microbial control by application of the Metarhizium anisopliae fungus isthe most recommended, most efficient biological method nowadays. Today,when properly implemented, it is the best, most cost-effective option. In the2004/05 crop, 26 tons of this fungus were used in 25,600 ha of infestedareas.
Monitoring spittlebug populations is essential to define the strategy forits biological control; the preservation of the control agents for the spittlebugand also for other insects (like the sugar cane beetle) must be considered.This biological control shows economic advantages over the use of
Chapter 8: Use of agrochemicals
153
1980
1981
1982
1983
1984
1985
1986
1987
1988
1989
1990
1991
1992
1993
1994
1995
1996
1997
1998
1999
2000
2001
2002
2003
2004
2005
40
30
20
10
0
12
10
8
6
4
2
0
I.I.(%)
Rele
ases
– m
asse
s(m
illio
n un
tis)
ReleasesI.I. (%)
FigurFigure 1:e 1: Number of parasitoids released (adult Tachinid flies andmasses of Cotesia flavipes) and Infestation Intensity (I.I.%)in CTC associated mills in the period from 1980 to 2005.
insecticides. Legal limitations in cane burning practices are increasing theneed for spittlebug control.
Leaf-cutting ants
Leaf-cutting ants are important; in São Paulo State, the main species areAtta bisphaerica and A. capiguara.
Each adult leaf-cutting ant causes mean losses of three tons of sugar caneper harvesting season, and the raw material loses quality because of thedecreased sucrose content. The mean infestation is currently estimated at 0.5to 0.7 adult leaf-cutting ant nests per hectare of sugar cane crop in theCenter-South region, which corresponds to losses of 1.5 to 2.1 tons of sugarcane / ha.year.
Leaf-cutting ants are controlled by specialized teams that search all of thesugar cane crops at the mills, using thermofogging with motorizedequipment to apply the insecticide mixture. Mechanical harvesting of sugarcane without straw burning favors occurrence of this pest for making itharder to locate and control the nests.
Migdolus fryanus (Migdolus beetle)
Migdolus fryanus is a beetle of the Vesperidae family whose larval stagecauses damage to the sugar cane root system, which begins to show droughtsymptoms. A mean reduction of 30 tons / ha.year occurs in infested areascompared to areas treated with soil insecticides. In São Paulo State, the sugarcane crops affected by the pest (that occurs in the Center-South region) coveran area estimated at 100,000 ha.
Mostly, it is controlled by application of insecticides on the distributedsugar cane seedling at the planting furrow, in a joint mechanical operation.This is done in order to protect rural workers from contact with theinsecticide. It is indispensable to thoroughly define the infested area and theinfestation level in order to reduce the use of pesticides. The harvestingmethod, either raw or through burning, does not interfere with thepopulation and spread of this pest.
Sphenophorus levis (sphenophorus or sugar cane weevil)
The sugar cane weevil, of the Curculionidae family, that causes damageto the sprouts and the base of developing stalks. It causes losses of 20 to 23tons / ha.year in infested areas.
The infested area expands rapidly, probably because of the movement ofseedlings. The most recommended method to control this pest is the culturalmethod, consisting of the early destruction of rootstocks in the infested areas
Sugar cane’s energy
154
to be reformed. The control methods that include insecticide application ortoxic bait distribution have the drawbacks of being more costly and requiringconstant re-applications.
Mechanical harvesting of sugar cane without trash burning significantlyfavors the populations of this pest and infestations.
Termites and other pests
Losses in infested areas are estimated at 10 tons of sugar cane / ha.year.Control is based on identification of areas where sugar cane stumps aredamaged or areas to be reformed and, using this information, arecommendation of chemical control only where there is potential fordamage. The soil pest monitoring method in reform areas enabled an 70-percent reduction of chemical control (data provided by CTC), therebyreducing costs and risks to operators and the environment.
No significant difference in soil pest populations and damages causedthereby occurs in different harvesting systems.
8.2.4 Sugar cane diseases and variety improvement programs
Sugar cane, as semi-permanent culture of annual cycle and vegetativepropagation, forms a crop planted with a certain variety that is reformed onlyafter 4 to 5 years of commercial use. These characteristics determine that theonly economically feasible disease control option is to use varietiesgenetically resistant to the main crop diseases. Diseases constitute one of themain reasons for the replacement of a commercially grown variety.
Nine bacteria, 159 fungi, 8 viruses and 1 mycoplasma are known to the109 sugar cane producing countries and regions, totaling 177 pathogens thatcause the crop diseases. Of these, only 40 of them have been reported in Brazil.
The main disease occurrences that have prompted Brazil to replacevarieties and caused production losses are as follows:
• The Mosaic virus epidemic in the 1920’s, which caused serious lossesand led to a quick replacement of the varieties known as “noble sugarcanes” with hybrid varieties imported form Java.• A major sugar cane smut epidemic in the 1980’s, associated with theoccurrence of rust (1996), affected the NA56-79 variety. Thies variety,which represented 50 percent of the crop area in São Paulo State, wasquickly replaced with the SP71-6163 variety.•A new disease called “Sugar Cane Yellow Leaf Syndrome” (SCYLV),affecting the SP6163 variety in 1990, which overtook this variety in allsugar cane plantations in 3 years and caused production losses of up to40 percent, forcing its fast replacement.
Chapter 8: Use of agrochemicals
155
11 BRAGA, D.P.V.; ARRIGONI,E.D.B.; SILVA-FILHO, M.C.;ULIAN, E.C.: “Expression ofthe Cry1Ab protein ingenetically modified sugarcane for the control ofDiatraea saccharalis (Lepi-doptara: Crambidae)”,Journal of New Seeds5(2/3), 2003, pp. 209-222
The phytopathology work performed in accordance with the varietyimprovement program (at CTC) has been designed to prevent the coming ofnew pathogens, as well as avoid or minimize losses caused by existingpathogens. There are quarantine safeguard works for foreign varieties that usepathogen testing and provision of information on progenitor responses, aswell as new clones for the main diseases occurring in Brazil. Theseprocedures contribute to the efforts of those who work to improve theselection of disease-resistant varieties, and allow the producer to choose thebest variety without worrying about the damages caused by diseases.
Notwithstanding the widespread of disease-resistant progenitors in thecrossings that have been made, diseases like the sugar cane smut and theMosaic virus, which limit the use of a new variety, account for the eliminationof almost 50 percent of all selected plants (at CTC), thereby reducing selectionopportunities for other desirable characteristics.
Recent advances in molecular biology and genetic engineering have anenormous potential for assisting sugar cane improvement experts inproducing commercial varieties featuring high productivity and improvedadaptation to biotic and abiotic stresses. The first transgenic sugar cane plantsproduced in Brazil were obtained in 1994 at CTC. Since then, sugar caneplants resistant to the glufosinate ammonium6 and glyphosate7 herbicides,the Mosaic virus (SCMV), the sugar cane yellow leaf virus (SCYLV) and themain sugar cane pest,8 the beetle Diatraea saccharalis, have been produced.
The efforts to obtain transgenic sugar cane varieties resistant to thedamaging pests that cause agricultural productivity losses and decreasedsugar and ethanol production, have been numerous. Among the relevantstrategies, it is worth pointing out the use of proteinase inhibitors,9 lectin10
production and the Bacillus thuringiensis (Bt) protein.The most commonly used strategy to induce insect-resistance in plants
by genetic engineering, is the insertion of genes that encode the Cry proteinsproduced by the Bt. These proteins are toxic to insects and are activated bythe alkaline pH of the digestive system of the insect and by proteinases. Uponactivation, they cause the insect to die within a few hours by breaking itsosmotic balance. Genetically modified sugar cane containing the Cry1Ab Btvirus was evaluated by CTC in a field experiment and displayed an excellentlevel of sugar cane beetle resistance.11
6 FALCO, M.C.; NETO,A.T.; ULIAN, E.C.: “Trans-formation and expres-sion of a gene for herbi-cide resistance in aBrazilian sugarcane plantcell”, Rep 19 (12) 2000,pp. 1188-1194
10 IRVINE, J.E.; MIRKOV, T.E.:“The development of genetictransformation of sugar canein Texas”, Sugar Journal vol.6,1997, pp. 25-29
Sugar cane’s energy
156
7 ULIAN, E.C.; BRAGA, D.P.V.;LAVRIK, P.B.; BAERSON, S.R.:“Transgenic sugar caneplants for roundup toler-ance obtained throughmicroprojectile bom-bardment”, in: Plant andAnimal Genome VIII SanDiego, Abstracts San Diego:NCGR, 2000, p. 205
8 BRAGA, D.P.V.; ARRIGONI,E.D.B.; BURNQUIST, W.L.;SILVA-FILHO, M.C.; ULIAN,E.C.: “A new approach forcontrol of Diatraea sacchar-alis (Lepidoptera: Cram-bidae) through the expres-sion of an insecticidalCryIa(b) protein in trans-genic sugarcane”, Proc. Int.Soc. Sugar Cane Technol,vol. 24, 2001, pp.331-336
9 SHEPHERD, K.M.; SMITH,G.R.; JOYCE, P.A., NUTT,K.A.; MCQUALTER, R.B.;MCGHIE, T.K.; ALLSOPP,P.G.: “Engineering cane-grub-tolerant transgenicsugarcane”, in: Pathologyand Molecular BiologyWorkshop, Kwazulu-Natal,Abstracts, 1997, Kwazulu-Natal: SASAExS, p 16
8.3 Pesticides: herbicides
Adhair Ricci JuniorCentro de Tecnologia Canavieira (Sugar Cane Technology Center)
8.3.1 Weeds and the decrease in sugar cane productivity
Weeds lead to substantial losses in sugar cane crops. The AmericanWeed Science Society12 estimated losses caused by infesting plants in the USat 20 percent. In Brazil (1980), production losses of 24 percent occurred,13
and much higher losses have been reported.14, 15 The competition betweenweeds and sugar cane in Brazil has been the subject of extensive studies. Theinterference, and interference prevention periods, may vary even with thesugar cane cycle. Productivity losses may range from 10 to more than 80percent.16 The interference intensity of sugar cane weeds depends on factorsrelated to the crop (type, species or variety, planting furrow spacing, andsowing density), the weed community (specific composition, density anddistribution), and environmental factors.17
8.3.2 Main weeds in Brazil’s sugar cane crops
A total of 566 plant species found in Brazil (LORENZI, 2000) have beendescribed, and can be considered undesirable plants or weeds. These
14 BLANCO, H.G.: “Ecologiadas plantas daninhas: com-petição das plantas dani-nhas com culturas brasi-leiras”, in: MARCONDES,D.A.S. et al.: Controle inte-grado de plantas daninhas,São Paulo, CREA, 1982, pp.42-75
17 PITELLI, R.A.; KUVA,M.A.: “Bases para manejointegrado de plantas danin-has em cana-de-açúcar”, in:Semana da Cana-de-Açúcarde Piracicaba, 2, Piracicaba,Abril 22-25, 1997, anais
16 GRAVENA, R.; KUVA,M.A.; MATTOS, E.D.; PITEL-LI, R.A.; ALVES, P.L.C.A.:“Períodos de convivência econtrole das plantas dani-nhas em cana-planta (Sac-charum spp)”, in: XXIIICongresso Brasileiro daCiência das Plantas Dani-nhas, Gramado, RS, 2002,Resumos: Gramado, RS,SBCPD, 2002, p. 95
15 LORENZI, H.: “Plantasdaninhas e seu controle nacultura da cana-de-açúcar”,in: Copersucar – ReuniãoTécnica Agronômica,1983, pp. 59-73
Chapter 8: Use of agrochemicals
157
TTable 5:able 5: The main weeds in sugar cane crops
Scientific name Common name
Cyperus rotundus L. Nutgrass
Cynodon dactylon (L.) Pers. Bermuda grass
Digitaria sanguinalis (L.) Scop. Hairy crabgrass; large crabgrass
Portulaca oleracea L. Little hogweed
Eleusine indica (L.) Gaertn. Goosegrass; Indian goosegrass
Echinochloa colonum (L.) Link. Junglegrass; junglerice
Sorghum halepense (L.) Pers. Johnsongrass
Panicum maximum Jacq. Guinea grass
Rottboelia exaltata L. f. Itchgrass
Amaranthus spinosus L. Spiny amaranth
Ageratum conyzoides L. Whiteweed; billygoat weed
Cyperus esculentus L. Yellow nutsedge
12 KISSMAN, H.: “Controlede plantas infestantes: pas-sado em futuro”, in: Semanado Controle de PlantasDaninhas, 10, 1990,Bandeirantes, Anais Bandei-rantes: Fundação Faculdadede Agronomia “Luiz Mene-ghel”, 1990, pp.01-02
13 COLLETI, J.T.; RODRI-GUES, J.C.S.; GIACOMINI,G.M.: “Influência da épocade controle da mato-competição na produtivi-dade da cana-de-açúcar,ciclo de 12 meses”, in:Congresso Brasileiro deHerbicidas e Ervas Dani-nhas, 13º, Ilhéus/Itabuna,1980, Resumos, Itabuna,Bahia, SBHED, CEPLAC,1980, p. 35
18 See p. 158
species are distributed among several Families and Orders of theMonocotyledone and Dichotyledone classes, Agiospermae division.Approximately 150 species of these occur in sugar cane crops most often.The 12 species that account for the most damage to the crops (1970) arelisted in Table 5.18
Today, the following should be added: Signalgrass (Brachiaria decumbensStapf.); Alexandergrass (Brachiaria plantaginea); Mexican fireplant or Wildpoinsettia (Euphorbia heterophilla L..); Tropical spiderwort (Commelinabenghalensis L.); and the weeds known as Ipomea violacea (Ipomoeas), whichare comprised of several species and have become very important in cropsmechanically harvested without trash burning.
8.3.3 Main control methods
The control or management of weeds encompasses specific methods orcombinations of mechanical, cultural, chemical and biological methods,making up an extremely dynamic process that is often reviewed. The use ofpesticides is regulated by the legislation referred to in item 8.2.1.
Preventive measures seek to prevent weeds from being introduced,developing and disseminating in a certain area where they don’t exist. Forexample, using seedlings from areas that are free of pests, while maintainingand controlling weeds in vinasse channels, constitute preventive controlmethods.19 And so is the cleaning of agricultural machines when shiftingworking places.20
Cultural measures are practices like crop rotation, crop plant spacingvariation, and the use of green covers.
Mechanical or Physical measures include soil preparation for planting,uprooting, harrowing, ground preparation, flooding, burning, dead coverand mechanical growing.
Biological measures entail the use of natural enemies (pests and diseases)to control weeds, including the possible allelopathic inhibition of one plantby another. The control of nutgrass (Cyperus rotundus L) using jack bean(Canavalia ensiformis) is an example of this possibility.21 In Brazil, naturalenemies have not been used in weed control.
Chemical measures include the use of herbicides, many of which havinga selective ability to eliminate some plant types or species, while preservingothers. They are currently the main weed controlling tool, and their properutilization can be efficient and safe.
18 HOLM, L.G.; PLUCK-NETT, D.L.; PANCHO, J.V.;HERBERGER, J.P.: The world’sworst weeds. Distributionand Biology, Honolulu,The East-West Center,University Press ofHawaii, 1977, 609 p.
19 LORENZI, H.: “Tiririca –Uma séria ameaça aoscanaviais”, Boletim Técni-co Copersucar n. 36, Coo-perativa Central dos Pro-dutores de Açúcar e Álcooldo Estado de São Paulo,1986, pp. 3-10
20 PITELLI, R.A.: “ManejoIntegrado de plantas dani-nhas”, in: Controle integradode plantas daninhas, SãoPaulo, CREA – ConselhoRegional de EngenhariaArquitetura e Agronomia –SP, 1982, pp. 28-41
21 DEUBER, R.: Ciênciadas plantas daninhas: fun-damentos, Jaboticabal,FUNEP, vol. 1, 1992
Sugar cane’s energy
158
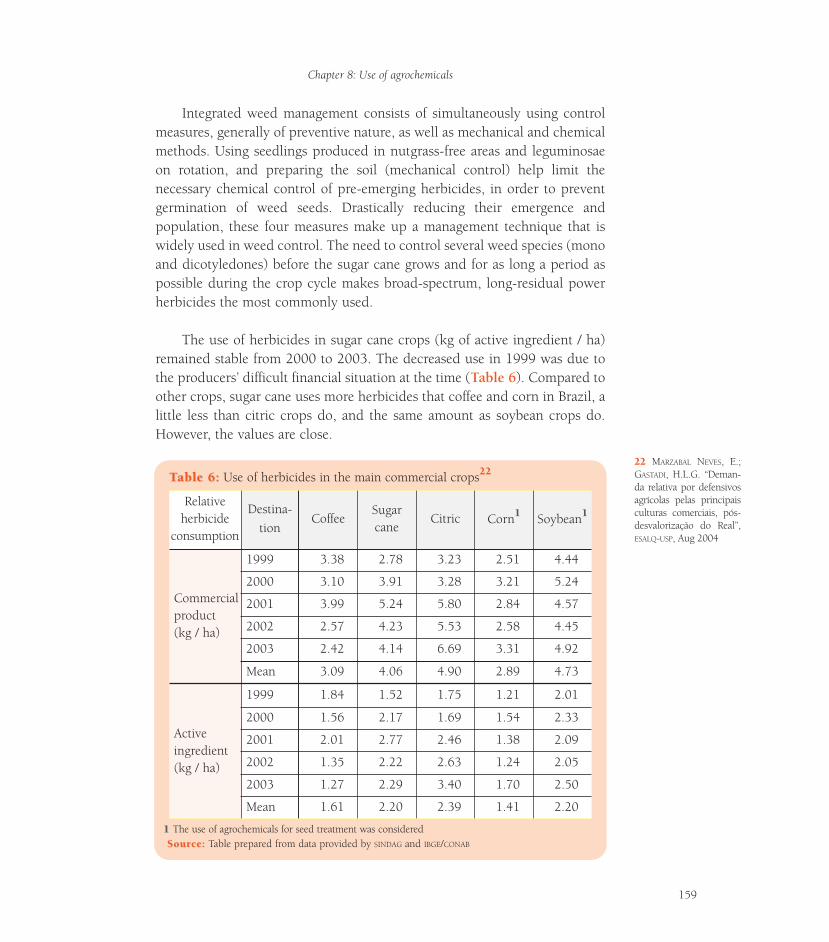
22 MARZABAL NEVES, E.;GASTADI, H.L.G. “Deman-da relativa por defensivosagrícolas pelas principaisculturas comerciais, pós-desvalorização do Real”,ESALQ-USP, Aug 2004
Chapter 8: Use of agrochemicals
159
TTable 6:able 6: Use of herbicides in the main commercial crops22
11 The use of agrochemicals for seed treatment was consideredSourSource:ce: Table prepared from data provided by SINDAG and IBGE/CONAB
Relativeherbicide
consumption
Destina-tion
CoffeeSugarcane
Citric Corn1 Soybean1
Commercial product(kg / ha)
1999 3.38 2.78 3.23 2.51 4.44
2000 3.10 3.91 3.28 3.21 5.24
2001 3.99 5.24 5.80 2.84 4.57
2002 2.57 4.23 5.53 2.58 4.45
2003 2.42 4.14 6.69 3.31 4.92
Mean 3.09 4.06 4.90 2.89 4.73
Activeingredient(kg / ha)
1999 1.84 1.52 1.75 1.21 2.01
2000 1.56 2.17 1.69 1.54 2.33
2001 2.01 2.77 2.46 1.38 2.09
2002 1.35 2.22 2.63 1.24 2.05
2003 1.27 2.29 3.40 1.70 2.50
Mean 1.61 2.20 2.39 1.41 2.20
Integrated weed management consists of simultaneously using controlmeasures, generally of preventive nature, as well as mechanical and chemicalmethods. Using seedlings produced in nutgrass-free areas and leguminosaeon rotation, and preparing the soil (mechanical control) help limit thenecessary chemical control of pre-emerging herbicides, in order to preventgermination of weed seeds. Drastically reducing their emergence andpopulation, these four measures make up a management technique that iswidely used in weed control. The need to control several weed species (monoand dicotyledones) before the sugar cane grows and for as long a period aspossible during the crop cycle makes broad-spectrum, long-residual powerherbicides the most commonly used.
The use of herbicides in sugar cane crops (kg of active ingredient / ha)remained stable from 2000 to 2003. The decreased use in 1999 was due tothe producers’ difficult financial situation at the time (Table 6). Compared toother crops, sugar cane uses more herbicides that coffee and corn in Brazil, alittle less than citric crops do, and the same amount as soybean crops do.However, the values are close.
In the United States, the use of active ingredient was 3.06 kg/ha, forcorn, and 1.83 for soybean.23
8.3.4 Herbicide resistance of weeds
The rise of herbicide-resistant weeds is recent,24 dating back to the1960’s, but have increased in number very fast. There are now 286 herbicide-resistant biotypes around the world,25 spread over 171 species (102monocotyledones and 69 dicotyledones). The countries having the highestnumbers of herbicide-resistant weed biotypes are the United States (107),Canada (43), Australia (41), France (30), and Spain (26). Several cases ofherbicide resistance have been reported in Brazil’s rice and soybean cropssince 1993. Soybean crops have the largest number of herbicide-resistantbiotypes, perhaps because they are the leading herbicide users (more than50%).24 Even though the size of crop areas currently having herbicide-resistant weed biotypes is relatively small, their expansion has been fast andrequires preventive and management measures in order to preserve theefficiency of herbicides. Strategies to prevent or retard the rise or evolution ofherbicide-resistant weeds include crop rotation, mechanical control,planning on and use of different herbicides, and integrated control (cultural,mechanical and chemical).
8.3.5 Trends
The sugar cane culture in Brazil, especially in São Paulo State, will usetwo technologies for harvesting over the next few years: with and withouttrash burning for harvesting.
In the first case (raw sugar cane), the straw remaining on the soil wasinitially believed to be sufficient for controlling weeds throughout the cropcycle.26, 27, 28 However, it is known today that the straw causes physical,chemical and biological change29, 30 that favors the development of speciesthat used to be rare or unusual in sugar cane plantations on uncovered soil.In addition, careless bush control during formation of the sugar cane cropmay lead to severe infestations on the rootstocks. Therefore, herbicides areexpected to continue in use, mostly in the pre-emerging mode, andintegrated with mechanical control of soil preparation. An efficient sugar caneplant control will reduce the potential for infestation on the first rootstocks,thereby diminishing the need for modern herbicides. These herbicides needrain in order to reach the soil surface when used, thereby showing limitedefficiency in drought times. Some mills have opted to remove the straw from
26 PHILLIPS, M.: “Trashblanketing on theincrease in Bundaberg”,in: BSES Bulletin, no. 55,1996, pp. 14-15
27 MANECHINI, C.:“Manejo agronômico dacana crua”, in: Anais doVII Seminário deTecnologia AgronômicaCopersucar, 1997, pp.309-327
28 AREVALO, R.A.; BER-TONCINI, E.I.: “Manejoquímico de plantas dani-nhas nos resíduos de co-lheita de cana crua”,STAB vol. 17. no. 4,1999, pp. 36-38
Sugar cane’s energy
160
24 CHISTOFOLLETI, P.J.;OVEJERO, R.F.L.; CARVALHO,J.C.: Aspectos de resistênciade plantas daninhas a herbi-cidas, Campinas, SP,Associação Brasileira deAção a Resistência dePlantas aos Herbicidas(HRAC-BR), 2nd ed.;2004, 100 p.
25 Weed Science,“International survey ofherbicide resistantweeds” (2004), site:w w w. w e e d s c i e n c e .org/in.asp (01/05/2003)
23 RANNEY, J.W.; MANN,L.K.: “Environmental con-siderations in energy cropproduction”, Biomass andBioenergy, vol. 6, no. 3,1994, pp. 211-228
29 See p. 161
30 See p. 161
the sugar cane line in order to control the spittlebugs and reduce theherbicide application area.
In burned sugar cane areas no change is expected in weed controltechniques.
8.4 Summary and conclusions
• The concern about the impacts of pesticides is present in many sec-tions of Agenda 21, which provides for specific control actions. The useof new technologies based on genetically modified plants is promising(reduction of pesticide utilization), but requires additional caution.Ideally, biological controls and, to the extent possible, “organic” agricul-ture techniques should be used.• The Brazilian legislation, including rules and controls from productionto use and disposal of materials, covers all important aspects.• Pesticide consumption in sugar cane crops is lower than in citric, corn,coffee and soybean crops; the use of insecticides is low, and that of fungi-cides is virtually nil.• Among the main sugar cane pests, the sugar cane beetle (the mostimportant pest) and spittlebug are currently biologically controlled. Thesugar cane beetle is the subject of the country’s largest biological controlprogram. Ants, beetles and termites are chemically controlled, and it hasbeen possible to substantially reduce the use of pesticides through selec-tive application.• Sugar cane diseases are fought with the selection of disease-resistantvarieties in major genetic improvement programs. This procedure hasbeen sufficient to address the occurrences in large proportions, such asthe Mosaic virus (1920), the sugar cane smut and rust (1980’s), and theSCYLV (1990’s), through replacement of varieties.• Genetic modifications (at field test stage) have produced plants resist-ant to herbicides, smut, the Mosaic virus, the SCYLV and the sugar canebeetle.• Weed control methods have been frequently changed because ofadvances in technology (cultural and mechanical or chemical). In Brazil,sugar cane crops still use more herbicides than coffee and corn crops,less herbicides than citric crops, and the same amounts as soybean crops.There is a strong trend towards an increase in the areas where raw sugarcane is harvested with the trash remaining on the soil. Today it seemsimpossible to use this to totally eliminate herbicides, as expected, espe-cially because of the rise of unusual of pests.
Chapter 8: Use of agrochemicals
161
29 VELINI, E.D.;NEGRISOLI, E.: “Controlede plantas daninhas emcana crua”, in: Anais doXXII Congresso Brasi-leiro da Ciência dasPlantas Daninhas, Fozdo Iguaçu, PR, 2000, pp.148-163
28 PITELLI, R.A.: “Plantasdaninhas no sistema deplantio direto de culturasanuais”, in: CongressoLatinoamericano de Male-zas, 12, Montevidéu,1995, Resumos Monte-vidéu: INIA (INIA.Technical Series, 56),1995, pp. 37-42
163
1 FAO: Faostat Database 2004,http://faostat.fao.org/faostat , Feb 2005
Chapter 9:Use of fertilizers
9.1 Introduction
Although Brazilian agriculture has been going through a greatexpansion period over the past few decades, and has reached a high level ofcompetitiveness in export markets, it is not characterized by an intensive useof fertilizers in general. In 1998, the mean use intensity (kg / ha N-P2O5-K2O) was equivalent to that of the United States and Venezuela, around 40percent of the intensity in France or China, and 22 percent of that of theNetherlands. In terms of total consumption, Brazil had1 an annualconsumption of 7.68 Mt in 2002, representing around 5.4 percent of thetotal world consumption. At the same time, the United States used 13.7percent, France used 2.8 percent, China 28.1 percent, India 11.4 percent,and Europe 15.5 percent.
The impact of fertilizers on water quality depends on many useconditions. Fertilization with nitrogen, sandy soil, irrigated soil, and soil withshallow water tables, are more vulnerable to nitrate contamination. Thepotential of nitrogen for reaching and contaminating water also depends onthe quantity used, the use by the plant, the level of nutrients and organicmatter in the soil, and the weather.
In the case of sugar cane crops in Brazil, an important characteristic is thefull recycling of waste to the field. The rise in ethanol production required thevinasse to be taken care of. The solution was to recycle it for the crop. Thebenefits provided by this ferti-irrigation have become evident, and anoptimization of potassium utilization was sought and yielded very favorableresults. The infrastructure created has enabled the development to use the waterfrom the industrial process and the ashes from boilers. Filtercake recyclingprocesses were also developed, thereby increasing the supply of nutrients to thefield. Recycling is addressed in this chapter because of its ability to reduce theneed for external mineral fertilizers, and also from an environmental standpoint,i.e. water quality protection. The evolution of the applicable legislation has been
Among Brazil’s large crops (area larger than 1 Mha),sugar cane uses smaller amounts of fertilizers than cotton,coffee and oranges, and is equivalent to soybean crops inthis respect. The amount of fertilizers used is also smallcompared to sugar cane crops in other countries: Australiauses 48 percent more. The most significant factor is nutri-ent recycling through the application of industrial wastes,as vinasse and filtercake.
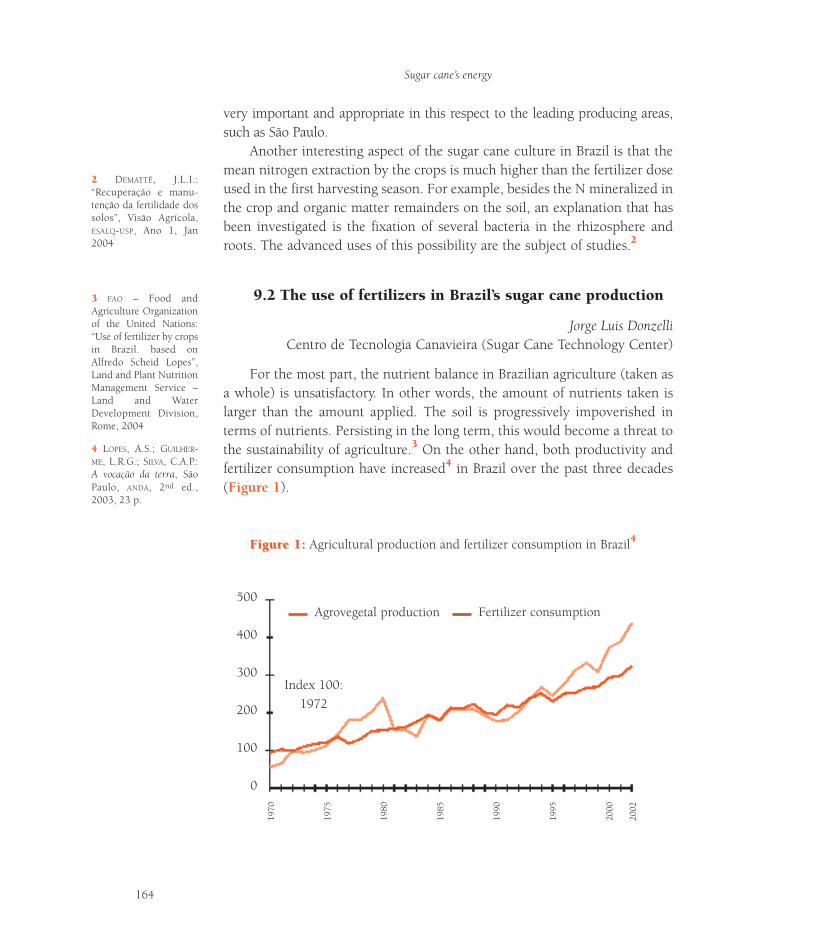
2 DEMATTÊ, J.L.I.:“Recuperação e manu-tenção da fertilidade dossolos”, Visão Agrícola,ESALQ-USP, Ano 1, Jan2004
4 LOPES, A.S.; GUILHER-ME, L.R.G.; SILVA, C.A.P.:A vocação da terra, SãoPaulo, ANDA, 2nd ed.,2003, 23 p.
Sugar cane’s energy
164
3 FAO – Food andAgriculture Organizationof the United Nations:“Use of fertilizer by cropsin Brazil. based onAlfredo Scheid Lopes”,Land and Plant NutritionManagement Service –Land and WaterDevelopment Division,Rome, 2004
Agrovegetal production Fertilizer consumption
200
100
0
500
400
300
1970
1975
1980
1985
1990
1995
2000
2002
Index 100:1972
very important and appropriate in this respect to the leading producing areas,such as São Paulo.
Another interesting aspect of the sugar cane culture in Brazil is that themean nitrogen extraction by the crops is much higher than the fertilizer doseused in the first harvesting season. For example, besides the N mineralized inthe crop and organic matter remainders on the soil, an explanation that hasbeen investigated is the fixation of several bacteria in the rhizosphere androots. The advanced uses of this possibility are the subject of studies.2
9.2 The use of fertilizers in Brazil’s sugar cane production
Jorge Luis DonzelliCentro de Tecnologia Canavieira (Sugar Cane Technology Center)
For the most part, the nutrient balance in Brazilian agriculture (taken asa whole) is unsatisfactory. In other words, the amount of nutrients taken islarger than the amount applied. The soil is progressively impoverished interms of nutrients. Persisting in the long term, this would become a threat tothe sustainability of agriculture.3 On the other hand, both productivity andfertilizer consumption have increased4 in Brazil over the past three decades(Figure 1).
FigurFigure 1:e 1: Agricultural production and fertilizer consumption in Brazil4
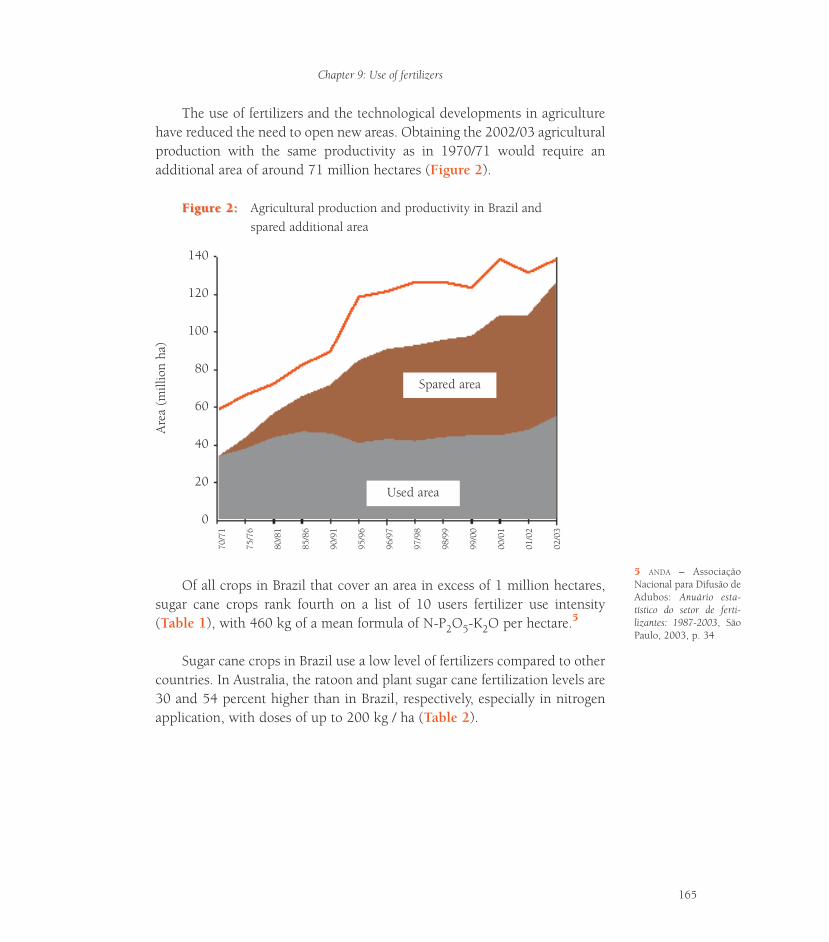
The use of fertilizers and the technological developments in agriculturehave reduced the need to open new areas. Obtaining the 2002/03 agriculturalproduction with the same productivity as in 1970/71 would require anadditional area of around 71 million hectares (Figure 2).
FigurFigure 2:e 2: Agricultural production and productivity in Brazil andspared additional area
Of all crops in Brazil that cover an area in excess of 1 million hectares,sugar cane crops rank fourth on a list of 10 users fertilizer use intensity(Table 1), with 460 kg of a mean formula of N-P2O5-K2O per hectare.5
Sugar cane crops in Brazil use a low level of fertilizers compared to othercountries. In Australia, the ratoon and plant sugar cane fertilization levels are30 and 54 percent higher than in Brazil, respectively, especially in nitrogenapplication, with doses of up to 200 kg / ha (Table 2).
5 ANDA – AssociaçãoNacional para Difusão deAdubos: Anuário esta-tístico do setor de ferti-lizantes: 1987-2003, SãoPaulo, 2003, p. 34
Chapter 9: Use of fertilizers
165
Spared area
Used area
Are
a (m
illio
n ha
)
40
0
20
80
60
140
120
100
70/7
1
75/7
6
80/8
1
85/8
6
90/9
1
95/9
6
96/9
7
97/9
8
98/9
9
99/0
0
00/0
1
01/0
2
02/0
3
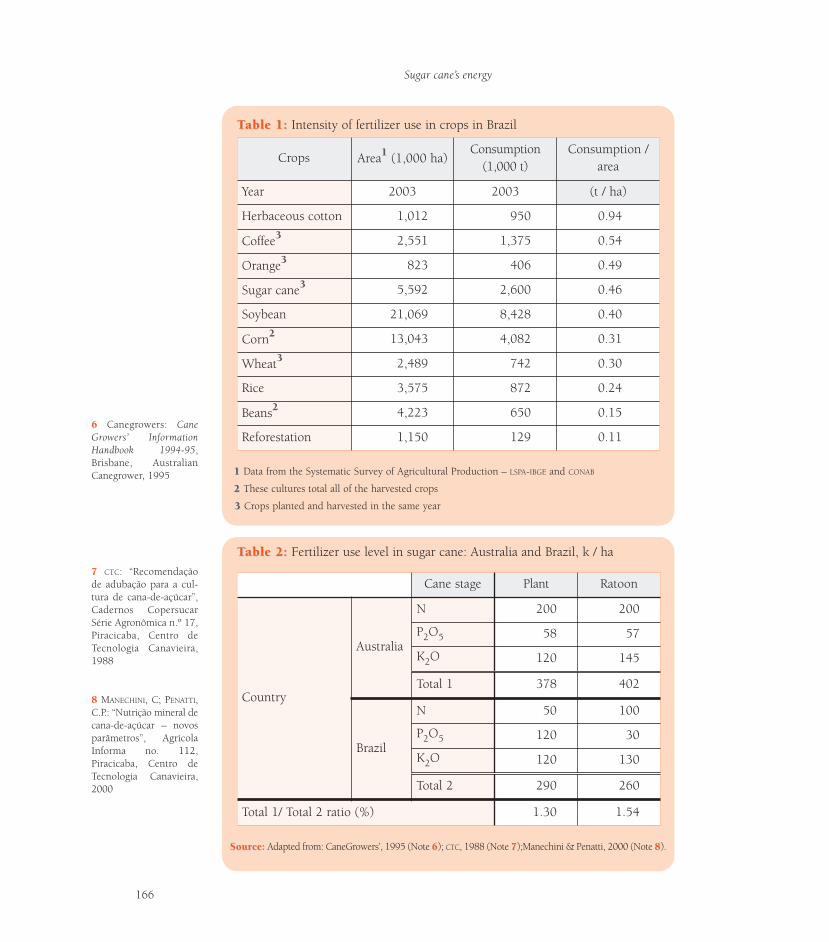
6 Canegrowers: CaneGrowers’ InformationHandbook 1994-95,Brisbane, AustralianCanegrower, 1995
7 CTC: “Recomendaçãode adubação para a cul-tura de cana-de-açúcar”,Cadernos CopersucarSérie Agronômica n.º 17,Piracicaba, Centro deTecnologia Canavieira,1988
8 MANECHINI, C; PENATTI,C.P.: “Nutrição mineral decana-de-açúcar – novosparâmetros”, AgrícolaInforma no. 112,Piracicaba, Centro deTecnologia Canavieira,2000
Sugar cane’s energy
166
TTable 1:able 1: Intensity of fertilizer use in crops in Brazil
11 Data from the Systematic Survey of Agricultural Production – LSPA-IBGE and CONAB
22 These cultures total all of the harvested crops
33 Crops planted and harvested in the same year
Crops Area1 (1,000 ha)Consumption
(1,000 t)Consumption /
area
Year 2003 2003 (t / ha)
Herbaceous cotton 1,012 950 0.94
Coffee3 2,551 1,375 0.54
Orange3 823 406 0.49
Sugar cane3 5,592 2,600 0.46
Soybean 21,069 8,428 0.40
Corn2 13,043 4,082 0.31
Wheat3 2,489 742 0.30
Rice 3,575 872 0.24
Beans2 4,223 650 0.15
Reforestation 1,150 129 0.11
TTable 2:able 2: Fertilizer use level in sugar cane: Australia and Brazil, k / ha
SourSource:ce: Adapted from: CaneGrowers’, 1995 (Note 66); CTC, 1988 (Note 77);Manechini & Penatti, 2000 (Note 88).
Cane stage Plant Ratoon
Country
Australia
N 200 200
P2O5 58 57
K2O 120 145
Total 1 378 402
Brazil
N 50 100
P2O5 120 30
K2O 120 130
Total 2 290 260
Total 1/ Total 2 ratio (%) 1.30 1.54
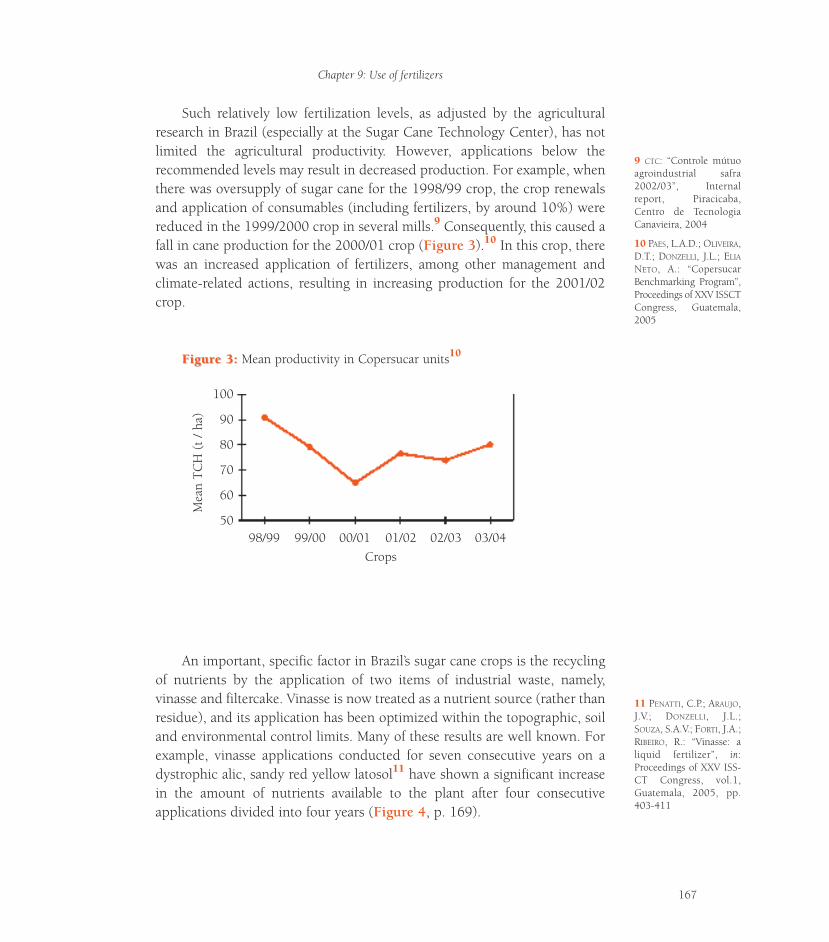
Such relatively low fertilization levels, as adjusted by the agriculturalresearch in Brazil (especially at the Sugar Cane Technology Center), has notlimited the agricultural productivity. However, applications below therecommended levels may result in decreased production. For example, whenthere was oversupply of sugar cane for the 1998/99 crop, the crop renewalsand application of consumables (including fertilizers, by around 10%) werereduced in the 1999/2000 crop in several mills.9 Consequently, this caused afall in cane production for the 2000/01 crop (Figure 3).10 In this crop, therewas an increased application of fertilizers, among other management andclimate-related actions, resulting in increasing production for the 2001/02crop.
FigurFigure 3:e 3: Mean productivity in Copersucar units10
An important, specific factor in Brazil’s sugar cane crops is the recyclingof nutrients by the application of two items of industrial waste, namely,vinasse and filtercake. Vinasse is now treated as a nutrient source (rather thanresidue), and its application has been optimized within the topographic, soiland environmental control limits. Many of these results are well known. Forexample, vinasse applications conducted for seven consecutive years on adystrophic alic, sandy red yellow latosol11 have shown a significant increasein the amount of nutrients available to the plant after four consecutiveapplications divided into four years (Figure 4, p. 169).
9 CTC: “Controle mútuoagroindustrial safra2002/03”, Internalreport, Piracicaba,Centro de TecnologiaCanavieira, 2004
10 PAES, L.A.D.; OLIVEIRA,D.T.; DONZELLI, J.L.; ELIA
NETO, A.: “CopersucarBenchmarking Program”,Proceedings of XXV ISSCTCongress, Guatemala,2005
Chapter 9: Use of fertilizers
167
11 PENATTI, C.P.; ARAUJO,J.V.; DONZELLI, J.L.;SOUZA, S.A.V.; FORTI, J.A.;RIBEIRO, R.: “Vinasse: aliquid fertilizer”, in:Proceedings of XXV ISS-CT Congress, vol.1,Guatemala, 2005, pp.403-411
98/99 99/00 00/01 01/02 02/03 03/04Crops
Mea
n TC
H (
t / h
a)
100
90
80
70
60
50
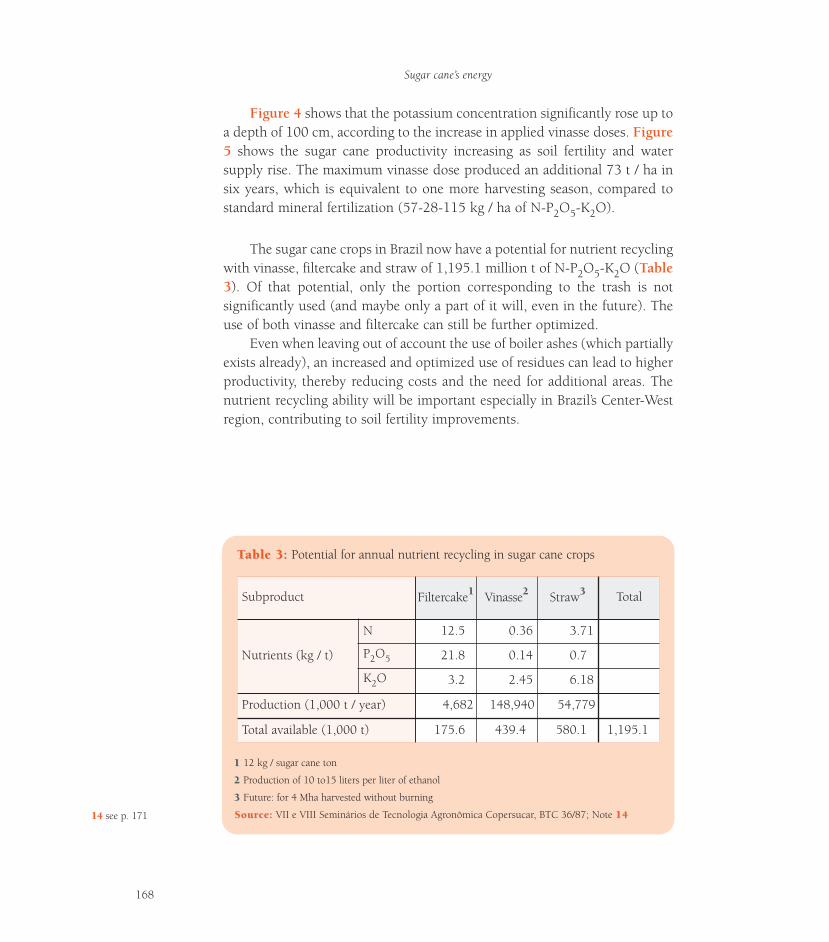
Sugar cane’s energy
168
TTable 3:able 3: Potential for annual nutrient recycling in sugar cane crops
11 12 kg / sugar cane ton
22 Production of 10 to15 liters per liter of ethanol
33 Future: for 4 Mha harvested without burning
SourSource:ce: VII e VIII Seminários de Tecnologia Agronômica Copersucar, BTC 36/87; Note 1414
Subproduct Filtercake1 Vinasse2 Straw3 Total
Nutrients (kg / t)
N 12.5 0.36 3.71
P2O5 21.8 0.14 0.7
K2O 3.2 2.45 6.18
Production (1,000 t / year) 4,682 148,940 54,779
Total available (1,000 t) 175.6 439.4 580.1 1,195.1
Figure 4 shows that the potassium concentration significantly rose up toa depth of 100 cm, according to the increase in applied vinasse doses. Figure5 shows the sugar cane productivity increasing as soil fertility and watersupply rise. The maximum vinasse dose produced an additional 73 t / ha insix years, which is equivalent to one more harvesting season, compared tostandard mineral fertilization (57-28-115 kg / ha of N-P2O5-K2O).
The sugar cane crops in Brazil now have a potential for nutrient recyclingwith vinasse, filtercake and straw of 1,195.1 million t of N-P2O5-K2O (Table3). Of that potential, only the portion corresponding to the trash is notsignificantly used (and maybe only a part of it will, even in the future). Theuse of both vinasse and filtercake can still be further optimized.
Even when leaving out of account the use of boiler ashes (which partiallyexists already), an increased and optimized use of residues can lead to higherproductivity, thereby reducing costs and the need for additional areas. Thenutrient recycling ability will be important especially in Brazil’s Center-Westregion, contributing to soil fertility improvements.
14 see p. 171
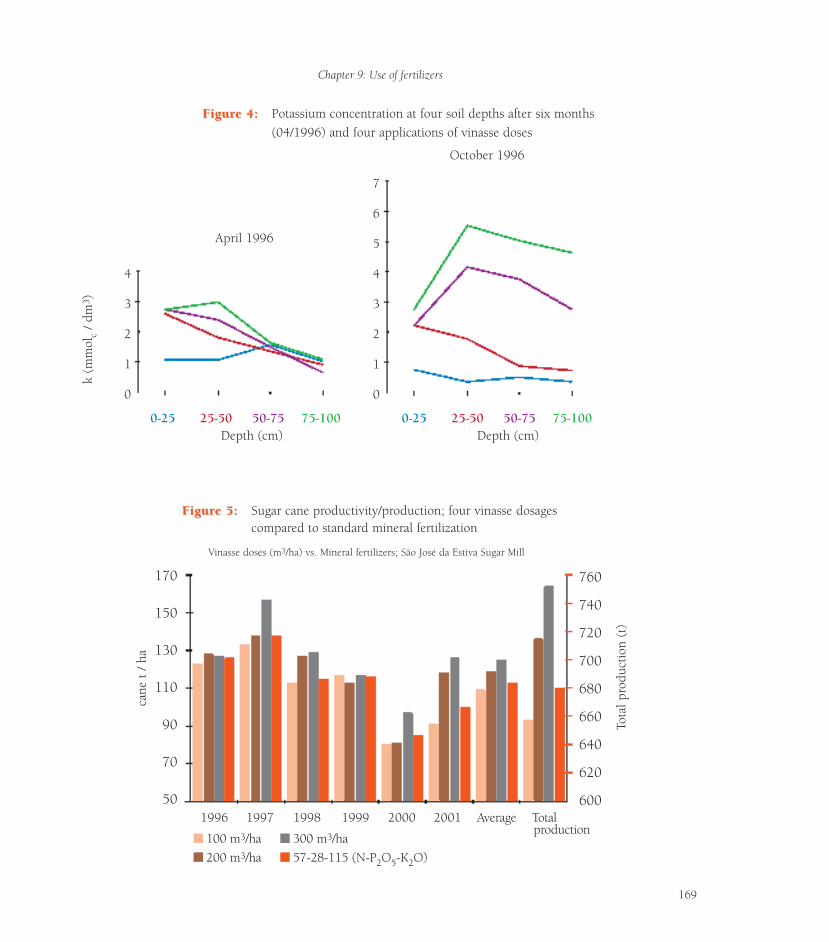
Chapter 9: Use of fertilizers
169
cane
t /
ha
Tota
l pro
duct
ion
(t)
1996 1997 1998 1999 2000 2001 Average Totalproduction
100 m3/ha200 m3/ha
300 m3/ha57-28-115 (N-P2O5-K2O)
April 1996
k (m
mol
c/ d
m3 )
October 1996
4
3
2
0
1
0-25 25-50 50-75 75-100Depth (cm)
0-25 25-50 50-75 75-100Depth (cm)
6
5
4
3
2
1
0
760
740
720
700
680
660
640
620
600
170
150
130
110
90
70
50
7
FigurFigure 4:e 4: Potassium concentration at four soil depths after six months (04/1996) and four applications of vinasse doses
FigurFigure 5:e 5: Sugar cane productivity/production; four vinasse dosagescompared to standard mineral fertilization
Vinasse doses (m3/ha) vs. Mineral fertilizers; São José da Estiva Sugar Mill
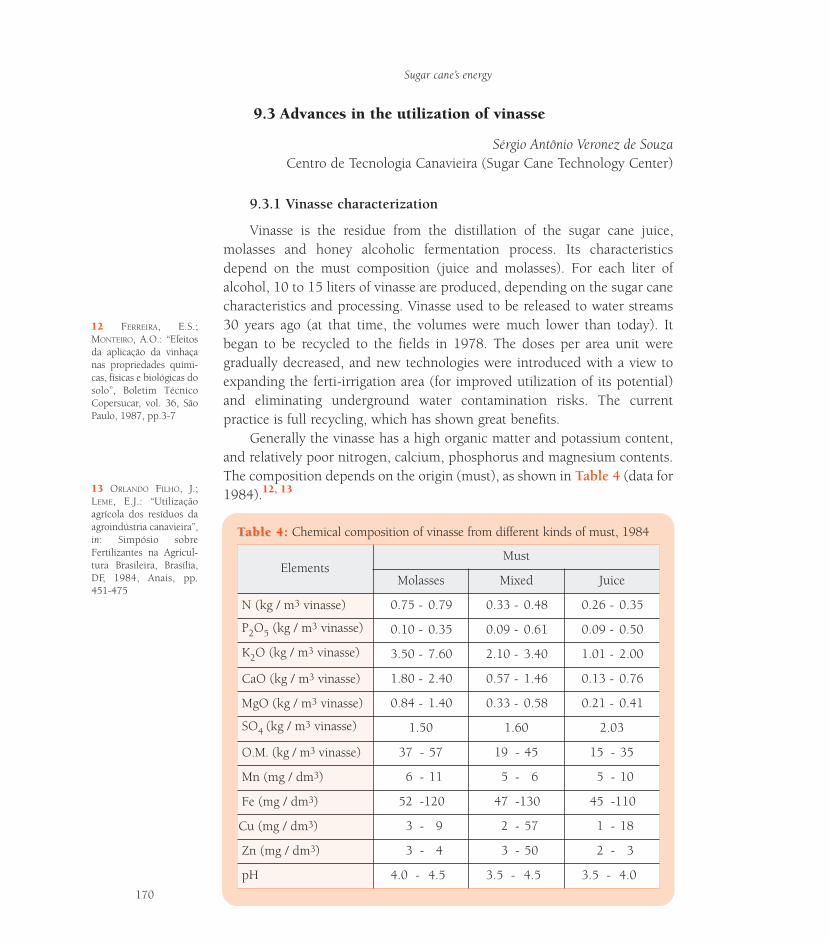
9.3 Advances in the utilization of vinasse
Sérgio Antônio Veronez de SouzaCentro de Tecnologia Canavieira (Sugar Cane Technology Center)
9.3.1 Vinasse characterization
Vinasse is the residue from the distillation of the sugar cane juice,molasses and honey alcoholic fermentation process. Its characteristicsdepend on the must composition (juice and molasses). For each liter ofalcohol, 10 to 15 liters of vinasse are produced, depending on the sugar canecharacteristics and processing. Vinasse used to be released to water streams30 years ago (at that time, the volumes were much lower than today). Itbegan to be recycled to the fields in 1978. The doses per area unit weregradually decreased, and new technologies were introduced with a view toexpanding the ferti-irrigation area (for improved utilization of its potential)and eliminating underground water contamination risks. The currentpractice is full recycling, which has shown great benefits.
Generally the vinasse has a high organic matter and potassium content,and relatively poor nitrogen, calcium, phosphorus and magnesium contents.The composition depends on the origin (must), as shown in Table 4 (data for1984).12, 13
Sugar cane’s energy
170
TTable 4:able 4: Chemical composition of vinasse from different kinds of must, 1984
ElementsMust
Molasses Mixed Juice
N (kg / m3 vinasse) 0.75 - 0.79 0.33 - 0.48 0.26 - 0.35
P2O5 (kg / m3 vinasse) 0.10 - 0.35 0.09 - 0.61 0.09 - 0.50
K2O (kg / m3 vinasse) 3.50 - 7.60 2.10 - 3.40 1.01 - 2.00
CaO (kg / m3 vinasse) 1.80 - 2.40 0.57 - 1.46 0.13 - 0.76
MgO (kg / m3 vinasse) 0.84 - 1.40 0.33 - 0.58 0.21 - 0.41
SO4 (kg / m3 vinasse) 1.50 1.60 2.03
O.M. (kg / m3 vinasse) 37 - 57 19 - 45 15 - 35
Mn (mg / dm3) 6 - 11 5 - 6 5 - 10
Fe (mg / dm3) 52 -120 47 -130 45 -110
Cu (mg / dm3) 3 - 9 2 - 57 1 - 18
Zn (mg / dm3) 3 - 4 3 - 50 2 - 3
pH 4.0 - 4.5 3.5 - 4.5 3.5 - 4.0
12 FERREIRA, E.S.;MONTEIRO, A.O.: “Efeitosda aplicação da vinhaçanas propriedades quími-cas, físicas e biológicas dosolo”, Boletim TécnicoCopersucar, vol. 36, SãoPaulo, 1987, pp.3-7
13 ORLANDO FILHO, J.;LEME, E.J.: “Utilizaçãoagrícola dos resíduos daagroindústria canavieira”,in: Simpósio sobreFertilizantes na Agricul-tura Brasileira, Brasília,DF, 1984, Anais, pp.451-475
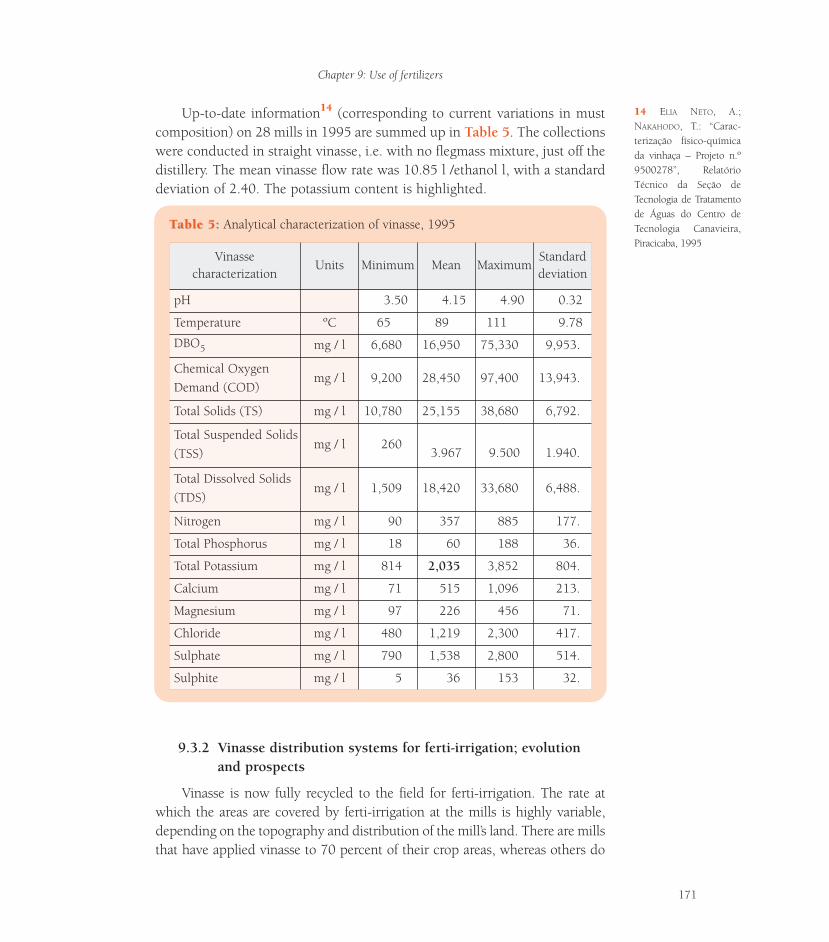
Up-to-date information14 (corresponding to current variations in mustcomposition) on 28 mills in 1995 are summed up in Table 5. The collectionswere conducted in straight vinasse, i.e. with no flegmass mixture, just off thedistillery. The mean vinasse flow rate was 10.85 l /ethanol l, with a standarddeviation of 2.40. The potassium content is highlighted.
9.3.2 Vinasse distribution systems for ferti-irrigation; evolutionand prospects
Vinasse is now fully recycled to the field for ferti-irrigation. The rate atwhich the areas are covered by ferti-irrigation at the mills is highly variable,depending on the topography and distribution of the mill’s land. There are millsthat have applied vinasse to 70 percent of their crop areas, whereas others do
Chapter 9: Use of fertilizers
171
TTable 5:able 5: Analytical characterization of vinasse, 1995
Vinassecharacterization
Units Minimum Mean MaximumStandarddeviation
pH 3.50 4.15 4.90 0.32
Temperature ºC 65 89 111 9.78
DBO5 mg / l 6,680 16,950 75,330 9,953.
Chemical OxygenDemand (COD)
mg / l 9,200 28,450 97,400 13,943.
Total Solids (TS) mg / l 10,780 25,155 38,680 6,792.
Total Suspended Solids(TSS)
mg / l 2603.967 9.500 1.940.
Total Dissolved Solids(TDS)
mg / l 1,509 18,420 33,680 6,488.
Nitrogen mg / l 90 357 885 177.
Total Phosphorus mg / l 18 60 188 36.
Total Potassium mg / l 814 2,035 3,852 804.
Calcium mg / l 71 515 1,096 213.
Magnesium mg / l 97 226 456 71.
Chloride mg / l 480 1,219 2,300 417.
Sulphate mg / l 790 1,538 2,800 514.
Sulphite mg / l 5 36 153 32.
14 ELIA NETO, A.;NAKAHODO, T.: “Carac-terização físico-químicada vinhaça – Projeto n.º9500278”, RelatórioTécnico da Seção deTecnologia de Tratamentode Águas do Centro deTecnologia Canavieira,Piracicaba, 1995
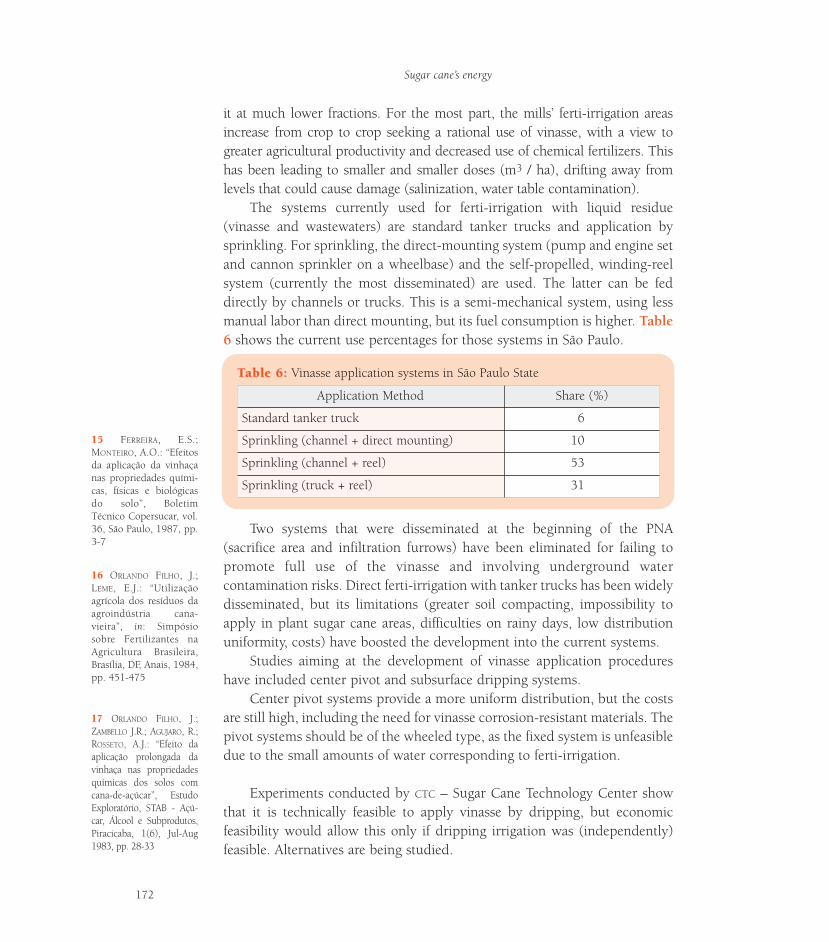
16 ORLANDO FILHO, J.;LEME, E.J.: “Utilizaçãoagrícola dos resíduos daagroindústria cana-vieira”, in: Simpósiosobre Fertilizantes naAgricultura Brasileira,Brasília, DF, Anais, 1984,pp. 451-475
it at much lower fractions. For the most part, the mills’ ferti-irrigation areasincrease from crop to crop seeking a rational use of vinasse, with a view togreater agricultural productivity and decreased use of chemical fertilizers. Thishas been leading to smaller and smaller doses (m3 / ha), drifting away fromlevels that could cause damage (salinization, water table contamination).
The systems currently used for ferti-irrigation with liquid residue(vinasse and wastewaters) are standard tanker trucks and application bysprinkling. For sprinkling, the direct-mounting system (pump and engine setand cannon sprinkler on a wheelbase) and the self-propelled, winding-reelsystem (currently the most disseminated) are used. The latter can be feddirectly by channels or trucks. This is a semi-mechanical system, using lessmanual labor than direct mounting, but its fuel consumption is higher. Table6 shows the current use percentages for those systems in São Paulo.
Two systems that were disseminated at the beginning of the PNA(sacrifice area and infiltration furrows) have been eliminated for failing topromote full use of the vinasse and involving underground watercontamination risks. Direct ferti-irrigation with tanker trucks has been widelydisseminated, but its limitations (greater soil compacting, impossibility toapply in plant sugar cane areas, difficulties on rainy days, low distributionuniformity, costs) have boosted the development into the current systems.
Studies aiming at the development of vinasse application procedureshave included center pivot and subsurface dripping systems.
Center pivot systems provide a more uniform distribution, but the costsare still high, including the need for vinasse corrosion-resistant materials. Thepivot systems should be of the wheeled type, as the fixed system is unfeasibledue to the small amounts of water corresponding to ferti-irrigation.
Experiments conducted by CTC – Sugar Cane Technology Center showthat it is technically feasible to apply vinasse by dripping, but economicfeasibility would allow this only if dripping irrigation was (independently)feasible. Alternatives are being studied.
15 FERREIRA, E.S.;MONTEIRO, A.O.: “Efeitosda aplicação da vinhaçanas propriedades quími-cas, físicas e biológicasdo solo”, BoletimTécnico Copersucar, vol.36, São Paulo, 1987, pp.3-7
Sugar cane’s energy
172
TTable 6:able 6: Vinasse application systems in São Paulo State
Application Method Share (%)
Standard tanker truck 6
Sprinkling (channel + direct mounting) 10
Sprinkling (channel + reel) 53
Sprinkling (truck + reel) 31
17 ORLANDO FILHO, J.;ZAMBELLO J.R.; AGUJARO, R.;ROSSETO, A.J.: “Efeito daaplicação prolongada davinhaça nas propriedadesquímicas dos solos comcana-de-açúcar”, EstudoExploratório, STAB - Açú-car, Álcool e Subprodutos,Piracicaba, 1(6), Jul-Aug1983, pp. 28-33
9.3.3 Ferti-irrigation; effects of vinasse on the soil
Analyses of the effects of vinasse on soil properties15 indicate that theaddition of in natura vinasse to the soil is a good option for taking advantageof this byproduct. It is an excellent fertilizer and provides several benefits interms of the physical, chemical and biological properties of the soil.Advantages to using vinasse include a rise in pH, increased cation exchangecapacity, availability of some nutrients, improved soil structure, increasedwater retention, and development of the soil’s microflora and microfauna.
Not only does the vinasse provide water and nutrients, it also recovers thesoil fertility, to some depth. The depth used by the sugar cane root systemreaches 160 cm in some countries, but the mean depth in Brazil is 60 cm (giventhe low fertility of the soil). The vinasse introduces nutrients in depth, such asCa++, Mg++ and K+, and enriches the soil.16, 17, 18, 19 There are manyexperiments that demonstrate the good agricultural productivity results (sugarcane t / ha), regardless of the savings attained by buying smaller amounts ofmineral fertilizers.19, 20 Depending on the dose used and the potassiumconcentration, a nitrogen complementation is required in ratoon growing.19, 20
Several works have shown the effects of vinasse on the soil andenvironment over years of application. One example is the increase ofpotassium-content to the a sandy dark red latosol.21
Salinization evaluations of three soil types22 (alluvial, 51% clay; redyellow podzolic, 38% clay; and hydromorphic, 5.5% clay) indicate that thereare no saline indeces for doses lower than 400 m3 / ha, and that applicationsshould be made based on the salt contents and soil characteristics.
The leaching of the elements would represent a waste of fertilizer andcould lead to pollution risks. In the case of vinasse, there are heavy elementsat very low levels that do not represent any danger to the environment. Themineral macro- and micro-elements present at higher concentrations inleached elements would be K+, Ca2+, SO4
2- and Cl-, respectively. Riskassessments of the metals present in the vinasse23 conducted over a period offive years concluded that the amounts of NO-
3, NH+4 and soluble phosphor
were not significantly changed. There were also no significant changes in thecontents of soluble zinc, copper, iron and manganese. Only SO4
2- showedleaching of up to 80 cm.
Many other studies have been conducted involving specific aspectspertaining to leaching and underground water contamination possibilities at
20 PENATTI, C.P.; CAMBRIA,S.; BONI, P.S.; ARRUDA, F.C.de O.; MANOEL, L.A.:“Efeitos da aplicação devinhaça e nitrogênio nasoqueira da cana-de-açú-car”, Boletim TécnicoCopersucar, vol. 44, SãoPaulo, 1988, pp. 32-38
22 FERREIRA, W.A.: Efeitoda vinhaça em solos de dife-rentes texturas, Piracicaba,1980, 67 p. Dissertação(Mestrado) - EscolaSuperior de Agricultura“Luiz de Queiroz”,Universidade de São Paulo
21 PENATTI, C.P.: “Dosesde vinhaça versus dosesde nitrogênio em cana-soca durante quatrosafras”, Copersucarinternal report, UsinaSão Luiz S.A., Clay soil(LR-2), 1999a
18 CAMARGO, O.A.;VALADARES, J.M.A.S.; GE-RALDI, R.N.: “Carac-terísticas químicas e físicasde solo que recebeu vi-nhaça por longo tempo”,Boletim Técnico IAC, vol.76, Campinas, SP, Insti-tuto de Agronomia deCampinas, 1983
Chapter 9: Use of fertilizers
173
19 PENATTI, C.P.; FORTI,J.A.: “Doses de vinhaçaversus doses de nitrogênioem cana-soca”, in: VIISeminário de TecnologiaAgronômica, Piracicaba,Anais Copersucar, Nov1997, pp. 328-39
23 CAMARGO, O.A. de.;VALADARES, J.M.A.S;BERTON, R.S.; SOBRINHO T.J.:“Aplicação de vinhaça nosolo e efeito no teor denitrogênio, fósforo e enxo-fre inorgânicos e no dealguns metais pesados”,Boletim Técnico IAC, vol. 8,Campinas, SP, Instituto deAgronomia de Campinas,1987
variable vinasse doses over periods of up to 15 years. On the other hand,there is a consensus among some researchers that doses in excess of 400 m3
/ ha are harmful to sugar cane (inhibiting quality and productivity).19, 24, 25
Today vinasse is considered an organic fertilizer, and is also released for“organic” sugar production (where no chemicals can be used: herbicides,insecticides and mineral fertilizers). Respecting the characteristics of the soilto which it is applied, as well as the location of water springs and the volumesdefined as suitable to each situation, vinasse does not have any negativeeffects. The results obtained from tests so far indicate that there are nodamaging impacts on the soil at doses lower than 300 m3/ha, while higherdoses may damage the sugar cane or, in specific cases (sandy or shallow soil),contaminate underground waters.
9.3.4 Legislation on vinasse application
The evolution of the legislation on the disposal (currently the use) ofvinasse dates back to 1978.
MINTER (National Integration Ministry) Ordinance no. 323 (1978)prohibited release of vinasse in surface fountainheads.
CONAMA (National Environment Council) Resolutions no. 0002(1984) and 0001 (1986) required studies and determination of rules on thecontrol of effluents from ethanol distilleries, and subsequently rendered theEIA and RIMA mandatory for new units or extensions, respectively.
Law no. 6,134 (1988), article 5th, of São Paulo State provided thatwaste from industrial and other activities shall not contaminate undergroundwaters.
Until the late 1970’s, when ethanol production was still relatively small,there was no legislation on the matter. The practice consisted of disposing ofthe vinasse in surface fountainheads, thereby increasing their organic load.That changed as of 1978, when the vinasse was totally redirected to ferti-irrigation.
Recently, the São Paulo State’s Office of the Secretary of Environment andthe production sector developed a technical standard in order to regulate theapplication of vinasse in São Paulo State. The technical standard seeks a safeway to apply the vinasse by specifying permitted places, doses, protection ofmaster channels and storage, etc. It also considered the results of years ofstudies seeking safe processes in respect to the various aspects ofenvironmental protection.26 The efficient use of vinasse is something in
19 see p. 173
26 Technical StandardP4.231: Vinasse: Criteriaand procedures forapplication in agricultur-al soils, 2005
Sugar cane’s energy
174
24 RODELLA, A.A.; FERRARI,S.E.: “A composição davinhaça e efeitos de suaaplicação como fertilizantena cana-de-açúcar”, Rio deJaneiro, Brasil Açucareiro,90 (1), 1977, pp. 6-13
25 PEIXOTO, M.J.C.; COE-LHO, M.B.: “Aplicação devinhaça diluída em cana-de-açúcar por sistema de asper-são”, Congresso Nacional daSociedade de TécnicosAçucareiros e Alcooleiros doBrasil, 2, Rio de Janeiro, Aug16-21, 1981, Anais, STAB,1981, pp. 177-194
which producers are very interested given the economic return. Thetechnologies are expected to keep on evolving in this respect, specificallyinvolving the interaction between vinasse and the waste trash left in the field.
9.4 Summary and conclusions
• The use of fertilizers in Brazilian agriculture is relatively small,although it has increased over the past thirty years, thereby substantial-ly reducing the need for new areas.• Among Brazil’s large crops (area larger than 1 Mha), sugar cane usessmaller amounts of fertilizers than cotton, coffee and oranges, and isequivalent to soybean crops in this respect. The amount of fertilizersused is also small compared to sugar cane crops in other countries(Australia uses 48% more).• The most important factor is nutrient recycling through the applicationof industrial waste (vinasse and filtercake), considering the limitingtopographic, soil and environmental control conditions. Substantial ris-es in the potassium content of the soil and productivity have beenobserved. Nutrient recycling is being optimized, although the use oftrash has yet to be implemented. It will be very important in expansionareas.• A large number of studies in respect to leaching and possibilities ofunderground water contamination with vinasse, indicate that there aregenerally no damaging impacts for applications of less than 300 m3 / ha.A technical standard by the Office of the Secretary of Environment (SãoPaulo) regulates all relevant aspects: risk areas (prohibition); permitteddoses; and technologies.
Chapter 9: Use of fertilizers
175
IIIIIISustainability of the agricultural
production base
The internal sustainability of an agricultural production system requiresthe ability to respond to pests and plant diseases and to periodical climatechanges, among other things. The idea is that these interferences must notharm the production system so seriously as to make it unfeasible.
This sustainability concept is essential to Brazil, which seeks a deeperinclusion in international markets not only in sugar, but also in ethanol. Inthe case of ethanol, any buyer is concerned about a reliable long term supply.
The problem of periodical climate changes (other than those occurringbecause of global warming, which are addressed in Chapter 4) are usuallyviewed in Brazil as substantially “under control” in the case of sugar canebecause the production areas are very spread, to the point of having differentgrowing periods (as in the Northeast), over a vast territory with remarkableregional differences. As a matter of fact, historical observations of sugar caneproduction seem to confirm this: only once over the past thirty years wasthere an important production fall, and even though it took place during adrought year, part of that decrease was intentional (there was an excess of theproduct on the market, and many mills intentionally reduced the fertilizationand cultural treatments, thereby decreasing the sugar cane output).
The ability to respond to diseases and pests is one of the main strengthsof Brazil’s production. The key of understanding this issue in Brazil assumesthat it would be impossible (yet desirable) to maintain a strict, efficient phy-tosanitary barrier system in a country with such extensive borders as Brazil.The response should consist (in addition to quarantines and barriers) of anefficient disease and pest-resistant variety selection and development systemand a proper use of a large number of varieties. This system is shown inChapter 10.
177

Chapter 10:Varieties and protection from diseases and pests
10.1 Introduction
Brazil’s sugar cane genetic improvement programs started providing vari-eties in the early 1980’s. There are four programs today covering the sugar canegrowing areas, with an emphasis on the Center-South region. In almost all cas-es, the search for pest and disease resistance is essential considering how diffi-cult it is to protect the country’s territory (and borders) with sanitary barriers.
The expansion areas require some new thinking for the programs with aview to a specific and, in some cases, regional orientation; this is being con-sidered.
In the world context, Brazil has a cutting-edge sugar cane biotechnolo-gy, with the development of transgenic varieties. The introduction of suchvarieties may take place within a few years.
10.2 Standard genetic improvement and availability ofvarieties
William Lee BurnquistCentro de Tecnologia Canavieira (Sugar Cane Technology Center)
Marcos Guimarães de Andrade LandellInstituto Agronômico de Campinas (Agronomic Institute of Campinas)
From the production sustainability viewpoint, one of the questions thatneeds an answer in agriculture is: does the country have an appropriate (suf-ficient) genetic base for a continued development of new varieties, so as tosupply the growing areas with them and be sure that new diseases or pestscan be controlled with acceptable losses?
179
Internal sustainability of sugar cane growing in Brazilrequires the ability ro respond to pests and diseases and to peri-odical climate changes. Protection from pests and diseases isconsidered a strength of Brazil’s production: it is based muchmore on a continued supply of disease and pest-resistant sugarcane varieties than on phytosanitary barriers, allowing growersto operate with a great diversification. Varieties developed inBrazil became commercial in 1980; today nearly 500 varietiesare being used.
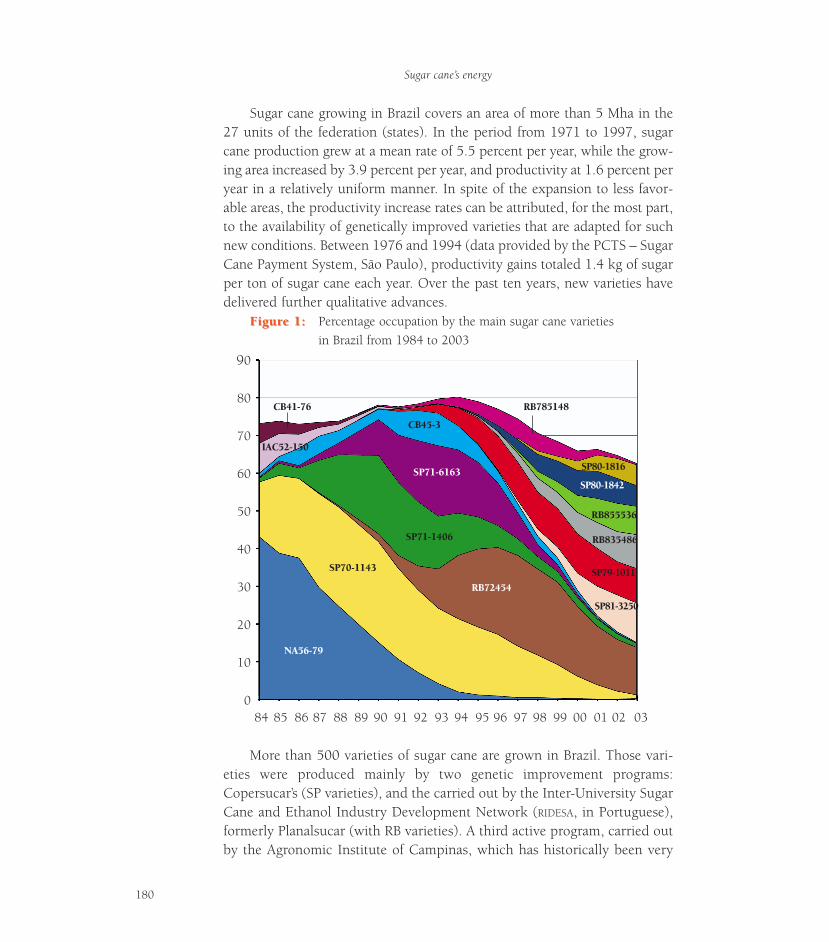
Sugar cane growing in Brazil covers an area of more than 5 Mha in the27 units of the federation (states). In the period from 1971 to 1997, sugarcane production grew at a mean rate of 5.5 percent per year, while the grow-ing area increased by 3.9 percent per year, and productivity at 1.6 percent peryear in a relatively uniform manner. In spite of the expansion to less favor-able areas, the productivity increase rates can be attributed, for the most part,to the availability of genetically improved varieties that are adapted for suchnew conditions. Between 1976 and 1994 (data provided by the PCTS – SugarCane Payment System, São Paulo), productivity gains totaled 1.4 kg of sugarper ton of sugar cane each year. Over the past ten years, new varieties havedelivered further qualitative advances.
FigurFigure 1:e 1: Percentage occupation by the main sugar cane varietiesin Brazil from 1984 to 2003
More than 500 varieties of sugar cane are grown in Brazil. Those vari-eties were produced mainly by two genetic improvement programs:Copersucar’s (SP varieties), and the carried out by the Inter-University SugarCane and Ethanol Industry Development Network (RIDESA, in Portuguese),formerly Planalsucar (with RB varieties). A third active program, carried outby the Agronomic Institute of Campinas, which has historically been very
Sugar cane’s energy
180
90
80
70
60
50
40
30
20
10
084 85 86 87 88 89 90 91 92 93 94 95 96 97 98 99 00 01 02 03
NA56-79
SP70-1143
RB72454
RB835486
RB855536
RB785148
SP71-1406
SP71-6163
CB45-3
SP81-3250
SP79-1011
SP80-1842
SP80-1816
IAC52-150
CB41-76
important to the industry, has been restructured and released some promis-ing varieties. It has recently enhanced its potential, including in biotechnol-ogy, and is advancing fast focusing on the Center-South region.Independently, a private company by the name of Canavialis was organizedin 2004 to develop sugar cane varieties. That company works in conjunc-tion with Allelyx, which develops transgenic varieties. Therefore, Brazil hastwo private and two public companies engaged in the genetic improvementof sugar cane varieties.
The two most active improvement programs (SP and RB) were intro-duced in 1970, when approximately 1.5 million hectares of sugar canewere grown in Brazil. These programs were sufficient to meet the require-ments for the major increase in area thereafter. The expansion in the1970’s and 80’s took place mostly in regions having less favorable edapho-climatic conditions, and the development of adapted sugar cane varietieswas important for such expansion to succeed. During that period (1970’sand 80’s), the programs established a broad physical base for convention-al genetic improvement. Copersucar’s germplasm bank has more than3,000 genotypes, including a wide collection of “wild” species, such asSaccharum officinarum (423 genotypes), S. spontaneum (187 genotypes), S.robustum (65 genotypes), S. barberi (61 genotypes), and S. sinense (32genotypes), which gave rise to modern sugar cane varieties and are sourcesof the great genetic variability found. It is in the best interests of the vari-ous programs for Brazil to have one of the world’s sugar cane germplasmcollections. A private quarantine facility (approved and inspected by theMinistry of Agriculture) processes 40 new varieties of several of the world’simprovement programs every year. The improvement programs haveexperimental facilities located in the country’s main sugar cane growingregions and complement their facility networks with areas provided byproducing units.
Brazil has two experimental hybridization facilities where crossings aremade: Camamu, in Bahia; and Serra d’Ouro, in Alagoas. The seedlings pro-duced by the Brazilian improvement programs are estimated at 1,420,000each year.
A census conducted in 260 sugar cane growing units in Brazil in2003-2004 indicates that 51 out of the 500 sugar cane varieties in usehave been released over the past ten years, and the 20 most important ofthem occupy 80 percent of the crop area, while RB72454, the most wide-ly used, occupies only 12.6 percent. It is gradually noted not only that thepermanence “cycles” for the best varieties get shorter and shorter, but alsothat these varieties coexist in larger number. This great diversification is
Chapter 10: Varieties and protection from diseases and pests
181
part of the pest and disease protection strategy. As a matter of fact, thenumber of varieties in use has been growing faster over the past 20 years,as shown in Figure 1. In 1984, if a new disease to which the NA56-79variety (main variety at that time) was susceptible had been introduced, itwould have had the potential for destroying 42 percent of the country’scrops. In 2003, if a disease affecting the main variety grown (RB72454)had been introduced, it would have affected only 12 percent of the sugarcane crops.
Compared to those of other important sugar cane research centersaround the world (Australia, South Africa, Colombia, and Mauritius),Brazil’s genetic improvement programs can be said to be more prolific, andBrazilian growers to be faster in incorporating new sugar cane varieties.Important epidemics were controlled by a fast replacement of varieties. Thatwas the case of the sugar cane smut (1980-1985), the sugar cane rust (1987-1992), and the yellow leaf virus (1994-1997). Today, each of the main vari-eties occupy a maximum of 10 to 15 percent of the total sugar cane area ineach mill. This has been the main defense against external pathogens inBrazilian mills.
The disease and pest-resistant varieties still haven’t provided an efficientcontribution to minimizing losses caused by some pests, namely, nematoids,spittlebugs, stalk beetles and migdolus.
The genetic improvement programs have also proved efficient in devel-oping varieties adapted for the new management conditions. Recently in SãoPaulo State, there has been a relative increase in the use of mechanical har-vesting of raw sugar cane without trash burning, which provides the cropswith much different biological conditions. It hasn’t been difficult to selectvarieties adapted for such new conditions.
Considering the success of sugar cane genetic improvement programs inthe past and the wide installed physical base, we believe that the industry willhave suitable varieties to safely support the maintenance and future expansionof the crops under any edaphoclimatic conditions in the Brazil. However,some cautions are required. For example, the expansion to areas that have notyet been specifically aimed at by the programs shall require new investments.
The investment in this field of research (conventional breeding)amounts to some R$ 15 million / year in São Paulo, and possibly R$ 20 mil-lion / year in Brazil. This corresponds to US$ 1.14 / ha per year; in Australia,the BSES operates with around US$ 12 / ha to create varieties; in Mauritius,US$ 82.2 / ha. Such underinvestment is partly compensated for by theinvolvement of dozens of companies of the sugar and ethanol industry with
Sugar cane’s energy
182
the final assessment stages. In the present expansion situation (and relative-ly new areas), it will be necessary to provide the programs with more fund-ing in order to keep the past development pace, and also to consider theinteraction with ongoing transgenic species development programs.
10.3 Transgenic varieties; present situation and prospects
William Lee BurnquistCTC – Centro de Tecnologia Canavieira (Sugar Cane Technology Center)
Eugenio UlianCTC – Centro de Tecnologia Canavieira (Sugar Cane Technology Center)
A significant development of sugar cane biotechnology has been goingon in Brazil over the past ten years. The country stands out from other pro-ducers, along with Australia and South Africa, for using this modern tech-nology in variety development programs.
In Brazil, the Sugar Cane Technology Center pioneered the creation oftransgenic sugar cane varieties in 1997, and has been very active in experi-mental planting of its findings. CTC had been conducting molecular biologyresearch since 1990 when it headed the conclusion of a cooperation agree-ment, forming the International Sugar Cane Biotechnology Consortium (ICSB,in Portuguese), an entity with a current membership of 17 institutions and12 sugar cane producing countries. The Technical Commission on Biosafety(CTNBio) of the Ministry of Science and Technology granted to CTC a biosafe-ty quality certificate in 1997, enabling the growing in a restricted experi-mental area of varieties featuring resistance to herbicides, pests, diseases andflowering obtained through modern biotechnology techniques. These mate-rials, currently at the experimental stage, are important to the evaluation ofbenefits and impacts of sugar cane biotechnology.
The development of the Cane Genome project, funded by Copersucarand FAPESP, was extremely relevant. The project was carried out from 2000until 2003, and mobilized 200 researchers from more than 20 universitiesand research institutes in Brazil to identify the sugar cane genes. The projectdescribed nearly 300,000 sugar cane gene sequences which were groupedinto approximately 40,000 genes upon analysis. In this genetic asset of sugarcane, genes were described relating to disease resistance, response to stress,nutrient metabolization, carbohydrate metabolization, transcription factorsand flowering process, among other things. Some research groups have
Chapter 10: Varieties and protection from diseases and pests
183
already used those genes in genetic improvement programs. The continuityof the Cane Genome project is supported by funds (also by CTC and FAPESP)from the functional genome project initiated in 2004. The preliminary resultsare promising in the development of varieties which show increasedresistance to pests, diseases and some important stresses, such as droughtsand cold weather, which could even encourage the expansion of sugar canecrops in regions that are now considered unfit. Another private company(Allelyx) has recently started activities in this field with important resources.
Sugar cane genomics has evolved in Brazil with complementary studiesas well, such as the full gene sequencing in 2002 of Leifsonia xylli, andimportant sugar cane pathogen, by a group headed by ESALQ. This will allowa better understanding of the bases on which the pathogenic bacteria andsugar cane interact and the development of mechanisms to put this diseaseunder control. More recently, the gene sequencing was completed of theGlucanocetobacter diazotrophicus bacteria associated with sugar cane, whichfixes atmospheric nitrogen and could substitute for part of the nitrogenouschemical fertilizers. With the genetic information obtained from the bacteria,the group responsible for this project in Rio de Janeiro expects to increase theefficiency of the microorganism.
Some lack of definition and the complexity of the legislation that governsresearch and development activities with transgenic organisms in Brazil havebeen the main barrier to the researchers’ activity in this field. Planting exper-iments with transgenic sugar cane requires the project in question to beapproved by agencies related to three ministries, the Ministry of Science andTechnology (CTNBio), the Ministry of the Environment (IBAMA), and theMinistry of Agriculture, Livestock and Supply (DDIV). Each of these threeagencies has its own particular protocols and requirements, depending on thetype of transgenic organism to be tested. The time needed for evaluating theresearch proposals submitted to each of the ministries has made some proj-ects unfeasible. In addition, there is no clear definition as to the protocol tobe followed by the companies who are interested in registering a transgenicproduct for commercial use.
In terms of technical qualification Brazil is on the cutting-edge of sugarcane biotechnology worldwide, but a major effort should be made on the leg-islative front so that the country can benefit from this technology over thenext 10 years.
Sugar cane’s energy
184
10.4 Summary and conclusions
• The internal sustainability of sugar cane growing in Brazil requires theability to respond to pests and diseases and to periodical climatechanges.• The production conditions in Brazil, with its regional and microcli-matic diversity, have been responding appropriately to periodical climatechanges.• Protection from pests and diseases is considered a strength of Brazil’s produc-tion: it is based much more on a continued supply of disease and pest-resistantsugar cane varieties than on phytosanitary barriers, allowing growers to oper-ate with a great diversification.• There are four operational sugar cane genetic improvement programsin Brazil (the two leading programs are private); they use one quarantineand two hybridization facilities, with germplasm banks. They work witharound 1.5 million seedlings per year.• More than 500 varieties are grown today (51 have been released overthe past ten years). The twenty most important varieties occupy 80 per-cent of the crop area, but the most widely used occupies just 12.6 per-cent. The substantial rise in diversification over the past twenty years hasprovided great safety concerning resistance to exogenous diseases andpests.• Brazil stands out from other producing countries for its sugar canebiotechnology, having had (non-commercial) transgenic varieties sincethe 1990’s. In 2003 the identification of 40,000 sugar cane genes wascompleted in Brazilian laboratories; there are dozens of groups workingon the functional genome, and they are already using the genes in genet-ic improvement programs (experimental stages). Commercial resultsmay arise over the next five years.• More funds are recommended in order to properly integrate thegermplasm banks for all programs and to support specific developmentsfor each expansion area.• Efforts on the legislative front should be carried on in order to facili-tate the development of biotechnological research in its final stages.
Chapter 10: Varieties and protection from diseases and pests
185
IVIVImpacts of productionon commercial actions
The search for external sustainability determines that agriculturalproduction should not impose any adverse economic impacts on the externalenvironment; the externalization of costs to be paid by other sectors ofsociety is evidence of an unsustainable production. As much as this conceptseems strict, considering the present situation of agriculture around theworld and the high subsidies that are currently in use, it is appropriate to useit as a way of showing and, to some extent, quantifying the inadequacy ofmany practices in the current system. The remarks on sustainability andinternational trade in the Rio Declaration go in the same direction: “Statesshould cooperate to promote a supportive and open international economic systemthat would lead to economic growth and sustainable development in all countries,to better address the problems of environmental degradation”.
Actually the relation between more liberal standards of internationaltrade and sustainable development has been marked by controversies anddisputes between civil entities and governments; alleged (or real)environmental problems have been used to justify trade barriers, for example.It is also noticeable that some “liberalizing” initiatives focused on immediateresults, which are sustained by some richer countries, have contributed in theopposite way: polarizing the disputes between rich and poor. Subsidies foragriculture (with their whole broad range of variations) have been setting aterrible example for perpetuating environmental problems. A report recentlyprepared by the WWF
1 indicates that the level of sugar subsidies andprotection in the European Union, the United States and Japan have beeninducing agricultural practices that are extremely damaging to theenvironment (especially related to the use of water for irrigation) in theseregions, while keeping prices very low in other regions, thereby preventingthem from using cleaner production systems too. Ideally, these issues wouldbe resolved with more information and a gradual convergence tosustainability ideals.
187
1 “Sugar and theEnvironment”, WWF,Nov 2004
For the most part, the promotion of specific economic interests has beenthe main consideration of international trade policies in most countries,instead of a broader sustainable development policy. Another problem is theposition of some developed countries, who view trade policies as substitutesfor international “financial aid,” without considering the conditions to beattained so that the flow of funds may lead to sustainable development: forexample, the payment of debts of developing countries.
The sugar cane products from the Center-South region of Brazil do nothave any price support mechanism under governmental policies; there are nosubsidies to sugar production or trade today, as they were eliminated yearsago as part of the deregulation processes. The need for subsidies hasdisappeared in face of the great advances in competitiveness for the twoproducts. The economic competitiveness of any activity is essential to itssustainability; Brazil’s sugar cane industry has advanced greatly in this respectwith its two main products. The competitiveness of the Brazilian sugar is nowunquestionable (its cost is the lowest in the world), and ethanol can now becompetitive with gasoline (international prices), while being the world’s firstrenewable liquid fuel to accomplish this. The present situation and theprospects for next few years are analyzed below.
Sugar cane’s energy
188
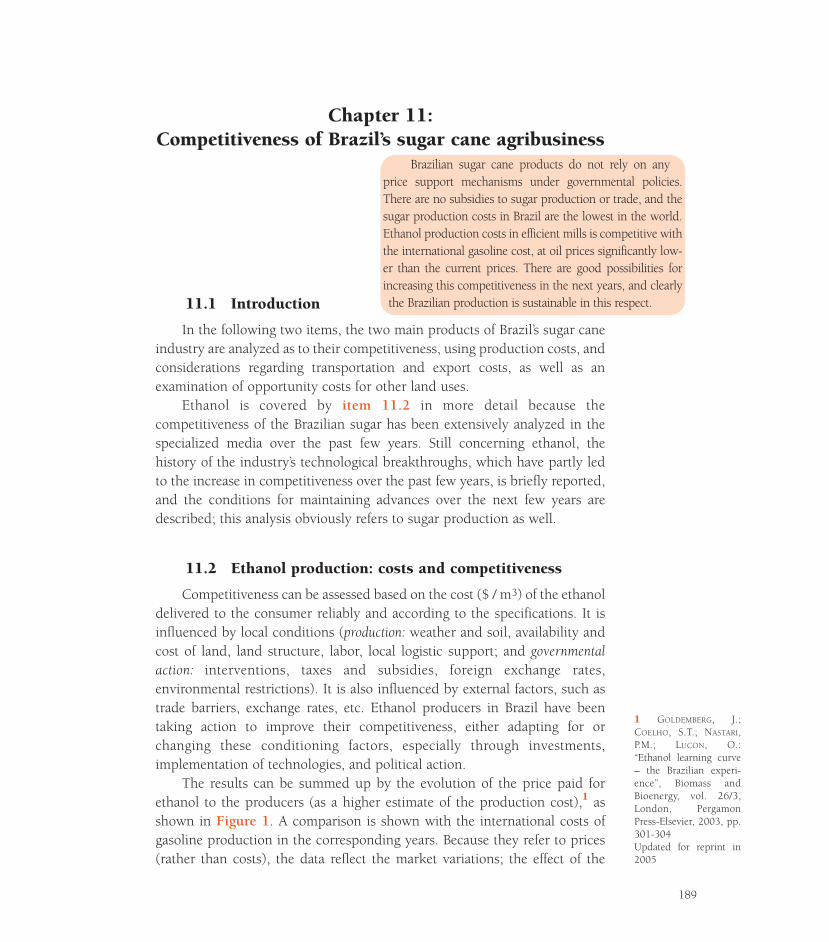
Chapter 11:Competitiveness of Brazil’s sugar cane agribusiness
11.1 Introduction
In the following two items, the two main products of Brazil’s sugar caneindustry are analyzed as to their competitiveness, using production costs, andconsiderations regarding transportation and export costs, as well as anexamination of opportunity costs for other land uses.
Ethanol is covered by item 11.2 in more detail because thecompetitiveness of the Brazilian sugar has been extensively analyzed in thespecialized media over the past few years. Still concerning ethanol, thehistory of the industry’s technological breakthroughs, which have partly ledto the increase in competitiveness over the past few years, is briefly reported,and the conditions for maintaining advances over the next few years aredescribed; this analysis obviously refers to sugar production as well.
11.2 Ethanol production: costs and competitiveness
Competitiveness can be assessed based on the cost ($ / m3) of the ethanoldelivered to the consumer reliably and according to the specifications. It isinfluenced by local conditions (production: weather and soil, availability andcost of land, land structure, labor, local logistic support; and governmentalaction: interventions, taxes and subsidies, foreign exchange rates,environmental restrictions). It is also influenced by external factors, such astrade barriers, exchange rates, etc. Ethanol producers in Brazil have beentaking action to improve their competitiveness, either adapting for orchanging these conditioning factors, especially through investments,implementation of technologies, and political action.
The results can be summed up by the evolution of the price paid forethanol to the producers (as a higher estimate of the production cost),1 asshown in Figure 1. A comparison is shown with the international costs ofgasoline production in the corresponding years. Because they refer to prices(rather than costs), the data reflect the market variations; the effect of the
1 GOLDEMBERG, J.;COELHO, S.T.; NASTARI,P.M.; LUCON, O.:“Ethanol learning curve– the Brazilian experi-ence”, Biomass andBioenergy, vol. 26/3,London, PergamonPress-Elsevier, 2003, pp.301-304Updated for reprint in2005
189
Brazilian sugar cane products do not rely on anyprice support mechanisms under governmental policies.There are no subsidies to sugar production or trade, and thesugar production costs in Brazil are the lowest in the world.Ethanol production costs in efficient mills is competitive withthe international gasoline cost, at oil prices significantly low-er than the current prices. There are good possibilities forincreasing this competitiveness in the next years, and clearlythe Brazilian production is sustainable in this respect.
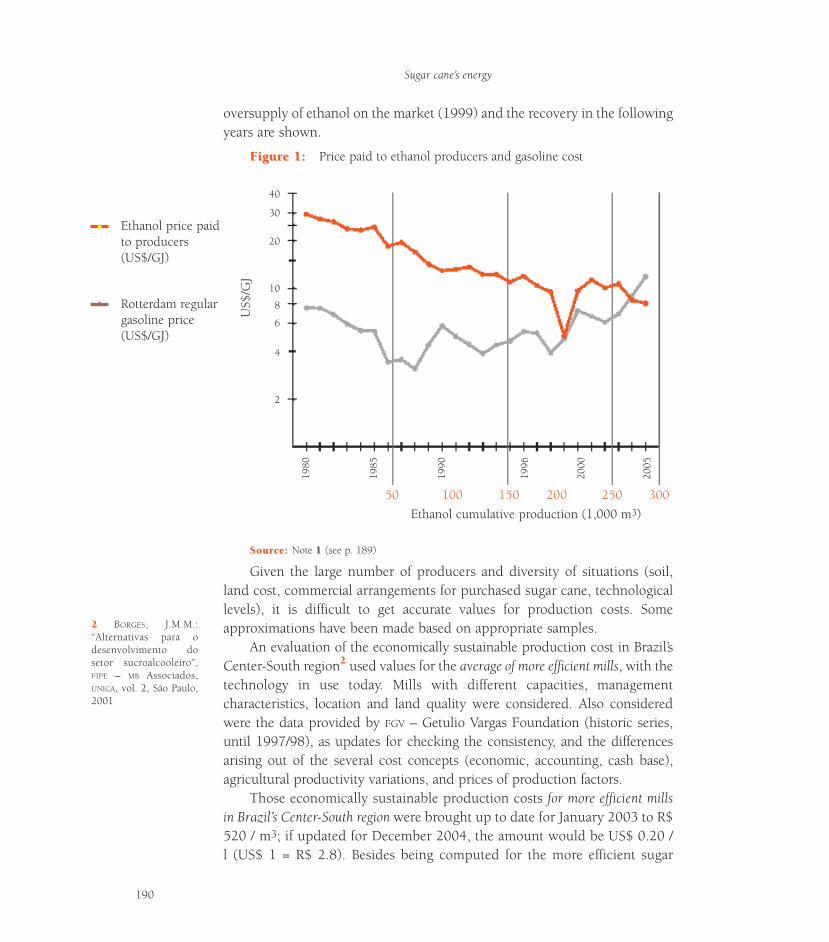
oversupply of ethanol on the market (1999) and the recovery in the followingyears are shown.
FigurFigure 1:e 1: Price paid to ethanol producers and gasoline cost
Given the large number of producers and diversity of situations (soil,land cost, commercial arrangements for purchased sugar cane, technologicallevels), it is difficult to get accurate values for production costs. Someapproximations have been made based on appropriate samples.
An evaluation of the economically sustainable production cost in Brazil’sCenter-South region2 used values for the average of more efficient mills, with thetechnology in use today. Mills with different capacities, managementcharacteristics, location and land quality were considered. Also consideredwere the data provided by FGV – Getulio Vargas Foundation (historic series,until 1997/98), as updates for checking the consistency, and the differencesarising out of the several cost concepts (economic, accounting, cash base),agricultural productivity variations, and prices of production factors.
Those economically sustainable production costs for more efficient millsin Brazil’s Center-South region were brought up to date for January 2003 to R$520 / m3; if updated for December 2004, the amount would be US$ 0.20 /l (US$ 1 = R$ 2.8). Besides being computed for the more efficient sugar
2 BORGES, J.M.M.:“Alternativas para odesenvolvimento dosetor sucroalcooleiro”,FIPE – MB Associados,UNICA, vol. 2, São Paulo,2001
Sugar cane’s energy
190
Ethanol cumulative production (1,000 m3)
SourSource: ce: Note 11 (see p. 189)
Ethanol price paidto producers(US$/GJ)
Rotterdam regulargasoline price(US$/GJ)
US$
/GJ
50 100 150 200 250 300
1980
40
8
30
2
20
6
10
4
1985
1990
1996
2000
2005
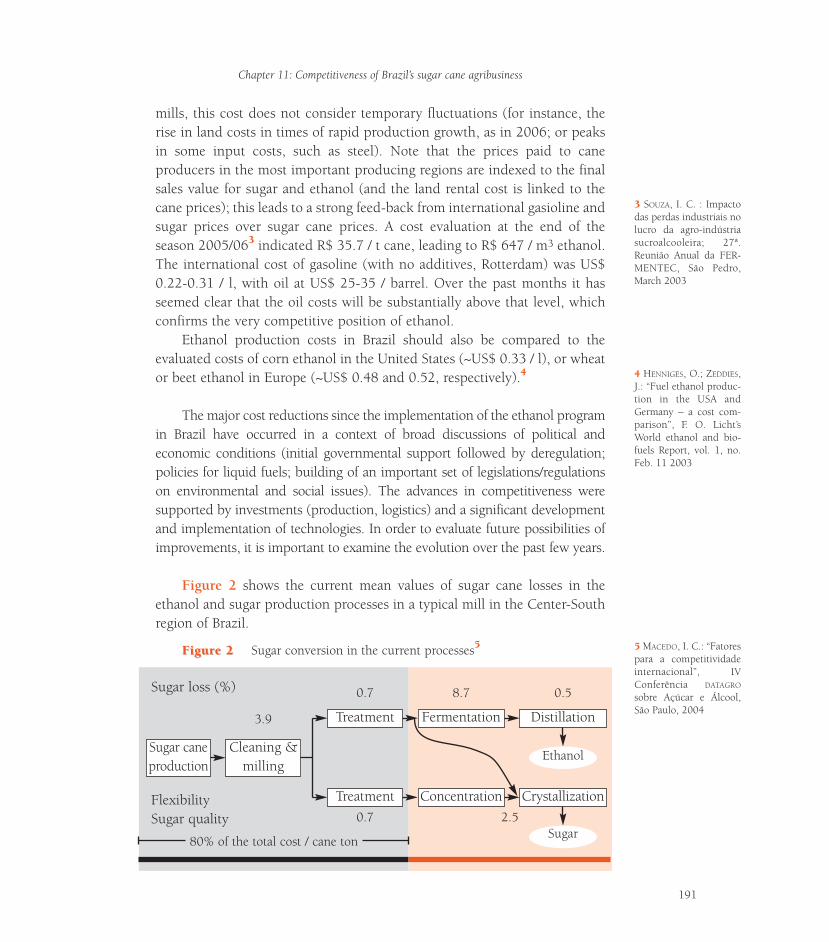
mills, this cost does not consider temporary fluctuations (for instance, therise in land costs in times of rapid production growth, as in 2006; or peaksin some input costs, such as steel). Note that the prices paid to caneproducers in the most important producing regions are indexed to the finalsales value for sugar and ethanol (and the land rental cost is linked to thecane prices); this leads to a strong feed-back from international gasioline andsugar prices over sugar cane prices. A cost evaluation at the end of theseason 2005/063 indicated R$ 35.7 / t cane, leading to R$ 647 / m3 ethanol.The international cost of gasoline (with no additives, Rotterdam) was US$0.22-0.31 / l, with oil at US$ 25-35 / barrel. Over the past months it hasseemed clear that the oil costs will be substantially above that level, whichconfirms the very competitive position of ethanol.
Ethanol production costs in Brazil should also be compared to theevaluated costs of corn ethanol in the United States (~US$ 0.33 / l), or wheator beet ethanol in Europe (~US$ 0.48 and 0.52, respectively).4
The major cost reductions since the implementation of the ethanol programin Brazil have occurred in a context of broad discussions of political andeconomic conditions (initial governmental support followed by deregulation;policies for liquid fuels; building of an important set of legislations/regulationson environmental and social issues). The advances in competitiveness weresupported by investments (production, logistics) and a significant developmentand implementation of technologies. In order to evaluate future possibilities ofimprovements, it is important to examine the evolution over the past few years.
Figure 2 shows the current mean values of sugar cane losses in theethanol and sugar production processes in a typical mill in the Center-Southregion of Brazil.
4 HENNIGES, O.; ZEDDIES,J.: “Fuel ethanol produc-tion in the USA andGermany – a cost com-parison”, F. O. Licht’sWorld ethanol and bio-fuels Report, vol. 1, no.Feb. 11 2003
3 SOUZA, I. C. : Impactodas perdas industriais nolucro da agro-indústriasucroalcooleira; 27ª.Reunião Anual da FER-MENTEC, São Pedro,March 2003
Chapter 11: Competitiveness of Brazil’s sugar cane agribusiness
191
Sugar caneproduction
Cleaning &milling
Treatment
Treatment
Fermentation
Concentration
Distillation
Crystallization
Ethanol
Sugar
3.9
0.7 8.7 0.5
0.7FlexibilitySugar quality
Sugar loss (%)
2.5
80% of the total cost / cane ton
FigurFigure 2e 2 Sugar conversion in the current processes5 5 MACEDO, I. C.: “Fatorespara a competitividadeinternacional”, IVConferência DATAGRO
sobre Açúcar e Álcool,São Paulo, 2004
Such conversion efficiencies, greater flexibility in operation with the twoproducts, and quality improvements were attained on the back of a strongprocess integration. The main technological advances were as follows:
1980-1990: Introduction of new sugar cane varieties developed in Brazil;new grinding systems; fermentation with much larger capacities; use ofvinasse as a fertilizer; biological control of sugar cane beetle; optimization ofagricultural operations; energy independence.
1990-2000: Introduction of excess energy sales; better technical,agricultural and industrial management; new sugar cane harvesting andtransportation systems; industrial automation advances.
The following are some of the overall results for the São Paulo area:+ 33% tons of sugar cane / ha; + 8% sugar cane sugar+ 14% sugar conversion for ethanol sugar cane+ 130% fermentation productivity (m3 of ethanol / m3 of reactor.day)
Technology will be of the essence in the years to come in order tostrengthen the competitive position; actions shall include a soliddissemination of already commercially available technologies, innovation inethanol production processes, and product diversification (from sucrose andlignocellulosic sugar cane residue).
In 2000, it was estimated that the additional implementation of com-mercially available technologies could result in cost reductions of up to 13percent in the Center-South region’s production6; the most important aspectswere better use of sugar cane varieties, optimization of sugar canetransportation, better agronomic controls, fermentation and grinding,technical management of industrial production, and maintenance.
New processes include “precision agriculture”, integrated sugar caneand trash harvesting and transportation systems, a much higher level ofindustrial automation, and new separation processes (juice and downstreamprocessing). The genetic modification of sugar cane is advancing veryquickly in Brazil (experimental scale, including field tests); the sugar canegenome was mapped in 2001 in São Paulo, and a few dozen projects(applications: functional genome) are in the pipeline in both public andprivate institutions.
Product diversification is being sought in two lines of activities:Sucrose products: the low cost of sucrose in Brazil has been leading to
the introduction of new industries, whether or not as additions to the mills;L-lysine, MSG, yeast extracts, citric acid and sorbitol are already in
6 Internal report, 36mills sample, São Paulo,700.000 ha; CTC, May2001
Sugar cane’s energy
192
commercial production, and other products are being considered. Brazil hadan important alcohol-chemical industry in the 1980’s (see item 2.3).
Sugar cane biomass energy: the use of sugar cane biomass to produce“clean energy” may take different paths. Excluding sucrose, the energycontained in one metric ton of sugar cane (including the straw) is equivalentto å of the energy contained in one oil barrel. That biomass can be recoveredfor ~US$ 1. / GJ; today, less than half of it is used (see item 1.4). Availabletechnologies can generate additional electricity (from the bagasse and 50percent of the straw) corresponding to an additional 30 percent of the salevalue of sugar and ethanol. The development of an efficient system forbiomass conversion into ethanol (expected to occur within the next ten years)could lead to the same additional sale value.
The development and implementation of technologies have asignificant potential for increase in competitiveness. However, as the casewas in the past, important results can be obtained with investments andpolicies to improve the infrastructure (logistics: ethanol and sugar transpor-tation/storage/shipment).
11.3 Competitiveness of sugar
All production factors (technology, investment, political action) thatinfluence ethanol production costs are equally present in the case of sugar.Therefore, production costs are expected to be maintained and possibly reduced,notwithstanding the increase in production in new areas (with some additionaltransportation cost, on average). Here, however, competitiveness should bemeasured in comparison with the production of sugar in other countries aroundthe world (similar to international gasoline compared to ethanol).
In a competitiveness analysis, having relatively low production costs is afactor that must be complemented with other data: transportation costs (FOBprice, for international trade); and, in some cases, considerations regardingopportunity costs for agricultural production (net gain for a possible use ofland for another crop). These factors, for the group of countries concerned insugar trade, are essential to determining the possibilities of sustainability (andpossible growth) of individual productions. Also important areconsiderations as to the capacity to expand production and the several formsof subsidies used in international trade, particularly to this product.
In short, we can say that Brazil (Center-South) has maintained theworld’s lowest sugar production costs for many years, and is strongly insertedin international trade as an exporter (in fact, it accounts for 40% of the sugar
Chapter 11: Competitiveness of Brazil’s sugar cane agribusiness
193
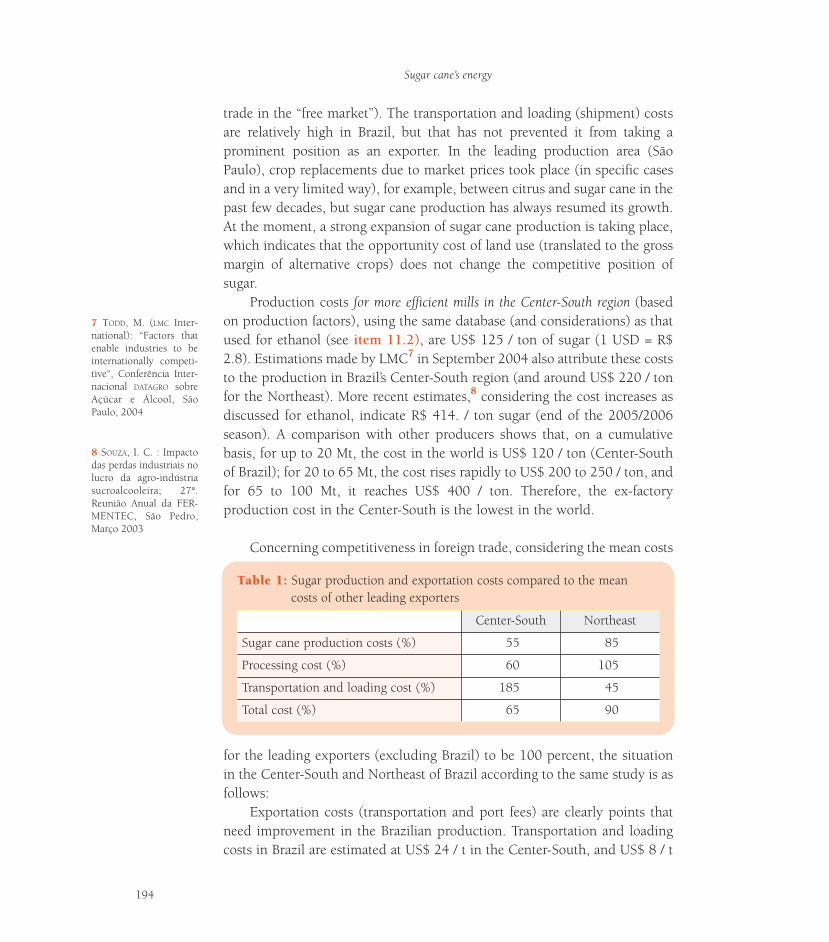
trade in the “free market”). The transportation and loading (shipment) costsare relatively high in Brazil, but that has not prevented it from taking aprominent position as an exporter. In the leading production area (SãoPaulo), crop replacements due to market prices took place (in specific casesand in a very limited way), for example, between citrus and sugar cane in thepast few decades, but sugar cane production has always resumed its growth.At the moment, a strong expansion of sugar cane production is taking place,which indicates that the opportunity cost of land use (translated to the grossmargin of alternative crops) does not change the competitive position ofsugar.
Production costs for more efficient mills in the Center-South region (basedon production factors), using the same database (and considerations) as thatused for ethanol (see item 11.2), are US$ 125 / ton of sugar (1 USD = R$2.8). Estimations made by LMC7 in September 2004 also attribute these coststo the production in Brazil’s Center-South region (and around US$ 220 / tonfor the Northeast). More recent estimates,8 considering the cost increases asdiscussed for ethanol, indicate R$ 414. / ton sugar (end of the 2005/2006season). A comparison with other producers shows that, on a cumulativebasis, for up to 20 Mt, the cost in the world is US$ 120 / ton (Center-Southof Brazil); for 20 to 65 Mt, the cost rises rapidly to US$ 200 to 250 / ton, andfor 65 to 100 Mt, it reaches US$ 400 / ton. Therefore, the ex-factoryproduction cost in the Center-South is the lowest in the world.
Concerning competitiveness in foreign trade, considering the mean costs
for the leading exporters (excluding Brazil) to be 100 percent, the situationin the Center-South and Northeast of Brazil according to the same study is asfollows:
Exportation costs (transportation and port fees) are clearly points thatneed improvement in the Brazilian production. Transportation and loadingcosts in Brazil are estimated at US$ 24 / t in the Center-South, and US$ 8 / t
Sugar cane’s energy
194
TTable 1:able 1: Sugar production and exportation costs compared to the mean costs of other leading exporters
Center-South Northeast
Sugar cane production costs (%) 55 85
Processing cost (%) 60 105
Transportation and loading cost (%) 185 45
Total cost (%) 65 90
7 TODD, M. (LMC Inter-national): “Factors thatenable industries to beinternationally competi-tive“, Conferência Inter-nacional DATAGRO sobreAçúcar e Álcool, SãoPaulo, 2004
8 SOUZA, I. C. : Impactodas perdas industriais nolucro da agro-indústriasucroalcooleira; 27ª.Reunião Anual da FER-MENTEC, São Pedro,Março 2003
in the Northeast, compared to US$ 9 / t in Australia, for example.Another fact to be considered in the context of international trade in sugar is
that there is practically no governmental policy-supported price in Brazil, which isa factor that reinforces the country’s competitiveness in a trade liberalizationscenario (as expected). The availability of suitable land for expansion in Brazil isalso much higher than in any other region in the world (see item 6.4).
11.4 The markets for the next few years
An evaluation of production sustainability in Brazil depends on theadditional production volumes considered, notwithstanding the enormousavailability of land for expansion. Many studies have focused on the future worlddemand for ethanol and sugar; the future is much clearer for sugar than forethanol. The following results sum up the current knowledge.
For the domestic sugar market, a recent analysis performed byDATAGRO
9considering the population and per capita consumption evolutionpoints to 11.4 Mt / year; including 1.4 Mt / year of sucrose for sucrose derivedproducts, the domestic demand for sugar is estimated at 12.8 Mt / year for 2013.
For the international sugar market, an analysis has been presented for a ten-year horizon covering ten regions around the world10 and anticipating for 2014 anincrease in exports from 45 to 71 Mt per year; Brazil would account for 40 percentof the world market (28 Mt / year). A more conservative position was presented atthe same time by DATAGRO a smaller expansion of the world market would takeBrazilian exports up to 20.9 Mt in 2013. The estimation by LMC is moreconservative as well (world demand of 170 Mt, 2014).
For Brazil’s domestic market in ethanol, the most significant new fact is thedramatic increase in demand that begins to take shape as result of the new bi-fuelcars coming into the market. The simulations conducted by DATAGRO using a mod-el developed by the Commission for Reexamination of the Energy Base indicatethat the demand for ethanol in 2013 (domestic market) would amount to 22.04Mm3, 9.4 Mm3 of which being of anhydrous ethanol, 11.54 Mm3 of hydrousethanol, and 1.10 Mm3 for other purposes. An evaluation made by the SectoralChamber of the Sugar and Ethanol Supply Chain11 points to a domestic demandof 16.9 Mm3 (2010) and 26.3 Mm3 (2015). More recent analyses12 confirm ahigher demand: production would reach 35.7 Mm3 ethanol in the 2012/13 sea-son, with 27.5 as fuel for the internal market. Cane supply would be 680 Mton,based on projects being implanted or in expansions of existing units (2006).
Fuel ethanol is expected to strongly expand its presence in many newregions of the world.13 As early as 2003, 13 countries in the five continents usedethanol as fuel component. Ethanol is used worldwide as a fuel, as an industri-
9 NASTARI, P.: “Projeçõesde demanda de açúcar eálcool no Brasil nomédio e longo prazos”,III Conferência Inter-nacional DATAGRO sobreAçúcar e Álcool, SãoPaulo, 2003
10 DRAKE, J. (CargillSugar): “The future oftrade flows in the WorldSugar Trade”, IIIConferência Inter-nacional DATAGRO sobreAçúcar e Álcool, SãoPaulo, 2003
11 Communication byLuiz C. CorreiaCarvalho, Min. Agri-cultura, 2004
Chapter 11: Competitiveness of Brazil’s sugar cane agribusiness
195
12 CARVALHO, E. P.;Formulação de umaestratégia para garantir oaumento da produção(UNICA); Seminário“Uma estratégia para oetanol brasileiro”, Rio deJaneiro, Nov 2006 ulton,L.; Hodges, A.: Biofuelsfor transport: an interna-tional perspective, IEA /EET, 2004
13 BERG, C.: “World FuelEthanol Analysis andOutlook”, F. O. Licht,2004
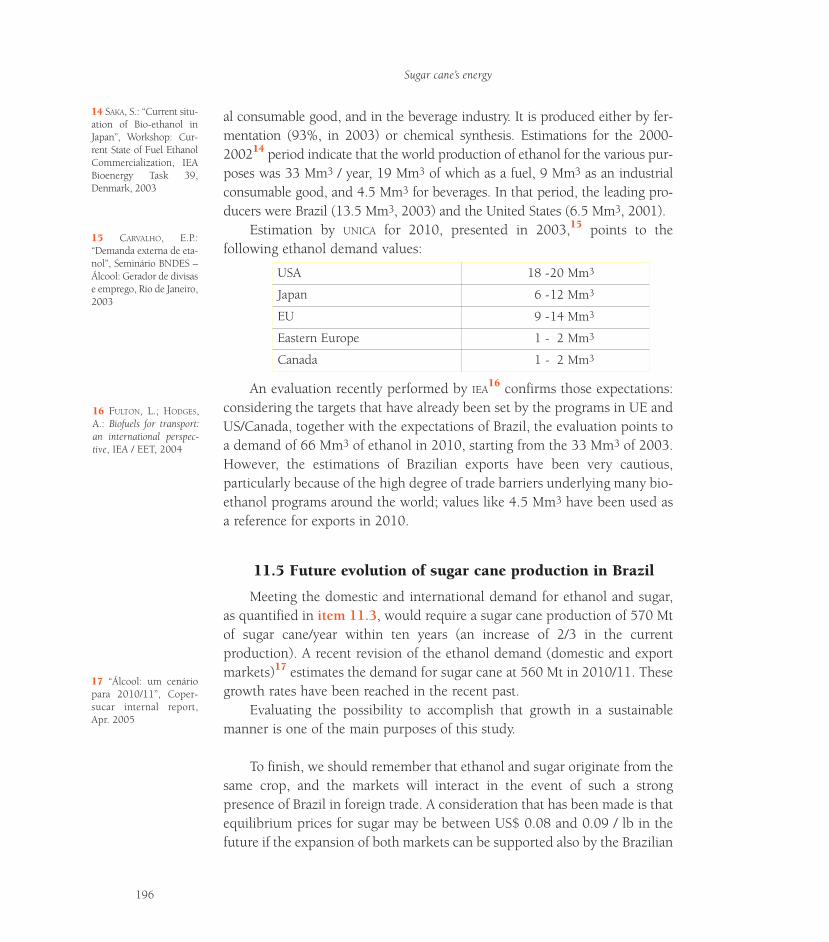
al consumable good, and in the beverage industry. It is produced either by fer-mentation (93%, in 2003) or chemical synthesis. Estimations for the 2000-200214 period indicate that the world production of ethanol for the various pur-poses was 33 Mm3 / year, 19 Mm3 of which as a fuel, 9 Mm3 as an industrialconsumable good, and 4.5 Mm3 for beverages. In that period, the leading pro-ducers were Brazil (13.5 Mm3, 2003) and the United States (6.5 Mm3, 2001).
Estimation by UNICA for 2010, presented in 2003,15 points to thefollowing ethanol demand values:
An evaluation recently performed by IEA16 confirms those expectations:
considering the targets that have already been set by the programs in UE andUS/Canada, together with the expectations of Brazil, the evaluation points toa demand of 66 Mm3 of ethanol in 2010, starting from the 33 Mm3 of 2003.However, the estimations of Brazilian exports have been very cautious,particularly because of the high degree of trade barriers underlying many bio-ethanol programs around the world; values like 4.5 Mm3 have been used asa reference for exports in 2010.
11.5 Future evolution of sugar cane production in Brazil
Meeting the domestic and international demand for ethanol and sugar,as quantified in item 11.3, would require a sugar cane production of 570 Mtof sugar cane/year within ten years (an increase of 2/3 in the currentproduction). A recent revision of the ethanol demand (domestic and exportmarkets)17 estimates the demand for sugar cane at 560 Mt in 2010/11. Thesegrowth rates have been reached in the recent past.
Evaluating the possibility to accomplish that growth in a sustainablemanner is one of the main purposes of this study.
To finish, we should remember that ethanol and sugar originate from thesame crop, and the markets will interact in the event of such a strongpresence of Brazil in foreign trade. A consideration that has been made is thatequilibrium prices for sugar may be between US$ 0.08 and 0.09 / lb in thefuture if the expansion of both markets can be supported also by the Brazilian
USA 18 -20 Mm3
Japan 6 -12 Mm3
EU 9 -14 Mm3
Eastern Europe 1 - 2 Mm3
Canada 1 - 2 Mm3
14 SAKA, S.: “Current situ-ation of Bio-ethanol inJapan”, Workshop: Cur-rent State of Fuel EthanolCommercialization, IEABioenergy Task 39,Denmark, 2003
15 CARVALHO, E.P.:“Demanda externa de eta-nol”, Seminário BNDES –Álcool: Gerador de divisase emprego, Rio de Janeiro,2003
16 FULTON, L.; HODGES,A.: Biofuels for transport:an international perspec-tive, IEA / EET, 2004
17 “Álcool: um cenáriopara 2010/11”, Coper-sucar internal report,Apr. 2005
Sugar cane’s energy
196
production. A final consideration refers to the subsidies to ethanol outside ofBrazil: subsidies and high import taxes cannot coexist with the formation ofa market in sustainable conditions.
11.6 Summary and conclusions
• The sugar cane products from the Center-South of Brazil do not relyon any price support mechanisms under governmental policies; there areno subsidies to sugar production or trade today.• Ethanol production cost (without taxes) in the Center-South mills wasestimated at R$ 647 / m3, which is highly competitive with internation-al gasoline costs. Ethanol production costs in Brazil are also lower thanthe costs for corn ethanol in the US or wheat and beet ethanol in Europe.• The ethanol cost reductions in Brazil since the program was introducedhave occurred on the back of advances in technology and managementand investments in infrastructure. A broader implementation of com-mercial technologies may further reduce costs in the Center-South, butthe best prospects relate to new technologies being developed. Theseinclude precision agriculture, new sugar cane and trash transportationsystems, and genetic modifications of sugar cane.• In addition, the production diversification will contribute to the rise incompetitiveness, as it did upon introduction of ethanol. Such diversifi-cation (in progress) includes the increase in the use of sucrose andethanol for new products, and the production of excess energy from sug-ar cane biomass in several ways (also in progress).• The sugar from the Center-South has had the world’s lowest produc-tion cost for many years now, amounting to R$ 410 / t. The world pro-duction cost is currently evaluated at US$ 120 / t, for up to 20 Mt (theproduction of Brazil’s Center-South region); for 20 Mt to 65 Mt, the costgoes up to US$ 200-250 / t; and for 65 Mt to 100 Mt, it rises to US$400 / t. The total sugar production and export cost in the Center-Southrepresents 65 percent of the mean cost of other exporters.• The high availability of adequate land for expansion and the absenceof governmental policy-supported prices in Brazil would allow evenmore competitiveness in a trade liberalization scenario (as expected).• Analyses of the ethanol and sugar markets point to a demand of 580Mt of sugar cane / year in Brazil for 2010 and 680 M tons for 2012/13.
Chapter 11: Competitiveness of Brazil’s sugar cane agribusiness
197
VVSocioeconomic impacts of the
sugar cane agribusiness
The socioeconomic importance of the industry in Brazil is widely knownand can be shown in several aspects. In Chapter 12, we analyze one of themost interesting aspects from a sustainability standpoint: job creation andincome. However, there are two points (among several others) that we shouldhighlight: the meaning of ethanol production for hard currency savings in thecountry; and the impact of the industry on the development of majorequipment manufacturers, which have an international projection today.
The replacement of gasoline with ethanol has saved an importantamount of foreign currency for Brazil. Computing the value of the replacedgasoline at its international market price, the imports avoided between 1976and 2004 represented savings of US$ 60.7 billion (at the exchange rate inDecember 2004). Considering interest on the foreign debt, the savingsamounted to 121.3 billion. For comparison, Brazil’s foreign currency reservesamounted to US$ 49.4 billion (October 2004), or just US$ 24.2 billion ifloans from the IMF are excluded.
The industry’s development required major advances frommanufacturers of equipment for both the agricultural and industrial sectors.The technological level of those manufacturers has been constantly upgraded,and some of them are world leaders in their segments. Domestically, thistranslates to job and income creation. Equipment for sugar and ethanolproduction and combined heat and power generation has now anationalization level of nearly 100 percent. They have grown since 1975 withthe National Alcohol Program (PNA), and in the 1990’s they recieved a greatboost from sugar exports, having now developed into more efficient systemsfor combined heat and power and full use of sugar cane energy. There havebeen several remarkable examples in this process. The pace at which theindustry has developed and implemented new solutions has led to the turn-key packages for the supply of distilleries and full combined heat and powersystems. In ten years, the main Brazilian suppliers produced around 200independent distilleries (and 200 corresponding combined cogeneration
199
plants), with a “historic” average of five plants per month. Consideringproduction “peaks”, the two leading manufacturers (Dedini and Zanini) haveproduced 96 milling systems in one year, and 81 distilleries per year; and anaverage of 63 boilers from 1973 until 1982. The leading manufacturer’s(Dedini, 80% of the equipment) accumulated experience has been acquiredin the course of a production of 726 distilleries (distillation units), 106 fullplants, 112 combined cogeneration plants, and 1,200 boilers, with 16 fulldistilleries in foreign countries.
The evolution in the industry’s business units, as it happens in thevarious other sectors of the economy, is leading companies to increasinglyaccept what is conventionally called “social responsibility” in the context oftheir business.
“Social responsibility” is a term used to describe business actions relatedto ethical values: compliance with the law and respect for people,communities and the environment. More specifically, it means businessunderstood as an integral part of society, contributing to its well-being bycaring about the social impacts of its policies and practices. This includes theimpacts of a specific business on the levels above and below its supply chain;and the impacts of voluntary business contributions on affectedcommunities.
Advances in this direction have intensified over the past few years,thereby consolidating principles, practices and systems for the businessworld and involving a growing number of companies. For example,principles are expressed in the responsibility extended to products,propositions about Factor 4 or Factor 10 in resource savings, and severalvoluntary codes of conduct. Practices include benchmarking, the GlobalReporting Initiative (GRI), several environmental accounting methods andenvironmental performance indicators, life-cycle evaluations, etc. Thesystems include audits, ISO 14001 EMS, quality management, etc. Inparticular, the GRI (UNEP/several countries) creates an economic, social andenvironmental reporting structure in order to raise sustainability reportsaround the world to the level of financial reports.
In Chapter 12, we include a description of São Paulo-based companiesin this context, although the subject is not limited to employmentrelationships.
Sugar cane’s energy
200
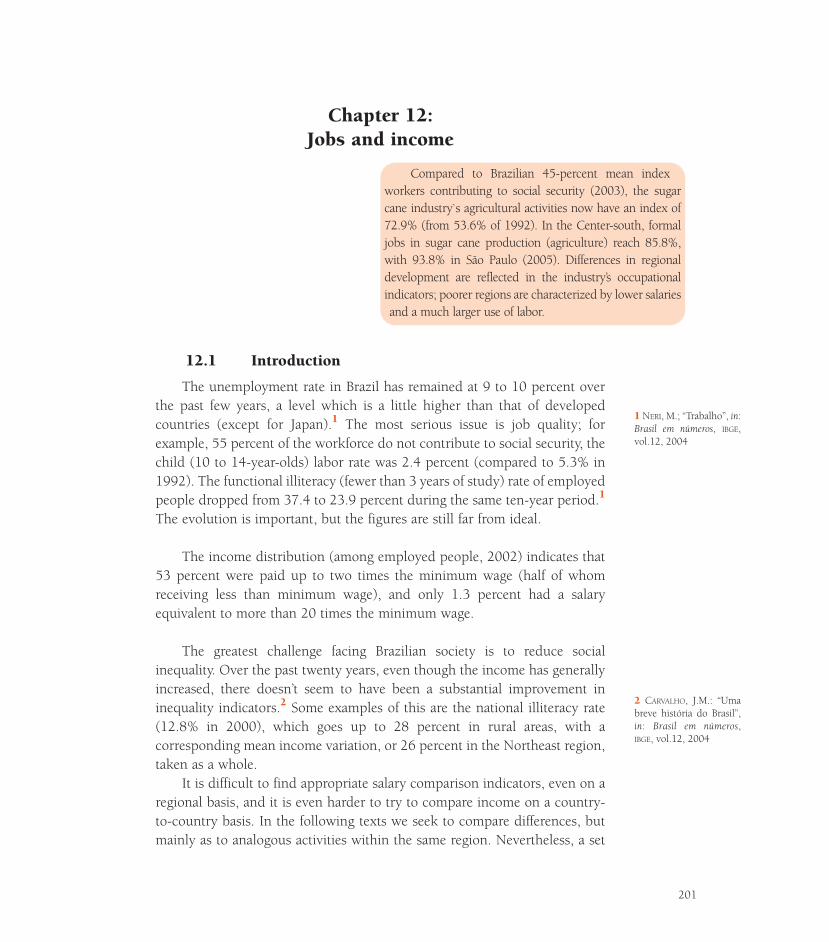
Chapter 12: Jobs and income
12.1 Introduction
The unemployment rate in Brazil has remained at 9 to 10 percent overthe past few years, a level which is a little higher than that of developedcountries (except for Japan).1 The most serious issue is job quality; forexample, 55 percent of the workforce do not contribute to social security, thechild (10 to 14-year-olds) labor rate was 2.4 percent (compared to 5.3% in1992). The functional illiteracy (fewer than 3 years of study) rate of employedpeople dropped from 37.4 to 23.9 percent during the same ten-year period.1
The evolution is important, but the figures are still far from ideal.
The income distribution (among employed people, 2002) indicates that53 percent were paid up to two times the minimum wage (half of whomreceiving less than minimum wage), and only 1.3 percent had a salaryequivalent to more than 20 times the minimum wage.
The greatest challenge facing Brazilian society is to reduce socialinequality. Over the past twenty years, even though the income has generallyincreased, there doesn’t seem to have been a substantial improvement ininequality indicators.2 Some examples of this are the national illiteracy rate(12.8% in 2000), which goes up to 28 percent in rural areas, with acorresponding mean income variation, or 26 percent in the Northeast region,taken as a whole.
It is difficult to find appropriate salary comparison indicators, even on aregional basis, and it is even harder to try to compare income on a country-to-country basis. In the following texts we seek to compare differences, butmainly as to analogous activities within the same region. Nevertheless, a set
1 NERI, M.; “Trabalho”, in:Brasil em números, IBGE,vol.12, 2004
2 CARVALHO, J.M.: “Umabreve história do Brasil”,in: Brasil em números,IBGE, vol.12, 2004
201
Compared to Brazilian 45-percent mean indexworkers contributing to social security (2003), the sugarcane industry`s agricultural activities now have an index of72.9% (from 53.6% of 1992). In the Center-south, formaljobs in sugar cane production (agriculture) reach 85.8%,with 93.8% in São Paulo (2005). Differences in regionaldevelopment are reflected in the industry’s occupationalindicators; poorer regions are characterized by lower salariesand a much larger use of labor.
of data in respect of Brazil’s and some of the selected countries’ economies isshown below, as adjusted for Purchasing Power Parity (PPP).
According to international references,3 in 2002 Brazil had a GrossDomestic Product of US$ 1.34 trillion (PPP: Purchasing Power Parity) andper capita income of US$ 7,600 (also in PPP). In legal tender, the GDPamounted to US$ 450 billion, and the per capita income US$ 2,630. Themean exchange rate for that year was R$ 2.912/US$ 1. For reference, stillusing values in PPP, the Gross Domestic Product of the United States was US$10.4 trillion, with per capita income of US$ 37,600.
In 2000, the per capita GDP (PPP) was US$ (PPP) 7,744 in Brazil, US$23,917 in Germany, US$ 22,876 in Italy, US$ 9,661 in Poland, US$ 11,062in Hungary, US$ 7,414 in Turkey, US$ 5,795 in Colombia, and US$ 6,715 inThailand.
Measurements by the Gini coefficient (the coefficient ranges from zero toone; the larger the income distribution inequality, the higher the coefficient)are more inaccurate and scattered; the same source points to 0.607 in Brazil(1998), 0.567 in Chile (1998), and 0.456 in the United States (1994).
Utilization of the several countries’ official minimum wages as a referencefor the salaries paid is impaired by the fact that such official minimum wages donot correspond to the same functional definition, and do not follow thedefinitions set for each country either, in many cases. Some of the distortions inthe case of Brazil are analyzed in paper prepared by IPEA,4 which concludes thatthere was (1996) a great difference to the international standards.
Sugar and ethanol agribusiness complex andindependent sugar cane growers
In Brazil, unlike most countries, sugar cane is used to produce sugar,ethanol and several other products. This makes the valuation of the raw mate-rial a unique process in the world, given the need to create a measurement unitcapable of translating the obtention of several products from the same source.That unit, the ATR (Total Recoverable Sugars, in Portuguese), is used in Brazilto regulate the sugar cane market.
The sugar cane may be owned by industrial units or independent growers,or produced by the industry in leased land. On average, the value of sugar cane(as an input) corresponds to 58.5 percent of the income from agribusiness end-product sales. São Paulo State has the largest concentration of independent grow-
3 The World Factbook2003, site:www.bartleby.com/151/
Sugar cane’s energy
202
4 BARROS, R.P.; FOGUEL,M.; GARCIA, G.;MENDONÇA, R.: “O níveldo salário mínimo noBrasil frente à evidênciainternacional”, IPEA, 1996
ers, with the actual market for raw material reaching 25 percent of the total; sug-ar cane is grown on approximately 11,000 agricultural properties.
Since the 1998/99 crop, the business relationship between the sugar andethanol agribusiness complex and independent sugar cane growers has been gov-erned by a joint self-management model. The new system has replaced one thatconsisted of pricing by the Federal Government, and is based on the quality of rawmaterials and the market price obtained for the end-products (sugar and ethanol).
The computation basis is the quantity of ATRs (Total Recoverable Sugars)contained in each ton of raw material, which are used in sugar and ethanolproduction. The ATR value is determined by analyzing the sucrose (sugar) con-tent, the fiber content, purity of the sugar cane and the losses in the sugar andethanol production processes. The price obtained for the end-products in themarket is monitored by an independent organization.
The end price paid to producers is determined by a parametric model thatforms the basis for individual negotiations between mills and sugar cane grow-ers from the various regions. This model is not static and is constantly reviewedby the parties of a specific organization created by producers. In São PauloState, that organization is called the Council of Sugar Cane, Sugar and EthanolProducers, or CONSECANA-SP, which has a joint self-management coordinationconsisting of members of the industries and growers.
12.2 Labor legislation in Brazil and its application to thesugar and ethanol industry
Elimara Aparecida Assad SallumAssad Sallum Advogados Associados, Campinas, SP
12.2.1 Brazilian labor legislation and union organization
Brazil’s labor legislation consists of countless rules set forth in the FederalConstitution, Complementary Laws, Laws, Executive Laws, OIT Conventions(ratified by Brazil), Provisional Measures, Decrees, Ordinances, Instructions,Administrative and Regulatory Rules.
The union organization is governed by the same rules and based on twoconstitutional principles: a) free labor or trade association, which precludesthe Public Power from interfering with or intervening in the unionorganization; b) unity, which prohibits the creation of more than one union,on any level, to represent one professional or economy category in the sameterritorial base. Employers and workers are represented by only one trade orlabor union, federation and/or confederation.
Chapter 12: Jobs and income
203
12.2.2 Governing legislation
The Federal Constitution, articles 1 and 2, provides for the fundamentalprinciples of the Federative Republic of Brazil, which are based on theDemocratic Rule of Law, sovereignty, citizenship, human dignity, the socialvalues of work and free enterprise, and political pluralism.
Articles 3 and 4 provide for the fundamental objectives and principlesthat govern the Federative Republic. Article 5 sets forth the fundamentalrights and assurances of Brazilian citizens.
They are followed by Section II, which provides for Social Rights, aslisted below:
Art. 6 Social rightsArt. 7 Rights of urban and rural workers, comprising 34 itemsArt. 8 Freedom of labor or trade unionsArt. 9 Right to strikeArt. 10 Workers and employers’ right to take part in the
government agencies where their business or socialsecurity rights are subject to discussion
Art. 11 Employee representation for companies having morethan 200 employees
Finally, there is article 10 in the Transitory Constitutional Provisions section,which addresses termination made arbitrarily or without cause, tenure of theemployee elected for a board office at CIPA (Internal Commission for AccidentPrevention), tenure of pregnant employees, period of maternity/paternity leave,and payment of contributions to support rural union activities.
Right under the Constitution, there is also the Labor Code (CLT) whichprovides the basis of Brazil’s labor legislation and governs the followingaspects, among other matters:
- General and Special Labor Protection Rules- Special Provisions on Employment Term and Conditions- Labor Nationalization- Woman, Child and Adolescent Labor Protection- Individual Employment Agreement- Union Organization- Collective Bargaining ConventionsEven though rural and urban labor are equalized by the Constitution (article
7, Federal Constitution), rural labor is still governed by Law no. 5,889/73 andDecree no. 73,626/74. It is worth remembering that article 4, sole paragraph, ofthe Decree lists the articles of the CLT that are applicable to rural labor.
Sugar cane’s energy
204
The Norma Regulamentadora 31 (Health and Safety for the work inAgriculture, Pasture, Forest products and Aquaculture) is considered one ofthe most advanced worldwide with respect to safety and comfort for the ruralworker
Also applicable to the industry are other rules arising out of the capital-labor relationships, such as, for example: Law no. 605/49 (Weekly HolidayPay); and Law 8,036/90 (Worker Dismissal Fund).
12.2.3 Union organization
Employer and employee representation in sugar and ethanol industry setforth in the table referred to in article 577 of the CLT:
1st Group – Food Industries (sugar production)10th Group – Chemical and Pharmaceutical Industries (ethanol
production) In rural areas, sugar cane suppliers and agribusiness companies (related to
the industries) are represented by rural trade unions and the State Federationof Agriculture. The workers are represented by Workers/Rural EmployeesUnions and/or by the local State Workers/Rural Employees Federations.
Despite the unity principle, the Brazilian legislation accepts representation by“differentiated categories.” In theory, such categories exist on account of thepeculiarities involving certain groups of employees, such as drivers, for example.
12.2.4 Collective rules
The law allows the parties to set up collective rules. Today, such rules couldbe summed up in a Collective Work Convention (Employers Union vs. LaborUnion), and a Collective Work Agreement (Companies x Labor Union).
Such rules must be filed with the Labor Stations, Labor Sub-Deparmentsor Regional Labor Departments, and may be effective for up to 2 years.
On the category’s reference date, salary clauses are determined by the freenegotiation criterion, as well as social clauses. Refusal to negotiate orimpossibility to enter into a Collective Work Convention/Agreement may leadthe parties to commence a collective labor dispute (by the latest labor rules,provided that the parties commence the dispute by mutual agreement).
Collective rules are “complementary” in their nature, and the clausessubject to negotiation cannot prevail over the legislation. If there are two rules(convention or agreement for the same employee or employer categories)effective for the same period, the rule setting the most beneficial conditions tothe worker must prevail.
Chapter 12: Jobs and income
205
In this respect, it is worth pointing out that there is a lot of doctrinal andjurisprudential divergence as to the criterion to be adopted for analyzing the rulemost beneficial to the worker. One stream of law interpretation thinks that the onlythe conflicting clause (or aspect) should be evaluated. The other thinks that suchanalysis should not be limited to a given conflicting clause (or aspect). Therefore,the rule to be regarded as the most beneficial is that which altogether provides forthe most favorable conditions to the worker (principle known as “conglobamento”).
12.2.5 Collective bargaining in São Paulo’ssugar and ethanol industry
1. Sugar mills with distillery additions are represented in São Paulo State bythe São Paulo State Sugar Industry’s Union. Their employees are represented by30 Food Industry Labor Unions for São Paulo State and by the Food IndustryWorkers’ Federation for São Paulo State.
On the reference date for the category (May 1st), a Collective WorkConvention is signed by the aforementioned parties. As a rule, such Conventionis effective from May 1st to April 30 of the subsequent year, and provides for therules for mill employees, such as the salary floor for the category, salaryadjustments, and other social clauses.
Recently, parallel with the Collective Convention, a large number ofcompanies have been entering into Collective Bargaining Agreements directlywith the labor union for their region. Such agreements aim at providing for therules applicable to the peculiarities of these companies for that same period (fromMay 1st until April 30 of the subsequent year).
Because of this new reality, the Collective Convention entered into at thestate level began to expressly confirm the Collective Bargaining Agreementssigned directly by the companies and the regional labor unions.
2. Ethanol distilleries are represented by the Ethanol Manufacturers’ TradeUnion for São Paulo State. Their employees are represented by 11 Chemicaland Pharmaceutical Industry’s Labor Unions for São Paulo State and by theChemical and Pharmaceutical Industry’s Federation for the State of São Paulo.
On the reference date for the category (May 1st), the EthanolManufacturers’ Trade Union for São Paulo State and the Federation of theChemical and Pharmaceutical Industry’s Workers for São Paulo State sign adocument ensuring that the reference date is May 1st and providing that thecollective bargaining agreements shall be concluded on a company-to-company/region-to-region basis.
The structure of those agreements is basically identical to that ofagreements between mills and food industry labor unions.
Sugar cane’s energy
206
3. On the reference date, i.e. May 1st, the Sugar Industry’s Trade Unionfor São Paulo State and the Ethanol Manufacturer’s Trade Union for São PauloState, as consenting parties (representing industry-related AgriculturalCompanies), sign the Collective Bargaining Convention entered into at thestate level between, on the one hand, the Federation of Agriculture for SãoPaulo State and the rural trade unions, as representatives of the relatedagricultural companies and/or suppliers, and, on the other hand, the ruralworkers’ labor unions.
Such rules replicate the basic structure of the collective rules applicableto mills and distilleries.
There are also conventions entered into by the rural trade union directlywith the labor union for the region, as well as agreements entered into by theagricultural companies related to the mills and/or distilleries directly with thelabor union.
Said conventions and agreements are specific to the sugar cane industrydue to the creation, in 1984, of the “Grupo Cana”, or Cane Group, withreference date on May 1st, which provided for specific rules, to wit: floorsalary; compensation of the “bituqueiros” (workers in charge of catching thesugar cane that falls from trucks); salary adjustments; value of one ton ofsugar cane for 18 months; and other specific points and social clauses.
In the rural area in the rural area, UNICA – União da Agro-indústriaCanavieira do Estado de São Paulo and FERAESP – Federação dos EmpregadosRurais Assalariados do Estado de São Paulo established a protocol (February2006) aiming at improving the work relations in the sector, analysing andproposing the best practices
Finally, said collective rules usually contemplate the provision of benefitsthat vary from company to company, including: medical, dental, hearing andpharmaceutical care; life insurance; meals; food basket (food that meetsminimum nutritional requirements set by the government); food andtransportation stamps; private pension plans; disease and funeral allowances;education allowances; breakfast; Christmas baskets (packages containing theseason’s typical foods); agreements with supermarkets; loans; subsidizedsales; and access to credit cooperatives.
Chapter 12: Jobs and income
207
12.3 Jobs and income in the agribusiness in the1980’s and 90’s
12.3.1 Production system in the sugar cane industry
The sugar cane industry’s production system in Brazil consisted of a largenumber of industrial units (> 350) with production areas ranging from 5,000to 50,000 hectares. Such scale is much smaller if we take into considerationthat the sugar cane is supplied by a group of dozens of thousands of growers,not to mention the mill owners’ own growing areas; in 1986, the supply byoutside growers represented 38 percent of the mills’ total sugar cane.5 Thatshare was reduced a little less than 30 percent over fifty years, and is growingagain in some regions.
Another relevant characteristic in terms of job creation and the quality ofsuch jobs in the industry is the seasonal pattern of the agricultural operation; theweather and agronomical conditions for sugar cane limit the harvesting period(the most labor-intensive operation) to six or seven months a year in Brazil. Thelevel of technology used in agriculture determines the relative demand for laborin the two periods, i.e. harvesting and in-between-harvest cycles. Greatdifferences (high “seasonal index,” defined as the “labor in the harvestingperiod/labor in between harvest cycles” ratio) imply more temporary labor and,as a result, low salaries. This is a universal problem in agriculture.
Since two thirds of the end cost of sugar cane products (ethanol and sugar)correspond to the sugar cane cost, which is strongly dependent on the labor cost,most of the jobs in the industry are similar those in other agricultural segments inBrazil. Employment levels, job creation cost, salaries, employment relationshipsand job quality are always compared with those of “other crops” for the largeportion of sugar cane production employees and, in sugar cane processing, withthose of similar industrial segments (chemistry, fuel processing, foods).
In the early 1990’s,6, 7 a mean rate of 21 to 24 percent of total sugar canecost (including land, capital costs, and all other fixed and variable costs)corresponded to direct labor costs and social taxes. Including processingcosts for ethanol (and also capital, marketing and other costs), the directlabor costs would reach 20 to 25 percent of the ethanol costs; labor inagriculture corresponded to more than 60 percent of the total labor cost.
In both cases (industry and agriculture), the number and quality of jobswere strongly dependent on the level of technology used, and there weresubstantial regional differences in Brazil. Therefore, from the employmentstandpoint, the sugar cane agribusiness can be said to have essentially
Sugar cane’s energy
208
7 Fundação Getúlio Var-gas: “Sistema Custo/Preço– Álcool hidratado”, SãoPaulo, 1994
6 GOLDEMBERG, J.; MONA-CO, L.; MACEDO, I.: “TheBrazilian fuel-alcoholprogram”, in: Renewableenergy sources for fuels andelectricity, Island Press,1993
5 BORGES, J.M.M.: “TheBrazilian alcohol program:Foundations, results, per-spectives, energy”, 1990,Sources 12, pp.451-461
consisted since that time of a large group of agribusiness units that are similarto food production units, but very different than the energy (fuel) productionsectors: it has much larger number of employees per energy unit produced,much lower job creation costs, a much wider job diversification, and a muchmore decentralized production.
12.3.2 Context: labor market in Brazil, 1980’s and 90’s
The official unemployment levels were low in Brazil8; the mean rate forthe 1980’s was 5 percent (minimum of 3% in 1989, and maximum of 8% in1981). However, it was easy to realize that disguised unemployment washigh: in 1988, 44 percent of the workers in agriculture, 6 percent in theindustry, and 15 percent in services were paid less than one official minimumwage (reference), i.e. US$ 53 / month at that time. Only 20 percent of theworkers in the industrial and service sectors and 5 percent of the workers inagriculture had salaries in excess of US$ 265/month. There were importantregional differences: among the leading sugar cane growing regions (SãoPaulo, 66%; Northeast, 20%), salaries were much higher in São Paulo. All ofthese values (including the official minimum wage) are different today.
Brazil’s family income distribution in 1988 indicated that 36.1% of thefamilies were paid less than US$ 106 / month, 67.3% had an income of lessthan US$ 265 / month, and 94.3% received less than US$ 1,060 / month.
12.3.3 Jobs and income in the sugar cane industry
We can sum up the data for two periods: the late 1980’s, and the secondhalf of the 1990’s. They will then be compared by a detailed analysis of thecurrent situation in items 12.4 and 12.5.
In the early 1990’s in São Paulo9 (with the highest technology level andaround 60% of the country’s production), around 30% of all workers werespecialized (agricultural supervision and industrial operations), 10% had amedium level of specialization (tractor operators and drivers, for example), and theremaining 60% had no specialization (sugar cane planting and harvesting; otherindustrial jobs). For every 1 M t of sugar cane, there were 2,200 direct jobs (1,600in sugar cane production, and 600 in processing), while indirect jobs (a limitedview: equipment manufacturing and maintenance, chemicals and otherconsumables only) were estimated at 30% of the number of direct ones. Therefore,the sugar cane industry employed a total of 380,000 people in São Paulo.
Estimations for Brazil would consider a much more intensive use of laborper production unit in the Northeast; in some cases, three times as much. Thetotals were estimated10 at 800,000 direct jobs and 250,000 indirect jobs in 1990.
Chapter 12: Jobs and income
209
9 BORGES, J.M.: “Theeffect on labor and socialissues of electricity salesin the Brazilian sugarcane industry”, Pro-ceedings of theInternational Conferenceon Energy from SugarCane, Hawaii, WinrockInternational, 1991
10 MAGALHÃES, J.;MACHADO, R.; KUPER-MANN, N.: Políticaseconômicas, emprego e dis-tribuição de renda naAmérica Latina, Rio deJaneiro, Editora Vozes,1991
8 BORGES, J.M.: “Geraçãode empregos na agro-indústria canavieira”, in:Desenvolvimento em har-monia com o meio ambi-ente, Rio de Janeiro,F.B.C.N., 1992
These are impressive figures per se, but it also important to point out thesystem’s capacity to create jobs in a large number of places, therebydecentralizing income generation. In 1991, there were ethanol distilleries in357 Brazilian municipalities (8% of all municipalities); the potential impact ofthe jobs in this industry compared to the total jobs in those municipalities was15.6 percent, on average, reaching 28 percent in the Center-West region.
There were strong regional differences that reflected in the sugar caneindustry (jobs/production unit, salaries and job quality), and technology wasusually the balancing factor for the system. As the most important example, thecompetition for workers among the various sectors of the economy in São Paulo,in the case of sugar cane harvesting, resulted in higher salaries, better workingconditions, and a much lower number of jobs (more efficient harvesting workersand, of course, higher degree of mechanical harvesting). In industrial operations,greater automation, productivity and conversion efficiency also led to a smallernumber of jobs, a higher degree of specialization, and higher salaries.
A study conducted in the mid 1980’s by the University of São Paulo11 in15 towns in the largest sugar cane growing areas pointed to local populationgrowth in all cases, and reversal of the trend towards migration to large urbancenters in most cases. The positive impacts (jobs, taxes resulting ininfrastructure improvements) were substantial in the Center-South, butrelatively smaller in other regions.
In São Paulo, non-specialized workers (sugar cane cutters) would have amean income of US$ 140/month. In the context of the Brazilian economy atthat time, such income was higher than that of 86 percent of agriculturalworkers, 46 percent of industrial workers, and 56 percent of the workers inthe service sector. The family income of those workers (sugar cane cutters)was estimated9 at US$ 220 / month, annual average; which was higher thanthe income of 50 percent of all Brazilian families. On the other hand, theseasonal index would result in US$ 280 / month in the harvesting period, andonly US$ 160 / month in between harvesting cycles.
The seasonal index for sugar cane crops was estimated at 2.2 in the late1970’s12; coffee, with an index of 2.0, was the only major culture to be in abetter situation in São Paulo. Several factors contributed to reducing thatcoefficient in the 1980’s and 90’s, including utilization of the same personnelfor soil conservation and maintenance tasks in between harvesting cycles,and a strong decrease in harvesting labor requirements due to the expansionof mechanical harvesting. Estimations in the late 1980’s9 pointed to aseasonal index of 1.8, while in the 1990’s several mills had an mean index of1.3.13 This is a clear trend, and it is now considered that most agricultural
9 see p. 209
Sugar cane’s energy
210
12 AIAA – Assoc. Indús-trias de Açúcar e Álcool,SP: “Açúcar e álcool:Energia para um cresci-mento econômico auto-sustentado”, São Paulo,DATAGRO, 1991
13 MARQUES, J.C.: Privatecommunication, eco-nomic consultant toCopersucar, São Paulo,1995
11 JOHNSON, B.; WRIGHT,T.: “Impactos comu-nitários do Proálcool”,Report to STI-MIC, FEA-USP, 1983
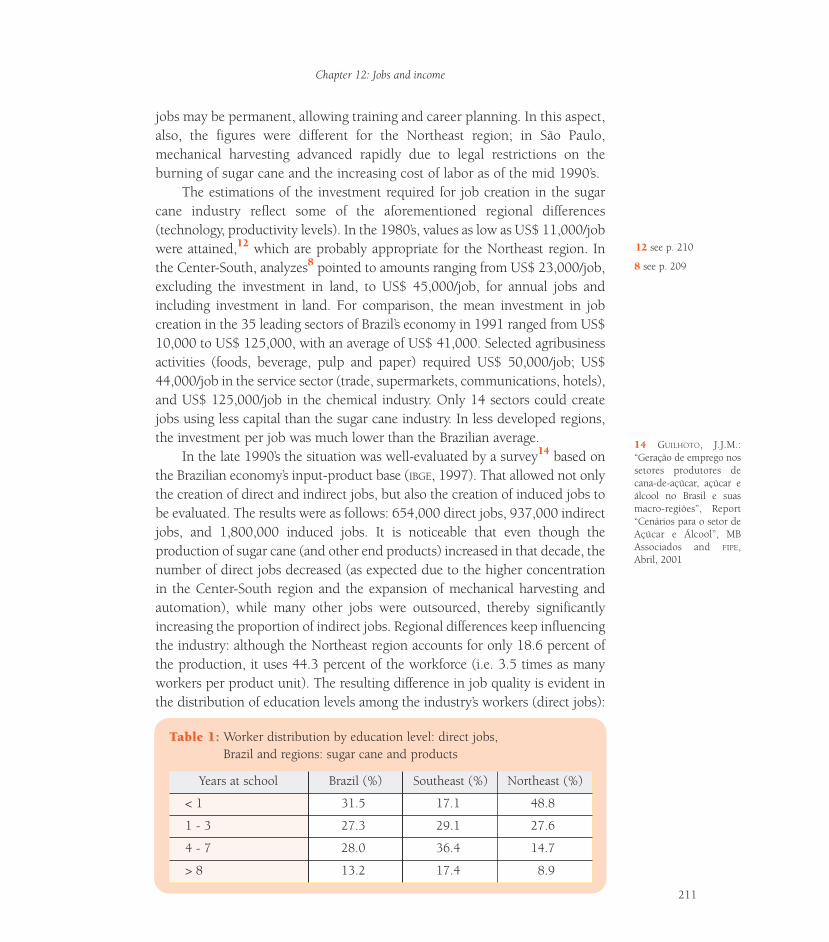
jobs may be permanent, allowing training and career planning. In this aspect,also, the figures were different for the Northeast region; in São Paulo,mechanical harvesting advanced rapidly due to legal restrictions on theburning of sugar cane and the increasing cost of labor as of the mid 1990’s.
The estimations of the investment required for job creation in the sugarcane industry reflect some of the aforementioned regional differences(technology, productivity levels). In the 1980’s, values as low as US$ 11,000/jobwere attained,12 which are probably appropriate for the Northeast region. Inthe Center-South, analyzes8 pointed to amounts ranging from US$ 23,000/job,excluding the investment in land, to US$ 45,000/job, for annual jobs andincluding investment in land. For comparison, the mean investment in jobcreation in the 35 leading sectors of Brazil’s economy in 1991 ranged from US$10,000 to US$ 125,000, with an average of US$ 41,000. Selected agribusinessactivities (foods, beverage, pulp and paper) required US$ 50,000/job; US$44,000/job in the service sector (trade, supermarkets, communications, hotels),and US$ 125,000/job in the chemical industry. Only 14 sectors could createjobs using less capital than the sugar cane industry. In less developed regions,the investment per job was much lower than the Brazilian average.
In the late 1990’s the situation was well-evaluated by a survey14 based onthe Brazilian economy’s input-product base (IBGE, 1997). That allowed not onlythe creation of direct and indirect jobs, but also the creation of induced jobs tobe evaluated. The results were as follows: 654,000 direct jobs, 937,000 indirectjobs, and 1,800,000 induced jobs. It is noticeable that even though theproduction of sugar cane (and other end products) increased in that decade, thenumber of direct jobs decreased (as expected due to the higher concentrationin the Center-South region and the expansion of mechanical harvesting andautomation), while many other jobs were outsourced, thereby significantlyincreasing the proportion of indirect jobs. Regional differences keep influencingthe industry: although the Northeast region accounts for only 18.6 percent ofthe production, it uses 44.3 percent of the workforce (i.e. 3.5 times as manyworkers per product unit). The resulting difference in job quality is evident inthe distribution of education levels among the industry’s workers (direct jobs):
Chapter 12: Jobs and income
211
14 GUILHOTO, J.J.M.:“Geração de emprego nossetores produtores decana-de-açúcar, açúcar eálcool no Brasil e suasmacro-regiões”, Report“Cenários para o setor deAçúcar e Álcool”, MBAssociados and FIPE,Abril, 2001
8 see p. 209
12 see p. 210
TTable 1:able 1: Worker distribution by education level: direct jobs,Brazil and regions: sugar cane and products
Years at school Brazil (%) Southeast (%) Northeast (%)
< 1 31.5 17.1 48.8
1 - 3 27.3 29.1 27.6
4 - 7 28.0 36.4 14.7
> 8 13.2 17.4 8.9
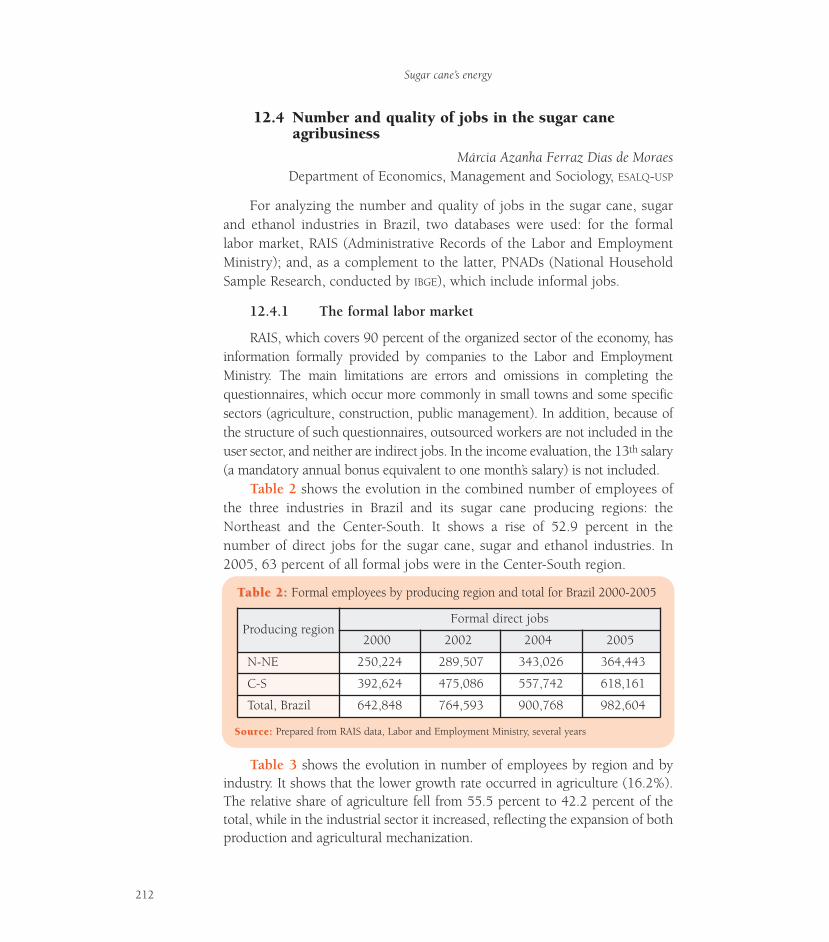
12.4 Number and quality of jobs in the sugar caneagribusiness
Márcia Azanha Ferraz Dias de MoraesDepartment of Economics, Management and Sociology, ESALQ-USP
For analyzing the number and quality of jobs in the sugar cane, sugarand ethanol industries in Brazil, two databases were used: for the formallabor market, RAIS (Administrative Records of the Labor and EmploymentMinistry); and, as a complement to the latter, PNADs (National HouseholdSample Research, conducted by IBGE), which include informal jobs.
12.4.1 The formal labor market
RAIS, which covers 90 percent of the organized sector of the economy, hasinformation formally provided by companies to the Labor and EmploymentMinistry. The main limitations are errors and omissions in completing thequestionnaires, which occur more commonly in small towns and some specificsectors (agriculture, construction, public management). In addition, because ofthe structure of such questionnaires, outsourced workers are not included in theuser sector, and neither are indirect jobs. In the income evaluation, the 13th salary(a mandatory annual bonus equivalent to one month’s salary) is not included.
Table 2 shows the evolution in the combined number of employees ofthe three industries in Brazil and its sugar cane producing regions: theNortheast and the Center-South. It shows a rise of 52.9 percent in thenumber of direct jobs for the sugar cane, sugar and ethanol industries. In2005, 63 percent of all formal jobs were in the Center-South region.
Table 3 shows the evolution in number of employees by region and byindustry. It shows that the lower growth rate occurred in agriculture (16.2%).The relative share of agriculture fell from 55.5 percent to 42.2 percent of thetotal, while in the industrial sector it increased, reflecting the expansion of bothproduction and agricultural mechanization.
Sugar cane’s energy
212
TTable 2:able 2: Formal employees by producing region and total for Brazil 2000-2005
SourSource:ce: Prepared from RAIS data, Labor and Employment Ministry, several years
Producing regionFormal direct jobs
2000 2002 2004 2005
N-NE 250,224 289,507 343,026 364,443
C-S 392,624 475,086 557,742 618,161
Total, Brazil 642,848 764,593 900,768 982,604
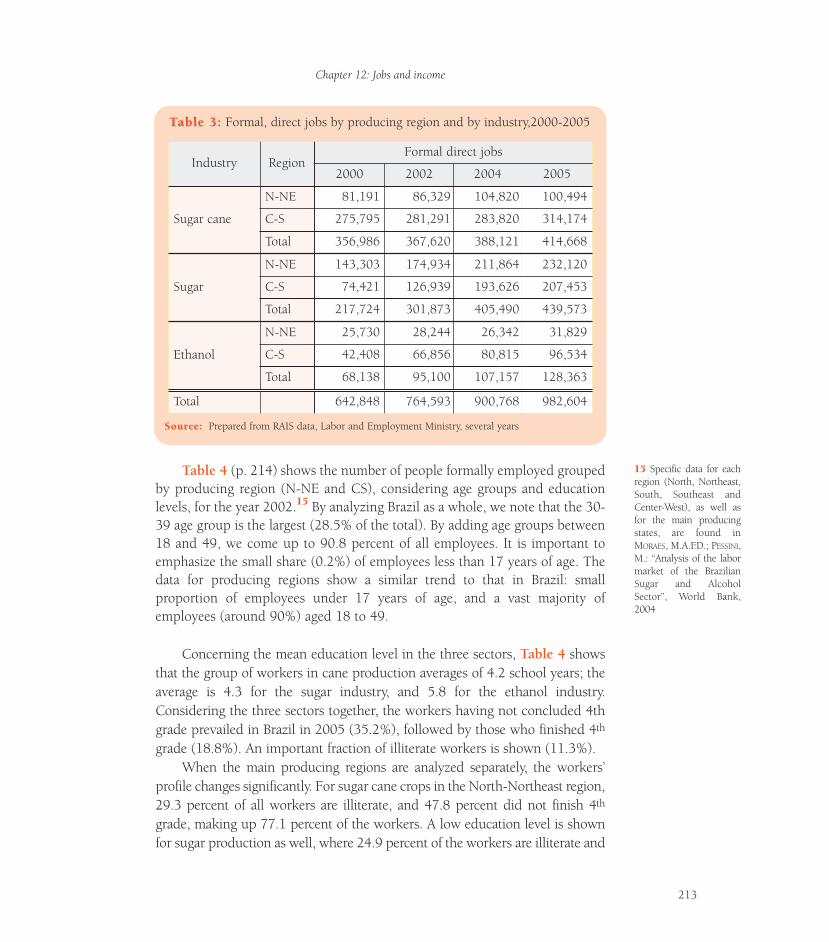
Table 4 (p. 214) shows the number of people formally employed groupedby producing region (N-NE and CS), considering age groups and educationlevels, for the year 2002.15 By analyzing Brazil as a whole, we note that the 30-39 age group is the largest (28.5% of the total). By adding age groups between18 and 49, we come up to 90.8 percent of all employees. It is important toemphasize the small share (0.2%) of employees less than 17 years of age. Thedata for producing regions show a similar trend to that in Brazil: smallproportion of employees under 17 years of age, and a vast majority ofemployees (around 90%) aged 18 to 49.
Concerning the mean education level in the three sectors, Table 4 showsthat the group of workers in cane production averages of 4.2 school years; theaverage is 4.3 for the sugar industry, and 5.8 for the ethanol industry.Considering the three sectors together, the workers having not concluded 4thgrade prevailed in Brazil in 2005 (35.2%), followed by those who finished 4th
grade (18.8%). An important fraction of illiterate workers is shown (11.3%).When the main producing regions are analyzed separately, the workers’
profile changes significantly. For sugar cane crops in the North-Northeast region,29.3 percent of all workers are illiterate, and 47.8 percent did not finish 4th
grade, making up 77.1 percent of the workers. A low education level is shownfor sugar production as well, where 24.9 percent of the workers are illiterate and
Chapter 12: Jobs and income
213
TTable 3:able 3: Formal, direct jobs by producing region and by industry,2000-2005
SourSource:ce: Prepared from RAIS data, Labor and Employment Ministry, several years
15 Specific data for eachregion (North, Northeast,South, Southeast andCenter-West), as well asfor the main producingstates, are found inMORAES, M.A.F.D.; PESSINI,M.: “Analysis of the labormarket of the BrazilianSugar and AlcoholSector”, World Bank,2004
Industry Region Formal direct jobs
2000 2002 2004 2005
Sugar cane
N-NE 81,191 86,329 104,820 100,494
C-S 275,795 281,291 283,820 314,174
Total 356,986 367,620 388,121 414,668
Sugar
N-NE 143,303 174,934 211,864 232,120
C-S 74,421 126,939 193,626 207,453
Total 217,724 301,873 405,490 439,573
Ethanol
N-NE 25,730 28,244 26,342 31,829
C-S 42,408 66,856 80,815 96,534
Total 68,138 95,100 107,157 128,363
Total 642,848 764,593 900,768 982,604
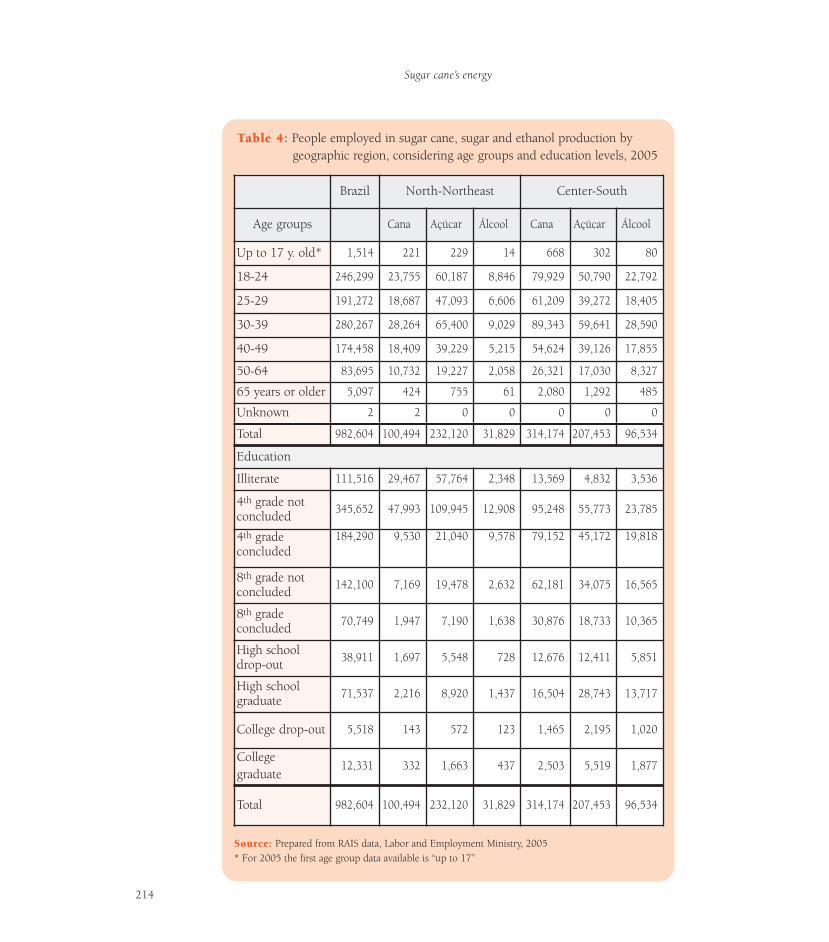
Sugar cane’s energy
214
TTable 4:able 4: People employed in sugar cane, sugar and ethanol production bygeographic region, considering age groups and education levels, 2005
SourSource:ce: Prepared from RAIS data, Labor and Employment Ministry, 2005* For 2005 the first age group data available is “up to 17”
Brazil North-Northeast Center-South
Age groups Cana Açúcar Álcool Cana Açúcar Álcool
Up to 17 y. old* 1,514 221 229 14 668 302 80
18-24 246,299 23,755 60,187 8,846 79,929 50,790 22,792
25-29 191,272 18,687 47,093 6,606 61,209 39,272 18,405
30-39 280,267 28,264 65,400 9,029 89,343 59,641 28,590
40-49 174,458 18,409 39,229 5,215 54,624 39,126 17,855
50-64 83,695 10,732 19,227 2,058 26,321 17,030 8,327
65 years or older 5,097 424 755 61 2,080 1,292 485
Unknown 2 2 0 0 0 0 0
Total 982,604 100,494 232,120 31,829 314,174 207,453 96,534
Education
Illiterate 111,516 29,467 57,764 2,348 13,569 4,832 3,536
4th grade notconcluded 345,652 47,993 109,945 12,908 95,248 55,773 23,785
4th gradeconcluded
184,290 9,530 21,040 9,578 79,152 45,172 19,818
8th grade notconcluded 142,100 7,169 19,478 2,632 62,181 34,075 16,565
8th gradeconcluded 70,749 1,947 7,190 1,638 30,876 18,733 10,365
High schooldrop-out 38,911 1,697 5,548 728 12,676 12,411 5,851
High schoolgraduate 71,537 2,216 8,920 1,437 16,504 28,743 13,717
College drop-out 5,518 143 572 123 1,465 2,195 1,020
Collegegraduate
12,331 332 1,663 437 2,503 5,519 1,877
Total 982,604 100,494 232,120 31,829 314,174 207,453 96,534
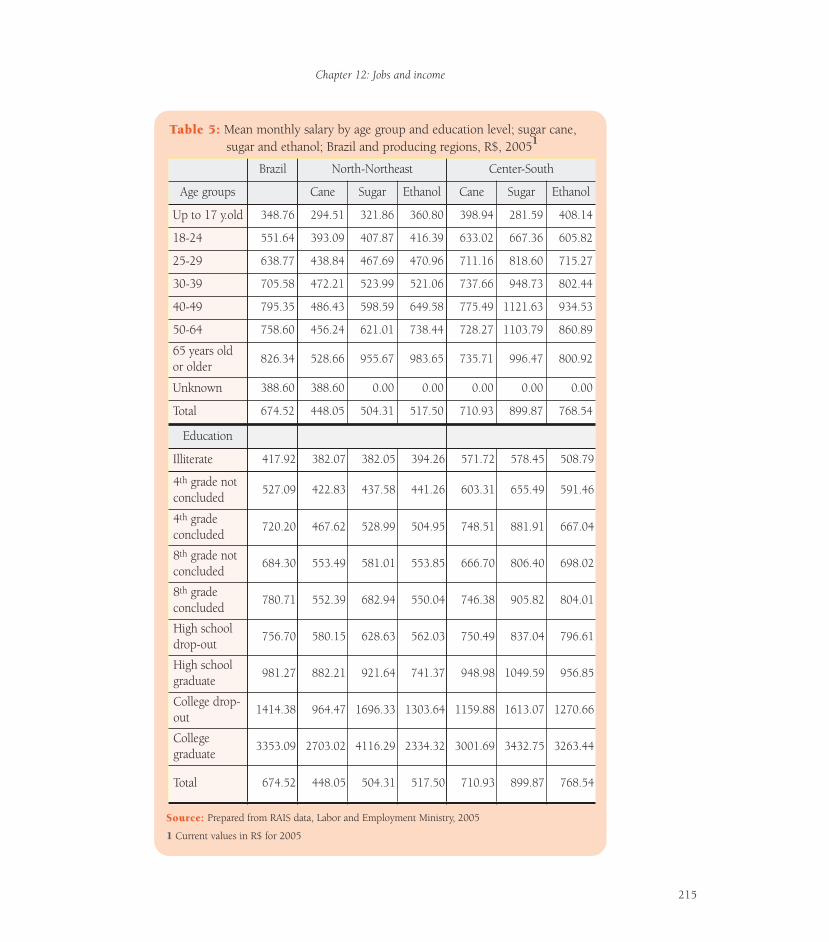
Chapter 12: Jobs and income
215
TTable 5:able 5: Mean monthly salary by age group and education level; sugar cane,sugar and ethanol; Brazil and producing regions, R$, 20051
SourSource:ce: Prepared from RAIS data, Labor and Employment Ministry, 2005
1 Current values in R$ for 2005
Brazil North-Northeast Center-South
Age groups Cane Sugar Ethanol Cane Sugar Ethanol
Up to 17 y.old 348.76 294.51 321.86 360.80 398.94 281.59 408.14
18-24 551.64 393.09 407.87 416.39 633.02 667.36 605.82
25-29 638.77 438.84 467.69 470.96 711.16 818.60 715.27
30-39 705.58 472.21 523.99 521.06 737.66 948.73 802.44
40-49 795.35 486.43 598.59 649.58 775.49 1121.63 934.53
50-64 758.60 456.24 621.01 738.44 728.27 1103.79 860.89
65 years oldor older
826.34 528.66 955.67 983.65 735.71 996.47 800.92
Unknown 388.60 388.60 0.00 0.00 0.00 0.00 0.00
Total 674.52 448.05 504.31 517.50 710.93 899.87 768.54
Education
Illiterate 417.92 382.07 382.05 394.26 571.72 578.45 508.79
4th grade notconcluded
527.09 422.83 437.58 441.26 603.31 655.49 591.46
4th gradeconcluded
720.20 467.62 528.99 504.95 748.51 881.91 667.04
8th grade notconcluded
684.30 553.49 581.01 553.85 666.70 806.40 698.02
8th gradeconcluded
780.71 552.39 682.94 550.04 746.38 905.82 804.01
High schooldrop-out
756.70 580.15 628.63 562.03 750.49 837.04 796.61
High schoolgraduate
981.27 882.21 921.64 741.37 948.98 1049.59 956.85
College drop-out
1414.38 964.47 1696.33 1303.64 1159.88 1613.07 1270.66
Collegegraduate
3353.09 2703.02 4116.29 2334.32 3001.69 3432.75 3263.44
Total 674.52 448.05 504.31 517.50 710.93 899.87 768.54
47.4 percent did not graduate from 4th grade (72.3% of all workers). Thesituation is better in ethanol production, but the low education level stillprevails: 7.4 percent are illiterate and 40.6 percent did not conclude 4th grade.
In turn, the Center-South region has the best education indicators: in thesugar cane culture, 4.3 percent of the workers are illiterate and 30.3 percentdid not conclude 4th grade (totaling 34.7 percent of all workers); in sugarproduction, 2.3 percent are illiterate and 26.9 percent did not finish 4th
grade; and in ethanol production, 3.7 percent are illiterate and 26.9 percentfailed to graduate from 4th grade.
The compensation of formal employees of the sugar cane, sugar andethanol industries (2005) is shown in Table 5 (p. 213).
The mean monthly salary (2005) for all three sectors in Brazil was R$674.52.
Considering the regions separately, the mean monthly salary for thesugar industry in the N-NE region was R$ 504.31, whereas for the Center-South region it was R$ 899.07 (78.4% higher); in the ethanol industry, themean salary was R$ 517.50 in the former region, and R$ 768.54 in theCenter-South region (48.5% higher); the lowest mean salary was found in thesugar cane culture, for which it amounted to R$ 448.05 in the North-Northeast and R$ 710.93 in the Center-South region (58.7% higher). Asexpected, there is a positive correlation between education level and income.
12.4.2 Inclusion of the informal labor market: PNAD
To consider both formal and informal jobs, we used the data from theNational Household Sample Survey (PNAD) conducted by the BrazilianInstitute of Geography and Statistics (IBGE). The PNAD and RAIS data are notdirectly comparable, as they result from different collection methodologies;the RAIS is a census of the formal labor market, and the relevant questionnaireis completed by the employer, whereas PNAD interviews are at the employee’shome. In this case, the analysis unit is the business establishment, and theanswers to the interview refer to the business establishment’s main activity.Considering the peculiarities of each database, the collected variables usuallyshow the same trends, and PNAD is very useful to evaluating the level ofinformal jobs, which is not detected by RAIS.
Table 6 shows the evolution of the number of employees in the sugar caneindustry from 1992 to 2005. During such period, it shows that there was adecrease in number of employees of approximately 23 percent, which is partlydue to the expansion of mechanical harvesting in sugar cane crops. It also showsthat proportion of permanent and temporary employees was reasonably stable,
Sugar cane’s energy
216
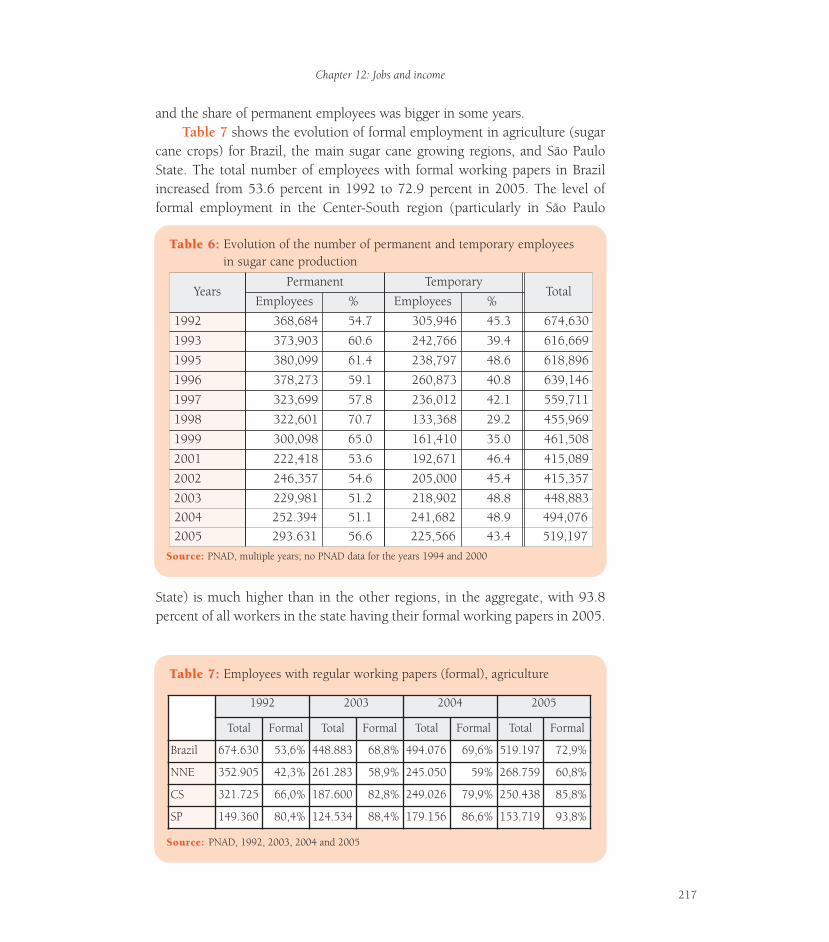
and the share of permanent employees was bigger in some years.Table 7 shows the evolution of formal employment in agriculture (sugar
cane crops) for Brazil, the main sugar cane growing regions, and São PauloState. The total number of employees with formal working papers in Brazilincreased from 53.6 percent in 1992 to 72.9 percent in 2005. The level offormal employment in the Center-South region (particularly in São Paulo
Chapter 12: Jobs and income
217
TTable 6:able 6: Evolution of the number of permanent and temporary employeesin sugar cane production
SourSource:ce: PNAD, multiple years; no PNAD data for the years 1994 and 2000
YearsPermanent Temporary
TotalEmployees % Employees %
1992 368,684 54.7 305,946 45.3 674,630
1993 373,903 60.6 242,766 39.4 616,669
1995 380,099 61.4 238,797 48.6 618,896
1996 378,273 59.1 260,873 40.8 639,146
1997 323,699 57.8 236,012 42.1 559,711
1998 322,601 70.7 133,368 29.2 455,969
1999 300,098 65.0 161,410 35.0 461,508
2001 222,418 53.6 192,671 46.4 415,089
2002 246,357 54.6 205,000 45.4 415,357
2003 229,981 51.2 218,902 48.8 448,8832004 252.394 51.1 241,682 48.9 494,0762005 293.631 56.6 225,566 43.4 519,197
TTable 7:able 7: Employees with regular working papers (formal), agriculture
SourSource: ce: PNAD, 1992, 2003, 2004 and 2005
1992 2003 2004 2005
Total Formal Total Formal Total Formal Total Formal
Brazil 674.630 53,6% 448.883 68,8% 494.076 69,6% 519.197 72,9%
NNE 352.905 42,3% 261.283 58,9% 245.050 59% 268.759 60,8%
CS 321.725 66,0% 187.600 82,8% 249.026 79,9% 250.438 85,8%
SP 149.360 80,4% 124.534 88,4% 179.156 86,6% 153.719 93,8%
State) is much higher than in the other regions, in the aggregate, with 93.8percent of all workers in the state having their formal working papers in 2005.
12.5 Income of people engaged in Brazil’s sugar caneagribusiness
Rodolfo HoffmannInstitute of Economics, UNICAMP
12.5.1 Introduction
The analysis of income distribution for people engaged in the mainactivity of sugar cane cropping, sugar production and/or ethanol production16
is summarized in this paper. The group formed by everyone in these activitiesis considered, but with an emphasis on those who are actually employed(wage earners). The analysis is based on data from the National HouseholdSample Survey (PNAD) of 2005, as provided by IBGE. All statistical analysestake into account the expansion factor associated with each sampleobservation, as provided by IBGE. The income of people employed in the sugarcane business is compared to the income of those employed in other crops(rice, soybean, coffee, etc.). The analysis considers Brazil as a whole, and thecontrast between the North-Northeast and the Center-South, which anemphasis on São Paulo State. The PNAD data allow no consideration of“migrating” workers separately.
It is important to point out that the income information is understated inthe PNADs. A comparison of previous PNADs with the income informationobtained by the National Accounts shows that the income stated in the formercorrespond to around 60 percent of the correct value. The degree ofunderstatement is likely to be higher for higher incomes, causing the PNAD (orDemographic Census) data to underestimate the existing degree of inequality.
12.5.2 The income of people engaged in the agribusiness:sugar cane culture and sugar and ethanol industries
The mean income of employed people all over Brazil in 2005, groupedby sector (agriculture, industry, and services), is shown in Table 8. ThePNAD analysis refers to 53 million private homes, with 180 million people;the per capita household income was R$ 436 (on average), with a medianincome of R$ 238 and Gini coefficient of 0.567.
Table 9 shows the main income distribution characteristics for people engagedin the sugar cane culture, the sugar industry, the ethanol industry, and three moreaggregated industrial fields: foods and beverages (including sugar), fuels (coke, oilrefining, nuclear fuels, and alcohol production), and the chemical industry.
Sugar cane (agricultural production) displays the lowest wages and low
Sugar cane’s energy
218
16 HOFFMANN, R.:“Rendimento e pobrezaurbana, rural e na culturada cana-de-açúcar”,Workshop: Mercado detrabalho, Setor Açúcar eÁlcool: desafios atuais eperspectivas futuras,ESALQ-USP, 2004
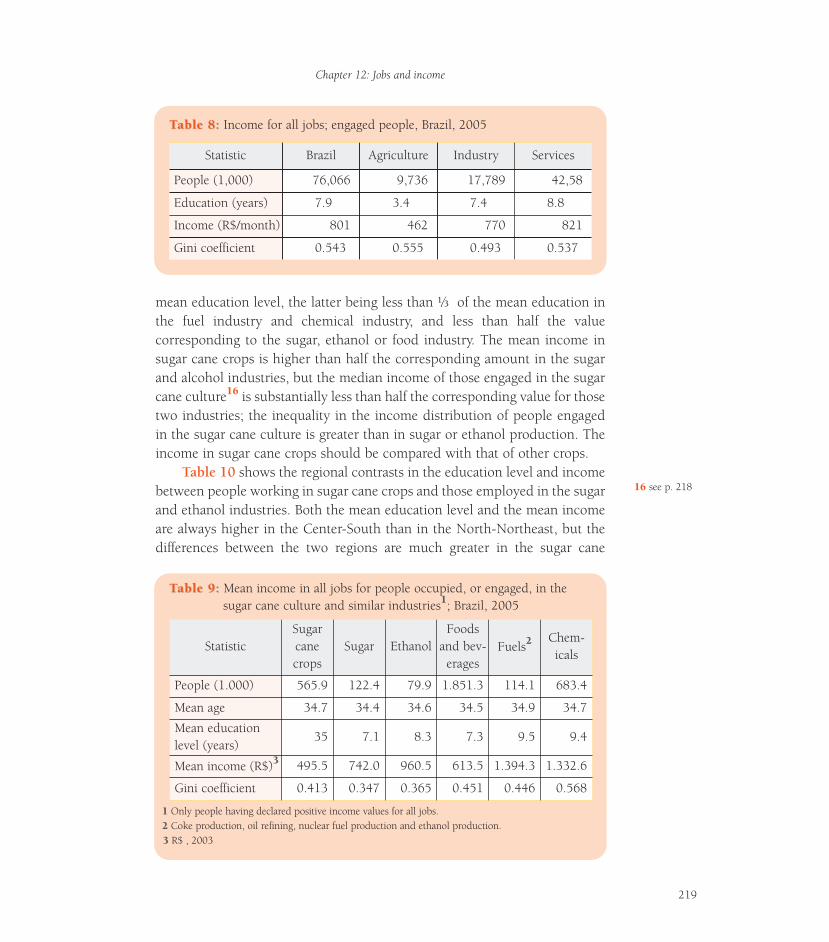
mean education level, the latter being less than Å of the mean education inthe fuel industry and chemical industry, and less than half the valuecorresponding to the sugar, ethanol or food industry. The mean income insugar cane crops is higher than half the corresponding amount in the sugarand alcohol industries, but the median income of those engaged in the sugarcane culture16 is substantially less than half the corresponding value for thosetwo industries; the inequality in the income distribution of people engagedin the sugar cane culture is greater than in sugar or ethanol production. Theincome in sugar cane crops should be compared with that of other crops.
Table 10 shows the regional contrasts in the education level and incomebetween people working in sugar cane crops and those employed in the sugarand ethanol industries. Both the mean education level and the mean incomeare always higher in the Center-South than in the North-Northeast, but thedifferences between the two regions are much greater in the sugar cane
16 see p. 218
Chapter 12: Jobs and income
219
TTable 8:able 8: Income for all jobs; engaged people, Brazil, 2005
Statistic Brazil Agriculture Industry Services
People (1,000) 76,066 9,736 17,789 42,58
Education (years) 7.9 3.4 7.4 8.8
Income (R$/month) 801 462 770 821
Gini coefficient 0.543 0.555 0.493 0.537
TTable 9:able 9: Mean income in all jobs for people occupied, or engaged, in thesugar cane culture and similar industries1; Brazil, 2005
1 Only people having declared positive income values for all jobs.2 Coke production, oil refining, nuclear fuel production and ethanol production.3 R$ , 2003
StatisticSugarcanecrops
Sugar EthanolFoods
and bev-erages
Fuels2 Chem-icals
People (1.000) 565.9 122.4 79.9 1.851.3 114.1 683.4
Mean age 34.7 34.4 34.6 34.5 34.9 34.7
Mean educationlevel (years)
35 7.1 8.3 7.3 9.5 9.4
Mean income (R$)3 495.5 742.0 960.5 613.5 1.394.3 1.332.6
Gini coefficient 0.413 0.347 0.365 0.451 0.446 0.568
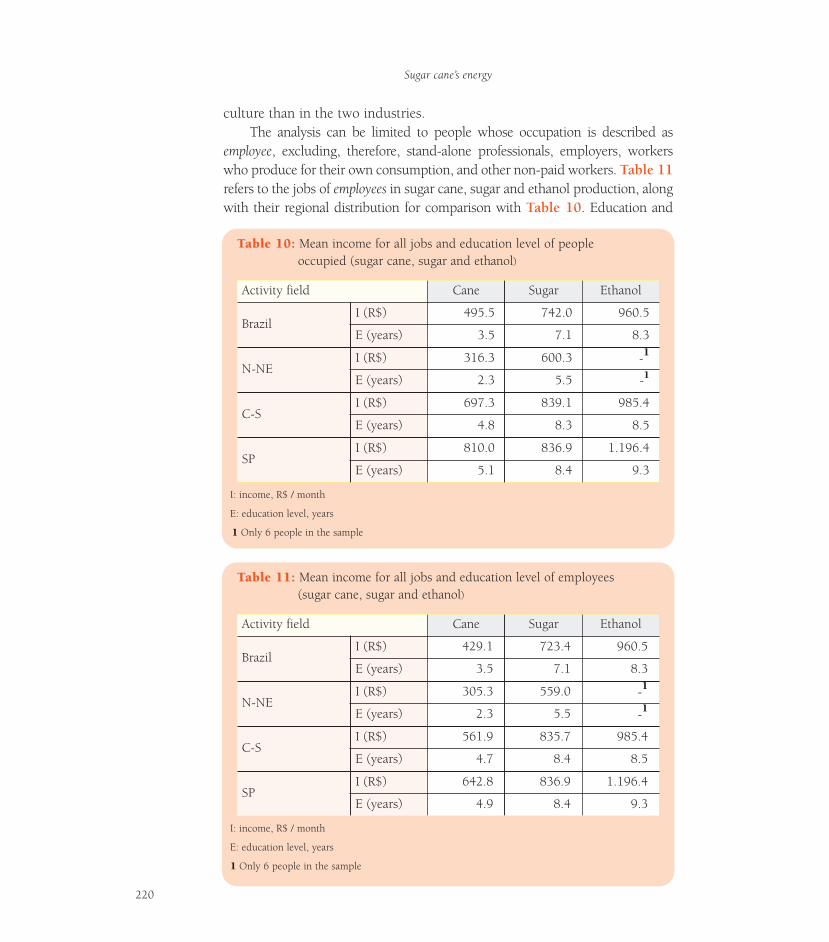
culture than in the two industries.The analysis can be limited to people whose occupation is described as
employee, excluding, therefore, stand-alone professionals, employers, workerswho produce for their own consumption, and other non-paid workers. Table 11refers to the jobs of employees in sugar cane, sugar and ethanol production, alongwith their regional distribution for comparison with Table 10. Education and
Sugar cane’s energy
220
TTable 11:able 11: Mean income for all jobs and education level of employees(sugar cane, sugar and ethanol)
I: income, R$ / month
E: education level, years
1 Only 6 people in the sample
Activity field Cane Sugar Ethanol
BrazilI (R$) 429.1 723.4 960.5
E (years) 3.5 7.1 8.3
N-NEI (R$) 305.3 559.0 -1
E (years) 2.3 5.5 -1
C-SI (R$) 561.9 835.7 985.4
E (years) 4.7 8.4 8.5
SPI (R$) 642.8 836.9 1.196.4
E (years) 4.9 8.4 9.3
TTable 10:able 10: Mean income for all jobs and education level of peopleoccupied (sugar cane, sugar and ethanol)
I: income, R$ / month
E: education level, years
1 Only 6 people in the sample
Activity field Cane Sugar Ethanol
BrazilI (R$) 495.5 742.0 960.5
E (years) 3.5 7.1 8.3
N-NEI (R$) 316.3 600.3 -1
E (years) 2.3 5.5 -1
C-SI (R$) 697.3 839.1 985.4
E (years) 4.8 8.3 8.5
SPI (R$) 810.0 836.9 1.196.4
E (years) 5.1 8.4 9.3
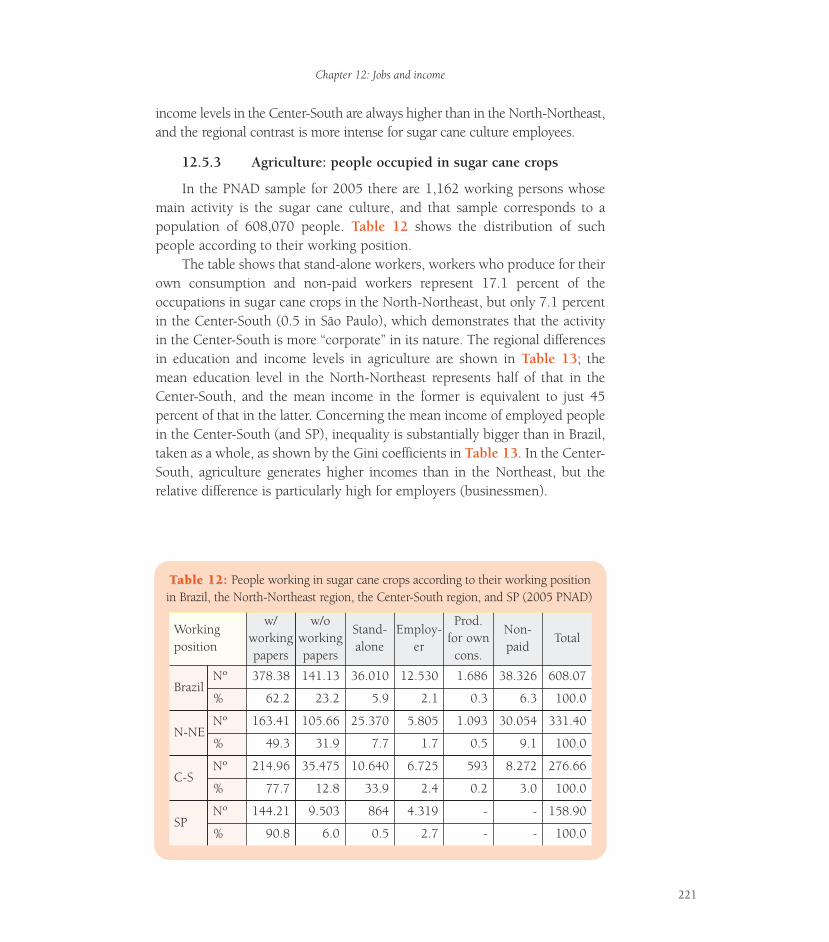
income levels in the Center-South are always higher than in the North-Northeast,and the regional contrast is more intense for sugar cane culture employees.
12.5.3 Agriculture: people occupied in sugar cane crops
In the PNAD sample for 2005 there are 1,162 working persons whosemain activity is the sugar cane culture, and that sample corresponds to apopulation of 608,070 people. Table 12 shows the distribution of suchpeople according to their working position.
The table shows that stand-alone workers, workers who produce for theirown consumption and non-paid workers represent 17.1 percent of theoccupations in sugar cane crops in the North-Northeast, but only 7.1 percentin the Center-South (0.5 in São Paulo), which demonstrates that the activityin the Center-South is more “corporate” in its nature. The regional differencesin education and income levels in agriculture are shown in Table 13; themean education level in the North-Northeast represents half of that in theCenter-South, and the mean income in the former is equivalent to just 45percent of that in the latter. Concerning the mean income of employed peoplein the Center-South (and SP), inequality is substantially bigger than in Brazil,taken as a whole, as shown by the Gini coefficients in Table 13. In the Center-South, agriculture generates higher incomes than in the Northeast, but therelative difference is particularly high for employers (businessmen).
Chapter 12: Jobs and income
221
TTable 12:able 12: People working in sugar cane crops according to their working positionin Brazil, the North-Northeast region, the Center-South region, and SP (2005 PNAD)
Workingposition
w/workingpapers
w/oworkingpapers
Stand-alone
Employ-er
Prod.for own
cons.
Non-paid
Total
BrazilNº 378.38 141.13 36.010 12.530 1.686 38.326 608.07
% 62.2 23.2 5.9 2.1 0.3 6.3 100.0
N-NENº 163.41 105.66 25.370 5.805 1.093 30.054 331.40
% 49.3 31.9 7.7 1.7 0.5 9.1 100.0
C-SNº 214.96 35.475 10.640 6.725 593 8.272 276.66
% 77.7 12.8 33.9 2.4 0.2 3.0 100.0
SPNº 144.21 9.503 864 4.319 - - 158.90
% 90.8 6.0 0.5 2.7 - - 100.0
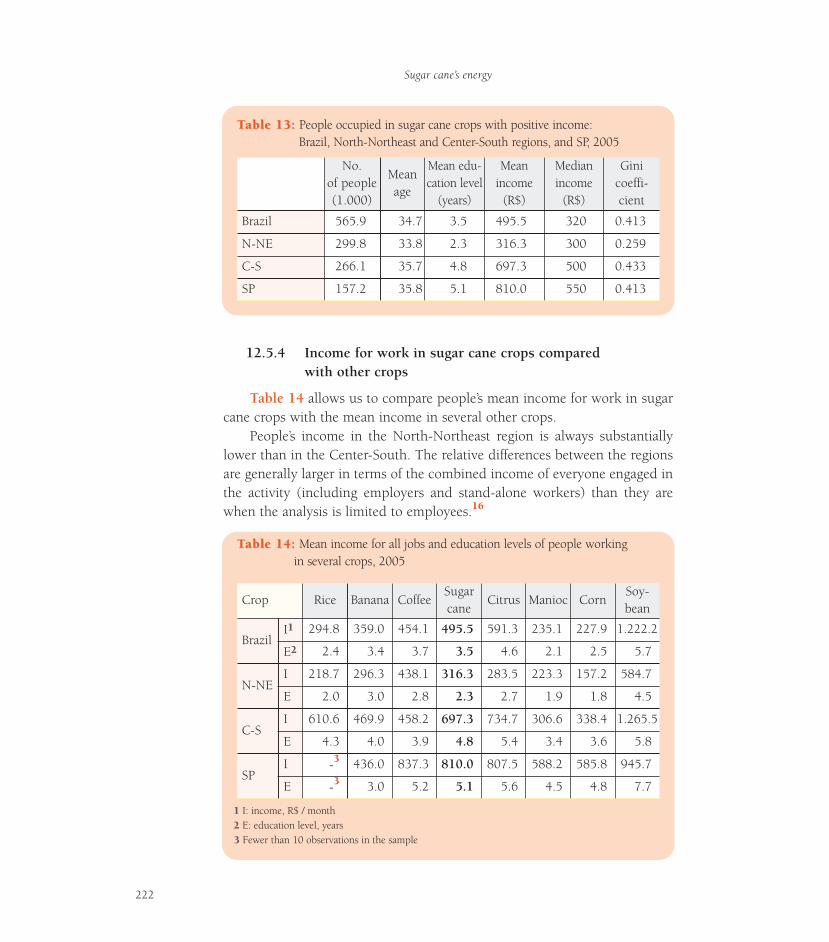
12.5.4 Income for work in sugar cane crops comparedwith other crops
Table 14 allows us to compare people’s mean income for work in sugarcane crops with the mean income in several other crops.
People’s income in the North-Northeast region is always substantiallylower than in the Center-South. The relative differences between the regionsare generally larger in terms of the combined income of everyone engaged inthe activity (including employers and stand-alone workers) than they arewhen the analysis is limited to employees.16
Sugar cane’s energy
222
TTable 14:able 14: Mean income for all jobs and education levels of people workingin several crops, 2005
1 I: income, R$ / month2 E: education level, years3 Fewer than 10 observations in the sample
Crop Rice Banana CoffeeSugarcane
Citrus Manioc CornSoy-bean
BrazilI1 294.8 359.0 454.1 495.5 591.3 235.1 227.9 1.222.2
E2 2.4 3.4 3.7 3.5 4.6 2.1 2.5 5.7
N-NEI 218.7 296.3 438.1 316.3 283.5 223.3 157.2 584.7
E 2.0 3.0 2.8 2.3 2.7 1.9 1.8 4.5
C-SI 610.6 469.9 458.2 697.3 734.7 306.6 338.4 1.265.5
E 4.3 4.0 3.9 4.8 5.4 3.4 3.6 5.8
SPI -3 436.0 837.3 810.0 807.5 588.2 585.8 945.7
E -3 3.0 5.2 5.1 5.6 4.5 4.8 7.7
TTable 13:able 13: People occupied in sugar cane crops with positive income:Brazil, North-Northeast and Center-South regions, and SP, 2005
No.of people(1.000)
Meanage
Mean edu-cation level
(years)
Meanincome
(R$)
Medianincome
(R$)
Ginicoeffi-cient
Brazil 565.9 34.7 3.5 495.5 320 0.413
N-NE 299.8 33.8 2.3 316.3 300 0.259
C-S 266.1 35.7 4.8 697.3 500 0.433
SP 157.2 35.8 5.1 810.0 550 0.413
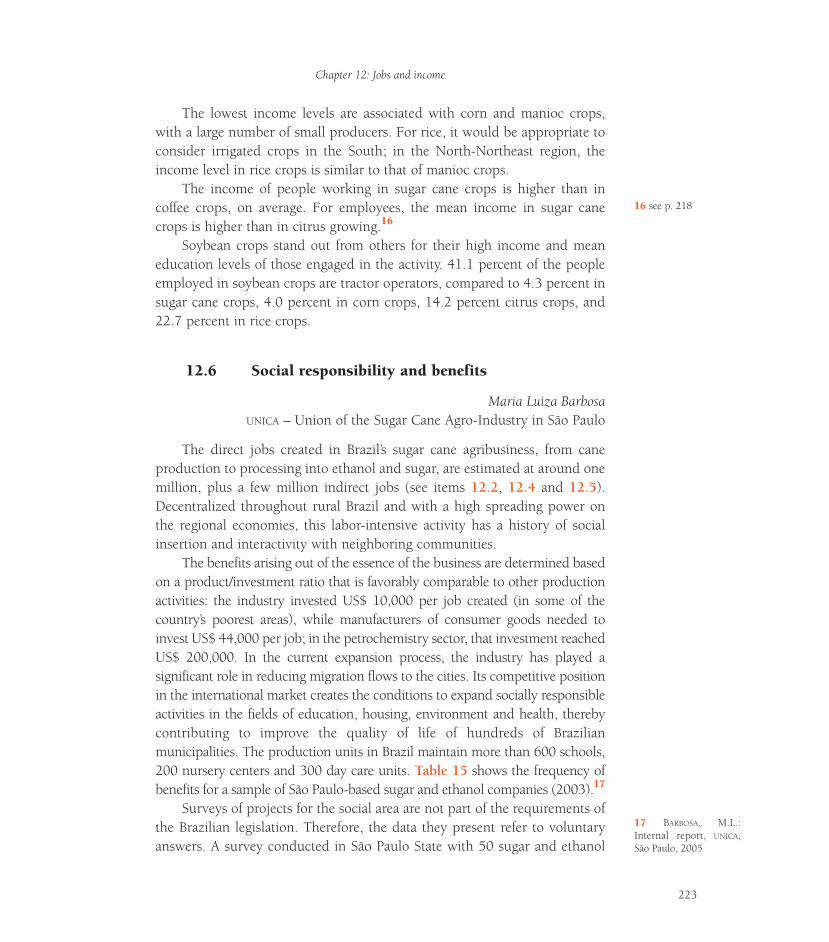
The lowest income levels are associated with corn and manioc crops,with a large number of small producers. For rice, it would be appropriate toconsider irrigated crops in the South; in the North-Northeast region, theincome level in rice crops is similar to that of manioc crops.
The income of people working in sugar cane crops is higher than incoffee crops, on average. For employees, the mean income in sugar canecrops is higher than in citrus growing.16
Soybean crops stand out from others for their high income and meaneducation levels of those engaged in the activity. 41.1 percent of the peopleemployed in soybean crops are tractor operators, compared to 4.3 percent insugar cane crops, 4.0 percent in corn crops, 14.2 percent citrus crops, and22.7 percent in rice crops.
12.6 Social responsibility and benefits
Maria Luiza BarbosaUNICA – Union of the Sugar Cane Agro-Industry in São Paulo
The direct jobs created in Brazil’s sugar cane agribusiness, from caneproduction to processing into ethanol and sugar, are estimated at around onemillion, plus a few million indirect jobs (see items 12.2, 12.4 and 12.5).Decentralized throughout rural Brazil and with a high spreading power onthe regional economies, this labor-intensive activity has a history of socialinsertion and interactivity with neighboring communities.
The benefits arising out of the essence of the business are determined basedon a product/investment ratio that is favorably comparable to other productionactivities: the industry invested US$ 10,000 per job created (in some of thecountry’s poorest areas), while manufacturers of consumer goods needed toinvest US$ 44,000 per job; in the petrochemistry sector, that investment reachedUS$ 200,000. In the current expansion process, the industry has played asignificant role in reducing migration flows to the cities. Its competitive positionin the international market creates the conditions to expand socially responsibleactivities in the fields of education, housing, environment and health, therebycontributing to improve the quality of life of hundreds of Brazilianmunicipalities. The production units in Brazil maintain more than 600 schools,200 nursery centers and 300 day care units. Table 15 shows the frequency ofbenefits for a sample of São Paulo-based sugar and ethanol companies (2003).17
Surveys of projects for the social area are not part of the requirements ofthe Brazilian legislation. Therefore, the data they present refer to voluntaryanswers. A survey conducted in São Paulo State with 50 sugar and ethanol
Chapter 12: Jobs and income
223
16 see p. 218
17 BARBOSA, M.L.:Internal report, UNICA,São Paulo, 2005
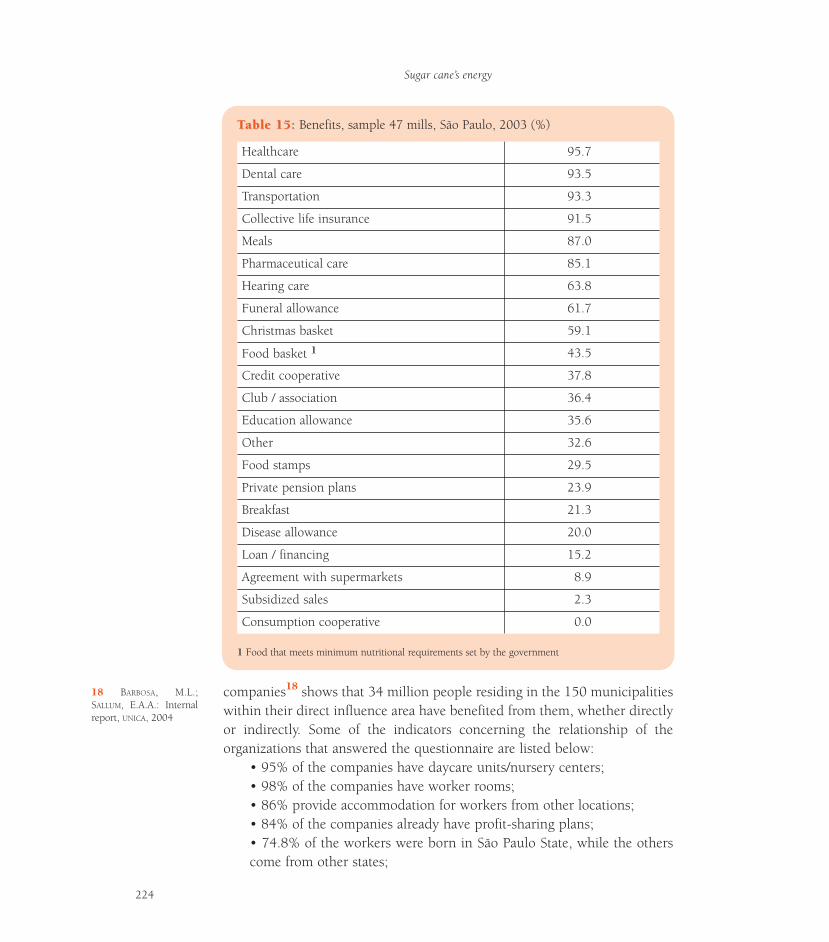
companies18 shows that 34 million people residing in the 150 municipalitieswithin their direct influence area have benefited from them, whether directlyor indirectly. Some of the indicators concerning the relationship of theorganizations that answered the questionnaire are listed below:
• 95% of the companies have daycare units/nursery centers;• 98% of the companies have worker rooms;• 86% provide accommodation for workers from other locations;• 84% of the companies already have profit-sharing plans;• 74.8% of the workers were born in São Paulo State, while the otherscome from other states;
Sugar cane’s energy
224
TTable 15:able 15: Benefits, sample 47 mills, São Paulo, 2003 (%)
1 Food that meets minimum nutritional requirements set by the government
Healthcare 95.7
Dental care 93.5
Transportation 93.3
Collective life insurance 91.5
Meals 87.0
Pharmaceutical care 85.1
Hearing care 63.8
Funeral allowance 61.7
Christmas basket 59.1
Food basket 1 43.5
Credit cooperative 37.8
Club / association 36.4
Education allowance 35.6
Other 32.6
Food stamps 29.5
Private pension plans 23.9
Breakfast 21.3
Disease allowance 20.0
Loan / financing 15.2
Agreement with supermarkets 8.9
Subsidized sales 2.3
Consumption cooperative 0.0
18 BARBOSA, M.L.;SALLUM, E.A.A.: Internalreport, UNICA, 2004
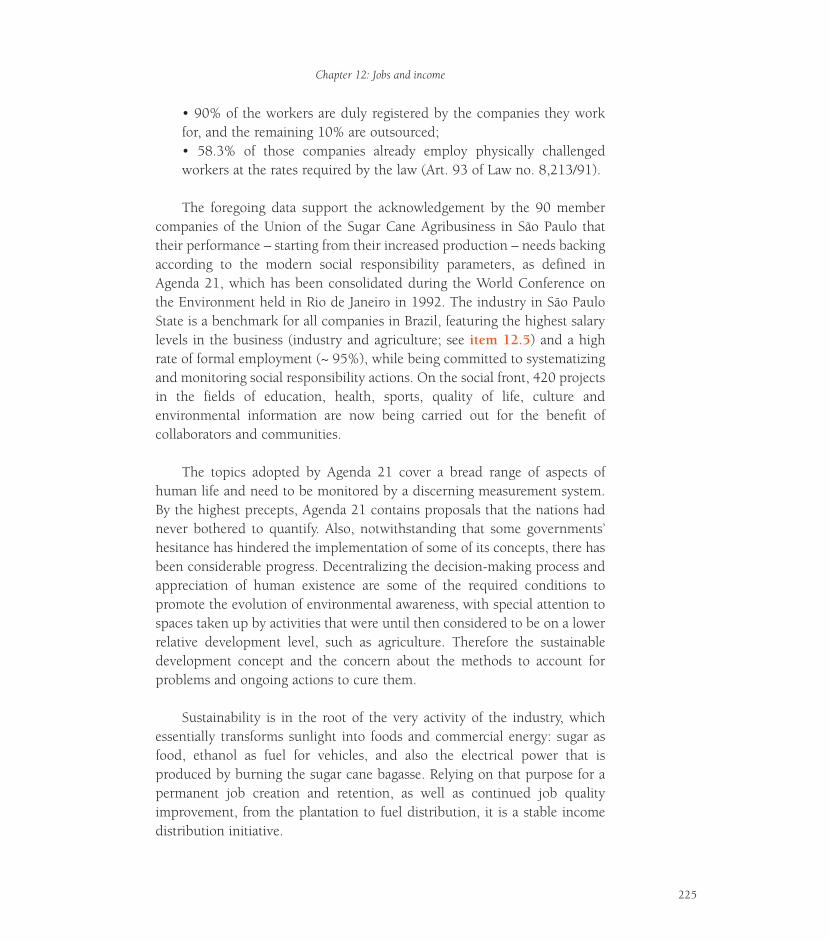
• 90% of the workers are duly registered by the companies they workfor, and the remaining 10% are outsourced;• 58.3% of those companies already employ physically challengedworkers at the rates required by the law (Art. 93 of Law no. 8,213/91).
The foregoing data support the acknowledgement by the 90 membercompanies of the Union of the Sugar Cane Agribusiness in São Paulo thattheir performance – starting from their increased production – needs backingaccording to the modern social responsibility parameters, as defined inAgenda 21, which has been consolidated during the World Conference onthe Environment held in Rio de Janeiro in 1992. The industry in São PauloState is a benchmark for all companies in Brazil, featuring the highest salarylevels in the business (industry and agriculture; see item 12.5) and a highrate of formal employment (~ 95%), while being committed to systematizingand monitoring social responsibility actions. On the social front, 420 projectsin the fields of education, health, sports, quality of life, culture andenvironmental information are now being carried out for the benefit ofcollaborators and communities.
The topics adopted by Agenda 21 cover a bread range of aspects ofhuman life and need to be monitored by a discerning measurement system.By the highest precepts, Agenda 21 contains proposals that the nations hadnever bothered to quantify. Also, notwithstanding that some governments’hesitance has hindered the implementation of some of its concepts, there hasbeen considerable progress. Decentralizing the decision-making process andappreciation of human existence are some of the required conditions topromote the evolution of environmental awareness, with special attention tospaces taken up by activities that were until then considered to be on a lowerrelative development level, such as agriculture. Therefore the sustainabledevelopment concept and the concern about the methods to account forproblems and ongoing actions to cure them.
Sustainability is in the root of the very activity of the industry, whichessentially transforms sunlight into foods and commercial energy: sugar asfood, ethanol as fuel for vehicles, and also the electrical power that isproduced by burning the sugar cane bagasse. Relying on that purpose for apermanent job creation and retention, as well as continued job qualityimprovement, from the plantation to fuel distribution, it is a stable incomedistribution initiative.
Chapter 12: Jobs and income
225
Monitoring the life conditions of the rural workforce in Brazil is one ofthe main challenges to be overcome before the country can follow therecommendations of Agenda 21. In this respect, the sugar and ethanolcompanies based in São Paulo State adopted in 2002 the Social Balance Sheetconcept (IBASE model) through UNICA, and the reports that they prepare nowserve also as a tool to detect and demonstrate, both quantitatively andqualitatively, the existing conditions and the evolution in both the internalsocial context and the relationship with the community.
Some of the indicators of the IBASE Social Balance Sheets19 for 73 SãoPaulo-based companies (2003, denoting expenses as a percentage of thepayroll) are presented below:
Willing to seek internationally accepted benchmarks for those practices,the sugar and ethanol industry has established, through UNICA, a partnershipwith the World Bank Institute to provide researchers and professionals in thebusiness with training on the basics of sustainable competitiveness andcorporate responsibility. In 2004 and 2005, 2,500 people (executives andemployees in the sugar mills) participated in the program, aiming at knowingthe best practices (World Bank’s methodology) and qualifying to assesspractical situations and reach reliable diagnostics.
A comprehensive program to help enterprises to identify impacts and toevaluate their sustainability was established using the internationalmethodology of the Business and Economic Development research; this workis conducted in partnership with Instituto Ethos (Brasil), BSR – Business forSocial Responsibility (EUA), Institute of Social an Ethical Accountability(England) and Fundação Dom Cabral (Brasil). In 2006 the first 30 enterpriseswere included, with 650 participants; the next step wil involve 30 more sugarmills.
Private pension plans 0.81%
Healthcare 5.9%
Education 0.93%
Capacity building and professional development 0.97%
Daycare units 0.27%
Profit-sharing programs 6.72%
Food 6.54%
Occupational safety & health 2.34%
Sugar cane’s energy
226
19 IBASE: Balanço Social(Mills associated toUNICA), 2004
12.7 Technologies being implemented andimpacts on jobs and income
The Sugar Cane Technology Center, among others,20, 21, 22 has evaluat-ed the impact of sugar cane harvesting without trash burning on the work-force.23 For a future situation of 100-percent mechanical harvesting in S.Paulo, and 50 percent in the rest of the country, 165,000 jobs would be lostcompared to the fully manual harvesting system. This process is in progress.On the other hand, the use of trash as an energy source may create approxi-mately 12,000 new jobs in agriculture for the option of using balers. Indirectjobs are not included in the computation.
12.8 Summary and conclusions
• The replacement of gasoline with ethanol has saved an importantamount of foreign currency for Brazil. Computing the value of thereplaced gasoline at its international market price, the imports avoidedbetween 1976 and 2004 represented savings of US$ 60.7 billion (at theexchange rate in December 2004). Considering interest on the foreigndebt, the savings amounted to 121.3 billion. For comparison, Brazil’sforeign currency reserves amounted to US$ 49.4 billion (October 2004),or just US$ 24.2 billion if loans from the IMF are excluded.• The Brazilian industry supplying equipment for cane, sugar andethanol production developed into a leading position; the largestmanufacturer, alone, produced 726 distilleries (distillation units), 106full plants, 112 combined cogeneration plants, and 1,200 boilers(including exported units).• Brazil has had an unemployment rate of 9 to 10 percent over the pastfew years. Job quality and income distribution are serious problems; theGini coefficient was 0.607 (1998) and 0.554 (2003). Notwithstandingthe increase in income, social inequalities have not been significantlyreduced over the past 20 years. Workers who do not contribute to thesocial security system are estimated at 55 percent; the rates of child labor(2.4%, 10-14 year-olds) and functional illiteracy (23.9%, less than 3years at school) have been significantly lowered, but are still high. Theper capita income in 2002 was US$ (PPP) 7,600.00.• Brazil’s labor legislation is renowned for being advanced in workerprotection; the union organization is developed and plays a key role inemployment relationships. For sugar cane, the specific aspects ofemployment relations in agriculture (specific unions) and industrialoperations (unions of the food and chemical industries) are well-defined,
Chapter 12: Jobs and income
227
20 GONÇALES, J.S.; SOUZA,S.A.M.: “Proibição dequeima de cana noEstado de São Paulo: sim-ulação dos efeitos na áreacultivada e na demandada força de trabalho”,Informações Econômicas,São Paulo, vol. 28, no. 3,Mar. 1998, pp. 21-40 21 CAMARGO, J.M.:“Tecnificação da cana-de-açúcar em São Paulo esazonalidade da mão-de-obra”, Master’s thesis –FEA-USP, 1988, 202p.
23 “Manpower: Agricul-tural Systems”, Technicalreport RLT-041, ProjectBRA/96/G31 – Biomasspower generation withsugar cane bagasee andtrash, UNDP/Copersucar,Centro de TecnologiaCanavieira
22 VEIGA FILHO, A.A. etal.: “Análise da mecaniza-ção do corte da cana-de-açúcar no Estado de SãoPaulo”, InformaçõesEconômicas, São Paulo,vol. 24, no. 10, Oct.1994, pp. 43-58
including the conclusion of collective agreements, which advancedduring the last decade. Compared to the Brazilian 55-percent mean rateof formal jobs, the sugar cane industry’s agricultural activities now havea rate of 68.5 percent (from the 53.6% of 1992). In the Center-South, therate of formal jobs in sugar cane production (agriculture) is 82.8 percent,reaching 88.4 percent in São Paulo (2003).• The differences in regional development are reflected in the industry’soccupational indicators; poorer regions are characterized by lowersalaries and a much larger use of labor, consistent with technologicallevels (automation, mechanization).• In the early 1990’s, there were 800,000 direct jobs; for every 1 M tonsof sugar cane produced and processed, there were 2,200 direct jobs(73% in agriculture); in the North-Northeast, three times as much as inthe Center-South. In São Paulo, non-specialized workers (sugar canecutters) were paid US$ 140 / month (amount at that time), which washigher than the amount paid to 86 percent of agricultural workers ingeneral, and 46 percent of industrial workers. The mean family incomeof those workers was higher than that of 50 percent of all Brazilianfamilies.• The seasonal index for the job (sugar cane production) was 2.2 in SãoPaulo in the early 1980’s, 1.8 in the late 1980’s, and 1.3 in the mid1990’s. The decrease was motivated mainly by the mechanical harvestingof sugar cane, which enabled more training and career planning.• In the late 1990’s, with 650,000 direct jobs and 940,000 indirect jobs(plus around 1,800,000 induced jobs), the number of jobs per productunit in the Center-South region was still 3.5 times higher than in theNorth-Northeast; there is a correlation between the in the mean jobquality (realted to years of education) and salary levels.• The formal, direct jobs in the industry are now increasing in number(more 18% from 2000 to 2002), and reached 764,000 in 2002. Of thoseformally employed, 90.4 percent are aged 18 to 48 (0.3% under the age of17). Jobs in agriculture decrease, while industrial jobs increase in number.People having studied for less than 4 years represent 37.6 percent of theworkers, 15.3 percent of whom being illiterate (4% in the Center-South).• Considering both formal and informal jobs (2003 PNAD sample), theincome of working people in Brazil was as follows: all industries, R$692/month; agriculture, R$ 390/month; industrial operations, R$ 671/month;services, R$ 706/month; Sugar cane crops: Brazil, 821; N-NE, 283; C-S, 678;São Paulo, 797; Sugar industry: Brazil, 821; N-NE, 707; C-S, 865; São Paulo,
Sugar cane’s energy
228
881. The amounts for ethanol are a little higher than those for sugar.• In agriculture, the mean education level in the North-Northeast isequivalent to half the level (years at school) of the Center-South.• In the Center-South, the income of people working in sugar cane crops ishigher than in coffee, citrus and corn crops, but lower than in soybean crops(highly mechanized, with more specialized jobs). In the North-Northeast, theincome in sugar cane crops is higher than in coffee, rice, banana, manioc andcorn crops, equivalent to the income in citrus crops, and lower than insoybean crops.• The income in formal jobs does not include the 13th salary or anybenefit. Mills maintain more than 600 schools, 200 daycare units and300 ambulatory care units. In a sample of 47 São Paulo-based units,more than 90 percent provide health and dental care, transportation andcollective life insurance, and over 80 percent provide meals andpharmaceutical care. More than 84 percent have profit-sharingprograms, accommodations and daycare units.• Social Balance Sheet Indicators for 73 companies (UNICA, SP, 2003)show that funds equivalent to 24.5 percent of the payroll are used forsuch purposes as profit-sharing programs (6.72%), food (6.54%),healthcare (5.9%), occupational safety and health (2.3%), andeducation, capacity building and professional development (1.9%).
Chapter 12: Jobs and income
229


Appendixes
Sugar cane’s energy
232
Abbreviations
APP environmental protection areaBIG/GT integrated biomass gasification / gas turbine combined cycleCLT Labor CodeCG central power generationCO carbon monoxideCO2 carbon dioxidecec ionic exchange capabilityDBO5 biochemical oxygen demandDG distributed power generationDM dry massEIA environmental impact evaluationGHG greenhouse gasesGMO genetically modified organismGNP gross national productGNV natural gas vehiclesGRI Global Reporting InitiativeHC hydrocarbonsHTM high test molasses K2O potassium oxide LPG liquefied petroleum gasCDM clean development mechanismMTBE methyl tertio-butyl etherMSG mono-sodium glutamateN nitrogenNGO non governmental organizationNOx nitrogen oxidesN2O nitrous oxideOIE internal energy productionOM organic matterPCTS cane payment based on sucrose PNA National Alcohol ProgramPNAD National Household Sample Research, IBGEP2O5 phosphor oxidePROINFA Program for promoting alternative electricity production, MMEPV photovoltaic effectRAIS Administrative Records of the Labor and Employment MinistryR-CHO aldehydesRIMA Environmental Impact ReportRMSP Metropolitan Area, city of São Paulo S sulphurSCYLV cane yellow leaf syndrome virusSAFCA cane yellow leaf syndromeSO2 sulphur dioxide
Appendixes
233
Entities, institutions, companies, etc.
ANVISA Agencia Nacional de Vigilância SanitáriaCATI Coord. Assistência Técnica Integral, Secretaria da Agricultura, S PCepel Centro de Pesquisas da EletrobrásCONAMA Conselho Nacional do Meio AmbienteCREA Conselho Nacional de Engenharia e ArquiteturaCTC Centro de Tecnologia CanavieiraEMBRAPA Empresa Brasileira de Pesquisa AgropecuáriaEESC Escola de Engenharia de São Carlos, SPEPA Environmental Protection Agency (EUA)ESALQ-USP Escola Superior de Agricultura Luiz de Queiroz, USPFAPESP Fundação de apoio à pesquisa no estado de São PauloFCE/UFMG Faculdade de Ciências Ecionomicas, Univ. Federal de Minas GeraisFEA-UNICAMP Faculdade de Engenharia de Alimentos, UNICAMPFGV Fundação Getúlio VargasIAC Instituto Agronômico de Campinas, SPIBGE Instituto Nacional de Geografia e EstatísticaINEE Instituto Nacional de Eficiência EnergéticaINPE Instituto Nacional de Pesquisas EspaciaisIPEA Instituto de Pesquisas Econômicas AplicadasITA Instituto Tecnológico de AeronáuticaIPCC Intergovernmental Panel on Climate ChangeLMC LMC International Ltd.MME Ministério das Minas e EnergiaOIT International Labor OrganizationPUC-RJ Pontifícia Universidade Católica – Rio de JaneiroSMA-SP Secretaria do Meio Ambiente, São PauloUNESP Universidade Estadual PaulistaUNICA Union of the Sugar Cane Agro-Industry in São PauloUNICAMP Universidade Estadual de CampinasWWF World Wildlife Foundation
Unit prefixes
k kilo (103)M mega (106)G giga (109)T tera (1012)
Units
The metric system is used throughout the text, with the adequate prefixes.º C degree Centigradecal calorieCO2 eq carbon dioxide equivalent (for global warming)ha hectare (104 m2)ppbv parts per billion, by volumeppmv parts per million, by volume t metric ton (1000 kg)toe ton (metric) of equivalent oil (energy equivalent)US$(PPP) Purchase Power Parity Exchange to US$ V % index of bases saturation


![CURRICULUM VITAECurriculum Vitae Joseph H. Silverman [7] The N eron ber of abelian varieties with potential good reduction, Math. Ann. 264 (1983), 1{3 [8] Integer points on curves](https://static.fdocumentos.com/doc/165x107/60c3d8b54e3bd619162be5bc/curriculum-vitae-curriculum-vitae-joseph-h-silverman-7-the-n-eron-ber-of-abelian.jpg)