Treinamento Oracle Backup e Recovery - Nerv Informática Ltda
applied sciences
Article
Sugarcane Industry Waste Recovery: A Case StudyUsing Thermochemical Conversion Technologies toIncrease Sustainability
Leonel J. R. Nunes 1,2,* , Liliana M. E. F. Loureiro 3, Letícia C. R. Sá 3 and Hugo F. C. Silva 4
1 PROMETHEUS–Unidade de Investigação em Materiais, Energia e Ambiente para a Sustentabilidade, EscolaSuperior Agrária, Instituto Politécnico de Viana do Castelo, Rua da Escola Industrial e Comercial deNun’Alvares, 4900-347 Viana do Castelo, Portugal
2 GOVCOPP–Unidade de Investigação em Governança, Competitividade e Políticas Públicas,DEGEIT—Departamento de Economia, Gestão, Engenharia Industrial e Turismo, Universidade de Aveiro,Campus Universitário de Santiago, 3810-193 Aveiro, Portugal
3 YGE–Yser Green Energy SA, Área de Acolhimento Empresarial de Úl/Loureiro, Lote 17,3720-075 Loureiro OAZ, Portugal; [email protected] (L.M.E.F.L.);[email protected] (L.C.R.S.)
4 AFS–Advanced Fuel Solutions SA, Área de Acolhimento Empresarial de Úl/Loureiro, Lote 17,3720-075 Loureiro OAZ, Portugal; [email protected]
* Correspondence: [email protected]; Tel.: +351-258-909-740
Received: 7 August 2020; Accepted: 16 September 2020; Published: 17 September 2020�����������������
Abstract: The sugarcane industry has assumed an increasingly important role at a global level, withcountries such as Brazil and India dominating the field. However, this causes environmental problems,since the industry produces large amounts of waste, such as sugarcane bagasse. This by-product,which is energetically partially recovered in sugar mills and in the pulp and paper industry, canmake a significant contribution to the general use of biomass energy, if the usual disadvantagesassociated with products with low density and a high moisture content are overcome. From thisperspective, thermochemical conversion technologies, especially torrefaction, are assumed to becapable of improving the fuel properties of this material, making it more appealing for potentialexport and use in far-off destinations. In this work, sugarcane samples were acquired, and the processof obtaining bagasse was simulated. Subsequently, the bagasse was dried and heat-treated at 200 and300 ◦C to simulate the over-drying and torrefaction process. Afterward, product characterizationwas performed, including thermogravimetric analysis, elemental analysis, calorimetry, and energydensification. The results showed significant improvements in the energy content, from 18.17 to33.36 MJ·kg−1 from dried bagasse to torrefied bagasse at 300 ◦C, showing that despite high mass loss,there is potential for a future value added chain for this waste form, since the increment in energydensity could enhance its transportation and use in locations far off the production site.
Keywords: sugarcane bagasse; energy recovery; circular economy; biomass waste torrefactionand pyrolysis
1. Introduction
Sugarcane belongs to a restrict group of agricultural crops considered dominant, which, togetherwith cotton, soy, corn, wheat, and rice, occupies millions of hectares of land [1–3]. In addition tocountries where the species originates, the main producers are Southeast Asian countries, particularlythe Philippines, Thailand, India, and Brazil, which have assumed global dominance concerning the areadedicated to production and yield per hectare achieved [4–6]. In fact, according to the information
Appl. Sci. 2020, 10, 6481; doi:10.3390/app10186481 www.mdpi.com/journal/applsci

Appl. Sci. 2020, 10, 6481 2 of 17
provided in 2020 by the United Nations Food and Agriculture Organization (FAO), there is currentlyan annual production of 1.89 billion tons, occupying a production area of 27,000,000 hectares spreadover more than 100 countries. As can be seen in Table 1, the 20 largest world producers representa production of 1.75 billion tons per year in an area of approximately 24,250,000 hectares, completelydominating the sector with 93% of world production in 91% of the total area occupied by sugarcane.In addition to being a food crop, sugarcane can also be considered an energy crop, since ethanol isproduced from sugar. In this regard, Brazil is considered as a pioneer, mainly due to the developmentsachieved from the 1970s after the oil crisis [7–10].
Table 1. Sugarcane production and area of cultivation in 20 main countries [11,12].
Country Production Area
(Tons/Year) (Hectares)
Brazil 768,678,382 10,226,205India 348,448,000 4,950,000China 123,059,739 1,675,215
Thailand 87,468,496 1,336,575Pakistan 65,450,704 1,130,820Mexico 56,446,821 781,054
Colombia 36,951,213 416,626Australia 34,403,004 447,204
Guatemala 33,533,403 259,850United States of America 29,926,210 370,530
Indonesia 27,158,830 472,693Philippines 22,370,546 410,104Argentina 21,990,823 331,699
Cuba 18,890,972 442,307Vietnam 16,313,145 256,322
Egypt 15,760,418 137,011South Africa 15,074,610 246,937
Myanmar 10,437,058 163,650Peru 9,832,526 87,696
Ecuador 8,661,609 104,661
The reality of sugarcane production in European countries is different from that in major productioncountries such as Brazil, India, the United States, and the Caribbean region [13–16]. In reality, productionin Portugal, Spain, and Italy occurs in isolated regions, namely, in the island regions of Madeira,the Canaries, and Sicily, where sugarcane production was introduced as a subsistence culture tosupport colonization efforts centuries ago [17–19].
In Portugal, according to the official website of the Institute of Wine, Embroidery, and Handicraftsof Madeira (http://ivbam.gov-madeira.pt/cana-de-acucar-1316.aspx), sugarcane was introduced in1425, imported from Sicily by order of D. Henrique shortly after the beginning of its colonization.The adaptability of this crop in terms of survival compared to others made it a vector for the creationof wealth [20–23]. In 1882, sugarcane was attacked by pests and almost disappeared completely in1884, 1885, and 1886. The introduction of new varieties made it possible to rebuild the cane fieldsthat, from 1890 onwards, expanded again, feeding the sugar industry and the manufacture of rumand alcohol on the island [24]. For farmers, sugarcane also had the advantage of having a remarkabledouble aptitude: it can also be used as fodder, as its leaves are rich in nutrients for animal feed [25].This occurred at a time when the dairy industry was growing in Madeira [26]. At the end of the 1930s,sugarcane, which occupied an area of 6500 hectares, was reduced due to the delimitation of agrarianareas to an estimated total area of 1420 hectares in 1952 [27]. The average production in 1952 wasconsidered to be limited to 30 tons per hectare. From 1952 onwards, the areas expanded a little more,and in 1955–1956, there was an appreciable increase in plantation. Until the end of the 1980s, there wasa substantial decrease in the cultivation area related to the closure of several industrial units of great

Appl. Sci. 2020, 10, 6481 3 of 17
importance [20]. This has led to a collapse in the crop due to the lack of outlets, with the crop limited tojust over 100 hectares (in 1986, it was 119.9 hectares, and it rapidly decreased to 90.3 hectares in 1988).In addition, farmers began to have other crops, such as bananas, vegetables, tropical and subtropicalfruit trees, and vines, among others [26]. Currently, the area is around 172 hectares, which correspondsto a production of 10,830 tons. Productivity still varies, ranging from 40 t/ha in old cane fields to120 t/ha in more recently installed cane fields. In terms of area, the most important municipalities arePonta do Sol and Machico (with relative importance levels of 29 and 28%, respectively), followed bySantana (14%) and Calheta (8%), totaling 79% of the area of influence [28,29].
From this agricultural production, in addition to the main material, sugar, there are someby-products that are of interest for recovery. Of these, sugarcane bagasse stands out as a productwith strong potential for energy recovery, since it is a renewable biological material that, if properlyprocessed and densified, can be used an alternative source of carbon-neutral renewable energy [30–32].Sugarcane bagasse is commonly used for the generation of steam in sugar plants and in the distillationof alcohol. In Brazil during the 1970s, Pro-Alcohol was the first major program to replace fossil fuel witha renewable fuel, hydrated ethanol [33–35]. At that time, bagasse was considered waste, and similar toany waste, it was necessary to discard it [36]. Burning or incineration in a boiler was a means to disposethis waste, generating part of the energy consumed at production plants [37]. Thus, over the years,bagasse has gone from a waste product to a relevant source of energy, and with each passing day, itsimportance increases proportionally to the evolution of energy prices in the international market [38].Thus, this by-product is no longer considered a waste product and has become an important type ofenergy input [39]. Sugarcane bagasse presents great potential for the production of derived fuels usinggasification, rapid pyrolysis, or hydrolysis followed by fermentation [40]. For further developmentof these technologies, detailed knowledge of the physical and chemical characteristics of sugarcanebagasse is necessary [41].
Sugarcane bagasse is also used in the pulp and paper industry, as documented in several studies,such as those presented by Samariha and Khakifirooz (2011) investigating the production of pulpfrom bagasse for the manufacture of corrugated board [42], the work of Lois-Correa (2012) studyingthe correlation between bagasse fiber quality and its influence on the final quality of the paperproduced [43], and the research conducted by Hemmasi et al. (2011) analyzing the chemical andanatomical properties of sugarcane bagasse used in paper production [44]. However, as describedin the referred works, it can be concluded that sugarcane bagasse presents a set of limitations—forexample, its low bulk density and high moisture content, and the speed with which it starts its biologicaldegradation process, similar to those identified in cereal straw, although it offers greater versatility [45].
This work aims to characterize the use of sugarcane bagasse for energy generation in a waythat allows both its storage and the possibility of exporting it as an energy product due tothe energy densification process using a thermochemical conversion process. To carry out this work,a bibliographical review of the processing of sugarcane bagasse was prepared when the sugarcanesamples were acquired, which were characterized and subjected to the thermochemical conversionprocess of torrefaction as a way to achieve preservation for long periods of time, allowing saferstorage without biological activity and becoming hydrophobic. These new thermally treated andenergy densified products can be transported, offsetting the logistical problems associated with hightransportation costs. As a result, the main parameters for the use of sugarcane bagasse as an energysource were identified. This review and analytical study brings together data obtained by previousresearch works in order to present and consolidate important information related to the physical andchemical characterization of sugarcane bagasse for energy purposes, as well as to compare the resultsobtained by the characterization, in order to indicate another option for creating a potential value chainfor the energy recovery of this product.

Appl. Sci. 2020, 10, 6481 4 of 17
2. Raw Material Characterization
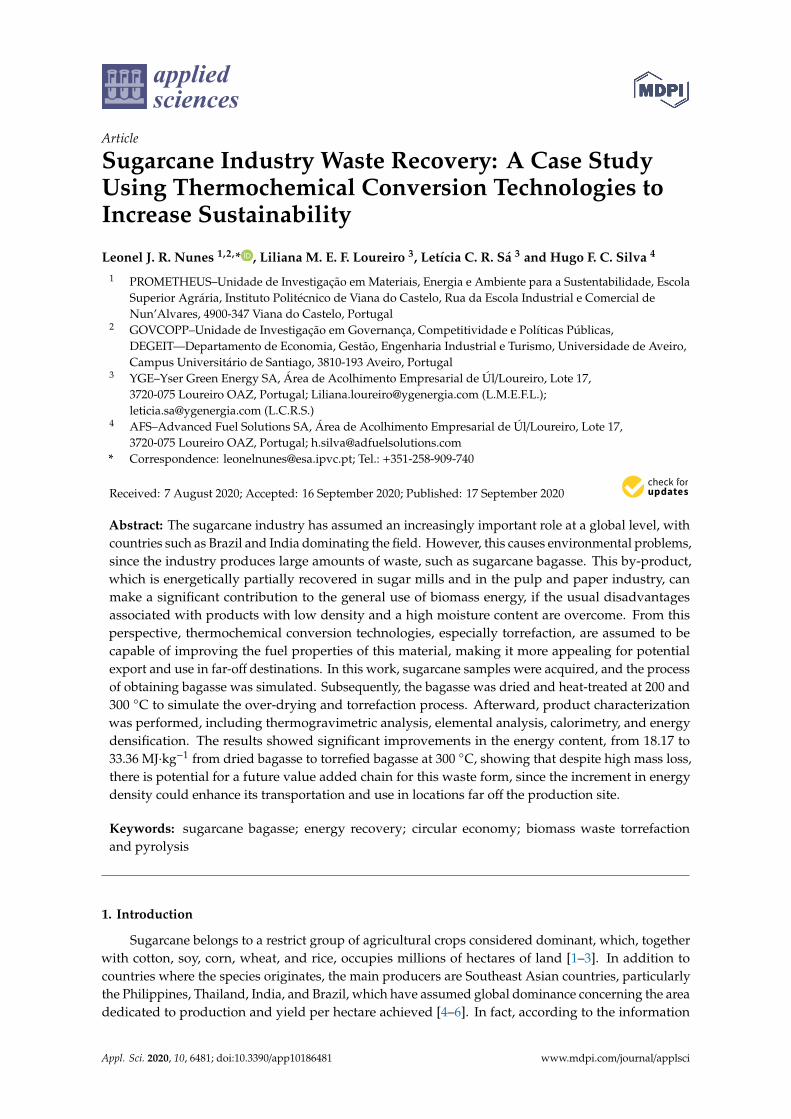
Sugarcane bagasse is the solid residue produced in sugar mills after the extraction of juice, andover the years, it has become an important energy input [46]. Thus, it is necessary to know itscharacteristics in order to use it efficiently with adequate drying performance for the generation ofsteam, pyrolysis, or gasification, or for hydrolysis [47]. Sugarcane, Saccharum officinarum L. (Poaceae),has been known since 8000 BC and is one of six species of the genus Saccharum, which is a group oftall grasses from Southeast Asia. The stems are the parts from which sugar juice and bagasse areproduced [46]. However, leaves and other parts can also play an important role in the generation ofenergy, mainly in co-generation systems, as described by Sampaio et al. (2019) [48]. The compositionof sugarcane is approximately 86 to 92% juice and 8 to 14% fibrous material [46]. This depends notonly on the composition of stems, but also on other factors, such as the plant variety, number of tipsand leaves, maturation, harvesting period, whether it was burned or not before harvesting, whetherthe harvest was mechanized or manual, and climatic factors such as whether it rained or not duringthe plant growth period [49]. Physical and chemical characteristics of sugarcane bagasse have a directinfluence on its use as an energy source. The commonly used method is bagasse combustion in steamgenerators, and knowledge of bagasse characteristics is necessary for the design of steam generationequipment [46]. Figure 1 shows a scheme of the sugar and sugarcane bagasse production process. Ascan be seen from the process diagram shown in the figure, after cutting the sugarcane, the materialsare successively processed through a set of roller mills, where the cane juice is extracted. This juicesubsequently undergoes an evaporation process in order to eliminate excess water and concentratethe sugar. In the end, the juice also undergoes a centrifugation process to eliminate all remainingwater and any solid particles, namely fibrous remains of the cane. After the pressing process bythe roller mills, the sugarcane gives way to bagasse. This is partly consumed to feed the furnace thatprovides the heat for the evaporation of water from the cane juice, while another part is left over asfinal waste [50].
Sugarcane bagasse is a complex mixture of cellulose, hemicellulose, and lignin, which make upthe cells of the walls in vascular bundles [51]. The amount of fiber in the stems depends on the lengthand diameter of the stems. The number of nodes and the distance between nodes influence the amountof fiber obtained in the extraction [46]. Cellulose is a high-molecular-weight polymer composed largelyof glucose units. Hemicellulose is largely composed of xylose units with small parts of arabinose, bothwith five carbons in the molecular structure (pentose), as opposed to glucose, which has six carbons inits molecular structure (hexose). Lignin is a complex substance composed largely of aromatic phenoliccompounds that generally give the sugarcane fiber its stiffness [52–54]. The relative amounts of thesecompounds depend on the variety of the cane, the age, and the size of the stems. There are alsosmall amounts of inorganic compounds, such as calcium and silica, present in the cellular structures,but these do not have a significant effect on the overall fiber composition [55]. Ash is an inorganiccompound found in the bagasse structure, and its composition depends on the plant species, soil,type of fertilization, and inorganic materials dragged during harvesting, which can be mechanizedor manual. The main elements are silica, potassium, calcium, phosphorus, magnesium, and otherinorganics [56–58].
Appl. Sci. 2020, 10, 6481 5 of 17Appl. Sci. 2020, 10, x FOR PEER REVIEW 5 of 17
Figure 1. Simplified sugar production process (adapted from [59]).
In a study, de Moraes Rocha et al. (2015) collected 60 samples of sugarcane bagasse from industrial sugar and alcohol production units located in São Paulo and northeastern Brazil [60]. These bagasse samples were selected to include different varieties of sugarcane, and to be representative of the types of soils and climates in different geographical regions and with different harvesting methods. It is a common practice to plant mixed varieties of sugarcane, which grow side-by-side and are harvested simultaneously, as a way to avoid the proliferation of pests. Collected samples were later ground and analyzed in the laboratory. Table 1 shows the results obtained for all samples, summarizing the representative composition of sugarcane, as well as the results obtained in a previous study conducted by Triana et al. (1990). As can be seen from the results, sugarcane bagasse is, on average, made up of 42.2% cellulose, 27.6% hemicellulose, 21.6% lignin, 5.63% extractive compounds, and 2.84% ash, with a standard deviation of 1.93, 0.88, 1.67, 2.31, and 1.22, and a coefficient of variation of 4.6, 3.2, 7.7, 41.0, and 43.0, respectively. As can also be inferred from the statistical analysis presented in Table 2, in general, the composition of main components did not differ significantly between samples. These results are in line with previous studies by the same authors [61,62], but also with other studies [55]. They are also in agreement with those presented by Triana et al. (1990), who classified the average values as being in the range of 40% to 50% for cellulose, 25% to 30% for hemicellulose, and 20% to 25% for lignin [63]. The extractables and ash content obtained in the study show a dispersion trend, which is justified by the fact that these parameters are dependent on the conditions where the plants grow [60].
Table 2. Typical composition of sugarcane bagasse.
Triana et al. (1990) de Moraes Rocha [63] et al. (2015) [60]
Cellulose (%) 40–50 42.19 Hemicellulose (%) 25–30 27.60
Lignin (%) 20–25 21.56 Extractives (%) – 5.63
Ash (%) – 2.84
3. Materials and Methods
3.1. Material Sampling
In order to verify the evolution of sugarcane bagasse properties resulting from the torrefaction process, several analyses were carried out to characterize them. Different techniques were used, including proximate analysis (fixed carbon content, volatiles, ash, and moisture), ultimate analysis
Figure 1. Simplified sugar production process (adapted from [59]).
In a study, de Moraes Rocha et al. (2015) collected 60 samples of sugarcane bagasse from industrialsugar and alcohol production units located in São Paulo and northeastern Brazil [60]. These bagassesamples were selected to include different varieties of sugarcane, and to be representative of the typesof soils and climates in different geographical regions and with different harvesting methods. It isa common practice to plant mixed varieties of sugarcane, which grow side-by-side and are harvestedsimultaneously, as a way to avoid the proliferation of pests. Collected samples were later groundand analyzed in the laboratory. Table 1 shows the results obtained for all samples, summarizingthe representative composition of sugarcane, as well as the results obtained in a previous studyconducted by Triana et al. (1990). As can be seen from the results, sugarcane bagasse is, on average,made up of 42.2% cellulose, 27.6% hemicellulose, 21.6% lignin, 5.63% extractive compounds, and 2.84%ash, with a standard deviation of 1.93, 0.88, 1.67, 2.31, and 1.22, and a coefficient of variation of 4.6, 3.2,7.7, 41.0, and 43.0, respectively. As can also be inferred from the statistical analysis presented in Table 2,in general, the composition of main components did not differ significantly between samples. Theseresults are in line with previous studies by the same authors [61,62], but also with other studies [55].They are also in agreement with those presented by Triana et al. (1990), who classified the averagevalues as being in the range of 40% to 50% for cellulose, 25% to 30% for hemicellulose, and 20% to25% for lignin [63]. The extractables and ash content obtained in the study show a dispersion trend,which is justified by the fact that these parameters are dependent on the conditions where the plantsgrow [60].
Table 2. Typical composition of sugarcane bagasse.
Triana et al. (1990)[63]
de Moraes Rochaet al. (2015) [60]
Cellulose (%) 40–50 42.19Hemicellulose (%) 25–30 27.60
Lignin (%) 20–25 21.56Extractives (%) – 5.63
Ash (%) – 2.84
3. Materials and Methods
3.1. Material Sampling
In order to verify the evolution of sugarcane bagasse properties resulting from the torrefactionprocess, several analyses were carried out to characterize them. Different techniques were used,

Appl. Sci. 2020, 10, 6481 6 of 17
including proximate analysis (fixed carbon content, volatiles, ash, and moisture), ultimate analysis (C,H, O, and N), and heating value. In order to carry out this study, 10 kg was purchased in a commercialretail area, with the sugarcane identified as having originated in Costa Rica. This is the only way toacquire sugarcane in mainland Portugal, since it is an exotic agricultural product that does not grow inthe territory. However, on the island of Madeira, sugarcane is a traditional agricultural crop that hasbeen explored for centuries, and despite being less important than in other times, it continues to be usedfor the production of sugar and its derivatives—specifically cane spirit, a drink similar to Caribbeanrum, and Brazilian cachaça, which is used in the production of poncha, a typical Madeiran drink.
3.2. Sample Preparation and Thermal Treatment
The next step was to produce laboratory samples similar to sugarcane bagasse throughthe industrial process. Thus, the canes were processed using a 4-roller Roskamp mill, simulatingthe industrial process. Then, the canes were washed several times with running water, to eliminateas much sugar as possible, and cut into small pieces with an average size of 20 × 10 × 5 mm, whichwere dried in an ECOCELL forced air oven at a temperature of 90 ◦C for 24 h. After this initial dryingperiod, the material was washed to extract the sugar by placing in water for 12 h, after which the waterwas renewed. This process was repeated 3 more times, until it was found that the water was clean andcolorless. After the washing process, the pieces of sugarcane were dried for an additional 12 h at 90 ◦C.Figure 2 shows the sequence from raw material to sugarcane pieces used in the torrefaction test.
Appl. Sci. 2020, 10, x FOR PEER REVIEW 6 of 17
(C, H, O, and N), and heating value. In order to carry out this study, 10 kg was purchased in a commercial retail area, with the sugarcane identified as having originated in Costa Rica. This is the only way to acquire sugarcane in mainland Portugal, since it is an exotic agricultural product that does not grow in the territory. However, on the island of Madeira, sugarcane is a traditional agricultural crop that has been explored for centuries, and despite being less important than in other times, it continues to be used for the production of sugar and its derivatives—specifically cane spirit, a drink similar to Caribbean rum, and Brazilian cachaça, which is used in the production of poncha, a typical Madeiran drink.
3.2. Sample Preparation and Thermal Treatment
The next step was to produce laboratory samples similar to sugarcane bagasse through the industrial process. Thus, the canes were processed using a 4-roller Roskamp mill, simulating the industrial process. Then, the canes were washed several times with running water, to eliminate as much sugar as possible, and cut into small pieces with an average size of 20 × 10 × 5 mm, which were dried in an ECOCELL forced air oven at a temperature of 90 °C for 24 h. After this initial drying period, the material was washed to extract the sugar by placing in water for 12 h, after which the water was renewed. This process was repeated 3 more times, until it was found that the water was clean and colorless. After the washing process, the pieces of sugarcane were dried for an additional 12 h at 90 °C. Figure 2 shows the sequence from raw material to sugarcane pieces used in the torrefaction test.
Figure 2. Sequence of procedures to obtain sugarcane pieces used in torrefaction tests: (a) raw material as bought; (b) sugarcane after being processed with the roller mill; (c) sugarcane pieces; and (d) pieces being washed.
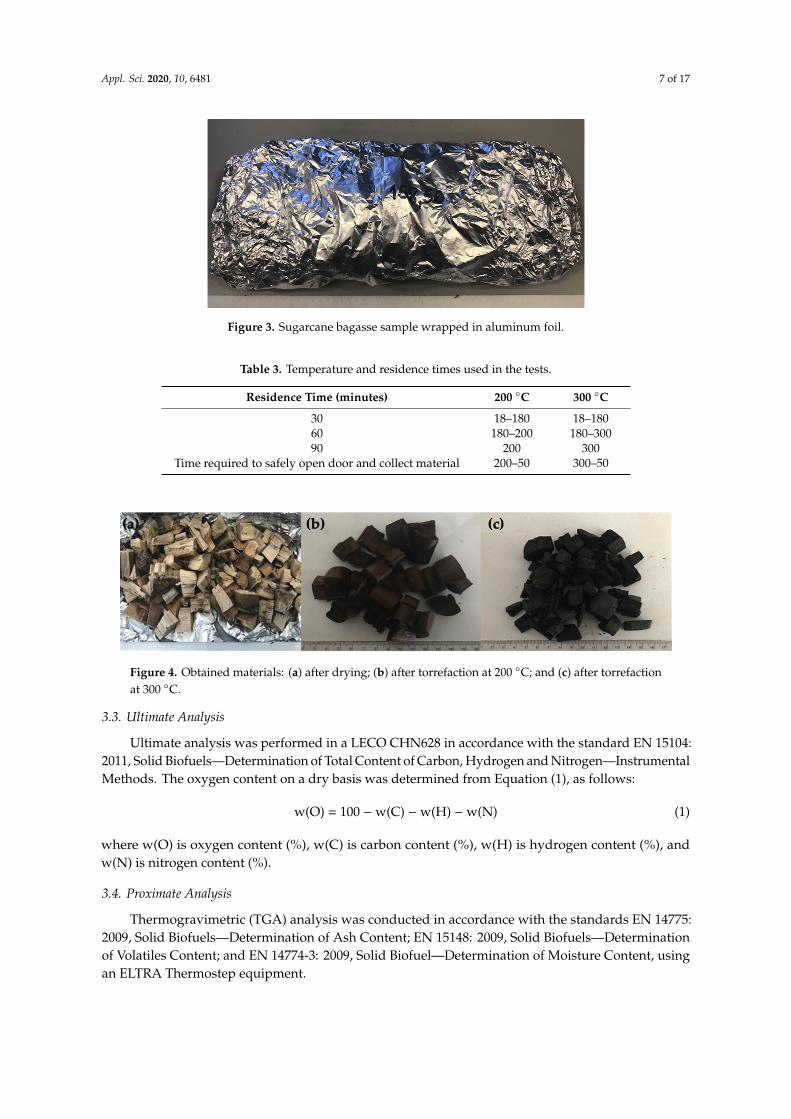
In this work, a torrefaction protocol described by Ribeiro et al. (2018) was used [64]. The samples were torrefied and pyrolyzed in the muffle furnace, which has a built-in controller with the ability to program 4 temperature thresholds and the residence time. There is a cavity on the top of the device to facilitate the extraction of torrefaction gases. Then, the muffle furnace was programmed to the desired temperature (°C) and residence time (minutes), with each level corresponding to a torrefaction phase. Sample preparation started by weighing approximately 0.5 kg of material. Preparation was aided by conventional aluminum foil with the objective to wrap the sugarcane bagasse in a cylindrical shape. During this study, torrefaction tests were carried out in triplicate to guarantee their reproducibility (Figure 3).
Figure 2. Sequence of procedures to obtain sugarcane pieces used in torrefaction tests: (a) raw materialas bought; (b) sugarcane after being processed with the roller mill; (c) sugarcane pieces; and (d) piecesbeing washed.
In this work, a torrefaction protocol described by Ribeiro et al. (2018) was used [64]. The sampleswere torrefied and pyrolyzed in the muffle furnace, which has a built-in controller with the ability toprogram 4 temperature thresholds and the residence time. There is a cavity on the top of the device tofacilitate the extraction of torrefaction gases. Then, the muffle furnace was programmed to the desiredtemperature (◦C) and residence time (minutes), with each level corresponding to a torrefaction phase.Sample preparation started by weighing approximately 0.5 kg of material. Preparation was aided byconventional aluminum foil with the objective to wrap the sugarcane bagasse in a cylindrical shape.During this study, torrefaction tests were carried out in triplicate to guarantee their reproducibility(Figure 3).
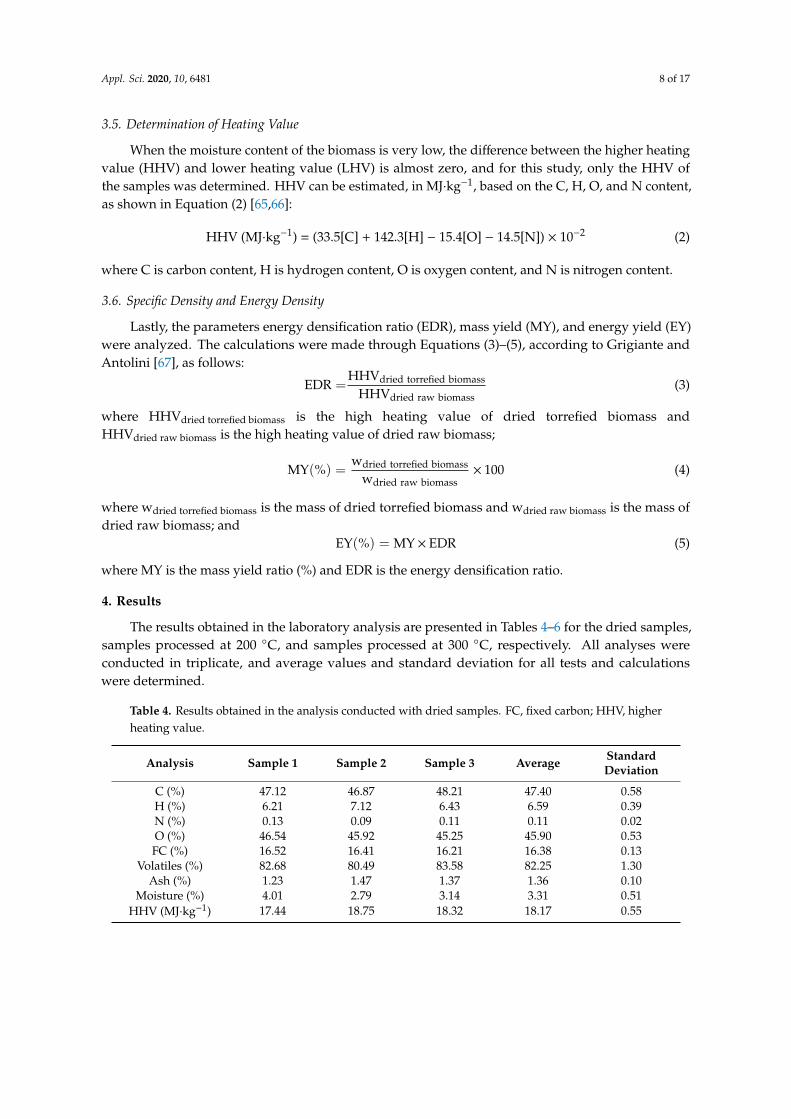
The particular parameters that can be changed during the thermal process are temperature andresidence time, which were changed in order to understand the best set of parameters to obtainhigh-quality samples. Table 3 defines the parameters used for each test performed. It should be notedthat the selection of parameters described in the table was done in a sequential manner, taking intoaccount the results obtained for each torrefaction type. That is, the results obtained in one processalways influenced the choice of parameters used in the next one. Obtained materials are shown inFigure 4.
Appl. Sci. 2020, 10, 6481 7 of 17
Appl. Sci. 2020, 10, x FOR PEER REVIEW 7 of 17
Figure 3. Sugarcane bagasse sample wrapped in aluminum foil.
The particular parameters that can be changed during the thermal process are temperature and residence time, which were changed in order to understand the best set of parameters to obtain high-quality samples. Table 3 defines the parameters used for each test performed. It should be noted that the selection of parameters described in the table was done in a sequential manner, taking into account the results obtained for each torrefaction type. That is, the results obtained in one process always influenced the choice of parameters used in the next one. Obtained materials are shown in Figure 4.
Table 3. Temperature and residence times used in the tests.
Residence Time (minutes) 200 °C 300 °C 30 18–180 18–180 60 180–200 180–300 90 200 300
Time required to safely open door and collect material 200–50 300–50
Figure 4. Obtained materials: (a) after drying; (b) after torrefaction at 200 °C; and (c) after torrefaction at 300 °C.
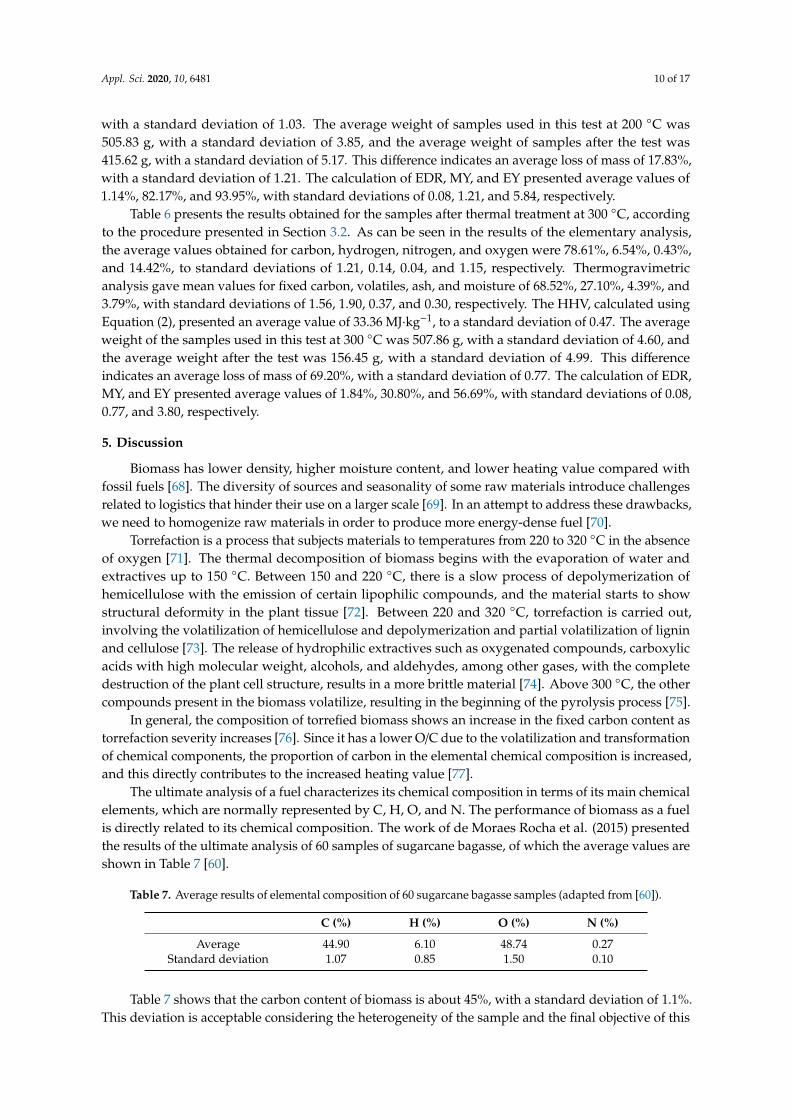
3.3. Ultimate Analysis
Ultimate analysis was performed in a LECO CHN628 in accordance with the standard EN 15104: 2011, Solid Biofuels—Determination of Total Content of Carbon, Hydrogen and Nitrogen—Instrumental Methods. The oxygen content on a dry basis was determined from Equation (1), as follows:
w(O) = 100 – w(C) – w(H) – w(N) (1)
where w(O) is oxygen content (%), w(C) is carbon content (%), w(H) is hydrogen content (%), and w(N) is nitrogen content (%).
3.4. Proximate Analysis
Figure 3. Sugarcane bagasse sample wrapped in aluminum foil.
Table 3. Temperature and residence times used in the tests.
Residence Time (minutes) 200 ◦C 300 ◦C
30 18–180 18–18060 180–200 180–30090 200 300
Time required to safely open door and collect material 200–50 300–50
Appl. Sci. 2020, 10, x FOR PEER REVIEW 7 of 17
Figure 3. Sugarcane bagasse sample wrapped in aluminum foil.
The particular parameters that can be changed during the thermal process are temperature and residence time, which were changed in order to understand the best set of parameters to obtain high-quality samples. Table 3 defines the parameters used for each test performed. It should be noted that the selection of parameters described in the table was done in a sequential manner, taking into account the results obtained for each torrefaction type. That is, the results obtained in one process always influenced the choice of parameters used in the next one. Obtained materials are shown in Figure 4.
Table 3. Temperature and residence times used in the tests.
Residence Time (minutes) 200 °C 300 °C 30 18–180 18–180 60 180–200 180–300 90 200 300
Time required to safely open door and collect material 200–50 300–50
Figure 4. Obtained materials: (a) after drying; (b) after torrefaction at 200 °C; and (c) after torrefaction at 300 °C.
3.3. Ultimate Analysis
Ultimate analysis was performed in a LECO CHN628 in accordance with the standard EN 15104: 2011, Solid Biofuels—Determination of Total Content of Carbon, Hydrogen and Nitrogen—Instrumental Methods. The oxygen content on a dry basis was determined from Equation (1), as follows:
w(O) = 100 – w(C) – w(H) – w(N) (1)
where w(O) is oxygen content (%), w(C) is carbon content (%), w(H) is hydrogen content (%), and w(N) is nitrogen content (%).
3.4. Proximate Analysis
Figure 4. Obtained materials: (a) after drying; (b) after torrefaction at 200 ◦C; and (c) after torrefactionat 300 ◦C.
3.3. Ultimate Analysis
Ultimate analysis was performed in a LECO CHN628 in accordance with the standard EN 15104:2011, Solid Biofuels—Determination of Total Content of Carbon, Hydrogen and Nitrogen—InstrumentalMethods. The oxygen content on a dry basis was determined from Equation (1), as follows:
w(O) = 100 −w(C) −w(H) −w(N) (1)
where w(O) is oxygen content (%), w(C) is carbon content (%), w(H) is hydrogen content (%), andw(N) is nitrogen content (%).
3.4. Proximate Analysis
Thermogravimetric (TGA) analysis was conducted in accordance with the standards EN 14775:2009, Solid Biofuels—Determination of Ash Content; EN 15148: 2009, Solid Biofuels—Determinationof Volatiles Content; and EN 14774-3: 2009, Solid Biofuel—Determination of Moisture Content, usingan ELTRA Thermostep equipment.
Appl. Sci. 2020, 10, 6481 8 of 17
3.5. Determination of Heating Value
When the moisture content of the biomass is very low, the difference between the higher heatingvalue (HHV) and lower heating value (LHV) is almost zero, and for this study, only the HHV ofthe samples was determined. HHV can be estimated, in MJ·kg−1, based on the C, H, O, and N content,as shown in Equation (2) [65,66]:
HHV (MJ·kg−1) = (33.5[C] + 142.3[H] − 15.4[O] − 14.5[N]) × 10−2 (2)
where C is carbon content, H is hydrogen content, O is oxygen content, and N is nitrogen content.
3.6. Specific Density and Energy Density
Lastly, the parameters energy densification ratio (EDR), mass yield (MY), and energy yield (EY)were analyzed. The calculations were made through Equations (3)–(5), according to Grigiante andAntolini [67], as follows:
EDR =HHVdried torrefied biomass
HHVdried raw biomass(3)
where HHVdried torrefied biomass is the high heating value of dried torrefied biomass andHHVdried raw biomass is the high heating value of dried raw biomass;
MY(%) =wdried torrefied biomass
wdried raw biomass× 100 (4)
where wdried torrefied biomass is the mass of dried torrefied biomass and wdried raw biomass is the mass ofdried raw biomass; and
EY(%) = MY× EDR (5)
where MY is the mass yield ratio (%) and EDR is the energy densification ratio.
4. Results
The results obtained in the laboratory analysis are presented in Tables 4–6 for the dried samples,samples processed at 200 ◦C, and samples processed at 300 ◦C, respectively. All analyses wereconducted in triplicate, and average values and standard deviation for all tests and calculationswere determined.
Table 4. Results obtained in the analysis conducted with dried samples. FC, fixed carbon; HHV, higherheating value.
Analysis Sample 1 Sample 2 Sample 3 Average StandardDeviation
C (%) 47.12 46.87 48.21 47.40 0.58H (%) 6.21 7.12 6.43 6.59 0.39N (%) 0.13 0.09 0.11 0.11 0.02O (%) 46.54 45.92 45.25 45.90 0.53FC (%) 16.52 16.41 16.21 16.38 0.13
Volatiles (%) 82.68 80.49 83.58 82.25 1.30Ash (%) 1.23 1.47 1.37 1.36 0.10
Moisture (%) 4.01 2.79 3.14 3.31 0.51HHV (MJ·kg−1) 17.44 18.75 18.32 18.17 0.55

Appl. Sci. 2020, 10, 6481 9 of 17
Table 5. Results obtained in analysis conducted with samples thermally treated at 200 ◦C. EDR, energydensification ratio; MY, mass yield; EY, energy yield.
Analysis Sample 1 Sample 2 Sample 3 Average StandardDeviation
C (%) 53.63 49.99 55.87 53.16 2.42H (%) 6.62 6.51 6.18 6.44 0.19N (%) 0.13 0.10 0.12 0.12 0.01O (%) 39.62 43.4 37.83 40.28 2.32FC (%) 21.44 19.99 20.95 20.79 0.60
Volatiles (%) 76.89 79.65 76.69 77.74 1.35Ash (%) 1.33 2.01 1.11 1.48 0.38
Moisture (%) 0.84 1.34 0.91 1.03 0.22HHV (MJ·kg−1) 21.27 19.31 21.67 20.75 1.03
Initial sample weight (g) 501.24 505.59 510.67 505.83 3.85Weight after thermal
treatment (g) 411.92 422.93 412.01 415.62 5.17
Mass loss (%) 17.82 16.35 19.32 17.83 1.21EDR 1.22 1.03 1.18 1.14 0.08
MY (%) 82.18 83.65 80.68 82.17 1.21EY (%) 100.23 86.17 95.44 93.95 5.84
Table 6. Results obtained in analysis of samples thermally treated at 300 ◦C.
Analysis Sample 1 Sample 2 Sample 3 Average StandardDeviation
C (%) 78.98 76.98 79.87 78.61 1.21H (%) 6.66 6.63 6.34 6.54 0.14N (%) 0.43 0.38 0.48 0.43 0.04O (%) 13.93 16.01 13.31 14.42 1.15FC (%) 70.30 66.51 68.74 68.52 1.56
Volatiles (%) 24.90 29.54 26.87 27.10 1.90Ash (%) 3.97 4.87 4.34 4.39 0.37
Moisture (%) 3.40 4.12 3.84 3.79 0.30HHV (MJ·kg−1) 33.73 32.70 33.66 33.36 0.47
Initial sample weight (g) 510.12 501.45 512.01 507.86 4.60Weight after thermal
treatment (g) 162.07 149.93 157.34 156.45 4.99
Mass loss (%) 68.23 70.10 69.27 69.20 0.77EDR 1.93 1.74 1.84 1.84 0.08
MY (%) 31.77 29.90 30.73 30.80 0.77EY (%) 61.46 52.15 56.47 56.69 3.80
Table 4 presents the results obtained for samples after drying. As can be seen in the results ofelementary analysis, the average values obtained for carbon, hydrogen, nitrogen, and oxygen were47.40%, 6.59%, 0.11%, and 45.99%, with standard deviations of 0.58, 0.39, 0.02, and 0.53, respectively.Thermogravimetric analysis gave mean values for fixed carbon, volatiles, ash, and moisture of 16.38%,81.25%, 1.36%, and 3.31%, with standard deviations of 0.13, 1.30, 0.10, and 0.51, respectively. The HHV,calculated using Equation (2), presented an average value of 18.17 MJ·kg−1 with a standard deviationof 0.55.
Table 5 presents the results obtained for the samples after thermal treatment at 200 ◦C. As can beseen in the results of elementary analysis, average values obtained for carbon, hydrogen, nitrogen,and oxygen were 53.16%, 6.44%, 0.12%, and 40.28%, with standard deviations of 2.42, 0.19, 0.01, and2.32, respectively. Thermogravimetric analysis gave mean values for fixed carbon, volatiles, ash, andmoisture of 20.79%, 77.74%, 1.48%, and 1.03%, with standard deviations of 0.60, 1.35, 0.38, and 0.22,respectively. The HHV, calculated using Equation (2), presented an average value of 20.75 MJ·kg−1
Appl. Sci. 2020, 10, 6481 10 of 17
with a standard deviation of 1.03. The average weight of samples used in this test at 200 ◦C was505.83 g, with a standard deviation of 3.85, and the average weight of samples after the test was415.62 g, with a standard deviation of 5.17. This difference indicates an average loss of mass of 17.83%,with a standard deviation of 1.21. The calculation of EDR, MY, and EY presented average values of1.14%, 82.17%, and 93.95%, with standard deviations of 0.08, 1.21, and 5.84, respectively.
Table 6 presents the results obtained for the samples after thermal treatment at 300 ◦C, accordingto the procedure presented in Section 3.2. As can be seen in the results of the elementary analysis,the average values obtained for carbon, hydrogen, nitrogen, and oxygen were 78.61%, 6.54%, 0.43%,and 14.42%, to standard deviations of 1.21, 0.14, 0.04, and 1.15, respectively. Thermogravimetricanalysis gave mean values for fixed carbon, volatiles, ash, and moisture of 68.52%, 27.10%, 4.39%, and3.79%, with standard deviations of 1.56, 1.90, 0.37, and 0.30, respectively. The HHV, calculated usingEquation (2), presented an average value of 33.36 MJ·kg−1, to a standard deviation of 0.47. The averageweight of the samples used in this test at 300 ◦C was 507.86 g, with a standard deviation of 4.60, andthe average weight after the test was 156.45 g, with a standard deviation of 4.99. This differenceindicates an average loss of mass of 69.20%, with a standard deviation of 0.77. The calculation of EDR,MY, and EY presented average values of 1.84%, 30.80%, and 56.69%, with standard deviations of 0.08,0.77, and 3.80, respectively.
5. Discussion
Biomass has lower density, higher moisture content, and lower heating value compared withfossil fuels [68]. The diversity of sources and seasonality of some raw materials introduce challengesrelated to logistics that hinder their use on a larger scale [69]. In an attempt to address these drawbacks,we need to homogenize raw materials in order to produce more energy-dense fuel [70].
Torrefaction is a process that subjects materials to temperatures from 220 to 320 ◦C in the absenceof oxygen [71]. The thermal decomposition of biomass begins with the evaporation of water andextractives up to 150 ◦C. Between 150 and 220 ◦C, there is a slow process of depolymerization ofhemicellulose with the emission of certain lipophilic compounds, and the material starts to showstructural deformity in the plant tissue [72]. Between 220 and 320 ◦C, torrefaction is carried out,involving the volatilization of hemicellulose and depolymerization and partial volatilization of ligninand cellulose [73]. The release of hydrophilic extractives such as oxygenated compounds, carboxylicacids with high molecular weight, alcohols, and aldehydes, among other gases, with the completedestruction of the plant cell structure, results in a more brittle material [74]. Above 300 ◦C, the othercompounds present in the biomass volatilize, resulting in the beginning of the pyrolysis process [75].
In general, the composition of torrefied biomass shows an increase in the fixed carbon content astorrefaction severity increases [76]. Since it has a lower O/C due to the volatilization and transformationof chemical components, the proportion of carbon in the elemental chemical composition is increased,and this directly contributes to the increased heating value [77].
The ultimate analysis of a fuel characterizes its chemical composition in terms of its main chemicalelements, which are normally represented by C, H, O, and N. The performance of biomass as a fuelis directly related to its chemical composition. The work of de Moraes Rocha et al. (2015) presentedthe results of the ultimate analysis of 60 samples of sugarcane bagasse, of which the average values areshown in Table 7 [60].
Table 7. Average results of elemental composition of 60 sugarcane bagasse samples (adapted from [60]).
C (%) H (%) O (%) N (%)
Average 44.90 6.10 48.74 0.27Standard deviation 1.07 0.85 1.50 0.10
Table 7 shows that the carbon content of biomass is about 45%, with a standard deviation of 1.1%.This deviation is acceptable considering the heterogeneity of the sample and the final objective of this

Appl. Sci. 2020, 10, 6481 11 of 17
material: thermal conversion. According to the results presented in Table 7, these samples had anaverage carbon/hydrogen ratio of 7:1, an average carbon/oxygen ratio of 1:1, an average carbon/nitrogenratio of 166:1, and an average oxygen/hydrogen ratio of 8:1 [60]. The decreased atomic ratios of O/Cand H/C in relation to untreated biomass make it possible to compare the characteristics of torrefactionbiomass with other solid fuels, such as mineral coal and charcoal, using the Van Krevelen diagram(Figure 5). Calculating the H/C and O/C ratios for the analyzed samples, the results shown in Table 8were obtained; then, they were projected onto the Van Krevelen diagram shown in Figure 5. The blackdots represent the analyzed samples. As can be seen, although one of the samples, produced at 200 ◦C,already had a higher HHV, it was still projected into the area of untreated biomass, indicating goodpotential performance with increased temperature, as seen with the heat-treated samples at 300 ◦C,which were projected into an area corresponding to bituminous coal.
Appl. Sci. 2020, 10, x FOR PEER REVIEW 11 of 17
of torrefaction biomass with other solid fuels, such as mineral coal and charcoal, using the Van Krevelen diagram (Figure 5). Calculating the H/C and O/C ratios for the analyzed samples, the results shown in Table 8 were obtained; then, they were projected onto the Van Krevelen diagram shown in Figure 5. The black dots represent the analyzed samples. As can be seen, although one of the samples, produced at 200 °C, already had a higher HHV, it was still projected into the area of untreated biomass, indicating good potential performance with increased temperature, as seen with the heat-treated samples at 300 °C, which were projected into an area corresponding to bituminous coal.
Table 8. H/C and O/C ratios.
Sample
H/C × 10 O/C Reference
Dried Sample 1 1.32 0.99 Sample 2 1.52 0.98
Sample Sample 3 1.33 0.94 Average 1.39 0.97
200 °C
Sample 1 1.23 0.74 Sample 2 1.30 0.87 Sample 3 1.11 0.68 Average 1.21 0.76
300 °C
Sample 1 0.84 0.18 Sample 2 0.86 0.21 Sample 3 0.79 0.17 Average 0.83 0.18
Figure 5. Van Krevelen diagram (adapted from [78]).
When evaluating the use of torrefied biomass as raw material for other thermochemical conversion processes, it was found that for combustion reactions, the solid product can be used as an industrial fuel in boilers for steam production and in co-combustion with mineral coal. In addition, the possibility of storing it for long periods can also facilitate its domestic use [79,80]. In the literature, torrefaction followed by densification has been reported. Densification is a compaction process that uses equipment such as presses or extruders to increase the durability and improve the physical characteristics of biomass residues [81–84]. In the case of torrefaction, it is possible to densify the material by briquetting or pelletizing in order to obtain a final product with greater hydrophobic
Figure 5. Van Krevelen diagram (adapted from [78]).
Table 8. H/C and O/C ratios.
Sample H/C × 10 O/CReference
DriedSample 1 1.32 0.99Sample 2 1.52 0.98
Sample Sample 3 1.33 0.94Average 1.39 0.97
200 ◦C
Sample 1 1.23 0.74Sample 2 1.30 0.87Sample 3 1.11 0.68Average 1.21 0.76
300 ◦C
Sample 1 0.84 0.18Sample 2 0.86 0.21Sample 3 0.79 0.17Average 0.83 0.18
Appl. Sci. 2020, 10, 6481 12 of 17
When evaluating the use of torrefied biomass as raw material for other thermochemical conversionprocesses, it was found that for combustion reactions, the solid product can be used as an industrialfuel in boilers for steam production and in co-combustion with mineral coal. In addition, the possibilityof storing it for long periods can also facilitate its domestic use [79,80]. In the literature, torrefactionfollowed by densification has been reported. Densification is a compaction process that uses equipmentsuch as presses or extruders to increase the durability and improve the physical characteristics ofbiomass residues [81–84]. In the case of torrefaction, it is possible to densify the material by briquettingor pelletizing in order to obtain a final product with greater hydrophobic character and high physicaland energetic density [85,86]. With this, the material can have standard sizes that favor transportation,storage, and handling, as well as facilitate the feeding of raw materials in industrial and domesticinstallations [78]. Apparently, for the lowest temperature used in this test, 200 ◦C, there should be noproblems during densification, since even the color of the material is still light to dark brown and notblack, as seen in samples treated at lower temperatures. Most likely, the state of lignin and cellulosedid not change during the test at 200 ◦C, but it most certainly did at 300 ◦C, making it more difficultwithout the use of binders.
The heating value tends to be higher for torrefied biomass than non-torrefied biomass. However,in contrast to this increase, there is mass loss of the material, as seen in Table 8, and the need toobtain a mass and energy balance to verify the technical–economic application of the thermochemicalconversion process to check its feasibility is evident.
From the thermogravimetric analysis, it can be inferred that there is an increased concentration offixed carbon, which is associated with the loss of hydrogenated compounds, in line with the resultspresented in the work of Quiroga et al. (2020) [87]. The moisture content decreases from an averagevalue of 3.31% for dry material to an average of 1.03% in material processed at 200 ◦C. This followsthe normal trend, since it is a process of forced drying of nonstructural water, but it is still presentin the material. However, when assessing the moisture content of materials processed at 300 ◦C, itappears that it rises again to 3.79%. This rise should be associated with the release of water containedin the material structure and/or the release of hydroxyl radicals, as was portrayed in the work of Chewand Doshi (2011) [88].
The results presented in Table 5 indicate that a simple heat treatment at 200 ◦C leads to anaverage energy densification of 1.14, with MY of 82.17% and EY of 93.85%. That is, even withoutentering the torrefaction zone, still in the over-drying zone, there was already energy densification inthe materials under study. Analyzing the results presented in Table 6, for the materials processed at300 ◦C, the energy densification is even more significant, since the EDR reaches an average value of 1.84,with a MY of 30.80% and EY of 56.69%. These values are in line with the values calculated for materialsmost commonly used in the production of energy from biomass in Europe, such as the maritime pine(Pinus pinaster), which has EDR, MY, and EY values of, respectively, 1.55%, 30.50%, and 47.41% [89].With the results related to the direct increase of heating value, but mainly with the EDR values, there isan energetic densification of the materials. This increase in energy density allows an evaluation ofthe possibility of exporting materials, especially if they are subjected to a densification process, forexample, through the production of pellets [90]. This can contribute to the optimization of logisticalprocesses, which still need to be evaluated and quantified [91]. The combination of the improvement ofproperties related to logistics, namely the increase in energy density, is in accordance with the propertiesfound in commercial coals, namely bituminous and sub-bituminous coals. In fact, with the energycontent above 25 MJ·kg−1, the heat-treated sugarcane bagasse approaches the values that these coalsnormally present. Thus, the torrefied sugarcane bagasse presents itself as a real alternative forthe replacement of coal in the thermoelectric plants, especially because, as presented in the work ofNunes et al. (2020), in addition to the energy properties, most of the torrefied biomasses have otherproperties that allow this substitution, namely the Hardgrove Grindability Index (HGI), which alsopresents similar values to those of coal [92].
Appl. Sci. 2020, 10, 6481 13 of 17
6. Conclusions and Future Developments
The sugarcane industry presents environmental problems, since it generates large amounts ofwaste that are normally valued energetically in sugar mills. However, growth in the industry hasalso led to increased production of waste, making it impossible to discharge the quantities generated.These residues have the potential to be exported for energy recovery in other areas, namely in Europe,where the demand for and consumption of biomass for energy has assumed particular importance.However, the low density of the material, associated with other problems common to biomass such asfermentation of the product, make export very difficult and costly.
The possibility of using thermochemical conversion technologies such as torrefaction to improvethe energy potential of sugarcane bagasse presents itself as a highly promising alternative, asdemonstrated by the results obtained in the tests performed. The improved energetic propertiesassociated with energy densification make heat-treated sugarcane bagasse an asset to the energymarket, mainly regarding the replacement of coal in the large-scale generation of energy.
Further studies are still needed, mainly to define the optimal temperature to be used in torrefaction,since high mass loss can hinder the economic viability of projects, by using, for example, a responsesurface methodology (RSM), which explores the relationships between several explanatory variablesand one or more response variables. It is also necessary to carry out new tests with a larger number ofsamples, so that the results can be statistically validated, since in the present study, it was not possibleto carry out a statistical study of the results, because, as previously mentioned, the tests were onlyconducted in triplicate. An assessment of the supply chain factors, namely those related to transportcosts and cargo conditioning in long-distance transport, similar to what already happens with woodpellet supply chains, should be carried out as well. Associated with this issue, there is also a need tocarry out studies on the potential for mechanical densification through the production of pellets orbriquettes of the resulting torrefied material.
Author Contributions: Conceptualization, L.J.R.N.; methodology, L.J.R.N. and H.F.C.S.; validation, L.J.R.N.,L.C.R.S. and L.M.E.F.L.; formal analysis, L.J.R.N.; investigation, L.J.R.N., L.C.R.S., and L.M.E.F.L.; resources,H.F.C.S.; data curation, L.J.R.N., L.C.R.S., and L.M.E.F.L.; writing—original draft preparation, L.J.R.N.;writing—review and editing, L.J.R.N. and H.F.C.S.; supervision, L.J.R.N.; funding acquisition, H.F.C.S. Allauthors have read and agreed to the published version of the manuscript.
Funding: This research received no external funding.
Acknowledgments: The authors would like to acknowledge the Portuguese companies Yser Green Energy SAand Advanced Fuel Solutions SA, which allowed the execution of the laboratory tests.
Conflicts of Interest: The authors declare no conflict of interest.
References
1. Dotaniya, M.; Datta, S.; Biswas, D.; Dotaniya, C.; Meena, B.; Rajendiran, S.; Regar, K.; Lata, M. Use ofsugarcane industrial by-products for improving sugarcane productivity and soil health. Int. J. Recycl. Org.Waste Agric. 2016, 5, 185–194. [CrossRef]
2. Zhang, N.; Wang, M.; Wang, N. Precision agriculture—A worldwide overview. Comput. Electron. Agric. 2002,36, 113–132. [CrossRef]
3. Khoury, C.K.; Achicanoy, H.A.; Bjorkman, A.D.; Navarro-Racines, C.; Guarino, L.; Flores-Palacios, X.;Engels, J.M.; Wiersema, J.H.; Dempewolf, H.; Sotelo, S. Origins of food crops connect countries worldwide.Proc. R. Soc. B Biol. Sci. 2016, 283, 20160792. [CrossRef]
4. Fischer, G.; Teixeira, E.; Hizsnyik, E.T.; Velthuizen, H.V. Land use dynamics and sugarcane production. InSugarcane Ethanol: Contribution to Climate Change Mitigation and the Environment; Wageningen Academic:Wageningen, DC, USA, 2008; pp. 29–62.
5. Goldemberg, J.; Coelho, S.T.; Guardabassi, P. The sustainability of ethanol production from sugarcane. EnergyPolicy 2008, 36, 2086–2097. [CrossRef]
6. Furtado, A.T.; Scandiffio, M.I.G.; Cortez, L.A.B. The Brazilian sugarcane innovation system. Energy Policy2011, 39, 156–166. [CrossRef]
Appl. Sci. 2020, 10, 6481 14 of 17
7. Goldemberg, J. The Brazilian biofuels industry. Biotechnol. Biofuels 2008, 1, 6. [CrossRef]8. Awwal, O.A.; Israel, O.K.; Yashim, Z. Physico-chemical, Calorific, and Emission Performance of Briquettes
Produced from Maize Cob, Sugarcane Bagasse, and Polythene Composites. Avicenna J. Environ. Health Eng.2019, 6, 49–54. [CrossRef]
9. Mohammadi, F.; Abdoli, M.; Amidpour, M.; Vahidi, H.; Gitipour, S. Environmental-economic evaluation ofsugar cane bagasse gasification power plants versus combined-cycle gas power plants. Glob. J. Environ. Sci.Manag. 2020, 6, 73–84.
10. Carvalho, M.; Segundo, V.; Medeiros, M.; Santos, N.; Coelho Junior, L.M. Carbon footprint of the generationof bioelectricity from sugarcane bagasse in a sugar and ethanol industry. Int. J. Glob. Warm. 2019, 17, 235–251.[CrossRef]
11. Kaab, A.; Sharifi, M.; Mobli, H.; Nabavi-Pelesaraei, A.; Chau, K.-w. Combined life cycle assessment andartificial intelligence for prediction of output energy and environmental impacts of sugarcane production.Sci. Total Environ. 2019, 664, 1005–1019. [CrossRef]
12. Kaab, A.; Sharifi, M.; Mobli, H.; Nabavi-Pelesaraei, A.; Chau, K.-W. Use of optimization techniques for energyuse efficiency and environmental life cycle assessment modification in sugarcane production. Energy 2019,181, 1298–1320. [CrossRef]
13. Valderrama, C.; Quintero, V.; Kafarov, V. Energy and water optimization of an integrated bioethanolproduction process from molasses and sugarcane bagasse: A Colombian case. Fuel 2020, 260, 116314.[CrossRef]
14. Mohammadi, F.; Roedl, A.; Abdoli, M.A.; Amidpour, M.; Vahidi, H. Life cycle assessment (LCA) ofthe energetic use of bagasse in Iranian sugar industry. Renew. Energy 2020, 145, 1870–1882. [CrossRef]
15. Asfaw, B.T.; Shebu, H.G.; Gari, M.T. Review on: Case study for the Construction of Particleboard UsingSugarcane Bagasse. J. Catal. Catal. 2019, 6, 14–24.
16. Coelho, R.D.; Lizcano, J.V.; da Silva Barros, T.H.; da Silva Barbosa, F.; Leal, D.P.V.; da Costa Santos, L.;Ribeiro, N.L.; Júnior, E.F.F.; Martin, D.L. Effect of water stress on renewable energy from sugarcane biomass.Renew. Sustain. Energy Rev. 2019, 103, 399–407. [CrossRef]
17. Maqueira-López, L.A.; Morejón-Rivera, R.; Roján-Herrera, O.; Torres-de-la-Noval, W. Relationship betweengrowth traits and yield formation in Indica-type rice crop. Agron. Mesoam. 2019, 30, 79–100. [CrossRef]
18. Ferreira, S.; Moreira, N.A.; Monteiro, E. Bioenergy overview for Portugal. Biomass Bioenergy 2009, 33,1567–1576. [CrossRef]
19. Maxwell, K. Portugal, Europe, and the Origins of the Atlantic Commercial System, 1415–1520. Port. Stud.1992, 8, 3–16.
20. Vieira, A. As Ilhas e a expansão da cultura e tecnologia da cana-de-açúcar no Atlântico nos séculos XV a XIX.Labor Eng. 2007, 1, 1–20. [CrossRef]
21. Tamás, S. DOSSIER SUCRE, PASSAT I PRESENT. The Impact of Sugar Cane Expansion on Five Continents.Illes Imp. 2006, 5–16. [CrossRef]
22. Moore, J.W. Madeira, Sugar, and the Conquest of Nature in the “First” Sixteenth Century: Part I: From“Island of Timber” to Sugar Revolution, 1420–1506. Review 2009, 32, 345–390.
23. Moore, J.W. Madeira, Sugar, and the Conquest of Nature in the “First” Sixteenth Century, Part II: FromRegional Crisis to Commodity Frontier, 1506–1530. Review 2010, 33, 1–24.
24. Strong, D.R., Jr.; McCoy, E.D.; Rey, J.R. Time and the number of herbivore species: The pests of sugarcane.Ecology 1977, 58, 167–175. [CrossRef]
25. De Souza Caldas, R.M.; Verslype, N.I.; Machado, J. Sustainable agriculture in Ilha da Madeira-Portugal|Agricultura sustentável na Ilha da Madeira-Portugal. Rev. Geama 2016, 2, 376–384.
26. Kiesow, S.; Bork, H.R. Agricultural terraces as a proxy to landscape history on Madeira island, Portugal. LerHistória 2017, 71, 127–152. [CrossRef]
27. Moore, J.W. Sugar and the expansion of the early modern world-economy: Commodity frontiers, ecologicaltransformation, and industrialization. Review 2000, 23, 409–433.
28. Silva, P.; Freitas, J.; Silva, C.L.; Perestrelo, R.; Nunes, F.M.; Câmara, J.S. Establishment of authenticity andtypicality of sugarcane honey based on volatile profile and multivariate analysis. Food Control 2017, 73,1176–1188. [CrossRef]

Appl. Sci. 2020, 10, 6481 15 of 17
29. Silva, P.; Silva, C.L.; Perestrelo, R.; Nunes, F.M.; Câmara, J.S. Fingerprint targeted compounds in authenticityof sugarcane honey—An approach based on chromatographic and statistical data. LWT 2018, 96, 82–89.[CrossRef]
30. Hofsetz, K.; Silva, M.A. Brazilian sugarcane bagasse: Energy and non-energy consumption. Biomass Bioenergy2012, 46, 564–573. [CrossRef]
31. Dantas, G.A.; Legey, L.F.; Mazzone, A. Energy from sugarcane bagasse in Brazil: An assessment ofthe productivity and cost of different technological routes. Renew. Sustain. Energy Rev. 2013, 21, 356–364.[CrossRef]
32. Ramajo-Escalera, B.; Espina, A.; García, J.; Sosa-Arnao, J.; Nebra, S. Model-free kinetics applied to sugarcanebagasse combustion. Thermochim. Acta 2006, 448, 111–116. [CrossRef]
33. Goldemberg, J.; Macedo, I.C. Brazilian alcohol program: An overview. Energy Sustain. Dev. 1994, 1, 17–22.[CrossRef]
34. Boddey, R.M.; Soares, L.H.d.B.; Alves, B.J.; Urquiaga, S. Bio-ethanol production in Brazil. In Biofuels, Solarand Wind as Renewable Energy Systems; Springer: Berlin/Heidelberg, Germany, 2008; pp. 321–356.
35. Turkenburg, W.C.; Faaij, A. Renewable Energy Technologies. In UNDP/UNDESA/WEC: Energy and the Challengeof Sustainability; World Energy Report; UNDP: New York, NY, USA, 2000.
36. Monteiro, S.; Rodriquez, R.; De Souza, M.; d’Almeida, J. Sugar cane bagasse waste as reinforcement in lowcost composites. Adv. Perform. Mater. 1998, 5, 183–191. [CrossRef]
37. Botha, T.; Von Blottnitz, H. A comparison of the environmental benefits of bagasse-derived electricity andfuel ethanol on a life-cycle basis. Energy Policy 2006, 34, 2654–2661. [CrossRef]
38. Omer, A.M. Green energies and the environment. Renew. Sustain. Energy Rev. 2008, 12, 1789–1821. [CrossRef]39. Rosillo-Calle, F. A review of biomass energy—Shortcomings and concerns. J. Chem. Technol. Biotechnol. 2016,
91, 1933–1945. [CrossRef]40. Naik, S.N.; Goud, V.V.; Rout, P.K.; Dalai, A.K. Production of first and second generation biofuels: A
comprehensive review. Renew. Sustain. Energy Rev. 2010, 14, 578–597. [CrossRef]41. Demirbas, A. Biofuels sources, biofuel policy, biofuel economy and global biofuel projections. Energy Convers.
Manag. 2008, 49, 2106–2116. [CrossRef]42. Samariha, A.; Khakifirooz, A. Application of NSSC pulping to sugarcane bagasse. BioResources 2011, 6,
3313–3323.43. Lois-Correa, J. Depithers for efficient preparation of sugar cane bagasse fibers in pulp and paper industry.
Ing. Investig. Tecnol. 2012, 13, 417–424. [CrossRef]44. Hemmasi, A.H.; Samariha, A.; Tabei, A.; Nemati, M.; Khakifirooz, A. Study of morphological and chemical
composition of fibers from Iranian sugarcane bagasse. Am. Eurasian J. Agric. Environ. Sci 2011, 11, 478–481.45. Loh, Y.; Sujan, D.; Rahman, M.E.; Das, C.A. Sugarcane bagasse—The future composite material: A literature
review. Resour. Conserv. Recycl. 2013, 75, 14–22. [CrossRef]46. Bizzo, W.A.; Lenço, P.C.; Carvalho, D.J.; Veiga, J.P.S. The generation of residual biomass during the production
of bio-ethanol from sugarcane, its characterization and its use in energy production. Renew. Sustain. EnergyRev. 2014, 29, 589–603. [CrossRef]
47. Lombardi, L.; Carnevale, E.; Corti, A. A review of technologies and performances of thermal treatmentsystems for energy recovery from waste. Waste Manag. 2015, 37, 26–44. [CrossRef]
48. Sampaio, I.L.; Cardoso, T.F.; Souza, N.R.; Watanabe, M.D.; Carvalho, D.J.; Bonomi, A.; Junqueira, T.L.Electricity production from sugarcane straw recovered through bale system: Assessment of retrofit projects.Bioenergy Res. 2019, 12, 865–877. [CrossRef]
49. Saidur, R.; Abdelaziz, E.; Demirbas, A.; Hossain, M.; Mekhilef, S. A review on biomass as a fuel for boilers.Renew. Sustain. Energy Rev. 2011, 15, 2262–2289. [CrossRef]
50. Dias, M.O.; Ensinas, A.V.; Nebra, S.A.; Maciel Filho, R.; Rossell, C.E.; Maciel, M.R.W. Production of bioethanoland other bio-based materials from sugarcane bagasse: Integration to conventional bioethanol productionprocess. Chem. Eng. Res. Des. 2009, 87, 1206–1216. [CrossRef]
51. Rezende, C.A.; de Lima, M.A.; Maziero, P.; deAzevedo, E.R.; Garcia, W.; Polikarpov, I. Chemical andmorphological characterization of sugarcane bagasse submitted to a delignification process for enhancedenzymatic digestibility. Biotechnol. Biofuels 2011, 4, 54. [CrossRef]
52. Sun, J.; Sun, X.; Zhao, H.; Sun, R. Isolation and characterization of cellulose from sugarcane bagasse. Polym.Degrad. Stab. 2004, 84, 331–339. [CrossRef]

Appl. Sci. 2020, 10, 6481 16 of 17
53. Cerqueira, D.A.; Rodrigues Filho, G.; da Silva Meireles, C. Optimization of sugarcane bagasse celluloseacetylation. Carbohydr. Polym. 2007, 69, 579–582. [CrossRef]
54. De Souza, A.P.; Leite, D.C.; Pattathil, S.; Hahn, M.G.; Buckeridge, M.S. Composition and structure ofsugarcane cell wall polysaccharides: Implications for second-generation bioethanol production. BioenergyRes. 2013, 6, 564–579. [CrossRef]
55. Sanjuan, R.; Anzaldo, J.; Vargas, J.; Turrado, J.; Patt, R. Morphological and chemical composition of pith andfibers from Mexican sugarcane bagasse. Eur. J. Wood Wood Prod. 2001, 59, 447–450. [CrossRef]
56. Frías, M.; Villar, E.; Savastano, H. Brazilian sugar cane bagasse ashes from the cogeneration industry asactive pozzolans for cement manufacture. Cem. Concr. Compos. 2011, 33, 490–496. [CrossRef]
57. Payá, J.; Monzó, J.; Borrachero, M.V.; Díaz-Pinzón, L.; Ordonez, L.M. Sugar-cane bagasse ash (SCBA): Studieson its properties for reusing in concrete production. J. Chem. Technol. Biotechnol. Int. Res. Process Environ.Clean Technol. 2002, 77, 321–325. [CrossRef]
58. Teixeira, S.R.; De Souza, A.E.; de Almeida Santos, G.T.; Vilche Pena, A.F.; Miguel, A.G. Sugarcane bagasseash as a potential quartz replacement in red ceramic. J. Am. Ceram. Soc. 2008, 91, 1883–1887. [CrossRef]
59. Pandey, A.; Soccol, C.R.; Nigam, P.; Soccol, V.T. Biotechnological potential of agro-industrial residues. I:Sugarcane bagasse. Bioresour. Technol. 2000, 74, 69–80. [CrossRef]
60. De Moraes Rocha, G.J.; Nascimento, V.M.; Gonçalves, A.R.; Silva, V.F.N.; Martín, C. Influence of mixedsugarcane bagasse samples evaluated by elemental and physical–chemical composition. Ind. Crop. Prod.2015, 64, 52–58. [CrossRef]
61. Rocha, G.J.d.M.; Silva, F.; Curvelo, A.A.D.S.; Araujo, G.T. A fast and accurate method for determination ofcellulose and polyoses by HPLC. In Proceedings of the 5th Brazilian Symposium on Chemistry of Ligninsand Other Wood Components, Curitiba, Brazil, 31 August–4 September 1997.
62. Gouveia, E.R.; Nascimento, R.T.d.; Souto-Maior, A.M.; Rocha, G.J.d.M. Validação de metodologia paraa caracterização química de bagaço de cana-de-açúcar. Química Nova 2009, 32, 1500–1503. [CrossRef]
63. Triana, O.; Leonard, M.; Saavedra, F.; Fernández, N.; Gálvez, G. Atlas del Bagazo de la Caña de Azucar; Grupode Paises Latinoamericanos y del Caribe Exportadores de Azucar: Mexico City, Mexico, 1990.
64. Ribeiro, J.M.C.; Godina, R.; Matias, J.C.d.O.; Nunes, L.J.R. Future perspectives of biomass torrefaction:Review of the current state-of-the-art and research development. Sustainability 2018, 10, 2323. [CrossRef]
65. Demirbas, A. Calculation of higher heating values of biomass fuels. Fuel 1997, 76, 431–434. [CrossRef]66. Demirbas, A. Combustion characteristics of different biomass fuels. Prog. Energy Combust. Sci. 2004, 30,
219–230. [CrossRef]67. Grigiante, M.; Antolini, D. Experimental results of mass and energy yield referred to different torrefaction
pathways. Waste Biomass Valorization 2014, 5, 11–17. [CrossRef]68. Nunes, L.; Matias, J.; Catalão, J. A review on torrefied biomass pellets as a sustainable alternative to coal in
power generation. Renew. Sustain. Energy Rev. 2014, 40, 153–160. [CrossRef]69. Yue, D.; You, F.; Snyder, S.W. Biomass-to-bioenergy and biofuel supply chain optimization: Overview, key
issues and challenges. Comput. Chem. Eng. 2014, 66, 36–56. [CrossRef]70. Elliott, L.G.; Feehan, C.; Laurens, L.M.; Pienkos, P.T.; Darzins, A.; Posewitz, M.C. Establishment of
a bioenergy-focused microalgal culture collection. Algal Res. 2012, 1, 102–113. [CrossRef]71. Ronsse, F.; Van Hecke, S.; Dickinson, D.; Prins, W. Production and characterization of slow pyrolysis biochar:
Influence of feedstock type and pyrolysis conditions. GCB Bioenergy 2013, 5, 104–115. [CrossRef]72. Kundu, K.; Chatterjee, A.; Bhattacharyya, T.; Roy, M.; Kaur, A. Thermochemical conversion of biomass to
bioenergy: A review. In Prospects of Alternative Transportation Fuels; Springer: Berlin/Heidelberg, Germany,2018; pp. 235–268.
73. Chen, D.; Gao, A.; Cen, K.; Zhang, J.; Cao, X.; Ma, Z. Investigation of biomass torrefaction based on threemajor components: Hemicellulose, cellulose, and lignin. Energy Convers. Manag. 2018, 169, 228–237.[CrossRef]
74. Beyene, D.; Chae, M.; Dai, J.; Danumah, C.; Tosto, F.; Demesa, A.G.; Bressler, D.C. Enzymatically-mediatedCo-production of cellulose nanocrystals and fermentable sugars. Catalysts 2017, 7, 322. [CrossRef]
75. Melchior, T.; Perkins, C.; Lichty, P.; Weimer, A.W.; Steinfeld, A. Solar-driven biochar gasification ina particle-flow reactor. Chem. Eng. Process. Process Intensif. 2009, 48, 1279–1287. [CrossRef]
Appl. Sci. 2020, 10, 6481 17 of 17
76. Iroba, K.L.; Baik, O.D.; Tabil, L.G. Torrefaction of biomass from municipal solid waste fractions II: Grindabilitycharacteristics, higher heating value, pelletability and moisture adsorption. Biomass Bioenergy 2017, 106, 8–20.[CrossRef]
77. Al-Wabel, M.I.; Al-Omran, A.; El-Naggar, A.H.; Nadeem, M.; Usman, A.R. Pyrolysis temperature inducedchanges in characteristics and chemical composition of biochar produced from conocarpus wastes. Bioresour.Technol. 2013, 131, 374–379. [CrossRef]
78. Van der Stelt, M.; Gerhauser, H.; Kiel, J.; Ptasinski, K. Biomass upgrading by torrefaction for the productionof biofuels: A review. Biomass Bioenergy 2011, 35, 3748–3762. [CrossRef]
79. Felfli, F. Torrefação de Biomassa, Viabilidade Técnica e Potencial de Mercado. Ph.D. Thesis, Faculdade deEngenharia Mecânica (UNICAMP), Campinas, Brazil, 2003; p. 137.
80. Felfli, F.F.; Luengo, C.A.; Rocha, J.D. Torrefied briquettes: Technical and economic feasibility and perspectivesin the Brazilian market. Energy Sustain. Dev. 2005, 9, 23–29. [CrossRef]
81. Tumuluru, J.S.; Wright, C.T.; Hess, J.R.; Kenney, K.L. A review of biomass densification systems to developuniform feedstock commodities for bioenergy application. Biofuels Bioprod. Biorefin. 2011, 5, 683–707.[CrossRef]
82. Kaliyan, N.; Morey, R.V. Factors affecting strength and durability of densified biomass products. BiomassBioenergy 2009, 33, 337–359. [CrossRef]
83. Manickam, I.N.; Ravindran, D.; Subramanian, P. Biomass densification methods and mechanism. Cogener.Distrib. Gener. J. 2006, 21, 33–45. [CrossRef]
84. Stelte, W.; Sanadi, A.R.; Shang, L.; Holm, J.K.; Ahrenfeldt, J.; Henriksen, U.B. Recent developments in biomasspelletization–A review. BioResources 2012, 7, 4451–4490.
85. Oladeji, J. Theoretical aspects of biomass briquetting: A review study. J. Energy Technol. Policy 2015, 5, 72–81.86. Tumuluru, J.S.; Cafferty, K.G.; Kenney, K.L. Techno-economic analysis of conventional, high moisture
pelletization and briquetting process. In Proceedings of the American Society of Agricultural and BiologicalEngineers Annual Meeting, Montreal, QC, Canada, 13–16 July 2014; p. 1.
87. Quiroga, E.; Moltó, J.; Conesa, J.A.; Valero, M.F.; Cobo, M. Kinetics of the Catalytic Thermal Degradation ofSugarcane Residual Biomass over Rh-Pt/CeO2-SiO2 for Syngas Production. Catalysts 2020, 10, 508. [CrossRef]
88. Chew, J.J.; Doshi, V. Recent advances in biomass pretreatment–Torrefaction fundamentals and technology.Renew. Sustain. Energy Rev. 2011, 15, 4212–4222. [CrossRef]
89. Rodrigues, A.; Loureiro, L.; Nunes, L. Torrefaction of woody biomasses from poplar SRC and Portugueseroundwood: Properties of torrefied products. Biomass Bioenergy 2018, 108, 55–65. [CrossRef]
90. Conag, A.T.; Villahermosa, J.E.R.; Cabatingan, L.K.; Go, A.W. Energy densification of sugarcane bagassethrough torrefaction under minimized oxidative atmosphere. J. Environ. Chem. Eng. 2017, 5, 5411–5419.[CrossRef]
91. Kutlu, O.; Kocar, G. Upgrading lignocellulosic waste to fuel by torrefaction: Characterisation and processoptimization by response surface methodology. Int. J. Energy Res. 2018, 42, 4746–4760. [CrossRef]
92. Nunes, L.J. Torrefied Biomass as an Alternative in Coal-Fueled Power Plants: A Case Study on Grindabilityof Agroforestry Waste Forms. Clean Technol. 2020, 2, 270–289. [CrossRef]
© 2020 by the authors. Licensee MDPI, Basel, Switzerland. This article is an open accessarticle distributed under the terms and conditions of the Creative Commons Attribution(CC BY) license (http://creativecommons.org/licenses/by/4.0/).


![Em 4Solid Waste Mgt[1].](https://static.fdocumentos.com/doc/165x107/577d29561a28ab4e1ea68124/em-4solid-waste-mgt1.jpg)