Tabela IDH 2010 inglês
99
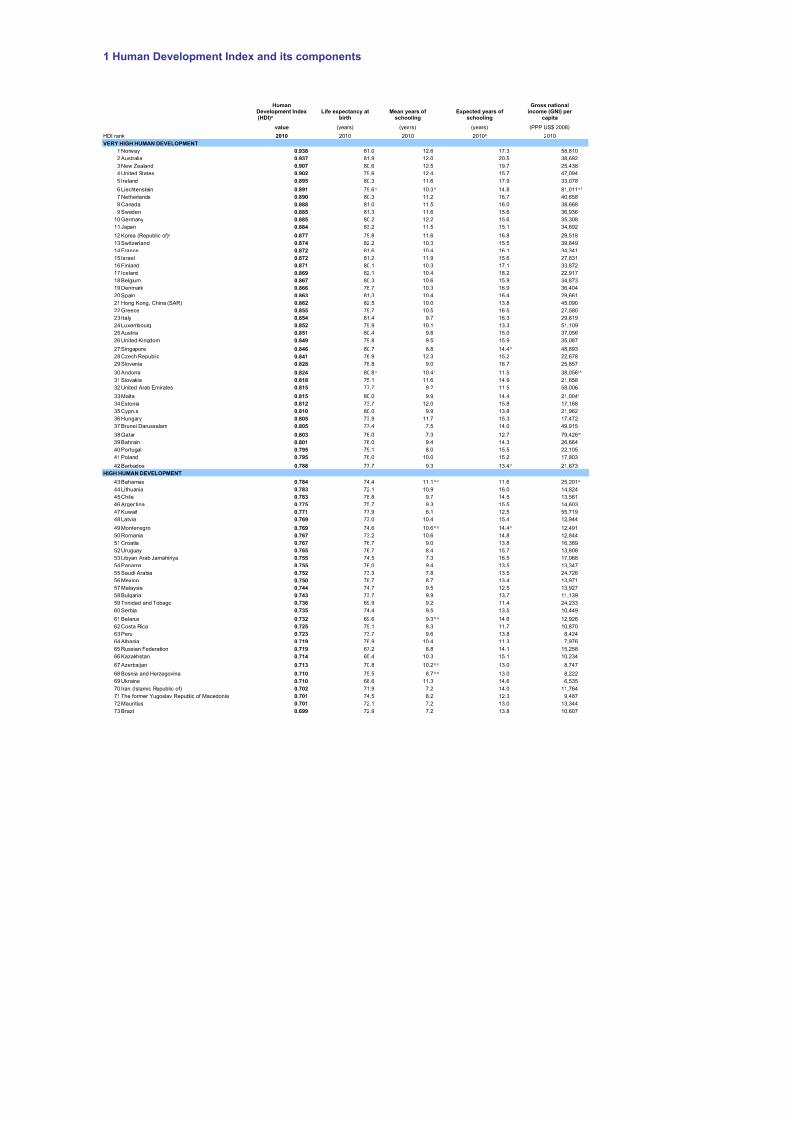
1 Human Development Index and its components value (years) (years) (years) (PPP US$ 2008) HDI rank 2010 2010 2010 2010 VERY HIGH HUMAN DEVELOPMENT 1 Nor way 0.938 81.0 12.6 17.3 58,810 2 Australia 0.937 81.9 12.0 20.5 38,692 3 New Zeal and 0.907 80.6 12.5 19.7 25,438 4 United States 0.902 79.6 12.4 15.7 47,094 5 Ireland 0.895 80.3 11.6 17.9 33,078 6 Liechtenstein 0.891 79.6 10.3 14.8 81,011 7 Nether lands 0.890 80.3 11.2 16.7 40,658 8 Canada 0.888 81.0 11.5 16.0 38,668 9 Sweden 0.885 81.3 11.6 15.6 36,936 10 Germany 0.885 80.2 12.2 15.6 35,308 11Japan 0.884 83.2 11.5 15.1 34,692 12 0.877 79.8 11.6 16.8 29,518 13 Switzerland 0.874 82.2 10.3 15.5 39,849 14 France 0.872 81.6 10.4 16.1 34,341 15 Israel 0.872 81.2 11.9 15.6 27,831 16 Finland 0.871 80.1 10.3 17.1 33,872 17 Iceland 0.869 82.1 10.4 18.2 22,917 18 Belgi um 0.867 80.3 10.6 15.9 34,873 19 Denmark 0.866 78.7 10.3 16.9 36,404 20Spain 0.863 81.3 10.4 16.4 29,661 21 Hong Kong, China (SAR) 0.862 82.5 10.0 13.8 45,090 22 Greece 0.855 79.7 10.5 16.5 27,580 23Ital y 0.854 81.4 9.7 16.3 29,619 24 Luxembour g 0.852 79.9 10.1 13.3 51,109 25 Austri a 0.851 80.4 9.8 15.0 37,056 26 United Kingdom 0.849 79.8 9.5 15.9 35,087 27 Singapore 0.846 80.7 8.8 14.4 48,893 28 Czech Republ ic 0.841 76.9 12.3 15.2 22,678 29 Slovenia 0.828 78.8 9.0 16.7 25,857 30 Andor ra 0.824 80.8 10.4 11.5 38,056 31 Slovakia 0.818 75.1 11.6 14.9 21,658 32 United Arab Emirates 0.815 77.7 9.2 11.5 58,006 33Mal ta 0.815 80.0 9.9 14.4 21,004 34 Estoni a 0.812 73.7 12.0 15.8 17,168 35 Cyprus 0.810 80.0 9.9 13.8 21,962 36 Hungary 0.805 73.9 11.7 15.3 17,472 37 Brunei Darussalam 0.805 77.4 7.5 14.0 49,915 38Qatar 0.803 76.0 7.3 12.7 79,426 39 Bahrain 0.801 76.0 9.4 14.3 26,664 40 Portugal 0.795 79.1 8.0 15.5 22,105 41 Poland 0.795 76.0 10.0 15.2 17,803 42 Barbados 0.788 77.7 9.3 13.4 21,673 HIGH HUMAN DEVELOPMENT 43 Bahamas 0.784 74.4 11.1 11.6 25,201 44 Lithuania 0.783 72.1 10.9 16.0 14,824 45Chi le 0.783 78.8 9.7 14.5 13,561 46 Argentina 0.775 75.7 9.3 15.5 14,603 47 Kuwai t 0.771 77.9 6.1 12.5 55,719 48 Latvia 0.769 73.0 10.4 15.4 12,944 49 Montenegro 0.769 74.6 10.6 14.4 12,491 50 Romania 0.767 73.2 10.6 14.8 12,844 51 Croati a 0.767 76.7 9.0 13.8 16,389 52 Uruguay 0.765 76.7 8.4 15.7 13,808 53 Libyan Arab Jamahiriya 0.755 74.5 7.3 16.5 17,068 54 Panama 0.755 76.0 9.4 13.5 13,347 55 Saudi Arabia 0.752 73.3 7.8 13.5 24,726 56 Mexico 0.750 76.7 8.7 13.4 13,971 57 Malaysia 0.744 74.7 9.5 12.5 13,927 58 Bulgaria 0.743 73.7 9.9 13.7 11,139 59 Trinidad and Tobago 0.736 69.9 9.2 11.4 24,233 60 Serbi a 0.735 74.4 9.5 13.5 10,449 61 Belar us 0.732 69.6 9.3 14.6 12,926 62 Costa Rica 0.725 79.1 8.3 11.7 10,870 63Per u 0.723 73.7 9.6 13.8 8,424 64 Albania 0.719 76.9 10.4 11.3 7,976 65 Russian Federation 0.719 67.2 8.8 14.1 15,258 66 Kazakhstan 0.714 65.4 10.3 15.1 10,234 67 Azerbaijan 0.713 70.8 10.2 13.0 8,747 68 Bosnia and Herzegovina 0.710 75.5 8.7 13.0 8,222 69 Ukrai ne 0.710 68.6 11.3 14.6 6,535 70 Iran (Islamic Republic of) 0.702 71.9 7.2 14.0 11,764 71 The former Yugoslav Republic of Macedonia 0.701 74.5 8.2 12.3 9,487 72 Mauriti us 0.701 72.1 7.2 13.0 13,344 73 Brazi l 0.699 72.9 7.2 13.8 10,607 Human Development Index (HDI) a Life expectancy at birth Mean years of schooling Expected years of schooling Gross national income (GNI) per capita 2010 b c d e,f Korea (Republic of) g h c i j,k l m n b,o p b,q h b,q b,o b,q
-
Upload
eduardo-campi -
Category
Documents
-
view
225 -
download
0
Transcript of Tabela IDH 2010 inglês
8/7/2019 Tabela IDH 2010 inglês
http://slidepdf.com/reader/full/tabela-idh-2010-ingles 1/102
1 Human Development Index and its components
value (years) (years) (years) (PPP US$ 2008)
HDI rank 2010 2010 2010 2010
VERY HIGH HUMAN DEVELOPMENT
1 Norway 0.938 81.0 12.6 17.3 58,810
2 Australia 0.937 81.9 12.0 20.5 38,692
3 New Zealand 0.907 80.6 12.5 19.7 25,438
4 United States 0.902 79.6 12.4 15.7 47,094
5 Ireland 0.895 80.3 11.6 17.9 33,078
6 Liechtenstein 0.891 79.6 10.3 14.8 81,011
7 Netherlands 0.890 80.3 11.2 16.7 40,658
8 Canada 0.888 81.0 11.5 16.0 38,668
9 Sweden 0.885 81.3 11.6 15.6 36,936
10 Germany 0.885 80.2 12.2 15.6 35,308
11Japan 0.884 83.2 11.5 15.1 34,692
12 0.877 79.8 11.6 16.8 29,518
13 Switzerland 0.874 82.2 10.3 15.5 39,849
14 France 0.872 81.6 10.4 16.1 34,341
15 Israel 0.872 81.2 11.9 15.6 27,831
16 Finland 0.871 80.1 10.3 17.1 33,872
17 Iceland 0.869 82.1 10.4 18.2 22,917
18 Belgium 0.867 80.3 10.6 15.9 34,873
19 Denmark 0.866 78.7 10.3 16.9 36,404
20Spain 0.863 81.3 10.4 16.4 29,661
21 Hong Kong, China (SAR) 0.862 82.5 10.0 13.8 45,090
22 Greece 0.855 79.7 10.5 16.5 27,58023 Italy 0.854 81.4 9.7 16.3 29,619
24 Luxembourg 0.852 79.9 10.1 13.3 51,109
25 Austria 0.851 80.4 9.8 15.0 37,056
26 United Kingdom 0.849 79.8 9.5 15.9 35,087
27 Singapore 0.846 80.7 8.8 14.4 48,893
28 Czech Republic 0.841 76.9 12.3 15.2 22,678
29 Slovenia 0.828 78.8 9.0 16.7 25,857
30 Andorra 0.824 80.8 10.4 11.5 38,056
31 Slovakia 0.818 75.1 11.6 14.9 21,658
32 United Arab Emirates 0.815 77.7 9.2 11.5 58,006
33Malta 0.815 80.0 9.9 14.4 21,004
34 Estonia 0.812 73.7 12.0 15.8 17,168
35 Cyprus 0.810 80.0 9.9 13.8 21,962
36 Hungary 0.805 73.9 11.7 15.3 17,472
37 Brunei Darussalam 0.805 77.4 7.5 14.0 49,915
38Qatar 0.803 76.0 7.3 12.7 79,426
39 Bahrain 0.801 76.0 9.4 14.3 26,664
40 Portugal 0.795 79.1 8.0 15.5 22,105
41 Poland 0.795 76.0 10.0 15.2 17,803
42 Barbados 0.788 77.7 9.3 13.4 21,673
HIGH HUMAN DEVELOPMENT
43 Bahamas 0.784 74.4 11.1 11.6 25,201
44 Lithuania 0.783 72.1 10.9 16.0 14,824
45Chile 0.783 78.8 9.7 14.5 13,561
46 Argentina 0.775 75.7 9.3 15.5 14,603
47 Kuwait 0.771 77.9 6.1 12.5 55,719
48 Latvia 0.769 73.0 10.4 15.4 12,94449 Montenegro 0.769 74.6 10.6 14.4 12,491
50 Romania 0.767 73.2 10.6 14.8 12,844
51 Croatia 0.767 76.7 9.0 13.8 16,389
52 Uruguay 0.765 76.7 8.4 15.7 13,808
53 Libyan Arab Jamahiriya 0.755 74.5 7.3 16.5 17,068
54 Panama 0.755 76.0 9.4 13.5 13,347
55 Saudi Arabia 0.752 73.3 7.8 13.5 24,726
56 Mexico 0.750 76.7 8.7 13.4 13,971
57 Malaysia 0.744 74.7 9.5 12.5 13,927
58 Bulgaria 0.743 73.7 9.9 13.7 11,139
59 Trinidad and Tobago 0.736 69.9 9.2 11.4 24,233
60 Serbia 0.735 74.4 9.5 13.5 10,449
61 Belarus 0.732 69.6 9.3 14.6 12,926
62 Costa Rica 0.725 79.1 8.3 11.7 10,870
63Peru 0.723 73.7 9.6 13.8 8,424
64 Albania 0.719 76.9 10.4 11.3 7,976
65 Russian Federation 0.719 67.2 8.8 14.1 15,258
66 Kazakhstan 0.714 65.4 10.3 15.1 10,234
67 Azerbaijan 0.713 70.8 10.2 13.0 8,747
68 Bosnia and Herzegovina 0.710 75.5 8.7 13.0 8,222
69 Ukraine 0.710 68.6 11.3 14.6 6,535
70 Iran (Islamic Republic of) 0.702 71.9 7.2 14.0 11,764
71 The former Yugoslav Republic of Macedonia 0.701 74.5 8.2 12.3 9,487
72 Mauritius 0.701 72.1 7.2 13.0 13,344
73 Brazil 0.699 72.9 7.2 13.8 10,607
HumanDevelopment Index(HDI)a
Life expectancy atbirth
Mean years of schooling
Expected years of schooling
Gross nationalincome (GNI) per
capita
2010b
c d e,f
Korea (Republic of)g
h
c i j,k
l
m
n
b,o p
b,q h
b,q
b,o
b,q
8/7/2019 Tabela IDH 2010 inglês
http://slidepdf.com/reader/full/tabela-idh-2010-ingles 2/102
2010 2010
2 0.954
11 0.989
30 0.979
5 0.917
20 0.936
-5 0.861
4 0.911
6 0.9138 0.911
9 0.915
11 0.915
16 0.918
-1 0.889
9 0.898
14 0.916
8 0.897
20 0.928
3 0.888
-1 0.883
6 0.897
-11 0.860
8 0.890
4 0.882
-18 0.836
-9 0.859
-6 0.860
-19 0.831
10 0.886
3 0.853
-15 0.817
12 0.854
-28 0.774
11 0.850
13 0.864
6 0.84010 0.851
-30 0.769
-36 0.737
-8 0.809
0 0.815
4 0.834
0 0.806
-9 0.788
7 0.832
11 0.840
6 0.821
-42 0.71413 0.822
16 0.825
13 0.820
-2 0.798
3 0.810
-5 0.775
4 0.796
-20 0.742
-3 0.785
-3 0.775
10 0.795
-23 0.719
11 0.788
1 0.763
7 0.768
14 0.788
19 0.787
-15 0.729
6 0.756
8 0.769
12 0.771
20 0.794
-3 0.725
3 0.742
-13 0.712
-3 0.728
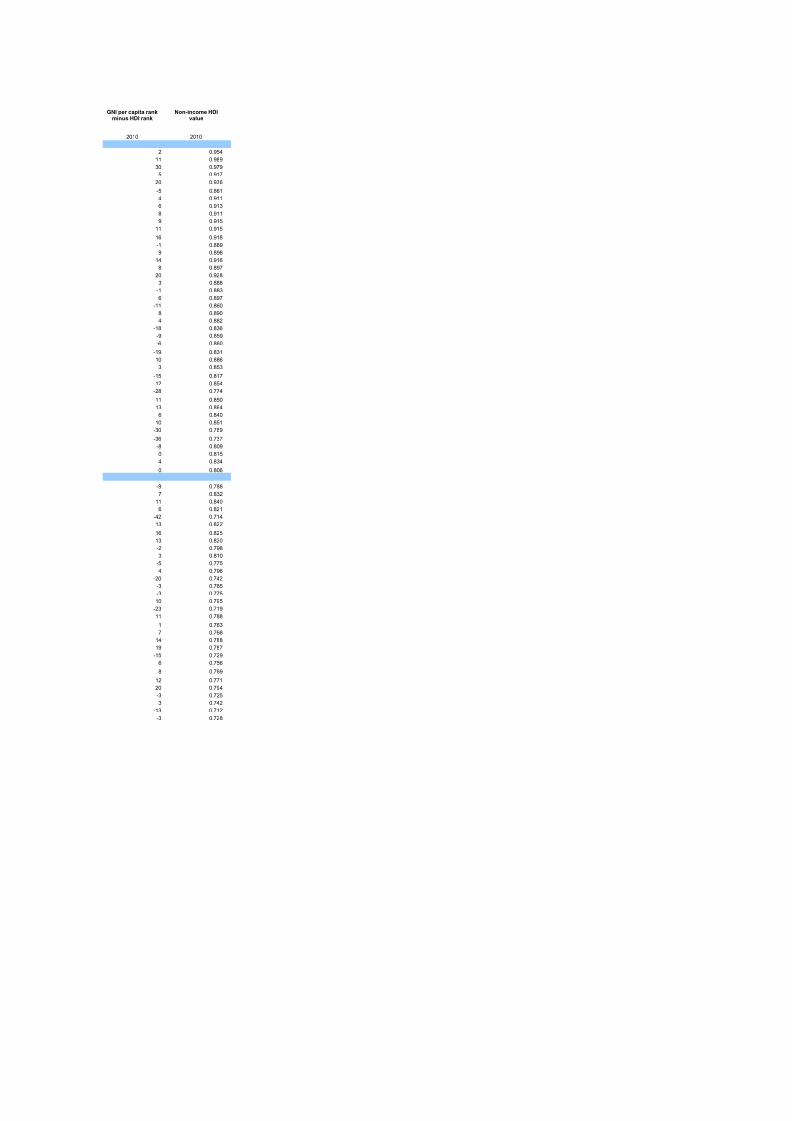
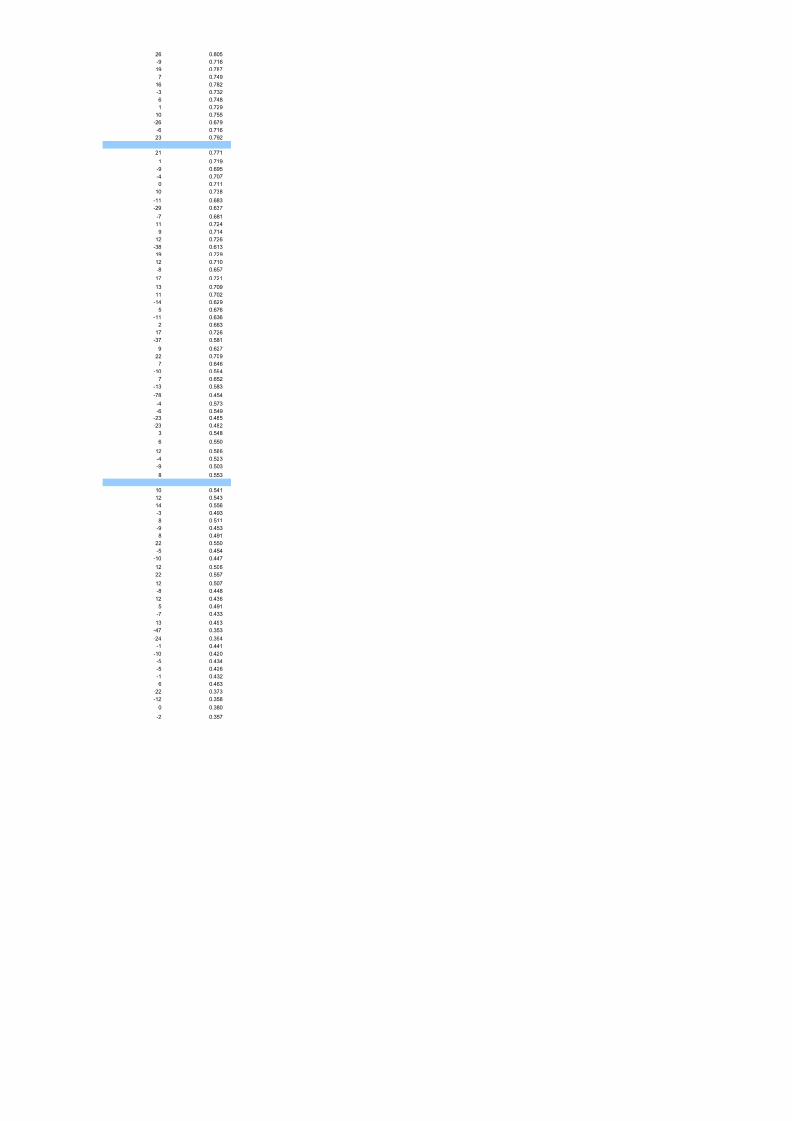
GNI per capita rankminus HDI rank
Non-income HDIvalue
8/7/2019 Tabela IDH 2010 inglês
http://slidepdf.com/reader/full/tabela-idh-2010-ingles 3/102
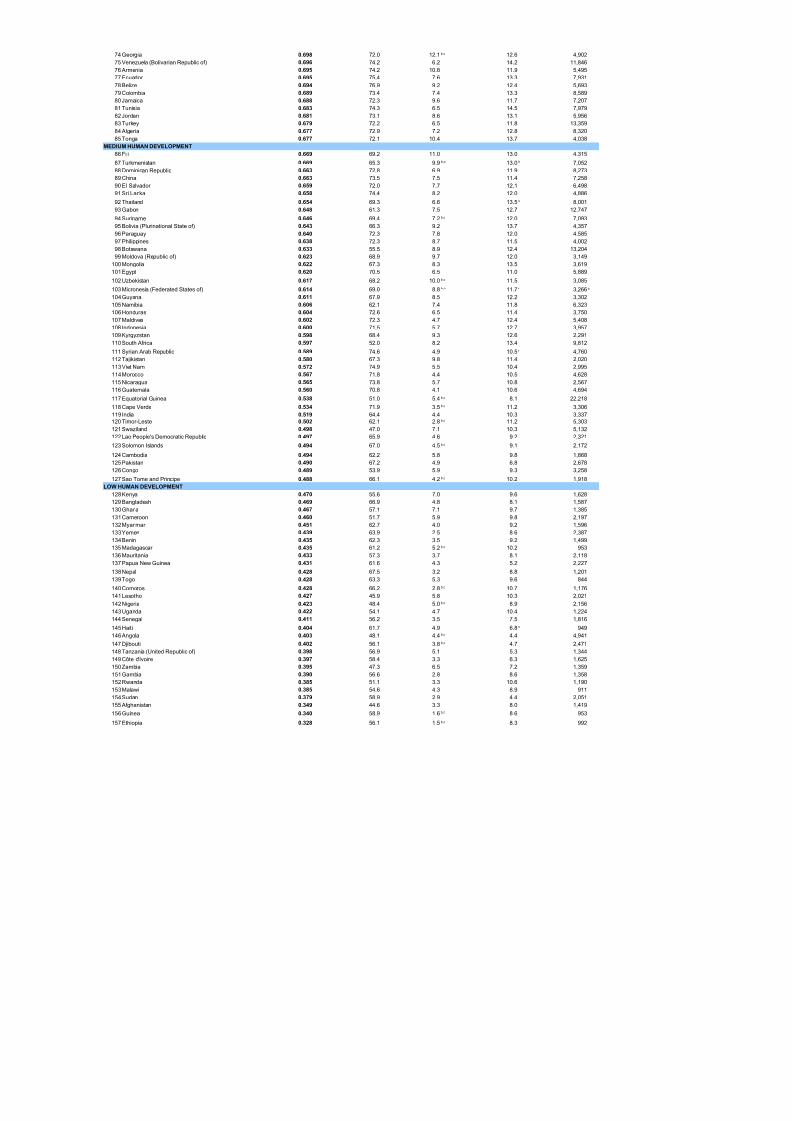
74 Georgia 0.698 72.0 12.1 12.6 4,902
75 Venezuela (Bolivarian Republic of) 0.696 74.2 6.2 14.2 11,846
76 Armenia 0.695 74.2 10.8 11.9 5,495
77 Ecuador 0.695 75.4 7.6 13.3 7,931
78 Belize 0.694 76.9 9.2 12.4 5,693
79 Colombia 0.689 73.4 7.4 13.3 8,589
80 Jamaica 0.688 72.3 9.6 11.7 7,20781 Tunisia 0.683 74.3 6.5 14.5 7,979
82 Jordan 0.681 73.1 8.6 13.1 5,956
83 Turkey 0.679 72.2 6.5 11.8 13,359
84 Algeria 0.677 72.9 7.2 12.8 8,320
85 Tonga 0.677 72.1 10.4 13.7 4,038
MEDIUM HUMAN DEVELOPMENT
86 Fiji 0.669 69.2 11.0 13.0 4,315
87 Turkmenistan 0.669 65.3 9.9 13.0 7,052
88 Dominican Republic 0.663 72.8 6.9 11.9 8,273
89 China 0.663 73.5 7.5 11.4 7,258
90 El Salvador 0.659 72.0 7.7 12.1 6,498
91 Sri Lanka 0.658 74.4 8.2 12.0 4,886
92 Thailand 0.654 69.3 6.6 13.5 8,001
93 Gabon 0.648 61.3 7.5 12.7 12,747
94 Suriname 0.646 69.4 7.2 12.0 7,093
95 Bolivia (Plurinational State of) 0.643 66.3 9.2 13.7 4,357
96 Paraguay 0.640 72.3 7.8 12.0 4,585
97 Philippines 0.638 72.3 8.7 11.5 4,002
98 Botswana 0.633 55.5 8.9 12.4 13,204
99 Moldova (Republic of) 0.623 68.9 9.7 12.0 3,149
100 Mongolia 0.622 67.3 8.3 13.5 3,619
101Egypt 0.620 70.5 6.5 11.0 5,889
102 Uzbekistan 0.617 68.2 10.0 11.5 3,085
103 Micronesia (Federated States of) 0.614 69.0 8.8 11.7 3,266
104Guyana 0.611 67.9 8.5 12.2 3,302
105 Namibia 0.606 62.1 7.4 11.8 6,323
106Honduras 0.604 72.6 6.5 11.4 3,750107 Maldives 0.602 72.3 4.7 12.4 5,408
108 Indonesia 0.600 71.5 5.7 12.7 3,957
109 Kyrgyzstan 0.598 68.4 9.3 12.6 2,291
110 South Africa 0.597 52.0 8.2 13.4 9,812
111 Syrian Arab Republic 0.589 74.6 4.9 10.5 4,760
112 Tajikistan 0.580 67.3 9.8 11.4 2,020
113Viet Nam 0.572 74.9 5.5 10.4 2,995
114Morocco 0.567 71.8 4.4 10.5 4,628
115 Nicaragua 0.565 73.8 5.7 10.8 2,567
116 Guatemala 0.560 70.8 4.1 10.6 4,694
117 Equatorial Guinea 0.538 51.0 5.4 8.1 22,218
118 Cape Verde 0.534 71.9 3.5 11.2 3,306
119India 0.519 64.4 4.4 10.3 3,337120 Timor-Leste 0.502 62.1 2.8 11.2 5,303
121 Swaziland 0.498 47.0 7.1 10.3 5,132
122 Lao People's Democratic Republic 0.497 65.9 4.6 9.2 2,321
123 Solomon Islands 0.494 67.0 4.5 9.1 2,172
124 Cambodia 0.494 62.2 5.8 9.8 1,868
125 Pakistan 0.490 67.2 4.9 6.8 2,678
126Congo 0.489 53.9 5.9 9.3 3,258
127 Sao Tome and Principe 0.488 66.1 4.2 10.2 1,918
LOW HUMAN DEVELOPMENT
128Kenya 0.470 55.6 7.0 9.6 1,628
129 Bangladesh 0.469 66.9 4.8 8.1 1,587
130Ghana 0.467 57.1 7.1 9.7 1,385
131Cameroon 0.460 51.7 5.9 9.8 2,197132Myanmar 0.451 62.7 4.0 9.2 1,596
133Yemen 0.439 63.9 2.5 8.6 2,387
134Benin 0.435 62.3 3.5 9.2 1,499
135 Madagascar 0.435 61.2 5.2 10.2 953
136 Mauritania 0.433 57.3 3.7 8.1 2,118
137 Papua New Guinea 0.431 61.6 4.3 5.2 2,227
138Nepal 0.428 67.5 3.2 8.8 1,201
139Togo 0.428 63.3 5.3 9.6 844
140Comoros 0.428 66.2 2.8 10.7 1,176
141Lesotho 0.427 45.9 5.8 10.3 2,021
142Nigeria 0.423 48.4 5.0 8.9 2,156
143Uganda 0.422 54.1 4.7 10.4 1,224
144 Senegal 0.411 56.2 3.5 7.5 1,816
145Haiti 0.404 61.7 4.9 6.8 949
146Angola 0.403 48.1 4.4 4.4 4,941
147 Djibouti 0.402 56.1 3.8 4.7 2,471
148 Tanzania (United Republic of) 0.398 56.9 5.1 5.3 1,344
149 Côte d'Ivoire 0.397 58.4 3.3 6.3 1,625
150Zambia 0.395 47.3 6.5 7.2 1,359
151Gambia 0.390 56.6 2.8 8.6 1,358
152Rwanda 0.385 51.1 3.3 10.6 1,190
153Malawi 0.385 54.6 4.3 8.9 911
154Sudan 0.379 58.9 2.9 4.4 2,051
155 Afghanistan 0.349 44.6 3.3 8.0 1,419
156Guinea 0.340 58.9 1.6 8.6 953
157 Ethiopia 0.328 56.1 1.5 8.3 992
b,q
b,o h
n
b,q
b,q
b,o r s
r
b,q
b,o
b,o
b,o
b,o
b,o
b,o
b,q
n
b,o
b,q
b,t
b,o
8/7/2019 Tabela IDH 2010 inglês
http://slidepdf.com/reader/full/tabela-idh-2010-ingles 4/102
26 0.805
-9 0.716
19 0.787
7 0.749
16 0.782
-3 0.732
6 0.748
1 0.729
10 0.755
-26 0.679
-6 0.716
23 0.792
21 0.771
1 0.719
-9 0.695
-4 0.707
0 0.711
10 0.738
-11 0.683
-29 0.637
-7 0.681
11 0.724
9 0.714
12 0.726
-38 0.613
19 0.729
12 0.710
-8 0.657
17 0.721
13 0.709
11 0.702
-14 0.629
5 0.676-11 0.636
2 0.663
17 0.726
-37 0.581
-9 0.627
22 0.709
7 0.646
-10 0.594
7 0.652
-13 0.583
-78 0.454
-4 0.573
-6 0.549-23 0.485
-23 0.482
3 0.548
6 0.550
12 0.566
-4 0.523
-9 0.503
8 0.553
10 0.541
12 0.543
14 0.556
-3 0.493
8 0.511
-9 0.453
8 0.491
22 0.550
-5 0.454
-10 0.447
12 0.506
22 0.557
12 0.507
-8 0.448
-12 0.436
5 0.491
-7 0.433
13 0.493-47 0.353
-24 0.394
-1 0.441
-10 0.420
-5 0.434
-5 0.426
-1 0.432
6 0.463
-22 0.373
-12 0.358
0 0.380
-2 0.357
8/7/2019 Tabela IDH 2010 inglês
http://slidepdf.com/reader/full/tabela-idh-2010-ingles 5/102
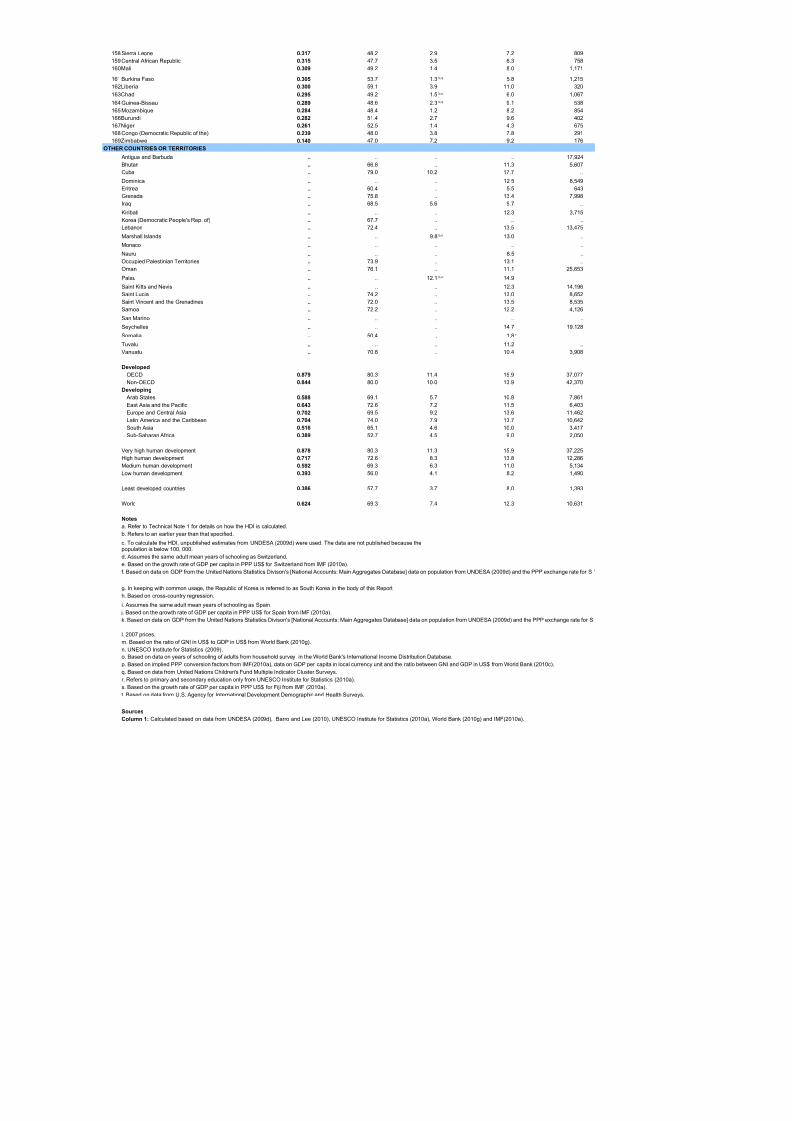
158 Sierra Leone 0.317 48.2 2.9 7.2 809
159 Central African Republic 0.315 47.7 3.5 6.3 758
160Mali 0.309 49.2 1.4 8.0 1,171
161 Burkina Faso 0.305 53.7 1.3 5.8 1,215
162Liberia 0.300 59.1 3.9 11.0 320
163Chad 0.295 49.2 1.5 6.0 1,067
164 Guinea-Bissau 0.289 48.6 2.3 9.1 538165 Mozambique 0.284 48.4 1.2 8.2 854
166Burundi 0.282 51.4 2.7 9.6 402
167Niger 0.261 52.5 1.4 4.3 675
168 Congo (Democratic Republic of the) 0.239 48.0 3.8 7.8 291
169Zimbabwe 0.140 47.0 7.2 9.2 176
OTHER COUNTRIES OR TERRITORIES
Antigua and Barbuda .. .. .. .. 17,924
Bhutan .. 66.8 .. 11.3 5,607
Cuba .. 79.0 10.2 17.7 ..
Dominica .. .. .. 12.5 8,549
Eritrea .. 60.4 .. 5.5 643
Grenada .. 75.8 .. 13.4 7,998
Iraq .. 68.5 5.6 9.7 ..
Kiribati .. .. .. 12.3 3,715
Korea (Democratic People's Rep. of) .. 67.7 .. .. ..
Lebanon .. 72.4 .. 13.5 13,475
Marshall Islands .. .. 9.8 13.0 ..
Monaco .. .. .. .. ..
Nauru .. .. .. 8.5 ..
Occupied Palestinian Territories .. 73.9 .. 13.1 ..
Oman .. 76.1 .. 11.1 25,653
Palau .. .. 12.1 14.9
Saint Kitts and Nevis .. .. .. 12.3 14,196
Saint Lucia .. 74.2 .. 13.0 8,652
Saint Vincent and the Grenadines .. 72.0 .. 13.5 8,535
Samoa .. 72.2 .. 12.2 4,126San Marino .. .. .. .. ..
Seychelles .. .. .. 14.7 19,128
Somalia .. 50.4 .. 1.8 ..
Tuvalu .. .. .. 11.2 ..
Vanuatu .. 70.8 .. 10.4 3,908
Developed
OECD 0.879 80.3 11.4 15.9 37,077
Non-OECD 0.844 80.0 10.0 13.9 42,370
Developing
Arab States 0.588 69.1 5.7 10.8 7,861
East Asia and the Pacific 0.643 72.6 7.2 11.5 6,403
Europe and Central Asia 0.702 69.5 9.2 13.6 11,462Latin America and the Caribbean 0.704 74.0 7.9 13.7 10,642
South Asia 0.516 65.1 4.6 10.0 3,417
Sub-Saharan Africa 0.389 52.7 4.5 9.0 2,050
Very high human development 0.878 80.3 11.3 15.9 37,225
High human development 0.717 72.6 8.3 13.8 12,286
Medium human development 0.592 69.3 6.3 11.0 5,134
Low human development 0.393 56.0 4.1 8.2 1,490
Least developed countries 0.386 57.7 3.7 8.0 1,393
World 0.624 69.3 7.4 12.3 10,631
Notesa. Refer to Technical Note 1 for details on how the HDI is calculated.
b. Refers to an earlier year than that specified.
d. Assumes the same adult mean years of schooling as Switzerland.
e. Based on the growth rate of GDP per capita in PPP US$ for Switzerland from IMF (2010a).
f. Based on data on GDP from the United Nations Statistics Divison's [National Accounts: Main Aggregates Database] data on population from UNDESA (2009d) and the PPP exchange rate for S
g. In keeping with common usage, the Republic of Korea is referred to as South Korea in the body of this Report.
h. Based on cross-country regression.
i. Assumes the same adult mean years of schooling as Spain.
j. Based on the growth rate of GDP per capita in PPP US$ for Spain from IMF (2010a).
k. Based on data on GDP from the United Nations Statistics Divison's [National Accounts: Main Aggregates Database] data on population from UNDESA (2009d) and the PPP exchange rate for S
l. 2007 prices.
m. Based on the ratio of GNI in US$ to GDP in US$ from World Bank (2010g).
n. UNESCO Institute for Statistics (2009).
o. Based on data on years of schooling of adults from household survey in the World Bank's International Income Distribution Database.
p. Based on implied PPP conversion factors from IMF(2010a), data on GDP per capita in local currency unit and the ratio between GNI and GDP in US$ from World Bank (2010c).
q. Based on data from United Nations Children's Fund Multiple Indicator Cluster Surveys.
r. Refers to primary and secondary education only from UNESCO Institute for Statistics (2010a).
s. Based on the growth rate of GDP per capita in PPP US$ for Fiji from IMF (2010a).
t. Based on data from U.S. Agency for International Development Demographic and Health Surveys.
Sources
b,q
b,o
b,q
b,o
b,o
r
c. To calculate the HDI, unpublished estimates from UNDESA (2009d) were used. The data are not published because thepopulation is below 100, 000.
Column 1: Calculated based on data from UNDESA (2009d), Barro and Lee (2010), UNESCO Institute for Statistics (2010a), World Bank (2010g) and IMF(2010a).
8/7/2019 Tabela IDH 2010 inglês
http://slidepdf.com/reader/full/tabela-idh-2010-ingles 6/102
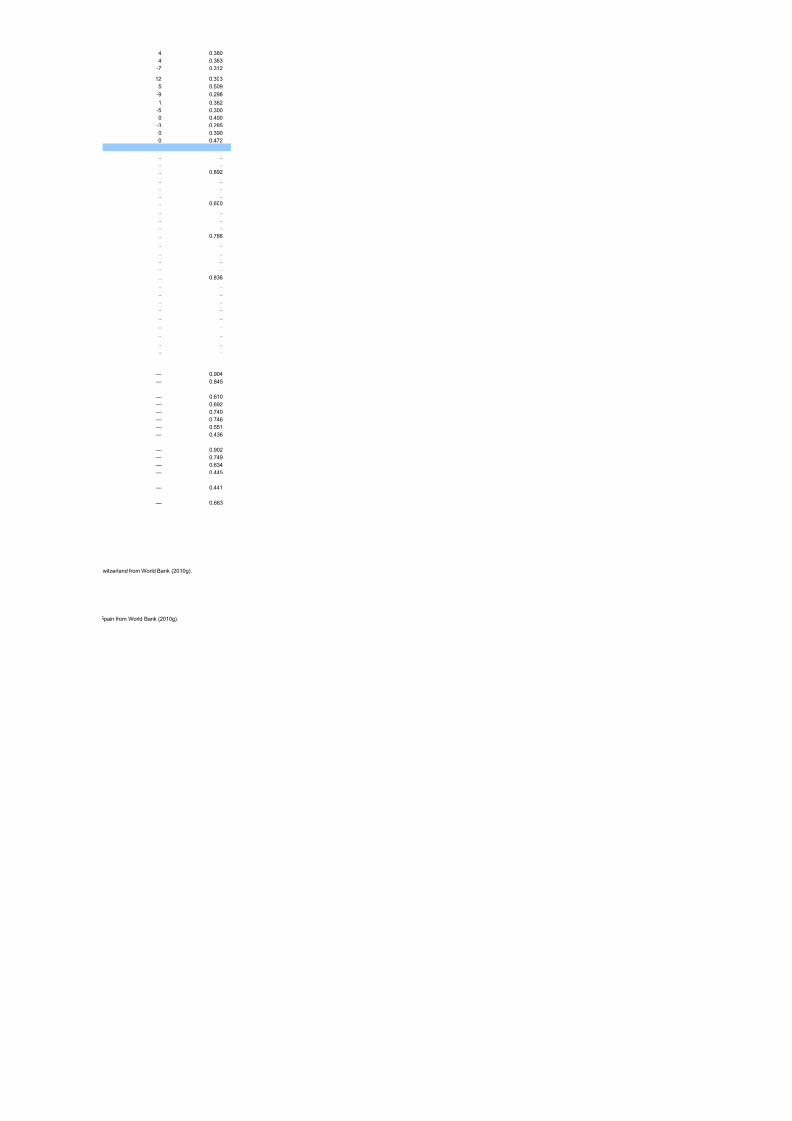
4 0.360
4 0.363
-7 0.312
-12 0.303
5 0.509
-9 0.298
1 0.362-5 0.300
0 0.400
-3 0.285
0 0.390
0 0.472
.. ..
.. ..
.. 0.892
.. ..
.. ..
.. ..
.. 0.600
.. ..
.. ..
.. ..
.. 0.766
.. ..
.. ..
.. ..
.. ..
.. 0.836
.. ..
.. ..
.. ..
.. ..
.. ..
.. ..
.. ..
.. ..
.. ..
— 0.904
— 0.845
— 0.610
— 0.692
— 0.740— 0.746
— 0.551
— 0.436
— 0.902
— 0.749
— 0.634
— 0.445
— 0.441
— 0.663
witzerland from World Bank (2010g).
pain from World Bank (2010g).

8/7/2019 Tabela IDH 2010 inglês
http://slidepdf.com/reader/full/tabela-idh-2010-ingles 7/102
Column 2: UNDESA (2009d).
Column 3: Barro and Lee(2010).
Column 4: UNESCO Institute for Statistics (2010a).
Column 5: Expressed in 2008 prices, based on data on GNI per capita and GDP per capita in PPP US$ (current and constant prices) from World Bank (2010g) and implied growth rates of GD(2010a).
Column 6: Calculated based on GNI per capita rank and HDI rank.
Column 7: Calculated based on data in columns 2-4.

8/7/2019 Tabela IDH 2010 inglês
http://slidepdf.com/reader/full/tabela-idh-2010-ingles 8/102
per capita from IMF
8/7/2019 Tabela IDH 2010 inglês
http://slidepdf.com/reader/full/tabela-idh-2010-ingles 9/102
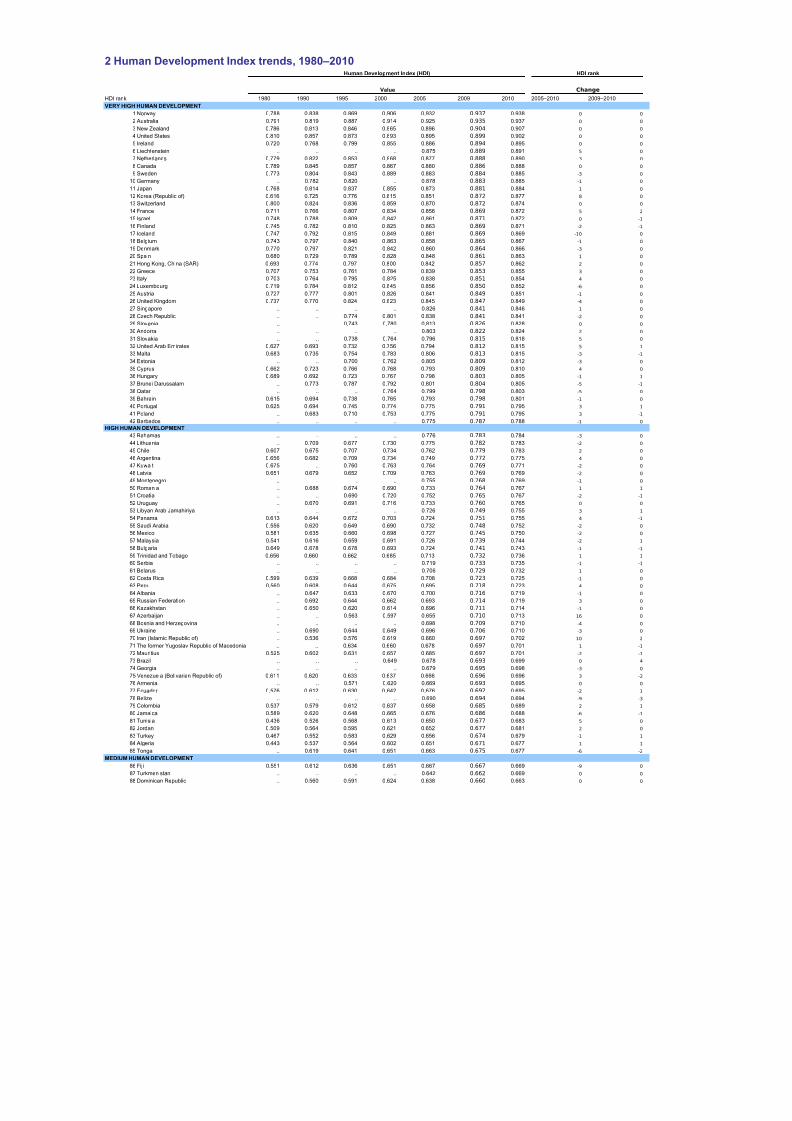
2 Human Development Index trends, 1980–2010Human Development Index (HDI) HDI rank
Value Change
HDI rank 1980 1990 1995 2000 2005 2009 2010 2005–2010 2009–2010
VERY HIGH HUMAN DEVELOPMENT
1 Norway 0.788 0.838 0.869 0.906 0.932 0.937 0.938 0 0
2 Australia 0.791 0.819 0.887 0.914 0.925 0.935 0.937 0 0
3 New Zealand 0.786 0.813 0.846 0.865 0.896 0.904 0.907 0 0
4 United States 0.810 0.857 0.873 0.893 0.895 0.899 0.902 0 0
5 Ireland 0.720 0.768 0.799 0.855 0.886 0.894 0.895 0 0
6 Liechtenstein .. .. .. .. 0.875 0.889 0.891 5 0
7 Netherlands 0.779 0.822 0.853 0.868 0.877 0.888 0.890 3 0
8 Canada 0.789 0.845 0.857 0.867 0.880 0.886 0.888 0 0
9 Sweden 0.773 0.804 0.843 0.889 0.883 0.884 0.885 -3 0
10 Germany .. 0.782 0.820 .. 0.878 0.883 0.885 -1 0
11 Japan 0.768 0.814 0.837 0.855 0.873 0.881 0.884 1 0
12 Korea (Republic of) 0.616 0.725 0.776 0.815 0.851 0.872 0.877 8 0
13 Switzerland 0.800 0.824 0.836 0.859 0.870 0.872 0.874 0 0
14 France 0.711 0.766 0.807 0.834 0.856 0.869 0.872 5 2
15 Israel 0.748 0.788 0.809 0.842 0.861 0.871 0.872 0 -1
16 Finland 0.745 0.782 0.810 0.825 0.863 0.869 0.871 -2 -1
17 Iceland 0.747 0.792 0.815 0.849 0.881 0.869 0.869 -10 0
18 Belgium 0.743 0.797 0.840 0.863 0.858 0.865 0.867 -1 0
19 Denmark 0.770 0.797 0.821 0.842 0.860 0.864 0.866 -3 0
20 Spain 0.680 0.729 0.789 0.828 0.848 0.861 0.863 1 0
21 Hong Kong, China (SAR) 0.693 0.774 0.797 0.800 0.842 0.857 0.862 2 0
22 Greece 0.707 0.753 0.761 0.784 0.839 0.853 0.855 3 0
23 Italy 0.703 0.764 0.795 0.825 0.838 0.851 0.854 4 0
24 Luxembourg 0.719 0.784 0.812 0.845 0.856 0.850 0.852 -6 0
25 Austria 0.727 0.777 0.801 0.826 0.841 0.849 0.851 -1 0
26 United Kingdom 0.737 0.770 0.824 0.823 0.845 0.847 0.849 -4 0
27 Singapore .. .. .. .. 0.826 0.841 0.846 1 028 Czech Republic .. .. 0.774 0.801 0.838 0.841 0.841 -2 0
29 Slovenia .. .. 0.743 0.780 0.813 0.826 0.828 0 0
30 Andorra .. .. .. .. 0.803 0.822 0.824 2 0
31 Slovakia .. .. 0.738 0.764 0.796 0.815 0.818 5 0
32 United Arab Emirates 0.627 0.693 0.732 0.756 0.794 0.812 0.815 5 1
33 Malta 0.683 0.735 0.754 0.783 0.806 0.813 0.815 -3 -1
34 Estonia .. .. 0.700 0.762 0.805 0.809 0.812 -3 0
35 Cyprus 0.662 0.723 0.766 0.768 0.793 0.809 0.810 4 0
36 Hungary 0.689 0.692 0.723 0.767 0.798 0.803 0.805 -1 1
37 Brunei Darussalam .. 0.773 0.787 0.792 0.801 0.804 0.805 -5 -1
38 Qatar .. .. .. 0.764 0.799 0.798 0.803 -5 0
39 Bahrain 0.615 0.694 0.738 0.765 0.793 0.798 0.801 -1 0
40 Portugal 0.625 0.694 0.745 0.774 0.775 0.791 0.795 3 1
41 Poland .. 0.683 0.710 0.753 0.775 0.791 0.795 3 -142 Barbados .. .. .. .. 0.775 0.787 0.788 -1 0
HIGH HUMAN DEVELOPMENT
43 Bahamas .. .. .. .. 0.776 0.783 0.784 -3 0
44 Lithuania .. 0.709 0.677 0.730 0.775 0.782 0.783 -2 0
45 Chile 0.607 0.675 0.707 0.734 0.762 0.779 0.783 2 0
46 Argentina 0.656 0.682 0.709 0.734 0.749 0.772 0.775 4 0
47 Kuwait 0.675 .. 0.760 0.763 0.764 0.769 0.771 -2 0
48 Latvia 0.651 0.679 0.652 0.709 0.763 0.769 0.769 -2 0
49 Montenegro .. .. .. .. 0.755 0.768 0.769 -1 0
50 Romania .. 0.688 0.674 0.690 0.733 0.764 0.767 1 1
51 Croatia .. .. 0.690 0.720 0.752 0.765 0.767 -2 -1
52 Uruguay .. 0.670 0.691 0.716 0.733 0.760 0.765 0 0
53 Libyan Arab Jamahiriya .. .. .. .. 0.726 0.749 0.755 3 1
54 Panama 0.613 0.644 0.672 0.703 0.724 0.751 0.755 4 -1
55 Saudi Arabia 0.556 0.620 0.649 0.690 0.732 0.748 0.752 -2 0
56 Mexico 0.581 0.635 0.660 0.698 0.727 0.745 0.750 -2 0
57 Malaysia 0.541 0.616 0.659 0.691 0.726 0.739 0.744 -2 1
58 Bulgaria 0.649 0.678 0.678 0.693 0.724 0.741 0.743 -1 -1
59 Trinidad and Tobago 0.656 0.660 0.662 0.685 0.713 0.732 0.736 1 1
60 Serbia .. .. .. .. 0.719 0.733 0.735 -1 -1
61 Belarus .. .. .. .. 0.706 0.729 0.732 1 0
62 Costa Rica 0.599 0.639 0.668 0.684 0.708 0.723 0.725 -1 0
63 Peru 0.560 0.608 0.644 0.675 0.695 0.718 0.723 4 0
64 Albania .. 0.647 0.633 0.670 0.700 0.716 0.719 -1 0
65 Russian Federation .. 0.692 0.644 0.662 0.693 0.714 0.719 3 0
66 Kazakhstan .. 0.650 0.620 0.614 0.696 0.711 0.714 -1 0
67 Azerbaijan .. .. 0.563 0.597 0.655 0.710 0.713 16 0
68 Bosnia and Herzegovina .. .. .. .. 0.698 0.709 0.710 -4 0
69 Ukraine .. 0.690 0.644 0.649 0.696 0.706 0.710 -3 0
70 Iran (Islamic Republic of) .. 0.536 0.576 0.619 0.660 0.697 0.702 10 2
71 The former Yugoslav Republic of Macedonia .. .. 0.634 0.660 0.678 0.697 0.701 1 -1
72 Mauritius 0.525 0.602 0.631 0.657 0.685 0.697 0.701 -2 -1
73 Brazil .. .. .. 0.649 0.678 0.693 0.699 0 4
74 Georgia .. .. .. .. 0.679 0.695 0.698 -3 0
75 Venezuela (Bolivarian Republic of) 0.611 0.620 0.633 0.637 0.666 0.696 0.696 3 -2
76 Armenia .. .. 0.571 0.620 0.669 0.693 0.695 0 0
77 Ecuador 0.576 0.612 0.630 0.642 0.676 0.692 0.695 -2 1
78 Belize .. .. .. .. 0.690 0.694 0.694 -9 -3
79 Colombia 0.537 0.579 0.612 0.637 0.658 0.685 0.689 2 1
80 Jamaica 0.589 0.620 0.648 0.665 0.676 0.686 0.688 -6 -1
81 Tunisia 0.436 0.526 0.568 0.613 0.650 0.677 0.683 5 0
82 Jordan 0.509 0.564 0.595 0.621 0.652 0.677 0.681 2 0
83 Turkey 0.467 0.552 0.583 0.629 0.656 0.674 0.679 -1 1
84 Algeria 0.443 0.537 0.564 0.602 0.651 0.671 0.677 1 1
85 Tonga .. 0.619 0.641 0.651 0.663 0.675 0.677 -6 -2
MEDIUM HUMAN DEVELOPMENT
86 Fiji 0.551 0.612 0.636 0.651 0.667 0.667 0.669 -9 0
87 Turkmenistan .. .. .. .. 0.642 0.662 0.669 0 0
88 Dominican Republic .. 0.560 0.591 0.624 0.638 0.660 0.663 0 0
8/7/2019 Tabela IDH 2010 inglês
http://slidepdf.com/reader/full/tabela-idh-2010-ingles 10/102
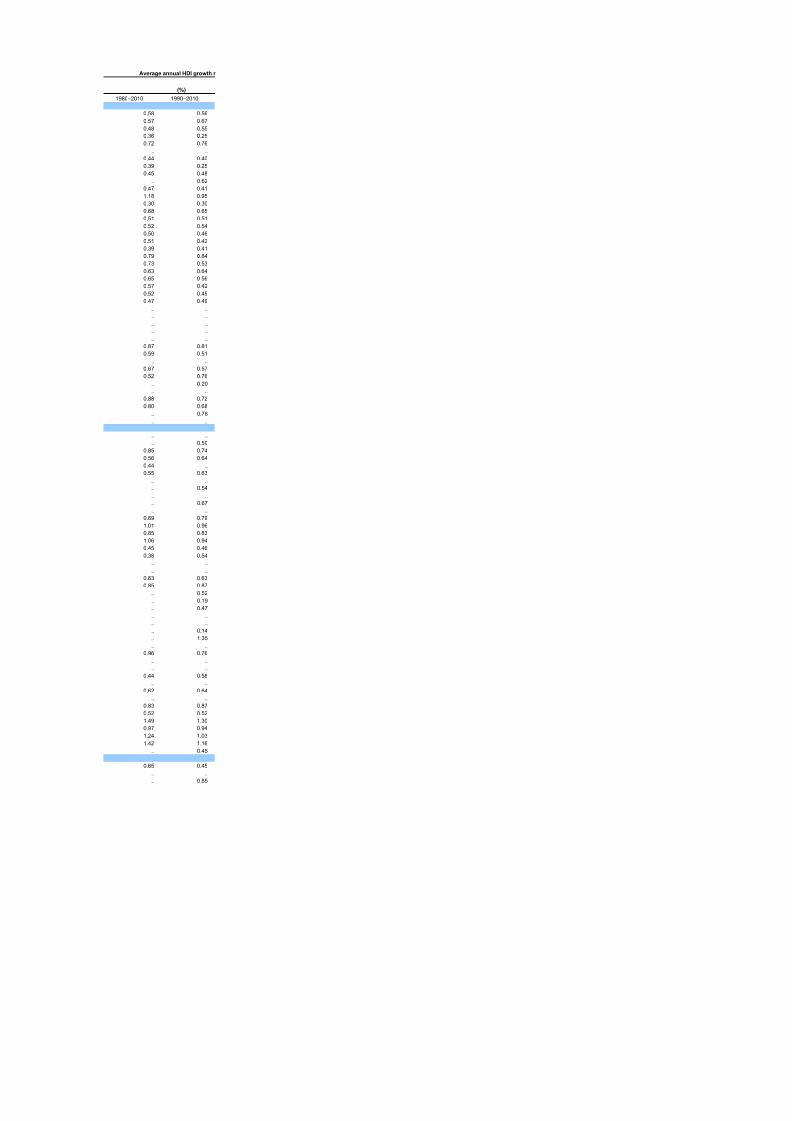
Average annual HDI growth r
1980–2010 1990–2010
0.58 0.56
0.57 0.67
0.48 0.55
0.36 0.25
0.72 0.76
.. ..
0.44 0.40
0.39 0.25
0.45 0.48
.. 0.62
0.47 0.41
1.18 0.95
0.30 0.30
0.68 0.65
0.51 0.51
0.52 0.54
0.50 0.46
0.51 0.42
0.39 0.41
0.79 0.84
0.73 0.53
0.63 0.64
0.65 0.56
0.57 0.42
0.52 0.45
0.47 0.49
.. .... ..
.. ..
.. ..
.. ..
0.87 0.81
0.59 0.51
.. ..
0.67 0.57
0.52 0.76
.. 0.20
.. ..
0.88 0.72
0.80 0.68
.. 0.76
.. ..
.. ..
.. 0.50
0.85 0.74
0.56 0.64
0.44 ..
0.55 0.63
.. ..
.. 0.54
.. ..
.. 0.67
.. ..
0.69 0.791.01 0.96
0.85 0.83
1.06 0.94
0.45 0.46
0.38 0.54
.. ..
.. ..
0.63 0.63
0.85 0.87
.. 0.52
.. 0.19
.. 0.47
.. ..
.. ..
.. 0.14
.. 1.35
.. ..
0.96 0.76
.. ..
.. ..
0.44 0.58
.. ..
0.62 0.64
.. ..
0.83 0.87
0.52 0.52
1.49 1.30
0.97 0.94
1.24 1.03
1.42 1.16
.. 0.45
0.65 0.45
.. ..
.. 0.85
(%)
8/7/2019 Tabela IDH 2010 inglês
http://slidepdf.com/reader/full/tabela-idh-2010-ingles 11/102
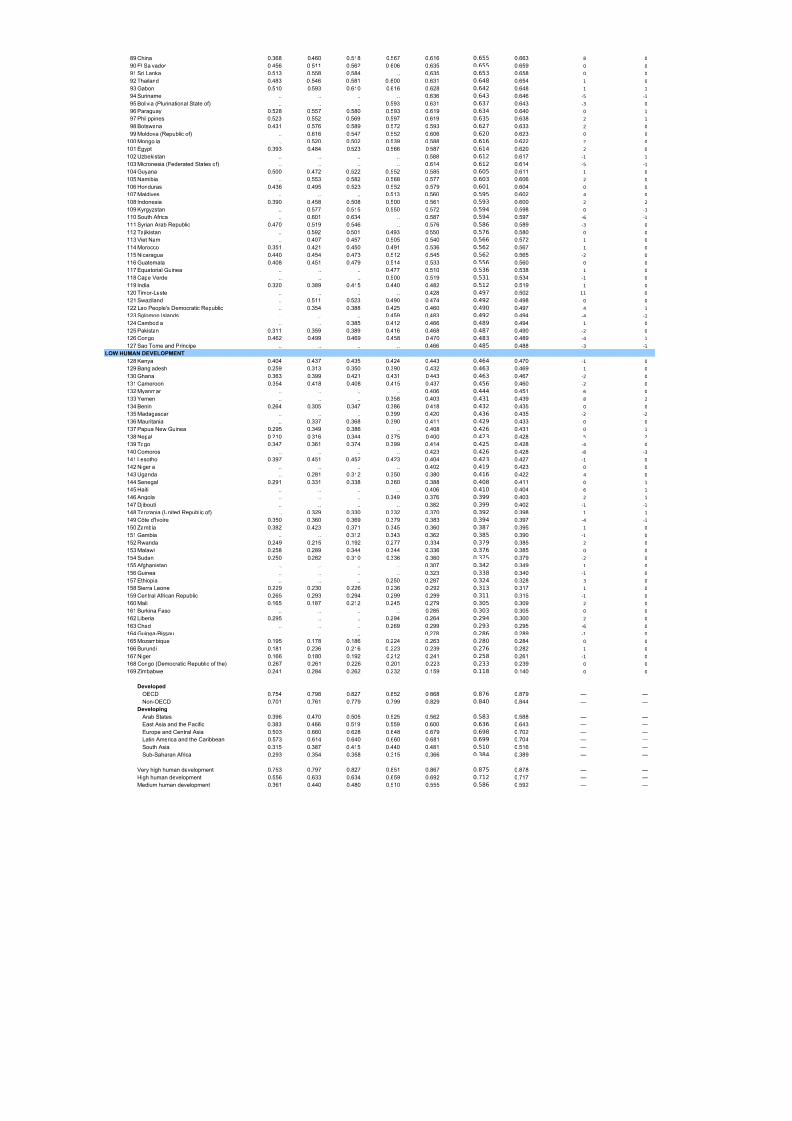
89 China 0.368 0.460 0.518 0.567 0.616 0.655 0.663 8 0
90 El Salvador 0.456 0.511 0.562 0.606 0.635 0.655 0.659 0 0
91 Sri Lanka 0.513 0.558 0.584 .. 0.635 0.653 0.658 0 0
92 Thailand 0.483 0.546 0.581 0.600 0.631 0.648 0.654 1 0
93 Gabon 0.510 0.593 0.610 0.616 0.628 0.642 0.648 1 1
94 Suriname .. .. .. .. 0.636 0.643 0.646 -5 -1
95 Bolivia (Plurinational State of) .. .. .. 0.593 0.631 0.637 0.643 -3 0
96 Paraguay 0.528 0.557 0.580 0.593 0.619 0.634 0.640 0 1
97 Philippines 0.523 0.552 0.569 0.597 0.619 0.635 0.638 -2 -1
98 Botswana 0.431 0.576 0.589 0.572 0.593 0.627 0.633 2 0
99 Moldova (Republic of) .. 0.616 0.547 0.552 0.606 0.620 0.623 0 0
100 Mongolia .. 0.520 0.502 0.539 0.588 0.616 0.622 2 0
101 Egypt 0.393 0.484 0.523 0.566 0.587 0.614 0.620 2 0
102 Uzbekistan .. .. .. .. 0.588 0.612 0.617 -1 1
103 Micronesia (Federated States of) .. .. .. .. 0.614 0.612 0.614 -5 -1
104 Guyana 0.500 0.472 0.522 0.552 0.585 0.605 0.611 1 0
105 Namibia .. 0.553 0.582 0.568 0.577 0.603 0.606 2 0
106 Honduras 0.436 0.495 0.523 0.552 0.579 0.601 0.604 0 0
107 Maldives .. .. .. 0.513 0.560 0.595 0.602 4 0
108 Indonesia 0.390 0.458 0.508 0.500 0.561 0.593 0.600 2 2
109 Kyrgyzstan .. 0.577 0.515 0.550 0.572 0.594 0.598 0 -1
110 South Africa .. 0.601 0.634 .. 0.587 0.594 0.597 -6 -1
111 Syrian Arab Republic 0.470 0.519 0.546 .. 0.576 0.586 0.589 -3 0
112 Tajikistan .. 0.592 0.501 0.493 0.550 0.576 0.580 0 0
113 Viet Nam .. 0.407 0.457 0.505 0.540 0.566 0.572 1 0
114 Morocco 0.351 0.421 0.450 0.491 0.536 0.562 0.567 1 0
115 Nicaragua 0.440 0.454 0.473 0.512 0.545 0.562 0.565 -2 0
116 Guatemala 0.408 0.451 0.479 0.514 0.533 0.556 0.560 0 0
117 Equatorial Guinea .. .. .. 0.477 0.510 0.536 0.538 1 0
118 Cape Verde .. .. .. 0.500 0.519 0.531 0.534 -1 0
119 India 0.320 0.389 0.415 0.440 0.482 0.512 0.519 1 0
120 Timor-Leste .. .. .. .. 0.428 0.497 0.502 11 0
121 Swaziland .. 0.511 0.523 0.490 0.474 0.492 0.498 0 0
122 Lao People's Democratic Republic .. 0.354 0.388 0.425 0.4600.490
0.4974 1
123 Solomon Islands .. .. .. 0.459 0.483 0.492 0.494 -4 -1
124 Cambodia .. .. 0.385 0.412 0.466 0.489 0.494 1 0
125 Pakistan 0.311 0.359 0.389 0.416 0.468 0.487 0.490 -2 0
126 Congo 0.462 0.499 0.469 0.458 0.470 0.483 0.489 -4 1
127 Sao Tome and Principe .. .. .. .. 0.466 0.485 0.488 -3 -1
LOW HUMAN DEVELOPMENT
128 Kenya 0.404 0.437 0.435 0.424 0.443 0.464 0.470 -1 0
129 Bangladesh 0.259 0.313 0.350 0.390 0.432 0.463 0.469 1 0
130 Ghana 0.363 0.399 0.421 0.431 0.443 0.463 0.467 -2 0
131 Cameroon 0.354 0.418 0.408 0.415 0.437 0.456 0.460 -2 0
132 Myanmar .. .. .. .. 0.406 0.444 0.451 6 0
133 Yemen .. .. .. 0.358 0.403 0.431 0.439 8 2
134 Benin 0.264 0.305 0.347 0.386 0.418 0.432 0.435 0 0
135 Madagascar .. .. .. 0.399 0.420 0.436 0.435 -2 -2136 Mauritania .. 0.337 0.368 0.390 0.411 0.429 0.433 0 0
137 Papua New Guinea 0.295 0.349 0.386 .. 0.408 0.426 0.431 0 1
138 Nepal 0.210 0.316 0.344 0.375 0.400 0.423 0.428 5 2
139 Togo 0.347 0.361 0.374 0.399 0.414 0.425 0.428 -4 0
140 Comoros .. .. .. .. 0.423 0.426 0.428 -8 -3
141 Lesotho 0.397 0.451 0.452 0.423 0.404 0.423 0.427 -1 0
142 Nigeria .. .. .. .. 0.402 0.419 0.423 0 0
143 Uganda .. 0.281 0.312 0.350 0.380 0.416 0.422 4 0
144 Senegal 0.291 0.331 0.338 0.360 0.388 0.408 0.411 0 1
145 Haiti .. .. .. .. 0.406 0.410 0.404 -6 -1
146 Angola .. .. .. 0.349 0.376 0.399 0.403 2 1
147 Djibouti .. .. .. .. 0.382 0.399 0.402 -1 -1
148 Tanzania (United Republic of) .. 0.329 0.330 0.332 0.370 0.392 0.398 1 1
149 Côte d'Ivoire 0.350 0.360 0.369 0.379 0.383 0.394 0.397 -4 -1
150 Zambia 0.382 0.423 0.371 0.345 0.360 0.387 0.395 1 0
151 Gambia .. .. 0.312 0.343 0.362 0.385 0.390 -1 0
152 Rwanda 0.249 0.215 0.192 0.277 0.334 0.379 0.385 2 0
153 Malawi 0.258 0.289 0.344 0.344 0.336 0.376 0.385 0 0
154 Sudan 0.250 0.282 0.310 0.336 0.360 0.375 0.379 -2 0
155 Afghanistan .. .. .. .. 0.307 0.342 0.349 1 0
156 Guinea .. .. .. .. 0.323 0.338 0.340 -1 0
157 Ethiopia .. .. .. 0.250 0.287 0.324 0.328 3 0
158 Sierra Leone 0.229 0.230 0.226 0.236 0.292 0.313 0.317 1 0
159 Central African Republic 0.265 0.293 0.294 0.299 0.299 0.311 0.315 -1 0
160 Mali 0.165 0.187 0.212 0.245 0.279 0.305 0.309 2 0
161 Burkina Faso .. .. .. .. 0.285 0.303 0.305 0 0
162 Liberia 0.295 .. .. 0.294 0.264 0.294 0.300 2 0
163 Chad .. .. .. 0.269 0.299 0.293 0.295 -6 0
164 Guinea-Bissau .. .. .. .. 0.278 0.286 0.289 -1 0
165 Mozambique 0.195 0.178 0.186 0.224 0.263 0.280 0.284 0 0
166 Burundi 0.181 0.236 0.216 0.223 0.239 0.276 0.282 1 0
167 Niger 0.166 0.180 0.192 0.212 0.241 0.258 0.261 -1 0
168 Congo (Democratic Republic of the) 0.267 0.261 0.226 0.201 0.223 0.233 0.239 0 0
169 Zimbabwe 0.241 0.284 0.262 0.232 0.159 0.118 0.140 0 0
Developed
OECD 0.754 0.798 0.827 0.852 0.868 0.876 0.879 — —
Non-OECD 0.701 0.761 0.779 0.799 0.829 0.840 0.844 — —
Developing
Arab States 0.396 0.470 0.505 0.525 0.562 0.583 0.588 — —
East Asia and the Pacific 0.383 0.466 0.519 0.559 0.600 0.636 0.643 — —Europe and Central Asia 0.503 0.660 0.628 0.648 0.679 0.698 0.702 — —
Latin America and the Caribbean 0.573 0.614 0.640 0.660 0.681 0.699 0.704 — —
South Asia 0.315 0.387 0.415 0.440 0.481 0.510 0.516 — —
Sub-Saharan Africa 0.293 0.354 0.358 0.315 0.366 0.384 0.389 — —
Very high human development 0.753 0.797 0.827 0.851 0.867 0.875 0.878 — —
High human development 0.556 0.633 0.634 0.659 0.692 0.712 0.717 — —
Medium human development 0.361 0.440 0.480 0.510 0.555 0.586 0.592 — —
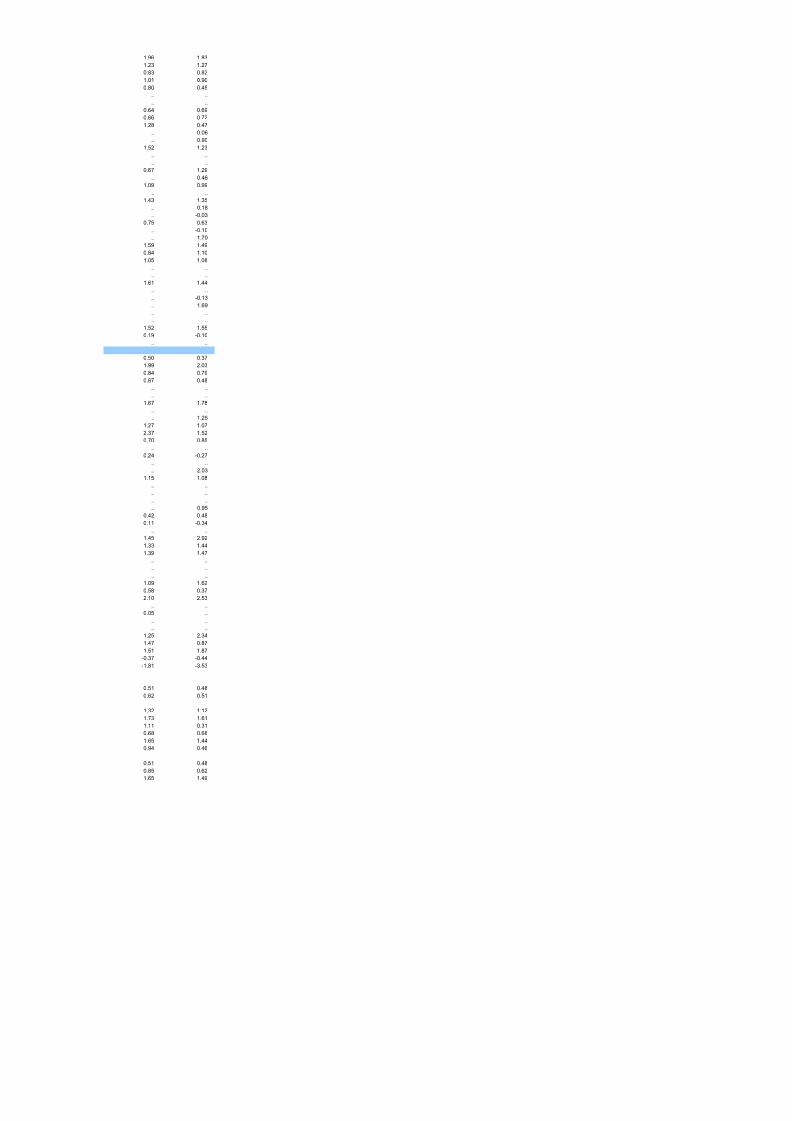
8/7/2019 Tabela IDH 2010 inglês
http://slidepdf.com/reader/full/tabela-idh-2010-ingles 12/102
1.96 1.83
1.23 1.27
0.83 0.82
1.01 0.90
0.80 0.45
.. ..
.. ..0.64 0.69
0.66 0.72
1.28 0.47
.. 0.06
.. 0.90
1.52 1.23
.. ..
.. ..
0.67 1.29
.. 0.46
1.09 0.99
.. ..
1.43 1.35
.. 0.18
.. -0.03
0.75 0.63
.. -0.10
.. 1.70
1.59 1.49
0.84 1.10
1.05 1.08
.. ..
.. ..
1.61 1.44
.. ..
.. -0.13
.. 1.69
.. ..
.. ..
1.52 1.55
0.19 -0.10
.. ..
0.50 0.37
1.99 2.03
0.84 0.79
0.87 0.48
.. ..
.. ..
1.67 1.78
.. ..
.. 1.25
1.27 1.07
2.37 1.52
0.70 0.85
.. ..
0.24 -0.27
.. ..
.. 2.03
1.15 1.08
.. ..
.. ..
.. ..
.. 0.95
0.42 0.480.11 -0.34
.. ..
1.45 2.92
1.33 1.44
1.39 1.47
.. ..
.. ..
.. ..
1.09 1.62
0.58 0.37
2.10 2.53
.. ..
0.05 ..
.. ..
.. ..
1.25 2.34
1.47 0.87
1.51 1.87
-0.37 -0.44
-1.81 -3.53
0.51 0.48
0.62 0.51
1.32 1.12
1.73 1.61
1.11 0.310.68 0.68
1.65 1.44
0.94 0.46
0.51 0.48
0.85 0.62
1.65 1.49
8/7/2019 Tabela IDH 2010 inglês
http://slidepdf.com/reader/full/tabela-idh-2010-ingles 13/102
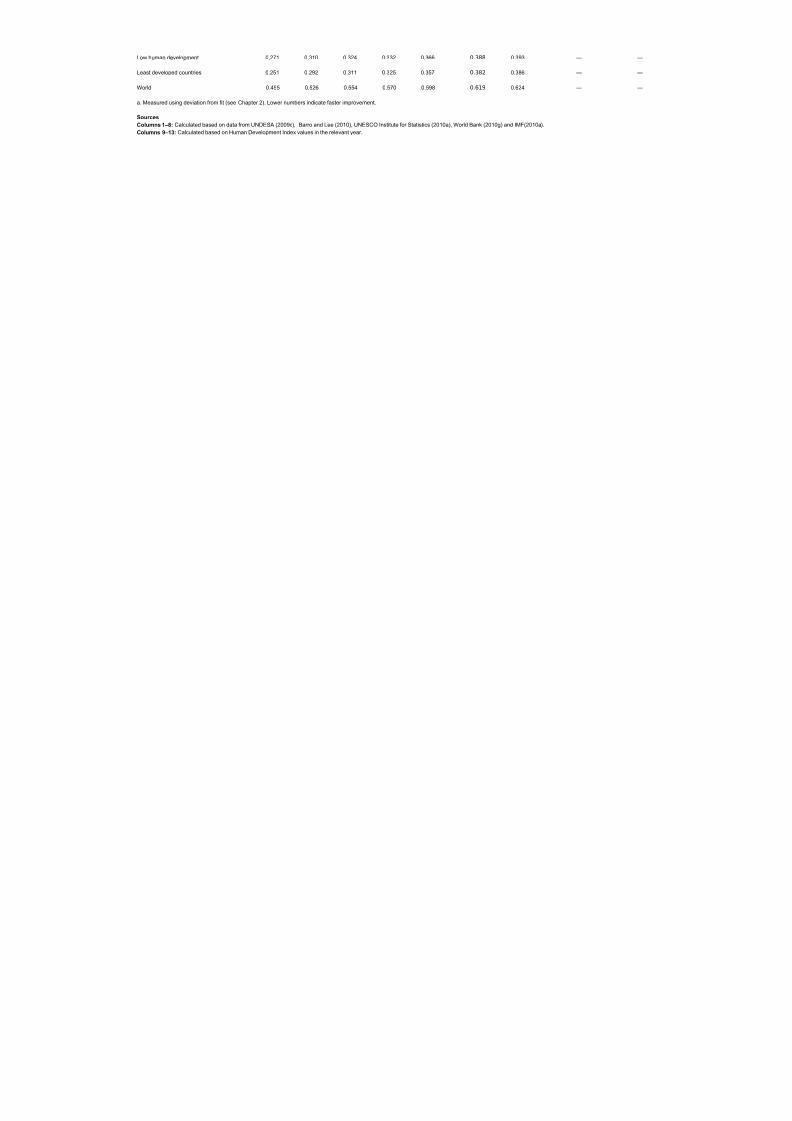
Low human development 0.271 0.310 0.324 0.332 0.366 0.388 0.393 — —
Least developed countries 0.251 0.292 0.311 0.325 0.357 0.382 0.386 — —
World 0.455 0.526 0.554 0.570 0.598 0.619 0.624 — —
a. Measured using deviation from fit (see Chapter 2). Lower numbers indicate faster improvement.
Sources
Columns 1–8: Calculated based on data from UNDESA (2009d), Barro and Lee (2010), UNESCO Institute for Statistics (2010a), World Bank (2010g) and IMF(2010a).
Columns 9–13: Calculated based on Human Development Index values in the relevant year.

8/7/2019 Tabela IDH 2010 inglês
http://slidepdf.com/reader/full/tabela-idh-2010-ingles 14/102
1.24 1.19
1.44 1.40
1.05 0.85
8/7/2019 Tabela IDH 2010 inglês
http://slidepdf.com/reader/full/tabela-idh-2010-ingles 15/102
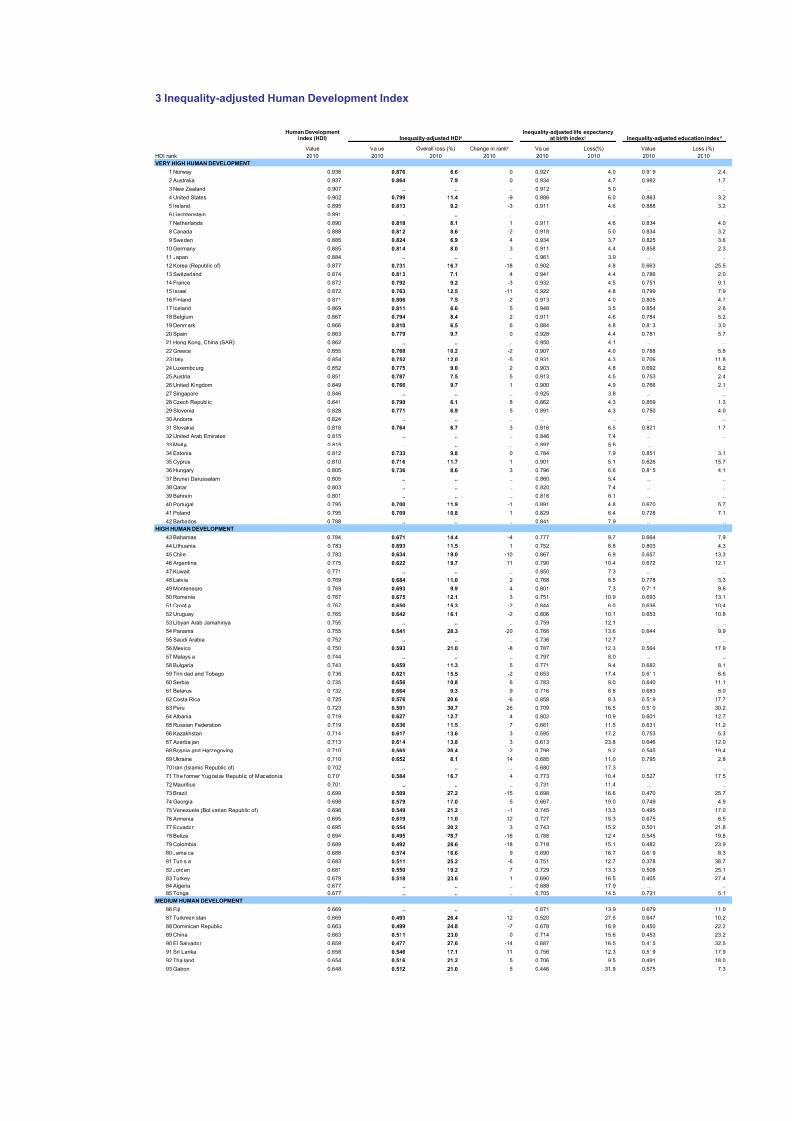
3 Inequality-adjusted Human Development Index
Value Overall loss (%) Value Loss(%) Value Loss (
HDI rank 2010 2010 2010 2010 2010 2010 2010 2010
VERY HIGH HUMAN DEVELOPMENT
1 Norway 0.938 0.876 6.6 0 0.927 4.0 0.919
2 Australia 0.937 0.864 7.9 0 0.934 4.7 0.982
3 New Zealand 0.907 .. .. .. 0.912 5.0 ..
4 United States 0.902 0.799 11.4 -9 0.886 6.0 0.863
5 Ireland 0.895 0.813 9.2 -3 0.911 4.6 0.888 6 Liechtenstein 0.891 .. .. .. .. .. ..
7 Netherlands 0.890 0.818 8.1 1 0.911 4.6 0.834
8 Canada 0.888 0.812 8.6 -2 0.918 5.0 0.834
9 Sweden 0.885 0.824 6.9 4 0.934 3.7 0.825
10 Germany 0.885 0.814 8.0 3 0.911 4.4 0.858
11 Japan 0.884 .. .. .. 0.961 3.9 ..
12 Korea (Republic of) 0.877 0.731 16.7 -18 0.902 4.8 0.663
13 Switzerland 0.874 0.813 7.1 4 0.941 4.4 0.786
14 France 0.872 0.792 9.2 -3 0.932 4.5 0.751
15 Israel 0.872 0.763 12.5 -11 0.922 4.8 0.799
16 Finland 0.871 0.806 7.5 2 0.913 4.0 0.805
17 Iceland 0.869 0.811 6.6 5 0.948 3.5 0.854 18 Belgium 0.867 0.794 8.4 2 0.911 4.6 0.784
19 Denmark 0.866 0.810 6.5 6 0.884 4.8 0.813
20 Spain 0.863 0.779 9.7 0 0.928 4.4 0.781
21 Hong Kong, China (SAR) 0.862 .. .. .. 0.950 4.1 ..
22 Greece 0.855 0.768 10.2 -2 0.907 4.0 0.788
23 Italy 0.854 0.752 12.0 -5 0.931 4.3 0.706
24 Luxembourg 0.852 0.775 9.0 2 0.903 4.8 0.692
25 Austria 0.851 0.787 7.5 5 0.913 4.5 0.753
26 United Kingdom 0.849 0.766 9.7 1 0.900 4.9 0.766
27 Singapore 0.846 .. .. .. 0.925 3.8 ..
28 Czech Republic 0.841 0.790 6.1 8 0.862 4.3 0.859
29 Slovenia 0.828 0.771 6.9 5 0.891 4.3 0.750
30 Andorra 0.824 .. .. .. .. .. ..
31 Slovakia 0.818 0.764 6.7 3 0.816 6.5 0.821
32 United Arab Emirates 0.815 .. .. .. 0.846 7.4 ..
33 Malta 0.815 .. .. .. 0.897 5.6 ..
34 Estonia 0.812 0.733 9.8 0 0.784 7.9 0.851
35 Cyprus 0.810 0.716 11.7 -1 0.901 5.1 0.626
36 Hungary 0.805 0.736 8.6 3 0.796 6.6 0.815
37 Brunei Darussalam 0.805 .. .. .. 0.860 5.4 ..
38 Qatar 0.803 .. .. .. 0.820 7.4 ..
39 Bahrain 0.801 .. .. .. 0.816 8.1 ..
40 Portugal 0.795 0.700 11.9 -1 0.891 4.8 0.670
41 Poland 0.795 0.709 10.8 1 0.829 6.4 0.728
42 Barbados 0.788 .. .. .. 0.841 7.9 ..
HIGH HUMAN DEVELOPMENT
43 Bahamas 0.784 0.671 14.4 -4 0.777 9.7 0.664
44 Lithuania 0.783 0.693 11.5 1 0.752 8.8 0.803
45 Chile 0.783 0.634 19.0 -10 0.867 6.9 0.657
46 Argentina 0.775 0.622 19.7 -11 0.790 10.4 0.672
47 Kuwait 0.771 .. .. .. 0.850 7.3 ..
48 Latvia 0.769 0.684 11.0 2 0.768 8.5 0.778
49 Montenegro 0.769 0.693 9.9 4 0.801 7.3 0.711
50 Romania 0.767 0.675 12.1 3 0.751 10.9 0.693
51 Croatia 0.767 0.650 15.3 -2 0.844 6.0 0.636
52 Uruguay 0.765 0.642 16.1 -2 0.806 10.1 0.653
53 Libyan Arab Jamahiriya 0.755 .. .. .. 0.759 12.1 .. 54 Panama 0.755 0.541 28.3 -20 0.766 13.6 0.644
55 Saudi Arabia 0.752 .. .. .. 0.736 12.7 ..
56 Mexico 0.750 0.593 21.0 -8 0.787 12.3 0.564
57 Malaysia 0.744 .. .. .. 0.797 8.0 ..
58 Bulgaria 0.743 0.659 11.3 5 0.771 9.4 0.682
59 Trinidad and Tobago 0.736 0.621 15.5 -2 0.653 17.4 0.611
60 Serbia 0.735 0.656 10.8 6 0.783 9.0 0.640
61 Belarus 0.732 0.664 9.3 9 0.716 8.8 0.683
62 Costa Rica 0.725 0.576 20.6 -6 0.858 8.3 0.519
63 Peru 0.723 0.501 30.7 -26 0.709 16.5 0.510
64 Albania 0.719 0.627 12.7 4 0.802 10.9 0.601
65 Russian Federation 0.719 0.636 11.5 7 0.661 11.5 0.631 66 Kazakhstan 0.714 0.617 13.6 3 0.595 17.2 0.753
67 Azerbaijan 0.713 0.614 13.8 3 0.613 23.8 0.646
68 Bosnia and Herzegovina 0.710 0.565 20.4 -2 0.798 9.2 0.545
69 Ukraine 0.710 0.652 8.1 14 0.685 11.0 0.795
70 Iran (Islamic Republic of) 0.702 .. .. .. 0.680 17.3 ..
71 The former Yugoslav Republ ic of Macedonia 0.701 0.584 16.7 4 0.773 10.4 0.527
72 Mauritius 0.701 .. .. .. 0.731 11.4 ..
73 Brazil 0.699 0.509 27.2 -15 0.698 16.6 0.470
74 Georgia 0.698 0.579 17.0 5 0.667 19.0 0.749
75 Venezuela (Bolivarian Republic of) 0.696 0.549 21.2 -1 0.745 13.3 0.495
76 Armenia 0.695 0.619 11.0 12 0.727 15.3 0.675
77 Ecuador 0.695 0.554 20.2 3 0.743 15.2 0.501 78 Belize 0.694 0.495 28.7 -16 0.788 12.4 0.545
79 Colombia 0.689 0.492 28.6 -18 0.718 15.1 0.482
80 Jamaica 0.688 0.574 16.6 9 0.690 16.7 0.619
81 Tunisia 0.683 0.511 25.2 -6 0.751 12.7 0.378
82 Jordan 0.681 0.550 19.2 7 0.729 13.3 0.508
83 Turkey 0 679 0 518 23 6 1 0 690 16 5 0 405
Human DevelopmentIndex (HDI) Inequality-adjusted HDIa
Inequality-adjusted life expectancyat birth indexc Inequality-adjusted education i
Value Change in rankb
8/7/2019 Tabela IDH 2010 inglês
http://slidepdf.com/reader/full/tabela-idh-2010-ingles 16/102
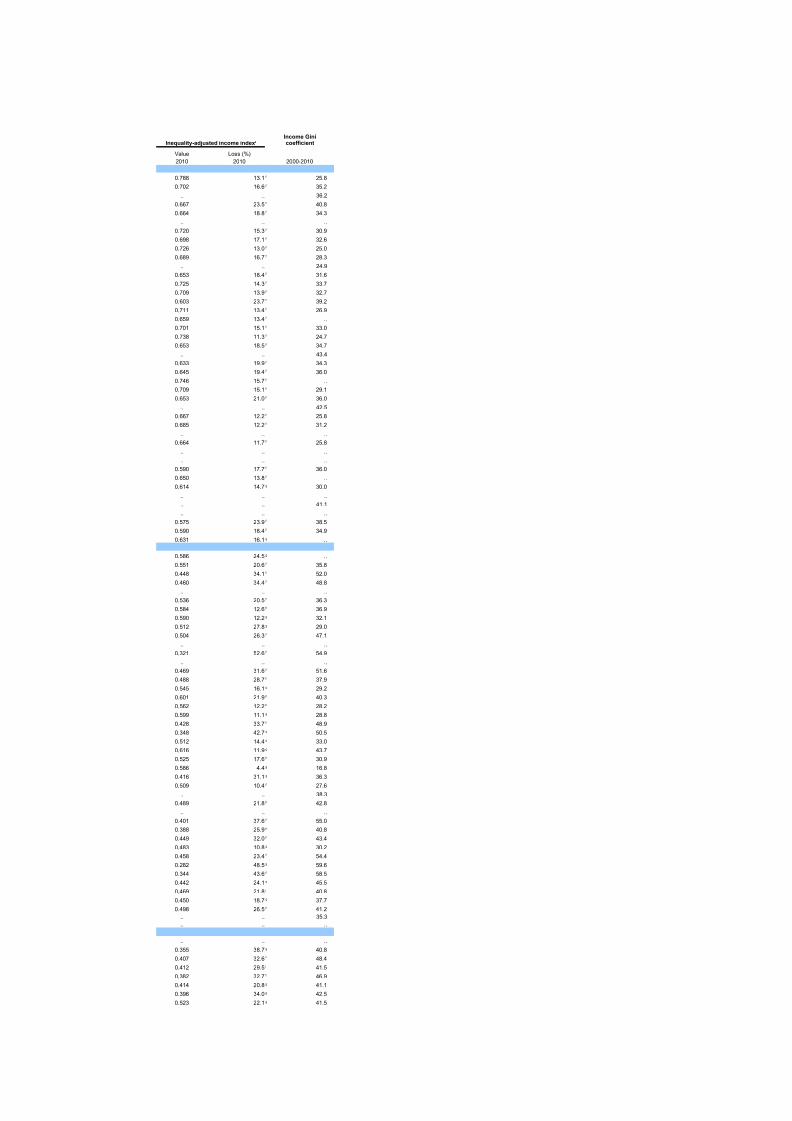
Value Loss (%)
2010 2010 2000-2010
0.788 13.1 25.8
0.702 16.6 35.2
.. .. 36.2
0.667 23.5 40.80.664 18.8 34.3
.. .. ..
0.720 15.3 30.9
0.698 17.1 32.6
0.726 13.0 25.0
0.689 16.7 28.3
.. .. 24.9
0.653 18.4 31.6
0.725 14.3 33.7
0.709 13.9 32.7
0.603 23.7 39.2
0.711 13.4 26.90.659 13.4 ..
0.701 15.1 33.0
0.738 11.3 24.7
0.653 18.5 34.7
.. .. 43.4
0.633 19.9 34.3
0.645 19.4 36.0
0.746 15.7 ..
0.709 15.1 29.1
0.653 21.0 36.0
.. .. 42.5
0.667 12.2 25.8
0.685 12.2 31.2
.. .. ..
0.664 11.7 25.8
.. .. ..
.. .. ..
0.590 17.7 36.0
0.650 13.8 ..
0.614 14.7 30.0
.. .. ..
.. .. 41.1
.. .. ..
0.575 23.9 38.5
0.590 18.4 34.9
0.631 16.1 ..
0.586 24.5 ..
0.551 20.6 35.8
0.448 34.1 52.0
0.460 34.4 48.8
.. .. ..
0.536 20.5 36.3
0.584 12.6 36.9
0.590 12.2 32.1
0.512 27.8 29.0
0.504 26.3 47.1
.. .. ..
0.321 52.6 54.9
.. .. ..
0.469 31.6 51.6
0.488 28.7 37.9
0.545 16.1 29.2
0.601 21.9 40.3
0.562 12.2 28.2
0.599 11.1 28.8
0.428 33.7 48.90.348 42.7 50.5
0.512 14.4 33.0
0.616 11.9 43.7
0.525 17.6 30.9
0.586 4.4 16.8
0.416 31.1 36.3
0.509 10.4 27.6
.. .. 38.3
0.489 21.8 42.8
.. .. ..
0.401 37.6 55.0
0.388 25.9 40.80.449 32.0 43.4
0.483 10.8 30.2
0.458 23.4 54.4
0.282 48.5 59.6
0.344 43.6 58.5
Inequality-adjusted income indexe
Income Ginicoefficient
f
f
f
f
f
f
f
f
f
f
f
f
f
f
f
f
f
f
f
f
f
f
f
f
f
f
f
g
f
f
g
g
f
f
f
f
h
g
g
f
f
f
f
g
h
h
g
f
g
g
g
h
g
g
f
h
f
h
f
g
f
g
f
8/7/2019 Tabela IDH 2010 inglês
http://slidepdf.com/reader/full/tabela-idh-2010-ingles 17/102
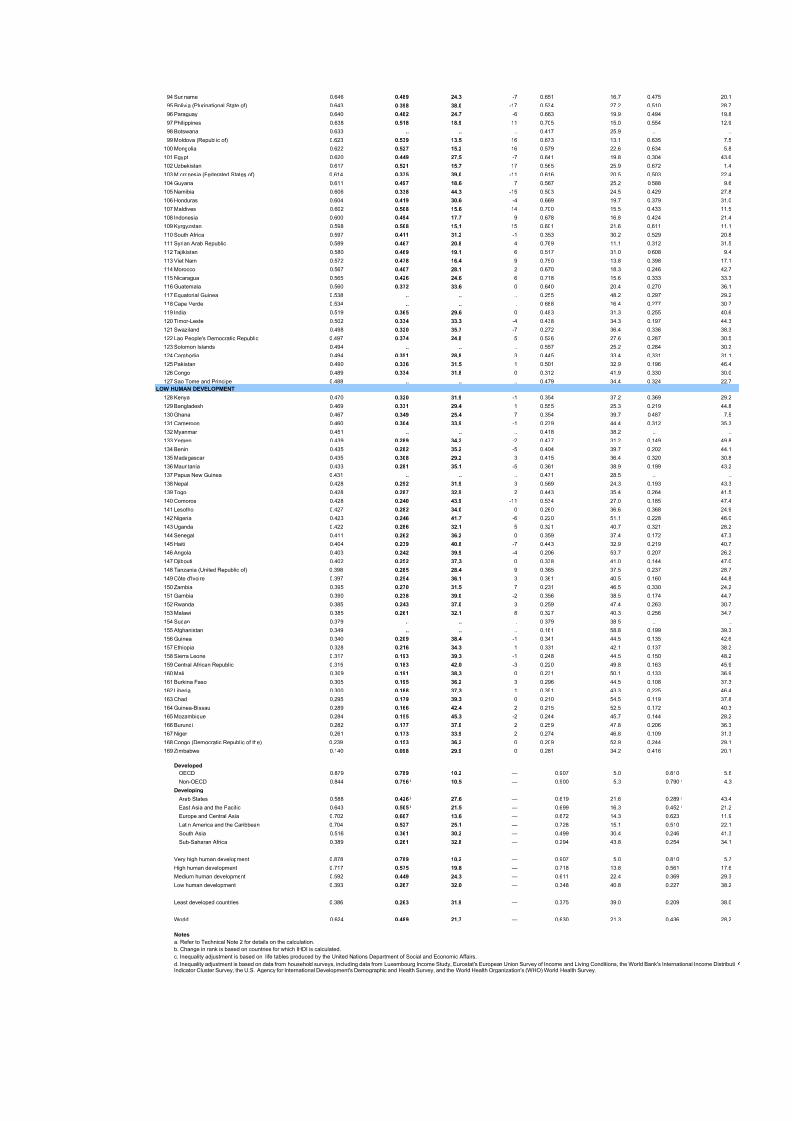
94 Suriname 0.646 0.489 24.3 -7 0.651 16.7 0.475
95 Bolivia (Plurinational State of) 0.643 0.398 38.0 -17 0.534 27.2 0.510
96 Paraguay 0.640 0.482 24.7 -6 0.663 19.9 0.494
97 Philippines 0.638 0.518 18.9 11 0.705 15.0 0.554
98 Botswana 0.633 .. .. .. 0.417 25.9 ..
99 Moldova (Republic of) 0.623 0.539 13.5 16 0.673 13.1 0.635
100 Mongolia 0.622 0.527 15.2 16 0.579 22.6 0.634
101 Egypt 0.620 0.449 27.5 -7 0.641 19.8 0.304
102 Uzbekistan 0.617 0.521 15.7 17 0.565 25.9 0.672
103 Micronesia (Federated States of) 0.614 0.375 39.0 -11 0.616 20.5 0.503
104 Guyana 0.611 0.497 18.6 7 0.567 25.2 0.588
105 Namibia 0.606 0.338 44.3 -15 0.503 24.5 0.429
106 Honduras 0.604 0.419 30.6 -4 0.669 19.7 0.379
107 Maldives 0.602 0.508 15.6 14 0.700 15.5 0.433
108 Indonesia 0.600 0.494 17.7 9 0.678 16.8 0.424
109 Kyrgyzstan 0.598 0.508 15.1 15 0.601 21.6 0.611
110 South Africa 0.597 0.411 31.2 -1 0.353 30.2 0.529
111 Syrian Arab Republic 0.589 0.467 20.8 4 0.769 11.1 0.312
112 Tajikistan 0.580 0.469 19.1 6 0.517 31.0 0.608
113 Viet Nam 0.572 0.478 16.4 9 0.750 13.8 0.398
114 Morocco 0.567 0.407 28.1 2 0.670 18.3 0.246
115 Nicaragua 0.565 0.426 24.6 6 0.718 15.6 0.333
116 Guatemala 0.560 0.372 33.6 0 0.640 20.4 0.270
117 Equatorial Guinea 0.538 .. .. .. 0.255 48.2 0.297
118 Cape Verde 0.534 .. .. .. 0.688 16.4 0.277
119 India 0.519 0.365 29.6 0 0.483 31.3 0.255
120 Timor-Leste 0.502 0.334 33.3 -4 0.438 34.3 0.197
121 Swaziland 0.498 0.320 35.7 -7 0.272 36.4 0.336
122 Lao People's Democratic Republic 0.497 0.374 24.8 5 0.526 27.6 0.287
123 Solomon Islands 0.494 .. .. .. 0.557 25.2 0.284
124 Cambodia 0.494 0.351 28.8 3 0.445 33.4 0.331
125 Pakistan 0.490 0.336 31.5 1 0.501 32.9 0.196
126 Congo 0.489 0.334 31.8 0 0.312 41.9 0.330
127 Sao Tome and Principe 0.488 .. .. .. 0.479 34.4 0.324
LOW HUMAN DEVELOPMENT
128 Kenya 0.470 0.320 31.9 -1 0.354 37.2 0.369
129 Bangladesh 0.469 0.331 29.4 1 0.555 25.3 0.219
130 Ghana 0.467 0.349 25.4 7 0.354 39.7 0.487 131 Cameroon 0.460 0.304 33.9 -1 0.279 44.4 0.312
132 Myanmar 0.451 .. .. .. 0.418 38.2 ..
133 Yemen 0.439 0.289 34.2 -2 0.477 31.2 0.149
134 Benin 0.435 0.282 35.2 -5 0.404 39.7 0.202
135 Madagascar 0.435 0.308 29.2 3 0.415 36.4 0.320
136 Mauritania 0.433 0.281 35.1 -5 0.361 38.9 0.199
137 Papua New Guinea 0.431 .. .. .. 0.471 28.5 ..
138 Nepal 0.428 0.292 31.9 3 0.569 24.3 0.193
139 Togo 0.428 0.287 32.9 2 0.443 35.4 0.264
140 Comoros 0.428 0.240 43.9 -11 0.534 27.0 0.185
141 Lesotho 0.427 0.282 34.0 0 0.260 36.6 0.368
142 Nigeria 0.423 0.246 41.7 -6 0.220 51.1 0.228 143 Uganda 0.422 0.286 32.1 5 0.321 40.7 0.321
144 Senegal 0.411 0.262 36.2 0 0.359 37.4 0.172
145 Haiti 0.404 0.239 40.8 -7 0.443 32.9 0.219
146 Angola 0.403 0.242 39.9 -4 0.206 53.7 0.207
147 Djibouti 0.402 0.252 37.3 0 0.338 41.0 0.144
148 Tanzania (United Republic of) 0.398 0.285 28.4 9 0.365 37.5 0.237
149 Côte d'Ivoire 0.397 0.254 36.1 3 0.361 40.5 0.160
150 Zambia 0.395 0.270 31.5 7 0.231 46.5 0.330
151 Gambia 0.390 0.238 39.0 -2 0.356 38.5 0.174
152 Rwanda 0.385 0.243 37.0 3 0.259 47.4 0.263
153 Malawi 0.385 0.261 32.1 8 0.327 40.3 0.256
154 Sudan 0.379 .. .. .. 0.379 38.5 .. 155 Afghanistan 0.349 .. .. .. 0.161 58.8 0.199
156 Guinea 0.340 0.209 38.4 -1 0.341 44.5 0.135
157 Ethiopia 0.328 0.216 34.3 1 0.331 42.1 0.137
158 Sierra Leone 0.317 0.193 39.3 -1 0.248 44.5 0.150
159 Central African Republic 0.315 0.183 42.0 -3 0.220 49.8 0.163
160 Mali 0.309 0.191 38.3 0 0.231 50.1 0.133
161 Burkina Faso 0.305 0.195 36.2 3 0.296 44.5 0.108
162 Liberia 0.300 0.188 37.3 1 0.351 43.3 0.225
163 Chad 0.295 0.179 39.3 0 0.210 54.5 0.119
164 Guinea-Bissau 0.289 0.166 42.4 -2 0.215 52.5 0.172
165 Mozambique 0.284 0.155 45.3 -2 0.244 45.7 0.144
166 Burundi 0.282 0.177 37.0 2 0.259 47.8 0.206 167 Niger 0.261 0.173 33.9 2 0.274 46.8 0.109
168 Congo (Democratic Republic of the) 0.239 0.153 36.2 0 0.209 52.9 0.244
169 Zimbabwe 0.140 0.098 29.9 0 0.281 34.2 0.416
Developed
OECD 0.879 0.789 10.2 — 0.907 5.0 0.810
Non-OECD 0.844 0.756 10.5 — 0.900 5.3 0.790
Developing
Arab States 0.588 0.426 27.6 — 0.619 21.6 0.289
East Asia and the Pacific 0.643 0.505 21.5 — 0.699 16.3 0.452
Europe and Central Asia 0.702 0.607 13.6 — 0.672 14.3 0.623
Latin America and the Caribbean 0.704 0.527 25.1 — 0.728 15.1 0.510
South Asia 0.516 0.361 30.2 — 0.499 30.4 0.246
Sub-Saharan Africa 0.389 0.261 32.8 — 0.294 43.8 0.254
Very high human development 0.878 0.789 10.2 — 0.907 5.0 0.810
High human development 0.717 0.575 19.8 — 0.718 13.8 0.561
Medium human development 0.592 0.449 24.3 — 0.611 22.4 0.369
j j j
j j j
j j j
8/7/2019 Tabela IDH 2010 inglês
http://slidepdf.com/reader/full/tabela-idh-2010-ingles 18/102
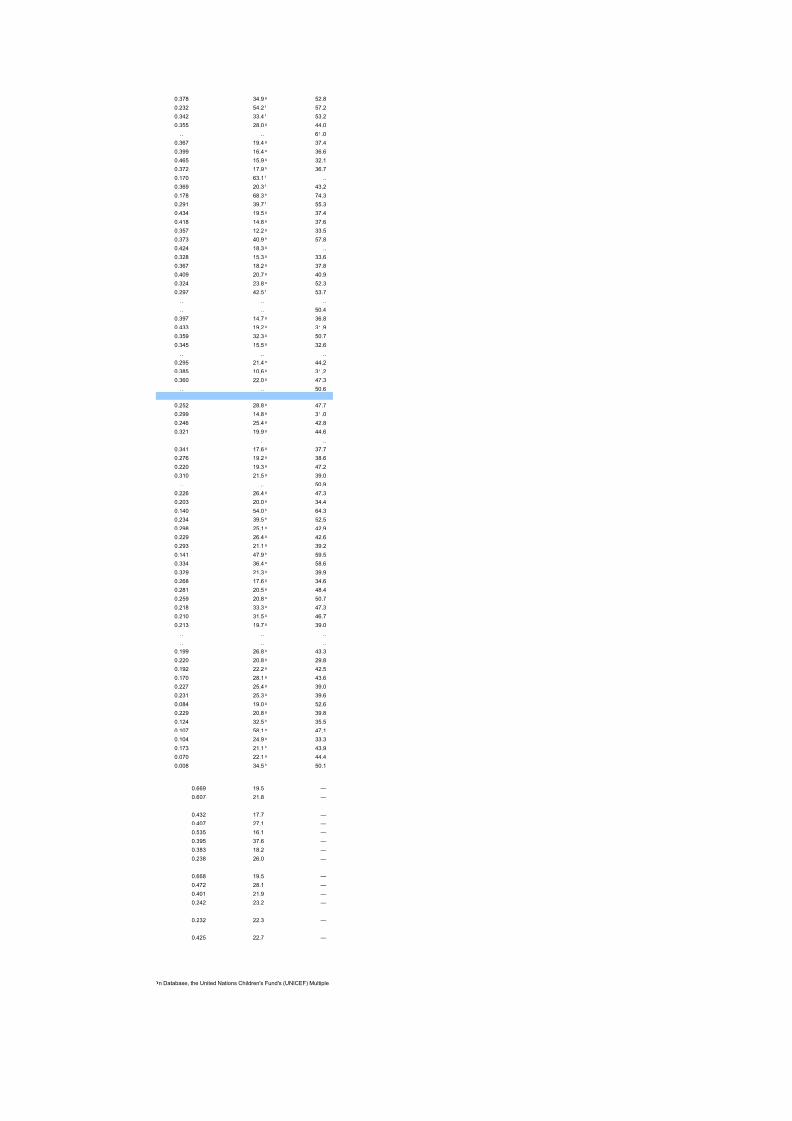
0.378 34.9 52.8
0.232 54.2 57.2
0.342 33.4 53.2
0.355 28.0 44.0
.. .. 61.0
0.367 19.4 37.4
0.399 16.4 36.6
0.465 15.9 32.1
0.372 17.9 36.7
0.170 63.1 ..
0.369 20.3 43.2
0.178 68.3 74.3
0.291 39.7 55.30.434 19.5 37.4
0.418 14.8 37.6
0.357 12.2 33.5
0.373 40.9 57.8
0.424 18.3 ..
0.328 15.3 33.6
0.367 18.2 37.8
0.409 20.7 40.9
0.324 23.8 52.3
0.297 42.5 53.7
.. .. ..
.. .. 50.40.397 14.7 36.8
0.433 19.2 31.9
0.359 32.3 50.7
0.345 15.5 32.6
.. .. ..
0.295 21.4 44.2
0.385 10.6 31.2
0.360 22.0 47.3
.. .. 50.6
0.252 28.8 47.7
0.299 14.8 31.00.246 25.4 42.8
0.321 19.9 44.6
.. .. ..
0.341 17.6 37.7
0.276 19.2 38.6
0.220 19.3 47.2
0.310 21.5 39.0
.. .. 50.9
0.226 26.4 47.3
0.203 20.0 34.4
0.140 54.0 64.3
0.234 39.5 52.5
0.298 25.1 42.9
0.229 26.4 42.6
0.293 21.1 39.2
0.141 47.9 59.5
0.334 36.4 58.6
0.329 21.3 39.9
0.268 17.6 34.6
0.281 20.5 48.4
0.259 20.8 50.7
0.218 33.3 47.3
0.210 31.5 46.7
0.213 19.7 39.0
.. .. ..
.. .. ..
0.199 26.8 43.3
0.220 20.8 29.8
0.192 22.2 42.5
0.170 28.1 43.6
0.227 25.4 39.0
0.231 25.3 39.6
0.084 19.0 52.6
0.229 20.8 39.8
0.124 32.5 35.5
0.107 58.1 47.1
0.104 24.9 33.3
0.173 21.1 43.9
0.070 22.1 44.4
0.008 34.5 50.1
0.669 19.5 —
0.607 21.8 —
0.432 17.7 —
0.407 27.1 —
0.535 16.1 —
0.395 37.6 —
0.383 18.2 —
0.238 26.0 —
0.668 19.5 —
g
f
f
g
g
g
g
h
f
f
h
f
g
g
g
h
g
g
g
g
g
f
g
g
g
g
g
g
g
g
g
g
g
g
g
g
g
g
g
h
h
g
g
g
h
g
g
g
g
g
g
g
g
g
g
g
g
g
g
g
g
h
g
g
h
g
h
j
j
j

8/7/2019 Tabela IDH 2010 inglês
http://slidepdf.com/reader/full/tabela-idh-2010-ingles 19/102
f. Inequality is estimated from household disposable income per capita.
g. Inequality is estimated from imputed income using the asset index matching methodology in Harttgen and Klasen, (2010).
h. Inequality is estimated from income deciles available from UNU-WIDER .
i. Inequality is estimated from household consumption per capita.
j. Based on less than half the countries.
Sources
e. Inequality adjustment is based on data from household surveys, including the Luxembourg Income Study, Eurostat's European Union Survey of Income and Living Conditions, the World Bank's International Income Dis
Demographic and Health Survey, and the United Nations University World Institute for Development Economics Research's (UNU-WIDER) World Income Inequality Database.
Column 1: Calculated based on data from UNDESA (2009d), Barro and Lee (2010), UNESCO Institute for Statistics (2010a), World Bank (2010g) and IMF(2010a).
Column 2: Calculated as the geometric mean of the values in Columns 5, 7 and 9 using the methodology in Technical note 2.
Columns 3, 6, 8 and 10: Calculated based on data from UN life tables, the Luxembourg Income Study, Eurostat's European Union Survey of Income and Living Conditions, the World Bank's International Income Distribuand Health Survey, the WHO's World Health Survey, and UNU-WIDER's World Income Inequality Database (UNU-WIDER) using the methodology in Technical note 2.
Column 4: Calculated based on data in columns 1 and 2.Column 5: Calculated based on data in column 6 and the unadjusted life expectancy index.
Column 7: Calculated based on data in column 10 and the unadjusted education index.
Column 9: Calculated based on data in column 9 and the unadjusted income index.
Column 11: World Bank (2010c).

8/7/2019 Tabela IDH 2010 inglês
http://slidepdf.com/reader/full/tabela-idh-2010-ingles 20/102
base, UNICEF's Multiple Indicators Cluster Survey, USAID's
e, UNICEF's Multiple Indicator Cluster Survey, USAID's Demographic
8/7/2019 Tabela IDH 2010 inglês
http://slidepdf.com/reader/full/tabela-idh-2010-ingles 21/102
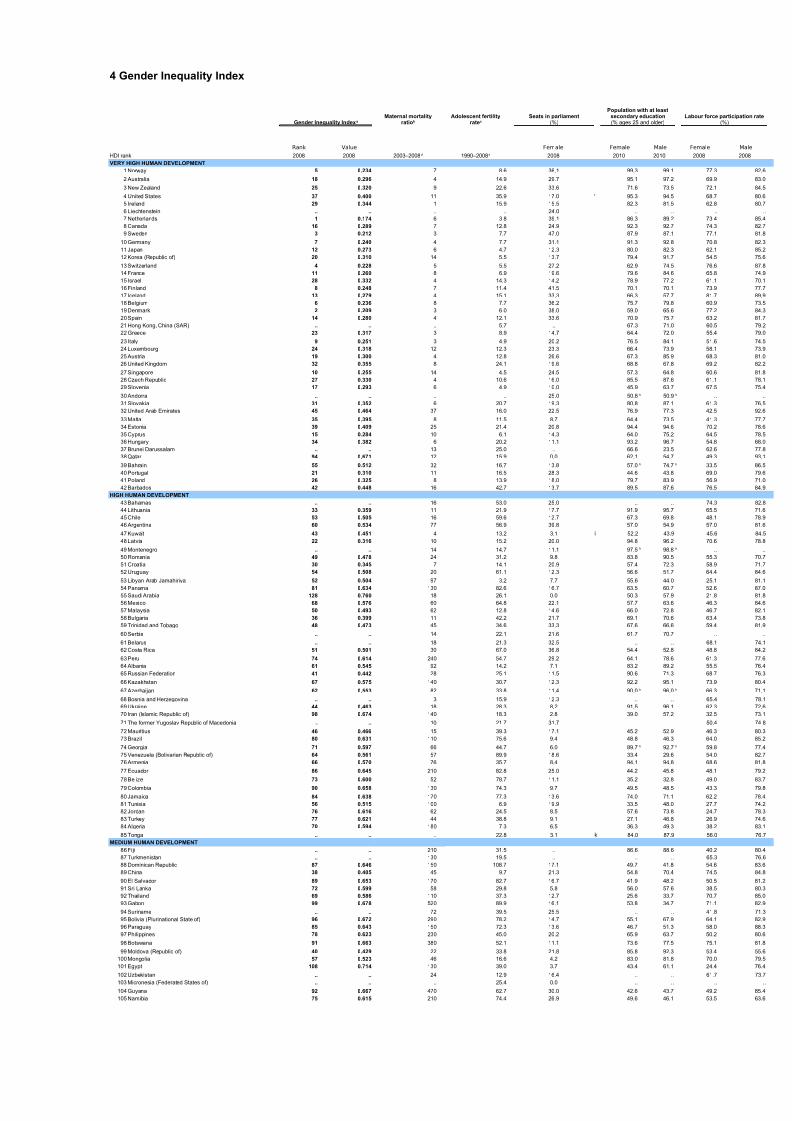
4 Gender Inequality Index
Rank Value Female Female Male Femal
HDI rank 2008 2008 2008 2010 2010 2008
VERY HIGH HUMAN DEVELOPMENT
1 Norway 5 0.234 7 8.6 36.1 99.3 99.1
2 Australia 18 0.296 4 14.9 29.7 95.1 97.2
3 New Zealand 25 0.320 9 22.6 33.6 71.6 73.5
4 United States 37 0.400 11 35.9 17.0 95.3 94.5
5 Ireland 29 0.344 1 15.9 15.5 82.3 81.5
6 Liechtenstein .. .. .. .. 24.0 .. ..
7 Netherlands 1 0.174 6 3.8 39.1 86.3 89.2
8 Canada 16 0.289 7 12.8 24.9 92.3 92.7
9 Sweden 3 0.212 3 7.7 47.0 87.9 87.1
10 Germany 7 0.240 4 7.7 31.1 91.3 92.8
11 Japan 12 0.273 6 4.7 12.3 80.0 82.3
12 Korea (Republic of) 20 0.310 14 5.5 13.7 79.4 91.7
13 Switzerland 4 0.228 5 5.5 27.2 62.9 74.5
14 France 11 0.260 8 6.9 19.6 79.6 84.6
15 Israel 28 0.332 4 14.3 14.2 78.9 77.2
16 Finland 8 0.248 7 11.4 41.5 70.1 70.1
17 Iceland 13 0.279 4 15.1 33.3 66.3 57.7
18 Belgium 6 0.236 8 7.7 36.2 75.7 79.8
19 Denmark 2 0.209 3 6.0 38.0 59.0 65.6 20 Spain 14 0.280 4 12.1 33.6 70.9 75.7
21 Hong Kong, China (SAR) .. .. .. 5.7 .. 67.3 71.0
22 Greece 23 0.317 3 8.9 14.7 64.4 72.0
23 Italy 9 0.251 3 4.9 20.2 76.5 84.1
24 Luxembourg 24 0.318 12 12.3 23.3 66.4 73.9
25 Austria 19 0.300 4 12.8 26.6 67.3 85.9
26 United Kingdom 32 0.355 8 24.1 19.6 68.8 67.8
27 Singapore 10 0.255 14 4.5 24.5 57.3 64.8
28 Czech Republic 27 0.330 4 10.6 16.0 85.5 87.6
29 Slovenia 17 0.293 6 4.9 10.0 45.9 63.7
30 Andorra .. .. .. .. 25.0 50.8 50.9
31 Slovakia 31 0.352 6 20.7 19.3 80.8 87.1
32 United Arab Emirates 45 0.464 37 16.0 22.5 76.9 77.3
33 Malta 35 0.395 8 11.5 8.7 64.4 73.5
34 Estonia 39 0.409 25 21.4 20.8 94.4 94.6
35 Cyprus 15 0.284 10 6.1 14.3 64.0 75.2
36 Hungary 34 0.382 6 20.2 11.1 93.2 96.7
37 Brunei Darussalam .. .. 13 25.0 .. 66.6 23.5
38 Qatar 94 0.671 12 15.9 0.0 62.1 54.7
39 Bahrain 55 0.512 32 16.7 13.8 57.0 74.7
40 Portugal 21 0.310 11 16.5 28.3 44.6 43.8
41 Poland 26 0.325 8 13.9 18.0 79.7 83.9
42 Barbados 42 0.448 16 42.7 13.7 89.5 87.6
HIGH HUMAN DEVELOPMENT
43 Bahamas .. .. 16 53.0 25.0 .. ..
44 Lithuania 33 0.359 11 21.9 17.7 91.9 95.7
45 Chile 53 0.505 16 59.6 12.7 67.3 69.8 46 Argentina 60 0.534 77 56.9 39.8 57.0 54.9
47 Kuwait 43 0.451 4 13.2 3.1 i 52.2 43.9
48 Latvia 22 0.316 10 15.2 20.0 94.8 96.2
49 Montenegro .. .. 14 14.7 11.1 97.5 98.8
50 Romania 49 0.478 24 31.2 9.8 83.8 90.5
51 Croatia 30 0.345 7 14.1 20.9 57.4 72.3
52 Uruguay 54 0.508 20 61.1 12.3 56.6 51.7
53 Libyan Arab Jamahiriya 52 0.504 97 3.2 7.7 55.6 44.0
54 Panama 81 0.634 130 82.6 16.7 63.5 60.7
55 Saudi Arabia 128 0.760 18 26.1 0.0 50.3 57.9
56 Mexico 68 0.576 60 64.8 22.1 57.7 63.6
57 Malaysia 50 0.493 62 12.8 14.6 66.0 72.8
58 Bulgaria 36 0.399 11 42.2 21.7 69.1 70.6
59 Trinidad and Tobago 48 0.473 45 34.6 33.3 67.6 66.6
60 Serbia .. .. 14 22.1 21.6 61.7 70.7
61 Belarus .. .. 18 21.3 32.5 .. ..
62 Costa Rica 51 0.501 30 67.0 36.8 54.4 52.8
63 Peru 74 0.614 240 54.7 29.2 64.1 78.6
64 Albania 61 0.545 92 14.2 7.1 83.2 89.2
65 Russian Federation 41 0.442 28 25.1 11.5 90.6 71.3
66 Kazakhstan 67 0.575 140 30.7 12.3 92.2 95.1
67 Azerbaijan 62 0.553 82 33.8 11.4 90.0 96.0
68 Bosnia and Herzegovina .. .. 3 15.9 12.3 .. ..
69 Ukraine 44 0.463 18 28.3 8.2 91.5 96.1
70 Iran (Islamic Republic of) 98 0.674 140 18.3 2.8 39.0 57.2
71 The former Yugoslav Republic of Macedonia .. .. 10 21.7 31.7 .. ..
72 Mauritius 46 0.466 15 39.3 17.1 45.2 52.9
73 Brazil 80 0.631 110 75.6 9.4 48.8 46.3
74 Georgia 71 0.597 66 44.7 6.0 89.7 92.7
75 Venezuela (Bolivarian Republic of) 64 0.561 57 89.9 18.6 33.4 29.6
76 Armenia 66 0.570 76 35.7 8.4 94.1 94.8
77 Ecuador 86 0.645 210 82.8 25.0 44.2 45.8
78 Belize 73 0.600 52 78.7 11.1 35.2 32.8
79 Colombia 90 0.658 130 74.3 9.7 49.5 48.5
80 Jamaica 84 0.638 170 77.3 13.6 74.0 71.1
81 Tunisia 56 0.515 100 6.9 19.9 33.5 48.0
82 Jordan 76 0.616 62 24.5 8.5 57.6 73.8
83 Turkey 77 0.621 44 38.8 9.1 27.1 46.8
84 Algeria 70 0.594 180 7.3 6.5 36.3 49.3
85 Tonga .. .. .. 22.8 3.1 k 84.0 87.9
MEDIUM HUMAN DEVELOPMENT
86 Fiji .. .. 210 31.5 .. 86.6 88.6
87 Turkmenistan .. .. 130 19.5 .. .. ..
88 Dominican Republic 87 0.646 150 108.7 17.1 49.7 41.8
89 China 38 0.405 45 9.7 21.3 54.8 70.4
Gender Inequality Indexa
Maternal mortalityratiob
Adolescent fertilityratec
Seats in parliament(%)
Population with at leastsecondary education(% ages 25 and older)
Labour f
2003–2008d 1990–2008d
f
h h
h h
h h
h h
h h
8/7/2019 Tabela IDH 2010 inglês
http://slidepdf.com/reader/full/tabela-idh-2010-ingles 22/102
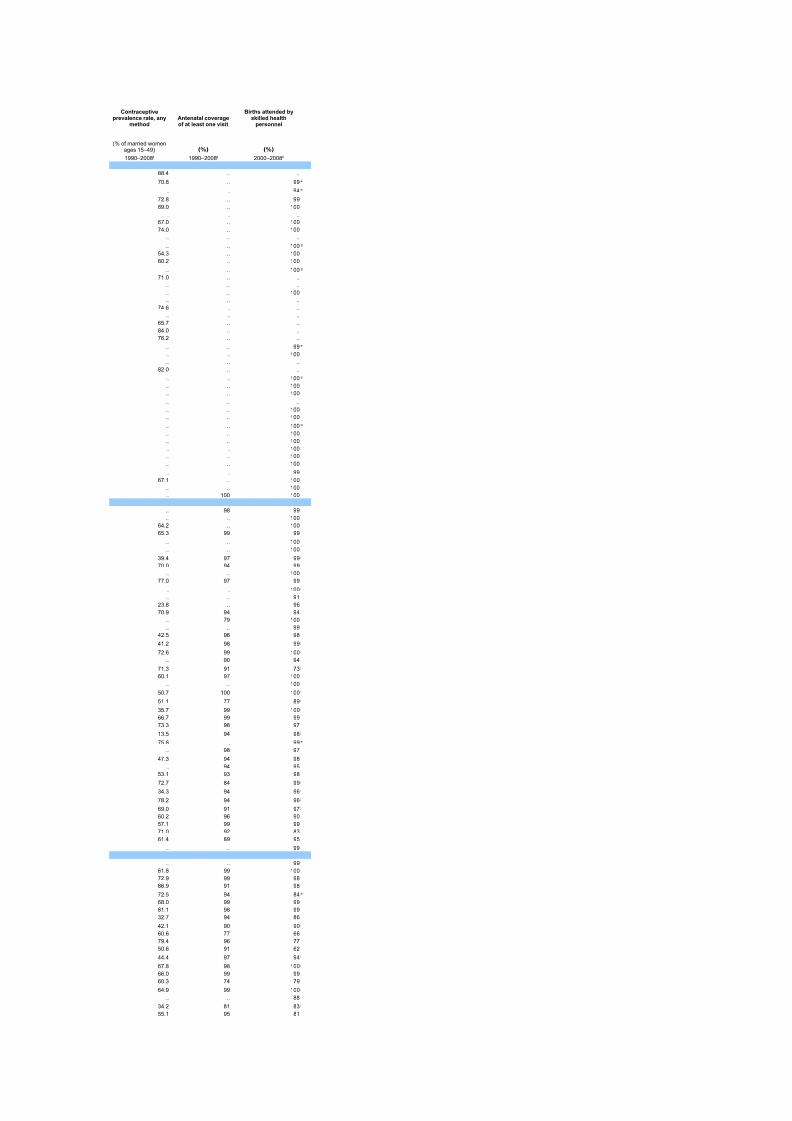
88.4 .. ..
70.8 .. 99
.. .. 94
72.8 .. 99
89.0 .. 100.. .. ..
67.0 .. 100
74.0 .. 100
.. .. ..
.. .. 100
54.3 .. 100
80.2 .. 100
.. .. 100
71.0 .. ..
.. .. ..
.. .. 100
.. .. ..
74.6 .. ..
.. .. ..
65.7 .. ..
84.0 .. ..
76.2 .. ..
.. .. 99
.. .. 100
.. .. ..
82.0 .. ..
.. .. 100
.. .. 100
.. .. 100
.. .. ..
.. .. 100
.. .. 100
.. .. 100
.. .. 100
.. .. 100
.. .. 100
.. .. 100
.. .. 100
.. .. 99
67.1 .. 100
.. .. 100
.. 100 100
.. 98 99
.. .. 10064.2 .. 100
65.3 99 99
.. .. 100
.. .. 100
39.4 97 99
70.0 94 99
.. .. 100
77.0 97 99
.. .. 100
.. .. 91
23.8 .. 96
70.9 94 94
.. 79 100.. .. 99
42.5 96 98
41.2 98 99
72.6 99 100
.. 90 94
71.3 91 73
60.1 97 100
.. .. 100
50.7 100 100
51.1 77 89
35.7 99 100
66.7 99 99
73.3 98 9713.5 94 98
75.8 .. 99
.. 98 97
47.3 94 98
.. 94 95
53.1 93 98
72.7 84 99
34.3 94 96
78.2 94 96
69.0 91 97
60.2 96 90
57.1 99 99
71.0 92 8361.4 89 95
.. .. 99
.. .. 99
61.8 99 100
72 9 99 98
Contraceptiveprevalence rate, any
methodAntenatal coverageof at least one visit
Births attended byskilled health
personnel
(% of married womenages 15–49) (%) (%)
1990–2008d 1990–2008d 2000–2008d
e
e
g
g
e
e
g
j
j
j
j
j
j
j
j
j
e
j
j
j
j
8/7/2019 Tabela IDH 2010 inglês
http://slidepdf.com/reader/full/tabela-idh-2010-ingles 23/102
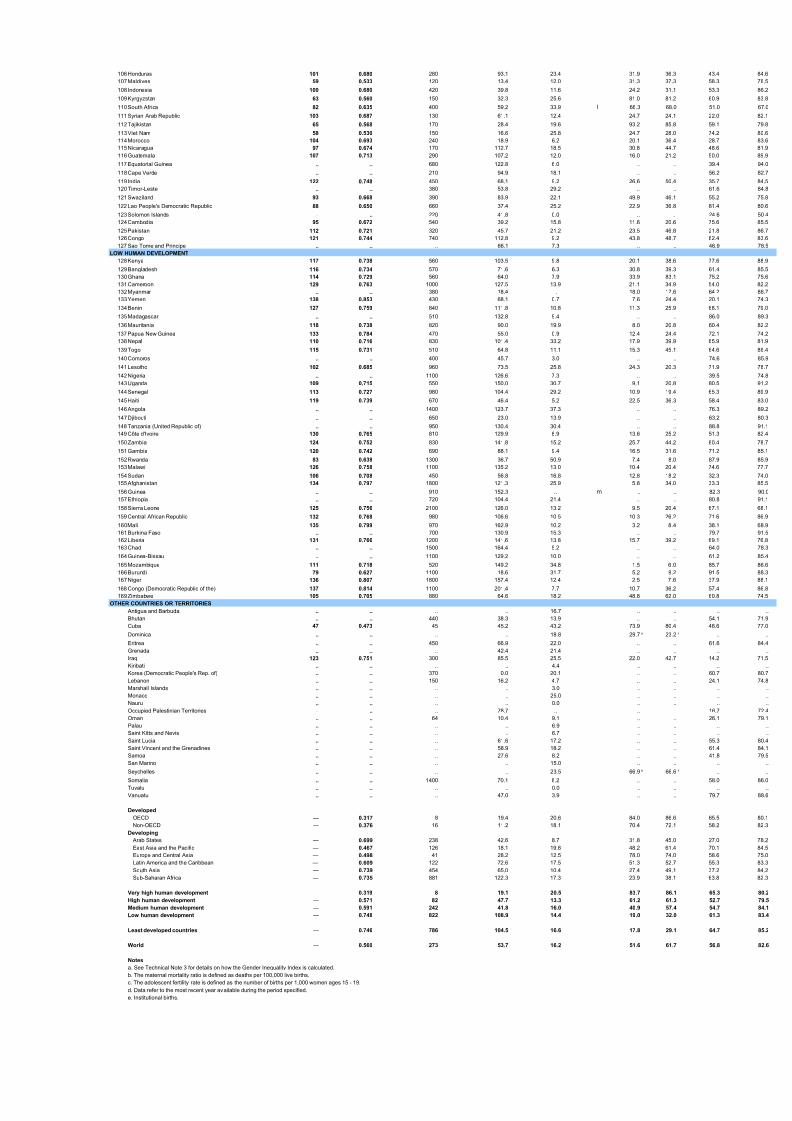
106Honduras 101 0.680 280 93.1 23.4 31.9 36.3
107Maldives 59 0.533 120 13.4 12.0 31.3 37.3
108 Indonesia 100 0.680 420 39.8 11.6 24.2 31.1
109Kyrgyzstan 63 0.560 150 32.3 25.6 81.0 81.2
110South Africa 82 0.635 400 59.2 33.9 l 66.3 68.0
111 Syrian Arab Republic 103 0.687 130 61.1 12.4 24.7 24.1
112Tajikistan 65 0.568 170 28.4 19.6 93.2 85.8
113Viet Nam 58 0.530 150 16.6 25.8 24.7 28.0
114Morocco 104 0.693 240 18.9 6.2 20.1 36.4
115Nicaragua 97 0.674 170 112.7 18.5 30.8 44.7
116Guatemala 107 0.713 290 107.2 12.0 16.0 21.2
117 Equatorial Guinea .. .. 680 122.8 6.0 .. ..
118Cape Verde .. .. 210 94.9 18.1 .. ..
119 India 122 0.748 450 68.1 9.2 26.6 50.4
120Timor-Leste .. .. 380 53.8 29.2 .. ..
121Swaziland 93 0.668 390 83.9 22.1 49.9 46.1
122 Lao People's Democratic Republic 88 0.650 660 37.4 25.2 22.9 36.8 123Solomon Islands .. .. 220 41.8 0.0 .. ..
124Cambodia 95 0.672 540 39.2 15.8 11.6 20.6
125Pakistan 112 0.721 320 45.7 21.2 23.5 46.8
126Congo 121 0.744 740 112.8 9.2 43.8 48.7
127 Sao Tome and Principe .. .. .. 66.1 7.3 .. ..
LOW HUMAN DEVELOPMENT
128Kenya 117 0.738 560 103.5 9.8 20.1 38.6
129Bangladesh 116 0.734 570 71.6 6.3 30.8 39.3
130Ghana 114 0.729 560 64.0 7.9 33.9 83.1
131Cameroon 129 0.763 1000 127.5 13.9 21.1 34.9
132Myanmar .. .. 380 18.4 .. 18.0 17.6
133Yemen 138 0.853 430 68.1 0.7 7.6 24.4
134Benin 127 0.759 840 111.8 10.8 11.3 25.9
135Madagascar .. .. 510 132.8 9.4 .. ..
136Mauritania 118 0.738 820 90.0 19.9 8.0 20.8
137 Papua New Guinea 133 0.784 470 55.0 0.9 12.4 24.4
138Nepal 110 0.716 830 101.4 33.2 17.9 39.9
139Togo 115 0.731 510 64.8 11.1 15.3 45.1
140Comoros .. .. 400 45.7 3.0 .. ..
141Lesotho 102 0.685 960 73.5 25.8 24.3 20.3
142Nigeria .. .. 1100 126.6 7.3 .. ..
143Uganda 109 0.715 550 150.0 30.7 9.1 20.8
144Senegal 113 0.727 980 104.4 29.2 10.9 19.4
145Haiti 119 0.739 670 46.4 5.2 22.5 36.3
146Angola .. .. 1400 123.7 37.3 .. ..
147Djibouti .. .. 650 23.0 13.9 .. ..
148 Tanzania (United Republic of) .. .. 950 130.4 30.4 .. ..
149 Côte d'Ivoire 130 0.765 810 129.9 8.9 13.6 25.2
150Zambia 124 0.752 830 141.8 15.2 25.7 44.2
151Gambia 120 0.742 690 88.1 9.4 16.5 31.6
152Rwanda 83 0.638 1300 36.7 50.9 7.4 8.0
153Malawi 126 0.758 1100 135.2 13.0 10.4 20.4
154Sudan 106 0.708 450 56.8 16.8 12.8 18.2
155Afghanistan 134 0.797 1800 121.3 25.9 5.8 34.0
156Guinea .. .. 910 152.3 .. m .. ..
157Ethiopia .. .. 720 104.4 21.4 .. ..
158Sierra Leone 125 0.756 2100 126.0 13.2 9.5 20.4
159 Central African Republic 132 0.768 980 106.6 10.5 10.3 26.2 160Mali 135 0.799 970 162.9 10.2 3.2 8.4
161Burkina Faso .. .. 700 130.9 15.3 .. ..
162Liberia 131 0.766 1200 141.6 13.8 15.7 39.2
163Chad .. .. 1500 164.4 5.2 .. ..
164Guinea-Bissau .. .. 1100 129.2 10.0 .. ..
165Mozambique 111 0.718 520 149.2 34.8 1.5 6.0
166Burundi 79 0.627 1100 18.6 31.7 5.2 9.2
167Niger 136 0.807 1800 157.4 12.4 2.5 7.6
168 Congo (Democratic Republic of the) 137 0.814 1100 201.4 7.7 10.7 36.2
169Zimbabwe 105 0.705 880 64.6 18.2 48.8 62.0
OTHER COUNTRIES OR TERRITORIES
Antigua and Barbuda .. .. .. .. 16.7 .. ..
Bhutan .. .. 440 38.3 13.9 .. ..
Cuba 47 0.473 45 45.2 43.2 73.9 80.4
Dominica .. .. .. .. 18.8 29.7 23.2
Eritrea .. .. 450 66.9 22.0 .. ..
Grenada .. .. .. 42.4 21.4 .. ..
Iraq 123 0.751 300 85.5 25.5 22.0 42.7
Kiribati .. .. .. .. 4.4 .. ..
Korea (Democratic People's Rep. of) .. .. 370 0.0 20.1 .. ..
Lebanon .. .. 150 16.2 4.7 .. ..
Marshall Islands .. .. .. .. 3.0 .. ..
Monaco .. .. .. .. 25.0 .. ..
Nauru .. .. .. .. 0.0 .. ..
Occupied Palestinian Territories .. .. .. 78.7 .. .. ..
Oman .. .. 64 10.4 9.1 .. ..
Palau .. .. .. .. 6.9 .. .. Saint Kitts and Nevis .. .. .. .. 6.7 .. ..
Saint Lucia .. .. .. 61.6 17.2 .. ..
Saint Vincent and the Grenadines .. .. .. 58.9 18.2 .. ..
Samoa .. .. .. 27.6 8.2 .. ..
San Marino .. .. .. .. 15.0 .. ..
Seychelles .. .. .. .. 23.5 66.9 66.6
Somalia .. .. 1400 70.1 8.2 .. ..
Tuvalu .. .. .. .. 0.0 .. ..
Vanuatu .. .. .. 47.0 3.9 .. ..
Developed
OECD — 0.317 8 19.4 20.6 84.0 86.6
Non-OECD — 0.376 16 11.2 18.1 70.4 72.1
Developing
Arab States — 0.699 238 42.6 8.7 31.8 45.0
East Asia and the Pacific — 0.467 126 18.1 19.8 48.2 61.4
Europe and Central Asia — 0.498 41 28.2 12.5 78.0 74.0
Latin America and the Caribbean — 0.609 122 72.6 17.5 51.3 52.7
South Asia — 0.739 454 65.0 10.4 27.4 49.1
Sub-Saharan Africa — 0 735 881 122 3 17 3 23 9 38 1
h h
h h
8/7/2019 Tabela IDH 2010 inglês
http://slidepdf.com/reader/full/tabela-idh-2010-ingles 24/102
65.2 92 67
39.0 81 84
61.4 93 73
47.8 97 98
60.3 92 91
58.3 84 93
37.9 89 83
79.0 91 88
63.0 68 63
72.4 90 74
43.3 84 41
10.1 86 63
61.3 98 78
56.3 74 47
10.0 61 19
50.6 85 74
32.2 35 20
.. 74 43
40.0 69 44
29.6 61 39
44.3 86 86
29.3 98 81
39.3 92 42
55.8 51 18
23.5 90 57
29.2 82 63
37.0 76 57
27.7 47 36
17.0 84 78
27.1 80 51
9.3 75 61
.. 79 39
48.0 44 19
16.8 84 62
25.7 75 62
37.3 90 55
14.7 58 39
23.7 94 42
11.8 87 52
32.0 85 26
6.2 80 47
17.8 92 93
26.4 76 46
12.9 85 57
40.8 94 47
17.5 98 57
36.4 96 52
41.0 92 54
7.6 64 49
18.6 16 14
9.1 88 38
14.7 28 6
8.2 87 4219.0 69 54
8.2 70 49
17.4 85 54
11.4 79 46
2.8 39 14
10.3 78 39
16.5 89 48
19.7 92 34
11.2 46 18
20.6 85 74
60.2 94 69
.. 100 10030.7 88 51
72.6 100 100
.. 100 94
8.0 70 28
.. 100 99
49.8 84 89
36.1 .. 90
68.6 .. 97
58.0 96 98
.. 81 95
.. .. ..
35.6 95 97
50.2 .. .... 100 98
32.8 .. 100
.. 100 100
.. 99 98
.. 95 100
.. .. 100
.. .. ..
.. .. ..
14.6 26 33
.. 97 100
.. 84 93
.. .. 99
.. 100 100
46.9 74 77
.. 91 91
63.0 95 96
95 91
j
j
j
j
j
j
j
j
j
j
j
e
j
j
j
j
j
e
j
j
j
j
j
j
j
j
j
j
j
j
j
j
j
j
j
j
j
j
j
j

8/7/2019 Tabela IDH 2010 inglês
http://slidepdf.com/reader/full/tabela-idh-2010-ingles 25/102
f. The denominator of the calculation refers to voting members of the House of Representatives only.
g. World Health Organization estimate.
h. United Nations Educational, Scientific and Cultural Organization Institute for Statistics estimate.
i. No women were elected in the 2008 elections; however, two women were appointed to the cabinet sworn in June 2008, and cabinet ministers also sit in parliament.
j. Includes deliveries by cadres of health workers other than doctors, nurses and midwives.k. No women were elected in 2008; however, one woman was appointed to the cabinet, and cabinet ministers also sit in parliament.
l. Does not include the 36 special rotating delegates appointed on an ad hoc basis; all percentages are calculated based on the 54 permanent seats.
m. The parliament was dissolved following the December 2008 coup.
Sources
Columns 1 and 2: Calculated based on data from UNICEF (2010c), UNDESA (2009d), IPU (2010), Barro and Lee (2010) and ILO (2010d).
Columns 3 and 11: UNICEF (2010c).
Column 4: UNDESA (2009d).
Columns 5: IPU (2010).
Columns 6 and 7: Barro and Lee (2010).
Columns 8 and 9: ILO (2010d).
Column 10: UN (2009).
Column 12: WHO (2010).
8/7/2019 Tabela IDH 2010 inglês
http://slidepdf.com/reader/full/tabela-idh-2010-ingles 26/102
8/7/2019 Tabela IDH 2010 inglês
http://slidepdf.com/reader/full/tabela-idh-2010-ingles 27/102
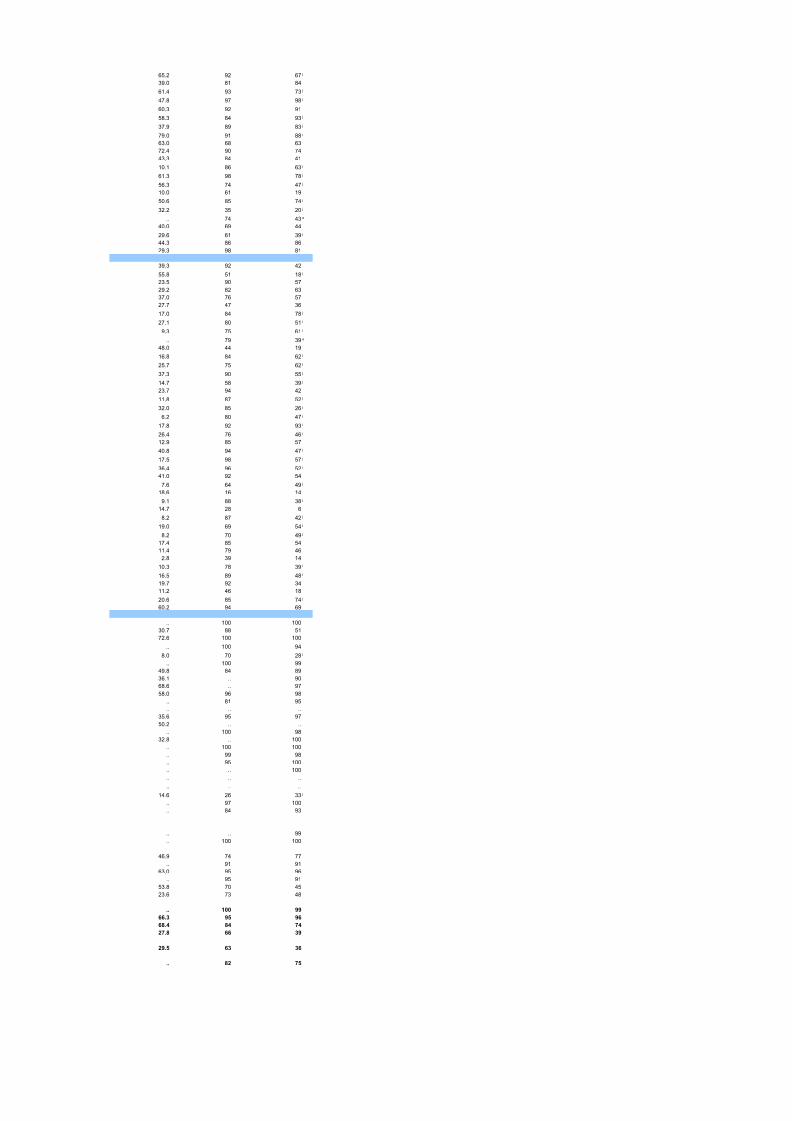
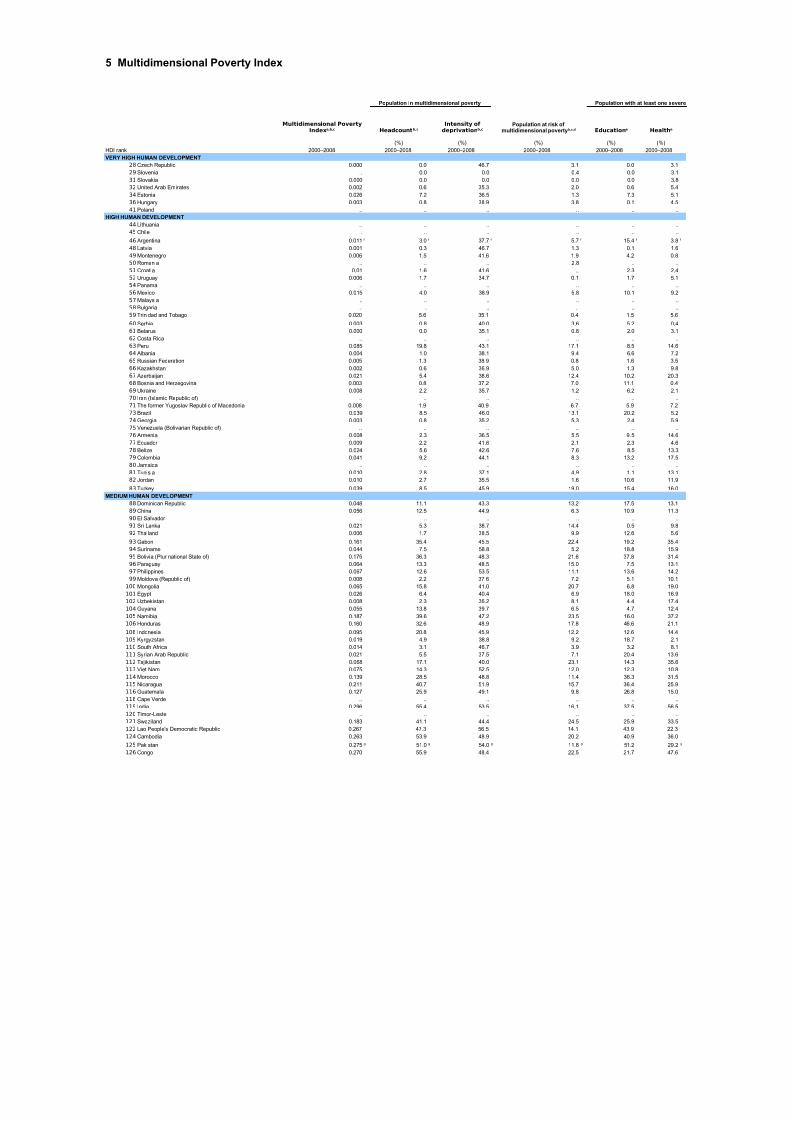
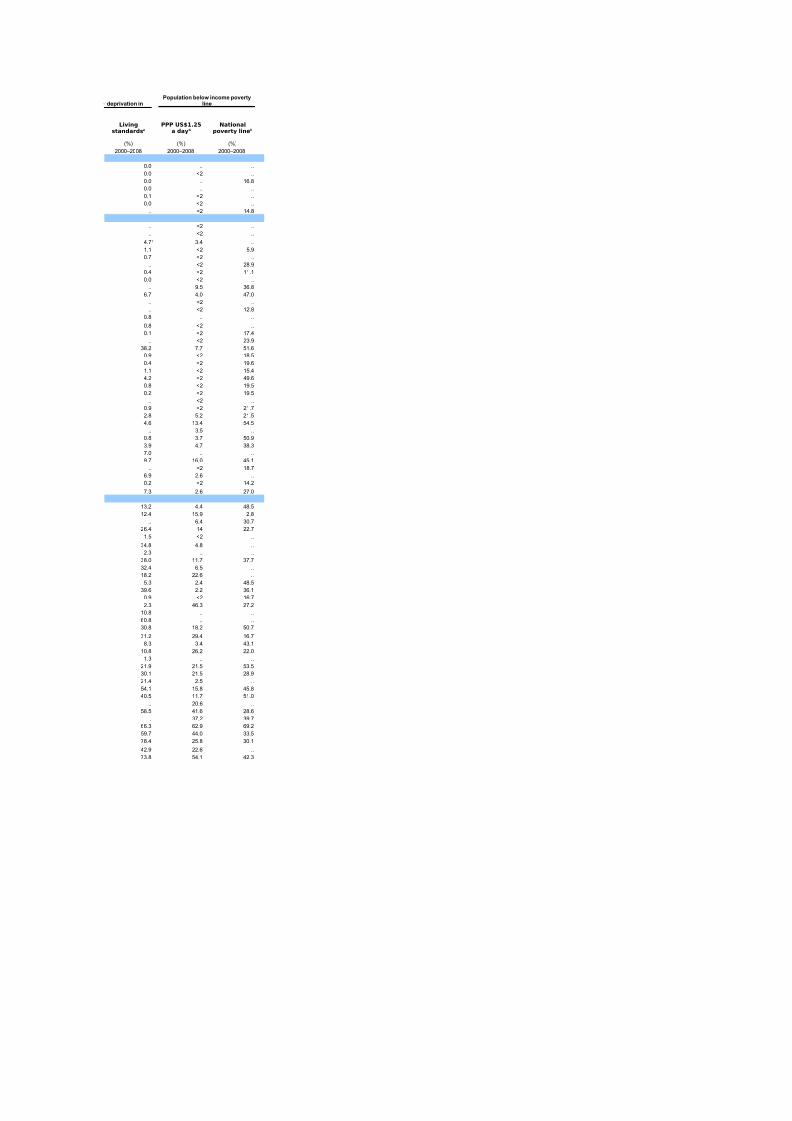
5 Multidimensional Poverty Index
Population in multidimensional poverty Population with at least one severe
(%) (%) (%) (%) (%)
HDI rank 2000–2008 2000–2008 2000–2008 2000–2008 2000–2008 2000–2008
VERY HIGH HUMAN DEVELOPMENT
28 Czech Republic 0.000 0.0 46.7 3.1 0.0 3.1
29 Slovenia .. 0.0 0.0 0.4 0.0 3.1
31 Slovakia 0.000 0.0 0.0 0.0 0.0 3.8
32 United Arab Emirates 0.002 0.6 35.3 2.0 0.6 5.4
34 Estonia 0.026 7.2 36.5 1.3 7.3 5.1
36 Hungary 0.003 0.8 38.9 3.8 0.1 4.5
41 Poland .. .. .. .. .. ..
HIGH HUMAN DEVELOPMENT
44 Lithuania .. .. .. .. .. ..
45 Chile .. .. .. .. .. ..
46 Argentina 0.011 3.0 37.7 5.7 15.4 3.8
48 Latvia 0.001 0.3 46.7 1.3 0.1 1.6
49 Montenegro 0.006 1.5 41.6 1.9 4.2 0.8
50 Romania .. .. .. 2.8 .. ..
51 Croatia 0.01 1.6 41.6 .. 2.3 2.4
52 Uruguay 0.006 1.7 34.7 0.1 1.7 5.1
54 Panama .. .. .. .. .. ..
56 Mexico 0.015 4.0 38.9 5.8 10.1 9.2
57 Malaysia .. .. .. .. .. ..
58 Bulgaria .. .. .. .. .. ..
59 Trinidad and Tobago 0.020 5.6 35.1 0.4 1.5 5.6
60 Serbia 0.003 0.8 40.0 3.6 5.2 0.4
61 Belarus 0.000 0.0 35.1 0.8 2.0 3.1
62 Costa Rica .. .. .. .. .. ..
63 Peru 0.085 19.8 43.1 17.1 8.5 14.6
64 Albania 0.004 1.0 38.1 9.4 6.6 7.2
65 Russian Federation 0.005 1.3 38.9 0.8 1.6 3.5
66 Kazakhstan 0.002 0.6 36.9 5.0 1.3 9.8
67 Azerbaijan 0.021 5.4 38.6 12.4 10.2 20.3
68 Bosnia and Herzegovina 0.003 0.8 37.2 7.0 11.1 0.4
69 Ukraine 0.008 2.2 35.7 1.2 6.2 2.1
70 Iran (Islamic Republic of) .. .. .. .. .. ..
71 The former Yugoslav Republic of Macedonia 0.008 1.9 40.9 6.7 5.9 7.2
73 Brazil 0.039 8.5 46.0 13.1 20.2 5.274 Georgia 0.003 0.8 35.2 5.3 2.4 5.9
75 Venezuela (Bolivarian Republic of) .. .. .. .. .. ..
76 Armenia 0.008 2.3 36.5 5.5 9.5 14.6
77 Ecuador 0.009 2.2 41.6 2.1 2.3 4.6
78 Belize 0.024 5.6 42.6 7.6 8.5 13.3
79 Colombia 0.041 9.2 44.1 8.3 13.2 17.5
80 Jamaica .. .. .. .. .. ..
81 Tunisia 0.010 2.8 37.1 4.9 1.1 13.1
82 Jordan 0.010 2.7 35.5 1.6 10.6 11.9
83 Turkey 0.039 8.5 45.9 19.0 15.4 16.0
MEDIUM HUMAN DEVELOPMENT
88 Dominican Republic 0.048 11.1 43.3 13.2 17.5 13.1
89 China 0.056 12.5 44.9 6.3 10.9 11.3
90 El Salvador .. .. .. .. .. ..91 Sri Lanka 0.021 5.3 38.7 14.4 0.5 9.8
92 Thailand 0.006 1.7 38.5 9.9 12.6 5.6
93 Gabon 0.161 35.4 45.5 22.4 19.2 35.4
94 Suriname 0.044 7.5 58.8 5.2 18.8 15.9
95 Bolivia (Plurinational State of) 0.175 36.3 48.3 21.6 37.8 31.4
96 Paraguay 0.064 13.3 48.5 15.0 7.5 13.1
97 Philippines 0.067 12.6 53.5 11.1 13.6 14.2
99 Moldova (Republic of) 0.008 2.2 37.6 7.2 5.1 10.1
100 Mongolia 0.065 15.8 41.0 20.7 6.8 19.0
101 Egypt 0.026 6.4 40.4 6.9 18.0 16.9
102 Uzbekistan 0.008 2.3 36.2 8.1 4.4 17.4
104 Guyana 0.055 13.8 39.7 6.5 4.7 12.4
105 Namibia 0.187 39.6 47.2 23.5 16.0 37.2
106 Honduras 0.160 32.6 48.9 17.8 46.6 21.1
108 Indonesia 0.095 20.8 45.9 12.2 12.6 14.4
109 Kyrgyzstan 0.019 4.9 38.8 9.2 18.7 2.1
110 South Africa 0.014 3.1 46.7 3.9 3.2 8.1
111 Syrian Arab Republic 0.021 5.5 37.5 7.1 20.4 13.6
112 Tajikistan 0.068 17.1 40.0 23.1 14.3 35.6
113 Viet Nam 0.075 14.3 52.5 12.0 12.3 10.8
114 Morocco 0.139 28.5 48.8 11.4 36.3 31.5
115 Nicaragua 0.211 40.7 51.9 15.7 36.4 25.9
116 Guatemala 0.127 25.9 49.1 9.8 26.8 15.0
118 Cape Verde .. .. .. .. .. ..
119 India 0.296 55.4 53.5 16.1 37.5 56.5
120 Timor-Leste .. .. .. .. .. ..
121 Swaziland 0.183 41.1 44.4 24.5 25.9 33.5
122 Lao People's Democratic Republic 0.267 47.3 56.5 14.1 43.9 22.3
124 Cambodia 0.263 53.9 48.9 20.2 40.9 36.0
125 Pakistan 0.275 51.0 54.0 11.8 51.2 29.2
126 Congo 0.270 55.9 48.4 22.5 21.7 47.6
Multidimensional PovertyIndexa,b,c Headcountb,c
Intensity of deprivationb,c
Population at risk of multidimensional povertyb,c,d Educatione Healthe
f f f f f f
g g g g g
8/7/2019 Tabela IDH 2010 inglês
http://slidepdf.com/reader/full/tabela-idh-2010-ingles 28/102
deprivation in
(%) (%) (%)
2000–2008 2000–2008 2000–2008
0.0 .. ..
0.0 <2 ..
0.0 .. 16.8
0.0 .. ..
0.1 <2 ..
0.0 <2 ..
.. <2 14.8
.. <2 ..
.. <2 ..
4.7 3.4 ..
1.1 <2 5.9
0.7 <2 ..
.. <2 28.9
0.4 <2 11.1
0.0 <2 ..
.. 9.5 36.8
6.7 4.0 47.0
.. <2 ..
.. <2 12.80.8 .. ..
0.8 <2 ..
0.1 <2 17.4
.. <2 23.9
38.2 7.7 51.6
0.9 <2 18.5
0.4 <2 19.6
1.1 <2 15.4
4.2 <2 49.6
0.8 <2 19.5
0.2 <2 19.5
.. <2 ..
0.9 <2 21.7
2.8 5.2 21.54.6 13.4 54.5
.. 3.5 ..
0.8 3.7 50.9
3.9 4.7 38.3
7.0 .. ..
9.7 16.0 45.1
.. <2 18.7
6.9 2.6 ..
0.2 <2 14.2
7.3 2.6 27.0
13.2 4.4 48.5
12.4 15.9 2.8
.. 6.4 30.7
26.4 14 22.7
1.5 <2 ..
34.8 4.8 ..
2.3 .. ..
38.0 11.7 37.7
32.4 6.5 ..
18.2 22.6 ..
5.3 2.4 48.5
39.6 2.2 36.1
0.9 <2 16.7
2.3 46.3 27.2
10.8 .. ..
60.8 .. ..30.8 18.2 50.7
31.2 29.4 16.7
8.3 3.4 43.1
10.8 26.2 22.0
1.3 .. ..
21.9 21.5 53.5
30.1 21.5 28.9
21.4 2.5 ..
54.1 15.8 45.8
40.5 11.7 51.0
.. 20.6 ..
58.5 41.6 28.6
.. 37.2 39.7
66.3 62.9 69.259.7 44.0 33.5
78.4 25.8 30.1
42.9 22.6 ..
73.8 54.1 42.3
Population below income poverty
line
Livingstandardse
PPP US$1.25a dayb
Nationalpoverty lineb
f
8/7/2019 Tabela IDH 2010 inglês
http://slidepdf.com/reader/full/tabela-idh-2010-ingles 29/102
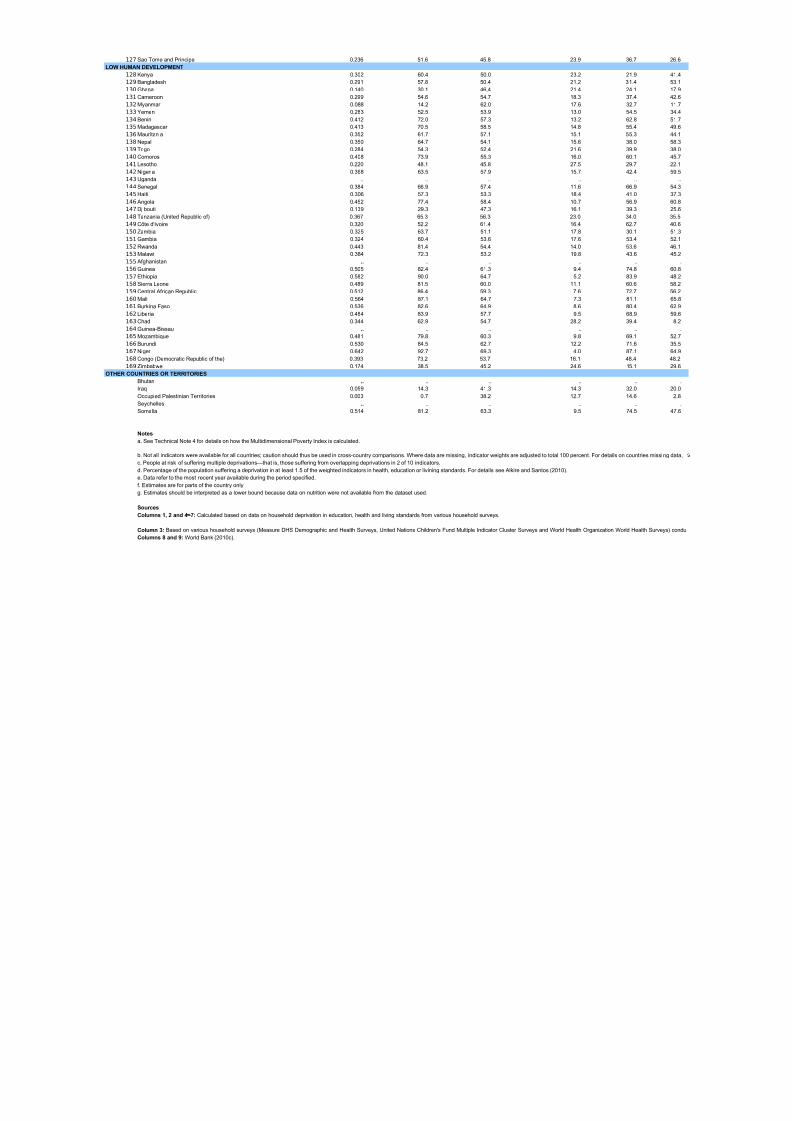
127 Sao Tome and Principe 0.236 51.6 45.8 23.9 36.7 26.6
LOW HUMAN DEVELOPMENT
128 Kenya 0.302 60.4 50.0 23.2 21.9 41.4
129 Bangladesh 0.291 57.8 50.4 21.2 31.4 53.1
130 Ghana 0.140 30.1 46.4 21.4 24.1 17.9
131 Cameroon 0.299 54.6 54.7 18.3 37.4 42.6
132 Myanmar 0.088 14.2 62.0 17.6 32.7 11.7133 Yemen 0.283 52.5 53.9 13.0 54.5 34.4
134 Benin 0.412 72.0 57.3 13.2 62.8 51.7
135 Madagascar 0.413 70.5 58.5 14.8 55.4 49.6
136 Mauritania 0.352 61.7 57.1 15.1 55.3 44.1
138 Nepal 0.350 64.7 54.1 15.6 38.0 58.3
139 Togo 0.284 54.3 52.4 21.6 39.9 38.0
140 Comoros 0.408 73.9 55.3 16.0 60.1 45.7
141 Lesotho 0.220 48.1 45.8 27.5 29.7 22.1
142 Nigeria 0.368 63.5 57.9 15.7 42.4 59.5
143 Uganda .. .. .. .. .. ..
144 Senegal 0.384 66.9 57.4 11.6 66.9 54.3
145 Haiti 0.306 57.3 53.3 18.4 41.0 37.3
146 Angola 0.452 77.4 58.4 10.7 56.9 60.8
147 Djibouti 0.139 29.3 47.3 16.1 39.3 25.6
148 Tanzania (United Republic of) 0.367 65.3 56.3 23.0 34.0 35.5
149 Côte d'Ivoire 0.320 52.2 61.4 16.4 62.7 40.6
150 Zambia 0.325 63.7 51.1 17.8 30.1 51.3
151 Gambia 0.324 60.4 53.6 17.6 53.4 52.1
152 Rwanda 0.443 81.4 54.4 14.0 53.6 46.1
153 Malawi 0.384 72.3 53.2 19.8 43.6 45.2
155 Afghanistan .. .. .. .. .. ..
156 Guinea 0.505 82.4 61.3 9.4 74.8 60.8
157 Ethiopia 0.582 90.0 64.7 5.2 83.9 48.2
158 Sierra Leone 0.489 81.5 60.0 11.1 60.6 58.2
159 Central African Republic 0.512 86.4 59.3 7.6 72.7 56.2
160 Mali 0.564 87.1 64.7 7.3 81.1 65.8
161 Burkina Faso 0.536 82.6 64.9 8.6 80.4 62.9
162 Liberia 0.484 83.9 57.7 9.5 68.9 59.6
163 Chad 0.344 62.9 54.7 28.2 39.4 8.2
164 Guinea-Bissau .. .. .. .. .. ..
165 Mozambique 0.481 79.8 60.3 9.8 69.1 52.7
166 Burundi 0.530 84.5 62.7 12.2 71.6 35.5
167 Niger 0.642 92.7 69.3 4.0 87.1 64.9
168 Congo (Democratic Republic of the) 0.393 73.2 53.7 16.1 48.4 48.2
169 Zimbabwe 0.174 38.5 45.2 24.6 15.1 29.6
OTHER COUNTRIES OR TERRITORIES
Bhutan .. .. .. .. .. ..
Iraq 0.059 14.3 41.3 14.3 32.0 20.0
Occupied Palestinian Territories 0.003 0.7 38.2 12.7 14.6 2.8
Seychelles .. .. .. .. .. ..
Somalia 0.514 81.2 63.3 9.5 74.5 47.6
Notes
a. See Technical Note 4 for details on how the Multidimensional Poverty Index is calculated.
b. Not all indicators were available for all countries; caution should thus be used in cross-country comparisons. Where data are missing, indicator weights are adjusted to total 100 percent. For details on countries missing data,
c. People at risk of suffering multiple deprivations—that is, those suffering from overlapping deprivations in 2 of 10 indicators.
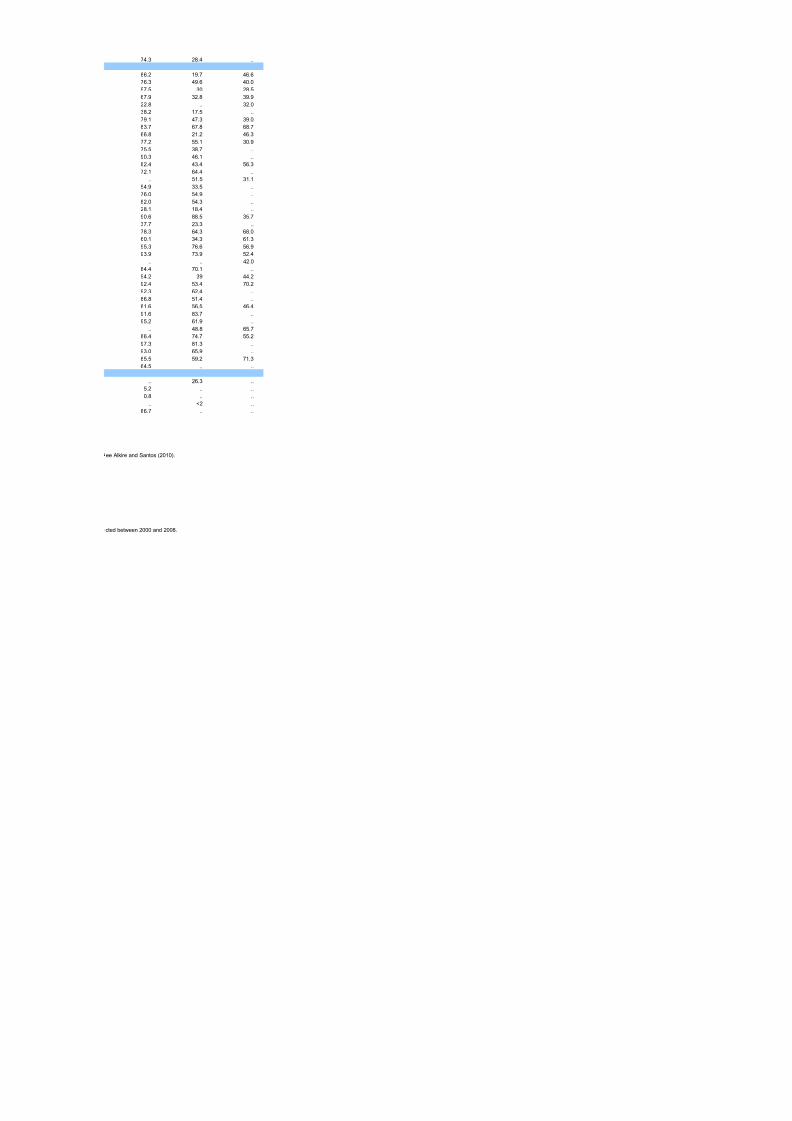
d. Percentage of the population suffering a deprivation in at least 1.5 of the weighted indicators in health, education or livining standards. For details see Alkire and Santos (2010).
e. Data refer to the most recent year available during the period specified.
f. Estimates are for parts of the country only.
g. Estimates should be interpreted as a lower bound because data on nutrition were not available from the dataset used.
Sources
Columns 1, 2 and 4–7: Calculated based on data on household deprivation in education, health and living standards from various household surveys.
Column 3: Based on various household surveys (Measure DHS Demographic and Health Surveys, United Nations Children's Fund Multiple Indicator Cluster Surveys and World Health Organization World Health Surveys) condu
Columns 8 and 9: World Bank (2010c).
8/7/2019 Tabela IDH 2010 inglês
http://slidepdf.com/reader/full/tabela-idh-2010-ingles 30/102
74.3 28.4 ..
86.2 19.7 46.6
76.3 49.6 40.0
57.5 30 28.5
67.9 32.8 39.9
22.8 .. 32.038.2 17.5 ..
79.1 47.3 39.0
83.7 67.8 68.7
66.8 21.2 46.3
77.2 55.1 30.9
75.5 38.7 ..
90.3 46.1 ..
82.4 43.4 56.3
72.1 64.4 ..
.. 51.5 31.1
54.9 33.5 ..
76.0 54.9 ..
82.0 54.3 ..
28.1 18.4 ..
90.6 88.5 35.7
37.7 23.3 ..
78.3 64.3 68.0
60.1 34.3 61.3
95.3 76.6 56.9
93.9 73.9 52.4
.. .. 42.0
84.4 70.1 ..
94.2 39 44.2
92.4 53.4 70.2
92.3 62.4 ..
86.8 51.4 ..
81.6 56.5 46.4
91.6 83.7 ..
95.2 61.9 ..
.. 48.8 65.7
86.4 74.7 55.2
97.3 81.3 ..
93.0 65.9 ..
85.5 59.2 71.3
64.5 .. ..
.. 26.3 ..
5.2 .. ..
0.8 .. ..
.. <2 ..
86.7 .. ..
ee Alkire and Santos (2010).
cted between 2000 and 2008.
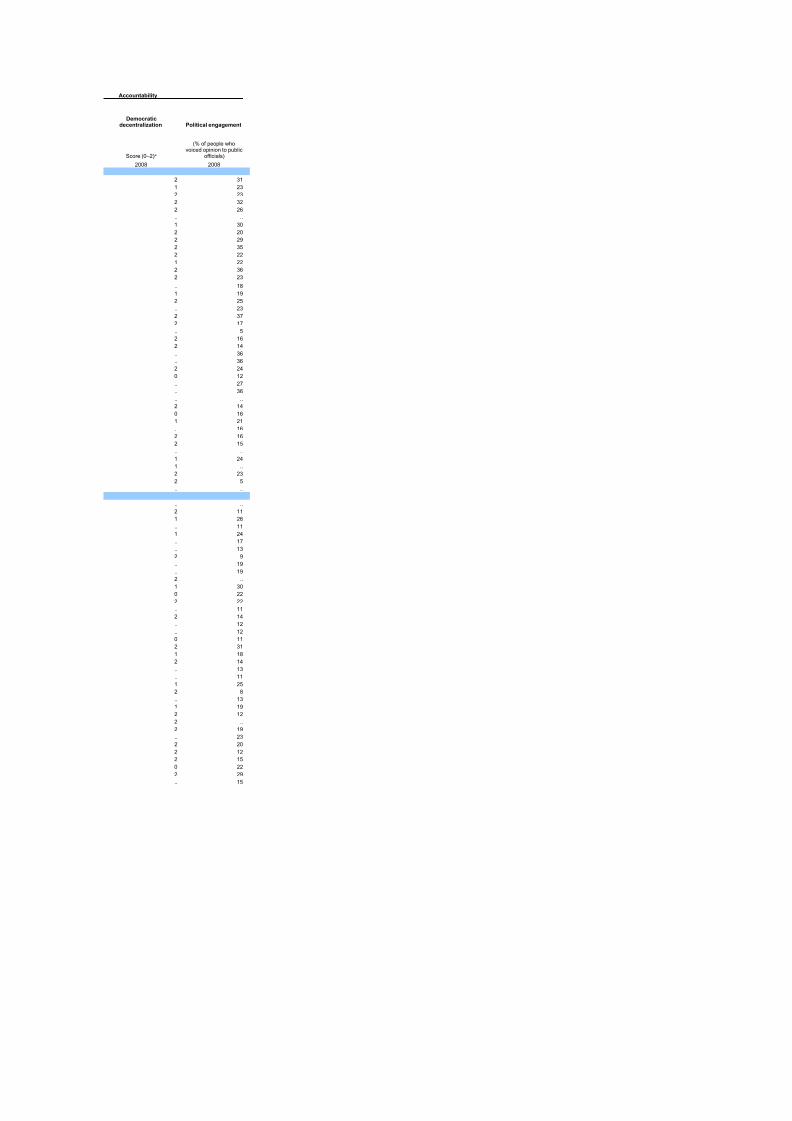
8/7/2019 Tabela IDH 2010 inglês
http://slidepdf.com/reader/full/tabela-idh-2010-ingles 31/102
6 Empowerment
Agency Political freedom Civil liberties
Democracy Press freedom Journalists imprisoned Corruption victims
Total Female
HDI rank 2009 2009 2008 2008 2009 2009 2008
VERY HIGH HUMAN DEVELOPMENT
1 Norway 93 93 2 .. 0.0 0 5
2 Australia 91 90 2 1 3.1 0 8
3 New Zealand 89 90 2 1 3.0 0 9
4 United States 83 85 2 3 4.0 0 9
5 Ireland 82 83 2 1 0.0 0 76 Liechtenstein .. .. 2 .. .. 0 ..
7 Netherlands 87 88 2 1 1.0 0 4
8 Canada 91 92 2 2 3.7 0 8
9 Sweden 90 81 2 1 0.0 0 6
10 Germany 85 86 2 1 3.5 0 4
11 Japan 70 75 2 1 3.3 0 3
12 Korea (Republic of) 55 56 2 2 15.7 0 10
13 Switzerland 90 87 2 2 1.0 0 ..
14 France 79 78 2 2 10.7 0 6
15 Israel 64 58 2 3 23.8 0 11
16 Finland 92 93 2 1 0.0 0 9
17 Iceland 86 87 2 .. 2.0 0 5
18 Belgium 86 85 2 2 2.5 0 6
19 Denmark 96 93 2 2 0.0 0 5
20 Spain 70 70 2 3 11.0 0 6
21 Hong Kong, China (SAR) 90 90 .. .. 11.8 0 3
22 Greece 43 39 2 3 9.0 0 15
23 Italy 63 60 2 2 12.1 0 6
24 Luxembourg 93 90 2 .. 4.0 0 4
25 Austria 85 86 2 1 3.0 0 5
26 United Kingdom 81 82 2 2 4.0 0 4
27 Singapore 73 73 1 1 45.0 0 1
28 Czech Republic 73 71 2 1 5.0 0 ..
29 Slovenia 89 88 2 1 9.5 0 9
30 Andorra .. .. 2 .. .. 0 ..
31 Slovakia 49 51 2 1 11.0 0 ..
32 United Arab Emirates 83 85 0 2 21.5 0 20
33 Malta 76 73 2 2 2.5 0 5
34 Estonia 53 53 2 2 0.5 0 9
35 Cyprus 74 73 2 1 5.5 0 18
36 Hungary 43 44 2 1 5.5 0 34
37 Brunei Darussalam .. .. .. .. .. 0 ..
38 Qatar 77 72 0 2 24.0 0 8
39 Bahrain .. 89 0 2 36.5 0 20
40 Portugal 60 67 2 2 8.0 0 6
41 Poland 74 68 2 1 9.5 0 8
42 Barbados .. .. 2 .. .. 0 ..
HIGH HUMAN DEVELOPMENT
43 Bahamas .. .. 2 2 .. 0 ..
44 Lithuania 45 47 2 1 2.3 0 21
45 Chile 72 74 2 2 10.5 0 846 Argentina 62 59 2 2 11.3 0 8
47 Kuwait 80 78 0 1 15.3 0 19
48 Latvia 39 41 2 2 3.0 0 22
49 Montenegro 47 50 1 2 17.0 0 ..
50 Romania 54 52 2 3 12.5 0 36
51 Croatia 62 48 2 1 17.2 0 ..
52 Uruguay 80 80 2 1 7.6 0 5
53 Libyan Arab Jamahiriya .. .. 0 3 64.5 0 ..
54 Panama 68 64 2 .. 14.5 0 6
55 Saudi Arabia 60 52 0 4 76.5 1 29
56 Mexico 66 66 2 4 48.3 0 11
57 Malaysia 83 83 1 2 44.3 0 4
58 Bulgaria 48 45 2 2 15.6 0 ..
59 Trinidad and Tobago 81 83 2 3 7.0 0 460 Serbia 42 37 2 .. 15.5 0 ..
61 Belarus 56 57 0 3 59.5 0 22
62 Costa Rica 87 87 2 .. 8.0 0 9
63 Peru 59 57 2 2 20.9 0 12
64 Albania 47 43 2 2 21.8 0 ..
65 Russian Federation 50 51 1 4 60.9 1 21
66 Kazakhstan 71 69 1 3 49.7 1 23
67 Azerbaijan 45 45 1 2 53.5 6 36
68 Bosnia and Herzegovina 32 25 0 2 10.5 0 ..
69 Ukraine 38 38 2 3 22.0 0 23
70 Iran (Islamic Republic of) 57 59 0 4 104.1 23 19
71 The former Yugoslav Republic of Macedonia 42 51 2 2 8.8 0 ..
72 Mauritius .. .. 2 .. 14.0 0 ..
73 Brazil 76 73 2 4 15.9 0 574 Georgia 43 40 2 3 18.8 0 2
75 Venezuela (Bolivarian Republic of) 65 61 2 3 39.5 1 7
76 Armenia 39 39 2 3 31.1 0 17
77 Ecuador 73 71 2 2 20.0 0 7
78 Belize 62 62 2 .. .. 0 ..
79 Colombia 75 75 2 5 40.1 0 11
80 Jamaica 73 74 2 4 4.8 0 ..
Satisfaction with freedomof choice
(% satisfied)Human rights
violations
Score (0–2)a
Score(1–5 )b (index)c (number)d
(% of people who faced abribe situation in the last
year)
f
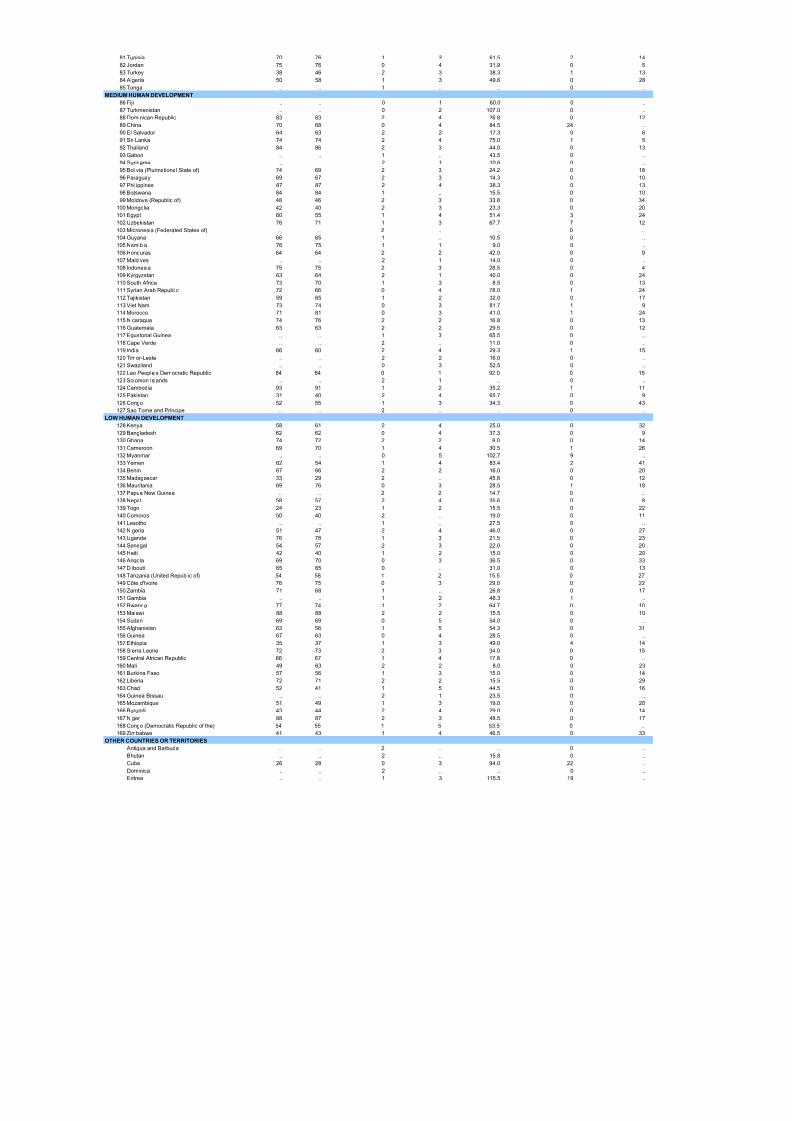
8/7/2019 Tabela IDH 2010 inglês
http://slidepdf.com/reader/full/tabela-idh-2010-ingles 32/102
Accountability
Political engagement
2008 2008
2 31
1 23
2 23
2 32
2 26
.. ..
1 30
2 20
2 29
2 35
2 22
1 22
2 36
2 23
.. 18
1 19
2 25
.. 232 37
2 17
.. 5
2 16
2 14
.. 36
.. 36
2 24
0 12
.. 27
.. 36
.. ..
2 14
0 161 21
.. 16
2 16
2 15
.. ..
1 24
1 ..
2 23
2 5
.. ..
.. ..
2 11
1 26.. 11
1 24
.. 17
.. 13
2 9
.. 19
.. 19
2 ..
1 30
0 22
2 22
.. 11
2 14
.. 12
.. 12
0 11
2 31
1 18
2 14
.. 13
.. 11
1 25
2 8
.. 13
1 19
2 12
2 ..
2 19
.. 23
2 20
2 12
2 15
0 22
2 29
.. 15
Democraticdecentralization
Score (0–2)e
(% of people whovoiced opinion to public
officials)
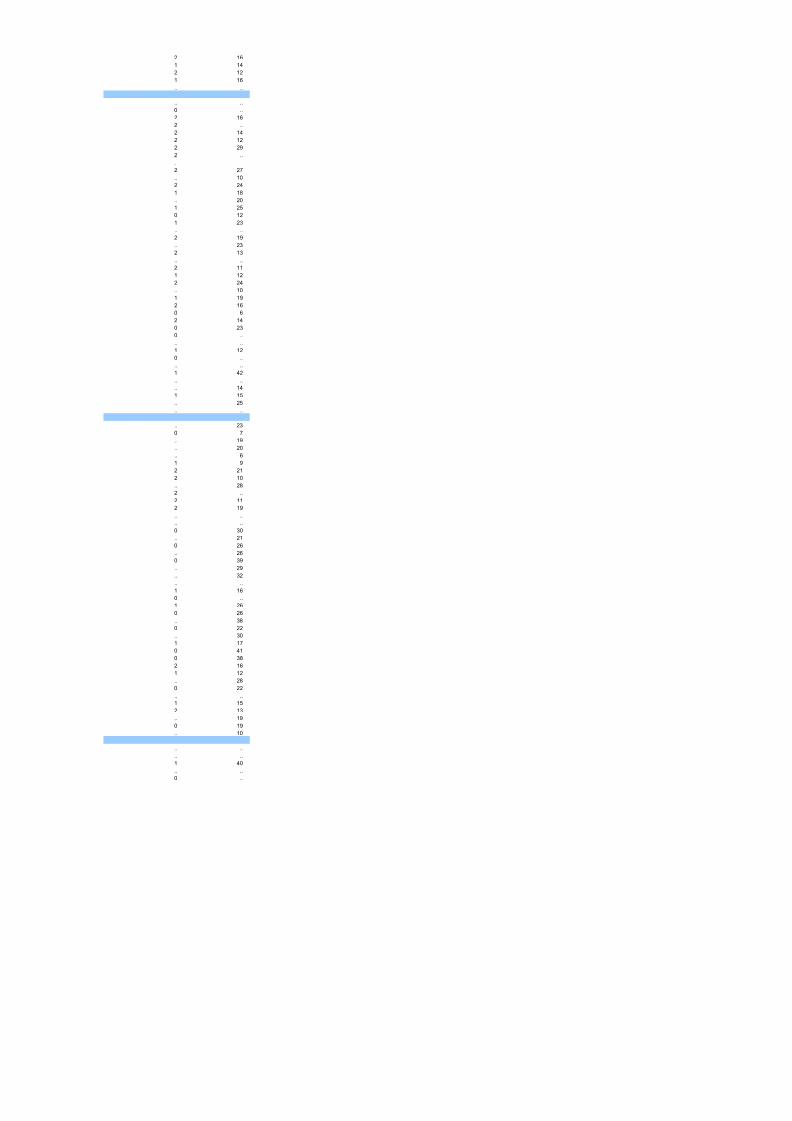
8/7/2019 Tabela IDH 2010 inglês
http://slidepdf.com/reader/full/tabela-idh-2010-ingles 33/102
81 Tunisia 70 76 1 3 61.5 2 14
82 Jordan 75 76 0 4 31.9 0 5
83 Turkey 38 46 2 3 38.3 1 13
84 Algeria 50 58 1 3 49.6 0 28
85 Tonga .. .. 1 .. .. 0 ..
MEDIUM HUMAN DEVELOPMENT
86 Fiji .. .. 0 1 60.0 0 ..87 Turkmenistan .. .. 0 2 107.0 0 ..
88 Dominican Republic 83 83 2 4 26.8 0 12
89 China 70 68 0 4 84.5 24 ..
90 El Salvador 64 63 2 2 17.3 0 6
91 Sri Lanka 74 74 2 4 75.0 1 5
92 Thailand 84 86 2 3 44.0 0 13
93 Gabon .. .. 1 .. 43.5 0 ..
94 Suriname .. .. 2 1 10.6 0 ..
95 Bolivia (Plurinational State of) 74 69 2 3 24.2 0 18
96 Paraguay 69 67 2 3 14.3 0 10
97 Philippines 87 87 2 4 38.3 0 13
98 Botswana 84 84 1 .. 15.5 0 10
99 Moldova (Republic of) 48 46 2 3 33.8 0 34
100 Mongolia 42 40 2 3 23.3 0 20101 Egypt 60 55 1 4 51.4 3 24
102 Uzbekistan 76 71 1 3 67.7 7 12
103 Micronesia (Federated States of) .. .. 2 .. .. 0 ..
104 Guyana 66 65 1 .. 10.5 0 ..
105 Namibia 76 75 1 1 9.0 0 ..
106 Honduras 64 64 2 2 42.0 0 9
107 Maldives .. .. 2 1 14.0 0 ..
108 Indonesia 75 75 2 3 28.5 0 4
109 Kyrgyzstan 63 64 2 1 40.0 0 24
110 South Africa 73 70 1 3 8.5 0 13
111 Syrian Arab Republic 72 66 0 4 78.0 1 24
112 Tajikistan 59 65 1 2 32.0 0 17
113 Viet Nam 73 74 0 3 81.7 1 9
114 Morocco 71 81 0 3 41.0 1 24115 Nicaragua 74 76 2 2 16.8 0 13
116 Guatemala 63 63 2 2 29.5 0 12
117 Equatorial Guinea .. .. 1 3 65.5 0 ..
118 Cape Verde .. .. 2 .. 11.0 0 ..
119 India 66 60 2 4 29.3 1 15
120 Timor-Leste .. .. 2 2 16.0 0 ..
121 Swaziland .. .. 0 3 52.5 0 ..
122 Lao People's Democratic Republic 84 84 0 1 92.0 0 15
123 Solomon Islands .. .. 2 1 .. 0 ..
124 Cambodia 93 91 1 2 35.2 1 11
125 Pakistan 31 40 2 4 65.7 0 9
126 Congo 52 55 1 3 34.3 0 43
127 Sao Tome and Principe .. .. 2 .. .. 0 ..
LOW HUMAN DEVELOPMENT
128 Kenya 58 61 2 4 25.0 0 32
129 Bangladesh 62 62 0 4 37.3 0 9
130 Ghana 74 72 2 2 6.0 0 14
131 Cameroon 69 70 1 4 30.5 1 26
132 Myanmar .. .. 0 5 102.7 9 ..
133 Yemen 62 54 1 4 83.4 2 41
134 Benin 67 66 2 2 16.0 0 20
135 Madagascar 33 29 2 .. 45.8 0 12
136 Mauritania 69 76 0 3 28.5 1 18
137 Papua New Guinea .. .. 2 2 14.7 0 ..
138 Nepal 58 57 2 4 35.6 0 8
139 Togo 24 23 1 2 15.5 0 22
140 Comoros 50 40 2 .. 19.0 0 11141 Lesotho .. .. 1 .. 27.5 0 ..
142 Nigeria 51 47 2 4 46.0 0 27
143 Uganda 76 78 1 3 21.5 0 23
144 Senegal 54 57 2 3 22.0 0 20
145 Haiti 42 40 1 2 15.0 0 20
146 Angola 69 70 0 3 36.5 0 33
147 Djibouti 65 65 0 .. 31.0 0 13
148 Tanzania (United Republic of) 54 58 1 2 15.5 0 27
149 Côte d'Ivoire 76 75 0 3 29.0 0 22
150 Zambia 71 68 1 .. 26.8 0 17
151 Gambia .. .. 1 2 48.3 1 ..
152 Rwanda 77 74 1 2 64.7 0 10
153 Malawi 88 88 2 2 15.5 0 10
154 Sudan 69 69 0 5 54.0 0 ..155 Afghanistan 63 56 1 5 54.3 0 31
156 Guinea 67 63 0 4 28.5 0 ..
157 Ethiopia 35 37 1 3 49.0 4 14
158 Sierra Leone 72 73 2 3 34.0 0 15
159 Central African Republic 66 67 1 4 17.8 0 ..
160 Mali 49 63 2 2 8.0 0 23
161 Burkina Faso 57 56 1 3 15.0 0 14
162 Liberia 72 71 2 2 15.5 0 29
163 Chad 52 41 1 5 44.5 0 16
164 Guinea-Bissau .. .. 2 1 23.5 0 ..
165 Mozambique 51 49 1 3 19.0 0 20
166 Burundi 43 44 2 4 29.0 0 14
167 Niger 88 87 2 3 48.5 0 17
168 Congo (Democratic Republic of the) 54 55 1 5 53.5 0 ..169 Zimbabwe 41 43 1 4 46.5 0 33
OTHER COUNTRIES OR TERRITORIES
Antigua and Barbuda .. .. 2 .. .. 0 ..
Bhutan .. .. 2 .. 15.8 0 ..
Cuba 26 28 0 3 94.0 22 ..
Dominica .. .. 2 .. .. 0 ..
Eritrea .. .. 1 3 115.5 19 ..
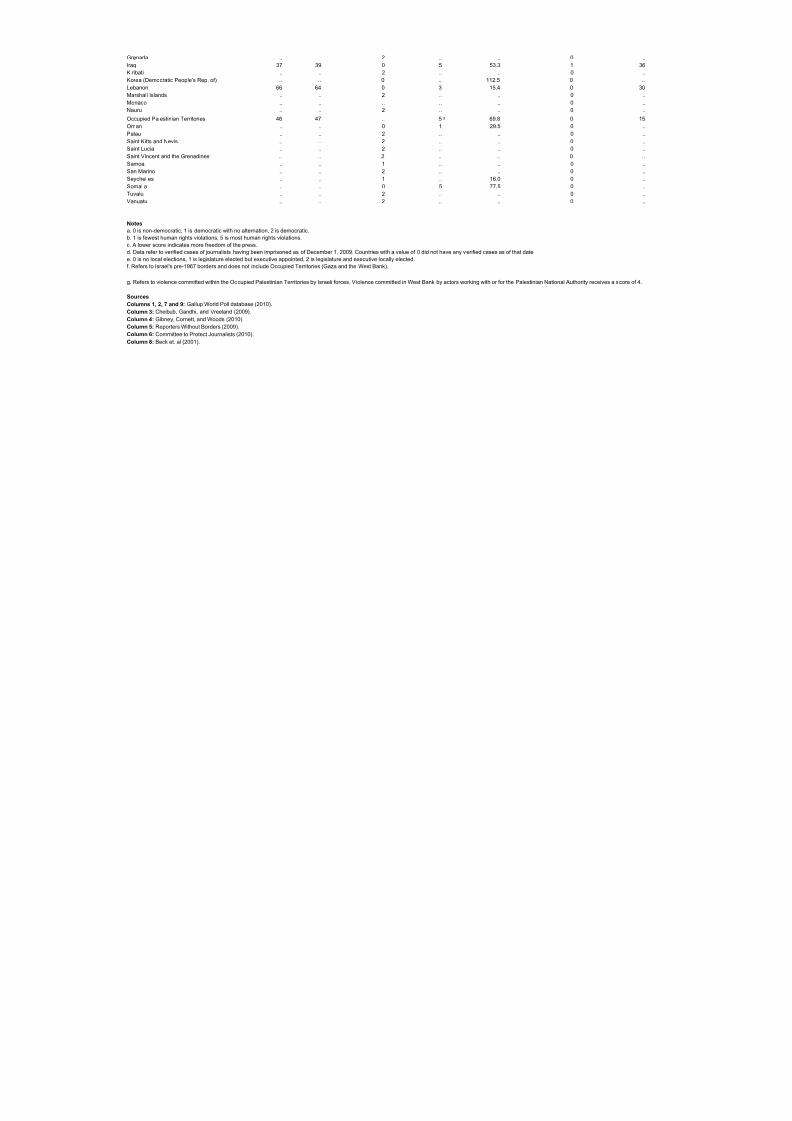
8/7/2019 Tabela IDH 2010 inglês
http://slidepdf.com/reader/full/tabela-idh-2010-ingles 34/102
2 16
1 14
2 12
1 16
.. ..
.. ..0 ..
2 16
2 ..
2 14
2 12
2 29
2 ..
.. ..
2 27
.. 10
2 24
1 18
.. 20
1 250 12
1 23
.. ..
2 19
.. 23
2 13
.. ..
2 11
1 12
2 24
.. 10
1 19
2 16
0 62 14
0 23
0 ..
.. ..
1 12
0 ..
.. ..
1 42
.. ..
.. 14
1 15
.. 25
.. ..
.. 23
0 7
.. 19
.. 20
.. 6
1 9
2 21
2 10
.. 28
2 ..
2 11
2 19
.. .... ..
0 30
.. 21
0 26
.. 26
0 39
.. 29
.. 32
.. ..
1 16
0 ..
1 26
0 26
.. 380 22
.. 30
1 17
0 41
0 38
2 16
1 12
.. 28
0 22
.. ..
1 15
2 13
.. 19
0 19.. 10
.. ..
.. ..
1 40
.. ..
0 ..

8/7/2019 Tabela IDH 2010 inglês
http://slidepdf.com/reader/full/tabela-idh-2010-ingles 35/102
Grenada .. .. 2 .. .. 0 ..
Iraq 37 39 0 5 53.3 1 36
Kiribati .. .. 2 .. .. 0 ..
Korea (Democratic People's Rep. of) .. .. 0 .. 112.5 0 ..
Lebanon 66 64 0 3 15.4 0 30
Marshall Islands .. .. 2 .. .. 0 ..
Monaco .. .. .. .. .. 0 ..Nauru .. .. 2 .. .. 0 ..
Occupied Palestinian Territories 46 47 .. 5 69.8 0 15
Oman .. .. 0 1 29.5 0 ..
Palau .. .. 2 .. .. 0 ..
Saint Kitts and Nevis .. .. 2 .. .. 0 ..
Saint Lucia .. .. 2 .. .. 0 ..
Saint Vincent and the Grenadines .. .. 2 .. .. 0 ..
Samoa .. .. 1 .. .. 0 ..
San Marino .. .. 2 .. .. 0 ..
Seychelles .. .. 1 .. 16.0 0 ..
Somalia .. .. 0 5 77.5 0 ..
Tuvalu .. .. 2 .. .. 0 ..
Vanuatu .. .. 2 .. .. 0 ..
Notes
a. 0 is non-democratic, 1 is democratic with no alternation, 2 is democratic.
b. 1 is fewest human rights violations, 5 is most human rights violations.
c. A lower score indicates more freedom of the press.
d. Data refer to verified cases of journalists having been imprisoned as of December 1, 2009. Countries with a value of 0 did not have any verified cases as of that date.
e. 0 is no local elections, 1 is legislature elected but executive appointed, 2 is legislature and executive locally elected.
f. Refers to Israel's pre-1967 borders and does not include Occupied Territories (Gaza and the West Bank).
g. Refers to violence committed within the Occupied Palestinian Territories by Israeli forces. Violence committed in West Bank by actors working with or for the Palestinian National Authority receives a score of 4.
Sources
g
Columns 1, 2, 7 and 9: Gallup World Poll database (2010).
Column 3: Cheibub, Gandhi, and Vreeland (2009).Column 4: Gibney, Cornett, and Woods (2010).
Column 5: Reporters Without Borders (2009).
Column 6: Committee to Protect Journalists (2010).
Column 8: Beck et. al (2001).
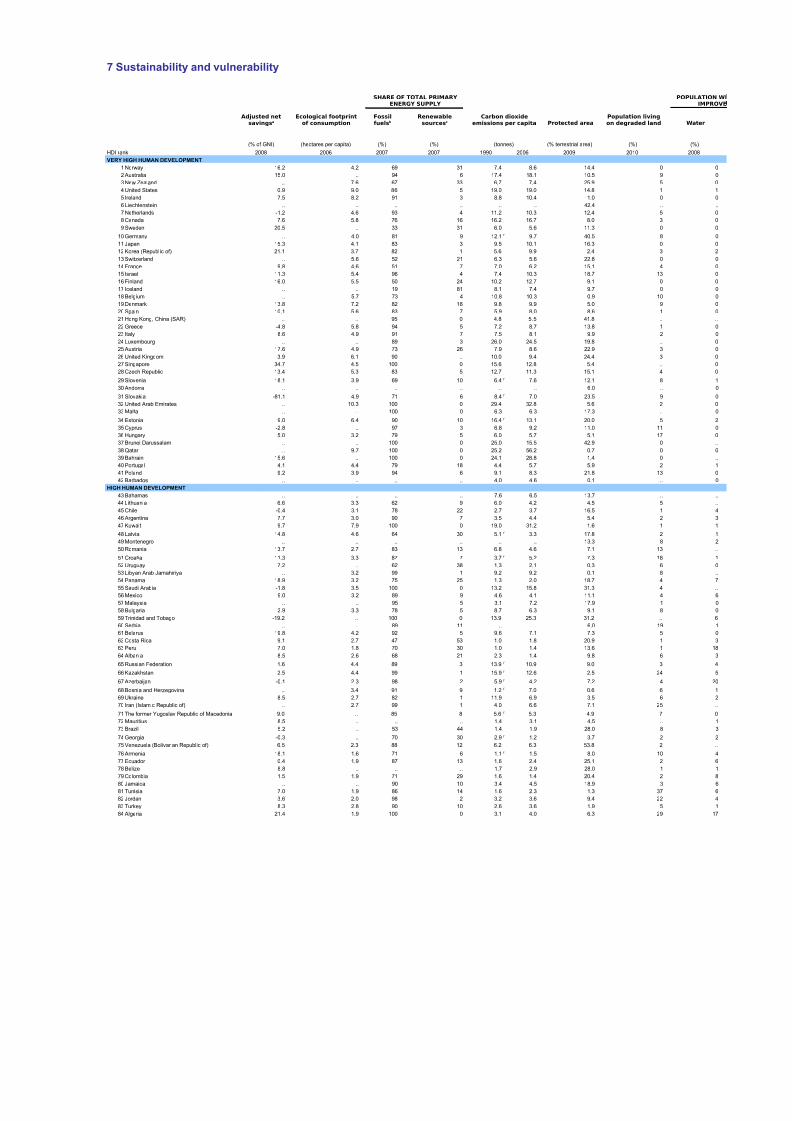
8/7/2019 Tabela IDH 2010 inglês
http://slidepdf.com/reader/full/tabela-idh-2010-ingles 36/102
.. ..
.. 21
.. ..
2 ..
1 12
.. ..
.. ..
.. ..
.. 20
0 ..
.. ..
.. ..
2 ..
.. ..
0 ..
.. ..
.. ..
.. ..
.. ..
2 ..
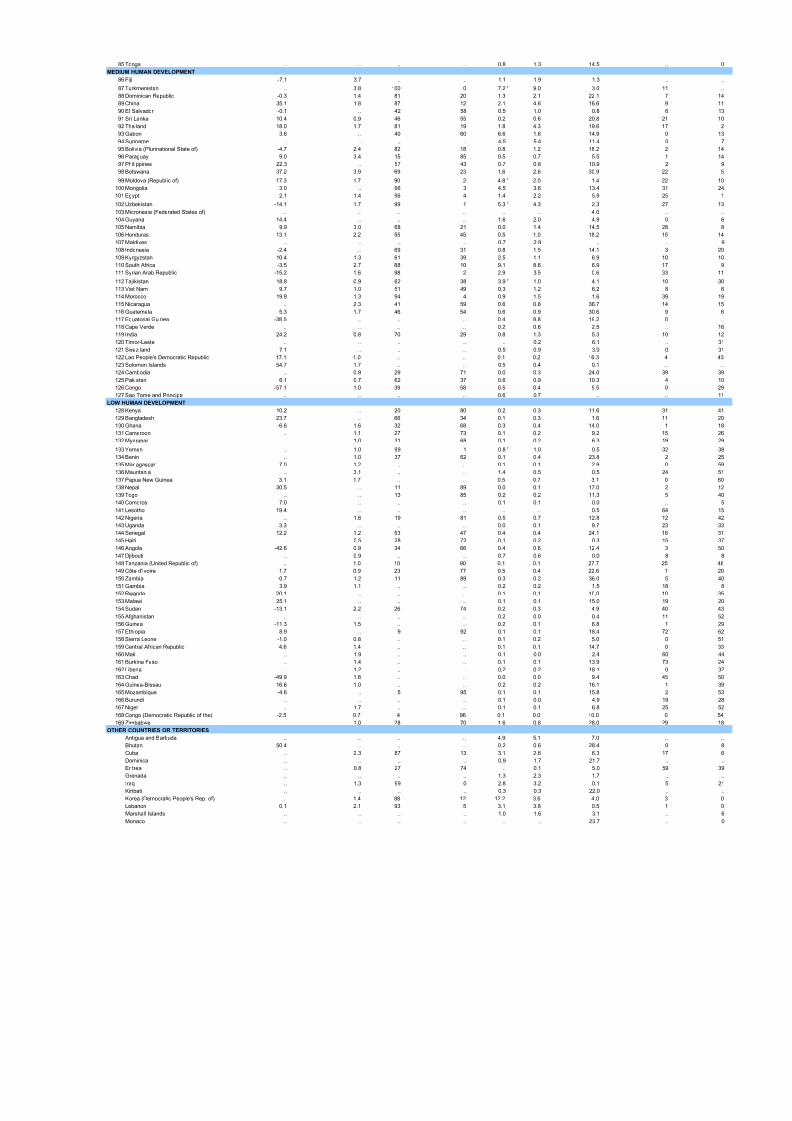
8/7/2019 Tabela IDH 2010 inglês
http://slidepdf.com/reader/full/tabela-idh-2010-ingles 37/102
7 Sustainability and vulnerability
Protected area Water
(% of GNI) (hectares per capita) (%) (%) (tonnes) (% terrestrial area) (%) (%)
HDI rank 2008 2006 2007 2007 1990 2006 2009 2010 2008
VERY HIGH HUMAN DEVELOPMENT
1 Norway 16.2 4.2 69 31 7.4 8.6 14.4 0
2 Australia 15.0 .. 94 6 17.4 18.1 10.5 9
3 New Zealand .. 7.6 67 33 6.7 7.4 25.9 5
4 United States 0.9 9.0 86 5 19.0 19.0 14.8 1
5 Ireland 7.5 8.2 91 3 8.8 10.4 1.0 0
6 Liechtenstein .. .. .. .. .. .. 42.4 .. 7 Netherlands -1.2 4.6 93 4 11.2 10.3 12.4 5
8 Canada 7.6 5.8 76 16 16.2 16.7 8.0 3
9 Sweden 20.5 .. 33 31 6.0 5.6 11.3 0
10 Germany .. 4.0 81 9 12.1 9.7 40.5 8
11 Japan 15.3 4.1 83 3 9.5 10.1 16.3 0
12 Korea (Republic of) 21.1 3.7 82 1 5.6 9.9 2.4 3
13 Switzerland .. 5.6 52 21 6.3 5.6 22.8 0
14 France 9.8 4.6 51 7 7.0 6.2 15.1 4
15 Israel 11.3 5.4 96 4 7.4 10.3 18.7 13
16 Finland 16.0 5.5 50 24 10.2 12.7 9.1 0
17 Iceland .. .. 19 81 8.1 7.4 9.7 0
18 Belgium .. 5.7 73 4 10.8 10.3 0.9 10
19 Denmark 13.8 7.2 82 18 9.8 9.9 5.0 9
20 Spain 10.1 5.6 83 7 5.9 8.0 8.6 1 21 Hong Kong, China (SAR) .. .. 95 0 4.8 5.5 41.8 ..
22 Greece -4.8 5.8 94 5 7.2 8.7 13.8 1
23 Italy 8.6 4.9 91 7 7.5 8.1 9.9 2
24 Luxembourg .. .. 89 3 26.0 24.5 19.8 ..
25 Austria 17.6 4.9 73 26 7.9 8.6 22.9 3
26 United Kingdom 3.9 6.1 90 .. 10.0 9.4 24.4 3
27 Singapore 34.7 4.5 100 0 15.6 12.8 5.4 ..
28 Czech Republic 13.4 5.3 83 5 12.7 11.3 15.1 4
29 Slovenia 18.1 3.9 69 10 6.4 7.6 12.1 8
30 Andorra .. .. .. .. .. .. 6.0 ..
31 Slovakia -81.1 4.9 71 6 8.4 7.0 23.5 9
32 United Arab Emirates .. 10.3 100 0 29.4 32.8 5.6 2
33 Malta .. .. 100 0 6.3 6.3 17.3 ..
34 Estonia 9.0 6.4 90 10 16.4 13.1 20.0 5
35 Cyprus -2.8 .. 97 3 6.8 9.2 11.0 11
36 Hungary 5.0 3.2 79 5 6.0 5.7 5.1 17
37 Brunei Darussalam .. .. 100 0 25.0 15.5 42.9 0
38 Qatar .. 9.7 100 0 25.2 56.2 0.7 0
39 Bahrain 15.6 .. 100 0 24.1 28.8 1.4 0
40 Portugal 4.1 4.4 79 18 4.4 5.7 5.9 2
41 Poland 9.2 3.9 94 6 9.1 8.3 21.8 13
42 Barbados .. .. .. .. 4.0 4.6 0.1 ..
HIGH HUMAN DEVELOPMENT
43 Bahamas .. .. .. .. 7.6 6.5 13.7 ..
44 Lithuania 6.6 3.3 62 9 6.0 4.2 4.5 5
45 Chile -0.4 3.1 78 22 2.7 3.7 16.5 1
46 Argentina 7.7 3.0 90 7 3.5 4.4 5.4 2 47 Kuwait 9.7 7.9 100 0 19.0 31.2 1.6 1
48 Latvia 14.8 4.6 64 30 5.1 3.3 17.8 2
49 Montenegro .. .. .. .. .. .. 13.3 8
50 Romania 13.7 2.7 83 13 6.8 4.6 7.1 13
51 Croatia 11.3 3.3 87 7 3.7 5.2 7.3 18
52 Uruguay 7.2 .. 62 38 1.3 2.1 0.3 6
53 Libyan Arab Jamahiriya .. 3.2 99 1 9.2 9.2 0.1 8
54 Panama 18.9 3.2 75 25 1.3 2.0 18.7 4
55 Saudi Arabia -1.8 3.5 100 0 13.2 15.8 31.3 4
56 Mexico 9.0 3.2 89 9 4.6 4.1 11.1 4
57 Malaysia .. .. 95 5 3.1 7.2 17.9 1
58 Bulgaria 2.9 3.3 78 5 8.7 6.3 9.1 8
59 Trinidad and Tobago -19.2 .. 100 0 13.9 25.3 31.2 ..
60 Serbia .. .. 89 11 .. .. 6.0 19
61 Belarus 19.8 4.2 92 5 9.6 7.1 7.3 5
62 Costa Rica 9.1 2.7 47 53 1.0 1.8 20.9 1
63 Peru 7.0 1.8 70 30 1.0 1.4 13.6 1
64 Albania 8.5 2.6 68 21 2.3 1.4 9.8 6
65 Russian Federation 1.6 4.4 89 3 13.9 10.9 9.0 3
66 Kazakhstan 2.5 4.4 99 1 15.9 12.6 2.5 24
67 Azerbaijan -0.1 2.3 98 2 5.9 4.2 7.2 4
68 Bosnia and Herzegovina .. 3.4 91 9 1.2 7.0 0.6 6
69 Ukraine 8.5 2.7 82 1 11.9 6.9 3.5 6
70 Iran (Islamic Republic of) .. 2.7 99 1 4.0 6.6 7.1 25
71 The former Yugoslav Republic of Macedonia 9.0 .. 85 8 5.6 5.3 4.9 7
72 Mauritius 8.5 .. .. .. 1.4 3.1 4.5 ..
73 Brazil 5.2 .. 53 44 1.4 1.9 28.0 8
74 Georgia -0.3 .. 70 30 2.9 1.2 3.7 2
75 Venezuela (Bolivarian Republic of) 6.5 2.3 88 12 6.2 6.3 53.8 2
76 Armenia 18.1 1.6 71 6 1.1 1.5 8.0 10
77 Ecuador 0.4 1.9 87 13 1.6 2.4 25.1 2
78 Belize 8.8 .. .. .. 1.7 2.9 28.0 1
79 Colombia 1.5 1.9 71 29 1.6 1.4 20.4 2
80 Jamaica .. .. 90 10 3.4 4.5 18.9 3
81 Tunisia 7.0 1.9 86 14 1.6 2.3 1.3 37
82 Jordan 3.6 2.0 98 2 3.2 3.6 9.4 22
83 Turkey 8.3 2.8 90 10 2.6 3.6 1.9 5
84 Algeria 21.4 1.9 100 0 3.1 4.0 6.3 29
Adjusted netsavingsa
Ecological footprintof consumption
SHARE OF TOTAL PRIMARY
ENERGY SUPPLY
Carbon dioxideemissions per capita
Population livingon degraded land
POPULATI
IMP
Fossilfuelsb
Renewablesourcesc
f
f
f
f
f
f
f
f
f
f
f
f
f
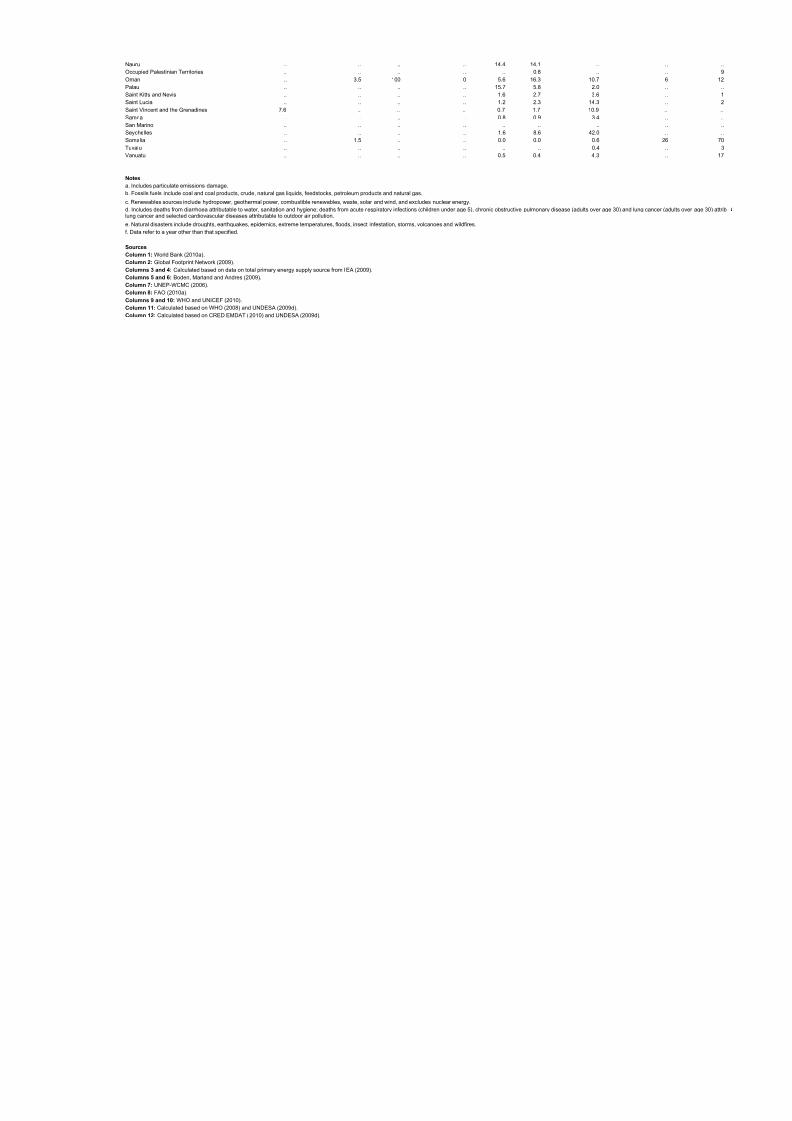
8/7/2019 Tabela IDH 2010 inglês
http://slidepdf.com/reader/full/tabela-idh-2010-ingles 38/102
85 Tonga .. .. .. .. 0.8 1.3 14.5 ..
MEDIUM HUMAN DEVELOPMENT
86 Fiji -7.1 3.7 .. .. 1.1 1.9 1.3 ..
87 Turkmenistan .. 3.8 100 0 7.2 9.0 3.0 11
88 Dominican Republic -0.3 1.4 81 20 1.3 2.1 22.1 7
89 China 35.1 1.8 87 12 2.1 4.6 16.6 9 90 El Salvador -0.1 .. 42 58 0.5 1.0 0.8 6
91 Sri Lanka 10.4 0.9 46 55 0.2 0.6 20.8 21
92 Thailand 18.0 1.7 81 19 1.8 4.3 19.6 17
93 Gabon 3.6 .. 40 60 6.6 1.6 14.9 0
94 Suriname .. .. .. .. 4.5 5.4 11.4 0
95 Bolivia (Plurinational State of) -4.7 2.4 82 18 0.8 1.2 18.2 2
96 Paraguay 9.0 3.4 15 85 0.5 0.7 5.5 1
97 Philippines 22.3 .. 57 43 0.7 0.8 10.9 2
98 Botswana 37.2 3.9 69 23 1.6 2.6 30.9 22
99 Moldova (Republic of) 17.3 1.7 90 2 4.8 2.0 1.4 22
100 Mongolia 3.0 .. 96 3 4.5 3.6 13.4 31
101 Egypt 2.1 1.4 96 4 1.4 2.2 5.9 25
102 Uzbekistan -14.1 1.7 99 1 5.3 4.3 2.3 27 103 Micronesia (Federated States of) .. .. .. .. .. .. 4.0 ..
104 Guyana 14.4 .. .. .. 1.6 2.0 4.9 0
105 Namibia 9.9 3.0 68 21 0.0 1.4 14.5 28
106 Honduras 13.1 2.2 55 45 0.5 1.0 18.2 15
107 Maldives .. .. .. .. 0.7 2.9 .. ..
108 Indonesia -2.4 .. 69 31 0.8 1.5 14.1 3
109 Kyrgyzstan 10.4 1.3 61 39 2.5 1.1 6.9 10
110 South Africa -3.5 2.7 88 10 9.1 8.6 6.9 17
111 Syrian Arab Republic -15.2 1.6 98 2 2.9 3.5 0.6 33
112 Tajikistan 18.8 0.9 62 38 3.9 1.0 4.1 10
113 Viet Nam 9.7 1.0 51 49 0.3 1.2 6.2 8
114 Morocco 19.8 1.3 94 4 0.9 1.5 1.6 39
115 Nicaragua .. 2.3 41 59 0.6 0.8 36.7 14
116 Guatemala 5.3 1.7 46 54 0.6 0.9 30.6 9 117 Equatorial Guinea -38.5 .. .. .. 0.4 8.8 19.2 0
118 Cape Verde .. .. .. .. 0.2 0.6 2.5 ..
119 India 24.2 0.8 70 29 0.8 1.3 5.3 10
120 Timor-Leste .. .. .. .. .. 0.2 6.1 ..
121 Swaziland 7.1 .. .. .. 0.5 0.9 3.0 0
122 Lao People's Democratic Republic 17.1 1.0 .. .. 0.1 0.2 16.3 4
123 Solomon Islands 54.7 1.7 .. .. 0.5 0.4 0.1 ..
124 Cambodia .. 0.9 29 71 0.0 0.3 24.0 39
125 Pakistan 6.1 0.7 62 37 0.6 0.9 10.3 4
126 Congo -57.1 1.0 39 58 0.5 0.4 9.5 0
127 Sao Tome and Principe .. .. .. .. 0.6 0.7 .. ..
LOW HUMAN DEVELOPMENT
128 Kenya 10.2 .. 20 80 0.2 0.3 11.6 31
129 Bangladesh 23.7 .. 66 34 0.1 0.3 1.6 11
130 Ghana -6.6 1.6 32 68 0.3 0.4 14.0 1
131 Cameroon .. 1.1 27 73 0.1 0.2 9.2 15
132 Myanmar .. 1.0 31 68 0.1 0.2 6.3 19
133 Yemen .. 1.0 99 1 0.8 1.0 0.5 32
134 Benin .. 1.0 37 62 0.1 0.4 23.8 2
135 Madagascar 7.0 1.2 .. .. 0.1 0.1 2.9 0
136 Mauritania .. 3.1 .. .. 1.4 0.5 0.5 24
137 Papua New Guinea 3.1 1.7 .. .. 0.5 0.7 3.1 0
138 Nepal 30.5 .. 11 89 0.0 0.1 17.0 2
139 Togo .. .. 13 85 0.2 0.2 11.3 5
140 Comoros 7.0 .. .. .. 0.1 0.1 0.0 ..
141 Lesotho 19.4 .. .. .. .. .. 0.5 64
142 Nigeria .. 1.6 19 81 0.5 0.7 12.8 12 143 Uganda 3.3 .. .. .. 0.0 0.1 9.7 23
144 Senegal 12.2 1.2 53 47 0.4 0.4 24.1 16
145 Haiti .. 0.5 28 72 0.1 0.2 0.3 15
146 Angola -42.6 0.9 34 66 0.4 0.6 12.4 3
147 Djibouti .. 0.9 .. .. 0.7 0.6 0.0 8
148 Tanzania (United Republic of) .. 1.0 10 90 0.1 0.1 27.7 25
149 Côte d'Ivoire 1.7 0.9 23 77 0.5 0.4 22.6 1
150 Zambia -0.7 1.2 11 89 0.3 0.2 36.0 5
151 Gambia 3.9 1.1 .. .. 0.2 0.2 1.5 18
152 Rwanda 20.1 .. .. .. 0.1 0.1 10.0 10
153 Malawi 25.1 .. .. .. 0.1 0.1 15.0 19
154 Sudan -13.1 2.2 26 74 0.2 0.3 4.9 40
155 Afghanistan .. .. .. .. 0.2 0.0 0.4 11
156 Guinea -11.3 1.5 .. .. 0.2 0.1 6.8 1
157 Ethiopia 8.9 .. 9 92 0.1 0.1 18.4 72
158 Sierra Leone -1.0 0.8 .. .. 0.1 0.2 5.0 0
159 Central African Republic -4.6 1.4 .. .. 0.1 0.1 14.7 0
160 Mali .. 1.9 .. .. 0.1 0.0 2.4 60
161 Burkina Faso .. 1.4 .. .. 0.1 0.1 13.9 73
162 Liberia .. 1.2 .. .. 0.2 0.2 18.1 0
163 Chad -49.9 1.8 .. .. 0.0 0.0 9.4 45
164 Guinea-Bissau 16.6 1.0 .. .. 0.2 0.2 16.1 1
165 Mozambique -4.6 .. 5 95 0.1 0.1 15.8 2
166 Burundi .. .. .. .. 0.1 0.0 4.9 19
167 Niger .. 1.7 .. .. 0.1 0.1 6.8 25
168 Congo (Democratic Republic of the) -2.5 0.7 4 96 0.1 0.0 10.0 0
169 Zimbabwe .. 1.0 28 70 1.6 0.8 28.0 29
OTHER COUNTRIES OR TERRITORIES
Antigua and Barbuda .. .. .. .. 4.9 5.1 7.0 ..
Bhutan 50.4 .. .. .. 0.2 0.6 28.4 0
Cuba .. 2.3 87 13 3.1 2.6 6.3 17
Dominica .. .. .. .. 0.9 1.7 21.7 ..
Eritrea .. 0.8 27 74 .. 0.1 5.0 59
Grenada .. .. .. .. 1.3 2.3 1.7 ..
Iraq .. 1.3 99 0 2.8 3.2 0.1 5
Kiribati .. .. .. .. 0.3 0.3 22.0 ..
Korea (Democratic People's Rep. of) .. 1.4 88 12 12.2 3.6 4.0 3
Lebanon 0.1 2.1 93 5 3.1 3.8 0.5 1
Marshall Islands .. .. .. .. 1.0 1.6 3.1 ..
Monaco .. .. .. .. .. .. 23.7 ..
f
f
f
f
f
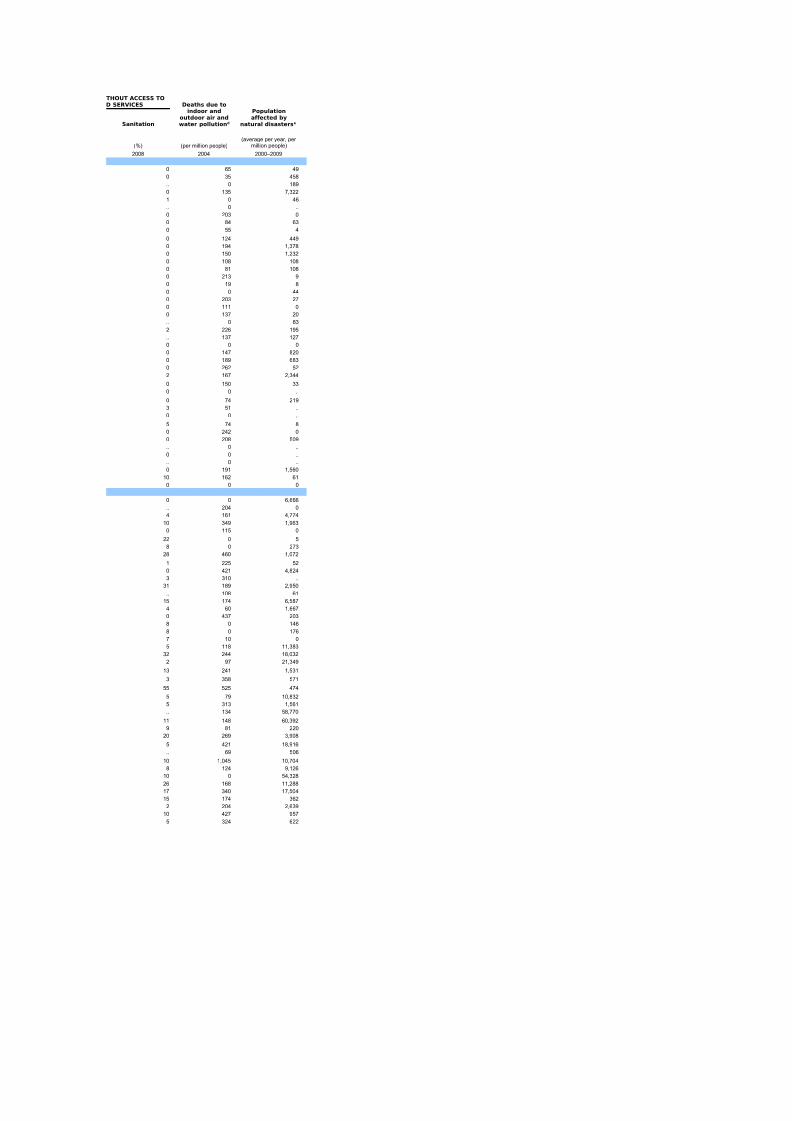
8/7/2019 Tabela IDH 2010 inglês
http://slidepdf.com/reader/full/tabela-idh-2010-ingles 39/102
Nauru .. .. .. .. 14.4 14.1 .. ..
Occupied Palestinian Territories .. .. .. .. .. 0.8 .. ..
Oman .. 3.5 100 0 5.6 16.3 10.7 6
Palau .. .. .. .. 15.7 5.8 2.0 ..
Saint Kitts and Nevis .. .. .. .. 1.6 2.7 3.6 ..
Saint Lucia .. .. .. .. 1.2 2.3 14.3 .. Saint Vincent and the Grenadines 7.6 .. .. .. 0.7 1.7 10.9 ..
Samoa .. .. .. .. 0.8 0.9 3.4 ..
San Marino .. .. .. .. .. .. .. ..
Seychelles .. .. .. .. 1.6 8.6 42.0 ..
Somalia .. 1.5 .. .. 0.0 0.0 0.6 26
Tuvalu .. .. .. .. .. .. 0.4 ..
Vanuatu .. .. .. .. 0.5 0.4 4.3 ..
Notes
a. Includes particulate emissions damage.
b. Fossils fuels include coal and coal products, crude, natural gas liquids, feedstocks, petroleum products and natural gas.
c. Renewables sources include hydropower, geothermal power, combustible renewables, waste, solar and wind, and excludes nuclear energy.
e. Natural disasters include droughts, earthquakes, epidemics, extreme temperatures, floods, insect infestation, storms, volcanoes and wildfires.
f. Data refer to a year other than that specified.
Sources
d. Includes deaths from diarrhoea attributable to water, sanitation and hygiene; deaths from acute respiratory infections (children under age 5), chronic obstructive pulmonary disease (adults over age 30) and lung cancer (adults over agelung cancer and selected cardiovascular diseases attributable to outdoor air pollution.
Column 1: World Bank (2010a).
Column 2: Global Footprint Network (2009).
Columns 3 and 4: Calculated based on data on total primary energy supply source from IEA (2009).
Columns 5 and 6: Boden, Marland and Andres (2009).
Column 7: UNEP-WCMC (2006).
Column 8: FAO (2010a).
Columns 9 and 10: WHO and UNICEF (2010).
Column 11: Calculated based on WHO (2008) and UNDESA (2009d).
Column 12: Calculated based on CRED EMDAT (2010) and UNDESA (2009d).
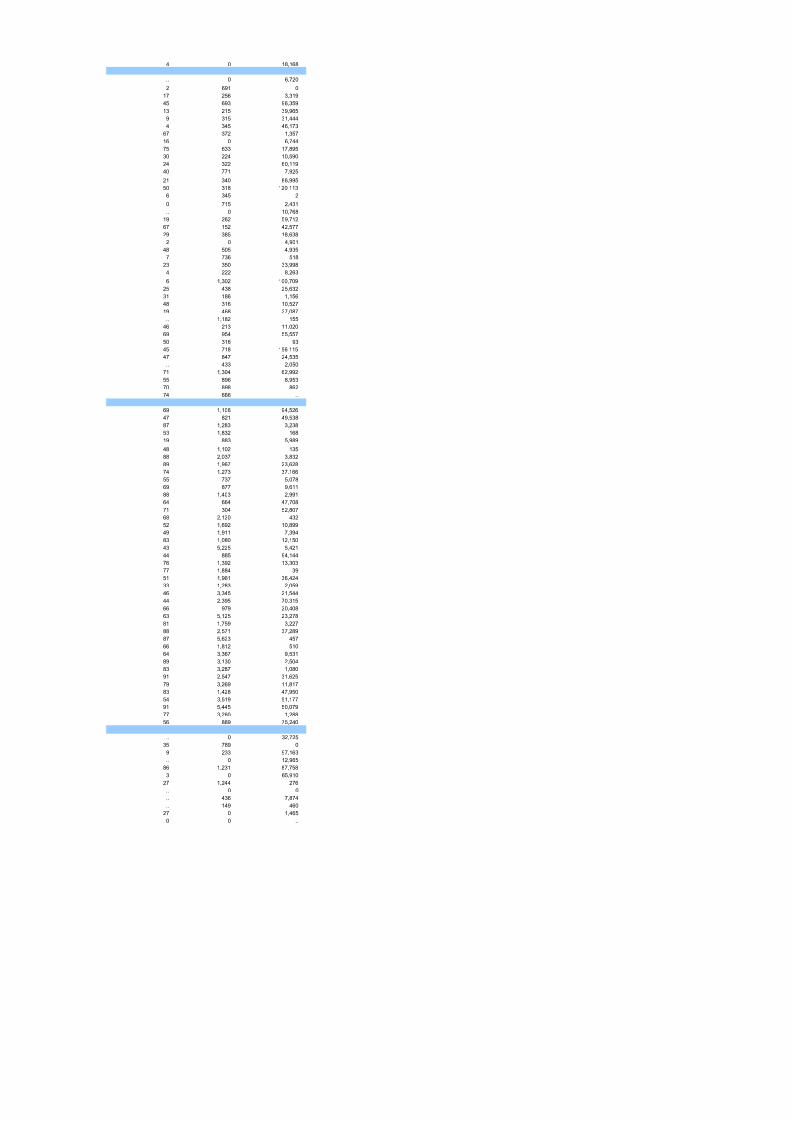
8/7/2019 Tabela IDH 2010 inglês
http://slidepdf.com/reader/full/tabela-idh-2010-ingles 40/102
Sanitation
(%) (per million people)
2008 2004 2000–2009
0 65 49
0 35 458
.. 0 189
0 135 7,322
1 0 46
.. 0 ..0 203 0
0 84 63
0 55 4
0 124 449
0 194 1,378
0 150 1,232
0 108 108
0 81 108
0 213 9
0 19 8
0 0 44
0 203 27
0 111 0
0 137 20
.. 0 83
2 226 195
.. 137 127
0 0 0
0 147 820
0 189 683
0 262 52
2 167 2,344
0 150 33
0 0 ..
0 74 219
3 51 ..
0 0 ..
5 74 8
0 242 0
0 208 509
.. 0 ..
0 0 ..
.. 0 ..
0 191 1,560
10 162 61
0 0 0
0 0 6,666
.. 204 0
4 161 4,774
10 349 1,963
0 115 0
22 0 5
8 0 273
28 460 1,072
1 225 52
0 421 4,824
3 310 ..
31 189 2,950
.. 108 61
15 174 6,587
4 60 1,667
0 437 203
8 0 1468 0 176
7 10 0
5 118 11,383
32 244 18,032
2 97 21,349
13 241 1,531
3 358 571
55 525 474
5 79 10,832
5 313 1,561
.. 134 58,770
11 148 60,392
9 81 220
20 269 3,908
5 421 18,916
.. 69 506
10 1,045 10,704
8 124 9,126
10 0 54,328
26 168 11,288
17 340 17,504
15 174 362
2 204 2,639
10 427 957
5 324 622
THOUT ACCESS TO
D SERVICES Deaths due toindoor and
outdoor air andwater pollutiond
Populationaffected by
natural disasterse
(average per year, per million people)

8/7/2019 Tabela IDH 2010 inglês
http://slidepdf.com/reader/full/tabela-idh-2010-ingles 41/102
4 0 18,168
.. 0 6,720
2 691 0
17 256 3,319
45 693 96,35913 215 39,965
9 315 31,444
4 345 46,173
67 372 1,357
16 0 6,744
75 633 17,895
30 224 10,590
24 322 60,119
40 771 7,925
21 340 86,995
50 318 120,113
6 345 2
0 715 2,431
.. 0 10,768
19 262 59,712
67 152 42,577
29 385 18,638
2 0 4,901
48 505 4,935
7 736 518
23 350 33,998
4 222 8,263
6 1,302 100,709
25 438 25,632
31 186 1,156
48 316 10,527
19 468 27,087.. 1,182 155
46 213 11,020
69 954 55,557
50 316 93
45 718 156,115
47 847 24,535
.. 433 2,050
71 1,304 62,992
55 896 8,953
70 898 862
74 666 ..
69 1,106 94,526
47 821 49,538
87 1,283 3,238
53 1,832 168
19 883 5,989
48 1,102 135
88 2,037 3,832
89 1,967 23,628
74 1,273 37,166
55 737 5,078
69 877 9,611
88 1,403 2,991
64 664 47,708
71 304 52,807
68 2,120 43252 1,692 10,899
49 1,911 7,394
83 1,080 12,150
43 5,225 5,421
44 885 94,144
76 1,392 13,303
77 1,884 39
51 1,961 36,424
33 1,283 2,059
46 3,345 21,544
44 2,395 70,315
66 979 20,408
63 5,125 23,278
81 1,759 3,22788 2,571 37,289
87 5,623 457
66 1,812 510
64 3,367 9,531
89 3,130 2,504
83 3,287 1,080
91 2,547 31,625
79 3,269 11,817
83 1,428 47,950
54 3,519 51,177
91 5,445 50,079
77 3,260 1,288
56 889 75,240
.. 0 32,725
35 789 0
9 233 97,163
.. 0 12,965
86 1,231 87,758
3 0 65,910
27 1,244 276
.. 0 0
.. 436 7,874
.. 149 460
27 0 1,465
0 0 ..
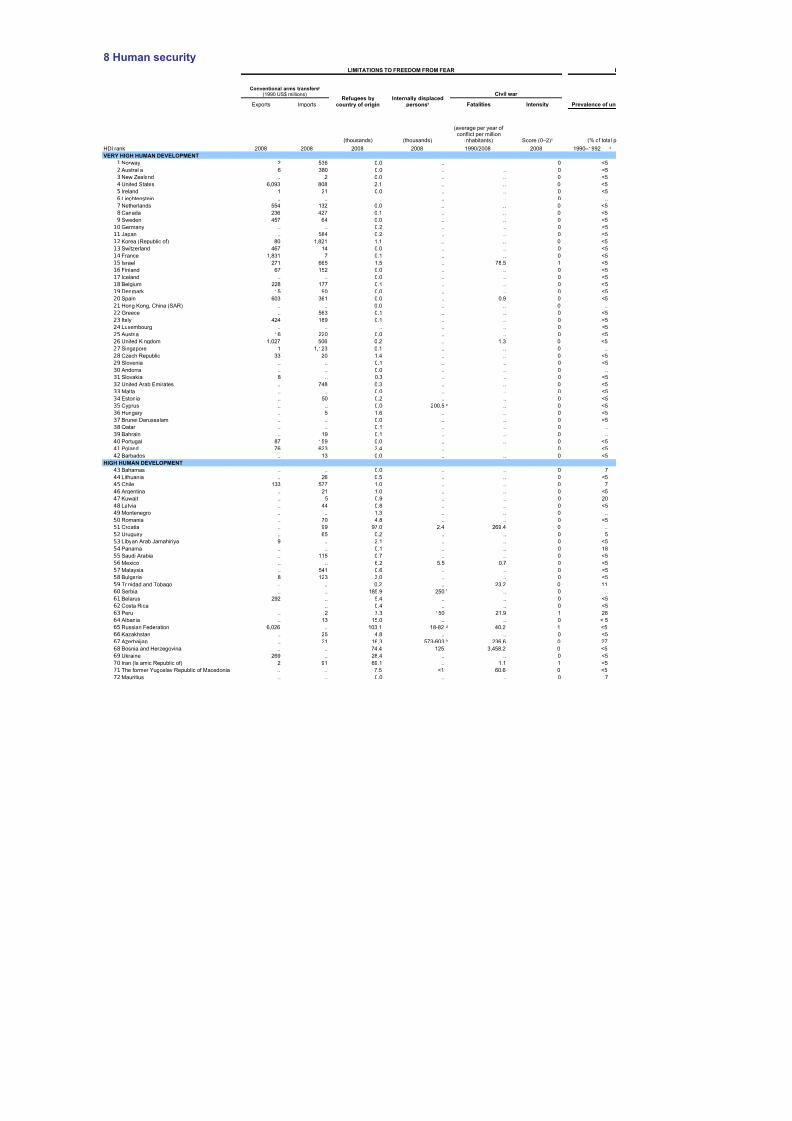
8/7/2019 Tabela IDH 2010 inglês
http://slidepdf.com/reader/full/tabela-idh-2010-ingles 42/102
.. 0 ..
11 0 0
.. 117 783
.. 0 ..
4 0 ..
.. 0 0
.. 0 1,557
0 0 3,277
.. 0 ..
.. 0 22,448
77 3,490 67,697
16 0 ..
48 0 36,308
table to indoor smoke; and deaths from respiratory infections and diseases,
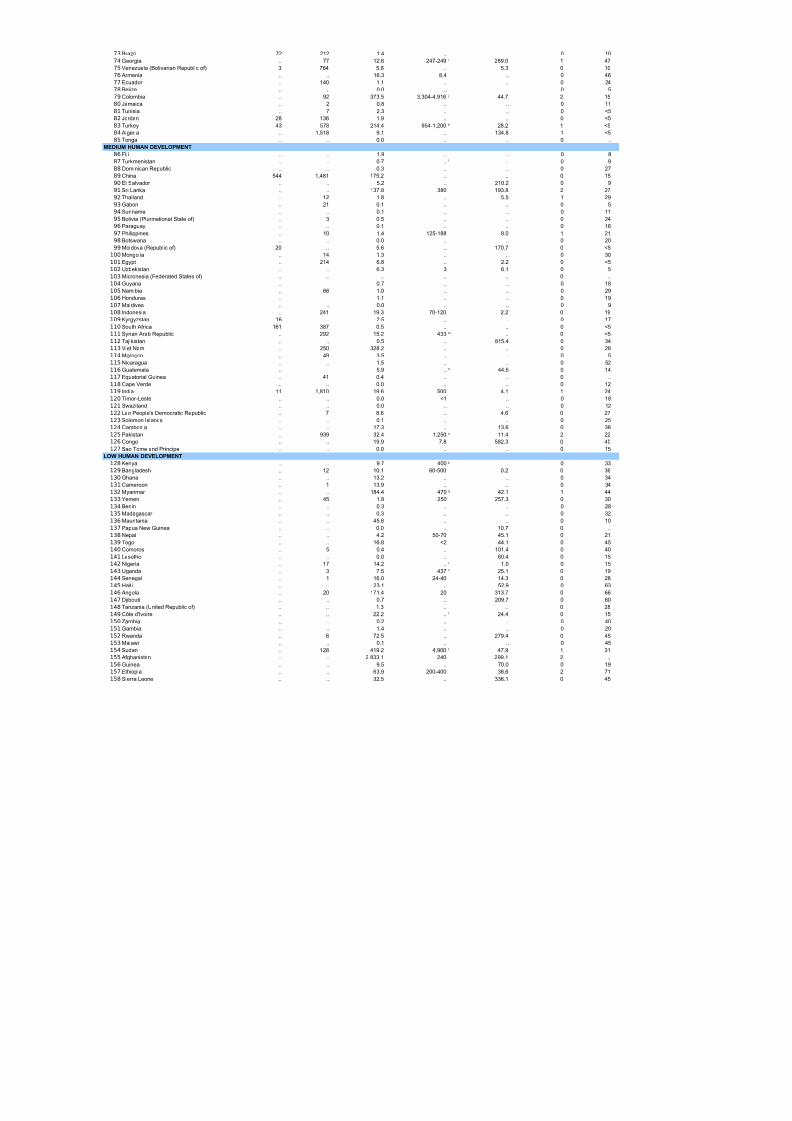
8/7/2019 Tabela IDH 2010 inglês
http://slidepdf.com/reader/full/tabela-idh-2010-ingles 43/102
8 Human securityLIMITATIONS TO FREEDOM FROM FEAR
Civil war
Prevalence of unExports Imports Fatalities Intensity
(thousands) (thousands) (% of total p
HDI rank 2008 2008 2008 2008 1990/2008 2008 1990–1992
VERY HIGH HUMAN DEVELOPMENT
1 Norway 2 536 0.0 .. .. 0 <5
2 Australia 6 380 0.0 .. .. 0 <5
3 New Zealand .. 2 0.0 .. .. 0 <5
4 United States 6,093 808 2.1 .. .. 0 <5
5 Ireland 1 21 0.0 .. .. 0 <5
6 Liechtenstein .. .. .. .. .. 0 ..
7 Netherlands 554 132 0.0 .. .. 0 <58 Canada 236 427 0.1 .. .. 0 <5
9 Sweden 457 64 0.0 .. .. 0 <5
10 Germany .. .. 0.2 .. .. 0 <5
11 Japan .. 584 0.2 .. .. 0 <5
12 Korea (Republic of) 80 1,821 1.1 .. .. 0 <5
13 Switzerland 467 14 0.0 .. .. 0 <5
14 France 1,831 7 0.1 .. .. 0 <5
15 Israel 271 665 1.5 .. 78.5 1 <5
16 Finland 67 152 0.0 .. .. 0 <5
17 Iceland .. .. 0.0 .. .. 0 <5
18 Belgium 228 177 0.1 .. .. 0 <5
19 Denmark 15 90 0.0 .. .. 0 <5
20 Spain 603 361 0.0 .. 0.9 0 <5
21 Hong Kong, China (SAR) .. .. 0.0 .. .. 0 ..
22 Greece .. 563 0.1 .. .. 0 <523 Italy 424 189 0.1 .. .. 0 <5
24 Luxembourg .. .. .. .. .. 0 <5
25 Austria 16 220 0.0 .. .. 0 <5
26 United Kingdom 1,027 506 0.2 .. 1.3 0 <5
27 Singapore 1 1,123 0.1 .. .. 0 ..
28 Czech Republic 33 20 1.4 .. .. 0 <5
29 Slovenia .. .. 0.1 .. .. 0 <5
30 Andorra .. .. 0.0 .. .. 0 ..
31 Slovakia 8 .. 0.3 .. .. 0 <5
32 United Arab Emirates .. 748 0.3 .. .. 0 <5
33 Malta .. .. 0.0 .. .. 0 <5
34 Estonia .. 50 0.2 .. .. 0 <5
35 Cyprus .. .. 0.0 200.5 .. 0 <5
36 Hungary .. 5 1.6 .. .. 0 <537 Brunei Darussalam .. .. 0.0 .. .. 0 <5
38 Qatar .. .. 0.1 .. .. 0 ..
39 Bahrain .. 19 0.1 .. .. 0 ..
40 Portugal 87 159 0.0 .. .. 0 <5
41 Poland 76 623 2.4 .. .. 0 <5
42 Barbados .. 13 0.0 .. .. 0 <5
HIGH HUMAN DEVELOPMENT
43 Bahamas .. .. 0.0 .. .. 0 7
44 Lithuania .. 26 0.5 .. .. 0 <5
45 Chile 133 577 1.0 .. .. 0 7
46 Argentina .. 21 1.0 .. .. 0 <5
47 Kuwait .. 5 0.9 .. .. 0 20
48 Latvia .. 44 0.8 .. .. 0 <5
49 Montenegro .. .. 1.3 .. .. 0 ..
50 Romania .. 70 4.8 .. .. 0 <551 Croatia .. 99 97.0 2.4 269.4 0 ..
52 Uruguay .. 65 0.2 .. .. 0 5
53 Libyan Arab Jamahiriya 9 .. 2.1 .. .. 0 <5
54 Panama .. .. 0.1 .. .. 0 18
55 Saudi Arabia .. 115 0.7 .. .. 0 <5
56 Mexico .. .. 6.2 5.5 0.7 0 <5
57 Malaysia .. 541 0.6 .. .. 0 <5
58 Bulgaria 8 123 3.0 .. .. 0 <5
59 Trinidad and Tobago .. .. 0.2 .. 23.2 0 11
60 Serbia .. .. 185.9 250 .. 0 ..
61 Belarus 292 .. 5.4 .. .. 0 <5
62 Costa Rica .. 0.4 .. .. 0 <5
63 Peru .. 2 7.3 150 21.9 1 28
64 Albania .. 13 15.0 .. .. 0 < 565 Russian Federation 6,026 .. 103.1 18-82 40.2 1 <5
66 Kazakhstan .. 25 4.8 .. .. 0 <5
67 Azerbaijan .. 21 16.3 573-603 236.6 0 27
68 Bosnia and Herzegovina .. .. 74.4 125 3,458.2 0 <5
69 Ukraine 269 .. 28.4 .. .. 0 <5
70 Iran (Islamic Republic of) 2 91 69.1 .. 1.1 1 <5
71 The former Yugoslav Republic of Macedonia .. .. 7.5 <1 60.6 0 <5
72 Mauritius .. .. 0.0 .. .. 0 7
Conventional arms transfersa
(1990 US$ millions)Refugees by
country of origin
Internally displaced
personsb
(average per year of conflict per million
inhabitants) Score (0–2)c
d
e
f
g
h
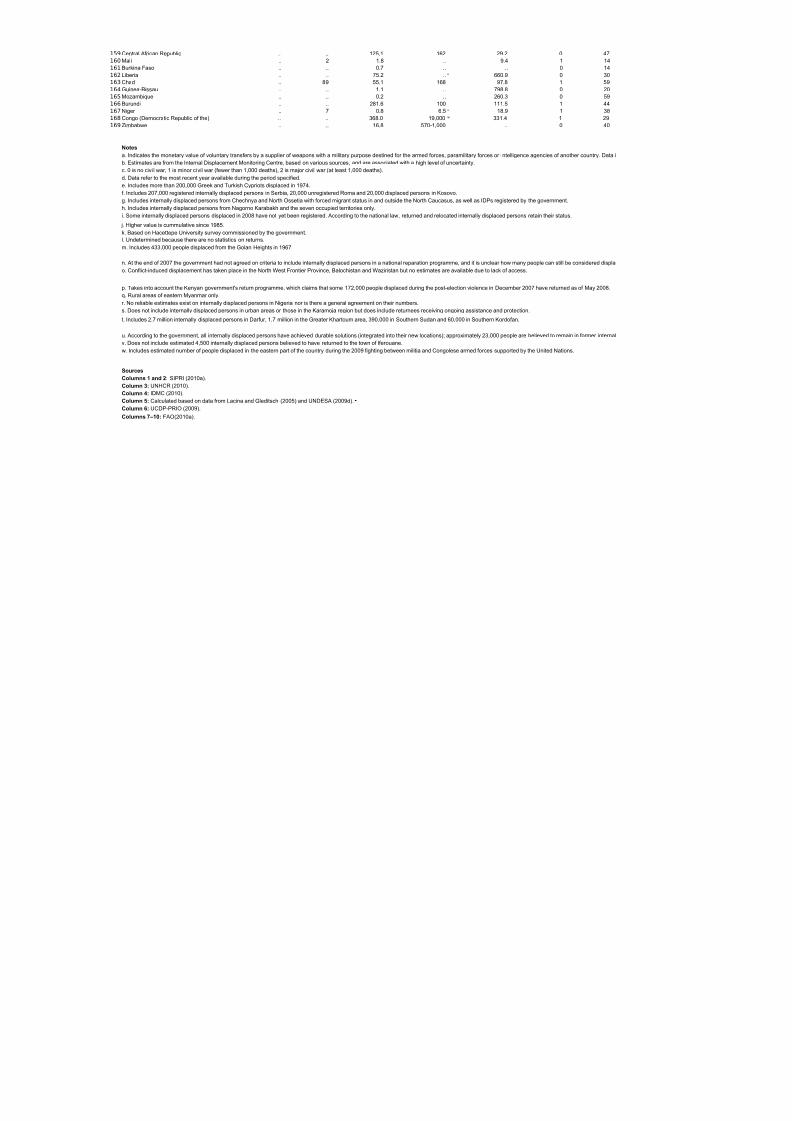
8/7/2019 Tabela IDH 2010 inglês
http://slidepdf.com/reader/full/tabela-idh-2010-ingles 44/102
73 Brazil 72 212 1.4 .. .. 0 10
74 Georgia .. 77 12.6 247-249 289.0 1 47
75 Venezuela (Bolivarian Republic of) 3 764 5.8 .. 5.3 0 10
76 Armenia .. .. 16.3 8.4 .. 0 46
77 Ecuador .. 140 1.1 .. .. 0 24
78 Belize .. .. 0.0 .. .. 0 5
79 Colombia .. 92 373.5 3,304-4,916 44.7 2 15
80 Jamaica .. 2 0.8 .. .. 0 1181 Tunisia .. 7 2.3 .. .. 0 <5
82 Jordan 28 136 1.9 .. .. 0 <5
83 Turkey 43 578 214.4 954-1,200 28.2 1 <5
84 Algeria .. 1,518 9.1 .. 134.8 1 <5
85 Tonga .. .. 0.0 .. .. 0 ..
MEDIUM HUMAN DEVELOPMENT
86 Fiji .. .. 1.9 .. .. 0 8
87 Turkmenistan .. .. 0.7 .. .. 0 9
88 Dominican Republic .. .. 0.3 .. .. 0 27
89 China 544 1,481 175.2 .. .. 0 15
90 El Salvador .. .. 5.2 .. 210.2 0 9
91 Sri Lanka .. .. 137.8 380 193.8 2 27
92 Thailand .. 12 1.8 .. 5.5 1 29
93 Gabon .. 21 0.1 .. .. 0 594 Suriname .. .. 0.1 .. .. 0 11
95 Bolivia (Plurinational State of) .. 3 0.5 .. .. 0 24
96 Paraguay .. .. 0.1 .. .. 0 16
97 Philippines .. 10 1.4 125-188 8.0 1 21
98 Botswana .. .. 0.0 .. .. 0 20
99 Moldova (Republic of) 20 .. 5.6 .. 170.7 0 <5
100 Mongolia .. 14 1.3 .. .. 0 30
101 Egypt .. 214 6.8 .. 2.2 0 <5
102 Uzbekistan .. .. 6.3 3 6.1 0 5
103 Micronesia (Federated States of) .. .. .. .. .. 0 ..
104 Guyana .. 0.7 .. .. 0 18
105 Namibia .. 66 1.0 .. .. 0 29
106 Honduras .. 1.1 .. .. 0 19
107 Maldives .. .. 0.0 .. .. 0 9
108 Indonesia .. 241 19.3 70-120 2.2 0 19109 Kyrgyzstan 16 .. 2.5 .. .. 0 17
110 South Africa 161 387 0.5 .. .. 0 <5
111 Syrian Arab Republic .. 292 15.2 433 .. 0 <5
112 Tajikistan .. .. 0.5 .. 815.4 0 34
113 Viet Nam .. 250 328.2 .. .. 0 28
114 Morocco .. 49 3.5 .. .. 0 5
115 Nicaragua .. .. 1.5 .. .. 0 52
116 Guatemala .. 5.9 .. 44.5 0 14
117 Equatorial Guinea .. 41 0.4 .. .. 0 ..
118 Cape Verde .. .. 0.0 .. .. 0 12
119 India 11 1,810 19.6 500 4.1 1 24
120 Timor-Leste .. .. 0.0 <1 .. 0 18
121 Swaziland .. .. 0.0 .. .. 0 12
122 Lao People's Democratic Republic .. 7 8.6 .. 4.6 0 27123 Solomon Islands .. .. 0.1 .. .. 0 25
124 Cambodia .. .. 17.3 .. 13.6 0 38
125 Pakistan .. 939 32.4 1,250 11.4 2 22
126 Congo .. .. 19.9 7.8 582.3 0 40
127 Sao Tome and Principe .. .. 0.0 .. .. 0 15
LOW HUMAN DEVELOPMENT
128 Kenya .. .. 9.7 400 .. 0 33
129 Bangladesh .. 12 10.1 60-500 0.2 0 36
130 Ghana .. .. 13.2 .. .. 0 34
131 Cameroon .. 1 13.9 .. .. 0 34
132 Myanmar .. .. 184.4 470 42.1 1 44
133 Yemen .. 45 1.8 250 257.3 0 30
134 Benin .. .. 0.3 .. .. 0 28
135 Madagascar .. .. 0.3 .. .. 0 32
136 Mauritania .. .. 45.6 .. .. 0 10
137 Papua New Guinea .. .. 0.0 .. 10.7 0 ..
138 Nepal .. .. 4.2 50-70 45.1 0 21
139 Togo .. .. 16.8 <2 44.1 0 45
140 Comoros .. 5 0.4 .. 101.4 0 40
141 Lesotho .. .. 0.0 .. 60.4 0 15
142 Nigeria .. 17 14.2 .. 1.0 0 15
143 Uganda .. 3 7.5 437 25.1 0 19
144 Senegal .. 1 16.0 24-40 14.3 0 28
145 Haiti .. .. 23.1 .. 52.9 0 63
146 Angola .. 20 171.4 20 313.7 0 66
147 Djibouti .. .. 0.7 .. 209.7 0 60
148 Tanzania (United Republic of) .. .. 1.3 .. .. 0 28
149 Côte d'Ivoire .. .. 22.2 .. 24.4 0 15
150 Zambia .. .. 0.2 .. .. 0 40151 Gambia .. .. 1.4 .. .. 0 20
152 Rwanda .. 6 72.5 .. 279.4 0 45
153 Malawi .. .. 0.1 .. .. 0 45
154 Sudan .. 128 419.2 4,900 47.9 1 31
155 Afghanistan .. .. 2,833.1 240 299.1 2 ..
156 Guinea .. .. 9.5 .. 70.0 0 19
157 Ethiopia .. .. 63.9 200-400 38.6 2 71
158 Sierra Leone .. .. 32.5 .. 336.1 0 45
i
j
k
l
m
n
o
p
q
r
s
l
t
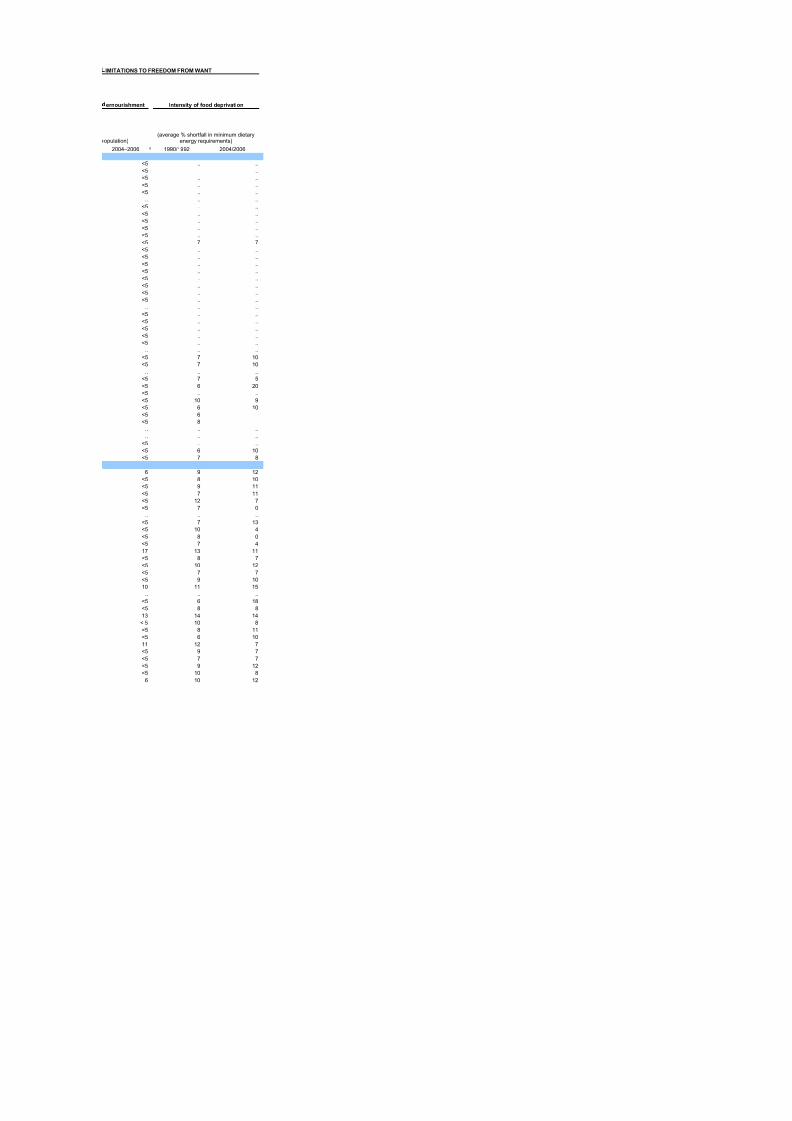
8/7/2019 Tabela IDH 2010 inglês
http://slidepdf.com/reader/full/tabela-idh-2010-ingles 45/102
159 Central African Republic .. .. 125.1 162 29.2 0 47
160 Mali .. 2 1.8 .. 9.4 1 14
161 Burkina Faso .. .. 0.7 .. .. 0 14
162 Liberia .. .. 75.2 .. 660.9 0 30
163 Chad .. 89 55.1 168 97.8 1 59
164 Guinea-Bissau .. .. 1.1 .. 798.8 0 20
165 Mozambique .. .. 0.2 .. 260.3 0 59
166 Burundi .. .. 281.6 100 111.5 1 44167 Niger .. 7 0.8 6.5 18.9 1 38
168 Congo (Democratic Republic of the) .. .. 368.0 19,000 331.4 1 29
169 Zimbabwe .. .. 16.8 570-1,000 .. 0 40
Notes
b. Estimates are from the Internal Displacement Monitoring Centre, based on various sources, and are associated with a high level of uncertainty.
c. 0 is no civi l war, 1 is minor civil war (fewer than 1,000 deaths), 2 is major civil war (at least 1,000 deaths).
d. Data refer to the most recent year available during the period specified.
e. Includes more than 200,000 Greek and Turkish Cypriots displaced in 1974.
f. Includes 207,000 registered internally displaced persons in Serbia, 20,000 unregistered Roma and 20,000 displaced persons in Kosovo.
g. Includes internally displaced persons from Chechnya and North Ossetia with forced migrant status in and outside the North Caucasus, as well as IDPs registered by the government.
h. Includes internally displaced persons from Nagorno Karabakh and the seven occupied territories only.i. Some internally displaced persons displaced in 2008 have not yet been registered. According to the national law, returned and relocated internally displaced persons retain their status.
j. Higher value is cummulative since 1985.
k. Based on Hacettepe University survey commissioned by the government.
l. Undetermined because there are no statistics on returns.
m. Includes 433,000 people displaced from the Golan Heights in 1967.
n. At the end of 2007 the government had not agreed on criteria to include internally displaced persons in a national reparation programme, and it is unclear how many people can still be considered displa
o. Conflict-induced displacement has taken place in the North West Frontier Province, Balochistan and Waziristan but no estimates are available due to lack of access.
p. Takes into account the Kenyan government's return programme, which claims that some 172,000 people displaced during the post-election violence in December 2007 have returned as of May 2008.
q. Rural areas of eastern Myanmar only.
r. No reliable estimates exist on internally displaced persons in Nigeria nor is there a general agreement on their numbers.
s. Does not include internally displaced persons in urban areas or those in the Karamoja region but does include returnees receiving ongoing assistance and protection.t. Includes 2.7 million internally displaced persons in Darfur, 1.7 million in the Greater Khartoum area, 390,000 in Southern Sudan and 60,000 in Southern Kordofan.
u. According to the government, all internally displaced persons have achieved durable solutions (integrated into their new locations); approximately 23,000 people are believed to remain in former internal
v. Does not include estimated 4,500 internally displaced persons believed to have returned to the town of Iferouane.
w. Includes estimated number of people displaced in the eastern part of the country during the 2009 fighting between militia and Congolese armed forces supported by the United Nations.
Sources
u
v
w
a. Indicates the monetary value of voluntary transfers by a supplier of weapons with a military purpose destined for the armed forces, paramilitary forces or intelligence agencies of another country. Data i
Columns 1 and 2: SIPRI (2010a).
Column 3: UNHCR (2010).
Column 4: IDMC (2010).
Column 5: Calculated based on data from Lacina and Gleditsch (2005) and UNDESA (2009d).
Column 6: UCDP-PRIO (2009).
Columns 7–10: FAO(2010a).
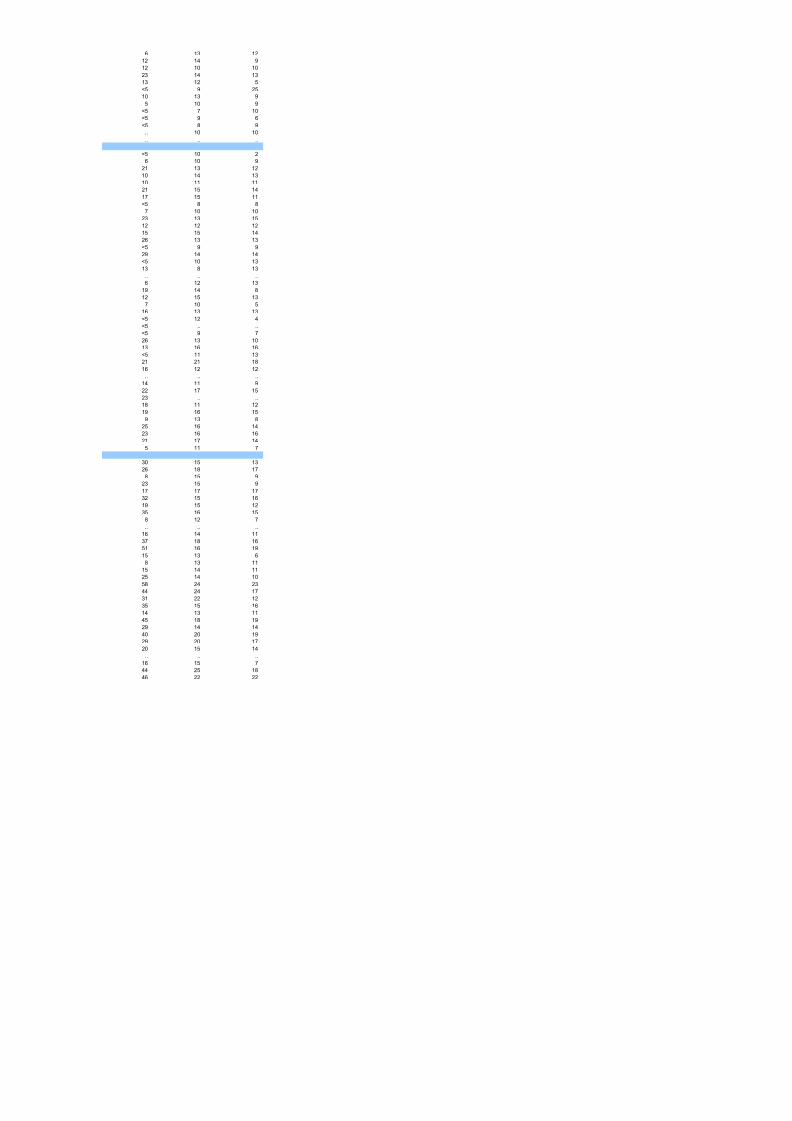
8/7/2019 Tabela IDH 2010 inglês
http://slidepdf.com/reader/full/tabela-idh-2010-ingles 46/102
IMITATIONS TO FREEDOM FROM WANT
ernourishment Intensity of food deprivation
opulation)
2004–2006 1990/1992 2004/2006
<5 .. ..
<5 .. ..
<5 .. ..
<5 .. ..
<5 .. ..
.. .. ..
<5 .. ..<5 .. ..
<5 .. ..
<5 .. ..
<5 .. ..
<5 7 7
<5 .. ..
<5 .. ..
<5 .. ..
<5 .. ..
<5 .. ..
<5 .. ..
<5 .. ..
<5 .. ..
.. .. ..
<5 .. ..
<5 .. ..
<5 .. ..
<5 .. ..
<5 .. ..
.. .. ..
<5 7 10
<5 7 10
.. .. ..
<5 7 5
<5 6 20
<5 .. ..
<5 10 9
<5 6 10
<5 6<5 8
.. .. ..
.. .. ..
<5 .. ..
<5 6 10
<5 7 8
6 9 12
<5 8 10
<5 9 11
<5 7 11
<5 12 7
<5 7 0
.. .. ..
<5 7 13
<5 10 4
<5 8 0
<5 7 4
17 13 11
<5 8 7
<5 10 12
<5 7 7
<5 9 10
10 11 15
.. .. ..
<5 6 18
<5 8 8
13 14 14
< 5 10 8<5 8 11
<5 6 10
11 12 7
<5 9 7
<5 7 7
<5 9 12
<5 10 8
6 10 12
(average % shortfall in minimum dietaryenergy requirements)
d
8/7/2019 Tabela IDH 2010 inglês
http://slidepdf.com/reader/full/tabela-idh-2010-ingles 47/102
6 13 12
12 14 9
12 10 10
23 14 13
13 12 5
<5 9 25
10 13 9
5 10 9<5 7 10
<5 9 6
<5 8 9
.. 10 10
.. .. ..
<5 10 2
6 10 9
21 13 12
10 14 13
10 11 11
21 15 14
17 15 11
<5 8 8
7 10 10
23 13 15
12 12 12
15 15 14
26 13 13
<5 9 9
29 14 14
<5 10 13
13 8 13
.. .. ..
6 12 13
19 14 8
12 15 13
7 10 5
16 13 13<5 12 4
<5 .. ..
<5 9 7
26 13 10
13 16 16
<5 11 13
21 21 18
16 12 12
.. .. ..
14 11 9
22 17 15
23 .. ..
18 11 12
19 16 159 13 8
25 16 14
23 16 16
21 17 14
5 11 7
30 15 13
26 18 17
8 15 9
23 15 9
17 17 17
32 15 16
19 15 12
35 16 15
8 12 7.. .. ..
16 14 11
37 18 16
51 16 19
15 13 6
8 13 11
15 14 11
25 14 10
58 24 23
44 24 17
31 22 12
35 15 16
14 13 11
45 18 1929 14 14
40 20 19
29 20 17
20 15 14
.. .. ..
16 15 7
44 25 18
46 22 22
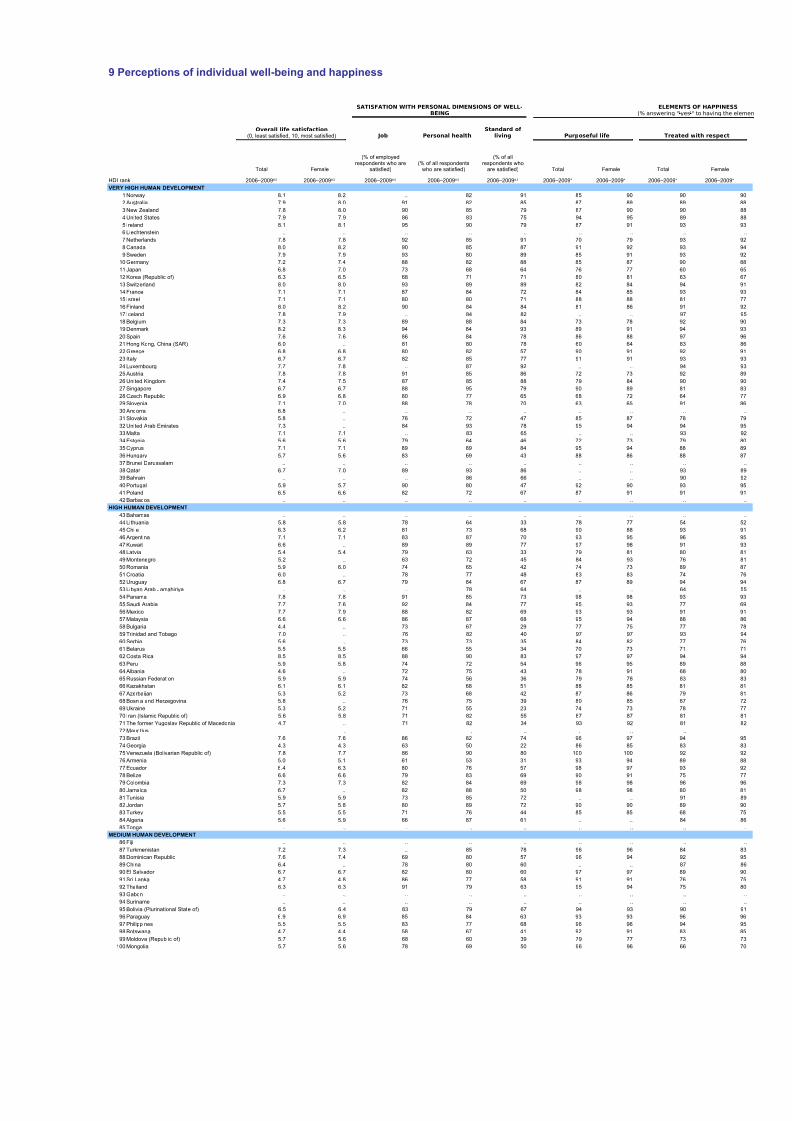
8/7/2019 Tabela IDH 2010 inglês
http://slidepdf.com/reader/full/tabela-idh-2010-ingles 48/102
41 19 16
10 13 12
9 13 10
38 18 18
38 22 17
31 14 14
37 22 16
63 18 2128 18 15
75 15 25
39 19 17
ced.
ly displaced persons camps.
ndicate only the volume of international arms transfers, not the a
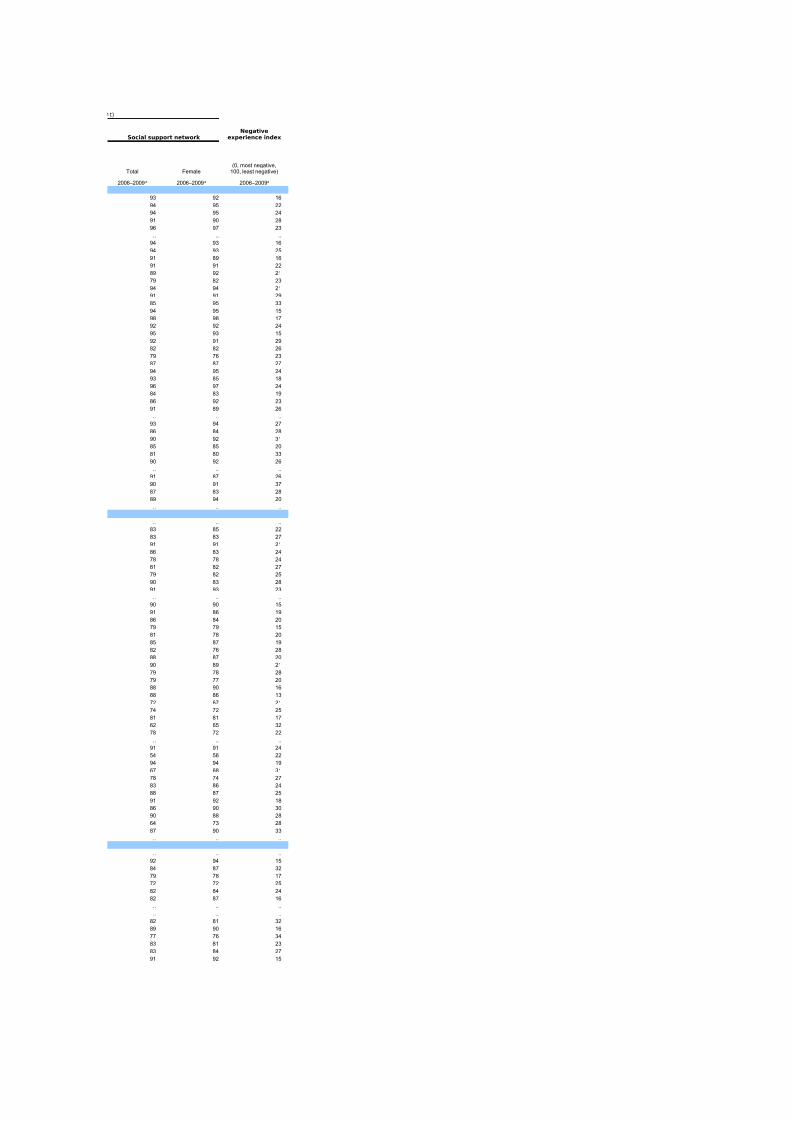
8/7/2019 Tabela IDH 2010 inglês
http://slidepdf.com/reader/full/tabela-idh-2010-ingles 49/102
9 Perceptions of individual well-being and happiness
Job Personal health Purposeful life Treated with r
Total Female Total Female Total
HDI rank
VERY HIGH HUMAN DEVELOPMENT
1 Norway 8.1 8.2 .. 82 91 85 90 90
2 Australia 7.9 8.0 91 82 85 87 89 89
3 New Zealand 7.8 8.0 90 85 79 87 90 90
4 United States 7.9 7.9 86 83 75 94 95 89
5 Ireland 8.1 8.1 95 90 79 87 91 93
6 Liechtenstein .. .. .. .. .. .. .. ..
7 Netherlands 7.8 7.8 92 85 91 70 79 93
8 Canada 8.0 8.2 90 85 87 91 92 93
9 Sweden 7.9 7.9 93 80 89 85 91 93
10 Germany 7.2 7.4 88 82 88 85 87 90
11 Japan 6.8 7.0 73 68 64 76 77 60
12 Korea (Republic of) 6.3 6.5 68 71 71 80 81 63
13 Switzerland 8.0 8.0 93 89 89 82 84 94
14 France 7.1 7.1 87 84 72 84 85 93
15 Israel 7.1 7.1 80 80 71 88 88 81
16 Finland 8.0 8.2 90 84 84 81 86 91
17 Iceland 7.8 7.9 .. 84 82 .. .. 97
18 Belgium 7.3 7.3 89 88 84 73 78 92
19 Denmark 8.2 8.3 94 84 93 89 91 94
20 Spain 7.6 7.6 86 84 78 86 88 97
21 Hong Kong, China (SAR) 6.0 .. 81 80 78 60 64 83
22 Greece 6.8 6.8 80 82 57 90 91 92
23 Italy 6.7 6.7 82 85 77 91 91 93
24 Luxembourg 7.7 7.8 .. 87 92 .. .. 94
25 Austria 7.8 7.8 91 85 86 72 73 92
26 United Kingdom 7.4 7.5 87 85 88 79 84 90
27 Singapore 6.7 6.7 88 95 79 90 89 81
28 Czech Republic 6.9 6.8 80 77 65 68 72 64
29 Slovenia 7.1 7.0 88 78 70 63 65 91
30 Andorra 6.8 .. .. .. .. .. .. ..
31 Slovakia 5.8 .. 76 72 47 85 87 78
32 United Arab Emirates 7.3 .. 84 93 78 95 94 94
33 Malta 7.1 7.1 .. 83 65 .. .. 93
34 Estonia 5.6 5.6 79 64 46 72 73 79
35 Cyprus 7.1 7.1 89 89 84 95 94 88
36 Hungary 5.7 5.6 83 69 43 88 86 88
37 Brunei Darussalam .. .. .. .. .. .. .. ..
38 Qatar 6.7 7.0 89 93 86 .. .. 93
39 Bahrain .. .. .. 86 66 .. .. 90
40 Portugal 5.9 5.7 90 80 47 92 90 93
41 Poland 6.5 6.6 82 72 67 87 91 91
42 Barbados .. .. .. .. .. .. .. ..
HIGH HUMAN DEVELOPMENT
43 Bahamas .. .. .. .. .. .. .. ..
44 Lithuania 5.8 5.8 78 64 33 78 77 54
45 Chile 6.3 6.2 81 73 68 90 88 93
46 Argentina 7.1 7.1 83 87 70 93 95 96
47 Kuwait 6.6 .. 89 89 77 97 98 91
48 Latvia 5.4 5.4 79 63 33 79 81 80
49 Montenegro 5.2 .. 63 72 45 84 93 76
50 Romania 5.9 6.0 74 65 42 74 73 89
51 Croatia 6.0 .. 78 77 48 83 83 74
52 Uruguay 6.8 6.7 79 84 67 87 89 94
53 Libyan Arab Jamahiriya .. .. .. 78 64 .. .. 64
54 Panama 7.8 7.8 91 85 73 98 98 93
55 Saudi Arabia 7.7 7.6 92 84 77 95 93 77
56 Mexico 7.7 7.9 88 82 69 93 93 91
57 Malaysia 6.6 6.6 86 87 68 95 94 88
58 Bulgaria 4.4 .. 73 67 29 77 75 77
59 Trinidad and Tobago 7.0 .. 76 82 40 97 97 93
60 Serbia 5.6 .. 73 73 35 84 82 77
61 Belarus 5.5 5.5 66 55 34 70 73 71
62 Costa Rica 8.5 8.5 88 90 83 97 97 94
63 Peru 5.9 5.8 74 72 54 96 95 89
64 Albania 4.6 .. 72 75 43 78 91 68
65 Russian Federation 5.9 5.9 74 56 36 79 78 83
66 Kazakhstan 6.1 6.1 82 68 51 88 85 81
67 Azerbaijan 5.3 5.2 73 68 42 87 86 79
68 Bosnia and Herzegovina 5.8 .. 76 75 39 80 85 67
69 Ukraine 5.3 5.2 71 55 23 74 73 78
70 Iran (Islamic Republic of) 5.6 5.8 71 82 55 87 87 81
71 The former Yugoslav Republic of Macedonia 4.7 .. 71 82 34 93 92 81 72 Mauritius .. .. .. .. .. .. .. ..
73 Brazil 7.6 7.6 86 82 74 96 97 94
74 Georgia 4.3 4.3 63 50 22 86 85 83
75 Venezuela (Bolivarian Republic of) 7.8 7.7 86 90 80 100 100 92
76 Armenia 5.0 5.1 61 53 31 93 94 89
77 Ecuador 6.4 6.3 80 76 57 98 97 93
78 Belize 6.6 6.6 79 83 69 90 91 75
79 Colombia 7.3 7.3 82 84 69 98 98 96
80 Jamaica 6.7 .. 82 88 50 98 98 80
81 Tunisia 5.9 5.9 73 85 72 .. .. 91
82 Jordan 5.7 5.8 80 89 72 90 90 89
83 Turkey 5.5 5.5 71 76 44 85 85 68
84 Algeria 5.6 5.9 66 87 61 .. .. 84
85 Tonga .. .. .. .. .. .. .. .. MEDIUM HUMAN DEVELOPMENT
86 Fiji .. .. .. .. .. .. .. ..
87 Turkmenistan 7.2 7.3 .. 85 78 96 96 84
88 Dominican Republic 7.6 7.4 69 80 57 96 94 92
89 China 6.4 .. 78 80 60 .. .. 87
90 El Salvador 6.7 6.7 82 80 60 97 97 89
91 S i L k 4 7 4 8 86 77 58 91 91 76
SATISFATION WITH PERSONAL DIMENSIONS OF WELL-BEING
ELEMENTS OF H(% answering "'yes'" to h
Overall life satisfaction(0, least satisfied, 10, most satisfied)
Standard of living
(% of employedrespondents who are
satisfied)(% of all respondents
who are satisfied)
(% of allrespondents who
are satisfied)
2006–2009a,b 2006–2009a,b 2006–2009a,b 2006–2009a,b 2006–2009a,b 2006–2009a 2006–2009a 2006–2009a 2
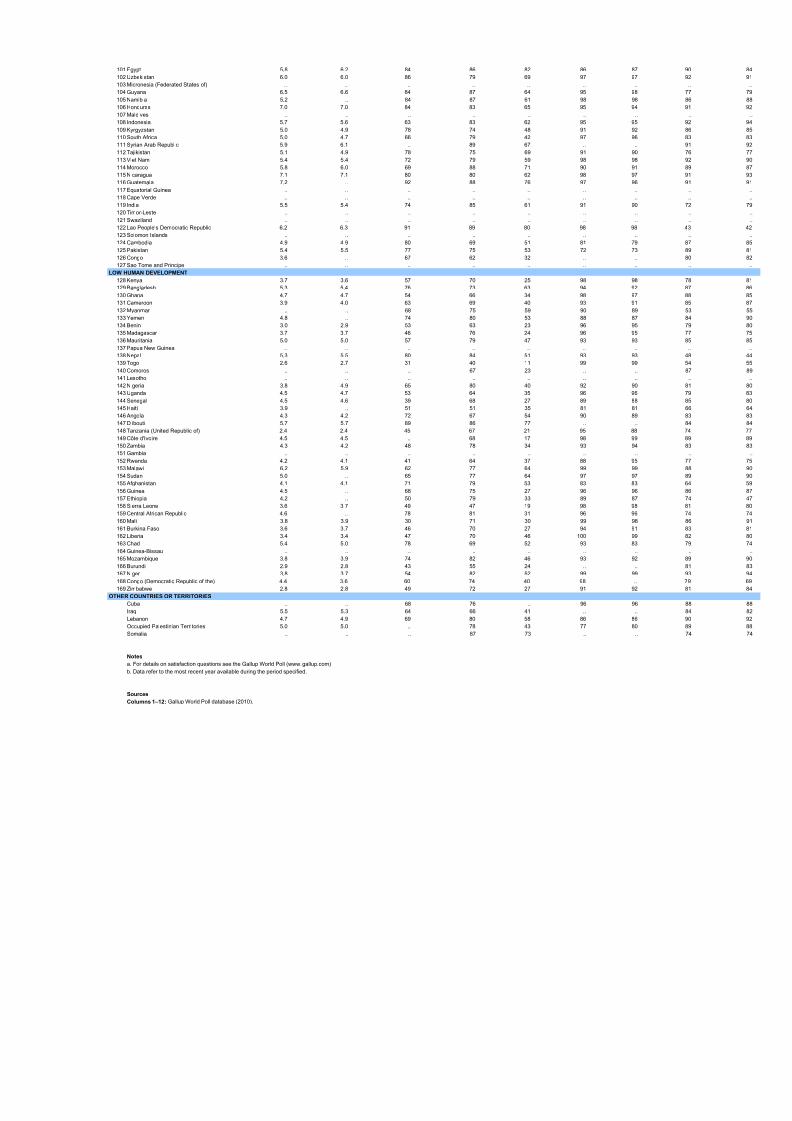
8/7/2019 Tabela IDH 2010 inglês
http://slidepdf.com/reader/full/tabela-idh-2010-ingles 50/102
Social support network
Total Female
93 92 16
94 95 2294 95 24
91 90 28
96 97 23
.. .. ..
94 93 16
94 93 25
91 89 16
91 91 22
89 92 21
79 82 23
94 94 21
91 91 29
85 95 33
94 95 1598 98 17
92 92 24
95 93 15
92 91 29
82 82 26
79 76 23
87 87 27
94 95 24
93 85 18
96 97 24
84 83 19
86 92 23
91 89 26
.. .. ..93 94 27
86 84 28
90 92 31
85 85 20
81 80 33
90 92 26
.. .. ..
91 87 26
90 91 37
87 83 28
89 94 20
.. .. ..
.. .. ..
83 85 22
83 83 27
91 91 21
86 83 24
78 78 24
81 82 27
79 82 25
90 83 28
91 93 23
.. .. ..
90 90 15
91 86 19
86 84 2079 79 15
81 78 20
85 87 19
82 76 28
88 87 20
90 89 21
79 78 28
79 77 20
88 90 16
88 86 13
72 67 21
74 72 25
81 81 17
62 65 3278 72 22
.. .. ..
91 91 24
54 56 22
94 94 19
67 68 31
78 74 27
83 86 24
88 87 25
91 92 18
86 90 30
90 88 28
64 73 28
87 90 33.. .. ..
.. .. ..
92 94 15
84 87 32
79 78 17
t)
Negativeexperience index
(0, most negative,100, least negative)
2006–2009a 2006–2009a 2006–2009a
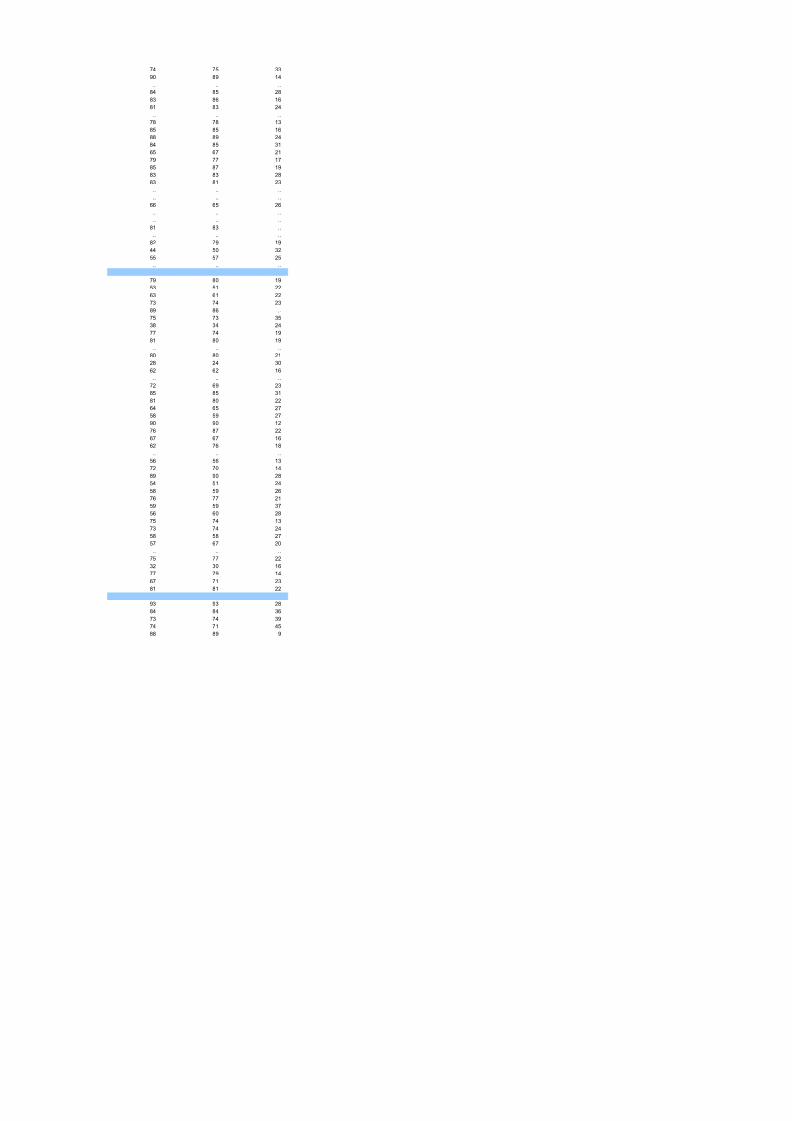
8/7/2019 Tabela IDH 2010 inglês
http://slidepdf.com/reader/full/tabela-idh-2010-ingles 51/102
101 Egypt 5.8 6.2 84 86 82 86 87 90
102 Uzbekistan 6.0 6.0 86 79 69 97 97 92
103 Micronesia (Federated States of) .. .. .. .. .. .. .. ..
104 Guyana 6.5 6.6 84 87 64 95 98 77
105 Namibia 5.2 .. 84 87 61 98 98 86
106 Honduras 7.0 7.0 84 83 65 95 94 91
107 Maldives .. .. .. .. .. .. .. ..
108 Indonesia 5.7 5.6 63 83 62 95 95 92
109 Kyrgyzstan 5.0 4.9 78 74 48 91 92 86
110 South Africa 5.0 4.7 66 79 42 97 96 83
111 Syrian Arab Republic 5.9 6.1 .. 89 67 .. .. 91
112 Tajikistan 5.1 4.9 78 75 69 91 90 76
113 Viet Nam 5.4 5.4 72 79 59 98 98 92
114 Morocco 5.8 6.0 69 88 71 90 91 89
115 Nicaragua 7.1 7.1 80 80 62 98 97 91
116 Guatemala 7.2 .. 92 88 76 97 96 91
117 Equatorial Guinea .. .. .. .. .. .. .. ..
118 Cape Verde .. .. .. .. .. .. .. ..
119 India 5.5 5.4 74 85 61 91 90 72 120 Timor-Leste .. .. .. .. .. .. .. ..
121 Swaziland .. .. .. .. .. .. .. ..
122 Lao People's Democratic Republic 6.2 6.3 91 89 80 98 98 43
123 Solomon Islands .. .. .. .. .. .. .. ..
124 Cambodia 4.9 4.9 80 69 51 81 79 87
125 Pakistan 5.4 5.5 77 75 53 72 73 89
126 Congo 3.6 .. 67 62 32 .. .. 80
127 Sao Tome and Principe .. .. .. .. .. .. .. ..
LOW HUMAN DEVELOPMENT
128 Kenya 3.7 3.6 57 70 25 98 98 78
129 Bangladesh 5.3 5.4 76 73 63 94 92 87
130 Ghana 4.7 4.7 54 66 34 98 97 88
131 Cameroon 3.9 4.0 63 69 40 93 91 85
132 Myanmar .. .. 68 75 59 90 89 53 133 Yemen 4.8 .. 74 80 53 88 87 84
134 Benin 3.0 2.9 53 63 23 96 95 79
135 Madagascar 3.7 3.7 46 76 24 96 95 77
136 Mauritania 5.0 5.0 57 79 47 93 93 85
137 Papua New Guinea .. .. .. .. .. .. .. ..
138 Nepal 5.3 5.5 80 84 51 93 93 48
139 Togo 2.6 2.7 31 40 11 99 99 54
140 Comoros .. .. .. 67 23 .. .. 87
141 Lesotho .. .. .. .. .. .. .. ..
142 Nigeria 3.8 4.9 65 80 40 92 90 81
143 Uganda 4.5 4.7 53 64 35 96 96 79
144 Senegal 4.5 4.6 39 68 27 89 88 85
145 Haiti 3.9 .. 51 51 35 81 81 66
146 Angola 4.3 4.2 72 67 54 90 89 83 147 Djibouti 5.7 5.7 89 86 77 .. .. 84
148 Tanzania (United Republic of) 2.4 2.4 45 67 21 95 88 74
149 Côte d'Ivoire 4.5 4.5 .. 68 17 98 99 89
150 Zambia 4.3 4.2 48 78 34 93 94 83
151 Gambia .. .. .. .. .. .. .. ..
152 Rwanda 4.2 4.1 41 64 37 88 95 77
153 Malawi 6.2 5.9 62 77 64 99 99 88
154 Sudan 5.0 .. 65 77 64 97 97 89
155 Afghanistan 4.1 4.1 71 79 53 83 83 64
156 Guinea 4.5 .. 68 75 27 96 96 86
157 Ethiopia 4.2 .. 50 79 33 89 87 74
158 Sierra Leone 3.6 3.7 49 47 19 98 98 81
159 Central African Republic 4.6 .. 78 81 31 96 96 74
160 Mali 3.8 3.9 30 71 30 99 98 86
161 Burkina Faso 3.6 3.7 46 70 27 94 91 83
162 Liberia 3.4 3.4 47 70 46 100 99 82
163 Chad 5.4 5.0 78 69 52 93 83 79
164 Guinea-Bissau .. .. .. .. .. .. .. ..
165 Mozambique 3.8 3.9 74 82 46 93 92 89
166 Burundi 2.9 2.8 43 55 24 .. .. 81
167 Niger 3.8 3.7 54 82 52 99 99 93
168 Congo (Democratic Republic of the) 4.4 3.6 60 74 40 98 .. 79
169 Zimbabwe 2.8 2.8 49 72 27 91 92 81
OTHER COUNTRIES OR TERRITORIES
Cuba .. .. 68 76 .. 96 96 88
Iraq 5.5 5.3 64 66 41 .. .. 84
Lebanon 4.7 4.9 69 80 58 86 86 90
Occupied Palestinian Territories 5.0 5.0 .. 78 43 77 80 89
Somalia .. .. .. 87 73 .. .. 74
Notes
a. For details on satisfaction questions see the Gallup World Poll (www.gallup.com)
b. Data refer to the most recent year available during the period specified.
Sources
Columns 1–12: Gallup World Poll database (2010).
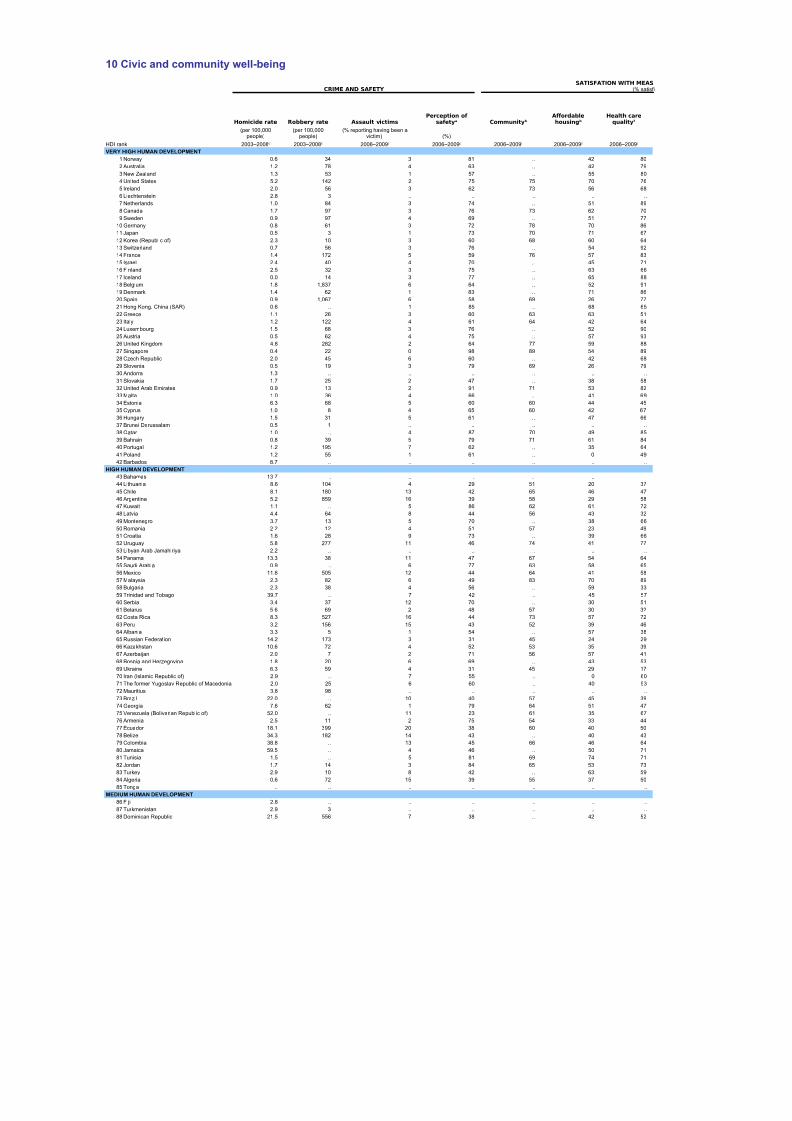
8/7/2019 Tabela IDH 2010 inglês
http://slidepdf.com/reader/full/tabela-idh-2010-ingles 52/102
74 75 33
90 89 14
.. .. ..
84 85 28
83 86 16
81 83 24
.. .. ..
78 78 13
85 85 16
88 89 24
84 85 31
65 67 21
79 77 17
85 87 19
83 83 28
83 81 23
.. .. ..
.. .. ..
66 65 26.. .. ..
.. .. ..
81 83 ..
.. .. ..
82 79 19
44 50 32
55 57 25
.. .. ..
79 80 19
53 51 22
63 61 22
73 74 23
89 86 ..75 73 35
38 34 24
77 74 19
81 80 19
.. .. ..
80 80 21
28 24 30
62 62 16
.. .. ..
72 69 23
85 85 31
81 80 22
64 65 27
58 59 2790 90 12
76 87 22
67 67 16
62 76 18
.. .. ..
56 56 13
72 70 14
89 90 28
54 51 24
58 59 26
76 77 21
59 59 37
56 60 28
75 74 13
73 74 24
58 58 27
57 67 20
.. .. ..
75 77 22
32 30 16
77 79 14
67 71 23
81 81 22
93 93 28
84 84 36
73 74 39
74 71 45
88 89 9
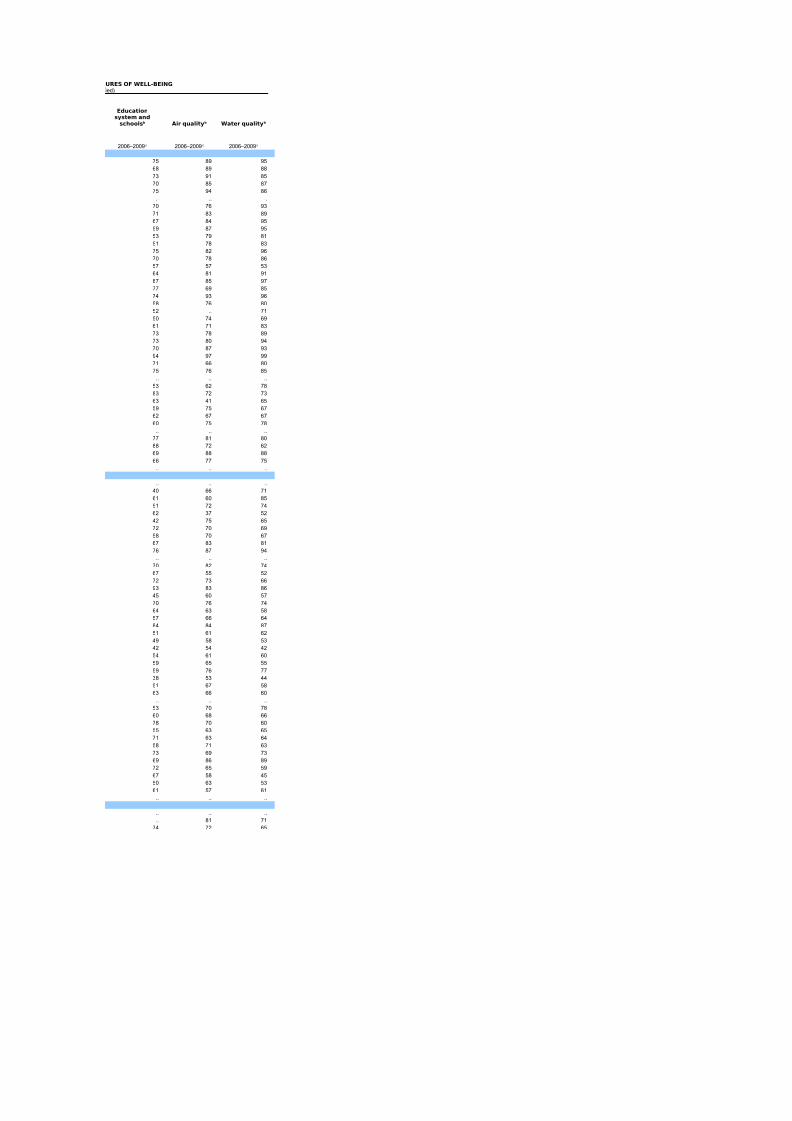
8/7/2019 Tabela IDH 2010 inglês
http://slidepdf.com/reader/full/tabela-idh-2010-ingles 53/102
10 Civic and community well-being
CRIME AND SAFETY
Homicide rate Robbery rate Assault victims
(%)
HDI rank
VERY HIGH HUMAN DEVELOPMENT
1 Norway 0.6 34 3 81 .. 42 80
2 Australia 1.2 78 4 63 .. 42 79
3 New Zealand 1.3 53 1 57 .. 55 80
4 United States 5.2 142 2 75 75 70 76
5 Ireland 2.0 56 3 62 73 56 68
6 Liechtenstein 2.8 3 .. .. .. .. ..
7 Netherlands 1.0 84 3 74 .. 51 89
8 Canada 1.7 97 3 76 73 62 70
9 Sweden 0.9 97 4 69 .. 51 77
10 Germany 0.8 61 3 72 78 70 86
11 Japan 0.5 3 1 73 70 71 67
12 Korea (Republic of) 2.3 10 3 60 68 60 64
13 Switzerland 0.7 56 3 76 .. 54 92
14 France 1.4 172 5 59 76 57 83
15 Israel 2.4 40 4 70 .. 45 71
16 Finland 2.5 32 3 75 .. 63 66
17 Iceland 0.0 14 3 77 .. 65 88
18 Belgium 1.8 1,837 6 64 .. 52 91
19 Denmark 1.4 62 1 83 .. 71 86
20 Spain 0.9 1,067 6 58 69 26 77
21 Hong Kong, China (SAR) 0.6 .. 1 85 .. 68 65
22 Greece 1.1 26 3 60 63 63 51
23 Italy 1.2 122 4 61 64 42 64
24 Luxembourg 1.5 68 3 76 .. 52 90
25 Austria 0.5 62 4 75 .. 57 93
26 United Kingdom 4.8 282 2 64 77 59 88
27 Singapore 0.4 22 0 98 89 54 89
28 Czech Republic 2.0 45 6 60 .. 42 68
29 Slovenia 0.5 19 3 79 69 26 79
30 Andorra 1.3 .. .. .. .. .. ..
31 Slovakia 1.7 25 2 47 .. 38 58
32 United Arab Emirates 0.9 13 2 91 71 53 82
33 Malta 1.0 36 4 66 .. 41 69
34 Estonia 6.3 68 5 60 60 44 45
35 Cyprus 1.0 8 4 65 60 42 67
36 Hungary 1.5 31 5 61 .. 47 66
37 Brunei Darussalam 0.5 1 .. .. .. .. ..
38 Qatar 1.0 .. 4 87 70 49 85
39 Bahrain 0.8 39 5 79 71 61 84
40 Portugal 1.2 195 7 62 .. 35 64
41 Poland 1.2 55 1 61 .. 0 49
42 Barbados 8.7 .. .. .. .. .. ..
HIGH HUMAN DEVELOPMENT
43 Bahamas 13.7 .. .. .. .. .. ..
44 Lithuania 8.6 104 4 29 51 20 37
45 Chile 8.1 180 13 42 65 46 47
46 Argentina 5.2 859 16 39 58 29 58
47 Kuwait 1.1 .. 5 86 62 61 72
48 Latvia 4.4 64 8 44 56 43 32
49 Montenegro 3.7 13 5 70 .. 38 66
50 Romania 2.2 12 4 51 57 23 49
51 Croatia 1.6 28 9 73 .. 39 66
52 Uruguay 5.8 277 11 46 74 41 77
53 Libyan Arab Jamahiriya 2.2 .. .. .. .. .. ..
54 Panama 13.3 38 11 47 67 54 64
55 Saudi Arabia 0.9 .. 6 77 63 58 65
56 Mexico 11.6 505 12 44 64 41 58
57 Malaysia 2.3 82 6 49 83 70 89
58 Bulgaria 2.3 38 4 56 .. 59 33
59 Trinidad and Tobago 39.7 .. 7 42 .. 45 57
60 Serbia 3.4 37 12 70 .. 30 51
61 Belarus 5.6 69 2 48 57 30 32
62 Costa Rica 8.3 527 16 44 73 57 72
63 Peru 3.2 156 15 43 52 39 46
64 Albania 3.3 5 1 54 .. 57 38
65 Russian Federation 14.2 173 3 31 45 24 29
66 Kazakhstan 10.6 72 4 52 53 35 39
67 Azerbaijan 2.0 7 2 71 56 57 41
68 Bosnia and Herzegovina 1.8 20 6 69 .. 43 53
69 Ukraine 6.3 59 4 31 45 29 17
70 Iran (Islamic Republic of) 2.9 .. 7 55 .. 0 60
71 The former Yugoslav Republic of Macedonia 2.0 25 6 60 .. 40 53
72 Mauritius 3.8 98 .. .. .. .. ..
73 Brazil 22.0 .. 10 40 57 45 39
74 Georgia 7.6 62 1 79 64 51 47
75 Venezuela (Bolivarian Republic of) 52.0 .. 11 23 61 35 67
76 Armenia 2.5 11 2 75 54 33 44
77 Ecuador 18.1 399 20 38 60 40 50
78 Belize 34.3 182 14 43 .. 40 43
79 Colombia 38.8 .. 13 45 66 46 64
80 Jamaica 59.5 .. 4 46 .. 50 71
81 Tunisia 1.5 .. 5 81 69 74 71
82 Jordan 1.7 14 3 84 65 53 73
83 Turkey 2.9 10 8 42 .. 63 59
84 Algeria 0.6 72 15 39 55 37 50
85 Tonga .. .. .. .. .. .. ..
MEDIUM HUMAN DEVELOPMENT
86 Fiji 2.8 .. .. .. .. .. ..
87 Turkmenistan 2.9 3 .. .. .. .. ..
88 Dominican Republic 21.5 556 7 38 .. 42 52
SATISFATION WITH MEAS(% satisfi
Perception of safetya Communityb
Affordablehousingb
Health carequalityb
(per 100,000people)
(per 100,000people)
(% reporting having been avictim)
2003–2008c 2003–2008c 2006–2009c 2006–2009c 2006–2009c 2006–2009c 2006–2009c
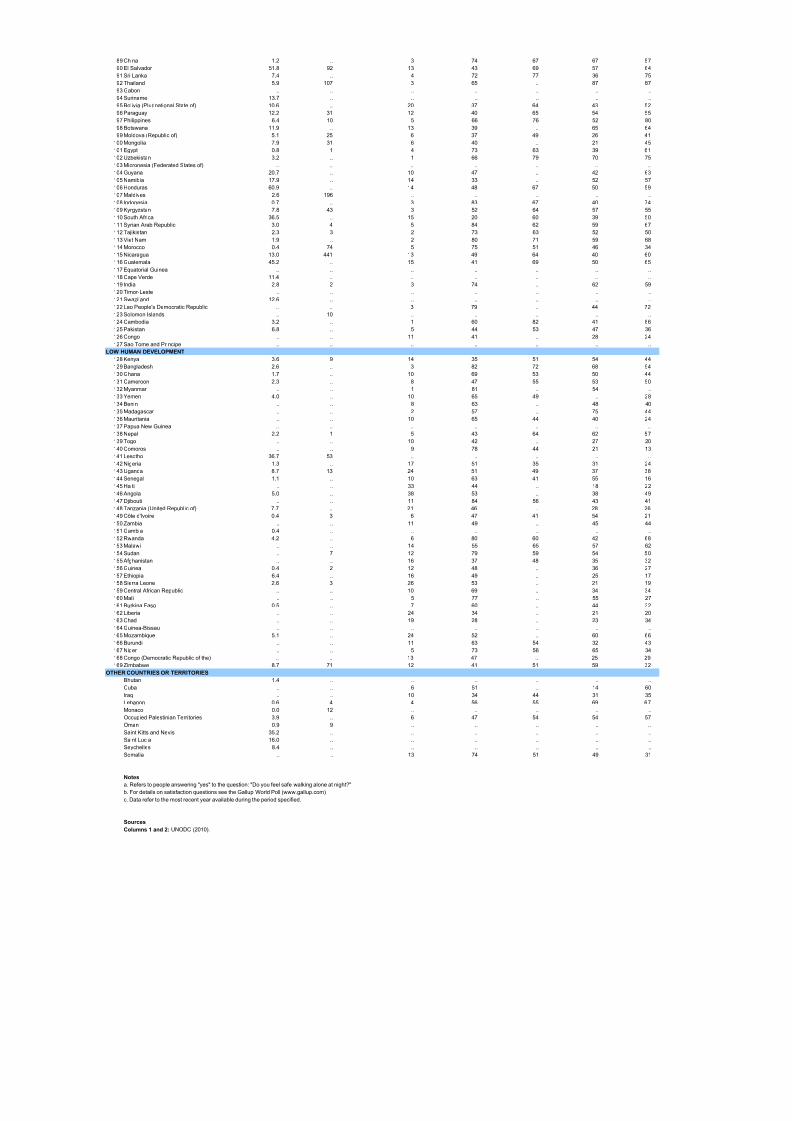
8/7/2019 Tabela IDH 2010 inglês
http://slidepdf.com/reader/full/tabela-idh-2010-ingles 54/102
75 89 95
68 89 88
73 91 85
70 85 87
75 94 86
.. .. ..
70 76 9371 83 89
67 84 95
59 87 95
53 79 81
51 78 83
75 82 96
70 78 86
57 57 53
64 81 91
87 85 97
77 69 85
74 93 96
58 76 80
52 .. 7150 74 69
61 71 83
73 78 89
73 80 94
70 87 93
94 97 99
71 66 80
75 76 85
.. .. ..
53 62 78
83 72 73
63 41 65
59 75 67
62 67 6760 75 78
.. .. ..
77 81 80
88 72 62
69 88 88
66 77 75
.. .. ..
.. .. ..
40 66 71
61 60 85
51 72 74
62 37 52
42 75 65
72 70 69
58 70 67
67 83 81
76 87 94
.. .. ..
70 82 74
67 55 52
72 73 66
93 83 86
45 60 57
70 76 74
64 63 58
57 66 64
84 84 87
51 61 62
49 58 53
42 54 42
54 61 60
59 65 55
59 76 77
38 53 44
51 67 58
63 66 60
.. .. ..
53 70 78
60 68 66
78 70 60
55 63 65
71 63 64
58 71 63
73 69 73
69 86 89
72 65 59
67 58 45
50 63 53
61 57 61
.. .. ..
.. .. ..
.. 81 71
74 72 65
URES OF WELL-BEINGied)
Educationsystem and
schoolsb Air qualityb Water qualityb
2006–2009c 2006–2009c 2006–2009c
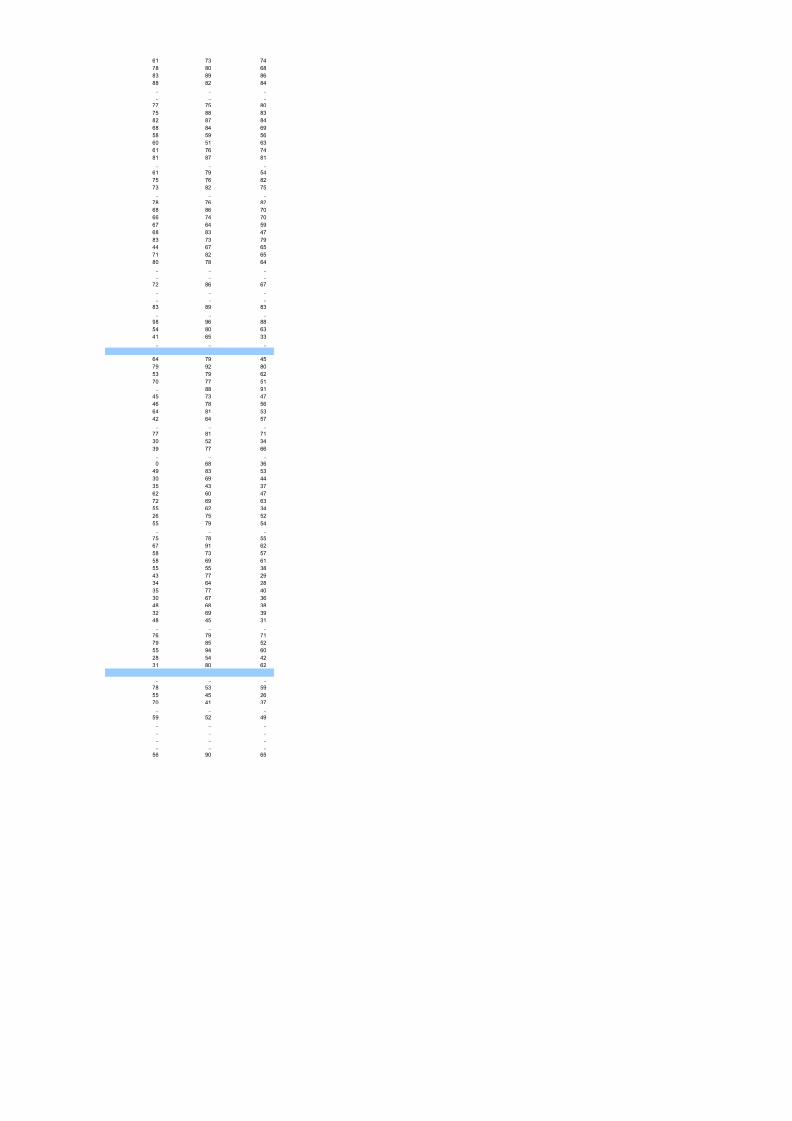
8/7/2019 Tabela IDH 2010 inglês
http://slidepdf.com/reader/full/tabela-idh-2010-ingles 55/102
89 China 1.2 .. 3 74 67 67 57
90 El Salvador 51.8 92 13 43 69 57 64
91 Sri Lanka 7.4 .. 4 72 77 36 75
92 Thailand 5.9 107 3 65 .. 87 87
93 Gabon .. .. .. .. .. .. ..
94 Suriname 13.7 .. .. .. .. .. ..
95 Bolivia (Plurinational State of) 10.6 .. 20 37 64 43 52
96 Paraguay 12.2 31 12 40 65 54 55
97 Philippines 6.4 10 5 66 76 52 80
98 Botswana 11.9 .. 13 39 .. 65 64
99 Moldova (Republic of) 5.1 25 6 37 49 26 41
100 Mongolia 7.9 31 6 40 .. 21 45
101 Egypt 0.8 1 4 73 63 39 61
102 Uzbekistan 3.2 .. 1 66 79 70 75
103 Micronesia (Federated States of) .. .. .. .. .. .. ..
104 Guyana 20.7 .. 10 47 .. 42 63
105 Namibia 17.9 .. 14 33 .. 52 57
106 Honduras 60.9 .. 14 48 67 50 59
107 Maldives 2.6 196 .. .. .. .. ..
108 Indonesia 0.7 .. 3 83 67 40 74
109 Kyrgyzstan 7.8 43 3 52 64 57 55
110 South Africa 36.5 .. 15 20 60 39 50
111 Syrian Arab Republic 3.0 4 5 84 62 59 67
112 Tajikistan 2.3 3 2 73 63 52 50
113 Viet Nam 1.9 .. 2 80 71 59 68
114 Morocco 0.4 74 5 75 51 46 34
115 Nicaragua 13.0 441 13 49 64 40 60
116 Guatemala 45.2 .. 15 41 69 50 65
117 Equatorial Guinea .. .. .. .. .. .. ..
118 Cape Verde 11.4 .. .. .. .. .. ..
119 India 2.8 2 3 74 .. 62 59
120 Timor-Leste .. .. .. .. .. .. ..
121 Swaziland 12.6 .. .. .. .. .. ..
122 Lao People's Democratic Republic .. .. 3 79 .. 44 72
123 Solomon Islands .. 10 .. .. .. .. ..
124 Cambodia 3.2 .. 1 60 82 41 86
125 Pakistan 6.8 .. 5 44 53 47 36
126 Congo .. .. 11 41 .. 28 24
127 Sao Tome and Principe .. .. .. .. .. .. ..
LOW HUMAN DEVELOPMENT
128 Kenya 3.6 9 14 35 51 54 44
129 Bangladesh 2.6 .. 3 82 72 68 54
130 Ghana 1.7 .. 10 69 53 50 44
131 Cameroon 2.3 .. 8 47 55 53 50
132 Myanmar .. .. 1 81 .. 54 ..
133 Yemen 4.0 .. 10 65 49 .. 28
134 Benin .. .. 8 63 .. 48 40
135 Madagascar .. .. 2 57 .. 75 44
136 Mauritania .. .. 10 65 44 40 24
137 Papua New Guinea .. .. .. .. .. .. ..
138 Nepal 2.2 1 5 43 64 62 57
139 Togo .. .. 10 42 .. 27 20
140 Comoros .. .. 9 78 44 21 13
141 Lesotho 36.7 53 .. .. .. .. ..
142 Nigeria 1.3 .. 17 51 35 31 24
143 Uganda 8.7 13 24 51 49 37 38
144 Senegal 1.1 .. 10 63 41 55 16
145 Haiti .. .. 33 44 .. 18 22
146 Angola 5.0 .. 38 53 .. 38 49
147 Djibouti .. .. 11 84 56 43 41
148 Tanzania (United Republic of) 7.7 .. 21 46 .. 28 26
149 Côte d'Ivoire 0.4 3 6 47 41 54 21150 Zambia .. .. 11 49 .. 45 44
151 Gambia 0.4 .. .. .. .. .. ..
152 Rwanda 4.2 .. 6 80 60 42 68
153 Malawi .. .. 14 55 65 57 62
154 Sudan .. 7 12 79 59 54 50
155 Afghanistan .. .. 16 37 48 35 32
156 Guinea 0.4 2 12 48 .. 36 27
157 Ethiopia 6.4 .. 16 49 .. 25 17
158 Sierra Leone 2.6 3 26 53 .. 21 19
159 Central African Republic .. .. 10 69 .. 34 34
160 Mali .. .. 5 77 .. 55 27
161 Burkina Faso 0.5 .. 7 60 .. 44 32
162 Liberia .. .. 24 34 .. 21 20
163 Chad .. .. 19 28 .. 23 34164 Guinea-Bissau .. .. .. .. .. .. ..
165 Mozambique 5.1 .. 24 52 .. 60 66
166 Burundi .. .. 11 63 54 32 43
167 Niger .. .. 5 73 56 65 34
168 Congo (Democratic Republic of the) .. .. 13 47 .. 25 29
169 Zimbabwe 8.7 71 12 41 51 59 32
OTHER COUNTRIES OR TERRITORIES
Bhutan 1.4 .. .. .. .. .. ..
Cuba .. .. 6 51 .. 14 60
Iraq .. .. 10 34 44 31 35
Lebanon 0.6 4 4 56 55 69 67
Monaco 0.0 12 .. .. .. .. ..
Occupied Palestinian Territories 3.9 .. 6 47 54 54 57
Oman 0.9 9 .. .. .. .. ..Saint Kitts and Nevis 35.2 .. .. .. .. .. ..
Saint Lucia 16.0 .. .. .. .. .. ..
Seychelles 8.4 .. .. .. .. .. ..
Somalia .. .. 13 74 51 49 31
Notes
a. Refers to people answering "yes" to the question: "Do you feel safe walking alone at night?"
b. For details on satisfaction questions see the Gallup World Poll (www.gallup.com)
c. Data refer to the most recent year available during the period specified.
Sources
Columns 1 and 2: UNODC (2010).

8/7/2019 Tabela IDH 2010 inglês
http://slidepdf.com/reader/full/tabela-idh-2010-ingles 56/102
61 73 74
78 80 68
83 89 86
88 82 84
.. .. ..
.. .. ..
77 75 80
75 88 83
82 87 84
68 84 69
58 59 56
60 51 63
61 76 74
81 87 81
.. .. ..
61 79 54
75 76 82
73 82 75
.. .. ..
78 76 82
68 86 70
66 74 70
67 64 59
68 83 47
83 73 79
44 67 65
71 82 65
80 78 64
.. .. ..
.. .. ..
72 86 67
.. .. ..
.. .. ..
83 89 83
.. .. ..
98 96 88
54 80 63
41 65 33
.. .. ..
64 79 45
79 92 80
53 79 62
70 77 51
.. 88 91
45 73 47
46 78 56
64 81 53
42 64 57
.. .. ..
77 81 71
30 52 34
39 77 66
.. .. ..
0 68 36
49 83 53
30 69 44
35 43 37
62 60 47
72 69 63
55 62 34
26 75 5255 79 54
.. .. ..
75 78 55
67 91 62
58 73 57
58 69 61
55 55 38
43 77 29
34 64 28
35 77 40
30 67 36
48 68 38
32 69 39
48 45 31.. .. ..
76 79 71
79 85 52
55 94 60
28 54 42
31 80 62
.. .. ..
78 53 59
55 45 26
70 41 37
.. .. ..
59 52 49
.. .. ..
.. .. ..
.. .. ..
.. .. ..
56 90 65
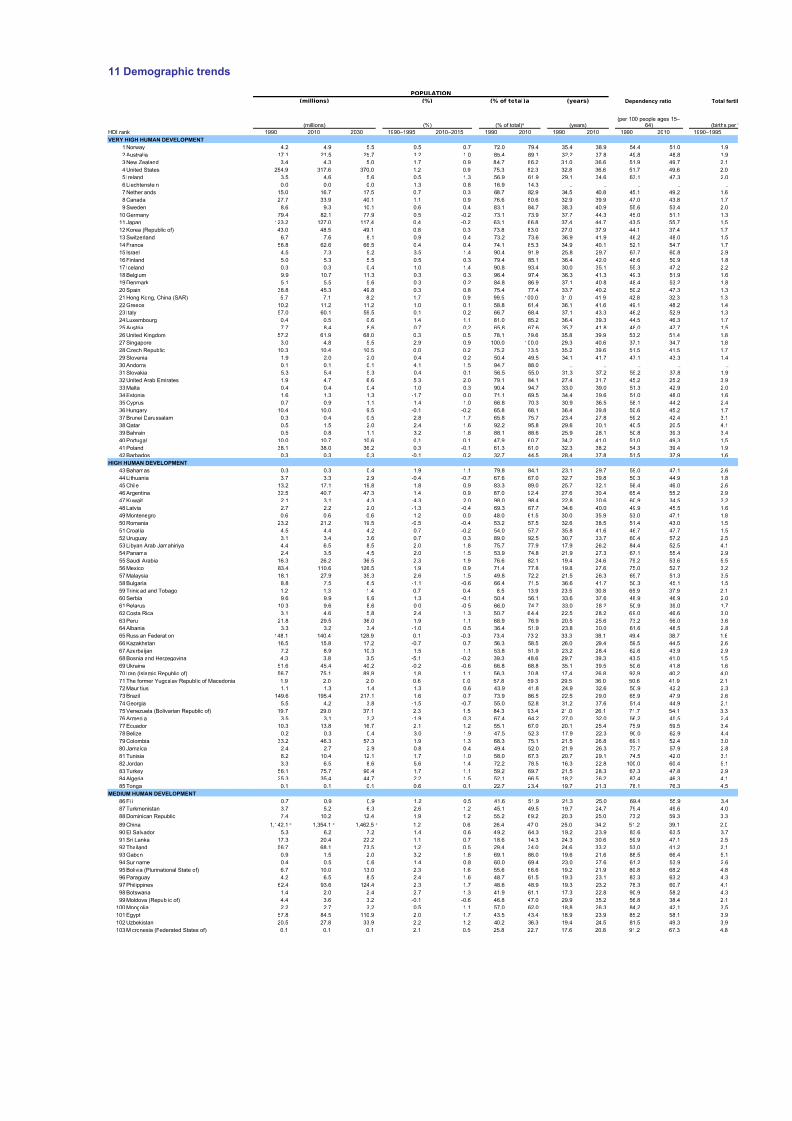
8/7/2019 Tabela IDH 2010 inglês
http://slidepdf.com/reader/full/tabela-idh-2010-ingles 57/102
Columns 3–10: Gallup World Poll database (2010).
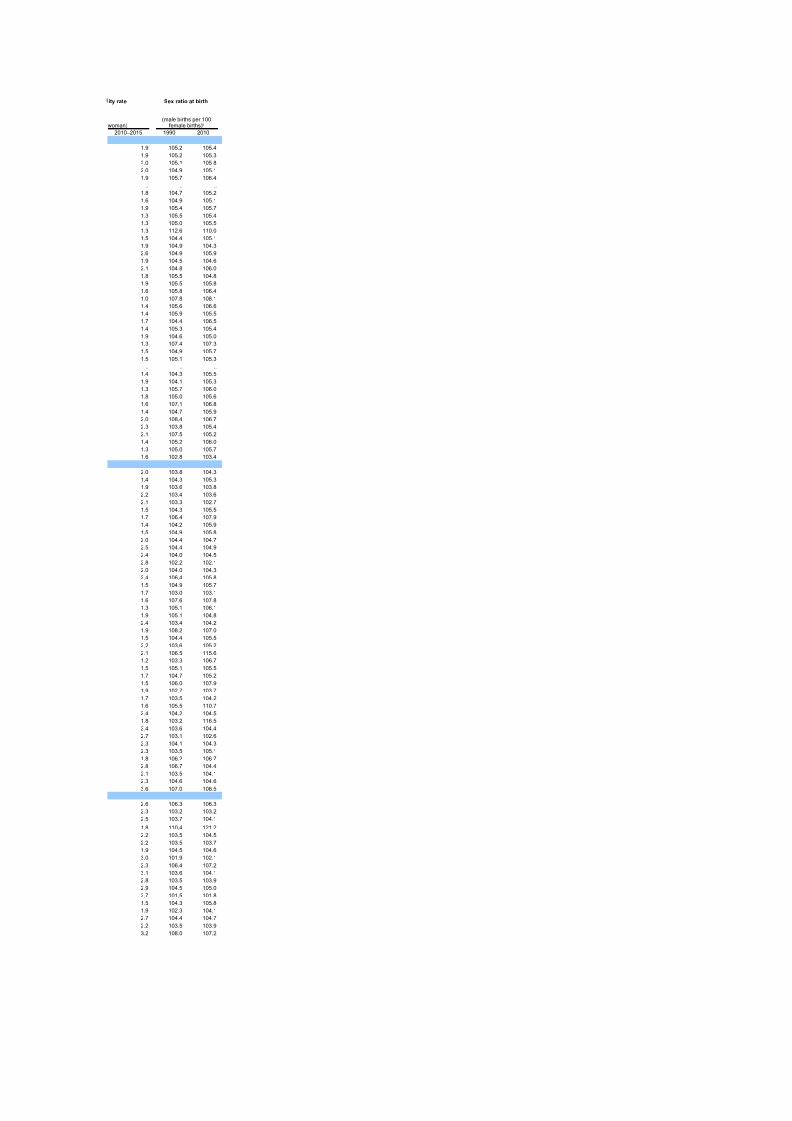
8/7/2019 Tabela IDH 2010 inglês
http://slidepdf.com/reader/full/tabela-idh-2010-ingles 58/102
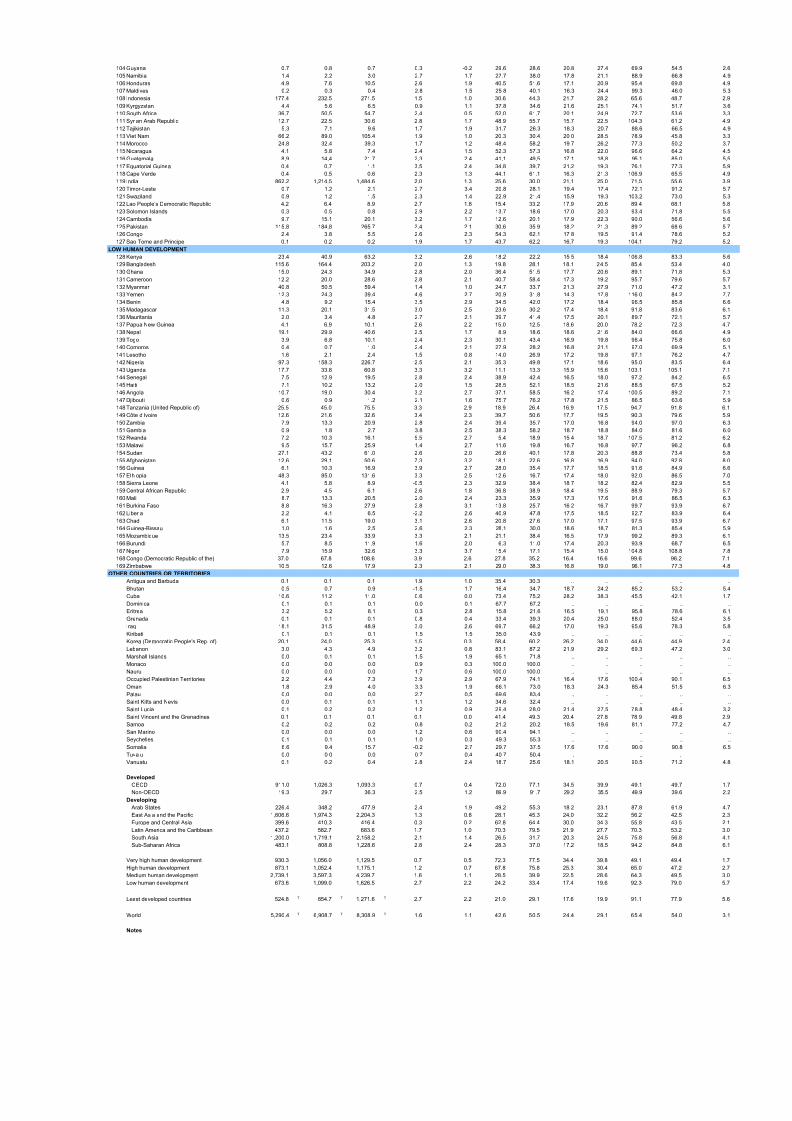
8/7/2019 Tabela IDH 2010 inglês
http://slidepdf.com/reader/full/tabela-idh-2010-ingles 59/102
11 Demographic trends
POPULATION
Dependency ratio
(millions) (%) (years)
HDI rank 1990 2010 2030 1990–1995 2010–2015 1990 2010 1990 2010 1990 2010 1990
VERY HIGH HUMAN DEVELOPMENT
1 Norway 4.2 4.9 5.5 0.5 0.7 72.0 79.4 35.4 38.9 54.4 51.0
2 Australia 17.1 21.5 25.7 1.2 1.0 85.4 89.1 32.2 37.8 49.8 48.8
3 New Zealand 3.4 4.3 5.0 1.7 0.9 84.7 86.2 31.0 36.6 51.9 49.7
4 United States 254.9 317.6 370.0 1.2 0.9 75.3 82.3 32.8 36.6 51.7 49.6
5 Ireland 3.5 4.6 5.6 0.5 1.3 56.9 61.9 29.1 34.6 63.1 47.3
6 Liechtenstein 0.0 0.0 0.0 1.3 0.8 16.9 14.3 .. .. .. ..
7 Netherlands 15.0 16.7 17.5 0.7 0.3 68.7 82.9 34.5 40.8 45.1 49.2
8 Canada 27.7 33.9 40.1 1.1 0.9 76.6 80.6 32.9 39.9 47.0 43.8
9 Sweden 8.6 9.3 10.1 0.6 0.4 83.1 84.7 38.3 40.9 55.6 53.4 10 Germany 79.4 82.1 77.9 0.5 -0.2 73.1 73.9 37.7 44.3 45.0 51.1
11 Japan 123.2 127.0 117.4 0.4 -0.2 63.1 66.8 37.4 44.7 43.5 55.7
12 Korea (Republic of) 43.0 48.5 49.1 0.8 0.3 73.8 83.0 27.0 37.9 44.1 37.4
13 Switzerland 6.7 7.6 8.1 0.9 0.4 73.2 73.6 36.9 41.9 46.2 48.0
14 France 56.8 62.6 66.5 0.4 0.4 74.1 85.3 34.9 40.1 52.1 54.7
15 Israel 4.5 7.3 9.2 3.5 1.4 90.4 91.9 25.8 29.7 67.7 60.8
16 Finland 5.0 5.3 5.5 0.5 0.3 79.4 85.1 36.4 42.0 48.6 50.9
17 Iceland 0.3 0.3 0.4 1.0 1.4 90.8 93.4 30.0 35.1 55.3 47.2
18 Belgium 9.9 10.7 11.3 0.3 0.3 96.4 97.4 36.3 41.3 49.3 51.9
19 Denmark 5.1 5.5 5.6 0.3 0.2 84.8 86.9 37.1 40.8 48.4 53.2
20 Spain 38.8 45.3 49.8 0.3 0.8 75.4 77.4 33.7 40.2 50.2 47.3
21 Hong Kong, China (SAR) 5.7 7.1 8.2 1.7 0.9 99.5 100.0 31.0 41.9 42.8 32.3
22 Greece 10.2 11.2 11.2 1.0 0.1 58.8 61.4 36.1 41.6 49.1 48.2
23 Italy 57.0 60.1 59.5 0.1 0.2 66.7 68.4 37.1 43.3 46.2 52.9 24 Luxembourg 0.4 0.5 0.6 1.4 1.1 81.0 85.2 36.4 39.3 44.5 46.3
25 Austria 7.7 8.4 8.6 0.7 0.2 65.8 67.6 35.7 41.8 48.0 47.7
26 United Kingdom 57.2 61.9 68.0 0.3 0.5 78.1 79.6 35.8 39.9 53.2 51.4
27 Singapore 3.0 4.8 5.5 2.9 0.9 100.0 100.0 29.3 40.6 37.1 34.7
28 Czech Republic 10.3 10.4 10.5 0.0 0.2 75.2 73.5 35.2 39.6 51.5 41.5
29 Slovenia 1.9 2.0 2.0 0.4 0.2 50.4 49.5 34.1 41.7 47.1 43.3
30 Andorra 0.1 0.1 0.1 4.1 1.5 94.7 88.0 .. .. .. ..
31 Slovakia 5.3 5.4 5.3 0.4 0.1 56.5 55.0 31.3 37.2 55.2 37.8
32 United Arab Emirates 1.9 4.7 6.6 5.3 2.0 79.1 84.1 27.4 31.7 45.2 25.2
33 Malta 0.4 0.4 0.4 1.0 0.3 90.4 94.7 33.0 39.0 51.3 42.9
34 Estonia 1.6 1.3 1.3 -1.7 0.0 71.1 69.5 34.4 39.6 51.0 48.0
35 Cyprus 0.7 0.9 1.1 1.4 1.0 66.8 70.3 30.9 36.5 58.1 44.2
36 Hungary 10.4 10.0 9.5 -0.1 -0.2 65.8 68.1 36.4 39.8 50.6 45.2
37 Brunei Darussalam 0.3 0.4 0.5 2.8 1.7 65.8 75.7 23.4 27.8 59.2 42.4
38 Qatar 0.5 1.5 2.0 2.4 1.6 92.2 95.8 29.6 30.1 40.5 20.5
39 Bahrain 0.5 0.8 1.1 3.2 1.8 88.1 88.6 25.9 28.1 50.8 39.3
40 Portugal 10.0 10.7 10.6 0.1 0.1 47.9 60.7 34.2 41.0 51.0 49.3
41 Poland 38.1 38.0 36.2 0.3 -0.1 61.3 61.0 32.3 38.2 54.3 39.4
42 Barbados 0.3 0.3 0.3 -0.1 0.2 32.7 44.5 28.4 37.8 51.5 37.9
HIGH HUMAN DEVELOPMENT
43 Bahamas 0.3 0.3 0.4 1.9 1.1 79.8 84.1 23.1 29.7 59.0 47.1
44 Lithuania 3.7 3.3 2.9 -0.4 -0.7 67.6 67.0 32.7 39.8 50.3 44.9
45 Chile 13.2 17.1 19.8 1.8 0.9 83.3 89.0 25.7 32.1 56.4 46.0
46 Argentina 32.5 40.7 47.3 1.4 0.9 87.0 92.4 27.6 30.4 65.4 55.2
47 Kuwait 2.1 3.1 4.3 -4.3 2.0 98.0 98.4 22.8 30.6 60.9 34.5
48 Latvia 2.7 2.2 2.0 -1.3 -0.4 69.3 67.7 34.6 40.0 49.9 45.5
49 Montenegro 0.6 0.6 0.6 1.2 0.0 48.0 61.5 30.0 35.9 53.0 47.1 50 Romania 23.2 21.2 19.5 -0.5 -0.4 53.2 57.5 32.6 38.5 51.4 43.0
51 Croatia 4.5 4.4 4.2 0.7 -0.2 54.0 57.7 35.8 41.6 46.7 47.7
52 Uruguay 3.1 3.4 3.6 0.7 0.3 89.0 92.5 30.7 33.7 60.4 57.2
53 Libyan Arab Jamahiriya 4.4 6.5 8.5 2.0 1.8 75.7 77.9 17.9 26.2 84.4 52.5
54 Panama 2.4 3.5 4.5 2.0 1.5 53.9 74.8 21.9 27.3 67.1 55.4
55 Saudi Arabia 16.3 26.2 36.5 2.3 1.9 76.6 82.1 19.4 24.6 79.2 53.6
56 Mexico 83.4 110.6 126.5 1.9 0.9 71.4 77.8 19.8 27.6 75.0 52.7
57 Malaysia 18.1 27.9 35.3 2.6 1.5 49.8 72.2 21.5 26.3 69.7 51.3
58 Bulgaria 8.8 7.5 6.5 -1.1 -0.6 66.4 71.5 36.6 41.7 50.3 45.1
59 Trinidad and Tobago 1.2 1.3 1.4 0.7 0.4 8.5 13.9 23.5 30.8 65.9 37.9
60 Serbia 9.6 9.9 9.6 1.3 -0.1 50.4 56.1 33.6 37.6 48.9 46.9
61 Belarus 10.3 9.6 8.6 0.0 -0.5 66.0 74.7 33.0 38.2 50.9 39.0
62 Costa Rica 3.1 4.6 5.8 2.4 1.3 50.7 64.4 22.5 28.2 69.0 46.6
63 Peru 21.8 29.5 36.0 1.9 1.1 68.9 76.9 20.5 25.6 73.2 56.0 64 Albania 3.3 3.2 3.4 -1.0 0.5 36.4 51.9 23.8 30.0 61.6 48.5
65 Russian Federation 148.1 140.4 128.9 0.1 -0.3 73.4 73.2 33.3 38.1 49.4 38.7
66 Kazakhstan 16.5 15.8 17.2 -0.7 0.7 56.3 58.5 26.0 29.4 59.5 44.5
67 Azerbaijan 7.2 8.9 10.3 1.5 1.1 53.8 51.9 23.2 28.4 62.6 43.9
68 Bosnia and Herzegovina 4.3 3.8 3.5 -5.1 -0.2 39.3 48.6 29.7 39.3 43.5 41.0
69 Ukraine 51.6 45.4 40.2 -0.2 -0.6 66.8 68.8 35.1 39.5 50.6 41.8
70 Iran (Islamic Republic of) 56.7 75.1 89.9 1.8 1.1 56.3 70.8 17.4 26.8 92.9 40.2
71 The former Yugoslav Republic of Macedonia 1.9 2.0 2.0 0.6 0.0 57.8 59.3 29.5 36.0 50.6 41.9
72 Mauritius 1.1 1.3 1.4 1.3 0.6 43.9 41.8 24.9 32.6 50.9 42.2
73 Brazil 149.6 195.4 217.1 1.6 0.7 73.9 86.5 22.5 29.0 65.9 47.9
74 Georgia 5.5 4.2 3.8 -1.5 -0.7 55.0 52.8 31.2 37.6 51.4 44.9
75 Venezuela (Bolivarian Republic of) 19.7 29.0 37.1 2.3 1.5 84.3 93.4 21.0 26.1 71.7 54.1
76 Armenia 3.5 3.1 3.2 -1.9 0.3 67.4 64.2 27.0 32.0 56.2 45.5
77 Ecuador 10.3 13.8 16.7 2.1 1.2 55.1 67.0 20.1 25.4 75.9 59.5 78 Belize 0.2 0.3 0.4 3.0 1.9 47.5 52.3 17.9 22.3 90.0 62.9
79 Colombia 33.2 46.3 57.3 1.9 1.3 68.3 75.1 21.5 26.8 69.1 52.4
80 Jamaica 2.4 2.7 2.9 0.8 0.4 49.4 52.0 21.9 26.3 73.7 57.9
81 Tunisia 8.2 10.4 12.1 1.7 1.0 58.0 67.3 20.7 29.1 74.5 42.0
82 Jordan 3.3 6.5 8.6 5.6 1.4 72.2 78.5 16.3 22.8 100.0 60.4
83 Turkey 56.1 75.7 90.4 1.7 1.1 59.2 69.7 21.5 28.3 67.3 47.8
84 Algeria 25.3 35.4 44.7 2.2 1.5 52.1 66.5 18.2 26.2 87.4 46.3
85 Tonga 0.1 0.1 0.1 0.6 0.1 22.7 23.4 19.7 21.3 78.1 76.3
MEDIUM HUMAN DEVELOPMENT
86 Fiji 0.7 0.9 0.9 1.2 0.5 41.6 51.9 21.3 25.0 69.4 55.9
87 Turkmenistan 3.7 5.2 6.3 2.6 1.2 45.1 49.5 19.7 24.7 79.4 49.6
88 Dominican Republic 7.4 10.2 12.4 1.9 1.2 55.2 69.2 20.3 25.0 73.2 59.3
89 China 1,142.1 1,354.1 1,462.5 1.2 0.6 26.4 47.0 25.0 34.2 51.2 39.1
90 El Salvador 5.3 6.2 7.2 1.4 0.6 49.2 64.3 19.2 23.9 83.6 63.5
91 Sri Lanka 17.3 20.4 22.2 1.1 0.7 18.6 14.3 24.3 30.6 59.9 47.1
92 Thailand 56.7 68.1 73.5 1.2 0.5 29.4 34.0 24.6 33.2 53.0 41.2
93 Gabon 0.9 1.5 2.0 3.2 1.8 69.1 86.0 19.6 21.6 88.5 66.4
94 Suriname 0.4 0.5 0.6 1.4 0.8 60.0 69.4 23.0 27.6 61.2 53.9
95 Bolivia (Plurinational State of) 6.7 10.0 13.0 2.3 1.6 55.6 66.6 19.2 21.9 80.8 68.2
96 Paraguay 4 2 6 5 8 5 2 4 1 6 48 7 61 5 19 3 23 1 83 3 63 2
(millions)
(%) (% of total)a
(years)
(% of total)a
(per 100 people ages 15–64)
c c c
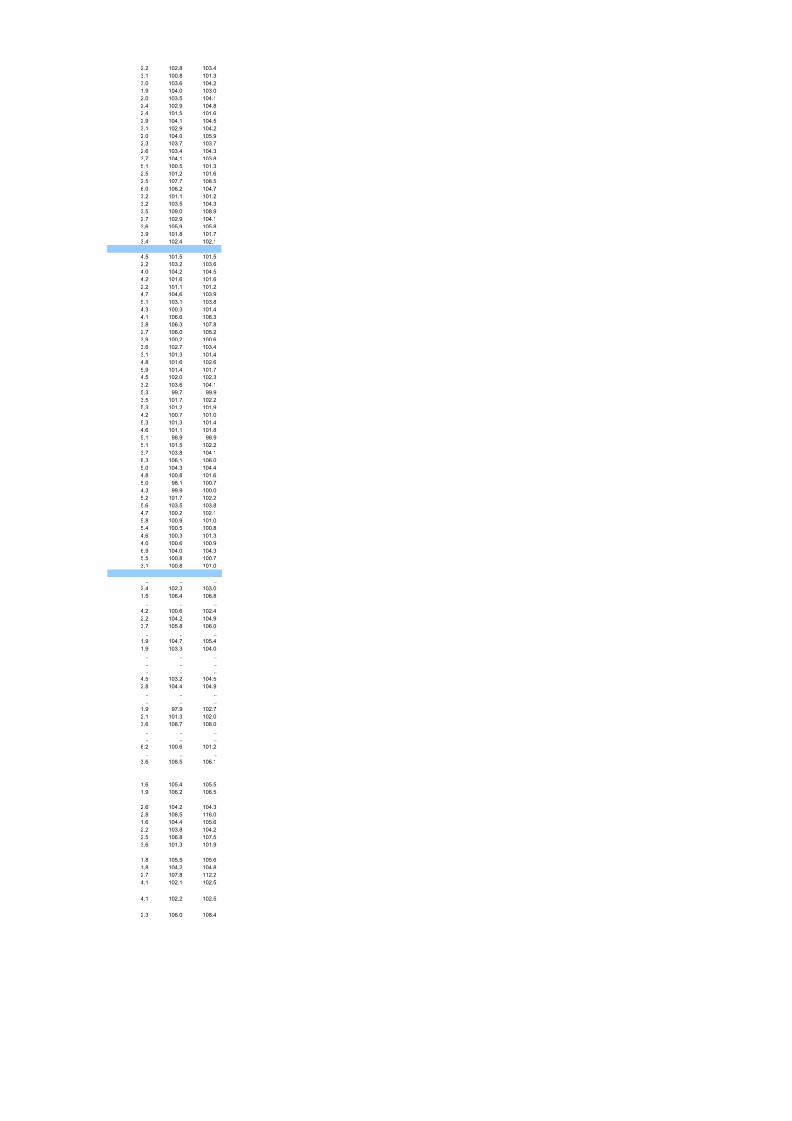
8/7/2019 Tabela IDH 2010 inglês
http://slidepdf.com/reader/full/tabela-idh-2010-ingles 60/102
ity rate Sex ratio at birth
woman)
2010–2015 1990 2010
1.9 105.2 105.4
1.9 105.2 105.3
2.0 105.1 105.8
2.0 104.9 105.1
1.9 105.7 106.4
.. .. ..
1.8 104.7 105.2
1.6 104.9 105.1
1.9 105.4 105.71.3 105.5 105.4
1.3 105.0 105.5
1.3 112.6 110.0
1.5 104.4 105.1
1.9 104.9 104.3
2.6 104.9 105.9
1.9 104.5 104.6
2.1 104.8 106.0
1.8 105.5 104.8
1.9 105.5 105.8
1.6 105.8 106.4
1.0 107.8 108.1
1.4 105.6 106.6
1.4 105.9 105.5
1.7 104.4 106.5
1.4 105.3 105.4
1.9 104.6 105.0
1.3 107.4 107.3
1.5 104.9 105.7
1.5 105.1 105.3
.. .. ..
1.4 104.3 105.5
1.9 104.1 105.3
1.3 105.7 106.0
1.8 105.0 105.6
1.6 107.1 106.8
1.4 104.7 105.92.0 108.4 106.7
2.3 103.8 105.4
2.1 107.5 105.2
1.4 105.2 106.0
1.3 105.0 105.7
1.6 102.8 103.4
2.0 103.8 104.3
1.4 104.3 105.3
1.9 103.6 103.8
2.2 103.4 103.6
2.1 103.3 102.7
1.5 104.3 105.5
1.7 106.4 107.91.4 104.2 105.9
1.5 104.9 105.8
2.0 104.4 104.7
2.5 104.4 104.9
2.4 104.0 104.5
2.8 102.2 102.1
2.0 104.0 104.3
2.4 106.4 105.8
1.5 104.9 105.7
1.7 103.0 103.1
1.6 107.6 107.8
1.3 105.1 106.1
1.9 105.1 104.8
2.4 103.4 104.21.9 108.2 107.0
1.5 104.4 105.5
2.2 103.6 105.2
2.1 106.5 115.6
1.2 103.3 106.7
1.5 105.1 105.5
1.7 104.7 105.2
1.5 106.0 107.9
1.9 102.7 103.7
1.7 103.5 104.2
1.6 105.5 110.7
2.4 104.2 104.5
1.8 103.2 116.5
2.4 103.6 104.4
2.7 103.1 102.6
2.3 104.1 104.3
2.3 103.5 105.1
1.8 106.2 106.7
2.8 106.7 104.4
2.1 103.5 104.1
2.3 104.6 104.6
3.6 107.0 106.5
2.6 106.3 106.3
2.3 103.2 103.2
2.5 103.7 104.1
1.8 110.4 121.22.2 103.5 104.5
2.2 103.5 103.7
1.9 104.5 104.6
3.0 101.9 102.1
2.3 106.4 107.2
3.1 103.6 104.1
(male births per 100female births)b

8/7/2019 Tabela IDH 2010 inglês
http://slidepdf.com/reader/full/tabela-idh-2010-ingles 61/102
104 Guyana 0.7 0.8 0.7 0.3 -0.2 29.6 28.6 20.8 27.4 69.9 54.5
105 Namibia 1.4 2.2 3.0 2.7 1.7 27.7 38.0 17.8 21.1 88.9 66.8
106 Honduras 4.9 7.6 10.5 2.6 1.9 40.5 51.6 17.1 20.9 95.4 69.8
107 Maldives 0.2 0.3 0.4 2.8 1.5 25.8 40.1 16.3 24.4 99.3 46.0
108 Indonesia 177.4 232.5 271.5 1.5 1.0 30.6 44.3 21.7 28.2 65.6 48.7
109 Kyrgyzstan 4.4 5.6 6.5 0.9 1.1 37.8 34.6 21.6 25.1 74.1 51.7
110 South Africa 36.7 50.5 54.7 2.4 0.5 52.0 61.7 20.1 24.9 72.7 53.6
111 Syrian Arab Republic 12.7 22.5 30.6 2.8 1.7 48.9 55.7 15.7 22.5 104.3 61.2
112 Tajikistan 5.3 7.1 9.6 1.7 1.9 31.7 26.3 18.3 20.7 88.6 66.5
113 Viet Nam 66.2 89.0 105.4 1.9 1.0 20.3 30.4 20.0 28.5 78.9 45.8
114 Morocco 24.8 32.4 39.3 1.7 1.2 48.4 58.2 19.7 26.2 77.3 50.2
115 Nicaragua 4.1 5.8 7.4 2.4 1.5 52.3 57.3 16.8 22.0 96.6 64.2
116 Guatemala 8.9 14.4 21.7 2.3 2.4 41.1 49.5 17.1 18.8 95.1 85.0
117 Equatorial Guinea 0.4 0.7 1.1 3.5 2.4 34.8 39.7 21.2 19.3 76.1 77.3
118 Cape Verde 0.4 0.5 0.6 2.3 1.3 44.1 61.1 16.3 21.3 106.9 65.5
119 India 862.2 1,214.5 1,484.6 2.0 1.3 25.6 30.0 21.1 25.0 71.5 55.6
120 Timor-Leste 0.7 1.2 2.1 2.7 3.4 20.8 28.1 19.4 17.4 72.1 91.2
121 Swaziland 0.9 1.2 1.5 2.3 1.4 22.9 21.4 15.9 19.3 103.2 73.0
122 Lao People's Democratic Republic 4.2 6.4 8.9 2.7 1.8 15.4 33.2 17.9 20.6 89.4 68.1
123 Solomon Islands 0.3 0.5 0.8 2.9 2.2 13.7 18.6 17.0 20.3 93.4 71.8
124 Cambodia 9.7 15.1 20.1 3.2 1.7 12.6 20.1 17.9 22.3 90.0 56.6
125 Pakistan 115.8 184.8 265.7 2.4 2.1 30.6 35.9 18.2 21.3 89.2 68.6
126 Congo 2.4 3.8 5.5 2.6 2.3 54.3 62.1 17.8 19.5 91.4 78.6
127 Sao Tome and Principe 0.1 0.2 0.2 1.9 1.7 43.7 62.2 16.7 19.3 104.1 79.2
LOW HUMAN DEVELOPMENT
128 Kenya 23.4 40.9 63.2 3.2 2.6 18.2 22.2 15.5 18.4 106.8 83.3
129 Bangladesh 115.6 164.4 203.2 2.0 1.3 19.8 28.1 18.1 24.5 85.4 53.4
130 Ghana 15.0 24.3 34.9 2.8 2.0 36.4 51.5 17.7 20.6 89.1 71.8
131 Cameroon 12.2 20.0 28.6 2.8 2.1 40.7 58.4 17.3 19.2 95.7 79.6
132 Myanmar 40.8 50.5 59.4 1.4 1.0 24.7 33.7 21.3 27.9 71.0 47.2
133 Yemen 12.3 24.3 39.4 4.6 2.7 20.9 31.8 14.3 17.8 116.0 84.2
134 Benin 4.8 9.2 15.4 3.5 2.9 34.5 42.0 17.2 18.4 96.5 85.8
135 Madagascar 11.3 20.1 31.5 3.0 2.5 23.6 30.2 17.4 18.4 91.8 83.6 136 Mauritania 2.0 3.4 4.8 2.7 2.1 39.7 41.4 17.5 20.1 89.7 72.1
137 Papua New Guinea 4.1 6.9 10.1 2.6 2.2 15.0 12.5 18.6 20.0 78.2 72.3
138 Nepal 19.1 29.9 40.6 2.5 1.7 8.9 18.6 18.6 21.6 84.0 66.6
139 Togo 3.9 6.8 10.1 2.4 2.3 30.1 43.4 16.9 19.8 96.4 75.8
140 Comoros 0.4 0.7 1.0 2.4 2.1 27.9 28.2 16.8 21.1 97.0 69.9
141 Lesotho 1.6 2.1 2.4 1.5 0.8 14.0 26.9 17.2 19.8 97.1 76.2
142 Nigeria 97.3 158.3 226.7 2.5 2.1 35.3 49.8 17.1 18.6 95.0 83.5
143 Uganda 17.7 33.8 60.8 3.3 3.2 11.1 13.3 15.9 15.6 103.1 105.1
144 Senegal 7.5 12.9 19.5 2.8 2.4 38.9 42.4 16.5 18.0 97.2 84.2
145 Haiti 7.1 10.2 13.2 2.0 1.5 28.5 52.1 18.5 21.6 88.5 67.5
146 Angola 10.7 19.0 30.4 3.2 2.7 37.1 58.5 16.2 17.4 100.5 89.2
147 Djibouti 0.6 0.9 1.2 2.1 1.6 75.7 76.2 17.8 21.5 86.5 63.6
148 Tanzania (United Republic of) 25.5 45.0 75.5 3.3 2.9 18.9 26.4 16.9 17.5 94.7 91.8
149 Côte d'Ivoire 12.6 21.6 32.6 3.4 2.3 39.7 50.6 17.7 19.5 90.3 79.6 150 Zambia 7.9 13.3 20.9 2.8 2.4 39.4 35.7 17.0 16.8 94.0 97.0
151 Gambia 0.9 1.8 2.7 3.8 2.5 38.3 58.2 18.7 18.8 84.0 81.6
152 Rwanda 7.2 10.3 16.1 -5.5 2.7 5.4 18.9 15.4 18.7 107.5 81.2
153 Malawi 9.5 15.7 25.9 1.4 2.7 11.6 19.8 16.7 16.8 97.7 96.2
154 Sudan 27.1 43.2 61.0 2.6 2.0 26.6 40.1 17.8 20.3 88.8 73.4
155 Afghanistan 12.6 29.1 50.6 7.3 3.2 18.1 22.6 16.8 16.9 94.0 92.8
156 Guinea 6.1 10.3 16.9 3.9 2.7 28.0 35.4 17.7 18.5 91.6 84.9
157 Ethiopia 48.3 85.0 131.6 3.3 2.5 12.6 16.7 17.4 18.0 92.0 86.5
158 Sierra Leone 4.1 5.8 8.9 -0.5 2.3 32.9 38.4 18.7 18.2 82.4 82.9
159 Central African Republic 2.9 4.5 6.1 2.6 1.8 36.8 38.9 18.4 19.5 88.9 79.3
160 Mali 8.7 13.3 20.5 2.0 2.4 23.3 35.9 17.3 17.6 91.6 86.5
161 Burkina Faso 8.8 16.3 27.9 2.8 3.1 13.8 25.7 16.2 16.7 99.7 93.9
162 Liberia 2.2 4.1 6.5 -2.2 2.6 40.9 47.8 17.5 18.5 92.7 83.9
163 Chad 6.1 11.5 19.0 3.1 2.6 20.8 27.6 17.0 17.1 97.5 93.9
164 Guinea-Bissau 1.0 1.6 2.5 2.6 2.3 28.1 30.0 18.6 18.7 81.3 85.4
165 Mozambique 13.5 23.4 33.9 3.3 2.1 21.1 38.4 16.5 17.9 99.2 89.3
166 Burundi 5.7 8.5 11.9 1.6 2.0 6.3 11.0 17.4 20.3 93.9 68.7
167 Niger 7.9 15.9 32.6 3.3 3.7 15.4 17.1 15.4 15.0 104.8 108.8
168 Congo (Democratic Republic of the) 37.0 67.8 108.6 3.9 2.6 27.8 35.2 16.4 16.6 99.6 96.2
169 Zimbabwe 10.5 12.6 17.9 2.3 2.1 29.0 38.3 16.8 19.0 96.1 77.3
OTHER COUNTRIES OR TERRITORIES
Antigua and Barbuda 0.1 0.1 0.1 1.9 1.0 35.4 30.3 .. .. .. ..
Bhutan 0.5 0.7 0.9 -1.5 1.7 16.4 34.7 18.7 24.2 85.2 53.2
Cuba 10.6 11.2 11.0 0.6 0.0 73.4 75.2 28.2 38.3 45.5 42.1
Dominica 0.1 0.1 0.1 0.0 0.1 67.7 67.2 .. .. .. ..
Eritrea 3.2 5.2 8.1 0.3 2.8 15.8 21.6 16.5 19.1 95.8 78.6
Grenada 0.1 0.1 0.1 0.8 0.4 33.4 39.3 20.4 25.0 88.0 52.4
Iraq 18.1 31.5 48.9 3.0 2.6 69.7 66.2 17.0 19.3 95.6 78.3
Kiribati 0.1 0.1 0.1 1.5 1.5 35.0 43.9 .. .. .. ..
Korea (Democratic People's Rep. of) 20.1 24.0 25.3 1.5 0.3 58.4 60.2 26.2 34.0 44.6 44.9
Lebanon 3.0 4.3 4.9 3.2 0.8 83.1 87.2 21.9 29.2 69.3 47.2
Marshall Islands 0.0 0.1 0.1 1.5 1.9 65.1 71.8 .. .. .. ..
Monaco 0.0 0.0 0.0 0.9 0.3 100.0 100.0 .. .. .. ..
Nauru 0.0 0.0 0.0 1.7 0.6 100.0 100.0 .. .. .. ..
Occupied Palestinian Territories 2.2 4.4 7.3 3.9 2.9 67.9 74.1 16.4 17.6 100.4 90.1
Oman 1.8 2.9 4.0 3.3 1.9 66.1 73.0 18.3 24.3 85.4 51.5
Palau 0.0 0.0 0.0 2.7 0.5 69.6 83.4 .. .. .. ..
Saint Kitts and Nevis 0.0 0.1 0.1 1.1 1.2 34.6 32.4 .. .. .. ..
Saint Lucia 0.1 0.2 0.2 1.2 0.9 29.4 28.0 21.4 27.5 78.8 48.4
Saint Vincent and the Grenadines 0.1 0.1 0.1 0.1 0.0 41.4 49.3 20.4 27.8 78.9 49.8
Samoa 0.2 0.2 0.2 0.8 0.2 21.2 20.2 18.5 19.6 81.1 77.2 San Marino 0.0 0.0 0.0 1.2 0.6 90.4 94.1 .. .. .. ..
Seychelles 0.1 0.1 0.1 1.0 0.3 49.3 55.3 .. .. .. ..
Somalia 6.6 9.4 15.7 -0.2 2.7 29.7 37.5 17.6 17.6 90.0 90.8
Tuvalu 0.0 0.0 0.0 0.7 0.4 40.7 50.4 .. .. .. ..
Vanuatu 0.1 0.2 0.4 2.8 2.4 18.7 25.6 18.1 20.5 90.5 71.2
Developed
OECD 911.0 1,026.3 1,093.3 0.7 0.4 72.0 77.1 34.5 39.9 49.1 49.7
Non-OECD 19.3 29.7 36.3 2.5 1.2 89.9 91.7 29.2 35.5 49.9 39.6
Developing
Arab States 226.4 348.2 477.9 2.4 1.9 49.2 55.3 18.2 23.1 87.8 61.9
East Asia and the Pacific 1,606.6 1,974.3 2,204.3 1.3 0.8 28.1 45.3 24.0 32.2 56.2 42.5
Europe and Central Asia 399.6 410.3 416.4 0.3 0.2 62.8 64.4 30.0 34.3 55.8 43.5
Latin America and the Caribbean 437.2 582.7 683.6 1.7 1.0 70.3 79.5 21.9 27.7 70.3 53.2 South Asia 1,200.0 1,719.1 2,158.2 2.1 1.4 26.5 31.7 20.3 24.5 75.8 56.8
Sub-Saharan Africa 483.1 808.8 1,228.6 2.8 2.4 28.3 37.0 17.2 18.5 94.2 84.8
Very high human development 930.3 1,056.0 1,129.5 0.7 0.5 72.3 77.5 34.4 39.8 49.1 49.4
High human development 873.1 1,052.4 1,175.1 1.2 0.7 67.8 75.8 25.3 30.4 65.0 47.2
Medium human development 2,739.1 3,597.3 4,239.7 1.6 1.1 28.5 39.9 22.5 28.6 64.3 49.5

8/7/2019 Tabela IDH 2010 inglês
http://slidepdf.com/reader/full/tabela-idh-2010-ingles 62/102
2.2 102.8 103.4
3.1 100.8 101.3
3.0 103.6 104.2
1.9 104.0 103.0
2.0 103.5 104.1
2.4 102.9 104.8
2.4 101.5 101.6
2.9 104.1 104.5
3.1 102.9 104.2
2.0 104.0 105.9
2.3 103.7 103.7
2.6 103.4 104.3
3.7 104.1 103.8
5.1 100.5 101.3
2.5 101.2 101.6
2.5 107.7 108.5
6.0 106.2 104.7
3.2 101.1 101.2
3.2 103.5 104.3
3.5 109.0 108.9
2.7 102.9 104.1
3.6 105.9 105.8
3.9 101.8 101.7
3.4 102.4 102.1
4.5 101.5 101.5
2.2 103.2 103.6
4.0 104.2 104.5
4.2 101.6 101.6
2.2 101.1 101.2
4.7 104.6 103.9
5.1 103.1 103.8
4.3 100.3 101.44.1 106.6 106.3
3.8 106.3 107.8
2.7 106.0 105.2
3.9 100.2 100.6
3.6 102.7 103.4
3.1 101.3 101.4
4.8 101.6 102.6
5.9 101.4 101.7
4.5 102.0 102.3
3.2 103.6 104.1
5.3 99.7 99.9
3.5 101.7 102.2
5.3 101.2 101.9
4.2 100.7 101.05.3 101.3 101.4
4.6 101.1 101.8
5.1 98.9 98.9
5.1 101.5 102.2
3.7 103.8 104.1
6.3 106.1 106.0
5.0 104.3 104.4
4.8 100.8 101.6
5.0 98.1 100.7
4.3 99.9 100.0
5.2 101.7 102.2
5.6 103.5 103.8
4.7 100.2 102.1
5.8 100.9 101.0
5.4 100.5 100.8
4.6 100.3 101.3
4.0 100.6 100.9
6.9 104.0 104.3
5.5 100.8 100.7
3.1 100.8 101.0
.. .. ..
2.4 102.3 103.0
1.5 106.4 106.8
.. .. ..
4.2 100.6 102.4
2.2 104.2 104.9
3.7 105.8 106.0
.. .. ..
1.9 104.7 105.4
1.9 103.3 104.0
.. .. ..
.. .. ..
.. .. ..
4.5 103.2 104.5
2.8 104.4 104.9
.. .. ..
.. .. ..
1.9 97.9 102.7
2.1 101.3 102.0
3.6 108.7 108.0.. .. ..
.. .. ..
6.2 100.6 101.2
.. .. ..
3.6 108.5 106.1
1.6 105.4 105.5
1.9 106.2 106.5
2.6 104.2 104.3
2.8 108.5 116.0
1.6 104.4 105.6
2.2 103.8 104.22.5 106.8 107.5
3.6 101.3 101.9
1.8 105.5 105.6
1.8 104.2 104.8
2.7 107.8 112.2
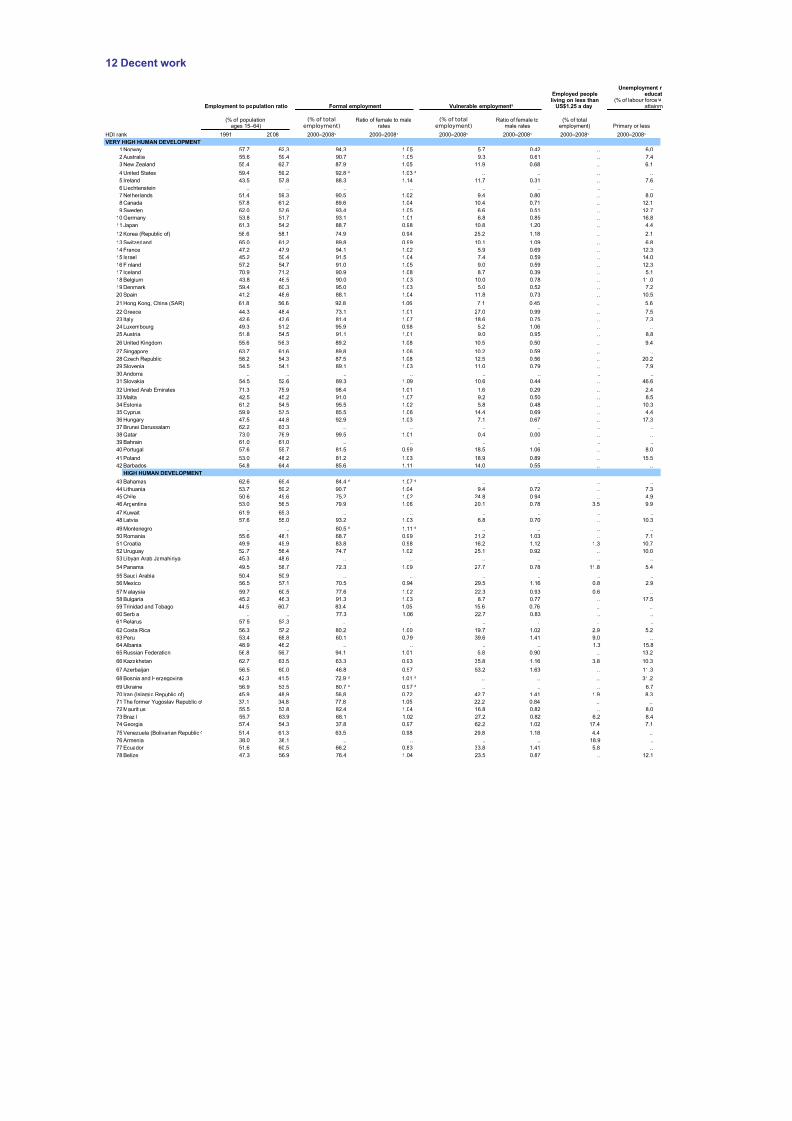
8/7/2019 Tabela IDH 2010 inglês
http://slidepdf.com/reader/full/tabela-idh-2010-ingles 63/102
a. Because data are based on national definitions of what constitutes a city or metropolitan area, cross country comparison should be made with caution.
b. The natural sex ratio at birth is commonly assumed and empirically confirmed to be 105 male births to 100 female births.
T. Data are aggregates provided by the original data source.
Sources
c. Includes Taiwan Province of China.
Columns 1–5 and 8–15: UNDESA (2009d).
Columns 6 and 7: UNDESA (2010).
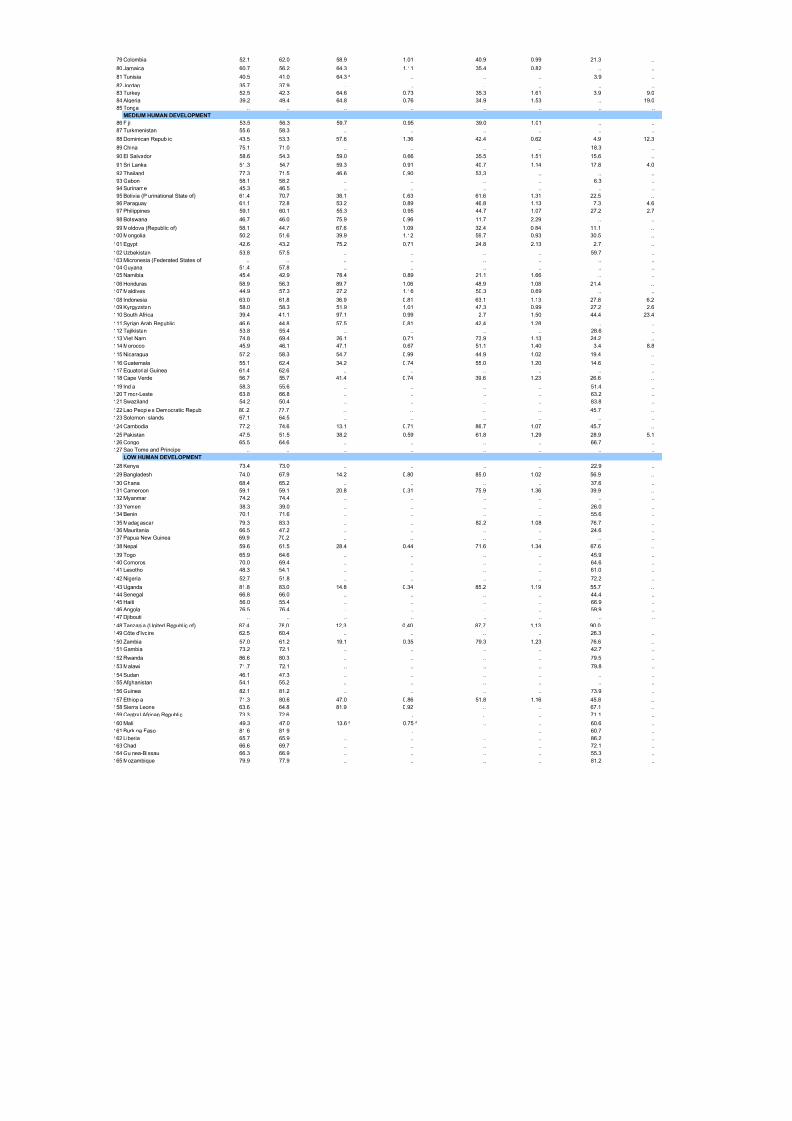
8/7/2019 Tabela IDH 2010 inglês
http://slidepdf.com/reader/full/tabela-idh-2010-ingles 64/102
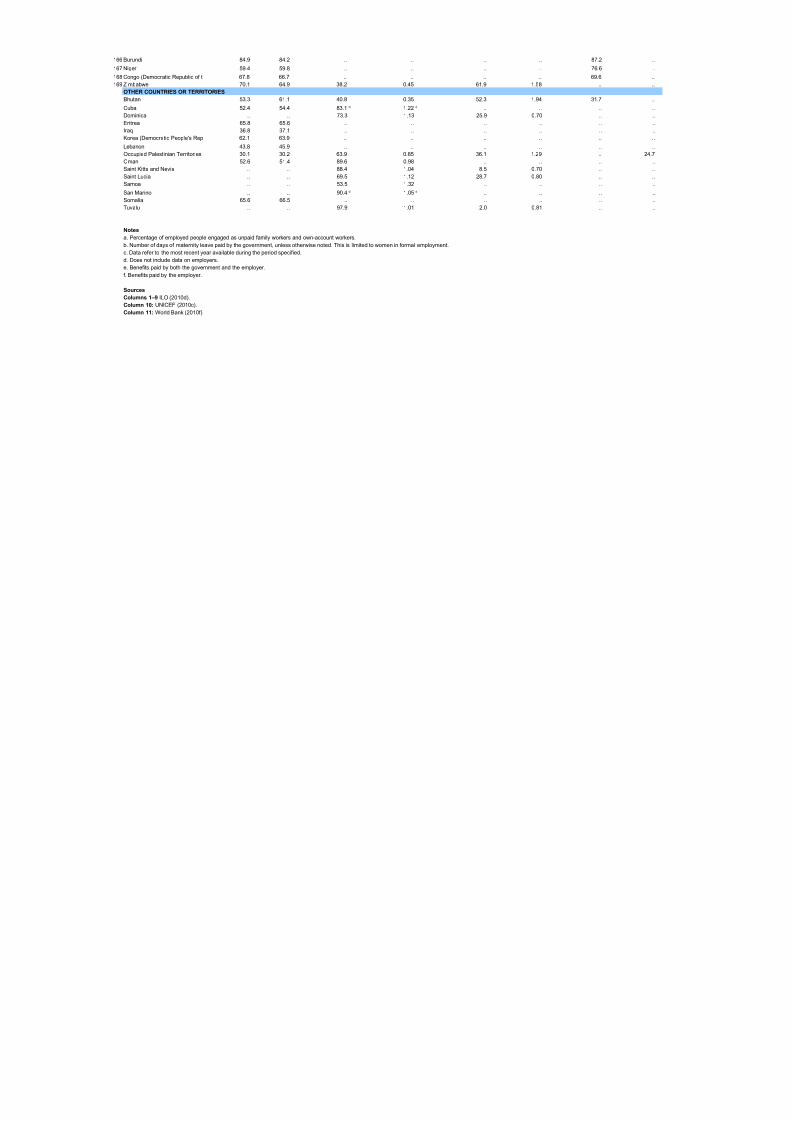
8/7/2019 Tabela IDH 2010 inglês
http://slidepdf.com/reader/full/tabela-idh-2010-ingles 65/102
12 Decent work
Employment to population ratio Formal employment
Primary or less
HDI rank 1991 2008
VERY HIGH HUMAN DEVELOPMENT
1 Norway 57.7 62.3 94.3 1.05 5.7 0.42 .. 6.0
2 Australia 55.6 59.4 90.7 1.05 9.3 0.61 .. 7.4
3 New Zealand 55.4 62.7 87.9 1.05 11.9 0.68 .. 6.1
4 United States 59.4 59.2 92.8 1.03 .. .. .. ..
5 Ireland 43.5 57.8 88.3 1.14 11.7 0.31 .. 7.6
6 Liechtenstein .. .. .. .. .. .. .. ..
7 Netherlands 51.4 59.3 90.5 1.02 9.4 0.80 .. 8.0
8 Canada 57.8 61.2 89.6 1.04 10.4 0.71 .. 12.1
9 Sweden 62.0 57.6 93.4 1.05 6.6 0.51 .. 12.7
10 Germany 53.8 51.7 93.1 1.01 6.8 0.85 .. 16.8
11 Japan 61.3 54.2 88.7 0.98 10.8 1.20 .. 4.4
12 Korea (Republic of) 58.6 58.1 74.9 0.94 25.2 1.18 .. 2.1
13 Switzerland 65.0 61.2 89.8 0.99 10.1 1.09 .. 6.8
14 France 47.2 47.9 94.1 1.02 5.9 0.69 .. 12.3
15 Israel 45.2 50.4 91.5 1.04 7.4 0.59 .. 14.0
16 Finland 57.2 54.7 91.0 1.05 9.0 0.59 .. 12.3
17 Iceland 70.9 71.2 90.9 1.08 8.7 0.39 .. 5.1
18 Belgium 43.8 46.5 90.0 1.03 10.0 0.78 .. 11.0
19 Denmark 59.4 60.3 95.0 1.03 5.0 0.52 .. 7.2
20 Spain 41.2 48.6 88.1 1.04 11.8 0.73 .. 10.5
21 Hong Kong, China (SAR) 61.8 56.6 92.8 1.06 7.1 0.45 .. 5.6
22 Greece 44.3 48.4 73.1 1.01 27.0 0.99 .. 7.523 Italy 42.6 43.6 81.4 1.07 18.6 0.75 .. 7.3
24 Luxembourg 49.3 51.2 95.9 0.98 5.2 1.06 .. ..
25 Austria 51.8 54.5 91.1 1.01 9.0 0.95 .. 8.8
26 United Kingdom 55.6 56.3 89.2 1.08 10.5 0.50 .. 9.4
27 Singapore 63.7 61.6 89.8 1.06 10.2 0.59 .. ..
28 Czech Republic 58.2 54.3 87.5 1.08 12.5 0.56 .. 20.2
29 Slovenia 54.5 54.1 89.1 1.03 11.0 0.79 .. 7.9
30 Andorra .. .. .. .. .. .. .. ..
31 Slovakia 54.5 52.6 89.3 1.09 10.6 0.44 .. 46.6
32 United Arab Emirates 71.3 75.9 98.4 1.01 1.6 0.29 .. 2.4
33 Malta 42.5 45.2 91.0 1.07 9.2 0.50 .. 8.5
34 Estonia 61.2 54.5 95.5 1.02 5.8 0.48 .. 10.3
35 Cyprus 59.9 57.5 85.5 1.06 14.4 0.69 .. 4.436 Hungary 47.5 44.8 92.9 1.03 7.1 0.67 .. 17.3
37 Brunei Darussalam 62.2 63.3 .. .. .. .. .. ..
38 Qatar 73.0 76.9 99.5 1.01 0.4 0.00 .. ..
39 Bahrain 61.0 61.0 .. .. .. .. .. ..
40 Portugal 57.6 55.7 81.5 0.99 18.5 1.06 .. 8.0
41 Poland 53.0 48.2 81.2 1.03 18.9 0.89 .. 15.5
42 Barbados 54.8 64.4 85.6 1.11 14.0 0.55 .. ..
HIGH HUMAN DEVELOPMENT
43 Bahamas 62.6 65.4 84.4 1.07 .. .. .. ..
44 Lithuania 53.7 50.2 90.7 1.04 9.4 0.72 .. 7.3
45 Chile 50.6 49.6 75.2 1.02 24.8 0.94 .. 4.9
46 Argentina 53.0 56.5 79.9 1.06 20.1 0.78 3.5 9.9
47 Kuwait 61.9 65.3 .. .. .. .. .. ..
48 Latvia 57.6 55.0 93.2 1.03 6.8 0.70 .. 10.3
49 Montenegro .. .. 80.5 1.11 .. .. .. ..
50 Romania 55.6 48.1 68.7 0.99 31.2 1.03 .. 7.1
51 Croatia 49.9 45.9 83.8 0.98 16.2 1.12 1.3 10.7
52 Uruguay 52.7 56.4 74.7 1.02 25.1 0.92 .. 10.0
53 Libyan Arab Jamahiriya 45.3 48.6 .. .. .. .. .. ..
54 Panama 49.5 58.7 72.3 1.09 27.7 0.78 11.8 5.4
55 Saudi Arabia 50.4 50.9 .. .. .. .. .. ..
56 Mexico 56.5 57.1 70.5 0.94 29.5 1.16 0.8 2.9
57 Malaysia 59.7 60.5 77.6 1.02 22.3 0.93 0.6 ..
58 Bulgaria 45.2 46.3 91.3 1.03 8.7 0.77 .. 17.5
59 Trinidad and Tobago 44.5 60.7 83.4 1.05 15.6 0.76 .. ..
60 Serbia .. .. 77.3 1.06 22.7 0.83 .. ..
61 Belarus 57.5 52.3 .. .. .. .. .. ..62 Costa Rica 56.3 57.2 80.2 1.00 19.7 1.02 2.9 5.2
63 Peru 53.4 68.8 60.1 0.79 39.6 1.41 9.0 ..
64 Albania 48.9 46.2 .. .. .. .. 1.3 15.8
65 Russian Federation 56.8 56.7 94.1 1.01 5.8 0.90 .. 13.2
66 Kazakhstan 62.7 63.5 63.3 0.93 35.8 1.16 3.8 10.3
67 Azerbaijan 56.5 60.0 46.8 0.57 53.2 1.63 .. 11.3
68 Bosnia and Herzegovina 42.3 41.5 72.9 1.01 .. .. .. 31.2
69 Ukraine 56.9 53.5 80.7 0.97 .. .. .. 6.7
70 Iran (Islamic Republic of) 45.9 48.9 56.8 0.72 42.7 1.41 1.9 8.3
71 The former Yugoslav Republic o 37.1 34.8 77.8 1.05 22.2 0.84 .. ..
72 Mauritius 55.5 53.8 82.4 1.04 16.8 0.82 .. 8.0
73 Brazil 55.7 63.9 68.1 1.02 27.2 0.82 6.2 8.4
74 Georgia 57.4 54.3 37.8 0.97 62.2 1.02 17.4 7.175 Venezuela (Bolivarian Republic 51.4 61.3 63.5 0.98 29.8 1.18 4.4 ..
76 Armenia 38.0 38.1 .. .. .. .. 18.9 ..
77 Ecuador 51.6 60.5 66.2 0.83 33.8 1.41 5.8 ..
78 Belize 47.3 56.9 76.4 1.04 23.5 0.87 .. 12.1
Vulnerable employmenta
Employed peopleliving on less than
US$1.25 a day
Unemployment r educat
(% of labour forceattainm
(% of populationages 15–64)
(% of totalemployment)
Ratio of female to malerates
(% of totalemployment)
Ratio of female tomale rates
(% of totalemployment)
2000–2008c 2000–2008c 2000–2008c 2000–2008c 2000–2008c 2000–2008c
d d
d d
d d
d d
d d
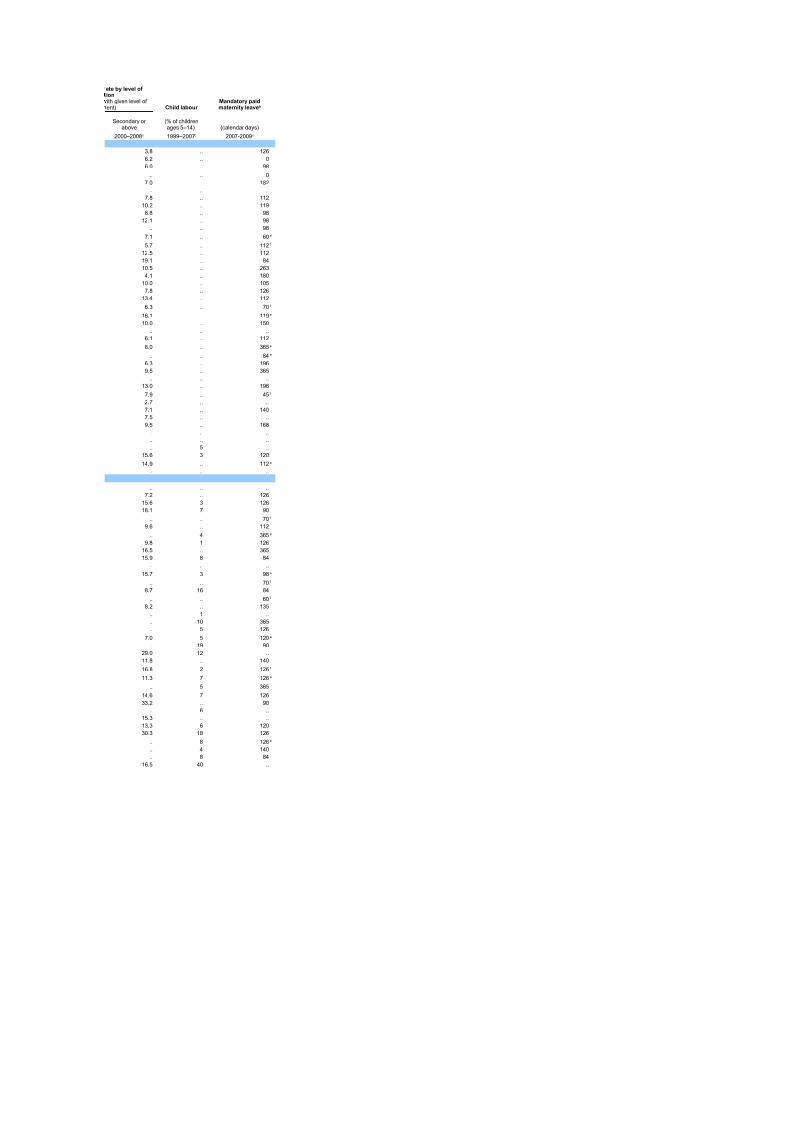
8/7/2019 Tabela IDH 2010 inglês
http://slidepdf.com/reader/full/tabela-idh-2010-ingles 66/102
79 Colombia 52.1 62.0 58.9 1.01 40.9 0.99 21.3 ..
80 Jamaica 60.7 56.2 64.3 1.11 35.4 0.82 .. ..
81 Tunisia 40.5 41.0 64.3 .. .. .. 3.9 ..
82 Jordan 35.7 37.9 .. .. .. .. .. ..
83 Turkey 52.5 42.3 64.6 0.73 35.3 1.61 3.9 9.0
84 Algeria 39.2 49.4 64.8 0.76 34.9 1.53 .. 19.0
85 Tonga .. .. .. .. .. .. .. ..
MEDIUM HUMAN DEVELOPMENT
86 Fiji 53.5 56.3 59.7 0.95 39.0 1.01 .. ..
87 Turkmenistan 55.6 58.3 .. .. .. .. .. ..
88 Dominican Republic 43.5 53.3 57.6 1.36 42.4 0.62 4.9 12.3
89 China 75.1 71.0 .. .. .. .. 18.3 ..
90 El Salvador 58.6 54.3 59.0 0.66 35.5 1.51 15.6 ..
91 Sri Lanka 51.3 54.7 59.3 0.91 40.7 1.14 17.8 4.0
92 Thailand 77.3 71.5 46.6 0.90 53.3 .. .. ..
93 Gabon 58.1 58.2 .. .. .. .. 6.3 ..
94 Suriname 45.3 46.5 .. .. .. .. .. ..
95 Bolivia (Plurinational State of) 61.4 70.7 38.1 0.63 61.6 1.31 22.5 ..
96 Paraguay 61.1 72.8 53.2 0.89 46.8 1.13 7.3 4.6
97 Philippines 59.1 60.1 55.3 0.95 44.7 1.07 27.2 2.7
98 Botswana 46.7 46.0 75.9 0.96 11.7 2.29 .. ..
99 Moldova (Republic of) 58.1 44.7 67.6 1.09 32.4 0.84 11.1 ..
100 Mongolia 50.2 51.6 39.9 1.12 59.7 0.93 30.5 ..
101 Egypt 42.6 43.2 75.2 0.71 24.8 2.13 2.7 ..
102 Uzbekistan 53.8 57.5 .. .. .. .. 59.7 ..
103 Micronesia (Federated States of .. .. .. .. .. .. .. ..
104 Guyana 51.4 57.8 .. .. .. .. .. ..
105 Namibia 45.4 42.9 78.4 0.89 21.1 1.66 .. ..
106 Honduras 58.9 56.3 89.7 1.06 48.9 1.08 21.4 ..
107 Maldives 44.9 57.3 27.2 1.16 50.3 0.69 .. ..
108 Indonesia 63.0 61.8 36.9 0.81 63.1 1.13 27.8 6.2
109 Kyrgyzstan 58.0 58.3 51.9 1.01 47.3 0.99 27.2 2.6
110 South Africa 39.4 41.1 97.1 0.99 2.7 1.50 44.4 23.4
111 Syrian Arab Republic 46.6 44.8 57.5 0.81 42.4 1.28 .. ..
112 Tajikistan 53.8 55.4 .. .. .. .. 28.6 ..
113 Viet Nam 74.8 69.4 26.1 0.71 73.9 1.13 24.2 ..
114 Morocco 45.9 46.1 47.1 0.67 51.1 1.40 3.4 8.8
115 Nicaragua 57.2 58.3 54.7 0.99 44.9 1.02 19.4 ..
116 Guatemala 55.1 62.4 34.2 0.74 55.0 1.20 14.6 ..
117 Equatorial Guinea 61.4 62.6 .. .. .. .. .. ..
118 Cape Verde 56.7 55.7 41.4 0.74 39.6 1.23 26.6 ..
119 India 58.3 55.6 .. .. .. .. 51.4 ..
120 Timor-Leste 63.8 66.8 .. .. .. .. 63.2 ..
121 Swaziland 54.2 50.4 .. .. .. .. 83.8 ..
122 Lao People's Democratic Repub 80.2 77.7 .. .. .. .. 45.7 ..
123 Solomon Islands 67.1 64.5 .. .. .. .. .. ..
124 Cambodia 77.2 74.6 13.1 0.71 86.7 1.07 45.7 ..
125 Pakistan 47.5 51.5 38.2 0.59 61.8 1.29 28.9 5.1
126 Congo 65.5 64.6 .. .. .. .. 66.7 ..
127 Sao Tome and Principe .. .. .. .. .. .. .. ..
LOW HUMAN DEVELOPMENT
128 Kenya 73.4 73.0 .. .. .. .. 22.9 ..
129 Bangladesh 74.0 67.9 14.2 0.80 85.0 1.02 56.9 ..
130 Ghana 68.4 65.2 .. .. .. .. 37.6 ..
131 Cameroon 59.1 59.1 20.8 0.31 75.9 1.36 39.9 ..
132 Myanmar 74.2 74.4 .. .. .. .. .. ..
133 Yemen 38.3 39.0 .. .. .. .. 26.0 ..
134 Benin 70.1 71.6 .. .. .. .. 55.6 ..
135 Madagascar 79.3 83.3 .. .. 82.2 1.08 76.7 ..
136 Mauritania 66.5 47.2 .. .. .. .. 24.6 ..
137 Papua New Guinea 69.9 70.2 .. .. .. .. .. ..
138 Nepal 59.6 61.5 28.4 0.44 71.6 1.34 67.6 ..
139 Togo 65.9 64.6 .. .. .. .. 45.9 ..
140 Comoros 70.0 69.4 .. .. .. .. 64.6 ..
141 Lesotho 48.3 54.1 .. .. .. .. 61.0 ..
142 Nigeria 52.7 51.8 .. .. .. .. 72.2 ..
143 Uganda 81.8 83.0 14.8 0.34 85.2 1.19 55.7 ..
144 Senegal 66.8 66.0 .. .. .. .. 44.4 ..
145 Haiti 56.0 55.4 .. .. .. .. 66.9 ..
146 Angola 76.5 76.4 .. .. .. .. 59.9 ..
147 Djibouti .. .. .. .. .. .. .. ..
148 Tanzania (United Republic of) 87.4 78.0 12.3 0.40 87.7 1.13 90.0 ..
149 Côte d'Ivoire 62.5 60.4 .. .. .. .. 26.3 ..
150 Zambia 57.0 61.2 19.1 0.35 79.3 1.23 76.6 ..
151 Gambia 73.2 72.1 .. .. .. .. 42.7 ..
152 Rwanda 86.6 80.3 .. .. .. .. 79.5 ..
153 Malawi 71.7 72.1 .. .. .. .. 79.8 ..
154 Sudan 46.1 47.3 .. .. .. .. .. ..
155 Afghanistan 54.1 55.2 .. .. .. .. .. ..
156 Guinea 82.1 81.2 .. .. .. .. 73.9 ..
157 Ethiopia 71.3 80.6 47.0 0.86 51.8 1.16 45.8 ..
158 Sierra Leone 63.6 64.8 81.9 0.92 .. .. 67.1 ..
159 Central African Republic 73.3 72.6 .. .. .. .. 71.1 ..
160 Mali 49.3 47.0 13.6 0.75 .. .. 60.6 ..161 Burkina Faso 81.6 81.9 .. .. .. .. 60.7 ..
162 Liberia 65.7 65.9 .. .. .. .. 86.2 ..
163 Chad 66.6 69.7 .. .. .. .. 72.1 ..
164 Guinea-Bissau 66.3 66.9 .. .. .. .. 55.3 ..
165 Mozambique 79.9 77.9 .. .. .. .. 81.2 ..
d
d d
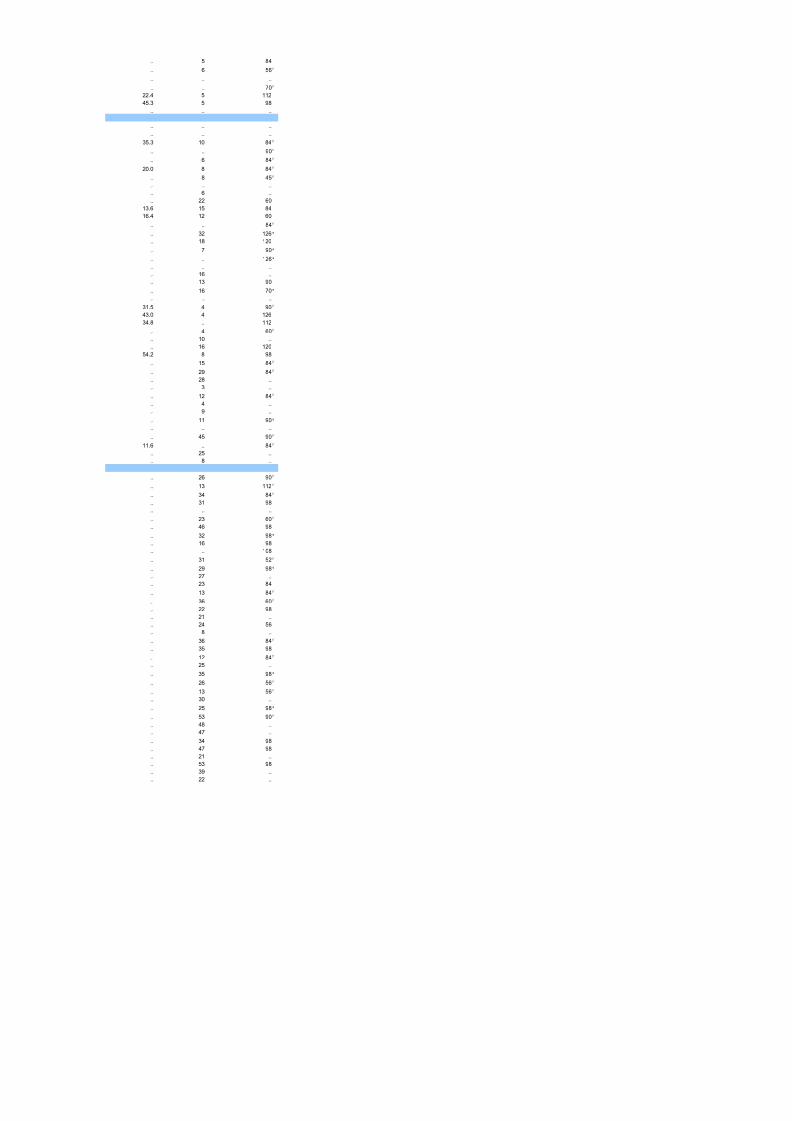
8/7/2019 Tabela IDH 2010 inglês
http://slidepdf.com/reader/full/tabela-idh-2010-ingles 67/102
166 Burundi 84.9 84.2 .. .. .. .. 87.2 ..
167 Niger 59.4 59.8 .. .. .. .. 76.6 ..
168 Congo (Democratic Republic of t 67.8 66.7 .. .. .. .. 69.6 ..
169 Zimbabwe 70.1 64.9 38.2 0.45 61.9 1.58 .. ..
OTHER COUNTRIES OR TERRITORIES
Bhutan 53.3 61.1 40.8 0.35 52.3 1.94 31.7 ..
Cuba 52.4 54.4 83.1 1.22 .. .. .. ..
Dominica .. .. 73.3 1.13 25.9 0.70 .. ..
Eritrea 65.8 65.6 .. .. .. .. .. ..
Iraq 36.8 37.1 .. .. .. .. .. ..
Korea (Democratic People's Rep 62.1 63.9 .. .. .. .. .. ..
Lebanon 43.8 45.9 .. .. .. .. .. ..
Occupied Palestinian Territories 30.1 30.2 63.9 0.85 36.1 1.29 .. 24.7
Oman 52.6 51.4 89.6 0.98 .. .. .. ..
Saint Kitts and Nevis .. .. 88.4 1.04 8.5 0.70 .. ..
Saint Lucia .. .. 69.5 1.12 28.7 0.80 .. ..
Samoa .. .. 53.5 1.32 .. .. .. ..
San Marino .. .. 90.4 1.05 .. .. .. ..
Somalia 65.6 66.5 .. .. .. .. .. ..
Tuvalu .. .. 97.9 1.01 2.0 0.81 .. ..
Notes
a. Percentage of employed people engaged as unpaid family workers and own-account workers.
b. Number of days of maternity leave paid by the government, unless otherwise noted. This is limited to women in formal employment.
c. Data refer to the most recent year available during the period specified.
d. Does not include data on employers.
e. Benefits paid by both the government and the employer.
f. Benefits paid by the employer.
Sources
d d
d d
Columns 1–9 ILO (2010d).
Column 10: UNICEF (2010c).
Column 11: World Bank (2010f).

8/7/2019 Tabela IDH 2010 inglês
http://slidepdf.com/reader/full/tabela-idh-2010-ingles 68/102
Child labour
(calendar days)
3.8 .. 126
6.2 .. 0
6.0 .. 98
.. .. 0
7.0 .. 182
.. .. ..
7.8 .. 112
10.2 .. 1198.8 .. 98
12.1 .. 98
.. .. 98
7.1 .. 60
5.7 .. 112
12.5 .. 112
19.1 .. 84
10.5 .. 263
4.1 .. 180
10.0 .. 105
7.8 .. 126
13.4 .. 112
6.3 .. 70
16.1 .. 119
10.0 .. 150
.. .. ..
6.1 .. 112
8.0 .. 365
.. .. 84
6.3 .. 196
9.5 .. 365
.. .. ..
13.0 .. 196
7.9 .. 45
2.7 .. ..
7.1 .. 140
7.5 .. ..
9.5 .. 168
.. .. ..
.. .. ..
.. 5 ..
15.6 3 120
14.9 .. 112
.. .. ..
.. .. ..
7.2 .. 126
15.6 3 126
18.1 7 90
.. .. 709.6 .. 112
.. 4 365
9.8 1 126
16.5 .. 365
15.9 8 84
.. .. ..
15.7 3 98
.. .. 70
8.7 16 84
.. .. 60
8.2 .. 135
.. 1 ..
.. 10 365
.. 5 126
7.0 5 120
.. 19 90
29.0 12 ..
11.8 .. 140
16.8 2 126
11.3 7 126
.. 5 365
14.6 7 126
33.2 .. 90
.. 6 ..
15.3 .. ..
13.3 6 12030.3 18 126
.. 8 126
.. 4 140
.. 8 84
16.5 40 ..
ate by level of ion
ith given level of ent) Mandatory paidmaternity leaveb
Secondary or above
(% of childrenages 5–14)
2000–2008c 1999–2007c 2007-2009c
e
f
f
e
e
e
f
e
f
e
e
f
f
e
f
e
e
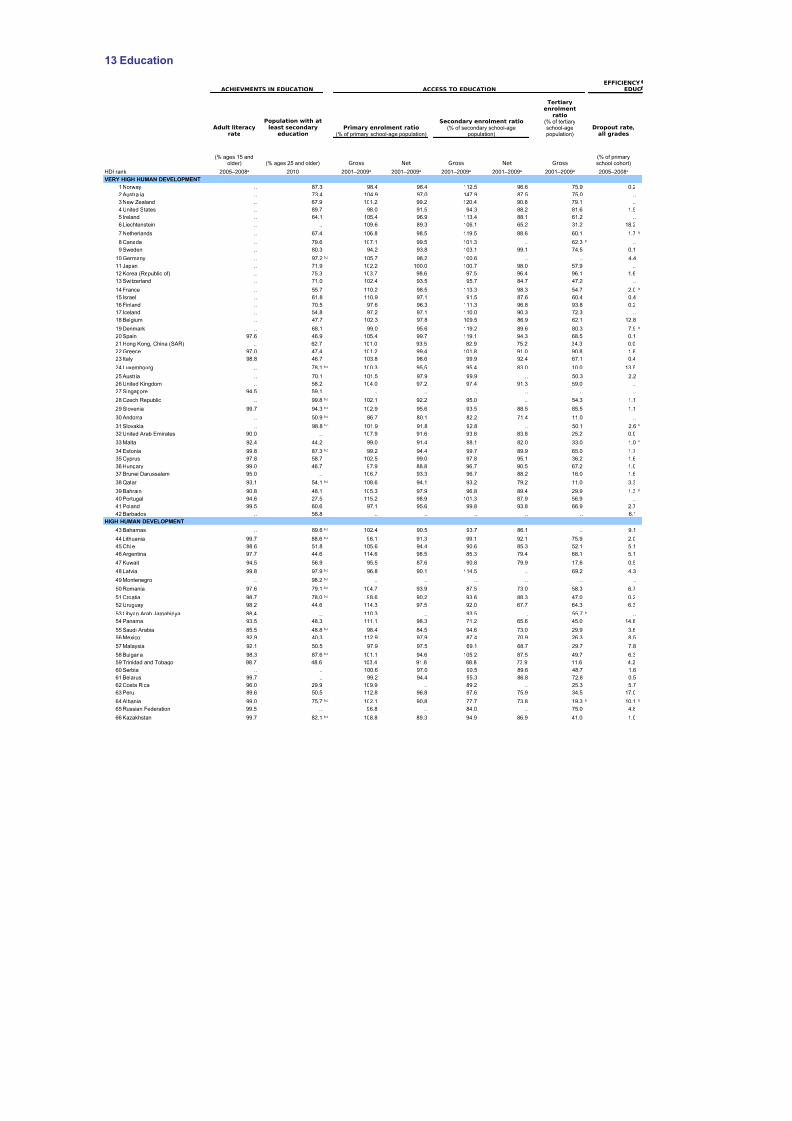
8/7/2019 Tabela IDH 2010 inglês
http://slidepdf.com/reader/full/tabela-idh-2010-ingles 69/102
.. 5 84
.. 6 56
.. .. ..
.. .. 70
22.4 5 112
45.3 5 98.. .. ..
.. .. ..
.. .. ..
35.3 10 84
.. .. 90
.. 6 84
20.0 8 84
.. 8 45
.. .. ..
.. 6 ..
.. 22 60
13.6 15 8416.4 12 60
.. .. 84
.. 32 126
.. 18 120
.. 7 90
.. .. 126
.. .. ..
.. 16 ..
.. 13 90
.. 16 70
.. .. ..
31.5 4 90
43.0 4 126
34.8 .. 112
.. 4 60
.. 10 ..
.. 16 120
54.2 8 98
.. 15 84
.. 29 84
.. 28 ..
.. 3 ..
.. 12 84
.. 4 ..
.. 9 ..
.. 11 90
.. .. ..
.. 45 90
11.6 .. 84
.. 25 ..
.. 8 ..
.. 26 90
.. 13 112
.. 34 84
.. 31 98
.. .. ..
.. 23 60
.. 46 98
.. 32 98
.. 16 98
.. .. 108
.. 31 52
.. 29 98
.. 27 ..
.. 23 84
.. 13 84
.. 36 60
.. 22 98
.. 21 ..
.. 24 56
.. 8 ..
.. 36 84
.. 35 98
.. 12 84
.. 25 ..
.. 35 98
.. 26 56
.. 13 56
.. 30 ..
.. 25 98
.. 53 90
.. 48 ..
.. 47 ..
.. 34 98
.. 47 98
.. 21 ..
.. 53 98
.. 39 ..
.. 22 ..
f
f
f
f
f
f
f
f
e
e
e
e
f
f
f
f
f
e
f
f
f
f
f
f
e
f
e
f
f
f
f
e
f
f
e
f
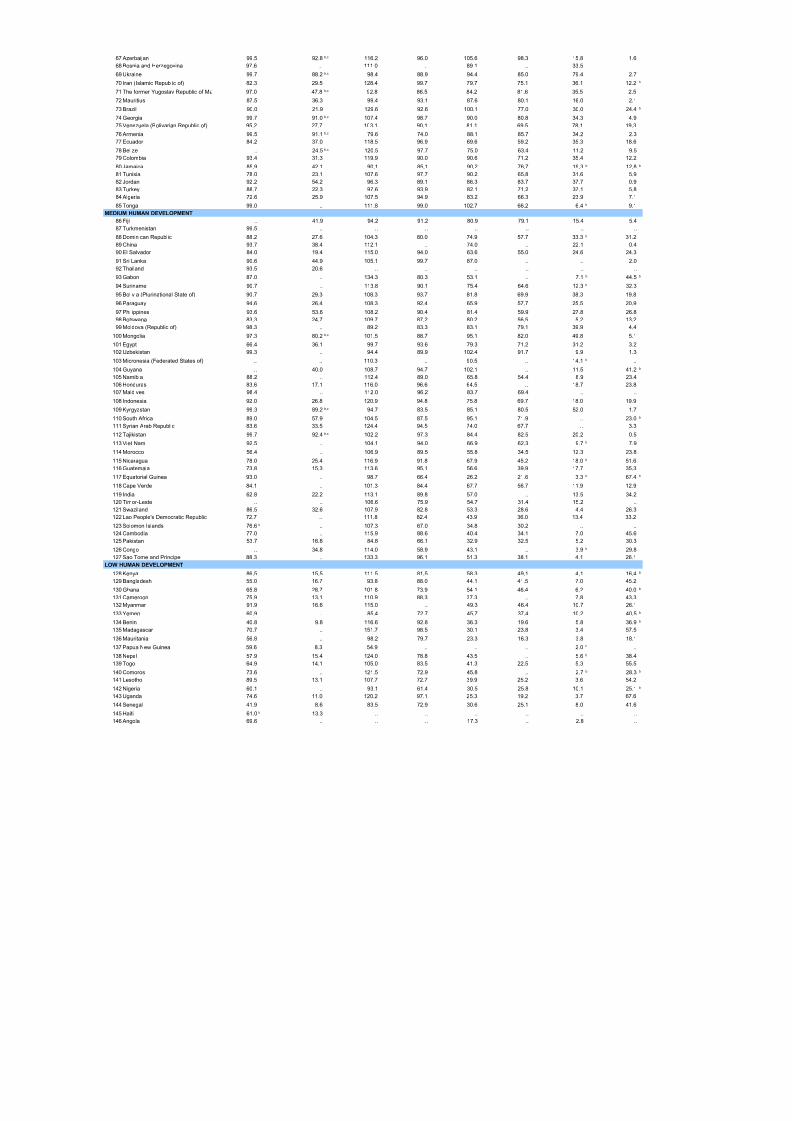
8/7/2019 Tabela IDH 2010 inglês
http://slidepdf.com/reader/full/tabela-idh-2010-ingles 70/102
.. 19 ..
.. 43 98
.. 32 105
.. 13 ..
.. 19 ..
.. .. ..
.. .. ..
.. .. ..
.. 11 ..
.. .. ..
.. 7 49
41.8 .. ..
.. .. 42
.. .. ..
.. .. ..
.. .. ..
.. .. ..
.. 49 ..
.. .. ..
f
e
e
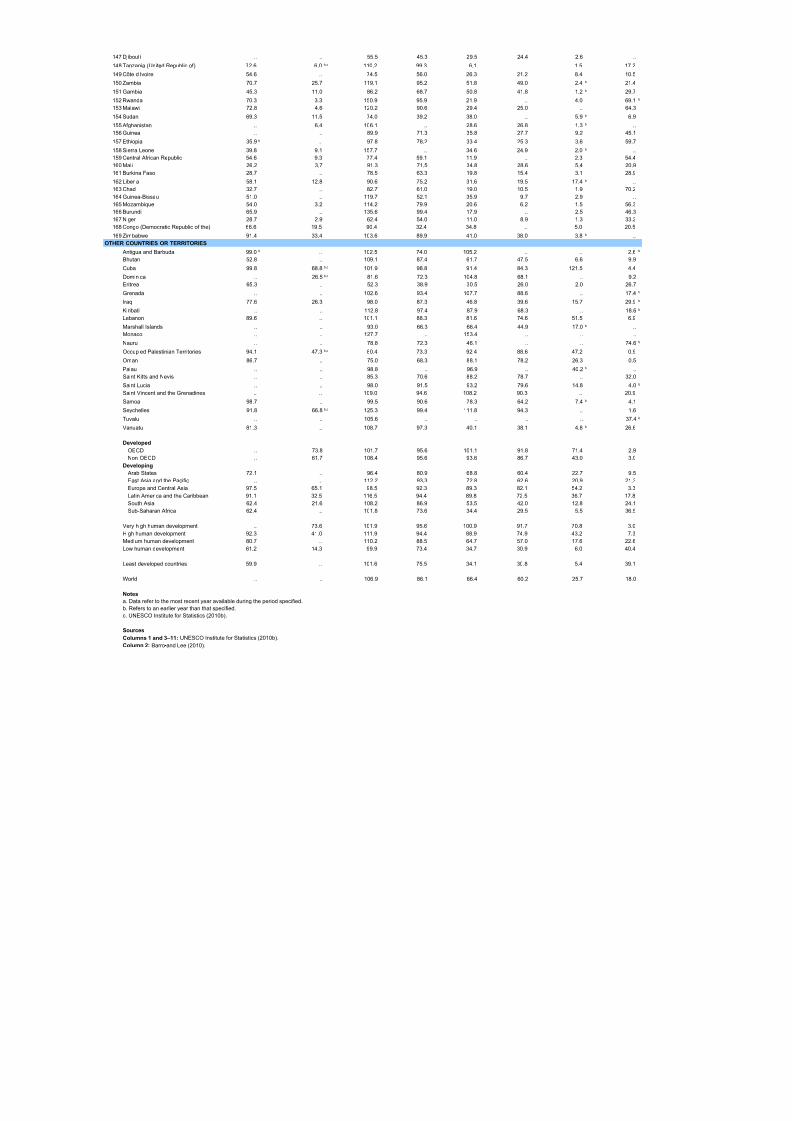
8/7/2019 Tabela IDH 2010 inglês
http://slidepdf.com/reader/full/tabela-idh-2010-ingles 71/102
13 Education
ACHIEVMENTS IN EDUCATION ACCESS TO EDUCATION
(% ages 25 and older) Gross Net Gross Net Gross
HDI rank 2010
VERY HIGH HUMAN DEVELOPMENT
1 Norway .. 87.3 98.4 98.4 112.5 96.6 75.9 0.2
2 Australia .. 73.4 104.9 97.0 147.9 87.5 75.0 ..
3 New Zealand .. 67.9 101.2 99.2 120.4 90.8 79.1 ..
4 United States .. 89.7 98.0 91.5 94.3 88.2 81.6 1.5
5 Ireland .. 64.1 105.4 96.9 113.4 88.1 61.2 ..
6 Liechtenstein .. .. 109.6 89.3 106.1 65.2 31.2 18.2
7 Netherlands .. 67.4 106.8 98.5 119.5 88.6 60.1 1.7
8 Canada .. 79.6 107.1 99.5 101.3 .. 62.3 ..
9 Sweden .. 80.3 94.2 93.8 103.1 99.1 74.5 0.1
10 Germany .. 97.2 105.7 98.2 100.6 .. .. 4.4
11 Japan .. 71.9 102.2 100.0 100.7 98.0 57.9 ..
12 Korea (Republic of) .. 75.3 103.7 98.6 97.5 96.4 96.1 1.6
13 Switzerland .. 71.0 102.4 93.5 95.7 84.7 47.2 ..
14 France .. 55.7 110.2 98.5 113.3 98.3 54.7 2.0
15 Israel .. 61.8 110.9 97.1 91.5 87.6 60.4 0.4
16 Finland .. 70.5 97.6 96.3 111.3 96.8 93.8 0.2
17 Iceland .. 54.8 97.2 97.1 110.0 90.3 72.3 ..18 Belgium .. 47.7 102.3 97.8 109.5 86.9 62.1 12.8
19 Denmark .. 68.1 99.0 95.6 119.2 89.6 80.3 7.9
20 Spain 97.6 46.9 105.4 99.7 119.1 94.3 68.5 0.1
21 Hong Kong, China (SAR) .. 62.7 101.0 93.5 82.9 75.2 34.3 0.0
22 Greece 97.0 47.4 101.2 99.4 101.8 91.0 90.8 1.8
23 Italy 98.8 46.7 103.8 98.6 99.9 92.4 67.1 0.4
24 Luxembourg .. 78.1 100.3 95.5 95.4 83.0 10.0 13.5
25 Austria .. 70.1 101.5 97.9 99.9 .. 50.3 2.2
26 United Kingdom .. 58.2 104.0 97.2 97.4 91.3 59.0 ..
27 Singapore 94.5 59.1 .. .. .. .. .. ..
28 Czech Republic .. 99.8 102.1 92.2 95.0 .. 54.3 1.1
29 Slovenia 99.7 94.3 102.9 95.6 93.5 88.5 85.5 1.1
30 Andorra .. 50.9 86.7 80.1 82.2 71.4 11.0 ..
31 Slovakia .. 98.8 101.9 91.8 92.8 .. 50.1 2.6
32 United Arab Emirates 90.0 .. 107.9 91.6 93.8 83.8 25.2 0.0
33 Malta 92.4 44.2 99.0 91.4 98.1 82.0 33.0 1.0
34 Estonia 99.8 87.3 99.2 94.4 99.7 89.9 65.0 1.7
35 Cyprus 97.8 58.7 102.5 99.0 97.8 95.1 36.2 1.6
36 Hungary 99.0 46.7 97.9 88.8 96.7 90.5 67.2 1.0
37 Brunei Darussalam 95.0 .. 106.7 93.3 96.7 88.2 16.0 1.6
38 Qatar 93.1 54.1 108.6 94.1 93.2 79.2 11.0 3.3
39 Bahrain 90.8 48.1 105.3 97.9 96.8 89.4 29.9 1.3
40 Portugal 94.6 27.5 115.2 98.9 101.3 87.9 56.9 ..
41 Poland 99.5 60.6 97.1 95.6 99.8 93.8 66.9 2.7
42 Barbados .. 58.8 .. .. .. .. .. 6.1
HIGH HUMAN DEVELOPMENT
43 Bahamas .. 89.6 102.4 90.5 93.7 86.1 .. 9.1
44 Lithuania 99.7 88.6 96.1 91.3 99.1 92.1 75.9 2.0
45 Chile 98.6 51.8 105.6 94.4 90.6 85.3 52.1 5.1
46 Argentina 97.7 44.6 114.6 98.5 85.3 79.4 68.1 5.1
47 Kuwait 94.5 56.9 95.5 87.6 90.8 79.9 17.6 0.5
48 Latvia 99.8 97.9 96.8 90.1 114.5 .. 69.2 4.3
49 Montenegro .. 98.2 .. .. .. .. .. ..
50 Romania 97.6 79.1 104.7 93.9 87.5 73.0 58.3 6.7
51 Croatia 98.7 78.0 98.6 90.2 93.6 88.3 47.0 0.2
52 Uruguay 98.2 44.6 114.3 97.5 92.0 67.7 64.3 6.3
53 Libyan Arab Jamahiriya 88.4 .. 110.3 .. 93.5 .. 55.7 ..
54 Panama 93.5 48.3 111.1 98.3 71.2 65.6 45.0 14.855 Saudi Arabia 85.5 48.8 98.4 84.5 94.6 73.0 29.9 3.6
56 Mexico 92.9 40.3 112.9 97.9 87.4 70.9 26.3 8.5
57 Malaysia 92.1 50.5 97.9 97.5 69.1 68.7 29.7 7.8
58 Bulgaria 98.3 87.6 101.1 94.6 105.2 87.5 49.7 6.3
59 Trinidad and Tobago 98.7 48.6 103.4 91.8 88.8 73.9 11.6 4.2
60 Serbia .. .. 100.6 97.0 90.5 89.6 48.7 1.6
61 Belarus 99.7 .. 99.2 94.4 95.3 86.8 72.8 0.5
62 Costa Rica 96.0 29.9 109.9 .. 89.2 .. 25.3 5.7
63 Peru 89.6 50.5 112.8 96.8 97.6 75.9 34.5 17.0
64 Albania 99.0 75.7 102.1 90.8 77.7 73.8 19.3 10.1
65 Russian Federation 99.5 .. 96.8 .. 84.0 .. 75.0 4.8
66 Kazakhstan 99.7 82.1 108.8 89.3 94.9 86.9 41.0 1.0
EFFICIENCY EDUC
Adult literacyrate
Population with atleast secondary
educationPrimary enrolment ratio
(% of primary school-age population)
Secondary enrolment ratio(% of secondary school-age
population)
Tertiaryenrolment
ratio(% of tertiaryschool-agepopulation)
Dropout rate,all grades
(% ages 15 andolder)
(% of primaryschool cohort)
2005–2008a 2001–2009a 2001–2009a 2001–2009a 2001–2009a 2001–2009a 2005–2008a
b
b
b,c
b
b
b,c
b,c
b,c
b,c
b,c b
b
b,c
b,c
b
b,c
b,c
b,c
b,c
b,c
b,c
b
b,c
b,c
b,c b b
b,c
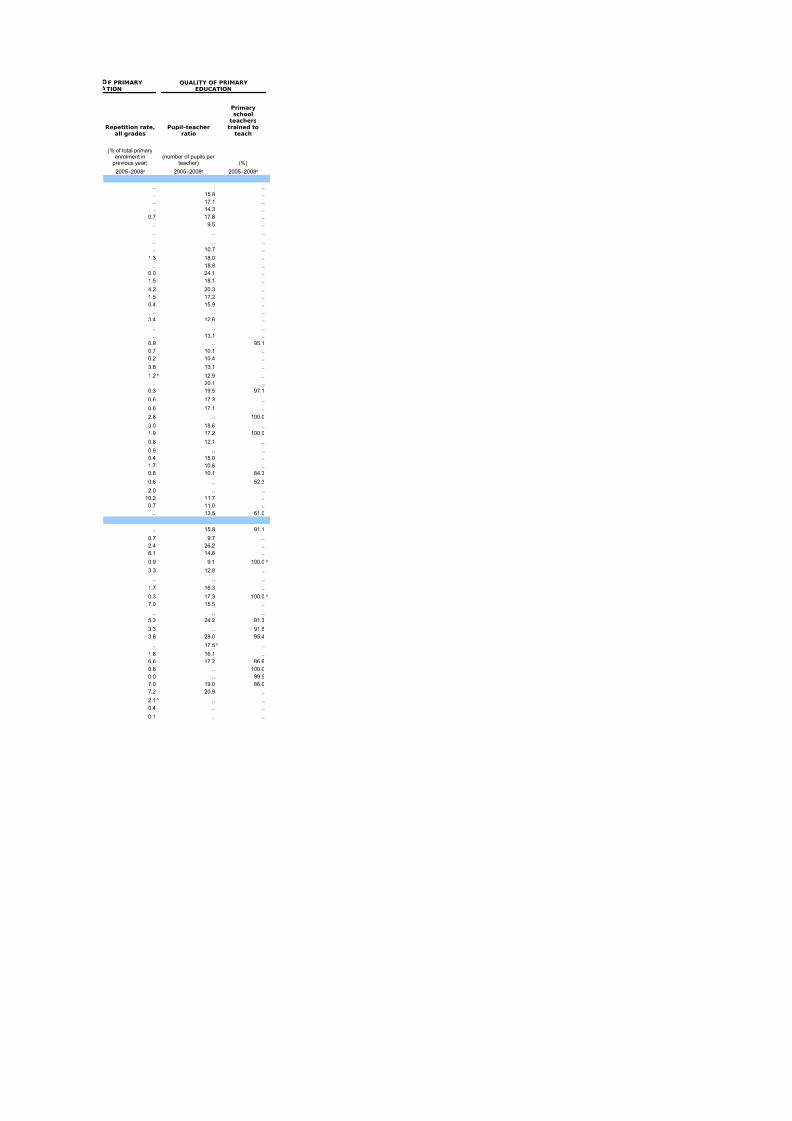
8/7/2019 Tabela IDH 2010 inglês
http://slidepdf.com/reader/full/tabela-idh-2010-ingles 72/102
67 Azerbaijan 99.5 92.8 116.2 96.0 105.6 98.3 15.8 1.6
68 Bosnia and Herzegovina 97.6 .. 111.0 .. 89.1 .. 33.5 ..
69 Ukraine 99.7 88.2 98.4 88.9 94.4 85.0 79.4 2.7
70 Iran (Islamic Republic of) 82.3 29.5 128.4 99.7 79.7 75.1 36.1 12.2
71 The former Yugoslav Republic of M 97.0 47.8 92.8 86.5 84.2 81.6 35.5 2.5
72 Mauritius 87.5 36.3 99.4 93.1 87.6 80.1 16.0 2.1
73 Brazil 90.0 21.9 129.6 92.6 100.1 77.0 30.0 24.4
74 Georgia 99.7 91.0 107.4 98.7 90.0 80.8 34.3 4.9
75 Venezuela (Bolivarian Republic of) 95.2 27.7 103.1 90.1 81.1 69.5 78.1 19.3
76 Armenia 99.5 91.1 79.6 74.0 88.1 85.7 34.2 2.3
77 Ecuador 84.2 37.0 118.5 96.9 69.6 59.2 35.3 18.6
78 Belize .. 24.5 120.5 97.7 75.0 63.4 11.2 9.5
79 Colombia 93.4 31.3 119.9 90.0 90.6 71.2 35.4 12.2
80 Jamaica 85.9 42.1 90.1 85.1 90.2 76.7 19.3 12.8
81 Tunisia 78.0 23.1 107.6 97.7 90.2 65.8 31.6 5.9
82 Jordan 92.2 54.2 96.3 89.1 86.3 83.7 37.7 0.9
83 Turkey 88.7 22.3 97.6 93.9 82.1 71.2 37.1 5.8
84 Algeria 72.6 25.9 107.5 94.9 83.2 66.3 23.9 7.1
85 Tonga 99.0 .. 111.8 99.0 102.7 66.2 6.4 9.1MEDIUM HUMAN DEVELOPMENT
86 Fiji .. 41.9 94.2 91.2 80.9 79.1 15.4 5.4
87 Turkmenistan 99.5 .. .. .. .. .. .. ..
88 Dominican Republic 88.2 27.6 104.3 80.0 74.9 57.7 33.3 31.2
89 China 93.7 38.4 112.1 .. 74.0 .. 22.1 0.4
90 El Salvador 84.0 19.4 115.0 94.0 63.6 55.0 24.6 24.3
91 Sri Lanka 90.6 44.9 105.1 99.7 87.0 .. .. 2.0
92 Thailand 93.5 20.6 .. .. .. .. .. ..
93 Gabon 87.0 .. 134.3 80.3 53.1 .. 7.1 44.5
94 Suriname 90.7 .. 113.8 90.1 75.4 64.6 12.3 32.3
95 Bolivia (Plurinational State of) 90.7 29.3 108.3 93.7 81.8 69.9 38.3 19.8
96 Paraguay 94.6 26.4 108.3 92.4 65.9 57.7 25.5 20.9
97 Philippines 93.6 53.6 108.2 90.4 81.4 59.9 27.8 26.898 Botswana 83.3 24.7 109.7 87.2 80.2 56.5 5.2 13.2
99 Moldova (Republic of) 98.3 .. 89.2 83.3 83.1 79.1 39.9 4.4
100 Mongolia 97.3 80.2 101.5 88.7 95.1 82.0 49.8 5.1
101 Egypt 66.4 36.1 99.7 93.6 79.3 71.2 31.2 3.2
102 Uzbekistan 99.3 .. 94.4 89.9 102.4 91.7 9.9 1.3
103 Micronesia (Federated States of) .. .. 110.3 .. 90.5 .. 14.1 ..
104 Guyana .. 40.0 108.7 94.7 102.1 .. 11.5 41.2
105 Namibia 88.2 .. 112.4 89.0 65.8 54.4 8.9 23.4
106 Honduras 83.6 17.1 116.0 96.6 64.5 .. 18.7 23.8
107 Maldives 98.4 .. 112.0 96.2 83.7 69.4 .. ..
108 Indonesia 92.0 26.8 120.9 94.8 75.8 69.7 18.0 19.9
109 Kyrgyzstan 99.3 89.2 94.7 83.5 85.1 80.5 52.0 1.7
110 South Africa 89.0 57.9 104.5 87.5 95.1 71.9 .. 23.0
111 Syrian Arab Republic 83.6 33.5 124.4 94.5 74.0 67.7 .. 3.3
112 Tajikistan 99.7 92.4 102.2 97.3 84.4 82.5 20.2 0.5
113 Viet Nam 92.5 .. 104.1 94.0 66.9 62.3 9.7 7.9
114 Morocco 56.4 .. 106.9 89.5 55.8 34.5 12.3 23.8
115 Nicaragua 78.0 25.4 116.9 91.8 67.9 45.2 18.0 51.6
116 Guatemala 73.8 15.3 113.6 95.1 56.6 39.9 17.7 35.3
117 Equatorial Guinea 93.0 .. 98.7 66.4 26.2 21.6 3.3 67.4
118 Cape Verde 84.1 .. 101.3 84.4 67.7 56.7 11.9 12.9
119 India 62.8 22.2 113.1 89.8 57.0 .. 13.5 34.2
120 Timor-Leste .. .. 106.6 75.9 54.7 31.4 15.2 ..
121 Swaziland 86.5 32.6 107.9 82.8 53.3 28.6 4.4 26.3
122 Lao People's Democratic Republic 72.7 .. 111.8 82.4 43.9 36.0 13.4 33.2123 Solomon Islands 76.6 .. 107.3 67.0 34.8 30.2 .. ..
124 Cambodia 77.0 .. 115.9 88.6 40.4 34.1 7.0 45.6
125 Pakistan 53.7 16.8 84.8 66.1 32.9 32.5 5.2 30.3
126 Congo .. 34.8 114.0 58.9 43.1 .. 3.9 29.8
127 Sao Tome and Principe 88.3 .. 133.3 96.1 51.3 38.1 4.1 26.1
LOW HUMAN DEVELOPMENT
128 Kenya 86.5 15.5 111.5 81.5 58.3 49.1 4.1 16.4
129 Bangladesh 55.0 16.7 93.8 88.0 44.1 41.5 7.0 45.2
130 Ghana 65.8 28.7 101.8 73.9 54.1 46.4 6.2 40.0
131 Cameroon 75.9 13.1 110.9 88.3 37.3 .. 7.8 43.3
132 Myanmar 91.9 16.6 115.0 .. 49.3 46.4 10.7 26.1
133 Yemen 60.9 .. 85.4 72.7 45.7 37.4 10.2 40.5
134 Benin 40.8 9.8 116.6 92.8 36.3 19.6 5.8 36.9135 Madagascar 70.7 .. 151.7 98.5 30.1 23.8 3.4 57.5
136 Mauritania 56.8 .. 98.2 79.7 23.3 16.3 3.8 18.1
137 Papua New Guinea 59.6 8.3 54.9 .. .. .. 2.0 ..
138 Nepal 57.9 15.4 124.0 78.8 43.5 .. 5.6 38.4
139 Togo 64.9 14.1 105.0 83.5 41.3 22.5 5.3 55.5
140 Comoros 73.6 .. 121.5 72.9 45.8 .. 2.7 28.3
141 Lesotho 89.5 13.1 107.7 72.7 39.9 25.2 3.6 54.2
142 Nigeria 60.1 .. 93.1 61.4 30.5 25.8 10.1 25.1
143 Uganda 74.6 11.0 120.2 97.1 25.3 19.2 3.7 67.6
144 Senegal 41.9 8.6 83.5 72.9 30.6 25.1 8.0 41.6
145 Haiti 61.0 13.3 .. .. .. .. .. ..
146 Angola 69.6 .. .. .. 17.3 .. 2.8 ..
b,c
b,c
b
b,c
b
b,c
b,c
b,c
b b
b
b
b b
b
b,c
b
b
b,c
b
b,c
b
b
b b
b
b
b
b
b
b
b
b
b b
b
b
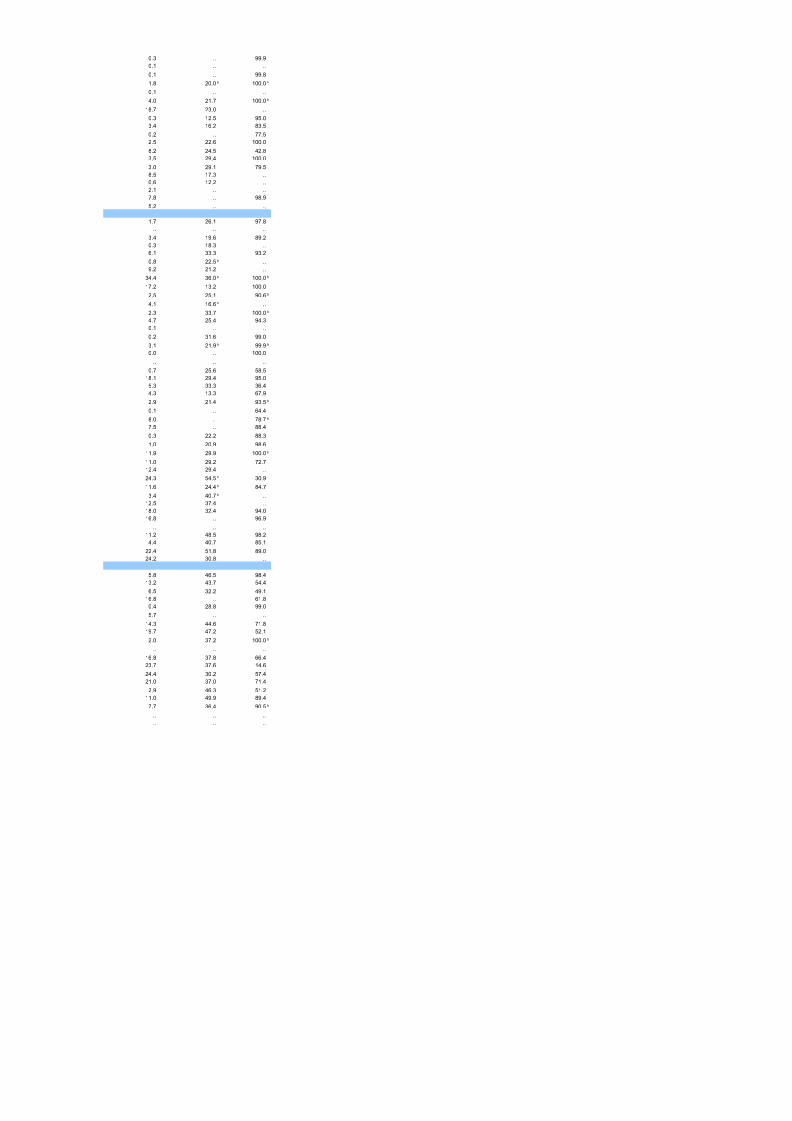
8/7/2019 Tabela IDH 2010 inglês
http://slidepdf.com/reader/full/tabela-idh-2010-ingles 73/102
147 Djibouti .. .. 55.5 45.3 29.5 24.4 2.6 ..
148 Tanzania (United Republic of) 72.6 6.0 110.2 99.3 6.1 .. 1.5 17.2
149 Côte d'Ivoire 54.6 .. 74.5 56.0 26.3 21.2 8.4 10.5
150 Zambia 70.7 25.7 119.1 95.2 51.8 49.0 2.4 21.4
151 Gambia 45.3 11.0 86.2 68.7 50.8 41.8 1.2 29.7
152 Rwanda 70.3 3.3 150.9 95.9 21.9 .. 4.0 69.1
153 Malawi 72.8 4.6 120.2 90.6 29.4 25.0 .. 64.3
154 Sudan 69.3 11.5 74.0 39.2 38.0 .. 5.9 6.9
155 Afghanistan .. 6.4 106.1 .. 28.6 26.8 1.3 ..
156 Guinea .. .. 89.9 71.3 35.8 27.7 9.2 45.1
157 Ethiopia 35.9 .. 97.8 78.2 33.4 25.3 3.6 59.7
158 Sierra Leone 39.8 9.1 157.7 .. 34.6 24.9 2.0 ..
159 Central African Republic 54.6 9.3 77.4 59.1 11.9 .. 2.3 54.4
160 Mali 26.2 3.7 91.3 71.5 34.8 28.6 5.4 20.9
161 Burkina Faso 28.7 .. 78.5 63.3 19.8 15.4 3.1 28.9
162 Liberia 58.1 12.8 90.6 75.2 31.6 19.5 17.4 ..
163 Chad 32.7 .. 82.7 61.0 19.0 10.5 1.9 70.2
164 Guinea-Bissau 51.0 .. 119.7 52.1 35.9 9.7 2.9 ..
165 Mozambique 54.0 3.2 114.2 79.9 20.6 6.2 1.5 56.3166 Burundi 65.9 .. 135.6 99.4 17.9 .. 2.5 46.3
167 Niger 28.7 2.9 62.4 54.0 11.0 8.9 1.3 33.2
168 Congo (Democratic Republic of the) 66.6 19.5 90.4 32.4 34.8 .. 5.0 20.5
169 Zimbabwe 91.4 33.4 103.6 89.9 41.0 38.0 3.8 ..
OTHER COUNTRIES OR TERRITORIES
Antigua and Barbuda 99.0 .. 102.5 74.0 105.2 .. .. 2.6
Bhutan 52.8 .. 109.1 87.4 61.7 47.5 6.6 9.9
Cuba 99.8 68.8 101.9 98.8 91.4 84.3 121.5 4.4
Dominica .. 26.5 81.6 72.3 104.8 68.1 .. 9.2
Eritrea 65.3 .. 52.3 38.9 30.5 26.0 2.0 26.7
Grenada .. .. 102.6 93.4 107.7 88.6 .. 17.4
Iraq 77.6 26.3 98.0 87.3 46.8 39.6 15.7 29.9
Kiribati .. .. 112.8 97.4 87.9 68.3 .. 18.6Lebanon 89.6 .. 101.1 88.3 81.6 74.6 51.5 6.9
Marshall Islands .. .. 93.0 66.3 66.4 44.9 17.0 ..
Monaco .. .. 127.7 .. 153.4 .. .. ..
Nauru .. .. 78.8 72.3 46.1 .. .. 74.6
Occupied Palestinian Territories 94.1 47.3 80.4 73.3 92.4 88.6 47.2 0.9
Oman 86.7 .. 75.0 68.3 88.1 78.2 26.3 0.5
Palau .. .. 98.8 .. 96.9 .. 40.2 ..
Saint Kitts and Nevis .. .. 85.3 70.6 88.2 78.7 .. 32.0
Saint Lucia .. .. 98.0 91.5 93.2 79.6 14.8 4.0
Saint Vincent and the Grenadines .. .. 109.0 94.6 108.2 90.3 .. 20.9
Samoa 98.7 .. 99.5 90.6 78.3 64.2 7.4 4.1
Seychelles 91.8 66.8 125.3 99.4 111.8 94.3 .. 1.6
Tuvalu .. .. 105.6 .. .. .. .. 37.4
Vanuatu 81.3 .. 108.7 97.3 40.1 38.1 4.8 26.6
Developed
OECD .. 73.8 101.7 95.6 101.1 91.8 71.4 2.9
Non-OECD .. 61.7 108.4 95.6 93.6 86.7 43.0 3.0
Developing
Arab States 72.1 .. 96.4 80.9 68.8 60.4 22.7 9.5
East Asia and the Pacific .. .. 112.2 93.3 72.8 62.6 20.9 21.3
Europe and Central Asia 97.5 65.1 98.5 92.3 89.3 82.1 54.2 3.3
Latin America and the Caribbean 91.1 32.5 116.5 94.4 89.8 72.5 36.7 17.8
South Asia 62.4 21.6 108.2 86.9 53.5 42.0 12.8 24.1
Sub-Saharan Africa 62.4 .. 101.8 73.6 34.4 29.5 5.5 36.5
Very high human development .. 73.6 101.9 95.6 100.9 91.7 70.8 3.0
High human development 92.3 41.0 111.9 94.4 88.9 74.9 43.2 7.3
Medium human development 80.7 .. 110.2 88.5 64.7 57.0 17.6 22.6
Low human development 61.2 14.3 99.9 73.4 34.7 30.9 6.0 40.4
Least developed countries 59.9 .. 101.6 75.5 34.1 30.8 5.4 39.1
World .. .. 106.9 86.1 66.4 60.2 25.7 18.0
Notes
a. Data refer to the most recent year available during the period specified.
b. Refers to an earlier year than that specified.
c. UNESCO Institute for Statistics (2010b).
Sources
b,c
b
b
b
b
b
b
b
b
b
b b
b,c
b,c
b
b
b
b
b
b,c
b
b
b
b,c
b
b
Columns 1 and 3–11: UNESCO Institute for Statistics (2010b).
Column 2: Barro and Lee (2010).
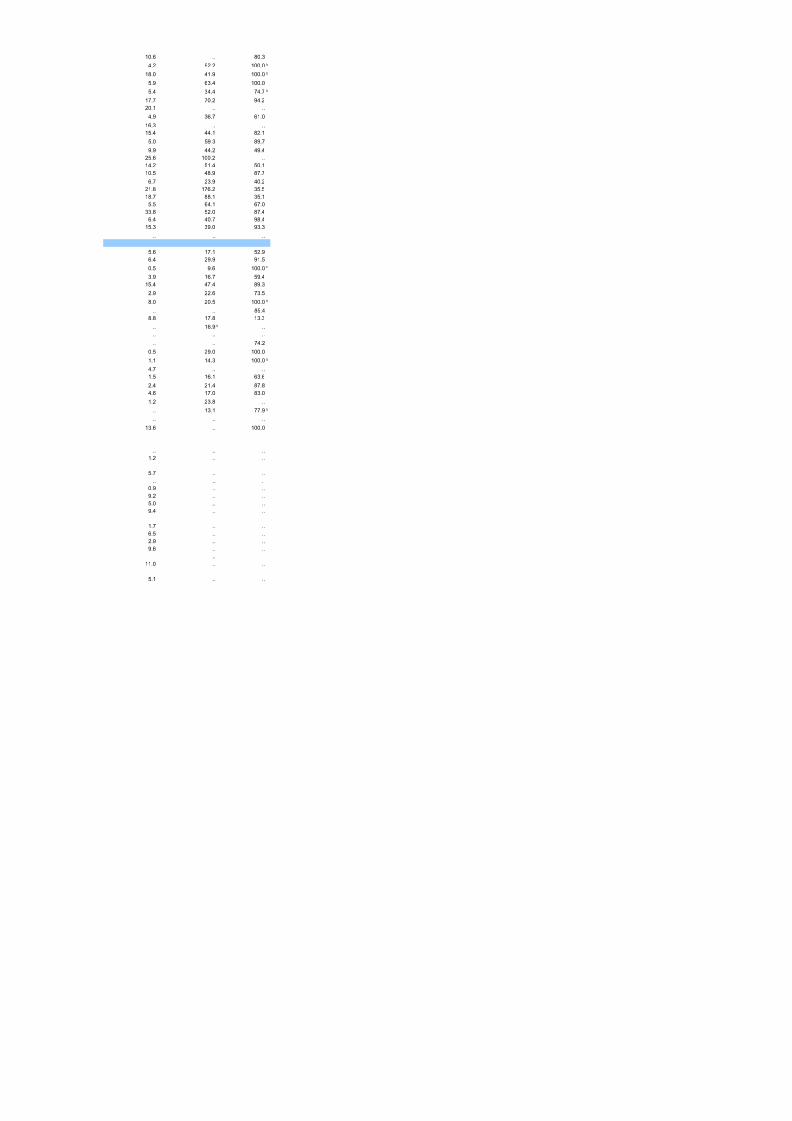
8/7/2019 Tabela IDH 2010 inglês
http://slidepdf.com/reader/full/tabela-idh-2010-ingles 74/102
(%)
.. .. ..
.. 15.8 ..
.. 17.1 ..
.. 14.3 ..
0.7 17.8 ..
.. 9.5 ..
.. .. ..
.. .. ..
.. 10.7 ..
1.3 18.0 ..
.. 18.8 ..
0.0 24.1 ..
1.5 18.1 ..
4.2 20.3 ..
1.5 17.2 ..
0.4 15.9 ..
.. .. ..3.4 12.6 ..
.. .. ..
.. 13.1 ..
0.9 .. 95.1
0.7 10.1 ..
0.2 10.4 ..
3.8 13.1 ..
1.2 12.9 ..
.. 20.1 ..
0.3 19.5 97.1
0.6 17.3 ..
0.6 17.1 ..
2.8 .. 100.0
3.0 18.6 ..
1.9 17.2 100.0
0.8 12.1 ..
0.9 .. ..
0.4 15.0 ..
1.7 10.6 ..
0.8 10.1 84.3
0.6 .. 52.3
2.0 .. ..
10.2 11.7 ..
0.7 11.0 ..
.. 13.5 61.0
.. 15.8 91.1
0.7 9.7 ..
2.4 26.2 ..
6.1 14.8 ..
0.9 9.1 100.0
3.3 12.8 ..
.. .. ..
1.7 16.3 ..
0.3 17.3 100.0
7.0 15.5 ..
.. .. ..
5.3 24.2 91.33.3 .. 91.5
3.6 28.0 95.4
.. 17.5 ..
1.8 16.1 ..
6.6 17.2 86.6
0.6 .. 100.0
0.0 .. 99.9
7.0 19.0 86.0
7.2 20.9 ..
2.1 .. ..
0.4 .. ..
0.1 .. ..
F PRIMARY TION
QUALITY OF PRIMARY EDUCATION
Repetition rate,all grades
Pupil–teacherratio
Primaryschool
teacherstrained to
teach
(% of total primaryenrolment in
previous year)(number of pupils per
teacher)
2005–2008a 2005–2008a 2005–2008a
b
b
b
b
b
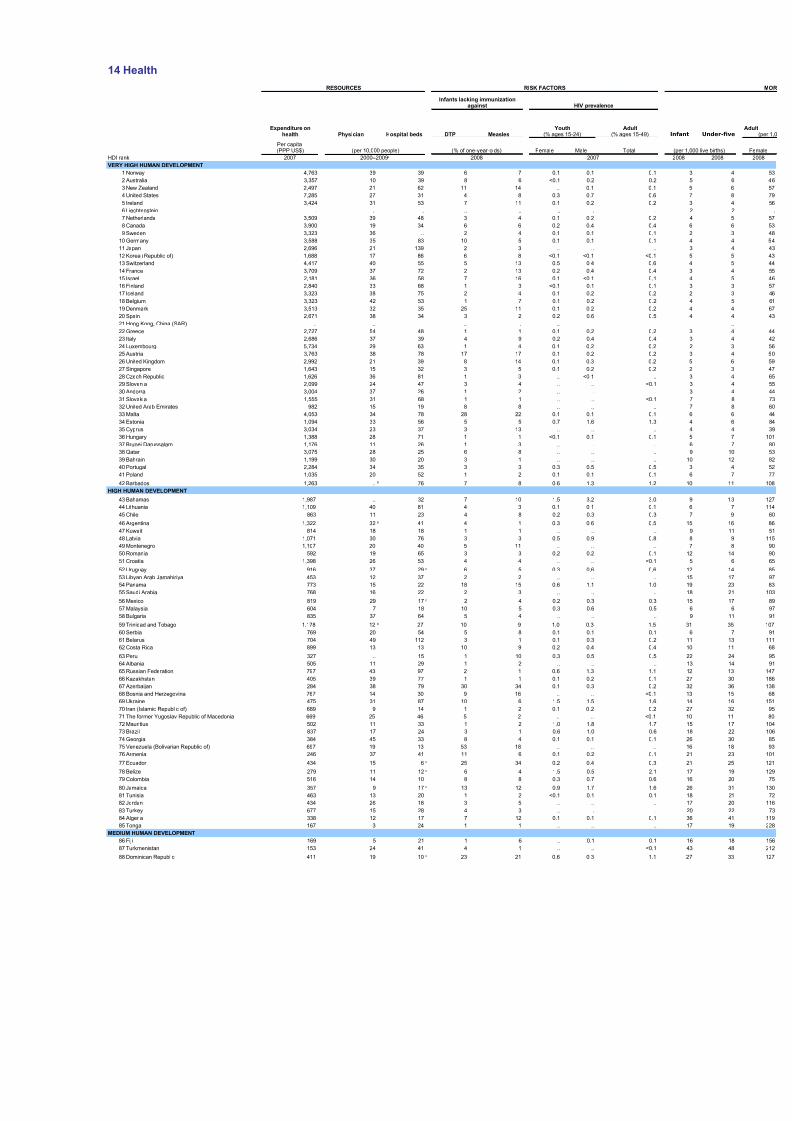
8/7/2019 Tabela IDH 2010 inglês
http://slidepdf.com/reader/full/tabela-idh-2010-ingles 75/102
0.3 .. 99.9
0.1 .. ..
0.1 .. 99.8
1.8 20.0 100.0
0.1 .. ..
4.0 21.7 100.018.7 23.0 ..
0.3 12.5 95.0
3.4 16.2 83.5
0.2 .. 77.5
2.5 22.6 100.0
8.2 24.5 42.8
3.5 29.4 100.0
3.0 29.1 79.5
8.5 17.3 ..
0.6 12.2 ..
2.1 .. ..
7.8 .. 98.9
5.2 .. ..
1.7 26.1 97.8
.. .. ..
3.4 19.6 89.2
0.3 18.3 ..
6.1 33.3 93.2
0.8 22.5 ..
9.2 21.2 ..
34.4 36.0 100.0
17.2 13.2 100.0
2.5 25.1 90.6
4.1 16.6 ..
2.3 33.7 100.04.7 25.4 94.3
0.1 .. ..
0.2 31.6 99.0
3.1 21.9 99.9
0.0 .. 100.0
.. .. ..
0.7 25.6 58.5
18.1 29.4 95.0
5.3 33.3 36.4
4.3 13.3 67.9
2.9 21.4 93.5
0.1 .. 64.4
8.0 .. 78.7
7.5 .. 88.4
0.3 22.2 88.3
1.0 20.9 98.6
11.9 29.9 100.0
11.0 29.2 72.7
12.4 29.4 ..
24.3 54.5 30.9
11.6 24.4 84.7
3.4 40.7 ..
12.5 37.4 ..
18.0 32.4 94.0
16.8 .. 96.9.. .. ..
11.2 48.5 98.2
4.4 40.7 85.1
22.4 51.8 89.0
24.2 30.8 ..
5.8 46.5 98.4
13.2 43.7 54.4
6.5 32.2 49.1
16.8 .. 61.8
0.4 28.8 99.0
5.7 .. ..
14.3 44.6 71.819.7 47.2 52.1
2.0 37.2 100.0
.. .. ..
16.8 37.8 66.4
23.7 37.6 14.6
24.4 30.2 57.4
21.0 37.0 71.4
2.9 46.3 51.2
11.0 49.9 89.4
7.7 36.4 90.5
.. .. ..
.. .. ..
b b
b
b
b b
b
b
b
b b
b
b
b
b
b
b
b
b
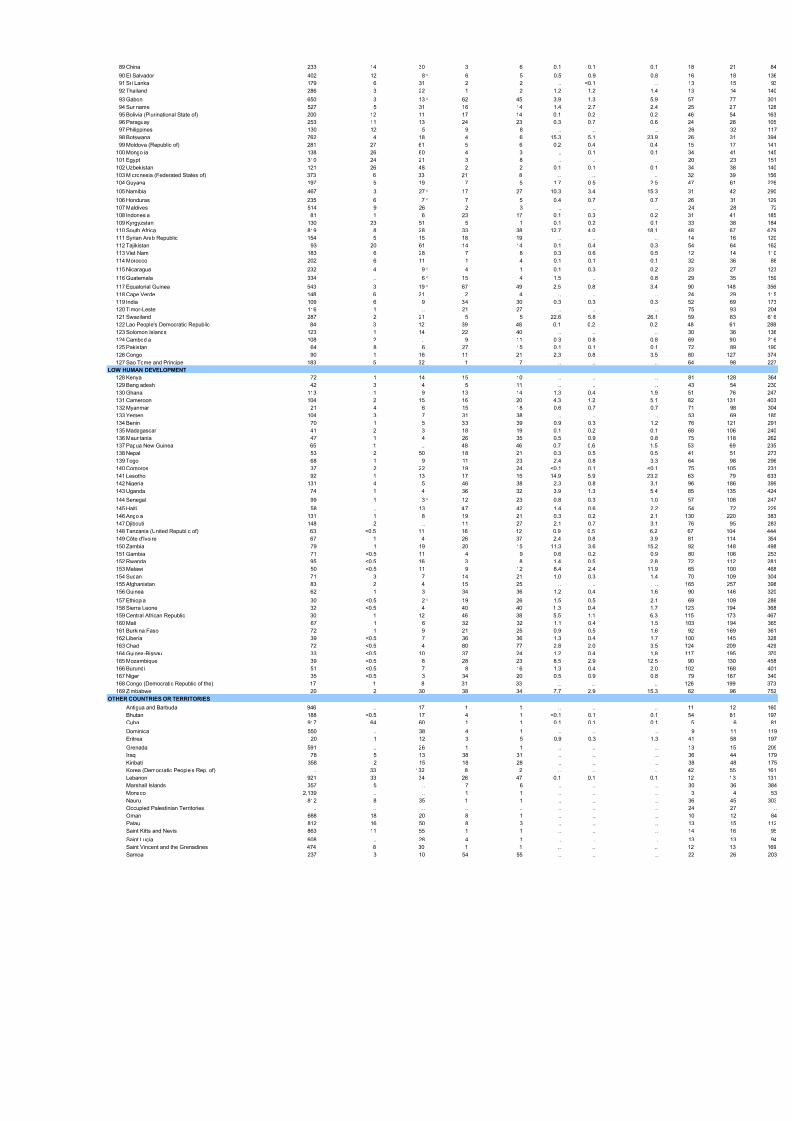
8/7/2019 Tabela IDH 2010 inglês
http://slidepdf.com/reader/full/tabela-idh-2010-ingles 76/102
10.6 .. 80.3
4.2 52.2 100.0
18.0 41.9 100.0
5.9 63.4 100.0
5.4 34.4 74.7
17.7 70.2 94.2
20.1 .. ..
4.9 36.7 61.0
16.3 .. ..
15.4 44.1 82.1
5.0 59.3 89.7
9.9 44.2 49.4
25.6 100.2 ..
14.2 51.4 50.1
10.5 48.9 87.7
6.7 23.9 40.2
21.8 176.2 35.5
18.7 88.1 35.1
5.5 64.1 67.033.8 52.0 87.4
6.4 40.7 98.4
15.3 39.0 93.3
.. .. ..
5.6 17.1 52.9
6.4 29.9 91.5
0.5 9.6 100.0
3.9 16.7 59.4
15.4 47.4 89.3
2.9 22.6 73.5
8.0 20.5 100.0
.. .. 85.48.8 17.8 13.3
.. 16.9 ..
.. .. ..
.. .. 74.2
0.5 29.0 100.0
1.1 14.3 100.0
4.7 .. ..
1.5 16.1 63.6
2.4 21.4 87.8
4.6 17.0 83.0
1.2 23.8 ..
.. 13.1 77.9
.. .. ..
13.6 .. 100.0
.. .. ..
1.2 .. ..
5.7 .. ..
.. .. ..
0.9 .. ..
9.2 .. ..
5.0 .. ..
9.4 .. ..
1.7 .. ..
6.5 .. ..
2.9 .. ..
9.6 .. ..
..
11.0 .. ..
5.1 .. ..
b
b
b
b
b
b
b
b
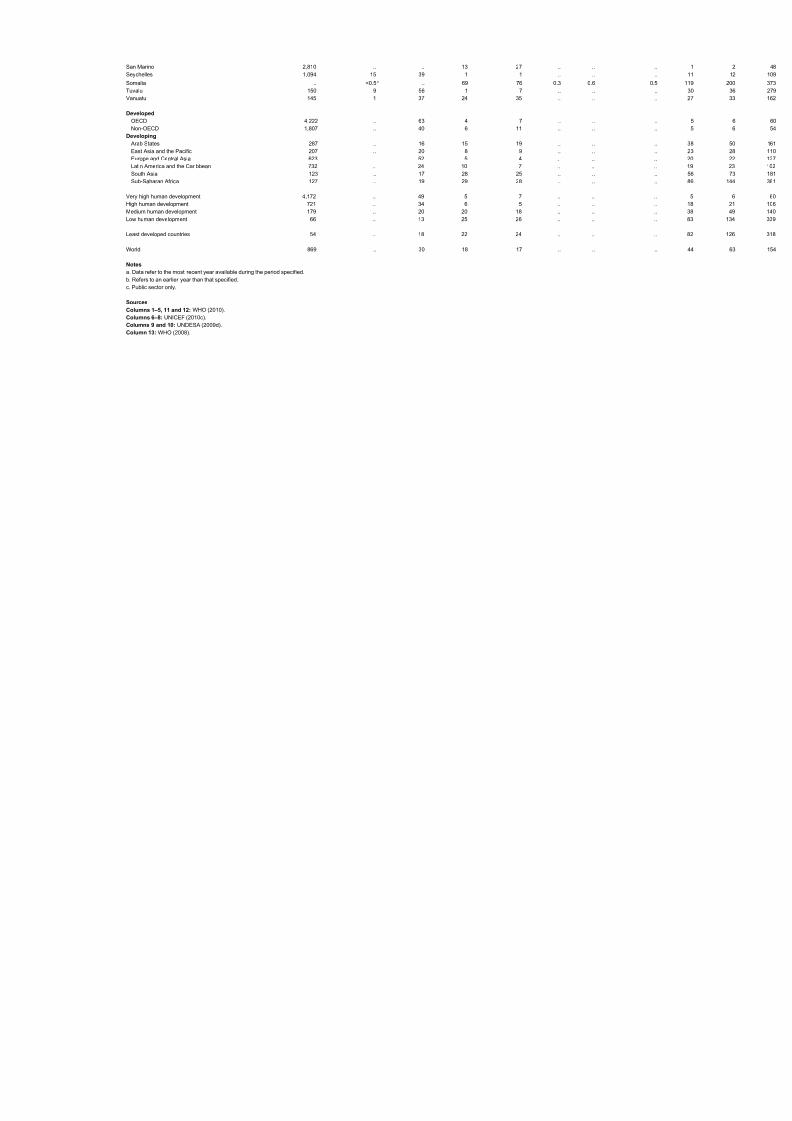
8/7/2019 Tabela IDH 2010 inglês
http://slidepdf.com/reader/full/tabela-idh-2010-ingles 77/102
14 Health
RESOURCES RISK FACTORS
HIV prevalence
DTP Measles Infant
(per 10,000 people) (% of one-year-olds) Female Male Total (per 1,000 live
HDI rank 2007 2008 2007 2008
VERY HIGH HUMAN DEVELOPMENT
1 Norway 4,763 39 39 6 7 0.1 0.1 0.1 3
2 Australia 3,357 10 39 8 6 <0.1 0.2 0.2 5
3 New Zealand 2,497 21 62 11 14 .. 0.1 0.1 5
4 United States 7,285 27 31 4 8 0.3 0.7 0.6 7
5 Ireland 3,424 31 53 7 11 0.1 0.2 0.2 3
6 Liechtenstein .. .. .. .. .. .. .. .. 2
7 Netherlands 3,509 39 48 3 4 0.1 0.2 0.2 4
8 Canada 3,900 19 34 6 6 0.2 0.4 0.4 6
9 Sweden 3,323 36 .. 2 4 0.1 0.1 0.1 2
10 Germany 3,588 35 83 10 5 0.1 0.1 0.1 4
11 Japan 2,696 21 139 2 3 .. .. .. 3
12 Korea (Republic of) 1,688 17 86 6 8 <0.1 <0.1 <0.1 5
13 Switzerland 4,417 40 55 5 13 0.5 0.4 0.6 4
14 France 3,709 37 72 2 13 0.2 0.4 0.4 3
15 Israel 2,181 36 58 7 16 0.1 <0.1 0.1 4
16 Finland 2,840 33 68 1 3 <0.1 0.1 0.1 3
17 Iceland 3,323 38 75 2 4 0.1 0.2 0.2 2
18 Belgium 3,323 42 53 1 7 0.1 0.2 0.2 4
19 Denmark 3,513 32 35 25 11 0.1 0.2 0.2 4 20 Spain 2,671 38 34 3 2 0.2 0.6 0.5 4
21 Hong Kong, China (SAR) .. .. .. .. .. .. .. .. ..
22 Greece 2,727 54 48 1 1 0.1 0.2 0.2 3
23 Italy 2,686 37 39 4 9 0.2 0.4 0.4 3
24 Luxembourg 5,734 29 63 1 4 0.1 0.2 0.2 2
25 Austria 3,763 38 78 17 17 0.1 0.2 0.2 3
26 United Kingdom 2,992 21 39 8 14 0.1 0.3 0.2 5
27 Singapore 1,643 15 32 3 5 0.1 0.2 0.2 2
28 Czech Republic 1,626 36 81 1 3 .. <0.1 .. 3
29 Slovenia 2,099 24 47 3 4 .. .. <0.1 3
30 Andorra 3,004 37 26 1 2 .. .. .. 3
31 Slovakia 1,555 31 68 1 1 .. .. <0.1 7
32 United Arab Emirates 982 15 19 8 8 .. .. .. 7
33 Malta 4,053 34 78 28 22 0.1 0.1 0.1 6 34 Estonia 1,094 33 56 5 5 0.7 1.6 1.3 4
35 Cyprus 3,034 23 37 3 13 .. .. .. 4
36 Hungary 1,388 28 71 1 1 <0.1 0.1 0.1 5
37 Brunei Darussalam 1,176 11 26 1 3 .. .. .. 6
38 Qatar 3,075 28 25 6 8 .. .. .. 9
39 Bahrain 1,199 30 20 3 1 .. .. .. 10
40 Portugal 2,284 34 35 3 3 0.3 0.5 0.5 3
41 Poland 1,035 20 52 1 2 0.1 0.1 0.1 6
42 Barbados 1,263 .. 76 7 8 0.6 1.3 1.2 10
HIGH HUMAN DEVELOPMENT
43 Bahamas 1,987 .. 32 7 10 1.5 3.2 3.0 9
44 Lithuania 1,109 40 81 4 3 0.1 0.1 0.1 6
45 Chile 863 11 23 4 8 0.2 0.3 0.3 7
46 Argentina 1,322 32 41 4 1 0.3 0.6 0.5 15
47 Kuwait 814 18 18 1 1 .. .. .. 9
48 Latvia 1,071 30 76 3 3 0.5 0.9 0.8 8
49 Montenegro 1,107 20 40 5 11 .. .. .. 7
50 Romania 592 19 65 3 3 0.2 0.2 0.1 12
51 Croatia 1,398 26 53 4 4 .. .. <0.1 5
52 Uruguay 916 37 29 6 5 0.3 0.6 0.6 12
53 Libyan Arab Jamahiriya 453 12 37 2 2 .. .. .. 15
54 Panama 773 15 22 18 15 0.6 1.1 1.0 19
55 Saudi Arabia 768 16 22 2 3 .. .. .. 18
56 Mexico 819 29 17 2 4 0.2 0.3 0.3 15
57 Malaysia 604 7 18 10 5 0.3 0.6 0.5 6
58 Bulgaria 835 37 64 5 4 .. .. .. 9
59 Trinidad and Tobago 1,178 12 27 10 9 1.0 0.3 1.5 31
60 Serbia 769 20 54 5 8 0.1 0.1 0.1 6
61 Belarus 704 49 112 3 1 0.1 0.3 0.2 11
62 Costa Rica 899 13 13 10 9 0.2 0.4 0.4 10
63 Peru 327 .. 15 1 10 0.3 0.5 0.5 22
64 Albania 505 11 29 1 2 .. .. .. 13
65 Russian Federation 797 43 97 2 1 0.6 1.3 1.1 12
66 Kazakhstan 405 39 77 1 1 0.1 0.2 0.1 27
67 Azerbaijan 284 38 79 30 34 0.1 0.3 0.2 32
68 Bosnia and Herzegovina 767 14 30 9 16 .. .. <0.1 13
69 Ukraine 475 31 87 10 6 1.5 1.5 1.6 14
70 Iran (Islamic Republic of) 689 9 14 1 2 0.1 0.2 0.2 27
71 The former Yugoslav Republic of Macedonia 669 25 46 5 2 .. .. <0.1 10
72 Mauritius 502 11 33 1 2 1.0 1.8 1.7 15 73 Brazil 837 17 24 3 1 0.6 1.0 0.6 18
74 Georgia 384 45 33 8 4 0.1 0.1 0.1 26
75 Venezuela (Bolivarian Republic of) 697 19 13 53 18 .. .. .. 16
76 Armenia 246 37 41 11 6 0.1 0.2 0.1 21
77 Ecuador 434 15 6 25 34 0.2 0.4 0.3 21
78 Belize 279 11 12 6 4 1.5 0.5 2.1 17
79 Colombia 516 14 10 8 8 0.3 0.7 0.6 16
80 Jamaica 357 9 17 13 12 0.9 1.7 1.6 26
81 Tunisia 463 13 20 1 2 <0.1 0.1 0.1 18
82 Jordan 434 26 18 3 5 .. .. .. 17
83 Turkey 677 15 28 4 3 .. .. .. 20
84 Algeria 338 12 17 7 12 0.1 0.1 0.1 36
85 Tonga 167 3 24 1 1 .. .. .. 17
MEDIUM HUMAN DEVELOPMENT
86 Fiji 169 5 21 1 6 .. 0.1 0.1 16
87 Turkmenistan 153 24 41 4 1 .. .. <0.1 43
88 Dominican Republic 411 19 10 23 21 0.6 0.3 1.1 27
Infants lacking immunizationagainst
Expenditure onhealth Physician Hospital beds
Youth(% ages 15-24)
Adult(% ages 15-49) U
Per capita(PPP US$)
2000–2009a
b
b
c
c
b
c
c
c
c
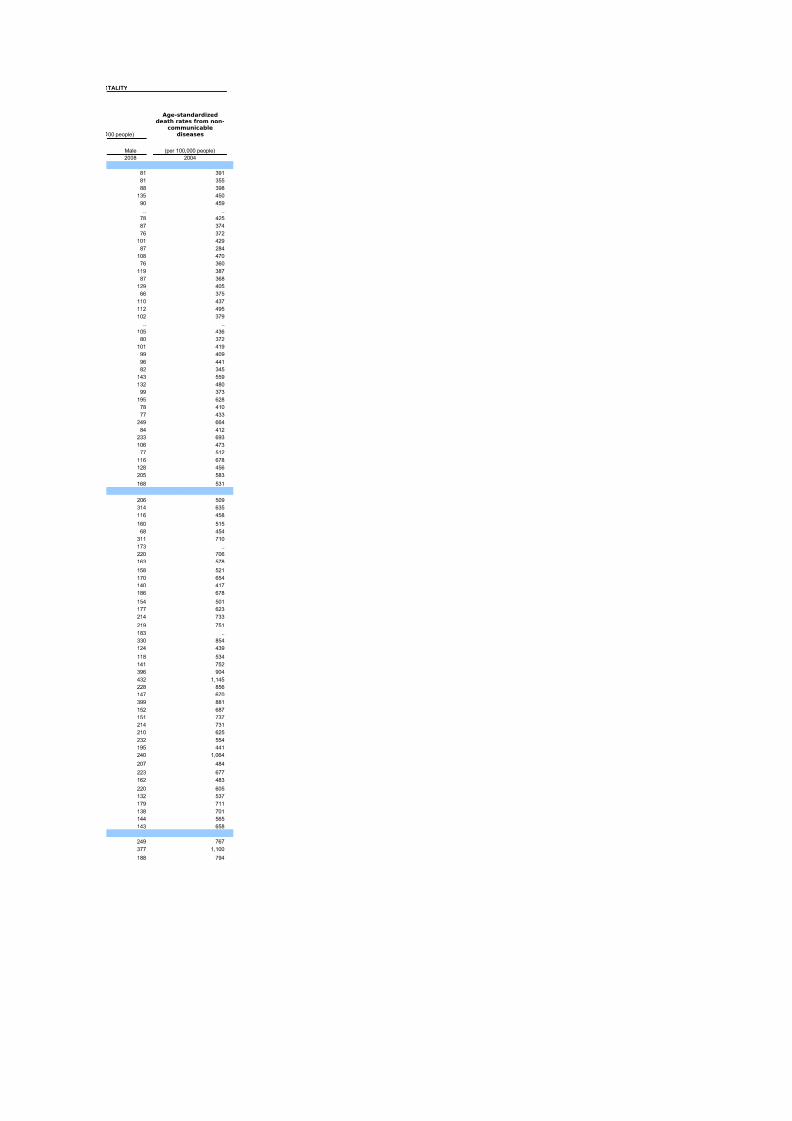
8/7/2019 Tabela IDH 2010 inglês
http://slidepdf.com/reader/full/tabela-idh-2010-ingles 78/102
89 China 233 14 30 3 6 0.1 0.1 0.1 18
90 El Salvador 402 12 8 6 5 0.5 0.9 0.8 16
91 Sri Lanka 179 6 31 2 2 .. <0.1 .. 13
92 Thailand 286 3 22 1 2 1.2 1.2 1.4 13
93 Gabon 650 3 13 62 45 3.9 1.3 5.9 57
94 Suriname 527 5 31 16 14 1.4 2.7 2.4 25
95 Bolivia (Plurinational State of) 200 12 11 17 14 0.1 0.2 0.2 46
96 Paraguay 253 11 13 24 23 0.3 0.7 0.6 24
97 Philippines 130 12 5 9 8 .. .. .. 26
98 Botswana 762 4 18 4 6 15.3 5.1 23.9 26
99 Moldova (Republic of) 281 27 61 5 6 0.2 0.4 0.4 15
100 Mongolia 138 26 60 4 3 .. 0.1 0.1 34
101 Egypt 310 24 21 3 8 .. .. .. 20
102 Uzbekistan 121 26 48 2 2 0.1 0.1 0.1 34
103 Micronesia (Federated States of) 373 6 33 21 8 .. .. .. 32
104 Guyana 197 5 19 7 5 1.7 0.5 2.5 47
105 Namibia 467 3 27 17 27 10.3 3.4 15.3 31
106 Honduras 235 6 7 7 5 0.4 0.7 0.7 26
107 Maldives 514 9 26 2 3 .. .. .. 24 108 Indonesia 81 1 6 23 17 0.1 0.3 0.2 31
109 Kyrgyzstan 130 23 51 5 1 0.1 0.2 0.1 33
110 South Africa 819 8 28 33 38 12.7 4.0 18.1 48
111 Syrian Arab Republic 154 5 15 18 19 .. .. .. 14
112 Tajikistan 93 20 61 14 14 0.1 0.4 0.3 54
113 Viet Nam 183 6 28 7 8 0.3 0.6 0.5 12
114 Morocco 202 6 11 1 4 0.1 0.1 0.1 32
115 Nicaragua 232 4 9 4 1 0.1 0.3 0.2 23
116 Guatemala 334 .. 6 15 4 1.5 .. 0.8 29
117 Equatorial Guinea 543 3 19 67 49 2.5 0.8 3.4 90
118 Cape Verde 148 6 21 2 4 .. .. .. 24
119 India 109 6 9 34 30 0.3 0.3 0.3 52
120 Timor-Leste 116 1 .. 21 27 .. .. .. 75 121 Swaziland 287 2 21 5 5 22.6 5.8 26.1 59
122 Lao People's Democratic Republic 84 3 12 39 48 0.1 0.2 0.2 48
123 Solomon Islands 123 1 14 22 40 .. .. .. 30
124 Cambodia 108 2 .. 9 11 0.3 0.8 0.8 69
125 Pakistan 64 8 6 27 15 0.1 0.1 0.1 72
126 Congo 90 1 16 11 21 2.3 0.8 3.5 80
127 Sao Tome and Principe 183 5 32 1 7 .. .. .. 64
LOW HUMAN DEVELOPMENT
128 Kenya 72 1 14 15 10 .. .. .. 81
129 Bangladesh 42 3 4 5 11 .. .. .. 43
130 Ghana 113 1 9 13 14 1.3 0.4 1.9 51
131 Cameroon 104 2 15 16 20 4.3 1.2 5.1 82
132 Myanmar 21 4 6 15 18 0.6 0.7 0.7 71
133 Yemen 104 3 7 31 38 .. .. .. 53 134 Benin 70 1 5 33 39 0.9 0.3 1.2 76
135 Madagascar 41 2 3 18 19 0.1 0.2 0.1 68
136 Mauritania 47 1 4 26 35 0.5 0.9 0.8 75
137 Papua New Guinea 65 1 .. 48 46 0.7 0.6 1.5 53
138 Nepal 53 2 50 18 21 0.3 0.5 0.5 41
139 Togo 68 1 9 11 23 2.4 0.8 3.3 64
140 Comoros 37 2 22 19 24 <0.1 0.1 <0.1 75
141 Lesotho 92 1 13 17 15 14.9 5.9 23.2 63
142 Nigeria 131 4 5 46 38 2.3 0.8 3.1 96
143 Uganda 74 1 4 36 32 3.9 1.3 5.4 85
144 Senegal 99 1 3 12 23 0.8 0.3 1.0 57
145 Haiti 58 .. 13 47 42 1.4 0.6 2.2 54
146 Angola 131 1 8 19 21 0.3 0.2 2.1 130 147 Djibouti 148 2 .. 11 27 2.1 0.7 3.1 76
148 Tanzania (United Republic of) 63 <0.5 11 16 12 0.9 0.5 6.2 67
149 Côte d'Ivoire 67 1 4 26 37 2.4 0.8 3.9 81
150 Zambia 79 1 19 20 15 11.3 3.6 15.2 92
151 Gambia 71 <0.5 11 4 9 0.6 0.2 0.9 80
152 Rwanda 95 <0.5 16 3 8 1.4 0.5 2.8 72
153 Malawi 50 <0.5 11 9 12 8.4 2.4 11.9 65
154 Sudan 71 3 7 14 21 1.0 0.3 1.4 70
155 Afghanistan 83 2 4 15 25 .. .. .. 165
156 Guinea 62 1 3 34 36 1.2 0.4 1.6 90
157 Ethiopia 30 <0.5 2 19 26 1.5 0.5 2.1 69
158 Sierra Leone 32 <0.5 4 40 40 1.3 0.4 1.7 123
159 Central African Republic 30 1 12 46 38 5.5 1.1 6.3 115
160 Mali 67 1 6 32 32 1.1 0.4 1.5 103 161 Burkina Faso 72 1 9 21 25 0.9 0.5 1.6 92
162 Liberia 39 <0.5 7 36 36 1.3 0.4 1.7 100
163 Chad 72 <0.5 4 80 77 2.8 2.0 3.5 124
164 Guinea-Bissau 33 <0.5 10 37 24 1.2 0.4 1.8 117
165 Mozambique 39 <0.5 8 28 23 8.5 2.9 12.5 90
166 Burundi 51 <0.5 7 8 16 1.3 0.4 2.0 102
167 Niger 35 <0.5 3 34 20 0.5 0.9 0.8 79
168 Congo (Democratic Republic of the) 17 1 8 31 33 .. .. .. 126
169 Zimbabwe 20 2 30 38 34 7.7 2.9 15.3 62
OTHER COUNTRIES OR TERRITORIES
Antigua and Barbuda 946 .. 17 1 1 .. .. .. 11
Bhutan 188 <0.5 17 4 1 <0.1 0.1 0.1 54
Cuba 917 64 60 1 1 0.1 0.1 0.1 5
Dominica 550 .. 38 4 1 .. .. .. 9
Eritrea 20 1 12 3 5 0.9 0.3 1.3 41
Grenada 591 .. 26 1 1 .. .. .. 13
Iraq 78 5 13 38 31 .. .. .. 36
Kiribati 358 2 15 18 28 .. .. .. 38
Korea (Democratic People's Rep. of) .. 33 132 8 2 .. .. .. 42
Lebanon 921 33 34 26 47 0.1 0.1 0.1 12
Marshall Islands 357 5 .. 7 6 .. .. .. 30
Monaco 2,139 .. .. 1 1 .. .. .. 3
Nauru 812 8 35 1 1 .. .. .. 36
Occupied Palestinian Territories .. .. .. .. .. .. .. .. 24
Oman 688 18 20 8 1 .. .. .. 10
Palau 812 16 50 8 3 .. .. .. 13
Saint Kitts and Nevis 863 11 55 1 1 .. .. .. 14
Saint Lucia 608 .. 28 4 1 .. .. .. 13
Saint Vincent and the Grenadines 474 8 30 1 1 .. .. .. 12
Samoa 237 3 10 54 55 .. .. .. 22
c
c
c
c
c
c
c
c
c
8/7/2019 Tabela IDH 2010 inglês
http://slidepdf.com/reader/full/tabela-idh-2010-ingles 79/102
San Marino 2,810 .. .. 13 27 .. .. .. 1
Seychelles 1,094 15 39 1 1 .. .. .. 11
Somalia .. <0.5 .. 69 76 0.3 0.6 0.5 119
Tuvalu 150 9 56 1 7 .. .. .. 30
Vanuatu 145 1 37 24 35 .. .. .. 27
Developed
OECD 4,222 .. 63 4 7 .. .. .. 5
Non-OECD 1,807 .. 40 6 11 .. .. .. 5
Developing
Arab States 287 .. 16 15 19 .. .. .. 38
East Asia and the Pacific 207 .. 20 8 9 .. .. .. 23
Europe and Central Asia 623 .. 52 5 4 .. .. .. 20
Latin America and the Caribbean 732 .. 24 10 7 .. .. .. 19
South Asia 123 .. 17 28 25 .. .. .. 56
Sub-Saharan Africa 127 .. 19 29 28 .. .. .. 86
Very high human development 4,172 .. 49 5 7 .. .. .. 5
High human development 721 .. 34 6 5 .. .. .. 18
Medium human development 179 .. 20 20 18 .. .. .. 38
Low human development 66 .. 13 25 26 .. .. .. 83
Least developed countries 54 .. 18 22 24 .. .. .. 82
World 869 .. 30 18 17 .. .. .. 44
Notes
a. Data refer to the most recent year available during the period specified.
b. Refers to an earlier year than that specified.
c. Public sector only.
Sources
b
Columns 1–5, 11 and 12: WHO (2010).Columns 6–8: UNICEF (2010c).
Columns 9 and 10: UNDESA (2009d).
Column 13: WHO (2008).

8/7/2019 Tabela IDH 2010 inglês
http://slidepdf.com/reader/full/tabela-idh-2010-ingles 80/102
TALITY
Male (per 100,000 people)
2008 2004
81 391
81 355
88 398
135 450
90 459
.. ..
78 425
87 374
76 372
101 429
87 284
108 470
76 360
119 387
87 368
129 405
66 375
110 437
112 495102 379
.. ..
105 436
80 372
101 419
99 409
96 441
82 345
143 559
132 480
99 373
195 628
78 410
77 433249 664
84 412
233 693
106 473
77 512
116 678
128 456
205 583
168 531
206 509
314 635
116 458
160 515
68 454
311 710
173 ..
220 706
163 578
158 521
170 654
140 417
186 678
154 501
177 623
214 733
219 751
183 ..
330 854
124 439
118 534
141 752
396 904
432 1,145
228 856
147 670
399 881
152 687
151 737
214 731210 625
232 554
195 441
240 1,064
207 484
223 677
162 483
220 605
132 537
179 711
138 701
144 565
143 658
249 767
377 1,100
188 794
Age-standardizeddeath rates from non-
communicablediseases00 people)
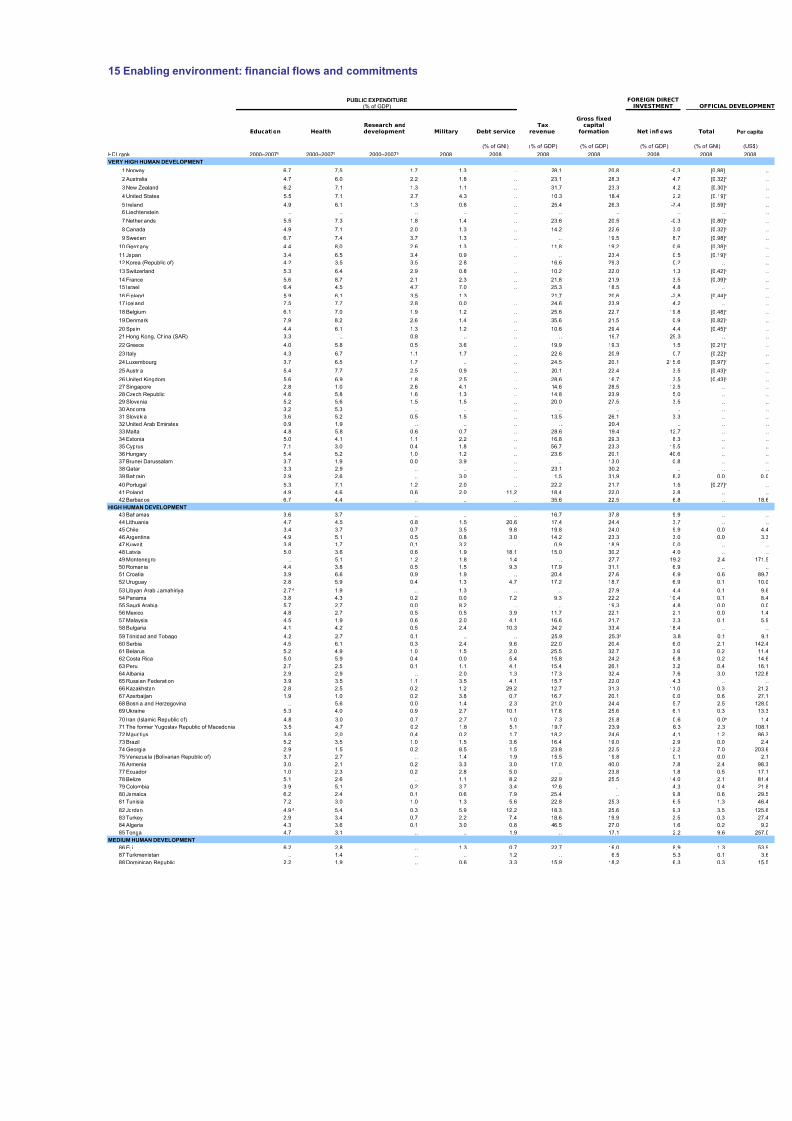
8/7/2019 Tabela IDH 2010 inglês
http://slidepdf.com/reader/full/tabela-idh-2010-ingles 81/102
140 627
301 518
315 681
276 516
353 716
218 728
230 765
170 602
227 620
419 594
312 963
291 923
222 891
223 880
187 682
291 835
356 513
227 761
100 953226 690
343 1,012
563 867
179 679
185 884
192 611
147 655
209 705
302 515
366 938
274 591
250 713
275 663631 707
317 828
182 694
294 832
216 717
389 716
271 788
382 729
247 730
298 699
405 840
368 775
249 941312 835
286 799
318 812
292 772
281 769
351 818
286 713
758 581
424 909
451 786
293 852
306 740
460 1,071
335 862
475 851
367 946
538 833
300 830
330 878
498 796
335 986
543 1,309
352 844
329 817
422 1,033
448 868
412 967388 924
353 931
465 910
436 925
485 777
425 919
374 1,030
443 921
812 816
192 674
256 708
122 437
209 580
266 686
245 827
377 1,018
321 730
229 642
191 715
427 961
118 321
448 1,093
.. ..
155 664
232 735
180 691193 522
305 674
235 766

8/7/2019 Tabela IDH 2010 inglês
http://slidepdf.com/reader/full/tabela-idh-2010-ingles 82/102
59 357
232 650
459 1,148
257 979
202 749
114 418
93 416
231 810
170 636
296 847
185 560
248 724
420 859
114 418
216 666
206 678
376 851
360 851
221 662

8/7/2019 Tabela IDH 2010 inglês
http://slidepdf.com/reader/full/tabela-idh-2010-ingles 83/102
15 Enabling environment: financial flows and commitments
OF
Education Health Military Debt service Net inflows Tot
(% of GNI) (% of GDP) (% of GDP) (% of GDP) (% of
HDI rank 2008 2008 2008 2008 2008 200
VERY HIGH HUMAN DEVELOPMENT
1 Norway 6.7 7.5 1.7 1.3 .. 28.1 20.8 -0.3
2 Australia 4.7 6.0 2.2 1.8 .. 23.1 28.3 4.7
3 New Zealand 6.2 7.1 1.3 1.1 .. 31.7 23.3 4.2
4 United States 5.5 7.1 2.7 4.3 .. 10.3 18.4 2.2
5 Ireland 4.9 6.1 1.3 0.6 .. 25.4 26.3 -7.4 6 Liechtenstein .. .. .. .. .. .. .. ..
7 Netherlands 5.5 7.3 1.8 1.4 .. 23.6 20.5 -0.3
8 Canada 4.9 7.1 2.0 1.3 .. 14.2 22.6 3.0
9 Sweden 6.7 7.4 3.7 1.3 .. .. 19.5 8.7
10 Germany 4.4 8.0 2.6 1.3 .. 11.8 19.2 0.6
11 Japan 3.4 6.5 3.4 0.9 .. .. 23.4 0.5
12 Korea (Republic of) 4.2 3.5 3.5 2.8 .. 16.6 29.3 0.2
13 Switzerland 5.3 6.4 2.9 0.8 .. 10.2 22.0 1.3
14 France 5.6 8.7 2.1 2.3 .. 21.8 21.9 3.5
15 Israel 6.4 4.5 4.7 7.0 .. 25.3 18.5 4.8
16 Finland 5.9 6.1 3.5 1.3 .. 21.7 20.6 -2.8
17 Iceland 7.5 7.7 2.8 0.0 .. 24.6 23.9 4.2
18 Belgium 6.1 7.0 1.9 1.2 .. 25.6 22.7 19.8
19 Denmark 7.9 8.2 2.6 1.4 .. 35.6 21.5 0.9
20 Spain 4.4 6.1 1.3 1.2 .. 10.6 29.4 4.4
21 Hong Kong, China (SAR) 3.3 .. 0.8 .. .. .. 19.7 29.3
22 Greece 4.0 5.8 0.5 3.6 .. 19.9 19.3 1.5
23 Italy 4.3 6.7 1.1 1.7 .. 22.6 20.9 0.7
24 Luxembourg 3.7 6.5 1.7 .. .. 24.5 20.1 215.6
25 Austria 5.4 7.7 2.5 0.9 .. 20.1 22.4 3.5
26 United Kingdom 5.6 6.9 1.8 2.5 .. 28.6 16.7 3.5
27 Singapore 2.8 1.0 2.6 4.1 .. 14.6 28.5 12.5
28 Czech Republic 4.6 5.8 1.6 1.3 .. 14.8 23.9 5.0
29 Slovenia 5.2 5.6 1.5 1.5 .. 20.0 27.5 3.5
30 Andorra 3.2 5.3 .. .. .. .. .. ..
31 Slovakia 3.6 5.2 0.5 1.5 .. 13.5 26.1 3.3
32 United Arab Emirates 0.9 1.9 .. .. .. .. 20.4 ..
33 Malta 4.8 5.8 0.6 0.7 .. 28.6 19.4 12.7
34 Estonia 5.0 4.1 1.1 2.2 .. 16.8 29.3 8.3
35 Cyprus 7.1 3.0 0.4 1.8 .. 56.7 23.3 15.5
36 Hungary 5.4 5.2 1.0 1.2 .. 23.6 20.1 40.6
37 Brunei Darussalam 3.7 1.9 0.0 3.9 .. .. 13.0 0.8
38 Qatar 3.3 2.9 .. .. .. 23.1 30.2 ..
39 Bahrain 2.9 2.6 .. 3.0 .. 1.5 31.9 8.2
40 Portugal 5.3 7.1 1.2 2.0 .. 22.2 21.7 1.5
41 Poland 4.9 4.6 0.6 2.0 11.2 18.4 22.0 2.8
42 Barbados 6.7 4.4 .. .. .. 35.6 22.5 6.8
HIGH HUMAN DEVELOPMENT
43 Bahamas 3.6 3.7 .. .. .. 16.7 37.8 9.9
44 Lithuania 4.7 4.5 0.8 1.5 20.6 17.4 24.4 3.7
45 Chile 3.4 3.7 0.7 3.5 9.8 19.8 24.0 9.9
46 Argentina 4.9 5.1 0.5 0.8 3.0 14.2 23.3 3.0
47 Kuwait 3.8 1.7 0.1 3.2 .. 0.9 18.9 0.0
48 Latvia 5.0 3.6 0.6 1.9 18.1 15.0 30.2 4.0
49 Montenegro .. 5.1 1.2 1.8 1.4 .. 27.7 19.2
50 Romania 4.4 3.8 0.5 1.5 9.3 17.9 31.1 6.9
51 Croatia 3.9 6.6 0.9 1.9 .. 20.4 27.6 6.9
52 Uruguay 2.8 5.9 0.4 1.3 4.7 17.2 18.7 6.9
53 Libyan Arab Jamahiriya 2.7 1.9 .. 1.3 .. .. 27.9 4.4
54 Panama 3.8 4.3 0.2 0.0 7.2 9.3 22.2 10.4
55 Saudi Arabia 5.7 2.7 0.0 8.2 .. .. 19.3 4.8
56 Mexico 4.8 2.7 0.5 0.5 3.9 11.7 22.1 2.1
57 Malaysia 4.5 1.9 0.6 2.0 4.1 16.6 21.7 3.3 58 Bulgaria 4.1 4.2 0.5 2.4 10.3 24.2 33.4 18.4
59 Trinidad and Tobago 4.2 2.7 0.1 .. .. 25.9 25.3 3.8
60 Serbia 4.5 6.1 0.3 2.4 9.6 22.0 20.4 6.0
61 Belarus 5.2 4.9 1.0 1.5 2.0 25.5 32.7 3.6
62 Costa Rica 5.0 5.9 0.4 0.0 5.4 15.8 24.2 6.8
63 Peru 2.7 2.5 0.1 1.1 4.1 15.4 26.1 3.2
64 Albania 2.9 2.9 .. 2.0 1.3 17.3 32.4 7.6
65 Russian Federation 3.9 3.5 1.1 3.5 4.1 15.7 22.0 4.3
66 Kazakhstan 2.8 2.5 0.2 1.2 29.2 12.7 31.3 11.0
67 Azerbaijan 1.9 1.0 0.2 3.8 0.7 16.7 20.1 0.0
68 Bosnia and Herzegovina .. 5.6 0.0 1.4 2.3 21.0 24.4 5.7
69 Ukraine 5.3 4.0 0.9 2.7 10.1 17.8 25.6 6.1
70 Iran (Islamic Republic of) 4.8 3.0 0.7 2.7 1.0 7.3 25.8 0.6
71 The former Yugoslav Republic of Macedonia 3.5 4.7 0.2 1.8 5.1 19.7 23.9 6.3 72 Mauritius 3.6 2.0 0.4 0.2 1.7 18.2 24.6 4.1
73 Brazil 5.2 3.5 1.0 1.5 3.6 16.4 19.0 2.9
74 Georgia 2.9 1.5 0.2 8.5 1.5 23.8 22.5 12.2
75 Venezuela (Bolivarian Republic of) 3.7 2.7 .. 1.4 1.9 15.5 19.8 0.1
76 Armenia 3.0 2.1 0.2 3.3 3.0 17.0 40.0 7.8
77 Ecuador 1.0 2.3 0.2 2.8 5.0 .. 23.8 1.8
78 Belize 5.1 2.6 .. 1.1 8.2 22.9 25.5 14.0
79 Colombia 3.9 5.1 0.2 3.7 3.4 12.6 .. 4.3
80 Jamaica 6.2 2.4 0.1 0.6 7.9 25.4 .. 9.8
81 Tunisia 7.2 3.0 1.0 1.3 5.6 22.8 25.3 6.5
82 Jordan 4.9 5.4 0.3 5.9 12.2 18.3 25.6 9.3
83 Turkey 2.9 3.4 0.7 2.2 7.4 18.6 19.9 2.5
84 Algeria 4.3 3.6 0.1 3.0 0.8 46.5 27.0 1.6
85 Tonga 4.7 3.1 .. .. 1.9 .. 17.1 2.2
MEDIUM HUMAN DEVELOPMENT
86 Fiji 6.2 2.8 .. 1.3 0.7 22.7 16.0 8.9
87 Turkmenistan .. 1.4 .. .. 1.2 .. 6.5 5.3
88 Dominican Republic 2.2 1.9 .. 0.6 3.3 15.9 18.2 6.3
PUBLIC EXPENDITURE(% of GDP)
FOREIGN DIRECTINVESTMENT
Research anddevelopment
Taxrevenue
Gross fixedcapital
formation
2000–2007b 2000–2007b 2000–2007b
d
d
d
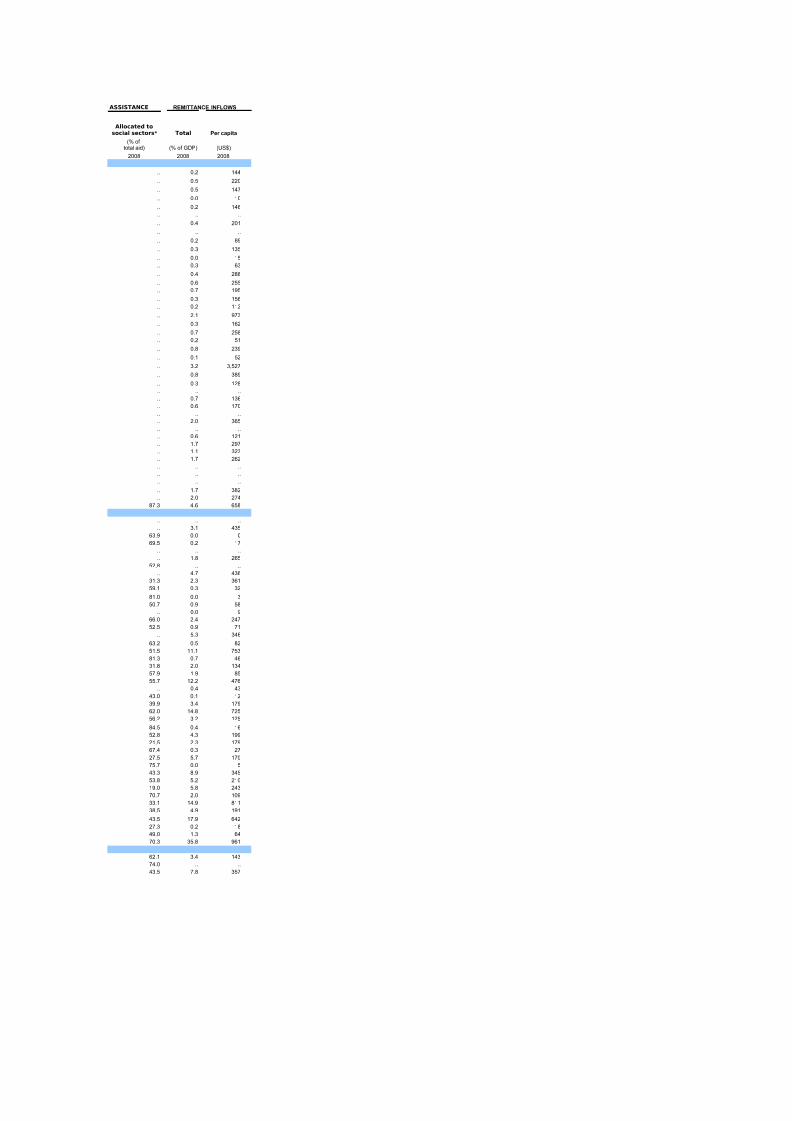
8/7/2019 Tabela IDH 2010 inglês
http://slidepdf.com/reader/full/tabela-idh-2010-ingles 84/102
89 China 1.9 1.9 1.5 2.0 0.8 9.4 42.0 3.4
90 El Salvador 3.6 3.6 0.1 0.5 4.6 13.9 15.0 3.5
91 Sri Lanka .. 2.0 0.2 3.6 3.1 14.2 25.3 1.9
92 Thailand 4.9 2.7 0.2 1.5 6.3 16.5 27.4 3.6
93 Gabon 3.8 3.0 .. .. 4.7 .. 24.4 0.1 94 Suriname .. 3.6 .. .. .. .. 25.1 -7.7
95 Bolivia (Plurinational State of) 6.3 3.4 0.3 1.5 5.9 17.0 17.2 3.1
96 Paraguay 4.0 2.4 0.1 0.8 2.9 12.5 19.6 2.0
97 Philippines 2.6 1.3 0.1 0.8 6.6 14.1 14.7 0.8
98 Botswana 8.1 4.3 0.4 2.7 0.5 .. 23.4 0.8
99 Moldova (Republic of) 8.2 5.2 0.5 0.6 7.5 20.5 34.1 11.7
100 Mongolia 5.1 3.5 0.2 .. 1.4 23.2 35.7 13.0
101 Egypt 3.8 2.4 0.2 2.3 1.9 15.4 22.4 5.9
102 Uzbekistan .. 2.3 .. .. 2.5 .. 23.0 3.3
103 Micronesia (Federated States of) 7.3 12.6 .. .. .. .. .. ..
104 Guyana 6.1 7.2 .. .. 2.3 .. 39.7 14.5
105 Namibia 6.5 3.2 .. 3.5 .. 27.2 23.4 6.1
106 Honduras .. 4.1 0.0 0.8 2.8 15.8 32.2 6.6
107 Maldives 8.1 6.4 .. .. 5.4 21.0 53.5 1.2 108 Indonesia 3.5 1.2 0.0 1.0 4.8 12.3 27.6 1.8
109 Kyrgyzstan 6.6 3.5 0.3 3.7 6.6 16.8 22.7 4.6
110 South Africa 5.1 3.6 1.0 1.3 1.7 27.7 23.2 3.5
111 Syrian Arab Republic 4.9 1.6 .. 3.4 .. .. 16.4 3.1
112 Tajikistan 3.5 1.1 0.1 .. 2.7 9.8 19.3 7.3
113 Viet Nam 5.3 2.8 0.2 2.4 1.5 .. 36.0 10.6
114 Morocco 5.7 1.7 0.6 3.4 4.8 27.5 33.1 2.8
115 Nicaragua 3.1 4.5 0.0 0.7 4.3 17.0 29.4 9.5
116 Guatemala 3.2 2.1 0.0 0.4 4.6 11.3 17.7 2.1
117 Equatorial Guinea 0.6 1.7 .. .. .. .. 28.2 ..
118 Cape Verde 5.7 3.4 .. 0.5 2.0 23.9 46.6 13.3
119 India 3.2 1.1 0.8 2.6 2.7 12.9 34.8 3.6
120 Timor-Leste 7.1 11.5 .. 4.7 .. .. 21.8 .. 121 Swaziland 7.9 3.8 .. .. 1.7 27.6 16.5 0.4
122 Lao People's Democratic Republic 2.3 0.8 0.0 0.4 3.8 10.1 37.1 4.1
123 Solomon Islands 2.2 4.3 .. .. 2.8 .. 13.4 11.8
124 Cambodia 1.6 1.7 0.0 1.1 0.4 8.2 19.4 7.9
125 Pakistan 2.9 0.8 0.7 2.6 1.8 9.8 20.4 3.3
126 Congo 1.8 1.7 .. 1.1 1.3 6.2 20.5 24.5
127 Sao Tome and Principe .. 5.3 .. .. 1.9 .. .. 18.9
LOW HUMAN DEVELOPMENT
128 Kenya 7.0 2.0 .. 1.9 1.3 18.9 19.4 0.3
129 Bangladesh 2.4 1.1 .. 1.0 1.2 8.8 24.2 1.2
130 Ghana 5.4 4.3 .. 0.7 1.6 22.9 35.9 12.7
131 Cameroon 2.9 1.3 .. 1.5 1.6 .. 17.1 0.2
132 Myanmar 1.3 0.2 0.2 .. .. 3.3 11.7 ..
133 Yemen 5.2 1.5 .. 4.2 1.2 .. 23.1 5.8
134 Benin 3.6 2.5 .. 1.1 1.5 17.3 20.7 1.8
135 Madagascar 2.9 2.7 0.1 1.1 0.3 11.4 35.6 15.6
136 Mauritania 4.4 1.6 .. 3.7 4.4 .. 25.9 3.6
137 Papua New Guinea .. 2.6 .. 0.4 12.7 21.0 18.1 -0.4
138 Nepal 3.8 2.0 .. 2.0 1.3 10.4 21.1 0.0
139 Togo 3.7 1.5 .. 1.9 6.8 16.3 22.3 2.3
140 Comoros 7.6 1.9 .. .. 2.3 .. 16.1 1.5
141 Lesotho 12.4 3.6 0.1 1.6 1.8 58.9 28.3 13.4
142 Nigeria .. 1.7 .. 0.8 0.3 .. .. 1.8
143 Uganda 3.8 1.6 0.4 2.3 0.5 12.8 23.3 5.5
144 Senegal 5.1 3.2 0.1 1.6 1.4 16.1 30.2 5.3
145 Haiti .. 1.2 .. 0.0 .. .. .. 0.4
146 Angola 2.6 2.0 .. 3.0 2.3 .. 12.4 2.0 147 Djibouti 8.7 5.5 .. 3.7 2.8 .. 38.9 28.9
148 Tanzania (United Republic of) 6.8 3.5 .. 1.1 0.3 .. 16.4 3.6
149 Côte d'Ivoire 4.6 1.0 .. 1.5 4.7 15.6 10.1 1.7
150 Zambia 1.4 3.6 0.0 2.0 1.3 17.1 22.7 6.6
151 Gambia 2.0 2.6 .. .. 3.3 .. 24.8 8.9
152 Rwanda 4.1 4.9 .. 1.5 0.4 .. 24.1 2.3
153 Malawi 4.2 5.9 .. .. 0.8 .. 24.2 0.9
154 Sudan .. 1.3 0.3 .. 0.8 .. 20.2 4.6
155 Afghanistan .. 1.8 .. 1.9 0.1 5.8 27.6 2.8
156 Guinea 1.7 0.6 .. .. 4.2 .. 15.5 10.1
157 Ethiopia 5.5 2.2 0.2 1.4 0.4 10.2 20.1 0.4
158 Sierra Leone 3.8 1.4 .. 2.4 0.3 10.8 14.7 -0.2
159 Central African Republic 1.3 1.4 .. 1.6 1.8 6.2 11.6 6.1
160 Mali 3.8 2.9 .. 1.9 0.8 15.6 23.3 1.5
161 Burkina Faso 4.6 3.4 0.1 1.4 0.6 12.5 20.8 1.7
162 Liberia 2.7 2.8 .. 0.6 135.2 .. 16.4 17.1
163 Chad 1.9 2.7 .. 6.6 2.1 .. 14.1 9.9
164 Guinea-Bissau 5.2 1.6 .. .. 4.0 .. 23.9 3.5
165 Mozambique 5.0 3.5 0.5 0.8 0.5 .. 18.5 6.0
166 Burundi 7.2 5.2 .. 4.0 3.7 .. 16.4 0.3
167 Niger 3.7 2.8 .. .. 0.5 11.5 18.9 2.7
168 Congo (Democratic Republic of the) .. 1.2 0.5 1.4 6.2 6.3 23.9 8.6
169 Zimbabwe 4.6 4.1 .. .. 7.3 .. 21.0 3.0
OTHER COUNTRIES OR TERRITORIES
Antigua and Barbuda 3.9 3.2 .. .. .. .. 73.7 20.8
Bhutan 5.1 3.3 .. .. 6.3 7.9 46.4 2.3
Cuba 13.6 9.9 0.4 .. .. .. .. ..
Dominica 4.8 3.9 .. .. 5.4 .. 32.7 14.6
Eritrea 2.0 1.5 .. .. 0.9 .. 10.6 2.2
Grenada 5.2 3.6 .. .. 3.9 .. 29.8 25.3
Iraq .. 1.9 .. 5.4 .. .. .. ..
Kiribati 17.9 16.1 .. .. .. .. .. ..
Korea (Democratic People's Rep. of) .. 3.0 .. .. .. .. .. ..
Lebanon 2.0 3.9 .. 3.9 15.6 16.3 30.7 12.3
Marshall Islands 12.3 14.3 .. .. .. .. .. ..
Monaco .. 2.9 .. .. .. .. .. ..
Nauru .. .. .. .. .. .. .. ..
Occupied Palestinian Territories .. .. .. .. .. .. 25.7 1.2
Oman 4.0 1.9 .. 7.7 .. 7.4 12.6 7.5
Palau 10.3 8.5 .. .. .. .. .. .. Saint Kitts and Nevis 9.9 3.4 .. .. 8.8 22.2 41.6 16.1
Saint Lucia 6.3 3.4 0.4 .. 5.2 .. 25.9 10.5
Saint Vincent and the Grenadines 7.0 3.3 0.2 .. 4.9 .. 37.9 20.0
Samoa 5.4 4.2 .. .. 2.7 .. .. 1.1
San Marino .. 6.1 .. .. .. 22.4 .. ..
Seychelles 5.0 3.6 0.4 1.3 12.6 26.0 28.3 43.7
d
d
d
d
d
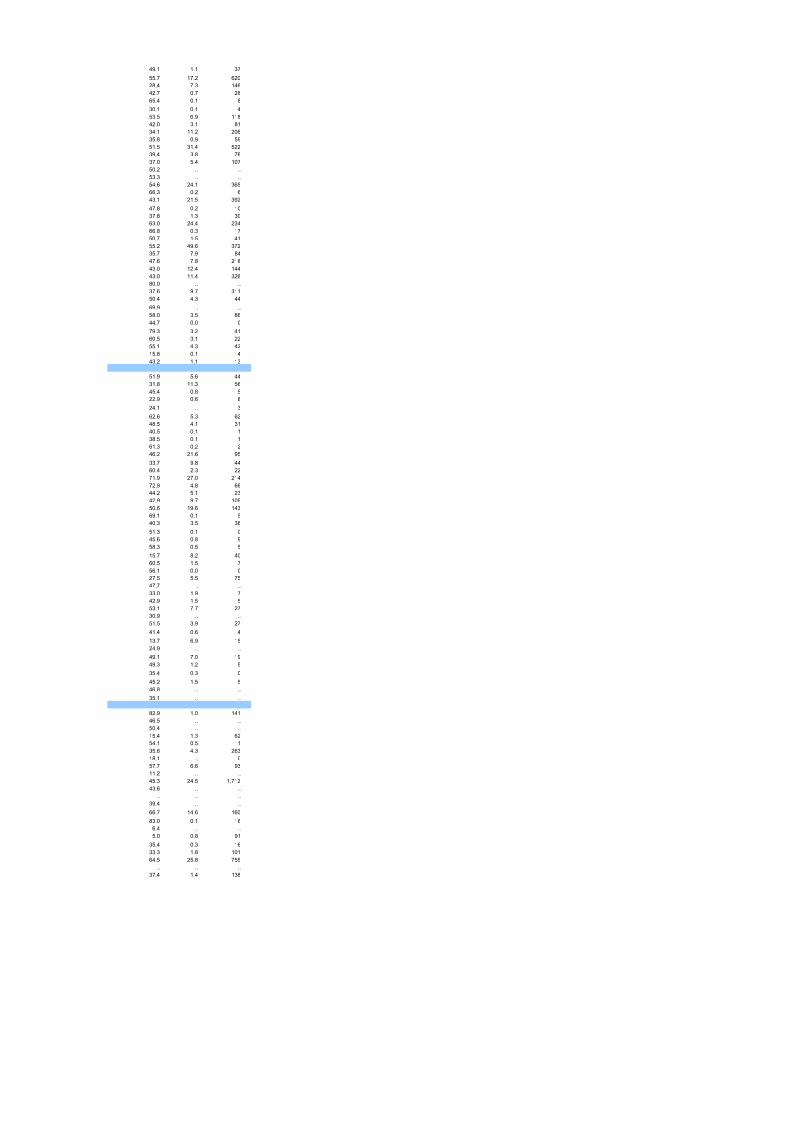
8/7/2019 Tabela IDH 2010 inglês
http://slidepdf.com/reader/full/tabela-idh-2010-ingles 85/102
Somalia .. .. .. .. .. .. .. ..
Tuvalu .. .. .. .. .. .. .. ..
Vanuatu 6.9 2.7 .. .. 0.8 .. 24.2 5.8
Notes
a. Data refer to allocation of aid to social infrastructure and services including health, education, water, sanitation, government, civil society and other services, expressed as a percentage of total official development assistance received.
b. Data refer to the most recent year available during the period specified.
c. Since 1970 developed countries committed to spending 0.7% of gross national income on official development assistance. Values in brackets refer to official development assistance disbursed by donor countries.
d. Refers to an earlier year than that specified.
e. Refers to 2007.
Sources
Column 1: UNESCO Institute for Statistics (2010b).
Columns 2, 3, 5–8, 12 and 13: World Bank (2010g)
Column 4: SIPRI (2010b).
Columns 9–11: OECD-DAC (2010b).

8/7/2019 Tabela IDH 2010 inglês
http://slidepdf.com/reader/full/tabela-idh-2010-ingles 86/102
ASSISTANCE REMITTANCE INFLOWS
Total Per capita
(% of GDP) (US$)
2008 2008 2008
.. 0.2 144
.. 0.5 220
.. 0.5 147
.. 0.0 10
.. 0.2 146
.. .. ..
.. 0.4 201
.. .. ..
.. 0.2 89
.. 0.3 135
.. 0.0 15
.. 0.3 63
.. 0.4 288
.. 0.6 255
.. 0.7 195
.. 0.3 156
.. 0.2 112
.. 2.1 973
.. 0.3 162
.. 0.7 258
.. 0.2 51
.. 0.8 239
.. 0.1 52
.. 3.2 3,527
.. 0.8 389
.. 0.3 128
.. .. ..
.. 0.7 136
.. 0.6 170
.. .. ..
.. 2.0 365
.. .. ..
.. 0.6 121
.. 1.7 297
.. 1.1 323
.. 1.7 262
.. .. ..
.. .. ..
.. .. ..
.. 1.7 382
.. 2.0 274
87.3 4.6 658
.. .. ..
.. 3.1 435
63.9 0.0 0
69.5 0.2 17
.. .. ..
.. 1.8 265
52.8 .. ..
.. 4.7 436
31.3 2.3 361
59.1 0.3 32
81.0 0.0 3
50.7 0.9 58
.. 0.0 9
66.0 2.4 24752.5 0.9 71
.. 5.3 346
63.2 0.5 82
51.5 11.1 753
81.3 0.7 46
31.8 2.0 134
57.9 1.9 85
55.7 12.2 476
.. 0.4 43
43.0 0.1 12
39.9 3.4 179
62.0 14.8 725
56.2 3.2 125
84.5 0.4 1652.8 4.3 199
21.5 2.3 179
67.4 0.3 27
27.5 5.7 170
75.7 0.0 5
43.3 8.9 345
53.8 5.2 210
19.0 5.8 243
70.7 2.0 109
33.1 14.9 811
38.5 4.9 191
43.5 17.9 642
27.3 0.2 1849.0 1.3 64
70.3 35.8 961
62.1 3.4 143
74.0 .. ..
43.5 7.8 357
Allocated tosocial sectorsa
(% of total aid)
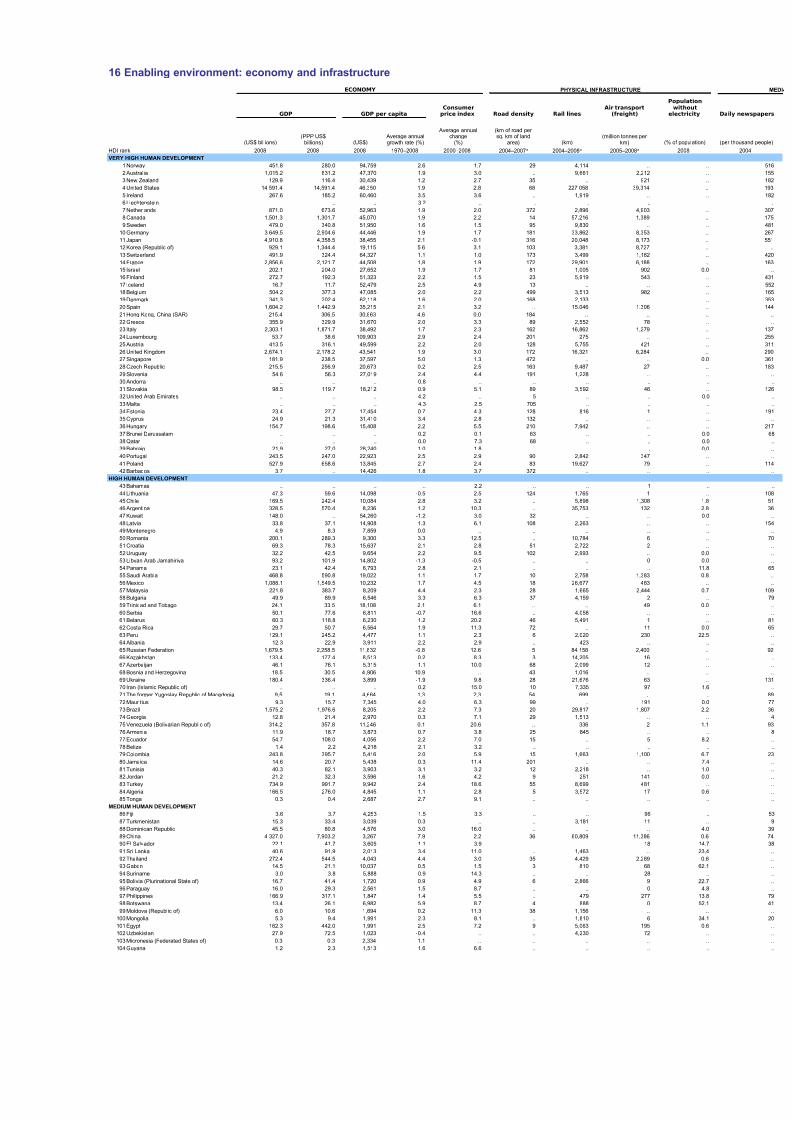
8/7/2019 Tabela IDH 2010 inglês
http://slidepdf.com/reader/full/tabela-idh-2010-ingles 87/102
49.1 1.1 37
55.7 17.2 620
28.4 7.3 146
42.7 0.7 28
65.4 0.1 830.1 0.1 4
53.5 6.9 118
42.0 3.1 81
34.1 11.2 206
35.8 0.9 59
51.5 31.4 522
39.4 3.8 76
37.0 5.4 107
50.2 .. ..
53.3 .. ..
54.6 24.1 365
66.3 0.2 6
43.1 21.5 392
47.8 0.2 1037.8 1.3 30
63.0 24.4 234
66.8 0.3 17
50.7 1.5 41
55.2 49.6 372
35.7 7.9 84
47.6 7.8 218
43.0 12.4 144
43.0 11.4 326
80.0 .. ..
37.6 9.7 311
50.4 4.3 44
69.9 .. ..
58.0 3.5 86
44.7 0.0 0
79.3 3.2 41
60.5 3.1 22
55.1 4.3 42
15.8 0.1 4
43.2 1.1 13
51.9 5.6 44
31.8 11.3 56
45.4 0.8 5
22.9 0.6 8
24.1 .. 3
62.6 5.3 6248.5 4.1 31
40.5 0.1 1
38.5 0.1 1
61.3 0.2 2
46.2 21.6 95
33.7 9.8 44
60.4 2.3 22
71.9 27.0 214
72.9 4.8 66
44.2 5.1 23
42.9 9.7 105
50.6 19.6 143
69.1 0.1 540.3 3.5 36
51.3 0.1 0
45.6 0.8 9
58.3 0.5 5
15.7 8.2 40
60.5 1.5 7
56.1 0.0 0
27.5 5.5 75
47.7 .. ..
33.0 1.9 7
42.9 1.5 5
53.1 7.7 27
30.9 .. ..
51.5 3.9 27
41.4 0.6 4
13.7 6.9 15
24.9 .. ..
49.1 7.0 19
49.3 1.2 5
35.4 0.3 0
45.2 1.5 5
46.8 .. ..
35.1 .. ..
82.9 1.0 141
46.5 .. ..
50.4 .. ..
15.4 1.3 62
54.1 0.5 1
35.6 4.3 263
18.1 .. 0
57.7 6.6 93
11.2 .. ..
45.3 24.5 1,712
43.6 .. ..
.. .. ..
39.4 .. ..
66.7 14.6 160
83.0 0.1 16
6.4 .. ..5.0 0.8 91
35.4 0.3 16
33.3 1.8 101
64.5 25.8 755
.. .. ..
37.4 1.4 138
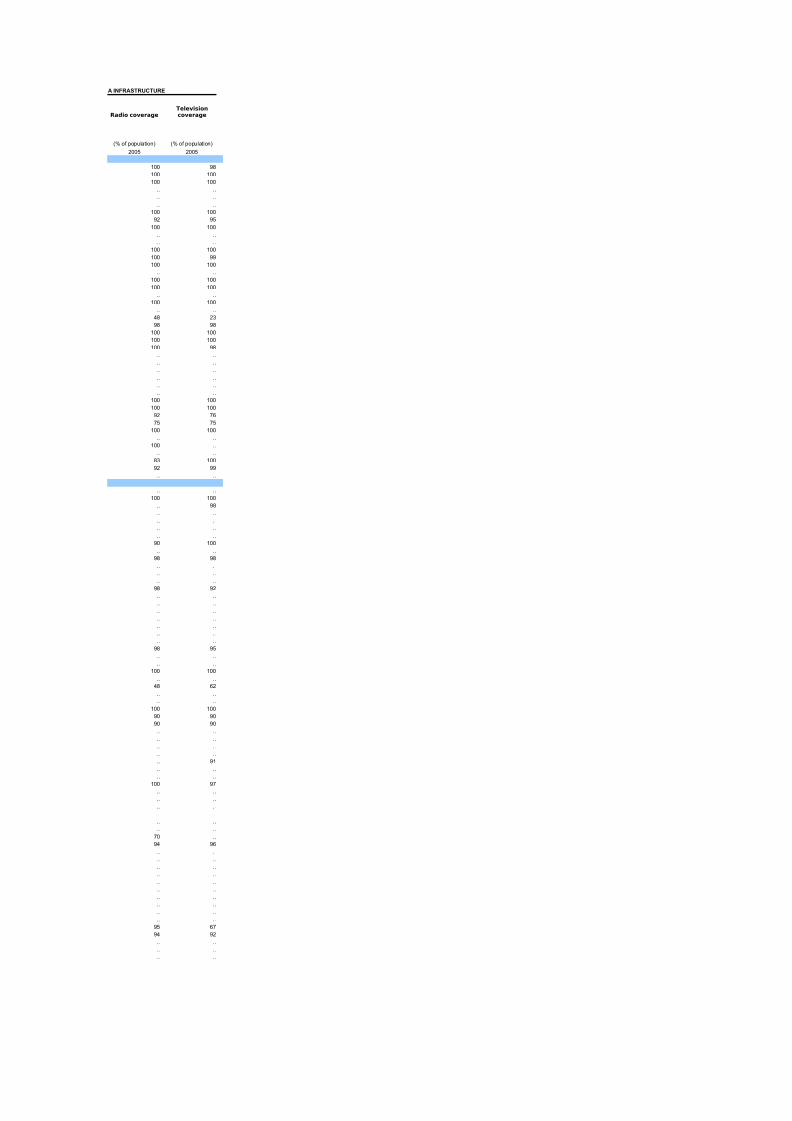
8/7/2019 Tabela IDH 2010 inglês
http://slidepdf.com/reader/full/tabela-idh-2010-ingles 88/102
16.8 .. ..
41.3 .. ..
36.9 1.2 30
ds exist between countries.

8/7/2019 Tabela IDH 2010 inglês
http://slidepdf.com/reader/full/tabela-idh-2010-ingles 89/102
16 Enabling environment: economy and infrastructure
ECONOMY PHYSICAL INFRASTRUCTURE
GDP GDP per capita Road density Rail lines
(US$ billions) (US$) (km) (% of population)
HDI rank 2008 2008 2008 1970–2008 2000–2008 2008
VERY HIGH HUMAN DEVELOPMENT
1 Norway 451.8 280.0 94,759 2.6 1.7 29 4,114 ..
2 Australia 1,015.2 831.2 47,370 1.9 3.0 .. 9,661 2,212
3 New Zealand 129.9 116.4 30,439 1.2 2.7 35 .. 921
4 United States 14,591.4 14,591.4 46,350 1.9 2.8 68 227,058 39,314
5 Ireland 267.6 185.2 60,460 3.5 3.6 .. 1,919 ..
6 Liechtenstein .. .. .. 3.2 .. .. .. ..
7 Netherlands 871.0 673.6 52,963 1.9 2.0 372 2,896 4,903
8 Canada 1,501.3 1,301.7 45,070 1.9 2.2 14 57,216 1,389
9 Sweden 479.0 340.8 51,950 1.6 1.5 95 9,830 ..
10 Germany 3,649.5 2,904.6 44,446 1.9 1.7 181 33,862 8,353
11 Japan 4,910.8 4,358.5 38,455 2.1 -0.1 316 20,048 8,173
12 Korea (Republic of) 929.1 1,344.4 19,115 5.6 3.1 103 3,381 8,727
13 Switzerland 491.9 324.4 64,327 1.1 1.0 173 3,499 1,182
14 France 2,856.6 2,121.7 44,508 1.8 1.9 172 29,901 6,188
15 Israel 202.1 204.0 27,652 1.9 1.7 81 1,005 902 0.
16 Finland 272.7 192.3 51,323 2.2 1.5 23 5,919 543
17 Iceland 16.7 11.7 52,479 2.5 4.9 13 .. ..
18 Belgium 504.2 377.3 47,085 2.0 2.2 499 3,513 982
19 Denmark 341.3 202.4 62,118 1.6 2.0 168 2,133 ..
20 Spain 1,604.2 1,442.9 35,215 2.1 3.2 .. 15,046 1,306
21 Hong Kong, China (SAR) 215.4 306.5 30,863 4.6 0.0 184 .. ..
22 Greece 355.9 329.9 31,670 2.0 3.3 89 2,552 78
23 Italy 2,303.1 1,871.7 38,492 1.7 2.3 162 16,862 1,279
24 Luxembourg 53.7 38.6 109,903 2.9 2.4 201 275 ..
25 Austria 413.5 316.1 49,599 2.2 2.0 128 5,755 421
26 United Kingdom 2,674.1 2,178.2 43,541 1.9 3.0 172 16,321 6,284
27 Singapore 181.9 238.5 37,597 5.0 1.3 472 .. .. 0.
28 Czech Republic 215.5 256.9 20,673 0.2 2.5 163 9,487 27
29 Slovenia 54.6 56.3 27,019 2.4 4.4 191 1,228 ..
30 Andorra .. .. .. 0.8 .. .. .. ..
31 Slovakia 98.5 119.7 18,212 0.9 5.1 89 3,592 46
32 United Arab Emirates .. .. .. 4.2 .. 5 .. .. 0.
33 Malta .. .. .. 4.3 2.5 705 .. ..
34 Estonia 23.4 27.7 17,454 0.7 4.3 128 816 1
35 Cyprus 24.9 21.3 31,410 3.4 2.8 132 .. ..
36 Hungary 154.7 198.6 15,408 2.2 5.5 210 7,942 ..
37 Brunei Darussalam .. .. .. 0.2 0.1 63 .. .. 0.
38 Qatar .. .. .. 0.0 7.3 68 .. .. 0.
39 Bahrain 21.9 27.0 28,240 1.0 1.8 .. .. .. 0.
40 Portugal 243.5 247.0 22,923 2.5 2.9 90 2,842 347
41 Poland 527.9 658.6 13,845 2.7 2.4 83 19,627 79
42 Barbados 3.7 .. 14,426 1.8 3.7 372 .. ..
HIGH HUMAN DEVELOPMENT
43 Bahamas .. .. .. .. 2.2 .. .. 1
44 Lithuania 47.3 59.6 14,098 -0.5 2.5 124 1,765 1
45 Chile 169.5 242.4 10,084 2.8 3.2 .. 5,898 1,308 1.
46 Argentina 328.5 570.4 8,236 1.2 10.3 .. 35,753 132 2.
47 Kuwait 148.0 .. 54,260 -1.2 3.0 32 .. .. 0.48 Latvia 33.8 37.1 14,908 1.3 6.1 108 2,263 ..
49 Montenegro 4.9 8.3 7,859 0.0 .. .. .. ..
50 Romania 200.1 289.3 9,300 3.3 12.5 .. 10,784 6
51 Croatia 69.3 78.3 15,637 2.1 2.8 51 2,722 2
52 Uruguay 32.2 42.5 9,654 2.2 9.5 102 2,993 .. 0.
53 Libyan Arab Jamahiriya 93.2 101.9 14,802 -1.3 -0.5 .. .. 0 0.
54 Panama 23.1 42.4 6,793 2.8 2.1 .. .. .. 11.
55 Saudi Arabia 468.8 590.8 19,022 1.1 1.7 10 2,758 1,383 0.
56 Mexico 1,088.1 1,549.5 10,232 1.7 4.5 18 26,677 483
57 Malaysia 221.8 383.7 8,209 4.4 2.3 28 1,665 2,444 0.
58 Bulgaria 49.9 89.9 6,546 3.3 6.3 37 4,159 2
59 Trinidad and Tobago 24.1 33.5 18,108 2.1 6.1 .. .. 49 0.
60 Serbia 50.1 77.6 6,811 -0.7 16.6 .. 4,058 ..
61 Belarus 60.3 118.8 6,230 1.2 20.2 46 5,491 1 62 Costa Rica 29.7 50.7 6,564 1.9 11.3 72 .. 11 0.
63 Peru 129.1 245.2 4,477 1.1 2.3 6 2,020 230 22.
64 Albania 12.3 22.9 3,911 2.2 2.9 .. 423 ..
65 Russian Federation 1,679.5 2,258.5 11,832 -0.8 12.6 5 84,158 2,400
66 Kazakhstan 133.4 177.4 8,513 0.2 8.3 3 14,205 16
67 Azerbaijan 46.1 76.1 5,315 1.1 10.0 68 2,099 12
68 Bosnia and Herzegovina 18.5 30.5 4,906 10.9 .. 43 1,016 ..
69 Ukraine 180.4 336.4 3,899 -1.9 9.8 28 21,676 63
70 Iran (Islamic Republic of) .. .. .. 0.2 15.0 10 7,335 97 1.
71 The former Yugoslav Republic of Macedonia 9.5 19.1 4,664 1.3 2.3 54 699 ..
72 Mauritius 9.3 15.7 7,345 4.0 6.3 99 .. 191 0.
73 Brazil 1,575.2 1,976.6 8,205 2.2 7.3 20 29,817 1,807 2.
74 Georgia 12.8 21.4 2,970 0.3 7.1 29 1,513 ..
75 Venezuela (Bolivarian Republic of) 314.2 357.8 11,246 0.1 20.6 .. 336 2 1.76 Armenia 11.9 18.7 3,873 0.7 3.8 25 845 ..
77 Ecuador 54.7 108.0 4,056 2.2 7.0 15 .. 5 8.
78 Belize 1.4 2.2 4,218 2.1 3.2 .. .. ..
79 Colombia 243.8 395.7 5,416 2.0 5.9 15 1,663 1,100 6.
80 Jamaica 14.6 20.7 5,438 0.3 11.4 201 .. .. 7.
81 Tunisia 40.3 82.1 3,903 3.1 3.2 12 2,218 .. 1.
82 Jordan 21.2 32.3 3,596 1.6 4.2 9 251 141 0.
83 Turkey 734.9 991.7 9,942 2.4 18.6 55 8,699 481
84 Algeria 166.5 276.0 4,845 1.1 2.8 5 3,572 17 0.
85 Tonga 0.3 0.4 2,687 2.7 9.1 .. .. ..
MEDIUM HUMAN DEVELOPMENT
86 Fiji 3.6 3.7 4,253 1.5 3.3 .. .. 96
87 Turkmenistan 15.3 33.4 3,039 0.3 .. .. 3,181 11
88 Dominican Republic 45.5 80.8 4,576 3.0 16.0 .. .. .. 4.89 China 4,327.0 7,903.2 3,267 7.9 2.2 36 60,809 11,386 0.
90 El Salvador 22.1 41.7 3,605 1.1 3.9 .. .. 18 14.
91 Sri Lanka 40.6 91.9 2,013 3.4 11.0 .. 1,463 .. 23.
92 Thailand 272.4 544.5 4,043 4.4 3.0 35 4,429 2,289 0.
93 Gabon 14.5 21.1 10,037 0.5 1.5 3 810 68 62.
94 Suriname 3.0 3.8 5,888 0.9 14.3 .. .. 28
Consumerprice index
Air transport(freight)
Populationwithoutelectricity
(PPP US$billions)
Average annualgrowth rate (%)
Average annualchange
(%)
(km of road per sq. km of land
area)(million tonnes per
km)
2004–2007a 2004–2008a 2005–2008a

8/7/2019 Tabela IDH 2010 inglês
http://slidepdf.com/reader/full/tabela-idh-2010-ingles 90/102
A INFRASTRUCTURE
Radio coverage
(% of population) (% of population)
2005 2005
100 98
100 100
100 100
.. ..
.. ..
.. ..100 100
92 95
100 100
.. ..
.. ..
100 100
100 99
100 100
.. ..
100 100
100 100
.. ..
100 100
.. ..48 23
98 98
100 100
100 100
100 98
.. ..
.. ..
.. ..
.. ..
.. ..
.. ..
100 100
100 100
92 7675 75
100 100
.. ..
100 ..
.. ..
83 100
92 99
.. ..
.. ..
100 100
.. 98
.. ..
.. ..
.. ..
.. ..
90 100
.. ..
98 98
.. ..
.. ..
.. ..
98 92
.. ..
.. ..
.. ..
.. ..
.. ..
.. ..
.. ..
98 95
.. ..
.. ..
100 100
.. ..
48 62
.. ..
.. ..
100 100
90 90
90 90.. ..
.. ..
.. ..
.. ..
.. 91
.. ..
.. ..
100 97
.. ..
.. ..
.. ..
.. ..
.. ..70 ..
94 96
.. ..
.. ..
.. ..
.. ..
Televisioncoverage
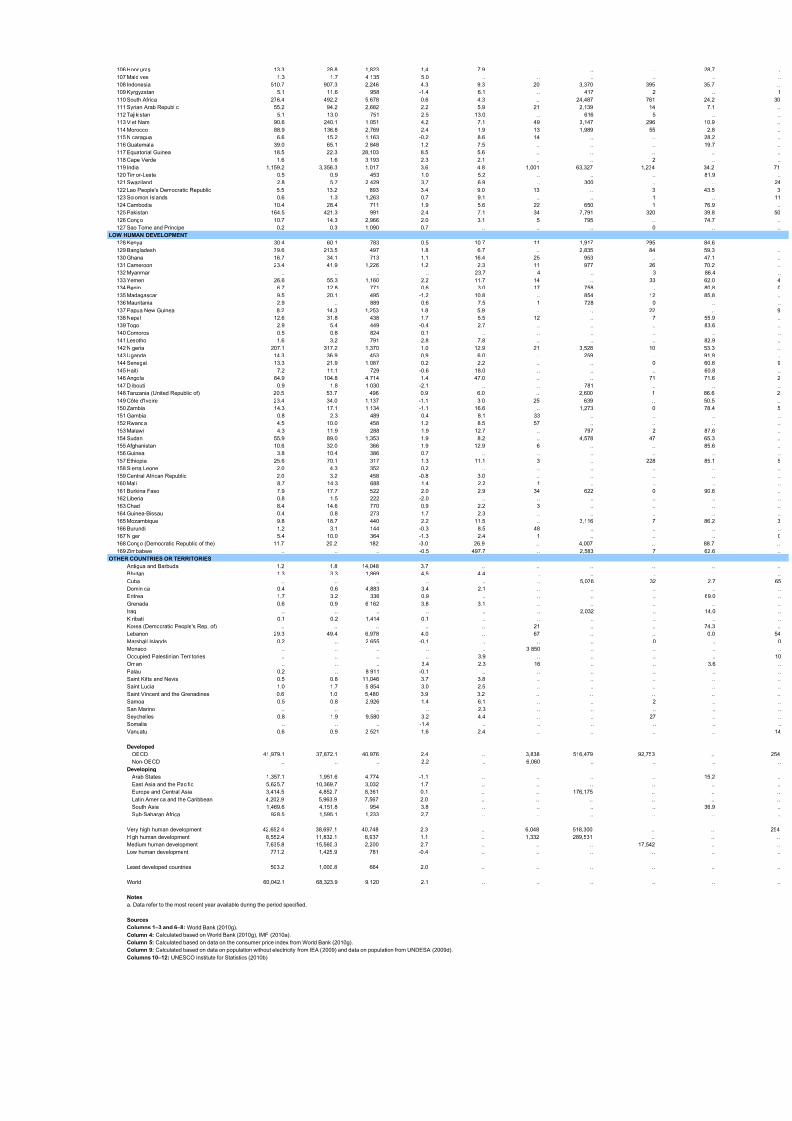
8/7/2019 Tabela IDH 2010 inglês
http://slidepdf.com/reader/full/tabela-idh-2010-ingles 91/102
105 Namibia 8.8 13.6 4,149 0.5 5.4 .. .. 0 6
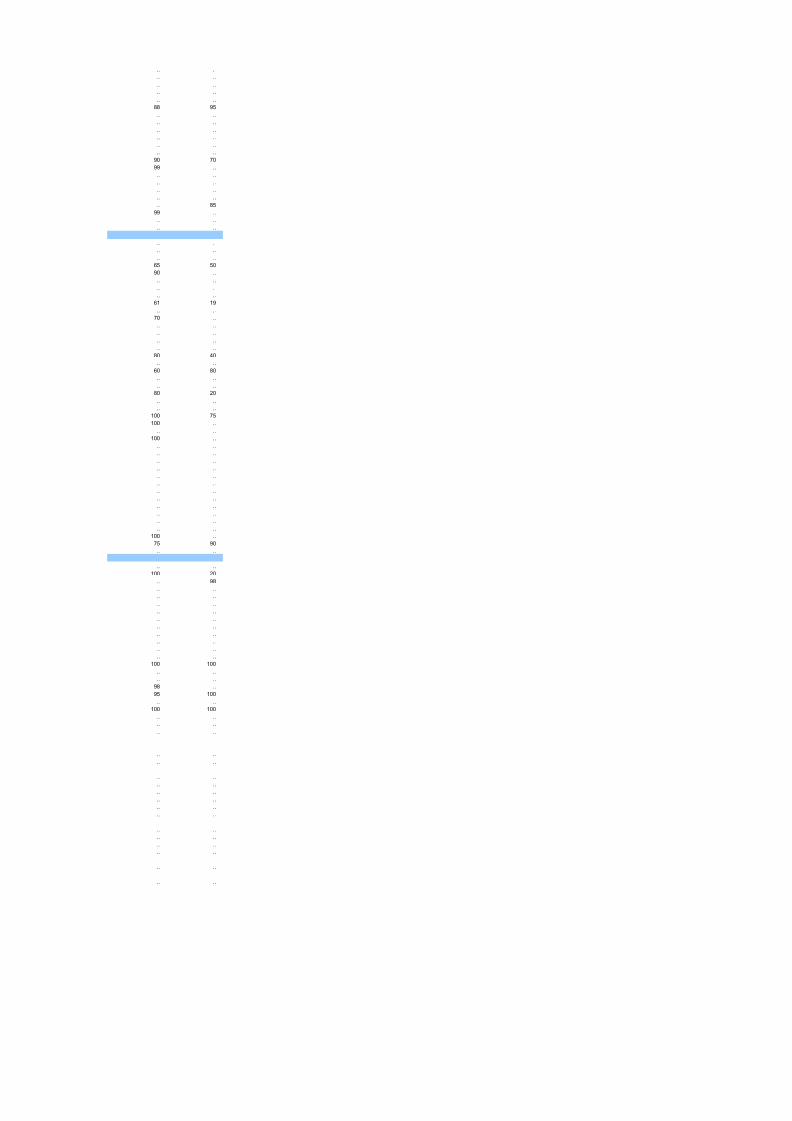
8/7/2019 Tabela IDH 2010 inglês
http://slidepdf.com/reader/full/tabela-idh-2010-ingles 92/102
.. ..

8/7/2019 Tabela IDH 2010 inglês
http://slidepdf.com/reader/full/tabela-idh-2010-ingles 93/102
106 Honduras 13.3 28.8 1,823 1.4 7.9 .. .. .. 2
107 Maldives 1.3 1.7 4,135 5.0 .. .. .. ..
108 Indonesia 510.7 907.3 2,246 4.3 9.3 20 3,370 395 3
109 Kyrgyzstan 5.1 11.6 958 -1.4 6.1 .. 417 2
110 South Africa 276.4 492.2 5,678 0.6 4.3 .. 24,487 761 2
111 Syrian Arab Republic 55.2 94.2 2,682 2.2 5.9 21 2,139 14
112 Tajikistan 5.1 13.0 751 -2.5 13.0 .. 616 5
113 Viet Nam 90.6 240.1 1,051 4.2 7.1 49 3,147 296 1
114 Morocco 88.9 136.8 2,769 2.4 1.9 13 1,989 55
115 Nicaragua 6.6 15.2 1,163 -0.2 8.6 14 .. .. 2
116 Guatemala 39.0 65.1 2,848 1.2 7.5 .. .. .. 1
117 Equatorial Guinea 18.5 22.3 28,103 8.5 5.6 .. .. ..
118 Cape Verde 1.6 1.6 3,193 2.3 2.1 .. .. 2
119 India 1,159.2 3,356.3 1,017 3.6 4.8 1,001 63,327 1,234 3
120 Timor-Leste 0.5 0.9 453 1.0 5.2 .. .. .. 8
121 Swaziland 2.8 5.7 2,429 3.7 6.9 .. 300 ..
122 Lao People's Democratic Republic 5.5 13.2 893 3.4 9.0 13 .. 3 4
123 Solomon Islands 0.6 1.3 1,263 0.7 9.1 .. .. 1
124 Cambodia 10.4 28.4 711 1.9 5.6 22 650 1 7125 Pakistan 164.5 421.3 991 2.4 7.1 34 7,791 320 3
126 Congo 10.7 14.3 2,966 2.0 3.1 5 795 .. 7
127 Sao Tome and Principe 0.2 0.3 1,090 0.7 .. .. .. 0
LOW HUMAN DEVELOPMENT
128 Kenya 30.4 60.1 783 0.5 10.7 11 1,917 295 8
129 Bangladesh 79.6 213.5 497 1.8 6.7 .. 2,835 84 5
130 Ghana 16.7 34.1 713 1.1 16.4 25 953 .. 4
131 Cameroon 23.4 41.9 1,226 1.2 2.3 11 977 26 7
132 Myanmar .. .. .. .. 23.7 4 .. 3 8
133 Yemen 26.6 55.3 1,160 2.2 11.7 14 .. 33 6
134 Benin 6.7 12.8 771 0.6 3.0 17 758 .. 8
135 Madagascar 9.5 20.1 495 -1.2 10.8 .. 854 12 8
136 Mauritania 2.9 .. 889 0.6 7.5 1 728 0
137 Papua New Guinea 8.2 14.3 1,253 1.8 5.9 .. .. 22 138 Nepal 12.6 31.8 438 1.7 5.5 12 .. 7 5
139 Togo 2.9 5.4 449 -0.4 2.7 .. .. .. 8
140 Comoros 0.5 0.8 824 0.1 .. .. .. ..
141 Lesotho 1.6 3.2 791 2.8 7.8 .. .. .. 8
142 Nigeria 207.1 317.2 1,370 1.0 12.9 21 3,528 10 5
143 Uganda 14.3 36.9 453 0.9 6.0 .. 259 .. 9
144 Senegal 13.3 21.9 1,087 0.2 2.2 .. .. 0 6
145 Haiti 7.2 11.1 729 -0.6 18.0 .. .. .. 6
146 Angola 84.9 104.8 4,714 1.4 47.0 .. .. 71 7
147 Djibouti 0.9 1.8 1,030 -2.1 .. .. 781 ..
148 Tanzania (United Republic of) 20.5 53.7 496 0.9 6.0 .. 2,600 1 8
149 Côte d'Ivoire 23.4 34.0 1,137 -1.1 3.0 25 639 .. 5
150 Zambia 14.3 17.1 1,134 -1.1 16.6 .. 1,273 0 7
151 Gambia 0.8 2.3 489 0.4 8.1 33 .. .. 152 Rwanda 4.5 10.0 458 1.2 8.5 57 .. ..
153 Malawi 4.3 11.9 288 1.9 12.7 .. 797 2 8
154 Sudan 55.9 89.0 1,353 1.9 8.2 .. 4,578 47 6
155 Afghanistan 10.6 32.0 366 1.9 12.9 6 .. .. 8
156 Guinea 3.8 10.4 386 0.7 .. .. .. ..
157 Ethiopia 25.6 70.1 317 1.3 11.1 3 .. 228 8
158 Sierra Leone 2.0 4.3 352 0.2 .. .. .. ..
159 Central African Republic 2.0 3.2 458 -0.8 3.0 .. .. ..
160 Mali 8.7 14.3 688 1.4 2.2 1 .. ..
161 Burkina Faso 7.9 17.7 522 2.0 2.9 34 622 0 9
162 Liberia 0.8 1.5 222 -2.0 .. .. .. ..
163 Chad 8.4 14.6 770 0.9 2.2 3 .. ..
164 Guinea-Bissau 0.4 0.8 273 1.7 2.3 .. .. ..
165 Mozambique 9.8 18.7 440 2.2 11.5 .. 3,116 7 8
166 Burundi 1.2 3.1 144 -0.3 8.5 48 .. ..
167 Niger 5.4 10.0 364 -1.3 2.4 1 .. ..
168 Congo (Democratic Republic of the) 11.7 20.2 182 -3.0 26.9 .. 4,007 .. 8
169 Zimbabwe .. .. .. -0.5 497.7 .. 2,583 7 6
OTHER COUNTRIES OR TERRITORIES
Antigua and Barbuda 1.2 1.8 14,048 3.7 .. .. .. ..
Bhutan 1.3 3.3 1,869 4.5 4.4 .. .. ..
Cuba .. .. .. .. .. .. 5,076 32
Dominica 0.4 0.6 4,883 3.4 2.1 .. .. ..
Eritrea 1.7 3.2 336 0.9 .. .. .. .. 6
Grenada 0.6 0.9 6,162 3.8 3.1 .. .. ..
Iraq .. .. .. .. .. .. 2,032 .. 1
Kiribati 0.1 0.2 1,414 0.1 .. .. .. ..
Korea (Democratic People's Rep. of) .. .. .. .. .. 21 .. .. 7
Lebanon 29.3 49.4 6,978 4.0 .. 67 .. ..
Marshall Islands 0.2 .. 2,655 -0.1 .. .. .. 0
Monaco .. .. .. .. .. 3,850 .. ..
Occupied Palestinian Territories .. .. .. .. 3.9 .. .. ..
Oman .. .. .. 3.4 2.3 16 .. ..
Palau 0.2 .. 8,911 -0.1 .. .. .. ..
Saint Kitts and Nevis 0.5 0.8 11,046 3.7 3.8 .. .. ..
Saint Lucia 1.0 1.7 5,854 3.0 2.5 .. .. ..
Saint Vincent and the Grenadines 0.6 1.0 5,480 3.9 3.2 .. .. ..
Samoa 0.5 0.8 2,926 1.4 6.1 .. .. 2
San Marino .. .. .. .. 2.3 .. .. ..
Seychelles 0.8 1.9 9,580 3.2 4.4 .. .. 27
Somalia .. .. .. -1.4 .. .. .. .. Vanuatu 0.6 0.9 2,521 1.6 2.4 .. .. ..
Developed
OECD 41,979.1 37,872.1 40,976 2.4 .. 3,838 516,479 92,753
Non-OECD .. .. .. 2.2 .. 6,060 .. ..
Developing
Arab States 1,357.1 1,951.6 4,774 -1.1 .. .. .. .. 1
East Asia and the Pacific 5,625.7 10,369.7 3,032 1.7 .. .. .. ..
Europe and Central Asia 3,414.5 4,852.7 8,361 0.1 .. .. 176,175 ..
Latin America and the Caribbean 4,202.9 5,963.9 7,567 2.0 .. .. .. ..
South Asia 1,469.6 4,151.8 954 3.8 .. .. .. .. 3
Sub-Saharan Africa 928.5 1,595.1 1,233 2.7 .. .. .. ..
Very high human development 42,652.4 38,697.1 40,748 2.3 .. 6,048 518,300 .. High human development 8,552.4 11,832.1 8,937 1.1 .. 1,332 289,531 ..
Medium human development 7,635.8 15,560.3 2,200 2.7 .. .. .. 17,542
Low human development 771.2 1,425.9 781 -0.4 .. .. .. ..
Least developed countries 503.2 1,000.8 664 2.0 .. .. .. ..
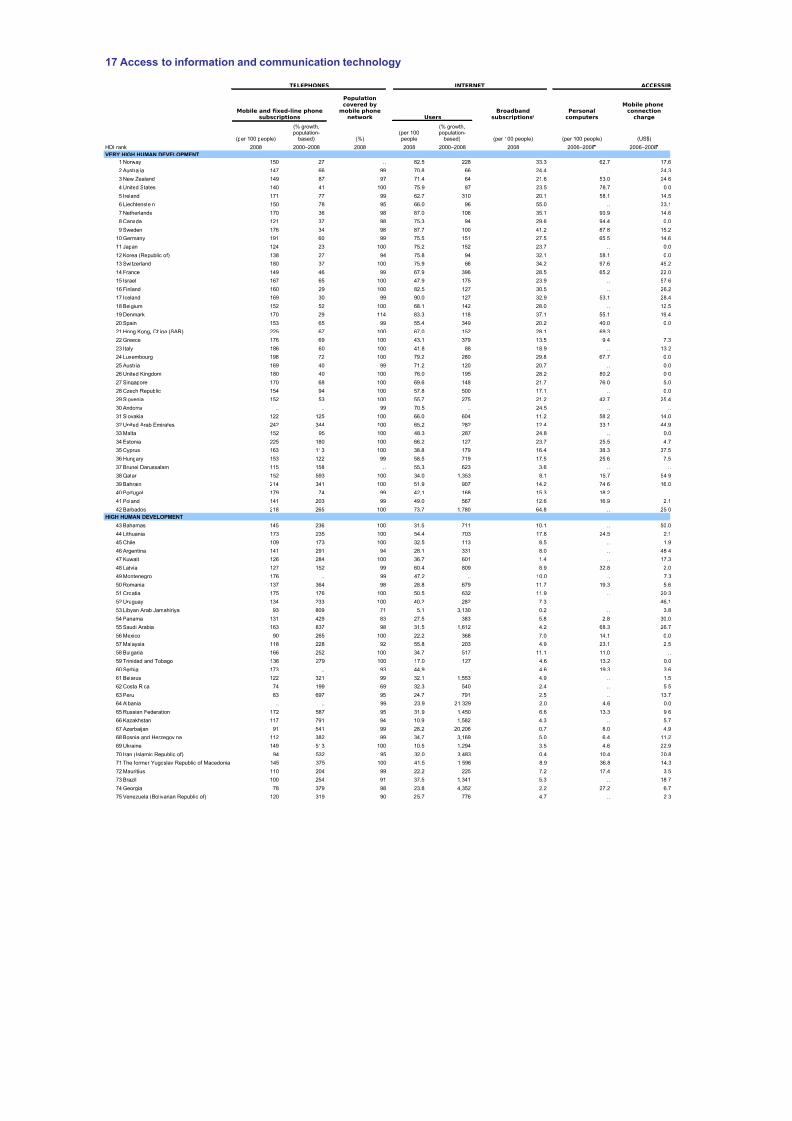
8/7/2019 Tabela IDH 2010 inglês
http://slidepdf.com/reader/full/tabela-idh-2010-ingles 94/102
.. ..
.. ..
.. ..
.. ..
.. ..
88 95
.. ..
.. ..
.. ..
.. ..
.. ..
.. ..
90 70
99 ..
.. ..
.. ..
.. ..
.. ..
.. 8599 ..
.. ..
.. ..
.. ..
.. ..
.. ..
65 50
90 ..
.. ..
.. ..
.. ..
61 19
.. ..70 ..
.. ..
.. ..
.. ..
.. ..
80 40
.. ..
60 80
.. ..
.. ..
80 20
.. ..
.. ..
100 75100 ..
.. ..
100 ..
.. ..
.. ..
.. ..
.. ..
.. ..
.. ..
.. ..
.. ..
.. ..
.. ..
.. ..
.. ..
100 ..
75 90
.. ..
.. ..
100 20
.. 98
.. ..
.. ..
.. ..
.. ..
.. ..
.. ..
.. ..
.. ..
.. ..
.. ..
100 100
.. ..
.. ..
98 ..
95 100
.. ..
100 100
.. ..
.. ..
.. ..
.. ..
.. ..
.. ..
.. ..
.. ..
.. ..
.. ..
.. ..
.. ..
.. ..
.. ..
.. ..
.. ..
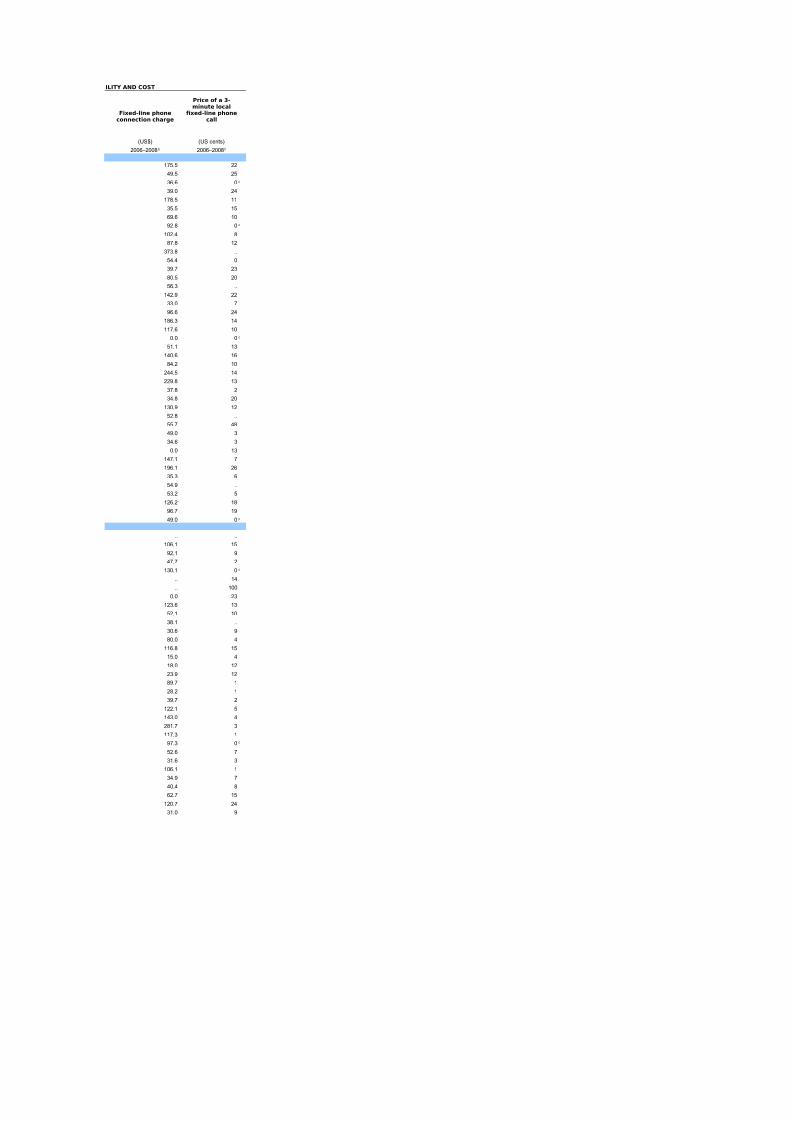
8/7/2019 Tabela IDH 2010 inglês
http://slidepdf.com/reader/full/tabela-idh-2010-ingles 95/102
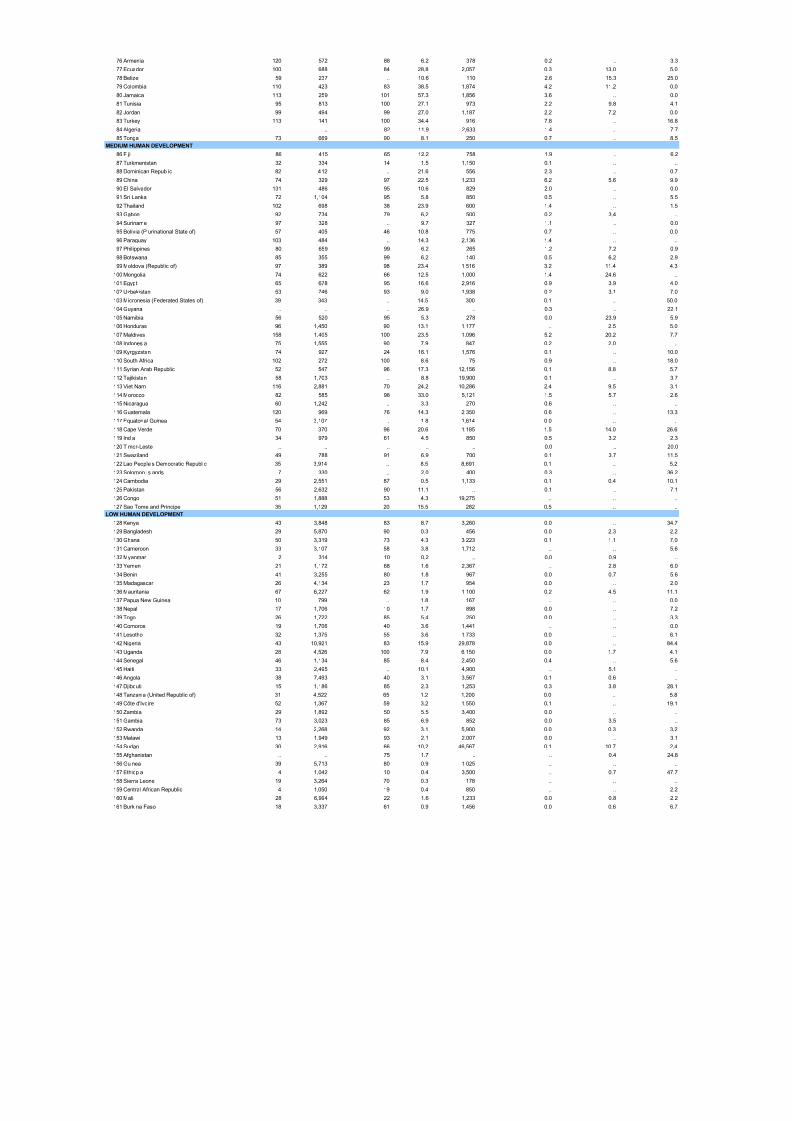
8/7/2019 Tabela IDH 2010 inglês
http://slidepdf.com/reader/full/tabela-idh-2010-ingles 96/102
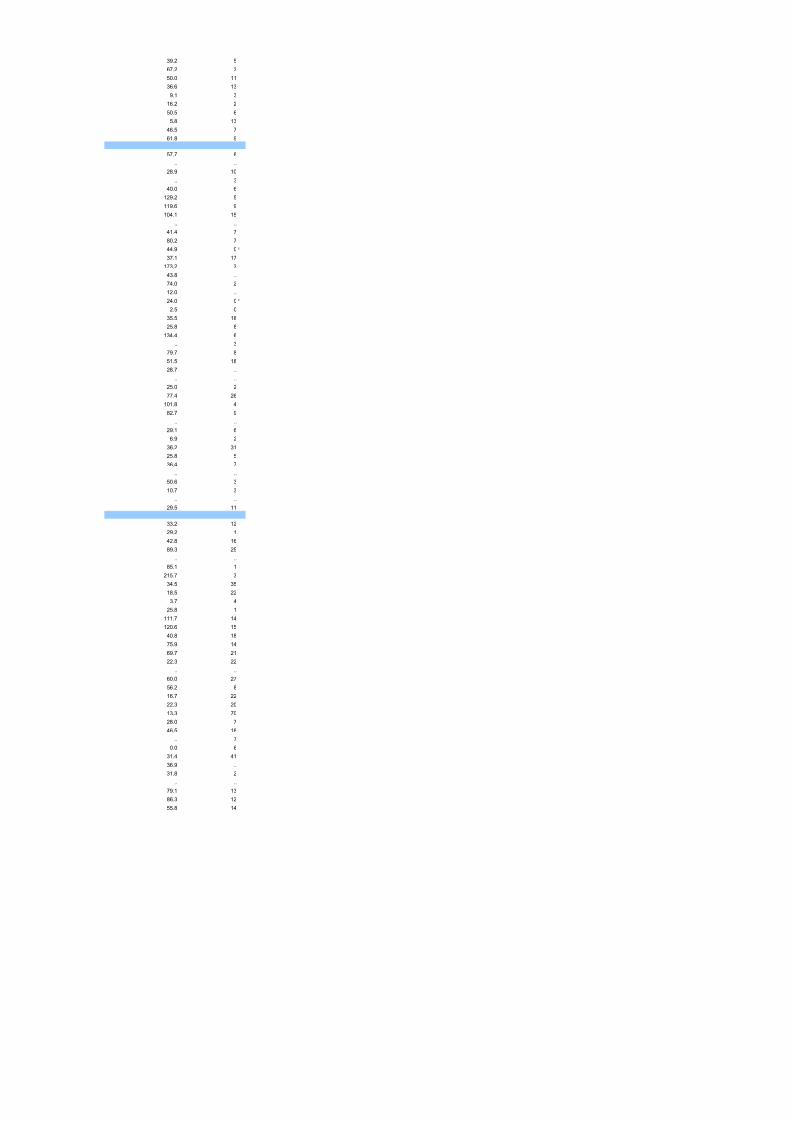
8/7/2019 Tabela IDH 2010 inglês
http://slidepdf.com/reader/full/tabela-idh-2010-ingles 97/102
17 Access to information and communication technology
TELEPHONES INTERNET ACCESSIB
Users
(per 100 people) (%) (per 100 people) (per 100 people) (US$)
HDI rank 2008 2000–2008 2008 2008 2000–2008 2008
VERY HIGH HUMAN DEVELOPMENT
1 Norway 150 27 .. 82.5 228 33.3 62.7 17.6
2 Australia 147 66 99 70.8 66 24.4 .. 24.3
3 New Zealand 149 87 97 71.4 64 21.6 53.0 24.6
4 United States 140 41 100 75.9 87 23.5 78.7 0.0
5 Ireland 171 77 99 62.7 310 20.1 58.1 14.5
6 Liechtenstein 150 78 95 66.0 96 55.0 .. 33.17 Netherlands 170 36 98 87.0 106 35.1 90.9 14.6
8 Canada 121 37 98 75.3 94 29.6 94.4 0.0
9 Sweden 176 34 98 87.7 100 41.2 87.8 15.2
10 Germany 191 60 99 75.5 151 27.5 65.5 14.6
11 Japan 124 23 100 75.2 152 23.7 .. 0.0
12 Korea (Republic of) 138 27 94 75.8 94 32.1 58.1 0.0
13 Switzerland 180 37 100 75.9 66 34.2 97.6 45.2
14 France 149 46 99 67.9 396 28.5 65.2 22.0
15 Israel 167 65 100 47.9 175 23.9 .. 57.6
16 Finland 160 29 100 82.5 127 30.5 .. 26.2
17 Iceland 169 30 99 90.0 127 32.9 53.1 28.4
18 Belgium 152 52 100 68.1 142 28.0 .. 12.5
19 Denmark 170 29 114 83.3 118 37.1 55.1 19.4
20 Spain 153 65 99 55.4 349 20.2 40.0 0.0
21 Hong Kong, China (SAR) 225 67 100 67.0 152 28.1 69.3 ..
22 Greece 176 69 100 43.1 379 13.5 9.4 7.3
23 Italy 186 60 100 41.8 88 18.9 .. 13.2
24 Luxembourg 198 72 100 79.2 280 29.8 67.7 0.0
25 Austria 169 40 99 71.2 120 20.7 .. 0.0
26 United Kingdom 180 40 100 76.0 195 28.2 80.2 0.0
27 Singapore 170 68 100 69.6 148 21.7 76.0 5.0
28 Czech Republic 154 94 100 57.8 500 17.1 .. 0.0
29 Slovenia 152 53 100 55.7 275 21.2 42.7 25.4
30 Andorra .. .. 99 70.5 .. 24.5 .. ..
31 Slovakia 122 125 100 66.0 604 11.2 58.2 14.0
32 United Arab Emirates 242 344 100 65.2 282 12.4 33.1 44.9
33 Malta 152 95 100 48.3 287 24.8 .. 0.0
34 Estonia 225 180 100 66.2 127 23.7 25.5 4.7
35 Cyprus 163 113 100 38.8 179 16.4 38.3 37.5
36 Hungary 153 122 99 58.5 719 17.5 25.6 7.5
37 Brunei Darussalam 115 158 .. 55.3 623 3.6 .. ..
38 Qatar 152 593 100 34.0 1,353 8.1 15.7 54.9
39 Bahrain 214 341 100 51.9 907 14.2 74.6 16.0
40 Portugal 179 74 99 42.1 168 15.3 18.2 ..
41 Poland 141 203 99 49.0 567 12.6 16.9 2.1
42 Barbados 218 265 100 73.7 1,780 64.8 .. 25.0
HIGH HUMAN DEVELOPMENT43 Bahamas 145 236 100 31.5 711 10.1 .. 50.0
44 Lithuania 173 235 100 54.4 703 17.8 24.5 2.1
45 Chile 109 173 100 32.5 113 8.5 .. 1.9
46 Argentina 141 291 94 28.1 331 8.0 .. 48.4
47 Kuwait 126 284 100 36.7 601 1.4 .. 17.3
48 Latvia 127 152 99 60.4 809 8.9 32.8 2.0
49 Montenegro 176 .. 99 47.2 .. 10.0 .. 7.3
50 Romania 137 364 98 28.8 679 11.7 19.3 5.6
51 Croatia 175 176 100 50.5 632 11.9 .. 20.3
52 Uruguay 134 233 100 40.2 282 7.3 .. 46.1
53 Libyan Arab Jamahiriya 93 809 71 5.1 3,130 0.2 .. 3.8
54 Panama 131 429 83 27.5 383 5.8 2.8 30.0
55 Saudi Arabia 163 837 98 31.5 1,612 4.2 68.3 26.7
56 Mexico 90 265 100 22.2 368 7.0 14.1 0.0
57 Malaysia 118 228 92 55.8 203 4.9 23.1 2.5
58 Bulgaria 166 252 100 34.7 517 11.1 11.0 ..
59 Trinidad and Tobago 136 279 100 17.0 127 4.6 13.2 0.0
60 Serbia 173 .. 93 44.9 .. 4.6 19.3 3.6
61 Belarus 122 321 99 32.1 1,553 4.9 .. 1.5
62 Costa Rica 74 199 69 32.3 540 2.4 .. 5.5
63 Peru 83 697 95 24.7 791 2.5 .. 13.7
64 Albania .. .. 99 23.9 21,329 2.0 4.6 0.0
65 Russian Federation 172 587 95 31.9 1,450 6.6 13.3 9.6
66 Kazakhstan 117 791 94 10.9 1,582 4.3 .. 5.7
67 Azerbaijan 91 541 99 28.2 20,206 0.7 8.0 4.9
68 Bosnia and Herzegovina 112 382 99 34.7 3,169 5.0 6.4 11.2
69 Ukraine 149 513 100 10.5 1,294 3.5 4.6 22.9
70 Iran (Islamic Republic of) 94 532 95 32.0 3,483 0.4 10.4 30.8
71 The former Yugoslav Republic of Macedonia 145 375 100 41.5 1,596 8.9 36.8 14.3
72 Mauritius 110 204 99 22.2 225 7.2 17.4 3.5
73 Brazil 100 254 91 37.5 1,341 5.3 .. 18.7
74 Georgia 78 379 98 23.8 4,352 2.2 27.2 6.7
75 Venezuela (Bolivarian Republic of) 120 319 90 25.7 776 4.7 .. 2.3
Mobile and fixed-line phonesubscriptions
Population
covered bymobile phone
network Broadband
subscriptionsa
Personalcomputers
Mobile phoneconnection
charge
(% growth,population-
based)(per 100people
(% growth,population-
based)
2006–2008b 2006–2008b
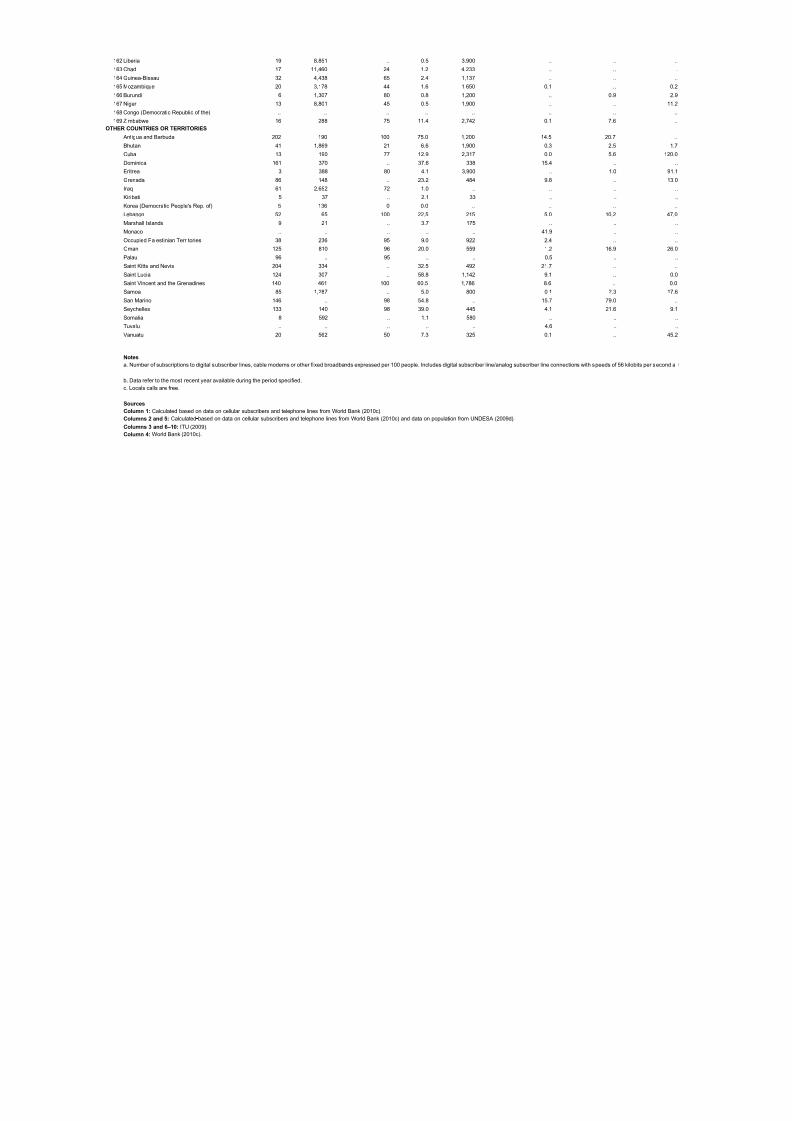
8/7/2019 Tabela IDH 2010 inglês
http://slidepdf.com/reader/full/tabela-idh-2010-ingles 98/102
ILITY AND COST
(US$) (US cents)
175.5 22
49.5 25
36.6 0
39.0 24
178.5 11
35.5 15
69.6 10
92.8 0
102.4 8
87.8 12
373.8 ..
54.4 0
39.7 23
80.5 20
56.3 ..
142.9 22
33.0 7
96.6 24
186.3 14
117.6 10
0.0 0
51.1 13
140.6 16
84.2 10
244.5 14
229.8 13
37.8 2
34.8 20
130.9 12
52.8 ..
55.7 48
49.0 3
34.6 3
0.0 13
147.1 7
196.1 26
35.3 6
54.9 ..
53.2 5
126.2 18
96.7 19
49.0 0
.. ..
106.1 15
92.1 9
47.7 2
130.1 0
.. 14
.. 100
0.0 23
123.6 13
52.1 10
38.1 ..30.6 9
80.0 4
116.8 15
15.0 4
18.0 12
23.9 12
89.7 1
28.2 1
39.7 2
122.1 5
143.0 4
281.7 3117.3 1
97.3 0
52.6 7
31.6 3
106.1 1
34.9 7
40.4 8
62.7 15
120.7 24
31.0 9
Fixed-line phoneconnection charge
Price of a 3-minute local
fixed-line phonecall
2006–2008b 2006–2008b
c
c
c
c
c
c
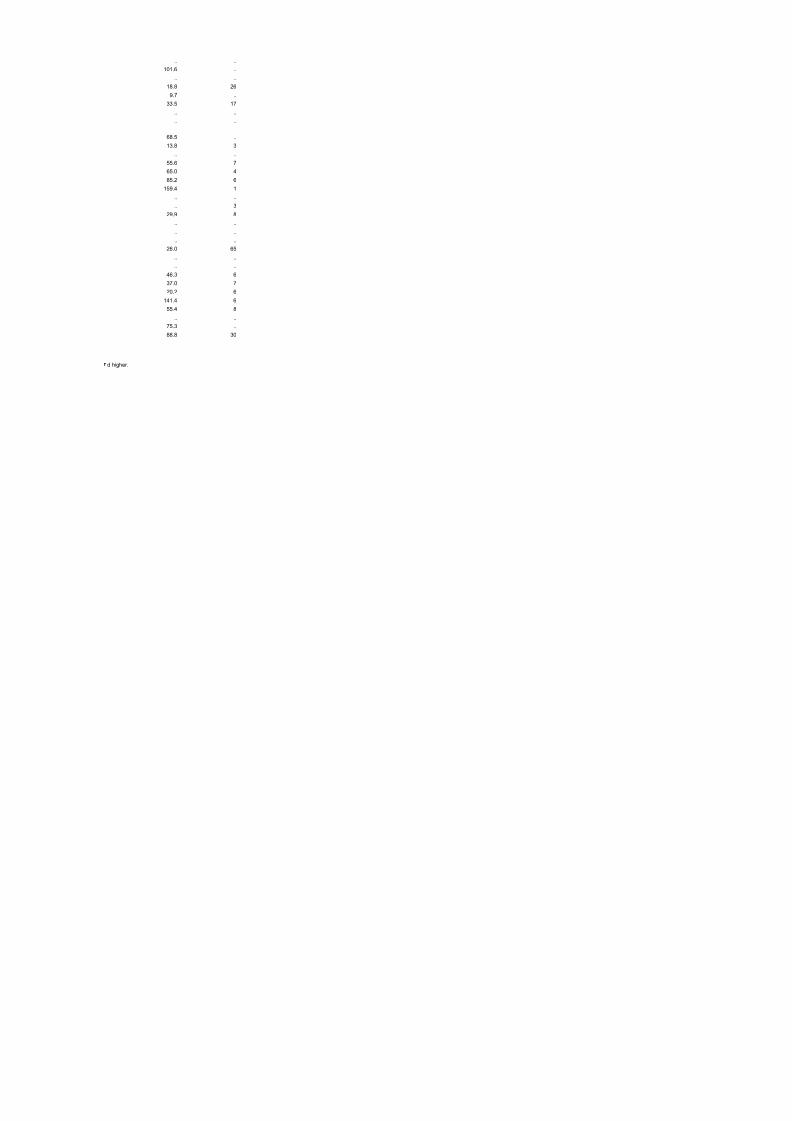
8/7/2019 Tabela IDH 2010 inglês
http://slidepdf.com/reader/full/tabela-idh-2010-ingles 99/102
76 Armenia 120 572 88 6.2 378 0.2 .. 3.3
77 Ecuador 100 688 84 28.8 2,057 0.3 13.0 5.0
78 Belize 59 237 .. 10.6 110 2.6 15.3 25.0
79 Colombia 110 423 83 38.5 1,874 4.2 11.2 0.0
80 Jamaica 113 259 101 57.3 1,856 3.6 .. 0.0
81 Tunisia 95 813 100 27.1 973 2.2 9.8 4.182 Jordan 99 494 99 27.0 1,187 2.2 7.2 0.0
83 Turkey 113 141 100 34.4 916 7.8 .. 16.8
84 Algeria .. .. 82 11.9 2,633 1.4 .. 7.7
85 Tonga 73 669 90 8.1 250 0.7 .. 8.5
MEDIUM HUMAN DEVELOPMENT
86 Fiji 86 415 65 12.2 758 1.9 .. 6.2
87 Turkmenistan 32 334 14 1.5 1,150 0.1 .. ..
88 Dominican Republic 82 412 .. 21.6 556 2.3 .. 0.7
89 China 74 329 97 22.5 1,233 6.2 5.6 9.9
90 El Salvador 131 486 95 10.6 829 2.0 .. 0.0
91 Sri Lanka 72 1,104 95 5.8 850 0.5 .. 5.5
92 Thailand 102 698 38 23.9 600 1.4 .. 1.593 Gabon 92 734 79 6.2 500 0.2 3.4 ..
94 Suriname 97 328 .. 9.7 327 1.1 .. 0.0
95 Bolivia (Plurinational State of) 57 405 46 10.8 775 0.7 .. 0.0
96 Paraguay 103 484 .. 14.3 2,136 1.4 .. ..
97 Philippines 80 659 99 6.2 265 1.2 7.2 0.9
98 Botswana 85 355 99 6.2 140 0.5 6.2 2.9
99 Moldova (Republic of) 97 389 98 23.4 1,516 3.2 11.4 4.3
100 Mongolia 74 622 66 12.5 1,000 1.4 24.6 ..
101 Egypt 65 678 95 16.6 2,916 0.9 3.9 4.0
102 Uzbekistan 53 746 93 9.0 1,938 0.2 3.1 7.0
103 Micronesia (Federated States of) 39 343 .. 14.5 300 0.1 .. 50.0
104 Guyana .. .. .. 26.9 .. 0.3 .. 22.1105 Namibia 56 520 95 5.3 278 0.0 23.9 5.9
106 Honduras 96 1,450 90 13.1 1,177 .. 2.5 5.0
107 Maldives 158 1,405 100 23.5 1,096 5.2 20.2 7.7
108 Indonesia 75 1,555 90 7.9 847 0.2 2.0 ..
109 Kyrgyzstan 74 927 24 16.1 1,576 0.1 .. 10.0
110 South Africa 102 272 100 8.6 75 0.9 .. 18.0
111 Syrian Arab Republic 52 547 96 17.3 12,156 0.1 8.8 5.7
112 Tajikistan 58 1,703 .. 8.8 19,900 0.1 .. 3.7
113 Viet Nam 116 2,881 70 24.2 10,286 2.4 9.5 3.1
114 Morocco 82 585 98 33.0 5,121 1.5 5.7 2.6
115 Nicaragua 60 1,242 .. 3.3 270 0.6 .. ..
116 Guatemala 120 969 76 14.3 2,350 0.6 .. 13.3117 Equatorial Guinea 54 3,107 .. 1.8 1,614 0.0 .. ..
118 Cape Verde 70 370 96 20.6 1,185 1.5 14.0 26.6
119 India 34 979 61 4.5 850 0.5 3.2 2.3
120 Timor-Leste .. .. .. .. .. 0.0 .. 20.0
121 Swaziland 49 788 91 6.9 700 0.1 3.7 11.5
122 Lao People's Democratic Republic 35 3,914 .. 8.5 8,691 0.1 .. 5.2
123 Solomon Islands 7 330 .. 2.0 400 0.3 .. 36.2
124 Cambodia 29 2,551 87 0.5 1,133 0.1 0.4 10.1
125 Pakistan 56 2,632 90 11.1 .. 0.1 .. 7.1
126 Congo 51 1,888 53 4.3 19,275 .. .. ..
127 Sao Tome and Principe 35 1,129 20 15.5 282 0.5 .. ..
LOW HUMAN DEVELOPMENT
128 Kenya 43 3,848 83 8.7 3,260 0.0 .. 34.7
129 Bangladesh 29 5,870 90 0.3 456 0.0 2.3 2.2
130 Ghana 50 3,319 73 4.3 3,223 0.1 1.1 7.0
131 Cameroon 33 3,107 58 3.8 1,712 .. .. 5.6
132 Myanmar 2 314 10 0.2 .. 0.0 0.9 ..
133 Yemen 21 1,172 68 1.6 2,367 .. 2.8 6.0
134 Benin 41 3,255 80 1.8 967 0.0 0.7 5.6
135 Madagascar 26 4,134 23 1.7 954 0.0 .. 2.0
136 Mauritania 67 6,227 62 1.9 1,100 0.2 4.5 11.1
137 Papua New Guinea 10 799 .. 1.8 167 .. .. 0.0
138 Nepal 17 1,706 10 1.7 898 0.0 .. 7.2
139 Togo 26 1,722 85 5.4 250 0.0 .. 3.3
140 Comoros 19 1,706 40 3.6 1,441 .. .. 0.0
141 Lesotho 32 1,375 55 3.6 1,733 0.0 .. 6.1
142 Nigeria 43 10,921 83 15.9 29,878 0.0 .. 84.4
143 Uganda 28 4,526 100 7.9 6,150 0.0 1.7 4.1
144 Senegal 46 1,134 85 8.4 2,450 0.4 .. 5.6
145 Haiti 33 2,495 .. 10.1 4,900 .. 5.1 ..
146 Angola 38 7,493 40 3.1 3,567 0.1 0.6 ..
147 Djibouti 15 1,186 85 2.3 1,253 0.3 3.8 28.1
148 Tanzania (United Republic of) 31 4,522 65 1.2 1,200 0.0 .. 5.8
149 Côte d'Ivoire 52 1,367 59 3.2 1,550 0.1 .. 19.1
150 Zambia 29 1,892 50 5.5 3,400 0.0 .. ..
151 Gambia 73 3,023 85 6.9 852 0.0 3.5 ..
152 Rwanda 14 2,268 92 3.1 5,900 0.0 0.3 3.2
153 Malawi 13 1,949 93 2.1 2,007 0.0 .. 3.1
154 Sudan 30 2,916 66 10.2 46,567 0.1 10.7 2.4
155 Afghanistan .. .. 75 1.7 .. .. 0.4 24.8
156 Guinea 39 5,713 80 0.9 1,025 .. .. ..
157 Ethiopia 4 1,042 10 0.4 3,500 .. 0.7 47.7
158 Sierra Leone 19 3,264 70 0.3 178 .. .. ..
159 Central African Republic 4 1,050 19 0.4 850 .. .. 2.2
160 Mali 28 6,994 22 1.6 1,233 0.0 0.8 2.2
161 Burkina Faso 18 3,337 61 0.9 1,456 0.0 0.6 6.7

8/7/2019 Tabela IDH 2010 inglês
http://slidepdf.com/reader/full/tabela-idh-2010-ingles 100/102
39.2 5
67.2 3
50.0 11
36.6 13
9.1 3
16.2 250.5 6
5.8 13
46.5 7
61.8 9
57.7 8
.. ..
28.9 10
.. 3
40.0 6
129.2 5
119.6 9104.1 15
.. ..
41.4 7
80.2 7
44.9 0
37.1 17
173.2 3
43.8 ..
74.0 2
12.0 ..
24.0 0
2.5 035.5 18
25.8 8
134.4 6
.. 3
79.7 8
51.5 18
28.7 ..
.. ..
25.0 2
77.4 26
101.8 4
82.7 9.. ..
29.1 6
6.9 2
36.2 31
25.8 5
36.4 7
.. ..
50.6 3
10.7 3
.. ..
29.5 11
33.2 12
29.2 1
42.8 16
89.3 25
.. ..
85.1 1
215.7 3
34.5 35
18.5 22
3.7 4
25.8 1
111.7 14
120.6 15
40.8 18
75.9 14
69.7 21
22.3 22
.. ..
60.0 27
56.2 8
16.7 22
22.3 20
13.3 70
28.0 7
46.5 18
.. 7
0.0 6
31.4 41
36.9 ..
31.8 2
.. ..
79.1 13
86.3 12
55.8 14
c
c

8/7/2019 Tabela IDH 2010 inglês
http://slidepdf.com/reader/full/tabela-idh-2010-ingles 101/102
162 Liberia 19 8,851 .. 0.5 3,900 .. .. ..
163 Chad 17 11,460 24 1.2 4,233 .. .. ..
164 Guinea-Bissau 32 4,438 65 2.4 1,137 .. .. ..
165 Mozambique 20 3,178 44 1.6 1,650 0.1 .. 0.2
166 Burundi 6 1,307 80 0.8 1,200 .. 0.9 2.9
167 Niger 13 8,801 45 0.5 1,900 .. .. 11.2168 Congo (Democratic Republic of the) .. .. .. .. .. .. .. ..
169 Zimbabwe 16 288 75 11.4 2,742 0.1 7.6 ..
OTHER COUNTRIES OR TERRITORIES
Antigua and Barbuda 202 190 100 75.0 1,200 14.5 20.7 ..
Bhutan 41 1,869 21 6.6 1,900 0.3 2.5 1.7
Cuba 13 190 77 12.9 2,317 0.0 5.6 120.0
Dominica 161 370 .. 37.6 338 15.4 .. ..
Eritrea 3 388 80 4.1 3,900 .. 1.0 91.1
Grenada 86 148 .. 23.2 484 9.8 .. 13.0
Iraq 61 2,652 72 1.0 .. .. .. ..
Kiribati 5 37 .. 2.1 33 .. .. ..
Korea (Democratic People's Rep. of) 5 136 0 0.0 .. .. .. ..Lebanon 52 65 100 22.5 215 5.0 10.2 47.0
Marshall Islands 9 21 .. 3.7 175 .. .. ..
Monaco .. .. .. .. .. 41.9 .. ..
Occupied Palestinian Territories 38 236 95 9.0 922 2.4 .. ..
Oman 125 810 96 20.0 559 1.2 16.9 26.0
Palau 96 .. 95 .. .. 0.5 .. ..
Saint Kitts and Nevis 204 334 .. 32.5 492 21.7 .. ..
Saint Lucia 124 307 .. 58.8 1,142 9.1 .. 0.0
Saint Vincent and the Grenadines 140 461 100 60.5 1,786 8.6 .. 0.0
Samoa 85 1,287 .. 5.0 800 0.1 2.3 17.6
San Marino 146 .. 98 54.8 .. 15.7 79.0 ..
Seychelles 133 140 98 39.0 445 4.1 21.6 9.1Somalia 8 592 .. 1.1 580 .. .. ..
Tuvalu .. .. .. .. .. 4.6 .. ..
Vanuatu 20 562 50 7.3 325 0.1 .. 45.2
Notes
a. Number of subscriptions to digital subscriber lines, cable modems or other fixed broadbands expressed per 100 people. Includes digital subscriber line/analog subscriber line connections with speeds of 56 kilobits per second a
b. Data refer to the most recent year available during the period specified.
c. Locals calls are free.
Sources
Column 1: Calculated based on data on cellular subscribers and telephone lines from World Bank (2010c).
Columns 2 and 5: Calculated based on data on cellular subscribers and telephone lines from World Bank (2010c) and data on population from UNDESA (2009d).
Columns 3 and 6–10: ITU (2009).
Column 4: World Bank (2010c).

8/7/2019 Tabela IDH 2010 inglês
http://slidepdf.com/reader/full/tabela-idh-2010-ingles 102/102
.. ..
101.6 ..
.. ..
18.8 26
9.7 ..
33.5 17.. ..
.. ..
68.5 ..
13.8 3
.. ..
55.6 7
65.0 4
85.2 6
159.4 1
.. ..
.. 329.9 8
.. ..
.. ..
.. ..
26.0 65
.. ..
.. ..
46.3 6
37.0 7
20.2 6
141.4 6
55.4 8.. ..
75.3 ..
88.8 30
d higher.


![Analise_Indicadores (Cidade de Sao Paulo IDH)[1]](https://static.fdocumentos.com/doc/165x107/5571f7cc49795991698c0580/analiseindicadores-cidade-de-sao-paulo-idh1.jpg)