
The Impact Of The Negative Interest Rate Policy On …i The Impact Of The Negative Interest Rate...
64
i The Impact Of The Negative Interest Rate Policy On Bank's Profitability Francisco André Coelho Ramos The Portuguese Experience Dissertação apresentada como requisito parcial para obtenção do grau de Mestre em Estatística e Gestão de Informação
Transcript of The Impact Of The Negative Interest Rate Policy On …i The Impact Of The Negative Interest Rate...
i
The Impact Of The Negative Interest Rate Policy
On Bank's Profitability
Francisco André Coelho Ramos
The Portuguese Experience
Dissertação apresentada como requisito parcial para
obtenção do grau de Mestre em Estatística e Gestão de
Informação

i
20
18
THE IMPACT OF THE NEGATIVE INTEREST RATE POLICY ON BANK'S PROFITABILITY: THE PORTUGUESE EXPERIENCE
Francisco André Coelho Ramos MGI

i
ii
NOVA Information Management School
Instituto Superior de Estatística e Gestão de Informação
Universidade Nova de Lisboa
THE IMPACT OF THE NEGATIVE INTEREST RATE POLICY ON BANK'S
PROFITABILITY: THE PORTUGUESE EXPERIENCE
por
Francisco Coelho Ramos
Dissertação apresentada como requisito parcial para a obtenção do grau de Mestre em Gestão de
Informação, Especialização em Gestão do Conhecimento e Business Intelligence
Orientador: Professor Doutor Jorge Miguel Ventura Bravo
Setembro 2018

iii
DEDICATÓRIA
Aos meus pais Helder Cardeira do Carmo Ramos e Ivone Soares Coelho Ramos pelo apoio
incondincional em toda esta jornada, que todos os dias me motivam e encorajam a perseguir os
meus objetivos. A todos os meus amigos pela hombridade, ajuda e suporte. À Mariana Figueira
Machado por estar sempre comigo, sobretudo nos momentos mais difíceis.
iv
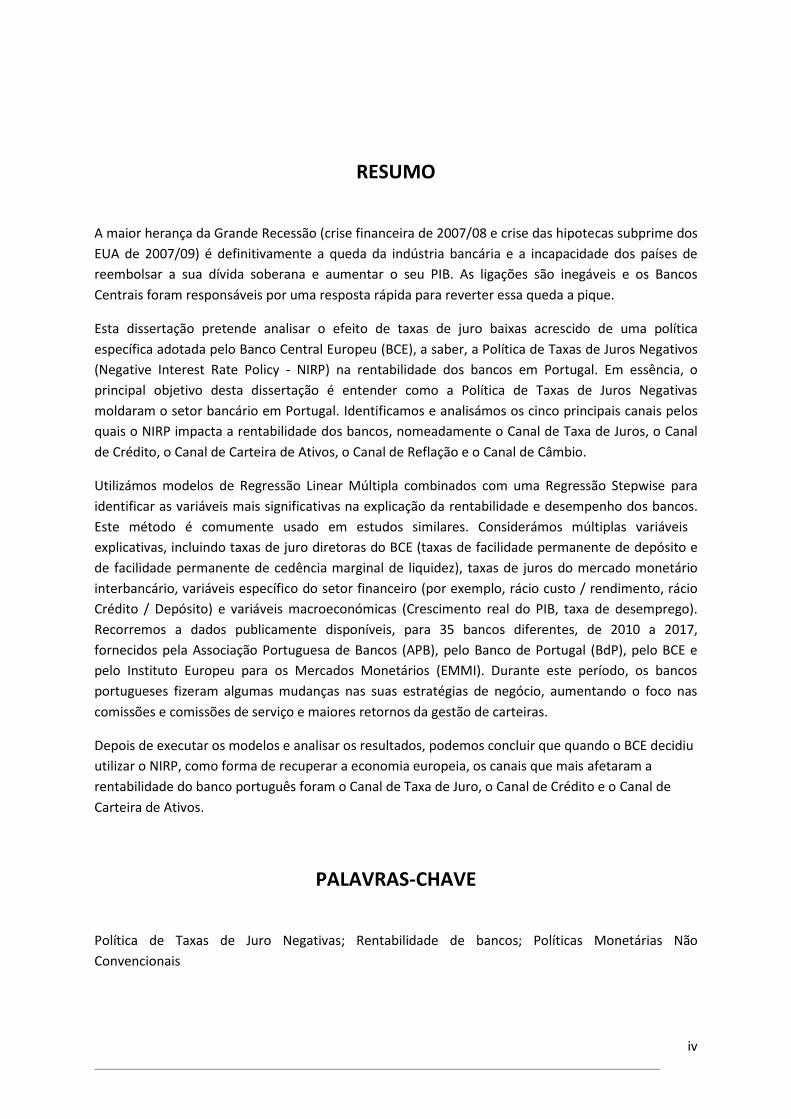
RESUMO
A maior herança da Grande Recessão (crise financeira de 2007/08 e crise das hipotecas subprime dos
EUA de 2007/09) é definitivamente a queda da indústria bancária e a incapacidade dos países de
reembolsar a sua dívida soberana e aumentar o seu PIB. As ligações são inegáveis e os Bancos
Centrais foram responsáveis por uma resposta rápida para reverter essa queda a pique.
Esta dissertação pretende analisar o efeito de taxas de juro baixas acrescido de uma política
específica adotada pelo Banco Central Europeu (BCE), a saber, a Política de Taxas de Juros Negativos
(Negative Interest Rate Policy - NIRP) na rentabilidade dos bancos em Portugal. Em essência, o
principal objetivo desta dissertação é entender como a Política de Taxas de Juros Negativas
moldaram o setor bancário em Portugal. Identificamos e analisámos os cinco principais canais pelos
quais o NIRP impacta a rentabilidade dos bancos, nomeadamente o Canal de Taxa de Juros, o Canal
de Crédito, o Canal de Carteira de Ativos, o Canal de Reflação e o Canal de Câmbio.
Utilizámos modelos de Regressão Linear Múltipla combinados com uma Regressão Stepwise para
identificar as variáveis mais significativas na explicação da rentabilidade e desempenho dos bancos.
Este método é comumente usado em estudos similares. Considerámos múltiplas variáveis
explicativas, incluindo taxas de juro diretoras do BCE (taxas de facilidade permanente de depósito e
de facilidade permanente de cedência marginal de liquidez), taxas de juros do mercado monetário
interbancário, variáveis específico do setor financeiro (por exemplo, rácio custo / rendimento, rácio
Crédito / Depósito) e variáveis macroeconómicas (Crescimento real do PIB, taxa de desemprego).
Recorremos a dados publicamente disponíveis, para 35 bancos diferentes, de 2010 a 2017,
fornecidos pela Associação Portuguesa de Bancos (APB), pelo Banco de Portugal (BdP), pelo BCE e
pelo Instituto Europeu para os Mercados Monetários (EMMI). Durante este período, os bancos
portugueses fizeram algumas mudanças nas suas estratégias de negócio, aumentando o foco nas
comissões e comissões de serviço e maiores retornos da gestão de carteiras.
Depois de executar os modelos e analisar os resultados, podemos concluir que quando o BCE decidiu
utilizar o NIRP, como forma de recuperar a economia europeia, os canais que mais afetaram a
rentabilidade do banco português foram o Canal de Taxa de Juro, o Canal de Crédito e o Canal de
Carteira de Ativos.
PALAVRAS-CHAVE
Política de Taxas de Juro Negativas; Rentabilidade de bancos; Políticas Monetárias Não
Convencionais
v
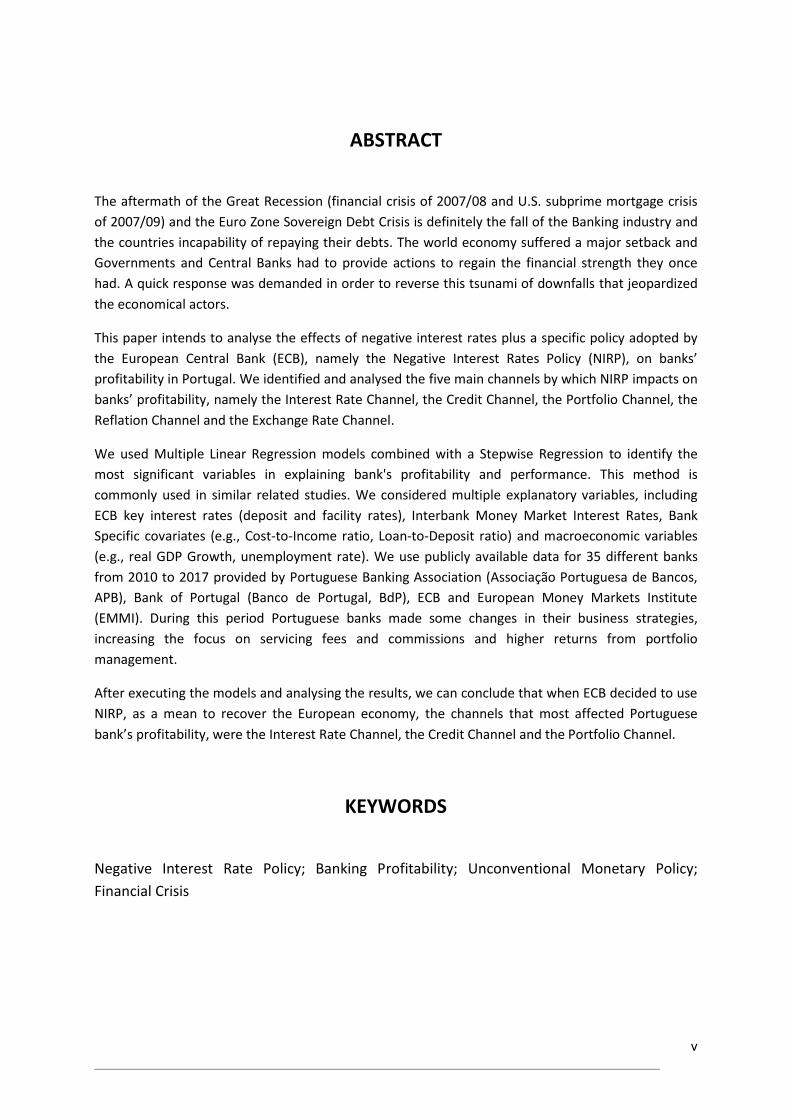
ABSTRACT
The aftermath of the Great Recession (financial crisis of 2007/08 and U.S. subprime mortgage crisis
of 2007/09) and the Euro Zone Sovereign Debt Crisis is definitely the fall of the Banking industry and
the countries incapability of repaying their debts. The world economy suffered a major setback and
Governments and Central Banks had to provide actions to regain the financial strength they once
had. A quick response was demanded in order to reverse this tsunami of downfalls that jeopardized
the economical actors.
This paper intends to analyse the effects of negative interest rates plus a specific policy adopted by
the European Central Bank (ECB), namely the Negative Interest Rates Policy (NIRP), on banks’
profitability in Portugal. We identified and analysed the five main channels by which NIRP impacts on
banks’ profitability, namely the Interest Rate Channel, the Credit Channel, the Portfolio Channel, the
Reflation Channel and the Exchange Rate Channel.
We used Multiple Linear Regression models combined with a Stepwise Regression to identify the
most significant variables in explaining bank's profitability and performance. This method is
commonly used in similar related studies. We considered multiple explanatory variables, including
ECB key interest rates (deposit and facility rates), Interbank Money Market Interest Rates, Bank
Specific covariates (e.g., Cost-to-Income ratio, Loan-to-Deposit ratio) and macroeconomic variables
(e.g., real GDP Growth, unemployment rate). We use publicly available data for 35 different banks
from 2010 to 2017 provided by Portuguese Banking Association (Associação Portuguesa de Bancos,
APB), Bank of Portugal (Banco de Portugal, BdP), ECB and European Money Markets Institute
(EMMI). During this period Portuguese banks made some changes in their business strategies,
increasing the focus on servicing fees and commissions and higher returns from portfolio
management.
After executing the models and analysing the results, we can conclude that when ECB decided to use
NIRP, as a mean to recover the European economy, the channels that most affected Portuguese
bank’s profitability, were the Interest Rate Channel, the Credit Channel and the Portfolio Channel.
KEYWORDS
Negative Interest Rate Policy; Banking Profitability; Unconventional Monetary Policy;
Financial Crisis
vi
INDEX
1. Introduction .................................................................................................................. 1
2. Literature Review ......................................................................................................... 7
2.1. Financial Crisis of 2007/08 and the Sovereign Debt Crisis .................................... 7
2.2. Negative Interest Rate Policy and How it Affects the Financial System ............. 10
2.3. Portuguese Financial System and Institutional Context ..................................... 18
3. Past Studies................................................................................................................. 23
4. Methodology .............................................................................................................. 27
4.1. Model ................................................................................................................... 27
4.2. Variables .............................................................................................................. 28
4.2.1. Dependent Variables .................................................................................... 28
4.2.2. Independent Variables ................................................................................. 29
4.3. Data ..................................................................................................................... 31
4.4. Method ................................................................................................................ 34
5. Results and Discussion ................................................................................................ 36
5.1. Empirical Results.................................................................................................. 36
6. Conclusions ................................................................................................................. 41
7. References .................................................................................................................. 44
7.1. Other References ................................................................................................. 48
8. Annexes ...................................................................................................................... 49
vii
TABLE OF TABLES
Table 1 – Characteristics of the Data (Number of Banks per Semester analysed), author’s
creation ............................................................................................................................ 32
Table 2 - Summary Statistics of the Variables, author’s creation ............................................ 32
Table 3 – Expected effects in the dependent variables, caused by the independent variables,
author’s creation .............................................................................................................. 35
Table 4 – Regression Model results of Return on Assets, author’s creation ........................... 36
Table 5 - Regression Model results of Return on Equity, author’s creation ............................ 52
Table 6 – Regression Model Results of Interest Income .......................................................... 52
Table 7 – Regression Model results of Non-Interest Income .................................................. 53
Table 8 – Regression Model results of Net Interest Margin .................................................... 53
viii
TABLE OF FIGURES
Figure 1 – The effects of decreasing interest rates on banks, (Source: Gibas, Juks, &
Söderberg 2015) ............................................................................................................... 14
Figure 2 – Impacts of low interest rates on banks, (ESBR, 2016)............................................. 15
Figure 3 – Banks’ reactions to decreasing profitability, (Gibas et al., 2015) ........................... 16
Figure 4 – Factors involved in Low Interest Rates Environment, (ESBR, 2016) ....................... 17
Figure 5 – Correlation Matrix, authors creation ..................................................................... 33
Figure 6 – GDP Growth in Portugal. Data from Banco de Portugal – BPStat. .......................... 49
Figure 7 – EURIBOR interest rates. Data from EMMI website (“EMMI,” 2017) ...................... 49
Figure 8 – Unemployment rate in Portugal. Data from Banco de Portugal - BPStat ............... 50
Figure 9 – Household Savings as percentage of Disposable Income. Data from Banco de
Portugal - BPStat .............................................................................................................. 50
Figure 10 – Inflation Rate in Portugal. Data from Banco de Portugal - BPStat ........................ 51
Figure 11 – ECB Key Reference Rates. Data from European Money Market Institute ............ 51

ix
LIST OF ABBREVIATIONS AND ACRONYMS
NIRP Negative Interest Rate Policy
ECB European Central Bank
EMI European Monetary Institute
BdP Banco de Portugal
QE Quantitative Easing
APP Asset Purchasing Program
EMU European Monetary Union
GDP Gross Domestic Product
IMM Interbank Money Market
CMVM Comissão do Mercado de Valores Mobiliários
NPL Non-Performing Loan
CRR Capital Requirements Regulation
CRD Capital Requirements Directive
SSM Single Supervisory Mechanism
SRM Single Resolution Mechanism
BRRD Bank Recovery and Resolution Directive
EURIBOR Euro Interbank Offered Rate
1
1. INTRODUCTION
Interest rates have been relatively low across all major advanced economies for more than
two decades now. The decline in both nominal and real interest rates has been a persistent
trend since the 1990s and is noticeable in the long-term interest rates on government
bonds. A variety of structural factors have been put forward to explain this secular decline in
the rate of return on risk-free assets, an increase in the propensity to save, driven in
particular by demographic developments, namely an ageing population, a slowdown in the
rate of technological progress, shifts in the preferences of investors towards safe bonds and
away from riskier assets, a high demand for risk-free assets relative to their supply, the
integration of China into global financial markets (Bean et al., 2015).
This downward trend in long-run interest rates has immediate implications for monetary
policy. Traditionally, monetary policymakers use the concept of real equilibrium rate or the
“natural” rate of interest to define the interest rate that is consistent with stable inflation
and output at its potential level. Setting short-term interest rates above (below) this rate
puts downward (upward) pressure on economic activity and inflation. The real equilibrium
interest rate has declined in advanced economies over the past two decades and by some
estimates it is currently negative in the euro area.
Since the global financial crisis, inflation has been kept low worldwide and economic growth
relatively unresponsive. Central bankers are responding to this low inflation and output
below potential by conducting accommodative policies. Given the persistent decline of
inflation and inflation expectations and short-term monetary policy rates approaching zero
percent, this has made it more difficult for classical accommodative monetary policies to
reduce real interest rates to a level consistent with stable inflation and output at its
potential level (Jobst & Lin, 2016).
The combination of both cyclical factors and the longer-term decline in the equilibrium real
rate of interest required monetary policy rates to be set at record low levels in advanced
economies. As short-term policy rates approached zero, central banks carried out further
loosening by providing forward guidance about the expected future path of interest rates
and by lowering term premia through large-scale asset purchase programmes. The
additional yield bondholders require for holding long-dated bonds as opposed to short-
dated paper declined significantly in recent years, and so does the real cost of long-term
borrowing.
For many years, central bankers assumed that the monetary policy rate could not drop
below zero, because this would induce households and corporates to convert deposits and
other liquid assets into cash to escape nominal devaluation. With persistent low inflation
levels, not going below zero percent would have meant that real interest rates could not fall
further to continue to contribute to reduce high public and private debt burdens and
support aggregate demand via consumption and investment.
2
Post this, decisions had to be made and a steady grip was the only way to hold back the
recession and bring back the financial and economic strength that was diminished by the
contagion created by the recession. Most regulators started to act as a “close quarter’s
vigilant”, monitoring every financially related institution’s activity through tight regulations
and legislation (either national or induced by economic agglomerate like Europe), enforced
by every states’ or the National Central Bank.
In June 2014, following the route set up by the Danish National Bank in July 2012, the
European Central Bank (ECB) became the first major central bank to lower one of its key
policy rates to negative territory, in order to stabilize the inflation rate below, but close to,
2% over the medium term (ECB, 2003). The strategy was lowering its key interest rates,
specifically: marginal lending facility for overnight lending to banks, the main refinancing
operations that provide the bulk of liquidity to the banking system and the deposit facility
that banks use for overnight deposits with the Eurosystem (Delivorias, 2015). As of today,
the rate of interest on the ECB deposit facility is -0.4% while the rate on our main refinancing
operations is zero and the marginal lending facility is 0.25%.
At the same time, the ECB implemented “quantitative easing” (QE) in 2015 through an asset
purchasing program (APP), under which private sector securities and public sector securities
are purchased to address the risks of a too prolonged period of low inflation, covering a
broad range of investment grade securities such as the third covered bond purchase
programme (CBPP3), the asset-backed securities purchase programme (ABSPP), the public
sector purchase programme (PSPP) and the corporate sector purchase programme (CSPP)
(Fang & Mohnen, 2016).
The strategy followed by the ECB was nothing new. Other central banks such as the Sveriges
Riksbank (SR) and the Swiss National Bank (SNB) also cut their marginal monetary policy
rates to negative values during this period. The Central banks in Norway (September 2015),
Japan (February 2016), and Hungary (March 2016) opted to reduce only their deposit facility
rate for excess bank reserves while keeping the main lending and open market operations
policy rates above zero (Stocker et al., 2016). These policies, which artificially reduce interest
rates are commonly known as Negative Interest Rates Policies (NIRP), an unconventional and
perhaps controversial monetary policy “tool” enforced by central bank or governments that
sets the key interest rates (e.g. deposit rates, certificates, etc.) at negative values, meaning
that banks and other financial institutions have to pay to keep their excess reserves stored at
the central bank rather than receiving positive interest. This is intended to incentivize banks
and other financial institutions to lend money more freely (and less costly) giving businesses
and individuals more margin to invest, lend, and spend money rather than pay a fee to keep
it safe.
It is difficult to predict for how long this low interest rate scenario will endure, but the
current view of financial markets as expressed, for instance, through forward interest rates
3
and through the negative return on government bonds for a range of countries even at long
very maturities, is that it is expected to continue for some time.
The adoption of NIRP by some central banks (ECB, BoJ, SR), combining negative policy rates
and asset purchase programmes to provide adequate monetary stimulus, was justified on
the grounds that it is needed to counter persistent low inflation (which incentivizes money
hoarding instead of spending and investing), help reduce debt and boost economic growth
(encouraging demand, stabilization of prices and increase the employment rate). The NIRP
policy removes the non-negativity restriction on future expected short rates and, as a result,
the forward curve becomes flatter than it would be if short rates were expected to be
constrained by a zero lower bound. Additionally, it charges bank cash hoarding creating an
extra downward pressure on long-term rates via term premium compression and push to
portfolio shifts, charges on excess liquidity, shifts the risk-reward calculus of bank’s portfolio
allocation making loans more attractive. The level of interest rates is relevant to the extent
that it affects the slope of the yield curve, i.e., the intermediation margins and the pricing of
retail deposits (mark-down on market rates) and zero lower bound.
Critics say that negative rates counteract their purpose in that they impact on the behaviour
of economic agents, on the resilience of financial intermediaries, widespread volatility in
financial markets and, ultimately, impact on financial stability. The NIRP is said to squeeze
banks’ profitability, which could then lead to higher lending rates and lower credit supply. In
the euro area, where banks are already burdened with low profitability, significant NPLs
levels and increasing difficulty to cope with capital requirement, this policy is being
questioned. Challenges to financial stability could potentially materialize if banks were to
increase their exposure to lower quality counterparties in order to boost returns
(Dell’Ariccia, Laeven & Marquez, 2014).
The overall effect of low and negative interest rates on banks’ profitability is a combined
effect of different sources. Profitability can be affected as a result of falling lending rates and
funding costs, due to changes in lending volumes, credit losses, trading book capital gains
and commission income. Given the downward stickiness of deposit rates, if NIRP rates are
transmitted to lower lending rates and lower term premia, banks are expected to see their
interest earnings decline unless they either impose negative rates (or commensurate fees)
on deposits or swap wholesale funding at money market rates for deposits.
Low and negative rates create both a short-term and a long-term impact on a bank’s
profitability and capital. Since bank capital is critical for credit provision and for financial
stability, low bank capital will ultimately induce high leverage, high risk and less financial
stability. In the short-term, reduction in interest rates generate one-off capital gains on the
outstanding fixed-income portfolio of a bank. With falling interest rates, the fair value of
fixed-income securities on a bank’s balance sheet augments, leading to higher profits. A
decline in the level of interest rates can also improve net interest margins in the short run
since funds become cheaper and banks carry out maturity transformation by borrowing
4
short term and lending long term. Given that fixed-rate loans in force take some time to
reprice to lower rates, the initial impact of lower rates on net interest margins is expected to
be positive.
In the long term, ceteris paribus lower interest rates are expected to decrease the bank's net
interest income. If the decline in level of interest rates is accompanied by a flattening of the
yield curve (decline in the curvature), the margin between lending and borrowing rates
compresses, reducing also the net interest income. The flattening of the yield curve may be
an outcome from market expectations of a prolonged low short-term interest rate period
and/or result from a compression of the term premium if the central bank additionally
operates a large-scale asset purchase programme like in the euro zone. Even for a given
slope of the yield curve, a low level of interest rates can also compress net interest margins
for banks dependent on retail deposits since retail deposits tend to have low and sticky
interest rates, and banks are reluctant to charge negative rates on them and/or have legal
restrictions on the application of negative rates (e.g., in Portugal) causing a struggle in
maintaining net income with all these changes (Banco de Portugal, 2016a). The evidence is
the fact that interest spreads are lowering but the costs are not following the same pattern.
As market interest rates decline, the yield on bank assets is expected to drop, but this
funding cost remains the same to banks, resulting in a decline in net interest margins. The
decline in present and future net interest margin reduces the forward-looking measure of
bank capital, hence the risk-bearing capacity of the bank, and its supply of credit (Cœuré,
2014, 2016). At the aggregate level, the magnitude of the effect of the NIRP policy on bank
profitability is more difficult to ascertain, since it has to be analysed in the context of what
would happen in the absence of NIRP intervention. Existing floating-rate loans and
mortgages become more affordable as interest rates fall, reducing the likelihood of default
and non-performing loans. Moreover, the accommodative monetary policy creates a more
favourable macroeconomic environment, which is likely to improve the financial situation of
bank borrowers. These positive effects are present at all rate levels and are likely to
dominate when rates are moderately negative.
The effects of NIRP are expected to vary across banks and markets and according their
balance-sheet structure. For instance, the larger the share of floating-rate lending in the
stock of loans, the more rapidly the negative impact on interest margins will be. Contrarily,
banks with large fixed-income lending and holdings of bonds will benefit from spread
compression and are likely to better cope with decreases in interest margins. Banks that are
more reliant on wholesale market-based funding rather than retail funding and banks with
greater market power suffer less from this zero lower bound, and will be better able to
protect their interest margin. In the euro area, this translates into geographic differences
based on national banking structures, implying that the negative interest rate policy has
distributional consequences across banks located in different jurisdictions (Cœuré, 2016).
5
In this paper we will explore the impacts of NIRP on the profitability in the Portuguese
financial system, analysing the channels that will be affected and the possible reactions that
occurred and the one’s that might still happen.
The Portuguese Financial System is quite different from its European peers, as described
further in this paper, a different structure of assets, a historical background that modelled
the business strategy and tight regulation gives this study an interesting motivation. With
the DuPont analysis we will increase the granularity of the study, certifying that all
mentioned channels are explored and conclusions are extracted.
As per used in other studies, an approach with linear regression, containing one model per
dependent variables, pre-chosen according to their correlation analysis.
Data for this study was extracted from the Portuguese Bank Association (APB – Associação
Portuguesa de Bancos), which collects financial data from the banks’ balance sheets and
income statements. The main limitation is that the banks need to be part of APB in order for
the data to be available, but it we managed to gather a great sample with a good timeframe
granularity (13 semesters, since 2010 to the first semester of 2016) and with several banks
analysed (see table 1 of Annexes). As the policies we have analysed were put into force in
mid-2014, our data covers the following period and the conclusions will provide some
insights on how the banks reacted and adjusted to these new paradigms.
We have selected the DuPont analysis to deepen our search, going further in the banks’
profitability and how it changed. So, in addition to the classical Return on Equity (ROE),
Return on Assets (ROA) and Net Interest Margin (NIM) we have added Equity Multiplier
(EM), Asset Utilization (AU), Interest Income Assets (II), Non-Interest Income Assets (NII) and
Gains and Losses from Portfolio Management (G&L). All of these variables are explained
further in this paper (Section 4.2.1). Overall we expect that NIRP will have a negative impact
along the profitability variables we have chosen, we the exception of G&L, as financial assets
tend to increase value as interest rates go down.
As interest rates plummet, so does the interest margin that bank’s get from collecting
deposits and selling credits, so new ways of revenue must arise The expectation is to see an
increase of commissions and other charges of banking operations to mitigate the lower
profit margins (Jackson, 2015), with a higher focus on credit products, so a rise on non-
interest income generating assets is expected. As the margin loss cannot get a whole
coverage by increasing commissions, and aggravated by the fall of interest rates, assets held
by the bank will get a new focus. The rise in value is mostly justified by the Discount Factors
used to valuate assets, as interest rates go down, asset value goes up. Leveraged by a
management focus on the banks own portfolio, we assume that the shift from credit based
business to a more diversified offer of services (investments, retirement, etc.) is slowly
occurring.
6
Most studies focus on what drives banks profitability, the main enhancers and the factors
that diminish it. Usually, sticking to the basic profitability variables, they usually support
their conclusions in: ROE, ROA and NIM. Also, no study of the Portuguese Financial System
was made in this context: NIRP and low interest rates.
The remaining of the paper is organized as follows. In section 2 we analyse the relevant
literature on factors that led to NIRP (2007/08 Financial Crisis and Sovereign Debt Crisis),
details of NIRP (characterization and impacts on the Financial Sector) and a thorough
analysis of the Portuguese Financial system and Institutional Context (Regulation and
Legislation applied to banks). Section 3 describes the various studies that are similar to this
paper, regarding what affects banks’ profitability, impacts of NIRP and low interest rates and
other studies of the Portuguese Financial system. In Section 4 we outline the methodology
(the regression model we used and the reasons behind it), and in its subsections we describe
the data sample, the dependent and independent variables used in our analyses. Section 5
presents the discussion of the results obtained by the empirical analysis. Section 6 concludes
this paper and Section 7 we explain some limitations found during this study with some
recommendations for future studies.
7
2. LITERATURE REVIEW
2.1. FINANCIAL CRISIS OF 2007/08 AND THE SOVEREIGN DEBT CRISIS
In the early 2000’s, the economy was growing at a surprising rate all around the world, with
only few predicting what would be the worst crisis since the Great Depression. This healthy
economic environment was holding hands with the banking sector with all the indicators
showing great values, the TED (Treasury-Eurodollar spread), a common measure of credit
risk in the banking sector, was around 0.25% in 2007, suggesting that there was no fear of
default and that “counterparty” risk in this sector was extremely low (Bodie, Kane, &
Marcus, 2011).
Credit conceding was reaching high values, moved by regulatory changes that allowed banks
to lend more freely and also to take more risk (Kaminsky & Reinhart, 2000; Tornell &
Wertermann, 2002). Real estate prices were rising rapidly due to an increase in supply of
mortgage credit, and banks started to lend more relative to their assets and their capital
(Mendoza & Terrones, 2008; Bodie et al., 2011).
Also, there was a change in housing finance as Fannie Mae (FNMA, or Federal National
Mortgage Association) and Freddie Mac (FHLMC, or Federal Home Loan Mortgage
Corporation) began buying mortgage loans from originators and bundling them into large
pools for trading purposes like a financial asset, starting the now known process of
securitization, in this case called Mortgage-backed securities.
The ratio Loan-to-value, which evaluates the amount of the credit and the value of the asset
that the loan is used for, were rising due to this trend of private investor intervening directly
with mortgage credits and also allowed asking for loans on top of the first loan (also known
as piggyback loans).
This was the start of the derivatives market based on mortgages, in which private investors
would take the homeowners risk of default but, opposite to a government agency, they had
little to no incentive to perform due diligence on the loan as long as the loans could be sold
to investors, relying solemnly on credit scores instead of conventional underwritings.
These derivatives gained a lot of traction as securitization, restructuring and credit
enhancement provided the best ratings for junk grade loans. New risk-shifting tools were
born, like the CDO (Collateralized debt obligations) that concentrated the default risk of a
pool of loans in one class of investors while providing protection to the other ones. By
prioritizing the claims on loan payments through a division of the pool into several tranches,
they were allowed to concede different ratings to these tranches. But this protection was
soon discovered to be wrong. In one hand ratings agencies were backing their scores in
historical data differentiated by geographical location but from an unrepresentative period,
on the other there was an increasing pressure by the issuers to provide better ratings (Bodie
et al., 2011).
8
The well-known Credit Default Swaps (CDS) also took a part in this “preparation for the
crisis”, as they were a way to mitigate risk for the investors, enhancing the credit and
providing safety (Bodie et al., 2011).
The dependency on house prices was so high, that as soon as those prices started to fall by
2007, homeowners could not fulfil the payments required because of the high interest rates
and of the accumulation of debt but, they could not ask for more credit because their assets
were worth much less. Default rates of mortgage credits began contaminating all of the
assets that were backed by them.
Without regulation or minimum capital requirements, banks were not prepared for this
systemic risk, some were leveraged by 30:1 (e.g. Lehman Brothers) having a massive
mismatch between asset liquidity and liabilities. Major devaluations on their assets and the
impossibility to sell them, as they were after all “junk” assets, meant the beginning of the
end (Bodie et al., 2011).
Starting in mid-2007, banks started to announce massive losses due to exposure to these
sub-prime loans, directly or indirectly through derivatives. House prices were universally low
and the stock market was in a free fall. Fannie Mae and Freddie Mac were put into
conservatorship. This led to mass panic, consequently leaving major banks in the brink of
bankruptcy. The latter ended up being sold or saved by the American Government, the most
famous one being the capital injection of 85 billion $ in the insurance company AIG, in order
to contain contamination and systemic risk of the rest of the financial and banking industry.
Yet one of them was not, Lehman Brothers filed for bankruptcy and it was neither granted
any capital injection by the government nor purchased by another bank. The result was
catastrophic for the money markets.
It all fell like dominoes, no credit was being granted, companies that depended on those
credits were not able to finance their business and people started to lose not only their
houses (because they could not pay them) but also their jobs because the enterprises or
Small and Medium Enterprises (SME) in which they worked could not fund their daily
operations nor seek funding. Economic recession took place and gave birth to the worst
financial crisis since the Great Depression that contaminated the rest of the world, especially
Europe.
Banks received mass amounts of money to correct their financial situation and to finance the
real economy. On the other hand, to finance the economy and save banks, governments had
to substantially increase their volume of public debt in order to inject large amounts in the
economy so that it did not stop. This action led to another phase of the financial crisis, the
Sovereign Debt Crisis (Guerreiro, 2013).
This is definitely the most undesired aftermath, causing massive contagion on the Euro Zone
countries, more specifically, the southern countries (Portugal, Spain, Italy and Greece). The
Financial Crisis of 2007/08 triggered a problem that was already pilling on these countries, it
9
is not the main cause but it definitely made the whole situation even worse. Public debts
and credit granted to the private sector were reaching a dangerous percentage of the GDP
(Lane, 2012).
As most European banks were exposed to U.S. assets (especially the mortgage backed
securities), after the bankruptcy of Lehman Brothers 2009 was a dark year for the EU. This
initiates times of financial distress and banks have a fundamental acting during this period,
injecting money in the economy to uplift it and that is why governments need to
(re)capitalize it with public money. But as markets began to show signs of recession, banks
start to have less money to fuel the economy and governments with a shortage in their
budget to adjust, leading to a recession (Arghyrou & Kontonikas, 2010).
The downfalls of the U.S. subprime crisis already affected the worlds’ markets and investors,
the rapidly increasing credits and enlarging deficits was the fuel needed for the southern
Europe countries to start announcing financial difficulties and later on asked for financial aid
to the IMF and EU (Greece and Ireland in 2010, Portugal in 2011), and the respective bonds’
markets were shut down (Lane, 2012) in addition to tight and strict rules and conditions to
receive the respective funds – austerity packages – creating a difficult economic scenario in
the short run, but aiming for growth and stabilization scenarios. The financial sector was on
the centre of the strategy to save these countries and, overall, the Euro Zone, as successive
contagions could still happen.
The critical role of the mortgage market in triggering the global financial crisis has led to a
surge in policy interest, bank regulation and academic research in credit risk modelling and
bank profitability. Encouraged by regulators, banks now devote significant resources in
developing internal credit risk models to better quantify expected credit losses and to assign
the mandatory economic capital. Rigorous credit risk analysis is not only of significance to
lenders and banks, but is also of paramount importance for sound economic policy making
and regulation as it provides a good check on the “health” of a financial system and the
course of the economy. Increasing loan impairment or delinquency, defaults and mortgage
foreclosures signals a sick economy and generates considerable financial stability concerns
(Chamboko & Bravo, 2016, 2018a,b,c).
Looking at Portugal, there were more factors that engorged the economic crisis resulting in
an inevitable bail-out. Several past governments had been increasing the national debt prior
to 2008 with no signs of increasing GDP to cover it (Correia da Cunha & Braz, 2012).
Additionally, due to unstable minority Governments and some resignations it was not
possible to fulfil the necessary amendments to counter the crisis that was ahead (Pereira &
Wemans, 2012). Due to greedy strategies led by banks, credit rapidly grew in Portugal
(consumer, mortgage, corporate, SME, etc.) since the 2000’s, but since it was conceded with
fewer and fewer risk analysis, impairments starter surging (Banco de Portugal, 2016b). A
factor that that played, and still plays, a major role on the setbacks of the financial system in
10
Portugal and the causes for the late recovery of the banks, and as a consequence, the
economy.
Debt levels rose to a level that was uncomfortable for the investor to believe that Portugal
might fulfil its obligations (Costa, 2014) and that was leveraged by the 10-year government
bonds yields that were increasing and diverging from the rest of the Euro Zone countries
(Lane, 2012; Santis, 2012). This resulted in a pitfall of the ratings given to Portugal by the
main agencies (Fitch, Moody’s and Standard & Poor’s), resulting in a “below junk” evaluation
(Pereira & Wemans, 2012).
Expected as it was, the financial aid for Portugal was much needed but unwanted. A
memorandum was signed between the Government and ‘Troika’ (IMF, ECB and EC) that
imposed austerity measures: major budgets cuts, an increase in income and consumer taxes,
privatizations of public companies, heavier supervision and regulation of the financial sector,
public employment restrictions and capital injection in banks. The goal was to redirect
Portugal to a stable and uprising economy, targeting a 3% deficit of the GDP in 2 years (it
was 11,2% in 2010) as well as several other measures (European Union, International
Montetary Fund, & European Central Bank, 2011).
2.2. NEGATIVE INTEREST RATE POLICY AND HOW IT AFFECTS THE FINANCIAL SYSTEM
An interest rate is the amount charged, expressed as a percentage of the principal, by a
lender to a borrower for the use of assets. Interest is charged by lenders as compensation
for the loss of the asset's use.
As such, a negative interest rate would penalize the savers, as they pay to keep their money
in the bank, and benefit the borrowers, since they would receive money for borrowing it.
Although it seems like a strange financial scenario, where the risk takers do not have any
benefits, the environment in which the NIRP is applied has to be taken in account: low
inflation and a declining equilibrium real rate of interest. Low inflation or deflation is a
negative change on prices which, if persistent, will lead to falling prices, output, profits and
consequently, unemployment (Kumar, Baig, Decressin, Faulkner-MacDonagh, & Feyzioglu,
2003). This is also known as deflationary spiral. As there is no optimal inflation rate (M. Billi
& A. Khan, 2008), most of the world’s central banks agreed at a 2% inflation rate, which
contribute to price stability and predictability. This macroeconomic scenario, either globally
or locally, demands a government reaction and the central banks apply the strategies.
There are common main objectives amongst central banks leading to the adoption of these
policies, generally speaking: anchoring inflation, prevent stabling prices, protecting safe
havens or exchange rate safety.
11
Central banks move the marginal rate into negative territory to adjust the real interest rate
downward and flattening the yield curve. This way, the demand for credit will increase since
bank’s excess reserves become costlier, boosting their risk and portfolio balancing.
In specific cases, Swiss National Bank (SNB) and Danmarks Nationalbank (DNB) the main
motivation was to counteract currency appreciation and capital inflow pressures. As for the
implementation of Quantitative Easing (QE), discussed further in this paper, besides the
reasons mentioned before, the narrowing of assets eligible for their purchase plans and the
probability of decreasing returns from QE (Stocker, Arteta, Kose, & Taskin, 2016).
The expected result is credit growth and a higher non-interest income. The increase in credit
supply will cause a reduced profitability from lower lending rates, induced by low interest
rates but it can be compensated by the credit demand effects if banks increase lending. A
problem might arise, if credit demand is low, assets re-price quickly, and competition among
banks is high.
Higher asset prices and lower funding costs are also the predicted result from NIRP. Portfolio
rebalancing with negative rates reduces term and credit risk premia, eases financial
conditions and ultimately supports credit creation and economic activity. The resulting
decline in risk aversion increases asset prices and generates capital gains for banks.
Furthermore, higher asset prices are likely to raise future income and strengthen borrowers’
repayment capacity, lowering banks’ expected provisioning costs and write-off charges for
non-performing loans (NPL).
Last, but not least, an increase in aggregate demand through portfolio rebalancing. Negative
rates can increase household consumption and guide portfolio rebalancing into other
investment opportunities, providing benefits on aggregate demand. Firms benefit from
portfolio rebalancing because they can decrease cost of capital through lower term premia
on corporate bond yields. If the cost of capital is low, more investment projects may become
profitable, raising investment and credit demand. Higher asset prices and lower interest
expenses for indebted households also boost household consumption through wealth
effects (Jobst & Lin, 2016).
Applying more than just straight forward laws and regulation, central bank’s need to revise
their current operations workflows and frameworks and, sometimes their terms of business
(Bech & Malkhozov, 2016). Besides the front-end changes, nowadays most of the bank’s
business occurs in their IT systems, which needed a deep review to comply with the new
policies.
As key examples for this subject matter, we found some studies from the Sweden’s Riksbank
(SR), SND, DNB, Bank of Japan (BoJ) and the core example for our study, ECB. Each central
bank chose a component to fine tune their interest rates of their accounts.
12
The DNB was one of the first, in 2012, through one-week certificate of deposit, lowering
their interest rate to prevent exchange rate pressures and to counter securities’ price
fluctuations (Turk, 2016).
Following DNB and ECB, in 2015 SNB purpose was to reduce appreciation and ease
deflationary pressures, so they lowered their overnight sight deposit rate to negative rates.
Unlike most countries, DNB was able to pass the negative interest burden, but only to large
corporate clients.
SNB had a similar strategy, but for Swiss franc-denominated sight deposits above a pre-
defined threshold (for domestic banks, there was not an applied charge for cash deposits
below 20 times the banks required reserves), which took effect on early 2015.
In order to prevent price changes and to anchor inflation, the SRB adopted negative rates for
the one-week reverse repo contracts in 2015 and its own asset purchase program of
government debt securities, right after. Additionally, daily fine-tuning operations aim to
drain any remaining reserves previous to the close of business, and so banks only hold small
amounts as overnight deposits with the central bank.
In 2016, the BoJ targeted price stability and inflation anchoring by adopting negative rates
on marginal excess reserves for current account deposits, with a remuneration schedule that
divided balances in the current accounts of financial institutions into three tiers. The three
tiers, at the time they were implemented, were remunerated at +10 bps, 0 bps and –10 bps,
respectively (Bech & Malkhozov, 2016).
As for ECB, in 2014 they changed the deposit rate to –10 basis points, lowering it ever since
to anchor inflation below, but close to, 2% and to maintain price stability. In the Euro
system, required reserves earn the Main Refinancing Operations (MRO) rate, whereas excess
reserves currently “earn” –30 bps (ECB, 2014). Both an aggregate limit and individual limits
have been set on the amount of funds that can be held in the current accounts. If the
aggregate limit is exceeded by the end of the day, then deposits exceeding the individual
limits are converted into certificates of deposit.
For a better understanding of the impacts of NIRP on banks, we must analyse the conceptual
transmission channels on which this policy will be transmitted and how they will influence
the banks’ profitability. According to Stocker et al. (2016), there are five main channels by
which NIRP impacts on banks’ profitability:
the Interest Rate Channel: through this channel, a reduction of the money market
rates and bond yields is expected, considering short term maturities, which will cause
a decrease in long term nominal interest rates as the market adjusts to these
changes. As explained before, hoarding will be costly, so banks will be encouraged to
lend more and at lower charges;
13
the Credit Channel: as banks will avoid paying for their reserves, as most say NIRP is a
“tax on hoarding money”, an increase in credit availability and affordability is
expected. This could leverage the whole economy, since companies and households
can borrow money cheaper;
the Portfolio Channel: this channel will work in two fronts. Firstly, assets will have
higher valuations since yields will decline moved by the lower interest rates and
there is a lower discount factor on the assets’ cash flow. Bank’s portfolios will
increase in value causing a better investing environment through better collaterals.
The second front is almost the same, but from the investor point of view, that will be
more motivated to pursue higher-yield assets (riskier), since they pay more.
Government bonds will be less interesting as their gains will shorten, influencing the
investor’s choice in increasing the riskier assets percentage of the portfolio;
the Reflation Channel: Addressing the issue of deflation risk, it attempts to lift the
real inflation rate to ease the debt deflation and boost economy, but at the same
time not raise it too much to prevent damages to the population;
the Exchange Rate Channel: NIRP will invariably affect currency adjustments, the
ones were the policy is enforced, relative to foreign rates. As the domestic currency
depreciates to become adjusted to the returns on various debt instruments leading
to lower capital inflows and increasing exports.
Adding to the NIRP, ECB implemented QE through an Asset Purchase Program (APP) to
enforce the prevention of prolonged period of low inflation (Fang & Mohnen, 2016). The
APP extended the programs of asset-backed securities and third covered bond purchases
adding sovereign bonds.
This program was studied and the predictions made about the theoretical channels
(Hannoun & Hofmann, 2015; Krishnamurthy & Vissing-Jorgensen, 2011) that may affect
medium and long term interest rates identified the:
Duration channel: purchasing long-term government securities, the duration risk is
reduced decreasing long-maturity bond yields (proportional to the bonds’ duration)
relative to short-maturity yields;
Liquidity channel: exchanging long-term securities for reserve balances, the investor
increase liquidity;
Safety premium channel: as the securities that will be bought are the safest, the
safest securities yields will decrease, rising demand and lowering safety premium;
Commitment to Keep Rates Low channel or Signalling channel: regarding central
banks’ policies to keep interest rates low, the rates of securities with intermediate
14
maturities might be lower when compared to securities with longer maturities, as
these policies only act until the economy recovers;
Prepayment Risk Premium channel: targeting the Mortgage Backed Securities
market, as they will be bought under program guidelines, hence lowering MBS yields
compared to other bond market yields;
Default Risk channel: default risk and default risk premium on bonds with lower
ratings might lower with the rise of economic activity, leading to lower rates on those
bonds. Also, investors might take on more risks;
Inflation channel: economy might be impacted by QE, due to the expansionary effect
of the program, duelling with inflation changes. This might increase or decrease
interest rates, depending on the inflation’s direction.
This directly affects banks’ profitability because it raises bonds prices (improving the banks’
portfolio), reduces long-term yields (shortening spreads and lowering income from loans)
and improving the economy. If banks were to be exposed to an improving economy, they
might find new sources of income due to emerging or and growing companies (Demertzis &
Wolff, 2016).
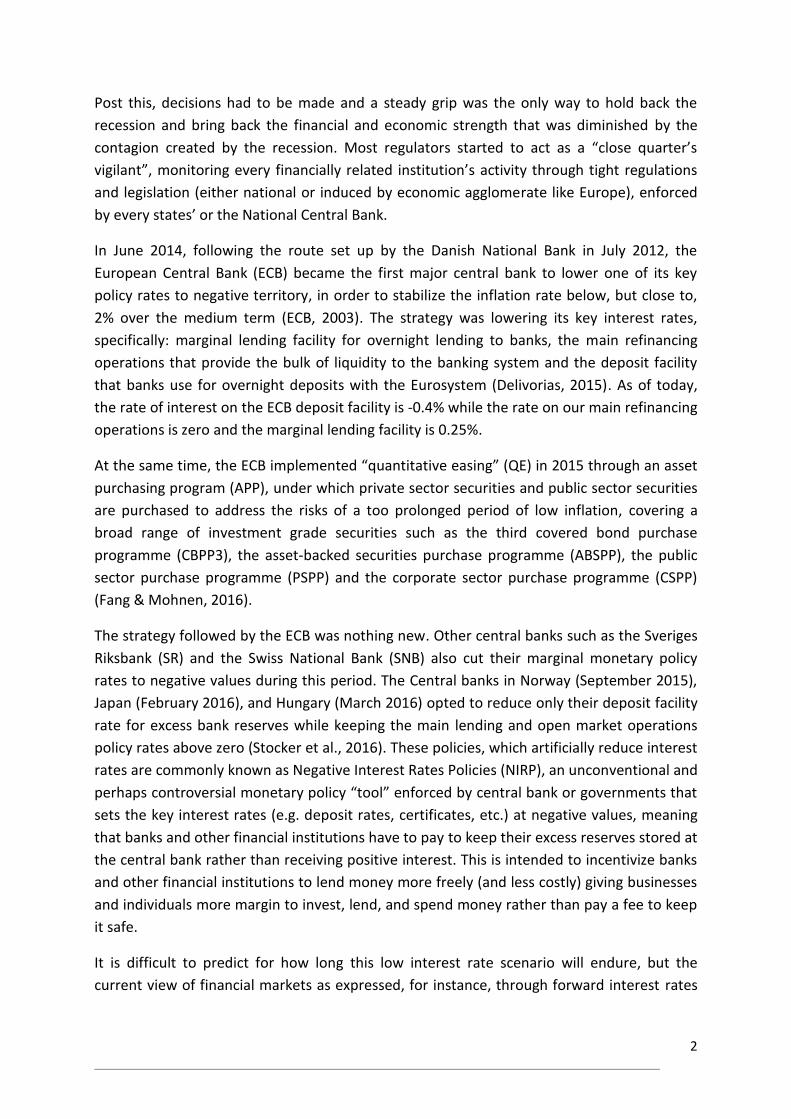
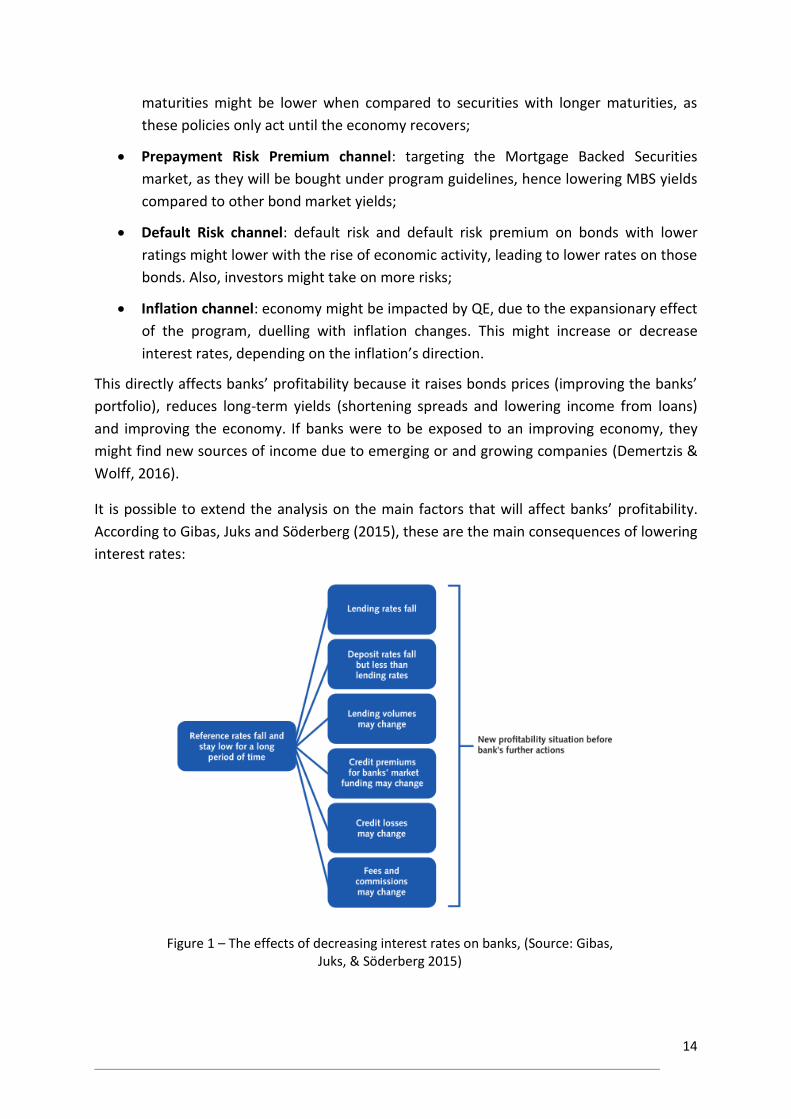
It is possible to extend the analysis on the main factors that will affect banks’ profitability.
According to Gibas, Juks and Söderberg (2015), these are the main consequences of lowering
interest rates:
Figure 1 – The effects of decreasing interest rates on banks, (Source: Gibas, Juks, & Söderberg 2015)
15
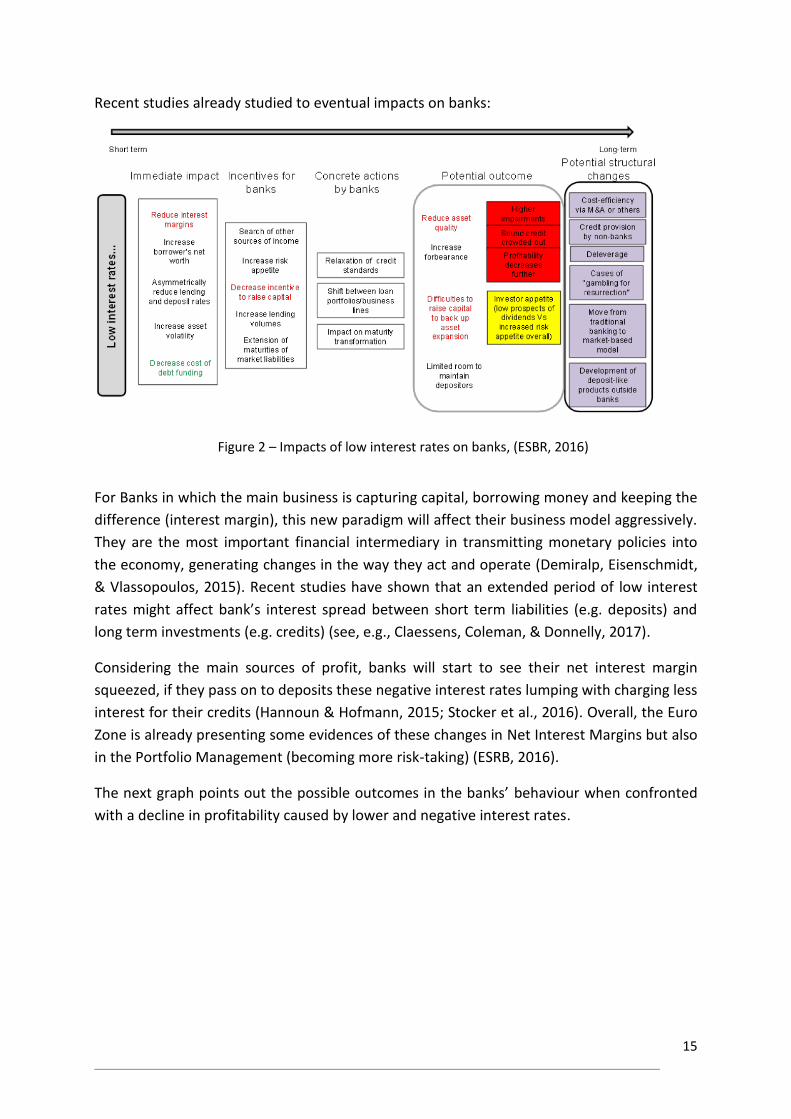
Recent studies already studied to eventual impacts on banks:
For Banks in which the main business is capturing capital, borrowing money and keeping the
difference (interest margin), this new paradigm will affect their business model aggressively.
They are the most important financial intermediary in transmitting monetary policies into
the economy, generating changes in the way they act and operate (Demiralp, Eisenschmidt,
& Vlassopoulos, 2015). Recent studies have shown that an extended period of low interest
rates might affect bank’s interest spread between short term liabilities (e.g. deposits) and
long term investments (e.g. credits) (see, e.g., Claessens, Coleman, & Donnelly, 2017).
Considering the main sources of profit, banks will start to see their net interest margin
squeezed, if they pass on to deposits these negative interest rates lumping with charging less
interest for their credits (Hannoun & Hofmann, 2015; Stocker et al., 2016). Overall, the Euro
Zone is already presenting some evidences of these changes in Net Interest Margins but also
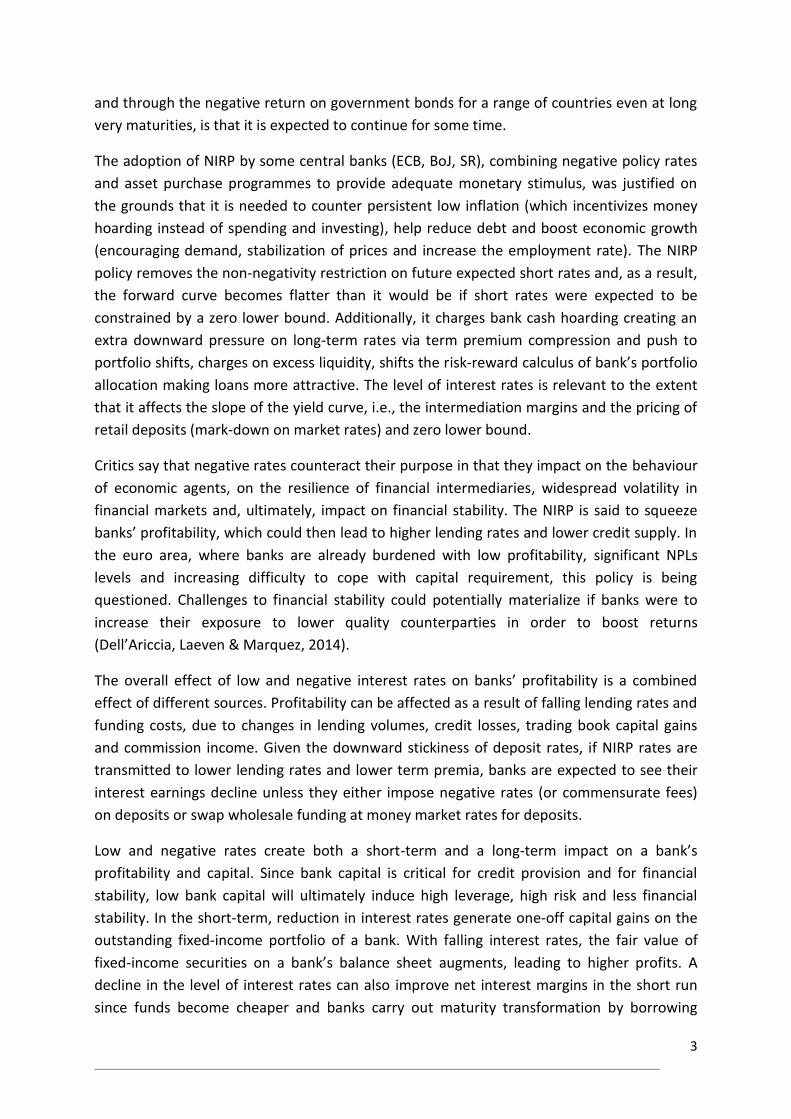
in the Portfolio Management (becoming more risk-taking) (ESRB, 2016).
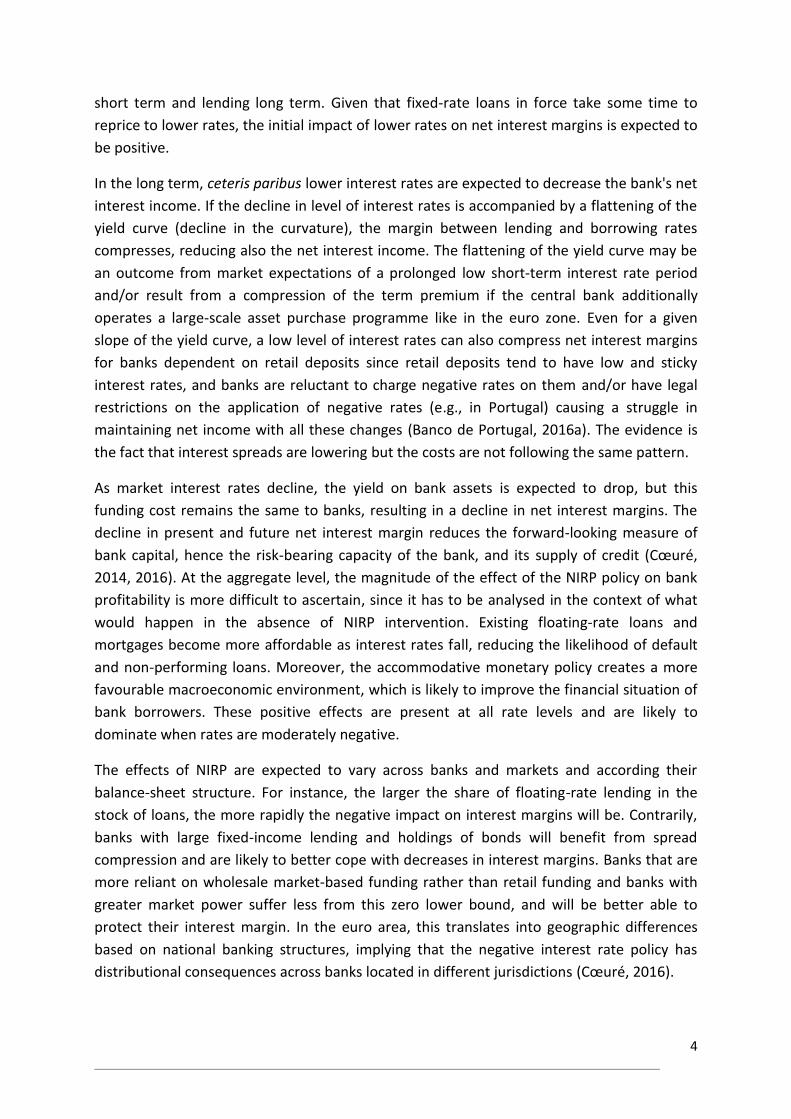
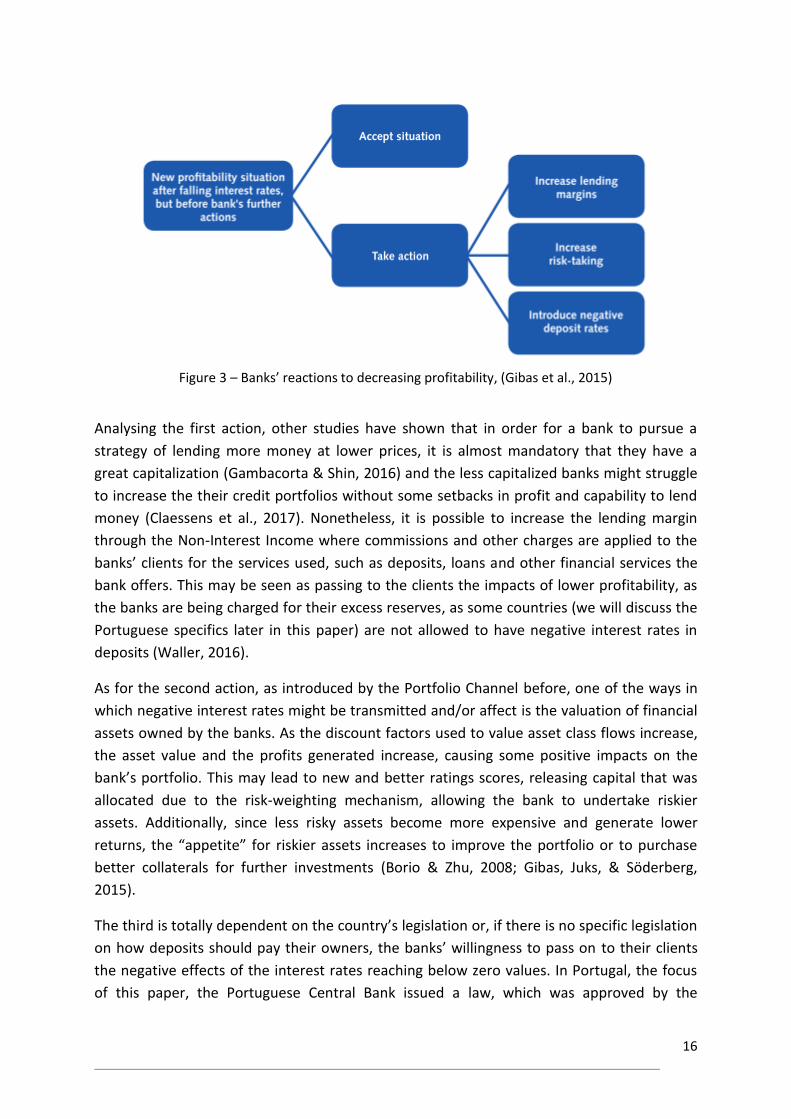
The next graph points out the possible outcomes in the banks’ behaviour when confronted
with a decline in profitability caused by lower and negative interest rates.
Figure 2 – Impacts of low interest rates on banks, (ESBR, 2016)
16
Analysing the first action, other studies have shown that in order for a bank to pursue a
strategy of lending more money at lower prices, it is almost mandatory that they have a
great capitalization (Gambacorta & Shin, 2016) and the less capitalized banks might struggle
to increase the their credit portfolios without some setbacks in profit and capability to lend
money (Claessens et al., 2017). Nonetheless, it is possible to increase the lending margin
through the Non-Interest Income where commissions and other charges are applied to the
banks’ clients for the services used, such as deposits, loans and other financial services the
bank offers. This may be seen as passing to the clients the impacts of lower profitability, as
the banks are being charged for their excess reserves, as some countries (we will discuss the
Portuguese specifics later in this paper) are not allowed to have negative interest rates in
deposits (Waller, 2016).
As for the second action, as introduced by the Portfolio Channel before, one of the ways in
which negative interest rates might be transmitted and/or affect is the valuation of financial
assets owned by the banks. As the discount factors used to value asset class flows increase,
the asset value and the profits generated increase, causing some positive impacts on the
bank’s portfolio. This may lead to new and better ratings scores, releasing capital that was
allocated due to the risk-weighting mechanism, allowing the bank to undertake riskier
assets. Additionally, since less risky assets become more expensive and generate lower
returns, the “appetite” for riskier assets increases to improve the portfolio or to purchase
better collaterals for further investments (Borio & Zhu, 2008; Gibas, Juks, & Söderberg,
2015).
The third is totally dependent on the country’s legislation or, if there is no specific legislation
on how deposits should pay their owners, the banks’ willingness to pass on to their clients
the negative effects of the interest rates reaching below zero values. In Portugal, the focus
of this paper, the Portuguese Central Bank issued a law, which was approved by the
Figure 3 – Banks’ reactions to decreasing profitability, (Gibas et al., 2015)
17
Government, mandating that deposits must not return an amount below the one that was
deposited, even if the deposit is indexed to a floating interest rate and it crushes the
possible return (Constâncio, 2009). The only exception is if the client clearly states that the
bank is allowed to do so. Banks are reluctant to pass the negative interest rates to their retail
deposits, moved by a certain fear that massive cash withdrawals or deposit outflow might
occur (Bech & Malkhozov, 2016; European Savings and Retail Banking, 2016; Gibas et al.,
2015; McAndrews, 2015; Stocker et al., 2016).
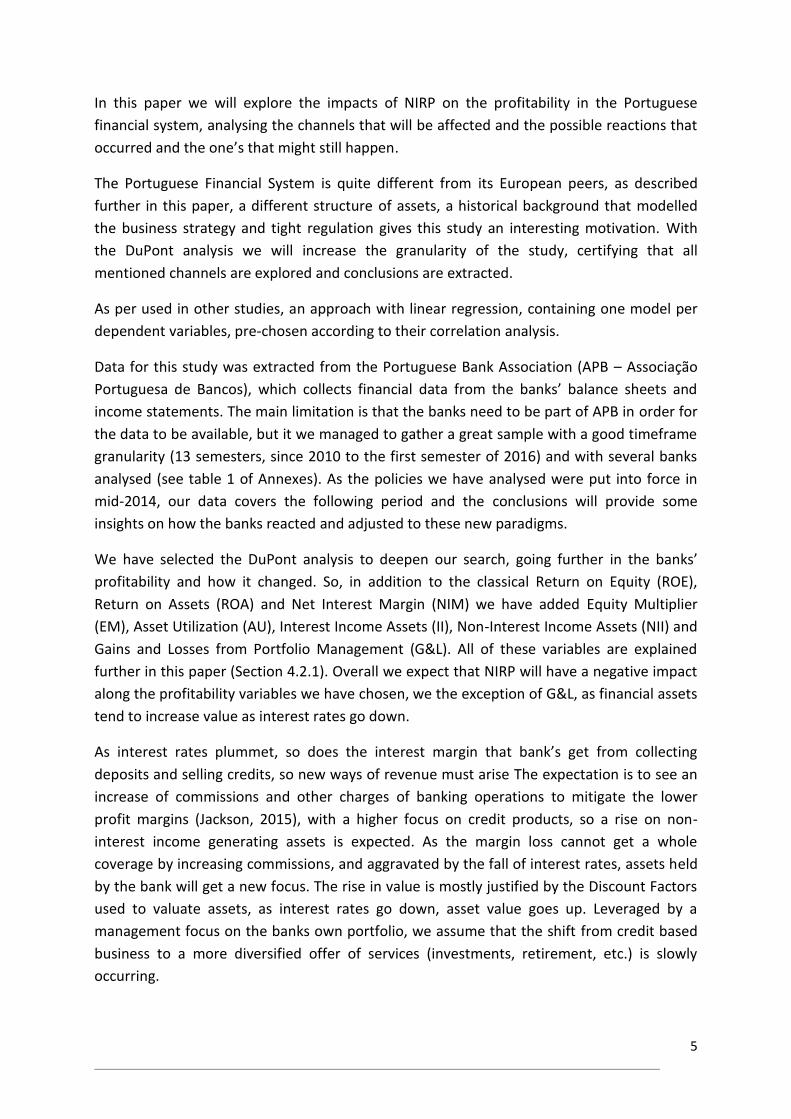
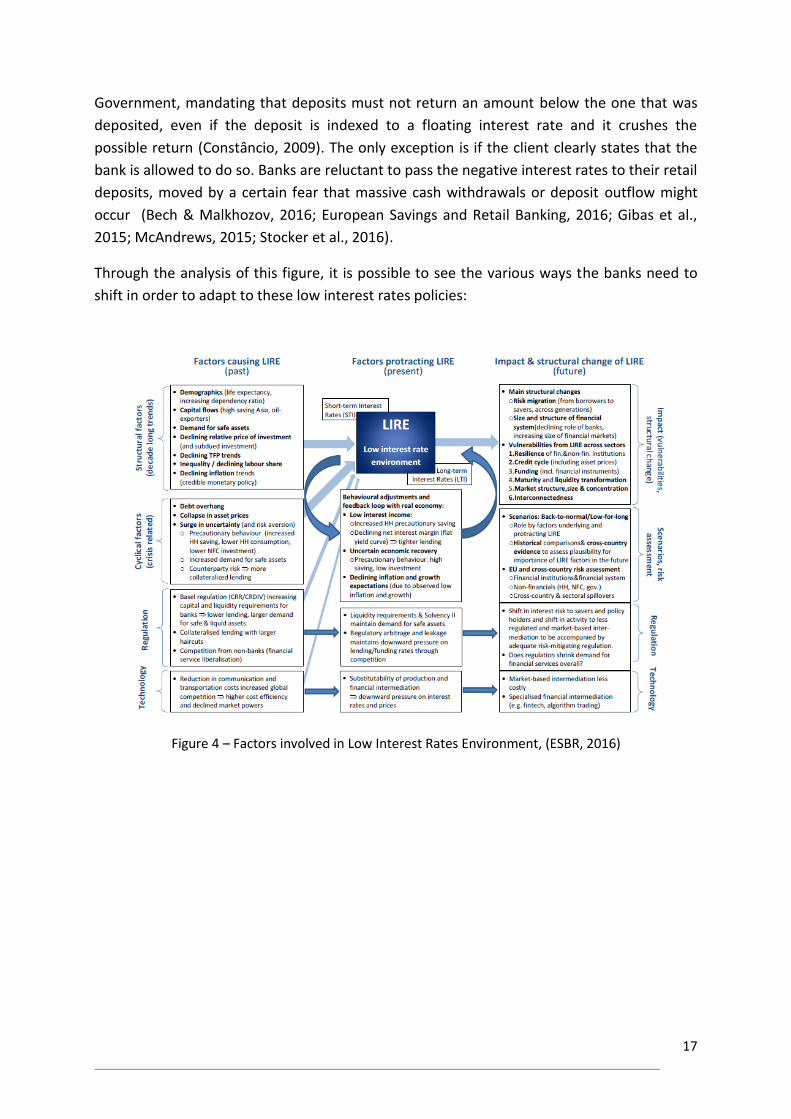
Through the analysis of this figure, it is possible to see the various ways the banks need to
shift in order to adapt to these low interest rates policies:
Figure 4 – Factors involved in Low Interest Rates Environment, (ESBR, 2016)
18
2.3. PORTUGUESE FINANCIAL SYSTEM AND INSTITUTIONAL CONTEXT
In order to understand the makings of Portugal’s current financial system, we have to go
back to 1974, when the country had just transitioned to parliamentary democracy from its
former dictatorship, “Estado Novo” (1933 to 1974). The newly elected government
nationalized almost every company in the country (except the international ones), including
banks and insurance companies. This wave of nationalizations was reverted in the 80’s, with
several privatizations processes taking place (Lima & Soares de Pinho, 2008), allowing cost
and input utilization to be more efficient (Mendes & Rebelo, 1999). This allowed the private
sector to own equity from the previously nationalized companies; the Banking and Insurance
sector were no exception (Costa, 2014).
Being one of the most prosperous sectors in Portugal in the 90’s, its evolution was based on
several mergers and acquisitions, by both national and international banks (mostly Spanish),
starting to decrease Portuguese Government ownership, since almost all of the banks were
previously nationalized (Canhoto & Dermine, 2003). This converted the financial sector
landscape in one of the most concentrated of the European Union, with three of the biggest
banks detaining over half the market share (Boucinha & Ribeiro, 2009).
According to Alves & Tavares (2017), in the Portuguese banking system, by mid-90’s,
corporate and consumer credit operations represented about 37% of income generating
assets and a low Deposit-to-Credit ratio of 60%, despite good profitability indicators, in
comparison to other European countries at that time, with ROA of 0,6% and ROE of 6,8%.
Through the mid-90’s to the early 00’s the annual growth of credit registered an outstanding
increase of 26%, leveraged by the mortgage credit (33% annual growth rate), representing
40% of credit conceded in the final period of 1999.
The fact that Portugal joined the Economic and Monetary Union (EMU) and switched its
currency from the Portuguese Escudo (PTE) to the Euro (EUR) allowed new accesses to
Interbank Money Markets (IMM), thus increasing its external debt (from 1% in 1996 to 10%
in 1999, which corresponded to 19% of GDP). In addition, the interest rates decreased
rapidly, creating a boost in credit demand. Other ratios indicated the growth of the financial
sector, such as the weight of credit over GDP (98% in 1999) and C/D conversion (115% in
1999).
New streams of credit demand emerged: Corporate Equity purchases (backed by the equity
itself) motivated by strategies that aimed increasing the participation in some companies
that were, at that time, partially or totally owned by the Portuguese Government as
mentioned in the beginning of this topic; as well as Project Finance, used for Public
Infrastructure using a Public-Private Partnerships model.
Credit expansion began in the early 00’s motivated by a great number of factors such as:
several unexplored opportunities (mortgage, consumer and the ones mentioned before),
19
construction and real state growth, low credit-to-deposits ratio and a solid economic growth
in Portugal. Banks concentrated their strategies and efforts in lending, sometimes
disregarding the associated risks as most of the credit was conceded to companies operating
mainly in the non-tradable sector, a sector more sensitive to changes in the domestic
environment. By 2012 the percentage of credit granted compared to GDP was over 200%.
In what regards the banking business, the most important key factors for the Portuguese
clients are: trust, fees and commissions that are charged, customer service and, with less
importance for the clients but with a high relevance for the analysis, the geographical
proximity (Bicho Pires, 2013). This is a good justification for the way banking business
defined their business strategy, as shown by Alves and Tavares (2017), with the number of
branches per 100 000 inhabitants was one of the highest in the EU. Equally, the number of
ATM’s per 100 000 inhabitants was 195 in 2009 even though the number of deposits and
loans per branch did not match that growth, being one of the lowest when compared to
other European countries. This mentality towards the financial system encouraged other
companies to follow and adapt, such as Sistema Interbancário de Serviços (SIBS) which is the
central operational body of the automated interbank payment system and owns almost all
ATM’s and Debit Cards (ECB, 2007), along with other services that the groups’ companies
can provide. SIBS was founded in 1983 and it is owned by the vast majority of the banks
operating in Portugal; this allowed them to provide better services to all customers and that
is why the Portuguese ATM network (called Multibanco) is one of the best in the world.
As mentioned before, the banking sector is highly concentrated. The top five banks in
Portugal hold 76% of all assets (APB, 2014). To better understand the reasons behind this, it
is important to briefly describe the top five banks operating in Portugal1:
Caixa Geral de Depósitos (CGD) is the biggest national and public financial group in
Portugal. Banco Nacional Ultramarino (BNU) was merged with CGD in 2002,
consolidating CGD as the biggest bank in Portugal;
Millennium BCP, the biggest private bank in Portugal, is a conglomerate composed by
former big private banks, starting with the acquisition of Banco Português Atlântico
in 1995 and the mergers with Banco Mello and Banco Pinto e Sotto Mayor in 2000;
Banco Espírito Santo (BES), the second largest private bank, merged with Banco
Comercial de Lisboa in 1937 and with Banco Internacional de Crédito. After its crisis
(explained further in this paper) BES was renamed to Novo Banco (NB). Grupo
Espírito Santo is the holding that has the ownership of NB, but also Banco Best (an
investment and retail bank);
Banco Santander Totta (BST) is the third biggest private bank and the only one from
this top 5 that is not Portuguese. Santander Group acquired two banks in order to get
1 For further detail, consult (Costa, 2014)
20
in the Portuguese market, Banco Totta Açores and Crédito Predial Português in 1999.
The holding Santander Totta SGPS owns BST, for retail, private and corporate banking
and Santander Consumer for consumer credit. Recently, it also acquired BANIF
following its default and more recently Banco Popular;
Banco Português de Investimento (BPI), the fourth biggest private bank, started as an
investment society, called Sociedade Portuguesa de Investimento, that got the
proper licenses to act as a bank. In 1991 merged with Banco Fonsecas e Burnay and
in 1996 acquired Banco de Fomento Exterior and Banco Borges e Irmão. Nowadays,
the holding BPI SGPS has Banco BPI, the retail bank, and BPI Investimento for private
and corporate.
In Portugal, the financial sector is mainly composed by banks (66 according to Associação
Portuguesa de Bancos, APB), regulated by the Banco de Portugal (BdP), the supervisory and
regulatory authority that responds directly to ECB and to the Portuguese Securities Market
Commission (Comissão do Mercado de Valores Mobiliários (CMVM)), that supervises and
regulates securities and other financial instruments markets as well as the activity of all the
entities that intervene in those markets.
In the last decade, a time frame more relevant for this study, besides the intervention of IMF
in 2011 there were significant occurrences in the banking sector in Portugal (Pereira &
Wemans, 2012).
The first was the polemic case of Banco Português de Negócios (BPN) in 2008, a sequence of
financial crimes, money laundering and frauds which caused the Portuguese Government to
take action and nationalize the bank, adjudicating it to CGD. It was later sold to Banco BIC, a
bank controlled by Angolan private investors, for 40 million € that was followed by some
investigations due to its strange development and closure. The motivations for the
nationalization were the impact on the economic crisis that would lead to a greater danger
to the Portuguese Financial Sector (Correia & Pereira Rosário, 2011).
Later on, there was the announcement of full bankruptcy of Banco Privado Português (BPP)
by BdP in 2010. Although the Portuguese Government injected an amount of 450 million €,
the damage was far too much in order for the bank to be reinstated to its proper financial
healthiness. Several financial crimes and money launderings schemed by the administrators
made the recapitalization and recovery impossible for BPP.
The most famous one was surely the crisis of BES in 2014. After announcing huge losses and
an audit that revealed irregularities in the accounting and ledger of the bank, the
administration was replaced by the BdP. This was the beginning of the end. After the
substitution, BES announced that the impairments were too high to handle, causing even
more losses and a stock price downfall of over 80% in only 8 months. The bank resolution
21
process involved an injection of almost 5 billion Euros by the Portuguese Government and
BES being split in two banks: a «bad bank», holding the toxic assets (BES) and a «good bank»
(NB). This also led to the sale of BESI, the investment bank owned by the same holding of
former BES, now NB, to Haitong Securities Co. in 2015, changing its name to Haitong.
And last but not the least, Banif in 2015, a private bank that had the Portuguese State as its
majority shareholder, suffered a bank run, causing more than 960 million € in withdraws
from ATM’s and branches (16 % of the banks total deposits), plus a massive downfall in stock
prices. This was the end of Banif, leading to a rushed sell to Santander Totta that only bought
the ‘good’ assets of the bank for a ‘sale’ price of 150 million €, leaving the toxic assets to the
Portuguese State to handle.
More recently, in 2016, CGD needed a major capital injection of € 5.6 billion due to increases
in impairments and Non-Performing Loans.
Overall, the Portuguese financial sector landscape is not one of the best, suffering several
losses, interventions and readjustments (Guerreiro, 2013), but it is recovering at a steady
pace with several adjustments in operations costs, rising income sources, renewing the
business model and improving political and legislation constraints (Ames, 2015).
Regarding specificities of the legislation applied to Portuguese Banks, there are some factors
that are worth mentioning. As stated in the bill issued by BdP (Constâncio, 2009), all deposits
defined in the bill issued by the Portuguese Government have to return to the deposit owner
the same amount they deposited in the bank and never less, only in the situations the
deposit owner stated specifically that he is willing to receive less.
National and European regulators bare on their minds that banks are the cornerstone of
global economies and have both a significant negative and positive impact (Cappiello,
Kadareja, Kok Sorensen, & Protopapa, 2010). As such, some protection must be provided, to
ensure no contagion.
Regulatory and compliance take on a significant role for these prudential supervisory,
defining several measures to prevent banks’ bankruptcy due to macroeconomic impacts and
occurrences, stopping further impacts on national economies.
The 2007/08 crisis and the Sovereign Debt Crisis led to more EU financial policies, making
way for more rigorous and ample legislation. The following are particularly noteworthy.
Taking the Basel III agreement in consideration, the Capital Requirements Regulation (CRR)
and Capital Requirements Directive IV (CRD IV) is brought on by ECB in 2013, to ensure Basel
III is followed in EU. From the Basel III agreement, CRR aggregates Pillar 1 (capital, risk
coverage, and leverage) and Pillar 3 requirements (market discipline, disclosure
requirements), and the CRD IV contains the requirements for Pillar 2 (risk management and
supervision) and the new buffers framework as well as new rules on supervision, corporate
22
governance, remuneration, sanctions, counterparty credit risk for derivatives (CFA Institute,
2013).
The Single Supervisory Mechanism (SSM), created in 2013, conferred bank-supervisory
powers to the ECB, creating a new system of financial supervision comprising the ECB and
the national competent authorities of participating EU countries. The SSM is responsible for
the prudential supervision of all credit institutions in the participating Member States. It
ensures that the EU’s policy on the prudential supervision of credit institutions is
implemented and that credit institutions are subject to its supervision. Its three main
objectives are: ensuring the safety and soundness of the European banking system,
increasing financial integration and stability and consistent supervision (European Central
Bank, 2014).
The European Parliament proposed to adopt in 2014 the bank recovery and resolution
directive (BRRD), which was originally proposed by the EU Commission in June 2012. The
BRRD will enable (from 2016) authorities to “bail-in” the eligible liabilities (including
unsecured creditors) of banks subject to resolution. Authorities will have substantial powers
to intervene ex ante in banks which are deemed irresolvable (European Systemic Risk Board,
2014).
In April 2014, the European Parliament adopted a text of a regulation establishing a Single
Resolution Mechanism (SRM). The SRM implements the BRRD in the euro zone, and
therefore will complement the SSM. As part of the SRM regulation, a Single Resolution Fund
financed by banks, will help to provide “bridge financing” for resolved banks. It is one of the
three pillars of the banking union alongside the SSM and a common deposit guarantee
scheme.
In addition to these four policy innovations, the Commission proposed in 2014 a regulation
on “structural reform” of the EU banking system, which is still currently being discussed. The
objective is to separate the lending activity of banks from their security trading activity,
limiting their risk exposure in order to control for systemic risk.
23
3. PAST STUDIES
There have been some studies on what affects banks’ profitability, with the following results.
The influences of industry specific and macroeconomic factors in banks’ profitability (Return
on Average Equity, Return on Average Assets and Net Interest Margin) showed that cost-to-
income ratio has an negative influence and that Difference between bank and market
growth of total loans and Household disposable income has a positive influence (Guerreiro,
2013).
Another paper, written by Abreu and Mendes (2001), studied the determinants that
impacted on banks profitability in Spain, Portugal, France and Germany revealing that less
efficient banks pass on the costs to their customers through higher interest rates in loans or
lower interest rates in deposits and well-capitalized banks (with higher Equity/Assets)
managed to have lower funding costs and higher net interest margins. Inflation is quite
preponderant for banks’ profitability, although when inflation is higher, the banks’ costs rise
quicker than the revenues.
The impact on banks’ profitability of macroeconomic and banking specific factors was
analysed by Albertazzi and Gambacorta (2009) with data from banks in the Euro Zone
countries, the U.K. and the U.S.. They concluded that profits are closely related to business
and economic cycles as the GDP impacts the net interest margin (due to the lending channel)
and loan loss provisions (credit quality changes). Banks in Spain and Portugal are
characterized for having assets with shorter duration, therefore are more affected by money
market interest rates and less by variations of long-term interest rates.
With a focus in the UK, Alessandri and Nelson (2012) obtained results that show the positive
link between high interest rates and a higher net interest margins. Additionally, they
conclude that the level and the slope of the yield curve impacts the gains from managing the
bank’s portfolio (“trading income”) in an opposite way it does with net interest margin, a
result explained by banks strategy in hedging interest rates with derivatives. They concluded
that monetary policies whose purpose is to compresses short-term rates and flattening the
yield, lowers the banks’ profit.
Regarding the transmission mechanism of monetary policy impulses, through the interbank
market, to the real economy, in the Euro area, Aristei and Gallo (2012) measured how the
financial crisis has impacted the transmission mechanism of monetary policy to the real
economy through the bank lending channel. The authors claim that financial turmoil periods
seem to weaken the short-run transmission between the money market and retail bank
rates, but they strongly increase the responsiveness of loan rates to deviations from the
long-run equilibrium. As the authors state “(…) effects of financial turmoil periods seem to
weaken the short-run transmission between the money market and retail bank rates, but
they strongly increase the responsiveness of loan rates to deviations from the long-run
equilibrium.” This transmission is more effective in the case of interest rates paid by
24
corporate loans, less effective in the case of mortgage loans and residual in consumer credit;
the reasons behind these different reactions lie in the various factors adjacent to each one
and the capability of negotiating the contracts, and the fact that in crisis there is less impact
from the variations of the reference rates (EURIBOR).
Athanasoglou, Brissimis, and Delis (2005) analysed the effects of bank and industry-specific
macroeconomic factors and business cycle on the profitability of Greek banks and concluded
that the bank’s capital and labour productivity growth have a positive effect in profits and
that management decisions regarding the operational costs have a great impact (depending
on the direction they take). A higher exposure to credit risks jeopardizes profits; ownership,
industry concentration and bank’s size tend to be irrelevant. As for macroeconomic factors:
inflation and business cycle are directly, but asymmetrical, correlated to the profitability.
A deep study on the effects of prolonged low interest rate environment was made by Bean,
Broda, Ito and Kroszner (2015). They considered the financial crisis, integration of China in
the global economy and a higher demand for less risky assets as the main cause for these
policies. They remarked that persistent low interest rates stimulate a strategy of higher
leverage and riskier investments, leading to an increase of the risks in financial. One of the
paths to ease this is the action of Governments and Central Banks with the use of prudential
policies. That path is, however, susceptible to the influence of longer-term fiscal and
structural policies, especially those that improve the return on investment are always a key
item, even if the problems associated with persistently low interest rates are discarded. They
conclude that raising the propensity to invest would uplift the neutral real interest rate, so
that it improves general growth and lowers debt for governments, corporations and
households. A study on the impacts of monetary policies in the banks’ profitability presented
a positive relation between interest rates and profitability (ROA and NIM) especially on
interest income, yet a reduction of non-interest income, due to portfolio devaluation.
Unusual monetary policies tend to decrease banks’ overall profitability, reducing ROA, due
to a decrease on short-term rates (Borio, Gambacorta, & Hofmann, 2015).
More similar to this study, when analysed the impact of NIRP in the banks’ profitability
(Jobst & Lin, 2016), the main findings were that, as per 2016, NIRP has a positive impact in
economy but with a serious concern that it may negatively affect the banks’.
The unconventional monetary policies and the effects in banks’ soundness (Lambert & Ueda,
2014), showed that unexpected monetary policy easing tends to increase bank’s medium-
term credit risk, despite the fact that, regarding profitability, they were indefinite. Leverage
and short-term debt ratios indicated a reduction but the risk-weighted ratios increased
compared to total assets.
Focusing on the effects of (low) interest rates on bank net interest margins (NIMs) and
profitability, Claessens et al. (2017) made several conclusions. Profitability is negatively
related to the length of time interest rate are low. This challenges banks’ ability to sustain
25
income if the low interest rate environment persists. That is why banks with short maturity
balance sheets are more affected than those with long maturity balance sheets. Banks’
profitability indicators are less affected from low rates on overall, as low interest rates can
provide for some valuation due to gains in portfolio management.
The adjustments that can be made to offset the negative effects of low interest rates take
time to present decent payoffs, but become arduous when there are already low profits and
high operational expenses. Policy issues might arise as the transmission channels could
compromise capitalization and ability to sell credit (lending channel), proving this policy
action ineffective or even counterproductive. Also, the long exposure to low interest rates
diminishes the bank’s capability to attract more capital and to inject it in the economy,
weakening the bank when it comes to changes in the market and confidence building. The
study shows that the various effects on the banks’ NIMs, profitability, capital adequacy and
franchise are not the same across the sample they have used, but the results were
adjustments to their funding structures, lending and investment portfolios and their non-
interest exploits.
Recurring to evidences from the Euro Zone, Demiralp et al. (2015) used bank-level data for
the euro area as to which the banks’ balance sheets expressed reactions to holdings of
excess liquidity altered since the introduction of negative rate on the deposit facility, by the
ECB. Banks with a high excess liquidity and that are within a less vulnerable (to interest rates
shifts) country tend to acquire, during negative interest terms, more non-domestic bonds
and extend their loan offer to non-financial private sectors and lower the level of wholesale
funding. The APP (Asset Purchase Plan) and QE (Quantitative Easing) enforced the policy of
negative interests, in the deposit facility.
After analysing bank-specific characteristics, macroeconomic variables, and industry-specific
factors affect the profitability of 453 commercial banks in Switzerland over the period from
1999 to 2008, Dietrich and Wanzenried (2011) concluded that the differences in profitability
among the sample can be justified by some factors. Namely, considering the return on
average assets as a measure of profitability, better capitalized banks tend to have higher
profits, cost to income ratio is inversely proportional and loan loss provisions relative to total
loans has negative impact. Furthermore, the bank’s loan volume has a positive impact in
profitability, opposed to interest income share that has a negative impact. The banks
ownership has no impact in profitability.
Following the topic of the impacts of prolonged ultra-low, or negative, interest rates
Hannoun and Hofmann (2015) studied the transmission channels of this policy action. Some
risks arise from these decisions, such as: financial dominance, exchange rate dominance and
fiscal dominance. To better put this sentence, that these policies might become too
supported on the demands of uprising financial markets, influencing the exchange rate
downwards, and maintaining public refinancing costs at low levels in a landscape of
unmatched public debt responsibilities. Although the stakeholders affected by this new
26
paradigm are adapting, a major fear of a new collapse in the asset prices is quite present, in
the eventuality that monetary easing stops. They have remarked that central banks must
never act without a pre-notice, always consulting the market and take a predictable action
plan, aligned with the players involved and affected. Recurring to a real-life example, the
Swiss National Bank decided to put a hold on the exchange rate cap, a well justified decision
and a key part in revamping the whole banking scenery. In conclusion, to exit an
Unconventional Monetary Policy must take its time in order to avoid the three major
“dominance” risks described by the authors, and that all comes down to a trade-off between
the short term and the long term.
An analysis to the banks behaviour when confronted with unanticipated credit, interest-rate,
and term-structure shocks, Hanweck and Ryu (2005) showed that net interest margins for
commercial banks commonly react in a predictable way. Some differences in those reactions
are justified by the various asset compositions and business models. The study displayed
that quarterly changes in net interest are sensitive to credit, interest-rate, and term-
structure shocks for banks. Generally, bigger and more diversified banks are more vulnerable
to credit shocks but less vulnerable to changes in interest rates or term-structure
modifications. Credit cards focused companies are not affected by short-term interest rates
changes or shifts in the yield curve. The hypothesis was proven right, the fact that the higher
the percentage of short-term net assets and non-maturing deposits allows a positive
influence on net interest margins, made by a rise in short-term interest rates. The ever
increasing competition in loans does not allow banks to profit from interest rates changes.
The results showed that most banks have a better capability to price actual and expected
credit risk.
Some other studies showed that there is a positive relationship between market structure,
GDP growth, unemployment rate, inflation, central bank interest (P. Athanasoglou et al.,
2005; Bikker & Hu, 2002; Bourke, 1989; Dietrich & Wanzenried, 2011; Mirzaei, Liu, & Moore,
2011; Molyneux & Thornton, 1992) and banks’ profitability.
27
4. METHODOLOGY
4.1. MODEL
For this study we decided to apply a multiple linear regression (MLR) model to analyse
banks’ profitability through 2010 and half of 2016 and how it is affected by internal and
external factors in a low and negative interest rate environment, as these policies took place
post 2007/08 financial crisis. This method is commonly used in related studies (Abreu &
Mendes, 2001; Bourke, 1989; Demirguç-Kunt & Huizinga, 1999; Dietrich & Wanzenried,
2011; Molyneux & Thornton, 1992). As described by Newbold, Carison, & Thorne (2013).
Achieving a clearer analysis and conclusions, this model provides a broader spectrum of
variables to determine better conclusions to this study. As the aim is to identify the main
influencers of banks’ profitability, so the more variables we analyse, the conclusions will be
more detailed. Through multiple linear regression, we can also find outliers and anomalies
(such as collinearities), providing a more robust model in the end, only possible if these
phenomena’s are identified are act upon them.
The MLR model can be defined as follows:
(1)
In which, Y represents the dependent variable we choose for the banks’ profitability, β are
the unknown coefficients for the X, which is the independent variable that will indicate the
impact on Y and is the random error term with a mean of 0 and a variance of , that
indicates the difference between the observed value Y and the estimated Y. The factors “i”
and “k” are, respectively, the dependent variable index and the independent variable index.
This means that β is a measure of the effect of a change in the independent variables X,
upon the expected value of Y, when all the other variables remain constant.
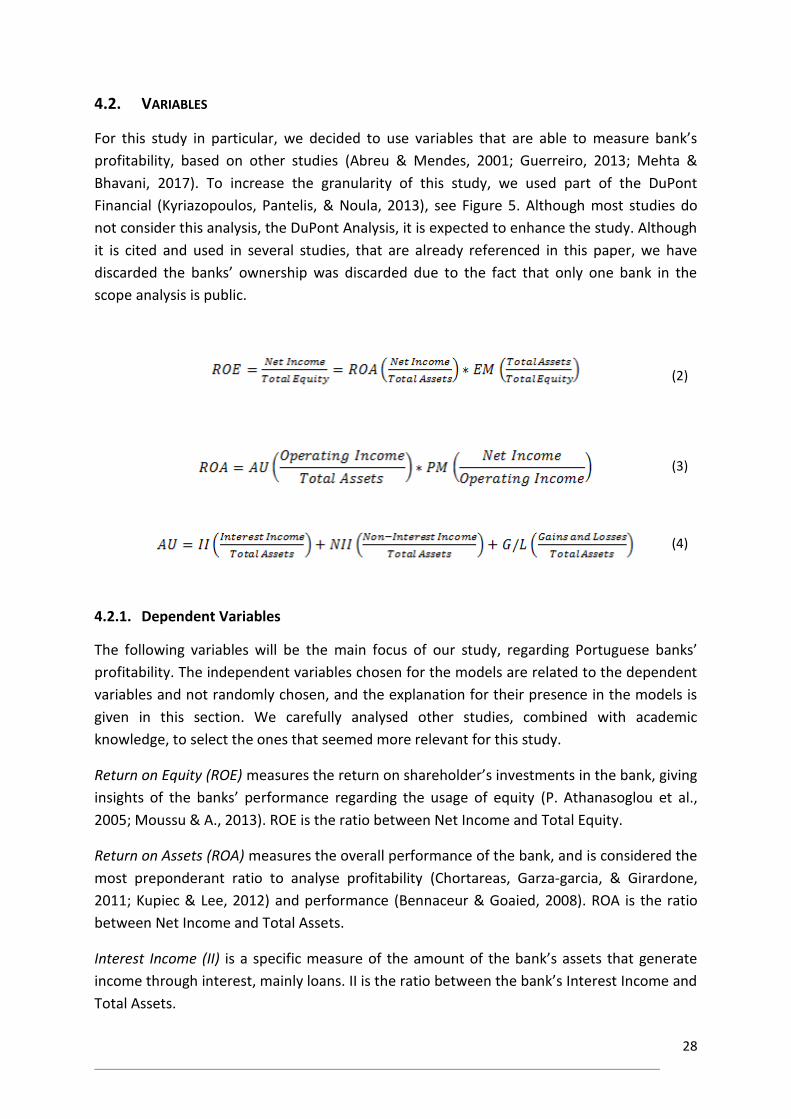
28
4.2. VARIABLES
For this study in particular, we decided to use variables that are able to measure bank’s
profitability, based on other studies (Abreu & Mendes, 2001; Guerreiro, 2013; Mehta &
Bhavani, 2017). To increase the granularity of this study, we used part of the DuPont
Financial (Kyriazopoulos, Pantelis, & Noula, 2013), see Figure 5. Although most studies do
not consider this analysis, the DuPont Analysis, it is expected to enhance the study. Although
it is cited and used in several studies, that are already referenced in this paper, we have
discarded the banks’ ownership was discarded due to the fact that only one bank in the
scope analysis is public.
4.2.1. Dependent Variables
The following variables will be the main focus of our study, regarding Portuguese banks’
profitability. The independent variables chosen for the models are related to the dependent
variables and not randomly chosen, and the explanation for their presence in the models is
given in this section. We carefully analysed other studies, combined with academic
knowledge, to select the ones that seemed more relevant for this study.
Return on Equity (ROE) measures the return on shareholder’s investments in the bank, giving
insights of the banks’ performance regarding the usage of equity (P. Athanasoglou et al.,
2005; Moussu & A., 2013). ROE is the ratio between Net Income and Total Equity.
Return on Assets (ROA) measures the overall performance of the bank, and is considered the
most preponderant ratio to analyse profitability (Chortareas, Garza-garcia, & Girardone,
2011; Kupiec & Lee, 2012) and performance (Bennaceur & Goaied, 2008). ROA is the ratio
between Net Income and Total Assets.
Interest Income (II) is a specific measure of the amount of the bank’s assets that generate
income through interest, mainly loans. II is the ratio between the bank’s Interest Income and
Total Assets.
(2)
(3)
(4)
29
Non-Interest Income (NII) is a specific measure of the amount of the bank’s assets that
generate income through means, other than interest and portfolio gains and losses,
primarily from fees and other service charges. This ratio, specifically, analyses the income
derived from fees and commissions charged by the banks, as the other sources of income
that do not come from interest are studied in the scope of the variable Gains and Losses on
Securities (Borio et al., 2015). NII is the ratio between the bank’s Non-Interest Income and
Total Assets.
Net Interest Margin (NIM) is one of the principal elements of bank net cash flows and after-
tax earnings (Hanweck & Ryu, 2005), as the main source of income of banks is the interest
income generating assets, this provides a great measure of banks profitability (P.
Athanasoglou et al., 2005) but also its performance (Bennaceur & Goaied, 2008). NIM is the
ration between the Net Interest Income and the banks Earning Assets, the Loans to
Customers.
4.2.2. Independent Variables
For the Independent Variables, our intention was to study and analyse the impacts on bank’s
profitability and performance, in low and negative reference interest rates motivating our
choice of ECB’s reference rates but also, Euro Interbank Offered Rate (EURIBOR) rates,
although the most affected directly by the first is the Euro Overnight Index Average (EONIA)
(Blot & Labondance, 2011), Euro Interbank Offered Rate (EURIBOR) is more related to
market factors (Aristei & Gallo, 2012).
As defined by (P. P. Athanasoglou, Brissimis, & Delis, 2008; Dietrich & Wanzenried, 2011;
Mirzaei et al., 2011) we added to the reference interest rates above, bank specific
profitability characteristics and macroeconomic indicators.
4.2.2.1. ECB Key Interest Rates
The following variables are the rates that ECB controls, and sets every six weeks, compose
the tools to apply the monetary policy strategies (Aristei & Gallo, 2012; Delivorias, 2015).
Deposit Facility Interest Rate (DFIR) is the interest banks receive for depositing money with
the central bank overnight.
Marginal Lending Facility Interest Rate (MLFIR) is the interest against eligible assets at that
which counterparties receive overnight credit from a national central bank, operated in a
standing facility of the Eurosystem.
Main Refinancing Operations Fixed Rate (MROFR) is the interest applied in reverse
transaction, of a regular open market operation executed by the Eurosystem, for the
purpose of providing the banking system with the amount of liquidity needed. Main
refinancing operations are conducted through weekly standard bids, usually with one-week
maturity.
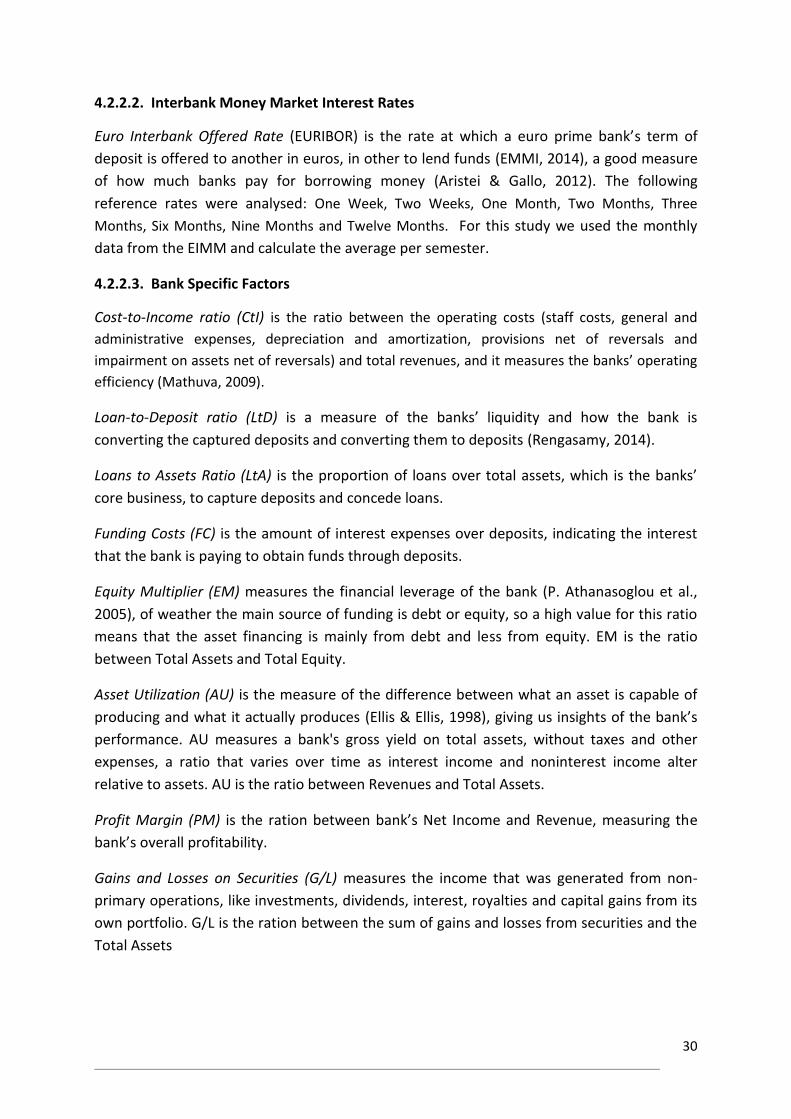
30
4.2.2.2. Interbank Money Market Interest Rates
Euro Interbank Offered Rate (EURIBOR) is the rate at which a euro prime bank’s term of
deposit is offered to another in euros, in other to lend funds (EMMI, 2014), a good measure
of how much banks pay for borrowing money (Aristei & Gallo, 2012). The following
reference rates were analysed: One Week, Two Weeks, One Month, Two Months, Three
Months, Six Months, Nine Months and Twelve Months. For this study we used the monthly
data from the EIMM and calculate the average per semester.
4.2.2.3. Bank Specific Factors
Cost-to-Income ratio (CtI) is the ratio between the operating costs (staff costs, general and
administrative expenses, depreciation and amortization, provisions net of reversals and
impairment on assets net of reversals) and total revenues, and it measures the banks’ operating
efficiency (Mathuva, 2009).
Loan-to-Deposit ratio (LtD) is a measure of the banks’ liquidity and how the bank is
converting the captured deposits and converting them to deposits (Rengasamy, 2014).
Loans to Assets Ratio (LtA) is the proportion of loans over total assets, which is the banks’
core business, to capture deposits and concede loans.
Funding Costs (FC) is the amount of interest expenses over deposits, indicating the interest
that the bank is paying to obtain funds through deposits.
Equity Multiplier (EM) measures the financial leverage of the bank (P. Athanasoglou et al.,
2005), of weather the main source of funding is debt or equity, so a high value for this ratio
means that the asset financing is mainly from debt and less from equity. EM is the ratio
between Total Assets and Total Equity.
Asset Utilization (AU) is the measure of the difference between what an asset is capable of
producing and what it actually produces (Ellis & Ellis, 1998), giving us insights of the bank’s
performance. AU measures a bank's gross yield on total assets, without taxes and other
expenses, a ratio that varies over time as interest income and noninterest income alter
relative to assets. AU is the ratio between Revenues and Total Assets.
Profit Margin (PM) is the ration between bank’s Net Income and Revenue, measuring the
bank’s overall profitability.
Gains and Losses on Securities (G/L) measures the income that was generated from non-
primary operations, like investments, dividends, interest, royalties and capital gains from its
own portfolio. G/L is the ration between the sum of gains and losses from securities and the
Total Assets
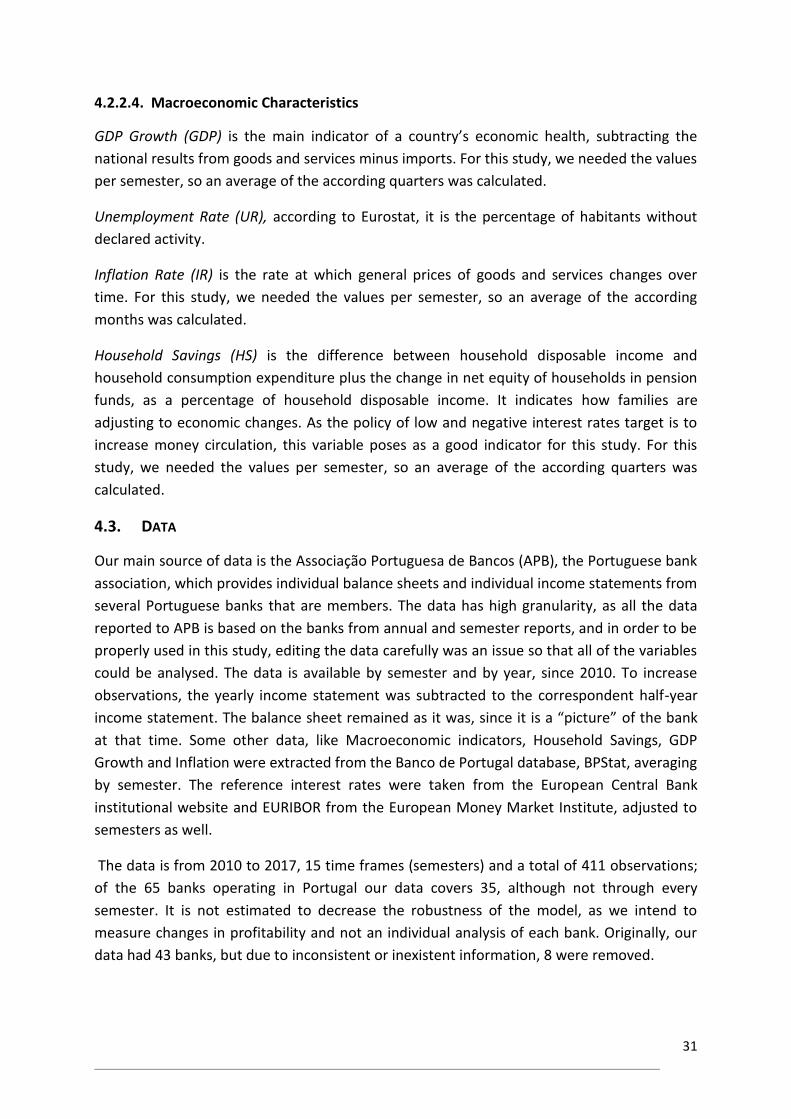
31
4.2.2.4. Macroeconomic Characteristics
GDP Growth (GDP) is the main indicator of a country’s economic health, subtracting the
national results from goods and services minus imports. For this study, we needed the values
per semester, so an average of the according quarters was calculated.
Unemployment Rate (UR), according to Eurostat, it is the percentage of habitants without
declared activity.
Inflation Rate (IR) is the rate at which general prices of goods and services changes over
time. For this study, we needed the values per semester, so an average of the according
months was calculated.
Household Savings (HS) is the difference between household disposable income and
household consumption expenditure plus the change in net equity of households in pension
funds, as a percentage of household disposable income. It indicates how families are
adjusting to economic changes. As the policy of low and negative interest rates target is to
increase money circulation, this variable poses as a good indicator for this study. For this
study, we needed the values per semester, so an average of the according quarters was
calculated.
4.3. DATA
Our main source of data is the Associação Portuguesa de Bancos (APB), the Portuguese bank
association, which provides individual balance sheets and individual income statements from
several Portuguese banks that are members. The data has high granularity, as all the data
reported to APB is based on the banks from annual and semester reports, and in order to be
properly used in this study, editing the data carefully was an issue so that all of the variables
could be analysed. The data is available by semester and by year, since 2010. To increase
observations, the yearly income statement was subtracted to the correspondent half-year
income statement. The balance sheet remained as it was, since it is a “picture” of the bank
at that time. Some other data, like Macroeconomic indicators, Household Savings, GDP
Growth and Inflation were extracted from the Banco de Portugal database, BPStat, averaging
by semester. The reference interest rates were taken from the European Central Bank
institutional website and EURIBOR from the European Money Market Institute, adjusted to
semesters as well.
The data is from 2010 to 2017, 15 time frames (semesters) and a total of 411 observations;
of the 65 banks operating in Portugal our data covers 35, although not through every
semester. It is not estimated to decrease the robustness of the model, as we intend to
measure changes in profitability and not an individual analysis of each bank. Originally, our
data had 43 banks, but due to inconsistent or inexistent information, 8 were removed.
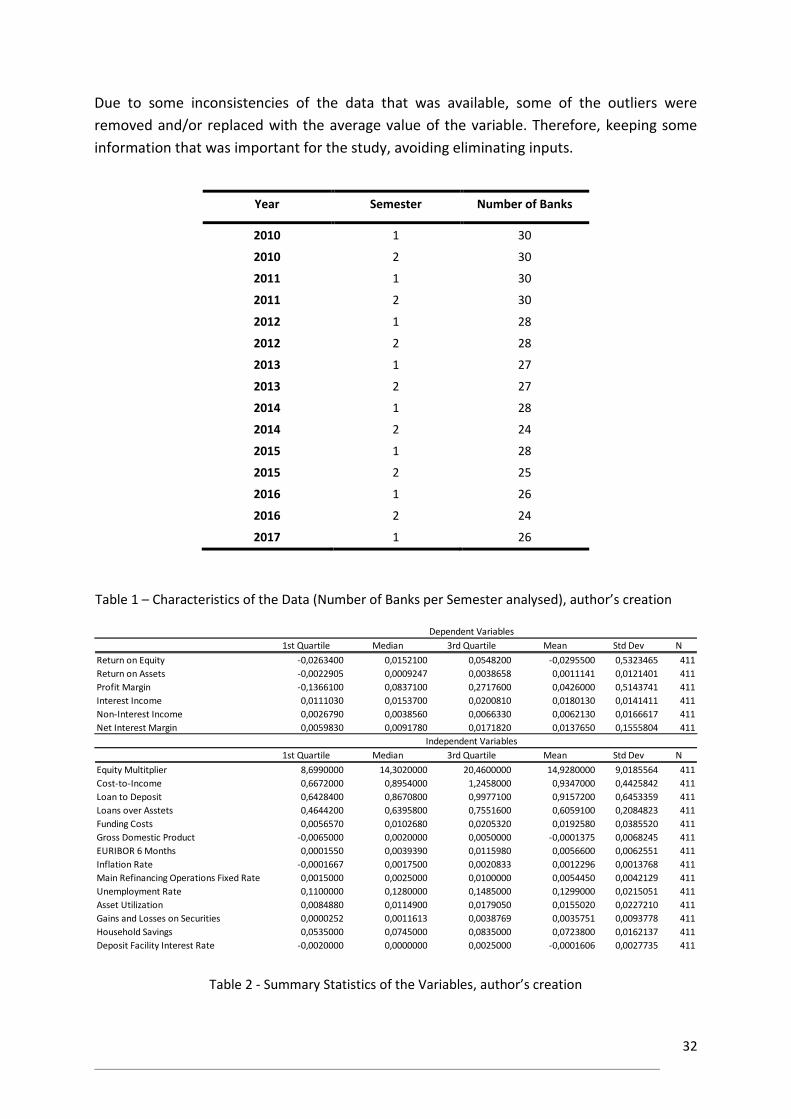
32
Due to some inconsistencies of the data that was available, some of the outliers were
removed and/or replaced with the average value of the variable. Therefore, keeping some
information that was important for the study, avoiding eliminating inputs.
1st Quartile Median 3rd Quartile Mean Std Dev N
Return on Equity -0,0263400 0,0152100 0,0548200 -0,0295500 0,5323465 411
Return on Assets -0,0022905 0,0009247 0,0038658 0,0011141 0,0121401 411
Profit Margin -0,1366100 0,0837100 0,2717600 0,0426000 0,5143741 411
Interest Income 0,0111030 0,0153700 0,0200810 0,0180130 0,0141411 411
Non-Interest Income 0,0026790 0,0038560 0,0066330 0,0062130 0,0166617 411
Net Interest Margin 0,0059830 0,0091780 0,0171820 0,0137650 0,1555804 411
1st Quartile Median 3rd Quartile Mean Std Dev N
Equity Multitplier 8,6990000 14,3020000 20,4600000 14,9280000 9,0185564 411
Cost-to-Income 0,6672000 0,8954000 1,2458000 0,9347000 0,4425842 411
Loan to Deposit 0,6428400 0,8670800 0,9977100 0,9157200 0,6453359 411
Loans over Asstets 0,4644200 0,6395800 0,7551600 0,6059100 0,2084823 411
Funding Costs 0,0056570 0,0102680 0,0205320 0,0192580 0,0385520 411
Gross Domestic Product -0,0065000 0,0020000 0,0050000 -0,0001375 0,0068245 411
EURIBOR 6 Months 0,0001550 0,0039390 0,0115980 0,0056600 0,0062551 411
Inflation Rate -0,0001667 0,0017500 0,0020833 0,0012296 0,0013768 411
Main Refinancing Operations Fixed Rate 0,0015000 0,0025000 0,0100000 0,0054450 0,0042129 411
Unemployment Rate 0,1100000 0,1280000 0,1485000 0,1299000 0,0215051 411
Asset Utilization 0,0084880 0,0114900 0,0179050 0,0155020 0,0227210 411
Gains and Losses on Securities 0,0000252 0,0011613 0,0038769 0,0035751 0,0093778 411
Household Savings 0,0535000 0,0745000 0,0835000 0,0723800 0,0162137 411
Deposit Facility Interest Rate -0,0020000 0,0000000 0,0025000 -0,0001606 0,0027735 411
Dependent Variables
Independent Variables
Year Semester Number of Banks
2010 1 30
2010 2 30
2011 1 30
2011 2 30
2012 1 28
2012 2 28
2013 1 27
2013 2 27
2014 1 28
2014 2 24
2015 1 28
2015 2 25
2016 1 26
2016 2 24
2017 1 26
Table 1 – Characteristics of the Data (Number of Banks per Semester analysed), author’s creation
Table 2 - Summary Statistics of the Variables, author’s creation
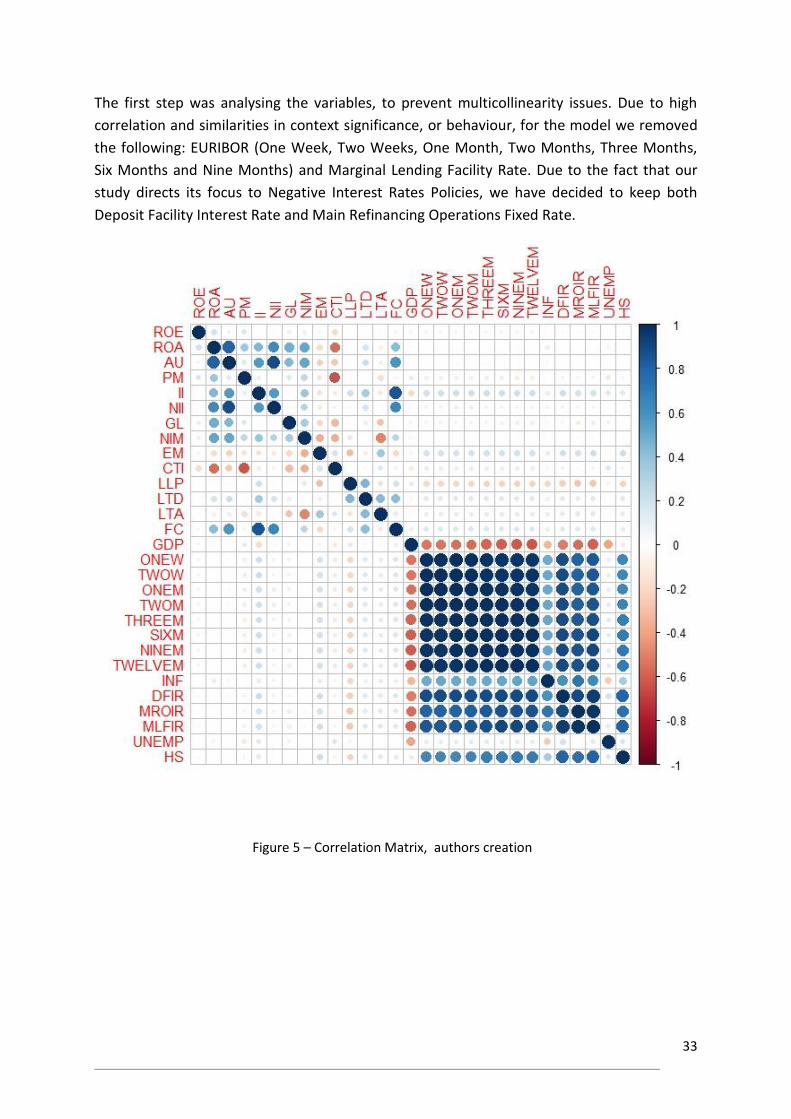
33
The first step was analysing the variables, to prevent multicollinearity issues. Due to high
correlation and similarities in context significance, or behaviour, for the model we removed
the following: EURIBOR (One Week, Two Weeks, One Month, Two Months, Three Months,
Six Months and Nine Months) and Marginal Lending Facility Rate. Due to the fact that our
study directs its focus to Negative Interest Rates Policies, we have decided to keep both
Deposit Facility Interest Rate and Main Refinancing Operations Fixed Rate.
Figure 5 – Correlation Matrix, authors creation

34
4.4. METHOD
This model was developed with the software RStudio for R, an open source programming
language for statistical computing and graphics. Having 5 dependent variables, we ran 5
different models, each for every one of them.
To enhance the models, the Stepwise Regression function of R was applied (both ways, for a
more accurate output) that will remove the independent variables that are irrelevant (or
without significant impact) for the regression analysis we are undertaking. This method is
used for fitting models to choose predictive variables in an automatic way, consisting in
iteratively adding and removing independent variables in the model, in order to find the
subset of variables that is best performing for the final model, lowering its error. For this
study we applied it both ways, which is a combination of a forward and a backward
selection, starting with no variables and sequentially adding the variables with the highest
impact on the model and removing the ones that are no longer significant, thus improving
the model.
After using the Stepwise Regression, we have applied the consistency tests to the models, so
they can comply with the following assumptions:
The average of the errors must have a probability distribution with zero mean;
Homoscedastic: The model’s errors must have the variance, which measures the
uncertainty in the statistical model, equal for every observation. This assumption
assures that for each observation, the models’ uncertainty is not directly linked to
any economic variable
Error Covariance: The errors must not be correlated; this means the covariance
between two arbitrary errors must be equal to zero;
Error Normality: the models’ errors must have a normal probability distribution.
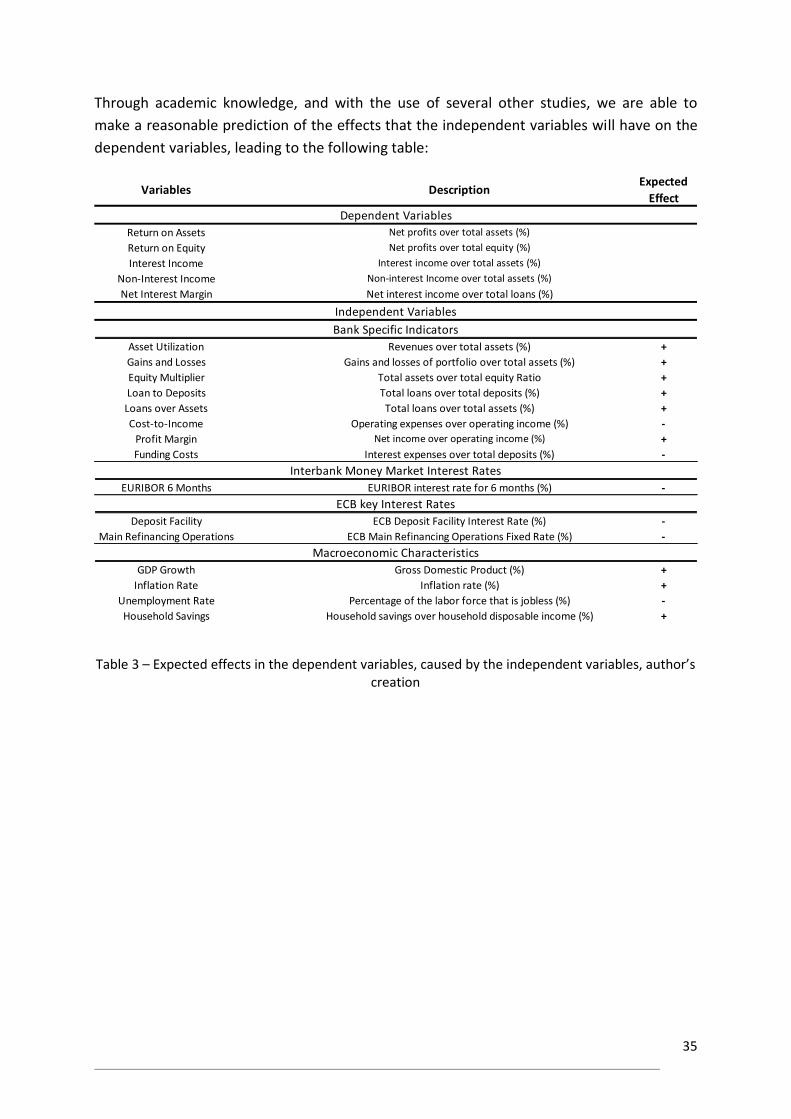
35
Return on Assets Net profits over total assets (%)
Return on Equity Net profits over total equity (%)
Interest Income Interest income over total assets (%)
Non-Interest Income Non-interest Income over total assets (%)
Net Interest Margin Net interest income over total loans (%)
Asset Utilization Revenues over total assets (%) +
Gains and Losses Gains and losses of portfolio over total assets (%) +
Equity Multiplier Total assets over total equity Ratio +
Loan to Deposits Total loans over total deposits (%) +
Loans over Assets Total loans over total assets (%) +
Cost-to-Income Operating expenses over operating income (%) -
Profit Margin Net income over operating income (%) +
Funding Costs Interest expenses over total deposits (%) -
EURIBOR 6 Months EURIBOR interest rate for 6 months (%) -
Deposit Facility ECB Deposit Facility Interest Rate (%) -
Main Refinancing Operations ECB Main Refinancing Operations Fixed Rate (%) -
GDP Growth Gross Domestic Product (%) +
Inflation Rate Inflation rate (%) +
Unemployment Rate Percentage of the labor force that is jobless (%) -
Household Savings Household savings over household disposable income (%) +
Bank Specific Indicators
Interbank Money Market Interest Rates
ECB key Interest Rates
Macroeconomic Characteristics
Expected
Effect
Dependent Variables
Independent Variables
Variables Description
Through academic knowledge, and with the use of several other studies, we are able to
make a reasonable prediction of the effects that the independent variables will have on the
dependent variables, leading to the following table:
Table 3 – Expected effects in the dependent variables, caused by the independent variables, author’s creation
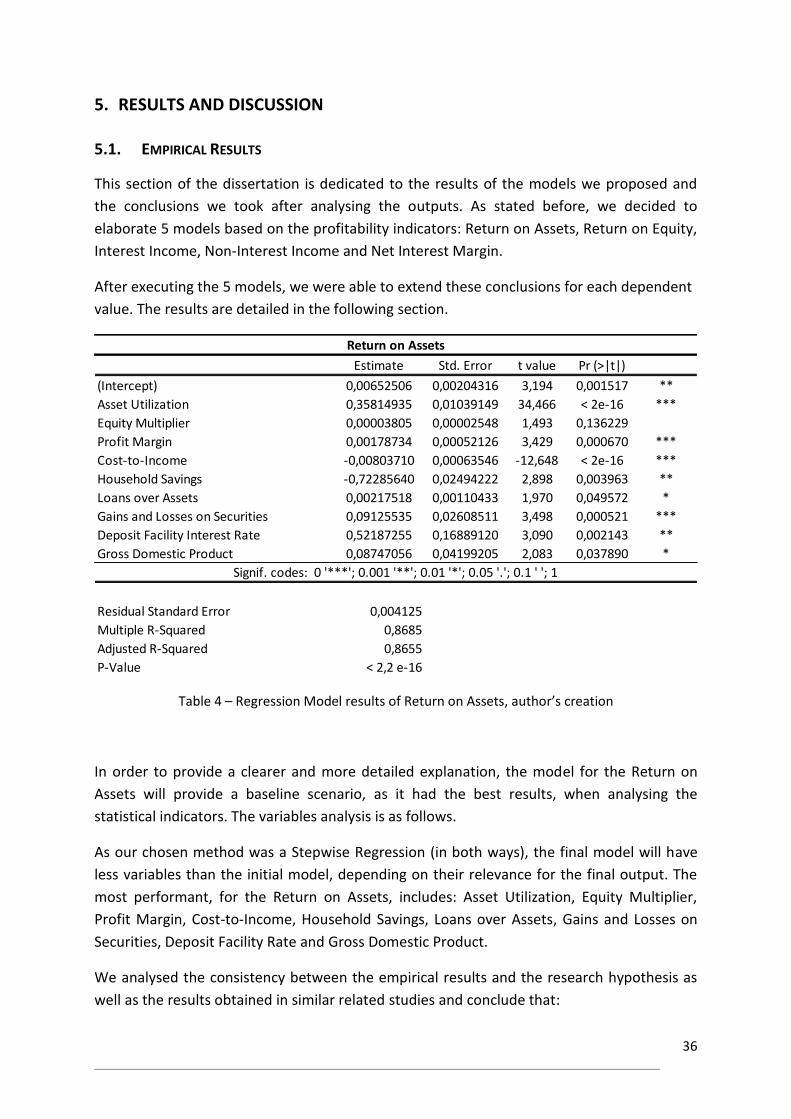
36
Estimate Std. Error t value Pr (>|t|)
(Intercept) 0,00652506 0,00204316 3,194 0,001517 **
Asset Utilization 0,35814935 0,01039149 34,466 < 2e-16 ***
Equity Multiplier 0,00003805 0,00002548 1,493 0,136229
Profit Margin 0,00178734 0,00052126 3,429 0,000670 ***
Cost-to-Income -0,00803710 0,00063546 -12,648 < 2e-16 ***
Household Savings -0,72285640 0,02494222 2,898 0,003963 **
Loans over Assets 0,00217518 0,00110433 1,970 0,049572 *
Gains and Losses on Securities 0,09125535 0,02608511 3,498 0,000521 ***
Deposit Facility Interest Rate 0,52187255 0,16889120 3,090 0,002143 **
Gross Domestic Product 0,08747056 0,04199205 2,083 0,037890 *
Residual Standard Error 0,004125
Multiple R-Squared 0,8685
Adjusted R-Squared 0,8655
P-Value < 2,2 e-16
Return on Assets
Signif. codes: 0 '***'; 0.001 '**'; 0.01 '*'; 0.05 '.'; 0.1 ' '; 1
5. RESULTS AND DISCUSSION
5.1. EMPIRICAL RESULTS
This section of the dissertation is dedicated to the results of the models we proposed and
the conclusions we took after analysing the outputs. As stated before, we decided to
elaborate 5 models based on the profitability indicators: Return on Assets, Return on Equity,
Interest Income, Non-Interest Income and Net Interest Margin.
After executing the 5 models, we were able to extend these conclusions for each dependent
value. The results are detailed in the following section.
Table 4 – Regression Model results of Return on Assets, author’s creation
In order to provide a clearer and more detailed explanation, the model for the Return on
Assets will provide a baseline scenario, as it had the best results, when analysing the
statistical indicators. The variables analysis is as follows.
As our chosen method was a Stepwise Regression (in both ways), the final model will have
less variables than the initial model, depending on their relevance for the final output. The
most performant, for the Return on Assets, includes: Asset Utilization, Equity Multiplier,
Profit Margin, Cost-to-Income, Household Savings, Loans over Assets, Gains and Losses on
Securities, Deposit Facility Rate and Gross Domestic Product.
We analysed the consistency between the empirical results and the research hypothesis as
well as the results obtained in similar related studies and conclude that:
37
Asset Utilization, just as we predicted, had a positive effect in Return on Assets and a
very high significance coefficient. Although there are few relevant studies on the
impact of Asset Utilization on Profitability Ratios, it is known to have a direct
proportionality with interest rates, but it can have a different behaviour depending
on the bank’s strategy (higher focus on non interest sources of income or selling
parts of the loan portfolio). As we analyse the DuPont Analysis, this is a key
component of Return on Assets and is composed both by Interest Income and Non-
Interest Income. Our study shows that banks made a big effort in increasing the
revenue generating assets, improving the efficiency in the overall business, especially
in a negative interest period, in which the assets that depend on interest to generate
income suffer a decrease in the amount generated.
Equity Multiplier presented a positive impact Return on Assets, as our predictions
indicated, but the lowest statistical significance. This may be explained by the
multiplicity of types and sizes of banks in our study, which do not have similar EM
ratios. As for the analysis of the result, it may encounter a justification in the fact that
banks reduced their financial leverage their balance sheet and focused on the assets
that provided safe and steady profits.
Profit Margin has a positive effect on Return on Assets, with a high statistical
relevance. It may encounter a justification in the fact that, in Portugal, the vast
majority of banks are commercial banks, highly dependent on credit products, fees
and commissions and transactions, so this variable is intrinsically related to interest
income sources. This is highly consistence with our prediction.
Cost-to-Income shows the banks capacity to change the organization’s expenses, as
profitability varies. The operating expenses did not change (or have increased) and
operating profit lowered along the years, due to the shrinking of the net interest
margin. As expected, it had a negative influence, with high significance coefficient,
since the sources of income that account interest rates have shrunken. It is aligned
with other studies such as Guerreiro (2013).
Household Savings returned a negative impact on Return on Assets, contrary to our
predictions. Our data shows a tendency of lower savings possesses by families which
can be explained by the 2007/08 crisis and the IMF intervention (in 2011). With
fewer savings, families tend to tighten their consumption expenditures and switch to
more conservative and less risky investment strategies to reduce the likelihood of
requiring financial assistance r be credit constrained.
Loans over Assets has a significant positive weight on Return on Assets, with good
significance levels, since in Portugal the majority of banks are commercial banks, as
the number of credits increase in terms of percentage of the overall assets, more
profits are obtained (from interests and non-interest sources).
38
The importance of the item Gains and Losses on Securities is shown to be very
significant for this baseline model we chose, showing a very high significance
coefficient. Theoretically, as interest rates decrease, security prices go up (due to less
discount factors) and improve the performance of asset management. Our results
confirm that theory, as Return on Assets was affected positively. In Portugal,
investment banking does not represent a significant percentage of overall banking
business, showing that as securities present a higher valuation, this strongly indicates
that the profits that are generated in interest means, tend to lower.
The Deposit Facility Interest Rate is the ECB’s interest rate for retaining overnight
deposits from other financial institutions. It was expected to impact negatively in
profitability. Our model shows an opposite result with a special remark to a positive
impact and a good significance when analysing Return on Assets. We can conclude
that, since the negative rates were applied later in 2014, only when more data is
made available we make better conclusions (EURIBOR presented low rates prior to
the deposit facility) or that the negative interest rates provided an increase in
banking business, benefiting the profitability.
GDP is commonly used to measure a country’s economic performance. Our results
show, as expected, that GDP real growth positively impacts the Return on Assets for
banks, which can easily be explained by the improvement on overall economy,
hence, more public and private investments resulting in more business for banks.
Regarding the other 4 models we have created (respective tables in the annexes), the
majority of the independent variables that the Stepwise Regression methodology chose
followed the same results as the Return on Assets one.
As predicted in this study, the Cost-to-Income affected negatively (with high significance
coefficients) the Return on Equity and the Net Interest Margin, since the costs are inversely
proportional to profitability if revenues are kept the same or decrease. This shows the
inefficiency that banks had in changing the organization as profitability gets lower. We have
verified that there was an exception in Non-Interest Income. This may be explained by the
fact that the burden of interest costs in the overall profitability lowered, benefiting the
operating income as a whole, hence a positive effect that we obtain (although its
significance coefficient does not provide enough robustness to fully prove this statement).
For the Loans over Assets variable, we have reached a significant positive weight on Return
on Equity and Non-Interest Income with good significance levels, with the same reasons we
have described in the Return on Assets model. Contrary to our expectations, it had a small
and negative impact, but with a high level of significance, in Net Interest Margin, since the
margins are lower due to the Negative Interest Rate Policy, even though the credit portfolio
might increase, the net margin from it is lower than before.
39
The Loan-to-Deposits ratio measures the capacity of a bank to convert deposits into credit in
order to pursue profit. This strategy provides a cheaper mechanism to obtain funds that will
be sold as credit or other products, and it aims to have lower costs (e.g. than the Money
Market ones). It had a positive impact over the years, matching our expectations, in Interest
Income, Non-Interest Income and Net Interest Margin. As interest rates decrease, banks
tend to push credit further, in order to increase profits.
As for Funding Costs, it shows the amount of interest costs paid for capturing capital and the
data shows a considerable positive impact on Interest Income, since banks are paying less
for obtaining money, due to the fact that, generically, interest rates are lower (both deposits
and Money Market), this eased the expenses in interests, benefiting income obtained
through interest. With a low effect and low significance level, there is a negative impact on
Net Interest Margin, this may be justified by a still considerable weight of deposits in the
profitability of banks, keeping the Net Interest Margin low.
The Deposit Facility Interest Rate is the ECB’s interest rate for retaining overnight deposits
from other financial institutions. It was expected to impact negatively in profitability. The
data shows otherwise, an overall positive impact in the Interest Income ratio. We can
conclude that since the negative rates were applied later in 2014, only when more data is
made available we make better conclusions (EURIBOR presented low rates prior to the
deposit facility) or that the negative interest rates provided an increase in banking business,
benefiting the profitability.
Inflation Rate and EURIBOR Six Months, in the regression models we made, was removed by
the Stepwise procedure, as it was not significant enough for any of the five dependent
variables, considering the data provided. This may be due to the fact that were other
variables that had the same impact, or, with the data set we have used, there were no
cause-effect to be detected.
The Unemployment Rate decreased over most of period analysed. This justifies the positive
impact it had on Return on Equity (although with a very low significance coefficient) and in
Interest Income (with a high significance coefficient) in the first half of our time frame of
study.
The variable Household Savings is used to access to capacity of families to save money, that
can be used to invest, and it shows a negative impact on Return on Equity. Our data shows a
tendency of lower savings possesses by families) which can be explained by the 2007/08
crisis and the IMF intervention (in 2011). With fewer saving, families tend to tighten their
budget and avoid spending on loans or other financial assets.
Regarding Asset Utilization, it has a considerably high and positive effect in Interest Income,
Non-Interest Income and Net Interest Margin, all with a very high significance coefficient,
with the same justification as the supra cited one for the Return on Assets.

40
Considering Gains and Losses on Securities, it has a significant impact for all the other 4
models we made, showing a very high significance coefficient for all of them. To justify its
positive effect, consider the already presented text in the Return on Assets topic. The ratios
Interest Income, Non-Interest Income (this only takes in account fees and commissions
derived from banking business) and Net Interest Margin had a negative influence by this
independent variable, with high coefficient significance.
Equity Multiplier presented a negative impact on Non-Interest Income, as banks were forced
to deleverage (regulatory impositions and IMF demands) hence shortening the profits from
Non-Interest sources, but it had a positive impact on Interest Income and Net Interest
Margin, as banks cleared their balance sheet and focused on the assets that provided safe
and steady profits.
Profit Margin has a positive effect on Interest Income (with a high significance coefficient),
just based on the fact that the business strategy of the commercial banks (the majority in
Portugal) has a great focus on credit products (mostly mortgage and consumer) and so the
bank’s profitability is linked to the credit margins. The same reason might explain the
negative, but with a low significance coefficient, impact on Non-Interest Income, as Profit
Margin is more influenced by interest rates than fees and commissions.
Main Refinancing Operations presented a high positive impact, with a great significance
coefficient, on Return on Equity, as banks access to cheaper capital increased, the ability to
achieve lower interest costs and increase liquidity also grew, providing better results for the
shareholders.
41
6. CONCLUSIONS
The question posed in the beginning of this paper was how was the profitability of banks
affected in a context of low and negative interests.
We analysed 35 banks in Portugal, over fifteen semesters, in order to compare their
profitability over time and how it was influenced by new policies of low and negative
interests, besides overlapping regulatory changes.
The negative interest rate scenario is quite recent (ECB initiated NIRP in 2014), but low
interest rates came first (2012), so we analysed 10 periods (from 2010 to 2013) with low
interest rates and 5 with negative and low interest rates (from 2014 to the first semester of
2017). From 2010 to the first semester of 2017, the Portuguese banks went through two
phases: an economic crisis and an economic recovery (enforced by legislation and the IMF
intervention).
The data was rich in granularity, but presented its normal flaws, as not all banks report their
balance sheet and income statement the same way to APB, our main source of data. Some
issues with the periodicity arose, in order to maintain comparability; several averages were
calculated to the macroeconomic indicators (from BdP), ECB reference interest rates and
EURIBOR rate. The data from APB was available in two ways: yearly data and data from the
first semester, and so, data cleansing was necessary to avoid too much noise and outliers in
the models and subtracting the first semester income statement to the yearly income
statement, in order to normalize the periods in semesters, increasing the number of time
frames and improving the monetarization of the ratio’s evolution.
The results of the models we chose could have been more robust, but a trade-off was made
to assure more banks and more timeframes were analysed which meant more detail
provided for the ratios and calculations. As key target of our study, low interest rates
influenced the profitability of the banks; we highlight Deposit Facility Interest Rate that
presented low values in time period between 2010 and half 2013, and negative values from
2014 to mid-2017, presented a positive weight, with acceptable confidence levels, on the
Return on Assets and Interest Income, although we expected to provide us a negative impact
in profitability, since it is only negative since mid-2014, banks would lose margin from their
main business, credit contracts. We can conclude that banks adapt quickly to these new
monetary policies and took on strategies to sell more credit and improve their investment
portfolio, as shown by the positive influence by Asset Utilization in all of the profitability
ratios we have chosen.
As shown in other studies, we can also confirm that Cost-to-Income has a negative weight in
Return on Assets and Return on Equity but we found the main affected is the Net Interest
Margin, since interest income declines and expenses maintain or rise, affecting the main
source of profit, which is generated by interest rates. Funding Costs is also studied in other
42
papers to investigate its implication in profitability and the conclusion was it has a negative
weight in Net Interest Margin. We managed to obtain the same conclusions and also
discovered that the main reasons are the positive impacts in Interest Income and Non-
Interest Income. If costs of funds captured raise so do interests on loans granted, and
respective commissions on them. This reflects a good adaptability of the banks in shifting
their efforts to the most effective source of income.
Based on our research, specifically the channels from which a negative interest rate policy
affects Portuguese bank’s profitability, we have evidence that the most relevant ones were
the Interest Rate Channel, the Credit Channel and the Portfolio Channel. The models we
designed showed that the Channel with the highest influence was the Credit Channel, as the
variables Asset Utilization, Loans over Assets and Profit showed high and positive impacts on
profitability ratios, besides having a significant statistical coefficient. For the Interest Rate
Channel, we have concluded its influence through the high significance and statistical
relevance of Deposit Facility Interest Rate and Main Refinancing Operations Interest Rate,
having a positive impact in profitability. Lastly, the Portfolio Channel has evidence of being a
way to influence bank’s profitability, due to negative interest rates, as the variable Gains and
Losses on Securities returned a high and positive impact for Return on Assets and Return on
Equity but a negative impact in the Interest related ratios.
As we can see from the models, Non-Interest Income was mostly negative affected by all the
variables that were selected by our method, showing that profits that are not related to
interest rates (e.g. commissions, fees, services) decreased with NIRP, as they are usually a
percentage of the interest charged. This evidence enhances our conclusion that the Credit
Channel was one of the most relevant ones, that impacted the most, when concerning
banks’ profitability.
As for the Reflation Channel, our models did not select the Inflation Rate as a relevant
variable that might affect profitability, so we can conclude that NIRP did not impact
Portuguese banks through this theoretical channel.
The Exchange Rate Channel was not considered, as Portuguese banks have a very low
exposure to foreign currencies, handling mostly in Euros, so we did not consider foreign
exchange ratios.
Being in line with other researches only soundproofs the study, as we are only studying
Portuguese banks and for a short period of time. We aimed to provide further knowledge in
the impacts of NIRP and low interest rates generally. The motives for them are anchoring
inflation to a value close to 2% and maintaining price stability, but this brings other
constraints to banks. Our research showed evidences that management decisions are being
made to counteract income decrease, shifting the earning assets and selling more credit to
ease the shortening of interest spread.

43
This is a highly important matter and it will require further investigation, an increase in both
granularity and time frame: Granularity in order to evaluate the assets that demonstrate
better performances in this environment and how banks take profit of them; time frame to
enhance the robustness of the model, reducing the influence of spikes or non-repetitive
events and obtaining more insights on the results of decisions taken by management and
administrations. The last would also be a good add to this study, the strategies and plans
defined for banks and their outputs through an individual model for each bank and
respective comparisons.
44
7. REFERENCES
Abreu, M., & Mendes, V. (2001). Commercial Bank Interest Margins and Profitability : Evidence for Some Eu.
Albertazzi, U., & Gambacorta, L. (2009). Bank profitability and the business cycle. Journal of Financial Stability, 5(4), 393–409. https://doi.org/10.1016/j.jfs.2008.10.002
Alessandri, P., & Nelson, B. (2012). Appendix to Working Paper No . 452 Simple banking : profitability and the yield curve Simple banking : profitability and the yield curve, (452).
Alves, C., & Tavares, C. (2017). A Banca e a Economia Portuguesa. (H. Piriquito, Ed.) (1st ed.). Lisbon: Bnomics.
Ames, P. (Financial T. (2015). Profits beckon for Portugal’s banks.
APB. (2014). Boletim informativo. APB, 2, 1–8.
Arghyrou, M. G., & Kontonikas, A. (2010). The EMU sovereign-debt crisis: Fundamentals, expectations and contagion. Cardiff.
Aristei, D., & Gallo, M. (2012). The Relationship Between Bank and Interbank Interest Rates during the Financial Crisis: Empirical Results for the Euro Area.
Athanasoglou, P., Brissimis, S., & Delis, M. (2005). Bank-specific, industry-specific and macroeconomic determinants of bank profitability. Bank of Greece (Vol. 8). https://doi.org/ISBN 978 92 4 1564403
Athanasoglou, P. P., Brissimis, S. N., & Delis, M. D. (2008). Bank-specific, industry-specific and macroeconomic determinants of bank profitability. Journal of International Financial Markets, Institutions and Money, 18(2), 121–136. https://doi.org/10.1016/j.intfin.2006.07.001
Banco de Portugal. (2016a). Financial Stability Report. Banco de Portugal Working Staff. Lisbon.
Banco de Portugal. (2016b). Novas estatísticas sobre empréstimos concedidos pelo setor financeiro residente. Lisbon.
Bean, C., Broda, C., Ito, T., & Kroszner, R. (2015). Low for Long ? Causes and Consequences of Persistently Low Interest Rates.
Bech, M., & Malkhozov, A. (2016). How have central banks implemented negative policy rates? Basel Committee on Banking Supervision, (March), 31–44.
Bennaceur, S., & Goaied, M. (2008). The Determinants of Commercial Bank Interest Margin and Profitability: Evidence from Tunisia. Frontiers in Finance and Economics, 5(1), 106–130.
Bicho Pires, C. A. (2013). O consumidor e a comunicação do sector bancário em Portugal : contextos e tendências Lisboa.
Bikker, J. A., & Hu, H. (2002). Cyclical patterns in profits, provisioning and lending of banks and procyclicality of the new Basel capital requirements. Banca Nazionale Del Lavoro Quarterly Review, 55(221), 143–175. https://doi.org/DOI: ,
Blot, C., & Labondance, F. (2011). Bank interest rate pass-through in the eurozone : monetary policy transmission during the boom and since the financial crash, 1–35.
45
Bodie, Z., Kane, A., & Marcus, A. (2011). Investments.
Borio, C., Gambacorta, L., & Hofmann, B. (2015). The influence of monetary policy on bank profitability. BIS Working Papers, (514), 1–37. https://doi.org/10.1111/infi.12104
Borio, C., & Zhu, H. (2008). Capital regulation , risk-taking and monetary policy : a missing link in the transmission mechanism ? Basel.
Boucinha, M. (Banco de P., & Ribeiro, N. (Banco de P. (2009). AN ASSESSMENT OF COMPETITION IN THE PORTUGUESE BANKING SYSTEM IN THE 1991-2004 PERIOD. Lisbon.
Bourke, P. (1989). Concentration and other determinants of bank profitability in Europe, North America and Australia. Journal of Banking & Finance, 13(1), 65–79. https://doi.org/10.1016/0378-4266(89)90020-4
Canhoto, A., & Dermine, J. (2003). A note on banking efficiency in A note on banking efficiency in Portugal , New vs . Old banks. Journal of Banking & Finance, (27), 1087–2098. https://doi.org/10.1016/S0378-4266(02)00316-3
Cappiello, L., Kadareja, A., Kok Sorensen, C., & Protopapa, M. (2010). Do Bank Loans and Credit Standards Have an Effect on Output? A Panel Approach for the Euro Area. ECB Working Paper Series, 2010(1150), 1–28.
CFA Institute. (2013). Capital Requirements Directive (CRD IV), (Crd Iv), 1–6.
Chamboko, R., Bravo, J. M. (2016). On the Modelling of Prognosis from Delinquency to Normal Performance on Retail Consumer Loans. Risk Management 18 (4), 264–287.
Chamboko, R., Bravo, J. M. (2018a). Modelling and forecasting recurrent recovery events on consumer loans. International Journal of Applied Decision Sciences. forthcoming
Chamboko, R., Bravo, J. M. (2018b). Frailty correlated default on retail consumer loans in developing markets. International Journal of Applied Decision Sciences. forthcoming
Chamboko, R. & Bravo, J. M. (2018c). A multi-state approach to modelling intermediate events and multiple mortgage loan outcomes. Working Paper, submitted to Journal of Urban Economics.
Chortareas, G. E., Garza-garcia, J. G., & Girardone, C. (2011). Banking Sector Performance in Latin America : Market Power versus Efficiency. Review of Development Economics, 15(2), 207–325.
Claessens, S., Coleman, N., & Donnelly, M. (2017). “Low-For-Long” Interest Rates and Banks ’ Interest Margins and Profitability : Cross-Country Evidence. International Finance Discussion Papers, (1197).
Constâncio, V. (Banco de P. Aviso do Banco de Portugal no 6/2009 A (2009). Lisbon: Banco de Portugal.
Correia, C., & Pereira Rosário, H. (2011). NACIONALIZAÇÕES E PRIVATIZAÇÕES: O REGIME DAS NACIONALIZAÇÕES EM PORTUGAL, DOS TEMPOS DA REVOLUÇÃO AO CASO BPN.
Correia da Cunha, J., & Braz, C. (2012). THE EVOLUTION OF PUBLIC EXPENDITURE : PORTUGAL IN THE EURO AREA CONTEXT. Banco de Portugal Economic Bulletin.
Costa, S. D. (2014). Concentração Bancária em Portugal - Uma análise de performance do sector bancário, 60.
46
Delivorias, A. (2015). Monetary Policy of the European Central Bank. European Parliamentary Research Service, (February), 1–22. https://doi.org/10.2861/388683
Demertzis, M., & Wolff, G. B. (2016). What impact does the ECB’s quantitative easing policy have on bank profitability? Retrieved from http://bruegel.org/wp-content/uploads/2016/11/pc-20-16-1.pdf
Demiralp, S., Eisenschmidt, J., & Vlassopoulos, T. (2015). The impact of negative interest rates on bank balance sheets: Evidence from the euro area.
Demirguç-Kunt, A., & Huizinga, H. (1999). Determinants of Commercial Bank Interest Margins and Profitability: Some International Evidence. The World Bank Economic Review, 13(2 (1999)), 379–408. https://doi.org/10.1093/wber/13.2.379
Dietrich, A., & Wanzenried, G. (2011). Determinants of bank profitability before and during the crisis: Evidence from Switzerland. Journal of International Financial Markets, Institutions and Money, 21(3), 307–327. https://doi.org/10.1016/j.intfin.2010.11.002
ECB. (2007). PAYMENT AND SECURITIES SETTLEMENT SYSTEMS IN THE EUROPEAN UNION (4th ed., Vol. 1). Frankfurt.
ECB. (2014). Key ECB interest rates.
Ellis, R., & Ellis, R. P. (1998). Asset Utilization : A Metric for Focusing Reliability Efforts Asset Utilization : A Metric for Focusing Reliability Efforts Asset Utilization Defined.
EMMI. (2014). Euribor Code of Conduct.
EMMI. (2017).
ESRB. (2016). Macroprudential policy issues arising from low interest rates and structural changes in the EU financial system. Working Paper, (November), 1–61.
European Central Bank. (2014). Guide to banking supervision. https://doi.org/10.2866/17199
European Savings and Retail Banking. (2016). Negative interest rates : Impact on the European Savings and Retail Banks. Esbg, (June), 1–15.
European Systemic Risk Board. (2014). Is Europe Overbanked? Reports of the Advisory Scientific Committee, (4), 1–52.
European Union, International Montetary Fund, & European Central Bank. MEMORANDUM OF UNDERSTANDING ON SPECIFIC ECONOMIC POLICY CONDITIONALITY (2011). Portugal.
Fang, C., & Mohnen, P. (2016). The ECB’s asset purchase programme: an early assessment. Working Paper Series, 1956(1956), 1–26. https://doi.org/10.1111/j.1467-629X.1980.tb00220.x
Gambacorta, L., & Shin, H. S. (2016). Why bank capital matters for monetary policy. Bank of International Settlements Working Papers, (558).
Gibas, N., Juks, R., & Söderberg, J. (2015). Swedish financial institutions and low interest rates. Sveriges Riksbank Economic Commentaries No. 16, 1–27.
Guerreiro, J. (2013). Determinants of Banks’ Profitability – Portuguese Case.
Hannoun, H., & Hofmann, B. (2015). Ultra-low or negative interest rates : what they mean for
47
financial stability and growth. Riga.
Hanweck, G. A., & Ryu, L. H. (2005). The Sensitivity of Bank Net Interest Margins and Profitability to Credit, Interest-Rate, and Term-Structure Shocks Across Bank Product Specializations. SSRN Electronic Journal, 1–77. https://doi.org/10.2139/ssrn.886727
Jackson, H. (Bank of C. (2015). The International Experience with Negative Policy Rates. Bank of Canada Staff Discussion Paper 2015-13.
Jobst, A., & Lin, H. (2016). Negative Interest Rate Policy (NIRP): Implications for Monetary Transmission and Bank Profitability in the Euro Area. IMF Working Papers.
Krishnamurthy, A., & Vissing-Jorgensen, A. (2011). The Effects of Quantitative Easing on Interest Rates: Channels and Implications for Policy. Brookings Papers on Economic Activity, 2011(2), 215–287. https://doi.org/10.1353/eca.2011.0019
Kumar, M. S., Baig, T., Decressin, J., Faulkner-MacDonagh, C., & Feyzioglu, T. (2003). Deflation: Determinants, Risks, and Policy Options - Findings of an Interdepartemental Task Force. International Monetary Fund, (March). Retrieved from http://scholar.google.com/scholar?hl=en&btnG=Search&q=intitle:Deflation:+Determinants,+Risks+and+Policy+Options#0
Kupiec, P., & Lee, Y. (2012). What Factors Explain Differences in Return on Assets Among Community Banks?, (December), 1–16. Retrieved from https://www.fdic.gov/regulations/resources/cbi/report/cbi-roa.pdf
Kyriazopoulos, G., Pantelis, P., & Noula, C. (2013). DU PONT ANALYSIS OF THE WORLD SYSTEMIC. International Conference ABSRC, (October 2013).
Lambert, F., & Ueda, K. (2014). The Effects of Unconventional Monetary Policies on Bank Soundness. IMF Working Papers, 14(152), 1–39. https://doi.org/10.5089/9781498363563.001
Lane, P. R. (2012). The European Sovereign Debt Crisis. Journal of Economic Perspectives, 26(3), 49–68.
Lima, F., & Soares de Pinho, P. (2008). Financial Desintermediation and the Measurement Efficiency in Banking : the case of Portuguese Banks. European Financial Management Association, 1–29.
M. Billi, R., & A. Khan, G. (2008). What Is the Optimal Inflation Rate? Federal Reserve Bank of of Kanses City, 1–24. Retrieved from www.KansasCityFed.org
Mathuva, D. M. (2009). Capital Adequacy, Cost Income Ratio and the Performance of Commercial Banks: The Kenyan Scenario. The International Journal of Applied Economics and Finance, 3(2), 35–47.
McAndrews, J. (Federal R. B. of N. Y. (2015). Negative nominal central bank policy rates – where is the lower bound ? Madison.
Mehta, A., & Bhavani, G. (2017). What Determines Banks ’ Profitability ? Evidence from Emerging Markets — the Case of the UAE Banking Sector, 6(1), 77–88. https://doi.org/10.5430/afr.v6n1p77
Mendes, V. (CEMPRE), & Rebelo, J. (1999). THE EFFECT OF BANK M&As ON EFFICIENCY: THE PORTUGUESE EXPERIENCE, (November), 1–19.
Mirzaei, A., Liu, G., & Moore, T. (2011). Does Market Structure Matter on Banks ’ Profitability and
48
Stability ? Emerging versus Advanced Economies, 11(12), 1–40.
Molyneux, P., & Thornton, J. (1992). Determinants of European bank profitability: A note. Journal of Banking and Finance, 16(6), 1173–1178. https://doi.org/10.1016/0378-4266(92)90065-8
Moussu, C., & A., P.-R. (2013). ROE in Banks: Myth and Reality. Working Paper, (August), 1–32. https://doi.org/10.2139/ssrn.2374068
Newbold, P., Carison, W. L., & Thorne, B. M. (2013). Statistics for Business and Economics. Retrieved from http://www.tandfonline.com/doi/abs/10.1198/tas.2006.s59
Pereira, P. T., & Wemans, L. (2012). Portugal and Global Financial short-sighted politics , deteriorating public finances and the bailout imperative Portugal and the Global Financial Crisis – short-sighted. School of Economics and Management - Techinical University of Lisbon.
Rengasamy, D. (2014). Impact of Loan Deposit Ratio ( LDR ) on Profitability : Panel Evidence from Commercial Banks in Malaysia. In Proceedings of the Third International Conference on Global Business, Economics, Finance and Social Sciences.
Santis, R. A. D. (ECB). (2012). THE EURO AREA SOVEREIGN DEBT CRISIS SAFE HAVEN , CREDIT RATING AGENCIES AND THE SPREAD OF THE FEVER FROM GREECE , IRELAND AND PORTUGAL (No. 1419).
Stocker, M., Arteta, C., Kose, M. A., & Taskin, T. (2016). Negative Interest Rate Policies: Sources and Implications. CEPR Discussion Paper No. DP11433.
Turk, R. A. (2016). Negative Interest Rates : How Big a Challenge for Large Danish and Swedish Banks ? IMF Working Papers, 1–29.
Waller, C. J. (2016). Negative Interest Rates: A Tax in Sheep’s Clothing.
7.1. OTHER REFERENCES
Associação Portuguesa de Bancos Data - http://www.apb.pt/estudos_e_publicacoes/estatisticas/
Banco de Portugal Data – BPStat -
https://www.bportugal.pt/EstatisticasWeb/(S(k1g0qv45qvelgf45stlwqcyo))/Default.aspx
European Central Bank Data - http://sdw.ecb.europa.eu/browse.do?node=9691107
European Money Markets Institute Data - https://www.emmi-benchmarks.eu/euribor-org/euribor-
rates.html
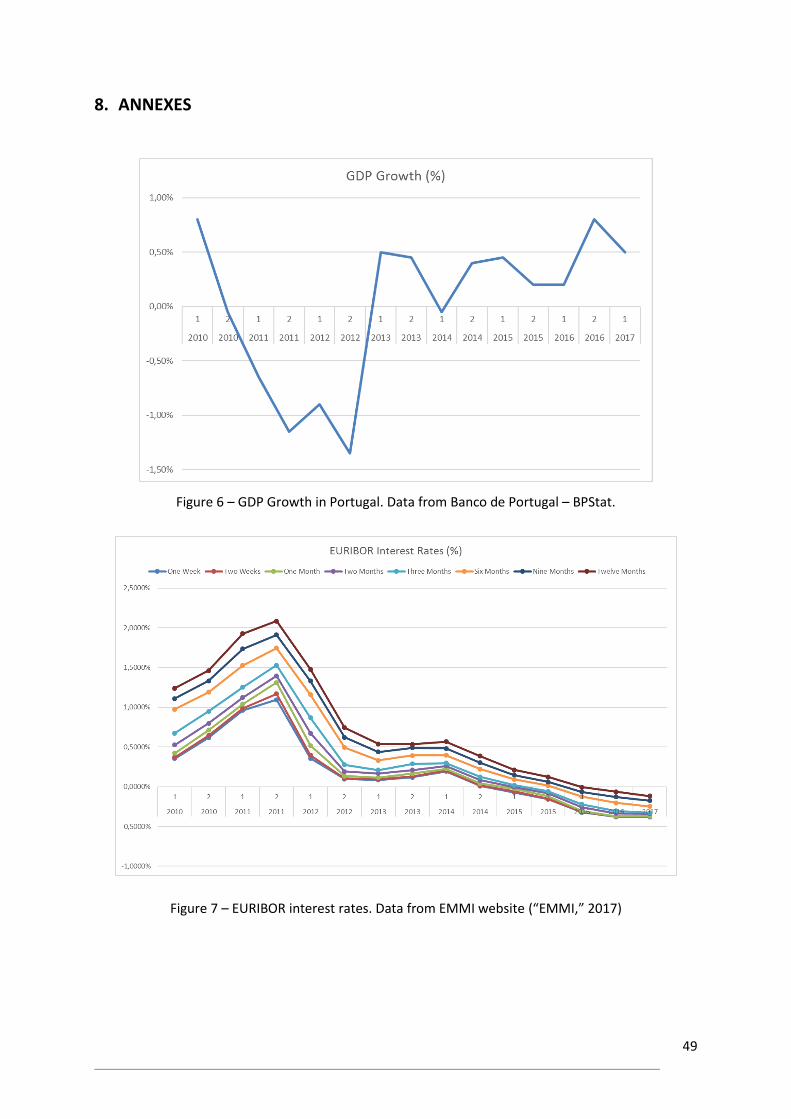
49
8. ANNEXES
Figure 6 – GDP Growth in Portugal. Data from Banco de Portugal – BPStat.
Figure 7 – EURIBOR interest rates. Data from EMMI website (“EMMI,” 2017)
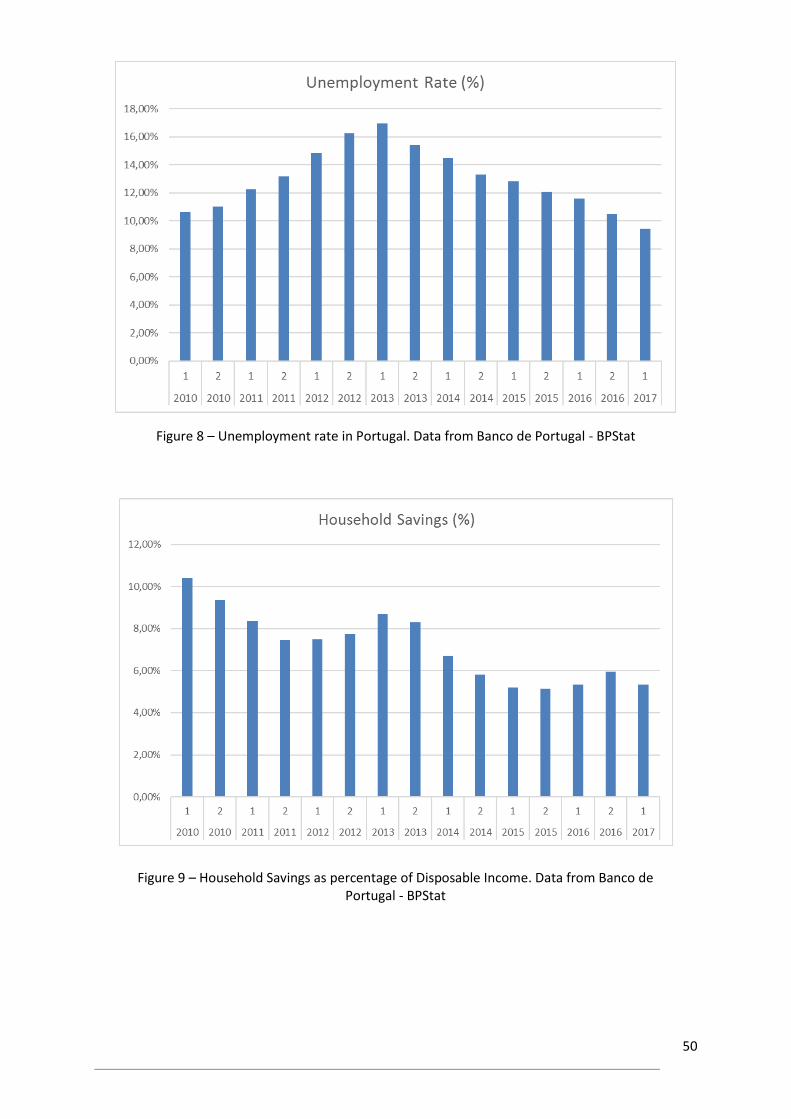
50
Figure 8 – Unemployment rate in Portugal. Data from Banco de Portugal - BPStat
Figure 9 – Household Savings as percentage of Disposable Income. Data from Banco de Portugal - BPStat
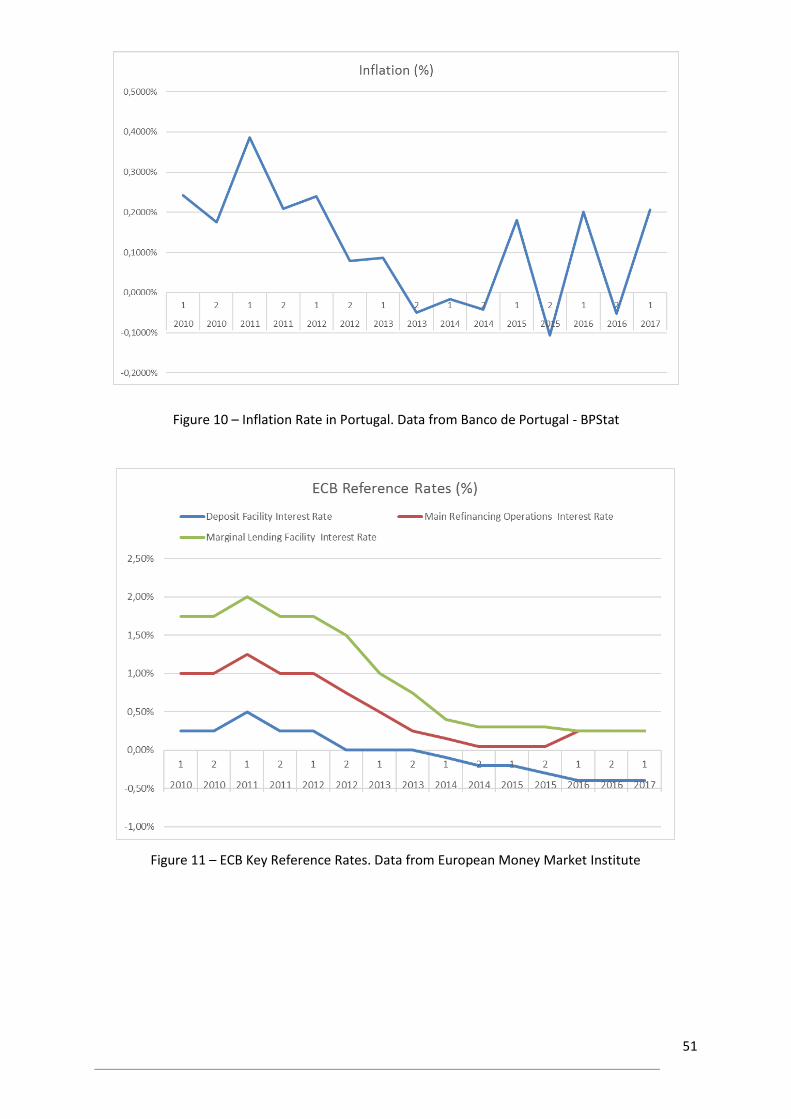
51
Figure 10 – Inflation Rate in Portugal. Data from Banco de Portugal - BPStat
Figure 11 – ECB Key Reference Rates. Data from European Money Market Institute
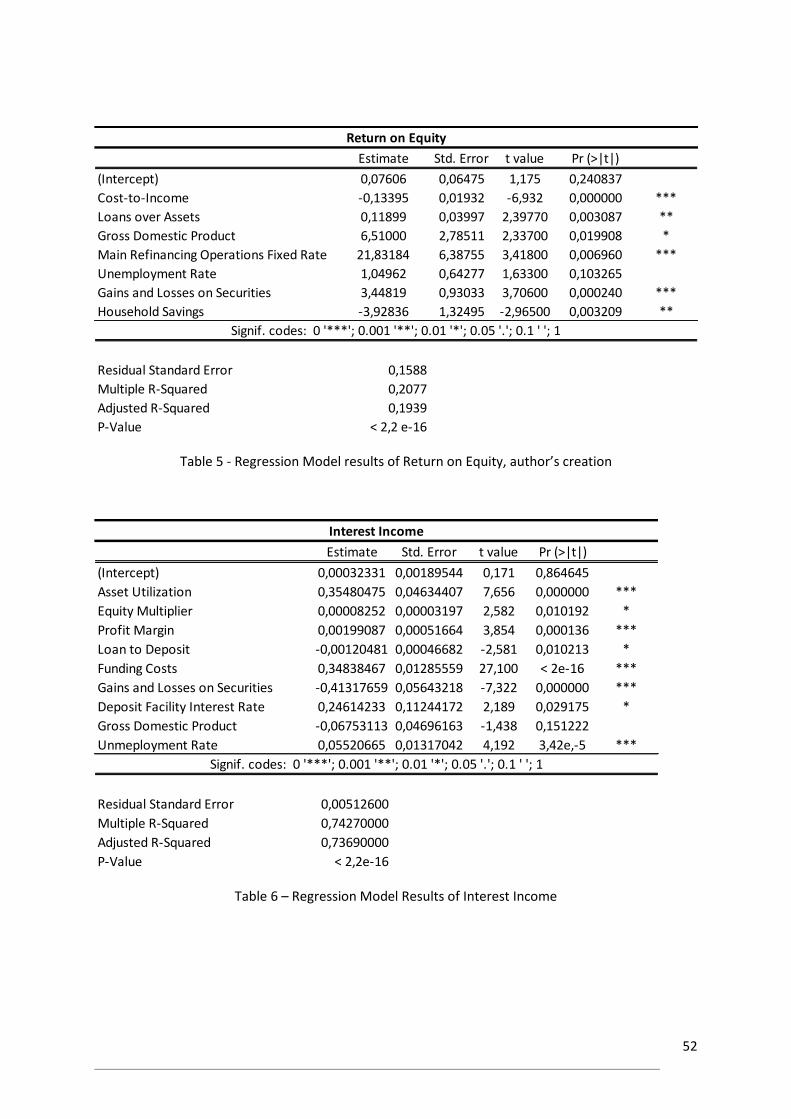
52
Estimate Std. Error t value Pr (>|t|)
(Intercept) 0,07606 0,06475 1,175 0,240837
Cost-to-Income -0,13395 0,01932 -6,932 0,000000 ***
Loans over Assets 0,11899 0,03997 2,39770 0,003087 **
Gross Domestic Product 6,51000 2,78511 2,33700 0,019908 *
Main Refinancing Operations Fixed Rate 21,83184 6,38755 3,41800 0,006960 ***
Unemployment Rate 1,04962 0,64277 1,63300 0,103265
Gains and Losses on Securities 3,44819 0,93033 3,70600 0,000240 ***
Household Savings -3,92836 1,32495 -2,96500 0,003209 **
Residual Standard Error 0,1588
Multiple R-Squared 0,2077
Adjusted R-Squared 0,1939
P-Value < 2,2 e-16
Signif. codes: 0 '***'; 0.001 '**'; 0.01 '*'; 0.05 '.'; 0.1 ' '; 1
Return on Equity
Table 5 - Regression Model results of Return on Equity, author’s creation
Estimate Std. Error t value Pr (>|t|)
(Intercept) 0,00032331 0,00189544 0,171 0,864645
Asset Utilization 0,35480475 0,04634407 7,656 0,000000 ***
Equity Multiplier 0,00008252 0,00003197 2,582 0,010192 *
Profit Margin 0,00199087 0,00051664 3,854 0,000136 ***
Loan to Deposit -0,00120481 0,00046682 -2,581 0,010213 *
Funding Costs 0,34838467 0,01285559 27,100 < 2e-16 ***
Gains and Losses on Securities -0,41317659 0,05643218 -7,322 0,000000 ***
Deposit Facility Interest Rate 0,24614233 0,11244172 2,189 0,029175 *
Gross Domestic Product -0,06753113 0,04696163 -1,438 0,151222
Unmeployment Rate 0,05520665 0,01317042 4,192 3,42e,-5 ***
Residual Standard Error 0,00512600
Multiple R-Squared 0,74270000
Adjusted R-Squared 0,73690000
P-Value < 2,2e-16
Signif. codes: 0 '***'; 0.001 '**'; 0.01 '*'; 0.05 '.'; 0.1 ' '; 1
Interest Income
Table 6 – Regression Model Results of Interest Income
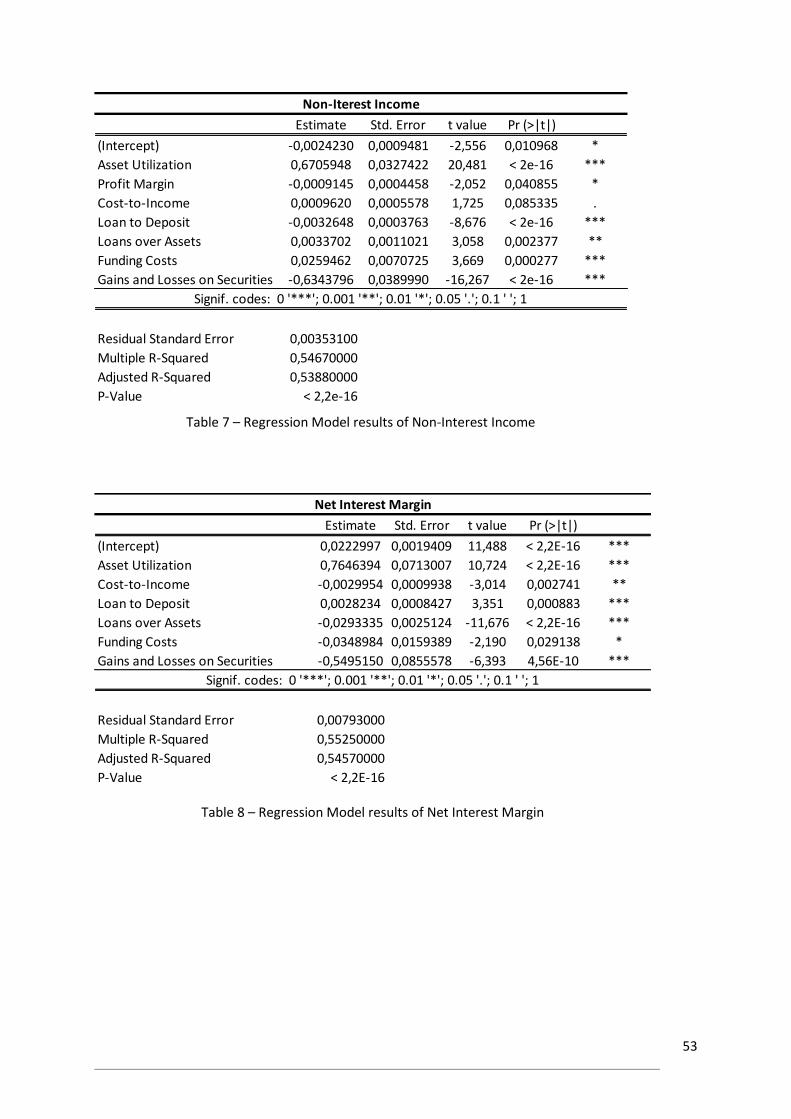
53
Estimate Std. Error t value Pr (>|t|)
(Intercept) -0,0024230 0,0009481 -2,556 0,010968 *
Asset Utilization 0,6705948 0,0327422 20,481 < 2e-16 ***
Profit Margin -0,0009145 0,0004458 -2,052 0,040855 *
Cost-to-Income 0,0009620 0,0005578 1,725 0,085335 .
Loan to Deposit -0,0032648 0,0003763 -8,676 < 2e-16 ***
Loans over Assets 0,0033702 0,0011021 3,058 0,002377 **
Funding Costs 0,0259462 0,0070725 3,669 0,000277 ***
Gains and Losses on Securities -0,6343796 0,0389990 -16,267 < 2e-16 ***
Residual Standard Error 0,00353100
Multiple R-Squared 0,54670000
Adjusted R-Squared 0,53880000
P-Value < 2,2e-16
Signif. codes: 0 '***'; 0.001 '**'; 0.01 '*'; 0.05 '.'; 0.1 ' '; 1
Non-Iterest Income
Estimate Std. Error t value Pr (>|t|)
(Intercept) 0,0222997 0,0019409 11,488 < 2,2E-16 ***
Asset Utilization 0,7646394 0,0713007 10,724 < 2,2E-16 ***
Cost-to-Income -0,0029954 0,0009938 -3,014 0,002741 **
Loan to Deposit 0,0028234 0,0008427 3,351 0,000883 ***
Loans over Assets -0,0293335 0,0025124 -11,676 < 2,2E-16 ***
Funding Costs -0,0348984 0,0159389 -2,190 0,029138 *
Gains and Losses on Securities -0,5495150 0,0855578 -6,393 4,56E-10 ***
Residual Standard Error 0,00793000
Multiple R-Squared 0,55250000
Adjusted R-Squared 0,54570000
P-Value < 2,2E-16
Signif. codes: 0 '***'; 0.001 '**'; 0.01 '*'; 0.05 '.'; 0.1 ' '; 1
Net Interest Margin
Table 7 – Regression Model results of Non-Interest Income
Table 8 – Regression Model results of Net Interest Margin