THE SHADOW PRICE OF COOPERATIVE MEMBERSHIP ON AGRICULTURE ... · 1 Professor adjunto do...
20
THE SHADOW PRICE OF COOPERATIVE MEMBERSHIP ON AGRICULTURE IN THE BRAZILIAN SOUTH AND SOUTHEAST REGIONS Mateus de Carvalho Reis Neves 1 Felipe de Figueiredo Silva 2 Carlos Otávio Freitas 3 Marcelo José Braga 4 Resumo: Por meio de uma função lucro quadrática normalizada estimou-se o efeito marginal (preço- sombra) da associação a cooperativas no lucro agropecuário das regiões Sul e Sudeste brasileiras. Tais regiões são responsáveis por mais de 50% da produção agropecuária brasileira e possuem uma média de 24% dos estabelecimentos rurais associados a cooperativas. Foram utilizados milho, soja, cana-de-açúcar e leite, como produtos, combustíveis e trabalho contratado, como insumos variáveis e associação a cooperativas, trabalho familiar e área irrigada, como insumos fixos. Os dados foram obtidos a partir do Censo Agropecuário de 2006. Com base nos resultados preliminares, observou-se um efeito positivo da associação de estabelecimentos agropecuários as cooperativas no lucro, para as regiões Sul e Sudeste. Adicionalmente, foi encontrado um efeito positivo da associação a cooperativas na oferta de produtos e demanda por insumos, indicando que, embora este fator fixo tenha elevado a oferta dos produtos analisados, também intensificou a utilização dos insumos variáveis. Palavras-chave: Cooperativismo, Agropecuária, Função lucro restrita. Abstract: A quadratic normalized restricted profit function was used to estimate the marginal effect of co-ops (shadow price) on agricultural profit of the South and Southeast regions of Brazil. These regions are responsible for more than 50% of Brazilian production and the government has implemented several public policies aiming to improve production management of co-ops, which correspond to 24% of producers in this region. We considered corn, soybean, sugarcane and milk as variable outputs, hired labor and fuel as variable inputs, and co-ops membership, family labor and irrigated area as quasi-fixed inputs for the Agricultural Census of 2006. Overall, the preliminary results suggest a positive effect of co-ops membership on agricultural profits for the South and Southeast regions of Brazil. Additionally, a positive effect of co-ops membership on commodity supply and on input demand was found, which suggest that although it increases supply of these commodities it also intensify the use of variable inputs. Key-words: Cooperatives, Agriculture, Restricted profit function. Área ANPEC: Área 11 - Economia Agrícola e do Meio Ambiente Classificação JEL: Q1, Q11, Q13. 1 Professor adjunto do Departamento de Economia Rural, Universidade Federal de Viçosa-MG (UFV). [email protected] 2 Doutorando do Programa de Pós-graduação em Economia Aplicada do Departamento de Economia Rural, UFV. [email protected] 3 Doutorando do Programa de Pós-graduação em Economia Aplicada do Departamento de Economia Rural, UFV. [email protected] 4 Professor titular do Departamento de Economia Rural, UFV. [email protected]
Transcript of THE SHADOW PRICE OF COOPERATIVE MEMBERSHIP ON AGRICULTURE ... · 1 Professor adjunto do...
THE SHADOW PRICE OF COOPERATIVE MEMBERSHIP ON AGRICULTURE IN THE BRAZILIAN SOUTH AND SOUTHEAST REGIONS
Mateus de Carvalho Reis Neves1
Felipe de Figueiredo Silva2 Carlos Otávio Freitas3
Marcelo José Braga4 Resumo: Por meio de uma função lucro quadrática normalizada estimou-se o efeito marginal (preço-sombra) da associação a cooperativas no lucro agropecuário das regiões Sul e Sudeste brasileiras. Tais regiões são responsáveis por mais de 50% da produção agropecuária brasileira e possuem uma média de 24% dos estabelecimentos rurais associados a cooperativas. Foram utilizados milho, soja, cana-de-açúcar e leite, como produtos, combustíveis e trabalho contratado, como insumos variáveis e associação a cooperativas, trabalho familiar e área irrigada, como insumos fixos. Os dados foram obtidos a partir do Censo Agropecuário de 2006. Com base nos resultados preliminares, observou-se um efeito positivo da associação de estabelecimentos agropecuários as cooperativas no lucro, para as regiões Sul e Sudeste. Adicionalmente, foi encontrado um efeito positivo da associação a cooperativas na oferta de produtos e demanda por insumos, indicando que, embora este fator fixo tenha elevado a oferta dos produtos analisados, também intensificou a utilização dos insumos variáveis. Palavras-chave: Cooperativismo, Agropecuária, Função lucro restrita. Abstract: A quadratic normalized restricted profit function was used to estimate the marginal effect of co-ops (shadow price) on agricultural profit of the South and Southeast regions of Brazil. These regions are responsible for more than 50% of Brazilian production and the government has implemented several public policies aiming to improve production management of co-ops, which correspond to 24% of producers in this region. We considered corn, soybean, sugarcane and milk as variable outputs, hired labor and fuel as variable inputs, and co-ops membership, family labor and irrigated area as quasi-fixed inputs for the Agricultural Census of 2006. Overall, the preliminary results suggest a positive effect of co-ops membership on agricultural profits for the South and Southeast regions of Brazil. Additionally, a positive effect of co-ops membership on commodity supply and on input demand was found, which suggest that although it increases supply of these commodities it also intensify the use of variable inputs. Key-words: Cooperatives, Agriculture, Restricted profit function. Área ANPEC: Área 11 - Economia Agrícola e do Meio Ambiente Classificação JEL: Q1, Q11, Q13.
1 Professor adjunto do Departamento de Economia Rural, Universidade Federal de Viçosa-MG (UFV). [email protected] 2 Doutorando do Programa de Pós-graduação em Economia Aplicada do Departamento de Economia Rural, UFV. [email protected] 3 Doutorando do Programa de Pós-graduação em Economia Aplicada do Departamento de Economia Rural, UFV. [email protected] 4 Professor titular do Departamento de Economia Rural, UFV. [email protected]
2
1. INTRODUCTION
The South and Southeast regions of Brazil are divided into seven states that in 2009 represented 53% of the Brazilian Agricultural Gross Domestic Product (GDP). The states of Minas Gerais (27%), Rio Grande do Sul (22%), and Sao Paulo (17%) represented 67% of the South and Southeast regions’ agricultural GDP (Brazilian Institute of Geography and Statistics – IBGE, 2009). Climate and soil characteristics in these regions yield higher productivity in some commodities such as coffee, rice, and sugarcane if compared to other regions. The most important agricultural commodities in these regions are corn, soybean, sugarcane and milk, which represents more than 65% of agricultural production value in these regions (IBGE, 2009).
In addition to technology inputs some farmers have been participating in co-ops aiming to increase their profits, given that a primary objective of a co-op is to increase the prices paid to members (Sexton and Iskow, 1988). According to IBGE (2006), in the South region of Brazil co-op participation is higher, around 32% of producers, than in the Southeast region, 18% of producers, and the Brazilian average of 14% of producers. Their participation increases with farm size, achieving 39% of farms with more than 1000 hectares in the South region (IBGE, 2009). Agricultural co-ops were responsible for 340 thousand direct jobs and 6% of Brazilian GDP in 2013 and half of Brazilian agricultural production, according to the Brazilian Cooperative Organization (OCB, 2014).
A few studies have analyzed the influence of co-ops on prices, production, and how they affect the profitability of its members: United States (McNamara et al., 2001; Folsom, 2003; Jardine et al., 2014), Mexico (Milford, 2004); Italy (Cazzuffi, 2013) and Ethiopia (Bernard, 2008; Rodrigo, 2012). These studies used different public policies methodologies but, overall, they have found a positive effect of co-op membership on members’ profitability. We propose an alternative methodology to evaluate the effect of co-ops on Brazilian agricultural profitability. A static short-run profit maximization behavior is modeled to identify how members’ participation on co-ops affects their profits.
A similar approach, which uses a restricted profit function, has been used in the literature to evaluate the impact of different factors (i.e. quasi-fixed capital) on agricultural profit and commodities supply such as in Disch (1983), Flores (1984), Fulginiti and Perrin (1990), Huffman et al. (2002), Huffman and Evenson (2006; 1989), and Schuring et al. (2011). For instance, a few studies have used this theoretical framework to evaluate the effect of education, research, and rural extension (similar to technical assistance) in Brazil but have not paid attention to the importance of co-ops on agricultural performance.
In this paper we propose to investigate the effect of being associated with a co-op in the South and Southeast regions of Brazil using a quadratic normalized restricted profit function to estimate the marginal effect of co-ops on profit (i.e. shadow price). In addition, we seek to identify the effect of co-ops in each commodity supply and input demand. For the South and Southeast regions of Brazil the restricted profit function was modeled using corn, soybean, sugarcane and milk5 as variable outputs, labor and fuel as variable inputs, and co-ops, family labor, and irrigated area as quasi-fixed inputs. This paper contributes to the literature by applying a different theoretical framework to evaluate the co-ops effect on agricultural profits. The outcome of this approach can be used by policy makers to develop and evaluate policies related to co-ops.
Overall, the preliminary results suggest a positive effect of co-ops6 on agricultural profits for the South and Southeast regions of Brazil, although a few municipalities (less than 3% of the region) presented a negative effect. Participation in co-ops had higher positive impact in the south in comparison to the southeast, where specific agricultural characteristics play an important role on this result. In addition, a 5 It represents 71% of both south and southeast regions production value. These products represent 68% of what is produced in the South and 75% of what is produced in Southeast regions of Brazil. 6 In this paper, Co-ops are measured as the share of producers that belong to a co-op in a municipality. Thus, it ranges from 0 to 1 where 0 means that none of the producers is a member of a co-op, and 1 represents when all producers are members. The average for the region is 0.24.
3
significant positive effect of co-ops on commodity supply (i.e. supply elasticity of corn with respect to co-ops is 0.27) and on input demand (i.e. demand elasticity of fuel with respect to co-ops is 0.08) was found, which suggest that even though a co-op membership increases supply of these commodities it also intensify the use of inputs, as expected.
The remainder of this study is divided in five sections, section 2 presents a brief description of co-ops in the Brazilian agricultural sector, section 3 illustrates the theoretical framework adopted, section 4 provides data description and empirical specification, section 5 discusses the results, and section 6 provides a brief conclusion of our study. 2. CO-OPS IN BRAZIL
According to Helmberger and Hoss (1968), the objective of a co-op is to provide stability and optimal production growth conditions for its members, which can be seen in rural credit co-ops, marketing co-ops, and input sellers. Several studies on organizational economics explain the existence of co-ops due to their ability to a) engendering economies of scale; b) access new markets, including international markets; c) reduce costs through vertical integration; d) reduce risks in joint actions; e) access and adopt new technologies and inputs via technical assistance and services; and, f) enable members to develop bargaining power for better prices (Bonus, 1986; Sexton, 1986; Staatz, 1987; Hansmann, 1988, 1996; Sexton; Iskow, 1988; Bialoskorski Neto, 2000; Valentinov, 2007).
In Brazil, agricultural co-ops were used by the government during the 1970s and 1980s as instruments to implement public policies for the rural sector. These policies aimed to provide technical assistance and better market access, among others objectives. At the end of the 1980s and during the 1990s, co-ops lost its importance as channel of public policies implementation, which resulted in a downfall of many of them and a traumatic process for many of their members (Presno, 2001; Bialoskorski Neto, 2005). It is important to notice that those were the most acute years for the co-ops due to a crisis that disrupted the Brazilian economy and agriculture.
During the 2000s, the government carried on programs that facilitated co-ops to make investments, implement managerial improvements, and overcome its weakened financial situation. Nowadays, although the Brazilian government has been neglecting the co-ops as a base for policy implementation, they have been used to strengthen the market relation within agents.
The co-ops linked to the agricultural sector in Brazil are considered a distinguished branch among co-ops, which have an important role on the agri-food chain coordination. In addition, Cechin (2014) highlights the importance of these co-ops in the dissemination of new technologies on crop plantation, harvesting and post-harvest processes in Brazil by spreading more effectively the information to members, in comparison to a group of farmers that are not associated.
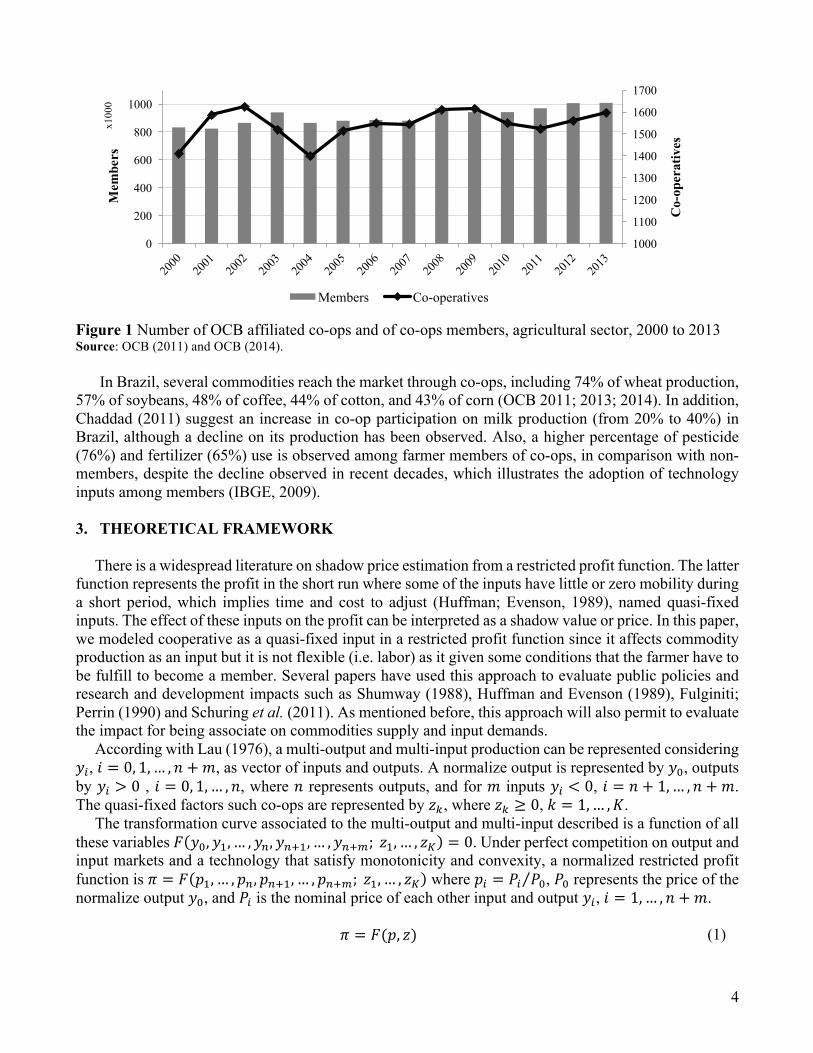
Figure 1 illustrates the recovering period of the agricultural co-op membership after the sharp fall in 2004, when a commodity price crisis disrupted the Brazilian agricultural market and caused an overall increase on farms and co-ops liabilities. After retaking the growth path, the number of co-ops remained fairly stable with a slight increase in the number of members, which already exceeded 1 million farmers in 2013.
4
Figure 1 Number of OCB affiliated co-ops and of co-ops members, agricultural sector, 2000 to 2013 Source: OCB (2011) and OCB (2014).
In Brazil, several commodities reach the market through co-ops, including 74% of wheat production,
57% of soybeans, 48% of coffee, 44% of cotton, and 43% of corn (OCB 2011; 2013; 2014). In addition, Chaddad (2011) suggest an increase in co-op participation on milk production (from 20% to 40%) in Brazil, although a decline on its production has been observed. Also, a higher percentage of pesticide (76%) and fertilizer (65%) use is observed among farmer members of co-ops, in comparison with non-members, despite the decline observed in recent decades, which illustrates the adoption of technology inputs among members (IBGE, 2009). 3. THEORETICAL FRAMEWORK
There is a widespread literature on shadow price estimation from a restricted profit function. The latter function represents the profit in the short run where some of the inputs have little or zero mobility during a short period, which implies time and cost to adjust (Huffman; Evenson, 1989), named quasi-fixed inputs. The effect of these inputs on the profit can be interpreted as a shadow value or price. In this paper, we modeled cooperative as a quasi-fixed input in a restricted profit function since it affects commodity production as an input but it is not flexible (i.e. labor) as it given some conditions that the farmer have to be fulfill to become a member. Several papers have used this approach to evaluate public policies and research and development impacts such as Shumway (1988), Huffman and Evenson (1989), Fulginiti; Perrin (1990) and Schuring et al. (2011). As mentioned before, this approach will also permit to evaluate the impact for being associate on commodities supply and input demands.
According with Lau (1976), a multi-output and multi-input production can be represented considering !", # = 0, 1, … , ) + +, as vector of inputs and outputs. A normalize output is represented by !,, outputs by !" > 0 , # = 0, 1, … , ), where ) represents outputs, and for + inputs !" < 0, # = ) + 1,… , ) + +. The quasi-fixed factors such co-ops are represented by /0, where /0 ≥ 0, 2 = 1,… , 3.
The transformation curve associated to the multi-output and multi-input described is a function of all these variables 4 !,, !5, … , !6, !675, … , !678;/5, … , /; = 0. Under perfect competition on output and input markets and a technology that satisfy monotonicity and convexity, a normalized restricted profit function is < = 4 =5, … , =6, =675, … , =678;/5, … , /; where =" = >" >,, >, represents the price of the normalize output !,, and >" is the nominal price of each other input and output !", # = 1,… , ) + +.
< = 4(=, /) (1)
1000
1100
1200
1300
1400
1500
1600
1700
0
200
400
600
800
1000M
embe
rs
Co-
oper
ativ
es
x100
0
Members Co-operatives

5
where < is the normalized restricted profit (< = <A/>,, where <A is the nominal profit), = is a vector of ) ++ normalized prices, and / is a vector of 3 quasi-fixed inputs. The normalized restricted profit function is homogeneous of degree one with respect to prices (which is imposed by dividing by one of the prices), non-decreasing in output prices and non-increasing in input prices (monotonicity in inputs and outputs), symmetric (which is also imposed in the estimation), and is convexity in prices (second order derivatives matrix is positive semidefinite).
We assume that all farms are profit maximizers on a perfect competition structure, so the supply curve and input demand can be recover by envelope theorem using the first derivative (which by the monotonicity property will have the following sign)
!"∗ =, / =
D<D="
> 0,# = 0, 1, … , ) (2)
!"∗ =, / =
D<D=E
< 0, # = ) + 1,… , ) + +
Once we normalized the restricted profit function by one of the output/input prices, the numeraire
supply/demand can be obtained by
D<D=,
= !,∗ = <∗ − ="
678
EG5
!"∗ (3)
We obtain the effect of being associate to a cooperative by evaluating the shadow price of a quasi-
fixed input (being associated)
H0 =D4D/0
= H0 =, / , 2 = 1,… , 3. (4)
where H0 is the shadow price of /0 (Huffman; Evenson, 1989; Nadiri, 1982). We are also interested on the effect of a quasi-fixed input on commodity supply and input demands (shift on supply or demand).
JKLMN =
D!"∗
D/0 (5a)
J0O = ="
6∗
"G5
D!"∗
D/0=, / , 2 = 1,… , 3. (5b)
where JKL
MN represents the commodity supply of input demand individual shift and, according to Huffman and Evenson (1989), equation (5b) represents the aggregate impact of a quasi-fixed input on variable factors of the normalized restricted profit function. It can also be translated to an elasticity
PMK = D!"
∗
D/0∙/0!"∗ , 2 = 1,… , 3; # = 1,… ,+ + ) (6)
where theoretically a sign is not excepted for equations (5a), (5b) and (6) but since we expect a positive effect of being associated with a cooperative on farm profitability throw positive effects on commodity supply we expect these equations to show a positive value when !"∗is representing an output.
6
4. DATA AND EMPIRICAL MODEL
4.1.Data
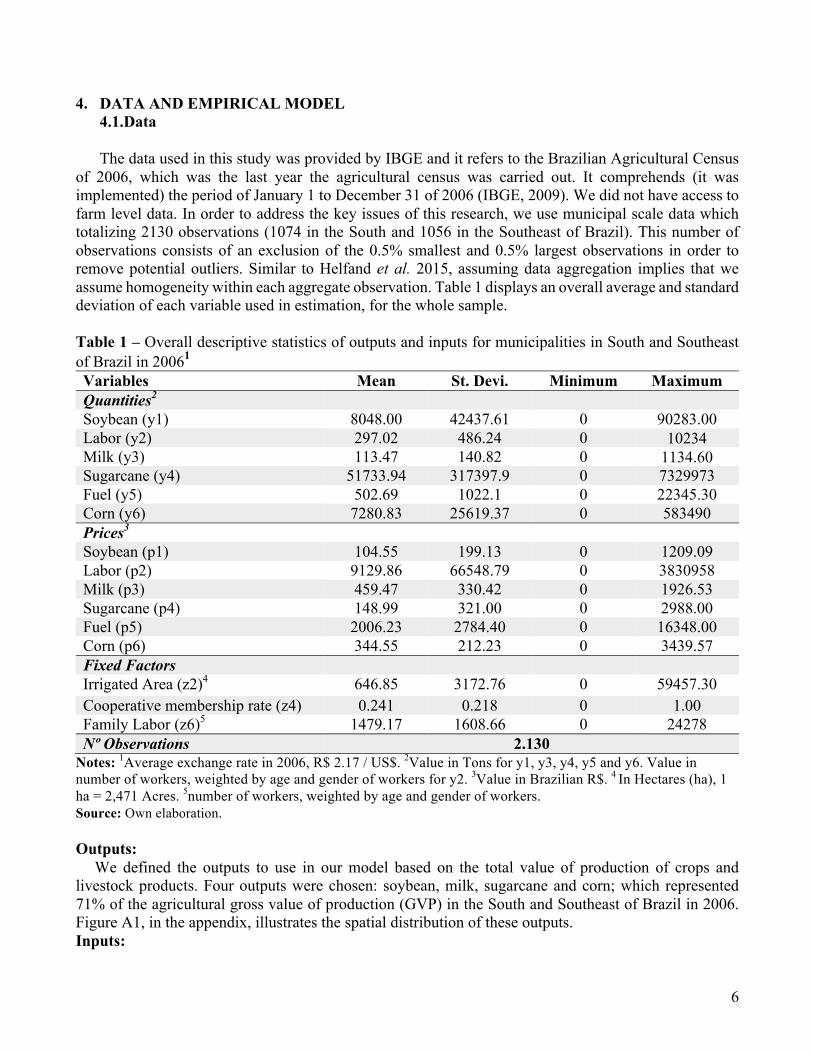
The data used in this study was provided by IBGE and it refers to the Brazilian Agricultural Census of 2006, which was the last year the agricultural census was carried out. It comprehends (it was implemented) the period of January 1 to December 31 of 2006 (IBGE, 2009). We did not have access to farm level data. In order to address the key issues of this research, we use municipal scale data which totalizing 2130 observations (1074 in the South and 1056 in the Southeast of Brazil). This number of observations consists of an exclusion of the 0.5% smallest and 0.5% largest observations in order to remove potential outliers. Similar to Helfand et al. 2015, assuming data aggregation implies that we assume homogeneity within each aggregate observation. Table 1 displays an overall average and standard deviation of each variable used in estimation, for the whole sample. Table 1 – Overall descriptive statistics of outputs and inputs for municipalities in South and Southeast of Brazil in 20061 Variables Mean St. Devi. Minimum Maximum Quantities2 Soybean (y1) 8048.00 42437.61 0 90283.00 Labor (y2) 297.02 486.24 0 10234 Milk (y3) 113.47 140.82 0 1134.60 Sugarcane (y4) 51733.94 317397.9 0 7329973 Fuel (y5) 502.69 1022.1 0 22345.30 Corn (y6) 7280.83 25619.37 0 583490 Prices3 Soybean (p1) 104.55 199.13 0 1209.09 Labor (p2) 9129.86 66548.79 0 3830958 Milk (p3) 459.47 330.42 0 1926.53 Sugarcane (p4) 148.99 321.00 0 2988.00 Fuel (p5) 2006.23 2784.40 0 16348.00 Corn (p6) 344.55 212.23 0 3439.57 Fixed Factors Irrigated Area (z2)4 646.85 3172.76 0 59457.30 Cooperative membership rate (z4) 0.241 0.218 0 1.00 Family Labor (z6)5 1479.17 1608.66 0 24278 Nº Observations 2.130
Notes: 1Average exchange rate in 2006, R$ 2.17 / US$. 2Value in Tons for y1, y3, y4, y5 and y6. Value in number of workers, weighted by age and gender of workers for y2. 3Value in Brazilian R$. 4 In Hectares (ha), 1 ha = 2,471 Acres. 5number of workers, weighted by age and gender of workers. Source: Own elaboration. Outputs:
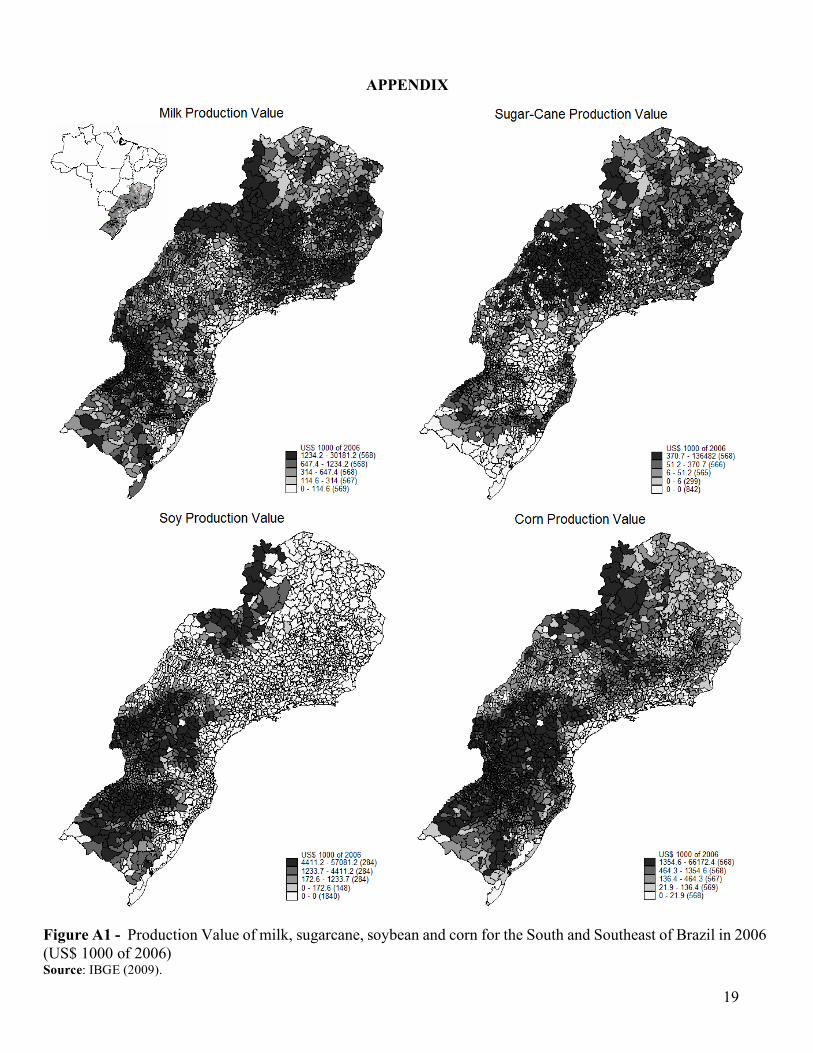
We defined the outputs to use in our model based on the total value of production of crops and livestock products. Four outputs were chosen: soybean, milk, sugarcane and corn; which represented 71% of the agricultural gross value of production (GVP) in the South and Southeast of Brazil in 2006. Figure A1, in the appendix, illustrates the spatial distribution of these outputs. Inputs:
7
- Labor: the average wage (price) of hired workers was calculated by the ratio of annual expenditure and hired worker’s unit. In the Agricultural Census (2006), the latter measure is estimated in as a weighted measure that take into account differences between adult males, women and children. Thus, the estimated average wage (price of hand-labor factor) take into account these differences. - Fuel: it is the sum in tons of alcohol, charcoal, gas (LPG), gasoline, and diesel. They were converted to tons considering the information about density contained in conversion table available in Petrobras (2015). Thus, fuel prices were calculated by dividing the monetary expenditure declared by the amount of fuel used in tons. Fixed Factors: - Irrigated area: it is considered as irrigation the practice of applying water, not rain, directly on the surface of the soil under pasture or crops, in certain quantities and intervals. The cost of implementation and its maintenance is not available in the Agricultural Census 2006, thus area irrigated was considered as a quasi-fixed input. - Family labor: similar to the hired labor, tis variables includes rural landowners and their relatives. The Agricultural Census also calculates a weighted measure to account for differences in the labor with respect to adult male, female and child as the hired labor. It has been considered as a quasi-fixed input since we assume that does not adjust in the sort-run and difficulties related to the measurement of its monetary value. - Cooperatives: it was considered as an input given its ability to influence production. This variable was defined as quasi-fixed input for three reasons. First, it might be necessary to incur in costs to become a member. Second, an absence of a monetary value prevents of using it as a variable input. Third, the existence of pre-establish contracts on commodity supply imposes a restriction on the flexibility of the membership.
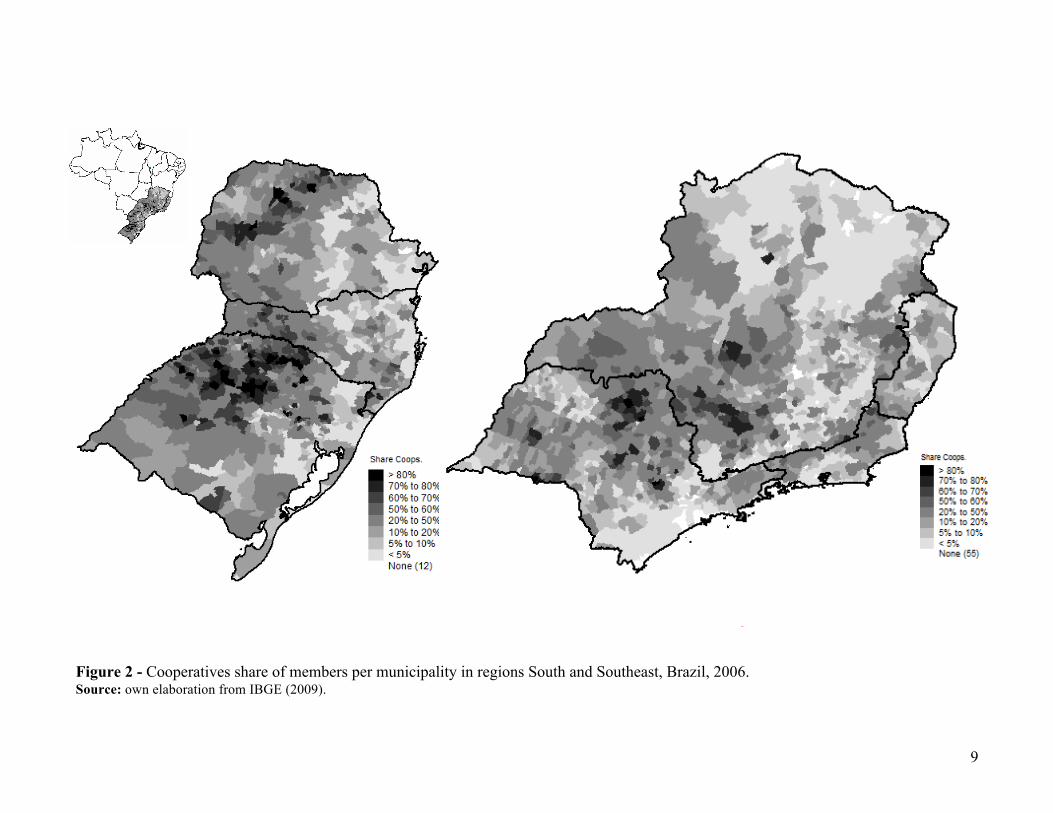
Given we did not have access to farm level data, the cooperatives variable was built as the percentage of farmers that answered "yes" to the question "are you a member of a cooperative?". On average, 24% of our sample answered yes to this question. This values ranges from zero to one, and has a higher average for the South (32%) than for the Southeast (18%) region of Brazil.
Figure 2 illustrates the geographical distribution of the proportion of cooperatives’ members by municipality in the South and Southeast regions of Brazil. States where agriculture has a larger role in economy and more socio-economic more developed this variable shows higher values. For example, in the Southeast region the states of São Paulo and Minas Gerais (mid-west of this region) play an important role in the region while in the west region of the South, which relies heavier on agriculture (in all three states - Paraná, Rio Grande do Sul and Santa Catarina).
1.1.Empirical Estimation
Several paper have used of a restricted profit function when considering multi-input and multi-output
technology such as Shumway et al. (1988), Huffman and Evenson (1989) and Schuring et al. (2011). For more details about this approach, see Lau (1976) and Nadiri (1982). Three functional forms are usually employed for restricted profit functions: transcendental logarithm (translog), quadratic normalized and generalized Leontief7. Chambers et al. (2013) indicated that the quadratic normalized is superior than the other using a Monte Carlo simulation. Therefore, we use a quadratic normalized restricted profit function to represent the farms of South and Southeast of Brazil, as Schuring et al. (2011) also used
< = R, + R"
678
"G5
=" + S0
;
0G5
/0 +12
U"E
678
EG5
678
"G5
="=E +12S0V/0/V + W"0
678
"G5
="/0 + XY (7)
7 For more details about these functional forms, see Diewert (1974), Lau (1976) and Diewert (1971).
8
where =" represents prices of n outputs and m inputs, i = n+m outputs and inputs (netputs), /0 represents the quasi-fixed inputs, and XY represents the random error. The restricted profit function was modeled using corn, soybean, sugarcane and milk8 as variable outputs, labor and fuel as variable inputs, and co-ops, family labor and irrigated area as quasi-fixed inputs. The normalized restricted profit represented in equation (7) is homogenous of degree one in prices. The commodity supply and input demand represented by equations (2) on the theoretical framework can now be represented as
D<D="
= !"∗ = R" + U"E
678
EG5
=E + W"0/0 + XMN
(8)
−D<D=E
= !E∗ = RE + UE"
678
"G5
=" + W"0/0 + XMZ
where the first equation represents supply and the second demand (which by Hotteling lemma has a negative sign on the left side), and XMN and XMZ represent random errors for these equations. A system of equations considering equation (7) and five (4 outputs and one input – corn, milk, soybean and sugarcane as output and fuel as variable input) equations represented in equation (8) were estimated using an Iterated Seemly Unrelated Regressions (SUR). The hired labor was used as a normalizer price on the estimation and its demand can be recover using the homogeneity property represented by equation (3) on the theoretical framework
!,∗ = R, + S0
;
0G5
/0 −12
U"E
678
EG5
678
"G5
="=E +12S0V/0/V (9)
Symmetry and homogeneity were imposed on the estimation but monotonicity (sign of the equations (8) that represent supply and demand) was not and it will be checked. Monotonicity, in special, has an important effect on the elasticity calculation. The own-price elasticity can be estimated as
P[" = D\)!"D\)="
=D!"D="
∙="!"=D (D< D=")
D="∙
="(D< D=")
=
=D!"
∗
D="
="!"∗ = U"" ∙
="!"∗
(10)
where for outputs have to be positive reflecting the positive slope of a supply curve, and for an input it has to be negative reflecting the negative slope of a demand. The sign of these elasticities are based on the second order derivatives matrix (Hessian) or convexity of the restricted profit function.
8 It represents 71% of both south and southeast regions production value. These products represent 68% of what is produced in the South and 75% of what is produced in Southeast regions of Brazil.
9
Figure 2 - Cooperatives share of members per municipality in regions South and Southeast, Brazil, 2006. Source: own elaboration from IBGE (2009).
10
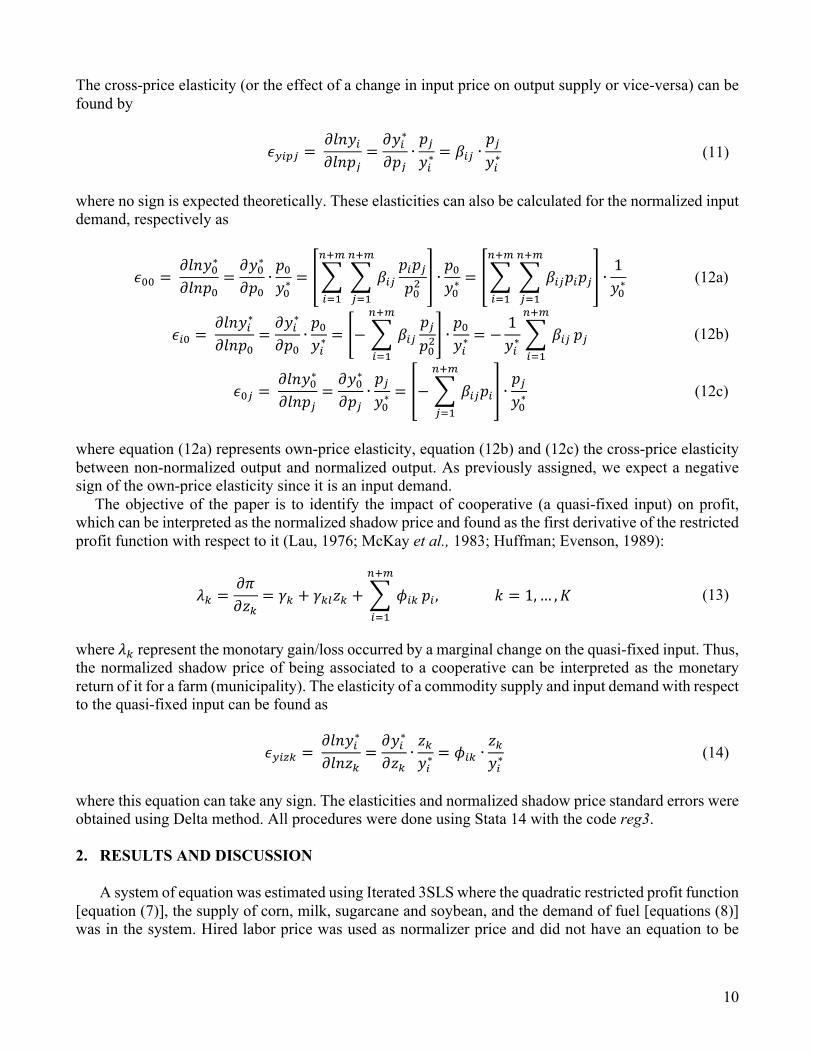
The cross-price elasticity (or the effect of a change in input price on output supply or vice-versa) can be found by
!"#$% = ()*+#()*,%
= (+#∗(,%
∙ ,%+#∗= /#% ∙
,%+#∗
(11)
where no sign is expected theoretically. These elasticities can also be calculated for the normalized input demand, respectively as
!00 = ()*+0∗()*,0
= (+0∗(,0
∙ ,0+0∗= /#%
,#,%,01
234
%56
234
#56∙ ,0+0∗
= /#%,#,%234
%56
234
#56∙ 1+0∗
(12a)
!#0 = ()*+#∗()*,0
= (+#∗(,0
∙ ,0+#∗= − /#%
,%,01
234
#56∙ ,0+#∗
= − 1+#∗
/#%234
#56,% (12b)
!0% = ()*+0∗()*,%
= (+0∗(,%
∙ ,%+0∗= − /#%,#
234
%56∙ ,%+0∗
(12c)
where equation (12a) represents own-price elasticity, equation (12b) and (12c) the cross-price elasticity between non-normalized output and normalized output. As previously assigned, we expect a negative sign of the own-price elasticity since it is an input demand.
The objective of the paper is to identify the impact of cooperative (a quasi-fixed input) on profit, which can be interpreted as the normalized shadow price and found as the first derivative of the restricted profit function with respect to it (Lau, 1976; McKay et al., 1983; Huffman; Evenson, 1989):
9: =(;(<:
= =: + =:?<: + @#:234
#56,#,B = 1,… , D (13)
where 9: represent the monotary gain/loss occurred by a marginal change on the quasi-fixed input. Thus, the normalized shadow price of being associated to a cooperative can be interpreted as the monetary return of it for a farm (municipality). The elasticity of a commodity supply and input demand with respect to the quasi-fixed input can be found as
!"#E: = ()*+#∗()*<:
= (+#∗(<:
∙ <:+#∗= @#: ∙
<:+#∗
(14)
where this equation can take any sign. The elasticities and normalized shadow price standard errors were obtained using Delta method. All procedures were done using Stata 14 with the code reg3. 2. RESULTS AND DISCUSSION
A system of equation was estimated using Iterated 3SLS where the quadratic restricted profit function [equation (7)], the supply of corn, milk, sugarcane and soybean, and the demand of fuel [equations (8)] was in the system. Hired labor price was used as normalizer price and did not have an equation to be
11
estimated9. Overall10, the estimation presented a good fit. Most of the coefficients were statistical significant (around 70% of the coefficients were significant at 10%), monotonicity11 was satisfied in at least 90% of the observations within outputs/inputs directly estimated in the system of equation.
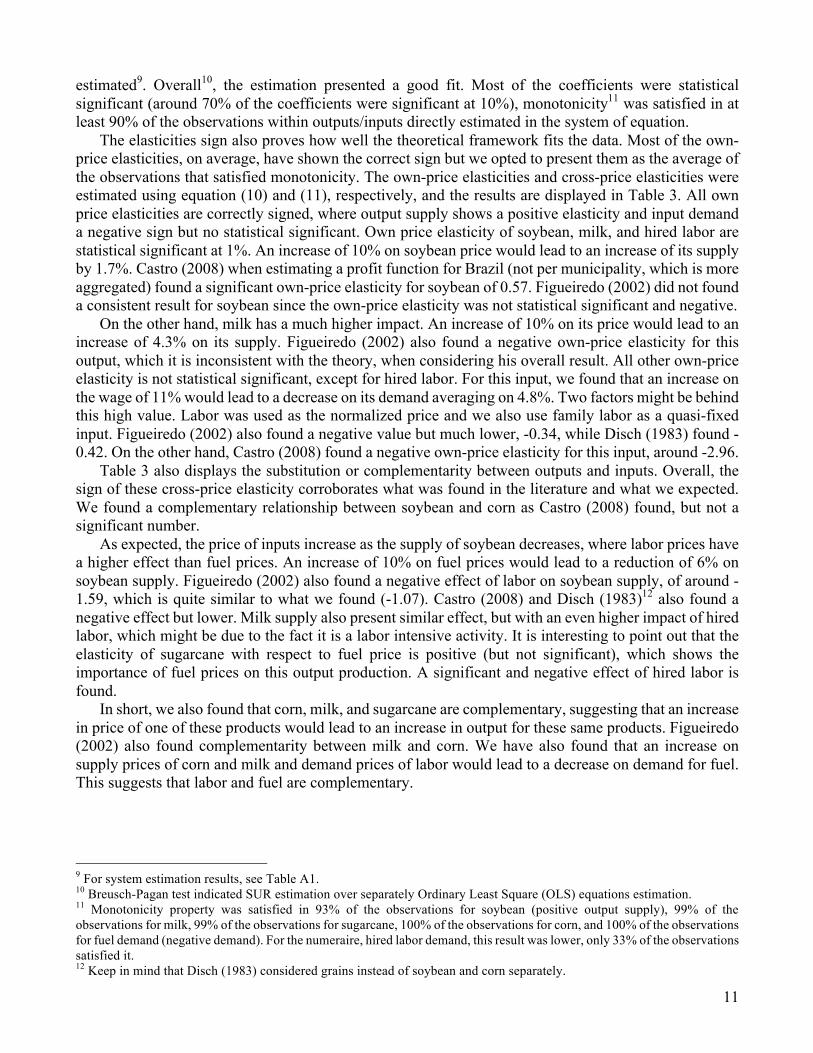
The elasticities sign also proves how well the theoretical framework fits the data. Most of the own-price elasticities, on average, have shown the correct sign but we opted to present them as the average of the observations that satisfied monotonicity. The own-price elasticities and cross-price elasticities were estimated using equation (10) and (11), respectively, and the results are displayed in Table 3. All own price elasticities are correctly signed, where output supply shows a positive elasticity and input demand a negative sign but no statistical significant. Own price elasticity of soybean, milk, and hired labor are statistical significant at 1%. An increase of 10% on soybean price would lead to an increase of its supply by 1.7%. Castro (2008) when estimating a profit function for Brazil (not per municipality, which is more aggregated) found a significant own-price elasticity for soybean of 0.57. Figueiredo (2002) did not found a consistent result for soybean since the own-price elasticity was not statistical significant and negative.
On the other hand, milk has a much higher impact. An increase of 10% on its price would lead to an increase of 4.3% on its supply. Figueiredo (2002) also found a negative own-price elasticity for this output, which it is inconsistent with the theory, when considering his overall result. All other own-price elasticity is not statistical significant, except for hired labor. For this input, we found that an increase on the wage of 11% would lead to a decrease on its demand averaging on 4.8%. Two factors might be behind this high value. Labor was used as the normalized price and we also use family labor as a quasi-fixed input. Figueiredo (2002) also found a negative value but much lower, -0.34, while Disch (1983) found -0.42. On the other hand, Castro (2008) found a negative own-price elasticity for this input, around -2.96.
Table 3 also displays the substitution or complementarity between outputs and inputs. Overall, the sign of these cross-price elasticity corroborates what was found in the literature and what we expected. We found a complementary relationship between soybean and corn as Castro (2008) found, but not a significant number.
As expected, the price of inputs increase as the supply of soybean decreases, where labor prices have a higher effect than fuel prices. An increase of 10% on fuel prices would lead to a reduction of 6% on soybean supply. Figueiredo (2002) also found a negative effect of labor on soybean supply, of around -1.59, which is quite similar to what we found (-1.07). Castro (2008) and Disch (1983)12 also found a negative effect but lower. Milk supply also present similar effect, but with an even higher impact of hired labor, which might be due to the fact it is a labor intensive activity. It is interesting to point out that the elasticity of sugarcane with respect to fuel price is positive (but not significant), which shows the importance of fuel prices on this output production. A significant and negative effect of hired labor is found.
In short, we also found that corn, milk, and sugarcane are complementary, suggesting that an increase in price of one of these products would lead to an increase in output for these same products. Figueiredo (2002) also found complementarity between milk and corn. We have also found that an increase on supply prices of corn and milk and demand prices of labor would lead to a decrease on demand for fuel. This suggests that labor and fuel are complementary.
9 For system estimation results, see Table A1. 10 Breusch-Pagan test indicated SUR estimation over separately Ordinary Least Square (OLS) equations estimation. 11 Monotonicity property was satisfied in 93% of the observations for soybean (positive output supply), 99% of the observations for milk, 99% of the observations for sugarcane, 100% of the observations for corn, and 100% of the observations for fuel demand (negative demand). For the numeraire, hired labor demand, this result was lower, only 33% of the observations satisfied it. 12 Keep in mind that Disch (1983) considered grains instead of soybean and corn separately.
12
Table 3 – Own and cross price elasticity of demand and supply for selected product of the South and Southeast region of Brazil in 2006
Prices
Qua
ntity
Soybean Milk Sugarcane Corn Fuel Labor
Soybean 0.1708 0.0276 -0.1778 1.668 -0.617 -1.071 (0.017) (0.002) (0.110) (0.258) (0.097) (0.311)
Milk 0.132 0.430 0.025 0.175 -0.283 -0.470 (0.011) (0.03) (0.119) (0.149) (0.041) (0.076)
Sugarcane -0.151 0.003 0.033 0.378 0.040 -0.446 (0.094) (0.001) (0.037) (0.419) (0.064) (0.1972)
Corn 0.087 0.002 0.038 0.032 -0.103 -0.056 (0.013) (0.0001) (0.018) (0.098) (0.027) (0.104)
Fuel 0.045 -0.036 0.177 -1.905 -0.005 -0.126 (0.007) (0.003) (0.11) (0.295) (0.006) (0.029)
Labor 1.037 0.112 0.518 9.811 -1.577 -4.881 (0.102) (0.012) (0.233) (5.049) (0.443) (1.111)
Note: All elasticities were estimated as the average of only observations that satisfied monotonicity. Standard errors are presented between brackets. Source: own elaboration.
As pointed out in the empirical section, we did not estimate a full quadratic and interacted all quasi-
fixed inputs with the prices of inputs/outputs13. Thus, in the next section we identify the normalized shadow price of co-op membership by evaluating the equation (13), where is the only quasi-fixed input interacted with the normalized prices.
2.1.Cooperative membership effect on commodities supply and Profit
Based on the equation (14) we estimated the elasticity of supply with respect to co-op membership. The higher effect was on soybean, which displayed a positive elasticity of 0.98 while corn, milk and sugarcane displayed an elasticity of 0.05, 0.34, 0.27, respectively. Only the sugarcane elasticity with respect to co-op membership was not significant. A positive elasticity was also found for the inputs, suggesting that as the number of member farms increase more inputs are used in their production (municipalities).
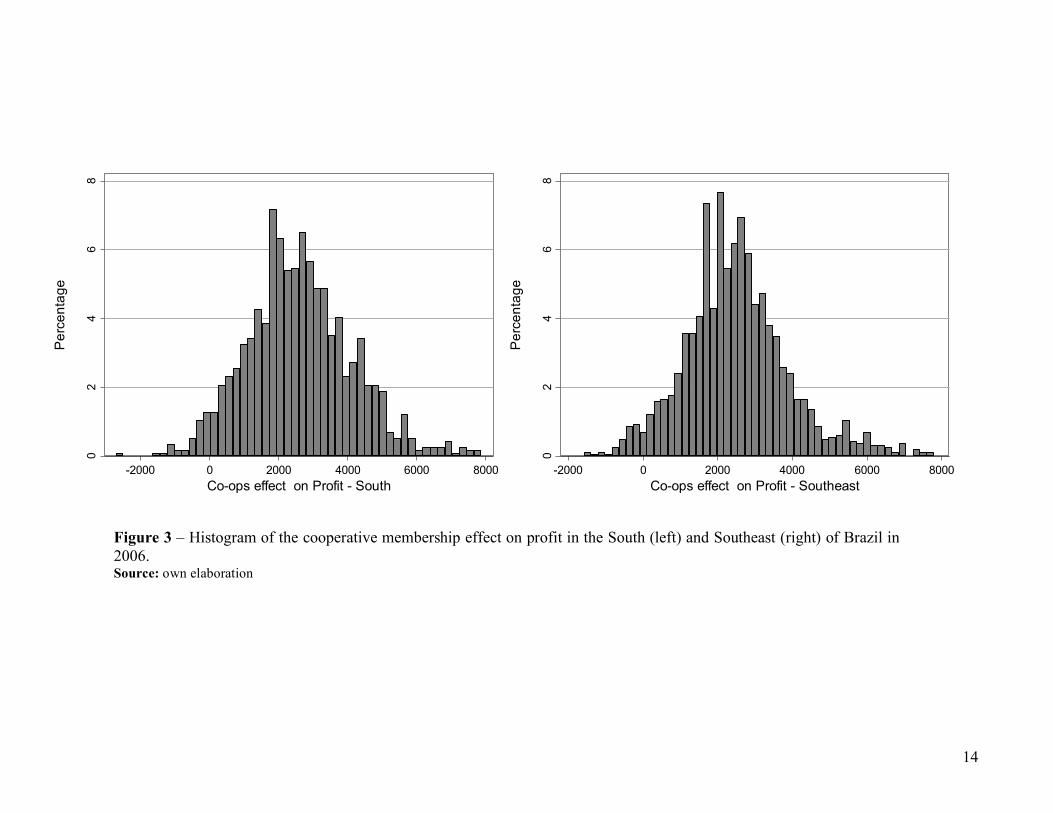
Overall, calculation of equation (13) based on the parameters estimated suggested a positive effect of cooperative membership on profits. Figure 3 displays the histogram of the marginal effect estimated for each region. On average, the normalized shadow price was of R$ 2697.40, which in US$ of 200614 is around US$ 1243.04. Since it is based on the parameter, we were able to estimate the statistical significance. On average, it was statistical significant at 5%., which corroborates our hypothesis that co-op membership affects positively the profits, at least for this two Brazilian regions. The average for each region was US$ 1307.76 for the South and US$ 1198.65 for the Southeast, both statistical significant.
13 We did not interact for several reasons. One of them is to build a more robust model without higher effect of multicollinearity (given the number of interactions). 14 US$ 1 = R$ 2.17.
13
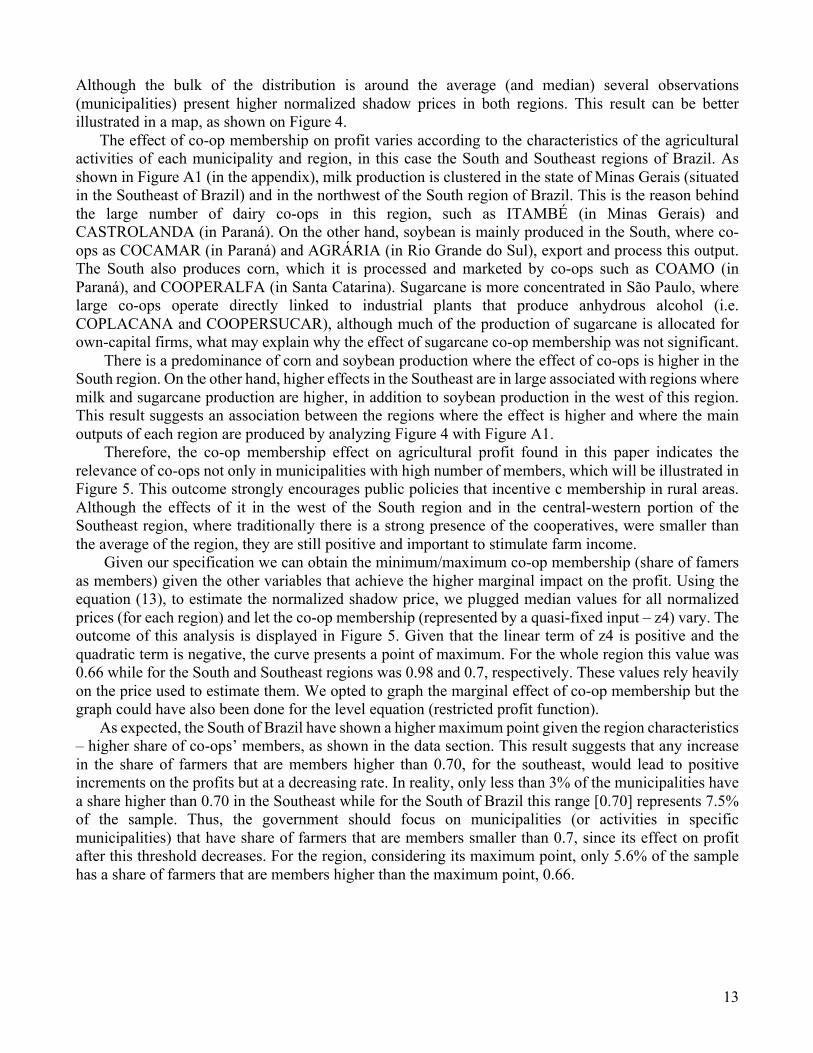
Although the bulk of the distribution is around the average (and median) several observations (municipalities) present higher normalized shadow prices in both regions. This result can be better illustrated in a map, as shown on Figure 4.
The effect of co-op membership on profit varies according to the characteristics of the agricultural activities of each municipality and region, in this case the South and Southeast regions of Brazil. As shown in Figure A1 (in the appendix), milk production is clustered in the state of Minas Gerais (situated in the Southeast of Brazil) and in the northwest of the South region of Brazil. This is the reason behind the large number of dairy co-ops in this region, such as ITAMBÉ (in Minas Gerais) and CASTROLANDA (in Paraná). On the other hand, soybean is mainly produced in the South, where co-ops as COCAMAR (in Paraná) and AGRÁRIA (in Rio Grande do Sul), export and process this output. The South also produces corn, which it is processed and marketed by co-ops such as COAMO (in Paraná), and COOPERALFA (in Santa Catarina). Sugarcane is more concentrated in São Paulo, where large co-ops operate directly linked to industrial plants that produce anhydrous alcohol (i.e. COPLACANA and COOPERSUCAR), although much of the production of sugarcane is allocated for own-capital firms, what may explain why the effect of sugarcane co-op membership was not significant.
There is a predominance of corn and soybean production where the effect of co-ops is higher in the South region. On the other hand, higher effects in the Southeast are in large associated with regions where milk and sugarcane production are higher, in addition to soybean production in the west of this region. This result suggests an association between the regions where the effect is higher and where the main outputs of each region are produced by analyzing Figure 4 with Figure A1.
Therefore, the co-op membership effect on agricultural profit found in this paper indicates the relevance of co-ops not only in municipalities with high number of members, which will be illustrated in Figure 5. This outcome strongly encourages public policies that incentive c membership in rural areas. Although the effects of it in the west of the South region and in the central-western portion of the Southeast region, where traditionally there is a strong presence of the cooperatives, were smaller than the average of the region, they are still positive and important to stimulate farm income.
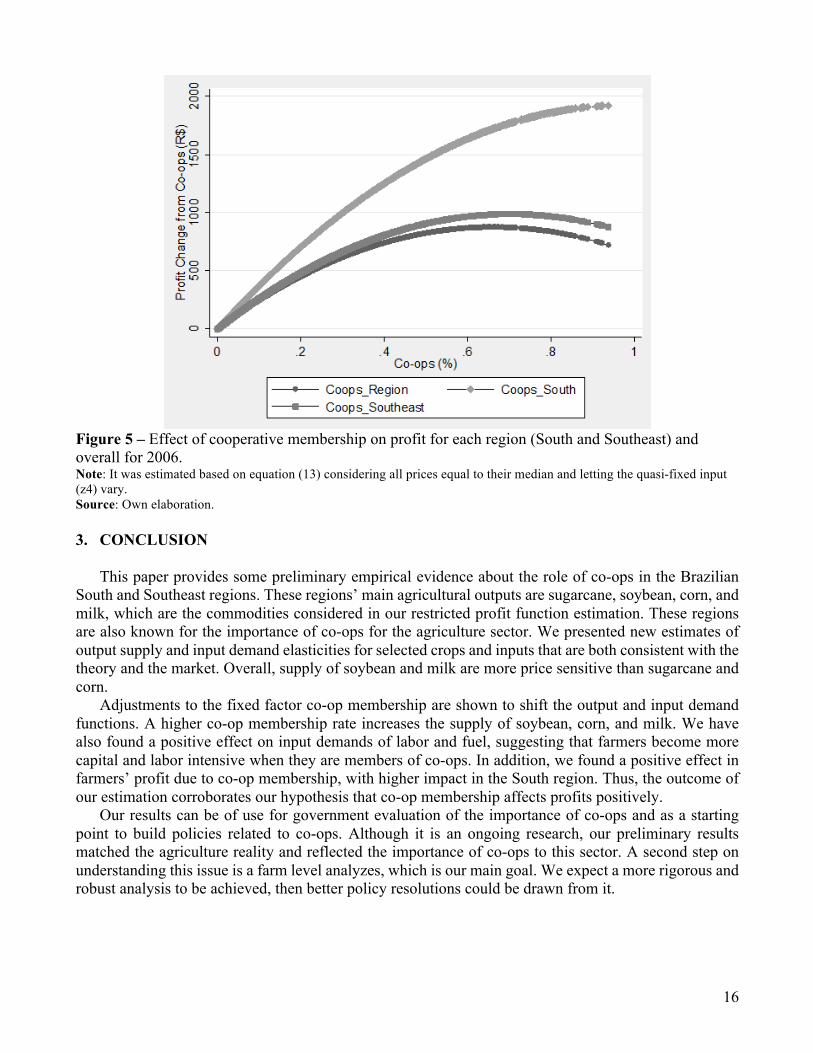
Given our specification we can obtain the minimum/maximum co-op membership (share of famers as members) given the other variables that achieve the higher marginal impact on the profit. Using the equation (13), to estimate the normalized shadow price, we plugged median values for all normalized prices (for each region) and let the co-op membership (represented by a quasi-fixed input – z4) vary. The outcome of this analysis is displayed in Figure 5. Given that the linear term of z4 is positive and the quadratic term is negative, the curve presents a point of maximum. For the whole region this value was 0.66 while for the South and Southeast regions was 0.98 and 0.7, respectively. These values rely heavily on the price used to estimate them. We opted to graph the marginal effect of co-op membership but the graph could have also been done for the level equation (restricted profit function).
As expected, the South of Brazil have shown a higher maximum point given the region characteristics – higher share of co-ops’ members, as shown in the data section. This result suggests that any increase in the share of farmers that are members higher than 0.70, for the southeast, would lead to positive increments on the profits but at a decreasing rate. In reality, only less than 3% of the municipalities have a share higher than 0.70 in the Southeast while for the South of Brazil this range [0.70] represents 7.5% of the sample. Thus, the government should focus on municipalities (or activities in specific municipalities) that have share of farmers that are members smaller than 0.7, since its effect on profit after this threshold decreases. For the region, considering its maximum point, only 5.6% of the sample has a share of farmers that are members higher than the maximum point, 0.66.
14
02
46
8
Perc
enta
ge
-2000 0 2000 4000 6000 8000Co-ops effect on Profit - South
02
46
8
Perc
enta
ge
-2000 0 2000 4000 6000 8000Co-ops effect on Profit - Southeast
Figure 3 – Histogram of the cooperative membership effect on profit in the South (left) and Southeast (right) of Brazil in 2006. Source: own elaboration

15
Figure 4 – Estimated normalized shadow price of cooperative membership on profit in the South (left) and Southeast (right) of Brazil in 2006. Source: own elaboration
16
Figure 5 – Effect of cooperative membership on profit for each region (South and Southeast) and overall for 2006. Note: It was estimated based on equation (13) considering all prices equal to their median and letting the quasi-fixed input (z4) vary. Source: Own elaboration. 3. CONCLUSION
This paper provides some preliminary empirical evidence about the role of co-ops in the Brazilian South and Southeast regions. These regions’ main agricultural outputs are sugarcane, soybean, corn, and milk, which are the commodities considered in our restricted profit function estimation. These regions are also known for the importance of co-ops for the agriculture sector. We presented new estimates of output supply and input demand elasticities for selected crops and inputs that are both consistent with the theory and the market. Overall, supply of soybean and milk are more price sensitive than sugarcane and corn.
Adjustments to the fixed factor co-op membership are shown to shift the output and input demand functions. A higher co-op membership rate increases the supply of soybean, corn, and milk. We have also found a positive effect on input demands of labor and fuel, suggesting that farmers become more capital and labor intensive when they are members of co-ops. In addition, we found a positive effect in farmers’ profit due to co-op membership, with higher impact in the South region. Thus, the outcome of our estimation corroborates our hypothesis that co-op membership affects profits positively.
Our results can be of use for government evaluation of the importance of co-ops and as a starting point to build policies related to co-ops. Although it is an ongoing research, our preliminary results matched the agriculture reality and reflected the importance of co-ops to this sector. A second step on understanding this issue is a farm level analyzes, which is our main goal. We expect a more rigorous and robust analysis to be achieved, then better policy resolutions could be drawn from it.
17
REFERENCES BERNARD, T.; TAFFESSE, A.S.; GABRE-MADHIN, E. Impact of cooperatives on smallholders' commercialization behavior: evidence from Ethiopia. Agricultural Economics, v. 39, n. 2, p. 147-161, 2008.
BIALOSKORSKI NETO. Cooperativas agropecuárias do Estado de São Paulo: uma análise da evolução na década de 90. Informações Econômicas, São Paulo, v. 35, p. 1-11, 2005.
BONUS, H. The cooperative association as a business enterprise: a study in the economics of transactions. Journal of Institutional and Theoretical Economics (JITE)/Zeitschrift für die gesamte Staatswissenschaft, v. 142, n.2, p. 310-339, 1986.
CASTRO, E.R.; TEIXEIRA, E.C. Rural credit and Agricultural supply in Brazil. Agricultural Economics, v.43, n.3, p. 293-302, 2012.
CAZZUFFI, C. Small scale farmers in the market and the role of processing and marketing cooperatives: A case study of Italian dairy farmers. 2013. Tese (Doutorado em Economia). University of Sussex, 2013.
CECHIN, A. Cooperativas brasileiras nos mercados agroalimentares contemporâneos: limites e perspectivas. In: BUAINAIN, A. M. et al. O Mundo Rural no Brasil do Século 21: a formação de um novo padrão agrário e agrícola. Área de Informação da Sede-Livros científicos (ALICE), 2014.
CHADDAD, F. R. Cooperativas no agronegócio do leite: mudanças organizacionais e estratégicas em resposta à globalização. Organizações Rurais & Agroindustriais, v. 9, n. 1, 2011.
CHAMBERS, R.G.; FÄRE, R.; GROSSKOPF, S.; VARDANYAN, M. Generalized quadratic revenue functions. Journal of Econometrics, v. 173, n. 1, p. 11-21, 2013.
DIEWERT, W. E. An application of the Shephard duality theorem: A generalized Leontief production function. The Journal of Political Economy, v.79, n.3, p. 481-507, 1971.
DIEWERT, W.E. Applications of duality theory. In: INTRILIGATOR, M.D; KENDRICK, D.A. (ed.), Frontiers of Quantitative Economics. Amsterdam, v. 2, p. 106-171, 1974.
DISCH, A. Agricultural Prices and real income changes: an application of duality theory to Brazilian agriculture. Dissertation (PhD in Economics), Yale University, 1983.
FLORES, M.X. Características Estruturais da Produção Agrícola e Mudança Tecnológica na Região dos Cerrados, Brasil. Tese (Mestrado em Economia Aplicada), Universidade Federal de Viçosa, 1984.
FOLSOM, J. Measuring the Economic Impact of Cooperatives in Minnesota. RBS Research Report 200, Washington, DC, United States Department of Agriculture, Rural Business-Cooperative Service, December 2003.
FULGINITI, L.E.; PERRIN, R.K. Argentine agricultural policy in a multiple-input, multiple-output framework. American Journal of Agricultural Economics, v. 72, n. 2, p. 279-288, 1990.
HANSMANN, H. Ownership of the Firm. Journal of Law, Economics, and Organization, v. 4, n. 2, p. 267-304, 1988.
HANSMANN, H. The Ownership of Enterprise, Cambridge: The Belknap Press of Harvard University Press, 1996.
HELFAND, S.M.; MAGALHÃES, M.M.; RADA, N.E. Brazil's Agricultural Total Factor Productivity Growth by Farm Size. Inter-American Development Bank, 2015.
HELMBERGER, P.; HOOS, S. Cooperative enterprise and organization theory. Journal of Farm Economics, v. 44, n. 2, p. 275-290, 1962.
HUFFMAN, W. E. BALL, V. E.; GOPINATH, M.; SOMWARU, A. Public R&D and infrastructure policies: effects on cost of Midwestern agriculture. In. Agricultural Productivity. Springer US, p. 167-183, 2002.
HUFFMAN, W.E.; EVENSON, R.E. Science for Agriculture: A Long-Term Perspective. Ames, IA: Blackwell Publishing, 2006.
HUFFMAN, W.E.; EVENSON, R.E. Supply and Demand Functions for Multi Product US Cash Grain Farms: Biases Caused by Research and Other Policies. American Journal of Agricultural Economics, v. 71, n. 3, p. 761-773, 1989.
18
IBGE - INSTITUTO BRASILEIRO DE GEOGRAFIA E ESTATÍSTICA. Censo Agropecuário Brasileiro 2006. Rio de Janeiro. Disponível em: http://www.sidra.ibge.gov.br/bda/pesquisas/ca/default.asp?o=2&i=P. Acesso em: 20 set 2015.
JARDINE, S.L.; LIN, C.Y.C.; SANCHIRICO, J.N. Measuring Benefits from a Marketing Cooperative in the Copper River Fishery. American Journal of Agricultural Economics, v. 96, n. 4, p. 1084-1101, 2014.
LAU, L. J. A characterization of the normalized restricted profit function. Journal of Economic Theory, v. 12, n. 1, p. 131-163, 1976.
McKAY, L.; LAWRENCE, D.; VLASTUIN, C. Profit, output supply, and input demand functions for multiproduct firms: The case of Australian agriculture. International Economic Review, v. 24, n. 2, p. 323-339, 1983.
McNAMARA, K.T.; FULTON, J.; HINE, S. The Economic impacts associated with locally owned agricultural cooperatives: a comparison of the Great Plains and the Eastern Cornbelt. In: Annals of 2001 Annual Meeting, Las Vegas, Nevada. NCERA-194 Research on Cooperatives, 2001.
MILFORD, A. Coffee, co-operatives and competition: the impact of fair trade. CMI Report, Oslo, v. 2004, n. 6, 2004.
NADIRI, M.I. Producers Theory. In. ARROW, K.J., INTRILIGATOR, M.D. (ed). Handbook of Mathematical Economics. New York, NY: North-Holland Publishing Co., v. 2, 1982.
OCB - Organização das Cooperativas Brasileiras. Cooperative membershipo Agropecuário Cooperative membershipo Agropecuário: Camara Temática de Insumos Agropecuários - 2013. Disponível em: <http://www.agricultura.gov.br/arq_editor/file/camaras_tematicas/ Insumos_agropecuarios/71RO/app_ocb>. Acesso em: 12 dez. 2015.
OCB - Organização das Cooperativas Brasileiras. Panorama do cooperative membershipo brasileiro – 2011. Relatório da gerência de monitoramento. Brasília, 2012. Disponível em: <www.ocb.org.br/gerenciador/ba/arquivos/panorama_do_cooperative membershipo_ brasileiro_2011.pdf>. Acesso em: 10 out. 2015.
OCB - Organização das Cooperativas Brasileiras. Relatório OCB 2014: o que nos torna cooperativistas. Disponível em: <http://www.brasilcooperativo.coop.br/arquivos/ publica/relatorio_OCB_2014_web.zip>. Acesso em: 30 set. 2015.
PETROBRAS. Fórmulas de Conversão. Disponível em: http://www.investidorpetrobras.com.br/pt/destaques-operacionais/formulas-de-conversao. Acesso em: Dez, 2015.
PRESNO, N.B. As cooperativas e os desafios da competitividade. Estudos, Sociedade e Agricultura, n. 17, p. 119-144, 2001.
RODRIGO, M. F. Do cooperatives help the poor? Evidence from Ethiopia. In: Annals of Agricultural and Applied Economics Association’s (AAEA) annual meeting, Seattle, Washington. 2012.
SCHURING, J., HUFFMAN, W.E., FAN, X. The Impact of Public and Private R&D on Farmers’ Production Decisions: 1960-2004. In: Annals of 2011 AAEA Annual Meeting, July 24-26, 2011, Pittsburgh, Pennsylvania. Agricultural and Applied Economics Association, 2011.
SEXTON, R. J.; ISKOW, J. Factors Critical to the Success or Failure of Emerging Agricultural Cooperatives (Vol. 88, No. 3). Davis: Division of Agriculture and Natural Resources, University of California, 1988.
SEXTON, R.J. Cooperatives and the forces shaping agricultural marketing. American Journal of Agricultural Economics, v. 68, n. 5, p. 1167-1172, 1986.
SHUMWAY, C.R.; SAEZ, R.R.; GOTTRET, P.E. Multiproduct supply and input demand in US agriculture. American Journal of Agricultural Economics, v. 70, n. 2, p. 330-337, 1988.
STAATZ, J.M. Farmers’ incentives to take collective action via cooperatives: A transaction-cost approach. In. ROYER, J.S. (Ed.), Cooperative Theory: New Approaches. (p. 87–107) (Agricultural Cooperative Service Report 18). Washington, DC: U.S. Department of Agriculture, 1987.
VALENTINOV, V. Why are cooperatives important in agriculture? An organizational economics perspective. Journal of Institutional Economics, v. 3, n. 01, p. 55-69, 2007.
19
APPENDIX
Figure A1 - Production Value of milk, sugarcane, soybean and corn for the South and Southeast of Brazil in 2006 (US$ 1000 of 2006) Source: IBGE (2009).

20
Table A1 – Iterated SUR parameter estimates for quadratic restricted profit function, four supply and one demand function Coefficient Std. Error Coefficient Std. Error Normalized Restricted Profit Corn supply
p1n -1.357,538 * 725,425 p3n 419,813 *** 140,931 p3n 41,663 *** 5,988 p1n 68.824,710 *** 10.658,640 p4n 878,387 1.417,397 p4n 21.593,100 ** 10.271,250 p5n -235,905 *** 46,774 p5n -3.155,457 *** 821,412 p6n 6.234,122 *** 934,675 p6n 6.532,886 20.472,520
p1n2 108.988,300 *** 11.062,750 z4 17.673,390 *** 2.192,157 p3n2 761,893 *** 51,796 Cons 6.234,122 *** 934,675 p4n2 4.074,695 4.633,249 Milk supply p5n2 24,666 32,337 p3n 761,893 *** 51,796 p6n2 6.532,886 20.472,520 p1n 862,268 *** 74,398
p1np3n 862,268 *** 74,398 p4n 121,321 ** 53,820 p1np4n -12.771,050 7.900,475 p5n -64,666 *** 9,523 p1np5n -3.559,165 *** 564,373 p6n 419,813 *** 140,931 p1np6n 68.824,710 *** 10.658,640 z4 21,250 * 11,741 p3np4n 121,321 ** 53,820 Cons 41,663 *** 5,988 p3np5n -64,666 *** 9,523 Soybean supply p3np6n 419,813 *** 140,931 p3n 862,268 *** 74,398 p4np5n 287,390 461,158 p1n 108.988,300 *** 11.062,750 p4np6n 21.593,100 ** 10.271,250 p4n -12.771,050 7.900,475 p5np6n -3.155,457 *** 821,412 p5n -3.559,165 *** 564,373
z4 2.014,561 *** 429,751 p6n 68.824,710 *** 10.658,640 z42 -4.013,673 *** 1.138,009 z4 27.358,430 *** 1.826,999 z2 -0,035 *** -0,010 Cons -1.357,538 * 725,425 z6 -0,020 -0,020 Sugarcane supply
p1nz4 27.358,430 *** 1.826,999 p3n 121,321 ** 53,820 p3nz4 21,250 * 11,741 p1n -12.771,050 7.900,475 p4nz4 4.581,997 * 2.753,221 p4n 4.074,695 4.633,249 p5nz4 -490,926 *** 100,453 p5n 287,390 461,158 p6nz4 17.673,390 *** 2.192,157 p6n 21.593,100 ** 10.271,250 Cons 40,980 72,253 z4 4.581,997 * 2.753,221
Cons 878,387 1.417,397 (negative) Fuel demand p3n -64,666 *** 9,523 p1n -3.559,165 *** 564,373
p4n 287,390 461,158 p5n 24,666 32,337
p6n -3.155,457 *** 821,412 z4 -490,926 *** 100,453 Cons -235,905 *** 46,774 Note: p1 - soybean price; p3 – milk price; p4 – sugarcane price; p5 – fuel price; p6 – corn price; z2 – irrigated area; z4 – proportion of cooperative members; z6 – family labor. Numeraire: p2 - labor price. Significance levels: *** - 1%; ** - 5%; * - 10%. Source: Own elaboration.


![Cooperative Pedagogy: Tutoring Activities and Sciences ... · Patrícia Cavalheiro [patriciaenicole@yahoo.com.br ] ... ajuda mútua, respeito pelas diferenças e responsabilidade](https://static.fdocumentos.com/doc/165x107/5be7335809d3f26f698c336c/cooperative-pedagogy-tutoring-activities-and-sciences-patricia-cavalheiro.jpg)