Trabalho laboratorial (1aula): IP1 ou IP2 – com relatório ... · Tabela 2 - Critério Nacional...
49
1 3. Módulo de Instalações Piloto – Prof. Jorge de Carvalho 3.1. Objectivo Familiarizar os alunos com a Investigação e Desenvolvimento que acompanha o arranque de uma Instalação Piloto. Interpretação dos dados experimentais obtidos, assim como a sua importância na transferência para Instalações Piloto de maiores dimensões. Interpretação de dados experimentais obtidos em unidades de dimensões pré-industriais. Análise crítica das condições operatórias nas várias etapas do processo em estudo 3.2. Introdução Os trabalhos a serem realizados inserem-se em duas áreas do conhecimento. Uma das áreas é a extracção não dispersiva, com a recuperação de zinco por membranas líquidas em contactores de fibras ocas. No laboratório dispomos de algumas unidades de contactores, cuja dimensão permite extrapolar os resultados para uma escala industrial. A outra área será no domínio do tratamento de Efluentes Industriais, recorrendo à tecnologia dos Leitos mistos com adsorção física e/ou química e para alguns grupos no recurso à tecnologia da filtração integrada com secagem de bolos. Dentro das duas áreas referidas (IP1 e IP2) são fornecidos aos alunos artigos científicos desenvolvidos no Grupo de Hidrometalurgia e Ambiente do IST. 3.3. Trabalho laboratorial (1aula): IP1 ou IP2 – com relatório detalhado IP1 – Responsável: Teresa Reis Recuperação de zinco por membranas líquidas em contactores de fibras ocas IP2 – Responsável: Jorge de Carvalho/Francisco Lemos Estudo da aplicação de leitos mistos e filtração integrada no tratamento de águas
Transcript of Trabalho laboratorial (1aula): IP1 ou IP2 – com relatório ... · Tabela 2 - Critério Nacional...

1
3. Módulo de Instalações Piloto – Prof. Jorge de Carvalho
3.1. Objectivo
Familiarizar os alunos com a Investigação e Desenvolvimento que acompanha o arranque de uma Instalação Piloto. Interpretação dos dados experimentais obtidos, assim como a sua importância na transferência para Instalações Piloto de maiores dimensões. Interpretação de dados experimentais obtidos em unidades de dimensões pré-industriais. Análise crítica das condições operatórias nas várias etapas do processo em estudo
3.2. Introdução
Os trabalhos a serem realizados inserem-se em duas áreas do conhecimento. Uma das áreas é a extracção não dispersiva, com a recuperação de zinco por membranas líquidas em contactores de fibras ocas. No laboratório dispomos de algumas unidades de contactores, cuja dimensão permite extrapolar os resultados para uma escala industrial. A outra área será no domínio do tratamento de Efluentes Industriais, recorrendo à tecnologia dos Leitos mistos com adsorção física e/ou química e para alguns grupos no recurso à tecnologia da filtração integrada com secagem de bolos. Dentro das duas áreas referidas (IP1 e IP2) são fornecidos aos alunos artigos científicos desenvolvidos no Grupo de Hidrometalurgia e Ambiente do IST.
3.3. Trabalho laboratorial (1aula): IP1 ou IP2 – com relatório detalhado IP1 – Responsável: Teresa Reis
Recuperação de zinco por membranas líquidas em contactores de fibras ocas IP2 – Responsável: Jorge de Carvalho/Francisco Lemos
Estudo da aplicação de leitos mistos e filtração integrada no tratamento de águas
2
3.4. Informação para IP1
3.4.1. Recuperação de zinco por membranas líquidas em contactores de fibras ocas.
O revestimento de zinco é muito utilizado como protector do aço contra a corrosão. As peças em fim de vida são sujeitas, muito frequentemente, a decapagem com ácido clorídrico tendo em vista a recuperação do zinco, metal de elevado valor económico. O zinco será extraído do banho esgotado por membranas liquidas utilizando novos extractantes (1-(3-piridil)undecano-1-ona oxima e respectivos sais quaternários) sintetizadas pelo grupo liderado pela Drª Karolina Wieszczyka do Institute of Chemical Technology and Engineering (Poznan University of Technology). O processo de extracção será realizado em contactores de fibras ocas com a fase aquosa a circular no interior das fibras a e dispersão (fase orgânica e fase regenerante) a circular no lado da caixa. Esta configuração é designada por PEHFSD (pseudo-emulsion hollow fibre strip dispersion). Irá analisar-se a influência composição da pseudo-emulsão e da fase de alimentação na recuperação de zinco. Em Anexo 1 encontra-se um artigo científico relacionado com o trabalho experimental.
Figura 1: Esquema do contactor de fibras ocas (2,5”× 8” da Celgard USA. ~ 10800 fibras em polipropileno, dext=0,26 mm, dint =0,22 mm, dporos=0.03 mm, A=1,16 m2 (2500 m-1))
Figura 2: Esquema da instalação de fibras ocas.
Fase aquosa
Fase aquosa
Pseudo-emulsão
Pseudo-emulsão

3
3.5. Informação para IP2
3.5.1. Descrição do Processo de Tratamento para a Remediação da água da Lagoa das Furnas
Objectivos
� Propor um Processo de Remediação da água da Lagoa das Furnas, diminuindo o teor em fósforo total para níveis aceitáveis (<35 ppb) e os níveis de clorofila abaixo das 10 mg/m3
� Clarificar a água da Lagoa, reduzindo a turbidez inicial de 9-20 NTU para valores inferiores a 0,2 NTU.
� Diminuir os teores de azoto e fósforo solúvel, ao baixar o teor de fósforo particulado da água.
� Tratamento que não introduza contaminantes na água, nomeadamente Fe(III) e Al(III), para níveis acima dos que existem presentemente.
� O processo de tratamento a inovar deverá ser sustentável, isto é, os resíduos produzidos durante o tratamento deverão ser uma commodity com interesse Regional
� Pelos resultados obtidos no IST podemos estimar que em media por cada m3 de água tratada iremos obter 75g de sólido húmido com 80% de água. Obviamente que esta quantidade varia com a altura do ano.
� Igualmente, após filtração dos rejeitados (“Backwash”) concentrados, estimamos que para uma unidade operando 250 m3/h, 24h por dia e 7 dias por semana deverá produzir-se cerca de 1170 kg de lama com 30% de humidade.
4
Estado da Arte e Caracterização
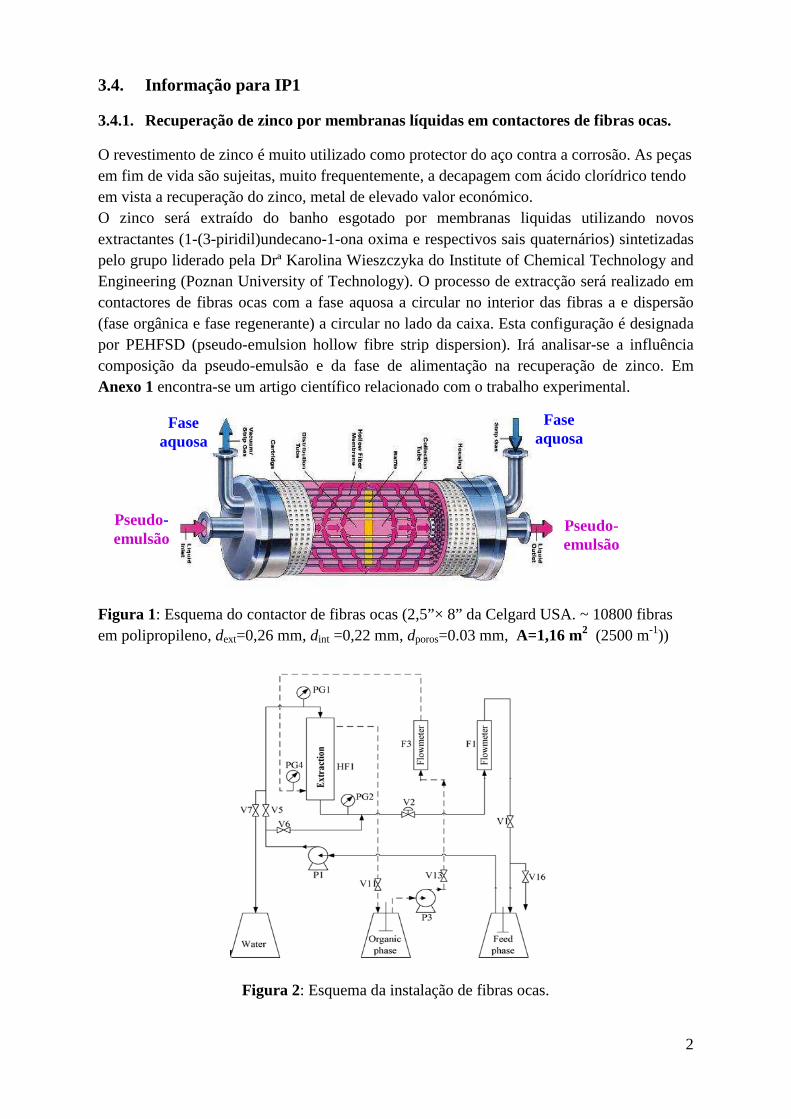
Figura 3 - Caracterização da água da Lagoa das Furnas de 28/05/2014 a 10/12/2014
Tabela 1 - Análise dos parâmetros relevantes da água da Lagoa (Novembro 2013)
Parâmetro Resultado
Alcalinidade Total 39,3 mg(CaCO3)/L
Fosfato <0,01 mg(P)/L
Sílica 11 mg(SiO2)/L
Fósforo Total 0,029 mg(P)/L
Fósforo Solúvel 0,018 mg(P)/L
Azoto Amoniacal 0,14 mg(N)/L
Azoto Kjeldahl 0,59 mg(N)/L
Azoto Orgânico 0,45 mg(N)/L
Azoto Total 1,6 mg(N)/L
Nitrato 1,0 mg(N)/L
Nitrito 0,005 mg(N)/L
Cálcio Total 3,5 mg/L
Magnésio Total 2,7 mg/L
Bário Total <0,06 mg/L
Estrôncio <0,020 mg/L
Ferro Total <0,23 mg/L
64,280,684,5
71,2
97,782,880,6
38
115,9
159,9
135,9
71,968,5
136,5147,2
109,996,589,9
65,2
23,91717 16,7 18,7 21,717,8 17
46,5 48,548,5
22,519
72,577,975,271,964,5
19,6
0
50
100
150
200
28-mai-14 28-jun-14 28-jul-14 28-ago-14 28-set-14 28-out-14 28-nov-14
A N Á L I S E S E F E C T UA DA S À Á G UA L A G O A DA S F U R N A S
Fósf. Total (ppb) Fósf. Solúvel (ppb)

5
Tabela 2 - Critério Nacional para a avaliação do estado trófico de uma água (INAG 2002)
� O fósforo da Lagoa das Furnas é o agente determinante para a sua eutrofização, contudo este fósforo encontra-se maioritariamente (70%), adsorvido à matéria orgânica e inorgânica, isto é, na forma particulada, estas partículas têm diâmetros inferiores a 1 micra e somente a fracção residual se encontra na forma de fósforo solúvel
� Para além do exposto vários catiões e aniões, nomeadamente, os portadores de átomos de azoto, também se encontram em larga percentagem adsorvidos às partículas existentes
� Em algumas estações do ano, a presença de microalgas contribuem para o aumento de clorofila no meio aquoso.
� Dos processos disponíveis na literatura para a remoção de fósforo de uma água, destacam-se os métodos de Precipitação Química, os Métodos Biológicos, os Métodos Físicos e, recentemente, os de Adsorção Química, incluindo a retenção em leitos mistos em colunas.
� A maioria dos meios aquosos contêm fósforo ao nível dos ppm e na forma solúvel.
� A Lagoa das Furnas, devido à sua envolvência, tem a particularidade de os níveis de fósforo serem da ordem dos 50 a 90 ppb e este se encontrar maioritariamente adsorvido a partículas de diâmetros inferiores a 1 micra. Igualmente a composição da água varia substancialmente ao longo do ano.

6
3.5.2. Processo desenvolvido que foi conducente à construção de uma unidade demonstrativa para tratar 5m3/h de água da Lagoa das Furnas
� Com os estudos realizados ao nível de bancada e semi-piloto no IST, viemos a propor, um tratamento que foi sendo testado de modo descontínuo no IST, mas simulando sequencialmente todas as etapas.
� O processo de tratamento com as etapas abaixo, foi proposto e está a ser implementado junto à Lagoa das Furnas, com unidade demonstrativa do processo.
� Neste processo, iremos utilizar areia de sílica com diâmetros entre 2 mm e 4 mm no fundo da coluna, até uma altura de 25 cm e areia entre 1 mm e 2 mm de diâmetro, a qual estará sob a areia grossa, estendendo-se ao longo da altura do leito.
Granulometrias (mm)
Areia de Sílica
1 <d<2
2<d<4
Descrição das Etapas
1 – Captação de água da Lagoa através de uma bomba montada numa jangada móvel, permitindo fazer captação em zonas com concentrações muito diferenciadas em algas e eventualmente fósforo e certos nutrientes.
2 – Sistema de pré-filtração da água (1) a ser introduzida na unidade de tratamento, com a facilidade de lavagem automática da tela, uma vez colmatada. Com esta unidade removem-se os sólidos de dimensões superiores à malha da tela, microalgas, etc e reduz-se substancialmente o nível de clorofila da água.
3 – Coluna de leito de areia de várias granulometrias (2), com possibilidade introdução de outros materiais se se considerar necessário. O fluxo de partida nesta coluna é de baixo para cima, podendo vir a ser alterado o seu sentido. Esta coluna de leito misto está preparada para fazer lavagem do leito, isto é, a remoção de tudo o que ficar retido no leito, logo que se atinja um nível de colmatação e utilizando um volume de água de lavagem correspondente a 2% do volume de água que atravessar o leito.
4 - Unidade de ultrafiltração, pela qual irá passar a água tratada no leito misto, afim de se reduzir a turbidez da fase aquosa e consequentemente os níveis de fósforo (6). A fase aquosa a tratar circula no exterior das fibras ocas da unidade

7
5 – Sempre que o Leito Misto (2) e/ou a unidade de ultrafiltração (6) necessitar de ser limpa, vai buscar-se a um tanque de água filtrada (4 e 5), água para realizar o Backwash.
6 – Todos os Backwash são enviados para um tanque de Backwash (7), a concentração destas correntes aquosas é inferior a 0,7 g/L de sólidos.
7 – Estas soluções de Backwash terão de ser concentradas e para o efeito dispomos de duas correntes em paralelo. Dispomos de uma unidade de ultrafiltração tubular cerâmica (8) e uma unidade de ultrafiltração de fibras ocas também para concentração (10). Nestas unidades de ultrafiltração a suspensão circula no interior dos tubos.
8 – Existem 2 tanques (9 e 11) que recebem a corrente aquosa concentrada nestas duas unidades de ultrafiltração.
9 – Dispomos de 2 decantadores (14 e 15) para cada uma das correntes de Backwash concentrado. Após utilizarmos um floculante (19) vamos produzir um espessado que será armazenado em tanques (18) para posterior estudo numa unidade de filtração com compressão do bolo e vácuo.
10 – Todos os efluentes da unidade demonstrativa serão encaminhados para o tanque (20) de onde são enviados para uma distância de 350 m, onde se encontra a saída dos efluentes da Lagoa para uma linha de água.
11- A unidade demonstrativa tem instrumentação e controlo o que nos permite operar com alguma segurança.

8
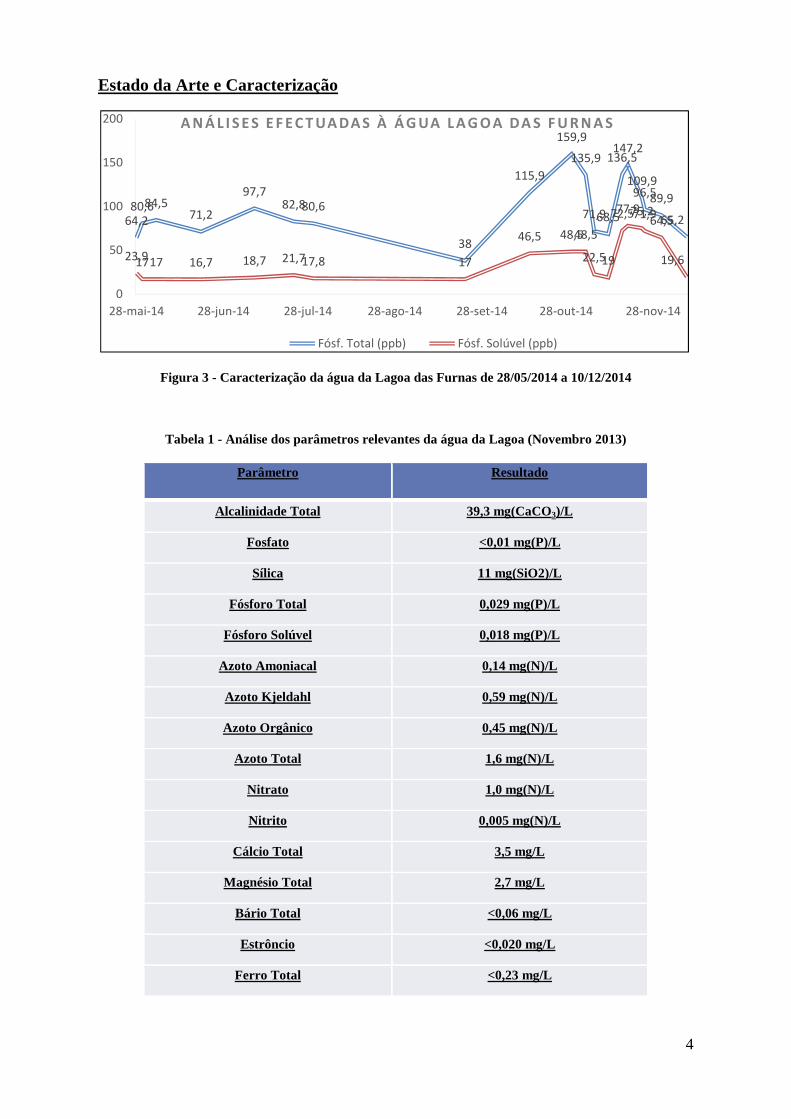
Diagrama do Processo de Remediação da água de uma lagoa recorrendo a métodos fisico-químicos para o tratamento
9
Diagrama de Instrumentação e Controlo
UF(Trativi)
6
TanqueConcentrado
(IST) 9
TanqueConcentrado (Trativi) 11
TanqueÁgua Limpa - 1
4
TanqueÁgua Limpa - 2
5
Tanque de Equalização
3
V3
TanqueDe
Descarga20
V1
71
LT
71LC
51
LT
53LT
51LC
31LT
33LT
31LC
111
LT
91LT
91LC
111LC
Água a tratar
Contador
VM1
Bomba Descarga(20)
201LC
201LT
203
LT
202LT
1XC
92LT
112
LT
72
LT52LT
32LT
TanqueBackwash
7
Leito Misto(Hubel)
2
UF Conc.
(Trativi)10
UF Conc.(IST)
8
Decantador(14)
Bombaalimentação
Bomba de clarificado (13)
Bomba de concentrado (12)
Bomba de espessado (16)
Pré – Filtro(Hubel)
1
CV3
CV2
Decantador(15)
Bomba de espessado (17)
ReservatórioEspessado
(18)
CV1
Linha de BackwashLinha de Água TratadaLinha de Água não Tratada
Floculante(19)
V2
V4
V5V6
V7
LAGOA

10
Controlo Tanque de Equalização (3) / Tanque Água Limpa 1 (4) / Tanque Água Limpa 2 (5) / UF - Trativi (6 )/ Filtro-Hubel (2)
Ciclo de Filtração UF - Trativi (6) / Filtro - Hubel (2)
� A válvula V2 é aberta.
O LC31 controla o nível no tanque 3 da seguinte forma:
� A válvula V4 é normalmente fechada.
� Quando atinge o nível LT31 abre válvula V4 (descarga Tanque 4).
� Quando atinge o nível LT32 manda fechar a V4.
� Se atingir o nível LT33 emitir alarme visual, sonoro e envia sinal de paragem à unidade UF6.
Ciclo de Filtração UF - Trativi (6) / Filtro - Hubel (2)
O LC41 controla o nível dos Tanques 4 e 5 da seguinte forma:
� A válvula V3 é normalmente fechada.
� Quando atinge o nível LT41 abre a válvula V3.
� Quando atinge o nível LT42 fecha a válvula V3.
� Se atingir o nível LT43 emitir alarme visual e sonoro.
Ciclo de lavagem - Filtro-Hubel (2)
� A válvula V2 é fechada.
O LC31 controla o nível no tanque 3 da seguinte forma:
� A válvula V4 é normalmente fechada.
� Quando atinge o nível LT31 abre válvula V4 (descarga Tanque 3).
� Se atingir o nível LT33 emitir alarme visual e sonoro e envia sinal de interrupção de lavagem à unidade UF6.
O LC41 controla o nível do tanque da seguinte forma:
� A válvula V3 é aberta enquanto o nível for superior a LT43.
� Se atingir o nível LT43 emitir alarme visual, sonoro e envial sinal e paragem à unidade Filtro 2.

11
Ciclo de lavagem – UF - Trativi (6)
� A válvula V3 é fechada.
� A válvula V2 é aberta.
O LC31 controla o nível no Tanque 3 como no Ciclo de Filtração.
O LC41 controla o nível do tanque da seguinte forma:
� A válvula V1 é aberta enquanto o nível for superior a LT33.
� Se atingir o nível LT43 emitir alarme visual, sonoro e envia sinal de interrupção de lavagem da unidade UF 6.
Zona Tanque Backwash (7) / Tanque UF concentrado – IST (9) / Tanque UF concentrado – Trativi (11)
O LC71 controla o nível do tanque da seguinte forma:
� A válvula V5 é fechada enquanto o nível for inferior a LT72.
� Se atingir o LT91 emitir sinal visual e sonoro.
� Se atingir o nível LT71 interrompe lavagem da unidade Filtro 2 e UF6.
O LC91 controla o nível do tanque da seguinte forma:
� A válvula V6 é aberta enquanto o nível for inferior a LT92.
� Se atingir o nível LT91 emitir alarme visual e sonoro.
O LC111 controla o nível do tanque da seguinte forma:
� A válvula V7 é aberta enquanto o nível for inferior a LT112.
� Se atingir o LT111 emitir sinal visual e sonoro.
Zona Tanque de Descarga (20)
O LC201 controla o nível do tanque da seguinte forma:
� Quando atinge o nível LT203 a Bomba de Descarga (20) arranca a meia capacidade.
� Se atingir o nível LT202 a bomba Bomba de Descarga (20) começa a funcionar à capacidade máxima.
Se atingir o LT201 emitir sinal visual e sonoro e envia informação à UF6 ou Filtro 2 (consoante a unidade que estiver em ciclo de lavagem) para interromper o ciclo de lavagem

12
3.5.3. Construção, montagem e arranque da Unidade Demonstrativa de tratamento da água da Lagoa das Furnas
Após a colocação dos contentores, com o respectivo equipamento instalado no interior iniciaram-se os trabalhos de montagem de tubagem, de instalação eléctrica e instrumentação e controlo.

13
Os trabalhos de montagem de tubagem e instrumentação e controlo foram terminados durante o mês de Dezembro.
Unidade de Leito misto
Unidade de ultrafiltração concentração tubular (fibras ocas)
Unidade de ultrafiltração de concentração tubular (cerâmica)
Decantadores
Unidade de Ultrafiltração Unidade Demonstrativa
14
Alterações realizadas na unidade de Leito misto para operar em fluxo ascendente e descendente
A unidade leito misto foi inicialmente projectada para operar em fluxo ascendente, no entanto após os primeiros testes decidiu-se tornar a unidade mais versátil, e passar a operar quer em fluxo ascendente quer em fluxo descendente. Para tal realizaram-se alterações na unidade a nível de tubagem, colocação de válvulas manuais, localização de electroválvulas e alteração de software.
As alterações a nível de tubagem, válvulas manuais e electroválvulas foram executadas no início de Fevereiro, no entanto, a alteração de software apenas foi possível no final do mês de Fevereiro (22 e 23) o que impediu que a operação da unidade de leito misto em fluxo descendente no modo automático. Adicionalmente no processo de alteração da tubagem foi danificado um transmissor de pressão o que impedia o funcionamento da unidade de leito misto em modo automático, pois o modo de lavagem é accionado quando a perda de carga estabelecida é atingida.
Em simultâneo, às alterações estruturais no leito misto e considerando os resultados obtidos para a turbidez da água da lagoa à saída, adicionaram-se 150kg de areia APAH30 para melhorar estes resultados.

15

16
Considerações finais dos ensaios realizados na Lagoa das Furnas
Com base nos resultados obtidos nas unidades de Leito misto e ultrafiltração que integram a unidade demonstrativa da Lagoa das Furnas:
� Leito misto – Boa autonomia, mas ineficiente redução do teor de fósforo particulado (48 para 37 ppb) e solúvel (39 para 37 ppb) e da turbidez da água da lagoa, quer em fluxo ascendente quer em fluxo descendente;
� Ultrafiltração – Eficiente na redução do teor em fósforo particulado (48 para 8 ppb) e solúvel (38 para 8 ppb), mas autonomia reduzida (< 4 horas de operação).
Os resultados obtidos na unidade demonstrativa das Furnas, isto é, valores de turbidez e níveis de fósforo à saída da coluna de leito misto mais elevados do que o esperado, levaram-nos a especular que as condições da água da lagoa que estava a ser utilizada, era diferente da utilizada anteriormente no IST. Isto é, neste momento deveríamos ter partículas muito mais pequenas que não ficavam retidas.
3.5.4. Dimensão de partículas
A dimensão das partículas presentes na água da Lagoa das Furnas e nas fases subsequentes de tratamento foi determinada através de duas técnicas diferentes:
� Dispersão dinâmica de luz – Microtrac Nano-Flex 180
� Difração laser – Malvern Mastersizer 2000
Dimensão de partículas – Dispersão dinâmica de luz
Dimensão de partículas de Fósforo e Sílica na água da Lagoa
0
5
10
15
20
25
0,0 2,0 4,0 6,0 8,0
%
Diâmetro (µm)
10 seg Fósforo
20 seg Fósforo
30 seg Fósforo
0
5
10
15
20
25
30
35
40
45
0,0 1,0 2,0 3,0 4,0 5,0 6,0 7,0
%
Diâmetro (µm)
10 seg Sílica
20 seg Sílica
30 seg Sílica

17
0
5
10
15
20
25
30
35
0,0 0,2 0,4 0,6 0,8 1,0
%
Diâmetro (µm)
Após leito misto (1)10 segFósforo20 segFósforo30 segFósforo
Conclusões
Os ensaios realizados pelas técnicas dispersão dinâmica de luz e difração laser permitiram obter as seguintes conclusões:
� o tamanho das partículas de fósforo presentes na água da lagoa, são na sua maioria inferiores a 1mm. Estes resultados comprovam que os valores de turbidez da água da lagoa após o leito misto na unidade demonstrativa se devem a partículas inferiores a 1mm;
� o Leito misto é eficiente na retenção de partículas de fósforo com dimensões superiores a 1mm;
� no Backwash concentrado, isto é, após ter passado na unidade de ultrafiltração tubular, estão presentes as partículas inferiores a 1mm o que permite concluir que a unidade de Ultrafiltração da Trativi retém a maioria das partículas que passam pelo Leito misto;
� existem partículas de sílica inferiores a 1mm na água após a passagem pelo Leito misto, que influenciam os valores de turbidez da água à saída;
� as partículas presentes na água após a unidade de Ultrafiltração apresentam dimensões muitos reduzidas que não foi possível determinar por nenhuma das duas técnicas experimentais.
0
5
10
15
20
25
0,0 1,0 2,0 3,0
%
Diâmetro (µm)
Após leito misto (2)
10 seg Fósforo
20 seg Fósforo
30 seg Fósforo
0
5
10
15
20
0,0 2,0 4,0 6,0 8,0
%
Diâmetro (µm)
Backwash concentrado (1)
10 seg Fósforo
20 seg Fósforo
30 seg Fósforo
0
5
10
15
20
25
0,0 2,0 4,0 6,0 8,0
%
Diâmetro (µm)
Backwash concentrado (2)10 seg Fósforo
20 seg Fósforo
30 seg Fósforo
18
Perante os resultados obtidos, a fim de se aglutinar as partículas realizaram-se ensaios em Jar-Test, cujas conclusões se apresentam:
� a aplicação de floculante catiónico, após a aplicação de coagulante orgânico demonstra ser ineficiente na redução da turbidez da água;
� o coagulante PAX XL10 apresenta o melhor resultado de turbidez da água da lagoa (0,58/0,61 NTU), no entanto, este coagulante é à base alumínio e como tal afastou-se a hipótese da sua utilização;
� os coagulantes orgânicos com melhores resultados são o Chemifloc PA47 e o Superfloc C577;
� os floculantes aniónicos com melhores resultados são Superfloc A-100 e o SNF alta carga;
� a razão coagulante/floculante mais favorável é de 5:1 – (20ppm:4ppm e/ou 10 ppm :2ppm)
Com base nestes resultados decidiu-se realizar ensaios com coagulantes e floculantes em colunas de leito misto laboratoriais com 2,5cm de diâmetro, quer em fluxo ascendente quer em fluxo descendente. A maioria dos grupos irá acompanhar a realização destes ensaios.
3.6. Parte Experimental do trabalho em colunas de leitos misto
Os leitos mistos podem são utilizados para a remoção de pequenas partículas que ficam retidas na porosidade do leito e/ou por processos de remoção por adsorção química em vários tipos de leitos (exemplo: Hidróxido Férrico granular).
No folheto da GEH (Anexo 2), que se junta em anexo, está descrito o processo da tecnologia de leitos mistos assim como as etapas de um ciclo operativo, que ilustra o trabalho experimental.
Protocolo
1 – Em primeiro lugar os alunos irão ensaiar coagulantes e floculantes na água da
Lagoa das Furnas, a fim de avaliar o seu efeito na eliminação da turbidez dessa água. 2 – Cada grupo irá fazer um estudo num leito misto numa coluna laboratorial com 2,5
cm de diâmetro e uma altura de leito ≈ 22 cm. Abaixo junta-se uma fotografia do equipamento onde o trabalho irá ser realizado.

19
Figura 4 – Coluna de leito misto
Cada grupo irá estudar o efeito da relação mássica de coagulante/floculante para
reagentes comerciais, na turbidez da água após passagem no leito, assim como na redução do teor em fósforo particulado e solúvel presente na água da Lagoa, parâmetro relevante nestes estudos. O que se acabou de referir depende da velocidade superficial de passagem do fluido através do leito. Para cada grupo será indicada a velocidade de passagem a utilizar.
Cada grupo de alunos irá realizar ensaios em fluxo descendente e ascendente, assim como proceder à lavagem do leito, comparando esta velocidade experimental de lavagem com os valores teóricos de fluidização de um leito.
4 – Será fornecido aos alunos a técnica de análise de fósforo total, fósforo solúvel e
turbidez. Os alunos poderão observar o procedimento analítico no tratamento de resultados que irão fazer, assim como detalhes das características do leito utilizado nas colunas laboratoriais.
20
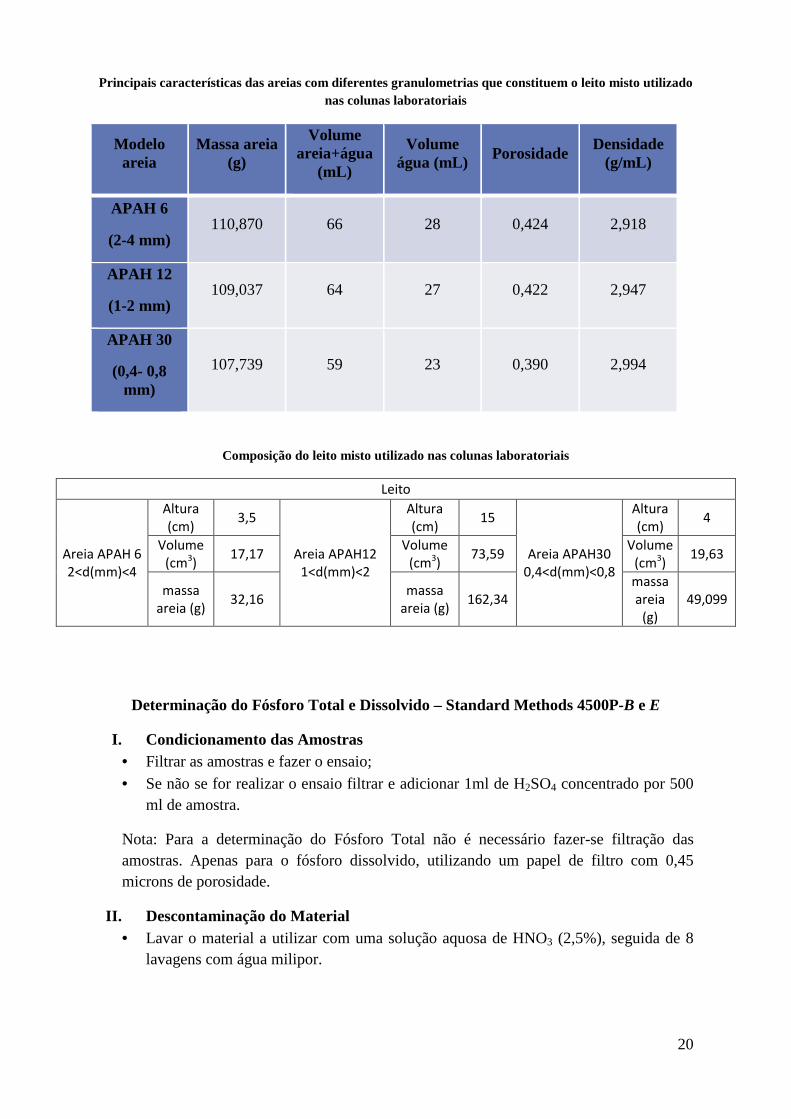
Principais características das areias com diferentes granulometrias que constituem o leito misto utilizado nas colunas laboratoriais
Modelo areia
Massa areia (g)
Volume areia+água
(mL)
Volume água (mL) Porosidade
Densidade (g/mL)
APAH 6
(2-4 mm) 110,870 66 28 0,424 2,918
APAH 12
(1-2 mm) 109,037 64 27 0,422 2,947
APAH 30
(0,4- 0,8 mm)
107,739 59 23 0,390 2,994
Composição do leito misto utilizado nas colunas laboratoriais
Leito
Areia APAH 6 2<d(mm)<4
Altura (cm)
3,5
Areia APAH12 1<d(mm)<2
Altura (cm)
15
Areia APAH30 0,4<d(mm)<0,8
Altura (cm)
4
Volume (cm3)
17,17 Volume
(cm3) 73,59
Volume (cm3)
19,63
massa areia (g)
32,16 massa
areia (g) 162,34
massa areia
(g) 49,099
Determinação do Fósforo Total e Dissolvido – Standard Methods 4500P-B e E
I. Condicionamento das Amostras • Filtrar as amostras e fazer o ensaio; • Se não se for realizar o ensaio filtrar e adicionar 1ml de H2SO4 concentrado por 500
ml de amostra.
Nota: Para a determinação do Fósforo Total não é necessário fazer-se filtração das amostras. Apenas para o fósforo dissolvido, utilizando um papel de filtro com 0,45 microns de porosidade.
II. Descontaminação do Material • Lavar o material a utilizar com uma solução aquosa de HNO3 (2,5%), seguida de 8
lavagens com água milipor.

21
Preparação do Padrão de Fósforo
• Pesar 1,065g de hidrogenofosfato de amónio e dissolver em 250 ml de água milipor (obtenção de uma solução com 1000ppm).
Ensaio:
1- Medir 150 ml de amostra, previamente agitada para um erlenmeyer de 250 ml. Medir também 150ml H2O milipor com solução de padrão de controlo de fósforo (1000ppm) diluída a 1:100, PC-0,01mg/l (150µl) e PC-0,03mg/l (450µl).
III. Determinação do Fósforo Total Nota: Para a determinação do fósforo total não é necessário filtrar.
2- Adicionar 1 ml de H2SO4 (3ml/10ml), 0,4g de peróxido-dissulfato de amónio as amostra medidas em 1 e levar à secura até um volume final de aproximadamente 10 ml.
3- Após a evaporação do solvente (cerca de 2/3 horas) vai ser feita uma nova filtração para remover as partículas não digeridas
4- Filtração: a. Colocar em balões volumétricos de 50 ml (de modo a aumentar a
concentração em 3x para se atingir um valor mínimo de fósforo de 10µg) um funil de vidro e papel de filtro (41 microns de porosidade) dobrado em 4 e proceder a filtração, com lavagens dos erlenmeyeres com água milipor (um baixo volume, cerca de 30ml) de modo a lavar bem o erlenmeyer.
5- Após a filtração adicionar aos balões volumétricos uma gota de solução alcoólica de fenolftaleína e adicionar algumas gotas de solução básica de NaOH a 25% até as amostras ficarem com uma coloração cor-de-rosa (deste modo realizou-se um acerto do pH) e perfazer o volume com água milipor.
6- De seguida adiciona-se 8ml de reagente combinado a cada amostra e espera-se durante 10 minutos (irá ser observada uma mudança de cor de rosa para azul que será mais intensa quanto maior a quantidade fósforo existente na amostra (este reagente combinado serve para provocar a reacção de colorimétrica).
22
Preparação do Reagente Combinado
Nota: O reagente combinado, constituído por ácido sulfúrico, tartarato de antimónio e potássio, molibdato de amónio e ácido ascórbico, deverá ser preparado para cada utilização (“na hora”)
Preparar soluções de molibdato de amónio e de ácido ascórbico (as outras soluções já podem estar preparados. Note-se que o tartarato de antimónio e potássio deverá ser armazenado no frio).
• Solução de H2SO4 5N – 150ml de H2SO4 concentrado/1l de H2O Milipor;
• Tartarato de antimónio e potássio – 0,686g/250ml H2O Milipor.
Para 200ml de reagente combinado:
• 100ml de H2SO4; • 10ml de Tartarato;
• 30ml de Molibdato; • 60ml de ác. Ascórbico.
Para 100ml de reagente combinado:
• 50ml de H2SO4;
• 5ml de Tartarato; • 15ml de Molibdato (2g/50ml);
• 30ml de ác. Ascórbico (0,88g/50ml).
Para 250ml de reagente combinado:
• 125ml de H2SO4; • 12,5ml de Tartarato;
• 37,5ml de Molibdato (2g/50ml); • 75ml de ác. Ascórbico (1,76g/100ml).
Nota: Os reagentes deverão ser adicionados pela ordem acima descrita. Após a adição do último reagente (ácido ascórbico) a solução de reagente combinado fica amarela.
IV. Análise no espectrofotómetro UV-Vis
Traçar inicialmente uma recta de calibração.
23
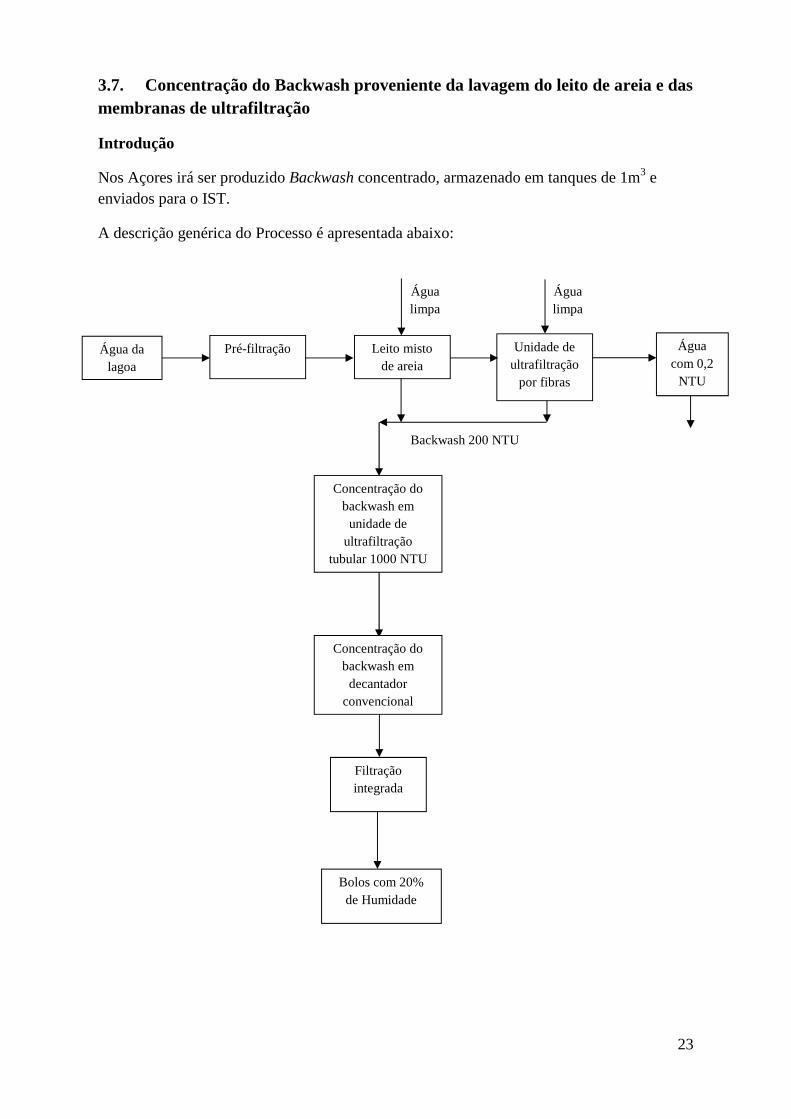
3.7. Concentração do Backwash proveniente da lavagem do leito de areia e das membranas de ultrafiltração
Introdução
Nos Açores irá ser produzido Backwash concentrado, armazenado em tanques de 1m3 e enviados para o IST.
A descrição genérica do Processo é apresentada abaixo:
Água da lagoa
Pré-filtração Leito misto de areia
Unidade de ultrafiltração
por fibras ocas
Água com 0,2
NTU
Backwash 200 NTU
Concentração do backwash em unidade de
ultrafiltração tubular 1000 NTU
Concentração do backwash em decantador
convencional
Filtração integrada
Bolos com 20% de Humidade
Água limpa
Água limpa

24
3.7.1. Parte experimental para os grupos que não realizam os ensaios em colunas de leitos misto
Objectivos do trabalho proposto
Estudar e optimizar as condições operatórias de desidratação do espessado obtido no flow-sheet anterior, utilizando um filtro prensa de membranas com desidratação sob vácuo. Para o efeito serão estudados e determinados os parâmetros abaixo.
a) Ensaios preliminares com vários tipos de placas de filtração, tipo e geometria de telas.
b) Determinação da resistência específica dos bolos de filtração e determinação da compressibilidade dos bolos.
c) Avaliação do efeito da espessura dos bolos e do tempo e do tempo de secagem na eficiência da etapa de desidratação térmica sob vácuo.
d) Avaliação do efeito de ciclos de calor e frio em superfícies alternadas dos bolos de filtração na eficiência da etapa de desidratação térmica sob vácuo.
Nota: Cada grupo de alunos irá fazer apenas um ensaio de filtração em condições específicas bem determinadas.
Em Anexo 3, junta-se um artigo sobre o modo de funcionamento da unidade de filtração integrada.
4. Execução do relatório
Cada grupo terá de apresentar um relatório sucinto cobrindo os seguintes itens:
i) objectivo do trabalho; ii) descrição de uma tecnologia alternativa ao processo proposto; iii) descrição detalhada do trabalho experimental com análise crítica dos resultados,
que serão fornecidos periodicamente. Explicação em detalhe do modo de lavagem do leito quer em fluxo ascendente quer em fluxo descendente;
iv) estimativa teórica da velocidade superficial necessária para o início da fluidização da areia intermédia, fina e grossa. Quando dois grupos tiverem feito o mesmo trabalho experimental cada grupo apresentará os resultados para uma fracção granulométrica da areia. Deverá ser discutido o valor teórico para a velocidade de fluidização e o valor da velocidade de lavagem que foi utilizada;
25
v) irá ser apresentado a cada grupo um resultado experimental obtido na Instalação Piloto a fim de ser comentado;
vi) conclusões e interesse do trabalho.

Anexo 1
Recovery of zinc(II) from chloride solutions using pseudo-emulsionbased hollow fiber strip dispersion (PEHFSD) with 1-(3-pyridyl)undecan-
1-one oxime or tributylphosphate
Karolina Wieszczycka a,⇑, Magdalena Regel-Rosocka a, Katarzyna Staszak a, Aleksandra Wojciechowska a,M. Teresa A. Reis b, M. Rosinda C. Ismael b, M. Lurdes F. Gameiro b, Jorge M.R. Carvalho b
a Poznan University of Technology, Institute of Chemical Technology and Engineering, ul. Berdychowo 4, 60-965 Poznan, PolandbCERENA – Centre for Natural Resources and the Environment, Department of Chemical Engineering, Instituto Superior Técnico, Universidade de Lisboa, Av. Rovisco Pais, 1049-001
Lisboa, Portugal
a r t i c l e i n f o
Article history:
Received 19 July 2015
Received in revised form 16 September
2015
Accepted 20 September 2015
Available online 25 September 2015
Keywords:
Pseudo-emulsion hollow fiber strip
dispersion (PEHFSD)
3-Pyridineketoxime
Tributyl phosphate (TBP)
Zinc(II) extraction
a b s t r a c t
The recovery of zinc from chloride solutions using pseudo-emulsion based hollow fiber strip dispersion
(PEHFSD) technique was investigated. The novel extractant, 1-(3-pyridyl)undecan-1-one oxime, and a
well-known one, tributyl phosphate (TBP), were used in the processes. The influence of several parame-
ters, including the initial concentration of Zn(II) and sodium chloride in the aqueous phase and the type of
extractant on Zn(II) extraction was studied. The Zn(II) transport was analyzed on the basis of the overall
mass transfer coefficient of permeation. The oxime was shown to be a potential carrier of zinc from chlo-
ride medium, being a promising alternative to the classical extractant TBP.
! 2015 Published by Elsevier B.V.
1. Introduction
Zinc coatings are widely used to protect steel against corrosion.
Thanks to the electrochemical potential of zinc (cathodic protec-
tion) and the thickness of zinc layer deposited on steel elements,
the coating has relatively favorable corrosion properties in relation
to those of the other metallic coatings. The advantages of zinc coat-
ings over other types of protection include low operational cost,
long working life and easiness in covering of complicated shapes.
A number of different methods of zinc coatings deposition on steel
surfaces are commercially available, such as hot-dip galvanizing,
metalizing, zinc-rich paint, electroplating, mechanical plating, zinc
plating. Currently, the most popular are hot dip galvanizing and
electroplating [1].
Different types of waste streams that may pose a potential
threat to the environment, are generated during preparation of
the steel surface for the deposition of zinc coatings (e.g. in the
processes of degreasing, washing, pickling). Generally, spent solu-
tions from steel pickling in hot-dip galvanizing plants contain zinc
(II), iron (mainly iron(II)), traces of lead, chromium and other heavy
metals (max. 500 mg/L) and hydrochloric acid [1]. Recovery of
these elements is important from the ecological point of view
and additionally these waste streams can be an alternative sec-
ondary source of metal ions, interesting also for economic reasons.
Various techniques of regeneration of spent pickling solutions,
including the methods with acid recovery, such as diffusion dialy-
sis, electrodialysis, membrane electrolysis and membrane distilla-
tion, evaporation, precipitation and spray roasting as well as those
with acid and metal recovery: ion exchange, retardation, adsorp-
tion, crystallization and membrane extraction, have been proposed
in the literature [1].
Currently, there is a tendency to combine various techniques
into hybrids, e.g. separation fully integrating extraction and strip-
ping in a membrane contactor. The new technique known as
pseudo-emulsion based hollow fiber strip dispersion (PEHFSD)
has been proposed in the literature [2] for the recovery of metal
ions i.e. Cu(II) [3,4], Zn(II) [5,6], Au(I) [7], Co(II) [8], Cr(III) [9,10],
Cr(VI) [11] from aqueous solutions. PEHFSD provides the following
advantages over classical extraction: (i) extraction and stripping
can be carried out in one operation, (ii) amount of extractant is rel-
atively small, (iii) no possibility of emulsion formation in water
http://dx.doi.org/10.1016/j.seppur.2015.09.017
1383-5866/! 2015 Published by Elsevier B.V.
⇑ Corresponding author.
E-mail addresses: [email protected] (K. Wieszczycka),
[email protected] (M. Regel-Rosocka), katarzyna.Staszak@
put.poznan.pl (K. Staszak), [email protected]
(A. Wojciechowska), [email protected] (M. Teresa A. Reis), [email protected].
pt (M. Rosinda C. Ismael), [email protected] (J.M.R. Carvalho).
Separation and Purification Technology 154 (2015) 204–210
Contents lists available at ScienceDirect
Separation and Purification Technology
journal homepage: www.elsevier .com/locate /seppur

phase, (iv) process parameters are very flexible, (v) large surface
area in hollow fiber membranes, and (vi) low energy consumption.
Pseudo-emulsion based hollow fiber strip dispersion means that
the stripping phase is dispersed in the organic membrane phase,
a pseudo-emulsion being formed before injection into hollow fiber
module. During this separation proves, the extraction and stripping
occur simultaneously in a single hollow fiber contactor, which per-
mits avoidance of membrane stability issues. In PEHFSD, the
pseudo-emulsion phase runs through the shell side, while the
aqueous feed phase flows in the lumen side. The solute is trans-
ported from the feed to the membrane and then to the stripping
phase simultaneously. As soon as the process stops, the strip phase
and organic phase get separated.
Over the last few years, the extraction of metal ions from differ-
ent aqueous solutions by hydrophobic pyridylketoximes has been
widely investigated. Those compounds have been mainly proposed
as ligands for removal of metals, i.e. copper(II) [12], zinc(II) [13],
cadmium(II) [14], iron(III) [15] and cobalt(II) from chloride solu-
tions using a liquid–liquid extraction technique [16]. However,
only 1-(3-pyridyl)undecan-1-one oxime has been proposed as an
effective extractant of zinc(II) ions from strong acidic chloride solu-
tions, e.g. this pyridylketoxime is able to reduce the content of zinc
ions from 65 to 4.5 g/L in a two-stage process [17].
The aim of this work is the removal and recovery of Zn(II) ions
in the presence of sodium chloride and hydrochloric acid, by the
method of pseudo-emulsion based hollow fiber strip dispersion
(PEHFSD). The approach assumed in the present work includes
the study of the effects of various experimental parameters like
metal, salt and acid concentration in the feed solution as well as
the type of extractant. The modeling of mass transfer was per-
formed on the basis of the overall mass transfer coefficient of per-
meation. The possibility to use the novel extractant oxime of 1-(3-
pyridyl)undecan-1-one for recovery of Zn(II) from chloride med-
ium using PEHFSD technique was studied and the results were
contrasted with those obtained with the well-known extractant
tributyl phosphate (TBP).
2. Experimental
2.1. Materials and methods
1-(3-pyridyl)undecan-1-one oxime was synthesized in a two-
stage reaction [17]. In the first stage 1-(3-pyridyl)undecan-1-one
was synthesized by treating 3-pyridylcarbonitrile (Sigma–Aldrich,
Germany) with decylmagnesium bromide (Mg powder and dode-
cyl bromide were produced by Sigma–Aldrich (Germany)). In the
second stage, the synthesized ketone was treated with hydroxy-
lamine hydrochloride (POCh, Poland) in the presence of sodium
carbonate (at pH = 7). After hot filtration and cooling, yellow crys-
tals were obtained. Recrystallization from ethanol and next from
hexane yielded pure (99.8%) yellow crystals melting at 124.3–
125.7 "C. The yield of the oxime was 59%.
NMR (1H, 13C) and MS(ESI) spectra proved the structure of the
synthesized oxime:1H NMR (CDCl3) d in ppm: 8.6 (d); 7.93 (t); 7.32 (d); 8.8 (s); 2.7
(t); 1.54 (q); 1.31–1.24 (m); 0.86 (t); 9.9 (s). 13C NMR (CDCl3) d in
ppm: 147.2; 132.2; 133.7; 149.3; 122.9; 157.0; 32.8; 31.6; 29.8;
29.6; 29.3; 29.1; 26.2; 25.6; 22.5; 14.0. ESI-MS/MS m/z (% rel.
intensity): 263.4 (100); 245.4 (5); 120.2 (22); 105.2 (43); 93.2
(34); 79.2 (39).
Toluene (Sigma–Aldrich, Germany), ShellSol D70 (aliphatic
diluent; aromatic content <0.01%, Drogas Vigo (Portugal), and
decan-1-ol (Merck, Germany) were used as components of the
organic phase. Oxime of 1-(3-pyridyl)undecan-1-one (3PC10) and
tributyl phosphate (TBP) (Rhodia, Netherlands) were used as
carriers for transport experiments. Sodium chloride, hydrochloric
acid (38%) and chloride salts of Zn(II) (Sigma–Aldrich, Germany)
were used as components of the aqueous phase. Sodium sulfate
(Sigma–Aldrich, Germany) was used as component of the oxime
of 1-(3-pyridyl)undecan-1-one stripping solution. All the chemi-
cals were of high purity analytical grade. The aqueous solutions
were analyzed for zinc(II) concentration by AAS using a Perkin
Elmer-AAnalyst 200 at 213 nm in the air–acetylene flame.
2.2. PEHFSD experiments
The experimental setup used for carrying out PEHFSD experi-
ments is shown in Fig. 1. In this schematic diagram, HF represents
the microporous fiber module, which was a Liqui-Cel# Extra-Flow
2.5 in. ! 8 in. membrane contactor from Celgard (USA). Further
module details are given in Table 1.
The aqueous strip solution was dispersed in the organic mem-
brane solution containing the extractant reagent. The pseudo-
emulsion was then pumped into the membrane module flowing
through the shell side of the fibers. The aqueous feed solution con-
taining the target species to be extracted was flown through the
lumen (tube side) of the fibers. The continuous organic phase of
the dispersion readily wetted the pores of the hydrophobic micro-
porous support (e.g. microporous polypropylene hollow fibers in
the module), and a stable liquid membrane (the organic phase)
supported in the pores was formed. A low pressure differential
(minimum 30 kPa in this system) between the aqueous feed solu-
tion side and the strip dispersion side was applied to prevent the
leakage of the organic solution of the strip dispersion to the aque-
ous side through the pores. The feed and strip dispersion phases
were in recycling mode in their respective reservoirs. Both phases
were circulated in a closed circuit to a constant value of the zinc(II)
concentration in the aqueous phase (2–3 h). At various time inter-
vals, samples of 0.5 mL of the aqueous phase were taken to deter-
mine the content of zinc(II) ions. As soon as the process stopped,
the strip and organic phases were separated. The volume of the
pseudo-emulsion phase used in the experiment was 800 mL
(400 mL of the organic phase + 400 mL of the stripping solution),
and that of the feed solution was 800 mL. The flow rates of the feed
phase and pseudo-emulsion phase were "300 mL/min, which was
Fig. 1. PEHFSD experimental setup.
K. Wieszczycka et al. / Separation and Purification Technology 154 (2015) 204–210 205

selected based upon our previous studies to establish the adequate
hydrodynamic conditions (data not shown). This value guarantees
optimum fluxes of metal entering in the membrane and stripping
phases. The compositions of the phases investigated are given in
Table 2.
3. Results and discussion
Experiments were conducted to check the operation of PEHFSD
in different conditions on changing type of extractant, initial con-
centration of zinc(II) and the contents of NaCl and HCl in the feed
solution. These factors would affect the transport of metal ion. The
stability of pseudo emulsion was found to be quite good during the
experimental run.
In the systems of high chloride concentrations, metal ions (Me)
are mainly in the form of chlorocomplexes:
Menþ þ iCl$¼ MeCl
n$ii ð1Þ
where i = 1, 2, 3 or 4.
Knowing the chlorocomplex formation constants (b), it is possi-
ble to calculate the content of each species present in the aqueous
phase. The values of b are very sensitive to ionic strength and the
constants are mainly determined for diluted solutions of relatively
low ionic strengths. Rough estimation of distribution of various Zn
(II) chlorocomplexes with the Medusa program [18] shows that
over 80% of zinc is in the form of ZnCl42$, and only a few percent
exist as ZnCl3$. Thus, mechanism of extraction depends on the dis-
tribution of Zn(II) chlorocomplexes in the feed solution.
The presence of oxime and pyridine moiety in the pyridineke-
toxime extractant allows metals formation of complexes according
to different mechanisms: the pyridine nitrogen has an ability to
coordinate metal by solvating mechanism, while oxime sub-
stituent as anion has the ability to create chelate complexes or,
as neutral moiety, to stabilize complexes by intermolecular hydro-
gen bond. However, the formation of metal ion chelate complexes
has been observed only for the compound having oxime group at
two position of the pyridine ring [12]. The reaction of zinc(II)
extraction with 1-(3-pyridyl)undecan-1-one oxime (HL) runs
according to the solvating mechanism, wherein the oxime mole-
cules coordinate neutral species of zinc(II) chloride according to
the equation [17,19]:
Zn2þaq þ 2Cl
$aq þ 2HLorg ¼ ZnCl2ðHLÞ2;org ð2Þ
or according to the ion-pair mechanism, wherein the oxime in a sin-
gle and double protonated form (3-[1-(hydroxyimino)undecyl]pyri
dinium hydrochloride and 3-[1-(hydroxyimino)-undecyl]pyridi
nium dihydrochloride) can make complexes mainly with ZnCl3$
and/or ZnCl42$ [17]:
Hþaq þHLorg ¼ H2L
þorg ð3Þ
ZnCl$3; aq þH2L
þorg ¼ ZnCl3ðH2LÞorg ð4Þ
ZnCl2$4; aq þ 2H2L
þorg ¼ ZnCl4ðH2LÞ2;org ð5Þ
or with the double protonated oxime:
ZnCl2$4; aq þH3L
2þorg ¼ ZnCl4ðH3LÞorg ð6Þ
The strong bonding of the hydrogen atom to the nitrogen atom
of pyridine ring is capable to form strong complexes which can be
effectively decomposed after washing with sodium sulfate solu-
tion. However, very short contact time of the loaded organic phase
with the stripping solution guarantees stability of the formed
hydrochlorides:
ZnClmðHnLÞp;org þ Na2SO4; aq ¼ pðHnLðn$1ÞþÞorg þ ZnSO4; aq
þmCl$aq=org þ 2Naþaq ð7Þ
The extraction reaction of zinc(II) in high concentration of chlo-
ride anions with TBP is expressed as [20]:
2Hþaq þ ZnCl
2$4; aq þ 2TBPorg ¼ H2ZnCl4 ( 2TBPorg ð8Þ
As acidity of the aqueous phase decreases, other reactions can
occur [21]:
Hþaq þ ZnCl
$3; aq þ 2TBPorg ¼ HZnCl3 ( 2TBPorg ð9Þ
ZnCl2; aq þ 2TBPorg ¼ ZnCl2 ( 2TBPorg ð10Þ
and finally, the extracted chlorometallate can be stripped into water
or an aqueous solution containing low chloride concentration:
HnZnClm ( 2TBPorg þ H2Oaq ¼ ZnCl2; aq þ nHþaq þ ðm$ 2ÞCl
$aq þ 2TBPorg
ð11Þ
In these reactions org and aq denote species existing in the organic
and aqueous phases, respectively. The organic complexes, i.e.
ZnCl2(HL)2, ZnCl3(H2L), ZnCl4(H2L)2 and ZnCl4(H3L), or H2ZnCl4-
(2TBP diffuse through the pores of the membrane toward the
membrane–pseudo-emulsion interface, where Zn(II) is stripped in
the pseudo-emulsion phase after coming into contact with the
stripping phase – 5 wt.% sodium sulfate and water for 3PC10 and
TBP, respectively.
3.1. Calculations
The model for the transport of zinc(II) ions in PEHFSD working
in the recycling mode consists of the set of the following equations
[22]:
) module mass balance for the feed solution:
d½Zn+Maqdt
¼ $uaq
d½Zn+Maqdz
$A
VM
! "
in
( KP ½Zn+Maq $ ½Zn+Mstr
# $
ð12Þ
) tank mass balance for the feed solution:
d½Zn+Taqdt
¼Q aq
Vaq
½Zn+Maq;z¼L $ ½Zn+Maq;z¼0
# $
ð13Þ
) module mass balance for the stripping solution:
d½Zn+Mstrdt
¼ $ustr
d½Zn+Mstrdz
$A
VM
! "
out
( KP ½Zn+Maq $ ½Zn+Mstr
# $
ð14Þ
) tank mass balance for the stripping solution:
d½Zn+Tstrdt
¼Q str
V str
½Zn+Mstr;z¼0 $ ½Zn+Mstr;z¼L
# $
ð15Þ
Table 1
Characteristics of hollow fiber membrane module.
Type of module G501 (contactor)
Module length (cm) 28
Module diameter (cm) 7.7
Case inner diameter (cm) 5.55
Center tube diameter (cm) 2.22
Number of fibers "10,800
Fiber X50 – polypropylene
Effective fiber length (cm) 15.6
Inner diameter of the fibers (lm) 214
Outer diameter of the fibers (lm) 300
Pore size (lm) 0.03
Porosity (%) 40
Tortuosity 2.6
Inner interfacial area (m2) 1.13
Area per unit volume (cm2/cm3) 28
206 K. Wieszczycka et al. / Separation and Purification Technology 154 (2015) 204–210
In these equations L is the fiber length, Q is the flow rate of the
phases, u is the linear velocity and V is the volume of each phase.
The superscripts M and T refer to the membrane module and tank,
respectively. The subscripts aq and str refer to the aqueous feed
phase and stripping phase, respectively. Because of the assumption
that the stripping reaction is instantaneous and assumed to occur at
the fiber outside, thus ½Zn+Mstr ¼ 0 and ½Zn+Tstr ¼ 0, the solution of
above equations is as follows:
Vaq ln½Zn+Taq;t¼0
½Zn+aq¼ Q aq 1$ exp
2KPL
uaqri
! "% &
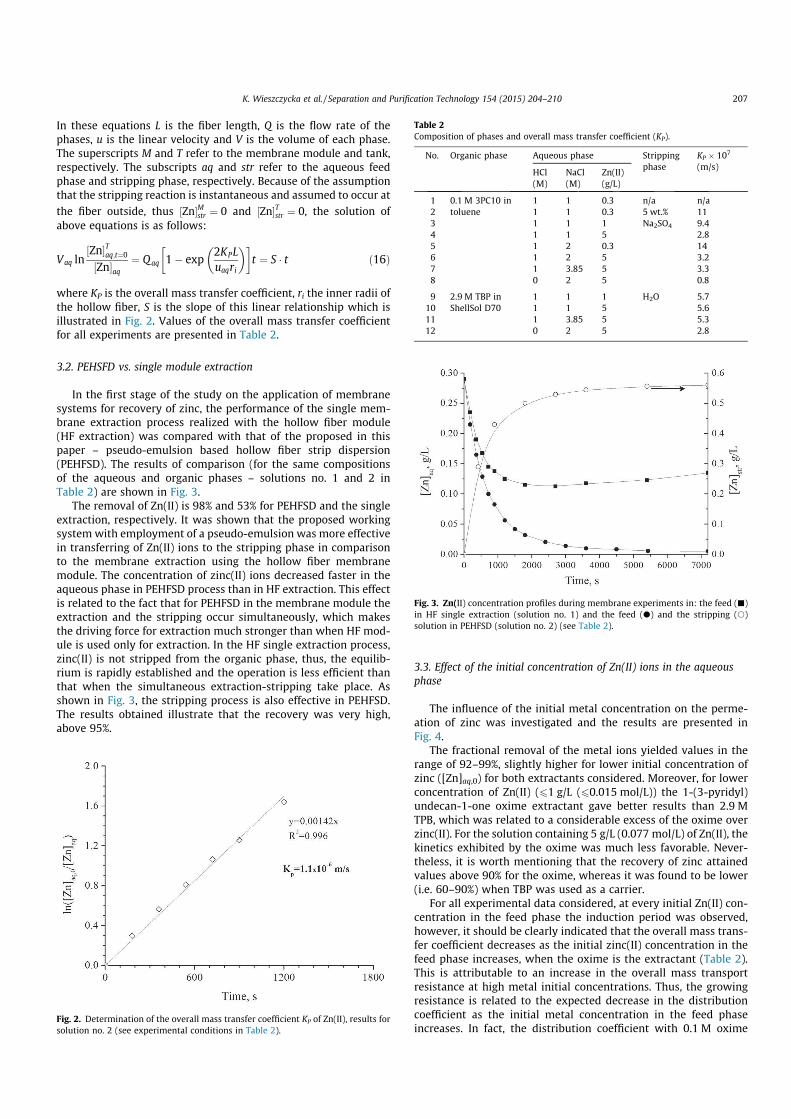
t ¼ S ( t ð16Þ
where KP is the overall mass transfer coefficient, ri the inner radii of
the hollow fiber, S is the slope of this linear relationship which is
illustrated in Fig. 2. Values of the overall mass transfer coefficient
for all experiments are presented in Table 2.
3.2. PEHSFD vs. single module extraction
In the first stage of the study on the application of membrane
systems for recovery of zinc, the performance of the single mem-
brane extraction process realized with the hollow fiber module
(HF extraction) was compared with that of the proposed in this
paper – pseudo-emulsion based hollow fiber strip dispersion
(PEHFSD). The results of comparison (for the same compositions
of the aqueous and organic phases – solutions no. 1 and 2 in
Table 2) are shown in Fig. 3.
The removal of Zn(II) is 98% and 53% for PEHFSD and the single
extraction, respectively. It was shown that the proposed working
systemwith employment of a pseudo-emulsion was more effective
in transferring of Zn(II) ions to the stripping phase in comparison
to the membrane extraction using the hollow fiber membrane
module. The concentration of zinc(II) ions decreased faster in the
aqueous phase in PEHFSD process than in HF extraction. This effect
is related to the fact that for PEHFSD in the membrane module the
extraction and the stripping occur simultaneously, which makes
the driving force for extraction much stronger than when HF mod-
ule is used only for extraction. In the HF single extraction process,
zinc(II) is not stripped from the organic phase, thus, the equilib-
rium is rapidly established and the operation is less efficient than
that when the simultaneous extraction-stripping take place. As
shown in Fig. 3, the stripping process is also effective in PEHFSD.
The results obtained illustrate that the recovery was very high,
above 95%.
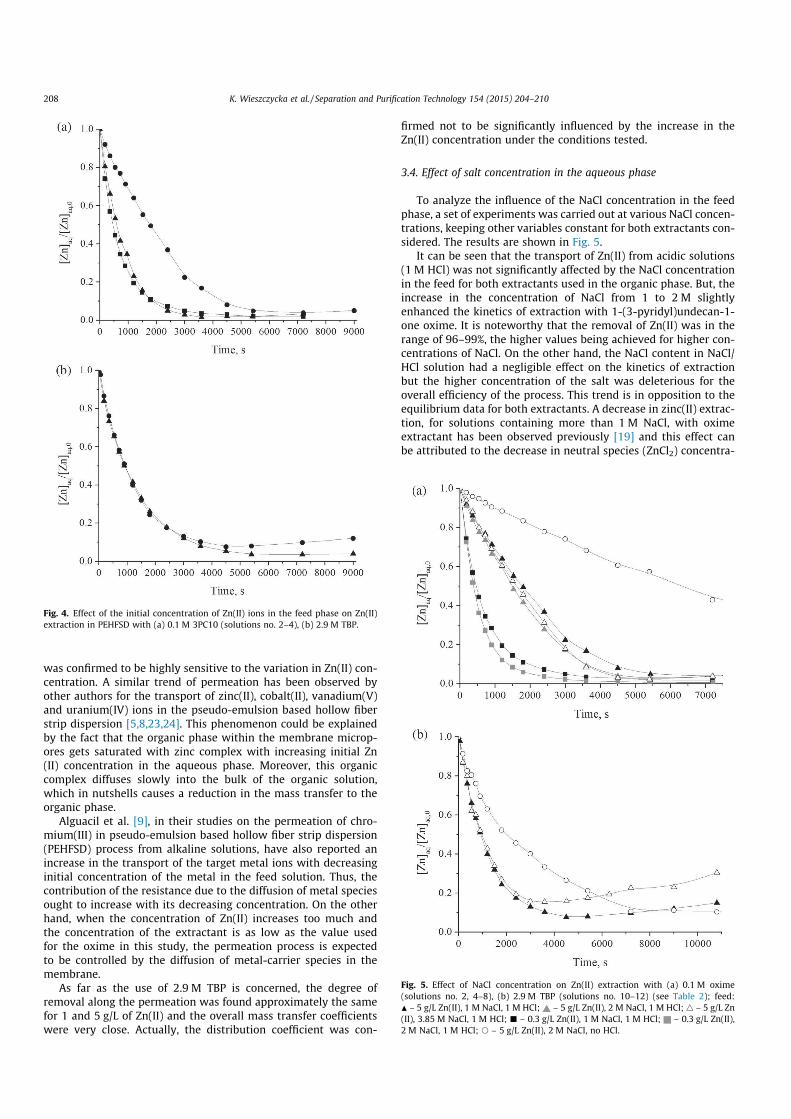
3.3. Effect of the initial concentration of Zn(II) ions in the aqueous
phase
The influence of the initial metal concentration on the perme-
ation of zinc was investigated and the results are presented in
Fig. 4.
The fractional removal of the metal ions yielded values in the
range of 92–99%, slightly higher for lower initial concentration of
zinc ([Zn]aq,0) for both extractants considered. Moreover, for lower
concentration of Zn(II) (61 g/L (60.015 mol/L)) the 1-(3-pyridyl)
undecan-1-one oxime extractant gave better results than 2.9 M
TPB, which was related to a considerable excess of the oxime over
zinc(II). For the solution containing 5 g/L (0.077 mol/L) of Zn(II), the
kinetics exhibited by the oxime was much less favorable. Never-
theless, it is worth mentioning that the recovery of zinc attained
values above 90% for the oxime, whereas it was found to be lower
(i.e. 60–90%) when TBP was used as a carrier.
For all experimental data considered, at every initial Zn(II) con-
centration in the feed phase the induction period was observed,
however, it should be clearly indicated that the overall mass trans-
fer coefficient decreases as the initial zinc(II) concentration in the
feed phase increases, when the oxime is the extractant (Table 2).
This is attributable to an increase in the overall mass transport
resistance at high metal initial concentrations. Thus, the growing
resistance is related to the expected decrease in the distribution
coefficient as the initial metal concentration in the feed phase
increases. In fact, the distribution coefficient with 0.1 M oximeFig. 2. Determination of the overall mass transfer coefficient KP of Zn(II), results for
solution no. 2 (see experimental conditions in Table 2).
Table 2
Composition of phases and overall mass transfer coefficient (KP).
No. Organic phase Aqueous phase Stripping
phase
KP ! 107
(m/s)HCl
(M)
NaCl
(M)
Zn(II)
(g/L)
1 0.1 M 3PC10 in
toluene
1 1 0.3 n/a n/a
2 1 1 0.3 5 wt.%
Na2SO4
11
3 1 1 1 9.4
4 1 1 5 2.8
5 1 2 0.3 14
6 1 2 5 3.2
7 1 3.85 5 3.3
8 0 2 5 0.8
9 2.9 M TBP in
ShellSol D70
1 1 1 H2O 5.7
10 1 1 5 5.6
11 1 3.85 5 5.3
12 0 2 5 2.8
Fig. 3. Zn(II) concentration profiles during membrane experiments in: the feed (j)
in HF single extraction (solution no. 1) and the feed (d) and the stripping (s)
solution in PEHFSD (solution no. 2) (see Table 2).
K. Wieszczycka et al. / Separation and Purification Technology 154 (2015) 204–210 207
was confirmed to be highly sensitive to the variation in Zn(II) con-
centration. A similar trend of permeation has been observed by
other authors for the transport of zinc(II), cobalt(II), vanadium(V)
and uranium(IV) ions in the pseudo-emulsion based hollow fiber
strip dispersion [5,8,23,24]. This phenomenon could be explained
by the fact that the organic phase within the membrane microp-
ores gets saturated with zinc complex with increasing initial Zn
(II) concentration in the aqueous phase. Moreover, this organic
complex diffuses slowly into the bulk of the organic solution,
which in nutshells causes a reduction in the mass transfer to the
organic phase.
Alguacil et al. [9], in their studies on the permeation of chro-
mium(III) in pseudo-emulsion based hollow fiber strip dispersion
(PEHFSD) process from alkaline solutions, have also reported an
increase in the transport of the target metal ions with decreasing
initial concentration of the metal in the feed solution. Thus, the
contribution of the resistance due to the diffusion of metal species
ought to increase with its decreasing concentration. On the other
hand, when the concentration of Zn(II) increases too much and
the concentration of the extractant is as low as the value used
for the oxime in this study, the permeation process is expected
to be controlled by the diffusion of metal-carrier species in the
membrane.
As far as the use of 2.9 M TBP is concerned, the degree of
removal along the permeation was found approximately the same
for 1 and 5 g/L of Zn(II) and the overall mass transfer coefficients
were very close. Actually, the distribution coefficient was con-
firmed not to be significantly influenced by the increase in the
Zn(II) concentration under the conditions tested.
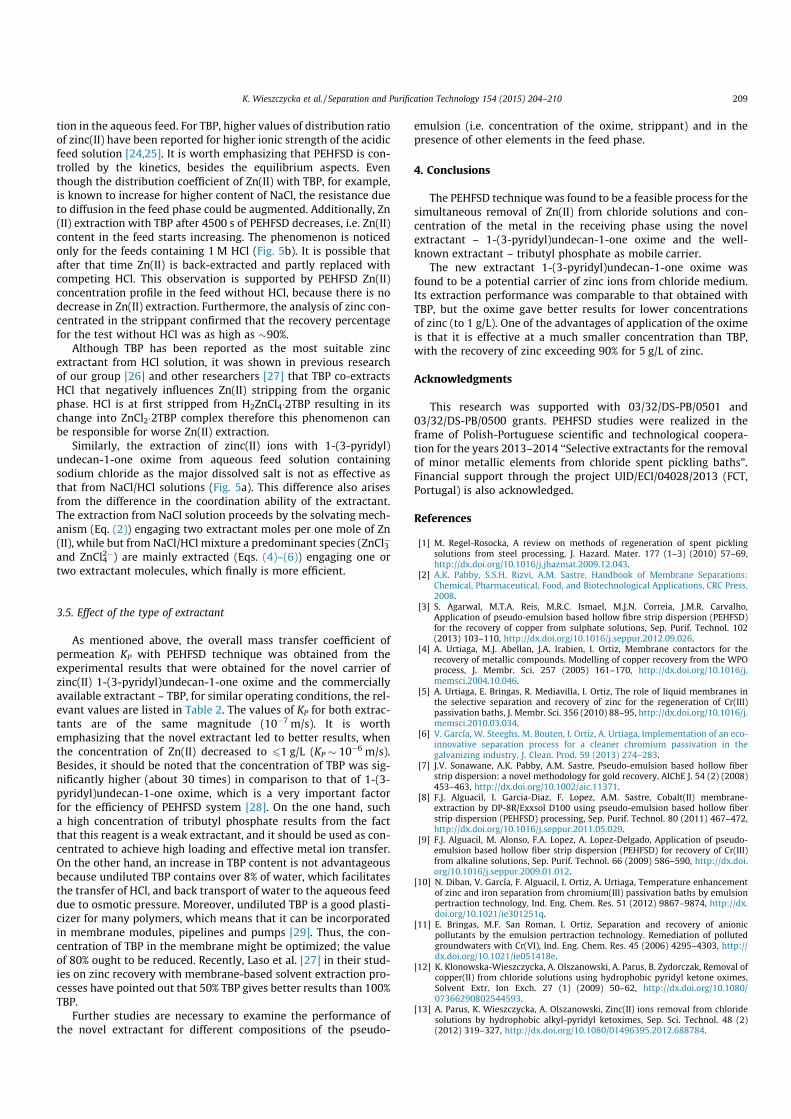
3.4. Effect of salt concentration in the aqueous phase
To analyze the influence of the NaCl concentration in the feed
phase, a set of experiments was carried out at various NaCl concen-
trations, keeping other variables constant for both extractants con-
sidered. The results are shown in Fig. 5.
It can be seen that the transport of Zn(II) from acidic solutions
(1 M HCl) was not significantly affected by the NaCl concentration
in the feed for both extractants used in the organic phase. But, the
increase in the concentration of NaCl from 1 to 2 M slightly
enhanced the kinetics of extraction with 1-(3-pyridyl)undecan-1-
one oxime. It is noteworthy that the removal of Zn(II) was in the
range of 96–99%, the higher values being achieved for higher con-
centrations of NaCl. On the other hand, the NaCl content in NaCl/
HCl solution had a negligible effect on the kinetics of extraction
but the higher concentration of the salt was deleterious for the
overall efficiency of the process. This trend is in opposition to the
equilibrium data for both extractants. A decrease in zinc(II) extrac-
tion, for solutions containing more than 1 M NaCl, with oxime
extractant has been observed previously [19] and this effect can
be attributed to the decrease in neutral species (ZnCl2) concentra-
Fig. 4. Effect of the initial concentration of Zn(II) ions in the feed phase on Zn(II)
extraction in PEHFSD with (a) 0.1 M 3PC10 (solutions no. 2–4), (b) 2.9 M TBP.
Fig. 5. Effect of NaCl concentration on Zn(II) extraction with (a) 0.1 M oxime
(solutions no. 2, 4–8), (b) 2.9 M TBP (solutions no. 10–12) (see Table 2); feed:
N – 5 g/L Zn(II), 1 M NaCl, 1 M HCl; – 5 g/L Zn(II), 2 M NaCl, 1 M HCl;4 – 5 g/L Zn
(II), 3.85 M NaCl, 1 M HCl; j – 0.3 g/L Zn(II), 1 M NaCl, 1 M HCl; – 0.3 g/L Zn(II),
2 M NaCl, 1 M HCl; s – 5 g/L Zn(II), 2 M NaCl, no HCl.
208 K. Wieszczycka et al. / Separation and Purification Technology 154 (2015) 204–210
tion in the aqueous feed. For TBP, higher values of distribution ratio
of zinc(II) have been reported for higher ionic strength of the acidic
feed solution [24,25]. It is worth emphasizing that PEHFSD is con-
trolled by the kinetics, besides the equilibrium aspects. Even
though the distribution coefficient of Zn(II) with TBP, for example,
is known to increase for higher content of NaCl, the resistance due
to diffusion in the feed phase could be augmented. Additionally, Zn
(II) extraction with TBP after 4500 s of PEHFSD decreases, i.e. Zn(II)
content in the feed starts increasing. The phenomenon is noticed
only for the feeds containing 1 M HCl (Fig. 5b). It is possible that
after that time Zn(II) is back-extracted and partly replaced with
competing HCl. This observation is supported by PEHFSD Zn(II)
concentration profile in the feed without HCl, because there is no
decrease in Zn(II) extraction. Furthermore, the analysis of zinc con-
centrated in the strippant confirmed that the recovery percentage
for the test without HCl was as high as "90%.
Although TBP has been reported as the most suitable zinc
extractant from HCl solution, it was shown in previous research
of our group [26] and other researchers [27] that TBP co-extracts
HCl that negatively influences Zn(II) stripping from the organic
phase. HCl is at first stripped from H2ZnCl4(2TBP resulting in its
change into ZnCl2(2TBP complex therefore this phenomenon can
be responsible for worse Zn(II) extraction.
Similarly, the extraction of zinc(II) ions with 1-(3-pyridyl)
undecan-1-one oxime from aqueous feed solution containing
sodium chloride as the major dissolved salt is not as effective as
that from NaCl/HCl solutions (Fig. 5a). This difference also arises
from the difference in the coordination ability of the extractant.
The extraction from NaCl solution proceeds by the solvating mech-
anism (Eq. (2)) engaging two extractant moles per one mole of Zn
(II), while but from NaCl/HCl mixture a predominant species (ZnCl3$
and ZnCl42$) are mainly extracted (Eqs. (4)–(6)) engaging one or
two extractant molecules, which finally is more efficient.
3.5. Effect of the type of extractant
As mentioned above, the overall mass transfer coefficient of
permeation KP with PEHFSD technique was obtained from the
experimental results that were obtained for the novel carrier of
zinc(II) 1-(3-pyridyl)undecan-1-one oxime and the commercially
available extractant – TBP, for similar operating conditions, the rel-
evant values are listed in Table 2. The values of KP for both extrac-
tants are of the same magnitude (10$7 m/s). It is worth
emphasizing that the novel extractant led to better results, when
the concentration of Zn(II) decreased to 61 g/L (KP " 10$6 m/s).
Besides, it should be noted that the concentration of TBP was sig-
nificantly higher (about 30 times) in comparison to that of 1-(3-
pyridyl)undecan-1-one oxime, which is a very important factor
for the efficiency of PEHFSD system [28]. On the one hand, such
a high concentration of tributyl phosphate results from the fact
that this reagent is a weak extractant, and it should be used as con-
centrated to achieve high loading and effective metal ion transfer.
On the other hand, an increase in TBP content is not advantageous
because undiluted TBP contains over 8% of water, which facilitates
the transfer of HCl, and back transport of water to the aqueous feed
due to osmotic pressure. Moreover, undiluted TBP is a good plasti-
cizer for many polymers, which means that it can be incorporated
in membrane modules, pipelines and pumps [29]. Thus, the con-
centration of TBP in the membrane might be optimized; the value
of 80% ought to be reduced. Recently, Laso et al. [27] in their stud-
ies on zinc recovery with membrane-based solvent extraction pro-
cesses have pointed out that 50% TBP gives better results than 100%
TBP.
Further studies are necessary to examine the performance of
the novel extractant for different compositions of the pseudo-
emulsion (i.e. concentration of the oxime, strippant) and in the
presence of other elements in the feed phase.
4. Conclusions
The PEHFSD technique was found to be a feasible process for the
simultaneous removal of Zn(II) from chloride solutions and con-
centration of the metal in the receiving phase using the novel
extractant – 1-(3-pyridyl)undecan-1-one oxime and the well-
known extractant – tributyl phosphate as mobile carrier.
The new extractant 1-(3-pyridyl)undecan-1-one oxime was
found to be a potential carrier of zinc ions from chloride medium.
Its extraction performance was comparable to that obtained with
TBP, but the oxime gave better results for lower concentrations
of zinc (to 1 g/L). One of the advantages of application of the oxime
is that it is effective at a much smaller concentration than TBP,
with the recovery of zinc exceeding 90% for 5 g/L of zinc.
Acknowledgments
This research was supported with 03/32/DS-PB/0501 and
03/32/DS-PB/0500 grants. PEHFSD studies were realized in the
frame of Polish-Portuguese scientific and technological coopera-
tion for the years 2013–2014 ‘‘Selective extractants for the removal
of minor metallic elements from chloride spent pickling baths”.
Financial support through the project UID/ECI/04028/2013 (FCT,
Portugal) is also acknowledged.
References
[1] M. Regel-Rosocka, A review on methods of regeneration of spent picklingsolutions from steel processing, J. Hazard. Mater. 177 (1–3) (2010) 57–69,http://dx.doi.org/10.1016/j.jhazmat.2009.12.043.
[2] A.K. Pabby, S.S.H. Rizvi, A.M. Sastre, Handbook of Membrane Separations:Chemical, Pharmaceutical, Food, and Biotechnological Applications, CRC Press,2008.
[3] S. Agarwal, M.T.A. Reis, M.R.C. Ismael, M.J.N. Correia, J.M.R. Carvalho,Application of pseudo-emulsion based hollow fibre strip dispersion (PEHFSD)for the recovery of copper from sulphate solutions, Sep. Purif. Technol. 102(2013) 103–110, http://dx.doi.org/10.1016/j.seppur.2012.09.026.
[4] A. Urtiaga, M.J. Abellan, J.A. Irabien, I. Ortiz, Membrane contactors for therecovery of metallic compounds. Modelling of copper recovery from the WPOprocess, J. Membr. Sci. 257 (2005) 161–170, http://dx.doi.org/10.1016/j.memsci.2004.10.046.
[5] A. Urtiaga, E. Bringas, R. Mediavilla, I. Ortiz, The role of liquid membranes inthe selective separation and recovery of zinc for the regeneration of Cr(III)passivation baths, J. Membr. Sci. 356 (2010) 88–95, http://dx.doi.org/10.1016/j.memsci.2010.03.034.
[6] V. García, W. Steeghs, M. Bouten, I. Ortiz, A. Urtiaga, Implementation of an eco-innovative separation process for a cleaner chromium passivation in thegalvanizing industry, J. Clean. Prod. 59 (2013) 274–283.
[7] J.V. Sonawane, A.K. Pabby, A.M. Sastre, Pseudo-emulsion based hollow fiberstrip dispersion: a novel methodology for gold recovery, AIChE J. 54 (2) (2008)453–463, http://dx.doi.org/10.1002/aic.11371.
[8] F.J. Alguacil, I. Garcia-Diaz, F. Lopez, A.M. Sastre, Cobalt(II) membrane-extraction by DP-8R/Exxsol D100 using pseudo-emulsion based hollow fiberstrip dispersion (PEHFSD) processing, Sep. Purif. Technol. 80 (2011) 467–472,http://dx.doi.org/10.1016/j.seppur.2011.05.029.
[9] F.J. Alguacil, M. Alonso, F.A. Lopez, A. Lopez-Delgado, Application of pseudo-emulsion based hollow fiber strip dispersion (PEHFSD) for recovery of Cr(III)from alkaline solutions, Sep. Purif. Technol. 66 (2009) 586–590, http://dx.doi.org/10.1016/j.seppur.2009.01.012.
[10] N. Diban, V. García, F. Alguacil, I. Ortiz, A. Urtiaga, Temperature enhancementof zinc and iron separation from chromium(III) passivation baths by emulsionpertraction technology, Ind. Eng. Chem. Res. 51 (2012) 9867–9874, http://dx.doi.org/10.1021/ie301251q.
[11] E. Bringas, M.F. San Roman, I. Ortiz, Separation and recovery of anionicpollutants by the emulsion pertraction technology. Remediation of pollutedgroundwaters with Cr(VI), Ind. Eng. Chem. Res. 45 (2006) 4295–4303, http://dx.doi.org/10.1021/ie051418e.
[12] K. Klonowska-Wieszczycka, A. Olszanowski, A. Parus, B. Zydorczak, Removal ofcopper(II) from chloride solutions using hydrophobic pyridyl ketone oximes,Solvent Extr. Ion Exch. 27 (1) (2009) 50–62, http://dx.doi.org/10.1080/07366290802544593.
[13] A. Parus, K. Wieszczycka, A. Olszanowski, Zinc(II) ions removal from chloridesolutions by hydrophobic alkyl-pyridyl ketoximes, Sep. Sci. Technol. 48 (2)(2012) 319–327, http://dx.doi.org/10.1080/01496395.2012.688784.
K. Wieszczycka et al. / Separation and Purification Technology 154 (2015) 204–210 209

[14] A. Parus, K. Wieszczycka, A. Olszanowski, Cadmium(II) extraction fromchloride solutions by hydrophobic pyridyl ketoximes, Hydrometallurgy 105(2011) 284–289, http://dx.doi.org/10.1016/j.hydromet.2010.10.007.
[15] A. Parus, K. Wieszczycka, A. Olszanowski, Solvent extraction of iron(III) fromchloride solutions in the presence of copper(II) and zinc(II) using hydrophobicpyridyl ketoximes, Sep. Sci. Technol. 46 (1) (2011) 87–93, http://dx.doi.org/10.1080/01496395.2010.498802.
[16] K. Wieszczycka, A. Wojciechowska, M. Krupa, Equilibrium and mechanism ofcobalt(II) extraction from chloride solution by hydrophobic 2-pyridineketoxime, Sep. Purif. Technol. 142 (2015) 129–136, http://dx.doi.org/10.1016/j.seppur.2014.12.034.
[17] K. Wieszczycka, Recovery of Zn(II) from multielemental acidic chloridesolution with hydrophobic 3-pyridineketoxime, Sep. Purif. Technol. 114(2013) 17–23, http://dx.doi.org/10.1016/j.seppur.2013.04.002.
[18] http://hydra-medusa.software.informer.com/ (22.06.15).[19] K. Wieszczycka, M. Krupa, A. Olszanowski, Solvent extraction of zinc(II) ions
from aqueous chloride solutions by hydrophobic 3-pyridyl ketoximes, in:Proceedings of the 19th International Solvent Extraction Conference, ISEC2011, Chile, vol. 2(40), 2011, pp. 1–8.
[20] D.C.F. Morris, E.L. Short, Zinc chloride and zinc bromide complexes. Part II.Solvent-extraction studies with zinc-65 as tracer, J. Chem. Soc. (1962) 2662–2671.
[21] S.J. Cook, J.M. Perera, G.W. Stevens, S.E. Kentish, The screening of extractantsfor the separation of Zn(II) from Australian hot-dip galvanizing effluent, Sep.Sci. Technol. 46 (2011) 2066–2074, http://dx.doi.org/10.1080/01496395.2011.593018.
[22] S. Agarwal, M.T.A. Reis, M.R.C. Ismael, J.M.R. Carvalho, Zinc extraction withIonquest 801 using pseudo-emulsion based hollow fibre strip dispersiontechnique, Sep. Purif. Technol. 127 (2014) 149–156, http://dx.doi.org/10.1016/j.seppur.2014.02.039.
[23] S.C. Roy, J.V. Sonawane, N.S. Rathore, A.K. Pabby, P. Janardan, R.D. Changrani, P.K. Dey, S.R. Bharadwaj, Pseudo-emulsion based hollow fiber strip dispersiontechnique (PEHFSD): optimization, modelling and application of PEHFSD forrecovery of U(VI) from process effluent, Sep. Sci. Technol. 43 (11–12) (2008)3305–3332, http://dx.doi.org/10.1080/01496395.2012.723103.
[24] M. Bartkowska, M. Regel-Rosocka, J. Szymanowski, Extraction of zinc(II), iron(III) and iron(II) with binary mixtures containing tributylphosphate and di(2-ethylhexyl)phosphoric acid or Cyanex 302, Physicochem. Probl. Miner.Process. 36 (2002) 217–224.
[25] I. Miesiac, J. Szymanowski, Separation of zinc(II) from hydrochloric acidsolutions in a double Lewis cell, Solvent Extr. Ion Exch. 22 (2) (2004) 243–265,http://dx.doi.org/10.1081/SEI-120030464.
[26] M. Regel-Rosocka, I. Miesiac, R. Cierpiszewski, I. Mishonov, K. Alejski, A.M.Sastre, J. Szymanowski, Recovery of zinc(II) from spent hydrochloric acidsolutions from zinc hot-dip galvanizing plants, in: Proceedings of the TMS FallExtraction and Processing Conference, Hydrometallurgy, vol. 2, 2003, pp.1577–1591.
[27] J. Laso, V. García, E. Bringas, A.M. Urtiaga, I. Ortiz, Selective recovery of zincover iron from spent pickling wastes by different membrane-based solventextraction process configurations, Ind. Eng. Chem. Res. 54 (12) (2015) 3218–3224, http://dx.doi.org/10.1021/acs.iecr.5b00099.
[28] F.J. Alguacil, M. Alonso, F.A. Lopez, A. Lopez-Delgado, I. Padilla, H. Tayibi,Pseudo-emulsion based hollow fiber with strip dispersion pertraction of iron(III) using (PJMTH+)2(SO4
2$) ionic liquid as carrier, Chem. Eng. J. 157 (2–3)(2010) 366–372, http://dx.doi.org/10.1016/j.cej.2009.11.016.
[29] A. Mondal, S. Ghosh, A. Bhowal, S. Datta, Vanadium extraction using pseudo-emulsion based hollow-fiber with strip dispersion technique, Sep. Sci. Technol.48 (2013) 877–883, http://dx.doi.org/10.1080/01496395.2012.723103.
210 K. Wieszczycka et al. / Separation and Purification Technology 154 (2015) 204–210

Anexo 2

Source of solutions.
Adsorber Units For Water Treatment with GEH® Granular Ferric Hydroxide
ktion . Betrieb
1 GEH Adsorber Units / Basic Design Info
Note:
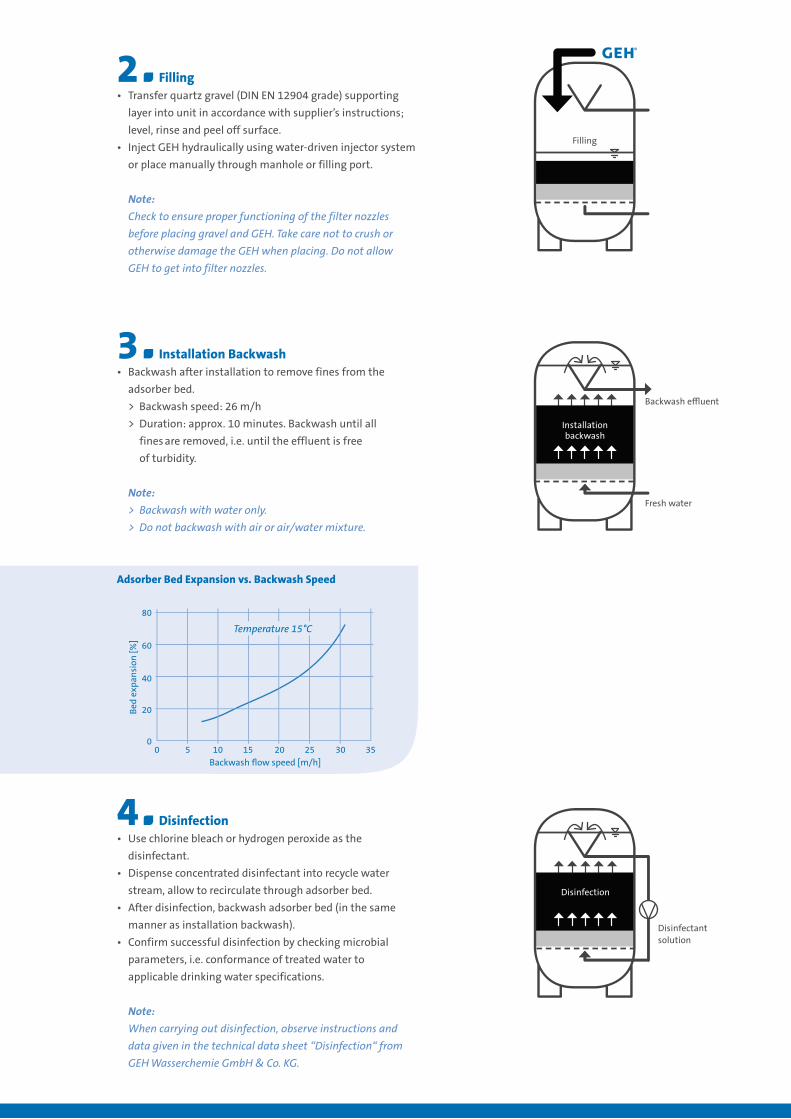
Check to ensure proper functioning of the filter nozzles
before placing gravel and GEH. Take care not to crush or
otherwise damage the GEH when placing. Do not allow
GEH to get into filter nozzles.
Note:
When carrying out disinfection, observe instructions and
data given in the technical data sheet “Disinfection“ from
GEH Wasserchemie GmbH & Co. KG.
Note:
> Backwash with water only.
> Do not backwash with air or air/water mixture.
2 Filling
4 Disinfection
3 Installation Backwash
Adsorber Bed Expansion vs. Backwash Speed
Temperature 15°C

Note:
Discontinuous or intermittent operation does not impair
functioning.
5 Adsorber Operation
Pressure Drop vs. Flow Speed Through Bed
Temperature 15°C
6 Operational Backwash
7 Replacement of GEH
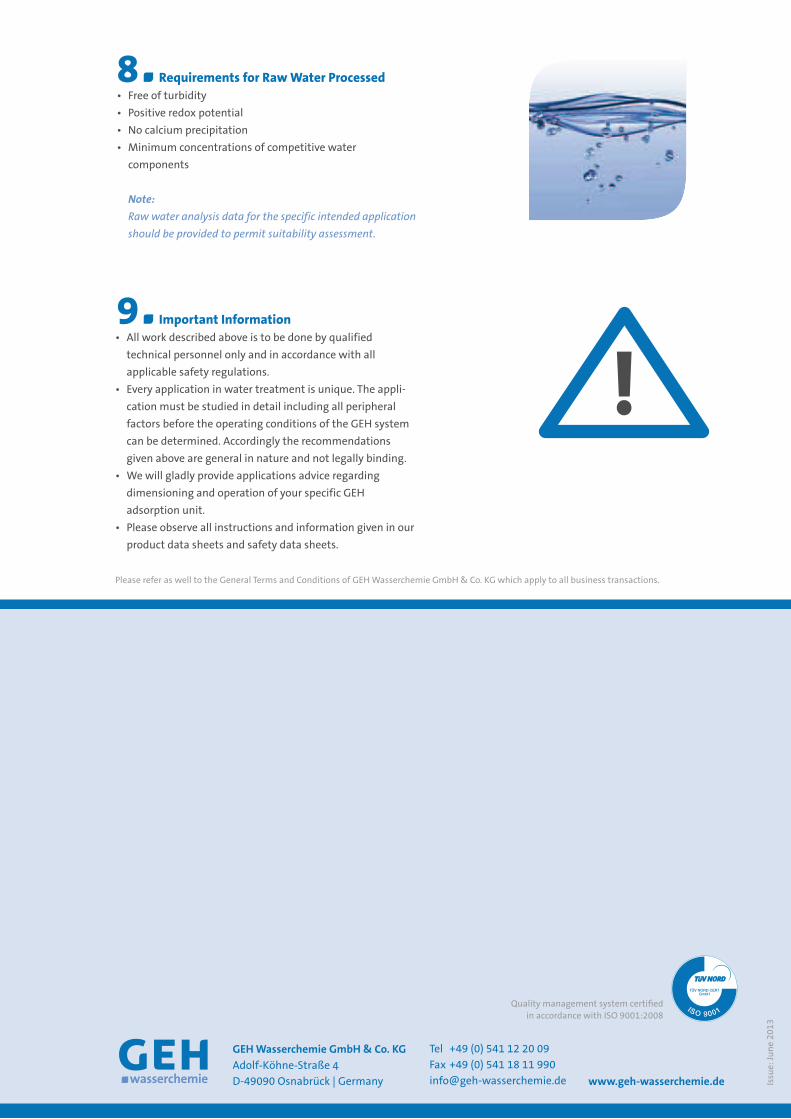
8 Requirements for Raw Water Processed
9 Important Information
Note:
Raw water analysis data for the specific intended application
should be provided to permit suitability assessment.
GEH Wasserchemie GmbH & Co. KG
Adolf-Köhne-Straße 4
www.geh-wasserchemie.de

Anexo 3

Dewatering of brewer’s spent grain using an integrated membrane filter presswith vacuum drying capabilities
Remígio M. Machado a, Ricardo A. D. Rodriguesa, Carlos M. C. Henriquesa, M. Lurdes F. Gameiro a,M. Rosinda C. Ismael a, M. Teresa A. Reis a, João P. B. Freireb, and Jorge M. R. Carvalho a
aCERENA – Centro de Recursos Naturais e Ambiente, Instituto Superior Técnico, Universidade de Lisboa, Lisboa, Portugal; bInstituto Superiorde Agronomia, Universidade de Lisboa, Tapada da Ajuda, Lisboa, Portugal
ABSTRACT
Brewer’s spent grain (BSG) is a by-product of the brewing process, rich in fiber, protein andcarbohydrates. Its potential application is limited because of high moisture content (80%). Thiswork presents a process for dewatering BSG using two different sets of membrane filter plates in afilter press with vacuum drying: recessive plates with polypropylene membranes and the innova-tive Rollfit® plates. A final moisture content of 12-15% was obtained in 15 mm-thick filter cakes,using both types of plates. The dewatering cycle included filtration, membrane-squeezing, andvacuum thermal drying using hot water (~90ºC) as heat source.
ARTICLE HISTORY
Received 6 February 2015Accepted 3 November 2015
KEYWORDS
Spent grain; filtration; filterpress; vacuum-drying;membrane plate
Introduction
Brewer’s spent grain (BSG) is the solid fraction thatresults from the separation of the mash in wort andgrain residues in a process known in the breweryindustry as lautering. This by-product is rich in pro-teins, fibers, and lipids, as well as in polyphenols, vita-mins, and antioxidants, and has the potential formultiple applications of high added value. Accordingto Kanauchi et al. (1), BSG is composed of protein(24%), pentosans (22%), lignin (12%), cellulose(24.5%), lipids (11%), and ash (2.4%), based on dryweight. The extraction of valuable compounds viaBSG enzymatic hydrolysis has been extensively studied.Faulds et al. (2) reported the production of arabinox-ylan and mono- and dimeric ferulic acid from BSGusing glycosyl hydrolases and feruloyl esterases.Mussatto et al. (3-6) described the dilute acid hydrolysisfor the hemicellulose recovery, the alkaline hydrolysisfor the lignin solubilization, and the enzymatic hydro-lysis for the cellulose conversion into glucose. Thecellulosic and hemicellulosic hydrolysates were used asthe fermentation medium for the production of lacticacid and xylitol. Lactic acid is used as an acidifier andfood preservative and it has also applications in thepharmaceutical, leather, and textile industries. Xylitolis a non-fermentable sugar used as a sweetener, in oralhygiene and dental care products. The alkaline hydro-lysis of BSG also produces liquors containing phenolic
acids, mainly ferulic and p-coumaric acids. Xiros andChristakopoulos (7) used alkali pretreated BSG for theproduction of ethanol by the mesophilic fungusFusarium oxysporum.
BSG is also a source of soluble and insoluble fiberand can be incorporated in composite food for humanconsumption, such as cookies (8-10). The consumptionof BSG has health benefits, which are associated withincreasing the fecal weight and shortening the residencetime in the digestive tract. The soluble fiber present inBSG has also a positive effect in reducing cholesteroland triglycerides (11). Although BSG has high addedvalue applications, its main use is still for cattle feeding,since BSG is considered a cheap source of proteins.Recent studies have shown that BSG may also be suc-cessfully incorporated in the diet of monogastric ani-mals such as piglets (12) and also in cecal fermenters(rabbits) (13). However, in spite of all the potentialapplications, the actual use of BSG is severely limiteddue to its high moisture content (around 80% w/w)which brings about microbial development. BSG mustbe used within 48 hours after production otherwisecomplex fermentation processes, including butyricanaerobic fermentation, will transform BSG into a use-less and toxic waste that must be disposed in landfills.The most promising technique to stabilize BSG isdewatering. A moisture content below 20% is obtainedusing this technique. So far, several technologies havebeen tested including hot air fluidization or the use of
CONTACT Jorge M. R. Carvalho [email protected] CERENA – Centro de Recursos Naturais e Ambiente, Instituto Superior Técnico,Universidade de Lisboa, Av. Rovisco Pais, 1, 1049-001 Lisboa, Portugal.
SEPARATION SCIENCE AND TECHNOLOGY
2016, VOL. 51, NO. 4, 692–700
http://dx.doi.org/10.1080/01496395.2015.1117102
© 2016 Taylor & Francis
Dow
nlo
aded
by [
b-o
n:
Bib
liote
ca d
o c
onhec
imen
to o
nli
ne
UL
] at
03:2
8 3
1 M
arch
2016

rotary dryers in a countercurrent system. These pro-cesses are capital intensive and also require an expen-sive source of energy, even when using energy from aco-generation unit.
More recently, a process has been developed (14) forthe separation of the BSG protein and fibrous fractions,by diluting the mixture to a moisture content of 95%,followed by a passage through a vibrating sieve, whichretains the fibrous fraction. The protein fraction isdewatered in a centrifugal settler to a maximum solidcontent of 30%. An extra step of drying, using a spraythermal dryer, a paste dryer, or an extrusion dryer,increases the solid content to about 80%. This fractioncan then be used as a valuable component for non-ruminant animals feed production. The fraction rich infiber is processed in a screw-press, increasing its drymatter content up to 40%, and then burned to producevapor. This process allows a better use of all the com-ponents of BSG, but it is a complex process that alsorequires a high input of energy.
The innovative process described in this paper isbased on dewatering BSG using an integrated filterpress with membranes and with thermal drying cap-ability. Low-cost hot water, available locally at thebreweries, is used as the main source of energy. Tothe best of our knowledge, the only application of thistechnology to brewer’s spent grain is the one publishedby El-Shafey et al. (15). However, this implementation
required a dilution of the BSG to more than 97% ofmoisture content. Otherwise, the air operated dia-phragm pump would be blocked by the sludge ofBSG. On an industrial scale (400 ton/week of BSGwith 73-75% of moisture content), the water quantityrequirements would prevent any economical and sus-tainable application of the process and, furthermore,the high dilution of the produced filtrate would invali-date its use as a source of polyphenols for severalindustrial processes.
The aim of this paper is to produce dry, shelf-storableBSG cakes using a membrane filter press. The obtaineddry cakes can be used not only as animal food (that can bepreserved for a long time without chemical or physicaldegradation) but also as a raw material for the biotech-nology and pharmaceutical industries.
Equipment and experimental methods
The membrane filter press used in this work was amodified US Filter J-VAP, model 470V30-7-1MYLW,serial number JV0044 (15). The schematic diagram isshown in Fig. 1. The starting unit was able to withstand8 bar working pressure, and the thermal fluid forsqueezing and heating the filter cake was limited to amaximum working temperature of 90ºC. Because theBSG sludge was fed to the filtration unit using an air-
Dehydrated BSG:
85-88% (w/w) solids
BSG:
25% (w/w)
solids
Hot water
(85-95 °C)
Condenser
Moisture
Air blowdown
Air supply
PP recessive
membrane plates
>35% water removal using
thermal vacuum drying
Vacuum
59% water removal using
filtration and squeezing
Rollfit® plates
Figure 1. Flowchart of the Brewer’s Spent Grain dewatering.
SEPARATION SCIENCE AND TECHNOLOGY 693
Dow
nlo
aded
by [
b-o
n:
Bib
liote
ca d
o c
onhec
imen
to o
nli
ne
UL
] at
03:2
8 3
1 M
arch
2016
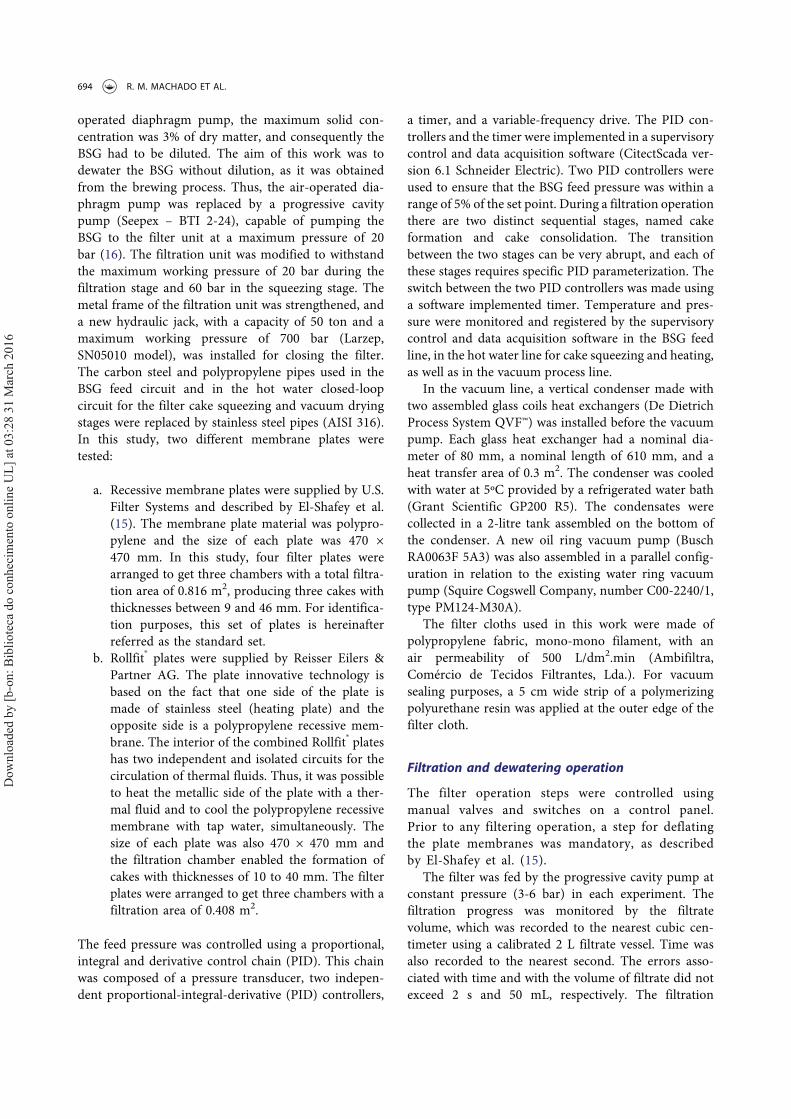
operated diaphragm pump, the maximum solid con-centration was 3% of dry matter, and consequently theBSG had to be diluted. The aim of this work was todewater the BSG without dilution, as it was obtainedfrom the brewing process. Thus, the air-operated dia-phragm pump was replaced by a progressive cavitypump (Seepex – BTI 2-24), capable of pumping theBSG to the filter unit at a maximum pressure of 20bar (16). The filtration unit was modified to withstandthe maximum working pressure of 20 bar during thefiltration stage and 60 bar in the squeezing stage. Themetal frame of the filtration unit was strengthened, anda new hydraulic jack, with a capacity of 50 ton and amaximum working pressure of 700 bar (Larzep,SN05010 model), was installed for closing the filter.The carbon steel and polypropylene pipes used in theBSG feed circuit and in the hot water closed-loopcircuit for the filter cake squeezing and vacuum dryingstages were replaced by stainless steel pipes (AISI 316).In this study, two different membrane plates weretested:
a. Recessive membrane plates were supplied by U.S.Filter Systems and described by El-Shafey et al.(15). The membrane plate material was polypro-pylene and the size of each plate was 470 ×470 mm. In this study, four filter plates werearranged to get three chambers with a total filtra-tion area of 0.816 m2, producing three cakes withthicknesses between 9 and 46 mm. For identifica-tion purposes, this set of plates is hereinafterreferred as the standard set.
b. Rollfit® plates were supplied by Reisser Eilers &Partner AG. The plate innovative technology isbased on the fact that one side of the plate ismade of stainless steel (heating plate) and theopposite side is a polypropylene recessive mem-brane. The interior of the combined Rollfit® plateshas two independent and isolated circuits for thecirculation of thermal fluids. Thus, it was possibleto heat the metallic side of the plate with a ther-mal fluid and to cool the polypropylene recessivemembrane with tap water, simultaneously. Thesize of each plate was also 470 × 470 mm andthe filtration chamber enabled the formation ofcakes with thicknesses of 10 to 40 mm. The filterplates were arranged to get three chambers with afiltration area of 0.408 m2.
The feed pressure was controlled using a proportional,integral and derivative control chain (PID). This chainwas composed of a pressure transducer, two indepen-dent proportional-integral-derivative (PID) controllers,
a timer, and a variable-frequency drive. The PID con-trollers and the timer were implemented in a supervisorycontrol and data acquisition software (CitectScada ver-sion 6.1 Schneider Electric). Two PID controllers wereused to ensure that the BSG feed pressure was within arange of 5% of the set point. During a filtration operationthere are two distinct sequential stages, named cakeformation and cake consolidation. The transitionbetween the two stages can be very abrupt, and each ofthese stages requires specific PID parameterization. Theswitch between the two PID controllers was made usinga software implemented timer. Temperature and pres-sure were monitored and registered by the supervisorycontrol and data acquisition software in the BSG feedline, in the hot water line for cake squeezing and heating,as well as in the vacuum process line.
In the vacuum line, a vertical condenser made withtwo assembled glass coils heat exchangers (De DietrichProcess System QVF™) was installed before the vacuumpump. Each glass heat exchanger had a nominal dia-meter of 80 mm, a nominal length of 610 mm, and aheat transfer area of 0.3 m2. The condenser was cooledwith water at 5ºC provided by a refrigerated water bath(Grant Scientific GP200 R5). The condensates werecollected in a 2-litre tank assembled on the bottom ofthe condenser. A new oil ring vacuum pump (BuschRA0063F 5A3) was also assembled in a parallel config-uration in relation to the existing water ring vacuumpump (Squire Cogswell Company, number C00-2240/1,type PM124-M30A).
The filter cloths used in this work were made ofpolypropylene fabric, mono-mono filament, with anair permeability of 500 L/dm2.min (Ambifiltra,Comércio de Tecidos Filtrantes, Lda.). For vacuumsealing purposes, a 5 cm wide strip of a polymerizingpolyurethane resin was applied at the outer edge of thefilter cloth.
Filtration and dewatering operation
The filter operation steps were controlled usingmanual valves and switches on a control panel.Prior to any filtering operation, a step for deflatingthe plate membranes was mandatory, as describedby El-Shafey et al. (15).
The filter was fed by the progressive cavity pump atconstant pressure (3-6 bar) in each experiment. Thefiltration progress was monitored by the filtratevolume, which was recorded to the nearest cubic cen-timeter using a calibrated 2 L filtrate vessel. Time wasalso recorded to the nearest second. The errors asso-ciated with time and with the volume of filtrate did notexceed 2 s and 50 mL, respectively. The filtration
694 R. M. MACHADO ET AL.
Dow
nlo
aded
by [
b-o
n:
Bib
liote
ca d
o c
onhec
imen
to o
nli
ne
UL
] at
03:2
8 3
1 M
arch
2016

process continued until the collected fluid flow rate wasless than 20 mL/min.
The second step of the mechanical dewatering wascake compression or cake squeezing. The membraneswere inflated with water pressurized up to 4 to 8 bar bythe centrifugal pump (MTH pump, T51G BF model).The filtrate resulting from the squeezing stage was alsocollected and added to the total filtrate. The compres-sion stage was considered completed when the filtrateflow was less than 20 mL/min. The duration of thisstage was normally 5 min.
Core blow was carried out by applying air, at lowpressure (1-2 bar), through the channel formed by theplates upper left eye, after closing the filtrate valves andopening the central core to the atmosphere. This opera-tion was essential to empty the central core of wet BSGthat would wet the filter cake during the thermal stage.
The subsequent step was the thermal stage of thedewatering cycle. This step used a centrifugal pump(MTH pump, T51G BF model) and a heater (Ogden,KS-0591-M7 model) to fill the membranes with hotwater (85-95ºC), from a water supply tank, at a squeezingpressure of 2-3 bar. At the same time, vacuum drying wasapplied over the hot cakes at 50-110 mbar (absolute pres-sure) via the vacuum pump (R 5 RA 0063-0100 F) throughthe filtrate outlet ports. Low pressure water saturated airdeparted from the hot cakes through the eyelets on the topand bottom of each membrane plate and passed throughthe condenser installed in the vacuum line.
In the case of the Rollfit® plates, a different procedurewas also tested. Cold water circulated through the mem-branes while the metal plates heated the cake, creating atemperature gradient within the filter cake. In order toachieve different levels of cake dryness, several vacuumdrying times were tested between 2 and 5 hours.
After the dewatering cycle, the filter cakes wereremoved from the filter press and the final moisturecontent was measured by drying five representativesamples of each cake (rectangles with 2 × 2 cm2 takenfrom five equidistant points on a main diagonal of thefilter cakes) in an oven (at 105ºC) until constant weight.The dried samples were cooled in a desiccator and thenweighed.
Filter cloth cleaning involved several steps. Firstly, pres-surized water was passed over the cloth surface to removebig particles. Then, the cloth was impregnated overnightin a 10% hypochlorite alkaline solution, to remove the fineunfiltered particles, and rinsed successively with water toremove any residuals of the hypochlorite solution.
The stages required for the BSG dewatering com-plete cycle are listed in Table 1, where nominal timesare presented.
BSG preparation and conditioning
The BSG used in this work was supplied by the produc-tion center of the UNICER brewery, located inSantarém, Portugal. In order to avoid microbial degra-dation, the BSG was kept in a cold room at 4ºC. TheBSE was analyzed at Instituto Superior de Agronomia –Laboratório Químico Agrícola Rebelo da Silva, Lisboa,Portugal. The results are presented in Table 2, for twoBSG samples of two different beer brands obtained inthe industrial process.
The BSG is produced by the industrial brewery ata temperature of 45 to 55ºC. Thus, to reproduce theindustrial conditions as close as possible, before eachdewatering experiment the BSG was heated to40-45ºC, for 3 to 4 hours, using a vessel heated bycopper coils with internal circulation of hot water at70ºC. The starting reference moisture for the BSGused in this work was 76% (most frequent moisturecontent). However, some samples reached the filtra-tion pilot plant with lower moisture content. In suchcases, the moisture was adjusted with small amountsof tap water.
Table 1. BSG dewatering steps.
Nominal time required (min)
StepRecessive Membrane/
Standard PlatesRollfit®
Plates
1. Filter press closing 2 22. Membrane draining 2 23. Press filling/Filtration 12 104. Cold water squeezing/Compressed air squeezing
5 5
5. Core blow 2 26. Transition for vacuum drying 1 37. Hot squeezing with vacuumdrying
180 to 300 180 to 300
8. Vacuum stop 1 19. Press opening 2 210. Retract plates and dischargecakes
3 3
Total Cycle Time 210 to 330 210 to 330
Table 2. Analytical composition of two samples of BSG, for twobeer brands, obtained in the production center of UNICER,Santarém, Portugal.
Analytical Fraction Brand 1 Brand 2
Moisture % 70.6 71.1Ash (% DM) 3.8 4.4Organic Matter (% DM) 96.2 95.6Total Protein (% DM) 26.8 21.4Total Lipids (% DM) 8.6 7.9Total Fibre (% DM) 17.52 21.4NDF (% DM) 60.3 60.7ADF (% DM) 22.6 21.8ADL (% DM) 4.1 4.6Celullose (ADF-ADL) (% DM) 18.5 17.2Hemicellulose (NDF-ADF) (% DM) 37.7 38.9
% DM: Percentage of Dry Matter, NDF: Neutral Detergent Fibre, ADF: AcidDetergent Fibre, ADL: Acid Detergent Lignin
SEPARATION SCIENCE AND TECHNOLOGY 695
Dow
nlo
aded
by [
b-o
n:
Bib
liote
ca d
o c
onhec
imen
to o
nli
ne
UL
] at
03:2
8 3
1 M
arch
2016
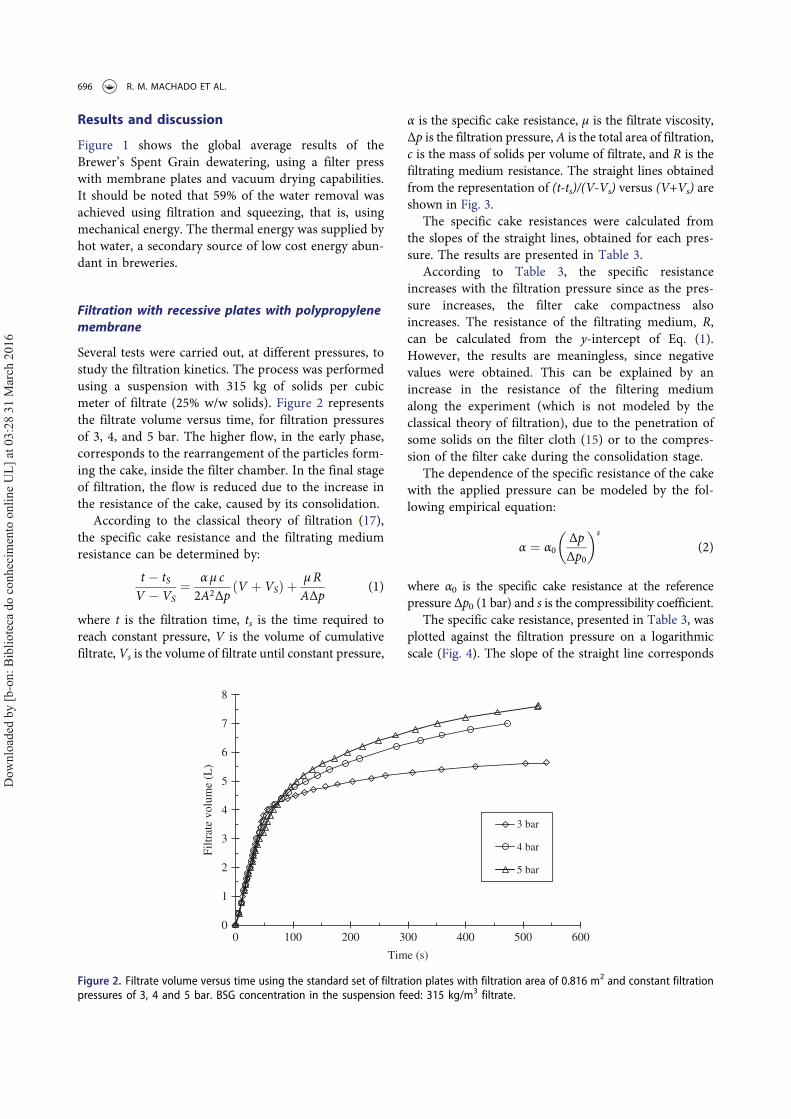
Results and discussion
Figure 1 shows the global average results of theBrewer’s Spent Grain dewatering, using a filter presswith membrane plates and vacuum drying capabilities.It should be noted that 59% of the water removal wasachieved using filtration and squeezing, that is, usingmechanical energy. The thermal energy was supplied byhot water, a secondary source of low cost energy abun-dant in breweries.
Filtration with recessive plates with polypropylene
membrane
Several tests were carried out, at different pressures, tostudy the filtration kinetics. The process was performedusing a suspension with 315 kg of solids per cubicmeter of filtrate (25% w/w solids). Figure 2 representsthe filtrate volume versus time, for filtration pressuresof 3, 4, and 5 bar. The higher flow, in the early phase,corresponds to the rearrangement of the particles form-ing the cake, inside the filter chamber. In the final stageof filtration, the flow is reduced due to the increase inthe resistance of the cake, caused by its consolidation.
According to the classical theory of filtration (17),the specific cake resistance and the filtrating mediumresistance can be determined by:
t ! tS
V ! VS¼
α μ c
2A2ΔpV þ VSð Þ þ
μR
AΔp(1)
where t is the filtration time, ts is the time required toreach constant pressure, V is the volume of cumulativefiltrate, Vs is the volume of filtrate until constant pressure,
α is the specific cake resistance, µ is the filtrate viscosity,∆p is the filtration pressure,A is the total area of filtration,c is the mass of solids per volume of filtrate, and R is thefiltrating medium resistance. The straight lines obtainedfrom the representation of (t-ts)/(V-Vs) versus (V+Vs) areshown in Fig. 3.
The specific cake resistances were calculated fromthe slopes of the straight lines, obtained for each pres-sure. The results are presented in Table 3.
According to Table 3, the specific resistanceincreases with the filtration pressure since as the pres-sure increases, the filter cake compactness alsoincreases. The resistance of the filtrating medium, R,can be calculated from the y-intercept of Eq. (1).However, the results are meaningless, since negativevalues were obtained. This can be explained by anincrease in the resistance of the filtering mediumalong the experiment (which is not modeled by theclassical theory of filtration), due to the penetration ofsome solids on the filter cloth (15) or to the compres-sion of the filter cake during the consolidation stage.
The dependence of the specific resistance of the cakewith the applied pressure can be modeled by the fol-lowing empirical equation:
α ¼ α0Δp
Δp0
! "s
(2)
where α0 is the specific cake resistance at the referencepressure ∆p0 (1 bar) and s is the compressibility coefficient.
The specific cake resistance, presented in Table 3, wasplotted against the filtration pressure on a logarithmicscale (Fig. 4). The slope of the straight line corresponds
0
1
2
3
4
5
6
7
8
0 100 200 300 400 500 600
Fil
trat
e v
olu
me
(L)
Time (s)
3 bar
4 bar
5 bar
Figure 2. Filtrate volume versus time using the standard set of filtration plates with filtration area of 0.816 m2 and constant filtrationpressures of 3, 4 and 5 bar. BSG concentration in the suspension feed: 315 kg/m3 filtrate.
696 R. M. MACHADO ET AL.
Dow
nlo
aded
by [
b-o
n:
Bib
liote
ca d
o c
onhec
imen
to o
nli
ne
UL
] at
03:2
8 3
1 M
arch
2016
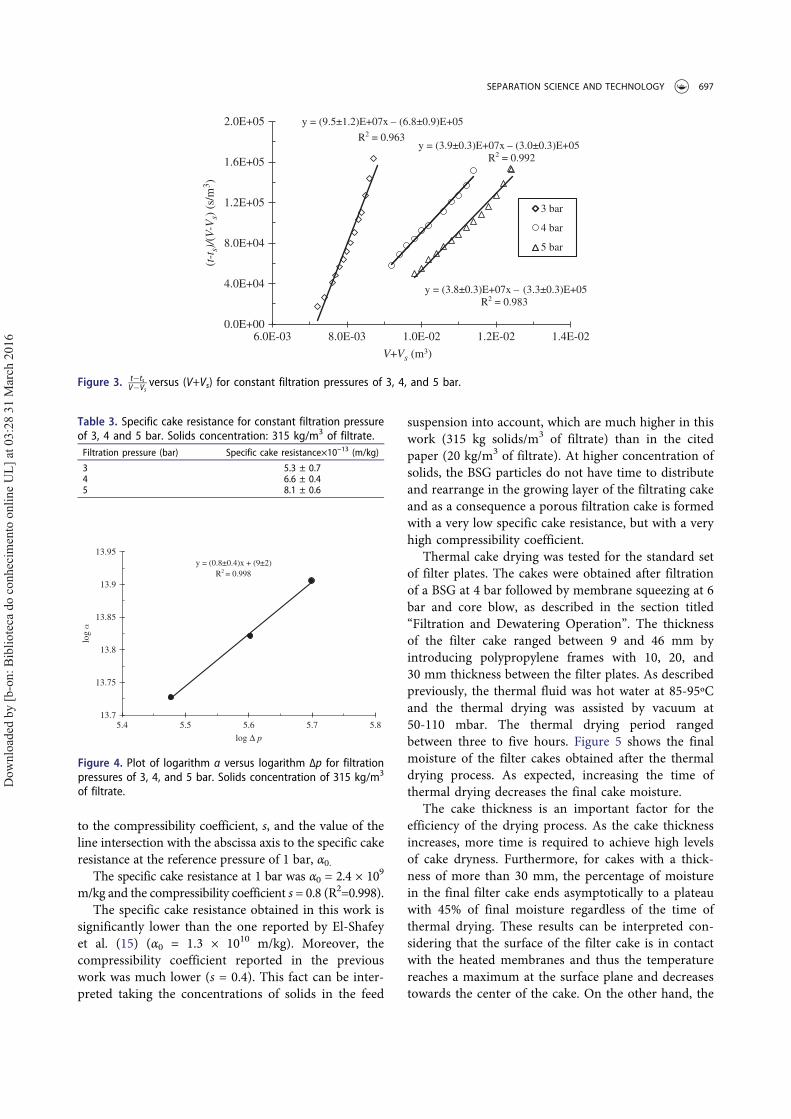
to the compressibility coefficient, s, and the value of theline intersection with the abscissa axis to the specific cakeresistance at the reference pressure of 1 bar, α0.
The specific cake resistance at 1 bar was α0 = 2.4 × 10⁹
m/kg and the compressibility coefficient s = 0.8 (R2=0.998).The specific cake resistance obtained in this work is
significantly lower than the one reported by El-Shafeyet al. (15) (α0 = 1.3 × 10¹⁰ m/kg). Moreover, thecompressibility coefficient reported in the previouswork was much lower (s = 0.4). This fact can be inter-preted taking the concentrations of solids in the feed
suspension into account, which are much higher in thiswork (315 kg solids/m3 of filtrate) than in the citedpaper (20 kg/m3 of filtrate). At higher concentration ofsolids, the BSG particles do not have time to distributeand rearrange in the growing layer of the filtrating cakeand as a consequence a porous filtration cake is formedwith a very low specific cake resistance, but with a veryhigh compressibility coefficient.
Thermal cake drying was tested for the standard setof filter plates. The cakes were obtained after filtrationof a BSG at 4 bar followed by membrane squeezing at 6bar and core blow, as described in the section titled“Filtration and Dewatering Operation”. The thicknessof the filter cake ranged between 9 and 46 mm byintroducing polypropylene frames with 10, 20, and30 mm thickness between the filter plates. As describedpreviously, the thermal fluid was hot water at 85-95ºCand the thermal drying was assisted by vacuum at50-110 mbar. The thermal drying period rangedbetween three to five hours. Figure 5 shows the finalmoisture of the filter cakes obtained after the thermaldrying process. As expected, increasing the time ofthermal drying decreases the final cake moisture.
The cake thickness is an important factor for theefficiency of the drying process. As the cake thicknessincreases, more time is required to achieve high levelsof cake dryness. Furthermore, for cakes with a thick-ness of more than 30 mm, the percentage of moisturein the final filter cake ends asymptotically to a plateauwith 45% of final moisture regardless of the time ofthermal drying. These results can be interpreted con-sidering that the surface of the filter cake is in contactwith the heated membranes and thus the temperaturereaches a maximum at the surface plane and decreasestowards the center of the cake. On the other hand, the
y = (9.5±1.2)E+07x – (6.8±0.9)E+05
R2 = 0.963y = (3.9±0.3)E+07x – (3.0±0.3)E+05
R2 = 0.992
y = (3.8±0.3)E+07x – (3.3±0.3)E+05
R2 = 0.983
0.0E+00
4.0E+04
8.0E+04
1.2E+05
1.6E+05
2.0E+05
6.0E-03 8.0E-03 1.0E-02 1.2E-02 1.4E-02
(t-t
s)/(
V-V
s) (
s/m
3)
V+Vs (m3)
3 bar
4 bar
5 bar
Figure 3. t!tsV!Vs
versus (V+Vs) for constant filtration pressures of 3, 4, and 5 bar.
Table 3. Specific cake resistance for constant filtration pressureof 3, 4 and 5 bar. Solids concentration: 315 kg/m3 of filtrate.
Filtration pressure (bar) Specific cake resistance×10‒13 (m/kg)
3 5.3 ± 0.74 6.6 ± 0.45 8.1 ± 0.6
y = (0.8±0.4)x + (9±2)
R2 = 0.998
13.7
13.75
13.8
13.85
13.9
13.95
5.4 5.5 5.6 5.7 5.8
log α
log ∆ p
Figure 4. Plot of logarithm α versus logarithm ∆p for filtrationpressures of 3, 4, and 5 bar. Solids concentration of 315 kg/m3
of filtrate.
SEPARATION SCIENCE AND TECHNOLOGY 697
Dow
nlo
aded
by [
b-o
n:
Bib
liote
ca d
o c
onhec
imen
to o
nli
ne
UL
] at
03:2
8 3
1 M
arch
2016
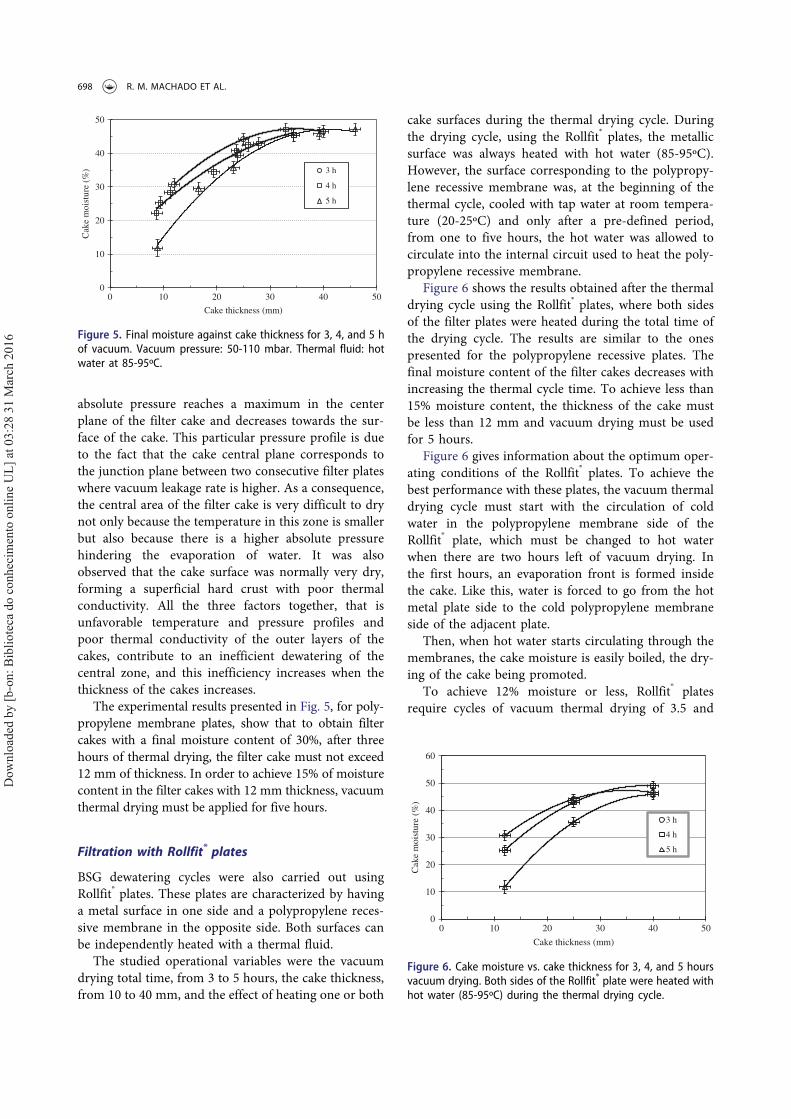
absolute pressure reaches a maximum in the centerplane of the filter cake and decreases towards the sur-face of the cake. This particular pressure profile is dueto the fact that the cake central plane corresponds tothe junction plane between two consecutive filter plateswhere vacuum leakage rate is higher. As a consequence,the central area of the filter cake is very difficult to drynot only because the temperature in this zone is smallerbut also because there is a higher absolute pressurehindering the evaporation of water. It was alsoobserved that the cake surface was normally very dry,forming a superficial hard crust with poor thermalconductivity. All the three factors together, that isunfavorable temperature and pressure profiles andpoor thermal conductivity of the outer layers of thecakes, contribute to an inefficient dewatering of thecentral zone, and this inefficiency increases when thethickness of the cakes increases.
The experimental results presented in Fig. 5, for poly-propylene membrane plates, show that to obtain filtercakes with a final moisture content of 30%, after threehours of thermal drying, the filter cake must not exceed12 mm of thickness. In order to achieve 15% of moisturecontent in the filter cakes with 12 mm thickness, vacuumthermal drying must be applied for five hours.
Filtration with Rollfit® plates
BSG dewatering cycles were also carried out usingRollfit® plates. These plates are characterized by havinga metal surface in one side and a polypropylene reces-sive membrane in the opposite side. Both surfaces canbe independently heated with a thermal fluid.
The studied operational variables were the vacuumdrying total time, from 3 to 5 hours, the cake thickness,from 10 to 40 mm, and the effect of heating one or both
cake surfaces during the thermal drying cycle. Duringthe drying cycle, using the Rollfit® plates, the metallicsurface was always heated with hot water (85-95ºC).However, the surface corresponding to the polypropy-lene recessive membrane was, at the beginning of thethermal cycle, cooled with tap water at room tempera-ture (20-25ºC) and only after a pre-defined period,from one to five hours, the hot water was allowed tocirculate into the internal circuit used to heat the poly-propylene recessive membrane.
Figure 6 shows the results obtained after the thermaldrying cycle using the Rollfit® plates, where both sidesof the filter plates were heated during the total time ofthe drying cycle. The results are similar to the onespresented for the polypropylene recessive plates. Thefinal moisture content of the filter cakes decreases withincreasing the thermal cycle time. To achieve less than15% moisture content, the thickness of the cake mustbe less than 12 mm and vacuum drying must be usedfor 5 hours.
Figure 6 gives information about the optimum oper-ating conditions of the Rollfit® plates. To achieve thebest performance with these plates, the vacuum thermaldrying cycle must start with the circulation of coldwater in the polypropylene membrane side of theRollfit® plate, which must be changed to hot waterwhen there are two hours left of vacuum drying. Inthe first hours, an evaporation front is formed insidethe cake. Like this, water is forced to go from the hotmetal plate side to the cold polypropylene membraneside of the adjacent plate.
Then, when hot water starts circulating through themembranes, the cake moisture is easily boiled, the dry-ing of the cake being promoted.
To achieve 12% moisture or less, Rollfit® platesrequire cycles of vacuum thermal drying of 3.5 and
0
10
20
30
40
50
60
0 10 20 30 40 50
Cak
e m
ois
ture
(%
)
Cake thickness (mm)
3 h
4 h
5 h
Figure 6. Cake moisture vs. cake thickness for 3, 4, and 5 hoursvacuum drying. Both sides of the Rollfit® plate were heated withhot water (85-95ºC) during the thermal drying cycle.
0
10
20
30
40
50
0 10 20 30 40 50
Cak
e m
ois
ture
(%
)
Cake thickness (mm)
3 h
4 h
5 h
Figure 5. Final moisture against cake thickness for 3, 4, and 5 hof vacuum. Vacuum pressure: 50-110 mbar. Thermal fluid: hotwater at 85-95ºC.
698 R. M. MACHADO ET AL.
Dow
nlo
aded
by [
b-o
n:
Bib
liote
ca d
o c
onhec
imen
to o
nli
ne
UL
] at
03:2
8 3
1 M
arch
2016
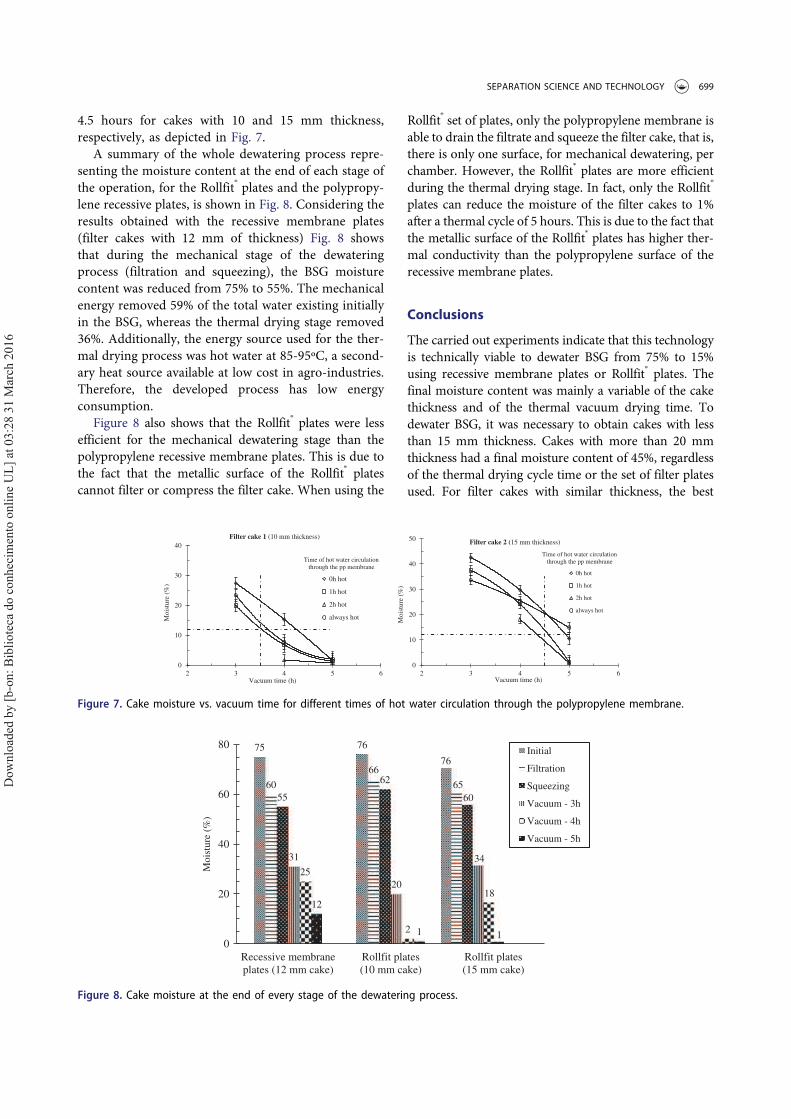
4.5 hours for cakes with 10 and 15 mm thickness,respectively, as depicted in Fig. 7.
A summary of the whole dewatering process repre-senting the moisture content at the end of each stage ofthe operation, for the Rollfit® plates and the polypropy-lene recessive plates, is shown in Fig. 8. Considering theresults obtained with the recessive membrane plates(filter cakes with 12 mm of thickness) Fig. 8 showsthat during the mechanical stage of the dewateringprocess (filtration and squeezing), the BSG moisturecontent was reduced from 75% to 55%. The mechanicalenergy removed 59% of the total water existing initiallyin the BSG, whereas the thermal drying stage removed36%. Additionally, the energy source used for the ther-mal drying process was hot water at 85-95ºC, a second-ary heat source available at low cost in agro-industries.Therefore, the developed process has low energyconsumption.
Figure 8 also shows that the Rollfit® plates were lessefficient for the mechanical dewatering stage than thepolypropylene recessive membrane plates. This is due tothe fact that the metallic surface of the Rollfit® platescannot filter or compress the filter cake. When using the
Rollfit® set of plates, only the polypropylene membrane isable to drain the filtrate and squeeze the filter cake, that is,there is only one surface, for mechanical dewatering, perchamber. However, the Rollfit® plates are more efficientduring the thermal drying stage. In fact, only the Rollfit®
plates can reduce the moisture of the filter cakes to 1%after a thermal cycle of 5 hours. This is due to the fact thatthe metallic surface of the Rollfit® plates has higher ther-mal conductivity than the polypropylene surface of therecessive membrane plates.
Conclusions
The carried out experiments indicate that this technologyis technically viable to dewater BSG from 75% to 15%using recessive membrane plates or Rollfit® plates. Thefinal moisture content was mainly a variable of the cakethickness and of the thermal vacuum drying time. Todewater BSG, it was necessary to obtain cakes with lessthan 15 mm thickness. Cakes with more than 20 mmthickness had a final moisture content of 45%, regardlessof the thermal drying cycle time or the set of filter platesused. For filter cakes with similar thickness, the best
0
10
20
30
40
2 3 4 5 6
Mois
ture
(%
)
Vacuum time (h)
0h hot
1h hot
2h hot
always hot
Filter cake 1 (10 mm thickness)
Time of hot water circulation
through the pp membrane
0
10
20
30
40
50
2 3 4 5 6
Mois
ture
(%
)
Vacuum time (h)
0h hot
1h hot
2h hot
always hot
Filter cake 2 (15 mm thickness)
Time of hot water circulation
through the pp membrane
Figure 7. Cake moisture vs. vacuum time for different times of hot water circulation through the polypropylene membrane.
75 76
76
60
66
65
55
62
60
31
20
34
25
2
1812
1 10
20
40
60
80
Recessive membrane
plates (12 mm cake)
Rollfit plates
(10 mm cake)
Rollfit plates
(15 mm cake)
Mo
istu
re (
%)
Initial
Filtration
Squeezing
Vacuum - 3h
Vacuum - 4h
Vacuum - 5h
Figure 8. Cake moisture at the end of every stage of the dewatering process.
SEPARATION SCIENCE AND TECHNOLOGY 699
Dow
nlo
aded
by [
b-o
n:
Bib
liote
ca d
o c
onhec
imen
to o
nli
ne
UL
] at
03:2
8 3
1 M
arch
2016
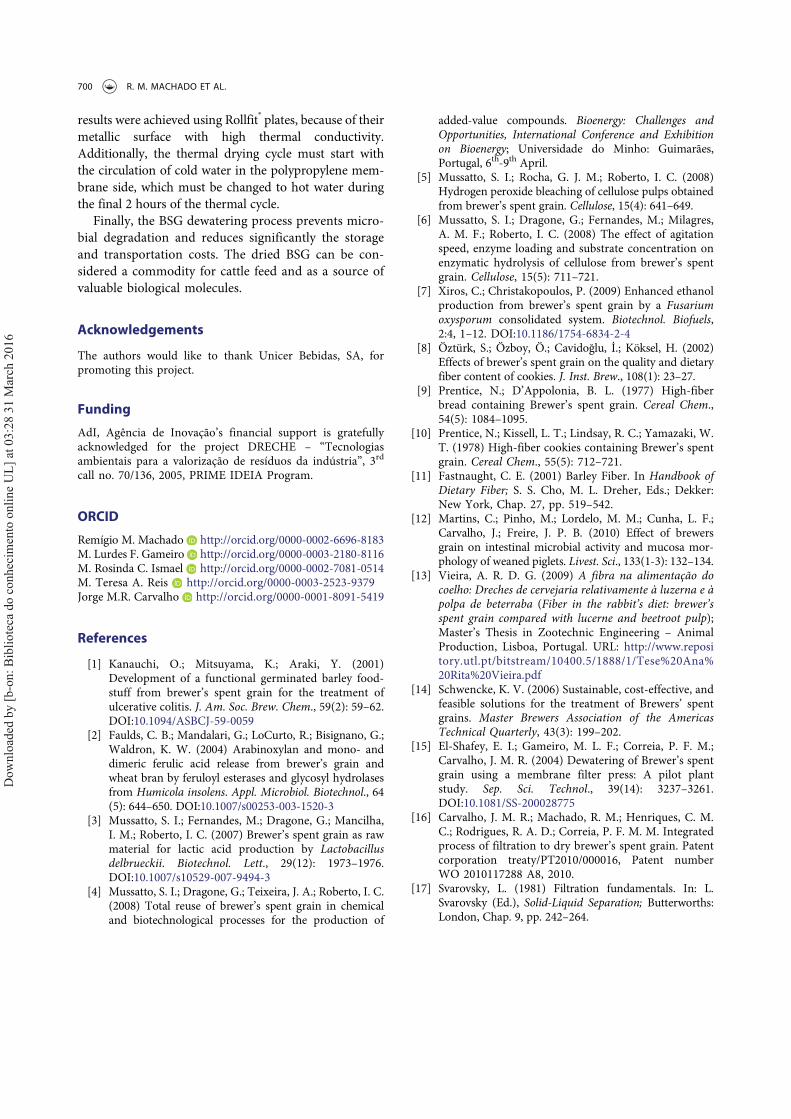
results were achieved using Rollfit® plates, because of theirmetallic surface with high thermal conductivity.Additionally, the thermal drying cycle must start withthe circulation of cold water in the polypropylene mem-brane side, which must be changed to hot water duringthe final 2 hours of the thermal cycle.
Finally, the BSG dewatering process prevents micro-bial degradation and reduces significantly the storageand transportation costs. The dried BSG can be con-sidered a commodity for cattle feed and as a source ofvaluable biological molecules.
Acknowledgements
The authors would like to thank Unicer Bebidas, SA, forpromoting this project.
Funding
AdI, Agência de Inovação’s financial support is gratefullyacknowledged for the project DRECHE – “Tecnologiasambientais para a valorização de resíduos da indústria”, 3rd
call no. 70/136, 2005, PRIME IDEIA Program.
ORCID
Remígio M. Machado http://orcid.org/0000-0002-6696-8183M. Lurdes F. Gameiro http://orcid.org/0000-0003-2180-8116M. Rosinda C. Ismael http://orcid.org/0000-0002-7081-0514M. Teresa A. Reis http://orcid.org/0000-0003-2523-9379Jorge M.R. Carvalho http://orcid.org/0000-0001-8091-5419
References
[1] Kanauchi, O.; Mitsuyama, K.; Araki, Y. (2001)Development of a functional germinated barley food-stuff from brewer’s spent grain for the treatment ofulcerative colitis. J. Am. Soc. Brew. Chem., 59(2): 59–62.DOI:10.1094/ASBCJ-59-0059
[2] Faulds, C. B.; Mandalari, G.; LoCurto, R.; Bisignano, G.;Waldron, K. W. (2004) Arabinoxylan and mono- anddimeric ferulic acid release from brewer’s grain andwheat bran by feruloyl esterases and glycosyl hydrolasesfrom Humicola insolens. Appl. Microbiol. Biotechnol., 64(5): 644–650. DOI:10.1007/s00253-003-1520-3
[3] Mussatto, S. I.; Fernandes, M.; Dragone, G.; Mancilha,I. M.; Roberto, I. C. (2007) Brewer’s spent grain as rawmaterial for lactic acid production by Lactobacillusdelbrueckii. Biotechnol. Lett., 29(12): 1973–1976.DOI:10.1007/s10529-007-9494-3
[4] Mussatto, S. I.; Dragone, G.; Teixeira, J. A.; Roberto, I. C.(2008) Total reuse of brewer’s spent grain in chemicaland biotechnological processes for the production of
added-value compounds. Bioenergy: Challenges andOpportunities, International Conference and Exhibitionon Bioenergy; Universidade do Minho: Guimarães,Portugal, 6th-9th April.
[5] Mussatto, S. I.; Rocha, G. J. M.; Roberto, I. C. (2008)Hydrogen peroxide bleaching of cellulose pulps obtainedfrom brewer’s spent grain. Cellulose, 15(4): 641–649.
[6] Mussatto, S. I.; Dragone, G.; Fernandes, M.; Milagres,A. M. F.; Roberto, I. C. (2008) The effect of agitationspeed, enzyme loading and substrate concentration onenzymatic hydrolysis of cellulose from brewer’s spentgrain. Cellulose, 15(5): 711–721.
[7] Xiros, C.; Christakopoulos, P. (2009) Enhanced ethanolproduction from brewer’s spent grain by a Fusariumoxysporum consolidated system. Biotechnol. Biofuels,2:4, 1–12. DOI:10.1186/1754-6834-2-4
[8] Öztürk, S.; Özboy, Ö.; Cavidoğlu, İ.; Köksel, H. (2002)Effects of brewer’s spent grain on the quality and dietaryfiber content of cookies. J. Inst. Brew., 108(1): 23–27.
[9] Prentice, N.; D’Appolonia, B. L. (1977) High-fiberbread containing Brewer’s spent grain. Cereal Chem.,54(5): 1084–1095.
[10] Prentice, N.; Kissell, L. T.; Lindsay, R. C.; Yamazaki, W.T. (1978) High-fiber cookies containing Brewer’s spentgrain. Cereal Chem., 55(5): 712–721.
[11] Fastnaught, C. E. (2001) Barley Fiber. In Handbook ofDietary Fiber; S. S. Cho, M. L. Dreher, Eds.; Dekker:New York, Chap. 27, pp. 519–542.
[12] Martins, C.; Pinho, M.; Lordelo, M. M.; Cunha, L. F.;Carvalho, J.; Freire, J. P. B. (2010) Effect of brewersgrain on intestinal microbial activity and mucosa mor-phology of weaned piglets. Livest. Sci., 133(1-3): 132–134.
[13] Vieira, A. R. D. G. (2009) A fibra na alimentação docoelho: Dreches de cervejaria relativamente à luzerna e àpolpa de beterraba (Fiber in the rabbit’s diet: brewer’sspent grain compared with lucerne and beetroot pulp);Master’s Thesis in Zootechnic Engineering – AnimalProduction, Lisboa, Portugal. URL: http://www.repository.utl.pt/bitstream/10400.5/1888/1/Tese%20Ana%20Rita%20Vieira.pdf
[14] Schwencke, K. V. (2006) Sustainable, cost-effective, andfeasible solutions for the treatment of Brewers’ spentgrains. Master Brewers Association of the AmericasTechnical Quarterly, 43(3): 199–202.
[15] El-Shafey, E. I.; Gameiro, M. L. F.; Correia, P. F. M.;Carvalho, J. M. R. (2004) Dewatering of Brewer’s spentgrain using a membrane filter press: A pilot plantstudy. Sep. Sci. Technol., 39(14): 3237–3261.DOI:10.1081/SS-200028775
[16] Carvalho, J. M. R.; Machado, R. M.; Henriques, C. M.C.; Rodrigues, R. A. D.; Correia, P. F. M. M. Integratedprocess of filtration to dry brewer’s spent grain. Patentcorporation treaty/PT2010/000016, Patent numberWO 2010117288 A8, 2010.
[17] Svarovsky, L. (1981) Filtration fundamentals. In: L.Svarovsky (Ed.), Solid-Liquid Separation; Butterworths:London, Chap. 9, pp. 242–264.
700 R. M. MACHADO ET AL.
Dow
nlo
aded
by [
b-o
n:
Bib
liote
ca d
o c
onhec
imen
to o
nli
ne
UL
] at
03:2
8 3
1 M
arch
2016