
UNIVERSIDADE DE LISBOA FACULDADE DE CIÊNCIAS DEPARTAMENTO...
95
UNIVERSIDADE DE LISBOA FACULDADE DE CIÊNCIAS DEPARTAMENTO DE BIOLOGIA ANIMAL HEAT TOLERANCE LIMITS AND PHYSIOLOGICAL RESPONSES TO CLIMATE WARMING IN SHRIMPS FROM DIFFERENT TIDAL HABITATS AND LATITUDINAL REGIONS Ana Rita José Lopes DISSERTAÇÃO MESTRADO EM ECOLOGIA MARINHA 2012
Transcript of UNIVERSIDADE DE LISBOA FACULDADE DE CIÊNCIAS DEPARTAMENTO...
UNIVERSIDADE DE LISBOA
FACULDADE DE CIÊNCIAS
DEPARTAMENTO DE BIOLOGIA ANIMAL
HEAT TOLERANCE LIMITS AND PHYSIOLOGICAL RESPONSES
TO CLIMATE WARMING IN SHRIMPS FROM DIFFERENT TIDAL
HABITATS AND LATITUDINAL REGIONS
Ana Rita José Lopes
DISSERTAÇÃO
MESTRADO EM ECOLOGIA MARINHA
2012


UNIVERSIDADE DE LISBOA
FACULDADE DE CIÊNCIAS
DEPARTAMENTO DE BIOLOGIA ANIMAL
HEAT TOLERANCE LIMITS AND PHYSIOLOGICAL RESPONSES
TO CLIMATE WARMING IN SHRIMPS FROM DIFFERENT TIDAL
HABITATS AND LATITUDINAL REGIONS
Ana Rita José Lopes
DISSERTAÇÃO
MESTRADO EM ECOLOGIA MARINHA
Dissertação orientada pelo Doutor Rui Rosa (CO/LMG) E co-orientada pelo Doutor Mário Diniz (FCT-UNL)
2012


i
Acknowledgements
I would like to express my gratitude to everyone that helped, guided and inspired
me along this work, namely to:
Professor Doutor Rui Rosa for kindly accepting me as his student and for all the
support, motivation and trust. I want to thank for all his supervision along this work,
friendship and enthusiasm, no doubt that all his knowledge and expertise helped me
grow as a scientist and to get even more passionate about this profession. He’s a role
model.
Doutor Mário Diniz for receiving me so well into his guard at Faculdade de Ciências
e Tecnologia da Universidade Nova de Lisboa and for all his teachings. Also I wish to
thank all the trust deposited in me and his unconditional supervision, support
friendship and companionship.
Professor Doutor Luís Narciso for his help during field work. His experience and
knowledge really helped me through this work.
To all of my dearest friends, to longtime friends from my childhood and new ones I
made during my stay in FCUL and FCT, in short all my new friends in Lisbon, mainly to
Manuel Neves for all of his support and company along this work, I would like to thank
him for all his help, it was really useful to have another friend and biologist’s eye on
these matters, no doubt that his companionship made this journey much more fun.

ii
All the team from the Laboratório Marítimo da Guia, in particular Filipa Faleiro,
Marta Pimentel, Tatiana Teixeira and Tiago Repolho for all their companionship,
encouragement, help and friendship. Their advices throughout this work really help
me.
My family, mainly my parents for believing in me, there is no doubt that they
made me the woman I am today, because they taught me to be strong, hard working,
to fight for what I want, but most important to believe in me. Without them I couldn’t
achieve my biologist dream. I would like to thank to my grandparents for all of their
love and pride. I feel very fulfilled and happy in my family they not only love me as
they make it a point to demonstrate each passing day.
To all those who received me in their home, as if I were part of the family, mainly
to my cousins Cristina, for being my “backup mother”, Armando and their girls (Maria
and Constança) for their kindness and love and to João Gonçalves, Aldina Gonçalves
and João Miguel for being so wonderful.
At last, but certainly not the least to João Pedro, who gave me his unconditional
love, support and care. I would like to thank him for being such an amazing boyfriend
who gave me motivation and encouraged my work. Thank you to cheering me up on
bad moments and to be present in the good ones.

iii
Resumo
Atualmente, a temática das alterações climáticas na biosfera marinha reveste-
se de importância fulcral com especial ênfase nos possíveis efeitos nefastos que
poderão provocar ao nível de ecossistemas, populações e espécies marinhas. Como
principais efeitos, podemos salientar alterações na distribuição geográfica de espécies,
extinções locais, migrações em grande escala, alterações fenológicas e a própria
estrutura das cadeias tróficas. Um dos principais problemas associados às alterações
globais, é o aquecimento médio dos oceanos (entre +3°C e +6°C segundo as previsões
do IPCC 2007), o qual influenciará a bio-ecologia (mortalidade, reprodução,
crescimento, comportamento) e ecofisiologia dos organismos marinhos.
Esta tese teve como principais objetivos a determinação da tolerância térmica
(LT50 e LT100), os padrões de expressão de proteínas de choque térmico (HSP’s) e
mecanismos de defesa face ao stress oxidativo (i.e. à produção de ROS), de quatro
espécies de camarões (Lysmata seticaudata, Lysmata amboinensis, Palaemon elegans
e Palaemon serratus), oriundos de diferentes habitats com o objetivo de avaliar o
impacto do aumento da temperatura na biologia destas espécies.
Mais concretamente, e numa primeira abordagem, pretendeu-se inferir a
suscetibilidade biológica de duas espécies congéneres (Palaemon elegans e Palaemon
serratus), oriundas da mesma localização geográfica mas de diferentes habitats
costeiros (intertidal e subtidal), face a um aumento de temperatura; e numa segunda
abordagem, pretendeu-se compreender a resposta fisiológica de congéneres do
género Lysmata de diferentes latitudes, nomeadamente de uma região tropical
(Lysmata amboinensis) e de uma região temperada (Lysmata seticaudata).

iv
O estudo da tolerância térmica constituiu a primeira abordagem para
compreender a vulnerabilidade/resiliência das espécies estudadas face a um aumento
da temperatura. Deste modo, foi determinado o limite de tolerância térmica máxima
(LT’s) para as quatro espécies estudadas, que consistiu em submeter os organismos a
um aumento crescente de temperatura (1°C/30 minutos) até o seu limite térmico
biológico ser atingido. Desta forma, concluiu-se que a espécie P. elegans possui um
limite de tolerância mais elevado do que P. serratus. No que diz respeito às espécies
congéneres oriundas de zonas temperada/subtropical e tropical, observou-se que a
espécie mais vulnerável ao stress térmico foi L. amboinensis (espécie tropical),
provavelmente devido a uma baixa amplitude térmica ao nível do seu habitat e ao
facto do seu limite de tolerância máximo se encontrar próximo da temperatura
máxima do seu habitat natural, tornando-a deste modo mais vulnerável que L.
seticaudata. De igual modo constatou-se que num cenário de aquecimento extremo (+
6°C acima da média do seu habitat) L. amboinensis exibiu um processo de supressão
no seu metabolismo (Q10 < 1.5).
Posteriormente estudou-se os mecanismos de defesa celular face a stress
térmico (e ao aumento de produção de ROS). As proteínas de choque térmico, são um
grupo de proteínas específico, que são induzidas quando ocorrem fatores de stress, de
forma a protegerem as células dos impactos negativos dos mesmos. Outro mecanismo
de defesa celular baseia-se na produção de enzimas antioxidantes que atuam sobre
espécies reativas responsáveis pelos efeitos tóxicos do oxigénio (ROS).
Assim sendo, determinaram-se os padrões de expressão das HSP de peso
molecular 70 DKa (HSP70), através do método ELISA (Enzyme Linked Immunosorbent
Assay), bem como a ocorrência de peroxidação lipídica (através da determinação do

v
MDA, Malonaldeído), e as actividades da catalase (CAT), glutationa s-transferase (GST)
e superóxido dismutase (SOD).
Para ambas as espécies do género Palaemon houve um aumento da
peroxidação lipídica (considerado o mecanismo mais frequente de lesão celular) e da
atividade dos restantes mecanismos enzimáticos de defesa celular, com especial
ênfase para a espécie P. serratus. No que respeita ao género Lysmata, verificou-se que
tanto a expressão de HSP´s assim como dos restantes mecanismos de defesa celular foi
superior para L. seticaudata.
Em conclusão, os resultados deste estudo demostram que para as espécies
estudadas, as que demonstraram maior vulnerabilidade face ao aquecimento global
foram aquelas que habitam ambientes mais estáveis, nomeadamente subtidais (P.
serratus) e tropicais (L. amboinensis), em oposição a espécies características de
ambientes intertidais (P. elegans) e temperadas/subtropicais (L.seticaudata).

vii
Abstract
This study was aimed to determine thermal tolerance limits (LT50, LT100), heat
shock protein (HSP) expression, activity of antioxidative enzymes (CAT, GST and SOD)
and lipid peroxidation (MDA buildup) in four species of shrimps (Lysmata seticaudata,
Lysmata amboinensis, Palaemon elegans e Palaemon serratus), in order to understand
how climate change will influence their vulnerability.
The present work was designed and performed taking into consideration two
different approaches. In the first instance, our study focused on congener’s shrimps of
genus Palaemon, since these organisms can be found in different tidal habitats and
thus determine which species would be more susceptible to an increasing
temperature, if an intertidal species, such as Palaemon elegans, or an subtidal one,
such as Palaemon serratus; a second approach was to compare species from different
latitudinal habitats, namely Lysmata amboinensis, a cleaner shrimp of coral reefs
inhabiting the tropical region and Lysmata seticaudata, also called the Monaco’s
shrimp, which inhabits temperate/subtropical region.
Through the method of maximum thermal tolerance limit’s (LT’s), species were
ranked in terms of their vulnerability. Results showed that species inhabiting unstable
tidal zones and temperate/subtropical environments, had a higher tolerance than their
congener’s, inhabiting subtidal and tropical habitats. Additionally and under an
extreme warming scenario (+ 6° C above habitat temperature), the tropical species
suppressed its metabolism (Q10 < 1.5), which showed that in response to increased
temperature, L. amboinensis does not prevent a decrease in their metabolic
performance.
viii
Secondly, cellular defense mechanisms against stress were analyzed. Higher mass-
specific metabolic rate of intertidal and temperate shrimps was compensated by
physiological mechanisms in order to minimize negative effects of thermal stress on
fitness, like HSP70 expression, lipid peroxidation, SOD, GST and CAT activities.
In conclusion, the results derived from our study show which species may be more
vulnerable to climate change and how molecular mechanisms may account for
thermotolerance. Additionally, evidence that species have adapted their tolerance
limits to coincide with microhabitat conditions is presented, which to some extent can
corroborate assumptions that ocean warming is expected to drive more profound
biological impacts on species that evolved in relatively stable and aseasonal
environments (P. serratus and L. amboinenis) - thermal specialists - in comparison to
species inhabiting seasonal and unstable habitats (P. elegans and L. seticaudata).
Table of contents
ACKNOWLEDGEMENTS ................................................................................................................... I
RESUMO ....................................................................................................................................... III
ABSTRACT ................................................................................................................................... VII
GENERAL INTRODUCTION .............................................................................................................. 1
1. CLIMATE CHANGE ................................................................................................................... 1
1.1 Climate change and tidal differences: Genus Palaemon case ...................................... 3
1.2 Climate change and latitudinal differences: Genus Lysmata case ............................... 4
2. MOLECULAR MECHANISMS BEHIND THERMAL TOLERANCE AND ADAPTATION ......................................... 5
2.1 Heat shock proteins ................................................................................................... 5
2.2 Oxidative stress enzymes and cellular damage (Lipid peroxidation) ............................ 8
REFERENCES ................................................................................................................................ 11
CHAPTER 1 ................................................................................................................................... 19
HEAT TOLERANCE LIMITS AND PHYSIOLOGICAL RESPONSES FROM GENUS PALAEMON SHRIMPS
TO A WARMING OCEAN ....................................................................................................................... 19
ABSTRACT ................................................................................................................................... 19
INTRODUCTION............................................................................................................................. 20
MATERIALS AND METHODS .............................................................................................................. 22
Specimen Collection and Maintenance.................................................................................. 22
Thermal Tolerance Limits ..................................................................................................... 22
Oxygen Consumption Rates and Thermal Sensitivity ............................................................. 23
Preparation of tissues extracts.............................................................................................. 24
Heat shock response (HSP70/HSC70) .................................................................................... 24
Lipid peroxidase (determination of malondialdehyde, MDA) ................................................. 25
Enzymatic Analyses .............................................................................................................. 26
Statistical Analyses ............................................................................................................... 28
RESULTS ..................................................................................................................................... 29
DISCUSSION ................................................................................................................................. 35
REFERENCES ................................................................................................................................ 37
CHAPTER 2 ................................................................................................................................... 43
CLIMATE WARMING AND PHYSIOLOGICAL RESPONSES IN SHRIMPS OF GENUS LYSMATA: A
LATITUDINAL APPROACH ..................................................................................................................... 44
ABSTRACT ................................................................................................................................... 42
INTRODUCTION............................................................................................................................. 43
MATERIALS AND METHODS .............................................................................................................. 45
Specimen Collection and Maintenance.................................................................................. 45
Thermal Tolerance Limits ..................................................................................................... 46
Oxygen Consumption Rates and Thermal Sensitivity ............................................................. 46
Preparation of tissues extracts.............................................................................................. 47
Heat shock response (HSP70/HSC70) .................................................................................... 48
Lipid peroxide assay (determination of malondialdehyde, MDA) ........................................... 49
Enzymatic Analyses .............................................................................................................. 50
Statistical Analyses ............................................................................................................... 52
RESULTS ..................................................................................................................................... 52
DISCUSSION ................................................................................................................................. 62
REFERENCES ................................................................................................................................ 64
FINAL CONSIDERATIONS .............................................................................................................. 69
REFERENCES ................................................................................................................................ 72

General Introduction
1
General Introduction
1. Climate change
Over the past century, the earth’s climate has increased by approximately 0.6°C
and oceans net heat uptake has approximately been 20 times greater than that by the
atmosphere (Levitus et al., 2005).
Expected alterations to physical environment under climate change scenarios
include potential sea level rise, increased warming of water temperatures, oceanic
circulation disruption and increased frequency and severity of storm occurrences
(Petes et al., 2007).
Considering marine ectotherms, the effects can be very pronounced, once
temperature is one of the most important factors affecting molecules kinetic energy
as well as biochemical reactions (Somero, 1969; Mora and Ospina, 2001). For instance
and at a molecular level, temperature affects the biochemical reactions leading to
physiological and behavioral changes (Mora and Ospina, 2001), which have
pronounced consequences on individual fitness and performance. Considering higher
levels of organization, ecosystem changes in response to climate warming include
poleward or altitudinal shifts in geographical distribution (Perry et al., 2005; Brander et
al., 2003; Grebmeier et al., 2006), population collapse or local extinction (Pörtner and
Knust, 2007), large scale migration failure (Farrell et al., 2008), changes in the seasonal
timing of biological events (Wiltshire et al., 2004), or even changes in food availability
and food web structure.
Dynamic fluctuations of these abiotic variables (e.g. temperature) can interfere
and dominate life history, demographics and competition between species (Christian
General Introduction
2
et al., 1983; Huey, 1991; Huey and Berrigan, 2001; Munday et al., 2009; Porter, 1989)
explaining to some extent the adaptation diversity among organisms (Lutterschmidt
and Hutchison, 1997). Therefore and according to climate change scenarios, it is
reasonable to expect inter and intraspecific competition to occur if thermal
microhabitat boundaries are narrow. These changes might involve stock redistribution,
invasion by exotic species (Bennett et al., 1997; Kimball et al., 2004) and resilience of
native or threatened species (Walsh et al., 1998).
In the face of climate change, these issues are particularly important because in
order to protect ecosystems there is the need to understand the causal-effect
relationship between climatic changes and ecosystem changes. Additionally and in
order to address the impacts of climate forcing on marine organisms, thus making
realistic predictions for the future, it is essential to know the species current
vulnerability status. This vulnerability is dependent not only on thermal limits but also
on factors like fishing pressure (once it alters the genetic structure of the population
and leads to a fragmentation in the food web - Perry et al., 2010), duplication time,
adaptation capacity, regional rate of temperature increase and predicted changes in
food availability due to climate forcing (Pörtner and Knust, 2007).
Facing current concerns about climate change scenarios, the knowledge of
thermal tolerance is the first step to understand how vulnerable species are
(Rivadenera and Fernández, 2005). The tolerance window for each species is described
as a favorable range of temperature or performance breadth. It includes an optimal
zone and a suboptimal zone. Above or below this range, performance is negatively
affected and the species cannot survive unless it occurs for a limited period of time.
General Introduction
3
To some extent, several studies already show and predict the effects of ongoing
changes. At the physiological level, oxygen availability can limit aerobic metabolism
and consequently thermal tolerance (Frederich and Pörtner, 2000; Pörtner et al., 2004;
Pörtner and Knust, 2007; Melzner et al., 2007; Rosa and Seibel, 2008). As such, ocean
warming may decrease oxygen availability and alter organism metabolism, thus
leading to aerobic performance decline, with a progressive transition towards an
anaerobic mode of energy production (the ‘‘oxygen limitation of thermal tolerance’’
concept (Pörtner and Knust, 2007; Pörtner et al., 2004)). The reduction in aerobic
scope is not caused by lower levels of ambient oxygen but through limited capacity of
oxygen supply mechanisms (ventilatory and circulatory systems), in order to meet an
animal’s temperature-dependent oxygen demand (Pörtner and Knust, 2007). If these
previously mentioned parameters are altered by thermal regime, both population
survival as well as reproduction, recruitment and structure (Mora and Ospina, 2001)
will be affected once temperature has an direct effect over time and frequency of
spawning and survival of eggs, larvae and juveniles (IPCC, 2001) but also on
temperature-dependent sex determination (Ospina-Alvaréz and Piferrer, 2008). At the
behavioral level, changes in reproductive strategies (Angilletta et al., 2006) and life
history patterns might also occur.
1.1 Climate change and tidal environments
Coastal marine ecosystems are among the most ecologically important habitats.
and they are warming at a much faster rate than many other ecosystems (MacKenzie
and Schiedek, 2007). Because many coastal organisms already live close to their

General Introduction
4
thermal tolerance limits (Stillman and Somero, 2000, Helmuth et al., 2006), ocean
warming will have a profound and negative impact on their performance and survival.
Shrimps of the genus Palaemon (Decapoda; Caridea; Palaemonidae) have a
broad distribution. While some are found in the intertidal zone, within seagrass beds
or rocky tidal pools (Palaemon elegans (Rathke, 1837)), others inhabit subtidal zones,
in rocky substrates and submerged caves, up to a depth of 40 m (Palaemon serratus
(Pennant, 1777)) (Udekem d’Acoz, 1999, Morais et al., 2002). Due to vertical
distribution variation, these congener species may experience different patterns of
emersion during each tidal cycle.
Studies focused on abiotic stress (e.g. temperature) have shown that species living
higher in the intertidal zone generally possess a greater resistance to abiotic factors in
comparison to species living in the subtidal zone (Stillman and Somero, 1996). It has
also been suggested that warm-adapted species of the intertidal/supratidal zone may
be particularly at risk since they live closer to their upper thermal limit (Hopkin et al.,
2006; Somero, 2010) with limited scope to tolerate further warming (Pörtner et al.,
2004; Somero, 2010; Stillman, 2002). Despite the fact that they are more thermally
tolerant, there is a high probability that maximum habitat temperatures surpass their
upper thermal limit (Somero, 2010) because they live in a hot and unstable
environment with daily and seasonal broad thermal amplitudes.
1.2 Climate change and latitudinal differences
Organisms inhabiting different latitudinal habitats are expected to suffer
differently according to temperature. In this manner, studies of congener’s species are
important as a method to determine which one is more vulnerable to ocean warming.
General Introduction
5
An example are shrimps of the genus Lysmata, once they have a large geographic
distribution. While some species occur in dense aggregations at rocky intertidal and/or
subtidal temperate and subtropical zones, e.g. Lysmata seticaudata (Risso, 1816),
others live as socially monogamous pairs in tropical zones, e.g. Lysmata amboinensis
(De Man, 1888) (Fieldler, 1998).
Because tropical organisms experience far more warm temperatures throughout
the year than temperate organisms do, it might be expected that tropical animals have
a greater heat tolerance. Surprisingly, that is often not the case - heat tolerance
typically varies very little across latitude in ectotherms (Ghalambor et al., 2006; Addo-
Bediako et al., 2000; Deutsch et al., 2008).
Most literature has focused on tropical regions, not only because models suggest
that impacts will be more severe in the tropics (Tewksbury et al., 2008) but also
because predictions for temperate regions are the hardest to make due to the diversity
of life history patterns, complexity of trophic relations, habitat variability and over-
fishing (IPCC, 1997; Roessig et al., 2004).
2. Molecular mechanisms behind thermal tolerance and adaptation
2.1 Heat shock proteins
Throughout their lifetime, organisms are exposed to several stress factors.
Environmental conditions tend to be stressful when they reach values outside the
tolerance limits of the organism, causing a decrease in fitness. Fitness is dependent on
the capacity of adaptation, which in turn can be related to the maintenance and
integrity of the protein pool (Hofmann and Todgham, 2010) through heat shock
response (HSR). Het shock response is characterized by the preferential synthesis of a
General Introduction
6
group of proteins, the heat shock proteins (HSP’s) (Ritossa, 1962), also called stress
response proteins, that are molecular chaperones, helping proteins fold correctly
during translation and facilitating their transport across membranes under non-
stressful conditions (Frydman, 2001; Hartl and Hayer-Hartl, 2002). Under stressful
conditions, molecular chaperones stabilize denaturing proteins and refold proteins
that have already been denatured.
The molecular chaperone role of HSP’s reflects the fact that protein
conformation is a thermally sensitive weak-link in the macromolecular machinery of
the cell that contributes to setting thermal tolerance limits (Somero, 2004). The HSR is
thus an important biochemical indicator to assess levels of thermal stress and thermal
tolerance limits.
This way, stressful conditions induce consequences at the cellular, physiological
and individual levels. They can lead to great changes in the metabolic processes,
disturbing vital functions and consequently survival, growth, reproduction, biological
interactions and ultimately community and ecosystem’s structure.
In general, stress response occurs at 3 levels:
Primary response – perception of an altered state and activation of the
neuroendocrine/endocrine response, characterized by a rapid production of stress
hormones (Iwama, 1999).
Secondary response – includes several physiological and biochemical adjustments and
is regulated by stress hormones (adrenaline and cortisol) which activate metabolic
pathways, which in turn lead to biochemical and hematological alterations (Barton and
Iwama, 1991), changes in the hydromineral balance and cardiovascular, respiratory

General Introduction
7
and immune functions (Barton, 2002). During stressful conditions, organisms mobilize
their energy stores in order to provide energy for tissues, to deal with an increased
need of energy.
Tertiary response – changes occurring at the organism and population levels, directly
linked to the alterations that occurred due to the primary and secondary responses. If
the organism cannot acclimate, adapt or maintain homeostasis, several changes may
occur: at the behavioral level, resistance to disease, growth and reproduction capacity
(Iwama, 1999; Barton, 2002). A severe or prolonged exposure to stress can eventually
alter population demographics and dynamics. Impacts can be critical when it comes to
larvae and juveniles because growth is of crucial importance to their fitness at these
stages. If growth is fast, there are two advantages: there is a lower chance of being
predated because a bigger size reduces the range of predators, and the first
maturation will occur faster leading to a higher investment in reproduction (in
iteroparous species). As such, if growth and reproduction become energetically
compromised due to stressful conditions, it is reasonable to expect lower recruitment
and production, altering the abundance and diversity of species in a community
(Barton, 1997).
It is widely known that heat stress leads not only to ROS production and cellular
damage in several components (mitochondria, Golgi complex, cytoskeleton, DNA and
proteins – Dubois et al., 1991; Vidair et al., 1996; Snoeckx et al., 2001) but also to a
slow-down or even shut-down of most original cellular functions (Csermely and
Yahara, 2003). Chaperoning function of HSPs is a mechanism of defense in order to
maintain cellular homeostasis. During stress, their production suggests that intrinsic

General Introduction
8
mechanisms of defense have developed in tissues in order to recover or destroy
damaged proteins.
Thus, heat shock proteins might be considered indirect biochemical indicators of
the degree of damage and protein unfolding that is occurring in the cell (Hofmann,
2005). Studies concerning these proteins may give us clues about the temperature at
which species become thermally stressed. Heat Shock Protein levels are related to past
thermal history (Hofmann, 2005), thermal regime and its variability occurring in the
habitat (Tomanek, 2010), which may partially explain species thermal limits and their
resistance/vulnerability to increasing temperature.
2.2 Oxidative stress enzymes and cellular damage (Lipid peroxidation)
Oxygen buildup in Earth’s atmosphere has an profound effect over organism´s
physiology. Reactive oxygen species (ROS) production is prevalent in the world’s
oceans, as well as oxidative stress response in marine organisms exposed to a variety
of environmental stressors such as thermal stress. The negative effects of ROS must
also be balanced by their role in signal transduction, which facilitates processes such as
apoptosis, autophagy and necrosis (Lesser, 2012).
Reactive oxygen species (ROS) are responsible for toxic effects of oxygen, and this
is because in its ground-state oxygen is a distinctive element, as it is a biradical and has
two unpaired electrons in its outer orbit (Asada and Takahashi, 1987; Cadenas, 1989;
Fridovic, 1998; Halliwell and Gutteridge, 1999). The univalent reduction of molecular
oxygen produces reactive intermediates such as O2•-, H2O2, HO•, and finally water
(Halliwell and Gutteridge, 1999).

General Introduction
9
The production of ROS beyond the capacity of an organism to quench these
reactive species, can provoke lipid, protein and DNA damage (Halliwell and Gutteridge,
1999). The primary reason of antioxidant defense in biological systems is to quench O2
at the site of production, and to quench or reduce the flux of other ROS such as O2•⁻
and H2O2 to ultimately prevent the production of HO•, the most damaging of the ROS
(Asada and Takahashi, 1987; Cadenas, 1989; Fridovich, 1998; Halliwell and Gutteridge,
1999).
Significant damage is caused by hydrogen peroxide (H2O2) since it’s diffusion,
within the cell, from its point of synthesis is less restrictive than other forms of ROS
and it can enter into numerous other reactions. Exposure to H2O2 can damage directly
many cellular constituents, such as DNA (Asada and Takahashi, 1987; Cadenas, 1989;
Fridovich, 1998; Halliwell and Gutteridge, 1999), despite being also involved in cellular
pathways such as programmed cell death or apoptosis (Halliwell and Gutteridge,
1999).
The reaction of ROS with lipids is considered one of the most prevalent cellular
injury mechanism (Halliwell and Gutteridge, 1999). Lipid peroxidation involves three
well-defined steps: initiation, propagation and termination (Yu, 1994; Halliwell and
Gutteridge, 1999), ultimately forming ROO• (peroxyl radical). Degradation products of
lipids peroxidation are aldehydes, such as malondialdehyde, and hydrocarbons, ethane
and ethylene (Gutteridge and Halliwell, 1990; Freeman and Crapo, 1982). Lipid
peroxidation in mitochondria is particularly cytotoxic, with multiple effects on enzyme
activity and ATP production as well as on apoptosis initiation (Green and Reed, 1998).
There are several enzymatic antioxidants such as Superoxide dismutase (SOD),
Catalase (CAT) and Glutathione S-Transferase (GST), SOD is the first line of defense,

General Introduction
10
against oxidative stress. However, cells are not completely detoxified since it converts
O2•⁻ into H2O2 and oxygen. Because antioxidative enzymes are known to be
intrinsically linked and dependent upon the activity of one another, Catalase removes
H2O2, resulting from SOD activity, avoiding its accumulation in cells and tissues. As for
Glutathione S-Transferase, it transforms xenobiotics into other conjugates (Lesser,
2006).
General Introduction
11
References
Addo-Bediako A, Chown SL, Gaston KJ (2000) Thermal tolerance, climatic variability
and latitude. Proc. R. Soc. Lond. B 267: 739-745
Angilleta MJ, Oufiero CE, Leaché AD (2006) Direct and indirect effects of
environmental temperature on the evolution of reproductive strategies: an
information-theoretic approach. Am Nat 168(4): E123-E135.
Asada K, Takahashi M (1987) Production and scavenging of active oxygen in
photosynthesis. In Photoinhibition, ed. DJ Kyle, CB Osmond, CJ Arntzen, pp.
228-87. Elsevier: Amsterdam.
Barton BA, Iwama GK (1991) Physiological changes in fish from stress in aquaculture
with emphasis on the response and effects of corticosteroids. Ann Rev Fish Dis
1: 3–26.
Barton BA (1997) Stress in finfish: Past, present, and future—a historical perspective.
In Iwama GK, Pickering AD, Sumpter JP, Schreck CB (eds) Fish stress and health
in aquaculture, pp.1-34. Cambridge University Press, Cambridge.
Barton BA (2002) Stress in Fishes: a diversity of responses with particular reference to
changes in circulating corticosteroids. Integ Comp Biol 42: 517–525.
Bennett W, Currier RJ, Beitinger TL (1997) Cold tolerance and potential overwinter of
red-bellied piranha, Pygocentrus nattereri, in the United States. T Am Fish Soc
126(5): 841-849.
Brander, K.M.; Blom, G.; Borges, M.F.; Erzini, K.; Henderson, G.; MacKenzie, B.R.;
Mendes, H.; Santos, A.M.P.; Toresen, P. (2003). Changes in fish distribution in

General Introduction
12
the eastern North Atlantic: are we seeing a coherent response to changing
temperature? ICES Mar. Sci. Symp. 219: 260-273
Cadenas E (1989) Biochemistry of oxygen toxicity. Annu. Rev. biochem. 58: 79-110.
Christian, K., Tracy, C.R., Porter, W.P., 1983. Seasonal shifts in body temperature and
use of microhabitats by Galapagos land iguanas (Conolophus pallidus). Ecology
64, 463–468.
Csermely P, Yahara I (2003) Heat shock proteins. In: Keri G, Toth I (eds) Molecular
pathomechanisms and new trends in drug research, Taylor & Francis Inc.,
London, pp 67-75.
Deutsch AC, Tewksbury JJ, Huey RB, Sheldon KS, Ghalambor CK, Haak D, Martin PR
(2008) Impacts of climate warming on terrestrial ectotherms across latitude.
PNAS 105: 6668-6672
Donelson JM, Munday PL, McCormick MI, Nilsson GE (2011) Acclimation to predicted
ocean warming through developmental plasticity in a tropical reef fish. Global
Change Biol 17: 1712–1719.
Dubois MF, Hovanessian AG, Bensaude O (1991) Heat shock-induced denaturation of
proteins. J Biol Chem 266: 9707–9711.
Edwards M, Richardson AJ (2004) Impact of climate change on marine pelagic
phenology and trophic mismatch. Nature 430: 881–884.
Farrell AP, Hinch SG, Cooke SJ, Patterson DA, Crossin GT, Lapointe M, Mathes MT (
2008) Pacific Salmon in Hot Water: Applying Aerobic Scope Models and
Biotelemetry to Predict the Success of Spawning Migrations. Physiological and
Biochemical Zoology 81: 697-708

General Introduction
13
Fiedler GC (1998) Functional, simultaneous hermaphroditism in female-phase Lysmata
amboinensis (Decapoda: Caridea: Hippolytidae). Pac Sci 52: 161-169.
Frederich M, Pörtner HO (2000). Oxygen limitation of thermal tolerance defined by
cardiac and ventilatory performance in the spider crab Maja squinado. Am J
Physiol 279: R1531–R1538.
Freeman BA, Crapo JD (1982) Biology of disease, free radicals and tissues injury. Lab.
Invest. 47: 412-26.
Fridovich I (1998) Oxygen toxicity: a radical explanation. J. exp. Boil. 201: 1203-9.
Frydman J (2001) Folding of newly translated proteins in vivo: the role of molecular
chaperones. Annu. Rev. Biochem. 70, 603-649.
Ghalambor C, Huey RB, Martin PR, Tewksbury JJ, Wang G (2006) Are mountain passes
higher in the tropics? Janzen’s hypothesis revisited. Integrative and
Comparative Biology 46: 5-17.
Grebmeier MJ, Overland EJ, Moore ES, Farley VE, Carmack CE, Cooper WL, Frey EK,
Helle HJ, McLaughlin AF, McNutt LS (2006) A Major Ecosystem Shift in the
Northern Bering Sea. Science 311: 1461-1463
Green DR, Reed JC (1998) Mitochondria and apoptosis. Science 281: 1309-12.
Gutteridge JMC, Halliwell B (1990) The measurement and the mechanism of lipid
peroxidation in biological systems. Trends Biochem. Sci. 15: 129-35.
Halliwell B, Gutteridge JMC (1999) Free radicals in biology and medicine. New York:
Oxford Univ. Press. 936 pp.
Hartl FU, Hayer-Hartl M (2002) Molecular chaperones in the cytosol: from nascent
chain to folded protein. Science 295, 1852-1858.

General Introduction
14
Helmuth B, Mieszkowska N, Moore P, Hawkins S (2006) Living on the edge of two
changing worlds: forecasting the responses of rocky intertidal ecosystems to
climate change. Annual Review of Ecology Evolution and Systematics 37: 373–
404.
Hofmann GE, Todgham AE (2010) Living in the now: physiological mechanisms to
tolerate a rapidly changing environment. Annu Rev Physiol 72: 22.1–22.19.
Hopkin RS, Qari S, Bowler K, Hyde D, Cuculescu M (2006) Seasonal thermal tolerance
in marine Crustacea. Journal of Experimental Marine Biology and Ecology 331,
74–81.
Huey, R., 1991. Physiological consequences of habitat selection. American Naturalist
137, S91–S115.
Huey, R.B., Berrigan, D., 2001. Temperature, demography, and ectotherm fitness.
American Naturalist 158, 204–210.
IPCC (1997) The Regional Impacts of Climate Change: An Assessment of Vulnerability.
Cambridge University Press, UK.
IPCC (2001) Climate change 2001: impacts, adaptation and vulnerability. Contribution
of Working Group II to the Third Assessment Report of the Intergovernmental
Panel on Climate Change. Cambridge University Press, Cambridge, United
Kingdom and New York, USA.
Iwama GK, MM Vijayan, RB Forsyth, PA Ackenrian (1999) Heat shock proteins and
physiological stress in fish. Am Zool 39: 901-909.
Kimball ME, Miller JM, Whitfield PE, Hare JA (2004) Thermal tolerance and potencial
distribution of invasive lionfish (Pterois volitans/miles complex) on the east
coast of the United States. Mar Ecol Prog Ser 283: 269-278.

General Introduction
15
Lesser MP (2006) Oxidative stress in marine environments: biochemistry and
physiological ecology. Ann Rev Physiol 68: 253–278.
Levitus S, Antonov J, Boyer T (2005) Warming of the world ocean, 1955–2003.
Geophys Res Lett 32.
Lutterschmidt WI, Hutchison VH (1997) The critical thermal maximum: history and
critique. Can J Zool 75(10): 1561-1574.
MacKenzie BR, Schiedek D (2007) Daily ocean monitoring since the 1860 s shows
record warming of northern European seas. Global Change Biol 13: 1335–1347.
Meehl GA, Stocker TF, Collins WD, others (2007) Global climate projections. In:
Solomon S, Qin D, Manning M, eds. Climate Change 2007: The Physical Science
Basis Cambridge: Cambridge University Press. pp 686–688.
Melzner, F; Mark, FC & Pörtner, H. (2007). Role of blood oxygen transport in thermal
tolerance of the cuttlefish, Sepia officinalis. Integr Comp Biol 47(4): 645-655.
Mora C, Ospina F (2001) Thermal tolerance and potential impact of sea warming on
reef fishes from Gorgona island (eastern Pacific Ocean). Mar Biol 139:765-769.
Morais S, Narciso L, Calado R, Nunes ML, Rosa R (2002) Lipid dynamics during the
embryonic development of Plesionika martia (Decapoda; Pandalidae),
Palaemon serratus and Palaemon elegans (Decapoda; Palaemonidae): relation
to metabolic consumption. Mar Ecol Prog Ser 242: 195-204
Munday PL, Crawley N, Nilsson GE (2009) Interacting effects of elevated temperature
and ocean acidification on the aerobic performance of coral reef fishes. Mar
Ecol Prog Ser 388: 235–242.

General Introduction
16
Ospina-Álvarez N, Piferrer F (2008) Temperature-dependent sex determination in fish
revisited: prevalence, a single sex-ratio response pattern, and possible effects
of climate change. PLoS ONE 3(7): e2837.
Perry AL, Low PJ, Ellis JR, Reynolds JD (2005) Climate change and distribution shifts in
marine fishes. Science 308: 1912–1915.
Porter, W.P., 1989. New animal models and experiments for calculating growth
potentials at different elevations. Physiological Zoology 62, 286–313.
Pörtner HO, Mark FC, Bock C (2004) Oxygen limited thermal tolerance in fish? Answers
obtained by nuclear magnetic resonance techniques. Resp. Physiol Neurobiol
141: 243–260
Pörtner HO, Knust R (2007) Climate change affects marine fishes through the oxygen
limitation of thermal tolerance. Science 315: 95–97.
Pörtner HO, Bock C, Knust R, Lannig G, Lucassen M, Mark FC, Sartoris FJ (2008) Cod
and climate in a latitudinal cline: physiological analyses of climate effects in
marine fishes. Climate Research 37, 253–270.
Ritossa F (1962) A new puffing pattern induced by temperature shock and DNP in
Drosophila. Experimentia 18-571.
Roessig JM, Woodley CM, Cech JJ, Hansen LJ (2004) Effects of global climate change
on marine and estuarine fishes and fisheries. Reviews in Fish Biology and
Fisheries 14, 251–275.
Rosa R, Seibel BA (2008) Synergistic effects of climate-related variables suggest future
physiological impairment in a top oceanic predator. Proc Natl Acad Sci USA
105: 20776–20780.
General Introduction
17
Snoeckx LEH, Cornelussen RN, van Nieuwenhoven FA, Reneman RS, van der Vusse GJ
(2001) Heat Shock Proteins and Cardiovascular Pathophysiology. Physiol Rev
81(4):1461-1485.
Sokolova IM, Sukhotin AA, Lannig G (2011) Stress effects on metabolism and energy
budgets in mollusks. In: Abele D, Zenteno-Savı´n T, Vazquez-Medina J, eds.
Oxidative stress in aquatic ecosystems. Chichester, UK: John Wiley & Sons. pp
261–280.
Somero GN (1969) Enzymic mechanisms of temperature compensation: immediate
and evolutionary effects of temperature on enzymes of aquatic poikilotherms.
American Naturalist 103, 517.
Somero GN (2004) Adaptation of enzymes to temperature: searching for basic
‘strategies’. Comp. Biochem. Physiol. B. Biochem. Mol. Biol. 139, 321-333.
Somero GN (2010) The physiology of climate change: how potentials for
acclimatization and genetic adaptation will determine ‘winners’ and ‘losers’.
Journal of Experimental Biology 213, 912–920.
Stillman JH, Somero GN (2000) A comparative analysis of the upper thermal tolerance
limits of eastern pacific porcelain crabs, genus Petrolisthes: influences of
latitude, vertical zonation, acclimation, and phylogeny. Physiol Biochem Zool
73: 200–208.
Stillman JH (2002) Causes and consequences of thermal tolerance limits in rocky
intertidal porcelain crabs, Genus Petrolisthes. Integrative and Comparative
Biology 42, 790–796.
Tewksbury JJ, Huey RB, Deutsch CA (2008) Putting the heat on tropical animals.
Science 320, 1296–1297.
General Introduction
18
Thomas CD, Cameron A, Green RE, Bakkenes M, Beaumont LJ, et al. (2004) Extinction
risk from climate change. Nature 427: 145–148.
Tomanek L (2010) Variation in the heat shock response and its implication for
predicting
Udekem d’Acoz C (1999) Inventaire et distribution des crustacés décapodes de
l’Atlantique nord-oriental, de la Méditerranée et des eaux continentales
adjacentes au nord de 25ºN. Patrimoines naturels (Mus Natl His Nat/ Serv
Patrimoine Nat) 40: 1-383.
Vidair CA, Huang RN, Doxsey SJ (1996) Heat shock causes protein aggregation and
reduces protein solubility at the centrosome and other cytoplasmic locations.
Int J Hypertherm 12: 681–695.
Walsh SJ, Haney DC, Timmerman CM, Dorazio RM (1998) Physiological tolerances of
juvenile robustred horse, Moxostoma robustum: conservation implications for
animperiled species. Environ Biol Fishes 51: 429–444.
Witshire KH, Manly BF (2004) The warming trend at Helgoland Roads, North Sea:
phytoplankton response. Helgol. Mar. Res. 58: 269-273.

CHAPTER 1


Chapter 1
19
Heat tolerance limits and physiological responses of Palaemon shrimps to ocean warming
Abstract
The present work aimed to determine the upper thermal limits (LT50 and LT100) of
shrimps from the genus Palaemon, inhabiting intertidal (Palaemon elegans) and
subtidal (Palaemon serratus) zones. Moreover, we investigate i) the expression of two
molecular chaperones, heat shock cognate 70 (HSC70) and heat shock protein 70
(HSP70), ii) metabolic rates, iii) lipid peroxidation (indicator of cellular damage) and iv)
activity of several antioxidant enzymes. It was found that intertidal species (Palaemon
elegans) had higher thermal tolerance (LT50) than subtidal congener, which was
followed by higher HSC70/ HSP70 concentrations, as well as higher SOD, GST and CAT
activities. Although there is some previous evidence that species inhabiting
intertidal/supratidal zone may be at greater risk of global warming since they live
closer to their upper thermal limit, the present findings suggest that they do not show
yet such limited scope to tolerate further warming.
Key words: Thermal stress, Palaemon serratus, Palaemon elegans, shrimps,
metabolism, respiratory enzymes, heat shock proteins, tidal zones

Heat tolerance limits and physiological responses of Palaemon shrimps to ocean
warming
20
Introduction
During the past century, global temperatures have risen 0.6°C and are predicted to
continue rising by 1.4-5.8°C over the next century (Houghton et al, 2001; Petes et al,
2007).
Temperature is one of the most important factors affecting organisms because it
impacts the kinetic energy of molecules and biochemical reactions (Kennedy et al.,
2002 ). Dynamic fluctuations of these abiotic variables can interfere and dominate life
history, demographics and interspecies competition (Madeira et al, 2012), which could,
to some extent, result in local if not total extinction of some species. In this manner,
mobile species should be able to adjust their geographic distribution over time, while
less mobile species may not (Kennedy et al, 2002).
Facing current concerns about climate change scenarios, the knowledge of
thermal tolerance is the first step to understand how vulnerable species behave.
However, not only there is a great diversity of responses but also global warming tends
to vary regionally (Rivadeneira and Fernández, 2005; Madeira, 2012).
Additionally, when thermal stress is present, heat-shock proteins (HSPs) synthesis
is initiated in order to promote refolding of denatured proteins and prevent further
protein unfolding and aggregation (Dong et al., 2008; Morimoto and Santoro, 1998;
Feder and Hofmann, 1999).
Another problem associated with ocean warming is oxidative stress. The
production and accumulation of reactive oxygen species (ROS) beyond the organism
capacity to quench them, can damage lipids, proteins and DNA (Lesser, 2006).
Chapter 1
21
Under most physiological states, ROS production is closely matched by antioxidant
responses (Rosa et al, 2012). Enzymatic antioxidants, such as superoxide dismutases,
catalase and peroxidases, form an important part of the antioxidant response (Lesser,
2006).
The coastal margin is an environmentally dynamic habitat that experiences
marked fluctuations in air and water temperature on a daily basis, as a consequence of
tidal exchange (McElroy et al., 2012; Somero, 2010; Tomanek, 2010). The physiological
tolerance of intertidal biota has long been focused by research (Somero, 2002; Pӧrtner
et al., 2005).
The rocky intertidal zone is an ideal model system for examining the effects of
environmental stress (Petes et al., 2007), once is one of the most physically harsh
environments on earth. Within this habitat, environmental conditions range from fully
aquatic to fully terrestrial over vertical distances of a few meters or less. Temperature
and desiccation potential change seasonally and daily, depending on the tidal cycle and
ambient weather conditions (Somero et al., 2008).
Intertidal organisms are routinely exposed to large variations in temperature and
have evolved in terms of physiological tolerance to abiotic stresses, whose adaptations
are important in determining the maximal vertical distributions of intertidal species
(Stillman and Somero, 2000).
Studies of congener’s species allow to predict the effects of increasing
temperatures, in order to establish which will be more vulnerable (Whiteley et al.,
2011; Stillman, 2003; Stillman, 2010). As an example are shrimps from the genus
Palaemon. While some species occur in the intertidal zone, in sea grass beds or in
rocky tidal pools (up to a depth of 5 m), e.g. Palaemon elegans (Rathke, 1837), others

Heat tolerance limits and physiological responses of Palaemon shrimps to ocean
warming
22
inhabit subtidal zones, in rocky substrates with algae and zostera or in dark caves (up
to a depth of 40 m), e.g. Palaemon serratus (Pennant, 1777) (Morais et al, 2002).
The aim of our study was to investigate heat tolerance limits (% survival, LT50) and
physiological responses (metabolic rates, heat shock proteins, lipid peroxidation and
oxidative stress enzymes) of intertidal (Palaemon elegans) and subtidal (Palaemon
serratus) caridean shrimps, in an ocean warming scenario.
Materials and methods
Specimen Collection and Maintenance
Specimens of Palaemon elegans and Palaemon serratus were collected in
intertidal and subtidal zones at Cabo Raso (Cascais, Portugal) using dip nets and scuba
diving, respectively. After collection, Palaemon spp. specimens where transferred to
the aquaculture facilities in Laboratório Marítimo da Guia (Cascais, Portugal).
Organisms were placed in two recirculating aquaculture systems (RAS) at 12°C (winter
temperature of their habitat) and 20°C (summer temperature), for a time period of 30
days. During this time ammonia and nitrite levels were monitored daily and kept below
detectable levels. Salinity and pH were kept at 34.0 ± 1.0 and 8.1 ± 0.1, respectively.
Thermal Tolerance Limits
The upper thermal tolerance limits of each species were determined according to
Stillman and Somero (1996). One hundred and sixty shrimps, consisting in 80
individuals of each species and temperature, where placed into separated plastic

Chapter 1
23
containers, each containing 20 specimens comprising 3 replicates and a control for
each species. Afterwards an acclimation temperature period was performed during
30–60 min. Thereafter, temperature was increased at a rate of 1°C/30 min. Every 30
min, aeration was provided to experimental beakers containing shrimps and
temperature in each container checked (with thermocouple probes). Sensory
antennules activity of each shrimp was visually monitored until they reached the end-
point, in which no sensory antennules activity was noticed. The temperature at which
50% of the shrimps have died was calculated (LT50), and used as the measure for the
upper thermal tolerance limits. Additionally, the temperature at which 100% of the
shrimps have died was used to determinate the maximal temperature these specimens
can withstand and consequently survive.
Oxygen Consumption Rates and Thermal Sensitivity
Oxygen consumption measurements were determined according to Rosa et al.
2008, 2009; Pimentel et al, 2012, by individual shrimps incubation in sealed water-
jacketed respirometry chambers (RC300 Respiration cell, Strathkelvin, North
Lanarkshire, Scotland) containing filtered seawater (35 PSU), at the different
incubation temperatures (winter temperature (12°C) and summer temperature
(20°C)). Water volumes were adjusted in relation to animal mass (up to 250 mL) to
avoid stress. Respiration chambers were placed in a temperature controlled water
bath (Lauda, Lauda-Konigshofen, Germany). Oxygen concentrations were recorded
with Clarke-type O2 electrodes connected to a multichannel oxygen interface
(Strathkelvin 928, North Lanarkshire, Scotland), during 3 to 4 hours. Thermal sensitivity
(Q10) was determined using the standard equation:
Heat tolerance limits and physiological responses of Palaemon shrimps to ocean
warming
24
Where R(T2) and R(T1) represent the oxygen consumption rates at temperatures T2 and
T1, respectively.
Preparation of tissues extracts
Approximately 100 mg of shrimp abdominal tissue was homogenized in 300 µl of
homogenization buffer (Phosphate Buffer Saline solution, PBS, pH 7.3: 0.14 M NaCl, 2.7
mM KCl, 8.1 mM Na2HPO4, 1.47 mM KH2PO4), using a glass Potter Elvejhem tissue
grinder. Consequently, homogenates were centrifuged (20 min at 14 000 x g, 4°C) and
enzyme activities and heat shock proteins were measured in the supernatant fraction.
All samples were analyzed for Glutathione S-Transferase, Catalase, Superoxide
Dismutase, Lipid Peroxidation (MDA concentration) and HSP70/HSC70 levels.
Heat shock response (HSP70/HSC70)
HSP70/HSC70 content was assessed by Enzyme-Linked Immunosorbent Assay
(ELISA), adapted from Njemini et al. (2005). Briefly, 10 µl of the homogenate’s
supernatant was diluted in 250 µl of PBS and 50 µl of the diluted sample was added to
96 well microplates (Nunc-Roskilde, Denmark) and allowed to incubate overnight at
4°C. Afterwards, microplates were washed three times in PBS 0.05% Tween-20 and 100
µl of blocking solution (1% BSA, Bovine Serum Albumin, Sigma-Aldrich, USA) was added
to each well and left to incubate at room temperature for 2 hours. Following
microplates washing (3x with 0.05% PBS-Tween-20), 50 µl of 5 µg mL-1 primary
Chapter 1
25
antibody (anti-HSP70/HSC70, Acris USA), detecting 72 and 73 kDa (molecular mass of
inducible HSP70 and HSC70, respectively) proteins was added to each well and
incubated overnight at 4°C. The non-linked antibody was removed from microplates by
repeating the washing step (3X) which were then incubated for 2 hours at room
temperature with 50 µl of 1 µg mL-1 of the secondary antibody, anti-mouse IgG, Fab
specific, alkaline phosphatase conjugate, Sigma-Aldrich, USA. After another wash, 100
µl of substrate (SIGMA FASTTM p-Nitrophenyl Phosphate Tablets, Sigma-Aldrich, USA)
was added to each well and incubated 30 min at room temperature. Stop solution (3N
NaOH) was then added (50 µl) to each well and then the absorbance read at 405 nm in
a 96 well microplate reader (BIO-RAD, Benchmark, USA). Hsp70/Hsc70 sample
quantifications were calculated by constructing a calibration curve obtained based on
serial dilutions of purified HSP70 active protein (Acris, USA) to give a 0 to 2000 ng/mL
range. The results were divided by the total amount of protein in the sample
determined by the Bradford method (Bradford, 1976) and expressed as micrograms of
total protein (ng hsp70/hsc70 mg-1 total protein).
Lipid peroxidation (determination of malondialdehyde, MDA)
Lipid peroxidation assay was adapted from the thiobarbituric acid reactive
substances (TBARS) protocol (Uchiyama and Mihara, 1978) and it was determined by
the quantification of a specific end-product of the oxidative degradation process of
lipids (malondialdehyde (MDA)) in which thiobarbituric acid reacts with MDA yielding a
fluorescent product that was detected spectrophotometrically (532 nm). Briefly, 5 µl of
each sample were treated with 12.5 µl of dodecyl sulfate sodium (SDS 8.1%), 93.5 µl of
trichloroacetic acid (20%, pH 3.5), and 93.5 µl of thiobarbituric acid (1%). Added to this

Heat tolerance limits and physiological responses of Palaemon shrimps to ocean
warming
26
mixture was 50.5 µl of Milli-Q grade ultrapure water and eppendorf’s were insert in a
vortex (30 s) and incubated in boiling water for 10 minutes. Then, they were placed on
ice for 3 minutes to lower the temperature. Afterwards, 62.5 µL of Milli-Q water and
312.5 µL of n-butanol pyridine (15:1, v/v) were added and eppendorf’s were placed in
a vortex and centrifuged at 7000 rpm for 5 min. Duplicates of 150 µL of the
supernatant of each reaction were inserted into a 96-well microplate and the
absorbance read. To quantify lipid peroxides, an eight-point calibration curve (0-0.3
µM TBARS) was calculated using malondialdehyde bis (dimethylacetal) standards
(Merck).
The results were divided by the total amount of protein in the sample calculated
by the Bradford method (Bradford, 1976) and expressed as micrograms of total protein
(nmol/mg total protein).
Enzymatic Analyses
1. Glutathione S-Transferase
Glutathione S-Transferase activity was determined spectrophotometrically (340
nm) in the supernatant, every 6 minutes, using a microplate reader (BIO-RAD,
Benchmark, USA). Briefly, total GST activity was determined as described by Habig et
al. (1974) by measuring the formation of the conjugate of glutathione (GSH) and 1-
chloro-2,4-dinitrobenzene (CDNB). Briefly, 180 μL of substrate solution (Dulbecco‘s
Phosphate Buffered Saline with 200 mM L-glutathione reduced and 100 mM CDNB all
from Sigma-Aldrich, Germany) were added to 20 μL of GST standard or sample into
each well of a 96-well microplate. The total enzyme activity was determined at 340 nm

Chapter 1
27
by recording the absorbance at every minute for 6 minutes, using a microplate reader
(BioRad Benchmark, USA). Equine liver GST (Sigma-Aldrich, Germany) was used as
standard and positive control. The change in absorbance per minute (ΔA340) was
estimated and the reaction rate at 340 nm was determined using CDNB extinction
coefficient of 0.0096 μM-1cm-1. The results are expressed in relation to total protein
concentration of the sample (nmol min-1 mg-1 total protein).
2. Determination of Catalase
A spectrophotometric method was applied, which consisted in measuring the
absorbance at 240 nm (Aebi, 1983; Li and Schellhorn, 2007), in a time interval of 1 min
30 s, when the sample was added to hydrogen peroxide. The reaction is followed by a
decrease in absorbance as the peroxide is transformed into oxygen and water. In order
to perform this reaction 100 µl of each sample were added to 2900 µl of hydrogen
peroxide (50 nmol/L potassium phosphate buffer (pH 7.0), 12.1 mmol/L H2O2) using
quartz cuvettes. Peroxide consumption was monitored by reading the absorbance
every 15 seconds. Standard catalase activity was measured using bovine catalase
solution (Sigma-Aldric, Germany) of 1523.6 U/mL. Catalase activity was calculated
using an absorption coefficient for H2O2 of 0.04 mmol-1 cm-1, using the following
equation:
The results were divided by the total amount of protein in the sample calculated
by the Bradford method (Bradford, 1976) and expressed as micrograms of total protein
(nmol min-1 µg-1 ).
Heat tolerance limits and physiological responses of Palaemon shrimps to ocean
warming
28
3. Superoxide dismutase (SOD)
Superoxide Dismutase activity was determined spectrophotometrically (BIO-RAD,
Banchmark, USA) in the supernatant at 550 nm. The adapted assay contained, at 25°C,
50 mM Potassium Phosphate Buffer (pH 7.8), 3 mM EDTA, 3 mM Xantine solution, 0.75
mM NBT (nitroblue tetrazolium), 100 mU XOD (Xanthine Oxidase Solution) and 1 U/µL
SOD Enzyme solution all from Sigma-Aldrich (Germany). Superoxide Dismutase from
bovine erythrocytes (Sigma-Aldrich, Germany) was used as standard and positive
control. Enzymatic assay results are given in units of SOD activity per milligram of total
protein in the sample (U mg-1 total protein), where one unit of SOD is defined as the
amount of sample causing 50% inhibition of NBT reduction.
Statistical Analyses
A two-way analysis of variance (two-way ANOVA) was performed to test the
effects of species and temperature on metabolism.
Three-way ANOVA’s were conducted in order to detect and analyze significant
differences in HSP70/HSC70, GST, MDA, CAT and SOD contents between species,
temperature and incubation time. Subsequently, post-hoc tests (Tukey HSD) were
performed. All statistical analyses were performed for a significant level of 0.05, using
Statistica software (version 10.0, StatSoft Inc., Tulsa, USA).

Chapter 1
29
Results
Thermal tolerance limits
Thermal tolerance experiments showed that upper thermal tolerance limits were
affected by acclimation temperature (Figure 1). Both LT50 and LT100 of P. elegans and P.
serratus were higher after acclimation at 20°C than after acclimation at 12°C. LT50 and
LT100 values for P.elegans were 34°C and 35°C at 12°C, and 37°C and 38°C at 20°C,
respectively. While for P. serratus LT50 values were 33°C and 35°C, at 12°C and 20°C,
respectively, and LT100 values were 34°C and 36°C, at 12°C and 20°C, respectively.
The acclimation temperature positively influenced both LT50 and LT100, and such
percent of increase were significantly higher in P. elegans than those observed for P.
serratus (Figure 1).
Figure 1. Thermal tolerance limits (A – LT50, °C; B – LT100, °C) of intertidal and subtidal shrimps,
P. elegans and P. serratus respectively, at different temperature scenarios. Values represent means of
triplicate experiments ± SD (=zero).
B
A
A B
Heat tolerance limits and physiological responses of Palaemon shrimps to ocean
warming
30
Metabolic Rates
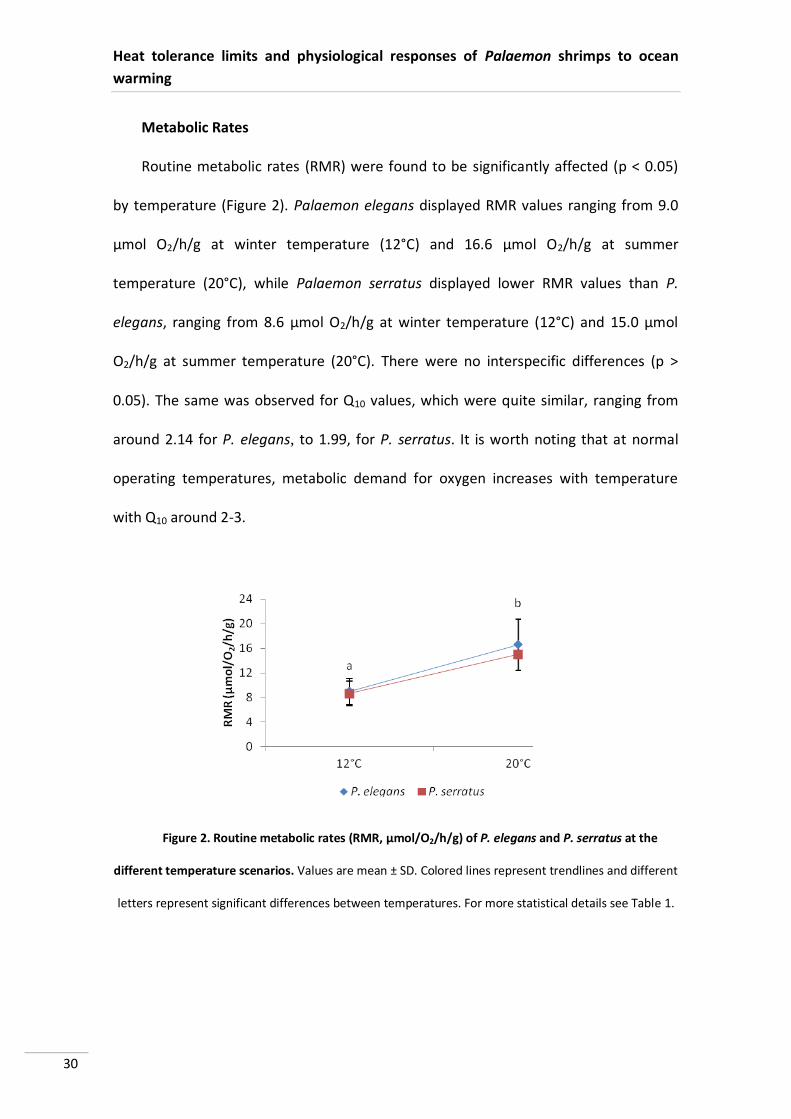
Routine metabolic rates (RMR) were found to be significantly affected (p < 0.05)
by temperature (Figure 2). Palaemon elegans displayed RMR values ranging from 9.0
µmol O2/h/g at winter temperature (12°C) and 16.6 µmol O2/h/g at summer
temperature (20°C), while Palaemon serratus displayed lower RMR values than P.
elegans, ranging from 8.6 µmol O2/h/g at winter temperature (12°C) and 15.0 µmol
O2/h/g at summer temperature (20°C). There were no interspecific differences (p >
0.05). The same was observed for Q10 values, which were quite similar, ranging from
around 2.14 for P. elegans, to 1.99, for P. serratus. It is worth noting that at normal
operating temperatures, metabolic demand for oxygen increases with temperature
with Q10 around 2-3.
Figure 2. Routine metabolic rates (RMR, µmol/O2/h/g) of P. elegans and P. serratus at the
different temperature scenarios. Values are mean ± SD. Colored lines represent trendlines and different
letters represent significant differences between temperatures. For more statistical details see Table 1.

Chapter 1
31
Heat shock response and Lipid peroxidation
HSP were found to be significantly affected by temperature (p < 0.05) (Figure 3),
being it’s expression higher at 20°C, for both studied species. Interestingly, compared
to the winter condition, there was a significant augment in the HSP levels of P. elegans
at the summer conditions, but stable during the three periods of incubation.
Regarding lipid peroxidation, i.e. MDA accumulation, there was a significant
different between species (p < 0.05); MDA production was higher in P. serratus, mainly
at 20°C (Figure 4).
Figure 3. Impact of environmental warming on the HSP70/HSC70 concentrations (ng/mg total
protein) of P. elegans and P. serratus. A) at 12°C; B) at 20°C. Values represent mean ± S.D. Colored
lines represent trendlines and different letters (capital letters for P. serratus and lowercase letters for P.
elegans), asterisks and cardinals represent significant differences between incubation time, species and
temperature scenarios. For more statistical details see Table 1.
A B A
B

Heat tolerance limits and physiological responses of Palaemon shrimps to ocean
warming
32
Figure 4. Impact of environmental warming on the MDA concentrations (nmol/mg total protein)
of P. elegans and P. serratus. A) at 12°C; B) at 20°C. Values represent mean ± S.D. Colored lines
represent trendlines and different letters (capital letters for P. serratus and lowercase letters for P.
elegans), asterisks and cardinals represent significant differences between incubation time, species and
temperature scenarios. For more statistical details see Table 1.
Oxidative Stress tolerance
Glutathione S-Transferase (GST) activity varied significantly between species,
being higher in P. serratus, mainly at 20°C (Figure 5).
A
B
A
B

Chapter 1
33
Figure 5. Impact of environmental warming on the GST concentrations (nmol/min/mg total
protein) of P. elegans and P. serratus. A) at 12°C; B) at 20°C. Values represent mean ± S.D. Colored
lines represent trendlines and different letters (capital letters for P. serratus and lowercase letters for P.
elegans), asterisks and cardinals represent significant differences between incubation time, species and
temperature scenarios, respectively. For more statistical details see Table 1.
Regarding catalase, differences were found between the interaction species and
temperatures (p < 0.05) for P. serratus, in which catalase activity was higher at 20°C
(Figure 6), however there were no significant differences for P.elegans, across the
thermal gradient.
A
B
A
B

Heat tolerance limits and physiological responses of Palaemon shrimps to ocean
warming
34
Figure 6. Impact of environmental warming on the Catalase concentrations (nmol/min/mg total
protein) of P. elegans and P. serratus. A) at 12°C; B) at 20°C. Values represent mean ± S.D. Colored
lines represent trendlines and different letters (capital letters for P. serratus and lowercase letters for P.
elegans), asterisks and cardinals represent significant differences between incubation time, species and
temperature scenariosFor more statistical details see Table 1.
Regarding SOD activity, there were significant interspecific differences (p < 0.05);
the production of this enzyme was greater for P. elegans than for P. serratus. However,
for P. elegans, it’s activity didn’t change through the thermal gradient, while for P.
serratus SOD activity was higher at 20°C (Figure 7).
A A
B

Chapter 1
35
Figure 7. Impact of environmental warming on SOD concentrations (U/mg total protein)of P.
elegans and P. serratus. A) at 12°C; B) at 20°C. Values represent mean ± S.D. Colored lines represent
trendlines and different letters (capital letters for P. serratus and lowercase letters for P. elegans),
asterisks and cardinals represent significant differences between incubation time, species and
temperature scenariosFor more statistical details see Table 1.
Discussion
Global warming may affect the distribution limits of intertidal species to a greater
extent than for subtidal species (Stillman and Somero, 2000). Our results, as for other
studies (e.g. Madeira et al., 2012;Danport and Davenport, 2005; Davenport and
McAlister, 1996) follow the idea that organisms living in higher shore (intertidal zone)
B
A
B
Heat tolerance limits and physiological responses of Palaemon shrimps to ocean
warming
36
are more tolerant than those in the lower shore (subtidal zone) (Figure 1). Yet, the
upper thermal tolerance limits of some intertidal species may be near current habitat
maximum temperature. Here, the results showed that Palaemon elegans inhabit an
extremely variable habitat in terms of temperature, salinity and dissolved oxygen ,will
be more tolerant to global warming then their subtidal congener, Palaemon serratus.
Subtidal species have a lower tolerance to temperature rising because they live in a
relatively variable or more stable habitat, so they are exposed to lower temperatures,
having physiological set-points lower in the temperature gradient (Davenport &
Davenport, 2005; Davenport & McAlister, 1996). This indicates that species have
adapted their upper thermal tolerance limits to coincide with microhabitat conditions.
Additionally and as expected, increased temperatures led to higher metabolic
rates (Figure 2) (Pörtner and Knust, 2007) which were quite similar for the two species.
As temperature risen similar Q10 values were obtained ranging from 2.14 for P.
elegans, to 1.99 for P. serratus.
Our results, also shows that heat shock proteins were very sensitive to
environmental stress (Figure 3), once both species expressed higher HSC70/HSP70
concentrations in summer temperature scenario (20°C). Heat shock proteins are a class
of functionally related proteins involved in the folding and unfolding of other proteins
and their expression increases when cells are exposed to elevated temperatures or
other stress (Tomanek, 2010). Concomitantly, warming also lead to an increase of
MDA concentrations, mainly for P. serratus (Figure 4), indicative of an enhancement of
ROS action in organism’s lipids, called peroxidation, a process considered to be one of
the most frequent cellular injury mechanisms (Lesser, 2006).

Chapter 1
37
The antioxidative enzymes are known to be intrinsically linked and dependent
upon the activity of one another, and therefore, one would expect to see correlative
changes in their activity (Cooper et al., 2005). This effect was evident for P. serratus in
summer warming scenario. In fact, increased MDA concentrations led to higher SOD
activity (Figure 7) which indicates a superoxide production increase. At the same time,
the increased SOD activity lead to higher GST and CAT activity (Figure 5 and 6,
respectively), which catabolizes peroxide resulting from its activity.
In conclusion, ocean warming is expected to drive much more profound biological
impacts on Palaemon serratus, once they have evolved in a relative stable and
aseasonal environment when compared to Palaemon elegans.
References
Aebi HE (1983) Catalase. In: Bergmeyer HU, Bergmeyer J, Grassl JM (Eds) Methods of
enzymatic analysis. VCH, Weinheim, pp. 273-286.
Cooper RU, Clough LM, Farwell MA, West TL (2002) Hypoxia-induced metabolic and
antioxidant enzymatic activities in the estuarine fish Leiostomus xanthurus. J
Exp Mar Biol Ecol 279: 1-20.
Davenport J, Davenport JL (2005) Effects of shore height, wave exposure and
geographical distance on thermal niche width of intertidal fauna. Ecology
Progress Series 292:41-50.
Davenport J, McAlister H (1996) Environmental conditions and physiological
tolerances of intertidal fauna in relation to shore zonation at Husvik, South
Georgia. Journal of the Marine Biological Association of the UK 76: 985-1002.

Heat tolerance limits and physiological responses of Palaemon shrimps to ocean
warming
38
Feder ME, Hofman GE (1999) Heat-shock proteins, molecular chaperones and the
stress response: evolutionary and ecological physiology. Ann Rev Physiol 61:
243-282.
Habig, W.H., Pabst, M.J., Jakoby, W.B., 1974. Glutathione S-transferases, the first
enzymatic step in mercapturic acid formation. Journal of Biological Chemistry
249:7130–7139.
Kennedy VS, Twilley RR, Kleypas JA, Cowan JH, Hare SR (2002) Coastal and marine
ecosystems & global climate change: Potential effects on U.S. resources. Pew
Center on Global Climate Change.
Lesser MP (2006) Oxidative stress in marine environments: biochemistry and
physiological ecology. Ann Rev Physiol 68: 253-278.
Li Y, Schellhorn HE (2007) Rapid kinetic microassay for catalase activity. J. Biomol.
Technol. 18: 185-187.
Madeira D, Narciso L, Cabral HN, Vinagre C (2012) Thermal tolerance and potential
impacts of climate change on coastal and estuarine organisms. Journal of Sea
Research 70: 32-41.
Morimoto RI, Tissieres A, Georgopoulos C (1994) Progress and perspectives on the
biology of heat shock proteins and molecular chaperones. In: Morimoto RI,
Tissieres A, Georgopoulos C (eds) The Biology of Heat Shock Proteins and
Molecular Chaperones, Cold Spring Harbor, NY: Cold Spring Harbor Laboratory
Press.
Njeimini R, Demanet C, Mets T (2005) Comparison of two ELISAs for the determination
of Hsp70 in serum. J Immunol Meth 306: 176-182.
Chapter 1
39
Pӧrtner HO, Langenbuch M, Michaelidis B (2005) Synergistic effect of temperature
extremes, hypoxia, and increases in CO2 on marine animals: From Earth history
to global change. J. Geophys. Res. 110.
Rivadeneira MM, Fernandéz M (2005) Shifts in southern endpoints of distribution in
rocky intertidal species along the south-eastern Pacific coast. Journal of
Biogeography 32: 203-209.
Somero GN (2002) Thermal physiology and vertical zonation of intertidal animals:
optima, limits, and costs of living. Integr. Comp. Biol. 42: 780-789.
Somero GN (2010) The physiology of climate change: how potentials for
acclimatization and genetic adaptation will determine “winners” and “losers”.
Journal of Experimental Biology 213: 912-920.
Stillman JH (2002) Causes and consequences of thermal tolerance limits in rocky
intertidal porcelain crabs, Genus Petrolisthes. Integrative and Comparative
Biology 42: 790-796.
Stillman JH, Somero GN (1996) Adaptation to temperature stress and aerial exposure
in congereric species of intertidal porcelain crabs (Genus Petrolisthes):
correlation of physiology, biochemist and morphology with vertical
distribution. The Journal of Experimental Biology 199: 1845-1855.
Stillman JH, Somero GN (2000) A comparative analysis of the upper thermal tolerance
limits of eastern pacific porcelain crabs, genus Petrolisthes: influences of
latitude, vertical zonation, acclimation, and phylogeny. Physiol Biochem Zool
73: 200–208.
Tomanek L (2010) Variation in the heat shock response and its implications for
predicting the effect of global climate change on species’ biogeographic
Heat tolerance limits and physiological responses of Palaemon shrimps to ocean
warming
40
distribution ranges and metabolic costs. Journal of Experimental Biology 213:
971-979.
Uchiyama M, Mihara M (1978) Determination of malonaldehyde precursor in tissues
by thiobarbituric acid test. Anal. Biochem. 86: 271-278
Vinagre C, Madeira D, Narciso L. Cabral HN, Diniz M (2012) Effect of temperature on
oxidative stress in fish: lipid peroxidation and catalase activity in the muscle of
juvenile seabass, Dicentrarchus labrax. Ecological Indicators 23: 274-279.
Whiteley NM, Rastrick SPS, Lunt DH, Rock J (2011) Latitudinal variations in the
physiology of marine gammarid amphipods. Journal of Experimental Biology
and Ecology 400: 70-77.
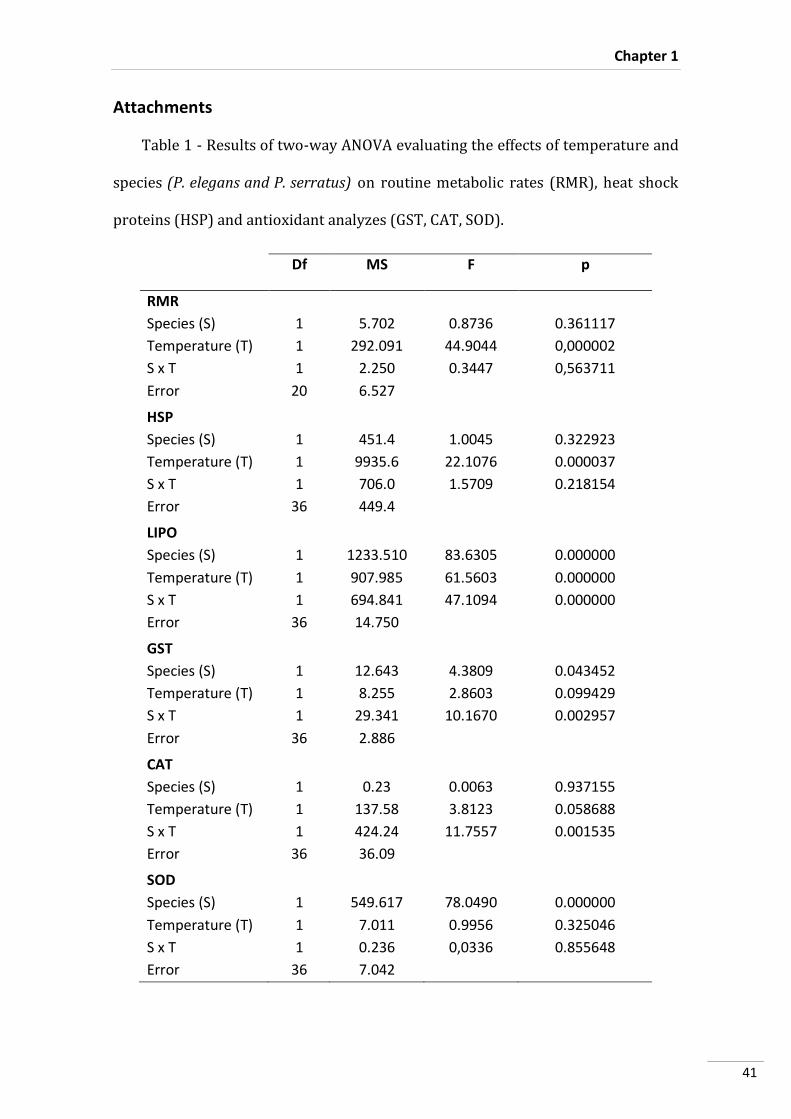
Chapter 1
41
Attachments
Table 1 - Results of two-way ANOVA evaluating the effects of temperature and
species (P. elegans and P. serratus) on routine metabolic rates (RMR), heat shock
proteins (HSP) and antioxidant analyzes (GST, CAT, SOD).
Df MS F p
RMR
Species (S) 1 5.702 0.8736 0.361117
Temperature (T) 1 292.091 44.9044 0,000002
S x T 1 2.250 0.3447 0,563711
Error 20 6.527
HSP
Species (S) 1 451.4 1.0045 0.322923
Temperature (T) 1 9935.6 22.1076 0.000037
S x T 1 706.0 1.5709 0.218154
Error 36 449.4
LIPO
Species (S) 1 1233.510 83.6305 0.000000
Temperature (T) 1 907.985 61.5603 0.000000
S x T 1 694.841 47.1094 0.000000
Error 36 14.750
GST
Species (S) 1 12.643 4.3809 0.043452
Temperature (T) 1 8.255 2.8603 0.099429
S x T 1 29.341 10.1670 0.002957
Error 36 2.886
CAT
Species (S) 1 0.23 0.0063 0.937155
Temperature (T) 1 137.58 3.8123 0.058688
S x T 1 424.24 11.7557 0.001535
Error 36 36.09
SOD
Species (S) 1 549.617 78.0490 0.000000
Temperature (T) 1 7.011 0.9956 0.325046
S x T 1 0.236 0,0336 0.855648
Error 36 7.042


CHAPTER 2


Chapter 2
42
Tropical and temperate (Lysmata) shrimps in a warming ocean: a physiological and biochemical comparison
Abstract
In the present study we investigate the physiological and biochemical responses of
tropical (Lysmata amboinensis) and temperate (Lysmata seticaudata) shrimps to
different warming scenarios (present-day temperatures, +3°C and +6°C warming
scenarios), namely routine metabolic rates, thermal sensitivity (LT50), heat shock
protein expression (HSP70/HSC70), antioxidant enzyme activities (SOD, CAT, GST) and
lipid peroxidation (namely MDA accumulation). Thermal sensitivity experiments
showed that at +6°C scenario, the temperate shrimps showed higher thermal
tolerance in comparison to tropical shrimps, with the latter also revealing metabolic
suppression (Q10 < 1.5). The higher mass-specific metabolic rate of the temperate
shrimp was accompanied by higher antioxidant enzyme activities and HSP response,
with no increased cellular damage (lipid peroxidation). Thus, we provide evidence that
the tropical cleaner shrimp Lysmata amboinensis has lower acclimation capacities and
will be more vulnerable to global warming than the higher-latitude species, because
the latter has evolved in a relatively unstable and seasonal environment.
Key words: shrimps, Lysmata seticaudata, Lysmata amboinensis, ocean warming,
heat shock proteins, antioxidant enzymes, metabolism.

Tropical and temperate (Lysmata) shrimps in a warming ocean: a physiological and
biochemical comparison
43
Introduction
Shrimps from the genus Lysmata are particularly peculiar organisms among
other caridean shrimp genera due to their wide diversity of lifestyles (Calado and Dinis,
2007). While some species like the Monaco’s shrimp Lysmata seticaudata (Risso,
1816), occur in dense aggregations and dwell freely both in rocky intertidal and/or
subtidal habitats of temperate and subtropical zones, others such as Lysmata
amboinensis (De Man, 1888) live as socially monogamous pairs (Fieldler, 1998),
displaying associative cleaning services to tropical fishes. Studies of congeners allow
predicting the effects of increasing temperatures in these species, in order to establish
in which these impacts will be more severe (Whitely et al., 2011; Stillman, 2003;
Somero, 2010).
Facing current concerns about future climate change scenarios, the knowledge
of thermal tolerance is the first step to understand how vulnerable species are.
However, not only there is a vast response diversity but also global warming tends to
vary regionally (Rivadeneira and Fernández, 2005; Madeira et al., 2012).
Impacts of climate warming in the tropics, the cradle of biodiversity, are often
predicted to be small in comparison to those in temperate regions (Parmesan, 2007;
Root et al., 2003), because the rate of climate warming in the tropics is lower in
comparison to higher latitudes (IPCC, 2007). However, predictions based upon the
magnitude of climate change may be misleading (Tewksburry et al., 2008). Most
literature has focused on tropical regions, possibly for the reasons that models that
include organism´s physiology suggests that the impacts will be more severe in the
tropics (Tewksburry et al., 2008), as well as predictions for temperate regions are the

Chapter 2
44
hardest to make due to the diversity of life history patterns, trophic relations
complexity and habitat variability (IPCC, 1997; Madeira et al., 2012).
It is expected that impacts of climate warming ought to be greatest on thermal
specialists (tropical ectotherms) which possess limited acclimation capacities (Hoegh-
Guldberg et al., 2007), in comparison to higher-latitude species, once they have
evolved in relatively constant, seasonal environments. In this manner, ecosystems that
evolved in stable conditions for a long time, e.g. cold environments or tropical
habitats, are especially at risk (Madeira et al., 2012).
The production and accumulation of reactive oxygen species (ROS), beyond the
capacity of an organism to quench these reactive species, is considered to be an
additional problem related to ocean warming, and it is called oxidative stress. Reactive
oxygen species are responsible for the toxic effects of oxygen, because the univalent
reduction of molecular oxygen produces reactive intermediates such as O2•⁻, H2O2,
HO•, and finally water (Lesser, 2006). They form as a natural by-product of the normal
metabolism of oxygen and have important roles in cell signaling and homeostasis
(Cadenas, 1989). However, during times of environmental stress, e.g. heat exposure,
ROS levels can increase dramatically (Cadenas, 1989; Vinagre at al., 2012). These free
radicals can damage lipids, proteins, and DNA (Lesser, 2006).
Under most physiological states, ROS production is closely matched by
antioxidant responses (Rosa et al., 2012), including superoxide dismutase (SOD), which
converts O2⁻ into H2O2, catalase (CAT) which removes H2O2 avoiding its accumulation in
cells and tissues, and glutathione-S-transferase (GST) that transforms xenobiotics into
other conjugates (Lesser, 2006).

Tropical and temperate (Lysmata) shrimps in a warming ocean: a physiological and
biochemical comparison
45
Additionally, thermal stress also induces heat shock protein (HSP) production
(Hochachka and Somero, 2002; Tomanek, 2008; Tomanek, 2010; Rosa et al., 2012).
HSP’s provides a proteomic defense, which includes protein synthesis, in way to repair,
refold, and eliminate damaged or denatured proteins (Tomanek, 2010; Rosa et al.,
2012).
The aim of this study was to investigate heat tolerance limits (% survival, LT50
and LT100) and physiological responses (metabolic rates, heat shock proteins
expression, lipid peroxidation and activity of antioxidant enzymes) of temperate
(Lysmata seticaudata) and tropical (Lysmata amboinensis) shrimp species in response
to increasing ocean warming scenarios.
Materials and methods
Specimen Collection and Maintenance
Specimens of Lysmata seticaudata where collected in subtidal zones at Cabo Raso
(Western coast of Portugal) using baited traps and scuba diving, while specimens of
tropical cleaner shrimp Lysmata amboinensis were commercially acquired by TMC
Iberia ( Portugal) , from Sri Lanka.
After collection, organisms were immediately placed in recirculation aquaculture
systems at the aquaculture facilities of Laboratório Marítimo da Guia (Cascais,
Portugal). Lysmata seticaudata specimens were acclimated at three different
temperatures, i.e. 18°C (present ocean temperature for this species), 21°C (+ 3°C
warming scenario) and 24°C (+ 6°C warming scenario), while Lysmata amboinensis
were stocked at 21°C (present ocean temperature for this species at the collection

Chapter 2
46
site), 24°C (+ 3°C warming scenario) and 27°C (+ 6°C warming scenario), for a time
period of 30 days. Ammonia and nitrite levels were monitored on a daily basis and
kept below detectable levels. Likewise salinity (34.0 ± 1.0) and pH (8.1 ± 0.1) were daily
controlled.
Thermal Tolerance Limits
The upper thermal tolerance limits of each species were determined according to
Stillman and Somero (1996). One hundred and sixty shrimps, comprising 80 of each
species and for each temperature, where placed into separated plastic containers,
each containing 20 specimens (n=3) and a control for each species. Afterwards,
specimens were subject to the acclimation temperature for a period of 30–60 min.
Subsequently, a temperature increase was performed at a rate of 1°C/30 min. Every 30
min, water bath aeration was performed as well as temperature in each container
checked (with thermocouple probes). During thermal tolerance limits experiment,
sensory antennules activity of each shrimp was visually checked until they reached the
end-point, where no sensory antennules activity was noticeable. The temperatures at
which 50% and 100% of the shrimps died were calculated, and used as the
measurements for upper thermal tolerance limits, being referred from now onwards
as LT50 and LT100 (maximal temperature this specimens can stand), respectively.
Oxygen Consumption Rates and Thermal Sensitivity
Oxygen consumption measurements were determined according to Rosa et al.
2008, 2009 and Pimentel et al, 2012, through incubation of individual shrimps in sealed

Tropical and temperate (Lysmata) shrimps in a warming ocean: a physiological and
biochemical comparison
47
water-jacketed respirometry chambers (RC300 Respiration cell, Strathkelvin, North
Lanarkshire, Scotland) containing filtered seawater, at the different incubation
temperatures for each species (present ocean temperature, + 3°C warming scenario
and + 6°C warming scenario). Water volumes were adjusted in relation to animal mass
(up to 250 mL), in order to avoid stress. Respiration chambers were placed in water
baths (Lauda, Lauda-Konigshofen, Germany) to control temperature and oxygen
concentrations were recorded with Clarke-type O2 electrodes connected to a
multichannel oxygen interface (Strathkelvin 929, North Lanarkshire, Scotland), during a
3 to 4 hours time period. Thermal sensitivity (Q10) was determined using the standard
equation:
where R(T2) and R(T1) represent the oxygen consumption rates at temperatures T2
and T1, respectively.
Preparation of tissue extracts
Approximately 60 mg of shrimp abdominal tissue was homogenized in 100 µl of
Phosphate Buffer Saline solution (PBS, pH 7.3: 0.14 M NaCl, 2.7 mM KCl, 8.1 mM
Na2HPO4, 1.47 mM KH2PO4), using a glass Potter Elvejhem tissue grinder. Resulting
homogenates were subsequently centrifuged (20 min at 14 000 x g at 4°C) and enzyme
activity as well as heat shock proteins were quantified in the supernatant fraction.

Chapter 2
48
All samples were assayed for Glutathione S-Transferase, Catalase, Superoxide
Dismutase, Lipid Peroxidation (MDA content) and HSP70/HSC70 levels.
Heat shock response (HSP70/HSC70)
Heat Shock Protein 70 was quantified through Enzyme Linked Immunoabsorbent
Assay (ELISA) (Njemini et al., 2005), using 96 well microplates (Nunc-Roskilde,
Denmark). Briefly, 10 µl of the homogenate’s supernatant were diluted in 250 µl of
PBS, and three replicates of the diluted sample (50 µl of each) were added to the
microplate wells and allowed to incubate overnight, at 4°C. Afterwards, microplates
were washed three tomes with PBS 0.05% Tween-20 and blocked by adding 100 µl of
1% BSA (Bovine Serum Albumin, Sigma-Aldrich, USA) to each well and left to incubate
for 2 hours, at room temperature. Following microplates washing (3X with PBS 0.05%
Tween-20), 50 µl of 5 µg mL-1 primary antibody (anti-HSP70/HSC70, Acris USA),
detecting 72 and 73 kDa proteins corresponding to the molecular mass of inducible
HSP70 and HSC70, was added to each well and then incubated overnight at 4°C. The
non-linked antibody was removed through microplates washing (3X), which were
incubated for 2 hours at room temperature, with 50 µl of 1 µg mL-1 of the secondary
antibody (anti-mouse IgG, Fab specific, alkaline phosphatase conjugate, Sigma-Aldrich,
USA). After another wash, 100 µl of substrate (SIGMA FASTTM p-Nitrophenyl Phosphate
Tablets, Sigma-Aldrich, USA) was added to each well and incubated during 30 min at
room temperature. Finally, 50 µl of stop solution (3N NaOH) was added to each well
and the absorbance read at 405 nm in a 96 well microplate reader (BIO-RAD,
Benchmark, USA). Hsp70/Hsc70 samples quantifications were calculated by
constructing a calibration curve obtained based on serial dilutions of purified HSP70
active protein (Acris, USA), as to give a range from 0 to 2000 ng/mL. The results were

Tropical and temperate (Lysmata) shrimps in a warming ocean: a physiological and
biochemical comparison
49
then divided by the total protein quantify in the sample determined by the Bradford
method (Bradford, 1976) and expressed as micrograms of total protein (ng
hsp70/hsc70 mg-1 total protein).
Lipid peroxide assay (determination of malondialdehyde, MDA)
Lipid peroxide assay was adapted from the thiobarbituric acid reactive substances
(TBARS) protocol (Uchiyama and Mihara, 1978) and it was determined by the
quantification of a specific end-product of the lipid oxidative degradation process, the
malondialdehyde (MDA) in which thiobarbituric acid reacts with MDA yielding a
fluorescent product that was detected spectrophotometrically at 532 nm. Briefly, 5 µl
of each sample were treated with 12.5 µl of dodecyl sulfate sodium (SDS 8.1%), 93.5 µl
of trichloroacetic acid (20%, pH 3.5), and 93.5 µl of thiobarbituric acid (1%). To this
mixture, 50.5 µl of Milli-Q grade ultrapure water were added and eppendorf’s were
placed in a vortex for 30 s and incubated in boiling water for 10 min. Thereafter, they
were placed on ice for 3 min in order to lower temperature. Subsequently, 62.5 µL of
Milli-Q water and 312.5 µL of n-butanol pyridine (15:1, v/v) were added and
eppendorf’s were placed in a vortex and centrifuged at 7000 rpm for 5 min. For each
reaction, 150 µL duplicates of the supernatant were inserted into a 96-well microplates
and the absorbance read. To quantify lipid peroxides, an eight-point calibration curve
(0-0.3 µM TBARS) was calculated using malondialdehyde bis (dimethylacetal) (from
Merck) standards.
Chapter 2
50
The results were divided by the total amount of protein in the sample calculated
by the Bradford method (Bradford, 1976) and expressed as micrograms of total protein
(MDA nmol/mg total protein).
Enzymatic Analyses
1. Glutathione S-Transferase
The enzyme activity was determined spectrophotometrically in the supernatant at
340 nm, every 6 minutes using a microplate reader (BIO-RAD, Benchmark, USA).
Briefly, total GST activity was determined as described by Habig et al. (1974) by
measuring the formation of the conjugate of glutathione (GSH) and 1-chloro-2,4-
dinitrobenzene (CDNB). Briefly, 180 μL of substrate solution (Dulbecco‘s Phosphate
Buffered Saline with 200 mM L-glutathione reduced and 100 mM CDNB all from Sigma-
Aldrich, Germany) were added to 20 μL of GST standard or sample into each well of a
96-well microplate. The total enzyme activity was determined at 340 nm by recording
the absorbance at every minute for 6 minutes, using a microplate reader (BioRad
Benchmark, USA). Equine liver GST (Sigma-Aldrich, Germany) was used as standard and
positive control. The change in absorbance per minute (ΔA340) was estimated and the
reaction rate at 340 nm was determined using CDNB extinction coefficient of 0.0096
μM-1cm-1. The results are expressed in relation to total protein concentration of the
sample(nmol min-1 mg-1 total protein).

Tropical and temperate (Lysmata) shrimps in a warming ocean: a physiological and
biochemical comparison
51
2. Determination of Catalase
A spectrophotometric (BIO-RAD, Benchmark, USA) methodology was applied and
consisted of measuring the absorbance at 240 nm (Aebi, 1983; Li and Schellhorn, 2007)
in a time interval of 1 minute and 30 seconds.
When the sample is added to hydrogen peroxide the reaction can be followed by a
decrease in absorbance as the peroxide is turned into oxygen and water. In order to
perform this reaction 100 µl of each sample were added to 2900 µl of hydrogen
peroxide (50 nmol/L potassium phosphate buffer (pH 7.0), 12.1 mmol/L H2O2) using
quartz cuvettes. Peroxide consumption was monitored by absorbance reading, every
15 seconds. Standard catalase activity was measured using 1523.6 U/mL of bovine
catalase solution (Sigma-Aldric, Germany). Catalase activity was calculated using an
absorption coefficient for H2O2 of 0.04 mmol-1 cm-1, using the following equation:
The results were divided by the total protein quantity in the sample (the total
protein in samples was calculated using the Bradford method (Bradford, 1976) and
expressed as micrograms of total protein) to obtain catalase activity in nmol min-1 µg-1.
3. Superoxide dismutase (SOD) assay
SOD activity was determined spectrophotometrically in the supernatant at 25°C
(BIO-RAD, Banchmark, USA) and 550 nm. The adapted assay contained, at 25°C, 50 mM
of Potassium Phosphate Buffer (pH 7.8), 3 mM EDTA, 3 mM Xantine solution, 0.75 mM
Chapter 2
52
NBT (nitroblue tetrazolium), 100 mU XOD (Xanthine Oxidase Solution) and 1 U/µL SOD
Enzyme solution all from Sigma-Aldrich (Germany). Superoxide Dismutase from bovine
erythrocytes (Sigma-Aldrich, Germany) was used as standard and positive control. The
results of this enzymatic assay are given in units of SOD activity per milligram of total
protein in the sample (U mg-1 total protein), where one unit of SOD is defined as the
amount of sample causing 50% inhibition of NBT reduction.
Statistical Analyses
A two-way analysis of variance (two-way ANOVA) was performed to test the
effects of species and temperature on metabolism.
Three-way ANOVA’s were conducted to detect significant differences in
HSP70/HSC70, GST, MDA, CAT and SOD contents between species, temperature and
incubation time. Subsequently, post-hoc tests (Tukey HSD) were performed. All
statistical analyses were performed for a significant level of 0.05, using Statistica
software (version 10.0, StatSoft Inc., Tulsa, USA).
Results
Thermal tolerance limits
Both LT50 and LT100 were influenced by the acclimation temperature that
specimens were exposed (Figure 1). When exposing to the +6°C scenario, the higher
thermal tolerance was observed for the temperate shrimp (Lysmata seticaudata)
(Figure 1).

Tropical and temperate (Lysmata) shrimps in a warming ocean: a physiological and
biochemical comparison
53
Figure 1. Thermal tolerance limits (A – LT50, °C; B – LT100, °C) of temperate (L. seticaudata) and
tropical (L. amboinensis) shrimps, at different temperature scenarios. Values are means of triplicate
experimens ± SD (=0). Colored lines represent trendlines.
Metabolic rates
Routine Metabolic Rates (RMR) was significantly affected by species and
temperature (p < 0.05) (Figure 2). Lysmata amboinensis displayed RMR values ranging
from 4.0 µmol O2/h/g at present ocean temperature to 5.7 µmol O2/h/g at + 3°C and
6.4 µmol O2/h/g at + 6°C warming scenarios, while Lysmata seticaudata displayed
higher RMR values than Lysmata amboinensis, ranging from 7.0 µmol O2/h/g at
present ocean temperature to 9.7 µmol O2/h/g at + 3°C and 14.3 µmol O2/h/g at + 6°C
warming scenario. At the extreme thermal scenario (+ 6°C), L. amboinensis suppressed
its metabolism, with a Q10 value of 1.5 (i.e. indicative of active metabolic suppression;
Rosa and Seibel 2008, 2010, Rosa et al. 2012), while L. seticaudata, showed a Q10 value
of 3.5 (Figure 3). At normal operating temperatures, metabolic demand for oxygen
33
34
35
36
37
38
Present ocean temperature
+ 3ºC scenario + 6ºC scenario
LT5
0
Thermal scenario
L.seticaudatta
L.amboinensis
33
34
35
36
37
38
Present ocean temperature
+ 3ºC scenario + 6ºC scenario
LT1
00
Thermal scenario
L.seticaudatta
L.amboinensis
A B

Chapter 2
54
0
1
2
3
4
Present-day to +3ºC +3ºC to 6ºC
The
rmal
se
nsi
tivi
ty (Q
10
)
Temperature interval
L. seticaudata L. amboinensis
increases with temperature with Q10 around 2-3. Thus, L. seticaudata, increased its
metabolic rates proportionally with temperature.
Figure 2. Routine metabolic rates (RMR, µmol O2 g-1 h-1) of temperate (Lysmata seticaudata) and tropical
(L. amboinensis) shrimps at different temperature scenarios. Rates were standardized to 500mg shrimps assuming
a scaling coefficient of -0.20. Values are mean ± SD. Different letters and asterisks represent significant differences
between temperatures and species, respectively. For more statistical details see Table 1. Dashed lines represents
the ‘‘expected’’ trend assuming a Q10 of 2 and 3.
Figure 3. Thermal sensitivity (Q10) of temperate (Lysmata seticaudata) and tropical (L.
amboinensis) shrimps at different temperature scenarios.
0
2
4
6
8
10
12
14
16
18
Present-day +3ºC +6ºC
RM
R (m
mo
l O2
g-1h
-1)
Thermal scenario
L. seticaudata L. amboinensis
Metabolic suppression
A
AB
B*
a a a
Tropical and temperate (Lysmata) shrimps in a warming ocean: a physiological and
biochemical comparison
55
Heat shock proteins and lipid peroxidation
Concerning heat shock proteins (HSP) significant differences were found between
species and thermal exposure scenarios (p < 0.05), L. seticaudata always showed
higher HSP values in comparison to L. amboinensis, but in both species the values
remained fairly stable at the different thermal scenarios and exposition time (Figure 4).
Considering MDA accumulation, there was no significant (p > 0.05) increased
cellular damage, since the levels were fairly similar between the two species and
thermal scenarios (Figure 5), with an exception in the beginning of the incubation of L.
amboensis at the +3°C scenario.

Chapter 2
56
Figure 4. Impact of environmental warming on the HSP70/HSC70 concentrations (ng/mg total
protein) of L. amboinensis and L. seticaudata. A) present ocean temperature, B) + 3°C warming
scenario, C) + 6°C warming scenario. Values represent mean ± S.D. Colored lines represent trendlines
and different letters (capital letters for L. seticaudata and lowercase letters for L. amboinensis and
numbers represent significant differences between incubation time and temperature scenarios. For
more statistical details see Table 1.
A
B
A
C

Tropical and temperate (Lysmata) shrimps in a warming ocean: a physiological and
biochemical comparison
57
Figure 5. Impact of environmental warming on the MDA concentrations (nmol/mg total protein)
of L. amboinensis and L. seticaudata. A) present ocean temperature, B) + 3°C warming scenario, C) +
6°C warming scenario. Values represent mean ± S.D. Colored lines represent trendlines and different
letters (capital letters for L. seticaudata and lowercase letters for L. amboinensis, asterisks and numbers
represent significant differences between incubation time, species and temperature scenarios. For more
statistical details see Table 1.
A
B
A
C

Chapter 2
58
Oxidative stress tolerance
Glutathione S-Transferase (GST) activity showed significant differences between
species and temperature scenarios (p < 0.05). GST activity was always significantly
higher for temperate shrimps (L. seticaudata). (Figure 6). Regarding catalase activity ()
there were also significant differences between species and experimental
temperatures (p < 0.05). Interestingly, the same trend occurred, i.e., consistent higher
activities in L. seticaudata (Figure 7).
Additionally, superoxide dismutase (SOD) activity also showed a significant
difference between species and temperatures tested (p < 0.05). Although, the trends
of variation are more complex that those observed in the previous enzymes, it is worth
noting that SOD decreases significantly (p < 0.05) throughout incubation in the L.
amboensis at all thermal scenarios.
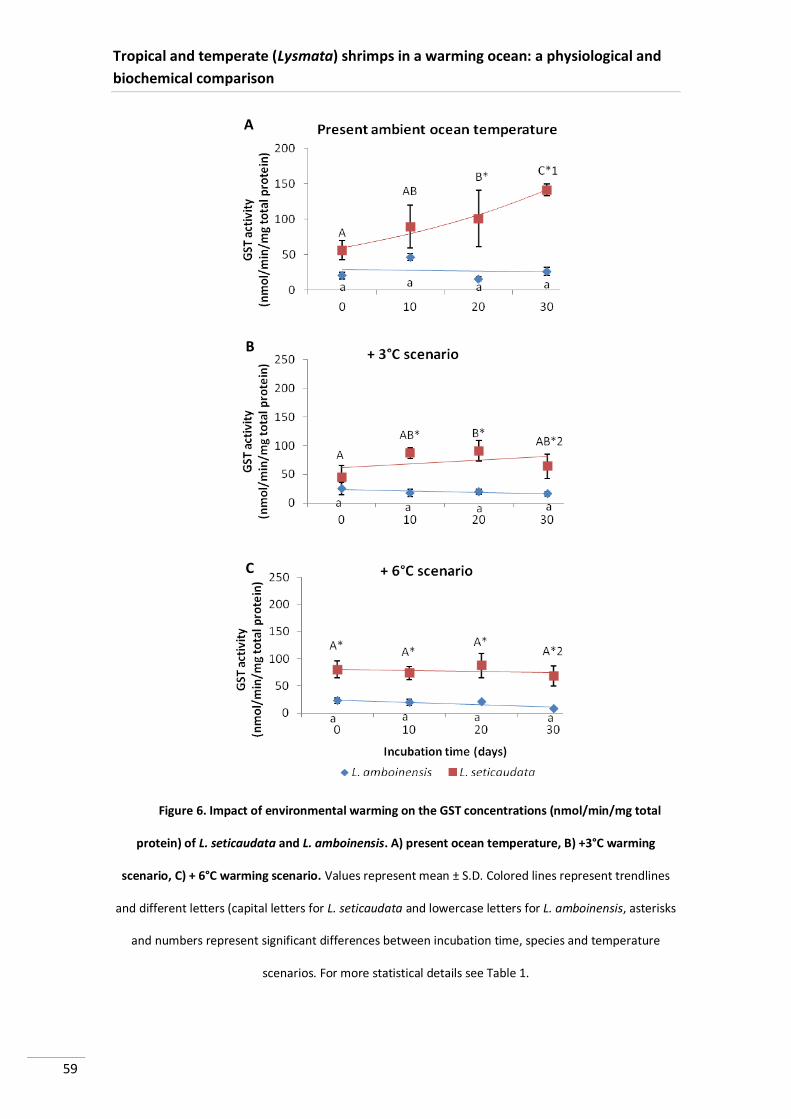
Tropical and temperate (Lysmata) shrimps in a warming ocean: a physiological and
biochemical comparison
59
Figure 6. Impact of environmental warming on the GST concentrations (nmol/min/mg total
protein) of L. seticaudata and L. amboinensis. A) present ocean temperature, B) +3°C warming
scenario, C) + 6°C warming scenario. Values represent mean ± S.D. Colored lines represent trendlines
and different letters (capital letters for L. seticaudata and lowercase letters for L. amboinensis, asterisks
and numbers represent significant differences between incubation time, species and temperature
scenarios. For more statistical details see Table 1.
A
B
A
C

Chapter 2
60
Figure 7. Impact of environmental warming on the Catalase concentrations (nmol/min/mg total
protein) of L. seticaudata and L. amboinensis. A) present ocean temperature, B) + 3°C warming
scenario, C) + 6°C warming scenario. Values represent mean ± S.D. Colored lines represent trendlines
and different letters (capital letters for L. seticaudata and lowercase letters for L. amboinensis, asterisks
and numbers represent significant differences between incubation time, species and temperature
scenarios. For more statistical details see Table 1.
A
B
A
C

Tropical and temperate (Lysmata) shrimps in a warming ocean: a physiological and
biochemical comparison
61
Figure 8. Impact of environmental warming on SOD concentrations (U/mg total protein) of L.
amboinensis and L. seticaudata. A) present ocean temperature, B) + 3°C warming scenario, C) + 6°C
warming scenario. Values represent mean ± S.D. Colored lines represent trendlines and different letters
(capital letters for L. seticaudata and lowercase letters for L. amboinensis, asterisks and numbers
represent significant differences between incubation time, species and temperature scenarios. For more
statistical details see Table 1.
A
B
A
C

Chapter 2
62
Discussion
It should be expectable that tropical organisms have a higher heat tolerance, since
they are subject to far more warmer conditions throughout the year than temperate
organisms. As also noticed in several studies (Pörtner and Farrell, 2003; Pörtner and
Knust, 2007, Parmesan, 2007; Tewsksbury et al., 2008), we have observed that a
shrimp species inhabiting the tropical zone will be more vulnerable to further increases
in temperature than a temperate species. Lysmata seticaudata demonstrated a higher
thermal tolerance limits than L. amboinensis, when exposed to a thermal setting of
+6°C above their habitat temperature (Figure 1).
Tropical ectotherms are thermal specialists (Janzen, 1960), and have limited
acclimation potential (Hoegh-Guldberg et al., 2007) in comparison to higher latitude
species, as they inhabit in aseasonal environments (Tewksbury et al., 2008) and live
close to their upper thermal limits (Jokiel and Coles, 1977; Sharp et al., 1997). Thereby,
ecosystems that have evolved in stable conditions for a long time, e.g. cold
environments and tropical habitats, are especially at risk.
Moreover, at the more extreme scenario (+ 6°C), the tropical shrimp suppressed
it’s metabolism (Q10 < 1.5) (see Figure 3). This depression means that, at such severe
scenario, tropical shrimps do not prevent a performance decrement as a result of a
consistently O2 cell concentration falling to critical levels and CO2 from rising. This
trend seemed to reduce the animal capacity to perform aerobically (a drop in aerobic
scope), with a progressive transition to an anaerobic mode of energy production (Rosa
and Seibel, 2008, 2010, Rosa et al., 2012). Additionally, this decrease in aerobic scope
was not caused by lower levels of environment avaible oxygen but through limited

Tropical and temperate (Lysmata) shrimps in a warming ocean: a physiological and
biochemical comparison
63
capacity of oxygen supply mechanisms, by ventilatory and circulatory systems, to meet
animal's temperature-dependent oxygen demand (Pӧrtner & knust, 2007).
The higher mass-specific metabolic rate of the temperate shrimp was
compensated by physiological mechanisms to minimize the negative effects of thermal
stress over fitness. The HSP70/HSC70 concentrations, were quite similar for different
thermal scenarios, with higher values obtained for L. seticaudata (Figure 4), although
no increased cellular damage (Figure 5) (lipid peroxidation), a process considered to be
one of the most frequent cellular injury mechanisms (Lesser, 2006), was observed.
This increased metabolic demands of Lysmata seticaudata lead to elevated ROS
formation (Oliveira et al., 2005). In fact, the growing oxygen requirements for
temperate shrimps led to an increase in SOD activity (Figure 8), due to an superoxide
production increase, one of the most important ROS (Lesser, 2006).
Once the antioxidative response is linked and the activity of an enzyme is
dependent upon the activity of one another (Cooper et al., 2002), this increase within
SOD activity will lead to an increment of GST and CAT activity (Figures 6 and 7,
respectively) as well, once they catabolize peroxide, which results of SOD action.
Our results suggest that heat shock proteins, SOD, CAT and GST production
constituted an integrated stress response to ocean warming in temperate shrimps, but
not in tropical ones.
We therefore conclude and provide evidence that tropical cleaner shrimp
(Lysmata amboinensis) has lower acclimation capacities and will be more vulnerable to
global warming than Lysmata seticaudata, partially due to the fact that the latter has
evolved in a relatively unstable and seasonal environment.

Chapter 2
64
References
Aebi HE (1983) Catalase. In: Bergmeyer HU, Bergmeyer J, Grassl JM (Eds) Methods of
enzymatic analysis. VCH, Weinheim, pp. 273-286.
Bradford MM (1976) A rapid and sensitive method for the quantification of microgram
quantities of protein utilizing the principle of protein-dye binding. Anal.
Biochem. 72: 248-254.
Cadenas E (1989) Biochemistry of oxygen toxicity. Annu. Rev. Biochem. 58: 79-110.
Calado R, Dinis MT (2007) Minimization of precocious sexual phase change during
culture of juvenile ornamental shrimps Lysmata seticaudata (Decapoda:
Hippolytidae). Aquaculture 269: 299-305.
Cooper RU, Clough LM, Farwell MA, West TL (2002) Hypoxia-induced metabolic and
antioxidant enzymatic activities in the estuarine fish Leiostomus xanthurus. J
Exp Mar Biol Ecol 279: 1-20.
Fiedler GC (1998) Functional, simultaneous hermaphroditism in female-phase Lysmata
amboinensis (Decapoda: Caridea: Hippolytidae). Pac Sci 52: 161-169.
Gutowska MA, Melzner F (2009) Abiotic conditions in cephalopod (Sepia officinalis)
eggs: embryonic development at low pH and high pCO2. Mar. Biol. 156: 515-
519.
Habig, W.H., Pabst, M.J., Jakoby, W.B., 1974. Glutathione S-transferases, the first
enzymatic step in mercapturic acid formation. Journal of Biological Chemistry
249:7130–7139.
Hoegh-Guldberg O, Mumby PJ, Hooten AJ, Steneck RS, Greenfield P, Gomez E, Harvell
CD, Sale PF, Edwards AJ, Caldeira K, Knowlton N, Eakin CM, Iglesias-Prieto R,

Tropical and temperate (Lysmata) shrimps in a warming ocean: a physiological and
biochemical comparison
65
Muthiga N, Bradbury RH, Dubi A, Hatziolos ME (2007) Coral reefs under rapid
climate change and ocean acidification. Science 318: 1737-1742.
Hu MY, Sucre E, Charmantier-Daures M, Charmantier G, Lucassen M, et al. (2010)
Localization of ion-regulatory epithelia in embryos and hatchlings of two
cephalopods. Cell Tissue Res 339: 571-583.
IPCC (1997) The regional impacts of climate change: an assessment of vulnerability.
Cambridge University Press. UK.
IPCC (2007) The physical science basis. Working group I contribution to the fourth
assessment report of the IPCC. Cambridge Univ. Press. UK.
Jokiel PL, Coles SL (1977) Effects of temperature on the mortality and growth of
Hawaiian reef corals. Marine Biology 4: 201-208.
Lesser MP (2006) Oxidative stress in marine environments: biochemistry and
physiological ecology. Ann Rev Physiol 68: 253-278.
Li Y, Schellhorn HE (2007) Rapid kinetic microassay for catalase activity. J. Biomol.
Technol. 18: 185-187.
Madeira D, Narciso L, Cabral HN, Vinagre C (2012) Thermal tolerance and potential
impacts of climate change on coastal and estuarine organisms. Journal of Sea
Research 70: 32-41.
Njeimini R, Demanet C, Mets T (2005) Comparison of two ELISAs for the determination
of Hsp70 in serum. J Immunol Meth 306: 176-182.
Parmesan, C., 2007. Influences of species, latitudes and methodologies on estimates
of phenological response to global warming. Global Change Biology 13: 1860–
1872.

Chapter 2
66
Pörtner HO, Farrell AP (2008) Physiology and climate change. Science 322: 690-691
Pörtner HO, Knust R (2007) Climate change affects marine fishes through the oxygen
limitation of thermal tolerance. Science 315: 95-97.
Rivadeneira MM, Fernandéz M (2005) Shifts in southern endpoints of distribution in
rocky intertidal species along the south-eastern Pacific coast. Journal of
Biogeography 32: 203-209.
Root TL, Price JT, Hall RK, Schneider SH, Rosenzweig C, Pounds JA (2003) Fingerprints
of global warming on wild animals and plants. Nature 421: 57–60
Rosa R, Pimentel MS, Boavida-Portugal J, Teixeira T, Trϋbenbach K, Diniz M (2012)
Ocean warming enhances malformations, premature hatching, metabolic
suppression and oxidative stress in the early life stages of a keystone squid.
PLoS ONE 7(6): e38282.
Sharp VA, Brown BE, Miller D (1997) Heat shock protein (hsp 70) expression in the
tropical reef coral Goniopora djiboutiensis. Journal of Thermal Biology 22: 11-
20.
Somero GN (2010) The physiology of climate change: how potentials for
acclimatization and genetic adaptation will determine “winners” and “losers”.
Journal of Experimental Biology 213: 912-920.
Stillman JH (2002) Causes and consequences of thermal tolerance limits in rocky
intertidal porcelain crabs, Genus Petrolisthes. Integrative and Comparative
Biology 42: 790-796.
Stillman JH, Somero GN (1996) Adaptation to temperature stress and aerial exposure
in congereric species of intertidal porcelain crabs (Genus Petrolisthes):

Tropical and temperate (Lysmata) shrimps in a warming ocean: a physiological and
biochemical comparison
67
correlation of physiology, biochemist and morphology with vertical
distribution. The Journal of Experimental Biology 199: 1845-1855.
Tomanek L (2010) Variation in the heat shock response and its implication for
predicting the effect of global climate change on species biogeographic
distribution ranges and metabolic costs. Journal of Experimental Biology 213:
971-979.
Tweksbury JJ, Huey RB, Deutsch CA (2008) Putting the heat on tropical animals.
Science 320: 1296-1297.
Uchiyama M, Mihara M (1978) Determination of malonaldehyde precursor in tissues
by thiobarbituric acid test. Anal. Biochem. 86: 271-278
Vinagre C, Madeira D, Narciso L. Cabral HN, Diniz M (2012) Effect of temperature on
oxidative stress in fish: lipid peroxidation and catalase activity in the muscle of
juvenile seabass, Dicentrarchus labrax. Ecological Indicators 23: 274-279.
Whiteley NM, Rastrick SPS, Lunt DH, Rock J (2011) Latitudinal variations in the
physiology of marine gammarid amphipods. Journal of Experimental Biology
and Ecology 400: 70-77.
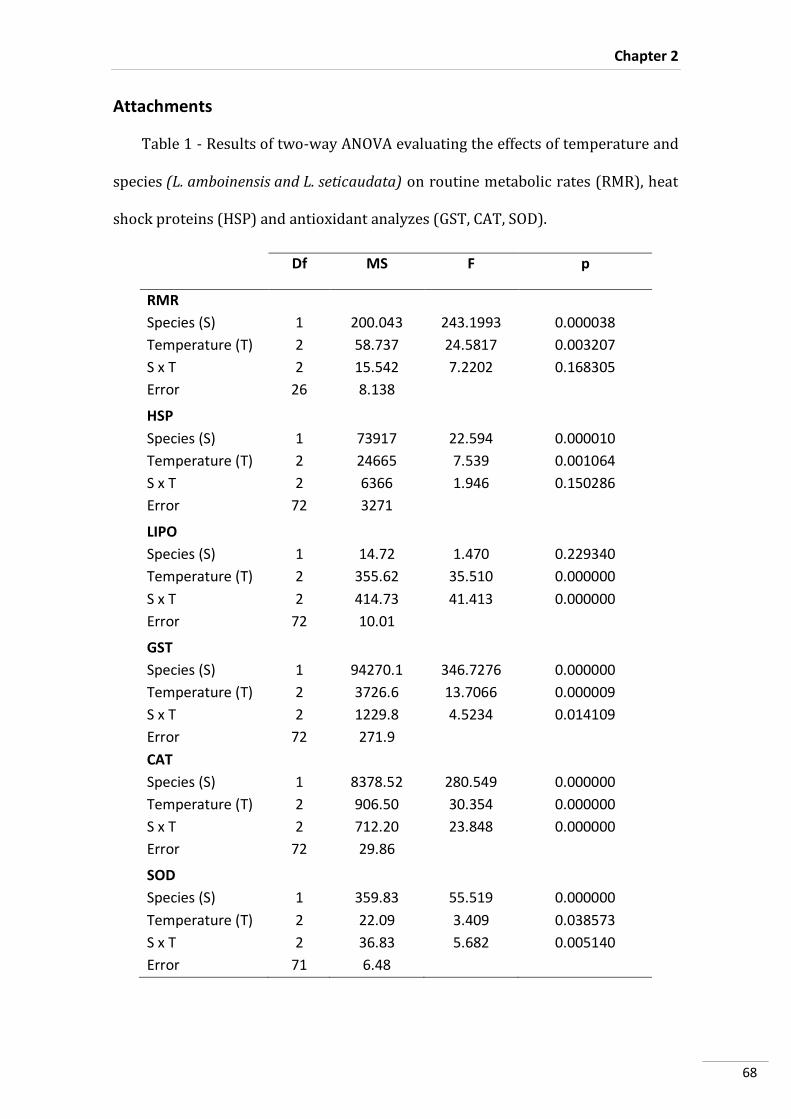
Chapter 2
68
Attachments
Table 1 - Results of two-way ANOVA evaluating the effects of temperature and
species (L. amboinensis and L. seticaudata) on routine metabolic rates (RMR), heat
shock proteins (HSP) and antioxidant analyzes (GST, CAT, SOD).
Df MS F p
RMR
Species (S) 1 200.043 243.1993 0.000038
Temperature (T) 2 58.737 24.5817 0.003207
S x T 2 15.542 7.2202 0.168305
Error 26 8.138
HSP
Species (S) 1 73917 22.594 0.000010
Temperature (T) 2 24665 7.539 0.001064
S x T 2 6366 1.946 0.150286
Error 72 3271
LIPO
Species (S) 1 14.72 1.470 0.229340
Temperature (T) 2 355.62 35.510 0.000000
S x T 2 414.73 41.413 0.000000
Error 72 10.01
GST
Species (S) 1 94270.1 346.7276 0.000000
Temperature (T) 2 3726.6 13.7066 0.000009
S x T 2 1229.8 4.5234 0.014109
Error 72 271.9
CAT
Species (S) 1 8378.52 280.549 0.000000
Temperature (T) 2 906.50 30.354 0.000000
S x T 2 712.20 23.848 0.000000
Error 72 29.86
SOD
Species (S) 1 359.83 55.519 0.000000
Temperature (T) 2 22.09 3.409 0.038573
S x T 2 36.83 5.682 0.005140
Error 71 6.48


Final Considerations
69
Final considerations
Crustaceans are excellent models to understand how environmental and
endogenous factors shape complex life cycles. Factors such as ultraviolet light (UV),
salinity, temperature, pollution and infections alter respiration and metabolism
(Fanjul-Moles and Gonsebatt, 2012), as well as thermal sensitivity and ROS production.
Moreover, marine shrimps are ectotherms, which enables these organisms to
be used as biomodels in order to study thermal stress response, once their body
temperature follows ocean temperature, having a direct effect on their biochemistry,
physiology and biogeographic distribution. Additionally, the study of thermal stress
response, HSP70 and ROS production enables us to understand if species are resistant
or vulnerable to temperature changes as well as to understand mechanisms they use
to cope with those changes.
This study covered four shrimp species from different habitats in order to allow
us a specific overview of stress response across a diverse set of ecological scenarios.
The purpose of the present work was to determined the thermal tolerance
response of four species of shrimps, from different habitats, in order to compare the
differences between two congener’s from different tidal habitats (Palaemon elegans
and Palaemon serratus, inhabiting intertidal and subtidal zones, respectively), and
between two congener’s who inhabit different geographic regions (Lysmata
amboinensis and Lysmata seticaudata, which are found in tropical and temperate
regions, respectively), to determine in which increasing temperatures will be more
severe.

Final Considerations
70
Our study showed that in tidal habitat, organisms living in intertidal zone are more
tolerant than those in the lower shore (subtidal zone). In fact, Palaemon elegans
showed higher tolerance values than Palaemon serratus, which means that although it
inhabits an extremely variable habitat at several levels (such as temperature, salinity
and dissolved oxygen) (Stillman, 2002; Tomanek, 2010), they are more tolerant to
global warming then their subtidal congener, Palaemon serratus, since the latter live in
a relatively variable or more stable habitat, so they are exposed to lower
temperatures, having physiological set-points lower in the temperature gradient
(Davenport & Davenport, 2005; Davenport & McAlister, 1996). .
With regard to differences between species of distinct geographic regions, it was
found that, , species inhabiting the tropical zone seem to be more vulnerable to
further increases in temperature than temperate shrimps, once Lysmata seticaudata
demonstrated a higher thermal tolerance limit than L. amboinensis, when exposed to a
thermal setting of + 6°C above their habitat temperature. This result may be explained,
by the fact that tropical ectotherms are thermal specialists and have limited
acclimation potential (Hoegh-Guldberg et al., 2007), in contrast to higher latitude
species that inhabit aseasonal environments (Tewksbury et al., 2008) and do not live
close to their upper thermal limits (Jokiel & Coles, 1977; Sharp et al., 1997).
Moreover, as expected, increased temperatures led to higher metabolic rates,
however at extreme scenarios (+ 6°C), the tropical shrimp suppresses it’s metabolism
(Q10 < 1.5). This depression means that, at such severe scenario, tropical shrimps do

Final Considerations
71
not prevent a drop in aerobic scope, with a progressive transition to an anaerobic
mode of energy production (Rosa and Seibel 2008, 2010, Rosa et al. 2012).
Heat shock proteins were a sensitive environmental stress marker. As expected,
HSP production increased in way to protect cells against higher temperatures
(Tomanek, 2010). Concomitantly, warming also lead to an augment of MDA
concentrations, SOD, GST and CAT activity, mainly for P. serratus.
Regarding to latitudinal differences, the higher mass-specific metabolic rate of the
temperate shrimp was compensated by physiological mechanisms to minimize the
negative effects of thermal stress on fitness. This way, the HSP70 concentration and
SOD, CAT and GST activities were higher L. seticaudata, however no increased cellular
damage (lipid peroxidation), a process considering to be one of the most frequent
cellular injury mechanisms (Lesser, 2006).
In conclusion, this work has shown that species have adapted their tolerance limits
to coincide with (micro)habitat conditions, this way it was proved that ocean warming
is expected to drive much more profound biological impacts on species that evolved in
relatively stable and aseasonal environment (P. serratus and L. amboinensis) than in
species inhabiting seasonal and unstable habitats (P. elegans and L. seticaudata).

Final Considerations
72
References
Davenport J, Davenport JL (2005) Effects of shore height, wave exposure and
geographical distance on thermal niche width of intertidal fauna. Ecology
Progress Series 292:41-50.
Davenport J, McAlister H (1996) Environmental conditions and physiological tolerances
of intertidal fauna in relation to shore zonation at Husvik, South Georgia.
Journal of the Marine Biological Association of the UK 76: 985-1002.
Fanjul-Moles ML, Gonsebatt ME (2012) Oxidative stress and antioxidant systems in
crustacean life cycles. In: Abele D, Vázquez-Medina JP, Zenteno-Savín T.
oxidative stress in aquatic ecosystems. Blackwell Publishing Ltd. Pp 208-219.
Gutowska MA, Melzner F (2009) Abiotic conditions in cephalopod (Sepia officinalis)
eggs: embryonic development at low pH and high pCO2. Mar. Biol. 156: 515-
519.
Hoegh-Guldberg O, Mumby PJ, Hooten AJ, Steneck RS, Greenfield P, Gomez E, Harvell
CD, Sale PF, Edwards AJ, Caldeira K, Knowlton N, Eakin CM, Iglesias-Prieto R,
Muthiga N, Bradbury RH, Dubi A, Hatziolos ME (2007) Coral reefs under rapid
climate change and ocean acidification. Science 318: 1737-1742.
Hu MY, Sucre E, Charmantier-Daures M, Charmantier G, Lucassen M, et al. (2010)
Localization of ion-regulatory epithelia in embryos and hatchlings of two
cephalopods. Cell Tissue Res 339: 571-583.
Jokiel PL, Coles SL (1977) Effects of temperature on the mortality and growth of
Hawaiian reef corals. Marine Biology 4: 201-208.

Final Considerations
73
Lesser MP (2006) Oxidative stress in marine environments: biochemistry and
physiological ecology. Ann Rev Physiol 68: 253-278.
Pörtner HO, Knust R (2007) Climate change affects marine fishes through the oxygen
limitation of thermal tolerance. Science 315: 95-97.
Sharp VA, Brown BE, Miller D (1997) Heat shock protein (hsp 70) expression in the
tropical reef coral Goniopora djiboutiensis. Journal of Thermal Biology 22: 11-
20.
Stillman JH (2002) Causes and consequences of thermal tolerance limits in rocky
intertidal porcelain crabs, Genus Petrolisthes. Integrative and Comparative
Biology 42: 790-796.
Tomanek L (2010) Variation in the heat shock response and its implications for
predicting the effect of global climate change on species’ biogeographic
distribution ranges and metabolic costs. Journal of Experimental Biology 213:
971-979.
Tweksbury JJ, Huey RB, Deutsch CA (2008) Putting the heat on tropical animals.
Science 320: 1296-1297.