UNIVERSIDADE ESTADUAL DE CAMPINAS FERNANDA ORTOLAN ...€¦ · characteristics of proteins that...
189
UNIVERSIDADE ESTADUAL DE CAMPINAS FACULDADE DE ENGENHARIA DE ALIMENTOS FERNANDA ORTOLAN CARACTERÍSTICAS PROTEICAS QUE AFETAM A QUALIDADE DO GLÚTEN VITAL PARA APLICAÇÃO EM PANIFICAÇÃO CHARACTERISTICS OF PROTEINS THAT AFFECT THE VITAL WHEAT GLUTEN QUALITY TO BE USED IN BREAD-MAKING CAMPINAS 2017
Transcript of UNIVERSIDADE ESTADUAL DE CAMPINAS FERNANDA ORTOLAN ...€¦ · characteristics of proteins that...
UNIVERSIDADE ESTADUAL DE CAMPINAS
FACULDADE DE ENGENHARIA DE ALIMENTOS
FERNANDA ORTOLAN
CARACTERÍSTICAS PROTEICAS QUE AFETAM A QUALIDADE DO GLÚTEN VITAL
PARA APLICAÇÃO EM PANIFICAÇÃO
CHARACTERISTICS OF PROTEINS THAT AFFECT THE VITAL WHEAT GLUTEN
QUALITY TO BE USED IN BREAD-MAKING
CAMPINAS
2017

FERNANDA ORTOLAN
CARACTERÍSTICAS PROTEICAS QUE AFETAM A QUALIDADE DO GLÚTEN VITAL
PARA APLICAÇÃO EM PANIFICAÇÃO
CHARACTERISTICS OF PROTEINS THAT AFFECT THE VITAL WHEAT GLUTEN
QUALITY TO BE USED IN BREAD-MAKING
Tese apresentada à Faculdade de Engenharia
de Alimentos da Universidade Estadual de
Campinas como parte dos requisitos exigidos
para a obtenção do título de Doutora em
TECNOLOGIA DE ALIMENTOS.
Thesis presented to the Faculty of Food
Engineering of the University of Campinas in
partial fulfillment of the requirements for the
degree of Doctor, in the area of FOOD
TECHNOLOGY.
ORIENTADORA: PROFA. DRA. CAROLINE JOY STEEL
ESTE EXEMPLAR CORRESPONDE A
VESÃO FINAL DA TESE DEFENDIDA
PELA ALUNA FERNANDA ORTOLAN, E
ORIENTADA PELA PROFA. DRA.
CAROLINE JOY STEEL
CAMPINAS
2017
FOLHA DE APROVAÇÃO
__________________________________
Profa. Dra. Caroline Joy Steel
Universidade Estadual de Campinas
Presidente da Banca Examinadora
__________________________________
Profa. Dra. Fernanda Maria Vanin
Universidade de São Paulo
Membro Titular da Banca Examinadora
__________________________________
Profa. Dra. Flavia Maria Netto
Universidade Estadual de Campinas
Membro Titular da Banca Examinadora
__________________________________
Prof. Dr. Luiz Carlos Gutkoski
Universidade de Passo Fundo
Membro Titular da Banca Examinadora
__________________________________
Profa. Dra. Rosiane Lopes da Cunha
Universidade Estadual de Campinas
Membro Titular da Banca Examinadora
__________________________________
Dra Elizabeth Harumi Nabeshima
Instituto de Tecnologia de Alimentos
Membro Suplente da Banca Examinadora
__________________________________
Profa. Dra. Maria Teresa Pedrosa Silva
Clerici
Universidade Estadual de Campinas
Membro Suplente da Banca Examinadora
__________________________________
Profa. Dra.Monica Ribeiro Pirozi
Universidade Federal de Viçosa
Membro Suplente da Banca Examinadora
A Ata da defesa da Tese com as respectivas assinaturas dos membros encontra-se no processo
de vida acadêmica do aluno.
DEDICATÓRIA
Dedico essa Tese à minha família, com muito amor e carinho.
AGRADECIMENTOS
Gostaria de agradecer à Profa. Dra. Caroline Joy Steel pela orientação no
Doutorado, que foi fundamental para o desenvolvimento do projeto e escrita da tese. Obrigada
pelo apoio e encorajamento ao longo dos últimos anos.
Faço aqui um agradecimento especial ao Instituto Federal de Educação, Ciência e
Tecnologia Farroupilha, principalmente, à Diretora do Campus Alegrete (2013-2016), Ana
Paula da Silveira Ribeiro, pelo afastamento integral das minhas atividades letivas para a
minha capacitação profissional, que sem dúvidas, foi fundamental para a minha dedicação
exclusiva ao desenvolvimento da tese. E ao Prof. Dr. Rodrigo Ferreira Machado, atual Diretor
do Câmpus Alegrete, pela prorrogação do afastamento para fins de conclusão da tese.
Agradeço à Faculdade de Engenharia de Alimentos (FEA) da Universidade
Estadual de Campinas (UNICAMP) pela infraestrutura disponibilizada para o
desenvolvimento de minha pesquisa. Aproveito para agradecer à supervisão em partes
específicas do meu trabalho às Professoras Dra. Flavia Maria Netto e Dra. Rosiane Lopes da
Cunha, que compartilharam comigo seus conhecimentos e enriqueceram minha tese.
Ao Conselho Nacional de Desenvolvimento Científico e Tecnológico (CNPq)
pela concessão de bolsa de doutorado e suporte financeiro à tese, além das bolsas de iniciação
científica fornecidas para as alunas do Curso de Graduação em Engenharia de Alimentos da
Universidade Estadual de Campinas, Gabriela Paiva Corrêa (2014/2015) e Karoline Urbano
(2015/2016). Agradeço também à Fundação de Amparo à Pesquisa do Estado de São Paulo
(FAPESP) pela concessão de bolsa de iniciação científica para a aluna Karoline Urbano no
ano de 2014/2015.
Agradeço muito às alunas citadas acima, Gabriela e Karoline, por toda a ajuda e
dedicação que colocaram neste trabalho. Elas se mostraram pessoas e profissionais
responsáveis, companheiras, dedicadas, e que encaram desafios com paciência e sabedoria.
Virtudes essas que encontramos em amigos.
Um reconhecimento e agradecimento especial a todos os membros do laboratório
de Cereais, Raízes e Tubérculos do Departamento de Tecnologia de Alimentos da Fea -
Unicamp, por sua amizade e por todo o conhecimento e sabedoria que compartilharam
comigo no laboratório. Faço aqui um agradecimento especial ao Marcio, que foi Técnico
Responsável durante o período experimental e grande parte do período de escrita da minha
tese, por toda a sua ajuda durante a elaboração de algumas técnicas, pelas discussões
pertinentes sobre resultados, mas, acima de tudo, pela sua amizade e dedicação. Também
agradeço aos Professores Dra. Maria Teresa Pedrosa Silva Clerici e Dr. Yoon Kil Chang,
pertencentes à área de Cereais, pelos conhecimentos, pela confiança e amizade. Embora sinta
medo de esquecer alguns nomes de colegas queridos, arrisco-me a citar alguns que fizeram
diferença em minha vida: Georgia, Lara, Amanda N., Thais (Pós-Doc), Eveline (Pós-Doc),
Ludmilla, Mária, Thaisa, Flavio, Ulliana, Amanda R., Elisa, Adriana, Michele, Aline.
Agradeço aos amigos (especialmente, Ana Laura, Amanda R., Fernanda M.,
Wellington, Adriana L., Adriana M., Alexandre, Taiana) por todo apoio e carinho, e às
minhas amigas de Santa Maria (Tatiana, Andressa, Lidiane, Maria Fernanda, Monique,
Michele, Helena, e tantas outras), que mesmo distantes sempre estiveram ao meu lado me
apoiando. Vocês são muito importantes para mim e sinto saudades!
Eu gostaria de expressar minha mais profunda gratidão à minha família, meu pai
Aido, minha mãe Ivone, meus irmãos Juliano e Daniel, minhas cunhadas Angela e Francielli e
meus sobrinhos Giovane e Paulo, que sempre me apoiaram e estiveram ao meu lado. Pelo seu
amor, apoio e entusiasmo em todos os aspectos de minha vida, que vocês sempre
compartilharam comigo, MUITO OBRIGADA. Sem vocês eu não seria ninguém!!
Quero fazer um agradecimento muito especial ao meu marido, Augusto Adelino
Ramos, do fundo do meu coração, por estar sempre comigo, por ajudar na construção desta
tese, pelo seu encorajamento me fazendo acreditar e nunca desistir dos meus sonhos, e pelo
seu contínuo amor. Você me ajudou a atravessar momentos difíceis, com muito amor e
dedicação, colocando sempre um sorriso em meu rosto. Encontrei ao seu lado mil razões para
ser feliz! MUITO OBRIGADA meu amor, você é um presente que a vida me deu. Te amo!

RESUMO
O glúten vital (GV), extraído da farinha de trigo, é um ingrediente importante para
a indústria de panificação, sendo utilizado, especialmente, para a fortificação de farinhas que
são consideradas fracas para a elaboração de pães, em especial, pães ricos em fibras, através
da suplementação de gliadinas e gluteninas à farinha de trigo. Porém, quando comercializado,
o GV apresenta poucas informações de qualidade, principalmente, a respeito de suas
proteínas, que interferem diretamente na utilização deste produto. Este trabalho teve por
objetivo avaliar as proteínas de dois glútens vitais de diferentes origens (GVA e GVB), e o
efeito destas proteínas sobre as propriedades viscoelásticas da massa de farinha de trigo (FT)
fortificada com 5 e 7 g/ 100g de GVA ou GVB, e a qualidade de pães elaborados com essas
farinhas, durante sua vida de prateleira. Além disso, este trabalho também foi desenvolvido
para avaliar a qualidade do GV comercial, correlacionando esses dados com os demais
resultados obtidos neste trabalho. Os resultados mostraram pequenas diferenças nas
características químicas e estruturais avaliadas de GVA e GVB, com exceção ao
fracionamento das proteínas que mostrou diferenças significativas, especialmente, no teor de
gliadinas encontrado, revelando que GVA apresentou quantidades semelhantes de gliadinas e
gluteninas na sua constituição. Os resultados reológicos fundamentais e empíricos
demonstraram que GVA, sob hidratação, formou uma rede de glúten mais elástica que GVB.
Os pães elaborados com farinha de trigo fortificada com GVA ou GVB apresentaram
características de firmeza menor que o pão elaborado com FT, resultando em pães mais
macios, mesmo durante a vida de prateleira deste produto de 9 dias. O pão elaborado com 7
g/100 g de GVA apresentou o melhor resultado de volume específico, enquanto os demais
pães oriundos da fortificação de 5 g/100 g de GVA e 5 e 7 g/100 g de GVB não apresentaram
diferenças significativas nesse aspecto em relação ao pão controle (elaborado com FT). Os
testes de qualidade do GV apresentaram resultados que ratificaram os resultados anteriores, e
mostraram que GVA apresentou uma rede de glúten mais elástica (pelo teste de
extensibilidade) e que suportou maior pressão dos gases na expansão da bola de glúten (pelo
teste de expansão) que GVB. O teste de correlação mostrou relações importantes entre os
testes simples do GV, e os testes reológicos da massa e de qualidade dos pães elaborados com
7 g/100 g de GV, comprovando que a qualidade viscoelástica deste produto pode ser medida
de maneira mais rápida e de menor custo. Este trabalho revelou a importância de maiores
informações sobre a qualidade da proteína de glútens vitais para sua comercialização como
ingrediente para a panificação.
ABSTRACT
The vital gluten (VG), extracted from wheat flour, is an important ingredient in
the baking industry and is used especially for the wheat flour fortification that are considered
weak for the bread preparation, especially those rich in fiber, by supplementation of gliadins
and glutenins on wheat flour. However, when marketed, the VG has few quality information,
especially about their proteins, which directly interferes in the use of this product. This work
aimed to evaluate the proteins of commercial vital glutens (VGA and VGB), and the effect of
these proteins on the viscoelastic properties of dough obtained from wheat flour fortified with
5 and 7 g/100 g of VGA and VGB, and the quality of breads elaborated with these flours,
during its shelf life. Furthermore, this work has also been developed to assess the quality of
the commercial VG through simple tests, correlate such data with other results of this study.
The results showed small differences in the chemical and structural characteristics evaluated
for VGA and VGB, except for the proteins fractionation that showed significant differences,
especially in the content of gliadins found, revealing that VGA presented similar amounts of
gliadins and glutenins in their constitution. Results from the fundamental and empirical
rheological tests showed that VGA, upon hydration, has formed a more elastic gluten network
than VGB, nevertheless VGB showed better viscoelastic properties that the dough prepared
with control wheat flour (CFW). Breads made with wheat flour fortified (VGA and VGB)
showed lower firmness characteristics that bread made with WFC, resulting in softer crumb
bread, even during its shelf life. The bread prepared with 7 g/100 g VGA showed the best
result of specific volume, while the others come from bread fortification with 5 g/100 g VGA
and 5 and 7 g/100 g VGB did not differ in this respect in relation to the control bread
(prepared with WFC). Simple tests showed results that have ratified the previous results and
showed that VGA presented a more elastic gluten network (by the extensibility test) and that
sustained higher gas pressure in the gluten ball expansion (by expansion test) than VGB. The
correlation test showed important relationships between the simple tests of VG, and the
rheological tests of the dough and quality parameters of the breads made with 7 g/100 g VG,
proving that the viscoelastic quality of this product can be measured faster and with lower
cost. This work revealed the importance of details on the protein quality of vital glutens for its
commercialization.

SUMÁRIO
1. INTRODUÇÃO GERAL .................................................................................................................. 15
2. DOCUMENTOS PUBLICADOS E/OU A PUBLICAR .................................................................. 19
ARTIGO I. ............................................................................................................................................ 19
I. Protein Characteristics that Affect the Quality of Vital Wheat Gluten to Be Used in Baking: A
Review................................................................................................................................................... 20
Abstract ................................................................................................................................................. 20
I.1. Introduction ..................................................................................................................................... 20
I.2. Vital wheat gluten ........................................................................................................................... 22
I.2.1. Gluten ........................................................................................................................................... 22
I.2.2. Gluten proteins ............................................................................................................................. 24
I.2.2.1. Gliadins ..................................................................................................................................... 24
I.2.2.2. Glutenins ................................................................................................................................... 25
I.2.3. The gluten network in the bread-making ..................................................................................... 26
I.2.3.1. The role of gluten proteins in the mixing process ..................................................................... 26
2.3.2. The role of gluten proteins in proofing ....................................................................................... 29
I.2.3.3. The role of gluten proteins in baking ........................................................................................ 31
I.3. Chemical composition of commercial vital wheat gluten ............................................................... 32
I.4. Vital wheat gluten uses ................................................................................................................... 32
I.5. Vital wheat gluten production ......................................................................................................... 34
I.5.1. Fractionation of wheat flour ......................................................................................................... 35
I.5.2. Drying step ................................................................................................................................... 36
I.6. Vital wheat gluten quality assessment ............................................................................................ 37
I.7. Conclusions ..................................................................................................................................... 42
References ............................................................................................................................................. 42
ARTIGO II. ........................................................................................................................................... 55
II. Características químicas e estruturais de proteínas de glúten vital de diferentes origens para
panificação ............................................................................................................................................ 56
Resumo .................................................................................................................................................. 56
II.1. Introdução ...................................................................................................................................... 56
II.2. Materiais e Métodos ...................................................................................................................... 59
II.2.1. Materiais ..................................................................................................................................... 59
II.2.2. Métodos ...................................................................................................................................... 59
II.2.2.1. Obtenção de glúten não vital ................................................................................................... 59

II.2.2.2. Composição química e aminoacídica ...................................................................................... 59
II.2.2.2. Fracionamento sequencial das proteínas ................................................................................. 60
II.2.2.3. Avaliação das interações químicas .......................................................................................... 60
II.2.2.3.1. Solubilidade proteica em diferentes solventes ...................................................................... 60
II.2.2.3.2. Avaliação dos grupos SH/SS ................................................................................................ 61
II.2.2.4.Eletroforese ............................................................................................................................... 61
II.2.2.5. SEC-HPLC .............................................................................................................................. 62
II.2.2.6. Análise por espectroscopia no FTIR........................................................................................ 63
II.2.2.7. Avaliação microscópica da superfície – MEV ........................................................................ 63
II.2.3. Análise estatística ....................................................................................................................... 64
II.3. Resultados e Discussão .................................................................................................................. 64
II.3.1. Composição química e aminoacídica ......................................................................................... 64
II.3.2. Composição relativa das frações proteicas ................................................................................. 65
II.3.3. Avaliação das interações químicas ............................................................................................. 68
II.3.4. Perfil das proteínas por tamanho molecular ............................................................................... 71
II.3.4.1. SDS-PAGE .............................................................................................................................. 71
II.3.4.2. SEC-HPLC .............................................................................................................................. 73
II.3.5. Espectroscopia no infravermelho por transformada de Fourier .................................................. 74
II.3.6. Avaliação microscópica da superfície da rede de glúten ............................................................ 76
II.4. Conclusões ..................................................................................................................................... 77
Referências ............................................................................................................................................ 77
ARTIGO III. .......................................................................................................................................... 83
III. Rheological properties of vital wheat glutens with water or sodium chloride ................................ 84
Abstract ................................................................................................................................................. 84
III.1. Introduction .................................................................................................................................. 84
III.2. Materials and methods ................................................................................................................. 86
III.2.1. Material ..................................................................................................................................... 86
III.2.2. Methods ..................................................................................................................................... 86
III.2.2.1. Sample codes .......................................................................................................................... 86
III.2.2.2. Gluten reconstitution and wet gluten preparation .................................................................. 87
III.2.2.3. Rheological measurements ..................................................................................................... 88
III.2.2.3.1. Calculation of power law parameters .................................................................................. 88
III.2.3 Statistical analysis ...................................................................................................................... 88
III.3. Results and discussion .................................................................................................................. 89
III.3.1. Fundamental rheological measurements ................................................................................... 89
III.3.1.1. Strain sweep ........................................................................................................................... 89
III.3.1.2. Frequency sweep .................................................................................................................... 91
III.3.1.3. Temperature sweep ................................................................................................................ 95
III.3.2. Empirical rheological measurements ........................................................................................ 97
III.4. Conclusions ................................................................................................................................ 100
References ........................................................................................................................................... 100
ARTIGO IV. ....................................................................................................................................... 105
IV. Technological characteristics of vital wheat gluten from different origins used for bread making
............................................................................................................................................................. 106
Abstract ............................................................................................................................................... 106
IV.1. Introduction ................................................................................................................................ 106
IV.2. Material e Methods .................................................................................................................... 108
IV.2.1. Material ................................................................................................................................... 108
IV.2.2. Methods ................................................................................................................................... 108
IV.2.2.1. Chemical composition .......................................................................................................... 108
IV.2.2.2 Empirical rheological tests .................................................................................................... 109
IV.2.2.2.2. α-amylase activity ............................................................................................................. 109
IV.2.2.2.3. Farinograph parameters ..................................................................................................... 109
IV.2.2.2.4 Alveograph parameters ...................................................................................................... 109
IV.2.2.2.5 Thermomechanical properties ............................................................................................ 109
IV.2.2.3. Baking test ........................................................................................................................... 110
IV.2.2.4. Pan bread quality tests .......................................................................................................... 111
IV.2.2.4.1. Bread quality tests on the production day (day 1) ............................................................. 111
IV.2.2.4.2. Quality testing of bread during shelf life (days 1, 4 and 9) ............................................... 111
IV.2.2.5. Statistical analysis ................................................................................................................ 112
IV.3. Results and Discussions ............................................................................................................. 112
IV.3.1. Chemical composition............................................................................................................. 112
IV.3.2 Technological analysis ............................................................................................................. 113
IV.3.2.1. Wet and dry gluten contents and gluten index ..................................................................... 113
IV.3.2.2. Falling Number .................................................................................................................... 115
IV.3.2.3. Farinograph parameters ........................................................................................................ 115
IV.3.2.4. Alveograph parameters ........................................................................................................ 115
IV.3.2.5. Thermomechanical properties .............................................................................................. 116

IV.3.3. Baking test and evaluation of bread quality ............................................................................ 118
IV.3.3.1. Physical-chemical analyses of bread on production day (day 1) ......................................... 118
IV.3.3.2. Physical-chemical analyses of bread during its shelf life (days 1, 4 and 9) ......................... 121
IV.3.3.3. Image analysis of bread crumb ............................................................................................ 122
IV.4. Conclusions ................................................................................................................................ 124
References ........................................................................................................................................... 125
ARTIGO V. ......................................................................................................................................... 130
V. Testes simples utilizados como ferramentas para avaliação de glúten vital ................................... 131
Resumo ................................................................................................................................................ 131
V.1. Introdução .................................................................................................................................... 131
V.2. Material e Métodos ...................................................................................................................... 134
V.2. 1. Material ................................................................................................................................... 134
V.2.2. Métodos .................................................................................................................................... 134
V.2.2.1. Preparo do glúten................................................................................................................... 134
V.2.2.2. Lavagem manual do glúten ................................................................................................... 134
V.2.2.3. Teores e índice de glúten ....................................................................................................... 135
V.2.2.4. Teste simples de extensibilidade ........................................................................................... 135
V.2.2.5. Teste de expansão .................................................................................................................. 135
V.2.3. Análise estatística ..................................................................................................................... 136
V.3. Resultados e Discussão ............................................................................................................... 136
V.3.1. Características tecnológicas dos glútens vitais medidas por testes simples ............................. 136
V.3.1.1. Avaliação da quantidade e da qualidade do glúten................................................................ 136
V.3.1.2. Avaliação da extensibilidade por teste simples ..................................................................... 137
V.3.1.3. Avaliação da qualidade pelo teste de expansão ..................................................................... 140
V.3.2. Correlação entre os testes simples e parâmetros tecnológicos dos glútens vitais..................... 141
V.4. Conclusões .................................................................................................................................. 143
Referências .......................................................................................................................................... 144
3. DISCUSSÃO GERAL .................................................................................................................... 148
3.1. Características químicas e estruturais dos glútens vitais .............................................................. 148
3.2. Reologia fundamental x reologia empírica .................................................................................. 151
3.3. Características tecnológicas das massas e dos pães elaborados com fortificação da farinha de trigo
com glúten vital ................................................................................................................................... 154
3.4. Testes simples para avaliar a qualidade tecnológica do glúten vital ............................................ 159
3.5. Teste de correlação ....................................................................................................................... 161

4. CONCLUSÃO GERAL .................................................................................................................. 163
5. REFERÊNCIAS GERAIS............................................................................................................... 164
ANEXOS............................................................................................................................................. 187
15
1. INTRODUÇÃO GERAL
O glúten vital é um concentrado proteico que contém, no mínimo, 60 % (base
seca) de proteína na sua constituição (BRASIL, 2005). É extraído da farinha de trigo, em um
processo de separação do amido e demais constituintes solúveis por via úmida. No processo
de extração do glúten vital, ocorre a formação de uma massa pela hidratação da farinha de
trigo associada ao trabalho mecânico. Após a etapa de mistura, a massa é lavada com água
para retirada dos compostos solúveis e do amido, restando, principalmente as proteínas
insolúveis (gliadinas e gluteninas), que formam a rede de glúten, responsáveis pela sua
viscoelasticidade (MARCHETTI et al., 2012).
Devido à alta umidade, o glúten úmido é seco, reduzindo seu conteúdo de água
para níveis abaixo de 10 %. A secagem é uma etapa crítica no processo de extração, pois a
temperatura pode levar à modificação estrutural das proteínas do glúten seco e perda de suas
propriedades viscoelásticas (DAY et al., 2006). Para ser comercializado, o glúten vital é
moído e acondicionado em embalagens, que podem ser plásticas ou de papel.
O glúten seco é chamado de “glúten vital de trigo”, produto que, após sua
hidratação, consegue recuperar suas propriedades viscoelásticas, que dependem da farinha de
trigo que o originou. Entretanto, em virtude do processo de obtenção do glúten vital, suas
proteínas não conseguem recuperar totalmente suas características de extensibilidade e
elasticidade quando hidratado. A modificação estrutural das proteínas do glúten vital pode ser
mecânica (pelo processo de mistura da massa) ou térmica (pelo processo de secagem do
glúten úmido). Além disso, quando o glúten obtido do processo de extração não recupera suas
características viscoelásticas após hidratação, é chamado de “glúten não vital de trigo”, que
pode ser utilizado apenas para aumento da absorção de água e teor proteico em produtos
alimentícios e não alimentícios.
Muitos são os usos de glúten vital na indústria alimentícia (pães de forma, pães
ricos em fibra, análogos de carne) e não alimentícia (biofilmes, ração para animais). Porém, o
principal mercado deste produto é as indústrias de panificação e padarias. Na indústria de
panificação, o glúten vital é utilizado para fortificar farinhas de trigo consideradas fracas na
elaboração de massas alimentícias e pães, em especial, aqueles que necessitam de farinhas
fortes para suportar o processo e/ou a adição de outros ingredientes em sua formulação, como
por exemplo, pães ricos em fibras ou panetones. Nos moinhos, o glúten vital pode ser
empregado para garantir a padronização das farinhas produzidas a partir de trigos de
diferentes origens eou qualidades. Geralmente, a sua adição ocorre dentro de uma faixa de 2

16
a 10 g/100 g (base farinha) (DAY et al., 2006), sendo 5 g/100 g a quantidade mais
frequentemente utilizada.
Quando comercializado, o glúten vital apresenta poucas informações sobre a sua
qualidade. Nos laudos, são apresentados resultados de análises físico-químicas (teores de
umidade, proteína total, cinzas e gordura), microbiológicas (bolores e leveduras, Escherichia
coli e Salmonella), propriedades funcionais (capacidade de se ligar a água) e descrição de sua
aparência (cor e odor). No entanto, a indústria de panificação requer maiores informações a
respeito das proteínas que constituem o glúten vital.
Sabe-se que a qualidade viscoelástica deste produto está associada às suas
proteínas, gliadinas e gluteninas (DELCOUR et al., 2012), que interagem entre si, formando a
rede de glúten, capaz de reter os gases formados nas etapas de fermentação e forneamento,
além de fornecer estrutura e textura aos produtos finais.
As proteínas do glúten são misturas complexas de proteínas heterogêneas, que
apresentam características de solubilidade e características viscoelásticas únicas dentre as
proteínas vegetais. As gliadinas são proteínas monoméricas com massa molecular que varia
de 30.000 a 80.000 Da, e conferem propriedades de viscosidade e de formação de espuma à
massa; são, portanto, responsáveis pela extensibilidade da rede de glúten (WIESER, 2007;
DELCOUR et al., 2012; WANG et al., 2015). As gliadinas podem ser classificadas de acordo
com a sua mobilidade eletroforética e sequência de aminoácidos em α/β-, ω-, γ-gliadinas e
gliadinas de alta massa molecular (high-molecular-weight - HMW) (DELCOUR et al., 2012).
As gliadinas, de um modo geral, apresentam estrutura globular. α/β-, γ-gliadinas e HMW-
gliadinas são proteínas ricas em aminoácidos sulfurados e apresentam ligações dissulfeto (SS)
intramoleculares, enquanto as ω-gliadinas, pobres em aminoácidos sulfurados e não formam
pontes dissulfeto, porém apresentam maior massa molecular (46.000 a 74.000 Da) que as α/β-
e γ-gliadinas (WIESER, 2007).
As gluteninas são proteínas poliméricas, compostas de agregados proteicos, com
ligações dissulfeto (SS) intramoleculares, além da existência de ligações SS intermoleculares
entre suas subunidades individuais , , resultando em proteínas de alta massa molecular (de
1x10⁵ a vários milhares de Da) (WIESER, 2007; DELCOUR et al., 2012). De acordo com a
massa molecular, são classificadas em subunidades de gluteninas de alta massa molecular
(high-molecular-weight – HMW-GS) e de baixa massa molecular (low-molecular-weight –
LMW-GS). As gluteninas são responsáveis pela elasticidade da rede de glúten, oferecendo
resistência à extensão às massas obtidas com farinha de trigo (WANG et al., 2015). Tanto as
gliadinas quanto as gluteninas são consideradas proteínas hidrofóbicas, isto é, insolúveis em
17
água e soluções diluídas de NaCl; por isso, facilmente separadas da farinha de trigo, mesmo
através de lavagem manual (DELCOUR et al., 2012).
A rede de glúten é formada pela interação entre gliadinas e gluteninas quando
hidratadas e submetidas ao trabalho mecânico. A interação entre essas proteínas ocorre por
ligações covalentes (ligações dissulfeto e ligações cruzadas de tirosina) ou ligações não
covalentes (interações hidrofóbicas, ligações de hidrogênio, e interações eletrostáticas). O
modo como essas interações ocorrem resulta em uma rede com características viscoelásticas
adequadas para a panificação. Portanto, os tipos de gliadinas e gluteninas presentes no glúten,
bem como a quantidade dessas proteínas influenciam na qualidade da rede de glúten que será
formada. Desta forma, uma avaliação química, estrutural e funcional das proteínas que
constituem os glútens vitais comerciais é importante para a definição da qualidade
viscoelástica deste produto.
A indústria de panificação, usualmente, utiliza testes de panificação para avaliar a
qualidade do glúten vital adquirido. O resultado mais utilizado para medir a vitalidade é a
alteração no volume do pão elaborado com farinha de trigo fortificada com glúten vital
(GUERRIERI; CERLETTI, 1996). Este é um procedimento complexo para o uso industrial de
rotina, já que o glúten da própria farinha pode interferir na qualidade do pão (WADHAWAN;
BUSHUK, 1989), além do grande tempo para realização desta análise. Outros ensaios para
avaliar a vitalidade são a absorção de água pelo glúten e a extensibilidade do glúten hidratado,
porém, estas análises não fornecem todas as informações necessárias para a avaliação de sua
qualidade (DUA et al., 2009).
Inúmeros testes físico-químicos e tecnológicos podem ser utilizados para avaliar a
qualidade do glúten vital. Dentre esses testes, os mais comuns são o teor de proteínas e os
testes de reologia empírica, que envolvem as análises de farinografia, alveografia,
extensografia, teores e índice de glúten através do Glutomatic®, e, mais recentemente, o uso
de Mixolab, equipamento que mede as características termomecânicas das massas. Além
disso, os testes reológicos fundamentais têm sido utilizados em estudos científicos para a
avaliação do comportamento elástico da rede de glúten.
Alguns problemas associados aos testes de qualidade envolvem a grande demanda
de tempo para a sua realização, bem como a exigência de pessoal treinado para trabalhar com
os equipamentos específicos e também a complexidade na interpretação dos resultados. Por
isso, testes tecnológicos simples podem ser usados para avaliar a qualidade viscoelástica do
glúten vital, reduzindo o tempo tornando mais fácil a interpretação dos resultados, auxiliando
a indústria de panificação na definição da quantidade de glúten vital a ser utilizado em

18
diferentes tipos de produtos, o que tem sido um desafio. Desta forma, são necessárias
informações químicas, físico-químicas e tecnológicas sobre a natureza do glúten vital, pois,
ele é comercializado sem uma descrição detalhada da sua qualidade. Por isso, o objetivo geral
desta Tese foi avaliar as características das proteínas de glútens vitais comerciais de diferentes
origens que afetam a qualidade viscoelástica deste produto quando utilizado na panificação,
em especial na elaboração de pão de forma. Os objetivos específicos deste trabalho estão
inseridos dentro dos artigos apresentados na Tese de Doutorado, apresentados abaixo:
Artigo 1 - Realizar uma ampla revisão sobre as proteínas que constituem o glúten
vital, dando ênfase aos efeitos dessas proteínas no processo de panificação, e verificar
quais análises podem ser realizadas para avaliação de sua qualidade viscoelástica.
Artigo 2 - Caracterizar os glútens vitais comerciais em relação à composição química,
composição aminoacídica, tipos de proteínas que os constituem e estrutura proteica,
comparando-os com glúten não vital, produzido em escala laboratorial.
Artigo 3 - Estudar as propriedades viscoelásticas da rede de glúten dos glútens vitais
comerciais através de testes reológicos fundamentais, e também, avaliar o efeito de
glúten vital de diferentes origens nas propriedades reológicas fundamentais da massa
de farinha de trigo fortificada em diferentes dosagens, e comparar os resultados da
reologia fundamental com os resultados de extensografia (teste de reologia empírica).
Artigo 4 - Caracterizar farinhas fortificadas com diferentes dosagens dos glútens vitais
comerciais do ponto de vista tecnológico, pelo uso de testes reológicos empírico, e
também pelo desenvolvimento e avaliação de pães durante sua vida de prateleira.
Artigo 5 - Utilizar testes simples para predizer a qualidade viscoelástica dos glútens
vitais comerciais, e correlacionar os resultados obtidos com parâmetros tecnológicos
das massas e dos pães produzidos com farinha de trigo fortificada com 7 g/100 g de
glúten vital, para definir se os testes simples podem predizer o comportamento
viscoelástico de glútens vitais comerciais.
19
2. DOCUMENTOS PUBLICADOS E/OU A PUBLICAR
ARTIGO I.
___________________________________________________________________________
Protein Characteristics that Affect the Quality of Vital Wheat Gluten to Be Used in
Baking: A Review
Ortolan, Fernanda; Steel, Caroline Joy
Accepted on February 1st, 2017, and available online on March 2nd, 2017 in
Comprehensive Reviews in Food Science and Food Safety
doi: 10.1111/1541-4337.12259
(Anexo 1)

20
I. Protein Characteristics that Affect the Quality of Vital Wheat Gluten to Be Used in
Baking: A Review
Ortolan, Fernanda; Steel, Caroline Joy
Abstract
The use of vital wheat gluten in the baking industry and wheat flour mills aims to
improve the rheological characteristics of flour considered unsuitable to obtain products such
as sliced bread, French bread, high-fiber breads, and other products that require strong flours.
To improve characteristics such as flour strength, dough mixing tolerance, and bread volume,
vital wheat gluten is added to flour at levels that can vary from 2 to 10% (flour basis), with
5% being a commonly used dosage. However, the vital wheat gluten commercialized in the
market has few quality specifications, especially related to the characteristics of the proteins
that constitute it and are responsible for the formation of the viscoelastic gluten network.
Information on protein quality is important, since variations are observed in the technological
quality of vital wheat gluten obtained from different sources, which could be associated to
damage caused to proteins during the obtainment process. Several tests, either physical-
chemical analyses or rheological tests, are carried out to establish gluten quality; however,
they are sometimes time-consuming and costly. Although these tests give good answers to
specify gluten quality, flour mills and the baking industries require fast and simple tests to
evaluate the uses and/or dosage of vital gluten addition to wheat flour. This review covers the
concepts, uses, obtainment processes, and quality analysis of vital wheat gluten, as well as
simple tests to help identify details about protein quality of commercial vital wheat gluten.
Keywords: vital wheat gluten, gluten proteins, chemical properties, protein structure,
technological quality.
I.1. Introduction
Vital wheat gluten is marketed as an ingredient for the bakery industry and is usually
added to weak wheat flour of poor bread-making quality (Weegels and others 1994a; Esteller
and others 2005; Marchetti and others 2012) to improve its viscoelastic properties, or it is
incorporated in bread formulations where the gluten from wheat flour is diluted, as flour
including bran. Usually, the vital wheat gluten commercialized is not classified according to
its protein profile or quality. However, it is expected that gluten quality influences dough
21
quality (Marchetti and others 2012), since the technological characteristics from different vital
glutens can vary widely between them (Weegels and others 1994a).
Even though the vital wheat gluten added to wheat flour improves bread quality
characteristics, it does not always retain its technological properties from the wheat flour from
which it was obtained (Miller and Hoseney 1999; van der Zalm and others 2011).
Additionally, the determination of chemical, physical, and technological properties of vital
gluten can improve its specifications to reach better bread-making performance when added
to flours.
Vital gluten can be produced from different extraction methods, starting with the
separation of wheat flour into starch and gluten, its main constituents, and ending with a
drying step (van der Borght and others 2005). There are many process factors that influence
the quality of the vital gluten obtained, such as the partial or total development of gluten
network in the dough-mixing step, which could have a deleterious effect on the gluten
viscoelasticity. Therefore, the gluten-drying step seems to be the most critical (Wadhawan
and Bushuk 1989; Guerrieri and Cerletti 1996; Marchetti and others 2012), due to two facts:
(i) protein denaturation when temperatures above 70 °C are used to dry the vital gluten
(Guerrieri and others 1996) and (ii) quick microbiological deterioration of gluten when kept in
a wet state (van der Zalm and others 2011), as a result of endogenous and exogenous
proteolytic action, making it inappropriate for application in the industry.
The processing conditions can be varied, leading to alterations in vital wheat gluten
quality, but these variations are not only a result of the production process, but also of the
wheat variety selected to produce vital gluten (Marchetti and others 2012). A cultivar suitable
for processing must have high protein content and be economically viable for the entire wheat
production chain. On the other hand, considering protein content as the only quality parameter
for the choice of wheat grain or wheat flour is not suitable, as sometimes high protein content
in the grain does not reflect in flour with good bread-making quality. A suitable flour for
bread-making should present gluten strength (W) with a minimum value of 220 x 10-4
J
(measured by an alveograph), stability with a minimum value about 7 min (measured by a
farinograph), and a Falling Number of 220 seconds (Cocchi and others 2005; Pizzinato 1997;
Roussel and Chiron 2005). When wheat flour does not present good quality for bread-making,
it can be supplemented with vital gluten, in order to improve its viscoelastic properties.
Vital wheat gluten manufacturers supply this product with few quality descriptors;
quality parameters normally presented are related to product appearance (color and odor),
chemical composition (moisture, protein, ash, and lipid contents), water-binding capacity, and
22
microbiological aspects (total plate count, coliforms, yeasts, and molds, Staphylococcus
aureus, and Salmonella).
The milling and bakery industry commonly uses practical baking tests to evaluate vital
wheat gluten quality (Guerrieri and Cerletti 1996). Therefore, more information on the
chemical, physicochemical, and technological properties of vital gluten is necessary, because,
currently, it is sold with no description of its quality. Besides that, simple tests should be
developed to reduce costs and time to evaluate gluten technological quality.
Knowledge of the relationship of vital wheat gluten chemical and structural
characteristics with technological properties may permit establishing criteria for its selection
for use in bakery products. This review describes concepts, uses, and obtainment processes of
vital wheat gluten, as well as analyses that permit assessing this relationship, focusing on the
quality of gluten proteins.
I.2. Vital wheat gluten
Vital wheat gluten is a protein concentrate (approximately 80% protein) obtained from
wheat flour (Tedrus and others 2001; Majzoobi and Abedi 2014), and it can be used to fortify
flours considered weak for bread-making (Bietz and Lookhart 1996). It is a beige to light-
brown powder.
According to the International Wheat Gluten Association (IWGA), gluten can be
marketed in two forms: “nonvital” and “vital”. Nonvital wheat gluten is gluten that has been
subjected to irreversible denaturation and, therefore, cannot be “revived” (Tedrus and others
2001). It is usually used for protein enrichment, but not for its viscoelastic properties. On the
other hand, vital wheat gluten, when in contact with water, can be rapidly hydrated and
recover its viscoelastic properties (elasticity and extensibility), due to gliadins and glutenins,
which form the gluten network.
I.2.1. Gluten
According to the Codex Alimentarius, “gluten is a protein fraction of wheat, rye,
barley, or their crossed varieties and derivatives thereof, being insoluble in water and NaCl
0.5 mol L-1
” (Codex Alimentarius 2008). In 2013, the U.S. Food and Drug Administration
defined gluten as “proteins that occur naturally in these same grains and can cause adverse
health effects in people with celiac disease” (FDA 2013). However, there are other definitions
that establish gluten as a protein network formed from covalent (disulfide bond) and non-
covalent interactions between gliadin and glutenin chains present in flour from wheat, rye,
23
and barley grains. The main non-covalent interactions involved in gluten network
development are hydrogen bonds, ionic bonds and hydrophobic interactions (Wang and others
2017; Wieser 2007). The development occurs during the mixing of flour and water, associated
with mechanical energy to give a cohesive dough with viscoelastic characteristics used for the
preparation of bakery products such as breads and some types of biscuits, as well as pasta
products (Shewry and Tatham 1997; Shewry and Halford 2002; van der Borght and others
2005; Xu and others 2007; Wieser 2007; Koehler and others 2010; Delcour and others 2012;
Melnyk and others 2012; McCann and Day 2013; Khatkar and others 2013; Singh and Singh
2013; Majzoobi and Adebi 2014; Tuhumury and others 2014; Zhou and others 2014).
Making up 80–90% of the proteins in the flour, these proteins consist of gliadins and
glutenins, which are hydrophobic. Gliadins are considered soluble in alcohol-water solutions
(typically 60-70% v/v of ethanol), while glutenins are soluble in this medium in the presence
of another chemical compound such as dilute acid, ionic detergents (sodium dodecyl sulfate -
SDS), urea, or/and β-mercaptoethanol or dithiothreitol (disulfide-reducing agents). This fact
occurs because of its intermolecular disulfide bonds (Payne and others 1984; Shewry and
others 2002; van der Borght and others 2005; Wieser 2007; Delcour and others 2012; Wang
and others 2015). Gliadins and glutenins are synthesized in the endosperm within the wheat
grain and are similar in their amino acid contents, although they are different in the amino
acid sequence (Ewart 1967; Shewry and others 2002; Mamone and others 2005; Wieser
2007). According to Ewart (1967), gliadins have more proline, glutamine (+ glutamic acid),
isoleucine, and phenylalanine, while glutenins have more glycine, lysine and tryptophan than
gliadins. Nevertheless, there are major chemical and physical differences between gliadins
and glutenins which have important effects on their functional characteristics (Osborne 1907;
Callejo and others 1999; Delcour and others 2012; Robertson and others 2013; Majzoobi and
Adebi 2014). These protein groups are responsible for the gluten network development that
provides the structure of bakery products, due its viscoelastic characteristics (Shewry and
Tatham 1997; Shewry and Halford 2002; van der Borght and others 2005; Xu and others
2007; Wieser 2007; Koehler and others 2010; Delcour and others 2012; Melnyk and others
2012; McCann and Day 2013; Khatkar and others 2013; Singh and Singh 2013; Majzoobi and
Adebi 2014; Tuhumury and others 2014). The technological importance of wheat is
associated with its capacity to develop an extensible and cohesive dough (Wang and others
2015), from wheat flour, water, and other ingredients incorporated in the bread baking
process. The viscoelastic properties of gluten are related to protein quantity and quality. These
properties influence bakery product quality, such as expansion, shape, and texture. Both
24
quality and quantity of gluten proteins affect processing quality (Singh and Singh 2013).
Variation in protein content alone is not responsible for the differences in dough properties
and suitability for the production of different end-products (Zhu and Khan 2002). Gluten
protein quality is fundamental in bread-making, as dough processing performance depends on
its viscoelastic properties. These properties are a consequence of the type of gliadins and
glutenins (insoluble proteins) present in the flour.
Gliadins assume the role of acting as plasticizers for glutenin, and thus increase the
viscosity of the dough (Delcour and others 2012) and decrease the high level of elasticity
conferred by glutenin. Therefore, an appropriate balance between gliadin and glutenin is a
determinant in gluten rheology (Melnyk and others 2012).
I.2.2. Gluten proteins
I.2.2.1. Gliadins
Gliadins are the main prolamins found in wheat. Most of them are monomeric
proteins, and they represent a heterogeneous group due to variations in the primary amino
acid sequence, enabling a classification of these proteins into 3 subunits (Shewry and Halford
2002; Mamone and others 2005; Wieser 2007; Delcour and others 2012; Khatkar and others
2013; Majzoobi and Adebi 2014; Tuhumury and others 2014): Gliadins poor in sulfur amino
acids (S-poor): this group is represented by ω-gliadin, monomers with a molecular weight
from 30,000 to 75,000; Gliadins rich in sulfur amino acids (S-rich): this group is represented
by α/β- and γ-gliadin monomers with a molecular weight from 30,000 to 45,000; and High-
molecular-weight gliadins (HMW-gliadins): polymers that are often classified into the
fraction of low-molecular-weight glutenin, although they are soluble in alcohol. The
monomeric chains are connected by disulfide bonds, and their molecular weights vary from
100,000 to 500,000 (Wieser 2007).
Since gliadins are classified into 3 distinct subunit groups, they may present small
structural differences amongst them. According to Wieser (2007), Lagrain and others (2008),
and Delcour and others (2012), ω-gliadins contain higher proline and glutamine contents in
their structure, and fewer cysteine residues, thus preventing the formation of disulfide bonds.
The α/β- and γ-gliadins present lower amounts of proline and glutamine, and cysteine residues
are all involved in intramolecular disulfide bonds (SS).
Studies on the secondary structure of gliadins (Shewry and Tatham 1997; Wieser
2007) have reported that in the N-terminal domain, where there are repeated sequences of
amino acids, there is a predominance of the β-turn structure, and in the C-terminal domain,
25
where no repeated sequence of amino acids occurs, there are predominantly α-helix and β-
sheet structures.
Gliadins, upon hydration, behave as a viscous liquid, providing dough extensibility
(Khatkar and others 2013). A balance between extensibility and elasticity (or resistance to
extension) (Melnyk and others 2012) is of interest for the gluten network functionality in
bread. Song and Zheng (2008) claim that greater amounts of gliadin in wheat flour may
contribute to decreases of mixing time and dough stability, as a consequence of a weakening
of the protein network, resulting in weak doughs, suitable for biscuit production, for example.
I.2.2.2. Glutenins
Glutenins are classified, due to their solubility, as glutelins, and consist of high-
molecular-weight glutenin subunits (HMW-GS) and low-molecular-weight glutenin subunits
(LMW-GS) (Lagrain and others 2008).
The LMW-GS have molecular weights from 30,000 to 45,000 and are classified as B,
C, and D types, according to their mobility profile on polyacrylamide gel electrophoresis
(Mamone and others 2005). According to Delcour and others (2012), the main difference
among them is the first amino acid residue that forms its primary structure, and it can be
serine, methionine, or isoleucine.
The HMW-GS are classified into 2 types according to their molecular weight: x-
HMW-GS type with molecular weights from 83,000 to 88,000 and y-HMW-GS type with
molecular weight from 67,000 to 74,000. The HMW-GS have higher amounts of cysteine
residues, when compared to other gluten-forming proteins (such as gliadin and LMW-GS),
which enables the formation of intra- and intermolecular disulfide linkages with LMW-GS.
Wellner and others (2005), studying the secondary structure of glutenins, indicated a
predominance of the α-helix structure in the C- and N-terminal domains due to the presence
of cysteine residues in these regions. In contrast, in the central areas, there was a
predominance of the β-spiral structure due to the presence of residues of glutamine, proline,
and glycine, favoring a more rigid structure of the HMW-GS (Delcour and others 2012).
Although the HMW-GS are in smaller amounts within the gluten proteins family (~10 %)
(Wieser 2007), they are crucial in gluten functionality in bakery processes.
The distribution of glutenins in terms of molecular weight and the presence of
intermolecular disulfide bonds are important characteristics to determine dough properties and
performance in the baking process. According to Shewry and others (2001), Don and others
(2003a, 2003b), Wieser (2007), Kontogiorgos (2011), Beck and others (2012), and Tomić and
26
others (2013), the so-called polymers “glutenin macropolymer” (GMP) make a higher
contribution to the technological quality of wheat flour and are strongly related to the
elasticity of the dough (dough strength) and bread volume (Domenek and others 2004;
Melnyk and others 2012; Schiedt and others 2013). GMP consists of very large structures of
both high-molecular-weight and low-molecular-weight glutenin subunits (HMW-GS and
LMW-GS, respectively) (Don and others 2003a), linked by intramolecular and intermolecular
disulfide bonds (Jekle and Becker 2013).
I.2.3. The gluten network in the bread-making
I.2.3.1. The role of gluten proteins in the mixing process
Many studies have been undertaken to explain the gluten network formation during
dough development. Researchers have tried to develop models to explain their hypotheses
involving gluten since the 1960s, and work has focused on wheat proteins (Beckwith and
Wall 1966; Ewart 1977a; Ewart 1977b; Tatham and others 1985; Gupta and others 1993;
Belton 1999, 2005; MacRitchie 2014a). For the gluten network development, the native
proteins of wheat flour must be hydrated by water addition and by mechanical work, in order
to modify the initial conformation of gliadin and glutenin chains (Belton 2005; Wieser 2007;
Tatham and Shewry 2012; Schiedt and others 2013). In this context, a sequential process that
involves the insoluble proteins and their interactions occurs. During the step of mixing flour
and water, various phenomena occur simultaneously, involving different components of the
dough, in particular proteins and starch (Salvador and others 2006; Singh and others 2011).
The macromolecular behavior of the dough is linked to wheat flour composition (Schiedt and
others 2013).
Wheat flour dough is a viscoelastic material, its characteristics mainly depend on the
properties of the flour, the quantity of water added, the air incorporated into it, and the mixing
conditions (Salvador and others 2006). When adding the water to the flour, the protein
molecules unfold, favoring the heterogeneous distribution of the water around the long protein
chains, especially around the polar amino acids and the charged ionizable groups (Schiedt and
others 2013).
With mixing, a complex protein network begins to be formed; however, the energy
applied breaks structural interactions faster than they can be rearranged, changing the water
binding capacity, and leading to increased free water in the system and the alignment of the
protein chains (Bock and Damodaran 2013). At the same time, there is a more uniform
distribution of starch granules. Furthermore, air is incorporated into the dough during mixing
27
in the form of bubbles, contributing to the rheological changes (Schiedt and others 2013).
The prior denaturation of proteins that occurs during the events mentioned above leads to the
formation of a structure that allows exposure of hydrophobic groups and favors hydrophilic
interactions necessary to stabilize the structure of the network formed.
Gluten has enough time to develop, and its structure remains stable for a while. When
the mixing time exceeds this period, there is a phenomenon known as depolymerization of
proteins (Schiedt and others 2013), the network is unstable, promoting excessive loss of
water and making it unfit for the production of products such as bread.
The chemical composition, as well as intra- and intermolecular interactions of gliadins
and glutenins favor the stabilization of the generated polymer, reflecting functional and
structural properties of the gluten in the breadmaking products (Wieser 2007; Melnyk and
others 2012; Schiedt and others 2013).
In contrast to classical protein polymer networks, wherein the bonds which are formed
are almost fixed, the gluten network is transitory in nature (Schiedt and others 2013), in that
the crosslinks are formed by disulfide bonds from the exchange of free SH groups and
available SH groups from previously formed disulfide intra- and intermolecular bonds
(gliadin and glutenin chains), and also other connections between different amino acids are
possible (Joye and others 2009).
Disulfide bonds formed by cross-links between cysteine residues are the most
important structural elements of the gluten network (Peña and others 2006; Tilley and others
2001; Ullsten and others 2009). In addition, tyrosine plays an important role in the protein
involved in β-helices (Peña and others 2006). Tilley and others (2001) have pointed out that
tyrosine cross-link formation (such as isodityrosine or dityrosine) is an important event in the
aggregation of gluten proteins. The tyrosine cross-links depend on the quantity of HMW
glutenin subunits present, particularly those of the HMW type x. These glutenin subunits are
tyrosine-rich proteins, and this amino acid might mediate the formation of covalent linkages
that influence the specific conformation of the gluten network (Peña and others 2006).
However, tyrosine cross-links have been shown to be formed in the presence of oxidizing
agents (Tilley and others 2001). Nevertheless, during dough formation, the number of cross-
links formed between tyrosine residues appears to be small and of little importance in the
structure of the gluten network compared to the disulfide bonds formed between cysteine
residues (Peña and others 2006).
The noncovalent interactions that are formed, in particular, the connections that occur
by agglomeration and aggregation of hydrophobic amino acids (van der Waals forces), or by

28
addition of β-sheets by electrostatic interactions and hydrogen bonds (Belton 1999, 2005;
Wellner and others 2005; Barth 2007; Schiedt and others 2013; Wang and others 2015), serve
to assist in stabilizing the gluten network. All types of bonds formed may produce different
behavior after deformation, which may lead to stronger or weaker interactions in the network,
providing extensibility and elasticity characteristics. At the molecular level, the elasticity has
been suggested to be mediated by covalent bonds (especially disulfide bonds), inter- and
intramolecular, among the individual chains of glutenins (Belton 1999; Shewry and others
2001; Veraverbeke and Delcour 2002; Don and others 2003a, 2003b; Wieser 2007; Wang
and others 2015). In this context, an elongation in the deformation resistance increases due to
protein-protein interactions in the extended rigid chains (Jekle and Becker 2013).
It is widely known that the strength of dough and its three-dimensional gluten network
depend on the arrangement and number of disulfide bonds and sulfhydryl groups of the
proteins, and that most of the changes in dough mixing properties are caused by thiol-
disulfide interchange reactions of gliadins and glutenins (Shewry and others 2001; Belton
2005; Delcour and others 2012; Macritchie 2014b; Lásztity and others 2000; Wang and
others 2015). Additionally, the conformation of the proteins can allow the occurrence of non-
covalent interactions that can strengthen or weaken the gluten network formed (Bock and
Damodaran 2013).
Several models for the structure of wheat gluten polymers have been proposed,
however, these theories do not explain all functional properties of gluten. Currently, the
models proposed by MacRitchie (1999) and by Belton (1999) have a large consensus in some
aspects of the viscoelastic behavior of the gluten network. These models are the first step to
resolving the structure-functionality relationships in the dough (Hamer and Vliet 2000).
MacRitchie (1999), based on polymer theory, suggested that the glutenin polymer can
be described as an entangled polymer network and the aggregates become joined through
physical entanglements. It is a physical approach to gluten structure. The gluten network
structure is a superimposition of both covalent and non-covalent interactions. Hydrogen
bonds, hydrophobic interactions and electrostatic interactions (salt, metal ion bridges) are
relatively weak but together give greater strength (Hamer and Vliet 2000).
Another model accepted currently was named the “loop-train theory”, and it was
elaborated by Belton (1999) who established that not only the disulfide bonds are involved in
the gluten network formation, but also the hydrogen bonds which contribute to the interaction
between gliadins and glutenins. In this model, the glutenin subunits interact through disulfide
bonds at the ends of the subunits and hydrogen bonds along the repeated regions. The loops

29
are formed in the repeated regions where water is contained (protein-water interaction) and,
when applying extension to the system, such as in the dough-mixing process, the loops
disappear, and the trains are formed (protein-protein interaction) (Belton 1999). The
elongation and reordering of the chains through tensile or mixing forces lead to a loss of
entropy. On the other hand, this could enable the formation of new bonds within the aligned
state, which could stabilize the system. If the extension is removed, and the polymer relaxes,
then the loops can re-appear (Jekle and Becker 2013).
In short, while mixing the dough, the “native” links of gluten-forming proteins are
broken and new bonds are formed during the preparation and the resting of the dough. The
result is a protein matrix that is much stronger than the protein clusters in the flour suspension
condition with water and without mechanical work (Schiedt and others 2013). Understanding
the role and the contribution of the proteins from the gluten network, and the type of
interactions involved in the stabilization, is a critical step in improving the dough
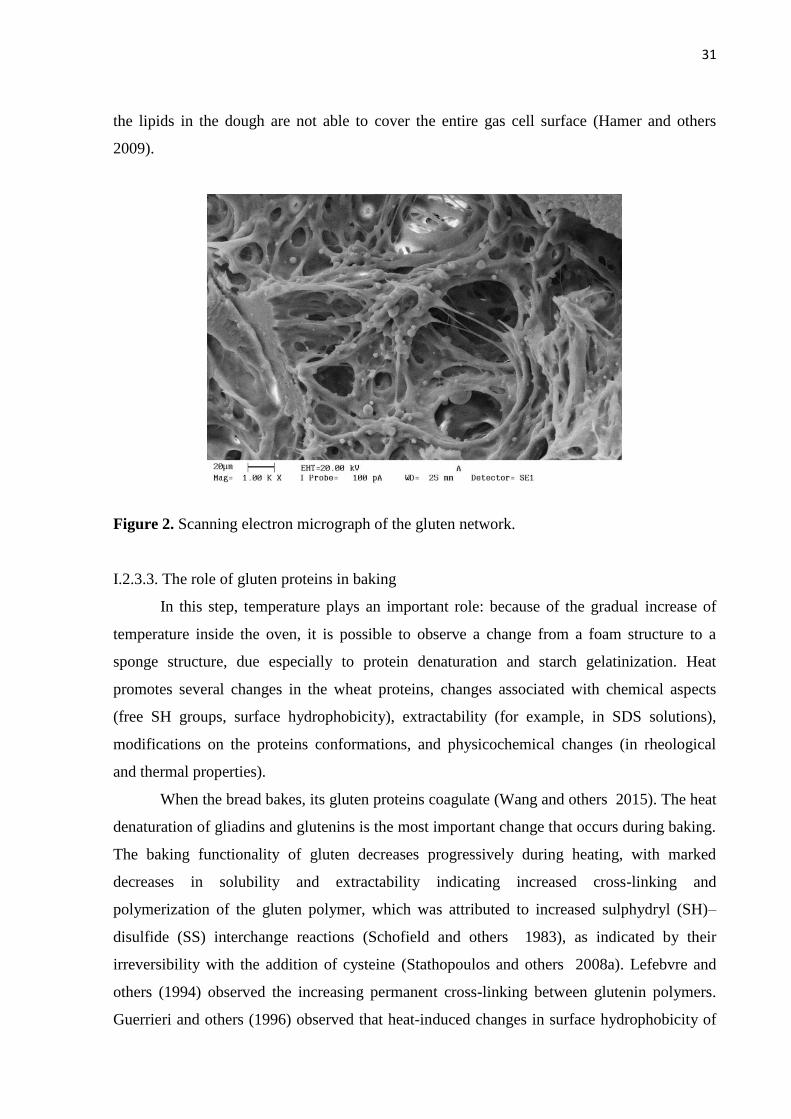
development processes, especially from wheat flour (Schluentz and others 2000). Figures 1
shows a molecular interpretation of the gluten network formation, and Figure 2 shows the
scanning electric micrograph of the gluten network.
2.3.2. The role of gluten proteins in proofing
Proofing is a period during which the dough is left to rest, after having been molded,
and when a series of complex reactions occur, especially to produce carbon dioxide gas due
the yeast action. At this stage of bread-making, starch breakdown and fermentation occur, and
dough becomes a foam during the initial phase of proofing (Cauvain 2015).
The yeast produces carbon dioxide gas that causes the gluten network to expand; this
leaves an open cellular structure with the gases trapped in pockets. Because of this, the quality
of gluten in dough is very important. It is well-known that weak wheat flour, when used in
bread-making, can produce bread with low volume, because its gluten network is unable to
prevent gas bubble coalescence during proofing and during the early stages of baking
(Cauvain 2015). Coalescence of gas bubbles in bread doughs occurs because the viscoelastic
properties of the gluten network in the dough have not been optimized or because the dough
lacks sufficient protein to form a stable gluten structure. Flours with an optimum gliadin-
glutenin ratio provide optimum bread quality (Barak and others 2014), due to the gas-holding
capacity of the gluten network developed in the dough. Thus, the increase of dough volume
during proofing refers to the gluten viscoelastic properties required. The gluten network must
have sufficient extensibility for its expansion under the rising gas pressure within the dough,

30
especially when the dough is subjected to biaxial extension; and the gluten network must have
sufficient elasticity, related to its resistance to deformation during processing (Dobraszczyk
and Roberts 1994; Dobraszczyk 2004).
Figure 1. Molecular interpretation of gluten network development after water addition
associated with mixing. Based on Abang-Zaidel and others (2010), Shewry and others (2001,
2002), Delcour and others (2012), and Belton (1999).
At the later stages of proofing, the strain-hardening properties, which are governed by
the polymeric glutenins, stabilize the foam. At elevated temperatures, these properties become
even more important (Hamer and others 2009). Gliadins also play an important role on foam.
The viscous gliadin has the potential to stabilize gas cells during bread-making due to its
surface-active properties (Wang and others 2015). Because of their structure, different types
of gliadins may give the additional degrees of freedom necessary to detect a common basis
between the surface-activity demonstrated in foaming or emulsification and that shown in
bread-making (Uthayakumaran and others 2001). Gliadins help to stabilize the foam where
31
the lipids in the dough are not able to cover the entire gas cell surface (Hamer and others
2009).
Figure 2. Scanning electron micrograph of the gluten network.
I.2.3.3. The role of gluten proteins in baking
In this step, temperature plays an important role: because of the gradual increase of
temperature inside the oven, it is possible to observe a change from a foam structure to a
sponge structure, due especially to protein denaturation and starch gelatinization. Heat
promotes several changes in the wheat proteins, changes associated with chemical aspects
(free SH groups, surface hydrophobicity), extractability (for example, in SDS solutions),
modifications on the proteins conformations, and physicochemical changes (in rheological
and thermal properties).
When the bread bakes, its gluten proteins coagulate (Wang and others 2015). The heat
denaturation of gliadins and glutenins is the most important change that occurs during baking.
The baking functionality of gluten decreases progressively during heating, with marked
decreases in solubility and extractability indicating increased cross-linking and
polymerization of the gluten polymer, which was attributed to increased sulphydryl (SH)–
disulfide (SS) interchange reactions (Schofield and others 1983), as indicated by their
irreversibility with the addition of cysteine (Stathopoulos and others 2008a). Lefebvre and
others (1994) observed the increasing permanent cross-linking between glutenin polymers.
Guerrieri and others (1996) observed that heat-induced changes in surface hydrophobicity of
32
gluten started at 45 °C, indicating unfolding of the gluten polymer exposing hydrophobic
groups and decreasing solubility. This sets the gluten, so that it is no longer elastic and
determines the bread loaf size and shape. This change does not reverse when bread is cooled.
The end result, after removal from the oven and cooling, should be a firm but open and light-
textured loaf of bread (Dobraszczyk 2004).
I.3. Chemical composition of commercial vital wheat gluten
Although this product is marketed as a “protein concentrate”, it is not composed only
of proteins. Vital gluten contains approximately 73 to 82% proteins (Day and others 2006), 6
to 8% moisture, and variable amounts of minerals (0.5 to 1.5%), carbohydrates (3 to 20%,
mainly starch), lipids (5 to 8%) and fibers (<1%). The starch and the fibers are trapped in the
cohesive protein matrix and become more difficult to be removed with higher protein content.
The amount of starch can vary, but with extensive washing a significant reduction of
the starch in the protein matrix can be observed (Miller and Hoseney 1999). The amount of
extra water that is required for this washing generates a large amount of process effluent,
increasing the biological oxygen demand (Day and others 2006). The non-polar lipids of the
wheat flour can interact with the hydrophobic regions of the gluten proteins during the
washing process, not allowing complete extraction of lipids in the washing step to obtain the
vital gluten (Autran 1993; Debet and Gidley 2006). Gluten is a protein complex which is
insoluble in water, although there may be small amounts of soluble proteins trapped in the
gluten matrix. Despite its insolubility and its hydrophobic nature, gluten absorbs about twice
its dry weight in water to form the gluten network (Day and others 2006).
I.4. Vital wheat gluten uses
Vital wheat gluten is an ingredient used mainly in the baking industry (Marchetti and
others 2012; Melnyk and others 2012; Majzoobi and Abedi 2014). Its use is recommended
for the production of certain specialty breads (loaf bread with added fibers and/or germ and
other ingredients), panettone, for which the fermentation step is long and the volume is
important, or even in flour with low gluten quality or quantity (Tedrus and others 2001).
In bakery products, vital wheat gluten is used to fortify flour with lower protein
content and of less than desirable quality or is inadequate for bread-making. The addition, this
ingredient increases the protein content of the flour and improves its technological quality.
This practice used by the baking industry, mills, and bakeries has become increasingly
common in many countries. When added, vital gluten generally improves the strength of the
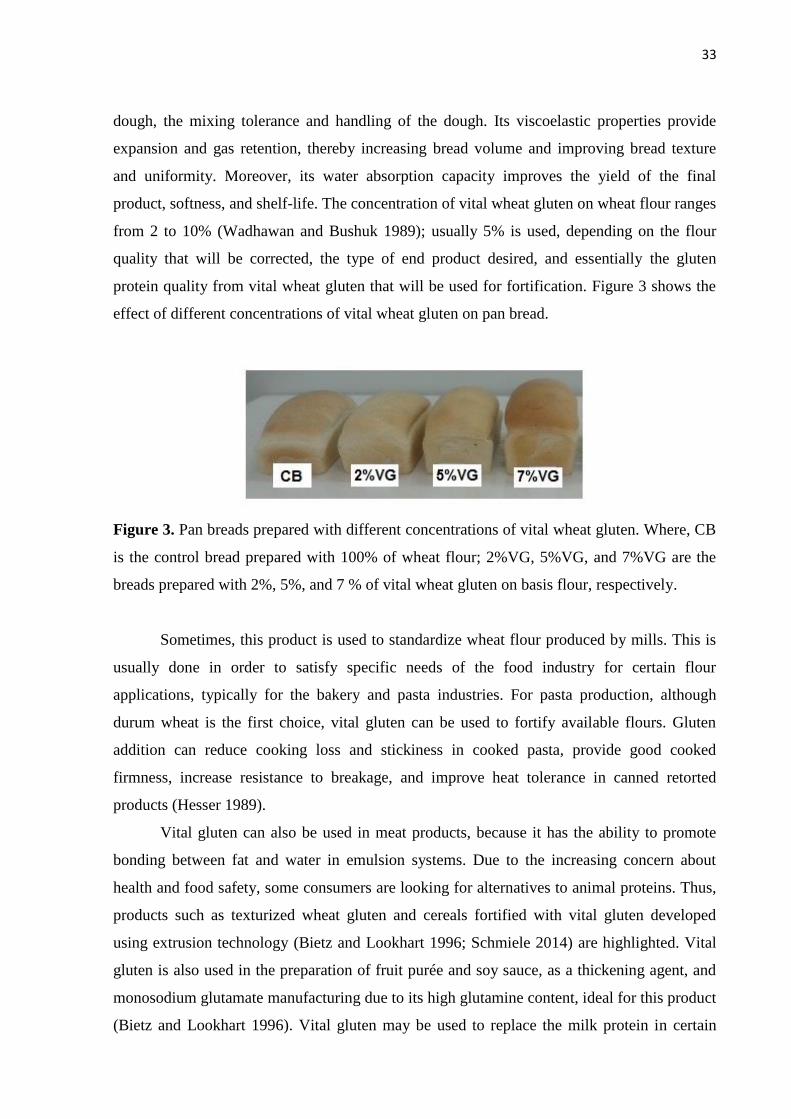
33
dough, the mixing tolerance and handling of the dough. Its viscoelastic properties provide
expansion and gas retention, thereby increasing bread volume and improving bread texture
and uniformity. Moreover, its water absorption capacity improves the yield of the final
product, softness, and shelf-life. The concentration of vital wheat gluten on wheat flour ranges
from 2 to 10% (Wadhawan and Bushuk 1989); usually 5% is used, depending on the flour
quality that will be corrected, the type of end product desired, and essentially the gluten
protein quality from vital wheat gluten that will be used for fortification. Figure 3 shows the
effect of different concentrations of vital wheat gluten on pan bread.
Figure 3. Pan breads prepared with different concentrations of vital wheat gluten. Where, CB
is the control bread prepared with 100% of wheat flour; 2%VG, 5%VG, and 7%VG are the
breads prepared with 2%, 5%, and 7 % of vital wheat gluten on basis flour, respectively.
Sometimes, this product is used to standardize wheat flour produced by mills. This is
usually done in order to satisfy specific needs of the food industry for certain flour
applications, typically for the bakery and pasta industries. For pasta production, although
durum wheat is the first choice, vital gluten can be used to fortify available flours. Gluten
addition can reduce cooking loss and stickiness in cooked pasta, provide good cooked
firmness, increase resistance to breakage, and improve heat tolerance in canned retorted
products (Hesser 1989).
Vital gluten can also be used in meat products, because it has the ability to promote
bonding between fat and water in emulsion systems. Due to the increasing concern about
health and food safety, some consumers are looking for alternatives to animal proteins. Thus,
products such as texturized wheat gluten and cereals fortified with vital gluten developed
using extrusion technology (Bietz and Lookhart 1996; Schmiele 2014) are highlighted. Vital
gluten is also used in the preparation of fruit purée and soy sauce, as a thickening agent, and
monosodium glutamate manufacturing due to its high glutamine content, ideal for this product
(Bietz and Lookhart 1996). Vital gluten may be used to replace the milk protein in certain

34
cheese products (if regulatory standard of identify allows), due its viscoelasticity, providing a
characteristic texture and better eating quality of the cheese (Hesser 1989).
In the pet food industry, vital gluten is used in the preparation of meat analogs, due to
its water absorption capacity and interaction with fat, thus also contributing to the nutritional
needs of animals (Bietz and Lookhart 1996; Abang Zaidel and others 2009). For dog biscuits,
the use of vital gluten contributes to improve resistance to breakage, especially during
packaging and shipping (Hesser 1989).
It can also be used as a plasticizer in the formation of adhesives and films as a barrier
for food and non-food products, such as cosmetics and medicines. Gluten is a renewable and
biodegradable alternative. Wheat gluten protein, a renewable resource, is capable of forming a
fibrous network which lends strength, elasticity, and plasticity when formed into a film
(Koehler and others 2010). However, its use for this purpose must be carefully controlled.
Due to the prevalence of gluten allergies and celiac disease, gluten films should only be
suitable for wheat-containing foods.
Besides all these uses, new technologies are being increasingly explored to modify the
structure and thus the functionality of this unique protein ingredient to provide a range of
functional properties at a more modest price than demanded by its competitors such as milk
and soy proteins (Day 2011).
I.5. Vital wheat gluten production
The greatest world producers of wheat gluten are the USA, Canada, Australia, the
Netherlands, France, and Germany (Boland and others 2005). Currently, in Asia, 2 countries
are highlighted for wheat production volume and for its vital gluten producers: India and
China. In the year 2015/2016, India produced 86,530 million tons of wheat, with an
increasing market and production industry. On the other hand, China has emerged as a major
producer, due especially to 2 factors: (i) great wheat production volume – in 2015/2016, its
production was 130 million tons of wheat (ABITRIGO 2016), only a little behind the
European Union countries which together totaled 160,012 million tons produced; and (ii)
cheap labor and tax incentives for the creation of new industries. According to Koehler and
others (2010), the production of vital gluten per year in Europe is around 600,000 tons, and
the world annual estimate for gluten production was over 1,200,000 metric tons for 2015
(personal information); generally, most of its production is used by the baking industry
(Wadhawan and Bushuk 1989).
35
Vital wheat gluten quality depends on the quality of the wheat grain used for its
production. The selection of suitable hard wheat varieties which give good yield of gluten is
important (Mekuria and Admassu 2011). For wet-milling to produce vital wheat gluten, flours
from wheats with high protein content (Sayaslan and others 2006), 14 to 17 % (Guarienti
1996), with high-yield and good mixing quality (strong gluten aggregation) are preferred
(Sayaslan and others 2006; Maningat and Bassi, 1999). In addition, sometimes this wheat
grain or wheat flour quality is not available for vital gluten production, hence a small
proportion of durum or soft wheat flour could be added to a hard wheat flour with no adverse
effect on the separation, yield, and quality of the co-products starch and gluten (Sayaslan
2004). The use of better wheat varieties on those considered weak wheats solves the quality
and scarcity problems of good quality vital wheat gluten in the global market.
To obtain vital wheat gluten, a multistep process that begins with the milling of the
wheat grain has been used. The milling step is followed by aqueous separation of starch from
gluten, which is insoluble in water. After this step, gluten must be dried and ground.
I.5.1. Fractionation of wheat flour
Wheat flour is the best raw material from which to obtain vital wheat gluten, because
it facilitates the fractionation process into starch and gluten. According to van der Borght and
others (2005), flour fractionation processes can be classified on the basis of the degree of
gluten protein agglomeration. The most important processes are the dough, dough-batter,
batter, and other batter-based processes. Here, we describe the first step of these methods,
where gluten and starch are separated from wheat flour.
Dough process: Vital gluten is typically produced by the Martin process. In this
process, flour and water (~ 60%) are mixed and left at rest to form a dough. The dough is then
washed under running water with gentle mixing, separating the gluten and starch, which is
carried by the water (Weegels and others 1988; Robertson and others 1999; Day and others
2006). In this wheat flour fractionation step, the starch may be separated by different
methods: by centrifugation, the use of hydrocyclones, decanters, or sieving (screening), as the
starch granules have a higher density and larger size than gluten (Robertson and others 2008).
The vital wheat gluten resulting from wheat flour fractionation is subjected to careful drying
and subsequent grinding and, when rehydrated, it is still able to form an elastic and cohesive
dough (Bietz and Lookhart 1996).
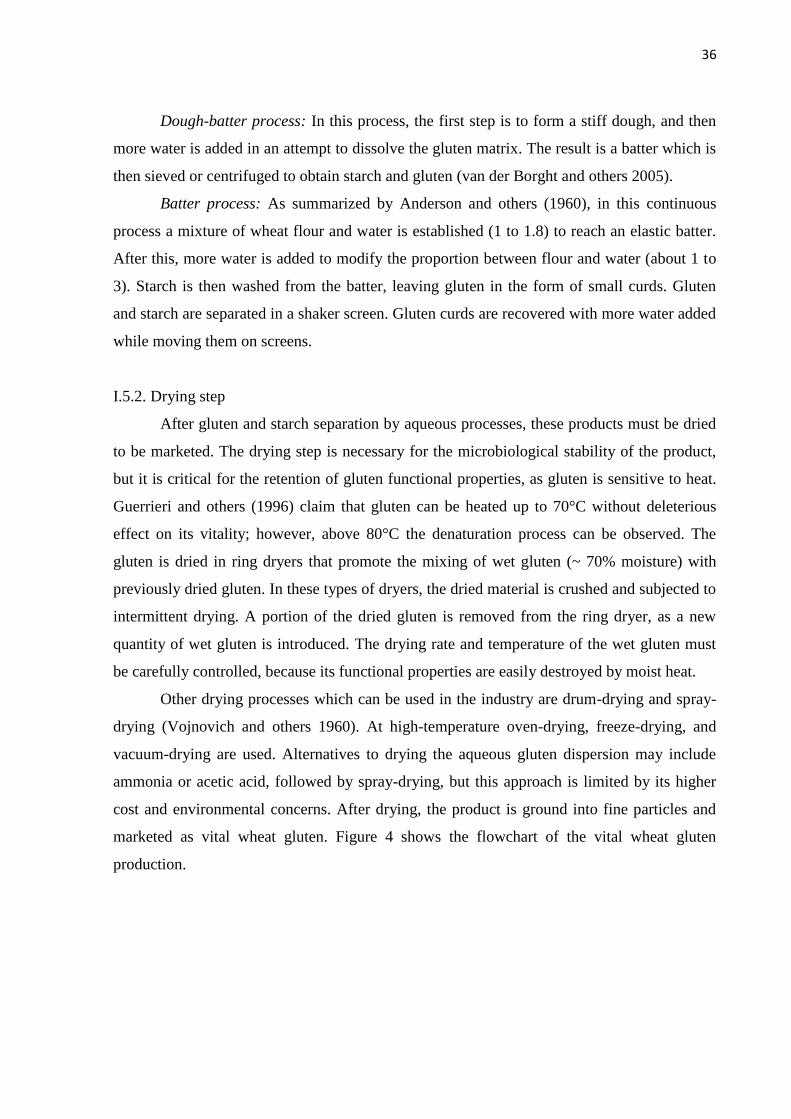
36
Dough-batter process: In this process, the first step is to form a stiff dough, and then
more water is added in an attempt to dissolve the gluten matrix. The result is a batter which is
then sieved or centrifuged to obtain starch and gluten (van der Borght and others 2005).
Batter process: As summarized by Anderson and others (1960), in this continuous
process a mixture of wheat flour and water is established (1 to 1.8) to reach an elastic batter.
After this, more water is added to modify the proportion between flour and water (about 1 to
3). Starch is then washed from the batter, leaving gluten in the form of small curds. Gluten
and starch are separated in a shaker screen. Gluten curds are recovered with more water added
while moving them on screens.
I.5.2. Drying step
After gluten and starch separation by aqueous processes, these products must be dried
to be marketed. The drying step is necessary for the microbiological stability of the product,
but it is critical for the retention of gluten functional properties, as gluten is sensitive to heat.
Guerrieri and others (1996) claim that gluten can be heated up to 70°C without deleterious
effect on its vitality; however, above 80°C the denaturation process can be observed. The
gluten is dried in ring dryers that promote the mixing of wet gluten (~ 70% moisture) with
previously dried gluten. In these types of dryers, the dried material is crushed and subjected to
intermittent drying. A portion of the dried gluten is removed from the ring dryer, as a new
quantity of wet gluten is introduced. The drying rate and temperature of the wet gluten must
be carefully controlled, because its functional properties are easily destroyed by moist heat.
Other drying processes which can be used in the industry are drum-drying and spray-
drying (Vojnovich and others 1960). At high-temperature oven-drying, freeze-drying, and
vacuum-drying are used. Alternatives to drying the aqueous gluten dispersion may include
ammonia or acetic acid, followed by spray-drying, but this approach is limited by its higher
cost and environmental concerns. After drying, the product is ground into fine particles and
marketed as vital wheat gluten. Figure 4 shows the flowchart of the vital wheat gluten
production.
37
Figure 4. Flowchart of the vital wheat gluten production. Based on van der Borght and others
2005.
I.6. Vital wheat gluten quality assessment
Gluten quality is one of the most important criteria for judging its performance in the
baking industry (Chandi and Seetharaman 2012). The vitality of gluten is generally evaluated
for its ability to increase the volume and to improve the crumb texture of bread produced from
standard fortified flour with vital gluten (Wadhawan and Bushuk 1989). This is the routine
Wheat grain
Milling
Wheat flour
Mixing wheat flour with water
Dough development
Dough washing
Wet gluten (insoluble proteins)
Pressing or centrifugation
Drying
Grinding
Packaging
"Dry vital wheat gluten"
Starch + water soluble
components

38
test carried out by baking industries to assess the vital gluten level needed to fortify wheat
flour with it (Guerrieri and Cerletti 1996; Chandi and Seetharaman 2012).
The American Association of Cereal Chemists International provides AACCI method
10-10.03 (AACCI, 2010), which is a guide to make a baking test with 100 g of flour and with
short proofing time (greater or less than 90 min, depending of the yeast level used). In this
test, standard recipes and standard procedures are used, and usually they are adapted to the
purpose of the baking test (Sluimer 2005).
The baking performance of wheat flour (fortified or not with vital wheat gluten) can be
measured by the baking test, and the main result obtained is loaf volume (Kieffer and others
1998). Besides, crumb firmness can be evaluated if texture analyses are conducted during
bread shelf life.
The functional properties of gluten proteins depend on their physical and chemical
properties that affect their behavior in food systems (Day and others 2006). The differences in
the functional quality parameters of vital wheat gluten are determined through chemical
analysis of its proteins, describing protein composition and also protein structure, or through
physical tests, emphasizing viscoelastic properties of the fortified wheat flour with vital
gluten.
To determine the differences in functionality of vital gluten, flour quality parameters
such as farinograph parameters, and determining the volume of bread, are commonly used
(Dua and others 2009). Several publications (Czuchajowska and Paszczynska 1996;
Dobraszczyk and Morgenstern 2003; Song and Zheng 2007; Dhaka and others 2012;
Marchetti and others 2012; MacRitchie 2014b) have described the use of alveograph,
farinograph, extensograph, and Mixolab™ equipment to test the functionality of vital gluten
obtained by different methods. In addition to these analyses, the ability of vital gluten in
improving bread performance is generally evaluated, by loaf volume and crumb structure,
when a poor quality flour is used for baking (Wadhawan and Bushuk 1989).
It is well known that protein content can be estimated quantitatively by the Kjeldahl
method by the determination of nitrogen with its conversion to protein using the 5.7 factor for
wheat (Wang and others 2014). However, this is not enough to characterize the type of
proteins in vital gluten, so it is also very common to determine wet and dry gluten contents as
a guide to their quality (Larsson and Eliasson 1996).
Polyacrylamide gel electrophoresis with sodium dodecyl sulfate (SDS-PAGE) and
reverse-phase high-performance liquid chromatography (RP-HPLC) are classic techniques
that can be used to separate gliadins and glutenins and their subunits according to molecular

39
size. However, as the reduction of disulfide bonds is a prerequisite to investigate the size of
the protein aggregates, these methods cannot avoid the loss of information as individual
polypeptides interact to form, especially, glutenin polymers or glutenin macropolymers
(GMP) (Don and others 2003a; Labuschagne and Aucamp 2004). Other techniques with
higher resolution for separation of proteins in non-denaturing medium can be applied, with
the advantage of evaluating the functionality of vital gluten for different applications. The
high-performance liquid chromatography by molecular size exclusion (SE-HPLC) is a
commonly used technique for investigating information on protein aggregates. It is an
important tool in the evaluation of native protein aggregates, because it can provide a
physical-chemical basis for dough strength. Furthermore, it is a quick test to evaluate the
bread-making quality of wheat genotypes for breeding programs.
Currently, SEC-HPLC is a technique used to separate the 4 major wheat protein
classes in flour and vital gluten: albumins, globulins, gliadins, and glutenins, and the results
obtained by this technique have been strongly correlated with the quality of dough
development (Singh and others 1990; Labuschagne and Aucamp 2004). Gupta and others
(1993) and Uthayakumaran and others (2002) found a correlation between the amount of
protein polymers found in wheat flour and technological parameters during the dough-mixing
process. The amount of some protein polymers is related to gluten strength and the volume of
bread (Autran 1993; El Haddad and others 1996; Weegels and others 1996; Scanlon and
Zghal 2001; Bekes and others 2004; Delcour and others 2012; Bock and Damodaran 2013).
Chemical predictive tests, including those for surface hydrophobicity, protein
solubility in various solvent systems, and the types of interactions that occur between the
proteins, as well as the ratio of gliadin-to-glutenin, have been investigated to evaluate gluten
vitality (Krull and Wall 1969; Melander and Horváth 1977; Jeanjean and others 1980;
Kinsella and Hale 1984; Robertson and others 1999; Singh and Macritchie 2001; Bennion
and Daggett 2003; Liu and Hsieh 2008; Stathopoulos and others 2008b). Near-infrared
spectroscopy has also been used to assess qualitative and quantitative properties of wheat
proteins (Guerrieri and Cerletti 1996; Bock and Damodaran 2013; Sivam and others 2013;
Czaja and others 2016).
Evaluations of the characteristics of the protein gel, using such fundamental
rheological tests as oscillatory dynamic tests and compression tests, appear as alternative
techniques to better assess gluten behavior during dough development (Létang and others
1999; Uthayakumaran and others 2002; Dobraszczyk and Morgenstern 2003; Dobraszczyk
2004; Ng and others 2006; Angioloni and others 2008; Mirsaeedghazi and others 2008; Ng
40
and McKinley 2008; van den Broeck and others 2009; Uthayakumaran and others 2014), as
some physical tests often do not have good intra- and inter-assay repeatability (Chandi and
Seetharaman 2012).
Knowing that vital gluten undergoes a drying step during its processing, it is necessary
to assess the degree of denaturation of proteins at high temperatures, relating it to their
functionality when applied to wheat flour or other flours. The gluten proteins, as protein
molecules, are characterized by a transition temperature between 2 phases, one semi-solid,
prevalent at high temperatures, and the other glassy-solid, prevalent at low temperatures (Hill
and others 2014). This type of physical change is called “glass transition”. The glass transition
temperature (Tg) is the main parameter to understand the thermal and mechanical properties
of gluten proteins (Cherian and Chinachoti 1997; Micard and Guilbert 2000; Hayta and
Schofield 2004; Thanatuksorn and others 2009; Khatkar and others 2013). An analytical tool
to study the thermal behavior of these proteins is differential scanning calorimetry (DSC),
which is a technique that allows observations of phenomena involving heat exchange
(Arntfield and Murray 1981; Wang and Damodaran 1990; Weegels and others 1994a, 1994b;
Leon and others 2003; Angioloni and Dalla Rosa 2005; Falcão-Rodrigues and others 2005;
Mohamed and others 2010).
The molecular structure of gluten is also relevant to determine its viscoelastic
characteristics. Studies of the molecular origin of viscoelasticity have been hampered by the
intrinsic complexity of gluten, since it is composed of dozens of proteins of high-molecular-
weight, and because it is insoluble in water. This has promoted the development of techniques
for determining three-dimensional structures in high resolution, such as X-ray diffraction
spectroscopy and nuclear magnetic resonance (NMR) (Umbach and others 1998).
As gluten protein structures vary depending on the solvent used, the secondary
structures of proteins have been studied for wheat gluten using infrared Fourier transform
spectroscopy (FTIR). This analysis allows the quantification of the secondary structures of
proteins in a solid, in tablet form, or as a film (Bernardes Fillho and others 1998). FTIR
coupled with Attenuated Total Reflectance (FTIR/ATR) cell is a powerful method to obtain
relevant information for understanding protein adsorption to surfaces (Chittur, 1998). The use
of ATR is usually related to the rapid obtaining of the difficult-to-handle samples spectrum,
with controlled temperature, and less intense interference of the solvent can be observed in the
infrared spectrum as a whole, allowing its easy subtraction of the sample spectrum (Fabian
and Mäntele 2002).
41
The circular dichroism technique (CD) also provides important data on the
conformation of the protein structures present in many systems. Molecules that have several
chiral centers, such as proteins and peptides, can interact with incident light and change its
polarization. Thus, the CD technique uses this fact to determine the secondary structure of
proteins, peptides, and nucleic acids (Kieffer and others 2007).
The surface formed in the gluten network can be assessed by scanning electron
microscopy (SEM), which provides interesting data on the surface morphology of the
structure from images at high magnification. Khatkar and others (2013) studied the changes in
microstructure after gliadin addition to doughs and reported structural differences between
them.
Polymerization of glutenin and gliadin to form the gluten network involves the
oxidation of sulfhydryl groups (SH) and the exchange with previously existing disulfide
bonds (SS) (Beveridge and others 1974; Hueqner and others 1977; Kuktaite and others
2011). In studies with the addition of reducing agents and oxidants to flour, it was observed
that the addition of a reducing agent breaks the disulfide bonds between gliadin and glutenin,
whereas the oxidizing agent aids in the polymerization of gluten (Lagrain and others 2006).
These observations were ascribed to a SH-SS exchange mechanism (Khatkar and others
1995). Thus, changes of free SH groups affect the association between gliadins and glutenins,
becoming an important factor for evaluating the quality of vital gluten.
While the rheological and practical baking tests are the most common tests in mills,
baking industries and research institutions use chemical tests for the assessment of vital gluten
quality (Chandi and Seetharaman 2012), as these are also important in determining the type
and quantity of the proteins found in the product. On the other hand, these chemical and
physical tests require a long time of analysis, specific instrumentation and reagents, and also
technical personnel trained for such analysis and interpretation of the data. Thus, the use of
simple tests to assess vital gluten quality is relevant for reducing analysis time and costs, as
long as they allow obtaining fast results associated with the technological quality of vital
gluten.
Simple tests, such as the expansion test of a gluten ball, hand-washing test and an
extensibility test by simply stretching the gluten ball, can be important for determining vital
gluten quality, often avoiding the need to carry out more time-consuming practical baking or
physical or chemical tests to check the viscoelastic properties of this product before its
application in the baking industry. These rapid tests can also be carried out in bakeries or
mills that must assess the quality of gluten.
42
I.7. Conclusions
Vital wheat gluten is an ingredient used in the bakery industry. It is obtained from
wheat flour through a process that involves washing and drying steps. Drying is a critical
process step, because heat can induce thermal denaturation of vital wheat gluten proteins, and
this can change viscoelastic characteristic of gluten when rehydrated. When vital wheat gluten
is added to wheat flour, it is expected that this protein supplementation improves the
viscoelastic properties of the gluten network and, consequently, dough quality.
The protein characteristics that affect the technological quality of vital gluten to be
used in baking are amino acid composition, protein structure and conformation, gluten protein
hydrophobicity, and gliadin and glutenin quantity and quality. Good quality of the gluten
network is achieved when its proteins, gliadins and glutenins, can interact with each other,
through non-covalent interactions and disulfide bonds, resulting in a cohesive and elastic
network able to retain gases from fermentation in the bread-making process.
The gluten network has a complex viscoelastic behavior that depends on its proteins,
thus there are many tests to verify its technological quality. Rheological tests are conducted to
determine the viscoelastic properties using different methods and equipment, at a macroscopic
level, but physical-chemical tests are also important to identify protein quality at microscopic
and molecular levels. Correlation studies of dough rheological properties and gluten protein
quality are relevant to expand our knowledge on the unique behavior of gluten.
Acknowledgements
The authors thank CNPq (National Council for Scientific and Technological
Development) for an author’s grant (163129/2013-4).
Author Contributions
Fernanda Ortolan researched prior studies and wrote the text.
Caroline Joy Steel reviewed the text and made suggestions to improve the work.
References
AACCI. 2010. American Association of Cereal Chemists International. Approved methods,
11th ed., St. Paul: AACCI.
Abang Zaidel DN, Chin NL, Yusof YA, Abdul Rahman R. 2009. Analysis and correlation
studies on gluten quantity and quality during production. J Appl Sci 9:1686–94.
ABITRIGO. 2016. Associação Brasileira da Indústria do Trigo. Estatísticas. Available from:

43
< http://abitrigo.com.br/associados/arquivos/5.prod_trigo.pdf>. Accessed in: 2016
October 14.
Anderson RA, Pfeifer VF, Lancaster EB, Vojnovich C, Griffin Jr EL. 1960. Pilot-plant
studies on the continous batter process to recover gluten from wheat flour. Cereal Chem
37:180–8.
Angioloni A, Balestra F, Pinnavaia GG, Rosa MD. 2008. Small and large deformation tests
for the evaluation of frozen dough viscoelastic behaviour. J Food Eng 87:527–31.
Angioloni A, Dalla Rosa M. 2005. Dough thermo-mechanical properties: Influence of
sodium chloride, mixing time and equipment. J Cereal Sci 41:327–31. Arntfield SD,
Murray ED. 1981. The influence of processing parameters on food protein functionality
I. Differential scanning calorimetry as an indicator of protein denaturation. Can Inst
Food Sci Technol J 14:289–94.
Autran JC. 1993. Recent perspectives on the genetics , biochemistry and functionality of
wheat proteins. Trends Food Sci Technol 4:358–64. Barak S, Mudgil D, Khatkar BS.
2014. Influence of gliadin and glutenin fractions on rheological, pasting, and textural
properties of dough. Int J Food Prop 17:1428–38.
Barth A. 2007. Infrared spectroscopy of proteins. Biochim Biophys Acta 1767:1073–101.
Beck M, Jekle M, Becker T. 2012. Impact of sodium chloride on wheat flour dough for yeast-
leavened products. I. Rheological attributes. J Sci Food Agric 92:585–92. Beckwith A,
Wall J. 1966. Reduction and reoxidation of wheat glutenin. Biochim Biophys
Acta130:155–62.
Bekes F, Gianibelli MC, Wrigley C. 2004. Grain proteins and flour quality. Aust J Agric Res
416–23.
Belton PS. 1999. On the elasticity of wheat gluten. J Cereal Sci 29:103–7. Belton PS. 2005.
New approaches to study the molecular basis of the mechanical properties of gluten. J
Cereal Sci 41:203–11.
Bennion BJ, Daggett V. 2003. The molecular basis for the chemical denaturation of proteins
by urea. Proc Natl Acad Sci U S A 100:5142–7.
Bernardes Fillho R, Otsuka R, Colnago LA. 1998. Análise das estruturas secundárias das
proteínas do glúten de trigo em estado sólido por FTIR. São Carlos, São Paulo, Brasil
Available from:
http://www.cnpdia.embrapa.br/publicacoes/download.php?file=CT24_98.pdf . Accessed
2016 July 27.
Beveridge T, Toma SJ, Nakai S. 1974. Determination of SH- and SS-groups in some food
44
proteins using Ellman’s reagent. J Food Sci 39:49–51. Bietz JA, Lookhart GL. 1996.
Properties and non-food potential of gluten. Cereal Foods World 41:377–82.
Bock JE, Damodaran S. 2013. Bran-induced changes in water structure and gluten
conformation in model gluten studied by Fourier transform infrared spectroscopy. Food
Hydrocoll 31:146–55.
Boland M, Brester GW, Taylor MR. 2005. Global and U.S. wheat gluten industries: structure,
competition, and trade. Agricultural Marketing Policy Center briefing n°. 76, Montana
State University, Bozeman.Available from: http://purl.umn.edu/29220. Accessed 2016
March 30.
Callejo MJ, Gil MJ, Rodríguez G, Ruiz M V. 1999. Effect of gluten addition and storage time
on white pan bread quality: instrumental evaluation. Zeitschrift für Leb und -Forsch
208:27–32.
Cauvain S. 2015. Technology of breadmaking, Third ed. Springer, New York. p.1-408.
Chandi GK, Seetharaman K. 2012. Optimization of gluten peak tester: a statistical approach. J
Food Qual 35:69–75. Cherian G, Chinachoti P. 1997. Nuclear magnetic resonance
mobility, and glass transition behavior of gluten. Cereal Chem 74:312–7.
Chittur KK. 1998. FTIR / ATR for protein adsorption to biomaterial surfaces. Mater Eng
19:357-69.
Cocchi M, Cobellini M, Foca G, Lucisano M, Ambrogina Pagani M, Tassi L, Ulrici A. 2005.
Classification of Bread Wheat Flours in Different Quality Categories by a Wavelet-
Based Feature Selection/classification Algorithm on NIR Spectra. Ana Chim Acta
544:100–7.
Codex Alimentarius. 2008. FAO / WHO. Thirty first Session. Geneva , Switzerland, 30 June -
5 July 2008 , Bad Neuenahr-Ahrweiler , Germany.
Czaja T, Mazurek S, Szostak R. 2016. Quantification of gluten in wheat flour by FT-Raman
spectroscopy. Food Chem 211:560–3.
Czuchajowska Z, Paszczynska B. 1996. Is wet gluten good for baking ? Cereal Chem 73:483–
9.
Day L, Augustin M a., Batey IL, Wrigley CW. 2006. Wheat-gluten uses and industry needs.
Trends Food Sci Technol 17:82–90.
Day L. 2011. Wheat gluten: production, properties and application. In Phillips G O, Williams
PA, editors, Handbook of food proteins, Woodhead Publishing, Sawston, UK. pp 267-
88
Debet MR, Gidley MJ. 2006. Three classes of starch granule swelling : Influence of surface
45
proteins and lipids. Carbohydr Polym 64:452–65.
Delcour Ja, Joye IJ, Pareyt B, Wilderjans E, Brijs K, Lagrain B. 2012. Wheat gluten
functionality as a quality determinant in cereal-based food products. Annu Rev Food Sci
Technol 3:469–92.
Dhaka V, Gulia N, Khatkar BS. 2012. application of mixolab to assess the bread making
quality of wheat varieties. Open Access Sci Reports 1:1–8. Dobraszczyk B.,
Morgenstern M. 2003. Rheology and the breadmaking process. J Cereal Sci 38:229–45.
Dobraszczyk BJ. 2004. The physics of baking: rheological and polymer molecular
structure–function relationships in breadmaking. J Nonnewton Fluid Mech 124:61–9.
Dobraszczyk BJ, Roberts CA. 1994. Strain hardening and dough gas cell-wall failure in
biaxial extension. J Cereal Sci 20:265–74.
Domenek S, Brendel L, Morel M-H, Guilbert S. 2004. Swelling behavior and structural
characteristics of wheat gluten polypeptide films. Biomacromolecules 5:1002–8. Don C,
Lichtendonk W, Plijter JJ, Hamer RJ. 2003a. Glutenin macropolymer: a gel formed by
glutenin particles. J Cereal Sci 37:1–7.
Don C, Lichtendonk WJ, Plijter JJ, Hamer RJ. 2003b. Understanding the link between GMP
and dough: From glutenin particles in flour towards developed dough. J Cereal Sci
38:157–65.
Dua S, Lukow OM, Humphreys G, Adams K. 2009. Effect of extraction methods and wheat
cultivars on gluten functionality. Open Food Sci J 3:84–92.
El Haddad L, Aussenac T, Fabre JL, Sarrafi A. 1996. Erratum: Relationships between
polymeric glutenin and the quality characteristics for seven common wheats (Triticum
aestivum) grown in the field and greenhouse (Cereal Chemistry (Nov.-Dec. 1995) 72:6
(599)). Cereal Chem 73:152.
Esteller MS, Pitombo RNM, Lannes SCS. 2005. Effect of freeze-dried gluten addition on
texture of hamburger buns. J Cereal Sci 41:19–21.
Ewart JAD. 1967. Amino acid analyses. J Sci Food Agric 18:176–83.
Ewart JAD. 1977a. Isolation of two y-gliadins from Cappelle-Desprez. J Sci Food Agric
28:843–8.
Ewart JAD. 1977b. Cappelle-Desprez P-gliadin. J Sci Food Agric 28:849–51.
Fabian H and Mäntele W. 2002. Infrared spectroscopy of proteins biochemical applications
infrared spectroscopy of proteins. In: Chalmers JM and Griffiths PR, editors. Handbook
of vibrational spectroscopy. Vol 1. Hoboken: Wiley. p1-27.
Falcão-Rodrigues MM, Moldão-Martins M, Beirão-da-Costa ML. 2005. Thermal properties

46
of gluten proteins of two soft wheat varieties. Food Chem 93:459–65.
Food and Drug Administration (U.S.FDA). 2013. What is gluten-free? FDA has an answer.
Available in: https://www.in.gov/isdh/files/Gluten_Free_Article_October_2013.pdf.
Accessed: January 29th
, 2016.
Guarienti EM. 1996. Qualidade industrial de trigo. 2nd ed. Passo Fundo: EMBRAPA-CNPT.
p1-36.
Guerrieri N, Alberti E, Lavelli V, Cerletti P. 1996. Use of spectroscopic and fluorescence
techniques to assess heat-induced molecular modifications of gluten. Cereal Chem
73:368–74.
Guerrieri N, Cerletti P. 1996. Effect of high-temperature short-time treatment of wheat flour
on gluten vitality and structure. Cereal Chem 73:6–9.
Gupta RB, Khan K, MacRitchie F. 1993. Biochemical basis of flour properties in bread
wheats. I. Effects of variation in the quantity and size distributon of polymeric protein. J
Cereal Sci 18:23–41.
Hamer RJ, van Vliet T. 2000. Understanding the structure and properties of gluten: an
overview. In: Shewry PR, Tatham AS,editors. Wheat gluten, The Royal Society of
Chemistry, Cambridge, U.K. pp 125–31.
Hayta M, Schofield JD. 2004. Heat and additive induced biochemical transitions in gluten
from good and poor breadmaking quality wheats. J Cereal Sci 40:245–56.
Hesser JM. 1989. World food uses of vital wheat gluten. In: Applewhite TH, editor.
Proccedings of the World Congress on vegetable protein utilization in human food and
animal feedstuffs. The American Oil Chemists Society, Urbana, IL. pp. 117-122.
Hill JJ, Shalaev EY, Zografi G. 2014. The importance of individual protein molecule
dynamics in developing and assessing solid state protein preparations. J Pharm Sci
103:2605–14.
Hueqner FR, Bietz A, Wall S. 1977. Disulfide bonds: key to wheat protein functionality.
Protein Crosslink. 1–15.
Jeanjean MF, Damidaux R, Feillet P. 1980. Effect of heat treatment on protein solubility and
viscoelastic properties of wheat gluten. Cereal Chem 57:325–31.
Jekle M, Becker T. 2013. Wheat dough microstructure: The relation between visual structure
and mechanical behavior. Crit Rev Food Sci Nutr 55:369-82.
Joye IJ, Lagrain B, Delcour J a. 2009. Use of chemical redox agents and exogenous enzymes
to modify the protein network during breadmaking – A review. J Cereal Sci 50:11–21.
Khatkar BS, Barak S, Mudgil D. 2013. Effects of gliadin addition on the rheological,
47
microscopic and thermal characteristics of wheat gluten. Int J Biol Macromol 53:38–41.
Khatkar BS, Bell AE, Schofield JD. 1995. The dynamic rheological properties of glutens and
gluten sub-fractions from wheats of good and poor bread making quality. J Cereal Sci
22:29–44.
Kieffer R, Wieser H, Henderson MH, Graveland A. 1998. Correlations of the breadmaking
performance of wheat flour with rheological measurements on a micro-scale. J Cereal
Sci 27:53-60.
Kieffer R, Schurer F, Köhler P, Wieser H. 2007. Effect of hydrostatic pressure and
temperature on the chemical and functional properties of wheat gluten: Studies on gluten,
gliadin and glutenin. J Cereal Sci 45:285–92.
Kinsella JE, Hale ML. 1984. Hydrophobic associations and gluten consistency: effect of
specific anions. J Agric Food Chem 32:1054–6.
Koehler P, Kieffer R, Wieser H. 2010. Effect of hydrostatic pressure and temperature on the
chemical and functional properties of wheat gluten III. Studies on gluten films. J Cereal
Sci 51:140–5.
Kontogiorgos V. 2011. Microstructure of hydrated gluten network. Food Res Int 44:2582–6.
Krull LH, Wall JS. 1969. Relationship of amino acid composition and wheat protein
properties. Bak Dig 43:30–4.
Kuktaite R, Plivelic TS, Cerenius Y, Hedenqvist MS, Gallstedt M, Marttila S, Ignell R,
Popineau Y, Tranquet O, Shewry PR, Johansson E. 2011. Structure and morphology of
wheat gluten films: From polymeric protein aggregates toward superstructure
arrangements. Biomacromolecules 12:1438–48.
Labuschagne MT, Aucamp U. 2004. The use of size exclusion high performance liquid
chromatography (SE-HPLC) for wheat quality prediction in South Africa. South African
J Plant Soil 21:8–12.
Lagrain B, Brijs K, Delcour J a. 2006. Impact of redox agents on the physico-chemistry of
wheat gluten proteins during hydrothermal treatment. J Cereal Sci 44:49–53.
Lagrain B, Thewissen BG, Brijs K, Delcour J a. 2008. Mechanism of gliadin–glutenin cross-
linking during hydrothermal treatment. Food Chem 107:753–60.
Larsson H, Eliasson A. 1996. Phase separation of wheat flour dough studied by
ultracentrifugation and stress relaxation. II. Influence of mixing time, ascorbic acid, and
lipids. Cereal Chem 73:25–31.
Leon A, Rosell CM, Benedito de Barber C. 2003. A differential scanning calorimetry study of
wheat proteins. Eur Food Res Technol 217:13–16.

48
Létang C, Piau M, Verdier C. 1999. Characterization of wheat flour-water doughs. Part I:
rheometry and microstructure. J Food Eng 41:121–32.
Lefebvre J, Popineau Y, Cornec M. 1994. Viscoelastic properties of gluten proteins: Influence
of prolamin composition and of temperature. In: Gluten proteins 1993. Association of
Cereal Research: Detmold, Germany. pp 180-189.
Liu K, Hsieh FH. 2008. Protein-protein interactions during high-moisture extrusion for
fibrous meat analogues and comparison of protein solubility methods using different
solvent systems. J Agric Food Chem 56:2681–87.
MacRitchie F. 1999. Wheat proteins: characterization and role in flour functionality. Cereal
Foods World 44, 188-93.
MacRitchie F. 2014a. Theories of glutenin / dough systems. J Cereal Sci 60:733–5.
MacRitchie F. 2014b. Requirements for a test to evaluate bread-making performance. J Cereal
Sci 59:1–2.
Majzoobi M., Abedi E. 2014. Effects of pH changes on functional properties of native and
acetylated wheat gluten. Int Food Res J 21:1219–24.
Mamone G, Addeo F, Chianese L, Di Luccia A, De Martino A, Nappo A, Formisano A, De
Vivo P, Ferranti P. 2005. Characterization of wheat gliadin proteins by combined two-
dimensional gel electrophoresis and tandem mass spectrometry. Proteomics 5:2859–65.
Maningat CC, Bassi SD. 1999. Wheat starch production. In Tumbleson M, Yang P, Eckhoff
S, editors. Proceedings of international starch technology conference. Urbana, IL:
University of Illinois.p26-40.
Marchetti L, Cardós M, Campaña L, Ferrero C. 2012. Effect of glutens of different quality on
dough characteristics and breadmaking performance. LWT - Food Sci Technol 46:224–
31.
McCann TH, Day L. 2013. Effect of sodium chloride on gluten network formation, dough
microstructure and rheology in relation to breadmaking. J Cereal Sci 57:444–52.
Mekuria B and Admassu S. 2011. Grain quality evaluation and characterization of vital gluten
powder from bread wheat varieties grown in Arsi and Bale, Ethiopia. E Afri J Sci 5:35–
41.
Melander W, Horváth C. 1977. Salt effect on hydrophobic interactions in precipitation and
chromatography of proteins: an interpretation of the lyotropic series. Arch Biochem
Biophys 183:200–15.
Melnyk JP, Dreisoerner J, Marcone MF, Seetharaman K. 2012. Using the gluten peak tester
as a tool to measure physical properties of gluten. J Cereal Sci 56:561–7.
49
Micard V, Guilbert S. 2000. Thermal behavior of native and hydrophobized wheat gluten ,
gliadin and glutenin-rich fractions by modulated DSC. Int J Biol Macromol 27:229–36.
Miller K a., Hoseney RC. 1999. Dynamic rheological properties of wheat starch-gluten
doughs. Cereal Chem 76:105–9.
Mirsaeedghazi H, Emam-Djomeh Z, Mousavi SMA. 2008. Rheometric measurement of
dough rheological characteristics and factors affecting it. Int J Agric Biol 10:112–9.
Mohamed A, Finkenstadt VL, Gordon SH, Palmquist DE. 2010. Thermal and mechanical
properties of compression-molded pMDI-reinforced PCL/gluten composites. J. Appl.
Polym. Sci.118:2778-90.
Ng TSK, McKinley GH. 2008. Power law gels at finite strains: The nonlinear rheology of
gluten gels. J Rheol (N Y N Y) 52:417–49.
Ng TSK, Mckinley GH, Padmanabhan M. 2006. Linear to non-linear rheology of wheat flour
dough linear to non-linear rheology of wheat flour dough. International Symposium on
Food Rheology and Structure (ISFRS2006), ETH, Zurich, Swiss. 1-9.
Osborne TB. 1907. The proteins of the wheat kernel. Washington: Carnegie Institution of
Washington 1-136.
Payne PI, Holt LM, Jackson EA, Law CN. 1984. Wheat storage proteins: their genetics and
their potential for manipulation by plant breeding. Philos Trans R Soc Lond B Biol Sci
304:359–71.
Peña E, Bernardo A, Soler C, Jouve N. 2006. Do tyrosine crosslinks contribute to the
formation of the gluten network in common wheat (Triticum Aestivum L.) dough?” J
Cereal Sci 44:144–53.
Pirozzi MR, Margiotta B, Lafiandra D, MacRitchie F. 2008. Composition of polymeric
proteins and bread-making quality of wheat lines with allelic HMW-GS differing in
number of cysteines. J Cereal Sci 48:117-22.
Pizzinatto A. 1997. Qualidade da farinha de trigo: conceitos, fatores determinantes,
parâmetros de avaliação e controle. Campinas: ITAL. p1-62.
Robertson GH, Cao TK, Gregorski KS, Hurkman WJ, Tanaka CK, Chiou B-S, Glenn GM,
Orts WJ. 2013. Modification of vital wheat gluten with phosphoric acid to produce high
free swelling capacity. J Appl Polym Sci 1-11.
Robertson GH, Cao TK, Ong I. 1999. Wheat gluten swelling and partial solubility with
potential impact on starch-from-gluten separation by ethanol washing. Cereal Chem
76:843–5.
Robertson GH, Cao TK, Orts WO. 2008. Effect on dough functional properties of partial
50
fractionation, redistribution, and in situ deposition of wheat flour gluten proteins exposed
to water, ethanol, and aqueous ethanol. Cereal Chem 85:599–606.
Roussel P, Chiron H. 2005. Le pains Français, évolution, qualité, production. 2éme édition.
Conflandey: MAÉ-ERTI Editeurs. p.1-433.
Salvador A, Sanz T, Fiszman SM. 2006. Dynamic rheological characteristics of wheat flour-
water doughs. Effect of adding NaCl, sucrose and yeast. Food Hydrocoll 20:780–6.
Sayaslan A. 2004. Wet-milling of wheat flour: industrial processes and small-scale test
methods. LWT - Food Sci Technol 37:499–515.
Sayaslan A, Seib PA, Chung OK. 2006. Wet-milling properties of waxy wheat flours by two
laboratory methods. J Food Eng 72:167–78.
Scanlon MG, Zghal MC. 2001. Bread properties and crumb structure. Food Res Int 34:841–
64.
Schaffarczyk M, Østdal H, Matheis O, Jekle M, Koehler P. 2016. Reconstitution baking tests
with defatted wheat flour are suitable for determining the functional effects of lipase-
treated wheat lipids. Food Chem 200:175-82.
Schiedt B, Baumann A, Conde-Petit B, Vilgis T A. 2013. Short- and long-range interactions
governing the viscoelastic properties during wheat dough and model dough
development. J Texture Stud 44:317–32.
Schluentz EJ, Steffe JF, Ng PKW. 2000. Rheology and microstructure of wheat dough
developed with controlled deformation. J Texture Stud 31:41–54.
Schmiele M. 2014. Interações físicas e químicas entre isolado protéico de soja e glúten vital
durante a extrusão termoplástica a alta e baixa umidade para a obtenção de análogo de
carne. Thesis. Campinas: Universidade Estadual de Campinas. p.1-275.Schofield JD,
Bottomley RC, Timms MF, Booth MR. 1983. The effect of heat on wheat gluten and the
involvement of sulphydryl-disulphide interchange reactions. J Cereal Sci 1:241–53.
Selmair PL, Koehler P. 2009. Molecular structure and baking performance of individual
glycolipid classes from lecithins. J Agr Food Chem 57:5597-609.
Shewry PR, Halford NG. 2002. Cereal seed storage proteins: structures, properties and role in
grain utilization. J Exp Bot 53:947–58.
Shewry PR, Halford NG, Belton PS, Tatham AS. 2002. The structure and properties of
gluten: an elastic protein from wheat grain. Philos Trans R Soc Lond B Biol Sci
357:133–42.
Shewry PR, Popineau Y, Lafiandra D, Belton P. 2001. Wheat glutenin subunits and dough
elasticity : findings of the EUROWHEAT project. Trends Food Sci Technol 11:433–41.
51
Shewry PR, Tatham AS. 1997. Disulphide bonds in wheat gluten proteins. J Cereal Sci
25:207–27.
Singh H, Macritchie F. 2001. Application of polymer science to properties of gluten. J Cereal
Sci 33:231–43.
Singh NK, Donovan GR, Batey IL, Macritchie F. 1990. Use of sonication and size-exclusion
high-performance liquid chromatography in the study of wheat flour proteins. I.
Dissolution of total proteins in the absence of reducing agents. Cereal Chem. 67:150–61.
Singh S, Singh N. 2013. Relationship of polymeric proteins and empirical dough rheology
with dynamic rheology of dough and gluten from different wheat varieties. Food
Hydrocoll 33:342–8. doi:
Singh S, Singh N, MacRitchie F. 2011. Relationship of polymeric proteins with pasting, gel
dynamic- and dough empirical-rheology in different Indian wheat varieties. Food
Hydrocoll 25:19–24.
Sivam AS, Sun-waterhouse D, Perera CO, Waterhouse GIN. 2013. Application of FT-IR and
Raman spectroscopy for the study of biopolymers in breads forti fi ed with fi bre and
polyphenols. Food Res Int 50:574–85.
Sluimer P. 2005. Principles of breadmaking. St. Paul: AACCI. p.1-212.
Song Y, Zheng Q. 2008. Influence of gliadin removal on strain hardening of hydrated wheat
gluten during equibiaxial extensional deformation. J Cereal Sci 48:58–67.
Song Y, Zheng Q. 2007. Dynamic rheological properties of wheat flour dough and proteins.
Trends Food Sci Technol 18:132–8.
Stathopoulos CE, Tsiami A A., David Schofield J, Dobraszczyk BJ. 2008a. Effect of heat on
rheology, surface hydrophobicity and molecular weight distribution of glutens extracted
from flours with different bread-making quality. J Cereal Sci 47:134–43.
Stathopoulos CE, Tsiami A A., David Schofield J, Dobraszczyk BJ. 2008b. Effect of heat on
rheology, surface hydrophobicity and molecular weight distribution of glutens extracted
from flours with different bread-making quality. J Cereal Sci 47:134–43.
Tanhaeuser S, Wieser H, Kieffer P. 2014. Correlation of quality parameters with the baking
performance of wheat flours. Cereal Chem 91:333-41.
Tatham AS, Drake AF, Shewry PR. 1985. A conformational study of a glutamine- and
proline-rich cereal seed protein, C hordein. Biochem J 226:557–62.
Tatham AS, Shewry PR. 2012. The S-poor prolamins of wheat, barley and rye: Revisited. J
Cereal Sci 55:79–99.
Tedrus GDAS, Cássia R De, Ormenese SC, Speranza SM, Chang YK, Bustos FM. 2001.
52
Estudo da adição de vital glúten à farinha de arroz, farinha de aveia e amido de trigo na
qualidade de pães 1. Ciência e Tecnol Aliment 21:20–5.
Thanatuksorn P, Kawai K, Kajiwara K, Suzuki T. 2009. Effects of ball-milling on the glass
transition of wheat flour constituents. J Sci Food Agric 89:430–5.
Tilley KA, Benjamin RE, Bagorogoza KE, Okot-Kotber BM, Prakash O, Kwen H. 2001.
Tyrosine cross-links : molecular basis of gluten structure and function. J Agr Food Chem
49:2627–32.
Tomić J, Pojić M, Torbica A, Rakita S, Zivancev D, Hajnal EJ, Hadnadev TD, Hadnadev M.
2013. Changes in the content of free sulphydryl groups during postharvest wheat and
flour maturation and their influence on technological quality. J Cereal Sci 58:495–501.
Tuhumury HCD, Small DM, Day L. 2014. The effect of sodium chloride on gluten network
formation and rheology. J Cereal Sci 60:229–37.
Ullsten NH, Cho S, Spencer G, Ga M, Johansson E. 2009. Properties of extruded vital wheat
gluten sheets with sodium hydroxide and salicylic acid. Biomacromolecules 10:479–88.
Umbach SL, Davis E a., Gordon J. 1998. 13C NMR Spectroscopy of conventional and
microwave heated vital wheat gluten. J Cereal Sci 28:233–42.
Uthayakumaran S, Tomoskozi S, Tatham AS, Savage AWJ, Gianibelli MC, Stoddard FL,
Bekes F. 2001. Effects of gliadin fractions on functional properties of wheat dough
depending on molecular size and hydrophobicity. Cereal Chem 78:138–41.
Uthayakumaran S, Newberry M, Phan-Thien N, Tanner R. 2002. Small and large strain
rheology of wheat gluten. Rheol Acta 41:162–72.
Uthayakumaran S, Tanner RI, Dai S-C, QI F, Wrigley CW. 2014. Relationships between
traditional and fundamental dough-testing methods. Cereal Res Commun 42:282–92.
van den Broeck HC, America AHP, Smulders MJM, Bosch D, Hamer RJ, Gilissen LJWJ, van
der Meer IM. 2009. A modified extraction protocol enables detection and quantification
of celiac disease-related gluten proteins from wheat. J Chromatogr B Analyt Technol
Biomed Life Sci 877:975–82. doi: 10.1016/j.jchromb.2009.02.035
van der Borght A, Goesaert H, Veraverbeke WS, Delcour J a. 2005. Fractionation of wheat
and wheat flour into starch and gluten: overview of the main processes and the factors
involved. J Cereal Sci 41:221–37.
van der Zalm EEJ, van der Goot AJ, Boom RM. 2011. Quality of shear fractionated wheat
gluten – Comparison to commercial vital wheat gluten. J Cereal Sci 53:154–9.
Veraverbeke WS, Delcour Ja. 2002. Wheat protein composition and properties of wheat
glutenin in relation to breadmaking functionality. Crit Rev Food Sci Nutr 42:179–208.
53
Vojnovich C, Pfeifer VF, Anderson RA, Griffing JEL. 1960. Vital wheat gluten by drum
drying. Cereal Chem 37:422–35.
Wadhawan CK, Bushuk W. 1989. Studies on vitality of commercial gluten. I. Physical,
chemical and technological characteristics. Cereal Chem 66:456–61.
Wang C, Damodaran S. 1990. Thermal gelation of globular proteins: weight-average
molecular weight dependence of gel strength. Trends Food Sci Technol 35:1158-64.
Wang P, Chen H, Mohanad B, Xua L, Ning Y, Xua J, Wua F, Yang N, Jin Z, Xu X. 2014.
Effect of frozen storage on physico-chemistry of wheat gluten proteins: Studies on
gluten-, glutenin- and gliadin-rich fractions. Food Hydrocoll 39:187–94.
Wang P, Jin Z, Xu X. 2015. Physicochemical alterations of wheat gluten proteins upon dough
formation and frozen storage – A review from gluten, glutenin and gliadin perspectives.
Trends Food Sci Technol 46:189–98.
Wang KQ, Luo SZ, Zhonga XY, Cai J, Jiang ST, Zheng Z. 2017. Changes in chemical
interactions and protein conformation during heat-induced wheat gluten gel formation.
Food Chem 214:393-9.
Weegels PL, Groot AMG, Verhoek JA, Hamer RJ. 1994a. Effects on gluten of heating at
different moisture contents. II. Changes in physico-chemical properties and secondary
structure. J Cereal Sci 19:39–47.
Weegels PL, Verhoek JA, Groot AMG, Hamer RJ. 1994b. Effects on gluten of heating at
different moiture contents. I. Changes in funcional properties. J Cereal Sci 19:31–8.
Weegels PL, Marseille JP, Hamer RJ. 1988. Small scale separation. Starch 40:342–6.
Weegels PL, Pijpekamp AM Van De, Graveland A, Hamer RJ, Schofiel JD. 1996.
Depolymerisation and re-polymerisation of wheat glutenin during dough processing. I .
Relationships between glutenin macropolymer content and quality parameters. J Cereal
Sci 23:103–11.
Wellner N, Mills ENC, Brownsey G, Wilson RH, Brown N, Freeman J, Halford NG, Shewry
PR, Belton PS. 2005. Changes in protein secondary structure during gluten deformation
studied by dynamic fourier transform infrared spectroscopy. Biomacromolecules 6:255–
61.
Wieser H. 2007. Chemistry of gluten proteins. Food Microbiol 24:115–9.
Wieser H, Kieffer R. 2001. Correlations of the amount of gluten protein types to the
technological properties of wheat flours determined on a micro-scale. J Cereal Sci 34:19-
27.
Xu J, Bietz J a., Carriere CJ. 2007. Viscoelastic properties of wheat gliadin and glutenin

54
suspensions. Food Chem 101:1025–30.
Zhou Y, Zhao D, Foster TJ, Liu Y, Wanga Y, Nirasawa S, Tatsumi E, Cheng Y. 2014. Konjac
glucomannan-induced changes in thiol/disulphide exchange and gluten conformation
upon dough mixing. Food Chem 143:163–9.
Zhu J, Khan K. 2002. Quantative variation of HMW glutenin subunits from hard red spring
wheats grown in different environments. Cereal Chem 79:783-6.

55
ARTIGO II.
___________________________________________________________________________
Características químicas e estruturais de proteínas de glúten vital de diferentes origens
para panificação
Ortolan, Fernanda; Urbano, Karoline; Netto, Flavia Maria; Steel, Caroline Joy
Este artigo será submetido à:
Food Research International

56
II. Características químicas e estruturais de proteínas de glúten vital de diferentes
origens para panificação
Ortolan, Fernanda; Urbano, Karoline; Netto, Flavia Maria; Steel, Caroline Joy
Resumo
Avaliar as características químicas das proteínas que constituem o glúten vital
comercial é importante, porque a qualidade tecnológica deste produto está associada não só à
quantidade de proteína total, mas também à qualidade funcional da proteína que constitui este
produto. O objetivo deste estudo foi avaliar as características químicas e estruturais das
proteínas de glútens vitais comerciais de diferentes origens (GVA e GVB) envolvidas na
qualidade tecnológica, visando definir os parâmetros mais relevantes para aplicação em
panificação. Poucas diferenças nas características químicas e estruturais de GVA e GVB
foram observadas, com exceção da quantidade relativa de proteínas das frações proteicas do
glúten, onde GVA apresentou maior quantidade de gliadinas (relacionadas à extensibilidade)
e a mesma quantidade de gluteninas (relacionadas à elasticidade) que GVB, revelando melhor
equilíbrio entre essas frações em GVA. Esta diferença mostrou a necessidade de maiores
informações sobre as proteínas do glúten vital comercial a ser utilizado na fabricação de pães.
Palavras chave: glúten vital, qualidade proteica, gliadinas e gluteninas.
II.1. Introdução
O glúten vital de trigo é comercializado como um ingrediente que pode ser adicionado
às farinhas que não apresentam qualidade adequada para a elaboração de pães (ESTELLER;
PITOMBO; LANNES, 2005; WEEGELS et al., 1994), ou ainda aos pães ricos em fibras.
Usualmente, o glúten comercializado não é classificado de acordo com o seu perfil proteico
ou de qualidade proteica. No entanto, se espera que o glúten adicionado interfira
positivamente na qualidade da massa (MARCHETTI et al., 2012), embora as características
tecnológicas dos diferentes glútens comerciais possam variar amplamente entre si
(WEEGELS et al., 1994).
Ainda que o glúten vital adicionado à farinha de trigo melhore as características de
qualidade dos pães, nem sempre ele mantém as propriedades tecnológicas da farinha original
da qual foi obtido (MILLER; HOSENEY, 1999). Desta forma, a determinação de suas
características química, físico-química e tecnológica auxilia na sua especificação, a fim de

57
alcançar melhor desempenho na elaboração dos produtos de panificação, quando adicionado
às farinhas.
O glúten vital pode ser produzido a partir de diferentes métodos de extração, que
apresentam múltiplos passos, iniciando-se com a moagem do grão de trigo. A moagem é
seguida pela separação aquosa associada ao trabalho mecânico do amido e do glúten,
insolúvel em água. Após essa etapa, o glúten deve ser seco e moído (DAY et al., 2006).
Muitos são os fatores do processo que influenciam na qualidade do glúten vital obtido, mas a
etapa de secagem parece ser a mais crítica (GUERRIERI; CERLETTI, 1996). Dois fatores são
considerados determinantes: (i) pode ocorrer desnaturação proteica quando temperaturas
acima de 70 °C são utilizadas para secar o glúten vital (GUERRIERI; CERLETTI, 1996), e
(ii) o glúten se deteriora rapidamente quando mantido num estado úmido, como resultado da
ação proteolítica endógena e exógena, tornando-o inadequado para sua aplicação na indústria
(VAN DER BORGHT et al., 2005). As condições de processamento podem ser variadas,
levando a alterações na qualidade do glúten vital, porém essas variações não são apenas
resultado do processo de obtenção, mas também, do genótipo de trigo selecionado para a
produção do glúten vital (FREDERIX; COURTIN; DELCOUR, 2004). Um genótipo
adequado para o processamento deve possuir alto teor proteico e ser economicamente viável
para toda a cadeia produtiva do trigo (WEEGELS; MARSEILLE; HAMER, 1988).
O glúten vital resultante deste processo contém no mínimo de 60% de proteínas
(BRASIL, 2005), principalmente gliadinas e gluteninas, que possuem diferenças estruturais
que influenciam as suas propriedades viscoelásticas. Os diferentes resíduos de aminoácidos
formadores das gliadinas e gluteninas levam à formação dos diferentes tipos de ligações que
estão envolvidas na formação da rede de glúten, influenciando suas propriedades
viscoelásticas (JEKLE; BECKER, 2013). Enquanto as gluteninas (maior massa molecular
comparada às gliadinas, e com ligações SS intra e intermoleculares) formam uma massa mais
elástica quando hidratadas, as gliadinas (ligações SS intramoleculares) produzem uma massa
mais fluida e extensível quando hidratadas (SINGH; MACRITCHIE, 2001; WIESER, 2007).
A associação entre gliadinas e gluteninas para formar a rede de glúten combina as
características desses dois componentes, exibindo propriedades físicas de coesão, viscosidade
e elasticidade (PYLER, 1973). A quantidade semelhante entre gliadinas e gluteninas é
determinante na reologia da rede de glúten (KHATKAR; BARAK; MUDGIL, 2013;
MACRITCHIE, 2014; SHEWRY et al., 2001; TUHUMURY; SMALL; DAY, 2014), porém
não deve ser considerado o único fator para avaliação da qualidade viscoelástica da rede de
glúten formada.
58
A solubilidade e associação molecular das proteínas em diferentes sistemas de
solventes são determinadas pelas diferentes cadeias laterais dos aminoácidos que constituem
as cadeias polipeptídicas (SINGH; MACRITCHIE, 2001). Gliadinas e gluteninas contêm
relativamente pequenas quantidades de resíduos de aminoácidos básicos e ácidos, que são
responsáveis pela solubilização de proteínas (PYLER, 1973), levando a baixa solubilidade das
proteínas do glúten em água. Por outro lado, elas apresentam grandes quantidades de
glutamina (WIESER, 2007), que possibilita a formação de ligações de hidrogênio entre os
grupamentos amina e carboxila terminais das glutaminas (PYLER, 1973). As proteínas do
glúten também contêm grandes quantidades de resíduos de aminoácidos apolares, consistindo
de grupos alifáticos e aromáticos que, em contato com a água, tendem a se associar, formando
as interações hidrofóbicas (SINGH; MACRITCHIE, 2001).
As interações não covalentes formadas, em especial, as interações hidrofóbicas
(GUERRIERI et al., 1996), ou por agregação de β-folhas por interações eletrostáticas e
ligações de hidrogênio (SCHIEDT et al., 2013), estabilizam a rede de glúten. Em nível
molecular, a elasticidade tem sido sugerida como sendo associada às ligações dissulfeto inter
e intra cadeias de gluteninas individuais (BELTON, 1999; DELCOUR et al., 2012;
MACRITCHIE, 2014; MCCANN; DAY, 2013). Sob alongamento, a resistência à deformação
aumenta devido às interações proteína-proteína nas cadeias rígidas estendidas (SHEWRY et
al., 2001). Durante a mistura da massa, as ligações existentes nas cadeias das proteínas
formadoras de glúten são quebradas e, posteriormente, novas ligações são formadas durante a
elaboração e o descanso da massa. O resultado é uma matriz proteica que é muito mais forte
do que os aglomerados de proteínas sob a condição de suspensão de farinha em água sem
trabalho mecânico associado (SCHIEDT et al., 2013; WANG; JIN; XU, 2015).
Compreender o papel e a contribuição das proteínas que formam a rede de glúten e os
tipos de interações envolvidas na sua estabilização é um passo essencial para aperfeiçoar os
processos de desenvolvimento de massa obtida a partir da farinha de trigo (SCHLUENTZ;
STEFFE; NG, 2000), ou com a adição de glúten vital sobre a farinha de trigo fraca ou farinha
de trigo integral, ou farinhas oriundas de outros grãos. Desta forma, o objetivo deste trabalho
foi avaliar quais sãos as características químicas e estruturais das proteínas que influenciam a
qualidade tecnológica de glútens vitais comerciais utilizados na fortificação de farinhas de
trigo para a panificação, visando predizer os parâmetros de qualidade mais relevantes destes
produtos e ampliar o conhecimento das características das proteínas do glúten vital.
59
II.2. Materiais e Métodos
II.2.1. Materiais
Foram utilizadas duas amostras de glúten vital comercial de diferentes origens,
nomeadas de glúten vital A (GVA) e glúten vital B (GVB). Além disso, um glúten de trigo
não vital (GNV) foi obtido por meio de tratamento térmico, para fins de comparação.
II.2.2. Métodos
II.2.2.1. Obtenção de glúten não vital
O glúten não vital (GNV) foi obtido por tratamento térmico de GVA pelo método
proposto por Schofield et al. (1983), com algumas modificações citadas por Guerrieri et al.
(1996). Em amostra de 20 g de glúten foi adicionada água suficiente para atingir 60 % de
umidade e feita a mistura manual em gral para a formação da rede de glúten. O glúten
umedecido foi colocado em placas de metal fechadas e devidamente lacradas, para evitar
perda de água, e aquecido em banho-maria a 98 °C por 30 minutos. Após este período, o
glúten foi congelado a -40 °C em ultracongelador UK 05 (Klimaquip, Pouso Alegre, Brasil),
seco em liofilizador modelo L108 (Liotop, São Carlos, Brasil), moído, peneirado (60 mesh) e
armazenado em frasco de vidro.
II.2.2.2. Composição química e aminoacídica
A composição química do glúten vital (GVA e GVB) e não vital (GNV) foi avaliada
utilizando metodologias padronizadas pela AACCI (2010): teor de umidade (método n° 44-
15.02), teor de cinzas (método n° 08-01.01), teor de proteínas (método n° 46-13.01),
utilizando como fator de correção o valor de 5,7, teor de lipídios (método n° 02-01.02) e
carboidratos por diferença [100 – (cinzas + proteínas + lipídios)]. As análises foram realizadas
em triplicata e os resultados expressos em base seca.
A composição em aminoácidos de GVA, GVB e GNV foi determinada segundo
White; Hart; Fry (1986), com algumas modificações. O glúten foi hidrolisado com 6 M HCl
na presença de fenol. Os resíduos foram desproteinizados com solução de HCl e metanol (80
% MeOH + 20 % 0,1 M HCl). Os aminoácidos livres reagiram com fenilisotilcianato (PITC)
em uma derivatização pré-coluna e foram separados por RP-HPLC C18, utilizando duas fases
móveis: fase móvel A composta por 60 mL de acetonitrila misturada com 940 mL de tampão
acetato de sódio contendo 0,05 % trietilamina; e fase móvel B composta por 60 % de
acetonitrila e 40 % de água. Foi utilizado gradiente de eluição, aumentando gradativamente o

60
eluente B. Um passo adicional com 100 % de tampão móvel B foi utilizado para a limpeza da
coluna, para que a mesma retornasse às suas condições iniciais. As frações separadas foram
detectadas a 254 nm. A análise foi realizada em duplicata e os resultados foram expressos em
teor de aminoácidos (g) em 100 g de proteínas totais (base seca).
II.2.2.2. Fracionamento sequencial das proteínas
As proteínas do glúten vital (GVA e GVB) e não vital (GNV) foram fracionadas em
albuminas-globulinas, gliadinas e gluteninas, de acordo com o método descrito por Singh;
Shepherd; Cornish (1991), com as modificações propostas por Kieffer et al. (2007) e algumas
adaptações. A extração sequencial em diferentes solventes iniciou com a separação das
albuminas e globulinas (ALB/GLO). Uma dispersão de 2 % de proteína (m/v) foi preparada
com 0,15 M NaCl, a solução foi agitada a 14.600 rpm em mini homogeneizador TE 103
(Tecnal®, Piracicaba, Brasil) por 60 minutos a 50 °C. Após este período, a dispersão foi
centrifugada a 15.000 x g por 15 minutos a 20 °C em centrífuga Allegra™ 64R (Beckman
Coulter, Brea, Estados Unidos); o sobrenadante contendo ALB/GLO foi recolhido e o resíduo
foi utilizado para a separação das gliadinas (GLI). Para separação da fração GLI, foi utilizada
solução 50 % 1-propanol, nas mesmas condições de agitação e de centrifugação descritas
anteriormente. O sobrenadante contendo GLI foi recolhido e o resíduo foi utilizado para
extração de gluteninas (GLU). Para GLU foi utilizada solução de 50 % 1-propanol contendo
0,05 mol L-1
de Tris-HCl (pH 7,5) e 2 % β-mercaptoetanol, com as mesmas condições de
agitação e centrifugação utilizadas para ALB/GLO e GLI. O sobrenadante contendo GLU foi
recolhido e o resíduo foi descartado. Todas as etapas do fracionamento foram realizadas duas
vezes. O conteúdo proteico das frações foi quantificado pelo método n° 46-13.01 da AACCI
(2010) e, para o resíduo, o teor proteico foi determinado por diferença [100 – (ALB/GLO +
GLI + GLU)]. Os resultados foram expressos em g/100 g de proteína solúvel em base seca e a
análise foi realizada em triplicata.
II.2.2.3. Avaliação das interações químicas
II.2.2.3.1. Solubilidade proteica em diferentes solventes
As interações químicas existentes nas cadeias proteicas do glúten vital e possivelmente
envolvidas na formação da rede de glúten foram avaliadas pela solubilidade das proteínas em
diferentes solventes, segundo metodologia proposta por Schmiele et al. (2013), com algumas
modificações. Os solventes utilizados foram: (TF) 40 mM tampão fosfato (pH 7,5), preparado

61
com água deionizada; (U) 8 M ureia; (SDS) 2 % dodecil sulfato de sódio; e (ME) 2 % β-
mercaptoetanol. Todos os sistemas foram preparados em TF.
A solubilização da proteína de GVA, GVB e GNV em cada sistema de solvente foi
realizada baseando-se no método descrito por Chiang (2007) e adaptado por Schmiele et al.
(2013). Em microtubo, 80 mg de amostra (em base seca) foi adicionada de 1,5 mL de
solvente, agitada em vórtex Mixer (Labnet, Rating, Estados Unidos), e incubada em banho-
maria 304-TPA (Nova Ética, Vargem Grande Paulista, Brasil) por 150 minutos a 40°C, com
agitação em vórtex a cada 30 minutos. Em seguida, os microtubos foram centrifugados em
centrífuga Mikro 200 R (Hettich Zentrifugen, Tuttlingen, Alemanha) a 10.000 x g, por 30
minutos, a 20 °C. A solubilização das proteínas foi realizada em triplicata. As proteínas
solubilizadas foram quantificadas pelo método de Lowry utilizando o Kit RC/DC™ (Bio-Rad
Laboratories Inc., Philadelphia, Estados Unidos) com adaptações. As análises foram
realizadas em microplacas, com 15 minutos de incubação e a absorbância foi medida em
espectrofotômetro FLUOstar® Omega (BMG Labtech, Ortenberg, Alemanha) com
comprimento de onda de 750 nm. Os resultados estão expressos em g/100 g em base seca.
II.2.2.3.2. Avaliação dos grupos SH/SS
Os conteúdos de grupos SH total e livre e ligações dissulfeto (SS) presentes em GVA,
GVB e GNV foram determinados conforme método descrito por Chan; Wasserman (1993),
com modificações propostas por Tuhumury; Small; Day (2014). Para a determinação de
grupos SH livres e SH total, a leitura de absorbância das amostras após reação com o reagente
de Ellmann foi medida a 412 nm. O conteúdo de SS foi calculado a partir dos SH livres e SH
total, pela equação: SS = [(SH total – SH livre)/2]. As determinações foram efetuadas em
triplicata e os resultados expressos em µmol/mg de proteína em base seca.
II.2.2.4.Eletroforese
A avaliação do perfil de massa molecular das amostras foi realizada em sistema SDS-
PAGE segundo a técnica descrita por Zhou et al. (2014) em condições redutoras e não
redutoras. Soluções de proteínas de GVA, GVB e GNV foram preparadas individualmente a
partir de 10 mg de amostra diluídos em 1 mL de tampão de corrida composto por: 0,4 %
(m/v) de SDS, 12 % (m/v) de glicerol, 50 M de tampão Tris-HCl (pH 6,8); 2 % (v/v) de β-
mercaptoetanol e 0,01 % (m/v) de azul de bromofenol, para a condição redutora. A mesma
solução tampão apenas sem o β-mercaptoetanol foi utilizada na condição não redutora. As
soluções foram misturadas em vórtex e aquecidas em banho a 95 °C por 4 minutos. Após este

62
tempo, as soluções foram resfriadas a temperatura ambiente, e então 20 µL foram inseridos
com auxílio de microseringa de 25 µL em gel de 10 % de poliacrilamida.
A análise SDS-PAGE foi conduzida em sistema de eletroforese Mini-PROTEAN
(Bio-Rad Laboratórios, Estados Unidos), com voltagem de 80 V por 40 minutos e 120 V por
tempo suficiente para que o corante azul de bromofenol atingisse a extremidade inferior do
gel. A análise foi conduzida em duplicata. Os géis foram corados “overnight” em solução
aquosa contendo 9 % de ácido acético (v/v), 45 % de metanol (v/v) e 0,25 % de corante azul
de Coomassie (m/v). A mesma solução, sem o corante, foi utilizada para a descoloração do
gel por 2 horas, com agitação.
O padrão de eletroforese (#161-0304) (Bio-Rad Laboratories Inc., Philadelphia,
Estados Unidos) composto por fosforilase b (97,4 kDa), albumina sérica (66,2 kDa),
ovalbumina (45 kDa), anidrase carbônica (31 kDa), inibidor de tripsina (21,5 kDa) e lisozima
(14,4 kDa), foi utilizado para as condições redutoras e não redutoras de eletroforese.
II.2.2.5. SEC-HPLC
A distribuição da massa molecular aparente das proteínas que constituem os glútens
foi avaliada por cromatografia líquida de alta eficiência por exclusão molecular (SEC-HPLC).
As proteínas de glúten vital (GVA e GVB) e não vital (GNV) foram extraídas usando
procedimento descrito por Tronsmo et al. (2002) com adaptações. As amostras foram
suspensas em 1 mL de solução com 0,05 M de tampão fosfato (pH 6,9) contendo 0,5 % de
SDS a fim de se obter dispersões com 0,08 g/mL de proteína. As amostras foram aquecidas a
50 °C por 5 minutos e, em seguida, agitadas em vórtex por 60 minutos à temperatura
ambiente. Logo após, as amostras foram sonicadas em banho ultrassônico Thornton T740
(Unique Ind. e Com. de Prod. Eletrônicos, Santo Amaro, Brasil) com potência de 63 W e
frequência de 40 Hz por 30 segundos à temperatura ambiente. As amostras foram
centrifugadas a 10.000 x g por 30 minutos a 25 °C em centrífuga Mikro 200 R (Hettich
Zentrifugen, Tuttlingen, Alemanha). O sobrenadante foi coletado e filtrado em membrana
filtrante em fluoreto polivinidileno (PVDF, diâmetro de 30 mm e abertura de 0,45 µm) (Jet
Biofil®, Guangzhou, China) para ser utilizado na análise de SEC-HPLC. A análise de perfil
cromatográfico por exclusão molecular foi realizada em Cromatógrafo a Líquido de Alta
Eficiência (Shimadzu, Columbia, Estados Unidos), composto por bomba LC-10AT VP, forno
CTO-10AS VP, detector de arranjo de diodos SPD-M20A VP, interface SCL-10A e software
CLASS VP. As separações cromatográficas foram realizadas em coluna de exclusão
molecular Yarra SEC-4000 (300 mm x 7,8 mm x 3 µm) (Phenomenex, Hercules, Estados
63
Unidos). As amostras foram eluídas no modo isocrático, com fase móvel constituída por 0,05
mol L-1
NaH2PO4.H2O, 0,05 mol L-1
Na2HPO4 e 0,15 mol L-1
NaCl (pH 6,8), vazão de 1,0
mL min-1
, temperatura do forno de coluna a 25 °C, volume de injeção de 20 µL e
comprimento de onda de 214 nm. A coluna foi calibrada com um padrão Gel Filtration (#151-
1901) (Bio-Rad Laboratories Inc., Philadelphia, Estados Unidos) composto pelas seguintes
proteínas: tireoglobulina bovina (MM 670.000), γ-globulina bovina (MM 158.000),
ovalbumina (MM 44.000), mioglobulina de cavalo (MM 17.000), e vitamina B12 (MM
1.350), dissolvidas no mesmo tampão das amostras e com as mesmas condições de análise.
Uma curva padrão foi elaborada com tempo de retenção x log massa molecular. As análises
foram realizadas em triplicata. Os picos obtidos para as proteínas que compõem o padrão de
tamanho molecular (670 kDa, 158 kDa, 44 kDa, 17 kDa e 1,35 kDa) apresentaram tempos de
retenção que variaram de 8 a 12 minutos.
II.2.2.6. Análise por espectroscopia no FTIR
A estrutura secundária das proteínas foi avaliada em espectrofotômetro no
infravermelho com transformada de Fourier (FTIR) modelo IRprestige-21 (Shimadzu, Kyoto,
Japão) com detector DLATGS. As amostras de glúten foram secas a 60 °C em estufa a vácuo
modelo TE-395 acoplada a bomba de vácuo modelo TE-058 (Tecnal, Piracicaba, Brasil), por
24 h, e, após este período, foram armanezadas em dessecador para prevenir o ganho de
umidade até o momento da análise. As pastilhas de KBr foram preparadas em prensa a vácuo
em uma proporção de 2 mg de amostra para 200 mg de KBr (1 % de amostra). Os espectros
de absorbância de 400 a 4000 cm-1
foram adquiridos com resolução de 4 cm-1
e 45 varreduras.
Os interferogramas por transformada de Fourier foram obtidos usando apodização Happ-
Genzel. Os espectros foram corrigidos com linha base de análise e obtidos em triplicata.
II.2.2.7. Avaliação microscópica da superfície – MEV
Para avaliar a superfície da rede proteica do glúten foi utilizada a microscopia
eletrônica de varredura (MEV). O glúten reconstituído com amido de trigo nativo numa
proporção de 12 g proteínas/100 g amostra foi previamente preparado no equipamento
Glutomatic 2200 (Perten, Suiça), de acordo com o método n° 38-12.02 da AACC (2010), sem
as etapas de centrifugação e secagem. Logo após, foi congelado a -40 °C em ultracongelador
modelo UK 05 (Klimaquip, Pouso Alegre, Brasil) e seco em liofilizador modelo L108
(Liotop, São Carlos, Brasil) para obtenção de um produto completamente seco. Foi utilizado
microscópio eletrônico de varredura com detector de energia dispersiva de raios X, modelo
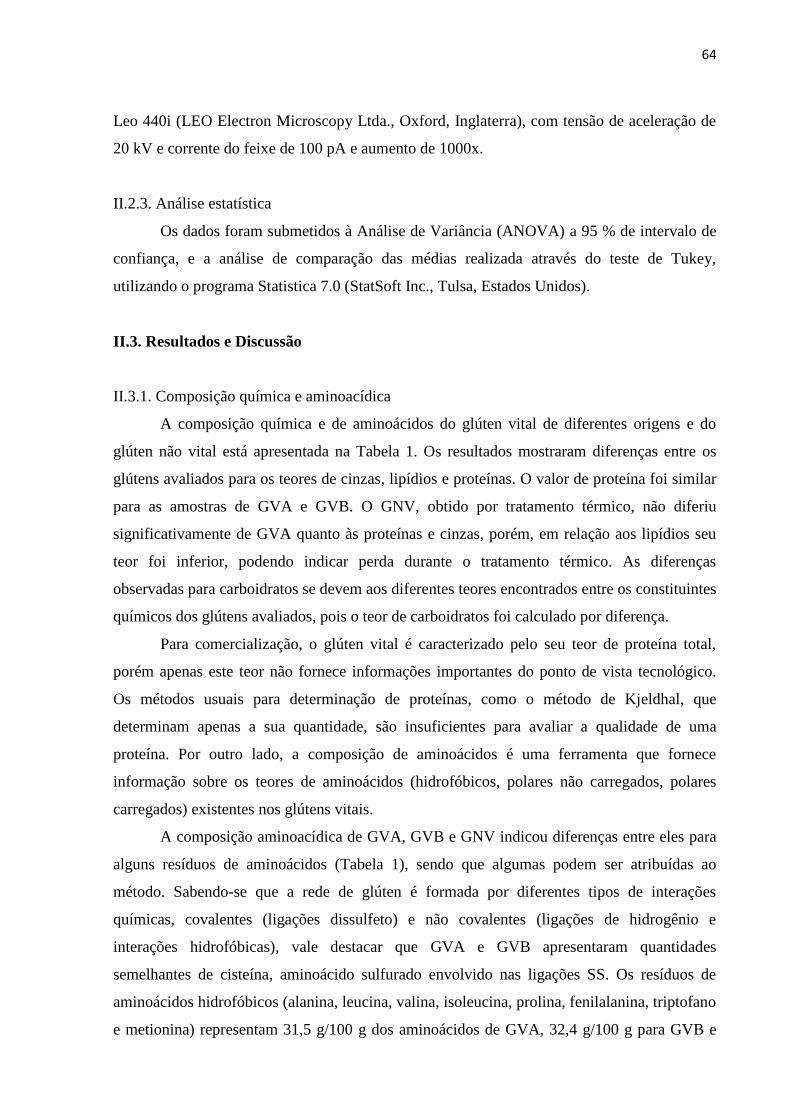
64
Leo 440i (LEO Electron Microscopy Ltda., Oxford, Inglaterra), com tensão de aceleração de
20 kV e corrente do feixe de 100 pA e aumento de 1000x.
II.2.3. Análise estatística
Os dados foram submetidos à Análise de Variância (ANOVA) a 95 % de intervalo de
confiança, e a análise de comparação das médias realizada através do teste de Tukey,
utilizando o programa Statistica 7.0 (StatSoft Inc., Tulsa, Estados Unidos).
II.3. Resultados e Discussão
II.3.1. Composição química e aminoacídica
A composição química e de aminoácidos do glúten vital de diferentes origens e do
glúten não vital está apresentada na Tabela 1. Os resultados mostraram diferenças entre os
glútens avaliados para os teores de cinzas, lipídios e proteínas. O valor de proteína foi similar
para as amostras de GVA e GVB. O GNV, obtido por tratamento térmico, não diferiu
significativamente de GVA quanto às proteínas e cinzas, porém, em relação aos lipídios seu
teor foi inferior, podendo indicar perda durante o tratamento térmico. As diferenças
observadas para carboidratos se devem aos diferentes teores encontrados entre os constituintes
químicos dos glútens avaliados, pois o teor de carboidratos foi calculado por diferença.
Para comercialização, o glúten vital é caracterizado pelo seu teor de proteína total,
porém apenas este teor não fornece informações importantes do ponto de vista tecnológico.
Os métodos usuais para determinação de proteínas, como o método de Kjeldhal, que
determinam apenas a sua quantidade, são insuficientes para avaliar a qualidade de uma
proteína. Por outro lado, a composição de aminoácidos é uma ferramenta que fornece
informação sobre os teores de aminoácidos (hidrofóbicos, polares não carregados, polares
carregados) existentes nos glútens vitais.
A composição aminoacídica de GVA, GVB e GNV indicou diferenças entre eles para
alguns resíduos de aminoácidos (Tabela 1), sendo que algumas podem ser atribuídas ao
método. Sabendo-se que a rede de glúten é formada por diferentes tipos de interações
químicas, covalentes (ligações dissulfeto) e não covalentes (ligações de hidrogênio e
interações hidrofóbicas), vale destacar que GVA e GVB apresentaram quantidades
semelhantes de cisteína, aminoácido sulfurado envolvido nas ligações SS. Os resíduos de
aminoácidos hidrofóbicos (alanina, leucina, valina, isoleucina, prolina, fenilalanina, triptofano
e metionina) representam 31,5 g/100 g dos aminoácidos de GVA, 32,4 g/100 g para GVB e
65
30,2 g/100 g para GNV; embora haja menor quantidade desses aminoácidos quando
comparados aos demais (hidrofílicos), eles contribuem para a hidrofobicidade das proteínas
do glúten, reduzindo a sua solubilidade em solventes aquosos (RASHEED et al., 2014),
porém esta depende da sequencia dos resíduos de aminoácidos.
Tabela 1. Composição química e aminoacídica (g/100 g, base seca) de glutens vitais de
diferentes origens (GVA e GVB) e glúten não vital (GNV)
GVA GVB GNV
Composição química
Cinzas 0,91 ± 0,00 a 0,82 ± 0,01 b 0,88 ± 0,02 a
Lipídios 3,01 ± 0,19 a 0,89 ± 0,04 b 0,33 ± 0,02 c
Proteínas 82,78 ± 2,81 ab 83,01 ± 1,92 a 79,85 ± 0,70 b
Carboidratos 13,30 15,28 18,94
Composição aminoacídica
Asparagina (ASP) 15,52 ± 0,02 c 15,68 ± 0,03 b 15,83 ± 0,03 a
Glutamina (GLU) 14,87 ± 0,01 a 13,70 ± 0,05 c 13,51 ± 0,02 b
Serina (SER) 4,09 ± 0,03 c 4,09 ± 0,02 b 4,00 ± 0,00 a
Glicina (GLY) 3,17 ± 0,03 ns 3,13 ± 0,02 ns 3,05 ± 0,01 ns
Histidina (HYS) 1,04 ± 0,01 c 1,57 ± 0,02 a 1,43 ± 0,01 b
Arginina (ARG) 2,39 ± 0,01 c 2,49 ± 0,02 b 2,51 ± 0,01 a
Treonina (TRE) 4,78 ± 0,02 a 4,52 ± 0,01 b 4,25 ± 0,00 b
Alanina (ALA) 6,43 ± 0,01 b 6,67 ± 0,02 a 6,38 ± 0,00 a
Prolina (PRO) 4,92 ± 0,01 c 4,98 ± 0,01 a 4,65 ± 0,00 b
Tirosina (TYR) 2,05 ± 0,00 b 2,10 ± 0,02 a 2,05 ± 0,01 a
Valina (VAL) 3,45 ± 0,01 b 3,46 ± 0,01 a 3,27 ± 0,00 a
Metionina (MET) 1,24 ± 0,01 b 1,20 ± 0,02 b 1,25 ± 0,01 a
Cisteína (CYS) 0,91 ± 0,03 b 0,97 ± 0,02 ab 0,99 ± 0,01 a
Isoleucina (ILE) 3,02 ± 0,00 c 3,05 ± 0,01 b 3,23 ± 0,01 a
Leucina (LEU) 7,48 ± 0,05 b 7,60 ± 0,01 a 6,54 ± 0,00 c
Fenilalanina (PHE) 4,29 ± 0,00 c 4,70 ± 0,04 a 4,30 ± 0,00 b
Lisina (LIS) 2,37 ± 0,02 a 2,37 ± 0,02 a 2,05 ± 0,01 b
Triptofano (TRP) 0,73 ± 0,01 a 0,73 ± 0,01 a 0,56 ± 0,02 b
GVA = glúten vital A; GVB = glúten vital B; GNV = gluten não vital; Teor de umidade: GVA = 9,01 g/100 g;
GVB = 6,79 g/100 g; GNV = 1,93 g/100 g; Letras diferentes nas linhas indicam diferenças significativas pelo
teste de Tukey (P < 0,05); ns = não significativo.
As informações sobre a quantidade de proteínas total e sua composição aminoacídica
não são suficientes para entender as diferenças tecnológicas dos glútens vitais comerciais
(MARCHETTI et al., 2012). Desta forma, outras análises são necessárias para verificar a
estrutura e as propriedades funcionais de suas proteínas, que influenciam na qualidade dos
produtos finais.
II.3.2. Composição relativa das frações proteicas
A composição relativa das frações proteicas, obtidas pelo fracionamento sequencial,
dos glútens vitais e do glúten não vital está apresentada na Figura 1.

66
Figura 1. Quantidade relativa de proteínas obtida do fracionamento sequencial de glútens
vitais (GVA e GVB) e glúten não vital (GNV) de albuminas + globulinas (ALB/GLO),
gliadinas (GLI), gluteninas (GLU) e resíduo (RES). Barras de erro representam os desvios
padrão das replicatas. Letras minúsculas diferentes entre as colunas da mesma fração de
proteína representam diferenças significativas entre as médias (P < 0,05).
O teor relativo de albuminas e globulinas foi diferente para GVA (7,82 g/100 g),
enquanto para GVB e GNV não diferiram significativamente entre si. A pequena quantidade
(< 10 g/100 g) de proteínas encontrada nessa fração foi observada porque durante a obtenção
do glúten vital, os constituintes solúveis, incluindo proteínas como albuminas e globulinas,
são extraídos no processo de lavagem do glúten, permanecendo predominantemente as
proteínas insolúveis (VAN DER BORGHT et al., 2005) em sua constituição.
A quantidade relativa de proteínas na fração de gliadinas apresentou diferenças
significativas entre os glútens avaliados, 34,4 g/100 g para GVA, 19,3 g/100 g para GVB e
5,9 g/100 g para GNV. As diferenças observadas entre GVA, GVB e GNV não se devem
apenas aos diferentes genótipos de trigo (já que os glútens foram obtidos de diferentes
origens), mas também, ao processo de obtenção do glúten vital. Quando são utilizadas
temperaturas próximas a 70 °C pode ocorrer modificação da estrutura das proteínas que
constituem os glútens vitais, reduzindo a solubilidade de proteínas, como as gliadinas, em
alguns solventes (WIESER, 1998, 2007), neste caso na solução de 50 % 1-propanol. Isso
provavelmente aconteceu para GVB e GNV, que apresentaram menores quantidades de
a b b
a
b
c
b b
a
b
a
c
0
10
20
30
40
50
60
70
80
90
100
GVA GVB GNV
Quan
tid
ade
rela
tiva
de
pro
teín
as
(g/
10
0g)
ALB/GLO
GLI
GLU
RES
67
proteínas na fração gliadina. As gliadinas são proteínas monoméricas, que apresentam
ligações dissulfeto intramoleculares e são responsáveis pela característica de extensibilidade
da rede de glúten (KHATKAR; BARAK; MUDGIL, 2013). A determinação da fração
gliadina no glúten vital é importante porque, em conjunto com as gluteninas, essas proteínas
são fundamentais para as propriedades viscoelásticas da rede de glúten. Quando as
propriedades viscoelásticas foram estudadas para GVA e GVB através de testes reológicos
fundamentais, verificou-se que GVB se mostrou menos elástico que GVA, e este
comportamento pode estar ligado à modificação estrutural parcial que as proteínas de GVB
sofreram durante o seu processo de obtenção, que alterou as propriedades funcionais de suas
proteínas (ORTOLAN et al., 2017).
Para os teores relativos da fração de gluteninas, não foram observadas diferenças entre
GVA e GVB. Para esta fração, GNV apresentou a maior proporção (84,7 g/100 g). Gluteninas
são proteínas poliméricas que apresentam ligações dissulfeto intra e intermoleculares,
fornecendo a característica de elasticidade à rede de glúten (SHEWRY et al., 2001), porém
não foram observadas diferenças significativas entre os glútens avaliados. A alta proporção de
proteínas verificada na fração de gluteninas de GNV, comparada ao seu precursor GVA, pode
sugerir a presença de aglomerados proteicos que se formaram devido ao processo térmico
para produção do glúten não vital e que foram solubilizados na fração de gluteninas devido ao
uso do β-mercaptoetanol. O β-mercaptoetanol é um agente redutor, que é capaz de romper as
ligações dissulfeto, tornando assim os aglomerados proteicos mais solúveis e, portanto,
quantificando-os na fração de glutenina.
A fração denominada de resíduo foi calculada por diferença entre as demais frações e
representa as proteínas que não foram solubilizadas em nenhum dos solventes utilizados.
Segundo Lookhart et al. (1993) e Dahesh et al. (2016), o trigo deveria apresentar
quantidades de proteínas similares das frações de gliadinas e gluteninas, que contribuem para
o balanço apropriado (ideal 1:1) dessas proteínas. Porém isso não aconteceu para GVA e
GVB, pois os tipos de agregados proteicos formados por estes glútens apresentaram
solubilidades diferentes nos solventes utilizados para o fracionamento. Não apenas o tipo de
proteína (α/β-, γ- e ω-gliadinas; LMW-GS, HMW-GS), mas também a quantidade presente
dessas frações irá refletir nas propriedades de elasticidade e extensibilidade da rede de glúten
(BEKES; GIANIBELLI; WRIGLEY, 2004; DELCOUR et al., 2012; WANG; JIN; XU,
2015). Desta forma, foi possível verificar, pelo fracionamento, que GVA apresentou melhor
balanço entre gliadinas e gluteninas que GVB, devido às quantidades relativas de proteínas
68
semelhantes entre suas frações, que refletiu no melhor comportamento viscoelástico da rede
de glúten de GVA avaliado em estudo complementar (ORTOLAN et al., 2017).
Além disso, cabe ressaltar que adaptações da técnica foram necessárias para garantir a
maior solubilidade das proteínas nos diferentes solventes utilizados no fracionamento
sequencial, desde o tipo e o tempo de agitação até o uso de 50 °C de temperatura de extração,
que podem ter influenciado na solubilidade das proteínas de GVA, GVB e GNV. Desta forma,
nas condições de análise utilizadas, foram observadas diferenças nos teores de proteínas das
frações avaliadas, sendo que, dentre os glútens vitais, GVA apresentou maior quantidade de
albuminas/globulinas e gliadinas, e a mesma quantidade de gluteninas que GVB.
II.3.3. Avaliação das interações químicas
A solubilidade das proteínas do glúten em diferentes solventes está apresentada na
Figura 2. O tampão fosfato (TF) foi utilizado como base para a elaboração dos demais
sistemas de solventes, portanto, a solubilidade das proteínas em TF foi usada para fins de
comparação. Assim, a comparação da solubilidade da proteína em diferentes meios de
extração ou tampões com ou sem desnaturante (ex. ureia - U), detergente (ex. dodecil sulfato
de sódio ou sodium dodecyl sulfate - SDS) e/ou agentes de redução (ex. β-mercaptoetanol -
ME), pode fornecer informações sobre as ligações intra e intermoleculares que existem entre
as proteínas do glúten (MANOI; RIZVI, 2009), e que podem depois estar envolvidas na
formação da rede de glúten quando o glúten vital é utilizado no processo de panificação.
O TF solubiliza as proteínas que se encontram em seu estado nativo; a U rompe as
ligações de hidrogênio que estabilizam as estruturas proteicas; o SDS forma micelas ao redor
das proteínas rompendo, principalmente, as interações hidrofóbicas, e também interações
elestrostáticas e iônicas; e o ME atua rompendo as ligações SS (SCHMIELE et al., 2013).
Pela Figura 2, verificou-se que GVA, GVB e GNV apresentaram pequenas
quantidades de proteínas solúveis (< 5 g/100 g) no tampão fosfato, pois as proteínas
formadoras da rede de glúten apresentam baixa solubilidade em sistemas aquosos, e os
glútens vitais e o glúten não vital apresentam pequenas quantidades de proteínas no estado
nativo, visto que eles já foram submetidos ao processo de mistura e ao tratamento térmico.
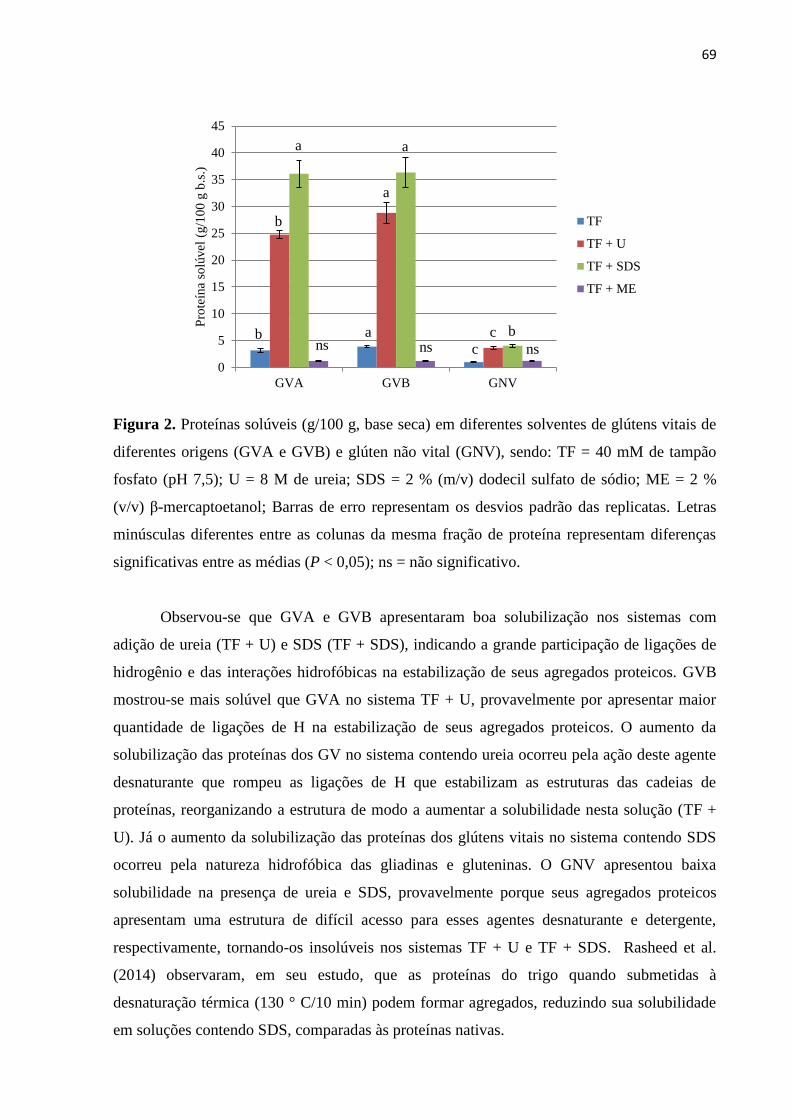
69
Figura 2. Proteínas solúveis (g/100 g, base seca) em diferentes solventes de glútens vitais de
diferentes origens (GVA e GVB) e glúten não vital (GNV), sendo: TF = 40 mM de tampão
fosfato (pH 7,5); U = 8 M de ureia; SDS = 2 % (m/v) dodecil sulfato de sódio; ME = 2 %
(v/v) β-mercaptoetanol; Barras de erro representam os desvios padrão das replicatas. Letras
minúsculas diferentes entre as colunas da mesma fração de proteína representam diferenças
significativas entre as médias (P < 0,05); ns = não significativo.
Observou-se que GVA e GVB apresentaram boa solubilização nos sistemas com
adição de ureia (TF + U) e SDS (TF + SDS), indicando a grande participação de ligações de
hidrogênio e das interações hidrofóbicas na estabilização de seus agregados proteicos. GVB
mostrou-se mais solúvel que GVA no sistema TF + U, provavelmente por apresentar maior
quantidade de ligações de H na estabilização de seus agregados proteicos. O aumento da
solubilização das proteínas dos GV no sistema contendo ureia ocorreu pela ação deste agente
desnaturante que rompeu as ligações de H que estabilizam as estruturas das cadeias de
proteínas, reorganizando a estrutura de modo a aumentar a solubilidade nesta solução (TF +
U). Já o aumento da solubilização das proteínas dos glútens vitais no sistema contendo SDS
ocorreu pela natureza hidrofóbica das gliadinas e gluteninas. O GNV apresentou baixa
solubilidade na presença de ureia e SDS, provavelmente porque seus agregados proteicos
apresentam uma estrutura de difícil acesso para esses agentes desnaturante e detergente,
respectivamente, tornando-os insolúveis nos sistemas TF + U e TF + SDS. Rasheed et al.
(2014) observaram, em seu estudo, que as proteínas do trigo quando submetidas à
desnaturação térmica (130 ° C/10 min) podem formar agregados, reduzindo sua solubilidade
em soluções contendo SDS, comparadas às proteínas nativas.
0
5
10
15
20
25
30
35
40
45
GVA GVB GNV
Pro
teín
a so
lúvel
(g/1
00
g b
.s.)
TF
TF + U
TF + SDS
TF + ME
b
b
a
ns ns ns
a
a
a
c
c b

70
Quando o β-mercaptoetanol (ME) foi utilizado no sistema TF + ME, percebeu-se uma
menor solubilidade das proteínas dos glútens vitais comparado aos demais sistemas de
solventes utilizados, possivelmente, pela pequena quantidade de ligações SS presentes em
suas proteínas. Por ser um agente redutor, o ME é capaz de romper as ligações SS,
aumentando a solubilidade das proteínas pela “abertura” dos agregados proteicos.
GVA e GVB apresentaram diferenças na solubilidade de suas proteínas, indicando que
ambos formaram aglomerados proteicos com características diferentes, que podem refletir em
diferenças nas propriedades viscoelásticas da rede de glúten por eles formadas.
Na Tabela 2, estão apresentados os resultados (µmol/mg) de grupos SH totais, livres e
pontes dissulfeto (SS) para as amostras de glúten vital e glúten não vital.
Tabela 2. Quantidades de grupos tiol acessíveis (SH total e SH livre) e ligações dissulfeto
(SS) de glutens vitais de diferentes origens (GVA e GVB) e glúten não vital (GNV)
Glútens SH total
(µmol/mg)
SH livre
(µmol/mg)
SS
(µmol/mg)
Glúten vital A 30,95 ± 2,27 a 2,58 ± 0,24 ns 28,37 ± 2,51 ns
Glúten vital B 29,69 ± 2,25 a 2,51 ± 0,25 ns 27,18 ± 2,42 ns
Glúten não vital 25,36 ± 0,30 b -- --
Médias seguidas de desvios-padrão; As médias com letras diferentes nas colunas diferem estatisticamente pelo
teste de Tukey (P < 0,05); ns = não houve diferença significativa entre as médias.
Analisando os resultados, foi possível verificar que GVA e GVB não diferiram na
quantidade de grupos sulfídricos totais e livres e nas ligações dissulfeto. Por outro lado, GNV
apresentou o menor valor de SH total e para esta amostra não foi possível quantificar SH livre
(e, portanto, SS). Em relação às ligações SS, os resultados estão de acordo com os
apresentados na Figura 2 (TF + ME), quando são avaliadas as interações SS pela utilização de
β-mercaptoetanol, um agente redutor, onde também não houve diferença entre GVA e GVB,
indicando que essas ligações são importantes para a formação de rede proteica, polímeros e
agregados proteicos, mas estas não são as únicas responsáveis pelas diferentes características
físico-químicas e tecnológicas dos glútens vitais.
Os grupos sulfídricos das cadeias de gliadinas e gluteninas têm papel importante no
desenvolvimento da rede de glúten (JOYE et al., 2009; JEKLE; BECKER, 2013). Embora em
pequena quantidade, os grupos sulfídricos não são estáticos durante o desenvolvimento da
rede de glúten, mas de natureza transitória (SCHIEDT et al., 2013), levando ao intercâmbio
das ligações SH/SS. Durante a mistura, as ligações dissulfeto “nativas” das cadeias de
71
gliadinas e gluteninas podem se romper pela força aplicada sobre elas, formando novos
SH/SS, dentro da mesma molécula de proteína (SS intramoleculares) ou com outra molécula
de proteína (SS intermoleculares) (SINGH; MACRITCHIE, 2001; WIESER, 2007; JEKLE;
BECKER, 2013; DELCOUR et al., 2012; WANG et al., 2015).
Segundo Pyler (1973), as ligações SS intermoleculares, por serem mais reativas, são
mais importantes para as propriedades reológicas da rede de glúten. Este intercâmbio fornece
um mecanismo de alívio da deformação criada entre as proteínas do glúten, atrasando assim o
enfraquecimento da massa no “overmixing” (PYLER, 1973; SLUIMER, 2007; CAUVAIN,
2015). No intercâmbio das ligações SH/SS não ocorrem perdas destes grupos, isto é, os
grupos sulfídricos podem reagir mais de uma vez, sem prejuízo aos grupamentos envolvidos
(PYLER, 1973).
O uso de diferentes materiais (farinha, massa, glúten) para a determinação de SH,
diferentes métodos analíticos e diferentes expressões dos resultados (RAKITA et al., 2014),
torna difícil a comparação com resultados oriundos de outras pesquisas.
II.3.4. Perfil das proteínas por tamanho molecular
II.3.4.1. SDS-PAGE
Na Figura 3 (A e B) está apresentado o perfil de separação por tamanho molecular das
proteínas constituintes dos glútens vitais (GVA e GVB) e do glúten não vital (GNV) em gel
de poliacrilamida sob condições redutoras, o que possibilitou avaliar a distribuição por
tamanho molecular das proteínas que se encontram nos glútens avaliados.
GVA, GVB e GNV apresentaram perfis eletroforéticos em condições redutoras (Fig.
4A) similares. Todos os perfis mostraram bandas de proteínas correspondendo às gluteninas
de alto peso molecular (HMW-GS ≥ 97 kDa) (GUERRIERI et al., 1996), ω-gliadinas (39-55
kDa) (WIESER, 2007), α-, β- e γ-gliadinas (30-41 kDa) (GUERRIERI et al., 1996),
gluteninas de baixo peso molecular (LMW-GS, 30-40 kDa) (GÓMEZ et al., 2012), e também
as albuminas/globulinas (14-16 kDa) (GUERRIERI et al., 1996). Enquanto GVA e GVB
apresentaram intensidades de bandas semelhantes, as do GNV mostrou intensidade menor,
provavelmente porque parte de suas proteínas não foi solubilizada no tampão da amostra, já
que a mesma concentração de proteínas foi utilizada no preparo de GVA, GVB e GNV (0,08
g/mL). Deste modo, pela Figura 3A, verificou-se que gliadinas (α-, β- e γ-) e LMW-GS estão
em maior proporção em GVA e GVB que GNV. Além disso, observaram-se bandas na
extremidade superior do gel, em especial para GVB e GNV, indicando a presença de
agregados proteicos mesmo em condições desnaturantes e redutoras.

72
Figura 3. Perfil eletroforético (SDS-PAGE) das proteínas dos glútens vitais e do glúten não
vital sob condições redutoras (A) e não redutoras (B). Coluna 1 – padrão de proteína para
eletroforese; ao lado estão indicadas as massas moleculares das proteínas do padrão utilizado
para comparação; Coluna 2 – glúten vital A – GVA; Coluna 3 – glúten vital B – GVB; Coluna
4 – glúten não vital – GNV.
Os perfis eletroforéticos, sob condições não redutoras (Fig. 3B), apresentaram
diferenças entre GVA, GVB e GNV. GVA apresentou maior quantidade de agregados
estabilizados por ligações dissulfeto que GVB, conforme observado pela fração retida no topo
do gel. Além disso, foi possível observar uma mesma fração proteica nos perfis de GVA e
GVB, com peso molecular compreendido entre 21,5 e 31 kDa, relacionado às albuminas e
globulinas, grupo heterogêneo de proteínas encontradas no trigo (BIETZ; SIMPSON, 1992).
O aumento das bandas entre 14,4 e 27 kDa, em condições não redutoras foi tambem
observado por Wang et al. (2014), indicando que esta fração não faz parte de agregados
estabilizados pelas pontes dissulfeto, que estão retidos no topo do gel. O GNV possivelmente
não foi solubilizado nas condições de análise, por isso, não apresentou bandas proteicas no gel
de separação e nem agregados proteicos retidos no topo do gel.
A análise do perfil de separação por tamanho molecular permitiu observar a presença
de proteínas com massas moleculares que correspondem às proteínas presentes no grão de
trigo e, consequentemente, nos produtos oriundos deste grão (como o glúten vital), com
classificação, de acordo com a massa molecular em albuminas e globulinas, gliadinas e
gluteninas. Também foi possível verificar a presença de agregados proteicos em GVA e GVB
quando eles foram submetidos a condições não redutoras.
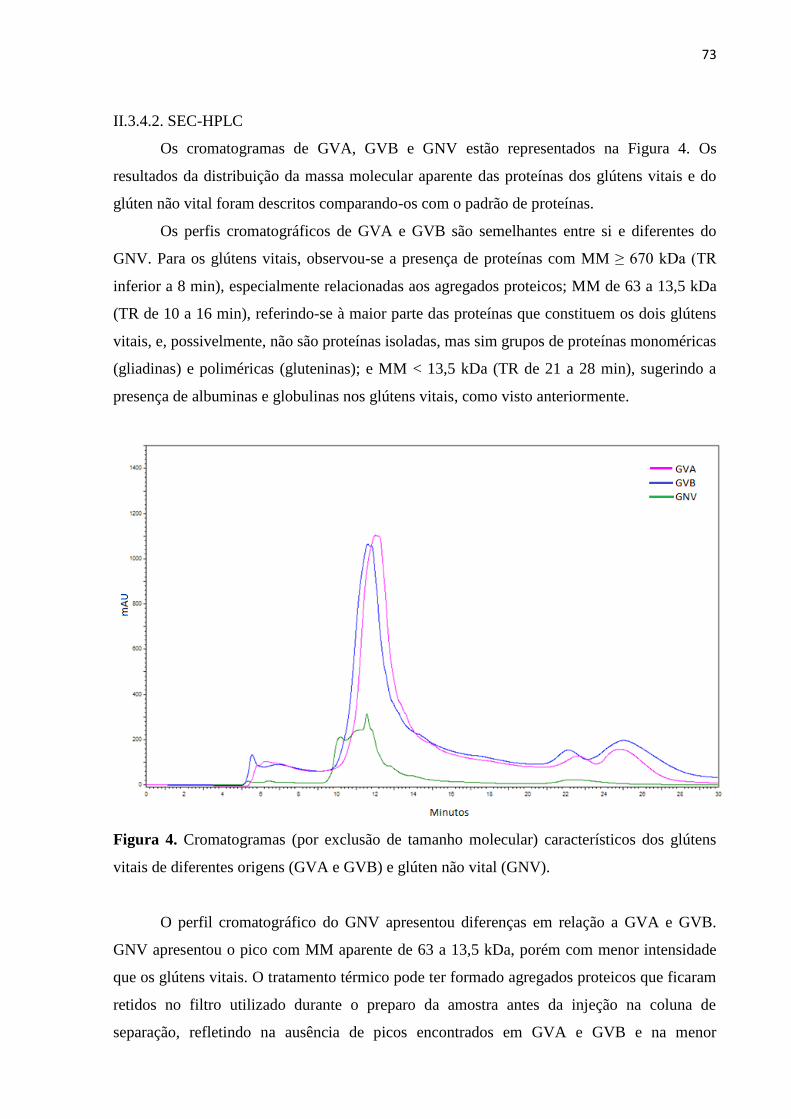
73
II.3.4.2. SEC-HPLC
Os cromatogramas de GVA, GVB e GNV estão representados na Figura 4. Os
resultados da distribuição da massa molecular aparente das proteínas dos glútens vitais e do
glúten não vital foram descritos comparando-os com o padrão de proteínas.
Os perfis cromatográficos de GVA e GVB são semelhantes entre si e diferentes do
GNV. Para os glútens vitais, observou-se a presença de proteínas com MM ≥ 670 kDa (TR
inferior a 8 min), especialmente relacionadas aos agregados proteicos; MM de 63 a 13,5 kDa
(TR de 10 a 16 min), referindo-se à maior parte das proteínas que constituem os dois glútens
vitais, e, possivelmente, não são proteínas isoladas, mas sim grupos de proteínas monoméricas
(gliadinas) e poliméricas (gluteninas); e MM < 13,5 kDa (TR de 21 a 28 min), sugerindo a
presença de albuminas e globulinas nos glútens vitais, como visto anteriormente.
Figura 4. Cromatogramas (por exclusão de tamanho molecular) característicos dos glútens
vitais de diferentes origens (GVA e GVB) e glúten não vital (GNV).
O perfil cromatográfico do GNV apresentou diferenças em relação a GVA e GVB.
GNV apresentou o pico com MM aparente de 63 a 13,5 kDa, porém com menor intensidade
que os glútens vitais. O tratamento térmico pode ter formado agregados proteicos que ficaram
retidos no filtro utilizado durante o preparo da amostra antes da injeção na coluna de
separação, refletindo na ausência de picos encontrados em GVA e GVB e na menor

74
intensidade do sinal do pico com MM aparente relacionada às proteínas monoméricas e
poliméricas do glúten.
Estes resultados mostram que os glútens vitais apresentaram perfis de massa molecular
aparente muito próximos, mesmo ambos sendo de diferentes origens, e, provavelmente, sendo
produzidos a partir de diferentes genótipos de trigo e por diferentes métodos de extração.
II.3.5. Espectroscopia no infravermelho por transformada de Fourier
A espectroscopia no infravermelho é uma técnica que pode ser utilizada para estudar
diferentes propriedades químicas das marcromoléculas, por exemplo, conformação estrutural,
ligações de hidrogênio, estado redox, entre outras (BARTH, 2007). A Figura 5 apresenta os
espectros de transmitância no infravermelho médio das amostras de glúten vital (GVA e
GVB) e não vital (GNV).
Figura 5. Espectros de transmitância no infravermelho médio por transformada de Fourier
(FTIR) obtidos dos glútens vitais (GVA e GVB) e do glúten não vital (GNV).
Os espectros de infravermelho (FTIR) (Fig.5) mostram que GVA, GVB e GNV
apresentaram bandas características de glúten, conforme relatado por Majzoobi; Abedi
(2014). Desta forma, GVA e GVB não apresentaram diferenças no espectro de IR, porém
75
GNV mostrou pequenas diferenças em relação a GVA (precursor de GNV), que serão
discutidas a seguir.
Foram observadas bandas na região de 3600-3100 cm-1
(FORATO; BERNARDES-
FILHO; COLNAGO, 1998) que caracterizam os estiramentos das ligações O-H e -NH2
(amina livre); na região de estiramento das ligações C-H (~2900 cm-1
) (WANG et al., 2016); e
também na região de ~1800-1000 cm-1
(que envolvem as ligações C=O e N-H), que
caracteriza a maior parte das frequências do IR para as classes químicas comumente
encontradas em proteínas (GARIDEL; SCHOTT, 2006), e são muito utilizadas para estudar as
estruturas secundárias das proteínas (FORATO et al., 1997). A forma e a intensidade das
bandas existentes nessa região são atribuídas às configurações em α-hélices (1648-1657 cm-1
),
estruturas β-folha (1623-1641 cm-1
e 1674-1695 cm-1
), β-voltas (1662-1686 cm-1
) e estruturas
desordenadas (1642-1657 cm-1
) (TATTINI JR; PARRA; PITOMBO, 2006; WANG et al.,
2016) que foram observadas para GVA, GVB e GNV (Fig. 5).
Uma vez que a grande maioria das moléculas orgânicas possui muitas ligações
simples, as bandas abaixo de 1500 cm-1
tornam-se muito complexas para interpretação
(GARIDEL; SCHOTT, 2006). Uma região de interesse para o estudo das estruturas do glúten
é a banda de 700-500 cm-1
, atribuída ao estiramento S-S e C-S, que caracterizam o espectro da
cistina (TATTINI JR; PARRA; PITOMBO, 2006), que foi observada para GVA, GVB e
GNV. Além disso, não foi observado o aparecimento de banda em 2560 cm-1
, caracterizando
a ausência do estiramento do grupo S-H, indicando que ocorreu a oxidação da cisteína em
cistina. A redução de SH no glúten vital e não vital está associada à etapa de formação da rede
de glúten que ocorre durante a obtenção do glúten vital, proporcionando a oxidação dos
grupos SH livres às ligações SS e o intercâmbio das ligações SS nas gliadinas e gluteninas
(JANSENS et al., 2011).
Considerando que GNV sofreu tratamento térmico de GVA e comparando os
espectros de ambos, foi possível observar algumas alterações no formato das bandas do GNV.
As alterações foram encontradas nas regiões de estiramento de O-H e -NH2 (3600-3100 cm-1
),
na região de estiramento de C-H (~2900 cm-1
), e na região de estiramento dos compostos
sulfurados (700-500 cm-1
). Essas alterações provavelmente ocorreram em virtude de
alterações promovidas pelo tratamento térmico de GNV, resultando em deformações das
bandas em virtude da modificação estrutural causada pelo tratamento térmico a que foi
exposto, refletindo em alterações no perfil das ligações de suas proteínas.
As respostas obtidas pelo IR são importantes para o entendimento da estrutura
secundária das proteínas que constituem as amostras de glúten vital, que são fundamentais

76
para o comportamento viscoelástico da rede de glúten que por elas será formada. Além disso,
esses resultados podem informar ainda sobre as perdas (por oxidação, redução, etc) dos
aminoácidos, ou ainda, sobre a desnaturação mecânica e/ou térmica que podem ocorrer
durante as etapas de mistura e secagem na obtenção do glúten vital. Foi possível observar que
as amostras de glúten vital encontravam-se estruturalmente organizadas, com estruturas
secundárias em α-hélices, β-folha e β-voltas semelhantes entre si. Já para o glúten não vital
observaram-se alterações estruturais, principalmente relacionadas aos compostos sulfurados
envolvidos na ligação SS, que ocorreu pelo tratamento térmico.
II.3.6. Avaliação microscópica da superfície da rede de glúten
As micrografias da rede de glúten formada a partir de GVA, GVB e GNV estão
apresentadas na Figura 6. Para GVA e GVB ocorreu a formação da rede de glúten, com
alguns grânulos de amido remanescentes presos à estrutura, já que as redes de glúten
avaliadas foram obtidas de glútens vitais reconstituídos com amido de trigo. GVA e GVB não
apresentaram diferenças em relação à estrutura de rede formada. O GNV não formou a rede
homogênea observada nos glútens vitais, pois a sua proteína, que estava previamente
agregada, não dezfez as ligações formadas anteriormente, e portanto, não foi capaz de formar
as interações necessárias (proteína-proteína e proteína-água) para o desenvolvimento da
estrutura da rede de glúten.
Figura 6. Microscopia eletrônica de varredura da rede de glúten formada a partir de glútens
vitais (GVA e GVB) e de agregados proteicos formados a partir do glúten não vital (GNV)
com aumento de 1000x.
77
II.4. Conclusões
Dentre as diferenças químicas e estruturais que envolveram os glútens avaliados, a
quantidade relativa de proteínas distribuídas entre as diferentes frações que constituem os
glútens vitais, e também as interações envolvidas na estabilização de suas cadeias proteicas,
parecem ser as mais relevantes para influenciar na qualidade tecnológica deste produto.
Quando há melhor balanço entre a quantidade de gliadinas e gluteninas, possivelmente, a rede
de glúten formada (pela hidratação do glúten vital associado ao trabalho mecânico) é de
melhor qualidade viscoelástica, contribuindo para o processo de panificação. O uso de glúten
não vital foi importante para revelar que o processo térmico, utilizado na etapa de secagem do
glúten vital, se não realizado sob rigoroso controle de temperatura e tempo, pode levar a
perdas na qualidade tecnológica, devido às alterações químicas e estruturais.
Este estudo representa uma importante contribuição para melhorar as informações
sobre as proteínas que constituem os diferentes glútens vitais comerciais, garantindo o uso
mais adequado deste produto, especialmente, na elaboração de pães.
Agradecimentos
Este trabalho foi apoiado pelo Conselho Nacional de Desenvolvimento Científico e
Tecnológico (concessão número 163129/2013-4) e pela Fundação de Amparo à Pesquisa do
Estado de São Paulo (concessão número 2014/02533-9) através de bolsas aos autores
Fernanda e Karoline, respectivamente. Os autores gostariam de agradecer a Labonathus®
(São Paulo, SP) e a Granotec® (Curitiba, PR, Brasil) pela doação de glúten vital de trigo.
Referências
AACCI. American Association of Cereal Chemists International. Approved methods, 11th
ed., St. Paul: AACCI. 2010.
ABANG ZAIDEL, D. N. et al. Rheological characterisation of gluten from extensibility
measurement. Journal of Food Engineering, v. 86, n. 4, p. 549–556, jun. 2008.
BARTH, A. Infrared spectroscopy of proteins. Biochimica et Biophysica, v. 1767, p. 1073–
1101, 2007.
BEKES, F.; GIANIBELLI, M. C.; WRIGLEY, C. Grain Proteins and Flour Quality.
Australian Journal of Agricultural Research, p. 416–423, 2004.
BELTON, P. S. On the Elasticity of Wheat Gluten. Journal of Cereal Science, v. 29, n. 2, p.
103–107, 1999.
78
BIETZ, J. A.; SIMPSON, D. G. Electrophoresis and chromatography of wheat proteins:
Available methods, and procedures for statistical evaluation of the data. Journal of
Chromatography, v. 624, n. 1–2, p. 53–80, 1992.
BRASIL. Regulamento técnico para produtos proteicos de origem vegetal. Brasil.
Agência Nacional de Vigilância Sanitária, Diário Oficial da Republica Federativa do Brasil,
2005. Disponível em:
<http://pesquisa.in.gov.br/imprensa/jsp/visualiza/index.jsp?jornal=1&pagina=371&data=23/0
9/2005>
CAUVAIN, S. Technology of breadmaking. Third edit ed. New York: Springer, 2015.
CHAN, K. Y.; WASSERMAN, B. P. Direct Colorimetric Assay of Free Thiol-Groups and
Disulfide Bonds in Suspensions of Solubilized and Particulate Cereal Proteins. Cereal
Chemistry, v. 70, n. 1, p. 22–26, 1993.
CHIANG, A. Protein-protein interaction of Soybean Protein from Extrusion Processing.
[s.l.] University of Missouri-Columbia, 2007.
DAHESH, M. et al. Spontaneous gelation of wheat gluten proteins in a food grade solvent.
Food Hydrocolloids, v. 52, p. 1–10, 2016.
DAY, L. et al. Wheat-gluten uses and industry needs. Trends in Food Science &
Technology, v. 17, n. 2, p. 82–90, fev. 2006.
DELCOUR, J. A et al. Wheat gluten functionality as a quality determinant in cereal-based
food products. Annual review of food science and technology, v. 3, p. 469–92, jan. 2012.
ESTELLER, M. S.; PITOMBO, R. N. M.; LANNES, S. C. S. Effect of freeze-dried gluten
addition on texture of hamburger buns. Journal of Cereal Science, v. 41, n. 1, p. 19–21, jan.
2005.
FORATO, L. A. et al. Estudo de métodos de aumento de resolução de espectros de ftir para
análise de estruturas secundárias de proteínas. Quimica Nova, v. 20, n. 5, p. 146–150, 1997.
FORATO, L. A.; BERNARDES-FILHO, R.; COLNAGO, L. A. Protein Structure in KBr
Pellets by Infrared Spectroscopy Protein Structure in KBr Pellets by Infrared Spectroscopy.
Analytical biochemistry, v. 259, November, p. 136–141, 1998.
FREDERIX, S. .; COURTIN, C. .; DELCOUR, J. . Influence of process parameters on yield
and composition of gluten fractions obtained in a laboratory scale dough batter procedure.
Journal of Cereal Science, v. 39, n. 1, p. 29–36, jan. 2004.
GARIDEL, P.; SCHOTT, H. Fourier-Transform Midinfrared Spectroscopy for Analysis and
Screening of Liquid Protein Formulations Part 2: Details Analysis and Applications.
BioProcess International, v. 1, p. 48–55, 2006.
79
GÓMEZ, A. V. et al. Analysis of soluble proteins/aggregates derived from gluten-emulsifiers
systems. Food Research International, v. 46, n. 1, p. 62–68, 2012.
GUERRIERI, N. et al. Use of spectroscopic and fluorescence techniques to assess heat-
induced molecular modifications of gluten. Cereal Chemistry, v. 73, n. 3, p. 368–374, 1996.
GUERRIERI, N.; CERLETTI, P. Effect of High-Temperature Short-Time Treatment of
Wheat Flour on Gluten Vitality and Structure. Cereal Chemistry, v. 73, n. 3, p. 6–9, 1996.
JANSENS, K. J. A. et al. Effect of temperature, time and wheat gluten moisture content on
wheat gluten network formation during thermomolding. Journal of Cereal Science, v. 54, n.
3, p. 434–441, nov. 2011.
JEKLE, M.; BECKER, T. Wheat dough microstructure: The relation between visual structure
and mechanical behavior. Critical Reviews in Food Science and Nutrition, v. 55, n.
February 2014, p. 369–382, 2013.
JOYE, I. J.; LAGRAIN, B.; DELCOUR, J. A. Use of chemical redox agents and exogenous
enzymes to modify the protein network during breadmaking – A review. Journal of Cereal
Science, v. 50, n. 1, p. 11–21, 2009.
KHATKAR, B. S.; BARAK, S.; MUDGIL, D. Effects of gliadin addition on the rheological,
microscopic and thermal characteristics of wheat gluten. International journal of biological
macromolecules, v. 53, p. 38–41, mar. 2013.
KHATKAR, B. S.; BELL, A. E.; SCHOFIELD, J. D. The dynamic rheological properties of
glutens and gluten sub-fractions from wheats of good and poor bread making quality. Journal
of Cereal Science, v. 22, n. 1, p. 29–44, jul. 1995.
KIEFFER, R. et al. Effect of hydrostatic pressure and temperature on the chemical and
functional properties of wheat gluten: Studies on gluten, gliadin and glutenin. Journal of
Cereal Science, v. 45, n. 3, p. 285–292, maio 2007.
LOOKHART, G. L. et al. Comparison of high-molecular-weight subunits of glutenin and
baking performance of flours varying in bread-making quality. Lebensmittel-Wissenschaft
& Technologie, v. 26, p. 301–306, 1993.
MACRITCHIE, F. Theories of glutenin / dough systems. Journal of Cereal Science, v. 60, p.
733–735, 2014.
MAJZOOBI, M. .; ABEDI, E. Effects of pH changes on functional properties of native and
acetylated wheat gluten. International Food Research Journal, v. 21, n. 3, p. 1219–1224,
2014.
MANOI, K.; RIZVI, S. S. H. Physicochemical changes in whey protein concentrate texturized
by reactive supercritical fluid extrusion. Journal of Food Engineering, v. 95, n. 4, p. 627–

80
635, 2009.
MARCHETTI, L. et al. Effect of glutens of different quality on dough characteristics and
breadmaking performance. LWT - Food Science and Technology, v. 46, n. 1, p. 224–231,
abr. 2012.
MCCANN, T. H.; DAY, L. Effect of sodium chloride on gluten network formation, dough
microstructure and rheology in relation to breadmaking. Journal of Cereal Science, v. 57, n.
3, p. 444–452, 2013.
MILLER, K. A.; HOSENEY, R. C. Dynamic rheological properties of wheat starch-gluten
doughs. Cereal Chemistry, v. 76, n. 1, p. 105–109, 1999.
ORTOLAN, F. et al. Rheological properties of vital wheat glutens with water or sodium
chloride. LWT - Food Science and Technology, v. 79, p. 647-654, 2017.
PYLER, E.J. Baking Science and Technology, 3rd Ed. Kansas City: Sosland Publishing
Company, p.357–377. 1988.
RAKITA, S. D. S. et al. Determination of free sulphydryl groups in wheat gluten under the
influence of different time and temperature of incubation: Method validation. Food
Chemistry, v. 150, p. 166–173, 2014.
RASHEED, F. et al. Structural architecture and solubility of native and modified gliadin and
glutenin proteins: non-crystalline molecular and atomic organization. RSC Adv., v. 4, n. 4, p.
2051–2060, 2014.
SCHIEDT, B. et al. Short- and Long-Range Interactions Governing the Viscoelastic
Properties during Wheat Dough and Model Dough Development. Journal of Texture
Studies, v. 44, n. 4, p. 317–332, 17 ago. 2013.
SCHLUENTZ, E. J.; STEFFE, J. F.; NG, P. K. W. Rheology and microstructure of wheat
dough developed with controlled deformation. Journal of Texture Studies, v. 31, p. 41–54,
2000.
SCHMIELE, M. et al. Determinação da concentração de diferentes sistemas de solventes na
solubilização de proteínas de análogo de carne. Ciência Rural, p. 1–6, 2013.
SCHOFIELD, J. D. et al. The effect of heat on wheat gluten and the involvement of
sulphydryl-disulphide interchange reactions. Journal of Cereal Science, v. 1, p. 241–253,
1983.
SHEWRY, P. R. et al. Wheat glutenin subunits and dough elasticity : findings of the
EUROWHEAT project. Trends in Food Science & Technology, v. 11, p. 433–441, 2001.
SINGH, N. K.; SHEPHERD, K. W.; CORNISH, G. B. A simplified SDS—PAGE procedure
for separating LMW subunits of glutenin. Journal of Cereal Science, v. 14, n. 3, p. 203–208,
81
nov. 1991.
SINGH, H., & MACRITCHIE, F. Application of polymer science to properties of gluten.
Journal of Cereal Science, v. 33, p. 231–243, 2001.
SLUIMER, P. Principles of breadmaking. St. Paul: AACCI. p.1-212. 2005.
TATTINI JR, V.; PARRA, D. F.; PITOMBO, R. N. D. M. Influência da taxa de
congelamento no comportamento físico-químico e estrutural durante a liofilização da
albumina bovina. Revista Brasileira de Ciências Farmacêuticas, v. 42, n. 1, p. 127–136,
2006.
TRONSMO, K. M. et al. A Study of how Size Distribution of Gluten Proteins, Surface
Properties of Gluten and Dough Mixing Properties Relate to Baking Properties of Wheat
Flours. Journal of Cereal Science, v. 35, p. 201–214, 2002.
TUHUMURY, H. C. D.; SMALL, D. M.; DAY, L. The effect of sodium chloride on gluten
network formation and rheology. Journal of Cereal Science, v. 60, n. 1, p. 229–237, 2014.
VAN DER BORGHT, A. et al. Fractionation of wheat and wheat flour into starch and gluten:
overview of the main processes and the factors involved. Journal of Cereal Science, v. 41, n.
3, p. 221–237, maio 2005.
WANG, K.-Q. et al. Changes in chemical interactions and protein conformation during heat-
induced wheat gluten formation. Food chemistry, 2016.
WANG, P. et al. Effect of frozen storage on physico-chemistry of wheat gluten proteins:
Studies on gluten-, glutenin- and gliadin-rich fractions. Food Hydrocolloids, v. 39, p. 187–
194, 2014.
WANG, P.; JIN, Z.; XU, X. Physicochemical alterations of wheat gluten proteins upon dough
formation and frozen storage – A review from gluten, glutenin and gliadin perspectives.
Trends in Food Science & Technology, v. 46, n. 2, Part A, p. 189–198, 2015.
WEEGELS, P. L. et al. Effects on gluten of heating at different moiture contents. I. Changes
in funcional properties. Journal of Cereal Science, v. 19, p. 31–38, 1994.
WEEGELS, P. L.; MARSEILLE, J. P.; HAMER, R. J. Small Scale Separation. Starch, v. 40,
n. 9, p. 342–346, 1988.
WHITE, J. A; HART, R. J.; FRY, J. C. An evaluation of the Waters Pico-Tag system for the
amino-acid analysis of food materials. The Journal of automatic chemistry, v. 8, n. 4, p.
170–7, jan. 1986.
WIESER, H. Investigations on the extractability of gluten proteins from wheat bread in
comparison with flour. Zeitschrift für Lebensmitteluntersuchung und -Forschung, v. 207,
p. 128–132, 1998.
82
WIESER, H. Chemistry of gluten proteins. Food microbiology, v. 24, n. 2, p. 115–9, abr.
2007.
ZHOU, Y. et al. Konjac glucomannan-induced changes in thiol/disulphide exchange and
gluten conformation upon dough mixing. Food chemistry, v. 143, p. 163–9, 15 jan. 2014.
83
ARTIGO III.
___________________________________________________________________________
Rheological properties of vital wheat glutens with water or sodium chloride
Fernanda Ortolan; Gabriela Paiva Corrêa; Rosiane Lopes da Cunha; Caroline Joy Steel
Published in
LWT - Food Science and Technology, v.79, p. 647-654, 2017
doi: 10.1016/j.lwt.2017.01.059
(Anexo 2)
84
III. Rheological properties of vital wheat glutens with water or sodium chloride
Fernanda Ortolan; Gabriela Paiva Corrêa; Rosiane Lopes da Cunha; Caroline Joy Steel
Abstract
Vital wheat gluten is an ingredient used in the bakery industry. The objective of this
research was to evaluate the quality of two different vital wheat glutens (A and B) through
fundamental and empirical rheological tests. Samples of wet gluten and of dough prepared
with wheat flour fortified with 5 or 7 g/100 g gluten were evaluated, with or without sodium
chloride. In the fundamental tests, the gluten network showed higher storage modulus values
when prepared with water than when prepared with salt solution. Extensograph measurements
showed that the dough prepared with salt solution presented greater resistance, maximum
resistance, and area under curve than when prepared with water. In both fundamental and
empirical tests, vital wheat gluten A was superior to vital wheat gluten B. The differences
found between fundamental and empirical tests can be associated with the magnitude and type
of force applied, as well as the protein composition and quality of the vital wheat glutens.
These tests were good tools for evaluating the differences between vital wheat glutens.
Keywords: fundamental rheology, empirical rheology, extensograph, rheometer, dough,
gluten network
III.1. Introduction
Wheat gluten is a common food ingredient that can be used to fortify weak wheat
flours to produce breads with good quality. This product is obtained from wheat flour and is
marketed as “vital wheat gluten” when its technological properties are maintained after
hydration. Dry vital wheat gluten, when in contact with water, rehydrates rapidly and regains
its intrinsic functionality. Vitality has been related to the rate of water absorption and degree
of viscoelasticity (Miller & Hoseney, 1999). To improve characteristics such as flour strength,
dough mixing tolerance, and bread volume, vital wheat gluten is added to flour at levels
varying from 2 to 10 g/100 g (Wadhawan & Bushuk, 1989), with 5 g/100 g being a
commonly used concentration (Czuchajowska & Paszczynska, 1996). However, the vital
wheat gluten commercialized in the market has few quality specifications, especially related
to the characteristics of the proteins that constitute the protein network responsible for its
viscoelastic properties. Gluten is a viscoelastic protein complex, having both elastic and
85
viscous properties (Tuhumury, Small, & Day, 2014; Wieser, 2007). Gluten contains two
major protein groups: glutenins and gliadins. It is generally accepted that glutenin contributes
mainly to elastic properties whereas gliadin contributes primarily to viscous properties
(Delcour et al., 2012; MacRitchie, 2014; McCann & Day, 2013).
It is widely known that the strength of a dough depends on the arrangement of the
three-dimensional gluten network, which is a consequence of the number of disulfide bonds
and sulfhydryl groups in the proteins. It should be noted that most of the changes in dough
mixing properties are caused by thiol-disulfide interchange reactions between gliadins and
glutenins (Delcour et al., 2012). Some studies (Delcour et al., 2012; MacRitchie, 2014; Wang,
Jin, & Xu, 2015; Wellner et al., 2005) have sought to understand the formation of the gluten
network. One of the most accepted theories is the “loop-train theory” (Belton, 1999), which
establishes that not only are disulfide bonds involved in gluten network formation, but
hydrogen bonds also contribute to the interaction between gliadins and glutenins (Ng &
McKinley, 2008). Thus, evaluating rheological properties is important in determining the
behavior of the gluten network in dough during mechanical handling, in addition to its
influence on the quality of the finished product. Rheological tests such as those applied in
cereal research and industry have been classified as empirical or fundamental.
Studies on the fundamental rheology of dough and/or gluten (McCann & Day, 2013;
Singh & Singh, 2013; Song & Zheng, 2007; Tronsmo, Magnus, Færgestad, & Schofield,
2003) are usually carried out using small deformation, whereas the empirical measurements
are made using large deformation. Empirical dough and gluten rheological tests using large
deformations are more popular for evaluating dough quality, but rheological measurements
carried out using small deformations can be useful to complement information on the strength
of the network. The structure and interactions between gliadins and glutenins that contribute
to gluten network formation are affected by solvents during hydration and the presence of salt
(Tuhumury et al., 2014). Salt, depending on its concentration, reduces protein repulsive
forces, allowing greater interaction between them, thus strengthening the gluten network. On
the other hand, salt can also have osmotic effects, preventing or delaying protein hydration
(McCann and Day, 2013; Schober, Dockery, & Arendt,2003; Tuhumury et al., 2014; Wellner,
Bianchini, Mills, & Belton, 2003), and water clearly plays a critical role in gluten
development (Abang Zaidel, Chin, Abdul Rahman, & Karim, 2008; Belton, 1999). Besides
that, the fact that salt can either strengthen or weaken noncovalent intermolecular interactions
makes it a good tool for studying protein-protein interactions in gluten (Wellner et al., 2003).

86
These rheological measurements can show the difference between vital wheat glutens
and the effects of sodium chloride on gluten network formation. Therefore, the aim of this
study was to evaluate the fundamental and empirical rheological properties of the gluten
network and of doughs produced, with or without sodium chloride, from vital wheat glutens
of different qualities and wheat flour fortified with 5 or 7 g/100 g of these vital wheat glutens.
III.2. Materials and methods
III.2.1. Material
Two samples of commercial vital wheat gluten were kindly donated by Labonathus
(São Paulo, SP, Brazil) and Granotec (Curitiba, PR, Brazil), which were named VGA and
VGB, respectively. The wheat flour control (CWF) was provided by Sul Mineiro Mill
(Varginha, MG, Brazil). The proximate composition of the raw materials was performed
according to AACCI (2010) and results showed the following: 9.01 g/100 g moisture, 0.83
g/100 g ash, 2.74 g/100 g lipids, 75.32 g/100 g proteins, and 21.11 g/100 g carbohydrates for
VGA; 6.79 g/100 g moisture, 0.72 g/100 g ash, 0.81 g/100 g lipids, 77.38 g/100 g proteins,
and 21.09 g/100 g carbohydrates for VGB; 11.89 g/100 g moisture, 0.72 g/100 g ash, 1.17
g/100 g lipids, 13.6 g/100 g proteins, and 72.62 g/100 g carbohydrates for CWF. The methods
applied to measure the proximate composition were: moisture content (AACCI method 44-
15.02), ash content (AACCI method 08-01.01), protein content (AACCI method 46-13.01),
using 5.7 as correction factor, lipids content (AACCI method 02-01.02), and carbohydrates by
difference [100-(ash + protein + lipids)]. The results are given on a dry weight basis except
for moisture content.
III.2.2. Methods
III.2.2.1. Sample codes
The sample codes used in this study are described in Table 1. VGA, VGB, and CWF
were used to prepare blends with different levels (5 and 7 g/100 g) of VGA or VGB for flour
fortification. These levels of fortification were chosen after pre-baking tests were carried out
(data not shown).

87
Table 1. Codes for the samples used in this study for fundamental rheological measurements
and empirical rheological measurement
Samples
Fundamental Rheological
Measurements
Empirical Rheological
Measurement
wet gluten (G) dough (D)
Wet gluten
prepared with
water (W)
Wet gluten
prepared with
salt (S)
Dough
prepared with
water (W)
Dough
prepared with
salt (S)
Vital gluten A VGA W VGA S -- --
Vital gluten B VGB W VGB S -- --
Control wheat flour GWF W GWF S DWF W DWF S
Wheat flour fortified with 5 g/100
g of vital wheat gluten A G5A W G5A S D5A W D5A S
Wheat flour fortified with 7 g/100
g of vital wheat gluten A G7A W G7A S D7A W D7A S
Wheat flour fortified with 5 g/100
g of vital wheat gluten B G5B W G5B S D5B W D5B S
Wheat flour fortified with 7 g/100
g of vital wheat gluten B G7B W G7B S D7B W D7B S
To better understand the difference between vital wheat glutens of different quality, all
of the rheological tests (fundamental and empirical) were performed by adding both water and
salt, owing to the fact that bakers routinely add a small amount of NaCl to wheat flour doughs
(1 to 2 g/100 g, flour basis) to prepare different types of breads (Wellner et al., 2003). The
fundamental rheological tests were carried out with wet gluten and the empirical rheological
tests were performed with dough.
III.2.2.2. Gluten reconstitution and wet gluten preparation
The fundamental rheological tests were carried out with wet gluten, which was
prepared with reconstituted vital wheat gluten. Before preparing the wet gluten, the dry vital
wheat glutens (VGA and VGB) were reconstituted with native wheat starch until each sample
reached 12 g/100 g (w/w) protein content to standardize the protein content in both samples.
The wet gluten was prepared in a Glutomatic 2200 machine (Perten Instruments,
Hägersten, Sweden), following AACCI method 38-12.02 (AACCI, 2010) without the
centrifugation and drying steps. The wet gluten was obtained from washing with water or salt
solution containing 2 g/100 mL (w/v) NaCl. The procedure was performed in triplicate, and
the samples were maintained in a water saturation environment until the fundamental
rheological analysis.
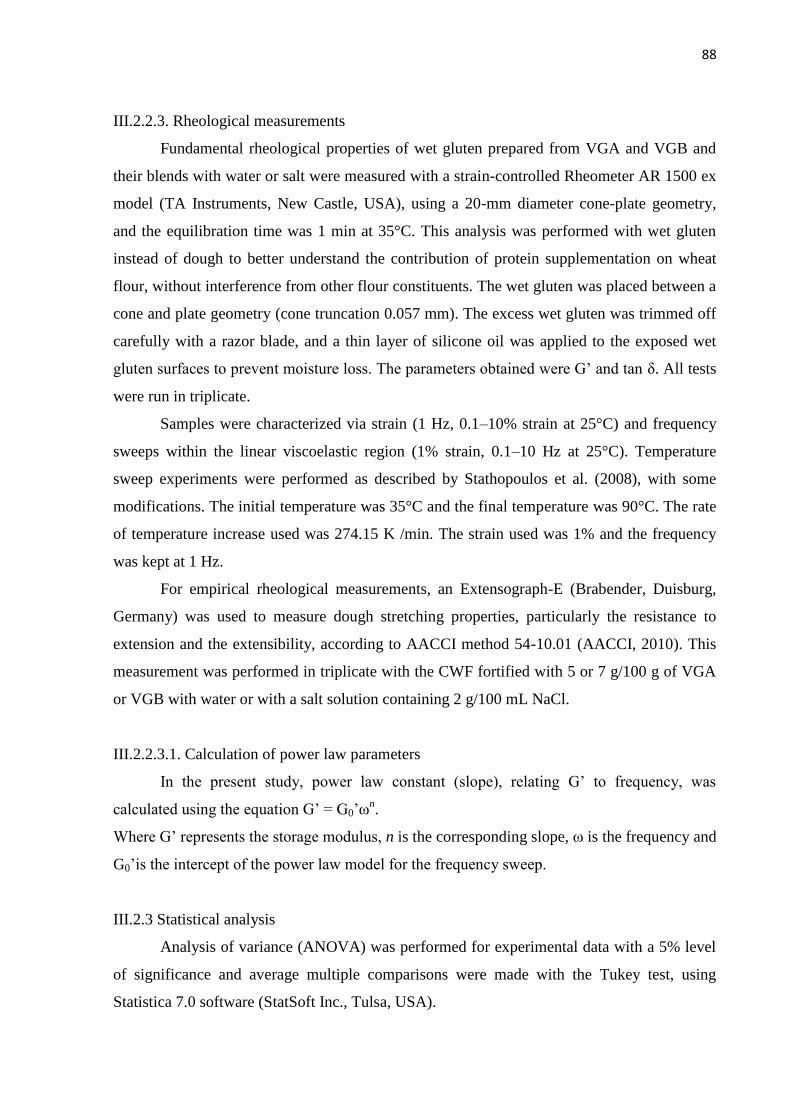
88
III.2.2.3. Rheological measurements
Fundamental rheological properties of wet gluten prepared from VGA and VGB and
their blends with water or salt were measured with a strain-controlled Rheometer AR 1500 ex
model (TA Instruments, New Castle, USA), using a 20-mm diameter cone-plate geometry,
and the equilibration time was 1 min at 35°C. This analysis was performed with wet gluten
instead of dough to better understand the contribution of protein supplementation on wheat
flour, without interference from other flour constituents. The wet gluten was placed between a
cone and plate geometry (cone truncation 0.057 mm). The excess wet gluten was trimmed off
carefully with a razor blade, and a thin layer of silicone oil was applied to the exposed wet
gluten surfaces to prevent moisture loss. The parameters obtained were G’ and tan δ. All tests
were run in triplicate.
Samples were characterized via strain (1 Hz, 0.1–10% strain at 25°C) and frequency
sweeps within the linear viscoelastic region (1% strain, 0.1–10 Hz at 25°C). Temperature
sweep experiments were performed as described by Stathopoulos et al. (2008), with some
modifications. The initial temperature was 35°C and the final temperature was 90°C. The rate
of temperature increase used was 274.15 K /min. The strain used was 1% and the frequency
was kept at 1 Hz.
For empirical rheological measurements, an Extensograph-E (Brabender, Duisburg,
Germany) was used to measure dough stretching properties, particularly the resistance to
extension and the extensibility, according to AACCI method 54-10.01 (AACCI, 2010). This
measurement was performed in triplicate with the CWF fortified with 5 or 7 g/100 g of VGA
or VGB with water or with a salt solution containing 2 g/100 mL NaCl.
III.2.2.3.1. Calculation of power law parameters
In the present study, power law constant (slope), relating G’ to frequency, was
calculated using the equation G’ = G0’ωn.
Where G’ represents the storage modulus, n is the corresponding slope, ω is the frequency and
G0’is the intercept of the power law model for the frequency sweep.
III.2.3 Statistical analysis
Analysis of variance (ANOVA) was performed for experimental data with a 5% level
of significance and average multiple comparisons were made with the Tukey test, using
Statistica 7.0 software (StatSoft Inc., Tulsa, USA).
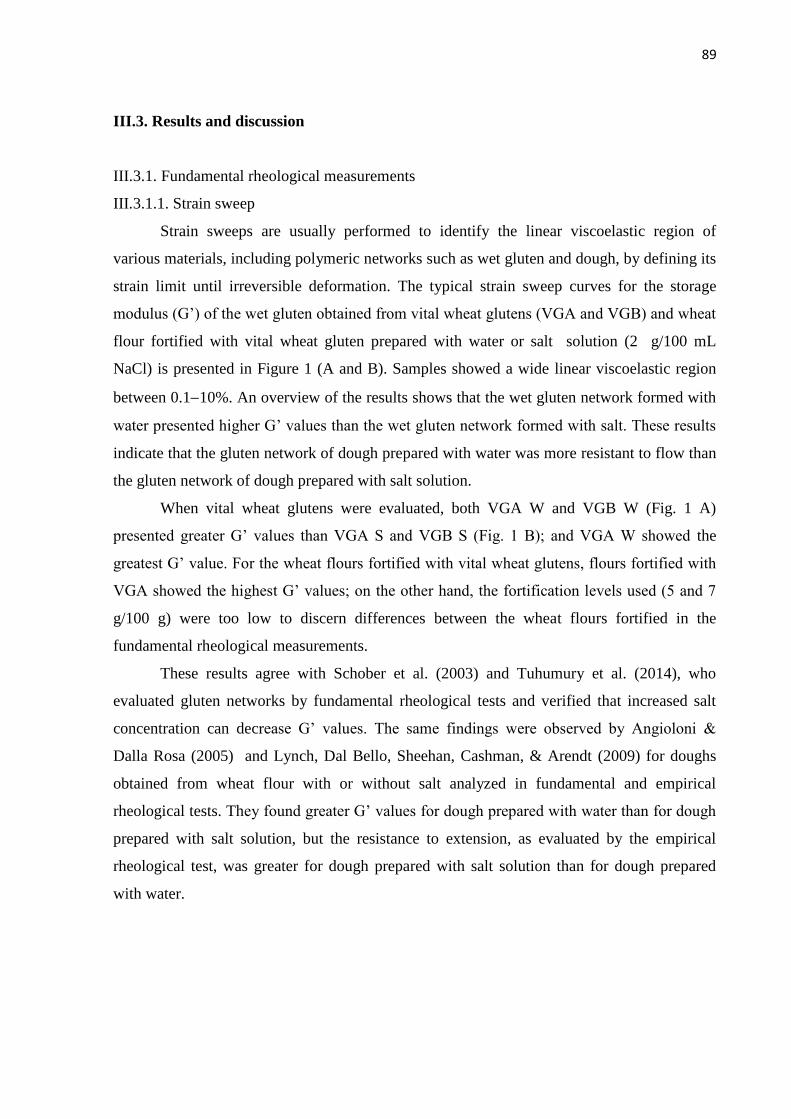
89
III.3. Results and discussion
III.3.1. Fundamental rheological measurements
III.3.1.1. Strain sweep
Strain sweeps are usually performed to identify the linear viscoelastic region of
various materials, including polymeric networks such as wet gluten and dough, by defining its
strain limit until irreversible deformation. The typical strain sweep curves for the storage
modulus (G’) of the wet gluten obtained from vital wheat glutens (VGA and VGB) and wheat
flour fortified with vital wheat gluten prepared with water or salt solution (2 g/100 mL
NaCl) is presented in Figure 1 (A and B). Samples showed a wide linear viscoelastic region
between 0.110%. An overview of the results shows that the wet gluten network formed with
water presented higher G’ values than the wet gluten network formed with salt. These results
indicate that the gluten network of dough prepared with water was more resistant to flow than
the gluten network of dough prepared with salt solution.
When vital wheat glutens were evaluated, both VGA W and VGB W (Fig. 1 A)
presented greater G’ values than VGA S and VGB S (Fig. 1 B); and VGA W showed the
greatest G’ value. For the wheat flours fortified with vital wheat glutens, flours fortified with
VGA showed the highest G’ values; on the other hand, the fortification levels used (5 and 7
g/100 g) were too low to discern differences between the wheat flours fortified in the
fundamental rheological measurements.
These results agree with Schober et al. (2003) and Tuhumury et al. (2014), who
evaluated gluten networks by fundamental rheological tests and verified that increased salt
concentration can decrease G’ values. The same findings were observed by Angioloni &
Dalla Rosa (2005) and Lynch, Dal Bello, Sheehan, Cashman, & Arendt (2009) for doughs
obtained from wheat flour with or without salt analyzed in fundamental and empirical
rheological tests. They found greater G’ values for dough prepared with water than for dough
prepared with salt solution, but the resistance to extension, as evaluated by the empirical
rheological test, was greater for dough prepared with salt solution than for dough prepared
with water.
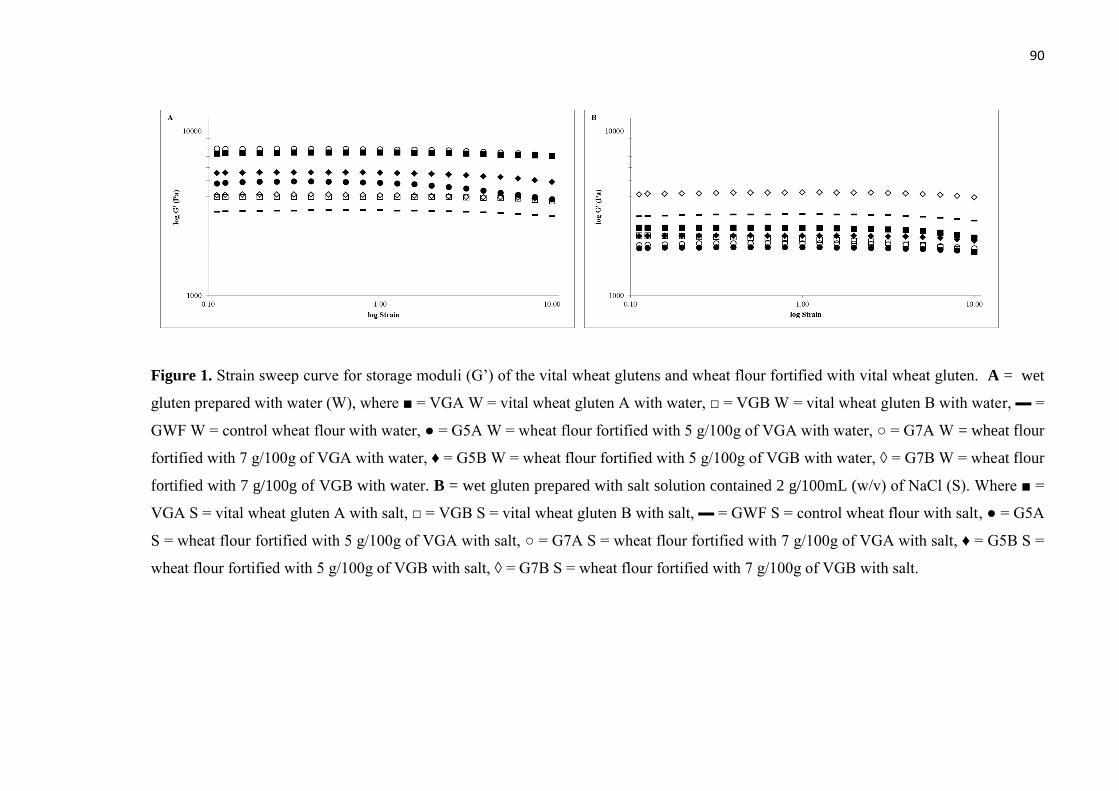
90
Figure 1. Strain sweep curve for storage moduli (G’) of the vital wheat glutens and wheat flour fortified with vital wheat gluten. A = wet
gluten prepared with water (W), where ■ = VGA W = vital wheat gluten A with water, □ = VGB W = vital wheat gluten B with water, ▬ =
GWF W = control wheat flour with water, ● = G5A W = wheat flour fortified with 5 g/100g of VGA with water, ○ = G7A W = wheat flour
fortified with 7 g/100g of VGA with water, ♦ = G5B W = wheat flour fortified with 5 g/100g of VGB with water, ◊ = G7B W = wheat flour
fortified with 7 g/100g of VGB with water. B = wet gluten prepared with salt solution contained 2 g/100mL (w/v) of NaCl (S). Where ■ =
VGA S = vital wheat gluten A with salt, □ = VGB S = vital wheat gluten B with salt, ▬ = GWF S = control wheat flour with salt, ● = G5A
S = wheat flour fortified with 5 g/100g of VGA with salt, ○ = G7A S = wheat flour fortified with 7 g/100g of VGA with salt, ♦ = G5B S =
wheat flour fortified with 5 g/100g of VGB with salt, ◊ = G7B S = wheat flour fortified with 7 g/100g of VGB with salt.

91
The presence of NaCl can decrease inter-protein hydrophobic interactions, as a result
of the effect of salt on the structure of water (Lynch et al., 2009; Salvador, Sanz, & Fiszman,
2006). This decrease, which largely depends on the content and quality of the proteins present
(Preston, 1989), reduces the tendency of the proteins to aggregate, reducing elasticity, and
consequently decreasing G’ values. Besides this, sodium chloride can reduce protein
hydration because of its water-holding capacity (Beck, Jekle, & Becker, 2012).
The linear viscoelastic region of wheat flour dough may show a shorter linear region
than the isolated gluten network, because the interactions among the wheat flour constituents
(such as proteins and starch) can reduce the linear region (Uthayakumaran, Newberry, Phan-
Thien, & Tanner, 2002), while in the gluten ball (rubbery gluten network) this region is larger
when compared with wheat flour doughs (Létang, Piau, & Verdier, 1999). These findings
were also observed by Dahesh, Banc, Duri, Morel, & Ramos (2016). These authors found an
extremely large linear region for gluten gel, which reached more than 300% in strain sweep.
In our work, we prepared the gluten network in a Glutomatic device, retaining only the
insoluble proteins in the gluten ball. In our study, the gluten ball obtained from both vital
wheat gluten and wheat flour fortified with 5 and 7 g/100 g of VGA or VGB showed similar
linear viscoelastic regions, as shown in Figure 1 (A and B). This may be explained by the
increased protein concentration in wheat flour when vital gluten was used for fortification.
The differences observed between VGA and VGB may be due their protein compositions,
especially with regard to gliadins and glutenins. Gliadins confer viscosity properties to the
gluten network (Khatkar, Barak, & Mudgil, 2013), while glutenins, especially high-molecular
weight glutenin subunits (HMW-GS), are related to gluten elasticity (Delcour et al., 2012;
Uthayakumaran, Tanner, Dai, Qi, & Wrigley, 2014). Therefore, an appropriate balance
between gliadin and glutenin is necessary to ensure adequate viscoelastic properties in the
gluten network.
III.3.1.2. Frequency sweep
The frequency sweep provides information about changes in the viscoelastic properties
of the polymer network at different observation times. The elastic modulus (G’) and tan δ as
measured by the frequency sweep for vital wheat glutens and wheat flour fortified with vital
gluten obtained from the washings with water or with salt solution are shown in Figure 2 (A,
B, C, and D).
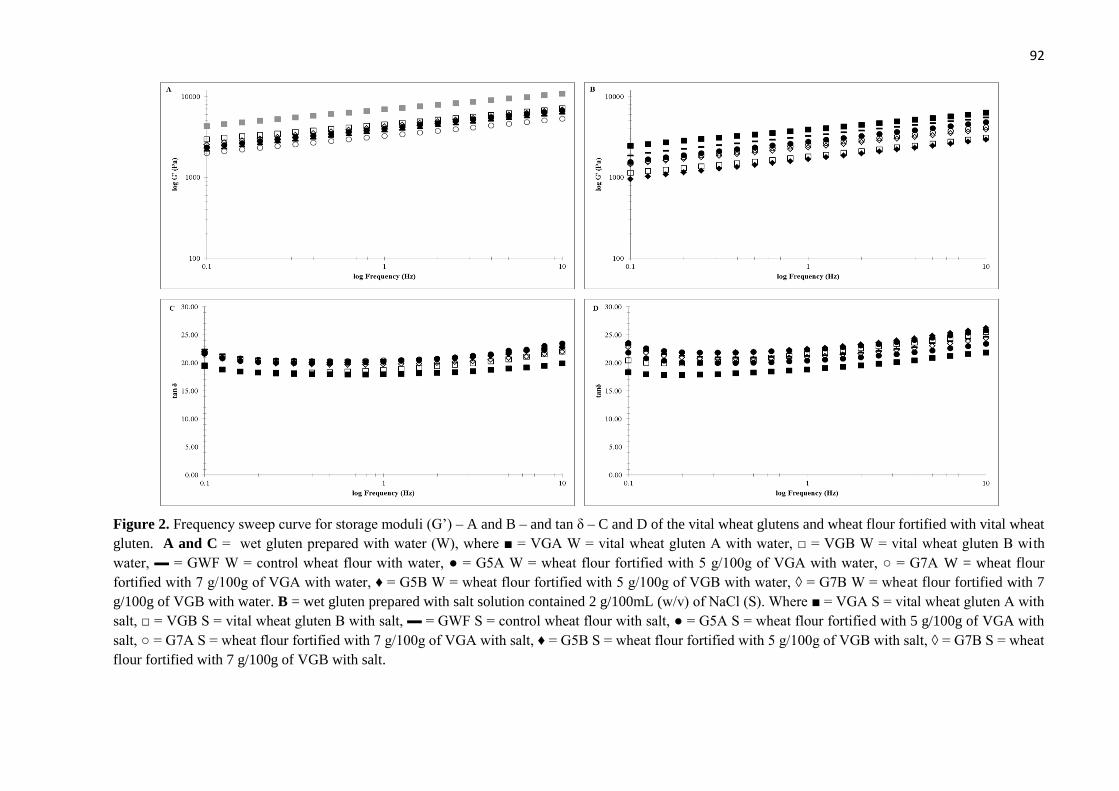
92
Figure 2. Frequency sweep curve for storage moduli (G’) – A and B – and tan δ – C and D of the vital wheat glutens and wheat flour fortified with vital wheat
gluten. A and C = wet gluten prepared with water (W), where ■ = VGA W = vital wheat gluten A with water, □ = VGB W = vital wheat gluten B with
water, ▬ = GWF W = control wheat flour with water, ● = G5A W = wheat flour fortified with 5 g/100g of VGA with water, ○ = G7A W = wheat flour
fortified with 7 g/100g of VGA with water, ♦ = G5B W = wheat flour fortified with 5 g/100g of VGB with water, ◊ = G7B W = wheat flour fortified with 7
g/100g of VGB with water. B = wet gluten prepared with salt solution contained 2 g/100mL (w/v) of NaCl (S). Where ■ = VGA S = vital wheat gluten A with
salt, □ = VGB S = vital wheat gluten B with salt, ▬ = GWF S = control wheat flour with salt, ● = G5A S = wheat flour fortified with 5 g/100g of VGA with
salt, ○ = G7A S = wheat flour fortified with 7 g/100g of VGA with salt, ♦ = G5B S = wheat flour fortified with 5 g/100g of VGB with salt, ◊ = G7B S = wheat
flour fortified with 7 g/100g of VGB with salt.
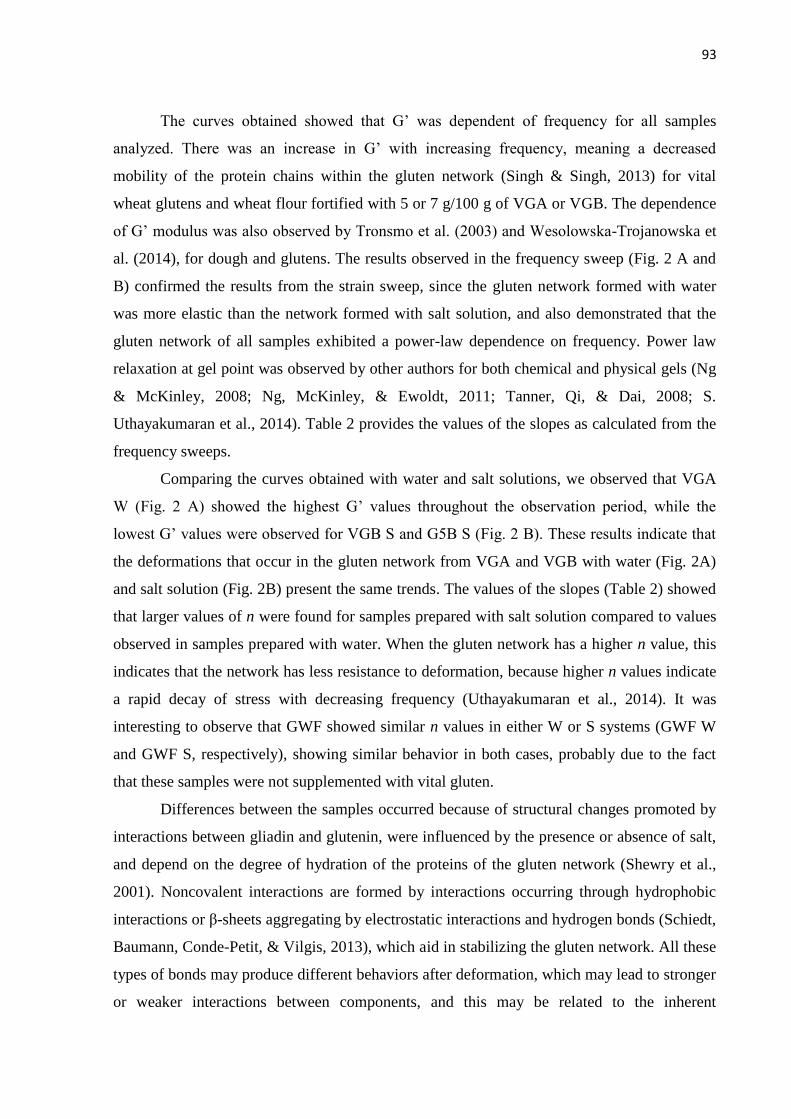
93
The curves obtained showed that G’ was dependent of frequency for all samples
analyzed. There was an increase in G’ with increasing frequency, meaning a decreased
mobility of the protein chains within the gluten network (Singh & Singh, 2013) for vital
wheat glutens and wheat flour fortified with 5 or 7 g/100 g of VGA or VGB. The dependence
of G’ modulus was also observed by Tronsmo et al. (2003) and Wesolowska-Trojanowska et
al. (2014), for dough and glutens. The results observed in the frequency sweep (Fig. 2 A and
B) confirmed the results from the strain sweep, since the gluten network formed with water
was more elastic than the network formed with salt solution, and also demonstrated that the
gluten network of all samples exhibited a power-law dependence on frequency. Power law
relaxation at gel point was observed by other authors for both chemical and physical gels (Ng
& McKinley, 2008; Ng, McKinley, & Ewoldt, 2011; Tanner, Qi, & Dai, 2008; S.
Uthayakumaran et al., 2014). Table 2 provides the values of the slopes as calculated from the
frequency sweeps.
Comparing the curves obtained with water and salt solutions, we observed that VGA
W (Fig. 2 A) showed the highest G’ values throughout the observation period, while the
lowest G’ values were observed for VGB S and G5B S (Fig. 2 B). These results indicate that
the deformations that occur in the gluten network from VGA and VGB with water (Fig. 2A)
and salt solution (Fig. 2B) present the same trends. The values of the slopes (Table 2) showed
that larger values of n were found for samples prepared with salt solution compared to values
observed in samples prepared with water. When the gluten network has a higher n value, this
indicates that the network has less resistance to deformation, because higher n values indicate
a rapid decay of stress with decreasing frequency (Uthayakumaran et al., 2014). It was
interesting to observe that GWF showed similar n values in either W or S systems (GWF W
and GWF S, respectively), showing similar behavior in both cases, probably due to the fact
that these samples were not supplemented with vital gluten.
Differences between the samples occurred because of structural changes promoted by
interactions between gliadin and glutenin, were influenced by the presence or absence of salt,
and depend on the degree of hydration of the proteins of the gluten network (Shewry et al.,
2001). Noncovalent interactions are formed by interactions occurring through hydrophobic
interactions or β-sheets aggregating by electrostatic interactions and hydrogen bonds (Schiedt,
Baumann, Conde-Petit, & Vilgis, 2013), which aid in stabilizing the gluten network. All these
types of bonds may produce different behaviors after deformation, which may lead to stronger
or weaker interactions between components, and this may be related to the inherent

94
differences in protein content (gliadins and glutenins) of a particular flour (Tuhumury et al.,
2014).
Table 2. Power law parameters of gluten networks obtained from wheat flour fortified with 5
and 7 g/100 g of vital wheat gluten A (VGA) or vital wheat gluten B (VGB) prepared using
water (W) or salt solution (S)
𝑮𝟎′ n R²
VGA W 6909.1 ± 156.3 a 0.20 ± 0.00 ab 0.99 ± 0.00 ns
VGB W 4551.8 ± 153.7 b 0.19 ± 0.01 b 0.99 ± 0.05 ns
GWF W 3671.8 ± 140.3 e 0.22 ± 0.01 a 0.99 ± 0.00 ns
G5A W 4020.6 ± 265.5 cde 0.23 ± 0.01 a 0.99 ± 0.00 ns
G7A W 3266.7 ± 45.3 f 0.21 ± 0.01 ab 0.99 ± 0.00 ns
G5B W 3936.3 ± 59.1 d 0.22 ± 0.01 a 0.99 ± 0.02 ns
G7B W 4241.8 ± 101.4 c 0.21 ± 0.00 a 0.99 ± 0.00 ns
VGA S 3919.4 ± 203.3 a 0.20 ± 0.00 c 0.99 ± 0.00 ns
VGB S 1839.1 ± 118.0 e 0.22 ± 0.00 b 0.99 ± 0.01 ns
GWF S 3246.6 ± 15.2 b 0.23 ± 0.00 a 0.99 ± 0.01 ns
G5A S 2769.0 ± 141.0 c 0.24 ± 0.01 a 0.99 ± 0.00 ns
G7A S 2527.5 ± 222.3 cd 0.22 ± 0.00 b 0.99 ± 0.00 ns
G5B S 1678.9 ± 96.7 e 0.24 ± 0.00 a 0.99 ± 0.03 ns
G7B S 2366.7 ± 37.6 d 0.21 ± 0.01 bc 0.99 ± 0.00 ns
𝐺0′ = intercept of the power law model for frequency sweep; n = corresponding slope; R² = regression
coefficient; VGA W = vital wheat gluten A with water; VGB W = vital wheat gluten B with water; GWF W =
control wheat flour with water; G5A W = wheat flour fortified with 5 g/100 g of vital wheat gluten A with water;
G7A W = wheat flour fortified with 7 g/100 g of vital wheat gluten A with water; G5B W = wheat flour fortified
with 5 g/100 g of vital wheat gluten B with water; G7B W = wheat flour fortified with 7 g/100 g of vital wheat
gluten B with water; VGA S = vital wheat gluten A with salt; VGB S = vital wheat gluten B with salt; GWF S =
control wheat flour with salt; G5A S = wheat flour fortified with 5 g/100 g of vital wheat gluten A with salt;
G7A S = wheat flour fortified with 7 g/100 g of vital wheat gluten A with salt; G5B S = wheat flour fortified
with 5 g/100 g of vital wheat gluten B with salt; G7B S = wheat flour fortified with 7 g/100 g of vital wheat
gluten B with salt. Means are followed by standard deviation. Different letter in the column represents
significant differences among means; ns = no significant.
For tan δ as measured by the frequency sweep for vital wheat glutens and wheat flour
fortified with vital gluten obtained from the washings with water (Fig. 2C) or with salt
solution (Fig. 2D), the results were similar among the samples. With regards to the
relationship between elastic and viscous behaviors, there was essentially no change upon the
addition of salt. That is, both samples increased at the same rate and all samples formed a
relatively strong gel with virtually independent frequency moduli.
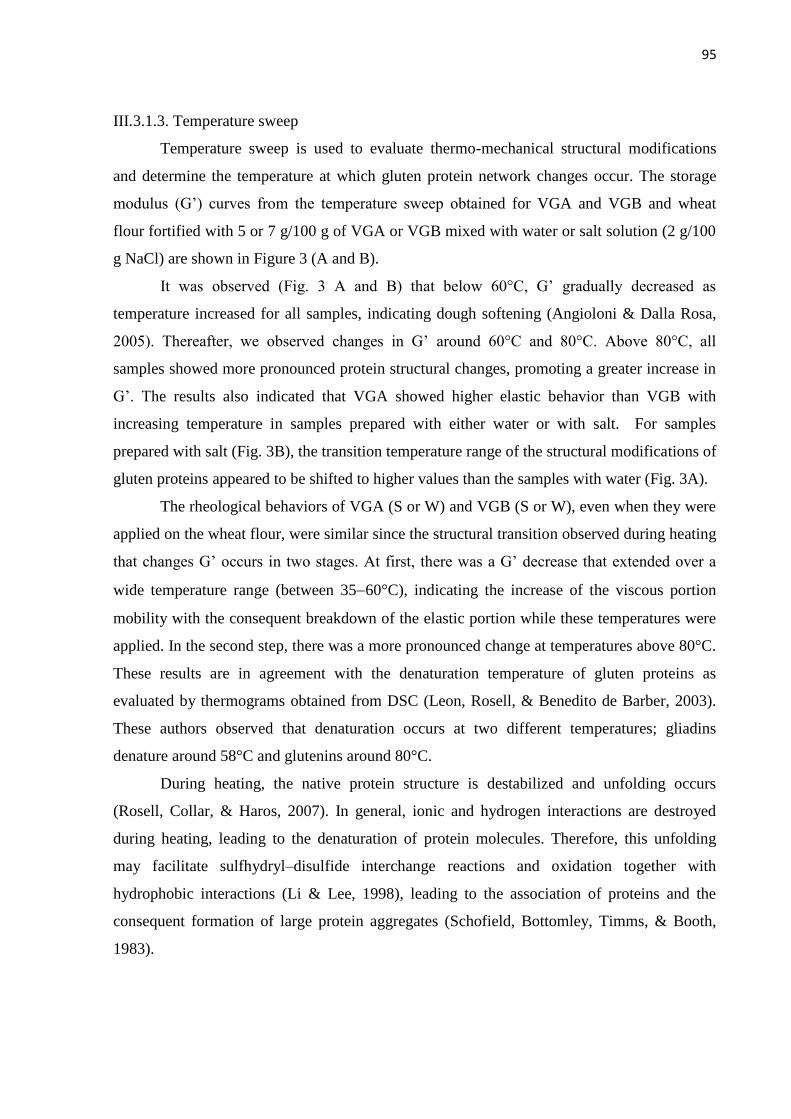
95
III.3.1.3. Temperature sweep
Temperature sweep is used to evaluate thermo-mechanical structural modifications
and determine the temperature at which gluten protein network changes occur. The storage
modulus (G’) curves from the temperature sweep obtained for VGA and VGB and wheat
flour fortified with 5 or 7 g/100 g of VGA or VGB mixed with water or salt solution (2 g/100
g NaCl) are shown in Figure 3 (A and B).
It was observed (Fig. 3 A and B) that below 60°C, G’ gradually decreased as
temperature increased for all samples, indicating dough softening (Angioloni & Dalla Rosa,
2005). Thereafter, we observed changes in G’ around 60°C and 80°C. Above 80°C, all
samples showed more pronounced protein structural changes, promoting a greater increase in
G’. The results also indicated that VGA showed higher elastic behavior than VGB with
increasing temperature in samples prepared with either water or with salt. For samples
prepared with salt (Fig. 3B), the transition temperature range of the structural modifications of
gluten proteins appeared to be shifted to higher values than the samples with water (Fig. 3A).
The rheological behaviors of VGA (S or W) and VGB (S or W), even when they were
applied on the wheat flour, were similar since the structural transition observed during heating
that changes G’ occurs in two stages. At first, there was a G’ decrease that extended over a
wide temperature range (between 3560°C), indicating the increase of the viscous portion
mobility with the consequent breakdown of the elastic portion while these temperatures were
applied. In the second step, there was a more pronounced change at temperatures above 80°C.
These results are in agreement with the denaturation temperature of gluten proteins as
evaluated by thermograms obtained from DSC (Leon, Rosell, & Benedito de Barber, 2003).
These authors observed that denaturation occurs at two different temperatures; gliadins
denature around 58°C and glutenins around 80°C.
During heating, the native protein structure is destabilized and unfolding occurs
(Rosell, Collar, & Haros, 2007). In general, ionic and hydrogen interactions are destroyed
during heating, leading to the denaturation of protein molecules. Therefore, this unfolding
may facilitate sulfhydryl–disulfide interchange reactions and oxidation together with
hydrophobic interactions (Li & Lee, 1998), leading to the association of proteins and the
consequent formation of large protein aggregates (Schofield, Bottomley, Timms, & Booth,
1983).

96
Figure 3. Temperature sweep curve for storage moduli (G’) of the vital wheat glutens and wheat flour fortified with vital wheat gluten. A = wet
gluten prepared with water (W), where ■ = VGA W = vital wheat gluten A with water, □ = VGB W = vital wheat gluten B with water, ▬ =
GWF W = control wheat flour with water, ● = G5A W = wheat flour fortified with 5 g/100g of VGA with water, ○ = G7A W = wheat flour
fortified with 7 g/100g of VGA with water, ♦ = G5B W = wheat flour fortified with 5 g/100g of VGB with water, ◊ = G7B W = wheat flour
fortified with 7 g/100g of VGB with water. B = wet gluten prepared with salt solution contained 2 g/100mL (w/v) of NaCl (S). Where ■ = VGA
S = vital wheat gluten A with salt, □ = VGB S = vital wheat gluten B with salt, ▬ = GWF S = control wheat flour with salt, ● = G5A S = wheat
flour fortified with 5 g/100g of VGA with salt, ○ = G7A S = wheat flour fortified with 7 g/100g of VGA with salt, ♦ = G5B S = wheat flour
fortified with 5 g/100g of VGB with salt, ◊ = G7B S = wheat flour fortified with 7 g/100g of VGB with salt.
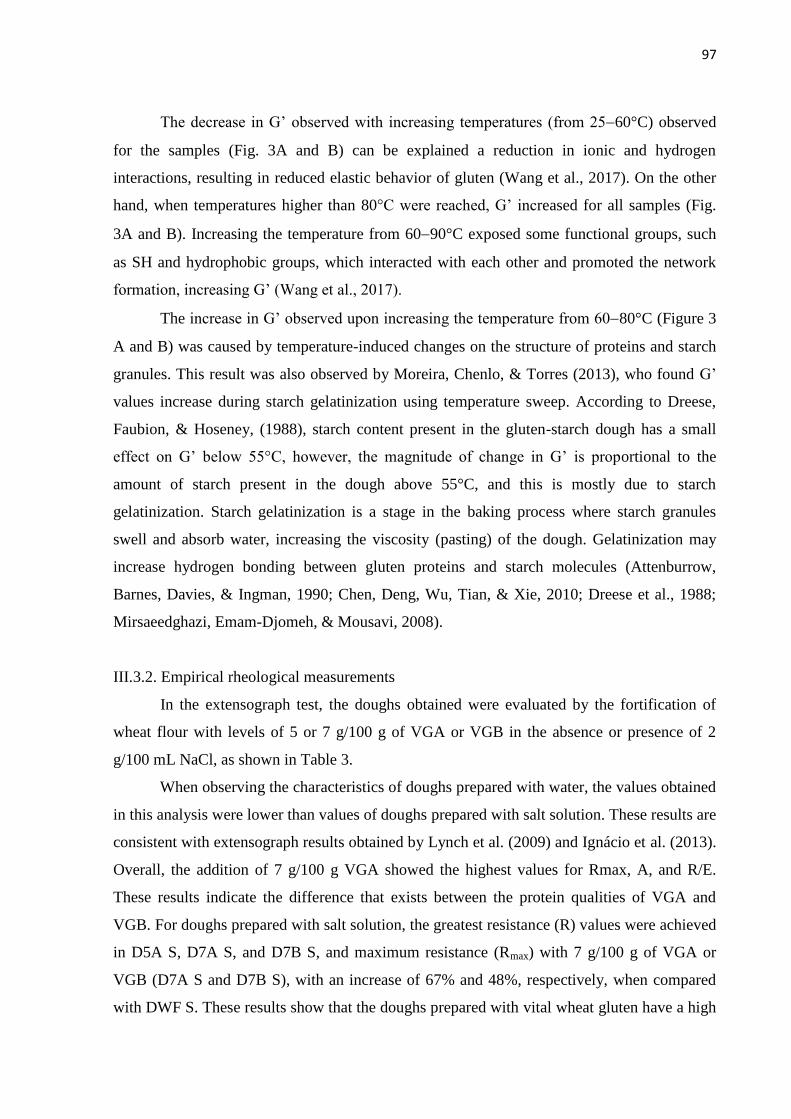
97
The decrease in G’ observed with increasing temperatures (from 2560°C) observed
for the samples (Fig. 3A and B) can be explained a reduction in ionic and hydrogen
interactions, resulting in reduced elastic behavior of gluten (Wang et al., 2017). On the other
hand, when temperatures higher than 80°C were reached, G’ increased for all samples (Fig.
3A and B). Increasing the temperature from 6090°C exposed some functional groups, such
as SH and hydrophobic groups, which interacted with each other and promoted the network
formation, increasing G’ (Wang et al., 2017).
The increase in G’ observed upon increasing the temperature from 6080°C (Figure 3
A and B) was caused by temperature-induced changes on the structure of proteins and starch
granules. This result was also observed by Moreira, Chenlo, & Torres (2013), who found G’
values increase during starch gelatinization using temperature sweep. According to Dreese,
Faubion, & Hoseney, (1988), starch content present in the gluten-starch dough has a small
effect on G’ below 55°C, however, the magnitude of change in G’ is proportional to the
amount of starch present in the dough above 55°C, and this is mostly due to starch
gelatinization. Starch gelatinization is a stage in the baking process where starch granules
swell and absorb water, increasing the viscosity (pasting) of the dough. Gelatinization may
increase hydrogen bonding between gluten proteins and starch molecules (Attenburrow,
Barnes, Davies, & Ingman, 1990; Chen, Deng, Wu, Tian, & Xie, 2010; Dreese et al., 1988;
Mirsaeedghazi, Emam-Djomeh, & Mousavi, 2008).
III.3.2. Empirical rheological measurements
In the extensograph test, the doughs obtained were evaluated by the fortification of
wheat flour with levels of 5 or 7 g/100 g of VGA or VGB in the absence or presence of 2
g/100 mL NaCl, as shown in Table 3.
When observing the characteristics of doughs prepared with water, the values obtained
in this analysis were lower than values of doughs prepared with salt solution. These results are
consistent with extensograph results obtained by Lynch et al. (2009) and Ignácio et al. (2013).
Overall, the addition of 7 g/100 g VGA showed the highest values for Rmax, A, and R/E.
These results indicate the difference that exists between the protein qualities of VGA and
VGB. For doughs prepared with salt solution, the greatest resistance (R) values were achieved
in D5A S, D7A S, and D7B S, and maximum resistance (Rmax) with 7 g/100 g of VGA or
VGB (D7A S and D7B S), with an increase of 67% and 48%, respectively, when compared
with DWF S. These results show that the doughs prepared with vital wheat gluten have a high
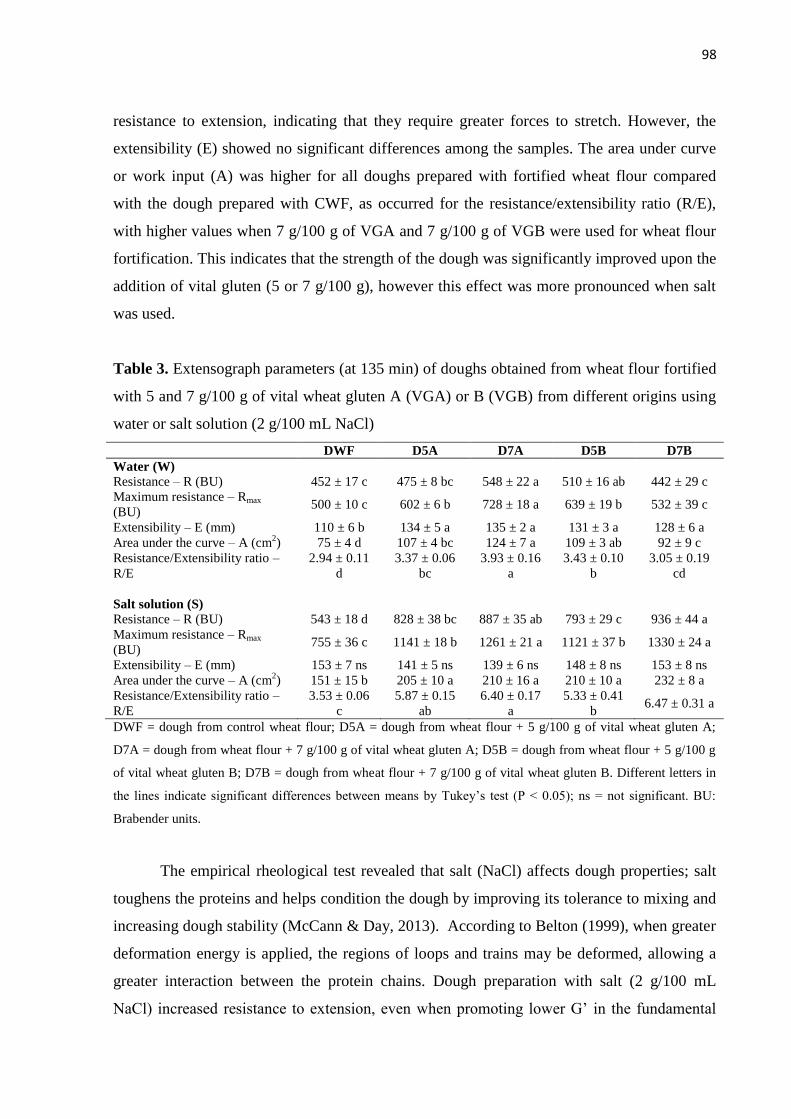
98
resistance to extension, indicating that they require greater forces to stretch. However, the
extensibility (E) showed no significant differences among the samples. The area under curve
or work input (A) was higher for all doughs prepared with fortified wheat flour compared
with the dough prepared with CWF, as occurred for the resistance/extensibility ratio (R/E),
with higher values when 7 g/100 g of VGA and 7 g/100 g of VGB were used for wheat flour
fortification. This indicates that the strength of the dough was significantly improved upon the
addition of vital gluten (5 or 7 g/100 g), however this effect was more pronounced when salt
was used.
Table 3. Extensograph parameters (at 135 min) of doughs obtained from wheat flour fortified
with 5 and 7 g/100 g of vital wheat gluten A (VGA) or B (VGB) from different origins using
water or salt solution (2 g/100 mL NaCl)
DWF D5A D7A D5B D7B
Water (W)
Resistance – R (BU) 452 ± 17 c 475 ± 8 bc 548 ± 22 a 510 ± 16 ab 442 ± 29 c
Maximum resistance – Rmax
(BU) 500 ± 10 c 602 ± 6 b 728 ± 18 a 639 ± 19 b 532 ± 39 c
Extensibility – E (mm) 110 ± 6 b 134 ± 5 a 135 ± 2 a 131 ± 3 a 128 ± 6 a
Area under the curve – A (cm2) 75 ± 4 d 107 ± 4 bc 124 ± 7 a 109 ± 3 ab 92 ± 9 c
Resistance/Extensibility ratio –
R/E
2.94 ± 0.11
d
3.37 ± 0.06
bc
3.93 ± 0.16
a
3.43 ± 0.10
b
3.05 ± 0.19
cd
Salt solution (S)
Resistance – R (BU) 543 ± 18 d 828 ± 38 bc 887 ± 35 ab 793 ± 29 c 936 ± 44 a
Maximum resistance – Rmax
(BU) 755 ± 36 c 1141 ± 18 b 1261 ± 21 a 1121 ± 37 b 1330 ± 24 a
Extensibility – E (mm) 153 ± 7 ns 141 ± 5 ns 139 ± 6 ns 148 ± 8 ns 153 ± 8 ns
Area under the curve – A (cm2) 151 ± 15 b 205 ± 10 a 210 ± 16 a 210 ± 10 a 232 ± 8 a
Resistance/Extensibility ratio –
R/E
3.53 ± 0.06
c
5.87 ± 0.15
ab
6.40 ± 0.17
a
5.33 ± 0.41
b 6.47 ± 0.31 a
DWF = dough from control wheat flour; D5A = dough from wheat flour + 5 g/100 g of vital wheat gluten A;
D7A = dough from wheat flour + 7 g/100 g of vital wheat gluten A; D5B = dough from wheat flour + 5 g/100 g
of vital wheat gluten B; D7B = dough from wheat flour + 7 g/100 g of vital wheat gluten B. Different letters in
the lines indicate significant differences between means by Tukey’s test (P < 0.05); ns = not significant. BU:
Brabender units.
The empirical rheological test revealed that salt (NaCl) affects dough properties; salt
toughens the proteins and helps condition the dough by improving its tolerance to mixing and
increasing dough stability (McCann & Day, 2013). According to Belton (1999), when greater
deformation energy is applied, the regions of loops and trains may be deformed, allowing a
greater interaction between the protein chains. Dough preparation with salt (2 g/100 mL
NaCl) increased resistance to extension, even when promoting lower G’ in the fundamental

99
rheological analysis (Fig. 1 B and 2 B). That is, the gluten network when submitted to normal
force was stronger, but was less elastic when subjected to shear force (fundamental
rheological tests). When salt was used to prepare the doughs for the extensographic analysis,
repulsion between charged protein chains was reduced, favoring hydrophobic interactions
between them (Beck et al., 2012), forming train regions (protein-protein interactions),
strengthening the gluten network as a result of a closer molecular alignment (Abang Zaidel et
al., 2008; Tuhumury et al., 2014), and reducing the number of loops in the gluten network
(Belton, 1999; Delcour et al., 2012; MacRitchie, 2014; Shewry et al., 2001). These
differences observed in fundamental and empirical rheological behaviors between small and
large deformation tests might be related to sample preparation or to the different deformation
forces/rates uses in the measurements (Lynch et al., 2009). Besides that, salt in the dough may
affect other constituents of flour such as starch during dough development, but the effect of
salt on starch is not well-understood (Lynch et al., 2009; Salvador et al., 2006).
We can compare our results with those of Ng & McKinley (2008) who observed that
gluten showed different behavior in shear and extensional trials. They found changes in the
power-law growth within the linear viscoelastic region when shear and uniaxial extension
forces were applied. These authors claim that gluten structure remains intact even under large
deformations because of the tensile strength of the network formed, reinforcing the
importance of intermolecular bonds between the protein chains. In our work, we also
observed that the salt plus tensile forces increased dough resistance in the empirical
rheological test. This is due to the effects of salt on proteins, which, at high strain rates,
allowed approximating gliadin and glutenin chains by reducing the electrostatic forces
between them (Schober et al., 2003).
Structural changes can be observed in the empirical test because the doughs were
prepared in the Brabender Farinograph-E, before the extension test in the extensograph,
imitating dough mixing and resting/proofing steps during bread making. Thus, the results
obtained from the Extensograph-E may correlate better with the bread-making process
(Abang Zaidel et al., 2008). Adding vital wheat gluten improved dough quality by increasing
the content of proteins that are able to form the gluten network, strengthening the dough
structure (Weegels, Verhoek, Groot, & Hamer, 1994).
100
III.4. Conclusions
In the fundamental rheological tests, we observed that the use of salt solution (2 g/100
mL NaCl) to form the gluten ball from reconstituted vital wheat gluten or fortified wheat flour
reduced the elastic modulus, when compared to gluten balls prepared with water. On the other
hand, the viscoelastic properties of wheat flour fortified with vital gluten measured by the
empirical rheological test in the extensograph were opposite to the results obtained in the
fundamental tests, and the doughs produced with the salt solution presented higher resistance
to extension than the doughs prepared with water. In a real baking system, this is important
because the dough can expand during fermentation and baking, maintaining sufficient
resilience to prevent rupture and collapse of the growing gas bubbles and increasing bread
volume. The differences between fundamental and empirical rheological tests might be
related to different sample preparations (in the first, samples were prepared in the Glutomatic,
and in the second, in the farinograph) and/or to the different deformation forces/rates uses in
the measurements. Differences between samples might be related to protein composition of
the different vital wheat glutens. Our results confirmed that even though there were
differences between the two vital wheat glutens, especially in the fundamental rheological
tests, both may improve the viscoelastic properties of doughs and can be used for bread
preparation to improve final product quality.
Acknowledgements
This work was supported by the National Council for Scientific and Technological
Development (CNPq, grants numbers 163129/2013-4 and 118348/2014-0). The authors
would like to thank Sul Mineiro Mill for wheat flour donation; and Labonathus and Granotec
for donating vital wheat gluten.
References
AACCI. American Association of Cereal Chemists International, 2010. Approved Methods of
Analysis, 11th Ed. Method. AACCI International, St. Paul, MN, USA.
Abang Zaidel, D. N., Chin, N. L., Abdul Rahman, R., & Karim, R. (2008). Rheological
characterisation of gluten from extensibility measurement. Journal of Food Engineering,
86, 549–556. Angioloni, A., & Dalla Rosa, M. (2005). Dough thermo-mechanical
properties: Influence of sodium chloride, mixing time and equipment. Journal of Cereal
101
Science, 41, 327–331. Attenburrow, G., Barnes, D. J., Davies, a. P., & Ingman, S. J.
(1990). Rheological properties of wheat gluten. Journal of Cereal Science, 12, 1–14.
Beck, M., Jekle, M., & Becker, T. (2012). Impact of sodium chloride on wheat flour dough
for yeast-leavened products. I. Rheological attributes. Journal of the Science of Food and
Agriculture, 92, Belton, P. S. (1999). On the Elasticity of Wheat Gluten. Journal of
Cereal Science, 29, 103–107.
Chen, J. sheng, Deng, Z. ying, Wu, P., Tian, J. chun, & Xie, Q. gang. (2010). Effect of Gluten
on Pasting Properties of Wheat Starch. Agricultural Sciences in China, 9, 1836–1844.
Czuchajowska, Z., & Paszczynska, B. (1996). Is Wet Gluten Good for Baking ? Cereal
Chemistry, 73, 483–489.
Dahesh, M., Banc, A., Duri, A., Morel, M. H., & Ramos, L. (2016). Spontaneous gelation of
wheat gluten proteins in a food grade solvent. Food Hydrocolloids, 52, 1–10. Delcour, J.
a, Joye, I. J., Pareyt, B., Wilderjans, E., Brijs, K., & Lagrain, B. (2012). Wheat gluten
functionality as a quality determinant in cereal-based food products. Annual Review of
Food Science and Technology, 3, 469–92. Dreese, P., Faubion, J., & Hoseney, R. C.
(1988). Dynamic rheological properties of flour, gluten, and gluten-starch doughs. I.
Temperature-dependent changes durign heating. Cereal Chemistry, 65, 348–353.
Esteller, M. S., Pitombo, R. N. M., & Lannes, S. C. S. (2005). Effect of freeze-dried gluten
addition on texture of hamburger buns. Journal of Cereal Science, 41, 19–21.
Ignácio, A. K. F., Rodrigues, J. T. D., Niizu, P. Y., Chang, Y. K., Estadual, U., & Steel, C. J.
(2013). Efeito da substituição de cloreto de sódio por cloreto de potássio em pão francês
Effect of the substitution of sodium chloride by potassium chloride in French rolls.
Brazilian Journal of Food Technology, 1, 1–11.
Khatkar, B. S., Barak, S., & Mudgil, D. (2013). Effects of gliadin addition on the rheological,
microscopic and thermal characteristics of wheat gluten. International Journal of
Biological Macromolecules, 53, 38–41.
Leon, A., Rosell, C. M., & Benedito de Barber, C. (2003). A differential scanning calorimetry
study of wheat proteins. European Food Research and Technology, 217, 13–16. Létang,
C., Piau, M., & Verdier, C. (1999). Characterization of wheat flour-water doughs. Part I:
Rheometry and microstructure. Journal of Food Engineering, 41, 121–132. Li, M., &
Lee, T.-C. (1998). Effect of cysteine on the functional properties and microstructures of
wheat flour extrudates. Journal of Agricultural and Food Chemistry, 46, 846–853.
Lynch, E. J., Dal Bello, F., Sheehan, E. M., Cashman, K. D., & Arendt, E. K. (2009).
102
Fundamental studies on the reduction of salt on dough and bread characteristics. Food
Research International, 42, 885–891.
MacRitchie, F. (2014). Requirements for a test to evaluate bread-making performance.
Journal of Cereal Science, 59, 1–2. McCann, T. H., & Day, L. (2013). Effect of sodium
chloride on gluten network formation, dough microstructure and rheology in relation to
breadmaking. Journal of Cereal Science, 57, 444–452.
Miller, K. a., & Hoseney, R. C. (1999). Dynamic rheological properties of wheat starch-gluten
doughs. Cereal Chemistry, 76, 105–109.
Mirsaeedghazi, H., Emam-Djomeh, Z., & Mousavi, S. M. A. (2008). Rheometric
measurement of dough rheological characteristics and factors affecting it. International
Journal of Agriculture and Biology, 10, 112–119.
Moreira, R., Chenlo, F., & Torres, M. D. (2013). Rheology of Gluten-Free Doughs from
Blends of Chestnut and Rice Flours. Food and Bioprocess Technology, 6, 1476–1485.
Ng, T. S. K., & McKinley, G. H. (2008). Power law gels at finite strains: The nonlinear
rheology of gluten gels. Journal of Rheology, 52, 417–449. Ng, T. S. K., McKinley, G.
H., & Ewoldt, R. H. (2011). Large amplitude oscillatory shear flow of gluten dough: A
model power-law gel. Journal of Rheology, 55, 627.
Preston, K. R. (1989). Effects of neutral salts of the lyotropic series on the physical dough
properties of a Canadian Red Spring Wheat flour. Cereal Chemistry, 66, 144–148.
Rosell, C. M., Collar, C., & Haros, M. (2007). Assessment of hydrocolloid effects on the
thermo-mechanical properties of wheat using the Mixolab. Food Hydrocolloids, 21,
452–462.
Salvador, A., Sanz, T., & Fiszman, S. M. (2006). Dynamic rheological characteristics of
wheat flour-water doughs. Effect of adding NaCl, sucrose and yeast. Food
Hydrocolloids, 20, 780–786. Schiedt, B., Baumann, A., Conde-Petit, B., & Vilgis, T. a.
(2013). Short- and Long-Range Interactions Governing the Viscoelastic Properties
during Wheat Dough and Model Dough Development. Journal of Texture Studies, 44,
317–332.
Schober, T. J., Dockery, P., & Arendt, E. K. (2003). Model studies for wheat sourdough
systems using gluten, lactate buffer and sodium chloride. European Food Research and
Technology, 217, 235–243.
Schofield, J. D., Bottomley, R. C., Timms, M. F., & Booth, M. R. (1983). The effect of heat
on wheat gluten and the involvement of sulphydryl-disulphide interchange reactions.
103
Journal of Cereal Science, 1, 241–253.
Shewry, P. R., Popineau, Y., Lafiandra, D., Belton, P., & Lellis, S. C. De. (2001). Wheat
glutenin subunits and dough elasticity : findings of the EUROWHEAT project. Trends in
Food Science & Technology, 11, 433–441.
Singh, S., & Singh, N. (2013). Relationship of polymeric proteins and empirical dough
rheology with dynamic rheology of dough and gluten from different wheat varieties.
Food Hydrocolloids, 33, 342–348.
Song, Y., & Zheng, Q. (2007). Dynamic rheological properties of wheat flour dough and
proteins. Trends in Food Science & Technology, 18, 132–138.
Stathopoulos, C. E., Tsiami, A. a., David Schofield, J., & Dobraszczyk, B. J. (2008). Effect of
heat on rheology, surface hydrophobicity and molecular weight distribution of glutens
extracted from flours with different bread-making quality. Journal of Cereal Science, 47,
134–143.
Tanner, R. I., Qi, F., & Dai, S. C. (2008). Bread dough rheology and recoil. I. Rheology.
Journal of Non-Newtonian Fluid Mechanics, 148, 33–40.
Tronsmo, K. M., Magnus, E. M., Færgestad, E. M., & Schofield, J. D. (2003). Relationships
between gluten rheological properties and hearth loaf characteristics. Cereal Chemistry,
80, 575–586.
Tuhumury, H. C. D., Small, D. M., & Day, L. (2014). The effect of sodium chloride on gluten
network formation and rheology. Journal of Cereal Science, 60, 229–237.
Uthayakumaran, S., Newberry, M., Phan-Thien, N., & Tanner, R. (2002). Small and large
strain rheology of wheat gluten. Rheologica Acta, 41, 162–172. Uthayakumaran, S.,
Tanner, R. I., Dai, S.-C., Qi, F., & Wrigley, C. W. (2014). Relationships between
traditional and fundamental dough-testing methods. Cereal Research Communications,
42, 282–292.
Wadhawan, C. K., & Bushuk, W. (1989). Studies on vitality of commercial gluten. I.
Physical, chemical and technological characteristics. Cereal Chemistry, 66, 456–461.
Wang, K.-Q., Luo, S.-Z., Zhong, X.-Y., Cai, J., Jiang, S.-T., & Zheng, Z. (2017). Changes in
chemical interactions and protein conformation during heat-induced wheat gluten gel
formation. Food Chemistry, 214, 393–399.
Wang, P., Jin, Z., & Xu, X. (2015). Physicochemical alterations of wheat gluten proteins upon
dough formation and frozen storage – A review from gluten, glutenin and gliadin
perspectives. Trends in Food Science & Technology, 46, 189–198.

104
Weegels, P. L., Verhoek, J. A., Groot, A. M. G., & Hamer, R. J. (1994). Effects on gluten of
heating at different moiture contents. I. Changes in funcional properties. Journal of
Cereal Science, 19, 31–38.
Wellner, N., Bianchini, D., Mills, E. N. C., & Belton, P. S. (2003). Selected hofmeister anions
on the secondary structure and dynamics of wheat prolamins in gluten. Cereal
Chemistry, 80, 596-600.
Wellner, N., Mills, E. N. C., Brownsey, G., Wilson, R. H., Brown, N., Freeman, J., & Belton,
P. S. (2005). Changes in Protein Secondary Structure during Gluten Deformation Studied
by Dynamic Fourier Transform Infrared Spectroscopy. Biomacromolecules, 6, 255–261.
Wesolowska-Trojanowska, M., Tomczynska-Mleko, M., Mazurkiewicz, J., Kwiatkowski, C.,
Kowalczyk, K., Solowiej, B., & Mleko, S. (2014). Rheological properties of gluten
obtained from polish wheat cultivars. Bulgarian Journal of Agricultural Science, 20,
1221–1226.
Wieser, H. (2007). Chemistry of gluten proteins. Food Microbiology, 24, 115–9. Xu, J., Bietz,
J. a., & Carriere, C. J. (2007). Viscoelastic properties of wheat gliadin and glutenin
suspensions. Food Chemistry, 101, 1025–1030.

105
ARTIGO IV.
___________________________________________________________________________
Technological characteristics of vital wheat gluten from different origins used for bread
making
Ortolan, Fernanda; Corrêa, Gabriela Paiva; Steel, Caroline Joy
This manuscript was submitted to:
Food Research International on March 2nd
, 2017
106
IV. Technological characteristics of vital wheat gluten from different origins used for
bread making
Ortolan, Fernanda; Corrêa, Gabriela Paiva; Steel, Caroline Joy
Abstract
Vital wheat gluten is used to improve the rheological characteristics of wheat flour
considered inadequate for bread making. The quality of this product is associated with its
proteins, gliadins and glutenins, which are responsible for its viscoelastic properties, but is
marketed with little information on its proteins quality. Thus, the aim of this study was to
evaluate the technological characteristics of two different vital wheat glutens (A and B),
through rheological analyses and baking test by wheat flour fortification with 5 and 7 g/100 g
of vital wheat gluten A or B. It was observed the contribution of vital wheat gluten added to
control wheat flour on dough viscoelastic quality and also on physical quality of bread,
especially, decreasing crumb firmness. The increase of specific volume was also observed,
when 7 g/100 g of vital gluten A was added on wheat flour, and this vital gluten was
technologically better than vital gluten B. This fact reinforces that there are differences in the
quality of vital wheat glutens commercialized, and it points out the needed of better
information about the protein quality of this product to better determine the level that will be
used in the baking industry.
Keywords: gluten network, dough viscoelastic properties, empirical rheological tests, bread
quality
IV.1. Introduction
Vital wheat gluten is commercialized as an ingredient that can be added to wheat flour
with poor quality for bread making (Esteller, Pitombo, & Lannes, 2005), or still to produce
bread rich in fiber. Usually, the gluten marketed is classified just by its appearance (color and
particle size) and its moisture, protein, ash and lipid contents, beside its microbiological
characteristics. However, it is expected that the gluten quality interferes directly on dough
quality (Marchetti, Cardós, Campaña, & Ferrero, 2012), and the technological characteristics
can vary widely between the vital wheat glutens available. Although the vital wheat gluten
added to wheat flour improves dough and bread quality, it does not always retain the
107
technological properties of the original wheat flour from which it was obtained (Miller &
Hoseney, 1999). Thus, the determination of vital gluten technological quality can improve its
specification to reach better performance in bread making, when it is used to fortify wheat
flours.
Some authors define gluten as a protein network formed by covalent and non-covalent
interactions between gliadins and glutenins (Barak, Mudgil, & Khatkar, 2013; Shewry &
Tatham, 1997; Herbert Wieser, 2007; Xu, Bietz, & Carriere, 2007; Zhou et al., 2014). Gluten
development occurs when wheat flour is mixed with water associated with mechanical work
giving a cohesive dough with viscoelastic properties (Goesaert et al., 2005; Hoseney, Finney,
& Pomeranz, 1970; MacRitchie, 2014). The viscoelastic properties of gluten are related to its
protein quantity and quality. These properties influence bakery product quality like texture,
shape and expansion (Delcour et al., 2012) evaluated by volume. Because of their structure,
gliadins, on hydration, behave as a viscous liquid, that provides dough extensibility (Khatkar,
Barak, & Mudgil, 2013), decreasing the higher elasticity level conferred by glutenins (Zhou et
al., 2014). Thus, the appropriate balance between gliadins and glutenins is determinant on
gluten rheological quality (Melnyk, Dreisoerner, Marcone, & Seetharaman, 2012).
Several tests have been used to determine vital wheat gluten quality, including protein
content, water absorption, gluten extensibility when it is hydrated, and the mixing properties
of the dough obtained from wheat flour fortified with vital gluten. To evaluate the differences
in functionality showed by different glutens, flour quality parameters are usually used, such as
farinograph parameters and bread volume (Dua, Lukow, Humphreys, & Adams, 2009). Some
studies (Czuchajowska & Paszczynska, 1996; Marchetti et al., 2012; Song & Zheng, 2007)
have demonstrated the utilization of the alveograph, farinograph and extensograph to verify
the quality of vital wheat gluten obtained from different methods. Furthermore, the
thermomechanical properties in the Mixolab™ have been used to evaluate the rheological
characteristics of flours, when submitted to different conditions of mixing and temperature
(Codina, Mironeasa, Bordei, & Leahu, 2010; Dhaka, Gulia, & Khatkar, 2012; Huang et al.,
2010). The Mixolab™ is based on principles of the farinograph and of the thermal analysis of
starch through the Rapid Visco Analyser (RVA) (Dhaka et al., 2012). The physical tests of the
dough formed by the addition of vital gluten to wheat flour are used to evaluate the baking
potential; that is, gluten strength and performance under mechanical conditions.
The analysis of the dough technological characteristics also plays an important role in
quality control (Barak et al., 2013; Barak, Mudgil, & Khatkar, 2014; Delcour et al., 2012;
108
Dhaka et al., 2012; Goesaert et al., 2005; Hoseney et al., 1970) of mill and baking industries,
and assists in defining the ingredients to be used in the manufacture of several bakery
products. Added to these analyses, the ability of vital wheat gluten to improve the baking
performance when a poor quality flour is used for baking is usually evaluated by loaf volume
and crumb structure (Wadhawan & Bushuk, 1989).
The baking industry requires more information on the technological parameters of
vital wheat gluten that is used in the manufacture of different products, to select the type and
the appropriate level of vital gluten addition to its flours (Esteller et al., 2005). Due to market
requirements, techniques that allow a quick conclusion about vital wheat gluten quality
should be used and are necessary to ensure the quality standards of the final products. Thus,
the aim of this study was to characterize commercial vital wheat glutens from different origins
through empirical rheological analyses and prepare pan bread from wheat flour fortified with
vital gluten, at levels of 5 and 7 g/100 g, evaluating bread during its shelf life, to check the
quality of different commercial vital wheat glutens and to assist in defining their
specifications.
IV.2. Material e Methods
IV.2.1. Material
Two commercial vital wheat glutens were used in this study, and both were from
different origins and were named vital gluten A (VGA) and vital gluten B (VGB). Wheat
flour was used as control (CWF) and to prepare blends with different levels (5 and 7 g/100 g)
of VGA and VGB. Such fortification levels were selected after conducting pre-tests with
different levels (data not shown). The fortified flours were named 5 g/100 g VGA (CWF + 5
g/100 g vital gluten A), 7 g/100 g VGA (CWF + 7 g/100 g vital gluten A), 5 g/100 g VGB
(CWF + 5 g/100 g vital gluten B) and 7 g/100 g VGB (CWF + 7 g/100 g vital gluten B). The
other ingredients used in the baking test (instant baker’s yeast, sodium chloride, sucrose,
hydrogenated vegetable fat, and calcium propionate) were obtained in the local market.
IV.2.2. Methods
IV.2.2.1. Chemical composition
The chemical composition of the control wheat flour and the flours fortified with vital
wheat gluten was evaluated through the methodologies described by AACCI (2010): moisture
109
content (method 44-15.02), ash content (method 08-01.01), protein content (method 46-
13.01), using 5.7 as correction factor, lipid content (method 02-01.02), and carbohydrates by
difference [100-(ash + protein + lipids)].
IV.2.2.2 Empirical rheological tests
The control wheat flour (CWF) and the fortified wheat flours (5 and 7 g/100 g of VGA
or VGB) were evaluated for their gluten contents and gluten index, α-amylase activity,
farinograph and alveograph parameters, thermomechanical properties and baking test.
IV.2.2.2.1. Gluten contents and gluten index
The gluten contents and gluten index were determined in a Glutomatic equipment
(Perten, Hägersten, Switzerland), by AACCI method 38-12.02 (2010).
IV.2.2.2.2. α-amylase activity
The α-amylase activity was determined indirectly in a Falling Number 1800 (Perten,
Hägersten, Switzerland), by AACCI method 56-81.03 (2010).
IV.2.2.2.3. Farinograph parameters
The water absorption (ABS), stability (STA) and other dough characteristics were
evaluated in a Farinograph-E (Brabender, Duisburg, Germany), by AACCI method 54-21.02
(2010).
IV.2.2.2.4 Alveograph parameters
The analysis of the elasticity (P), extensibility (L) and gluten strength (W) was carried
out in an Alveograph (Chopin, Villeneuve-la-Garenne, France), by biaxial expansion of the
dough produced, according to AACCI method 54-30.02 (2010).
IV.2.2.2.5 Thermomechanical properties
The thermomechanical properties were evaluated using a Mixolab™ (Chopin,
Villeneuve-la-Garenne, France), according to AACCI method 54-60.01 (2010), using the
Chopin+ protocol. The parameters obtained from the curve were: water absorption (%);
dough development time (DDT, min) or the time to reach the maximum torque (C1) at 30 °C.
At that point, the dough is able to resist deformation for a certain time, which determines

110
dough stability (STA, min) (1st stage). The simultaneous mechanical shear stress and
temperature constraint (2nd stage) decrease the torque, until a minimum value (C2) that could
be related to the beginning of the protein structure destabilization or protein weakening. As
the temperature increases, starch gelatinization takes place (3rd stage), with a concomitant
increase in the torque until a new maximum value (C3). A reduction in viscosity is observed
in the 4th stage, derived from the physical breakdown of the starch granules, leading to a
minimum value of the torque (C4). The decrease in the temperature produces an enhancement
in dough consistency (5th stage), resulting in a maximum torque (C5).
IV.2.2.3. Baking test
For the baking test, pan breads were prepared, as a type of bread that needs wheat
flour with good gluten quality, in terms of balance between strength, and its elasticity and
extensibility characteristics. In addition, these breads are classified into the category of
"packaged breads" and must have their quality assessed during the shelf life.
The breads were prepared based on the formulation used by Schmiele, Jaekel, Patricio,
Steel, & Chang (2012), with modifications: control wheat flour or wheat flour fortified with
vital gluten (100 %); water (based on the water absorption in the farinograph); instant baker’s
yeast (1.3 %); sodium chloride (1.5 %); sucrose (4 %); hydrogenated vegetable fat (4 %); and
calcium propionate (0.2 %) (flour basis). The breads were prepared without additives or
processing aids addition in order to observe only the contribution of vital wheat gluten on
bread quality.
The breads were prepared using the modified straight dough method. The ingredients
were mixed at low speed (~90 rpm) for 3 min in a Hyppolito model HAE 10 mixer
(Hyppolito, Ferraz de Vasconcelos, BRA), and then at high speed (~ 210 rpm) until the
optimal development of the gluten network (observed manually by stretching the dough). The
doughs were divided into portions of 400 ± 1 g, rounded by hand, left to rest for 15 min at 21–
22 °C and molded in a HM2 Hp 0.5 molder (Hyppolito, Ferraz de Vasconcelos, Brazil),
placed in open pans (dimensions of 20 x 10 x 5 cm) and taken to the fermentation chamber
model CCKU 5868 20-1 (Super Freezer, Poços de Caldas, BRA), at 35 °C, and controlled
relative humidity of 95 %, where they remained until the optimum fermentation time
(checked manually by dough resistance to touch). Proofed doughs were baked in an Ipanema
IP 4/80 hearth oven (Haas, Curitiba, Brazil), at 180 °C top temperature, and 195 °C hearth
temperature. The baking time was monitored visually by the development of crust color. After
111
baking, the breads were removed from the pans and cooled to room temperature (~1 h), cut in
an electric slicer (GPaniz of Caxias, BRA) into slices 1.2 cm thick, packed in polyethylene
bags and stored under controlled temperature (~20 °C) until the bread quality analyses. These
analyses were made during the shelf life of bread on days 1, 4 and 9 (storage).
IV.2.2.4. Pan bread quality tests
The pan breads were characterized on days 1, 4 and 9 through the following analyses:
specific volume, moisture and water activity of the crumb and the crust, instrumental color
and texture of the crumb, as well as crumb image analysis. The entire inner portion leaving
only 1 cm from the boarder was considered as crumb.
IV.2.2.4.1. Bread quality tests on the production day (day 1)
The specific volume of the breads was determined by AACCI method 10-05.01
(2010), and expressed in mL/g. The crumb color of the breads was measured using a
MiniScan HunterLab spectrophotometer (Reston, USA), according to the CIELab system,
determining the values of L*, a* and b* (MINOLTA 1993). The bread crumb image analysis
was performed using the program Image J (Oliveira, Rosell, & Steel, 2015; Rosell, Santos, &
Collar, 2010). The bread crumb image was captured using HP Scanjet G2710 (Hewlett-
Packard, California, USA) with resolution of 300 dpi.
IV.2.2.4.2. Quality testing of bread during shelf life (days 1, 4 and 9)
The crumb and crust moisture contents were determined by AACCI method 44-15.02
(2010). The crumb and crust water activity (Aw) was measured in a Digital AquaLab 4TEV
model (Decagon, Washington, USA), according to manufacturer specifications.
The crumb firmness of the bread was evaluated by AACCI method 74-10.02 (2010),
in a TA-XT2i Texture Analyser (Stable Micro Systems, Surrey, UK), with force capacity of
25 kg, using an aluminum probe P/35, and the following parameters: pre-test speed = 1.7
mm/s; test speed = 1.7 mm/s; post-test speed = 10.0 mm/s; strength = 10 g; distance 40 %;
mode: compression strength. The evaluation was conducted on six replicates, the probe
compression on two central slices arranged horizontally to the platform.

112
IV.2.2.5. Statistical analysis
All the analyses, including the baking test, were performed in triplicate, except for
crumb firmness that was determined on six replicates. Data was submitted to analysis of
variance with a 95 % confidence interval, and the mean comparison analysis was performed
by Tukey’s test, using the Statistica 7.0 software (StatSoft. Inc., Tulsa, USA).
IV.3. Results and Discussions
IV.3.1. Chemical composition
Table 1 shows the results of the chemical composition of the control wheat flour
(CWF) and wheat flour fortified at levels of 5 and 7 g/100 g of vital gluten (VGA and VGB)
from different origins.
Table 1. Chemical composition (g/100 g, dry basis) of the control wheat flour and wheat flour
fortified with vital wheat gluten from different origins
Samples Ash Lipids Proteins Carbohydrates
CWF 0.82 ± 0.05 ns 1.33 ± 0.08 b 15.44 ± 0.46 c 82.41
5 g/100 g VGA 0.83 ± 0.04 ns 1.11 ± 0.11 b 19.13 ± 0.23 b 78.93
7 g/100 g VGA 0.86 ± 0.00 ns 1.74 ± 0.11 a 20.92 ± 0.22 a 76.48
5 g/100 g VGB 0.85 ± 0.04 ns 1.30 ± 0.05 b 19.71 ± 0.25 b 78.14
7 g/100 g VGB 0.82 ± 0.04 ns 1.11 ± 0.06 b 21.03 ± 1.08 a 77.04
CWF = control wheat flour; VGA = vital wheat gluten A; VGB = vital wheat gluten B. Different letters in the
columns indicate significant differences between means by Tukey’s test (P < 0.05); ns = non-significant.
Carbohydrates were calculated by difference. Moisture content: 11.89 % for CWF; 12.03 % for 5 g/100 g VGA;
12.30 % for 7 g/100 g VGA; 12.07 % for 5 g/100 g VGB; 12.32 % for 7 g/100 g VGB.
Regarding the chemical composition of CWF and fortified wheat flour, there were no
differences in mineral and lipids content, except for 7 g/100 g VGA with the highest amount
of lipids in the blend. It was observed that the protein content increased in the fortified wheat
flour, compared to the CWF and it was proportional with the increasing level (5 and 7 g/100
g) of vital gluten added, decreasing the carbohydrate content, calculated by difference. These
results occurred because the vital gluten is a protein concentrate, which when added to flour
contributes to the increase in total protein content providing mostly gliadins and glutenins.

113
IV.3.2 Technological analysis
Table 2 shows the results of the technological parameters for control wheat flour
(CWF) and wheat flour fortified with levels of 5 and 7 g/100 g of vital gluten (VGA and
VGB) from different origins.
IV.3.2.1. Wet and dry gluten contents and gluten index
When vital wheat gluten was added to wheat flour, the WG and DG were higher than
for CWF, demonstrating the involvement of supplemented gliadins and glutenins in the
formation of the gluten network. Analyzing the ratio WG/DG (Table 2), it was observed that
the fortified flours were not different to CWF, however VGA presented WG/DG lower than
VGB, indicating lower loss of water when the wet gluten passed by drying to obtain the dried
gluten, probably because the gluten network formed by the addition of VGA physically held a
greater quantity of water within its protein structure than VGB.
The GI is directly proportional to the viscoelastic quality of the gluten formed (Barak
et al., 2014), and it is strongly influenced by glutenins (Wieser & Kieffer, 2001), which are
responsible to the elastic behavior of the gluten network. The supplementation of wheat flour
with vital gluten increased the amount of wet gluten (proportional to the amount added),
however it did not imply in an increase in GI. This depends on the types of gluten proteins of
the vital gluten and on the interaction between gliadins and glutenins from wheat flour and the
vital gluten added. Therefore, by performing the GI calculations, it was observed that flour
fortified with VGA and VGB, regardless of the level, had lower GI values compared to CWF.
VGA showed higher GI than VGB on both levels studied, indicating that VGA was
more elastic than VGB. In a previous work (data not shown) it was observed that VGA
presented better gliadin/glutenin ratio than VGB. According to Khatkar, Bell, & Schofield
(1995) and Khatkar et al. (2013), the ideal dough viscoelastic behavior occurs due to the
glutenin and gliadin balance, because each one of these proteins has a fundamental role in the
development and stabilization of the gluten network. Besides, according to Cubadda, Carcea,
& Pasqui (1992), the gluten index can be used as a quality classification criterion of gluten
from wheat flour, ranking as weak gluten (GI < 30 %), normal (GI 30-80 %) or strong (GI >
80 %). In this way, we used this standard to classify the glutens obtained from CWF and 5
and 7 g/100 g of VGA as strong glutens, while 5 and 7 g/100 g of VGB are classified as
normal glutens.
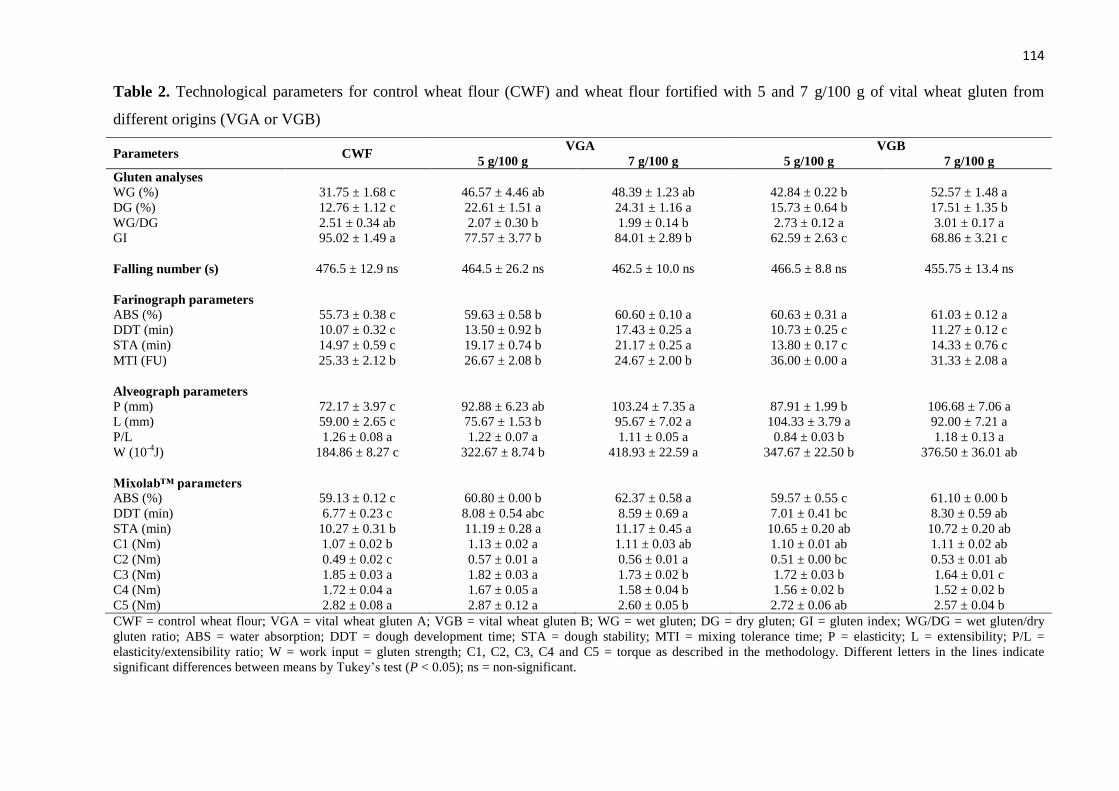
114
Table 2. Technological parameters for control wheat flour (CWF) and wheat flour fortified with 5 and 7 g/100 g of vital wheat gluten from
different origins (VGA or VGB)
Parameters CWF VGA VGB
5 g/100 g 7 g/100 g 5 g/100 g 7 g/100 g
Gluten analyses
WG (%) 31.75 ± 1.68 c 46.57 ± 4.46 ab 48.39 ± 1.23 ab 42.84 ± 0.22 b 52.57 ± 1.48 a
DG (%) 12.76 ± 1.12 c 22.61 ± 1.51 a 24.31 ± 1.16 a 15.73 ± 0.64 b 17.51 ± 1.35 b
WG/DG 2.51 ± 0.34 ab 2.07 ± 0.30 b 1.99 ± 0.14 b 2.73 ± 0.12 a 3.01 ± 0.17 a
GI 95.02 ± 1.49 a 77.57 ± 3.77 b 84.01 ± 2.89 b 62.59 ± 2.63 c 68.86 ± 3.21 c
Falling number (s) 476.5 ± 12.9 ns 464.5 ± 26.2 ns 462.5 ± 10.0 ns 466.5 ± 8.8 ns 455.75 ± 13.4 ns
Farinograph parameters
ABS (%) 55.73 ± 0.38 c 59.63 ± 0.58 b 60.60 ± 0.10 a 60.63 ± 0.31 a 61.03 ± 0.12 a
DDT (min) 10.07 ± 0.32 c 13.50 ± 0.92 b 17.43 ± 0.25 a 10.73 ± 0.25 c 11.27 ± 0.12 c
STA (min) 14.97 ± 0.59 c 19.17 ± 0.74 b 21.17 ± 0.25 a 13.80 ± 0.17 c 14.33 ± 0.76 c
MTI (FU) 25.33 ± 2.12 b 26.67 ± 2.08 b 24.67 ± 2.00 b 36.00 ± 0.00 a 31.33 ± 2.08 a
Alveograph parameters
P (mm) 72.17 ± 3.97 c 92.88 ± 6.23 ab 103.24 ± 7.35 a 87.91 ± 1.99 b 106.68 ± 7.06 a
L (mm) 59.00 ± 2.65 c 75.67 ± 1.53 b 95.67 ± 7.02 a 104.33 ± 3.79 a 92.00 ± 7.21 a
P/L 1.26 ± 0.08 a 1.22 ± 0.07 a 1.11 ± 0.05 a 0.84 ± 0.03 b 1.18 ± 0.13 a
W (10-4
J) 184.86 ± 8.27 c 322.67 ± 8.74 b 418.93 ± 22.59 a 347.67 ± 22.50 b 376.50 ± 36.01 ab
Mixolab™ parameters
ABS (%) 59.13 ± 0.12 c 60.80 ± 0.00 b 62.37 ± 0.58 a 59.57 ± 0.55 c 61.10 ± 0.00 b
DDT (min) 6.77 ± 0.23 c 8.08 ± 0.54 abc 8.59 ± 0.69 a 7.01 ± 0.41 bc 8.30 ± 0.59 ab
STA (min) 10.27 ± 0.31 b 11.19 ± 0.28 a 11.17 ± 0.45 a 10.65 ± 0.20 ab 10.72 ± 0.20 ab
C1 (Nm) 1.07 ± 0.02 b 1.13 ± 0.02 a 1.11 ± 0.03 ab 1.10 ± 0.01 ab 1.11 ± 0.02 ab
C2 (Nm) 0.49 ± 0.02 c 0.57 ± 0.01 a 0.56 ± 0.01 a 0.51 ± 0.00 bc 0.53 ± 0.01 ab
C3 (Nm) 1.85 ± 0.03 a 1.82 ± 0.03 a 1.73 ± 0.02 b 1.72 ± 0.03 b 1.64 ± 0.01 c
C4 (Nm) 1.72 ± 0.04 a 1.67 ± 0.05 a 1.58 ± 0.04 b 1.56 ± 0.02 b 1.52 ± 0.02 b
C5 (Nm) 2.82 ± 0.08 a 2.87 ± 0.12 a 2.60 ± 0.05 b 2.72 ± 0.06 ab 2.57 ± 0.04 b
CWF = control wheat flour; VGA = vital wheat gluten A; VGB = vital wheat gluten B; WG = wet gluten; DG = dry gluten; GI = gluten index; WG/DG = wet gluten/dry
gluten ratio; ABS = water absorption; DDT = dough development time; STA = dough stability; MTI = mixing tolerance time; P = elasticity; L = extensibility; P/L =
elasticity/extensibility ratio; W = work input = gluten strength; C1, C2, C3, C4 and C5 = torque as described in the methodology. Different letters in the lines indicate
significant differences between means by Tukey’s test (P < 0.05); ns = non-significant.
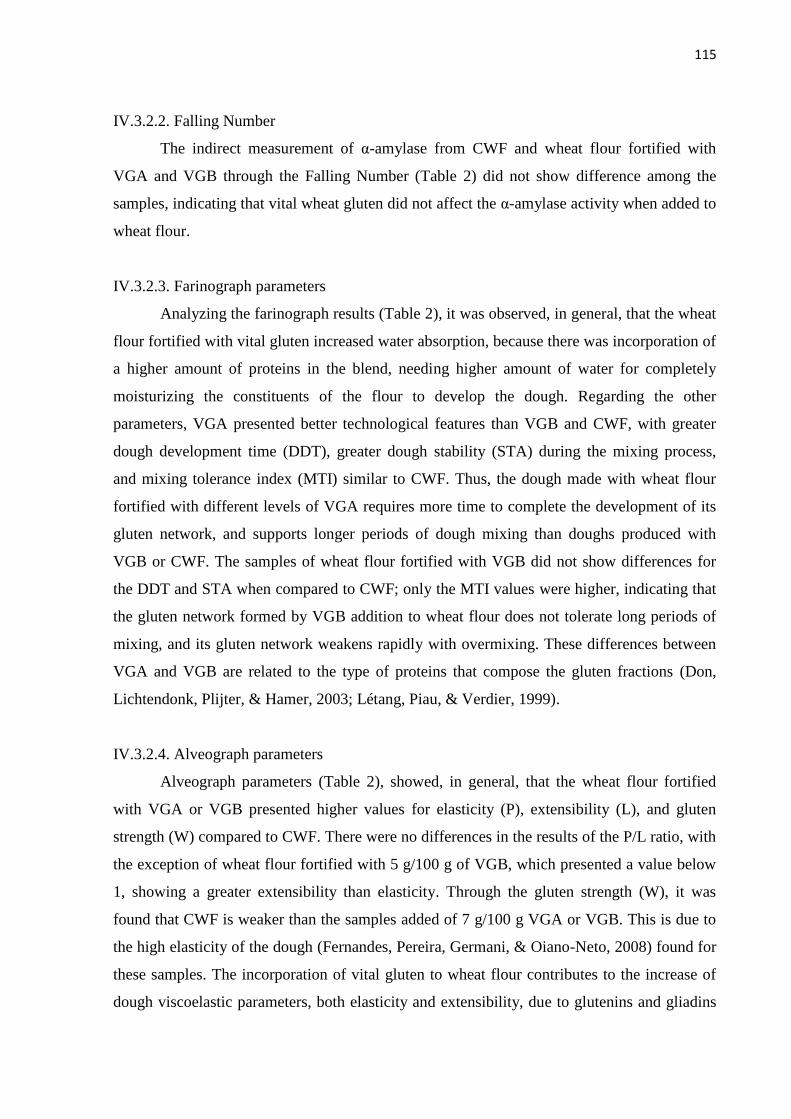
115
IV.3.2.2. Falling Number
The indirect measurement of α-amylase from CWF and wheat flour fortified with
VGA and VGB through the Falling Number (Table 2) did not show difference among the
samples, indicating that vital wheat gluten did not affect the α-amylase activity when added to
wheat flour.
IV.3.2.3. Farinograph parameters
Analyzing the farinograph results (Table 2), it was observed, in general, that the wheat
flour fortified with vital gluten increased water absorption, because there was incorporation of
a higher amount of proteins in the blend, needing higher amount of water for completely
moisturizing the constituents of the flour to develop the dough. Regarding the other
parameters, VGA presented better technological features than VGB and CWF, with greater
dough development time (DDT), greater dough stability (STA) during the mixing process,
and mixing tolerance index (MTI) similar to CWF. Thus, the dough made with wheat flour
fortified with different levels of VGA requires more time to complete the development of its
gluten network, and supports longer periods of dough mixing than doughs produced with
VGB or CWF. The samples of wheat flour fortified with VGB did not show differences for
the DDT and STA when compared to CWF; only the MTI values were higher, indicating that
the gluten network formed by VGB addition to wheat flour does not tolerate long periods of
mixing, and its gluten network weakens rapidly with overmixing. These differences between
VGA and VGB are related to the type of proteins that compose the gluten fractions (Don,
Lichtendonk, Plijter, & Hamer, 2003; Létang, Piau, & Verdier, 1999).
IV.3.2.4. Alveograph parameters
Alveograph parameters (Table 2), showed, in general, that the wheat flour fortified
with VGA or VGB presented higher values for elasticity (P), extensibility (L), and gluten
strength (W) compared to CWF. There were no differences in the results of the P/L ratio, with
the exception of wheat flour fortified with 5 g/100 g of VGB, which presented a value below
1, showing a greater extensibility than elasticity. Through the gluten strength (W), it was
found that CWF is weaker than the samples added of 7 g/100 g VGA or VGB. This is due to
the high elasticity of the dough (Fernandes, Pereira, Germani, & Oiano-Neto, 2008) found for
these samples. The incorporation of vital gluten to wheat flour contributes to the increase of
dough viscoelastic parameters, both elasticity and extensibility, due to glutenins and gliadins
116
addition (Codina et al., 2010; Hadna, Dap, Šimurina, & Filip, 2013; Mirsaeedghazi, Emam-
Djomeh, & Mousavi, 2008). Thus, VGA and VGB addition increased the area under the
curve, indicating greater gluten strength (W).
IV.3.2.5. Thermomechanical properties
Technological analysis through the Mixolab™ assesses the quality of the gluten
network and the pasting properties when flour is mixed at 30 °C, heated to 95 °C and cooled
to 50 °C, always with stirring (Codina et al., 2010; Dhaka et al., 2012; Gil-Humanes, Pistón,
Rosell, & Barro, 2012; Rosell et al., 2010). The curve obtained is usually divided into two
parts: the first part refers to the gluten network properties of the dough during mixing
(parameters: absorption - ABS, dough development time - DDT, dough stability - STA,
maximum minimum torque - C1 and protein weakening - C2); and the second part is linked to
the starch properties and it represents the dough viscosity under mixing and concomitant
heating (starch gelatinization - C3, breakdown of the starch granules - C4 and dough
consistency after cooling - C5). The results obtained in the Mixolab™ are presented in Table
2 and Figure 1.
Figure 1. Mixolab™ curves obtained for control wheat flour (CWF) and wheat flour fortified
with 5 or 7 g/100 g of vital wheat gluten from different origins (VGA or VGB)
In general, there was increased water absorption (Table 2) for the wheat flour fortified
with VGA or VGB compared to CWF, except for 5 g/100 g VGB. Moreover, the dough
0
1
2
3
4
0 4 7 11 15 19 22 26 30 33 37 41 44
To
rque
(Nm
)
Time (minutes)
WFC
5 % VGA
7 % VGA
5 % VGB
7 % VGB
C1
C2
C3
C4
C5
117
obtained from CWF showed lower DDT being different to 7 g/100 g VGA or VGB; for STA,
the dough obtained from VGA showed high stability of its gluten network, differing from
CWF, while the STA for VGB did not differ either from VGA or CFW. For C1, a difference
was observed between CWF and 5 g/100 g VGA, and for C2, the highest values were found
for 5 and 7 g/100 g VGA and 7 g/100 g VGB.
Assessing the first part of the Mixolab™ curve (Figure 1), the differences among the
samples are more related to the secondary endpoints of the curve, which refer to the extent of
weakening (C1-C2) and the rate of weakening (fall angle of the curve C1-C2) of the gluten
network when subjected to overmixing. Thus, it is possible to see that CWF and 5 g/100 g
VGB are the doughs that had greater weakening of the protein network. According Gil-
Humanes et al. (2012), the reduction in dough consistency (C2 torque, Table 2) is related to
proteins of lower quality for baking connected to gliadin content. Also according to these
authors, DDT and STA are related to the dough strength when subjected to the mixing
process. Between the proteins involved in the gluten network formation, the gliadins are
responsible for reducing the strength and stability of the dough when added to flour (Khatkar
et al., 2013; MacRitchie, 1987; Rosell et al., 2010). Lundh & Macritchie (1989) observed that
the difference between the DDT from excellent and reasonably good for baking wheat
varieties is attributed to glutenin ratio, and Dhaka et al. (2012) found a strong relationship
between DDT and the balance of glutenin and gliadin. Thus, we found that, even with larger
amounts of gliadin (data not shown), VGA, at the different levels used, developed a gluten
network with better viscoelastic characteristics for baking than VGB, because VGA its better
glutenin/gliadin ratio in its composition.
Evaluating the second part of the curve (Figure 1) related to the starch properties,
together with the values of torque at C3, C4 and C5 (Table 2), it was found that CWF and 5
g/100 g VGA showed the same behavior with higher C3, C4 and C5. In C5, 5 g/100 g VGB
also showed a higher gain in consistency, but it did not differ from the dough with 7 g/100 g
VGA or VGB addition. The torque reduction at C3, related to starch gelatinization, occurred
because the incorporation of gluten to wheat flour influenced dough consistency, by reducing
starch and increasing proteins in the blend. This can limit the swelling of the starch granules,
reducing the viscosity of the slurry (Debet & Gidley, 2006).

118
IV.3.3. Baking test and evaluation of bread quality
The results of the physical-chemical analyses obtained from bread produced with
wheat flour fortified with 5 and 7 g/100 g VGA or VGB compared with the control bread are
presented in Table 3.
IV.3.3.1. Physical-chemical analyses of bread on production day (day 1)
The analyses carried out only on the bread preparation day were specific volume (SV)
and color, and their results are presented in Table 3. The specific volume of the breads is
widely used in industries and bakeries (Hoseney et al., 1970), and it provides relevant data
about the dough development during the mixing process and growth of the bread during its
proofing and baking (Czuchajowska & Paszczynska, 1996; Dua et al., 2009; Scanlon &
Zghal, 2001; van der Zalm, van der Goot, & Boom, 2011). The volume directly affects the
visual appearance of bread (at the time of purchase), besides other characteristics, such as
crumb color and texture (Cauvain, 2015).
Analyzing the SV values (Table 3), it was observed that the bread made with wheat
flour fortified with 7 g/100 g VGA showed larger volume (4.30 mL/g) than breads prepared
with CWF, 5 g/100 g VGA, and 5 and 7 g/100 g VGB. These last breads did not differ from
each other (Figure 2). These results are in agreement with Marchetti et al. (2012), who found
that vital gluten addition to wheat flour increased the specific volume of the bread due to its
better viscoelastic behavior than wheat flour only, because of the increase of the amount of
glutenin in the samples.
Figure 2. Slices of breads made with control wheat flour (CWF) and wheat flour fortified
with 5 and 7 % of vital wheat gluten from different origins (VGA or VGB).
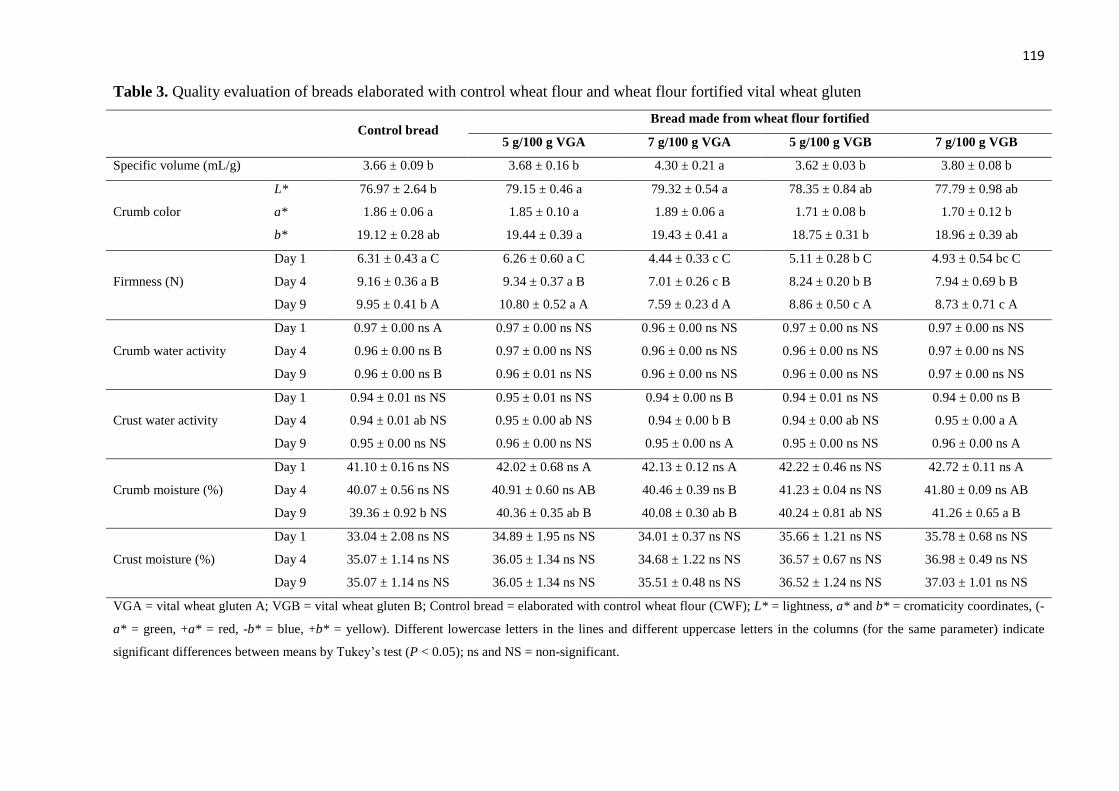
119
Table 3. Quality evaluation of breads elaborated with control wheat flour and wheat flour fortified vital wheat gluten
Control bread
Bread made from wheat flour fortified
5 g/100 g VGA 7 g/100 g VGA 5 g/100 g VGB 7 g/100 g VGB
Specific volume (mL/g) 3.66 ± 0.09 b 3.68 ± 0.16 b 4.30 ± 0.21 a 3.62 ± 0.03 b 3.80 ± 0.08 b
Crumb color
L* 76.97 ± 2.64 b 79.15 ± 0.46 a 79.32 ± 0.54 a 78.35 ± 0.84 ab 77.79 ± 0.98 ab
a* 1.86 ± 0.06 a 1.85 ± 0.10 a 1.89 ± 0.06 a 1.71 ± 0.08 b 1.70 ± 0.12 b
b* 19.12 ± 0.28 ab 19.44 ± 0.39 a 19.43 ± 0.41 a 18.75 ± 0.31 b 18.96 ± 0.39 ab
Firmness (N)
Day 1 6.31 ± 0.43 a C 6.26 ± 0.60 a C 4.44 ± 0.33 c C 5.11 ± 0.28 b C 4.93 ± 0.54 bc C
Day 4 9.16 ± 0.36 a B 9.34 ± 0.37 a B 7.01 ± 0.26 c B 8.24 ± 0.20 b B 7.94 ± 0.69 b B
Day 9 9.95 ± 0.41 b A 10.80 ± 0.52 a A 7.59 ± 0.23 d A 8.86 ± 0.50 c A 8.73 ± 0.71 c A
Crumb water activity
Day 1 0.97 ± 0.00 ns A 0.97 ± 0.00 ns NS 0.96 ± 0.00 ns NS 0.97 ± 0.00 ns NS 0.97 ± 0.00 ns NS
Day 4 0.96 ± 0.00 ns B 0.97 ± 0.00 ns NS 0.96 ± 0.00 ns NS 0.96 ± 0.00 ns NS 0.97 ± 0.00 ns NS
Day 9 0.96 ± 0.00 ns B 0.96 ± 0.01 ns NS 0.96 ± 0.00 ns NS 0.96 ± 0.00 ns NS 0.97 ± 0.00 ns NS
Crust water activity
Day 1 0.94 ± 0.01 ns NS 0.95 ± 0.01 ns NS 0.94 ± 0.00 ns B 0.94 ± 0.01 ns NS 0.94 ± 0.00 ns B
Day 4 0.94 ± 0.01 ab NS 0.95 ± 0.00 ab NS 0.94 ± 0.00 b B 0.94 ± 0.00 ab NS 0.95 ± 0.00 a A
Day 9 0.95 ± 0.00 ns NS 0.96 ± 0.00 ns NS 0.95 ± 0.00 ns A 0.95 ± 0.00 ns NS 0.96 ± 0.00 ns A
Crumb moisture (%)
Day 1 41.10 ± 0.16 ns NS 42.02 ± 0.68 ns A 42.13 ± 0.12 ns A 42.22 ± 0.46 ns NS 42.72 ± 0.11 ns A
Day 4 40.07 ± 0.56 ns NS 40.91 ± 0.60 ns AB 40.46 ± 0.39 ns B 41.23 ± 0.04 ns NS 41.80 ± 0.09 ns AB
Day 9 39.36 ± 0.92 b NS 40.36 ± 0.35 ab B 40.08 ± 0.30 ab B 40.24 ± 0.81 ab NS 41.26 ± 0.65 a B
Crust moisture (%)
Day 1 33.04 ± 2.08 ns NS 34.89 ± 1.95 ns NS 34.01 ± 0.37 ns NS 35.66 ± 1.21 ns NS 35.78 ± 0.68 ns NS
Day 4 35.07 ± 1.14 ns NS 36.05 ± 1.34 ns NS 34.68 ± 1.22 ns NS 36.57 ± 0.67 ns NS 36.98 ± 0.49 ns NS
Day 9 35.07 ± 1.14 ns NS 36.05 ± 1.34 ns NS 35.51 ± 0.48 ns NS 36.52 ± 1.24 ns NS 37.03 ± 1.01 ns NS
VGA = vital wheat gluten A; VGB = vital wheat gluten B; Control bread = elaborated with control wheat flour (CWF); L* = lightness, a* and b* = cromaticity coordinates, (-
a* = green, +a* = red, -b* = blue, +b* = yellow). Different lowercase letters in the lines and different uppercase letters in the columns (for the same parameter) indicate
significant differences between means by Tukey’s test (P < 0.05); ns and NS = non-significant.
120
The increase in the SV occurred due to the incorporation of gliadins and glutenins in
CWF, enabling the formation of a better gluten network, which prevents the exit of gases
from the fermentation process (Dobraszczyk & Morgenstern, 2003; Dobraszczyk &
Salmanowicz, 2008; Khatkar et al., 1995). Thus, higher specific volume is achieved when
enough amounts of vital gluten with good technological quality is added to the wheat flour, 7
g/100 g VGA in this study. The largest bread volumes are obtained with those doughs that
have a good alveograph behavior (Marchetti et al., 2012), especially with a good relationship
between elasticity (P, glutenin) and extensibility (L, gliadin) and gluten strength (W), but also
when doughs have good mixing properties, such as increased dough development time (DDT)
and stability (STA) (Tronsmo, Magnus, Færgestad, & Schofield, 2003), as measured by the
farinograph and Mixolab (Dhaka et al., 2012). Furthermore, according to Singh (2001), the
macromolecules, such as the glutenin macropolymer (GMP) (Don et al., 2003), contributes to
the higher specific volume of the bread, because they are directly related to the elastic
characteristic of the dough (Don et al., 2003; Wang et al., 2014). In this study, we observed
that 7 g/100 g VGA presented better viscoelastic properties for baking (Table 2), reflecting on
an increase in SV.
With respect to bread color (Table 3), color is a critical parameter in baked products
(Cauvain, 2015). Breads with very light or very dark crusts are associated with faults during
processing. The presence of sugars in the formulation accelerates the reactions of
caramelization and Maillard, leading to the progressive darkening of the crust (Esteller &
Lannes, 2005). As the crumb reaches temperatures below 100 °C (about 98 °C), its color is
mostly a consequence of the color of the flour and other raw materials used, and the bread
volume. For L* of the crumb, breads with VGA showed higher L* values than bread made
with control wheat flour. This may be due to the gluten network formed in the mixing
process, which gave breads with high volume, more uniform crumb structure, increasing the
extent of light reflected. Regarding the chromaticity coordinates of the bread crumb, the
results indicate that the bread prepared with VGB had the lowest values of a* (less red)
compared to VGA and the control bread. On the other hand, when analyzing the b*
coordinate, the bread with 5 g/100 g VGB showed a lower value (less yellow) when compared
to blends with VGA. These differences may be explained by differences in color observed for
the vital gluten (A and B) powders that were added to wheat flour, even in small quantities
121
(VGA had L* = 86.96, a* = 1.81 and b* = 18.95 and VGB had L* = 86.77, a* = 1.01 and b*
= 15.23), where VGA visually looked more yellow, and VGB was grayer.
IV.3.3.2. Physical-chemical analyses of bread during its shelf life (days 1, 4 and 9)
Crumb firmness for bakery products depends on the formulation (flour quality, amount
of sugar, fat, emulsifiers, enzymes, addition of gluten and the use of bread improvers), dough
moisture and storage conditions (Esteller & Lannes, 2005; Luyten, Plijter, & Vliet, 2004;
Roudaut, Dacremont, Valle, & Meste, 2002). Observing the values found (Table 3), bread
crumb firmness increased with storage time. The bread with 7 g/100 g VGA presented lower
firmness compared to the other breads within the same day of evaluation. This happened
because VGA promoted a higher volume of bread, as it presented better viscoelastic
properties (Table 2). The better viscoelastic properties of VGA permitted greater gas retention
during proofing and baking, yielding bread with higher specific volume. This leads to more
aerated, less dense crumbs, with thinner cell walls, and consequently softer texture. In
addition, the increase of the crumb bread firmness during storage occurred due to the process
of retrogradation of amylopectin and the migration of water from the crumb to the crust, a
process that occurs during storage of this product (Cauvain, 2015).
Bread has high water activity (Aw ~ 0.90) (Czuchajowska, Pomeranz, & Jeffers,
1989), ie, it has a lot of free water available for microbial growth and chemical reactions
deterioration. For this reason, usually the commercially available products have relatively
short shelf life (10 – 12 days); and are likely mainly to present the growth of molds and yeasts
on the surface (Montenegro, 2011.). The results for Aw of the bread crumb were higher than
0.96, with no significant differences (P < 0.05) between the samples, which ends up putting
all breads within a critical range of microbiological stability. They are therefore more
susceptible to growth of molds and yeasts, as observed from the ninth day of bread storage,
even with the addition of 0.2 % (flour basis) calcium propionate. Also regarding the bread
crumb Aw, the control bread showed differences in the results between the different days
analyzed, reducing Aw with increasing storage time, which did not occur with the breads
produced with vital gluten, most likely because it retains water in its structure.
Oliveira, Telis-Romero, Da-Silva, & Franco (2014) report some changes that occur in
baked products related to shelf life, among which the loss of crust crispness due to water

122
absorption or water migration from the crumb to the crust. Regarding the bread crust Aw,
significant differences between the samples from the first day to last day of storage were
observed. This may be due to increased water retention in the crumb by the gluten network
formed by VGA.
Observing the results in Table 3, there was no significant difference in crumb moisture
content in the samples on the first and fourth days of storage, but on day 9, it was observed
that the bread crumb of the blend with 7 g/100 g VGB showed a significant difference from
the control bread, with higher moisture. Also regarding bread crumb moisture, the blends with
5 and 7 g/100 g VGA and 7 g/100 g VGB presented significant differences during the storage
period, and the moisture on the 9th day was lower than the moisture on day 1. For bread crust
moisture, no significant difference was observed among the different formulations of bread
and among the days of storage.
IV.3.3.3. Image analysis of bread crumb
The results of the image analysis of bread crumb made with control wheat flour
(CWF) and flour fortified with different levels of VGA or VGB are presented in Table 4 and
Figure 3.
Table 4. Parameters obtained in the image analysis of the bread crumb made with control
wheat flour (CWF) and wheat flour fortified with 5 and 7 g/100 g of vital gluten from
different origins (VGA or VGB)
Breads Alveoli number Alveoli area (mm²) Alveoli perimeter (mm)
Control bread 7552 ± 417 b 0.20 ± 0.01 a 1.24 ± 0.08 ab
Bread with 5 % VGA 9450 ± 886 a 0.14 ± 0.01 b 1.22 ± 0.03 ab
Bread with 7 % VGA 7735 ± 329 b 0.20 ± 0.00 a 1.34 ± 0.03 a
Bread with 5 % VGB 7830 ± 770 b 0.21 ± 0.02 a 1.14 ± 0.04 b
Bread with 7 % VGB 8295 ± 205 ab 0.19 ± 0.01 a 1.22 ± 0.10 ab
VGA = vital wheat gluten A; VGB = vital wheat gluten B; Control bread = bread made of control wheat flour
(CWF). Different letters in the columns indicate significant differences between means by Tukey’s test (P <
0.05).
The analysis of the structure of the bread crumb indicates that the formulations
containing vital wheat gluten did not promote great changes regarding the number, area and
perimeter of the alveoli. The bread prepared with 5 g/100 g VGA presented the greatest
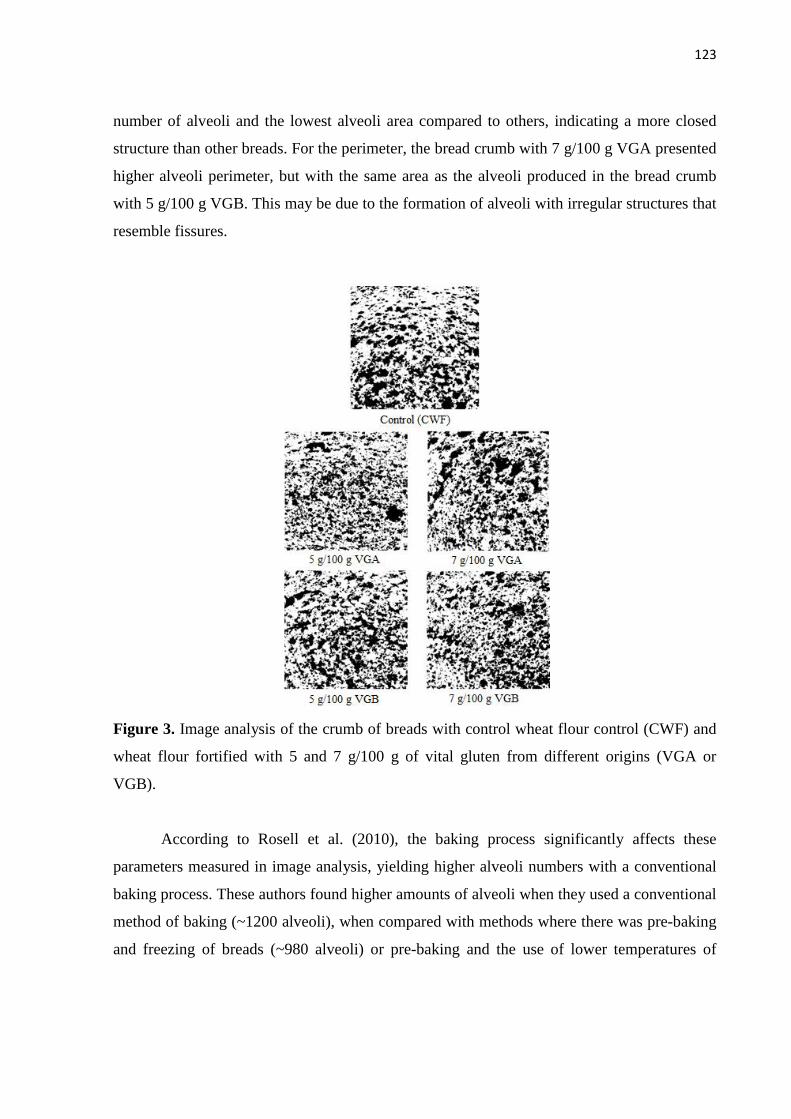
123
number of alveoli and the lowest alveoli area compared to others, indicating a more closed
structure than other breads. For the perimeter, the bread crumb with 7 g/100 g VGA presented
higher alveoli perimeter, but with the same area as the alveoli produced in the bread crumb
with 5 g/100 g VGB. This may be due to the formation of alveoli with irregular structures that
resemble fissures.
Figure 3. Image analysis of the crumb of breads with control wheat flour control (CWF) and
wheat flour fortified with 5 and 7 g/100 g of vital gluten from different origins (VGA or
VGB).
According to Rosell et al. (2010), the baking process significantly affects these
parameters measured in image analysis, yielding higher alveoli numbers with a conventional
baking process. These authors found higher amounts of alveoli when they used a conventional
method of baking (~1200 alveoli), when compared with methods where there was pre-baking
and freezing of breads (~980 alveoli) or pre-baking and the use of lower temperatures of
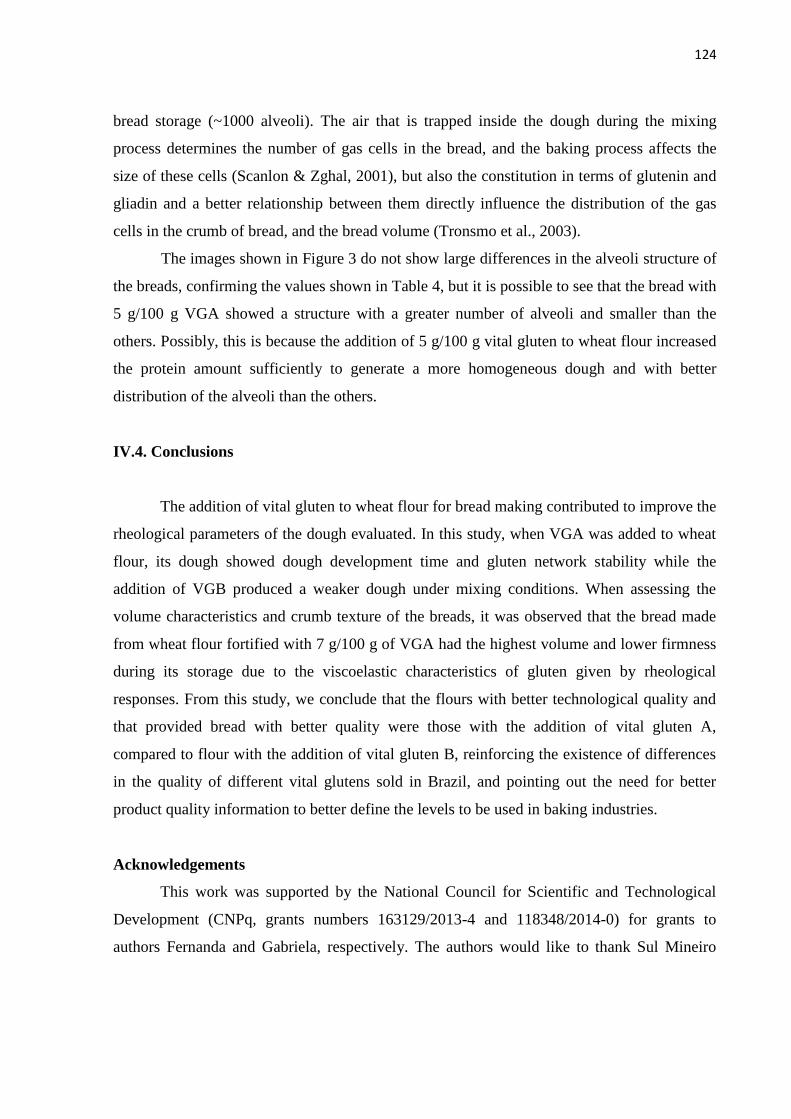
124
bread storage (~1000 alveoli). The air that is trapped inside the dough during the mixing
process determines the number of gas cells in the bread, and the baking process affects the
size of these cells (Scanlon & Zghal, 2001), but also the constitution in terms of glutenin and
gliadin and a better relationship between them directly influence the distribution of the gas
cells in the crumb of bread, and the bread volume (Tronsmo et al., 2003).
The images shown in Figure 3 do not show large differences in the alveoli structure of
the breads, confirming the values shown in Table 4, but it is possible to see that the bread with
5 g/100 g VGA showed a structure with a greater number of alveoli and smaller than the
others. Possibly, this is because the addition of 5 g/100 g vital gluten to wheat flour increased
the protein amount sufficiently to generate a more homogeneous dough and with better
distribution of the alveoli than the others.
IV.4. Conclusions
The addition of vital gluten to wheat flour for bread making contributed to improve the
rheological parameters of the dough evaluated. In this study, when VGA was added to wheat
flour, its dough showed dough development time and gluten network stability while the
addition of VGB produced a weaker dough under mixing conditions. When assessing the
volume characteristics and crumb texture of the breads, it was observed that the bread made
from wheat flour fortified with 7 g/100 g of VGA had the highest volume and lower firmness
during its storage due to the viscoelastic characteristics of gluten given by rheological
responses. From this study, we conclude that the flours with better technological quality and
that provided bread with better quality were those with the addition of vital gluten A,
compared to flour with the addition of vital gluten B, reinforcing the existence of differences
in the quality of different vital glutens sold in Brazil, and pointing out the need for better
product quality information to better define the levels to be used in baking industries.
Acknowledgements
This work was supported by the National Council for Scientific and Technological
Development (CNPq, grants numbers 163129/2013-4 and 118348/2014-0) for grants to
authors Fernanda and Gabriela, respectively. The authors would like to thank Sul Mineiro
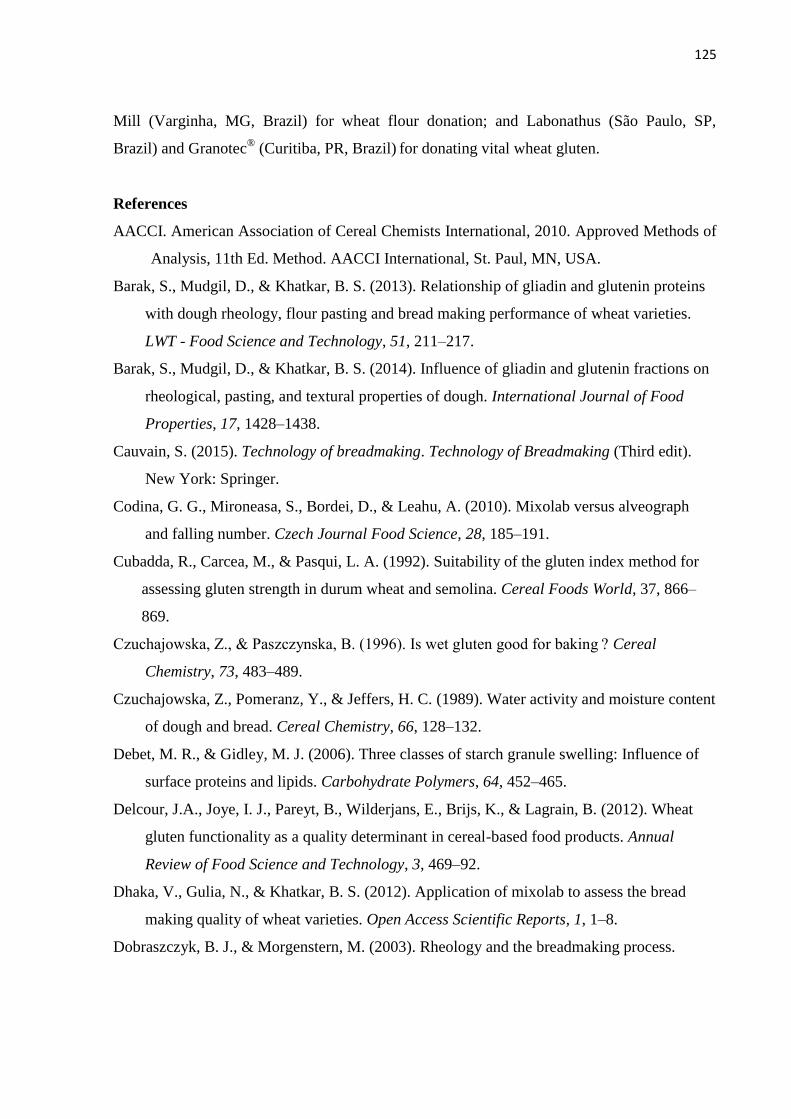
125
Mill (Varginha, MG, Brazil) for wheat flour donation; and Labonathus (São Paulo, SP,
Brazil) and Granotec® (Curitiba, PR, Brazil)
for donating vital wheat gluten.
References
AACCI. American Association of Cereal Chemists International, 2010. Approved Methods of
Analysis, 11th Ed. Method. AACCI International, St. Paul, MN, USA.
Barak, S., Mudgil, D., & Khatkar, B. S. (2013). Relationship of gliadin and glutenin proteins
with dough rheology, flour pasting and bread making performance of wheat varieties.
LWT - Food Science and Technology, 51, 211–217.
Barak, S., Mudgil, D., & Khatkar, B. S. (2014). Influence of gliadin and glutenin fractions on
rheological, pasting, and textural properties of dough. International Journal of Food
Properties, 17, 1428–1438.
Cauvain, S. (2015). Technology of breadmaking. Technology of Breadmaking (Third edit).
New York: Springer.
Codina, G. G., Mironeasa, S., Bordei, D., & Leahu, A. (2010). Mixolab versus alveograph
and falling number. Czech Journal Food Science, 28, 185–191.
Cubadda, R., Carcea, M., & Pasqui, L. A. (1992). Suitability of the gluten index method for
assessing gluten strength in durum wheat and semolina. Cereal Foods World, 37, 866–
869.
Czuchajowska, Z., & Paszczynska, B. (1996). Is wet gluten good for baking ? Cereal
Chemistry, 73, 483–489.
Czuchajowska, Z., Pomeranz, Y., & Jeffers, H. C. (1989). Water activity and moisture content
of dough and bread. Cereal Chemistry, 66, 128–132.
Debet, M. R., & Gidley, M. J. (2006). Three classes of starch granule swelling: Influence of
surface proteins and lipids. Carbohydrate Polymers, 64, 452–465.
Delcour, J.A., Joye, I. J., Pareyt, B., Wilderjans, E., Brijs, K., & Lagrain, B. (2012). Wheat
gluten functionality as a quality determinant in cereal-based food products. Annual
Review of Food Science and Technology, 3, 469–92.
Dhaka, V., Gulia, N., & Khatkar, B. S. (2012). Application of mixolab to assess the bread
making quality of wheat varieties. Open Access Scientific Reports, 1, 1–8.
Dobraszczyk, B. J., & Morgenstern, M. (2003). Rheology and the breadmaking process.
126
Journal of Cereal Science, 38, 229–245.
Dobraszczyk, B. J., & Salmanowicz, B. P. (2008). Comparison of predictions of baking
volume using large deformation rheological properties. Journal of Cereal Science, 47,
292–301.
Don, C., Lichtendonk, W. J., Plijter, J. J., & Hamer, R. J. (2003). Understanding the link
between GMP and dough: From glutenin particles in flour towards developed dough.
Journal of Cereal Science, 38, 157–165.
Dua, S., Lukow, O. M., Humphreys, G., & Adams, K. (2009). Effect of extraction methods
and wheat cultivars on gluten functionality. The Open Food Science Journal, 3, 84–92.
Esteller, M. S., Pitombo, R. N. M., & Lannes, S. C. S. (2005). Effect of freeze-dried gluten
addition on texture of hamburger buns. Journal of Cereal Science, 41, 19–21.
Esteller, M. S., & Lannes, S. C. S. (2005). Parâmetros complementares para fixação de
identidade e qualidade de produtos panificados. Ciência e Tecnologia de Alimentos, 25,
802-806.
Fernandes, A. F., Pereira, J., Germani, R., & Oiano-Neto, J. (2008). Efeito da substituição
parcial da farinha de trigo por farinha de casca de batata (Solanum Tuberosum Lineu).
Ciência E Tecnologia de Alimentos, 28, 56–65.
Gil-Humanes, J., Pistón, F., Rosell, C. M., & Barro, F. (2012). Significant down-regulation of
γ-gliadins has minor effect on gluten and starch properties of bread wheat. Journal of
Cereal Science, 56, 161–170.
Goesaert, H., Brijs, K., Veraverbeke, W. S., Courtin, C. M., Gebruers, K., & Delcour, J. A.
(2005). Wheat flour constituents: how they impact bread quality, and how to impact their
functionality. Trends in Food Science & Technology, 16, 12–30.
Hadna, M., Dap, T., Šimurina, O., & Filip, B. (2013). Empirical and fundamental rheological
properties of wheat flour dough as affected by different climatic conditions. Journal of
Agricultural Science and Technology, 15, 1381–1391.
Hoseney, R. C., Finney, K. F., & Pomeranz, Y. (1970). Functional (breadmaking) and
biochemical properties of wheat flour components. VI. Gliadin-lipid-glutenin interaction
in wheat gluten. Cereal Chemistry. Retrieved from
http://www.aaccnet.org/cerealchemistry/abstracts/1970/cc1970a22.asp
Huang, W., Li, L., Wang, F., Wan, J., Tilley, M., & Ren, C. (2010). Effects of

127
transglutaminase on the rheological and Mixolab thermomechanical characteristics of oat
dough quality. Food Chemistry, 121, 934–939.
Khatkar, B. S., Barak, S., & Mudgil, D. (2013). Effects of gliadin addition on the rheological,
microscopic and thermal characteristics of wheat gluten. International Journal of
Biological Macromolecules, 53, 38–41.
Khatkar, B. S., Bell, A. E., & Schofield, J. D. (1995). The dynamic rheological properties of
glutens and gluten sub-fractions from wheats of good and poor bread making quality.
Journal of Cereal Science, 22, 29–44.
Létang, C., Piau, M., & Verdier, C. (1999). Characterization of wheat flour-water doughs.
Part I: Rheometry and microstructure. Journal of Food Engineering, 41, 121–132.
Lundh, G., & Macritchie, F. (1989). Size exclusion HPLC characterisation of gluten protein
fractions varying in breadmaking potential. Journal of Cereal Science, 10, 247–253.
Luyten, H., Plijter, J. J., & Vliet, T. O. N. V. A. N. (2004). Crispy/crunchy crusts of cellular
solid foods: a literature review with discussion . Journal of Texture Studies, 35, 445–492.
MacRitchie, F. (1987). Evaluation of contributions from wheat protein fractions to dough
mixing and breadmaking. Journal of Cereal Science, 6, 259–268.
MacRitchie, F. (2014). Requirements for a test to evaluate bread-making performance.
Journal of Cereal Science, 59, 1–2.
Marchetti, L., Cardós, M., Campaña, L., & Ferrero, C. (2012). Effect of glutens of different
quality on dough characteristics and breadmaking performance. LWT - Food Science and
Technology, 46, 224–231.
Melnyk, J. P., Dreisoerner, J., Marcone, M. F., & Seetharaman, K. (2012). Using the gluten
peak tester as a tool to measure physical properties of gluten. Journal of Cereal Science,
56, 561–567.
Miller, K. A., & Hoseney, R. C. (1999). Dynamic rheological properties of wheat starch-
gluten doughs. Cereal Chemistry, 76, 105–109.
Mirsaeedghazi, H., Emam-Djomeh, Z., & Mousavi, S. M. A. (2008). Rheometric
measurement of dough rheological characteristics and factors affecting it. International
Journal of Agriculture and Biology, 10, 112–119.
Montenegro, F. M. (2011). Avaliação do desempenho tecnológico de misturas de farinhas de
triticale e trigo em produtos de panificação, 94p. Dissertação (Mestre em Tecnologia de
128
Alimentos), Faculdade de Engenharia de Alimentos, Universidade Estadual de Campinas
- UNICAMP.
Oliveira, D. S., Telis-Romero, J., Da-Silva, R., & Franco, C. M. L. (2014). Effect of a
thermoascus aurantiacus thermostable enzyme cocktail on wheat bread quality. Food
Chemistry, 143, 139–146.
Oliveira, L. C., Rosell, C. M., & Steel, C. J. (2015). Original article Effect of the addition of
whole-grain wheat flour and of extrusion process parameters on dietary fibre content ,
starch transformation and mechanical properties of a ready-to-eat breakfast cereal.
International Journal of Food Science and Technology, 50, 1504–1514.
Rosell, C. M., Santos, E., & Collar, C. (2010). Physical characterization of fiber-enriched
bread doughs by dual mixing and temperature constraint using the Mixolab. European
Food Research and Technology, 231, 535–544.
Roudaut, G., Dacremont, C., Valle, B., & Meste, M. Le. (2002). Crispness : a critical review
on sensory and material science approaches. Trends in Food Science & Technology 13,
217–227.
Scanlon, M. G., & Zghal, M. C. (2001). Bread properties and crumb structure. Food Research
International, 34, 841–864.
Schmiele, M., Jaekel, L. Z., Patricio, S. M. C., Steel, C. J., & Chang, Y. K. (2012).
Rheological properties of wheat flour and quality characteristics of pan bread as
modified by partial additions of wheat bran or whole grain wheat flour. International
Journal of Food Science and Technology, 47, 2141–2150.
Shewry, P. R., & Tatham, A. S. (1997). Disulphide Bonds in Wheat Gluten Proteins. Journal
of Cereal Science, 25, 207–227.
Singh, H., & Macritchie, F. (2001). Application of polymer science to properties of gluten.
Journal of Cereal Science, 33, 231–243.
Song, Y., & Zheng, Q. (2007). Dynamic rheological properties of wheat flour dough and
proteins. Trends in Food Science & Technology, 18, 132–138.
Tronsmo, K. M., Magnus, E. M., Færgestad, E. M., & Schofield, J. D. (2003). Relationships
between gluten rheological properties and hearth loaf characteristics. Cereal Chemistry,
80, 575–586.
van der Zalm, E. E. J., van der Goot, A. J., & Boom, R. M. (2011). Quality of shear
129
fractionated wheat gluten – Comparison to commercial vital wheat gluten. Journal of
Cereal Science, 53, 154–159.
Wadhawan, C. K., & Bushuk, W. (1989). Studies on vitality of commercial gluten. I.
Physical, chemical and technological characteristics. Cereal Chemistry, 66, 456–461.
Wang, P., Xu, L., Nikoo, M., Ocen, D., Wu, F., Yang, N., Jin, Z., & Xu, X. (2014). Effect of
frozen storage on the conformational, thermal and microscopic properties of gluten:
Comparative studies on gluten-, glutenin- and gliadin-rich fractions. Food
Hydrocolloids, 35, 238–246.
Wieser, H. (2007). Chemistry of gluten proteins. Food Microbiology, 24, 115–9.
Wieser, H., & Kieffer, R. (2001). Correlations of the amount of gluten protein types to the
technological properties of wheat flours determined on a micro-scale. Journal of Cereal
Science, 34, 19–27.
Xu, J., Bietz, J. a., & Carriere, C. J. (2007). Viscoelastic properties of wheat gliadin and
glutenin suspensions. Food Chemistry, 101, 1025–1030.
Zhou, Y., Zhao, D., Foster, T. J., Liu, Y., Wang, Y., Nirasawa, S., Tatsumi, E., & Cheng, Y.
(2014). Konjac glucomannan-induced changes in thiol/disulphide exchange and gluten
conformation upon dough mixing. Food Chemistry, 143, 163–9.
130
ARTIGO V.
___________________________________________________________________________
Testes simples utilizados como ferramentas para avaliação de glúten vital
Ortolan, Fernanda; Urbano, Karoline; Steel, Caroline Joy
Este artigo será submetido à:
International Journal of Food Science and Technology

131
V. Testes simples utilizados como ferramentas para avaliação de glúten vital
Ortolan, Fernanda; Urbano, Karoline; Steel, Caroline Joy
Resumo
O glúten vital é um ingrediente muito utilizado na indústria de panificação, porém
comercializado com poucas especificações de suas proteínas e de suas propriedades
viscoelásticas. Por outro lado, essas informações devem ser obtidas de forma rápida e com
baixo custo. A vitalidade do glúten comercializado na forma de pó para a fortificação de
farinha de trigo é, geralmente, avaliada através de teste de panificação. Embora este teste
forneça respostas importantes para a avaliação da qualidade viscoelástica do glúten vital,
requer muito tempo para sua realização. O objetivo deste trabalho foi avaliar a qualidade
viscoelástica de dois glútens vitais comerciais de diferentes origens (A e B) através de testes
simples, e correlacionar os resultados obtidos nos testes simples com parâmetros reológicos
da massa (farinografia e extensografia) e de qualidade dos pães (volume específico do pão e
firmeza do miolo) obtidos da farinha de trigo fortificada com 7 g/100 g de glúten vital A ou
glúten vital B. Os resultados dos testes simples mostraram diferenças nas propriedades
viscoelásticas entre os glútens; O glúten vital A apresentou-se mais elástico e menos
extensível que o glúten vital B, e sua bola de glúten mostrou maior volume específico. As
correlações indicaram que os testes simples podem ser utilizados para determinar o
desempenho de glúten vital comercial quando utilizado na fortificação de farinhas, reforçando
a ideia de sua utilização para aferir a qualidade viscoelástica. Além disso, os resultados
evidenciam a necessidade de maiores informações sobre as proteínas do glúten vital para sua
comercialização e uso.
Palavras chaves: glúten vital, teste de expansão, teste de extensibilidade, índice de glúten
V.1. Introdução
O glúten vital é um concentrado proteico (com cerca de 80 g/100 g de proteínas),
comercializado em forma de pó de cor branco-acinzentada que é utilizado para fortificar
farinhas que não apresentam propriedades viscoelásticas adequadas para o processo de

132
panificação. O glúten vital é obtido da farinha de trigo, através da separação aquosa de
proteínas e amido, e tem a capacidade de recuperar suas propriedades viscoelásticas quando
hidratado, podendo ser aplicado às farinhas que não apresentam características tecnológicas
adequadas para panificação (DAY et al., 2006; MAJZOOBI; ABEDI, 2014).
Segundo a Associação Internacional de Glúten de Trigo (MARCHETTI et al., 2012), a
comercialização pode ser realizada nas formas “não vital” e “vital”. Glúten “não vital” é
aquele que foi submetido a um processo irreversível de desnaturação, e, desta forma, não pode
ser “revitalizado”, apresentando apenas capacidade de absorver água em quantidade relativa
ao tamanho e distribuição de suas partículas (TEDRUS et al., 2001). Por outro lado, o glúten
“vital”, quando em contato com a água, pode ser hidratado e recuperar suas propriedades
viscoelásticas (elasticidade e extensibilidade) (CZUCHAJOWSKA; PASZCZYNSKA, 1996).
As propriedades viscoelásticas do glúten estão relacionadas com a quantidade e
qualidade de suas proteínas (KHATKAR; BARAK; MUDGIL, 2013; MARCHETTI et al.,
2012). Essas propriedades influenciam a qualidade de textura, formato e expansão de
produtos de panificação (ABANG ZAIDEL et al., 2008). As gliadinas são responsáveis pela
extensibilidade da rede de glúten, e as gluteninas responsáveis pela elasticidade. Desta forma,
um balanço apropriado entre gliadinas e gluteninas é determinante na reologia do glúten,
porém não deve ser considerado o único fator para avaliação de sua qualidade (BARAK;
MUDGIL; KHATKAR, 2013; DELCOUR et al., 2012; WANG; JIN; XU, 2015).
A vitalidade do glúten é geralmente avaliada pela sua habilidade em aumentar o
volume e melhorar a textura do miolo de pães elaborados a partir de uma farinha padrão
fortificada com o glúten vital (WADHAWAN; BUSHUK, 1989). Este é o teste de rotina
realizado pelas indústrias de panificação para avaliação do nível de glúten vital necessário
para fortificar a farinha de trigo (GUERRIERI; CERLETTI, 1996).
Para determinar as diferenças na funcionalidade do glúten vital, parâmetros de
qualidade de farinha e determinação de volume do pão são usualmente utilizados (DUA et al.,
2009). Diversos estudos (CZUCHAJOWSKA; PASZCZYNSKA, 1996; MARCHETTI et al.,
2012; SONG; ZHENG, 2007) têm demonstrado a utilização de farinografia, extensografia e
alveografia para testar a funcionalidade do glúten vital obtido por diferentes métodos de
extração. Os testes físicos da massa formada pela adição de glúten vital à farinha de trigo são
usados para avaliar o potencial de panificação, ou seja, a força e o desempenho do glúten sob
133
condições mecanizadas (DOBRASZCZYK; MORGENSTERN, 2003). Segundo Tronsmo et
al. (2003), a avaliação reológica ajuda a predizer o comportamento da massa e a qualidade dos
produtos finais. A análise das características reológicas da massa também desempenha papel
importante no controle de qualidade e na definição da especificação de ingredientes dos
produtos elaborados (CODINA et al., 2010).
Somado a estas análises, os testes químicos preditivos, incluindo o estudo da
proporção de gliadinas e gluteninas, a adição dessas frações isoladas sobre a farinha de trigo,
e a solubilidade das proteínas do glúten em diferentes sistemas, tem sido utilizados para
avaliar os efeitos das gliadinas e gluteninas sobre as propriedades reológicas, de pasta e de
textura de massas (BARAK; MUDGIL; KHATKAR, 2014; CHANDI; SEETHARAMAN,
2012; KHATKAR et al., 2002; UTHAYAKUMARAN et al., 2001), ou ainda avaliar seus
efeitos sobre a qualidade de produtos finais (BARAK; MUDGIL; KHATKAR, 2014). Porém,
muitos destes testes demandam tempo, custos elevados, equipamentos específicos e mão de
obra qualificada para o desenvolvimento da análise e interpretação dos resultados, portanto,
dificultam a obtenção de resultados rápidos (CHANDI; SEETHARAMAN, 2012), que são
essenciais para moinhos, padarias, e indústrias de panificação.
No Brasil, faltam especificações técnicas com relação as características das proteínas
do glúten vital comercializado, dificultando sua aplicação nos produtos de panificação, já que
a qualidade do produto final é influenciada pela qualidade do glúten vital adicionado à farinha
(WEEGELS et al., 1994). Devido às exigências do mercado, técnicas que permitem uma
rápida conclusão sobre a qualidade do glúten vital são necessárias.
Testes simples, como os teores de glúten úmido e seco e o índice de glúten, podem ser
bons indicativos da qualidade tecnológica do glúten vital (KAUR et al., 2013; OIKONOMOU
et al., 2015). Um teste simples e muito comum é o teste de expansão do glúten, no qual o
glúten é extraído da farinha de trigo por lavagem manual e assado para obtenção de uma bola
de glúten expandida (CHEN et al., 1998; CHIANG; CHEN; CHANG, 2006; ORTOLAN et
al., 2014). Este teste pode ser utilizado em indústrias de panificação e moinhos para calcular o
percentual de proteínas da farinha de trigo [Proteína (g/100 g) = (Peso do glúten assado/peso
da farinha) x 100)], ou para avaliar a capacidade de expansão biaxial, indicando o quanto a
rede de glúten suporta a pressão do vapor d’água formado no seu interior (MARTELO, 1998).
Isso poderia estar associado ao volume de pães, pois a rede de glúten precisa suportar a
134
pressão dos gases que promove a expansão do pão no início do seu assamento. O volume
específico da bola de glúten poderia ser utilizado para avaliação da qualidade de glúten vital.
Este estudo tem por finalidade avaliar a qualidade viscoelástica de glútens vitais
comerciais de diferentes origens através de testes rápidos e simples, e correlacionar os
resultados dos testes simples obtidos neste trabalho com parâmetros tecnológicos,
considerados decisivos na avaliação da qualidade de glúten vital nas indústrias de panificação,
moinhos e para verificar se estes testes simples refletem o comportamento tecnológico deste
produto.
V.2. Material e Métodos
V.2. 1. Material
Duas amostras de glúten comercial de diferentes origens foram usadas neste estudo,
sendo nomeadas de glúten vital A (GVA) e glúten vital B (GVB).
V.2.2. Métodos
V.2.2.1. Preparo do glúten
Os glútens vitais foram misturados com amido de trigo nativo (Serrana Química
Industrial Ltda., Porto Alegre, Brasil) para obtenção de um blend contendo 12 g/100 g de
proteína total. A mistura de glúten em pó e amido de trigo foi realizada em batedeira elétrica
planetária modelo K45SS (KitchenAid™, Benton Harbor, Estados Unidos), a 220 rpm, por
um período de 15 minutos. Após isto, o blend foi armazenado em frascos fechados à
temperatura ambiente e ao abrigo da umidade. Esse blend foi utilizado para a realização da
avaliação viscoelástica de glúten vital, através de testes simples.
V.2.2.2. Lavagem manual do glúten
A lavagem manual do glúten foi realizada com os blends de GVA e GVB misturados
ao amido, adicionando-se água suficiente para a hidratação das proteínas e formação da rede
de glúten, de acordo com o método 38-10.02 da AACCI (2010).

135
V.2.2.3. Teores e índice de glúten
A determinação dos teores de glúten úmido (GU) e de glúten seco (GS) e do índice de
glúten (IG) de GVA e GVB foi realizada com os blends dos glútens misturados ao amido,
pelo método 38-12.02 da AACCI (2010), utilizando-se o equipamento Glutomatic (Perten,
Hägersten, Suiça).
V.2.2.4. Teste simples de extensibilidade
O teste de extensibilidade foi realizado com os blends de GVA e GVB com obtenção
do glúten úmido pelo uso do Glutomatic (método 38-12.02 da AACCI, 2010), sem as etapas
de centrifugação e secagem. Um equipamento simples, constituído de placa de madeira (15
cm x 30 cm) com marcações de 0 (zero) a 20 cm foi desenvolvida pelos autores para a
realização do teste simples de extensibilidade. O glúten úmido foi colocado sobre um prego
no topo da placa de madeira (Fig.1), com marcações para a medida da sua extensibilidade em
centímetros. A placa foi pendurada a cerca de 2 metros de altura, em um local com condições
ambiente de temperatura e umidade (UR ~85 %, T ~25 °C). O término da análise se deu
quando, ao estirar-se por seu próprio peso, o glúten ficou completamente seco (tempo ~24 h).
Esta análise foi realizada em triplicata.
V.2.2.5. Teste de expansão
O teste de expansão foi realizado pelo forneamento do glúten úmido que foi preparado
com os blends de GVA e GVB, em Glutomatic, pelo método 38-12.02 da AACCI (2010), sem
as etapas de centrifugação e secagem. Assim que foi retirado do equipamento, o glúten foi
colocado em uma forma de alumínio retangular (38 cm x 28 cm x 5 cm) e levado ao forno
elétrico de convecção modelo HPE80 (Prática Technicook-Technipan, Pouso Alegre-MG,
Brasil), a 200 °C, por 20 minutos (MARTELO, 1998). Após este período, a bola de glúten
assada foi resfriada à temperatura ambiente por aproximadamente uma hora, e então foi
realizada a medida do volume (v) pelo deslocamento de sementes de painço, e a massa (m)
em balança analítica modelo B-TEC 500 (Tecnal, Piracicaba-SP, Brasil), calculando-se o
volume específico como a razão volume/massa (v/m).
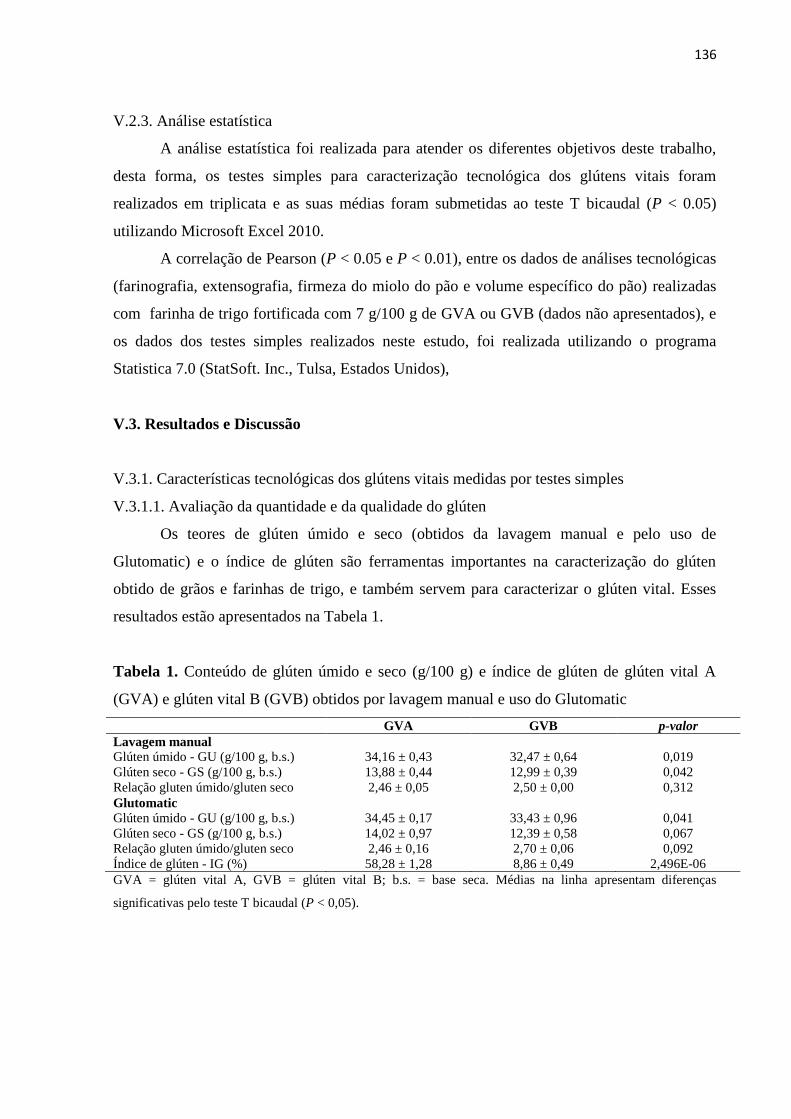
136
V.2.3. Análise estatística
A análise estatística foi realizada para atender os diferentes objetivos deste trabalho,
desta forma, os testes simples para caracterização tecnológica dos glútens vitais foram
realizados em triplicata e as suas médias foram submetidas ao teste T bicaudal (P < 0.05)
utilizando Microsoft Excel 2010.
A correlação de Pearson (P < 0.05 e P < 0.01), entre os dados de análises tecnológicas
(farinografia, extensografia, firmeza do miolo do pão e volume específico do pão) realizadas
com farinha de trigo fortificada com 7 g/100 g de GVA ou GVB (dados não apresentados), e
os dados dos testes simples realizados neste estudo, foi realizada utilizando o programa
Statistica 7.0 (StatSoft. Inc., Tulsa, Estados Unidos),
V.3. Resultados e Discussão
V.3.1. Características tecnológicas dos glútens vitais medidas por testes simples
V.3.1.1. Avaliação da quantidade e da qualidade do glúten
Os teores de glúten úmido e seco (obtidos da lavagem manual e pelo uso de
Glutomatic) e o índice de glúten são ferramentas importantes na caracterização do glúten
obtido de grãos e farinhas de trigo, e também servem para caracterizar o glúten vital. Esses
resultados estão apresentados na Tabela 1.
Tabela 1. Conteúdo de glúten úmido e seco (g/100 g) e índice de glúten de glúten vital A
(GVA) e glúten vital B (GVB) obtidos por lavagem manual e uso do Glutomatic
GVA GVB p-valor
Lavagem manual
Glúten úmido - GU (g/100 g, b.s.) 34,16 ± 0,43 32,47 ± 0,64 0,019
Glúten seco - GS (g/100 g, b.s.) 13,88 ± 0,44 12,99 ± 0,39 0,042
Relação gluten úmido/gluten seco 2,46 ± 0,05 2,50 ± 0,00 0,312
Glutomatic
Glúten úmido - GU (g/100 g, b.s.) 34,45 ± 0,17 33,43 ± 0,96 0,041
Glúten seco - GS (g/100 g, b.s.) 14,02 ± 0,97 12,39 ± 0,58 0,067
Relação gluten úmido/gluten seco 2,46 ± 0,16 2,70 ± 0,06 0,092
Índice de glúten - IG (%) 58,28 ± 1,28 8,86 ± 0,49 2,496E-06
GVA = glúten vital A, GVB = glúten vital B; b.s. = base seca. Médias na linha apresentam diferenças
significativas pelo teste T bicaudal (P < 0,05).

137
Os resultados pelos dois métodos apontaram diferenças no teor de glúten úmido (GU)
e índice de glúten (IG) para os glútens vitais avaliados. Em ambos os casos, os teores de GU
para GVA foram maiores que para GVB (p-valor < 0,05), assim como o IG (medido no
sistema Glutomatic) foi maior para GVA que para GVB. GS apresentou diferença
significativa apenas quando medido pela lavagem manual.
A capacidade de hidratação do glúten vital é relacionada principalmente à quantidade
e qualidade das suas proteínas (DAHESH et al., 2016; NG; MCKINLEY, 2008), mas fatores
físicos como a distribuição do tamanho de partícula também poderiam influenciar. Entretanto,
GVA e GVB apresentaram aparentemente o mesmo tamanho de partícula, mas a capacidade
de hidratação foi diferente entre eles, resultando em diferentes teores de glúten úmido, sendo
maior para GVA que para GVB (Tabela 1).
A quantidade e qualidade do glúten determinam a absorção de água e a
viscoelasticidade da massa, que é favorável para a retenção do dióxido de carbono durante o
processo de fermentação (CAUVAIN, 2015), contribuindo para o aumento do volume dos
pães. Portanto, quando o glúten vital é adicionado à farinha de trigo, pode contribuir para o
aumento da absorção de água, melhorando as propriedades reológicas da massa,
consequentemente, melhorando a qualidade dos produtos finais.
Quando analisamos o IG obtido no Glutomatic observamos que GVA apresentou
melhor qualidade para panificação que GVB, com uma rede mais elástica que extensível. O
IG é calculado a partir da quantidade de glúten que fica retido na peneira depois da
centrifugação do glúten úmido, sendo diretamente proporcional à sua qualidade (BARAK;
MUDGIL; KHATKAR, 2014) e à elasticidade da rede de glúten formada (OIKONOMOU et
al., 2015). O IG pode ser utilizado como um critério de classificação do glúten, podendo
diferenciar os trigos que apresentam quantidade de proteínas similares. Segundo a
classificação proposta por Oikonomou et al. (2015), GVA formou uma rede de glúten
considerada normal (quando IG = 30 até 80 %), enquanto GVB formou uma rede de glúten
considerada fraca (IG < 30 %).
V.3.1.2. Avaliação da extensibilidade por teste simples
Vários instrumentos têm sido utilizados para avaliar a capacidade de extensão da
massa e do glúten, como a extensografia, texturômetros e reômetros (ABANG ZAIDEL et al.,
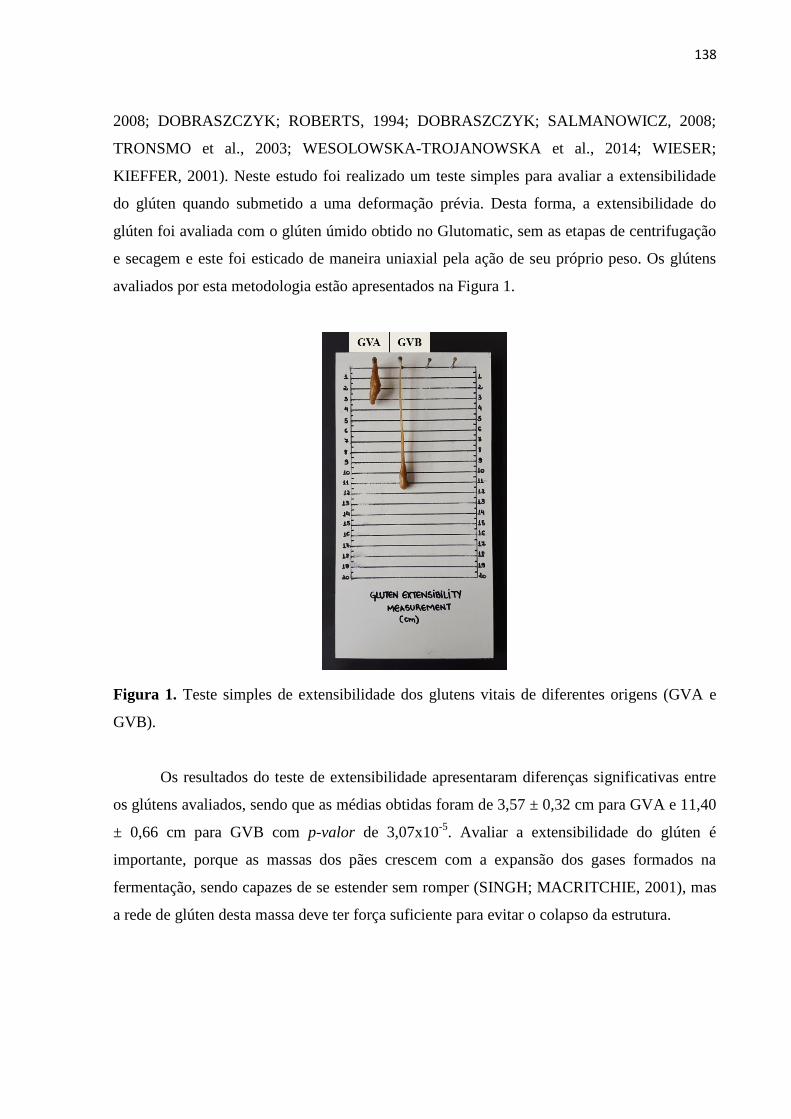
138
2008; DOBRASZCZYK; ROBERTS, 1994; DOBRASZCZYK; SALMANOWICZ, 2008;
TRONSMO et al., 2003; WESOLOWSKA-TROJANOWSKA et al., 2014; WIESER;
KIEFFER, 2001). Neste estudo foi realizado um teste simples para avaliar a extensibilidade
do glúten quando submetido a uma deformação prévia. Desta forma, a extensibilidade do
glúten foi avaliada com o glúten úmido obtido no Glutomatic, sem as etapas de centrifugação
e secagem e este foi esticado de maneira uniaxial pela ação de seu próprio peso. Os glútens
avaliados por esta metodologia estão apresentados na Figura 1.
Figura 1. Teste simples de extensibilidade dos glutens vitais de diferentes origens (GVA e
GVB).
Os resultados do teste de extensibilidade apresentaram diferenças significativas entre
os glútens avaliados, sendo que as médias obtidas foram de 3,57 ± 0,32 cm para GVA e 11,40
± 0,66 cm para GVB com p-valor de 3,07x10⁻⁵
. Avaliar a extensibilidade do glúten é
importante, porque as massas dos pães crescem com a expansão dos gases formados na
fermentação, sendo capazes de se estender sem romper (SINGH; MACRITCHIE, 2001), mas
a rede de glúten desta massa deve ter força suficiente para evitar o colapso da estrutura.
139
Segundo Abang Zaidel et al. (2008), o principal problema encontrado nos testes de
extensibilidade de glúten e massa é manter a amostra intacta sem seu rompimento até a
aquisição do resultado. Neste teste simples desenvolvido, não houve a ruptura da amostra de
glúten. Por outro lado, o tempo de análise foi maior (~24h) do que as técnicas que utilizam
instrumentos, porque dependeu das condições climáticas de temperatura e umidade relativa do
ar para a secagem completa do glúten estendido, como observado na Figura 1.
Entretanto, o método tem limitações, pois, segundo as nossas observações, se a
umidade relativa do ar estiver muito baixa (<30 %) e/ou a temperatura ambiente estiver muito
alta (>30 °C), o glúten úmido pode rapidamente perder água para o ambiente, reduzindo sua
umidade e tornando-se seco mais rápido, sem que tenha se estendido pela placa. Isso
prejudicaria o uso deste teste para avaliação da extensibilidade da rede de glúten.
Muitos fatores podem interferir na capacidade de extensão do glúten úmido, por
exemplo, o tempo e o tipo de mistura para obtenção do glúten, que influencia no
desenvolvimento da rede de glúten, a temperatura e a quantidade de água adicionada para a
hidratação de suas proteínas (ABANG ZAIDEL; CHIN; YUSOF, 2010; DOMENEK et al.,
2004). Quando o mesmo teste foi realizado com o glúten obtido pela lavagem manual, sem
controle da força aplicada, muitas vezes, a amostra não se estendeu, impossibilitando a
medida de sua extensibilidade. Desta forma, a padronização das condições de análise
(processo de formação e lavagem do glúten, temperatura e umidade relativa do teste), mesmo
que difícil nas instalações fabris pode garantir a observação de melhores resultados para
diferenciar glútens vitais comerciais.
Pelos resultados observados, GVA apresentou menor extensibilidade que GVB,
portanto, rede de glúten mais elástica, ratificando os resultados já encontrados em trabalhos
anteriores para estes mesmos glútens vitais (ORTOLAN et al., 2017), pois GVA apresentou
melhor balanço entre gliadinas e gluteninas que GVB (dados não apresentados). O teste de
extensibilidade em placa é muito simples, mas fornece uma resposta importante em relação à
qualidade do glúten vital utilizado. Um glúten mais extensível está relacionado a uma rede de
glúten com características mais fracas, isto é, que rapidamente é formada, mas não apresenta
boa estabilidade frente ao trabalho mecânico a que é submetida na etapa de mistura,
apresentando também baixa resistência à extensão nas etapas posteriores de descanso,
fermentação e forneamento (MELNYK et al., 2012).
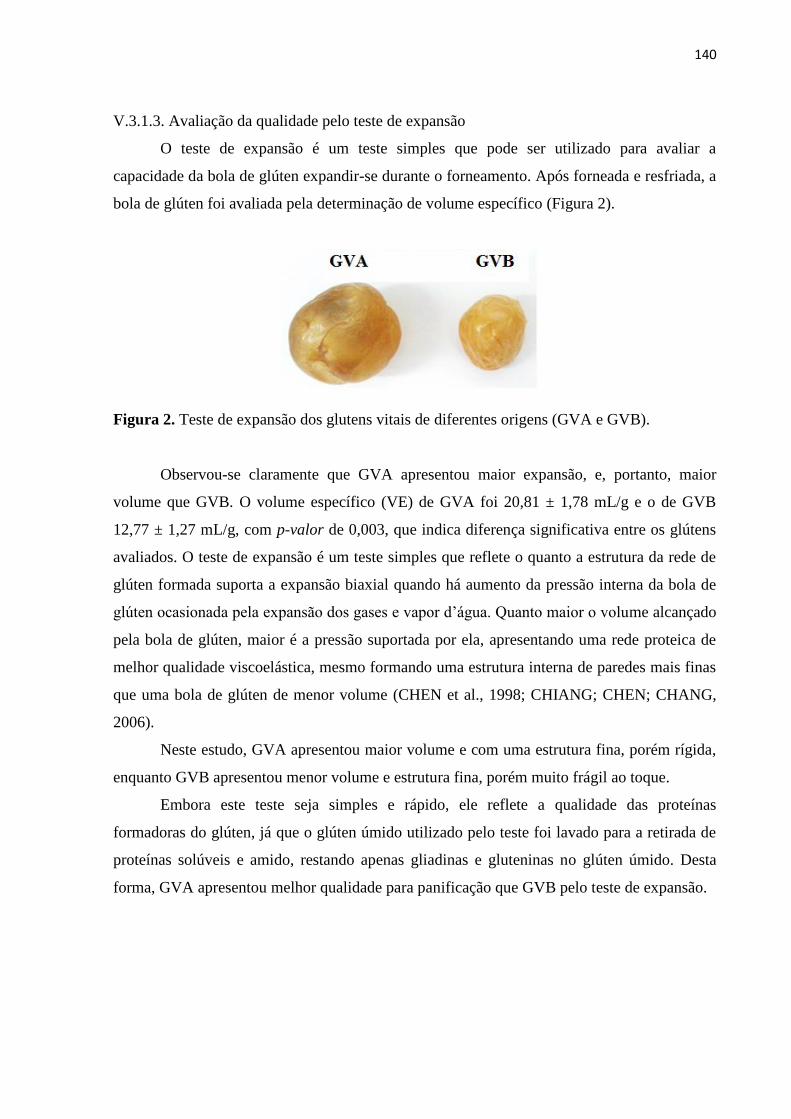
140
V.3.1.3. Avaliação da qualidade pelo teste de expansão
O teste de expansão é um teste simples que pode ser utilizado para avaliar a
capacidade da bola de glúten expandir-se durante o forneamento. Após forneada e resfriada, a
bola de glúten foi avaliada pela determinação de volume específico (Figura 2).
Figura 2. Teste de expansão dos glutens vitais de diferentes origens (GVA e GVB).
Observou-se claramente que GVA apresentou maior expansão, e, portanto, maior
volume que GVB. O volume específico (VE) de GVA foi 20,81 ± 1,78 mL/g e o de GVB
12,77 ± 1,27 mL/g, com p-valor de 0,003, que indica diferença significativa entre os glútens
avaliados. O teste de expansão é um teste simples que reflete o quanto a estrutura da rede de
glúten formada suporta a expansão biaxial quando há aumento da pressão interna da bola de
glúten ocasionada pela expansão dos gases e vapor d’água. Quanto maior o volume alcançado
pela bola de glúten, maior é a pressão suportada por ela, apresentando uma rede proteica de
melhor qualidade viscoelástica, mesmo formando uma estrutura interna de paredes mais finas
que uma bola de glúten de menor volume (CHEN et al., 1998; CHIANG; CHEN; CHANG,
2006).
Neste estudo, GVA apresentou maior volume e com uma estrutura fina, porém rígida,
enquanto GVB apresentou menor volume e estrutura fina, porém muito frágil ao toque.
Embora este teste seja simples e rápido, ele reflete a qualidade das proteínas
formadoras do glúten, já que o glúten úmido utilizado pelo teste foi lavado para a retirada de
proteínas solúveis e amido, restando apenas gliadinas e gluteninas no glúten úmido. Desta
forma, GVA apresentou melhor qualidade para panificação que GVB pelo teste de expansão.

141
V.3.2. Correlação entre os testes simples e parâmetros tecnológicos dos glútens vitais
Para verificar se os testes simples predizem o comportamento dos glútens vitais no
processo de panificação, alguns parâmetros considerados importantes para avaliar a qualidade
da massa no processo de mistura e no descanso da massa e dos pães produzidos com farinha
de trigo fortificada com GVA e GVB (7 g/100 g), foi realizada análise de correlação Pearson
(Tabela 2). Os parâmetros de qualidade de massas e pães utilizados para a análise de
correlação foram medidos em trabalhos anteriores (ORTOLAN et al., 2017; Artigo IV), que
utilizaram as mesmas amostras de glúten (GVA e GVB) e os mesmos níveis de fortificação da
farinha de trigo controle (5 e 7 g/100 g).
Pela Tabela 2, foi possível verificar as correlações existentes entre os testes simples de
avaliação da qualidade do glúten vital, e as análises reológicas das massas e dos pães obtidos
da farinha de trigo fortificada com 7 g/100 g de GVA ou GVB. O volume específico da bola
de glúten (VE-GV) não apresentou nenhuma correlação significativa com os parâmetros
reológicos das massas e com os parâmetros de qualidade dos pães.
Um fato interessante observado neste estudo foi que nenhuma das respostas
viscoelásticas dos glútens (GVA e GVB), medidas pelos testes simples, influenciou os
parâmetros reológicos da massa obtidos pela extensografia. Isso ocorreu, possivelmente, pelas
interações entre as proteínas dos glútens vitais e da farinha de trigo que foi suplementada com
GVA e GVB, especialmente, devido ao grande tempo de descanso dado à massa durante a
análise (135 min). O período de descanso de 135 min foi suficiente para ocorrer a interação
entre as proteínas do glúten e da farinha e a estabilização da estrutura da matriz proteica
formada, resultando em parâmetros extensográficos semelhantes entre a farinha suplementada
com GVA e com GVB (dados não apresentados).
O índice de glúten do glúten vital (IG-GV) apresentou relação direta com TD (r =
0,98), indicando que glútens vitais elásticos adicionados à farinha de trigo formam massas que
requerem maior tempo para o desenvolvimento completo da sua rede de glúten, e com maior
estabilidade (EST) (r = 0,99) na etapa de mistura do processo de panificação, reduzindo seu
enfraquecimento quando exposto ao “overmixing” (ITM, r = -0,93). Além disso, a adição de
glúten elástico foi capaz de produzir pães com miolo com menor firmeza durante a sua vida
de prateleira, como observado pelos coeficientes de correlação positivos entre IG e firmeza do
miolo dos pães nos dias 1, 4 e 9 de armazenamento. Em trabalho anterior (dados não
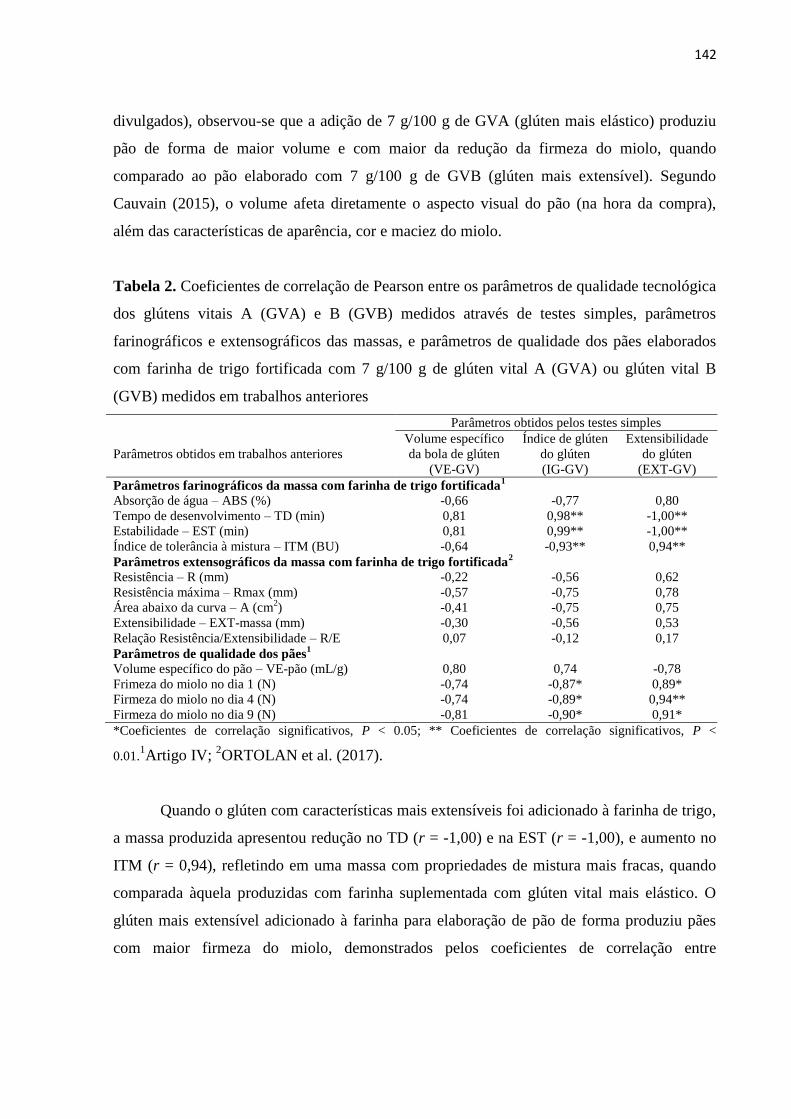
142
divulgados), observou-se que a adição de 7 g/100 g de GVA (glúten mais elástico) produziu
pão de forma de maior volume e com maior da redução da firmeza do miolo, quando
comparado ao pão elaborado com 7 g/100 g de GVB (glúten mais extensível). Segundo
Cauvain (2015), o volume afeta diretamente o aspecto visual do pão (na hora da compra),
além das características de aparência, cor e maciez do miolo.
Tabela 2. Coeficientes de correlação de Pearson entre os parâmetros de qualidade tecnológica
dos glútens vitais A (GVA) e B (GVB) medidos através de testes simples, parâmetros
farinográficos e extensográficos das massas, e parâmetros de qualidade dos pães elaborados
com farinha de trigo fortificada com 7 g/100 g de glúten vital A (GVA) ou glúten vital B
(GVB) medidos em trabalhos anteriores
Parâmetros obtidos pelos testes simples
Parâmetros obtidos em trabalhos anteriores
Volume específico
da bola de glúten
(VE-GV)
Índice de glúten
do glúten
(IG-GV)
Extensibilidade
do glúten
(EXT-GV)
Parâmetros farinográficos da massa com farinha de trigo fortificada1
Absorção de água – ABS (%) -0,66 -0,77 0,80
Tempo de desenvolvimento – TD (min) 0,81 0,98** -1,00**
Estabilidade – EST (min) 0,81 0,99** -1,00**
Índice de tolerância à mistura – ITM (BU) -0,64 -0,93** 0,94**
Parâmetros extensográficos da massa com farinha de trigo fortificada2
Resistência – R (mm) -0,22 -0,56 0,62
Resistência máxima – Rmax (mm) -0,57 -0,75 0,78
Área abaixo da curva – A (cm2) -0,41 -0,75 0,75
Extensibilidade – EXT-massa (mm) -0,30 -0,56 0,53
Relação Resistência/Extensibilidade – R/E 0,07 -0,12 0,17
Parâmetros de qualidade dos pães1
Volume específico do pão – VE-pão (mL/g) 0,80 0,74 -0,78
Frimeza do miolo no dia 1 (N) -0,74 -0,87* 0,89*
Firmeza do miolo no dia 4 (N) -0,74 -0,89* 0,94**
Firmeza do miolo no dia 9 (N) -0,81 -0,90* 0,91*
*Coeficientes de correlação significativos, P < 0.05; ** Coeficientes de correlação significativos, P <
0.01.1Artigo IV;
2ORTOLAN et al. (2017).
Quando o glúten com características mais extensíveis foi adicionado à farinha de trigo,
a massa produzida apresentou redução no TD (r = -1,00) e na EST (r = -1,00), e aumento no
ITM (r = 0,94), refletindo em uma massa com propriedades de mistura mais fracas, quando
comparada àquela produzidas com farinha suplementada com glúten vital mais elástico. O
glúten mais extensível adicionado à farinha para elaboração de pão de forma produziu pães
com maior firmeza do miolo, demonstrados pelos coeficientes de correlação entre
143
extensibilidade do glúten úmido e firmeza do miolo nos diferentes dias de armazenamento dos
pães.
Os testes simples podem ser boas alternativas para avaliação da qualidade de glúten
vital comercial, apresentando correlação com importantes parâmetros tecnológicos de farinhas
de trigo e pães. Desta forma, esses testes podem suprir algumas análises reológicas que
demandam muito tempo, equipamentos específicos, pessoal treinado, e custos elevados, etc.
Os testes simples favorecem a obtenção de resultados rápidos e com baixo custo, e de fácil
interpretação, permitindo que as indústrias de panificação e moinhos estabeleçam a qualidade
de glútens vitais comerciais, já que eles não recebem informações completas sobre a
qualidade deste produto.
V.4. Conclusões
Os testes simples mostraram diferenças entre os glútens vitais comerciais analisados,
onde GVA apresentou rede de glúten com maior elasticidade, e maior volume específico da
sua bola de glúten, enquanto GVB formou rede de glúten mais extensível, e com menor
volume específico para a sua bola de glúten. O índice de glúten mostrou relação direta com os
parâmetros de mistura da massa (tempo de desenvolvimento e estabilidade), e inversa com o
índice de tolerância à mistura e com a firmeza dos pães. Por outro lado, a extensibilidade
apresentou relações opostas àquelas obtidas para o índice de glúten, indicando que a adição de
glúten mais elástico foi capaz de formar massas com melhores propriedades de mistura, e com
menor possibilidade de enfraquecimento da sua rede de glúten, além de produzir pães com
menor firmeza durante o armazenamento. O teste de expansão da bola de glúten foi o mais
rápido para execução, porém não foi eficiente para predizer o comportamento viscoelástico de
glútens vitais, em contrapartida, o índice de glúten e o teste de extensibilidade se mostraram
eficientes para esta avaliação, mesmo sendo análises que exigem a utilização de um
equipamento específico (Glutomatic), no caso da medida do índice de glúten, ou condições
ambientais específicas (T ~25 °C/UR ~85 %), no caso do teste de extensibilidade. Os
resultados obtidos pelos testes simples podem auxiliar na adequação do tipo de glúten vital
utilizado para a fortificação de farinha de trigo, a fim de alcançar a melhor qualidade do
144
produto final; além de ser uma alternativa de baixo custo para as indústrias de panificação e
moinhos.
Agradecimentos
Este trabalho foi apoiado pelo Conselho Nacional de Desenvolvimento Científico e
Tecnológico (concessões números 163129/2013-4 e 123530/2015-6) através de bolsas aos
autores Fernanda e Karoline, respectivamente. Os autores gostariam de agradecer a
Labonathus® (São Paulo, SP) e a Granotec® (Curitiba, PR, Brasil) pela doação de glúten
vital de trigo.
Referências
AACCI. American Association of Cereal Chemists International. Approved methods, 11th
ed., St. Paul, AACCI, 2010.
ABANG ZAIDEL, D. N. et al. Rheological characterisation of gluten from extensibility
measurement. Journal of Food Engineering, v. 86, n. 4, p. 549–556, jun. 2008.
ABANG ZAIDEL, D. N.; CHIN, N. L.; YUSOF, Y. A. A review on rheological properties
and measurements of dough and gluten. Journal of Applied Sciences, v. 10, n. 20, p. 2478–
2490, 2010.
BARAK, S.; MUDGIL, D.; KHATKAR, B. S. Relationship of gliadin and glutenin proteins
with dough rheology, flour pasting and bread making performance of wheat varieties. LWT -
Food Science and Technology, v. 51, n. 1, p. 211–217, abr. 2013.
BARAK, S.; MUDGIL, D.; KHATKAR, B. S. Influence of Gliadin and Glutenin Fractions on
Rheological, Pasting, and Textural Properties of Dough. International Journal of Food
Properties, v. 17, n. January 2015, p. 1428–1438, 2014.
CAUVAIN, S. Technology of breadmaking. Third edit ed. New York: Springer, 2015.
CHANDI, G. K.; SEETHARAMAN, K. Optimization of Gluten Peak Tester: a Statistical
Approach. Journal of Food Quality, v. 35, n. 1, p. 69–75, 20 fev. 2012.
CHEN, C. et al. Optimising the Frying Temperature of Gluten Balls using Response Surface
Methodology. Science, v. 64, n. Thompson 1982, p. 64–70, 1998.
CHIANG, S. H.; CHEN, C. S.; CHANG, C. Y. Effect of wheat flour protein compositions on
the quality of deep-fried gluten balls. Food Chemistry, v. 97, n. 4, p. 666–673, 2006.

145
CODINA, G. G. et al. Mixolab versus alveograph and falling number. Czech Journal Food
Science, v. 28, n. 3, p. 185–191, 2010.
CZUCHAJOWSKA, Z.; PASZCZYNSKA, B. Is Wet Gluten Good for Baking ? Cereal
Chemistry, v. 73, n. 4, p. 483–489, 1996.
DAHESH, M. et al. Spontaneous gelation of wheat gluten proteins in a food grade solvent.
Food Hydrocolloids, v. 52, p. 1–10, 2016.
DAY, L. et al. Wheat-gluten uses and industry needs. Trends in Food Science &
Technology, v. 17, n. 2, p. 82–90, fev. 2006.
DELCOUR, J. A et al. Wheat gluten functionality as a quality determinant in cereal-based
food products. Annual review of food science and technology, v. 3, p. 469–92, jan. 2012.
DOBRASZCZYK, B. .; MORGENSTERN, M. . Rheology and the breadmaking process.
Journal of Cereal Science, v. 38, n. 3, p. 229–245, nov. 2003.
DOBRASZCZYK, B. J.; ROBERTS, C. A. Strain hardening and dough gas cell-wall failure
in biaxial extension. Journal of Cereal Science, v. 20, p. 265–274, 1994.
DOBRASZCZYK, B. J.; SALMANOWICZ, B. P. Comparison of predictions of baking
volume using large deformation rheological properties. Journal of Cereal Science, v. 47, n.
2, p. 292–301, mar. 2008.
DOMENEK, S. et al. Swelling behavior and structural characteristics of wheat gluten
polypeptide films. Biomacromolecules, v. 5, n. 3, p. 1002–8, 2004.
DUA, S. et al. Effect of Extraction Methods and Wheat Cultivars on Gluten Functionality.
The Open Food Science Journal, v. 3, n. 1, p. 84–92, 23 out. 2009.
GUERRIERI, N.; CERLETTI, P. Effect of High-Temperature Short-Time Treatment of
Wheat Flour on Gluten Vitality and Structure. Cereal Chemistry, v. 73, n. 3, p. 6–9, 1996.
KAUR, A. et al. Diversity in grain, flour, dough and gluten properties amongst Indian wheat
cultivars varying in high molecular weight subunits (HMW-GS). Food Research
International, v. 53, n. 1, p. 63–72, ago. 2013.
KHATKAR, B. S. et al. Functional Properties of Wheat Gliadins . II . Effects on Dynamic
Rheological Properties of Wheat Gluten. Journal of Cereal Science, v. 35, p. 307–313, 2002.
KHATKAR, B. S.; BARAK, S.; MUDGIL, D. Effects of gliadin addition on the rheological,
microscopic and thermal characteristics of wheat gluten. International journal of biological
macromolecules, v. 53, p. 38–41, mar. 2013.
146
MAJZOOBI, M.; ABEDI, E. Effects of pH changes on functional properties of native and
acetylated wheat gluten. International Food Research Journal, v. 21, n. 3, p. 1219–1224,
2014.
MARCHETTI, L. et al. Effect of glutens of different quality on dough characteristics and
breadmaking performance. LWT - Food Science and Technology, v. 46, n. 1, p. 224–231,
abr. 2012.
MARTELO, E. Panificação: básico para padeiro. Serviço Nacional de Aprendizagem
Industrial. SENAI: Porto Alegre. 95p., 1998.
MELNYK, J. P. et al. Using the Gluten Peak Tester as a tool to measure physical properties
of gluten. Journal of Cereal Science, v. 56, n. 3, p. 561–567, nov. 2012.
NG, T. S. K.; MCKINLEY, G. H. Power law gels at finite strains: The nonlinear rheology of
gluten gels. Journal of Rheology, v. 52, n. 2, p. 417–449, 2008.
OIKONOMOU, N. A. et al. Gluten Index for Wheat Products : Main Variables in Affecting
the Value and Nonlinear Regression Model Gluten Index for Wheat Products : Main
Variables in Affecting the Value and Nonlinear Regression Model. International Journal of
Food Properties, v. 18, n. September, p. 1–11, 2015.
ORTOLAN, F. et al. Correlations between vital wheat gluten protein fractions, gluten
index and specific volume obtained from a gluten expansion test. AACC International
Annual Meeting. Anais...Providence, Rhode Island, USA: 2014 Annual Meeting Abastract,
2014. Disponível em: http://doi.wiley.com/10.1111/hae.12083
ORTOLAN, F. et al. Rheological properties of vital wheat glutens with water or sodium
chloride. LWT - Food Science and Technology, v.79, p. 647-654.
SINGH, H.; MACRITCHIE, F. Application of Polymer Science to Properties of Gluten.
Journal of Cereal Science, v. 33, p. 231–243, 2001.
SONG, Y.; ZHENG, Q. Dynamic rheological properties of wheat flour dough and proteins.
Trends in Food Science & Technology, v. 18, n. 3, p. 132–138, mar. 2007.
TEDRUS, G. D. A. S. et al. Estudo da adição de vital glúten à farinha de arroz, farinha de
aveia e amido de trigo na qualidade de pães 1. Ciência e Tecnologia de Alimentos, v. 21, n.
1, p. 20–25, 2001.
TRONSMO, K. M. et al. Relationships between gluten rheological properties and hearth loaf
characteristics. Cereal Chemistry, v. 80, n. 5, p. 575–586, 2003.
147
UTHAYAKUMARAN, S. et al. Effects of gliadin fractions on functional properties of wheat
dough depending on molecular size and hydrophobicity. Cereal Chemistry, v. 78, n. 2, p.
138–141, 2001.
WADHAWAN, C. K.; BUSHUK, W. Studies on vitality of commercial gluten. I. Physical,
chemical and technological characteristics. Cereal Chemistry, v. 66, n. 6, p. 456–461, 1989.
WANG, P.; JIN, Z.; XU, X. Physicochemical alterations of wheat gluten proteins upon dough
formation and frozen storage – A review from gluten, glutenin and gliadin perspectives.
Trends in Food Science & Technology, v. 46, n. 2, Part A, p. 189–198, 2015.
WEEGELS, P. L. et al. Effects on gluten of heating at different moiture contents. I. Changes
in funcional properties. Journal of Cereal Science, v. 19, p. 31–38, 1994.
WESOLOWSKA-TROJANOWSKA, M. et al. Rheological properties of gluten obtained
from polish wheat cultivars. Bulgarian Journal of Agricultural Science, v. 20, n. 5, p.
1221–1226, 2014.
WIESER, H.; KIEFFER, R. Correlations of the Amount of Gluten Protein Types to the
Technological Properties of Wheat Flours Determined on a Micro-scale. Journal of Cereal
Science, v. 34, p. 19–27, 2001.

148
3. DISCUSSÃO GERAL
3.1. Características químicas e estruturais dos glútens vitais
As características químicas e aminoacídicas dos glútens vitais comerciais (GV) e
do glúten não vital (GNV) foram similares, especialmente, no teor de proteínas, que foi de 80
% em base seca, e no teor de umidade, que foi inferior a 10 %. Essas são geralmente as
informações fornecidas pelos produtores de glúten vital, e que são utilizadas para a
classificação do produto como “concentrado proteico” (BRASIL, 2005), porém não refletem a
sua qualidade. Usualmente, os testes para determinação do teor de proteína são testes
destrutivos, isto é, que não preservam a estrutura da proteína, por isso, estes testes não são
capazes de fornecer informações sobre o tipo e a estrutura das proteínas que constituem o GV,
dificultando a definição da sua aplicação na panificação.
O fracionamento sequencial de proteínas foi desenvolvido por Osborne (1907) e
representa grande importância na avaliação dos tipos e quantidades relativas de proteínas que
constituem as frações do GV. Muitos desafios estão presentes nesta técnica, pois a agregação
das proteínas, em especial, gliadinas e gluteninas, dificulta a sua separação. Isso pode levar à
contaminação das diferentes frações, ou ainda aumentar a insolubilidade dessas proteínas nos
solventes, podendo ser erroneamente quantificadas como resíduos. No fracionamento, o
fenômeno de agregação das proteínas do GV pode ocorrer pelo uso de diferentes solventes, e
também devido à desnaturação mecânica e/ou térmica a que essas proteínas são submetidas
durante o processo de obtenção do glúten vital.
Segundo Fu; Sapirstein; Bushuk (1996), a utilização de NaCl na primeira etapa do
fracionamento possibilita a agregação entre gliadinas e gluteninas, interferindo na
solubilidade dessas proteínas nos demais solventes. Por outro lado, a mistura da farinha e
água para obtenção da massa, que leva à desnaturação mecânica do glúten
(DOBRASZCZYK, 2004) e a secagem, que leva à desnaturação térmica do glúten
(JEANJEAN; DAMIDAUX; FEILLET, 1980; LAGRAIN et al., 2008; MICARD;
GUILBERT, 2000; SCHOFIELD et al., 1983; SINGH; MACRITCHIE, 2004;
STATHOPOULOS et al., 2008; TATHAM; DRAKE; SHEWRY, 1985; WEEGELS et al.,
1994) resultam em modificações estruturais de suas proteínas.
149
A desnaturação mecânica promove modificações estruturais pela exposição dos
resíduos de aminoácidos apolares, que antes estavam localizados em uma região central da
molécula de proteína, para a sua superfície, ficando em contato com o ar introduzido com a
agitação. Enquanto isso, os aminoácidos polares ficam expostos à fase aquosa, criando uma
interface ar-líquido (CAUVAIN, 2015; DAMODARAN; PARKIN; FENNEMA 2010). À
medida que a energia nessas interfaces aumenta, novas orientações moleculares podem levar a
alterações estruturais, resultando em agregados proteicos insolúveis.
O tratamento térmico pode levar a uma nova conformação molecular, podendo
modificar a quantidade de ligações de hidrogênio e interações eletrostáticas entre as cadeias
de proteínas. Por outro lado, as interações hidrofóbicas, que são exotérmicas até
aproximadamente 70 °C (DAMODARAN; PARKIN; FENNEMA 2010), podem se
estabilizar, levando à formação de agregados proteicos insolúveis, mesmo na presença de
agente redutor, a exemplo do β-mercaptoetanol.
Os resultados encontrados para o fracionamento das proteínas mostrou que GVA
apresentou quantidades relativas de proteínas nas frações de albuminas/globulinas e de
gluteninas semelhantes a GVB, e maior quantidade de proteínas na fração de gliadinas que
GVB. Possivelmente, isso ocorreu pela agregação das gliadinas e gluteninas de GVB que
dificultou sua separação. A possível alteração da estrutura pelo tratamento térmico das
proteínas de GVB foi comprovada pela comparação com glúten não vital (GNV). O GNV
apresentou maior quantidade de proteínas na fração de gluteninas que GVA e GVB, refletindo
a agregação de gliadinas e gluteninas, pelo efeito da temperatura, resultando na maior
quantidade de proteínas na fração de glutenina, por se tratar de agregados solúveis em
condições redutoras.
Além disso, os resultados do fracionamento revelaram que GVA apresentou
melhor balanço entre gliadinas e gluteninas extraíveis, devido às quantidades relativas de
proteínas semelhantes entre suas frações, sendo considerado o principal fator para a qualidade
viscoelástica da rede de glúten. Segundo Dahesh et al. (2016); Khatkar; Barak; Mudgil
(2013); Khatkar; Bell; Schofield (1995); Lookhart et al. (1993), tanto as gliadinas, quanto as
gluteninas, interferem na qualidade viscoelástica da rede de glúten, por isso, quando há um
equilíbrio nas quantidades dessas proteínas, a rede de glúten apresenta melhor qualidade, com
equilíbrio entre as propriedades de extensibilidade e elasticidade (BEKES; GIANIBELLI;

150
WRIGLEY, 2004; DELCOUR et al., 2012; WANG; JIN; XU, 2015), refletindo em melhor
qualidade dos produtos de panificação, a exemplo dos pães de forma.
Não apenas o fracionamento sequencial foi utilizado para avaliar as frações
proteicas existentes no GV, mas também as análises qualitativas de eletroforese em gel de
poliacrilamida na presença de dodecil sulfato de sódio (sodium dodecyl sulfate-
polyacrylamide gel electrophoresis – SDS-PAGE) em condições redutoras (pelo uso de β-
mercaptoetanol) e não redutoras (sem β-mercaptoetanol) e cromatografia líquida de alta
eficiência de exclusão molecular (size exclusion high-performance liquid chromatography –
SEC-HPLC) foram utilizadas para observar a massa molecular aparente das proteínas do GV.
Os resultados dessas análises confirmaram a existência de proteínas de diferentes massas
moleculares que constituem as frações de albuminas/globulinas, gliadinas e gluteninas de
GVA, GVB e GNV; além de agregados proteicos insolúveis, mesmo em condições redutoras
e não redutoras na análise de eletroforese, em especial para GVB e GNV. Provavelmente,
esses agregados se formaram nessas amostras pela exposição de suas proteínas à alta
temperatura.
As interações entre proteínas podem ser avaliadas através da solubilização dos
agregados proteicos em solventes específicos (SCHMIELE, 2014). As interações proteicas do
glúten envolvem as interações químicas covalentes, principalmente as ligações dissulfeto e
em menor grau as ligações cruzadas de tirosina, e as interações químicas não covalentes
(interações hidrofóbicas, ligações de hidrogênio, interações eletrostáticas, entre outras). Os
tipos de interações proteicas que ocorrem nos glútens vitais podem influenciar no mecanismo
de formação da rede de glúten, refletindo em diferentes comportamentos viscoelásticos na
panificação.
Os resultados da avaliação das interações proteicas deste trabalho mostraram
evidências de que as interações hidrofóbicas e as ligações de hidrogênio são fundamentais
para a estabilização dos agregados proteicos, tanto para GVA quanto para GVB. As ligações
SS, embora em pequenas quantidades, também têm papel importante na formação dos
agregados, principalmente, por participarem do mecanismo de intercâmbio entre SH/SS. Já, o
GNV, apresentou baixa solubilidade em todos os sistemas utilizados para avaliação das
interações químicas, provavelmente porque o tratamento térmico provocou alterações
estruturais que impossibilitaram a solubilização de seus agregados nos solventes utilizados.
151
As interações SS, geralmente, ocorrem em menor quantidade que as interações
não covalentes, mesmo assim são relevantes na estabilização de agregados e na formação da
rede (HUEQNER et al., 1977; WALL, 1971), e isso foi observado para GVA e GVB. A
pequena quantidade de SH livre encontrada nos GV e no GNV foi também confirmada pela
técnica de espectroscopia no infravermelho por transformada de Fourier (Fourier transform
infrared spectroscopy – FTIR). Pelo FTIR, foi possível verificar a presença das estruturas
secundárias das proteínas presentes nos GV e no GNV, e confirmou-se a pequena quantidade
de grupos SH livres, pela presença da banda de cistina em detrimento da banda de SH livre
(banda em 2560 cm-1
), indicando que a cisteína foi oxidada à cistina por meio de ligações SS.
As estruturas secundárias encontradas foram α-hélice (1648-1657 cm-1
), β-folha (1623-1641
cm-1
e 1674-1695 cm-1
), β-volta (1662-1686 cm-1
), e estruturas desordenadas (1642-1657 cm-
1) (TATTINI JR; PARRA; PITOMBO, 2006; WANG; GUO; ZHU, 2016).
Muito embora tenham sido observadas pequenas diferenças químicas entre GVA e
GVB, a microscopia eletrônica de varredura revelou que ambos os GV formaram rede de
glúten uniforme e contínua com estruturas semelhantes, podendo ser utilizados na
panificação. Porém, os tipos de interações moleculares que ocorrem entre as gliadinas e
gluteninas de GVA ou GVB podem levar a diferenças nas propriedades viscoelásticas de suas
redes quando hidratados e submetidos ao trabalho mecânico. Desta forma, os testes reológicos
fundamentais e empíricos podem ser boas ferramentas para melhor entender as diferenças
entre os glútens vitais comerciais.
3.2. Reologia fundamental x reologia empírica
A formação da rede de glúten é crucial para muitos produtos da indústria de
panificação, de um modo especial para os pães (LAGRAIN et al., 2008). As características
deste produto, como volume do pão e maciez, são impactadas pela formação de uma rede
viscoelástica contínua. Portanto, as características viscoelásticas do glúten são decisivas para
garantir a qualidade do produto final. Com isso, o glúten vital (GV) se torna um ingrediente
de destaque na indústria de panificação.
A suplementação da farinha de trigo com glúten vital tende a melhorar as
propriedades viscoelásticas da massa, mas estas dependem de fatores como o tipo de proteína
152
que constitui o GV, como se dá a interação destas proteínas com as proteínas da farinha de
trigo, o tipo de processo para obtenção da massa, e os ingredientes utilizados no
processamento dos pães (MARCHETTI et al., 2012). Como anteriormente discutido, as
propriedades viscoelásticas da rede de glúten dependem mais do equilíbrio na relação entre
gliadinas e gluteninas (BEKES; GIANIBELLI; WRIGLEY, 2004; DELCOUR et al., 2012;
WANG; JIN; XU, 2015), presentes tanto no GV como na farinha de trigo, do que de seus
teores isolados. Isto, porque a rede de glúten formada na massa deve apresentar resistência
frente ao trabalho mecânico e à extensão, mas também deve conseguir se estender sem romper
diante da pressão exercida pelos gases formados na etapa de fermentação de pães e nas etapas
iniciais do seu forneamento.
O módulo de energia de armazenamento (G’) medido pelos testes reológicos
fundamentais contribuiu com a avaliação das propriedades viscoelásticas da rede formada no
Glutomatic (glúten úmido) a partir dos glútens vitais reconstituídos com amido de trigo (12%
proteína) e das farinhas fortificadas com 5 e 7 g/100 g de GVA ou GVB, submetendo-as a
diferentes taxas de deformação e variações de frequência e temperatura. Estas análises foram
realizadas com água e com solução salina (2 g/ 100 mL de NaCl), para observar o
comportamento da rede de glúten formada por GVA ou GVB sem e com a interferência do
sal, que é comumente utilizado na indústria de panificação.
Através da varredura de deformação (taxa de deformação de 0,1 a 10 %) foi
possível definir a zona linear para todas as amostras. Verificou-se também que GVA
apresentou maior G’ que GVB, indicando que a rede proteica formada por ele no glúten
úmido e na massa, foi mais elástica que GVB, tanto na presença quanto na ausência de sal.
Um fato interessante foi que os glútens úmidos preparados apenas com água apresentaram
maior G’ que aquelas preparadas com sal. O mesmo comportamento em relação ao módulo de
elasticidade (G’) entre água e sal foi observado para as varreduras de frequência e
temperatura.
Pela varredura de frequência foi observado que a rede de glúten, no glúten úmido,
apresentou G’ dependente da frequência, onde G’ aumentou com o aumento da frequência,
resultando em redução da mobilidade das cadeias de proteínas dentro da rede de glúten
formada. Além disso, os glútens úmidos de GVA e GVB (obtidos a partir de farinha
reconstituída ou de farinha fortificada) também demonstraram que a rede de glúten de todas
153
as amostras exibiu dependência da lei de potência na frequência, que é característica das redes
poliméricas no ponto de gel (NG; MCKINLEY, 2008; NG; MCKINLEY; EWOLDT, 2011;
TANNER; QI; DAI, 2008; UTHAYAKUMARAN et al., 2014). Novamente, GVA mostrou
maior G’ que GVB, tanto na avaliação do glúten úmido obtido de farinhas reconstituídas,
como de farinhas fortificadas.
Na varredura de temperatura, foram observadas em quais temperaturas ocorrem
alterações na estrutura das proteínas que constituem os GV. A mesma tendência foi
encontrada para GVA e GVB; GVA mostrou maior G’ que GVB para os glútens úmidos, e as
alterações estruturais ocorreram em dois estágios diferentes: o primeiro em temperatura
próxima a 35 °C, que se estendeu até aproximadamente 60 °C, indicando que parte das
proteínas que constituem o GV apresenta alteração estrutural dentro desta faixa pelo aumento
da porção viscosa (G”) em detrimento da porção elástica (G’) da rede; e o segundo em
temperatura próxima a 80 °C, onde ocorreu alteração estrutural mais pronunciada, observada
pelo aumento do módulo de elasticidade da rede de glúten. Estes resultados estão de acordo
com a literatura (LEON; ROSELL; BENEDITO DE BARBER, 2003), que apresenta
temperaturas de desnaturação para gliadinas de 58 °C e para gluteninas de 80 °C.
Nos testes fundamentais, GVA apresentou maior G’ que GVB, assim como as
amostras preparadas com água apresentaram maior G’ que as amostras preparadas com sal.
Por outro lado, quando as farinhas de trigo fortificadas com 5 e 7 g/100 g de GVA ou GVB
foram submetidas ao teste de extensografia usando água ou sal (2 g/100 mL de NaCl), foram
verificados resultados opostos aos testes reológicos fundamentais.
Utilizando a extensografia, como teste reológico empírico, observou-se que as
massas elaboradas com a adição de sal apresentaram melhores características de resistência à
extensão que aquelas preparadas com água. O sal (2 g/100 mL de NaCl) atuou como agente
reforçador da rede de glúten, reduzindo a repulsão eletrostática existente entre as cadeias
proteicas, fortalecendo a rede pelo alinhamento e aproximação das cadeias de gliadinas e
gluteninas (ANGIOLONI; DALLA ROSA, 2005; FU; SAPIRSTEIN; BUSHUK, 1996;
SIMSEK; MARTINEZ, 2015), possibilitando que novas interações químicas ocorram entre
elas.
Os resultados opostos encontrados entre os testes reológicos fundamentais e
empíricos ocorreram, possivelmente, pelas diferenças no preparo das amostras (o Glutomatic
154
foi usado para preparar o glúten úmido para ser avaliado no reômetro, tanto a partir de farinha
reconstituída, como de farinha fortificada, enquanto o farinógrafo foi utilizado para preparar a
massa para ser avaliada no extensógrafo), e pelo tipo e magnitude das forças aplicadas sobre
as amostras nos diferentes testes reológicos. Em testes reológicos empíricos, ocorrem
predominantemente forças de tração (DOBRASZCZYK, 2004), a exemplo da extensão da
massa que ocorre durante a medida de resistência e resistência máxima na extensografia
(UTHAYAKUMARAN et al., 2014); nos testes reológicos fundamentais, há predominância
das forças de cisalhamento (VAN DER ZALM; VAN DER GOOT; BOOM, 2011), podendo
perceber-se que a rede de glúten, quando elaborada com sal, respondeu melhor às forças de
tração do que às forças de cisalhamento. Já as diferenças observadas entre os glútens
avaliados por testes reológicos fundamentais e empírico estão relacionadas, provavelmente, à
constituição de suas proteínas.
Quando observado o efeito da adição de GV à farinha de trigo na extensografia,
percebeu-se melhoria das características viscoelásticas da massa para a produção de pães, com
aumento da resistência à extensão (R) e da resistência máxima (Rmax), e da relação entre
resistência e extensibilidade (R/E), comparadas com as massas produzidas com farinha de
trigo controle (FTC). A extensibilidade aumentou para as massas com fortificação de GV
quando avaliadas com água, e permaneceu igual à massa controle quando avaliadas na
presença de sal. O aumento da resistência da massa, com consequente aumento da área da
curva, ocorreu pela suplementação de proteínas com funcionalidade, especificamente
gliadinas e gluteninas, com redução proporcional da quantidade de amido e outros
componentes da farinha de trigo.
3.3. Características tecnológicas das massas e dos pães elaborados com fortificação da farinha
de trigo com glúten vital
O uso de glúten vital (GV) pela indústria de panificação é uma boa alternativa
para correções de farinhas, pela suplementação com proteínas do glúten, contribuindo para
melhorar as características viscoelásticas das massas. O GV é um ingrediente que não
apresenta restrições em relação à quantidade a ser utilizada; seu uso é restrito apenas para
aquelas pessoas que são intolerantes ou alérgicas ao glúten. Para verificar a qualidade do
155
glúten vital, a fortificação de farinha de trigo com GV é a primeira alternativa usada pelas
indústrias de panificação e moinhos; desta forma, são desenvolvidos testes reológicos
empíricos e testes de panificação (WADHAWAN; BUSHUK, 1989). Isso porque a descrição
do produto não contempla dados sobre a sua qualidade tecnológica, com exceção da
capacidade de absorção de água, e os GV comercialmente disponíveis apresentam
comportamentos tecnológicos diferentes entre si.
A análise da composição química da farinha de trigo controle (FTC) e da FTC
fortificada com 5 e 7 g/100 g de GVA ou GVB apresentou semelhança entre as amostras, com
exceção do teor de proteínas que, como esperado, aumentou para as farinhas fortificadas,
proporcionalmente ao aumento do nível de fortificação. Quando avaliados os teores de glúten
úmido e seco através do Glutomatic, foi possível observar um aumento nesses teores em
comparação à FTC, especialmente, porque houve redução dos compostos solúveis e do amido
na composição das farinhas fortificadas. Por outro lado, quando o índice de glúten (IG) foi
avaliado, observou-se redução do IG das farinhas fortificadas em comparação à FTC. No
entanto, foi possível verificar as diferenças na viscoelasticidade entre GVA e GVB, porque as
farinhas adicionadas de GVA apresentaram maior IG que as farinhas com GVB, indicando
que GVA apresentou glúten com maior elasticidade que GVB. A determinação do IG
confirmou os dados obtidos pela reologia fundamental, onde GVA apresentou maior G’ que
GVB.
Pela farinografia, observou-se aumento da absorção de água para as farinhas
adicionadas de GVA e GVB, pois as proteínas, em maior quantidade nessas amostras, são as
principais responsáveis pelo aumento de absorção de água da mescla, já que absorvem de 2,7
a 3 vezes o seu peso em água (HOSENEY 1998). Avaliando os demais parâmetros, observou-
se que as farinhas fortificadas com GVA (5 e 7 g/100 g) apresentaram maior tempo de
desenvolvimento da massa (TD) e estabilidade da massa frente à mistura (EST) que FTC e
aquelas fortificadas com GVB (5 e 7 g/100 g). Já as farinhas com adição de GVB
apresentaram maior índice de tolerância à mistura (ITM), quando comparadas à FTC e às
farinhas adicionadas de GVA (5 e 7 g/100 g), resultando em massas que não suportam longos
períodos de mistura.
Os parâmetros alveográficos mostraram que a adição de GV à farinha de trigo
melhorou as características de elasticidade (P), extensibilidade (L) e força do glúten (W),
156
tanto para GVA quanto para GVB, nos dois níveis analisados, quando comparados à FTC.
Isso indica que, independente da qualidade das proteínas, o GV pode contribuir com as
propriedades viscoelásticas das massas. Porém, o teste de alveografia, que é utilizado como
medida de classificação de grãos e farinhas de trigo no Brasil (BRASIL, 2010), não foi capaz
de distinguir as diferenças entre os glútens vitais comerciais usados para a fortificação de FTC
neste trabalho.
Um novo instrumento para avaliação da qualidade de farinha de trigo, e também
de glúten vital, que vem sendo utilizado recentemente é o Mixolab (Chopin). Este
equipamento é capaz de medir as propriedades de mistura da massa e o comportamento da
pasta de amido durante o aquecimento (CODINA et al., 2010; DHAKA; GULIA;
KHATKAR, 2012; ROSELL; SANTOS; COLLAR, 2010). O Mixolab consegue abranger as
propriedades das proteínas e do amido da farinha, com um tempo relativamente curto (45
minutos) e pequena quantidade de amostra (CHOPIN, 2012). Por este teste foi possível
verificar que a adição de 5 g/100 g de GV, que é o nível comumente utilizado na indústria de
panificação no Brasil, mostrou diferenças entre os glútens avaliados, indicando que as
melhores propriedades viscoelásticas da rede de glúten ocorreram quando GVA foi
adicionado à FTC.
Ao nível de 7 g/100 g de fortificação, comparado à FTC, foram observados
aumento na absorção de água (ABS) e tempo de desenvolvimento da massa (TD), e redução
nos parâmetros de C3 (viscosidade máxima, aumento da temperatura até 95 °C), C4 (quebra -
redução da viscosidade, temperatura constante a 95 °C) e C5 (retrogradação - viscosidade
final, redução da temperatura até 50 °C) para ambos os glútens. Estes resultados podem estar
relacionados ao aumento de proteínas responsáveis pela formação da rede de glúten, e
também à redução da quantidade de amido na mescla de farinha e glúten, refletindo em
alterações dos parâmetros tecnológicos avaliados quando comparados à FTC. Para Barak;
Mudgil; Khatkar (2013), farinhas com grandes quantidades de proteínas, em especial, aquelas
com boa relação entre gliadinas e gluteninas, apresentam menor quebra e menor viscosidade
final.
Muitos trabalhos foram desenvolvidos para determinar as características
reológicas das massas (ABANG ZAIDEL et al., 2008; DOBRASZCZYK; MORGENSTERN,
2003; JANSSEN; VLIET; VEREIJKEN, 1996; KHATKAR et al., 2002; SCHMIELE et al.,
157
2012; UTHAYAKUMARAN et al., 2002) e do glúten (JANSSEN; VAN VLIET;
VEREIJKEN, 1996a; KHATKAR et al., 2002; SONG; ZHENG, 2008; TRONSMO et al.,
2003; WIESER; KIEFFER, 2001), e suas propriedades afetam a qualidade do produto final,
como o volume do pão (DOBRASZCZYK; SALMANOWICZ, 2008; JANSSEN; VAN
VLIET; VEREIJKEN, 1996b; TRONSMO et al., 2003) e a textura (UTHAYAKUMARAN et
al., 2002).
Os pães elaborados com farinha de trigo fortificada com GV foram avaliados no
dia de produção, e também durante sua vida de prateleira de nove dias, em ambiente com
temperatura controlada (~ 20 °C). Um dos principais parâmetros de qualidade dos pães
avaliado foi o volume específico (VE), pois o volume pode afetar diretamente o aspecto visual
do pão (na hora da compra), além das características de aparência, cor e maciez do miolo.
Neste trabalho, apenas o pão elaborado com 7 g/100 g de GVA apresentou volume específico
maior que os demais pães obtidos pela fortificação de farinha de trigo com GVA (5 g/100 g)
ou GVB (5 e 7 g/100 g) e FTC, e alcançou valor de 4,13 mL/g. Os demais pães não
apresentaram diferenças significativas entre si. Possivelmente, o maior VE alcançado no pão
com 7 g/100 g de GVA ocorreu pela melhor qualidade das proteínas deste GV, que
apresentou valores consideráveis de gliadinas e gluteninas, contribuindo para a formação de
uma rede que suportou maior quantidade de gases formados na fermentação e nos estágios
iniciais do forneamento.
Com relação às análises de cor do miolo, teor de umidade do miolo e da casca, e
atividade de água do miolo e da casca, os pães obtidos com GVA e GVB apresentaram
pequenas diferenças entre si, e também quando comparados ao pão controle. A análise de cor
do miolo mostrou que os pães com adição de 5 e 7 g/100 g de GVA apresentaram-se mais
claros que o pão elaborado com FTC e aqueles elaborados com 5 e 7 g/100 g de GVB. Isto
provavelmente ocorreu porque os pães com GVA apresentaram estrutura do miolo mais
uniforme, além do pão com 7 g/100 g de GVA apresentar maior volume. Além disso, a cor
dos pães foi afetada pela cor dos glútens vitais em pó. Com isso, os pães com GVA (5 e 7
g/100 g) apresentaram-se com tonalidade mais amarelada que o pão elaborado com 5 g/100 g
de GVB, e não diferiram com relação à cor dos pães produzidos com FTC e 7 g/100 g de
GVB. Os teores de umidade e atividade de água do miolo e da casca não apresentaram

158
grandes diferenças entre as amostras, por isso não representaram resultados interessantes para
avaliar a diferença entre os glútens vitais comerciais avaliados neste trabalho.
A firmeza de pães é medida como a força necessária para ocasionar deformação
ou rompimento da amostra e pode ser correlacionada com a mastigação humana. A força
máxima avaliada para produtos panificados depende da formulação (qualidade da farinha,
quantidade de açúcares, gorduras, emulsificantes, enzimas, adição de glúten e melhoradores
de farinha), umidade da massa e conservação (tempo de fabricação do produto e embalagem)
(ESTELLER; PITOMBO; LANNES, 2005; LUYTEN; PLIJTER; VLIET, 2004; ROUDAUT
et al., 2002). Sendo assim, observou-se que os valores de firmeza dos pães no dia 9 foram
maiores do que no dia 4, que por sua vez, foram maiores do que aqueles obtidos no primeiro
dia, ou seja, a firmeza dos pães aumentou com o decorrer da vida de prateleira. Esse fato
ocorre devido ao processo de retrogradação da amilopectina presente no pão e pela migração
da água do miolo para a casca do pão, processo que ocorre durante a estocagem deste produto.
Além disso, o pão da mescla com 7 g/100 g de GVA apresentou o menor valor de firmeza
quando comparado às demais amostras dentro dos mesmos dias de avaliação. Isto aconteceu,
pois GVA apresentou melhores características viscoelásticas, conforme resultados discutidos
anteriormente, resultando em maior volume específico do pão (7 g/100 g de GVA), que
contribuiu para a redução da firmeza do miolo.
A análise da estrutura dos miolos dos pães de forma obtidos de um processo de
panificação convencional indica que as formulações contendo glúten vital não promoveram
alterações com relação ao número, área e perímetro dos alvéolos, com exceção do pão
elaborado com 5 g/100 g de GVA que apresentou o maior número de alvéolos, não diferindo
apenas do pão com 7 g/100 g de GVB, e a menor área média dos alvéolos quando comparado
aos demais. Isso significa que o pão com 5 g/100 g de GVA apresentou uma grande
quantidade de alvéolos, mas com pequena abertura, portanto, uma estrutura mais fechada.
Quando observamos o perímetro, apenas houve diferença significativa entre os pães com 7
g/100 g de GVA e 5 g/100 g de GVB, os demais apresentaram resultados semelhantes entre
eles.
159
3.4. Testes simples para avaliar a qualidade tecnológica do glúten vital
Embora se saiba que a adição de glúten vital contribui para as características
viscoelásticas das massas, e para o volume e textura de pães, a avaliação de sua qualidade
ainda tem se restringido ao teste de panificação ou testes reológicos fundamentais e empíricos
que demandam tempo, quantidade relativamente grande de amostra, equipamentos específicos
e mão de obra qualificada para a execução e interpretação dos resultados. Nesse sentido, os
testes simples se tornam uma alternativa para a redução de custo e tempo, e podem predizer o
comportamento de glútens vitais comerciais quando estes são utilizados na indústria de
panificação.
A medida do teor de glúten úmido e seco do glúten vital em pó é importante, e
pode ser facilmente realizada por lavagem manual, a qual não necessita de equipamentos
específicos, ou pelo uso do equipamento Glutomatic. Essa medida serve para verificar a
capacidade de absorção de água pelas proteínas, e também a quantidade de glúten que o GV
pode formar. Esta pode ser uma análise interessante para detectar fraudes, quando são
adicionadas outras proteínas vegetais ao produto, com o intuito de garantir/aumentar o teor
mínimo de proteínas no GV que será comercializado.
A lavagem manual é facilmente executada, porém não apresenta muito controle,
visto que a qualidade da rede de glúten formada depende, além de outros fatores, do tipo e
magnitude da força aplicada no processo de mistura, assim como da temperatura da água para
formar a massa e realizar a lavagem dos constituintes solúveis e amido, e do tempo de
lavagem. Por outro lado, o uso do Glutomatic proporciona um método mais padronizado, com
poucas variações entre as amostras testadas, além de possibilitar a avaliação da qualidade
viscoelástica da rede de glúten extraída do GV, através da medida do índice de glúten (IG).
Nesse sentido, os teores de glúten úmido de GVA e GVB mostraram diferenças,
tanto na medida por lavagem manual quanto pelo uso do Glutomatic. GVA apresentou maior
capacidade de absorção de água que GVB, apresentando maior teor de glúten úmido em
ambos os testes. Para o teor de glúten seco, pela lavagem manual observou-se diferença entre
GVA e GVB, sendo o maior teor de glúten seco obtido para GVA, porém pelo uso do
Glutomatic, este teor foi semelhante para os dois glútens. Ao analisar a qualidade do glúten
pelo Glutomatic, verificaram-se resultados muito diferentes. Enquanto GVA apresentou IG de
160
58,28, GVB apresentou IG de 8,86. Este resultado confirma todos os outros que foram
discutidos anteriormente, onde GVA mostrou formar uma rede de glúten com características
mais elásticas que GVB, sendo consequência da constituição de suas proteínas.
Como os testes que avaliam os teores de glúten úmido e seco (lavagem manual ou
Glutomatic) nem sempre fornecem respostas suficientes para entender a qualidade tecnológica
do glúten vital, outros dois testes podem ser utilizados para garantir maiores informações
sobre este produto: o teste de extensibilidade e o teste de expansão. Ambos utilizam o glúten
úmido obtido pela lavagem do glúten.
O teste de extensibilidade desenvolvido neste trabalho (pela utilização de uma
placa de madeira com marcações em centímetros que foi colocada a 2 metros de altura do
solo), foi realizado em ambiente com condições de umidade relativa de ~85 % e temperatura
de ~25 °C. Porém, algumas vezes, os moinhos e as indústrias de panificação (onde este teste
pode ser utilizado de forma rápida) apresentam condições de temperatura e umidade muito
altas ou muito baixas, dificultando a execução do teste. Desta forma, para o seu
desenvolvimento nos ambientes fabris, recomenda-se o controle destas condições, garantindo
a obtenção de resultados mais reprodutíveis. Embora simples, esta análise apresentou
resultados interessantes, e que confirmaram os resultados já obtidos por análises instrumentais
mais sofisticadas. A extensibilidade de GVA foi de 3,57 cm, e a de GVB foi de 11,40 cm,
ratificando os resultados já encontrados, onde GVA foi mais elástico, e por isso não se
estendeu muito pela ação da gravidade, e GVB foi mais extensível, com seu glúten
estendendo-se ao longo da placa, pela ação da gravidade. Este resultado comprovou que um
teste simples é capaz de fornecer respostas sobre a qualidade viscoelástica da rede de glúten
formada pelo GV, e também melhorou o entendimento de como utilizar este produto na
indústria de panificação.
Da mesma forma, o teste de expansão da bola de glúten também confirmou
resultados obtidos de análises instrumentais para a avaliação da qualidade de GV. GVA
expandiu-se mais durante o forneamento da bola de glúten que GVB. O resultado desta
análise foi obtido pelo volume específico da bola forneada, e os valores encontrados foram de
20,81 mL/g para GVA e 12,77 mL/g para GVB, indicando que a rede formada por GVA
consegue expandir-se mais sem a sua ruptura (ou seja, suporta maior pressão dos gases),
mantendo a sua estrutura, que GVB, demonstrando o equilíbrio de suas propriedades de

161
extensibilidade e elasticidade (relação gliadina/glutenina). Muito embora, numericamente, o
resultado obtido pelo teste de expansão tenha sido maior para GVA, não apenas o volume
deve ser levado em consideração, mas também, a estrutura da bola após o forneamento. Desta
forma, GVA apresentou maior volume, com uma estrutura fina, porém rígida, enquanto GVB
apresentou menor volume, com uma estrutura fina, porém sensível ao toque, indicando a
fragilidade da rede formada.
Todos estes testes simples podem ser facilmente utilizados por indústrias de
panificação antes da realização de testes de panificação para verificar a qualidade do produto
a ser adquirido, que influenciará a qualidade do produto final (pão).
3.5. Teste de correlação
O teste de correlação de Pearson foi utilizado para mostrar as relações existentes
entre os testes simples de avaliação da qualidade viscoelástica do glúten vital e as
características reológicas de massas e os parâmetros de qualidade de pães elaborados com
farinha de trigo fortificada com 7 g/100 g de glúten vital. Verificaram-se as seguintes
correlações significativas:
(a) Índice de glúten do glúten úmido apresentou relações positivas com tempo de
desenvolvimento (r = 0,98) e estabilidade da massa (r = 0,99), avaliadas pela
farinografia; e relações negativas com o índice de tolerância à mistura (r = -0,93),
medida pela farinografia, e com a firmeza dos pães durante toda a sua vida de
prateleira (r = -0,87 para dia 1, r = -0,89 para dia 4, r = -0,90 para dia 9).
(b) Extensibilidade do glúten mostrou-se diretamente proporcional ao índice de tolerância
à mistura (r = 0,94) medida pela farinografia e à firmeza dos pães durante toda a sua
vida de prateleira (r = 0,89 para dia 1, r = 0,94 para dia 4, r = 0,91 para dia 9); e
inversamente proporcional ao tempo de desenvolvimento (r = 1,00) e estabilidade da
massa (r = 1,00), medidos pela farinografia.
(c) Volume específico da bola de glúten não apresentou coeficientes de correlação
significativos com nenhum parâmetro de qualidade de massas e pães.
Os coeficientes correlação indicam que um glúten vital com maior índice de
glúten (mais elástico) e menor extensibilidade, quando adicionado à farinha de trigo em

162
concentração de 7 g/100 g, foi capaz de melhorar as propriedades de mistura da massa, com
maior tempo de desenvolvimento e maior estabilidade. Por outro lado, um glúten com grande
extensibilidade, adicionado à farinha, produziu massa com menor estabilidade frente à
mistura, levando ao enfraquecimento da sua rede quando submetida ao overmixing. Além
disso, os pães elaborados com GV elástico apresentaram miolo mais macio, em comparação
aos pães elaborados com farinha suplementada com glúten vital com maior extensibilidade.
A análise de correlação de Pearson mostrou que os testes de índice de glúten e
de extensibilidade foram capazes de fornecer dados que apresentam relações com parâmetros
farinográficos e com parâmetros de qualidade de pães. Desta forma, estes dois testes podem
ser utilizados para predizer o comportamento do glúten vital no processo de mistura, e como
este produto pode afetar a qualidade dos pães de forma durante sua vida de prateleira. Em
contrapartida, o teste de expansão da bola de glúten foi capaz de refletir a qualidade
viscoelástica do glúten vital, pois foram observadas diferenças entre os glútens avaliados,
porém não apresentou correlações significativas com parâmetros de qualidade de massas e
pães, quando esse foi utilizado na fortificação da farinha de trigo.
163
4. CONCLUSÃO GERAL
Este trabalho foi desenvolvido para estudar as características físico-químicas
das proteínas do glúten vital que influenciam a sua qualidade tecnológica, quando usado na
panificação, pois apenas determinar o conteúdo proteico deste produto – como é feito
atualmente para a sua comercialização - pode ser importante para classificar o produto de
acordo com a legislação, mas não expressa a qualidade da proteína que o constitui. Pelos
resultados encontrados, foram observadas diferenças entre os glútens vitais avaliados,
comercializados no Brasil.
As características químicas que se mostraram diferentes entre os glútens foram a
quantidade relativa de proteínas nas frações de gliadinas e gluteninas e os tipos de interações
que podem estar envolvidas na formação da rede de glúten. As características tecnológicas
revelaram diferenças associadas ao comportamento elástico da rede de glúten formada por
eles, e também diferenças associadas aos parâmetros de qualidade das massas durante as
etapas de mistura e descanso, e aos parâmetros de qualidade dos pães relacionados ao volume
específico e à firmeza do miolo dos pães de forma.
A qualidade do glúten vital pode ser medida por diferentes testes, sendo que a
maioria deles é complexa para sua execução e interpretação, por isso os testes simples, como
os desenvolvidos nesta Tese, foram importantes para verificar a qualidade viscoelástica do
produto comercializado e também, o efeito da adição de glúten vital na qualidade dos pães de
forma, reduzindo custos e a necessidade de mão de obra qualificada para a execução de testes
mais complexos e interpretação de seus resultados. As relações encontradas sugerem que os
glútens vitais com características mais elásticas, medidas através do teste simples de
extensibilidade e do índice de glúten, apresentam maior tempo de desenvolvimento da rede de
glúten durante o desenvolvimento das massas, com maior estabilidade e menor índice de
tolerância à mistura, além de menor firmeza do miolo dos pães.
Acreditamos que esta Tese pode contribuir para as indústrias de panificação e
moinhos que necessitam compreender o papel do glúten vital na elaboração de produtos como
os pães de forma, colaborando para o entendimento da complexidade do mecanismo de
formação da rede de glúten.
164
5. REFERÊNCIAS GERAIS
AACCI. American Association of Cereal Chemists International. Approved methods,
11th ed., St. Paul: AACCI. 2010.
ABANG ZAIDEL, D. N. et al. Analysis and correlation studies on gluten quantity and
quality during production. Journal of Applied Sciences, v. 9, n. 9, p. 1686–1694, 2009.
ABANG ZAIDEL, D. N. et al. Rheological characterisation of gluten from extensibility
measurement. Journal of Food Engineering, v. 86, n. 4, p. 549–556, jun. 2008.
ABANG ZAIDEL, D. N.; CHIN, N. L.; YUSOF, Y. A. A review on rheological
properties and measurements of dough and gluten. Journal of Applied Sciences, v. 10, n.
20, p. 2478–2490, 2010.
ABITRIGO. Associação Brasileira da Indústria do Trigo. Estatísticas. 2016.
Disponível em: < http://abitrigo.com.br/associados/arquivos/5.prod_trigo.pdf>
ANDERSON, R. A. et al. Pilot-plant studies on the continous batter process to recover
gluten from wheat flour. Cereal Chemistry, v. 37, p. 180–188, 1960.
ANGIOLONI, A. et al. Small and large deformation tests for the evaluation of frozen
dough viscoelastic behaviour. Journal of Food Engineering, v. 87, n. 4, p. 527–531,
2008.
ANGIOLONI, A.; DALLA ROSA, M. Dough thermo-mechanical properties: Influence of
sodium chloride, mixing time and equipment. Journal of Cereal Science, v. 41, n. 3, p.
327–331, 2005.
ARNTFIELD, S. D.; MURRAY, E. D. The Influence of Processing Parameters on Food
Protein Functionality I. Differential Scanning Calorimetry as an Indicator of Protein
Denaturation. Canadian Institute of Food Science and Technology Journal, v. 14, n. 4,
p. 289–294, jan. 1981.
ATTENBURROW, G. et al. Rheological properties of wheat gluten. Journal of Cereal
Science, v. 12, n. 1, p. 1–14, 1990.
AUTRAN, J. Recent perspectives on the genetics , biochemistry and functionality of
wheat proteins. Trends in Food Science & Technology, v. 4, n. 11, p. 358–364, 1993.
BARAK, S.; MUDGIL, D.; KHATKAR, B. S. Influence of gliadin and glutenin fractions
on rheological, pasting, and textural properties of dough. International Journal of Food

165
Properties, v. 17, n. January 2015, p. 1428–1438, 2014.
BARAK, S.; MUDGIL, D.; KHATKAR, B. S. Relationship of gliadin and glutenin
proteins with dough rheology, flour pasting and bread making performance of wheat
varieties. LWT - Food Science and Technology, v. 51, n. 1, p. 211–217, abr. 2013.
BARTH, A. Infrared spectroscopy of proteins. Biochimica et Biophysica, v. 1767, p.
1073–1101, 2007.
BECK, M.; JEKLE, M.; BECKER, T. Impact of sodium chloride on wheat flour dough
for yeast-leavened products. I. Rheological attributes. Journal of the Science of Food
and Agriculture, v. 92, n. 3, p. 585–592, 2012.
BECKWITH, A.; WALL, J. Reduction and reoxidation of wheat glutenin. Biochimica et
Biophysica Acta, v.130, p. 155–162, 1966.
BEKES, F.; GIANIBELLI, M. C.; WRIGLEY, C. Grain Proteins and Flour Quality.
Australian Journal of Agricultural Research, p. 416–423, 2004.
BELTON, P. S. New approaches to study the molecular basis of the mechanical properties
of gluten. Journal of Cereal Science, v. 41, p. 203–211, 2005.
BELTON, P. S. On the Elasticity of Wheat Gluten. Journal of Cereal Science, v. 29, n.
2, p. 103–107, 1999.
BENNION, B. J.; DAGGETT, V. The molecular basis for the chemical denaturation of
proteins by urea. Proceedings of the National Academy of Sciences of the United
States of America, v. 100, n. Track II, p. 5142–5147, 2003.
BERNARDES FILLHO, R.; OTSUKA, R.; COLNAGO, L. A. Análise das estruturas
secundárias das proteínas do glúten de trigo em estado sólido por FTIR. São Calos,
São Paulo, Brasil: [s.n.]. Disponível em:
<www.cnpdia.embrapa.br/publicacoes/download.php?file=CT24_98.pdf >.
BEVERIDGE, T.; TOMA, S. J.; NAKAI, S. Determination of SH- and SS-groups in some
food proteins using Ellman’s reagent. Journal of Food Science, v. 39, p. 49–51, 1974.
BIETZ, J. A.; LOOKHART, G. L. Properties and non-food potential of gluten. Cereal
Foods World, v. 41, n. 5, p. 377–382, 1996.
BIETZ, J. A.; SIMPSON, D. G. Electrophoresis and chromatography of wheat proteins:
Available methods, and procedures for statistical evaluation of the data. Journal of
Chromatography, v. 624, n. 1–2, p. 53–80, 1992.
166
BOCK, J. E.; DAMODARAN, S. Bran-induced changes in water structure and gluten
conformation in model gluten studied by Fourier transform infrared spectroscopy. Food
Hydrocolloids, v. 31, p. 146–155, 2013.
BOLAND, M. et al. Global and U.S. wheat gluten industries: structure, competition, and
trade. Agricultural Marketing Policy Center, n. 76, 2005.
BOZKURT, F. et al. Distribution and location of ethanol soluble proteins (Osborne
gliadin) as a function of mixing time in strong wheat flour dough using quantum dots as a
labeling tool with confocal laser scanning microscopy. Food Research International, v.
66, p. 279–288, 2014.
BRASIL. Regulamento técnico do trigo. Brasil. Ministério da Agricultura, Pecuária e
Abastecimento, Diário Oficial da República Federativa do Brasil, 2010. Disponível em:
<http://pesquisa.in.gov.br/imprensa/jsp/visualiza/index.jsp?data=01/12/2010&jornal=1&p
agina=2&totalArquivos=136>
BRASIL. Regulamento técnico para produtos proteicos de origem vegetal. Brasil.
Agência Nacional de Vigilância Sanitária, Diário Oficial da Republica Federativa do
Brasil, 2005. Disponível em:
<http://pesquisa.in.gov.br/imprensa/jsp/visualiza/index.jsp?jornal=1&pagina=371&data=2
3/09/2005>
CALLEJO, M. J. et al. Effect of gluten addition and storage time on white pan bread
quality: instrumental evaluation. Zeitschrift für Lebensmitteluntersuchung und
Forschung, v. 208, n. 1, p. 27–32, 1999.
CAUVAIN, S. Technology of breadmaking. Third edit ed. New York: Springer, 2015.
CHAN, K. Y.; WASSERMAN, B. P. Direct Colorimetric Assay of Free Thiol-Groups and
Disulfide Bonds in Suspensions of Solubilized and Particulate Cereal Proteins. Cereal
Chemistry, v. 70, n. 1, p. 22–26, 1993.
CHANDI, G. K.; SEETHARAMAN, K. Optimization of Gluten Peak Tester: a Statistical
Approach. Journal of Food Quality, v. 35, n. 1, p. 69–75, 20 fev. 2012.
CHEN, C. et al. Optimising the Frying Temperature of Gluten Balls using Response
Surface Methodology. Science, v. 64, n. Thompson 1982, p. 64–70, 1998.
CHEN, J. SHENG et al. Effect of Gluten on Pasting Properties of Wheat Starch.
Agricultural Sciences in China, v. 9, n. 12, p. 1836–1844, 2010.
167
CHERIAN, G.; CHINACHOTI, P. H Nuclear Magnetic Resonance Mobility, and Glass
Transition Behavior of Gluten. Cereal Chemistry, v. 74, n. C, p. 312–317, 1997.
CHIANG, A. Protein-protein interaction of Soybean Protein from Extrusion
Processing. [s.l.] University of Missouri-Columbia, 2007.
CHIANG, S. H.; CHEN, C. S.; CHANG, C. Y. Effect of wheat flour protein compositions
on the quality of deep-fried gluten balls. Food Chemistry, v. 97, n. 4, p. 666–673, 2006.
CHITTUR, K.K. FTIR/ATR for protein adsorption to biomaterial surfaces. Materials
Engineering, v.19, p.357-369. 1998.
CHOPIN. Mixolab applications handbook. Rheological and enzyme analyses. Chopin
Technologies, p.1-163, 2012.
COCCHI, M. et al.Classification of bread wheat flours in different quality categories by a
wavelet-based feature selection/classification algorithm on nir spectra. Analytica Chima
Acta, v.544, p.100–107. 2005.
CODEX ALIMENTARIUS. FAO / WHO Food standards programe Codex
Alimentarius Comission. Thirty first Session. Geneva , Switzerland, 30 June - 5 July
2008 , Bad Neuenahr-Ahrweiler , Germany.
CODINA, G. G. et al. Mixolab versus alveograph and falling number. Czech Journal
Food Science, v. 28, n. 3, p. 185–191, 2010.
CUBADDA, R., CARCEA, M.; PASQUI, L. A. Suitability of the gluten index method for
assessing gluten strength in durum wheat and semolina. Cereal Foods World, v. 37,
p.866–869, 1992.
CZAJA, T.; MAZUREK, S.; SZOSTAK, R. Quantification of gluten in wheat flour by
FT-Raman spectroscopy. Food Chemistry, v. 211, p. 560–563, 2016.
CZUCHAJOWSKA, Z.; PASZCZYNSKA, B. Is Wet Gluten Good for Baking ? Cereal
Chemistry, v. 73, n. 4, p. 483–489, 1996.
CZUCHAJOWSKA, Z.; POMERANZ, Y.; JEFFERS, H. C. Water activity and moisture
content of dough and bread. Cereal Chemistry, v. 66, n. 2, p. 128–132, 1989.
DAHESH, M. et al. Spontaneous gelation of wheat gluten proteins in a food grade
solvent. Food Hydrocolloids, v. 52, p. 1–10, 2016.
DAMODARAN, S.; PARKIN, K.L.; FENNEMA, O.R. Química de alimentos de
Fennema. 4°ed. Porto Alegre: Artmed. p.179-342. 2010.
168
DAY, L. et al. Wheat-gluten uses and industry needs. Trends in Food Science &
Technology, v. 17, n. 2, p. 82–90, fev. 2006.
DAY, L. Wheat gluten: production, properties and application. In: PHILLIPS, G. O.;
WILLIAMS, P.A. Handbook of Food Proteins. Sawston: Woodhead Publishing, p.267-
288. 2011.
DEBET, M. R.; GIDLEY, M. J. Three classes of starch granule swelling : Influence of
surface proteins and lipids. Carbohydrate Polymers, v. 64, p. 452–465, 2006.
DELCOUR, J. A et al. Wheat gluten functionality as a quality determinant in cereal-based
food products. Annual review of food science and technology, v. 3, p. 469–92, jan.
2012.
DHAKA, V.; GULIA, N.; KHATKAR, B. S. Application of Mixolab to Assess the Bread
Making Quality of Wheat Varieties. Open Access Scientific Reports, v. 1, n. 3, p. 1–8,
2012.
DOBRASZCZYK, B. .; MORGENSTERN, M. . Rheology and the breadmaking process.
Journal of Cereal Science, v. 38, n. 3, p. 229–245, nov. 2003.
DOBRASZCZYK, B. J. The physics of baking: rheological and polymer molecular
structure–function relationships in breadmaking. Journal of Non-Newtonian Fluid
Mechanics, v. 124, n. 1–3, p. 61–69, dez. 2004.
DOBRASZCZYK, B. J.; ROBERTS, C. A. Strain hardening and dough gas cell-wall
failure in biaxial extension. Journal of Cereal Science, v. 20, p. 265–274, 1994.
DOBRASZCZYK, B. J.; SALMANOWICZ, B. P. Comparison of predictions of baking
volume using large deformation rheological properties. Journal of Cereal Science, v. 47,
n. 2, p. 292–301, 2008.
DOMENEK, S. et al. Swelling behavior and structural characteristics of wheat gluten
polypeptide films. Biomacromolecules, v. 5, n. 3, p. 1002–8, 2004.
DON, C. et al. Glutenin macropolymer: a gel formed by glutenin particles. Journal of
Cereal Science, v. 37, n. 1, p. 1–7, 2003b.
DON, C. et al. The effect of mixing on glutenin particle properties: Aggregation factors
that affect gluten function in dough. Journal of Cereal Science, v. 41, n. 1, p. 69–83,
2005.
DON, C. et al. Understanding the link between GMP and dough: From glutenin particles

169
in flour towards developed dough. Journal of Cereal Science, v. 38, n. 2, p. 157–165,
2003.
DREESE, P.; FAUBION, J.; HOSENEY, R. C. Dynamic rheological properties of flour,
gluten, and gluten-starch doughs. I. Temperature-dependent changes durign heating.
Cereal Chemistry, v. 65, n. 4, p. 348–353, 1988.
DUA, S. et al. Effect of Extraction Methods and Wheat Cultivars on Gluten Functionality.
The Open Food Science Journal, v. 3, n. 1, p. 84–92, 23 out. 2009.
EL HADDAD, L. et al. Erratum: Relationships between polymeric glutenin and the
quality characteristics for seven common wheats (Triticum aestivum) grown in the field
and greenhouse (Cereal Chemistry (Nov.-Dec. 1995) 72:6 (599)). Cereal Chemistry, v.
73, n. 1, p. 152, 1996.
ESTELLER, M. S.; LANNES, S. C. S. Parâmetros complementares para fixação de
identidade e qualidade de produtos panificados. Ciência e Tecnologia de Alimentos, 25,
802-806, 2005.
ESTELLER, M. S.; PITOMBO, R. N. M.; LANNES, S. C. S. Effect of freeze-dried gluten
addition on texture of hamburger buns. Journal of Cereal Science, v. 41, n. 1, p. 19–21,
jan. 2005.
EWART, J. A. D. Amino acid analyses. Journal of the Science of Food and
Agriculture, v. 18, p. 176–183, 1967.
EWART, J. A. D. Cappelle-Desprez p-gliadin. Journal of the Science of Food and
Agriculture, v. 28, n. February, p. 849–851, 1977b.
EWART, J. A. D. Isolation of two y-gliadins from Cappelle-Desprez. Journal of the
Science of Food and Agriculture, v. 28, n. February, p. 843–848, 1977a.
FABIAN, H.; MÄNTELE, W. Infrared spectroscopy of proteins biochemical applications
infrared spectroscopy of proteins. In: CHALMERS, J.M.; GRIFFITHS, P.R. Handbook
of vibrational spectroscopy. Vol 1. Hoboken: Wiley. p.1-27. 2002.
FALCÃO-RODRIGUES, M. M.; MOLDÃO-MARTINS, M.; BEIRÃO-DA-COSTA, M.
L. Thermal properties of gluten proteins of two soft wheat varieties. Food Chemistry, v.
93, n. 3, p. 459–465, 2005.
FERNANDES, A. F. et al. Efeito da substituição parcial da farinha de trigo por farinha de
casca de batata (Solanum Tuberosum Lineu). Ciência e Tecnologia de Alimentos, v. 28,

170
p. 56–65, 2008.
FOOD AND DRUG ADMINISTRATION, F. What Is Gluten-Free ? FDA Has an
AnswerConsumer Health Information. [s.l: s.n.]. Disponível em:
<https://www.in.gov/isdh/files/Gluten_Free_Article_October_2013.pdf>.
FORATO, L. A. et al. Estudo de métodos de aumento de resolução de espectros de ftir
para análise de estruturas secundárias de proteínas. Quimica Nova, v. 20, n. 5, p. 146–
150, 1997.
FORATO, L. A.; BERNARDES-FILHO, R.; COLNAGO, L. A. Protein Structure in KBr
Pellets by Infrared Spectroscopy Protein Structure in KBr Pellets by Infrared
Spectroscopy. Analytical biochemistry, v. 259, n. November, p. 136–141, 1998.
FREDERIX, S. .; COURTIN, C. .; DELCOUR, J. . Influence of process parameters on
yield and composition of gluten fractions obtained in a laboratory scale dough batter
procedure. Journal of Cereal Science, v. 39, n. 1, p. 29–36, jan. 2004.
FU, B. X.; SAPIRSTEIN, H. D. Procedure for isolating monomeric proteins and
polymeric glutenin of wheat flour. Cereal Chemistry, v. 73, n. 1, p. 143–152, 1996.
FU, B.X.; SAPIRSTEIN, H.D.; BUSHUK, W. Salt-Induced Disaggregation/
Solubilization of Gliadin and Glutenin Proteins in Water. Journal of Cereal Science, v.
24, n. 3, p. 241–246, 1996.
GARIDEL, P.; SCHOTT, H. Fourier-Transform Midinfrared Spectroscopy for Analysis
and Screening of Liquid Protein Formulations Part 2: Details Analysis and Applications.
BioProcess International, v. 1, p. 48–55, 2006.
GIL-HUMANES, J. et al. Significant down-regulation of γ-gliadins has minor effect on
gluten and starch properties of bread wheat. Journal of Cereal Science, v. 56, n. 2, p.
161–170, set. 2012.
GOESAERT, H. et al. Wheat flour constituents: how they impact bread quality, and how
to impact their functionality. Trends in Food Science & Technology, v. 16, n. 1–3, p.
12–30, jan. 2005.
GÓMEZ, A. V. et al. Analysis of soluble proteins/aggregates derived from gluten-
emulsifiers systems. Food Research International, v. 46, n. 1, p. 62–68, 2012.
GUARIENTI, E.M. 1996. Qualidade industrial de trigo. 2nd ed. Passo Fundo:
EMBRAPA-CNPT. p1-36.
171
GUERRIERI, N. et al. Use of spectroscopic and fluorescence techniques to assess heat-
induced molecular modifications of gluten. Cereal Chemistry, v. 73, n. 3, p. 368–374,
1996.
GUERRIERI, N.; CERLETTI, P. Effect of High-Temperature Short-Time Treatment of
Wheat Flour on Gluten Vitality and Structure. Cereal Chemistry, v. 73, n. 3, p. 6–9,
1996.
GUPTA, R. B.; KHAN, K.; MACRITCHIE, F. Biochemical basis of flour properties in
bread wheats. I. Effects of variation in the quantity and size distributon of polymeric
protein. Journal of Cereal Science, v. 18, p. 23–41, 1993.
HADNA, M. et al. Empirical and fundamental rheological properties of wheat flour dough
as affected by different climatic conditions. Journal of Agricultural Science and
Technology, v. 15, p.1381–1391, 2013.
HAMER, R.J.; MACRITCHIE, F.; WEEGELS, P.L. Structure and functional properties
of gluten. In: KHAN, K.; SHEWRY, P.R. Wheat: chemistry and technology. St. Paul:
AACC International. p 153–178. 2009.
HAMER, R.J.; VAN VLIET, T. Understanding the structure and properties of gluten: an
overview. In: SHEWRY, P.R.; TATHAM, A.S. Wheat gluten. Cambridge: The Royal
Society of Chemistry. p. 125–131. 2000.
HAYTA, M.; SCHOFIELD, J. D. Heat and additive induced biochemical transitions in
gluten from good and poor breadmaking quality wheats. Journal of Cereal Science, v.
40, p. 245–256, 2004.
HESSER, J. M. World food uses of vital wheat gluten. In: APPLEWHITE, T. H.
Proccedings of the World Congress on vegetable protein utilization in human food
and animal feedstuffs. Urbana: The American Oil Chemists Society, p.117-122. 1989.
HILL, J. J.; SHALAEV, E. Y.; ZOGRAFI, G. The Importance of Individual Protein
Molecule Dynamics in Developing and Assessing Solid State Protein Preparations.
Journal of Pharmaceutical Sciences, v. 103, p. 2605–2614, 2014.
HOSENEY, R. C.; FINNEY, K. F.; POMERANZ, Y. Functional (breadmaking) and
biochemical properties of wheat flour components. VI. Gliadin-lipid-glutenin interaction
in wheat gluten. Cereal Chemistry, 1970. Disponível em:
<http://www.aaccnet.org/cerealchemistry/abstracts/1970/cc1970a22.asp>
172
HOSENEY, R.C. Principles of cereal science and technology. 2nd St. Paul: American
Association of Cereal Chemists. 1998
HUANG, W. et al. Effects of transglutaminase on the rheological and Mixolab
thermomechanical characteristics of oat dough q. Food Chemistry, v. 121, n. 4, p. 934–
939, 2010.
HUEQNER, F. R. et al. Disulfide bonds: key to wheat protein functionality. Protein
Crosslinking, p. 1–15, 1977.
IGNÁCIO, A. K. F. et al. Efeito da substituição de cloreto de sódio por cloreto de potássio
em pão francês Effect of the substitution of sodium chloride by potassium chloride in
French rolls. Brazilian Journal of Food Technology, v. 1, p. 1–11, 2013.
JANSENS, K. J. A. et al. Effect of temperature, time and wheat gluten moisture content
on wheat gluten network formation during thermomolding. Journal of Cereal Science, v.
54, n. 3, p. 434–441, nov. 2011.
JANSSEN, A. M.; VAN VLIET, T.; VEREIJKEN, J. M. Rheological behaviour of wheat
glutens at small and large deformations. Comparisons of two glutens differing in
breadmaking potential. Journal of Cereal Science, v. 23, p. 19–31, 1996b.
JANSSEN, A. M.; VAN VLIET, T.; VEREIJKEN, J. M. Rheological Behaviour of Wheat
Glutens at Small and Large Deformations. Effect of Gluten Composition. Journal of
Cereal Science, v. 23, n. 1, p. 33–42, 1996a.
JEANJEAN, M. F.; DAMIDAUX, R.; FEILLET, P. Effect of heat treatment on protein
solubility and viscoelastic properties of wheat gluten. Cereal Chemistry, v. 57, p. 325–
331, 1980.
JEKLE, M.; BECKER, T. Wheat dough microstructure: The relation between visual
structure and mechanical behavior. Critical Reviews in Food Science and Nutrition, v.
55, n. February 2014, p. 369–382, 2013.
JOYE, I. J.; LAGRAIN, B.; DELCOUR, J. A. Use of chemical redox agents and
exogenous enzymes to modify the protein network during breadmaking – A review.
Journal of Cereal Science, v. 50, n. 1, p. 11–21, 2009.
KAUR, A. et al. Diversity in grain, flour, dough and gluten properties amongst Indian
wheat cultivars varying in high molecular weight subunits (HMW-GS). Food Research
International, v. 53, n. 1, p. 63–72, ago. 2013.
173
KHATKAR, B. S. et al. Functional properties of wheat gliadins. II. Effects on dynamic
rheological properties of wheat gluten. Journal of Cereal Science, v. 35, p. 307–313,
2002.
KHATKAR, B. S.; BARAK, S.; MUDGIL, D. Effects of gliadin addition on the
rheological, microscopic and thermal characteristics of wheat gluten. International
journal of biological macromolecules, v. 53, p. 38–41, mar. 2013.
KHATKAR, B. S.; BELL, A. E.; SCHOFIELD, J. D. The dynamic rheological properties
of glutens and gluten sub-fractions from wheats of good and poor bread making quality.
Journal of Cereal Science, v. 22, n. 1, p. 29–44, jul. 1995.
KHATKAR, B. S.; BELL, A. E.; SCHOFIELD, J. D. The dynamic rheological properties
of glutens and gluten sub-fractions from wheats of good and poor bread making quality.
Journal of Cereal Science, v. 22, p.29–44, 1995.
KIEFFER, R. et al. Correlations of the breadmaking performance of wheat flour with
rheological measurements on a micro-scale. Journal of Cereal Science, v.27, p. 53-60,
1998.
KIEFFER, R. et al. Effect of hydrostatic pressure and temperature on the chemical and
functional properties of wheat gluten: Studies on gluten, gliadin and glutenin. Journal of
Cereal Science, v. 45, n. 3, p. 285–292, maio 2007.
KINSELLA, J. E.; HALE, M. L. Hydrophobic associations and gluten consistency: effect
of specific anions. Journal of Agricultural and Food Chemistry, v. 32, p. 1054–1056,
1984.
KOEHLER, P.; KIEFFER, R.; WIESER, H. Effect of hydrostatic pressure and
temperature on the chemical and functional properties of wheat gluten III. Studies on
gluten films. Journal of Cereal Science, v. 51, n. 1, p. 140–145, jan. 2010.
KONTOGIORGOS, V. Microstructure of hydrated gluten network. Food Research
International, v. 44, n. 9, p. 2582–2586, nov. 2011.
KRULL, L. H.; WALL, J. S. Relationship of Amino Acid Composition and Wheat Protein
Properties. Bakers Digest, v. 43, n. 4, p. 30–34, 1969.
KUKTAITE, R. et al. Structure and morphology of wheat gluten films: From polymeric
protein aggregates toward superstructure arrangements. Biomacromolecules, v. 12, p.
1438–1448, 2011.
174
LABUSCHAGNE, M. T.; AUCAMP, U. The use of size exclusion high performance
liquid chromatography (SE-HPLC) for wheat quality prediction in South Africa. South
African Journal of Plant and Soil, v. 21, n. 1, p. 8–12, jan. 2004.
LAGRAIN, B. et al. Mechanism of gliadin–glutenin cross-linking during hydrothermal
treatment. Food Chemistry, v. 107, n. 2, p. 753–760, mar. 2008.
LAGRAIN, B.; BRIJS, K.; DELCOUR, J. A. Impact of redox agents on the physico-
chemistry of wheat gluten proteins during hydrothermal treatment. Journal of Cereal
Science, v. 44, n. 1, p. 49–53, jul. 2006.
LARSSON, H.; ELIASSON, A. Phase separation of wheat flour dough studied by
ultracentrifugation and stress relaxation. II. Influence of mixing time, ascorbic acid, and
lipids. Cereal Chemistry, v. 73, n. 1, p. 25–31, 1996.
LEFEBVRE J, POPINEAU Y, CORNEC M. Viscoelastic properties of gluten proteins:
Influence of prolamin composition and of temperature. In: Gluten Proteins 1993.
Detmold: Association of Cereal Research, p.180-189. 1994.
LEON, A.; ROSELL, C. M.; BENEDITO DE BARBER, C. A differential scanning
calorimetry study of wheat proteins. European Food Research and Technology, v. 217,
n. 1, p. 13–16, 1 jul. 2003.
LEON, A.; ROSELL, C. M.; BENEDITO DE BARBER, C. A differential scanning
calorimetry study of wheat proteins. European Food Research and Technology, v. 217,
n. 1, p. 13–16, 1 jul. 2003.
LÉTANG, C.; PIAU, M.; VERDIER, C. Characterization of wheat flour-water doughs.
Part I: Rheometry and microstructure. Journal of Food Engineering, v. 41, p. 121–132,
1999.
LI, M.; LEE, T.-C. Effect of cysteine on the functional properties and microstructures of
wheat flour extrudates. Journal of Agricultural and Food Chemistry, v. 46, p. 846–853,
1998.
LIU, K.; HSIEH, F. H. Protein-protein interactions during high-moisture extrusion for
fibrous meat analogues and comparison of protein solubility methods using different
solvent systems. Journal of Agricultural and Food Chemistry, v. 56, n. 8, p. 2681–
2687, 2008.
LOOKHART, G. L. et al. Comparison of high-molecular-weight subunits of glutenin and
175
baking performance of flours varying in bread-making quality. Lebensmittel-
Wissenschaft & Technologie, v. 26, p. 301–306, 1993.
LUNDH, G.; MACRITCHIE, F. Size exclusion HPLC characterisation of gluten protein
fractions varying in breadmaking potential. Journal of Cereal Science, v. 10, n. 3, p.
247–253, nov. 1989.
LUYTEN, H.; PLIJTER, J. J.; van VLIET, T. O. N. Crispy/crunchy crusts of cellular solid
foods: a literature review with discussion . Journal of Texture Studies, 35, 445–492,
2004.
LYNCH, E. J. et al. Fundamental studies on the reduction of salt on dough and bread
characteristics. Food Research International, v. 42, n. 7, p. 885–891, 2009.
MACRITCHIE, F. Evaluation of contributions from wheat protein fractions to dough
mixing and breadmaking. Journal of Cereal Science, v. 6, n. 3, p. 259–268, nov. 1987.
MACRITCHIE, F. Wheat proteins: characterization and role in flour functionality. Cereal
Foods World, v. 44, p.188-193, 1999.
MACRITCHIE, F. Requirements for a test to evaluate bread-making performance.
Journal of Cereal Science, v. 59, n. 1, p. 1–2, 2014b.
MACRITCHIE, F. Theories of glutenin / dough systems. Journal of Cereal Science, v.
60, p. 733–735, 2014a.
MAJZOOBI, M. .; ABEDI, E. Effects of pH changes on functional properties of native
and acetylated wheat gluten. International Food Research Journal, v. 21, n. 3, p. 1219–
1224, 2014.
MAMONE, G. et al. Characterization of wheat gliadin proteins by combined two-
dimensional gel electrophoresis and tandem mass spectrometry. Proteomics, v. 5, p.
2859–2865, 2005.
MANINGAT, C. C.; BASSI, S. D. Wheat starch production. In TUMBLESON, M.;
YANG, P.; ECKHOFF, S. Proceedings of international starch technology conference.
Urbana: University of Illinois. p.26-40. 1999.
MANOI, K.; RIZVI, S. S. H. Physicochemical changes in whey protein concentrate
texturized by reactive supercritical fluid extrusion. Journal of Food Engineering, v. 95,
n. 4, p. 627–635, 2009.
MARCHETTI, L. et al. Effect of glutens of different quality on dough characteristics and
176
breadmaking performance. LWT - Food Science and Technology, v. 46, n. 1, p. 224–
231, abr. 2012.
MARTELO, E. Panificação: básico para padeiro. Serviço Nacional de Aprendizagem
Industrial. Porto Alegre: SENAI. 95p., 1998.
MCCANN, T. H.; DAY, L. Effect of sodium chloride on gluten network formation, dough
microstructure and rheology in relation to breadmaking. Journal of Cereal Science, v.
57, n. 3, p. 444–452, 2013.
MEKURIA, B.; ADMASSU, S. Grain quality evaluation and characterization of vital
gluten powder from bread wheat varieties grown in Arsi and Bale, Ethiopia. European
African Journal Science, v.5, p.35–41, 2011.
MELANDER, W.; HORVÁTH, C. Salt effect on hydrophobic interactions in precipitation
and chromatography of proteins: an interpretation of the lyotropic series. Archives of
biochemistry and biophysics, v. 183, p. 200–215, 1977.
MELNYK, J. P. et al. Using the Gluten Peak Tester as a tool to measure physical
properties of gluten. Journal of Cereal Science, v. 56, n. 3, p. 561–567, nov. 2012.
MICARD, V.; GUILBERT, S. Thermal behavior of native and hydrophobized wheat
gluten , gliadin and glutenin-rich fractions by modulated DSC. International Journal of
Biological Macromolecules, v. 27, p. 229–236, 2000.
MILLER, K. A.; HOSENEY, R. C. Dynamic rheological properties of wheat starch-
gluten doughs. Cereal Chemistry, v. 76, n. 1, p. 105–109, 1999.
MIRSAEEDGHAZI, H.; EMAM-DJOMEH, Z.; MOUSAVI, S. M. A. Rheometric
measurement of dough rheological characteristics and factors affecting it. International
Journal of Agriculture and Biology, v. 10, n. 1, p. 112–119, 2008.
MOHAMED, A. et al. Thermal and mechanical properties of compression-molded pMDI-
reinforced PCL/gluten composites. Journal of Applied Polymer Science, v. 118, p.
2778–2790, 2010.
MONTENEGRO, F. M. Avaliação do desempenho tecnológico de misturas de
farinhas de triticale e trigo em produtos de panificação, 94p. Dissertação (Mestre em
Tecnologia de Alimentos), Faculdade de Engenharia de Alimentos, Universidade Estadual
de Campinas, Campinas, 2011.

177
MOREIRA, R.; CHENLO, F.; TORRES, M. D. Rheology of gluten-free doughs from
blends of chestnut and rice flours. Food and Bioprocess Technology, v. 6, n. 6, p. 1476–
1485, 2013.
NG, T. S. K.; MCKINLEY, G. H. Power law gels at finite strains: The nonlinear rheology
of gluten gels. Journal of Rheology, v. 52, n. 2, p. 417–449, 2008.
NG, T. S. K.; MCKINLEY, G. H.; EWOLDT, R. H. Large amplitude oscillatory shear
flow of gluten dough: A model power-law gel. Journal of Rheology, v. 55, n. 3, p. 627,
2011.
NG, T. S. K.; MCKINLEY, G. H.; PADMANABHAN, M. Linear to non-linear rheology
of wheat flour dough linear to non-linear rheology of wheat flour dough. International
Symposium on Food Rheology and Structure, n. 6, p.1-9, 2006.
OIKONOMOU, N. A. et al. Gluten Index for Wheat products : main variables in affecting
the value and nonlinear regression model. International Journal of Food Properties, v.
18, n. September, p. 1–11, 2015.
OLIVEIRA, D. S. et al. Effect of a thermoascus aurantiacus thermostable enzyme cocktail
on wheat bread quality. Food Chemistry, v. 143, p. 139–146, 2014.
OLIVEIRA, L. C.; ROSELL, C. M.; STEEL, C. J. Original article Effect of the addition
of whole-grain wheat flour and of extrusion process parameters on dietary fibre content ,
starch transformation and mechanical properties of a ready-to-eat breakfast cereal.
International Journal of Food Science and Technology, v. 50, p. 1504–1514, 2015.
ORTOLAN, F. et al. Correlations between vital wheat gluten protein fractions, gluten
index and specific volume obtained from a gluten expansion test. AACC International
Annual Meeting. Anais...Providence, Rhode Island, USA: 2014 Annual Meeting
Abastract, 2014. Disponível em: <http://doi.wiley.com/10.1111/hae.12083>
ORTOLAN, F. et al. Rheological properties of vital wheat glutens with water or sodium
chloride. LWT - Food Science and Technology, v.79, p. 647-654.
OSBORNE, T. B. The Proteins of the Wheat Kernel. Science, v. 26, n. 677, p. 865–865,
1907.
PAYNE, P. I. et al. Wheat storage proteins: their genetics and their potential for
manipulation by plant breeding. Philosophical transactions of the Royal Society of
London. Series B, Biological sciences, v. 304, p. 359–371, 1984.
178
PEÑA, E. et al. Do tyrosine crosslinks contribute to the formation of the gluten network in
common wheat (Triticum Aestivum L.) dough?” Journal of Cereal Science, v.44, p.144–
153, 2006.
PIZZINATTO, A. Qualidade da farinha de trigo: conceitos, fatores determinantes,
parâmetros de avaliação e controle. Campinas: ITAL. p1-62. 1997.
PRESTON, K. R. Effects of neutral salts of the lyotropic series on the physical dough
properties of a Canadian Red Spring Wheat flour. Cereal Chemistry, v. 66, p. 144–148,
1989.
PYLER, E.J. Baking Science and Technology, 3rd Ed. Kansas City: Sosland Publishing
Company, p.357–377. 1988.
RAKITA, S. D. S. et al. Determination of free sulphydryl groups in wheat gluten under
the influence of different time and temperature of incubation: Method validation. Food
Chemistry, v. 150, p. 166–173, 2014.
RAKITA, S. D. S. et al. Determination of free sulphydryl groups in wheat gluten under
the influence of different time and temperature of incubation: Method validation. Food
Chemistry, v. 150, p. 166–173, 2014.
RASHEED, F. et al. Structural architecture and solubility of native and modified gliadin
and glutenin proteins: non-crystalline molecular and atomic organization. RSC Adv., v. 4,
n. 4, p. 2051–2060, 2014.
ROBERTSON, G. H. et al. Modification of vital wheat gluten with phosphoric acid to
produce high free swelling capacity. Journal of Applied Polymer Science, p. 1–11,
2013.
ROBERTSON, G. H.; CAO, T. K.; ONG, I. Wheat gluten swelling and partial solubility
with potential impact on starch-from-gluten separation by ethanol washing. Cereal
Chemistry, v. 76, n. C, p. 843–845, 1999.
ROBERTSON, G. H.; CAO, T. K.; ORTS, W. O. Effect on dough functional properties of
partial fractionation, redistribution, and in situ deposition of wheat flour gluten proteins
exposed to water, ethanol, and aqueous ethanol. Cereal Chemistry, v. 85, n. 5, p. 599–
606, 2008.

179
ROSELL, C. M.; COLLAR, C.; HAROS, M. Assessment of hydrocolloid effects on the
thermo-mechanical properties of wheat using the Mixolab. Food Hydrocolloids, v. 21, n.
3, p. 452–462, 2007.
ROSELL, C. M.; SANTOS, E. Impact of fibers on physical characteristics of fresh and
staled bake off bread. Journal of Food Engineering, v. 98, n. 2, p. 273–281, 2010.
ROSELL, C. M.; SANTOS, E.; COLLAR, C. Physical characterization of fiber-enriched
bread doughs by dual mixing and temperature constraint using the Mixolab. European
Food Research and Technology, v. 231, p. 535–544, 2010.
ROUDAUT, G. et al.Crispness : a critical review on sensory and material science
approaches. Trends in Food Science & Technology, v. 13, p.217–227, 2002.
ROUSSEL, P.; CHIRON, H. Le pains Français, évolution, qualité, production. 2éme
édition. Conflandey: MAÉ-ERTI Editeurs. p.1-433. 2005.
SALVADOR, A.; SANZ, T.; FISZMAN, S. M. Dynamic rheological characteristics of
wheat flour-water doughs. Effect of adding NaCl, sucrose and yeast. Food
Hydrocolloids, v. 20, n. 6, p. 780–786, 2006.
SAYASLAN, A. Wet-milling of wheat flour: industrial processes and small-scale test
methods. LWT - Food Science and Technology, v. 37, n. 5, p. 499–515, ago. 2004.
SAYASLAN, A.; SEIB, P. A.; CHUNG, O. K. Wet-milling properties of waxy wheat
flours by two laboratory methods. Journal of Food Engineering, v.72, p.167–178, 2006.
SCANLON, M. G.; ZGHAL, M. C. Bread properties and crumb structure. Food
Research International, v. 34, n. 10, p. 841–864, 2001.
SCHIEDT, B. et al. Short- and Long-Range Interactions Governing the Viscoelastic
Properties during Wheat Dough and Model Dough Development. Journal of Texture
Studies, v. 44, n. 4, p. 317–332, 17 ago. 2013.
SCHLUENTZ, E. J.; STEFFE, J. F.; NG, P. K. W. Rheology and microstructure of wheat
dough developed with controlled deformation. Journal of Texture Studies, v. 31, p. 41–
54, 2000.
SCHMIELE, M. et al. Determinação da concentração de diferentes sistemas de solventes
na solubilização de proteínas de análogo de carne. Ciência Rural, p. 1–6, 2013.
SCHMIELE, M. et al. Rheological properties of wheat flour and quality characteristics of
pan bread as modified by partial additions of wheat bran or whole grain wheat flour.
180
International Journal of Food Science and Technology, v. 47, n. 10, p. 2141–2150,
2012.
SCHMIELE, M. Interações físicas e químicas entre isolado protéico de soja e glúten
vital durante a extrusão termoplástica a alta e baixa umidade para a obtenção de
análogo de carne. [s.l.] Tese (Doutor em Tecnologia de Alimentos), Faculdade de
Engenharia de Alimentos, Universidade Estadual de Campinas, Campinas, 2014.
SCHOBER, T. J.; DOCKERY, P.; ARENDT, E. K. Model studies for wheat sourdough
systems using gluten, lactate buffer and sodium chloride. European Food Research and
Technology, v. 217, n. 3, p. 235–243, 2003.
SCHOFIELD, J. D. et al. The effect of heat on wheat gluten and the involvement of
sulphydryl-disulphide interchange reactions. Journal of Cereal Science, v. 1, p. 241–253,
1983.
SHEWRY, P. R. et al. The structure and properties of gluten: an elastic protein from
wheat grain. Philosophical transactions of the Royal Society of London. Series B,
Biological sciences, v. 357, n. 1418, p. 133–142, 2002.
SHEWRY, P. R. et al. Wheat glutenin subunits and dough elasticity : findings of the
EUROWHEAT project. Trends in Food Science & Technology, v. 11, p. 433–441,
2001.
SHEWRY, P. R.; HALFORD, N. G. Cereal seed storage proteins: structures, properties
and role in grain utilization. Journal of experimental botany, v. 53, n. 370, p. 947–58,
abr. 2002.
SHEWRY, P. R.; TATHAM, A. S. Disulphide Bonds in Wheat Gluten Proteins. Journal
of Cereal Science, v. 25, p. 207–227, 1997.
SIMSEK, S.; MARTINEZ, M. O. Quality of Dough and Bread Prepared with Sea Salt or
Sodium Chloride. Journal of Food Process Engineering, p.1-9, 2015.
SINGH, H., & MACRITCHIE, F. Application of polymer science to properties of gluten.
Journal of Cereal Science, v. 33, p. 231–243, 2001.
SINGH, H.; MACRITCHIE, F. Changes in proteins induced by heating gluten dispersions
at high temperature. Journal of Cereal Science, v. 39, n. 2, p. 297–301, mar. 2004.
SINGH, N. K. et al. Use of sonication and size-exclusion high-performance liquid
chromatography in the study of wheat flour proteins. I. Dissolution of total proteins in the
181
absence of reducing agents. Cereal Chemistry, v.67, n.2, p.150-161, 1990.
SINGH, N. K.; SHEPHERD, K. W.; CORNISH, G. B. A simplified SDS—PAGE
procedure for separating LMW subunits of glutenin. Journal of Cereal Science, v. 14, n.
3, p. 203–208, nov. 1991.
SINGH, S.; SINGH, N. Relationship of polymeric proteins and empirical dough rheology
with dynamic rheology of dough and gluten from different wheat varieties. Food
Hydrocolloids, v. 33, n. 2, p. 342–348, dez. 2013.
SINGH, S.; SINGH, N.; MACRITCHIE, F. Relationship of polymeric proteins with
pasting, gel dynamic- and dough empirical-rheology in different Indian wheat varieties.
Food Hydrocolloids, v. 25, n. 1, p. 19–24, jan. 2011.
SIVAM, A. S. et al. Application of FT-IR and Raman spectroscopy for the study of
biopolymers in breads forti fi ed with fi bre and polyphenols. Food Research
International, v. 50, p. 574–585, 2013.
SLUIMER, P. Principles of breadmaking. St. Paul: AACCI. p.1-212. 2005.
SONG, Y.; ZHENG, Q. Dynamic rheological properties of wheat flour dough and
proteins. Trends in Food Science & Technology, v. 18, n. 3, p. 132–138, mar. 2007.
SONG, Y.; ZHENG, Q. Influence of gliadin removal on strain hardening of hydrated
wheat gluten during equibiaxial extensional deformation. Journal of Cereal Science, v.
48, n. 1, p. 58–67, jul. 2008.
STATHOPOULOS, C. E. et al. Effect of heat on rheology, surface hydrophobicity and
molecular weight distribution of glutens extracted from flours with different bread-making
quality. Journal of Cereal Science, v. 47, n. 2, p. 134–143, mar. 2008.
TANNER, R. I.; QI, F.; DAI, S. C. Bread dough rheology and recoil. I. Rheology.
Journal of Non-Newtonian Fluid Mechanics, v. 148, n. 1–3, p. 33–40, 2008.
TATHAM, A. S.; DRAKE, A. F.; SHEWRY, P. R. A conformational study of a
glutamine- and proline-rich cereal seed protein, C hordein. The Biochemical journal, v.
226, n. 2, p. 557–62, 1985.
TATHAM, A. S.; SHEWRY, P. R. The S-poor prolamins of wheat, barley and rye:
Revisited. Journal of Cereal Science, v. 55, n. 2, p. 79–99, 2012.
TATTINI JR, V.; PARRA, D. F.; PITOMBO, R. N. D. M. Influência da taxa de
congelamento no comportamento físico-químico e estrutural durante a liofilização da
182
albumina bovina. Revista Brasileira de Ciências Farmacêuticas, v. 42, n. 1, p. 127–136,
2006.
TEDRUS, G. D. A. S. et al. Estudo da adição de vital glúten à farinha de arroz, farinha de
aveia e amido de trigo na qualidade de pães 1. Ciência e Tecnologia de Alimentos, v. 21,
n. 1, p. 20–25, 2001.
THANATUKSORN, P. et al. Effects of ball-milling on the glass transition of wheat flour
constituents. Journal of the Science of Food and Agriculture, v. 89, n. December 2008,
p. 430–435, 2009.
TILLEY, K.A. et al. Tyrosine cross-links : molecular basis of gluten structure and
function. Journal of Agriculture and Food Chemistry, v.49, p.2627–2632, 2001.
TOMIĆ, J. et al. Changes in the content of free sulphydryl groups during postharvest
wheat and flour maturation and their influence on technological quality. Journal of
Cereal Science, v. 58, n. 3, p. 495–501, 2013.
TRONSMO, K. M. et al. A Study of how Size Distribution of Gluten Proteins, Surface
Properties of Gluten and Dough Mixing Properties Relate to Baking Properties of Wheat
Flours. Journal of Cereal Science, v. 35, p. 201–214, 2002.
TRONSMO, K. M. et al. Relationships between gluten rheological properties and hearth
loaf characteristics. Cereal Chemistry, v. 80, n. 5, p. 575–586, 2003.
TUHUMURY, H. C. D.; SMALL, D. M.; DAY, L. The effect of sodium chloride on
gluten network formation and rheology. Journal of Cereal Science, v. 60, n. 1, p. 229–
237, 2014.
ULLSTEN, N.H. et al. Properties of extruded vital wheat gluten sheets with sodium
hydroxide and salicylic acid. Biomacromolecules, v.10, p.479–488, 2009.
UMBACH, S. L.; DAVIS, E. A.; GORDON, J. 13C NMR Spectroscopy of conventional
and microwave heated vital wheat gluten. Journal of Cereal Science, v. 28, n. 3, p. 233–
242, nov. 1998.
UTHAYAKUMARAN, S. et al. Effects of gliadin fractions on functional properties of
wheat dough depending on molecular size and hydrophobicity. Cereal Chemistry, v. 78,
n. 2, p. 138–141, 2001.
UTHAYAKUMARAN, S. et al. Relationships between traditional and fundamental
dough-testing methods. Cereal Research Communications, v. 42, n. 2, p. 282–292,

183
2014.
UTHAYAKUMARAN, S. et al. Small and large strain rheology of wheat gluten.
Rheologica Acta, v. 41, n. 1–2, p. 162–172, 2002.
VAN DEN BROECK, H. C. et al. A modified extraction protocol enables detection and
quantification of celiac disease-related gluten proteins from wheat. Journal of
chromatography. B, Analytical technologies in the biomedical and life sciences, v.
877, n. 10, p. 975–82, 1 abr. 2009.
VAN DER BORGHT, A. et al. Fractionation of wheat and wheat flour into starch and
gluten: overview of the main processes and the factors involved. Journal of Cereal
Science, v. 41, n. 3, p. 221–237, 2005.
VAN DER ZALM, E. E. J.; VAN DER GOOT, A. J.; BOOM, R. M. Quality of shear
fractionated wheat gluten – Comparison to commercial vital wheat gluten. Journal of
Cereal Science, v. 53, n. 2, p. 154–159, mar. 2011.
VERAVERBEKE, W. S.; DELCOUR, J. A. Wheat protein composition and properties of
wheat glutenin in relation to breadmaking functionality. Critical reviews in food science
and nutrition, v. 42, n. February 2014, p. 179–208, 2002.
VOJNOVICH, C. et al. Vital wheat gluten by drum drying. Cereal Chemistry, v. 37, p.
422–435, 1960.
WADHAWAN, C. K.; BUSHUK, W. Studies on vitality of commercial gluten. I.
Physical, chemical and technological characteristics. Cereal Chemistry, v. 66, n. 6, p.
456–461, 1989a.
WADHAWAN, C. K.; BUSHUK, W. Studies on vitality of commercial gluten. II.
Solubility fractionation, electrophoresis, and fluorescence results. Cereal Chemistry, v.
66, n. 6, p. 461–466, 1989b.
WALL, J. S. Disulfide bonds: determination, location, and influence on molecular
properties of proteins. Journal of agricultural and food chemistry, v. 19, n. 4, p. 619–
625, 1971.
WANG, C.; DAMODARAN, S. Thermal gelation of globular proteins: weight-average
molecular weight dependence of gel strength. Trends in Food Science & Technology, v.
38, n. 5, p. 1158–1164, 1990.
184
WANG, K.-Q. et al. Changes in chemical interactions and protein conformation during
heat-induced wheat gluten gel formation. Food Chemistry, v. 214, p. 393–399, 2017.
WANG, P. et al. Effect of frozen storage on physico-chemistry of wheat gluten proteins:
Studies on gluten-, glutenin- and gliadin-rich fractions. Food Hydrocolloids, v. 39, p.
187–194, 2014.
WANG, P.; JIN, Z.; XU, X. Physicochemical alterations of wheat gluten proteins upon
dough formation and frozen storage – A review from gluten, glutenin and gliadin
perspectives. Trends in Food Science & Technology, v. 46, n. 2, p. 189–198, 2015.
WANG, X. Y.; GUO, X. N.; ZHU, K. X. Polymerization of wheat gluten and the changes
of glutenin macropolymer (GMP) during the production of Chinese steamed bread. Food
Chemistry, v. 201, p. 275–283, 2016.
WEEGELS, P. L. et al. Depolymerisation and Re-polymerisation of Wheat Glutenin
During Dough Processing . I . Relationships between Glutenin Macropolymer Content
and Quality Parameters. Journal of Cereal Science, v. 23, p. 103–111, 1996.
WEEGELS, P. L. et al. Effects on gluten of heating at different moisture contents. II.
Changes in physico-chemical properties and secondary structure. Journal of Cereal
Science, v. 19, p. 39–47, 1994a.
WEEGELS, P. L. et al. Effects on gluten of heating at different moiture contents. I.
Changes in funcional properties. Journal of Cereal Science, v. 19, p. 31–38, 1994b.
WEEGELS, P. L.; MARSEILLE, J. P.; HAMER, R. J. Small Scale Separation. Starch, v.
40, n. 9, p. 342–346, 1988.
WELLNER, N. et al. Changes in Protein Secondary Structure during Gluten Deformation
Studied by Dynamic Fourier Transform Infrared Spectroscopy. Biomacromolecules, v. 6,
p. 255–261, 2005.
WELLNER, N. et al. Selected hofmeister anions on the secondary structure and dynamics
of wheat prolamins in gluten. Cereal Chemistry, v. 80, p.596-600. 2003.
WESOLOWSKA-TROJANOWSKA, M. et al. Rheological properties of gluten obtained
from polish wheat cultivars. Bulgarian Journal of Agricultural Science, v. 20, n. 5, p.
1221–1226, 2014.
WHITE, J. A; HART, R. J.; FRY, J. C. An evaluation of the Waters Pico-Tag system for
the amino-acid analysis of food materials. The Journal of automatic chemistry, v. 8, n.

185
4, p. 170–7, jan. 1986.
WIESER, H. Chemistry of gluten proteins. Food microbiology, v. 24, n. 2, p. 115–9, abr.
2007.
WIESER, H. Investigations on the extractability of gluten proteins from wheat bread in
comparison with flour. Zeitschrift für Lebensmitteluntersuchung und -Forschung, v.
207, p. 128–132, 1998.
WIESER, H.; KIEFFER, R. Correlations of the Amount of Gluten Protein Types to the
Technological Properties of Wheat Flours Determined on a Micro-scale. Journal of
Cereal Science, v. 34, p. 19–27, 2001.
XU, J.; BIETZ, J. A.; CARRIERE, C. J. Viscoelastic properties of wheat gliadin and
glutenin suspensions. Food Chemistry, v. 101, n. 3, p. 1025–1030, 2007.
ZHOU, Y. et al. Konjac glucomannan-induced changes in thiol/disulphide exchange and
gluten conformation upon dough mixing. Food chemistry, v. 143, p. 163–169, 15 jan.
2014.
ZHU, J.; KHAN, K. Quantative variation of HMW glutenin subunits from hard red spring
wheats grown in different environments. Cereal Chemistry, v.79, p.783-786, 2002.

186

187
ANEXOS
188
Anexo 1 - Autorização para uso do Artigo I
O Anexo 1 mostra a cópia do email do Editor Científico do Comprehensive Reviews of
Food Science and Food Safety.

189
Anexo 2 - Autorização para uso do Artigo IV
O Anexo 2 mostra o Copyright da LWT – Food Science and Technology.