Ver.CY16 June MS60 Experienced同軸レーザーポインター ライカ トータルステーションで好評のレーザーポインター搭載 水平& 上下で360度サーチします。

PESCA E ECOLOGIA DO TUBARÃO GALHA-BRANCA OCEÂNICO
(Carcharhinus longimanus, Poey 1861) NO ATLÂNTICO OESTE TROPICAL
MARIANA TRAVASSOS TOLOTTI
RECIFE
2011
UNIVERSIDADE FEDERAL DE PERNAMBUCO
CENTRO DE TECNOLOGIA E GEOCIÊNCIAS
DEPARTAMENTO DE OCEANPGRAFIA
PROGRAMA DE PÓS-GRADUAÇÃO EM OCEANOGRAFIA

Universidade Federal de Pernambuco
Centro De Tecnologia de Geociências
Departamento de Oceanografia
Programa de Pós-Graduação em Oceanografia
PESCA E ECOLOGIA DO TUBARÃO GALHA-BRANCA OCEÂNICO
(Carcharhinus longimanus, Poey 1861) NO ATLÂNTICO OESTE TROPICAL
Mariana Travassos Tolotti
Dissertação apresentada ao Programa
de Pós-Graduação em Oceanografia da
Universidade Federal de Pernambuco
(PPGO - UFPE), como um dos requisitos
para obtenção do título de Mestre em
Oceanografia, na área de Oceanografia
Biológica.
Orientador: Prof. Dr. Paulo Travassos
Recife
Fevereiro, 2011

Catalogação na fonte
Bibliotecário Marcos Aurélio Soares da Silva, CRB-4 / 1175
T653p Tolotti, Mariana Travassos.
Pesca e ecologia do tubarão galha-branca oceânico
(Carcharhinus longimanus, Poey 1861) no atlântico oeste
tropical / Mariana Travassos Tolotti. - Recife: O Autor, 2011.
46 folhas, il., gráfs., tabs.
Orientador: Prof. Dr. Paulo Travassos.
Dissertação (Mestrado) – Universidade Federal de
Pernambuco. CTG. Programa de Pós-Graduação em
Oceanografia, 2011.
Inclui Referências.
1. Oceanografia. 2.Tubarão Galha-Branca. 3.Carcharhinus
longimanus. 4.Telemetria por Satélite. I.Travassos, Paulo
(Orientador). II. Título.
UFPE
551.46 CDD (22. ed.) BCTG/2011-057


Keep walking…

Agradecimentos
À minha mãe Cristina e às minhas irmãzinhas Calu e Lili, por tudo que já
passamos juntas e pelo amor que nos faz a família mais feliz do mundo. Ao meu pai
Mauro e à minha querida tia Celéia, porque mesmo longe sempre estiveram pertinho
de mim. Ao meu vovô Tarcísio (in memorian) e a minha vovó Lúcia, por sempre me
motivarem a deixá-los cada vez mais orgulhosos. E a todas as pessoas da minha
família, que sempre me apoiaram e me deram o carinho que eu precisava.
Ao meu orientador e tio, professor Paulo Travassos, pela paciência e pela
confiança em mim depositada durante a realização desse mestrado, e por ter estado
ao meu lado em mais uma importante etapa da minha vida.
À professora Flávia Lucena Frédou, minha orientadora de coração, pelas
grandes contribuições e apoio durante a realização do trabalho.
Ao coordenador da Pós-graduação em Oceanografia Prof. Manoel Flores, e a
todos os funcionários do DOCEAN, em especial à secretária Myrna Lins, pela grande
ajuda prestada durante todas as etapas do meu mestrado.
Aos professores, Thierry Frédou, Humber Andrade, Fábio Hazin e Beatrice
Ferreira, por aceitarem o convite para compor a banca examinadora desta dissertação,
se disponibilizando a contribuir na melhoria do trabalho.
Ao programa de observador de bordo do Ministério de Pesca e Aqüicultura pelo
fornecimento dos dados, à Comunidade Européia pelo financiamento do projeto no
qual o presente trabalho está inserido, e ao Conselho Nacional de Desenvolvimento
Científico e Tecnológico (CNPq) pela concessão da bolsa de mestrado.
Ao meu marido, amigo e companheiro, Dráusio Véras, pela indispensável ajuda
na realização desse trabalho, principalmente na busca pelas referências bibliográficas,
nada como ter um serviço de Comut pessoal! E mais do que tudo, obrigada por fazer
parte da minha vida, te amo.
À minha querida Bridinha que desempenhou um papel fundamental durante a
redação dessa dissertação, sempre me fazendo companhia e me acalmando nos
momentos de angústia.
Aos meus queridos amigos de turma, Luciana Ferreira e Henrique Maranhão
por tornarem a minha vida de mestranda muito mais agradável. À Mariana Coxey e à
Catarina Wor por serem minhas amigas de todas as horas.
Aos meus amigos do LEMAR, Raul, Hudson, Eudes, Natália, Fernanda e Patrícia,
por me ajudarem sempre que precisei. Aos meus amigos dos laboratórios vizinhos,
Dani, Fê Lana, Lecca, Ilka e Paulinho, pelo carinho e apoio. E a todas as pessoas que
fazem ou fizeram parte da família LEMAR/LOP/LEP/LATEP.
Em especial, agradeço a Lucas Flores pelo excelente trabalho nas marcações
dos tubarões. A Bruno Mourato pela indispensável ajuda com a geolocalização das
marcas e as diversas contribuições para o trabalho. A Felipe Correia e a Bruno Macena
pelas sugestões e conselhos e pela disposição em me ajudar sempre que alguma
dúvida surgia. A todos vocês muito obrigada mesmo!

Resumo O objetivo geral do presente trabalho consistiu em agregar informações ao conhecimento sobre o tubarão galha-branca oceânico (Carcharhinus longimanus), principalmente no que se refere à sua distribuição, abundância relativa e preferências de habitat no Atlântico oeste tropical. Apesar de ser uma espécie muito capturada na pesca oceânica de atuns, informações sobre estes aspectos da biologia da espécie são escassas e até mesmo ausentes na literatura. No primeiro artigo, foram analisados dados de captura e esforço de 14.560 lançamentos de espinhel pelágico realizados por embarcações arrendadas da frota atuneira brasileira, nos anos de 2004 a 2009. A CPUE, expressa pelo número de tubarões capturados a cada mil anzóis, exibiu uma tendência de aumento gradual ao longo dos anos, variando de 0,04 em 2004 para 0,14 em 2007. Em 2008, entretanto, a CPUE sofreu um aumento considerável, chegando a 0,45 e em seguida caindo para 0,10 em 2009. A distribuição espacial da CPUE por ano e por trimestre mostrou que a área delimitada por 10°S e 20°S de latitude e por 030°W e 040°W de longitude concentrou os maiores valores. Embora o comprimento total tenha variado entre 50 e 320 cm, quase 80% dos indivíduos capturados eram menores que 180 cm, tamanho de primeira maturação publicado na literatura. A distribuição espacial dos comprimentos mostrou uma concentração de indivíduos maiores entre 020°W e 030°W e entre 05°S e 20°S. Outra área de concentração de indivíduos maiores parece estar presente ao norte de 5°N, entre estas mesmas longitudes. No segundo artigo, foram analisados dados referentes ao deslocamento horizontal e vertical, com ênfase nas preferências de temperaturas e profundidades de dois tubarões galha-branca marcados com marcas do tipo “pop-up satellite archival tag”. As marcações ocorreram no final de janeiro e início de fevereiro de 2010, sendo o primeiro galha-branca marcado uma fêmea de 135 cm de comprimento total e o segundo um macho de 152 cm. Os resultados mostraram que ambos os tubarões apresentaram uma nítida preferência pelas águas quentes e superficiais da camada de mistura, permanecendo pelo menos 95% do tempo em águas com temperaturas acima de 26,0°C e 86% nos primeiros 50 m. Não foram registrados mergulhos profundos, com a profundidade máxima de 128 m e a temperatura mínima foi 15,6°C. Apesar da distribuição vertical restrita, os dados indicaram que os dois tubarões realizaram migrações circadianas na coluna d’água, estando mais próximos da superfície durante o dia. Os locais de marcação e desprendimento das marcas não foram distantes um do outro, com a máxima distância percorrida sendo de 1.884 milhas náuticas. O deslocamento diário
variou de 12,86 a 20,94 milhas náuticas e a velocidade média de natação ( SE) variou
de 0,41 0,16 a 1,00 0,09 nós. Os movimentos verticais indicam migração no sentido leste-oeste.
Palavras chave: Abundância relativa, distribuição, CPUE, telemetria por satélite, movimentos horizontais, preferências térmicas e batimétricas.

Abstract The aim of this study was to add valuable information to the knowledge of the oceanic whitetip shark, especially with regard to its distribution, relative abundance and habitat preferences in the western tropical Atlantic Ocean. Despite of being a widely distributed and abundant species this kind of information is scarce or even absent in the literature. In the first article, catch and effort data from 14,560 longline sets carried out by the Brazilian chartered tuna longline fleet, from 2004 to 2009, were analyzed. The CPUE, expressed as the number of sharks caught per thousand hooks, exhibited a tendency to increase gradually over the years, ranging from 0.04 in 2004 to 0.14 in 2007. In 2008, however, the CPUE increased sharply, reaching 0.45 and then dropping back to 0.10 in 2009. The CPUE spatial distribution by year and quarters of the year showed that the area bounded by 10°S and 20°S of latitude and 030°W and 040°W of longitude concentrated the highest values. The majority of the oceanic withetip sharks caught by this fleet were under the size of first maturity. Although the total length ranged from 50 to 320 cm, almost 80% were under 180 cm (published size at first maturity). The spatial distribution showed a concentration of larger specimens from about 020°W to 030°W and from5°S to 20°S. Another area of concentration of larger specimens seems to be present to the north of 5°N, between the same longitudes. In the second article, data on horizontal movements and temperatures and depths experienced by two oceanic whitetip sharks tagged with pop-up satellite archival tags were analyzed. Tagging occurred in late January and early February of 2010, the first whitetip tagged was a female measuring 135 cm in total length and the second was male measuring 152 cm. Both sharks had a remarkable preference for warm and shallow waters of the mixed layer, spending at least 95% of the deployment period in waters with temperatures above 26.0°C and 86% in the first 50 m. Deep diving behavior was not registered. The maximum recorded depth was 128 m and the minimum temperature was 15.6°C. Despite their narrow depth distribution, both sharks performed diel vertical migrations. Tagging and pop-off sites were not far from each other and the maximum distance traveled was 1,884 nautical miles. Daily
displacement ranged from 12.86 to 20.94 nautical miles and mean swimming speed (
SE) ranged from 0.41 0.16 to 1.00 0.09 knots. The horizontal movements indicated a westward migration. Keywords: relative abundance, distribution, CPUE, satellite telemetry, horizontal movements, temperature and depth preferences.

Lista de tabelas
Artigo científico II
Table 1. Summary data of the two oceanic whitetip sharks tagged with pop-up satellite
archival tags in the western equatorial Atlantic Ocean. 31

Lista de figuras
Espécie estudada
Figura 1. Desenho esquemático do tubarão galha-branca oceânico, Carcharhinus
longimanus. Fonte: Last & Stevens, 1994. 15
Artigo científico I
Figure 1. Yearly total effort and mean CPUE of the oceanic whitetip shark, Carcharhinus
longimanus, caught by the Brazilian chartered tuna longline fleet, from 2004 to 2009, in
the equatorial and southwestern Atlantic Ocean.
18
Figure 2. Yearly distribution of the fishing effort (in number of hooks), of the Brazilian
chartered tuna longline fleet, from 2004 to 2009, in the equatorial and southwestern
Atlantic Ocean.
19
Figure 3. Quarterly distribution of the fishing effort (in number of hooks), of the Brazilian
chartered tuna longline fleet, from 2004 to 2009, in the equatorial and southwestern
Atlantic Ocean.
20
Figure 4. Yearly distribution of the CPUE of the oceanic whitetip shark, Carcharhinus
longimanus, caught by the Brazilian chartered tuna longline fleet, from 2004 to 2009, in
the equatorial and southwestern Atlantic Ocean. The crosses represent zero catch.
20
Figure 5. Quarterly distribution of the CPUE of the oceanic whitetip shark, Carcharhinus
longimanus, caught by the Brazilian chartered tuna longline fleet, from 2004 to 2009, in
the equatorial and southwestern Atlantic Ocean. The crosses represent zero catch.
21
Figure 6. Proportion of the oceanic whitetip shark, Carcharhinus longimanus, in total and
elasmobranch catches, of the Brazilian chartered tuna longline fleet, from 2004 to 2009,
in the equatorial and southwestern Atlantic Ocean.
22
Figure 7. Yearly number of chartered longline vessels, by flag, operating in the equatorial
and southwestern Atlantic Ocean, from 2004 to 2009. 23
Figure 8. Catch per Unit of Effort (CPUE), of the oceanic whitetip shark, Carcharhinus
longimanus, by flag, of the Brazilian chartered longline vessels, operating in the equatorial
and southwestern Atlantic Ocean, from 2004 to 2009 (SPA= Spain, PAN= Panama, MOR=
Morocco, ENG= United Kingdom (UK), HON= Honduras, and POR= Portugal).
23
Figure 9. Length-frequency distribution of the oceanic whitetip shark, Carcharhinus
longimanus, caught in the southwestern equatorial Atlantic Ocean, between 2005 and
2009.
24

Figure 10. Spatial distribution of males and females of the oceanic whitetip shark,
Carcharhinus longimanus, caught in the southwestern equatorial Atlantic Ocean, between
2005 and 2009.
25
Figure 11. Mean lengths, by 5o squares, of the oceanic whitetip shark, Carcharhinus
longimanus, caught in the southwestern equatorial Atlantic Ocean, between 2005 and
2009.
25
Artigo científico II
Figure 1. Tagging and pop-off positions of the two oceanic whitetip sharks tagged with
pop-up satellite archival tags in the western equatorial Atlantic Ocean. Crosses represent
tagging location, and circles, the pop-off location..
31
Figure 2. Most probable track for an oceanic whitetip shark (shark A) tagged in the
western equatorial Atlantic Ocean determined by Kalman Filter. Blue shaded area
represents the confidence intervals. The inverse triangle () indicates the begging of the
track and the open triangle () indicates the end.
32
Figure 3. Most probable track for an oceanic whitetip shark (shark B) tagged in the
western equatorial Atlantic Ocean determined by Kalman Filter. Blue shaded area
represents the confidence intervals. The inverse triangle () indicates the begging of the
track and the open triangle () indicates the end.
33
Figure 4. Minimum-maximum depths and water temperatures experienced by two
oceanic whitetip sharks in the western equatorial Atlantic Ocean (shark A: top, shark B:
bottom).
34
Figure 5. Depth and temperature distributions of two oceanic whitetip sharks tagged in
the western equatorial Atlantic Ocean. Mean frequencies ( SE) were determined using
all one hour histograms received from satellites (shark A: top, shark B: bottom).
35
Figure 6. Box plots showing the distribution of maximum depths in relation to day and
nighttime (top) and to each hour of the day (bottom) for two oceanic whitetip sharks
tagged in the western equatorial Atlantic Ocean. Whiskers indicate the 95% confidence
intervals, boxes represent the 25th and 75th quartiles, horizontal black lines indicate the
median and open circles are the outliers.
36
Figure 7. Vertical temperature profiles experienced by two oceanic whitetip sharks in the
western equatorial Atlantic Ocean (shark A: right, shark B: left). 37

Sumário Resumo
Abstract
Lista de tabelas
Lista de figuras
1. Introdução ............................................................................................................................... 12
2. Espécie estudada ..................................................................................................................... 14
3. Artigos científicos .................................................................................................................... 16
3.1. Artigo científico I: Size, distribution and relative abundance of the oceanic whitetip
shark caught by the Brazilian tuna longline fleet ................................................................ 16
Summary ................................................................................................................... 16
Introduction ............................................................................................................... 16
Material and methods ............................................................................................... 17
Results and discussion ............................................................................................... 18
Acknowledgments ..................................................................................................... 26
Literature cited .......................................................................................................... 26
3.2. Artigo científico II: Temperature and depth preferences and small-scale horizontal
movements of the oceanic whitetip shark in the western equatorial Atlantic Ocean ........ 28
Summary ................................................................................................................... 28
Introduction ............................................................................................................... 28
Material and methods ............................................................................................... 29
Results ....................................................................................................................... 31
Horizontal movements ........................................................................................ 31
Depth and temperature preferences ................................................................... 33
Discussion .................................................................................................................. 37
Acknowledgments .................................................................................................... 39
Literature cited .......................................................................................................... 39
4. Considerações finais ................................................................................................................ 43
5. Referências bibliográficas ....................................................................................................... 44

12
1. Introdução
Os Chondrichties formam um grupo relativamente pequeno, que inclui espécies
de tubarões, raias e quimeras. Atualmente, esse grupo contém aproximadamente
1.115 espécies descritas, das quais, 481 espécies pertencem a 101 gêneros e 30
famílias de tubarões (Compagno, 1990). Tubarões e raias pelágicos representam cerca
de 6% do total das espécies de elasmobrânquios existentes no mundo e dessas, apenas
64 habitam regiões oceânicas (Camhi et al., 2009). Os elasmobrânquios possuem um
ciclo de vida do tipo K-estrategista, caracterizado pelo crescimento lento, alta
longevidade, maturidade sexual tardia e baixa fecundidade (Hoenig e Gruber, 1990).
Em razão dessas características, os elasmobrânquios, apresentam uma baixa taxa de
crescimento populacional (Cortés, 2000) que os tornam muito mais vulneráveis à
sobrepesca, quando comparados aos peixes teleósteos (Musick et at., 2002;
Compagno et al., 2005).
De acordo com o Shark Specialist Group - SSG (1996), as populações de
elasmobrânquios estão sendo negativamente impactadas por um conjunto de
atividades humanas, encontrando-se, algumas delas, seriamente ameaçadas devido a:
1) estratégias de vida, referidas acima, que as tornam particularmente vulneráveis à
exploração, dificultando a sua recuperação quando em depleção; 2) rápido
crescimento de pescarias não regulamentadas nas quais as mesmas incidem tanto
como espécie-alvo quanto como fauna acompanhante; 3) altos índices de captura e
mortalidade; 4) estímulo à captura “incidental” e ao descarte, devido ao alto preço de
subprodutos, especialmente das barbatanas; 5) perda de zonas de berçário e outras
áreas costeiras críticas para o seu desenvolvimento; 6) degradação ambiental e
poluição. Segundo a mesma fonte, até as pescarias sujeitas a regimes de manejo são
ainda pouco compreendidas ou controladas. Em geral, há baixo esforço de pesquisa, as
espécies não são adequadamente identificadas e não há, em muitos casos, qualquer
registro de captura das espécies que compõem a fauna acompanhante.
Desde 1980, o número de elasmobrânquios desembarcados vem aumentando
significativamente, alcançando, na última década, uma taxa estimada de 5% ao ano
(Clarke, 2004), com uma produção atual em torno de 800.000 t (FAO, 2009). Dulvy et
al. (2008), avaliando a condição de populações de 21 espécies de tubarões e raias
oceânicos capturados regularmente por diferentes pescarias, concluiu que mais da
metade se encontrava ameaçada (52%), principalmente em razão das elevadas
mortalidades por pesca, associadas à uma completa ausência de medidas de manejo e
à freqüente baixa qualidade dos dados de captura.
Entre os métodos de pesca com maior incidência de elasmobrânquios inclui-se
a pesca de atuns e afins com espinhel. No Oceano Atlântico, essa pescaria se iniciou
em 1956, a partir de embarcações japonesas arrendadas, baseadas em Recife (Hazin et
al., 1990; Mazzoleni e Schwingel, 2002), de onde se desenvolveu para todo o Atlântico,

13
sendo atualmente praticada por diversos países, dentre os quais o Brasil. Embora, esta
pescaria seja direcionada à captura de atuns (Thunnus spp.) e do espadarte (Xiphias
gladius), um considerável montante de elasmobrânquios é capturado como fauna
acompanhante (Bonfil, 1994). Entre as principais espécies de fauna acompanhante
incluem-se os tubarões das famílias Carcharhinidae, Lamnidae, Alopidae e Sphyrnidae.
A família Carcharhinidae se destaca pelos altos índices de captura dos tubarões galha
branca oceânico (Carcharhinus longimanus), azul (Prionace glauca) e lombo preto
(Carcharhinus falciformis), que são consideradas as espécies de tubarões oceânicos
mais abundantes do globo (Compagno, 1984; Taniuchi, 1990; Bonfil, 1994).
A organização responsável pela avaliação e manejo dos estoques de tubarões e
raias oceânicos capturados em conjunção com a pesca de atuns e afins no Oceano
Atlântico, é a Comissão Internacional para a Conservação do Atum Atlântico (ICCAT-
International Commission for the Conservation of Atlantic Tunas). Criada em 1966, no
Rio de Janeiro, e constituída atualmente por quase 50 países, a ICCAT é hoje a maior
organização regional de ordenamento pesqueiro do mundo. Acompanhando a
tendência observada em outros fóruns internacionais, a ICCAT tem aumentado
substancialmente a atenção dispensada às questões relativas ao manejo e à
conservação dos tubarões. A primeira medida de ordenamento adotada pela Comissão
relativa a esse importante grupo zoológico foi a Resolução 95-2 (1995), a qual
incentivou os países membros a aportarem dados sobre os elasmobrânquios
capturados como fauna acompanhante. Desde então, além de monitorar a condição
dos estoques das principais espécies de tubarão capturadas, a ICCAT tem aprovado,
também, uma série de medidas de ordenamento pesqueiro voltadas à conservação,
incluindo, entre várias outras, a proibição, em 2004, da prática do descarte de
tubarões após a retirada das suas barbatanas (finning) (ICCAT Rec. 04-10). Tais
iniciativas têm sido amplamente apoiadas pelo Brasil, uma vez que o país foi um dos
primeiros em todo mundo a ter uma legislação no sentido de banir a prática do finning
já em 1998 (Portaria do IBAMA, Nº 121, de 24 de agosto de 1998). Recentemente, na
reunião da ICCAT ocorrida em Paris em novembro de 2010, uma recomendação
específica para o tubarão galha-branca foi aprovada (ICCAT Rec. 10-07), proibindo a
retenção a bordo, o transbordo, armazenamento e venda deste tubarão (inteiro ou
partes do corpo).
Dentre as espécies de tubarões citadas acima, o tubarão galha-branca oceânico
tem sido um grande alvo da prática do finning, principalmente devido ao alto valor das
suas longas e distintas nadadeiras (Camhi et al., 2009), constituindo-se tal prática um
motivo de grande preocupação mundial. Em decorrência da intensa pressão pesqueira
sofrida pela espécie, somada a escassez de informações acerca de seus aspectos
populacionais, o tubarão galha-branca oceânico teve sua classificação recentemente
modificada de baixo risco para vulnerável na Lista Vermelha da IUCN (Baum et al.,
2006). Poucas informações estão disponíveis para a espécie, principalmente no

14
Oceano Atlântico Sul, entre estas cita-se Lessa et al. (1999a e 1999b), Domingo et
al.(2007) e Coelho et al. (2009). A maior parte dessas informações está relacionada a
aspectos biológicos, tais como, morfometria, reprodução, idade e crescimento. No que
se refere à distribuição espacial, abundância relativa e preferências de habitat, as
informações são praticamente inexistentes.
Diante deste contexto, foram elaborados dois artigos científicos visando
contribuir para o enriquecimento do conhecimento sobre alguns aspectos ecológicos e
pesqueiros de tubarão galha branca oceânico no Atlântico Oeste Tropical. O primeiro
artigo teve como objetivo avaliar a distribuição, abundância relativa e a composição de
tamanhos das capturas da espécie, a partir da análise de dados provenientes da frota
atuneira brasileira. O segundo artigo teve como objetivo avaliar as preferências de
habitat do tubarão galha-branca oceânico, principalmente no que se refere às faixas de
profundidade e temperatura e aos seus movimentos verticais, através do uso de
marcas do tipo PSAT (pop-up satellite archival tags). Além de servirem para a
elaboração de futuros planos de manejo e conservação da espécie, espera-se que os
resultados gerados também contribuam para o fortalecimento da participação
brasileira no âmbito da ICCAT, a partir da proposição de medidas de conservação.
Neste sentido, a presente pesquisa, além de ecologicamente relevante, assume
também uma significativa importância política e sócio-econômica.
2. Espécie estudada
O tubarão galha-branca oceânico, Carcharhinus longimanus (Figura 1), é uma
espécie amplamente distribuída nas águas epipelágicas de regiões tropicais e
subtropicais (Compagno, 1984). É facilmente distinguida das outras espécies da família
Carcharhinidae por apresentar nadadeiras peitorais muito longas, largas e
arredondadas. Outra característica marcante é a presença de manchas esbranquiçadas
nas extremidades das suas nadadeiras. O tubarão galha-branca é considerado como
uma das espécies de tubarões pelágicos mais abundantes, juntamente com os
tubarões azul e lombo-preto (Prionace glauca e Carcharhinus falciformis) (Compagno,
1984; Taniuchi, 1990; Bonfil, 1994). A espécie é freqüentemente capturada nas
pescarias de atuns (Thunnus spp.) e espadarte (Xiphias gladius) com espinhel pelágico.
Os primeiros trabalhos a descreverem a distribuição, abundância, estrutura de
tamanhos, dieta, comportamento e reprodução da espécie foram realizados há mais
de 50 anos, na porção oeste de Atlântico Norte (Backus et al., 1956) e no Pacífico Leste
(Strasburg, 1958). Muitos anos se passaram até que mais informações acerca da
história natural do tubarão galha-branca oceânico se tornassem disponíveis (Saika e
Yoshimura, 1985), e apenas ao final da década de 90 é que dados do Atlântico Sul
começaram a ser publicados (Lessa et al., 1999a & 1999b). Recentemente, Domingo et

15
al. (2007) e Coelho et al. (2009) acrescentaram mais informações acerca da
distribuição, abundância relativa e biologia reprodutiva da espécie no Atlântico Sul.
Figura 1. Desenho esquemático do tubarão galha-branca oceânico, Carcharhinus longimanus
(Fonte: Last & Stevens, 1994.).
O tubarão galha-branca oceânico é um predador de topo de cadeia, que se
alimenta principalmente de teleósteos e cefalópodes oceânicos. Na sua dieta são
comuns diversas espécies da família Scombridae e Carangidae, assim como peixe-
espada, barracuda e dourado (Backus et al., 1956; Compagno, 1984). Assim como os
outros representantes da família Carcharhinidae, o galha-branca oceânico é vivíparo
placentário, com tamanhos de primeira maturação estimados variando entre 168 e
196 cm de comprimento total (Saika e Yoshimura, 1985; Seki et al., 1998; Lessa et al.
1999; Coelho et al., 2009). A espécie apresenta um crescimento moderado e atinge o
tamanho de primeira maturação com cerca de 6 a 7 anos de idade (Seki et al., 1998;
Lessa et al. 1999a). Os tamanhos máximos reportados indicam que o tubarão galha-
branca oceânico pode chegar a 300 cm ou mais (Compagno, 1984).

16
3. Artigos científicos
3.1. Artigo científico I
SIZE, DISTRIBUTION AND CATCH RATES OF THE OCEANIC WHITETIP SHARK CAUGHT BY THE BRAZILIAN TUNA LONGLINE FLEET
SUMMARY
Catch and effort data from 14,560 longline sets carried out by the Brazilian chartered
tuna longline fleet, from 2004 to 2009, were analyzed aiming at assessing the size,
distribution and the relative abundance of the oceanic whitetip shark (Carcharhinus
longimanus) in the southwestern and equatorial Atlantic Ocean. For the spatial
analyzes, all data were grouped into 5° x 5° squares. The CPUE for the oceanic whitetip
shark exhibited a gradual increase, from 0.04, in 2004, the first year of the time series,
up to 0.14, in 2007. In 2008, however, the CPUE increased sharply, reaching 0.45,
dropping, then, back to 0.10, in 2009. The spatial distribution of the CPUE by quarters
of the year and by year (quarters combined) showed that the square bounded by 10°S
and 20°S and by 030°W and 040°W concentrated the highest values for the species. The
majority of the oceanic withetip sharks caught by this fleet were under the size of first
maturity. Although the total length ranged from 50 to 320 cm, almost 80% were under
180 cm (published size at first maturity). The spatial distribution showed a
concentration of larger specimens from about 020°W to 030°W and from 5°S to 20°S.
Another area of concentration of larger specimens seems to be present to the north of
5oN, between the same longitudes.
KEYWORDS
CPUE, Carcharhinus longimanus, distribution, size
Introduction
The oceanic whitetip shark, Carcharhinus longimanus, is widely distributed in
tropical and subtropical epipelagic waters of all oceans (Compagno, 1990). It is easily
distinguishable from the other species of the Carcharhinidae family by the round shape
of its long pectoral and dorsal fins, as well as by the white stains in their margins. The
species is considered to be one of the three most abundant pelagic sharks, together
with the blue and silky sharks (Prionace glauca and Carcharhinus falciformis)
(Compagno, 1984; Taniuchi, 1990; Bonfil, 1994).
The oceanic whitetip shark is frequently caught by pelagic longline fisheries
targeting tuna and swordfish, all over the world. Due to the great increase of the

17
fishing pressure on its stocks in the past decades, the species has been classified, since
2006, as vulnerable by the IUCN Red List of Threatened Species (Baum et al., 2006).
Despite the great ecological importance of the oceanic whitetip shark and its
high vulnerability, only little information is available on the species, especially in the
South Atlantic Ocean (Lessa et al., 1999a & 1999b; Domingo et al., 2007; Coelho et al.,
2009). Besides, most of the information available is related to biological aspects
(morphometry, reproduction, age and growth), with very little being yet known in
relation to its spatial distribution and relative abundance.
Therefore, in the present study, data from the Brazilian tuna longline fleet were
analyzed, aiming at assessing the distribution, catch rates and size composition of the
oceanic whitetip shark in the southwestern and equatorial Atlantic Ocean.
Material and methods
Catch and effort data from 14,560 longline sets carried out by the Brazilian
chartered tuna longline fleet, from 2004 to 2009, were analyzed. The longline sets
were distributed in a wide area of the equatorial and southwestern Atlantic Ocean,
ranging from 10°N to 35°S of latitude and from 007°E to 045°W of longitude. Data
were obtained from the logbooks filled out by on-board observers of the National
Observer Program. The logbook contained information on the number of hooks, the
number of fish caught, by species, and the geographic position at the beginning of
each set.
The National Observer Program aims to collect precise information on fishery
strategy, catch composition and biological data of chartered foreign vessels, mainly the
ones that are based on ports of northeast Brazil. The program covers approximately
30% of the whole Brazilian longline fleet and almost 60% of the fleet based on the
northeast. This data series was chosen due to its known accuracy, especially when
compared with the logbooks filled out by the fishermen (Travassos, unpublished data).
Catch per unit of effort (CPUE) was calculated as the number of sharks/1,000
hooks by year and by quarters (years combined). For the spatial distribution of the
CPUE the catch and effort data were grouped into 5°x5° squares of latitude and
longitude. In this case, the CPUE was calculated by the sum of all catch and all effort in
each square.
From 2005 on, additional data on sex, total length (TL), fork length (FL) and
inter-dorsal (ID) length begun also to be collected. All lengths were obtained by laying
the fish on the deck and measuring it in a straight line. Whenever the TL was not
available, the FL and the ID were converted to TL by the following equations,

18
calculated with the available data: CT= 1.1348 FL + 12.537 and CT= 3.4221 ID + 27.396.
A total of 1,612 individuals were measured, representing 68% of the oceanic whitetip
sharks caught (2,353). Of these, 1,218 were sexed. For the spatial analysis, the mean
length was calculated for each 5°x5° square. Squares in which the number of fish
measured was smaller than five were excluded from the spatial analysis.
Results and discussion
The fishing effort peaked in 2005, when about 8 million hooks were deployed,
almost the double from the previous year. From 2005 on, the number of hooks
exhibited a declining trend, until 2009, last year included in the series, when about
only 1 million hooks were used (Figure 1). The spatial distribution of the fishing effort
also varied throughout the period, with 2005 showing the greatest spatial coverage,
naturally due to the higher number of hooks deployed that year (Figure 2).
Figure 1. Yearly total effort and mean CPUE of the oceanic whitetip shark, Carcharhinus longimanus, caught by the Brazilian chartered tuna longline fleet, from 2004 to 2009, in the equatorial and southwestern Atlantic Ocean.
The area with the greatest concentration of effort was located between the
latitudes of 5°N and 5°S (Figures 2 and 3). Oceanic islands, such as the Archipelago of
Saint Peter and Saint Paul, Fernando de Noronha Island and Rocas Atoll, as well as
several seamounts, pertaining to the North Brazil Chain and to the Fernando de
Noronha Chain, present in that area, are considered to be important fishing grounds
for tuna and tuna-like species off northeast Brazil (Hazin, 1993). Moreover, that
important fishing ground is located at a rather short distance from the ports where the
longliners are based (Natal - Rio Grande do Norte, Recife - Pernambuco and Cabedelo -
Paraiba). Another important fishing area is located further south, near the seamounts
and islands of the Vitoria-Trindade Chain (Figures 2 and 3).
0
0.1
0.2
0.3
0.4
0.5
0
2000
4000
6000
8000
10000
2004 2005 2006 2007 2008 2009
CP
UE
(1
00
0 h
oo
ks
)
Eff
ort
(1
00
0 h
oo
ks
) effort
cpue

19
The catch per unit of effort (CPUE) for the oceanic whitetip shark exhibited a
gradual increase, from 0.04 sharks/1000 hooks, in 2004, the first year of the time
series, up to 0.14, in 2007 (Figure 1). In 2008, however, the CPUE increased sharply,
reaching 0.45, dropping, then, back to 0.10, in 2009.
The spatial distribution of the CPUE by year (Figure 4) shows that, in 2004, the
number of zero catches was very high, with positive catches being only recorded
between the latitudes of 10°N and 5°S, and values ranging from 0.01 to 0.08
sharks/1000 hooks. From 2005 on, positive catches were recorded more southward
(up to 30°S) and eastward (up to 0o), than in 2004. High CPUE values (> 0.58), from
2005 to 2007, were recorded in the square from 10°S to 20°S and from 30°W to 40°W,
with the only exception of a high value also recorded in 2006, close to the African
coast (0-5oN; 10o- 15oW). In 2008, the year with the highest mean CPUE (0.45), the
area with the highest catch rates was expanded northwestward, extending from 5oS to
20oS and from 25oW to 40oW. During that year, catches of the oceanic whitetip shark
were recorded in almost all 5o squares where there was effort. In 2009, the 5o square
mean CPUE values became generally low again, with none being above 0.28, and
several squares exhibiting no catch. Domingo et al. (2007), analyzing data from the
Uruguayan longline fleet, found the highest CPUE (0.49 sharks/ 1,000 hooks) for the
species in an area close to the one which showed the highest CPUE in the present
study (around 20oS/ 35oW). Except from an apparent trend for the oceanic whitetip
shark to move away from the Brazilian southeast coast in the fourth quarter of the
year, the CPUE distribution by quarters (Figure 5) showed no clear pattern of seasonal
change.
Figure 2. Yearly distribution of the fishing effort (in number of hooks), of the Brazilian chartered tuna longline fleet, from 2004 to 2009, in the equatorial and southwestern Atlantic Ocean.
-60 -50 -40 -30 -20 -10 0 10
-50
-40
-30
-20
-10
0
10
20
-60 -50 -40 -30 -20 -10 0 10-50
-40
-30
-20
-10
0
10
20
-60 -50 -40 -30 -20 -10 0 10
-50
-40
-30
-20
-10
0
10
20
-60 -50 -40 -30 -20 -10 0 10-50
-40
-30
-20
-10
0
10
20
-60 -50 -40 -30 -20 -10 0 10-50
-40
-30
-20
-10
0
10
20
2004 2005 2006
2007 2008
-60 -50 -40 -30 -20 -10 0 10
-50
-40
-30
-20
-10
0
10
20
2009
935 to 5000
5000 to 15000
15000 to 55000
55000 to 75000
75000 to 115000
115000 to 315000
315000 to 2403000

20
Figure 3. Quarterly distribution of the fishing effort (in number of hooks), of the Brazilian chartered tuna longline fleet, from 2004 to 2009, in the equatorial and southwestern Atlantic Ocean.
Figure 4. Yearly distribution of the CPUE of the oceanic whitetip shark, Carcharhinus longimanus, caught by the Brazilian chartered tuna longline fleet, from 2004 to 2009, in the equatorial and southwestern Atlantic Ocean. The crosses represent zero catch.
-60 -50 -40 -30 -20 -10 0 10
-50
-40
-30
-20
-10
0
10
20
-60 -50 -40 -30 -20 -10 0 10
-50
-40
-30
-20
-10
0
10
20
-60 -50 -40 -30 -20 -10 0 10
-50
-40
-30
-20
-10
0
10
20
-60 -50 -40 -30 -20 -10 0 10
-50
-40
-30
-20
-10
0
10
20
0 10 20 1st 2nd
3rd 4th
924 to 5000
5000 to 10000
10000 to 15000
15000 to 35000
35000 to 75000
75000 to 115000
115000 to 1258000
-60 -50 -40 -30 -20 -10 0 10-50
-40
-30
-20
-10
0
10
20
-60 -50 -40 -30 -20 -10 0 10-50
-40
-30
-20
-10
0
10
20
-60 -50 -40 -30 -20 -10 0 10-50
-40
-30
-20
-10
0
10
20
-60 -50 -40 -30 -20 -10 0 10
-50
-40
-30
-20
-10
0
10
20
-60 -50 -40 -30 -20 -10 0 10
-50
-40
-30
-20
-10
0
10
20
2004 2005 2006
2007 2008
-60 -50 -40 -30 -20 -10 0 10-50
-40
-30
-20
-10
0
10
20
2009
0.01 to 0.04
0.04 to 0.08
0.08 to 0.28
0.28 to 0.58
0.58 to 1.48

21
Figure 5. Quarterly distribution of the CPUE of the oceanic whitetip shark, Carcharhinus longimanus, caught by the Brazilian chartered tuna longline fleet, from 2004 to 2009, in the equatorial and southwestern Atlantic Ocean. The crosses represent zero catch.
The proportion of the oceanic whitetip shark in relation to the total catch and
in relation to the catches of elasmobranches were very low (Figure 6), equaling 0.3%
and 2.8%, respectively. The oceanic whitetip shark yearly proportion of the total catch
did not exceed 0.4%, except for 2008, when it reached 1.4%. Its proportion in relation
to the elasmobranch catches also showed a peak of 8.2% in 2008. In the remaining
years this proportion ranged from 0.8% to 3.4%. These values are much lower than
those observed by Lessa et al. (1999a), in an experimental survey of pelagic fishes
conducted between 1992 and 1997 in the southwestern equatorial Atlantic, where the
whitetip catches represented almost 30% of all elasmobranchs, being the second most
abundant shark, outnumbered only by the blue shark (Prionace glauca).
The results, however, are not comparable, due to the significant differences in
the fishing gear and methods used by the experimental and the commercial
operations, the first ones having operated in much shallower layers, where the species
is known to be much frequently caught (Nakano et al., 1997). More recent results,
obtained with the use of PSAT tags (Pop-up satellite archival tags), have confirmed that
this species is closely associated to the surface (Tolotti et al., unpublished data).
-60 -50 -40 -30 -20 -10 0 10
-50
-40
-30
-20
-10
0
10
20
-60 -50 -40 -30 -20 -10 0 10
-50
-40
-30
-20
-10
0
10
20
-60 -50 -40 -30 -20 -10 0 10-50
-40
-30
-20
-10
0
10
20
-60 -50 -40 -30 -20 -10 0 10
-50
-40
-30
-20
-10
0
10
20
0 10 20 1st 2nd
3rd 4th
0.01 to 0.05
0.05 to 0.15
0.15 to 0.35
0.35 to 0.55
0.55 to 0.85
0.85 to 1.45

22
Besides the depth of fishing, there are several other factors that may directly
influence the catchability of a fish species in the longline fishery, thus altering the
relationship between its catch rate (CPUE) and its actual abundance. Hazin et al.
(1998), for instance, described marked fluctuations in the CPUE of several species,
including the oceanic whitetip shark, over a period of many years, due to modifications
in fishing strategy, such as changes on target species, discovery of new fishing grounds
and introduction of new fishing technologies. Burgess et al. (2005), in turn, reported
that the material of the branch line (nylon or steel), as well as the size, type and depth
of the hook, can greatly influence the catchability of shark species. They also indicated
that market changes may modify the target species of the fishery, directly interfering,
therefore, in the catchability of the species caught.
Figure 6. Proportion of the oceanic whitetip shark, Carcharhinus longimanus, in total and elasmobranch catches, of the Brazilian chartered tuna longline fleet, from 2004 to 2009, in the equatorial and southwestern Atlantic Ocean.
In the present case, as well, the changes of CPUE over the years can probably
be explained, at least in part, by changes in fishing strategies, especially related to
longline configuration of different flags that were active during the study period. The
most representative flags from 2004 to 2009 were Panama, Spain and Morocco, the
late also fishing with Spanish technology. Over the studied years there was a great
variation in the number of vessels by flag, with a predominance of Panamanian boats
in the first three years (2004 to 2006), and of vessels with Spanish technology in the
last three (2007 to 2009) (Figure 7). The annual mean CPUE of the oceanic whitetip
shark by flag (Figure 8), on the other hand, clearly shows much lower values for the UK
(ENG), Portugal (POR) and Panama (PAN) flagged vessels, than for those flying Spanish
0
2
4
6
8
10
2004 2005 2006 2007 2008 2009
Pro
po
rtio
n o
f th
e o
cean
ic w
hit
eti
p s
hark
(%
)
Year
in total catch in elasmobranch catch
0.3%
87.3%
12.4%
Oceanic whitetip shark
Total catch
Elasmobranch catch

23
(SPA), Honduran (HON) and Moroccan (MOR) flags, and therefore the changes in the
yearly mean CPUE throughout the period might very well merely reflect the changes in
fleet composition. Even if that is the case, however, the change in the proportion of
fishing effort from different fleets would not be sufficient to explain the sharp increase
observed in 2008, which resulted mainly from the sign coming from the Spanish fleet
(Figure 8). The reasons for such anomaly, however, could not be identified in the
present work, and might be related to operational, biological or ecological factors.
Figure 7. Yearly number of chartered longline vessels, by flag, operating in the equatorial and southwestern Atlantic Ocean, from 2004 to 2009.
Figure 8. Catch per Unit of Effort (CPUE), of the oceanic whitetip shark, Carcharhinus longimanus, by flag, of the Brazilian chartered longline vessels, operating in the equatorial and southwestern Atlantic Ocean, from 2004 to 2009 (SPA= Spain, PAN= Panama, MOR= Morocco, ENG= United Kingdom (UK), HON= Honduras, and POR= Portugal).
0
5
10
15
20
25
30
35
2004 2005 2006 2007 2008 2009
Nu
mb
er o
f ve
ss
els
Year
SPA PAN MOR ENG HON POR
0
0.1
0.2
0.3
0.4
0.5
0.6
2004 2005 2006 2007 2008 2009
CP
UE
(n
um
be
r o
f s
ha
rks
/10
00
ho
ok
s)
Year
SPA
PAN
MOR
ENG
HON
POR

24
The total length of the 1,612 individuals measured ranged from 50 to 320 cm,
in males, and from 50 to 311 cm, in females. The majority of males and females lied
between 100 and 180 cm TL (Figure 9), with 78% having less than 180 cm and being,
thus, probably juvenile according to Lessa et al. (1999b). Of the 1,218 specimens
sexed, 653 were female and 565 were male, resulting in a sex ratio very close to 1:1
(1:0.86, female: male). These values were very close to those found by other studies
carried out in the same area (Lessa et al., 1999a & 1999b; Asano et al., 2004; García-
Cortéz & Mejuto, 2002; Coelho et al., 2009).
Lessa et al. (1999b) suggested, based on a small individual caught with fresh
umbilical scars, that the size at birth is around 70 cm TL. Coelho et al. (2009) found
near-term embryos measuring 52 cm, and therefore hypothesized that the size at birth
should be around 55 and 65 cm, as proposed by Compagno (1984). The three
individuals measuring 50 cm TL found in the present work, however, indicate that the
size at birth might be smaller than previously reported.
Figure 9. Length-frequency distribution of the oceanic whitetip shark, Carcharhinus longimanus, caught in the southwestern equatorial Atlantic Ocean, between 2005 and 2009.
Former studies indicated that a geographical segregation by sex may occur for
the oceanic whitetip shark (Backus et al., 1956; Strasburg, 1958). In the present study,
however, no evidence has been found of a spatial segregation by sex (Figure 10).
Coelho et al. (2009) suggested that the high percentage of small individuals in the
southwestern equatorial Atlantic, also found in the present work, may indicate a
segregation by size in the Atlantic Ocean. Alternatively, Lessa et al. (1999)
hypothesized that the large proportion of juveniles might be a result of the continuous
fishing pressure on the entire population. In order to clarify this matter, however, data
0
5
10
15
20
25
50 70 90 110 130 150 170 190 210 230 250 270 290 310 330
Fre
qu
en
cy
(%
)
Total length (cm)
Male (n = 565) Female (n = 653)
n = 1218

25
from a much longer time series and a much broader geographical coverage of the
Atlantic Ocean are necessary.
The spatial distribution of the 5° square mean lengths (Figure 11) shows a
concentration of larger specimens from about 020°W to 030°W and from 5°S to 20°S.
Another area of concentration of larger specimens seems to be present to the north of
5°N, between the same longitudes.
Figure 10. Spatial distribution of males and females of the oceanic whitetip shark, Carcharhinus longimanus, caught in the southwestern equatorial Atlantic Ocean, between 2005 and 2009.
Figure 11. Mean lengths, by 5o squares, of the oceanic whitetip shark, Carcharhinus longimanus, caught in
the southwestern equatorial Atlantic Ocean, between 2005 and 2009.
-50 -40 -30 -20 -10
-30
-20
-10
0
10
-50 -40 -30 -20 -10
-30
-20
-10
0
10
FemaleMale
-50 -40 -30 -20 -10
-30
-20
-10
0
10
-50 -40 -30 -20 -10
-30
-20
-10
0
10
100 to 115
115 to 130
130 to 145
145 to 160
160 to 175

26
This study has shown that the catch rates of the oceanic whitetip shark are very
sensitive to changes in fishing strategy and gear, especially to those related with hook
depth. It is also clear that the largest part of the specimens of this species caught in the
southwestern equatorial Atlantic is composed of juveniles. These results indicate that
conservation measures, such as adoption of a minimum size of capture to protect
juveniles or even prohibition of onboard retention, should be applied to ensure the
sustainability of the oceanic whitetip shark exploited in the Atlantic Ocean.
Acknowledgments
This work was made possible by the Ministry of Fisheries and Aquaculture of Brazil.
The authors would also like to acknowledge the Conselho Nacional de
Desenvolvimento Científico e Tecnológico (CNPq) for providing a scholarship to M.T.
Tolotti.
Literature cited
ASANO-FILHO, M.; HOLANDA, F.; SANTOS, F.; LUCENA F.; PANTALEÃO, G. 2004. A short note on the catch composition and weight-length relationship of tunas, billfishes and sharks of north Brazil. Brazilian Journal of Oceanography, 52(3/4):249-253.
BACKUS, R.H., SPRINGER S.; ARNOLD JR, E.L. 1956. A contribution to the natural history of the
white-tip shark, Pterolamiops longimanus (Poey). Deep-Sea Res. 3:178-188.
BAUM, J.; MEDINA, E.; MUSICK, J.A.; SMALE, M. 2006. Carcharhinus longimanus. In: 2007 IUCN
Red List of Threatened Species. <www.iucnredlist.org>. Downloaded on 28 August 2008.
BONFIL, R. 1994. Overview of world elasmobranch fisheries. FAO Fisheries Technical Paper, v.
341, 119p.
BURGESS, G.H.; BEERKIRCHER, L.W.; CAILLIET, G.M.; CARLSON, J.K.; CORTES, E.; GOLDMAN,
K.J.; GRUBBS, R.D.; MUSICK, J.A.; MUSYL, M.K.; SIMPFENDORFER, C.A. 2005. Is the collapse of
shark populations in the northwest Atlantic Ocean and Gulf of Mexico real? Fisheries 30:10.
COELHO, R.; HAZIN, F.H.V.; REGO, M.; TAMBOURGI, M.; OLIVEIRA, P.; TRAVASSOS, P.;
CARVALHO, F.; BURGESS, G. 2009. Notes On The Reproduction Of The Oceanic Whitetip Shark,
Carcharhinus Longimanus, In The Southwestern Equatorial Atlantic Ocean. Col. Vol. Sci. Pap.
ICCAT, 64 (5): 1734-1740.
COMPAGNO, L.J.V. 1984. FAO species catalogue. Sharks of the world: An annotated and
illustrated catalogue of shark species known to date. FAO Fish. Synop., v. 4(125).

27
DOMINGO, A.; MILLER, P.; FORSELLEDO, R.; PONS, M.; BERRONDO, L. 2007. Abundancia del
tiburon loco (Carcharhinus longimanus) en el Atlantico Sur. Col. Vol. Sci. Pap. ICCAT, 60(2):
561-565.
COMPAGNO, L.J.V. 1990. Shark exploitation and conservation. In: Elasmobranch as living
resources: Advances in the biology, ecology, systematics, and the status of the fisheries, (ed)
Pratt, H.L.; Gruber S.H.; Taniuchi T. NOAA Technical Report.
GARCÍA-CORTÉZ. B. & J. MEJUTO. 2002. Size-weight relationships of the Swordfish (Xiphias
gladius) and several pelagic shark species caught in the Spanish surface longline fishery in the
Atlantic, Indian and Pacific Oceans. Col. Vol. Sci. Pap. ICCAT, 54 (4): 1132-1149.
HAZIN, F.H.V., 1993. Fisheries oceanographical study on tuna, billfishes and sharks in the
southwestern equatorial Atlantic Ocean. PhD theses Tokyo Univ. of Fisheries, Tokyo, 286 p.
HAZIN, F.H.V.; J.R. ZAGAGLIA; M.K. BROADHURST; P. TRAVASSOS; T.R.Q. BEZERRA, 1998.
Review of a small scale pelagic longline fishery of Northeastern Brazil. Marine Fisheries Review,
6(3):1-8.
LESSA, R., SANTANA, F.M.; PAGLERANI, R. 1999a. Age, growth and stock structure of the
oceanic whitetip shark, Carcharhinus longimanus (Carcharhinidae), of North-Eastern Brazil.
Cybium, 23(4):353-368.
LESSA, R., PAGLERANI, R.; SANTANA, F.M. 1999b. Biology and morphometry of the oceanic
whitetip shark, Carcharhinus longimanus, from the southwestern equatorial Atlantic. Fish.
Res., 42:21-30.
NAKANO, H.; OKAZAKI, M.; OKAMOTO, H. 1997. Analysis of catch depth by species for tuna
longline fishery based on catch by branch lines. Bull. Nat. Res. Inst. Far Seas Fish. 34: 43-62.
STRASBURG, D.W. 1958. Distribution, abundance, and habits of pelagic sharks in the Central
Pacific Ocean. Fishery Bulletin, v. 58(138): 335-361.
TANIUCHI, T. 1990. The role of elasmobranchs in Japanese fisheries. In: Elasmobranchs as living
resources: advances in the biology, ecology, systematics, and the status of the fisheries. (Ed)
Pratt, H.L.; Gruber S.H.; Taniuchi T. NOAA Technical Report NMFS, v. 90: 415–426p.

28
3.2. Artigo científico II
TEMPERATURE AND DEPTH PREFERENCES AND SMALL-SCALE
HORIZONTAL MOVEMENTS OF THE OCEANIC WHITETIP SHARK IN THE
WESTERN EQUATORIAL ATLANTIC OCEAN
SUMMARY
The objective of this study was to generate information on depth and temperature
preferences and horizontal movements of the oceanic whitetip shark (Carcharhinus
longimanus) in the western equatorial Atlantic Ocean. To that aim two sharks were
tagged with pop-up satellite archival tags during a fishing trip of a commercial fishing
boat from the Brazilian tuna longline fleet in the beginning of 2010. The first shark
tagged was a female measuring 135 cm TL and the second one was a male measuring
152 cm TL. Both sharks had a remarkable preference for warm and shallow waters of
the mixed layer, spending at least 95% of the deployment period in waters with
temperatures above 26.0°C and 86% in the first 50 m. Deep diving behavior was not
registered. The maximum recorded depth was 128 m and the minimum temperature
was 15.6°C. Despite their narrow depth distribution, both sharks performed diel vertical
migrations. Tagging and pop-off sites were not far from each other and the maximum
distance traveled was 1,884 nautical miles. Daily displacement ranged from 12.86 to
20.94 nautical miles and mean swimming speed ( SE) ranged from 0.41 0.16 to 1.00
0.09 knots. The horizontal movements indicated a westward migration.
KEYWORDS
Pop-up satellite archival tag, diel vertical movements, migration
Introduction
The oceanic whitetip shark (Carcharhinus longimanus) is a circumtropical
species known as one of the most abundant pelagic sharks worldwide (Compagno,
1984; Bonfil et al., 2008), being frequently caught by pelagic longline fisheries targeting
tuna and swordfish. Bonfil (1994) estimated that 7,253 oceanic whitetip sharks (about
145 t) were taken annually as incidental catch in the North Pacific and another 539,946
individuals (about 10,800 t) were taken in the central and South Pacific. For the
Atlantic and Indian Oceans it was not possible to estimate annual caches due to
insufficient amount of data and high expected variation in catch rates.

29
Despite its worldwide distribution and frequent catches in most of the high-
seas fisheries little has been published on the species biology and ecology. Some
general studies, including data on distribution, abundance, size structure, diet,
reproduction and behavior of the oceanic whitetip shark were conducted in the
western North Atlantic and in the eastern Pacific Ocean, more than fifty years ago
(Strasburg, 1958; Backus et al., 1956). Since then, however, very little was added to the
knowledge on the species until the past decade when new data from the South
Atlantic was published by Lessa et al. (1999a & 1999b), Domingo, et al. (2007) and
Coelho et al. (2009). Except for assumptions made on the basis of fisheries data and
conventional tagging programs (Backus et al., 1956; Strasburg, 1958; Kohler et al.,
1998), information regarding oceanic whitetip migration, vertical movements and
temperature preferences are still almost inexistent.
The use of electronic tags has recently added valuable information on the
species depth and temperature preferences in the Pacific Ocean, although these
results were not yet published and have only been cited in other scientific publications
(Burgess et al., 2005; Bernal et al., 2009). Electronic tags allow the remote monitoring
of fishes and other marine species, making it possible to study the species behavior,
habitat preferences and movement patterns (Nelson, 1990).
During the past decades, this kind of tags underwent major technological
improvements, among which the development of pop-up satellite archival tags (PSAT)
stands out (Block et al., 2001). PSATs were developed in the mid 90’s, especially for
tracking large marine species (Arnold & Dewar, 2001; Gunn & Block, 2001), and have
been successfully used in a great variety of pelagic species, including tunas (Block et
al., 1998, 2001; Lutcavage et al., 1999; Sibert et al., 2003; Teo et al., 2007), billfishes
(Graves et al., 2002; Kerstetter et al., 2003; Goodyear et al., 2006), and sharks (Sims et
al., 2003; Bonfil et al., 2005; Weng et al., 2005; Stokesbury et al., 2005).
In this context, the present work intends to generate information on the
oceanic whitetip shark habitat preferences, regarding depth distribution, temperature
ranges and horizontal movements, in the western equatorial Atlantic Ocean, through
the use of pop-up satellite archival tags.
Material and methods
Two oceanic whitetip sharks, caught on sets done by a commercial fishing boat
of the Brazilian tuna longline fleet operating off the Northeast cost of Brazil, were
tagged with pop-up satellite archival tags (PAT tag version MK 10, Wildlife Computers).
The Mk10 PATs collect data on water temperature, pressure (depth) and ambient light
level (for estimation of geolocations). Temperature and depth resolutions are 0.05°C
and 0.5 m, respectively. Tags were set to collect data at 10 seconds intervals

30
throughout the deployment period, summarized into one hour histograms of 14 bins.
Circle hooks were used to increase the chances of post release survival. Sharks were
brought on board for body length measurement and tagging, for no longer than five
minutes prior to release. Tags were attached through a fin loop of polyamide
monofilament (2.0 mm) coated with a silicon tube to minimize friction damage.
Tagging locations were recorded by using the vessel’s global positioning system.
The first oceanic whitetip shark tagged (A) was a female, measuring 135 cm
total length (TL), while the second (B) was a male, measuring 152 cm TL. The female
specimen was tagged on January 29, 2010, and the tag started transmitting after 60
days of deployment, as scheduled. The second tagging occurred about one week after
the first one, on February 5, with the tag beginning to transmit after 90 days of
deployment, also as scheduled. The tag from shark A was 69% successfully decoded by
the Argos satellites and 108 one-hour histograms of time-at-depth and temperature
were received. A total of 12 light readings were also received, making it possible to
estimate 6 light-based geolocations. The second tag was 86% successfully decoded,
with 678 histograms and 114 light readings received, allowing the estimation of 51
geolocations. The tags detached from the oceanic whitetip sharks at a depth of 63 and
89 meters for shark A and B, respectively.
The horizontal movements of tagged sharks were estimated by processing the
data received from the Argos satellites with the manufacturer light-based geolocation
software (WC-GPE: Global Position Estimator Program suite, available on:
www.wildlifecomputers.com). Longitude is estimated from the time of local noon and
latitude from the length of the day through the dawn and dusk symmetry method. In
order to minimize the errors usually associated to this geolocation estimation
(Metcalfe, 2001; Musyl et al., 2001; Nielsen et al., 2006; Lam et al., 2008), the state-
space Kalman filter statistical model was applied (Sibert et al., 2003). This model is
widely used and is freely available as the KFtrack package, which is plug-in for the open
source statistical software R (Nielsen & Sibert, 2004).
The total traveled distance was calculated by summing the distances between
each consecutive geolocation point, while the daily displacement was estimated by
dividing the total traveled distance by the number of days from the deployment
period. To obtain better accuracy, the swimming speed was calculated by dividing the
distance between all consecutive days that were available per 24 hours. After this, a
mean swimming speed standard error was estimated. Depth and temperature data
were analyzed in relation to the different periods of the day to search for diel
movement patterns. Day and night data were separated according to the local times of
sunrise and sunset. To compare daytime and nighttime distributions, for both depth
and temperature, Pearson’s chi-squared tests were performed. All statistical tests
were performed at the 95% confidence level.

31
Results
Horizontal movements
Both tagging took place near the equator in the western side of the Atlantic
Ocean and for the two sharks tagging and pop-up sites were not much far from each
other (Figure 1). If the sharks had moved in a straight line, shark A would have moved
231 nautical miles (nm) and shark B 510 nm (Table 1).
During the 60 days of deployment, shark A moved approximately 771 nm, with
an estimated daily displacement of 12.86 nm. The mean swimming speed was ( SE)
0.41 0.16 knots. The movement of Shark A was predominantly westward, towards
the American continent, and slightly northward (Figure 2).
Figure 1. Tagging and pop-off positions of the two oceanic whitetip sharks tagged with pop-up satellite
archival tags in the western equatorial Atlantic Ocean. Crosses represent tagging location, and
circles, the pop-off location.
Table 1. Summary data of the two oceanic whitetip sharks tagged with pop-up satellite archival tags in
the western equatorial Atlantic Ocean.
-60 -40 -20 0
-40
-20
0
20
A
Brazil
Africa
A
BB
Shark SexTotal
lengthTagging
dateTaggingLatitude
TaggingLongitude
Pop-update
Days atliberty
Pop-upLatitude
Pop-upLongitude
Distance between tagging and pop-up
A F 135 cm 01/29/2010 0.995° S 30.88° W 03/30/2010 60 1.914° S 34.62° W 231 nmi
B M 152 cm 05/02/2010 0.158° N 29.77° W 05/06/2010 90 0.218° S 38.25° W 510 nmi

32
Shark B moved approximately 1,884 nm over the 90 days deployment, with an
estimated daily displacement of 20.94 nm. Its mean swimming speed was 1.00
0.09 knots. The horizontal movements of shark B can be divided into three phases,
with the following predominant directions: a) northward and westward; b) eastward
and south; and c) west and slightly southward (Figure 3). Overall, however, shark B
movements were mainly westward, as were the movements of shark A. Both sharks
remained approximately within the same area, near the equator, from 30oW to 40oW
and from 0o to 5oN.
Figure 2. Most probable track for an oceanic whitetip shark (shark A) tagged in the western equatorial
Atlantic Ocean determined by Kalman Filter. Blue shaded area represents the confidence
intervals. The inverse triangle () indicates the begging of the track and open triangle () indicates the end.
-50 -45 -40 -35 -30 -25 -20
Longitude
-10
-5
0
5
10
La
titu
de
-33 -32 -31 -30
Longitude
2.0
2.5
3.0
3.5
La
titu
de
-50 -45 -40 -35 -30 -25 -20
Longitude
-10
-5
0
5
10
La
titu
de

33
Figure 3. Most probable track for an oceanic whitetip shark (shark B) tagged in the western equatorial
Atlantic Ocean determined by Kalman Filter. Blue shaded area represents the confidence
intervals. The inverse triangle () indicates the begging of the track and open triangle () indicates the end.
Depth and temperature preferences
Both sharks exhibited a remarkable preference for warm and shallow waters of
the mixed layer. Shark A spent 97% of the time in waters with temperatures above
26.0°C and 86% in the first 50 m. Average depth of the mixed layer according to the
vertical temperature profiles from both tagged sharks and other research results in
-50 -45 -40 -35 -30 -25 -20
Longitude
-10
-5
0
5
10L
atitu
de
-38 -36 -34 -32 -30
Longitude
-1
0
1
2
3
La
titu
de

34
this area is 50 m (Travassos et al., 1999). Similarly, shark B spent 95% of the time at
warm waters above 26.0°C and 88% in the mixed layer. The minimum temperature
experienced by shark A was 15.6°C, at a corresponding depth of 112 m, while shark B
dove down to 128 m and experienced a minimum temperature of 17.6°C. For both
sharks, incursions to depths below 100 m, under the thermocline, were not very
common and expositions to waters under 20°C were even rarer. Shark A made only
two dives beyond this depth, one to 104 m, in the beginning of the deployment period,
on January 31st; and another to 112 m, on March 21st, near the end of the deployment
period. Shark B made considerably more dives to depths below 100 m. Those dives
occurred in three distinct periods: a) between February 21 and 25; b) between March
12 and 13; and c) on May 05 (Figure 4).
Figure 4. Minimum-maximum depths and water temperatures experienced by two oceanic whitetip
sharks in the western equatorial Atlantic Ocean (shark A: top, shark B: bottom).
There was no evident difference in temperature preference between day and
night, for both sharks, with the most frequent temperatures ranging from 26° to 30°C,
in both periods of the day (Figure 5). The Pearson’s chi-squared test did not indicate
significant differences between daytime and nighttime temperature-frequency
distributions (p = 0.97 and 0.76, for sharks A and B, respectively). For shark A, day and
night frequencies were: (mean standard error) 57.3 6.23 and 51.7 6.12, for the

35
28-30°C, interval, and 39.7 6.30 and 45.1 6.16, for the 26-28°C interval. For shark B,
day and night frequencies were 68.0 2.35 and 59.0 2.15, for the 28-30°C interval,
and 29.2 2.24 and 34.4 1.95, for the 26-28°C interval.
Day and night depth preferences, however, seemed to differ, with both sharks
staying at shallower depths during the day. This apparent difference was confirmed by
the chi-squared test (p = 2.32E-04 and 6.23E-03; respectively). For shark A the most
frequent depth intervals were 0-10 m during daytime (36.9% 3.56), followed by 30-
50 m during night time (27.7% 2.51). The most frequent intervals for shark B were 0-
10 m during both day and night time, but the frequency dropped from 46.4% 1.68,
during the day, to 27.3% 1.46, during the night. Both sharks spent some time at the
surface, especially in the daytime period (Figure 5). Shark A stayed at the surface up to
4.07% 1.13 of the time, while shark B stayed 15.67% 1.35.
Figure 5. Depth and temperature distributions of two oceanic whitetip sharks tagged in the western
equatorial Atlantic Ocean. Mean frequencies ( SE) were determined using all one hour histograms received from satellites (shark A: top, shark B: bottom).
The differences between day and night depth preferences might indicate diel
movement pattern and the maximum depth data set also suggest the same diel
movements (Figure 6). During daytime depth ranges were much shallower than during
nighttime, especially for shark B, which had a wider depth distribution. Regarding the
hours of the day, depth ranges were much shallower during light hours then within
dark hours. The hours when sharks were closer to the surface were 09:00 and 10:00
am, followed by 11:00 am and noon. In general, day maximum depths ranged from the
surface to 50 m and night maximum depths were from 50 m down.
-60 -50 -40 -30 -20 -10 0 10 20 30 40 50 60
0
0-10
10-20
20-30
30-50
50-80
80-120
Frequency
De
pth
(m
)
Day
Nigth
-80 -60 -40 -20 0 20 40 60 80
18-20
20-22
22-24
24-26
26-28
28-30
Frequency
Te
mp
era
ture
( C
)
Day
Night
-60 -50 -40 -30 -20 -10 0 10 20 30 40 50 60
0
0-10
10-20
20-30
30-50
50-80
80-120
120-150
Frequency
De
pth
(m
)
Day
Night
-80 -60 -40 -20 0 20 40 60 80
18-20
20-22
22-24
24-26
26-28
28-30
Frequency
Te
mp
era
ture
( C
)
Day
Night

36
Figure 6. Box plots showing the distribution of maximum depths in relation to day and nighttime (top)
and to each hour of the day (bottom) for two oceanic whitetip sharks tagged in the western equatorial Atlantic Ocean. Whiskers indicate the 95% confidence intervals, boxes represent the 25th and 75th quartiles, horizontal black lines indicate the median and open circles are the outliers.
According to the vertical temperature profiles, shark A experienced more
stratified waters than shark B (Figure 7). The temperature profile of shark A exhibited a
very steep thermocline with a gradient of 1.9°C.10m-1, while in the profile from shark B
the thermocline gradient was 0.9°C.10m-1, indicating a less steep thermocline. The
mixed layer temperature varied from (mean standard deviation) 28.4°C 0.56 to
27.9°C 0.70, in shark A profile, and from 28.4°C 0.56 to 27.8°C 0.83, in shark B.

37
Figure 7. Vertical temperature profiles experienced by two oceanic whitetip sharks in the western
equatorial Atlantic Ocean (shark A: left, shark B: right).
Discussion
The oceanic whitetip shark has been known as an epipelagic predator of warm
tropical waters (Compagno, 1984), an assumption that is in accordance with the results
found by the present study. Bernal et al. (2009) considered the oceanic whitetip as
being part of a diverse group of pelagic fishes that spend the majority of their time in
the upper uniform-temperature surface layer and rarely descend to water
temperatures below 20°C. This description is consistent with the findings of the
present study, as well. Both tagged sharks showed a remarkable preference for waters
of the mixed layer, which went down to approximately 50 m and varied from 28.4° to
27.8°C. Both sharks did dive to waters below 20°C, however these instances accounted
for less than 1% of the deployment period. The preferred temperatures were clearly
above 26°C, since sharks spent at least 95% of their time in such temperatures.
Musyl et al. (2004), working with tagging experiments off Hawaii, found the
oceanic whitetip sharks to spend 95% of their time between the surface and 102 m
depth and in waters with temperature between 25.3° and 30.0°C, which is close to the
pattern seen in the present case. Differently from the oceanic whitetip sharks tagged
off Hawaii, however, those tagged in the western Atlantic Ocean spent more time
inside the thermocline (up to 14% of the time). Yet, this could be due to the
differences in the vertical temperature profiles of both areas, since the thermocline off
Hawaii is much deeper, located as deep as 200 m, than in the western Atlantic (Rebert
et al. 1985).
Oceanic whitetip shark remarkable preference for shallow waters is also
reflected on the depths of the longline hooks where the species is most commonly
caught. Nakano et al. (1997), for instance, concluded that the catch rates of the
oceanic whitetip shark increased significantly with the decrease of hook depth. Data
from the Brazilian longline fleet also showed that the CPUE of the oceanic whitetip
0
20
40
60
80
100
120
140
0 5 10 15 20 25 30 35D
ep
th (m
)
Temperature ( C)
mixed layer
thermocline
0
20
40
60
80
100
120
140
0 5 10 15 20 25 30 35
Dep
th (m
)
Temperature ( C)
mixed layer
thermocline

38
shark tended to be lower for the vessels aiming at bigeye tuna (Thunnus obesus),
which operate with deeper longline, than for the vessels aiming at swordfish (Xiphias
gladius), which operate with a shallower gear (Tolotti et al., unpublished data).
Even though the depth range was not much wide, there were significant
differences between day and night depths for both tagged sharks, which might
indicate diel movements, although in a reverse way since in a normal diel movement
pattern the species tend to stay near the surface at shallower waters during nighttime
and at deeper waters during daytime (Sims et al., 2005). Different patterns in circadian
depth distributions are very common within pelagic fishes, even when depth ranges
are not wide (Brill et al., 1999; Huse & Korneliussen, 2000; Musyl et al., 2003; Sims et
al., 2005; Pade et al., 2009). Musyl et al. (2004) also found differences in the circadian
depth preferences of the oceanic whitetip shark, but, differently from what was seen
in the present study, the species tended to spend more time at deeper waters during
the day and at shallower waters during the night. These circadian differences are most
likely related with the vertical migration of prey species within the deep scattering
layer (Sims et al., 2005; Bernal et al., 2009; Pade et al., 2009), an aspect, however, that
could not be investigated in the present study.
The fact that both whitetip sharks tagged showed an overall westward
movement might be an indication that they were following the South Equatorial
Current, which moves in this same direction (Stramma & Schott, 1999). Data from a
cooperative tagging program conducted by the US Nactional Marine Fisheries Service
between 1962 and 1993 also found indications of westward movements for the
species along the equatorial Atlantic (Kholer et al., 1998). This same tagging program
estimated a daily displacement of 17.50 nm and a maximum swimming speed of
0.73 knots, which are very close to the ones found in the present study. These
swimming speeds, therefore, confirm that the oceanic whitetip shark is a slow-moving
species when compared to other pelagic sharks, such as the silky shark (Carcharhinus
falciformis) (Backus et al., 1956; Strasburg, 1958; Compagno, 1984).
The present results showed that the oceanic whitetip shark has a remarkable
preference for warm and shallow waters and that, despite of its relatively narrow deph
distribution, it does perform diel vertical migrations. Additionaly, horizontal
movements indicate a westward migration, probably following the water flow of the
South Equatorial Current in the western equatorial Atlantic. In order to better
understand, however, the species general migratory pattern in this ocean, additional
studies on its vertical and horizontal movements are still required.
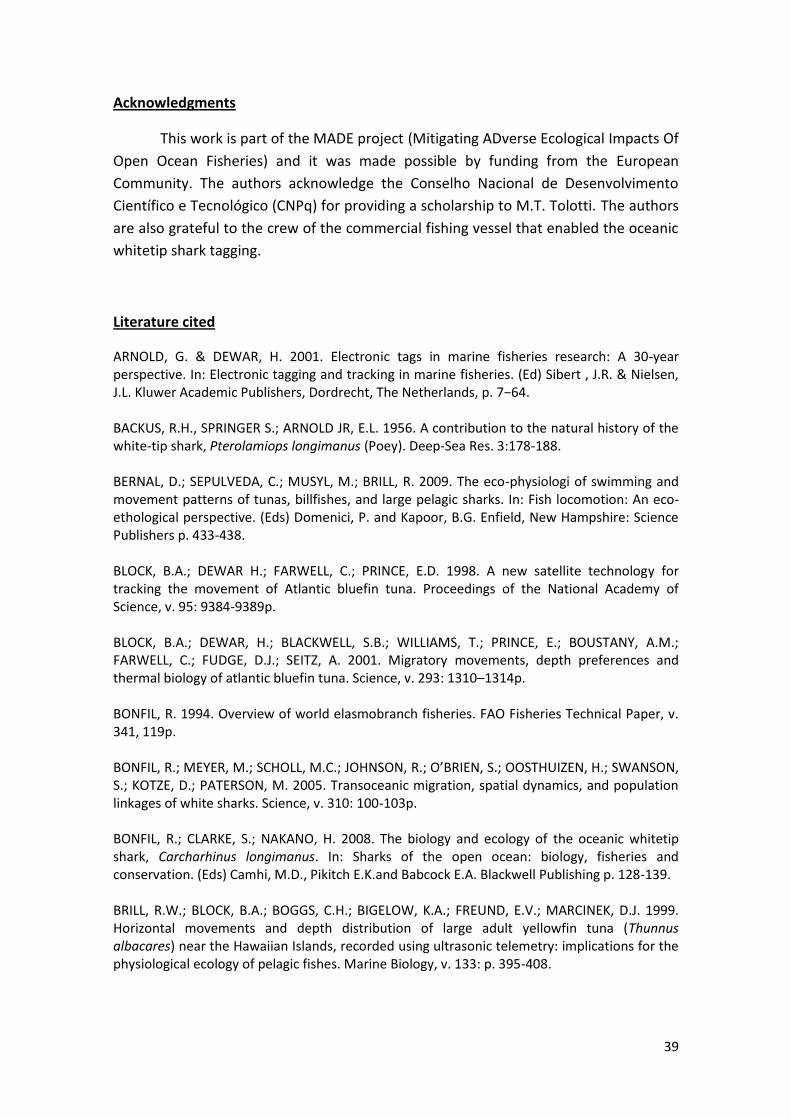
39
Acknowledgments
This work is part of the MADE project (Mitigating ADverse Ecological Impacts Of
Open Ocean Fisheries) and it was made possible by funding from the European
Community. The authors acknowledge the Conselho Nacional de Desenvolvimento
Científico e Tecnológico (CNPq) for providing a scholarship to M.T. Tolotti. The authors
are also grateful to the crew of the commercial fishing vessel that enabled the oceanic
whitetip shark tagging.
Literature cited
ARNOLD, G. & DEWAR, H. 2001. Electronic tags in marine fisheries research: A 30-year perspective. In: Electronic tagging and tracking in marine fisheries. (Ed) Sibert , J.R. & Nielsen, J.L. Kluwer Academic Publishers, Dordrecht, The Netherlands, p. 7−64. BACKUS, R.H., SPRINGER S.; ARNOLD JR, E.L. 1956. A contribution to the natural history of the white-tip shark, Pterolamiops longimanus (Poey). Deep-Sea Res. 3:178-188. BERNAL, D.; SEPULVEDA, C.; MUSYL, M.; BRILL, R. 2009. The eco-physiologi of swimming and movement patterns of tunas, billfishes, and large pelagic sharks. In: Fish locomotion: An eco-ethological perspective. (Eds) Domenici, P. and Kapoor, B.G. Enfield, New Hampshire: Science Publishers p. 433-438. BLOCK, B.A.; DEWAR H.; FARWELL, C.; PRINCE, E.D. 1998. A new satellite technology for tracking the movement of Atlantic bluefin tuna. Proceedings of the National Academy of Science, v. 95: 9384-9389p. BLOCK, B.A.; DEWAR, H.; BLACKWELL, S.B.; WILLIAMS, T.; PRINCE, E.; BOUSTANY, A.M.; FARWELL, C.; FUDGE, D.J.; SEITZ, A. 2001. Migratory movements, depth preferences and thermal biology of atlantic bluefin tuna. Science, v. 293: 1310–1314p. BONFIL, R. 1994. Overview of world elasmobranch fisheries. FAO Fisheries Technical Paper, v. 341, 119p. BONFIL, R.; MEYER, M.; SCHOLL, M.C.; JOHNSON, R.; O’BRIEN, S.; OOSTHUIZEN, H.; SWANSON, S.; KOTZE, D.; PATERSON, M. 2005. Transoceanic migration, spatial dynamics, and population linkages of white sharks. Science, v. 310: 100-103p. BONFIL, R.; CLARKE, S.; NAKANO, H. 2008. The biology and ecology of the oceanic whitetip shark, Carcharhinus longimanus. In: Sharks of the open ocean: biology, fisheries and conservation. (Eds) Camhi, M.D., Pikitch E.K.and Babcock E.A. Blackwell Publishing p. 128-139. BRILL, R.W.; BLOCK, B.A.; BOGGS, C.H.; BIGELOW, K.A.; FREUND, E.V.; MARCINEK, D.J. 1999. Horizontal movements and depth distribution of large adult yellowfin tuna (Thunnus albacares) near the Hawaiian Islands, recorded using ultrasonic telemetry: implications for the physiological ecology of pelagic fishes. Marine Biology, v. 133: p. 395-408.

40
BURGESS, G.H.; BEERKIRCHER, L.W.; CAILLIET, G.M.; CARLSON, J.K.; CORTES, E.; GOLDMAN, K.J.; GRUBBS, R.D.; MUSICK, J.A.; MUSYL, M.K.; SIMPFENDORFER, C.A. 2005. Is the collapse of shark populations in the northwest Atlantic Ocean and Gulf of Mexico real? Fisheries 30:10. COELHO, R.; HAZIN, F.H.V.; REGO, M.; TAMBOURGI, M.; OLIVEIRA, P.; TRAVASSOS, P.; CARVALHO, F.; BURGESS, G. 2009. Notes On The Reproduction Of The Oceanic Whitetip Shark, Carcharhinus Longimanus, in The Southwestern Equatorial Atlantic Ocean. Col. Vol. Sci. Pap. ICCAT, 64 (5): 1734-1740. COMPAGNO, L.J.V. 1984. FAO species catalogue. Sharks of the world: An annotated and illustrated catalogue of shark species known to date. FAO Fish. Synop., v. 4(125). DOMINGO, A.; MILLER, P.; FORSELLEDO, R.; PONS, M.; BERRONDO, L. 2007. Abundancia del tiburon loco (Carcharhinus longimanus) en el Atlantico Sur. Col. Vol. Sci. Pap. ICCAT, 60(2): 561-565. GOODYEAR, C.P.; LUO, J.; PRINCE, E.D.; SERAFY, J.E. 2006. Temperature-depth habitat utilization of blue marlin monitored with PSAT tags in the context of simulation modeling of pelagic longline CPUE. ICCAT, Coll. Vol. Sci. Pap., v. 59: 224-237p. GRAVES, J.E.; LUCKHURST, B.E.; PRINCE E.D. 2002. An evaluation of pop-up satellite tags for estimating post-release survival of blue marlin. Fishery Bulletin, v. 100: 134-142p. GUNN, J.S. & BLOCK, B.A. 2001. Advance in acoustic, archival, and satellite tagging of tunas. In: Tuna: Physiology, ecology, and evolution. (Ed) Block, B.A. & Stevens, E.D. San Diego, Academic Press, 167–224p. HUSE, I. & KORNELIUSSEN, R. 2000. Diel variation in accoustic density measurments of overwintering herring (Clupea harengus L.). ICES J. Mar. Sci. 57, 903–910. KERSTETTER, D.W.; LUCKHURST, B.E.; PRINCE, E.D.; GRAVES, J.E. 2003. Use of pop-up satellite archival tags to demonstrate survival of blue marlin (Makaira nigricans) released from pelagic longline gear. Fish. Bull., v. 101: 939–948p. KOHLER, N., CASEY, J.G. AND TURNER, P.A. 1998. NMFS Cooperative Shark Tagging Program, 1962–93: An atlas of shark tag and recapture data. Marine Fisheries Review 60(2), 1–87. LAM, C.H.; NIELSEN, A.; SIBERT, J.R. 2008. Improving light and temperature based geolocation by unscented Kalman filtering. Fisheries Research, v.91, p.15-25. LESSA, R., SANTANA, F.M.; PAGLERANI, R. 1999a. Age, growth and stock structure of the oceanic whitetip shark, Carcharhinus longimanus (Carcharhinidae), of North-Eastern Brazil. Cybium, 23(4):353-368. LESSA, R., PAGLERANI, R.; SANTANA, F.M. 1999b. Biology and morphometry of the oceanic whitetip shark, Carcharhinus longimanus, from the southwestern equatorial Atlantic. Fish. Res., 42:21-30. LUTCAVAGE, M.E.; BRILL, R.W.; SKOMAL, G.B.; CHASE, B.; HOWEY, P. 1999. Results of pop-up satellite tagging of spawning size class fish in the Gulf of Maine: Do North Atlantic bluefin tuna spawn in the mid-Atlantic? Canadian Journal of Fisheries and Aquatic Sciences, v. 56: 173-177p.

41
METCALFE, J.D. 2001. Summary report of a workshop on daylight measurements for geolocation in animal telemetry. In: Electronic Tagging and Tracking In Marine Fisheries Reviews: Methods and Technologies in Fish Biology and Fisheries. J. Sibert & J. Nielsen (eds) Dordrecht: Kluwer Academic Press, p. 443–456. MUSYL, M.K.; BRILL, R.W.; CURRAN, D.S. 2001. Ability of archival tags to provide estimates of geographical position based on light intensity. In: Electronic Tagging and Tracking in Marine Fisheries Reviews: Methods and Technologies in Fish Biology and Fisheries. J.R. Sibert & J.L. Nielsen (eds) Dordrecht: Kluwer Academic Press, p. 343-368. MUSYL, M.K.; BRILL, R.W.; BOGGS, C.H.; CURRAN, D.S.; KAZAMA, T.K.; SEKI, M.P. 2003. Vertical movements of bigeye tuna (Thunnus obesus) associated with islands, buoys, and seamounts near the main Hawaiian Islands from archival tagging data. Fish. Oceanogr. 12:152–169. MUSYL, M.K.; MCNAUGHTON, L.M.; SWIMMER, J.Y.; BRILL, R.W. 2004. Convergent evolution of vertical movement behavior in swordfish, bigeye tuna, and bigeye thresher sharks: Vertical niche partitioning in the pelagic environment as shown by electronic tagging studies. Pelagic Fisheries Research Program (PFRP) University of Hawaii at Manoa, v. 9(4): 4. p. 1-4. NAKANO, H.; OKAZAKI, M.; OKAMOTO, H. 1997. Analysis of catch depth by species for tuna longline fishery based on catch by branch lines. Bull. Nat. Res. Inst. Far Seas Fish. 34: 43-62. NELSON, D.R., 1990. Telemetry studies of sharks: a Review, with applications in resouce management. In: Elasmobranchs as living resources: advances in the biology, ecology, systematics, and the status of the fisheries. (Ed) Pratt, H.L.; Gruber S.H.; Taniuchi T. NOAA Technical Report NMFS, v. 90: 239-256p. NIELSEN, A. & SIBERT, J.R. 2004. KFtrack: R-package to efficiently estimate movement parameters and predict “most probable track” from raw geo-locations of tagged individuals. Available at: http://www.soest.hawaii.edu/tag-data/tracking/kftrack. NIELSEN, A., BIGELOW, K.A.; MUSYL, M.K.; SIBERT, J.R., 2006. Improving lightbased geolocation by including sea surface temperature. Fish Oceanogr. 15(4), 314–325. PADE, N.G.; QUEIROZ, N.; HUMPHRIES, N.E.; WITT, M.J.; JONES, C.S.; NOBLE, L.R.; SIMS, D.W. 2009. First results from satellite-linked archival tagging of porbeagle shark, Lamna nasus: Area fidelity, wider-scale movements and plasticity in diel depth changes. Journal of Experimental Marine Biology and Ecology, v. 370, p. 64-74. REBERT, J.P.; DONGUY, J.R.; ELDIN, G. 1985. Relations between sea level, thermocline depth, heat content, and dynamic height in the tropical Pacific Ocean. Journal of Geophysical Research, v. 90 (C6), p. 11,719-11,725. SIBERT, J.R.; MUSYL, M.K.; BRILL, R. W. 2003. Horizontal movements of bigeye tuna (Thunnus obesus) near Hawaii determined by Kalman filter analysis of archival tagging data. Fish. Oceanogr., v. 12: 141−151p. SIMS, D.W.; SOUTHALL, E.J.; RICHARDSON, A.J.; REID, P.C.; METCALFE, J.D. 2003. Seasonal movements and behaviour of basking sharks from archival tagging: No evidence of winter hibernation. Marine Ecology Progress Series, v. 248: 187-196p.

42
SIMS, D.W.; SOUTHALL, E.J.; TARLING, G.A.; METCALFE, J.D. 2005. Habitat specific normal and reserve diel vertical migration in the plankton-feeding basking shark. J. Anim. Ecol. 74, 755–761. STOKESBURY, M.J.W.; HARVEY-CLARK, C.; GALLANT, J.; BLOCK, B.A.; MYERS, R.A. 2005. Movement and environmental preferences of greenland sharks (Somniosus microcephalus) electronically tagged in the St. Lawrence Estuary, Canada. Mar. Biol., v. 148: 159–165p. STRAMMA, L. &, SCHOTT, F. 1999. The mean flow field of the tropical Atlantic Ocean. Deep-Sea Research II, v.46: p. 279-303. STRASBURG, D.W. 1958. Distribution, abundance, and habits of pelagic sharks in the Central Pacific Ocean. Fishery Bulletin, v. 58(138): 335-361. TEO, S.L.H.; BOUSTANY, A.; DEWAR, H.; STOKESBURY, M.J.W.; WENG, K.C.; BEEMER, S.; SEITZ, A.C.; FARWELL, C.J.; PRINCE, E.D.; BLOCK, B.A. 2007. Annual migrations, diving behavior, and thermal biology of Atlantic bluefin tuna, Thunnus thynnus, on their Gulf of Mexico breeding grounds. Marine Biology, v. 151(1): 1-18p. TOLOTTI, M.T.; TRAVASSOS, P.; FRÉDOU, F.L.; ANDRADE, H.; CARVALHO, F.C.; HAZIN, F.H.V. Size, distribution and relative abundance of the oceanic whitetip shark caught by the brazilian tuna longline fleet. Unpublished data, contact: [email protected]. TRAVASSOS, P.E.P.F.; HAZIN, F.H.V.; SCHOBER, J.; ZAGAGLIA, J.R.; ADVINCULA, R. 1999. Thermohaline structure around seamounts and islands of northeast Brazil. Archive Of Fishery And Marine Research, v. 47(2/3), p.211-222. WENG, K.C.; CASTILHO, P.C.; MORRISSETTE, J.M.; LANDEIRA-FERNANDEZ, A.M.; HOLTS, D.B.; SCHALLERT, R.J.; GOLDMAN, K.J.; BLOCK, B.A. 2005. Satellite tagging and cardiac physiology reveal niche expansion in salmon sharks. Science, v. 310: 104 - 106p.

43
4. Considerações finais
Os resultados apresentados mostram que o tubarão galha-branca oceânico é
freqüente nas capturas da frota atuneira nacional e suas taxas de captura estão
fortemente associadas à configuração do espinhel, principalmente no que se refere à
profundidade dos anzóis. Essa condição está relacionada à natureza altamente
epipelágica da espécie, que permanece grande parte do tempo (>85%) nos primeiros
50 m de profundidade. Os resultados também mostraram que a pesca no Atlântico
oeste Tropical incide fortemente sobre a parcela juvenil da população, com a grande
maioria dos espécimes capturados estando abaixo do tamanho de primeira maturação
sexual. De maneira conjunta, todas essas informações podem contribuir para a criação
de ações de manejo que auxiliem na manutenção e conservação da espécie.
Na prática, algumas das informações geradas no presente trabalho já foram
efetivamente utilizadas para sugerir um tamanho mínimo de captura como medida de
manejo para a espécie junto a ICCAT, que culminou na Resolução 10-07 citada
anteriormente. Em conjunto com informações geradas através de outros estudos, a
exemplo da biologia reprodutiva, essa medida foi sugerida com base na alta proporção
de jovens capturados e no fato do C. longimanus apresentar alta probabilidade de
sobrevivência pós-captura, conforme demonstrado através do sucesso dos
experimentos de marcação. Esse exemplo ressalta a importância dos resultados
gerados, bem como evidencia a atenção que vem sendo dada a espécie em comissões
internacionais em decorrência da sua vulnerabilidade à crescente pressão pesqueira.
A natureza das informações geradas em ambos os artigos apresentados
também podem embasar outras medidas de manejo. Um exemplo seria a retirada dos
anzóis mais superficiais do espinhel quando a espécie-alvo apresentar uma distribuição
vertical mais profunda, como é o caso da albacora bandolim (Thunnus obesus). Beverly
et al. (2009) sugerem que essa medida pode ser eficiente já que diminui as taxas de
capturas de várias espécies de fauna acompanhante e aumenta o número de anzóis
disponíveis para a espécie-alvo de distribuição mais ampla. Além disso, os autores
também sugerem que a utilização de anzóis mais profundos no espinhel reduziria as
interações entre a pesca esportiva, recreativa e comercial.
De qualquer forma, é necessário salientar, que mesmo gerando informações
importantes e que podem ser efetivamente utilizadas na criação de medidas de
manejo, o presente trabalho representa apenas uma pequena parcela no
conhecimento da espécie. Principalmente para o Atlântico Sul, poucas informações
estão disponíveis, sendo de suma importância que o tubarão galha-branca oceânico
continue sendo objeto de pesquisas envolvendo aspectos biológicos, ecológicos e
pesqueiros. Sendo assim, pretende-se dar continuidade ao monitoramento pesqueiro
da espécie e realizar mais experimentos de marcação eletrônica, focando em períodos
de marcação mais longos.

44
5. Referências bibliográficas
BACKUS, R.H., SPRINGER S.; ARNOLD JR, E.L. 1956. A contribution to the natural history of the white-tip shark, Pterolamiops longimanus (Poey). Deep-Sea Res. 3:178-188. BAUM, J.; MEDINA, E.; MUSICK, J.A.; SMALE, M. 2006. Carcharhinus longimanus. In: 2007 IUCN Red List of Threatened Species. <www.iucnredlist.org>. Downloaded on 28 August 2008. BEVERLY, S.; CURRANB, D.; MUSYL, M.; MOLONYA, B. 2009. Effects of eliminating shallow hooks from tuna longline sets on target and non-target species in the Hawaii-based pelagic tuna fishery. Fisheries Research, (96) p. 281–288. BONFIL, R. 1994. Overview of World Elasmobranch Fisheries. FAO Fisheries Technical Paper. Vol. 341, 119 pp. CAMHI, M.D.; VALENTI, S.V.; FORDHAM, S.V.; FOWLER, S.L.; GIBSON, C. 2009. The Conservation Status of Pelagic Sharks and Rays: Report of the IUCN Shark Specialist Group Pelagic Shark Red List Workshop. IUCN Species Survival Commission Shark Specialist Group. Newbury, UK. x + 78p. CLARKE, S.C. 2004. Shark Product Trade in Hong Kong and Mainland China, and Implementation of the CITES Shark Listings. Hong Kong: TRAFFIC East Asia. COELHO, R.; HAZIN, F.H.V.; REGO, M.; TAMBOURGI, M.; OLIVEIRA, P.; TRAVASSOS, P.; CARVALHO, F.; BURGESS, G. 2009. Notes On The Reproduction Of The Oceanic Whitetip Shark, Carcharhinus Longimanus, in The Southwestern Equatorial Atlantic Ocean. Col. Vol. Sci. Pap. ICCAT, 64 (5): 1734-1740. COMPAGNO, L.J.V. 1984. FAO species catalogue. Sharks of the world: An annotated and illustrated catalogue of shark species known to date. FAO Fish. Synop., v. 4(125). COMPAGNO, L.J.V. 1990. Shark Exploitation and Conservation. In: Elasmobranch as living resources: Advances in the biology, ecology, systematics, and the status of the fisheries, (ed) H. L. Pratt, S. H. Gruber and T. Taniuchi. NOAA Technical Report. COMPAGNO, L.J.V.; DANDO, M.; FOWLER, S. 2005. Sharks of the World. Princeton University Press, Princeton. 368 p. CORTÉS, E. 2000. Life history patterns and correlations in sharks. Rev. Fish. Sci. 8(4):299-344. DOMINGO, A.; MILLER, P.; FORSELLEDO, R.; PONS, M.; BERRONDO, L. 2007. Abundancia del tiburon loco (Carcharhinus longimanus) en el Atlantico Sur. Col. Vol. Sci. Pap. ICCAT, 60(2): 561-565.

45
DULVY, N.K.; BAUM, J.K.; CLARKE, S.; COMPAGNO, L.J.V.; CORTÉS, E.; DOMINGO, A.S.; FORDHAM, S.; FOWLER, S.; FRANCIS, M.P.; GIBSON, C.; MARTINEZ, J.; MUSICK, J.A.; SOLDO, A.; STEVENS, J.D.; VALENTI, S. 2008. You can swim but you can’t hide: the global status and conservation of oceanic pelagic sharks and rays. Aquatic Conservation 18: 459-482. FAO. 2009. FISHSTAT Plus, Version 2.3. Capture Production Database, 1970–2007. FAO, Rome, Italy. HAZIN, F.H.V.; COUTO, A.A.; KIHARA, K.; OTSUKA, K.; ISHINO, D.M. 1990. Distribution and abundance of pelagic sharks in the south-western equatorial Atlantic. J. Tokyo Univ. Fish. 77(1):51–64. HOENIG, J.M. & GRUBER, S.H. 1990 Life-history patterns in the elasmobranches: implications for fisheries management. In: H. L. Pratt, S. H. Gruber, and T. Taniuchi (Eds). Elasmobranchs as Living resources: advances in the Biology, Ecology, systematics and Status of the Fisheries. NOAA Technical Report NMFS90. ICCAT. 1995. Resolution by ICCAT on cooperation with the Food and Agriculture Organization of the United Nations (FAO) with regard to study on the status of stocks and by-catches of shark species. Disponível on-line via: http://www.iccat.int/Documents/Recs/compendiopdf-e/1995-02-e.pdf ICCAT. 2004. Recommendation by ICCAT concerning the conservation of sharks caught in association with fisheries managed by ICCAT (Rec. 04-10). Disponível on-line via: http://www.iccat.int/Documents/Recs/compendiopdf-e/2004-10-e.pdf ICCAT. 2010. Recommendation by ICCAT on the conservation of oceanic whitetip shark caught In association with fisheries in the ICCAT convention area (Rec. 10-07). Disponível on-line via: http://www.iccat.int/Documents/Recs/compendiopdf-e/2010-07-e.pdf LAST, P.R. & STEVENS, J.D. 1994. Sharks and rays of Australia. CSIRO, Australia. 513 p. LESSA, R., SANTANA, F.M.; PAGLERANI, R. 1999a. Age, growth and stock structure of the oceanic whitetip shark, Carcharhinus longimanus (Carcharhinidae), of North-Eastern Brazil. Cybium, 23(4):353-368. LESSA, R., PAGLERANI, R.; SANTANA, F.M. 1999b. Biology and morphometry of the oceanic whitetip shark, Carcharhinus longimanus, from the southwestern equatorial Atlantic. Fish. Res., 42:21-30. MAZZOLENI, R.C. & P.R. SCHWINGEL. 2002. Aspectos da biologia das espécies capturadas por espinhel pelágico na região sul das ilhas de Trindade e Martin Vaz no verão de 2001. Notas Técnicas da FACIMAR, 6: 51-57, 2002.

46
MUSICK, J.A.; BURGESS, G.; CAILLIET, G.; CAMHI, M.; FORDHAM, S. 2002. Management of sharks and their relatives (Elasmobranchii). Fisheries 25 (3): 9 - 13. SAIKA, S. & YOSHIMURA, H. 1985. Oceanic whitetip shark Carcharhinus longimanus in the Western Pacific. Report of the Japanese Group for Elasmobranch Studies 20, 11-12 (in Japanese at jses.ac.affrc.go.jp/report/20/20-3.pdf). 26 SEKI T.; TANIUCHI, T.; NAKANO, H.; SHIMIZU, M. 1998. Age, growth and reproduction of the Oceanic Whitetip Shark from the Pacific Ocean. Fisheries Science, Tokio, v.64, n.1, p. 14 – 20. SHARK SPECIALIST GROUP. 1996. The Implications of Biology for the Conservation and Management of Sharks. SSG IUCN. STRASBURG, D.W. 1958. Distribution, abundance, and habits of pelagic sharks in the Central Pacific Ocean. Fishery Bulletin, v. 58(138): 335-361. TANIUCHI, T. 1990. The role of elasmobranchs in Japanese fisheries. In: Elasmobranchs as living resources: advances in the biology, ecology, systematics, and the status of the fisheries. (Ed) Pratt, H.L.; Gruber S.H.; Taniuchi T. NOAA Technical Report NMFS, v. 90: 415–426p.