UNIVERSIDADE FEDERAL DO CEARÁ CENTRO DE TECNOLOGIA … · 2015-02-07 · Abstract The...
60
UNIVERSIDADE FEDERAL DO CEARÁ CENTRO DE TECNOLOGIA DEPARTAMENTO DE ENGENHARIA QUÍMICA CURSO DE GRADUAÇÃO EM ENGENHARIA QUÍMICA CESAR AUGUSTO DE ARAUJO FILHO CATALYTIC SYNTHESIS OF PEROXYFATTY ACIDS Fortaleza 2010
Transcript of UNIVERSIDADE FEDERAL DO CEARÁ CENTRO DE TECNOLOGIA … · 2015-02-07 · Abstract The...
UNIVERSIDADE FEDERAL DO CEARÁ
CENTRO DE TECNOLOGIA
DEPARTAMENTO DE ENGENHARIA QUÍMICA
CURSO DE GRADUAÇÃO EM ENGENHARIA QUÍMICA
CESAR AUGUSTO DE ARAUJO FILHO
CATALYTIC SYNTHESIS OF PEROXYFATTY ACIDS
Fortaleza
2010
CESAR AUGUSTO DE ARAUJO FILHO
CATALYTIC SYNTHESIS OF PEROXYFATTY ACIDS
Trabalho de Final de Curso submetido à
Coordenação do Curso de Graduação em
Engenharia Química, da Universidade Federal
do Ceará, como requisito parcial para obtenção
do grau de Bacharel em Engenharia Química.
Área de concentração: Catálise Heterogênea
Orientador: Dr. Fabiano André Narciso
Fernandes
Fortaleza
2010

A658c Araujo Filho, Cesar Augusto de
Catalytic Synthesis of Peroxyfatty Acids / Cesar Augusto de
Araujo Filho. Fortaleza: 2010.
47 p.; il.
Orientador: Prof. Dr. Fabiano André Narciso Fernandes
Área de concentração: Catálise Heterogênea.
Trabalho de Final de Curso – Universidade Federal do Ceará,
Departamento de Engenharia Química.
1. Heterogeneous Catalysis 2. Perhydrolysis reaction
3. Biphasic liquid system
I. Título
CDD660
Catalytic synthesis of peroxyfatty acids
2
À meus primeiros e eternos
professores por todas as lições de amor
e humanidade que me ensinam até hoje: Meus Pais

AGRADECIMENTOS
Em primeiro lugar, gostaria de agradecer aos meus pais César e Nazinha por todo o
apoio e amor incondicional que recebi desses que são os grandes responsáveis por
tudo que já conquistei. Aos meus irmãos Caio e Thiago por serem meus
companheiros de todas as horas e cujas lembranças de nossas brincadeiras e bons
momentos me ajudaram a superar a distância. Sem o apoio unânime de minha
família este trabalho não existiria.
À CAPES e a Åbo Akademi pelo apoio financeiro durante minha estadia na
Finlândia. Experiência essa de valor incomensurável para mim e cujas
conseqüências trouxeram-me um amadurecimento sem precedentes.
À equipe do Laboratório de Química Industrial e Engenharia de Reações da
Universidade Åbo Akademi por todo o apoio que me deram tanto em forma de
orientações e suporte técnico quanto pela agradável companhia dos inúmeros
encontros fora do ambiente acadêmico.
Ao meu orientador Professor Dr. Fabiano André Narciso Fernandes pela
disponibilidade e perspicácia com que me colaborou para a realização deste
trabalho.
Ao Professor Dr. João José Hiluy Filho pelo auxílio imprescindível nos momentos de
orientação profissional e acadêmico que me fizeram crer que poderia alcançar o
sonho de uma experiência internacional.
À todos os professores que tive ao longo de minha vida acadêmica e que
contribuíram para minha formação.
Aos meus queridos amigos e colegas de curso com os quais tive o prazer de
conviver nesses últimos anos. Agradecimentos especiais aos meus amigos
Anderson Pinheiro, Jader Fernandes, Marcelo de Lima, Rodrigo Paschoal e Ronan
Sousa.
Aos amigos que fiz durante o período que estive em intercâmbio cuja amizade
estimo para além da distância e do tempo, são eles Ekaterina Korotkova, Elena
Privalova, Jerônimo Siro, Maija Kinnunen e Nina Björkman.

“This is not the end.
This is not even the beginning of the end.
But it is, perhaps, the end of the beginning. ”
Wiston Churchill

Abstract
The perhydrolysis of valeric acid was studied in a batch reactor at 40-60°C, using Amberlite
IR-120 as the heterogeneous catalyst. The reversible reaction can be illustrated as:
Two liquid phases exist in the system, one of them is polar and constituted mainly of
hydrogen peroxide and water and the other one is a non-polar phase and consists mainly of
valeric acid.
A study of the influence of the stirring speed and the internal mass transfer effect was done.
The equilibrium constant KC was determined for different temperatures and the enthalpy of
reaction estimated by the Arrhennius equation. A kinetic model was developed taking into
account the biphasic nature of the system. The mass transfer coefficients were estimated using
correlations found in the literature. The energy of activation and the heterogeneous rate
constant were estimated by our model.
An experimental method based in catalyst washes was used to find the concentration of
components inside the catalyst particles. Although the kinetic modeling does not include this
parameter yet, it will be introduced in this work due to its promising results.
Keywords: Heterogeneous catalysis. Perhydrolysis reaction. Biphasic liquid system.
List of Figures
Figure 1 – Experimental apparatus…………………………………………………………...17
Figure 2 – Overview of equilibrium experiments…………………………………………….22
Figure 3 – Overview of kinetic experiments I………………………………………………..23
Figure 4 – Overview of kinetic experiments II …………………………................................23
Figure 5 - Schematic picture of reaction and mass transfer phenomena …………..…………25
Figure 6 – External mass transfer results……..………………………………………………26
Figure 7 – Internal mass transfer results …………………………………………………27
Figure 8 – Catalyst washing decay…………………………………………………………...28
Figure 9 – Time influence in the intra-particle concentration………………………………..29
Figure 10 – Intra-particle concentrations versus Bulk concentration………………………...30
Figure 11 – Distribution coefficient…………………………………………………………..32
Figure 12 – Blank experiment………………………………………………………………...33
Figure 13 – Homogeneous reaction mechanism……………………………………………...34
Figure 14 – Equilibrium constant versus valeric acid molar fraction…….…………………..37
Figure 15 – Enthalpy of reaction……………………………………………………………...38
Figure 16 – Diffusion coefficient of different compounds in the organic phase at
different temperatures…………………………………………………………………..45
Figure 17 – Diffusion coefficient of different compounds in the aqueous phase at different
temperatures…………………………………………………………………………….45
Figure 18 – Diffusion coefficient of different compounds in the liquid-liquid system at
different temperatures...………………………………………………………………...46
Figure 19 – Mass transfer coefficients in the organic phase………………………………….47
Figure 20 – Mass transfer coefficients in the aqueous phase at vs d32 ……………………….48
Figure 21 – Model results for the perhydrolysis of valeric acid at 60°C……………………. 50
Figure 22 – Model results for the perhydrolysis of valeric acid at different temperatures and
catalyst loadings………………………………………………………………………...51
List of Tables
Table 1 – General experimental conditions ……………………………………………….....18
Table 2 – Catalyst properties given by the fabricants………………………………………...20
Table 3 – Distribution coefficient…………………………………………………………….32
Table 4 – Kinetic parameters estimated…………………………………………....................49
Table 5 – Thermodynamic parameters calculated……………………………...…………….50
List of Equations
Equation 1 – Distribution constant……………………………………………………………31
Equation 2 – Gibbs free energy versus distribution constant…………………………………31
Equation 3 – Law of Van’T Hoff for the distribution constant………………………………31
Equation 4 – Total rate of reaction……………………………………………………………34
Equation 5 – Quasi-equilibrium hypothesis…………………………………………………..34
Equation 6 – Discrimination of 2(OH)RC……………………………………………………...34
Equation 7 – Definition of the equilibrium constant for the protolysis of valeric acid………34
Equation 8 – Concentration of hydroxonium anions …………………………………………34
Equation 9 – Homogeneous rate of reaction, incomplete…………………………………….35
Equation 10 – Homogeneous rate of reaction………………………………………………...35
Equation 11 – Heterogeneous rate of reaction………………………………………………..35
Equation 12 – Total rate of reaction…………………………………………………………..36
Equation 13 – Reaction quotient definition…………………………………………………..36
Equation 14 – Differential Law of Van’t Hoff for the equilibrium constant…………………37
Equation 15 – Integrated Law of Van’t Hoff for the equilibrium constant…………………..38
Equation 16 – General mass balance…………………………………………………………39
Equation 17 – General mass balance for the aqueous phase………………………………….39
Equation 18 – General equation for the Double Film Model………………………………...39
Equation 19 – Interfacial area………………………………………………………………...40
Equation 20 – Development of the aqueous mass balance…………………………………...40
Equation 21 – Application of the distribution coefficient in the mass balance………………40
Equation 22 – Final general mass balance for the aqueous phase……………………………40
Equation 23 – Mass balance for each compound in the aqueous phase……………………...40
Equation 24 - Mass balance for each compound in the aqueous phase………………………41
Equation 25 – General mass balance in the organic phase…………………………………...41
Equation 26 – General mass balance in the organic phase…………………………………...41

Equation 27 - Mass balance for each compound in the organic phase………………….……41
Equation 28 – Sauter number…………………………………………………………………42
Equation 29 – Sauter number correlation…………………………………………………….42
Equation 30 – Webber number……………………………………………………………….42
Equation 31 - Delichatsios and Probstein function…………………………………………...42
Equation 32 – Good and Girifalco’s model for the surface tension………………………….43
Equation 33 – Surface tension correlation……………………………………………………43
Equation 34 - Surface tension correlation…………………………………………………….43
Equation 35- Interaction parameter…………………………………………………………...43
Equation 36 - Perkins-Geankoplis model for the diffusion coefficient………………………44
Equation 37 – Viscosity model……………………………………………………………….44
Equation 38 – Viscosity correlation for the organic phase…………………….……………..44
Equation 39 – Viscosity correlation for the aqueous phase....………………………………..44
Equation 40 – Diffusion coefficient in the aqueous phase……………………………………44
Equation 41 – Diffusion coefficient in organic phase………………………………………...44
Equation 42 – Mass transfer coefficient for the organic phase……………………………….46
Equation 43 – Power dissipated by the stirrer………………………………………………..46
Equation 44 – Diameter d*…………………………………………………………………...47
Equation 45 – Mass transfer coefficient for the aqueous phase………………………………48
Equation 46 – Objective function ……………………………………………………………48
Equation 47 – General equation for a batch reactor………………………………………….49
Equation 48 – Modified Arrenhius equation…………………………………………………49
Equation 49 – kave calculation………………………………………………………………49

Contents
Abstract .................................................................................................................................................. 8
List of Figures ........................................................................................................................................ 9
List of Tables ....................................................................................................................................... 10
List of Equations ................................................................................................................................. 11
Contents ............................................................................................................................................... 13
1. Introduction ................................................................................................................................. 15
2. Objectives ..................................................................................................................................... 16
3. Experimental Part ........................................................................................................................... 17
3.1 Reaction system ................................................................................................................... 17
3.2 Catalyst washing .................................................................................................................. 18
2.3 Analytical Method ................................................................................................................ 19
3.4 Catalyst properties ............................................................................................................... 19
3.4.1 Pretreatment ................................................................................................................... 20
4 Results and discussion ................................................................................................................. 21
4.1. Description of the system .................................................................................................... 21
4.1.1 Preliminary results ........................................................................................................... 21
4.1.2 Reaction and mass transfer considerations .................................................................... 22
4.2 The influence of the rotating speed in the reaction velocity .............................................. 25
4.3 Internal mass transfer .......................................................................................................... 27
4.4 Concentration inside the particle ........................................................................................ 28
4.5 Determination of the distribution constant ........................................................................ 31
4.6 Kinetics ................................................................................................................................. 33
4.7 Equilibrium analysis ............................................................................................................. 36
4.7.1 Influence of the molar fraction in the equilibrium constant ............................................... 36
4.7.2 Enthalpy of reaction ........................................................................................................ 37
4.8 Mathematical model ............................................................................................................ 39

Catalytic synthesis of peroxyfatty acids
14
5 Conclusions .................................................................................................................................. 53
6 Acknowledgements ...................................................................................................................... 54
7 Notation ........................................................................................................................................ 55
8 References .................................................................................................................................... 58
1. Introduction
The peroxycarboxylic acids are commonly used as antimicrobial agents in the
food manufacture, bleaching agents in textile and paper industry and in fine chemical industry
(epoxidation, Bayer-Villiger reaction), all of these applications are based in the oxidative
potential of these compounds, Pruss et al. (2001), Ölmez et al. (2009), Kitis (2004), Polanca
et al. (2008) and Goud et al. (2007) . The low toxicity, high stability and the liquid form are
features that mitigate problems like safety and waste treatment in industrial oxidation
processes.
The organic chain associated with the –COOOH group makes the
peroxycarboxylic acids more suitable to act in an organic media than others inorganic
oxidants. According to Leveneur et al. (2009), peroxyacetic acid (PAA) is more potent anti-
microbial agent than hydrogen peroxide, being rapidly active at low concentrations against a
wide spectrum of micro-organisms. Moreover, PAA is a better bleaching agent compared to
hydrogen peroxide, Pan et al (2000).
It is remarkable that mainly peroxyacetic and peroxypropionic acids (PPA) are used in the
industrial applications of peroxycarboxylic acids and there is not much information about the
perhydrolysis of fatty acids in the literature. Peroxyfatty acids are already used as bleaching
agents in washing powders, Nardello-Rataj et al. (2003). In fact, they are very effective for
removal of persistent yellowish stains. The solubility of its compounds in an organic solvent
can be increased by the augment of the carbon chain. Therefore, one supposes that
epoxidation reactions carried out with short chain peroxycarboxylic acids could be improved
by using peroxyfatty acids instead, Campanella et al. (2006).

Catalytic synthesis of peroxyfatty acids
16
2. Objectives
The primary aim of the this work is to verify if the perhydrolysis of fatty acids is
in fact possible, since no data of such reaction is available in the literature. Once proved, it is
interesting to study how the reaction rate is influenced by some key parameters such as
stirring speed, particle size diameter, catalyst loading, reactants concentration and
temperature. An estimation of the enthalpy of reaction can be made by an equilibrium study at
different temperatures using the Van’t Hoff relation. Finally, the formulation of a kinetic
model comprising the liquid-liquid mass transfer effect is the most challenging step of the
present work.

Catalytic synthesis of peroxyfatty acids
17
3. Experimental Part
3.1 Reaction system
The experiments were carried out in a 250 milliliters jacketed batch reactor and a
pitched blade impeller provided a vigorous mixing of the reaction mixture (Figure 1). A
carrier gas, Argonium (AGA, 99.996%), was inserted through one of the necks of the reactor
in order to remove the gas compounds produced by an occasional decomposition of hydrogen
peroxide (HP) or peroxyvaleric acid (VA). This gas steam must leave the system passing
through a condenser at 0oC where the volatile compounds are recovered.
The reactor was washed with a solution of hydrochloric acid 10% wt. followed by
another washing with a solution of 5% wt. of a phosphate-free detergent, as well as many
washes with deionized water. The samples were taken with plastic syringes. All the parts in
contact with the reaction mixture were carefully checked to not be contaminated with any
metal, which would start the decomposition of hydrogen peroxide and the peroxyvaleric acid
(PVA).
Figure 1 - Experimental apparatus
The experiments were initiated by stirring valeric acid (Acros, ≥99%) and the
catalyst inside the reactor, which is been heated by the outside jacket. Meanwhile, the
hydrogen peroxide (Merck, ≥30%) is been preheated. When all the components achieve the
Catalytic synthesis of peroxyfatty acids
18
desired temperature, hydrogen peroxide is added to the reactor through a dropping funnel.
This is when the time “zero” is set.
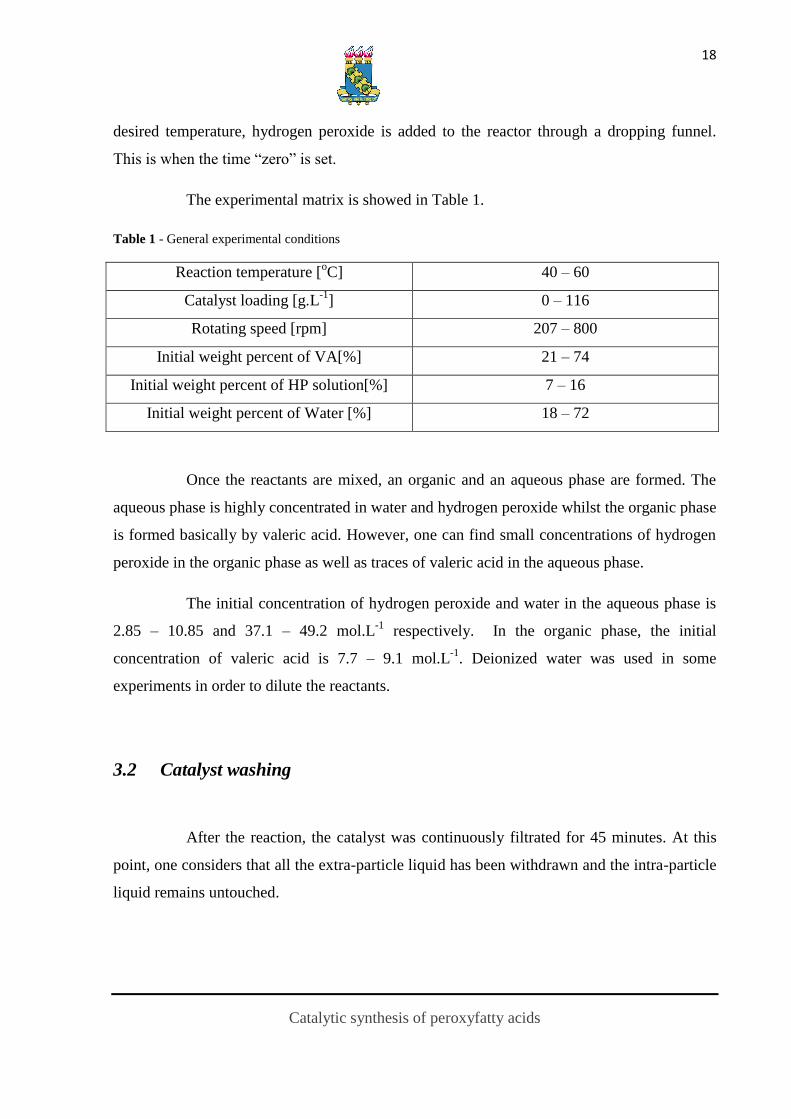
The experimental matrix is showed in Table 1.
Table 1 - General experimental conditions
Reaction temperature [oC] 40 – 60
Catalyst loading [g.L-1
] 0 – 116
Rotating speed [rpm] 207 – 800
Initial weight percent of VA[%] 21 – 74
Initial weight percent of HP solution[%] 7 – 16
Initial weight percent of Water [%] 18 – 72
Once the reactants are mixed, an organic and an aqueous phase are formed. The
aqueous phase is highly concentrated in water and hydrogen peroxide whilst the organic phase
is formed basically by valeric acid. However, one can find small concentrations of hydrogen
peroxide in the organic phase as well as traces of valeric acid in the aqueous phase.
The initial concentration of hydrogen peroxide and water in the aqueous phase is
2.85 – 10.85 and 37.1 – 49.2 mol.L-1
respectively. In the organic phase, the initial
concentration of valeric acid is 7.7 – 9.1 mol.L-1
. Deionized water was used in some
experiments in order to dilute the reactants.
3.2 Catalyst washing
After the reaction, the catalyst was continuously filtrated for 45 minutes. At this
point, one considers that all the extra-particle liquid has been withdrawn and the intra-particle
liquid remains untouched.
Catalytic synthesis of peroxyfatty acids
19
Thus, 100 milliliters of deionized water was poured in the filter with the catalyst
and the liquid extracted was analyzed. The washing procedure was done six times for each
experiment.
2.3 Analytical Method
The concentrations of valeric acid and peroxyvaleric acid were determined [14] by
titration with a standard solution of sodium hydroxide (0.2 N), using the Greespan and
Mackellar (1948) method in an automatic titrator (Metrohm 751 GPD Titrino). A standard
solution of ammonium cerium sulfate (0.1 N) was used to determine the concentration of
hydrogen peroxide in the samples. Each analyze has been done twice and an average of the
values is used as the final result. It is important to remark that both analyses did not differ too
much from each other.
3.4 Catalyst properties
The catalysts used have a styrene-divinyl benzene (gel) matrix with sulfonic
groups as active sites. Leveneur et al. (2009) used it for the perhydrolysis of propionic and
acetic acids and a satisfactory activity was demonstrated.
The catalysts Dowex 50Wx8-400 and Dowex 50Wx8-50 were only used for the
internal mass transfer experiments. For all the others experiments Amberlite-120 was used
instead.
Some properties of the catalysts are listed in Table 2.

Catalytic synthesis of peroxyfatty acids
20
Table 2 – Catalyst properties given by the fabricants
Supplier Polymer
type
Moisture
Content
%mass
Capacity
by dry
weight
meq/g
Cross
linking
%
Native
particle
size mm
Amberlite
IR-120
Aldrich Gel 45 4.4 8 0.3-1.2
Dowex
50Wx8-
400
Sigma-
Aldrich
Gel 54 4.8 8 0.04-0.08
Dowex
50Wx8-50
Sigma-
Aldrich
Gel 52 4.8 8 0.3-0.84
3.4.1 Pretreatment
A pretreatment was done in order to remove traces of impurities and release the
water from the catalyst. Therefore, the catalyst was left under stirring for 2 hours in a mixture
of 50% wt. water and hydrogen peroxide solution. Afterwards, it was washed with 1 liter of
deionized water, filtrated and left in the oven at 99oC for 48 hours.

Catalytic synthesis of peroxyfatty acids
21
4 Results and discussion
4.1. Description of the system
Conductivity experiments were performed to investigate the nature of the
dispersed and continuous phase according to the ratio VA / Water. Measurements made with
valeric acid and tap water showed that under a 45% wt. of VA the continuous phase is the
aqueous and over that point the continuous phase is the organic one.
4.1.1 Preliminary results
Before starting the experiments one pertinent question was presented: what is the
proper initial amounts of reactants that one should use to reach a reasonable production of
peroxyvaleric acid? In other words, what is the better relation HP/VA that leads to a higher
conversion of reactants? In this sense, equilibrium experiments carried out at 40oC and
different initial ratios of HP/VA were done. The results are shown in Figure 2:

Catalytic synthesis of peroxyfatty acids
22
0
5
10
15
20
25
30
35
40
45
0 10 20 30 40 50 60
Time[hour]
Co
nvers
ion
of
VA
[%
]
[VA]o = 21 wt.%
[VA]o = 34 wt.%
Continuous phase: aqueous
[VA]o= 50 wt.%
Continuous phase: organic
Figure 2 - Experiments carried out at 40°C, 45 g/L of catalyst loading and 370 rpm
It is demonstrated in figure 2 that the conversion of valeric acid is considerable
higher if one works with at 50% wt. instead of 34% or 21%. As a matter of fact, experiments
using more than 50% wt. of VA did not achieve such high conversion, therefore, this ratio
was assumed to be the optimum one.
4.1.2 Reaction and mass transfer considerations
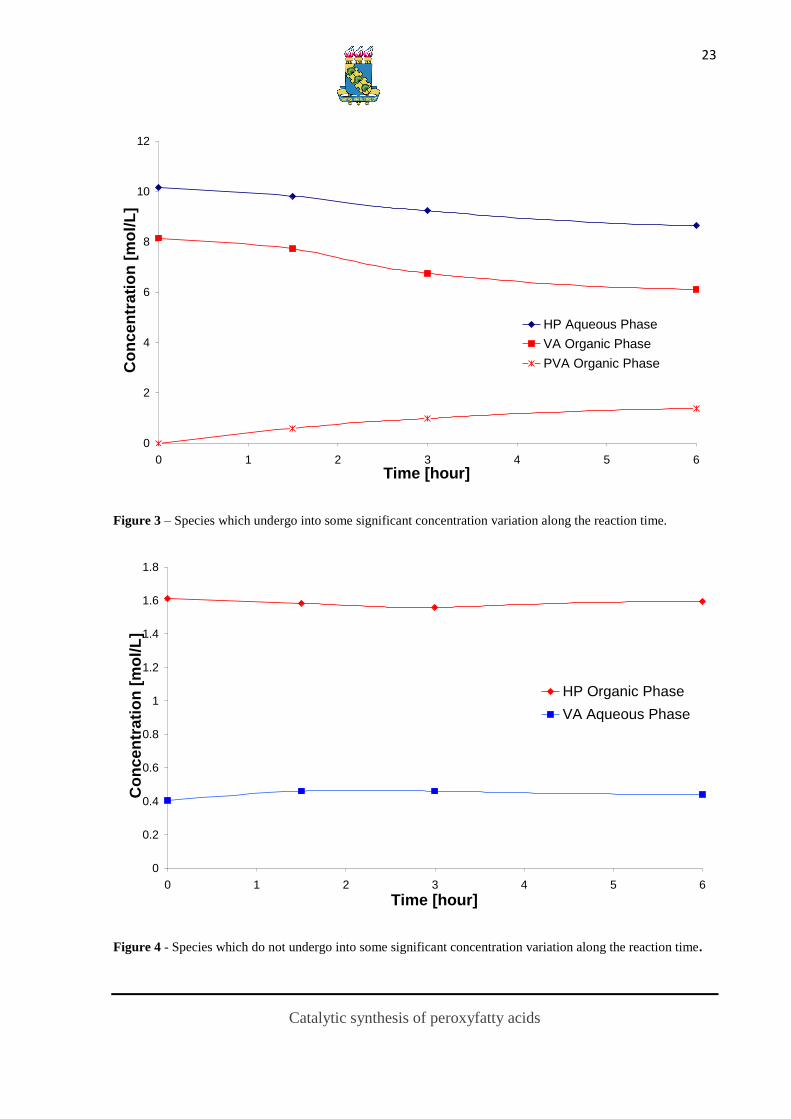
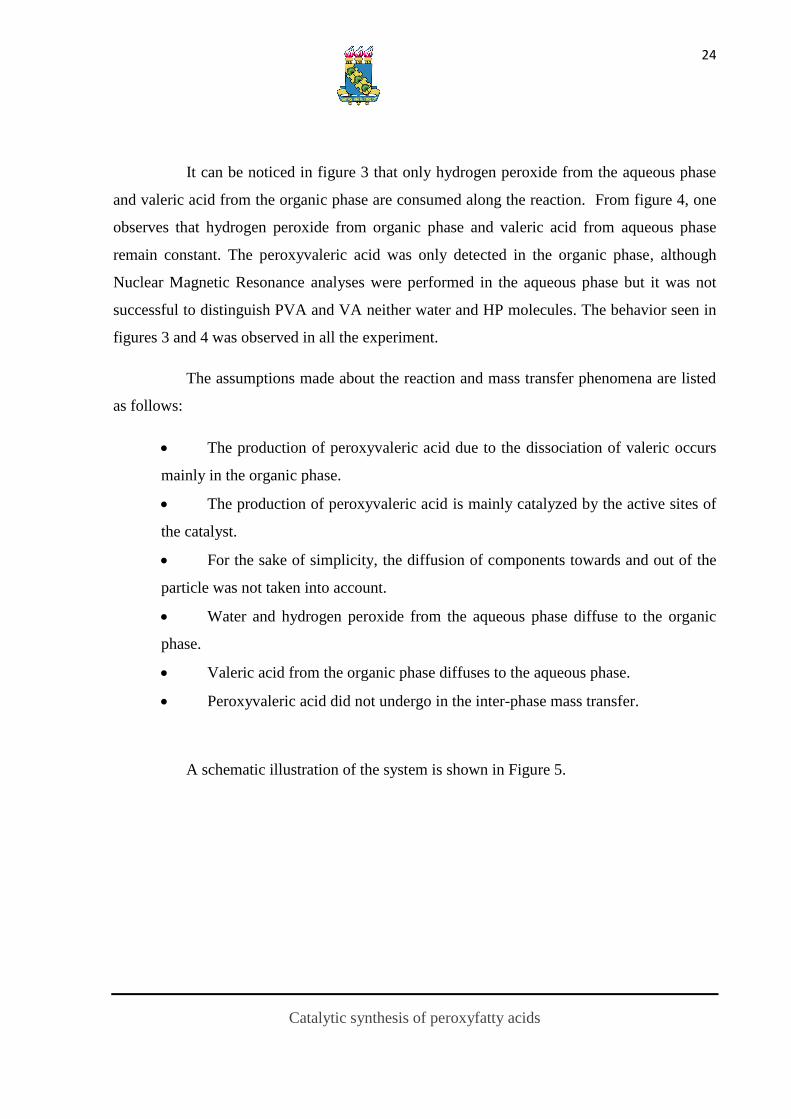
A typical graph of kinetic experiment is presented in Figure 3 and Figure 4. These
graphs show separately the result of an experiment carried out at 60°C, 370 rpm and 43 g/L of
catalyst loading.
Catalytic synthesis of peroxyfatty acids
23
0
2
4
6
8
10
12
0 1 2 3 4 5 6
Time [hour]
Co
nc
en
tra
tio
n [
mo
l/L
]
HP Aqueous Phase
VA Organic Phase
PVA Organic Phase
Figure 3 – Species which undergo into some significant concentration variation along the reaction time.
0
0.2
0.4
0.6
0.8
1
1.2
1.4
1.6
1.8
0 1 2 3 4 5 6
Time [hour]
Co
nc
en
tra
tio
n [
mo
l/L
]
HP Organic Phase
VA Aqueous Phase
Figure 4 - Species which do not undergo into some significant concentration variation along the reaction time.
Catalytic synthesis of peroxyfatty acids
24
It can be noticed in figure 3 that only hydrogen peroxide from the aqueous phase
and valeric acid from the organic phase are consumed along the reaction. From figure 4, one
observes that hydrogen peroxide from organic phase and valeric acid from aqueous phase
remain constant. The peroxyvaleric acid was only detected in the organic phase, although
Nuclear Magnetic Resonance analyses were performed in the aqueous phase but it was not
successful to distinguish PVA and VA neither water and HP molecules. The behavior seen in
figures 3 and 4 was observed in all the experiment.
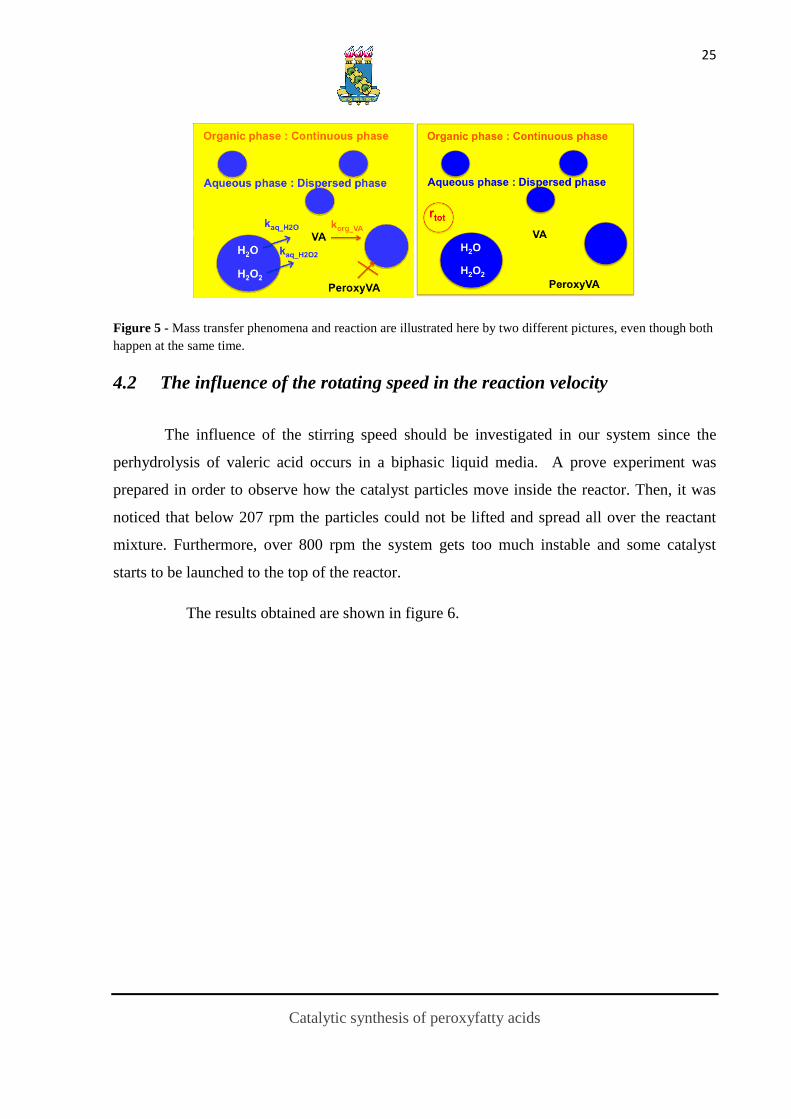
The assumptions made about the reaction and mass transfer phenomena are listed
as follows:
The production of peroxyvaleric acid due to the dissociation of valeric occurs
mainly in the organic phase.
The production of peroxyvaleric acid is mainly catalyzed by the active sites of
the catalyst.
For the sake of simplicity, the diffusion of components towards and out of the
particle was not taken into account.
Water and hydrogen peroxide from the aqueous phase diffuse to the organic
phase.
Valeric acid from the organic phase diffuses to the aqueous phase.
Peroxyvaleric acid did not undergo in the inter-phase mass transfer.
A schematic illustration of the system is shown in Figure 5.
Catalytic synthesis of peroxyfatty acids
25
Figure 5 - Mass transfer phenomena and reaction are illustrated here by two different pictures, even though both
happen at the same time.
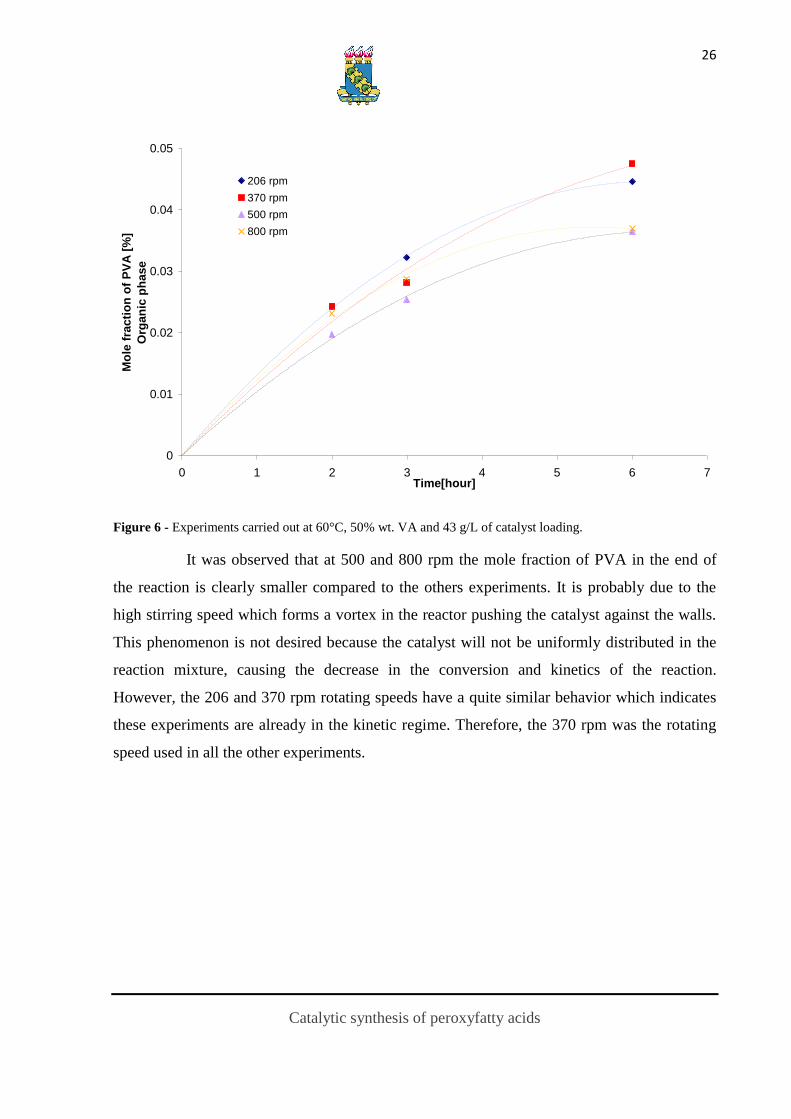
4.2 The influence of the rotating speed in the reaction velocity
The influence of the stirring speed should be investigated in our system since the
perhydrolysis of valeric acid occurs in a biphasic liquid media. A prove experiment was
prepared in order to observe how the catalyst particles move inside the reactor. Then, it was
noticed that below 207 rpm the particles could not be lifted and spread all over the reactant
mixture. Furthermore, over 800 rpm the system gets too much instable and some catalyst
starts to be launched to the top of the reactor.
The results obtained are shown in figure 6.
Catalytic synthesis of peroxyfatty acids
26
0
0.01
0.02
0.03
0.04
0.05
0 1 2 3 4 5 6 7Time[hour]
Mo
le f
racti
on
of
PV
A [
%]
Org
an
ic p
hase
206 rpm
370 rpm
500 rpm
800 rpm
Figure 6 - Experiments carried out at 60°C, 50% wt. VA and 43 g/L of catalyst loading.
It was observed that at 500 and 800 rpm the mole fraction of PVA in the end of
the reaction is clearly smaller compared to the others experiments. It is probably due to the
high stirring speed which forms a vortex in the reactor pushing the catalyst against the walls.
This phenomenon is not desired because the catalyst will not be uniformly distributed in the
reaction mixture, causing the decrease in the conversion and kinetics of the reaction.
However, the 206 and 370 rpm rotating speeds have a quite similar behavior which indicates
these experiments are already in the kinetic regime. Therefore, the 370 rpm was the rotating
speed used in all the other experiments.

Catalytic synthesis of peroxyfatty acids
27
4.3 Internal mass transfer
The internal mass transfer effect was studied by comparing kinetic experiments
with Dowex 50Wx8-400 and Dowex 50Wx8-50. In spite of these materials are not strictly
similar to Amberlite IR-120, the crosss-linking, which is the parameter governing the
diffusion, is identical in all of them. Catalyst properties were listed in Table 2.
The results are shown in Figure 7.
0
0.005
0.01
0.015
0.02
0.025
0.03
0.035
0.04
0.045
0 1 2 3 4 5 6 7
Time[hour]
Mo
le f
racti
on
of
PV
A
Org
an
ic p
hase
Dowex 50Wx8-400 (0.04-0.08 mm
Dowex 50Wx8-50 (0.3-0.84 mm)
Figure 7 - Influence of the mass transfer on the mole fraction of PVA at 60°C and 370 rpm of stirring speed.
Figure 7 shows that the effect of the internal mass transfer can be neglected in our
reaction system. Leveneur et al. (2009) used the same heterogeneous catalysts in the
perhydrolysis of acetic and propionic acids and the internal mass transfer limitation was found
to be non-negligible in that case. This might be due to the faster kinetics of the small carbon
chain carboxylic acids Musante et al. (2000).

Catalytic synthesis of peroxyfatty acids
28
4.4 Concentration inside the particle
Figure 8 illustrates the amounts of VA and HP found in each catalyst wash for a
reaction performed at 60oC, 50% wt. of VA and 43 g/L of initial catalyst loading.
Figure 8 - Grams of HP and VA extracted after a series of 6 washes.
This is a typical curve of the catalyst washing procedure. One assumes that after
the sixth wash the amounts of VA and HP are negligible for the calculation.
Prove experiments were done in order to have a better understanding of how the
concentration inside the particle varies with the time. The result is shown in Figure 9:

Catalytic synthesis of peroxyfatty acids
29
Figure 9 - Experiments performed at 25oC with 50% wt. of VA and 45 g/L of catalyst loading.
Figure 9 shows that the time has no influence in the concentration inside the
catalyst.
It was noticed that the concentration inside the catalyst is not dependent on the
temperature and catalyst loading. However, the concentration in the bulk phase showed a
particular influence on it.
Four experiments performed using 45-55% wt. of VA and different proportions of
HP were compared and the results are shown in figure 10. These experiments were carried out
under the same temperature, rotating speed and catalyst loading. The concentrations of HP are
measured in the aqueous phase and the VA in the organic phase, both at the end of the
reaction.
Catalytic synthesis of peroxyfatty acids
30
[HP]p = 0,65*[HP]aq-bulk
R2 = 0,99
0
1
2
3
4
5
6
7
0 1 2 3 4 5 6 7 8 9 10
Bulk concentration [mol/L]
Part
icle
co
ncen
trati
on
[m
ol/
L]
HP
VA
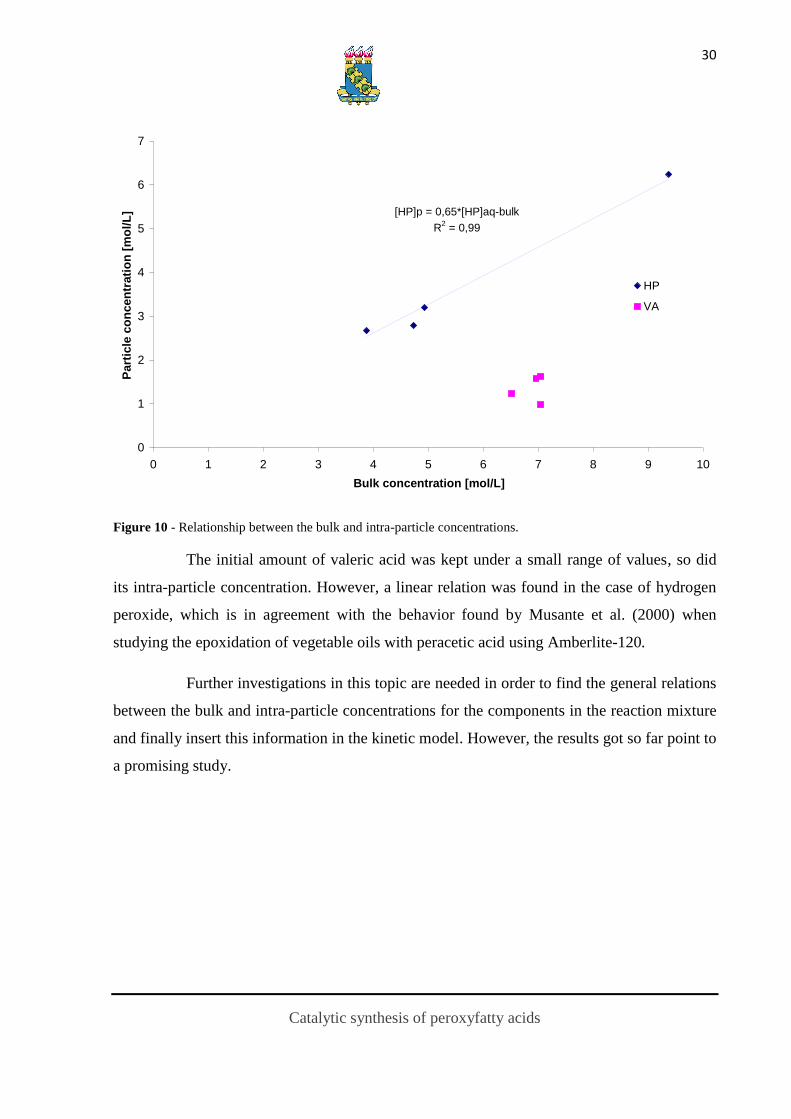
Figure 10 - Relationship between the bulk and intra-particle concentrations.
The initial amount of valeric acid was kept under a small range of values, so did
its intra-particle concentration. However, a linear relation was found in the case of hydrogen
peroxide, which is in agreement with the behavior found by Musante et al. (2000) when
studying the epoxidation of vegetable oils with peracetic acid using Amberlite-120.
Further investigations in this topic are needed in order to find the general relations
between the bulk and intra-particle concentrations for the components in the reaction mixture
and finally insert this information in the kinetic model. However, the results got so far point to
a promising study.
Catalytic synthesis of peroxyfatty acids
31
4.5 Determination of the distribution constant
The distribution constant of the species i is defined as:
aq
org
ii
iK (1)
Where the concentrations are calculated at the equilibrium.
As the liquid-liquid equilibrium is a chemical thermodynamic system, the Ki is
related to a Gibbs energy:
RT
ΔGexpKi (2)
The law of Van’t Hoff describes the temperature dependence of Ki:
ref
o
R
refi
i
T
1
T
1exp
R
ΔH
TK
TKln (3)
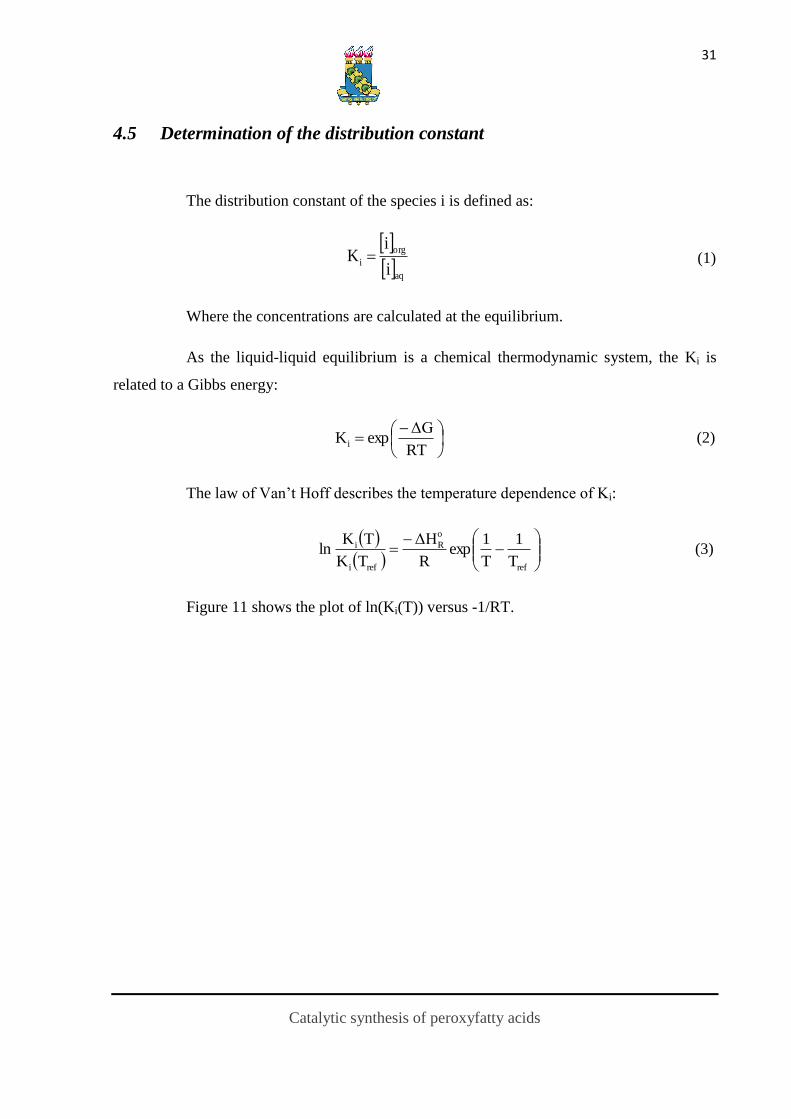
Figure 11 shows the plot of ln(Ki(T)) versus -1/RT.
Catalytic synthesis of peroxyfatty acids
32
Figure 11 - Experiments carried out at 50% of VA and 45g/L of catalyst loading.
Table 3 - Distribution coefficient of different compounds in different temperatures with a solution of 50% of VA
K = [i]org/[i]aqu
Temperature °C Valeric acid H2O2 Water
40 15.86 0.16 0.19
50 13.23 0.18 0.21
60 12.66 0.19 0.18
As the peroxyvaleric acid was not detected in the aqueous phase in any experiment
KPVA was not taken under consideration.
Catalytic synthesis of peroxyfatty acids
33
4.6 Kinetics
According to Leveneur et al. (2009), the perhydrolysis reaction catalyzed by
cation exchange resins can be divided into two different parts: the self-catalyzed reaction due
to the protolysis of the carboxylic acid and an Eley-Rideal mechanism with the adsorption of
the carboxylic acid on the sulfonic group.
The range of concentration used for the kinetic experiments varied between 48-
55% wt. of valeric acid. In these cases, the continuous phase was the organic and the
dispersed one was the aqueous.
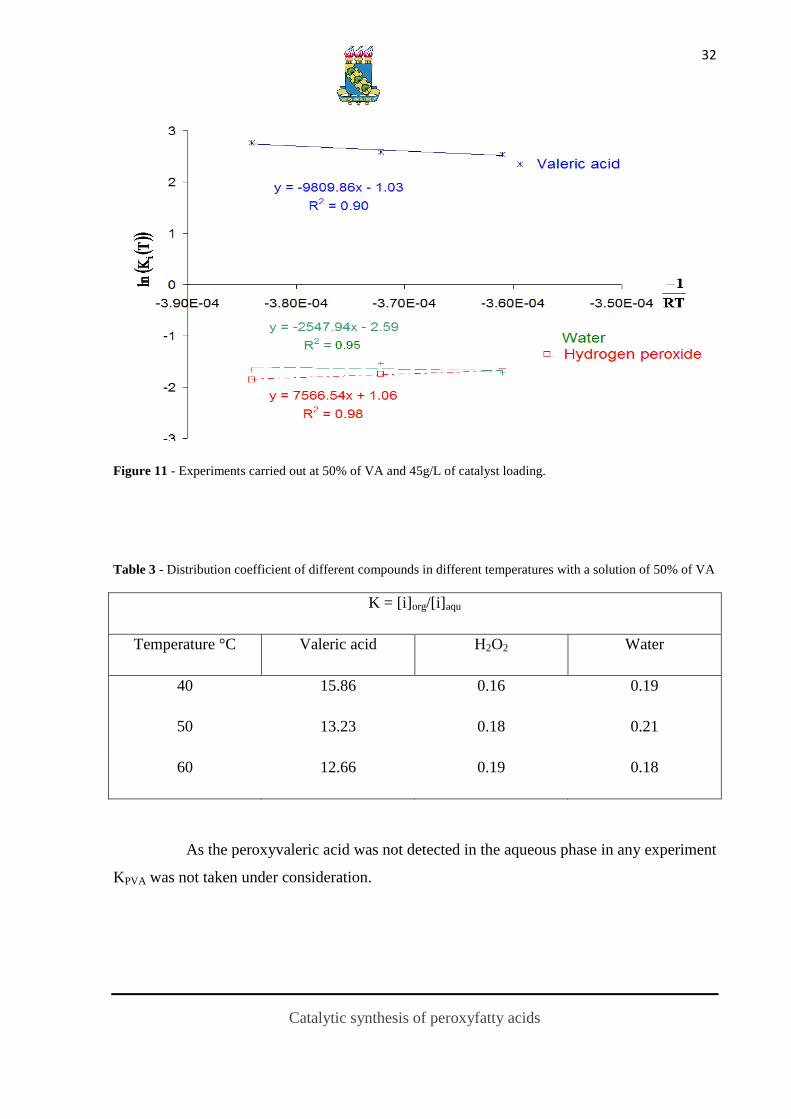
A blank experiment was performed in order to study how the reaction system
behaves in the absence of catalyst. The result is shown in figure 12.
0
5
10
15
20
25
30
35
40
45
0 10 20 30 40 50 60
Time [hour]
Co
nvert
ion
of
VA
[%
]
Org
an
ic P
hase
Blank
Initial catalyst loading = 45g/l
Figure 12 - Convertion of valeric acid in the blank experiment at 45 g/L of catalyst loading. Both experiments
were carried out at 50% wt. of VA and 370 rpm.
Catalytic synthesis of peroxyfatty acids
34
Figure 12 shows that even in the absence of catalyst the perhydrolysis of valeric
acids takes place in our system. Therefore, the influence of the self-catalyzed reaction could
not be neglected in our model.
The total rate of reaction can be described as:
rtot = rhom + rhet (4)
The proposed mechanism for the homogeneous reaction is presented in Figure 13.
1. RCOOH + H2O RCOO- + H3O
+
2. RCOOH + H3O+ RC
+(OH)2 +H2O
3. RC+(OH)2 + H2O2 RCO3H + H3O
+
Figure 13 - Simplified mechanism for the self-catalyzed perhydrolysis reaction.
The quasi-equilibrium hypothesis is applied for the reversible proton donor
reaction (reaction number 2 in Fig. 13). This assumption implies that
OH*(OH)RC*kOH*RCOOH*k 22232
(5)
By noting the ratio 2
2
k
k
is equal to C
2K , the concentration of the intermediate
RC+(OH)2 is obtained from
OH
OH*RCOOH*K(OH)RC
2
3
C
2
2
(6)
The concentration-based equilibrium constant C
1K is defined as
OH*RCOOH
OH*RCOOK
2
3
-C
1
(7)
It is reasonable to assume that [RCOO-] = [H3O
+] since the protolysis of valeric
acid (reaction 1) is very much significant than the subsequent reactions, then Eq. (7) becomes
OHRCOOHKOH 2
C
13 (8)
Catalytic synthesis of peroxyfatty acids
35
The rate-determining step for the homogeneous system is the reversible reaction 3,
and the rate rhom can now be expressed as
OH*HRCO*KK
1OH*RCOOH*
OH
OH*RCOOH*K*K*k
OH*HRCO*kOH*(OH)RC*krr
23C
3
C
2
22
2
2
C
1
C
23
33322233hom
(9)
Where the equilibrium constant C
3K is equal to the ratio 3
3
k
k
. The products
C
23 K*k and C
3
C
2 K*K are denoted by the merged constants homk and C
homK , respectively.
Then, Eq. (9) becomes
OH*HRCO*
K
1OH*RCOOH*
OH
OH*RCOOH*Kkrr 23C
hom
22
2
2
C
1hom
3hom (10)
For the heterogeneous part, it was used the same approach as Musante et al. (2000)
by assuming a pseudo homogeneous model:
OH*HRCO*
KOH*RCOOH*CL*kr
Chethet 23
hom
22
1 (11)
Where the CL is the catalyst loading and it is expressed in grams of dry catalyst
per cubic meters of organic phase.
Indeed, equations like (11) occur frequently in heterogeneous catalysis as a simple
way to take the mass of catalyst into account.
The global equilibrium constant for homogeneous and heterogeneous system was
assumed to be equal.
Finally, the total rate of reaction can be expressed as
Catalytic synthesis of peroxyfatty acids
36
OHHRCO
KOHRCOOHCLk
OH
OHRCOOHKkr
Chet
C
tot 23
hom
22
2
21hom **1
*****
(12)
The value of CK1 was calculated by using the equation from Sue et al. (2004). The
apparent rate constant for the homogeneous reaction was calculated from different blank
experiments carried for a long reaction time.
4.7 Equilibrium analysis
4.7.1 Influence of the molar fraction in the equilibrium constant
Perhydrolysis reactions are governed by equilibrium constant. In order to
determine the thermodynamics parameters of our reaction an equilibrium study is necessary.
The equilibrium constant was determined by analysis of the reaction quotient,
defined as:
org22org
org2org
OHVA
OHPVAQ (13)
Once this parameter becomes constant one assumes that the equilibrium is attained
and at this point Q is equal to KC. Bucalà et al. (2006) have demonstrated that in case of
liquid-liquid system the thermodynamic equilibrium constant in the organic and aqueous
phase are equal, however in our case, as no PVA was detected in the aqueous phase, it was
assumed that no reaction occurs there. Figure 14 illustrates how the value of KC
varies with
the initial molar fraction of VA.

Catalytic synthesis of peroxyfatty acids
37
0
0.5
1
1.5
2
2.5
0 0.05 0.1 0.15 0.2 0.25 0.3 0.35 0.4 0.45 0.5
Initial molar fraction of VA
Kc
Continuous phase: Organic Continuous phase:
Aqueous
Figure 14 - Experiments carried out at 40oC and 45 g/l of catalyst loading
The equilibrium constant reaches a maximum in the molar fraction of 0.161 of
VA. This behavior can be accredited to the non-ideality of the system which inverts the
dispersed and continuous phase at this point.
4.7.2 Enthalpy of reaction
For the sake of simplicity, one assumes that KC is equivalent to the true
thermodynamic constant KT. Thus, K
T can be described by the law of Van’t Hoff:
2
ln
RT
H
dT
Kdo
r
T (14)
Catalytic synthesis of peroxyfatty acids
38
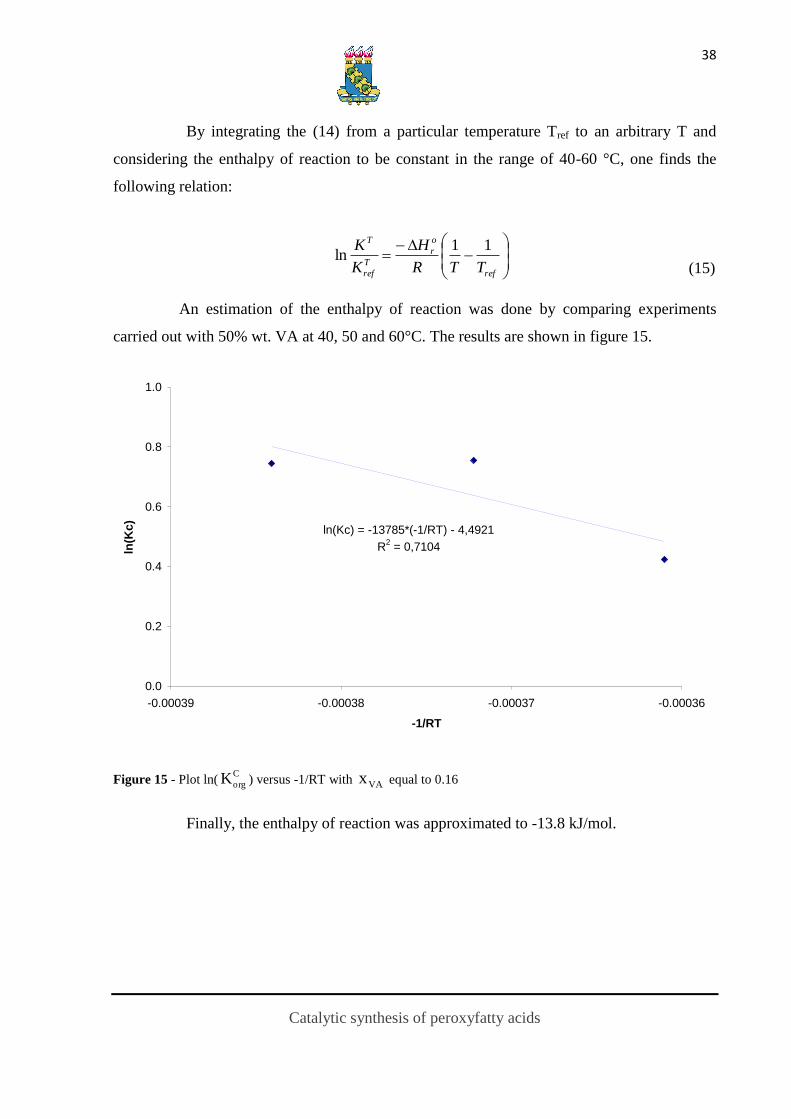
By integrating the (14) from a particular temperature Tref to an arbitrary T and
considering the enthalpy of reaction to be constant in the range of 40-60 °C, one finds the
following relation:
(15)
An estimation of the enthalpy of reaction was done by comparing experiments
carried out with 50% wt. VA at 40, 50 and 60°C. The results are shown in figure 15.
ln(Kc) = -13785*(-1/RT) - 4,4921
R2 = 0,7104
0.0
0.2
0.4
0.6
0.8
1.0
-0.00039 -0.00038 -0.00037 -0.00036
-1/RT
ln(K
c)
Figure 15 - Plot ln(C
orgK ) versus -1/RT with VAx equal to 0.16
Finally, the enthalpy of reaction was approximated to -13.8 kJ/mol.
ref
o
r
T
ref
T
TTR
H
K
K 11ln

Catalytic synthesis of peroxyfatty acids
39
4.8 Mathematical model
The heterogeneous and homogeneous reactions were assumed to happen in the
organic phase and the catalyst was treated only as a promoter of the reaction, no diffusion
towards or out of the particle was assumed to occur.
For the sake of simplicity, the water and hydrogen peroxide from the aqueous
phase diffuse to the organic phase (characterized by the mass transfer coefficient kp-i); valeric
acid from the organic phase diffuses to the aqueous phase (characterized by the mass transfer
coefficient kc-i); since no peroxyvaleric acid was detected in the aqueous phase, its phase
transfer was neglected.
Mass balance in the aqueous phase
The general mass balance for any compounds (i) in the aqueous phase is:
totrdt
idnAiNAiN
aq
aq/orgaqaq/orgorg (16)
As rtot is zero in the aqueous phase, (16) becomes
aq/orgaqorg
aqA(i)N(i)N
dt
idn (17)
Where the Aaq/org is the interfacial area between the liquid-liquid system.
The law of Fick describes the interfacial mass transfer, so:
(i)c(i)ck(i)N
(i)c(i)ck (i)N
*
aqaqi-aqaq
org
*
orgi-orgorg
(18)
Where c*(i) is the concentration in the liquid-liquid interface, kx(i) is the mass
transfer coefficient of the compound (i) in the X phase.
The interfacial area between the organic and the aqueous phase is introduced as
the parameter ao:
Catalytic synthesis of peroxyfatty acids
40
ototo,aq/org
toto,
aq/org
o aVAV
Aa (19)
Where Vo,tot is the total volume of organic and liquid phase measured in the end of
the reaction. The calculation of the mass transfer coefficients will be discussed later.
By inserting the equations (18) and (19) in (17),
toto,o
*
aqaqi-aqorg
*
orgi-org
aqVacckcck
dt
idn (20)
The concentration at the aqueous-organic interface is obtained from:
mequilibriuaqu
org
aq
org
ic
c
c
cK
*
*
(21)
Where Ki is the distribution coefficient of the compound (i).
Therefore, (20) becomes
toto,o
i
org
aqi-aqorgaqii-org
aqVa
K
cckccKk
dt
idn
(22)
Applying equation (22) to the species present in the aqueous phase, one obtains
the following system:
toto,o
OH
org22
aq22OH-aq
22aq
toto,o
OH
org2
aq2OH-aq
2aq
toto,oorgaqVAVA-org
aq
VaK
OHOHk-
dt
OHdn
VaK
OHOHk-
dt
OHdn
VaVAVAKkdt
VAdn
22
22
2
2
(23)
The system (23) can be rearranged to:

Catalytic synthesis of peroxyfatty acids
41
22
22
2
2
OH
org22
aq22OH-aq
aq
toto,
o
aq22
OH
org2
aq2OH-aq
aq
toto,
o
aq2
orgaqVAVA-org
aq
toto,
o
aq
K
OHOHk
V
Va
dt
OHd
K
OHOHk
V
Va
dt
OHd
VAVAKkV
Va
dt
VAd
(24)
Mass balance in the organic phase
The mass balance of the compound (i) in the organic phase is
dt
idnAiNVriνAiN
org
aq/orgorgorgtotaq/orgaq (25)
Rearranging (25):
aq/orgorgaqorgtot
orgAiNiNVriν
dt
idn (26)
Applying (26) to the species present in the organic phase, one obtains the
following system:
totr
r
dt
PVAd
rK
OHOHk
V
Va
dt
OHd
rK
OHOHk
V
Va
dt
OHd
VAVAKkV
Va
dt
VAd
org
tot
OH
org22
aq22OH-aq
aq
toto,
o
org22
tot
OH
org2
aq2OH-aq
org
toto,
o
aq2
totorgaqVAVA-org
org
toto,
o
org
22
22
2
2
(27)
Catalytic synthesis of peroxyfatty acids
42
Calculation of the interfacial area between the organic and aqueous phase a0
The following expression was used to calculate the parameter ao (van Woezik and
Westerterp, 2000; Zaldìvar et al., 1996; Campanella and Baltanás, 2007):
32
do
d
6Φa (28)
Where Φd is the fraction of dispersed phase (aqueous phase) and d32 is the Sauter
number (m).
The sauter number can be calculated by the following expression (Zaldìvar et al.,
1996):
0.6
d
a
32
We
ΦAf
D
d (29)
Where Da is the diameter of the stirrer (4 cm) and A is a parameter varying
between 0.04 and 4 (Zaldìvar et al., 1996).
We is the so-called Webber number, which is equal to:
σ
DnρWe
3
a
2
ac (30)
Where ρc is the density of the continuous phase (kg.m-3
), which is the organic
phase in our system (969 kg/m3), na is the stirring speed (s
-1) which is equal to 6.16 s
-1 (370
rpm), σ is the surface tension (N.m-1
) of the system.
The function dΦf (Delichatsios and Probstein, 1976) is equal to:
5
3
2
d32d
lnC
)ΦCln(CΦf
(31)
Where C2 is 0.011and C3→1 on case of Φd>3. This function can be represented in
two ways, both of which account for re-dispersion and coalescence effects.
Catalytic synthesis of peroxyfatty acids
43
Calculation of the surface tension
According to the Good and Girifalco’s model (1960), the surface tension can be
calculated as:
dcdc γγ2γγσ (32)
Where cγ and dγ are the surface tension of the continuous and dispersed phase
respectively. For the sake of simplicity, the surface tension of the continuous phase was
supposed to be the same as the valeric acid, and surface tension for the dispersed to be the
same as hydrogen peroxide (Yaws, 1999).
1.2257
c651
KT-1*.
1000
56.8N/mγ
(33)
1.2222
d730.15
KT-1*.
1000
141.031N/mγ
(34)
The interaction parameter is calculated according to the mean molar volumes of
continuous (Vm,c) and dispersed phase (Vm,d):
2
31
m,d3
1
m,c
31
m,dm,c
VV
VV*4
(35)
At 40ºC the interfacial surface area can be estimated to 0.019 N/m for the
perhydrolysis of valeric acid.
Estimation of diffusion coefficient in mixed solvent
The Perkins-Geankoplis (1969) equation estimates the diffusion coefficient of a
solute in a liquid-liquid system:

Catalytic synthesis of peroxyfatty acids
44
0.8
aq
0
iaqaq
0.8
org
0
iorgorg
0.8
X
0
iX
AX1X
X
0.8
m
0
im
μDxμDx
μDxμD
(36)
Where 0
imD and 0
iXD are the diffusion coefficients in the mixed solvent and in
pure solvent, respectively. The viscosity of the solution can be calculated by:
aqaqorgorg
n
1i
iim
lnμxlnμx
lnμxμln
(37)
For the sake of simplicity, the viscosities of the organic and aqueous phase were
assumed to be equal to the viscosity of water and valeric acid respectively (Yaws, 1999).
252
3
T(K)101.2781T(K)101.5088T(K)
101.45837.9425
acid valericorg 10μ(cP)μ
(38)
252
3
T(K)101.2631T(K)101.7730T(K)
101.792510.2158
wateraq 10μ(cP)μ
(39)
Based on the study of Liu et al. (2004), the correlation of Hayduk-Laudie (1974)
can be used to calculate the diffusion coefficients of the component in the aqueous phase (Eq.
(40)), and the correlation of Scheibel (1954) (Eq. (41)) to calculate the diffusion coefficients
of the component in the organic phase.
]mol[cm[cP]μ
10 13.26]s[cmD]s[cmD
130.589
i
1.4
aq
-5120
iaq
120
iX
V
(40)
3
2
13
i
13
org
133
1
iorg
8-120
iorg
120
iX]mol[cm
]mol[cm31
]mol[cm[cP]μ
T[K]10 8.2]s[cmD]s[cmD
V
V
V
(41)
Where Vi is the molar volume at boiling point of the solute.
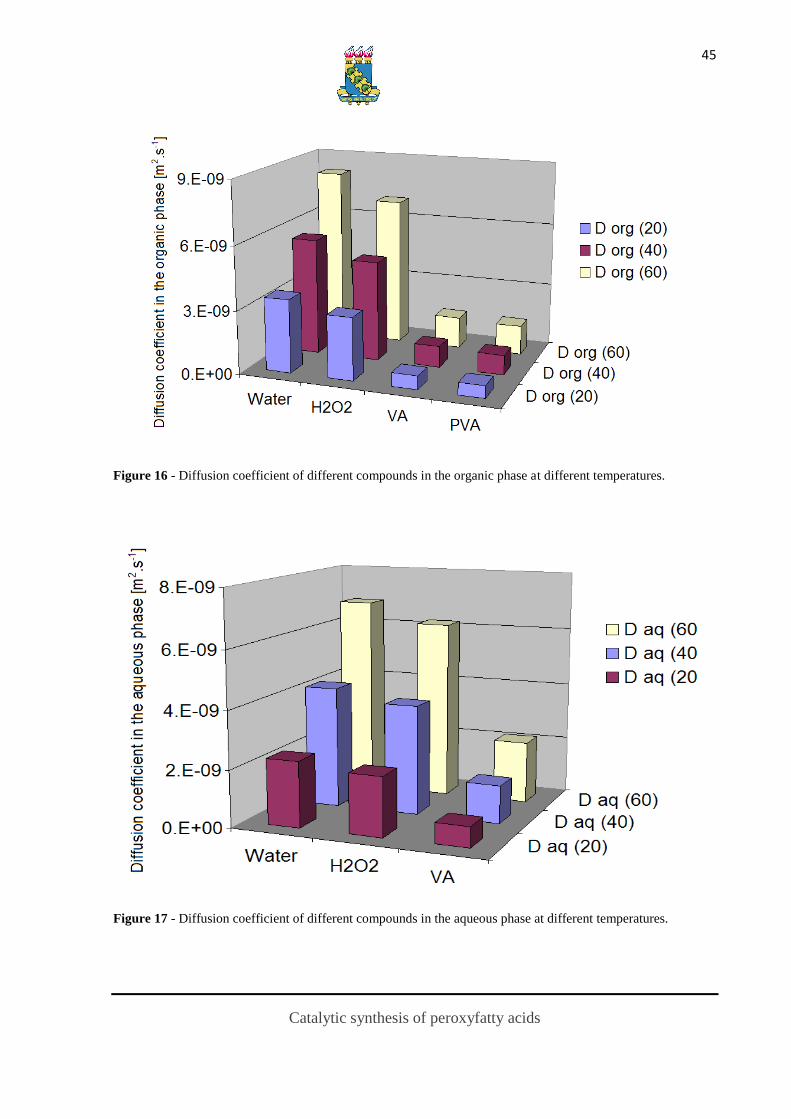
Figures 16, 17 and 18 show the values of the diffusion coefficients calculated at
different temperature for each component of the system.
Catalytic synthesis of peroxyfatty acids
45
Figure 16 - Diffusion coefficient of different compounds in the organic phase at different temperatures.
Figure 17 - Diffusion coefficient of different compounds in the aqueous phase at different temperatures.
Catalytic synthesis of peroxyfatty acids
46
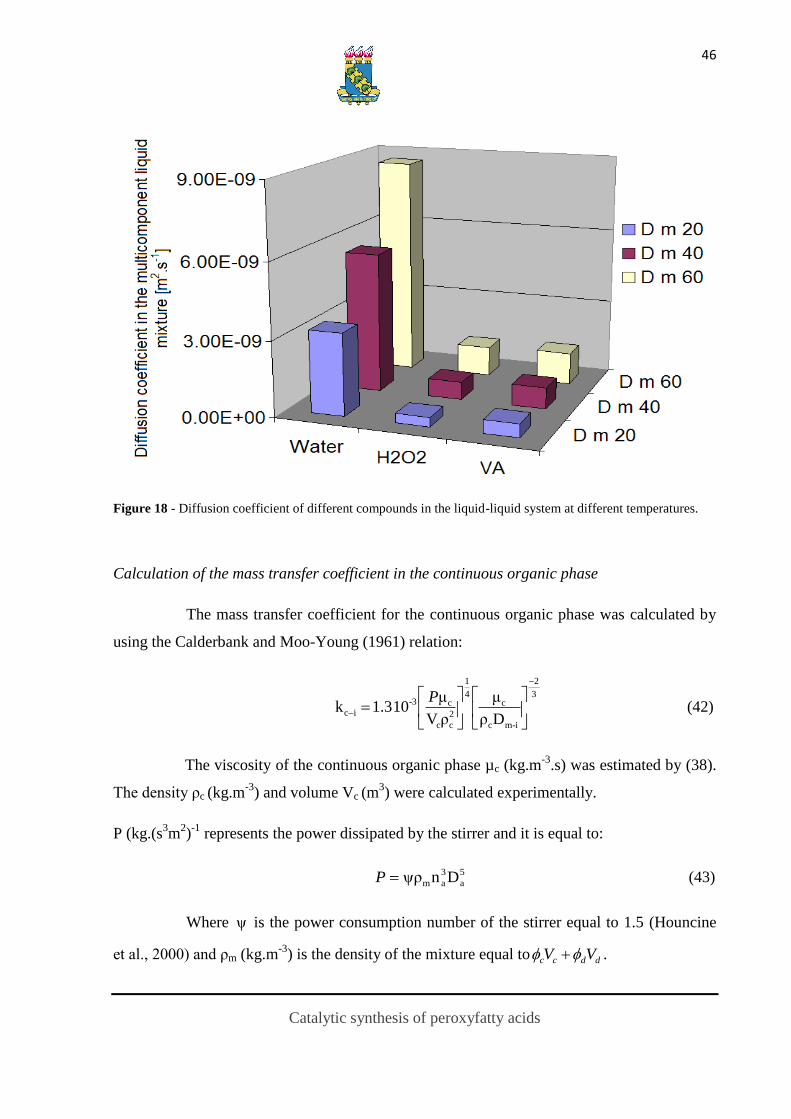
Figure 18 - Diffusion coefficient of different compounds in the liquid-liquid system at different temperatures.
Calculation of the mass transfer coefficient in the continuous organic phase
The mass transfer coefficient for the continuous organic phase was calculated by
using the Calderbank and Moo-Young (1961) relation:
3
2
i-mc
c4
1
2
cc
c3-
icDρ
μ
ρV
μ10 1.3k
P (42)
The viscosity of the continuous organic phase µc (kg.m-3
.s) was estimated by (38).
The density ρc (kg.m-3
) and volume Vc (m3) were calculated experimentally.
P (kg.(s3m
2)-1
represents the power dissipated by the stirrer and it is equal to:
5
a
3
am DnψρP (43)
Where ψ is the power consumption number of the stirrer equal to 1.5 (Houncine
et al., 2000) and ρm (kg.m-3
) is the density of the mixture equal to ddcc VV .
Catalytic synthesis of peroxyfatty acids
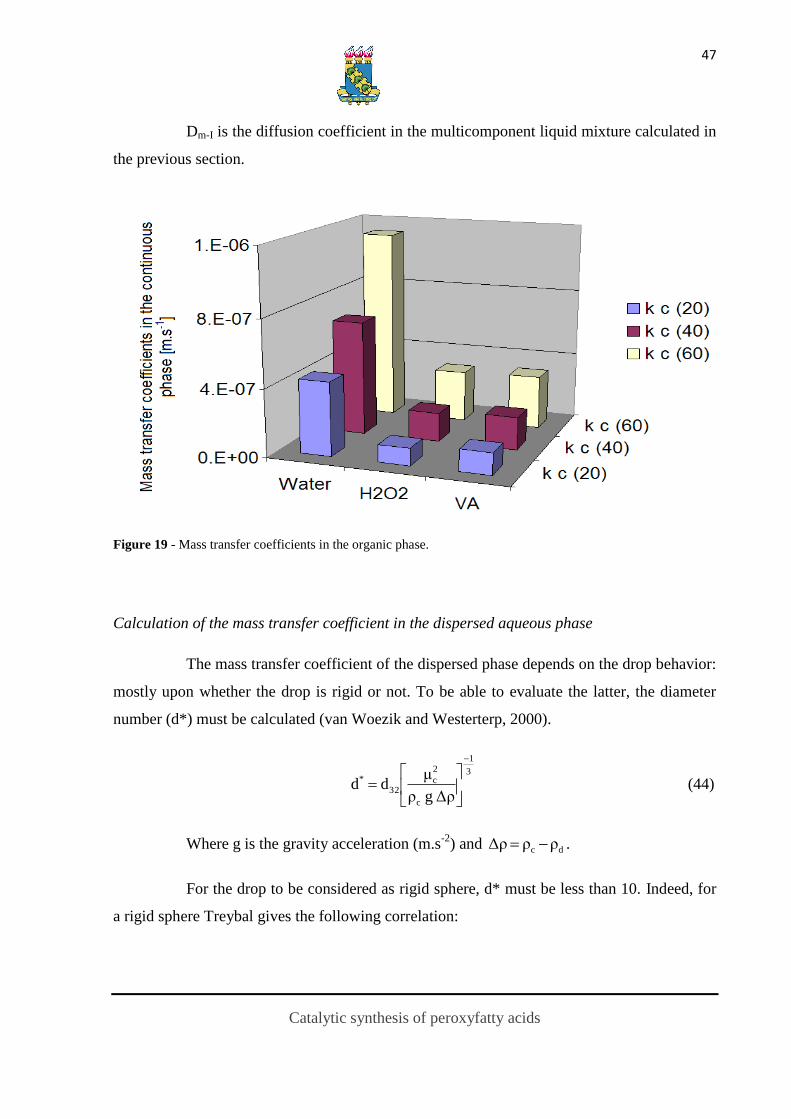
47
Dm-I is the diffusion coefficient in the multicomponent liquid mixture calculated in
the previous section.
Figure 19 - Mass transfer coefficients in the organic phase.
Calculation of the mass transfer coefficient in the dispersed aqueous phase
The mass transfer coefficient of the dispersed phase depends on the drop behavior:
mostly upon whether the drop is rigid or not. To be able to evaluate the latter, the diameter
number (d*) must be calculated (van Woezik and Westerterp, 2000).
3
1
c
2
c32
*
Δρ g ρ
μdd
(44)
Where g is the gravity acceleration (m.s-2
) and dc ρρΔρ .
For the drop to be considered as rigid sphere, d* must be less than 10. Indeed, for
a rigid sphere Treybal gives the following correlation:

Catalytic synthesis of peroxyfatty acids
48
32
im
2
idd 3
D2πk
(45)
Figure 20 – Mass transfer coefficients in the aqueous phase at 40ºC vs d32.
Modeling and results
The software MODEST [13] was used for the estimation of khet and Ea
parameters. The Simplex and Levenberg-Maquardt algorithms were used to minimize the
objective function θ:
2^
ii yy (46)
Where iy is the experimental value of concentration and ^
iy is the concentration
predicted by the model.
The general equation for a batch reactor is set for all the compounds in our system:

Catalytic synthesis of peroxyfatty acids
49
totOH
totOH
totPVA
totVA
rdt
OHdr
rdt
OHdr
rdt
PVAdr
rdt
VAdr
2
22
2
22
(47)
These equations combined with the mass balance were solved numerically during
the parameter estimation.
A modified Arrhenius equation is used for describing the temperature dependence
of the homogeneous rate of reaction khom:
ave
aveTTR
Eakk
11exphom (48)
Where Tave is the average temperature of the experiments, 45°C, and kave is
calculated as follows:
RT
EaAkave exp (49)
This modification in the Arrhenius equation was done in order to minimize the
correlation between the frequency factor and the activation energy during the parameter
estimation.
A summary of the general results obtained is shown in tables 5 and 6.
Table 4 - Kinetic parameters estimated
Parameters Estimation Errors(%)
khet(L.mol-1
.g-1
.s-1
) 1010*74.0 13.7
Ea (kJ/mol) 63.6 23.2

Catalytic synthesis of peroxyfatty acids
50
Table 5 - Thermodynamic parameters calculated
Parameters Estimation
Keq (at 40°C) 2.1
o
rH (kJ/mol) -13.8
The modeling results are presented in figure 21 and 22.
Figure 21 - Fit of the model for the perhydrolysis of valeric acid at 60°C and 370 rpm.
Catalytic synthesis of peroxyfatty acids
51
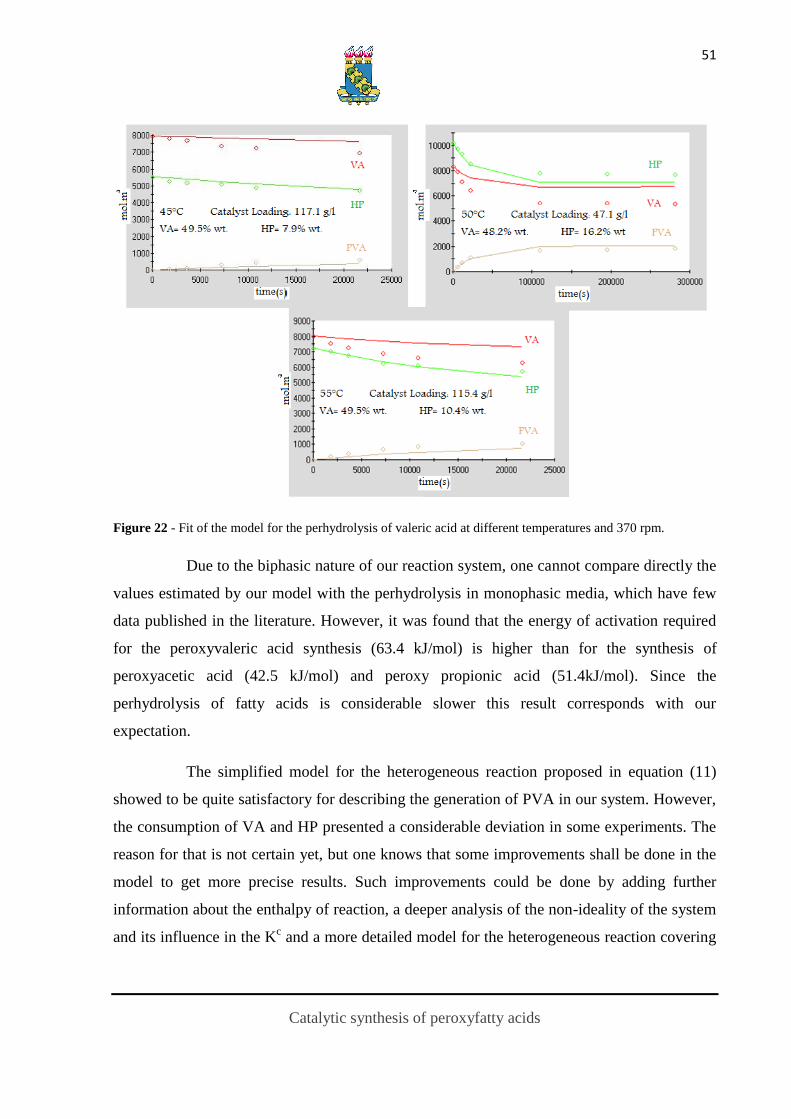
Figure 22 - Fit of the model for the perhydrolysis of valeric acid at different temperatures and 370 rpm.
Due to the biphasic nature of our reaction system, one cannot compare directly the
values estimated by our model with the perhydrolysis in monophasic media, which have few
data published in the literature. However, it was found that the energy of activation required
for the peroxyvaleric acid synthesis (63.4 kJ/mol) is higher than for the synthesis of
peroxyacetic acid (42.5 kJ/mol) and peroxy propionic acid (51.4kJ/mol). Since the
perhydrolysis of fatty acids is considerable slower this result corresponds with our
expectation.
The simplified model for the heterogeneous reaction proposed in equation (11)
showed to be quite satisfactory for describing the generation of PVA in our system. However,
the consumption of VA and HP presented a considerable deviation in some experiments. The
reason for that is not certain yet, but one knows that some improvements shall be done in the
model to get more precise results. Such improvements could be done by adding further
information about the enthalpy of reaction, a deeper analysis of the non-ideality of the system
and its influence in the Kc and a more detailed model for the heterogeneous reaction covering

Catalytic synthesis of peroxyfatty acids
52
the intra-particle concentration approach. It would be interesting if these parameters could be
easily calculated by some computational thermodynamic model; however, unfortunately there
is a lack of data concerning the influence of the peroxide group.

Catalytic synthesis of peroxyfatty acids
53
5 Conclusions
The present work has demonstrated that the perhydrolysis of valeric acid is
feasible and occurs even in the absence of catalyst, although the heterogeneous catalyst,
Amberlite IR-120, performed a significant increase in the kinetics and conversion of the
reaction.
The influence of the stirring speed was analyzed for kinetic experiments at 207,
370, 500 and 800 rpm. Below 207 rpm the catalyst particles were not able to be suspended all
over the reactor and over 800 rpm the system got too much instable, presenting vibrations and
some catalyst particles were launched to the roof of the reactor. Therefore, the velocities of
207 and 370 rpm showed that the reaction was already in the kinetic regime. The experiments
carried out at 500 and 800 rpm showed a smaller conversion compared to the others: one can
assume this is due to a vortex created that pushes the catalyst against the reactor walls.
The internal mass transfer effect was tested by using two catalysts with different
particle sizes than Amberlite IR-120 but with the same degree of cross linking, matrix and
active sites. Dowex 50x8-400 and Dowex 50x8-50 have demonstrated that the internal mass
transfer effect is negligible.
An experimental method was developed with the aim to find the concentration of
components inside the catalyst particles. The method is based in several catalyst washes
followed by the analysis of the filtrated liquid. The results are quite promising; however there
was not enough time to include this parameter in the present kinetic model.
The kinetic model developed took into account the mass transfer between the
organic and the aqueous phase. The results obtained presented a good agreement for most of
the experiments modeled, especially for the production of peroxyvaleric acid. Further
investigations about the non-ideality of the system, the enthalpy of reaction and the
heterogeneous mechanism of reaction should be done in order to improve the accuracy of the
kinetic model.
Catalytic synthesis of peroxyfatty acids
54
6 Acknowledgements
The financial support from Åbo Akademi and CAPES is greatefully acknowledge.
Catalytic synthesis of peroxyfatty acids
55
7 Notation
A interfacial area [m2]
ao mass transfer-to-volume ratio [m2.m
-3]
CL cataltyst loading [g.m-3
]
d32 Sauter number [m]
Da diameter of the stirrer [m]
0
imD diffusion coefficients of i in the mixed solvent [cm2.s
-1]
0
iXD diffusion coefficients of i in the pure solvent [cm2.s
-1]
d* diameter number [m]
Ea activation energy [J.mol-1
]
G Gibbs energy [kJ.mol-1
]
g gravity acceleration [m.s-2
]
o
RΔH standard enthalpy change of reaction [kJ.mol-1
]
[i] or ci concentration of i [mol.L-1
]
k rate constant [L.mol-1
.s-1
]
khet rate constant [L.mol-1
.g-1
.s-1
]
kD mass transfer coefficient [m.s-1
]
i-orgk mass transfer coefficient for i in the organic phase [m.s-1
]
i-orgk mass transfer coefficient for i in the aqueous phase[m.s-1
]
Catalytic synthesis of peroxyfatty acids
56
Ki distribution coefficient
KC equilibrium constant, based on concentrations
KT true thermodynamic constant, based on activities
na stirring speed [s-1
]
N flux [mol.m-2
.s-1
]
n amount of substance [mol]
P power dissipated by the stirrer [kg.(s3m
2)-1
]
Q reaction quotient
R gas constant [J.mol-1
.K-1
]
rtot total rate of reaction
rhom homogeneous rate of reaction
rhet heterogeneous rate of reaction
T temperature
x mole fraction
Vi molar volume at boiling point of the solute [m3.mol
-1]
V volume [m-3
]
Vo,tot total volume measured in the end of the reaction [m-3
]
Greek letters
θ objective function
μf viscosity of the fluid [Ns.m-2
]
Catalytic synthesis of peroxyfatty acids
57
ρf fluid density [kg.m-3
]
Φd fraction of dispersed phase
ψ power consumption number of the stirrer
σ surface tension [N.m-1
]
Dimensionless groups
We Webber number σ
DnρWe
3
a
2
ac
Catalytic synthesis of peroxyfatty acids
58
8 References
Pruss, A.; Hansen, A.; Kao, M.; Gürtler, L.; Pauli, G.; Benedix, F.; von Versen, R.; Cell
and Tissue Banking, 2, 201-215 (2001).
Ölmez, H.; Kretzschmar, U.; Food Sci. Technology, 42, 686-693 (2009).
Kitis M.; Environ. Int., 30, 47-55 (2004).
Polonca, P.; Tavčer, P. T. ; Color. Technol., 124, 36-42 (2008).
Goud, V. V.; Patwardhan, A. V.; Dinda, S.; Pradhan, N. C.; Chem. Eng. Sci., 62, 4065-
4076 (2007)
Nardello-Rataj, V.; Taï, L. H. T.; Aubry, J. M.; L’Actualité Chimique (2003),
Campanella, A.; Baltanas, M. A.; “Degradation of oxirane ring of epoxidized vegetable
oils in liquid-liquid heterogeneous reaction systems”, Chem. Eng. Journal, 118, 141-152
(2006).
Leveneur, S.; Murzin, D. Yu.; Salmi, T.; Mikkola, J.-P.; Kumar, N.; Eränen, K.; Estel, L.;
”Synthesis of peroxypropionic acid from propionic acid and hydrogen peroxide over
heterogeneous catalysts”, Chem. Eng. J., 147, 323-329, (2009).
Leveneur, S; Wärnå, J.; Salmi, T.; Murzin, D. Yu.; Estel, L.; “Interaction of intrinsic
kinetics and internal mass transfer in porous ion-exchange catalysts: green synthesis of
peroxycarboxylic acids”. Chem. Eng. Sci., 64, 4104-4114, (2009).
Musante, R.L.; Grau, R.J.; Baltanas, M.A.; “Kinetic of liquid-phase reactions catalyzed by
acidic resins: the formation of peracetic acid for vegetable oil epoxidation”, Appl. Catal.,
197, 165-173, (2000).

Catalytic synthesis of peroxyfatty acids
59
Sue, K. ; Ouchi, F. ; Minami, K. ; Arai, K. ; “Determination of carboxylic acid
dissociation constants to 350°C at 23MPa by potentiometric pH measurements“, J. Chem.
Eng. Data., 49, 1359-1363, (2004).
Altiokka, M.R.; “Kinetics of hydrolysis of benzaldehyde dimethyl acetal over Amberlite
IR-120”, Ind. Eng. Res., 46, 1058-1062, (2007).
Cantieni, R.; “Photochemical peroxide formation. VII. Oxidation of acetic, propionic,
butyric and isovaleric acids by means of molecular oxygen in ultraviolet light”, Zeitschrift
fuer Wissenschaftliche Photographie, Photophysik und Photochemie, 36, 90-95 (1937).
Greenspan, F.P.; Mackellar, D.G.; “Analysis of aliphatic per acids”, Anal. Chem., 20,
1061-1063, (1948).
Hawkinson, A.T.; Schitz, W.R.; “Improvements in or relating to the oxidation of aliphatic
carboxylic acids to peracids”, Adv. Science Tech., 39, 350-382, (2004).
Levenspiel, O.; Chemical Reaction Engineering. 3rd ed. New York: John Wiley & Sons
Inc., (1999).
Phillips, B.; Starcher, P. S.; Ash, B.D.; “Preparation of aliphatic peroxyacids”, J. Org.
Chem., 23, 1823-1826 (1958).
Rüsch gen. Klaas, M.; Steffens, K.; Patett, N.; “Biocatalytic peroxy acid formation for
disinfection”, J. Mol. Catal. B-Enzym., 19-20, 499-505 (2002).
Saha, M.S; Nishiki, Y.; Furuta, T.; Denggerile, A.; Ohsaka, T.; “A new method for the
preparation of peroxyacetic acid using solid superacid catalysts”, Tetrahedron Lett. , 44,
5535-5537, 2003.
Salmi T.O.; Mikkola J.-P.; Wärnå J.P.; Chemical reaction engineering and reactor
technology, 1st Ed. Turku: CRC Press (2010).
Trambouze, P. ; Euzen, J.-P. ; Les Réacteurs Chimiques. 2nd
Ed., Paris : Editions
TECHNIP (2002).
Catalytic synthesis of peroxyfatty acids
60
Villermaux, J. ; Génie de la Réaction Chimique. 2nd ed., Paris : Tec&Doc Lavoisier
(1993).
Pan, G. X. ; Spencer, L. ; Leary, G. J. ; Holzforschung, 54, 144-152 (2000).
Pan, G. X. ; Spencer, L. ; Leary, G. J. ; Holzforschung, 54, 153-158 (2000).
Zaldívar, J. M. ; Molga, E. ; Alós, M. A. ; Hernández, H. ; Westerterp, K. R. ; “Aromatic
nitrations by mixed acid, slow liquid-liquid reaction regime”, Chem. Eng. Process, 35,
91-105 (2006) .
Sawistowski, H. ; “Physical aspects of liquid-liquid extraction, in: Proceedings with
NATO in Mass Transfer with Chemical Reaction in Multiphase Systems”, Istambul,
Turkey (2001).
Van Woezik, B. A. A. ; Westerterp, K. R. ; “Measurement of interfacial areas with
chemical method for a system with alternating dispersed phases”, Chem. Eng. Process,
39, 299-314 (2000).
Delichatsios, M. A.; Probstein, R. F.; “The effect of coalescence on the average drop size
in liquid-liquid dispersions”, Ind. Eng. Chem. Fundam., 15, 134-138 (1976).
Calderbank, P. H.; Moo-Young, M. B.; “The continuous phase heat and mass-transfer
properties of dispersions”, Chem. Eng. Sci., 16, 39-54 (1961).
Treybal, R. E.; Liquid Extraction, second ed., McGraw-Hill, New York, NY (1963).