
Assessment of analytical techniques for characterization ...
Ci. Fl., Santa Maria, v. 31, n. 1, p. 252-270, jan./mar. 2021 • https://doi.org/10.5902/1980509840346Submitted: 03/10/2019 • Approved: 07/10/2020 • Published: 15/03/2021
Published by Ciência Florestal under a CC BY-NC 4.0 license.
ISSN 1980-5098Open access
Artigos
Use of experimental design techniques for the optimization of the resin distillation process of Pinus elliottii
Utilização de técnicas de planejamento experimental para a otimização do processo de destilação de resina de Pinus elliottii
Afonso Henrique da Silva Júnior I , Arthur Doria Nogueira II ,Manoel Leonardo Martins II , Toni Jefferson Lopes II
I Universidade Federal de Santa Catarina, Florianópolis, SC, BrazilII Universidade Federal do Rio Grande, Santo Antônio da Patrulha, RS, Brazil
ABSTRACT
In the last decades, the resin product sector in Brazil is demonstrating a growing demand perspective for resin gum producers, what requires advances in the technical part of the extraction and purification processes. This work aimed to analyze, through experimental design techniques, the washing and distillation processes of the Pinus elliottii oleoresin. The natural resin was collected in the coastal region of Rio Grande do Sul state, Brazil. The results of the washing step revealed that the linear with second-order interactions was the empirical model that best suited for this study. Therefore, the optimal test was determined with the following factors: temperature of 50ºC, time of 20 min, and 20% turpentine used for dilution. For the distillation process, the best model was the linear without interactions taking into account the Monetary Value (Real – R$) response per 100 g of processed resin. Thus, it was determined that the optimum region obtained the following factors: temperature between 156 and 170 ºC and time between 61 and 100 min. Therefore, the use of experimental design techniques enabled to propose some alternatives on the processing of natural resin to the producer, what consequently caused the increase in its added value to the marketed product.
Keywords: Resination; Pitch; Turpentine
Ci. Fl., Santa Maria, v. 31, n. 1, p. 252-270, jan./mar. 2021
| Use of experimental design techniques ...253
RESUMO
Nas últimas décadas, o setor de produtos de resina no Brasil está demonstrando uma perspectiva de demanda crescente para os produtores de goma de resina, o que exige avanços na parte técnica dos processos de extração e purificação. Este trabalho teve como objetivo analisar, através de técnicas de planejamento experimental, os processos de lavagem e destilação da oleorresina de Pinus elliottii. A resina natural foi coletada na região costeira do estado do Rio Grande do Sul, Brasil. Os resultados da etapa de lavagem revelaram que as interações lineares de segunda ordem foi o modelo empírico mais adequado para este estudo. Portanto, o teste ideal foi determinado com os seguintes fatores: temperatura de 50ºC, tempo de 20 min e 20% de terebentina utilizada para a diluição. Para o processo de destilação, o melhor modelo foi o linear sem interações, considerando a resposta do Valor Monetário (Real – R$) por 100 g de resina processada. Assim, determinou-se que a região ótima obteve os seguintes fatores: temperatura entre 156 e 170ºC e tempo entre 61 e 100 minutos. Portanto, o uso de técnicas de planejamento experimental permitiu propor ao produtor algumas alternativas no processamento de resina natural, o que consequentemente causou o aumento do valor agregado ao produto comercializado.
Palavras-chave: Resinagem; Breu; Terebentina
1 INTRODUCTION
Brazil has the second-largest forest area in the world, covering almost 60% of
the national territory. The data obtained by the Food and Agriculture Organization
(FAO) reveal that the practice of silviculture in the Brazilian territory is growing and
totals 494 million hectares of forests (FOOD AND AGRICULTURE ORGANIZATION OF
THE UNITED NATIONS, 2015). In 2011, the Ministry of Agriculture, Livestock, and Supply
(MAPA) announced that the forestry sector is strategic for Brazil since it has indicated
environmental and mainly economic benefits due to alternative logging (BRASIL, 2011).
In this context, the resin was one of the important activities for the success of the
forestry sector. This activity increased in the 1970s through tax incentive laws for the
planting of Pinuselliottii. However, there was a slight improvement in the exploration
stages (HASELEIN et al., 2000; MISSIO et al., 2015).
Currently, Brazil is the world’s second-largest producer of resin, coming after
China. According to the Association of Resinators of Brazil (ARESB), the Brazilian
production of resin gum for the 2017/18 crop is estimated at 185,692 tons, double the
Silva Júnior, A. H.; Nogueira, A. D.; Martins, M. L.; Lopes, T. J. | 254
Ci. Fl., Santa Maria, v. 31, n. 1, p. 252-270, jan./mar. 2021
amount obtained in the 2014/15 crop (ASSOCIAÇÃO DOS RESINADORES DO BRASIL,
2018; CASSOL et al., 2019). Natural resin is a yellowish-white flammable substance, of
noticeable fluidity, insoluble in water, and has several industrial applications. In the
initial process of the resin, different extraction methods are used, such as the French
system and the American system. The latter system consists of using an acidic paste
in the “streaking” process containing 30 to 60% sulfuric acid (H2SO4) (SUKARNO et al.,
2015).
The economic potential of the resin is due to its main components, pitch, and
turpentine. The average yield of the separation process is 79-88% for pitch and 7-15%
for turpentine, in which the highest-selling value corresponds to the lowest yield being
sold at R$ 95 L-1 (US$ 18.23 L-1). Pitch is marketed according to criteria that evaluate its
quality. To qualify it, the number of saponification, acidity, color, and the softening point
is analyzed. This material is a solid, glassy, brittle substance with color that varies from
amber to yellow. Pitch is used in the manufacture of glues for paper, varnishes, paints,
rubbers, adhesives, and cosmetics. Turpentine, on the other hand, is characterized
by its volatility and intense odor and it can be used in the manufacture of solvents,
paints, varnishes, disinfectants, soaps, fragrances, and synthetic camphor (BRITO;
BARRICHELO; GUTIERREZ, 1980; KOLICHESKI, 2006).
Given the above, there are countless possibilities of using the constituents
of the resin in industrial applications, being essential the evaluation of means that
can increase production and purity and adding value to the products of the sector
(MARCELINO; FENNER, 2005; GEORGIN, 2014; AMPESSAN et al., 2015). However, it is
still necessary to promote studies aimed at improving the resin steps, starting with
the extraction process. This process many times has no pattern of the collection in
the exploration areas what results in commercializing the natural resin with dirt and
impurities. Consequently, it decreases the sale values to the industries and even may
cause the return of the product. Therefore, it is extremely important to improve the
processes of extraction and partial purification of the resin. As a result, there will be
Ci. Fl., Santa Maria, v. 31, n. 1, p. 252-270, jan./mar. 2021
| Use of experimental design techniques ...255
progress in the activity, increasing production, and possibly adding commercial value
to it. Thus, the objective of this study was to analyze, through experimental design
techniques, the washing and distillation processes of the Pinuselliottii oleoresin.
2 MATERIAL AND METHODS
This study used natural resin collected in the coastal plain region of Rio Grande
do Sul state (Latitude 31˚17’14’’ South and Longitude 51˚05’37’’ West), obtained from
Pinuselliottii tree incisions, with the application of 30% H2SO4 acid paste. The pine trees
were aged between 18-20 years, with diameters between 15-30 cm, and the soil type
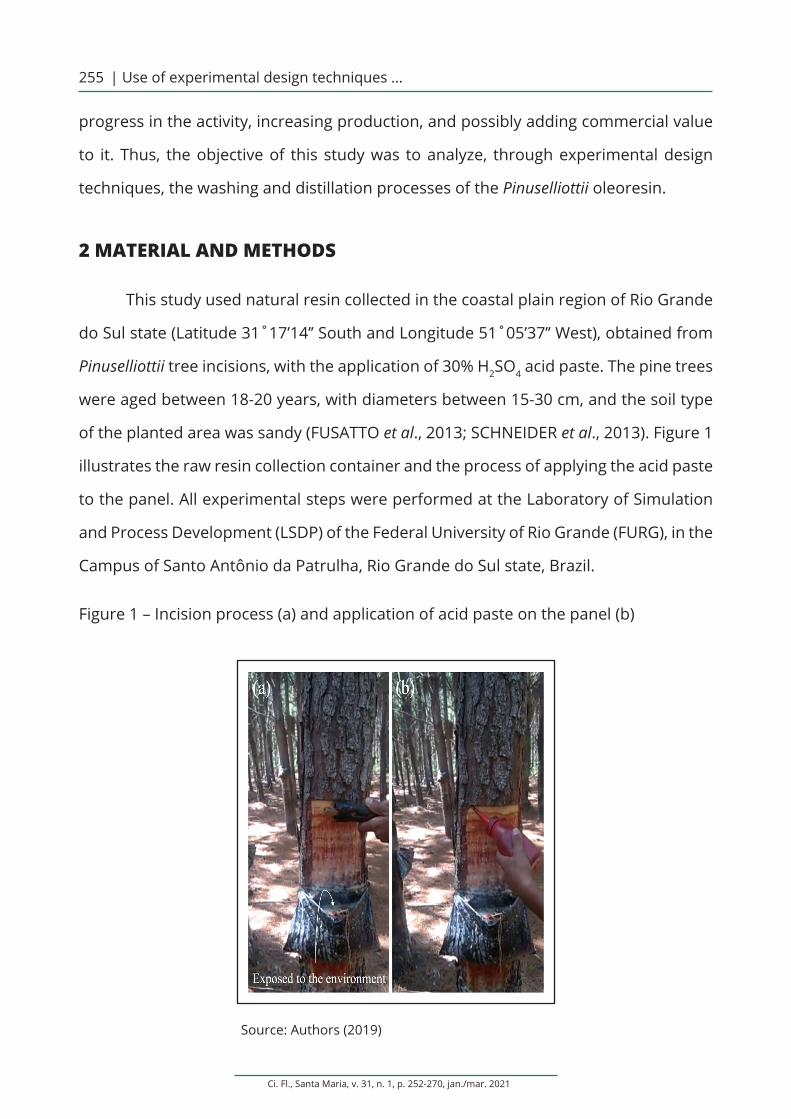
of the planted area was sandy (FUSATTO et al., 2013; SCHNEIDER et al., 2013). Figure 1
illustrates the raw resin collection container and the process of applying the acid paste
to the panel. All experimental steps were performed at the Laboratory of Simulation
and Process Development (LSDP) of the Federal University of Rio Grande (FURG), in the
Campus of Santo Antônio da Patrulha, Rio Grande do Sul state, Brazil.
Figure 1 – Incision process (a) and application of acid paste on the panel (b)
Source: Authors (2019)

Silva Júnior, A. H.; Nogueira, A. D.; Martins, M. L.; Lopes, T. J. | 256
Ci. Fl., Santa Maria, v. 31, n. 1, p. 252-270, jan./mar. 2021
2.1 Experimental procedure of distillation of natural resin
The distillation equipment consisted of a heating blanket connected to a flask
with three outlets containing a total volume of 500 mL. The distillation column was
coupled to one of the outlets. In the other outlet of the balloon, a thermometer was
added to measure the boiling temperature. In the third outlet, a lid was placed to add
and remove the material without needing to disassemble the column. The crude resin
from the study site was poured into a reservoir container for heating. In this step,
oxalic acid was added to precipitate the iron contained in the resin and diatomaceous
earth that acted as a filter aid (ASSUMPÇÃO, 1978; BRITO; BARRICHELO; GUTIERREZ,
1980).
Turpentine was added to the resin dilution, approximately 30% of the total,
in order to reach the desired temperature of 80°C. The vessel remained for 15
minutes at 80°C. Then, the heated solution was filtered hot. After the filtration step,
the filtrate substance was collected in a vessel that remained to settle for five hours
at 80°C (ASSUMPÇÃO, 1978). After the decantation period, the resin was placed in a
500 mL flask, and it was subjected to vacuum distillation (Figure 2). The heating of
the blanket was achieved with temperatures between 130 and 170°C. The distillation
was interrupted according to the time of each trial. After distillation, the water was
separated from turpentine by decantation (BRITO; BARRICHELO; GUTIERREZ, 1980).
Figure 2 – Schematic representation of the distillation process of in natura resin
Source: Authors (2019)
Ci. Fl., Santa Maria, v. 31, n. 1, p. 252-270, jan./mar. 2021
| Use of experimental design techniques ...257
Experimental design was used, following the laboratory procedure, in the two stages
under study. These steps consisted of washing, with conditions varying temperature,
time, and percentage of turpentine, and distillation, with conditions varying the time and
temperature at the base of the column. Experimental design is a tool used in processes
involving analysis and optimization of operations. It allows to evaluate the effects among a
set of variables involved in the process, taking advantage of a small number of experimental
tests (BOX; HUNTER; HUNTER, 2005; MONTGOMERY, 2012; FERNANDES et al., 2016; LOPES
et al., 2016; SILVA JÚNIOR et al., 2018).
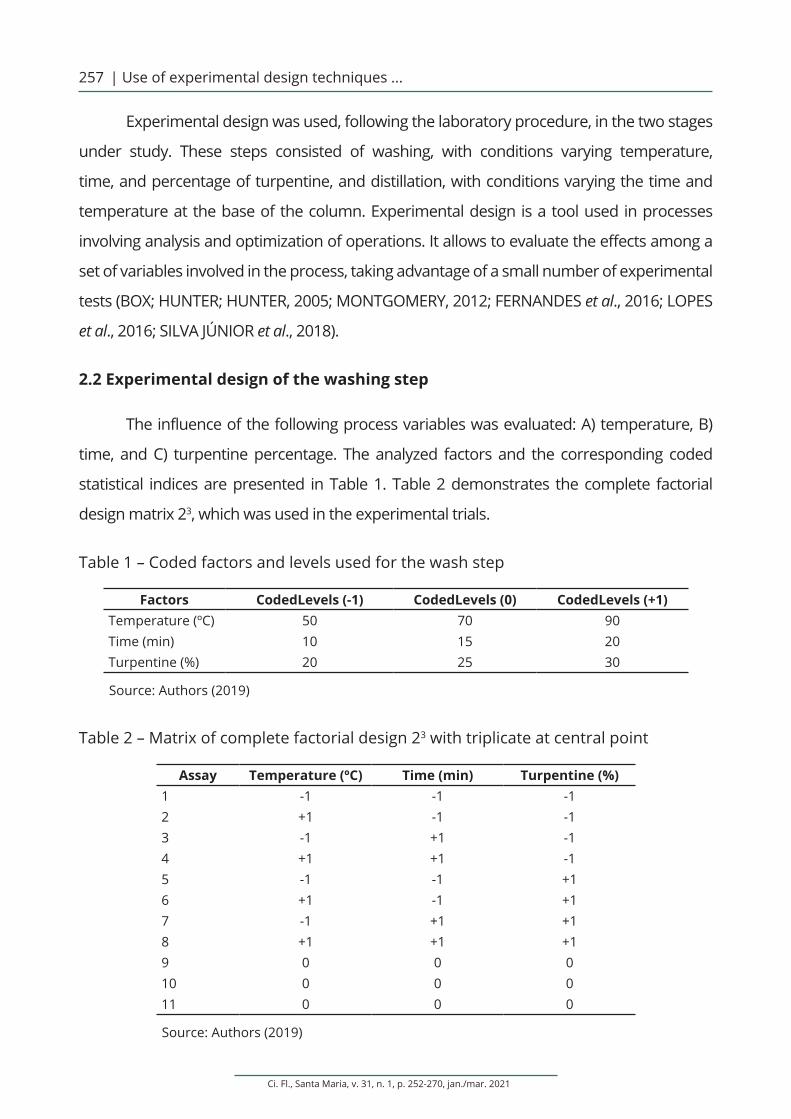
2.2 Experimental design of the washing step
The influence of the following process variables was evaluated: A) temperature, B)
time, and C) turpentine percentage. The analyzed factors and the corresponding coded
statistical indices are presented in Table 1. Table 2 demonstrates the complete factorial
design matrix 23, which was used in the experimental trials.
Table 1 – Coded factors and levels used for the wash step
Factors CodedLevels (-1) CodedLevels (0) CodedLevels (+1)Temperature (ºC) 50 70 90Time (min) 10 15 20Turpentine (%) 20 25 30
Source: Authors (2019)
Table 2 – Matrix of complete factorial design 23 with triplicate at central point
Assay Temperature (ºC) Time (min) Turpentine (%)1 -1 -1 -12 +1 -1 -13 -1 +1 -14 +1 +1 -15 -1 -1 +16 +1 -1 +17 -1 +1 +18 +1 +1 +19 0 0 010 0 0 011 0 0 0
Source: Authors (2019)
Silva Júnior, A. H.; Nogueira, A. D.; Martins, M. L.; Lopes, T. J. | 258
Ci. Fl., Santa Maria, v. 31, n. 1, p. 252-270, jan./mar. 2021
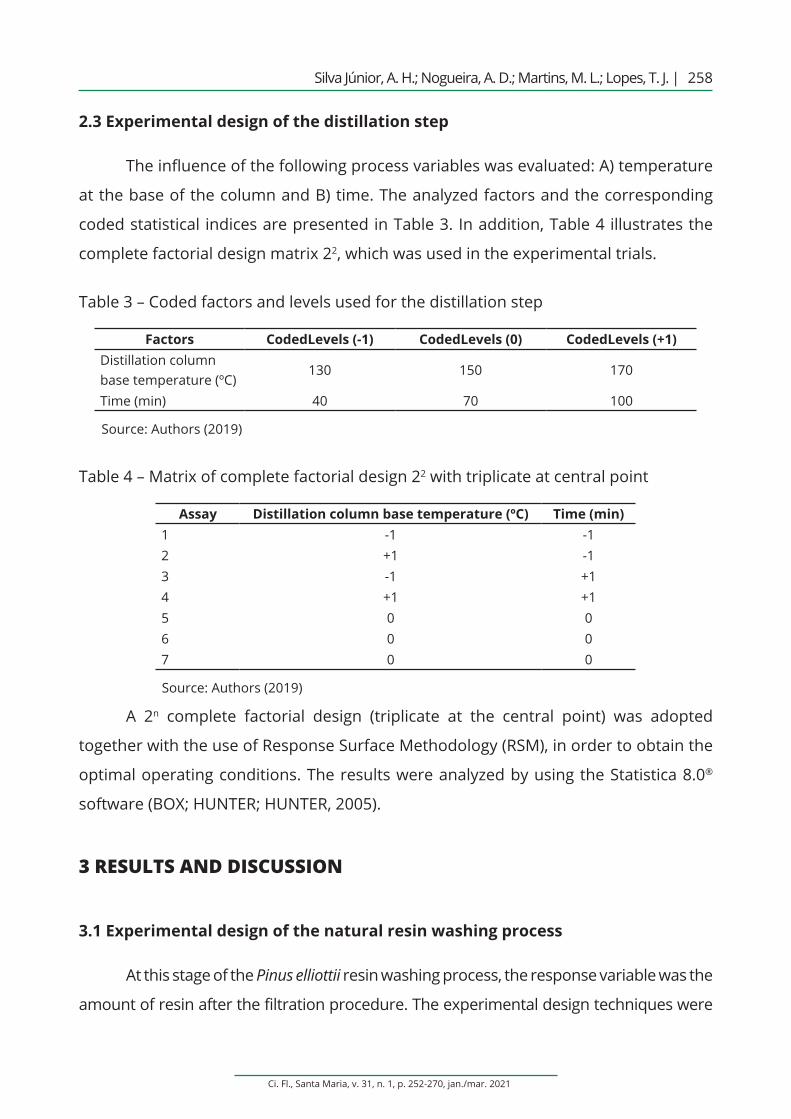
2.3 Experimental design of the distillation step
The influence of the following process variables was evaluated: A) temperature
at the base of the column and B) time. The analyzed factors and the corresponding
coded statistical indices are presented in Table 3. In addition, Table 4 illustrates the
complete factorial design matrix 22, which was used in the experimental trials.
Table 3 – Coded factors and levels used for the distillation step
Factors CodedLevels (-1) CodedLevels (0) CodedLevels (+1)Distillation column base temperature (ºC)
130 150 170
Time (min) 40 70 100
Source: Authors (2019)
Table 4 – Matrix of complete factorial design 22 with triplicate at central point
Assay Distillation column base temperature (ºC) Time (min)1 -1 -12 +1 -13 -1 +14 +1 +15 0 06 0 07 0 0
Source: Authors (2019)
A 2n complete factorial design (triplicate at the central point) was adopted
together with the use of Response Surface Methodology (RSM), in order to obtain the
optimal operating conditions. The results were analyzed by using the Statistica 8.0®
software (BOX; HUNTER; HUNTER, 2005).
3 RESULTS AND DISCUSSION
3.1 Experimental design of the natural resin washing process
At this stage of the Pinus elliottii resin washing process, the response variable was the
amount of resin after the filtration procedure. The experimental design techniques were
Ci. Fl., Santa Maria, v. 31, n. 1, p. 252-270, jan./mar. 2021
| Use of experimental design techniques ...259
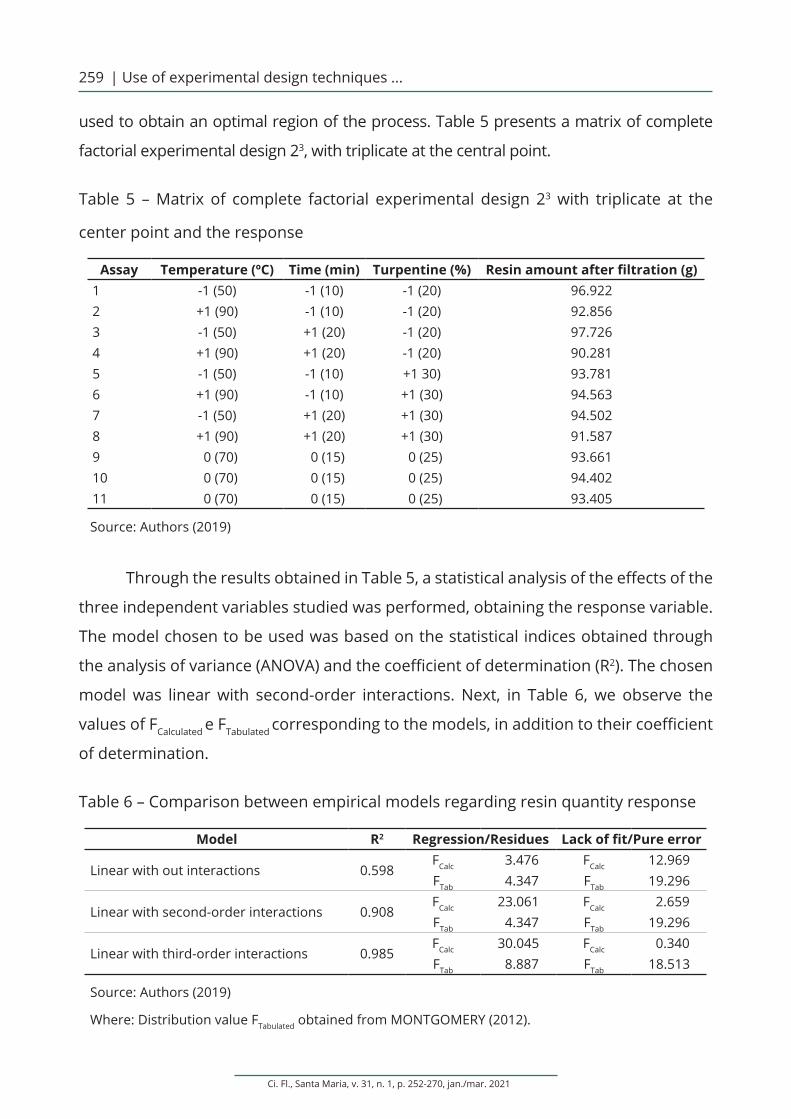
used to obtain an optimal region of the process. Table 5 presents a matrix of complete
factorial experimental design 23, with triplicate at the central point.
Table 5 – Matrix of complete factorial experimental design 23 with triplicate at the
center point and the response
Assay Temperature (ºC) Time (min) Turpentine (%) Resin amount after filtration (g) 1 -1 (50) -1 (10) -1 (20) 96.9222 +1 (90) -1 (10) -1 (20) 92.8563 -1 (50) +1 (20) -1 (20) 97.7264 +1 (90) +1 (20) -1 (20) 90.2815 -1 (50) -1 (10) +1 30) 93.7816 +1 (90) -1 (10) +1 (30) 94.5637 -1 (50) +1 (20) +1 (30) 94.5028 +1 (90) +1 (20) +1 (30) 91.5879 0 (70) 0 (15) 0 (25) 93.66110 0 (70) 0 (15) 0 (25) 94.40211 0 (70) 0 (15) 0 (25) 93.405
Source: Authors (2019)
Through the results obtained in Table 5, a statistical analysis of the effects of the
three independent variables studied was performed, obtaining the response variable.
The model chosen to be used was based on the statistical indices obtained through
the analysis of variance (ANOVA) and the coefficient of determination (R2). The chosen
model was linear with second-order interactions. Next, in Table 6, we observe the
values of FCalculated e FTabulated corresponding to the models, in addition to their coefficient
of determination.
Table 6 – Comparison between empirical models regarding resin quantity response
Model R2 Regression/Residues Lack of fit/Pure error
Linear with out interactions 0.598FCalc 3.476 FCalc 12.969FTab 4.347 FTab 19.296
Linear with second-order interactions 0.908FCalc 23.061 FCalc 2.659FTab 4.347 FTab 19.296
Linear with third-order interactions 0.985FCalc 30.045 FCalc 0.340FTab 8.887 FTab 18.513
Source: Authors (2019)
Where: Distribution value FTabulated obtained from MONTGOMERY (2012).
Silva Júnior, A. H.; Nogueira, A. D.; Martins, M. L.; Lopes, T. J. | 260
Ci. Fl., Santa Maria, v. 31, n. 1, p. 252-270, jan./mar. 2021
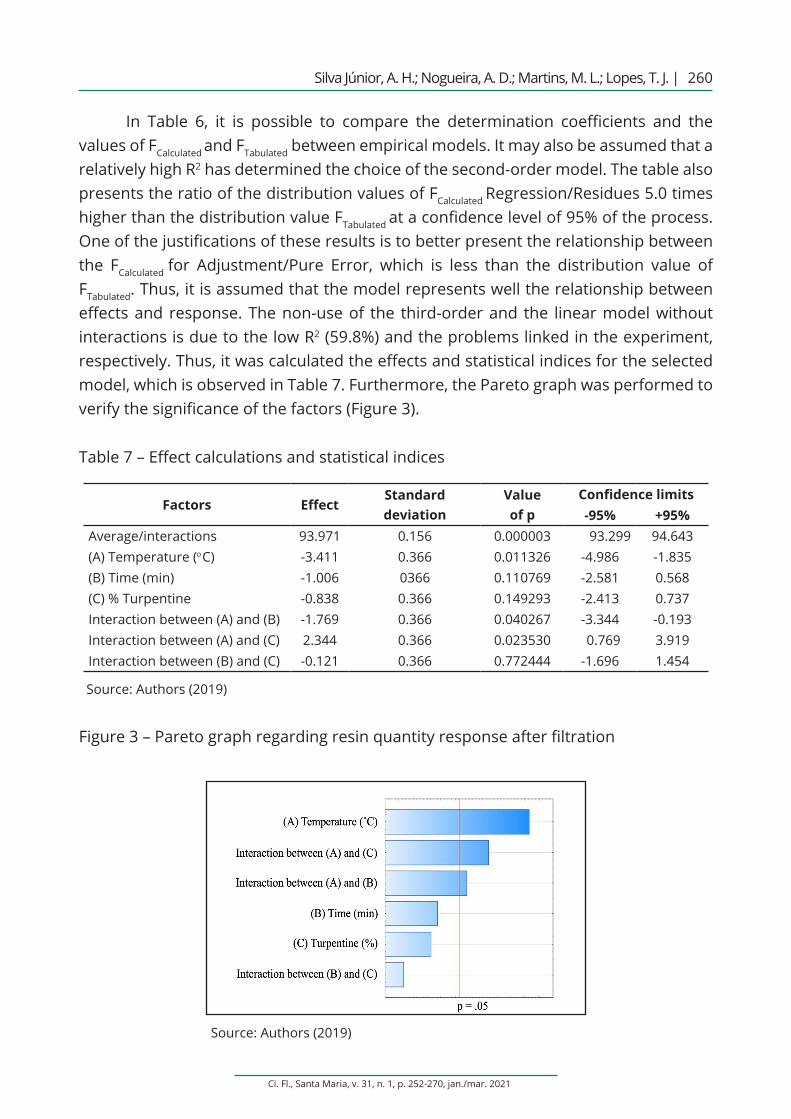
In Table 6, it is possible to compare the determination coefficients and the values of FCalculated and FTabulated between empirical models. It may also be assumed that a relatively high R2 has determined the choice of the second-order model. The table also presents the ratio of the distribution values of FCalculated Regression/Residues 5.0 times higher than the distribution value FTabulated at a confidence level of 95% of the process. One of the justifications of these results is to better present the relationship between the FCalculated for Adjustment/Pure Error, which is less than the distribution value of FTabulated. Thus, it is assumed that the model represents well the relationship between effects and response. The non-use of the third-order and the linear model without interactions is due to the low R2 (59.8%) and the problems linked in the experiment, respectively. Thus, it was calculated the effects and statistical indices for the selected model, which is observed in Table 7. Furthermore, the Pareto graph was performed to verify the significance of the factors (Figure 3).
Table 7 – Effect calculations and statistical indices
Factors EffectStandard deviation
Valueof p
Confidence limits-95% +95%
Average/interactions 93.971 0.156 0.000003 93.299 94.643(A) Temperature (°C) -3.411 0.366 0.011326 -4.986 -1.835(B) Time (min) -1.006 0366 0.110769 -2.581 0.568(C) % Turpentine -0.838 0.366 0.149293 -2.413 0.737Interaction between (A) and (B) -1.769 0.366 0.040267 -3.344 -0.193Interaction between (A) and (C) 2.344 0.366 0.023530 0.769 3.919Interaction between (B) and (C) -0.121 0.366 0.772444 -1.696 1.454
Source: Authors (2019)
Figure 3 – Pareto graph regarding resin quantity response after filtration
Source: Authors (2019)
Ci. Fl., Santa Maria, v. 31, n. 1, p. 252-270, jan./mar. 2021
| Use of experimental design techniques ...261
Analyzing Table 7 and Figure 3, it appears that the terms (A), the interaction
between (A) and (C), and the interaction between (A) and (B) are significant, as seen by
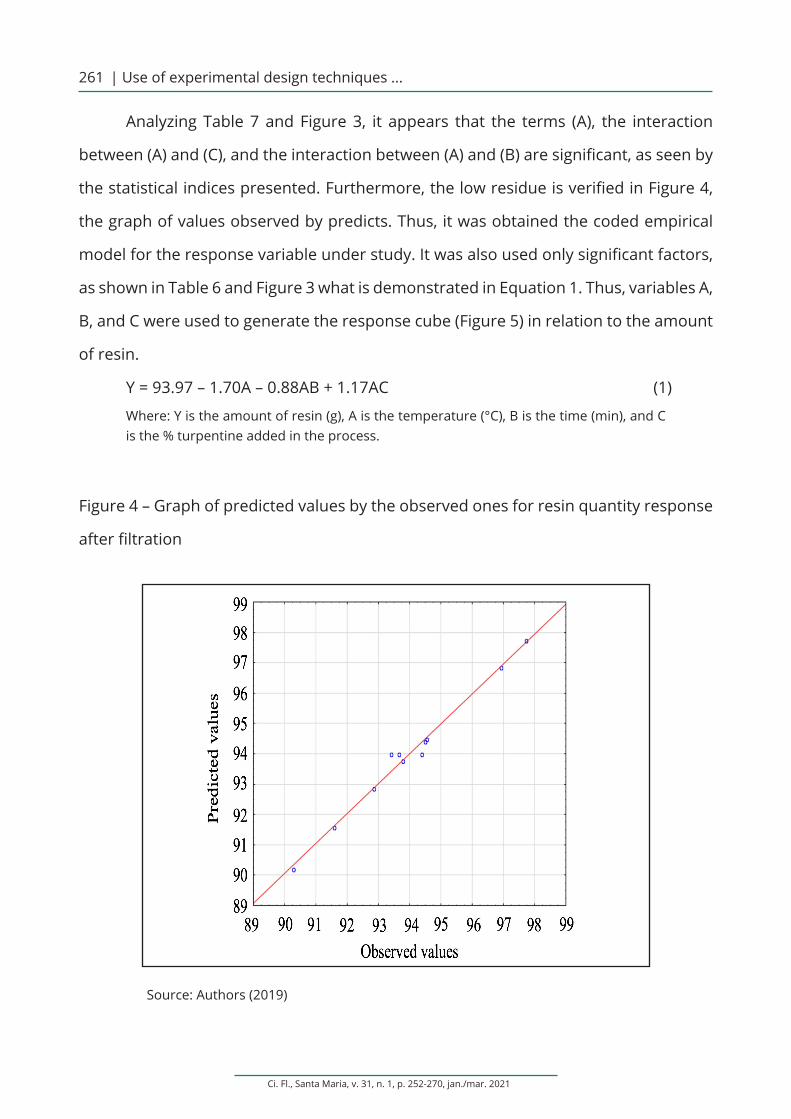
the statistical indices presented. Furthermore, the low residue is verified in Figure 4,
the graph of values observed by predicts. Thus, it was obtained the coded empirical
model for the response variable under study. It was also used only significant factors,
as shown in Table 6 and Figure 3 what is demonstrated in Equation 1. Thus, variables A,
B, and C were used to generate the response cube (Figure 5) in relation to the amount
of resin.
Y = 93.97 – 1.70A – 0.88AB + 1.17AC (1)
Where: Y is the amount of resin (g), A is the temperature (°C), B is the time (min), and C is the % turpentine added in the process.
Figure 4 – Graph of predicted values by the observed ones for resin quantity response
after filtration
Source: Authors (2019)
Silva Júnior, A. H.; Nogueira, A. D.; Martins, M. L.; Lopes, T. J. | 262
Ci. Fl., Santa Maria, v. 31, n. 1, p. 252-270, jan./mar. 2021
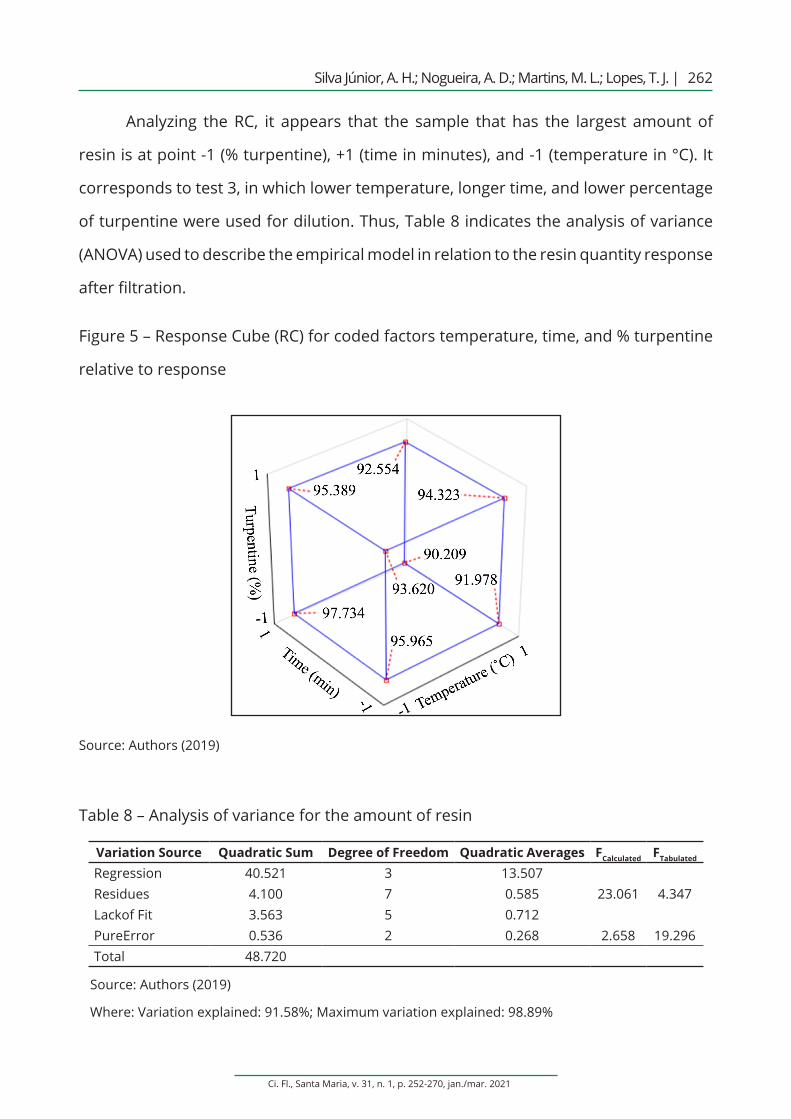
Analyzing the RC, it appears that the sample that has the largest amount of
resin is at point -1 (% turpentine), +1 (time in minutes), and -1 (temperature in °C). It
corresponds to test 3, in which lower temperature, longer time, and lower percentage
of turpentine were used for dilution. Thus, Table 8 indicates the analysis of variance
(ANOVA) used to describe the empirical model in relation to the resin quantity response
after filtration.
Figure 5 – Response Cube (RC) for coded factors temperature, time, and % turpentine
relative to response
Source: Authors (2019)
Table 8 – Analysis of variance for the amount of resin
Variation Source Quadratic Sum Degree of Freedom Quadratic Averages FCalculated FTabulated
Regression 40.521 3 13.507Residues 4.100 7 0.585 23.061 4.347Lackof Fit 3.563 5 0.712PureError 0.536 2 0.268 2.658 19.296Total 48.720
Source: Authors (2019)
Where: Variation explained: 91.58%; Maximum variation explained: 98.89%
Ci. Fl., Santa Maria, v. 31, n. 1, p. 252-270, jan./mar. 2021
| Use of experimental design techniques ...263
Table 8 reveals that the Pure Error found has a low value and the variation
explained by the model is high compared to the maximum explainable variation, which
is close to 100%. Also, it appears that the residues, as seen in Figure 3, are low.
3.2 Experimental design of Pinus elliotti resin distillation process
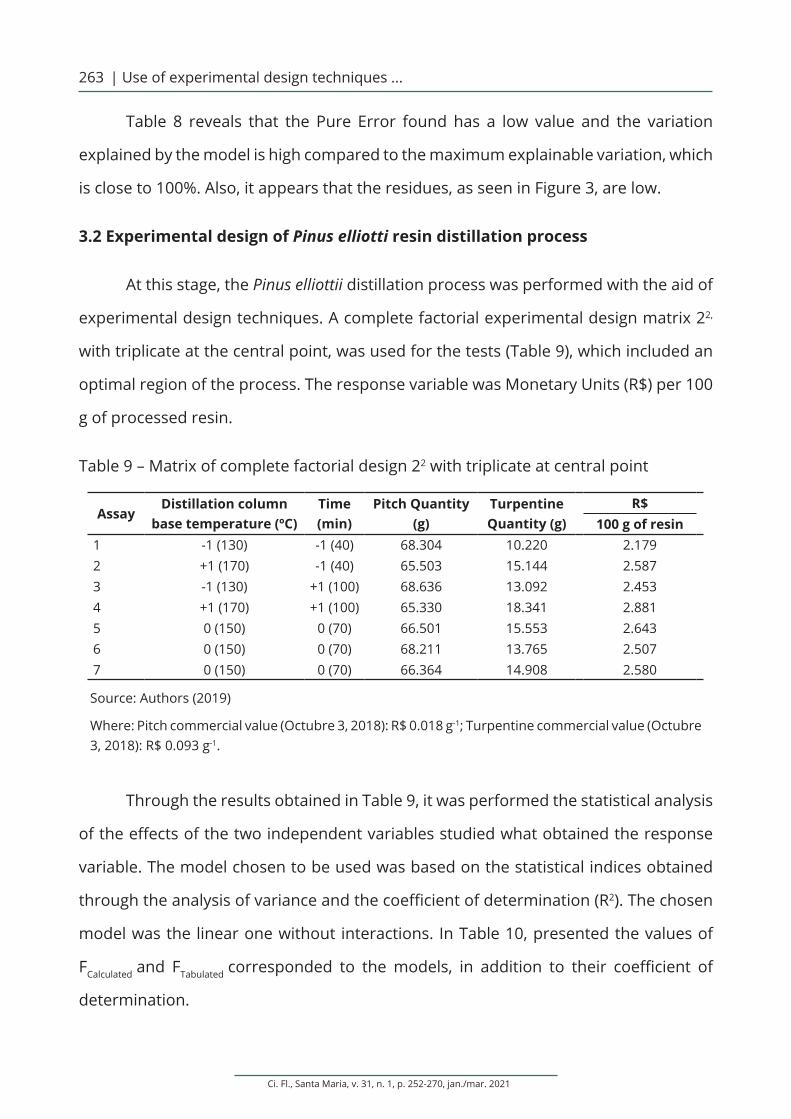
At this stage, the Pinus elliottii distillation process was performed with the aid of
experimental design techniques. A complete factorial experimental design matrix 22,
with triplicate at the central point, was used for the tests (Table 9), which included an
optimal region of the process. The response variable was Monetary Units (R$) per 100
g of processed resin.
Table 9 – Matrix of complete factorial design 22 with triplicate at central point
AssayDistillation column
base temperature (ºC)Time (min)
Pitch Quantity (g)
TurpentineQuantity (g)
R$100 g of resin
1 -1 (130) -1 (40) 68.304 10.220 2.1792 +1 (170) -1 (40) 65.503 15.144 2.5873 -1 (130) +1 (100) 68.636 13.092 2.4534 +1 (170) +1 (100) 65.330 18.341 2.8815 0 (150) 0 (70) 66.501 15.553 2.6436 0 (150) 0 (70) 68.211 13.765 2.5077 0 (150) 0 (70) 66.364 14.908 2.580
Source: Authors (2019)
Where: Pitch commercial value (Octubre 3, 2018): R$ 0.018 g-1; Turpentine commercial value (Octubre 3, 2018): R$ 0.093 g-1.
Through the results obtained in Table 9, it was performed the statistical analysis
of the effects of the two independent variables studied what obtained the response
variable. The model chosen to be used was based on the statistical indices obtained
through the analysis of variance and the coefficient of determination (R2). The chosen
model was the linear one without interactions. In Table 10, presented the values of
FCalculated and FTabulated
corresponded to the models, in addition to their coefficient of
determination.
Silva Júnior, A. H.; Nogueira, A. D.; Martins, M. L.; Lopes, T. J. | 264
Ci. Fl., Santa Maria, v. 31, n. 1, p. 252-270, jan./mar. 2021
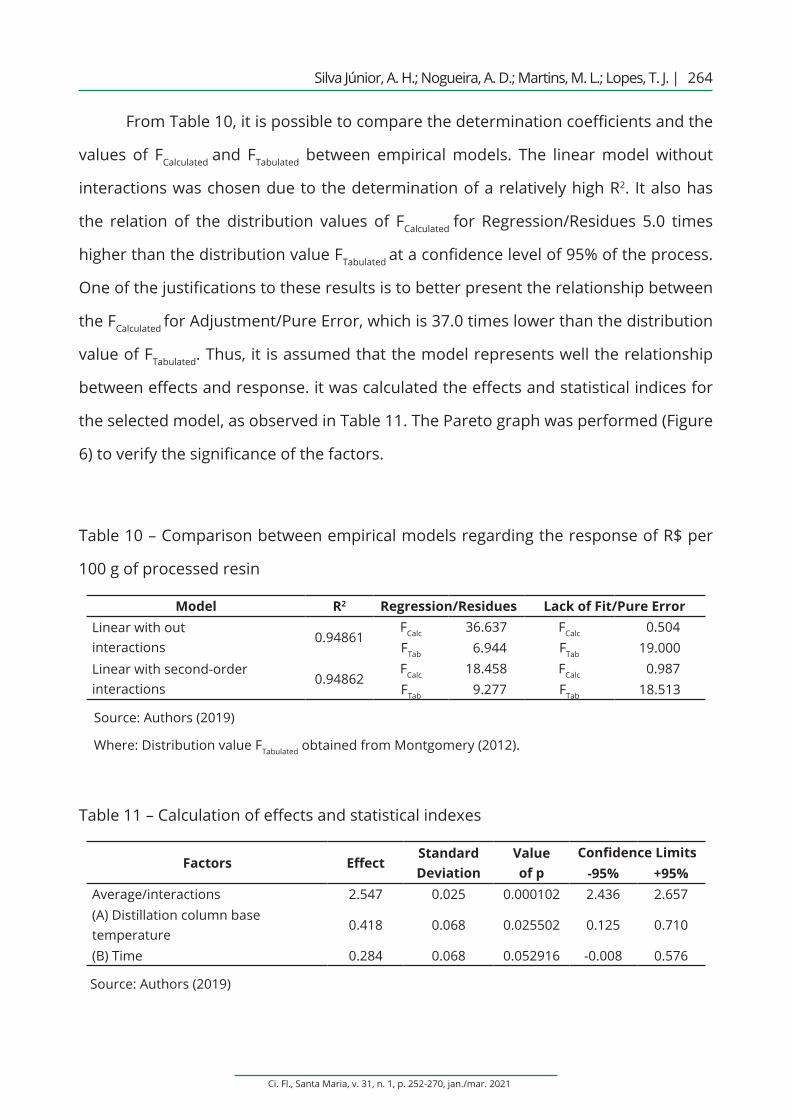
From Table 10, it is possible to compare the determination coefficients and the
values of FCalculated and FTabulated between empirical models. The linear model without
interactions was chosen due to the determination of a relatively high R2. It also has
the relation of the distribution values of FCalculated for Regression/Residues 5.0 times
higher than the distribution value FTabulated at a confidence level of 95% of the process.
One of the justifications to these results is to better present the relationship between
the FCalculated for Adjustment/Pure Error, which is 37.0 times lower than the distribution
value of FTabulated. Thus, it is assumed that the model represents well the relationship
between effects and response. it was calculated the effects and statistical indices for
the selected model, as observed in Table 11. The Pareto graph was performed (Figure
6) to verify the significance of the factors.
Table 10 – Comparison between empirical models regarding the response of R$ per
100 g of processed resin
Model R2 Regression/Residues Lack of Fit/Pure ErrorLinear with outinteractions
0.94861FCalc 36.637 FCalc 0.504FTab 6.944 FTab 19.000
Linear with second-order interactions
0.94862FCalc 18.458 FCalc 0.987FTab 9.277 FTab 18.513
Source: Authors (2019)
Where: Distribution value FTabulated obtained from Montgomery (2012).
Table 11 – Calculation of effects and statistical indexes
Factors EffectStandard Deviation
Value of p
Confidence Limits-95% +95%
Average/interactions 2.547 0.025 0.000102 2.436 2.657(A) Distillation column base temperature
0.418 0.068 0.025502 0.125 0.710
(B) Time 0.284 0.068 0.052916 -0.008 0.576
Source: Authors (2019)
Ci. Fl., Santa Maria, v. 31, n. 1, p. 252-270, jan./mar. 2021
| Use of experimental design techniques ...265
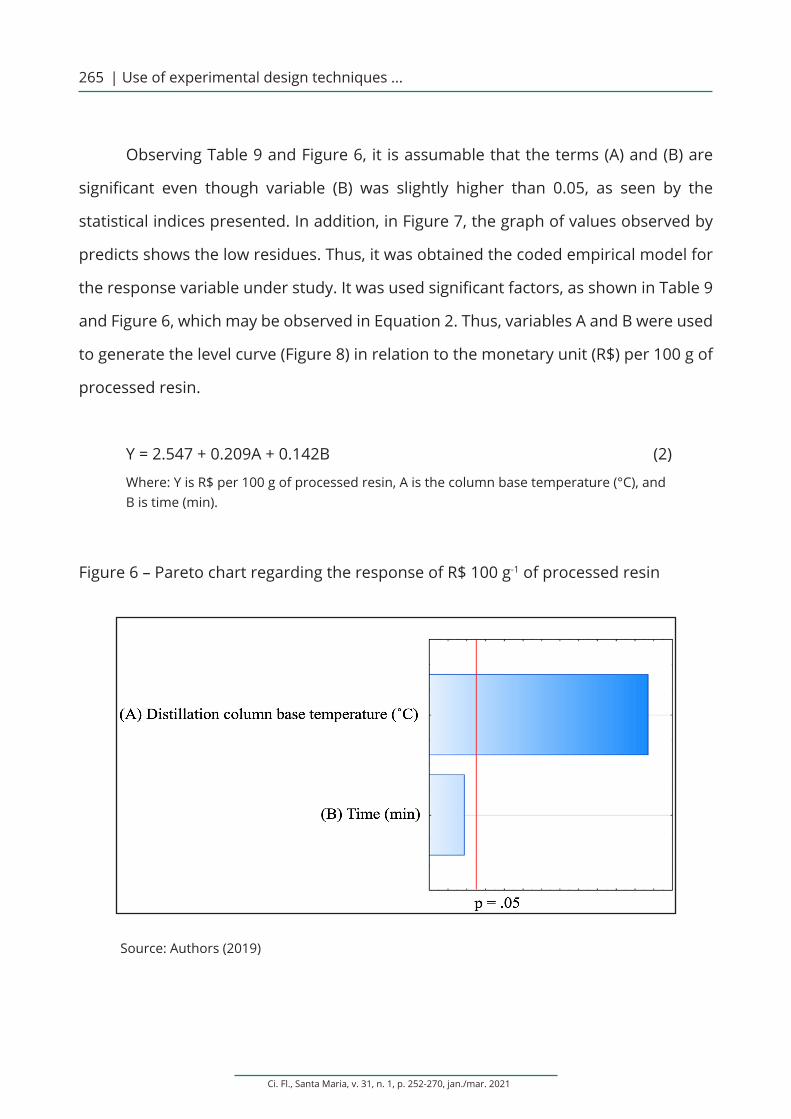
Observing Table 9 and Figure 6, it is assumable that the terms (A) and (B) are
significant even though variable (B) was slightly higher than 0.05, as seen by the
statistical indices presented. In addition, in Figure 7, the graph of values observed by
predicts shows the low residues. Thus, it was obtained the coded empirical model for
the response variable under study. It was used significant factors, as shown in Table 9
and Figure 6, which may be observed in Equation 2. Thus, variables A and B were used
to generate the level curve (Figure 8) in relation to the monetary unit (R$) per 100 g of
processed resin.
Y = 2.547 + 0.209A + 0.142B (2)
Where: Y is R$ per 100 g of processed resin, A is the column base temperature (°C), and B is time (min).
Figure 6 – Pareto chart regarding the response of R$ 100 g-1 of processed resin
Source: Authors (2019)
Silva Júnior, A. H.; Nogueira, A. D.; Martins, M. L.; Lopes, T. J. | 266
Ci. Fl., Santa Maria, v. 31, n. 1, p. 252-270, jan./mar. 2021
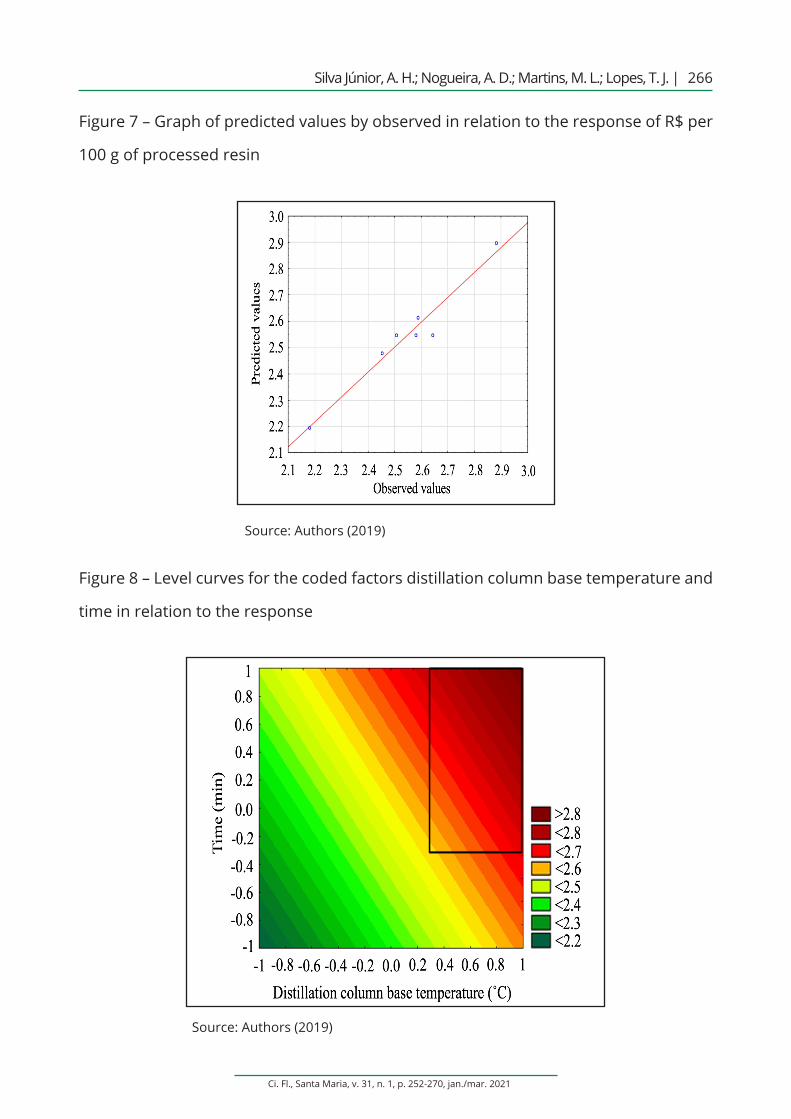
Figure 7 – Graph of predicted values by observed in relation to the response of R$ per
100 g of processed resin
Source: Authors (2019)
Figure 8 – Level curves for the coded factors distillation column base temperature and
time in relation to the response
Source: Authors (2019)
Ci. Fl., Santa Maria, v. 31, n. 1, p. 252-270, jan./mar. 2021
| Use of experimental design techniques ...267
It can be observed, by analyzing the level curves for the chosen empirical model
in Figure 8, that the experiment that has the highest Monetary Value (R$) per 100 g of
processed resin has the coded levels +1.0 for distillation column base temperature
and +1.0 for time, assay 4. It is due to be the best yield for the turpentine component,
which has the highest marketable value. However, there is an optimal region for high
response values, which is between -0.3 and 1.0 for time and between 0.3 and 1.0 for
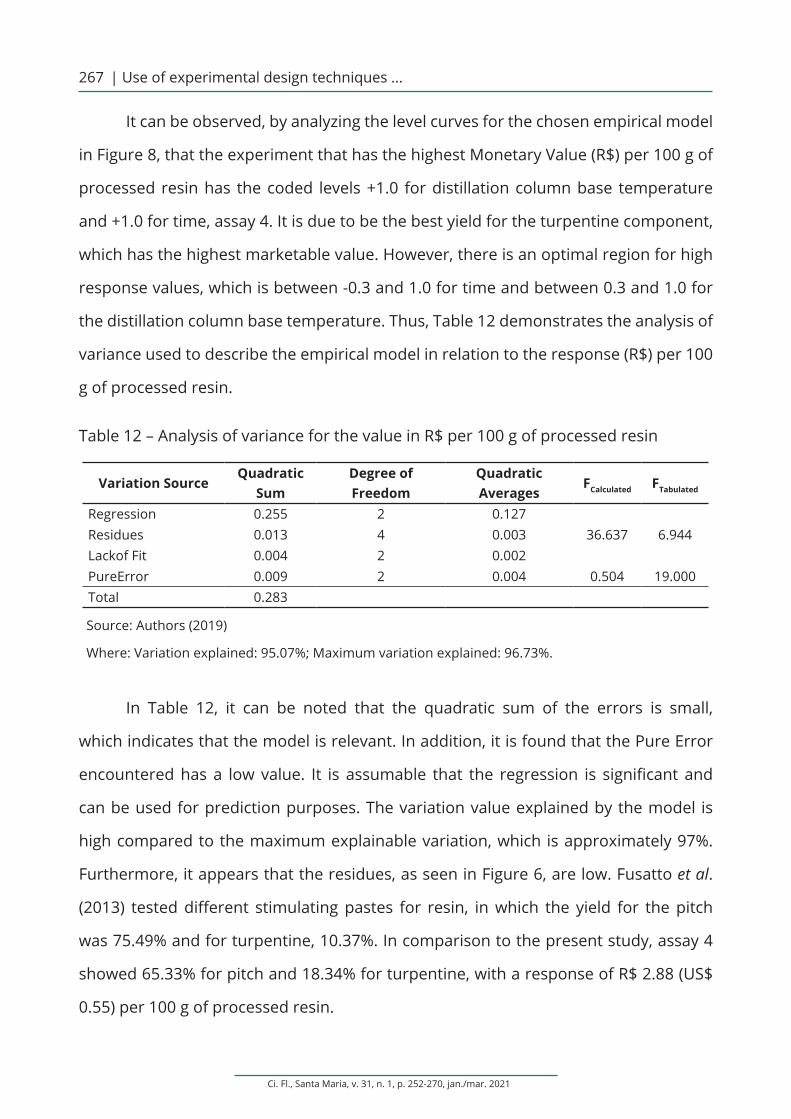
the distillation column base temperature. Thus, Table 12 demonstrates the analysis of
variance used to describe the empirical model in relation to the response (R$) per 100
g of processed resin.
Table 12 – Analysis of variance for the value in R$ per 100 g of processed resin
Variation SourceQuadratic
SumDegree ofFreedom
QuadraticAverages
FCalculated FTabulated
Regression 0.255 2 0.127Residues 0.013 4 0.003 36.637 6.944Lackof Fit 0.004 2 0.002PureError 0.009 2 0.004 0.504 19.000Total 0.283
Source: Authors (2019)
Where: Variation explained: 95.07%; Maximum variation explained: 96.73%.
In Table 12, it can be noted that the quadratic sum of the errors is small,
which indicates that the model is relevant. In addition, it is found that the Pure Error
encountered has a low value. It is assumable that the regression is significant and
can be used for prediction purposes. The variation value explained by the model is
high compared to the maximum explainable variation, which is approximately 97%.
Furthermore, it appears that the residues, as seen in Figure 6, are low. Fusatto et al.
(2013) tested different stimulating pastes for resin, in which the yield for the pitch
was 75.49% and for turpentine, 10.37%. In comparison to the present study, assay 4
showed 65.33% for pitch and 18.34% for turpentine, with a response of R$ 2.88 (US$
0.55) per 100 g of processed resin.
Silva Júnior, A. H.; Nogueira, A. D.; Martins, M. L.; Lopes, T. J. | 268
Ci. Fl., Santa Maria, v. 31, n. 1, p. 252-270, jan./mar. 2021
4 CONCLUSIONS
Results demonstrated that for the present study, the experimental design of the
washing step, an initial pre-distillation procedure, test 3 (temperature 50 ºC, time 20
min, and 20% turpentine used for dilution) obtained higher amount of resin gum after
the filtration procedure for the Pinuselliottii. For distillation the Monetary Value (R$) per
100 g of processed resin gum was verified, which has an optimal region of temperatures
between 156 and 170ºC and time between 61 and 100 min. The region obtained the
highest revenue from the yield of pitch and turpentine due to reaching the highest
percentages of turpentine in the trials since it has the highest commercialization value.
Therefore, it became possible, with the use of experimental design techniques, to
provide the producer alternatives to a natural resin processing and an increased value
added to the marketed product.
ACKNOWLEDGMENT
The authors thank the owner and collaborators of the study site.
REFERENCES
AMPESSAN, C. G. M. et al. Optimization of the storage time of Pinus taeda and Pinus elliottii chips for pulp and paper production. Scientia Forestalis, Piracicaba, v. 43, n. 108, p. 885-893, 2015.
ASSOCIAÇÃO DOS RESINADORES DO BRASIL. Produção nacional de goma resina de pinus. Avaré, 2018. Disponível em: http://www.aresb.com.br/portal/estatisticas/. Acesso em: 14 maio 2018.
ASSUMPÇÃO, R. M. V. Destilaria piloto de resinagem. Piracicaba: IPEF, 1978. v. 39.
BOX, G. E. P; HUNTER, J. S.; HUNTER, W. G. Statistics for experimenters: design, innovation and discovery. 2nd ed. New Jersey: Wiley-Interscience, 2005. 633 p.
BRASIL. Ministério da Agricultura, Pecuária e Abastecimento. Ministério da Agricultura incentiva plantio de florestas comerciais. Brasília, 2011. Disponível em: http://www.brasil.gov.br/economia-e-emprego/2011/02/ministerio-da-agricultura-incentiva-plantio-de-florestas-comerciais. Acesso em: 14 maio 2018.
Ci. Fl., Santa Maria, v. 31, n. 1, p. 252-270, jan./mar. 2021
| Use of experimental design techniques ...269
BRITO, J; BARRICHELO, L; GUTIERREZ, L. Qualidade do breu e terebintina de pinheiros tropicais. Piracicaba: IPEF, 1980.
CASSOL, P. C. et al. Changes in organic carbon in soil of natural grassland converted to Pinus taeda plantations at three ages. Ciência Florestal, Santa Maria, v. 29, n. 2, p. 545-558, 2019.
FERNANDES, G. A. et al. Utilização de técnicas de planejamento experimental na obtenção de carvão de pinhão (Araucaria angustifolia) para a adsorção de corante de azul de metileno. Revista Ciência e Engenharia, Uberlância, v. 25, n. 1, p. 105-111, 2016.
FOOD AND AGRICULTURE ORGANIZATION OF THE UNITED NATIONS. Global forest resources assessment 2015. Rome, 2015. 253 p. Disponível em: http://www.fao.org/3/a-i4808e.pdf. Acesso em: 14 maio 2018.
FUSATTO, A. L. M. et al. Stimulating pastes on system for resin flow of Pinus elliottii var. elliottii. Ciência Florestal, Santa Maria, v. 23, n. 3, p. 483-488, 2013.
GEORGIN, J. Pinus elliottii on small farms in the north of Rio Grande do Sul. Revista Monografias Ambientais, Santa Maria, v. 14, n. 3, p. 3341-3345, 2014.
HASELEIN, C. R. et al. Wood characteristics of plantation slash pine at age 30. Ciência Florestal, Santa Maria, v. 10, n. 2, p. 135-144, 2000.
KOLICHESKI, M. B. Síntese do mirceno a partir da isomerização térmica do β-pineno. 2006. Tese (Doutorado em Engenharia de Processos Térmicos e Químicos) – Universidade Federal do Paraná, Curitiba, 2006.
LOPES, T. J. et al. Statistical analysis of the result of hypothetical accident scenarios with leakage of chlorine gas obtained by simulation using the software ALOHA ®. Revista Ciências Exatas e Naturais, Guarapuava, v. 18, p. 296-308, 2016.
MARCELINO, F. A.; FENNER, P. T. Estudo dos custos de produção da atividade de resinagem em Pinus elliottii Engelm. var. elliottii.Energia Agrícola, Botucatu, v. 20, n. 2, p. 41-52, 2005.
MISSIO, A. L. et al. Propriedades mecânicas da madeira resinada de Pinus elliottii. ciência Rural, Santa Maria, v. 45, n. 8, p. 1432-1438, 2015.
MONTGOMERY, D. C. Design and analysis of experiments. 8th ed. Chichester: John Wiley & Song, 2012.
SCHNEIDER, P. R. et al. Dominant height growth of Pinus elliottii and Pinus taeda in arenized degraded soils in the west of Rio Grande do Sul, Brazil. Ciência Rural, Santa Maria, v. 43, n. 11, p. 1981-1986, 2013.
SILVA JÚNIOR, A. H.et al. Analysis of consequence applied to hypothetical scenarios of accidents with industrial leakage of hydrogen sulfide using aloha 5.4.4® software. International Journal of Research in Engineering and Technology, Bangalore, v. 7, p. 88-97, 2018.
SUKARNO, A. et al. Oleoresin production, turpentine yield and components of Pinus merkusii from various indonesian provenances. Journal of Tropical Forest Science, Kuala Lumpur, v. 27, n. 1, p. 136-141, 2015.
Silva Júnior, A. H.; Nogueira, A. D.; Martins, M. L.; Lopes, T. J. | 270
Ci. Fl., Santa Maria, v. 31, n. 1, p. 252-270, jan./mar. 2021
Authorship Contribution
1 – Afonso Henrique da Silva Júnior
Agro-industrial and Agrochemical Engineer
https://orcid.org/0000-0001-5461-5367 • [email protected]
Contribution: Conceptualization, Data curation, Formal Analysis, Investigation,
Methodology, Project administration, Validation, Writing – original draft, Writing –
review & editing
2 – Arthur Doria Nogueira
Agro-industrial Engineer - Food Industries
https://orcid.org/0000-0003-1274-3488 • [email protected]
Contribution: Conceptualization, Data curation, Formal Analysis, Investigation,
Methodology, Project administration, Validation
3 – Manoel Leonardo Martins
Industrial Chemist, Dr., Professor
https://orcid.org/0000-0002-5130-5467 • [email protected]
Contribution: Conceptualization, Data curation, Formal Analysis, Funding acquisition,
Investigation, Methodology, Project administration, Resources, Software, Supervision,
Validation, Visualization, Writing – original draf, Writing – review & editing
4 – Toni Jefferson Lopes
Food Engineer, Dr., Professor
https://orcid.org/0000-0001-6210-4508 • [email protected]
Contribution: Conceptualization, Data curation, Formal Analysis, Funding acquisition,
Investigation, Methodology, Project administration, Resources, Software, Supervision,
Validation, Visualization, Writing – original draft, Writing – review & editing
How to quote this article
Silva Júnior, A. H.; Nogueira, A. D.; Martins, M. L.; Lopes, T. J. Use of experimental design techniques for the optimization of the resin distillation process of Pinus elliottii. Ciência Florestal, Santa Maria, v. 31, n. 1, p. 252-270, 2021. DOI 10.5902/1980509840346. Available from: https://doi.org/10.5902/1980509840346. Accessed: xx abbreviated month 202x.