
VERY LARGE TELESCOPE - eso.orgsleveque/PRIMET_doc_and_COMreport/CIDL...SPE-ESO-15731-2852, issue1....
80
EUROPEAN SOUTHERN OBSERVATORY Organisation Européenne pour des Recherches Astronomiques dans l’Hémisphere Austral Europäische Organisation für astronomische Forschung in der südlichen Hemisphäre VERY LARGE TELESCOPE Prepared . . . . . . . . . . . . . . . . . . . . . . . . . . . . . . . . . . . . . . . . . . . . . . . . . . . . . . . . . . . . . . . . . . . . Approved . . . . . . . . . . . . . . . . . . . . . . . . . . . . . . . . . . . . . . . . . . . . . . . . . . . . . . . . . . . . . . . . . . . Released . . . . . . . . . . . . . . . . . . . . . . . . . . . . . . . . . . . . . . . . . . . . . . . . . . . . . . . . . . . . . . . . . . . . Name Name Name Date Date Date Signature Signature Signature VLT PROGRAMME — TELEPHONE: (089) 3 20 06–0 — FAX: (089) 3 20 23 62 Doc. No. VLT-SPE-ESO-15731-3884 Issue 1.0 Date 26 June 2006 N.Schuhler/S.Leveque A.Glindemann R. Gilmozzi Test of the laser frequency stabilization system of the PRIMA Metrology System
Transcript of VERY LARGE TELESCOPE - eso.orgsleveque/PRIMET_doc_and_COMreport/CIDL...SPE-ESO-15731-2852, issue1....

EUROPEAN SOUTHERN OBSERVATORYOrganisation Européenne pour des Recherches Astronomiques dans l’Hémisphere AustralEuropäische Organisation für astronomische Forschung in der südlichen Hemisphäre
VERY LARGE TELESCOPE
Prepared . . . . . . . . . . . . . . . . . . . . . . . . . . . . . . . . . . . . . . . . . . . . . . . . . . . . . . . . . . . . . . . . . . . .
Approved . . . . . . . . . . . . . . . . . . . . . . . . . . . . . . . . . . . . . . . . . . . . . . . . . . . . . . . . . . . . . . . . . . .
Released . . . . . . . . . . . . . . . . . . . . . . . . . . . . . . . . . . . . . . . . . . . . . . . . . . . . . . . . . . . . . . . . . . . .
Name
Name
Name
Date
Date
Date
Signature
Signature
Signature
VLT PROGRAMME — TELEPHONE: (089) 3 20 06–0 — FAX: (089) 3 20 23 62
Doc. No. VLT-SPE-ESO-15731-3884Issue 1.0Date 26 June 2006
N.Schuhler/S.Leveque
A.Glindemann
R. Gilmozzi
Test of the laser frequency stabilization system of the PRIMA Metrology System

Doc VLT-SPE-ESO-15731-3884Issue 1.0Date 26 June 2006Page 1 of 79
Test of the laser frequency stabi-lization system of the PRIMA Metrology System
Change Record
Issue / Rev. Date Section / Page. affected Reason/Remarks
1.0 all First Issue

Doc VLT-SPE-ESO-15731-3884Issue 1.0Date 26 June 2006Page 2 of 79
Test of the laser frequency stabi-lization system of the PRIMA Metrology System
Table of Contents
1 Scope .................................................................................. 42 Applicable Documents ....................................................... 43 Acronyms ........................................................................... 44 Introduction ....................................................................... 55 Tests and optimization of the components ....................... 5
5.1 Summary of the stabilization principle ................................... 55.2 Summary of the design ............................................................. 65.3 Laser .......................................................................................... 9
5.3.1 Laser standard parameter during operation ............... 95.3.2 Output power stability ................................................ 105.3.3 Polarization stability ....................................................11
5.4 Nonlinear cristal ..................................................................... 125.4.1 Nonlinear cristal temperature .................................... 125.4.2 Focus and alignment of the beam in the nonlinear cristal 125.4.3 Second harmonic generation stability ........................ 13
5.5 Iodine cell ................................................................................ 145.6 Detector ................................................................................... 17
5.6.1 Detector modification .................................................. 175.6.2 Detector sensitivity at 659nm ..................................... 18
5.7 Electro-Optic modulator ......................................................... 185.7.1 Amplitude of modulation ............................................. 18
5.8 Lock-in amplifier settings ...................................................... 195.8.1 Settings ........................................................................ 195.8.2 Analog output voltage ................................................. 195.8.3 Autophase .................................................................... 19
5.9 Analog output board ............................................................... 205.10 Measurement of the error signal ........................................... 215.11 Summary of the hardware parameters ................................. 22
6 Control loop tests and optimization ............................... 236.1 Design of the control loop ....................................................... 236.2 PID parameters ....................................................................... 246.3 TAC implementation of the control loop ................................ 286.4 Test of the stability ................................................................. 286.5 Conclusion ............................................................................... 30
Doc VLT-SPE-ESO-15731-3884Issue 1.0Date 26 June 2006Page 3 of 79
Test of the laser frequency stabi-lization system of the PRIMA Metrology System
7 System characterization with an independent frequency sensor 307.1 Independent frequency reference and sensor ........................ 307.2 First serie of tests at MPQ (March 2005) .............................. 31
7.2.1 Setup ............................................................................ 317.2.2 Test of the frequency stability ..................................... 337.2.3 Calibration of the error signal .................................... 357.2.4 Characterization of the system using Siglab ............. 357.2.5 Optimized loop parameters ......................................... 377.2.6 Performance of the optimized loop ............................. 387.2.7 Repeatability tests ....................................................... 397.2.8 Impact of the laser power on the stability .................. 407.2.9 Measurement of the detection noise ........................... 417.2.10 Conclusion on the first serie of tests carried out at MPQ 42
7.3 Second serie of tests (October 2005) ...................................... 427.3.1 Upgrade of the system after the March measurements 427.3.2 Set-up of the november tests ....................................... 457.3.3 Results of the frequency stability measurements ...... 467.3.4 Absolute frequency ...................................................... 487.3.5 Required accuracy for the EOM temperature stabilisation sys-tem 49
7.4 Conclusion on the tests done with an independant frequency sensor 52
8 Impact on PRIMET performance ................................... 529 Wavelength calibration with a reference interferometer 5310 Conclusion ........................................................................ 5511 Acknowledgements .......................................................... 5712 Appendix A: TAC files ..................................................... 57
12.1 pmlss_Innolight.tac ................................................................ 5712.2 pmlss_Lightwave.tac .............................................................. 64
13 Appendix B: frequency measurement with a self-referenced optical frequency comb generator 72
14 Appendix C: data files and results ................................. 7414.1 MPQ measurements March 2005 .......................................... 7414.2 MPQ measurements November 2005 .................................... 79

Doc VLT-SPE-ESO-15731-3884Issue 1.0Date 26 June 2006Page 4 of 79
Test of the laser frequency stabi-lization system of the PRIMA Metrology System
1 Scope
The PRIMA Laser Metrology system will operate with a Nd:YAG laser emmiting at 1319nmwhich requires an external frequency stabilization system. This document presents the tests doneat ESO Garching on the frequency stabilization system delivered by IMT.
2 Applicable DocumentsAD 1 Technical Specifications for the Laser assembly of PRIMA Metrology System, VLT-
SPE-ESO-15731-2852, issue1.
AD 2 Feasibility Study for the Frequency Stabilization of the PRIMA Metrology Laser, VLT-TRE-IMT-15731-2868, Issue 1, 20/07/03
AD 3 Design of the Laser Assembly of the PRIMA Metrology System,VLT-TRE-IMT-15731-3154, A.R Pourzand, Y. Salvadé, O. Scherler, issue 1.0, 08/10/03
AD 4 Iodine Spectroscopy and Absolute Frequency Stabilization with the Second Harmonic of the 1319-nm Nd:YAG Laser, A. Arie, Optics Letters, October 93, Vol. 18, No. 20
AD 5 Design Description of the PRIMA Metrology System, VLT-TRE-ESO-15730-3000, issue 1, 12/01/04
AD 6 An introduction to Pound-Drever-Hall laser frequency stabilization, E. D. Black, Am. J. Phys. 69 (1), January 2001
AD 7 Characterization of the performance of PPKTP for the second harmonic generation of a 1.319mm Nd:YAG laser, VLT-TRE-ESO-15731-3065, issue 1.0, August 2003
AD 8 Characterization of iodine transitions around 659.5nm, VLT-TRE-ESO-15731-3064, issue 2.0, 14/10/03
AD 9 Atlas du spectre d’absorption de la molécule d’iode, S. Gerstenkorn, P. Luc, Laboratoire Aimé Cotton, CNRS II, 91405 Orsay (France)
AD 10 Carrier-envelope phase control of femtoseconde mode-locked lasers and direct optical frequency synthesis, David. J. Jones et al, Science, Vol. 288, 635-639, 28 April 2000
AD 11 Residual amplitude modulation in laser electro-optic phase modulation, Edward A. Whittake et al., J. Opt. Soc. Am. B, Vol. 2 No. 8, August 1985
3 Acronyms• AD: Applicable Document
• FWHM: Full Width at Half Maximum
• IMT: Institut de Microtechnologie de Neuchatel
• IR: Infrared
• MPQ: Max Planck institute of Quantum Optics
• PID: Proportionnal Integral Derivative

Doc VLT-SPE-ESO-15731-3884Issue 1.0Date 26 June 2006Page 5 of 79
Test of the laser frequency stabi-lization system of the PRIMA Metrology System
• PPLN: Periodically Poled Lithium Niobate
• PRIMET: PRIMA Metrology System
• PSD: Power Spectral Density
• RAM: Residual Amplitude Modulation
• SH: Second Harmonic
4 Introduction
The accuracy of the PRIMA Metrology System, PRIMET based on laser superheterodyne interfer-ometry depends on the frequency stability of the laser. To fulfil the specifications, 2.26MHz fre-quency stability at 1319nm, AD 1, the laser source of the PRIMA Metrology System has to befrequency stabilized at a dν/ν<10-8 level. A feasibility study for a frequency stabilization systemwas carried out at IMT, AD 2. A stabilization method based on the work of Arie, AD 4, using atransition of iodine at 659.5nm as an absolute frequency reference, was selected. IMT hasdesigned, AD 3, and integrated the stabilization system for the PRIMA Metrology System lightsource. Eso developped the LCU control hardware and the control software. In addition, ESO per-formed the system testing and optimization. Moreover, a precise characterization of the system hasbeen done using an independant frequency sensor from the Max Planck Insitute for QuantumOptics (Garching). As it may be required to recalibrate the laser wavelength after its integration atParanal a calibration procedure based on the use of an HP/Agilent interferometer as a reference hasbeen tested in the Garching optical laboratory.
This report describes the whole process of integration and testing in Garching. Section 5 recallsbriefly the principle of the stabilization system and gives the optimal values for the parameters ofthe hardware devices. The control loop architecture is decribed in the Section 6 with the firstresults of stabilization based on the control loop error signal. Section 7 describes the tests carriedout at the Max Planck Institute for Quantun optics with a self-referenced optical frequency comb.The measured system performance is compared to the specifications in Section 8. Finally the fea-sibility of the wavelength calibration procedure with a reference interferometer is discussed inSection 9.
5 Tests and optimization of the components
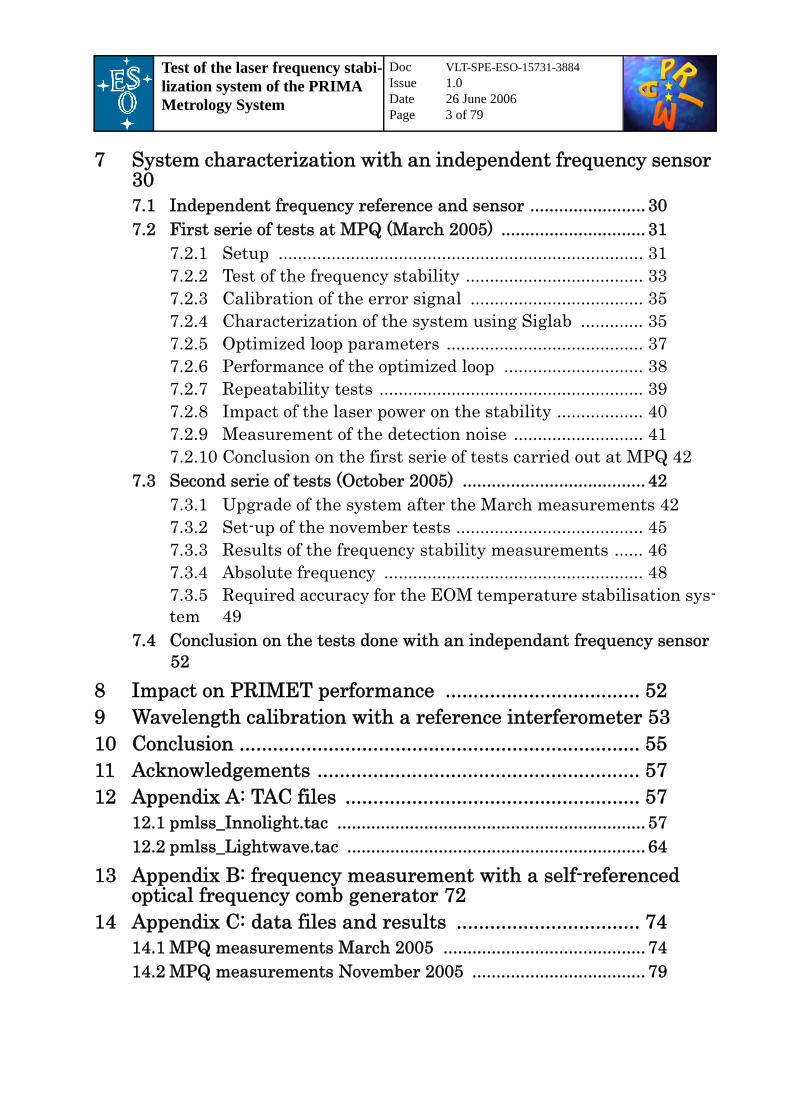
5.1 Summary of the stabilization principleThe stabilization of the laser frequency is based on the Pound-Drever-Hall method, AD 6. Theabsorption of an atomic or molecular transition is used as a frequency reference. A part of the laseroutput power is frequency modulated and sent through a glass cell containing the gas used for thereference. If the laser optical frequency is within a transition the frequency modulation induces amodulation of the absorption, i.e an intensity modulation at the output of the cell, Figure 1. Theamplitude of the modulation increases with the slope of the transmission spectra (with the distance
Doc VLT-SPE-ESO-15731-3884Issue 1.0Date 26 June 2006Page 6 of 79
Test of the laser frequency stabi-lization system of the PRIMA Metrology System
from the center of the transition) and is zero at the center of the transition thus providing a gooderror signal. The rms amplitude of modulation is detected using a lock-in amplifier and is fed to acontrol loop. In the case of PRIMET laser stabilization system, the laser frequency is correctedusing two actuators:
• a fast actuator with a limited range of correction (+/- 20MHz): a piezo which changes the length of the cavity by applying a mechanical strain on it;
• a slow actuator with a large range of correction (+/- 16GHz): a resistor used to modify the length of the optical path in the cavity by heating the cristal and changing its refractive index.
5.2 Summary of the design
The system can be separated in two parts: an optical part mounted on a 75x90cm2 breadboard andan electronic part whose elements are stored in the Metrology System Electronic cabinet. AtParanal the whole system will be located in the Storage Room next to the interferometry lab.
The whole optical part of the system in its basic configuration is presented in Figure 2. The lightsource is a fiber coupled (SM-PM) Lightwave 125 NPRO Nd:YAG CW laser head emitting200mW of linearly polarized light at 1.319µm1. The power at the output of this fiber is splittedusing a 25%/75% SM-PM fiber coupler from Canadian Instrumentation and Research Limited(ESO-VLT-TRE-IMT-15731-3154). The 75% output is connected to a SM-PM fiber which propa-gates the light to the heterodyne assembly (described in AD 5). A SM-PM fiber is connected to the
Figure 1 Principle of the Pound-Drever-Hall stabilization method. A part of the light emitted bythe laser is frequency modulated with an amplitude smaller than the linewidth of theabsorption transition (black line) used as an absolute frequency reference.The modula-tion of the frequency introduces a modulation of transmission, i.e a modulation of inten-sity. The amplitude of the intensity modulation is proportionnal to the slope of thetransmission curve and can be used as an error signal for a control loop.
1. Alternatlively: Innolight, Mephisto MIR500NE-FC. All data in this document refer to the Lightwave laser head.
Intensity
Frequencymodulation
Absorption modulation
Intensitymodulation
Doc VLT-SPE-ESO-15731-3884Issue 1.0Date 26 June 2006Page 7 of 79
Test of the laser frequency stabi-lization system of the PRIMA Metrology System
25% output and guides the light to the focusing optics. The fiber is connected to a fiber aligner(New Focus 9091) and the light is focused using a lens (focal length 15.4mm) into a non linearcrystal (Periodically Poled Lithium Niobate, HCPhotonics, 20x1x5mm3) which doubles the fre-quency of the light (i.e divides the wavelength by two from 1.319µm to 659.5nm), AD 7. The nonlinear crystal is held in a temperature controlled oven mounted on a New Focus (9071) translationstage. After the nonlinear crystal, the beam is collimated with a lens (focal length 40mm) and sentthrough an Electro-Optic Modulator (New Focus 4001M EOM) mounted on a New Focus stage(9071). The EOM modulates the phase with an amplitude of π at a frequency of 25MHz generatinga frequency modulation of 80MHz amplitude at a frequency of 25MHz. The modulated beampropagates through a custom made cell containing iodine vapor, AD 4. The I2 cell is on a custommade mount. A dichroic high pass filter (Edmund Optics) separates the infrared light from the redlight. After a folding mirror the visible beam is focused (60mm focal length lens) on an AC cou-pled detector (Analog Module 712-A2). All the electronics is stored in a single cabinet Figure 3. The signal coming from the detector is fedto the lock-in amplifier (Stanford Research Systems, Model SR844RF lock-in amplifier). Thelock-in amplifier demodulates the signal using as phase reference a signal coming from the EOMdriver (New Focus 3363B). The output of the lock-in amplifier is a voltage proportionnal to therms amplitude of the detector signal filtered at 25MHz with a 160Hz bandwidth. This voltage isthe error signal of the control loop and is fed to the analog input board (VMIC VMIVME 3123)located in the LCU rack. The control loop is run by the master CPU of PRIMET MeasurementLCU using TAC. Two correction signals are generated by the loop and are send respectively to thelaser driver piezo input (labelled “fast input on the driver) and to the temperature input (“slowinput”) using two outputs of the digital to analog ouput board (MPV-955) located in the LCU rack.The laser driver applies then these signals on the two actuators which modify the laser optical fre-quency. The rest of the electronic is composed of two temperature controllers (Newport OmegaCN77352-C4) for the cristal oven and the iodine cell, a 15V voltage generator for the detector.

Doc VLT-SPE-ESO-15731-3884Issue 1.0Date 26 June 2006Page 8 of 79
Test of the laser frequency stabi-lization system of the PRIMA Metrology System
Figure 2 Optical set-up of the PRIMA metrology laser absolute frequency stabilization system.

Doc VLT-SPE-ESO-15731-3884Issue 1.0Date 26 June 2006Page 9 of 79
Test of the laser frequency stabi-lization system of the PRIMA Metrology System
5.3 Laser
5.3.1 Laser standard parameter during operationThe microprocessor based laser driver allows to set the center frequency of the light and the outputpower. The frequency emited by the laser, when no modulation is imposed to it, is defined by the
Figure 3 Electronic set-up of the PRIMA Metrology laser absolute frequency stabilization. Fromtop to bottom: PRIMET LCU, temperature controllers and 15V voltage generator, lock-in amplifier, oscilloscope, laser power supply and EOM driver.

Doc VLT-SPE-ESO-15731-3884Issue 1.0Date 26 June 2006Page 10 of 79
Test of the laser frequency stabi-lization system of the PRIMA Metrology System
temperature of the cristal (cavity) which is set by the laser driver. This temperature is controlledwith a low accuracy and is not controlled when the laser temperature input is used. It definesapproximately at which wavelength the laser will start emitting when it is switched on (a curvegiving the wavelength as a function of the cristal temperature for the laser with serial number 597is given in AD 8). The output power is set directly using the laser driver (one should consider thelaser diver power display as an indication only and use a powermeter to get a precise value).
5.3.2 Output power stabilityThe stability of the output power of the Lightwave 125 NPRO Nd:YAG laser has been monitoredwith a powermeter (Newport Dual Channel Power Meter Model 2832C). The laser fiber is con-nected to the powermeter fiber connector. An optical density (1000) was introduced between thefiber coupler and the InGaAs detector. The powermeter was connected to the LCU via an RS-232link. The LCU provided a file with a timestamp and the power. Measurements have been done overseveral hours. One can notice a rise time longuer than one hour. After this time the laser outputpower standard deviation is below 0.5%.
Table 1 Settings of the laser driver.
Parameter Value Comments
Cristal temperature 40.3°C
Output Power Full power corresponds to ~236mW (on the laser driver power display) after stabilization of the out-put power
Figure 4 Laser output power. The rise time is longuer than 50min. After the rise time: meanpower=208.5mW, standard deviation=0.35%, peak-to-valey stability=1.4%.

Doc VLT-SPE-ESO-15731-3884Issue 1.0Date 26 June 2006Page 11 of 79
Test of the laser frequency stabi-lization system of the PRIMA Metrology System
5.3.3 Polarization stabilityThe change of polarization of the laser light can introduce a change of intensity of the red beamsince the frequency doubling process is sensitive to the polarization. The polarization state of thelaser beam has been measured using a Thorlabs PA430 polarimeter, Figure 5 and Figure 6.
The peak-to-valey variations of the orientation of the the polarization state can reach 6 degrees.This would account for a variation of 2% peak-to-valey of the second harmonic power.The extinction ratio2 remains better than 20dB which is satisfactory.
Figure 5 Polarization stability measurement setup.
Figure 6 Stability of the polarization state of the light emitted by the laser. Upper graph: orienta-tion of the main axis of the polarization ellipse as a function of time. Standard deviationis 1.8°. Bottom graph: ellipticity (defined as the ratio of the small axis over the long axisof the electrical field ellipse) as a function of time.
2. The extinction ratio, ER, is defined by the ratio between maximum and minimum intensities recorded while a linear polarizer is rotated by 360 degrees. The extinction ratio in dB is given by ERdb=-10×log10[ER].
Nd:YAG ThorlabsPA430
Optical density 103
PC data file
Doc VLT-SPE-ESO-15731-3884Issue 1.0Date 26 June 2006Page 12 of 79
Test of the laser frequency stabi-lization system of the PRIMA Metrology System
5.4 Nonlinear cristal
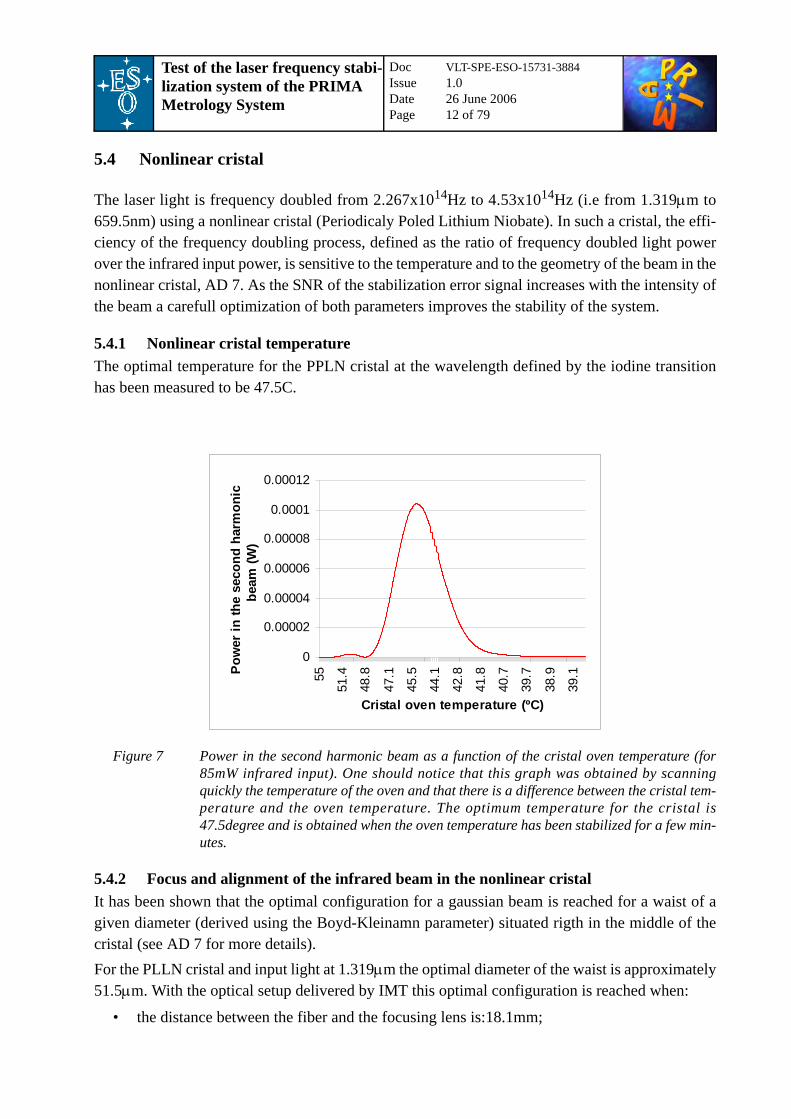
The laser light is frequency doubled from 2.267x10¹⁴Hz to 4.53x10¹⁴Hz (i.e from 1.319µm to659.5nm) using a nonlinear cristal (Periodicaly Poled Lithium Niobate). In such a cristal, the effi-ciency of the frequency doubling process, defined as the ratio of frequency doubled light powerover the infrared input power, is sensitive to the temperature and to the geometry of the beam in thenonlinear cristal, AD 7. As the SNR of the stabilization error signal increases with the intensity ofthe beam a carefull optimization of both parameters improves the stability of the system.
5.4.1 Nonlinear cristal temperatureThe optimal temperature for the PPLN cristal at the wavelength defined by the iodine transitionhas been measured to be 47.5C.
5.4.2 Focus and alignment of the infrared beam in the nonlinear cristalIt has been shown that the optimal configuration for a gaussian beam is reached for a waist of agiven diameter (derived using the Boyd-Kleinamn parameter) situated rigth in the middle of thecristal (see AD 7 for more details).For the PLLN cristal and input light at 1.319µm the optimal diameter of the waist is approximately51.5µm. With the optical setup delivered by IMT this optimal configuration is reached when:
• the distance between the fiber and the focusing lens is:18.1mm;
Figure 7 Power in the second harmonic beam as a function of the cristal oven temperature (for85mW infrared input). One should notice that this graph was obtained by scanningquickly the temperature of the oven and that there is a difference between the cristal tem-perature and the oven temperature. The optimum temperature for the cristal is47.5degree and is obtained when the oven temperature has been stabilized for a few min-utes.
0
0.00002
0.00004
0.00006
0.00008
0.0001
0.00012
55
51.4
48.8
47.1
45.5
44.1
42.8
41.8
40.7
39.7
38.9
39.1
Cristal oven temperature (ºC)
Pow
er in
the
seco
nd h
arm
onic
be
am (W
)

Doc VLT-SPE-ESO-15731-3884Issue 1.0Date 26 June 2006Page 13 of 79
Test of the laser frequency stabi-lization system of the PRIMA Metrology System
• the distance between the focusing lens and the center of the cristal is: 72.6mm.
When working with the cristal at 47.5°C the incident beam should be perpendicular to the inputfacet of the cristal (it should not be useful to tilt the cristal to improve the conversion efficiency).As it is difficult to measure the distance between the lens and the fiber and the lens and the cristalthe best way to maximize the second harmonic output is to optimize step by step the focus. Thefocus is modified by tuning the distance between the fiber and the lens. Doing so moves the posi-tion of the waist and so it is required to correct the shift of the waist by translating the cristal so asto put back the waist in the middle of the cristal (position in which the output visible flux is max-imum). Doing these two steps recursively (change of focus/repositioning of the waist) allows toconverge to the optimal configuration.During the tests carried out in Garching the second harmonic power was approximately 12µW(after the collimating lens) for approximately 50mW of input infrared light (~25% of laser fullpower), i.e a conversion efficiency η=2.4x10⁻⁴.
5.4.3 Second harmonic generation stabilityThe stability of the laser and of the second harmonic power have been measured simultaneouslyusing the Newport powermeter and recording the data with the LCU (setup in Figure 9).
Figure 8 Optimal focus of the infrared light in the nonlinear cristal.
Figure 9 Setup for the measurement of the laser and second harmonic power stability.
PPLN
focal length = 15.4mm
fiber (core diameter = 9µm)
L
L/2
w=51.5µm
72.6mm18.1mm
Nd:YAG
PPLN Newport
LCUdata file
RS-
232
Optical density 103
InGaAs detector
Si detector

Doc VLT-SPE-ESO-15731-3884Issue 1.0Date 26 June 2006Page 14 of 79
Test of the laser frequency stabi-lization system of the PRIMA Metrology System
One can see on Figure 10 that the visible and the infrared power are in phase opposition. Thiscould be explained by the fact that the fiber coupler ratio is not stable.
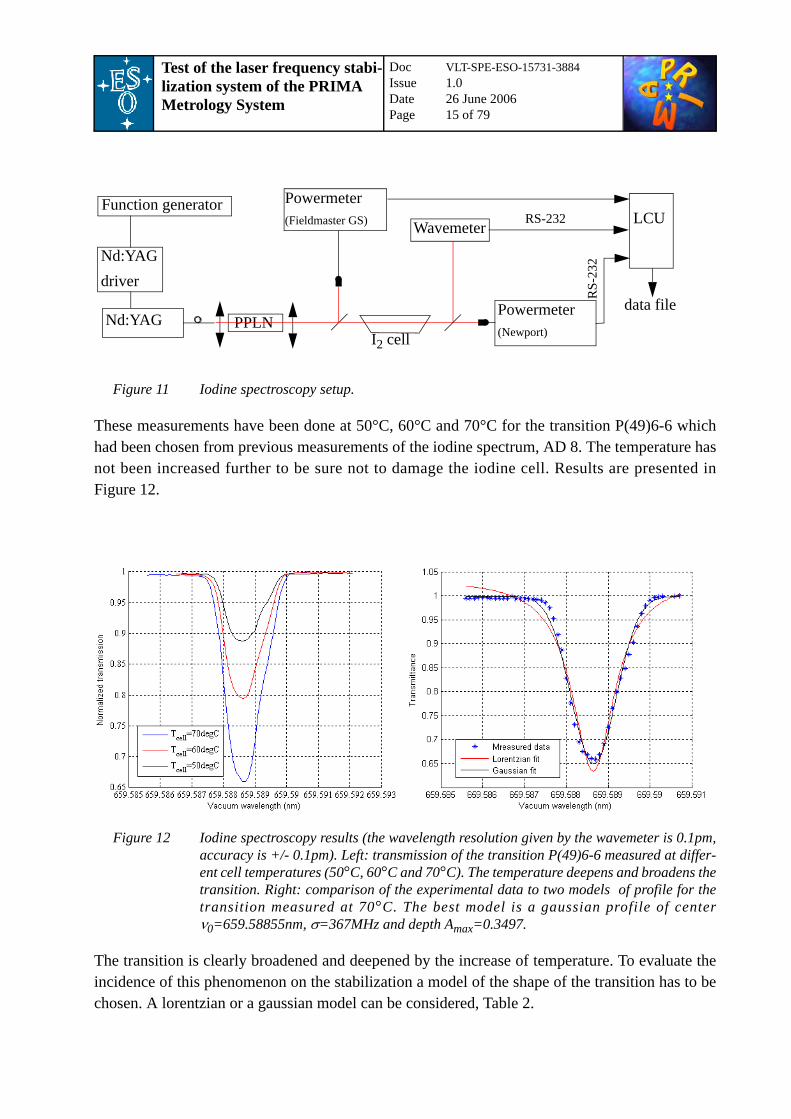
5.5 Iodine cellThe shape, and in particular the depth and the width of the molecular transition, is a function of thepressure. In a cell equipped with a cold finger the pressure is set by the temperature of the cold fin-ger. The impact of the cell temperature on the shape of the transition has been measured using asimple laser spectroscopy setup, Figure 11. The frequency of the laser was swept by sending aramp of voltage into the input modifying the temperature of the cristal. The frequency of the lightwas doubled with the cristal of PPLN. A beam splitter was used to measure the intensity of thebeam before the cell. After the cell a second beam splitter was used to send a part of the beam tothe wavemeter (Burleigh WA-1500) and to measure the intensity of the output beam. The wave-length and the two intensities were recorded with a timestamp by the LCU. The transmission wascomputed from the two intensities and normalized using a measurement of transmission withoutcell.
Figure 10 Simultaneous measurement of the power at the 75% output of the fiber coupler and of thepower in the second harmonic beam.
Doc VLT-SPE-ESO-15731-3884Issue 1.0Date 26 June 2006Page 15 of 79
Test of the laser frequency stabi-lization system of the PRIMA Metrology System
These measurements have been done at 50°C, 60°C and 70°C for the transition P(49)6-6 whichhad been chosen from previous measurements of the iodine spectrum, AD 8. The temperature hasnot been increased further to be sure not to damage the iodine cell. Results are presented inFigure 12.
The transition is clearly broadened and deepened by the increase of temperature. To evaluate theincidence of this phenomenon on the stabilization a model of the shape of the transition has to bechosen. A lorentzian or a gaussian model can be considered, Table 2.
Figure 11 Iodine spectroscopy setup.
Figure 12 Iodine spectroscopy results (the wavelength resolution given by the wavemeter is 0.1pm,accuracy is +/- 0.1pm). Left: transmission of the transition P(49)6-6 measured at differ-ent cell temperatures (50°C, 60°C and 70°C). The temperature deepens and broadens thetransition. Right: comparison of the experimental data to two models of profile for thetransition measured at 70°C. The best model is a gaussian profile of centerν0=659.58855nm, σ=367MHz and depth Amax=0.3497.
Nd:YAG PPLN
Powermeter(Fieldmaster GS)
Powermeter(Newport)
LCU
data file
Wavemeter RS-232
RS-
232
I2 cell
Function generator
Nd:YAGdriver

Doc VLT-SPE-ESO-15731-3884Issue 1.0Date 26 June 2006Page 16 of 79
Test of the laser frequency stabi-lization system of the PRIMA Metrology System
The gaussian model describes best P(49)6-6.For the three test temperatures the characteristicsobtained after fitting the data are given in Table 3. The transition gets deeper with the temperaturefaster than it gets wider. As a result the error signal will increase with the temperature, Table 3.
Table 2 Transmission models of a transition.
Gaussian Lorentzian
Transmis-sion as a function of the optical frequency (ν)
T0 maximum transmission of the cellAmax maximum absorption of the transitionν0 center frequency of the transitionσ=∆ν/(2*sqrt(4)), with ∆ν linewidth (FWHM)
T0 maximum transmission of the cellAmax maximum absorption of the transi-tionν0 center frequency of the transition∆ν linewidth (FWHM)
Error signal as a function of the optical frequency (ν) with Pin the power of the beam
νFM the modulation frequencySVP the detector sensitivity
with Pin the power of the beamνFM the modulation frequencySVP the detector sensitivity
Error signal close to ν0
(5.5-1)
with Pin the power of the beamνFM the modulation frequencySVP the detector sensitivity
with Pin the power of the beamνFM the modulation frequencySVP the detector sensitivity
Table 3 Characteristics of P(49)6-6 for three different cell temperature (gaussian profile of transition)
Cell Temperature
(C)Amax(%) σ(MHz)
Amax/σ2
(Hz-2)
50 11.58 352 9.34x10⁻⁹
60 21.16 362 1.6x10⁻⁸
70 34.97 367 2.59x10⁻⁸
T ν( ) T0 Amaxν ν0–( )2
2σ2----------------------–⎝ ⎠⎜ ⎟⎛ ⎞
exp–= T ν( ) T0 Amax∆ν 2⁄( )2
ν ν0–( )2 ∆ν 2⁄( )2+--------------------------------------------------–=
ε ν( ) PinπνFMSVPAmax
σ2------------- ν ν0–( )ν ν0–( )2
2σ2----------------------–⎝ ⎠⎜ ⎟⎛ ⎞
exp= ε ν( ) 2Amax ν ν0–( )PinπνFMSVP ∆ν 2⁄( )2
ν ν0–( )2 ∆ν 2⁄( )2+( )2---------------------------------------------------------=
ε ν( )PinπνFMSVPAmax
σ2--------------------------------------------- ν ν0–( )= ε ν( ) PinπνFMSVP8Amax
∆ν2---------------- ν ν0–( )=

Doc VLT-SPE-ESO-15731-3884Issue 1.0Date 26 June 2006Page 17 of 79
Test of the laser frequency stabi-lization system of the PRIMA Metrology System
The stabilization system should be operated with the iodine cell at 70°C. A higher temperaturewould probably increase the error signal but may reduce the lifetime of the iodine cell.During these tests the position of the center of the transition has been measured to be 659.58855nmbased on the wavelength measured with the wavemeter (Burleigh WA-1500). Nevertheless previ-ous measurements (AD 4, AD 8, AD 9) indicate that the transition is in fact at 659.5880nm. Mea-surements done at the MPQ (see Section7.2.7) has proved that the transition is at 659.5880nm andthat the error in our measurements comes from a bad calibration of the wavemeter.
5.6 Detector
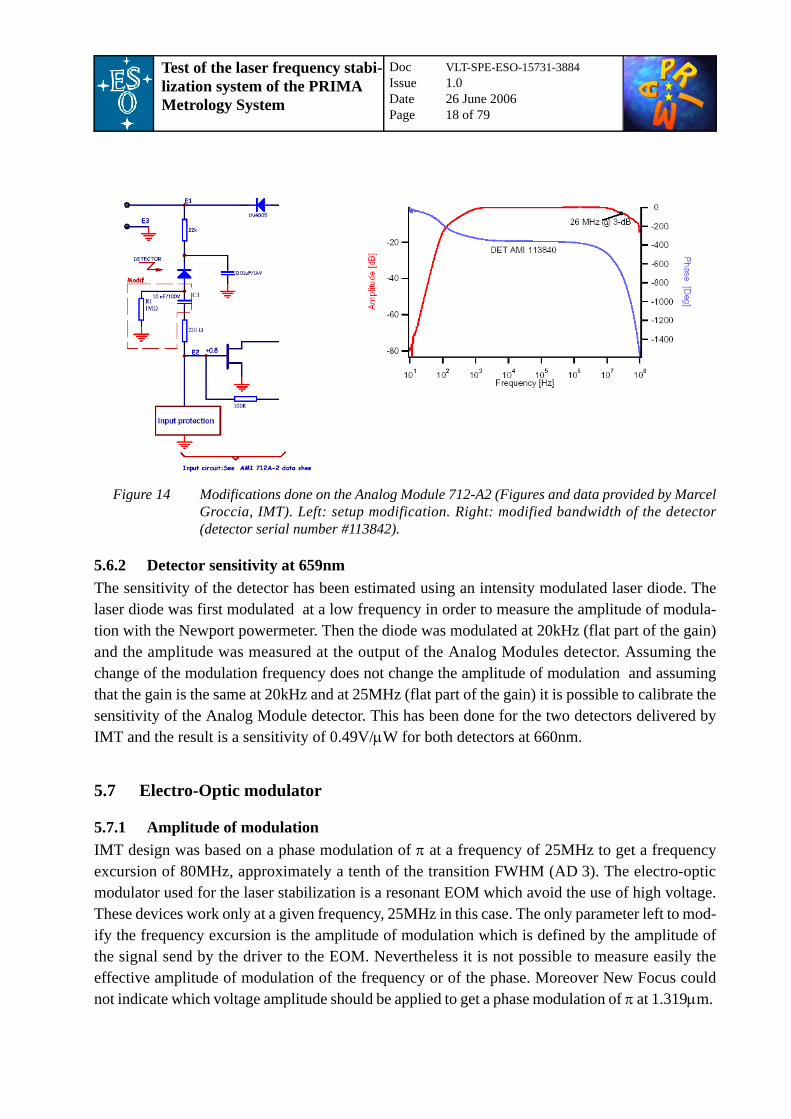
5.6.1 Detector modificationIn its design IMT proposed to use an Analog Modules model no 712-A2. The first tests carried outat IMT showed that the detector was saturated. IMT has then AC coupled the detector to removethe DC signal responsible for the saturation. This has reduced the bandwidth of the detector from60MHz to approximately 26MHz (see Figure 14).
Figure 13 Amplitude of the signal delivered by the detector as a function of the frequency separationfrom the center of the transition (computed from gaussian model obtained from experi-mental data).
Doc VLT-SPE-ESO-15731-3884Issue 1.0Date 26 June 2006Page 18 of 79
Test of the laser frequency stabi-lization system of the PRIMA Metrology System
5.6.2 Detector sensitivity at 659nmThe sensitivity of the detector has been estimated using an intensity modulated laser diode. Thelaser diode was first modulated at a low frequency in order to measure the amplitude of modula-tion with the Newport powermeter. Then the diode was modulated at 20kHz (flat part of the gain)and the amplitude was measured at the output of the Analog Modules detector. Assuming thechange of the modulation frequency does not change the amplitude of modulation and assumingthat the gain is the same at 20kHz and at 25MHz (flat part of the gain) it is possible to calibrate thesensitivity of the Analog Module detector. This has been done for the two detectors delivered byIMT and the result is a sensitivity of 0.49V/µW for both detectors at 660nm.
5.7 Electro-Optic modulator
5.7.1 Amplitude of modulationIMT design was based on a phase modulation of π at a frequency of 25MHz to get a frequencyexcursion of 80MHz, approximately a tenth of the transition FWHM (AD 3). The electro-opticmodulator used for the laser stabilization is a resonant EOM which avoid the use of high voltage.These devices work only at a given frequency, 25MHz in this case. The only parameter left to mod-ify the frequency excursion is the amplitude of modulation which is defined by the amplitude ofthe signal send by the driver to the EOM. Nevertheless it is not possible to measure easily theeffective amplitude of modulation of the frequency or of the phase. Moreover New Focus couldnot indicate which voltage amplitude should be applied to get a phase modulation of π at 1.319µm.
Figure 14 Modifications done on the Analog Module 712-A2 (Figures and data provided by MarcelGroccia, IMT). Left: setup modification. Right: modified bandwidth of the detector(detector serial number #113842).

Doc VLT-SPE-ESO-15731-3884Issue 1.0Date 26 June 2006Page 19 of 79
Test of the laser frequency stabi-lization system of the PRIMA Metrology System
The error signal for a given frequency offset increases with the amplitude of modulation. As a con-sequence the amplitude of the signal delivered by the EOM driver was increased until the signalgot saturated. This corresponds to a peak-to-peak amplitude of 18V measured in 1MΩ.
5.8 Lock-in amplifier settings
5.8.1 SettingsThe lock-in amplifer uses the same settings as the one used in Neuchatel by IMT. The bandwidthis set to 160Hz by setting the time constant to 1.34ms. The slope of the filter is set to the maximum,24dB/Octave, to suppress as much as possible the noise. The sensitivity is set to 100mV.
5.8.2 Analog output voltageOne has to remember that the output of the lock-in is the rms amplitude of the detector signal at25MHz scaled to the sensitivity. The ouput voltage of the lock-in amplifier is given by
(5.8-1)
where X is the rms amplitude of the detector signal, sensitivity is a parameter selected on the lock-in used to scale the output to -/+10V (100mV for the frequency stabilization system, i.e 100mVmeasured by the lock-in amplifier correspond to 10V at the analog output of the lock-in), Xoffsetis an offset set on the lock-in (0V for the frequency stabilization system), Expand is a proportion-nal factor set on the lock-in amplifier (1 for the frequency stabilization system).With the setup of the frequency stabilization system the output voltage of the lock-in amplifier isgiven by
. (5.8-2)
5.8.3 AutophaseThe error signal is positive on one side of the transition and negative on the other side of the tran-sition. Nevertheless depending on the phase of the signal detected by the lock-in these two sidescan be swapped. Therefore it is sometimes required to reset the phase of the signal detected by thelock-in by using the autophase button.Both actuators increase the frequency of the light emitted by the laser when the voltage applied tothem increase (see Table 4 and Table 5). This means that when the error signal is positive, the loopis increasing the frequency of the laser, i.e that the error signal should be positive for frequencieslower than the center of the transition and negative for frequencies larger than the center of thetransition, as in Figure 13.The sign of the error signal can be checked opened loop by scanning the frequency of the laser (forexample by applying a voltage to the temperature input) and watching the sign of the error signalon the lock-in. When increasing the voltage the error signal should vary from positive to negative.
Output voltage (V) Xsensitivity------------------------ Xoffset–⎝ ⎠
⎛ ⎞ Expand 10××=
Output voltage (V) X0.1------- 0–⎝ ⎠
⎛ ⎞ 1 10×× X 100×= =

Doc VLT-SPE-ESO-15731-3884Issue 1.0Date 26 June 2006Page 20 of 79
Test of the laser frequency stabi-lization system of the PRIMA Metrology System
If this not the case, the frequency of the laser should be tuned until the lock-in phase display showsa phase of 180° and then the autophase button should be pressed. This shifts the frequency of thedetector signal by 180° compared to the reference and inverts the sign of the error signal.
5.9 Analog output boardThe correction of the frequency has a resolution which depends on the resolution of the correctionsignal. The digital to analogic board, MPV-955, converts the error signal coded on 16bits in ananalogic value in the range -10V/10V or -5V/5V. One can take into account the conversion factorfor the piezo and the temperature given in Table 5 and Table 4 to estimate the resolution of the sta-bilization loops signal Table 6.
Table 4 Piezo tuning characteristics given for the Lightwave 125 (lightwave datasheet).
“fast input” (piezo tuning) LightwaveDatasheet
10 V DC 1.9 MHz/V
10 V AC Peak to peak 2.45 MHz/V
Tuning range until 30 MHz for low mod-ulation rates (<10kHz)
Modulation rate until 100 kHz for small depth of modulation
Table 5 Temperature tuning measured characteristics for the Lightwave 125 (laser head serial number957,AD 8)
“Slow input” (temperature
tuning)
Measuredl=659.5nm
Measuredl=1319nm
DatasheetLightwavel=1319nm
within a mode -5.4 GHz/ºC5.17 GHz/V
-2.26 GHz/ºC2.59 GHz/V
-2.4 GHz/ºC
over several modes
2.2 GHz/ºC-3.22 GHz/V
1.1 GHz/ºC-1.61 GHz/V
-1 GHz/ºC
Mode width 27 GHz 13.5 GHz 10 GHz
Total tuning range 66 GHz 33 GHz 30 GHz
Modulation rate Hertz level

Doc VLT-SPE-ESO-15731-3884Issue 1.0Date 26 June 2006Page 21 of 79
Test of the laser frequency stabi-lization system of the PRIMA Metrology System
The piezo has a high resolution but suffers from a limited range of correction. As a consequencethe analog output (channel 0) feeding the piezo actuator is configured to deliver a voltage in therange -10V/10V. On the contrary the output (channel 1) connected to the temperature actuator isconfigured to offer the highest resolution (-5V/5V). The range of correction of the temperatureactuator remains larger than what is required.
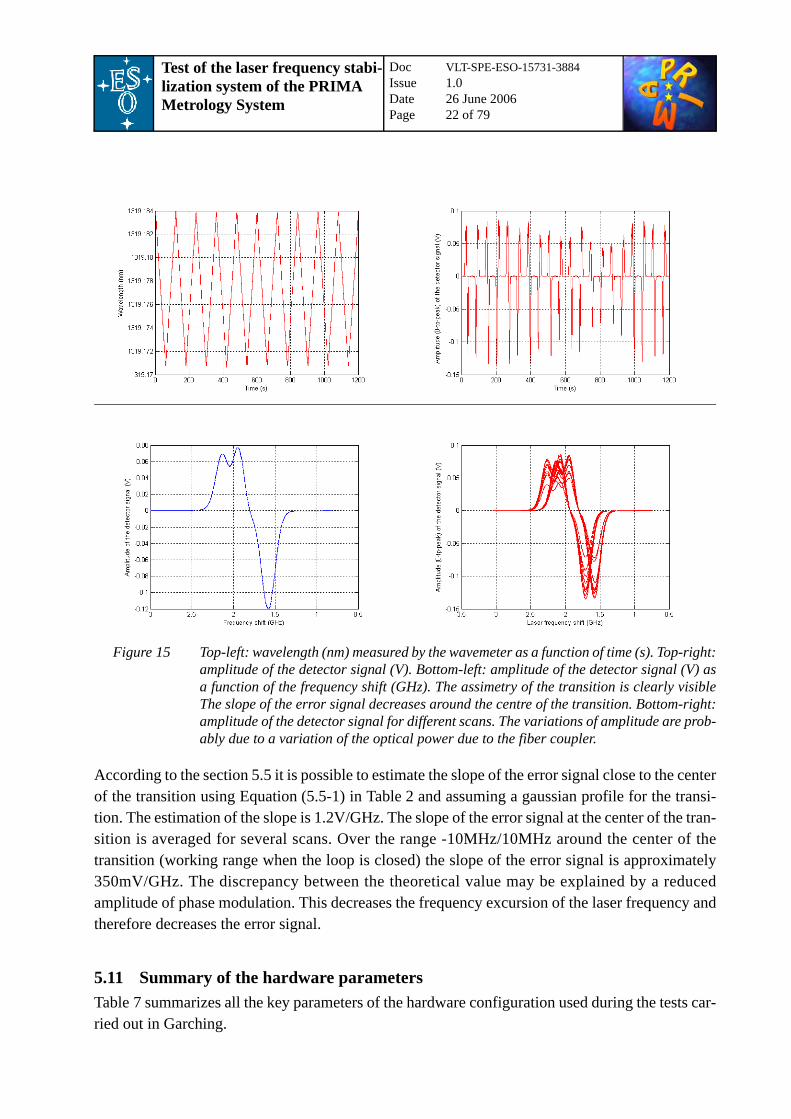
5.10 Measurement of the error signalThe error signal has been measured during multiple scans of the transition P(49)6-6. For thesemeasurements the power of the visible beam was 12µW and the temperature of the cell was 70°C.The transition was scanned by sending a voltage triangular signal to the laser driver temperatureinput. The LCU was used to save the timestamp, the voltage command, the wavelength (given bythe wavemeter) and the error signal (from the lock-in) in a single file. The error signal is then con-verted to the 0-to-peak amplitude of the detector signal by removing the proportionnal factors dueto the lock-in (multiplied by 1.4 to convert the rms value to 0-to-peak, divided by 100 to removethe lock-in sensitivity).Results are presented in Figure 15. On a single scan one notices that theerror signal is not symetrical which was slightly visible in the spectroscopy measurement. On theserie of scan one notices that two successive scans are symetric. This is caused by the modulationof the wavelength which is also symetric. Moreover the amplitude of the error signal varies fromscan to scan. This may be due to variations of the input beam power and may be a limitation forthe long term stability of the wavelength.
Table 6 Resolution of the stabilization loops.
Configuration of the MPV-955 output
216 bits over -5V/5V
216 bits over -10V/10V
Resolution of the board output signal (V)
0.00015 0.00030
Resolution of piezo loop (Hz) 300 600
Resolution of the temperature loop (Hz)
390000 780000
Doc VLT-SPE-ESO-15731-3884Issue 1.0Date 26 June 2006Page 22 of 79
Test of the laser frequency stabi-lization system of the PRIMA Metrology System
According to the section 5.5 it is possible to estimate the slope of the error signal close to the centerof the transition using Equation (5.5-1) in Table 2 and assuming a gaussian profile for the transi-tion. The estimation of the slope is 1.2V/GHz. The slope of the error signal at the center of the tran-sition is averaged for several scans. Over the range -10MHz/10MHz around the center of thetransition (working range when the loop is closed) the slope of the error signal is approximately350mV/GHz. The discrepancy between the theoretical value may be explained by a reducedamplitude of phase modulation. This decreases the frequency excursion of the laser frequency andtherefore decreases the error signal.
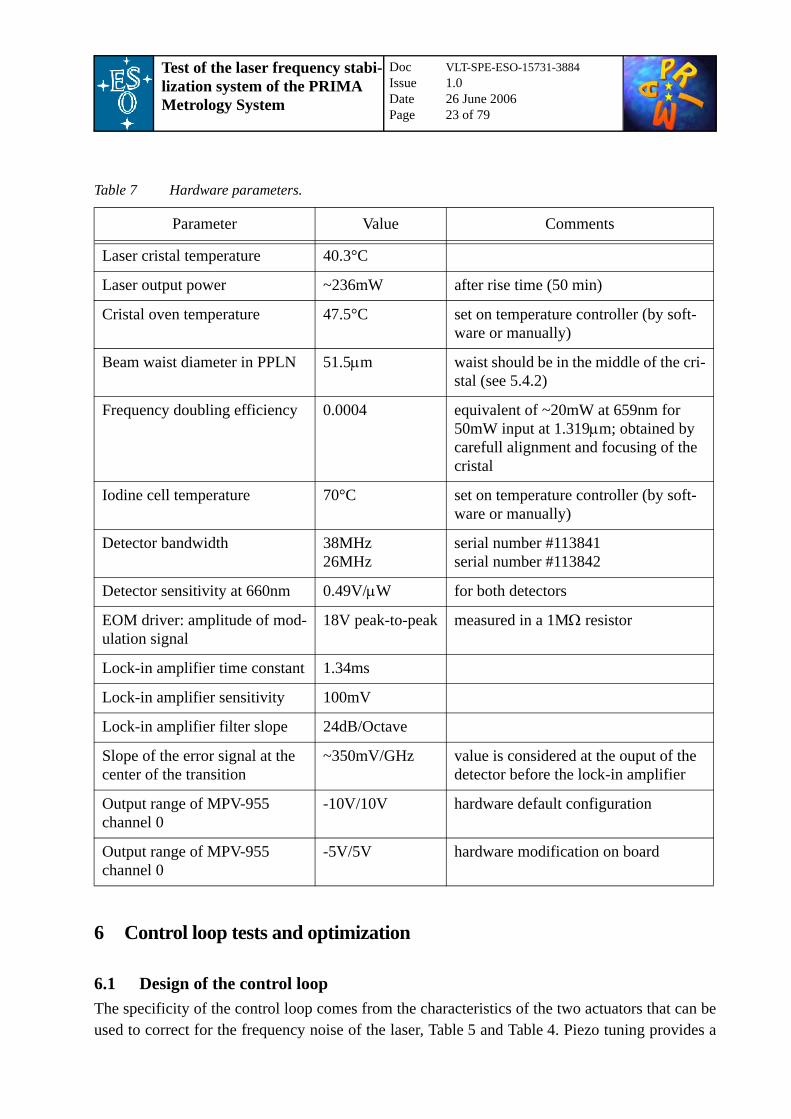
5.11 Summary of the hardware parametersTable 7 summarizes all the key parameters of the hardware configuration used during the tests car-ried out in Garching.
Figure 15 Top-left: wavelength (nm) measured by the wavemeter as a function of time (s). Top-right:amplitude of the detector signal (V). Bottom-left: amplitude of the detector signal (V) asa function of the frequency shift (GHz). The assimetry of the transition is clearly visibleThe slope of the error signal decreases around the centre of the transition. Bottom-right:amplitude of the detector signal for different scans. The variations of amplitude are prob-ably due to a variation of the optical power due to the fiber coupler.
Doc VLT-SPE-ESO-15731-3884Issue 1.0Date 26 June 2006Page 23 of 79
Test of the laser frequency stabi-lization system of the PRIMA Metrology System
6 Control loop tests and optimization
6.1 Design of the control loopThe specificity of the control loop comes from the characteristics of the two actuators that can beused to correct for the frequency noise of the laser, Table 5 and Table 4. Piezo tuning provides a
Table 7 Hardware parameters.
Parameter Value Comments
Laser cristal temperature 40.3°C
Laser output power ~236mW after rise time (50 min)
Cristal oven temperature 47.5°C set on temperature controller (by soft-ware or manually)
Beam waist diameter in PPLN 51.5µm waist should be in the middle of the cri-stal (see 5.4.2)
Frequency doubling efficiency 0.0004 equivalent of ~20mW at 659nm for 50mW input at 1.319µm; obtained by carefull alignment and focusing of the cristal
Iodine cell temperature 70°C set on temperature controller (by soft-ware or manually)
Detector bandwidth 38MHz26MHz
serial number #113841serial number #113842
Detector sensitivity at 660nm 0.49V/µW for both detectors
EOM driver: amplitude of mod-ulation signal
18V peak-to-peak measured in a 1MΩ resistor
Lock-in amplifier time constant 1.34ms
Lock-in amplifier sensitivity 100mV
Lock-in amplifier filter slope 24dB/Octave
Slope of the error signal at the center of the transition
~350mV/GHz value is considered at the ouput of the detector before the lock-in amplifier
Output range of MPV-955 channel 0
-10V/10V hardware default configuration
Output range of MPV-955 channel 0
-5V/5V hardware modification on board

Doc VLT-SPE-ESO-15731-3884Issue 1.0Date 26 June 2006Page 24 of 79
Test of the laser frequency stabi-lization system of the PRIMA Metrology System
fast correction with a high resolution but with a limited range of +/-20MHz which is usuallyexceded when the laser is operated more than 30min. Temperature tuning offers a broad range ofcorrection (several GHz) with a poor resolution and a small bandwidth.To correct the frequency noise the two actuators have to be used simultaneously. The difficulty isto implement a loop using these two actuators in spite of their much different scaling. Tests haveshown that it is not possible to use the control loop proposed in the initial design. A new design hadbeen introduced, Figure 16.
In this design the two loops work almost independently. The error signal seen by the temperaturecontroller is just overestimated by adding the (converted) piezo correction signal. This is done toforce the temperature loop to desaturate the piezo actuator. Such a scheme could create problem asthe two loops, piezo loop and temperature loop, could compete against each other. Nevertheless inthis case the scaling of the two loops is so different that the piezo loop has little effect on the tem-perature loop.
6.2 PID parametersBoth PID parameters were computed as if each loop was working alone. In this case the loop isdescribed by the Figure 17 where Y(s) is the frequency output of the laser, P(s) is the transfertfunction of the actuator, N(s) the frequency noise of the laser, S(s) is the transfert function of ourdetection scheme and C(s) is the transfert function of the corrector one wants to implement.
Figure 16 Design of the control loop.
Piezo
Temperature +++
+
++
Frequency noise
Sensor
+ +
-
-
Conversion
DAC
DAC ADC
laserfrequency
PID
PID

Doc VLT-SPE-ESO-15731-3884Issue 1.0Date 26 June 2006Page 25 of 79
Test of the laser frequency stabi-lization system of the PRIMA Metrology System
The corrector is calculated so that the opened loop transfert function is just an integrator
(6.2-1)
the closed loop transfert function in rejection (Yc(s)=0) is a high-pass filter
. (6.2-2)
The Bode diagram of such a transfert function is plotted in Figure 18.
Piezo loop parametersThe sensor can be considered as a first order integrator with a time constant equal to the time con-stant of the lock-in amplifier. Similarly the piezo actuator can be,as a first approximation, consid-
Figure 17 Control loop if only one actuator is considered. Yc is the command, P the actuator, N thenoise, Y the controlled parameter, S the sensor and C the corrector.
Figure 18 Bode diagram of the transfert function s/(s+1).
P(s)
C(s) S(s)
N(s)Y(s)Yc(s)
-+ +
+
OL s( ) P s( )S s( )C s( ) 1s---= =
CL s( ) Y s( )N s( )----------- 1
1 P s( )S s( )C s( )+------------------------------------------- ss 1+-----------= = =
Doc VLT-SPE-ESO-15731-3884Issue 1.0Date 26 June 2006Page 26 of 79
Test of the laser frequency stabi-lization system of the PRIMA Metrology System
ered as a first order integrator with a small time constant cooresponding to the high bandwidth ofthe piezo actuator (a few tens of kHz). This two systems considered in serie can be approximatedagain by a first order integrator as the lock-in amplifier time constant is a level of magnitude lowerthan the piezo constant. The opened loop transfert function of the two system in serie is then
. (6.2-3)
Inserting this equation in Equation (6.2-1) it is obvious that the corrector should be a proportion-nal-integral corrector with a transfert function C(s) of the form:
. (6.2-4)
The parameters of KP and τP had already been calculated at IMT in Neuchatel and were found tobe:
• KP=746.27;
• τP=0.00088.
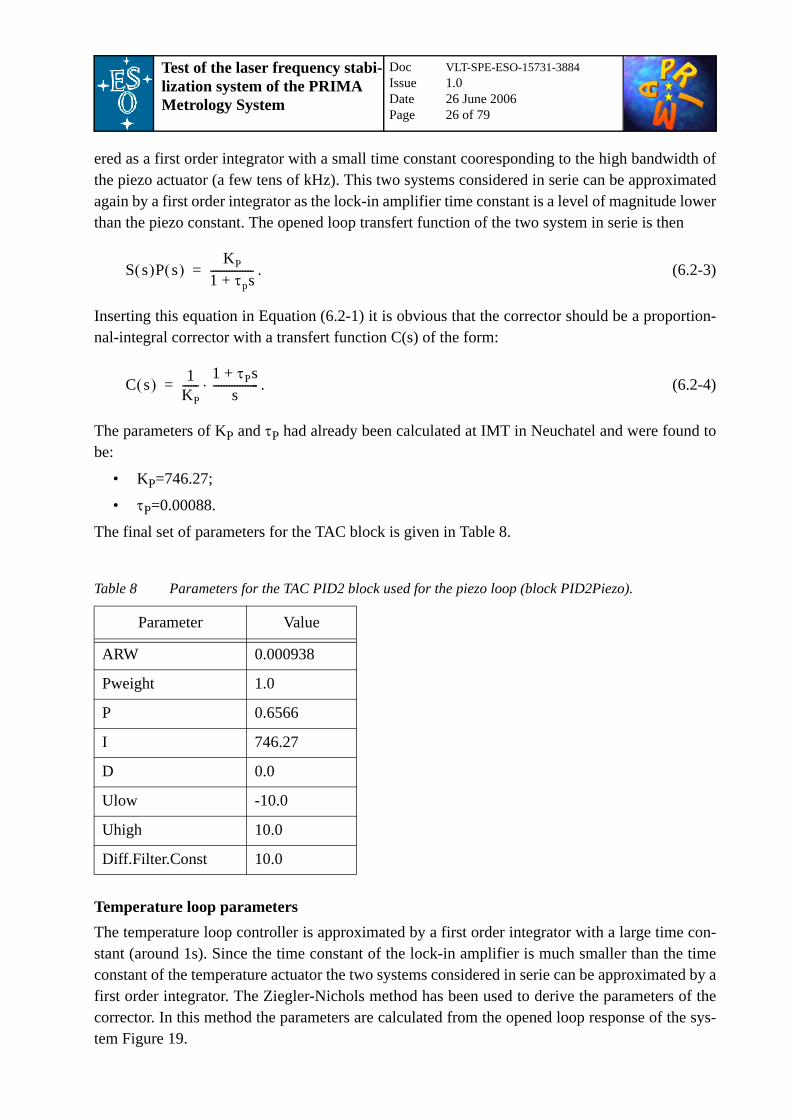
The final set of parameters for the TAC block is given in Table 8.
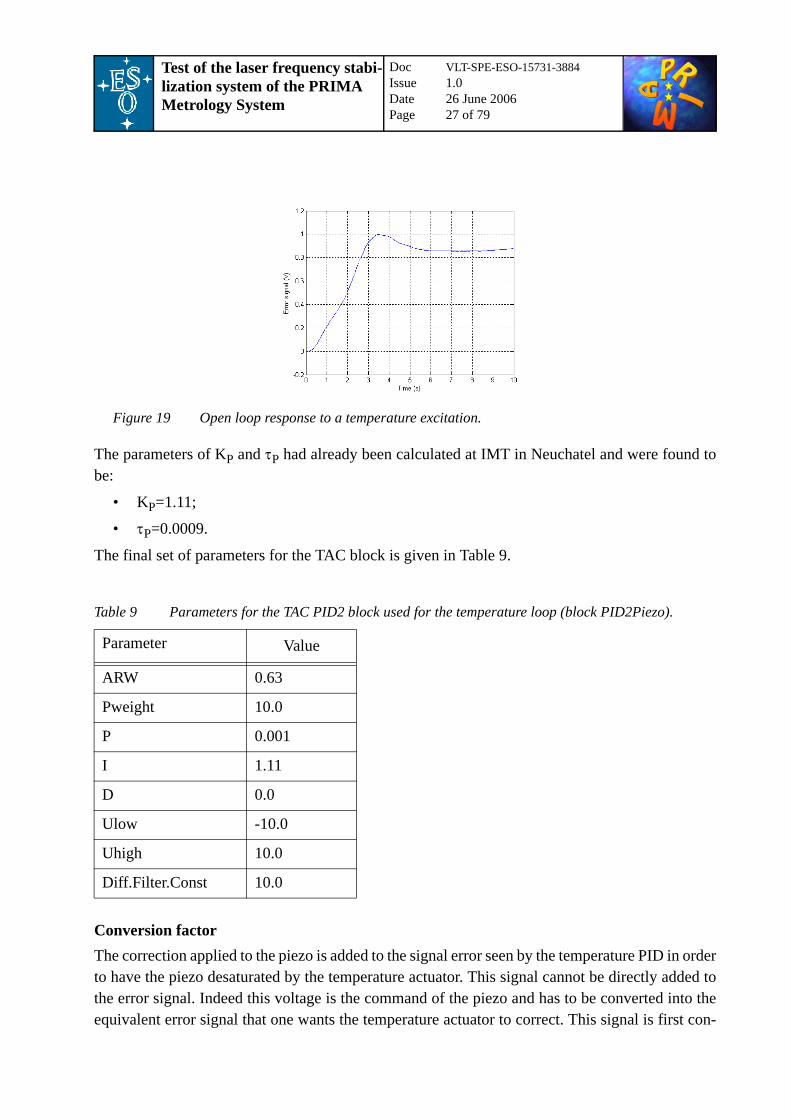
Temperature loop parametersThe temperature loop controller is approximated by a first order integrator with a large time con-stant (around 1s). Since the time constant of the lock-in amplifier is much smaller than the timeconstant of the temperature actuator the two systems considered in serie can be approximated by afirst order integrator. The Ziegler-Nichols method has been used to derive the parameters of thecorrector. In this method the parameters are calculated from the opened loop response of the sys-tem Figure 19.
Table 8 Parameters for the TAC PID2 block used for the piezo loop (block PID2Piezo).
Parameter Value
ARW 0.000938
Pweight 1.0
P 0.6566
I 746.27
D 0.0
Ulow -10.0
Uhigh 10.0
Diff.Filter.Const 10.0
S s( )P s( )KP
1 τps+----------------=
C s( ) 1KP------
1 τPs+s-----------------⋅=
Doc VLT-SPE-ESO-15731-3884Issue 1.0Date 26 June 2006Page 27 of 79
Test of the laser frequency stabi-lization system of the PRIMA Metrology System
The parameters of KP and τP had already been calculated at IMT in Neuchatel and were found tobe:
• KP=1.11;
• τP=0.0009.
The final set of parameters for the TAC block is given in Table 9.
Conversion factorThe correction applied to the piezo is added to the signal error seen by the temperature PID in orderto have the piezo desaturated by the temperature actuator. This signal cannot be directly added tothe error signal. Indeed this voltage is the command of the piezo and has to be converted into theequivalent error signal that one wants the temperature actuator to correct. This signal is first con-
Figure 19 Open loop response to a temperature excitation.
Table 9 Parameters for the TAC PID2 block used for the temperature loop (block PID2Piezo).
Parameter Value
ARW 0.63
Pweight 10.0
P 0.001
I 1.11
D 0.0
Ulow -10.0
Uhigh 10.0
Diff.Filter.Const 10.0

Doc VLT-SPE-ESO-15731-3884Issue 1.0Date 26 June 2006Page 28 of 79
Test of the laser frequency stabi-lization system of the PRIMA Metrology System
verted into the shift it will induce in the laser frequency. This is done using the voltage to fre-quency conversion ratio given by Lightwave for the piezo actuator (Table 4). Next it is possible toderive the equivalent error signal using the conversion factor measured in 5.10.
(6.2-5)
6.3 TAC implementation of the control loopIt had been decided to implement the control loop with the ESO standard TAC librairies. The errorsignal is read on the channel 0 of the analog input board (VMIVME 3123). The frequency of theloop is set by the TIM board and is set to 1kHz. Two switch blocks, respectively SwitchPiezo andSwitchTemp, have been implemented to allow to switch respectively the piezo loop and the temploop on and off. The swicthes can be activated from the tacgui panel. When the switch parameteris set to one the PID2 block of the loop sees a zero error signal whereas when the switch parameteris set to 2 the PID2 block sees the real error signal. An offset is added to the temperature commandin case the laser does not start emitting in the transition. The correction signal for the piezo actuatoris sent through the channel 0 of the analog output board. The correction for the temperature is sentwith the channel 1. The error signal and the two commands are displayed (1Hz samplig frequency)on the tacgui. Blocks have also been implemented to use RTDscope to check these signals. OneTAC per laser head type presented in 12 Appendix A: TAC files.
6.4 Test of the stability
Opened loop measurementA voltage offset is fed to the temperature actuator input of the laser driver to set the laser frequencyin the middle of the transition. The laser is left opened loop while the error signal is measured bythe LCU using the TAC file with the switches opened (set to 1). Due to the width of the transitionit is possible to record tens of minutes before the laser has drifted outside of the transition.
Figure 20 Implementation of the tac file. pmlss_cl2_scope.tac.
Conversion factor Piezo conversion (Hz/V) Error signal conversion (V/Hz)×=
Conversion factor 2 106×( ) 0.35 10 9–× 1001.4---------×⎝ ⎠
⎛ ⎞× 0.05= =

Doc VLT-SPE-ESO-15731-3884Issue 1.0Date 26 June 2006Page 29 of 79
Test of the laser frequency stabi-lization system of the PRIMA Metrology System
Closed loop measurementThe laser is brought in the transition and the loops are then closed using the switches implementedin the TAC file. After a few minutes when the laser seems to be stabilized the measurement isstarted and the error signal at the output of the lock-in amplifier is recorded.Results of both measurements are plotted in Figure 21. As described in 5.10 it is possible to esti-mate the frequency noise from the error signal.
One can see a large improvement of the laser frequency stability. On a 8 hours measurement theclosed loop fequency variation is measured to be 800kHz. On the PSD of the frequency variationsthe performance of the closed loop system are just above the level of the specifications on this partof the bandwidth. Nevertheless these curves are computed from the signal error and cannot be con-sidered to represent the exact frequency variations of the laser. Precise measurements obtained bycomparison with an independant frequency sensor have been done at MPQ and are presented in thenext section.
Loop frequencyThe incidence of the loop frequency on the performance has been measured. The loop has beenclosed using exactly the same configuration as before but with the loop running at 0.1kHz insteadof 1kHz. Results are plotted in Figure 22.
Figure 21 Performance of the stabilization system in the ESO laboratory. The frequency variationsare estimated from the error signal using the conversion factor measured in 5.10.

Doc VLT-SPE-ESO-15731-3884Issue 1.0Date 26 June 2006Page 30 of 79
Test of the laser frequency stabi-lization system of the PRIMA Metrology System
6.5 ConclusionTests carried out at ESO Garching have lead to a change of design for the control loop. PID param-eters have been derived and the loop has been closed succesfully. The closed loop stability of thesystem has been tested and measured using the error signal. The performance measured this wayis slightly over the specifications for the low frequency part of the bandwidth. However such mea-surements are biased due to the fact that the same sensor is used for the loop and for the estimationof the loop performance. Moreover, it is possible that noise appears at the detection (this includedthe RAM) and is then amplified by the control loop. As a consequence it was mandatory to per-form a better system characterization with an independent frequency sensor to asses the exact fre-quency stability of the system.
7 System characterization with an independent frequency sensor
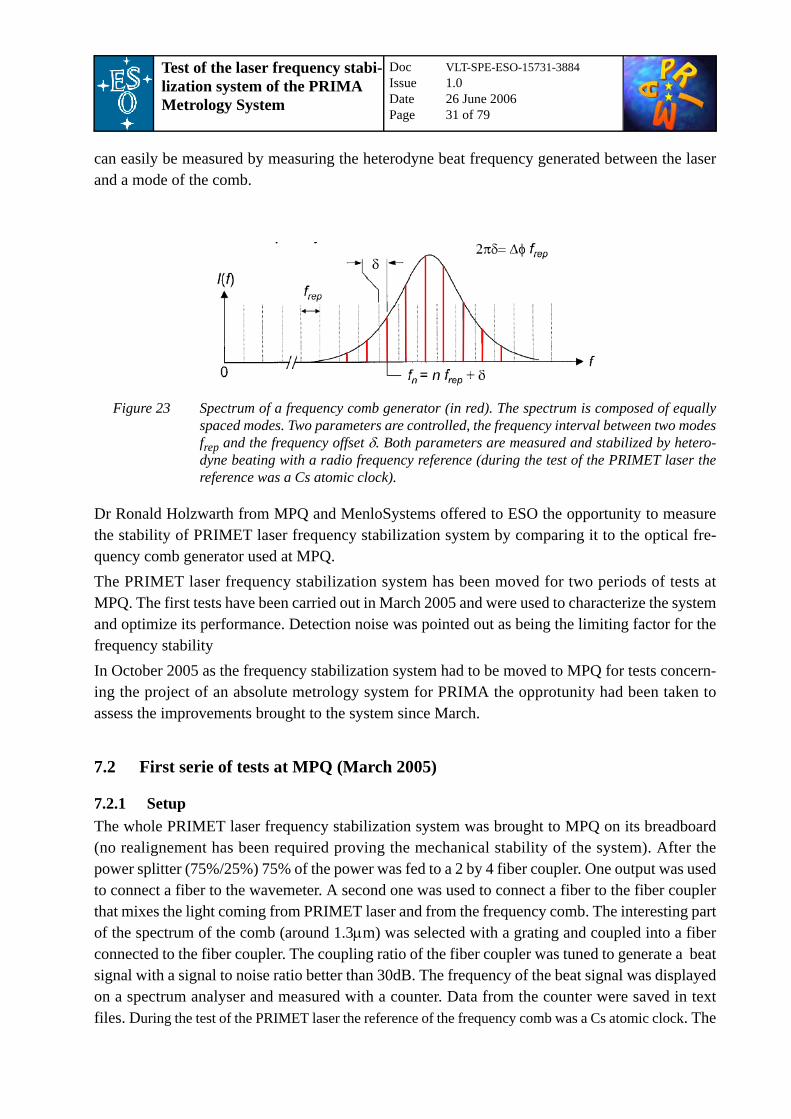
7.1 Independent frequency reference and sensorAs explained in the previous section an exact characterization of the performance of the systemrequires a sensor different from the one used in the loop. Unfortunately few frequency sensors (andfrequency references) that offer the required accuracy are available at 1.319µm. It is in fact themain difficulty of the frequency stabilization of a laser at this wavelength. The Max Planck Insti-tute for Quantum Optics (Garching) through the company MenloSystems has developped aninstrument that provides extremely stable references in the range between one and two microns.The instrument is a self-referenced optical frequency comb generator (the principle of this systemis described in AD 10). It generates light with an extremely stable “discrete” spectrum made ofequally spaced frequencies, Figure 23. The absolute stability of each frequency and of the intervalbetween two modes is derived from a stabilized radio frequency source. The frequency of the laser
Figure 22 Power spectral density of the laser frequency variations opened loop and closed loopwith the loop running at 100Hz and 1kHz. The performance is deteriorated when the loopfrequency is decreased.
Doc VLT-SPE-ESO-15731-3884Issue 1.0Date 26 June 2006Page 31 of 79
Test of the laser frequency stabi-lization system of the PRIMA Metrology System
can easily be measured by measuring the heterodyne beat frequency generated between the laserand a mode of the comb.
Dr Ronald Holzwarth from MPQ and MenloSystems offered to ESO the opportunity to measurethe stability of PRIMET laser frequency stabilization system by comparing it to the optical fre-quency comb generator used at MPQ. The PRIMET laser frequency stabilization system has been moved for two periods of tests atMPQ. The first tests have been carried out in March 2005 and were used to characterize the systemand optimize its performance. Detection noise was pointed out as being the limiting factor for thefrequency stabilityIn October 2005 as the frequency stabilization system had to be moved to MPQ for tests concern-ing the project of an absolute metrology system for PRIMA the opprotunity had been taken toassess the improvements brought to the system since March.
7.2 First serie of tests at MPQ (March 2005)
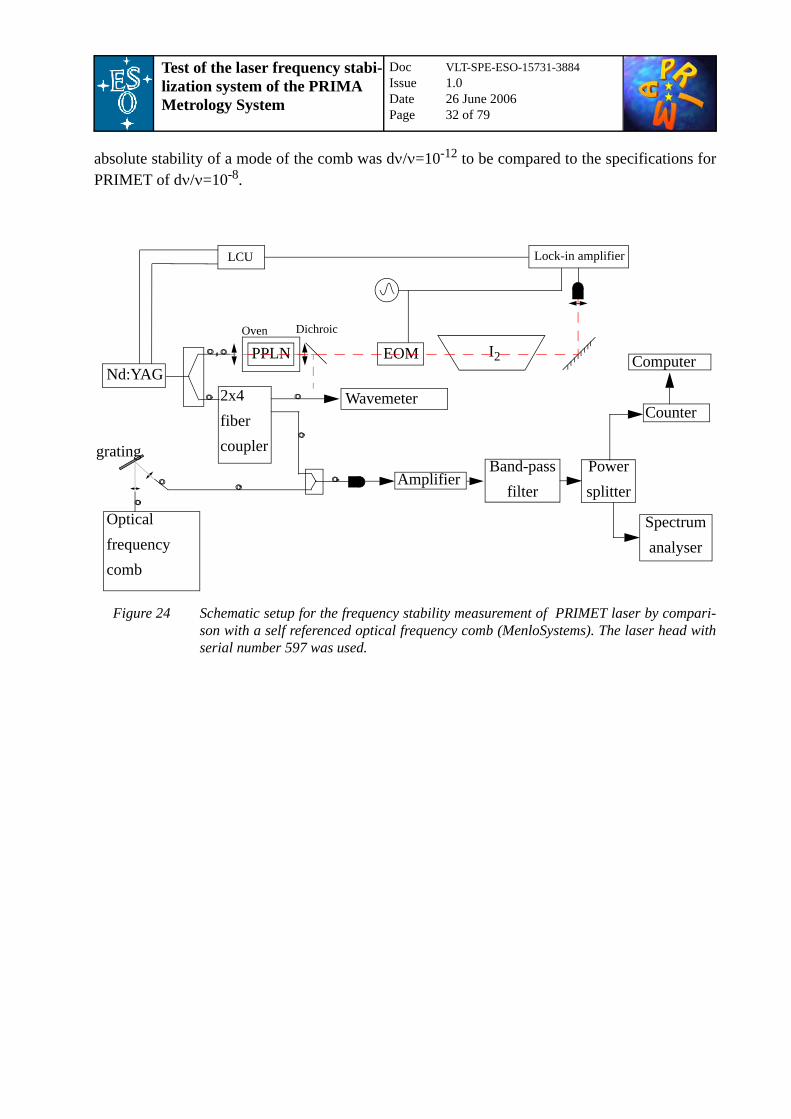
7.2.1 SetupThe whole PRIMET laser frequency stabilization system was brought to MPQ on its breadboard(no realignement has been required proving the mechanical stability of the system). After thepower splitter (75%/25%) 75% of the power was fed to a 2 by 4 fiber coupler. One output was usedto connect a fiber to the wavemeter. A second one was used to connect a fiber to the fiber couplerthat mixes the light coming from PRIMET laser and from the frequency comb. The interesting partof the spectrum of the comb (around 1.3µm) was selected with a grating and coupled into a fiberconnected to the fiber coupler. The coupling ratio of the fiber coupler was tuned to generate a beatsignal with a signal to noise ratio better than 30dB. The frequency of the beat signal was displayedon a spectrum analyser and measured with a counter. Data from the counter were saved in textfiles. During the test of the PRIMET laser the reference of the frequency comb was a Cs atomic clock. The
Figure 23 Spectrum of a frequency comb generator (in red). The spectrum is composed of equallyspaced modes. Two parameters are controlled, the frequency interval between two modesfrep and the frequency offset δ. Both parameters are measured and stabilized by hetero-dyne beating with a radio frequency reference (during the test of the PRIMET laser thereference was a Cs atomic clock).
Doc VLT-SPE-ESO-15731-3884Issue 1.0Date 26 June 2006Page 32 of 79
Test of the laser frequency stabi-lization system of the PRIMA Metrology System
absolute stability of a mode of the comb was dν/ν=10-12 to be compared to the specifications forPRIMET of dν/ν=10-8.
Figure 24 Schematic setup for the frequency stability measurement of PRIMET laser by compari-son with a self referenced optical frequency comb (MenloSystems). The laser head withserial number 597 was used.
Nd:YAG2x4 fiber coupler
Opticalfrequencycomb
Amplifier
Counter
Computer
Wavemeter
gratingBand-pass
filterPowersplitter
Spectrumanalyser
PPLNDichroic
EOM I2
Lock-in amplifierLCU
Oven

Doc VLT-SPE-ESO-15731-3884Issue 1.0Date 26 June 2006Page 33 of 79
Test of the laser frequency stabi-lization system of the PRIMA Metrology System
7.2.2 Test of the frequency stabilityThe optical frequency of the closed loop PRIMET laser has been measured over 66 hours with thefrequency comb, Figure 26.
Figure 25 Setup for the frequency stability measurement of PRIMET laser by comparison with aself referenced optical frequency comb (MenloSystems). Bottom-left: frequency combbreadboard. Just behind PRIMET frequency stabilization system. On top: comb lockingelectronic.

Doc VLT-SPE-ESO-15731-3884Issue 1.0Date 26 June 2006Page 34 of 79
Test of the laser frequency stabi-lization system of the PRIMA Metrology System
The power spectral density of the frequency variations is plotted in Figure 27. The average powerspectral density (for measurements of 30min) is compared to an equivalent measurement made atESO where the frequency stability is estimated from the error signal (see 6). One can see that usingthe error signal underestimates the frequency noise.
This measurement reveals that the stability of the system is out of the specifications (as defined fora white frequency noise) by a factor 4. Moreover at low frequencies the correction loop should pro-vide a flat PSD which is not the case as it can be seen on the right graph of Figure 28. Furthermoreat frequencies higher than 0.1Hz the stabilization system increases the noise compare to the freerunning system. This can be caused by a non optimal setting of the loop parameters or by detectionnoise.
Figure 26 Beat frequency measured between the self-reference optical frequency comb andPRIMET stabilized laser.Left: measurement over 66 hours. Right: 30min sample of thesame measurement.
Figure 27 Comparison between the frequency noise measured with the frequency comb and the fre-quency noise estimated from the error signal. Using the error signal to measure the sta-bility underestimates the frequency noise.
Doc VLT-SPE-ESO-15731-3884Issue 1.0Date 26 June 2006Page 35 of 79
Test of the laser frequency stabi-lization system of the PRIMA Metrology System
7.2.3 Calibration of the error signalThe frequency of the laser was brought to the center of the transition where the error signal is closeto zero. The control loop was opened and a sine wave was sent to the piezo actuator (1V peak-to-peak at 0.15Hz). The error signal and the beat frequency with the comb were recorded.
The average peak-to-peak value of the error signal was 0.6mV and was compared to the averagepeak-to-peak value of the beat frequency 3.97MHz. This gives a conversion ratio of 0.21V/GHzwith a 8µW red beam, i.e 300mV/GHz with a 12µW red beam.
7.2.4 Characterization of the system using SiglabThe first measurements of the stability have shown that the loop did not behave properly at lowfrequencies. Consequently it had been decided to do a complete characterization of the system
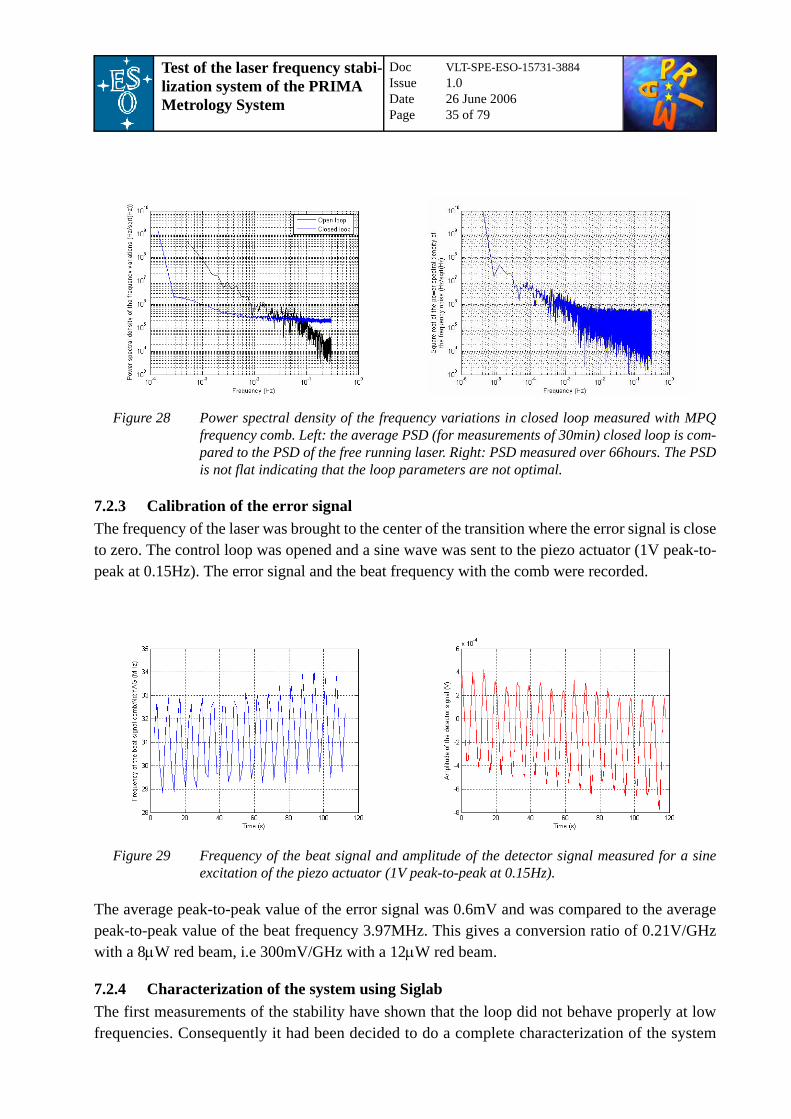
Figure 28 Power spectral density of the frequency variations in closed loop measured with MPQfrequency comb. Left: the average PSD (for measurements of 30min) closed loop is com-pared to the PSD of the free running laser. Right: PSD measured over 66hours. The PSDis not flat indicating that the loop parameters are not optimal.
Figure 29 Frequency of the beat signal and amplitude of the detector signal measured for a sineexcitation of the piezo actuator (1V peak-to-peak at 0.15Hz).

Doc VLT-SPE-ESO-15731-3884Issue 1.0Date 26 June 2006Page 36 of 79
Test of the laser frequency stabi-lization system of the PRIMA Metrology System
using Siglab. Siglab is a hardware device that can compute easily the transfert function of a sys-tem. In that case it injected a noise in the error signal and recorded the error signal and the com-mand of one of the actuator, Figure 30.
Siglab measures directly the transfert function O1(s)/I(s) and O2(s)/I(s)
(7.2-1)
. (7.2-2)
From these transfert functions it is easy to compute the trasnfert function O1(s)/O2(s) which is thetransfert function of the system (actuator + sensor) seen by the corrector
. (7.2-3)
In the case of the temperature for example the cutting frequency was found to be lower than 0.1Hz(Figure 32) which is much lower than what was expected. The same analysis made on the piezobrought the same conclusions. As a consequence the loops had to been optimized.
Figure 30 Setup for the characterization of the system with Siglab. I(s) is the signal injected by theSiglab in the error signal of the control loop. O1(s) and O2(s) are signals measured by theSiglab. The tac file was modified to add one input and two outputs. Moreover a switchallowed to take O2(s) after the piezo or the temperature PID.
Figure 31 Diagram of the tac file.
P(s)
C(s) S(s)
N(s)Y(s)Yc(s)
-+ +
+
I(s)O2(s)
O1(s)to siglab
to siglab
from siglab
++
O1 s( )I s( )
-------------- C s( )P s( )S s( )1 C s( )P s( )S s( )+-------------------------------------------=
O2 s( )I s( )
-------------- C s( )1 C s( )P s( )S s( )+-------------------------------------------=
O1 s( )O2 s( )-------------- P s( )S s( )=

Doc VLT-SPE-ESO-15731-3884Issue 1.0Date 26 June 2006Page 37 of 79
Test of the laser frequency stabi-lization system of the PRIMA Metrology System
7.2.5 Optimized loop parametersOptimized PID parameters derived from the measurements made with Siglab have been proposedby Martin Dimmler.
The improvement of the PID parameters can be judged by comparing the autospectrum of the errorsignal for both settings as in Figure 33. One can see that the new settings introduce a little bit morenoise around 60Hz but reduce significantly he noise at lower frequencies.
Figure 32 Transfert function of the temperature measured with Siglab. The cutting frequency islower than expected (~1Hz).
Table 10 Parameters for the TAC PID2 block used for the piezo loop (block PID2Piezo).
Parameter Value
ARW 0.000938
Pweight 10.0
P 9.0
I 450.0
D 0.0
Ulow -10.0
Uhigh 10.0
Diff.Filter.Const 10.0

Doc VLT-SPE-ESO-15731-3884Issue 1.0Date 26 June 2006Page 38 of 79
Test of the laser frequency stabi-lization system of the PRIMA Metrology System
7.2.6 Performance of the optimized loopThe performance of the loop with the optimized parameters has been measured. The same setup asbefore was used except for the counter which had been exchanged by a faster one (sampling fre-quency 10Hz instead of 0.6Hz). The power spectral density is plotted in Figure 34. With the opti-mized parameters the standard deviation (226kHz) is better than with the old parameters (231kHz)although it is measured over a larger bandwidth (10 Hz instead of 0.6Hz).
Figure 33 Autospectrum of the error signal for the old and new parameters of the piezo PID. Thenew parameters slightly increase the noise around 60Hz but reduce significantly thenoise at lower frequencies.
Table 11 Parameters for the TAC PID2 block used for the temperature loop (block PID2Temperature).
Parameter Value
ARW 0.63
Pweight 10.0
P 0.000034
I 190.0
D 0.0
Ulow -10.0
Uhigh 10.0
Diff.Filter.Const 10.0
Doc VLT-SPE-ESO-15731-3884Issue 1.0Date 26 June 2006Page 39 of 79
Test of the laser frequency stabi-lization system of the PRIMA Metrology System
The performance of the system at low frequencies is probably degraded by the presence of “detec-tion noise” as explained in 7.2.9. The reduction of this noise is probably the only mean of gettingthe PSD in the specifications.
7.2.7 Repeatability testsPRIMET requires not only a stabilized frequency but also a calibrated frequency. As it is difficult(or time consuming) to calibrate accurately the laser frequency, the repeatability should beextremely high and the laser stabilization system should lock always on the same frequency. Bydesign the loop should lock at the bottom of the transition and this frequency should not changewith time. To test this assertion the lock has been closed and opened four times and the frequencyhas been measured absolutely using the frequency comb as a reference. The repetition and offsetfrequencies have been measured at 1Hz while the beat frequency has been measured at 10Hz.From the averages of these three values the absolute value of the laser frequency can be computedas explained in Appendix B.According to the wavemeter the laser wavelength is 1.3191772mm which yields with the combcharacteristics a mode number of 2 272 571. According to this value the transition of iodine usedfor the stabilization is situated at 659.58855nm which does not correspond with the iodine atlas(659.5877nm, AD 9), the measurement done by Arie (659.5880nm, AD 4) or the one done at ESOwith a different wavemeter (659.5880nm, AD 8). However if one computes the mode numberfrom these references, one obtains n=2272571 and the transition is then situated at 659.58797nmwhich is good agreement with the references.The control loop has been closed several time from different wavelength and the locking frequencyhas been measured each time. Results are summarized in Table 12 The standard deviation of thelocking point is 34.5kHz which is between one and two orders of magnitude lower than the fre-quency stability. The repeatability of the locking frequency is satisfactory.
Figure 34 Power spectral density of the frequency variations of the PRIMET laser stabilized usingthe optimized loop parameters.

Doc VLT-SPE-ESO-15731-3884Issue 1.0Date 26 June 2006Page 40 of 79
Test of the laser frequency stabi-lization system of the PRIMA Metrology System
7.2.8 Impact of the laser power on the stabilityThe stability of the loop has been measured for different power in the red beam with the same setupand the same loop parameters. The PSD are plotted in Figure 35. The power in the red beam doesnot change significantly the stability of the loop. This is probably due to the fact that at thismoment the stability is limited by the “detection” noise. Furthermore, these results imply that thepower used for the frequency stabilization can be reduced if it is required (in case power is missingfor the heterodyne assembly).
Table 12 Results of the repeatability tests. The loop is opened and closed several times to measure thestability of the locking point.
Files Wavelength when loop is closed (µm)
Average Absolute laser frequency (Hz)
Average absolute laser wavelength
(µm)
eso4.dat23_3_2.dat
~1.319,176,5 227,257,330,646,610 1.319,176,182,995
eso5.dat23_3_3.dat
~1.319,177,8 227,257,330,640,792 1.319,176,183,029
eso6.dat23_3_4.dat
~1.319,176,1 227,257,330,633,383 1.319,176,183,072
eso7.dat23_3_5.dat
~1.319,178,3 227,257,330,571,293 1.319,176,183,432
Average 227,257,330,623,020 1.319,176,183,132
Standard deviation 34907 0.000,017

Doc VLT-SPE-ESO-15731-3884Issue 1.0Date 26 June 2006Page 41 of 79
Test of the laser frequency stabi-lization system of the PRIMA Metrology System
7.2.9 Measurement of the detection noiseThe detection has been measured by taking benefit of the possibility to lock the PRIMET laser onthe frequency comb. The PRIMET laser has been brought in the transition and was then locked onthe frequency comb using an external analog PID corrector and the piezo actuator. The stability ofthe PRIMET laser frequency is extremely high once it is locked to the comb. When the laser is sta-bilized at the center of the transition the error signal should be exactly zero. However it is not thecase, and the fluctuations of the error signal are detection noise. These fluctuations have beenrecorded with the LCU, Figure 36.
Figure 35 Impact of the power in the visible beam on the frequency stability in closed loop. The PSDof the frequency variations are displayed in the case of a 16µW and a 5µW visible beam.The difference between the two can be neglected.
Figure 36 “Detection noise” (left) and equivalent frequency shift (right) measured using the fre-quency comb.
Doc VLT-SPE-ESO-15731-3884Issue 1.0Date 26 June 2006Page 42 of 79
Test of the laser frequency stabi-lization system of the PRIMA Metrology System
The measured detection noise has a frequency noise equivalent to 134.5kHz standard deviationover 5min compared to 200kHz frequency noise closed loop (measured with the frequency comb).This shoes that the stability of the system may be improved by a reduction of the detection noise.
7.2.10 Conclusion on the first serie of tests carried out at MPQRonald Holzwarth from MPQ and MenloSystems offered us the opportunity to test PRIMET laserfrequency stabilization system against the optical frequency comb used at MPQ. The frequency ofthe PRIMET laser light has been measured with a detector independant from the one used in thecontrol loop thus allowing to characterize the system. This has proved that the stability of the sys-tem was worse than the one deduced from the error signal. New parameters have been computedto optimize the two PID controllers of the stabilization loop thus improving the performance of thesystem. The measurement have confirmed the hypothesis that the stability of the system is limitedby the detection noise. Moreover, repeatability tests have been carried out and show a satisfatorystability of the locking frequency (a few kHz when the loop is opened and closed).
7.3 Second serie of tests (October 2005)
7.3.1 Upgrade of the system after the March measurementsThe first serie of tests indicated the presence of detection noise. Such a noise is reinjected in thefrequency noise of the laser by the control loop thus reducing the frequency stability of the system.The sources of this detection noise have been investigated in the ESO laboratory. Detector noise,caused by electromagnetic cross-talk, and Residual Amplitude Modulation (RAM) in the EOMhave been identified as being responsible for the detection noise.
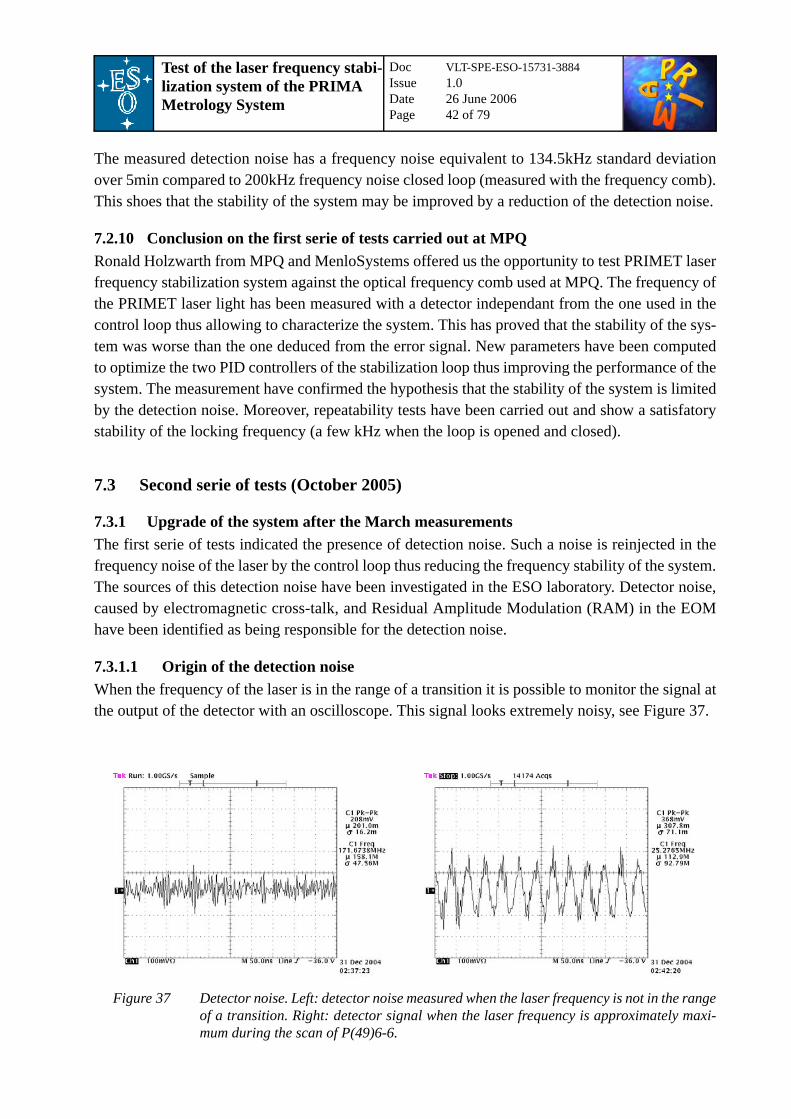
7.3.1.1 Origin of the detection noiseWhen the frequency of the laser is in the range of a transition it is possible to monitor the signal atthe output of the detector with an oscilloscope. This signal looks extremely noisy, see Figure 37.
Figure 37 Detector noise. Left: detector noise measured when the laser frequency is not in the rangeof a transition. Right: detector signal when the laser frequency is approximately maxi-mum during the scan of P(49)6-6.

Doc VLT-SPE-ESO-15731-3884Issue 1.0Date 26 June 2006Page 43 of 79
Test of the laser frequency stabi-lization system of the PRIMA Metrology System
The laser frequency was set outside of the transition using a voltage generator and the temperatureinput of the laser driver. The error signal send by the lock-in to the LCU has been recorded(Figure 38). Outside of a transition the error signal should be extremely low and is mostly due todetection noise. The part of this detection noise which is not filtered by the lock-in amplifier willbe interpreted as frequency noise by the control loop.
The origins of the detection noise has been investigated. The output of the detector has been mon-itored using a Spectrum Analyser. This measurement has highlighted two different causes for thedetection noise:
• electronic cross-talk at 25MHz caused mostly by the cable delivering the power to the EOM;
• residual amplitude modulation at the output of the EOM.
7.3.1.2 Attenuation of the electronic cross-talkThe power spectrum of the detector signal has been measured without any incident light. In thatcase one expects to see no signal at 25MHz. Nevertheless a pic was clearly visible in the spectrunand was measured at a value of approximately 60dBµV. After investigation it has been discoveredthat the main cause of this cross-talk was the cable delivering the power to the EOM. A carefulwiring of this cable and of the input power cable of the detector has allowed to reduce the elec-tronic cross-talk to a level close to the noise Figure 39. A clean and stable wiring of the whole sys-tem has been done.
Figure 38 Error signal outside of a transition. Left: error signal at the output of the lock-in ampli-fier as a function of time. Right: power spectral density of the signal.

Doc VLT-SPE-ESO-15731-3884Issue 1.0Date 26 June 2006Page 44 of 79
Test of the laser frequency stabi-lization system of the PRIMA Metrology System
7.3.1.3 Attenuation of the Residual Amplitude ModulationIn theory an EOM modulates only the phase of the light. In practice an EOM modulates also theintensity of the beam. This phenomenon can have two origins:
• interferences caused by a misalignement between the slow axis of the EOM cristal and the incident polarization;
• interferences caused by multiple passage through the EOM cristal (AD 11).
The RAM has been measured by removing the iodine cell and monitoring the signal delivered bythe detector. As the iodine cell which transforms the frequency modulation into a intensity modu-lation is not in the set-up the signal should not exhibit any modulation at 25MHz. However it isclearly visible in Figure 40 that this is not the case.
Figure 39 Electronic cross-talk after a carefull wiring of the EOM and of the detector.

Doc VLT-SPE-ESO-15731-3884Issue 1.0Date 26 June 2006Page 45 of 79
Test of the laser frequency stabi-lization system of the PRIMA Metrology System
According to AD 11 part of the RAM is caused by a cavity effect created in the EOM cristal. TheRAM is then temperature dependent since the the length of the cavity depends on the temperaturethrough thermal dilatation and thermal modification of the refractive index. As a consequence, athermal stabilization system for the EOM has been implemented. At ESO the fluctuations of tem-perature of the EOM is divided by 6 compared to the laboratory temperature.
7.3.2 Set-up of the november testsCompared to the set-up used in March the differences are:
• the laser head has the serial number 3154 and was lent by IMT Neuchatel has one of ESO’s laser head was broken and the second one was at Alenia Spazio (Torino) for the FSU tests; this laser head provides only around 100mW instead of 200mW;
• no fiber coupler were used at all, because the laser head provided less power and because it was noticed at an early stage of the tests that the use of the 75/25 coupler degraded the per-formance of the stabilization system; this may have also been the case during the March measurements;
• the IR light reflected by the dichroic is recoupled in a SM-PM fiber coupled to the comb output fiber;
• the EOM is mounted in an aluminium box that can be temperature stabilized;
• a half-wave plate and a linear polarizer are mounted in front of the EOM and can be used to match as much as possible the linear polarization state of the incoming wave with the slow axis of the cristal to reduce the RAM;
Figure 40 The spectrum of the detector signal shows a peak at 25MHz indicating the presence ofResidual Intenisty Modulation.

Doc VLT-SPE-ESO-15731-3884Issue 1.0Date 26 June 2006Page 46 of 79
Test of the laser frequency stabi-lization system of the PRIMA Metrology System
• the TAC loop uses the Analog Input board clock instead of the TIM board.
All these modifications are visible in Figure 41. Around 10mW of infrared light are coupled in thefiber located after the dichroic mirror. It is sufficient to generate a beat signal with a signal to noiseratio better than 30dB.
7.3.3 Results of the frequency stability measurementsThe tests are carried out as in March, the frequency of the Nd:YAG laser is measured by the beatsignal frequency generated with the comb assumed to be perfectly stable. The frequency of thebeat signal is measured with an MPQ custom made counter which delivers samples with a gatetime of 0.1s and no dead time. A long term measurement carried out over a week-end is presentedin Figure 42. Although the stability is slightly improved between 0.4Hz and 10Hz the global per-formance measured in November is worse due to an increase of the frequency noise at low fre-quencies. The possible reasons for this are:
• a different laser head is used, it is possible that the PID parameters derived for one laser are not directly applicable to another laser head;
• the noise of the temperature control loop due to the poor resolution of the controller is higher than the natural noise of the MPQ lab.
Figure 41 Frequency measurement set-up with the MPQ comb during the november test session.Laser head has serial number 3154 and provides only 100mW
Nd:YAG
Opticalfrequencycomb
Amplifier
Counter
Computer
gratingBand-pass
filterPowersplitter
Spectrumanalyser
PPLNDichroic
EOM I2
Lock-in amplifierLCU
λ/2
LinearPolarizer
Oven
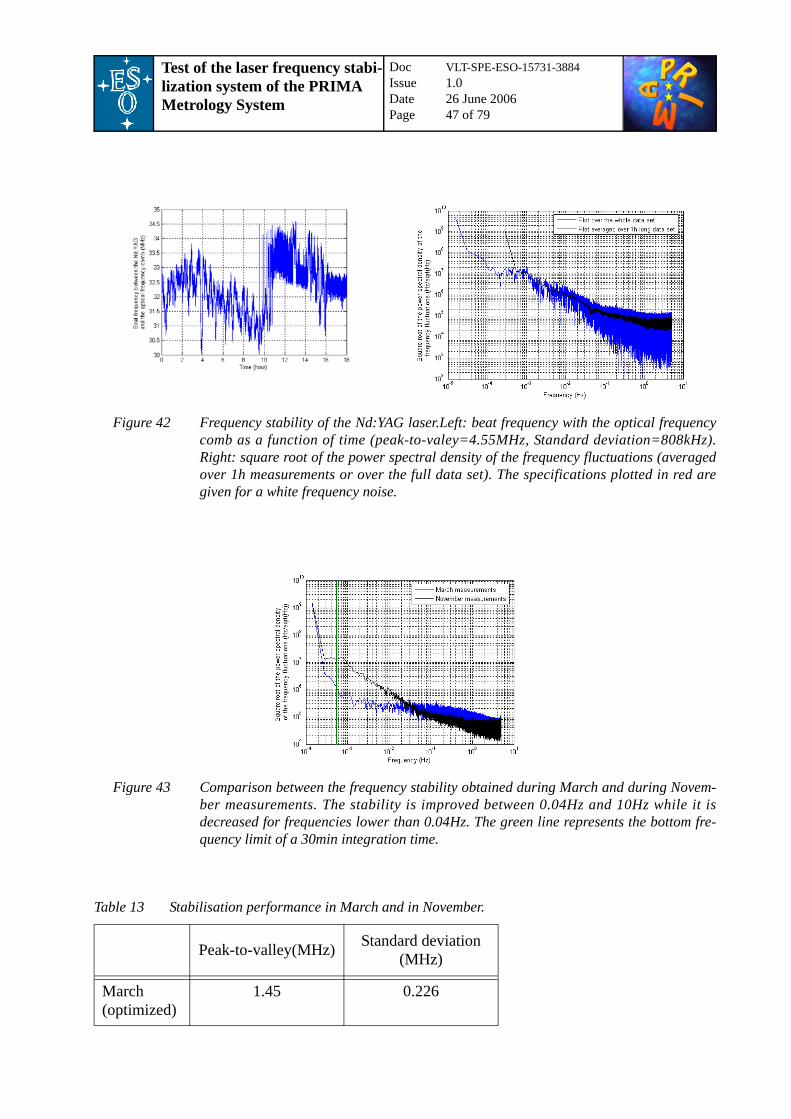
Doc VLT-SPE-ESO-15731-3884Issue 1.0Date 26 June 2006Page 47 of 79
Test of the laser frequency stabi-lization system of the PRIMA Metrology System
Figure 42 Frequency stability of the Nd:YAG laser.Left: beat frequency with the optical frequencycomb as a function of time (peak-to-valey=4.55MHz, Standard deviation=808kHz).Right: square root of the power spectral density of the frequency fluctuations (averagedover 1h measurements or over the full data set). The specifications plotted in red aregiven for a white frequency noise.
Figure 43 Comparison between the frequency stability obtained during March and during Novem-ber measurements. The stability is improved between 0.04Hz and 10Hz while it isdecreased for frequencies lower than 0.04Hz. The green line represents the bottom fre-quency limit of a 30min integration time.
Table 13 Stabilisation performance in March and in November.
Peak-to-valley(MHz) Standard deviation (MHz)
March (optimized)
1.45 0.226

Doc VLT-SPE-ESO-15731-3884Issue 1.0Date 26 June 2006Page 48 of 79
Test of the laser frequency stabi-lization system of the PRIMA Metrology System
The temperature of the MPQ laboratory has been measured over one night to assess the level oftemperature noise. The result is shown in Figure 44 and the power spectral density of the temper-ature of the lab and of the stabilized EOM are compared.
The temperature stabilisation system seems to improve the temperature stability of the EOM com-paraed to the laboratory. However there was no more time to test further the influence of temper-ature on the stability of the laser with the frequency comb. Consequently additional tests werecarried out at ESO on the level of RAM as a function of the temperature stability (seeSection 7.3.5).
7.3.4 Absolute frequencyDuring the November measurements it has not been possible to define without ambiguity the abso-lute value of the frequency. Indeed, two values are possible (as the sign of the comb offset fre-quency was not determined, the sign of the beat frequency can be determined from the data files I-stab_NdYAG_1s_gate_1_111105.dat and I-stab_NdYAG_1s_gate_2_111105.dat as explained inAppendix B). The absolute frequency of the stabilized Nd:YAG are plotted in Figure 45 for differ-ent measurements obtained during both series of tests. The scaling is the same for both plots. Onenotices immediatly that the repeatability of the locking frequency was better in March (standarddeviation = 0.095MHz) than in November (standard deviation = 1.4MHz). This is again probablydue to the use of a new laser head with non optimized PID parameters. The frequency differencebetween the average frequencies of both test series is 56kHz only.
November 4.55 0.808
Figure 44 Temperature stability of the MPQ laboratory.
Table 13 Stabilisation performance in March and in November.
Peak-to-valley(MHz) Standard deviation (MHz)

Doc VLT-SPE-ESO-15731-3884Issue 1.0Date 26 June 2006Page 49 of 79
Test of the laser frequency stabi-lization system of the PRIMA Metrology System
7.3.5 Required accuracy for the EOM temperature stabilisation systemThe influence of temperature variations on the RAM has been studied more precisely by imple-menting a temperature stabilization system for the EOM. Although it was not possible to measureat ESO the effect on the frequency noise of the laser it is possible to estimate it by using the errorsignal conversion factor derived in Section 5.10 and measured in Section 7.2.3.
7.3.5.1 Achieved temperature stabilityThe RAM has been measured for three different configurations over several hours to understand itsrelation with the temperature fluctuations. It has been measured with the EOM in direct contactwith the air of the laboratory and no temperature stabilisation, then it has been measured as theEOM is enclosed in an aluminium box which provides isolation and it has finally been measuredwith the temperature stabilisation system on. Figure 46 shows the results summarized in Table 14.The performance of the temperature stabilization system is limited by the resolution of the sensorand by the absence of a cooling device.
Figure 45 Average frequency of the stabilized Nd:YAG laser for several measurements over theMarch and November test campaign. The repeatability of the frequency is better in March(standard deviation=0.095MHz) compared to November (standard deviation=1.41MHz)probably because of the use of a new laser with non optimized parameters in November.

Doc VLT-SPE-ESO-15731-3884Issue 1.0Date 26 June 2006Page 50 of 79
Test of the laser frequency stabi-lization system of the PRIMA Metrology System
Figure 46 RAM dependence on the EOM temperature (the temperature shift is due to a bad calibra-tion of one pt100, relatives value are valid).Top row: the EOM aluminium box is opened,the temperature stabilization is switched off. On the left: temperature of the laboratoryand of the EOM. On the right the RAM measured simultaneously to the temperature isconverted into the equivalent frequency noise reinjected by the control loop. Middle row:the EOM is in its aluminium box, the temperature stabilization is switched off. Bottomrow: the EOM is in the aluminium box, the temperature stabilization is switched on.

Doc VLT-SPE-ESO-15731-3884Issue 1.0Date 26 June 2006Page 51 of 79
Test of the laser frequency stabi-lization system of the PRIMA Metrology System
7.3.5.2 Required temperature accuracyA measurement over a wide range of temperature has been done to derive what is the level of thetemperaure stability required to reduce the RAM fluctuations. The result is presented in Figure 47.From the initial slope it is possible to derive that the frequency fluctuation is about 4.2MHz/K witha maximum of 840kHz frequency shift. Therefore the temperature stabilization should be signifi-cantly better than 0.2K peak to peak to reduce the RAM.
Table 14 Estimation of the frequency noise reinjected by the control loop for different conditions.Theequivalent frequency noise are computed with the conversion factor derived in 5.10.
ConditionLaboratory temperature
fluctuations (K)
EOM temperature fluctuations (K)
Equivalent frequency noise
(MHz))
Electrnonic noise (no laser light)
n.a n.a p-v=0.054std=0.006
Box opened / stabilization OFF
p-v=2.5 p-v=1.1std=0.22
p-v=1.17std=0.2.57
Box closed / stabilization OFF
p-v=2.9 p-v=0.8std=0.18
p-v=0.887std=0.163
BOX closed / stabiliza-tion ON
p-v=2.3 p-v=0.5std=0.077
p-v=1.08std=0.170
Figure 47 Measurements of the RAM fluctuations over a large temperature drift of the EOM. TheRAM variation due to temperature variations induces a frequency shift of the laser of4.2MHz/K. This shift is limited to around 840kHz corresponding to 0.2K shift. As a con-sequence the temperature stabilisation of the EOM has to be significantly better than0.2K peak to peak to improve the system.

Doc VLT-SPE-ESO-15731-3884Issue 1.0Date 26 June 2006Page 52 of 79
Test of the laser frequency stabi-lization system of the PRIMA Metrology System
7.4 Conclusion on the tests done with an independant frequency sensorThese tests have allowed to assess the real performance of the stabilization system. The PIDparameters have been improved for one laser head. After the first serie of measurements theremaining noise was identified as detection noise caused by electronic cross-talk and RAM in theEOM. Electronic cross-talk has been reduced by a proper cabling of the set-up. An attempt wasmade to reduce the RAM by stabilizing the temperature of the EOM but no improvement havebeen measured because of the limited resolution of the temperature sensor. Further measurementshave proved that the temperature stability required to reduce significantly the RAM is a fraction ofa tenth of a degree. This would increase the complexity of the system for a reduced increase of theperformance. A second laser head has been tested during a second serie of tests. The performacewere lower than the one measured with the first laser head. This discrepancy may be due to the factthat the PID parameters were optimized for another laser head. Furthermore during the tests ofNovember it has been shown that the fiber coupler used after the laser head is a source of fre-quency noise sensitive to mechanical and accoustic vibrations. Solutions to this problem are beinginvestigated. The repeatability of the average locking frequency has also been decreased by thechange of laser head. However the average locking frequency measured over the september mea-surements is close to the March average frequency (the frequency difference is 56kHz).
8 Impact on PRIMET performanceThe specifications of PRIMET is a 5nm accuracy with a 8kHz bandwidth over a maximal stellarOPD, ∆L=60mm, given by the observation of two stars with maximal separation (1arcmin) with amaximal baseline of 200m. To keep a security margin the maximal error of PRIMET due to the fre-quency stability and calibration is set to 3.6nm equivalent to a standard deviation subnanometric.For a normal distribution this corresponds to a standard deviation (rms) σ∆L=0.6nm over 30 min.The relative accuracy of the system is then given by
. (8.0-1)
For PRIMET, the phase of the metrology system is defined for the stellar OPD and the two are tiedby the following equation
. (8.0-2)
The OPD seen by the metrology system is OPD=2∆L.One can easily show that
. (8.0-3)
Using Equation (8.0-1) one gets
. (8.0-4)
εRσ∆L
∆L--------- 10 8–= =
∆L Φ2π------ λ
2---⋅=
∂ ∆L( )∆L--------------- ∂Φ
Φ------- ∂λ
λ------ ∂ν
ν------= = =
σ∆L
∆L---------σΦ
Φ------
σλ
λ------
σν
ν----- εR= = = =
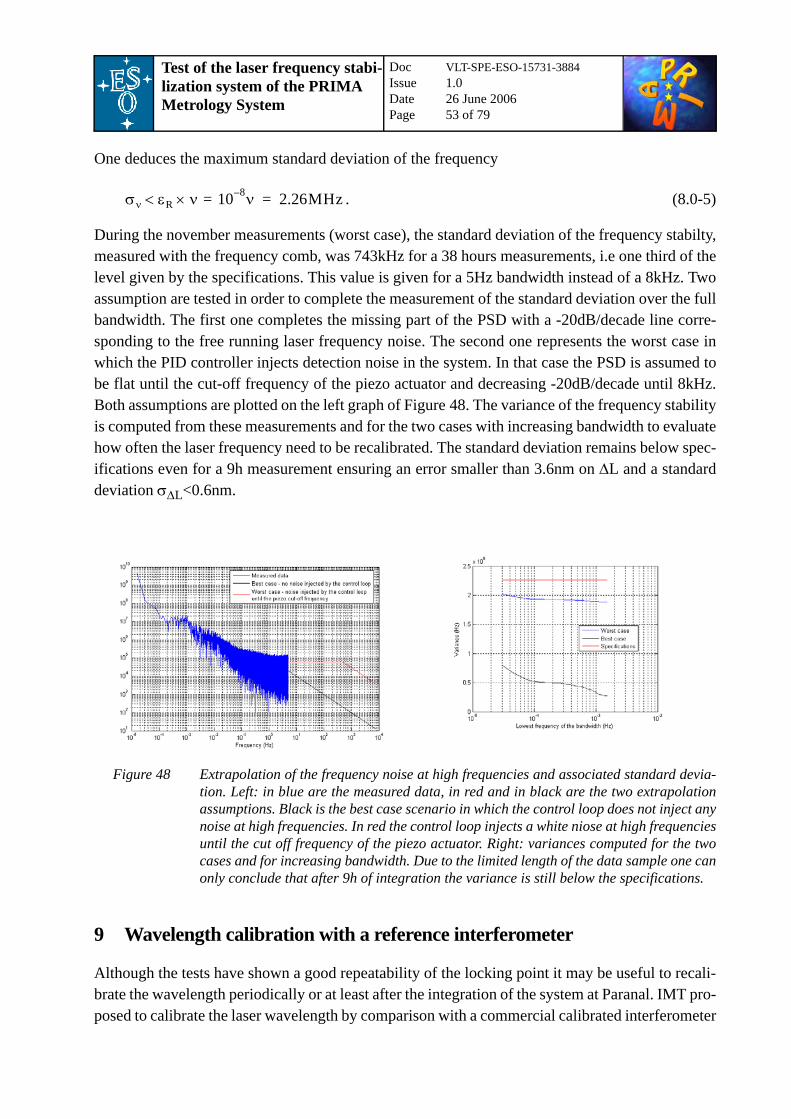
Doc VLT-SPE-ESO-15731-3884Issue 1.0Date 26 June 2006Page 53 of 79
Test of the laser frequency stabi-lization system of the PRIMA Metrology System
One deduces the maximum standard deviation of the frequency
. (8.0-5)
During the november measurements (worst case), the standard deviation of the frequency stabilty,measured with the frequency comb, was 743kHz for a 38 hours measurements, i.e one third of thelevel given by the specifications. This value is given for a 5Hz bandwidth instead of a 8kHz. Twoassumption are tested in order to complete the measurement of the standard deviation over the fullbandwidth. The first one completes the missing part of the PSD with a -20dB/decade line corre-sponding to the free running laser frequency noise. The second one represents the worst case inwhich the PID controller injects detection noise in the system. In that case the PSD is assumed tobe flat until the cut-off frequency of the piezo actuator and decreasing -20dB/decade until 8kHz.Both assumptions are plotted on the left graph of Figure 48. The variance of the frequency stabilityis computed from these measurements and for the two cases with increasing bandwidth to evaluatehow often the laser frequency need to be recalibrated. The standard deviation remains below spec-ifications even for a 9h measurement ensuring an error smaller than 3.6nm on ∆L and a standarddeviation σ∆L<0.6nm.
9 Wavelength calibration with a reference interferometer
Although the tests have shown a good repeatability of the locking point it may be useful to recali-brate the wavelength periodically or at least after the integration of the system at Paranal. IMT pro-posed to calibrate the laser wavelength by comparison with a commercial calibrated interferometer
Figure 48 Extrapolation of the frequency noise at high frequencies and associated standard devia-tion. Left: in blue are the measured data, in red and in black are the two extrapolationassumptions. Black is the best case scenario in which the control loop does not inject anynoise at high frequencies. In red the control loop injects a white niose at high frequenciesuntil the cut off frequency of the piezo actuator. Right: variances computed for the twocases and for increasing bandwidth. Due to the limited length of the data sample one canonly conclude that after 9h of integration the variance is still below the specifications.
σν εR ν× 10 8– ν=< 2.26MHz=

Doc VLT-SPE-ESO-15731-3884Issue 1.0Date 26 June 2006Page 54 of 79
Test of the laser frequency stabi-lization system of the PRIMA Metrology System
such as the HP/Agilent systems used for the metrology of the delay lines. However IMT could notachieve conclusive results with their set-up. Consequently it has been decided to build the set-upat ESO and study the feasibility of such a calibration.
The set-up is presented in Figure 49. The principle is to use two interferometers to measure thesame optical path length. Provided the wavelength of one interferomter is calibrated and stable itis theoritically possible to compute the value of the second laser wavelength. The measurements ofthe two interferometers must be simultaneous to avoid errors due to vibrations.
As shown in AD 3 it is required to scan an OPD larger than 1.5m so that the error due to thephasemeter and to the cross-talk (+/- 13nm) are brought to a relative value smaller than 10-8.Figure 50 shows an example of the results obtained with this set-up. The plot on the left shows theOPD measured with the two systems as a function of time. From these data the plot on the right isconstructed and shows the phase of the PRIMA phasemeter as a function of the phase of the HPinterferometer. The slope of this plot obtained by a linear fit is equal to the ratio λNd:YAG/λHP.The
Figure 49 Set-up for the wavelength calibration by comparison with an HP/Agilent interferome-ter.The stabilized Nd:YAG laser is used to create a heterodyne interferometer. PRIMETphasemeter is used with only one channel (the second one is fed with an electric signal).The measurement of both interferometers are synchronised with the Time Bus which syn-chronises the TIM board of both LCUs. The data are processed offline with a Matlabscript.
Nd:YAG PPLNDichroic
EOM I2
Lock-in amplifierLCU 1
Oven
AOM
AOM
HP
LinearPolarizer
Achromatic
Translation stage
LCU 2
LCU 1
Phasemeter
Tim
e B
us
LinearPolarizer
Dichroic
Beam Splitter
2x4 fibercoupler
∆L=0.9m

Doc VLT-SPE-ESO-15731-3884Issue 1.0Date 26 June 2006Page 55 of 79
Test of the laser frequency stabi-lization system of the PRIMA Metrology System
slope measured is 0.4798367113 corresponding to the frequency 227257270085045.4Hz and the vacuumwavelength 1.3191765345µm. Compared to the average value measured at MPQ with the optical frequencycomb the error is 60.537MHz or -0.351pm corresponding to a relative error of 2.66x10⁻⁷. The frequencyoffset may be explained by a bad calibration of the HP laser. However if the measurements are repeatedquickly the stability of the HP laser should ensure a good repeatability of the measurements. This is no thecase as two measurements carried out successively presents a frequency difference for the Nd:YAG laser oftens of MHz while it was measured with the comb that peak-to-peak variation of the laser frequency doesnot exceed 5MHz. This is probably caused by the combined effect of the two lasers wavelength drift and ofa slow misalignement of the two interferometers. It does not seem possible to reach the required 10-8 accu-racy. Consequently alternative solutions are studied to provide a mean of calibrating the laser wavelengthafter it has been installed at Paranal.
10 ConclusionThe frequency stabilization system of PRIMET laser has been integrated and tested in the ESOlaboratory. Improvements have been obtained compared to the performance of the system as deliv-ered by IMT.The performance of the system has been measured with a precise and independent sensor at theMax Planck Institute for Quantum Optics. Two series of tests have been carried out. In March thecontrol loop parameters have been optimized for one laser head. Due to technical problem anotherlaser head had to be used for the second serie of tests carried out in November. With the second
Figure 50 Calibration of the Nd:YAG wavelength by comparison with a HP/Agilent interferometer.Left: the phase measured by both interferomerters are plotted as a function of time. Right:the phase of the phasemeter is plotted as a function of the phase of the HP interferometer.The slope of the plot is equal to the ration of the wavelength λNd:YAG/λHP. The slope mea-sured is 0.4798367113 corresponding to the frequency 227257270085045.4Hz and thevacuum wavelength 1.3191765345µm. Compared to the theoretical value the error is60.537MHz or -0.351pm corresponding to a relative error of 2.66x10⁻⁷.
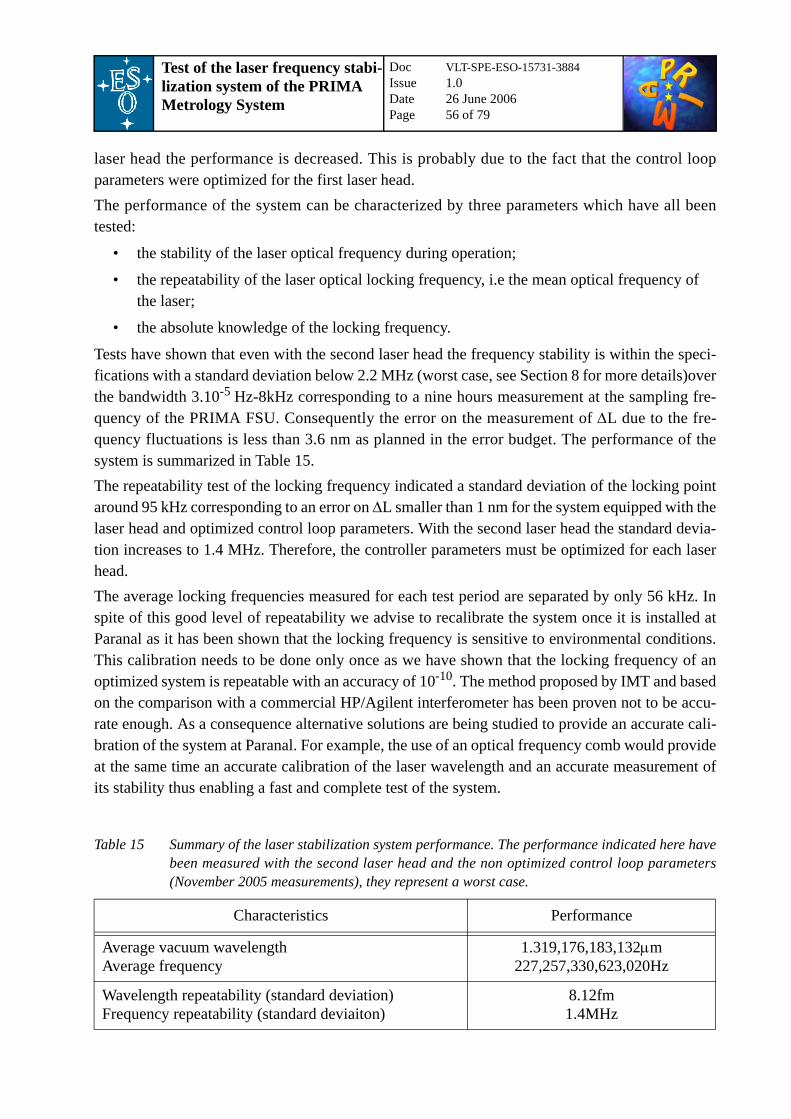
Doc VLT-SPE-ESO-15731-3884Issue 1.0Date 26 June 2006Page 56 of 79
Test of the laser frequency stabi-lization system of the PRIMA Metrology System
laser head the performance is decreased. This is probably due to the fact that the control loopparameters were optimized for the first laser head.The performance of the system can be characterized by three parameters which have all beentested:
• the stability of the laser optical frequency during operation;
• the repeatability of the laser optical locking frequency, i.e the mean optical frequency of the laser;
• the absolute knowledge of the locking frequency.
Tests have shown that even with the second laser head the frequency stability is within the speci-fications with a standard deviation below 2.2 MHz (worst case, see Section 8 for more details)overthe bandwidth 3.10-5 Hz-8kHz corresponding to a nine hours measurement at the sampling fre-quency of the PRIMA FSU. Consequently the error on the measurement of ∆L due to the fre-quency fluctuations is less than 3.6 nm as planned in the error budget. The performance of thesystem is summarized in Table 15.The repeatability test of the locking frequency indicated a standard deviation of the locking pointaround 95 kHz corresponding to an error on ∆L smaller than 1 nm for the system equipped with thelaser head and optimized control loop parameters. With the second laser head the standard devia-tion increases to 1.4 MHz. Therefore, the controller parameters must be optimized for each laserhead.The average locking frequencies measured for each test period are separated by only 56 kHz. Inspite of this good level of repeatability we advise to recalibrate the system once it is installed atParanal as it has been shown that the locking frequency is sensitive to environmental conditions.This calibration needs to be done only once as we have shown that the locking frequency of anoptimized system is repeatable with an accuracy of 10-10. The method proposed by IMT and basedon the comparison with a commercial HP/Agilent interferometer has been proven not to be accu-rate enough. As a consequence alternative solutions are being studied to provide an accurate cali-bration of the system at Paranal. For example, the use of an optical frequency comb would provideat the same time an accurate calibration of the laser wavelength and an accurate measurement ofits stability thus enabling a fast and complete test of the system.
Table 15 Summary of the laser stabilization system performance. The performance indicated here havebeen measured with the second laser head and the non optimized control loop parameters(November 2005 measurements), they represent a worst case.
Characteristics Performance
Average vacuum wavelengthAverage frequency
1.319,176,183,132µm227,257,330,623,020Hz
Wavelength repeatability (standard deviation)Frequency repeatability (standard deviaiton)
8.12fm1.4MHz

Doc VLT-SPE-ESO-15731-3884Issue 1.0Date 26 June 2006Page 57 of 79
Test of the laser frequency stabi-lization system of the PRIMA Metrology System
11 Acknowledgements
The authors would like to thanks Robert Frahm for implementing the software of the frequencystabilization system. Furthermore we would like to think Martin Dimmler for his help in the designof the control loop and for the calculation of the optimal PID parameters.
Finally we would like to thank Ronald Holzwarth and Philipp Kubina from MPQ (Garching)/Menlo Systems for having offered to us the possiblity to use one of their self-referenced frequencycomb and for helping us carrying out the measurements.
12 Appendix A: TAC files
12.1 pmlss_Innolight.tac## BLOCKS##!!!!!!!!!!!!! CLOSED LOOP !!!!!!!!!!!!!## The control loop's for the AO#0 (Piezo) and AO#1 (Temp.)# can be switched OFF or ON separately.# A offset is always added to the AO#1
# TAC.BLOCK0.TYPE AuxClock# TAC.BLOCK0.NAME Synchro# Auxiliary Clock of CPU board (trigger period can not be changed!)
TAC.BLOCK1.TYPE VMIVME3123
Frequency stability (standard deviation) over bandwidth 0.03mHz-8kHz (9hours measurement)0.55mHz-8kHz (30min measurement)
<2.0MHz<1.9MHz (2.26MHz specifications)
Equivalent Differential OPD error (rms) for 2 stars sep-arated by 1arcmin and observed with a 200m baseline
0.5nm (0.6nm specifications)
Table 15 Summary of the laser stabilization system performance. The performance indicated here havebeen measured with the second laser head and the non optimized control loop parameters(November 2005 measurements), they represent a worst case.
Characteristics Performance
Doc VLT-SPE-ESO-15731-3884Issue 1.0Date 26 June 2006Page 58 of 79
Test of the laser frequency stabi-lization system of the PRIMA Metrology System
TAC.BLOCK1.NAME SynchroTAC.BLOCK1.PARAM 0.001, "TASK", "INTERN"# AI Sampling period in sec: 0.0 = use TIM Sampling Period
TAC.BLOCK2.TYPE MPV955TAC.BLOCK2.NAME AOTAC.BLOCK2.PARAM 0.0, 2, "INTERN"# AO Sampling period in sec: 0.0 = use TIM Sampling Period
TAC.BLOCK3.TYPE ProbeTAC.BLOCK3.NAME ScopeTAC.BLOCK3.PARAM 0.1, 4# Probe Sampling period in sec: 0.0 = use TIM Sampling Period
TAC.BLOCK4.TYPE MonitorTAC.BLOCK4.NAME MonitorTAC.BLOCK4.PARAM 0.1, 3# Monitor Sampling period in sec
TAC.BLOCK5.TYPE PID2TAC.BLOCK5.NAME PID2PiezoTAC.BLOCK5.PARAM 0.000938, 1.0, 9.0, 450.0, 0.0, -10.0, 10.0, 10.0# ARW 0.7*Tlock# Pweight 1# P k*Tlock# I 1/Tlock# D 0# Ulow -10# Uhigh 10# Diff.FilterConst 10
TAC.BLOCK6.TYPE PID2TAC.BLOCK6.NAME PID2TempTAC.BLOCK6.PARAM 0.63, 1.0, -0.000034, 190.0, 0.0, -10.0, 10.0, 10.0# ARW 0.7*Tlock

Doc VLT-SPE-ESO-15731-3884Issue 1.0Date 26 June 2006Page 59 of 79
Test of the laser frequency stabi-lization system of the PRIMA Metrology System
# Pweight 1# P k*Tlock# I 1/Tlock# D 0# Ulow -10# Uhigh 10# Diff.FilterConst 10
TAC.BLOCK7.TYPE ConstantTAC.BLOCK7.NAME Constant1TAC.BLOCK7.PARAM 0.0
TAC.BLOCK8.TYPE ProductTAC.BLOCK8.NAME ProductPz
# AOOffset = Offset added after AnalogTF block
TAC.BLOCK9.TYPE ConstantTAC.BLOCK9.NAME AOOffsetTAC.BLOCK9.PARAM 0.0
TAC.BLOCK10.TYPE ConstantTAC.BLOCK10.NAME ConstantScalingTAC.BLOCK10.PARAM 0.05
TAC.BLOCK11.TYPE SumTAC.BLOCK11.NAME Sum1
TAC.BLOCK12.TYPE SumTAC.BLOCK12.NAME Sum2
TAC.BLOCK13.TYPE ManualSwitchTAC.BLOCK13.NAME SwitchTempTAC.BLOCK13.PARAM 1, 2# The SwitchTemp block has two inputs: 0.0 and the output of AnalogTF

Doc VLT-SPE-ESO-15731-3884Issue 1.0Date 26 June 2006Page 60 of 79
Test of the laser frequency stabi-lization system of the PRIMA Metrology System
# By default, input "1" (0.0) is used.
TAC.BLOCK14.TYPE ManualSwitchTAC.BLOCK14.NAME SwitchPiezoTAC.BLOCK14.PARAM 1, 2# The SwitchLoops block switchs both loops on or off
TAC.BLOCK15.TYPE ConstantTAC.BLOCK15.NAME plotEnableTAC.BLOCK15.PARAM 1.0
## LINKS#
TAC.LINK1.NAME SwitchPzInput1TAC.LINK1.SOURCE.NAME Constant1TAC.LINK1.SOURCE.PORT 1TAC.LINK1.DEST.NAME SwitchPiezoTAC.LINK1.DEST.PORT 1
TAC.LINK2.NAME SwitchPzInput2TAC.LINK2.SOURCE.NAME SynchroTAC.LINK2.SOURCE.PORT 1TAC.LINK2.DEST.NAME SwitchPiezoTAC.LINK2.DEST.PORT 2
TAC.LINK3.NAME PID2PzInput1TAC.LINK3.SOURCE.NAME SwitchPiezoTAC.LINK3.SOURCE.PORT 1TAC.LINK3.DEST.NAME PID2PiezoTAC.LINK3.DEST.PORT 1
TAC.LINK4.NAME PID2PzInput2TAC.LINK4.SOURCE.NAME Constant1

Doc VLT-SPE-ESO-15731-3884Issue 1.0Date 26 June 2006Page 61 of 79
Test of the laser frequency stabi-lization system of the PRIMA Metrology System
TAC.LINK4.SOURCE.PORT 1TAC.LINK4.DEST.NAME PID2PiezoTAC.LINK4.DEST.PORT 2
TAC.LINK5.NAME PIDPzOutputTAC.LINK5.SOURCE.NAME PID2PiezoTAC.LINK5.SOURCE.PORT 1TAC.LINK5.DEST.NAME AOTAC.LINK5.DEST.PORT 1
TAC.LINK6.NAME Sum1Input1TAC.LINK6.SOURCE.NAME SynchroTAC.LINK6.SOURCE.PORT 1TAC.LINK6.DEST.NAME Sum1TAC.LINK6.DEST.PORT 1
TAC.LINK7.NAME Sum1Input2TAC.LINK7.SOURCE.NAME ProductPzTAC.LINK7.SOURCE.PORT 1TAC.LINK7.DEST.NAME Sum1TAC.LINK7.DEST.PORT 2
TAC.LINK8.NAME ProdPzInput1TAC.LINK8.SOURCE.NAME PID2PiezoTAC.LINK8.SOURCE.PORT 1TAC.LINK8.DEST.NAME ProductPzTAC.LINK8.DEST.PORT 1
TAC.LINK9.NAME ProdPzInput2TAC.LINK9.SOURCE.NAME ConstantScalingTAC.LINK9.SOURCE.PORT 1TAC.LINK9.DEST.NAME ProductPzTAC.LINK9.DEST.PORT 2
TAC.LINK10.NAME SwitchTmInput1

Doc VLT-SPE-ESO-15731-3884Issue 1.0Date 26 June 2006Page 62 of 79
Test of the laser frequency stabi-lization system of the PRIMA Metrology System
TAC.LINK10.SOURCE.NAME Constant1TAC.LINK10.SOURCE.PORT 1TAC.LINK10.DEST.NAME SwitchTempTAC.LINK10.DEST.PORT 1
TAC.LINK11.NAME SwitchTmInput2TAC.LINK11.SOURCE.NAME Sum1TAC.LINK11.SOURCE.PORT 1TAC.LINK11.DEST.NAME SwitchTempTAC.LINK11.DEST.PORT 2
TAC.LINK12.NAME PID2TmInput1TAC.LINK12.SOURCE.NAME SwitchTempTAC.LINK12.SOURCE.PORT 1TAC.LINK12.DEST.NAME PID2TempTAC.LINK12.DEST.PORT 1
TAC.LINK13.NAME PID2TmInput2TAC.LINK13.SOURCE.NAME Constant1TAC.LINK13.SOURCE.PORT 1TAC.LINK13.DEST.NAME PID2TempTAC.LINK13.DEST.PORT 2
TAC.LINK14.NAME Sum2Input1TAC.LINK14.SOURCE.NAME AOOffsetTAC.LINK14.SOURCE.PORT 1TAC.LINK14.DEST.NAME Sum2TAC.LINK14.DEST.PORT 1
TAC.LINK15.NAME Sum2Input2TAC.LINK15.SOURCE.NAME PID2TempTAC.LINK15.SOURCE.PORT 1TAC.LINK15.DEST.NAME Sum2TAC.LINK15.DEST.PORT 2

Doc VLT-SPE-ESO-15731-3884Issue 1.0Date 26 June 2006Page 63 of 79
Test of the laser frequency stabi-lization system of the PRIMA Metrology System
TAC.LINK16.NAME Sum2OutputTAC.LINK16.SOURCE.NAME Sum2TAC.LINK16.SOURCE.PORT 1TAC.LINK16.DEST.NAME AOTAC.LINK16.DEST.PORT 2
TAC.LINK17.NAME MONITORInput1TAC.LINK17.SOURCE.NAME SynchroTAC.LINK17.SOURCE.PORT 1TAC.LINK17.DEST.NAME MonitorTAC.LINK17.DEST.PORT 1
TAC.LINK18.NAME MONITORInput2TAC.LINK18.SOURCE.NAME PID2PiezoTAC.LINK18.SOURCE.PORT 1TAC.LINK18.DEST.NAME MonitorTAC.LINK18.DEST.PORT 2
TAC.LINK19.NAME MONITORInput3TAC.LINK19.SOURCE.NAME Sum2TAC.LINK19.SOURCE.PORT 1TAC.LINK19.DEST.NAME MonitorTAC.LINK19.DEST.PORT 3
TAC.LINK23.NAME ScopeInput0TAC.LINK23.SOURCE.NAME plotEnableTAC.LINK23.SOURCE.PORT 1TAC.LINK23.DEST.NAME ScopeTAC.LINK23.DEST.PORT 1
TAC.LINK20.NAME ScopeInput1TAC.LINK20.SOURCE.NAME SynchroTAC.LINK20.SOURCE.PORT 1TAC.LINK20.DEST.NAME ScopeTAC.LINK20.DEST.PORT 2
Doc VLT-SPE-ESO-15731-3884Issue 1.0Date 26 June 2006Page 64 of 79
Test of the laser frequency stabi-lization system of the PRIMA Metrology System
TAC.LINK21.NAME ScopeInput2TAC.LINK21.SOURCE.NAME PID2PiezoTAC.LINK21.SOURCE.PORT 1TAC.LINK21.DEST.NAME ScopeTAC.LINK21.DEST.PORT 3
TAC.LINK22.NAME ScopeInput3TAC.LINK22.SOURCE.NAME Sum2TAC.LINK22.SOURCE.PORT 1TAC.LINK22.DEST.NAME ScopeTAC.LINK22.DEST.PORT 4
#TAC.LINK8.NAME Dummy#TAC.LINK8.SOURCE.NAME AnalogTF#TAC.LINK8.SOURCE.PORT 1#TAC.LINK8.DEST.NAME Monitor#TAC.LINK8.DEST.PORT 2
12.2 pmlss_Lightwave.tac## BLOCKS##!!!!!!!!!!!!! CLOSED LOOP !!!!!!!!!!!!!## The control loop's for the AO#0 (Piezo) and AO#1 (Temp.)# can be switched OFF or ON separately.# A offset is always added to the AO#1
# TAC.BLOCK0.TYPE AuxClock# TAC.BLOCK0.NAME Synchro# Auxiliary Clock of CPU board (trigger period can not be changed!)
TAC.BLOCK1.TYPE VMIVME3123TAC.BLOCK1.NAME Synchro

Doc VLT-SPE-ESO-15731-3884Issue 1.0Date 26 June 2006Page 65 of 79
Test of the laser frequency stabi-lization system of the PRIMA Metrology System
TAC.BLOCK1.PARAM 0.001, "TASK", "INTERN"# AI Sampling period in sec: 0.0 = use TIM Sampling Period
TAC.BLOCK2.TYPE MPV955TAC.BLOCK2.NAME AOTAC.BLOCK2.PARAM 0.0, 2, "INTERN"# AO Sampling period in sec: 0.0 = use TIM Sampling Period
TAC.BLOCK3.TYPE ProbeTAC.BLOCK3.NAME ScopeTAC.BLOCK3.PARAM 1.0, 4# Probe Sampling period in sec: 0.0 = use TIM Sampling Period
TAC.BLOCK4.TYPE MonitorTAC.BLOCK4.NAME MonitorTAC.BLOCK4.PARAM 0.1, 3# Monitor Sampling period in sec
TAC.BLOCK5.TYPE PID2TAC.BLOCK5.NAME PID2PiezoTAC.BLOCK5.PARAM 0.000938, 1.0, 9.0, 450.0, 0.0, -10.0, 10.0, 10.0# ARW 0.7*Tlock# Pweight 1# P k*Tlock# I 1/Tlock# D 0# Ulow -10# Uhigh 10# Diff.FilterConst 10
TAC.BLOCK6.TYPE PID2TAC.BLOCK6.NAME PID2TempTAC.BLOCK6.PARAM 0.63, 1.0, 0.000034, 190.0, 0.0, -10.0, 10.0, 10.0# ARW 0.7*Tlock# Pweight 1

Doc VLT-SPE-ESO-15731-3884Issue 1.0Date 26 June 2006Page 66 of 79
Test of the laser frequency stabi-lization system of the PRIMA Metrology System
# P k*Tlock# I 1/Tlock# D 0# Ulow -10# Uhigh 10# Diff.FilterConst 10
TAC.BLOCK7.TYPE ConstantTAC.BLOCK7.NAME Constant1TAC.BLOCK7.PARAM 0.0
TAC.BLOCK8.TYPE ProductTAC.BLOCK8.NAME ProductPz
# AOOffset = Offset added after AnalogTF block
TAC.BLOCK9.TYPE ConstantTAC.BLOCK9.NAME AOOffsetTAC.BLOCK9.PARAM 0.0
TAC.BLOCK10.TYPE ConstantTAC.BLOCK10.NAME ConstantScalingTAC.BLOCK10.PARAM 0.05
TAC.BLOCK11.TYPE SumTAC.BLOCK11.NAME Sum1
TAC.BLOCK12.TYPE SumTAC.BLOCK12.NAME Sum2
TAC.BLOCK13.TYPE ManualSwitchTAC.BLOCK13.NAME SwitchTempTAC.BLOCK13.PARAM 1, 2# The SwitchTemp block has two inputs: 0.0 and the output of AnalogTF# By default, input "1" (0.0) is used.

Doc VLT-SPE-ESO-15731-3884Issue 1.0Date 26 June 2006Page 67 of 79
Test of the laser frequency stabi-lization system of the PRIMA Metrology System
TAC.BLOCK14.TYPE ManualSwitchTAC.BLOCK14.NAME SwitchPiezoTAC.BLOCK14.PARAM 1, 2# The SwitchLoops block switchs both loops on or off
TAC.BLOCK15.TYPE ConstantTAC.BLOCK15.NAME plotEnableTAC.BLOCK15.PARAM 1.0
## LINKS#
TAC.LINK1.NAME SwitchPzInput1TAC.LINK1.SOURCE.NAME Constant1TAC.LINK1.SOURCE.PORT 1TAC.LINK1.DEST.NAME SwitchPiezoTAC.LINK1.DEST.PORT 1
TAC.LINK2.NAME SwitchPzInput2TAC.LINK2.SOURCE.NAME SynchroTAC.LINK2.SOURCE.PORT 1TAC.LINK2.DEST.NAME SwitchPiezoTAC.LINK2.DEST.PORT 2
TAC.LINK3.NAME PID2PzInput1TAC.LINK3.SOURCE.NAME SwitchPiezoTAC.LINK3.SOURCE.PORT 1TAC.LINK3.DEST.NAME PID2PiezoTAC.LINK3.DEST.PORT 1
TAC.LINK4.NAME PID2PzInput2TAC.LINK4.SOURCE.NAME Constant1TAC.LINK4.SOURCE.PORT 1
Doc VLT-SPE-ESO-15731-3884Issue 1.0Date 26 June 2006Page 68 of 79
Test of the laser frequency stabi-lization system of the PRIMA Metrology System
TAC.LINK4.DEST.NAME PID2PiezoTAC.LINK4.DEST.PORT 2
TAC.LINK5.NAME PIDPzOutputTAC.LINK5.SOURCE.NAME PID2PiezoTAC.LINK5.SOURCE.PORT 1TAC.LINK5.DEST.NAME AOTAC.LINK5.DEST.PORT 1
TAC.LINK6.NAME Sum1Input1TAC.LINK6.SOURCE.NAME SynchroTAC.LINK6.SOURCE.PORT 1TAC.LINK6.DEST.NAME Sum1TAC.LINK6.DEST.PORT 1
TAC.LINK7.NAME Sum1Input2TAC.LINK7.SOURCE.NAME ProductPzTAC.LINK7.SOURCE.PORT 1TAC.LINK7.DEST.NAME Sum1TAC.LINK7.DEST.PORT 2
TAC.LINK8.NAME ProdPzInput1TAC.LINK8.SOURCE.NAME PID2PiezoTAC.LINK8.SOURCE.PORT 1TAC.LINK8.DEST.NAME ProductPzTAC.LINK8.DEST.PORT 1
TAC.LINK9.NAME ProdPzInput2TAC.LINK9.SOURCE.NAME ConstantScalingTAC.LINK9.SOURCE.PORT 1TAC.LINK9.DEST.NAME ProductPzTAC.LINK9.DEST.PORT 2
TAC.LINK10.NAME SwitchTmInput1TAC.LINK10.SOURCE.NAME Constant1

Doc VLT-SPE-ESO-15731-3884Issue 1.0Date 26 June 2006Page 69 of 79
Test of the laser frequency stabi-lization system of the PRIMA Metrology System
TAC.LINK10.SOURCE.PORT 1TAC.LINK10.DEST.NAME SwitchTempTAC.LINK10.DEST.PORT 1
TAC.LINK11.NAME SwitchTmInput2TAC.LINK11.SOURCE.NAME Sum1TAC.LINK11.SOURCE.PORT 1TAC.LINK11.DEST.NAME SwitchTempTAC.LINK11.DEST.PORT 2
TAC.LINK12.NAME PID2TmInput1TAC.LINK12.SOURCE.NAME SwitchTempTAC.LINK12.SOURCE.PORT 1TAC.LINK12.DEST.NAME PID2TempTAC.LINK12.DEST.PORT 1
TAC.LINK13.NAME PID2TmInput2TAC.LINK13.SOURCE.NAME Constant1TAC.LINK13.SOURCE.PORT 1TAC.LINK13.DEST.NAME PID2TempTAC.LINK13.DEST.PORT 2
TAC.LINK14.NAME Sum2Input1TAC.LINK14.SOURCE.NAME AOOffsetTAC.LINK14.SOURCE.PORT 1TAC.LINK14.DEST.NAME Sum2TAC.LINK14.DEST.PORT 1
TAC.LINK15.NAME Sum2Input2TAC.LINK15.SOURCE.NAME PID2TempTAC.LINK15.SOURCE.PORT 1TAC.LINK15.DEST.NAME Sum2TAC.LINK15.DEST.PORT 2
TAC.LINK16.NAME Sum2Output
Doc VLT-SPE-ESO-15731-3884Issue 1.0Date 26 June 2006Page 70 of 79
Test of the laser frequency stabi-lization system of the PRIMA Metrology System
TAC.LINK16.SOURCE.NAME Sum2TAC.LINK16.SOURCE.PORT 1TAC.LINK16.DEST.NAME AOTAC.LINK16.DEST.PORT 2
TAC.LINK17.NAME MONITORInput1TAC.LINK17.SOURCE.NAME SynchroTAC.LINK17.SOURCE.PORT 1TAC.LINK17.DEST.NAME MonitorTAC.LINK17.DEST.PORT 1
TAC.LINK18.NAME MONITORInput2TAC.LINK18.SOURCE.NAME PID2PiezoTAC.LINK18.SOURCE.PORT 1TAC.LINK18.DEST.NAME MonitorTAC.LINK18.DEST.PORT 2
TAC.LINK19.NAME MONITORInput3TAC.LINK19.SOURCE.NAME Sum2TAC.LINK19.SOURCE.PORT 1TAC.LINK19.DEST.NAME MonitorTAC.LINK19.DEST.PORT 3
TAC.LINK23.NAME ScopeInput0TAC.LINK23.SOURCE.NAME plotEnableTAC.LINK23.SOURCE.PORT 1TAC.LINK23.DEST.NAME ScopeTAC.LINK23.DEST.PORT 1
TAC.LINK20.NAME ScopeInput1TAC.LINK20.SOURCE.NAME SynchroTAC.LINK20.SOURCE.PORT 1TAC.LINK20.DEST.NAME ScopeTAC.LINK20.DEST.PORT 2
Doc VLT-SPE-ESO-15731-3884Issue 1.0Date 26 June 2006Page 71 of 79
Test of the laser frequency stabi-lization system of the PRIMA Metrology System
TAC.LINK21.NAME ScopeInput2TAC.LINK21.SOURCE.NAME PID2PiezoTAC.LINK21.SOURCE.PORT 1TAC.LINK21.DEST.NAME ScopeTAC.LINK21.DEST.PORT 3
TAC.LINK22.NAME ScopeInput3TAC.LINK22.SOURCE.NAME Sum2TAC.LINK22.SOURCE.PORT 1TAC.LINK22.DEST.NAME ScopeTAC.LINK22.DEST.PORT 4
#TAC.LINK8.NAME Dummy#TAC.LINK8.SOURCE.NAME AnalogTF#TAC.LINK8.SOURCE.PORT 1#TAC.LINK8.DEST.NAME Monitor#TAC.LINK8.DEST.PORT 2

Doc VLT-SPE-ESO-15731-3884Issue 1.0Date 26 June 2006Page 72 of 79
Test of the laser frequency stabi-lization system of the PRIMA Metrology System
13 Appendix B: frequency measurement with a self-referenced optical frequency comb generator
The spectrum of the frequency comb generator is shown in Figure 33. The frequency of one mode,fn, of the comb depends on three parameters:
• the repetition rate, frep, of the pulsed laser which is also the frequency separation between two adjacent modes of the comb;
• the frequency offset δ which is the frequency of the mode the closest to the 0Hz frequency (of course these modes are not emitted by the laser but the frequency comb can be theoret-ically assumed to be infinite);
• the number of the mode, n, the first mode being the closest to the 0Hz frequency.
The frequency of the mode number n is given by
. (13.0-1)
The frequency of the Nd:YAG laser can be written
(13.0-2)
where fn is the frequency of the closest mode of the frequency comb and ∆f the frequency differ-ence. The frequency of the beat signal generated between the frequency comb and the Nd:YAGlaser gives the absolute value of ∆f but the sign remains unknown. The sign of ∆f is deduced bymonitoring ∆f while the repetition rate of the comb is tunned. If ∆f is positive, i.e the frequency ofthe Nd:YAG is larger than the frequency of the mode of the comb, ∆f varies in the opposite direc-tion of the repetition rate. If ∆f is negative, ∆f increases with frep and decreases with frep.
Figure 51 Frequency comb and frequency of one mode of the comb. The spectrum of the comb iscomposed of equally spaced modes. The frequency of one mode is equal to the number ofthe mode time the frequency separation of two modes (equal to the repetition rate of thepulsed laser) plus the frequency offset of the first mode from the frequency 0.
fn n frep× δ+=
fNd:YAG fn ∆f+=

Doc VLT-SPE-ESO-15731-3884Issue 1.0Date 26 June 2006Page 73 of 79
Test of the laser frequency stabi-lization system of the PRIMA Metrology System
In Menlo’s comb the offset frequency is measured by the frequency of the beat signal generatedbetween the mode number 2n of the comb and the mode n whose frequency is doubled with a nonlinear cristal
(13.0-3)
The sign of the offset frequency is not known. To get the sign of δ, one uses the informationobtained on the sign of ∆f and monitors its absolute value as the offset frequency of the comb istuned. For ∆f positive, if the absolute value of δ increases ∆f decreases if δ is positive (translationof the comb toward the high frequencies) and decereases if δ is negative (translation of the combtoward the low frequencies). The same reasoning can be applied for ∆f negative, the results arethen inverted.The value of n is deduced from the wavelength given by a wavemeter. The accuracy of thewavemeter has to better than half of the repetition rate. In the case of the frequency comb operatedat MPQ the repetition rate is usually close to 100MHz. Consequently the accuracy has to betterthan 50MHz which is satisfied in theory by a Burleigh WA-1500 infrared wavemeter.
fbeat signal f2n 2 fn×–= 2n frep× δ 2 n frep× δ+( )×–+ δ= =
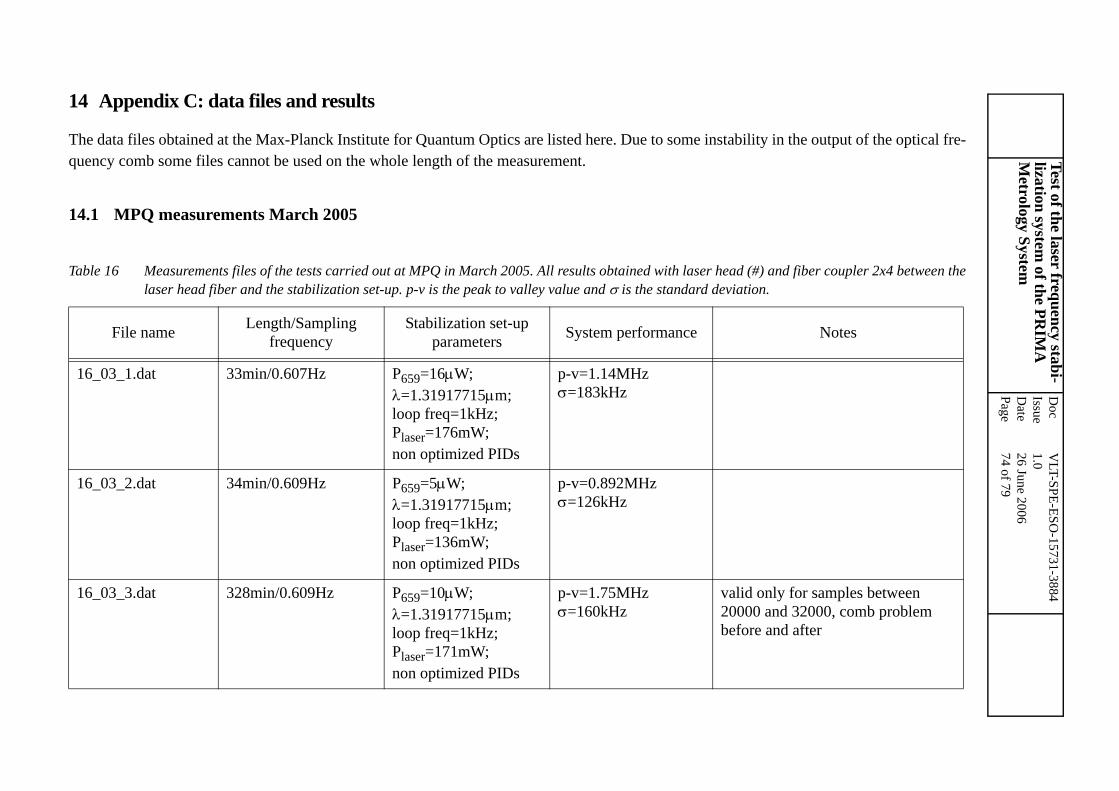
Doc
VLT-SPE-ESO
-15731-3884Issue
1.0D
ate26 June 2006
Page74 of 79
Test of the laser frequency stabi-lization system
of the PRIM
A
Metrology System
14 Appendix C: data files and results
Th bility in the output of the optical fre-qu
14
Ta ad (#) and fiber coupler 2x4 between theiation.
Notes
1
1
1 alid only for samples between 0000 and 32000, comb problem efore and after
e data files obtained at the Max-Planck Institute for Quantum Optics are listed here. Due to some instaency comb some files cannot be used on the whole length of the measurement.
.1 MPQ measurements March 2005
ble 16 Measurements files of the tests carried out at MPQ in March 2005. All results obtained with laser helaser head fiber and the stabilization set-up. p-v is the peak to valley value and σ is the standard dev
File name Length/Sampling frequency
Stabilization set-up parameters System performance
6_03_1.dat 33min/0.607Hz P659=16µW;λ=1.31917715µm;loop freq=1kHz;Plaser=176mW;non optimized PIDs
p-v=1.14MHzσ=183kHz
6_03_2.dat 34min/0.609Hz P659=5µW;λ=1.31917715µm;loop freq=1kHz;Plaser=136mW;non optimized PIDs
p-v=0.892MHzσ=126kHz
6_03_3.dat 328min/0.609Hz P659=10µW;λ=1.31917715µm;loop freq=1kHz;Plaser=171mW;non optimized PIDs
p-v=1.75MHzσ=160kHz
v2b

Doc
VLT-SPE-ESO
-15731-3884Issue
1.0D
ate26 June 2006
Page75 of 79
Test of the laser frequency stabi-lization system
of the PRIM
A
Metrology System
1 nly temperature loop is closed, alid for samples 700-1444
1 emperature step response, not sable, drift larger than band-pass lter before the frequency counter
1 emperature step response, not sable, drift larger than band-pass lter before the frequency counter
1e
op error signal and corresponding eat frequency (for a sine excitation f the laser piezo)
1 op error signal and corresponding eat frequency open and closed loop
Table 16 Measurements files of the tests carried out at MPQ in March 2005. All results obtained with laser head (#) and fiber coupler 2x4 between thelaser head fiber and the stabilization set-up. p-v is the peak to valley value and σ is the standard deviation.
Notes
7_03_1.dat 20min/0.609Hz P659=9.5µW;λ=1.3191771µm;loop freq=1kHz;Plaser=171mW;non optimized PIDs
p-v=1.39MHzσ=206kHz
ov
7_03_2.dat Tufi
7_03_3.dat Tufi
7_03_4.datrror_1.txt
->conversion factor error signal before lock-in/frequency drift=280mV/GHz
lobo
7_03_5.dat lob
File name Length/Sampling frequency
Stabilization set-up parameters System performance

Doc
VLT-SPE-ESO
-15731-3884Issue
1.0D
ate26 June 2006
Page76 of 79
Test of the laser frequency stabi-lization system
of the PRIM
A
Metrology System
1 nly temperature loop is closed
1 alid for samples 1-25000
1e
pen loop measuremnt of beat freq/nd error signal
1 eek-end measurements,
Table 16 Measurements files of the tests carried out at MPQ in March 2005. All results obtained with laser head (#) and fiber coupler 2x4 between thelaser head fiber and the stabilization set-up. p-v is the peak to valley value and σ is the standard deviation.
Notes
7_03_6.dat 55min/0.606Hz P659=9.5µW;λ=1.3191771µm;loop freq=1kHz;Plaser=171mW;EOM driver out-put=9V in 50Ω;RAM on lock-in=-54dBm;non optimized PIDs
p-v=1.57MHzσ=243kHz
o
7_03_7.dat 687min/0.606Hz P659=9.5µW;λ=1.3191771µm;loop freq=1kHz;Plaser=171mW;EOM driver out-put=9V in 50Ω;RAM on lock-in=-54dBm;non optimized PIDs
p-v=1.26MHzσ=178kHz
v
8_03_1.datrror3.txt
oa
8_03_2.dat 65h/0.607Hz P659=9.5µW;λ=1.3191771µm;loop freq=1kHz;non optimized PIDs
p-v=1.59MHzσ=231kHz
w
File name Length/Sampling frequency
Stabilization set-up parameters System performance
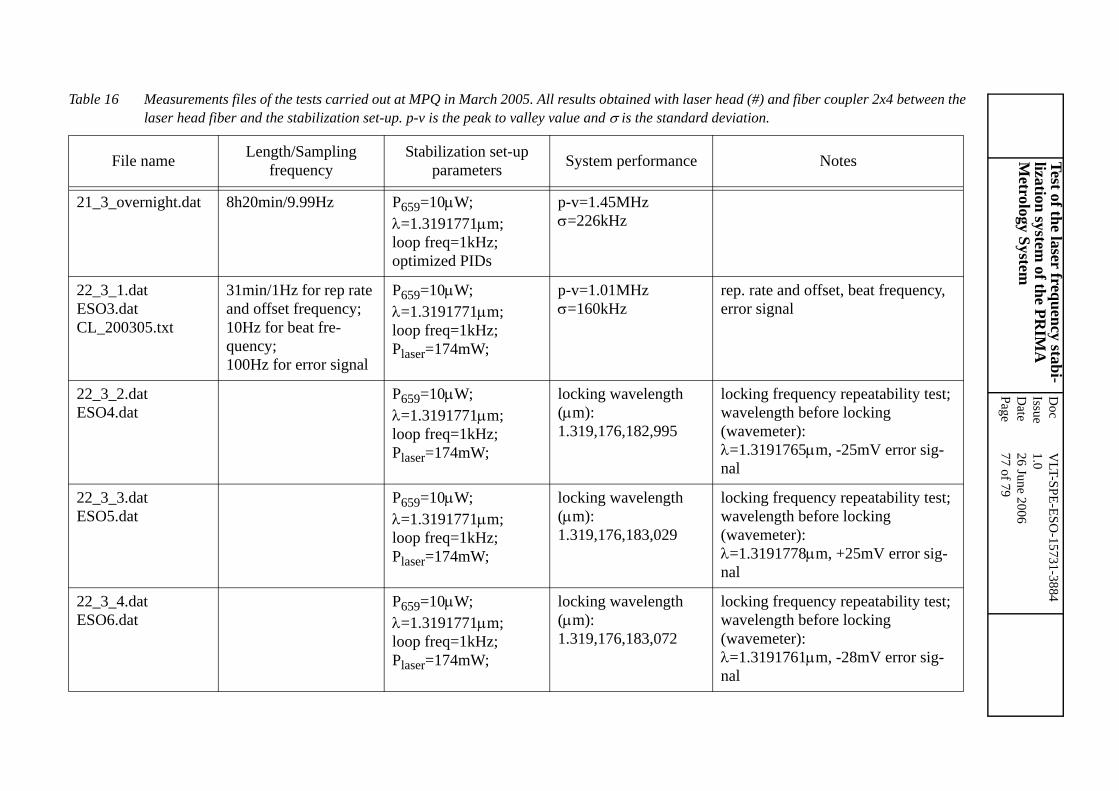
Doc
VLT-SPE-ESO
-15731-3884Issue
1.0D
ate26 June 2006
Page77 of 79
Test of the laser frequency stabi-lization system
of the PRIM
A
Metrology System
2
2EC
p. rate and offset, beat frequency, rror signal
2E
cking frequency repeatability test; avelength before locking avemeter):
=1.3191765µm, -25mV error sig-al
2E
cking frequency repeatability test; avelength before locking avemeter):
=1.3191778µm, +25mV error sig-al
2E
cking frequency repeatability test; avelength before locking avemeter):
=1.3191761µm, -28mV error sig-al
Table 16 Measurements files of the tests carried out at MPQ in March 2005. All results obtained with laser head (#) and fiber coupler 2x4 between thelaser head fiber and the stabilization set-up. p-v is the peak to valley value and σ is the standard deviation.
Notes
1_3_overnight.dat 8h20min/9.99Hz P659=10µW;λ=1.3191771µm;loop freq=1kHz;optimized PIDs
p-v=1.45MHzσ=226kHz
2_3_1.datSO3.datL_200305.txt
31min/1Hz for rep rate and offset frequency;10Hz for beat fre-quency;100Hz for error signal
P659=10µW;λ=1.3191771µm;loop freq=1kHz;Plaser=174mW;
p-v=1.01MHzσ=160kHz
ree
2_3_2.datSO4.dat
P659=10µW;λ=1.3191771µm;loop freq=1kHz;Plaser=174mW;
locking wavelength (µm):1.319,176,182,995
low(wλn
2_3_3.datSO5.dat
P659=10µW;λ=1.3191771µm;loop freq=1kHz;Plaser=174mW;
locking wavelength (µm): 1.319,176,183,029
low(wλn
2_3_4.datSO6.dat
P659=10µW;λ=1.3191771µm;loop freq=1kHz;Plaser=174mW;
locking wavelength (µm): 1.319,176,183,072
low(wλn
File name Length/Sampling frequency
Stabilization set-up parameters System performance

Doc
VLT-SPE-ESO
-15731-3884Issue
1.0D
ate26 June 2006
Page78 of 79
Test of the laser frequency stabi-lization system
of the PRIM
A
Metrology System
2E
cking frequency repeatability test; avelength before locking avemeter):
=1.3191783µm, +24mV error sig-al
2222
avemeter calibration:=1,319.176181571µm measured ith comb (correspondin to the dine transition P(49)6-
=659.5881nm) instead of =1.3191771µm indicated by avemeter
c_
oise measured when Nd:YAG is cked to the comb at the center of e transition, measures the detec-on noise
2 alid for samples 150-1107
2
Table 16 Measurements files of the tests carried out at MPQ in March 2005. All results obtained with laser head (#) and fiber coupler 2x4 between thelaser head fiber and the stabilization set-up. p-v is the peak to valley value and σ is the standard deviation.
Notes
2_3_5.datSO7.dat
P659=10µW;λ=1.3191771µm;loop freq=1kHz;Plaser=174mW;
locking wavelength (µm):1.319,176,183,432
low(wλn
2_3_6.dat2_3_7.dat2_3_8.dat2_3_9.dat
Wλwio6λw
omb_locked_noise22_03_05.txt
nlothti
2_3_10 26min/0.607Hz P659=1.8µW;λ=1.3191771µm;loop freq=1kHz;
p-v=1.07MHzσ=157kHz
v
2_3_11.dat 16min/0.6Hz P659=6µW;λ=1.3191771µm;loop freq=1kHz;
p-v=0.781MHzσ=138kHz
File name Length/Sampling frequency
Stabilization set-up parameters System performance

Doc
VLT-SPE-ESO
-15731-3884Issue
1.0D
ate26 June 2006
Page79 of 79
Test of the laser frequency stabi-lization system
of the PRIM
A
Metrology System
14.2 MPQ measurements November 2005
Ta r head (#) and no fiber coupler between
Notes
I-sa
valid only for sample 1-2500
I-sa
valid only for sample 1-20000
I-sa
valid only for sample 1-140000
Naa
valid only for sample 50000-700000
Nig
without EOM temperature stabili-zation, without polarizers,valid only for sample12500-38000
Nvt
with EOM temperature stabiliza-tion , without polarizers, valid only for sample 1000-9000
ble 17 Measurements files of the tests carried out at MPQ in November 2005. All results obtained with lasethe laser head fiber and the stabilization set-up.
File name Length/Sampling frequency
Stabilization set-up parameters System performance
tab_NdYAG_1s_gte_1_111105.dat
68min/0.6Hz P659=6µW;loop freq=1kHz;
p-v=1.41MHzσ=249kHz
tab_NdYAG_1s_gte_2_111105.dat
9h/0.609Hz P659=6µW;loop freq=1kHz;
p-v=2.48MHzσ=259kHz
tab_NdYAG_1s_gte_1_141105.dat
64h/0.609 P659=6µW;loop freq=1kHz;
p-v=5.51MHzσ=743kHz
dYag_100msec_gte_FXM_161105.dt
18h/10Hz P659=10µW;loop freq=1kHz;
p-v=4.55MHzσ=808kHz
dYag_1sec_HP_nht_171105.dat
11h40min/0.607Hz P659=10µW;loop freq=1kHz;
p-v=4.7MHzσ=1400kHz
dYag_1sec_HP_oernight_181105.da
3h40min/0.607Hz P659=10µW;loop freq=1kHz;
p-v=3.27MHzσ=269kHz